UNITED STATES
SECURITIES AND EXCHANGE COMMISSION
Washington, D.C. 20549
FORM N-CSR
CERTIFIED SHAREHOLDER REPORT OF REGISTERED
MANAGEMENT INVESTMENT COMPANIES
Investment Company Act file number | 811-09054 |
|
CREDIT SUISSE OPPORTUNITY FUNDS |
(Exact name of registrant as specified in charter) |
|
Eleven Madison Avenue, New York, New York | | 10010 |
(Address of principal executive offices) | | (Zip code) |
|
John G. Popp Credit Suisse Opportunity Funds Eleven Madison Avenue New York, New York 10010 |
(Name and address of agent for service) |
|
Registrant’s telephone number, including area code: | (212) 325-2000 | |
|
Date of fiscal year end: | October 31st | |
|
Date of reporting period: | November 1, 2018 to October 31, 2019 | |
| | | | | | | | |
Item 1. Reports to Stockholders.

CREDIT SUISSE FUNDS
Annual Report
October 31, 2019
n CREDIT SUISSE
FLOATING RATE HIGH INCOME FUND
Beginning on January 1, 2021, as permitted by regulations adopted by the Securities and Exchange Commission, paper copies of the Fund's shareholder reports will no longer be sent by mail, unless you specifically request paper copies of the reports from Credit Suisse Asset Management, LLC or from your financial intermediary, such as a broker-dealer or bank. Instead, the reports will be made available on a website, and you will be notified by mail each time a report is posted and provided with a website link to access the report.
You may elect to receive all future reports in paper free of charge. If you hold accounts directly with the Fund, you can call 877-870-2874 to inform Credit Suisse Asset Management, LLC that you wish to continue receiving paper copies of your shareholder reports. If you hold accounts through a financial intermediary, you can contact your financial intermediary to request that you continue to receive paper copies of your shareholder reports. Please note that not all financial intermediaries may offer this service. Your election to receive reports in paper will apply to all funds advised by Credit Suisse Asset Management, LLC, or all funds held with your financial intermediary, as applicable.
If you already elected to receive shareholder reports electronically, you will not be affected by this change and you need not take any action. You may elect to receive electronic delivery of shareholder reports and other communications by: (i) accessing the Credit Suisse Asset Management, LLC website at www.credit-suisse.com/us/funds and logging into your accounts, if you hold accounts directly with the Fund, or (ii) contacting your financial intermediary, if you hold accounts through a financial intermediary. Please note that not all financial intermediaries may offer this service.
The Fund's investment objectives, risks, charges and expenses (which should be considered carefully before investing), and more complete information about the Fund, are provided in the Prospectus, which should be read carefully before investing. You may obtain additional copies by calling 877-870-2874 or by visiting our website at www.credit-suisse.com/us/funds.
Credit Suisse Securities (USA) LLC, Distributor, is located at Eleven Madison Avenue, New York, NY 10010. Credit Suisse Funds are advised by Credit Suisse Asset Management, LLC.
Investors in the Credit Suisse Funds should be aware that they may be eligible to purchase Class I shares (where offered) directly or through certain intermediaries. Such shares are not subject to a sales charge. Investors in the Credit Suisse Funds should also be aware that they may be eligible for a reduction or waiver of the sales charge with respect to Class A or C shares (where offered). For more information, please review the relevant prospectuses or consult your financial representative.
Fund shares are not deposits or other obligations of Credit Suisse Asset Management, LLC ("Credit Suisse") or any affiliate, are not FDIC-insured and are not guaranteed by Credit Suisse or any affiliate. Fund investments are subject to investment risks, including loss of your investment.
Credit Suisse Floating Rate High Income Fund
Annual Investment Adviser's Report
October 31, 2019 (unaudited)
November 19, 2019
Dear Shareholder:
We are pleased to present this Annual Report covering the activities of the Credit Suisse Floating Rate High Income Fund (the "Fund") for the 12-month period ended October 31, 2019.
Performance Summary
11/1/2018 – 10/31/2019
Fund & Benchmark | | Performance | |
| Class I1 | | | 1.47 | % | |
| Class A1,2 | | | 1.23 | % | |
| Class C1,2 | | | 0.34 | % | |
| Credit Suisse Leveraged Loan Index3 | | | 2.61 | % | |
Performance shown for the Fund's Class A and Class C Shares does not reflect sales charges, which are a maximum of 4.75% and 1.00%, respectively.2
Market Review: A mixed period for the asset class
The 12-month period ended October 31, 2019 was a positive one for the senior secured loan asset class. The Credit Suisse Leveraged Loan Index (the "Index"), the Fund's benchmark (the "Benchmark"), returned 2.61% for the period. The discount margin for senior loans, using a three-year average life assumption, widened 114 basis points during the period to +512 basis points. Principal depreciation, however, was a large detractor, as the price of the Index decreased 2.81% to end the period at $95.22.
Along with the drop in the overall Index price, the market saw a relatively significant increase in the amount of loans trading below 90. In fact, sub-90 loans grew from 5.18% of the Index a year ago to 13.22% (by par amount) at period end. Fundamentals, however, continue to remain strong with a par-weighted default rate of 1.65%, still well below the historical average of about 3%.
From a quality point of view, the higher rated portion of the Index outperformed for the year. Split BBB posted the highest returns, at 4.76%, followed by BB loans, which returned 4.25% for the period. Split B and CCC/Split CCC rated loans underperformed, returning -1.89% and -3.90%, respectively.
As Federal Reserve policy swings shifted demand out of floating rate products, loan funds reported outflows each month, totaling -$53.4 billion for the year. Mutual fund managers have been able to raise cash for these redemptions, thanks
1
Credit Suisse Floating Rate High Income Fund
Annual Investment Adviser's Report (continued)
October 31, 2019 (unaudited)
to demand from CLO creation and light primary issuances. Gross and net CLO issuance for the period were $173.3 billion and $119.3 billion, respectively.
The period saw a significant decrease in new issue activity. According to JPMorgan, gross and net issuance were $341.9 billion and $203.8 billion, respectively — which represents respective decreases of 59% and 33.6% compared to the prior year.
Strategic Review and Outlook: Searching for pockets of opportunity
For the annual period ended October 31, 2019, the Fund underperformed the benchmark. While higher rated loans outperformed the market, lower quality assets lagged for much of the year. As rate expectations stabilize, we will look to find pockets of opportunity.
Separately, with the expectation of a potential trade deal between the United States and China, we believe the markets will likely experience continued volatility as White House rhetoric is carefully analyzed. And if political uneasiness creates another pocket of weakness, we will likely view it as an opportunity to deploy cash at lower levels.
Additionally, although CLO year-to-date issuance continues to lag 2018 by around 10%, it is about the same on a deal count basis. Since January, the average Caa basket has increased 20 basis points to 3.5%, while the average CCC basket increased 50 basis points to 3.4%, as Standard & Poor's has been more actively downgrading.
The Credit Suisse Credit Investments Group Team
John G. Popp
Thomas J. Flannery
Louis I. Farano
Wing Chan
David J. Mechlin
Senior secured floating rate loans ("Senior Loans") typically hold the most senior position in the issuer's capital structure. Senior Loans are subject to the risk that a court could subordinate a Senior Loan to presently existing or future indebtedness or take other action detrimental to the holders of Senior Loans.
2
Credit Suisse Floating Rate High Income Fund
Annual Investment Adviser's Report (continued)
October 31, 2019 (unaudited)
High yield bonds are bonds rated below BBB- by S&P or Baa3 by Moody's that are also known as "junk bonds." Such bonds entail greater risks than those found in higher- rated securities.
Additional principal risk factors for the Fund include conflict of interest risk, credit risk, foreign securities risk, interest rate risk, liquidity risk, market risk, prepayment risk and valuation risk. Before you invest, please make sure you understand the risks that apply to the Fund. As with any mutual fund, you could lose money over any period of time.
Investments in the Fund are not bank deposits and are not insured or guaranteed by the Federal Deposit Insurance Corporation or any government agency. For a detailed discussion of these and other risks, please refer to the Fund's Prospectus, which should be read carefully before investing.
In addition to historical information, this report contains forward-looking statements, which may concern, among other things, domestic and foreign markets, industry and economic trends and developments and government regulation, and their potential impact on the Fund's investments. These statements are subject to risks and uncertainties and actual trends, developments and regulations in the future, and their impact on the Fund, could be materially different from those projected, anticipated or implied. The Fund has no obligation to update or revise forward-looking statements.
The views of the Fund's management are as of the date of this letter and the Fund holdings described in this document are as of October 31, 2019; these views and Fund holdings may have changed subsequent to these dates. Nothing in this document is a recommendation to purchase or sell securities.
3
Credit Suisse Floating Rate High Income Fund
Annual Investment Adviser's Report (continued)
October 31, 2019 (unaudited)
Comparison of Change in Value of $10,000 Investment in the
Credit Suisse Floating Rate High Income Fund1,2 and the
Credit Suisse Leveraged Loan Index3 for Ten Years
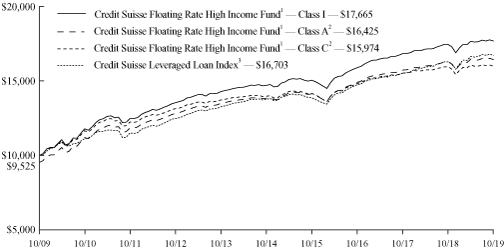
1 Fee waivers and/or expense reimbursements reduce expenses for the Fund, without which performance would be lower. Effective April 22, 2019, the Fund entered into a written contract to limit expenses to 0.70% of the Fund's average daily net assets for Class I shares, 0.95% of the Fund's average daily net assets for Class A shares and 1.70% of the Fund's average daily net assets for Class C shares through at least February 29, 2021. This limit excludes certain expenses, as set forth in the Fund's Prospectus.
2 Total return for the Fund's Class A shares for the reporting period, based on offering price (including maximum sales charge of 4.75%), was (3.56%). Total return for the Fund's Class C shares for the reporting period, based on redemption value including maximum contingent deferred sales charge ("CDSC") of 1.00%, was (0.62%).
3 Credit Suisse Leveraged Loan Index is an unmanaged index that is designed to mirror the investable universe of the U.S. dollar denominated institutional leveraged loan market. The index does not have transaction costs and investors cannot invest directly in the index.
4
Credit Suisse Floating Rate High Income Fund
Annual Investment Adviser's Report (continued)
October 31, 2019 (unaudited)
Average Annual Returns as of October 31, 20191
| | | 1 Year | | 5 Years | | 10 Years | |
Class I | | | 1.47 | % | | | 3.74 | % | | | 5.85 | % | |
Class A Without Sales Charge | | | 1.23 | % | | | 3.49 | % | | | 5.60 | % | |
Class A With Maximum Sales Charge | | | (3.56 | )% | | | 2.50 | % | | | 5.09 | % | |
Class C Without CDSC | | | 0.34 | % | | | 2.72 | % | | | 4.80 | % | |
Class C With CDSC | | | (0.62 | )% | | | 2.72 | % | | | 4.80 | % | |
Returns represent past performance and include change in share price and reinvestment of dividends and capital gain distributions, if any. Past performance cannot guarantee future results. The current performance of the Fund may be lower or higher than the figures shown. Returns and share price will fluctuate, and redemption value may be more or less than original cost. The performance results do not reflect the deduction of taxes that a shareholder would pay on Fund distributions or the redemption of Fund shares. Performance information current to the most recent month end is available at www.credit-suisse.com/us/funds.
The annual gross expense ratios are 0.78% for Class I shares, 1.03% for Class A shares and 1.78% for Class C shares. The annual net expense ratios after fee waivers and/or expense reimbursements are 0.70% for Class I shares, 0.95% for Class A shares and 1.70% for Class C shares.
1 Fee waivers and/or expense reimbursements reduce expenses for the Fund, without which performance would be lower. Effective April 22, 2019, the Fund entered into a written contract to limit expenses to 0.70% of the Fund's average daily net assets for Class I shares, 0.95% of the Fund's average daily net assets for Class A shares and 1.70% of the Fund's average daily net assets for Class C shares through at least February 29, 2021. This limit excludes certain expenses, as set forth in the Fund's Prospectus.
5
Credit Suisse Floating Rate High Income Fund
Annual Investment Adviser's Report (continued)
October 31, 2019 (unaudited)
Information About Your Fund's Expenses
As an investor of the Fund, you incur two types of costs: ongoing expenses and transaction costs. Ongoing expenses include management fees, distribution and service (12b-1) fees and other Fund expenses. Examples of transaction costs include sales charges (loads), redemption fees and account maintenance fees, which are not shown in this section and which would result in higher total expenses. The following table is intended to help you understand your ongoing expenses of investing in the Fund and to help you compare these expenses with the ongoing expenses of investing in other mutual funds. The table is based on an investment of $1,000 made at the beginning of the six months ended October 31, 2019.
The table illustrates your Fund's expenses in two ways:
• Actual Fund Return. This helps you estimate the actual dollar amount of ongoing expenses paid on a $1,000 investment in the Fund using the Fund's actual return during the period. To estimate the expenses you paid over the period, simply divide your account value by $1,000 (for example, an $8,600 account value divided by $1,000 = 8.6), then multiply the result by the number in the "Expenses Paid per $1,000" line.
• Hypothetical 5% Fund Return. This helps you to compare the Fund's ongoing expenses with those of other mutual funds using the Fund's actual expense ratio and a hypothetical rate of return of 5% per year before expenses. Examples using a 5% hypothetical fund return may be found in the shareholder reports of other mutual funds. The hypothetical account values and expenses may not be used to estimate the actual ending account balance or expenses you paid for the period.
Please note that the expenses shown in these tables are meant to highlight your ongoing expenses only and do not reflect any transaction costs, such as sales charges (loads) or redemption fees. If these transaction costs had been included, your costs would have been higher. The "Expenses Paid per $1,000" line of the tables is useful in comparing ongoing expenses only and will not help you determine the relative total expenses of owning different funds.
6
Credit Suisse Floating Rate High Income Fund
Annual Investment Adviser's Report (continued)
October 31, 2019 (unaudited)
Expenses and Value for a $1,000 Investment
for the six-month period ended October 31, 2019
Actual Fund Return | | Class I | | Class A | | Class C | |
Beginning Account Value 05/01/19 | | $ | 1,000.00 | | | $ | 1,000.00 | | | $ | 1,000.00 | | |
Ending Account Value 10/31/19 | | $ | 1,000.80 | | | $ | 998.20 | | | $ | 994.50 | | |
Expenses Paid per $1,000* | | $ | 3.53 | | | $ | 4.78 | | | $ | 8.55 | | |
Hypothetical 5% Fund Return | |
Beginning Account Value 05/01/19 | | $ | 1,000.00 | | | $ | 1,000.00 | | | $ | 1,000.00 | | |
Ending Account Value 10/31/19 | | $ | 1,021.68 | | | $ | 1,020.42 | | | $ | 1,016.64 | | |
Expenses Paid per $1,000* | | $ | 3.57 | | | $ | 4.84 | | | $ | 8.64 | | |
| | | Class I | | Class A | | Class C | |
Annualized Expense Ratios* | | | 0.70 | % | | | 0.95 | % | | | 1.70 | % | |
* Expenses are equal to the Fund's annualized expense ratio for each share class, multiplied by the average account value over the period, multiplied by 184/365 to reflect the one-half year period.
The "Expenses Paid per $1,000" and the "Annualized Expense Ratios" in the tables are based on actual expenses paid by the Fund during the period, net of fee waivers and/or actual expense reimbursements, if applicable. If those fee waivers and/or expense reimbursements had not been in effect, the Fund's actual expenses would have been higher. Expenses do not reflect additional charges and expenses that are, or may be, imposed under the variable contracts or plans. Such charges and expenses are described in the prospectus of the insurance company separate account or in the plan documents or other informational materials supplied by plan sponsors. The Fund's expenses should be considered with these charges and expenses in evaluating the overall cost of investing in the separate account.
For more information, please refer to the Fund's Prospectus.
7
Credit Suisse Floating Rate High Income Fund
Annual Investment Adviser's Report (continued)
October 31, 2019 (unaudited)
Credit Quality Breakdown*
(% of Total Investments as of October 31, 2019)
S&P Ratings** | |
A | | | 1.4 | % | |
BBB | | | 5.4 | | |
BB | | | 27.3 | | |
B | | | 50.8 | | |
CCC | | | 10.8 | | |
NR | | | 4.0 | | |
Subtotal | | | 99.7 | | |
Equity and Other | | | 0.3 | | |
Total | | | 100.0 | % | |
* Expressed as a percentage of total investments (excluding securities lending collateral if applicable) and may vary over time.
** Credit Quality is based on ratings provided by the S&P Global Ratings Division of S&P Global Inc. ("S&P"). S&P is a main provider of ratings for credit assets classes and is widely used amongst industry participants. The NR category consists of securities that have not been rated by S&P.
8
Credit Suisse Floating Rate High Income Fund
Schedule of Investments
October 31, 2019
Par
(000) | |
| | Ratings†
(S&P/Moody's) | | Maturity | | Rate% | | Value | |
| BANK LOANS (81.2%) | | | |
Advertising (0.7%) | | | |
$ | 8,707 | | | Clear Channel Outdoor Holdings, Inc.,
LIBOR 1M + 3.500%(1) | | (B+, B1) | | 08/21/26 | | | 5.286 | | | $ | 8,733,789 | | |
| | 4,368 | | | MH Sub I LLC, LIBOR 1M + 3.750%(1) | | (B, B2) | | 09/13/24 | | | 5.536 | | | | 4,268,144 | | |
| | 5,980 | | | MH Sub I LLC, LIBOR 1M + 7.500%(1) | | (CCC+, Caa2) | | 09/15/25 | | | 9.286 | | | | 5,855,407 | | |
| | | | 18,857,340 | | |
| Aerospace & Defense (0.8%) | | | |
| | 2,968 | | | Fly Funding II Sarl, LIBOR 3M + 2.000%(1) | | (BBB-, Ba2) | | 02/09/23 | | | 4.180 | | | | 2,971,992 | | |
| | 11,078 | | | Sequa Mezzanine Holdings LLC,
LIBOR 3M + 5.000%(1) | | (CCC+, B3) | | 11/28/21 | | | 7.187 | | | | 10,944,612 | | |
| | 5,237 | | | TransDigm, Inc., LIBOR 1M + 2.500%(1) | | (B+, Ba3) | | 08/22/24 | | | 4.286 | | | | 5,205,176 | | |
| | | | 19,121,780 | | |
| Air Transportation (0.6%) | | | |
| | 1,908 | | | American Airlines, Inc., LIBOR 1M + 2.000%(1) | | (BB+, Ba1) | | 10/12/21 | | | 3.939 | | | | 1,910,619 | | |
| | 12,733 | | | American Airlines, Inc., LIBOR 1M + 2.000%(1) | | (BB+, Ba1) | | 12/14/23 | | | 3.921 | | | | 12,732,704 | | |
| | | | 14,643,323 | | |
| Auto Parts & Equipment (2.7%) | | | |
| | 16,053 | | | American Axle & Manufacturing, Inc.,
LIBOR 1M + 2.250%(1) | | (BB, Ba2) | | 04/06/24 | | | 4.102 | | | | 15,324,059 | | |
| | 21,029 | | | CS Intermediate Holdco 2 LLC,
LIBOR 1M + 2.000%(1) | | (BB+, Ba2) | | 11/02/23 | | | 3.786 | | | | 20,121,762 | | |
| | 9,868 | | | Jason, Inc., LIBOR 3M + 4.500%(1),(2) | | (CCC+, Caa1) | | 06/30/21 | | | 6.516 | | | | 8,753,965 | | |
| | 2,963 | | | L&W, Inc., LIBOR 1M + 6.375%(1),(3) | | (BB-, B2) | | 05/22/25 | | | 8.161 | | | | 2,866,219 | | |
| | 8,600 | | | Panther BF Aggregator 2 LP,
LIBOR 1M + 3.500%(1) | | (B+, Ba3) | | 04/30/26 | | | 5.300 | | | | 8,503,250 | | |
| | 13,092 | | | U.S. Farathane LLC, LIBOR 1M + 3.500%(1),(3) | | (B+, B3) | | 12/23/21 | | | 5.286 | | | | 11,979,008 | | |
| | | | 67,548,263 | | |
| Automakers (0.7%) | | | |
| | 12,136 | | | TI Group Automotive Systems LLC,
EURIBOR 3M + 2.750%(1),(4) | | (BB-, B1) | | 06/30/22 | | | 3.500 | | | | 13,492,730 | | |
| | 3,811 | | | TI Group Automotive Systems LLC,
LIBOR 1M + 2.500%(1) | | (BB-, B1) | | 06/30/22 | | | 4.286 | | | | 3,785,518 | | |
| | | | 17,278,248 | | |
| Banking (0.3%) | | | |
| | 6,809 | | | Citco Funding LLC, LIBOR 1M + 2.500%(1),(3) | | (NR, Ba3) | | 09/28/23 | | | 4.286 | | | | 6,779,594 | | |
| Building & Construction (0.2%) | | | |
| | 4,234 | | | SiteOne Landscape Supply, Inc.,
LIBOR 1M + 2.750%(1) | | (BB, B2) | | 10/29/24 | | | 4.540 | | | | 4,249,389 | | |
| Building Materials (3.6%) | | | |
| | 3,950 | | | Airxcel, Inc., LIBOR 1M + 4.500%(1) | | (B, B3) | | 04/28/25 | | | 6.286 | | | | 3,747,563 | | |
| | 1,775 | | | Airxcel, Inc., LIBOR 1M + 8.750%(1),(2) | | (CCC+, Caa2) | | 04/27/26 | | | 10.536 | | | | 1,624,125 | | |
| | 15,000 | | | American Builders & Contractors Supply Co.,
Inc., LIBOR 1M + 2.250%(1) | | (BB+, B1) | | 01/15/27 | | | 3.786 | | | | 14,995,350 | | |
See Accompanying Notes to Financial Statements.
9
Credit Suisse Floating Rate High Income Fund
Schedule of Investments (continued)
October 31, 2019
Par
(000) | |
| | Ratings†
(S&P/Moody's) | | Maturity | | Rate% | | Value | |
| BANK LOANS (continued) | | | |
Building Materials | | | |
$ | 7,280 | | | Floor & Decor Outlets of America, Inc.,
LIBOR 1M + 2.500%(1),(3) | | (BB-, B1) | | 09/30/23 | | | 4.290 | | | $ | 7,261,645 | | |
| | 9,431 | | | Installed Building Products, Inc.,
LIBOR 1M + 2.500%(1),(3) | | (BB+, Ba3) | | 04/15/25 | | | 4.286 | | | | 9,466,221 | | |
| | 1,958 | | | NCI Building Systems, Inc., LIBOR 1M + 3.750%(1) | | (B+, B2) | | 04/12/25 | | | 5.671 | | | | 1,897,259 | | |
| | 20,696 | | | Priso Acquisition Corp., LIBOR 1M + 3.000%(1) | | (B+, B2) | | 05/08/22 | | | 5.044 | | | | 19,695,823 | | |
| | 15,586 | | | Summit Materials Cos. I LLC,
LIBOR 1M + 2.000%(1) | | (BBB-, Ba2) | | 11/21/24 | | | 3.786 | | | | 15,637,012 | | |
| | 15,956 | | | Wilsonart LLC, LIBOR 3M + 3.250%(1) | | (B+, B2) | | 12/19/23 | | | 5.360 | | | | 15,652,188 | | |
| | | | 89,977,186 | | |
| Cable & Satellite TV (1.8%) | | | |
| | 14,409 | | | Charter Communications Operating, LLC,
LIBOR 1M +1.750%(1) | | (BBB-, Ba1) | | 04/30/25 | | | 3.580 | | | | 14,473,114 | | |
| | 21,672 | | | CSC Holdings LLC, LIBOR 1M + 2.250%(1) | | (BB, Ba3) | | 07/17/25 | | | 4.171 | | | | 21,601,702 | | |
| | 2,000 | | | Ziggo B.V., EURIBOR 3M + 3.000%(1),(4) | | (B+, B1) | | 01/31/29 | | | 3.000 | | | | 2,223,246 | | |
| | 6,408 | | | Ziggo Secured Finance Partnership,
LIBOR 1M + 2.500%(1) | | (B+, B1) | | 04/15/25 | | | 4.421 | | | | 6,340,434 | | |
| | | | 44,638,496 | | |
| Chemicals (8.3%) | | | |
| | 5,234 | | | Allnex (Luxembourg) & Cy S.C.A.,
EURIBOR 3M + 3.250%(1),(4) | | (B, B2) | | 09/13/23 | | | 3.250 | | | | 5,561,252 | | |
| | 1,839 | | | Allnex (Luxembourg) & Cy S.C.A.,
LIBOR 3M + 3.250%(1) | | (B, B2) | | 09/13/23 | | | 5.394 | | | | 1,750,155 | | |
| | 1,385 | | | Allnex U.S.A., Inc., LIBOR 3M + 3.250%(1) | | (B, B2) | | 09/13/23 | | | 5.394 | | | | 1,318,560 | | |
| | 18,485 | | | Alpha 3 B.V., LIBOR 3M + 3.000%(1) | | (B, B1) | | 01/31/24 | | | 5.104 | | | | 18,165,430 | | |
| | 9,237 | | | Ascend Performance Materials Operations LLC,
LIBOR 3M + 5.250%(1) | | (BB-, B1) | | 08/27/26 | | | 7.354 | | | | 9,277,253 | | |
| | 3,835 | | | ASP Chromaflo Dutch I B.V.,
LIBOR 1M + 3.500%(1) | | (B, B2) | | 11/20/23 | | | 5.286 | | | | 3,722,597 | | |
| | 1,907 | | | ASP Chromaflo Intermediate Holdings, Inc.,
LIBOR 1M + 8.000%(1),(2),(3) | | (CCC, Caa2) | | 11/18/24 | | | 9.786 | | | | 1,840,675 | | |
| | 2,949 | | | ASP Chromaflo Intermediate Holdings, Inc.,
LIBOR 1M + 3.500%(1) | | (B, B2) | | 11/20/23 | | | 5.286 | | | | 2,862,833 | | |
| | 18,282 | | | Axalta Coating Systems U.S. Holdings, Inc.,
LIBOR 3M + 1.750%(1) | | (BBB-, Ba1) | | 06/01/24 | | | 3.854 | | | | 18,283,974 | | |
| | 7,286 | | | CTC AcquiCo GmbH, EURIBOR 3M + 2.500%(1),(4) | | (B, B2) | | 03/07/25 | | | 2.500 | | | | 8,083,388 | | |
| | 2,646 | | | Ferro Corp., LIBOR 3M + 2.250%(1) | | (BB-, Ba3) | | 02/14/24 | | | 4.354 | | | | 2,625,395 | | |
| | 2,590 | | | Ferro Corp., LIBOR 3M + 2.250%(1) | | (BB-, Ba3) | | 02/14/24 | | | 4.354 | | | | 2,569,535 | | |
| | 1,925 | | | Flint Group GmbH, EURIBOR 3M + 3.000%(1),(4) | | (CCC+, Caa1) | | 09/07/21 | | | 3.750 | | | | 1,779,460 | | |
| | 557 | | | Flint Group GmbH, LIBOR 3M + 3.000%(1),(3) | | (CCC+, Caa1) | | 09/07/21 | | | 4.936 | | | | 446,337 | | |
| | 3,369 | | | Flint Group U.S. LLC, LIBOR 3M + 3.000%(1),(3) | | (CCC+, Caa1) | | 09/07/21 | | | 4.936 | | | | 2,699,975 | | |
| | 11,755 | | | Gemini HDPE LLC, LIBOR 3M + 2.500%(1) | | (BB, Ba2) | | 08/07/24 | | | 4.430 | | | | 11,755,061 | | |
| | 6,649 | | | Ineos U.S. Finance LLC, LIBOR 1M + 2.000%(1) | | (BB+, Ba1) | | 03/31/24 | | | 3.786 | | | | 6,590,090 | | |
| | 8,944 | | | PMHC II, Inc., LIBOR 3M + 3.500%(1) | | (CCC+, B3) | | 03/31/25 | | | 5.604 | | | | 7,272,550 | | |
See Accompanying Notes to Financial Statements.
10
Credit Suisse Floating Rate High Income Fund
Schedule of Investments (continued)
October 31, 2019
Par
(000) | |
| | Ratings†
(S&P/Moody's) | | Maturity | | Rate% | | Value | |
| BANK LOANS (continued) | | | |
Chemicals | | | |
$ | 2,907 | | | PMHC II, Inc., LIBOR 3M + 7.750%(1) | | (CCC, Caa2) | | 03/30/26 | | | 9.933 | | | $ | 2,272,420 | | |
| | 16,872 | | | Polar U.S. Borrower LLC, LIBOR 3M + 4.750%(1),(3) | | (B, B2) | | 10/15/25 | | | 6.794 | | | | 15,944,512 | | |
| | 11,397 | | | PQ Corp., LIBOR 3M + 2.500%(1) | | (BB-, B1) | | 02/08/25 | | | 4.427 | | | | 11,407,074 | | |
| | 3,179 | | | Ravago Holdings America, Inc.,
LIBOR 1M + 2.750%(1),(3) | | (BB-, B2) | | 06/30/23 | | | 4.540 | | | | 3,180,795 | | |
| | 5,560 | | | Solenis Holdings LLC, LIBOR 3M + 4.000%(1) | | (B-, B2) | | 06/26/25 | | | 6.124 | | | | 5,303,301 | | |
| | 18,472 | | | Starfruit Finco B.V, LIBOR 1M + 3.250%(1) | | (B+, B1) | | 10/01/25 | | | 5.190 | | | | 18,064,703 | | |
| | 11,876 | | | Tronox Finance LLC, LIBOR 1M + 2.750%(1) | | (BB-, Ba3) | | 09/23/24 | | | 4.660 | | | | 11,788,779 | | |
| | 4,209 | | | Univar, Inc., LIBOR 1M + 2.250%(1) | | (BB+, Ba3) | | 07/01/24 | | | 4.036 | | | | 4,227,649 | | |
| | 22,517 | | | UTEX Industries, Inc., LIBOR 1M + 4.000%(1) | | (CCC, Caa1) | | 05/22/21 | | | 5.786 | | | | 17,450,883 | | |
| | 3,978 | | | Vantage Specialty Chemicals, Inc.,
LIBOR 3M + 8.250%(1),(2),(3) | | (CCC, Caa2) | | 10/27/25 | | | 10.337 | | | | 3,471,039 | | |
| | 7,132 | | | Zep, Inc., LIBOR 3M + 4.000%(1) | | (CCC+, Caa1) | | 08/12/24 | | | 6.044 | | | | 5,533,410 | | |
| | 2,250 | | | Zep, Inc., LIBOR 3M + 8.250%(1),(2) | | (CCC-, Ca) | | 08/11/25 | | | 10.354 | | | | 1,186,875 | | |
| | | | 206,435,960 | | |
| Diversified Capital Goods (1.1%) | | | |
| | 3,186 | | | Callaway Golf Co., LIBOR 3M + 4.500%(1) | | (BB-, Ba3) | | 01/02/26 | | | 6.440 | | | | 3,225,630 | | |
| | 16,133 | | | Cortes NP Acquisition Corp.,
LIBOR 3M + 4.000%(1) | | (B, B2) | | 11/30/23 | | | 5.927 | | | | 15,251,502 | | |
| | 3,419 | | | Dynacast International LLC,
LIBOR 3M + 3.250%(1),(3) | | (B-, B2) | | 01/28/22 | | | 5.354 | | | | 3,162,980 | | |
| | 3,950 | | | Electrical Components International, Inc.,
LIBOR 3M + 4.250%(1),(3) | | (B-, B2) | | 06/26/25 | | | 6.355 | | | | 3,555,000 | | |
| | 2,785 | | | Filtration Group Corp., LIBOR 1M + 3.000%(1) | | (B, B2) | | 03/29/25 | | | 4.786 | | | | 2,786,385 | | |
| | | | 27,981,497 | | |
| Electric - Generation (0.6%) | | | |
| | 14,499 | | | Brookfield WEC Holdings, Inc.,
LIBOR 1M + 3.500%(1) | | (B, B2) | | 08/01/25 | | | 5.286 | | | | 14,430,045 | | |
| Electronics (3.7%) | | | |
| | 4,205 | | | Brooks Automation, Inc., LIBOR 3M + 2.500%(1),(3) | | (BB-, Ba3) | | 10/04/24 | | | 4.460 | | | | 4,215,277 | | |
| | 2,456 | | | EXC Holdings III Corp., LIBOR 3M + 3.500%(1),(3) | | (B-, B2) | | 12/02/24 | | | 5.604 | | | | 2,416,336 | | |
| | 24,379 | | | MACOM Technology Solutions Holdings, Inc.,
LIBOR 1M + 2.250%(1) | | (B-, B3) | | 05/17/24 | | | 4.036 | | | | 21,316,050 | | |
| | 14,609 | | | Microchip Technology, Inc.,
LIBOR 1M + 2.000%(1) | | (BB+, Baa3) | | 05/29/25 | | | 3.790 | | | | 14,673,171 | | |
| | 13,780 | | | Oberthur Technologies S.A.,
LIBOR 3M + 3.750%(1) | | (B-, B3) | | 01/10/24 | | | 5.854 | | | | 13,144,474 | | |
| | 7,000 | | | Oberthur Technologies S.A.,
EURIBOR 3M + 3.750%(1),(4) | | (B-, B3) | | 01/10/24 | | | 3.750 | | | | 7,570,894 | | |
| | 13,110 | | | Seattle Spinco, Inc., LIBOR 1M + 2.500%(1) | | (BB-, B1) | | 06/21/24 | | | 4.300 | | | | 12,761,317 | | |
| | 17,259 | | | Tempo Acquisition LLC, LIBOR 1M + 3.000%(1) | | (B, B1) | | 05/01/24 | | | 4.786 | | | | 17,295,057 | | |
| | | | 93,392,576 | | |
See Accompanying Notes to Financial Statements.
11
Credit Suisse Floating Rate High Income Fund
Schedule of Investments (continued)
October 31, 2019
Par
(000) | |
| | Ratings†
(S&P/Moody's) | | Maturity | | Rate% | | Value | |
| BANK LOANS (continued) | | | |
| Energy - Exploration & Production (0.9%) | | | |
$ | 6,634 | | | Lower Cadence Holdings LLC,
LIBOR 1M + 4.000%(1) | | (B, B2) | | 05/22/26 | | | 5.804 | | | $ | 6,186,360 | | |
| | 5,474 | | | PES Holdings LLC, Prime + 6.250%(1),(5) | | (NR, NR) | | 12/31/22 | | | 12.000 | | | | 4,561,299 | | |
| | 14,548 | | | PES Holdings LLC, LIBOR 3M + 6.990%(1),(5) | | (NR, NR) | | 12/31/22 | | | 13.490 | | | | 4,800,822 | | |
| | 1,163 | | | PES Holdings LLC(6),(7) | | (B+, NR) | | 04/30/20 | | | 3.000 | | | | 1,177,031 | | |
| | 2,438 | | | PES Holdings LLC, LIBOR 2M + 14.000%(1) | | (NR, NR) | | 04/30/20 | | | 15.883 | | | | 2,467,969 | | |
| | 3,967 | | | PES Holdings LLC, Prime + 9.000%(1),(2),(3),(5) | | (NR, NR) | | 12/31/22 | | | 13.750 | | | | 3,113,714 | | |
| | | | 22,307,195 | | |
| Environmental (0.7%) | | | |
| | 16,665 | | | GFL Environmental, Inc., LIBOR 1M + 3.000%(1) | | (B+, B1) | | 05/30/25 | | | 4.786 | | | | 16,633,973 | | |
| Food & Drug Retailers (0.2%) | | | |
| | 2,999 | | | L1R HB Finance Limited  ,
EURIBOR 3M + 4.250%(1),(4) | | (B, B2) | | 09/02/24 | | | 4.250 | | | | 2,180,398 | | |
| | 2,999 | | | L1R HB Finance Limited  ,
LIBOR 3M + 5.250%(1),(8) | | (B, B2) | | 09/02/24 | | | 6.015 | | | | 2,472,042 | | |
| | | | 4,652,440 | | |
| Food - Wholesale (0.9%) | | | |
| | 1,985 | | | AI Aqua Merger Sub, Inc., LIBOR 1M + 3.250%(1) | | (B-, B2) | | 12/13/23 | | | 5.036 | | | | 1,858,993 | | |
| | 2,977 | | | AI Aqua Merger Sub, Inc., LIBOR 1M + 3.250%(1) | | (B-, B2) | | 12/13/23 | | | 5.036 | | | | 2,778,114 | | |
| | 2,784 | | | AI Aqua Merger Sub, Inc.,
LIBOR 3M + 4.250%(1),(3) | | (B-, B2) | | 12/13/23 | | | 6.354 | | | | 2,631,204 | | |
| | 2,154 | | | U.S. Foods, Inc., LIBOR 1M + 2.000%(1) | | (BB+, Ba3) | | 09/13/26 | | | 3.786 | | | | 2,163,420 | | |
| | 9,005 | | | United Natural Foods, Inc., LIBOR 1M + 4.250%(1) | | (B, B3) | | 10/22/25 | | | 6.036 | | | | 7,254,452 | | |
| | 5,000 | | | Zara UK Midco Ltd.,
EURIBOR 6M + 5.750%(1),(2),(3),(4) | | (B, B2) | | 01/31/25 | | | 5.750 | | | | 5,097,128 | | |
| | | | 21,783,311 | | |
| Gaming (2.6%) | | | |
| | 19,339 | | | Caesars Resort Collection LLC,
LIBOR 1M + 2.750%(1) | | (BB, Ba3) | | 12/23/24 | | | 4.536 | | | | 19,081,207 | | |
| | 7,445 | | | CBAC Borrower LLC, LIBOR 1M + 4.000%(1) | | (B, B3) | | 07/08/24 | | | 5.786 | | | | 7,190,407 | | |
| | 11,043 | | | Eldorado Resorts LLC, LIBOR 1M + 2.250%(1) | | (BB, Ba1) | | 04/17/24 | | | 4.214 | | | | 11,044,813 | | |
| | 4,402 | | | Gateway Casinos & Entertainment Ltd.,
LIBOR 3M + 3.000%(1),(3) | | (BB-, Ba3) | | 03/13/25 | | | 5.104 | | | | 4,314,229 | | |
| | 15,000 | | | Jackpotjoy PLC, LIBOR 1M + 5.000%(1),(8) | | (B+, B1) | | 12/06/24 | | | 5.713 | | | | 19,534,406 | | |
| | 4,750 | | | MGM Growth Properties Operating
Partnership LP, LIBOR 1M + 2.000%(1) | | (BB+, Ba3) | | 03/21/25 | | | 3.786 | | | | 4,770,585 | | |
| | | | 65,935,647 | | |
| Gas Distribution (0.2%) | | | |
| | 4,477 | | | Traverse Midstream Partners LLC,
LIBOR 1M + 4.000%(1) | | (B+, B2) | | 09/27/24 | | | 5.800 | | | | 3,951,294 | | |
See Accompanying Notes to Financial Statements.
12
Credit Suisse Floating Rate High Income Fund
Schedule of Investments (continued)
October 31, 2019
Par
(000) | |
| | Ratings†
(S&P/Moody's) | | Maturity | | Rate% | | Value | |
| BANK LOANS (continued) | | | |
| Health Facilities (1.4%) | | | |
$ | 11,250 | | | DaVita, Inc., LIBOR 1M + 2.250%(1) | | (BBB-, Ba1) | | 08/12/26 | | | 4.036 | | | $ | 11,292,694 | | |
| | 6,451 | | | Surgery Center Holdings, Inc.,
LIBOR 1M + 3.250%(1) | | (B-, B1) | | 09/02/24 | | | 5.040 | | | | 6,246,373 | | |
| | 2,735 | | | Western Dental Services, Inc.,
LIBOR 1M + 4.500%(1),(3) | | (B-, B3) | | 06/30/23 | | | 6.286 | | | | 2,718,051 | | |
| | 14,434 | | | Western Dental Services, Inc.,
LIBOR 1M + 5.250%(1),(3) | | (B-, B3) | | 06/30/23 | | | 7.036 | | | | 14,398,253 | | |
| | | | 34,655,371 | | |
| Health Services (2.1%) | | | |
| | 14,643 | | | Athenahealth, Inc., LIBOR 3M + 4.500%(1) | | (B, B2) | | 02/11/26 | | | 6.681 | | | | 14,551,559 | | |
| | 7,960 | | | Auris Luxembourg III Sarl, LIBOR 1M + 3.750%(1) | | (B+, B2) | | 02/27/26 | | | 5.536 | | | | 7,840,603 | | |
| | 5,379 | | | Carestream Health, Inc., LIBOR 1M + 5.750%(1) | | (B, B1) | | 02/28/21 | | | 7.536 | | | | 5,185,861 | | |
| | 3,750 | | | Radiology Partners Holdings LLC,
LIBOR 12M + 8.250%(1),(3) | | (CCC+, Caa2) | | 07/09/26 | | | 10.153 | | | | 3,656,250 | | |
| | 3,732 | | | Radiology Partners Holdings LLC,
LIBOR 6M + 4.750%(1) | | (B, B2) | | 07/09/25 | | | 6.661 | | | | 3,630,040 | | |
| | 13,562 | | | Sotera Health Holdings LLC,
LIBOR 3M + 3.000%(1) | | (B, B1) | | 05/15/22 | | | 4.927 | | | | 13,363,088 | | |
| | 798 | | | Sotera Health Holdings LLC,
LIBOR 1M + 3.500%(1) | | (B, B1) | | 05/15/22 | | | 5.427 | | | | 797,003 | | |
| | 2,885 | | | Valitas Health Services, Inc.,
LIBOR 3M + 10.000%(1),(3),(9) | | (NR, NR) | | 06/30/20 | | | 12.104 | | | | 2,855,993 | | |
| | 5,118 | | | Valitas Health Services, Inc.,
LIBOR 3M + 12.000%(1),(3),(9) | | (NR, NR) | | 06/30/20 | | | 14.104 | | | | 486,227 | | |
| | | | 52,366,624 | | |
| Hotels (1.0%) | | | |
| | 5,000 | | | Compass III Ltd., EURIBOR 6M + 4.500%(1),(4) | | (B+, B2) | | 05/07/25 | | | 4.500 | | | | 5,595,713 | | |
| | 3,000 | | | Compass IV Ltd., EURIBOR 6M + 8.000%(1),(4) | | (CCC+, Caa2) | | 04/30/26 | | | 9.000 | | | | 3,319,055 | | |
| | 5,098 | | | Playa Resorts Holding B.V., LIBOR 1M + 2.750%(1) | | (B+, B2) | | 04/29/24 | | | 4.540 | | | | 4,981,962 | | |
| | 4,757 | | | RHP Hotel Properties, LP, LIBOR 1M + 2.000%(1) | | (BB, Ba3) | | 05/11/24 | | | 3.790 | | | | 4,764,454 | | |
| | 5,308 | | | Wyndham Hotels & Resorts, Inc.,
LIBOR 1M + 1.750%(1) | | (BBB-, Baa3) | | 05/30/25 | | | 3.536 | | | | 5,338,559 | | |
| | | | 23,999,743 | | |
| Insurance Brokerage (3.4%) | | | |
| | 13,845 | | | Acrisure LLC, LIBOR 3M + 4.250%(1) | | (B, B2) | | 11/22/23 | | | 6.354 | | | | 13,632,693 | | |
| | 4,679 | | | Acrisure LLC, LIBOR 3M + 3.750%(1) | | (B, B2) | | 11/22/23 | | | 5.854 | | | | 4,564,388 | | |
| | 20,535 | | | Alliant Holdings Intermediate, LLC,
LIBOR 3M + 3.000%(1) | | (B, B2) | | 05/09/25 | | | 4.804 | | | | 20,044,079 | | |
| | 7,537 | | | AssuredPartners, Inc., LIBOR 1M + 3.500%(1) | | (B, B2) | | 10/22/24 | | | 5.286 | | | | 7,420,480 | | |
| | 16,956 | | | Hub International Ltd., LIBOR 3M + 3.000%(1) | | (B, B2) | | 04/25/25 | | | 4.940 | | | | 16,612,888 | | |
| | 7,370 | | | Hyperion Insurance Group Ltd.,
EURIBOR 1M + 3.500%(1),(4) | | (B, B2) | | 12/13/24 | | | 3.500 | | | | 8,234,231 | | |
| | 13,414 | | | NFP Corp., LIBOR 1M + 3.000%(1) | | (B, B2) | | 01/08/24 | | | 4.786 | | | | 13,042,542 | | |
| | | | 83,551,301 | | |
See Accompanying Notes to Financial Statements.
13
Credit Suisse Floating Rate High Income Fund
Schedule of Investments (continued)
October 31, 2019
Par
(000) | |
| | Ratings†
(S&P/Moody's) | | Maturity | | Rate% | | Value | |
| BANK LOANS (continued) | | | |
| Investments & Misc. Financial Services (1.8%) | | | |
$ | 10,184 | | | Altisource Solutions Sarl, LIBOR 3M + 4.000%(1) | | (B+, B3) | | 04/03/24 | | | 6.104 | | | $ | 9,694,051 | | |
| | 19,055 | | | Ditech Holding Corp., Prime + 7.000%(1),(5) | | (NR, NR) | | 06/30/22 | | | 12.250 | | | | 7,776,841 | | |
| | 1,250 | | | EIG Management Company, LLC,
LIBOR 1M + 3.750%(1) | | (BB, Ba2) | | 02/22/25 | | | 5.550 | | | | 1,251,563 | | |
| | 8,950 | | | FinCo I LLC, LIBOR 1M + 2.000%(1) | | (BB, Baa3) | | 12/27/22 | | | 3.786 | | | | 8,975,510 | | |
| | 6,481 | | | Ocwen Loan Servicing LLC,
LIBOR 1M + 5.000%(1) | | (B+, B2) | | 12/07/20 | | | 6.786 | | | | 6,373,048 | | |
| | 9,768 | | | VFH Parent LLC, LIBOR 6M + 3.500%(1) | | (B+, Ba3) | | 03/01/26 | | | 6.044 | | | | 9,768,887 | | |
| | | | 43,839,900 | | |
| Machinery (1.6%) | | | |
| | 6,930 | | | Cohu, Inc., LIBOR 6M + 3.000%(1) | | (B, B2) | | 10/01/25 | | | 5.200 | | | | 6,635,475 | | |
| | 2,331 | | | CPM Holdings, Inc., LIBOR 1M + 3.750%(1) | | (B-, B2) | | 11/17/25 | | | 5.536 | | | | 2,289,367 | | |
| | 1,977 | | | CPM Holdings, Inc., LIBOR 1M + 8.250%(1),(2) | | (CCC+, Caa2) | | 11/15/26 | | | 10.036 | | | | 1,936,552 | | |
| | 6,355 | | | Doncasters Finance U.S. LLC,
LIBOR 3M + 3.750%(1),(8) | | (CCC-, Caa3) | | 04/09/20 | | | 4.750 | | | | 5,715,663 | | |
| | 3,696 | | | LTI Holdings, Inc., LIBOR 1M + 6.750%(1) | | (CCC+, Caa2) | | 09/06/26 | | | 8.536 | | | | 3,164,557 | | |
| | 13,880 | | | LTI Holdings, Inc., LIBOR 1M + 3.500%(1) | | (B-, B2) | | 09/06/25 | | | 5.286 | | | | 12,811,055 | | |
| | 8,323 | | | Welbilt, Inc., LIBOR 1M + 2.500%(1) | | (BB-, B1) | | 10/23/25 | | | 4.286 | | | | 8,271,440 | | |
| | | | 40,824,109 | | |
| Managed Care (0.4%) | | | |
| | 8,699 | | | Inovalon Holdings, Inc., LIBOR 1M + 3.500%(1) | | (B+, B2) | | 04/02/25 | | | 5.438 | | | | 8,726,466 | | |
| | 2,000 | | | MPH Acquisition Holdings LLC,
LIBOR 3M + 2.750%(1) | | (B+, B1) | | 06/07/23 | | | 4.854 | | | | 1,881,020 | | |
| | | | 10,607,486 | | |
| Media - Diversified (0.4%) | | | |
| | 6,203 | | | NEP/NCP Holdco, Inc., LIBOR 1M + 3.250%(1) | | (B+, B2) | | 10/20/25 | | | 5.036 | | | | 5,974,385 | | |
| | 5,000 | | | NEP/NCP Holdco, Inc., LIBOR 1M + 7.000%(1) | | (CCC+, Caa2) | | 10/19/26 | | | 8.786 | | | | 4,806,250 | | |
| | | | 10,780,635 | | |
| Media Content (0.5%) | | | |
| | 12,542 | | | WMG Acquisition Corp., LIBOR 1M + 2.125%(1) | | (BB-, Ba3) | | 11/01/23 | | | 3.911 | | | | 12,556,356 | | |
| Medical Products (0.8%) | | | |
| | 15,046 | | | ABB Concise Optical Group LLC,
LIBOR 6M + 5.000%(1) | | (CCC+, B3) | | 06/15/23 | | | 7.168 | | | | 14,331,310 | | |
| | 4,781 | | | Avantor, Inc., LIBOR 1M + 3.000%(1) | | (B+, Ba2) | | 11/21/24 | | | 4.786 | | | | 4,816,590 | | |
| | 223 | | | Lifescan Global Corp., LIBOR 3M + 6.000%(1) | | (B, B2) | | 10/01/24 | | | 8.056 | | | | 199,698 | | |
| | | | 19,347,598 | | |
| Metals & Mining - Excluding Steel (0.6%) | | | |
| | 14,037 | | | GrafTech Finance, Inc., LIBOR 1M + 3.500%(1),(3) | | (BB-, B1) | | 02/12/25 | | | 5.286 | | | | 13,527,971 | | |
| | 7,529 | | | Noranda Aluminum Acquisition Corp.,
Prime + 3.500%(1),(3),(5) | | (NR, NR) | | 02/28/19 | | | 8.500 | | | | 451,730 | | |
| | | | 13,979,701 | | |
See Accompanying Notes to Financial Statements.
14
Credit Suisse Floating Rate High Income Fund
Schedule of Investments (continued)
October 31, 2019
Par
(000) | |
| | Ratings†
(S&P/Moody's) | | Maturity | | Rate% | | Value | |
| BANK LOANS (continued) | | | |
| Non - Electric Utilities (0.2%) | | | |
$ | 4,759 | | | BCP Raptor LLC, LIBOR 1M + 4.250%(1) | | (B, B3) | | 06/24/24 | | | 6.036 | | | $ | 4,215,112 | | |
| Oil Field Equipment & Services (0.1%) | | | |
| | 5,483 | | | Seadrill Partners Finco LLC,
LIBOR 3M + 6.000%(1) | | (CCC+, Caa2) | | 02/21/21 | | | 8.104 | | | | 2,806,108 | | |
| Oil Refining & Marketing (0.7%) | | | |
| | 2,269 | | | EG America LLC, LIBOR 3M + 8.000%(1) | | (CCC+, Caa1) | | 04/20/26 | | | 10.104 | | | | 2,147,248 | | |
| | 13,248 | | | EG Finco Ltd., EURIBOR 3M + 4.000%(1),(4) | | (B, B2) | | 02/07/25 | | | 4.000 | | | | 14,317,856 | | |
| | | | 16,465,104 | | |
| Packaging (1.7%) | | | |
| | 3,949 | | | Anchor Glass Container Corp.,
LIBOR 1M + 2.750% (1) | | (CCC+, B3) | | 12/07/23 | | | 4.729 | | | | 2,985,818 | | |
| | 6,175 | | | Anchor Glass Container Corp.,
LIBOR 1M + 7.750%(1) | | (CCC-, Caa2) | | 12/07/24 | | | 9.740 | | | | 3,500,453 | | |
| | 4,988 | | | Berry Global, Inc., LIBOR 1M + 2.500%(1) | | (BBB-, Ba2) | | 07/01/26 | | | 4.439 | | | | 5,010,168 | | |
| | 15,372 | | | Flex Acquisition Co., Inc., LIBOR 1M + 3.000%(1) | | (B, B2) | | 12/29/23 | | | 5.096 | | | | 14,553,188 | | |
| | 10,000 | | | Klockner-Pentaplast of America, Inc.,
EURIBOR 3M + 4.750%(1),(4) | | (B-, B3) | | 06/30/22 | | | 4.750 | | | | 9,042,013 | | |
| | 3,758 | | | Proampac PG Borrower LLC,
LIBOR 3M + 3.500%(1) | | (B, B3) | | 11/20/23 | | | 5.532 | | | | 3,551,709 | | |
| | 4,375 | | | Strategic Materials, Inc.,
LIBOR 1M + 7.750%(1),(2),(3) | | (CCC-, Caa3) | | 10/27/25 | | | 9.677 | | | | 3,018,750 | | |
| | | | 41,662,099 | | |
| Personal & Household Products (1.5%) | | | |
| | 6,910 | | | Comfort Holding LLC, LIBOR 1M + 4.750%(1) | | (CCC+, Caa1) | | 02/05/24 | | | 6.536 | | | | 6,894,511 | | |
| | 4,400 | | | Keter Group B.V., EURIBOR 3M + 4.250%(1),(4) | | (CCC+, Caa1) | | 10/31/23 | | | 5.250 | | | | 4,101,355 | | |
| | 22,436 | | | Serta Simmons Bedding LLC,
LIBOR 1M + 3.500%(1) | | (CCC+, Caa1) | | 11/08/23 | | | 5.405 | | | | 13,360,832 | | |
| | 6,612 | | | Serta Simmons Bedding LLC,
LIBOR 1M + 8.000%(1) | | (CCC-, Caa3) | | 11/08/24 | | | 9.846 | | | | 1,849,963 | | |
| | 12,797 | | | TricorBraun Holdings, Inc., LIBOR 3M + 3.750%(1) | | (B-, B2) | | 11/30/23 | | | 5.859 | | | | 12,528,913 | | |
| | | | 38,735,574 | | |
| Pharmaceuticals (1.8%) | | | |
| | 3,004 | | | Akorn, Inc., LIBOR 1M + 7.000%(1) | | (B-, Caa1) | | 04/16/21 | | | 8.813 | | | | 2,795,107 | | |
| | 2,171 | | | Alkermes, Inc., LIBOR 1M + 2.250%(1) | | (BB, Ba3) | | 03/23/23 | | | 4.410 | | | | 2,166,833 | | |
| | 4,656 | | | Bausch Health Companies, Inc.,
LIBOR 1M + 3.000%(1) | | (BB-, Ba2) | | 06/02/25 | | | 4.921 | | | | 4,677,303 | | |
| | 11,187 | | | Bausch Health Companies, Inc.,
LIBOR 1M + 2.750%(1) | | (BB-, Ba2) | | 11/27/25 | | | 4.671 | | | | 11,213,866 | | |
| | 16,583 | | | Endo Luxembourg Finance Co. I Sarl,
LIBOR 1M + 4.250%(1) | | (B+, B1) | | 04/29/24 | | | 6.063 | | | | 15,303,657 | | |
| | 10,223 | | | Syneos Health, Inc., LIBOR 1M + 1.500%(1),(3) | | (BB, Ba3) | | 03/25/24 | | | 3.286 | | | | 9,954,265 | | |
| | | | 46,111,031 | | |
See Accompanying Notes to Financial Statements.
15
Credit Suisse Floating Rate High Income Fund
Schedule of Investments (continued)
October 31, 2019
Par
(000) | |
| | Ratings†
(S&P/Moody's) | | Maturity | | Rate% | | Value | |
| BANK LOANS (continued) | | | |
| Real Estate Development & Management (1.7%) | | | |
$ | 10,754 | | | Capital Automotive LP, LIBOR 1M + 2.500%(1) | | (B, B1) | | 03/24/24 | | | 4.290 | | | $ | 10,763,531 | | |
| | 754 | | | Capital Automotive LP, LIBOR 1M + 6.000%(1) | | (CCC+, B3) | | 03/24/25 | | | 7.790 | | | | 757,613 | | |
| | 8,873 | | | Forest City Enterprises LP, LIBOR 1M + 4.000%(1) | | (B+, B2) | | 12/07/25 | | | 5.786 | | | | 8,936,934 | | |
| | 23,000 | | | Hanjin International Corp.,
LIBOR 1M + 2.500%(1),(3) | | (B+, Ba3) | | 10/18/20 | | | 4.304 | | | | 22,942,500 | | |
| | | | 43,400,578 | | |
| Real Estate Investment Trusts (0.4%) | | | |
| | 9,260 | | | iStar, Inc., LIBOR 1M + 2.750%(1),(3) | | (BB-, Ba2) | | 06/28/23 | | | 4.671 | | | | 9,282,920 | | |
| Recreation & Travel (3.0%) | | | |
| | 14,322 | | | Alterra Mountain Co., LIBOR 1M + 3.000%(1) | | (B, B1) | | 07/31/24 | | | 4.786 | | | | 14,384,682 | | |
| | 2,154 | | | Bulldog Purchaser, Inc., LIBOR 1M + 7.750%(1),(2) | | (CCC+, Caa2) | | 09/04/26 | | | 9.536 | | | | 2,132,307 | | |
| | 10,103 | | | Bulldog Purchaser, Inc., LIBOR 1M + 3.750%(1),(3) | | (B+, B2) | | 09/05/25 | | | 5.536 | | | | 9,900,875 | | |
| | 10,583 | | | Crown Finance U.S., Inc., LIBOR 1M + 2.250%(1) | | (BB-, B1) | | 02/28/25 | | | 4.036 | | | | 10,456,705 | | |
| | 9,420 | | | Hornblower Sub LLC, LIBOR 3M + 4.500%(1) | | (B, B2) | | 04/27/25 | | | 6.604 | | | | 9,434,495 | | |
| | 813 | | | Merlin Entertainments PLC(7) | | (B+, Ba3) | | 10/16/26 | | | 0.000 | | | | 817,364 | | |
| | 6,187 | | | Merlin Entertainments PLC(7) | | (B+, Ba3) | | 10/11/26 | | | 5.260 | | | | 6,219,071 | | |
| | 3,980 | | | Richmond UK Bidco Ltd.,
LIBOR 1M + 4.250%(1),(8) | | (B, B2) | | 03/03/24 | | | 4.963 | | | | 5,018,853 | | |
| | 16,019 | | | SeaWorld Parks & Entertainment, Inc.,
LIBOR 1M + 3.000%(1) | | (B+, B2) | | 03/31/24 | | | 4.786 | | | | 15,998,990 | | |
| | | | 74,363,342 | | |
| Restaurants (1.9%) | | | |
| | 9,213 | | | 1011778 B.C. Unlimited Liability Co.,
LIBOR 1M + 2.250%(1) | | (BB, Ba2) | | 02/16/24 | | | 4.036 | | | | 9,241,310 | | |
| | 16,757 | | | Golden Nugget, Inc., LIBOR 1M + 2.750%(1) | | (B+, Ba3) | | 10/04/23 | | | 4.688 | | | | 16,746,355 | | |
| | 14,054 | | | IRB Holding Corp., LIBOR 3M + 3.250%(1) | | (B+, B2) | | 02/05/25 | | | 5.216 | | | | 13,969,013 | | |
| | 8,493 | | | K-Mac Holdings Corp., LIBOR 1M + 3.000%(1) | | (B-, B2) | | 03/14/25 | | | 4.786 | | | | 8,274,284 | | |
| | | | 48,230,962 | | |
| Software - Services (8.7%) | | | |
| | 8,716 | | | Almonde, Inc., LIBOR 3M + 3.500%(1) | | (B-, B2) | | 06/13/24 | | | 5.696 | | | | 8,351,111 | | |
| | 4,078 | | | Almonde, Inc., LIBOR 6M + 7.250%(1) | | (CCC, Caa2) | | 06/13/25 | | | 9.446 | | | | 3,829,862 | | |
| | 4,664 | | | Applied Systems, Inc., LIBOR 3M + 3.000%(1) | | (B-, B2) | | 09/19/24 | | | 5.104 | | | | 4,643,455 | | |
| | 6,948 | | | Compuware Corp., LIBOR 1M + 4.000%(1) | | (B, B2) | | 08/22/25 | | | 5.786 | | | | 6,985,121 | | |
| | 5,727 | | | Cypress Intermediate Holdings III, Inc.,
LIBOR 1M + 2.750%(1) | | (B, B2) | | 04/29/24 | | | 4.540 | | | | 5,642,988 | | |
| | 22,982 | | | Epicor Software Corp., LIBOR 1M + 3.250%(1) | | (B-, B2) | | 06/01/22 | | | 5.040 | | | | 22,939,294 | | |
| | 16,770 | | | Flexera Software LLC, LIBOR 1M + 3.500%(1) | | (B-, B1) | | 02/26/25 | | | 5.290 | | | | 16,816,139 | | |
| | 2,846 | | | Flexera Software LLC, LIBOR 1M + 7.250%(1) | | (CCC+, Caa1) | | 02/26/26 | | | 9.040 | | | | 2,853,269 | | |
| | 10,342 | | | GHX Ultimate Parent Corp.,
LIBOR 3M + 3.250%(1),(3) | | (B, B3) | | 06/28/24 | | | 5.354 | | | | 10,122,541 | | |
| | 17,272 | | | Go Daddy Operating Company LLC,
LIBOR 1M + 1.750% (1) | | (BB, Ba1) | | 02/15/24 | | | 3.536 | | | | 17,310,957 | | |
See Accompanying Notes to Financial Statements.
16
Credit Suisse Floating Rate High Income Fund
Schedule of Investments (continued)
October 31, 2019
Par
(000) | |
| | Ratings†
(S&P/Moody's) | | Maturity | | Rate% | | Value | |
| BANK LOANS (continued) | | | |
Software - Services | | | |
$ | 3,867 | | | Greeneden U.S. Holdings II LLC,
EURIBOR 3M + 3.500%(1),(4) | | (B-, B2) | | 12/01/23 | | | 3.500 | | | $ | 4,311,166 | | |
| | 7,000 | | | Hyland Software, Inc., LIBOR 1M + 7.000%(1) | | (CCC, Caa1) | | 07/07/25 | | | 8.786 | | | | 7,041,580 | | |
| | 9,553 | | | Hyland Software, Inc., LIBOR 1M + 3.250%(1) | | (B-, B1) | | 07/01/24 | | | 5.036 | | | | 9,507,521 | | |
| | 5,776 | | | Infor (U.S.), Inc., EURIBOR 3M + 2.250%(1),(4) | | (B, Ba3) | | 02/01/22 | | | 3.250 | | | | 6,466,937 | | |
| | 3,986 | | | Infor (U.S.), Inc., LIBOR 3M + 2.750%(1) | | (B, Ba3) | | 02/01/22 | | | 4.854 | | | | 3,995,010 | | |
| | 13,905 | | | MA FinanceCo. LLC, LIBOR 1M + 2.250%(1) | | (BB-, B1) | | 11/19/21 | | | 4.050 | | | | 13,837,797 | | |
| | 1,958 | | | MA FinanceCo. LLC, LIBOR 1M + 2.500%(1) | | (BB-, B1) | | 06/21/24 | | | 4.300 | | | | 1,906,026 | | |
| | 1,185 | | | Mitchell International, Inc., LIBOR 1M + 7.250%(1) | | (CCC, Caa2) | | 12/01/25 | | | 9.036 | | | | 1,093,333 | | |
| | 13,689 | | | Project Alpha Intermediate Holding, Inc.,
LIBOR 3M + 3.500%(1) | | (B, B3) | | 04/26/24 | | | 5.490 | | | | 13,406,844 | | |
| | 1,511 | | | Project Alpha Intermediate Holding, Inc.,
LIBOR 3M + 4.250%(1) | | (B, B3) | | 04/26/24 | | | 6.240 | | | | 1,511,371 | | |
| | 15,696 | | | Solera LLC, LIBOR 1M + 2.750%(1) | | (B, Ba3) | | 03/03/23 | | | 4.536 | | | | 15,585,355 | | |
| | 6,616 | | | SS&C Technologies Holdings Europe Sarl,
LIBOR 1M + 2.250%(1) | | (BB+, Ba2) | | 04/16/25 | | | 4.036 | | | | 6,641,817 | | |
| | 10,149 | | | SS&C Technologies, Inc., LIBOR 1M + 2.250%(1) | | (BB+, Ba2) | | 04/16/25 | | | 4.036 | | | | 10,188,688 | | |
| | 13,195 | | | The Ultimate Software Group, Inc.,
LIBOR 1M + 3.750%(1) | | (B, B2) | | 05/04/26 | | | 5.536 | | | | 13,237,158 | | |
| | 7,765 | | | Verint Systems, Inc., LIBOR 2M + 2.000%(1) | | (BBB-, Ba1) | | 06/28/24 | | | 4.147 | | | | 7,808,770 | | |
| | | | 216,034,110 | | |
| Specialty Retail (0.5%) | | | |
| | 2,881 | | | Boing U.S. Holdco, Inc., LIBOR 3M + 7.500%(1) | | (CCC+, Caa2) | | 10/03/25 | | | 9.440 | | | | 2,747,754 | | |
| | 2,364 | | | Champ Acquisition Corp., LIBOR 3M + 5.500%(1) | | (B, B1) | | 12/19/25 | | | 7.604 | | | | 2,367,253 | | |
| | 383 | | | Mister Car Wash Holdings, Inc.(6),(7) | | (NR, B2) | | 05/14/26 | | | 3.500 | | | | 380,370 | | |
| | 7,641 | | | Mister Car Wash Holdings, Inc.,
LIBOR 3M + 3.500%(1) | | (B-, B2) | | 05/14/26 | | | 5.658 | | | | 7,588,369 | | |
| | | | 13,083,746 | | |
| Steel Producers/Products (1.8%) | | | |
| | 22,224 | | | Atkore International, Inc., LIBOR 3M + 2.750%(1) | | (BB-, B2) | | 12/22/23 | | | 4.860 | | | | 22,220,717 | | |
| | 23,665 | | | Zekelman Industries, Inc., LIBOR 1M + 2.250%(1) | | (BB-, B1) | | 06/14/21 | | | 4.073 | | | | 23,657,548 | | |
| | | | 45,878,265 | | |
| Support - Services (4.7%) | | | |
| | 1,206 | | | Allied Universal Holdco LLC(6),(7) | | (B-, B3) | | 07/10/26 | | | 2.125 | | | | 1,199,412 | | |
| | 12,184 | | | Allied Universal Holdco LLC,
LIBOR 6M + 4.250%(1) | | (B-, B3) | | 07/10/26 | | | 6.507 | | | | 12,114,064 | | |
| | 11,606 | | | Brand Energy & Infrastructure Services, Inc.,
LIBOR 3M + 4.250%(1) | | (B-, B3) | | 06/21/24 | | | 6.236 | | | | 11,294,138 | | |
| | 16,404 | | | Change Healthcare Holdings LLC,
LIBOR 1M + 2.500%(1) | | (B+, B1) | | 03/01/24 | | | 4.286 | | | | 16,327,389 | | |
| | 5,000 | | | MSX International, Inc.,
EURIBOR 3M + 4.500%(1),(2),(4) | | (B-, B2) | | 01/06/24 | | | 4.500 | | | | 5,155,282 | | |
| | 10,548 | | | PODS LLC, LIBOR 1M + 2.750%(1) | | (B+, B2) | | 12/06/24 | | | 4.671 | | | | 10,440,772 | | |
| | 6,291 | | | Sabre GLBL, Inc., LIBOR 1M + 2.000%(1) | | (BB, Ba2) | | 02/22/24 | | | 3.786 | | | | 6,310,457 | | |
See Accompanying Notes to Financial Statements.
17
Credit Suisse Floating Rate High Income Fund
Schedule of Investments (continued)
October 31, 2019
Par
(000) | |
| | Ratings†
(S&P/Moody's) | | Maturity | | Rate% | | Value | |
| BANK LOANS (continued) | | | |
Support - Services | | | |
$ | 14,201 | | | SAI Global Holdings II (Australia) Pty. Ltd.,
LIBOR 3M + 4.500%(1),(2) | | (CCC, Caa1) | | 12/20/23 | | | 6.436 | | | $ | 12,639,007 | | |
| | 15,709 | | | Sedgwick Claims Management Services, Inc.,
LIBOR 1M + 3.250%(1) | | (B, B2) | | 12/31/25 | | | 5.036 | | | | 15,273,615 | | |
| | 14,152 | | | The Geo Group, Inc., LIBOR 1M + 2.000%(1) | | (BB+, Ba3) | | 03/22/24 | | | 3.790 | | | | 12,870,963 | | |
| | 7,336 | | | Tribe Buyer LLC, LIBOR 1M + 4.500%(1) | | (B-, B3) | | 02/16/24 | | | 6.300 | | | | 6,465,095 | | |
| | 6,717 | | | USS Ultimate Holdings, Inc.,
LIBOR 3M + 7.750%(1) | | (CCC+, Caa2) | | 08/25/25 | | | 9.950 | | | | 6,609,697 | | |
| | | | 116,699,891 | | |
| Tech Hardware & Equipment (0.4%) | | | |
| | 10,000 | | | CommScope, Inc., LIBOR 1M + 3.250%(1) | | (B+, Ba3) | | 04/06/26 | | | 5.036 | | | | 9,828,150 | | |
| Telecom - Wireless (1.6%) | | | |
| | 14,312 | | | SBA Senior Finance II LLC,
LIBOR 1M + 2.000%(1) | | (BB+, Ba3) | | 04/11/25 | | | 3.790 | | | | 14,363,795 | | |
| | 25,095 | | | Sprint Communications, Inc.,
LIBOR 1M + 2.500%(1) | | (BB-, Ba2) | | 02/02/24 | | | 4.313 | | | | 24,855,036 | | |
| | | | 39,218,831 | | |
| Telecom - Wireline Integrated & Services (2.6%) | | | |
| | 7,711 | | | Altice France S.A., LIBOR 1M + 3.688%(1) | | (B, B2) | | 01/31/26 | | | 5.609 | | | | 7,546,809 | | |
| | 7,664 | | | CenturyLink Inc., LIBOR 1M + 2.750%(1) | | (BBB-, Ba3) | | 01/31/25 | | | 4.536 | | | | 7,597,474 | | |
| | 1,672 | | | GTT Communications, Inc.,
LIBOR 1M + 2.750%(1) | | (B-, B2) | | 05/31/25 | | | 4.540 | | | | 1,251,642 | | |
| | 18,280 | | | Level 3 Financing, Inc., LIBOR 1M + 2.250%(1) | | (BBB-, Ba1) | | 02/22/24 | | | 4.036 | | | | 18,325,700 | | |
| | 2,487 | | | MTN Infrastructure TopCo, Inc.,
LIBOR 1M + 3.000%(1) | | (B, B2) | | 11/15/24 | | | 4.786 | | | | 2,461,455 | | |
| | 3,900 | | | Numericable Group S.A., LIBOR 1M + 2.750%(1) | | (B, B2) | | 07/31/25 | | | 4.536 | | | | 3,786,042 | | |
| | 2,487 | | | TVC Albany, Inc., LIBOR 1M + 3.500%(1) | | (B-, B2) | | 07/23/25 | | | 5.290 | | | | 2,468,781 | | |
| | 20,318 | | | Zayo Group LLC, LIBOR 1M + 2.250%(1) | | (BB, Ba2) | | 01/19/24 | | | 4.036 | | | | 20,372,737 | | |
| | | | 63,810,640 | | |
| Theaters & Entertainment (3.1%) | | | |
| | 13,203 | | | AMC Entertainment Holdings, Inc.,
LIBOR 6M + 3.000%(1) | | (BB-, Ba2) | | 04/22/26 | | | 5.230 | | | | 13,213,524 | | |
| | 10,580 | | | Metro-Goldwyn-Mayer, Inc.,
LIBOR 1M + 4.500%(1),(3) | | (B-, B2) | | 07/03/26 | | | 6.290 | | | | 10,156,394 | | |
| | 9,349 | | | NAI Entertainment Holdings LLC,
LIBOR 1M + 2.500%(1) | | (BB, B1) | | 05/08/25 | | | 4.290 | | | | 9,348,930 | | |
| | 7,000 | | | Technicolor S.A., EURIBOR 3M + 3.000%(1),(4) | | (B, B3) | | 12/06/23 | | | 3.000 | | | | 6,807,979 | | |
| | 2,903 | | | Technicolor S.A., LIBOR 3M + 2.750%(1) | | (B, B3) | | 12/06/23 | | | 4.874 | | | | 2,387,494 | | |
| | 6,500 | | | Technicolor S.A., EURIBOR 3M + 3.500%(1),(4) | | (B, B3) | | 12/06/23 | | | 3.500 | | | | 6,381,521 | | |
| | 8,414 | | | UFC Holdings, LLC, LIBOR 1M + 3.250%(1) | | (B, B2) | | 04/29/26 | | | 5.040 | | | | 8,420,412 | | |
| | 21,452 | | | William Morris Endeavor Entertainment LLC,
LIBOR 3M + 2.750%(1) | | (B, B2) | | 05/18/25 | | | 4.600 | | | | 20,777,554 | | |
| | | | 77,493,808 | | |
See Accompanying Notes to Financial Statements.
18
Credit Suisse Floating Rate High Income Fund
Schedule of Investments (continued)
October 31, 2019
Par
(000) | |
| | Ratings†
(S&P/Moody's) | | Maturity | | Rate% | | Value | |
| BANK LOANS (continued) | | | |
| Transport Infrastructure/Services (0.2%) | | | |
$ | 7,024 | | | AI Mistral Holdco Ltd., LIBOR 1M + 3.000%(1) | | (B-, B2) | | 03/11/24 | | | 4.786 | | | $ | 5,548,826 | | |
| TOTAL BANK LOANS (Cost $2,125,170,927) | | | 2,019,975,478 | | |
| CORPORATE BONDS (8.9%) | | | |
| Aerospace & Defense (0.3%) | | | |
| | 7,365 | | | TransDigm, Inc., Rule 144A, Senior Secured
Notes (Callable 03/15/22 @ 103.13)(10) | | (B+, Ba3) | | 03/15/26 | | | 6.250 | | | | 7,908,169 | | |
| Auto Parts & Equipment (0.6%) | | | |
| | 6,665 | | | Cooper-Standard Automotive, Inc., Rule 144A,
Company Guaranteed Notes
(Callable 11/15/21 @ 102.81)(10) | | (B, B2) | | 11/15/26 | | | 5.625 | | | | 5,698,575 | | |
| | 1,345 | | | Panther Finance Co., Inc., Rule 144A,
Company Guaranteed Notes
(Callable 05/15/22 @ 104.25)(10) | | (B, B3) | | 05/15/27 | | | 8.500 | | | | 1,358,450 | | |
| | 7,000 | | | Panther Finance Co., Inc., Rule 144A, Senior
Secured Notes (Callable 05/15/22 @ 103.13)(10) | | (B+, Ba3) | | 05/15/26 | | | 6.250 | | | | 7,417,900 | | |
| | | | 14,474,925 | | |
| Building Materials (1.2%) | | | |
| | 23,600 | | | Omnimax International, Inc., Rule 144A, Senior
Secured Notes (Callable 11/15/19 @ 100.00)(10) | | (CCC, Caa1) | | 08/15/20 | | | 12.000 | | | | 23,216,500 | | |
| | 7,135 | | | PriSo Acquisition Corp., Rule 144A,
Senior Unsecured Notes
(Callable 12/02/19 @ 102.25)(10),(11) | | (CCC+, Caa1) | | 05/15/23 | | | 9.000 | | | | 6,573,119 | | |
| | | | 29,789,619 | | |
| Cable & Satellite TV (0.5%) | | | |
| | 2,500 | | | CSC Holdings LLC, Rule 144A,
Company Guaranteed Notes
(Callable 02/01/23 @ 102.69)(10) | | (BB, Ba3) | | 02/01/28 | | | 5.375 | | | | 2,650,000 | | |
| | 3,200 | | | CSC Holdings LLC, Rule 144A,
Company Guaranteed Notes
(Callable 05/15/21 @ 102.75)(10) | | (BB, Ba3) | | 05/15/26 | | | 5.500 | | | | 3,380,000 | | |
| | 1,000 | | | CSC Holdings LLC, Rule 144A,
Company Guaranteed Notes
(Callable 10/15/20 @ 103.31)(10) | | (BB, Ba3) | | 10/15/25 | | | 6.625 | | | | 1,067,500 | | |
| | 3,400 | | | Telenet Finance Luxembourg Notes Sarl,
Rule 144A, Senior Secured Notes
(Callable 12/01/22 @ 102.75)(10) | | (BB-, Ba3) | | 03/01/28 | | | 5.500 | | | | 3,632,900 | | |
| | 2,730 | | | Ziggo B.V., Rule 144A, Senior Secured Notes
(Callable 01/15/22 @ 102.75)(10) | | (B+, B1) | | 01/15/27 | | | 5.500 | | | | 2,893,800 | | |
| | | | 13,624,200 | | |
See Accompanying Notes to Financial Statements.
19
Credit Suisse Floating Rate High Income Fund
Schedule of Investments (continued)
October 31, 2019
Par
(000) | |
| | Ratings†
(S&P/Moody's) | | Maturity | | Rate% | | Value | |
| CORPORATE BONDS (continued) | | | |
| Chemicals (0.2%) | | | |
$ | 4,500 | | | Atotech Alpha 2 B.V., 8.75% Cash, 9.50% PIK,
Rule 144A, Senior Unsecured Notes
(Callable 12/02/19 @ 102.00)(10),(12) | | (CCC+, Caa1) | | 06/01/23 | | | 8.750 | | | $ | 4,443,750 | | |
| | 1,390 | | | Nufarm Americas, Inc., Rule 144A,
Company Guaranteed Notes
(Callable 04/30/21 @ 102.88)(10) | | (BB-, B1) | | 04/30/26 | | | 5.750 | | | | 1,403,900 | | |
| | | | 5,847,650 | | |
| Electronics (0.3%) | | | |
| | 6,300 | | | Entegris, Inc., Rule 144A,
Company Guaranteed Notes
(Callable 11/10/20 @ 103.47)(10) | | (BB, Ba2) | | 02/10/26 | | | 4.625 | | | | 6,517,523 | | |
| Energy - Exploration & Production (0.4%) | | | |
| | 11,000 | | | W&T Offshore, Inc., Rule 144A, Secured Notes
(Callable 11/01/20 @ 104.88)(10) | | (B+, B3) | | 11/01/23 | | | 9.750 | | | | 10,367,500 | | |
| Health Services (0.3%) | | | |
| | 1,367 | | | AMN Healthcare, Inc., Rule 144A,
Company Guaranteed Notes
(Callable 12/16/19 @ 103.84)(10) | | (BB-, Ba2) | | 10/01/24 | | | 5.125 | | | | 1,421,680 | | |
| | 2,000 | | | Sotera Health Holdings LLC, Rule 144A,
Senior Unsecured Notes
(Callable 12/02/19 @ 103.25)(10) | | (CCC+, Caa2) | | 05/15/23 | | | 6.500 | | | | 2,042,500 | | |
| | 3,250 | | | Sotera Health Topco, Inc., 8.125% Cash,
8.875% PIK, Rule 144A, Senior Unsecured
Notes (Callable 12/02/19 @ 100.00)(10),(12) | | (CCC+, Caa2) | | 11/01/21 | | | 8.125 | | | | 3,241,875 | | |
| | | | 6,706,055 | | |
| Insurance Brokerage (0.2%) | | | |
| | 5,000 | | | Acrisure Finance, Inc., Rule 144A,
Senior Unsecured Notes
(Callable 11/15/20 @ 103.50)(10) | | (CCC+, Caa2) | | 11/15/25 | | | 7.000 | | | | 4,600,000 | | |
| Investments & Misc. Financial Services (0.1%) | | | |
| | 3,175 | | | Compass Group Diversified Holdings LLC,
Rule 144A, Senior Unsecured Notes
(Callable 05/01/21 @ 104.00)(10) | | (B-, B3) | | 05/01/26 | | | 8.000 | | | | 3,429,000 | | |
| Media - Diversified (0.1%) | | | |
| | 2,000 | | | National CineMedia LLC, Global Senior
Secured Notes (Callable 11/07/19 @ 101.00) | | (B+, Ba3) | | 04/15/22 | | | 6.000 | | | | 2,025,200 | | |
| | 1,000 | | | National CineMedia LLC, Global Senior
Unsecured Notes (Callable 08/15/21 @ 102.88) | | (B-, B3) | | 08/15/26 | | | 5.750 | | | | 982,500 | | |
| | | | 3,007,700 | | |
See Accompanying Notes to Financial Statements.
20
Credit Suisse Floating Rate High Income Fund
Schedule of Investments (continued)
October 31, 2019
Par
(000) | |
| | Ratings†
(S&P/Moody's) | | Maturity | | Rate% | | Value | |
| CORPORATE BONDS (continued) | | | |
| Metals & Mining - Excluding Steel (0.9%) | | | |
$ | 4,750 | | | Cleveland-Cliffs, Inc., Rule 144A, Senior
Secured Notes (Callable 01/15/21 @ 102.44)(10) | | (BB, Ba2) | | 01/15/24 | | | 4.875 | | | $ | 4,892,500 | | |
| | 6,250 | | | Kaiser Aluminum Corp., Global Company
Guaranteed Notes (Callable 12/02/19 @ 104.41) | | (BB+, Ba3) | | 05/15/24 | | | 5.875 | | | | 6,515,625 | | |
| | 13,320 | | | Taseko Mines Ltd., Rule 144A,
Senior Secured Notes
(Callable 12/02/19 @ 104.38)(2),(10) | | (B, B3) | | 06/15/22 | | | 8.750 | | | | 11,788,200 | | |
| | | | 23,196,325 | | |
| Oil Field Equipment & Services (0.3%) | | | |
| | 7,525 | | | Pioneer Energy Services Corp., Global Company
Guaranteed Notes (Callable 12/02/19 @ 101.53) | | (CCC, Caa2) | | 03/15/22 | | | 6.125 | | | | 2,821,875 | | |
| | 7,000 | | | Shelf Drilling Holdings Ltd., Rule 144A,
Company Guaranteed Notes
(Callable 02/15/21 @ 106.19)(10) | | (B-, B3) | | 02/15/25 | | | 8.250 | | | | 5,915,000 | | |
| | | | 8,736,875 | | |
| Oil Refining & Marketing (0.2%) | | | |
| | 5,992 | | | Coffeyville Finance, Inc., Global Company
Guaranteed Notes (Callable 12/02/19 @ 101.08) | | (BB-, B1) | | 11/01/22 | | | 6.500 | | | | 6,066,900 | | |
| Packaging (0.4%) | | | |
| | 1,900 | | | Flex Acquisition Co., Inc., Rule 144A,
Senior Unsecured Notes
(Callable 01/15/20 @ 103.44)(10) | | (CCC+, Caa2) | | 01/15/25 | | | 6.875 | | | | 1,790,750 | | |
| | 7,275 | | | TriMas Corp., Rule 144A,
Company Guaranteed Notes
(Callable 10/15/20 @ 102.44)(10) | | (BB-, Ba3) | | 10/15/25 | | | 4.875 | | | | 7,415,953 | | |
| | | | 9,206,703 | | |
| Pharmaceuticals (0.5%) | | | |
| | 355 | | | Bausch Health Americas, Inc., Rule 144A,
Company Guaranteed Notes
(Callable 04/01/22 @ 104.63)(10) | | (B-, B3) | | 04/01/26 | | | 9.250 | | | | 402,488 | | |
| | 453 | | | Bausch Health Cos., Inc., Rule 144A,
Company Guaranteed Notes
(Callable 12/02/19 @ 101.47)(10) | | (B-, B3) | | 05/15/23 | | | 5.875 | | | | 461,494 | | |
| | 1,685 | | | Bausch Health Cos., Inc., Rule 144A, Senior
Secured Notes (Callable 11/01/20 @ 102.75)(10) | | (BB-, Ba2) | | 11/01/25 | | | 5.500 | | | | 1,767,161 | | |
| | 11,204 | | | Owens & Minor, Inc., Global Senior Secured
Notes (Callable 09/15/24 @ 100.00) | | (B, B2) | | 12/15/24 | | | 4.375 | | | | 8,683,100 | | |
| | | | 11,314,243 | | |
| Real Estate Investment Trusts (0.2%) | | | |
| | 5,000 | | | iStar, Inc., Senior Unsecured Notes
(Callable 12/02/19 @ 102.63) | | (BB-, Ba3) | | 09/15/22 | | | 5.250 | | | | 5,131,250 | | |
See Accompanying Notes to Financial Statements.
21
Credit Suisse Floating Rate High Income Fund
Schedule of Investments (continued)
October 31, 2019
Par
(000) | |
| | Ratings†
(S&P/Moody's) | | Maturity | | Rate% | | Value | |
| CORPORATE BONDS (continued) | | | |
| Recreation & Travel (0.4%) | | | |
$ | 4,000 | | | Six Flags Entertainment Corp., Rule 144A,
Company Guaranteed Notes
(Callable 04/15/22 @ 102.75)(10),(11) | | (BB-, B2) | | 04/15/27 | | | 5.500 | | | $ | 4,200,000 | | |
| | 4,478 | | | Six Flags Entertainment Corp., Rule 144A,
Company Guaranteed Notes
(Callable 12/02/19 @ 103.66)(10) | | (BB-, B2) | | 07/31/24 | | | 4.875 | | | | 4,634,730 | | |
| | | | 8,834,730 | | |
| Restaurants (0.1%) | | | |
| | 3,462 | | | Golden Nugget, Inc., Rule 144A,
Senior Unsecured Notes
(Callable 12/02/19 @ 103.38)(10) | | (CCC+, B3) | | 10/15/24 | | | 6.750 | | | | 3,574,861 | | |
| Software - Services (0.3%) | | | |
| | 2,295 | | | Epicor Software Corp., Rule 144A,
Secured Notes (Callable 12/02/19 @ 100.00),
LIBOR 3M + 7.250%(1),(10) | | (CCC, Caa2) | | 06/30/23 | | | 9.350 | | | | 2,285,801 | | |
| | 5,002 | | | Solera Finance, Inc., Rule 144A,
Senior Unsecured Notes
(Callable 12/02/19 @ 107.88)(10) | | (CCC+, Caa1) | | 03/01/24 | | | 10.500 | | | | 5,258,353 | | |
| | | | 7,544,154 | | |
| Specialty Retail (0.2%) | | | |
| | 3,500 | | | Penske Automotive Group, Inc., Company
Guaranteed Notes (Callable 05/15/21 @ 102.75) | | (B+, Ba3) | | 05/15/26 | | | 5.500 | | | | 3,670,625 | | |
| | 1,000 | | | Penske Automotive Group, Inc., Company
Guaranteed Notes (Callable 12/02/19 @ 102.69) | | (B+, Ba3) | | 12/01/24 | | | 5.375 | | | | 1,030,000 | | |
| | | | 4,700,625 | | |
| Support - Services (0.1%) | | | |
| | 1,782 | | | WeWork Cos., Inc., Rule 144A, Company
Guaranteed Notes(10),(11) | | (B, NR) | | 05/01/25 | | | 7.875 | | | | 1,519,155 | | |
| Tech Hardware & Equipment (0.3%) | | | |
| | 3,000 | | | CommScope Technologies LLC, Rule 144A,
Company Guaranteed Notes
(Callable 03/15/22 @ 102.50)(10) | | (B-, B3) | | 03/15/27 | | | 5.000 | | | | 2,467,500 | | |
| | 2,750 | | | CommScope, Inc., Rule 144A,
Company Guaranteed Notes
(Callable 03/01/22 @ 104.13)(10),(11) | | (B-, B3) | | 03/01/27 | | | 8.250 | | | | 2,615,195 | | |
| | 1,920 | | | CommScope, Inc., Rule 144A, Senior Secured
Notes (Callable 03/01/22 @ 103.00)(10) | | (B+, Ba3) | | 03/01/26 | | | 6.000 | | | | 1,982,400 | | |
| | | | 7,065,095 | | |
| Telecom - Wireline Integrated & Services (0.6%) | | | |
| | 4,000 | | | Altice Financing S.A., Rule 144A,
Senior Secured Notes
(Callable 05/15/21 @ 103.75)(10) | | (B+, B2) | | 05/15/26 | | | 7.500 | | | | 4,260,000 | | |
See Accompanying Notes to Financial Statements.
22
Credit Suisse Floating Rate High Income Fund
Schedule of Investments (continued)
October 31, 2019
Par
(000) | |
| | Ratings†
(S&P/Moody's) | | Maturity | | Rate% | | Value | |
| CORPORATE BONDS (continued) | | | |
Telecom - Wireline Integrated & Services | | | |
$ | 755 | | | Altice Financing S.A., Rule 144A, Senior
Secured Notes (Callable 12/02/19 @ 103.31)(10) | | (B+, B2) | | 02/15/23 | | | 6.625 | | | $ | 777,423 | | |
| | 5,000 | | | Altice France S.A., Rule 144A, Senior
Secured Notes (Callable 05/01/21 @ 103.69)(10) | | (B, B2) | | 05/01/26 | | | 7.375 | | | | 5,366,725 | | |
| | 7,000 | | | GTT Communications, Inc., Rule 144A,
Company Guaranteed Notes
(Callable 12/31/19 @ 105.91)(10),(11) | | (CCC, Caa1) | | 12/31/24 | | | 7.875 | | | | 4,112,500 | | |
| | | | 14,516,648 | | |
| Theaters & Entertainment (0.2%) | | | |
| | 775 | | | AMC Entertainment Holdings, Inc., Global
Company Guaranteed Notes
(Callable 05/15/22 @ 103.06)(11) | | (CCC+, B3) | | 05/15/27 | | | 6.125 | | | | 704,766 | | |
| | 3,800 | | | AMC Entertainment Holdings, Inc., Global
Company Guaranteed Notes
(Callable 11/15/21 @ 102.94) | | (CCC+, B3) | | 11/15/26 | | | 5.875 | | | | 3,481,750 | | |
| | | | 4,186,516 | | |
| TOTAL CORPORATE BONDS (Cost $229,874,079) | | | 221,866,421 | | |
| ASSET BACKED SECURITIES (5.4%) | | | |
| Collateralized Debt Obligations (5.4%) | | | |
| | 3,500 | | | ALM V Ltd., 2012-5A, Rule 144A,
LIBOR 3M + 5.250%(1),(10) | | (NR, Ba3) | | 10/18/27 | | | 7.253 | | | | 3,315,165 | | |
| | 5,000 | | | Ares XXXVIII CLO Ltd., 2015-38A, Rule 144A,
LIBOR 3M + 5.050%(1),(10) | | (NR, Ba3) | | 04/20/30 | | | 7.016 | | | | 4,389,941 | | |
| | 2,150 | | | Barings CLO Ltd., 2018-3A, Rule 144A,
LIBOR 3M + 2.900%(1),(10) | | (BBB-, NR) | | 07/20/29 | | | 4.866 | | | | 2,020,042 | | |
| | 2,100 | | | BlueMountain CLO Ltd., 2015-3A, Rule 144A,
LIBOR 3M + 5.400%(1),(10) | | (BB-, NR) | | 04/20/31 | | | 7.366 | | | | 1,811,571 | | |
| | 2,900 | | | Bowman Park CLO Ltd., 2014-1A, Rule 144A,
LIBOR 3M + 5.400%(1),(10) | | (BB-, NR) | | 11/23/25 | | | 7.548 | | | | 2,819,095 | | |
| | 4,316 | | | Capital Automotive LLC, 2017-1A, Rule 144A(10) | | (A+, NR) | | 04/15/47 | | | 3.870 | | | | 4,358,501 | | |
| | 2,606 | | | Capital Automotive LLC, 2017-1A, Rule 144A(10) | | (A+, NR) | | 04/15/47 | | | 4.180 | | | | 2,683,249 | | |
| | 750 | | | Carlyle Global Market Strategies CLO Ltd.,
2014-3RA, Rule 144A, LIBOR 3M + 5.400%(1),(10) | | (BB-, NR) | | 07/27/31 | | | 7.336 | | | | 610,546 | | |
| | 2,000 | | | Carlyle Global Market Strategies CLO Ltd.,
2014-5A, Rule 144A, LIBOR 3M + 3.150%(1),(10) | | (BBB-, NR) | | 07/15/31 | | | 5.151 | | | | 1,855,706 | | |
| | 1,850 | | | Carlyle Global Market Strategies CLO Ltd.,
2015-2A, Rule 144A, LIBOR 3M + 6.150%(1),(10) | | (NR, B1) | | 04/27/27 | | | 8.086 | | | | 1,716,970 | | |
| | 2,000 | | | Carlyle U.S. CLO Ltd., 2017-2A,
Rule 144A(2),(7),(10),(13) | | (NR, NR) | | 07/20/31 | | | 0.000 | | | | 1,364,404 | | |
| | 2,625 | | | CIFC Funding Ltd., 2014-1A, Rule 144A,
LIBOR 3M + 5.850%(1),(10) | | (BB-, NR) | | 01/18/31 | | | 7.853 | | | | 2,233,661 | | |
| | 4,000 | | | Crown Point CLO Ltd., 2018-4A, Rule 144A,
LIBOR 3M + 2.750%(1),(10) | | (NR, Baa3) | | 04/20/31 | | | 4.716 | | | | 3,642,661 | | |
See Accompanying Notes to Financial Statements.
23
Credit Suisse Floating Rate High Income Fund
Schedule of Investments (continued)
October 31, 2019
Par
(000) | |
| | Ratings†
(S&P/Moody's) | | Maturity | | Rate% | | Value | |
| ASSET BACKED SECURITIES (continued) | | | |
Collateralized Debt Obligations | | | |
$ | 3,500 | | | Elevation CLO Ltd., 2014-2A, Rule 144A,
LIBOR 3M + 3.200%(1),(10) | | (NR, Baa3) | | 10/15/29 | | | 5.201 | | | $ | 3,286,601 | | |
| | 5,000 | | | Galaxy CLO XVIII Ltd., 2018-28A, Rule 144A,
LIBOR 3M + 3.000%(1),(10) | | (BBB-, NR) | | 07/15/31 | | | 5.001 | | | | 4,585,626 | | |
| | 5,500 | | | Gallatin CLO IX Ltd., 2018-1A, Rule 144A,
LIBOR 3M + 1.050%(1),(10) | | (NR, Aaa) | | 01/21/28 | | | 3.016 | | | | 5,489,093 | | |
| | 3,250 | | | Goldentree Loan Opportunities XI Ltd.,
2015-11A, Rule 144A, LIBOR 3M + 5.400%(1),(10) | | (NR, Ba3) | | 01/18/31 | | | 7.403 | | | | 2,919,432 | | |
| | 2,250 | | | Greywolf CLO II Ltd., 2013-1A, Rule 144A,
LIBOR 3M + 6.350%(1),(10) | | (BB-, NR) | | 10/15/29 | | | 8.351 | | | | 2,047,264 | | |
| | 1,250 | | | Greywolf CLO III Ltd., 2018-3RA, Rule 144A,
LIBOR 3M + 2.250%(1),(10) | | (A, NR) | | 10/22/28 | | | 4.203 | | | | 1,232,402 | | |
| | 2,125 | | | Greywolf CLO III Ltd., 2018-3RA, Rule 144A,
LIBOR 3M + 3.150%(1),(10) | | (BBB-, NR) | | 10/22/28 | | | 5.103 | | | | 2,089,203 | | |
| | 3,000 | | | Greywolf CLO III Ltd., 2018-3RA, Rule 144A,
LIBOR 3M + 5.500%(1),(10) | | (BB-, NR) | | 10/22/28 | | | 7.453 | | | | 2,876,488 | | |
| | 7,000 | | | Greywolf CLO IV Ltd., 2019-1A, Rule 144A,
LIBOR 3M + 2.950%(1),(10) | | (A, NR) | | 04/17/30 | | | 4.952 | | | | 6,985,587 | | |
| | 1,000 | | | Greywolf CLO IV Ltd., 2019-1A, Rule 144A,
LIBOR 3M + 3.950%(1),(10) | | (BBB-, NR) | | 04/17/30 | | | 5.952 | | | | 993,988 | | |
| | 6,000 | | | Greywolf CLO V Ltd., 2015-1A, Rule 144A,
LIBOR 3M + 2.000%(1),(10) | | (A, NR) | | 01/27/31 | | | 3.940 | | | | 5,755,290 | | |
| | 3,950 | | | Greywolf CLO V Ltd., 2015-1A, Rule 144A,
LIBOR 3M + 3.000%(1),(10) | | (BBB-, NR) | | 01/27/31 | | | 4.940 | | | | 3,672,449 | | |
| | 5,150 | | | Greywolf CLO V Ltd., 2015-1A, Rule 144A,
LIBOR 3M + 5.850%(1),(10) | | (BB-, NR) | | 01/27/31 | | | 7.790 | | | | 4,598,632 | | |
| | 2,250 | | | Greywolf CLO VI Ltd., 2018-1A, Rule 144A,
LIBOR 3M + 5.750%(1),(10) | | (BB-, NR) | | 04/26/31 | | | 7.686 | | | | 2,012,008 | | |
| | 3,000 | | | Highbridge Loan Management Ltd., 12A-2018,
Rule 144A, LIBOR 3M + 1.850%(1),(10) | | (A, NR) | | 07/18/31 | | | 3.853 | | | | 2,904,903 | | |
| | 4,500 | | | Highbridge Loan Management Ltd., 7A-2015,
Rule 144A, LIBOR 3M + 1.700%(1),(10) | | (A, NR) | | 03/15/27 | | | 3.858 | | | | 4,360,562 | | |
| | 2,500 | | | KKR CLO Ltd., 20, Rule 144A,
LIBOR 3M + 5.500%(1),(10) | | (NR, Ba3) | | 10/16/30 | | | 7.501 | | | | 2,130,821 | | |
| | 3,250 | | | KKR Financial CLO Ltd., 2013-1A, Rule 144A,
LIBOR 3M + 6.080%(1),(10) | | (NR, Ba3) | | 04/15/29 | | | 8.081 | | | | 2,757,327 | | |
| | 2,250 | | | Octagon Investment Partners 26 Ltd., 2016-1A,
Rule 144A, LIBOR 3M + 2.850%(1),(10) | | (BBB-, NR) | | 07/15/30 | | | 4.851 | | | | 2,061,259 | | |
| | 3,500 | | | Shackleton CLO Ltd., 2014-6RA, Rule 144A,
LIBOR 3M + 2.970%(1),(10) | | (NR, Baa3) | | 07/17/28 | | | 4.972 | | | | 3,365,226 | | |
| | 4,000 | | | Symphony Credit Opportunities Fund Ltd.,
2015-2A, Rule 144A, LIBOR 3M + 3.060%(1),(10) | | (NR, Baa3) | | 07/15/28 | | | 5.061 | | | | 3,858,049 | | |
| | 3,000 | | | Venture 35 CLO Ltd., 2018-35A, Rule 144A,
LIBOR 3M + 3.500%(1),(10) | | (NR, Baa3) | | 10/22/31 | | | 5.453 | | | | 2,743,849 | | |
| | 3,000 | | | Venture CLO Ltd., 2017-28AA, Rule 144A,
LIBOR 3M + 2.400%(1),(10) | | (NR, A2) | | 10/20/29 | | | 4.366 | | | | 2,935,116 | | |
See Accompanying Notes to Financial Statements.
24
Credit Suisse Floating Rate High Income Fund
Schedule of Investments (continued)
October 31, 2019
Par
(000) | |
| | Ratings†
(S&P/Moody's) | | Maturity | | Rate% | | Value | |
| ASSET BACKED SECURITIES (continued) | | | |
Collateralized Debt Obligations | | | |
$ | 1,250 | | | Venture CLO Ltd., 2018-31A, Rule 144A,
LIBOR 3M + 2.820%(1),(10) | | (NR, Baa3) | | 04/20/31 | | | 4.786 | | | $ | 1,147,028 | | |
| | 3,000 | | | Venture XIII CLO Ltd., 2013-13A, Rule 144A,
LIBOR 3M + 3.300%(1),(10) | | (NR, Baa2) | | 09/10/29 | | | 5.434 | | | | 2,867,342 | | |
| | 4,500 | | | Venture XX CLO Ltd., 2015-20A, Rule 144A,
LIBOR 3M + 1.900%(1),(10) | | (A+, NR) | | 04/15/27 | | | 3.901 | | | | 4,400,334 | | |
| | 2,250 | | | Vibrant Clo V Ltd., 2016-5A, Rule 144A,
LIBOR 3M + 2.800%(1),(10) | | (NR, A2) | | 01/20/29 | | | 4.766 | | | | 2,211,601 | | |
| | 2,150 | | | Vibrant CLO V Ltd., 2016-5A, Rule 144A,
LIBOR 3M + 7.000%(1),(10) | | (NR, Ba3) | | 01/20/29 | | | 8.966 | | | | 1,819,386 | | |
| | 6,000 | | | Vibrant CLO VI Ltd., 2017-6A, Rule 144A,
LIBOR 3M + 2.600%(1),(10) | | (NR, A2) | | 06/20/29 | | | 4.756 | | | | 5,865,546 | | |
| | 1,500 | | | Vibrant CLO VI Ltd., 2017-6A, Rule 144A,
LIBOR 3M + 5.750%(1),(10) | | (NR, Ba3) | | 06/20/29 | | | 7.906 | | | | 1,318,169 | | |
| | 3,000 | | | Voya CLO Ltd., 2014-4A, Rule 144A,
LIBOR 3M + 3.350%(1),(10) | | (BBB-, NR) | | 07/14/31 | | | 5.351 | | | | 2,798,693 | | |
| | 3,000 | | | Voya CLO Ltd., 2017-1A, Rule 144A(2),(7),(10),(13) | | (NR, NR) | | 04/17/30 | | | 0.000 | | | | 1,707,972 | | |
| | 1,474 | | | Wendy's Funding LLC, 2018-1A, Rule 144A(10) | | (BBB, NR) | | 03/15/48 | | | 3.573 | | | | 1,499,853 | | |
| TOTAL ASSET BACKED SECURITIES (Cost $143,276,305) | | | 134,118,611 | | |
Number of
Shares | | | | | | | | | | | |
| COMMON STOCKS (0.3%) | | | |
| Auto Parts & Equipment (0.1%) | | | |
| | 134,659 | | | UCI International, Inc.(2),(3),(9) | | | | | | | | | | | | | | | 3,029,827 | | |
| Building & Construction (0.0%) | | | |
| | 6 | | | White Forest Resources, Inc.(2),(3),(9) | | | | | | | | | | | | | | | — | | |
| Chemicals (0.2%) | | | |
| | 9,785 | | | Huntsman Corp.(2) | | | | | | | | | | | | | | | 216,542 | | |
| | 31,756 | | | Project Investor Holdings LLC(2),(3),(9) | | | | | | | | | | | | | | | 318 | | |
| | 529,264 | | | Proppants Holdings LLC(2),(3),(9) | | | | | | | | | | | | | | | 4,848,058 | | |
| | | | 5,064,918 | | |
| Energy - Exploration & Production (0.0%) | | | |
| | 872,375 | | | PES Energy, Inc.(2) | | | | | | | | | | | | | | | 109,047 | | |
| Health Services (0.0%) | | | |
| | 161,122 | | | Valitas Health Services, Inc.(3),(9),(14) | | | | | | | | | | | | | | | 1,611 | | |
| Support - Services (0.0%) | | | |
| | 779 | | | Sprint Industrial Holdings LLC, Class G(2),(3),(9) | | | | | | | | | | | | | | | — | | |
| | 71 | | | Sprint Industrial Holdings LLC, Class H(2),(3),(9) | | | | | | | | | | | | | | | — | | |
| | 172 | | | Sprint Industrial Holdings LLC, Class I(2),(3),(9) | | | | | | | | | | | | | | | 2 | | |
| | | | 2 | | |
See Accompanying Notes to Financial Statements.
25
Credit Suisse Floating Rate High Income Fund
Schedule of Investments (continued)
October 31, 2019
Number of
Shares | | | | | | | | | | Value | |
| COMMON STOCKS (continued) | | | |
| Theaters & Entertainment (0.0%) | | | |
| | 40 | | | NEG Holdings LLC, Litigation Trust Units(2),(3),(9) | | | | | | | | | | | | | | $ | 40 | | |
| TOTAL COMMON STOCKS (Cost $16,875,566) | | | 8,205,445 | | |
| WARRANTS (0.0%) | | | |
| Chemicals (0.0%) | | | |
| | 132,316 | | | Project Investor Holdings LLC, expires 02/20/2022(2),(3),(9) | | | | | | | | | | | | | | | — | | |
| Diversified Capital Goods (0.0%) | | | |
| | 17,726 | | | Horizon Global Corp. expires 06/30/2021(14) | | | | | | | | | | | | | | | 41,479 | | |
| TOTAL WARRANTS (Cost $68,804) | | | 41,479 | | |
| SHORT-TERM INVESTMENT (0.5%) | | | |
| | 11,163,773 | | | State Street Navigator Securities Lending
Government Money Market Portfolio, 1.77%(15)
(Cost $11,163,773) | | | | | | | | | | | | | | | 11,163,773 | | |
| TOTAL INVESTMENTS AT VALUE (96.3%) (Cost $2,526,429,454) | | | 2,395,371,207 | | |
| OTHER ASSETS IN EXCESS OF LIABILITIES (3.7%) | | | 90,943,129 | | |
| NET ASSETS (100.0%) | | $ | 2,486,314,336 | | |
† Credit ratings given by the S&P Global Ratings Division of S&P Global Inc. ("S&P") and Moody's Investors Service, Inc. ("Moody's") are unaudited.
(1) Variable rate obligation — The interest rate shown is the rate in effect as of October 31, 2019.
(2) Illiquid security (unaudited).
(3) Security is valued using significant unobservable inputs.
(4) This security is denominated in Euro.
(5) Bond is currently in default.
(6) All or a portion is an unfunded loan commitment (See note 2-I).
(7) The rates on certain variable rate securities are not based on a published reference rate and spread but are determined by the issuer or agent and are based on current market conditions. These securities do not indicate a reference rate and spread in their description above. The interest rate shown is the rate in effect as of October 31, 2019.
(8) This security is denominated in British Pound.
(9) Not readily marketable security; security is valued at fair value as determined in good faith by, or under the direction of, the Board of Trustees.
(10) Security exempt from registration under Rule 144A of the Securities Act of 1933, as amended. These securities may be resold in transactions exempt from registration, normally to qualified institutional buyers. At October 31, 2019, these securities amounted to a value of $314,871,441 or 12.7% of net assets.
(11) Security or portion thereof is out on loan (See note 2-J).
(12) PIK: Payment-in-kind security for which part of the income earned may be paid as additional principal.
(13) Zero coupon security.
(14) Non-income producing security.
(15) Represents security purchased with cash collateral received for securities on loan. The rate shown is the annualized one-day yield at October 31, 2019.
See Accompanying Notes to Financial Statements.
26
Credit Suisse Floating Rate High Income Fund
Schedule of Investments (continued)
October 31, 2019
INVESTMENT ABBREVIATIONS
12M = 12 Month
1M = 1 Month
2M = 2 Month
3M = 3 Month
6M = 6 Month
EURIBOR = Euro Interbank Offered Rate
LIBOR = London Interbank Offered Rate
NR = Not Rated
Sarl - société à responsabilité limitée
Forward Foreign Currency Contracts
Forward
Currency to be
Purchased (Local) | | Forward
Currency to be
Sold (Local) | | Expiration
Date | | Counterparty | | Value on
Settlement Date | | Current
Value/
Notional | | Net Unrealized
Appreciation
(Depreciation) | |
EUR | 5,793,046 | | | USD | 6,572,048 | | | 10/13/20 | | Morgan Stanley | | $ | 6,572,048 | | | $ | 6,600,840 | | | $ | 28,792 | | |
EUR | 3,028,861 | | | USD | 3,440,973 | | | 10/13/20 | | Barclays Bank PLC | | | 3,440,973 | | | | 3,451,211 | | | | 10,238 | | |
GBP | 338,399 | | | USD | 438,257 | | | 10/13/20 | | Barclays Bank PLC | | | 438,257 | | | | 441,621 | | | | 3,364 | | |
USD | 135,674,192 | | | EUR | 120,749,548 | | | 10/13/20 | | Morgan Stanley | | | (135,674,192 | ) | | | (137,587,115 | ) | | | (1,912,923 | ) | |
USD | 31,885,371 | | | GBP | 25,811,217 | | | 10/13/20 | | Morgan Stanley. | | | (31,885,371 | ) | | | (33,684,467 | ) | | | (1,799,096 | ) | |
| | | $ | (3,669,625 | ) | |
Currency Abbreviations:
EUR = Euro
GBP = British Pound
USD = United States Dollar
See Accompanying Notes to Financial Statements.
27
Credit Suisse Floating Rate High Income Fund
Statement of Assets and Liabilities
October 31, 2019
Assets | |
Investments at value, including collateral for securities on loan of $11,163,773
(Cost $2,526,429,454) (Note 2) | | $ | 2,395,371,2071 | | |
Cash | | | 143,193,088 | | |
Foreign currency at value (Cost $3,342,717) | | | 3,429,903 | | |
Receivable for investments sold | | | 40,157,916 | | |
Interest receivable | | | 12,948,167 | | |
Receivable for Fund shares sold | | | 3,239,379 | | |
Unrealized appreciation on forward foreign currency contracts (Note 2) | | | 42,394 | | |
Prepaid expenses and other assets | | | 62,507 | | |
Total assets | | | 2,598,444,561 | | |
Liabilities | |
Investment advisory fee payable (Note 3) | | | 1,199,686 | | |
Administrative services fee payable (Note 3) | | | 66,517 | | |
Shareholder servicing/Distribution fee payable (Note 3) | | | 117,600 | | |
Payable for investments purchased | | | 83,303,204 | | |
Payable upon return of securities loaned (Note 2) | | | 11,163,773 | | |
Payable for Fund shares redeemed | | | 7,727,743 | | |
Unrealized depreciation on forward foreign currency contracts (Note 2) | | | 3,712,019 | | |
Unfunded loan commitments (Note 2) | | | 2,751,809 | | |
Dividend payable | | | 1,467,330 | | |
Trustees' fee payable | | | 16,998 | | |
Accrued expenses | | | 603,546 | | |
Total liabilities | | | 112,130,225 | | |
Net Assets | |
Capital stock, $.001 par value (Note 6) | | | 378,844 | | |
Paid-in capital (Note 6) | | | 2,646,496,154 | | |
Total distributable earnings (loss) | | | (160,560,662 | ) | |
Net assets | | $ | 2,486,314,336 | | |
I Shares | |
Net assets | | $ | 2,199,606,118 | | |
Shares outstanding | | | 335,395,082 | | |
Net asset value, offering price and redemption price per share | | $ | 6.56 | | |
A Shares | |
Net assets | | $ | 199,328,435 | | |
Shares outstanding | | | 30,235,673 | | |
Net asset value and redemption price per share | | $ | 6.59 | | |
Maximum offering price per share (net asset value/(1-4.75%)) | | $ | 6.92 | | |
C Shares | |
Net assets | | $ | 87,379,783 | | |
Shares outstanding | | | 13,212,865 | | |
Net asset value and offering price per share | | $ | 6.61 | | |
1 Includes $10,944,144 of securities on loan.
See Accompanying Notes to Financial Statements.
28
Credit Suisse Floating Rate High Income Fund
Statement of Operations
For the Year Ended October 31, 2019
Investment Income | |
Interest | | $ | 173,958,360 | | |
Dividends | | | 78,462 | | |
Securities lending (net of rebates) | | | 55,973 | | |
Total investment income | | | 174,092,795 | | |
Expenses | |
Investment advisory fees (Note 3) | | | 17,676,300 | | |
Administrative services fees (Note 3) | | | 448,760 | | |
Shareholder servicing/Distribution fees (Note 3) | |
Class A | | | 579,194 | | |
Class C | | | 1,029,426 | | |
Transfer agent fees (Note 3) | | | 3,219,548 | | |
Commitment fees (Note 4) | | | 688,867 | | |
Custodian fees | | | 584,962 | | |
Printing fees | | | 157,630 | | |
Registration fees | | | 123,118 | | |
Insurance expense | | | 87,649 | | |
Audit and tax fees | | | 81,401 | | |
Trustees' fees | | | 61,767 | | |
Legal fees | | | 22,036 | | |
Miscellaneous expense | | | 51,356 | | |
Total expenses | | | 24,812,014 | | |
Less: fees waived (Note 3) | | | (2,468,800 | ) | |
Net expenses | | | 22,343,214 | | |
Net investment income | | | 151,749,581 | | |
Net Realized and Unrealized Gain (Loss) from Investments , Foreign Currency and
Forward Foreign Currency Contracts | |
Net realized loss from investments | | | (34,847,473 | ) | |
Net realized gain from foreign currency transactions | | | 911,057 | | |
Net realized gain from forward foreign currency contracts | | | 16,581,828 | | |
Net change in unrealized appreciation (depreciation) from investments | | | (99,186,021 | ) | |
Net change in unrealized appreciation (depreciation) from foreign currency translations | | | 622,123 | | |
Net change in unrealized appreciation (depreciation) from forward foreign currency contracts | | | (10,281,099 | ) | |
Net realized and unrealized loss from investments, foreign currency and forward foreign
currency contracts | | | (126,199,585 | ) | |
Net increase in net assets resulting from operations | | $ | 25,549,996 | | |
See Accompanying Notes to Financial Statements.
29
Credit Suisse Floating Rate High Income Fund
Statements of Changes in Net Assets
| | | For the Year
Ended
October 31, 2019 | | For the Year
Ended
October 31, 2018 | |
From Operations | |
Net investment income | | $ | 151,749,581 | | | $ | 163,342,483 | | |
Net realized gain (loss) from investments, foreign currency transactions
and forward foreign currency contracts | | | (17,354,588 | ) | | | 5,284,635 | | |
Net change in unrealized appreciation (depreciation) from investments,
foreign currency translations and forward foreign currency contracts | | | (108,844,997 | ) | | | (38,440,436 | ) | |
Net increase in net assets resulting from operations | | | 25,549,996 | | | | 130,186,682 | | |
From Distributions | |
From distributable earnings | |
Class I | | | (136,066,401 | ) | | | (148,009,901 | ) | |
Class A | | | (11,431,407 | ) | | | (11,246,262 | ) | |
Class B* | | | — | | | | (3,343 | ) | |
Class C | | | (4,317,758 | ) | | | (3,827,480 | ) | |
Net decrease in net assets resulting from dividends | | | (151,815,566 | ) | | | (163,086,986 | ) | |
| From Capital Share Transactions (Note 6) | |
Proceeds from sale of shares | | | 829,774,372 | | | | 1,638,251,437 | | |
Reinvestment of dividends | | | 129,983,502 | | | | 136,274,585 | | |
Net asset value of shares redeemed | | | (2,458,533,098 | ) | | | (1,270,696,540 | ) | |
Net increase (decrease) in net assets from capital share transactions | | | (1,498,775,224 | ) | | | 503,829,482 | | |
Net increase (decrease) in net assets | | | (1,625,040,794 | ) | | | 470,929,178 | | |
Net Assets | |
Beginning of year | | | 4,111,355,130 | | | | 3,640,425,952 | | |
End of year | | $ | 2,486,314,336 | | | $ | 4,111,355,130 | | |
* The Class B shares were terminated on December 15, 2017 and are no longer offered.
See Accompanying Notes to Financial Statements.
30
Credit Suisse Floating Rate High Income Fund
Financial Highlights
(For a Class I Share of the Fund Outstanding Throughout Each Year)
| | | For the Year Ended October 31, | |
| | | 2019 | | 2018 | | 2017 | | 2016 | | 2015 | |
Per share data | |
Net asset value, beginning of year | | $ | 6.813 | | | $ | 6.87 | | | $ | 6.77 | | | $ | 6.72 | | | $ | 6.86 | | |
INVESTMENT OPERATIONS | |
Net investment income1 | | | 0.35 | | | | 0.29 | | | | 0.28 | | | | 0.32 | | | | 0.29 | | |
Net gain (loss) from investments, foreign currency
transactions and forward foreign currency
contracts (both realized and unrealized) | | | (0.25 | ) | | | (0.06 | ) | | | 0.10 | | | | 0.05 | | | | (0.14 | ) | |
Total from investment operations | | | 0.10 | | | | 0.23 | | | | 0.38 | | | | 0.37 | | | | 0.15 | | |
LESS DIVIDENDS AND DISTRIBUTIONS | |
Dividends from net investment income | | | (0.35 | ) | | | (0.29 | ) | | | (0.27 | ) | | | (0.31 | ) | | | (0.29 | ) | |
Distributions from net realized gains | | | — | | | | — | | | | — | | | | — | | | | (0.00 | )2 | |
Return of capital | | | — | | | | — | | | | (0.01 | ) | | | (0.01 | ) | | | (0.00 | )2 | |
Total dividends and distributions | | | (0.35 | ) | | �� | (0.29 | ) | | | (0.28 | ) | | | (0.32 | ) | | | (0.29 | ) | |
Net asset value, end of year | | $ | 6.56 | | | $ | 6.813 | | | $ | 6.87 | | | $ | 6.77 | | | $ | 6.72 | | |
Total return4 | | | 1.47 | % | | | 3.45 | % | | | 5.75 | % | | | 5.79 | % | | | 2.33 | % | |
RATIOS AND SUPPLEMENTAL DATA | |
Net assets, end of year (000s omitted) | | $ | 2,199,606 | | | $ | 3,704,519 | | | $ | 3,236,360 | | | $ | 2,438,027 | | | $ | 2,167,955 | | |
Ratio of net expenses to average net assets | | | 0.70 | % | | | 0.70 | % | | | 0.70 | % | | | 0.70 | % | | | 0.70 | % | |
Ratio of expenses to average net assets
excluding interest expense | | | 0.70 | % | | | 0.70 | % | | | 0.70 | % | | | 0.70 | % | | | 0.70 | % | |
Ratio of net investment income to average
net assets | | | 5.18 | % | | | 4.29 | % | | | 4.12 | % | | | 4.87 | % | | | 4.29 | % | |
Decrease reflected in above operating expense
ratios due to waivers/reimbursements | | | 0.08 | % | | | 0.06 | % | | | 0.07 | % | | | 0.11 | % | | | 0.07 | % | |
Portfolio turnover rate | | | 23 | % | | | 45 | % | | | 64 | % | | | 48 | % | | | 46 | % | |
1 Per share information is calculated using the average shares outstanding method.
2 This amount represents less than $(0.01) per share.
3 Includes adjustments in accordance with accounting principles generally accepted in the United States of America and as such, the net asset values for financial reporting purposes and the returns based upon net asset values may differ from the net asset values and returns for shareholder transactions.
4 Total returns are historical and include change in share price and reinvestment of all dividends and distributions. Had certain expenses not been reduced during the years shown, total returns would have been lower.
See Accompanying Notes to Financial Statements.
31
Credit Suisse Floating Rate High Income Fund
Financial Highlights
(For a Class A Share of the Fund Outstanding Throughout Each Year)
| | | For the Year Ended October 31, | |
| | | 2019 | | 2018 | | 2017 | | 2016 | | 2015 | |
Per share data | |
Net asset value, beginning of year | | $ | 6.843 | | | $ | 6.90 | | | $ | 6.80 | | | $ | 6.75 | | | $ | 6.89 | | |
INVESTMENT OPERATIONS | |
Net investment income1 | | | 0.33 | | | | 0.28 | | | | 0.27 | | | | 0.31 | | | | 0.28 | | |
Net gain (loss) from investments, foreign currency
transactions and forward foreign currency
contracts (both realized and unrealized) | | | (0.25 | ) | | | (0.06 | ) | | | 0.10 | | | | 0.05 | | | | (0.14 | ) | |
Total from investment operations | | | 0.08 | | | | 0.22 | | | | 0.37 | | | | 0.36 | | | | 0.14 | | |
LESS DIVIDENDS AND DISTRIBUTIONS | |
Dividends from net investment income | | | (0.33 | ) | | | (0.28 | ) | | | (0.26 | ) | | | (0.30 | ) | | | (0.28 | ) | |
Distributions from net realized gains | | | — | | | | — | | | | — | | | | — | | | | (0.00 | )2 | |
Return of capital | | | — | | | | — | | | | (0.01 | ) | | | (0.01 | ) | | | (0.00 | )2 | |
Total dividends and distributions | | | (0.33 | ) | | | (0.28 | ) | | | (0.27 | ) | | | (0.31 | ) | | | (0.28 | ) | |
Net asset value, end of year | | $ | 6.59 | | | $ | 6.843 | | | $ | 6.90 | | | $ | 6.80 | | | $ | 6.75 | | |
Total return4 | | | 1.23 | % | | | 3.20 | % | | | 5.48 | % | | | 5.52 | % | | | 2.09 | % | |
RATIOS AND SUPPLEMENTAL DATA | |
Net assets, end of year (000s omitted) | | $ | 199,328 | | | $ | 289,959 | | | $ | 284,456 | | | $ | 227,399 | | | $ | 286,805 | | |
Ratio of net expenses to average net assets | | | 0.95 | % | | | 0.95 | % | | | 0.95 | % | | | 0.95 | % | | | 0.95 | % | |
Ratio of expenses to average net assets
excluding interest expense | | | 0.95 | % | | | 0.95 | % | | | 0.95 | % | | | 0.95 | % | | | 0.95 | % | |
Ratio of net investment income to average
net assets | | | 4.93 | % | | | 4.03 | % | | | 3.87 | % | | | 4.63 | % | | | 4.06 | % | |
Decrease reflected in above operating expense
ratios due to waivers/reimbursements | | | 0.08 | % | | | 0.06 | % | | | 0.07 | % | | | 0.11 | % | | | 0.07 | % | |
Portfolio turnover rate | | | 23 | % | | | 45 | % | | | 64 | % | | | 48 | % | | | 46 | % | |
1 Per share information is calculated using the average shares outstanding method.
2 This amount represents less than $(0.01) per share.
3 Includes adjustments in accordance with accounting principles generally accepted in the United States of America and as such, the net asset values for financial reporting purposes and the returns based upon net asset values may differ from the net asset values and returns for shareholder transactions.
4 Total returns are historical and include change in share price, reinvestment of all dividends and distributions and no sales charge. Had certain expenses not been reduced during the years shown, total returns would have been lower.
See Accompanying Notes to Financial Statements.
32
Credit Suisse Floating Rate High Income Fund
Financial Highlights
(For a Class C Share of the Fund Outstanding Throughout Each Year)
| | | For the Year Ended October 31, | |
| | | 2019 | | 2018 | | 2017 | | 2016 | | 2015 | |
Per share data | |
Net asset value, beginning of year | | $ | 6.873 | | | $ | 6.92 | | | $ | 6.82 | | | $ | 6.77 | | | $ | 6.91 | | |
INVESTMENT OPERATIONS | |
Net investment income1 | | | 0.28 | | | | 0.23 | | | | 0.22 | | | | 0.26 | | | | 0.23 | | |
Net gain (loss) from investments, foreign currency
transactions and forward foreign currency
contracts (both realized and unrealized) | | | (0.26 | ) | | | (0.05 | ) | | | 0.10 | | | | 0.05 | | | | (0.14 | ) | |
Total from investment operations | | | 0.02 | | | | 0.18 | | | | 0.32 | | | | 0.31 | | | | 0.09 | | |
LESS DIVIDENDS AND DISTRIBUTIONS | |
Dividends from net investment income | | | (0.28 | ) | | | (0.23 | ) | | | (0.21 | ) | | | (0.25 | ) | | | (0.23 | ) | |
Distributions from net realized gains | | | — | | | | — | | | | — | | | | — | | | | (0.00 | )2 | |
Return of capital | | | — | | | | — | | | | (0.01 | ) | | | (0.01 | ) | | | (0.00 | )2 | |
Total dividends and distributions | | | (0.28 | ) | | | (0.23 | ) | | | (0.22 | ) | | | (0.26 | ) | | | (0.23 | ) | |
Net asset value, end of year | | $ | 6.61 | | | $ | 6.873 | | | $ | 6.92 | | | $ | 6.82 | | | $ | 6.77 | | |
Total return4 | | | 0.34 | % | | | 2.58 | % | | | 4.69 | % | | | 4.73 | % | | | 1.33 | % | |
RATIOS AND SUPPLEMENTAL DATA | |
Net assets, end of year (000s omitted) | | $ | 87,380 | | | $ | 116,877 | | | $ | 118,654 | | | $ | 114,343 | | | $ | 134,433 | | |
Ratio of net expenses to average net assets | | | 1.70 | % | | | 1.70 | % | | | 1.70 | % | | | 1.70 | % | | | 1.70 | % | |
Ratio of expenses to average net assets
excluding interest expense | | | 1.70 | % | | | 1.70 | % | | | 1.70 | % | | | 1.70 | % | | | 1.70 | % | |
Ratio of net investment income to average
net assets | | | 4.19 | % | | | 3.28 | % | | | 3.13 | % | | | 3.89 | % | | | 3.32 | % | |
Decrease reflected in above operating expense
ratios due to waivers/reimbursements | | | 0.08 | % | | | 0.06 | % | | | 0.07 | % | | | 0.11 | % | | | 0.07 | % | |
Portfolio turnover rate | | | 23 | % | | | 45 | % | | | 64 | % | | | 48 | % | | | 46 | % | |
1 Per share information is calculated using the average shares outstanding method.
2 This amount represents less than $(0.01) per share.
3 Includes adjustments in accordance with accounting principles generally accepted in the United States of America and as such, the net asset values for financial reporting purposes and the returns based upon net asset values may differ from the net asset values and returns for shareholder transactions.
4 Total returns are historical and include change in share price, reinvestment of all dividends and distributions and no sales charge. Had certain expenses not been reduced during the years shown, total returns would have been lower.
See Accompanying Notes to Financial Statements.
33
Credit Suisse Floating Rate High Income Fund
Notes to Financial Statements
October 31, 2019
Credit Suisse Floating Rate High Income Fund (the "Fund"), a series of Credit Suisse Opportunity Funds (the "Trust"), a Delaware statutory trust, is registered under the Investment Company Act of 1940, as amended (the "1940 Act"), as a diversified open-end management investment company that seeks to provide a high level of current income and, secondarily, capital appreciation. The Trust was organized under the laws of the State of Delaware as a business trust on May 31, 1995.
The Fund offers three classes of shares: Class I shares, Class A shares and Class C shares. Each class of shares represents an equal pro rata interest in the Fund, except the share classes bear different expenses. Class A shares are sold subject to a front-end sales charge of up to 4.75%. Class C shares are sold subject to a CDSC of 1.00% if the shares are redeemed within the first year of purchase. Class I shares are sold without a sales charge. Class B shares were terminated on December 15, 2017 and are no longer offered.
Note 2. Significant Accounting Policies
The following is a summary of significant accounting policies followed by the Fund in the preparation of its financial statements. The policies are in accordance with generally accepted accounting principles in the United States of America ("GAAP"). The preparation of financial statements requires management to make estimates and assumptions that affect the reported amounts and disclosures in the financial statements. Actual results could differ from those estimates. The Fund is considered an investment company for financial reporting purposes under GAAP and follows the accounting and reporting guidance in Financial Accounting Standards Board ("FASB") Accounting Standard Codification ("ASC") Topic 946 — Financial Services — Investment Companies.
A) SECURITY VALUATION — The Board of Trustees (the "Board") is responsible for the Fund's valuation process. The Board has delegated the supervision of the daily valuation process to Credit Suisse Asset Management, LLC, the Fund's investment adviser ("Credit Suisse" or the "Adviser"), who has established a Pricing Committee which, pursuant to the policies adopted by the Board, is responsible for making fair valuation determinations and overseeing the Fund's pricing policies. The net asset value of the Fund is determined daily as of the close of regular trading on the New York Stock Exchange, Inc. (the "Exchange") on each day the Exchange is open for business. The valuations for fixed income securities (which may include, but are not limited to, corporate, government, municipal, mortgage-backed, collateralized
34
Credit Suisse Floating Rate High Income Fund
Notes to Financial Statements (continued)
October 31, 2019
Note 2. Significant Accounting Policies (continued)
mortgage obligations and asset-backed securities) and certain derivative instruments are typically the prices supplied by independent third party pricing services, which may use market prices or broker/dealer quotations or a variety of valuation techniques and methodologies. The independent third party pricing services use inputs that are observable such as issuer details, interest rates, yield curves, prepayment speeds, credit risks/spreads, default rates and quoted prices for similar securities. These pricing services generally price fixed income securities assuming orderly transactions of an institutional "round lot" size, but some trades occur in smaller "odd lot" sizes which may be effected at lower prices than institutional round lot trades. Structured note agreements are valued in accordance with a dealer-supplied valuation based on changes in the value of the underlying index. Futures contracts are valued daily at the settlement price established by the board of trade or exchange on which they are traded. Forward contracts are valued at the London closing spot rates and the London closing forward point rates on a daily basis. The currency forward contract pricing model derives the differential in point rates to the expiration date of the forward and calculates its present value. Equity securities for which market quotations are available are valued at the last reported sales price or official closing price on the primary market or exchange on which they trade. The Fund may utilize a service provided by an independent third party which has been approved by the Board to fair value certain securities. When fair value pricing is employed, the prices of securities used by the Fund to calculate its net asset value may differ from quoted or published prices for the same securities. If independent third party pricing services are unable to supply prices for a portfolio investment, or if the prices supplied are deemed by the investment adviser to be unreliable, the market price may be determined by the investment adviser using quotations from one or more brokers/dealers or at the transaction price if the security has recently been purchased and no value has yet been obtained from a pricing service or pricing broker. When reliable prices are not readily available, such as when the value of a security has been significantly affected by events after the close of the exchange or market on which the security is principally traded, but before the Fund calculates its net asset value, these securities will be fair valued in good faith by the Pricing Committee, in accordance with procedures adopted by the Board.
35
Credit Suisse Floating Rate High Income Fund
Notes to Financial Statements (continued)
October 31, 2019
Note 2. Significant Accounting Policies (continued)
The Fund uses valuation techniques to measure fair value that are consistent with the market approach and/or income approach, depending on the type of security and the particular circumstance. The market approach uses prices and other relevant information generated by market transactions involving identical or comparable securities. The income approach uses valuation techniques to discount estimated future cash flows to present value.
GAAP established a disclosure hierarchy that categorizes the inputs to valuation techniques used to value assets and liabilities at each measurement date. These inputs are summarized in the three broad levels listed below:
• Level 1 – quoted prices in active markets for identical investments
• Level 2 – other significant observable inputs (including quoted prices for similar investments, interest rates, prepayment speeds, credit risk, etc.)
• Level 3 – significant unobservable inputs (including the Fund's own assumptions in determining the fair value of investments)
The inputs or methodologies used to value securities are not necessarily an indication of the risk associated with investing in those securities.
The following is a summary of the inputs used as of October 31, 2019 in valuing the Fund's assets and liabilities carried at fair value:
Assets | | Level 1 | | Level 2 | | Level 3 | | Total | |
Investments in Securities | |
Bank Loans | | $ | — | | | $ | 1,812,060,870 | | | $ | 207,914,608 | | | $ | 2,019,975,478 | | |
Corporate Bonds | | | — | | | | 221,866,421 | | | | — | | | | 221,866,421 | | |
Asset Backed Securities | | | — | | | | 134,118,611 | | | | — | | | | 134,118,611 | | |
Common Stocks | | | 216,542 | | | | 109,047 | | | | 7,879,856 | (1) | | | 8,205,445 | (1) | |
Warrants | | | — | | | | 41,479 | | | | — | (1) | | | 41,479 | (1) | |
Short-term Investment | | | — | | | | 11,163,773 | | | | — | | | | 11,163,773 | | |
| | | $ | 216,542 | | | $ | 2,179,360,201 | | | $ | 215,794,464 | (1) | | $ | 2,395,371,207 | (1) | |
Other Financial Instruments* | |
Forward Foreign Currency Contracts | | $ | — | | | $ | 42,394 | | | $ | — | | | $ | 42,394 | | |
Liabilities | | Level 1 | | Level 2 | | Level 3 | | Total | |
Other Financial Instruments* | |
Forward Foreign Currency Contracts | | $ | — | | | $ | 3,712,019 | | | $ | — | | | $ | 3,712,019 | | |
* Other financial instruments include unrealized appreciation/(depreciation) on forward foreign currency contracts.
(1) Includes zero valued securities.
36
Credit Suisse Floating Rate High Income Fund
Notes to Financial Statements (continued)
October 31, 2019
Note 2. Significant Accounting Policies (continued)
The following is a reconciliation of investments as of October 31, 2019 for which significant unobservable inputs were used in determining fair value. All transfers, if any, are assumed to occur at the end of the reporting period.
| | | Bank
Loans | | Corporate
Bonds | | Common
Stocks | | Warrants | | Total | |
Balance as of October 31, 2018 | | $ | 212,933,399 | | | $ | 2,317,950 | (1) | | $ | 8,207,136 | | | $ | — | | | $ | 223,458,485 | | |
Accrued discounts (premiums) | | | 930,227 | | | | (1,322 | ) | | | — | | | | — | | | | 928,905 | | |
Purchases | | | 73,455,288 | | | | — | | | | 7,005,407 | | | | 68,804 | | | | 80,529,499 | | |
Sales | | | (103,116,413 | ) | | | (3,802 | ) | | | — | | | | — | | | | (103,120,215 | ) | |
Realized gain (loss) | | | (13,040,658 | ) | | | 3,802 | | | | — | | | | — | | | | (13,036,856 | ) | |
Change in unrealized appreciation
(depreciation) | | | (17,295,325 | ) | | | (30,827 | ) | | | (7,223,640 | ) | | | (68,804 | ) | | | (24,618,596 | ) | |
Transfers into Level 3 | | | 94,669,790 | | | | — | | | | — | | | | — | | | | 94,669,790 | | |
Transfers out of Level 3 | | | (40,621,700 | ) | | | (2,285,801 | ) | | | (109,047 | ) | | | — | | | | (43,016,548 | ) | |
Balance as of October 31, 2019 | | $ | 207,914,608 | | | $ | — | | | $ | 7,879,856 | (1) | | $ | — | (1) | | $ | 215,794,464 | (1) | |
Net change in unrealized appreciation
(depreciation) from investments
still held as of October 31,2019 | | $ | (15,944,805 | ) | | $ | — | | | $ | (1,980,376 | ) | | $ | (68,804 | ) | | $ | (17,993,985 | ) | |
(1) Includes zero valued securities
| | | Quantitative Disclosure About Significant Unobservable Inputs | |
Asset Class | | Fair Value
At 10/31/2019 | | Valuation
Technique | | Unobservable
Input | | Range
(Weighted Average)* | |
Bank Loans | | $ | 3,342,220 | | | Market Approach | | EBITDA Multiples | | | 7.0 (N/A) | | |
| | | $ | 204,572,391 | | | Vendor pricing | | Single Broker Quote | | $ | 0.06 – $1.02 | ($0.93) | |
Common Stocks | | $ | 41
| | | Income Approach
| | Expected Remaining
Distribution | | $ | 0.01 – $1.00 | ($0.02) | |
| | | $ | 4,849,987 | | | Market Approach | | EBITDA Multiples | | | 3.0 – 7.0 | (5.90) | |
| | | $ | 3,029,828 | | | Vendor pricing | | Single Broker Quote | | | $22.50 (N/A) | | |
Warrants | | $ | 0 | | | Market Approach | | EBITDA Multiples | | | 4.9 (N/A) | | |
* Weighted by relative fair value
Each fair value determination is based on a consideration of relevant factors, including both observable and unobservable inputs. Observable and unobservable inputs that Credit Suisse considers may include (i) the existence of any contractual restrictions on the disposition of securities; (ii) information obtained from the company, which may include an analysis of the company's financial statements, the company's products or intended markets or the company's technologies; (iii) the price of the same or similar security negotiated at arm's length in an issuer's completed subsequent round of financing; (iv) the price and extent of public trading in similar securities of the issuer or of comparable companies; or (v) a probability and time value adjusted analysis of contractual term. Where available and appropriate, multiple valuation methodologies are applied to confirm fair value. To the extent that valuation is based on models or inputs that are less observable or unobservable in the
37
Credit Suisse Floating Rate High Income Fund
Notes to Financial Statements (continued)
October 31, 2019
Note 2. Significant Accounting Policies (continued)
market, determining fair value requires more judgment. Because of the inherent uncertainty of valuation, those estimated values may be materially higher or lower than the values that would have been used had a ready market for the investments existed. Accordingly, the degree of judgment exercised by the Fund in determining fair value is greatest for investments categorized in Level 3. In some circumstances, the inputs used to measure fair value might be categorized within different levels of the fair value hierarchy. In those instances, the fair value measurement is categorized in its entirety in the fair value hierarchy based on the least observable input that is significant to the fair value measurement. Additionally, changes in the market environment and other events that may occur over the life of the investments may cause the gains or losses ultimately realized on these investments to be different from the valuations used at the date of these financial statements.
For the year ended October 31, 2019, $94,669,790 was transferred from Level 2 to Level 3 due to a lack of pricing source supported by observable inputs and $43,016,548 was transferred from Level 3 to Level 2 as a result of the availability of a pricing source supported by observable inputs. All transfers, if any, are assumed to occur at the end of the reporting period.
B) DERIVATIVE INSTRUMENTS AND HEDGING ACTIVITIES — The Fund adopted amendments to authoritative guidance on disclosures about derivative instruments and hedging activities which require that a fund disclose (a) how and why an entity uses derivative instruments, (b) how derivative instruments and hedging activities are accounted for and (c) how derivative instruments and related hedging activities affect a fund's financial position, financial performance and cash flows. For the year ended October 31, 2019, the Fund's derivatives did not qualify for hedge accounting as they are held at fair value.
The following table presents the fair value and the location of derivatives within the Statement of Assets and Liabilities at October 31, 2019 and the effect of these derivatives on the Statement of Operations for the year ended October 31, 2019.
Primary Underlying Risk | | Derivative
Assets | | Derivative
Liabilities | | Realized
Gain (Loss) | | Change in Unrealized
Appreciation (Depreciation) | |
Foreign currency exchange rate | |
Forward contracts | | $ | 42,394 | | | $ | 3,712,019 | | | $ | 16,581,828 | | | $ | (10,281,099 | ) | |
For the year ended October 31, 2019, the Fund held an average monthly value on a net basis of $380,300,444 in forward foreign currency contracts.
38
Credit Suisse Floating Rate High Income Fund
Notes to Financial Statements (continued)
October 31, 2019
Note 2. Significant Accounting Policies (continued)
The Fund is a party to International Swap and Derivatives Association, Inc. ("ISDA") Master Agreements ("Master Agreements") with certain counterparties that govern over-the-counter derivative (including Total Return, Credit Default and Interest Rate Swaps) and foreign exchange contracts entered into by the Fund. The Master Agreements may contain provisions regarding, among other things, the parties' general obligations, representations, agreements, collateral requirements, events of default and early termination. Termination events applicable to the Fund may occur upon a decline in the Fund's net assets below a specified threshold over a certain period of time.
The following table presents by counterparty the Fund's derivative assets, net of related collateral held by the Fund, at October 31, 2019:
Counterparty | | Gross Amount of
Derivative Assets
Presented in the
Statement of Assets
and Liabilities(a) | | Financial
Instruments
and Derivatives
Available for Offset | | Non-Cash
Collateral
Received | | Cash
Collateral
Received | | Net Amount
of Derivative
Assets | |
Barclays Bank PLC | | $ | 13,602 | | | $ | — | | | $ | — | | | $ | — | | | $ | 13,602 | | |
Morgan Stanley | | | 28,792 | | | | (28,792 | ) | | | — | | | | — | | | | — | | |
| | | $ | 42,394 | | | $ | (28,792 | ) | | $ | — | | | $ | — | | | $ | 13,602 | | |
The following table presents by counterparty the Fund's derivative liabilities, net of related collateral pledged by the Fund, at October 31, 2019:
Counterparty | | Gross Amount of
Derivative Liabilities
Presented in the
Statement of Assets
and Liabilities(a) | | Financial
Instruments
and Derivatives
Available for Offset | | Non-Cash
Collateral
Pledged | | Cash
Collateral
Pledged | | Net Amount
of Derivative
Liabilities | |
Morgan Stanley | | $ | 3,712,019 | | | $ | (28,792 | ) | | $ | — | | | $ | — | | | $ | 3,683,227 | | |
(a) Forward foreign currency contracts are included.
C) FOREIGN CURRENCY TRANSACTIONS — The books and records of the Fund are maintained in U.S. dollars. Transactions denominated in foreign currencies are recorded at the current prevailing exchange rates. All assets and liabilities denominated in foreign currencies, including purchases and sales of investments, and income and expenses are translated into US dollar amounts on the date of those transactions.
Reported net realized gain (loss) from foreign currency transactions arises from sales of foreign currencies; currency gains or losses realized between the trade and settlement dates on securities transactions; and the difference between the amounts of dividends, interest, and foreign withholding taxes recorded on the Fund's books and the U.S. dollar equivalent of the amounts
39
Credit Suisse Floating Rate High Income Fund
Notes to Financial Statements (continued)
October 31, 2019
Note 2. Significant Accounting Policies (continued)
actually received or paid. Net change in unrealized gains and losses on translation of assets and liabilities denominated in foreign currencies arises from changes in the fair values of assets and liabilities, other than investments at the end of the period, resulting from changes in exchange rates.
The Fund does not isolate that portion of the results of operations resulting from fluctuations in foreign exchange rates on investments from the fluctuations arising from changes in market prices of investments held. Such fluctuations are included with net realized and unrealized gain or loss from investments in the Statement of Operations.
D) SECURITY TRANSACTIONS AND INVESTMENT INCOME/EXPENSE — Security transactions are accounted for on a trade date basis. Interest income/expense is recorded on the accrual basis. The Fund amortizes premiums and accretes discounts using the effective interest method. Dividend income/expense is recorded on the ex-dividend date. Certain expenses are class-specific expenses, vary by class and are charged only to that class. Income, expenses (excluding class-specific expenses) and realized/unrealized gains/losses are allocated proportionately to each class of shares based upon the relative net asset value of the outstanding shares of that class. The cost of investments sold is determined by use of the specific identification method for both financial reporting and income tax purposes. To the extent any issuer defaults or a credit event occurs that impacts the issuer, the Fund may halt any additional interest income accruals and consider the realizability of interest accrued up to the date of default or credit event.
E) DIVIDENDS AND DISTRIBUTIONS TO SHAREHOLDERS — Dividends from net investment income, if any, are declared daily and paid monthly. Distributions of net realized capital gains, if any, are declared and paid at least annually. However, to the extent that a net realized capital gain can be reduced by a capital loss carryforward, such gain will not be distributed. Dividends and distributions to shareholders of the Fund are recorded on the ex-dividend date and are determined in accordance with federal income tax regulations, which may differ from GAAP.
F) FEDERAL AND OTHER TAXES — No provision is made for federal taxes as it is the Fund's intention to continue to qualify as a regulated investment company ("RIC") under the Internal Revenue Code of 1986, as amended (the "Code"), and to make the requisite distributions to its shareholders, which will be sufficient to relieve it from federal income and excise taxes.
40
Credit Suisse Floating Rate High Income Fund
Notes to Financial Statements (continued)
October 31, 2019
Note 2. Significant Accounting Policies (continued)
In order to qualify as a RIC under the Code, the Fund must meet certain requirements regarding the source of its income, the diversification of its assets and the distribution of its income. One of these requirements is that the Fund derive at least 90% of its gross income for each taxable year from dividends, interest, payments with respect to certain securities loans, gains from the sale or other disposition of stock, securities or foreign currencies, other income derived with respect to its business of investing in such stock, securities or currencies or net income derived from interests in certain publicly-traded partnerships ("Qualifying Income").
The Fund adopted the authoritative guidance for uncertainty in income taxes and recognizes a tax benefit or liability from an uncertain position only if it is more likely than not that the position is sustainable based solely on its technical merits and consideration of the relevant taxing authority's widely understood administrative practices and procedures. The Fund has reviewed its current tax positions and has determined that no provision for income tax is required in the Fund's financial statements. The Fund's federal and state income and federal excise tax returns for tax years for which the applicable statutes of limitations have not expired are subject to examination by the Internal Revenue Service and state departments of revenue.
G) CASH — The Fund's uninvested cash balance is held in an interest bearing variable rate demand deposit account at State Street Bank and Trust Company ("SSB"), the Fund's custodian.
H) FORWARD FOREIGN CURRENCY CONTRACTS — A forward foreign currency exchange contract ("forward currency contract") is a commitment to purchase or sell a foreign currency at the settlement date at a negotiated rate. The Fund will enter into forward currency contracts primarily for hedging foreign currency risk. Forward currency contracts are valued at the prevailing forward exchange rate of the underlying currencies and unrealized gain/loss is recorded daily. On the settlement date of the forward currency contract, the Fund records a realized gain or loss equal to the difference between the value of the contract at the time it was opened and the value of the contract at the time it was closed. Certain risks may arise upon entering into forward currency contracts from the potential inability of counterparties to meet the terms of their contracts. The maximum counterparty credit risk to the Fund is measured by the unrealized gain on appreciated contracts. Additionally, when utilizing forward currency contracts to hedge, the Fund forgoes the opportunity to profit from favorable exchange rate movements during the term of the contract. The
41
Credit Suisse Floating Rate High Income Fund
Notes to Financial Statements (continued)
October 31, 2019
Note 2. Significant Accounting Policies (continued)
Fund's open forward currency contracts at October 31, 2019 are disclosed in the Schedule of Investments.
I) UNFUNDED LOAN COMMITMENTS — The Fund enters into certain agreements, all or a portion of which may be unfunded. The Fund is obligated to fund these loan commitments at the borrowers' discretion. Funded and unfunded portions of credit agreements are presented in the Schedule of Investments. As of October 31, 2019, unfunded commitments were as follows:
| | | Borrower | | Maturity | | Rate | | Unfunded
Commitment | |
| | | | | Allied Universal Holdco LLC | | 07/10/26 | | | 4.250 | | | $ | 1,197,235 | | |
| | | | | Mister Car Wash Holdings, Inc. | | 05/14/26 | | | 3.500 | | | | 379,679 | | |
| | | | | PES Holdings LLC | | 04/30/20 | | | 3.000 | | | | 1,174,895 | | |
Unfunded loan commitments and funded portions of credit agreements are marked to market daily and any unrealized appreciation or depreciation is included in the Statement of Assets and Liabilities and the Statement of Operations.
J) SECURITIES LENDING — The initial collateral received by the Fund is required to have a value of at least 102% of the market value of domestic securities on loan (including any accrued interest thereon) and 105% of the market value of foreign securities on loan (including any accrued interest thereon). The collateral is maintained thereafter at a value equal to at least 102% of the current market value of the securities on loan. The market value of loaned securities is determined at the close of each business day of the Fund and any additional required collateral is delivered to the Fund, or excess collateral returned by the Fund, on the next business day. Cash collateral received by the Fund in connection with securities lending activity may be pooled together with cash collateral for other funds/portfolios advised by Credit Suisse and may be invested in a variety of investments, including funds advised by SSB, the Fund's securities lending agent, or money market instruments. However, in the event of default or bankruptcy by the other party to the agreement, realization and/or retention of the collateral may be subject to legal proceedings.
SSB has been engaged by the Fund to act as the Fund's securities lending agent. As of October 31, 2019, the Fund had investment securities on loan with a fair value of $10,944,144. Collateral received for securities loaned and a related liability of $11,163,773 are presented gross in the Statement of Assets and Liabilities. The collateral for securities loaned is valued consistently to the other investments held by the Fund and is included in Level 2 of the fair value hierarchy. As of October 31, 2019, the value of the related collateral exceeded the value of the securities loaned.
42
Credit Suisse Floating Rate High Income Fund
Notes to Financial Statements (continued)
October 31, 2019
Note 2. Significant Accounting Policies (continued)
The Fund's securities lending arrangement provides that the Fund and SSB will share the net income earned from securities lending activities. Securities lending income is accrued as earned. During the year ended October 31, 2019, total earnings from the Fund's investment in cash collateral received in connection with securities lending arrangements was $200,179, of which $125,533 was rebated to borrowers (brokers). The Fund retained $55,973 in income from the cash collateral investment, and SSB, as lending agent, was paid $18,673.
K) OTHER — The high yield, fixed income securities in which the Fund invests will primarily consist of senior secured floating rate loans ("Senior Loans") issued by non-investment grade companies. Senior Loans are typically secured by specific collateral of the issuer and hold the most senior position in the issuer's capital structure. The interest rate on Senior Loans is periodically adjusted to a recognized base rate, typically the London Interbank Offered Rate ("LIBOR"). While these characteristics may reduce interest rate risk and mitigate losses in the event of borrower default, the Senior Loans in which the Fund invests have below investment grade credit ratings and thereby are considered speculative because of the significant credit risk of their issuers.
Lower-rated debt securities (commonly known as "junk bonds") possess speculative characteristics and are subject to greater market fluctuations and risk of lost income and principal than higher-rated debt securities for a variety of reasons. Also, during an economic downturn or substantial period of rising interest rates, highly leveraged issuers may experience financial stress which would adversely affect their ability to service their principal and interest payment obligations, to meet projected business goals and to obtain additional financing.
In addition, periods of economic uncertainty and changes can be expected to result in increased volatility of market prices of lower-rated debt securities and the Fund's net asset value.
L) NEW ACCOUNTING PRONOUNCEMENTS — In March 2017, the FASB issued Accounting Standards Update 2017-08, Receivables — Nonrefundable Fees and Other Costs (Subtopic 310-20): Premium Amortization On Purchased Callable Debt Securities ("ASU 2017-08"). The update shortens the amortization period for the premium on certain purchased callable debt securities to the earliest call date. ASU 2017-08 will be effective for annual periods beginning after December 15, 2018. Management is currently assessing the potential impact of these changes to future financial statements.
43
Credit Suisse Floating Rate High Income Fund
Notes to Financial Statements (continued)
October 31, 2019
Note 2. Significant Accounting Policies (continued)
Also, in August 2018, the FASB issued Accounting Standards Update 2018-13, Fair Value Measurement (Topic 820): Disclosure Framework — Changes to the Disclosure Requirements for Fair Value Measurement ("ASU 2018-13"). The update provides guidance that eliminates, adds and modifies certain disclosure requirements for fair value measurements. ASU 2018-13 will be effective for annual periods beginning after December 15, 2019. Management is currently assessing the potential impact of these changes to future financial statements.
M) SUBSEQUENT EVENTS — In preparing the financial statements as of October 31, 2019, management considered the impact of subsequent events for potential recognition or disclosure in these financial statements through the date of release of this report. No such events requiring recognition or disclosure were identified through the date of the release of this report.
Note 3. Transactions with Affiliates and Related Parties
Credit Suisse serves as investment adviser and co-administrator for the Fund. For its investment advisory and administration services, Credit Suisse is entitled to receive a fee from the Fund at an annual rate of 0.79% of the Fund's average daily net assets less than or equal to $100 million and 0.59% of the Fund's average daily net assets greater than $100 million. For the year ended October 31, 2019, investment advisory and administration fees earned and waived by Credit Suisse were $17,676,300 and $2,468,800, respectively. Effective April 22, 2019, Credit Suisse has contractually agreed to limit expenses so that the Fund's annual operating expenses do not exceed 0.70% of the Fund's average daily net assets for Class I shares, 0.95% of the Fund's average daily net assets for Class A shares and 1.70% of the Fund's average daily net assets for Class C shares. The Fund is authorized to reimburse Credit Suisse for management fees previously limited and/or for expenses previously reimbursed by Credit Suisse, provided, however, that any reimbursements must be paid at a date not more than thirty-six months following the applicable month during which such fees were limited or expenses were reimbursed by Credit Suisse and the reimbursements do not cause the Fund to exceed the applicable expense limitation at the time the fees are recouped. Prior to April 22, 2019, these expense limitations were voluntary.
44
Credit Suisse Floating Rate High Income Fund
Notes to Financial Statements (continued)
October 31, 2019
Note 3. Transactions with Affiliates and Related Parties (continued)
The amounts waived and reimbursed by Credit Suisse, which are available for potential future recoupment by Credit Suisse, and the expiration schedule at October 31, 2019 are as follows:
| | | Fee waivers/
expense
reimbursements
subject to
recoupment | | Expires
October 31,
2022 | |
Class I | | $ | 962,994 | | | $ | 962,994 | | |
Class A | | | 85,810 | | | | 85,810 | | |
Class C | | | 38,540 | | | | 38,540 | | |
Totals | | $ | 1,087,344 | | | $ | 1,087,344 | | |
For its co-administrative services, SSB receives a fee, exclusive of out-of-pocket expenses, calculated in total for all the Credit Suisse funds/portfolios co-administered by SSB and allocated based upon the relative average net assets of each fund/portfolio, subject to an annual minimum fee. For the year ended October 31, 2019, co-administrative services fees earned by SSB (including out-of-pocket expenses) with respect to the Fund were $448,760.
Credit Suisse Securities (USA) LLC ("CSSU"), an affiliate of Credit Suisse, serves as the distributor of the Fund's shares. Pursuant to a distribution plan adopted by the Fund pursuant to Rule 12b-1 under the 1940 Act, CSSU receives fees for its distribution services. These fees are calculated at an annual rate of 0.25% of the average daily net assets of the Class A shares. For the Class B and Class C shares, the fee is calculated at an annual rate of 1.00% of the average daily net assets. For the year ended October 31, 2019, the Fund paid Rule 12b-1 distribution fees of $579,194 for Class A shares and $1,029,426 for Class C shares. Class I shares are not subject to Rule 12b-1 distribution fees.
Certain brokers, dealers and financial representatives provide transfer agent-related services to the Fund and receive compensation from the Fund. For the year ended October 31, 2019, the Fund paid $ 2,888,695, which is included within transfer agent fees.
For the year ended October 31, 2019, CSSU and its affiliates advised the Fund that they retained $25,514 from commissions earned on the sale of the Fund's Class A shares. There were no commissions earned on sale of Class C shares.
The Fund from time to time purchases or sells loan investments in the secondary market through Credit Suisse or its affiliates acting in the capacity as broker-dealer. Credit Suisse or its affiliates may have acted in some type of agent capacity to the initial loan offering prior to such loan trading in the secondary market.
45
Credit Suisse Floating Rate High Income Fund
Notes to Financial Statements (continued)
October 31, 2019
The Fund, together with other funds/portfolios advised by Credit Suisse (collectively, the "Participating Funds"), participates in a committed, unsecured line of credit facility ("Credit Facility"), with SSB in an aggregated amount of $250 million for temporary or emergency purposes on a first-come, first-served basis. Under the terms of the Credit Facility, the Participating Funds pay an aggregate commitment fee on the average unused amount of the Credit Facility, which is allocated among the Participating Funds in such manner as is determined by the governing Boards of the Participating Funds. In addition, the Participating Funds pay interest on borrowings at either the Overnight Federal Funds rate or the Overnight LIBOR rate plus a spread. At October 31, 2019 and during the year ended October 31, 2019, the Fund had no borrowings outstanding under the Credit Facility. Additionally, the Fund is party to a joint uncommitted line of credit facility with SSB. For the year ended October 31, 2019, the line was not drawn upon and no fees were incurred.
Note 5. Purchases and Sales of Securities
For the year ended October 31, 2019, purchases and sales of investment securities (excluding short-term investments) were $647,135,722 and $2,072,058,848, respectively.
Note 6. Capital Share Transactions
The Fund is authorized to issue an unlimited number of full and fractional shares of beneficial interest, $.001 par value per share. The Fund offers Class I, Class A, and Class C shares. Class B shares are shown but not offered. Transactions in capital shares for each class of the Fund were as follows:
| | | Class I | |
| | | For the Year Ended
October 31, 2019 | | For the Year Ended
October 31, 2018 | |
| | | Shares | | Value | | Shares | | Value | |
Shares sold | | | 113,941,985 | | | $ | 759,934,587 | | | | 220,405,496 | | | $ | 1,508,511,813 | | |
Shares issued in reinvestment
of dividends | | | 17,578,160 | | | | 116,970,877 | | | | 18,071,264 | | | | 123,621,374 | | |
Shares redeemed | | | (340,256,494 | ) | | | (2,269,438,615 | ) | | | (165,704,354 | ) | | | (1,134,496,890 | ) | |
Net increase (decrease) | | | (208,736,349 | ) | | $ | (1,392,533,151 | ) | | | 72,772,406 | | | $ | 497,636,297 | | |
46
Credit Suisse Floating Rate High Income Fund
Notes to Financial Statements (continued)
October 31, 2019
Note 6. Capital Share Transactions (continued)
| | | Class A | |
| | | For the Year Ended
October 31, 2019 | | For the Year Ended
October 31, 2018 | |
| | | Shares | | Value | | Shares | | Value | |
Shares sold | | | 8,597,735 | | | $ | 57,731,244 | | | | 15,677,994 | | | $ | 107,844,265 | | |
Shares issued in reinvestment
of dividends | | | 1,430,238 | | | | 9,567,517 | | | | 1,391,492 | | | | 9,571,666 | | |
Shares redeemed | | | (22,160,020 | ) | | | (148,015,224 | ) | | | (15,913,531 | ) | | | (109,490,069 | ) | |
Net increase (decrease) | | | (12,132,047 | ) | | $ | (80,716,463 | ) | | | 1,155,955 | | | $ | 7,925,862 | | |
| | | Class B1 | |
| | | For the Year Ended
October 31, 2019 | | For the Year Ended
October 31, 2018 | |
| | | Shares | | Value | | Shares | | Value | |
Shares issued in reinvestment
of dividends | | | — | | | $ | — | | | | 226 | | | $ | 1,568 | | |
Shares redeemed | | | — | | | | — | | | | (138,051 | ) | | | (955,344 | ) | |
Net decrease | | | — | | | $ | — | | | | (137,825 | ) | | $ | (953,776 | ) | |
| | | Class C | |
| | | For the Year Ended
October 31, 2019 | | For the Year Ended
October 31, 2018 | |
| | | Shares | | Value | | Shares | | Value | |
Shares sold | | | 1,800,768 | | | $ | 12,108,541 | | | | 3,171,735 | | | $ | 21,895,359 | | |
Shares issued in reinvestment
of dividends | | | 513,410 | | | | 3,445,108 | | | | 446,361 | | | | 3,079,977 | | |
Shares redeemed | | | (6,125,376 | ) | | | (41,079,259 | ) | | | (3,730,669 | ) | | | (25,754,237 | ) | |
Net decrease | | | (3,811,198 | ) | | $ | (25,525,610 | ) | | | (112,573 | ) | | $ | (778,901 | ) | |
1 The Class B shares were terminated on December 15, 2017 and are no longer offered.
On October 31, 2019, the number of shareholders that held 5% or more of the outstanding shares of each class of the Fund was as follows:
| | | Number of
Shareholders | | Approximate Percentage
of Outstanding Shares | |
Class I | | | 4 | | | | 49 | % | |
Class A | | | 5 | | | | 70 | % | |
Class C | | | 6 | | | | 76 | % | |
The Fund's performance may be negatively impacted in the event one or more of the Fund's greater than 5% shareholders were to redeem at a given time. Some of the shareholders are omnibus accounts, which hold shares on behalf of individual shareholders.
47
Credit Suisse Floating Rate High Income Fund
Notes to Financial Statements (continued)
October 31, 2019
Note 7. Income Tax Information and Distributions to Shareholders
Income and capital gain distributions are determined in accordance with federal income tax regulations, which may differ from GAAP.
The tax character of dividends paid by the Fund during the fiscal years ended October 31, 2019 and 2018, respectively, was as follows:
| | | Ordinary Income | |
| | 2019 | | 2018 | |
| | | | | $ | 151,815,566 | | | $ | 163,086,986 | | |
The tax basis components of distributable earnings differ from the amounts reflected in the Statement of Assets and Liabilities by temporary book/tax differences. These differences are primarily due to differing treatments of dividends payable, wash sales and forward contracts marked to market.
At October 31, 2019, the components of distributable earnings on a tax basis were as follows:
Accumulated net realized loss | | $ | (28,331,814 | ) | |
Undistributed ordinary income | | | 389,089 | | |
Unrealized depreciation | | | (131,150,607 | ) | |
| | $ | (159,093,332 | ) | |
At October 31, 2019, the Fund had $6,022,277 of unlimited short-term capital loss carryforwards and $22,309,537 of unlimited long-term capital loss carryforwards available to offset possible future capital gains.
At October 31, 2019, the cost and net unrealized appreciation (depreciation) of investments and derivatives for income tax purposes were as follows:
Cost of Investments | | $ | 2,522,957,907 | | |
Unrealized appreciation | | $ | 12,534,990 | | |
| Unrealized depreciation | | | (143,791,315 | ) | |
Net Unrealized appreciation(depreciation) | | $ | (131,256,325 | ) | |
To adjust for current period permanent book/tax differences which arose principally from differing book/tax treatment of foreign currency gain (loss), distributions in excess of net investment income was debited $1,036,981 and accumulated net realized loss was credited $1,036,981. Net assets were not affected by these reclassifications.
In the normal course of business, the Fund may provide general indemnifications pursuant to certain contracts and organizational documents. The Fund's maximum exposure under these arrangements is dependent on future claims that may be made against the Fund and, therefore, cannot be
48
Credit Suisse Floating Rate High Income Fund
Notes to Financial Statements (continued)
October 31, 2019
estimated; however, based on experience, the risk of loss from such claims is considered remote.
49
Credit Suisse Floating Rate High Income Fund
Report of Independent Registered Public Accounting Firm
To the Shareholders and Board of Trustees
Credit Suisse Floating Rate High Income Fund:
Opinion on the Financial Statements
We have audited the accompanying statement of assets and liabilities of Credit Suisse Floating Rate High Income Fund (the Fund), a series of the Credit Suisse Opportunity Funds, including the schedule of investments, as of October 31, 2019, the related statement of operations for the year then ended, the statements of changes in net assets for each of the years in the two-year period then ended, and the related notes (collectively, the financial statements) and the financial highlights for each of the years in the five-year period then ended. In our opinion, the financial statements and financial highlights present fairly, in all material respects, the financial position of the Fund as of October 31, 2019, the results of its operations for the year then ended, the changes in its net assets for each of the years in the two-year period then ended, and the financial highlights for each of the years in the five-year period then ended, in conformity with U.S. generally accepted accounting principles.
Basis for Opinion
These financial statements and financial highlights are the responsibility of the Fund's management. Our responsibility is to express an opinion on these financial statements and financial highlights based on our audits. We are a public accounting firm registered with the Public Company Accounting Oversight Board (United States) (PCAOB) and are required to be independent with respect to the Fund in accordance with the U.S. federal securities laws and the applicable rules and regulations of the Securities and Exchange Commission and the PCAOB.
We conducted our audits in accordance with the standards of the PCAOB. Those standards require that we plan and perform the audit to obtain reasonable assurance about whether the financial statements and financial highlights are free of material misstatement, whether due to error or fraud. Our audits included performing procedures to assess the risks of material misstatement of the financial statements and financial highlights, whether due to error or fraud, and performing procedures that respond to those risks. Such procedures included examining, on a test basis, evidence regarding the amounts and disclosures in the financial statements and financial highlights. Such procedures also included confirmation of securities owned as of October 31, 2019, by correspondence with custodians and brokers or by other appropriate auditing procedures when replies were not received. Our audits also included evaluating the accounting principles used and significant estimates made by management, as well as evaluating the
50
Credit Suisse Floating Rate High Income Fund
Report of Independent Registered Public Accounting Firm
overall presentation of the financial statements and financial highlights. We believe that our audits provide a reasonable basis for our opinion.

We have served as the auditor of one or more Credit Suisse Asset Management, LLC investment companies since 2015.
New York, New York
December 20, 2019
51
Credit Suisse Floating Rate High Income Fund
Information Concerning Trustees and Officers (unaudited)
Name, Address
(Year of Birth) | | Position(s)
Held with
Fund | | Term
of Office1
and
Length
of Time
Served | | Principal
Occupation(s) During
Past Five Years | | Number of
Portfolios
in Fund
Complex
Overseen
by Trustee | | Other
Trusteeships
Held by Trustee
During Past Five Years | |
Independent Trustees | | | | | | | | | | | |
Laura A. DeFelice
c/o Credit Suisse Asset
Management, LLC
Attn: General Counsel
Eleven Madison Avenue
New York, New York
10010
(1959) | | Trustee, Nominating and Audit Committee member | | Since 2017 | | Partner of Acacia Properties LLC (multi-family and commercial real estate ownership and operation) from 2008 to present; Stonegate Advisors LLC (renewable energy and energy efficiency) from 2007 to present. | | | 9 | | | None. | |
Jeffrey E. Garten
c/o Credit Suisse Asset Management, LLC
Attn: General Counsel Eleven Madison Avenue New York, New York 10010
(1946) | | Trustee, Nominating and Audit Committee member | | Since 2001 | | Dean Emeritus of Yale School of Management from July 2015 to present; The Juan Trippe Professor in the Practice of International Trade, Finance and Business, Yale School of Management, from July 2005 to July 2015; Partner and Chairman of Garten Rothkopf (consulting firm) from October 2005 to June 2017. | | | 9 | | | Director of Aetna, Inc. (insurance company); Director of CarMax Group (used car dealers); Director of Miller Buckfire & Co., LLC (financial restructuring). | |
1 Subject to the Trust's retirement policy, each Trustee may continue to serve as a Trustee until the last day of the calendar year in which the applicable Trustee attains age 75. Officer serves until his or her respective successor has been duly elected and qualified.
52
Credit Suisse Floating Rate High Income Fund
Information Concerning Trustees and Officers (unaudited) (continued)
Name, Address
(Year of Birth) | | Position(s)
Held with
Fund | | Term
of Office1
and
Length
of Time
Served | | Principal
Occupation(s) During
Past Five Years | | Number of
Portfolios
in Fund
Complex
Overseen
by Trustee | | Other
Trusteeships
Held by Trustee
During Past Five Years | |
Independent Trustees | | | | | | | | | | | |
Mahendra R. Gupta
c/o Credit Suisse Asset
Management, LLC
Attn: General Counsel
Eleven Madison Avenue
New York, New York
10010
(1956) | | Trustee, Nominating Committee member and Audit Committee Chairman | | Since 2017 | | Professor, Washington University in St. Louis from July 1990 to present; Dean of Olin Business School at Washington University in St. Louis from July 2005 to July 2016; Partner, R.J. Mithaiwala (food manufacturing and retail, India) from March 1977 to present; Partner, F.F.B. Corporation (agriculture, India) from March 1977 to present; Partner, RPMG Research Corporation (benchmark research) from July 2001 to present. | | | 9 | | | Director of Caleres
Inc. (footwear) from May 2012 to present; Director of Koch Development Corporation (real estate development) from November 2017 to present; Director of Supernova (fin-tech) from June 2014 to September 2018. | |
1 Subject to the Trust's retirement policy, each Trustee may continue to serve as a Trustee until the last day of the calendar year in which the applicable Trustee attains age 75. Officer serves until his or her respective successor has been duly elected and qualified.
53
Credit Suisse Floating Rate High Income Fund
Information Concerning Trustees and Officers (unaudited) (continued)
Name, Address
(Year of Birth) | | Position(s)
Held with
Fund | | Term
of Office1
and
Length
of Time
Served | | Principal
Occupation(s) During
Past Five Years | | Number of
Portfolios
in Fund
Complex
Overseen
by Trustee | | Other
Trusteeships
Held by Trustee
During Past Five Years | |
Independent Trustees | | | | | | | | | | | |
Steven N. Rappaport
c/o Credit Suisse Asset Management, LLC
Attn: General Counsel
Eleven Madison Avenue
New York, New York
10010
(1948) | | Chairman of the Board, Nominating Committee Chairman and Audit Committee member | | Trustee since 2001 and Chairman since 2005 | | Partner of Lehigh Court, LLC and RZ Capital (private investment firms) from July 2002 to present; Partner of Backstage Acquisition Holdings, LLC (publication job postings) from November 2013 to 2018. | | | 9 | | | Director of Aberdeen Emerging Markets Equity Income Fund, Inc. (a closed-end investment company); Director of Aberdeen Funds (25 open-end portfolios); Director of iCAD, Inc. (surgical & medical instruments & apparatus company) from 2006 to 2018. | |
Interested Trustee | | | | | | | | | | | |
John G. Popp2
Credit Suisse Asset
Management, LLC
Eleven Madison Avenue
New York, New York
10010
(1956) | | Trustee, Chief Executive Officer and President | | Trustee since 2017
Chief Executive Officer and President since 2010 | | Managing Director of Credit Suisse; Global Head and Chief Investment Officer of the Credit Investments Group; Associated with Credit Suisse or its predecessor since 1997; Officer of other Credit Suisse Funds. | | | 9 | | | None. | |
1 Subject to the Trust's retirement policy, each Trustee may continue to serve as a Trustee until the last day of the calendar year in which the applicable Trustee attains age 75. Officer serves until his or her respective successor has been duly elected and qualified.
2 Mr. Popp is an "interested person" of the Trust, as defined in the 1940 Act, by virtue of his current position as an officer of Credit Suisse.
54
Credit Suisse Floating Rate High Income Fund
Information Concerning Trustees and Officers (unaudited) (continued)
Name, Address
(Year of Birth) | | Position(s)
Held with
Fund | | Term of
Office1
and
Length of
Time
Served | | Principal Occupation(s) During Past Five Years | |
Officers* | | | | | | | |
Emidio Morizio
Credit Suisse Asset
Management, LLC
Eleven Madison Avenue
New York, New York 10010
(1966) | | Chief Compliance Officer | | Since Fund Inception | | Managing Director and Global Head of Compliance of Credit Suisse since 2010; Associated with Credit Suisse since July 2000; Officer of other Credit Suisse Funds. | |
Lou Anne McInnis
Credit Suisse Asset Management, LLC
Eleven Madison Avenue
New York, New York 10010
(1959) | | Chief Legal Officer | | Since 2015 | | Director of Credit Suisse; Associated with Credit Suisse since April 2015; Counsel at DLA Piper US LLP from 2011 to April 2015; Associated with Morgan Stanley Investment Management from 1997 to 2010; Officer of other Credit Suisse Funds. | |
Omar Tariq
Credit Suisse Asset
Management, LLC
Eleven Madison Avenue
New York, New York 10010
(1983) | | Chief Financial Officer and Treasurer | | Since 2019 | | Director of Credit Suisse since March 2019; Senior Manager of PriceWaterhouseCoopers, LLP from September 2010 to March 2019; Officer of other Credit Suisse Funds. | |
Karen Regan
Credit Suisse Asset
Management, LLC
Eleven Madison Avenue
New York, New York 10010
(1963) | | Vice President and Secretary | | Since 2010 | | Vice President of Credit Suisse; Associated with Credit Suisse since December 2004; Officer of other Credit Suisse Funds. | |
1 Subject to the Trust's retirement policy, each Trustee may continue to serve as a Trustee until the last day of the calendar year in which the applicable Trustee attains age 75. Officer serves until his or her respective successor has been duly elected and qualified.
* The officers of the Fund shown are officers that make policy decisions.
The Statement of Additional Information includes additional information about the Trustees and is available, without charge, upon request, by calling 877-870-2874.
55
Credit Suisse Floating Rate High Income Fund
Proxy Voting and Portfolio Holdings Information (unaudited)
Information regarding how the Fund voted proxies related to its portfolio securities during the 12-month period ended June 30 of each year, as well as the policies and procedures that the Fund uses to determine how to vote proxies relating to its portfolio securities are available:
• By calling 1-877-870-2874
• On the Fund's website, www.credit-suisse.com/us/funds
• On the website of the Securities and Exchange Commission, www.sec.gov
The Fund files a complete schedule of its portfolio holdings for the first and third quarters of its fiscal year with the SEC as an exhibit to its reports on Form N-PORT, and for reporting periods ended prior to March 31, 2019, filed such information on Form N-Q. The Fund's Forms N-PORT and N-Q are available on the SEC's website at www.sec.gov.
56

P.O. BOX 219916, KANSAS CITY, MO 64121-9916
877-870-2874 n www.credit-suisse.com/us
CREDIT SUISSE SECURITIES (USA) LLC, DISTRIBUTOR. FLHI-AR-1019

CREDIT SUISSE FUNDS
Annual Report
October 31, 2019
n CREDIT SUISSE
MANAGED FUTURES STRATEGY FUND
Beginning on January 1, 2021, as permitted by regulations adopted by the Securities and Exchange Commission, paper copies of the Fund's shareholder reports will no longer be sent by mail, unless you specifically request paper copies of the reports from Credit Suisse Asset Management, LLC or from your financial intermediary, such as a broker-dealer or bank. Instead, the reports will be made available on a website, and you will be notified by mail each time a report is posted and provided with a website link to access the report.
You may elect to receive all future reports in paper free of charge. If you hold accounts directly with the Fund, you can call 877-870-2874 to inform Credit Suisse Asset Management, LLC that you wish to continue receiving paper copies of your shareholder reports. If you hold accounts through a financial intermediary, you can contact your financial intermediary to request that you continue to receive paper copies of your shareholder reports. Please note that not all financial intermediaries may offer this service. Your election to receive reports in paper will apply to all funds advised by Credit Suisse Asset Management, LLC, or all funds held with your financial intermediary, as applicable.
If you already elected to receive shareholder reports electronically, you will not be affected by this change and you need not take any action. You may elect to receive electronic delivery of shareholder reports and other communications by: (i) accessing the Credit Suisse Asset Management, LLC website at www.credit-suisse.com/us/funds and logging into your accounts, if you hold accounts directly with the Fund, or (ii) contacting your financial intermediary, if you hold accounts through a financial intermediary. Please note that not all financial intermediaries may offer this service.
The Fund's investment objectives, risks, charges and expenses (which should be considered carefully before investing), and more complete information about the Fund, are provided in the Prospectus, which should be read carefully before investing. You may obtain additional copies by calling 877-870-2874 or by visiting our website at www.credit-suisse.com/us/funds.
Credit Suisse Securities (USA) LLC, Distributor, is located at Eleven Madison Avenue, New York, NY 10010. Credit Suisse Funds are advised by Credit Suisse Asset Management, LLC.
Investors in the Credit Suisse Funds should be aware that they may be eligible to purchase Class I shares (where offered) directly or through certain intermediaries. Such shares are not subject to a sales charge. Investors in the Credit Suisse Funds should also be aware that they may be eligible for a reduction or waiver of the sales charge with respect to Class A or C shares (where offered). For more information, please review the relevant prospectuses or consult your financial representative.
Fund shares are not deposits or other obligations of Credit Suisse Asset Management, LLC ("Credit Suisse") or any affiliate, are not FDIC-insured and are not guaranteed by Credit Suisse or any affiliate. Fund investments are subject to investment risks, including loss of your investment.
Credit Suisse Managed Futures Strategy Fund
Annual Investment Adviser's Report
October 31, 2019 (unaudited)
November 19, 2019
Dear Shareholder:
We are pleased to present this Annual Report covering the activities of the Credit Suisse Managed Futures Strategy Fund (the "Fund") for the 12-month period ended October 31, 2019.
Performance Summary
11/01/2018 – 10/31/2019
Fund & Benchmark | | Performance | |
| Class I1 | | | 1.53 | % | |
| Class A1,2 | | | 1.34 | % | |
| Class C1,2 | | | 0.65 | % | |
| Credit Suisse Managed Futures Liquid Index3 | | | 1.46 | % | |
Performance shown for the Fund's Class A and Class C Shares does not reflect sales charges, which are a maximum of 5.25% and 1.00%, respectively.2
Market Review: A positive period for managed futures
The annual period ended October 31, 2019 was a positive one for the managed futures industry. The Credit Suisse Managed Futures Hedge Fund Index gained 8.33% over the period, while the Credit Suisse Managed Futures Liquid Index, the Fund's benchmark (the "Benchmark"), returned 1.46% over the same period.
The year 2018 ended against a backdrop of rising US interest rates, a sharp slowdown in Eurozone business confidence, weaker Chinese growth and rising geopolitical concerns. On the other hand, government bonds, generating positive returns, lived up to their traditional role as the defensive piece of a diversified portfolio.
Concerns over the US-China trade dispute eased and markets turned bullish as we entered 2019. Within the commodity markets, both precious and industrial metals made significant gains in addition to gasoline, in the energy sector, leading the way higher with significant gains. During the course of the year, we saw central banks coming to the rescue time and again, confronted by weaker economic data and still low inflation.
The general upward trend in the US Dollar during the year was marked by severe choppiness with the currency failing to find direction against major rivals on several occasions. Moreover, the U.S. dollar index reached new lows after the Labor Department's employment report showed that job growth slowed sharply in May and wages rose less than expected.
1
Credit Suisse Managed Futures Strategy Fund
Annual Investment Adviser's Report (continued)
October 31, 2019 (unaudited)
After a difficult summer for risk assets, equities made moderate gains in September. A continued slowdown in the global economic data was offset by further monetary easing globally. The US bond rally, however, reversed during September as government bond yields posted their biggest weekly increase in more than six years, buoyed by data that signaled the economy continued to grow, albeit at a slowing pace. Consumer inflation pressures rose in line with expectations during July while the Agricultural sector saw modest losses especially after projections for larger-than-expected crop output following better-than-expected climatic conditions were released.
Financial markets welcomed signs of an easing in geopolitical tensions in October, with risk assets generally outperforming traditional safe havens. The US and Chinese authorities moved closer towards agreeing to a partial deal on trade, while the UK once again edged back from the precipice of a no-deal Brexit. Global central banks reiterated their dovish stances and the US Federal Reserve cut interest rates for the third time this year.
Strategic Review and Outlook: A period marked by reversals in many markets
The managed futures strategy seeks to identify and profit from price trends — upward or downward — in four broad asset classes: commodities, bonds, equities and currencies.
From an asset class perspective, fixed income was the only asset class to deliver positive overall returns for the bulk of the period, while equities, currencies and commodities delivered mixed results.
Equity positions, which were the largest detractor from program performance over Q1 2019, contributed positively during the last two months of 2018. The initial January reversal in equity markets incurred losses against short positions that had scaled with the magnitude of last year's sell-off. As the market recovery gained momentum, the program began paring short exposures through January. During Q2 2019, equity exposures' contribution to program performance was flat as the gains made by developed market equities were offset by negative performance from Asian stocks which retreated on weak economic data. Q3 2019, which was marked by a continued slowdown in the global economic data, saw negative contribution from the sector. October was a good month for equity markets, with the S&P 500 making new all-time highs at the end of the month and leading to moderate positive contribution to overall program performance.
Fixed income positions contributed positively to program performance during the last two months of 2018 and until the end of Q3. The dovish tone adopted by central banks generated profits as global yields continued to fall. Despite the
2
Credit Suisse Managed Futures Strategy Fund
Annual Investment Adviser's Report (continued)
October 31, 2019 (unaudited)
recovery of global markets during the first few months of 2019, yields remained suppressed with weaker economic data signals. The dovish tone of central banks around the world was the catalyst for yields to push even lower, generating profits from long positions during Q2 2019. Amid renewed optimism over U.S.-China trade negotiations, global bond yields rose further during October leading to losses across long exposure to all fixed income contracts.
Currencies, which contributed positively during the last two months of 2018, were the second largest detractor from performance over Q1 2019. Fluctuations in performance throughout the period were driven by choppiness around the upward-trending US Dollar. Short FX (versus US Dollar) exposures yielded gains during end of 2018 as the US Dollar uptrend reached new highs. Range-bound pricing of the US Dollar was a drag on performance and hence caused the program to moderate exposures during early 2019. During Q2 2019, the U.S. Dollar index fell to its lowest level since March after the Labor Department's employment report showed that wages rose less than expected. Consequently, net short positioning across the sector detracted from performance. Net short exposures contributed positively during Q3 2019 as the US Dollar strengthened against major rivals. During October, the asset class was the largest performance detractor as the US dollar reversed trend yet again amid renewed optimism over political developments, especially, in the UK.
Commodities, which contributed positively towards the end of 2018, caused detractions from program performance during Q1 2019. The reversals in Energy, Industrial and Precious Metals markets were primarily responsible for losses in Q1 2019. Relief from concerns over the global growth outlook stoked the upward reversal of growth-sensitive Energy and Industrial Metal commodities, which incurred losses on short positions. During Q2 2019, the price appreciation in the Precious Metals market was the prime driver for gains and also compensated for the losses from reversals in the Agricultural and Energy sectors. Exposure to Precious Metals continued to yield gains even during Q3 2019 in addition to short exposures to the Agricultural sector which contributed positively especially after the U.S. Department of Agriculture's production estimates projected larger-than-expected crop output following better-than-expected climatic conditions.
We continue to believe that the unique return profile of managed futures may appeal to investors searching for portfolio diversifiers and sources of uncorrelated returns.
The Quantitative Investment Strategies Group
3
Credit Suisse Managed Futures Strategy Fund
Annual Investment Adviser's Report (continued)
October 31, 2019 (unaudited)
Yung-Shin Kung
Sheel Dhande
The Fund is non-diversified, which means it may invest a greater proportion of its assets in the securities of a smaller number of issuers than a diversified mutual fund and may therefore be subject to greater volatility. The Fund's investment in alternative instruments may subject the Fund to greater volatility than investments in traditional securities, particularly in investments involving leverage.
The use of alternative assets and strategies entails substantial risks, including risk of loss of principal, commodity exposure risks, credit risk, currency risk, derivatives risk, equity exposure risk, exchange-traded notes risk, fixed income risk, foreign securities risk, forwards risk, futures contracts risk, interest rate risk, leveraging risk, market risk, options risk, portfolio turnover risk, repurchase agreements risk, short position risk, speculative exposure risk, structured note risk, subsidiary risk, swap agreements risk, tax risk and U.S. government securities risk. For a detailed discussion of these and other risks, please refer to the Fund's Prospectus, which should be read carefully before investing.
In addition to historical information, this report contains forward-looking statements, which may concern, among other things, domestic and foreign markets, industry and economic trends and developments and government regulation, and their potential impact on the Fund's investments. These statements are subject to risks and uncertainties and actual trends, developments and regulations in the future, and their impact on the Fund, could be materially different from those projected, anticipated or implied. The Fund has no obligation to update or revise forward-looking statements.
The views of the Fund's management are as of the date of this letter and the Fund holdings described in this document are as of October 31, 2019; these views and Fund holdings may have changed subsequent to these dates. Nothing in this document is a recommendation to purchase or sell securities.
4
Credit Suisse Managed Futures Strategy Fund
Annual Investment Adviser's Report (continued)
October 31, 2019 (unaudited)
Comparison of Change in Value of $10,000 Investment in the
Credit Suisse Managed Futures Strategy Fund1 Class I Shares,
Class A Shares2, Class C Shares2 and Credit Suisse Managed Futures
Liquid Index3 from Inception (9/28/12)
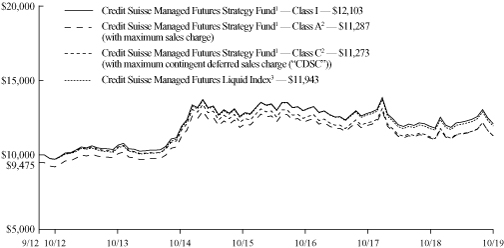
1 Fee waivers and/or expense reimbursements reduce expenses for the Fund, without which performance would be lower. The Fund entered into a written contract to limit expenses to 1.30% of the Fund's average daily net assets for Class I shares, 1.55% of the Fund's average daily net assets for Class A shares and 2.30% of the Fund's average daily net assets for Class C shares through at least February 28, 2021. This limit excludes certain expenses, as set forth in the Fund's Prospectus.
2 Total return for the Fund's Class A shares for the reporting period, based on offering price (including maximum sales charge of 5.25%), was (4.01)%. Total return for the Fund's Class C shares for the reporting period, based on redemption value including Contingent Deferred Sales Charge ("CDSC") of 1.00%, was (0.35)%.
3 The Credit Suisse Managed Futures Liquid Index is a broadly diversified futures index currently composed of 14 futures contracts and 4 commodity indices which provide exposure to the asset classes. The Index uses a proprietary quantitative methodology to seek to identify price trends in each of the asset classes over a variety of time horizons. Components of the Index, which may change from time to time, are positioned either long or short based on the price trends within the asset classes determined using the Index's quantitative methodology. The Index does not have transaction costs and investors may not invest directly in the Index.
5
Credit Suisse Managed Futures Strategy Fund
Annual Investment Adviser's Report (continued)
October 31, 2019 (unaudited)
Average Annual Returns as of October 31, 20191
| | 1 Year | | 5 Years | | Since
Inception2 | |
Class I | | | 1.53 | % | | | 1.65 | % | | | 2.73 | % | |
Class A Without Sales Charge | | | 1.34 | % | | | 1.40 | % | | | 2.49 | % | |
Class A With Maximum Sales Charge | | | (4.01 | )% | | | 0.31 | % | | | 1.72 | % | |
Class C Without CDSC | | | 0.65 | % | | | 0.62 | % | | | 1.70 | % | |
Class C With CDSC | | | (0.35 | )% | | | 0.62 | % | | | 1.70 | % | |
Returns represent past performance and include change in share price and reinvestment of dividends and capital gain distributions, if any. Past performance cannot guarantee future results. The current performance of the Fund may be lower or higher than the figures shown. Returns and share price will fluctuate, and redemption value may be more or less than original cost. The performance results do not reflect the deduction of taxes that a shareholder would pay on Fund distributions or the redemption of Fund shares. Performance information current to the most recent month end is available at www.credit-suisse.com/us/funds.
The annual gross expense ratios are 1.32% for Class I shares, 1.57% for Class A shares and 2.32% for Class C shares. The annual net expense ratios after fee waivers and/or expense reimbursements are 1.30% for Class I shares, 1.55% for Class A shares and 2.30% for Class C shares.
1 Fee waivers and/or expense reimbursements reduce expenses for the Fund, without which performance would be lower. The Fund has entered into a written contract to limit expenses to 1.30% of the Fund's average daily net assets for Class I shares, 1.55% of the Fund's average daily net assets for Class A shares and 2.30% of the Fund's average daily net assets for Class C shares through at least February 28, 2021. This limit excludes certain expenses, as set forth in the Fund's Prospectus.
2 Inception Date: September 28, 2012.
6
Credit Suisse Managed Futures Strategy Fund
Annual Investment Adviser's Report (continued)
October 31, 2019 (unaudited)
Information About Your Fund's Expenses
As an investor of the Fund, you incur two types of costs: ongoing expenses and transaction costs. Ongoing expenses include management fees, distribution and service (12b-1) fees and other Fund expenses. Examples of transaction costs include sales charges (loads), redemption fees and account maintenance fees, which are not shown in this section and which would result in higher total expenses. The following table is intended to help you understand your ongoing expenses of investing in the Fund and to help you compare these expenses with the ongoing expenses of investing in other mutual funds. The table is based on an investment of $1,000 made at the beginning of the six months ended October 31, 2019.
The table illustrates your Fund's expenses in two ways:
• Actual Fund Return. This helps you estimate the actual dollar amount of ongoing expenses paid on a $1,000 investment in the Fund using the Fund's actual return during the period. To estimate the expenses you paid over the period, simply divide your account value by $1,000 (for example, an $8,600 account value divided by $1,000 = 8.6), then multiply the result by the number in the "Expenses Paid per $1,000" line.
• Hypothetical 5% Fund Return. This helps you to compare the Fund's ongoing expenses with those of other mutual funds using the Fund's actual expense ratio and a hypothetical rate of return of 5% per year before expenses. Examples using a 5% hypothetical fund return may be found in the shareholder reports of other mutual funds. The hypothetical account values and expenses may not be used to estimate the actual ending account balance or expenses you paid for the period.
Please note that the expenses shown in these tables are meant to highlight your ongoing expenses only and do not reflect any transaction costs, such as sales charges (loads) or redemption fees. If these transaction costs had been included, your costs would have been higher. The "Expenses Paid per $1,000" line of the tables is useful in comparing ongoing expenses only and will not help you determine the relative total expenses of owning different funds.
7
Credit Suisse Managed Futures Strategy Fund
Annual Investment Adviser's Report (continued)
October 31, 2019 (unaudited)
Expenses and Value for a $1,000 Investment
for the six-month period ended October 31, 2019
Actual Fund Return | | Class I | | Class A | | Class C | |
Beginning Account Value 05/01/19 | | $ | 1,000.00 | | | $ | 1,000.00 | | | $ | 1,000.00 | | |
Ending Account Value 10/31/19 | | $ | 992.00 | | | $ | 990.90 | | | $ | 987.30 | | |
Expenses Paid per $1,000* | | $ | 6.53 | | | $ | 7.78 | | | $ | 11.52 | | |
Hypothetical 5% Fund Return | |
Beginning Account Value 05/01/19 | | $ | 1,000.00 | | | $ | 1,000.00 | | | $ | 1,000.00 | | |
Ending Account Value 10/31/19 | | $ | 1,018.65 | | | $ | 1,017.39 | | | $ | 1,013.61 | | |
Expenses Paid per $1,000* | | $ | 6.61 | | | $ | 7.88 | | | $ | 11.67 | | |
| | | Class I | | Class A | | Class C | |
Annualized Expense Ratios* | | | 1.30 | % | | | 1.55 | % | | | 2.30 | % | |
* Expenses are equal to the Fund's annualized expense ratio for each share class, multiplied by the average account value over the period, multiplied by 184/365 to reflect the one-half year period.
The "Expenses Paid per $1,000" and the "Annualized Expense Ratios" in the tables are based on actual expenses paid by the Fund during the period, net of fee waivers and/or actual expense reimbursements, if applicable. If those fee waivers and/or expense reimbursements had not been in effect, the Fund's actual expenses would have been higher. Expenses do not reflect additional charges and expenses that are, or may be, imposed under the variable contracts or plans. Such charges and expenses are described in the prospectus of the insurance company separate account or in the plan documents or other informational materials supplied by plan sponsors. The Fund's expenses should be considered with these charges and expenses in evaluating the overall cost of investing in the separate account.
For more information, please refer to the Fund's Prospectus.
Portfolio Breakdown**
United States Treasury Obligations | | | 100.00 | % | |
Total | | | 100.00 | % | |
** Expressed as a percentage of total investments (excluding securities lending collateral, if applicable) and may vary over time.
8
Credit Suisse Managed Futures Strategy Fund
Consolidated Schedule of Investments
October 31, 2019
Par
(000) | |
| | Ratings†
(S&P/Moody's) | | Maturity | | Rate%(1) | | Value | |
| UNITED STATES TREASURY OBLIGATIONS (65.7%) | | | |
$ | 85,000 | | | United States Treasury Bills | | (AA+, Aaa) | | 12/19/19 | | | 2.133 | | | $ | 84,836,233 | | |
| | 60,000 | | | United States Treasury Bills | | (AA+, Aaa) | | 04/23/20 | | | 2.238 | | | | 59,561,375 | | |
| | 40,000 | | | United States Treasury Bills | | (AA+, Aaa) | | 07/16/20 | | | 1.755 | | | | 39,564,267 | | |
| | 35,000 | | | United States Treasury Bills | | (AA+, Aaa) | | 08/13/20 | | | 1.556 | | | | 34,581,109 | | |
| | 7,000 | | | United States Treasury Bills | | (AA+, Aaa) | | 01/30/20 | | | 2.458 | | | | 6,973,400 | | |
| TOTAL UNITED STATES TREASURY OBLIGATIONS (Cost $225,130,542) | | | 225,516,384 | | |
| TOTAL INVESTMENTS AT VALUE (65.7%) (Cost $225,130,542) | | | 225,516,384 | | |
| OTHER ASSETS IN EXCESS OF LIABILITIES (34.3%) | | | 117,631,789 | | |
| NET ASSETS (100.0%) | | $ | 343,148,173 | | |
† Credit ratings given by the S&P Global Ratings Division of S&P Global Inc. ("S&P") and Moody's Investors Service, Inc. ("Moody's") are unaudited.
(1) Securities are zero coupon. Rate presented is yield to maturity as of October 31, 2019.
Futures Contracts
Contract Description | | Currency | | Expiration
Date | | Number of
Contracts | | Notional
Value | | Net Unrealized
Appreciation
(Depreciation) | |
Contracts to Purchase | |
Foreign Exchange Contracts | | | | | | | | | | | |
| CAD Currency Futures | | USD | | | | Dec 2019 | | | 1,593 | | | $ | 121,028,175 | | | $ | (676,219 | ) | |
| GBP Currency Futures | | USD | | | | Dec 2019 | | | 291 | | | | 23,565,544 | | | | 124,736 | | |
| | | $ | (551,483 | ) | |
Index Contracts | | | | | | | | | | | |
EURO Stoxx 50 Index Futures | | EUR | | | | Dec 2019 | | | 1,010 | | | | 40,666,467 | | | $ | 1,040,773 | | |
FTSE 100 Index Futures | | GBP | | | | Dec 2019 | | | 475 | | | | 44,537,512 | | | | (231,266 | ) | |
Nikkei 225 Index Futures OSE | | JPY | | | | Dec 2019 | | | 211 | | | | 44,793,950 | | | | 2,190,635 | | |
S&P 500 E Mini Index Futures | | USD | | | | Dec 2019 | | | 244 | | | | 37,036,760 | | | | 494,236 | | |
| | | $ | 3,494,378 | | |
Interest Rate Contracts | | | | | | | | | | | |
10YR Japanese Bond Futures | | JPY | | | | Dec 2019 | | | 67 | | | | 95,413,256 | | | $ | (786,737 | ) | |
10YR U.S. Treasury Note Futures | | USD | | | | Dec 2019 | | | 591 | | | | 77,005,453 | | | | (549,222 | ) | |
| EURO Bund Futures | | EUR | | | | Dec 2019 | | | 211 | | | | 40,432,694 | | | | (944,232 | ) | |
Long Gilt Futures | | GBP | | | | Dec 2019 | | | 393 | | | | 67,554,678 | | | | (92,443 | ) | |
| | | $ | (2,372,634 | ) | |
Contracts to Sell | |
Foreign Exchange Contracts | | | | | | | | | | | |
| AUD Currency Futures | | USD | | | | Dec 2019 | | | (433 | ) | | | (29,859,680 | ) | | $ | (84,551 | ) | |
| EUR Currency Futures | | USD | | | | Dec 2019 | | | (346 | ) | | | (48,338,362 | ) | | | (392,683 | ) | |
| JPY Currency Futures | | USD | | | | Dec 2019 | | | (722 | ) | | | (83,774,563 | ) | | | (322,085 | ) | |
| | | $ | (799,319 | ) | |
See Accompanying Notes to Consolidated Financial Statements.
9
Credit Suisse Managed Futures Strategy Fund
Consolidated Schedule of Investments (continued)
October 31, 2019
Futures Contracts (continued)
Contract Description | | Currency | | Expiration
Date | | Number of
Contracts | | Notional
Value | | Net Unrealized
Appreciation
(Depreciation) | |
Index Contracts | |
Hang Seng Index Futures | | HKD | | | | Nov 2019 | | | (165 | ) | | $ | (28,403,486 | ) | | $ | (304,869 | ) | |
| | | $ | (533,927 | ) | |
Total Return Swap Contracts
Currency | | Notional
Amount | | Expiration
Date | | Counterparty | | Receive | | Pay | | Payment
Frequency | | Upfront
Premiums
Paid/
(Received) | | Net Unrealized
Appreciation
(Depreciation) | |
USD | | | | $ | 51,772,289 | | | 12/06/19 | | Goldman Sachs | | Bloomberg
Precious
Metals Index | | 0.11% | | At
Maturity | | $ | — | | | $ | 7,533,376 | | |
USD | | | | | 16,828,000 | �� | | 12/06/19 | | Goldman Sachs | | (0.10)% | | Bloomberg
Agriculture
Index | | At
Maturity | | | — | | | | (72,639 | ) | |
USD | | | | | 13,130,708 | | | 12/06/19 | | Goldman Sachs | | (0.06)% | | Bloomberg
Energy Index | | At
Maturity | | | — | | | | (222,832 | ) | |
USD | | | | | 44,979,207 | | | 12/06/19 | | Goldman Sachs | | Bloomberg
Industrial
Metals Index | | 0.12% | | At
Maturity | | | — | | | | (142,269 | ) | |
| | | $ | 7,095,636 | | |
Currency Abbreviations:
AUD = Australian Dollar
CAD = Canadian Dollar
EUR = Euro
GBP = British Pound
HKD = Hong Kong Dollar
JPY = Japanese Yen
USD = United States Dollar
U.S. Treasury securities in the amount of $1,885,000 received at the custodian bank as collateral for OTC swaps.
See Accompanying Notes to Consolidated Financial Statements.
10
Credit Suisse Managed Futures Strategy Fund
Consolidated Statement of Assets and Liabilities
October 31, 2019
Assets | |
Investments at value (Cost $225,130,542) (Note 2) | | $ | 225,516,384 | | |
Cash | | | 93,782,730 | | |
Cash segregated at brokers for futures contracts and swap contracts (Note 2) | | | 16,757,248 | | |
Unrealized appreciation on open swap contracts (Note 2) | | | 7,533,376 | | |
Receivable for Fund shares sold | | | 521,770 | | |
Variation margin receivable on futures contracts (Note 2) | | | 147,174 | | |
Prepaid expenses | | | 37,280 | | |
Total assets | | | 344,295,962 | | |
Liabilities | |
Investment advisory fee payable (Note 3) | | | 245,605 | | |
Administrative services fee payable (Note 3) | | | 8,197 | | |
Shareholder servicing/Distribution fee payable (Note 3) | | | 5,703 | | |
Unrealized depreciation on open swap contracts (Note 2) | | | 437,740 | | |
Payable for Fund shares redeemed | | | 263,961 | | |
Net payable for open swap contracts | | | 36,859 | | |
Trustees' fee payable | | | 16,998 | | |
Due to custodian (Cost $1,018) | | | 986 | | |
Accrued expenses | | | 131,740 | | |
Total liabilities | | | 1,147,789 | | |
Net Assets | |
Capital stock, $.001 par value (Note 6) | | | 34,540 | | |
Paid-in capital (Note 6) | | | 347,345,309 | | |
Total distributable earnings (loss) | | | (4,231,676 | ) | |
Net assets | | $ | 343,148,173 | | |
I Shares | |
Net assets | | $ | 318,590,398 | | |
Shares outstanding | | | 32,036,706 | | |
Net asset value, offering price and redemption price per share | | $ | 9.94 | | |
A Shares | |
Net assets | | $ | 24,233,733 | | |
Shares outstanding | | | 2,468,439 | | |
Net asset value and redemption price per share | | $ | 9.82 | | |
Maximum offering price per share (net asset value/(1-5.25%)) | | $ | 10.36 | | |
C Shares | |
Net assets | | $ | 324,042 | | |
Shares outstanding | | | 34,673 | | |
Net asset value and offering price per share | | $ | 9.35 | | |
See Accompanying Notes to Consolidated Financial Statements.
11
Credit Suisse Managed Futures Strategy Fund
Consolidated Statement of Operations
For the Year Ended October 31, 2019
Investment Income | |
Interest | | $ | 5,289,976 | | |
Total investment income | | | 5,289,976 | | |
Expenses | |
Investment advisory fees (Note 3) | | | 3,202,651 | | |
Administrative services fees (Note 3) | | | 46,410 | | |
Shareholder servicing/Distribution fees (Note 3) | |
Class A | | | 86,935 | | |
Class C | | | 5,963 | | |
Transfer agent fees (Note 3) | | | 387,087 | | |
Custodian fees | | | 99,607 | | |
Registration fees | | | 70,161 | | |
Legal fees | | | 62,978 | | |
Trustees' fees | | | 61,767 | | |
Audit and tax fees | | | 59,458 | | |
Printing fees | | | 40,302 | | |
Commitment fees (Note 4) | | | 10,853 | | |
Insurance expense | | | 6,242 | | |
Miscellaneous expense | | | 10,890 | | |
Total expenses | | | 4,151,304 | | |
Less: fees waived (Note 3) | | | (55,092 | ) | |
Net expenses | | | 4,096,212 | | |
Net investment income | | | 1,193,764 | | |
Net Realized and Unrealized Gain (Loss) from Investments, Futures Contracts, Swap Contracts
and Foreign Currency Related Items | |
Net realized loss from investments | | | (11,375 | ) | |
Net realized gain from futures contracts | | | 9,007,073 | | |
Net realized loss from swap contracts | | | (1,932,230 | ) | |
Net realized loss from foreign currency translations | | | (329,030 | ) | |
Net change in unrealized appreciation (depreciation) from investments | | | 558,587 | | |
Net change in unrealized appreciation (depreciation) from futures contracts | | | (7,058,001 | ) | |
Net change in unrealized appreciation (depreciation) from swap contracts | | | 1,083,827 | | |
Net change in unrealized appreciation (depreciation) from foreign currency translations | | | 260,602 | | |
Net realized and unrealized gain from investments, futures contracts, swap contracts
and foreign currency related items | | | 1,579,453 | | |
Net increase in net assets resulting from operations | | $ | 2,773,217 | | |
See Accompanying Notes to Consolidated Financial Statements.
12
Credit Suisse Managed Futures Strategy Fund
Consolidated Statements of Changes in Net Assets
| | | For the Year
Ended
October 31, 2019 | | For the Year
Ended
October 31, 2018 | |
From Operations | |
Net investment income (loss) | | $ | 1,193,764 | | | $ | (776,276 | ) | |
Net realized gain (loss) from investments, futures contracts,
swap contracts and foreign currency transactions | | | 6,734,438 | | | | (32,732,738 | ) | |
Net change in unrealized appreciation (depreciation) from investments,
futures contracts, swap contracts and foreign currency translations | | | (5,154,985 | ) | | | 8,251,052 | | |
Net increase (decrease) in net assets resulting from operations | | | 2,773,217 | | | | (25,257,962 | ) | |
| From Capital Share Transactions (Note 6) | |
Proceeds from sale of shares | | | 218,197,002 | | | | 242,032,418 | | |
Net asset value of shares redeemed | | | (157,656,320 | ) | | | (240,538,724 | ) | |
Net increase in net assets from capital share transactions | | | 60,540,682 | | | | 1,493,694 | | |
Net increase (decrease) in net assets | | | 63,313,899 | | | | (23,764,268 | ) | |
Net Assets | |
Beginning of year | | | 279,834,274 | | | | 303,598,542 | | |
End of year | | $ | 343,148,173 | | | $ | 279,834,274 | | |
See Accompanying Notes to Consolidated Financial Statements.
13
Credit Suisse Managed Futures Strategy Fund
Consolidated Financial Highlights
(For a Class I Share of the Fund Outstanding Throughout Each Year)
| | | For the Year Ended October 31, | |
| | | 2019 | | 2018 | | 2017 | | 2016 | | 2015 | |
Per share data | |
Net asset value, beginning of year | | $ | 9.79 | | | $ | 10.49 | | | $ | 10.94 | | | $ | 11.53 | | | $ | 10.851 | | |
INVESTMENT OPERATIONS | |
Net investment income (loss)2 | | | 0.04 | | | | (0.02 | ) | | | (0.10 | ) | | | (0.15 | ) | | | (0.16 | ) | |
Net gain (loss) from investments, futures contracts,
swap contracts and foreign currency related items
(both realized and unrealized) | | | 0.11 | | | | (0.68 | ) | | | (0.06 | ) | | | 0.49 | | | | 1.51 | | |
Total from investment operations | | | 0.15 | | | | (0.70 | ) | | | (0.16 | ) | | | 0.34 | | | | 1.35 | | |
LESS DIVIDENDS AND DISTRIBUTIONS | |
Dividends from net investment income | | | — | | | | — | | | | — | | | | (0.52 | ) | | | (0.04 | ) | |
Distributions from net realized gains | | | — | | | | — | | | | (0.29 | ) | | | (0.41 | ) | | | (0.63 | ) | |
Total dividends and distributions | | | — | | | | — | | | | (0.29 | ) | | | (0.93 | ) | | | (0.67 | ) | |
Net asset value, end of year | | $ | 9.94 | | | $ | 9.79 | | | $ | 10.49 | | | $ | 10.94 | | | $ | 11.53 | | |
Total return3 | | | 1.53 | % | | | (6.67 | )% | | | (1.60 | )% | | | 3.12 | % | | | 12.88 | % | |
RATIOS AND SUPPLEMENTAL DATA | |
Net assets, end of year (000s omitted) | | $ | 318,590 | | | $ | 227,703 | | | $ | 201,478 | | | $ | 127,597 | | | $ | 72,606 | | |
Ratio of net expenses to average net assets | | | 1.30 | % | | | 1.30 | % | | | 1.30 | % | | | 1.30 | % | | | 1.32 | % | |
Ratio of net investment income (loss) to
average net assets | | | 0.42 | % | | | (0.15 | )% | | | (0.99 | )% | | | (1.29 | )% | | | (1.31 | )% | |
Decrease reflected in above operating expense
ratios due to waivers/reimbursements | | | 0.02 | % | | | 0.03 | % | | | 0.09 | % | | | 0.05 | % | | | 0.15 | % | |
Portfolio turnover rate | | | — | % | | | — | % | | | — | % | | | — | % | | | — | % | |
1 Includes adjustments in accordance with accounting principles generally accepted in the United States of America and as such, the net asset values for financial reporting purposes and the returns based upon net asset values may differ from the net asset values and returns for shareholder transactions.
2 Per share information is calculated using the average shares outstanding method.
3 Total returns are historical and include change in share price and reinvestment of all dividends and distributions. Had certain expenses not been reduced during the periods shown, total returns would have been lower.
See Accompanying Notes to Consolidated Financial Statements.
14
Credit Suisse Managed Futures Strategy Fund
Consolidated Financial Highlights
(For a Class A Share of the Fund Outstanding Throughout Each Year)
| | | For the Year Ended October 31, | |
| | | 2019 | | 2018 | | 2017 | | 2016 | | 2015 | |
Per share data | |
Net asset value, beginning of year | | $ | 9.69 | | | $ | 10.41 | | | $ | 10.88 | | | $ | 11.47 | | | $ | 10.80 | | |
INVESTMENT OPERATIONS | |
Net investment income (loss)1 | | | 0.01 | | | | (0.05 | ) | | | (0.12 | ) | | | (0.17 | ) | | | (0.19 | ) | |
Net gain (loss) from investments, futures contracts,
swap contracts and foreign currency related items
(both realized and unrealized) | | | 0.12 | | | | (0.67 | ) | | | (0.06 | ) | | | 0.48 | | | | 1.50 | | |
Total from investment operations | | | 0.13 | | | | (0.72 | ) | | | (0.18 | ) | | | 0.31 | | | | 1.31 | | |
LESS DIVIDENDS AND DISTRIBUTIONS | |
Dividends from net investment income | | | — | | | | — | | | | — | | | | (0.49 | ) | | | (0.01 | ) | |
Distributions from net realized gains | | | — | | | | — | | | | (0.29 | ) | | | (0.41 | ) | | | (0.63 | ) | |
Total dividends and distributions | | | — | | | | — | | | | (0.29 | ) | | | (0.90 | ) | | | (0.64 | ) | |
Net asset value, end of year | | $ | 9.82 | | | $ | 9.69 | | | $ | 10.41 | | | $ | 10.88 | | | $ | 11.47 | | |
Total return2 | | | 1.34 | % | | | (6.92 | )% | | | (1.79 | )% | | | 2.87 | % | | | 12.47 | % | |
RATIOS AND SUPPLEMENTAL DATA | |
Net assets, end of year (000s omitted) | | $ | 24,234 | | | $ | 50,474 | | | $ | 98,756 | | | $ | 38,060 | | | $ | 20,200 | | |
Ratio of net expenses to average net assets | | | 1.55 | % | | | 1.55 | % | | | 1.55 | % | | | 1.55 | % | | | 1.56 | % | |
Ratio of net investment income (loss) to
average net assets | | | 0.14 | % | | | (0.50 | )% | | | (1.20 | )% | | | (1.54 | )% | | | (1.55 | )% | |
Decrease reflected in above operating expense
ratios due to waivers/reimbursements | | | 0.02 | % | | | 0.03 | % | | | 0.09 | % | | | 0.05 | % | | | 0.15 | % | |
Portfolio turnover rate | | | — | % | | | — | % | | | — | % | | | — | % | | | — | % | |
1 Per share information is calculated using the average shares outstanding method.
2 Total returns are historical and include change in share price, reinvestment of all dividends and distributions and no sales charge. Had certain expenses not been reduced during the years shown, total returns would have been lower.
See Accompanying Notes to Consolidated Financial Statements.
15
Credit Suisse Managed Futures Strategy Fund
Consolidated Financial Highlights
(For a Class C Share of the Fund Outstanding Throughout Each Year)
| | | For the Year Ended October 31, | |
| | | 2019 | | 2018 | | 2017 | | 2016 | | 2015 | |
Per share data | |
Net asset value, beginning of year | | $ | 9.29 | | | $ | 10.06 | | | $ | 10.60 | | | $ | 11.19 | | | $ | 10.62 | | |
INVESTMENT OPERATIONS | |
Net investment income (loss)1 | | | (0.06 | ) | | | (0.12 | ) | | | (0.20 | ) | | | (0.25 | ) | | | (0.27 | ) | |
Net gain (loss) from investments, futures contracts,
swap contracts and foreign currency related items
(both realized and unrealized) | | | 0.12 | | | | (0.65 | ) | | | (0.05 | ) | | | 0.48 | | | | 1.47 | | |
Total from investment operations | | | 0.06 | | | | (0.77 | ) | | �� | (0.25 | ) | | | 0.23 | | | | 1.20 | | |
LESS DIVIDENDS AND DISTRIBUTIONS | |
Dividends from net investment income | | | — | | | | — | | | | — | | | | (0.41 | ) | | | — | | |
Distributions from net realized gains | | | — | | | | — | | | | (0.29 | ) | | | (0.41 | ) | | | (0.63 | ) | |
Total dividends and distributions | | | — | | | | — | | | | (0.29 | ) | | | (0.82 | ) | | | (0.63 | ) | |
Net asset value, end of year | | $ | 9.352 | | | $ | 9.29 | | | $ | 10.06 | | | $ | 10.60 | | | $ | 11.19 | | |
Total return3 | | | 0.65 | % | | | (7.65 | )% | | | (2.52 | )% | | | 2.13 | % | | | 11.60 | % | |
RATIOS AND SUPPLEMENTAL DATA | |
Net assets, end of year (000s omitted) | | $ | 324 | | | $ | 1,658 | | | $ | 3,365 | | | $ | 3,667 | | | $ | 2,920 | | |
Ratio of net expenses to average net assets | | | 2.30 | % | | | 2.30 | % | | | 2.30 | % | | | 2.30 | % | | | 2.32 | % | |
Ratio of net investment income (loss) to
average net assets | | | (0.64 | )% | | | (1.22 | )% | | | (2.01 | )% | | | (2.29 | )% | | | (2.31 | )% | |
Decrease reflected in above operating expense
ratios due to waivers/reimbursements | | | 0.02 | % | | | 0.04 | % | | | 0.09 | % | | | 0.05 | % | | | 0.15 | % | |
Portfolio turnover rate | | | — | % | | | — | % | | | — | % | | | — | % | | | — | % | |
1 Per share information is calculated using the average shares outstanding method.
2 Includes adjustments in accordance with accounting principles generally accepted in the United States of America and as such, the net asset values for financial reporting purposes and the returns based upon net asset values may differ from the net asset values and returns for shareholder transactions.
3 Total returns are historical and include change in share price, reinvestment of all dividends and distributions and no sales charge. Had certain expenses not been reduced during the years shown, total returns would have been lower.
See Accompanying Notes to Consolidated Financial Statements.
16
Credit Suisse Managed Futures Strategy Fund
Notes to Consolidated Financial Statements
October 31, 2019
Credit Suisse Managed Futures Strategy Fund (the "Fund"), a series of Credit Suisse Opportunity Funds (the "Trust"), a Delaware statutory trust, is registered under the Investment Company Act of 1940, as amended (the "1940 Act"), as a non-diversified open-end management investment company that seeks to achieve investment results that correspond generally to the risk and return patterns of managed futures funds. The Trust was organized under the laws of the State of Delaware as a business trust on May 31, 1995.
Credit Suisse Asset Management, LLC ("Credit Suisse"), the investment adviser to the Fund, is registered as an investment adviser with the Securities and Exchange Commission and as a Commodity Pool Operator with the Commodity Futures Trading Commission. The Fund seeks to achieve its investment objective by investing directly and/or indirectly through the Credit Suisse Cayman Managed Futures Strategy Fund, Ltd. (the "Subsidiary"), a wholly-owned subsidiary of the Fund organized under the laws of the Cayman Islands, in a combination of securities and derivative instruments. The Subsidiary invests in commodity-linked derivative instruments, such as swaps and futures, as well as other types of futures, swaps and options. The Subsidiary may also invest in debt securities, some of which are intended to serve as margin or collateral for the Subsidiary's derivatives positions.
The Subsidiary is managed by the same portfolio managers that manage the Fund and the accompanying financial statements reflect the financial position of the Fund and the Subsidiary and the results of operations on a consolidated basis. The consolidated financial statements include portfolio holdings of the Fund and the Subsidiary and all intercompany transactions and balances have been eliminated. The Fund may invest up to 25% of its total assets in the Subsidiary. As of October 31, 2019, the Fund held $15,254,540 in the Subsidiary, representing 4.5% of the Fund's consolidated net assets. For the year ended October 31, 2019, the net realized loss on securities and other financial instruments held in the Subsidiary was $1,932,230.
Subsequent references to the Fund within the Notes to Consolidated Financial Statements collectively refer to the Fund and the Subsidiary.
The Fund offers three classes of shares: Class I shares, Class A shares and Class C shares. Each class of shares represents an equal pro rata interest in the Fund, except the share classes bear different expenses. Class A shares are sold subject to a front-end sales charge of up to 5.25%. Class C shares are sold subject to a contingent deferred sales charge ("CDSC") of 1.00% if the shares are redeemed within the first year of purchase. Class I shares are sold without a sales charge.
17
Credit Suisse Managed Futures Strategy Fund
Notes to Consolidated Financial Statements (continued)
October 31, 2019
Note 2. Significant Accounting Policies
The following is a summary of significant accounting policies followed by the Fund in the preparation of its consolidated financial statements. The policies are in accordance with generally accepted accounting principles in the United States of America ("GAAP"). The preparation of consolidated financial statements requires management to make estimates and assumptions that affect the reported amounts and disclosures in the consolidated financial statements. Actual results could differ from those estimates. The Fund is considered an investment company for financial reporting purposes under GAAP and follows the accounting and reporting guidance in Financial Accounting Standards Board ("FASB") Accounting Standards Codification ("ASC") Topic 946 — Financial Services — Investment Companies.
A) SECURITY VALUATION — The Board of Trustees (the "Board") is responsible for the Fund's valuation process. The Board has delegated the supervision of the daily valuation process to Credit Suisse Asset Management, LLC, the Fund's investment adviser ("Credit Suisse" or the "Adviser"), who has established a Pricing Committee which, pursuant to the policies adopted by the Board, is responsible for making fair valuation determinations and overseeing the Fund's pricing policies. The net asset value of the Fund is determined daily as of the close of regular trading on the New York Stock Exchange, Inc. (the "Exchange") on each day the Exchange is open for business. The valuations for fixed income securities (which may include, but are not limited to, corporate, government, municipal, mortgage-backed, collateralized mortgage obligations and asset-backed securities) and certain derivative instruments are typically the prices supplied by independent third party pricing services, which may use market prices or broker/dealer quotations or a variety of valuation techniques and methodologies. The independent third party pricing services use inputs that are observable such as issuer details, interest rates, yield curves, prepayment speeds, credit risks/spreads, default rates and quoted prices for similar securities. These pricing services generally price fixed income securities assuming orderly transactions of an institutional "round lot" size, but some trades occur in smaller "odd lot" sizes which may be effected at lower prices than institutional round lot trades. Structured note agreements are valued in accordance with a dealer-supplied valuation based on changes in the value of the underlying index. Futures contracts are valued daily at the settlement price established by the board of trade or exchange on which they are traded. Forward contracts are valued at the London closing spot rates and the London closing forward point rates on a daily basis. The currency forward contract pricing model derives the differential in point rates
18
Credit Suisse Managed Futures Strategy Fund
Notes to Consolidated Financial Statements (continued)
October 31, 2019
Note 2. Significant Accounting Policies (continued)
to the expiration date of the forward and calculates its present value. Equity securities for which market quotations are available are valued at the last reported sales price or official closing price on the primary market or exchange on which they trade. The Fund may utilize a service provided by an independent third party which has been approved by the Board to fair value certain securities. When fair value pricing is employed, the prices of securities used by the Fund to calculate its net asset value may differ from quoted or published prices for the same securities. If independent third party pricing services are unable to supply prices for a portfolio investment, or if the prices supplied are deemed by the investment adviser to be unreliable, the market price may be determined by the investment adviser using quotations from one or more brokers/dealers or at the transaction price if the security has recently been purchased and no value has yet been obtained from a pricing service or pricing broker. When reliable prices are not readily available, such as when the value of a security has been significantly affected by events after the close of the exchange or market on which the security is principally traded, but before the Fund calculates its net asset value, these securities will be fair valued in good faith by the Pricing Committee, in accordance with procedures adopted by the Board.
The Fund uses valuation techniques to measure fair value that are consistent with the market approach and/or income approach, depending on the type of security and the particular circumstance. The market approach uses prices and other relevant information generated by market transactions involving identical or comparable securities. The income approach uses valuation techniques to discount estimated future cash flows to present value.
GAAP established a disclosure hierarchy that categorizes the inputs to valuation techniques used to value assets and liabilities at each measurement date. These inputs are summarized in the three broad levels listed below:
• Level 1 – quoted prices in active markets for identical investments
• Level 2 – other significant observable inputs (including quoted prices for similar investments, interest rates, prepayment speeds, credit risk, etc.)
• Level 3 – significant unobservable inputs (including the Fund's own assumptions in determining the fair value of investments)
The inputs or methodologies used to value securities are not necessarily an indication of the risk associated with investing in those securities.
19
Credit Suisse Managed Futures Strategy Fund
Notes to Consolidated Financial Statements (continued)
October 31, 2019
Note 2. Significant Accounting Policies (continued)
The following is a summary of the inputs used as of October 31, 2019 in valuing the Fund's assets and liabilities carried at fair value:
Assets | | Level 1 | | Level 2 | | Level 3 | | Total | |
Investments in Securities | |
United States Treasury Obligations | | $ | — | | | $ | 225,516,384 | | | $ | — | | | $ | 225,516,384 | | |
| | | $ | — | | | $ | 225,516,384 | | | $ | — | | | $ | 225,516,384 | | |
Other Financial Instruments* | |
Futures Contracts | | $ | 3,850,380 | | | $ | — | | | $ | — | | | $ | 3,850,380 | | |
Swap Contracts** | | | — | | | | 7,533,376 | | | | — | | | | 7,533,376 | | |
Liabilities | | Level 1 | | Level 2 | | Level 3 | | Total | |
Other Financial Instruments* | |
Futures Contracts | | $ | 4,384,307 | | | $ | — | | | $ | — | | | $ | 4,384,307 | | |
Swap Contracts** | | | | | 437,740 | | | | | | 437,740 | | |
* Other financial instruments include unrealized appreciation/(depreciation) on futures and swap contracts.
** Value includes any premium paid or received with respect to swap contracts, if applicable
For the year ended October 31, 2019, there were no transfers among Level 2 and Level 3. All transfers, if any, are assumed to occur at the end of the reporting period.
B) DERIVATIVE INSTRUMENTS AND HEDGING ACTIVITIES — The Fund adopted amendments to authoritative guidance on disclosures about derivative instruments and hedging activities which require that a fund disclose (a) how and why an entity uses derivative instruments, (b) how derivative instruments and hedging activities are accounted for and (c) how derivative instruments and related hedging activities affect a fund's financial position, financial performance and cash flows. For the year ended October 31, 2019, the Fund's derivatives did not qualify for hedge accounting as they are held at fair value.
The following table presents the fair value and the location of derivatives within the Consolidated Statement of Assets and Liabilities at October 31, 2019 and the effect of these derivatives on the Consolidated Statement of Operations for the year ended October 31, 2019.
Primary Underlying Risk | | Derivative
Assets1 | | Derivative
Liabilities1 | | Realized Gain
(Loss) | | Change in Unrealized
Appreciation (Depreciation) | |
Foreign currency exchange rate | |
Futures contracts2 | | $ | 124,736 | | | $ | 1,475,538 | | | $ | (4,927,277 | ) | | $ | (6,893,672 | ) | |
Index Contracts | |
Futures contracts2 | | | 3,725,644 | | | | 536,135 | | | | (11,840,246 | ) | | | 3,396,791 | | |
Swap contracts3 | | | 7,533,376 | | | | 437,740 | | | | (1,932,230 | ) | | | 1,083,827 | | |
Interest rate | |
Futures contracts2 | | | — | | | | 2,372,634 | | | | 25,774,596 | | | | (3,561,120 | ) | |
Total | | $ | 11,383,756 | | | $ | 4,822,047 | | | $ | 7,074,843 | | | $ | (5,974,174 | ) | |
1 Generally, the balance sheet location for asset derivatives is receivables/net unrealized appreciation (depreciation) and for liability derivatives is payables/net unrealized appreciation (depreciation).
20
Credit Suisse Managed Futures Strategy Fund
Notes to Consolidated Financial Statements (continued)
October 31, 2019
Note 2. Significant Accounting Policies (continued)
2 Includes cumulative appreciation (depreciation) of futures contracts as reported in the Schedule of Investments. Only variation margin is reported within the receivables and/or payables on the Statement of Assets and Liabilities.
3 Includes cumulative appreciation (depreciation) of centrally cleared swap contracts as reported in the Schedule of Investments. Only variation margin is reported within the receivables and/or payables on the Statement of Assets and Liabilities.
The notional amount of futures contracts and swap contracts open at October 31, 2019 is reflected in the Consolidated Schedule of Investments. For the year ended October 31, 2019, the Fund held average monthly notional values on a net basis of $607,249,927, $278,866,117 and $101,603,089 in long futures contracts, short futures contracts and swap contracts, respectively.
The Fund is a party to International Swap and Derivatives Association, Inc. ("ISDA") Master Agreements ("Master Agreements") with certain counterparties that govern over-the-counter derivative (including Total Return, Credit Default and Interest Rate Swaps) and foreign exchange contracts entered into by the Fund. The Master Agreements may contain provisions regarding, among other things, the parties' general obligations, representations, agreements, collateral requirements, events of default and early termination. Termination events applicable to the Fund may occur upon a decline in the Fund's net assets below a specified threshold over a certain period of time.
The following table presents by counterparty the Fund's derivative assets, net of related collateral held by the Fund, at October 31, 2019:
Counterparty | | Gross Amount of
Derivative
Assets Presented in
the Consolidated
Statement of Assets
and Liabilities(a) | | Financial
Instruments
and Derivatives
Available for Offset | | Non-Cash
Collateral
Received | | Cash
Collateral
Received(b) | | Net Amount
of Derivative
Assets | |
Goldman Sachs | | $ | 7,533,376 | | | $ | (437,740 | ) | | $ | (1,885,000 | ) | | $ | — | | | $ | 5,210,636 | | |
The following table presents by counterparty the Fund's derivative liabilities, net of related collateral pledged by the Fund, at October 31, 2019:
Counterparty | | Gross Amount of
Derivative
Liabilities Presented in
the Consolidated
Statement of Assets
and Liabilities(a) | | Financial
Instruments
and Derivatives
Available for Offset | | Non-Cash
Collateral
Pledged | | Cash
Collateral
Pledged | | Net Amount
of Derivative
Liabilities | |
Goldman Sachs | | $ | 437,740 | | | $ | (437,740 | ) | | $ | — | | | $ | — | | | $ | — | | |
(a) Swap contracts are included.
(b) The actual collateral pledged may be more than the amounts shown.
21
Credit Suisse Managed Futures Strategy Fund
Notes to Consolidated Financial Statements (continued)
October 31, 2019
Note 2. Significant Accounting Policies (continued)
C) SECURITY TRANSACTIONS AND INVESTMENT INCOME/EXPENSE — Security transactions are accounted for on a trade date basis. Interest income/expense is recorded on the accrual basis. The Fund amortizes premiums and accretes discounts using the effective interest method. Dividend income/expense is recorded on the ex-dividend date. Certain expenses are class-specific expenses, vary by class and are charged only to that class. Income, expenses (excluding class-specific expenses) and realized/unrealized gains/losses are allocated proportionately to each class of shares based upon the relative net asset value of the outstanding shares of that class. The cost of investments sold is determined by use of the specific identification method for both financial reporting and income tax purposes. To the extent any issuer defaults or a credit event occurs that impacts the issuer, the Fund may halt any additional interest income accruals and consider the realizability of interest accrued up to the date of default or credit event.
D) DIVIDENDS AND DISTRIBUTIONS TO SHAREHOLDERS — Dividends from net investment income, if any, are declared and paid quarterly. Distributions of net realized capital gains, if any, are declared and paid at least annually. However, to the extent that a net realized capital gain can be reduced by a capital loss carryforward, such gain will not be distributed. Dividends and distributions to shareholders of the Fund are recorded on the ex-dividend date and are determined in accordance with federal income tax regulations, which may differ from GAAP.
E) FEDERAL AND OTHER TAXES — No provision is made for federal taxes as it is the Fund's intention to continue to qualify as a regulated investment company ("RIC") under the Internal Revenue Code of 1986, as amended (the "Code"), and to make the requisite distributions to its shareholders, which will be sufficient to relieve it from federal income and excise taxes.
In order to qualify as a RIC under the Code, the Fund must meet certain requirements regarding the source of its income, the diversification of its assets and the distribution of its income. One of these requirements is that the Fund derive at least 90% of its gross income for each taxable year from dividends, interest, payments with respect to certain securities loans, gains from the sale or other disposition of stock, securities or foreign currencies, other income derived with respect to its business of investing in such stock, securities or currencies or net income derived from interests in certain publicly-traded partnerships ("Qualifying Income"). The Internal Revenue Service ("IRS") has issued a ruling that income realized from certain types of commodity-linked derivatives would not be Qualifying Income. As a result, the Fund's ability to
22
Credit Suisse Managed Futures Strategy Fund
Notes to Consolidated Financial Statements (continued)
October 31, 2019
Note 2. Significant Accounting Policies (continued)
realize income from investments in such commodity-linked derivatives as part of its investment strategy would be limited to a maximum of 10% of its gross income.
If the Fund is unable to ensure continued qualification as a RIC, the Fund may be required to change its investment objective, policies or techniques, or may be liquidated. If the Fund fails to qualify as a RIC, the Fund will be subject to federal income tax on its net income and capital gains at regular corporate rates (without reduction for distributions to shareholders). If the Fund were to fail to qualify as a RIC and become subject to federal income tax, shareholders of the Fund would be subject to the risk of diminished returns.
The Fund adopted the authoritative guidance for uncertainty in income taxes and recognizes a tax benefit or liability from an uncertain position only if it is more likely than not that the position is sustainable based solely on its technical merits and consideration of the relevant taxing authority's widely understood administrative practices and procedures. The Fund has reviewed its current tax positions and has determined that no provision for income tax is required in the Fund's financial statements. The Fund's federal and state income and federal excise tax returns for tax years for which the applicable statutes of limitations have not expired are subject to examination by the Internal Revenue Service and state departments of revenue.
F) CASH — The Fund's uninvested cash balance is held in an interest bearing variable rate demand deposit account at State Street Bank and Trust Company ("SSB"), the Fund's custodian.
G) FUTURES — The Fund may enter into futures contracts to the extent permitted by its investment policies and objectives. The Fund may use futures contracts to gain exposure to or hedge against changes in interest rates, equity and market price movements and/or currency risks. Upon entering into a futures contract, the Fund is required to deposit cash and/or pledge U.S. Government securities as initial margin with a Futures Commission Merchant ("FCM"). Subsequent payments, which are dependent on the daily fluctuations in the value of the underlying instrument, are made or received by the Fund each day (daily variation margin) and are recorded as unrealized gains or losses in the Consolidated Statement of Operations until the contracts are closed. When the contracts are closed, the Fund records a realized gain or loss equal to the difference between the proceeds from (or cost of) the closing transaction and the Fund's basis in the contract. Risks of entering into futures contracts
23
Credit Suisse Managed Futures Strategy Fund
Notes to Consolidated Financial Statements (continued)
October 31, 2019
Note 2. Significant Accounting Policies (continued)
for hedging purposes include the possibility that a change in the value of the contract may not correlate with the changes in the value of the underlying instruments. Futures have minimal counterparty credit risk because futures are exchange traded and the exchange's clearinghouse, as counterparty to all exchange-traded futures, guarantees the futures against default. In addition, the purchase of a futures contract involves the risk that the Fund could lose more than the original margin deposit and subsequent payments may be required for a futures transaction. The Fund's open futures contracts are disclosed in the Consolidated Schedule of Investments. At October 31, 2019, the amount of restricted cash held at brokers related to open futures contracts was $16,757,248.
The Commodity Exchange Act requires an FCM to segregate all customer transactions and assets from the FCM's proprietary activities. A customer's cash and other equity deposited with an FCM are considered commingled with all other customer funds subject to the FCM's segregation requirements. In the event of an FCM's insolvency, recovery may be limited to the Fund's pro-rata share of segregated customer funds available. It is possible that the recovery amount could be less than the total of cash and other equity deposited.
H) SWAPS — The Fund may enter into swap contracts either for hedging purposes or to seek to increase total return. A swap contract is an agreement that obligates two parties to exchange a series of cash flows at specified intervals based upon or calculated by reference to changes in specified prices or rates for a specified amount of an underlying asset or notional principal amount. The Fund will enter into swap contracts only on a net basis, which means that the two payment streams are netted out, with the Fund receiving or paying, as the case may be, only the net amount of the two payments. Risks may arise as a result of the failure of the counterparty to the swap contract to comply with the terms of the swap contract. The extent of the Fund's exposure to credit and counterparty risks is the discounted net value of the cash flows to be received from the counterparty over the contract's remaining life, to the extent that the amount is positive. These risks are mitigated by having a master netting arrangement between the Fund and the counterparty and by the posting of collateral by the counterparty to the Fund to cover the Fund's exposure to the counterparty. Therefore, the Fund considers the creditworthiness of each counterparty as well as the amounts posted by the counterparty pursuant to the master netting agreement to a swap contract in evaluating potential credit risk. Additionally, risks may arise from
24
Credit Suisse Managed Futures Strategy Fund
Notes to Consolidated Financial Statements (continued)
October 31, 2019
Note 2. Significant Accounting Policies (continued)
unanticipated movements in interest rates or in the value of the underlying reference asset or index.
The Fund may enter into total return swap contracts, involving commitments to pay interest in exchange for a market-linked return, both based on notional amounts. The Fund may invest in total return swap contracts for hedging purposes or to seek to increase total return. To the extent the total return of the security or index underlying the transaction exceeds or falls short of the offsetting interest rate obligation, the Fund will receive a payment from or make a payment to the counterparty.
The Fund records unrealized gains or losses on a daily basis representing the value and the current net receivable or payable relating to open swap contracts. Net amounts received or paid on the swap contract are recorded as realized gains or losses. Fluctuations in the value of swap contracts are recorded for financial statement purposes as unrealized appreciation or depreciation from swap contracts. Realized gains and losses from terminated swaps are included in net realized gains/losses from swap contracts. The Fund's open swap contracts are disclosed in the Consolidated Schedule of Investments. At October 31, 2019, the amount of restricted cash held at brokers related to open swap contracts was $0.
I) SECURITIES LENDING — The initial collateral received by the Fund is required to have a value of at least 102% of the market value of domestic securities on loan (including any accrued interest thereon) and 105% of the market value of foreign securities on loan (including any accrued interest thereon). The collateral is maintained thereafter at a value equal to at least 102% of the current market value of the securities on loan. The market value of loaned securities is determined at the close of each business day of the Fund and any additional required collateral is delivered to the Fund, or excess collateral returned by the Fund, on the next business day. Cash collateral received by the Fund in connection with securities lending activity may be pooled together with cash collateral for other funds/portfolios advised by Credit Suisse and may be invested in a variety of investments, including funds advised by SSB, the Fund's securities lending agent, or money market instruments. However, in the event of default or bankruptcy by the other party to the agreement, realization and/or retention of the collateral may be subject to legal proceedings.
25
Credit Suisse Managed Futures Strategy Fund
Notes to Consolidated Financial Statements (continued)
October 31, 2019
Note 2. Significant Accounting Policies (continued)
SSB has been engaged by the Fund to act as the Fund's securities lending agent. The Fund's securities lending arrangement provides that the Fund and SSB will share the net income earned from securities lending activities. Securities lending income is accrued as earned. At October 31, 2019 and during the year ended October 31, 2019, there were no securities out on loan.
J) OTHER — In the normal course of business the Fund trades financial instruments and enters into financial transactions for which risk of potential loss exists due to changes in the market (market risk) or failure of the other party to a transaction to perform (credit risk). Similar to credit risk, the Fund may be exposed to counterparty risk, including securities lending, or the risk that an institution or other entity with which the Fund has unsettled or open transactions will default. The potential loss could exceed the value of the financial assets recorded in the consolidated financial statements. Financial assets, which potentially expose the Fund to credit risk, consist principally of cash due from counterparties and investments. The extent of the Fund's exposure to credit and counterparty risks in respect to these financial assets approximates their carrying value as recorded in the Fund's Consolidated Statement of Assets and Liabilities.
K) RECENT ACCOUNTING PRONOUNCEMENTS — In August 2018, the FASB issued Accounting Standards Update 2018-13, Fair Value Measurement (Topic 820): Disclosure Framework — Changes to the Disclosure Requirements for Fair Value Measurement ("ASU 2018-13"). The update provides guidance that eliminates, adds and modifies certain disclosure requirements for fair value measurements. ASU 2018-13 will be effective for annual periods beginning after December 15, 2019. Management is currently assessing the potential impact of these changes to future financial statements.
L) SUBSEQUENT EVENTS — In preparing the financial statements as of October 31, 2019, management considered the impact of subsequent events for potential recognition or disclosure in these financial statements through the date of release of this report. No such events requiring recognition or disclosure were identified through the date of the release of this report.
Note 3. Transactions with Affiliates and Related Parties
Credit Suisse serves as investment adviser and co-administrator for the Fund. For its investment advisory and administration services, Credit Suisse is entitled to receive a fee from the Fund at an annualized rate of 1.04% of the Fund's average daily net assets. For the year ended October 31, 2019,
26
Credit Suisse Managed Futures Strategy Fund
Notes to Consolidated Financial Statements (continued)
October 31, 2019
Note 3. Transactions with Affiliates and Related Parties (continued)
investment advisory and administration fees earned and fees waived/expenses reimbursed by Credit Suisse were $3,202,651 and $55,092, respectively. Credit Suisse has contractually agreed to limit expenses so that the Fund's annual operating expenses do not exceed 1.30% of the Fund's average daily net assets for Class I shares, 1.55% of the Fund's average daily net assets for Class A shares, and 2.30% of the Fund's average daily net assets for Class C shares. The Fund is authorized to reimburse Credit Suisse for management fees previously limited and/or for expenses previously reimbursed by Credit Suisse, provided, however, that any reimbursements must be paid at a date not more than thirty-six months following the applicable month during which such fees were limited or expenses were reimbursed by Credit Suisse and the reimbursements do not cause the Fund to exceed the applicable expense limitation in the contract at the time the fees are recouped. This contract may not be terminated before February 28, 2021.
The amounts waived and reimbursed by Credit Suisse, which are available for potential future recoupment by Credit Suisse, and the expiration schedule at October 31, 2019 are as follows:
| | | Fee waivers/
expense
reimbursements
subject to
recoupment* | | Expires
October 31,
2020 | | Expires
October 31,
2021 | | Expires
October 31,
2022 | |
Class I | | $ | 129,839 | | | $ | 76,199 | | | $ | 37,859 | | | $ | 15,781 | | |
Class A | | | 47,023 | | | | 32,707 | | | | 12,286 | | | | 2,030 | | |
Class C | | | 2,311 | | | | 1,765 | | | | 511 | | | | 35 | | |
Totals | | $ | 179,173 | | | $ | 110,671 | | | $ | 50,656 | | | $ | 17,846 | | |
* ��The Subsidiary expenses are not eligible for recoupment.
For its co-administrative services, SSB receives a fee, exclusive of out-of-pocket expenses, calculated in total for all the Credit Suisse funds/portfolios co-administered by SSB and allocated based upon the relative average net assets of each fund/portfolio, subject to an annual minimum fee. For the year ended October 31, 2019, co-administrative services fees earned by SSB (including out-of-pocket expenses) with respect to the Fund were $46,410.
Credit Suisse Securities (USA) LLC ("CSSU"), an affiliate of Credit Suisse, serves as the distributor of the Fund's shares. Pursuant to a distribution plan adopted by the Fund pursuant to Rule 12b-1 under the 1940 Act, CSSU receives fees for its distribution services. These fees are calculated at an annual rate of 0.25% of the average daily net assets of the Class A shares. For the Class C
27
Credit Suisse Managed Futures Strategy Fund
Notes to Consolidated Financial Statements (continued)
October 31, 2019
Note 3. Transactions with Affiliates and Related Parties (continued)
shares, the fee is calculated at an annual rate of 1.00% of the average daily net assets. For the year ended October 31, 2019, the Fund paid Rule 12b-1 distribution fees of $86,935 for Class A shares and $5,963 for Class C shares. Class I shares are not subject to Rule 12b-1 distribution fees.
Certain brokers, dealers and financial representatives provide transfer agent-related services to the Fund and receive compensation from the Fund. For the year ended October 31, 2019, the Fund paid $311,022, which is included within transfer agent fees.
For the year ended October 31, 2019, CSSU and its affiliates advised the Fund that they retained $27 from commissions earned on the sale of the Fund's Class A shares. There were no commissions earned on the sale of Class C shares.
Note 4. Line of Credit
The Fund, together with other funds/portfolios advised by Credit Suisse (collectively, the "Participating Funds"), participates in a committed, unsecured line of credit facility ("Credit Facility"), with SSB in an aggregated amount of $250 million for temporary or emergency purposes under a first-come, first-served basis. Under the terms of the Credit Facility, the Participating Funds pay an aggregate commitment fee on the average unused amount of the Credit Facility, which is allocated among the Participating Funds in such manner as is determined by the governing Boards of the Participating Funds. In addition, the Participating Funds pay interest on borrowings at either the Overnight Federal Funds rate or the Overnight LIBOR rate plus a spread. At October 31, 2019 and during the year ended October 31, 2019, the Fund had no borrowings outstanding under the Credit Facility.
Note 5. Purchases and Sales of Securities
For the year ended October 31, 2019, purchases and sales of investment securities (excluding short-term investments) and U.S. Government and Agency Obligations were as follows:
Investment Securities | | U.S. Government/
Agency Obligations | |
| Purchases | | Sales | | Purchases | | Sales | |
| $ | 0 | | | $ | 0 | | | $ | 0 | | | $ | 0 | | |
28
Credit Suisse Managed Futures Strategy Fund
Notes to Consolidated Financial Statements (continued)
October 31, 2019
Note 6. Capital Share Transactions
The Fund is authorized to issue an unlimited number of full and fractional shares of beneficial interest, $.001 par value per share. The Fund offers Class I, Class A and Class C shares. Transactions in capital shares for each class of the Fund were as follows:
| | | Class I | |
| | | For the Year Ended
October 31, 2019 | | For the Year Ended
October 31, 2018 | |
| | | Shares | | Value | | Shares | | Value | |
Shares sold | | | 20,828,825 | | | $ | 208,889,608 | | | | 20,225,666 | | | $ | 210,356,002 | | |
Shares redeemed | | | (12,054,533 | ) | | | (120,020,953 | ) | | | (16,168,919 | ) | | | (164,239,926 | ) | |
Net increase | | | 8,774,292 | | | $ | 88,868,655 | | | | 4,056,747 | | | $ | 46,116,076 | | |
| | | Class A | |
| | | For the Year Ended
October 31, 2019 | | For the Year Ended
October 31, 2018 | |
| | | Shares | | Value | | Shares | | Value | |
Shares sold | | | 934,751 | | | $ | 9,263,794 | | | | 3,018,697 | | | $ | 31,323,369 | | |
Shares redeemed | | | (3,676,154 | ) | | | (36,255,502 | ) | | | (7,297,035 | ) | | | (74,465,595 | ) | |
Net decrease | | | (2,741,403 | ) | | $ | (26,991,708 | ) | | | (4,278,338 | ) | | $ | (43,142,226 | ) | |
| | | Class C | |
| | | For the Year Ended
October 31, 2019 | | For the Year Ended
October 31, 2018 | |
| | | Shares | | Value | | Shares | | Value | |
Shares sold | | | 4,737 | | | $ | 43,600 | | | | 34,802 | | | $ | 353,047 | | |
Shares redeemed | | | (148,468 | ) | | | (1,379,865 | ) | | | (190,957 | ) | | | (1,833,203 | ) | |
Net decrease | | | (143,731 | ) | | $ | (1,336,265 | ) | | | (156,155 | ) | | $ | (1,480,156 | ) | |
On October 31, 2019, the number of shareholders that held 5% or more of the outstanding shares of each class of the Fund was as follows:
| | | Number of
Shareholders | | Approximate Percentage
of Outstanding Shares | |
Class I | | | 5 | | | | 90 | % | |
Class A | | | 2 | | | | 61 | % | |
Class C | | | 8 | | | | 91 | % | |
The Fund's performance may be negatively impacted in the event one or more of the Fund's greater than 5% shareholders were to redeem at a given time. Some of the shareholders may be omnibus accounts, which hold shares on behalf of individual shareholders.
29
Credit Suisse Managed Futures Strategy Fund
Notes to Consolidated Financial Statements (continued)
October 31, 2019
Note 7 . Income Tax Information and Distributions to Shareholders
Income and capital gain distributions are determined in accordance with federal income tax regulations, which may differ from GAAP.
There were no distributions paid by the Fund to shareholders during the years ended October 31, 2019 and October 31, 2018.
The tax basis components of distributable earnings differ from the amounts reflected in the Consolidated Statement of Assets and Liabilities by temporary book/tax differences. These differences are primarily due to differing treatments of futures contracts marked to market and deferred operational expenses. At October 31, 2019, the components of distributable earnings on a tax basis were as follows:
Accumulated net realized loss | | $ | (18,591,890 | ) | |
Undistributed ordinary Income | | | 5,702,339 | | |
Unrealized appreciation | | | 8,686,310 | | |
| | $ | (4,203,241 | ) | |
At October 31, 2019, the cost and net unrealized appreciation (depreciation) of investments and derivatives for income tax purposes were as follows:
Cost of Investments | | $ | 223,497,521 | | |
Unrealized appreciation | | $ | 11,769,598 | | |
Unrealized depreciation | | $ | (3,189,026 | ) | |
Net Unrealized appreciation(depreciation) | | $ | 8,580,572 | | |
To adjust for current period permanent book/tax differences which arose principally from differing book/tax treatment of foreign currency gain (loss) and subsidiary accumulative income (loss), paid-in capital was charged $1,818,473, and distributable earnings (loss) was credited $1,818,473. Net assets were not affected by these reclassifications.
Note 8. Contingencies
In the normal course of business, the Fund may provide general indemnifications pursuant to certain contracts and organizational documents. The Fund's maximum exposure under these arrangements is dependent on future claims that may be made against the Fund and, therefore, cannot be estimated; however, based on experience, the risk of loss from such claims is considered remote.
30
Credit Suisse Managed Futures Strategy Fund
Report of Independent Registered Public Accounting Firm
To the Shareholders and Board of Trustees
Credit Suisse Managed Futures Strategy Fund:
Opinion on the Consolidated Financial Statements
We have audited the accompanying consolidated statement of assets and liabilities of Credit Suisse Managed Futures Strategy Fund (the Fund), a series of the Credit Suisse Opportunity Funds, including the consolidated schedule of investments, as of October 31, 2019, the related consolidated statement of operations for the year then ended, the consolidated statements of changes in net assets for each of the years in the two-year period then ended, and the related notes (collectively, the consolidated financial statements) and the consolidated financial highlights for each of the years in the five-year period then ended. In our opinion, the consolidated financial statements and consolidated financial highlights present fairly, in all material respects, the financial position of the Fund as of October 31, 2019, the results of its operations for the year then ended, the changes in its net assets for each of the years in the two-year period then ended, and the consolidated financial highlights for each of the years in the five-year period then ended, in conformity with U.S. generally accepted accounting principles.
Basis for Opinion
These consolidated financial statements and consolidated financial highlights are the responsibility of the Fund's management. Our responsibility is to express an opinion on these consolidated financial statements and consolidated financial highlights based on our audits. We are a public accounting firm registered with the Public Company Accounting Oversight Board (United States) (PCAOB) and are required to be independent with respect to the Fund in accordance with the U.S. federal securities laws and the applicable rules and regulations of the Securities and Exchange Commission and the PCAOB.
We conducted our audits in accordance with the standards of the PCAOB. Those standards require that we plan and perform the audit to obtain reasonable assurance about whether the consolidated financial statements and consolidated financial highlights are free of material misstatement, whether due to error or fraud. Our audits included performing procedures to assess the risks of material misstatement of the consolidated financial statements and consolidated financial highlights, whether due to error or fraud, and performing procedures that respond to those risks. Such procedures included examining, on a test basis, evidence regarding the amounts and disclosures in the consolidated financial statements and consolidated financial highlights. Such procedures also included confirmation of securities owned as of October 31, 2019, by correspondence with
31
Credit Suisse Managed Futures Strategy Fund
Report of Independent Registered Public Accounting Firm
custodians and brokers or by other appropriate auditing procedures when replies were not received. Our audits also included evaluating the accounting principles used and significant estimates made by management, as well as evaluating the overall presentation of the consolidated financial statements and consolidated financial highlights. We believe that our audits provide a reasonable basis for our opinion.
We have served as the auditor of one or more Credit Suisse Asset Management, LLC investment companies since 2015.
New York, New York
December 20, 2019
32
Credit Suisse Managed Futures Strategy Fund
Information Concerning Trustees and Officers (unaudited)
Name, Address
(Year of Birth) | | Position(s)
Held with
Fund | | Term
of Office1
and
Length
of Time
Served | | Principal
Occupation(s) During
Past Five Years | | Number of
Portfolios
in Fund
Complex
Overseen
by Trustee | | Other
Trusteeships
Held by Trustee
During Past Five Years | |
Independent Trustees | | | | | | | | | | | |
Laura A. DeFelice
c/o Credit Suisse Asset
Management, LLC
Attn: General Counsel
Eleven Madison Avenue
New York, New York
10010
(1959) | | Trustee, Nominating and Audit Committee member | | Since 2017 | | Partner of Acacia Properties LLC (multi-family and commercial real estate ownership and operation) from 2008 to present; Stonegate Advisors LLC (renewable energy and energy efficiency) from 2007 to present. | | | 9 | | | None | |
Jeffrey E. Garten
c/o Credit Suisse Asset Management, LLC
Attn: General Counsel Eleven Madison Avenue New York, New York 10010
(1946) | | Trustee, Nominating and Audit Committee member | | Since Fund Inception | | Dean Emeritus of Yale School of Management from July 2015 to present; The Juan Trippe Professor in the Practice of International Trade, Finance and Business, Yale School of Management, from July 2005 to July 2015; Partner and Chairman of Garten Rothkopf (consulting firm) from October 2005 to June 2017. | | | 9 | | | Director of Aetna, Inc. (insurance company); Director of CarMax Group (used car dealers); Director of Miller Buckfire & Co., LLC (financial restructuring). | |
1 Subject to the Trust's retirement policy, each Trustee may continue to serve as a Trustee until the last day of the calendar year in which the applicable Trustee attains age 75. Officer serves until his or her respective successor has been duly elected and qualified.
33
Credit Suisse Managed Futures Strategy Fund
Information Concerning Trustees and Officers (unaudited) (continued)
Name, Address
(Year of Birth) | | Position(s)
Held with
Fund | | Term
of Office1
and
Length
of Time
Served | | Principal
Occupation(s) During
Past Five Years | | Number of
Portfolios
in Fund
Complex
Overseen
by Trustee | | Other
Trusteeships
Held by Trustee
During Past Five Years | |
Independent Trustees | | | | | | | | | | | |
Mahendra R. Gupta
c/o Credit Suisse Asset
Management, LLC
Attn: General Counsel
Eleven Madison Avenue
New York, New York
10010
(1956) | | Trustee, Nominating Committee member and Audit Committee Chairman | | Since 2017 | | Professor, Washington University in St. Louis from July 1990 to present; Dean of Olin Business School at Washington University in St. Louis from July 2005 to July 2016; Partner, R.J. Mithaiwala (food manufacturing and retail, India) from March 1977 to present; Partner, F.F.B. Corporation (agriculture, India) from March 1977 to present; Partner, RPMG Research Corporation (benchmark research) from July 2001 to present. | | | 9 | | | Director of Caleres Inc. (footwear) from May 2012 to present; Director of Koch Development Corporation (real estate development) from November 2017 to present; Director of Supernova (fin-tech) from June 2014 to September 2018. | |
1 Subject to the Trust's retirement policy, each Trustee may continue to serve as a Trustee until the last day of the calendar year in which the applicable Trustee attains age 75. Officer serves until his or her respective successor has been duly elected and qualified.
34
Credit Suisse Managed Futures Strategy Fund
Information Concerning Trustees and Officers (unaudited) (continued)
Name, Address
(Year of Birth) | | Position(s)
Held with
Fund | | Term
of Office1
and
Length
of Time
Served | | Principal
Occupation(s) During
Past Five Years | | Number of
Portfolios
in Fund
Complex
Overseen
by Trustee | | Other
Trusteeships
Held by Trustee
During Past Five Years | |
Independent Trustees | | | | | | | | | | | |
Steven N. Rappaport
c/o Credit Suisse Asset
Management, LLC
Attn: General Counsel
Eleven Madison Avenue
New York, New York
10010
(1948) | | Chairman of the Board, Nominating Committee Chairman and Audit Committee member | | Trustee since Fund Inception and Chairman since 2005 | | Partner of Lehigh Court, LLC and RZ Capital (private investment firms) from July 2002 to present; Partner of Backstage Acquisition Holdings, LLC (publication job postings) from November 2013 to 2018. | | | 9 | | | Director of Aberdeen Emerging Markets Equity Income Fund, Inc. (a closed-end investment company); Director of Aberdeen Funds (25 open-end portfolios); Director of iCAD, Inc. (surgical & medical instruments & apparatus company) from 2006 to 2018. | |
Interested Trustee | | | | | | | | | | | |
John G. Popp2
Credit Suisse Asset
Management, LLC
Eleven Madison Avenue
New York, New York
10010
Year of Birth: 1956 | | Trustee, Chief Executive Officer and President | | Trustee since 2017
Chief Executive Officer and President since 2010 | | Managing Director of Credit Suisse; Global Head and Chief Investment Officer of the Credit Investments Group; Associated with Credit Suisse or its predecessor since 1997; Officer of other Credit Suisse Funds. | | | 9 | | | None. | |
1 Subject to the Trust's retirement policy, each Trustee may continue to serve as a Trustee until the last day of the calendar year in which the applicable Trustee attains age 75. Officer serves until his or her respective successor has been duly elected and qualified.
2 Mr. Popp is an "interested person" of the Trust, as defined in the 1940 Act, by virtue of his current position as an officer of Credit Suisse.
35
Credit Suisse Managed Futures Strategy Fund
Information Concerning Trustees and Officers (unaudited) (continued)
Name, Address
(Year of Birth) | | Position(s)
Held with
Fund | | Term of
Office1
and
Length of
Time
Served | | Principal Occupation(s) During Past Five Years | |
Officers* | | | | | | | |
Emidio Morizio
Credit Suisse Asset
Management, LLC
Eleven Madison Avenue
New York, New York 10010
(1966) | | Chief Compliance Officer | | Since Fund Inception | | Managing Director and Global Head of Compliance of Credit Suisse since 2010; Associated with Credit Suisse since July 2000; Officer of other Credit Suisse Funds. | |
Lou Anne McInnis
Credit Suisse Asset Management, LLC
Eleven Madison Avenue
New York, New York 10010
(1959) | | Chief Legal Officer | | Since 2015 | | Director of Credit Suisse; Associated with Credit Suisse since April 2015; Counsel at DLA Piper US LLP from 2011 to April 2015; Associated with Morgan Stanley Investment Management from 1997 to 2010; Officer of other Credit Suisse Funds. | |
Omar Tariq
Credit Suisse Asset
Management, LLC
Eleven Madison Avenue
New York, New York 10010
(1983) | | Chief Financial Officer and Treasurer | | Since 2019 | | Director of Credit Suisse since March 2019; Senior Manager of PriceWaterhouseCoopers, LLP from September 2010 to March 2019; Officer of other Credit Suisse Funds. | |
Karen Regan
Credit Suisse Asset
Management, LLC
Eleven Madison Avenue
New York, New York 10010
(1963) | | Vice President and Secretary | | Since 2010 | | Vice President of Credit Suisse; Associated with Credit Suisse since December 2004; Officer of other Credit Suisse Funds. | |
1 Subject to the Trust's retirement policy, each Trustee may continue to serve as a Trustee until the last day of the calendar year in which the applicable Trustee attains age 75. Officer serves until his or her respective successor has been duly elected and qualified.
* The officers of the Fund shown are officers that make policy decisions.
The Statement of Additional Information includes additional information about the Trustees and is available, without charge, upon request, by calling 877-870-2874.
36
Credit Suisse Managed Futures Strategy Fund
Proxy Voting and Portfolio Holdings Information (unaudited)
Information regarding how the Fund voted proxies related to its portfolio securities during the 12-month period ended June 30 of each year, as well as the policies and procedures that the Fund uses to determine how to vote proxies relating to its portfolio securities are available:
• By calling 1-877-870-2874
• On the Fund's website, www.credit-suisse.com/us/funds
• On the website of the Securities and Exchange Commission, www.sec.gov
The Fund files a complete schedule of its portfolio holdings for the first and third quarters of its fiscal year with the SEC as an exhibit to its reports on Form N-PORT, and for reporting periods ended prior to March 31, 2019, filed such information on Form N-Q. The Fund's Forms N-PORT and N-Q are available on the SEC's website at www.sec.gov.
37

P.O. BOX 219916, KANSAS CITY, MO 64121-9916
877-870-2874 n www.credit-suisse.com/us/funds
CREDIT SUISSE SECURITIES (USA) LLC, DISTRIBUTOR. MFS-AR-1019

CREDIT SUISSE FUNDS
Annual Report
October 31, 2019
n CREDIT SUISSE
MULTIALTERNATIVE STRATEGY FUND
Beginning on January 1, 2021, as permitted by regulations adopted by the Securities and Exchange Commission, paper copies of the Fund's shareholder reports will no longer be sent by mail, unless you specifically request paper copies of the reports from Credit Suisse Asset Management, LLC or from your financial intermediary, such as a broker-dealer or bank. Instead, the reports will be made available on a website, and you will be notified by mail each time a report is posted and provided with a website link to access the report.
You may elect to receive all future reports in paper free of charge. If you hold accounts directly with the Fund, you can call 877-870-2874 to inform Credit Suisse Asset Management, LLC that you wish to continue receiving paper copies of your shareholder reports. If you hold accounts through a financial intermediary, you can contact your financial intermediary to request that you continue to receive paper copies of your shareholder reports. Please note that not all financial intermediaries may offer this service. Your election to receive reports in paper will apply to all funds advised by Credit Suisse Asset Management, LLC, or all funds held with your financial intermediary, as applicable.
If you already elected to receive shareholder reports electronically, you will not be affected by this change and you need not take any action. You may elect to receive electronic delivery of shareholder reports and other communications by: (i) accessing the Credit Suisse Asset Management, LLC website at www.credit-suisse.com/us/funds and logging into your accounts, if you hold accounts directly with the Fund, or (ii) contacting your financial intermediary, if you hold accounts through a financial intermediary. Please note that not all financial intermediaries may offer this service.
The Fund's investment objectives, risks, charges and expenses (which should be considered carefully before investing), and more complete information about the Fund, are provided in the Prospectus, which should be read carefully before investing. You may obtain additional copies by calling 877-870-2874 or by visiting our website at www.credit-suisse.com/us/funds.
Credit Suisse Securities (USA) LLC, Distributor, is located at Eleven Madison Avenue, New York, NY 10010. Credit Suisse Funds are advised by Credit Suisse Asset Management, LLC.
Investors in the Credit Suisse Funds should be aware that they may be eligible to purchase Class I shares (where offered) directly or through certain intermediaries. Such shares are not subject to a sales charge. Investors in the Credit Suisse Funds should also be aware that they may be eligible for a reduction or waiver of the sales charge with respect to Class A or C shares (where offered). For more information, please review the relevant prospectuses or consult your financial representative.
Fund shares are not deposits or other obligations of Credit Suisse Asset Management, LLC ("Credit Suisse") or any affiliate, are not FDIC-insured and are not guaranteed by Credit Suisse or any affiliate. Fund investments are subject to investment risks, including loss of your investment.
Credit Suisse Multialternative Strategy Fund
Annual Investment Adviser's Report
October 31, 2019 (unaudited)
November 19, 2019
Dear Shareholder:
We are pleased to present this Annual Report covering the activities of the Credit Suisse Multialternative Strategy Fund (the "Fund") for the 12-month period ended October 31, 2019.
Performance Summary
11/1/2018 – 10/31/2019
Fund & Benchmark | | Performance | |
Class I1 | | | 0.11 | % | |
Class A1,2 | | | -0.10 | % | |
Credit Suisse Hedge Fund Index3 | | | 5.18 | % | |
Credit Suisse Liquid Alternative Beta Index4 | | | 5.06 | % | |
Performance shown for the Fund's Class A shares does not reflect sales charges, which are a maximum of 5.25%.2
Market Review: A period marked by one constant — change
The annual period ended October 31, 2019 was an interesting one for Multialternative strategies. The Credit Suisse Hedge Fund Index, the Fund's benchmark (the "Benchmark"), returned 5.18%.
The year 2018 ended against a backdrop of rising US interest rates, a sharp slowdown in Eurozone business confidence, weaker Chinese growth and rising geopolitical concerns. On the other hand, government bonds, generating positive returns, lived up to their traditional role as the defensive piece of a diversified portfolio.
Concerns over the US-China trade dispute eased and markets turned bullish as we entered 2019. Within the commodity markets, both precious and industrial metals made significant gains in addition to gasoline, in the energy sector, leading the way higher with significant gains. During the course of the year, we saw central banks coming to the rescue time and again, confronted by weaker economic data and still low inflation.
The general upward trend in the US Dollar during the year was marked by severe choppiness with the currency failing to find direction against major rivals on several occasions. Moreover, the U.S. dollar index reached new lows after the Labor Department's employment report showed that job growth slowed sharply in May and wages rose less than expected.
1
Credit Suisse Multialternative Strategy Fund
Annual Investment Adviser's Report (continued)
October 31, 2019 (unaudited)
After a difficult summer for risk assets, equities made moderate gains in September. A continued slowdown in the global economic data was offset by further monetary easing globally. The US bond rally, however, reversed during September as government bond yields posted their biggest weekly increase in more than six years, buoyed by data that signaled the economy continued to grow, albeit at a slowing pace. Consumer inflation pressures rose in line with expectations during July while the Agricultural sector saw modest losses especially after projections for larger-than-expected crop output following better-than-expected climatic conditions were released.
Financial markets welcomed signs of an easing in geopolitical tensions in October, with risk assets generally outperforming traditional safe havens. The US and Chinese authorities moved closer towards agreeing to a partial deal on trade, while the UK once again edged back from the precipice of a no-deal Brexit. Global central banks reiterated their dovish stances and the US Federal Reserve cut interest rates for the third time this year.
Strategic Review and Outlook: Mixed results from an interesting period
The Credit Suisse Multialternative Strategy Fund is designed to provide investors with efficient exposure to a variety of investment strategies spanning a broad range of markets and asset classes.
For the annual period ended October 31, 2019, the Fund's Class I shares underperformed its benchmark.
Markets ended 2018 with a sharp sell-off that challenged value strategies, which were moderated by the harvesting of market trend/momentum.
During the beginning of the year, we saw positive contribution coming in from seasonal commodity dynamics strategy which is designed to harvest the relative performance differentials of fundamentally-linked pairs across the commodity complex.
With an escalation in geopolitical tensions leading to panic in the markets, the portfolio benefited from a shift towards strategies that benefited from the dovish tone adopted by central banks globally. Short-Term Rates Trend, which seeks to take advantage of an empirical feature of interest rates markets that have exhibited trending behavior that persist over certain time frames, generated profits by capturing the momentum in rates developing due to the prospect of future rate cuts.
Equity Defensive strategies, which tilt allocation towards minimum volatility stocks, were another major contributor despite facing a sharp reversal at the start of September.
2
Credit Suisse Multialternative Strategy Fund
Annual Investment Adviser's Report (continued)
October 31, 2019 (unaudited)
Towards the latter part of the year, the portfolio reduced allocation to Credit Value and Equities Trend/Momentum strategies while increasing exposure to Equity Defensive strategies. The portfolio also scaled back exposure to Commodities Carry strategies after an initial increase. This switch occurred against a backdrop of changing central bank policy, increasing global growth worries, and recessionary signals indicating a late-cycle market environment.
Commodity Carry strategies had the largest negative contribution towards the end of the period. Carry strategies were impacted by the rise in volatility throughout the quarter along with idiosyncratic losses in specific commodity contracts.
A repricing of the trajectory of the federal funds rate during September, which sent interest rates higher, negatively impacted the performance of several broadly used equity and cross-asset factors. Trend/Momentum strategies, which had scaled exposure into duration-sensitive instruments when central banks adopted a dovish tone after the market sell-off in December 2018, suffered.
We continue to believe that the unique return profile of Multialternative strategies may appeal to investors searching for meaningful performance drivers that may draw on many hedge-fund styles that have historically offered diversification benefits to traditional portfolios.
The Quantitative Investment Strategies Group
Yung-Shin Kung
Sheel Dhande
The Fund is non-diversified, which means it may invest a greater proportion of its assets in the securities of a smaller number of issuers than a diversified mutual fund and may therefore be subject to greater volatility. The Fund's investment in alternative instruments may subject the Fund to greater volatility than investments in traditional securities, particularly in investments involving leverage.
The use of alternative assets and strategies entails substantial risks, including risk of loss of principal, arbitrage or fundamental risk, below investment grade securities risk, commodity exposure risks, concentration risk, credit risk, derivatives risk, exchange traded notes risk, fixed income risk, foreign securities risk, forwards risk, futures contracts risk, interest rate risk, leveraging risk, market risk, portfolio turnover risk, risks of investing in other funds, small- and mid- cap stock risk, speculative exposure risk, subsidiary risk, swap agreements risk and tax risk. For a detailed discussion of
3
Credit Suisse Multialternative Strategy Fund
Annual Investment Adviser's Report (continued)
October 31, 2019 (unaudited)
these and other risks, please refer to the Fund's Prospectus, which should be read carefully before investing.
In addition to historical information, this report contains forward-looking statements, which may concern, among other things, domestic and foreign markets, industry and economic trends and developments and government regulation, and their potential impact on the Fund's investments. These statements are subject to risks and uncertainties and actual trends, developments and regulations in the future, and their impact on the Fund, could be materially different from those projected, anticipated or implied. The Fund has no obligation to update or revise forward-looking statements.
The views of the Fund's management are as of the date of this letter and the Fund holdings described in this document are as of October 31, 2019; these views and Fund holdings may have changed subsequent to these dates. Nothing in this document is a recommendation to purchase or sell securities.
4
Credit Suisse Multialternative Strategy Fund
Annual Investment Adviser's Report (continued)
October 31, 2019 (unaudited)
Comparison of Change in Value of $10,000 Investment in the
Credit Suisse Multialternative Strategy Fund1 Class I shares,
Class A shares2, the Credit Suisse Hedge Fund Index3 and
the Credit Suisse Liquid Alternative Beta Index4
from Inception (03/30/12)
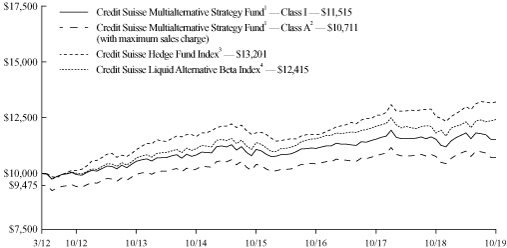
1 Fee waivers and/or expense reimbursements reduce expenses for the Fund, without which performance would be lower. The Fund entered into a written contract to limit expenses to 0.85% of the Fund's average daily net assets for Class I shares and 1.10% of the Fund's average daily net assets for Class A shares through at least February 28, 2021. This limit excludes certain expenses, as set forth in the Fund's Prospectus.
2 Total return for the Fund's Class A shares for the reporting period, based on offering price (including maximum sales charge of 5.25%), was (5.35)%.
3 The Credit Suisse Hedge Fund Index is compiled by Credit Suisse Hedge Index LLC. It is an asset-weighted hedge fund index and includes only hedge funds. It is rebalanced quarterly, is shown net of all performance fees and provides a rules-based and investable index, enabling investors to utilize the performance of a diversified market barometer for the hedge fund industry.
4 The Credit Suisse Liquid Alternative Beta Index reflects the return of a dynamic basket of liquid, investable market factors selected and weighted in accordance with an algorithm that aims to approximate the aggregate returns of the universe of hedge fund managers as represented by the Credit Suisse Hedge Fund Index. The index does not have transaction costs and investors may not invest directly in the index.
5
Credit Suisse Multialternative Strategy Fund
Annual Investment Adviser's Report (continued)
October 31, 2019 (unaudited)
Average Annual Returns as of October 31, 20191
| | | 1 Year | | 5 Years | | Since
Inception2 | |
Class I | | | 0.11 | % | | | 1.24 | % | | | 1.88 | % | |
Class A Without Sales Charge | | | (0.10 | )% | | | 0.99 | % | | | 1.62 | % | |
Class A With Maximum Sales Charge | | | (5.35 | )% | | | (0.09 | )% | | | 0.91 | % | |
Returns represent past performance and include change in share price and reinvestment of dividends and capital gain distributions, if any. Past performance cannot guarantee future results. The current performance of the Fund may be lower or higher than the figures shown. Returns and share price will fluctuate, and redemption value may be more or less than original cost. The performance results do not reflect the deduction of taxes that a shareholder would pay on Fund distributions or the redemption of Fund shares. Performance information current to the most recent month end is available at www.credit-suisse.com/us/funds.
The annualized gross expense ratios are 1.98% for Class I shares and 2.23% for Class A shares. The annualized net expense ratios after fee waivers and/or expense reimbursements and excluding securities sold short dividend expense are 0.85% for Class I shares and 1.10% for Class A.
1 Fee waivers and/or expense reimbursements reduce expenses for the Fund, without which performance would be lower. The Fund entered into a written contract to limit expenses to 0.85% of the Fund's average daily net assets for Class I shares and 1.10% of the Fund's average daily net assets for Class A shares through at least February 28, 2021. This limit excludes certain expenses, as set forth in the Fund's Prospectus.
2 Inception Date: March 30, 2012.
6
Credit Suisse Multialternative Strategy Fund
Annual Investment Adviser's Report (continued)
October 31, 2019 (unaudited)
Information About Your Fund's Expenses
As an investor of the Fund, you incur two types of costs: ongoing expenses and transaction costs. Ongoing expenses include management fees, distribution and service (12b-1) fees and other Fund expenses. Examples of transaction costs include sales charges (loads), redemption fees and account maintenance fees, which are not shown in this section and which would result in higher total expenses. The following table is intended to help you understand your ongoing expenses of investing in the Fund and to help you compare these expenses with the ongoing expenses of investing in other mutual funds. The table is based on an investment of $1,000 made at the beginning of the six months ended October 31, 2019.
The table illustrates your Fund's expenses in two ways:
• Actual Fund Return. This helps you estimate the actual dollar amount of ongoing expenses paid on a $1,000 investment in the Fund using the Fund's actual return during the period. To estimate the expenses you paid over the period, simply divide your account value by $1,000 (for example, an $8,600 account value divided by $1,000 = 8.6), then multiply the result by the number in the "Expenses Paid per $1,000" line.
• Hypothetical 5% Fund Return. This helps you to compare the Fund's ongoing expenses with those of other mutual funds using the Fund's actual expense ratio and a hypothetical rate of return of 5% per year before expenses. Examples using a 5% hypothetical fund return may be found in the shareholder reports of other mutual funds. The hypothetical account values and expenses may not be used to estimate the actual ending account balance or expenses you paid for the period.
Please note that the expenses shown in these tables are meant to highlight your ongoing expenses only and do not reflect any transaction costs, such as sales charges (loads) or redemption fees. If these transaction costs had been included, your costs would have been higher. The "Expenses Paid per $1,000" line of the tables is useful in comparing ongoing expenses only and will not help you determine the relative total expenses of owning different funds.
7
Credit Suisse Multialternative Strategy Fund
Annual Investment Adviser's Report (continued)
October 31, 2019 (unaudited)
Expenses and Value for a $1,000 Investment
for the six-month period ended October 31, 2019
Actual Fund Return | | Class I | | Class A | |
Beginning Account Value 05/01/19 | | $ | 1,000.00 | | | $ | 1,000.00 | | |
Ending Account Value 10/31/19 | | $ | 974.30 | | | $ | 973.00 | | |
Expenses Paid per $1,000* | | $ | 4.23 | | | $ | 5.47 | | |
Hypothetical 5% Fund Return | |
Beginning Account Value 05/01/19 | | $ | 1,000.00 | | | $ | 1,000.00 | | |
Ending Account Value 10/31/19 | | $ | 1,020.92 | | | $ | 1,019.66 | | |
Expenses Paid per $1,000* | | $ | 4.33 | | | $ | 5.60 | | |
| | | Class I | | Class A | |
Annualized Expense Ratios* | | | 0.85 | % | | | 1.10 | % | |
* Expenses are equal to the Fund's annualized expense ratio for each share class, multiplied by the average account value over the period, multiplied by 184/365 to reflect the one-half year period.
The "Expenses Paid per $1,000" and the "Annualized Expense Ratios" in the tables are based on actual expenses paid by the Fund during the period, net of fee waivers and/or actual expense reimbursements, if applicable. If those fee waivers and/or expense reimbursements had not been in effect, the Fund's actual expenses would have been higher. Expenses do not reflect additional charges and expenses that are, or may be, imposed under the variable contracts or plans. Such charges and expenses are described in the prospectus of the insurance company separate account or in the plan documents or other informational materials supplied by plan sponsors. The Fund's expenses should be considered with these charges and expenses in evaluating the overall cost of investing in the separate account.
For more information, please refer to the Fund's Prospectus.
Investment Type Breakdown**
Exchange-Traded Fund | | | 11.02 | % | |
United States Treasury Obligations | | | 88.98 | | |
Total | | | 100.00 | % | |
** Expressed as a percentage of total investments (excluding securities lending collateral, if applicable) and may vary over time.
8
Credit Suisse Multialternative Strategy Fund
Consolidated Schedule of Investments
October 31, 2019
| | | Number of
Shares | | Value | |
| EXCHANGE-TRADED FUND (4.9%) | |
| UNITED STATES (4.9%) | |
| Energy (4.9%) | |
Alerian MLP ETF(1) (Cost $4,035,442) | | | 433,366 | | | $ | 3,700,945 | | |
Par
(000) | |
| | Ratings†
(S&P/Moody's) | | Maturity | | Rate%(2) | | | |
| UNITED STATES TREASURY OBLIGATIONS (39.6%) | |
$ | 10,000 | | | United States Treasury Bills | | (AA+, Aaa) | | 01/02/20 | | | 2.458 | | | | 9,973,435 | | |
| | 20,000 | | | United States Treasury Bills | | (AA+, Aaa) | | 01/30/20 | | | 2.458 | | | | 19,924,000 | | |
| TOTAL UNITED STATES TREASURY OBLIGATIONS (Cost $29,834,767) | | | 29,897,435 | | |
| | | Number of
Shares | | | |
| SHORT-TERM INVESTMENTS (2.9%) | |
State Street Navigator Securities Lending Government Money Market Portfolio, 1.77%(3)
(Cost $2,175,854) | | | 2,175,854 | | | | 2,175,854 | | |
| TOTAL INVESTMENTS AT VALUE (47.4%) (Cost $36,046,063) | | | 35,774,234 | | |
| OTHER ASSETS IN EXCESS OF LIABILITIES (52.6%) | | | 39,706,636 | | |
| NET ASSETS (100.0%) | | $ | 75,480,870 | | |
† Credit ratings given by the S&P Global Ratings Division of S&P Global Inc. ("S&P") and Moody's Investors Service, Inc. ("Moody's") are unaudited.
(1) Security or portion thereof is out on loan (See note 2-M).
(2) Securities are zero coupon. Rate presented is yield to maturity as of October 31, 2019.
(3) Represents security purchased with cash collateral received for securities on loan. The rate shown is the annualized one-day yield at October 31, 2019.
Forward Foreign Currency Contracts
Forward
Currency to be
Purchased (Local) | | Forward
Currency to be
Sold (Local) | | Expiration
Date | | Counterparty | | Value on
Settlement Date | | Current
Value/
Notional | | Net Unrealized
Appreciation
(Depreciation) | |
USD | 7,845,121 | | | HKD | 61,333,156 | | | 06/17/20 | | Morgan Stanley | | $ | (7,845,121 | ) | | $ | (7,826,036 | ) | | $ | 19,085 | | |
Futures Contracts
Contract Description | | Currency | | Expiration
Date | | Number of
Contracts | | Notional
Value | | Net Unrealized
Appreciation
(Depreciation) | |
Contracts to Purchase | |
Agriculture | |
Coffee "C" Futures | | USD | | | | Mar 2020 | | | 31 | | | $ | 1,225,856 | | | $ | 17,391 | | |
Corn Futures | | USD | | | | Mar 2020 | | | 151 | | | | 3,010,562 | | | | 14,023 | | |
Cotton No. 2 Futures | | USD | | | | Mar 2020 | | | 19 | | | | 625,860 | | | | 530 | | |
Wheat Futures | | USD | | | | Mar 2020 | | | 81 | | | | 2,084,738 | | | | (22,005 | ) | |
| | | $ | 9,939 | | |
See Accompanying Notes to Consolidated Financial Statements.
9
Credit Suisse Multialternative Strategy Fund
Consolidated Schedule of Investments (continued)
October 31, 2019
Futures Contracts (continued)
Contract Description | | Currency | | Expiration
Date | | Number of
Contracts | | Notional
Value | | Net Unrealized
Appreciation
(Depreciation) | |
Energy | |
Brent Crude Oil Futures | | USD | | | | Mar 2020 | | | 65 | | | $ | 3,792,100 | | | $ | (101,862 | ) | |
Foreign Exchange Contracts | |
| CAD Currency Futures | | USD | | | | Dec 2019 | | | 34 | | | | 2,583,150 | | | $ | (10,209 | ) | |
| GBP Currency Futures | | USD | | | | Dec 2019 | | | 9 | | | | 728,831 | | | | 4,004 | | |
| | | $ | (6,205 | ) | |
Index Contracts | |
FTSE 100 Index Futures | | GBP | | | | Dec 2019 | | | 9 | | | | 843,869 | | | $ | (5,878 | ) | |
Nikkei 225 Index Futures OSE | | JPY | | | | Dec 2019 | | | 5 | | | | 1,061,468 | | | | 51,895 | | |
| | | $ | 46,017 | | |
Industrial Metals | |
LME Nickel Futures | | USD | | | | Nov 2019 | | | 52 | | | | 5,207,592 | | | $ | 305,773 | | |
LME Nickel Futures | | USD | | | | Jan 2020 | | | 22 | | | | 2,200,572 | | | | (69,521 | ) | |
LME Primary Aluminum Futures | | USD | | | | Nov 2019 | | | 119 | | | | 5,240,463 | | | | (74,262 | ) | |
LME Primary Aluminum Futures | | USD | | | | Jan 2020 | | | 51 | | | | 2,233,800 | | | | 17,092 | | |
LME Zinc Futures | | USD | | | | Nov 2019 | | | 66 | | | | 4,166,250 | | | | 180,901 | | |
LME Zinc Futures | | USD | | | | Jan 2020 | | | 28 | | | | 1,745,450 | | | | 126,375 | | |
| | | $ | 486,358 | | |
Interest Rate Contracts | |
10YR AUD Bond Futures | | AUD | | | | Dec 2019 | | | 56 | | | | 5,625,485 | | | $ | (138 | ) | |
2YR U.S. Treasury Note Futures | | USD | | | | Dec 2019 | | | 101 | | | | 21,775,758 | | | | 39,269 | | |
5YR U.S. Treasury Note Futures | | USD | | | | Dec 2019 | | | 183 | | | | 21,814,172 | | | | 112,197 | | |
10YR U.S. Treasury Note Futures | | USD | | | | Dec 2019 | | | 227 | | | | 29,577,391 | | | | 202,097 | | |
30YR U.S. Treasury Bond Futures | | USD | | | | Dec 2019 | | | 137 | | | | 22,108,375 | | | | 322,692 | | |
| EURO Bund Futures | | EUR | | | | Dec 2019 | | | 35 | | | | 6,706,845 | | | | 3,440 | | |
| | | $ | 679,557 | | |
Livestock | |
Lean Hogs Futures | | USD | | | | Feb 2020 | | | 33 | | | | 967,890 | | | $ | (1,037 | ) | |
Live Cattle Futures | | USD | | | | Feb 2020 | | | 40 | | | | 1,957,600 | | | | 11,961 | | |
| | | $ | 10,924 | | |
Precious Metals | |
Copper Futures | | USD | | | | Mar 2020 | | | 56 | | | | 3,705,800 | | | $ | (51,361 | ) | |
Gold100 OZ Futures | | USD | | | | Feb 2020 | | | 48 | | | | 7,304,640 | | | | 70,521 | | |
Silver Futures | | USD | | | | Mar 2020 | | | 25 | | | | 2,277,500 | | | | 18,758 | | |
| | | $ | 37,918 | | |
See Accompanying Notes to Consolidated Financial Statements.
10
Credit Suisse Multialternative Strategy Fund
Consolidated Schedule of Investments (continued)
October 31, 2019
Futures Contracts (continued)
Contract Description | | Currency | | Expiration
Date | | Number of
Contracts | | Notional
Value | | Net Unrealized
Appreciation
(Depreciation) | |
Contracts to Sell | |
Agriculture | |
Coffee "C" Futures | | USD | | | | Dec 2019 | | | (31 | ) | | $ | (1,185,169 | ) | | $ | (17,540 | ) | |
Corn Futures | | USD | | | | Dec 2019 | | | (151 | ) | | | (2,944,500 | ) | | | (25,619 | ) | |
Cotton No. 2 Futures | | USD | | | | Dec 2019 | | | (19 | ) | | | (612,180 | ) | | | 2,600 | | |
Wheat Futures | | USD | | | | Dec 2019 | | | (81 | ) | | | (2,060,437 | ) | | | 21,120 | | |
| | | $ | (19,439 | ) | |
Energy | |
Brent Crude Oil Futures | | USD | | | | Jan 2020 | | | (65 | ) | | | (3,875,300 | ) | | $ | 87,851 | | |
Foreign Exchange Contracts | |
| AUD Currency Futures | | USD | | | | Dec 2019 | | | (11 | ) | | | (758,560 | ) | | $ | (2,000 | ) | |
| EUR Currency Futures | | USD | | | | Dec 2019 | | | (8 | ) | | | (1,117,650 | ) | | | (9,079 | ) | |
| JPY Currency Futures | | USD | | | | Dec 2019 | | | (13 | ) | | | (1,508,406 | ) | | | (6,086 | ) | |
| | | $ | (17,165 | ) | |
Index Contracts | |
Hang Seng Index Futures | | HKD | | | | Nov 2019 | | | (4 | ) | | | (688,569 | ) | | $ | (7,397 | ) | |
EURO Stoxx 50 Index Futures | | EUR | | | | Dec 2019 | | | (142 | ) | | | (5,717,464 | ) | | | (128,929 | ) | |
S&P 500 E Mini Index Futures | | USD | | | | Dec 2019 | | | (73 | ) | | | (11,080,670 | ) | | | (137,209 | ) | |
| | | $ | (273,535 | ) | |
Industrial Metals | |
LME Nickel Futures | | USD | | | | Nov 2019 | | | (52 | ) | | | (5,207,592 | ) | | $ | (127,295 | ) | |
LME Nickel Futures | | USD | | | | Jan 2020 | | | (22 | ) | | | (2,200,572 | ) | | | 115,411 | | |
LME Primary Aluminum Futures | | USD | | | | Nov 2019 | | | (119 | ) | | | (5,240,463 | ) | | | (8,218 | ) | |
LME Primary Aluminum Futures | | USD | | | | Jan 2021 | | | (51 | ) | | | (2,233,800 | ) | | | (14,833 | ) | |
LME Zinc Futures | | USD | | | | Nov 2019 | | | (66 | ) | | | (4,166,250 | ) | | | (369,074 | ) | |
LME Zinc Futures | | USD | | | | Jan 2020 | | | (28 | ) | | | (1,745,450 | ) | | | (108,425 | ) | |
| | | $ | (512,434 | ) | |
Interest Rate Contracts | |
10YR CAD Bond Futures | | CAD | | | | Dec 2019 | | | (53 | ) | | | (5,727,637 | ) | | $ | (79,504 | ) | |
10YR JGB Mini Futures | | JPY | | | | Dec 2019 | | | (24 | ) | | | (3,422,673 | ) | | | (9,409 | ) | |
Long Gilt Futures | | GBP | | | | Dec 2019 | | | (26 | ) | | | (4,469,266 | ) | | | (26,070 | ) | |
| | | $ | (114,983 | ) | |
Livestock | |
Lean Hogs Futures | | USD | | | | Dec 2019 | | | (33 | ) | | | (871,200 | ) | | $ | (13,767 | ) | |
Live Cattle Futures | | USD | | | | Dec 2019 | | | (40 | ) | | | (1,875,600 | ) | | | (11,509 | ) | |
| | | $ | (25,276 | ) | |
See Accompanying Notes to Consolidated Financial Statements.
11
Credit Suisse Multialternative Strategy Fund
Consolidated Schedule of Investments (continued)
October 31, 2019
Futures Contracts (continued)
Contract Description | | Currency | | Expiration
Date | | Number of
Contracts | | Notional
Value | | Net Unrealized
Appreciation
(Depreciation) | |
Precious Metals | |
Copper Futures | | USD | | | | Dec 2019 | | | (56 | ) | | $ | (3,693,200 | ) | | $ | 50,839 | | |
Gold100 OZ Futures | | USD | | | | Dec 2019 | | | (48 | ) | | | (7,271,040 | ) | | | (70,979 | ) | |
Silver Futures | | USD | | | | Dec 2019 | | | (25 | ) | | | (2,258,375 | ) | | | (18,865 | ) | |
| | | $ | (39,005 | ) | |
| | | $ | 248,660 | | |
Total Return Swap Contracts
Currency | | Notional
Amount | | Expiration
Date | | Counterparty | | Receive | | Pay | | Periodic
Payment
Frequency | | Upfront
Premiums
Paid/
(Received) | | Net Unrealized
Appreciation
(Depreciation) | |
USD | | | | $ | 14,314,250 | | | 01/17/20 | |
Barclays
Bank PLC | | Barclays
WSVC
Strategy(a) | | 0.60% | | At Maturity | | $ | — | | | $ | 707,097 | | |
USD | | | | | 18,692,235 | | | 03/11/20 | | Barclays
Bank PLC | | Barclays
Commodity
Hedging
Insights 2
Index(b) | | 0.15% | | Quarterly | | | 36,901 | | | | 1,035,416 | | |
USD | | | | | 1,759,999 | | | 12/20/19 | | BNP Paribas | | 2.16% | | iBoxx $ Liquid
High Yield
Index | | Quarterly | | | — | | | | (56,507 | ) | |
EUR | | | | | 2,427,933 | | | 06/05/20 | | BNP Paribas | | EUR Custom
Equity Basket(b) | | 1.00% | | Monthly | | | — | | | | (20,933 | ) | |
GBP | | | | | 1,652,207 | | | 06/05/20 | | BNP Paribas | | GBP Custom
Equity Basket(b) | | 1.21% | | Monthly | | | — | | | | (18,827 | ) | |
USD | | | | | 1,000,000 | | | 06/20/20 | | BNP Paribas | | iBoxx $ Liquid
High Yield
Index | | 2.16% | | Quarterly | | | (1,737 | ) | | | (3,289 | ) | |
CHF | | | | | 863,126 | | | 10/02/20 | | BNP Paribas | | CHF Custom
Equity Basket(b) | | (0.73)% | | Monthly | | | — | | | | 42,148 | | |
DKK | | | | | 291,526 | | | 10/02/20 | | BNP Paribas | | DKK Custom
Equity Basket | | (0.24)% | | Monthly | | | — | | | | 33,825 | | |
CAD | | | | | 1,299,141 | | | 10/02/20 | | BNP Paribas | | CAD Basket(b) | | 2.06% | | Monthly | | | — | | | | 46,892 | | |
USD | | | | | 9,339,043 | | | 11/06/20 | | BNP Paribas | | BNP Paribas
CPS 2x1 D15
US Index ER(a) | | 0.35% | | At Maturity | | | — | | | | (12,448 | ) | |
USD | | | | | 15,463,656 | | | 10/19/20 | | Citigroup | | Citi
Commodities
Term
Structure
Alpha II Light
Energy
Capped(c) | | 0.40% | |
At Maturity | | | — | | | | 106,019 | | |
See Accompanying Notes to Consolidated Financial Statements.
12
Credit Suisse Multialternative Strategy Fund
Consolidated Schedule of Investments (continued)
October 31, 2019
Total Return Swap Contracts (continued)
Currency | | Notional
Amount | | Expiration
Date | | Counterparty | | Receive | | Pay | | Periodic
Payment
Frequency | | Upfront
Premiums
Paid/
(Received) | | Net Unrealized
Appreciation
(Depreciation) | |
USD | | | | $ | 3,705,968 | | | 11/29/19 | | Citigroup | | Citi
Commodities
Term
Structure
Alpha II Light
Energy
Capped(c) | | 0.40% | | At Maturity | | $ | — | | | $ | (68,180 | ) | |
USD | | | | | 5,611,195 | | | 10/30/20 | | Citigroup | | Citi Pure
Estimates
Momentum
US Long-Short
TR Index(b) | | 0.95% | | At Maturity | | | — | | | | (1,727 | ) | |
USD | | | | | 76,558 | | | 11/29/19 | | Goldman Sachs | | (0.20)% | | Bloomberg
Energy Index | | At Maturity | | | — | | | | 3,538 | | |
USD | | | | | 6,377,150 | | | 12/06/19 | | Goldman Sachs | | Goldman
Sachs RP 109
Long Short
Series SR
Excess Return
Strategy(c) | | (0.60)% | | At Maturity | | | — | | | | (1,093,475 | ) | |
USD | | | | | 118,285 | | | 12/06/19 | | Goldman Sachs | | (0.10)% | | Bloomberg
Agriculture
Index | | At Maturity | | | — | | | | 2,579 | | |
USD | | | | | 9,184,867 | | | 12/06/19 | | Goldman Sachs | | Goldman
Sachs RP 110
Long Short
Series SR
Excess Return
Strategy(c) | | (0.60)% | | At Maturity | | | — | | | | 482,128 | | |
USD | | | | | 946,831 | | | 12/06/19 | | Goldman Sachs | | Bloomberg
Precious
Metals Index | | 0.11% | | At Maturity | | | — | | | | 141,344 | | |
USD | | | | | 461,735 | | | 12/06/19 | | Goldman Sachs | | (0.06)% | | Bloomberg
Energy
Index | | At Maturity | | | — | | | | (16,082 | ) | |
USD | | | | | 854,620 | | | 12/06/19 | | Goldman Sachs | | Bloomberg
Industrial
Metals Index | | 0.12% | | At Maturity | | | — | | | | 2,485 | | |
USD | | | | | 918,084 | | | 02/13/20 | | Goldman Sachs | | Suntrust
Banks, Inc. | | 2.36% | | Monthly | | | — | | | | 25,828 | | |
USD | | | | | 922,969 | | | 02/13/20 | | Goldman Sachs | | 1.61% | | BB&T Corp. | | Monthly | | | — | | | | (25,936 | ) | |
USD | | | | | 490,100 | | | 02/27/20 | | Goldman Sachs | | Spark
Therapeutics,
Inc. | | 2.36% | | Monthly | | | — | | | | 55,750 | | |
USD | | | | | 326,722 | | | 04/03/20 | | Goldman Sachs | | 1.61% | | Centene Corp. | | Monthly | | | — | | | | (69,043 | ) | |
See Accompanying Notes to Consolidated Financial Statements.
13
Credit Suisse Multialternative Strategy Fund
Consolidated Schedule of Investments (continued)
October 31, 2019
Total Return Swap Contracts (continued)
Currency | | Notional
Amount | | Expiration
Date | | Counterparty | | Receive | | Pay | | Periodic
Payment
Frequency | | Upfront
Premiums
Paid/
(Received) | | Net Unrealized
Appreciation
(Depreciation) | |
USD | | | | $ | 581,458 | | | 04/03/20 | | Goldman Sachs | | Wellcare
Health
Plans, Inc. | | 2.39% | | Monthly | | $ | — | | | $ | 72,842 | | |
USD | | | | | 879,133 | | | 04/17/20 | | Goldman Sachs | | Advanced
Disposal
Services, Inc. | | 2.36% | | Monthly | | | — | | | | 4,583 | | |
USD | | | | | 297,142 | | | 04/24/20 | | Goldman Sachs | | Advanced
Disposal
Services, Inc. | | 2.36% | | Monthly | | | — | | | | 1,549 | | |
USD | | | | | 231,478 | | | 04/24/20 | | Goldman Sachs | | 1.61% | | BB&T Corp. | | Monthly | | | — | | | | (6,505 | ) | |
USD | | | | | 230,252 | | | 04/24/20 | | Goldman Sachs | | Suntrust
Banks, Inc. | | 2.36% | | Monthly | | | — | | | | 6,478 | | |
USD | | | | | 10,743,331 | | | 05/01/20 | | Goldman Sachs | | US Equity
Buyback
Basket(c) | | 2.15% | | Monthly | | | — | | | | (102,943 | ) | |
USD | | | | | 716,228 | | | 05/01/20 | | Goldman Sachs | | US Equity
Buyback
Basket(c) | | 2.13% | | Monthly | | | — | | | | (7,373 | ) | |
CAD | | | | | 970,603 | | | 05/15/20 | | Goldman Sachs | | Westjet
Airlines Ltd. | | 2.35% | | Monthly | | | — | | | | — | | |
USD | | | | | 1,199,134 | | | 05/15/20 | | Goldman Sachs | | Zayo Group
Holdings, Inc. | | 2.36% | | Monthly | | | — | | | | 7,066 | | |
USD | | | | | 78,131 | | | 05/26/20 | | Goldman Sachs | | 1.61% | | Centene Corp. | | Monthly | | | — | | | | (16,511 | ) | |
USD | | | | | 100,569 | | | 05/26/20 | | Goldman Sachs | | Spark
Therapeutics,
Inc. | | 2.36% | | Monthly | | | — | | | | 11,440 | | |
USD | | | | | 139,170 | | | 05/26/20 | | Goldman Sachs | | Wellcare
Health
Plans, Inc. | | 2.36% | | Monthly | | | — | | | | 17,435 | | |
USD | | | | | 574,024 | | | 06/05/20 | | Goldman Sachs | | Cypress
Semiconductor
Corp. | | 2.36% | | Monthly | | | — | | | | (3,676 | ) | |
USD | | | | | 1,184,200 | | | 06/05/20 | | Goldman Sachs | | EL Paso
Electric Co. | | 2.36% | | Monthly | | | — | | | | (10,905 | ) | |
USD | | | | | 1,211,460 | | | 06/12/20 | | Goldman Sachs | | 1.61% | | United
Technologies
Corp. | | Monthly | | | — | | | | (99,426 | ) | |
USD | | | | | 758,462 | | | 06/12/20 | | Goldman Sachs | | Raytheon Co. | | 2.36% | | Monthly | | | — | | | | 71,279 | | |
USD | | | | | 16,000,000 | | | 06/20/20 | | Goldman Sachs | | iBoxx $ Liquid
High Yield
Index | | 2.16% | | Quarterly | | | (39,285 | ) | | | (61,725 | ) | |
EUR | | | | | 1,406,685 | | | 06/26/20 | | Goldman Sachs | | Altran
Technologies
SA | | (0.02)% | | Monthly | | | — | | | | (7,980 | ) | |
USD | | | | | 761,774 | | | 06/26/20 | | Goldman Sachs | | LegacyTexas
Financial
Group, Inc. | | 2.36% | | Monthly | | | — | | | | (5,158 | ) | |
See Accompanying Notes to Consolidated Financial Statements.
14
Credit Suisse Multialternative Strategy Fund
Consolidated Schedule of Investments (continued)
October 31, 2019
Total Return Swap Contracts (continued)
Currency | | Notional
Amount | | Expiration
Date | | Counterparty | | Receive | | Pay | | Periodic
Payment
Frequency | | Upfront
Premiums
Paid/
(Received) | | Net Unrealized
Appreciation
(Depreciation) | |
USD | | | | $ | 647,979 | | | 06/26/20 | | Goldman Sachs | | 1.61% | | Prosperity
Bancshares, Inc. | | Monthly | | $ | — | | | $ | (188 | ) | |
USD | | | | | 172,646 | | | 07/17/20 | | Goldman Sachs | | 1.61% | | Petroleum Co. | | Callon
Monthly | | | — | | | | 4,857 | | |
USD | | | | | 162,189 | | | 07/17/20 | | Goldman Sachs | | Carrizo
Oil & Gas, Inc. | | 2.36% | | Monthly | | | — | | | | (3,662 | ) | |
USD | | | | | 61,978 | | | 07/17/20 | | Goldman Sachs | | 1.61% | | Hillenbrand, Inc. | | Monthly | | | — | | | | (4,560 | ) | |
USD | | | | | 218,400 | | | 07/17/20 | | Goldman Sachs | | Milacron
Holdings Corp. | | 2.36% | | Monthly | | | — | | | | 5,765 | | |
USD | | | | | 220,075 | | | 07/17/20 | | Goldman Sachs | | 1.61% | | People's United
Financial, Inc. | | Monthly | | | — | | | | (12,514 | ) | |
USD | | | | | 219,789 | | | 07/17/20 | | Goldman Sachs | | United
Financial
Bancorp, Inc. | | 2.36% | | Monthly | | | — | | | | 12,329 | | |
USD | | | | | 526,104 | | | 07/17/20 | | Goldman Sachs | | Acacia
Communications,
Inc. | | 2.36% | | Monthly | | | — | | | | 883 | | |
GBP | | | | | 680,949 | | | 07/24/20 | | Goldman Sachs | | EI Group PLC | | 1.16% | | Monthly | | | — | | | | 1,017 | | |
USD | | | | | 54,764 | | | 08/07/20 | | Goldman Sachs | | Gannett Co.,
Inc. | | 2.32% | | Monthly | | | — | | | | 1,081 | | |
USD | | | | | 24,658 | | | 08/07/20 | | Goldman Sachs | | 1.60% | | New Media
Investment
Group, Inc. | | Monthly | | | — | | | | (1,173 | ) | |
USD | | | | | 1,119,282 | | | 08/07/20 | | Goldman Sachs | | Genomic
Health, Inc. | | 2.32% | | Monthly | | | — | | | | (34,332 | ) | |
USD | | | | | 263,965 | | | 08/10/20 | | Goldman Sachs | | 1.60% | | New Media
Investment
Group, Inc. | | Monthly | | | — | | | | (12,555 | ) | |
USD | | | | | 618,078 | | | 08/10/20 | | Goldman Sachs | | Gannett Co.,
Inc. | | 2.36% | | Monthly | | | — | | | | 12,199 | | |
EUR | | | | | 690,566 | | | 08/21/20 | | Goldman Sachs | | Green REIT
PLC | | (0.02)% | | Monthly | | | — | | | | (734 | ) | |
USD | | | | | 1,162,816 | | | 08/28/20 | | Goldman Sachs | | Pivotal
Software, Inc.
Class A | | 2.36% | | Monthly | | | — | | | | 4,680 | | |
CAD | | | | | 1,078,092 | | | 09/18/20 | | Goldman Sachs | | Dream Global
Real Estate
Investment
Trust | | 2.35% | | Monthly | | | — | | | | 2,623 | | |
USD | | | | | 672,369 | | | 10/16/20 | | Goldman Sachs | | RA
Pharmaceuticals,
Inc. | | 2.25% | | Monthly | | | — | | | | 4,921 | | |
GBP | | | | | 1,133,096 | | | 10/16/20 | | Goldman Sachs | | Sophos
Group PLC | | 1.16% | �� | Monthly | | | — | | | | (5,860 | ) | |
USD | | | | | 221,835 | | | 10/23/20 | | Goldman Sachs | | Achillion
Pharmaceuticals,
Inc. | | 2.20% | | Monthly | | | — | | | | 11,848 | | |
See Accompanying Notes to Consolidated Financial Statements.
15
Credit Suisse Multialternative Strategy Fund
Consolidated Schedule of Investments (continued)
October 31, 2019
Total Return Swap Contracts (continued)
Currency | | Notional
Amount | | Expiration
Date | | Counterparty | | Receive | | Pay | | Periodic
Payment
Frequency | | Upfront
Premiums
Paid/
(Received) | | Net Unrealized
Appreciation
(Depreciation) | |
CAD | | | | $ | 669,770 | | | 10/23/20 | | Goldman Sachs | | Hudson's
Bay Co. | | 2.35% | | Monthly | | $ | — | | | $ | (2,406 | ) | |
USD | | | | | 1,147,515 | | | 10/30/20 | | Goldman Sachs | | Liberty
Property
Trust | | 1.00% | | Monthly | | | — | | | | 97 | | |
EUR | | | | | 1,134,434 | | | 10/30/20 | | Goldman Sachs | | Osram
Licht AG | | 1.00% | | Monthly | | | — | | | | (2,435 | ) | |
USD | | | | | 1,149,770 | | | 10/30/20 | | Goldman Sachs | | 1.00% | | Prologis, Inc. | | Monthly | | | — | | | | (1,115 | ) | |
USD | | | | | 56,977 | | | 12/09/19 | | JPMorgan Chase | | Pacific
Biosciences
of California,
Inc. | | 2.34% | | Monthly | | | — | | | | (3,010 | ) | |
USD | | | | | 15,499,999 | | | 12/20/19 | | JPMorgan Chase | | iBoxx $ Liquid
High Yield
Index | | 2.16% | | Quarterly | | | (113,817 | ) | | | 15,674 | | |
USD | | | | | 4,100,000 | | | 01/23/20 | | JPMorgan Chase | | J.P. Morgan
EMBI
Global Core(c) | | 2.84% | | Quarterly | | | — | | | | 11,300 | | |
USD | | | | | 3,700,000 | | | 01/23/20 | | JPMorgan Chase | | J.P. Morgan
EMBI Global
Core(c) | | 1.00% | | Quarterly | | | — | | | | 10,974 | | |
USD | | | | | 28,368,239 | | | 01/24/20 | | JPMorgan Chase | | J.P. Morgan
Helix 3 Index(c) | | 0.60% | | Monthly | | | — | | | | (256,353 | ) | |
USD | | | | | 1,959,267 | | | 01/24/20 | | JPMorgan Chase | | J.P. Morgan
Divimont
Bespoke(c) | | 0.10% | | Monthly | | | — | | | | (1,080 | ) | |
USD | | | | | 33,287,726 | | | 01/24/20 | | JPMorgan Chase | | J.P. Morgan
Seasonal
Spreads
Portfolio
Commodity
Index(c) | | 0.60% | | Monthly | | | — | | | | (122,131 | ) | |
USD | | | | | 62,838 | | | 03/09/20 | | JPMorgan Chase | | Pacific
Biosciences of
California,
Inc. | | 2.34% | | Monthly | | | — | | | | (3,320 | ) | |
USD | | | | | 789,045 | | | 04/13/20 | | JPMorgan Chase | | Mellanox
Technologies
Ltd. | | 2.34% | | Monthly | | | — | | | | 13,977 | | |
USD | | | | | 227,607 | | | 05/26/20 | | JPMorgan Chase | | Mellanox
Technologies
Ltd. | | 2.39% | | Monthly | | | — | | | | 4,032 | | |
GBP | | | | | 1,137,074 | | | 08/03/20 | | JPMorgan Chase | | Merlin
Entertainments
PLC | | 1.06% | | Monthly | | | — | | | | 3,954 | | |
See Accompanying Notes to Consolidated Financial Statements.
16
Credit Suisse Multialternative Strategy Fund
Consolidated Schedule of Investments (continued)
October 31, 2019
Total Return Swap Contracts (continued)
| Currency | | Notional
Amount | | Expiration
Date | | Counterparty | | Receive | | Pay | | Periodic
Payment
Frequency | | Upfront
Premiums
Paid/
(Received) | | Net Unrealized
Appreciation
(Depreciation) | |
USD | | | | $ | 1,176,099 | | | 08/03/20 | | JPMorgan Chase | | Genesee &
Wyoming,
Inc. Class A | | 2.39% | | Monthly | | $ | — | | | $ | 6,926 | | |
EUR | | | | | 1,158,793 | | | 09/21/20 | | JPMorgan Chase | | Axel
Springer SE | | 1.00% | | Monthly | | | — | | | | (9,332 | ) | |
USD | | | | | 984,313 | | | 10/29/20 | | JPMorgan Chase | | J.P. Morgan
Helix 3 Index(c) | | 0.60% | | Monthly | | | — | | | | 4,634 | | |
USD | | | | | 6,638,178 | | | 10/30/20 | | JPMorgan Chase | | J.P. Morgan
Seasonal
Spreads
Portfolio
Commodity
Index(c) | | 0.10% | | Monthly | | | — | | | | (12,586 | ) | |
USD | | | | | 5,068,810 | | | 10/29/20 | | Macquarie
Bank Ltd. | | Macquarie
Commodity
Volatility
Basket 2(b) | | 0.10% | | At Maturity | | | — | | | | (45,213 | ) | |
USD | | | | | 36,415,186 | | | 11/29/19 | | Societe Generale | | SGI
Commodity
Dynamic
Alpha VT6
Index | | 1.20% | | At Maturity | | | — | | | | (470,757 | ) | |
USD | | | | | 561,358 | | | 12/06/19 | | Societe Generale | | SGI
Commodity
Dynamic
Alpha VT6
Index(c) | | 1.20% | | At Maturity | | | — | | | | (8,650 | ) | |
USD | | | | | 28,289,233 | | | 12/06/19 | | Societe Generale | | SG US
Trend Index(a) | | 0.30% | | At Maturity | | | — | | | | 256,139 | | |
USD | | | | | 868,186 | | | 01/24/20 | | Societe Generale | | SG US Trend
Index(a) | | 0.30% | | At Maturity | | | — | | | | (159 | ) | |
USD | | | | | 1,598,533 | | | 10/30/20 | | Societe Generale | | SGI
Commodity
Dynamic
Alpha VT6
Index(c) | | 1.20% | | At Maturity | | | — | | | | 6,051 | | |
| | | $ | (117,938 | ) | | $ | 550,908 | | |
(a) The index intends to provide exposure to the S&P 500 index.
(b) The index constituents are available on the Fund's website.
(c) The index constituents are available on the counterparty's website.
See Accompanying Notes to Consolidated Financial Statements.
17
Credit Suisse Multialternative Strategy Fund
Consolidated Schedule of Investments (continued)
October 31, 2019
Currency Abbreviations:
AUD = Australian Dollar
CAD = Canadian Dollar
CHF = Swiss Franc
DKK = Danish Krone
EUR = Euro
GBP = British Pound
HKD = Hong Kong Dollar
JPY = Japanese Yen
USD = United States Dollar
U.S. Treasury securities in the amount of $1,100,000 received at the custodian bank as collateral for OTC swaps.
See Accompanying Notes to Consolidated Financial Statements.
18
Credit Suisse Multialternative Strategy Fund
Consolidated Statement of Assets and Liabilities
October 31, 2019
Assets | |
Investments at value, including collateral for securities on loan of $2,175,854
(Cost $36,046,063) (Note 2) | | $ | 35,774,2341 | | |
Cash | | | 16,093,085 | | |
Foreign currency at value (Cost $173,452) | | | 193,746 | | |
Cash segregated held at brokers2 (Note 2) | | | 25,302,909 | | |
Unrealized appreciation on open swap contracts (Note 2) | | | 3,273,682 | | |
Variation margin receivable on futures contracts (Note 2) | | | 537,945 | | |
Receivable for Fund shares sold | | | 191,271 | | |
Net receivable for open swap contracts | | | 861,931 | | |
Receivable from investment adviser (Note 3) | | | 237 | | |
Unrealized appreciation on forward foreign currency contracts (Note 2) | | | 19,085 | | |
Receivable for investments sold | | | 3,372 | | |
Interest receivable | | | 2,357 | | |
Prepaid expenses and other assets | | | 15,044 | | |
Total assets | | | 82,268,898 | | |
Liabilities | |
Administrative services fee payable (Note 3) | | | 3,701 | | |
Shareholder servicing/Distribution fee payable (Note 3) | | | 212 | | |
Unrealized depreciation on open swap contracts (Note 2) | | | 2,722,774 | | |
Payable upon return of securities loaned (Note 2) | | | 2,175,854 | | |
Payable for investments purchased | | | 1,585,302 | | |
Payable for Fund shares redeemed | | | 34,123 | | |
Trustees' fee payable | | | 16,998 | | |
Accrued expenses | | | 249,064 | | |
Total liabilities | | | 6,788,028 | | |
Net Assets | |
Capital stock, $.001 par value (Note 6) | | | 7,656 | | |
Paid-in capital (Note 6) | | | 78,609,491 | | |
Total distributable earnings (loss) | | | (3,136,277 | ) | |
Net assets | | $ | 75,480,870 | | |
I Shares | |
Net assets | | $ | 74,486,433 | | |
Shares outstanding | | | 7,554,154 | | |
Net asset value, offering price and redemption price per share | | $ | 9.86 | | |
A Shares | |
Net assets | | $ | 994,437 | | |
Shares outstanding | | | 102,167 | | |
Net asset value and redemption price per share | | $ | 9.73 | | |
Maximum offering price per share (net asset value/(1-5.25%)) | | $ | 10.27 | | |
1 Includes $2,123,633 of securities on loan.
2 For futures contracts, swap contracts and forward foreign currency contracts.
See Accompanying Notes to Consolidated Financial Statements.
19
Credit Suisse Multialternative Strategy Fund
Consolidated Statement of Operations
For the Year Ended October 31, 2019
Investment Income | |
Interest | | $ | 828,540 | | |
Dividends | | | 311,921 | | |
Securities lending (net of rebates) | | | 12,019 | | |
Foreign taxes withheld | | | (8,720 | ) | |
Total investment income | | | 1,143,760 | | |
Expenses | |
Investment advisory fees (Note 3) | | | 819,564 | | |
Administrative services fees (Note 3) | | | 24,174 | | |
Shareholder servicing/Distribution fees (Note 3) | |
Class A | | | 2,846 | | |
Custodian fees | | | 365,632 | | |
Transfer agent fees (Note 3) | | | 61,909 | | |
Trustees' fees | | | 61,767 | | |
Legal fees | | | 61,443 | | |
Audit and tax fees | | | 60,023 | | |
Registration fees | | | 48,872 | | |
Printing fees | | | 33,923 | | |
Commitment fees (Note 4) | | | 14,478 | | |
Insurance expense | | | 2,409 | | |
Miscellaneous expense | | | 7,654 | | |
Total expenses | | | 1,564,694 | | |
Less: fees waived and expenses reimbursed (Note 3) | | | (892,012 | ) | |
Net expenses | | | 672,682 | | |
Net investment income | | | 471,078 | | |
Net Realized and Unrealized Gain (Loss) from Investments, Futures Contracts, Swap Contracts,
Written Options and Foreign Currency Related Items | |
Net realized loss from investments | | | (1,624,107 | ) | |
Net realized gain from futures contracts | | | 1,590,747 | | |
Net realized loss from swap contracts | | | (1,834,841 | ) | |
Net realized loss from written options | | | (1,451,259 | ) | |
Net realized loss from foreign currency transactions | | | (118,682 | ) | |
Net realized gain from forward foreign currency contracts | | | 872,975 | | |
Net change in unrealized appreciation (depreciation) from investments | | | 1,676,781 | | |
Net change in unrealized appreciation (depreciation) from futures contracts | | | (2,305,412 | ) | |
Net change in unrealized appreciation (depreciation) from swap contracts | | | 1,246,186 | | |
Net change in unrealized appreciation (depreciation) from written options | | | 221,010 | | |
Net change in unrealized appreciation (depreciation) from foreign currency translations | | | 75,199 | | |
Net change in unrealized appreciation (depreciation) from forward foreign currency contracts | | | (444,215 | ) | |
Net realized and unrealized loss from investments, futures contracts, swap contracts,
written options and foreign currency related items | | | (2,095,618 | ) | |
Net decrease in net assets resulting from operations | | $ | (1,624,540 | ) | |
See Accompanying Notes to Consolidated Financial Statements.
20
Credit Suisse Multialternative Strategy Fund
Consolidated Statements of Changes in Net Assets
| | | For the Year
Ended
October 31, 2019 | | For the Year
Ended
October 31, 2018 | |
From Operations | |
Net investment income | | $ | 471,078 | | | $ | 467,493 | | |
Net realized gain (loss) from investments, futures contracts, swap contracts,
written options, securities sold short, foreign currency transactions
and forward foreign currency contracts | | | (2,565,167 | ) | | | (48,644 | ) | |
Net change in unrealized appreciation (depreciation) from investments,
futures contracts, swap contracts, written options, securities sold short,
foreign currency transactions and forward foreign currency contracts | | | 469,549 | | | | (877,287 | ) | |
Net decrease in net assets resulting from operations | | | (1,624,540 | ) | | | (458,438 | ) | |
From Distributions | |
From distributable earnings | |
Class I | | | (1,803,690 | ) | | | (4,686,749 | ) | |
Class A | | | (24,902 | ) | | | (61,137 | ) | |
Class C* | | | — | | | | (2,114 | ) | |
Net decrease in net assets resulting from distributions | | | (1,828,592 | ) | | | (4,750,000 | ) | |
| From Capital Share Transactions (Note 6) | |
Proceeds from sale of shares | | | 49,695,132 | | | | 31,293,414 | | |
Reinvestment of dividends and distributions | | | 1,821,562 | | | | 4,729,725 | | |
Net asset value of shares redeemed | | | (78,882,851 | ) | | | (28,052,586 | ) | |
Net increase (decrease) in net assets from capital share transactions | | | (27,366,157 | ) | | | 7,970,553 | | |
Net increase (decrease) in net assets | | | (30,819,289 | ) | | | 2,762,115 | | |
Net Assets | |
Beginning of year | | | 106,300,159 | | | | 103,538,044 | | |
End of year | | $ | 75,480,870 | | | $ | 106,300,159 | | |
* Class C was fully redeemed on February 15, 2018 and currently has no shareholders.
See Accompanying Notes to Consolidated Financial Statements.
21
Credit Suisse Multialternative Strategy Fund
Consolidated Financial Highlights
(For a Class I Share of the Fund Outstanding Throughout Each Year)
| | | For the Year Ended October 31, | |
| | | 2019 | | 2018 | | 2017 | | 2016 | | 2015 | |
Per share data | |
Net asset value, beginning of year | | $ | 10.031 | | | $ | 10.54 | | | $ | 10.391 | | | $ | 10.36 | | | $ | 10.42 | | |
INVESTMENT OPERATIONS | |
Net investment income (loss)2 | | | 0.06 | | | | 0.05 | | | | (0.04 | ) | | | (0.08 | ) | | | (0.01 | ) | |
Net gain (loss) from investments, futures contracts,
swap contracts, written options and foreign
currency related items (both realized and
unrealized) | | | (0.06 | ) | | | (0.08 | ) | | | 0.41 | | | | 0.13 | | | | 0.25 | | |
Total from investment operations | | | 0.003 | | | | (0.03 | ) | | | 0.37 | | | | 0.05 | | | | 0.24 | | |
LESS DIVIDENDS AND DISTRIBUTIONS | |
Dividends from net investment income | | | — | | | | — | | | | (0.04 | ) | | | — | | | | (0.18 | ) | |
Distributions from net realized gains | | | (0.17 | ) | | | (0.48 | ) | | | (0.18 | ) | | | (0.02 | ) | | | (0.12 | ) | |
Total dividends and distributions | | | (0.17 | ) | | | (0.48 | ) | | | (0.22 | ) | | | (0.02 | ) | | | (0.30 | ) | |
Net asset value, end of year | | $ | 9.86 | | | $ | 10.031 | | | $ | 10.54 | | | $ | 10.391 | | | $ | 10.36 | | |
Total return4 | | | 0.11 | % | | | (0.29 | )% | | | 3.68 | % | | | 0.53 | % | | | 2.33 | % | |
RATIOS AND SUPPLEMENTAL DATA | |
Net assets, end of year (000s omitted) | | $ | 74,486 | | | $ | 104,886 | | | $ | 102,227 | | | $ | 114,951 | | | $ | 13,015 | | |
Ratio of net expenses to average net assets | | | 0.85 | % | | | 0.89 | % | | | 1.00 | % | | | 0.91 | % | | | 1.56 | % | |
Ratio of expenses to average net assets excluding
securities sold short dividend expense | | | 0.85 | % | | | 0.85 | % | | | 0.85 | % | | | 0.85 | % | | | 1.32 | % | |
Ratio of net investment income (loss) to
average net assets | | | 0.60 | % | | | 0.44 | % | | | (0.40 | )% | | | (0.79 | )% | | | (0.14 | )% | |
Decrease reflected in above operating expense
ratios due to waivers/reimbursements | | | 1.13 | % | | | 0.95 | % | | | 0.68 | % | | | 0.65 | % | | | 2.34 | % | |
Portfolio turnover rate | | | 305 | % | | | 1,373 | % | | | 586 | % | | | 1,021 | % | | | 292 | % | |
1 Includes adjustments in accordance with accounting principles generally accepted in the United States of America and as such, the net asset values for financial reporting purposes and the returns based upon net asset values may differ from the net asset values and returns for shareholder transactions.
2 Per share information is calculated using the average shares outstanding method.
3 This amount represents less than $0.01 per share.
4 Total returns are historical and include change in share price and reinvestment of all dividends and distributions. Had certain expenses not been reduced during the years shown, total returns would have been lower.
See Accompanying Notes to Consolidated Financial Statements.
22
Credit Suisse Multialternative Strategy Fund
Consolidated Financial Highlights
(For a Class A Share of the Fund Outstanding Throughout Each Year)
| | | For the Year Ended October 31, | |
| | | 2019 | | 2018 | | 2017 | | 2016 | | 2015 | |
Per share data | |
Net asset value, beginning of year | | $ | 9.921 | | | $ | 10.47 | | | $ | 10.31 | | | $ | 10.31 | | | $ | 10.37 | | |
INVESTMENT OPERATIONS | |
Net investment income (loss)2 | | | 0.03 | | | | 0.02 | | | | (0.07 | ) | | | (0.10 | ) | | | (0.05 | ) | |
Net gain (loss) from investments, futures contracts,
swap contracts, written options and foreign
currency related items (both realized and
unrealized) | | | (0.05 | ) | | | (0.09 | ) | | | 0.42 | | | | 0.12 | | | | 0.26 | | |
Total from investment operations | | | (0.02 | ) | | | (0.07 | ) | | | 0.35 | | | | 0.02 | | | | 0.21 | | |
LESS DIVIDENDS AND DISTRIBUTIONS | |
Dividends from net investment income | | | — | | | | — | | | | (0.01 | ) | | | — | | | | (0.15 | ) | |
Distributions from net realized gains | | | (0.17 | ) | | | (0.48 | ) | | | (0.18 | ) | | | (0.02 | ) | | | (0.12 | ) | |
Total dividends and distributions | | | (0.17 | ) | | | (0.48 | ) | | | (0.19 | ) | | | (0.02 | ) | | | (0.27 | ) | |
Net asset value, end of year | | $ | 9.73 | | | $ | 9.921 | | | $ | 10.47 | | | $ | 10.31 | | | $ | 10.31 | | |
Total return3 | | | (0.10 | )% | | | (0.68 | )% | | | 3.45 | % | | | 0.24 | % | | | 2.08 | % | |
RATIOS AND SUPPLEMENTAL DATA | |
Net assets, end of year (000s omitted) | | $ | 994 | | | $ | 1,414 | | | $ | 1,267 | | | $ | 1,319 | | | $ | 320 | | |
Ratio of net expenses to average net assets | | | 1.10 | % | | | 1.14 | % | | | 1.26 | % | | | 1.17 | % | | | 1.82 | % | |
Ratio of expenses to average net assets
excluding securities sold short dividend expense | | | 1.10 | % | | | 1.10 | % | | | 1.10 | % | | | 1.11 | % | | | 1.57 | % | |
Ratio of net investment income (loss) to
average net assets | | | 0.30 | % | | | 0.19 | % | | | (0.65 | )% | | | (0.98 | )% | | | (0.44 | )% | |
Decrease reflected in above operating expense
ratios due to waivers/reimbursements | | | 1.13 | % | | | 0.94 | % | | | 0.68 | % | | | 0.65 | % | | | 2.33 | % | |
Portfolio turnover rate | | | 305 | % | | | 1,373 | % | | | 586 | % | | | 1,021 | % | | | 292 | % | |
1 Includes adjustments in accordance with accounting principles generally accepted in the United States of America and as such, the net asset values for financial reporting purposes and the returns based upon net asset values may differ from the net asset values and returns for shareholder transactions.
2 Per share information is calculated using the average shares outstanding method.
3 Total returns are historical and include change in share price, reinvestment of all dividends and distributions and no sales charge. Had certain expenses not been reduced during the years shown, total returns would have been lower.
See Accompanying Notes to Consolidated Financial Statements.
23
Credit Suisse Multialternative Strategy Fund
Notes to Consolidated Financial Statements
October 31, 2019
Credit Suisse Multialternative Strategy Fund (the "Fund"), a series of Credit Suisse Opportunity Funds (the "Trust"), a Delaware statutory trust, is registered under the Investment Company Act of 1940, as amended (the "1940 Act"), as a non-diversified open-end management investment company that seeks to achieve total return consistent with the risk and return patterns of a diversified universe of hedge funds. The Trust was organized under the laws of the State of Delaware as a business trust on May 31, 1995.
Credit Suisse Asset Management, LLC ("Credit Suisse"), the investment adviser to the Fund, is registered as an investment adviser with the Securities and Exchange Commission and as a Commodity Pool Operator with the Commodity Futures Trading Commission. The Fund intends to gain exposure to commodity derivatives through investing in a wholly-owned subsidiary, Credit Suisse Cayman Multialternative Strategy Fund, Ltd. (the "Subsidiary"), organized under the laws of the Cayman Islands. The Subsidiary invests in commodity-linked derivative instruments, such as swaps and futures. The Subsidiary may also invest in debt securities, some of which are intended to serve as margin or collateral for the Subsidiary's derivatives positions.
The Subsidiary is managed by the same portfolio managers that manage the Fund and the accompanying financial statements reflect the financial position of the Fund and the Subsidiary and the results of operations on a consolidated basis. The consolidated financial statements include portfolio holdings of the Fund and the Subsidiary and all intercompany transactions and balances have been eliminated. The Fund may invest up to 25% of its total assets in the Subsidiary. As of October 31, 2019, the Fund held $8,937,729 in the Subsidiary, representing 11.84% of the Fund's consolidated net assets. For the year ended October 31, 2019, the net realized gain on securities and other financial instruments held in the Subsidiary was $1,056,684.
Subsequent references to the Fund within the Notes to Consolidated Financial Statements collectively refer to the Fund and the Subsidiary.
The Fund offers two classes of shares: Class I shares and Class A shares. Each class of shares represents an equal pro rata interest in the Fund, except the share classes bear different expenses. Class A shares are sold subject to a front-end sales charge of up to 5.25%. Class I shares are sold without a sales charge.
24
Credit Suisse Multialternative Strategy Fund
Notes to Consolidated Financial Statements (continued)
October 31, 2019
Note 2. Significant Accounting Policies
The following is a summary of significant accounting policies followed by the Fund in the preparation of its consolidated financial statements. The policies are in accordance with generally accepted accounting principles in the United States of America ("GAAP"). The preparation of consolidated financial statements requires management to make estimates and assumptions that affect the reported amounts and disclosures in the consolidated financial statements. Actual results could differ from those estimates. The Fund is considered an investment company for financial reporting purposes under GAAP and follows the accounting and reporting guidance in Financial Accounting Standards Board ("FASB") Accounting Standards Codification ("ASC") Topic 946 — Financial Services — Investment Companies.
A) SECURITY VALUATION — The Board of Trustees (the "Board") is responsible for the Fund's valuation process. The Board has delegated the supervision of the daily valuation process to Credit Suisse Asset Management, LLC, the Fund's investment adviser ("Credit Suisse" or the "Adviser"), who has established a Pricing Committee which, pursuant to the policies adopted by the Board, is responsible for making fair valuation determinations and overseeing the Fund's pricing policies. The net asset value of the Fund is determined daily as of the close of regular trading on the New York Stock Exchange, Inc. (the "Exchange") on each day the Exchange is open for business. For certain international equity securities, in order to adjust for events which may occur between the close of the foreign exchanges and the close of the Exchange, a fair valuation model may be used. This fair valuation model takes into account comparisons to the valuation of American Depository Receipts (ADRs), exchange-traded funds, futures contracts and certain indices and these securities are categorized as Level 2. The valuations for fixed income securities (which may include, but are not limited to, corporate, government, municipal, mortgage-backed, collateralized mortgage obligations and asset-backed securities) and certain derivative instruments are typically the prices supplied by independent third party pricing services, which may use market prices or broker/dealer quotations or a variety of valuation techniques and methodologies. The independent third party pricing services use inputs that are observable such as issuer details, interest rates, yield curves, prepayment speeds, credit risks/spreads, default rates and quoted prices for similar securities. These pricing services generally price fixed income securities assuming orderly transactions of an institutional "round lot" size, but some trades occur in smaller "odd lot" sizes which may be effected at lower prices than institutional round lot trades. Structured note agreements are valued in accordance with a dealer-supplied valuation based on changes in the value of
25
Credit Suisse Multialternative Strategy Fund
Notes to Consolidated Financial Statements (continued)
October 31, 2019
Note 2. Significant Accounting Policies (continued)
the underlying index. Option contracts on securities, currencies, indices, futures contracts, swaps and other instruments are valued at the mid-point between the last bid and ask quotations as of the close of trading on the exchange on which the option is traded. Futures contracts are valued daily at the settlement price established by the board of trade or exchange on which they are traded. Forward contracts are valued at the London closing spot rates and the London closing forward point rates on a daily basis. The currency forward contract pricing model derives the differential in point rates to the expiration date of the forward and calculates its present value. Equity securities for which market quotations are available are valued at the last reported sales price or official closing price on the primary market or exchange on which they trade. The Fund may utilize a service provided by an independent third party which has been approved by the Board to fair value certain securities. When fair value pricing is employed, the prices of securities used by the Fund to calculate its net asset value may differ from quoted or published prices for the same securities. If independent third party pricing services are unable to supply prices for a portfolio investment, or if the prices supplied are deemed by the investment adviser to be unreliable, the market price may be determined by the investment adviser using quotations from one or more brokers/dealers or at the transaction price if the security has recently been purchased and no value has yet been obtained from a pricing service or pricing broker. When reliable prices are not readily available, such as when the value of a security has been significantly affected by events after the close of the exchange or market on which the security is principally traded, but before the Fund calculates its net asset value, these securities will be fair valued in good faith by the Pricing Committee, in accordance with procedures adopted by the Board.
The Fund uses valuation techniques to measure fair value that are consistent with the market approach and/or income approach, depending on the type of security and the particular circumstance. The market approach uses prices and other relevant information generated by market transactions involving identical or comparable securities. The income approach uses valuation techniques to discount estimated future cash flows to present value.
GAAP established a disclosure hierarchy that categorizes the inputs to valuation techniques used to value assets and liabilities at each measurement date. These inputs are summarized in the three broad levels listed below:
• Level 1 – quoted prices in active markets for identical investments
26
Credit Suisse Multialternative Strategy Fund
Notes to Consolidated Financial Statements (continued)
October 31, 2019
Note 2. Significant Accounting Policies (continued)
• Level 2 – other significant observable inputs (including quoted prices for similar investments, interest rates, prepayment speeds, credit risk, etc.)
• Level 3 – significant unobservable inputs (including the Fund's own assumptions in determining the fair value of investments)
The inputs or methodologies used to value securities are not necessarily an indication of the risk associated with investing in those securities.
The following is a summary of the inputs used as of October 31, 2019 in valuing the Fund's assets and liabilities carried at fair value:
Assets | | Level 1 | | Level 2 | | Level 3 | | Total | |
Investments in Securities | |
Exchange-Traded Fund | | $ | 3,700,945 | | | $ | — | | | $ | — | | | $ | 3,700,945 | | |
United States Treasury Obligations | | | — | | | | 29,897,435 | | | | — | | | | 29,897,435 | | |
Short-term Investment | | | — | | | | 2,175,854 | | | | — | | | | 2,175,854 | | |
| | | $ | 3,700,945 | | | $ | 32,073,289 | | | $ | — | | | $ | 35,774,234 | | |
Other Financial Instruments* | |
Forward Foreign Currency Contracts | | $ | — | | | $ | 19,085 | | | $ | — | | | $ | 19,085 | | |
Futures Contracts | | | 1,776,740 | | | | — | | | | — | | | | 1,776,740 | | |
Swap Contracts** | | | — | | | | 3,273,682 | | | | — | | | | 3,273,682 | | |
Liabilities | | Level 1 | | Level 2 | | Level 3 | | Total | |
Other Financial Instruments* | |
Futures Contracts | | $ | 1,528,080 | | | $ | — | | | $ | — | | | $ | 1,528,080 | | |
Swap Contracts** | | | — | | | | 2,722,774 | | | | — | | | | 2,722,774 | | |
* Other financial instruments include unrealized appreciation (depreciation) on forward foreign currency contracts, futures and swap contracts.
** Value includes any premium paid or received with respect to swap contracts, if applicable.
For the year ended October 31, 2019, there were no transfers among Level 2 and Level 3. All transfers, if any, are assumed to occur at the end of the reporting period.
B) DERIVATIVE INSTRUMENTS AND HEDGING ACTIVITIES — The Fund adopted amendments to authoritative guidance on disclosures about derivative instruments and hedging activities which require that a fund disclose (a) how and why an entity uses derivative instruments, (b) how derivative instruments and hedging activities are accounted for and (c) how derivative instruments and related hedging activities affect a fund's financial position, financial performance and cash flows. For the year ended October 31, 2019, the Fund's derivatives did not qualify for hedge accounting as they are held at fair value.
27
Credit Suisse Multialternative Strategy Fund
Notes to Consolidated Financial Statements (continued)
October 31, 2019
Note 2. Significant Accounting Policies (continued)
The following table presents the fair value and the location of derivatives within the Consolidated Statement of Assets and Liabilities at October 31, 2019 and the effect of these derivatives on the Consolidated Statement of Operations for the year ended October 31, 2019.
Primary Underlying Risk | | Derivative
Assets(1) | | Derivative
Liabilities(1) | | Realized
Gain (Loss) | | Change in
Unrealized
Appreciation
(Depreciation) | |
Foreign currency exchange rate | |
Forward contracts | | $ | 19,085 | | | $ | — | | | $ | 872,975 | | | $ | (444,215 | ) | |
Futures contracts(2) | | | 4,004 | | | | 27,374 | | | | 166,812 | | | | (411,698 | ) | |
Interest rate | |
Futures contracts(2) | | | 679,695 | | | | 115,121 | | | | 1,743,277 | | | | 96,703 | | |
Swap contracts(3) | | | 4,634 | | | | 257,433 | | | | (302,689 | ) | | | (252,799 | ) | |
Equity price | |
Futures contracts(2) | | | 51,895 | | | | 279,413 | | | | (64,250 | ) | | | (2,089,122 | ) | |
Swap contracts(3) | | | 2,991,358 | | | | 1,645,434 | | | | (2,072,938 | ) | | | 2,041,202 | | |
Purchased options | | | — | | | | — | | | | 825,083 | | | | (36,340 | ) | |
Written options | | | — | | | | — | | | | (1,451,259 | ) | | | 221,010 | | |
Credit risk | |
Swap contracts(3) | | | 15,674 | | | | 121,521 | | | | (131,522 | ) | | | (105,847 | ) | |
Commodity price | |
Futures contracts(2) | | | 1,041,146 | | | | 1,106,172 | | | | (344,027 | ) | | | 98,705 | | |
Swap contracts(3) | | | 262,016 | | | | 698,386 | | | | 672,308 | | | | (436,370 | ) | |
Total | | $ | 5,069,507 | | | $ | 4,250,854 | | | $ | (86,230 | ) | | $ | (1,318,771 | ) | |
(1) Generally, the balance sheet location for asset derivatives is receivables/net unrealized appreciation (depreciation) and for liability derivatives is payables/net unrealized appreciation (depreciation).
(2) Includes cumulative appreciation (depreciation) of futures contracts as reported in the Schedule of Investments. Only variation margin is reported within the receivables and/or payables on the Statement of Assets and Liabilities.
(3) Includes cumulative appreciation (depreciation) of total return swap contracts as reported in the Schedule of Investments. Only variation margin is reported within the receivables and/or payables on the Statement of Assets and Liabilities.
For the year ended October 31, 2019, the Fund held average monthly value on a net basis of $22,936,145 in forward foreign currency contracts and average monthly notional values on a net basis of $107,641,280 and $123,593,145 in long futures contracts and short futures contracts and $359,474,083 in swap contracts, respectively. For the year ended October 31, 2019, the Fund received average monthly premiums of $175,969 from written options contracts.
The Fund is a party to International Swap and Derivatives Association, Inc. ("ISDA") Master Agreements ("Master Agreements") with certain counterparties that govern over-the-counter derivative (including Total Return, Credit Default and Interest Rate Swaps) and foreign exchange contracts entered
28
Credit Suisse Multialternative Strategy Fund
Notes to Consolidated Financial Statements (continued)
October 31, 2019
Note 2. Significant Accounting Policies (continued)
into by the Fund. The Master Agreements may contain provisions regarding, among other things, the parties' general obligations, representations, agreements, collateral requirements, events of default and early termination. Termination events applicable to the Fund may occur upon a decline in the Fund's net assets below a specified threshold over a certain period of time.
The following table presents by counterparty the Fund's derivative assets, net of related collateral pledged to the Fund, at October 31, 2019:
Counterparty | | Gross Amount of
Derivative Assets
Presented in the
Consolidated
Statement of Assets
and Liabilities(a) | | Financial
Instruments
and Derivatives
Available for Offset | | Non-Cash
Collateral
Pledged | | Cash
Collateral
Pledged(b) | | Net Amount
of Derivative
Assets | |
Barclays Bank PLC | | $ | 1,742,513 | | | $ | — | | | $ | (1,100,000 | ) | | $ | — | | | $ | 642,513 | | |
BNP Paribas | | | 122,865 | | | | (112,004 | ) | | | — | | | | — | | | | 10,861 | | |
Citigroup | | | 106,019 | | | | (69,907 | ) | | | — | | | | — | | | | 36,112 | | |
Morgan Stanley | | | 19,085 | | | | — | | | | — | | | | — | | | | 19,085 | | |
Goldman Sachs | | | 968,624 | | | | (968,624 | ) | | | — | | | | — | | | | — | | |
JPMorgan Chase | | | 71,471 | | | | (71,471 | ) | | | — | | | | — | | | | — | | |
Societe Generale | | | 262,190 | | | | (262,190 | ) | | | — | | | | — | | | | — | | |
| | | $ | 3,292,767 | | | $ | (1,484,196 | ) | | $ | (1,100,000 | ) | | $ | — | | | $ | 708,571 | | |
The following table presents by counterparty the Fund's derivative liabilities, net of related collateral pledged by the Fund, at October 31, 2019:
Counterparty | | Gross Amount of
Derivative Liabilities
Presented in the
Consolidated
Statement of Assets
and Liabilities(a) | | Financial
Instruments
and Derivatives
Available for Offset | | Non-Cash
Collateral
Pledged | | Cash
Collateral
Pledged(b) | | Net Amount
of Derivative
Liabilities | |
BNP Paribas | | $ | 112,004 | | | $ | (112,004 | ) | | $ | — | | | $ | — | | | $ | — | | |
Citigroup | | | 69,907 | | | | (69,907 | ) | | | — | | | | — | | | | — | | |
Goldman Sachs | | | 1,608,431 | | | | (968,624 | ) | | | — | | | | (639,807 | ) | | | — | | |
JPMorgan Chase | | | 407,812 | | | | (71,471 | ) | | | — | | | | (336,341 | ) | | | — | | |
Macquarie Bank Ltd. | | | 45,213 | | | | — | | | | — | | | | — | | | | 45,213 | | |
Societe Generale | | | 479,407 | | | | (262,190 | ) | | | — | | | | (217,217 | ) | | | — | | |
| | | $ | 2,722,774 | | | $ | (1,484,196 | ) | | $ | — | | | $ | (1,193,365 | ) | | $ | 45,213 | | |
(a) Swap contracts and forward foreign currency exchange contracts are included.
(b) The actual collateral pledged may be more than the amounts shown.
C) FOREIGN CURRENCY TRANSACTIONS — The books and records of the Fund are maintained in U.S. dollars. Transactions denominated in foreign currencies are recorded at the current prevailing exchange rates. All assets and liabilities denominated in foreign currencies, including purchases and sales of
29
Credit Suisse Multialternative Strategy Fund
Notes to Consolidated Financial Statements (continued)
October 31, 2019
Note 2. Significant Accounting Policies (continued)
investments, and income and expenses, are translated into US dollar amounts on the date of those transactions.
Reported net realized gain (loss) from foreign currency transactions arises from sales of foreign currencies; currency gains or losses realized between the trade and settlement dates on securities transactions; and the difference between the amounts of dividends, interest, and foreign withholding taxes recorded on the Fund's books and the U.S. dollar equivalent of the amounts actually received or paid. Net change in unrealized gains and losses on translation of assets and liabilities denominated in foreign currencies arises from changes in the fair values of assets and liabilities, other than investments, at the end of the period, resulting from changes in exchange rates.
The Fund does not isolate that portion of the results of operations resulting from fluctuations in foreign exchange rates on investments from the fluctuations arising from changes in market prices of investments held. Such fluctuations are included with net realized and unrealized gain or loss from investments in the Consolidated Statement of Operations.
D) SECURITY TRANSACTIONS AND INVESTMENT INCOME/EXPENSE — Security transactions are accounted for on a trade date basis. Interest income/expense is recorded on the accrual basis. The Fund amortizes premiums and accretes discounts using the effective interest method. Dividend income/expense is recorded on the ex-dividend date. Foreign dividend income is recorded on the ex-dividend date or as soon as practicable after the Fund determines the existence of a dividend declaration after exercising reasonable due diligence. Certain expenses are class-specific expenses, vary by class and are charged only to that class. Income, expenses (excluding class-specific expenses) and realized/unrealized gains/losses are allocated proportionately to each class of shares based upon the relative net asset value of the outstanding shares of that class. The cost of investments sold is determined by use of the specific identification method for both financial reporting and income tax purposes. To the extent any issuer defaults or a credit event occurs that impacts the issuer, the Fund may halt any additional interest income accruals and consider the realizability of interest accrued up to the date of default or credit event.
E) DIVIDENDS AND DISTRIBUTIONS TO SHAREHOLDERS — Dividends from net investment income, if any, are declared and paid quarterly. Distributions of net realized capital gains, if any, are declared and paid at least annually. However, to the extent that a net realized capital gain can be reduced
30
Credit Suisse Multialternative Strategy Fund
Notes to Consolidated Financial Statements (continued)
October 31, 2019
Note 2. Significant Accounting Policies (continued)
by a capital loss carryforward, such gain will not be distributed. Dividends and distributions to shareholders of the Fund are recorded on the ex-dividend date and are determined in accordance with federal income tax regulations, which may differ from GAAP.
F) FEDERAL AND OTHER TAXES — No provision is made for federal taxes as it is the Fund's intention to continue to qualify as a regulated investment company ("RIC") under the Internal Revenue Code of 1986, as amended (the "Code"), and to make the requisite distributions to its shareholders, which will be sufficient to relieve it from federal income and excise taxes.
In order to qualify as a RIC under the Code, the Fund must meet certain requirements regarding the source of its income, the diversification of its assets and the distribution of its income. One of these requirements is that the Fund derive at least 90% of its gross income for each taxable year from dividends, interest, payments with respect to certain securities loans, gains from the sale or other disposition of stock, securities or foreign currencies, other income derived with respect to its business of investing in such stock, securities or currencies or net income derived from interests in certain publicly-traded partnerships ("Qualifying Income"). The Internal Revenue Service ("IRS") has issued a ruling that income realized from certain types of commodity-linked derivatives would not be Qualifying Income. As a result, the Fund's ability to realize income from investments in such commodity-linked derivatives as part of its investment strategy would be limited to a maximum of 10% of its gross income.
If the Fund is unable to ensure continued qualification as a RIC, the Fund may be required to change its investment objective, policies or techniques, or may be liquidated. If the Fund fails to qualify as a RIC, the Fund will be subject to federal income tax on its net income and capital gains at regular corporate rates (without reduction for distributions to shareholders). If the Fund were to fail to qualify as a RIC and become subject to federal income tax, shareholders of the Fund would be subject to the risk of diminished returns. The Fund adopted the authoritative guidance for uncertainty in income taxes and recognizes a tax benefit or liability from an uncertain position only if it is more likely than not that the position is sustainable based solely on its technical merits and consideration of the relevant taxing authority's widely understood administrative practices and procedures. The Fund has reviewed its current tax positions and has determined that no provision for income tax is required in the Fund's financial statements. The Fund's federal and state income and federal excise tax returns for tax years for which the applicable statutes of
31
Credit Suisse Multialternative Strategy Fund
Notes to Consolidated Financial Statements (continued)
October 31, 2019
Note 2. Significant Accounting Policies (continued)
limitations have not expired are subject to examination by the Internal Revenue Service and state departments of revenue.
G) CASH — The Fund's uninvested cash balance is held in an interest bearing variable rate demand deposit account at State Street Bank and Trust Company ("SSB"), the Fund's custodian.
H) SHORT SALES — When the Fund engages in a short sale, the collateral for the short position will be maintained by the Fund's custodian or qualified sub-custodian. While the short sale is open, the Fund will maintain in a segregated account an amount of liquid securities equal in value to its obligation to the securities sold short. The collateral amounts required are determined daily by reference to the market value of the short positions. Short sales expose the Fund to the risk that it will be required to cover its short position at a time when the securities have appreciated in value, thus resulting in a loss to the Fund. The Fund's loss on a short sale could theoretically be unlimited in a case where the Fund is unable, for whatever reason, to close out its short position. Short sales also involve transaction and other costs that will reduce potential gains and increase potential Fund losses. The use by the Fund of short sales in combination with long positions in the Fund in an attempt to improve performance may not be successful and may result in greater losses or lower positive returns than if the Fund held only long positions. It is possible that the Fund's long equity positions will decline in value at the same time that the value of the securities it has sold short increases, thereby increasing potential losses to the Fund. In addition, the Fund's short selling strategies may limit its ability to fully benefit from increases in the equity markets. Short selling also involves a form of financial leverage that may exaggerate any losses realized by the Fund. Also, there is the risk that the counterparty to a short sale may fail to honor its contractual terms, causing a loss to the Fund. At October 31, 2019, the Fund had no open short positions.
I) FUTURES — The Fund may enter into futures contracts to the extent permitted by its investment policies and objectives. The Fund may use futures contracts to gain exposure to or hedge against changes in interest rates, equity and market price movements and/or currency risks. Upon entering into a futures contract, the Fund is required to deposit cash and/or pledge U.S. Government securities as initial margin with a Futures Commission Merchant ("FCM"). Subsequent payments, which are dependent on the daily fluctuations in the value of the underlying instrument, are made or received by the Fund each day (daily variation margin) and are recorded as unrealized gains or losses in the Consolidated Statement of Operations until the contracts are closed.
32
Credit Suisse Multialternative Strategy Fund
Notes to Consolidated Financial Statements (continued)
October 31, 2019
Note 2. Significant Accounting Policies (continued)
When the contracts are closed, the Fund records a realized gain or loss equal to the difference between the proceeds from (or cost of) the closing transaction and the Fund's basis in the contract. Risks of entering into futures contracts for hedging purposes include the possibility that a change in the value of the contract may not correlate with the changes in the value of the underlying instruments. Futures have minimal counterparty credit risk because futures are exchange traded and the exchange's clearinghouse, as counterparty to all exchange-traded futures, guarantees the futures against default. In addition, the purchase of a futures contract involves the risk that the Fund could lose more than the original margin deposit and subsequent payments may be required for a futures transaction. The Fund's open futures contracts are disclosed in the Consolidated Schedule of Investments. At October 31, 2019, the amount of restricted cash held at brokers related to open futures contracts was $4,145,185.
The Commodity Exchange Act requires an FCM to segregate all customer transactions and assets from the FCM's proprietary activities. A customer's cash and other equity deposited with an FCM are considered commingled with all other customer funds subject to the FCM's segregation requirements. In the event of an FCM's insolvency, recovery may be limited to the Fund's pro-rata share of segregated customer funds available. It is possible that the recovery amount could be less than the total of cash and other equity deposited.
J) FORWARD FOREIGN CURRENCY CONTRACTS — A forward foreign currency exchange contract ("forward currency contract") is a commitment to purchase or sell a foreign currency at the settlement date at a negotiated rate. The Fund will enter into forward currency contracts primarily for hedging foreign currency risk. Forward currency contracts are valued at the prevailing forward exchange rate of the underlying currencies and unrealized gain/loss is recorded daily. On the settlement date of the forward currency contract, the Fund records a realized gain or loss equal to the difference between the value of the contract at the time it was opened and the value of the contract at the time it was closed. Certain risks may arise upon entering into forward currency contracts from the potential inability of counterparties to meet the terms of their contracts. The maximum counterparty credit risk to the Fund is measured by the unrealized gain on appreciated contracts. Additionally, when utilizing forward currency contracts to hedge, the Fund forgoes the opportunity to profit from favorable exchange rate movements during the term of the contract. The Fund's open forward currency contracts at October 31, 2019 are disclosed in the Consolidated Schedule of Investments. At October 31, 2019, the amounts
33
Credit Suisse Multialternative Strategy Fund
Notes to Consolidated Financial Statements (continued)
October 31, 2019
Note 2. Significant Accounting Policies (continued)
of restricted cash held at brokers related to open forward currency contracts for the Fund was $380,000.
K) SWAPS — The Fund may enter into swaps either for hedging purposes or to seek to increase total return. A swap contract is an agreement that obligates two parties to exchange a series of cash flows at specified intervals based upon or calculated by reference to changes in specified prices or rates for a specified amount of an underlying asset or notional principal amount. A centrally cleared swap is a transaction executed between the Fund and a counterparty, then cleared by a clearing member through a central clearinghouse. The central clearinghouse serves as the counterparty, with whom the Fund exchanges cash flows. The Fund will enter into swap contracts only on a net basis, which means that the two payment streams are netted out, with the Fund receiving or paying, as the case may be, only the net amount of the two payments. Risks may arise as a result of the failure of the counterparty to the swap contract to comply with the terms of the swap contract. The extent of the Fund's exposure to credit and counterparty risks is the discounted net value of the cash flows to be received from the counterparty over the contract's remaining life, to the extent that the amount is positive. These risks are mitigated by having a master netting arrangement between the Fund and the counterparty and by the posting of collateral by the counterparty to the Fund to cover the Fund's exposure to the counterparty. Therefore, the Fund considers the creditworthiness of each counterparty as well as the amounts posted by the counterparty pursuant to the master netting agreement to a swap contract in evaluating potential credit risk. Additionally, risks may arise from unanticipated movements in interest rates or in the value of the underlying reference asset or index.
The Fund may enter into total return swap contracts, involving commitments to pay interest in exchange for a market-linked return, both based on notional amounts. The Fund may invest in total return swap contracts for hedging purposes or to seek to increase total return. To the extent the total return of the security or index underlying the transaction exceeds or falls short of the offsetting interest rate obligation, the Fund will receive a payment from or make a payment to the counterparty.
The Fund may enter into credit default swap agreements either as a buyer or seller. The Fund may buy a credit default swap to attempt to mitigate the risk of default or credit quality deterioration in one or more individual holdings or in a segment of the fixed income securities market. The Fund may sell a
34
Credit Suisse Multialternative Strategy Fund
Notes to Consolidated Financial Statements (continued)
October 31, 2019
Note 2. Significant Accounting Policies (continued)
credit default swap in an attempt to gain exposure to an underlying issuer's credit quality characteristics without investing directly in that issuer.
The Fund bears the risk of loss of the amount expected to be received under a credit default swap agreement in the event of the default or bankruptcy of the counterparty. The Fund will enter into swap agreements only with counterparties that meet certain standards of creditworthiness (generally, such counterparties would have to be eligible counterparties under the terms of the Fund's repurchase agreement guidelines). Credit default swap agreements are generally valued at a price at which the counterparty to such agreement would terminate the agreement.
The Fund records unrealized gains or losses on a daily basis representing the value and the current net receivable or payable relating to open swap contracts. Net amounts received or paid on the swap contract are recorded as realized gains or losses. Fluctuations in the value of swap contracts are recorded for financial statement purposes as unrealized appreciation or depreciation from swap contracts. Realized gains and losses from terminated swaps are included in net realized gains/losses from swap contracts. Upon entering into a centrally cleared swap, the Fund is required to deposit with a financial intermediary cash or securities ("initial margin") in an amount equal to a certain percentage of the notional amount of the swap. Subsequent payments ("variation margin") are made or received by the Fund dependent upon the daily fluctuations in the value of the swap. In a cleared swap transaction, counterparty risk is minimized as the central clearinghouse acts as the counterparty. The Fund's open swap contracts are disclosed in the Consolidated Schedule of Investments. At October 31, 2019, the amounts of restricted cash held at brokers related to open swap contracts for the Fund was $18,293,571.
L) OPTION CONTRACTS — The Fund will enter into options contracts to gain exposure to risk volatility based assets. When the Fund purchases an option, it pays a premium and the option is subsequently marked to market to reflect current value. Premiums paid for purchasing options which expire are treated as realized losses. Premiums paid for purchasing options which are exercised or closed are added to the cost or deducted from the proceeds on the underlying instrument to determine the realized gain or loss. The risk associated with purchasing options is limited to the premium paid.
When the Fund writes an option, an amount equal to the net premium received (the premium less commission) is recorded as a liability and is subsequently adjusted to the current value. Net premiums received for written
35
Credit Suisse Multialternative Strategy Fund
Notes to Consolidated Financial Statements (continued)
October 31, 2019
Note 2. Significant Accounting Policies (continued)
options which expire are treated as realized gains. Net premiums received for written options which are exercised or closed are deducted from the cost or added to the proceeds on the underlying instrument or closing purchase transaction to determine the realized gain or loss. The Fund, as writer of a written option, bears the risk of an unfavorable change in the market value of the instrument underlying the written option.
Exchange-traded options have standardized contracts and are settled through a clearing house with fulfillment guaranteed by the credit of the exchange. Therefore, counterparty credit risks to the Fund are limited. Over-the-counter options are subject to the risk that the counterparty is unable or unwilling to meet its obligations under the option. The Fund's exchange-traded written options are disclosed in the Consolidated Schedule of Investments. At October 31, 2019, the amount of restricted cash held at brokers related to option contracts was $2,484,153.
M) SECURITIES LENDING — The initial collateral received by the Fund is required to have a value of at least 102% of the market value of domestic securities on loan (including any accrued interest thereon) and 105% of the market value of foreign securities on loan (including any accrued interest thereon). The collateral is maintained thereafter at a value equal to at least 102% of the current market value of the securities on loan. The market value of loaned securities is determined at the close of each business day of the Fund and any additional required collateral is delivered to the Fund, or excess collateral returned by the Fund, on the next business day. Cash collateral received by the Fund in connection with securities lending activity may be pooled together with cash collateral for other funds/portfolios advised by Credit Suisse and may be invested in a variety of investments, including funds advised by SSB, the Fund's securities lending agent, or money market instruments. However, in the event of default or bankruptcy by the other party to the agreement, realization and/or retention of the collateral may be subject to legal proceedings.
SSB has been engaged by the Fund to act as the Fund's securities lending agent. As of October 31, 2019, the Fund had investment securities on loan with a fair value of $2,123,633. Collateral received for securities loaned and a related liability of $2,175,854 are presented gross in the Consolidated Statement of Assets and Liabilities. The collateral for securities loaned is valued consistently with the other investments held by the Fund and is included in Level 2 of the fair value hierarchy. As of October 31, 2019, the value of the related collateral exceeded the value of the securities loaned.
36
Credit Suisse Multialternative Strategy Fund
Notes to Consolidated Financial Statements (continued)
October 31, 2019
Note 2. Significant Accounting Policies (continued)
During the year ended October 31, 2019, total earnings from the Fund's investment in cash collateral received in connection with securities lending arrangements was $48,142, of which $32,115 was rebated to borrowers (brokers). The Fund retained $12,019 in income from the cash collateral investment, and SSB, as lending agent, was paid $4,008. Securities lending income is accrued as earned.
N) OTHER — In the normal course of business the Fund trades financial instruments and enters into financial transactions for which risk of potential loss exists due to changes in the market (market risk) or failure of the other party to a transaction to perform (credit risk). Similar to credit risk, the Fund may be exposed to counterparty risk, including securities lending, or the risk that an institution or other entity with which the Fund has unsettled or open transactions will default. The potential loss could exceed the value of the financial assets recorded in the consolidated financial statements. Financial assets, which potentially expose the Fund to credit risk, consist principally of cash due from counterparties and investments. The extent of the Fund's exposure to credit and counterparty risks in respect to these financial assets approximates their carrying value as recorded in the Fund's Consolidated Statement of Assets and Liabilities.
O) FOREIGN INVESTMENTS RISK — The Fund may have elements of risk not typically associated with investments in the U.S. due to concentrated investments in a limited number of countries or regions, which may vary throughout the year. Such concentrations may subject the Fund to additional risks resulting from political or economic conditions in such countries or regions and the possible imposition of adverse governmental laws or currency exchange restrictions could cause the securities and their markets to be less liquid and their prices to be more volatile than those of comparable U.S. securities.
Because the Fund may invest a significant portion of its assets in these markets, it is subject to greater risks of adverse events that occur in those markets and may experience greater volatility than a Fund that is more broadly diversified geographically.
P) RECENT ACCOUNTING PRONOUNCEMENTS — In August 2018, the FASB issued Accounting Standards Update 2018-13, Fair Value Measurement (Topic 820): Disclosure Framework — Changes to the Disclosure Requirements for Fair Value Measurement ("ASU 2018-13"). The update provides guidance that eliminates, adds and modifies certain disclosure requirements for fair
37
Credit Suisse Multialternative Strategy Fund
Notes to Consolidated Financial Statements (continued)
October 31, 2019
Note 2. Significant Accounting Policies (continued)
value measurements. ASU 2018-13 will be effective for annual periods beginning after December 15, 2019. Management is currently assessing the potential impact of these changes to future financial statements.
Q) SUBSEQUENT EVENTS — In preparing the financial statements as of October 31, 2019, management considered the impact of subsequent events for potential recognition or disclosure in these financial statements through the date of release of this report. No such events requiring recognition or disclosure were identified through the date of the release of this report.
Note 3. Transactions with Affiliates and Related Parties
Credit Suisse serves as investment adviser and co-administrator for the Fund. Credit Suisse is entitled to receive a fee from the Fund at an annual rate of 1.04% of the Fund's average daily net assets. For the year ended October 31, 2019, investment advisory and administration fees earned and fees waived/expenses reimbursed by Credit Suisse were $819,564 and $892,012, respectively. Credit Suisse has contractually agreed to limit expenses so that the Fund's annual operating expenses do not exceed 0.85% of the Fund's average daily net assets for Class I shares and 1.10% of the Fund's average daily net assets for Class A shares. The Fund is authorized to reimburse Credit Suisse for management fees previously limited and/or for expenses previously reimbursed by Credit Suisse, provided, however, that any reimbursements must be paid at a date not more than thirty-six months following the applicable month during which such fees were limited or expenses were reimbursed by Credit Suisse and the reimbursements do not cause the Fund to exceed the applicable expense limitation in the contract at the time the fees are recouped. This contract may not be terminated before February 28, 2021.
The amounts waived and reimbursed by Credit Suisse, which are available for potential future recoupment by Credit Suisse, and the expiration schedule at October 31, 2019 are as follows:
| | | Fee waivers/expense
reimbursements
subject to
recoupment* | | Expires
October 31,
2020 | | Expires
October 31,
2021 | | Expires
October 31,
2022 | |
Class I | | $ | 2,484,471 | | | $ | 701,219 | | | $ | 929,934 | | | $ | 853,318 | | |
Class A | | | 33,023 | | | | 8,368 | | | | 12,157 | | | | 12,498 | | |
Totals | | $ | 2,517,494 | | | $ | 709,587 | | | $ | 942,091 | | | $ | 865,816 | | |
* The Subsidiary expenses are not eligible for recoupment.
For its co-administrative services, SSB receives a fee, exclusive of out-of-pocket expenses, calculated in total for all the Credit Suisse funds/portfolios
38
Credit Suisse Multialternative Strategy Fund
Notes to Consolidated Financial Statements (continued)
October 31, 2019
Note 3. Transactions with Affiliates and Related Parties (continued)
co-administered by SSB and allocated based upon the relative average net assets of each fund/portfolio, subject to an annual minimum fee. For the year ended October 31, 2019, co-administrative services fees earned by SSB (including out-of-pocket expenses) with respect to the Fund were $24,174.
Credit Suisse Securities (USA) LLC ("CSSU"), an affiliate of Credit Suisse, serves as the distributor of the Fund's shares. Pursuant to a distribution plan adopted by the Fund pursuant to Rule 12b-1 under the 1940 Act, CSSU receives fees for its distribution services. These fees are calculated at an annual rate of 0.25% of the average daily net assets of the Class A shares. For the year ended October 31, 2019, the Fund paid Rule 12b-1 distribution fees of $2,846 for Class A shares. Class I shares are not subject to Rule 12b-1 distribution fees.
Certain brokers, dealers and financial representatives provide transfer agent-related services to the Fund and receive compensation from the Fund. For the year ended October 31, 2019, the Fund paid $54,713, which is included within transfer agent fees in the Consolidated Statement of Operations.
For the year ended October 31, 2019, CSSU and its affiliates advised the Fund that there were no commissions earned on the sale of Class A shares.
Note 4. Line of Credit
The Fund, together with other funds/portfolios advised by Credit Suisse (collectively, the "Participating Funds"), participates in a committed, unsecured line of credit facility ("Credit Facility"), with SSB in an aggregated amount of $250 million for temporary or emergency purposes under a first-come, first-served basis. Under the terms of the Credit Facility, the Participating Funds pay an aggregate commitment fee on the average unused amount of the Credit Facility, which is allocated among the Participating Funds in such manner as is determined by the governing Boards of the Participating Funds. In addition, the Participating Funds pay interest on borrowings at either the Overnight Federal Funds rate or the Overnight LIBOR rate plus a spread. At October 31, 2019 and during the year ended October 31, 2019, the Fund had no borrowings outstanding under the Credit Facility.
39
Credit Suisse Multialternative Strategy Fund
Notes to Consolidated Financial Statements (continued)
October 31, 2019
Note 5. Purchases and Sales of Securities
For the year ended October 31, 2019, purchases and sales of investment securities (excluding short-term investments) and U.S. Government and Agency Obligations were as follows:
| Investment Securities | | U.S. Government/
Agency Obligations | |
| Purchases | | Sales | | Purchases | | Sales | |
| $ | 0 | | | $ | 0 | | | $ | 35,060,453 | | | $ | 79,124,464 | | |
Note 6. Capital Share Transactions
The Fund is authorized to issue an unlimited number of full and fractional shares of beneficial interest, $.001 par value per share. The Fund offers Class I and Class A shares. Class C was redeemed on February 15, 2018 and currently has no shareholders. Transactions in capital shares for each class of the Fund were as follows:
| | | Class I | |
| | | For the Year Ended
October 31, 2019 | | For the Year Ended
October 31, 2018 | |
| | | Shares | | Value | | Shares | | Value | |
Shares sold | | | 5,009,238 | | | $ | 49,546,498 | | | | 3,003,190 | | | $ | 30,529,151 | | |
Shares issued in reinvestment
of dividends and distributions | | | 189,642 | | | | 1,801,599 | | | | 462,544 | | | | 4,680,939 | | |
Shares redeemed | | | (8,105,787 | ) | | | (78,320,344 | ) | | | (2,700,628 | ) | | | (27,418,088 | ) | |
Net increase (decrease) | | | (2,906,907 | ) | | $ | (26,972,247 | ) | | | 765,106 | | | $ | 7,792,002 | | |
| | | Class A | |
| | | For the Year Ended
October 31, 2019 | | For the Year Ended
October 31, 2018 | |
| | | Shares | | Value | | Shares | | Value | |
Shares sold | | | 15,138 | | | $ | 148,634 | | | | 75,605 | | | $ | 764,263 | | |
Shares issued in reinvestment
of dividends and distributions | | | 2,124 | | | | 19,963 | | | | 4,859 | | | | 48,786 | | |
Shares redeemed | | | (57,597 | ) | | | (562,507 | ) | | | (58,975 | ) | | | (591,939 | ) | |
Net increase (decrease) | | | (40,335 | ) | | $ | (393,910 | ) | | | 21,489 | | | $ | 221,110 | | |
| | | Class C1 | |
| | | For the Year Ended
October 31, 2019 | | For the Year Ended
October 31, 2018 | |
| | | Shares | | Value | | Shares | | Value | |
Shares redeemed | | | — | | | $ | — | | | | (4,366 | ) | | $ | (42,559 | ) | |
Net increase (decrease) | | | — | | | $ | — | | | | (4,366 | ) | | $ | (42,559 | ) | |
1 Class C was fully redeemed on February 15, 2018 and currently has no shareholders.
40
Credit Suisse Multialternative Strategy Fund
Notes to Consolidated Financial Statements (continued)
October 31, 2019
Note 6. Capital Share Transactions (continued)
On October 31, 2019, the number of shareholders that held 5% or more of the outstanding shares of each class of the Fund was as follows:
| | | Number of
Shareholders | | Approximate Percentage
of Outstanding Shares | |
Class I | | | 4 | | | | 98 | % | |
Class A | | | 3 | | | | 74 | % | |
The Fund's performance may be negatively impacted in the event one or more of the Fund's greater than 5% shareholders were to redeem at a given time. Some of the shareholders may be omnibus accounts, which hold shares on behalf of individual shareholders.
Note 7. Income Tax Information and Distributions to Shareholders
Income and capital gain distributions are determined in accordance with federal income tax regulations, which may differ from GAAP.
The tax character of dividends paid by the Fund during the years ended October 31, 2019 and 2018, respectively, was as follows:
| Ordinary Income | | Long-Term Capital Gain | |
| 2019 | | 2018 | | 2019 | | 2018 | |
| $ | 1,707,836 | | | $ | 4,589,753 | | | $ | 120,756 | | | $ | 160,247 | | |
The tax basis components of distributable earnings differ from the amounts reflected in the Consolidated Statement of Assets and Liabilities by temporary book/tax differences. These differences are primarily due to differing treatments of wash sales, mark to market of forward contracts, futures contracts, swap contracts, options contracts and deferred organizational expenses.
At October 31, 2019, the components of distributable earnings on a tax basis were as follows:
Undistributed net investment income | | $ | 3,482,356 | | |
Accumulated net realized Loss | | | (6,822,974 | ) | |
Unrealized appreciation | | | 220,468 | | |
| | $ | (3,120,150 | ) | |
At October 31, 2019, the Fund had $6,478,167 of unlimited short-term capital loss carryforwards and $344,807 of unlimited long-term capital loss carryforwards available to offset possible future capital gains.
41
Credit Suisse Multialternative Strategy Fund
Notes to Consolidated Financial Statements (continued)
October 31, 2019
Note 7. Income Tax Information and Distributions to Shareholders (continued)
At October 31, 2019, the cost and net unrealized appreciation (depreciation) of investments and derivatives for income tax purposes were as follows:
Cost of Investments | | $ | 36,392,628 | | |
Unrealized appreciation | | $ | 4,965,590 | | |
Unrealized depreciation | | | (4,765,331 | ) | |
Net unrealized appreciation (depreciation) | | $ | 200,259 | | |
To adjust for current period permanent book/tax differences which arose principally from differing book/tax treatment of foreign currency gain/loss, Subsidiary cumulative income/loss and swap gain/loss, paid-in capital was charged $15,588, and distributable earnings/loss was credited $15,588. Net assets were not affected by this reclassification.
Note 8. Contingencies
In the normal course of business, the Fund may provide general indemnifications pursuant to certain contracts and organizational documents. The Fund's maximum exposure under these arrangements is dependent on future claims that may be made against the Fund and, therefore, cannot be estimated; however, based on experience, the risk of loss from such claims is considered remote.
42
Credit Suisse Multialternative Strategy Fund
Report of Independent Registered Public Accounting Firm
To the Shareholders and Board of Trustees
Credit Suisse Multialternative Strategy Fund:
Opinion on the Consolidated Financial Statements
We have audited the accompanying consolidated statement of assets and liabilities of Credit Suisse Multialternative Strategy Fund (the Fund), a series of the Credit Suisse Opportunity Funds, including the consolidated schedule of investments, as of October 31, 2019, the related consolidated statement of operations for the year then ended, the consolidated statements of changes in net assets for each of the years in the two-year period then ended, and the related notes (collectively, the consolidated financial statements) and the consolidated financial highlights for each of the years in the five-year period then ended. In our opinion, the consolidated financial statements and consolidated financial highlights present fairly, in all material respects, the financial position of the Fund as of October 31, 2019, the results of its operations for the year then ended, the changes in its net assets for each of the years in the two-year period then ended, and the consolidated financial highlights for each of the years in the five-year period then ended, in conformity with U.S. generally accepted accounting principles.
Basis for Opinion
These consolidated financial statements and consolidated financial highlights are the responsibility of the Fund's management. Our responsibility is to express an opinion on these consolidated financial statements and consolidated financial highlights based on our audits. We are a public accounting firm registered with the Public Company Accounting Oversight Board (United States) (PCAOB) and are required to be independent with respect to the Fund in accordance with the U.S. federal securities laws and the applicable rules and regulations of the Securities and Exchange Commission and the PCAOB.
We conducted our audits in accordance with the standards of the PCAOB. Those standards require that we plan and perform the audit to obtain reasonable assurance about whether the consolidated financial statements and consolidated financial highlights are free of material misstatement, whether due to error or fraud. Our audits included performing procedures to assess the risks of material misstatement of the consolidated financial statements and consolidated financial highlights, whether due to error or fraud, and performing procedures that respond to those risks. Such procedures included examining, on a test basis, evidence regarding the amounts and disclosures in the consolidated financial statements and consolidated financial highlights. Such procedures also included confirmation of securities owned as of October 31, 2019, by correspondence with
43
Credit Suisse Multialternative Strategy Fund
Report of Independent Registered Public Accounting Firm
custodians and brokers or by other appropriate auditing procedures when replies were not received. Our audits also included evaluating the accounting principles used and significant estimates made by management, as well as evaluating the overall presentation of the consolidated financial statements and consolidated financial highlights. We believe that our audits provide a reasonable basis for our opinion.

We have served as the auditor of one or more Credit Suisse Asset Management, LLC investment companies since 2015.
New York, New York
December 20, 2019
44
Credit Suisse Multialternative Strategy Fund
Information Concerning Trustees and Officers (unaudited)
Name, Address
(Year of Birth) | | Position(s)
Held with
Fund | | Term
of Office1
and
Length
of Time
Served | | Principal
Occupation(s) During
Past Five Years | | Number of
Portfolios
in Fund
Complex
Overseen
by Trustee | | Other
Trusteeships
Held by Trustee
During Past Five Years | |
Independent Trustees | | | | | | | | | | | |
Laura A. DeFelice
c/o Credit Suisse Asset
Management, LLC
Attn: General Counsel
Eleven Madison Avenue
New York, New York
10010
(1959) | | Trustee, Nominating and Audit Committee member | | Since 2017 | | Partner of Acacia Properties LLC (multi-family and commercial real estate ownership and operation) from 2008 to present; Stonegate Advisors LLC (renewable energy and energy efficiency) from 2007 to present. | | | 9 | | | None | |
Jeffrey E. Garten
c/o Credit Suisse Asset Management, LLC
Attn: General Counsel Eleven Madison Avenue New York, New York 10010
(1946) | | Trustee, Nominating and Audit Committee member | | Since Fund Inception | | Dean Emeritus of Yale School of Management from July 2015 to present; The Juan Trippe Professor in the Practice of International Trade, Finance and Business, Yale School of Management, from July 2005 to July 2015; Partner and Chairman of Garten Rothkopf (consulting firm) from October 2005 to June 2017. | | | 9 | | | Director of Aetna, Inc. (insurance company); Director of CarMax Group (used car dealers); Director of Miller Buckfire & Co., LLC (financial restructuring). | |
1 Subject to the Trust's retirement policy, each Trustee may continue to serve as a Trustee until the last day of the calendar year in which the applicable Trustee attains age 75. Officer serves until his or her respective successor has been duly elected and qualified.
45
Credit Suisse Multialternative Strategy Fund
Information Concerning Trustees and Officers (unaudited) (continued)
Name, Address
(Year of Birth) | | Position(s)
Held with
Fund | | Term
of Office1
and
Length
of Time
Served | | Principal
Occupation(s) During
Past Five Years | | Number of
Portfolios
in Fund
Complex
Overseen
by Trustee | | Other
Trusteeships
Held by Trustee
During Past Five Years | |
Independent Trustees | | | | | | | | | | | |
Mahendra R. Gupta
c/o Credit Suisse Asset
Management, LLC
Attn: General Counsel
Eleven Madison Avenue
New York, New York
10010
(1956) | | Trustee, Nominating Committee member and Audit Committee Chairman | | Since 2017 | | Professor, Washington University in St. Louis from July 1990 to present; Dean of Olin Business School at Washington University in St. Louis from July 2005 to July 2016; Partner, R.J. Mithaiwala (food manufacturing and retail, India) from March 1977 to present; Partner, F.F.B. Corporation (agriculture, India) from March 1977 to present; Partner, RPMG Research Corporation (benchmark research) from July 2001 to present. | | | 9 | | | Director of Caleres Inc. (footwear) from May 2012 to present; Director of Koch Development Corporation (real estate development) from November 2017 to present; Director of Supernova (fin-tech) from June 2014 to September 2018. | |
Steven N. Rappaport
c/o Credit Suisse Asset Management, LLC
Attn: General Counsel
Eleven Madison Avenue
New York, New York
10010
(1948) | | Chairman of the Board, Nominating Committee Chairman and Audit Committee member | | Trustee since Fund Inception and Chairman since 2005 | | Partner of Lehigh Court, LLC and RZ Capital (private investment firms) from July 2002 to present; Partner of Backstage Acquisition Holdings, LLC (publication job postings) from November 2013 to 2018. | | | 9 | | | Director of Aberdeen Emerging Markets Equity Income Fund, Inc. (a closed-end investment company); Director of Aberdeen Funds (25 open-end portfolios); Director of iCAD, Inc. (surgical & medical instruments & apparatus company) from 2006 to 2018. | |
1 Subject to the Trust's retirement policy, each Trustee may continue to serve as a Trustee until the last day of the calendar year in which the applicable Trustee attains age 75. Officer serves until his or her respective successor has been duly elected and qualified.
46
Credit Suisse Multialternative Strategy Fund
Information Concerning Trustees and Officers (unaudited) (continued)
Name, Address
(Year of Birth) | | Position(s)
Held with
Fund | | Term
of Office1
and
Length
of Time
Served | | Principal
Occupation(s) During
Past Five Years | | Number of
Portfolios
in Fund
Complex
Overseen
by Trustee | | Other
Trusteeships
Held by Trustee
During Past Five Years | |
Interested Trustee | | | | | | | | | | | |
John G. Popp2
Credit Suisse Asset
Management, LLC
Eleven Madison Avenue
New York, New York
10010
Year of Birth: 1956 | | Trustee, Chief Executive Officer and President | | Trustee since 2017
Chief Executive Officer and President since 2010 | | Managing Director of Credit Suisse; Global Head and Chief Investment Officer of the Credit Investments Group; Associated with Credit Suisse or its predecessor since 1997; Officer of other Credit Suisse Funds. | | | 9 | | | Trustee of Credit Suisse High Yield Bond Fund; Director of Credit Suisse Asset Management Income Fund, Inc. | |
1 Subject to the Trust's retirement policy, each Trustee may continue to serve as a Trustee until the last day of the calendar year in which the applicable Trustee attains age 75. Officer serves until his or her respective successor has been duly elected and qualified.
2 Mr. Popp is an "interested person" of the Trust, as defined in the 1940 Act, by virtue of his current position as an officer of Credit Suisse.
47
Credit Suisse Multialternative Strategy Fund
Information Concerning Trustees and Officers (unaudited) (continued)
Name, Address
(Year of Birth) | | Position(s)
Held with
Fund | | Term of
Office1
and
Length of
Time
Served | | Principal Occupation(s) During Past Five Years | |
Emidio Morizio
Credit Suisse Asset
Management, LLC
Eleven Madison Avenue
New York, New York 10010
(1966) | | Chief Compliance Officer | | Since Fund Inception | | Managing Director and Global Head of Compliance of Credit Suisse since 2010; Associated with Credit Suisse since July 2000; Officer of other Credit Suisse Funds. | |
Lou Anne McInnis
Credit Suisse Asset Management, LLC
Eleven Madison Avenue
New York, New York 10010
(1959) | | Chief Legal Officer | | Since 2015 | | Director of Credit Suisse; Associated with Credit Suisse since April 2015; Counsel at DLA Piper US LLP from 2011 to April 2015; Associated with Morgan Stanley Investment Management from 1997 to 2010; Officer of other Credit Suisse Funds. | |
Omar Tariq
Credit Suisse Asset
Management, LLC
Eleven Madison Avenue
New York, New York 10010
(1983) | | Chief Financial Officer and Treasurer | | Since 2019 | | Director of Credit Suisse since March 2019; Senior Manager of PriceWaterhouseCoopers, LLP from September 2010 to March 2019; Officer of other Credit Suisse Funds. | |
Karen Regan
Credit Suisse Asset
Management, LLC
Eleven Madison Avenue
New York, New York 10010
(1963) | | Vice President and Secretary | | Since 2010 | | Vice President of Credit Suisse; Associated with Credit Suisse since December 2004; Officer of other Credit Suisse Funds. | |
1 Subject to the Trust's retirement policy, each Trustee may continue to serve as a Trustee until the last day of the calendar year in which the applicable Trustee attains age 75. Officer serves until his or her respective successor has been duly elected and qualified.
* The officers of the Fund shown are officers that make policy decisions.
The Statement of Additional Information includes additional information about the Trustees and is available, without charge, upon request, by calling 877-870-2874.
48
Credit Suisse Multialternative Strategy Fund
Proxy Voting and Portfolio Holdings Information (unaudited)
Information regarding how the Fund voted proxies related to its portfolio securities during the 12-month period ended June 30 of each year, as well as the policies and procedures that the Fund uses to determine how to vote proxies relating to its portfolio securities are available:
• By calling 1-877-870-2874
• On the Fund's website, www.credit-suisse.com/us/funds
• On the website of the Securities and Exchange Commission, www.sec.gov
The Fund files a complete schedule of its portfolio holdings for the first and third quarters of its fiscal year with the SEC as an exhibit to its reports on Form N-PORT, and for reporting periods ended prior to March 31, 2019, filed such information on Form N-Q. The Fund's Forms N-PORT and N-Q are available on the SEC's website at www.sec.gov.
49

P.O. BOX 219916, KANSAS CITY, MO 64121-9916
877-870-2874 n www.credit-suisse.com/us/funds
CREDIT SUISSE SECURITIES (USA) LLC, DISTRIBUTOR. MSF-AR-1019

CREDIT SUISSE FUNDS
Annual Report
October 31, 2019
n CREDIT SUISSE
STRATEGIC INCOME FUND
Beginning on January 1, 2021, as permitted by regulations adopted by the Securities and Exchange Commission, paper copies of the Fund's shareholder reports will no longer be sent by mail, unless you specifically request paper copies of the reports from Credit Suisse Asset Management, LLC or from your financial intermediary, such as a broker-dealer or bank. Instead, the reports will be made available on a website, and you will be notified by mail each time a report is posted and provided with a website link to access the report.
You may elect to receive all future reports in paper free of charge. If you hold accounts directly with the Fund, you can call 877-870-2874 to inform Credit Suisse Asset Management, LLC that you wish to continue receiving paper copies of your shareholder reports. If you hold accounts through a financial intermediary, you can contact your financial intermediary to request that you continue to receive paper copies of your shareholder reports. Please note that not all financial intermediaries may offer this service. Your election to receive reports in paper will apply to all funds advised by Credit Suisse Asset Management, LLC, or all funds held with your financial intermediary, as applicable.
If you already elected to receive shareholder reports electronically, you will not be affected by this change and you need not take any action. You may elect to receive electronic delivery of shareholder reports and other communications by: (i) accessing the Credit Suisse Asset Management, LLC website at www.credit-suisse.com/us/funds and logging into your accounts, if you hold accounts directly with the Fund, or (ii) contacting your financial intermediary, if you hold accounts through a financial intermediary. Please note that not all financial intermediaries may offer this service.
The Fund's investment objectives, risks, charges and expenses (which should be considered carefully before investing), and more complete information about the Fund, are provided in the Prospectus, which should be read carefully before investing. You may obtain additional copies by calling 877-870-2874 or by visiting our website at www.credit-suisse.com/us/funds.
Credit Suisse Securities (USA) LLC, Distributor, is located at Eleven Madison Avenue, New York, NY 10010. Credit Suisse Funds are advised by Credit Suisse Asset Management, LLC.
Investors in the Credit Suisse Funds should be aware that they may be eligible to purchase Class I shares (where offered) directly or through certain intermediaries. Such shares are not subject to a sales charge. Investors in the Credit Suisse Funds should also be aware that they may be eligible for a reduction or waiver of the sales charge with respect to Class A or C shares (where offered). For more information, please review the relevant prospectuses or consult your financial representative.
Fund shares are not deposits or other obligations of Credit Suisse Asset Management, LLC ("Credit Suisse") or any affiliate, are not FDIC-insured and are not guaranteed by Credit Suisse or any affiliate. Fund investments are subject to investment risks, including loss of your investment.
Credit Suisse Strategic Income Fund
Annual Investment Adviser's Report
October 31, 2019 (unaudited)
November 19, 2019
Dear Shareholder:
We are pleased to present this Annual Report covering the activities of the Credit Suisse Strategic Income Fund (the "Fund") for the 12-month period ended October 31, 2019.
Performance Summary
11/1/2018 – 10/31/19
Fund & Benchmark | | Performance | |
| Class I1 | | | 4.68 | % | |
| Class A1,2 | | | 4.42 | % | |
| Class C1,2 | | | 3.64 | % | |
ICE BofAML 3-Month
US Treasury Bill Index3 | | | 2.41 | % | |
Performance shown for the Fund's Class A and Class C Shares does not reflect sales charges, which are a maximum of 4.75% and 1.00%, respectively.2
Market Review: A positive period for high yield and senior secured loans
The annual period ended October 31, 2019 was a positive one for the ICE BofAML 3-Month US Treasury Bill Index, the Fund's benchmark (the "Benchmark"), which returned 2.41% for the period. Additionally, the senior secured loan asset class, as represented by the Credit Suisse Leveraged Loan Index, returned 2.61% for the period, while high yield, represented by the ICE BofAML US High Yield Constrained Index, returned 8.32%.
As the Federal Reserve's policy swings shifted demand out of floating rate products, senior secured loan funds reported outflows each month, totaling -$53.4 billion for the year. Additionally, after some weakness in the final months of 2018, the high yield asset class saw a return to positive flows and firm investor demand throughout 2019. This, in turn, led to overall outperformance of high yield versus loans.
Strategic Review and Outlook: Expecting technicals to balance and create pockets of opportunity
For the 12-month period ended October 31, 2019, the Fund outperformed the Benchmark. Allocations to the high yield asset class were the most significant contributors to return thanks to the positive performance of the asset class. From a sector perspective, housing, information technology, media/telecommunications and gaming/leisure were the largest contributors to returns, while energy was the
1
Credit Suisse Strategic Income Fund
Annual Investment Adviser's Report (continued)
October 31, 2019 (unaudited)
largest detractor. Finally, from a ratings perspective, higher rated bonds and loans helped performance the most, with Ba3, Ba2 and Ba1 rated positions performing the best.
Both the senior secured loan and high yield asset classes delivered positive returns for the period. High yield, in particular, outperformed due to the pivot from the Federal Reserve earlier this year that led to a rally in the asset class. We believe that, going forward, the Fed's activity could be more muted and, as such, technicals within high yield may become more balanced. Given this, we believe there will be some pockets of opportunity for shifting relative value out of the high yield asset class and into loans. We will continue to look for these opportunities to rotate at a measured pace.
The Credit Suisse Credit Investments Group
John G. Popp
Andrew H. Marshak
Thomas J. Flannery
Louis I. Farano
Wing Chan
David J. Mechlin
Senior secured floating rate loans ("Senior Loans") typically hold the most senior position in the issuer's capital structure. Senior Loans are subject to the risk that a court could subordinate a Senior Loan to presently existing or future indebtedness or take other action detrimental to the holders of Senior Loans.
High yield bonds are bonds rated below BBB- by S&P or Baa3 by Moody's that are also known as "junk bonds." Such bonds entail greater risks than those found in higher- rated securities.
CLOs are subject to the risk of substantial losses due to actual defaults, decrease of market value due to collateral defaults and disappearance of subordinate tranches, market anticipation of defaults, and investor aversion to CLO securities as a class. The risks of CLOs depend largely on the type of the underlying loans and the tranche of CLOs in which the Fund invests. In addition, CLOs carry risks including interest rate risk and credit risk.
2
Credit Suisse Strategic Income Fund
Annual Investment Adviser's Report (continued)
October 31, 2019 (unaudited)
Additional principal risk factors for the Fund include conflict of interest risk, convertible securities risk, credit risk, derivatives risk, extension risk, foreign securities risk, futures contracts risk, hedged exposure risk, interest rate risk, liquidity risk, market risk, mortgage- and asset-backed securities risk, prepayment risk, short position risk, U.S. government securities risk and valuation risk. Before you invest, please make sure you understand the risks that apply to the Fund. As with any mutual fund, you could lose money over any period of time. Investments in the Fund are not bank deposits and are not insured or guaranteed by the Federal Deposit Insurance Corporation or any government agency. For a detailed discussion of these and other risks, please refer to the Fund's Prospectus, which should be read carefully before investing.
In addition to historical information, this report contains forward-looking statements, which may concern, among other things, domestic and foreign markets, industry and economic trends and developments and government regulation, and their potential impact on the Fund's investments. These statements are subject to risks and uncertainties and actual trends, developments and regulations in the future, and their impact on the Fund, could be materially different from those projected, anticipated or implied. The Fund has no obligation to update or revise forward-looking statements.
The views of the Fund's management are as of the date of this letter and the Fund holdings described in this document are as of October 31, 2019; these views and Fund holdings may have changed subsequent to these dates. Nothing in this document is a recommendation to purchase or sell securities.
3
Credit Suisse Strategic Income Fund
Annual Investment Adviser's Report (continued)
October 31, 2019 (unaudited)
Comparison of Change in Value of $10,000 Investment in the
Credit Suisse Strategic Income Fund1 Class I Shares,
Class A Shares2, Class C Shares2 and the ICE BofAML
3-Month US Treasury Bill Index3
from Inception (9/28/12)

1 Fee waivers and/or expense reimbursements reduce expenses for the Fund, without which performance would be lower. Effective April 22, 2019, the Fund entered into a written contract to limit expenses to 0.99% of the Fund's average daily net assets for Class I shares, 1.24% of the Fund's average daily net assets for Class A shares and 1.99% of the Fund's average daily net assets for Class C shares through at least February 28, 2021. This limit excludes certain expenses, as set forth in the Fund's Prospectus.
2 Total return for the Fund's Class A shares for the reporting period, based on offering price (including maximum sales charge of 4.75%), was (0.57)%. Total return for the Fund's Class C shares for the reporting period, based on redemption value including maximum contingent deferred sales charge ("CDSC") of 1.00%), was 2.65%.
3 The ICE BofAML 3-Month US Treasury Bill Index is comprised of a single issue purchased at the beginning of the month and held for a full month. Each month the index is rebalanced and the issue selected is the outstanding Treasury Bill that matures closest to, but not beyond
3 months from the rebalancing date. The index does not have transaction costs and investors may not invest directly in the index. The index was previously known as the BofA Merrill Lynch 3-Month US Treasury Bill Index.
4
Credit Suisse Strategic Income Fund
Annual Investment Adviser's Report (continued)
October 31, 2019 (unaudited)
Average Annual Returns as of October 31, 20191
| | | 1 Year | | 5 Years | | Since
Inception2 | |
Class I | | | 4.68 | % | | | 5.46 | % | | | 6.44 | % | |
Class A Without Sales Charge | | | 4.42 | % | | | 5.17 | % | | | 6.16 | % | |
Class A With Maximum Sales Charge | | | (0.57 | )% | | | 4.16 | % | | | 5.43 | % | |
Class C Without CDSC | | | 3.64 | % | | | 4.41 | % | | | 5.38 | % | |
Class C With CDSC | | | 2.65 | % | | | 4.41 | % | | | 5.38 | % | |
Returns represent past performance and include change in share price and reinvestment of dividends and capital gain distributions, if any. Past performance cannot guarantee future results. The current performance of the Fund may be lower or higher than the figures shown. Returns and share price will fluctuate, and redemption value may be more or less than original cost. The performance results do not reflect the deduction of taxes that a shareholder would pay on Fund distributions or the redemption of Fund shares. Performance information current to the most recent month end is available at www.credit-suisse.com/us/funds.
The annual gross expense ratios are 1.09% for Class I shares, 1.34% for Class A shares and 2.09% for Class C shares. The annual net expense ratios after fee waivers and/or expense reimbursements are 0.99% for Class I shares, 1.24% for Class A shares and 1.99% for Class C shares.
1 Fee waivers and/or expense reimbursements reduce expenses for the Fund, without which performance would be lower. Effective April 22, 2019, the Fund entered into a written contract to limit expenses to 0.99% of the Fund's average daily net assets for Class I shares, 1.24% of the Fund's average daily net assets for Class A shares and 1.99% of the Fund's average daily net assets for Class C shares through at least February 28, 2021. This limit excludes certain expenses, as set forth in the Fund's Prospectus.
2 Inception Date: September 28, 2012.
5
Credit Suisse Strategic Income Fund
Annual Investment Adviser's Report (continued)
October 31, 2019 (unaudited)
Information About Your Fund's Expenses
As an investor of the Fund, you incur two types of costs: ongoing expenses and transaction costs. Ongoing expenses include management fees, distribution and service (12b-1) fees and other Fund expenses. Examples of transaction costs include sales charges (loads), redemption fees and account maintenance fees, which are not shown in this section and which would result in higher total expenses. The following table is intended to help you understand your ongoing expenses of investing in the Fund and to help you compare these expenses with the ongoing expenses of investing in other mutual funds. The table is based on an investment of $1,000 made at the beginning of the six months ended October 31, 2019.
The table illustrates your Fund's expenses in two ways:
• Actual Fund Return. This helps you estimate the actual dollar amount of ongoing expenses paid on a $1,000 investment in the Fund using the Fund's actual return during the period. To estimate the expenses you paid over the period, simply divide your account value by $1,000 (for example, an $8,600 account value divided by $1,000 = 8.6), then multiply the result by the number in the "Expenses Paid per $1,000" line.
• Hypothetical 5% Fund Return. This helps you to compare the Fund's ongoing expenses with those of other mutual funds using the Fund's actual expense ratio and a hypothetical rate of return of 5% per year before expenses. Examples using a 5% hypothetical fund return may be found in the shareholder reports of other mutual funds. The hypothetical account values and expenses may not be used to estimate the actual ending account balance or expenses you paid for the period.
Please note that the expenses shown in these tables are meant to highlight your ongoing expenses only and do not reflect any transaction costs, such as sales charges (loads) or redemption fees. If these transaction costs had been included, your costs would have been higher. The "Expenses Paid per $1,000" line of the tables is useful in comparing ongoing expenses only and will not help you determine the relative total expenses of owning different funds.
6
Credit Suisse Strategic Income Fund
Annual Investment Adviser's Report (continued)
October 31, 2019 (unaudited)
Expenses and Value for a $1,000 Investment
for the six-month period ended October 31, 2019
Actual Fund Return | | Class I | | Class A | | Class C | |
Beginning Account Value 05/01/19 | | $ | 1,000.00 | | | $ | 1,000.00 | | | $ | 1,000.00 | | |
Ending Account Value 10/31/19 | | $ | 1,011.60 | | | $ | 1,009.40 | | | $ | 1,005.60 | | |
Expenses Paid per $1,000* | | $ | 5.02 | | | $ | 6.28 | | | $ | 10.06 | | |
Hypothetical 5% Fund Return | |
Beginning Account Value 05/01/19 | | $ | 1,000.00 | | | $ | 1,000.00 | | | $ | 1,000.00 | | |
Ending Account Value 10/31/19 | | $ | 1,020.21 | | | $ | 1,018.95 | | | $ | 1,015.17 | | |
Expenses Paid per $1,000* | | $ | 5.04 | | | $ | 6.31 | | | $ | 10.11 | | |
| | | Class I | | Class A | | Class C | |
Annualized Expense Ratios* | | | 0.99 | % | | | 1.24 | % | | | 1.99 | % | |
* Expenses are equal to the Fund's annualized expense ratio for each share class, multiplied by the average account value over the period, multiplied by 184/365 to reflect the one-half year period.
The "Expenses Paid per $1,000" and the "Annualized Expense Ratios" in the tables are based on actual expenses paid by the Fund during the period, net of fee waivers and/or actual expense reimbursements, if applicable. If those fee waivers and/or expense reimbursements had not been in effect, the Fund's actual expenses would have been higher. Expenses do not reflect additional charges and expenses that are, or may be, imposed under the variable contracts or plans. Such charges and expenses are described in the prospectus of the insurance company separate account or in the plan documents or other informational materials supplied by plan sponsors. The Fund's expenses should be considered with these charges and expenses in evaluating the overall cost of investing in the separate account.
For more information, please refer to the Fund's Prospectus.
7
Credit Suisse Strategic Income Fund
Annual Investment Adviser's Report (continued)
October 31, 2019 (unaudited)
Credit Quality Breakdown*
(% of Total Investments as of October 31, 2019)
S&P Ratings** | |
A | | | 0.2 | % | |
BBB | | | 2.6 | | |
BB | | | 30.0 | | |
B | | | 49.3 | | |
CCC | | | 13.8 | | |
D | | | 0.01 | | |
NR | | | 3.6 | | |
Subtotal | | | 99.5 | | |
Equity and Other | | | 0.5 | | |
Total | | | 100.0 | % | |
* Expressed as a percentage of total investments (excluding securities lending collateral, if applicable) and may vary over time.
** Credit Quality is based on ratings provided by the Standard & Poor's Division of The McGraw-Hill Companies, Inc. (S&P"). S&P is a main provider of ratings for Credit Assets Classes and is widely used amongst industry participants. The NR category consists of securities that have not been rated by S&P.
1 This amount represents less than 0.1%.
8
Credit Suisse Strategic Income Fund
Schedule of Investments
October 31, 2019
Par
(000) | |
| | Ratings†
(S&P/Moody's) | | Maturity | | Rate% | | Value | |
| CORPORATE BONDS (43.1%) | | | |
| Aerospace & Defense (1.2%) | |
$ | 1,750 | | | BBA U.S. Holdings, Inc., Rule 144A,
Company Guaranteed Notes
(Callable 03/01/23 @ 102.00)(1) | | (BB, Ba2) | | 03/01/28 | | | 4.000 | | | $ | 1,741,250 | | |
| | 750 | | | TransDigm, Inc.,
Global Company Guaranteed Notes
(Callable 03/15/22 @ 103.75) | | (B-, B3) | | 03/15/27 | | | 7.500 | | | | 807,203 | | |
| | 1,350 | | | TransDigm, Inc., Rule 144A,
Senior Secured Notes
(Callable 03/15/22 @ 103.13)(1) | | (B+, Ba3) | | 03/15/26 | | | 6.250 | | | | 1,449,562 | | |
| | | | 3,998,015 | | |
| Auto Parts & Equipment (1.4%) | |
| | 1,350 | | | Cooper-Standard Automotive, Inc., Rule 144A,
Company Guaranteed Notes
(Callable 11/15/21 @ 102.81)(1) | | (B, B2) | | 11/15/26 | | | 5.625 | | | | 1,154,250 | | |
| | 1,400 | | | Delphi Technologies PLC, Rule 144A,
Company Guaranteed Notes(1) | | (BB, B1) | | 10/01/25 | | | 5.000 | | | | 1,218,000 | | |
| | 1,835 | | | Panther Finance Co., Inc., Rule 144A,
Company Guaranteed Notes
(Callable 05/15/22 @ 104.25)(1) | | (B, B3) | | 05/15/27 | | | 8.500 | | | | 1,853,350 | | |
| | 500 | | | Panther Finance Co., Inc., Rule 144A,
Senior Secured Notes
(Callable 05/15/22 @ 103.13)(1) | | (B+, Ba3) | | 05/15/26 | | | 6.250 | | | | 529,850 | | |
| | | | 4,755,450 | | |
| Brokerage (0.5%) | |
| | 1,500 | | | LPL Holdings, Inc., Rule 144A,
Company Guaranteed Notes
(Callable 03/15/20 @ 104.31)(1) | | (BB, B1) | | 09/15/25 | | | 5.750 | | | | 1,560,000 | | |
| Building & Construction (0.2%) | |
| | 658 | | | TopBuild Corp., Rule 144A,
Company Guaranteed Notes
(Callable 05/01/21 @ 102.81)(1) | | (BB-, B1) | | 05/01/26 | | | 5.625 | | | | 694,190 | | |
| Building Materials (3.4%) | |
| | 700 | | | Advanced Drainage Systems, Inc., Rule 144A,
Senior Secured Notes
(Callable 09/30/22 @ 102.50)(1) | | (B, B1) | | 09/30/27 | | | 5.000 | | | | 717,500 | | |
| | 50 | | | American Builders & Contractors Supply Co., Inc.,
Rule 144A, Senior Unsecured Notes
(Callable 12/02/19 @ 104.31)(1) | | (B+, B3) | | 12/15/23 | | | 5.750 | | | | 51,550 | | |
| | 500 | | | Beacon Roofing Supply, Inc., Rule 144A,
Senior Secured Notes
(Callable 11/15/22 @ 102.25)(1) | | (BB, B1) | | 11/15/26 | | | 4.500 | | | | 510,625 | | |
| | 1,000 | | | Installed Building Products, Inc., Rule 144A,
Company Guaranteed Notes
(Callable 02/01/23 @ 102.88)(1) | | (B+, B3) | | 02/01/28 | | | 5.750 | | | | 1,052,987 | | |
See Accompanying Notes to Financial Statements.
9
Credit Suisse Strategic Income Fund
Schedule of Investments (continued)
October 31, 2019
Par
(000) | |
| | Ratings†
(S&P/Moody's) | | Maturity | | Rate% | | Value | |
| CORPORATE BONDS (continued) | | | |
Building Materials | |
$ | 1,400 | | | James Hardie International Finance DAC,
Rule 144A, Company Guaranteed Notes
(Callable 01/15/23 @ 102.50)(1) | | (BB, Ba1) | | 01/15/28 | | | 5.000 | | | $ | 1,473,500 | | |
| | 500 | | | Jeld-Wen, Inc., Rule 144A,
Company Guaranteed Notes
(Callable 12/15/22 @ 102.44)(1) | | (BB-, B1) | | 12/15/27 | | | 4.875 | | | | 491,250 | | |
| | 750 | | | Masonite International Corp., Rule 144A,
Company Guaranteed Notes
(Callable 02/01/23 @ 102.69)(1) | | (BB+, Ba3) | | 02/01/28 | | | 5.375 | | | | 795,938 | | |
| | 3,050 | | | Omnimax International, Inc., Rule 144A,
Senior Secured Notes
(Callable 11/15/19 @ 100.00)(1) | | (CCC, Caa1) | | 08/15/20 | | | 12.000 | | | | 3,000,437 | | |
| | 2,310 | | | PriSo Acquisition Corp., Rule 144A,
Senior Unsecured Notes
(Callable 12/02/19 @ 102.25)(1) | | (CCC+, Caa1) | | 05/15/23 | | | 9.000 | | | | 2,128,088 | | |
| | 1,000 | | | Summit Materials Finance Corp., Rule 144A,
Company Guaranteed Notes
(Callable 06/01/20 @ 102.56)(1) | | (BB, B3) | | 06/01/25 | | | 5.125 | | | | 1,028,750 | | |
| | | | 11,250,625 | | |
| Cable & Satellite TV (1.5%) | |
| | 550 | | | CSC Holdings LLC, Rule 144A,
Company Guaranteed Notes
(Callable 02/01/23 @ 102.69)(1) | | (BB, Ba3) | | 02/01/28 | | | 5.375 | | | | 583,000 | | |
| | 900 | | | CSC Holdings LLC, Rule 144A,
Company Guaranteed Notes
(Callable 05/15/21 @ 102.75)(1) | | (BB, Ba3) | | 05/15/26 | | | 5.500 | | | | 950,625 | | |
| | 300 | | | CSC Holdings LLC, Rule 144A,
Company Guaranteed Notes
(Callable 10/15/20 @ 103.31)(1) | | (BB, Ba3) | | 10/15/25 | | | 6.625 | | | | 320,250 | | |
| | 251 | | | CSC Holdings LLC, Rule 144A,
Senior Unsecured Notes
(Callable 10/15/20 @ 105.44)(1) | | (B, B3) | | 10/15/25 | | | 10.875 | | | | 283,714 | | |
| | 614 | | | Midcontinent Finance Corp., Rule 144A,
Company Guaranteed Notes
(Callable 08/15/22 @ 102.69)(1) | | (B, B3) | | 08/15/27 | | | 5.375 | | | | 644,700 | | |
| | 1,200 | | | Telenet Finance Luxembourg Notes Sarl,
Rule 144A, Senior Secured Notes
(Callable 12/01/22 @ 102.75)(1) | | (BB-, Ba3) | | 03/01/28 | | | 5.500 | | | | 1,282,200 | | |
| | 461 | | | Virgin Media Secured Finance PLC, Rule 144A,
Senior Secured Notes
(Callable 08/15/21 @ 102.75)(1) | | (BB-, Ba3) | | 08/15/26 | | | 5.500 | | | | 485,779 | | |
| | 500 | | | Ziggo B.V., Rule 144A,
Senior Secured Notes
(Callable 01/15/22 @ 102.75)(1) | | (B+, B1) | | 01/15/27 | | | 5.500 | | | | 530,000 | | |
| | | | 5,080,268 | | |
See Accompanying Notes to Financial Statements.
10
Credit Suisse Strategic Income Fund
Schedule of Investments (continued)
October 31, 2019
Par
(000) | |
| | Ratings†
(S&P/Moody's) | | Maturity | | Rate% | | Value | |
| CORPORATE BONDS (continued) | | | |
| Chemicals (2.8%) | |
$ | 1,025 | | | Alpha U.S. Bidco, Inc., Rule 144A,
Company Guaranteed Notes
(Callable 02/01/20 @ 103.13)(1) | | (CCC+, Caa1) | | 02/01/25 | | | 6.250 | | | $ | 1,035,250 | | |
| | 1,250 | | | Atotech Alpha 2 B.V., 8.75% Cash, 9.50% PIK,
Rule 144A, Senior Unsecured Notes
(Callable 12/02/19 @ 102.00)(1),(2) | | (CCC+, Caa1) | | 06/01/23 | | | 8.750 | | | | 1,234,375 | | |
| | 1,900 | | | Ingevity Corp., Rule 144A,
Senior Unsecured Notes
(Callable 02/01/21 @ 102.25)(1) | | (NR, Ba3) | | 02/01/26 | | | 4.500 | | | | 1,929,094 | | |
| | 1,000 | | | Nufarm Americas, Inc., Rule 144A,
Company Guaranteed Notes
(Callable 04/30/21 @ 102.88)(1) | | (BB-, B1) | | 04/30/26 | | | 5.750 | | | | 1,010,000 | | |
| | 250 | | | PQ Corp., Rule 144A,
Senior Secured Notes
(Callable 12/02/19 @ 103.38)(1) | | (BB-, B1) | | 11/15/22 | | | 6.750 | | | | 259,062 | | |
| | 52 | | | Reichhold Industries, Inc., Rule 144A,
Senior Secured Notes(1),(3),(4),(5),(6) | | (NR, NR) | | 05/01/20 | | | 9.000 | | | | 706 | | |
| | 1,500 | | | Starfruit U.S. Holdco LLC, Rule 144A,
Senior Unsecured Notes
(Callable 10/01/21 @ 104.00)(1) | | (B-, Caa1) | | 10/01/26 | | | 8.000 | | | | 1,500,000 | | |
| | 450 | | | Trinseo Materials Finance, Inc., Rule 144A,
Company Guaranteed Notes
(Callable 09/01/20 @ 102.69)(1) | | (B+, B2) | | 09/01/25 | | | 5.375 | | | | 435,375 | | |
| | 750 | | | Tronox, Inc., Rule 144A,
Company Guaranteed Notes
(Callable 04/15/21 @ 103.25)(1) | | (B, B3) | | 04/15/26 | | | 6.500 | | | | 731,887 | | |
| | 1,695 | | | Venator Materials LLC, Rule 144A,
Company Guaranteed Notes
(Callable 07/15/20 @ 104.31)(1) | | (BB-, B2) | | 07/15/25 | | | 5.750 | | | | 1,359,051 | | |
| | | | 9,494,800 | | |
| Diversified Capital Goods (0.7%) | |
| | 1,100 | | | Anixter, Inc.,
Global Company Guaranteed Notes
(Callable 09/01/25 @ 100.00) | | (BB, Ba3) | | 12/01/25 | | | 6.000 | | | | 1,133,000 | | |
| | 350 | | | EnerSys, Rule 144A,
Company Guaranteed Notes
(Callable 01/30/23 @ 100.00)(1) | | (BB+, Ba2) | | 04/30/23 | | | 5.000 | | | | 362,688 | | |
| | 750 | | | Stevens Holding Co., Inc., Rule 144A,
Company Guaranteed Notes
(Callable 10/01/23 @ 101.53)(1) | | (B+, B2) | | 10/01/26 | | | 6.125 | | | | 810,000 | | |
| | | | 2,305,688 | | |
See Accompanying Notes to Financial Statements.
11
Credit Suisse Strategic Income Fund
Schedule of Investments (continued)
October 31, 2019
Par
(000) | |
| | Ratings†
(S&P/Moody's) | | Maturity | | Rate% | | Value | |
| CORPORATE BONDS (continued) | | | |
| Electronics (0.8%) | |
$ | 1,500 | | | Entegris, Inc., Rule 144A,
Company Guaranteed Notes
(Callable 11/10/20 @ 103.47)(1) | | (BB, Ba2) | | 02/10/26 | | | 4.625 | | | $ | 1,551,791 | | |
| | 639 | | | Sensata Technologies B.V., Rule 144A,
Company Guaranteed Notes(1) | | (BB+, Ba3) | | 10/01/25 | | | 5.000 | | | | 691,845 | | |
| | 500 | | | Sensata Technologies Inc., Rule 144A,
Company Guaranteed Notes(1) | | (BB+, Ba3) | | 02/15/30 | | | 4.375 | | | | 504,688 | | |
| | | | 2,748,324 | | |
| Energy - Exploration & Production (0.5%) | |
| | 500 | | | Aker BP ASA, Rule 144A,
Senior Unsecured Notes
(Callable 06/15/21 @ 102.38)(1) | | (BB+, Ba1) | | 06/15/24 | | | 4.750 | | | | 521,250 | | |
| | 1,250 | | | W&T Offshore, Inc., Rule 144A,
Secured Notes
(Callable 11/01/20 @ 104.88)(1) | | (B+, B3) | | 11/01/23 | | | 9.750 | | | | 1,178,125 | | |
| | | | 1,699,375 | | |
| Forestry & Paper (0.2%) | |
| | 575 | | | Norbord, Inc., Rule 144A,
Senior Secured Notes
(Callable 07/15/22 @ 102.88)(1) | | (BB+, Ba1) | | 07/15/27 | | | 5.750 | | | | 596,563 | | |
| Gaming (1.4%) | |
| | 1,500 | | | Churchill Downs, Inc., Rule 144A,
Company Guaranteed Notes
(Callable 01/15/23 @ 102.38)(1) | | (B+, Ba3) | | 01/15/28 | | | 4.750 | | | | 1,560,000 | | |
| | 1,700 | | | Gateway Casinos & Entertainment Ltd.,
Rule 144A, Secured Notes
(Callable 03/01/20 @ 104.13)(1) | | (CCC+, Caa1) | | 03/01/24 | | | 8.250 | | | | 1,755,250 | | |
| | 450 | | | Jacobs Entertainment, Inc., Rule 144A,
Secured Notes (Callable 02/01/20 @ 105.91)(1) | | (B, B2) | | 02/01/24 | | | 7.875 | | | | 479,250 | | |
| | 700 | | | MGP Finance Co-Issuer, Inc., Rule 144A,
Company Guaranteed Notes
(Callable 11/01/26 @ 100.00)(1) | | (BB-, B1) | | 02/01/27 | | | 5.750 | | | | 791,875 | | |
| | | | 4,586,375 | | |
| Gas Distribution (0.6%) | |
| | 450 | | | Genesis Energy Finance Corp.,
Company Guaranteed Notes
(Callable 02/15/21 @ 104.69) | | (B+, B1) | | 05/15/26 | | | 6.250 | | | | 418,500 | | |
| | 750 | | | Genesis Energy Finance Corp.,
Company Guaranteed Notes
(Callable 10/01/20 @ 104.88) | | (B+, B1) | | 10/01/25 | | | 6.500 | | | | 715,312 | | |
See Accompanying Notes to Financial Statements.
12
Credit Suisse Strategic Income Fund
Schedule of Investments (continued)
October 31, 2019
Par
(000) | |
| | Ratings†
(S&P/Moody's) | | Maturity | | Rate% | | Value | |
| CORPORATE BONDS (continued) | | | |
Gas Distribution | |
$ | 650 | | | Holly Energy Finance Corp., Rule 144A,
Company Guaranteed Notes
(Callable 11/15/19 @ 104.50)(1) | | (BB, B1) | | 08/01/24 | | | 6.000 | | | $ | 680,063 | | |
| | | | 1,813,875 | | |
| Health Facilities (0.3%) | |
| | 500 | | | HCA, Inc.,
Company Guaranteed Notes
(Callable 03/01/26 @ 100.00) | | (BB-, Ba2) | | 09/01/26 | | | 5.375 | | | | 546,250 | | |
| | 250 | | | Sabra Health Care LP,
Global Company Guaranteed Notes
(Callable 05/15/26 @ 100.00) | | (BBB-, Ba1) | | 08/15/26 | | | 5.125 | | | | 271,040 | | |
| | 275 | | | Surgery Center Holdings, Inc., Rule 144A,
Company Guaranteed Notes
(Callable 04/15/22 @ 105.00)(1) | | (CCC, Caa2) | | 04/15/27 | | | 10.000 | | | | 279,125 | | |
| | | | 1,096,415 | | |
| Health Services (1.5%) | |
| | 1,500 | | | AMN Healthcare, Inc., Rule 144A,
Company Guaranteed Notes
(Callable 12/16/19 @ 103.84)(1) | | (BB-, Ba2) | | 10/01/24 | | | 5.125 | | | | 1,560,000 | | |
| | 900 | | | CareTrust Capital Corp.,
Company Guaranteed Notes
(Callable 06/01/20 @ 103.94) | | (BB, Ba2) | | 06/01/25 | | | 5.250 | | | | 938,250 | | |
| | 1,300 | | | Sotera Health Holdings LLC, Rule 144A,
Senior Unsecured Notes
(Callable 12/02/19 @ 103.25)(1) | | (CCC+, Caa2) | | 05/15/23 | | | 6.500 | | | | 1,327,625 | | |
| | 1,250 | | | Sotera Health Topco, Inc.,
8.125% Cash, 8.875% PIK, Rule 144A,
Senior Unsecured Notes
(Callable 12/02/19 @ 100.00)(1),(2) | | (CCC+, Caa2) | | 11/01/21 | | | 8.125 | | | | 1,246,875 | | |
| | | | 5,072,750 | | |
| Insurance Brokerage (1.5%) | |
| | 250 | | | Acrisure Finance, Inc., Rule 144A,
Senior Secured Notes
(Callable 02/15/21 @ 104.06)(1) | | (B, B2) | | 02/15/24 | | | 8.125 | | | | 265,706 | | |
| | 500 | | | Acrisure Finance, Inc., Rule 144A,
Senior Unsecured Notes
(Callable 08/01/22 @ 107.59)(1) | | (CCC+, Caa2) | | 08/01/26 | | | 10.125 | | | | 518,750 | | |
| | 1,700 | | | Acrisure Finance, Inc., Rule 144A,
Senior Unsecured Notes
(Callable 11/15/20 @ 103.50)(1) | | (CCC+, Caa2) | | 11/15/25 | | | 7.000 | | | | 1,564,000 | | |
| | 750 | | | GTCR AP Finance, Inc., Rule 144A,
Senior Unsecured Notes
(Callable 05/15/22 @ 104.00)(1) | | (CCC+, Caa2) | | 05/15/27 | | | 8.000 | | | | 768,750 | | |
See Accompanying Notes to Financial Statements.
13
Credit Suisse Strategic Income Fund
Schedule of Investments (continued)
October 31, 2019
Par
(000) | |
| | Ratings†
(S&P/Moody's) | | Maturity | | Rate% | | Value | |
| CORPORATE BONDS (continued) | | | |
Insurance Brokerage | |
$ | 1,375 | | | NFP Corp., Rule 144A,
Senior Unsecured Notes
(Callable 07/15/20 @ 103.44)(1) | | (CCC+, Caa2) | | 07/15/25 | | | 6.875 | | | $ | 1,359,531 | | |
| | 500 | | | NFP Corp., Rule 144A,
Senior Unsecured Notes
(Callable 07/15/20 @ 104.00)(1) | | (CCC+, Caa2) | | 07/15/25 | | | 8.000 | | | | 508,750 | | |
| | | | 4,985,487 | | |
| lnvestments & Misc. Financial Services (0.7%) | |
| | 2,200 | | | Compass Group Diversified Holdings LLC,
Rule 144A, Senior Unsecured Notes
(Callable 05/01/21 @ 104.00)(1) | | (B-, B3) | | 05/01/26 | | | 8.000 | | | | 2,376,000 | | |
| Machinery (0.5%) | |
| | 1,450 | | | Rexnord LLC, Rule 144A,
Company Guaranteed Notes
(Callable 12/15/20 @ 102.44)(1) | | (BB-, B1) | | 12/15/25 | | | 4.875 | | | | 1,502,563 | | |
| Managed Care (0.1%) | |
| | 370 | | | WellCare Health Plans, Inc., Rule 144A,
Senior Unsecured Notes
(Callable 08/15/21 @ 104.03)(1) | | (BB, Ba2) | | 08/15/26 | | | 5.375 | | | | 394,513 | | |
| Media - Diversified (0.3%) | |
| | 650 | | | National CineMedia LLC,
Global Senior Secured Notes
(Callable 11/07/19 @ 101.00) | | (B+, Ba3) | | 04/15/22 | | | 6.000 | | | | 658,190 | | |
| | 250 | | | National CineMedia LLC,
Global Senior Unsecured Notes
(Callable 08/15/21 @ 102.88) | | (B-, B3) | | 08/15/26 | | | 5.750 | | | | 245,625 | | |
| | 200 | | | National CineMedia LLC, Rule 144A,
Senior Secured Notes
(Callable 04/15/23 @ 102.94)(1) | | (B+, Ba3) | | 04/15/28 | | | 5.875 | | | | 210,720 | | |
| | | | 1,114,535 | | |
| Media Content (1.4%) | |
| | 325 | | | Diamond Sports Finance Co., Rule 144A,
Company Guaranteed Notes
(Callable 08/15/22 @ 103.31)(1) | | (B, B2) | | 08/15/27 | | | 6.625 | | | | 335,562 | | |
| | 2,000 | | | Diamond Sports Finance Co., Rule 144A,
Senior Secured Notes
(Callable 08/15/22 @ 102.69)(1) | | (BB, Ba2) | | 08/15/26 | | | 5.375 | | | | 2,095,000 | | |
| | 733 | | | Sirius XM Radio, Inc., Rule 144A,
Company Guaranteed Notes
(Callable 07/01/24 @ 102.75)(1) | | (BB, Ba3) | | 07/01/29 | | | 5.500 | | | | 794,169 | | |
See Accompanying Notes to Financial Statements.
14
Credit Suisse Strategic Income Fund
Schedule of Investments (continued)
October 31, 2019
Par
(000) | |
| | Ratings†
(S&P/Moody's) | | Maturity | | Rate% | | Value | |
| CORPORATE BONDS (continued) | | | |
Media Content | |
$ | 1,500 | | | WMG Acquisition Corp., Rule 144A,
Senior Secured Notes
(Callable 11/01/19 @ 103.66)(1) | | (BB-, Ba3) | | 11/01/24 | | | 4.875 | | | $ | 1,560,000 | | |
| | | | 4,784,731 | | |
| Metals & Mining - Excluding Steel (1.5%) | |
| | 1,600 | | | Cleveland-Cliffs, Inc., Rule 144A,
Senior Secured Notes
(Callable 01/15/21 @ 102.44)(1) | | (BB, Ba2) | | 01/15/24 | | | 4.875 | | | | 1,648,000 | | |
| | 500 | | | First Quantum Minerals Ltd., Rule 144A,
Company Guaranteed Notes
(Callable 03/01/21 @ 105.16)(1) | | (B-, NR) | | 03/01/26 | | | 6.875 | | | | 491,875 | | |
| | 1,000 | | | First Quantum Minerals Ltd., Rule 144A,
Company Guaranteed Notes
(Callable 09/01/20 @ 103.25)(1) | | (B-, NR) | | 03/01/24 | | | 6.500 | | | | 982,000 | | |
| | 1,950 | | | Taseko Mines Ltd., Rule 144A,
Senior Secured Notes
(Callable 12/02/19 @ 104.38)(1),(5) | | (B, B3) | | 06/15/22 | | | 8.750 | | | | 1,725,750 | | |
| | | | 4,847,625 | | |
| Oil Field Equipment & Services (0.9%) | |
| | 400 | | | KCA Deutag UK Finance PLC, Rule 144A,
Senior Secured Notes
(Callable 04/01/20 @ 109.88)(1) | | (CCC+, Caa1) | | 04/01/22 | | | 9.875 | | | | 254,500 | | |
| | 300 | | | KCA Deutag UK Finance PLC, Rule 144A,
Senior Secured Notes
(Callable 12/02/2019 @ 100.00)(1) | | (CCC+, Caa1) | | 05/15/21 | | | 7.250 | | | | 192,000 | | |
| | 2,140 | | | Pioneer Energy Services Corp.,
Global Company Guaranteed Notes
(Callable 12/02/19 @ 101.53) | | (CCC, Caa2) | | 03/15/22 | | | 6.125 | | | | 802,500 | | |
| | 2,000 | | | Shelf Drilling Holdings Ltd., Rule 144A,
Company Guaranteed Notes
(Callable 02/15/21 @ 106.19)(1) | | (B-, B3) | | 02/15/25 | | | 8.250 | | | | 1,690,000 | | |
| | | | 2,939,000 | | |
| Oil Refining & Marketing (0.3%) | |
| | 906 | | | Coffeyville Finance, Inc.,
Global Company Guaranteed Notes
(Callable 12/02/19 @ 101.08) | | (BB-, B1) | | 11/01/22 | | | 6.500 | | | | 917,325 | | |
| Packaging (2.6%) | |
| | 1,300 | | | Ardagh Holdings U.S.A., Inc., Rule 144A,
Company Guaranteed Notes
(Callable 02/15/20 @ 104.50)(1) | | (B, B3) | | 02/15/25 | | | 6.000 | | | | 1,368,250 | | |
| | 750 | | | Ardagh Holdings U.S.A., Inc., Rule 144A,
Senior Secured Notes
(Callable 12/02/19 @ 102.31)(1) | | (BB, Ba3) | | 05/15/23 | | | 4.625 | | | | 769,687 | | |
See Accompanying Notes to Financial Statements.
15
Credit Suisse Strategic Income Fund
Schedule of Investments (continued)
October 31, 2019
Par
(000) | |
| | Ratings†
(S&P/Moody's) | | Maturity | | Rate% | | Value | |
| CORPORATE BONDS (continued) | | | |
Packaging | |
$ | 975 | | | Crown Americas Capital Corp. VI,
Global Company Guaranteed Notes
(Callable 02/01/21 @ 103.56) | | (BB-, Ba3) | | 02/01/26 | | | 4.750 | | | $ | 1,025,505 | | |
| | 1,500 | | | Flex Acquisition Co., Inc., Rule 144A,
Senior Unsecured Notes
(Callable 01/15/20 @ 103.44)(1) | | (CCC+, Caa2) | | 01/15/25 | | | 6.875 | | | | 1,413,750 | | |
| | 630 | | | Reynolds Group Issuer LLC,
Global Senior Secured Notes
(Callable12/02/2019 @ 100.00) | | (B+, B1) | | 10/15/20 | | | 5.750 | | | | 632,881 | | |
| | 500 | | | Reynolds Group Issuer LLC, Rule 144A,
Senior Secured Notes
(Callable 12/02/19 @ 102.56)(1) | | (B+, B1) | | 07/15/23 | | | 5.125 | | | | 514,225 | | |
| | 475 | | | Silgan Holdings, Inc.,
Global Senior Unsecured Notes
(Callable 03/15/20 @ 102.38) | | (BB-, Ba3) | | 03/15/25 | | | 4.750 | | | | 488,062 | | |
| | 2,010 | | | TriMas Corp., Rule 144A,
Company Guaranteed Notes
(Callable 10/15/20 @ 102.44)(1) | | (BB-, Ba3) | | 10/15/25 | | | 4.875 | | | | 2,048,944 | | |
| | 500 | | | Trivium Packaging Finance B.V., Rule 144A,
Senior Secured Notes
(Callable 08/15/22 @ 102.75)(1) | | ((P)B+, B2) | | 08/15/26 | | | 5.500 | | | | 525,000 | | |
| | | | 8,786,304 | | |
| Personal & Household Products (0.6%) | |
| | 750 | | | High Ridge Brands Co., Rule 144A,
Company Guaranteed Notes
(Callable 03/15/20 @ 104.44)(1),(3) | | (D, C) | | 03/15/25 | | | 8.875 | | | | 5,625 | | |
| | 930 | | | Mattel, Inc., Rule 144A,
Company Guaranteed Notes
(Callable 12/31/20 @ 105.06)(1) | | (BB-, B1) | | 12/31/25 | | | 6.750 | | | | 973,013 | | |
| | 960 | | | Prestige Brands, Inc., Rule 144A,
Company Guaranteed Notes
(Callable 12/02/2019 @ 104.78)(1) | | (B, Caa1) | | 03/01/24 | | | 6.375 | | | | 1,006,800 | | |
| | | | 1,985,438 | | |
| Pharmaceuticals (1.4%) | |
| | 950 | | | Bausch Health Cos., Inc., Rule 144A,
Company Guaranteed Notes
(Callable 01/15/23 @ 103.50)(1) | | (B-, B3) | | 01/15/28 | | | 7.000 | | | | 1,027,187 | | |
| | 165 | | | Bausch Health Cos., Inc., Rule 144A,
Company Guaranteed Notes
(Callable 12/02/19 @ 101.47)(1) | | (B-, B3) | | 05/15/23 | | | 5.875 | | | | 168,094 | | |
| | 500 | | | Bausch Health Cos., Inc., Rule 144A,
Company Guaranteed Notes
(Callable 12/15/21 @ 104.50)(1) | | (B-, B3) | | 12/15/25 | | | 9.000 | | | | 563,225 | | |
See Accompanying Notes to Financial Statements.
16
Credit Suisse Strategic Income Fund
Schedule of Investments (continued)
October 31, 2019
Par
(000) | |
| | Ratings†
(S&P/Moody's) | | Maturity | | Rate% | | Value | |
| CORPORATE BONDS (continued) | | | |
Pharmaceuticals | |
$ | 750 | | | Bausch Health Cos., Inc., Rule 144A,
Senior Secured Notes
(Callable 11/01/20 @ 102.75)(1) | | (BB-, Ba2) | | 11/01/25 | | | 5.500 | | | $ | 786,570 | | |
| | 200 | | | Endo Finance LLC, Rule 144A,
Company Guaranteed Notes
(Callable 02/01/20 @ 103.00)(1) | | (CCC+, Caa2) | | 02/01/25 | | | 6.000 | | | | 128,500 | | |
| | 750 | | | Horizon Pharma U.S.A., Inc., Rule 144A,
Company Guaranteed Notes
(Callable 08/01/22 @ 104.13)(1) | | (BB-, B1) | | 08/01/27 | | | 5.500 | | | | 784,688 | | |
| | 1,538 | | | Owens & Minor, Inc.,
Global Senior Secured Notes
(Callable 09/15/24 @ 100.00) | | (B, B2) | | 12/15/24 | | | 4.375 | | | | 1,191,950 | | |
| | | | 4,650,214 | | |
| Real Estate Development & Management (0.7%) | |
| | 2,125 | | | Newmark Group, Inc.,
Global Senior Unsecured Notes
(Callable 10/15/23 @ 100.00) | | (BB+, NR) | | 11/15/23 | | | 6.125 | | | | 2,319,070 | | |
| Real Estate Investment Trusts (1.2%) | |
| | 2,000 | | | ESH Hospitality, Inc., Rule 144A,
Company Guaranteed Notes
(Callable 05/01/20 @ 102.63)(1) | | (BB-, Ba3) | | 05/01/25 | | | 5.250 | | | | 2,067,500 | | |
| | 250 | | | iStar, Inc., Senior Unsecured Notes
(Callable 12/02/19 @ 102.63) | | (BB-, Ba3) | | 09/15/22 | | | 5.250 | | | | 256,563 | | |
| | 1,250 | | | iStar, Inc., Senior Unsecured Notes
(Callable 12/02/19 @ 103.00) | | (BB-, Ba3) | | 04/01/22 | | | 6.000 | | | | 1,285,937 | | |
| | 500 | | | Starwood Property Trust, Inc.,
Global Senior Unsecured Notes
(Callable 09/15/21 @ 100.00) | | (BB-, Ba3) | | 12/15/21 | | | 5.000 | | | | 518,750 | | |
| | | | 4,128,750 | | |
| Recreation & Travel (1.8%) | |
| | 1,430 | | | Boyne U.S.A., Inc., Rule 144A,
Secured Notes (Callable 05/01/21 @ 103.63)(1) | | (B, B1) | | 05/01/25 | | | 7.250 | | | | 1,569,425 | | |
| | 1,500 | | | Canada's Wonderland Co.,
Global Company Guaranteed Notes
(Callable 04/15/22 @ 102.69) | | (BB-, B1) | | 04/15/27 | | | 5.375 | | | | 1,605,000 | | |
| | 750 | | | Cedar Fair LP, Rule 144A,
Company Guaranteed Notes
(Callable 07/15/24 @ 102.63)(1) | | (BB-, B1) | | 07/15/29 | | | 5.250 | | | | 808,125 | | |
| | 600 | | | Merlin Entertainments PLC, Rule 144A,
Company Guaranteed Notes
(Callable 03/17/26 @ 100.00)(1) | | (B+, Ba3) | | 06/15/26 | | | 5.750 | | | | 641,250 | | |
| | 750 | | | Six Flags Entertainment Corp., Rule 144A,
Company Guaranteed Notes
(Callable 12/02/19 @ 103.66)(1) | | (BB-, B2) | | 07/31/24 | | | 4.875 | | | | 776,250 | | |
See Accompanying Notes to Financial Statements.
17
Credit Suisse Strategic Income Fund
Schedule of Investments (continued)
October 31, 2019
Par
(000) | |
| | Ratings†
(S&P/Moody's) | | Maturity | | Rate% | | Value | |
| CORPORATE BONDS (continued) | | | |
Recreation & Travel | |
$ | 600 | | | Speedway Funding II, Inc., Rule 144A,
Senior Unsecured Notes
(Callable 11/01/22 @ 102.44)(1) | | (BB+, B1) | | 11/01/27 | | | 4.875 | | | $ | 600,180 | | |
| | | | 6,000,230 | | |
| Restaurants (1.0%) | |
| | 1,320 | | | Golden Nugget, Inc., Rule 144A,
Senior Unsecured Notes
(Callable 12/02/19 @ 103.38)(1) | | (CCC+, B3) | | 10/15/24 | | | 6.750 | | | | 1,363,032 | | |
| | 1,100 | | | New Red Finance, Inc., Rule 144A,
Secured Notes
(Callable 10/15/20 @ 102.50)(1) | | (B+, B2) | | 10/15/25 | | | 5.000 | | | | 1,130,250 | | |
| | 750 | | | Yum! Brands, Inc., Rule 144A,
Senior Unsecured Notes
(Callable 10/15/29 @ 100.00)(1) | | (B+, B1) | | 01/15/30 | | | 4.750 | | | | 788,437 | | |
| | | | 3,281,719 | | |
| Software - Services (2.3%) | |
| | 1,125 | | | CDK Global, Inc.,
Global Senior Unsecured Notes
(Callable 06/01/22 @ 102.44) | | (BB+, Ba1) | | 06/01/27 | | | 4.875 | | | | 1,191,094 | | |
| | 383 | | | Epicor Software Corp., Rule 144A,
Secured Notes
(Callable 12/02/19 @ 100.00),
LIBOR 3M + 7.250%(1),(7) | | (CCC, Caa2) | | 06/30/23 | | | 9.350 | | | | 381,465 | | |
| | 2,250 | | | GD Finance Co., Inc., Rule 144A,
Company Guaranteed Notes
(Callable 06/01/22 @ 102.63)(1) | | (BB-, B1) | | 12/01/27 | | | 5.250 | | | | 2,393,437 | | |
| | 3,400 | | | Solera Finance, Inc., Rule 144A,
Senior Unsecured Notes
(Callable 12/02/19 @ 107.88)(1) | | (CCC+, Caa1) | | 03/01/24 | | | 10.500 | | | | 3,574,250 | | |
| | | | 7,540,246 | | |
| Specialty Retail (1.2%) | |
| | 500 | | | eG Global Finance PLC, Rule 144A,
Senior Secured Notes
(Callable 10/30/21 @ 104.25)(1) | | (B, B2) | | 10/30/25 | | | 8.500 | | | | 526,440 | | |
| | 650 | | | GrubHub Holdings, Inc., Rule 144A,
Company Guaranteed Notes
(Callable 07/01/22 @ 102.75)(1) | | (BB-, Ba3) | | 07/01/27 | | | 5.500 | | | | 611,000 | | |
| | 770 | | | Lithia Motors, Inc., Rule 144A,
Company Guaranteed Notes
(Callable 08/01/20 @ 103.94)(1) | | (BB, Ba2) | | 08/01/25 | | | 5.250 | | | | 809,463 | | |
| | 500 | | | Penske Automotive Group, Inc.,
Company Guaranteed Notes
(Callable 05/15/21 @ 102.75) | | (B+, Ba3) | | 05/15/26 | | | 5.500 | | | | 524,375 | | |
See Accompanying Notes to Financial Statements.
18
Credit Suisse Strategic Income Fund
Schedule of Investments (continued)
October 31, 2019
Par
(000) | |
| | Ratings†
(S&P/Moody's) | | Maturity | | Rate% | | Value | |
| CORPORATE BONDS (continued) | | | |
Specialty Retail | |
$ | 1,750 | | | Ruyi U.S. Finance LLC, Rule 144A,
Senior Secured Notes
(Callable 05/01/21 @ 105.63)(1) | | (B-, B1) | | 05/01/25 | | | 7.500 | | | $ | 1,533,437 | | |
| | | | 4,004,715 | | |
| Steel Producers/Products (0.0%) | |
| | 120 | | | Zekelman Industries, Inc., Rule 144A,
Senior Secured Notes
(Callable 12/02/19 @ 104.94)(1) | | (B, B3) | | 06/15/23 | | | 9.875 | | | | 126,639 | | |
| Support - Services (1.8%) | |
| | 650 | | | Ashtead Capital, Inc., Rule 144A,
Secured Notes
(Callable 08/01/21 @ 103.94)(1) | | (BBB-, Baa3) | | 08/01/26 | | | 5.250 | | | | 696,312 | | |
| | 500 | | | CoreCivic, Inc.,
Company Guaranteed Notes
(Callable 07/15/27 @ 100.00) | | (BB, Ba1) | | 10/15/27 | | | 4.750 | | | | 424,375 | | |
| | 275 | | | Gartner, Inc., Rule 144A,
Company Guaranteed Notes
(Callable 04/01/20 @ 103.84)(1) | | (BB-, B1) | | 04/01/25 | | | 5.125 | | | | 289,080 | | |
| | 1,000 | | | Gems Education Delaware LLC, Rule 144A,
Senior Secured Notes
(Callable 07/31/22 @ 103.56)(1) | | (B, B2) | | 07/31/26 | | | 7.125 | | | | 1,040,000 | | |
| | 540 | | | KAR Auction Services, Inc., Rule 144A,
Company Guaranteed Notes
(Callable 06/01/20 @ 103.84)(1) | | (B+, B3) | | 06/01/25 | | | 5.125 | | | | 566,325 | | |
| | 200 | | | United Rentals North America, Inc.,
Company Guaranteed Notes
(Callable 10/15/20 @ 102.31) | | (BB-, Ba3) | | 10/15/25 | | | 4.625 | | | | 205,250 | | |
| | 250 | | | United Rentals North America, Inc.,
Global Company Guaranteed Notes
(Callable 12/15/21 @ 103.25) | | (BB-, Ba3) | | 12/15/26 | | | 6.500 | | | | 271,563 | | |
| | 500 | | | United Rentals North America, Inc.,
Secured Notes
(Callable 11/15/22 @ 101.94) | | (BBB-, Ba1) | | 11/15/27 | | | 3.875 | | | | 506,375 | | |
| | 1,754 | | | WeWork Cos., Inc., Rule 144A,
Company Guaranteed Notes(1) | | (B, NR) | | 05/01/25 | | | 7.875 | | | | 1,495,285 | | |
| | 450 | | | Williams Scotsman International, Inc., Rule 144A,
Senior Secured Notes
(Callable 08/15/20 @ 103.44)(1) | | (B, B3) | | 08/15/23 | | | 6.875 | | | | 473,625 | | |
| | | | 5,968,190 | | |
| Tech Hardware & Equipment (1.0%) | |
| | 750 | | | CommScope Technologies LLC, Rule 144A,
Company Guaranteed Notes
(Callable 03/15/22 @ 102.50)(1) | | (B-, B3) | | 03/15/27 | | | 5.000 | | | | 616,875 | | |
See Accompanying Notes to Financial Statements.
19
Credit Suisse Strategic Income Fund
Schedule of Investments (continued)
October 31, 2019
Par
(000) | |
| | Ratings†
(S&P/Moody's) | | Maturity | | Rate% | | Value | |
| CORPORATE BONDS (continued) | | | |
Tech Hardware & Equipment | |
$ | 1,150 | | | CommScope, Inc., Rule 144A,
Company Guaranteed Notes
(Callable 03/01/22 @ 104.13)(1) | | (B-, B3) | | 03/01/27 | | | 8.250 | | | $ | 1,093,627 | | |
| | 500 | | | CommScope, Inc., Rule 144A,
Senior Secured Notes
(Callable 03/01/22 @ 103.00)(1) | | (B+, Ba3) | | 03/01/26 | | | 6.000 | | | | 516,250 | | |
| | 1,115 | | | EMC Corp., Rule 144A,
Senior Secured Notes
(Callable 08/01/26 @ 100.00)(1) | | (BBB-, Baa3) | | 10/01/26 | | | 4.900 | | | | 1,210,707 | | |
| | | | 3,437,459 | | |
| Telecom - Wireless (0.5%) | |
| | 250 | | | T-Mobile U.S.A., Inc.,
Company Guaranteed Notes
(Callable 02/01/21 @ 102.25) | | (BB+, Ba2) | | 02/01/26 | | | 4.500 | | | | 258,750 | | |
| | 1,300 | | | T-Mobile U.S.A., Inc.,
Company Guaranteed Notes
(Callable 02/01/23 @ 102.38) | | (BB+, Ba2) | | 02/01/28 | | | 4.750 | | | | 1,374,750 | | |
| | | | 1,633,500 | | |
| Telecom - Wireline Integrated & Services (1.3%) | |
| | 800 | | | Altice Financing S.A., Rule 144A,
Senior Secured Notes
(Callable 05/15/21 @ 103.75)(1) | | (B+, B2) | | 05/15/26 | | | 7.500 | | | | 852,000 | | |
| | 475 | | | Altice France S.A., Rule 144A,
Senior Secured Notes
(Callable 05/01/21 @ 103.69)(1) | | (B, B2) | | 05/01/26 | | | 7.375 | | | | 509,839 | | |
| | 200 | | | Equinix, Inc.,
Senior Unsecured Notes
(Callable 05/15/22 @ 102.69) | | (BBB-, Ba1) | | 05/15/27 | | | 5.375 | | | | 217,500 | | |
| | 1,125 | | | GTT Communications, Inc., Rule 144A,
Company Guaranteed Notes
(Callable 12/31/19 @ 105.91)(1) | | (CCC, Caa1) | | 12/31/24 | | | 7.875 | | | | 660,937 | | |
| | 1,000 | | | LCPR Senior Secured Financing DAC, Rule 144A,
Senior Secured Notes
(Callable 10/15/22 @ 103.38)(1) | | ((P)B+, B1) | | 10/15/27 | | | 6.750 | | | | 1,028,750 | | |
| | 1,100 | | | QTS Finance Corp., Rule 144A,
Company Guaranteed Notes
(Callable 11/15/20 @ 103.56)(1) | | (BB, B1) | | 11/15/25 | | | 4.750 | | | | 1,155,000 | | |
| | | | 4,424,026 | | |
| Theaters & Entertainment (1.3%) | |
| | 1,725 | | | AMC Entertainment Holdings, Inc.,
Global Company Guaranteed Notes
(Callable 05/15/22 @ 103.06) | | (CCC+, B3) | | 05/15/27 | | | 6.125 | | | | 1,568,672 | | |
See Accompanying Notes to Financial Statements.
20
Credit Suisse Strategic Income Fund
Schedule of Investments (continued)
October 31, 2019
Par
(000) | |
| | Ratings†
(S&P/Moody's) | | Maturity | | Rate% | | Value | |
| CORPORATE BONDS (continued) | | | |
Theaters & Entertainment | |
$ | 1,679 | | | Cinemark U.S.A., Inc.,
Global Company Guaranteed Notes
(Callable 12/02/19 @ 101.63) | | (BB, B2) | | 06/01/23 | | | 4.875 | | | $ | 1,708,382 | | |
| | 650 | | | Live Nation Entertainment, Inc., Rule 144A,
Company Guaranteed Notes
(Callable 10/15/22 @ 103.56)(1) | | (B+, Ba3) | | 10/15/27 | | | 4.750 | | | | 679,315 | | |
| | 500 | | | Live Nation Entertainment, Inc., Rule 144A,
Company Guaranteed Notes
(Callable 11/05/19 @ 103.66)(1) | | (B+, Ba3) | | 11/01/24 | | | 4.875 | | | | 518,750 | | |
| | | | 4,475,119 | | |
| Transport Infrastructure/Services (0.2%) | |
| | 1,000 | | | Navios Maritime Finance II U.S., Inc., Rule 144A,
Senior Secured Notes
(Callable 12/02/2019 @ 100.00)(1) | | (B, Caa1) | | 08/15/22 | | | 11.250 | | | | 710,000 | | |
| TOTAL CORPORATE BONDS (Cost $144,587,776) | | | 144,086,111 | | |
| BANK LOANS (47.7%) | | | |
| Advertising (0.8%) | | | |
| | 1,661 | | | Clear Channel Outdoor Holdings, Inc.,
LIBOR 1M + 3.500%(7) | | (B+, B1) | | 08/21/26 | | | 5.286 | | | | 1,666,068 | | |
| | 994 | | | MH Sub I LLC,
LIBOR 1M + 3.750%(7) | | (B, B2) | | 09/13/24 | | | 5.536 | | | | 970,840 | | |
| | | | 2,636,908 | | |
| Aerospace & Defense (0.6%) | |
| | 995 | | | Sequa Mezzanine Holdings LLC,
LIBOR 3M + 5.000%(7) | | (CCC+, B3) | | 11/28/21 | | | 7.187 | | | | 982,892 | | |
| | 992 | | | TransDigm, Inc.,
LIBOR 3M + 2.500%(7) | | (B+, Ba3) | | 06/09/23 | | | 4.286 | | | | 989,263 | | |
| | | | 1,972,155 | | |
| Auto Parts & Equipment (1.1%) | |
| | 978 | | | Dayco Products LLC,
LIBOR 3M + 4.250%(6),(7) | | (B-, B3) | | 05/19/23 | | | 6.374 | | | | 865,088 | | |
| | 745 | | | Jason, Inc.,
LIBOR 3M + 4.500%(5),(7) | | (CCC+, Caa1) | | 06/30/21 | | | 6.516 | | | | 660,610 | | |
| | 1,070 | | | L&W, Inc.,
LIBOR 1M + 4.000%(6),(7) | | (BB-, B2) | | 05/22/25 | | | 8.161 | | | | 1,035,023 | | |
| | 1,000 | | | Panther BF Aggregator 2 LP,
LIBOR 1M + 3.500%(7) | | (B+, Ba3) | | 04/30/26 | | | 5.300 | | | | 988,750 | | |
| | | | 3,549,471 | | |
See Accompanying Notes to Financial Statements.
21
Credit Suisse Strategic Income Fund
Schedule of Investments (continued)
October 31, 2019
Par
(000) | |
| | Ratings†
(S&P/Moody's) | | Maturity | | Rate% | | Value | |
| BANK LOANS (continued) | | | |
| Building & Construction (0.1%) | |
$ | 423 | | | SiteOne Landscape Supply, Inc.,
LIBOR 1M + 2.750%(7) | | (BB, B2) | | 10/29/24 | | | 4.540 | | | $ | 424,939 | | |
| Building Materials (1.1%) | |
| | 593 | | | Airxcel, Inc.,
LIBOR 1M + 4.500%(7) | | (B, B3) | | 04/28/25 | | | 6.286 | | | | 562,135 | | |
| | 753 | | | Foundation Building Materials Holding, Co. LLC,
LIBOR 1M + 3.000%(7) | | (BB-, B2) | | 08/13/25 | | | 4.786 | | | | 754,522 | | |
| | 209 | | | Henry Co. LLC,
LIBOR 1M + 4.000%(7) | | (B, B2) | | 10/05/23 | | | 5.786 | | | | 209,059 | | |
| | 1,244 | | | NCI Building Systems, Inc.,
LIBOR 1M + 3.750%(7) | | (B+, B2) | | 04/12/25 | | | 5.671 | | | | 1,205,353 | | |
| | 1,006 | | | Priso Acquisition Corp.,
LIBOR 1M + 3.000%(7) | | (B+, B2) | | 05/08/22 | | | 5.044 | | | | 957,518 | | |
| | | | 3,688,587 | | |
| Cable & Satellite TV (0.2%) | |
| | 773 | | | Midcontinent Communications,
LIBOR 1M + 2.250%(7) | | (BB, Ba3) | | 08/15/26 | | | 4.164 | | | | 778,523 | | |
| Chemicals (2.6%) | |
| | 415 | | | Allnex (Luxembourg) & Cy S.C.A.,
LIBOR 3M + 3.250%(7) | | (B, B2) | | 09/13/23 | | | 5.394 | | | | 394,918 | | |
| | 313 | | | Allnex U.S.A., Inc.,
LIBOR 3M + 3.250%(7) | | (B, B2) | | 09/13/23 | | | 5.394 | | | | 297,527 | | |
| | 966 | | | Ascend Performance Materials Operations LLC,
LIBOR 3M + 5.250%(7) | | (BB-, B1) | | 08/27/26 | | | 7.354 | | | | 970,015 | | |
| | 643 | | | Minerals Technologies, Inc.(6) | | (BB+, Ba2) | | 05/09/21 | | | 4.750 | | | | 643,333 | | |
| | 1,238 | | | PMHC II, Inc.,
LIBOR 3M + 3.500%(7) | | (CCC+, B3) | | 03/31/25 | | | 5.604 | | | | 1,006,711 | | |
| | 1,489 | | | Polar U.S. Borrower LLC,
LIBOR 3M + 4.750%(6),(7) | | (B, B2) | | 10/15/25 | | | 6.795 | | | | 1,407,456 | | |
| | 1,072 | | | Tronox Finance LLC,
LIBOR 1M + 3.000%(7) | | (BB-, Ba3) | | 09/23/24 | | | 4.660 | | | | 1,064,438 | | |
| | 747 | | | UTEX Industries, Inc.,
LIBOR 1M + 4.000%(7) | | (CCC, Caa1) | | 05/22/21 | | | 5.786 | | | | 579,216 | | |
| | 737 | | | Vantage Specialty Chemicals, Inc.,
LIBOR 3M + 3.500%(7) | | (B-, B3) | | 10/28/24 | | | 5.350 | | | | 678,540 | | |
| | 455 | | | Vantage Specialty Chemicals, Inc.,
LIBOR 3M + 8.250%(5),(6),(7) | | (CCC, Caa2) | | 10/27/25 | | | 10.337 | | | | 397,045 | | |
| | 1,474 | | | Zep, Inc.,
LIBOR 3M + 4.000%(7) | | (CCC+, Caa1) | | 08/12/24 | | | 6.104 | | | | 1,143,343 | | |
| | | | 8,582,542 | | |
See Accompanying Notes to Financial Statements.
22
Credit Suisse Strategic Income Fund
Schedule of Investments (continued)
October 31, 2019
Par
(000) | |
| | Ratings†
(S&P/Moody's) | | Maturity | | Rate% | | Value | |
| BANK LOANS (continued) | | | |
| Diversified Capital Goods (2.1%) | |
$ | 1,122 | | | Callaway Golf Co.,
LIBOR 1M + 4.500%(7) | | (BB-, Ba3) | | 01/02/26 | | | 6.440 | | | $ | 1,135,832 | | |
| | 1,977 | | | Cortes NP Acquisition Corp.,
LIBOR 3M + 4.000%(7) | | (B, B2) | | 11/30/23 | | | 5.927 | | | | 1,869,274 | | |
| | 526 | | | Douglas Dynamics Holdings, Inc.,
LIBOR 1M + 3.000%(7) | | (BB-, B2) | | 12/31/21 | | | 4.790 | | | | 526,292 | | |
| | 1,472 | | | Dynacast International LLC,
LIBOR 3M + 3.250%(6),(7) | | (B-, B2) | | 01/28/22 | | | 5.354 | | | | 1,361,452 | | |
| | 491 | | | Element Materials Technology Group
U.S. Holdings, Inc.,
LIBOR 3M + 3.500%(7) | | (B, B1) | | 06/28/24 | | | 5.604 | | | | 492,171 | | |
| | 957 | | | Filtration Group Corp.,
LIBOR 1M + 3.000%(7) | | (B, B2) | | 03/29/25 | | | 4.786 | | | | 957,821 | | |
| | 584 | | | Thermon Industries, Inc.,
LIBOR 1M + 3.750%(7) | | (B+, B2) | | 10/24/24 | | | 5.782 | | | | 585,335 | | |
| | | | 6,928,177 | | |
| Electronics (1.3%) | |
| | 640 | | | AI Ladder (Luxembourg) Subco Sarl,
LIBOR 3M + 4.500%(7) | | (B, B2) | | 07/09/25 | | | 6.604 | | | | 613,166 | | |
| | 490 | | | CPI International, Inc.,
LIBOR 1M + 3.500%(7) | | (B, B3) | | 07/26/24 | | | 5.304 | | | | 478,975 | | |
| | 500 | | | CPI International, Inc.,
LIBOR 1M + 7.250%(6),(7) | | (CCC+, Caa2) | | 07/26/25 | | | 9.054 | | | | 481,250 | | |
| | 1,004 | | | Microchip Technology, Inc.,
LIBOR 1M + 2.000%(7) | | (BB+, Baa3) | | 05/29/25 | | | 3.790 | | | | 1,008,062 | | |
| | 976 | | | Oberthur Technologies S.A.,
LIBOR 3M + 3.750%(7) | | (B-, B3) | | 01/10/24 | | | 5.854 | | | | 930,611 | | |
| | 250 | | | Rovi Solutions Corp.,
LIBOR 1M + 2.500%(7) | | (BB, Ba3) | | 07/02/21 | | | 4.290 | | | | 247,724 | | |
| | 301 | | | Seattle Spinco, Inc.,
LIBOR 1M + 2.500%(7) | | (BB-, B1) | | 06/21/24 | | | 4.300 | | | | 293,079 | | |
| | 413 | | | Triton Solar U.S. Acquisition Co.,
LIBOR 3M + 6.000%(6),(7) | | (B+, B3) | | 10/29/24 | | | 7.786 | | | | 344,968 | | |
| | | | 4,397,835 | | |
| Energy - Exploration & Production (0.5%) | |
| | 1,496 | | | Lower Cadence Holdings LLC,
LIBOR 1M + 4.000%(7) | | (B, B2) | | 05/22/26 | | | 5.804 | | | | 1,395,253 | | |
| | 830 | | | PES Holdings LLC,
LIBOR 3M + 6.990%(3),(7) | | (NR, NR) | | 12/31/22 | | | 6.990 | | | | 274,016 | | |
| | | | 1,669,269 | | |
| Environmental (0.1%) | |
| | 496 | | | GFL Environmental, Inc., LIBOR 1M + 3.000%(7) | | (B+, B1) | | 05/30/25 | | | 4.786 | | | | 495,301 | | |
See Accompanying Notes to Financial Statements.
23
Credit Suisse Strategic Income Fund
Schedule of Investments (continued)
October 31, 2019
Par
(000) | |
| | Ratings†
(S&P/Moody's) | | Maturity | | Rate% | | Value | |
| BANK LOANS (continued) | | | |
| Food - Wholesale (0.9%) | |
$ | 490 | | | AI Aqua Merger Sub, Inc.,
LIBOR 1M + 3.250%(7) | | (B-, B2) | | 12/13/23 | | | 5.036 | | | $ | 457,231 | | |
| | 278 | | | AI Aqua Merger Sub, Inc.,
LIBOR 3M + 4.250%(6),(7) | | (B-, B2) | | 12/13/23 | | | 6.354 | | | | 263,121 | | |
| | 992 | | | U.S. Foods, Inc.,
LIBOR 1M + 2.000%(7) | | (BB+, Ba3) | | 06/27/23 | | | 3.786 | | | | 996,530 | | |
| | 215 | | | U.S. Foods, Inc.,
LIBOR 1M + 2.000%(7) | | (BB+, Ba3) | | 09/13/26 | | | 3.786 | | | | 216,342 | | |
| | 1,493 | | | United Natural Foods, Inc.,
LIBOR 1M + 4.250%(7) | | (B, B3) | | 10/22/25 | | | 6.036 | | | | 1,202,395 | | |
| | | | 3,135,619 | | |
| Gaming (1.2%) | |
| | 1,484 | | | Caesars Resort Collection LLC,
LIBOR 1M + 2.750%(7) | | (BB, Ba3) | | 12/23/24 | | | 4.536 | | | | 1,463,846 | | |
| | 980 | | | CBAC Borrower LLC,
LIBOR 1M + 4.000%(7) | | (B, B3) | | 07/08/24 | | | 5.786 | | | | 946,518 | | |
| | 1,472 | | | Stars Group Holdings B.V. (The),
LIBOR 3M + 3.500%(7) | | (B+, B1) | | 07/10/25 | | | 5.604 | | | | 1,480,500 | | |
| | | | 3,890,864 | | |
| Gas Distribution (0.7%) | |
| | 1,131 | | | BCP Renaissance Parent LLC,
LIBOR 3M + 3.500%(7) | | (B+, B1) | | 10/31/24 | | | 5.363 | | | | 1,027,902 | | |
| | 1,417 | | | Traverse Midstream Partners LLC,
LIBOR 1M + 4.000%(7) | | (B+, B2) | | 09/27/24 | | | 5.800 | | | | 1,250,660 | | |
| | | | 2,278,562 | | |
| Health Facilities (1.0%) | |
| | 1,000 | | | DaVita, Inc.,
LIBOR 1M + 3.250%(7) | | (BBB-, Ba1) | | 08/12/26 | | | 4.036 | | | | 1,003,795 | | |
| | 992 | | | Surgery Center Holdings, Inc.,
LIBOR 1M + 3.250%(7) | | (B-, B1) | | 09/02/24 | | | 5.040 | | | | 960,981 | | |
| | 162 | | | Western Dental Services, Inc.,
LIBOR 1M + 4.500%(6),(7) | | (B-, B3) | | 06/30/23 | | | 6.286 | | | | 160,560 | | |
| | 1,102 | | | Western Dental Services, Inc.,
LIBOR 1M + 5.250%(6),(7) | | (B-, B3) | | 06/30/23 | | | 7.036 | | | | 1,099,410 | | |
| | | | 3,224,746 | | |
| Health Services (2.8%) | |
| | 2,032 | | | Athenahealth, Inc.,
LIBOR 3M + 4.500%(7) | | (B, B2) | | 02/11/26 | | | 6.681 | | | | 2,019,000 | | |
| | 1,494 | | | Auris Luxembourg III Sarl,
LIBOR 1M + 3.750%(7) | | (B+, B2) | | 02/27/26 | | | 5.536 | | | | 1,471,341 | | |
| | 338 | | | Carestream Health, Inc.,
LIBOR 1M + 5.750%(7) | | (B, B1) | | 02/28/21 | | | 7.536 | | | | 325,813 | | |
See Accompanying Notes to Financial Statements.
24
Credit Suisse Strategic Income Fund
Schedule of Investments (continued)
October 31, 2019
Par
(000) | |
| | Ratings†
(S&P/Moody's) | | Maturity | | Rate% | | Value | |
| BANK LOANS (continued) | | | |
Health Services | |
$ | 1,739 | | | KUEHG Corp.,
LIBOR 3M + 3.750%(7) | | (B-, B2) | | 02/21/25 | | | 5.854 | | | $ | 1,721,922 | | |
| | 1,492 | | | Learning Care Group, Inc.,
LIBOR 3M + 3.250%(7) | | (B-, B2) | | 03/13/25 | | | 5.336 | | | | 1,471,433 | | |
| | 163 | | | Navicure, Inc.,
LIBOR 1M + 4.000%(7) | | (B-, B2) | | 10/22/26 | | | 5.868 | | | | 162,488 | | |
| | 500 | | | Radiology Partners Holdings LLC,
LIBOR 3M + 8.250%(6),(7) | | (CCC+, Caa2) | | 07/09/26 | | | 10.153 | | | | 487,500 | | |
| | 992 | | | Sotera Health Holdings LLC,
LIBOR 1M + 3.000%(7) | | (B, B1) | | 05/15/22 | | | 4.927 | | | | 977,794 | | |
| | 499 | | | Sotera Health Holdings LLC,
LIBOR 1M + 3.500%(7) | | (B, B1) | | 05/15/22 | | | 5.427 | | | | 498,127 | | |
| | 172 | | | Valitas Health Services, Inc.,
LIBOR 3M + 10.000%(4),(6),(7) | | (NR, NR) | | 06/30/20 | | | 12.104 | | | | 170,265 | | |
| | 305 | | | Valitas Health Services, Inc.,
LIBOR 3M + 12.000%(4),(6),(7) | | (NR, NR) | | 06/30/20 | | | 14.104 | | | | 28,970 | | |
| | | 9,334,653 | | |
| Insurance Brokerage (1.3%) | |
| | 1,059 | | | Acrisure LLC,
LIBOR 3M + 4.250%(7) | | (B, B2) | | 11/22/23 | | | 6.354 | | | | 1,043,137 | | |
| | 1,429 | | | Alliant Holdings Intermediate, LLC,
LIBOR 3M + 3.000%(7) | | (B, B2) | | 05/09/25 | | | 4.804 | | | | 1,394,483 | | |
| | 673 | | | AssuredPartners, Inc.,
LIBOR 1M + 3.500%(7) | | (B, B2) | | 10/22/24 | | | 5.286 | | | | 662,168 | | |
| | 1,293 | | | NFP Corp.,
LIBOR 1M + 3.000%(7) | | (B, B2) | | 01/08/24 | | | 4.786 | | | | 1,257,247 | | |
| | | | 4,357,035 | | |
| Investments & Misc. Financial Services (1.5%) | |
| | 546 | | | Altisource Solutions Sarl,
LIBOR 3M + 4.000%(7) | | (B+, B3) | | 04/03/24 | | | 6.104 | | | | 519,324 | | |
| | 513 | | | Compass Group Diversified Holdings LLC,
LIBOR 1M + 2.500%(7) | | (BB, Ba3) | | 04/18/25 | | | 4.036 | | | | 515,444 | | |
| | 563 | | | Ditech Holding Corp.,
Prime + 7.000%(3),(7) | | (NR, NR) | | 06/30/22 | | | 12.000 | | | | 229,632 | | |
| | 569 | | | FinCo I LLC,
LIBOR 1M + 2.000%(7) | | (BB, Baa3) | | 12/27/22 | | | 3.786 | | | | 570,584 | | |
| | 430 | | | Focus Financial Partners LLC,
LIBOR 1M + 2.500%(7) | | (BB-, Ba3) | | 07/03/24 | | | 4.286 | | | | 431,508 | | |
| | 784 | | | Liquidnet Holdings, Inc.,
LIBOR 1M + 3.250%(7) | | (BB-, Ba3) | | 07/15/24 | | | 5.036 | | | | 779,676 | | |
| | 946 | | | Ocwen Loan Servicing LLC,
LIBOR 1M + 5.000%(7) | | (B+, B2) | | 12/07/20 | | | 6.786 | | | | 929,926 | | |
See Accompanying Notes to Financial Statements.
25
Credit Suisse Strategic Income Fund
Schedule of Investments (continued)
October 31, 2019
Par
(000) | |
| | Ratings†
(S&P/Moody's) | | Maturity | | Rate% | | Value | |
| BANK LOANS (continued) | | | |
Investments & Misc. Financial Services | |
$ | 1,096 | | | VFH Parent LLC,
LIBOR 6M + 3.500%(7) | | (B+, Ba3) | | 03/01/26 | | | 6.044 | | | $ | 1,095,823 | | |
| | | | 5,071,917 | | |
| Machinery (1.4%) | |
| | 924 | | | Cohu, Inc.,
LIBOR 6M + 3.000%(7) | | (B, B2) | | 10/01/25 | | | 5.200 | | | | 884,730 | | |
| | 291 | | | CPM Holdings, Inc.,
LIBOR 1M + 3.750%(7) | | (B-, B2) | | 11/17/25 | | | 5.536 | | | | 286,170 | | |
| | 247 | | | CPM Holdings, Inc.,
LIBOR 1M + 8.250%(5),(7) | | (CCC+, Caa2) | | 11/15/26 | | | 10.036 | | | | 242,069 | | |
| | 411 | | | LTI Holdings, Inc.,
LIBOR 1M + 6.750%(7) | | (CCC+, Caa2) | | 09/06/26 | | | 8.536 | | | | 352,311 | | |
| | 477 | | | LTI Holdings, Inc.,
LIBOR 1M + 3.500%(7) | | (B-, B2) | | 09/06/25 | | | 5.286 | | | | 440,336 | | |
| | 926 | | | Milacron LLC,
LIBOR 1M + 2.500%(6),(7) | | (B+, B2) | | 09/28/23 | | | 4.286 | | | | 926,093 | | |
| | 667 | | | Penn Engineering & Manufacturing Corp.,
LIBOR 1M + 2.750%(6),(7) | | (B+, B1) | | 06/27/24 | | | 4.536 | | | | 657,665 | | |
| | 794 | | | Pro Mach Group, Inc.,
LIBOR 1M + 2.750%(7) | | (B-, B2) | | 03/07/25 | | | 4.596 | | | | 752,272 | | |
| | | | 4,541,646 | | |
| Managed Care (0.4%) | |
| | 1,406 | | | Inovalon Holdings, Inc.,
LIBOR 1M + 3.500%(7) | | (B+, B2) | | 04/02/25 | | | 5.438 | | | | 1,410,585 | | |
| Media - Diversified (0.4%) | |
| | 989 | | | Diamond Sports Group LLC,
LIBOR 1M + 3.2500%(7) | | (BB, Ba2) | | 08/24/26 | | | 5.080 | | | | 995,058 | | |
| | 250 | | | NEP/NCP Holdco, Inc.,
LIBOR 1M + 7.000%(7) | | (CCC+, Caa2) | | 10/19/26 | | | 8.786 | | | | 240,312 | | |
| | | | 1,235,370 | | |
| Media Content (0.3%) | |
| | 1,000 | | | NASCAR Holdings, Inc., LIBOR 1M + 2.750%(7) | | (BB, Ba2) | | 10/19/26 | | | 4.628 | | | | 1,006,170 | | |
| Medical Products (0.9%) | |
| | 1,062 | | | ABB Concise Optical Group LLC,
LIBOR 6M + 5.000%(7) | | (CCC+, B3) | | 06/15/23 | | | 7.168 | | | | 1,011,304 | | |
| | 886 | | | Avantor, Inc.,
LIBOR 1M + 3.000%(7) | | (B+, Ba2) | | 11/21/24 | | | 4.786 | | | | 893,082 | | |
| | 995 | | | CryoLife, Inc.,
LIBOR 3M + 3.250%(7) | | (B, B2) | | 12/02/24 | | | 5.354 | | | | 996,802 | | |
| | 222 | | | Viant Medical Holdings, Inc.,
LIBOR 3M + 3.750%(7) | | (B-, B3) | | 07/02/25 | | | 5.854 | | | | 207,675 | | |
| | | | 3,108,863 | | |
See Accompanying Notes to Financial Statements.
26
Credit Suisse Strategic Income Fund
Schedule of Investments (continued)
October 31, 2019
Par
(000) | |
| | Ratings†
(S&P/Moody's) | | Maturity | | Rate% | | Value | |
| BANK LOANS (continued) | | | |
| Metals & Mining - Excluding Steel (0.6%) | |
$ | 1,899 | | | GrafTech Finance, Inc.,
LIBOR 1M + 3.500%(6),(7) | | (BB-, B1) | | 02/12/25 | | | 5.286 | | | $ | 1,830,456 | | |
| | 221 | | | Noranda Aluminum Acquisition Corp.,
Prime + 3.500%(3),(7) | | (NR, NR) | | 02/28/19 | | | 8.500 | | | | 13,274 | | |
| | | | 1,843,730 | | |
| Non - Electric Utilities (0.2%) | |
| | 733 | | | BCP Raptor LLC,
LIBOR 1M + 4.250%(7) | | (B, B3) | | 06/24/24 | | | 6.036 | | | | 649,274 | | |
| Oil Refining & Marketing (0.4%) | |
| | 1,374 | | | EG America LLC,
LIBOR 3M + 4.000%(7) | | (B, B2) | | 02/07/25 | | | 6.104 | | | | 1,330,102 | | |
| Packaging (1.0%) | |
| | 998 | | | Berry Global, Inc.,
LIBOR 1M + 2.500%(7) | | (BBB-, Ba2) | | 07/01/26 | | | 4.439 | | | | 1,002,034 | | |
| | 658 | | | Flex Acquisition Co., Inc.,
LIBOR 3M + 3.000%(7) | | (B, B2) | | 12/29/23 | | | 5.096 | | | | 623,433 | | |
| | 823 | | | Proampac PG Borrower LLC,
LIBOR 1M + 3.500%(7) | | (B, B3) | | 11/20/23 | | | 5.532 | | | | 777,940 | | |
| | 741 | | | Strategic Materials, Inc.,
LIBOR 3M + 3.750%(5),(6),(7) | | (CCC+, B3) | | 10/25/24 | | | 5.677 | | | | 603,571 | | |
| | 500 | | | Strategic Materials, Inc.,
LIBOR 3M + 7.750%(5),(6),(7) | | (CCC-, Caa3) | | 10/27/25 | | | 9.677 | | | | 345,000 | | |
| | | | 3,351,978 | | |
| Personal & Household Products (1.0%) | |
| | 490 | | | ABG Intermediate Holdings 2 LLC,
LIBOR 1M + 7.750%(7) | | (CCC+, Caa1) | | 09/29/25 | | | 9.536 | | | | 489,979 | | |
| | 1,729 | | | Comfort Holding LLC,
LIBOR 1M + 4.750%(7) | | (CCC+, Caa1) | | 02/05/24 | | | 6.536 | | | | 1,724,674 | | |
| | 1,229 | | | Serta Simmons Bedding LLC,
LIBOR 1M + 3.500%(7) | | (CCC+, Caa1) | | 11/08/23 | | | 5.405 | | | | 732,021 | | |
| | 250 | | | Serta Simmons Bedding LLC,
LIBOR 1M + 8.000%(7) | | (CCC-, Caa3) | | 11/08/24 | | | 9.846 | | | | 69,943 | | |
| | 457 | | | TricorBraun Holdings, Inc.,
LIBOR 3M + 3.750%(7) | | (B-, B2) | | 11/30/23 | | | 5.859 | | | | 447,804 | | |
| | | | 3,464,421 | | |
| Pharmaceuticals (1.3%) | |
| | 1,002 | | | Akorn, Inc.,
LIBOR 1M + 7.000%(7) | | (B-, Caa1) | | 04/16/21 | | | 8.813 | | | | 932,285 | | |
| | 430 | | | Bausch Health Companies, Inc.,
LIBOR 1M + 3.000%(7) | | (BB-, Ba2) | | 06/02/25 | | | 4.921 | | | | 432,464 | | |
| | 230 | | | Bausch Health Companies, Inc.,
LIBOR 1M + 2.750%(7) | | (BB-, Ba2) | | 11/27/25 | | | 4.671 | | | | 230,806 | | |
See Accompanying Notes to Financial Statements.
27
Credit Suisse Strategic Income Fund
Schedule of Investments (continued)
October 31, 2019
Par
(000) | |
| | Ratings†
(S&P/Moody's) | | Maturity | | Rate% | | Value | |
| BANK LOANS (continued) | | | |
Pharmaceuticals | |
$ | 873 | | | Endo Luxembourg Finance Co. I Sarl,
LIBOR 1M + 4.250%(7) | | (B+, B1) | | 04/29/24 | | | 6.063 | | | $ | 805,456 | | |
| | 970 | | | Explorer Holdings, Inc.,
LIBOR 3M + 3.750%(7) | | (B, B2) | | 05/02/23 | | | 5.854 | | | | 969,943 | | |
| | 1,000 | | | Syneos Health, Inc.,
LIBOR 1M + 1.500%(6),(7) | | (BB, Ba3) | | 03/25/24 | | | 3.286 | | | | 973,750 | | |
| | | | 4,344,704 | | |
| Real Estate Development & Management (0.9%) | |
| | 357 | | | Capital Automotive LP,
LIBOR 1M + 2.500%(7) | | (B, B1) | | 03/24/24 | | | 4.290 | | | | 357,261 | | |
| | 684 | | | Capital Automotive LP,
LIBOR 1M + 6.000%(7) | | (CCC+, B3) | | 03/24/25 | | | 7.790 | | | | 687,228 | | |
| | 1,021 | | | Forest City Enterprises LP,
LIBOR 1M + 4.000%(7) | | (B+, B2) | | 12/07/25 | | | 5.786 | | | | 1,028,062 | | |
| | 1,000 | | | Hanjin International Corp.,
LIBOR 1M + 2.500%(6),(7) | | (B+, Ba3) | | 10/18/20 | | | 4.304 | | | | 997,500 | | |
| | | | 3,070,051 | | |
| Real Estate Investment Trusts (0.7%) | |
| | 2,239 | | | DTZ U.S. Borrower LLC,
LIBOR 1M + 3.250%(7) | | (BB-, Ba3) | | 08/21/25 | | | 5.036 | | | | 2,246,327 | | |
| Recreation & Travel (1.1%) | |
| | 250 | | | Bulldog Purchaser, Inc.,
LIBOR 1M + 7.750%(5),(7) | | (CCC+, Caa2) | | 09/04/26 | | | 9.536 | | | | 247,500 | | |
| | 1,485 | | | Bulldog Purchaser, Inc.,
LIBOR 1M + 3.750%(6),(7) | | (B+, B2) | | 09/05/25 | | | 5.536 | | | | 1,455,720 | | |
| | 1,968 | | | Hornblower Sub LLC,
LIBOR 3M + 4.500%(7) | | (B, B2) | | 04/27/25 | | | 6.604 | | | | 1,971,321 | | |
| | | | 3,674,541 | | |
| Restaurants (2.1%) | |
| | 1,772 | | | Flynn Restaurant Group LP,
LIBOR 1M + 3.500%(7) | | (B, B2) | | 06/27/25 | | | 5.286 | | | | 1,678,587 | | |
| | 1,896 | | | Golden Nugget, Inc.,
LIBOR 1M + 2.750%(7) | | (B+, Ba3) | | 10/04/23 | | | 4.688 | | | | 1,894,599 | | |
| | 1,243 | | | IRB Holding Corp.,
LIBOR 3M + 3.250%(7) | | (B+, B2) | | 02/05/25 | | | 5.216 | | | | 1,235,509 | | |
| | 496 | | | K-Mac Holdings Corp.,
LIBOR 1M + 3.000%(7) | | (B-, B2) | | 03/14/25 | | | 4.786 | | | | 483,271 | | |
| | 296 | | | K-Mac Holdings Corp.,
LIBOR 1M + 6.750%(7) | | (CCC, Caa2) | | 03/16/26 | | | 8.536 | | | | 293,822 | | |
| | 742 | | | Miller's Ale House, Inc.,
LIBOR 12M + 4.750%(6),(7) | | (B-, B3) | | 05/26/25 | | | 6.958 | | | | 683,083 | | |
See Accompanying Notes to Financial Statements.
28
Credit Suisse Strategic Income Fund
Schedule of Investments (continued)
October 31, 2019
Par
(000) | |
| | Ratings†
(S&P/Moody's) | | Maturity | | Rate% | | Value | |
| BANK LOANS (continued) | | | |
Restaurants | |
$ | 746 | | | Tacala LLC,
LIBOR 1M + 3.000%(7) | | (B-, B2) | | 01/31/25 | | | 4.786 | | | $ | 735,795 | | |
| | | | 7,004,666 | | |
| Software - Services (6.1%) | |
| | 750 | | | Air Newco LLC,
LIBOR 3M + 4.250%(7) | | (B-, B2) | | 10/09/26 | | | 6.262 | | | | 745,313 | | |
| | 1,000 | | | Almonde, Inc.,
LIBOR 1M + 3.500%(7) | | (B-, B2) | | 06/13/24 | | | 5.696 | | | | 958,180 | | |
| | 1,242 | | | Compuware Corp.,
LIBOR 1M + 4.000%(7) | | (B, B2) | | 08/22/25 | | | 5.786 | | | | 1,248,593 | | |
| | 1,230 | | | Cypress Intermediate Holdings III, Inc.,
LIBOR 1M + 2.750%(7) | | (B, B2) | | 04/29/24 | | | 4.540 | | | | 1,211,934 | | |
| | 902 | | | Emerald TopCo, Inc.,
LIBOR 1M + 3.500%(7) | | (B, B2) | | 07/24/26 | | | 5.286 | | | | 889,273 | | |
| | 1,714 | | | Epicor Software Corp.,
LIBOR 1M + 3.250%(7) | | (B-, B2) | | 06/01/22 | | | 5.040 | | | | 1,710,324 | | |
| | 364 | | | Flexera Software LLC,
LIBOR 1M + 3.500%(7) | | (B-, B1) | | 02/26/25 | | | 5.290 | | | | 364,546 | | |
| | 1,535 | | | Flexera Software LLC,
LIBOR 1M + 7.250%(7) | | (CCC+, Caa1) | | 02/26/26 | | | 9.040 | | | | 1,539,049 | | |
| | 498 | | | Go Daddy Operating Company LLC,
LIBOR 1M + 1.750%(7) | | (BB, Ba1) | | 02/15/24 | | | 3.536 | | | | 499,441 | | |
| | 750 | | | Huskies Parent, Inc.,
LIBOR 1M + 4.000%(6),(7) | | (B-, B2) | | 07/31/26 | | | 5.786 | | | | 746,250 | | |
| | 1,244 | | | Hyland Software, Inc.,
LIBOR 1M + 7.000%(7) | | (CCC, Caa1) | | 07/07/25 | | | 8.786 | | | | 1,251,389 | | |
| | 1,244 | | | Hyland Software, Inc.,
LIBOR 1M + 3.250%(7) | | (B-, B1) | | 07/01/24 | | | 5.036 | | | | 1,238,388 | | |
| | 685 | | | MA FinanceCo. LLC,
LIBOR 1M + 2.250%(7) | | (BB-, B1) | | 11/19/21 | | | 4.050 | | | | 681,868 | | |
| | 45 | | | MA FinanceCo. LLC,
LIBOR 1M + 2.500%(7) | | (BB-, B1) | | 06/21/24 | | | 4.300 | | | | 43,398 | | |
| | 384 | | | Newport Group, Inc.,
LIBOR 3M + 3.750%(6),(7) | | (B, B2) | | 09/13/25 | | | 5.895 | | | | 381,778 | | |
| | 1,134 | | | Project Alpha Intermediate Holding, Inc.,
LIBOR 3M + 4.250%(7) | | (B, B3) | | 04/26/24 | | | 6.240 | | | | 1,133,528 | | |
| | 1,119 | | | Project Boost Purchaser, LLC,
LIBOR 1M + 3.500%(7) | | (B-, B2) | | 06/01/26 | | | 5.286 | | | | 1,102,773 | | |
| | 249 | | | Project Leopard Holdings, Inc.,
LIBOR 6M + 4.500%(7) | | (B, B2) | | 07/07/23 | | | 6.700 | | | | 249,677 | | |
| | 497 | | | Project Leopard Holdings, Inc.,
LIBOR 1M + 4.250%(7) | | (B, B2) | | 07/07/23 | | | 6.450 | | | | 496,253 | | |
| | 693 | | | Project Ruby Ultimate Parent Corp.,
LIBOR 1M + 3.500%(7) | | (B-, B2) | | 02/09/24 | | | 5.286 | | | | 684,428 | | |
See Accompanying Notes to Financial Statements.
29
Credit Suisse Strategic Income Fund
Schedule of Investments (continued)
October 31, 2019
Par
(000) | |
| | Ratings†
(S&P/Moody's) | | Maturity | | Rate% | | Value | |
| BANK LOANS (continued) | | | |
Software - Services | |
$ | 311 | | | S2P Acquisition Borrower, Inc.,
LIBOR 1M + 4.000%(7) | | (B-, B2) | | 08/14/26 | | | 5.786 | | | $ | 310,132 | | |
| | 497 | | | SolarWinds Holdings, Inc.,
LIBOR 1M + 2.750%(7) | | (B, B1) | | 02/05/24 | | | 4.536 | | | | 497,563 | | |
| | 226 | | | SS&C Technologies Holdings Europe Sarl,
LIBOR 1M + 2.250%(7) | | (BB+, Ba2) | | 04/16/25 | | | 4.036 | | | | 227,112 | | |
| | 347 | | | SS&C Technologies, Inc.,
LIBOR 1M + 2.250%(7) | | (BB+, Ba2) | | 04/16/25 | | | 4.036 | | | | 347,916 | | |
| | 1,700 | | | The Ultimate Software Group, Inc.,
LIBOR 1M + 3.750%(7) | | (B, B2) | | 05/04/26 | | | 5.536 | | | | 1,705,432 | | |
| | | | 20,264,538 | | |
| Specialty Retail (0.4%) | |
| | 680 | | | Champ Acquisition Corp.,
LIBOR 3M + 5.500%(7) | | (B, B1) | | 12/19/25 | | | 7.604 | | | | 680,808 | | |
| | 38 | | | Mister Car Wash Holdings, Inc.(8),(9) | | (NR, B2) | | 05/14/26 | | | 3.500 | | | | 38,037 | | |
| | 764 | | | Mister Car Wash Holdings, Inc.,
LIBOR 3M + 3.500%(7) | | (B-, B2) | | 05/14/26 | | | 5.658 | | | | 758,837 | | |
| | | | 1,477,682 | | |
| Steel Producers/Products (0.9%) | |
| | 1,203 | | | Atkore International, Inc.,
LIBOR 3M + 2.750%(7) | | (BB-, B2) | | 12/22/23 | | | 4.860 | | | | 1,202,962 | | |
| | 1,814 | | | Zekelman Industries, Inc.,
LIBOR 1M + 2.250%(7) | | (BB-, B1) | | 06/14/21 | | | 4.073 | | | | 1,813,185 | | |
| | | | 3,016,147 | | |
| Support - Services (2.5%) | |
| | 90 | | | Allied Universal Holdco LLC(9) | | (B-, B3) | | 07/10/26 | | | 2.125 | | | | 89,575 | | |
| | 910 | | | Allied Universal Holdco LLC,
LIBOR 6M + 4.250%(7) | | (B-, B3) | | 07/10/26 | | | 6.507 | | | | 904,710 | | |
| | 1,469 | | | Brand Energy & Infrastructure Services, Inc.,
LIBOR 3M + 4.250%(7) | | (B-, B3) | | 06/21/24 | | | 6.240 | | | | 1,429,837 | | |
| | 1,982 | | | Change Healthcare Holdings LLC,
LIBOR 1M + 2.500%(7) | | (B+, B1) | | 03/01/24 | | | 4.286 | | | | 1,972,786 | | |
| | 701 | | | Long Term Care Group, Inc.,
LIBOR 1M + 5.250%(7) | | (B, B3) | | 12/06/22 | | | 7.036 | | | | 686,769 | | |
| | 977 | | | Pike Corp.,
LIBOR 1M + 3.250%(7) | | (B, B2) | | 07/24/26 | | | 5.040 | | | | 978,878 | | |
| | 980 | | | SAI Global Holdings II (Australia) Pty. Ltd.,
LIBOR 3M + 4.500%(5),(7) | | (CCC, Caa1) | | 12/20/23 | | | 6.436 | | | | 872,115 | | |
| | 719 | | | Sedgwick Claims Management Services, Inc.,
LIBOR 1M + 3.250%(7) | | (B, B2) | | 12/31/25 | | | 5.036 | | | | 699,256 | | |
| | 470 | | | St. George's University Scholastic Services,
LIBOR 1M + 3.500%(7) | | (B+, B2) | | 07/17/25 | | | 5.290 | | | | 471,110 | | |
See Accompanying Notes to Financial Statements.
30
Credit Suisse Strategic Income Fund
Schedule of Investments (continued)
October 31, 2019
Par
(000) | |
| | Ratings†
(S&P/Moody's) | | Maturity | | Rate% | | Value | |
| BANK LOANS (continued) | | | |
Support - Services | |
$ | 327 | | | USS Ultimate Holdings, Inc.,
LIBOR 3M + 7.750%(7) | | (CCC+, Caa2) | | 08/25/25 | | | 9.950 | | | $ | 322,036 | | |
| | | | 8,427,072 | | |
| Tech Hardware & Equipment (0.2%) | |
| | 600 | | | CommScope, Inc.,
LIBOR 1M + 3.250%(7) | | (B+, Ba3) | | 04/06/26 | | | 5.036 | | | | 590,113 | | |
| Telecom - Wireless (0.5%) | |
| | 996 | | | Sprint Communications, Inc.,
LIBOR 1M + 2.500%(7) | | (BB-, Ba2) | | 02/02/24 | | | 4.313 | | | | 986,627 | | |
| | 746 | | | Sprint Communications, Inc.,
LIBOR 1M + 3.000%(7) | | (BB-, Ba2) | | 02/02/24 | | | 4.813 | | | | 742,976 | | |
| | | | 1,729,603 | | |
| Telecom - Wireline Integrated & Services (2.4%) | |
| | 490 | | | Altice Financing S.A.,
LIBOR 1M + 2.750%(7) | | (B+, B2) | | 01/31/26 | | | 4.596 | | | | 473,551 | | |
| | 499 | | | Altice France S.A.,
LIBOR 1M + 4.000%(7) | | (B, B2) | | 08/14/26 | | | 5.921 | | | | 492,329 | | |
| | 995 | | | Altice France S.A.,
LIBOR 1M + 3.688%(7) | | (B, B2) | | 01/31/26 | | | 5.609 | | | | 973,782 | | |
| | 1,496 | | | CenturyLink Inc.,
LIBOR 1M + 2.750%(7) | | (BBB-, Ba3) | | 01/31/25 | | | 4.536 | | | | 1,483,198 | | |
| | 649 | | | GTT Communications, Inc.,
LIBOR 1M + 2.750%(7) | | (B-, B2) | | 05/31/25 | | | 4.540 | | | | 486,082 | | |
| | 1,500 | | | Level 3 Financing, Inc.,
LIBOR 1M + 2.250%(7) | | (BBB-, Ba1) | | 02/22/24 | | | 4.036 | | | | 1,503,750 | | |
| | 1,629 | | | MTN Infrastructure TopCo, Inc.,
LIBOR 1M + 3.000%(7) | | (B, B2) | | 11/15/24 | | | 4.786 | | | | 1,611,633 | | |
| | 461 | | | TVC Albany, Inc.,
LIBOR 1M + 3.500%(7) | | (B-, B2) | | 07/23/25 | | | 5.290 | | | | 457,271 | | |
| | 438 | | | TVC Albany, Inc.,
LIBOR 1M + 7.500%(7) | | (CCC, Caa2) | | 07/23/26 | | | 9.290 | | | | 434,219 | | |
| | | | 7,915,815 | | |
| Theaters & Entertainment (1.7%) | |
| | 498 | | | AMC Entertainment Holdings, Inc.,
LIBOR 6M + 3.000%(7) | | (BB-, Ba2) | | 04/22/26 | | | 5.230 | | | | 497,916 | | |
| | 1,204 | | | Metro-Goldwyn-Mayer, Inc.,
LIBOR 1M + 4.500%(6),(7) | | (B-, B2) | | 07/03/26 | | | 6.290 | | | | 1,156,056 | | |
| | 1,806 | | | Technicolor S.A.,
LIBOR 3M + 2.750%(7) | | (B, B3) | | 12/06/23 | | | 4.874 | | | | 1,485,112 | | |
| | 171 | | | TopGolf International, Inc.,
LIBOR 1M + 5.500%(7) | | (B-, B3) | | 02/08/26 | | | 7.421 | | | | 172,555 | | |
See Accompanying Notes to Financial Statements.
31
Credit Suisse Strategic Income Fund
Schedule of Investments (continued)
October 31, 2019
Par
(000) | |
| | Ratings†
(S&P/Moody's) | | Maturity | | Rate% | | Value | |
| BANK LOANS (continued) | | | |
Theaters & Entertainment | |
$ | 2,493 | | | William Morris Endeavor Entertainment LLC,
LIBOR 1M + 2.750%(7) | | (B, B2) | | 05/18/25 | | | 4.600 | | | $ | 2,414,988 | | |
| | | | 5,726,627 | | |
| Trucking & Delivery (0.4%) | |
| | 423 | | | International Seaways, Inc.,
LIBOR 3M + 6.000%(7) | | (B+, B3) | | 06/22/22 | | | 7.790 | | | | 424,905 | | |
| | 987 | | | Transplace Holdings, Inc.,
LIBOR 1M + 3.750%(7) | | (B-, B1) | | 10/07/24 | | | 5.554 | | | | 966,389 | | |
| | | | 1,391,294 | | |
| TOTAL BANK LOANS (Cost $164,310,887) | | | 159,238,422 | | |
| ASSET BACKED SECURITIES (4.4%) | | | |
| Collateralized Debt Obligations (4.4%) | |
| | 500 | | | BlueMountain CLO 2016-2 Ltd.,
2016-2A, Rule 144A,
LIBOR 3M + 7.790%(1),(7) | | (BB-, NR) | | 08/20/32 | | | 9.926 | | | | 485,724 | | |
| | 500 | | | BlueMountain CLO 2018-1 Ltd.,
2018-1A, Rule 144A,
LIBOR 3M + 2.050%(1),(7) | | (A, NR) | | 07/30/30 | | | 3.986 | | | | 479,345 | | |
| | 750 | | | BlueMountain Fuji U.S. CLO III Ltd.,
2017-3A, Rule 144A,
LIBOR 3M + 5.200%(1),(7) | | (BB-, NR) | | 01/15/30 | | | 7.201 | | | | 659,792 | | |
| | 750 | | | Carlyle Global Market Strategies CLO Ltd.,
2014-3RA, Rule 144A,
LIBOR 3M + 5.400%(1),(7) | | (BB-, NR) | | 07/27/31 | | | 7.356 | | | | 610,546 | | |
| | 500 | | | Carlyle Global Market Strategies CLO Ltd.,
2015-2A, Rule 144A,
LIBOR 3M + 6.150%(1),(7) | | (NR, B1) | | 04/27/27 | | | 8.086 | | | | 464,046 | | |
| | 500 | | | Carlyle U.S. CLO Ltd.,
2017-2A, Rule 144A(1),(5),(9),(10) | | (NR, NR) | | 07/20/31 | | | 0.000 | | | | 341,101 | | |
| | 750 | | | CIFC Funding Ltd.,
2014-1A, Rule 144A,
LIBOR 3M + 5.850%(1),(7) | | (BB-, NR) | | 01/18/31 | | | 7.853 | | | | 638,189 | | |
| | 750 | | | Goldentree Loan Opportunities XI Ltd.,
2015-11A, Rule 144A,
LIBOR 3M + 5.400%(1),(7) | | (NR, Ba3) | | 01/18/31 | | | 7.403 | | | | 673,715 | | |
| | 750 | | | Greywolf CLO II Ltd.,
2013-1A, Rule 144A,
LIBOR 3M + 6.350%(1),(7) | | (BB-, NR) | | 10/15/29 | | | 8.351 | | | | 682,421 | | |
| | 750 | | | Greywolf CLO V Ltd.,
2015-1A, Rule 144A,
LIBOR 3M + 5.850%(1),(7) | | (BB-, NR) | | 01/27/31 | | | 7.790 | | | | 669,704 | | |
See Accompanying Notes to Financial Statements.
32
Credit Suisse Strategic Income Fund
Schedule of Investments (continued)
October 31, 2019
Par
(000) | |
| | Ratings†
(S&P/Moody's) | | Maturity | | Rate% | | Value | |
| ASSET BACKED SECURITIES (continued) | | | |
Collateralized Debt Obligations | |
$ | 750 | | | Greywolf CLO VI Ltd.,
2018-1A, Rule 144A,
LIBOR 3M + 5.750%(1),(7) | | (BB-, NR) | | 04/26/31 | | | 7.686 | | | $ | 670,669 | | |
| | 500 | | | Halcyon Loan Advisors Funding Ltd.,
2015-2A, Rule 144A(1),(5),(9),(10) | | (NR, NR) | | 07/25/27 | | | 0.000 | | | | 79,273 | | |
| | 500 | | | JFIN CLO Ltd.,
2013-1A, Rule 144A,
LIBOR 3M + 4.750%(1),(7) | | (BB, NR) | | 01/20/25 | | | 6.716 | | | | 476,570 | | |
| | 500 | | | KKR CLO Ltd.,
20, Rule 144A,
LIBOR 3M + 5.500%(1),(7) | | (NR, Ba3) | | 10/16/30 | | | 7.501 | | | | 426,164 | | |
| | 750 | | | KKR Financial CLO Ltd.,
2013-1A, Rule 144A,
LIBOR 3M + 6.080%(1),(7) | | (NR, Ba3) | | 04/15/29 | | | 8.081 | | | | 636,306 | | |
| | 750 | | | Octagon Investment Partners 31 LLC,
2017-1A, Rule 144A,
LIBOR 3M + 6.30%(1),(7) | | (NR, Ba3) | | 07/20/30 | | | 8.266 | | | | 687,261 | | |
| | 500 | | | Shackleton CLO Ltd.,
2014-6RA, Rule 144A,
LIBOR 3M + 2.970%(1),(7) | | (NR, Baa3) | | 07/17/28 | | | 4.972 | | | | 480,747 | | |
| | 750 | | | Symphony Credit Opportunities Fund Ltd.,
2015-2A, Rule 144A,
LIBOR 3M + 3.060%(1),(7) | | (NR, Baa3) | | 07/15/28 | | | 5.061 | | | | 723,384 | | |
| | 750 | | | THL Credit Wind River CLO Ltd.,
2015-2A, Rule 144A,
LIBOR 3M + 5.550%(1),(7) | | (NR, Ba3) | | 10/15/27 | | | 7.536 | | | | 680,102 | | |
| | 1,000 | | | TICP CLO XIII Ltd.,
2019-13A, Rule 144A,
LIBOR 3M + 6.750%(1),(7) | | (NR, Ba3) | | 07/15/32 | | | 9.115 | | | | 980,774 | | |
| | 500 | | | Venture 35 CLO Ltd.,
2018-35A, Rule 144A,
LIBOR 3M + 3.500%(1),(7) | | (NR, Baa3) | | 10/22/31 | | | 5.453 | | | | 457,308 | | |
| | 750 | | | Venture CDO Ltd.,
2016 24A, Rule 144A,
LIBOR 3M + 3.900%(1),(7) | | (NR, Baa2) | | 10/20/28 | | | 5.866 | | | | 750,125 | | |
| | 500 | | | Venture XXVIII CLO Ltd.,
2017-28A, Rule 144A,
LIBOR 3M + 6.150%(1),(7) | | (NR, Ba3) | | 07/20/30 | | | 8.116 | | | | 438,466 | | |
| | 500 | | | Vibrant CLO V Ltd.,
2016-5A, Rule 144A,
LIBOR 3M + 7.000%(1),(7) | | (NR, Ba3) | | 01/20/29 | | | 8.966 | | | | 423,113 | | |
| | 750 | | | Vibrant CLO VI Ltd.,
2017-6A, Rule 144A,
LIBOR 3M + 5.750%(1),(7) | | (NR, Ba3) | | 06/20/29 | | | 7.906 | | | | 659,085 | | |
See Accompanying Notes to Financial Statements.
33
Credit Suisse Strategic Income Fund
Schedule of Investments (continued)
October 31, 2019
Par
(000) | |
| | Ratings†
(S&P/Moody's) | | Maturity | | Rate% | | Value | |
| ASSET BACKED SECURITIES (continued) | | | |
Collateralized Debt Obligations | |
$ | 500 | | | Voya CLO Ltd.,
2014-4A, Rule 144A,
LIBOR 3M + 3.350%(1),(7) | | (BBB-, NR) | | 07/14/31 | | | 5.351 | | | $ | 466,449 | | |
| TOTAL ASSET BACKED SECURITIES (Cost $16,535,998) | | | 14,740,379 | | |
Number of
Shares | |
| |
| |
| |
| |
| |
| COMMON STOCKS (0.5%) | | | |
| Auto Parts & Equipment (0.2%) | |
| | 23,014 | | | UCI International, Inc.(4),(5),(6) | | | | | | | | | | | | | | | 517,815 | | |
| Building & Construction (0.0%) | |
| | 2 | | | White Forest Resources, Inc.(4),(5),(6) | | | | | | | | | | | | | | | — | | |
| Building Materials (0.1%) | |
| | 60,000 | | | Cornerstone Building Brands, Inc.(11) | | | | | | | | | | | | | | | 375,000 | | |
| | 2,935 | | | Euramax International, Inc.(4),(6),(11) | | | | | | | | | | | | | | | 85,112 | | |
| | | | 460,112 | | |
| Chemicals (0.1%) | |
| | 1,512 | | | Project Investor Holdings LLC(4),(5),(6),(11) | | | | | | | | | | | | | | | 15 | | |
| | 25,202 | | | Proppants Holdings LLC(4),(5),(6) | | | | | | | | | | | | | | | 230,850 | | |
| | | | 230,865 | | |
| Energy - Exploration & Production (0.0%) | |
| | 54,344 | | | Independence Contract Drilling, Inc.(11) | | | | | | | | | | | | | | | 48,366 | | |
| | 37,190 | | | PES Energy, Inc.(5) | | | | | | | | | | | | | | | 4,649 | | |
| | | | 53,015 | | |
| Health Services (0.0%) | |
| | 19,765 | | | Valitas Health Services, Inc.(4),(6),(11) | | | | | | | | | | | | | | | 198 | | |
| Metals & Mining - Excluding Steel (0.1%) | |
| | 1,100,000 | | | Taseko Mines Ltd.(11) | | | | | | | | | | | | | | | 435,196 | | |
| Support - Services (0.0%) | |
| | 87 | | | Sprint Industrial Holdings LLC, Class G(4),(5),(6) | | | | | | | | | | | | | | | — | | |
| | 8 | | | Sprint Industrial Holdings LLC, Class H(4),(5),(6) | | | | | | | | | | | | | | | — | | |
| | 19 | | | Sprint Industrial Holdings LLC, Class I(4),(5),(6) | | | | | | | | | | | | | | | — | | |
| | | | 0 | | |
| TOTAL COMMON STOCKS (Cost $2,922,025) | | | 1,697,201 | | |
See Accompanying Notes to Financial Statements.
34
Credit Suisse Strategic Income Fund
Schedule of Investments (continued)
October 31, 2019
Number of
Shares | |
| |
| |
| |
| | Value | |
| WARRANTS (0.0%) | |
| Chemicals (0.0%) | |
| | 6,300 | | | Project Investor Holdings LLC,
expires 02/20/2022(4),(5),(6),(11) | | | | | | | | | | | | | | $ | — | | |
| Diversified Capital Goods (0.0%) | |
| | 5,506 | | | Horizon Global Corp. expires 06/30/2021(11) | | | | | | | | | | | | | | | 12,884 | | |
| TOTAL WARRANTS (Cost $3,276) | | | 12,884 | | |
| TOTAL INVESTMENTS AT VALUE (95.7%) (Cost $328,359,962) | | | 319,774,997 | | |
| OTHER ASSETS IN EXCESS OF LIABILITIES (4.3%) | | | 14,308,262 | | |
| NET ASSETS (100.0%) | | $ | 334,083,259 | | |
† Credit ratings given by the S&P Global Ratings Division of S&P Global Inc. ("S&P") and Moody's Investors Service, Inc. ("Moody's") are unaudited.
(1) Security exempt from registration under Rule 144A of the Securities Act of 1933, as amended. These securities may be resold in transactions exempt from registration, normally to qualified institutional buyers. At October 31, 2019, these securities amounted to a value of $133,798,491 or 40.0% of net assets.
(2) PIK: Payment-in-kind security for which part of the income earned may be paid as additional principal.
(3) Bond is currently in default.
(4) Not readily marketable security; security is valued at fair value as determined in good faith by, or under the direction of, the Board of Trustees.
(5) Illiquid security (unaudited).
(6) Security is valued using significant unobservable inputs.
(7) Variable rate obligation — The interest rate shown is the rate in effect as of October 31, 2019.
(8) The rates on certain variable rate securities are not based on a published reference rate and spread but are determined by the issuer or agent and are based on current market conditions. These securities do not indicate a reference rate and spread in their description above. The interest rate shown is the rate in effect as of October 31, 2019.
(9) All or a portion is an unfunded loan commitment (See note 2-I).
(10) Securities are zero coupon. Rate presented is yield to maturity as of October 31, 2019.
(11) Non-income producing security.
INVESTMENT ABBREVIATIONS
12M = 12 Month
1M = 1 Month
3M = 3 Month
6M = 6 Month
LIBOR = London Interbank Offered Rate
NR = Not Rated
Sarl - société à responsabilité limitée
See Accompanying Notes to Financial Statements.
35
Credit Suisse Strategic Income Fund
Schedule of Investments (continued)
October 31, 2019
Forward Foreign Currency Contracts | |
Forward
Currency to be
Purchased (Local) | | Forward
Currency to be
Sold (Local) | | Expiration
Date | | Counterparty | | Value on
Settlement Date | | Current
Value/
Notional | | Net Unrealized
Appreciation
(Depreciation) | |
CAD | 66,000 | | | USD | 50,139 | | | 10/13/20 | | Deutsche Bank AG | | $ | 50,139 | | | $ | 50,211 | | | $ | 72 | | |
USD | 488,198 | | | CAD | 649,000 | | | 10/13/20 | | Morgan Stanley | | | (488,198 | ) | | | (493,743 | ) | | | (5,545 | ) | |
| | | $ | (5,473 | ) | |
Currency Abbreviations:
CAD = Canadian Dollar
USD = United States Dollar
See Accompanying Notes to Financial Statements.
36
Credit Suisse Strategic Income Fund
Statement of Assets and Liabilities
October 31, 2019
Assets | |
Investments at value (Cost $328,359,962) (Note 2) | | $ | 319,774,997 | | |
Cash | | | 17,496,875 | | |
Interest receivable | | | 3,235,092 | | |
Receivable for Fund shares sold | | | 913,167 | | |
Receivable for investments sold | | | 416,479 | | |
Unrealized appreciation on forward foreign currency contracts (Note 2) | | | 72 | | |
Prepaid expenses and other assets | | | 42,408 | | |
Total assets | | | 341,879,090 | | |
Liabilities | |
Investment advisory fee payable (Note 3) | | | 198,130 | | |
Administrative services fee payable (Note 3) | | | 16,617 | | |
Shareholder servicing/Distribution fee payable (Note 3) | | | 56,148 | | |
Payable for investments purchased | | | 6,606,832 | | |
Payable for Fund shares redeemed | | | 633,686 | | |
Dividend payable | | | 75,647 | | |
Unfunded loan commitments (Note 2) | | | 38,300 | | |
Trustees' fee payable | | | 16,998 | | |
Unrealized depreciation on forward foreign currency contracts (Note 2) | | | 5,545 | | |
Accrued expenses | | | 147,928 | | |
Total liabilities | | | 7,795,831 | | |
Net Assets | |
Capital stock, $.001 par value (Note 6) | | | 33,824 | | |
Paid-in capital (Note 6) | | | 350,089,707 | | |
Total distributable earnings (loss) | | | (16,040,272 | ) | |
Net assets | | $ | 334,083,259 | | |
I Shares | |
Net assets | | $ | 230,330,248 | | |
Shares outstanding | | | 23,323,121 | | |
Net asset value, offering price and redemption price per share | | $ | 9.88 | | |
A Shares | |
Net assets | | $ | 50,343,049 | | |
Shares outstanding | | | 5,096,074 | | |
Net asset value and redemption price per share | | $ | 9.88 | | |
Maximum offering price per share (net asset value/(1-4.75%)) | | $ | 10.37 | | |
C Shares | |
Net assets | | $ | 53,409,962 | | |
Shares outstanding | | | 5,405,278 | | |
Net asset value, offering price and redemption price per share | | $ | 9.88 | | |
See Accompanying Notes to Financial Statements.
37
Credit Suisse Strategic Income Fund
Statement of Operations
For the Year Ended October 31, 2019
Investment Income | |
Interest | | $ | 19,107,414 | | |
Dividends | | | 8,010 | | |
Total investment income | | | 19,115,424 | | |
Expenses | |
Investment advisory fees (Note 3) | | | 2,527,169 | | |
Administrative services fees (Note 3) | | | 95,899 | | |
Shareholder servicing/Distribution fees (Note 3) | |
Class A | | | 121,213 | | |
Class C | | | 497,710 | | |
Transfer agent fees (Note 3) | | | 230,196 | | |
Audit and tax fees | | | 67,765 | | |
Registration fees | | | 66,663 | | |
Custodian fees | | | 62,926 | | |
Trustees' fees | | | 61,767 | | |
Printing fees | | | 49,970 | | |
Legal fees | | | 47,281 | | |
Commitment fees (Note 4) | | | 40,591 | | |
Insurance expense | | | 5,237 | | |
Miscellaneous expense | | | 14,188 | | |
Total expenses | | | 3,888,575 | | |
Less: fees waived (Note 3) | | | (291,203 | ) | |
Net expenses | | | 3,597,372 | | |
Net investment income | | | 15,518,052 | | |
Net Realized and Unrealized Gain (Loss) from Investments
and Foreign Currency Related Items | |
Net realized loss from investments | | | (464,287 | ) | |
Net realized loss from foreign currency transactions | | | (32,559 | ) | |
Net realized gain from forward foreign currency contracts | | | 129,176 | | |
Net change in unrealized appreciation (depreciation) from investments | | | (2,661,494 | ) | |
Net change in unrealized appreciation (depreciation) from foreign currency translations | | | 22,894 | | |
Net change in unrealized appreciation (depreciation) from forward foreign currency contracts | | | (51,308 | ) | |
Net realized and unrealized loss from investments and foreign currency related items | | | (3,057,578 | ) | |
Net increase in net assets resulting from operations | | $ | 12,460,474 | | |
See Accompanying Notes to Financial Statements.
38
Credit Suisse Strategic Income Fund
Statements of Changes in Net Assets
| | | For the Year
Ended
October 31, 2019 | | For the Year
Ended
October 31, 2018 | |
From Operations | |
Net investment income | | $ | 15,518,052 | | | $ | 10,906,459 | | |
Net realized loss from investments, forward foreign currency contracts
and foreign currency transactions | | | (367,670 | ) | | | (975,833 | ) | |
Net change in unrealized appreciation (depreciation) from investments,
forward foreign currency contracts and foreign currency translations | | | (2,689,908 | ) | | | (5,481,740 | ) | |
Net increase in net assets resulting from operations | | | 12,460,474 | | | | 4,448,886 | | |
From Distributions | |
From distributable earnings | | | | | |
Class I | | | (10,684,898 | ) | | | (7,172,692 | ) | |
Class A | | | (2,448,231 | ) | | | (1,985,570 | ) | |
Class C | | | (2,143,869 | ) | | | (1,694,777 | ) | |
Return of Capital | | | | | |
Class I | | | (163,611 | ) | | | (26,230 | ) | |
Class A | | | (37,488 | ) | | | (7,261 | ) | |
Class C | | | (32,828 | ) | | | (6,198 | ) | |
Net decrease in net assets resulting from distributions | | | (15,510,925 | ) | | | (10,892,728 | ) | |
| From Capital Share Transactions (Note 6) | |
Proceeds from sale of shares | | | 192,306,895 | | | | 188,618,647 | | |
Reinvestment of dividends | | | 14,727,482 | | | | 9,932,376 | | |
Net asset value of shares redeemed | | | (136,604,533 | ) | | | (108,380,424 | ) | |
Net increase in net assets from capital share transactions | | | 70,429,844 | | | | 90,170,599 | | |
Net increase in net assets | | | 67,379,393 | | | | 83,726,757 | | |
Net Assets | |
Beginning of year | | | 266,703,866 | | | | 182,977,109 | | |
End of year | | $ | 334,083,259 | | | $ | 266,703,866 | | |
See Accompanying Notes to Financial Statements.
39
Credit Suisse Strategic Income Fund
Financial Highlights
(For a Class I Share of the Fund Outstanding Throughout Each Year)
| | | For the Year Ended October 31, | |
| | | 2019 | | 2018 | | 2017 | | 2016 | | 2015 | |
Per share data | |
Net asset value, beginning of year | | $ | 9.96 | | | $ | 10.24 | | | $ | 9.73 | | | $ | 9.78 | | | $ | 10.46 | | |
INVESTMENT OPERATIONS | |
Net investment income1 | | | 0.53 | | | | 0.51 | | | | 0.54 | | | | 0.71 | | | | 0.66 | | |
Net gain (loss) from investments and foreign currency
related items (both realized and unrealized) | | | (0.08 | ) | | | (0.27 | ) | | | 0.52 | | | | (0.04 | ) | | | (0.46 | ) | |
Total from investment operations | | | 0.45 | | | | 0.24 | | | | 1.06 | | | | 0.67 | | | | 0.20 | | |
LESS DIVIDENDS AND DISTRIBUTIONS | |
Dividends from net investment income | | | (0.52 | ) | | | (0.52 | ) | | | (0.53 | ) | | | (0.72 | ) | | | (0.60 | ) | |
Distributions from net realized gains | | | — | | | | — | | | | — | | | | — | | | | (0.22 | ) | |
Return of capital | | | (0.01 | ) | | | (0.00 | )2 | | | (0.02 | ) | | | — | | | | (0.06 | ) | |
Total dividends and distributions | | | (0.53 | ) | | | (0.52 | ) | | | (0.55 | ) | | | (0.72 | ) | | | (0.88 | ) | |
Net asset value, end of year | | $ | 9.88 | | | $ | 9.96 | | | $ | 10.24 | | | $ | 9.73 | | | $ | 9.78 | | |
Total return3 | | | 4.68 | % | | | 2.34 | % | | | 11.11 | % | | | 7.40 | % | | | 2.05 | % | |
RATIOS AND SUPPLEMENTAL DATA | |
Net assets, end of year (000s omitted) | | $ | 230,330 | | | $ | 175,189 | | | $ | 114,605 | | | $ | 60,899 | | | $ | 65,651 | | |
Ratio of net expenses to average net assets | | | 0.99 | % | | | 0.99 | % | | | 0.99 | % | | | 1.00 | % | | | 1.00 | % | |
Ratio of expenses to average net assets
excluding interest expense | | | 0.99 | % | | | 0.99 | % | | | 0.99 | % | | | 0.99 | % | | | 0.99 | % | |
Ratio of net investment income to average net assets | | | 5.36 | % | | | 5.08 | % | | | 5.34 | % | | | 7.64 | % | | | 6.59 | % | |
Decrease reflected in above operating expense
ratios due to waivers/reimbursements | | | 0.10 | % | | | 0.17 | % | | | 0.26 | % | | | 0.29 | % | | | 0.16 | % | |
Portfolio turnover rate | | | 37 | % | | | 45 | % | | | 79 | % | | | 73 | % | | | 85 | % | |
1 Per share information is calculated using the average shares outstanding method.
2 This amount represents less than $0.01 or $(0.01) per share.
3 Total returns are historical and include change in share price and reinvestment of all dividends and distributions. Had certain expenses not been reduced during the periods shown, total returns would have been lower.
See Accompanying Notes to Financial Statements.
40
Credit Suisse Strategic Income Fund
Financial Highlights
(For a Class A Share of the Fund Outstanding Throughout Each Year)
| | | For the Year Ended October 31, | |
| | | 2019 | | 2018 | | 2017 | | 2016 | | 2015 | |
Per share data | |
Net asset value, beginning of year | | $ | 9.96 | | | $ | 10.24 | | | $ | 9.74 | | | $ | 9.79 | | | $ | 10.47 | | |
INVESTMENT OPERATIONS | |
Net investment income1 | | | 0.51 | | | | 0.49 | | | | 0.51 | | | | 0.64 | | | | 0.55 | | |
Net gain (loss) from investments and foreign currency
related items (both realized and unrealized) | | | (0.08 | ) | | | (0.28 | ) | | | 0.51 | | | | 0.002 | | | | (0.38 | ) | |
Total from investment operations | | | 0.43 | | | | 0.21 | | | | 1.02 | | | | 0.64 | | | | 0.17 | | |
LESS DIVIDENDS AND DISTRIBUTIONS | |
Dividends from net investment income | | | (0.50 | ) | | | (0.49 | ) | | | (0.50 | ) | | | (0.69 | ) | | | (0.57 | ) | |
Distributions from net realized gains | | | — | | | | — | | | | — | | | | — | | | | (0.22 | ) | |
Return of capital | | | (0.01 | ) | | | (0.00 | )2 | | | (0.02 | ) | | | — | | | | (0.06 | ) | |
Total dividends and distributions | | | (0.51 | ) | | | (0.49 | ) | | | (0.52 | ) | | | (0.69 | ) | | | (0.85 | ) | |
Net asset value, end of year | | $ | 9.88 | | | $ | 9.96 | | | $ | 10.24 | | | $ | 9.74 | | | $ | 9.79 | | |
Total return3 | | | 4.42 | % | | | 2.09 | % | | | 10.71 | % | | | 7.12 | % | | | 1.78 | % | |
RATIOS AND SUPPLEMENTAL DATA | |
Net assets, end of year (000s omitted) | | $ | 50,343 | | | $ | 44,930 | | | $ | 36,961 | | | $ | 8,447 | | | $ | 66,244 | | |
Ratio of net expenses to average net assets | | | 1.24 | % | | | 1.24 | % | | | 1.24 | % | | | 1.25 | % | | | 1.24 | % | |
Ratio of expenses to average net assets
excluding interest expense | | | 1.24 | % | | | 1.24 | % | | | 1.24 | % | | | 1.24 | % | | | 1.24 | % | |
Ratio of net investment income to average net assets | | | 5.13 | % | | | 4.84 | % | | | 4.99 | % | | | 6.73 | % | | | 5.45 | % | |
Decrease reflected in above operating expense
ratios due to waivers/reimbursements | | | 0.10 | % | | | 0.17 | % | | | 0.26 | % | | | 0.29 | % | | | 0.16 | % | |
Portfolio turnover rate | | | 37 | % | | | 45 | % | | | 79 | % | | | 73 | % | | | 85 | % | |
1 Per share information is calculated using the average shares outstanding method.
2 This amount represents less than $0.01 or $(0.01) per share.
3 Total returns are historical and include change in share price, reinvestment of all dividends and distributions and no sales charge. Had certain expenses not been reduced during the years shown, total returns would have been lower.
See Accompanying Notes to Financial Statements.
41
Credit Suisse Strategic Income Fund
Financial Highlights
(For a Class C Share of the Fund Outstanding Throughout Each Year)
| | | For the Year Ended October 31, | |
| | | 2019 | | 2018 | | 2017 | | 2016 | | 2015 | |
Per share data | |
Net asset value, beginning of year | | $ | 9.961 | | | $ | 10.24 | | | $ | 9.74 | | | $ | 9.79 | | | $ | 10.471 | | |
INVESTMENT OPERATIONS | |
Net investment income2 | | | 0.43 | | | | 0.41 | | | | 0.43 | | | | 0.63 | | | | 0.55 | | |
Net gain (loss) from investments and foreign currency
related items (both realized and unrealized) | | | (0.08 | ) | | | (0.28 | ) | | | 0.52 | | | | (0.06 | ) | | | (0.45 | ) | |
Total from investment operations | | | 0.35 | | | | 0.13 | | | | 0.95 | | | | 0.57 | | | | 0.10 | | |
LESS DIVIDENDS AND DISTRIBUTIONS | |
Dividends from net investment income | | | (0.42 | ) | | | (0.41 | ) | | | (0.43 | ) | | | (0.62 | ) | | | (0.51 | ) | |
Distributions from net realized gains | | | — | | | | — | | | | — | | | | — | | | | (0.22 | ) | |
Return of capital | | | (0.01 | ) | | | (0.00 | )3 | | | (0.02 | ) | | | — | | | | (0.05 | ) | |
Total dividends and distributions | | | (0.43 | ) | | | (0.41 | ) | | | (0.45 | ) | | | (0.62 | ) | | | (0.78 | ) | |
Net asset value, end of year | | $ | 9.88 | | | $ | 9.961 | | | $ | 10.24 | | | $ | 9.74 | | | $ | 9.79 | | |
Total return4 | | | 3.64 | % | | | 1.33 | % | | | 9.88 | % | | | 6.33 | % | | | 1.14 | % | |
RATIOS AND SUPPLEMENTAL DATA | |
Net assets, end of year (000s omitted) | | $ | 53,410 | | | $ | 46,586 | | | $ | 31,411 | | | $ | 6,673 | | | $ | 3,022 | | |
Ratio of net expenses to average net assets | | | 1.99 | % | | | 1.99 | % | | | 1.99 | % | | | 2.00 | % | | | 2.00 | % | |
Ratio of expenses to average net assets
excluding interest expense | | | 1.99 | % | | | 1.99 | % | | | 1.99 | % | | | 1.99 | % | | | 1.99 | % | |
Ratio of net investment income to average net assets | | | 4.38 | % | | | 4.09 | % | | | 4.25 | % | | | 6.70 | % | | | 5.52 | % | |
Decrease reflected in above operating expense
ratios due to waivers/reimbursements | | | 0.10 | % | | | 0.17 | % | | | 0.26 | % | | | 0.29 | % | | | 0.16 | % | |
Portfolio turnover rate | | | 37 | % | | | 45 | % | | | 79 | % | | | 73 | % | | | 85 | % | |
1 Includes adjustments in accordance with accounting principles generally accepted in the United States of America and as such, the net asset values for financial reporting purposes and the returns based upon net asset values may differ from the net asset values and returns for shareholder transactions.
2 Per share information is calculated using the average shares outstanding method.
3 This amount represents less than $0.01 or $(0.01) per share.
4 Total returns are historical and include change in share price, reinvestment of all dividends and distributions and no sales charge. Had certain expenses not been reduced during the years shown, total returns would have been lower.
See Accompanying Notes to Financial Statements.
42
Credit Suisse Strategic Income Fund
Notes to Financial Statements
October 31, 2019
Credit Suisse Strategic Income Fund (the "Fund"), a series of Credit Suisse Opportunity Funds (the "Trust"), a Delaware statutory trust, is registered under the Investment Company Act of 1940, as amended (the "1940 Act"), as a non-diversified open-end management investment company that seeks total return. The Trust was organized under the laws of the State of Delaware as a business trust on May 31, 1995.
The Fund offers three classes of shares: Class I shares, Class A shares and Class C shares. Each class of shares represents an equal pro rata interest in the Fund, except the share classes bear different expenses. Class A shares are sold subject to a front-end sales charge of up to 4.75%. Class C shares are sold subject to a contingent deferred sales charge ("CDSC") of 1.00% if the shares are redeemed within the first year of purchase. Class I shares are sold without a sales charge.
Note 2. Significant Accounting Policies
The following is a summary of significant accounting policies followed by the Fund in the preparation of its financial statements. The policies are in accordance with generally accepted accounting principles in the United States of America ("GAAP"). The preparation of financial statements requires management to make estimates and assumptions that affect the reported amounts and disclosures in the financial statements. Actual results could differ from those estimates. The Fund is considered an investment company for financial reporting purposes under GAAP and follows the accounting and reporting guidance in Financial Accounting Standards Board ("FASB") Accounting Standards Codification ("ASC") Topic 946 — Financial Services — Investment Companies.
A) SECURITY VALUATION — The Board of Trustees (the "Board") is responsible for the Fund's valuation process. The Board has delegated the supervision of the daily valuation process to Credit Suisse Asset Management, LLC, the Fund's investment adviser ("Credit Suisse" or the "Adviser"), who has established a Pricing Committee which, pursuant to the policies adopted by the Board, is responsible for making fair valuation determinations and overseeing the Fund's pricing policies. The net asset value of the Fund is determined daily as of the close of regular trading on the New York Stock Exchange, Inc. (the "Exchange") on each day the Exchange is open for business. The valuations for fixed income securities (which may include, but are not limited to, corporate, government, municipal, mortgage-backed, collateralized mortgage obligations and asset-backed securities) and certain derivative
43
Credit Suisse Strategic Income Fund
Notes to Financial Statements (continued)
October 31, 2019
Note 2. Significant Accounting Policies (continued)
instruments are typically the prices supplied by independent third party pricing services, which may use market prices or broker/dealer quotations or a variety of valuation techniques and methodologies. The independent third party pricing services use inputs that are observable such as issuer details, interest rates, yield curves, prepayment speeds, credit risks/spreads, default rates and quoted prices for similar securities. These pricing services generally price fixed income securities assuming orderly transactions of an institutional "round lot" size, but some trades occur in smaller "odd lot" sizes which may be effected at lower prices than institutional round lot trades. Structured note agreements are valued in accordance with a dealer-supplied valuation based on changes in the value of the underlying index. Futures contracts are valued daily at the settlement price established by the board of trade or exchange on which they are traded. Forward contracts are valued at the London closing spot rates and the London closing forward point rates on a daily basis. The currency forward contract pricing model derives the differential in point rates to the expiration date of the forward and calculates its present value. Equity securities for which market quotations are available are valued at the last reported sales price or official closing price on the primary market or exchange on which they trade. The Fund may utilize a service provided by an independent third party which has been approved by the Board to fair value certain securities. When fair value pricing is employed, the prices of securities used by the Fund to calculate its net asset value may differ from quoted or published prices for the same securities. If independent third party pricing services are unable to supply prices for a portfolio investment, or if the prices supplied are deemed by the investment adviser to be unreliable, the market price may be determined by the investment adviser using quotations from one or more brokers/dealers or at the transaction price if the security has recently been purchased and no value has yet been obtained from a pricing service or pricing broker. When reliable prices are not readily available, such as when the value of a security has been significantly affected by events after the close of the exchange or market on which the security is principally traded, but before the Fund calculates its net asset value, these securities will be fair valued in good faith by the Pricing Committee, in accordance with procedures adopted by the Board.
The Fund uses valuation techniques to measure fair value that are consistent with the market approach and/or income approach, depending on the type of security and the particular circumstance. The market approach uses prices and other relevant information generated by market transactions involving
44
Credit Suisse Strategic Income Fund
Notes to Financial Statements (continued)
October 31, 2019
Note 2. Significant Accounting Policies (continued)
identical or comparable securities. The income approach uses valuation techniques to discount estimated future cash flows to present value.
GAAP established a disclosure hierarchy that categorizes the inputs to valuation techniques used to value assets and liabilities at each measurement date. These inputs are summarized in the three broad levels listed below:
• Level 1 – quoted prices in active markets for identical investments
• Level 2 – other significant observable inputs (including quoted prices for similar investments, interest rates, prepayment speeds, credit risk, etc.)
• Level 3 – significant unobservable inputs (including the Fund's own assumptions in determining the fair value of investments)
The inputs or methodologies used to value securities are not necessarily an indication of the risk associated with investing in those securities.
The following is a summary of the inputs used as of October 31, 2019 in valuing the Fund's assets and liabilities carried at fair value:
Assets | | Level 1 | | Level 2 | | Level 3 | | Total | |
Investments in Securities | |
Corporate Bonds | | $ | — | | | $ | 144,085,405 | | | $ | 706 | | | $ | 144,086,111 | | |
Bank Loans | | | — | | | | 139,722,785 | | | | 19,515,637 | | | | 159,238,422 | | |
Asset Backed Securities | | | — | | | | 14,740,379 | | | | — | | | | 14,740,379 | | |
Common Stocks | | | 858,562 | | | | 4,649 | | | | 833,990 | (1) | | | 1,697,201 | (1) | |
Warrants | | | — | | | | 12,884 | | | | — | (1) | | | 12,884 | (1) | |
| | | $ | 858,562 | | | $ | 298,566,102 | | | $ | 20,350,333 | (1) | | $ | 319,774,997 | (1) | |
Other Financial Instruments* | |
Forward Foreign Currency Contracts | | $ | — | | | $ | 72 | | | $ | — | | | $ | 72 | | |
Liabilities | | Level 1 | | Level 2 | | Level 3 | | Total | |
Other Financial Instruments* | |
Forward Foreign Currency Contracts | | $ | — | | | $ | 5,545 | | | $ | — | | | $ | 5,545 | | |
* Other financial instruments include unrealized appreciation (depreciation) on forward foreign currency contracts.
(1) Includes a zero valued security.
The following is a reconciliation of investments as of October 31, 2019 for which significant unobservable inputs were used in determining fair value. All transfers, if any, are assumed to occur at the end of the reporting period.
45
Credit Suisse Strategic Income Fund
Notes to Financial Statements (continued)
October 31, 2019
Note 2. Significant Accounting Policies (continued)
| | | Corporate
Bonds | | Bank
Loans | | Common
Stocks | | Warrants | | Total | |
Balance as of October 31, 2018 | | $ | 388,712 | (1) | | $ | 14,704,079 | | | $ | 1,152,121 | (1) | | $ | — | | | $ | 16,244,912 | (1) | |
Accrued discounts (premiums) | | | (89 | ) | | | 101,936 | | | | — | | | | — | | | | 101,847 | | |
Purchases | | | 48,322 | | | | 9,249,076 | | | | 573,309 | | | | 3,276 | | | | 9,873,983 | | |
Sales | | | (54,542 | ) | | | (6,336,048 | ) | | | — | | | | — | | | | (6,390,590 | ) | |
Realized gain (loss) | | | 5,386 | | | | (470,994 | ) | | | — | | | | — | | | | (465,608 | ) | |
Change in unrealized appreciation
(depreciation) | | | (5,618 | ) | | | (825,942 | ) | | | (838,425 | ) | | | (3,276 | ) | | | (1,673,261 | ) | |
Transfers into Level 3 | | | — | | | | 8,418,957 | | | | — | | | | — | | | | 8,418,957 | | |
Transfers out of Level 3 | | | (381,465 | ) | | | (5,325,427 | ) | | | (53,015 | ) | | | — | | | | (5,759,907 | ) | |
Balance as of October 31, 2019 | | $ | 706 | | | $ | 19,515,637 | | | $ | 833,990 | (1) | | $ | — | (1) | | $ | 20,350,333 | (1) | |
Net change in unrealized appreciation
(depreciation) from investments still
held as of October 31, 2019 | | $ | (1,716 | ) | | $ | (848,594 | ) | | $ | (466,579 | ) | | $ | (3,276 | ) | | $ | (1,320,165 | ) | |
(1) Includes a zero valued security.
| | | Quantitative Disclosure About Significant Unobservable Inputs | |
| Asset Class | | Fair Value
At 10/31/2019 | | Valuation
Technique | | Unobservable
Input | | Range
(Weighted Average*) | |
Corporate Bonds | | $ | 706 | | | Income Approach | | Expected Remaining Distribution | | | $0.01 (N/A) | | |
Bank Loans | | $ | 199,235 | | | Market Approach | | EBITDA Multiples | | | 7.0 (N/A) | | |
| | | $ | 19,316,402 | | | Vendor Pricing | | Single Broker Quote | | $ | 0.06 – $1.00 | ($0.95) | |
Common Stocks | | $ | 316,175 | | | Market Approach | | EBITDA Multiples | | | 3.0 – 9.1 | (6.78) | |
| | | $ | 0 | | | Income Approach | | Expected Remaining Distribution | | $ | 0.00 – $0.01 | ($0.00) | |
| | | $ | 517,815 | | | Vendor Pricing | | Single Broker Quote | | | $22.50 (N/A) | | |
Warrant | | $ | 0 | | | Market Approach | | EBITDA Multiples | | | 4.9 (N/A) | | |
* Weighted by relative fair value
Each fair value determination is based on a consideration of relevant factors, including both observable and unobservable inputs. Observable and unobservable inputs that Credit Suisse considers may include (i) the existence of any contractual restrictions on the disposition of securities; (ii) information obtained from the company, which may include an analysis of the company's financial statements, the company's products or intended markets or the company's technologies; (iii) the price of the same or similar security negotiated at arm's length in an issuer's completed subsequent round of financing; (iv) the price and extent of public trading in similar securities of the issuer or of comparable companies; or (v) a probability and time value adjusted analysis of contractual term. Where available and appropriate, multiple valuation methodologies are applied to confirm fair value. To the extent that valuation is based on models or inputs that are less observable or unobservable in the market, determining fair value requires more judgment. Because of the inherent uncertainty of valuation, those estimated values may be materially higher or lower than the values that would have been used had a ready market for the investments existed. Accordingly, the degree of judgment exercised by the Fund in determining fair value is greatest for investments categorized in
46
Credit Suisse Strategic Income Fund
Notes to Financial Statements (continued)
October 31, 2019
Note 2. Significant Accounting Policies (continued)
Level 3. In some circumstances, the inputs used to measure fair value might be categorized within different levels of the fair value hierarchy. In those instances, the fair value measurement is categorized in its entirety in the fair value hierarchy based on the least observable input that is significant to the fair value measurement. Additionally, changes in the market environment and other events that may occur over the life of the investments may cause the gains or losses ultimately realized on these investments to be different from the valuations used at the date of these financial statements.
For the year ended October 31, 2019, $8,418,957 was transferred from Level 2 to Level 3 due to a lack of a pricing source supported by observable inputs, $ 5,711,541 was transferred from Level 3 to Level 2 and $ 48,366 was transferred from Level 3 to Level 1 as a result of the availability of a pricing source supported by observable inputs. All transfers, if any, are assumed to occur at the end of the reporting period.
B) DERIVATIVE INSTRUMENTS AND HEDGING ACTIVITIES — The Fund adopted amendments to authoritative guidance on disclosures about derivative instruments and hedging activities which require that a fund disclose (a) how and why an entity uses derivative instruments, (b) how derivative instruments and hedging activities are accounted for and (c) how derivative instruments and related hedging activities affect a fund's financial position, financial performance and cash flows. For the year ended October 31, 2019, the Fund's derivatives did not qualify for hedge accounting as they are held at fair value.
The following table presents the fair value and the location of derivatives within the Statement of Assets and Liabilities at October 31, 2019 and the effect of these derivatives on the Statement of Operations for the year ended October 31, 2019.
Primary Underlying Risk | | Derivative
Assets | | Derivative
Liabilities | | Realized
Gain (Loss) | | Change in Unrealized
Appreciation (Depreciation) | |
Foreign currency exchange rate | |
Forward contracts | | $ | 72 | | | $ | 5,545 | | | $ | 129,176 | | | $ | (51,308 | ) | |
For the year ended October 31, 2019, the Fund held an average monthly value on a net basis of $4,293,805 in forward foreign currency contracts.
The Fund is a party to International Swap and Derivatives Association, Inc. ("ISDA") Master Agreements ("Master Agreements") with certain counterparties that govern over-the-counter derivative (including Total Return, Credit Default and Interest Rate Swaps) and foreign exchange contracts entered
47
Credit Suisse Strategic Income Fund
Notes to Financial Statements (continued)
October 31, 2019
Note 2. Significant Accounting Policies (continued)
into by the Fund. The Master Agreements may contain provisions regarding, among other things, the parties' general obligations, representations, agreements, collateral requirements, events of default and early termination. Termination events applicable to the Fund may occur upon a decline in the Fund's net assets below a specified threshold over a certain period of time.
The following table presents by counterparty the Fund's derivative assets, net of related collateral held by the Fund, at October 31, 2019:
Counterparty | | Gross Amount of
Derivative Assets
Presented in
Statement of Assets
and Liabilities(a) | | Financial
Instruments
and Derivatives
Available for Offset | | Non-Cash
Collateral
Received | | Cash
Collateral
Received | | Net Amount
of Derivative
Assets | |
Deutsche Bank AG | | $ | 72 | | | $ | — | | | $ | — | | | $ | — | | | $ | 72 | | |
The following table presents by counterparty the Fund's derivative liabilities, net of related collateral pledged by the Fund, at October 31, 2019:
Counterparty | | Gross Amount of
Derivative Liabilities
Presented in
Statement of Assets
and Liabilities(a) | | Financial
Instruments
and Derivatives
Available for Offset | | Non-Cash
Collateral
Pledged | | Cash
Collateral
Pledged | | Net Amount
of Derivative
Assets | |
Morgan Stanley | | $ | 5,545 | | | $ | — | | | $ | — | | | $ | — | | | $ | 5,545 | | |
(a) Forward foreign currency contracts are included.
C) FOREIGN CURRENCY TRANSACTIONS — The books and records of the Fund are maintained in U.S. dollars. Transactions denominated in foreign currencies are recorded at the current prevailing exchange rates. All assets and liabilities denominated in foreign currencies, including purchases and sales of investments, and income and expenses, are translated into US dollar amounts on the date of those transactions.
Reported net realized gain (loss) from foreign currency transactions arises from sales of foreign currencies; currency gains or losses realized between the trade and settlement dates on securities transactions; and the difference between the amounts of dividends, interest, and foreign withholding taxes recorded on the Fund's books and the U.S. dollar equivalent of the amounts actually received or paid. Net change in unrealized gains and losses on translation of assets and liabilities denominated in foreign currencies arises from changes in the fair values of assets and liabilities, other than investments, at the end of the period, resulting from changes in exchange rates.
48
Credit Suisse Strategic Income Fund
Notes to Financial Statements (continued)
October 31, 2019
Note 2. Significant Accounting Policies (continued)
The Fund does not isolate that portion of the results of operations resulting from fluctuations in foreign exchange rates on investments from the fluctuations arising from changes in market prices of investments held. Such fluctuations are included with net realized and unrealized gain or loss from investments in the Statement of Operations.
D) SECURITY TRANSACTIONS AND INVESTMENT INCOME/EXPENSE — Security transactions are accounted for on a trade date basis. Interest income/expense is recorded on the accrual basis. The Fund amortizes premiums and accretes discounts using the effective interest method. Dividend income/expense is recorded on the ex-dividend date. Certain expenses are class-specific expenses, vary by class and are charged only to that class. Income, expenses (excluding class-specific expenses) and realized/unrealized gains/losses are allocated proportionately to each class of shares based upon the relative net asset value of the outstanding shares of that class. The cost of investments sold is determined by use of the specific identification method for both financial reporting and income tax purposes. To the extent any issuer defaults or a credit event occurs that impacts the issuer, the Fund may halt any additional interest income accruals and consider the realizability of interest accrued up to the date of default or credit event.
E) DIVIDENDS AND DISTRIBUTIONS TO SHAREHOLDERS — Dividends from net investment income, if any, are declared daily and paid monthly. Distributions of net realized capital gains, if any, are declared and paid at least annually. However, to the extent that a net realized capital gain can be reduced by a capital loss carryforward, such gain will not be distributed. Dividends and distributions to shareholders of the Fund are recorded on the ex-dividend date and are determined in accordance with federal income tax regulations, which may differ from GAAP.
F) FEDERAL AND OTHER TAXES — No provision is made for federal taxes as it is the Fund's intention to continue to qualify as a regulated investment company ("RIC") under the Internal Revenue Code of 1986, as amended (the "Code"), and to make the requisite distributions to its shareholders, which will be sufficient to relieve it from federal income and excise taxes.
In order to qualify as a RIC under the Code, the Fund must meet certain requirements regarding the source of its income, the diversification of its assets and the distribution of its income. One of these requirements is that the Fund derive at least 90% of its gross income for each taxable year from dividends, interest, payments with respect to certain securities loans, gains from the sale
49
Credit Suisse Strategic Income Fund
Notes to Financial Statements (continued)
October 31, 2019
Note 2. Significant Accounting Policies (continued)
or other disposition of stock, securities or foreign currencies, other income derived with respect to its business of investing in such stock, securities or currencies or net income derived from interests in certain publicly-traded partnerships ("Qualifying Income"). The Fund adopted the authoritative guidance for uncertainty in income taxes and recognizes a tax benefit or liability from an uncertain position only if it is more likely than not that the position is sustainable based solely on its technical merits and consideration of the relevant taxing authority's widely understood administrative practices and procedures. The Fund has reviewed its current tax positions and has determined that no provision for income tax is required in the Fund's financial statements. The Fund's federal and state income and federal excise tax returns for tax years for which the applicable statutes of limitations have not expired are subject to examination by the Internal Revenue Service and state departments of revenue.
G) CASH — The Fund's uninvested cash balance is held in an interest bearing variable rate demand deposit account at State Street Bank and Trust Company ("SSB"), the Fund's custodian.
H) FUTURES — The Fund may enter into futures contracts to the extent permitted by its investment policies and objectives. The Fund may use futures contracts to gain exposure to or hedge against changes in interest rates, equity and market price movements and/or currency risks. Upon entering into a futures contract, the Fund is required to deposit cash and/or pledge U.S. Government securities as initial margin with a Futures Commission Merchant ("FCM"). Subsequent payments, which are dependent on the daily fluctuations in the value of the underlying instrument, are made or received by the Fund each day (daily variation margin) and are recorded as unrealized gains or losses until the contracts are closed. When the contracts are closed, the Fund records a realized gain or loss equal to the difference between the proceeds from (or cost of) the closing transaction and the Fund's basis in the contract. Risks of entering into futures contracts for hedging purposes include the possibility that a change in the value of the contract may not correlate with the changes in the value of the underlying instruments. Futures have minimal counterparty credit risk because futures are exchange traded and the exchange's clearinghouse, as counterparty to all exchange-traded futures, guarantees the futures against default. In addition, the purchase of a futures contract involves the risk that the Fund could lose more than the original margin deposit and subsequent payments may be required for a futures transaction. The Fund's open futures contracts are disclosed in the Schedule of Investments. At October 31, 2019, the Fund had no open futures contracts.
50
Credit Suisse Strategic Income Fund
Notes to Financial Statements (continued)
October 31, 2019
Note 2. Significant Accounting Policies (continued)
The Commodity Exchange Act requires an FCM to segregate all customer transactions and assets from the FCM's proprietary activities. A customer's cash and other equity deposited with an FCM are considered commingled with all other customer funds subject to the FCM's segregation requirements. In the event of an FCM's insolvency, recovery may be limited to the Fund's pro-rata share of segregated customer funds available. It is possible that the recovery amount could be less than the total of cash and other equity deposited.
I) FORWARD FOREIGN CURRENCY CONTRACTS — A forward foreign currency exchange contract ("forward currency contract") is a commitment to purchase or sell a foreign currency at the settlement date at a negotiated rate. The Fund will enter into forward currency contracts primarily for hedging foreign currency risk. Forward currency contracts are valued at the prevailing forward exchange rate of the underlying currencies and unrealized gain/loss is recorded daily. On the settlement date of the forward currency contract, the Fund records a realized gain or loss equal to the difference between the value of the contract at the time it was opened and the value of the contract at the time it was closed. Certain risks may arise upon entering into forward currency contracts from the potential inability of counterparties to meet the terms of their contracts. The maximum counterparty credit risk to the Fund is measured by the unrealized gain on appreciated contracts. Additionally, when utilizing forward currency contracts to hedge, the Fund forgoes the opportunity to profit from favorable exchange rate movements during the term of the contract. The Fund's open forward currency contracts at October 31, 2019 are disclosed in the Schedule of Investments.
J) UNFUNDED LOAN COMMITMENTS — The Fund enters into certain agreements, all or a portion of which may be unfunded. The Fund is obligated to fund these loan commitments at the borrowers' discretion. Funded and unfunded portions of credit agreements are presented on the Schedule of Investments. As of October 31, 2019, unfunded commitments were as follows:
| Borrower | | Maturity | | Rate | | Unfunded
Commitment | |
| Mister Car Wash Holdings, Inc. | | 05/14/26 | | | 3.500 | | | $ | 38,300 | | |
Unfunded loan commitments and funded portions of credit agreements are marked to market daily and any unrealized appreciation or depreciation is included in the Statement of Assets and Liabilities and the Statement of Operations.
K) SECURITIES LENDING — The initial collateral received by the Fund is required to have a value of at least 102% of the market value of domestic
51
Credit Suisse Strategic Income Fund
Notes to Financial Statements (continued)
October 31, 2019
Note 2. Significant Accounting Policies (continued)
securities on loan (including any accrued interest thereon) and 105% of the market value of foreign securities on loan (including any accrued interest thereon). The collateral is maintained thereafter at a value equal to at least 102% of the current market value of the securities on loan. The market value of loaned securities is determined at the close of each business day of the Fund and any additional required collateral is delivered to the Fund, or excess collateral returned by the Fund, on the next business day. Cash collateral received by the Fund in connection with securities lending activity may be pooled together with cash collateral for other funds/portfolios advised by Credit Suisse and may be invested in a variety of investments, including funds advised by SSB, the Fund's securities lending agent, or money market instruments. However, in the event of default or bankruptcy by the other party to the agreement, realization and/or retention of the collateral may be subject to legal proceedings.
SSB has been engaged by the Fund to act as the Fund's securities lending agent. The Fund's securities lending arrangement provides that the Fund and SSB will share the net income earned from securities lending activities. Securities lending income is accrued as earned. At October 31, 2019 and during the year ended October 31, 2019, there were no securities out on loan.
L) OTHER — The high yield, fixed income securities in which the Fund invests will primarily consist of senior secured floating rate loans ("Senior Loans") issued by non-investment grade companies. Senior Loans are typically secured by specific collateral of the issuer and hold the most senior position in the issuer's capital structure. The interest rate on Senior Loans is periodically adjusted to a recognized base rate, typically the London Interbank Offered Rate ("LIBOR"). While these characteristics may reduce interest rate risk and mitigate losses in the event of borrower default, the Senior Loans in which the Fund invests have below investment grade credit ratings and thereby are considered speculative because of the significant credit risk of their issuers.
Lower-rated debt securities (commonly known as "junk bonds") possess speculative characteristics and are subject to greater market fluctuations and risk of lost income and principal than higher-rated debt securities for a variety of reasons. Also, during an economic downturn or substantial period of rising interest rates, highly leveraged issuers may experience financial stress which would adversely affect their ability to service their principal and interest payment obligations, to meet projected business goals and to obtain additional financing.
52
Credit Suisse Strategic Income Fund
Notes to Financial Statements (continued)
October 31, 2019
Note 2. Significant Accounting Policies (continued)
In addition, periods of economic uncertainty and changes can be expected to result in increased volatility of market prices of lower-rated debt securities and the Fund's net asset value.
M) RECENT ACCOUNTING PRONOUNCEMENTS — In March 2017, the FASB issued Accounting Standards Update 2017-08, Receivables — Nonrefundable Fees and Other Costs (Subtopic 310-20): Premium Amortization On Purchased Callable Debt Securities ("ASU 2017-08"). The update shortens the amortization period for the premium on certain purchased callable debt securities to the earliest call date. ASU 2017-08 will be effective for annual periods beginning after December 15, 2018. Management is currently assessing the potential impact of these changes to future financial statements.
Also, in August 2018, the FASB issued Accounting Standards Update 2018-13, Fair Value Measurement (Topic 820): Disclosure Framework — Changes to the Disclosure Requirements for Fair Value Measurement ("ASU 2018-13"). The update provides guidance that eliminates, adds and modifies certain disclosure requirements for fair value measurements. ASU 2018-13 will be effective for annual periods beginning after December 15, 2019. Management is currently assessing the potential impact of these changes to future financial statements.
N) SUBSEQUENT EVENTS — In preparing the financial statements as of October 31, 2019, management considered the impact of subsequent events for potential recognition or disclosure in these financial statements through the date of release of this report. No such events requiring recognition or disclosure were identified through the date of the release of this report.
Effective November 12, 2019, Credit Suisse has contractually agreed to limit expenses so that the Fund's annual operating expenses do not exceed 0.79% of the Fund's average daily net assets for Class I shares, 1.04% of the Fund's average daily net assets for Class A shares, and 1.79% of the Fund's average daily net assets for Class C shares.
Note 3. Transactions with Affiliates and Related Parties
Credit Suisse serves as investment adviser and co-administrator for the Fund. For its investment advisory and administration services, Credit Suisse is entitled to receive a fee from the Fund at an annualized rate of 0.84% of the Fund's average daily net assets. For the year ended October 31, 2019, investment advisory and administration fees earned and fees waived/expenses reimbursed by Credit Suisse were $2,527,169 and $291,203, respectively. Prior
53
Credit Suisse Strategic Income Fund
Notes to Financial Statements (continued)
October 31, 2019
Note 3. Transactions with Affiliates and Related Parties (continued)
to March 1, 2018 and effective April 22, 2019, Credit Suisse has contractually agreed to limit expenses so that the Fund's annual operating expenses do not exceed 0.99% of the Fund's average daily net assets for Class I shares, 1.24% of the Fund's average daily net assets for Class A shares, and 1.99% of the Fund's average daily net assets for Class C shares. The Fund is authorized to reimburse Credit Suisse for management fees previously limited and/or for expenses previously reimbursed by Credit Suisse under the contractual expense limitation arrangement, provided, however, that any reimbursements must be paid at a date not more than thirty-six months following the applicable month during which such fees were limited or expenses were reimbursed by Credit Suisse and the reimbursements do not cause the Fund to exceed the applicable expense limitation at the time the fees are recouped.
The amounts waived and reimbursed by Credit Suisse, which are available for potential future recoupment by Credit Suisse, and the expiration schedule at October 31, 2019 are as follows:
| | | Fee waivers/expense
reimbursements
subject to
recoupment | | Expires
October 31,
2020 | | Expires
October 31,
2021 | | Expires
October 31,
2022 | |
Class I | | $ | 378,473 | | | $ | 219,725 | | | $ | 57,746 | | | $ | 101,002 | | |
Class A | | | 112,153 | | | | 70,189 | | | | 18,678 | | | | 23,286 | | |
Class C | | | 84,383 | | | | 42,606 | | | | 17,570 | | | | 24,207 | | |
Totals | | $ | 575,009 | | | $ | 332,520 | | | $ | 93,994 | | | $ | 148,495 | | |
Credit Suisse Asset Management Limited ("Credit Suisse U.K."), an affiliate of Credit Suisse, serves as sub-investment advisor to the Fund directly. Credit Suisse U.K.'s sub-investment advisor fees are paid by Credit Suisse.
For its co-administrative services, SSB receives a fee, exclusive of out-of-pocket expenses, calculated in total for all the Credit Suisse funds/portfolios co-administered by SSB and allocated based upon the relative average net assets of each fund/portfolio, subject to an annual minimum fee. For the year ended October 31, 2019, co-administrative services fees earned by SSB (including out-of-pocket expenses) with respect to the Fund were $95,899.
Credit Suisse Securities (USA) LLC ("CSSU"), an affiliate of Credit Suisse, serves as the distributor of the Fund's shares. Pursuant to a distribution plan adopted by the Fund pursuant to Rule 12b-1 under the 1940 Act, CSSU receives fees for its distribution services. These fees are calculated at an annual rate of 0.25% of the average daily net assets of the Class A shares. For the Class C shares, the fee is calculated at an annual rate of 1.00% of the average daily net
54
Credit Suisse Strategic Income Fund
Notes to Financial Statements (continued)
October 31, 2019
Note 3. Transactions with Affiliates and Related Parties (continued)
assets. For the year ended October 31, 2019, the Fund paid Rule 12b-1 distribution fees of $121,213 for Class A shares and $497,710 for Class C shares. Class I shares are not subject to Rule 12b-1 distribution fees.
Certain brokers, dealers and financial representatives provide transfer agent-related services to the Fund and receive compensation from the Fund. For the year ended October 31, 2019, the Fund paid $167,152, which is included within transfer agent fees.
For the year ended October 31, 2019, CSSU and its affiliates advised the Fund that they retained $34,262 from commissions earned on the sale of the Fund's Class A shares. There were no commissions earned on the sale of Class C shares.
The Fund from time to time purchases or sells loan investments in the secondary market through Credit Suisse or its affiliates acting in the capacity as broker-dealer. Credit Suisse or its affiliates may have acted in some type of agent capacity to the initial loan offering prior to such loan trading in the secondary market.
Note 4. Line of Credit
The Fund, together with other funds/portfolios advised by Credit Suisse (collectively, the "Participating Funds"), participates in a committed, unsecured line of credit facility ("Credit Facility"), with SSB in an aggregated amount of $250 million for temporary or emergency purposes under a first-come, first-served basis. Under the terms of the Credit Facility, the Participating Funds pay an aggregate commitment fee on the average unused amount of the Credit Facility, which is allocated among the Participating Funds in such manner as is determined by the governing Boards of the Participating Funds. In addition, the Participating Funds pay interest on borrowings at either the Overnight Federal Funds rate or the Overnight LIBOR rate plus a spread. At October 31, 2019 and during the year ended October 31, 2019, the Fund had no borrowings outstanding under the Credit Facility. Additionally, the Fund is party to a joint uncommitted line of credit facility with SSB. For the year ended October 31, 2019, the line was not drawn upon and no fees were incurred.
Note 5. Purchases and Sales of Securities
For the year ended October 31, 2019, purchases and sales of investment securities (excluding short-term investments) were $174,521,447 and $104,089,466, respectively.
55
Credit Suisse Strategic Income Fund
Notes to Financial Statements (continued)
October 31, 2019
Note 6. Capital Share Transactions
The Fund is authorized to issue an unlimited number of full and fractional shares of beneficial interest, $.001 par value per share. The Fund offers Class I, Class A and Class C shares. Transactions in capital shares for each class of the Fund were as follows:
| | | Class I | |
| | | For the Year Ended
October 31, 2019 | | For the Year Ended
October 31, 2018 | |
| | | Shares | | Value | | Shares | | Value | |
Shares sold | | | 16,020,683 | | | $ | 158,880,864 | | | | 14,377,206 | | | $ | 145,493,006 | | |
Shares issued in reinvestment
of dividends | | | 1,040,714 | | | | 10,308,101 | | | | 661,315 | | | | 6,680,270 | | |
Shares redeemed | | | (11,330,312 | ) | | | (111,828,758 | ) | | | (8,640,791 | ) | | | (87,482,417 | ) | |
Net increase | | | 5,731,085 | | | $ | 57,360,207 | | | | 6,397,730 | | | $ | 64,690,859 | | |
| | | Class A | |
| | | For the Year Ended
October 31, 2019 | | For the Year Ended
October 31, 2018 | |
| | | Shares | | Value | | Shares | | Value | |
Shares sold | | | 1,841,627 | | | $ | 18,205,631 | | | | 2,132,305 | | | $ | 21,599,295 | | |
Shares issued in reinvestment
of dividends | | | 232,793 | | | | 2,305,904 | | | | 169,722 | | | | 1,715,488 | | |
Shares redeemed | | | (1,488,521 | ) | | | (14,712,852 | ) | | | (1,400,877 | ) | | | (14,184,386 | ) | |
Net increase | | | 585,899 | | | $ | 5,798,683 | | | | 901,150 | | | $ | 9,130,397 | | |
| | | Class C | |
| | | For the Year Ended
October 31, 2019 | | For the Year Ended
October 31, 2018 | |
| | | Shares | | Value | | Shares | | Value | |
Shares sold | | | 1,534,833 | | | $ | 15,220,400 | | | | 2,121,083 | | | $ | 21,526,346 | | |
Shares issued in reinvestment
of dividends | | | 213,349 | | | | 2,113,477 | | | | 151,999 | | | | 1,536,618 | | |
Shares redeemed | | | (1,018,335 | ) | | | (10,062,923 | ) | | | (664,145 | ) | | | (6,713,621 | ) | |
Net increase | | | 729,847 | | | $ | 7,270,954 | | | | 1,608,937 | | | $ | 16,349,343 | | |
On October 31, 2019, the number of shareholders that held 5% or more of the outstanding shares of each class of the Fund was as follows:
| | | Number of
Shareholders | | Approximate Percentage
of Outstanding Shares | |
Class I | | | 3 | | | | 72 | % | |
Class A | | | 5 | | | | 65 | % | |
Class C | | | 3 | | | | 87 | % | |
56
Credit Suisse Strategic Income Fund
Notes to Financial Statements (continued)
October 31, 2019
Note 6. Capital Share Transactions (continued)
The Fund's performance may be negatively impacted in the event one or more of the Fund's greater than 5% shareholders were to redeem at a given time. Some of the shareholders may be omnibus accounts, which hold shares on behalf of individual shareholders.
Note 7. Income Tax Information and Distributions to Shareholders
Income and capital gain distributions are determined in accordance with federal income tax regulations, which may differ from GAAP.
The tax character of dividends paid by the Fund during the years ended October 31, 2019 and 2018, respectively, by the Fund was as follows:
| Ordinary Income | | Return of Capital | |
| 2019 | | 2018 | | 2019 | | 2018 | |
| $ | 15,276,998 | | | $ | 10,853,039 | | | $ | 233,927 | | | $ | 39,689 | | |
The tax basis components of distributable earnings differ from the amounts reflected in the Statement of Assets and Liabilities by temporary book/tax differences. These differences are primarily due to differing treatments of dividends payable, wash sales, forwards and deferred organizational expenses.
At October 31, 2019, the components of distributable earnings on a tax basis were as follows:
Accumulated net realized loss | | $ | (7,352,279 | ) | |
Unrealized depreciation | | | (8,585,183 | ) | |
| | $ | (15,937,462 | ) | |
At October 31, 2018, the Fund had $987,344 of unlimited short-term capital loss carryforwards and $6,364,935 of unlimited long-term capital loss carryforwards available to offset possible future capital gains.
At October 31, 2019, the cost and net unrealized appreciation (depreciation) of investments and derivatives for income tax purposes were as follows:
Cost of Investments | | $ | 328,354,707 | | |
Unrealized appreciation | | $ | 5,742,295 | | |
Unrealized depreciation | | | (14,327,478 | ) | |
Net unrealized appreciation (depreciation) | | $ | (8,585,183 | ) | |
57
Credit Suisse Strategic Income Fund
Notes to Financial Statements (continued)
October 31, 2019
In the normal course of business, the Fund may provide general indemnifications pursuant to certain contracts and organizational documents. The Fund's maximum exposure under these arrangements is dependent on future claims that may be made against the Fund and, therefore, cannot be estimated; however, based on experience, the risk of loss from such claims is considered remote.
58
Credit Suisse Strategic Income Fund
Report of Independent Registered Public Accounting Firm
To the Shareholders and Board of Trustees
Credit Suisse Strategic Income Fund:
Opinion on the Financial Statements
We have audited the accompanying statement of assets and liabilities of Credit Suisse Strategic Income Fund (the Fund), a series of the Credit Suisse Opportunity Funds, including the schedule of investments, as of October 31, 2019, the related statement of operations for the year then ended, the statements of changes in net assets for each of the years in the two-year period then ended, and the related notes (collectively, the financial statements) and the financial highlights for each of the years in the five-year period then ended. In our opinion, the financial statements and financial highlights present fairly, in all material respects, the financial position of the Fund as of October 31, 2019, the results of its operations for the year then ended, the changes in its net assets for each of the years in the two-year period then ended, and the financial highlights for each of the years in the five-year period then ended, in conformity with U.S. generally accepted accounting principles.
Basis for Opinion
These financial statements and financial highlights are the responsibility of the Fund's management. Our responsibility is to express an opinion on these financial statements and financial highlights based on our audits. We are a public accounting firm registered with the Public Company Accounting Oversight Board (United States) (PCAOB) and are required to be independent with respect to the Fund in accordance with the U.S. federal securities laws and the applicable rules and regulations of the Securities and Exchange Commission and the PCAOB.
We conducted our audits in accordance with the standards of the PCAOB. Those standards require that we plan and perform the audit to obtain reasonable assurance about whether the financial statements and financial highlights are free of material misstatement, whether due to error or fraud. Our audits included performing procedures to assess the risks of material misstatement of the financial statements and financial highlights, whether due to error or fraud, and performing procedures that respond to those risks. Such procedures included examining, on a test basis, evidence regarding the amounts and disclosures in the financial statements and financial highlights. Such procedures also included confirmation of securities owned as of October 31, 2019, by correspondence with custodians and brokers or by other appropriate auditing procedures when replies were not received. Our audits also included evaluating the accounting principles used and significant estimates made by management, as well as evaluating the
59
Credit Suisse Strategic Income Fund
Report of Independent Registered Public Accounting Firm
overall presentation of the financial statements and financial highlights. We believe that our audits provide a reasonable basis for our opinion.

We have served as the auditor of one or more Credit Suisse Asset Management, LLC investment companies since 2015.
New York, New York
December 20, 2019
60
Credit Suisse Strategic Income Fund
Information Concerning Trustees and Officers (unaudited)
Name, Address
(Year of Birth) | | Position(s)
Held with
Fund | | Term
of Office1
and
Length
of Time
Served | | Principal
Occupation(s) During
Past Five Years | | Number of
Portfolios
in Fund
Complex
Overseen
by Trustee | | Other
Trusteeships
Held by Trustee
During Past Five Years | |
Independent Trustees | | | | | | | | | | | |
Laura A. DeFelice
c/o Credit Suisse Asset
Management, LLC
Attn: General Counsel
Eleven Madison Avenue
New York, New York
10010
(1959) | | Trustee, Nominating and Audit Committee member | | Since 2017 | | Partner of Acacia Properties LLC (multi-family and commercial real estate ownership and operation) from 2008 to present; Stonegate Advisors LLC (renewable energy and energy efficiency) from 2007 to present. | | | 9 | | | None. | |
Jeffrey E. Garten
c/o Credit Suisse Asset Management, LLC Attn: General Counsel Eleven Madison Avenue New York, New York 10010
(1946) | | Trustee, Nominating and Audit Committee member | | Since Fund Inception | | Dean Emeritus of Yale School of Management from July 2015 to present; The Juan Trippe Professor in the Practice of International Trade, Finance and Business, Yale School of Management, from July 2005 to July 2015; Partner and Chairman of Garten Rothkopf (consulting firm) from October 2005 to June 2017. | | | 9 | | | Director of Aetna, Inc. (insurance company); Director of CarMax Group (used car dealers); Director of Miller Buckfire & Co., LLC (financial restructuring). | |
1 Subject to the Trust's retirement policy, each Trustee may continue to serve as a Trustee until the last day of the calendar year in which the applicable Trustee attains age 75. Officer serves until his or her respective successor has been duly elected and qualified.
61
Credit Suisse Strategic Income Fund
Information Concerning Trustees and Officers (unaudited) (continued)
Name, Address
(Year of Birth) | | Position(s)
Held with
Fund | | Term
of Office1
and
Length
of Time
Served | | Principal
Occupation(s) During
Past Five Years | | Number of
Portfolios
in Fund
Complex
Overseen
by Trustee | | Other
Trusteeships
Held by Trustee
During Past Five Years | |
Independent Trustees | | | | | | | | | | | |
Mahendra R. Gupta
c/o Credit Suisse Asset
Management, LLC
Attn: General Counsel
Eleven Madison Avenue
New York, New York
10010
(1956) | | Trustee, Nominating Committee member and Audit Committee Chairman | | Since 2017 | | Professor, Washington University in St. Louis from July 1990 to present; Dean of Olin Business School at Washington University in St. Louis from July 2005 to July 2016; Partner, R.J. Mithaiwala (food manufacturing and retail, India) from March 1977 to present; Partner, F.F.B. Corporation (agriculture, India) from March 1977 to present; Partner, RPMG Research Corporation (benchmark research) from July 2001 to present. | | | 9 | | | Director of Caleres Inc. (footwear) from May 2012 to present; Director of Koch Development Corporation (real estate development) from November 2017 to present; Director of Supernova (fin-tech) from June 2014 to September 2018. | |
1 Subject to the Trust's retirement policy, each Trustee may continue to serve as a Trustee until the last day of the calendar year in which the applicable Trustee attains age 75. Officer serves until his or her respective successor has been duly elected and qualified.
62
Credit Suisse Strategic Income Fund
Information Concerning Trustees and Officers (unaudited) (continued)
Name, Address
(Year of Birth) | | Position(s)
Held with
Fund | | Term
of Office1
and
Length
of Time
Served | | Principal
Occupation(s) During
Past Five Years | | Number of
Portfolios
in Fund
Complex
Overseen
by Trustee | | Other
Trusteeships
Held by Trustee
During Past Five Years | |
Independent Trustees | | | | | | | | | | | |
Steven N. Rappaport
c/o Credit Suisse Asset Management, LLC
Attn: General Counsel
Eleven Madison Avenue
New York, New York
10010
(1948) | | Chairman of the Board, Nominating Committee Chairman and Audit Committee member | | Trustee since Fund Inception and Chairman since 2005 | | Partner of Lehigh Court, LLC and RZ Capital (private investment firms) from July 2002 to present; Partner of Backstage Acquisition Holdings, LLC (publication job postings) from November 2013 to 2018. | | | 9 | | | Director of Aberdeen Emerging Markets Equity Income Fund, Inc. (a closed-end investment company); Director of Aberdeen Funds (25 open-end portfolios); Director of iCAD, Inc. (surgical & medical instruments & apparatus company) from 2006 to 2018. | |
Interested Trustee | | | | | | | | | | | |
John G. Popp2
Credit Suisse Asset
Management, LLC
Eleven Madison Avenue
New York, New York
10010
(1956) | | Trustee, Chief Executive Officer and President | | Trustee since 2017
Chief Executive Officer and President since 2010 | | Managing Director of Credit Suisse; Global Head and Chief Investment Officer of the Credit Investments Group; Associated with Credit Suisse or its predecessor since 1997; Officer of other Credit Suisse Funds. | | | 9 | | | None. | |
1 Subject to the Trust's retirement policy, each Trustee may continue to serve as a Trustee until the last day of the calendar year in which the applicable Trustee attains age 75. Officer serves until his or her respective successor has been duly elected and qualified.
2 Mr. Popp is an "interested person" of the Trust, as defined in the 1940 Act, by virtue of his current position as an officer of Credit Suisse.
63
Credit Suisse Strategic Income Fund
Information Concerning Trustees and Officers (unaudited) (continued)
Name, Address
(Year of Birth) | | Position(s)
Held with
Fund | | Term of
Office1
and
Length of
Time
Served | | Principal Occupation(s) During Past Five Years | |
Officers* | | | | | | | |
Emidio Morizio
Credit Suisse Asset
Management, LLC
Eleven Madison Avenue
New York, New York 10010
(1966) | | Chief Compliance Officer | | Since Fund Inception | | Managing Director and Global Head of Compliance of Credit Suisse since 2010; Associated with Credit Suisse since July 2000; Officer of other Credit Suisse Funds. | |
Lou Anne McInnis
Credit Suisse Asset Management, LLC
Eleven Madison Avenue
New York, New York 10010
(1959) | | Chief Legal Officer | | Since 2015 | | Director of Credit Suisse; Associated with Credit Suisse since April 2015; Counsel at DLA Piper US LLP from 2011 to April 2015; Associated with Morgan Stanley Investment Management from 1997 to 2010; Officer of other Credit Suisse Funds. | |
Omar Tariq
Credit Suisse Asset
Management, LLC
Eleven Madison Avenue
New York, New York 10010
(1983) | | Chief Financial Officer and Treasurer | | Since 2019 | | Director of Credit Suisse since March 2019; Senior Manager of PriceWaterhouseCoopers, LLP from September 2010 to March 2019; Officer of other Credit Suisse Funds. | |
Karen Regan
Credit Suisse Asset
Management, LLC
Eleven Madison Avenue
New York, New York 10010
(1963) | | Vice President and Secretary | | Since 2010 | | Vice President of Credit Suisse; Associated with Credit Suisse since December 2004; Officer of other Credit Suisse Funds. | |
1 Subject to the Trust's retirement policy, each Trustee may continue to serve as a Trustee until the last day of the calendar year in which the applicable Trustee attains age 75. Officer serves until his or her respective successor has been duly elected and qualified.
* The officers of the Fund shown are officers that make policy decisions.
The Statement of Additional Information includes additional information about the Trustees and is available, without charge, upon request, by calling 877-870-2874.
64
Credit Suisse Strategic Income Fund
Proxy Voting and Portfolio Holdings Information (unaudited)
Information regarding how the Fund voted proxies related to its portfolio securities during the 12-month period ended June 30 of each year, as well as the policies and procedures that the Fund uses to determine how to vote proxies relating to its portfolio securities are available:
• By calling 1-877-870-2874
• On the Fund's website, www.credit-suisse.com/us/funds
• On the website of the Securities and Exchange Commission, www.sec.gov
The Fund files a complete schedule of its portfolio holdings for the first and third quarters of its fiscal year with the SEC as an exhibit to its reports on Form N-PORT, and for reporting periods ended prior to March 31, 2019, filed such information on Form N-Q. The Fund's Forms N-PORT and N-Q are available on the SEC's website at www.sec.gov.
65

P.O. BOX 219916, KANSAS CITY, MO 64121-9916
877-870-2874 n www.credit-suisse.com/us/funds
CREDIT SUISSE SECURITIES (USA) LLC, DISTRIBUTOR. SIF-AR-1019
Item 2. Code of Ethics.
The registrant has adopted a code of ethics applicable to its Chief Executive Officer, President, Chief Financial Officer and Chief Accounting Officer, or persons performing similar functions. A copy of the code is filed as Exhibit 12(a)(1) to this Form. There were no amendments to the code during the fiscal year ended October 31, 2019. There were no waivers or implicit waivers from the code granted by the registrant during the fiscal year ended October 31, 2019.
Item 3. Audit Committee Financial Expert.
The registrant’s governing board has determined that it has two audit committee financial experts serving on its audit committee: Mahendra R. Gupta and Steven N. Rappaport. Each audit committee financial expert is “independent” for purposes of this item.
Item 4. Principal Accountant Fees and Services.
(a) through (d). The information in the table below is provided for services rendered to the registrant by its independent registered public accounting firm, KPMG LLP (“KPMG”), for its fiscal years ended October 31, 2018 and October 31, 2019.
| | 2018 | | 2019 | |
Audit Fees | | $ | 170,000 | | $ | 175,600 | |
Audit-Related Fees(1) | | $ | 28,913 | | $ | 34,736 | |
Tax Fees(2) | | $ | 13,680 | | $ | 13,680 | |
All Other Fees | | $ | 13,910 | | $ | — | |
Total | | $ | 226,503 | | $ | 224,016 | |
(1) Services include agreed-upon procedures in connection with the registrant’s semi-annual financial statements ($28,913 for 2018 and $34,736 for 2019).
(2) Tax services in connection with the registrant’s excise tax calculations and review of the registrant’s applicable tax returns.
The information in the table below is provided with respect to non-audit services that directly relate to the registrant’s operations and financial reporting and that were rendered by KPMG to the registrant’s investment adviser, Credit Suisse Asset Management, LLC (“Credit Suisse”), and any service provider to the registrant controlling, controlled by or under common control with Credit Suisse that provided ongoing services to the registrant (“Covered Services Provider”), for the registrant’s fiscal years ended October 31, 2018 and October 31, 2019.
| | 2018 | | 2019 | |
Audit-Related Fees | | N/A | | N/A | |
Tax Fees | | N/A | | N/A | |
All Other Fees | | N/A | | N/A | |
Total | | N/A | | N/A | |
(e)(1) Pre-Approval Policies and Procedures. The Audit Committee (“Committee”) of the registrant is responsible for pre-approving (i) all audit and permissible non-audit services to be provided by the independent registered public accounting firm to the registrant and (ii) all permissible non-audit services to be provided by the independent registered public accounting firm to Credit Suisse and any Covered Services Provider if the engagement relates directly to the operations and financial reporting of the registrant. The Committee may delegate its responsibility to pre-approve any such audit and permissible non-audit services to the Chairperson of the Committee, and the Chairperson shall report to the Committee, at its next regularly scheduled meeting after the Chairperson’s pre-approval of such services, his or her decision(s). The Committee may also establish detailed pre-approval policies and procedures for pre-approval of such services in accordance with applicable laws, including the delegation of some or all of the Committee’s pre-approval responsibilities to other persons (other than Credit Suisse or the registrant’s officers). Pre-approval by the Committee of any permissible non-audit services shall not be required so long as: (i) the aggregate amount of all such permissible non-audit services provided to the registrant, Credit Suisse and any Covered Services Provider constitutes not more than 5% of the total amount of revenues paid by the registrant to its independent registered public accounting firm during the fiscal year in which the permissible non-audit services are provided; (ii) the permissible non-audit services were not recognized by the registrant at the time of the engagement to be non-audit services; and (iii) such services are promptly brought to the attention of the Committee and approved by the Committee (or its delegate(s)) prior to the completion of the audit.
(e)(2) The information in the table below sets forth the percentages of fees for services (other than audit, review or attest services) rendered by KPMG to the registrant for which the pre-approval requirement was waived pursuant to Rule 2-01(c)(7)(i)(C) of Regulation S-X:
| | 2018 | | 2019 | |
Audit-Related Fees | | N/A | | N/A | |
Tax Fees | | N/A | | N/A | |
All Other Fees | | N/A | | N/A | |
Total | | N/A | | N/A | |
The information in the table below sets forth the percentages of fees for services (other than audit, review or attest services) rendered by KPMG to Credit Suisse and any Covered Services Provider required to be approved pursuant to Rule 2-01(c)(7)(ii) of Regulation S-X, for the registrant’s fiscal years ended October 31, 2018 and October 31, 2019:
| | 2018 | | 2019 | |
Audit-Related Fees | | N/A | | N/A | |
Tax Fees | | N/A | | N/A | |
All Other Fees | | N/A | | N/A | |
Total | | N/A | | N/A | |
(f) Not Applicable.
(g) The aggregate fees billed by KPMG for non-audit services rendered to the registrant, Credit Suisse and Covered Service Providers for the fiscal years ended October 31, 2018 and October 31, 2019 were $0 and $0, respectively.
(h) Not Applicable.
Item 5. Audit Committee of Listed Registrants.
Form N-CSR disclosure requirement is not applicable to the registrant.
Item 6. Schedule of Investments.
Included as part of the report to shareholders filed under Item 1 of this Form.
Item 7. Disclosure of Proxy Voting Policies and Procedures for Closed-End Management Investment Companies.
Form N-CSR disclosure requirement is not applicable to the registrant.
Item 8. Portfolio Managers of Closed-End Management Investment Companies.
Form N-CSR disclosure requirement is not applicable to the registrant.
Item 9. Purchases of Equity Securities by Closed-End Management Investment Company and Affiliated Purchasers.
Form N-CSR disclosure requirement is not applicable to the registrant.
Item 10. Submission of Matters to a Vote of Security Holders.
None.
Item 11. Controls and Procedures.
(a) As of a date within 90 days from the filing date of this report, the principal executive officer and principal financial officer concluded that the registrant’s disclosure controls and procedures (as defined in Rule 30a-3(c) under the Investment Company Act of 1940 (the “Act”)) were effective based on their evaluation of the disclosure controls and procedures required by Rule 30a-3(b) under the Act and Rules 13a-15(b) or 15d-15(b) under the Securities Exchange Act of 1934.
(b) There were no changes in registrant’s internal control over financial reporting (as defined in Rule 30a-3(d) under the Act) that occurred during the most recent fiscal half-year covered by this report that have materially affected, or are reasonably likely to materially affect, the registrant’s internal control over financial reporting.
Item 12. Disclosure of Securities Lending Activities for Closed-End Management Investment Companies.
Form N-CSR disclosure requirement is not applicable to the registrant.
Item 13. Exhibits.
(a)(1) Registrant’s Code of Ethics is an exhibit to this report.
(a)(2) The certifications of the registrant as required by Rule 30a-2(a) under the Act are exhibits to this report.
(a)(3) Not applicable.
(b) The certifications of the registrant as required by Rule 30a-2(b) under the Act are an exhibit to this report.
(other) Iran related activities disclosure requirement.
SIGNATURES
Pursuant to the requirements of the Securities Exchange Act of 1934 and the Investment Company Act of 1940, the registrant has duly caused this report to be signed on its behalf by the undersigned, thereunto duly authorized.
CREDIT SUISSE OPPORTUNITY FUNDS | |
| |
/s/ John G. Popp | |
Name: | John G. Popp | |
Title: | Chief Executive Officer and President | |
Date: | January 6, 2020 | |
Pursuant to the requirements of the Securities Exchange Act of 1934 and the Investment Company Act of 1940, this report has been signed below by the following persons on behalf of the registrant and in the capacities and on the dates indicated.
/s/ John G. Popp | |
Name: | John G. Popp | |
Title: | Chief Executive Officer and President | |
Date: | January 6, 2020 | |
| | |
/s/ Omar Tariq | |
Name: | Omar Tariq | |
Title: | Chief Financial Officer and Treasurer | |
Date: | January 6, 2020 | |