UNITED STATES
SECURITIES AND EXCHANGE COMMISSION
Washington, D.C. 20549
FORM N-CSR
CERTIFIED SHAREHOLDER REPORT OF REGISTERED
MANAGEMENT INVESTMENT COMPANIES
Investment Company Act File No. 811-09054
CREDIT SUISSE OPPORTUNITY FUNDS
(Exact Name of Registrant as Specified in Charter)
Eleven Madison Avenue, New York, New York 10010
(Address of Principal Executive Offices) (Zip Code)
Omar Tariq
Credit Suisse Opportunity Funds
Eleven Madison Avenue
New York, New York 10010
Registrant’s telephone number, including area code: (212) 325-2000
Date of fiscal year end: October 31st
Date of reporting period: November 1, 2023 to October 31, 2024
Item 1. Reports to Stockholders.
TABLE OF CONTENTS
Annual Shareholder Report
Credit Suisse Multialternative Strategy Fund
This annual shareholder report contains important information about Credit Suisse Multialternative Strategy Fund (the "Fund") for the period of November 1, 2023 to October 31, 2024. You can find additional information about the Fund at https://us-fund.credit-suisse.com/CSQAX. You can also request this information by contacting us at 877-870-2874. This report describes changes to the Fund that occurred during the reporting period.
What were the Fund costs for the last year?
Annual Fund Operating Expenses
(based on a hypothetical $10,000 investment)
| Class Name | Costs of a $10,000 investment | Costs paid as a percentage of a $10,000 investment |
|---|
| Class A | $111 | 1.10% |
|---|
How did the fund perform last year and what affected its performance?
Portfolio performance summary
What worked:
Carry strategies: Carry strategies seek to profit from stable markets and efficient asset pricing. In addition to security holdings, the program frequently uses options, forwards, futures, and swaps to implement carry strategies. A healthy macroeconomic backdrop, particularly in the US, supported a range of carry strategies, including Carry in Commodity Infrastructure.
Flow strategies: Flow strategies target lead-lag effects in markets. The program often uses a range of derivatives including futures and swaps to implement flow strategies. While late cycle, data dependent monetary policy calibration caused fixed income markets to bandy about, the allure of companies driving the advancement of emergent structural trends proved durable. Momentum in Structural Equity Themes generated healthy returns for much of the reporting period.
Intermediation strategies: These strategies, which seek to profit from liquidity provisioning, generated modest performance contribution. The program may use derivatives, including swaps, to implement intermediation strategies. Shifting growth expectations instigated frequent repositioning, driving demand for liquidity but also market whipsaws, and performance across intermediation strategies was mixed. Gains, supported by strategies such as Seasonality in Commodities, ultimately prevailed.
What didn’t work:
Valuation strategies: Valuation strategies seek to exploit market inefficiencies by comparing market pricing against other measures of fair value. The program may use derivatives, including swaps, to implement valuation strategies. Limited market breadth resulted in the underperformance of less expensive segments of the market. Strategies including Relative Value Across Equity Sectors detracted.
Positioning strategies: Positioning strategies attempt to utilize commonality and difference in the preferences of market participants to source returns. The program may use derivatives, including futures and swaps, to implement positioning strategies. The persistence of flows into certain large capitalization market segments saw crowded positions rewarded, negatively impacting strategies such as Dispersion in US Equities.
Credit Suisse Multialternative Strategy Fund
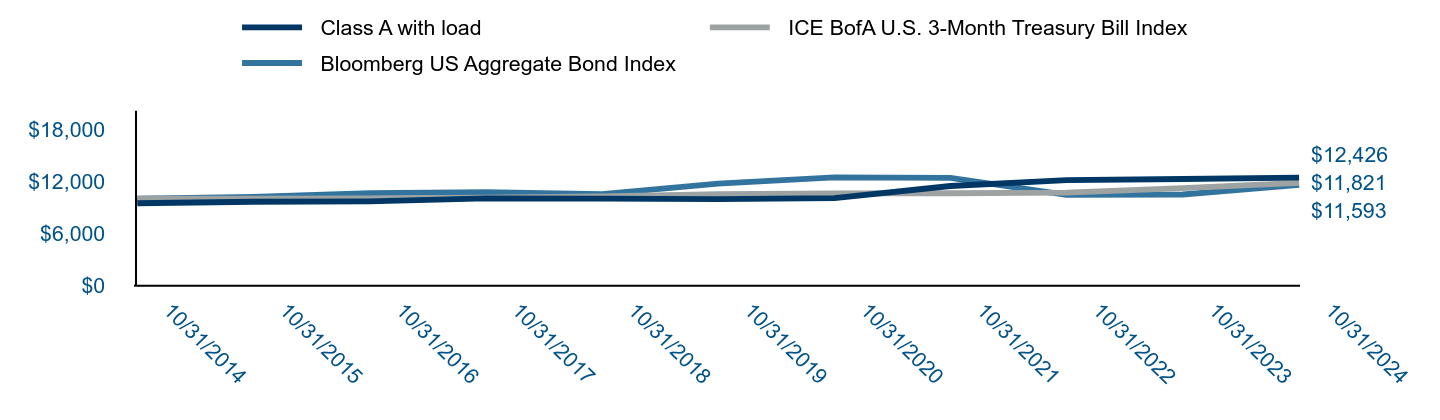
| Class A with load | ICE BofA U.S. 3-Month Treasury Bill Index | Bloomberg US Aggregate Bond Index |
|---|
| 10/31/2014 | $9,479 | $10,000 | $10,000 |
|---|
| 10/31/2015 | $9,648 | $10,002 | $10,196 |
|---|
| 10/31/2016 | $9,699 | $10,032 | $10,641 |
|---|
| 10/31/2017 | $10,034 | $10,105 | $10,737 |
|---|
| 10/31/2018 | $10,005 | $10,274 | $10,517 |
|---|
| 10/31/2019 | $9,955 | $10,521 | $11,727 |
|---|
| 10/31/2020 | $10,065 | $10,617 | $12,453 |
|---|
| 10/31/2021 | $11,462 | $10,623 | $12,393 |
|---|
| 10/31/2022 | $12,131 | $10,706 | $10,450 |
|---|
| 10/31/2023 | $12,270 | $11,217 | $10,487 |
|---|
| 10/31/2024 | $12,426 | $11,821 | $11,593 |
|---|
Average Annual Total Returns (%)
| Name | 1 Year | 5 Years | 10 Years |
|---|
| Class A | 1.27% | 4.53% | 2.74% |
|---|
| Class A with load | (4.04%) | 3.41% | 2.20% |
|---|
| ICE BofA U.S. 3-Month Treasury Bill Index | 5.39% | 2.36% | 1.69% |
|---|
| Bloomberg US Aggregate Bond Index | 10.55% | (0.23%) | 1.49% |
|---|
Performance data represents past performance, which does not guarantee future results. The graph and table assume the maximum sales charge and do not reflect the deduction of taxes that a shareholder would pay on Fund distributions or a redemption of Fund shares.
| Total Net Assets | $232,710,152 |
|---|
| # of Portfolio Holdings | 283 |
|---|
| Portfolio Turnover Rate | 214% |
|---|
| Total Advisory Fees Paid | $2,469,409 |
|---|
What is the Fund’s investment objective?
The Fund seeks positive absolute returns.
Portfolio Breakdown (% of Total Investments)
| United States Treasury Obligations | 65.8% |
| Short-Term Investments | 21.4 |
| Common Stocks | 12.6 |
| Exchange-traded Funds | 0.2 |
Derivatives are not reflected in amounts reported above.
Credit Suisse Multialternative Strategy Fund
Top 5 Holdings (% of Net Assets)
| U.S. Treasury Bills, 4.830%, due 11/29/24 | 6.4% |
| U.S. Treasury Bills, 4.829%, due 02/20/25 | 6.4 |
| U.S. Treasury Bills, 4.848%, due 05/15/25 | 6.3 |
| U.S. Treasury Bills, 4.090%, due 08/07/25 | 6.2 |
| U.S. Treasury Bills, 4.615%, due 12/26/24 | 3.0 |
Changes in or Disagreements with Accountants
On April 23, 2024, the Fund’s Board of Trustees (the “Board”) approved the dismissal of PricewaterhouseCoopers LLP (“PwC”) as the independent registered public accounting firm for the Fund, due to PwC’s ceasing to be deemed an independent registered public accounting firm with respect to the Fund after April 30, 2024. The Board’s decision to approve the dismissal of PwC was recommended by the Audit Committee of the Board. PwC’s reports on the Fund’s financial statements for the fiscal periods ended October 31, 2023 and October 31, 2022 contained no adverse opinion or disclaimer of opinion nor were they qualified or modified as to uncertainty, audit scope or accounting principle. During the Fund’s fiscal periods ended October 31, 2023 and October 31, 2022 and the subsequent interim period through April 23, 2024, (i) there were no disagreements with PwC on any matter of accounting principles or practices, financial statement disclosure or auditing scope or procedure, which disagreements, if not resolved to the satisfaction of PwC, would have caused them to make reference to the subject matter of the disagreements in connection with their reports on the Fund’s financial statements for such periods, and (ii) there were no “reportable events” of the kind described in Item 304(a)(1)(v) of Regulation S-K under the Securities Exchange Act of 1934, as amended. Effective June 19, 2024, Ernst & Young LLP (“EY”) was engaged as the independent registered public accounting firm following the recommendation of the Audit Committee of the Fund’s Board and approval by the Fund’s Board. During the Fund’s fiscal periods ended October 31, 2023 and October 31, 2022 and the subsequent interim period through June 19, 2024, neither the Fund, nor anyone on its behalf, consulted with EY on items which: (i) concerned the application of accounting principles to a specified transaction, either completed or proposed, or the type of audit opinion that might be rendered on the Fund’s financial statements; or (ii) concerned the subject of a disagreement (as defined in paragraph (a)(1)(iv) of Item 304 of Regulation S-K) or reportable events (as described in paragraph (a)(1)(v) of said Item 304).
The below is a summary of certain changes that occurred since the Fund's prior fiscal year ended October 31, 2023.
On May 1, 2024, Credit Suisse Asset Management, LLC (“Credit Suisse”) merged into UBS Asset Management (Americas) LLC (“UBS AM (Americas)”), with UBS AM (Americas) as the surviving entity, and UBS AM (Americas) became the investment manager to the Fund. Also on May 1, 2024, UBS Asset Management (US) Inc. replaced Credit Suisse Securities (USA) LLC as the Fund’s underwriter and distributor.
On August 16, 2024, UBS AM entered into an agreement with Manteio Scalable Technologies LLC (“Manteio”), Manteio Capital LLC and Manteio Partners LLC to transfer management of UBS AM’s Quantitative Investment Strategies business, including the portfolio management team of the Fund, to Manteio (the “Transaction”). At a meeting held on August 15, 2024, the Board of the Trust approved an Agreement and Plan of Reorganization (the “Agreement and Plan”) pursuant to which the Fund would be reorganized into Manteio Multialternative Strategy Fund, a newly created mutual fund advised by Manteio (the “Reorganization”). At a Special Meeting of Shareholders of the Fund on November 15, 2024, shareholders of the Fund approved the Agreement and Plan. The Reorganization closed on November 22, 2024 (the “Closing Date”). As a result of the Reorganization, the Manteio Multialternative Strategy Fund acquired the assets, subject to the liabilities, of the Fund, and shareholders of the Fund became shareholders of the Manteio Multialternative Strategy Fund as of the Closing Date.
If you wish to view additional information about the Fund, including but not limited to financial statements or holdings, please visit https://us-fund.credit-suisse.com/CSQAX.
Credit Suisse Multialternative Strategy Fund
Annual Shareholder Report
Credit Suisse Multialternative Strategy Fund
This annual shareholder report contains important information about Credit Suisse Multialternative Strategy Fund (the "Fund") for the period of November 1, 2023 to October 31, 2024. You can find additional information about the Fund at https://us-fund.credit-suisse.com/CSQIX. You can also request this information by contacting us at 877-870-2874. This report describes changes to the Fund that occurred during the reporting period.
What were the Fund costs for the last year?
Annual Fund Operating Expenses
(based on a hypothetical $10,000 investment)
| Class Name | Costs of a $10,000 investment | Costs paid as a percentage of a $10,000 investment |
|---|
| Class I | $86 | 0.85% |
|---|
How did the fund perform last year and what affected its performance?
Portfolio performance summary
What worked:
Carry strategies: Carry strategies seek to profit from stable markets and efficient asset pricing. In addition to security holdings, the program frequently uses options, forwards, futures, and swaps to implement carry strategies. A healthy macroeconomic backdrop, particularly in the US, supported a range of carry strategies, including Carry in Commodity Infrastructure.
Flow strategies: Flow strategies target lead-lag effects in markets. The program often uses a range of derivatives including futures and swaps to implement flow strategies. While late cycle, data dependent monetary policy calibration caused fixed income markets to bandy about, the allure of companies driving the advancement of emergent structural trends proved durable. Momentum in Structural Equity Themes generated healthy returns for much of the reporting period.
Intermediation strategies: These strategies, which seek to profit from liquidity provisioning, generated modest performance contribution. The program may use derivatives, including swaps, to implement intermediation strategies. Shifting growth expectations instigated frequent repositioning, driving demand for liquidity but also market whipsaws, and performance across intermediation strategies was mixed. Gains, supported by strategies such as Seasonality in Commodities, ultimately prevailed.
What didn’t work:
Valuation strategies: Valuation strategies seek to exploit market inefficiencies by comparing market pricing against other measures of fair value. The program may use derivatives, including swaps, to implement valuation strategies. Limited market breadth resulted in the underperformance of less expensive segments of the market. Strategies including Relative Value Across Equity Sectors detracted.
Positioning strategies: Positioning strategies attempt to utilize commonality and difference in the preferences of market participants to source returns. The program may use derivatives, including futures and swaps, to implement positioning strategies. The persistence of flows into certain large capitalization market segments saw crowded positions rewarded, negatively impacting strategies such as Dispersion in US Equities.
Credit Suisse Multialternative Strategy Fund
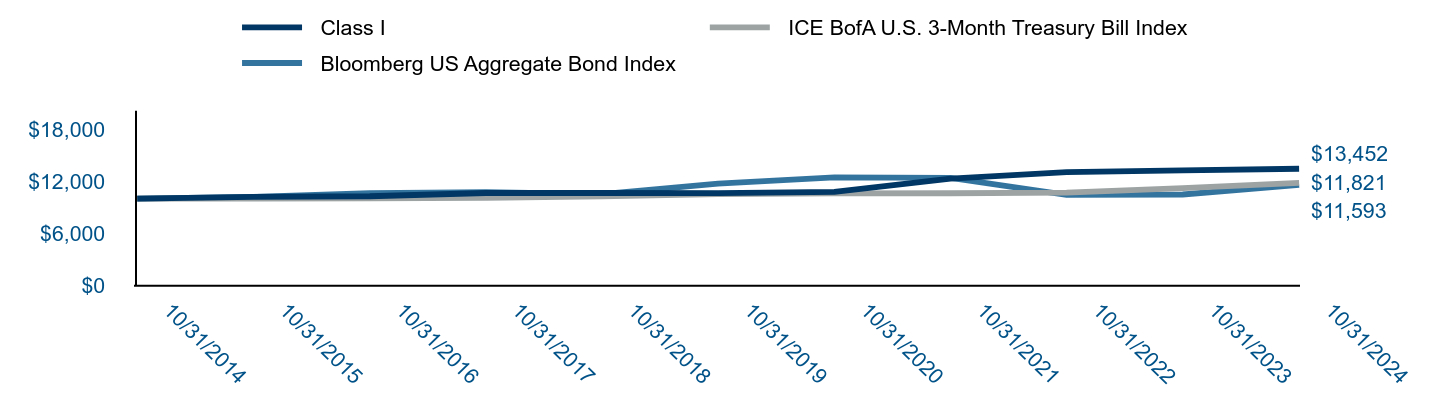
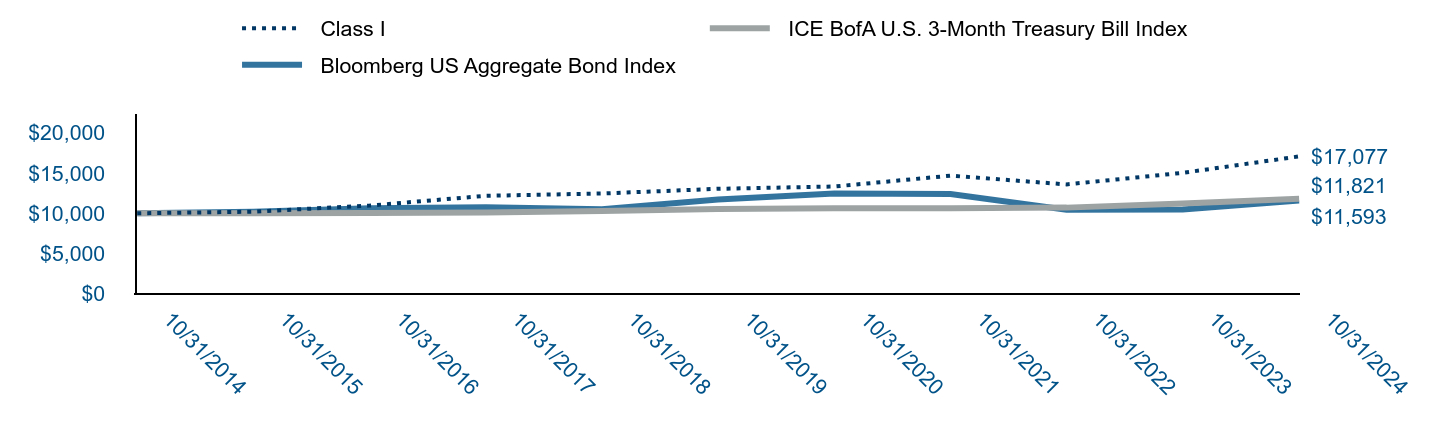
| Class I | ICE BofA U.S. 3-Month Treasury Bill Index | Bloomberg US Aggregate Bond Index |
|---|
| 10/31/2014 | $10,000 | $10,000 | $10,000 |
|---|
| 10/31/2015 | $10,203 | $10,002 | $10,196 |
|---|
| 10/31/2016 | $10,277 | $10,032 | $10,641 |
|---|
| 10/31/2017 | $10,656 | $10,105 | $10,737 |
|---|
| 10/31/2018 | $10,657 | $10,274 | $10,517 |
|---|
| 10/31/2019 | $10,637 | $10,521 | $11,727 |
|---|
| 10/31/2020 | $10,780 | $10,617 | $12,453 |
|---|
| 10/31/2021 | $12,314 | $10,623 | $12,393 |
|---|
| 10/31/2022 | $13,057 | $10,706 | $10,450 |
|---|
| 10/31/2023 | $13,252 | $11,217 | $10,487 |
|---|
| 10/31/2024 | $13,452 | $11,821 | $11,593 |
|---|
Average Annual Total Returns (%)
| Name | 1 Year | 5 Years | 10 Years |
|---|
| Class I | 1.51% | 4.81% | 3.01% |
|---|
| ICE BofA U.S. 3-Month Treasury Bill Index | 5.39% | 2.36% | 1.69% |
|---|
| Bloomberg US Aggregate Bond Index | 10.55% | (0.23%) | 1.49% |
|---|
Performance data represents past performance, which does not guarantee future results. The graph and table do not reflect the deduction of taxes that a shareholder would pay on Fund distributions or a redemption of Fund shares.
| Total Net Assets | $232,710,152 |
|---|
| # of Portfolio Holdings | 283 |
|---|
| Portfolio Turnover Rate | 214% |
|---|
| Total Advisory Fees Paid | $2,469,409 |
|---|
What is the Fund’s investment objective?
The Fund seeks positive absolute returns.
Portfolio Breakdown (% of Total Investments)
| United States Treasury Obligations | 65.8% |
| Short-Term Investments | 21.4 |
| Common Stocks | 12.6 |
| Exchange-traded Funds | 0.2 |
Derivatives are not reflected in amounts reported above.
Credit Suisse Multialternative Strategy Fund
Top 5 Holdings (% of Net Assets)
| U.S. Treasury Bills, 4.830%, due 11/29/24 | 6.4% |
| U.S. Treasury Bills, 4.829%, due 02/20/25 | 6.4 |
| U.S. Treasury Bills, 4.848%, due 05/15/25 | 6.3 |
| U.S. Treasury Bills, 4.090%, due 08/07/25 | 6.2 |
| U.S. Treasury Bills, 4.615%, due 12/26/24 | 3.0 |
Changes in or Disagreements with Accountants
On April 23, 2024, the Fund’s Board of Trustees (the “Board”) approved the dismissal of PricewaterhouseCoopers LLP (“PwC”) as the independent registered public accounting firm for the Fund, due to PwC’s ceasing to be deemed an independent registered public accounting firm with respect to the Fund after April 30, 2024. The Board’s decision to approve the dismissal of PwC was recommended by the Audit Committee of the Board. PwC’s reports on the Fund’s financial statements for the fiscal periods ended October 31, 2023 and October 31, 2022 contained no adverse opinion or disclaimer of opinion nor were they qualified or modified as to uncertainty, audit scope or accounting principle. During the Fund’s fiscal periods ended October 31, 2023 and October 31, 2022 and the subsequent interim period through April 23, 2024, (i) there were no disagreements with PwC on any matter of accounting principles or practices, financial statement disclosure or auditing scope or procedure, which disagreements, if not resolved to the satisfaction of PwC, would have caused them to make reference to the subject matter of the disagreements in connection with their reports on the Fund’s financial statements for such periods, and (ii) there were no “reportable events” of the kind described in Item 304(a)(1)(v) of Regulation S-K under the Securities Exchange Act of 1934, as amended. Effective June 19, 2024, Ernst & Young LLP (“EY”) was engaged as the independent registered public accounting firm following the recommendation of the Audit Committee of the Fund’s Board and approval by the Fund’s Board. During the Fund’s fiscal periods ended October 31, 2023 and October 31, 2022 and the subsequent interim period through June 19, 2024, neither the Fund, nor anyone on its behalf, consulted with EY on items which: (i) concerned the application of accounting principles to a specified transaction, either completed or proposed, or the type of audit opinion that might be rendered on the Fund’s financial statements; or (ii) concerned the subject of a disagreement (as defined in paragraph (a)(1)(iv) of Item 304 of Regulation S-K) or reportable events (as described in paragraph (a)(1)(v) of said Item 304).
The below is a summary of certain changes that occurred since the Fund's prior fiscal year ended October 31, 2023.
On May 1, 2024, Credit Suisse Asset Management, LLC (“Credit Suisse”) merged into UBS Asset Management (Americas) LLC (“UBS AM (Americas)”), with UBS AM (Americas) as the surviving entity, and UBS AM (Americas) became the investment manager to the Fund. Also on May 1, 2024, UBS Asset Management (US) Inc. replaced Credit Suisse Securities (USA) LLC as the Fund’s underwriter and distributor.
On August 16, 2024, UBS AM entered into an agreement with Manteio Scalable Technologies LLC (“Manteio”), Manteio Capital LLC and Manteio Partners LLC to transfer management of UBS AM’s Quantitative Investment Strategies business, including the portfolio management team of the Fund, to Manteio (the “Transaction”). At a meeting held on August 15, 2024, the Board of the Trust approved an Agreement and Plan of Reorganization (the “Agreement and Plan”) pursuant to which the Fund would be reorganized into Manteio Multialternative Strategy Fund, a newly created mutual fund advised by Manteio (the “Reorganization”). At a Special Meeting of Shareholders of the Fund on November 15, 2024, shareholders of the Fund approved the Agreement and Plan. The Reorganization closed on November 22, 2024 (the “Closing Date”). As a result of the Reorganization, the Manteio Multialternative Strategy Fund acquired the assets, subject to the liabilities, of the Fund, and shareholders of the Fund became shareholders of the Manteio Multialternative Strategy Fund as of the Closing Date.
If you wish to view additional information about the Fund, including but not limited to financial statements or holdings, please visit https://us-fund.credit-suisse.com/CSQIX.
Credit Suisse Multialternative Strategy Fund
Annual Shareholder Report
Credit Suisse Floating Rate High Income Fund
This annual shareholder report contains important information about Credit Suisse Floating Rate High Income Fund (the "Fund") for the period of November 1, 2023 to October 31, 2024. You can find additional information about the Fund at https://us-fund.credit-suisse.com/CHIAX. You can also request this information by contacting us at 877-870-2874. This report describes changes to the Fund that occurred during the reporting period.
What were the Fund costs for the last year?
Annual Fund Operating Expenses
(based on a hypothetical $10,000 investment)
| Class Name | Costs of a $10,000 investment | Costs paid as a percentage of a $10,000 investment |
|---|
| Class A | $99 | 0.95% |
|---|
How did the fund perform last year and what affected its performance?
Portfolio performance summary
What worked:
- Asset allocation to High Yield and Collateralized Loan Obligation asset classes positively contributed to relative returns.
- Positive selection within the Aerospace, Information Technology, Transportation and Metals/Minerals sectors were the greatest contributors to sector attribution.
- From ratings perspective, there was positive selection in the Caa3, B3 and B1 ratings categories.
What didn’t work:
- The Fund experienced negative selection from Media/Telecommunication, Service, Chemicals, Manufacturing and Financial sectors.
- From a ratings perspective, there was negative selection from Caa2, C and Ca-rated investments.
Credit Suisse Floating Rate High Income Fund
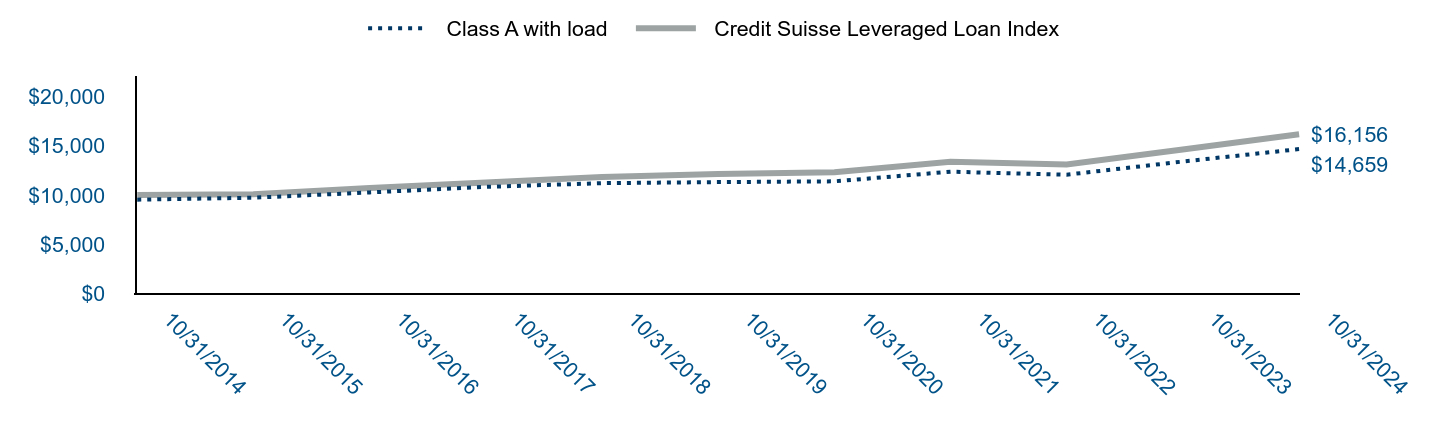
| Class A with load | Credit Suisse Leveraged Loan Index |
|---|
| 10/31/2014 | $9,530 | $10,000 |
|---|
| 10/31/2015 | $9,729 | $10,081 |
|---|
| 10/31/2016 | $10,266 | $10,716 |
|---|
| 10/31/2017 | $10,828 | $11,279 |
|---|
| 10/31/2018 | $11,207 | $11,830 |
|---|
| 10/31/2019 | $11,313 | $12,139 |
|---|
| 10/31/2020 | $11,391 | $12,321 |
|---|
| 10/31/2021 | $12,367 | $13,372 |
|---|
| 10/31/2022 | $12,061 | $13,101 |
|---|
| 10/31/2023 | $13,396 | $14,615 |
|---|
| 10/31/2024 | $14,659 | $16,156 |
|---|
Average Annual Total Returns (%)
| Name | 1 Year | 5 Years | 10 Years |
|---|
| Class A | 9.43% | 5.32% | 4.40% |
|---|
| Class A with load | 4.16% | 4.29% | 3.90% |
|---|
| Credit Suisse Leveraged Loan Index | 10.55% | 5.89% | 4.91% |
|---|
Performance data represents past performance, which does not guarantee future results. The graph and table assume the maximum sales charge and do not reflect the deduction of taxes that a shareholder would pay on Fund distributions or a redemption of Fund shares.
| Total Net Assets | $1,971,472,265 |
|---|
| # of Portfolio Holdings | 438 |
|---|
| Portfolio Turnover Rate | 50% |
|---|
| Total Advisory Fees Paid | $9,782,023 |
|---|
What is the Fund’s investment objective?
The Fund seeks high current income and, secondarily, capital appreciation.
Portfolio Breakdown (% of Total Investments)
| Bank Loans | 82.3% |
| Corporate Bonds | 6.5 |
| Short-Term Investments | 6.5 |
| Asset Backed Securities | 3.9 |
| Common Stocks | 0.8 |
| Warrants | 0.0 |
Derivatives are not reflected in amounts reported above.
Credit Suisse Floating Rate High Income Fund
Credit Quality BreakdownFootnote Reference
(% of Total Investments)
S&P RatingsFootnote Reference | Value |
| A | 0.1% |
| A+ | 0.1 |
| B | 30.4 |
| B- | 10.4 |
| B+ | 8.5 |
| BB | 14.4 |
| BB- | 5.7 |
| BB+ | 3.0 |
| BBB | 0.4 |
| BBB- | 4.4 |
| C | 0.1 |
| CC | 0.3 |
| CCC | 2.4 |
| CCC- | 1.0 |
| CCC+ | 4.1 |
| D | 0.1 |
| NR | 7.1 |
| Subtotal | 92.5 |
| Equity and Other | 7.5 |
| Total | 100.0% |
| Footnote | Description |
Footnote | Expressed as a percentage of total investments (excluding securities lending collateral, if applicable) and may vary over time. |
Footnote | Credit Quality is based on ratings provided by the S&P Global Ratings Division of S&P Global Inc. ("S&P"). S&P is a main provider of ratings for credit asset classes and is widely used amongst industry participants. The NR category consists of securities that have not been rated by S&P. |
Derivatives are not reflected in amounts reported above.
Changes in or Disagreements with Accountants
On April 23, 2024, the Fund’s Board of Trustees (the “Board”) approved the dismissal of PricewaterhouseCoopers LLP (“PwC”) as the independent registered public accounting firm for the Fund, due to PwC’s ceasing to be deemed an independent registered public accounting firm with respect to the Fund after April 30, 2024. The Board’s decision to approve the dismissal of PwC was recommended by the Audit Committee of the Board. PwC’s reports on the Fund’s financial statements for the fiscal periods ended October 31, 2023 and October 31, 2022 contained no adverse opinion or disclaimer of opinion nor were they qualified or modified as to uncertainty, audit scope or accounting principle. During the Fund’s fiscal periods ended October 31, 2023 and October 31, 2022 and the subsequent interim period through April 23, 2024, (i) there were no disagreements with PwC on any matter of accounting principles or practices, financial statement disclosure or auditing scope or procedure, which disagreements, if not resolved to the satisfaction of PwC, would have caused them to make reference to the subject matter of the disagreements in connection with their reports on the Fund’s financial statements for such periods, and (ii) there were no “reportable events” of the kind described in Item 304(a)(1)(v) of Regulation S-K under the Securities Exchange Act of 1934, as amended. Effective June 19, 2024, Ernst & Young LLP (“EY”) was engaged as the independent registered public accounting firm following the recommendation of the Audit Committee of the Fund’s Board and approval by the Fund’s Board. During the Fund’s fiscal periods ended October 31, 2023 and October 31, 2022 and the subsequent interim period through June 19, 2024, neither the Fund, nor anyone on its behalf, consulted with EY on items which: (i) concerned the application of accounting principles to a specified transaction, either completed or proposed, or the type of audit opinion that might be rendered on the Fund’s financial statements; or (ii) concerned the subject of a disagreement (as defined in paragraph (a)(1)(iv) of Item 304 of Regulation S-K) or reportable events (as described in paragraph (a)(1)(v) of said Item 304).
The below is a summary of certain changes that occurred since the Fund's prior fiscal year ended October 31, 2023.
On May 1, 2024, Credit Suisse Asset Management, LLC (“Credit Suisse”) merged into UBS Asset Management (Americas) LLC (“UBS AM (Americas)”), with UBS AM (Americas) as the surviving entity, and UBS AM (Americas) became the investment manager to the Fund. Also on May 1, 2024, UBS Asset Management (US) Inc. replaced Credit Suisse Securities (USA) LLC as the Fund’s underwriter and distributor.
If you wish to view additional information about the Fund, including but not limited to financial statements or holdings, please visit https://us-fund.credit-suisse.com/CHIAX.
Credit Suisse Floating Rate High Income Fund
Annual Shareholder Report
Credit Suisse Floating Rate High Income Fund
This annual shareholder report contains important information about Credit Suisse Floating Rate High Income Fund (the "Fund") for the period of November 1, 2023 to October 31, 2024. You can find additional information about the Fund at https://us-fund.credit-suisse.com/CHICX. You can also request this information by contacting us at 877-870-2874. This report describes changes to the Fund that occurred during the reporting period.
What were the Fund costs for the last year?
Annual Fund Operating Expenses
(based on a hypothetical $10,000 investment)
| Class Name | Costs of a $10,000 investment | Costs paid as a percentage of a $10,000 investment |
|---|
| Class C | $177 | 1.70% |
|---|
How did the fund perform last year and what affected its performance?
Portfolio performance summary
What worked:
- Asset allocation to High Yield and Collateralized Loan Obligation asset classes positively contributed to relative returns.
- Positive selection within the Aerospace, Information Technology, Transportation and Metals/Minerals sectors were the greatest contributors to sector attribution.
- From ratings perspective, there was positive selection in the Caa3, B3 and B1 ratings categories.
What didn’t work:
- The Fund experienced negative selection from Media/Telecommunication, Service, Chemicals, Manufacturing and Financial sectors.
- From a ratings perspective, there was negative selection from Caa2, C and Ca-rated investments.
Credit Suisse Floating Rate High Income Fund
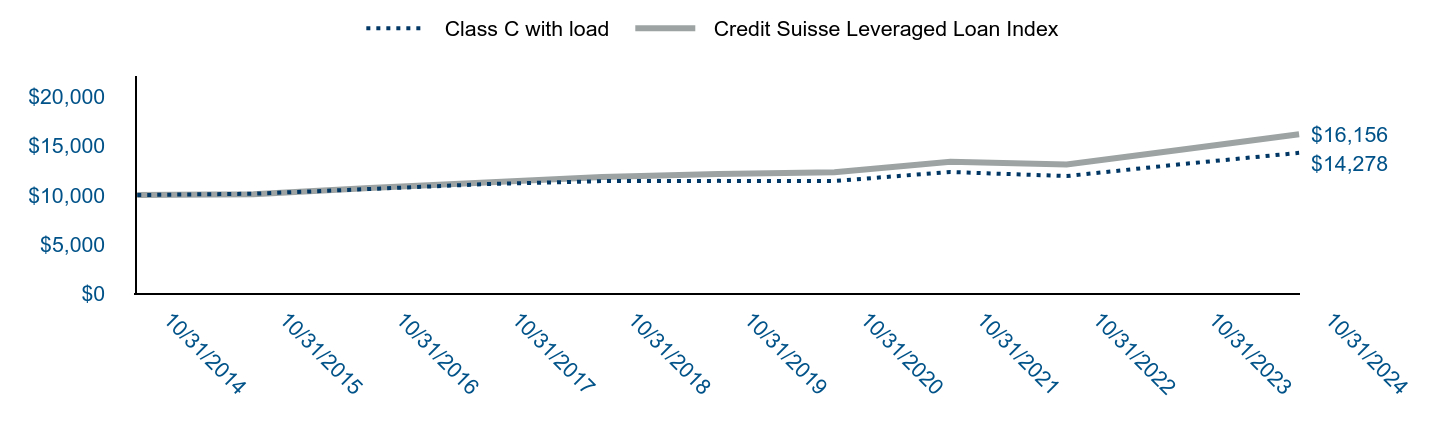
| Class C with load | Credit Suisse Leveraged Loan Index |
|---|
| 10/31/2014 | $10,000 | $10,000 |
|---|
| 10/31/2015 | $10,133 | $10,081 |
|---|
| 10/31/2016 | $10,613 | $10,716 |
|---|
| 10/31/2017 | $11,111 | $11,279 |
|---|
| 10/31/2018 | $11,414 | $11,830 |
|---|
| 10/31/2019 | $11,437 | $12,139 |
|---|
| 10/31/2020 | $11,431 | $12,321 |
|---|
| 10/31/2021 | $12,335 | $13,372 |
|---|
| 10/31/2022 | $11,924 | $13,101 |
|---|
| 10/31/2023 | $13,146 | $14,615 |
|---|
| 10/31/2024 | $14,278 | $16,156 |
|---|
Average Annual Total Returns (%)
| Name | 1 Year | 5 Years | 10 Years |
|---|
| Class C | 8.61% | 4.54% | 3.63% |
|---|
| Class C with load | 7.61% | 4.54% | 3.63% |
|---|
| Credit Suisse Leveraged Loan Index | 10.55% | 5.89% | 4.91% |
|---|
Performance data represents past performance, which does not guarantee future results. The graph and table assume the maximum deferred sales charge and do not reflect the deduction of taxes that a shareholder would pay on Fund distributions or a redemption of Fund shares.
| Total Net Assets | $1,971,472,265 |
|---|
| # of Portfolio Holdings | 438 |
|---|
| Portfolio Turnover Rate | 50% |
|---|
| Total Advisory Fees Paid | $9,782,023 |
|---|
What is the Fund’s investment objective?
The Fund seeks high current income and, secondarily, capital appreciation.
Portfolio Breakdown (% of Total Investments)
| Bank Loans | 82.3% |
| Corporate Bonds | 6.5 |
| Short-Term Investments | 6.5 |
| Asset Backed Securities | 3.9 |
| Common Stocks | 0.8 |
| Warrants | 0.0 |
Derivatives are not reflected in amounts reported above.
Credit Suisse Floating Rate High Income Fund
Credit Quality BreakdownFootnote Reference
(% of Total Investments)
S&P RatingsFootnote Reference | Value |
| A | 0.1% |
| A+ | 0.1 |
| B | 30.4 |
| B- | 10.4 |
| B+ | 8.5 |
| BB | 14.4 |
| BB- | 5.7 |
| BB+ | 3.0 |
| BBB | 0.4 |
| BBB- | 4.4 |
| C | 0.1 |
| CC | 0.3 |
| CCC | 2.4 |
| CCC- | 1.0 |
| CCC+ | 4.1 |
| D | 0.1 |
| NR | 7.1 |
| Subtotal | 92.5 |
| Equity and Other | 7.5 |
| Total | 100.0% |
| Footnote | Description |
Footnote | Expressed as a percentage of total investments (excluding securities lending collateral, if applicable) and may vary over time. |
Footnote | Credit Quality is based on ratings provided by the S&P Global Ratings Division of S&P Global Inc. ("S&P"). S&P is a main provider of ratings for credit asset classes and is widely used amongst industry participants. The NR category consists of securities that have not been rated by S&P. |
Derivatives are not reflected in amounts reported above.
Changes in or Disagreements with Accountants
On April 23, 2024, the Fund’s Board of Trustees (the “Board”) approved the dismissal of PricewaterhouseCoopers LLP (“PwC”) as the independent registered public accounting firm for the Fund, due to PwC’s ceasing to be deemed an independent registered public accounting firm with respect to the Fund after April 30, 2024. The Board’s decision to approve the dismissal of PwC was recommended by the Audit Committee of the Board. PwC’s reports on the Fund’s financial statements for the fiscal periods ended October 31, 2023 and October 31, 2022 contained no adverse opinion or disclaimer of opinion nor were they qualified or modified as to uncertainty, audit scope or accounting principle. During the Fund’s fiscal periods ended October 31, 2023 and October 31, 2022 and the subsequent interim period through April 23, 2024, (i) there were no disagreements with PwC on any matter of accounting principles or practices, financial statement disclosure or auditing scope or procedure, which disagreements, if not resolved to the satisfaction of PwC, would have caused them to make reference to the subject matter of the disagreements in connection with their reports on the Fund’s financial statements for such periods, and (ii) there were no “reportable events” of the kind described in Item 304(a)(1)(v) of Regulation S-K under the Securities Exchange Act of 1934, as amended. Effective June 19, 2024, Ernst & Young LLP (“EY”) was engaged as the independent registered public accounting firm following the recommendation of the Audit Committee of the Fund’s Board and approval by the Fund’s Board. During the Fund’s fiscal periods ended October 31, 2023 and October 31, 2022 and the subsequent interim period through June 19, 2024, neither the Fund, nor anyone on its behalf, consulted with EY on items which: (i) concerned the application of accounting principles to a specified transaction, either completed or proposed, or the type of audit opinion that might be rendered on the Fund’s financial statements; or (ii) concerned the subject of a disagreement (as defined in paragraph (a)(1)(iv) of Item 304 of Regulation S-K) or reportable events (as described in paragraph (a)(1)(v) of said Item 304).
The below is a summary of certain changes that occurred since the Fund's prior fiscal year ended October 31, 2023.
On May 1, 2024, Credit Suisse Asset Management, LLC (“Credit Suisse”) merged into UBS Asset Management (Americas) LLC (“UBS AM (Americas)”), with UBS AM (Americas) as the surviving entity, and UBS AM (Americas) became the investment manager to the Fund. Also on May 1, 2024, UBS Asset Management (US) Inc. replaced Credit Suisse Securities (USA) LLC as the Fund’s underwriter and distributor.
If you wish to view additional information about the Fund, including but not limited to financial statements or holdings, please visit https://us-fund.credit-suisse.com/CHICX.
Credit Suisse Floating Rate High Income Fund
Annual Shareholder Report
Credit Suisse Floating Rate High Income Fund
This annual shareholder report contains important information about Credit Suisse Floating Rate High Income Fund (the "Fund") for the period of November 1, 2023 to October 31, 2024. You can find additional information about the Fund at https://us-fund.credit-suisse.com/CSHIX. You can also request this information by contacting us at 877-870-2874. This report describes changes to the Fund that occurred during the reporting period.
What were the Fund costs for the last year?
Annual Fund Operating Expenses
(based on a hypothetical $10,000 investment)
| Class Name | Costs of a $10,000 investment | Costs paid as a percentage of a $10,000 investment |
|---|
| Class I | $73 | 0.70% |
|---|
How did the fund perform last year and what affected its performance?
Portfolio performance summary
What worked:
- Asset allocation to High Yield and Collateralized Loan Obligation asset classes positively contributed to relative returns.
- Positive selection within the Aerospace, Information Technology, Transportation and Metals/Minerals sectors were the greatest contributors to sector attribution.
- From ratings perspective, there was positive selection in the Caa3, B3 and B1 ratings categories.
What didn’t work:
- The Fund experienced negative selection from Media/Telecommunication, Service, Chemicals, Manufacturing and Financial sectors.
- From a ratings perspective, there was negative selection from Caa2, C and Ca-rated investments.
Credit Suisse Floating Rate High Income Fund
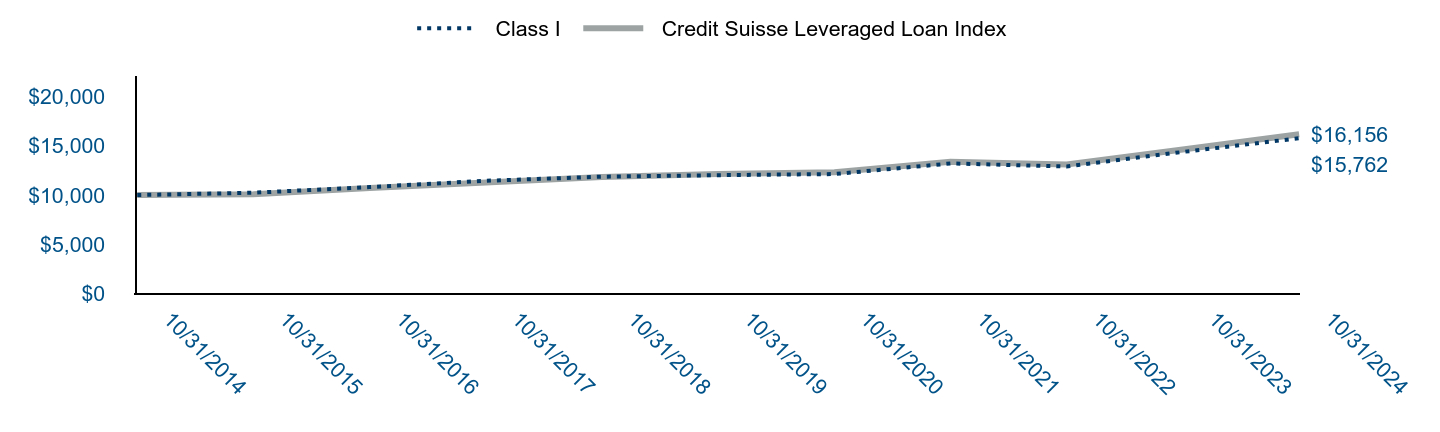
| Class I | Credit Suisse Leveraged Loan Index |
|---|
| 10/31/2014 | $10,000 | $10,000 |
|---|
| 10/31/2015 | $10,233 | $10,081 |
|---|
| 10/31/2016 | $10,809 | $10,716 |
|---|
| 10/31/2017 | $11,448 | $11,279 |
|---|
| 10/31/2018 | $11,861 | $11,830 |
|---|
| 10/31/2019 | $12,017 | $12,139 |
|---|
| 10/31/2020 | $12,128 | $12,321 |
|---|
| 10/31/2021 | $13,202 | $13,372 |
|---|
| 10/31/2022 | $12,904 | $13,101 |
|---|
| 10/31/2023 | $14,369 | $14,615 |
|---|
| 10/31/2024 | $15,762 | $16,156 |
|---|
Average Annual Total Returns (%)
| Name | 1 Year | 5 Years | 10 Years |
|---|
| Class I | 9.70% | 5.58% | 4.66% |
|---|
| Credit Suisse Leveraged Loan Index | 10.55% | 5.89% | 4.91% |
|---|
Performance data represents past performance, which does not guarantee future results. The graph and table do not reflect the deduction of taxes that a shareholder would pay on Fund distributions or a redemption of Fund shares.
| Total Net Assets | $1,971,472,265 |
|---|
| # of Portfolio Holdings | 438 |
|---|
| Portfolio Turnover Rate | 50% |
|---|
| Total Advisory Fees Paid | $9,782,023 |
|---|
What is the Fund’s investment objective?
The Fund seeks high current income and, secondarily, capital appreciation.
Portfolio Breakdown (% of Total Investments)
| Bank Loans | 82.3% |
| Corporate Bonds | 6.5 |
| Short-Term Investments | 6.5 |
| Asset Backed Securities | 3.9 |
| Common Stocks | 0.8 |
| Warrants | 0.0 |
Derivatives are not reflected in amounts reported above.
Credit Suisse Floating Rate High Income Fund
Credit Quality BreakdownFootnote Reference
(% of Total Investments)
S&P RatingsFootnote Reference | Value |
| A | 0.1% |
| A+ | 0.1 |
| B | 30.4 |
| B- | 10.4 |
| B+ | 8.5 |
| BB | 14.4 |
| BB- | 5.7 |
| BB+ | 3.0 |
| BBB | 0.4 |
| BBB- | 4.4 |
| C | 0.1 |
| CC | 0.3 |
| CCC | 2.4 |
| CCC- | 1.0 |
| CCC+ | 4.1 |
| D | 0.1 |
| NR | 7.1 |
| Subtotal | 92.5 |
| Equity and Other | 7.5 |
| Total | 100.0% |
| Footnote | Description |
Footnote | Expressed as a percentage of total investments (excluding securities lending collateral, if applicable) and may vary over time. |
Footnote | Credit Quality is based on ratings provided by the S&P Global Ratings Division of S&P Global Inc. ("S&P"). S&P is a main provider of ratings for credit asset classes and is widely used amongst industry participants. The NR category consists of securities that have not been rated by S&P. |
Derivatives are not reflected in amounts reported above.
Changes in or Disagreements with Accountants
On April 23, 2024, the Fund’s Board of Trustees (the “Board”) approved the dismissal of PricewaterhouseCoopers LLP (“PwC”) as the independent registered public accounting firm for the Fund, due to PwC’s ceasing to be deemed an independent registered public accounting firm with respect to the Fund after April 30, 2024. The Board’s decision to approve the dismissal of PwC was recommended by the Audit Committee of the Board. PwC’s reports on the Fund’s financial statements for the fiscal periods ended October 31, 2023 and October 31, 2022 contained no adverse opinion or disclaimer of opinion nor were they qualified or modified as to uncertainty, audit scope or accounting principle. During the Fund’s fiscal periods ended October 31, 2023 and October 31, 2022 and the subsequent interim period through April 23, 2024, (i) there were no disagreements with PwC on any matter of accounting principles or practices, financial statement disclosure or auditing scope or procedure, which disagreements, if not resolved to the satisfaction of PwC, would have caused them to make reference to the subject matter of the disagreements in connection with their reports on the Fund’s financial statements for such periods, and (ii) there were no “reportable events” of the kind described in Item 304(a)(1)(v) of Regulation S-K under the Securities Exchange Act of 1934, as amended. Effective June 19, 2024, Ernst & Young LLP (“EY”) was engaged as the independent registered public accounting firm following the recommendation of the Audit Committee of the Fund’s Board and approval by the Fund’s Board. During the Fund’s fiscal periods ended October 31, 2023 and October 31, 2022 and the subsequent interim period through June 19, 2024, neither the Fund, nor anyone on its behalf, consulted with EY on items which: (i) concerned the application of accounting principles to a specified transaction, either completed or proposed, or the type of audit opinion that might be rendered on the Fund’s financial statements; or (ii) concerned the subject of a disagreement (as defined in paragraph (a)(1)(iv) of Item 304 of Regulation S-K) or reportable events (as described in paragraph (a)(1)(v) of said Item 304).
The below is a summary of certain changes that occurred since the Fund's prior fiscal year ended October 31, 2023.
On May 1, 2024, Credit Suisse Asset Management, LLC (“Credit Suisse”) merged into UBS Asset Management (Americas) LLC (“UBS AM (Americas)”), with UBS AM (Americas) as the surviving entity, and UBS AM (Americas) became the investment manager to the Fund. Also on May 1, 2024, UBS Asset Management (US) Inc. replaced Credit Suisse Securities (USA) LLC as the Fund’s underwriter and distributor.
If you wish to view additional information about the Fund, including but not limited to financial statements or holdings, please visit https://us-fund.credit-suisse.com/CSHIX.
Credit Suisse Floating Rate High Income Fund
Annual Shareholder Report
Credit Suisse Managed Futures Strategy Fund
This annual shareholder report contains important information about Credit Suisse Managed Futures Strategy Fund (the "Fund") for the period of November 1, 2023 to October 31, 2024. You can find additional information about the Fund at https://us-fund.credit-suisse.com/CSAAX. You can also request this information by contacting us at 877-870-2874. This report describes changes to the Fund that occurred during the reporting period.
What were the Fund costs for the last year?
Annual Fund Operating Expenses
(based on a hypothetical $10,000 investment)
| Class Name | Costs of a $10,000 investment | Costs paid as a percentage of a $10,000 investment |
|---|
| Class A | $148 | 1.55% |
|---|
How did the fund perform last year and what affected its performance?
Portfolio performance summary
What worked:
Long-biased equity futures trading: Resilient corporate earnings, the intensification of pro-growth Chinese policy measures, and indications of easing inflationary pressure joined with money manager fear of missing out to send global equity markets higher to the benefit of the Fund.
Commodity swap trading also contributed, albeit modestly: Short-biased Agriculture exposure generated gains as supportive weather conditions and diminishing demand for ethanol feedstocks weighed on prices.
What didn’t work:
Mercurial positioning in currencies futures: With developed market monetary policy desynchronizing, investors paid particular attention to the rate of change in economic conditions in the US versus the rest of the G7 and to the impending US elections, as the Bank of Japan generally struck a gradualist tone in seeking to normalize monetary policy without spooking markets. The Fund’s exposure in the asset class shifted frequently and unprofitably.
Whipsawing fixed income futures trading: Fixed income markets flip-flopped as markets absorbed indications of lingering inflationary pressures even as volatile employment data, dwindling consumer confidence, and softening economic data left little doubt that higher for longer interest rates were closing in on their target and perhaps overshooting.
Credit Suisse Managed Futures Strategy Fund
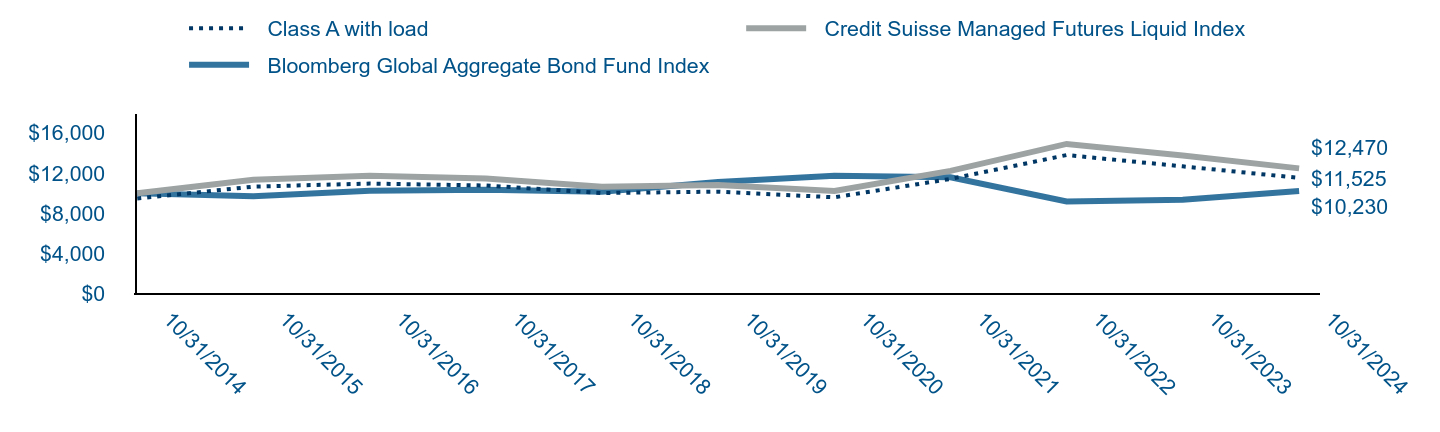
| Class A with load | Credit Suisse Managed Futures Liquid Index | Bloomberg Global Aggregate Bond Fund Index |
|---|
| 10/31/2014 | $9,474 | $10,000 | $10,000 |
|---|
| 10/31/2015 | $10,655 | $11,336 | $9,693 |
|---|
| 10/31/2016 | $10,961 | $11,725 | $10,234 |
|---|
| 10/31/2017 | $10,764 | $11,468 | $10,355 |
|---|
| 10/31/2018 | $10,019 | $10,652 | $10,143 |
|---|
| 10/31/2019 | $10,154 | $10,808 | $11,110 |
|---|
| 10/31/2020 | $9,593 | $10,223 | $11,736 |
|---|
| 10/31/2021 | $11,419 | $12,225 | $11,590 |
|---|
| 10/31/2022 | $13,797 | $14,902 | $9,181 |
|---|
| 10/31/2023 | $12,672 | $13,751 | $9,339 |
|---|
| 10/31/2024 | $11,525 | $12,470 | $10,230 |
|---|
Average Annual Total Returns (%)
| Name | 1 Year | 5 Years | 10 Years |
|---|
| Class A | (9.06%) | 2.56% | 1.98% |
|---|
| Class A with load | (13.85%) | 1.47% | 1.43% |
|---|
| Credit Suisse Managed Futures Liquid Index | (9.31%) | 2.90% | 2.23% |
|---|
| Bloomberg Global Aggregate Bond Fund Index | 9.55% | (1.64%) | 0.23% |
|---|
Performance data represents past performance, which does not guarantee future results. The graph and table assume the maximum sales charge and do not reflect the deduction of taxes that a shareholder would pay on Fund distributions or a redemption of Fund shares.
| Total Net Assets | $201,552,407 |
|---|
| # of Portfolio Holdings | 13 |
|---|
| Portfolio Turnover Rate | 0% |
|---|
| Total Advisory Fees Paid | $1,878,310 |
|---|
What is the Fund’s investment objective?
The Fund seeks to achieve investment results that correspond generally to the risk and return patterns of managed futures funds.
Portfolio Breakdown (% of Total Investments)
| United States Treasury Obligations | 82.8% |
| Short-Term Investments | 17.2 |
Derivatives are not reflected in amounts reported above.
Credit Suisse Managed Futures Strategy Fund
The below is a summary of certain changes that occurred since the Fund's prior fiscal year ended October 31, 2023.
On May 1, 2024, Credit Suisse Asset Management, LLC (“Credit Suisse”) merged into UBS Asset Management (Americas) LLC (“UBS AM (Americas)”), with UBS AM (Americas) as the surviving entity, and UBS AM (Americas) became the investment manager to the Fund. Also on May 1, 2024, UBS Asset Management (US) Inc. replaced Credit Suisse Securities (USA) LLC as the Fund’s underwriter and distributor.
On August 16, 2024, UBS (Americas) entered into an agreement with Manteio Scalable Technologies LLC (“Manteio”), Manteio Capital LLC and Manteio Partners LLC to transfer management of UBS (Americas)’s Quantitative Investment Strategies business, including the portfolio management team of the Fund, to Manteio (the “Transaction”). At a meeting held on August 15, 2024, the Board of the Trust approved an Agreement and Plan of Reorganization (the “Agreement and Plan”) pursuant to which the Fund would be reorganized into Manteio Managed Futures Strategy Fund, a newly created mutual fund advised by Manteio (the “Reorganization”). At a Special Meeting of Shareholders of the Fund on November 15, 2024, shareholders of the Fund approved the Agreement and Plan. The Reorganization closed on November 22, 2024 (the “Closing Date”). As a result of the Reorganization, the Manteio Managed Futures Strategy Fund acquired the assets, subject to the liabilities, of the Fund, and shareholders of the Fund became shareholders of the Manteio Managed Futures Strategy Fund as of the Closing Date.
Changes in or Disagreements with Accountants
On April 23, 2024, the Fund’s Board of Trustees (the “Board”) approved the dismissal of PricewaterhouseCoopers LLP (“PwC”) as the independent registered public accounting firm for the Fund, due to PwC’s ceasing to be deemed an independent registered public accounting firm with respect to the Fund after April 30, 2024. The Board’s decision to approve the dismissal of PwC was recommended by the Audit Committee of the Board. PwC’s reports on the Fund’s financial statements for the fiscal periods ended October 31, 2023 and October 31, 2022 contained no adverse opinion or disclaimer of opinion nor were they qualified or modified as to uncertainty, audit scope or accounting principle. During the Fund’s fiscal periods ended October 31, 2023 and October 31, 2022 and the subsequent interim period through April 23, 2024, (i) there were no disagreements with PwC on any matter of accounting principles or practices, financial statement disclosure or auditing scope or procedure, which disagreements, if not resolved to the satisfaction of PwC, would have caused them to make reference to the subject matter of the disagreements in connection with their reports on the Fund’s financial statements for such periods, and (ii) there were no “reportable events” of the kind described in Item 304(a)(1)(v) of Regulation S-K under the Securities Exchange Act of 1934, as amended. Effective June 19, 2024, Ernst & Young LLP (“EY”) was engaged as the independent registered public accounting firm following the recommendation of the Audit Committee of the Fund’s Board and approval by the Fund’s Board. During the Fund’s fiscal periods ended October 31, 2023 and October 31, 2022 and the subsequent interim period through June 19, 2024, neither the Fund, nor anyone on its behalf, consulted with EY on items which: (i) concerned the application of accounting principles to a specified transaction, either completed or proposed, or the type of audit opinion that might be rendered on the Fund’s financial statements; or (ii) concerned the subject of a disagreement (as defined in paragraph (a)(1)(iv) of Item 304 of Regulation S-K) or reportable events (as described in paragraph (a)(1)(v) of said Item 304).
If you wish to view additional information about the Fund, including but not limited to financial statements or holdings, please visit https://us-fund.credit-suisse.com/CSAAX.
Credit Suisse Managed Futures Strategy Fund
Annual Shareholder Report
Credit Suisse Managed Futures Strategy Fund
This annual shareholder report contains important information about Credit Suisse Managed Futures Strategy Fund (the "Fund") for the period of November 1, 2023 to October 31, 2024. You can find additional information about the Fund at https://us-fund.credit-suisse.com/CSACX. You can also request this information by contacting us at 877-870-2874. This report describes changes to the Fund that occurred during the reporting period.
What were the Fund costs for the last year?
Annual Fund Operating Expenses
(based on a hypothetical $10,000 investment)
| Class Name | Costs of a $10,000 investment | Costs paid as a percentage of a $10,000 investment |
|---|
| Class C | $219 | 2.30% |
|---|
How did the fund perform last year and what affected its performance?
Portfolio performance summary
What worked:
Long-biased equity futures trading: Resilient corporate earnings, the intensification of pro-growth Chinese policy measures, and indications of easing inflationary pressure joined with money manager fear of missing out to send global equity markets higher to the benefit of the Fund.
Commodity swap trading also contributed, albeit modestly: Short-biased Agriculture exposure generated gains as supportive weather conditions and diminishing demand for ethanol feedstocks weighed on prices.
What didn’t work:
Mercurial positioning in currencies futures: With developed market monetary policy desynchronizing, investors paid particular attention to the rate of change in economic conditions in the US versus the rest of the G7 and to the impending US elections, as the Bank of Japan generally struck a gradualist tone in seeking to normalize monetary policy without spooking markets. The Fund’s exposure in the asset class shifted frequently and unprofitably.
Whipsawing fixed income futures trading: Fixed income markets flip-flopped as markets absorbed indications of lingering inflationary pressures even as volatile employment data, dwindling consumer confidence, and softening economic data left little doubt that higher for longer interest rates were closing in on their target and perhaps overshooting.
Credit Suisse Managed Futures Strategy Fund
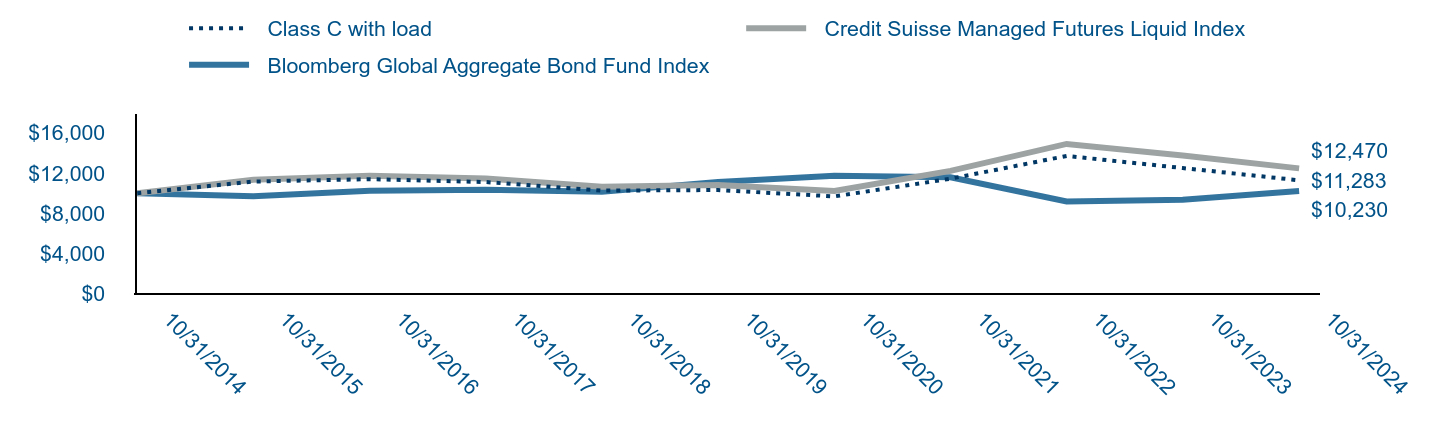
| Class C with load | Credit Suisse Managed Futures Liquid Index | Bloomberg Global Aggregate Bond Fund Index |
|---|
| 10/31/2014 | $10,000 | $10,000 | $10,000 |
|---|
| 10/31/2015 | $11,160 | $11,336 | $9,693 |
|---|
| 10/31/2016 | $11,398 | $11,725 | $10,234 |
|---|
| 10/31/2017 | $11,111 | $11,468 | $10,355 |
|---|
| 10/31/2018 | $10,260 | $10,652 | $10,143 |
|---|
| 10/31/2019 | $10,315 | $10,808 | $11,110 |
|---|
| 10/31/2020 | $9,682 | $10,223 | $11,736 |
|---|
| 10/31/2021 | $11,440 | $12,225 | $11,590 |
|---|
| 10/31/2022 | $13,709 | $14,902 | $9,181 |
|---|
| 10/31/2023 | $12,503 | $13,751 | $9,339 |
|---|
| 10/31/2024 | $11,283 | $12,470 | $10,230 |
|---|
Average Annual Total Returns (%)
| Name | 1 Year | 5 Years | 10 Years |
|---|
| Class C | (9.76%) | 1.81% | 1.21% |
|---|
| Class C with load | (10.66%) | 1.81% | 1.21% |
|---|
| Credit Suisse Managed Futures Liquid Index | (9.31%) | 2.90% | 2.23% |
|---|
| Bloomberg Global Aggregate Bond Fund Index | 9.55% | (1.64%) | 0.23% |
|---|
Performance data represents past performance, which does not guarantee future results. The graph and table assume the maximum deferred sales charge and do not reflect the deduction of taxes that a shareholder would pay on Fund distributions or a redemption of Fund shares.
| Total Net Assets | $201,552,407 |
|---|
| # of Portfolio Holdings | 13 |
|---|
| Portfolio Turnover Rate | 0% |
|---|
| Total Advisory Fees Paid | $1,878,310 |
|---|
What is the Fund’s investment objective?
The Fund seeks to achieve investment results that correspond generally to the risk and return patterns of managed futures funds.
Portfolio Breakdown (% of Total Investments)
| United States Treasury Obligations | 82.8% |
| Short-Term Investments | 17.2 |
Derivatives are not reflected in amounts reported above.
Credit Suisse Managed Futures Strategy Fund
The below is a summary of certain changes that occurred since the Fund's prior fiscal year ended October 31, 2023.
On May 1, 2024, Credit Suisse Asset Management, LLC (“Credit Suisse”) merged into UBS Asset Management (Americas) LLC (“UBS AM (Americas)”), with UBS AM (Americas) as the surviving entity, and UBS AM (Americas) became the investment manager to the Fund. Also on May 1, 2024, UBS Asset Management (US) Inc. replaced Credit Suisse Securities (USA) LLC as the Fund’s underwriter and distributor.
On August 16, 2024, UBS (Americas) entered into an agreement with Manteio Scalable Technologies LLC (“Manteio”), Manteio Capital LLC and Manteio Partners LLC to transfer management of UBS (Americas)’s Quantitative Investment Strategies business, including the portfolio management team of the Fund, to Manteio (the “Transaction”). At a meeting held on August 15, 2024, the Board of the Trust approved an Agreement and Plan of Reorganization (the “Agreement and Plan”) pursuant to which the Fund would be reorganized into Manteio Managed Futures Strategy Fund, a newly created mutual fund advised by Manteio (the “Reorganization”). At a Special Meeting of Shareholders of the Fund on November 15, 2024, shareholders of the Fund approved the Agreement and Plan. The Reorganization closed on November 22, 2024 (the “Closing Date”). As a result of the Reorganization, the Manteio Managed Futures Strategy Fund acquired the assets, subject to the liabilities, of the Fund, and shareholders of the Fund became shareholders of the Manteio Managed Futures Strategy Fund as of the Closing Date.
Changes in or Disagreements with Accountants
On April 23, 2024, the Fund’s Board of Trustees (the “Board”) approved the dismissal of PricewaterhouseCoopers LLP (“PwC”) as the independent registered public accounting firm for the Fund, due to PwC’s ceasing to be deemed an independent registered public accounting firm with respect to the Fund after April 30, 2024. The Board’s decision to approve the dismissal of PwC was recommended by the Audit Committee of the Board. PwC’s reports on the Fund’s financial statements for the fiscal periods ended October 31, 2023 and October 31, 2022 contained no adverse opinion or disclaimer of opinion nor were they qualified or modified as to uncertainty, audit scope or accounting principle. During the Fund’s fiscal periods ended October 31, 2023 and October 31, 2022 and the subsequent interim period through April 23, 2024, (i) there were no disagreements with PwC on any matter of accounting principles or practices, financial statement disclosure or auditing scope or procedure, which disagreements, if not resolved to the satisfaction of PwC, would have caused them to make reference to the subject matter of the disagreements in connection with their reports on the Fund’s financial statements for such periods, and (ii) there were no “reportable events” of the kind described in Item 304(a)(1)(v) of Regulation S-K under the Securities Exchange Act of 1934, as amended. Effective June 19, 2024, Ernst & Young LLP (“EY”) was engaged as the independent registered public accounting firm following the recommendation of the Audit Committee of the Fund’s Board and approval by the Fund’s Board. During the Fund’s fiscal periods ended October 31, 2023 and October 31, 2022 and the subsequent interim period through June 19, 2024, neither the Fund, nor anyone on its behalf, consulted with EY on items which: (i) concerned the application of accounting principles to a specified transaction, either completed or proposed, or the type of audit opinion that might be rendered on the Fund’s financial statements; or (ii) concerned the subject of a disagreement (as defined in paragraph (a)(1)(iv) of Item 304 of Regulation S-K) or reportable events (as described in paragraph (a)(1)(v) of said Item 304).
If you wish to view additional information about the Fund, including but not limited to financial statements or holdings, please visit https://us-fund.credit-suisse.com/CSACX.
Credit Suisse Managed Futures Strategy Fund
Annual Shareholder Report
Credit Suisse Managed Futures Strategy Fund
This annual shareholder report contains important information about Credit Suisse Managed Futures Strategy Fund (the "Fund") for the period of November 1, 2023 to October 31, 2024. You can find additional information about the Fund at https://us-fund.credit-suisse.com/CSAIX. You can also request this information by contacting us at 877-870-2874. This report describes changes to the Fund that occurred during the reporting period.
What were the Fund costs for the last year?
Annual Fund Operating Expenses
(based on a hypothetical $10,000 investment)
| Class Name | Costs of a $10,000 investment | Costs paid as a percentage of a $10,000 investment |
|---|
| Class I | $124 | 1.30% |
|---|
How did the fund perform last year and what affected its performance?
Portfolio performance summary
What worked:
Long-biased equity futures trading: Resilient corporate earnings, the intensification of pro-growth Chinese policy measures, and indications of easing inflationary pressure joined with money manager fear of missing out to send global equity markets higher to the benefit of the Fund.
Commodity swap trading also contributed, albeit modestly: Short-biased Agriculture exposure generated gains as supportive weather conditions and diminishing demand for ethanol feedstocks weighed on prices.
What didn’t work:
Mercurial positioning in currencies futures: With developed market monetary policy desynchronizing, investors paid particular attention to the rate of change in economic conditions in the US versus the rest of the G7 and to the impending US elections, as the Bank of Japan generally struck a gradualist tone in seeking to normalize monetary policy without spooking markets. The Fund’s exposure in the asset class shifted frequently and unprofitably.
Whipsawing fixed income futures trading: Fixed income markets flip-flopped as markets absorbed indications of lingering inflationary pressures even as volatile employment data, dwindling consumer confidence, and softening economic data left little doubt that higher for longer interest rates were closing in on their target and perhaps overshooting.
Credit Suisse Managed Futures Strategy Fund
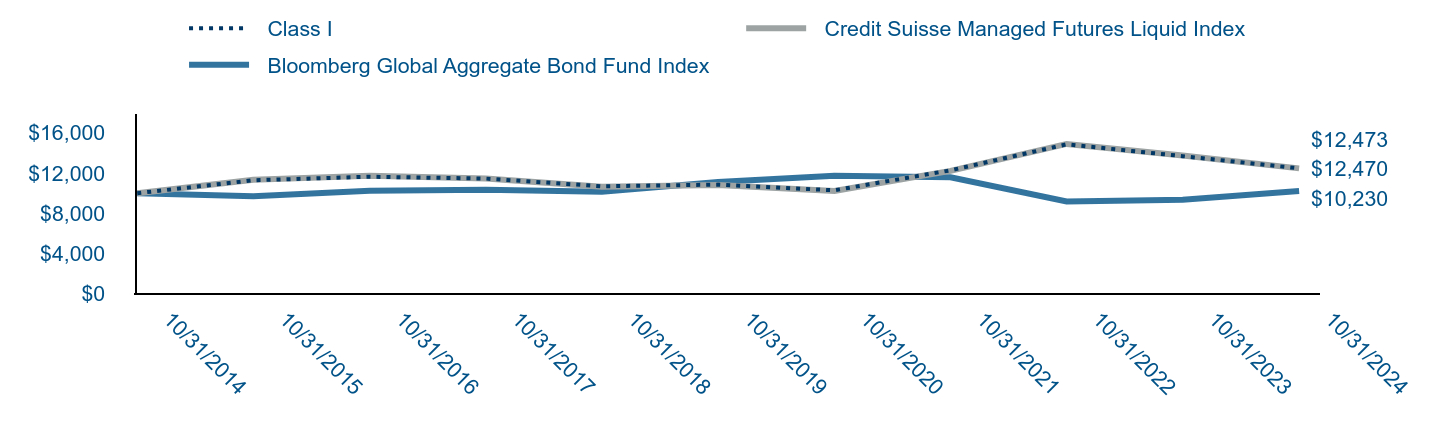
| Class I | Credit Suisse Managed Futures Liquid Index | Bloomberg Global Aggregate Bond Fund Index |
|---|
| 10/31/2014 | $10,000 | $10,000 | $10,000 |
|---|
| 10/31/2015 | $11,288 | $11,336 | $9,693 |
|---|
| 10/31/2016 | $11,641 | $11,725 | $10,234 |
|---|
| 10/31/2017 | $11,455 | $11,468 | $10,355 |
|---|
| 10/31/2018 | $10,690 | $10,652 | $10,143 |
|---|
| 10/31/2019 | $10,854 | $10,808 | $11,110 |
|---|
| 10/31/2020 | $10,287 | $10,223 | $11,736 |
|---|
| 10/31/2021 | $12,276 | $12,225 | $11,590 |
|---|
| 10/31/2022 | $14,865 | $14,902 | $9,181 |
|---|
| 10/31/2023 | $13,687 | $13,751 | $9,339 |
|---|
| 10/31/2024 | $12,473 | $12,470 | $10,230 |
|---|
Average Annual Total Returns (%)
| Name | 1 Year | 5 Years | 10 Years |
|---|
| Class I | (8.87%) | 2.82% | 2.23% |
|---|
| Credit Suisse Managed Futures Liquid Index | (9.31%) | 2.90% | 2.23% |
|---|
| Bloomberg Global Aggregate Bond Fund Index | 9.55% | (1.64%) | 0.23% |
|---|
Performance data represents past performance, which does not guarantee future results. The graph and table do not reflect the deduction of taxes that a shareholder would pay on Fund distributions or a redemption of Fund shares.
| Total Net Assets | $201,552,407 |
|---|
| # of Portfolio Holdings | 13 |
|---|
| Portfolio Turnover Rate | 0% |
|---|
| Total Advisory Fees Paid | $1,878,310 |
|---|
What is the Fund’s investment objective?
The Fund seeks to achieve investment results that correspond generally to the risk and return patterns of managed futures funds.
Portfolio Breakdown (% of Total Investments)
| United States Treasury Obligations | 82.8% |
| Short-Term Investments | 17.2 |
Derivatives are not reflected in amounts reported above.
Credit Suisse Managed Futures Strategy Fund
The below is a summary of certain changes that occurred since the Fund's prior fiscal year ended October 31, 2023.
On May 1, 2024, Credit Suisse Asset Management, LLC (“Credit Suisse”) merged into UBS Asset Management (Americas) LLC (“UBS AM (Americas)”), with UBS AM (Americas) as the surviving entity, and UBS AM (Americas) became the investment manager to the Fund. Also on May 1, 2024, UBS Asset Management (US) Inc. replaced Credit Suisse Securities (USA) LLC as the Fund’s underwriter and distributor.
On August 16, 2024, UBS (Americas) entered into an agreement with Manteio Scalable Technologies LLC (“Manteio”), Manteio Capital LLC and Manteio Partners LLC to transfer management of UBS (Americas)’s Quantitative Investment Strategies business, including the portfolio management team of the Fund, to Manteio (the “Transaction”). At a meeting held on August 15, 2024, the Board of the Trust approved an Agreement and Plan of Reorganization (the “Agreement and Plan”) pursuant to which the Fund would be reorganized into Manteio Managed Futures Strategy Fund, a newly created mutual fund advised by Manteio (the “Reorganization”). At a Special Meeting of Shareholders of the Fund on November 15, 2024, shareholders of the Fund approved the Agreement and Plan. The Reorganization closed on November 22, 2024 (the “Closing Date”). As a result of the Reorganization, the Manteio Managed Futures Strategy Fund acquired the assets, subject to the liabilities, of the Fund, and shareholders of the Fund became shareholders of the Manteio Managed Futures Strategy Fund as of the Closing Date.
Changes in or Disagreements with Accountants
On April 23, 2024, the Fund’s Board of Trustees (the “Board”) approved the dismissal of PricewaterhouseCoopers LLP (“PwC”) as the independent registered public accounting firm for the Fund, due to PwC’s ceasing to be deemed an independent registered public accounting firm with respect to the Fund after April 30, 2024. The Board’s decision to approve the dismissal of PwC was recommended by the Audit Committee of the Board. PwC’s reports on the Fund’s financial statements for the fiscal periods ended October 31, 2023 and October 31, 2022 contained no adverse opinion or disclaimer of opinion nor were they qualified or modified as to uncertainty, audit scope or accounting principle. During the Fund’s fiscal periods ended October 31, 2023 and October 31, 2022 and the subsequent interim period through April 23, 2024, (i) there were no disagreements with PwC on any matter of accounting principles or practices, financial statement disclosure or auditing scope or procedure, which disagreements, if not resolved to the satisfaction of PwC, would have caused them to make reference to the subject matter of the disagreements in connection with their reports on the Fund’s financial statements for such periods, and (ii) there were no “reportable events” of the kind described in Item 304(a)(1)(v) of Regulation S-K under the Securities Exchange Act of 1934, as amended. Effective June 19, 2024, Ernst & Young LLP (“EY”) was engaged as the independent registered public accounting firm following the recommendation of the Audit Committee of the Fund’s Board and approval by the Fund’s Board. During the Fund’s fiscal periods ended October 31, 2023 and October 31, 2022 and the subsequent interim period through June 19, 2024, neither the Fund, nor anyone on its behalf, consulted with EY on items which: (i) concerned the application of accounting principles to a specified transaction, either completed or proposed, or the type of audit opinion that might be rendered on the Fund’s financial statements; or (ii) concerned the subject of a disagreement (as defined in paragraph (a)(1)(iv) of Item 304 of Regulation S-K) or reportable events (as described in paragraph (a)(1)(v) of said Item 304).
If you wish to view additional information about the Fund, including but not limited to financial statements or holdings, please visit https://us-fund.credit-suisse.com/CSAIX.
Credit Suisse Managed Futures Strategy Fund
Annual Shareholder Report
Credit Suisse Strategic Income Fund
This annual shareholder report contains important information about Credit Suisse Strategic Income Fund (the "Fund") for the period of November 1, 2023 to October 31, 2024. You can find additional information about the Fund at https://us-fund.credit-suisse.com/CSOAX. You can also request this information by contacting us at 877-870-2874. This report describes changes to the Fund that occurred during the reporting period.
What were the Fund costs for the last year?
Annual Fund Operating Expenses
(based on a hypothetical $10,000 investment)
| Class Name | Costs of a $10,000 investment | Costs paid as a percentage of a $10,000 investment |
|---|
| Class A | $111 | 1.04% |
|---|
How did the fund perform last year and what affected its performance?
Portfolio performance summary
What worked:
- Greatest contributors to the Fund's performance were asset allocation to High Yield Bonds, followed by Bank Loans and then Collateralized Loan Obligations.
- Sectors that contributed the most to returns include Information Technology, Financials and Healthcare.
- By ratings, B2, B3 and B1-rated investments contributed the most to returns.
What didn’t work:
- No sectors produced negative returns for the twelve-month period, but Utility and Consumer Non-Durables contributed the least to overall returns.
- The only rating that produced negative returns was C-rated.
Credit Suisse Strategic Income Fund
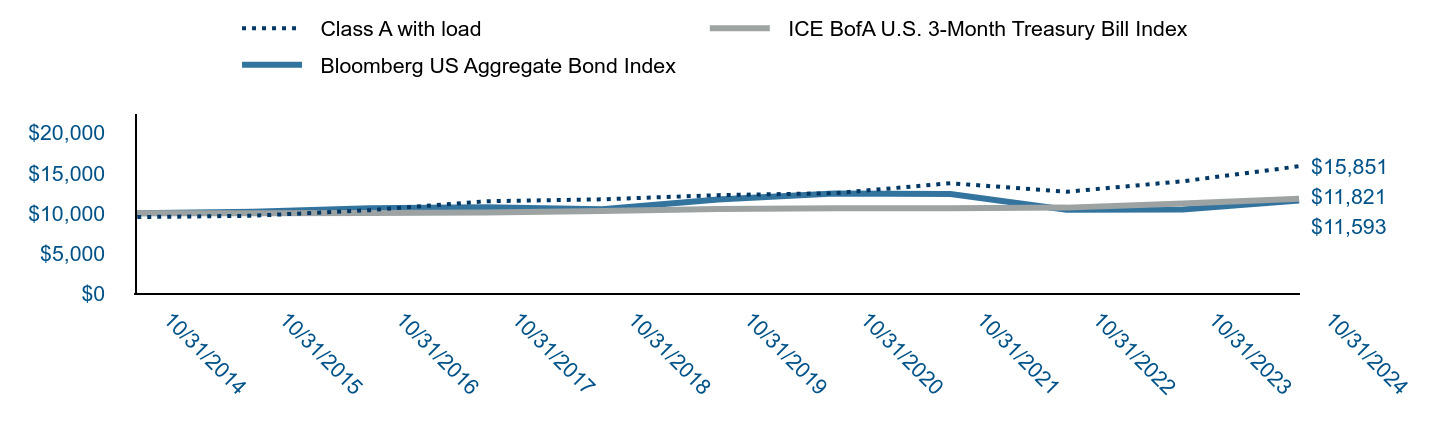
| Class A with load | ICE BofA U.S. 3-Month Treasury Bill Index | Bloomberg US Aggregate Bond Index |
|---|
| 10/31/2014 | $9,527 | $10,000 | $10,000 |
|---|
| 10/31/2015 | $9,697 | $10,002 | $10,196 |
|---|
| 10/31/2016 | $10,387 | $10,032 | $10,641 |
|---|
| 10/31/2017 | $11,500 | $10,105 | $10,737 |
|---|
| 10/31/2018 | $11,740 | $10,274 | $10,517 |
|---|
| 10/31/2019 | $12,259 | $10,521 | $11,727 |
|---|
| 10/31/2020 | $12,499 | $10,617 | $12,453 |
|---|
| 10/31/2021 | $13,742 | $10,623 | $12,393 |
|---|
| 10/31/2022 | $12,679 | $10,706 | $10,450 |
|---|
| 10/31/2023 | $13,985 | $11,217 | $10,487 |
|---|
| 10/31/2024 | $15,851 | $11,821 | $11,593 |
|---|
Average Annual Total Returns (%)
| Name | 1 Year | 5 Years | 10 Years |
|---|
| Class A | 13.34% | 5.27% | 5.22% |
|---|
| Class A with load | 7.99% | 4.26% | 4.71% |
|---|
| ICE BofA U.S. 3-Month Treasury Bill Index | 5.39% | 2.36% | 1.69% |
|---|
| Bloomberg US Aggregate Bond Index | 10.55% | (0.23%) | 1.49% |
|---|
Performance data represents past performance, which does not guarantee future results. The graph and table assume the maximum sales charge and do not reflect the deduction of taxes that a shareholder would pay on Fund distributions or a redemption of Fund shares.
| Total Net Assets | $848,520,788 |
|---|
| # of Portfolio Holdings | 517 |
|---|
| Portfolio Turnover Rate | 44% |
|---|
| Total Advisory Fees Paid | $3,427,671 |
|---|
What is the Fund’s investment objective?
The Fund seeks total return.
Portfolio Breakdown (% of Total Investments)
| Bank Loans | 51.2% |
| Corporate Bonds | 36.8 |
| Short-Term Investments | 8.3 |
| Asset Backed Securities | 2.9 |
| Common Stocks | 0.8 |
| Warrants | 0.0 |
Derivatives are not reflected in amounts reported above.
Credit Suisse Strategic Income Fund
Credit Quality BreakdownFootnote Reference
(% of Total Investments)
S&P RatingsFootnote Reference | Value |
| AAA | 0.2% |
| B | 28.0 |
| B- | 8.8 |
| B+ | 8.0 |
| BB | 17.1 |
| BB- | 7.7 |
| BB+ | 6.2 |
| BBB | 0.0 |
| BBB- | 2.6 |
| C | 0.0 |
| CC | 0.2 |
| CCC | 1.9 |
| CCC- | 0.5 |
| CCC+ | 4.4 |
| NR | 5.2 |
| Subtotal | 90.8 |
| Equity and Other | 9.2 |
| Total | 100.0% |
| Footnote | Description |
Footnote | Expressed as a percentage of total investments (excluding securities lending collateral, if applicable) and may vary over time. |
Footnote | Credit Quality is based on ratings provided by the S&P Global Ratings Division of S&P Global Inc. ("S&P"). S&P is a main provider of ratings for credit asset classes and is widely used amongst industry participants. The NR category consists of securities that have not been rated by S&P. |
Derivatives are not reflected in amounts reported above.
Changes in or Disagreements with Accountants
On April 23, 2024, the Fund’s Board of Trustees (the “Board”) approved the dismissal of PricewaterhouseCoopers LLP (“PwC”) as the independent registered public accounting firm for the Fund, due to PwC’s ceasing to be deemed an independent registered public accounting firm with respect to the Fund after April 30, 2024. The Board’s decision to approve the dismissal of PwC was recommended by the Audit Committee of the Board. PwC’s reports on the Fund’s financial statements for the fiscal periods ended October 31, 2023 and October 31, 2022 contained no adverse opinion or disclaimer of opinion nor were they qualified or modified as to uncertainty, audit scope or accounting principle. During the Fund’s fiscal periods ended October 31, 2023 and October 31, 2022 and the subsequent interim period through April 23, 2024, (i) there were no disagreements with PwC on any matter of accounting principles or practices, financial statement disclosure or auditing scope or procedure, which disagreements, if not resolved to the satisfaction of PwC, would have caused them to make reference to the subject matter of the disagreements in connection with their reports on the Fund’s financial statements for such periods, and (ii) there were no “reportable events” of the kind described in Item 304(a)(1)(v) of Regulation S-K under the Securities Exchange Act of 1934, as amended. Effective June 19, 2024, Ernst & Young LLP (“EY”) was engaged as the independent registered public accounting firm following the recommendation of the Audit Committee of the Fund’s Board and approval by the Fund’s Board. During the Fund’s fiscal periods ended October 31, 2023 and October 31, 2022 and the subsequent interim period through June 19, 2024, neither the Fund, nor anyone on its behalf, consulted with EY on items which: (i) concerned the application of accounting principles to a specified transaction, either completed or proposed, or the type of audit opinion that might be rendered on the Fund’s financial statements; or (ii) concerned the subject of a disagreement (as defined in paragraph (a)(1)(iv) of Item 304 of Regulation S-K) or reportable events (as described in paragraph (a)(1)(v) of said Item 304).
The below is a summary of certain changes that occurred since the Fund's prior fiscal year ended October 31, 2023.
On May 1, 2024, Credit Suisse Asset Management, LLC (“Credit Suisse”) merged into UBS Asset Management (Americas) LLC (“UBS AM (Americas)”), with UBS AM (Americas) as the surviving entity, and UBS AM (Americas) became the investment manager to the Fund. Also on May 1, 2024, UBS Asset Management (US) Inc. replaced Credit Suisse Securities (USA) LLC as the Fund’s underwriter and distributor. Credit Suisse Asset Management Limited, an affiliate of Credit Suisse, ceased serving as sub-investment advisor to the Fund on May 1, 2024.
If you wish to view additional information about the Fund, including but not limited to financial statements or holdings, please visit https://us-fund.credit-suisse.com/CSOAX.
Credit Suisse Strategic Income Fund
Annual Shareholder Report
Credit Suisse Strategic Income Fund
This annual shareholder report contains important information about Credit Suisse Strategic Income Fund (the "Fund") for the period of November 1, 2023 to October 31, 2024. You can find additional information about the Fund at https://us-fund.credit-suisse.com/CSOCX. You can also request this information by contacting us at 877-870-2874. This report describes changes to the Fund that occurred during the reporting period.
What were the Fund costs for the last year?
Annual Fund Operating Expenses
(based on a hypothetical $10,000 investment)
| Class Name | Costs of a $10,000 investment | Costs paid as a percentage of a $10,000 investment |
|---|
| Class C | $190 | 1.79% |
|---|
How did the fund perform last year and what affected its performance?
Portfolio performance summary
What worked:
- Greatest contributors to the Fund's performance were asset allocation to High Yield Bonds, followed by Bank Loans and then Collateralized Loan Obligations.
- Sectors that contributed the most to returns include Information Technology, Financials and Healthcare.
- By ratings, B2, B3 and B1-rated investments contributed the most to returns.
What didn’t work:
- No sectors produced negative returns for the twelve-month period, but Utility and Consumer Non-Durables contributed the least to overall returns.
- The only rating that produced negative returns was C-rated.
Credit Suisse Strategic Income Fund
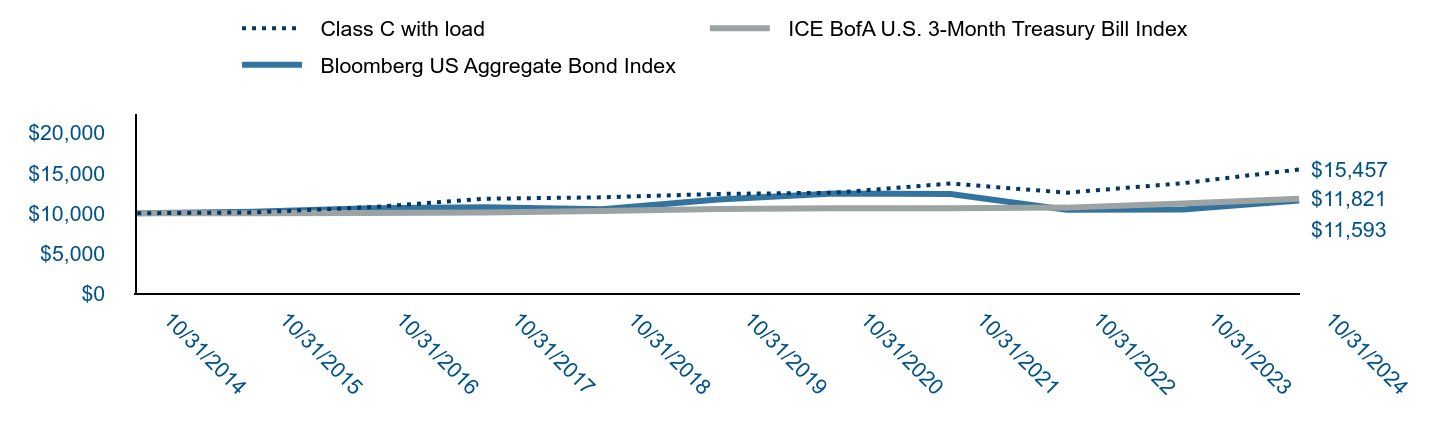
| Class C with load | ICE BofA U.S. 3-Month Treasury Bill Index | Bloomberg US Aggregate Bond Index |
|---|
| 10/31/2014 | $10,000 | $10,000 | $10,000 |
|---|
| 10/31/2015 | $10,114 | $10,002 | $10,196 |
|---|
| 10/31/2016 | $10,754 | $10,032 | $10,641 |
|---|
| 10/31/2017 | $11,817 | $10,105 | $10,737 |
|---|
| 10/31/2018 | $11,986 | $10,274 | $10,517 |
|---|
| 10/31/2019 | $12,410 | $10,521 | $11,727 |
|---|
| 10/31/2020 | $12,558 | $10,617 | $12,453 |
|---|
| 10/31/2021 | $13,705 | $10,623 | $12,393 |
|---|
| 10/31/2022 | $12,564 | $10,706 | $10,450 |
|---|
| 10/31/2023 | $13,740 | $11,217 | $10,487 |
|---|
| 10/31/2024 | $15,457 | $11,821 | $11,593 |
|---|
Average Annual Total Returns (%)
| Name | 1 Year | 5 Years | 10 Years |
|---|
| Class C | 12.50% | 4.49% | 4.45% |
|---|
| Class C with load | 11.50% | 4.49% | 4.45% |
|---|
| ICE BofA U.S. 3-Month Treasury Bill Index | 5.39% | 2.36% | 1.69% |
|---|
| Bloomberg US Aggregate Bond Index | 10.55% | (0.23%) | 1.49% |
|---|
Performance data represents past performance, which does not guarantee future results. The graph and table assume the maximum deferred sales charge and do not reflect the deduction of taxes that a shareholder would pay on Fund distributions or a redemption of Fund shares.
| Total Net Assets | $848,520,788 |
|---|
| # of Portfolio Holdings | 517 |
|---|
| Portfolio Turnover Rate | 44% |
|---|
| Total Advisory Fees Paid | $3,427,671 |
|---|
What is the Fund’s investment objective?
The Fund seeks total return.
Portfolio Breakdown (% of Total Investments)
| Bank Loans | 51.2% |
| Corporate Bonds | 36.8 |
| Short-Term Investments | 8.3 |
| Asset Backed Securities | 2.9 |
| Common Stocks | 0.8 |
| Warrants | 0.0 |
Derivatives are not reflected in amounts reported above.
Credit Suisse Strategic Income Fund
Credit Quality BreakdownFootnote Reference
(% of Total Investments)
S&P RatingsFootnote Reference | Value |
| AAA | 0.2% |
| B | 28.0 |
| B- | 8.8 |
| B+ | 8.0 |
| BB | 17.1 |
| BB- | 7.7 |
| BB+ | 6.2 |
| BBB | 0.0 |
| BBB- | 2.6 |
| C | 0.0 |
| CC | 0.2 |
| CCC | 1.9 |
| CCC- | 0.5 |
| CCC+ | 4.4 |
| NR | 5.2 |
| Subtotal | 90.8 |
| Equity and Other | 9.2 |
| Total | 100.0% |
| Footnote | Description |
Footnote | Expressed as a percentage of total investments (excluding securities lending collateral, if applicable) and may vary over time. |
Footnote | Credit Quality is based on ratings provided by the S&P Global Ratings Division of S&P Global Inc. ("S&P"). S&P is a main provider of ratings for credit asset classes and is widely used amongst industry participants. The NR category consists of securities that have not been rated by S&P. |
Derivatives are not reflected in amounts reported above.
Changes in or Disagreements with Accountants
On April 23, 2024, the Fund’s Board of Trustees (the “Board”) approved the dismissal of PricewaterhouseCoopers LLP (“PwC”) as the independent registered public accounting firm for the Fund, due to PwC’s ceasing to be deemed an independent registered public accounting firm with respect to the Fund after April 30, 2024. The Board’s decision to approve the dismissal of PwC was recommended by the Audit Committee of the Board. PwC’s reports on the Fund’s financial statements for the fiscal periods ended October 31, 2023 and October 31, 2022 contained no adverse opinion or disclaimer of opinion nor were they qualified or modified as to uncertainty, audit scope or accounting principle. During the Fund’s fiscal periods ended October 31, 2023 and October 31, 2022 and the subsequent interim period through April 23, 2024, (i) there were no disagreements with PwC on any matter of accounting principles or practices, financial statement disclosure or auditing scope or procedure, which disagreements, if not resolved to the satisfaction of PwC, would have caused them to make reference to the subject matter of the disagreements in connection with their reports on the Fund’s financial statements for such periods, and (ii) there were no “reportable events” of the kind described in Item 304(a)(1)(v) of Regulation S-K under the Securities Exchange Act of 1934, as amended. Effective June 19, 2024, Ernst & Young LLP (“EY”) was engaged as the independent registered public accounting firm following the recommendation of the Audit Committee of the Fund’s Board and approval by the Fund’s Board. During the Fund’s fiscal periods ended October 31, 2023 and October 31, 2022 and the subsequent interim period through June 19, 2024, neither the Fund, nor anyone on its behalf, consulted with EY on items which: (i) concerned the application of accounting principles to a specified transaction, either completed or proposed, or the type of audit opinion that might be rendered on the Fund’s financial statements; or (ii) concerned the subject of a disagreement (as defined in paragraph (a)(1)(iv) of Item 304 of Regulation S-K) or reportable events (as described in paragraph (a)(1)(v) of said Item 304).
The below is a summary of certain changes that occurred since the Fund's prior fiscal year ended October 31, 2023.
On May 1, 2024, Credit Suisse Asset Management, LLC (“Credit Suisse”) merged into UBS Asset Management (Americas) LLC (“UBS AM (Americas)”), with UBS AM (Americas) as the surviving entity, and UBS AM (Americas) became the investment manager to the Fund. Also on May 1, 2024, UBS Asset Management (US) Inc. replaced Credit Suisse Securities (USA) LLC as the Fund’s underwriter and distributor. Credit Suisse Asset Management Limited, an affiliate of Credit Suisse, ceased serving as sub-investment advisor to the Fund on May 1, 2024.
If you wish to view additional information about the Fund, including but not limited to financial statements or holdings, please visit https://us-fund.credit-suisse.com/CSOCX.
Credit Suisse Strategic Income Fund
Annual Shareholder Report
Credit Suisse Strategic Income Fund
This annual shareholder report contains important information about Credit Suisse Strategic Income Fund (the "Fund") for the period of November 1, 2023 to October 31, 2024. You can find additional information about the Fund at https://us-fund.credit-suisse.com/CSOIX. You can also request this information by contacting us at 877-870-2874. This report describes changes to the Fund that occurred during the reporting period.
What were the Fund costs for the last year?
Annual Fund Operating Expenses
(based on a hypothetical $10,000 investment)
| Class Name | Costs of a $10,000 investment | Costs paid as a percentage of a $10,000 investment |
|---|
| Class I | $84 | 0.79% |
|---|
How did the fund perform last year and what affected its performance?
Portfolio performance summary
What worked:
- Greatest contributors to the Fund's performance were asset allocation to High Yield Bonds, followed by Bank Loans and then Collateralized Loan Obligations.
- Sectors that contributed the most to returns include Information Technology, Financials and Healthcare.
- By ratings, B2, B3 and B1-rated investments contributed the most to returns.
What didn’t work:
- No sectors produced negative returns for the twelve-month period, but Utility and Consumer Non-Durables contributed the least to overall returns.
- The only rating that produced negative returns was C-rated.
Credit Suisse Strategic Income Fund
| Class I | ICE BofA U.S. 3-Month Treasury Bill Index | Bloomberg US Aggregate Bond Index |
|---|
| 10/31/2014 | $10,000 | $10,000 | $10,000 |
|---|
| 10/31/2015 | $10,205 | $10,002 | $10,196 |
|---|
| 10/31/2016 | $10,960 | $10,032 | $10,641 |
|---|
| 10/31/2017 | $12,177 | $10,105 | $10,737 |
|---|
| 10/31/2018 | $12,463 | $10,274 | $10,517 |
|---|
| 10/31/2019 | $13,046 | $10,521 | $11,727 |
|---|
| 10/31/2020 | $13,334 | $10,617 | $12,453 |
|---|
| 10/31/2021 | $14,682 | $10,623 | $12,393 |
|---|
| 10/31/2022 | $13,594 | $10,706 | $10,450 |
|---|
| 10/31/2023 | $15,031 | $11,217 | $10,487 |
|---|
| 10/31/2024 | $17,077 | $11,821 | $11,593 |
|---|
Average Annual Total Returns (%)
| Name | 1 Year | 5 Years | 10 Years |
|---|
| Class I | 13.61% | 5.53% | 5.50% |
|---|
| ICE BofA U.S. 3-Month Treasury Bill Index | 5.39% | 2.36% | 1.69% |
|---|
| Bloomberg US Aggregate Bond Index | 10.55% | (0.23%) | 1.49% |
|---|
Performance data represents past performance, which does not guarantee future results. The graph and table do not reflect the deduction of taxes that a shareholder would pay on Fund distributions or a redemption of Fund shares.
| Total Net Assets | $848,520,788 |
|---|
| # of Portfolio Holdings | 517 |
|---|
| Portfolio Turnover Rate | 44% |
|---|
| Total Advisory Fees Paid | $3,427,671 |
|---|
What is the Fund’s investment objective?
The Fund seeks total return.
Portfolio Breakdown (% of Total Investments)
| Bank Loans | 51.2% |
| Corporate Bonds | 36.8 |
| Short-Term Investments | 8.3 |
| Asset Backed Securities | 2.9 |
| Common Stocks | 0.8 |
| Warrants | 0.0 |
Derivatives are not reflected in amounts reported above.
Credit Suisse Strategic Income Fund
Credit Quality BreakdownFootnote Reference
(% of Total Investments)
S&P RatingsFootnote Reference | Value |
| AAA | 0.2% |
| B | 28.0 |
| B- | 8.8 |
| B+ | 8.0 |
| BB | 17.1 |
| BB- | 7.7 |
| BB+ | 6.2 |
| BBB | 0.0 |
| BBB- | 2.6 |
| C | 0.0 |
| CC | 0.2 |
| CCC | 1.9 |
| CCC- | 0.5 |
| CCC+ | 4.4 |
| NR | 5.2 |
| Subtotal | 90.8 |
| Equity and Other | 9.2 |
| Total | 100.0% |
| Footnote | Description |
Footnote | Expressed as a percentage of total investments (excluding securities lending collateral, if applicable) and may vary over time. |
Footnote | Credit Quality is based on ratings provided by the S&P Global Ratings Division of S&P Global Inc. ("S&P"). S&P is a main provider of ratings for credit asset classes and is widely used amongst industry participants. The NR category consists of securities that have not been rated by S&P. |
Derivatives are not reflected in amounts reported above.
Changes in or Disagreements with Accountants
On April 23, 2024, the Fund’s Board of Trustees (the “Board”) approved the dismissal of PricewaterhouseCoopers LLP (“PwC”) as the independent registered public accounting firm for the Fund, due to PwC’s ceasing to be deemed an independent registered public accounting firm with respect to the Fund after April 30, 2024. The Board’s decision to approve the dismissal of PwC was recommended by the Audit Committee of the Board. PwC’s reports on the Fund’s financial statements for the fiscal periods ended October 31, 2023 and October 31, 2022 contained no adverse opinion or disclaimer of opinion nor were they qualified or modified as to uncertainty, audit scope or accounting principle. During the Fund’s fiscal periods ended October 31, 2023 and October 31, 2022 and the subsequent interim period through April 23, 2024, (i) there were no disagreements with PwC on any matter of accounting principles or practices, financial statement disclosure or auditing scope or procedure, which disagreements, if not resolved to the satisfaction of PwC, would have caused them to make reference to the subject matter of the disagreements in connection with their reports on the Fund’s financial statements for such periods, and (ii) there were no “reportable events” of the kind described in Item 304(a)(1)(v) of Regulation S-K under the Securities Exchange Act of 1934, as amended. Effective June 19, 2024, Ernst & Young LLP (“EY”) was engaged as the independent registered public accounting firm following the recommendation of the Audit Committee of the Fund’s Board and approval by the Fund’s Board. During the Fund’s fiscal periods ended October 31, 2023 and October 31, 2022 and the subsequent interim period through June 19, 2024, neither the Fund, nor anyone on its behalf, consulted with EY on items which: (i) concerned the application of accounting principles to a specified transaction, either completed or proposed, or the type of audit opinion that might be rendered on the Fund’s financial statements; or (ii) concerned the subject of a disagreement (as defined in paragraph (a)(1)(iv) of Item 304 of Regulation S-K) or reportable events (as described in paragraph (a)(1)(v) of said Item 304).
The below is a summary of certain changes that occurred since the Fund's prior fiscal year ended October 31, 2023.
On May 1, 2024, Credit Suisse Asset Management, LLC (“Credit Suisse”) merged into UBS Asset Management (Americas) LLC (“UBS AM (Americas)”), with UBS AM (Americas) as the surviving entity, and UBS AM (Americas) became the investment manager to the Fund. Also on May 1, 2024, UBS Asset Management (US) Inc. replaced Credit Suisse Securities (USA) LLC as the Fund’s underwriter and distributor. Credit Suisse Asset Management Limited, an affiliate of Credit Suisse, ceased serving as sub-investment advisor to the Fund on May 1, 2024.
If you wish to view additional information about the Fund, including but not limited to financial statements or holdings, please visit https://us-fund.credit-suisse.com/CSOIX.
Credit Suisse Strategic Income Fund
Item 2. Code of Ethics.
The registrant has adopted a code of ethics applicable to its Chief Executive Officer, President, Chief Financial Officer and Chief Accounting Officer, or persons performing similar functions. A copy of the code is filed as Exhibit 19(a)(1) to this Form. There were no amendments to the code during the fiscal year ended October 31, 2024. There were no waivers or implicit waivers from the code granted by the registrant during the fiscal year ended October 31, 2024.
Item 3. Audit Committee Financial Expert.
The registrant's governing board has determined that it has three audit committee financial experts serving on its audit committee: Laura A. DeFelice, Mahendra R. Gupta and Steven N. Rappaport. Each audit committee financial expert is "independent" for purposes of this item.
Item 4. Principal Accountant Fees and Services.
(a) through (d). The information in the table below is provided for services rendered to the registrant showing the amount of fees billed to the registrant during the registrant’s last two fiscal years by Ernst & Young LLP (“EY”), the registrant’s current independent registered public accounting firm, and the registrant’s former independent registered public accounting firm. The audit fees billed to the registrant for the fiscal year 2024 are the only fees that have been billed to the registrant by EY. All other fees listed in the tables below were billed to the registrant by the registrant’s former independent registered public accounting firm. For engagements with EY and by the registrant’s former independent registered public accounting firm the Audit Committee approved in advance all audit services and non-audit services that EY and the registrant’s former independent registered public accounting firm provided to the registrant for its fiscal years ended October 31, 2023 and October 31, 2024.
| | | 2023 | | | 2024 | |
| Audit Fees | | $ | 203,100 | | | $ | 198,850 | |
| Audit-Related Fees | | $ | - | | | $ | - | |
| Tax Fees1 | | $ | 18,000 | | | $ | - | |
| All Other Fees | | $ | - | | | $ | - | |
| Total | | $ | 221,100 | | | $ | 198,850 | |
1 Tax services in connection with the registrant’s excise tax calculations and review of the registrant’s applicable tax returns.
The information in the table below is provided with respect to non-audit services that directly relate to the registrant’s operations and financial reporting and that were rendered by the registrant’s former independent registered public accounting firm for the fiscal year ended October 31, 2023 and by EY for the fiscal year ended October 31, 2024 to the registrant’s investment adviser, UBS Asset Management (Americas) LLC (“UBS AM (“Americas”)), and any service provider to the registrant controlling, controlled by or under common control with UBS AM (Americas) that provided ongoing services to the registrant (“Covered Services Provider”).
| | | | 2023 | | | | 2024 | |
| Audit-Related Fees | | | N/A | | | | N/A | |
| Tax Fees | | | N/A | | | | N/A | |
| All Other Fees | | | N/A | | | | N/A | |
| Total | | | N/A | | | | N/A | |
(e)(1) Pre-Approval Policies and Procedures. The Audit Committee (“Committee”) of the registrant is responsible for pre-approving (i) all audit and permissible non-audit services to be provided by the independent registered public accounting firm to the registrant and (ii) all permissible non-audit services to be provided by the independent registered public accounting firm to UBS AM (Americas) and any Covered Services Provider if the engagement relates directly to the operations and financial reporting of the registrant. The Committee may delegate its responsibility to pre-approve any such audit and permissible non-audit services to the Chairperson of the Committee, and the Chairperson shall report to the Committee, at its next regularly scheduled meeting after the Chairperson’s pre-approval of such services, his or her decision(s). The Committee may also establish detailed pre-approval policies and procedures for pre-approval of such services in accordance with applicable laws, including the delegation of some or all of the Committee’s pre-approval responsibilities to other persons (other than UBS AM (Americas) or the registrant’s officers). Pre-approval by the Committee of any permissible non-audit services shall not be required so long as: (i) the aggregate amount of all such permissible non-audit services provided to the registrant, UBS AM (Americas) and any Covered Services Provider constitutes not more than 5% of the total amount of revenues paid by the registrant to its independent registered public accounting firm during the fiscal year in which the permissible non-audit services are provided; (ii) the permissible non-audit services were not recognized by the registrant at the time of the engagement to be non-audit services; and (iii) such services are promptly brought to the attention of the Committee and approved by the Committee (or its delegate(s)) prior to the completion of the audit.
(e)(2) The information in the table below sets forth the percentages of fees for services (other than audit, review or attest services) rendered by the registrant’s former independent registered public accounting firm for the fiscal year ended October 31, 2023 and by EY for the fiscal year ended October 31, 2024 to the registrant for which the pre-approval requirement was waived pursuant to Rule 2-01(c)(7)(i)(C) of Regulation S-X:
| | | | 2023 | | | | 2024 | |
| Audit-Related Fees | | | N/A | | | | N/A | |
| Tax Fees | | | N/A | | | | N/A | |
| All Other Fees | | | N/A | | | | N/A | |
| Total | | | N/A | | | | N/A | |
The information in the table below sets forth the percentages of fees for services (other than audit, review or attest services) rendered by the registrant’s former independent registered public accounting firm for the fiscal year ended October 31, 2023 and by EY for the fiscal year ended October 31, 2024 to UBS AM (Americas) and any Covered Services Provider required to be approved pursuant to Rule 2-01(c)(7)(ii) of Regulation S-X:
| | | | 2023 | | | | 2024 | |
| Audit-Related Fees | | | N/A | | | | N/A | |
| Tax Fees | | | N/A | | | | N/A | |
| All Other Fees | | | N/A | | | | N/A | |
| Total | | | N/A | | | | N/A | |
(f) Not Applicable.
(g) For the fiscal year ended October 31, 2023, the aggregate fees billed by the registrant’s former independent registered public accounting firm of $18,000 for non-audit services rendered on behalf of the registrant (“covered”), and for the fiscal year ended October 31, 2024, the aggregate fees billed by EY of $979,248 for non-audit services rendered on behalf of its investment adviser and any entity controlling, controlled by, or under common control with the adviser (“non-covered”) that provides ongoing services (or provided during the relevant fiscal period) to the registrant for each of the last two fiscal years of the registrant is shown in the table below:
| | | 2023 | | | 2024 | |
| Covered Services | | $ | 18,000 | | | $ | - | |
| Non-Covered Services | | $ | - | | | $ | 979,248 | |
(h) Not Applicable.
(i) Not Applicable.
(j) Not Applicable.
Item 5. Audit Committee of Listed Registrants.
| (a) | Form N-CSR disclosure requirement is not applicable to the registrant. |
| (b) | Not applicable to the registrant. |
Item 6. Schedule of Investments.
| (a) | The compete schedule of investments for the registrant is disclosed in the registrant’s annual report, which is included in Item 1 of this form. |
| (b) | Not applicable |
Item 7. Financial Statements and Financial Highlights for Open-End Management Investment Companies.
(a) Copy of the most recent financial statements:

Credit Suisse Floating Rate High
Income Fund
Annual Financial Statements | October 31, 2024
The Fund's investment objectives, risks, charges and expenses (which should be considered carefully before investing), and more complete information about the Fund, are provided in the Prospectus, which should be read carefully before investing. You may obtain additional copies by calling 877-870-2874 or by visiting our website at www.credit-suisse.com/us/funds.
Credit Suisse Securities (USA) LLC, the Distributor for the six months ended April 30, 2024, is located at Eleven Madison Avenue, New York, NY 10010. UBS Asset Management (US) Inc. became the distributor as of May 1, 2024. The Credit Suisse Funds were advised by Credit Suisse Asset Management, LLC for the six months ended April 30, 2024. UBS Asset Management (Americas) LLC became the investment manager on May 1, 2024 pursuant to an internal merger between Credit Suisse Asset Management, LLC and UBS Asset Management (Americas) LLC.
Investors in the Credit Suisse Funds should be aware that they may be eligible to purchase Class I shares (where offered) directly or through certain intermediaries. Such shares are not subject to a sales charge. Investors in the Credit Suisse Funds should also be aware that they may be eligible for a reduction or waiver of the sales charge with respect to Class A or C shares (where offered). For more information, please review the relevant prospectuses or consult your financial representative.
Fund shares are not deposits or other obligations of UBS Asset Management (Americas) LLC or any affiliate, are not FDIC-insured and are not guaranteed by UBS Asset Management (Americas) LLC or any affiliate. Fund investments are subject to investment risks, including loss of your investment.
Credit Suisse Floating Rate High Income Fund
Schedule of Investments
Par
(000) | | | | Ratings†
(S&P/Moody's) | | Maturity | | Rate% | | Value | |
Bank loans (84.7%) | | | |
Advertising (0.5%) | | | |
$ | 9,147 | | | MH Sub I LLC, 1 mo. USD Term SOFR + 4.250%1 | | (B, B1) | | 05/03/28 | | | 8.935 | | | $ | 9,100,038 | | |
Aerospace & Defense (3.5%) | | | |
| | 16,890 | | | Amentum Government Services Holdings LLC, 3 mo. USD Term SOFR + 2.250%1 | | (BB-, Ba3) | | 09/29/31 | | | 7.099 | | | | 16,909,001 | | |
| | 2,102 | | | Arcline FM Holdings LLC, 6 mo. USD Term SOFR + 4.500%1 | | (B, B3) | | 06/23/28 | | | 9.742 | | | | 2,112,094 | | |
| | 3,042 | | | Bleriot U.S. Bidco, Inc., 3 mo. USD Term SOFR + 3.250%1 | | (B, B2) | | 10/31/30 | | | 7.854 | | | | 3,053,510 | | |
| | 5,071 | | | Brown Group Holding LLC,
1 mo. USD Term SOFR + 2.750%,
3 mo. USD Term SOFR + 2.750%1 | |
(B+, B2) | |
07/01/31 | | | 7.335
7.807 | - | | |
5,074,131 | | |
| | 6,239 | | | Brown Group Holding LLC, 1 mo. USD Term SOFR + 2.750%1 | | (B+, B2) | | 07/01/31 | | | 7.435 | | | | 6,242,534 | | |
| | 2,644 | | | CACI International, Inc.2,3 | | (BB+, Ba1) | | 10/30/31 | | | 0.000 | | | | 2,650,678 | | |
| | 1,822 | | | Fly Funding II SARL, 3 mo. USD LIBOR + 1.750%1 | | (B, B2) | | 08/11/25 | | | 7.120 | | | | 1,786,554 | | |
| | 3,388 | | | KBR, Inc., 1 mo. USD Term SOFR + 2.000%1 | | (BB+, Ba1) | | 01/19/31 | | | 6.685 | | | | 3,395,683 | | |
| | 2,572 | | | KKR Apple Bidco LLC, 1 mo. USD Term SOFR + 2.750%1 | | (B, B2) | | 09/22/28 | | | 7.550 | | | | 2,575,805 | | |
| | 3,720 | | | KKR Apple Bidco LLC, 1 mo. USD Term SOFR + 3.500%1 | | (B, B2) | | 09/22/28 | | | 8.185 | | | | 3,733,766 | | |
| | 13,814 | | | Peraton Corp., 1 mo. USD Term SOFR + 3.750%1 | | (B-, B2) | | 02/01/28 | | | 8.535 | | | | 13,407,566 | | |
| | 7,271 | | | TransDigm, Inc., 3 mo. USD Term SOFR + 2.500%1 | | (BB-, Ba3) | | 02/28/31 | | | 7.104 | | | | 7,286,169 | | |
| | | | | | | | | | | | | | 68,227,491 | | |
Air Transportation (0.1%) | | | |
| | 1,990 | | | United Airlines, Inc., 3 mo. USD Term SOFR + 2.750%1 | | (BB+, Ba1) | | 02/22/31 | | | 7.385 | | | | 1,996,925 | | |
Auto Parts & Equipment (2.2%) | | | |
| | 8,531 | | | Autokiniton U.S. Holdings, Inc., 1 mo. USD Term SOFR + 4.000%1 | | (B, B2) | | 04/06/28 | | | 8.800 | | | | 8,547,758 | | |
| | 10,056 | | | Clarios Global LP, 1 mo. USD Term SOFR + 2.500%1 | | (BB-, Ba3) | | 05/06/30 | | | 7.185 | | | | 10,088,571 | | |
| | 426 | | | First Brands Group LLC (2021 Term Loan), 3 mo. USD Term SOFR + 5.000%1 | | (B+, B1) | | 03/30/27 | | | 9.847 | | | | 415,122 | | |
| | 2,355 | | | First Brands Group LLC (2022 Incremental Term Loan), 3 mo. USD Term SOFR + 5.000%1 | | (B+, B1) | | 03/30/27 | | | 9.847 | | | | 2,294,702 | | |
| | 2,723 | | | Jason Group, Inc., 1 mo. USD Term SOFR + 6.000%, 0.000% PIK1,4,5 | | (NR, WR) | | 08/28/25 | | | 10.800 | | | | 2,470,773 | | |
| | 5,365 | | | Les Schwab Tire Centers, 1 mo. USD Term SOFR + 3.000%1 | | (B, B2) | | 04/23/31 | | | 7.685 | | | | 5,376,733 | | |
| | 7,073 | | | RVR Dealership Holdings LLC, 3 mo. USD Term SOFR + 3.750%1 | | (B, B3) | | 02/08/28 | | | 8.504 | | | | 6,367,249 | | |
| | 6,829 | | | TI Group Automotive Systems LLC, 1 mo. EURIBOR + 3.250%1,6 | | (BBB-, Ba2) | | 12/16/26 | | | 6.396 | | | | 7,428,981 | | |
| | | | | | | | | | | | | | 42,989,889 | | |
Banking (0.3%) | | | |
| | 5,940 | | | Citco Funding LLC, 6 mo. USD Term SOFR + 2.750%1 | | (BB, Ba2) | | 04/27/28 | | | 7.308 | | | | 5,965,776 | | |
Beverages (0.2%) | | | |
| | 3,676 | | | Aspire Bakeries Holdings LLC, 1 mo. USD Term SOFR + 4.250%1 | | (B, B2) | | 12/13/30 | | | 8.968 | | | | 3,680,978 | | |
Brokerage (0.4%) | | | |
| | 7,194 | | | DRW Holdings LLC, 6 mo. USD Term SOFR + 3.500%1 | | (BB-, Ba3) | | 06/26/31 | | | 8.588 | | | | 7,175,893 | | |
| | 1,324 | | | Jefferies Finance LLC, 1 mo. USD Term SOFR + 3.000%1,3 | | (BB-, Ba2) | | 10/21/31 | | | 7.759 | | | | 1,315,686 | | |
| | | | | | | | | | | | | | 8,491,579 | | |
Building & Construction (0.9%) | | | |
| | 5,433 | | | Latham Pool Products, Inc., 3 mo. USD Term SOFR + 3.750%1 | | (BB-, B2) | | 02/23/29 | | | 8.485 | | | | 5,334,904 | | |
| | 4,187 | | | Pike Corp., 1 mo. USD Term SOFR + 3.000%1 | | (BB-, Ba3) | | 01/21/28 | | | 7.800 | | | | 4,205,925 | | |
| | 954 | | | Quikrete Holdings, Inc., 1 mo. USD Term SOFR + 2.500%1 | | (BB, Ba2) | | 04/14/31 | | | 7.185 | | | | 955,071 | | |
| | 4,975 | | | Quikrete Holdings, Inc., 1 mo. USD Term SOFR + 2.250%1 | | (BB, Ba2) | | 03/19/29 | | | 6.935 | | | | 4,980,970 | | |
| | 2,981 | | | Service Logic Acquisition, Inc.,
1 mo. USD Term SOFR + 3.500%,
3 mo. USD Term SOFR + 3.500%1 | |
(B, B2) | |
10/29/27 | | | 8.085
8.185 | - | | |
2,996,834 | | |
| | | | | | | | | | | | | | 18,473,704 | | |
1
Credit Suisse Floating Rate High Income Fund
Schedule of Investments
Par
(000) | | | | Ratings†
(S&P/Moody's) | | Maturity | | Rate% | | Value | |
Bank loans—(continued) | | | |
Building Materials (1.8%) | | | |
$ | 6,661 | | | Core & Main LP, 1 mo. USD Term SOFR + 2.000%1 | | (BB-, Ba3) | | 07/27/28 | | | 6.718 | | | $ | 6,660,092 | | |
| | 5,073 | | | Cornerstone Building Brands, Inc., 1 mo. USD Term SOFR + 3.250%1 | | (B, B2) | | 04/12/28 | | | 8.154 | | | | 4,994,686 | | |
| | 3,588 | | | Cornerstone Building Brands, Inc., 1 mo. USD Term SOFR + 5.625%1 | | (B, B2) | | 08/01/28 | | | 10.429 | | | | 3,621,289 | | |
| | 9,344 | | | Foundation Building Materials Holding Co. LLC, 3 mo. USD Term SOFR + 3.250%1 | | (B, B2) | | 01/31/28 | | | 7.835 | | | | 9,222,833 | | |
| | 5,679 | | | Gulfside Supply, Inc., 1 mo. USD Term SOFR + 3.000%1 | | (B, B2) | | 06/17/31 | | | 7.784 | | | | 5,686,474 | | |
| | 3,864 | | | MI Windows & Doors LLC, 1 mo. USD Term SOFR + 3.000%1 | | (BB-, B1) | | 03/28/31 | | | 7.685 | | | | 3,880,336 | | |
| | 2,207 | | | Oscar AcquisitionCo LLC, 3 mo. USD Term SOFR + 4.250%1 | | (B, B1) | | 04/29/29 | | | 8.495 | | | | 2,192,664 | | |
| | | | | | | | | | | | | | 36,258,374 | | |
Cable & Satellite TV (0.4%) | | | |
| | 192 | | | Altice France SA, 3 mo. USD LIBOR + 4.000%1 | | (CCC+, Caa1) | | 08/14/26 | | | 9.380 | | | | 163,788 | | |
| | 7,000 | | | Ziggo BV, 1 mo. EURIBOR + 3.000%1,6 | | (B+, B1) | | 01/31/29 | | | 6.245 | | | | 7,487,268 | | |
| | 1,000 | | | Ziggo Financing Partnership, 1 mo. USD Term SOFR + 2.500%1 | | (B+, B1) | | 04/30/28 | | | 7.418 | | | | 987,220 | | |
| | | | | | | | | | | | | | 8,638,276 | | |
Chemicals (4.2%) | | | |
| | 3,750 | | | AAP Buyer, Inc., 3 mo. USD Term SOFR + 3.250%1,3 | | (B+, B1) | | 09/09/31 | | | 7.854 | | | | 3,768,750 | | |
| | 2,981 | | | Ascend Performance Materials Operations LLC, 3 mo. USD Term SOFR + 4.750%1 | | (B, B2) | | 08/27/26 | | | 9.095 | | | | 2,774,642 | | |
| | 4,000 | | | CeramTec AcquiCo GmbH, 3 mo. EURIBOR + 3.500%1,6 | | (B, B1) | | 03/16/29 | | | 7.005 | | | | 4,352,719 | | |
| | 3,455 | | | CPC Acquisition Corp., 3 mo. USD Term SOFR + 7.750%1 | | (CC, Ca) | | 12/29/28 | | | 12.615 | | | | 2,107,592 | | |
| | 3,477 | | | CPC Acquisition Corp., 3 mo. USD Term SOFR + 3.750%1 | | (CCC, Caa2) | | 12/29/27 | | | 8.615 | | | | 3,049,984 | | |
| | 1,850 | | | Eastman Chemical Co., 3 mo. USD Term SOFR + 5.250%1 | | (B, B2) | | 11/01/28 | | | 10.115 | | | | 1,570,438 | | |
| | 4,292 | | | Element Solutions, Inc., 1 mo. USD Term SOFR + 1.750%1 | | (BBB-, Ba1) | | 12/18/30 | | | 6.203 | | | | 4,300,488 | | |
| | 4,322 | | | Hexion Holdings Corp., 3 mo. USD Term SOFR + 4.500%1 | | (B-, B2) | | 03/15/29 | | | 9.771 | | | | 4,327,207 | | |
| | 4,169 | | | INEOS Quattro Holdings U.K. Ltd., 1 mo. USD Term SOFR + 4.250%1 | | (BB, B1) | | 04/02/29 | | | 9.035 | | | | 4,156,042 | | |
| | 1,494 | | | INEOS Quattro Holdings U.K. Ltd., 1 mo. USD Term SOFR + 4.250%1,3 | | (NR, B1) | | 10/01/31 | | | 8.935 | | | | 1,490,730 | | |
| | 6,814 | | | INEOS U.S. Finance LLC, 1 mo. USD Term SOFR + 3.250%1 | | (BB, Ba3) | | 02/18/30 | | | 7.935 | | | | 6,829,163 | | |
| | 2,582 | | | INEOS U.S. Finance LLC, 1 mo. USD Term SOFR + 3.750%1 | | (NR, Ba3) | | 02/07/31 | | | 8.435 | | | | 2,591,446 | | |
| | 2,135 | | | New Arclin U.S. Holding Corp., 1 mo. USD Term SOFR + 3.500%1 | | (B, B2) | | 09/30/28 | | | 8.285 | | | | 2,141,684 | | |
| | 1,110 | | | Nouryon Finance BV, 6 mo. USD Term SOFR + 3.500%1 | | (B+, B2) | | 04/03/28 | | | 7.784 | | | | 1,116,155 | | |
| | 2,648 | | | Nouryon Finance BV, 3 mo. USD Term SOFR + 3.500%1 | | (B+, B2) | | 04/03/28 | | | 8.628 | | | | 2,665,946 | | |
| | 4,302 | | | PMHC II, Inc., 3 mo. USD Term SOFR + 4.250%1 | | (B-, B3) | | 04/23/29 | | | 9.058 | | | | 4,252,648 | | |
| | 10,243 | | | Polar U.S. Borrower LLC, 1 mo. USD Term SOFR + 5.500%1,5 | | (NR, NR) | | 10/16/28 | | | 9.605 | | | | 7,708,184 | | |
| | 3,979 | | | Polar U.S. Borrower LLC, 1 mo. USD Term SOFR + 5.500%1,5 | | (NR, NR) | | 10/16/28 | | | 9.593 | | | | 2,994,224 | | |
| | 1,007 | | | RelaDyne, Inc., 1 mo. USD Term SOFR + 4.250%1 | | (B, B3) | | 12/22/28 | | | 8.935 | | | | 1,008,907 | | |
| | 5,315 | | | RelaDyne, Inc., 1 mo. USD Term SOFR + 4.500%1 | | (B, B3) | | 12/22/28 | | | 9.185 | | | | 5,335,845 | | |
| | 2,001 | | | SK Neptune Husky Finance SARL3,5,7,8 | | (NR, WR) | | 04/30/25 | | | 0.000 | | | | 1,550,995 | | |
| | 9,227 | | | SK Neptune Husky Group SARL5,7,8 | | (NR, WR) | | 01/03/29 | | | 0.000 | | | | 155,703 | | |
| | 10,136 | | | Vantage Specialty Chemicals, Inc., 3 mo. USD Term SOFR + 4.750%1 | | (B-, B3) | | 10/26/26 | | | 9.871 | | | | 10,114,573 | | |
| | 2,182 | | | Zep, Inc., 3 mo. USD Term SOFR + 4.000%1,3,5,9 | | (NR, NR) | | 10/02/28 | | | 8.245 | | | | 2,091,592 | | |
| | | | | | | | | | | | | | 82,455,657 | | |
Discount Stores (0.1%) | | | |
| | 2,750 | | | Peer Holding III BV, 3 mo. USD Term SOFR + 3.000%1 | | (BB, Ba2) | | 07/01/31 | | | 7.604 | | | | 2,757,741 | | |
Diversified Capital Goods (1.2%) | | | |
| | 1,690 | | | DexKo Global, Inc.2 | | (B-, B2) | | 10/04/28 | | | 0.000 | | | | 1,622,577 | | |
| | 11,196 | | | Dynacast International LLC, 3 mo. USD Term SOFR + 4.750%1 | | (CCC, B2) | | 07/22/25 | | | 9.907 | | | | 11,042,377 | | |
| | 1,959 | | | Dynacast International LLC, 3 mo. USD Term SOFR + 9.250%1 | | (CC, Caa2) | | 10/22/25 | | | 14.407 | | | | 1,836,846 | | |
| | 9,370 | | | Topgolf Callaway Brands Corp., 1 mo. USD Term SOFR + 3.000%1 | | (B+, B1) | | 03/18/30 | | | 7.685 | | | | 9,329,086 | | |
| | | | | | | | | | | | | | 23,830,886 | | |
2
Credit Suisse Floating Rate High Income Fund
Schedule of Investments
Par
(000) | | | | Ratings†
(S&P/Moody's) | | Maturity | | Rate% | | Value | |
Bank loans—(continued) | | | |
Electronics (2.8%) | | | |
$ | 5,652 | | | Entegris, Inc., 3 mo. USD Term SOFR + 1.750%1 | | (BB, Baa3) | | 07/06/29 | | | 6.354 | | | $ | 5,670,484 | | |
| | 9,808 | | | Escape Velocity Holdings, Inc., 3 mo. USD Term SOFR + 4.250%1 | | (B, B3) | | 10/08/28 | | | 9.115 | | | | 9,761,883 | | |
| | 11,876 | | | Idemia Group, 3 mo. USD Term SOFR + 4.250%1,3 | | (B, B2) | | 09/30/28 | | | 8.854 | | | | 11,994,433 | | |
| | 7,000 | | | Idemia Identity & Security France SAS, 3 mo. EURIBOR + 4.000%1,6 | | (B, B2) | | 09/30/28 | | | 7.345 | | | | 7,629,190 | | |
| | 7,759 | | | II-VI, Inc., 1 mo. USD Term SOFR + 2.500%1 | | (BB-, Ba1) | | 07/02/29 | | | 7.185 | | | | 7,777,094 | | |
| | 1,548 | | | Infinite Bidco LLC, 3 mo. USD Term SOFR + 7.000%1,5 | | (CCC, Caa2) | | 03/02/29 | | | 11.847 | | | | 1,332,887 | | |
| | 4,150 | | | Ingram Micro, Inc., 3 mo. USD Term SOFR + 2.750%1 | | (BB-, B1) | | 09/22/31 | | | 7.564 | | | | 4,156,661 | | |
| | 1,000 | | | MaxLinear, Inc., 1 mo. USD Term SOFR + 2.250%1,5 | | (B, B1) | | 06/23/28 | | | 7.082 | | | | 969,170 | | |
| | 4,386 | | | MKS Instruments, Inc., 1 mo. USD Term SOFR + 2.250%1 | | (BB, Ba1) | | 08/17/29 | | | 6.995 | | | | 4,396,517 | | |
| | 1,800 | | | SolarWinds Holdings, Inc., 1 mo. USD Term SOFR + 2.750%1 | | (B+, B1) | | 02/05/30 | | | 7.435 | | | | 1,805,067 | | |
| | | | | | | | | | | | | | 55,493,386 | | |
Energy—Exploration & Production (0.2%) | | | |
| | 581 | | | AL GCX Holdings LLC, 1 mo. USD Term SOFR + 2.750%1 | | (B+, Ba3) | | 05/17/29 | | | 7.601 | | | | 583,057 | | |
| | 1,602 | | | BIP PipeCo Holdings LLC, 3 mo. USD Term SOFR + 2.500%1 | | (B+, Ba3) | | 12/06/30 | | | 7.090 | | | | 1,604,108 | | |
| | 2,219 | | | EMG Utica LLC2,3 | | (B+, B3) | | 10/24/29 | | | 0.000 | | | | 2,213,495 | | |
| | 16,352 | | | PES Holdings LLC, 3.000% PIK3,4,5,7 | | (NR, WR) | | 12/31/24 | | | 3.000 | | | | 122,638 | | |
| | | | | | | | | | | | | | 4,523,298 | | |
Environmental (0.6%) | | | |
| | 3,372 | | | Clean Harbors, Inc., 3 mo. USD Term SOFR + 1.750%1 | | (BBB-, Ba1) | | 10/09/28 | | | 6.435 | | | | 3,390,737 | | |
| | 650 | | | Covanta Holding Corp. (2021 Term Loan B)2 | | (BB, Ba2) | | 11/30/28 | | | 0.000 | | | | 651,511 | | |
| | 50 | | | Covanta Holding Corp. (2021 Term Loan C)2 | | (BB, Ba2) | | 11/30/28 | | | 0.000 | | | | 50,054 | | |
| | 899 | | | Covanta Holding Corp. (2024 1st Lien Term Loan B)2 | | (BB, Ba2) | | 11/30/28 | | | 0.000 | | | | 900,632 | | |
| | 49 | | | Covanta Holding Corp. (2024 1st Lien Term Loan C)2 | | (BB, Ba2) | | 11/30/28 | | | 0.000 | | | | 49,338 | | |
| | 1,960 | | | GFL Environmental, Inc., 3 mo. USD Term SOFR + 2.000%1 | | (BB, Ba2) | | 07/03/31 | | | 6.610 | | | | 1,959,741 | | |
| | 2,664 | | | LRS Holdings LLC, 3 mo. USD Term SOFR + 4.250%1 | | (B-, Caa1) | | 08/31/28 | | | 8.867 | | | | 2,537,600 | | |
| | 1,755 | | | Vestis Corp., 3 mo. USD Term SOFR + 2.250%1 | | (BB, Ba3) | | 02/22/31 | | | 7.371 | | | | 1,751,882 | | |
| | | | | | | | | | | | | | 11,291,495 | | |
Food & Drug Retailers (0.6%) | | | |
| | 5,374 | | | Sharp Services LLC, 3 mo. USD Term SOFR + 3.250%1 | | (B-, B3) | | 12/31/28 | | | 7.876 | | | | 5,374,402 | | |
| | 8,856 | | | WOOF Holdings, Inc., 3 mo. USD Term SOFR + 3.750%1 | | (CCC, Caa2) | | 12/21/27 | | | 8.615 | | | | 5,980,057 | | |
| | 2,923 | | | WOOF Holdings, Inc., 3 mo. USD Term SOFR + 7.250%1,5 | | (CC, Ca) | | 12/21/28 | | | 11.985 | | | | 1,422,688 | | |
| | | | | | | | | | | | | | 12,777,147 | | |
Food—Wholesale (1.6%) | | | |
| | 7,471 | | | AI Aqua Merger Sub, Inc., 1 mo. USD Term SOFR + 3.500%1 | | (B, B3) | | 07/31/28 | | | 8.357 | | | | 7,492,280 | | |
| | 5,416 | | | Froneri International Ltd.2 | | (BB-, Ba3) | | 09/17/31 | | | 0.000 | | | | 5,397,614 | | |
| | 2,000 | | | Froneri International Ltd., 6 mo. EURIBOR + 2.125%1,6 | | (BB-, Ba3) | | 01/29/27 | | | 5.715 | | | | 2,172,657 | | |
| | 3,462 | | | Golden State Food LLC2 | | (B, B2) | | 10/07/31 | | | 0.000 | | | | 3,468,545 | | |
| | 2,320 | | | U.S. Foods, Inc., 1 mo. USD Term SOFR + 1.750%1 | | (BBB-, Ba2) | | 10/03/31 | | | 6.435 | | | | 2,330,651 | | |
| | 5,872 | | | UTZ Quality Foods LLC, 3 mo. USD Term SOFR + 2.750%1 | | (B, B2) | | 01/20/28 | | | 7.354 | | | | 5,888,252 | | |
| | 4,223 | | | Zara U.K. Midco Ltd., 6 mo. EURIBOR + 5.750%1,6 | | (B-, Caa1) | | 08/01/28 | | | 9.313 | | | | 3,844,616 | | |
| | | | | | | | | | | | | | 30,594,615 | | |
Gaming (1.1%) | | | |
| | 5,769 | | | Arcis Golf LLC, 1 mo. USD Term SOFR + 3.750%1 | | (B+, B2) | | 11/24/28 | | | 8.572 | | | | 5,809,019 | | |
| | 1,995 | | | Caesars Entertainment, Inc., 1 mo. USD Term SOFR + 2.750%1 | | (BB-, Ba3) | | 02/06/31 | | | 7.435 | | | | 1,999,197 | | |
| | 2,921 | | | Caesars Entertainment, Inc., 1 mo. USD Term SOFR + 2.750%1 | | (BB-, Ba3) | | 02/06/30 | | | 7.435 | | | | 2,928,150 | | |
| | 4,455 | | | Fertitta Entertainment LLC, 1 mo. USD Term SOFR + 3.750%1 | | (B, B2) | | 01/27/29 | | | 8.084 | | | | 4,461,580 | | |
| | 3,577 | | | Light & Wonder International, Inc., 1 mo. USD Term SOFR + 2.250%1 | | (BB, Ba1) | | 04/14/29 | | | 7.034 | | | | 3,581,034 | | |
| | 3,005 | | | PENN Entertainment, Inc., 1 mo. USD Term SOFR + 2.750%1 | | (BB-, Ba3) | | 05/03/29 | | | 7.535 | | | | 3,012,815 | | |
| | | | | | | | | | | | | | 21,791,795 | | |
3
Credit Suisse Floating Rate High Income Fund
Schedule of Investments
Par
(000) | | | | Ratings†
(S&P/Moody's) | | Maturity | | Rate% | | Value | |
Bank loans—(continued) | | | |
Gas Distribution (0.9%) | | | |
$ | 2,465 | | | AL NGPL Holdings LLC, 3 mo. USD Term SOFR + 2.500%1 | | (B+, Ba3) | | 04/17/28 | | | 7.090 | | | $ | 2,472,826 | | |
| | 7,207 | | | BCP Renaissance Parent LLC, 3 mo. USD Term SOFR + 3.250%1 | | (B+, B2) | | 10/31/28 | | | 7.854 | | | | 7,219,885 | | |
| | 1,358 | | | EPIC Crude Services LP, 3 mo. USD Term SOFR + 3.000%1 | | (BB-, Ba3) | | 10/10/31 | | | 7.656 | | | | 1,358,876 | | |
| | 7,433 | | | Traverse Midstream Partners LLC, 3 mo. USD Term SOFR + 3.500%1 | | (B+, B2) | | 02/16/28 | | | 8.085 | | | | 7,469,903 | | |
| | | | | | | | | | | | | | 18,521,490 | | |
Health Facilities (1.5%) | | | |
| | 5,101 | | | Bayou Intermediate II LLC, 3 mo. USD Term SOFR + 4.500%1 | | (B-, B2) | | 08/02/28 | | | 9.347 | | | | 4,996,917 | | |
| | 2,887 | | | Carestream Health, Inc., 3 mo. USD Term SOFR + 7.500%1 | | (B-, Caa1) | | 09/30/27 | | | 12.204 | | | | 2,649,116 | | |
| | 4,759 | | | Insulet Corp., 1 mo. USD Term SOFR + 2.500%1 | | (BB-, Ba2) | | 08/04/31 | | | 7.185 | | | | 4,784,825 | | |
| | 3,952 | | | Sonrava Health Holdings LLC, 3 mo. USD Term SOFR + 6.500%1 | | (B-, B2) | | 05/18/28 | | | 11.499 | | | | 3,971,622 | | |
| | 16,344 | | | Sonrava Health Holdings LLC, 3 mo. USD Term SOFR + 1.000%, 5.500% PIK1,4,5 | | (NR, Caa2) | | 08/18/28 | | | 11.499 | | | | 7,763,251 | | |
| | 4,832 | | | Surgery Center Holdings, Inc., 1 mo. USD Term SOFR + 2.750%1 | | (B, Ba3) | | 12/19/30 | | | 7.495 | | | | 4,848,590 | | |
| | | | | | | | | | | | | | 29,014,321 | | |
Health Services (4.1%) | | | |
| | 9,988 | | | ADMI Corp., 1 mo. USD Term SOFR + 3.375%1 | | (B-, B3) | | 12/23/27 | | | 8.175 | | | | 9,808,613 | | |
| | 1,527 | | | ADMI Corp., 1 mo. USD Term SOFR + 5.750%1 | | (B-, B3) | | 12/23/27 | | | 10.435 | | | | 1,540,646 | | |
| | 14,004 | | | Athenahealth Group, Inc., 1 mo. USD Term SOFR + 3.250%1 | | (B-, B2) | | 02/15/29 | | | 7.935 | | | | 13,981,936 | | |
| | 2,170 | | | Concentra Health Services, Inc., 1 mo. USD Term SOFR + 2.250%1,3 | | (BB, Ba1) | | 07/28/31 | | | 6.935 | | | | 2,178,156 | | |
| | 1,364 | | | EyeCare Partners LLC,
3 mo. USD Term SOFR + 1.000%,
3 mo. USD Term SOFR + 4.610%1 | |
(CCC+, Caa3) | |
11/30/28 | | | 5.717
9.257 | - | | |
1,010,434 | | |
| | 1,380 | | | IVC Acquisition Ltd., 3 mo. USD Term SOFR + 4.750%1 | | (B, B3) | | 12/12/28 | | | 9.393 | | | | 1,387,586 | | |
| | 8,600 | | | Learning Care Group U.S. No. 2, Inc.,
3 mo. USD Term SOFR + 4.000%1 | |
(B, B2) | |
08/11/28 | | | 8.604
9.113 | - | | |
8,642,270 | | |
| | 4,741 | | | MedAssets Software Intermediate Holdings, Inc., 1 mo. USD Term SOFR + 6.750%1,5 | | (D, C) | | 12/17/29 | | | 11.550 | | | | 2,085,884 | | |
| | 1,474 | | | MedAssets Software Intermediate Holdings, Inc., 1 mo. USD Term SOFR + 4.000%1,5 | | (CCC, Caa3) | | 12/18/28 | | | 8.800 | | | | 1,013,041 | | |
| | 4,362 | | | Pacific Dental Services LLC, 1 mo. USD Term SOFR + 2.750%1 | | (B, B1) | | 03/15/31 | | | 7.536 | | | | 4,367,369 | | |
| | 3,593 | | | Packaging Coordinators Midco, Inc., 3 mo. USD Term SOFR + 3.250%1 | | (B-, B3) | | 11/30/27 | | | 7.835 | | | | 3,601,544 | | |
| | 9,031 | | | PointClickCare Technologies, Inc., 3 mo. USD Term SOFR + 3.000%1,3 | | (B, B2) | | 12/29/27 | | | 7.604 | | | | 9,042,211 | | |
| | 3,368 | | | Radiology Partners, Inc., 3 mo. USD Term SOFR + 3.500%, 1.500% PIK1,4 | | (B-, B3) | | 01/31/29 | | | 10.383 | | | | 3,325,962 | | |
| | 904 | | | Southern Veterinary Partners LLC2,3 | | (B, B2) | | 10/31/31 | | | 0.000 | | | | 902,038 | | |
| | 4,115 | | | Southern Veterinary Partners LLC, 6 mo. USD Term SOFR + 3.750%1 | | (B-, B3) | | 10/05/27 | | | 7.995 | | | | 4,118,949 | | |
| | 12,229 | | | U.S. Radiology Specialists, Inc., 3 mo. USD Term SOFR + 4.750%1 | | (B-, B3) | | 12/15/27 | | | 9.354 | | | | 12,293,808 | | |
| | 1,928 | | | Women's Care Enterprises LLC, 3 mo. USD Term SOFR + 4.500%1,5 | | (B-, B2) | | 01/15/28 | | | 9.185 | | | | 1,866,684 | | |
| | | | | | | | | | | | | | 81,167,131 | | |
Hotels (1.0%) | | | |
| | 3,142 | | | Aimbridge Acquisition Co., Inc. (2019 Term Loan B)2 | | (CCC, B3) | | 02/02/26 | | | 0.000 | | | | 2,720,442 | | |
| | 1,858 | | | Aimbridge Acquisition Co., Inc. (2020 Incremental Term Loan B)2 | | (CCC, B3) | | 02/02/26 | | | 0.000 | | | | 1,660,599 | | |
| | 7,184 | | | Alterra Mountain Co., 1 mo. USD Term SOFR + 3.250%1 | | (B+, B1) | | 08/17/28 | | | 7.935 | | | | 7,206,274 | | |
| | 1,026 | | | Alterra Mountain Co., 1 mo. USD Term SOFR + 3.500%1 | | (B+, B1) | | 05/31/30 | | | 8.185 | | | | 1,029,551 | | |
| | 1,572 | | | RHP Hotel Properties LP, 1 mo. USD Term SOFR + 2.250%1 | | (BB, Ba3) | | 05/18/30 | | | 6.935 | | | | 1,576,107 | | |
| | 4,988 | | | Wyndham Hotels & Resorts, Inc., 1 mo. USD Term SOFR + 1.750%1 | | (BBB-, Ba1) | | 05/24/30 | | | 6.435 | | | | 4,991,789 | | |
| | | | | | | | | | | | | | 19,184,762 | | |
Insurance Brokerage (4.4%) | | | |
| | 8,803 | | | Alliant Holdings Intermediate LLC, 1 mo. USD Term SOFR + 3.000%1 | | (B, B2) | | 09/19/31 | | | 7.759 | | | | 8,773,496 | | |
| | 11,519 | | | AmWINS Group, Inc., 1 mo. USD Term SOFR + 2.250%1 | | (B+, Ba3) | | 02/19/28 | | | 7.050 | | | | 11,526,196 | | |
| | 5,949 | | | Ardonagh Midco 3 PLC,
3 mo. USD Term SOFR + 3.750%1 | |
(B-, B3) | |
02/15/31 | | | 8.354
8.535 | - | | |
5,977,186 | | |
| | 12,651 | | | AssuredPartners, Inc., 1 mo. USD Term SOFR + 3.500%1 | | (B, B2) | | 02/14/31 | | | 8.185 | | | | 12,683,927 | | |
| | 7,058 | | | Howden Group Holdings Ltd., 1 mo. EURIBOR + 4.000%1,6 | | (B, B2) | | 02/15/31 | | | 7.188 | | | | 7,711,853 | | |
4
Credit Suisse Floating Rate High Income Fund
Schedule of Investments
Par
(000) | | | | Ratings†
(S&P/Moody's) | | Maturity | | Rate% | | Value | |
Bank loans—(continued) | | | |
Insurance Brokerage—(concluded) | | | |
$ | 3,375 | | | Howden Group Holdings Ltd., 1 mo. USD Term SOFR + 3.500%1 | | (B, B2) | | 04/18/30 | | | 8.185 | | | $ | 3,389,975 | | |
| | 5,569 | | | Howden Group Holdings Ltd., 1 mo. USD Term SOFR + 3.500%1 | | (B, B2) | | 02/15/31 | | | 8.185 | | | | 5,590,136 | | |
| | 21,550 | | | HUB International Ltd., 3 mo. USD Term SOFR + 2.750%1 | | (B, B1) | | 06/20/30 | | | 7.367 | | | | 21,615,588 | | |
| | 2,633 | | | Ryan Specialty Group LLC, 1 mo. USD Term SOFR + 2.250%1 | | (BB-, B1) | | 09/15/31 | | | 6.935 | | | | 2,634,850 | | |
| | 7,818 | | | Truist Insurance Holdings LLC, 3 mo. USD Term SOFR + 3.250%1 | | (B, B2) | | 05/06/31 | | | 7.854 | | | | 7,837,999 | | |
| | | | | | | | | | | | | | 87,741,206 | | |
Investments & Misc. Financial Services (6.6%) | | | |
| | 7,602 | | | Altisource Solutions SARL, 3 mo. USD Term SOFR + 8.750%1,3,5 | | (CCC-, Caa2) | | 04/30/25 | | | 13.454 | | | | 3,496,928 | | |
| | 11,164 | | | Ankura Consulting Group LLC, 1 mo. USD Term SOFR + 4.250%1 | | (B-, B3) | | 03/17/28 | | | 8.935 | | | | 11,248,603 | | |
| | 11,872 | | | AqGen Island Holdings, Inc., 1 mo. USD Term SOFR + 3.500%1 | | (B-, B3) | | 08/02/28 | | | 8.300 | | | | 11,908,807 | | |
| | 12,347 | | | Boost Newco Borrower LLC, 3 mo. USD Term SOFR + 2.500%1 | | (BB, Ba3) | | 01/31/31 | | | 7.104 | | | | 12,396,689 | | |
| | 13,337 | | | Citadel Securities LP, 1 mo. USD Term SOFR + 2.000%1 | | (NR, NR) | | 07/29/30 | | | 6.718 | | | | 13,351,816 | | |
| | 3,371 | | | CPI Holdco B LLC2 | | (BB-, Ba3) | | 05/17/31 | | | 0.000 | | | | 3,354,963 | | |
| | 3,110 | | | CPI Holdco B LLC, 1 mo. USD Term SOFR + 2.000%1 | | (BB-, Ba3) | | 05/19/31 | | | 6.685 | | | | 3,081,299 | | |
| | 4,160 | | | CTC Holdings LP, 3 mo. USD Term SOFR + 5.000%1,3,5 | | (B+, B1) | | 02/20/29 | | | 10.271 | | | | 4,108,395 | | |
| | 2,888 | | | Deerfield Dakota Holding LLC, 3 mo. USD Term SOFR + 3.750%1 | | (B-, B2) | | 04/09/27 | | | 8.354 | | | | 2,852,160 | | |
| | 413 | | | Focus Financial Partners LLC10 | | (B+, B2) | | 09/15/31 | | | 0.000 | | | | 414,027 | | |
| | 3,847 | | | Focus Financial Partners LLC, 1 mo. USD Term SOFR + 3.250%1 | | (B+, B2) | | 09/15/31 | | | 7.935 | | | | 3,854,908 | | |
| | 4,322 | | | Franklin Square Holdings LP, 1 mo. USD Term SOFR + 2.250%1 | | (BB, Ba1) | | 04/25/31 | | | 6.935 | | | | 4,329,840 | | |
| | 6,236 | | | Galaxy U.S. Opco, Inc., 3 mo. USD Term SOFR + 4.750%1 | | (CCC-, Caa1) | | 04/29/29 | | | 9.335 | | | | 5,325,552 | | |
| | 2,802 | | | HighTower Holdings LLC, 3 mo. USD Term SOFR + 3.500%1 | | (B-, B2) | | 04/21/28 | | | 8.748 | | | | 2,809,726 | | |
| | 2,026 | | | Hudson River Trading LLC2 | | (NR, NR) | | 03/29/30 | | | 0.000 | | | | 2,006,180 | | |
| | 5,079 | | | Hudson River Trading LLC, 3 mo. USD Term SOFR + 3.000%1 | | (BB-, Ba3) | | 03/20/28 | | | 8.319 | | | | 5,085,164 | | |
| | 4,605 | | | Jane Street Group LLC, 1 mo. USD Term SOFR + 2.000%1 | | (NR, Ba1) | | 01/26/28 | | | 6.685 | | | | 4,604,914 | | |
| | 1,423 | | | Jump Financial LLC, 3 mo. USD Term SOFR + 4.500%1,3 | | (BB-, Ba2) | | 08/07/28 | | | 9.365 | | | | 1,419,565 | | |
| | 6,059 | | | Mariner Wealth Advisors LLC, 3 mo. USD Term SOFR + 3.000%1 | | (B-, WR) | | 08/18/28 | | | 7.604 | | | | 6,070,114 | | |
| | 5,508 | | | Resolute Investment Managers, Inc., 3 mo. USD Term SOFR + 6.500%1 | | (B, B2) | | 04/30/27 | | | 11.365 | | | | 5,088,170 | | |
| | 14,872 | | | Sedgwick Claims Management Services, Inc., 3 mo. USD Term SOFR + 3.000%1 | | (B+, B2) | | 07/31/31 | | | 7.585 | | | | 14,894,029 | | |
| | 7,557 | | | VFH Parent LLC, 1 mo. USD Term SOFR + 2.750%1 | | (B+, B1) | | 06/21/31 | | | 7.435 | | | | 7,583,819 | | |
| | | | | | | | | | | | | | 129,285,668 | | |
Life Insurance (0.4%) | | | |
| | 2,311 | | | OneDigital Borrower LLC, 1 mo. USD Term SOFR + 5.250%1 | | (CCC+, Caa2) | | 07/02/31 | | | 9.935 | | | | 2,291,180 | | |
| | 6,136 | | | OneDigital Borrower LLC, 1 mo. USD Term SOFR + 3.250%1 | | (B, B2) | | 07/02/31 | | | 7.935 | | | | 6,138,094 | | |
| | | | | | | | | | | | | | 8,429,274 | | |
Machinery (2.3%) | | | |
| | 6,587 | | | 19th Holdings Golf LLC, 1 mo. USD Term SOFR + 3.250%1 | | (B, B1) | | 02/07/29 | | | 8.201 | | | | 6,518,523 | | |
| | 5,078 | | | Alloy Finco Ltd. (GBP Holdco PIK Term Loan), 0.500% Cash, 13.500% PIK3,4,11 | | (NR, NR) | | 03/06/25 | | | 14.000 | | | | 6,985,412 | | |
| | 4,816 | | | Alloy Finco Ltd. (USD Holdco PIK Term Loan), 0.500% Cash, 13.500% PIK4,5 | | (NR, NR) | | 03/06/25 | | | 14.000 | | | | 5,273,006 | | |
| | 655 | | | Clark Equipment Co., 3 mo. USD Term SOFR + 2.000%1 | | (BB+, Ba2) | | 04/20/29 | | | 6.604 | | | | 654,734 | | |
| | 7,622 | | | CPM Holdings, Inc., 1 mo. USD Term SOFR + 4.500%1 | | (B, B2) | | 09/28/28 | | | 9.344 | | | | 7,483,255 | | |
| | 1,500 | | | Cube Industrials Buyer, Inc.2 | | (B, B3) | | 10/09/31 | | | 0.000 | | | | 1,503,750 | | |
| | 982 | | | Generac Power Systems, Inc., 3 mo. USD Term SOFR + 1.750%1 | | (BB+, Ba1) | | 07/03/31 | | | 6.343 | | | | 983,838 | | |
| | 1,257 | | | John Bean Technologies Corp.2 | | (BB, Ba2) | | 10/09/31 | | | 0.000 | | | | 1,260,317 | | |
| | 5,037 | | | LSF12 Badger Bidco LLC, 1 mo. USD Term SOFR + 6.000%1 | | (B, B3) | | 08/30/30 | | | 10.685 | | | | 4,970,498 | | |
| | 543 | | | LTI Holdings, Inc., 1 mo. USD Term SOFR + 4.750%1 | | (B-, B3) | | 07/19/29 | | | 9.435 | | | | 540,732 | | |
| | 2,112 | | | Madison Safety & Flow LLC, 1 mo. USD Term SOFR + 3.250%1 | | (B, B2) | | 09/26/31 | | | 7.968 | | | | 2,122,929 | | |
| | 6,674 | | | Pro Mach Group, Inc., 3 mo. USD Term SOFR + 3.500%1 | | (B-, B2) | | 08/31/28 | | | 8.327 | | | | 6,708,528 | | |
| | | | | | | | | | | | | | 45,005,522 | | |
5
Credit Suisse Floating Rate High Income Fund
Schedule of Investments
Par
(000) | | | | Ratings†
(S&P/Moody's) | | Maturity | | Rate% | | Value | |
Bank loans—(continued) | | | |
Media—Diversified (1.0%) | | | |
$ | 11,354 | | | Cast & Crew Payroll LLC, 1 mo. USD Term SOFR + 3.750%1 | | (B, B2) | | 12/29/28 | | | 8.435 | | | $ | 11,112,857 | | |
| | 3,928 | | | Delta 2 LUX SARL, 3 mo. USD Term SOFR + 2.000%1 | | (BB+, NR) | | 09/10/31 | | | 6.604 | | | | 3,932,195 | | |
| | 1,964 | | | Delta 2 LUX SARL2 | | (BB+, NR) | | 09/10/31 | | | 0.000 | | | | 1,966,097 | | |
| | 3,069 | | | Technicolor Creative Studios3,6,7,8,9 | | (NR, NR) | | 08/06/33 | | | 0.000 | | | | 0 | | |
| | 2,041 | | | United Talent Agency LLC, 1 mo. USD Term SOFR + 3.750%1,3 | | (B+, B2) | | 07/07/28 | | | 8.568 | | | | 2,056,789 | | |
| | | | | | | | | | | | | | 19,067,938 | | |
Media Content (0.3%) | | | |
| | 1,923 | | | Aragorn Parent Corp., 1 mo. USD Term SOFR + 4.000%1 | | (B, B2) | | 12/15/28 | | | 8.745 | | | | 1,932,173 | | |
| | 4,230 | | | WMG Acquisition Corp., 3 mo. USD Term SOFR + 1.750%1 | | (BBB-, Ba2) | | 01/24/31 | | | 6.335 | | | | 4,238,170 | | |
| | | | | | | | | | | | | | 6,170,343 | | |
Medical Products (1.0%) | | | |
| | 3,950 | | | Covetrus, Inc., 3 mo. USD Term SOFR + 5.000%1 | | (B-, B1) | | 10/13/29 | | | 9.604 | | | | 3,755,585 | | |
| | 13,833 | | | Medline Borrower LP, 1 mo. USD Term SOFR + 2.750%1 | | (B+, Ba3) | | 10/23/28 | | | 7.435 | | | | 13,861,097 | | |
| | 2,387 | | | Sotera Health Holdings LLC, 3 mo. USD Term SOFR + 3.250%1 | | (BB-, B1) | | 05/30/31 | | | 7.835 | | | | 2,393,784 | | |
| | | | | | | | | | | | | | 20,010,466 | | |
Oil Field Equipment & Services (0.9%) | | | |
| | 13,332 | | | CQP Holdco LP, 3 mo. USD Term SOFR + 2.250%1 | | (BB, Ba2) | | 12/31/30 | | | 6.854 | | | | 13,341,789 | | |
| | 669 | | | MRC Global U.S., Inc.2,3 | | (B, B2) | | 10/24/31 | | | 0.000 | | | | 668,568 | | |
| | 4,416 | | | Rockpoint Gas Storage Partners LP, 3 mo. USD Term SOFR + 3.500%1 | | (BB, B1) | | 09/12/31 | | | 8.363 | | | | 4,411,573 | | |
| | | | | | | | | | | | | | 18,421,930 | | |
Packaging (3.0%) | | | |
| | 2,254 | | | Anchor Glass Container Corp., 3 mo. USD Term SOFR + 9.000%1,5 | | (CCC-, Caa3) | | 06/07/26 | | | 14.374 | | | | 853,265 | | |
| | 6,703 | | | Anchor Glass Container Corp.,
3 mo. USD Term SOFR + 5.000%1 | |
(CCC+, Caa1) | |
12/07/25 | | | 9.865
10.374 | - | | |
4,821,616 | | |
| | 4,489 | | | Berlin Packaging LLC,
1 mo. USD Term SOFR + 3.750%,
3 mo. USD Term SOFR + 3.750%1 | |
(B-, B2) | |
06/09/31 | | | 8.354
8.594 | - | | |
4,503,181 | | |
| | 3,947 | | | Flint Group Midco Ltd., 3 mo. USD Term SOFR + 4.250%, 0.750% PIK1,4 | | (B-, B3) | | 12/31/26 | | | 9.888 | | | | 3,790,368 | | |
| | 664 | | | Flint Group Packaging INKS North America Holdings LLC,
3 mo. EURIBOR + 4.250%, 0.750% PIK1,4,6 | | (B-, B3) | | 12/31/26 | | | 8.138 | | | | 696,590 | | |
| | 475 | | | Flint Group Packaging INKS North America Holdings LLC,
3 mo. EURIBOR + 0.100%, 6.900% PIK1,4,6 | | (CCC-, Caa3) | | 12/30/27 | | | 10.138 | | | | 103,125 | | |
| | 356 | | | Flint Group Packaging INKS North America Holdings LLC,
3 mo. EURIBOR + 0.100%, 6.900% PIK1,4,6 | | (CCC-, Caa2) | | 12/30/27 | | | 10.138 | | | | 347,312 | | |
| | 2,164 | | | Flint Group Topco Ltd., 3 mo. USD Term SOFR + 0.362%, 6.900% PIK1,4 | | (CCC-, Caa2) | | 12/30/27 | | | 11.888 | | | | 1,934,308 | | |
| | 2,886 | | | Flint Group Topco Ltd., 3 mo. USD Term SOFR + 0.362%, 6.900% PIK1,4,5 | | (CCC-, Caa3) | | 12/30/27 | | | 11.888 | | | | 584,444 | | |
| | 10,938 | | | Mauser Packaging Solutions Holding Co., 1 mo. USD Term SOFR + 3.500%1 | | (B, B2) | | 04/15/27 | | | 8.346 | | | | 10,985,827 | | |
| | 15,484 | | | Proampac PG Borrower LLC,
3 mo. USD Term SOFR + 4.000%1 | |
(B-, B3) | |
09/15/28 | | | 8.656
9.118 | - | | |
15,556,511 | | |
| | 7,330 | | | Technimark Holdings LLC, 1 mo. USD Term SOFR + 3.500%1 | | (B-, B2) | | 04/14/31 | | | 8.286 | | | | 7,321,215 | | |
| | 7,668 | | | TricorBraun Holdings, Inc., 1 mo. USD Term SOFR + 3.250%1 | | (B-, B2) | | 03/03/28 | | | 8.050 | | | | 7,611,662 | | |
| | | | | | | | | | | | | | 59,109,424 | | |
Personal & Household Products (2.2%) | | | |
| | 16,486 | | | ABG Intermediate Holdings 2 LLC, 1 mo. USD Term SOFR + 2.750%1 | | (BB-, B1) | | 12/21/28 | | | 7.447 | | | | 16,538,529 | | |
| | 2,785 | | | Amer Sports Co.,
3 mo. USD Term SOFR + 2.750%1 | |
(BB, B1) | |
02/17/31 | | | 7.354
7.846 | - | | |
2,798,598 | | |
| | 7,865 | | | Keter Group BV, 3 mo. EURIBOR + 4.750%1,6 | | (B+, B3) | | 12/31/29 | | | 7.806 | | | | 8,086,207 | | |
| | 8,002 | | | Keter Group BV, 3 mo. EURIBOR + 0.000%, 5.000% PIK1,4,6 | | (CCC+, NR) | | 12/28/29 | | | 5.077 | | | | 7,836,444 | | |
6
Credit Suisse Floating Rate High Income Fund
Schedule of Investments
Par
(000) | | | | Ratings†
(S&P/Moody's) | | Maturity | | Rate% | | Value | |
Bank loans—(continued) | | | |
Personal & Household Products—(concluded) | | | |
$ | 4,685 | | | Serta Simmons Bedding LLC, 3 mo. USD Term SOFR + 7.500%1 | | (NR, NR) | | 06/29/28 | | | 12.218 | | | $ | 3,940,709 | | |
| | 511 | | | Serta Simmons Bedding LLC, 3 mo. USD Term SOFR + 7.500%1,3 | | (NR, NR) | | 06/29/28 | | | 12.232 | | | | 511,240 | | |
| | 4,173 | | | Tempur Sealy International, Inc.2 | | (BBB-, Ba1) | | 10/03/31 | | | 0.000 | | | | 4,176,521 | | |
| | | | | | | | | | | | | | 43,888,248 | | |
Pharmaceuticals (0.5%) | | | |
| | 9,121 | | | Certara LP, 1 mo. USD Term SOFR + 3.000%1,3 | | (BB-, B1) | | 06/26/31 | | | 7.685 | | | | 9,132,379 | | |
| | | | | | | | | | | | | | 9,132,379 | | |
Property & Casualty Insurance (0.1%) | | | |
| | 1,439 | | | Summit Acquisition, Inc., 3 mo. USD Term SOFR + 3.750%1,3 | | (B-, B3) | | 10/10/31 | | | 8.397 | | | | 1,443,130 | | |
Rail (0.5%) | | | |
| | 10,184 | | | Genesee & Wyoming, Inc., 3 mo. USD Term SOFR + 2.000%1 | | (BB, Ba3) | | 04/10/31 | | | 6.604 | | | | 10,168,771 | | |
Real Estate Development & Management (0.4%) | | | |
| | 8,727 | | | BIFM U.S. Finance LLC, 1 mo. USD Term SOFR + 4.250%1 | | (B, B3) | | 05/31/28 | | | 8.935 | | | | 8,764,743 | | |
Real estate investment trusts (0.5%) | | | |
| | 4,149 | | | Starwood Property Trust, Inc., 1 mo. USD Term SOFR + 3.250%1 | | (BB, Ba2) | | 07/26/26 | | | 8.035 | | | | 4,154,029 | | |
| | 4,852 | | | Starwood Property Trust, Inc., 1 mo. USD Term SOFR + 2.750%1 | | (BB, Ba2) | | 11/18/27 | | | 7.435 | | | | 4,874,409 | | |
| | | | | | | | | | | | | | 9,028,438 | | |
Recreation & Travel (1.2%) | | | |
| | 7,691 | | | Motion Finco SARL, 3 mo. USD Term SOFR + 3.500%1 | | (B+, B2) | | 11/12/29 | | | 8.104 | | | | 7,364,514 | | |
| | 2,889 | | | OVG Business Services LLC, 1 mo. USD Term SOFR + 3.000%1 | | (B, B2) | | 06/25/31 | | | 7.685 | | | | 2,885,443 | | |
| | 6,265 | | | SeaWorld Parks & Entertainment, Inc., 1 mo. USD Term SOFR + 2.500%1 | | (BB+, Ba2) | | 08/25/28 | | | 7.185 | | | | 6,274,963 | | |
| | 6,493 | | | Six Flags Entertainment Corp., 1 mo. USD Term SOFR + 2.000%1 | | (BBB-, Ba1) | | 05/01/31 | | | 6.845 | | | | 6,497,457 | | |
| | | | | | | | | | | | | | 23,022,377 | | |
Restaurants (2.0%) | | | |
| | 5,882 | | | 1011778 B.C. Unlimited Liability Co., 1 mo. USD Term SOFR + 1.750%1 | | (BB+, Ba2) | | 09/20/30 | | | 6.435 | | | | 5,840,845 | | |
| | 8,301 | | | Flynn Restaurant Group LP, 1 mo. USD Term SOFR + 4.250%1 | | (B, B2) | | 12/01/28 | | | 9.050 | | | | 8,343,471 | | |
| | 16,095 | | | IRB Holding Corp., 1 mo. USD Term SOFR + 2.750%1 | | (B+, B2) | | 12/15/27 | | | 7.535 | | | | 16,111,064 | | |
| | 1,715 | | | K-Mac Holdings Corp., 1 mo. USD Term SOFR + 3.500%1 | | (B-, B3) | | 07/21/28 | | | 9.050 | | | | 1,719,403 | | |
| | 1,204 | | | Tacala LLC, 3 mo. USD Term SOFR + 3.500%1 | | (B-, B3) | | 01/31/31 | | | 8.185 | | | | 1,208,420 | | |
| | 5,264 | | | Whatabrands LLC, 1 mo. USD Term SOFR + 2.750%1 | | (B, B2) | | 08/03/28 | | | 7.435 | | | | 5,269,749 | | |
| | | | | | | | | | | | | | 38,492,952 | | |
Software—Services (15.9%) | | | |
| | 9,533 | | | Applied Systems, Inc., 3 mo. USD Term SOFR + 3.000%1 | | (B-, B2) | | 02/24/31 | | | 7.604 | | | | 9,565,827 | | |
| | 6,861 | | | AQ Carver Buyer, Inc., 3 mo. USD Term SOFR + 5.500%1 | | (B, B2) | | 08/02/29 | | | 10.185 | | | | 6,891,668 | | |
| | 2,664 | | | AQA Acquisition Holding, Inc., 3 mo. USD Term SOFR + 4.250%1 | | (B-, B2) | | 03/03/28 | | | 9.097 | | | | 2,669,718 | | |
| | 9,638 | | | Aston FinCo SARL, 1 mo. USD Term SOFR + 4.250%1 | | (CCC+, B3) | | 10/09/26 | | | 9.050 | | | | 9,300,901 | | |
| | 1,580 | | | Astra Acquisition Corp., 3 mo. USD Term SOFR + 6.750%1,5 | | (CCC+, Caa1) | | 02/25/28 | | | 11.354 | | | | 1,240,140 | | |
| | 11,250 | | | Astra Acquisition Corp., 3 mo. USD Term SOFR + 5.250%1 | | (CC, C) | | 10/25/28 | | | 9.854 | | | | 984,341 | | |
| | 5,761 | | | BCPE Pequod Buyer, Inc.2 | | (B, B3) | | 09/19/31 | | | 0.000 | | | | 5,765,432 | | |
| | 1,161 | | | CE Intermediate I LLC, 3 mo. USD Term SOFR + 3.500%1 | | (B-, B3) | | 11/10/28 | | | 8.763 | | | | 1,163,904 | | |
| | 8,803 | | | Celestica, Inc., 1 mo. USD Term SOFR + 1.750%1,3 | | (BB, Ba1) | | 06/20/31 | | | 6.468 | | | | 8,808,064 | | |
| | 11,939 | | | Cloud Software Group, Inc., 3 mo. USD Term SOFR + 4.000%1 | | (B, B2) | | 03/30/29 | | | 8.604 | | | | 11,949,908 | | |
| | 4,905 | | | CommerceHub, Inc., 3 mo. USD Term SOFR + 4.000%1 | | (B, B3) | | 12/29/27 | | | 8.797 | | | | 4,576,829 | | |
| | 2,494 | | | CommerceHub, Inc., 3 mo. USD Term SOFR + 6.250%1 | | (NR, B3) | | 12/29/27 | | | 10.897 | | | | 2,411,052 | | |
| | 8,000 | | | ConnectWise LLC, 3 mo. USD Term SOFR + 3.500%1 | | (NR, B2) | | 09/29/28 | | | 8.365 | | | | 8,009,043 | | |
| | 8,632 | | | Corel Corp., 3 mo. USD Term SOFR + 5.000%1,3,5 | | (B-, B2) | | 07/02/26 | | | 10.157 | | | | 8,157,667 | | |
| | 5,676 | | | Cornerstone OnDemand, Inc., 1 mo. USD Term SOFR + 3.750%1 | | (B-, B2) | | 10/16/28 | | | 8.550 | | | | 5,352,099 | | |
7
Credit Suisse Floating Rate High Income Fund
Schedule of Investments
Par
(000) | | | | Ratings†
(S&P/Moody's) | | Maturity | | Rate% | | Value | |
Bank loans—(continued) | | | |
Software—Services—(concluded) | | | |
$ | 6,329 | | | Corpay Technologies Operating Co. LLC, 1 mo. USD Term SOFR + 1.750%1 | | (BB+, Ba1) | | 04/28/28 | | | 6.435 | | | $ | 6,326,487 | | |
| | 14,633 | | | Dayforce, Inc., 3 mo. USD Term SOFR + 2.500%1,3 | | (BB-, Ba3) | | 02/26/31 | | | 7.085 | | | | 14,679,054 | | |
| | 841 | | | DCert Buyer, Inc., 1 mo. USD Term SOFR + 4.000%1 | | (B-, B2) | | 10/16/26 | | | 8.685 | | | | 816,341 | | |
| | 2,083 | | | DCert Buyer, Inc., 1 mo. USD Term SOFR + 7.000%1 | | (CCC, Caa2) | | 02/19/29 | | | 11.685 | | | | 1,764,895 | | |
| | 4,446 | | | EAB Global, Inc., 1 mo. USD Term SOFR + 3.250%1 | | (B-, B3) | | 08/16/28 | | | 7.935 | | | | 4,435,105 | | |
| | 8,355 | | | EagleView Technology Corp., 3 mo. USD Term SOFR + 3.500%1 | | (CCC+, Caa1) | | 08/14/25 | | | 8.366 | | | | 7,958,251 | | |
| | 5,381 | | | EverCommerce, Inc., 1 mo. USD Term SOFR + 3.000%1 | | (B+, B1) | | 07/06/28 | | | 7.800 | | | | 5,397,710 | | |
| | 2,765 | | | Evertec Group LLC, 1 mo. USD Term SOFR + 3.250%1,3 | | (BB-, Ba3) | | 10/30/30 | | | 7.935 | | | | 2,771,994 | | |
| | 6,261 | | | First Advantage Holdings LLC2,3 | | (B+, B1) | | 09/19/31 | | | 0.000 | | | | 6,276,247 | | |
| | 1,876 | | | Fleet Midco I Ltd., 6 mo. USD Term SOFR + 2.750%1,3 | | (B+, B2) | | 02/21/31 | | | 7.578 | | | | 1,883,491 | | |
| | 4,615 | | | Flexera Software LLC, 1 mo. USD Term SOFR + 3.500%1 | | (B-, B2) | | 03/03/28 | | | 8.259 | | | | 4,631,328 | | |
| | 4,771 | | | Go Daddy Operating Co. LLC, 1 mo. USD Term SOFR + 2.000%1 | | (BB, Ba1) | | 11/09/29 | | | 6.685 | | | | 4,774,872 | | |
| | 1,746 | | | Go Daddy Operating Co. LLC, 1 mo. USD Term SOFR + 1.750%1 | | (BB, Ba1) | | 05/30/31 | | | 6.435 | | | | 1,742,081 | | |
| | 4,825 | | | IGT Holding IV AB, 3 mo. USD Term SOFR + 3.400%1,3 | | (B, B3) | | 03/31/28 | | | 8.742 | | | | 4,846,109 | | |
| | 5,347 | | | Instructure Holdings, Inc., 3 mo. USD Term SOFR + 2.750%1,3 | | (NR, B1) | | 10/30/28 | | | 8.074 | | | | 5,350,868 | | |
| | 3,681 | | | Johnstone Supply LLC, 1 mo. USD Term SOFR + 3.000%1 | | (B, B2) | | 06/09/31 | | | 7.851 | | | | 3,681,344 | | |
| | 5,912 | | | Marcel LUX IV SARL, 1 mo. USD Term SOFR + 4.000%1,3 | | (B+, B2) | | 11/11/30 | | | 8.840 | | | | 5,937,802 | | |
| | 6,053 | | | Mitnick Corporate Purchaser, Inc., 3 mo. USD Term SOFR + 4.500%1 | | (B-, B3) | | 05/02/29 | | | 9.085 | | | | 5,422,844 | | |
| | 1,869 | | | Mosel Bidco SE, 3 mo. USD Term SOFR + 4.500%1,3 | | (B, B2) | | 09/16/30 | | | 9.104 | | | | 1,885,793 | | |
| | 8,048 | | | Open Text Corp., 1 mo. USD Term SOFR + 2.250%1 | | (BBB-, Ba1) | | 01/31/30 | | | 6.935 | | | | 8,084,334 | | |
| | 5,722 | | | Perforce Software, Inc., 1 mo. USD Term SOFR + 3.750%1 | | (B-, B2) | | 07/01/26 | | | 8.535 | | | | 5,714,958 | | |
| | 1,750 | | | Polaris Newco LLC2,11 | | (B-, B2) | | 06/02/28 | | | 0.000 | | | | 2,165,516 | | |
| | 12,096 | | | Polaris Newco LLC, 3 mo. USD Term SOFR + 4.000%1 | | (B-, B2) | | 06/02/28 | | | 8.847 | | | | 12,027,833 | | |
| | 16,325 | | | Project Alpha Intermediate Holding, Inc., 3 mo. USD Term SOFR + 3.750%1 | | (B, B2) | | 10/28/30 | | | 8.335 | | | | 16,403,425 | | |
| | 8,631 | | | Project Boost Purchaser LLC, 3 mo. USD Term SOFR + 3.500%1 | | (B-, B2) | | 07/16/31 | | | 8.147 | | | | 8,651,938 | | |
| | 5,004 | | | Project Ruby Ultimate Parent Corp., 1 mo. USD Term SOFR + 3.250%1 | | (B, B2) | | 03/10/28 | | | 8.050 | | | | 5,019,808 | | |
| | 473 | | | Quartz Acquireco LLC, 3 mo. USD Term SOFR + 2.750%1 | | (B, B1) | | 06/28/30 | | | 7.354 | | | | 474,079 | | |
| | 16,060 | | | Quest Software U.S. Holdings, Inc., 3 mo. USD Term SOFR + 4.250%1,5,9 | | (CCC+, B3) | | 02/01/29 | | | 8.985 | | | | 11,563,248 | | |
| | 3,905 | | | RealPage, Inc., 1 mo. USD Term SOFR + 3.000%1 | | (B, B2) | | 04/24/28 | | | 7.800 | | | | 3,854,003 | | |
| | 5,311 | | | Redstone Holdco 2 LP, 3 mo. USD Term SOFR + 4.750%1 | | (CCC+, B3) | | 04/27/28 | | | 9.597 | | | | 3,991,692 | | |
| | 1,564 | | | Rinchem Co., Inc., 3 mo. USD Term SOFR + 4.250%1 | | (CCC+, B3) | | 03/02/29 | | | 8.954 | | | | 1,384,468 | | |
| | 3,490 | | | SkillSoft Corp., 1 mo. USD Term SOFR + 5.250%1 | | (B-, B2) | | 07/14/28 | | | 10.082 | | | | 2,855,809 | | |
| | 1,996 | | | Sovos Compliance LLC, 1 mo. USD Term SOFR + 4.500%1 | | (B-, B3) | | 08/11/28 | | | 9.300 | | | | 1,998,046 | | |
| | 11,107 | | | SS&C Technologies, Inc., 1 mo. USD Term SOFR + 2.000%1 | | (BB+, Ba1) | | 05/09/31 | | | 6.685 | | | | 11,117,567 | | |
| | 3,713 | | | Storable, Inc., 1 mo. USD Term SOFR + 3.500%1 | | (B, B2) | | 04/17/28 | | | 8.185 | | | | 3,721,256 | | |
| | 3,852 | | | Symplr Software, Inc., 3 mo. USD Term SOFR + 4.500%1 | | (B-, B3) | | 12/22/27 | | | 9.185 | | | | 3,545,845 | | |
| | 8,779 | | | UKG, Inc., 3 mo. USD Term SOFR + 3.000%1 | | (B-, B2) | | 02/10/31 | | | 7.617 | | | | 8,798,821 | | |
| | 10,712 | | | VS Buyer LLC, 1 mo. USD Term SOFR + 3.250%1 | | (B, B2) | | 04/11/31 | | | 8.036 | | | | 10,739,012 | | |
| | 1,428 | | | Waystar Technologies, Inc., 1 mo. USD Term SOFR + 2.750%1 | | (B+, B1) | | 10/22/29 | | | 7.435 | | | | 1,435,703 | | |
| | 2,625 | | | WEX, Inc., 1 mo. USD Term SOFR + 2.000%1 | | (BB-, Ba2) | | 03/31/28 | | | 6.685 | | | | 2,630,665 | | |
| | 2,755 | | | World Wide Technology Holding Co. LLC, 1 mo. USD Term SOFR + 2.750%1,3 | | (BB, Ba3) | | 03/01/30 | | | 7.609 | | | | 2,761,481 | | |
| | 7,975 | | | ZoomInfo LLC, 1 mo. USD Term SOFR + 1.750%1 | | (NR, Ba1) | | 02/28/30 | | | 6.435 | | | | 7,926,626 | | |
| | | | | | | | | | | | | | 314,295,342 | | |
Steel Producers/Products (0.2%) | | | |
| | 3,503 | | | Grinding Media, Inc., 3 mo. USD Term SOFR + 4.000%1 | | (B-, B3) | | 10/12/28 | | | 8.898 | | | | 3,511,663 | | |
Support—Services (4.9%) | | | |
| | 4,277 | | | Allied Universal Holdco LLC, 1 mo. USD Term SOFR + 3.750%1 | | (B, B3) | | 05/12/28 | | | 8.535 | | | | 4,273,509 | | |
| | 1,129 | | | Armorica Lux SARL, 3 mo. EURIBOR + 5.000%1,6 | | (B-, Caa1) | | 07/28/28 | | | 8.056 | | | | 1,141,934 | | |
| | 3,984 | | | Belfor Holdings, Inc., 1 mo. USD Term SOFR + 3.750%1 | | (B-, B1) | | 11/01/30 | | | 8.435 | | | | 4,008,439 | | |
| | 7,500 | | | Belron Finance 2019 LLC, 1 mo. USD Term SOFR + 2.750%1 | | (BB-, Ba3) | | 10/16/31 | | | 7.536 | | | | 7,537,500 | | |
| | 1,080 | | | Centuri Group, Inc., 1 mo. USD Term SOFR + 2.500%1 | | (B+, Ba3) | | 08/27/28 | | | 7.311 | | | | 1,082,172 | | |
| | 68 | | | Chrysaor Bidco SARL2 | | (B, B3) | | 05/14/31 | | | 0.000 | | | | 68,054 | | |
| | 916 | | | Chrysaor Bidco SARL2 | | (B, B3) | | 07/17/31 | | | 0.000 | | | | 920,217 | | |
8
Credit Suisse Floating Rate High Income Fund
Schedule of Investments
Par
(000) | | | | Ratings†
(S&P/Moody's) | | Maturity | | Rate% | | Value | |
Bank loans—(concluded) | | | |
Support—Services—(concluded) | | | |
$ | 1,762 | | | Construction Partners, Inc.2,3 | | (B+, B1) | | 10/29/31 | | | 0.000 | | | $ | 1,766,401 | | |
| | 8,543 | | | CoreLogic, Inc., 1 mo. USD Term SOFR + 3.500%1 | | (B-, B2) | | 06/02/28 | | | 8.300 | | | | 8,515,335 | | |
| | 10,000 | | | Fugue Finance BV, 3 mo. EURIBOR + 4.250%1,6 | | (B, B2) | | 01/31/28 | | | 7.755 | | | | 10,925,712 | | |
| | 982 | | | Fugue Finance BV, 3 mo. USD Term SOFR + 4.000%1 | | (B, B2) | | 01/31/28 | | | 9.057 | | | | 989,171 | | |
| | 6,147 | | | GYP Holdings III Corp., 1 mo. USD Term SOFR + 2.250%1 | | (BB-, Ba1) | | 05/12/30 | | | 6.935 | | | | 6,167,513 | | |
| | 2,090 | | | KUEHG Corp.2 | | (NR, NR) | | 06/12/30 | | | 0.000 | | | | 2,097,566 | | |
| | 4,430 | | | LaserShip, Inc., 3 mo. USD Term SOFR + 7.500%1,5 | | (C, Ca) | | 05/07/29 | | | 12.104 | | | | 1,033,583 | | |
| | 9,252 | | | LaserShip, Inc., 3 mo. USD Term SOFR + 4.500%1,5 | | (CCC-, Caa2) | | 05/07/28 | | | 9.365 | | | | 4,001,333 | | |
| | 6,450 | | | Nuvei Technologies Corp.2 | | (B+, B1) | | 07/18/31 | | | 0.000 | | | | 6,437,491 | | |
| | 7,045 | | | Nuvei Technologies Corp., 1 mo. USD Term SOFR + 3.000%1 | | (BB-, Ba3) | | 12/19/30 | | | 7.785 | | | | 7,038,546 | | |
| | 1,357 | | | Savage Enterprises LLC, 1 mo. USD Term SOFR + 3.000%1 | | (BB-, B1) | | 09/15/28 | | | 7.685 | | | | 1,362,626 | | |
| | 4,407 | | | SRAM LLC, 1 mo. USD Term SOFR + 2.750%1 | | (BB-, B1) | | 05/18/28 | | | 7.550 | | | | 4,416,867 | | |
| | 3,003 | | | Synechron, Inc., 3 mo. USD Term SOFR + 3.750%1,3 | | (B+, B1) | | 10/03/31 | | | 8.360 | | | | 2,991,773 | | |
| | 8,298 | | | Tempo Acquisition LLC, 1 mo. USD Term SOFR + 2.250%1 | | (BB, Ba3) | | 08/31/28 | | | 6.935 | | | | 8,309,973 | | |
| | 1,429 | | | Teneo Holdings LLC, 1 mo. USD Term SOFR + 4.750%1 | | (B, B2) | | 03/13/31 | | | 9.435 | | | | 1,431,732 | | |
| | 1,631 | | | Trans Union LLC, 1 mo. USD Term SOFR + 2.000%1 | | (BBB-, Ba2) | | 12/01/28 | | | 6.685 | | | | 1,632,916 | | |
| | 2,075 | | | TruGreen LP, 3 mo. USD Term SOFR + 8.500%1,3 | | (CCC, Caa3) | | 11/02/28 | | | 13.347 | | | | 1,867,500 | | |
| | 7,565 | | | Wrench Group LLC, 3 mo. USD Term SOFR + 4.000%1 | | (B-, B3) | | 10/30/28 | | | 8.865 | | | | 7,470,754 | | |
| | | | | | | | | | | | | | 97,488,617 | | |
Tech Hardware & Equipment (1.3%) | | | |
| | 9,000 | | | Atlas CC Acquisition Corp., 3 mo. USD Term SOFR + 4.250%1 | | (B, Caa2) | | 05/25/28 | | | 9.569 | | | | 6,541,036 | | |
| | 1,831 | | | Atlas CC Acquisition Corp., 3 mo. USD Term SOFR + 4.250%1 | | (B+, B1) | | 05/25/28 | | | 9.569 | | | | 1,330,377 | | |
| | 4,020 | | | Ultra Clean Holdings, Inc., 1 mo. USD Term SOFR + 3.250%1,3 | | (B+, B1) | | 02/28/28 | | | 7.935 | | | | 4,042,330 | | |
| | 13,045 | | | Vertiv Group Corp., 1 mo. USD Term SOFR + 2.000%1 | | (BB+, Ba2) | | 03/02/27 | | | 6.846 | | | | 13,058,644 | | |
| | | | | | | | | | | | | | 24,972,387 | | |
Telecom—Wireless (1.0%) | | | |
| | 4,992 | | | Eagle Broadband Investments LLC, 3 mo. USD Term SOFR + 3.000%1 | | (B+, B2) | | 11/12/27 | | | 7.865 | | | | 4,987,675 | | |
| | 13,364 | | | SBA Senior Finance II LLC, 1 mo. USD Term SOFR + 1.750%1 | | (BBB-, Ba2) | | 01/25/31 | | | 6.440 | | | | 13,360,277 | | |
| | 1,401 | | | Xplornet Communications, Inc., 3 mo. USD Term SOFR + 5.000%1,3 | | (NR, NR) | | 10/24/31 | | | 9.635 | | | | 1,156,097 | | |
| | | | | | | | | | | | | | 19,504,049 | | |
Telecom—Wireline Integrated & Services (1.7%) | | | |
| | 1,290 | | | Altice Financing SA, 3 mo. USD Term SOFR + 5.000%1 | | (B-, Caa1) | | 10/31/27 | | | 9.656 | | | | 1,174,038 | | |
| | 12,361 | | | Altice France SA, 3 mo. USD Term SOFR + 5.500%1 | | (CCC+, Caa1) | | 08/15/28 | | | 10.147 | | | | 9,933,066 | | |
| | 2,964 | | | Ciena Corp., 1 mo. USD Term SOFR + 2.000%1 | | (BB+, Baa3) | | 10/24/30 | | | 6.759 | | | | 2,973,312 | | |
| | 7,626 | | | Patagonia Holdco LLC, 3 mo. USD Term SOFR + 5.750%1 | | (NR, B1) | | 08/01/29 | | | 10.854 | | | | 7,135,118 | | |
| | 6,738 | | | Virgin Media Bristol LLC, 1 mo. USD Term SOFR + 3.250%1 | | (B+, Ba3) | | 01/31/29 | | | 8.150 | | | | 6,578,819 | | |
| | 4,074 | | | Virgin Media Bristol LLC, 1 mo. USD Term SOFR + 2.500%1 | | (B+, Ba3) | | 01/31/28 | | | 7.418 | | | | 3,963,114 | | |
| | 936 | | | Voyage Australia Pty. Ltd., 3 mo. USD Term SOFR + 3.500%1 | | (BB-, B1) | | 07/20/28 | | | 8.379 | | | | 937,947 | | |
| | | | | | | | | | | | | | 32,695,414 | | |
Theaters & Entertainment (2.0%) | | | |
| | 2,042 | | | Herschend Entertainment Co. LLC, 1 mo. USD Term SOFR + 3.000%1 | | (BB-, Ba3) | | 08/27/28 | | | 7.685 | | | | 2,051,434 | | |
| | 17,500 | | | UFC Holdings LLC, 3 mo. USD Term SOFR + 2.750%1 | | (BB, Ba3) | | 04/29/26 | | | 7.638 | | | | 17,536,018 | | |
| | 19,294 | | | William Morris Endeavor Entertainment LLC,
1 mo. USD Term SOFR + 2.750%1 | |
(BB-, B3) | |
05/18/25 | | | 7.435
7.550 | - | | |
19,325,874 | | |
| | | | | | | | | | | | | | 38,913,326 | | |
Transport Infrastructure/Services (0.2%) | | | |
| | 3,435 | | | XPO Logistics, Inc., 1 mo. USD Term SOFR + 2.000%1 | | (BBB-, Ba1) | | 02/03/31 | | | 6.804 | | | | 3,449,307 | | |
| | | | | Total bank loans
(Cost $1,734,072,995) | | | | | | | | | 1,669,239,668 | | |
9
Credit Suisse Floating Rate High Income Fund
Schedule of Investments
Par
(000) | | | | Ratings†
(S&P/Moody's) | | Maturity | | Rate% | | Value | |
Corporate bonds (6.7%) | | | |
Auto Parts & Equipment (0.2%) | | | |
$ | 3,000 | | | TI Automotive Finance PLC, Rule 144A, Company Guaranteed Notes
(Callable 11/30/24 @ 101.88)6,12 | | (BB, B2) | | 04/15/29 | | | 3.750 | | | $ | 3,145,024 | | |
Brokerage (0.4%) | | | |
| | 6,900 | | | StoneX Group, Inc., Rule 144A, Senior Secured Notes (Callable 03/01/27 @ 103.94)12 | | (BB-, Ba3) | | 03/01/31 | | | 7.875 | | | | 7,266,190 | | |
Cable & Satellite TV (0.2%) | | | |
| | 590 | | | Altice France SA, Rule 144A, Senior Secured Notes (Callable 12/01/24 @ 102.56)12 | | (CCC+, Caa1) | | 07/15/29 | | | 5.125 | | | | 441,962 | | |
| | 3,775 | | | Altice France SA, Rule 144A, Senior Secured Notes (Callable 12/01/24 @ 102.75)12 | | (CCC+, Caa1) | | 10/15/29 | | | 5.500 | | | | 2,830,811 | | |
| | | | | | | | | | | | | | 3,272,773 | | |
Chemicals (0.5%) | | | |
| | 4,000 | | | Herens Holdco SARL, Rule 144A, Senior Secured Notes (Callable 12/01/24 @ 102.38)12 | | (B-, B2) | | 05/15/28 | | | 4.750 | | | | 3,513,910 | | |
| | 8,000 | | | Vibrantz Technologies, Inc., Rule 144A, Senior Unsecured Notes
(Callable 02/15/25 @ 104.50)12,13 | | (CCC+, Caa2) | | 02/15/30 | | | 9.000 | | | | 7,508,200 | | |
| | | | | | | | | | | | | | 11,022,110 | | |
Diversified Capital Goods (0.1%) | | | |
| | 2,916 | | | Atkore, Inc., Rule 144A, Senior Unsecured Notes (Callable 06/01/26 @ 102.13)12 | | (BB+, Ba2) | | 06/01/31 | | | 4.250 | | | | 2,630,841 | | |
Electronics (0.0%) | | | |
| | 793 | | | Synaptics, Inc., Rule 144A, Company Guaranteed Notes (Callable 11/11/24 @ 102.00)12,13 | | (B+, Ba3) | | 06/15/29 | | | 4.000 | | | | 728,138 | | |
Health Services (0.1%) | | | |
| | 1,813 | | | Radiology Partners, Inc., Rule 144A, Senior Secured Notes (Callable 12/01/24 @ 100.00)12 | | (B-, B3) | | 01/31/29 | | | 7.775 | | | | 1,787,604 | | |
Insurance Brokerage (0.4%) | | | |
| | 6,050 | | | Jones Deslauriers Insurance Management, Inc., Rule 144A, Senior Secured Notes
(Callable 03/15/26 @ 104.25)12 | | (B-, B2) | | 03/15/30 | | | 8.500 | | | | 6,414,137 | | |
| | 897 | | | Panther Escrow Issuer LLC, Rule 144A, Senior Secured Notes (Callable 06/01/27 @ 103.56)12 | | (B, B2) | | 06/01/31 | | | 7.125 | | | | 917,441 | | |
| | 1,500 | | | Ryan Specialty LLC, Rule 144A, Senior Secured Notes (Callable 08/01/27 @ 102.94)12 | | (BB-, B1) | | 08/01/32 | | | 5.875 | | | | 1,496,359 | | |
| | | | | | | | | | | | | | 8,827,937 | | |
Investments & Misc. Financial Services (0.9%) | | | |
| | 13,911 | | | Armor Holdco, Inc., Rule 144A, Company Guaranteed Notes
(Callable 12/01/24 @ 104.25)12 | | (CCC+, Caa1) | | 11/15/29 | | | 8.500 | | | | 13,635,873 | | |
| | 1,800 | | | Focus Financial Partners LLC, Rule 144A, Senior Secured Notes
(Callable 09/15/27 @ 103.38)12 | | (B+, B2) | | 09/15/31 | | | 6.750 | | | | 1,795,065 | | |
| | 2,000 | | | VFH Parent LLC/Valor Co-Issuer, Inc., Rule 144A, Senior Secured Notes
(Callable 06/15/27 @ 103.75)12 | | (B+, B1) | | 06/15/31 | | | 7.500 | | | | 2,055,216 | | |
| | | | | | | | | | | | | | 17,486,154 | | |
Machinery (0.2%) | | | |
| | 4,508 | | | Arcosa, Inc., Rule 144A, Company Guaranteed Notes (Callable 12/01/24 @ 102.19)12 | | (B+, Ba3) | | 04/15/29 | | | 4.375 | | | | 4,257,202 | | |
Media—Diversified (0.1%) | | | |
| | 395 | | | Tech 7 SAS Super Senior3,6,9 | | (NR, NR) | | 03/31/26 | | | 15.000 | | | | 429,113 | | |
| | 659 | | | Tech 7 SAS Super Senior3,6,9 | | (NR, NR) | | 03/31/26 | | | 18.682 | | | | 715,188 | | |
| | 198 | | | Tech 7 SAS Technicolor Creative Studios Super Senior3,6,9 | | (NR, NR) | | 04/01/26 | | | 15.000 | | | | 214,557 | | |
| | 329 | | | Technicolor Creative Studios3,6,9 | | (NR, NR) | | 03/31/26 | | | 15.000 | | | | 357,595 | | |
| | 198 | | | Technicolor Creative Studios3,6,9 | | (NR, NR) | | 04/01/26 | | | 15.000 | | | | 214,557 | | |
| | | | | | | | | | | | | | 1,931,010 | | |
Metals & Mining—Excluding Steel (0.0%) | | | |
| | 975 | | | ERO Copper Corp., Rule 144A, Company Guaranteed Notes (Callable 02/15/25 @ 103.25)12 | | (B, B1) | | 02/15/30 | | | 6.500 | | | | 957,201 | | |
10
Credit Suisse Floating Rate High Income Fund
Schedule of Investments
Par
(000) | | | | Ratings†
(S&P/Moody's) | | Maturity | | Rate% | | Value | |
Corporate bonds—(continued) | | | |
Packaging (0.3%) | | | |
$ | 6,675 | | | TriMas Corp., Rule 144A, Company Guaranteed Notes (Callable 12/01/24 @ 102.06)12 | | (BB-, Ba3) | | 04/15/29 | | | 4.125 | | | $ | 6,233,491 | | |
Real Estate Investment Trusts (0.1%) | | | |
| | 1,875 | | | Starwood Property Trust, Inc., Rule 144A, Senior Unsecured Notes
(Callable 10/15/29 @ 100.00)12 | | (BB-, Ba3) | | 04/15/30 | | | 6.000 | | | | 1,839,557 | | |
Recreation & Travel (0.3%) | | | |
| | 552 | | | SeaWorld Parks & Entertainment, Inc., Rule 144A, Company Guaranteed Notes
(Callable 11/11/24 @ 102.63)12,13 | | (B+, B2) | | 08/15/29 | | | 5.250 | | | | 531,150 | | |
| | 4,757 | | | Speedway Motorsports LLC/Speedway Funding II, Inc., Rule 144A, Senior Unsecured Notes
(Callable 12/01/24 @ 100.00)12 | | (BB+, B1) | | 11/01/27 | | | 4.875 | | | | 4,652,596 | | |
| | | | | | | | | | | | | | 5,183,746 | | |
Software—Services (0.9%) | | | |
| | 4,962 | | | Newfold Digital Holdings Group, Inc., Rule 144A, Senior Unsecured Notes
(Callable 12/01/24 @ 103.00)12,13 | | (CCC, Caa2) | | 02/15/29 | | | 6.000 | | | | 3,337,678 | | |
| | 3,475 | | | Open Text Corp., Rule 144A, Company Guaranteed Notes (Callable 12/01/24 @ 101.94)12 | | (BB, Ba3) | | 12/01/29 | | | 3.875 | | | | 3,173,252 | | |
| | 817 | | | UKG, Inc., Rule 144A, Senior Secured Notes (Callable 02/01/27 @ 103.44)12 | | (B-, B2) | | 02/01/31 | | | 6.875 | | | | 837,875 | | |
| | 9,106 | | | Virtusa Corp., Rule 144A, Senior Unsecured Notes (Callable 12/01/24 @ 103.56)12 | | (B-, Caa1) | | 12/15/28 | | | 7.125 | | | | 8,840,045 | | |
| | 1,603 | | | ZoomInfo Technologies LLC/ZoomInfo Finance Corp., Rule 144A,
Company Guaranteed Notes (Callable 11/11/24 @ 101.94)12 | | (B+, B1) | | 02/01/29 | | | 3.875 | | | | 1,462,188 | | |
| | | | | | | | | | | | | | 17,651,038 | | |
Specialty Retail (0.1%) | | | |
| | 3,745 | | | Eagle Intermediate Global Holding BV/Eagle U.S. Finance LLC, Rule 144A,
Senior Secured Notes (Callable 11/11/24 @ 100.00)12 | | (NR, Caa3) | | 05/01/25 | | | 7.500 | | | | 2,142,683 | | |
| | 102 | | | Eagle Intermediate Global Holding BV/Eagle U.S. Finance LLC, Rule 144A,
Senior Secured Notes (Callable 11/11/24 @ 100.00)3,9,12 | | (NR, Caa3) | | 05/01/25 | | | 7.500 | | | | 58,040 | | |
| | 137 | | | Eagle Intermediate Global Holding BV/Ruyi U.S. Finance LLC3,8,9 | | (NR, NR) | | 05/01/25 | | | 0.000 | | | | 74,455 | | |
| | | | | | | | | | | | | | 2,275,178 | | |
Steel Producers/Products (0.1%) | | | |
| | 2,027 | | | TMS International Corp., Rule 144A, Senior Unsecured Notes (Callable 11/11/24 @ 103.13)12 | | (B, Caa1) | | 04/15/29 | | | 6.250 | | | | 1,962,952 | | |
Support—Services (1.2%) | | | |
| | 5,251 | | | Allied Universal Holdco LLC/Allied Universal Finance Corp., Rule 144A,
Senior Unsecured Notes (Callable 12/01/24 @ 100.00)12 | | (CCC+, Caa2) | | 07/15/27 | | | 9.750 | | | | 5,267,698 | | |
| | 4,455 | | | Allied Universal Holdco LLC/Allied Universal Finance Corp., Rule 144A,
Senior Unsecured Notes (Callable 12/01/24 @ 103.00)12,13 | | (CCC+, Caa2) | | 06/01/29 | | | 6.000 | | | | 4,080,791 | | |
| | 1,471 | | | Allied Universal Holdco LLC/Allied Universal Finance Corp./Atlas Luxco 4 SARL, Rule 144A,
Senior Secured Notes (Callable 11/30/24 @ 101.81)6,12 | | (B, B3) | | 06/01/28 | | | 3.625 | | | | 1,506,055 | | |
| | 8,500 | | | CoreLogic, Inc., Rule 144A, Senior Secured Notes (Callable 12/01/24 @ 102.25)12 | | (B-, B2) | | 05/01/28 | | | 4.500 | | | | 7,989,889 | | |
| | 2,974 | | | GYP Holdings III Corp., Rule 144A, Company Guaranteed Notes
(Callable 12/01/24 @ 102.31)12 | | (B, Ba2) | | 05/01/29 | | | 4.625 | | | | 2,810,655 | | |
| | 2,250 | | | H&E Equipment Services, Inc., Rule 144A, Company Guaranteed Notes
(Callable 12/01/24 @ 101.94)12 | | (BB-, B1) | | 12/15/28 | | | 3.875 | | | | 2,080,142 | | |
| | | | | | | | | | | | | | 23,735,230 | | |
Tech Hardware & Equipment (0.2%) | | | |
| | 3,349 | | | CommScope Technologies LLC, Rule 144A, Company Guaranteed Notes
(Callable 11/11/24 @ 100.00)12 | | (CCC-, Ca) | | 06/15/25 | | | 6.000 | | | | 3,286,206 | | |
11
Credit Suisse Floating Rate High Income Fund
Schedule of Investments
Par
(000) | | | | Ratings†
(S&P/Moody's) | | Maturity | | Rate% | | Value | |
Corporate bonds—(concluded) | | | |
Telecom—Wireline Integrated & Services (0.4%) | | | |
$ | 4,486 | | | LCPR Senior Secured Financing DAC, Rule 144A, Senior Secured Notes
(Callable 12/01/24 @ 100.00)12 | | (B+, B2) | | 10/15/27 | | | 6.750 | | | $ | 4,219,104 | | |
| | 1,464 | | | Level 3 Financing, Inc., Rule 144A, Secured Notes (Callable 03/22/26 @ 102.13)12 | | (CCC+, Caa1) | | 04/01/30 | | | 4.500 | | | | 1,178,434 | | |
| | 2,600 | | | Level 3 Financing, Inc., Rule 144A, Secured Notes (Callable 03/22/25 @ 101.81)12 | | (CCC+, Caa1) | | 10/15/30 | | | 3.875 | | | | 1,988,973 | | |
| | | | | | | | | | | | | | 7,386,511 | | |
| | | | | Total corporate bonds
(Cost $134,581,196) | | | | | | | | | 132,866,093 | | |
Asset backed securities (4.0%) | | | |
Collateralized Debt Obligations (4.0%) | | | |
| | 3,500 | | | Anchorage Capital CLO 16 Ltd., 2020-16A, Rule 144A, 3 mo. USD Term SOFR + 3.982%1,12 | | (NR, NR) | | 01/19/35 | | | 8.599 | | | | 3,540,632 | | |
| | 2,500 | | | Battalion CLO XXI Ltd., 2021-21A, Rule 144A, 3 mo. USD Term SOFR + 3.562%1,12 | | (NR, Baa3) | | 07/15/34 | | | 8.218 | | | | 2,513,147 | | |
| | 1,750 | | | Benefit Street Partners CLO X Ltd., 2016-10A, Rule 144A, 3 mo. USD Term SOFR + 7.012%1,12 | | (BB-, NR) | | 04/20/34 | | | 11.629 | | | | 1,759,499 | | |
| | 2,100 | | | BlueMountain CLO Ltd., 2015-3A, Rule 144A, 3 mo. USD Term SOFR + 5.662%1,12 | | (B+, NR) | | 04/20/31 | | | 10.279 | | | | 2,000,598 | | |
| | 5,500 | | | BlueMountain CLO Ltd., 2016-2A, Rule 144A, 3 mo. USD Term SOFR + 4.562%1,12 | | (BBB-, NR) | | 08/20/32 | | | 9.690 | | | | 5,463,343 | | |
| | 3,000 | | | BlueMountain Fuji U.S. CLO III Ltd., 2017-3A, Rule 144A, 3 mo. USD Term SOFR + 1.962%1,12 | | (A+, NR) | | 01/15/30 | | | 6.618 | | | | 3,002,711 | | |
| | 750 | | | Carlyle Global Market Strategies CLO Ltd., 2014-3RA, Rule 144A,
3 mo. USD Term SOFR + 5.662%1,12 | | (BB-, NR) | | 07/27/31 | | | 10.279 | | | | 714,675 | | |
| | 2,000 | | | Carlyle Global Market Strategies CLO Ltd., 2014-5A, Rule 144A,
3 mo. USD Term SOFR + 3.412%1,12 | | (BBB-, NR) | | 07/15/31 | | | 8.068 | | | | 2,015,631 | | |
| | 2,625 | | | CIFC Funding Ltd., 2014-1A, Rule 144A, 3 mo. USD Term SOFR + 6.112%1,12 | | (B+, NR) | | 01/18/31 | | | 10.744 | | | | 2,631,875 | | |
| | 4,000 | | | Crown Point CLO IV Ltd., 2018-4A, Rule 144A, 3 mo. USD Term SOFR + 3.012%1,12 | | (NR, Baa3) | | 04/20/31 | | | 7.629 | | | | 4,018,103 | | |
| | 2,280 | | | Dewolf Park CLO Ltd., 2017-1A, Rule 144A, 3 mo. USD Term SOFR + 1.182%1,12 | | (NR, Aaa) | | 10/15/30 | | | 5.838 | | | | 2,282,066 | | |
| | 1,750 | | | Dryden 86 CLO Ltd., 2020-86A, Rule 144A, 3 mo. USD Term SOFR + 3.462%1,12 | | (BBB-, NR) | | 07/17/34 | | | 8.109 | | | | 1,759,618 | | |
| | 5,000 | | | Galaxy XXVIII CLO Ltd., 2018-28A, Rule 144A, 3 mo. USD Term SOFR + 3.262%1,12 | | (BBB-, NR) | | 07/15/31 | | | 7.918 | | | | 5,034,422 | | |
| | 3,500 | | | Greywolf CLO II Ltd., 2013-1A, Rule 144A, 3 mo. USD Term SOFR + 4.460%1,12 | | (BBB-, NR) | | 04/15/34 | | | 9.116 | | | | 3,505,564 | | |
| | 2,800 | | | Greywolf CLO III Ltd., 2020-3RA, Rule 144A, 3 mo. USD Term SOFR + 2.712%1,12 | | (A, NR) | | 04/15/33 | | | 7.343 | | | | 2,800,140 | | |
| | 1,000 | | | Greywolf CLO III Ltd., 2020-3RA, Rule 144A, 3 mo. USD Term SOFR + 3.612%1,12 | | (BBB-, NR) | | 04/15/33 | | | 8.243 | | | | 1,003,798 | | |
| | 2,000 | | | Greywolf CLO III Ltd., 2020-3RA, Rule 144A, 3 mo. USD Term SOFR + 7.182%1,12 | | (BB-, NR) | | 04/15/33 | | | 11.813 | | | | 1,940,257 | | |
| | 3,390 | | | Greywolf CLO IV Ltd., 2019-1A, Rule 144A, 3 mo. USD Term SOFR + 3.910%1,12 | | (BBB-, NR) | | 04/17/34 | | | 8.557 | | | | 3,424,438 | | |
| | 3,950 | | | Greywolf CLO V Ltd., 2015-1A, Rule 144A, 3 mo. USD Term SOFR + 3.262%1,12 | | (BBB-, NR) | | 01/27/31 | | | 7.887 | | | | 3,973,748 | | |
| | 2,500 | | | KKR CLO 14 Ltd., Rule 144A, 3 mo. USD Term SOFR + 6.412%1,12 | | (NR, B1) | | 07/15/31 | | | 11.068 | | | | 2,511,797 | | |
| | 3,450 | | | Marble Point CLO XVIII Ltd., 2020-2A, Rule 144A, 3 mo. USD Term SOFR + 7.962%1,12 | | (NR, Ba3) | | 10/15/34 | | | 12.618 | | | | 3,440,225 | | |
| | 5,275 | | | Marble Point CLO XXIII Ltd., 2021-4A, Rule 144A, 3 mo. USD Term SOFR + 6.012%1,12 | | (NR, Ba1) | | 01/22/35 | | | 10.643 | | | | 5,301,477 | | |
| | 2,250 | | | Octagon Investment Partners 26 Ltd., 2016-1A, Rule 144A,
3 mo. USD Term SOFR + 3.112%1,12 | | (BBB-, NR) | | 07/15/30 | | | 7.768 | | | | 2,247,094 | | |
| | 1,650 | | | Strata CLO II Ltd., 2021-1A, Rule 144A, 3 mo. USD Term SOFR + 4.410%1,12 | | (BBB-, NR) | | 10/20/33 | | | 9.027 | | | | 1,665,811 | | |
| | 3,000 | | | Venture 35 CLO Ltd., 2018-35A, Rule 144A, 3 mo. USD Term SOFR + 3.762%1,12 | | (NR, Baa1) | | 10/22/31 | | | 8.393 | | | | 2,889,054 | | |
| | 3,278 | | | Venture XXIII CLO Ltd., 2016-23A, Rule 144A, 3 mo. USD Term SOFR + 5.332%1,12 | | (NR, Ba1) | | 07/19/34 | | | 9.949 | | | | 3,028,759 | | |
| | 1,750 | | | Vibrant CLO 1X Ltd., 2018-9A, Rule 144A, 3 mo. USD Term SOFR + 3.462%1,12 | | (NR, Baa3) | | 07/20/31 | | | 8.079 | | | | 1,754,702 | | |
| | 3,000 | | | Voya CLO Ltd., 2014-4A, Rule 144A, 3 mo. USD Term SOFR + 3.612%1,12 | | (BBB-, NR) | | 07/14/31 | | | 8.268 | | | | 3,012,126 | | |
| | | | | Total asset backed securities
(Cost $78,738,820) | | | | | | | | | 79,235,310 | | |
12
Credit Suisse Floating Rate High Income Fund
Schedule of Investments
Shares | | | |
| |
| |
| | Value | |
Common stocks (0.8%) | | | |
Auto Parts & Equipment (0.2%) | | | |
| | 311,079 | | | Jason, Inc.8 | | | | | | | | $ | 2,799,711 | | |
Chemicals (0.3%) | | | |
| | 529,264 | | | Proppants Holdings LLC3,5,9 | | | | | | | | | 10,586 | | |
| | 191,054 | | | Utex Industries | | | | | | | | | 6,663,008 | | |
| | | | | | | | | | | | | | 6,673,594 | | |
Energy—Exploration & Production (0.0%) | | | |
| | 926,254 | | | PES Energy, Class A3,5,8,9 | | | | | | | | | 9,263 | | |
Investments & Misc. Financial Services (0.0%) | | | |
| | 68,579 | | | Resolute Topco, Inc.8 | | | | | | | | | 240,026 | | |
Machinery (0.0%) | | | |
| | 6,315,768 | | | Alloy Topco Ltd.3,8,9,11 | | | | | | | | | 0 | | |
Packaging (0.0%) | | | |
| | 2,646,421 | | | Campfire Topco Ltd.3,6,8,9 | | | | | | | | | 0 | | |
Personal & Household Products (0.1%) | | | |
| | 196,189 | | | Dream Well, Inc.8 | | | | | | | | | 1,128,087 | | |
| | 780,993,504 | | | Keter Group BV3,6,8,9 | | | | | | | | | 0 | | |
| | 196,189 | | | Serta Simmons Bedding Equipment Co.3,8,9 | | | | | | | | | 0 | | |
| | | | | | | | | | | | | | 1,128,087 | | |
Pharmaceuticals (0.0%) | | | |
| | 156,133 | | | Akorn, Inc.8 | | | | | | | | | 7,807 | | |
Private Placement (0.1%) | | | |
| | 999,012,630 | | | Technicolor Creative Studios SA8,14 | | | | | | | | | 1,626,867 | | |
Recreation & Travel (0.1%) | | | |
| | 113,516 | | | Cineworld Group PLC8 | | | | | | | | | 2,525,731 | | |
Software—Services (0.0%) | | | |
| | 3,935 | | | Skillsoft Corp.8 | | | | | | | | | 60,087 | | |
Specialty Retail (0.0%) | | | |
| | 141 | | | Eagle Investments Holding Co. LLC, Class B3,8,9 | | | | | | | | | 1 | | |
Telecom—Wireless (0.0%) | | | |
| | 78,999 | | | Stonepeak Falcon Holidngs LP3,8,9 | | | | | | | | | 394,995 | | |
| | 7,290 | | | Xplore, Inc.3,8,9 | | | | | | | | | 0 | | |
| | | | | | | | | | | | | | 394,995 | | |
| | | | | Total common stocks
(Cost $38,296,542) | | | | | | | | | 15,466,169 | | |
Warrants (0.0%) | | | |
Chemicals (0.0%) | | | |
| | 132,316 | | | Project Investor Holdings LLC, expires 02/08/20263,5,8,9 | | | | | | | | | 0 | | |
Investments & Misc. Financial Services (0.0%) | | | |
| | 53,142 | | | Altisource Solutions SARL, expires 05/31/20273,8,9 | | | | | | | | | 63,239 | | |
| | | | | Total warrants
(Cost $68,804) | | | | | | | | | 63,239 | | |
13
Credit Suisse Floating Rate High Income Fund
Schedule of Investments
Shares | | | |
| |
| |
| | Value | |
Short-term investments (6.7%) | |
| | 117,521,860 | | | State Street Institutional U.S. Government Money Market Fund—Premier Class, 4.81% | | | | | | | | $ | 117,521,860 | | |
| | 14,412,457 | | | State Street Navigator Securities Lending Government Money Market Portfolio, 4.86%15 | | | | | | | | | 14,412,457 | | |
| | | Total short-term investments
(Cost $131,934,317) | | | | | | | | | 131,934,317 | | |
| | | Total investments at value (102.9%)
(Cost $2,117,692,674) | | | | | | | | | 2,028,804,796 | | |
| | | Liabilities In Excess of other Assets (-2.9%) | | | | | | | | | (57,332,531 | ) | |
| | | Net assets (100.0%) | | | | | | | | $ | 1,971,472,265 | | |
† Credit ratings given by the S&P Global Ratings Division of S&P Global Inc. ("S&P") and Moody's Investors Service, Inc. ("Moody's") are unaudited.
1 Variable rate obligation—The interest rate shown is the rate in effect as of October 31, 2024. The rate may be subject to a cap and floor.
2 The rates on certain variable rate securities are not based on a published reference rate and spread but are determined by the issuer or agent and are based on current market conditions. These securities do not indicate a reference rate and spread in their description above. The interest rate shown is the rate in effect as of October 31, 2024.
3 Security is valued using significant unobservable inputs.
4 PIK: Payment-in-kind security for which part of the income earned may be paid as additional principal.
5 Illiquid security.
6 This security is denominated in Euro.
7 Bond is currently in default.
8 Non-income producing security.
9 Not readily marketable security; security is valued at fair value as determined in good faith by UBS Asset Management (Americas) LLC as the Fund's valuation designee under the oversight of the Board of Trustees (See Note 2-A).
10 All or a portion is an unfunded loan commitment (See Note 2-I).
11 This security is denominated in British Pound.
12 Security exempt from registration under Rule 144A of the Securities Act of 1933, as amended. These securities may be resold in transactions exempt from registration, normally to qualified institutional buyers. At October 31, 2024, these securities amounted to a value of $210,095,938 or 10.7% of net assets.
13 Security or portion thereof is out on loan (See Note 2-J).
14 Security is held through holdings of 100 shares of the CIG Special Purpose SPC—Credit Suisse Floating Rate High Income Fund Segregated Portfolio, an affiliated entity.
15 Represents security purchased with cash collateral received for securities on loan.
Investment abbreviations
1 mo. = 1 month
3 mo. = 3 month
6 mo. = 6 month
EURIBOR = Euro Interbank Offered Rate
LIBOR = London Interbank Offered Rate
NR = Not Rated
SARL = société à responsabilité limitée
SOFR = Secured Overnight Financing Rate
WR = Withdrawn Rating
14
Credit Suisse Floating Rate High Income Fund
Schedule of Investments
Forward foreign currency contracts
Forward
currency to be
purchased | | Forward
currency to be
sold | | Settlement
date | | Counterparty | | Value on
settlement date | | Current
value/notional | | Unrealized
appreciation | |
USD | 71,238,131 | | | EUR | 63,254,137 | | | 09/25/25 | | Deutsche Bank AG | | $ | (71,238,131 | ) | | $ | (69,750,098 | ) | | $ | 1,488,033 | | |
USD | 7,690,317 | | | EUR | 6,871,108 | | | 10/07/25 | | Morgan Stanley | | | (7,690,317 | ) | | | (7,581,253 | ) | | | 109,064 | | |
USD | 130,723 | | | GBP | 100,699 | | | 10/07/25 | | Deutsche Bank AG | | | (130,723 | ) | | | (129,187 | ) | | | 1,536 | | |
USD | 9,315,355 | | | GBP | 7,140,719 | | | 10/07/25 | | Morgan Stanley | | | (9,315,355 | ) | | | (9,160,796 | ) | | | 154,559 | | |
Total unrealized appreciation | | | | | | | | | | | | $ | 1,753,192 | | |
Forward
currency to be
purchased | | Forward
currency to be
sold | | Settlement
date | | Counterparty | | Value on
settlement date | | Current
value/notional | | Unrealized
depreciation | |
GBP | 130,063 | | | USD | 169,728 | | | 10/07/25 | | Deutsche Bank AG | | $ | 169,728 | | | $ | 166,858 | | | $ | (2,870 | ) | |
Total unrealized depreciation | | | | | | | | | | | | $ | (2,870 | ) | |
Total net unrealized appreciation/(depreciation) | | | | | | | | | | | | $ | 1,750,322 | | |
Currency abbreviations:
EUR = Euro
GBP = British Pound
USD = United States Dollar
See accompanying notes to financial statements.
15
Credit Suisse Floating Rate High Income Fund
Statement of assets and liabilities
October 31, 2024
Assets: | |
Investments at value, including collateral for securities on loan of $14,412,457 (Cost $2,117,692,674) (Note 2) | | $ | 2,028,804,7961 | | |
Cash | | | 477 | | |
Foreign currency at value (Cost $694,494) | | | 687,117 | | |
Cash segregated at brokers for forwards contracts (Note 2) | | | 10,386 | | |
Interest receivable | | | 22,178,154 | | |
Receivable for investments sold | | | 15,742,844 | | |
Receivable for Fund shares sold | | | 8,522,975 | | |
Unrealized appreciation on forward foreign currency contracts (Note 2) | | | 1,753,192 | | |
Prepaid expenses and other assets | | | 145,053 | | |
Total assets | | | 2,077,844,994 | | |
Liabilities: | |
Investment advisory fee payable (Note 3) | | | 3,214,528 | | |
Administrative services fee payable (Note 3) | | | 178,119 | | |
Shareholder servicing/Distribution fee payable (Note 3) | | | 68,445 | | |
Due to brokers | | | 1,600,000 | | |
Payable for investments purchased | | | 79,020,216 | | |
Payable upon return of securities loaned (Note 2) | | | 14,412,457 | | |
Payable for Fund shares redeemed | | | 3,855,483 | | |
Dividend payable | | | 2,558,260 | | |
Unfunded loan commitments (Note 2) | | | 413,141 | | |
Trustees' fee payable | | | 28,135 | | |
Unrealized depreciation on forward foreign currency contracts (Note 2) | | | 2,870 | | |
Accrued expenses | | | 1,021,075 | | |
Total liabilities | | | 106,372,729 | | |
Net assets: | |
Capital stock, $.001 par value (Note 6) | | | 312,381 | | |
Paid-in capital (Note 6) | | | 2,308,301,880 | | |
Total distributable earnings (loss) | | | (337,141,996 | ) | |
Net assets | | $ | 1,971,472,265 | | |
I Shares | |
Net assets | | $ | 1,789,046,557 | | |
Shares outstanding | | | 283,631,917 | | |
Net asset value, offering price and redemption price per share | | $ | 6.31 | | |
A Shares | |
Net assets | | $ | 134,431,971 | | |
Shares outstanding | | | 21,203,112 | | |
Net asset value and redemption price per share | | $ | 6.34 | | |
Maximum offering price per share (net asset value/(1-4.75%)) | | $ | 6.66 | | |
C Shares | |
Net assets | | $ | 47,993,737 | | |
Shares outstanding | | | 7,545,937 | | |
Net asset value and offering price per share | | $ | 6.36 | | |
1 Includes $14,103,069 of securities on loan.
See accompanying notes to financial statements.
16
Credit Suisse Floating Rate High Income Fund
Statement of operations
For the year ended October 31, 2024
Investment income: | |
Interest | | $ | 197,083,058 | | |
Dividends | | | 296,981 | | |
Other Income | | | 41,128 | | |
Securities lending (net of rebates) | | | 64,093 | | |
Total investment income | | | 197,485,260 | | |
Expenses: | |
Investment advisory fees (Note 3) | | | 12,054,345 | | |
Administrative services fees (Note 3) | | | 338,064 | | |
Shareholder servicing/Distribution fees (Note 3) | |
Class A | | | 315,522 | | |
Class C | | | 452,488 | | |
Transfer agent fees | | | 2,008,870 | | |
Commitment fees (Note 4) | | | 527,787 | | |
Legal fees | | | 487,139 | | |
Custodian fees | | | 486,318 | | |
Trustees' fees | | | 109,603 | | |
Registration fees | | | 92,065 | | |
Printing fees | | | 70,432 | | |
Audit and tax fees | | | 63,700 | | |
Insurance expense | | | 61,537 | | |
Miscellaneous expense | | | 36,940 | | |
Total expenses | | | 17,104,810 | | |
Less: fees waived and expenses reimbursed (Note 3) | | | (2,272,322 | ) | |
Net expenses | | | 14,832,488 | | |
Net investment income | | | 182,652,772 | | |
Net realized and unrealized gain (loss) from investments, foreign currency and forward foreign currency contracts: | |
Net realized loss from investments | | | (31,102,509 | ) | |
Net realized gain from foreign currency transactions | | | 581,988 | | |
Net realized loss from forward foreign currency contracts | | | (2,788,328 | ) | |
Net change in unrealized appreciation (depreciation) from investments | | | 34,116,214 | | |
Net change in unrealized appreciation (depreciation) from foreign currency translations | | | (21,148 | ) | |
Net change in unrealized appreciation (depreciation) from forward foreign currency contracts | | | 1,010,800 | | |
Net realized and unrealized gain from investments, foreign currency and forward foreign currency contracts | | | 1,797,017 | | |
Net increase in net assets resulting from operations | | $ | 184,449,789 | | |
See accompanying notes to financial statements.
17
Credit Suisse Floating Rate High Income Fund
Statements of changes in net assets
| | | For the
year ended
October 31, 2024 | | For the
year ended
October 31, 2023 | |
From operations: | |
Net investment income | | $ | 182,652,772 | | | $ | 196,738,803 | | |
Net realized loss from investments, foreign currency transactions and forward foreign currency contracts | | | (33,308,849 | ) | | | (77,667,677 | ) | |
Net change in unrealized appreciation (depreciation) from investments, foreign currency translations and
forward foreign currency contracts | | | 35,105,866 | | | | 126,101,132 | | |
Net increase in net assets resulting from operations | | | 184,449,789 | | | | 245,172,258 | | |
From distributions: | |
From distributable earnings | |
Class I | | | (164,779,201 | ) | | | (182,837,373 | ) | |
Class A | | | (10,989,652 | ) | | | (9,847,877 | ) | |
Class C | | | (3,611,899 | ) | | | (3,663,893 | ) | |
Return of capital | | | | | |
Class I | | | (2,828,102 | ) | | | (626,387 | ) | |
Class A | | | (188,615 | ) | | | (33,738 | ) | |
Class C | | | (61,991 | ) | | | (12,552 | ) | |
Net decrease in net assets resulting from distributions | | | (182,459,460 | ) | | | (197,021,820 | ) | |
From capital share transactions (Note 6): | |
Proceeds from sale of shares | | | 694,282,060 | | | | 737,057,328 | | |
Reinvestment of distributions | | | 147,879,797 | | | | 161,320,735 | | |
Net asset value of shares redeemed | | | (850,682,398 | ) | | | (1,514,656,539 | ) | |
Net decrease in net assets from capital share transactions | | | (8,520,541 | ) | | | (616,278,476 | ) | |
Net decrease in net assets | | | (6,530,212 | ) | | | (568,128,038 | ) | |
Net assets: | |
Beginning of year | | | 1,978,002,477 | | | | 2,546,130,515 | | |
End of year | | $ | 1,971,472,265 | | | $ | 1,978,002,477 | | |
See accompanying notes to financial statements.
18
Credit Suisse Floating Rate High Income Fund
Financial highlights
(For a Class I share of the Fund outstanding throughout each year)
| | | For the year ended October 31, | |
| | | 2024 | | 2023 | | 2022 | | 2021 | | 2020 | |
Per share data: | |
Net asset value, beginning of year | | $ | 6.30 | | | $ | 6.171 | | | $ | 6.62 | | | $ | 6.31 | | | $ | 6.56 | | |
Investment operations: | |
Net investment income2 | | | 0.58 | | | | 0.55 | | | | 0.29 | | | | 0.24 | | | | 0.30 | | |
Net gain (loss) from investments, foreign currency transactions and forward foreign
currency contracts (both realized and unrealized) | | | 0.01 | | | | 0.14 | | | | (0.45 | ) | | | 0.31 | | | | (0.25 | ) | |
Total from investment operations | | | 0.59 | | | | 0.69 | | | | (0.16 | ) | | | 0.55 | | | | 0.05 | | |
Less dividends: | |
Dividends from net investment income | | | (0.57 | ) | | | (0.56 | ) | | | (0.29 | ) | | | (0.24 | ) | | | (0.30 | ) | |
Return of capital | | | (0.01 | ) | | | (0.00 | )3 | | | — | | | | — | | | | — | | |
Total dividends | | | (0.58 | ) | | | (0.56 | ) | | | (0.29 | ) | | | (0.24 | ) | | | (0.30 | ) | |
Net asset value, end of year | | $ | 6.31 | | | $ | 6.30 | | | $ | 6.171 | | | $ | 6.62 | | | $ | 6.31 | | |
Total return4 | | | 9.70 | % | | | 11.54 | % | | | (2.42 | )% | | | 8.86 | % | | | 0.92 | % | |
Ratios and supplemental data: | |
Net assets, end of year (000s omitted) | | $ | 1,789,047 | | | $ | 1,816,028 | | | $ | 2,376,866 | | | $ | 2,770,167 | | | $ | 1,699,373 | | |
Ratio of net expenses to average net assets | | | 0.70 | % | | | 0.70 | % | | | 0.70 | % | | | 0.70 | % | | | 0.70 | % | |
Ratio of net investment income to average net assets | | | 9.13 | % | | | 8.79 | % | | | 4.54 | % | | | 3.62 | % | | | 4.80 | % | |
Decrease reflected in above operating expense ratios due to waivers/reimbursements | | | 0.11 | % | | | 0.11 | % | | | 0.09 | % | | | 0.07 | % | | | 0.09 | % | |
Portfolio turnover rate5 | | | 50 | % | | | 35 | % | | | 47 | % | | | 54 | % | | | 30 | % | |
1 Includes adjustments in accordance with accounting principles generally accepted in the United States of America and as such, the net asset values for financial reporting purposes and the returns based upon net asset values may differ from the net asset values and returns for shareholder transactions.
2 Per share information is calculated using the average shares outstanding method.
3 This amount represents less than $0.01 per share.
4 Total returns are historical and include change in share price, reinvestment of all distributions and no sales charge. Had certain expenses not been reduced during the years shown, total returns would have been lower.
5 Portfolio turnover is calculated by dividing the lesser of total purchases or sales of portfolio securities for the reporting period by the monthly average of portfolio securities owned during the reporting period. Excluded from both the numerator and denominator are amounts relating to derivatives and securities whose maturities or expiration dates at the time of acquisition were one year or less.
See accompanying notes to financial statements.
19
Credit Suisse Floating Rate High Income Fund
Financial highlights
(For a Class A share of the Fund outstanding throughout each year)
| | | For the year ended October 31, | |
| | | 2024 | | 2023 | | 2022 | | 2021 | | 2020 | |
Per share data: | |
Net asset value, beginning of year | | $ | 6.33 | | | $ | 6.21 | | | $ | 6.65 | | | $ | 6.34 | | | $ | 6.59 | | |
Investment operations: | |
Net investment income1 | | | 0.57 | | | | 0.54 | | | | 0.28 | | | | 0.23 | | | | 0.29 | | |
Net gain (loss) from investments, foreign currency transactions and forward
foreign currency contracts (both realized and unrealized) | | | 0.01 | | | | 0.12 | | | | (0.44 | ) | | | 0.31 | | | | (0.25 | ) | |
Total from investment operations | | | 0.58 | | | | 0.66 | | | | (0.16 | ) | | | 0.54 | | | | 0.04 | | |
Less dividends: | |
Dividends from net investment income | | | (0.56 | ) | | | (0.54 | ) | | | (0.28 | ) | | | (0.23 | ) | | | (0.29 | ) | |
Return of capital | | | (0.01 | ) | | | (0.00 | )2 | | | — | | | | — | | | | — | | |
Total dividends | | | (0.57 | ) | | | (0.54 | ) | | | (0.28 | ) | | | (0.23 | ) | | | (0.29 | ) | |
Net asset value, end of year | | $ | 6.34 | | | $ | 6.33 | | | $ | 6.21 | | | $ | 6.65 | | | $ | 6.34 | | |
Total return3 | | | 9.43 | % | | | 11.07 | % | | | (2.48 | )% | | | 8.57 | % | | | 0.70 | % | |
Ratios and supplemental data: | |
Net assets, end of year (000s omitted) | | $ | 134,432 | | | $ | 116,439 | | | $ | 116,540 | | | $ | 144,713 | | | $ | 146,803 | | |
Ratio of net expenses to average net assets | | | 0.95 | % | | | 0.95 | % | | | 0.95 | % | | | 0.95 | % | | | 0.95 | % | |
Ratio of net investment income to average net assets | | | 8.87 | % | | | 8.59 | % | | | 4.25 | % | | | 3.41 | % | | | 4.54 | % | |
Decrease reflected in above operating expense ratios due to waivers/reimbursements | | | 0.11 | % | | | 0.11 | % | | | 0.09 | % | | | 0.07 | % | | | 0.09 | % | |
Portfolio turnover rate4 | | | 50 | % | | | 35 | % | | | 47 | % | | | 54 | % | | | 30 | % | |
1 Per share information is calculated using the average shares outstanding method.
2 This amount represents less than $0.01 per share.
3 Total returns are historical and include change in share price, reinvestment of all distributions and no sales charge. Had certain expenses not been reduced during the years shown, total returns would have been lower.
4 Portfolio turnover is calculated by dividing the lesser of total purchases or sales of portfolio securities for the reporting period by the monthly average of portfolio securities owned during the reporting period. Excluded from both the numerator and denominator are amounts relating to derivatives and securities whose maturities or expiration dates at the time of acquisition were one year or less.
See accompanying notes to financial statements.
20
Credit Suisse Floating Rate High Income Fund
Financial highlights
(For a Class C share of the Fund outstanding throughout each year)
| | | For the year ended October 31, | |
| | | 2024 | | 2023 | | 2022 | | 2021 | | 2020 | |
Per share data: | |
Net asset value, beginning of year | | $ | 6.35 | | | $ | 6.221 | | | $ | 6.68 | | | $ | 6.36 | | | $ | 6.61 | | |
Investment operations: | |
Net investment income2 | | | 0.52 | | | | 0.50 | | | | 0.23 | | | | 0.18 | | | | 0.24 | | |
Net gain (loss) from investments, foreign currency transactions and forward
foreign currency contracts (both realized and unrealized) | | | 0.01 | | | | 0.13 | | | | (0.46 | ) | | | 0.32 | | | | (0.25 | ) | |
Total from investment operations | | | 0.53 | | | | 0.63 | | | | (0.23 | ) | | | 0.50 | | | | (0.01 | ) | |
Less dividends: | |
Dividends from net investment income | | | (0.51 | ) | | | (0.50 | ) | | | (0.23 | ) | | | (0.18 | ) | | | (0.24 | ) | |
Return of capital | | | (0.01 | ) | | | (0.00 | )3 | | | — | | | | — | | | | — | | |
Total dividends | | | (0.52 | ) | | | (0.50 | ) | | | (0.23 | ) | | | (0.18 | ) | | | (0.24 | ) | |
Net asset value, end of year | | $ | 6.36 | | | $ | 6.35 | | | $ | 6.221 | | | $ | 6.68 | | | $ | 6.36 | | |
Total return4 | | | 8.61 | % | | | 10.42 | % | | | (3.48 | )% | | | 7.90 | % | | | (0.05 | )% | |
Ratios and supplemental data: | |
Net assets, end of year (000s omitted) | | $ | 47,994 | | | $ | 45,535 | | | $ | 52,725 | | | $ | 60,182 | | | $ | 58,959 | | |
Ratio of net expenses to average net assets | | | 1.70 | % | | | 1.70 | % | | | 1.70 | % | | | 1.70 | % | | | 1.70 | % | |
Ratio of net investment income to average net assets | | | 8.13 | % | | | 7.82 | % | | | 3.54 | % | | | 2.66 | % | | | 3.83 | % | |
Decrease reflected in above operating expense ratios due to waivers/reimbursements | | | 0.11 | % | | | 0.11 | % | | | 0.09 | % | | | 0.07 | % | | | 0.09 | % | |
Portfolio turnover rate5 | | | 50 | % | | | 35 | % | | | 47 | % | | | 54 | % | | | 30 | % | |
1 Includes adjustments in accordance with accounting principles generally accepted in the United States of America and as such, the net asset values for financial reporting purposes and the returns based upon net asset values may differ from the net asset values and returns for shareholder transactions.
2 Per share information is calculated using the average shares outstanding method.
3 This amount represents less than $0.01 per share.
4 Total returns are historical and include change in share price, reinvestment of all distributions and no sales charge. Had certain expenses not been reduced during the years shown, total returns would have been lower.
5 Portfolio turnover is calculated by dividing the lesser of total purchases or sales of portfolio securities for the reporting period by the monthly average of portfolio securities owned during the reporting period. Excluded from both the numerator and denominator are amounts relating to derivatives and securities whose maturities or expiration dates at the time of acquisition were one year or less.
See accompanying notes to financial statements.
21
Credit Suisse Floating Rate High Income Fund
Notes to Financial Statements
October 31, 2024
Note 1. Organization
Credit Suisse Floating Rate High Income Fund (the "Fund"), a series of Credit Suisse Opportunity Funds (the "Trust"), a Delaware statutory trust, is registered under the Investment Company Act of 1940, as amended (the "1940 Act"), as a diversified open-end management investment company that seeks to provide a high level of current income and, secondarily, capital appreciation. The Trust was organized under the laws of the State of Delaware as a business trust on May 31, 1995.
UBS Asset Management (Americas) LLC ("UBS AM" or the "Adviser"), the investment adviser to the Fund, is registered as an investment adviser with the Securities and Exchange Commission ("SEC") and as a Commodity Pool Operator with the Commodity Futures Trading Commission. UBS Asset Management (US) Inc. ("UBS AM (US)") serves as the principal underwriter for the Fund. UBS AM and UBS AM (US) are indirect wholly owned subsidiaries of UBS Group AG. UBS Group AG is an internationally diversified organization with headquarters in Zurich, Switzerland. UBS Group AG operates in many areas of the financial services industry.
The Fund offers three classes of shares: Class I shares, Class A shares and Class C shares. Each class of shares represents an equal pro rata interest in the Fund, except the share classes bear different expenses. Class A shares are sold subject to a front-end sales charge of up to 4.75%. Class C shares are sold subject to a contingent deferred sales charge ("CDSC") of 1.00% if the shares are redeemed within the first year of purchase. Class I shares are sold without a sales charge. Effective June 30, 2021, Class C shares, upon the eight year anniversary of purchase, will convert to Class A shares.
In October 2022, the SEC adopted the Tailored Shareholder Reports for Mutual Funds and Exchange-Traded Funds rule and reform amendments requiring open-end management investment companies, including mutual funds and exchange-traded funds, to transmit concise and visually engaging semi-annual and annual tailored shareholder reports that highlight key information, including fund expenses, performance, and holdings to shareholders. Certain information from the Fund's prior shareholder reports, including the Fund's investment portfolio, financial statements and financial highlights, does not appear in the tailored shareholder report but will be filed on a semiannual basis on Form N-CSR. This information will be available online, mailed upon request and filed on a semiannual basis. The rule and form amendments had a compliance date of July 24, 2024.
Note 2. Significant accounting policies
The following is a summary of significant accounting policies followed by the Fund in the preparation of its financial statements. The policies are in accordance with generally accepted accounting principles in the United States of America ("GAAP"). The preparation of financial statements requires management to make estimates and assumptions that affect the reported amounts and disclosures in the financial statements. Actual results could differ from those estimates. The Fund is considered an investment company for financial reporting purposes under GAAP and follows the accounting and reporting guidance in Financial Accounting Standards Board ("FASB") Accounting Standards Codification ("ASC") Topic 946—Financial Services—Investment Companies.
A) SECURITY VALUATION—The Board of Trustees (the "Board") is responsible for the Fund's valuation process. The Board has delegated the supervision of the daily valuation process to the adviser, who has established a Pricing Committee and a Pricing Group, which, pursuant to the policies adopted by the Board, are responsible for making fair valuation determinations and overseeing the Fund's pricing policies. The net asset value ("NAV") of the Fund is determined daily as of the close of regular trading on the New York Stock Exchange, Inc. (the "Exchange") on each day the Exchange is open for business. The valuations for fixed income securities (which may include, but are not limited to, corporate, government, municipal, mortgage-backed, collateralized mortgage obligations and asset-backed securities) and certain derivative instruments are typically the prices supplied by independent third party pricing services, which may use market prices or broker/dealer quotations or a variety of valuation techniques and methodologies. The independent third party pricing services use inputs that are observable such as issuer details,
22
Credit Suisse Floating Rate High Income Fund
Notes to Financial Statements
October 31, 2024
interest rates, yield curves, prepayment speeds, credit risks/spreads, default rates and quoted prices for similar securities. These pricing services generally price fixed income securities assuming orderly transactions of an institutional "round lot" size, but some trades occur in smaller "odd lot" sizes which may be effected at lower prices than institutional round lot trades. Structured note agreements are valued in accordance with a dealer-supplied valuation based on changes in the value of the underlying index. Futures contracts are valued daily at the settlement price established by the board of trade or exchange on which they are traded. Forward contracts are valued at the London closing spot rates and the London closing forward point rates on a daily basis. The currency forward contract pricing model derives the differential in point rates to the expiration date of the forward and calculates its present value. Equity securities for which market quotations are available are valued at the last reported sales price or official closing price on the primary market or exchange on which they trade. Investments in open-ended mutual funds are valued at the NAV as reported on each business day and under normal circumstances. Securities for which market quotations are not readily available are valued at their fair value as determined in good faith by the Adviser, as the Board's valuation designee (as defined in Rule 2a-5 under the 1940 Act), in accordance with the Adviser's procedures. The Board oversees the Adviser in its role as valuation designee in accordance with the requirements of Rule 2a-5 under the 1940 Act. The Fund may utilize a service provided by an independent third party to fair value certain securities. When fair value pricing is employed, the prices of securities used by the Fund to calculate its NAV may differ from quoted or published prices for the same securities. If independent third party pricing services are unable to supply prices for a portfolio investment, or if the prices supplied are deemed by the Adviser to be unreliable, the market price may be determined by the Adviser using quotations from one or more brokers/dealers or at the transaction price if the security has recently been purchased and no value has yet been obtained from a pricing service or pricing broker. When reliable prices are not readily available, such as when the value of a security has been significantly affected by events after the close of the exchange or market on which the security is principally traded, but before the Fund calculates its NAV, these securities will be fair valued in good faith by the Pricing Group, in accordance with procedures established by the Adviser.
The Fund uses valuation techniques to measure fair value that are consistent with the market approach and/or income approach, depending on the type of security and the particular circumstance. The market approach uses prices and other relevant information generated by market transactions involving identical or comparable securities. The income approach uses valuation techniques to discount estimated future cash flows to present value.
GAAP established a disclosure hierarchy that categorizes the inputs to valuation techniques used to value assets and liabilities at each measurement date. These inputs are summarized in the three broad levels listed below:
Level 1—quoted prices in active markets for identical investments
Level 2—other significant observable inputs (including quoted prices for similar investments, interest rates, prepayment speeds, credit risk, etc.)
Level 3—significant unobservable inputs (including the Fund's own assumptions in determining the fair value of investments)
The inputs or methodologies used to value securities are not necessarily an indication of the risk associated with investing in those securities.
23
Credit Suisse Floating Rate High Income Fund
Notes to Financial Statements
October 31, 2024
The following is a summary of the inputs used as of October 31, 2024 in valuing the Fund's assets and liabilities carried at fair value:
Assets | | Level 1 | | Level 2 | | Level 3 | | Total | |
Investments in Securities | | | | | | | | | |
Bank Loans | | $ | — | | | $ | 1,524,913,189 | | | $ | 144,326,479 | | | $ | 1,669,239,668 | | |
Corporate Bonds | | | — | | | | 130,802,588 | | | | 2,063,505 | | | | 132,866,093 | | |
Asset Backed Securities | | | — | | | | 79,235,310 | | | | — | | | | 79,235,310 | | |
Common Stocks | | | — | | | | 15,051,325 | | | | 414,844 | | | | 15,466,169 | | |
Warrants | | | — | | | | — | | | | 63,239 | | | | 63,239 | | |
Short-term Investments | | | 131,934,317 | | | | — | | | | — | | | | 131,934,317 | | |
| | | $ | 131,934,317 | | | $ | 1,750,002,412 | | | $ | 146,868,067 | | | $ | 2,028,804,796 | | |
Other Financial Instruments* | |
Forward Foreign Currency Contracts | | $ | — | | | $ | 1,753,192 | | | $ | — | | | $ | 1,753,192 | | |
Liabilities | |
Other Financial Instruments* | |
Forward Foreign Currency Contracts | | $ | — | | | $ | 2,870 | | | $ | — | | | $ | 2,870 | | |
* Other financial instruments include unrealized appreciation (depreciation) on forward foreign currency contracts.
The following is a reconciliation of investments as of October 31, 2024 for which significant unobservable inputs were used in determining fair value.
| | | Bank loans | | Corporate bonds | | Common stocks | | Warrants | | Total | |
Balance as of October 31, 2023 | | $ | 117,212,484 | | | $ | 141,447 | | | $ | 3,390,086 | | | $ | 167,953 | | | $ | 120,911,970 | | |
Accrued discounts (premiums) | | | 767,506 | | | | — | | | | — | | | | — | | | | 767,506 | | |
Purchases | | | 112,079,937 | | | | 1,912,916 | | | | 394,995 | | | | — | | | | 114,387,848 | | |
Sales | | | (76,405,284 | ) | | | — | | | | (794 | ) | | | — | | | | (76,406,078 | ) | |
Realized gain (loss) | | | (4,985,524 | ) | | | — | | | | (102,413 | ) | | | — | | | | (5,087,937 | ) | |
Change in unrealized appreciation (depreciation) | | | 3,076,368 | | | | 9,142 | | | | (467,319 | ) | | | (104,714 | ) | | | 2,513,477 | | |
Transfers into Level 3 | | | 27,567,846 | | | | — | | | | — | | | | — | | | | 27,567,846 | | |
Transfers out of Level 3 | | | (34,986,854 | ) | | | — | | | | (2,799,711 | ) | | | — | | | | (37,786,565 | ) | |
Balance as of October 31, 2024 | | $ | 144,326,479 | | | $ | 2,063,505 | | | $ | 414,844 | | | $ | 63,239 | | | $ | 146,868,067 | | |
Net change in unrealized appreciation (depreciation)
from investments still held as of October 31, 2024 | | $ | 240,878 | | | $ | 9,142 | | | $ | — | | | $ | (104,714 | ) | | $ | 145,306 | | |
| | Quantitative disclosure about significant unobservable inputs | |
| Asset class | | Fair value
at October 31, 2024 | | Valuation
technique | | Unobservable
input | | Price range
(Weighted average)* | |
Bank Loans | | $ | 2,091,592 | | | Income Approach | | Expected Remaining Distribution | | $ | 0.00 – $0.96 | ($0.96) | |
| | | 142,234,887 | | | Vendor Pricing | | Single Broker Quote | | | 0.01 – 1.38 | (1.00) | |
Corporate Bonds | | | 1,491,353 | | | Income Approach | | Expected Remaining Distribution | | | 0.54 – 1.09 | (1.04) | |
| | | 572,152 | | | Recent Transactions | | Trade Price | | | 1.09 | (1.09) | |
Common Stocks | | | 19,849 | | | Income Approach | | Expected Remaining Distribution | | | 0.00 – 0.02 | (0.02) | |
| | | 394,995 | | | Recent Transactions | | Trade Price | | | 0.00 – 5.00 | (5.00) | |
Warrants | | | 63,239 | | | Income Approach | | Expected Remaining Distribution | | | 0.00 – 1.19 | (1.19) | |
* Weighted by relative fair value
24
Credit Suisse Floating Rate High Income Fund
Notes to Financial Statements
October 31, 2024
Each fair value determination is based on a consideration of relevant factors, including both observable and unobservable inputs. Observable and unobservable inputs that UBS AM considers may include (i) the existence of any contractual restrictions on the disposition of securities; (ii) information obtained from the company, which may include an analysis of the company's financial statements, the company's products or intended markets or the company's technologies; (iii) the price of the same or similar security negotiated at arm's length in an issuer's completed subsequent round of financing; (iv) the price and extent of public trading in similar securities of the issuer or of comparable companies; or (v) a probability and time value adjusted analysis of contractual term. Where available and appropriate, multiple valuation methodologies are applied to confirm fair value. To the extent that valuation is based on models or inputs that are less observable or unobservable in the market, determining fair value requires more judgment. Because of the inherent uncertainty of valuation, those estimated values may be materially higher or lower than the values that would have been used had a ready market for the investments existed. Accordingly, the degree of judgment exercised by the Fund in determining fair value is greatest for investments categorized in Level 3. In some circumstances, the inputs used to measure fair value might be categorized within different levels of the fair value hierarchy. In those instances, the fair value measurement is categorized in its entirety in the fair value hierarchy based on the least observable input that is significant to the fair value measurement. Additionally, changes in the market environment and other events that may occur over the life of the investments may cause the gains or losses ultimately realized on these investments to be different from the valuations used at the date of these financial statements.
For the year ended October 31, 2024, $27,567,846 was transferred from Level 2 to Level 3 due to a lack of a pricing source supported by observable inputs and $37,786,565 was transferred from Level 3 to Level 2 as a result of the availability of a pricing source supported by observable inputs. All transfers, if any, are assumed to occur at the end of the reporting period.
B) DERIVATIVE INSTRUMENTS AND HEDGING ACTIVITIES—The Fund adopted amendments to authoritative guidance on disclosures about derivative instruments and hedging activities which require that a fund disclose (a) how and why an entity uses derivative instruments, (b) how derivative instruments and hedging activities are accounted for and (c) how derivative instruments and related hedging activities affect a fund's financial position, financial performance and cash flows.
The following table presents the fair value and the location of derivatives within the Statement of Assets and Liabilities at October 31, 2024 and the effect of these derivatives on the Statement of Operations for the year ended October 31, 2024.
Primary underlying risk | | Derivative
assets | | Derivative
liabilities | | Realized
gain (loss) | | Net Change in
unrealized
appreciation
(depreciation) | |
Foreign currency exchange rate | |
Forward contracts | | $ | 1,753,192 | | | $ | 2,870 | | | $ | (2,788,328 | ) | | $ | 1,010,800 | | |
For the year ended October 31, 2024, the Fund held an average monthly value on a net basis of $121,342,877 in forward foreign currency contracts.
The Fund is a party to International Swap and Derivatives Association, Inc. ("ISDA") Master Agreements ("Master Agreements") with certain counterparties that govern over-the-counter derivative (including total return, credit default and interest rate swaps) and foreign exchange contracts entered into by the Fund. The Master Agreements may contain provisions regarding, among other things, the parties' general obligations, representations, agreements, collateral requirements, events of default and early termination. Termination events applicable to the Fund may occur upon a decline in the Fund's net assets below a specified threshold over a certain period of time.
25
Credit Suisse Floating Rate High Income Fund
Notes to Financial Statements
October 31, 2024
The following table presents by counterparty the Fund's derivative assets, net of related collateral held by the Fund, at October, 31 2024:
Counterparty | | Gross amount of derivative
assets presented in the
statement of assets
and liabilitiesa | | Financial
instruments
and derivatives
available for offset | | Non-cash
collateral
received | | Cash
collateral
received | | Net amount
of derivative
assets | |
Deutsche Bank AG | | $ | 1,489,569 | | | $ | (2,870 | ) | | $ | — | | | $ | — | | | $ | 1,486,699 | | |
Morgan Stanley | | | 263,623 | | | | — | | | | — | | | | — | | | | 263,623 | | |
| | | $ | 1,753,192 | | | $ | (2,870 | ) | | $ | — | | | $ | — | | | $ | 1,750,322 | | |
The following table presents by counterparty the Fund's derivative liabilities, net of related collateral pledged by the Fund, at October 31, 2024:
Counterparty | | Gross amount of derivative
liabilities presented in the
statement of assets
and liabilitiesa | | Financial
instruments
and derivatives
available for offset | | Non-cash
collateral
pledged | | Cash
collateral
pledged | | Net amount
of derivative
liabilities | |
Deutsche Bank AG | | $ | 2,870 | | | $ | (2,870 | ) | | $ | — | | | $ | — | | | $ | — | | |
a Forward foreign currency contracts are included.
C) FOREIGN CURRENCY TRANSACTIONS—The books and records of the Fund are maintained in U.S. dollars. Transactions denominated in foreign currencies are recorded at the current prevailing exchange rates. All assets and liabilities denominated in foreign currencies, including purchases and sales of investments, and income and expenses, are translated into U.S. dollar amounts on the date of those transactions.
Reported net realized gain (loss) from foreign currency transactions arises from sales of foreign currencies; currency gains or losses realized between the trade and settlement dates on securities transactions; and the difference between the amounts of dividends, interest, and foreign withholding taxes recorded on the Fund's books and the U.S. dollar equivalent of the amounts actually received or paid. Net change in unrealized gains and losses on translation of assets and liabilities denominated in foreign currencies arises from changes in the fair values of assets and liabilities, other than investments, at the end of the period, resulting from changes in exchange rates.
The Fund does not isolate that portion of the results of operations resulting from fluctuations in foreign exchange rates on investments from the fluctuations arising from changes in market prices of investments held. Such fluctuations are included with net realized and unrealized gain or loss from investments in the Statement of Operations.
D) SECURITY TRANSACTIONS AND INVESTMENT INCOME/EXPENSE—Security transactions are accounted for on a trade date basis. Interest income/expense is recorded on the accrual basis. The Fund amortizes premiums and accretes discounts using the effective interest method. Dividend income/expense is recorded on the ex-dividend date. Certain expenses are class-specific expenses, vary by class and are charged only to that class. Income, expenses (excluding class-specific expenses) and realized/unrealized gains/losses are allocated proportionately to each class of shares based upon the relative NAV of the outstanding shares of that class. The cost of investments sold is determined by use of the specific identification method for both financial reporting and income tax purposes. To the extent any issuer defaults or a credit event occurs that impacts the issuer, the Fund may halt any additional interest income accruals and consider the realizability of interest accrued up to the date of default or credit event.
E) DIVIDENDS AND DISTRIBUTIONS TO SHAREHOLDERS—Dividends from net investment income, if any, are declared daily and paid monthly. Distributions of net realized capital gains, if any, are declared and paid at least annually. However, to the extent that a net realized capital gain can be reduced by a capital loss carryforward, such
26
Credit Suisse Floating Rate High Income Fund
Notes to Financial Statements
October 31, 2024
gain will not be distributed. Dividends and distributions to shareholders of the Fund are recorded on the ex-dividend date and are determined in accordance with federal income tax regulations, which may differ from GAAP.
F) FEDERAL AND OTHER TAXES—No provision is made for federal taxes as it is the Fund's intention to continue to qualify as a regulated investment company ("RIC") under the Internal Revenue Code of 1986, as amended (the "Code"), and to make the requisite distributions to its shareholders, which will be sufficient to relieve it from federal income and excise taxes.
In order to qualify as a RIC under the Code, the Fund must meet certain requirements regarding the source of its income, the diversification of its assets and the distribution of its income. One of these requirements is that the Fund derive at least 90% of its gross income for each taxable year from dividends, interest, payments with respect to certain securities loans, gains from the sale or other disposition of stock, securities or foreign currencies, other income derived with respect to its business of investing in such stock, securities or currencies or net income derived from interests in certain publicly-traded partnerships ("Qualifying Income"). The Fund adopted the authoritative guidance for uncertainty in income taxes and recognizes a tax benefit or liability from an uncertain position only if it is more likely than not that the position is sustainable based solely on its technical merits and consideration of the relevant taxing authority's widely understood administrative practices and procedures. The Fund has reviewed its current tax positions and has determined that no provision for income tax is required in the Fund's financial statements. The Fund's federal and state income and federal excise tax returns for each of the tax years in the four year period ended October 31, 2024, for which the applicable statutes of limitations have not expired are subject to examination by the Internal Revenue Service and state departments of revenue.
G) CASH—The Fund's uninvested cash balance is held in an interest bearing variable rate demand deposit account at State Street Bank and Trust Company ("SSB"), the Fund's custodian.
H) FORWARD FOREIGN CURRENCY CONTRACTS—A forward foreign currency exchange contract ("forward currency contract") is a commitment to purchase or sell a foreign currency at the settlement date at a negotiated rate. The Fund will enter into forward currency contracts primarily for hedging foreign currency risk. Forward currency contracts are valued at the prevailing forward exchange rate of the underlying currencies and unrealized gain/loss is recorded daily. On the settlement date of the forward currency contract, the Fund records a realized gain or loss equal to the difference between the value of the contract at the time it was opened and the value of the contract at the time it was closed. Certain risks may arise upon entering into forward currency contracts from the potential inability of counterparties to meet the terms of their contracts. The maximum counterparty credit risk to the Fund is measured by the unrealized gain on appreciated contracts. Additionally, when utilizing forward currency contracts to hedge, the Fund forgoes the opportunity to profit from favorable exchange rate movements during the term of the contract. The Fund's open forward currency contracts at October 31, 2024 are disclosed in the Schedule of Investments. At October 31, 2024, the amount of restricted cash held at brokers related to open forward foreign currency contracts was $10,386.
I) UNFUNDED LOAN COMMITMENTS—The Fund enters into certain agreements, all or a portion of which may be unfunded. The Fund is obligated to fund these loan commitments at the borrowers' discretion. Funded and unfunded portions of credit agreements are presented in the Schedule of Investments. As of October 31, 2024, unfunded commitments were as follows:
Borrower | | Maturity | | Rate | | Unfunded
commitment | |
Focus Financial Partners LLC | | 09/15/31 | | | 0.000 | % | | $ | 413,141 | | |
27
Credit Suisse Floating Rate High Income Fund
Notes to Financial Statements
October 31, 2024
Unfunded loan commitments and funded portions of credit agreements are marked to market daily and any unrealized appreciation or depreciation is included in the Statement of Assets and Liabilities and the Statement of Operations.
J) SECURITIES LENDING—The initial collateral received by the Fund is required to have a value of at least 102% of the market value of domestic securities on loan (including any accrued interest thereon) and 105% of the market value of foreign securities on loan (including any accrued interest thereon). The collateral is maintained thereafter at a value equal to at least 102% of the current market value of the securities on loan. The market value of loaned securities is determined at the close of each business day of the Fund and any additional required collateral is delivered to the Fund, or excess collateral returned by the Fund, on the next business day. Cash collateral received by the Fund in connection with securities lending activity may be pooled together with cash collateral for other funds/portfolios advised by UBS AM and may be invested in a variety of investments, including funds advised by SSB or an affiliate, the Fund's securities lending agent, or money market instruments. However, in the event of default or bankruptcy by the other party to the agreement, realization and/or retention of the collateral may be subject to legal proceedings. The remaining maturities of the securities lending transactions are considered overnight and continuous. Loans are subject to termination by the Fund or the borrower at any time.
SSB has been engaged by the Fund to act as the Fund's securities lending agent. As of October 31, 2024, the Fund had outstanding loans of securities to certain approved brokers for which the Fund received collateral:
Market value of loaned
securities | | Market value of cash
collateral | |
| $ | 14,103,069 | | | $ | 14,412,457 | | |
The following table presents financial instruments that are subject to enforceable netting arrangements as of October 31, 2024.
Gross amounts not offset in the statement of assets and liabilities
Gross asset amounts presented
in the statement
of assets and liabilitiesa | | Collateral receivedb | | Net amount | |
| $ | 14,103,069 | | | $ | (14,103,069 | ) | | $ | — | | |
a Represents market value of loaned securities at year end.
b The actual collateral received is greater than the amount shown here due to collateral requirements of the security lending agreement.
The Fund's securities lending arrangement provides that the Fund and SSB will share the net income earned from securities lending activities. Securities lending income is accrued as earned. For the year ended October 31, 2024, total earnings received in connection with securities lending arrangements was $824,810, of which $739,320 was rebated to borrowers (brokers). The Fund retained $64,093 in income, and SSB, as lending agent, was paid $21,397.
K) OTHER—The high yield, fixed income securities in which the Fund invests will primarily consist of senior secured floating rate loans ("Senior Loans") issued by non-investment grade companies. Senior Loans are typically secured by specific collateral of the issuer and hold the most senior position in the issuer's capital structure. The interest rate on Senior Loans is periodically adjusted to a recognized base rate. While these characteristics may reduce interest rate risk and mitigate losses in the event of borrower default, the Senior Loans in which the Fund invests have below investment grade credit ratings and thereby are considered speculative because of the significant credit risk of their issuers.
28
Credit Suisse Floating Rate High Income Fund
Notes to Financial Statements
October 31, 2024
The United Kingdom's Financial Conduct Authority (the "FCA"), which regulates LIBOR, has ceased publishing all LIBOR settings. In April 2023, however, the FCA announced that some USD LIBOR settings would continue to be published under a synthetic methodology until September 30, 2024 for certain legacy contracts. After September 30, 2024, the remaining synthetic LIBOR settings ceased to be published, and all LIBOR settings have permanently ceased. The Secured Overnight Financing Rate, or "SOFR," is a broad measure of the cost of borrowing cash overnight collateralized by U.S. Treasury securities in the purchase agreement ("repo") market and has been used increasingly on a voluntary basis in new instruments and transactions. On March 15, 2022, the Adjustable Interest Rate Act was signed into law, providing a statutory fallback mechanism to replace LIBOR with a benchmark rate that is selected by the Federal Reserve Board and based on SOFR for certain contracts that reference LIBOR without adequate fallback provisions. On December 16, 2022, the Federal Reserve Board adopted regulations implementing the Adjustable Interest Rate Act by identifying benchmark rates based on SOFR that replaced LIBOR in different categories of financial contracts after June 30, 2023. These regulations apply only to contracts governed by U.S. law, among other limitations. Neither the effect of the LIBOR transition process nor its ultimate success can yet be known. Not all existing LIBOR-based instruments may have alternative rate-setting provisions and there remains uncertainty regarding the willingness and ability of issuers to add alternative rate-setting provisions in certain existing instruments. Parties to contracts, securities or other instruments using LIBOR may disagree on transition rates or the application of applicable transition regulation, potentially resulting in uncertainty of performance and the possibility of litigation. The Fund may have instruments linked to other interbank offered rates that may also cease to be published in the future.
Lower-rated debt securities (commonly known as "junk bonds") possess speculative characteristics and are subject to greater market fluctuations and risk of lost income and principal than higher-rated debt securities for a variety of reasons. Also, during an economic downturn or substantial period of rising interest rates, highly leveraged issuers may experience financial stress which would adversely affect their ability to service their principal and interest payment obligations, to meet projected business goals and to obtain additional financing.
In addition, periods of economic uncertainty and changes can be expected to result in increased volatility of market prices of lower-rated debt securities and the Fund's NAV.
In the normal course of business, the Fund trades financial instruments and enters into financial transactions for which risk of potential loss exists due to changes in the market (market risk) or failure of the other party to a transaction to perform (credit risk). Similar to credit risk, the Fund may be exposed to counterparty risk, including with respect to securities lending, or the risk that an institution or other entity with which the Fund has unsettled or open transactions will default. The potential loss could exceed the value of the financial assets recorded in the financial statements. Financial assets, which potentially expose the Fund to credit risk, consist principally of cash due from counterparties and investments. The extent of the Fund's exposure to credit and counterparty risks in respect to these financial assets approximates their carrying value as recorded in the Fund's Statement of Assets and Liabilities.
Note 3. Transactions with affiliates and related parties
Credit Suisse served as investment adviser and co-administrator for the Fund through April 30, 2024. On May 1, 2024, Credit Suisse merged into UBS AM, with UBS AM as the surviving entity, and UBS AM became the investment manager to the Fund. For its investment advisory and administration services, UBS AM is entitled to receive a fee from the Fund at an annual rate of 0.79% of the Fund's average daily net assets less than or equal to $100 million and 0.59% of the Fund's average daily net assets greater than $100 million. For the year ended October 31, 2024, investment advisory and administration fees earned and fees waived/expenses reimbursed by UBS AM were $12,054,345 and $2,272,322, respectively.
29
Credit Suisse Floating Rate High Income Fund
Notes to Financial Statements
October 31, 2024
Effective April 22, 2019, UBS AM has contractually agreed to limit expenses so that the Fund's annual operating expenses do not exceed 0.70% of the Fund's average daily net assets for Class I shares, 0.95% of the Fund's average daily net assets for Class A shares and 1.70% of the Fund's average daily net assets for Class C shares. The Fund is authorized to reimburse UBS AM for management fees previously waived and/or for expenses previously paid by UBS AM, provided, however, that any reimbursement must be paid at a date not more than thirty-six months following the applicable month during which such fees were waived or expenses were paid by UBS AM and the reimbursement does not cause the applicable class's aggregate expenses, on an annualized basis, to exceed either (i) the applicable expense limitation in effect at the time such fees were waived or such expenses were paid by UBS AM or (ii) the applicable expense limitation in effect at the time of such reimbursement. This contract may not be terminated before February 28, 2026. Prior to April 22, 2019, these expense limitations were voluntary. For the year ended October 31, 2024, there was no recoupment.
The amounts waived and reimbursed by UBS AM, which are available for potential future recoupment by UBS AM, and the expiration schedule at October 31, 2024 are as follows:
| | | Fee waivers/
expense
reimbursements
subject to
recoupment | | Expires
October 31,
2025 | | Expires
October 31,
2026 | | Expires
October 31,
2027 | |
Class I | | $ | 6,976,996 | | | $ | 2,639,316 | | | $ | 2,259,861 | | | $ | 2,077,819 | | |
Class A | | | 383,280 | | | | 116,498 | | | | 123,793 | | | | 142,989 | | |
Class C | | | 155,036 | | | | 52,688 | | | | 50,834 | | | | 51,514 | | |
Totals | | $ | 7,515,312 | | | $ | 2,808,502 | | | $ | 2,434,488 | | | $ | 2,272,322 | | |
Credit Suisse Securities (USA) LLC ("CSSU"), an affiliate of Credit Suisse, served as the distributor of the Fund's shares through April 30, 2024. On May 1, 2024, UBS AM (US) replaced CSSU as the Fund's underwriter and distributor. Pursuant to a distribution plan adopted by the Fund pursuant to Rule 12b-1 under the 1940 Act, UBS AM (US) receives fees for its distribution services. These fees are calculated at an annual rate of 0.25% of the average daily net assets of the Class A shares. For the Class C shares, the fee is calculated at an annual rate of 1.00% of the average daily net assets. For the year ended October 31, 2024, the Fund paid Rule 12b-1 distribution fees of $315,522 for Class A shares and $452,488 for Class C shares. Class I shares are not subject to Rule 12b-1 distribution fees.
For the year ended October 31, 2024, UBS AM (US) and its affiliates advised the Fund that they retained $15,125 from commissions earned on the sale of the Fund's Class A shares. There were no commissions earned on the sale of Class C shares.
The Fund from time to time purchases or sells loan investments in the secondary market through UBS AM or its affiliates acting in the capacity as broker-dealer. UBS AM or its affiliates may have acted in some type of agent capacity to the initial loan offering prior to such loan trading in the secondary market.
Note 4. Line of credit
The Fund, together with other funds/portfolios advised by UBS AM (collectively, the "Participating Funds"), participates in a committed, unsecured line of credit facility ("Credit Facility"), with SSB in an aggregated amount of $250 million for temporary or emergency purposes on a first-come, first-served basis. Of the aggregate $250 million amount, $125 million is specifically designated for the Fund. The remaining $125 million is available to all Participating Funds, including the Fund. Under the terms of the Credit Facility, the Participating Funds pay an aggregate commitment fee on the average unused amount of the Credit Facility, which is allocated among the Participating Funds in such manner as is determined by the governing boards of the Participating Funds. In addition, the Participating Funds pay interest on borrowings at either the Federal Funds Effective rate or the Overnight Bank
30
Credit Suisse Floating Rate High Income Fund
Notes to Financial Statements
October 31, 2024
Funding rate plus a spread. At October 31, 2024 and for the year ended October 31, 2024, the Fund had no borrowings outstanding under the Credit Facility. Additionally, the Fund and another Participating Fund are parties to a joint uncommitted line of credit facility with SSB in an aggregated amount of $200 million. For the year ended October 31, 2024, the line was not drawn upon and no fees were incurred.
Note 5. Purchases and sales of securities
For the year ended October 31, 2024, purchases and sales of investment securities and U.S. Government and Agency Obligations (excluding short-term investments) were as follows:
Investment securities | | U.S. Government/
agency obligations | |
| Purchases | | Sales | | Purchases | | Sales | |
| $ | 955,724,513 | | | $ | 1,024,755,065 | | | $ | 0 | | | $ | 0 | | |
Note 6. Capital share transactions
The Fund is authorized to issue an unlimited number of full and fractional shares of beneficial interest, $0.001 par value per share. The Fund offers Class I, Class A and Class C shares. Transactions in capital shares for each class of the Fund were as follows:
| | | Class I | |
| | | For the year ended
October 31, 2024 | | For the year ended
October 31, 2023 | |
| | | Shares | | Value | | Shares | | Value | |
Shares sold | | | 98,062,786 | | | $ | 622,452,249 | | | | 110,944,148 | | | $ | 696,216,807 | | |
Shares issued in reinvestment of distributions | | | 21,355,332 | | | | 135,563,185 | | | | 23,910,029 | | | | 150,149,227 | | |
Shares redeemed | | | (123,972,329 | ) | | | (786,967,715 | ) | | | (231,689,918 | ) | | | (1,452,088,296 | ) | |
Net decrease | | | (4,554,211 | ) | | $ | (28,952,281 | ) | | | (96,835,741 | ) | | $ | (605,722,262 | ) | |
| | | Class A | |
| | | For the year ended
October 31, 2024 | | For the year ended
October 31, 2023 | |
| | | Shares | | Value | | Shares | | Value | |
Shares sold | | | 9,008,735 | | | $ | 57,492,967 | | | | 4,954,585 | | | $ | 31,321,019 | | |
Shares issued in reinvestment of distributions | | | 1,427,145 | | | | 9,103,832 | | | | 1,273,924 | | | | 8,044,816 | | |
Shares redeemed | | | (7,615,414 | ) | | | (48,589,200 | ) | | | (6,626,901 | ) | | | (41,761,989 | ) | |
Net increase (decrease) | | | 2,820,466 | | | $ | 18,007,599 | | | | (398,392 | ) | | $ | (2,396,154 | ) | |
| | | Class C | |
| | | For the year ended
October 31, 2024 | | For the year ended
October 31, 2023 | |
| | | Shares | | Value | | Shares | | Value | |
Shares sold | | | 2,242,067 | | | $ | 14,336,844 | | | | 1,500,639 | | | $ | 9,519,502 | | |
Shares issued in reinvestment of distributions | | | 502,035 | | | | 3,212,780 | | | | 493,655 | | | | 3,126,692 | | |
Shares redeemed | | | (2,364,190 | ) | | | (15,125,483 | ) | | | (3,298,938 | ) | | | (20,806,254 | ) | |
Net increase (decrease) | | | 379,912 | | | $ | 2,424,141 | | | | (1,304,644 | ) | | $ | (8,160,060 | ) | |
31
Credit Suisse Floating Rate High Income Fund
Notes to Financial Statements
October 31, 2024
On October 31, 2024, the number of shareholders that held 5% or more of the outstanding shares of each class of the Fund was as follows:
| | | Number of
shareholders | | Approximate percentage
of outstanding shares | |
Class I | | | 8 | | | | 67 | % | |
Class A | | | 7 | | | | 79 | % | |
Class C | | | 4 | | | | 73 | % | |
The Fund's performance may be negatively impacted in the event one or more of the Fund's greater than 5% shareholders were to redeem at a given time. Some of the shareholders may be omnibus accounts, which hold shares on behalf of individual shareholders.
Note 7. Income tax information and distributions to shareholders
Income and capital gain distributions are determined in accordance with federal income tax regulations, which may differ from GAAP.
The tax character of dividends paid by the Fund during the fiscal years ended October 31, 2024 and 2023, respectively, was as follows:
Ordinary income | | Return of capital | |
| 2024 | | 2023 | | 2024 | | 2023 | |
| $ | 179,380,752 | | | $ | 196,349,143 | | | $ | 3,078,708 | | | $ | 672,677 | | |
The tax basis components of distributable earnings differ from book basis by temporary book/tax differences. These differences are primarily due to differing treatments of dividends payable, wash sales, premium amortization, and forward contracts marked to market.
At October 31, 2024, the components of distributable earnings on a tax basis were as follows:
Accumulated net realized loss | | $ | (245,305,027 | ) | |
Unrealized depreciation | | | (89,278,709 | ) | |
Other temporary differences | | | (2,558,260 | ) | |
| | | $ | (337,141,996 | ) | |
At October 31, 2024, the Fund had $31,531,045 of unlimited short-term capital loss carryforwards and $213,773,982 of unlimited long-term capital loss carryforwards available to offset possible future capital gains.
At October 31, 2024, the cost and net unrealized appreciation (depreciation) of investments and derivatives for income tax purposes were as follows:
Cost of Investments | | $ | 2,119,826,381 | | |
Unrealized appreciation | | $ | 20,051,829 | | |
Unrealized depreciation | | | (111,073,414 | ) | |
Net unrealized appreciation (depreciation) | | $ | (91,021,585 | ) | |
32
Credit Suisse Floating Rate High Income Fund
Notes to Financial Statements
October 31, 2024
Note 8. Contingencies
In the normal course of business, the Fund may provide general indemnifications pursuant to certain contracts and organizational documents. The Fund's maximum exposure under these arrangements is dependent on future claims that may be made against the Fund and, therefore, cannot be estimated; however, based on experience, the risk of loss from such claims is considered remote.
Note 9. Subsequent events
In preparing the financial statements as of October 31, 2024, management considered the impact of subsequent events for potential recognition or disclosure in these financial statements through the date of release of this report. No such events requiring recognition or disclosure were identified through the date of the release of this report.
33
Credit Suisse Floating Rate High Income Fund
Report of independent registered public accounting firm
To the Shareholders and the Board of Trustees of Credit Suisse Floating Rate High Income Fund
Opinion on the Financial Statements
We have audited the accompanying statement of assets and liabilities of Credit Suisse Floating Rate High Income Fund (the "Fund") (one of the funds constituting Credit Suisse Opportunity Funds (the "Trust")), including the schedule of investments, as of October 31, 2024, and the related statements of operations and changes in net assets, the financial highlights for the year then ended and the related notes (collectively referred to as the "financial statements"). In our opinion, the financial statements present fairly, in all material respects, the financial position of the Fund (one of the funds constituting Credit Suisse Opportunity Funds) at October 31, 2024, the results of its operations, the changes in its net assets and its financial highlights for the year then ended, in conformity with U.S. generally accepted accounting principles.
The statement of changes in net assets for the year ended October 31, 2023, and the financial highlights for each of the years in the four-year period then ended, were audited by another independent registered public accounting firm whose report, dated December 27, 2023, expressed an unqualified opinion on that statement of changes in net assets and those financial highlights.
Basis for Opinion
These financial statements are the responsibility of the Trust's management. Our responsibility is to express an opinion on the Fund's financial statements based on our audit. We are a public accounting firm registered with the Public Company Accounting Oversight Board (United States) ("PCAOB") and are required to be independent with respect to the Trust in accordance with the U.S. federal securities laws and the applicable rules and regulations of the Securities and Exchange Commission and the PCAOB.
We conducted our audit in accordance with the standards of the PCAOB. Those standards require that we plan and perform the audit to obtain reasonable assurance about whether the financial statements are free of material misstatement, whether due to error or fraud. The Trust is not required to have, nor were we engaged to perform, an audit of the Trust's internal control over financial reporting. As part of our audit, we are required to obtain an understanding of internal control over financial reporting but not for the purpose of expressing an opinion on the effectiveness of the Trust's internal control over financial reporting. Accordingly, we express no such opinion.
Our audit included performing procedures to assess the risks of material misstatement of the financial statements, whether due to error or fraud, and performing procedures that respond to those risks. Such procedures included examining, on a test basis, evidence regarding the amounts and disclosures in the financial statements. Our procedures included confirmation of securities owned as of October 31, 2024, by correspondence with the custodian, brokers and others; when replies were not received from brokers and others, we performed other auditing procedures. Our audit also included evaluating the accounting principles used and significant estimates made by management, as well as evaluating the overall presentation of the financial statements. We believe that our audit provides a reasonable basis for our opinion.

We have served as the auditor of one or more UBS investment companies since 1978.
New York, New York
December 26, 2024
34
Credit Suisse Floating Rate High Income Fund
Proxy voting and portfolio holdings information (unaudited)
Information regarding how the Fund voted proxies related to its portfolio securities during the 12-month period ended June 30 of each year, as well as the policies and procedures that the Fund uses to determine how to vote proxies relating to its portfolio securities are available:
• By calling 1-877-870-2874
• On the Fund's website, www.credit-suisse.com/us/funds
• On the website of the Securities and Exchange Commission, www.sec.gov
The Fund files a complete schedule of its portfolio holdings for the first and third quarters of its fiscal year with the SEC as an exhibit to its reports on Form N-PORT, and for reporting periods ended prior to March 31, 2019, filed such information on Form N-Q. The Fund's Forms N-PORT and N-Q are available on the SEC's website at www.sec.gov.

UBS Asset Management (US) Inc., DISTRIBUTOR.
P.O. Box 219916, Kansas City, Mo 64121-9916
877-870-2874 ◼ www.credit-suisse.com/us

Credit Suisse Strategic Income Fund
Annual Financial Statements | October 31, 2024
The Fund's investment objective, risks, charges and expenses (which should be considered carefully before investing), and more complete information about the Fund, are provided in the Prospectus, which should be read carefully before investing. You may obtain additional copies by calling 877-870-2874 or by visiting our website at www.credit-suisse.com/us/funds.
Credit Suisse Securities (USA) LLC, the Distributor for the six months ended April 30, 2024, is located at Eleven Madison Avenue, New York, NY 10010. UBS Asset Management (US) Inc. became the distributor as of May 1, 2024. The Credit Suisse Funds were advised by Credit Suisse Asset Management, LLC for the six months ended April 30, 2024. UBS Asset Management (Americas) LLC became the investment manager on May 1, 2024 pursuant to an internal merger between Credit Suisse Asset Management, LLC and UBS Asset Management (Americas) LLC.
Investors in the Credit Suisse Funds should be aware that they may be eligible to purchase Class I shares (where offered) directly or through certain intermediaries. Such shares are not subject to a sales charge. Investors in the Credit Suisse Funds should also be aware that they may be eligible for a reduction or waiver of the sales charge with respect to Class A or C shares (where offered). For more information, please review the relevant prospectuses or consult your financial representative.
Fund shares are not deposits or other obligations of UBS Asset Management (Americas) LLC or any affiliate, are not FDIC-insured and are not guaranteed by UBS Asset Management (Americas) LLC or any affiliate. Fund investments are subject to investment risks, including loss of your investment.
Credit Suisse Strategic Income Fund
Schedule of Investments
Par
(000) | | | | Ratings†
(S&P/Moody's) | | Maturity | | Rate% | | Value | |
Corporate bonds (39.6%) | | | |
Aerospace & Defense (0.7%) | | | |
$ | 800 | | | AAR Escrow Issuer LLC, Rule 144A, Company Guaranteed Notes
(Callable 03/15/26 @ 103.38)1 | | (BB, Ba2) | | 03/15/29 | | | 6.750 | | | $ | 818,588 | | |
| | 2,396 | | | Amentum Holdings, Inc., Rule 144A, Company Guaranteed Notes
(Callable 08/01/27 @ 103.63)1 | | (B, B3) | | 08/01/32 | | | 7.250 | | | | 2,484,724 | | |
| | 489 | | | Bombardier, Inc., Rule 144A, Senior Unsecured Notes (Callable 02/01/26 @ 103.75)1 | | (B+, B1) | | 02/01/29 | | | 7.500 | | | | 509,656 | | |
| | 507 | | | KBR, Inc., Rule 144A, Company Guaranteed Notes (Callable 11/11/24 @ 101.19)1 | | (BB, B1) | | 09/30/28 | | | 4.750 | | | | 485,490 | | |
| | 750 | | | TransDigm, Inc., Rule 144A, Senior Secured Notes (Callable 03/01/26 @ 103.19)1 | | (BB-, Ba3) | | 03/01/29 | | | 6.375 | | | | 763,230 | | |
| | 750 | | | TransDigm, Inc., Rule 144A, Senior Secured Notes (Callable 03/01/27 @ 103.31)1 | | (BB-, Ba3) | | 03/01/32 | | | 6.625 | | | | 764,631 | | |
| | | | | | | | | | | | | | 5,826,319 | | |
Air Transportation (0.2%) | | | |
| | 1,650 | | | VistaJet Malta Finance PLC/Vista Management Holding, Inc., Rule 144A,
Senior Unsecured Notes (Callable 02/01/25 @ 103.19)1,2 | | (B-, B3) | | 02/01/30 | | | 6.375 | | | | 1,414,108 | | |
Auto Parts & Equipment (2.1%) | | | |
| | 2,034 | | | Adient Global Holdings Ltd., Rule 144A, Senior Secured Notes
(Callable 04/15/25 @ 103.50)1 | | (BBB-, Ba2) | | 04/15/28 | | | 7.000 | | | | 2,068,006 | | |
| | 1,500 | | | Clarios Global LP/Clarios U.S. Finance Co., Rule 144A, Company Guaranteed Notes
(Callable 12/01/24 @ 100.00)1 | | (B, B3) | | 05/15/27 | | | 8.500 | | | | 1,510,022 | | |
| | 1,250 | | | Cougar JV Subsidiary LLC, Rule 144A, Senior Unsecured Notes
(Callable 05/15/27 @ 104.00)1 | | (B+, B2) | | 05/15/32 | | | 8.000 | | | | 1,307,814 | | |
| | 2,787 | | | Dealer Tire LLC/DT Issuer LLC, Rule 144A, Senior Unsecured Notes
(Callable 12/01/24 @ 102.00)1 | | (CCC, Caa1) | | 02/01/28 | | | 8.000 | | | | 2,757,091 | | |
| | 3,750 | | | Garrett Motion Holdings, Inc./Garrett LX I SARL, Rule 144A, Company Guaranteed Notes
(Callable 05/31/27 @ 103.88)1 | | (B, B1) | | 05/31/32 | | | 7.750 | | | | 3,752,543 | | |
| | 4,950 | | | Phinia, Inc., Rule 144A, Senior Secured Notes (Callable 04/15/26 @ 103.38)1 | | (BB+, Baa3) | | 04/15/29 | | | 6.750 | | | | 5,061,708 | | |
| | 1,000 | | | TI Automotive Finance PLC, Rule 144A, Company Guaranteed Notes
(Callable 11/30/24 @ 101.88)1,3 | | (BB, B2) | | 04/15/29 | | | 3.750 | | | | 1,048,341 | | |
| | | | | | | | | | | | | | 17,505,525 | | |
Brokerage (0.3%) | | | |
| | 2,450 | | | StoneX Group, Inc., Rule 144A, Senior Secured Notes (Callable 03/01/27 @ 103.94)1 | | (BB-, Ba3) | | 03/01/31 | | | 7.875 | | | | 2,580,024 | | |
Building & Construction (0.8%) | | | |
| | 4,693 | | | Pike Corp., Rule 144A, Company Guaranteed Notes (Callable 12/01/24 @ 101.38)1 | | (B-, B3) | | 09/01/28 | | | 5.500 | | | | 4,603,166 | | |
| | 1,200 | | | Pike Corp., Rule 144A, Senior Unsecured Notes (Callable 01/31/27 @ 104.31)1 | | (B-, B3) | | 01/31/31 | | | 8.625 | | | | 1,276,471 | | |
| | 1,100 | | | TopBuild Corp., Rule 144A, Company Guaranteed Notes (Callable 10/15/26 @ 102.06)1 | | (BB+, Ba2) | | 02/15/32 | | | 4.125 | | | | 981,689 | | |
| | | | | | | | | | | | | | 6,861,326 | | |
Building Materials (2.1%) | | | |
| | 754 | | | Advanced Drainage Systems, Inc., Rule 144A, Company Guaranteed Notes
(Callable 07/15/25 @ 103.19)1 | | (BB-, Ba2) | | 06/15/30 | | | 6.375 | | | | 760,632 | | |
| | 1,756 | | | Cornerstone Building Brands, Inc., Rule 144A, Senior Secured Notes
(Callable 08/15/26 @ 104.75)1 | | (B, B2) | | 08/15/29 | | | 9.500 | | | | 1,809,474 | | |
| | 2,750 | | | Eco Material Technologies, Inc., Rule 144A, Senior Secured Notes
(Callable 12/01/24 @ 103.94)1 | | (B, B2) | | 01/31/27 | | | 7.875 | | | | 2,759,254 | | |
| | 1,690 | | | Foundation Building Materials, Inc., Rule 144A, Company Guaranteed Notes
(Callable 12/01/24 @ 103.00)1 | | (CCC+, Caa1) | | 03/01/29 | | | 6.000 | | | | 1,494,924 | | |
| | 600 | | | Installed Building Products, Inc., Rule 144A, Company Guaranteed Notes
(Callable 11/16/24 @ 101.44)1 | | (B+, Ba2) | | 02/01/28 | | | 5.750 | | | | 596,189 | | |
| | 2,100 | | | Masterbrand, Inc., Rule 144A, Company Guaranteed Notes (Callable 07/15/27 @ 103.50)1 | | (BB, Ba3) | | 07/15/32 | | | 7.000 | | | | 2,153,172 | | |
| | 1,940 | | | Miter Brands Acquisition Holdco, Inc./MIWD Borrower LLC, Rule 144A, Senior Secured Notes
(Callable 04/01/27 @ 103.38)1 | | (BB-, B1) | | 04/01/32 | | | 6.750 | | | | 1,977,163 | | |
| | 696 | | | MIWD Holdco II LLC/MIWD Finance Corp., Rule 144A, Company Guaranteed Notes
(Callable 02/01/25 @ 102.75)1,2 | | (B-, B3) | | 02/01/30 | | | 5.500 | | | | 666,791 | | |
1
Credit Suisse Strategic Income Fund
Schedule of Investments
Par
(000) | | | | Ratings†
(S&P/Moody's) | | Maturity | | Rate% | | Value | |
Corporate bonds—(continued) | | | |
Building Materials—(concluded) | | | |
$ | 1,000 | | | Oscar AcquisitionCo LLC/Oscar Finance, Inc., Rule 144A, Senior Unsecured Notes
(Callable 04/15/25 @ 104.75)1 | | (CCC+, Caa1) | | 04/15/30 | | | 9.500 | | | $ | 977,842 | | |
| | 940 | | | Standard Industries, Inc., Rule 144A, Senior Unsecured Notes (Callable 07/15/25 @ 102.19)1 | | (BB, B1) | | 07/15/30 | | | 4.375 | | | | 864,478 | | |
| | 500 | | | Standard Industries, Inc., Rule 144A, Senior Unsecured Notes (Callable 08/15/27 @ 103.25)1 | | (BB, B1) | | 08/15/32 | | | 6.500 | | | | 503,561 | | |
| | 750 | | | Summit Materials LLC/Summit Materials Finance Corp., Rule 144A, Company Guaranteed
Notes (Callable 01/15/27 @ 103.63)1 | | (BB+, Ba3) | | 01/15/31 | | | 7.250 | | | | 780,019 | | |
| | 2,700 | | | White Cap Buyer LLC, Rule 144A, Senior Unsecured Notes (Callable 12/01/24 @ 101.72)1,2 | | (CCC+, Caa1) | | 10/15/28 | | | 6.875 | | | | 2,711,146 | | |
| | | | | | | | | | | | | | 18,054,645 | | |
Cable & Satellite TV (0.5%) | | | |
| | 1,000 | | | Altice France SA, Rule 144A, Senior Secured Notes (Callable 12/01/24 @ 102.56)1 | | (CCC+, Caa1) | | 07/15/29 | | | 5.125 | | | | 749,088 | | |
| | 1,770 | | | Altice France SA, Rule 144A, Senior Secured Notes (Callable 12/01/24 @ 102.75)1 | | (CCC+, Caa1) | | 10/15/29 | | | 5.500 | | | | 1,327,294 | | |
| | 1,530 | | | Sunrise FinCo I BV, Rule 144A, Senior Secured Notes (Callable 07/15/26 @ 102.44)1 | | (BB-, B1) | | 07/15/31 | | | 4.875 | | | | 1,401,320 | | |
| | 400 | | | Telenet Finance Luxembourg Notes SARL, Rule 144A, Senior Secured Notes
(Callable 11/11/24 @ 101.38)1 | | (BB-, B1) | | 03/01/28 | | | 5.500 | | | | 389,448 | | |
| | | | | | | | | | | | | | 3,867,150 | | |
Chemicals (1.6%) | | | |
| | 750 | | | Avient Corp., Rule 144A, Senior Unsecured Notes (Callable 08/01/25 @ 103.56)1 | | (BB-, Ba3) | | 08/01/30 | | | 7.125 | | | | 771,928 | | |
| | 600 | | | Avient Corp., Rule 144A, Senior Unsecured Notes (Callable 09/15/27 @ 103.13)1 | | (BB-, Ba3) | | 11/01/31 | | | 6.250 | | | | 601,962 | | |
| | 500 | | | Axalta Coating Systems Dutch Holding B BV, Rule 144A, Company Guaranteed Notes
(Callable 11/15/26 @ 103.63)1 | | (BB, Ba3) | | 02/15/31 | | | 7.250 | | | | 523,164 | | |
| | 500 | | | Herens Holdco SARL, Rule 144A, Senior Secured Notes (Callable 12/01/24 @ 102.38)1 | | (B-, B2) | | 05/15/28 | | | 4.750 | | | | 439,239 | | |
| | 1,064 | | | INEOS Finance PLC, Rule 144A, Senior Secured Notes (Callable 02/15/25 @ 103.38)1 | | (BB, Ba3) | | 05/15/28 | | | 6.750 | | | | 1,076,606 | | |
| | 500 | | | INEOS Quattro Finance 2 PLC, Rule 144A, Senior Secured Notes
(Callable 11/15/25 @ 104.81)1,2 | | (BB, B1) | | 03/15/29 | | | 9.625 | | | | 529,645 | | |
| | 5,000 | | | Tronox, Inc., Rule 144A, Company Guaranteed Notes (Callable 12/01/24 @ 102.31)1,2 | | (BB-, B1) | | 03/15/29 | | | 4.625 | | | | 4,540,792 | | |
| | 4,631 | | | Vibrantz Technologies, Inc., Rule 144A, Senior Unsecured Notes
(Callable 02/15/25 @ 104.50)1,2 | | (CCC+, Caa2) | | 02/15/30 | | | 9.000 | | | | 4,346,309 | | |
| | 374 | | | WR Grace Holdings LLC, Rule 144A, Senior Secured Notes (Callable 03/01/26 @ 103.69)1 | | (B-, B1) | | 03/01/31 | | | 7.375 | | | | 386,905 | | |
| | | | | | | | | | | | | | 13,216,550 | | |
Consumer/Commercial/Lease Financing (0.6%) | | | |
| | 5,250 | | | Cargo Aircraft Management, Inc., Rule 144A, Company Guaranteed Notes
(Callable 11/16/24 @ 101.19)1,2 | | (BB, Ba2) | | 02/01/28 | | | 4.750 | | | | 5,026,416 | | |
Diversified Capital Goods (1.0%) | | | |
| | 2,746 | | | Atkore, Inc., Rule 144A, Senior Unsecured Notes (Callable 06/01/26 @ 102.13)1 | | (BB+, Ba2) | | 06/01/31 | | | 4.250 | | | | 2,477,465 | | |
| | 2,200 | | | Dornoch Debt Merger Sub, Inc., Rule 144A, Senior Unsecured Notes
(Callable 12/01/24 @ 103.31)1,2 | | (CCC, Caa2) | | 10/15/29 | | | 6.625 | | | | 1,861,241 | | |
| | 3,434 | | | EnerSys, Rule 144A, Company Guaranteed Notes (Callable 09/15/27 @ 100.00)1 | | (BB+, Ba3) | | 12/15/27 | | | 4.375 | | | | 3,311,590 | | |
| | 1,000 | | | EnerSys, Rule 144A, Company Guaranteed Notes (Callable 01/15/27 @ 103.31)1 | | (BB+, Ba3) | | 01/15/32 | | | 6.625 | | | | 1,028,229 | | |
| | | | | | | | | | | | | | 8,678,525 | | |
Electronics (0.2%) | | | |
| | 1,500 | | | Sensata Technologies, Inc., Rule 144A, Company Guaranteed Notes
(Callable 07/15/27 @ 103.31)1 | | (BB+, Ba2) | | 07/15/32 | | | 6.625 | | | | 1,520,467 | | |
Energy—Exploration & Production (1.4%) | | | |
| | 500 | | | Civitas Resources, Inc., Rule 144A, Company Guaranteed Notes
(Callable 07/01/25 @ 104.19)1 | | (BB-, B1) | | 07/01/28 | | | 8.375 | | | | 517,371 | | |
| | 500 | | | Civitas Resources, Inc., Rule 144A, Company Guaranteed Notes
(Callable 07/01/26 @ 104.38)1 | | (BB-, B1) | | 07/01/31 | | | 8.750 | | | | 524,381 | | |
| | 3,750 | | | CNX Midstream Partners LP, Rule 144A, Company Guaranteed Notes
(Callable 04/15/25 @ 102.38)1 | | (BB, B1) | | 04/15/30 | | | 4.750 | | | | 3,494,287 | | |
2
Credit Suisse Strategic Income Fund
Schedule of Investments
Par
(000) | | | | Ratings†
(S&P/Moody's) | | Maturity | | Rate% | | Value | |
Corporate bonds—(continued) | | | |
Energy—Exploration & Production—(concluded) | | | |
$ | 250 | | | Matador Resources Co., Rule 144A, Company Guaranteed Notes
(Callable 04/15/25 @ 103.44)1 | | (BB-, B1) | | 04/15/28 | | | 6.875 | | | $ | 254,681 | | |
| | 6,565 | | | Northern Oil & Gas, Inc., Rule 144A, Senior Unsecured Notes (Callable 12/01/24 @ 104.06)1 | | (B+, B2) | | 03/01/28 | | | 8.125 | | | | 6,633,493 | | |
| | 500 | | | Northern Oil & Gas, Inc., Rule 144A, Senior Unsecured Notes (Callable 06/15/26 @ 104.38)1 | | (B+, B2) | | 06/15/31 | | | 8.750 | | | | 517,220 | | |
| | | | | | | | | | | | | | 11,941,433 | | |
Environmental (0.0%) | | | |
| | 140 | | | Clean Harbors, Inc., Rule 144A, Company Guaranteed Notes (Callable 02/01/26 @ 103.19)1 | | (BB+, Ba3) | | 02/01/31 | | | 6.375 | | | | 141,184 | | |
Food & Drug Retailers (0.3%) | | | |
| | 2,567 | | | Murphy Oil USA, Inc., Rule 144A, Company Guaranteed Notes (Callable 02/15/26 @ 101.88)1 | | (BB+, Ba2) | | 02/15/31 | | | 3.750 | | | | 2,283,991 | | |
Food—Wholesale (1.1%) | | | |
| | 3,717 | | | Darling Ingredients, Inc., Rule 144A, Company Guaranteed Notes
(Callable 06/15/25 @ 103.00)1 | | (BB+, Ba2) | | 06/15/30 | | | 6.000 | | | | 3,694,696 | | |
| | 1,400 | | | Performance Food Group, Inc., Rule 144A, Company Guaranteed Notes
(Callable 09/15/27 @ 103.06)1 | | (BB, B1) | | 09/15/32 | | | 6.125 | | | | 1,407,533 | | |
| | 1,000 | | | Post Holdings, Inc., Rule 144A, Company Guaranteed Notes (Callable 09/01/27 @ 103.19)1 | | (B+, B2) | | 03/01/33 | | | 6.375 | | | | 991,800 | | |
| | 500 | | | Post Holdings, Inc., Rule 144A, Senior Unsecured Notes (Callable 10/15/29 @ 103.13)1 | | (B+, B2) | | 10/15/34 | | | 6.250 | | | | 494,908 | | |
| | 1,250 | | | U.S. Foods, Inc., Rule 144A, Company Guaranteed Notes (Callable 10/15/27 @ 102.88)1 | | (BB, Ba3) | | 04/15/33 | | | 5.750 | | | | 1,232,563 | | |
| | 666 | | | U.S. Foods, Inc., Rule 144A, Company Guaranteed Notes (Callable 09/15/25 @ 103.44)1 | | (BB, Ba3) | | 09/15/28 | | | 6.875 | | | | 685,488 | | |
| | 684 | | | U.S. Foods, Inc., Rule 144A, Company Guaranteed Notes (Callable 09/15/26 @ 103.63)1 | | (BB, Ba3) | | 01/15/32 | | | 7.250 | | | | 711,599 | | |
| | | | | | | | | | | | | | 9,218,587 | | |
Gaming (0.4%) | | | |
| | 400 | | | Boyd Gaming Corp., Rule 144A, Company Guaranteed Notes (Callable 06/15/26 @ 102.38)1 | | (BB, B1) | | 06/15/31 | | | 4.750 | | | | 373,526 | | |
| | 500 | | | Caesars Entertainment, Inc., Rule 144A, Senior Secured Notes
(Callable 02/15/26 @ 103.50)1 | | (BB-, Ba3) | | 02/15/30 | | | 7.000 | | | | 513,493 | | |
| | 2,100 | | | Caesars Entertainment, Inc., Rule 144A, Senior Secured Notes
(Callable 02/15/27 @ 103.25)1 | | (BB-, Ba3) | | 02/15/32 | | | 6.500 | | | | 2,131,193 | | |
| | | | | | | | | | | | | | 3,018,212 | | |
Gas Distribution (1.4%) | | | |
| | 350 | | | Blue Racer Midstream LLC/Blue Racer Finance Corp., Rule 144A, Senior Unsecured Notes
(Callable 07/15/26 @ 103.50)1 | | (B+, B2) | | 07/15/29 | | | 7.000 | | | | 359,233 | | |
| | 350 | | | Blue Racer Midstream LLC/Blue Racer Finance Corp., Rule 144A, Senior Unsecured Notes
(Callable 07/15/27 @ 103.63)1 | | (B+, B2) | | 07/15/32 | | | 7.250 | | | | 361,763 | | |
| | 268 | | | Genesis Energy LP/Genesis Energy Finance Corp., Global Company Guaranteed Notes
(Callable 04/15/26 @ 104.44) | | (B, B3) | | 04/15/30 | | | 8.875 | | | | 277,536 | | |
| | 750 | | | Hess Midstream Operations LP, Rule 144A, Company Guaranteed Notes
(Callable 10/15/25 @ 102.75)1 | | (BB+, Ba2) | | 10/15/30 | | | 5.500 | | | | 733,276 | | |
| | 2,000 | | | Rockies Express Pipeline LLC, Rule 144A, Senior Unsecured Notes
(Callable 04/15/25 @ 100.00)1 | | (BB, Ba2) | | 05/15/25 | | | 3.600 | | | | 1,974,126 | | |
| | 2,500 | | | Rockies Express Pipeline LLC, Rule 144A, Senior Unsecured Notes
(Callable 04/15/29 @ 100.00)1 | | (BB, Ba2) | | 07/15/29 | | | 4.950 | | | | 2,351,234 | | |
| | 1,250 | | | Rockies Express Pipeline LLC, Rule 144A, Senior Unsecured Notes
(Callable 02/15/30 @ 100.00)1 | | (BB, Ba2) | | 05/15/30 | | | 4.800 | | | | 1,157,498 | | |
| | 1,868 | | | Tallgrass Energy Partners LP/Tallgrass Energy Finance Corp., Rule 144A, Company
Guaranteed Notes (Callable 12/31/25 @ 103.00)1 | | (B+, B1) | | 12/31/30 | | | 6.000 | | | | 1,752,730 | | |
| | 2,920 | | | Tallgrass Energy Partners LP/Tallgrass Energy Finance Corp., Rule 144A, Senior Unsecured
Notes (Callable 02/15/26 @ 103.69)1 | | (B+, B1) | | 02/15/29 | | | 7.375 | | | | 2,931,575 | | |
| | | | | | | | | | | | | | 11,898,971 | | |
3
Credit Suisse Strategic Income Fund
Schedule of Investments
Par
(000) | | | | Ratings†
(S&P/Moody's) | | Maturity | | Rate% | | Value | |
Corporate bonds—(continued) | | | |
Health Services (0.9%) | | | |
$ | 1,279 | | | AMN Healthcare, Inc., Rule 144A, Company Guaranteed Notes
(Callable 11/11/24 @ 102.00)1,2 | | (BB-, Ba3) | | 04/15/29 | | | 4.000 | | | $ | 1,180,524 | | |
| | 2,560 | | | Option Care Health, Inc., Rule 144A, Company Guaranteed Notes
(Callable 12/01/24 @ 102.19)1 | | (B, B2) | | 10/31/29 | | | 4.375 | | | | 2,358,361 | | |
| | 4,000 | | | Pediatrix Medical Group, Inc., Rule 144A, Company Guaranteed Notes
(Callable 02/15/25 @ 102.69)1,2 | | (BB-, Ba3) | | 02/15/30 | | | 5.375 | | | | 3,825,361 | | |
| | | | | | | | | | | | | | 7,364,246 | | |
Hotels (0.2%) | | | |
| | 160 | | | Hilton Domestic Operating Co., Inc., Rule 144A, Company Guaranteed Notes
(Callable 04/01/26 @ 102.94)1 | | (BB+, Ba2) | | 04/01/29 | | | 5.875 | | | | 161,481 | | |
| | 1,325 | | | RHP Hotel Properties LP/RHP Finance Corp., Rule 144A, Company Guaranteed Notes
(Callable 04/01/27 @ 103.25)1 | | (BB-, Ba3) | | 04/01/32 | | | 6.500 | | | | 1,341,533 | | |
| | | | | | | | | | | | | | 1,503,014 | | |
Insurance Brokerage (1.4%) | | | |
| | 572 | | | Alliant Holdings Intermediate LLC/Alliant Holdings Co-Issuer, Rule 144A, Senior Secured
Notes (Callable 01/15/27 @ 103.50)1 | | (B, B2) | | 01/15/31 | | | 7.000 | | | | 576,308 | | |
| | 2,300 | | | Jones Deslauriers Insurance Management, Inc., Rule 144A, Senior Secured Notes
(Callable 03/15/26 @ 104.25)1 | | (B-, B2) | | 03/15/30 | | | 8.500 | | | | 2,438,432 | | |
| | 3,500 | | | Jones Deslauriers Insurance Management, Inc., Rule 144A, Senior Unsecured Notes
(Callable 12/15/25 @ 105.25)1 | | (CCC, Caa2) | | 12/15/30 | | | 10.500 | | | | 3,773,296 | | |
| | 2,000 | | | Panther Escrow Issuer LLC, Rule 144A, Senior Secured Notes (Callable 06/01/27 @ 103.56)1 | | (B, B2) | | 06/01/31 | | | 7.125 | | | | 2,045,576 | | |
| | 647 | | | Ryan Specialty LLC, Rule 144A, Senior Secured Notes (Callable 02/01/25 @ 102.19)1 | | (BB-, B1) | | 02/01/30 | | | 4.375 | | | | 614,160 | | |
| | 2,625 | | | Ryan Specialty LLC, Rule 144A, Senior Secured Notes (Callable 08/01/27 @ 102.94)1 | | (BB-, B1) | | 08/01/32 | | | 5.875 | | | | 2,618,628 | | |
| | | | | | | | | | | | | | 12,066,400 | | |
Investments & Misc. Financial Services (3.5%) | | | |
| | 4,250 | | | Armor Holdco, Inc., Rule 144A, Company Guaranteed Notes (Callable 12/01/24 @ 104.25)1 | | (CCC+, Caa1) | | 11/15/29 | | | 8.500 | | | | 4,165,945 | | |
| | 600 | | | Block, Inc., Rule 144A, Senior Unsecured Notes (Callable 05/15/27 @ 103.25)1 | | (BB+, Ba2) | | 05/15/32 | | | 6.500 | | | | 611,451 | | |
| | 4,000 | | | Boost Newco Borrower LLC, Rule 144A, Senior Secured Notes (Callable 01/15/27 @ 103.75)1 | | (BB, Ba3) | | 01/15/31 | | | 7.500 | | | | 4,214,172 | | |
| | 1,250 | | | Compass Group Diversified Holdings LLC, Rule 144A, Company Guaranteed Notes
(Callable 12/01/24 @ 102.63)1 | | (B+, B1) | | 04/15/29 | | | 5.250 | | | | 1,203,657 | | |
| | 3,275 | | | Compass Group Diversified Holdings LLC, Rule 144A, Senior Unsecured Notes
(Callable 01/15/27 @ 102.50)1,2 | | (B+, B1) | | 01/15/32 | | | 5.000 | | | | 3,024,100 | | |
| | 3,450 | | | Focus Financial Partners LLC, Rule 144A, Senior Secured Notes
(Callable 09/15/27 @ 103.38)1 | | (B+, B2) | | 09/15/31 | | | 6.750 | | | | 3,440,541 | | |
| | 3,000 | | | Jane Street Group/JSG Finance, Inc., Rule 144A, Senior Secured Notes
(Callable 04/30/27 @ 103.56)1 | | (BB, Ba1) | | 04/30/31 | | | 7.125 | | | | 3,111,477 | | |
| | 2,750 | | | Jane Street Group/JSG Finance, Inc., Rule 144A, Senior Secured Notes
(Callable 11/01/27 @ 103.06)1 | | (BB, Ba1) | | 11/01/32 | | | 6.125 | | | | 2,753,082 | | |
| | 1,400 | | | Paysafe Finance PLC/Paysafe Holdings U.S. Corp., Rule 144A, Senior Secured Notes
(Callable 12/01/24 @ 102.00)1,2 | | (B, B2) | | 06/15/29 | | | 4.000 | | | | 1,293,478 | | |
| | 1,841 | | | Shift4 Payments LLC/Shift4 Payments Finance Sub, Inc., Rule 144A, Company Guaranteed
Notes (Callable 12/01/24 @ 100.00)1 | | (NR, Ba3) | | 11/01/26 | | | 4.625 | | | | 1,814,412 | | |
| | 3,960 | | | VFH Parent LLC/Valor Co-Issuer, Inc., Rule 144A, Senior Secured Notes
(Callable 06/15/27 @ 103.75)1 | | (B+, B1) | | 06/15/31 | | | 7.500 | | | | 4,069,328 | | |
| | | | | | | | | | | | | | 29,701,643 | | |
Machinery (2.2%) | | | |
| | 2,806 | | | Arcosa, Inc., Rule 144A, Company Guaranteed Notes (Callable 12/01/24 @ 102.19)1 | | (B+, Ba3) | | 04/15/29 | | | 4.375 | | | | 2,649,891 | | |
| | 1,750 | | | Arcosa, Inc., Rule 144A, Company Guaranteed Notes (Callable 08/15/27 @ 103.44)1 | | (B+, Ba3) | | 08/15/32 | | | 6.875 | | | | 1,797,194 | | |
| | 4,325 | | | ATS Corp., Rule 144A, Company Guaranteed Notes (Callable 12/01/24 @ 102.06)1 | | (BB, B1) | | 12/15/28 | | | 4.125 | | | | 4,070,545 | | |
| | 6,949 | | | Enviri Corp., Rule 144A, Company Guaranteed Notes (Callable 12/01/24 @ 100.00)1 | | (B, B3) | | 07/31/27 | | | 5.750 | | | | 6,704,557 | | |
4
Credit Suisse Strategic Income Fund
Schedule of Investments
Par
(000) | | | | Ratings†
(S&P/Moody's) | | Maturity | | Rate% | | Value | |
Corporate bonds—(continued) | | | |
Machinery—(concluded) | | | |
$ | 1,000 | | | Griffon Corp., Global Company Guaranteed Notes (Callable 12/01/24 @ 101.92) | | (B, B3) | | 03/01/28 | | | 5.750 | | | $ | 982,300 | | |
| | 1,500 | | | Hillenbrand, Inc., Global Company Guaranteed Notes (Callable 02/15/26 @ 103.13)2 | | (BB+, Ba1) | | 02/15/29 | | | 6.250 | | | | 1,509,391 | | |
| | 500 | | | Hillenbrand, Inc., Global Company Guaranteed Notes (Callable 03/01/26 @ 101.88)2 | | (BB+, Ba1) | | 03/01/31 | | | 3.750 | | | | 438,106 | | |
| | 319 | | | Regal Rexnord Corp., Global Company Guaranteed Notes (Callable 01/15/33 @ 100.00) | | (BB+, Baa3) | | 04/15/33 | | | 6.400 | | | | 333,318 | | |
| | | | | | | | | | | | | | 18,485,302 | | |
Media—Diversified (0.0%) | | | |
| | 50 | | | Tech 7 SAS Super Senior3,4,5 | | (NR, NR) | | 03/31/26 | | | 15.000 | | | | 54,739 | | |
| | 84 | | | Tech 7 SAS Super Senior3,4,5 | | (NR, NR) | | 03/31/26 | | | 18.682 | | | | 91,233 | | |
| | 25 | | | Tech 7 SAS Technicolor Creative Studios Super Senior3,4,5 | | (NR, NR) | | 04/01/26 | | | 15.000 | | | | 27,370 | | |
| | 42 | | | Technicolor Creative Studios3,4,5 | | (NR, NR) | | 03/31/26 | | | 15.000 | | | | 45,617 | | |
| | 25 | | | Technicolor Creative Studios3,4,5 | | (NR, NR) | | 04/01/26 | | | 15.000 | | | | 27,370 | | |
| | | | | | | | | | | | | | 246,329 | | |
Media Content (0.2%) | | | |
| | 2,200 | | | Sirius XM Radio, Inc., Rule 144A, Company Guaranteed Notes
(Callable 09/01/26 @ 101.94)1,2 | | (BB+, Ba3) | | 09/01/31 | | | 3.875 | | | | 1,891,996 | | |
Metals & Mining—Excluding Steel (1.2%) | | | |
| | 5,010 | | | ERO Copper Corp., Rule 144A, Company Guaranteed Notes (Callable 02/15/25 @ 103.25)1 | | (B, B1) | | 02/15/30 | | | 6.500 | | | | 4,918,540 | | |
| | 2,050 | | | First Quantum Minerals Ltd., Rule 144A, Secured Notes (Callable 03/01/26 @ 104.69)1 | | (B, NR) | | 03/01/29 | | | 9.375 | | | | 2,182,280 | | |
| | 2,595 | | | Kaiser Aluminum Corp., Rule 144A, Company Guaranteed Notes
(Callable 06/01/26 @ 102.25)1,2 | | (BB-, B2) | | 06/01/31 | | | 4.500 | | | | 2,318,969 | | |
| | 1,000 | | | Novelis Corp., Rule 144A, Company Guaranteed Notes (Callable 01/30/25 @ 102.38)1 | | (BB, Ba3) | | 01/30/30 | | | 4.750 | | | | 939,029 | | |
| | | | | | | | | | | | | | 10,358,818 | | |
Oil Field Equipment & Services (0.7%) | | | |
| | 5,400 | | | CQP Holdco LP/BIP-V Chinook Holdco LLC, Rule 144A, Senior Secured Notes
(Callable 12/15/28 @ 103.75)1 | | (BB, Ba2) | | 12/15/33 | | | 7.500 | | | | 5,717,342 | | |
Oil Refining & Marketing (0.3%) | | | |
| | 550 | | | Global Partners LP/GLP Finance Corp., Rule 144A, Company Guaranteed Notes
(Callable 01/15/27 @ 104.13)1 | | (B+, B2) | | 01/15/32 | | | 8.250 | | | | 561,551 | | |
| | 700 | | | Sunoco LP, Rule 144A, Company Guaranteed Notes (Callable 05/01/27 @ 103.63)1 | | (BB+, Ba1) | | 05/01/32 | | | 7.250 | | | | 729,306 | | |
| | 1,545 | | | Sunoco LP/Sunoco Finance Corp., Rule 144A, Company Guaranteed Notes
(Callable 09/15/25 @ 103.50)1 | | (BB+, Ba1) | | 09/15/28 | | | 7.000 | | | | 1,589,082 | | |
| | | | | | | | | | | | | | 2,879,939 | | |
Packaging (1.3%) | | | |
| | 350 | | | Ardagh Metal Packaging Finance USA LLC/Ardagh Metal Packaging Finance PLC, Rule 144A,
Senior Unsecured Notes (Callable 11/30/24 @ 101.50)1,3 | | (CCC+, Caa1) | | 09/01/29 | | | 3.000 | | | | 330,753 | | |
| | 1,920 | | | Mauser Packaging Solutions Holding Co., Rule 144A, Senior Secured Notes
(Callable 02/15/25 @ 103.94)1 | | (B, B2) | | 04/15/27 | | | 7.875 | | | | 1,974,816 | | |
| | 348 | | | Owens-Brockway Glass Container, Inc., Rule 144A, Company Guaranteed Notes
(Callable 05/15/26 @ 103.63)1,2 | | (B+, B2) | | 05/15/31 | | | 7.250 | | | | 343,582 | | |
| | 250 | | | Sealed Air Corp./Sealed Air Corp. U.S., Rule 144A, Company Guaranteed Notes
(Callable 02/01/25 @ 103.06)1 | | (BB+, Ba2) | | 02/01/28 | | | 6.125 | | | | 252,841 | | |
| | 2,750 | | | Trident TPI Holdings, Inc., Rule 144A, Company Guaranteed Notes
(Callable 12/31/25 @ 106.38)1 | | (CCC+, Caa2) | | 12/31/28 | | | 12.750 | | | | 3,020,740 | | |
| | 4,307 | | | TriMas Corp., Rule 144A, Company Guaranteed Notes (Callable 12/01/24 @ 102.06)1 | | (BB-, Ba3) | | 04/15/29 | | | 4.125 | | | | 4,022,120 | | |
| | 913 | | | Verde Purchaser LLC, Rule 144A, Senior Secured Notes (Callable 11/30/26 @ 105.25)1 | | (B+, B2) | | 11/30/30 | | | 10.500 | | | | 975,896 | | |
| | | | | | | | | | | | | | 10,920,748 | | |
5
Credit Suisse Strategic Income Fund
Schedule of Investments
Par
(000) | | | | Ratings†
(S&P/Moody's) | | Maturity | | Rate% | | Value | |
Corporate bonds—(continued) | | | |
Personal & Household Products (0.4%) | | | |
$ | 350 | | | Acushnet Co., Rule 144A, Company Guaranteed Notes (Callable 10/15/25 @ 103.69)1 | | (BB, Ba3) | | 10/15/28 | | | 7.375 | | | $ | 365,295 | | |
| | 850 | | | Amer Sports Co., Rule 144A, Senior Secured Notes (Callable 02/16/27 @ 103.38)1,2 | | (BB, B1) | | 02/16/31 | | | 6.750 | | | | 864,200 | | |
| | 2,820 | | | Tempur Sealy International, Inc., Rule 144A, Company Guaranteed Notes
(Callable 10/15/26 @ 101.94)1 | | (BB, Ba2) | | 10/15/31 | | | 3.875 | | | | 2,456,168 | | |
| | | | | | | | | | | | | | 3,685,663 | | |
Pharmaceuticals (0.0%) | | | |
| | 350 | | | Prestige Brands, Inc., Rule 144A, Company Guaranteed Notes (Callable 04/01/26 @ 101.88)1 | | (BB, B1) | | 04/01/31 | | | 3.750 | | | | 312,249 | | |
Rail (0.3%) | | | |
| | 2,826 | | | Genesee & Wyoming, Inc., Rule 144A, Senior Secured Notes (Callable 04/15/27 @ 103.13)1 | | (BB, Ba3) | | 04/15/32 | | | 6.250 | | | | 2,853,197 | | |
Real Estate Investment Trusts (0.5%) | | | |
| | 2,349 | | | Global Net Lease, Inc./Global Net Lease Operating Partnership LP, Rule 144A, Company
Guaranteed Notes (Callable 09/15/27 @ 100.00)1 | | (BB+, WR) | | 12/15/27 | | | 3.750 | | | | 2,156,758 | | |
| | 58 | | | Starwood Property Trust, Inc., Rule 144A, Senior Unsecured Notes
(Callable 01/15/26 @ 100.00)1 | | (BB-, Ba3) | | 07/15/26 | | | 3.625 | | | | 55,649 | | |
| | 1,150 | | | Starwood Property Trust, Inc., Rule 144A, Senior Unsecured Notes
(Callable 07/15/26 @ 100.00)1 | | (BB-, Ba3) | | 01/15/27 | | | 4.375 | | | | 1,109,447 | | |
| | 1,250 | | | Starwood Property Trust, Inc., Rule 144A, Senior Unsecured Notes
(Callable 10/15/29 @ 100.00)1 | | (BB-, Ba3) | | 04/15/30 | | | 6.000 | | | | 1,226,371 | | |
| | | | | | | | | | | | | | 4,548,225 | | |
Recreation & Travel (1.4%) | | | |
| | 2,430 | | | Boyne USA, Inc., Rule 144A, Senior Unsecured Notes (Callable 12/01/24 @ 102.38)1 | | (B, B1) | | 05/15/29 | | | 4.750 | | | | 2,319,376 | | |
| | 582 | | | SeaWorld Parks & Entertainment, Inc., Rule 144A, Company Guaranteed Notes
(Callable 11/11/24 @ 102.63)1,2 | | (B+, B2) | | 08/15/29 | | | 5.250 | | | | 560,016 | | |
| | 2,968 | | | Six Flags Entertainment Corp., Rule 144A, Company Guaranteed Notes
(Callable 05/15/26 @ 103.63)1,2 | | (BB-, B1) | | 05/15/31 | | | 7.250 | | | | 3,044,723 | | |
| | 5,550 | | | Speedway Motorsports LLC/Speedway Funding II, Inc., Rule 144A, Senior Unsecured Notes
(Callable 12/01/24 @ 100.00)1 | | (BB+, B1) | | 11/01/27 | | | 4.875 | | | | 5,428,192 | | |
| | 410 | | | Vail Resorts, Inc., Rule 144A, Company Guaranteed Notes (Callable 05/15/27 @ 103.25)1 | | (BB, Ba3) | | 05/15/32 | | | 6.500 | | | | 420,214 | | |
| | | | | | | | | | | | | | 11,772,521 | | |
Restaurants (0.8%) | | | |
| | 1,000 | | | 1011778 BC ULC/New Red Finance, Inc., Rule 144A, Senior Secured Notes
(Callable 06/15/26 @ 103.06)1 | | (BB+, Ba2) | | 06/15/29 | | | 6.125 | | | | 1,018,315 | | |
| | 1,000 | | | 1011778 BC ULC/New Red Finance, Inc., Rule 144A, Senior Secured Notes
(Callable 09/15/26 @ 102.81)1 | | (BB+, Ba2) | | 09/15/29 | | | 5.625 | | | | 998,752 | | |
| | 2,300 | | | Papa John's International, Inc., Rule 144A, Company Guaranteed Notes
(Callable 12/01/24 @ 101.94)1,2 | | (BB-, B1) | | 09/15/29 | | | 3.875 | | | | 2,099,422 | | |
| | 2,238 | | | Raising Cane's Restaurants LLC, Rule 144A, Senior Unsecured Notes
(Callable 11/01/25 @ 104.69)1 | | (B, B3) | | 05/01/29 | | | 9.375 | | | | 2,408,426 | | |
| | | | | | | | | | | | | | 6,524,915 | | |
Software—Services (2.9%) | | | |
| | 3,677 | | | CA Magnum Holdings, Rule 144A, Senior Secured Notes (Callable 12/01/24 @ 101.34)1,2 | | (NR, B1) | | 10/31/26 | | | 5.375 | | | | 3,615,283 | | |
| | 2,225 | | | Insight Enterprises, Inc., Rule 144A, Company Guaranteed Notes
(Callable 05/15/27 @ 103.31)1 | | (BB+, Ba3) | | 05/15/32 | | | 6.625 | | | | 2,276,455 | | |
| | 3,395 | | | Newfold Digital Holdings Group, Inc., Rule 144A, Senior Unsecured Notes
(Callable 12/01/24 @ 103.00)1,2 | | (CCC, Caa2) | | 02/15/29 | | | 6.000 | | | | 2,283,639 | | |
| | 972 | | | Open Text Corp., Rule 144A, Company Guaranteed Notes (Callable 12/01/24 @ 100.97)1 | | (BB, Ba3) | | 02/15/28 | | | 3.875 | | | | 914,688 | | |
| | 3,000 | | | Open Text Corp., Rule 144A, Company Guaranteed Notes (Callable 12/01/24 @ 101.94)1 | | (BB, Ba3) | | 12/01/29 | | | 3.875 | | | | 2,739,498 | | |
6
Credit Suisse Strategic Income Fund
Schedule of Investments
Par
(000) | | | | Ratings†
(S&P/Moody's) | | Maturity | | Rate% | | Value | |
Corporate bonds—(continued) | | | |
Software—Services—(concluded) | | | |
$ | 1,500 | | | Open Text Holdings, Inc., Rule 144A, Company Guaranteed Notes
(Callable 02/15/25 @ 102.06)1 | | (BB, Ba3) | | 02/15/30 | | | 4.125 | | | $ | 1,378,260 | | |
| | 975 | | | Open Text Holdings, Inc., Rule 144A, Company Guaranteed Notes
(Callable 12/01/26 @ 102.06)1 | | (BB, Ba3) | | 12/01/31 | | | 4.125 | | | | 876,488 | | |
| | 1,000 | | | UKG, Inc., Rule 144A, Senior Secured Notes (Callable 02/01/27 @ 103.44)1 | | (B-, B2) | | 02/01/31 | | | 6.875 | | | | 1,025,551 | | |
| | 5,075 | | | Virtusa Corp., Rule 144A, Senior Unsecured Notes (Callable 12/01/24 @ 103.56)1 | | (B-, Caa1) | | 12/15/28 | | | 7.125 | | | | 4,926,777 | | |
| | 4,953 | | | ZoomInfo Technologies LLC/ZoomInfo Finance Corp., Rule 144A, Company Guaranteed
Notes (Callable 11/11/24 @ 101.94)1 | | (B+, B1) | | 02/01/29 | | | 3.875 | | | | 4,517,915 | | |
| | | | | | | | | | | | | | 24,554,554 | | |
Specialty Retail (0.9%) | | | |
| | 1,750 | | | Eagle Intermediate Global Holding BV/Eagle U.S. Finance LLC, Rule 144A, Senior Secured
Notes (Callable 11/11/24 @ 100.00)1 | | (NR, Caa3) | | 05/01/25 | | | 7.500 | | | | 1,001,254 | | |
| | 48 | | | Eagle Intermediate Global Holding BV/Eagle U.S. Finance LLC, Rule 144A, Senior Secured
Notes (Callable 11/11/24 @ 100.00)1,4,5 | | (NR, Caa3) | | 05/01/25 | | | 7.500 | | | | 27,313 | | |
| | 64 | | | Eagle Intermediate Global Holding BV/Ruyi U.S. Finance LLC4,5,11 | | (NR, NR) | | 05/01/25 | | | 0.000 | | | | 34,782 | | |
| | 3,275 | | | Group 1 Automotive, Inc., Rule 144A, Company Guaranteed Notes
(Callable 12/01/24 @ 101.33)1 | | (BB+, Ba2) | | 08/15/28 | | | 4.000 | | | | 3,076,829 | | |
| | 1,500 | | | Group 1 Automotive, Inc., Rule 144A, Company Guaranteed Notes
(Callable 07/15/26 @ 103.19)1 | | (BB+, Ba2) | | 01/15/30 | | | 6.375 | | | | 1,511,690 | | |
| | 750 | | | LCM Investments Holdings II LLC, Rule 144A, Senior Unsecured Notes
(Callable 08/01/26 @ 104.13)1 | | (BB-, B2) | | 08/01/31 | | | 8.250 | | | | 783,076 | | |
| | 950 | | | Lithia Motors, Inc., Rule 144A, Company Guaranteed Notes (Callable 10/15/25 @ 102.19)1 | | (BB+, Ba2) | | 01/15/31 | | | 4.375 | | | | 870,136 | | |
| | 271 | | | Sonic Automotive, Inc., Rule 144A, Company Guaranteed Notes
(Callable 11/15/26 @ 102.44)1 | | (BB-, B1) | | 11/15/31 | | | 4.875 | | | | 243,899 | | |
| | | | | | | | | | | | | | 7,548,979 | | |
Steel Producers/Products (0.4%) | | | |
| | 3,279 | | | TMS International Corp., Rule 144A, Senior Unsecured Notes (Callable 11/11/24 @ 103.13)1 | | (B, Caa1) | | 04/15/29 | | | 6.250 | | | | 3,175,393 | | |
Support—Services (2.5%) | | | |
| | 1,342 | | | Allied Universal Holdco LLC/Allied Universal Finance Corp., Rule 144A, Senior Unsecured
Notes (Callable 12/01/24 @ 100.00)1 | | (CCC+, Caa2) | | 07/15/27 | | | 9.750 | | | | 1,346,268 | | |
| | 1,200 | | | Allied Universal Holdco LLC/Allied Universal Finance Corp., Rule 144A, Senior Unsecured
Notes (Callable 12/01/24 @ 103.00)1,2 | | (CCC+, Caa2) | | 06/01/29 | | | 6.000 | | | | 1,099,203 | | |
| | 944 | | | Allied Universal Holdco LLC/Allied Universal Finance Corp./Atlas Luxco 4 SARL, Rule 144A,
Senior Secured Notes (Callable 11/30/24 @ 101.81)1,3 | | (B, B3) | | 06/01/28 | | | 3.625 | | | | 966,496 | | |
| | 1,113 | | | ASGN, Inc., Rule 144A, Company Guaranteed Notes (Callable 12/01/24 @ 101.52)1 | | (BB, Ba3) | | 05/15/28 | | | 4.625 | | | | 1,064,056 | | |
| | 1,490 | | | Beacon Roofing Supply, Inc., Rule 144A, Senior Secured Notes
(Callable 12/01/24 @ 100.00)1 | | (BB, Ba2) | | 11/15/26 | | | 4.500 | | | | 1,461,692 | | |
| | 1,750 | | | Belron U.K. Finance PLC, Rule 144A, Senior Secured Notes (Callable 10/15/26 @ 102.88)1 | | (BB-, Ba3) | | 10/15/29 | | | 5.750 | | | | 1,755,057 | | |
| | 4,100 | | | CoreLogic, Inc., Rule 144A, Senior Secured Notes (Callable 12/01/24 @ 102.25)1 | | (B-, B2) | | 05/01/28 | | | 4.500 | | | | 3,853,947 | | |
| | 5,360 | | | H&E Equipment Services, Inc., Rule 144A, Company Guaranteed Notes
(Callable 12/01/24 @ 101.94)1 | | (BB-, B1) | | 12/15/28 | | | 3.875 | | | | 4,955,361 | | |
| | 500 | | | WESCO Distribution, Inc., Rule 144A, Company Guaranteed Notes
(Callable 12/01/24 @ 102.42)1 | | (BB, Ba3) | | 06/15/28 | | | 7.250 | | | | 512,179 | | |
| | 500 | | | WESCO Distribution, Inc., Rule 144A, Company Guaranteed Notes
(Callable 03/15/26 @ 103.19)1 | | (BB, Ba3) | | 03/15/29 | | | 6.375 | | | | 510,804 | | |
| | 1,000 | | | Williams Scotsman, Inc., Rule 144A, Senior Secured Notes (Callable 12/01/24 @ 101.16)1 | | (BB-, B2) | | 08/15/28 | | | 4.625 | | | | 956,911 | | |
| | 2,200 | | | Williams Scotsman, Inc., Rule 144A, Senior Secured Notes (Callable 06/15/26 @ 103.31)1 | | (BB-, B2) | | 06/15/29 | | | 6.625 | | | | 2,234,460 | | |
| | 800 | | | ZipRecruiter, Inc., Rule 144A, Senior Unsecured Notes (Callable 01/15/25 @ 102.50)1 | | (B+, B2) | | 01/15/30 | | | 5.000 | | | | 722,294 | | |
| | | | | | | | | | | | | | 21,438,728 | | |
7
Credit Suisse Strategic Income Fund
Schedule of Investments
Par
(000) | | | | Ratings†
(S&P/Moody's) | | Maturity | | Rate% | | Value | |
Corporate bonds—(concluded) | | | |
Tech Hardware & Equipment (0.9%) | | | |
$ | 1,814 | | | CommScope Technologies LLC, Rule 144A, Company Guaranteed Notes
(Callable 11/11/24 @ 100.00)1 | | (CCC-, Ca) | | 06/15/25 | | | 6.000 | | | $ | 1,779,987 | | |
| | 2,000 | | | Vertiv Group Corp., Rule 144A, Senior Secured Notes (Callable 12/01/24 @ 102.06)1 | | (BB+, Ba2) | | 11/15/28 | | | 4.125 | | | | 1,905,020 | | |
| | 3,564 | | | Zebra Technologies Corp., Rule 144A, Company Guaranteed Notes
(Callable 06/01/27 @ 103.25)1 | | (BB, Ba2) | | 06/01/32 | | | 6.500 | | | | 3,649,009 | | |
| | | | | | | | | | | | | | 7,334,016 | | |
Telecom—Wireline Integrated & Services (1.4%) | | | |
| | 2,500 | | | Altice Financing SA, Rule 144A, Senior Secured Notes (Callable 12/01/24 @ 101.25)1 | | (B-, Caa1) | | 01/15/28 | | | 5.000 | | | | 2,116,378 | | |
| | 2,005 | | | LCPR Senior Secured Financing DAC, Rule 144A, Senior Secured Notes
(Callable 12/01/24 @ 100.00)1 | | (B+, B2) | | 10/15/27 | | | 6.750 | | | | 1,885,712 | | |
| | 300 | | | Level 3 Financing, Inc., Rule 144A, Secured Notes (Callable 03/22/26 @ 102.13)1 | | (CCC+, Caa1) | | 04/01/30 | | | 4.500 | | | | 241,482 | | |
| | 4,800 | | | Level 3 Financing, Inc., Rule 144A, Secured Notes (Callable 03/22/25 @ 101.81)1 | | (CCC+, Caa1) | | 10/15/30 | | | 3.875 | | | | 3,671,949 | | |
| | 2,500 | | | Virgin Media Secured Finance PLC, Rule 144A, Senior Secured Notes
(Callable 08/15/25 @ 102.25)1 | | (B+, Ba3) | | 08/15/30 | | | 4.500 | | | | 2,191,790 | | |
| | 2,500 | | | Vmed O2 U.K. Financing I PLC, Rule 144A, Senior Secured Notes
(Callable 01/31/26 @ 102.13)1 | | (B+, Ba3) | | 01/31/31 | | | 4.250 | | | | 2,152,461 | | |
| | | | | | | | | | | | | | 12,259,772 | | |
Theaters & Entertainment (0.3%) | | | |
| | 500 | | | Live Nation Entertainment, Inc., Rule 144A, Company Guaranteed Notes1,2 | | (B+, B1) | | 11/01/24 | | | 4.875 | | | | 500,000 | | |
| | 500 | | | Live Nation Entertainment, Inc., Rule 144A, Company Guaranteed Notes
(Callable 12/01/24 @ 101.19)1 | | (B+, B1) | | 10/15/27 | | | 4.750 | | | | 486,852 | | |
| | 1,500 | | | Live Nation Entertainment, Inc., Rule 144A, Senior Secured Notes
(Callable 12/01/24 @ 103.25)1 | | (BB, Ba2) | | 05/15/27 | | | 6.500 | | | | 1,521,849 | | |
| | | | | | | | | | | | | | 2,508,701 | | |
Transport Infrastructure/Services (0.2%) | | | |
| | 250 | | | XPO, Inc., Rule 144A, Company Guaranteed Notes (Callable 06/01/26 @ 103.56)1 | | (BB-, Ba3) | | 06/01/31 | | | 7.125 | | | | 259,026 | | |
| | 1,000 | | | XPO, Inc., Rule 144A, Company Guaranteed Notes (Callable 02/01/27 @ 103.56)1,2 | | (BB-, Ba3) | | 02/01/32 | | | 7.125 | | | | 1,039,784 | | |
| | 830 | | | XPO, Inc., Rule 144A, Senior Secured Notes (Callable 06/01/25 @ 103.13)1 | | (BBB-, Ba1) | | 06/01/28 | | | 6.250 | | | | 843,992 | | |
| | | | | | | | | | | | | | 2,142,802 | | |
Trucking & Delivery (0.1%) | | | |
| | 1,252 | | | RXO, Inc., Rule 144A, Company Guaranteed Notes (Callable 12/01/24 @ 103.75)1 | | (BB, Baa3) | | 11/15/27 | | | 7.500 | | | | 1,300,728 | | |
| | | | | Total corporate bonds
(Cost $332,869,067) | | | | | | | | | 336,149,653 | | |
Bank loans (55.1%) | | | |
Advertising (0.4%) | | | |
| | 3,519 | | | MH Sub I LLC, 1 mo. USD Term SOFR + 4.250%6 | | (B, B1) | | 05/03/28 | | | 8.935 | | | | 3,500,585 | | |
Aerospace & Defense (2.8%) | | | |
| | 4,000 | | | Amentum Government Services Holdings LLC, 1 mo. USD Term SOFR + 2.250%6 | | (BB-, Ba3) | | 09/29/31 | | | 6.935 | | | | 4,004,500 | | |
| | 1,334 | | | Arcline FM Holdings LLC, 6 mo. USD Term SOFR + 4.500%6 | | (B, B3) | | 06/23/28 | | | 9.742 | | | | 1,340,236 | | |
| | 1,247 | | | Bleriot U.S. Bidco, Inc., 3 mo. USD Term SOFR + 3.250%6 | | (B, B2) | | 10/31/30 | | | 7.854 | | | | 1,251,439 | | |
| | 1,971 | | | Brown Group Holding LLC,
1 mo. USD Term SOFR + 2.750%,
3 mo. USD Term SOFR + 2.750%6 | |
(B+, B2) | |
07/01/31 | | |
7.335 -
7.807 | | | | 1,972,251 | | |
| | 2,518 | | | Brown Group Holding LLC, 1 mo. USD Term SOFR + 2.750%6 | | (B+, B2) | | 07/01/31 | | | 7.435 | | | | 2,519,416 | | |
| | 881 | | | CACI International, Inc.5,7 | | (BB+, Ba1) | | 10/30/31 | | | 0.000 | | | | 883,559 | | |
| | 1,279 | | | HDI Aerospace Intermediate Holding III Corp.5,7 | | (B, B2) | | 09/19/31 | | | 0.000 | | | | 1,274,672 | | |
| | 1,757 | | | KBR, Inc., 1 mo. USD Term SOFR + 2.000%6 | | (BB+, Ba1) | | 01/19/31 | | | 6.685 | | | | 1,761,411 | | |
8
Credit Suisse Strategic Income Fund
Schedule of Investments
Par
(000) | | | | Ratings†
(S&P/Moody's) | | Maturity | | Rate% | | Value | |
Bank loans—(continued) | | | |
Aerospace & Defense—(concluded) | | | |
$ | 2,208 | | | KKR Apple Bidco LLC, 1 mo. USD Term SOFR + 2.750%6 | | (B, B2) | | 09/22/28 | | | 7.550 | | | $ | 2,210,876 | | |
| | 5,475 | | | Peraton Corp., 1 mo. USD Term SOFR + 3.750%6 | | (B-, B2) | | 02/01/28 | | | 8.535 | | | | 5,313,871 | | |
| | 1,448 | | | TransDigm, Inc., 3 mo. USD Term SOFR + 2.500%6 | | (BB-, Ba3) | | 02/28/31 | | | 7.104 | | | | 1,450,680 | | |
| | | | | | | | | | | | | | 23,982,911 | | |
Auto Parts & Equipment (1.3%) | | | |
| | 2,139 | | | Autokiniton U.S. Holdings, Inc., 1 mo. USD Term SOFR + 4.000%6 | | (B, B2) | | 04/06/28 | | | 8.800 | | | | 2,143,451 | | |
| | 2,260 | | | Clarios Global LP, 1 mo. USD Term SOFR + 2.500%6 | | (BB-, Ba3) | | 05/06/30 | | | 7.185 | | | | 2,267,183 | | |
| | 990 | | | First Brands Group LLC (2021 Term Loan), 3 mo. USD Term SOFR + 5.000%6 | | (B+, B1) | | 03/30/27 | | | 9.847 | | | | 965,223 | | |
| | 799 | | | First Brands Group LLC (2022 Incremental Term Loan), 3 mo. USD Term SOFR + 5.000%6 | | (B+, B1) | | 03/30/27 | | | 9.847 | | | | 778,315 | | |
| | 247 | | | Garrett LX I SARL, 3 mo. USD Term SOFR + 2.750%6 | | (BB+, Ba1) | | 04/30/28 | | | 7.335 | | | | 248,222 | | |
| | 205 | | | Jason Group, Inc., 1 mo. USD Term SOFR + 6.000%, 0.000% PIK6,8,9 | | (NR, WR) | | 08/28/25 | | | 10.800 | | | | 186,455 | | |
| | 1,237 | | | Les Schwab Tire Centers, 1 mo. USD Term SOFR + 3.000%6 | | (B, B2) | | 04/23/31 | | | 7.685 | | | | 1,239,682 | | |
| | 3,079 | | | RVR Dealership Holdings LLC, 3 mo. USD Term SOFR + 3.750%6 | | (B, B3) | | 02/08/28 | | | 8.504 | | | | 2,771,435 | | |
| | 415 | | | Wand NewCo 3, Inc.,
1 mo. USD Term SOFR + 3.250%,
3 mo. USD Term SOFR + 3.250%6 | |
(B, B3) | |
01/30/31 | | |
7.854 -
7.935 | | | | 415,514 | | |
| | | | | | | | | | | | | | 11,015,480 | | |
Automakers (0.1%) | | | |
| | 478 | | | Fastlane Parent Co., Inc., 1 mo. USD Term SOFR + 4.500%6 | | (B-, B3) | | 09/29/28 | | | 9.185 | | | | 454,837 | | |
Banking (0.2%) | | | |
| | 1,147 | | | Citco Funding LLC, 6 mo. USD Term SOFR + 2.750%6 | | (BB, Ba2) | | 04/27/28 | | | 7.308 | | | | 1,152,136 | | |
| | 609 | | | HarbourVest Partners LLC, 3 mo. USD Term SOFR + 2.250%6 | | (NR, NR) | | 04/18/30 | | | 6.854 | | | | 611,564 | | |
| | | | | | | | | | | | | | 1,763,700 | | |
Beverages (0.1%) | | | |
| | 1,086 | | | Aspire Bakeries Holdings LLC, 1 mo. USD Term SOFR + 4.250%6 | | (B, B2) | | 12/13/30 | | | 8.968 | | | | 1,087,418 | | |
Brokerage (0.4%) | | | |
| | 2,969 | | | DRW Holdings LLC, 6 mo. USD Term SOFR + 3.500%6 | | (BB-, Ba3) | | 06/26/31 | | | 8.588 | | | | 2,961,911 | | |
| | 504 | | | Jefferies Finance LLC, 1 mo. USD Term SOFR + 3.000%5,6 | | (BB-, Ba2) | | 10/09/31 | | | 7.759 | | | | 501,214 | | |
| | | | | | | | | | | | | | 3,463,125 | | |
Building & Construction (0.6%) | | | |
| | 2,139 | | | Energize HoldCo LLC, 1 mo. USD Term SOFR + 3.750%6 | | (B, B3) | | 12/08/28 | | | 8.550 | | | | 2,143,843 | | |
| | 1,493 | | | Quikrete Holdings, Inc., 1 mo. USD Term SOFR + 2.250%6 | | (BB, Ba2) | | 03/19/29 | | | 6.935 | | | | 1,494,291 | | |
| | 1,489 | | | Service Logic Acquisition, Inc.,
1 mo. USD Term SOFR + 3.500%,
3 mo. USD Term SOFR + 3.500%6 | |
(B, B2) | |
10/29/27 | | |
8.085 -
8.185 | | | | 1,496,469 | | |
| | | | | | | | | | | | | | 5,134,603 | | |
Building Materials (0.8%) | | | |
| | 441 | | | Cornerstone Building Brands, Inc., 1 mo. USD Term SOFR + 3.250%6 | | (B, B2) | | 04/12/28 | | | 8.154 | | | | 434,534 | | |
| | 175 | | | Cornerstone Building Brands, Inc., 1 mo. USD Term SOFR + 5.625%6 | | (B, B2) | | 08/01/28 | | | 10.429 | | | | 176,648 | | |
| | 1,638 | | | Foundation Building Materials Holding Co. LLC, 3 mo. USD Term SOFR + 3.250%6 | | (B, B2) | | 01/31/28 | | | 7.835 | | | | 1,616,953 | | |
| | 1,985 | | | Gulfside Supply, Inc., 1 mo. USD Term SOFR + 3.000%6 | | (B, B2) | | 06/17/31 | | | 7.784 | | | | 1,987,915 | | |
| | 1,244 | | | Kodiak Building Partners, Inc., 1 mo. USD Term SOFR + 3.750%6 | | (B+, B2) | | 03/12/28 | | | 8.435 | | | | 1,249,776 | | |
| | 804 | | | MI Windows & Doors LLC, 1 mo. USD Term SOFR + 3.000%6 | | (BB-, B1) | | 03/28/31 | | | 7.685 | | | | 807,510 | | |
| | 334 | | | Oscar AcquisitionCo LLC, 3 mo. USD Term SOFR + 4.250%6 | | (B, B1) | | 04/29/29 | | | 8.495 | | | | 331,715 | | |
| | | | | | | | | | | | | | 6,605,051 | | |
Cable & Satellite TV (0.3%) | | | |
| | 2,900 | | | Ziggo Financing Partnership, 1 mo. USD Term SOFR + 2.500%6 | | (B+, B1) | | 04/30/28 | | | 7.418 | | | | 2,862,938 | | |
9
Credit Suisse Strategic Income Fund
Schedule of Investments
Par
(000) | | | | Ratings†
(S&P/Moody's) | | Maturity | | Rate% | | Value | |
Bank loans—(continued) | | | |
Chemicals (1.9%) | | | |
$ | 1,800 | | | AAP Buyer, Inc., 3 mo. USD Term SOFR + 3.250%5,6 | | (B+, B1) | | 09/09/31 | | | 7.854 | | | $ | 1,809,000 | | |
| | 1,079 | | | Ascend Performance Materials Operations LLC, 3 mo. USD Term SOFR + 4.750%6 | | (B, B2) | | 08/27/26 | | | 9.095 | | | | 1,004,566 | | |
| | 430 | | | CPC Acquisition Corp., 3 mo. USD Term SOFR + 7.750%6 | | (CC, Ca) | | 12/29/28 | | | 12.615 | | | | 262,219 | | |
| | 729 | | | CPC Acquisition Corp., 3 mo. USD Term SOFR + 3.750%6 | | (CCC, Caa2) | | 12/29/27 | | | 8.615 | | | | 639,506 | | |
| | 449 | | | INEOS Enterprises Holdings U.S. Finco LLC, 3 mo. USD Term SOFR + 3.750%6 | | (BB, Ba3) | | 07/08/30 | | | 8.907 | | | | 450,952 | | |
| | 492 | | | INEOS Quattro Holdings U.K. Ltd., 1 mo. USD Term SOFR + 4.250%6 | | (BB, B1) | | 04/02/29 | | | 9.035 | | | | 489,996 | | |
| | 897 | | | INEOS Quattro Holdings U.K. Ltd., 1 mo. USD Term SOFR + 4.250%5,6 | | (NR, B1) | | 10/01/31 | | | 8.935 | | | | 894,438 | | |
| | 1,234 | | | INEOS U.S. Finance LLC, 1 mo. USD Term SOFR + 3.250%6 | | (BB, Ba3) | | 02/18/30 | | | 7.935 | | | | 1,236,390 | | |
| | 273 | | | New Arclin U.S. Holding Corp., 1 mo. USD Term SOFR + 7.000%6 | | (CCC+, Caa1) | | 09/30/29 | | | 11.785 | | | | 257,654 | | |
| | 783 | | | New Arclin U.S. Holding Corp., 1 mo. USD Term SOFR + 3.500%6 | | (B, B2) | | 09/30/28 | | | 8.285 | | | | 785,315 | | |
| | 1,809 | | | Polar U.S. Borrower LLC, 1 mo. USD Term SOFR + 5.500%6,9 | | (NR, NR) | | 10/16/28 | | | 9.605 | | | | 1,361,579 | | |
| | 3,758 | | | Polar U.S. Borrower LLC, 1 mo. USD Term SOFR + 5.500%6,9 | | (NR, NR) | | 10/16/28 | | | 9.593 | | | | 2,828,256 | | |
| | 299 | | | RelaDyne, Inc., 1 mo. USD Term SOFR + 4.500%6 | | (B, B3) | | 12/22/28 | | | 9.185 | | | | 299,682 | | |
| | 283 | | | SK Neptune Husky Finance SARL5,9,10,11 | | (NR, WR) | | 04/30/25 | | | 0.000 | | | | 219,452 | | |
| | 1,306 | | | SK Neptune Husky Group SARL9,10,11 | | (NR, WR) | | 01/03/29 | | | 0.000 | | | | 22,031 | | |
| | 3,529 | | | Vantage Specialty Chemicals, Inc., 3 mo. USD Term SOFR + 4.750%6 | | (B-, B3) | | 10/26/26 | | | 9.871 | | | | 3,521,875 | | |
| | | | | | | | | | | | | | 16,082,911 | | |
Diversified Capital Goods (0.3%) | | | |
| | 300 | | | DexKo Global, Inc.7 | | (B-, B2) | | 10/04/28 | | | 0.000 | | | | 288,032 | | |
| | 1,533 | | | Dynacast International LLC, 3 mo. USD Term SOFR + 4.750%6 | | (CCC, B2) | | 07/22/25 | | | 9.907 | | | | 1,511,591 | | |
| | 1,184 | | | Dynacast International LLC, 3 mo. USD Term SOFR + 9.250%6 | | (CC, Caa2) | | 10/22/25 | | | 14.407 | | | | 1,109,646 | | |
| | | | | | | | | | | | | | 2,909,269 | | |
Electronics (1.7%) | | | |
| | 3,281 | | | Escape Velocity Holdings, Inc., 3 mo. USD Term SOFR + 4.250%6 | | (B, B3) | | 10/08/28 | | | 9.115 | | | | 3,265,526 | | |
| | 1,940 | | | Idemia Group, 3 mo. USD Term SOFR + 4.250%5,6 | | (B, B2) | | 09/30/28 | | | 8.854 | | | | 1,959,629 | | |
| | 2,769 | | | II-VI, Inc., 1 mo. USD Term SOFR + 2.500%6 | | (BB-, Ba1) | | 07/02/29 | | | 7.185 | | | | 2,775,130 | | |
| | 500 | | | Infinite Bidco LLC, 3 mo. USD Term SOFR + 7.000%6,9 | | (CCC, Caa2) | | 03/02/29 | | | 11.847 | | | | 430,625 | | |
| | 2,077 | | | Ingram Micro, Inc., 3 mo. USD Term SOFR + 2.750%6 | | (BB-, B1) | | 09/22/31 | | | 7.564 | | | | 2,080,386 | | |
| | 1,773 | | | Mirion Technologies, Inc., 3 mo. USD Term SOFR + 2.250%6 | | (B+, B1) | | 10/20/28 | | | 6.854 | | | | 1,772,955 | | |
| | 846 | | | MKS Instruments, Inc., 1 mo. USD Term SOFR + 2.250%6 | | (BB, Ba1) | | 08/17/29 | | | 6.995 | | | | 847,666 | | |
| | 1,250 | | | SolarWinds Holdings, Inc., 1 mo. USD Term SOFR + 2.750%6 | | (B+, B1) | | 02/05/30 | | | 7.435 | | | | 1,253,519 | | |
| | | | | | | | | | | | | | 14,385,436 | | |
Energy—Exploration & Production (0.4%) | | | |
| | 235 | | | AL GCX Holdings LLC, 1 mo. USD Term SOFR + 2.750%6 | | (B+, Ba3) | | 05/17/29 | | | 7.601 | | | | 236,375 | | |
| | 1,019 | | | BIP PipeCo Holdings LLC, 3 mo. USD Term SOFR + 2.500%6 | | (B+, Ba3) | | 12/06/30 | | | 7.090 | | | | 1,021,096 | | |
| | 1,036 | | | EMG Utica LLC5,7 | | (B+, B3) | | 10/24/29 | | | 0.000 | | | | 1,032,964 | | |
| | 676 | | | GIP Pilot Acquisition Partners LP, 3 mo. USD Term SOFR + 2.500%6 | | (BB-, Ba3) | | 10/04/30 | | | 7.090 | | | | 675,924 | | |
| | 691 | | | M6 ETX Holdings II Midco LLC, 1 mo. USD Term SOFR + 4.500%6 | | (B, B2) | | 09/19/29 | | | 9.285 | | | | 691,819 | | |
| | 933 | | | PES Holdings LLC, 3.000% PIK5,8,9,10 | | (NR, WR) | | 12/31/24 | | | 3.000 | | | | 7,000 | | |
| | | | | | | | | | | | | | 3,665,178 | | |
Environmental (0.3%) | | | |
| | 1,167 | | | GFL Environmental, Inc., 3 mo. USD Term SOFR + 2.000%6 | | (BB, Ba2) | | 07/03/31 | | | 6.610 | | | | 1,166,631 | | |
| | 880 | | | The Action Environmental Group, Inc., 3 mo. USD Term SOFR + 4.000%5,6 | | (B, B2) | | 10/24/30 | | | 8.617 | | | | 886,535 | | |
| | 179 | | | The Action Environmental Group, Inc.5,12 | | (B, B2) | | 10/24/30 | | | 2.000 | | | | 180,036 | | |
| | 475 | | | Vestis Corp., 3 mo. USD Term SOFR + 2.250%6 | | (BB, Ba3) | | 02/22/31 | | | 7.371 | | | | 473,972 | | |
| | | | | | | | | | | | | | 2,707,174 | | |
Food & Drug Retailers (0.2%) | | | |
| | 861 | | | Sharp Services LLC, 3 mo. USD Term SOFR + 3.250%5,6 | | (B-, B3) | | 12/31/28 | | | 7.876 | | | | 861,485 | | |
| | 866 | | | WOOF Holdings, Inc., 3 mo. USD Term SOFR + 7.250%6,9 | | (CC, Ca) | | 12/21/28 | | | 11.985 | | | | 421,535 | | |
| | | | | | | | | | | | | | 1,283,020 | | |
10
Credit Suisse Strategic Income Fund
Schedule of Investments
Par
(000) | | | | Ratings†
(S&P/Moody's) | | Maturity | | Rate% | | Value | |
Bank loans—(continued) | | | |
Food—Wholesale (1.0%) | | | |
$ | 3,168 | | | AI Aqua Merger Sub, Inc., 1 mo. USD Term SOFR + 3.500%6 | | (B, B3) | | 07/31/28 | | | 8.357 | | | $ | 3,177,139 | | |
| | 1,319 | | | Golden State Food LLC7 | | (B, B2) | | 10/07/31 | | | 0.000 | | | | 1,321,351 | | |
| | 1,966 | | | Nomad Foods U.S. LLC, 6 mo. USD Term SOFR + 2.500%6 | | (BB-, B1) | | 11/12/29 | | | 6.968 | | | | 1,970,010 | | |
| | 1,188 | | | Sycamore Buyer LLC, 1 mo. USD Term SOFR + 2.250%6 | | (BB, Ba3) | | 07/23/29 | | | 7.102 | | | | 1,189,458 | | |
| | 559 | | | U.S. Foods, Inc., 1 mo. USD Term SOFR + 1.750%6 | | (BBB-, Ba2) | | 10/03/31 | | | 6.435 | | | | 561,458 | | |
| | | | | | | | | | | | | | 8,219,416 | | |
Gaming (0.4%) | | | |
| | 1,169 | | | Arcis Golf LLC, 1 mo. USD Term SOFR + 3.750%6 | | (B+, B2) | | 11/24/28 | | | 8.572 | | | | 1,176,834 | | |
| | 997 | | | Caesars Entertainment, Inc., 1 mo. USD Term SOFR + 2.750%6 | | (BB-, Ba3) | | 02/06/31 | | | 7.435 | | | | 999,598 | | |
| | 1,453 | | | Caesars Entertainment, Inc., 1 mo. USD Term SOFR + 2.750%6 | | (BB-, Ba3) | | 02/06/30 | | | 7.435 | | | | 1,456,554 | | |
| | | | | | | | | | | | | | 3,632,986 | | |
Gas Distribution (0.6%) | | | |
| | 1,286 | | | AL NGPL Holdings LLC, 3 mo. USD Term SOFR + 2.500%6 | | (B+, Ba3) | | 04/17/28 | | | 7.090 | | | | 1,290,433 | | |
| | 1,800 | | | BCP Renaissance Parent LLC, 3 mo. USD Term SOFR + 3.250%6 | | (B+, B2) | | 10/31/28 | | | 7.854 | | | | 1,802,918 | | |
| | 543 | | | EPIC Crude Services LP, 3 mo. USD Term SOFR + 3.000%6 | | (BB-, Ba3) | | 10/10/31 | | | 7.656 | | | | 543,551 | | |
| | 1,250 | | | NGP XI Midstream Holdings LLC, 3 mo. USD Term SOFR + 4.000%6 | | (B, B3) | | 07/25/31 | | | 8.604 | | | | 1,252,350 | | |
| | | | | | | | | | | | | | 4,889,252 | | |
Health Facilities (0.8%) | | | |
| | 1,289 | | | Bayou Intermediate II LLC, 3 mo. USD Term SOFR + 4.500%6 | | (B-, B2) | | 08/02/28 | | | 9.347 | | | | 1,262,725 | | |
| | 637 | | | Carestream Health, Inc., 3 mo. USD Term SOFR + 7.500%6 | | (B-, Caa1) | | 09/30/27 | | | 12.204 | | | | 585,013 | | |
| | 1,679 | | | Insulet Corp., 1 mo. USD Term SOFR + 2.500%6 | | (BB-, Ba2) | | 08/04/31 | | | 7.185 | | | | 1,688,210 | | |
| | 752 | | | Sonrava Health Holdings LLC, 3 mo. USD Term SOFR + 6.500%6 | | (B-, B2) | | 05/18/28 | | | 11.499 | | | | 756,225 | | |
| | 2,911 | | | Sonrava Health Holdings LLC, 3 mo. USD Term SOFR + 1.000%, 5.500% PIK6,8,9 | | (NR, Caa2) | | 08/18/28 | | | 11.499 | | | | 1,382,775 | | |
| | 1,298 | | | Surgery Center Holdings, Inc., 1 mo. USD Term SOFR + 2.750%6 | | (B, Ba3) | | 12/19/30 | | | 7.495 | | | | 1,302,704 | | |
| | | | | | | | | | | | | | 6,977,652 | | |
Health Services (2.9%) | | | |
| | 3,478 | | | ADMI Corp., 1 mo. USD Term SOFR + 3.375%6 | | (B-, B3) | | 12/23/27 | | | 8.175 | | | | 3,415,346 | | |
| | 247 | | | ADMI Corp., 1 mo. USD Term SOFR + 5.750%6 | | (B-, B3) | | 12/23/27 | | | 10.435 | | | | 249,637 | | |
| | 4,960 | | | Athenahealth Group, Inc., 1 mo. USD Term SOFR + 3.250%6 | | (B-, B2) | | 02/15/29 | | | 7.935 | | | | 4,952,039 | | |
| | 222 | | | EyeCare Partners LLC, 3 mo. USD Term SOFR + 1.000%6 | | (CCC+, Caa3) | | 11/30/28 | | | 5.717 | | | | 164,183 | | |
| | 444 | | | IVC Acquisition Ltd., 3 mo. USD Term SOFR + 4.750%6 | | (B, B3) | | 12/12/28 | | | 9.393 | | | | 446,250 | | |
| | 1,293 | | | Learning Care Group U.S. No. 2, Inc.,
3 mo. USD Term SOFR + 4.000%6 | |
(B, B2) | |
08/11/28 | | | 8.604 -
9.113 | | | | 1,299,434 | | |
| | 902 | | | MedAssets Software Intermediate Holdings, Inc., 1 mo. USD Term SOFR + 4.000%6,9 | | (CCC, Caa3) | | 12/18/28 | | | 8.800 | | | | 620,366 | | |
| | 1,252 | | | Pacific Dental Services LLC, 1 mo. USD Term SOFR + 2.750%6 | | (B, B1) | | 03/15/31 | | | 7.536 | | | | 1,253,915 | | |
| | 1,407 | | | Packaging Coordinators Midco, Inc., 3 mo. USD Term SOFR + 3.250%6 | | (B-, B3) | | 11/30/27 | | | 7.835 | | | | 1,410,586 | | |
| | 522 | | | PointClickCare Technologies, Inc., 3 mo. USD Term SOFR + 3.000%5,6 | | (B, B2) | | 12/29/27 | | | 7.604 | | | | 522,860 | | |
| | 640 | | | PointClickCare Technologies, Inc.7 | | (B, B3) | | 10/10/31 | | | 0.000 | | | | 641,799 | | |
| | 1,999 | | | Radiology Partners, Inc., 3 mo. USD Term SOFR + 3.500%, 1.500% PIK6,8 | | (B-, B3) | | 01/31/29 | | | 10.383 | | | | 1,973,771 | | |
| | 1,266 | | | Southern Veterinary Partners LLC5,7 | | (B, B2) | | 10/31/31 | | | 0.000 | | | | 1,262,854 | | |
| | 1,215 | | | Therapy Brands Holdings LLC, 1 mo. USD Term SOFR + 4.000%6,9 | | (CCC+, B3) | | 05/18/28 | | | 8.800 | | | | 1,044,133 | | |
| | 1,500 | | | TTF Holdings LLC, 1 mo. USD Term SOFR + 3.750%6 | | (B, B2) | | 07/18/31 | | | 8.435 | | | | 1,510,320 | | |
| | 4,183 | | | U.S. Radiology Specialists, Inc., 3 mo. USD Term SOFR + 4.750%6 | | (B-, B3) | | 12/15/27 | | | 9.354 | | | | 4,205,730 | | |
| | | | | | | | | | | | | | 24,973,223 | | |
Hotels (0.8%) | | | |
| | 1,891 | | | Alterra Mountain Co., 1 mo. USD Term SOFR + 3.250%6 | | (B+, B1) | | 08/17/28 | | | 7.935 | | | | 1,896,953 | | |
| | 1,881 | | | Alterra Mountain Co., 1 mo. USD Term SOFR + 3.500%6 | | (B+, B1) | | 05/31/30 | | | 8.185 | | | | 1,887,194 | | |
| | 250 | | | Hilton Domestic Operating Co., Inc., 1 mo. USD Term SOFR + 1.750%6 | | (BBB-, Baa2) | | 11/08/30 | | | 6.488 | | | | 250,248 | | |
| | 2,279 | | | Wyndham Hotels & Resorts, Inc., 1 mo. USD Term SOFR + 1.750%6 | | (BBB-, Ba1) | | 05/24/30 | | | 6.435 | | | | 2,280,480 | | |
| | | | | | | | | | | | | | 6,314,875 | | |
11
Credit Suisse Strategic Income Fund
Schedule of Investments
Par
(000) | | | | Ratings†
(S&P/Moody's) | | Maturity | | Rate% | | Value | |
Bank loans—(continued) | | | |
Insurance Brokerage (3.5%) | | | |
$ | 3,096 | | | Alliant Holdings Intermediate LLC, 1 mo. USD Term SOFR + 3.000%6 | | (B, B2) | | 09/19/31 | | | 7.759 | | | $ | 3,085,243 | | |
| | 4,121 | | | AmWINS Group, Inc., 1 mo. USD Term SOFR + 2.250%6 | | (B+, Ba3) | | 02/19/28 | | | 7.050 | | | | 4,123,857 | | |
| | 2,341 | | | Ardonagh Midco 3 PLC,
3 mo. USD Term SOFR + 3.750%6 | |
(B-, B3) | |
02/15/31 | | | 8.354 -
8.535 | | | | 2,352,475 | | |
| | 5,020 | | | AssuredPartners, Inc., 1 mo. USD Term SOFR + 3.500%6 | | (B, B2) | | 02/14/31 | | | 8.185 | | | | 5,032,722 | | |
| | 1,794 | | | Howden Group Holdings Ltd., 1 mo. USD Term SOFR + 3.500%6 | | (B, B2) | | 04/18/30 | | | 8.185 | | | | 1,801,824 | | |
| | 2,853 | | | Howden Group Holdings Ltd., 1 mo. USD Term SOFR + 3.500%6 | | (B, B2) | | 02/15/31 | | | 8.185 | | | | 2,864,000 | | |
| | 8,672 | | | HUB International Ltd., 3 mo. USD Term SOFR + 2.750%6 | | (B, B1) | | 06/20/30 | | | 7.367 | | | | 8,698,144 | | |
| | 2,000 | | | Truist Insurance Holdings LLC, 3 mo. USD Term SOFR + 3.250%6 | | (B, B2) | | 05/06/31 | | | 7.854 | | | | 2,005,010 | | |
| | | | | | | | | | | | | | 29,963,275 | | |
Investments & Misc. Financial Services (4.0%) | | | |
| | 407 | | | Altisource Solutions SARL, 3 mo. USD Term SOFR + 8.750%5,6,9 | | (CCC-, Caa2) | | 04/30/25 | | | 13.454 | | | | 187,335 | | |
| | 3,652 | | | Ankura Consulting Group LLC, 1 mo. USD Term SOFR + 4.250%6 | | (B-, B3) | | 03/17/28 | | | 8.935 | | | | 3,679,398 | | |
| | 4,267 | | | AqGen Island Holdings, Inc., 1 mo. USD Term SOFR + 3.500%6 | | (B-, B3) | | 08/02/28 | | | 8.300 | | | | 4,280,263 | | |
| | 1,174 | | | Boost Newco Borrower LLC, 3 mo. USD Term SOFR + 2.500%6 | | (BB, Ba3) | | 01/31/31 | | | 7.104 | | | | 1,178,353 | | |
| | 3,120 | | | Citadel Securities LP, 1 mo. USD Term SOFR + 2.000%6 | | (NR, NR) | | 10/31/31 | | | 6.718 | | | | 3,123,284 | | |
| | 749 | | | CPI Holdco B LLC7 | | (BB-, Ba3) | | 05/17/31 | | | 0.000 | | | | 745,547 | | |
| | 3,500 | | | CPI Holdco B LLC, 1 mo. USD Term SOFR + 2.000%6 | | (BB-, Ba3) | | 05/19/31 | | | 6.685 | | | | 3,467,188 | | |
| | 165 | | | Focus Financial Partners LLC12 | | (B+, B2) | | 09/15/31 | | | 0.000 | | | | 165,611 | | |
| | 1,539 | | | Focus Financial Partners LLC, 1 mo. USD Term SOFR + 3.250%6 | | (B+, B2) | | 09/15/31 | | | 7.935 | | | | 1,541,963 | | |
| | 1,592 | | | Galaxy U.S. Opco, Inc., 3 mo. USD Term SOFR + 4.750%6 | | (CCC-, Caa1) | | 04/29/29 | | | 9.335 | | | | 1,360,028 | | |
| | 1,698 | | | HighTower Holdings LLC, 3 mo. USD Term SOFR + 3.500%6 | | (B-, B2) | | 04/21/28 | | | 8.748 | | | | 1,702,289 | | |
| | 3,100 | | | Hudson River Trading LLC7 | | (NR, NR) | | 03/29/30 | | | 0.000 | | | | 3,069,185 | | |
| | 496 | | | Jane Street Group LLC, 1 mo. USD Term SOFR + 2.000%6 | | (NR, Ba1) | | 01/26/28 | | | 6.685 | | | | 496,176 | | |
| | 970 | | | Mariner Wealth Advisors LLC, 3 mo. USD Term SOFR + 3.000%6 | | (B-, WR) | | 08/18/28 | | | 7.604 | | | | 972,125 | | |
| | 5,100 | | | Sedgwick Claims Management Services, Inc., 3 mo. USD Term SOFR + 3.000%6 | | (B+, B2) | | 07/31/31 | | | 7.585 | | | | 5,107,446 | | |
| | 2,345 | | | VFH Parent LLC, 1 mo. USD Term SOFR + 2.750%6 | | (B+, B1) | | 06/21/31 | | | 7.435 | | | | 2,353,009 | | |
| | 856 | | | Walker & Dunlop, Inc., 1 mo. USD Term SOFR + 2.250%5,6 | | (BB+, Ba1) | | 12/16/28 | | | 7.035 | | | | 860,246 | | |
| | | | | | | | | | | | | | 34,289,446 | | |
Life Insurance (0.6%) | | | |
| | 1,000 | | | OneDigital Borrower LLC, 1 mo. USD Term SOFR + 5.250%6 | | (CCC+, Caa2) | | 07/02/31 | | | 9.935 | | | | 991,250 | | |
| | 3,849 | | | OneDigital Borrower LLC, 1 mo. USD Term SOFR + 3.250%6 | | (B, B2) | | 07/02/31 | | | 7.935 | | | | 3,850,638 | | |
| | | | | | | | | | | | | | 4,841,888 | | |
Machinery (1.5%) | | | |
| | 1,966 | | | 19th Holdings Golf LLC, 1 mo. USD Term SOFR + 3.250%6 | | (B, B1) | | 02/07/29 | | | 8.201 | | | | 1,945,069 | | |
| | 1,426 | | | Arcosa, Inc., 1 mo. USD Term SOFR + 2.250%5,6 | | (BBB-, Ba1) | | 08/12/31 | | | 6.935 | | | | 1,433,245 | | |
| | 666 | | | Chart Industries, Inc., 3 mo. USD Term SOFR + 2.500%6 | | (BB-, Ba3) | | 03/15/30 | | | 7.092 | | | | 667,861 | | |
| | 458 | | | Clark Equipment Co., 3 mo. USD Term SOFR + 2.000%6 | | (BB+, Ba2) | | 04/20/29 | | | 6.604 | | | | 458,314 | | |
| | 1,413 | | | CPM Holdings, Inc., 1 mo. USD Term SOFR + 4.500%6 | | (B, B2) | | 09/28/28 | | | 9.344 | | | | 1,387,101 | | |
| | 552 | | | Cube Industrials Buyer, Inc., 3 mo. USD Term SOFR + 3.500%6 | | (B, B3) | | 10/09/31 | | | 8.132 | | | | 553,328 | | |
| | 687 | | | Generac Power Systems, Inc., 3 mo. USD Term SOFR + 1.750%6 | | (BB+, Ba1) | | 07/03/31 | | | 6.343 | | | | 688,687 | | |
| | 479 | | | John Bean Technologies Corp.7 | | (BB, Ba2) | | 10/09/31 | | | 0.000 | | | | 480,121 | | |
| | 1,488 | | | LSF12 Badger Bidco LLC, 1 mo. USD Term SOFR + 6.000%6 | | (B, B3) | | 08/30/30 | | | 10.685 | | | | 1,467,983 | | |
| | 414 | | | LTI Holdings, Inc., 1 mo. USD Term SOFR + 4.750%6 | | (B-, B3) | | 07/19/29 | | | 9.435 | | | | 412,089 | | |
| | 704 | | | Madison Safety & Flow LLC, 1 mo. USD Term SOFR + 3.250%6 | | (B, B2) | | 09/26/31 | | | 7.968 | | | | 707,643 | | |
| | 2,402 | | | Pro Mach Group, Inc., 1 mo. USD Term SOFR + 3.500%6 | | (B-, B2) | | 08/31/28 | | | 8.185 | | | | 2,414,515 | | |
| | | | | | | | | | | | | | 12,615,956 | | |
12
Credit Suisse Strategic Income Fund
Schedule of Investments
Par
(000) | | | | Ratings†
(S&P/Moody's) | | Maturity | | Rate% | | Value | |
Bank loans—(continued) | | | |
Media—Diversified (0.9%) | | | |
$ | 4,606 | | | Cast & Crew Payroll LLC, 1 mo. USD Term SOFR + 3.750%6 | | (B, B2) | | 12/29/28 | | | 8.435 | | | $ | 4,508,338 | | |
| | 1,571 | | | Delta 2 LUX SARL, 3 mo. USD Term SOFR + 2.000%6 | | (BB+, NR) | | 09/10/31 | | | 6.585 | | | | 1,572,878 | | |
| | 786 | | | Delta 2 LUX SARL7 | | (BB+, NR) | | 09/10/31 | | | 0.000 | | | | 786,439 | | |
| | 392 | | | Technicolor Creative Studios3,4,5,10,11 | | (NR, NR) | | 08/06/33 | | | 0.000 | | | | 0 | | |
| | 746 | | | United Talent Agency LLC, 1 mo. USD Term SOFR + 3.750%5,6 | | (B+, B2) | | 07/07/28 | | | 8.568 | | | | 751,847 | | |
| | | | | | | | | | | | | | 7,619,502 | | |
Media Content (0.2%) | | | |
| | 790 | | | Aragorn Parent Corp., 1 mo. USD Term SOFR + 4.000%6 | | (B, B2) | | 12/15/28 | | | 8.745 | | | | 793,992 | | |
| | 500 | | | WMG Acquisition Corp., 3 mo. USD Term SOFR + 1.750%6 | | (BBB-, Ba2) | | 01/24/31 | | | 6.335 | | | | 500,938 | | |
| | | | | | | | | | | | | | 1,294,930 | | |
Medical Products (0.6%) | | | |
| | 1,376 | | | Covetrus, Inc., 3 mo. USD Term SOFR + 5.000%6 | | (B-, B1) | | 10/13/29 | | | 9.604 | | | | 1,308,824 | | |
| | 1,995 | | | Medline Borrower LP7 | | (B+, Ba3) | | 10/23/28 | | | 0.000 | | | | 1,999,087 | | |
| | 1,817 | | | Sotera Health Holdings LLC, 3 mo. USD Term SOFR + 3.250%6 | | (BB-, B1) | | 05/30/31 | | | 7.835 | | | | 1,821,771 | | |
| | | | | | | | | | | | | | 5,129,682 | | |
Oil Field Equipment & Services (0.4%) | | | |
| | 1,075 | | | CQP Holdco LP, 3 mo. USD Term SOFR + 2.250%6 | | (BB, Ba2) | | 12/31/30 | | | 6.854 | | | | 1,075,795 | | |
| | 272 | | | MRC Global U.S., Inc.5,7 | | (B, B2) | | 10/24/31 | | | 0.000 | | | | 272,482 | | |
| | 2,115 | | | Rockpoint Gas Storage Partners LP, 3 mo. USD Term SOFR + 3.500%6 | | (BB, B1) | | 09/12/31 | | | 8.363 | | | | 2,112,898 | | |
| | | | | | | | | | | | | | 3,461,175 | | |
Packaging (1.5%) | | | |
| | 2,244 | | | Berlin Packaging LLC,
1 mo. USD Term SOFR + 3.750%,
3 mo. USD Term SOFR + 3.750%6 | |
(B-, B2) | |
06/09/31 | | |
8.354 -
8.594 | | | | 2,251,591 | | |
| | 1,826 | | | Mauser Packaging Solutions Holding Co., 1 mo. USD Term SOFR + 3.500%6 | | (B, B2) | | 04/15/27 | | | 8.346 | | | | 1,834,375 | | |
| | 4,842 | | | Proampac PG Borrower LLC,
3 mo. USD Term SOFR + 4.000%6 | |
(B-, B3) | |
09/15/28 | | | 8.656 -
9.118 | | | | 4,864,950 | | |
| | 1,331 | | | Technimark Holdings LLC, 1 mo. USD Term SOFR + 3.500%6 | | (B-, B2) | | 04/14/31 | | | 8.286 | | | | 1,329,794 | | |
| | 2,489 | | | TricorBraun Holdings, Inc., 1 mo. USD Term SOFR + 3.250%6 | | (B-, B2) | | 03/03/28 | | | 8.050 | | | | 2,470,773 | | |
| | | | | | | | | | | | | | 12,751,483 | | |
Personal & Household Products (0.7%) | | | |
| | 3,280 | | | ABG Intermediate Holdings 2 LLC, 1 mo. USD Term SOFR + 2.750%6 | | (BB-, B1) | | 12/21/28 | | | 7.447 | | | | 3,290,162 | | |
| | 1,178 | | | Serta Simmons Bedding LLC, 3 mo. USD Term SOFR + 7.500%6 | | (NR, NR) | | 06/29/28 | | | 12.218 | | | | 990,860 | | |
| | 13 | | | Serta Simmons Bedding LLC, 3 mo. USD Term SOFR + 7.500%5,6 | | (NR, NR) | | 06/29/28 | | | 12.232 | | | | 13,246 | | |
| | 1,669 | | | Tempur Sealy International, Inc.7 | | (BBB-, Ba1) | | 10/03/31 | | | 0.000 | | | | 1,670,608 | | |
| | | | | | | | | | | | | | 5,964,876 | | |
Property & Casualty Insurance (0.1%) | | | |
| | 617 | | | Summit Acquisition, Inc., 3 mo. USD Term SOFR + 3.750%5,6 | | (B-, B3) | | 10/10/31 | | | 8.397 | | | | 618,484 | | |
Rail (0.4%) | | | |
| | 3,000 | | | Genesee & Wyoming, Inc., 3 mo. USD Term SOFR + 2.000%6 | | (BB, Ba3) | | 04/10/31 | | | 6.604 | | | | 2,995,515 | | |
Real Estate Development & Management (0.5%) | | | |
| | 3,829 | | | BIFM U.S. Finance LLC, 1 mo. USD Term SOFR + 4.250%6 | | (B, B3) | | 05/31/28 | | | 8.935 | | | | 3,845,590 | | |
Recreation & Travel (1.0%) | | | |
| | 2,213 | | | Motion Finco SARL, 3 mo. USD Term SOFR + 3.500%6 | | (B+, B2) | | 11/12/29 | | | 8.104 | | | | 2,118,788 | | |
| | 1,350 | | | OVG Business Services LLC, 1 mo. USD Term SOFR + 3.000%6 | | (B, B2) | | 06/25/31 | | | 7.685 | | | | 1,348,338 | | |
13
Credit Suisse Strategic Income Fund
Schedule of Investments
Par
(000) | | | | Ratings†
(S&P/Moody's) | | Maturity | | Rate% | | Value | |
Bank loans—(continued) | | | |
Recreation & Travel—(concluded) | | | |
$ | 2,214 | | | SeaWorld Parks & Entertainment, Inc., 1 mo. USD Term SOFR + 2.500%6 | | (BB+, Ba2) | | 08/25/28 | | | 7.185 | | | $ | 2,217,282 | | |
| | 3,139 | | | Six Flags Entertainment Corp., 1 mo. USD Term SOFR + 2.000%6 | | (BBB-, Ba1) | | 05/01/31 | | | 6.845 | | | | 3,141,022 | | |
| | | | | | | | | | | | | | 8,825,430 | | |
Restaurants (2.1%) | | | |
| | 1,925 | | | 1011778 B.C. Unlimited Liability Co., 1 mo. USD Term SOFR + 1.750%6 | | (BB+, Ba2) | | 09/20/30 | | | 6.435 | | | | 1,911,799 | | |
| | 3,284 | | | Flynn Restaurant Group LP, 1 mo. USD Term SOFR + 4.250%6 | | (B, B2) | | 12/01/28 | | | 9.050 | | | | 3,300,607 | | |
| | 6,895 | | | IRB Holding Corp., 1 mo. USD Term SOFR + 2.750%6 | | (B+, B2) | | 12/15/27 | | | 7.535 | | | | 6,901,957 | | |
| | 2,050 | | | K-Mac Holdings Corp., 1 mo. USD Term SOFR + 3.500%6 | | (B-, B3) | | 07/21/28 | | | 9.050 | | | | 2,055,187 | | |
| | 2,206 | | | Tacala LLC, 3 mo. USD Term SOFR + 3.500%6 | | (B-, B3) | | 01/31/31 | | | 8.185 | | | | 2,214,598 | | |
| | 1,493 | | | Whatabrands LLC, 1 mo. USD Term SOFR + 2.750%6 | | (B, B2) | | 08/03/28 | | | 7.435 | | | | 1,494,030 | | |
| | | | | | | | | | | | | | 17,878,178 | | |
Software—Services (11.6%) | | | |
| | 3,454 | | | Applied Systems, Inc., 3 mo. USD Term SOFR + 3.000%6 | | (B-, B2) | | 02/24/31 | | | 7.604 | | | | 3,465,405 | | |
| | 2,050 | | | AQ Carver Buyer, Inc., 3 mo. USD Term SOFR + 5.500%6 | | (B, B2) | | 08/02/29 | | | 10.185 | | | | 2,059,184 | | |
| | 2,289 | | | Aston FinCo SARL, 1 mo. USD Term SOFR + 4.250%6 | | (CCC+, B3) | | 10/09/26 | | | 9.050 | | | | 2,209,358 | | |
| | 930 | | | Astra Acquisition Corp., 3 mo. USD Term SOFR + 6.750%6,9 | | (CCC+, Caa1) | | 02/25/28 | | | 11.354 | | | | 730,047 | | |
| | 1,139 | | | Astra Acquisition Corp., 3 mo. USD Term SOFR + 5.250%6 | | (CC, C) | | 10/25/28 | | | 9.854 | | | | 99,642 | | |
| | 2,033 | | | BCPE Pequod Buyer, Inc.7 | | (B, B3) | | 09/19/31 | | | 0.000 | | | | 2,034,858 | | |
| | 1,164 | | | Camelot U.S. Acquisition LLC, 1 mo. USD Term SOFR + 2.750%6 | | (BB-, B1) | | 01/31/31 | | | 7.435 | | | | 1,166,594 | | |
| | 2,487 | | | CE Intermediate I LLC, 3 mo. USD Term SOFR + 3.500%6 | | (B-, B3) | | 11/10/28 | | | 8.763 | | | | 2,492,692 | | |
| | 2,240 | | | Celestica, Inc., 1 mo. USD Term SOFR + 1.750%5,6 | | (BB, Ba1) | | 06/20/31 | | | 6.468 | | | | 2,241,400 | | |
| | 250 | | | Cloud Software Group, Inc.7 | | (B, B2) | | 03/21/31 | | | 0.000 | | | | 250,293 | | |
| | 4,612 | | | Cloud Software Group, Inc., 3 mo. USD Term SOFR + 4.000%6 | | (B, B2) | | 03/30/29 | | | 8.604 | | | | 4,616,029 | | |
| | 1,053 | | | CommerceHub, Inc., 3 mo. USD Term SOFR + 4.000%6 | | (B, B3) | | 12/29/27 | | | 8.797 | | | | 982,589 | | |
| | 1,496 | | | CommerceHub, Inc., 3 mo. USD Term SOFR + 6.250%6 | | (NR, B3) | | 12/29/27 | | | 10.897 | | | | 1,446,631 | | |
| | 2,473 | | | ConnectWise LLC, 3 mo. USD Term SOFR + 3.500%6 | | (NR, B2) | | 09/29/28 | | | 8.365 | | | | 2,475,403 | | |
| | 1,219 | | | Cornerstone OnDemand, Inc., 1 mo. USD Term SOFR + 3.750%6 | | (B-, B2) | | 10/16/28 | | | 8.550 | | | | 1,149,760 | | |
| | 3,491 | | | Dayforce, Inc., 3 mo. USD Term SOFR + 2.500%5,6 | | (BB-, Ba3) | | 02/26/31 | | | 7.085 | | | | 3,502,160 | | |
| | 1,250 | | | DCert Buyer, Inc., 1 mo. USD Term SOFR + 7.000%6 | | (CCC, Caa2) | | 02/19/29 | | | 11.685 | | | | 1,058,856 | | |
| | 3,527 | | | EagleView Technology Corp., 3 mo. USD Term SOFR + 3.500%6 | | (CCC+, Caa1) | | 08/14/25 | | | 8.366 | | | | 3,359,193 | | |
| | 1,253 | | | Evertec Group LLC, 1 mo. USD Term SOFR + 3.250%5,6 | | (BB-, Ba3) | | 10/30/30 | | | 7.935 | | | | 1,256,522 | | |
| | 2,348 | | | First Advantage Holdings LLC5,7 | | (B+, B1) | | 09/19/31 | | | 0.000 | | | | 2,353,593 | | |
| | 914 | | | Fleet Midco I Ltd., 6 mo. USD Term SOFR + 2.750%5,6 | | (B+, B2) | | 02/21/31 | | | 7.578 | | | | 917,595 | | |
| | 2,835 | | | Flexera Software LLC, 1 mo. USD Term SOFR + 3.500%6 | | (B-, B2) | | 03/03/28 | | | 8.259 | | | | 2,845,687 | | |
| | 750 | | | Geosyntec Consultants, 1 mo. USD Term SOFR + 3.750%5,6 | | (B-, B3) | | 07/31/31 | | | 8.435 | | | | 752,813 | | |
| | 686 | | | GHX Ultimate Parent Corp.7 | | (B-, B2) | | 06/30/27 | | | 0.000 | | | | 688,092 | | |
| | 1,496 | | | Go Daddy Operating Co. LLC, 1 mo. USD Term SOFR + 1.750%6 | | (BB, Ba1) | | 05/30/31 | | | 6.435 | | | | 1,493,213 | | |
| | 417 | | | IGT Holding IV AB, 3 mo. USD Term SOFR + 3.400%5,6 | | (B, B3) | | 03/31/28 | | | 8.742 | | | | 418,330 | | |
| | 2,321 | | | Instructure Holdings, Inc., 3 mo. USD Term SOFR + 2.750%5,6 | | (NR, B1) | | 10/30/28 | | | 8.074 | | | | 2,322,364 | | |
| | 1,634 | | | Johnstone Supply LLC, 1 mo. USD Term SOFR + 3.000%6 | | (B, B2) | | 06/09/31 | | | 7.851 | | | | 1,634,004 | | |
| | 1,024 | | | Marcel LUX IV SARL, 1 mo. USD Term SOFR + 4.000%5,6 | | (B+, B2) | | 11/11/30 | | | 8.840 | | | | 1,028,521 | | |
| | 2,657 | | | Mitnick Corporate Purchaser, Inc., 3 mo. USD Term SOFR + 4.500%6 | | (B-, B3) | | 05/02/29 | | | 9.185 | | | | 2,380,324 | | |
| | 484 | | | Mosel Bidco SE, 3 mo. USD Term SOFR + 4.500%5,6 | | (B, B2) | | 09/16/30 | | | 9.104 | | | | 487,759 | | |
| | 1,493 | | | Particle Investments SARL, 1 mo. USD Term SOFR + 4.000%6 | | (B+, B1) | | 03/28/31 | | | 8.685 | | | | 1,500,903 | | |
| | 1,942 | | | Perforce Software, Inc., 1 mo. USD Term SOFR + 3.750%6 | | (B-, B2) | | 07/01/26 | | | 8.535 | | | | 1,939,622 | | |
| | 703 | | | Polaris Newco LLC7,13 | | (B-, B2) | | 06/02/28 | | | 0.000 | | | | 869,756 | | |
| | 5,898 | | | Polaris Newco LLC, 3 mo. USD Term SOFR + 4.000%6 | | (B-, B2) | | 06/02/28 | | | 8.847 | | | | 5,865,205 | | |
| | 848 | | | Press Ganey Holdings, Inc., 1 mo. USD Term SOFR + 3.500%6 | | (B-, B3) | | 04/30/31 | | | 8.185 | | | | 848,569 | | |
| | 6,651 | | | Project Alpha Intermediate Holding, Inc., 3 mo. USD Term SOFR + 3.750%6 | | (B, B2) | | 10/28/30 | | | 8.335 | | | | 6,683,265 | | |
| | 2,416 | | | Project Boost Purchaser LLC, 3 mo. USD Term SOFR + 3.500%6 | | (B-, B2) | | 07/16/31 | | | 8.147 | | | | 2,421,581 | | |
| | 1,566 | | | Project Ruby Ultimate Parent Corp., 1 mo. USD Term SOFR + 3.250%6 | | (B, B2) | | 03/10/28 | | | 8.050 | | | | 1,570,741 | | |
| | 6,451 | | | Quest Software U.S. Holdings, Inc., 3 mo. USD Term SOFR + 4.250%4,6,9 | | (CCC+, B3) | | 02/01/29 | | | 8.985 | | | | 4,644,710 | | |
14
Credit Suisse Strategic Income Fund
Schedule of Investments
Par
(000) | | | | Ratings†
(S&P/Moody's) | | Maturity | | Rate% | | Value | |
Bank loans—(continued) | | | |
Software—Services—(concluded) | | | |
$ | 1,076 | | | RealPage, Inc., 1 mo. USD Term SOFR + 3.000%6 | | (B, B2) | | 04/24/28 | | | 7.800 | | | $ | 1,061,979 | | |
| | 1,232 | | | Redstone Holdco 2 LP, 3 mo. USD Term SOFR + 4.750%6 | | (CCC+, B3) | | 04/27/28 | | | 9.597 | | | | 925,852 | | |
| | 427 | | | Sovos Compliance LLC, 1 mo. USD Term SOFR + 4.500%6 | | (B-, B3) | | 08/11/28 | | | 9.300 | | | | 427,557 | | |
| | 4,048 | | | SS&C Technologies, Inc., 1 mo. USD Term SOFR + 2.000%6 | | (BB+, Ba1) | | 05/09/31 | | | 6.685 | | | | 4,052,171 | | |
| | 1,456 | | | Thevelia U.S. LLC, 3 mo. USD Term SOFR + 3.250%6 | | (B+, B1) | | 06/18/29 | | | 7.854 | | | | 1,459,215 | | |
| | 2,960 | | | UKG, Inc., 3 mo. USD Term SOFR + 3.000%6 | | (B-, B2) | | 02/10/31 | | | 7.617 | | | | 2,967,125 | | |
| | 3,741 | | | VS Buyer LLC, 1 mo. USD Term SOFR + 3.250%6 | | (B, B2) | | 04/11/31 | | | 8.036 | | | | 3,749,977 | | |
| | 835 | | | Waystar Technologies, Inc., 1 mo. USD Term SOFR + 2.750%6 | | (B+, B1) | | 10/22/29 | | | 7.435 | | | | 839,003 | | |
| | 2,414 | | | ZoomInfo LLC, 1 mo. USD Term SOFR + 1.750%6 | | (NR, Ba1) | | 02/28/30 | | | 6.435 | | | | 2,399,182 | | |
| | | | | | | | | | | | | | 98,145,324 | | |
Specialty Retail (0.2%) | | | |
| | 1,870 | | | Mister Car Wash Holdings, Inc., 1 mo. USD Term SOFR + 3.000%6 | | (B, B2) | | 03/27/31 | | | 7.685 | | | | 1,874,068 | | |
Steel Producers/Products (0.1%) | | | |
| | 742 | | | Grinding Media, Inc., 3 mo. USD Term SOFR + 4.000%6 | | (B-, B3) | | 10/12/28 | | | 8.898 | | | | 744,203 | | |
Support—Services (3.0%) | | | |
| | 528 | | | Albion Financing 3 SARL, 3 mo. USD Term SOFR + 4.250%6 | | (BB-, B1) | | 08/16/29 | | | 9.096 | | | | 530,270 | | |
| | 995 | | | Allied Universal Holdco LLC, 1 mo. USD Term SOFR + 3.750%6 | | (B, B3) | | 05/12/28 | | | 8.535 | | | | 994,026 | | |
| | 775 | | | Belfor Holdings, Inc., 1 mo. USD Term SOFR + 3.750%6 | | (B-, B1) | | 11/01/30 | | | 8.435 | | | | 779,589 | | |
| | 2,500 | | | Belron Finance 2019 LLC, 1 mo. USD Term SOFR + 2.750%6 | | (BB-, Ba3) | | 10/16/31 | | | 7.495 | | | | 2,512,500 | | |
| | 23 | | | Chrysaor Bidco SARL7 | | (B, B3) | | 05/14/31 | | | 0.000 | | | | 22,685 | | |
| | 305 | | | Chrysaor Bidco SARL7 | | (B, B3) | | 07/17/31 | | | 0.000 | | | | 306,739 | | |
| | 705 | | | Construction Partners, Inc.5,7 | | (B+, B1) | | 10/29/31 | | | 0.000 | | | | 706,560 | | |
| | 1,709 | | | CoreLogic, Inc., 1 mo. USD Term SOFR + 3.500%6 | | (B-, B2) | | 06/02/28 | | | 8.300 | | | | 1,703,872 | | |
| | 1,990 | | | Gloves Buyer, Inc., 1 mo. USD Term SOFR + 4.000%6 | | (B-, B3) | | 12/29/27 | | | 8.800 | | | | 1,984,715 | | |
| | 1,558 | | | KUEHG Corp., 3 mo. USD Term SOFR + 3.250%6 | | (NR, NR) | | 06/12/30 | | | 7.839 | | | | 1,563,646 | | |
| | 830 | | | LaserShip, Inc., 3 mo. USD Term SOFR + 7.500%6,9 | | (C, Ca) | | 05/07/29 | | | 12.104 | | | | 193,558 | | |
| | 2,086 | | | LaserShip, Inc., 3 mo. USD Term SOFR + 4.500%6,9 | | (CCC-, Caa2) | | 05/07/28 | | | 9.365 | | | | 902,380 | | |
| | 2,564 | | | Nuvei Technologies Corp.7 | | (B+, B1) | | 07/18/31 | | | 0.000 | | | | 2,558,912 | | |
| | 1,758 | | | Nuvei Technologies Corp., 1 mo. USD Term SOFR + 3.000%6 | | (BB-, Ba3) | | 12/19/30 | | | 7.785 | | | | 1,756,320 | | |
| | 593 | | | Paint Intermediate III LLC, U.S. (Fed) Prime Rate + 2.000%5,6 | | (B, B2) | | 09/11/31 | | | 10.000 | | | | 592,921 | | |
| | 536 | | | Savage Enterprises LLC, 1 mo. USD Term SOFR + 3.000%6 | | (BB-, B1) | | 09/15/28 | | | 7.685 | | | | 538,695 | | |
| | 1,386 | | | Synechron, Inc., 3 mo. USD Term SOFR + 3.750%5,6 | | (B+, B1) | | 10/03/31 | | | 8.360 | | | | 1,380,818 | | |
| | 2,039 | | | Tempo Acquisition LLC, 1 mo. USD Term SOFR + 2.250%6 | | (BB, Ba3) | | 08/31/28 | | | 6.935 | | | | 2,042,358 | | |
| | 390 | | | Teneo Holdings LLC, 1 mo. USD Term SOFR + 4.750%6 | | (B, B2) | | 03/13/31 | | | 9.435 | | | | 390,473 | | |
| | 2,479 | | | Trans Union LLC, 1 mo. USD Term SOFR + 1.750%6 | | (BBB-, Ba2) | | 06/24/31 | | | 6.435 | | | | 2,478,112 | | |
| | 400 | | | TruGreen LP, 3 mo. USD Term SOFR + 8.500%5,6 | | (CCC, Caa3) | | 11/02/28 | | | 13.347 | | | | 360,000 | | |
| | 1,471 | | | Wrench Group LLC, 3 mo. USD Term SOFR + 4.000%6 | | (B-, B3) | | 10/30/28 | | | 8.865 | | | | 1,453,071 | | |
| | | | | | | | | | | | | | 25,752,220 | | |
Tech Hardware & Equipment (1.0%) | | | |
| | 3,137 | | | Atlas CC Acquisition Corp., 3 mo. USD Term SOFR + 4.250%6 | | (B, Caa2) | | 05/25/28 | | | 9.569 | | | | 2,279,556 | | |
| | 638 | | | Atlas CC Acquisition Corp., 3 mo. USD Term SOFR + 4.250%6 | | (B+, B1) | | 05/25/28 | | | 9.569 | | | | 463,637 | | |
| | 247 | | | CommScope, Inc., 1 mo. USD Term SOFR + 3.250%6 | | (CCC+, B3) | | 04/06/26 | | | 8.050 | | | | 242,510 | | |
| | 1,056 | | | Ultra Clean Holdings, Inc., 1 mo. USD Term SOFR + 3.250%5,6 | | (B+, B1) | | 02/28/28 | | | 7.935 | | | | 1,062,371 | | |
| | 4,245 | | | Vertiv Group Corp., 1 mo. USD Term SOFR + 2.000%6 | | (BB+, Ba2) | | 03/02/27 | | | 6.846 | | | | 4,249,033 | | |
| | | | | | | | | | | | | | 8,297,107 | | |
Telecom—Wireless (0.2%) | | | |
| | 1,746 | | | SBA Senior Finance II LLC, 1 mo. USD Term SOFR + 1.750%6 | | (BBB-, Ba2) | | 01/25/31 | | | 6.440 | | | | 1,745,536 | | |
15
Credit Suisse Strategic Income Fund
Schedule of Investments
Par
(000) | | | | Ratings†
(S&P/Moody's) | | Maturity | | Rate% | | Value | |
Bank loans—(concluded) | | | |
Telecom—Wireline Integrated & Services (0.8%) | | | |
$ | 1,161 | | | Altice Financing SA, 3 mo. USD Term SOFR + 5.000%6 | | (B-, Caa1) | | 10/31/27 | | | 9.656 | | | $ | 1,056,860 | | |
| | 981 | | | Altice France SA, 3 mo. USD Term SOFR + 5.500%6 | | (CCC+, Caa1) | | 08/15/28 | | | 10.147 | | | | 788,408 | | |
| | 879 | | | Altice France SA, 6 mo. USD LIBOR + 3.688%6 | | (CCC+, Caa1) | | 01/31/26 | | | 8.370 | | | | 755,922 | | |
| | 2,032 | | | Patagonia Holdco LLC, 3 mo. USD Term SOFR + 5.750%6 | | (NR, B1) | | 08/01/29 | | | 10.854 | | | | 1,901,145 | | |
| | 1,000 | | | Virgin Media Bristol LLC, 1 mo. USD Term SOFR + 3.250%6 | | (B+, Ba3) | | 01/31/29 | | | 8.150 | | | | 976,320 | | |
| | 1,000 | | | Virgin Media Bristol LLC7 | | (B+, Ba3) | | 01/31/28 | | | 0.000 | | | | 972,690 | | |
| | | | | | | | | | | | | | 6,451,345 | | |
Theaters & Entertainment (1.9%) | | | |
| | 3,127 | | | Herschend Entertainment Co. LLC, 1 mo. USD Term SOFR + 3.000%6 | | (BB-, Ba3) | | 08/27/28 | | | 7.685 | | | | 3,140,701 | | |
| | 8,386 | | | UFC Holdings LLC, 3 mo. USD Term SOFR + 2.750%6 | | (BB, Ba3) | | 04/29/26 | | | 7.638 | | | | 8,403,845 | | |
| | 4,704 | | | William Morris Endeavor Entertainment LLC,
1 mo. USD Term SOFR + 2.750%6 | |
(BB-, B3) | |
05/18/25 | | | 7.435 -
7.550 | | | | 4,711,624 | | |
| | | | | | | | | | | | | | 16,256,170 | | |
| | | | | Total bank loans
(Cost $474,676,770) | | | | | | | | | 467,272,423 | | |
Asset backed securities (3.1%) | | | |
Collateralized Debt Obligations (3.1%) | | | |
| | 1,350 | | | Anchorage Capital CLO 15 Ltd., 2020-15A, Rule 144A, 3 mo. USD Term SOFR + 7.662%1,6 | | (NR, Ba3) | | 07/20/34 | | | 12.279 | | | | 1,345,943 | | |
| | 2,000 | | | Arbour CLO VII DAC, Rule 144A, 3 mo. EURIBOR + 0.980%1,3,4,6 | | (AAA, NR) | | 03/15/33 | | | 4.461 | | | | 2,173,106 | | |
| | 1,000 | | | Battalion CLO XIV Ltd., 2019-14A, Rule 144A, 3 mo. USD Term SOFR + 3.702%1,6 | | (NR, Baa3) | | 01/20/35 | | | 8.319 | | | | 1,007,230 | | |
| | 2,500 | | | Battalion CLO XXIV Ltd., 2022-24A, Rule 144A, 3 mo. USD Term SOFR + 3.500%1,6 | | (NR, NR) | | 07/14/36 | | | 8.156 | | | | 2,541,747 | | |
| | 1,000 | | | BlueMountain CLO Ltd., 2016-2A, Rule 144A, 3 mo. USD Term SOFR + 4.562%1,6 | | (BBB-, NR) | | 08/20/32 | | | 9.690 | | | | 993,335 | | |
| | 1,000 | | | BlueMountain Fuji U.S. CLO I Ltd., 2017-1A, Rule 144A, 3 mo. USD Term SOFR + 6.262%1,6 | | (BB-, NR) | | 07/20/29 | | | 10.879 | | | | 965,387 | | |
| | 1,000 | | | BlueMountain Fuji U.S. CLO III Ltd., 2017-3A, Rule 144A, 3 mo. USD Term SOFR + 5.462%1,6 | | (BB-, NR) | | 01/15/30 | | | 10.118 | | | | 967,228 | | |
| | 750 | | | Carlyle Global Market Strategies CLO Ltd., 2014-3RA, Rule 144A,
3 mo. USD Term SOFR + 5.662%1,6 | | (BB-, NR) | | 07/27/31 | | | 10.279 | | | | 714,675 | | |
| | 1,250 | | | CIFC Funding Ltd., 2013-2A, Rule 144A, 3 mo. USD Term SOFR + 6.782%1,6 | | (B+, NR) | | 10/18/30 | | | 11.414 | | | | 1,242,195 | | |
| | 750 | | | CIFC Funding Ltd., 2014-1A, Rule 144A, 3 mo. USD Term SOFR + 6.112%1,6 | | (B+, NR) | | 01/18/31 | | | 10.744 | | | | 751,964 | | |
| | 2,150 | | | Generate CLO 3 Ltd., Rule 144A, 3 mo. USD Term SOFR + 4.900%1,6 | | (BBB-, NR) | | 10/20/36 | | | 9.517 | | | | 2,182,279 | | |
| | 1,225 | | | Greywolf CLO V Ltd., 2015-1A, Rule 144A, 3 mo. USD Term SOFR + 6.112%1,6 | | (BB-, NR) | | 01/27/31 | | | 10.737 | | | | 1,231,768 | | |
| | 500 | | | Halcyon Loan Advisors Funding Ltd., 2015-2A, Rule 144A1,9 | | (NR, NR) | | 07/25/27 | | | 0.000 | | | | 75 | | |
| | 1,000 | | | KKR CLO 16 Ltd., Rule 144A, 3 mo. USD Term SOFR + 7.372%1,6 | | (BB-, NR) | | 10/20/34 | | | 11.989 | | | | 991,705 | | |
| | 500 | | | KKR CLO 20 Ltd., Rule 144A, 3 mo. USD Term SOFR + 5.762%1,6 | | (NR, Ba3) | | 10/16/30 | | | 10.409 | | | | 502,576 | | |
| | 1,000 | | | Marble Point CLO XXIII Ltd., 2021-4A, Rule 144A, 3 mo. USD Term SOFR + 6.012%1,6 | | (NR, Ba1) | | 01/22/35 | | | 10.643 | | | | 1,005,020 | | |
| | 2,500 | | | Octagon Investment Partners 38 Ltd., 2018-1A, Rule 144A,
3 mo. USD Term SOFR + 4.650%1,6 | | (NR, NR) | | 10/20/37 | | | 9.776 | | | | 2,537,341 | | |
| | 3,000 | | | Strata CLO II Ltd., 2021-1A, Rule 144A, 3 mo. USD Term SOFR + 4.410%1,6 | | (BBB-, NR) | | 10/20/33 | | | 9.027 | | | | 3,028,748 | | |
| | 500 | | | Venture XXVIII CLO Ltd., 2017-28A, Rule 144A, 3 mo. USD Term SOFR + 6.412%1,6 | | (NR, Ba3) | | 07/20/30 | | | 11.029 | | | | 348,897 | | |
| | 1,000 | | | Vibrant CLO III Ltd., 2015-3A, Rule 144A, 3 mo. USD Term SOFR + 3.762%1,6 | | (NR, Ba1) | | 10/20/31 | | | 8.379 | | | | 1,008,963 | | |
| | 500 | | | Voya CLO Ltd., 2014-4A, Rule 144A, 3 mo. USD Term SOFR + 3.612%1,6 | | (BBB-, NR) | | 07/14/31 | | | 8.268 | | | | 502,021 | | |
| | | | | Total asset backed securities
(Cost $26,525,063) | | | | | | | | | 26,042,203 | | |
Shares | | | | | | | | | | | |
Common stocks (0.9%) | | | |
Auto Parts & Equipment (0.0%) | | | |
| | 23,475 | | | Jason, Inc.11 | | | | | | | | | 211,277 | | |
Cable & Satellite TV (0.0%) | | | |
| | 54,000 | | | Altice USA, Inc., Class A11 | | | | | | | | | 131,220 | | |
16
Credit Suisse Strategic Income Fund
Schedule of Investments
Shares | | | | | | | | | | Value | |
Common stocks—(concluded) | | | |
Chemicals (0.1%) | | | |
| | 25,202 | | | Proppants Holdings LLC4,5,9 | | | | | | | | $ | 504 | | |
| | 6,341 | | | Utex Industries | | | | | | | | | 221,142 | | |
| | | | | | | | | | | | | | 221,646 | | |
Energy—Exploration & Production (0.0%) | | | |
| | 37,190 | | | PES Energy, Class A4,5,9,11 | | | | | | | | | 372 | | |
Metals & Mining—Excluding Steel (0.3%) | | | |
| | 1,100,000 | | | Taseko Mines Ltd.11 | | | | | | | | | 2,438,394 | | |
Personal & Household Products (0.0%) | | | |
| | 29,405 | | | Dream Well, Inc.11 | | | | | | | | | 169,079 | | |
| | 29,405 | | | Serta Simmons Bedding Equipment Co.4,5,11 | | | | | | | | | 0 | | |
| | | | | | | | | | | | | | 169,079 | | |
Pharmaceuticals (0.0%) | | | |
| | 37,299 | | | Akorn, Inc.11 | | | | | | | | | 1,865 | | |
Private Placement (0.0%) | | | |
| | 127,439,226 | | | Technicolor Creative Studios SA11,14 | | | | | | | | | 207,532 | | |
Recreation & Travel (0.5%) | | | |
| | 196,081 | | | Cineworld Group PLC11 | | | | | | | | | 4,362,802 | | |
Specialty Retail (0.0%) | | | |
| | 66 | | | Eagle Investments Holding Co. LLC, Class B4,5,11 | | | | | | | | | 1 | | |
| | | | | Total common stocks
(Cost $7,498,837) | | | | | | | | | 7,744,188 | | |
Warrants (0.0%) | | | |
Chemicals (0.0%) | | | |
| | 6,300 | | | Project Investor Holdings LLC, expires 02/08/20264,5,9,11 | | | | | | | | | 0 | | |
Investments & Misc. Financial Services (0.0%) | | | |
| | 2,847 | | | Altisource Solutions SARL, expires 05/31/20274,5,11 | | | | | | | | | 3,388 | | |
| | 6,000 | | | Movella Holdings, Inc., expires 12/31/20274,5,11 | | | | | | | | | 0 | | |
| | 2,500 | | | Northern Star Investment Corp. IV, expires 12/31/20274,5,11 | | | | | | | | | 7 | | |
| | | | | | | | | | | | | | 3,395 | | |
Software—Services (0.0%) | | | |
| | 26,666 | | | Brand Engagement Network, Inc., expires 03/14/202911 | | | | | | | | | 555 | | |
| | | | | Total warrants
(Cost $21,320) | | | | | | | | | 3,950 | | |
Short-term investments (8.9%) | | | |
| | 45,341,156 | | | State Street Institutional U.S. Government Money Market Fund—Premier Class, 4.81% | | | | | | | | | 45,341,156 | | |
| | 30,499,255 | | | State Street Navigator Securities Lending Government Money Market Portfolio, 4.86%15 | | | | | | | | | 30,499,255 | | |
| | | | | Total short-term investments
(Cost $75,840,411) | | | | | | | | | 75,840,411 | | |
| | | | | Total investments at value (107.6%)
(Cost $917,431,468) | | | | | | | | | 913,052,828 | | |
| | | | | Liabilities in Excess of Other Assets (-7.6%) | | | | | | | | | (64,532,040 | ) | |
| | | | | Net assets (100.0%) | | | | | | | | $ | 848,520,788 | | |
17
Credit Suisse Strategic Income Fund
Schedule of Investments
† Credit ratings given by the S&P Global Ratings Division of S&P Global Inc. ("S&P") and Moody's Investors Service, Inc. ("Moody's") are unaudited.
1 Security exempt from registration under Rule 144A of the Securities Act of 1933, as amended. These securities may be resold in transactions exempt from registration, normally to qualified institutional buyers. At October 31, 2024, these securities amounted to a value of $358,370,094 or 42.2% of net assets.
2 Security or portion thereof is out on loan (See Note 2-K).
3 This security is denominated in Euro.
4 Not readily marketable security; security is valued at fair value as determined in good faith by UBS Asset Management (Americas) LLC as the Fund's valuation designee under the oversight of the Board of Trustees (See Note 2-A).
5 Security is valued using significant unobservable inputs.
6 Variable rate obligation—The interest rate shown is the rate in effect as of October 31, 2024. The rate may be subject to a cap and floor.
7 The rates on certain variable rate securities are not based on a published reference rate and spread but are determined by the issuer or agent and are based on current market conditions. These securities do not indicate a reference rate and spread in their description above. The interest rate shown is the rate in effect as of October 31, 2024.
8 PIK: Payment-in-kind security for which part of the income earned may be paid as additional principal.
9 Illiquid security.
10 Bond is currently in default.
11 Non-income producing security.
12 All or a portion is an unfunded loan commitment (See Note 2-J).
13 This security is denominated in British Pound.
14 Security is held through holdings of 100 shares of the CIG Special Purpose SPC—Credit Suisse Strategic Income Fund Segregated Portfolio, an affiliated entity.
15 Represents security purchased with cash collateral received for securities on loan.
Investment abbreviations
1 mo. = 1 month
3 mo. = 3 month
6 mo. = 6 month
EURIBOR = Euro Interbank Offered Rate
LIBOR = London Interbank Offered Rate
NR = Not Rated
SARL = société à responsabilité limitée
SOFR = Secured Overnight Financing Rate
WR = Withdrawn Rating
Forward foreign currency contracts
Forward
currency to be
purchased | | Forward
currency to be
sold | | Settlement
date | | Counterparty | | Value on
settlement date | | Current
value/notional | | Unrealized
appreciation | |
USD | 2,849,965 | | | CAD | 3,828,000 | | | 10/07/25 | | Deutsche Bank AG | | $ | (2,849,965 | ) | | $ | (2,777,515 | ) | | $ | 72,450 | | |
USD | 2,643,316 | | | EUR | 2,361,738 | | | 10/07/25 | | Morgan Stanley | | | (2,643,316 | ) | | | (2,605,829 | ) | | | 37,487 | | |
USD | 877,014 | | | GBP | 675,633 | | | 10/07/25 | | Morgan Stanley | | | (877,014 | ) | | | (866,766 | ) | | | 10,248 | | |
Total unrealized appreciation | | | | | | | | | | | | $ | 120,185 | | |
18
Credit Suisse Strategic Income Fund
Schedule of Investments
Forward foreign currency contracts—(concluded)
Forward
currency to be
purchased | | Forward
currency to be
sold | | Settlement
date | | Counterparty | | Value on
settlement date | | Current
value/notional | | Unrealized
depreciation | |
CAD | 198,000 | | | USD | 145,210 | | | 10/07/25 | | Deutsche Bank AG | | $ | 145,210 | | | $ | 143,665 | | | $ | (1,545 | ) | |
USD | 2,292,948 | | | EUR | 2,079,544 | | | 10/07/25 | | Deutsche Bank AG | | | (2,292,948 | ) | | | (2,294,470 | ) | | | (1,522 | ) | |
Total unrealized depreciation | | | | | | | | | | | | $ | (3,067 | ) | |
Total net unrealized appreciation/(depreciation) | | | | | | | | | | | | $ | 117,118 | | |
Currency abbreviations:
CAD = Canadian Dollar
EUR = Euro
USD = United States Dollar
See accompanying notes to financial statements.
19
Credit Suisse Strategic Income Fund
Statement of assets and liabilities
October 31, 2024
Assets: | |
Investments at value, including collateral for securities on loan of $30,499,255 (Cost $917,431,468) (Note 2) | | $ | 913,052,8281 | | |
Cash | | | 1,949,963 | | |
Foreign currency at value (Cost $50,815) | | | 51,095 | | |
Interest receivable | | | 9,294,198 | | |
Receivable for investments sold | | | 5,950,062 | | |
Receivable for Fund shares sold | | | 3,684,281 | | |
Unrealized appreciation on forward foreign currency contracts (Note 2) | | | 120,185 | | |
Prepaid expenses and other assets | | | 113,701 | | |
Total assets | | | 934,216,313 | | |
Liabilities: | |
Investment advisory fee payable (Note 3) | | | 1,404,952 | | |
Administrative services fee payable (Note 3) | | | 85,625 | | |
Shareholder servicing/Distribution fee payable (Note 3) | | | 53,088 | | |
Payable for investments purchased | | | 49,657,444 | | |
Payable upon return of securities loaned (Note 2) | | | 30,499,255 | | |
Payable for Fund shares redeemed | | | 1,997,289 | | |
Dividend payable | | | 1,305,356 | | |
Unfunded loan commitments (Note 2) | | | 343,952 | | |
Trustees' fee payable | | | 28,135 | | |
Unrealized depreciation on forward foreign currency contracts (Note 2) | | | 3,067 | | |
Accrued expenses | | | 317,362 | | |
Total liabilities | | | 85,695,525 | | |
Net assets: | |
Capital stock, $.001 par value (Note 6) | | | 88,980 | | |
Paid-in capital (Note 6) | | | 892,579,140 | | |
Total distributable earnings (loss) | | | (44,147,332 | ) | |
Net assets | | $ | 848,520,788 | | |
I Shares | |
Net assets | | $ | 740,430,637 | | |
Shares outstanding | | | 77,647,780 | | |
Net asset value, offering price and redemption price per share | | $ | 9.54 | | |
A Shares | |
Net assets | | $ | 58,890,264 | | |
Shares outstanding | | | 6,175,895 | | |
Net asset value and redemption price per share | | $ | 9.54 | | |
Maximum offering price per share (net asset value/(1-4.75%)) | | $ | 10.02 | | |
C Shares | |
Net assets | | $ | 49,199,887 | | |
Shares outstanding | | | 5,155,996 | | |
Net asset value, offering price and redemption price per share | | $ | 9.54 | | |
1 Includes $29,798,551 of securities on loan.
See accompanying notes to financial statements.
20
Credit Suisse Strategic Income Fund
Statement of operations
For the year ended October 31, 2024
Investment income: | |
Interest | | $ | 51,988,209 | | |
Dividends | | | 10,662 | | |
Other Income | | | 1,958 | | |
Securities lending (net of rebates) | | | 119,981 | | |
Total investment income | | | 52,120,810 | | |
Expenses: | |
Investment advisory fees (Note 3) | | | 5,115,342 | | |
Administrative services fees (Note 3) | | | 148,915 | | |
Shareholder servicing/Distribution fees (Note 3) | |
Class A | | | 106,919 | | |
Class C | | | 382,898 | | |
Transfer agent fees | | | 531,658 | | |
Custodian fees | | | 169,029 | | |
Trustees' fees | | | 109,603 | | |
Legal fees | | | 108,991 | | |
Commitment fees (Note 4) | | | 105,334 | | |
Registration fees | | | 96,055 | | |
Audit and tax fees | | | 50,600 | | |
Printing fees | | | 43,031 | | |
Insurance expense | | | 10,838 | | |
Miscellaneous expense | | | 9,132 | | |
Total expenses | | | 6,988,345 | | |
Less: fees waived and expenses reimbursed (Note 3) | | | (1,687,671 | ) | |
Net expenses | | | 5,300,674 | | |
Net investment income | | | 46,820,136 | | |
Net realized and unrealized gain (loss) from investments, foreign currency and forward foreign currency contracts: | |
Net realized loss from investments | | | (950,358 | ) | |
Net realized loss from foreign currency transactions | | | (29,750 | ) | |
Net realized loss from forward foreign currency contracts | | | (62,015 | ) | |
Net change in unrealized appreciation (depreciation) from investments | | | 23,473,131 | | |
Net change in unrealized appreciation (depreciation) from foreign currency translations | | | 2,538 | | |
Net change in unrealized appreciation (depreciation) from forward foreign currency contracts | | | 117,273 | | |
Net realized and unrealized gain from investments, foreign currency and forward foreign currency contracts | | | 22,550,819 | | |
Net increase in net assets resulting from operations | | $ | 69,370,955 | | |
See accompanying notes to financial statements.
21
Credit Suisse Strategic Income Fund
Statements of changes in net assets
| | | For the
year ended
October 31, 2024 | | For the
year ended
October 31, 2023 | |
From operations: | |
Net investment income | | $ | 46,820,136 | | | $ | 25,775,883 | | |
Net realized loss from investments, foreign currency transactions and forward foreign currency contracts | | | (1,042,123 | ) | | | (18,387,719 | ) | |
Net change in unrealized appreciation (depreciation) from investments, foreign currency translations and
forward foreign currency contracts | | | 23,592,942 | | | | 24,337,697 | | |
Net increase in net assets resulting from operations | | | 69,370,955 | | | | 31,725,861 | | |
From distributions: | |
From distributable earnings | |
Class I | | | (40,990,878 | ) | | | (21,861,973 | ) | |
Class A | | | (3,219,628 | ) | | | (1,766,502 | ) | |
Class C | | | (2,611,178 | ) | | | (2,146,176 | ) | |
Net decrease in net assets resulting from distributions | | | (46,821,684 | ) | | | (25,774,651 | ) | |
From capital share transactions (Note 6): | |
Proceeds from sale of shares | | | 624,227,892 | | | | 253,132,745 | | |
Reinvestment of distributions | | | 38,220,961 | | | | 23,268,008 | | |
Net asset value of shares redeemed | | | (209,711,466 | ) | | | (324,419,661 | ) | |
Net increase (decrease) in net assets from capital share transactions | | | 452,737,387 | | | | (48,018,908 | ) | |
Net increase (decrease) in net assets | | | 475,286,658 | | | | (42,067,698 | ) | |
Net assets: | |
Beginning of year | | | 373,234,130 | | | | 415,301,828 | | |
End of year | | $ | 848,520,788 | | | $ | 373,234,130 | | |
See accompanying notes to financial statements.
22
Credit Suisse Strategic Income Fund
Financial highlights
(For a Class I share of the Fund outstanding throughout each year)
| | | For the year ended October 31, | |
| | | 2024 | | 2023 | | 2022 | | 2021 | | 2020 | |
Per share data: | |
Net asset value, beginning of year | | $ | 9.08 | | | $ | 8.91 | | | $ | 10.12 | | | $ | 9.57 | | | $ | 9.88 | | |
Investment operations: | |
Net investment income1 | | | 0.74 | | | | 0.75 | | | | 0.47 | | | | 0.40 | | | | 0.51 | | |
Net gain (loss) from investments, foreign currency transactions and forward foreign
currency contracts (both realized and unrealized) | | | 0.46 | | | | 0.17 | | | | (1.20 | ) | | | 0.56 | | | | (0.31 | ) | |
Total from investment operations | | | 1.20 | | | | 0.92 | | | | (0.73 | ) | | | 0.96 | | | | 0.20 | | |
Less dividends: | |
Dividends from net investment income | | | (0.74 | ) | | | (0.75 | ) | | | (0.48 | ) | | | (0.41 | ) | | | (0.51 | ) | |
Total dividends | | | (0.74 | ) | | | (0.75 | ) | | | (0.48 | ) | | | (0.41 | ) | | | (0.51 | ) | |
Net asset value, end of year | | $ | 9.54 | | | $ | 9.08 | | | $ | 8.91 | | | $ | 10.12 | | | $ | 9.57 | | |
Total return2 | | | 13.61 | % | | | 10.57 | % | | | (7.41 | )% | | | 10.11 | % | | | 2.21 | % | |
Ratios and supplemental data: | |
Net assets, end of year (000s omitted) | | $ | 740,431 | | | $ | 316,613 | | | $ | 363,915 | | | $ | 420,435 | | | $ | 190,537 | | |
Ratio of net expenses to average net assets | | | 0.79 | % | | | 0.79 | % | | | 0.79 | % | | | 0.79 | % | | | 0.80 | % | |
Ratio of net investment income to average net assets | | | 7.77 | % | | | 8.14 | % | | | 4.88 | % | | | 3.93 | % | | | 5.33 | % | |
Decrease reflected in above operating expense ratios due to waivers/reimbursements | | | 0.28 | % | | | 0.31 | % | | | 0.29 | % | | | 0.26 | % | | | 0.31 | % | |
Portfolio turnover rate3 | | | 44 | % | | | 73 | % | | | 56 | % | | | 46 | % | | | 34 | % | |
1 Per share information is calculated using the average shares outstanding method.
2 Total returns are historical and include change in share price and reinvestment of all distributions. Had certain expenses not been reduced during the years shown, total returns would have been lower.
3 Portfolio turnover is calculated by dividing the lesser of total purchases or sales of portfolio securities for the reporting period by the monthly average of portfolio securities owned during the reporting period. Excluded from both the numerator and denominator are amounts relating to derivatives and securities whose maturities or expiration dates at the time of acquisition were one year or less.
See accompanying notes to financial statements.
23
Credit Suisse Strategic Income Fund
Financial highlights
(For a Class A share of the Fund outstanding throughout each year)
| | | For the year ended October 31, | |
| | | 2024 | | 2023 | | 2022 | | 2021 | | 2020 | |
Per share data: | |
Net asset value, beginning of year | | $ | 9.08 | | | $ | 8.91 | | | $ | 10.13 | | | $ | 9.57 | | | $ | 9.88 | | |
Investment operations: | |
Net investment income1 | | | 0.71 | | | | 0.72 | | | | 0.44 | | | | 0.38 | | | | 0.49 | | |
Net gain (loss) from investments, foreign currency transactions and forward foreign
currency contracts (both realized and unrealized) | | | 0.47 | | | | 0.18 | | | | (1.21 | ) | | | 0.56 | | | | (0.31 | ) | |
Total from investment operations | | | 1.18 | | | | 0.90 | | | | (0.77 | ) | | | 0.94 | | | | 0.18 | | |
Less dividends: | |
Dividends from net investment income | | | (0.72 | ) | | | (0.73 | ) | | | (0.45 | ) | | | (0.38 | ) | | | (0.49 | ) | |
Total dividends | | | (0.72 | ) | | | (0.73 | ) | | | (0.45 | ) | | | (0.38 | ) | | | (0.49 | ) | |
Net asset value, end of year | | $ | 9.54 | | | $ | 9.08 | | | $ | 8.91 | | | $ | 10.13 | | | $ | 9.57 | | |
Total return2 | | | 13.34 | % | | | 10.30 | % | | | (7.73 | )% | | | 9.95 | % | | | 1.96 | % | |
Ratios and supplemental data: | |
Net assets, end of year (000s omitted) | | $ | 58,890 | | | $ | 25,795 | | | $ | 21,933 | | | $ | 31,102 | | | $ | 34,254 | | |
Ratio of net expenses to average net assets | | | 1.04 | % | | | 1.04 | % | | | 1.04 | % | | | 1.04 | % | | | 1.05 | % | |
Ratio of net investment income to average net assets | | | 7.52 | % | | | 7.90 | % | | | 4.62 | % | | | 3.78 | % | | | 5.10 | % | |
Decrease reflected in above operating expense ratios due to waivers/reimbursements | | | 0.28 | % | | | 0.31 | % | | | 0.29 | % | | | 0.26 | % | | | 0.31 | % | |
Portfolio turnover rate3 | | | 44 | % | | | 73 | % | | | 56 | % | | | 46 | % | | | 34 | % | |
1 Per share information is calculated using the average shares outstanding method.
2 Total returns are historical and include change in share price, reinvestment of all distributions and no sales charge. Had certain expenses not been reduced during the years shown, total returns would have been lower.
3 Portfolio turnover is calculated by dividing the lesser of total purchases or sales of portfolio securities for the reporting period by the monthly average of portfolio securities owned during the reporting period. Excluded from both the numerator and denominator are amounts relating to derivatives and securities whose maturities or expiration dates at the time of acquisition were one year or less.
See accompanying notes to financial statements.
24
Credit Suisse Strategic Income Fund
Financial highlights
(For a Class C share of the Fund outstanding throughout each year)
| | | For the year ended October 31, | |
| | | 2024 | | 2023 | | 2022 | | 2021 | | 2020 | |
Per share data: | |
Net asset value, beginning of year | | $ | 9.08 | | | $ | 8.92 | | | $ | 10.13 | | | $ | 9.57 | | | $ | 9.88 | | |
Investment operations: | |
Net investment income1 | | | 0.65 | | | | 0.66 | | | | 0.37 | | | | 0.31 | | | | 0.41 | | |
Net gain (loss) from investments, foreign currency transactions and forward foreign
currency contracts (both realized and unrealized) | | | 0.46 | | | | 0.16 | | | | (1.20 | ) | | | 0.56 | | | | (0.31 | ) | |
Total from investment operations | | | 1.11 | | | | 0.82 | | | | (0.83 | ) | | | 0.87 | | | | 0.10 | | |
Less dividends: | |
Dividends from net investment income | | | (0.65 | ) | | | (0.66 | ) | | | (0.38 | ) | | | (0.31 | ) | | | (0.41 | ) | |
Total dividends | | | (0.65 | ) | | | (0.66 | ) | | | (0.38 | ) | | | (0.31 | ) | | | (0.41 | ) | |
Net asset value, end of year | | $ | 9.54 | | | $ | 9.08 | | | $ | 8.92 | | | $ | 10.13 | | | $ | 9.57 | | |
Total return2 | | | 12.50 | % | | | 9.36 | % | | | (8.32 | )% | | | 9.13 | % | | | 1.19 | % | |
Ratios and supplemental data: | |
Net assets, end of year (000s omitted) | | $ | 49,200 | | | $ | 30,826 | | | $ | 29,454 | | | $ | 39,867 | | | $ | 42,566 | | |
Ratio of net expenses to average net assets | | | 1.79 | % | | | 1.79 | % | | | 1.79 | % | | | 1.79 | % | | | 1.80 | % | |
Ratio of net investment income to average net assets | | | 6.82 | % | | | 7.19 | % | | | 3.89 | % | | | 3.03 | % | | | 4.35 | % | |
Decrease reflected in above operating expense ratios due to waivers/reimbursements | | | 0.28 | % | | | 0.31 | % | | | 0.29 | % | | | 0.26 | % | | | 0.31 | % | |
Portfolio turnover rate3 | | | 44 | % | | | 73 | % | | | 56 | % | | | 46 | % | | | 34 | % | |
1 Per share information is calculated using the average shares outstanding method.
2 Total returns are historical and include change in share price, reinvestment of all distributions and no sales charge. Had certain expenses not been reduced during the years shown, total returns would have been lower.
3 Portfolio turnover is calculated by dividing the lesser of total purchases or sales of portfolio securities for the reporting period by the monthly average of portfolio securities owned during the reporting period. Excluded from both the numerator and denominator are amounts relating to derivatives and securities whose maturities or expiration dates at the time of acquisition were one year or less.
See accompanying notes to financial statements.
25
Credit Suisse Strategic Income Fund
Notes to Financial Statements
October 31, 2024
Note 1. Organization
Credit Suisse Strategic Income Fund (the "Fund"), a series of Credit Suisse Opportunity Funds (the "Trust"), a Delaware statutory trust, is registered under the Investment Company Act of 1940, as amended (the "1940 Act"), as a diversified open-end management investment company that seeks total return. The Trust was organized under the laws of the State of Delaware as a business trust on May 31, 1995.
UBS Asset Management (Americas) LLC ("UBS AM" or the "Adviser"), the investment adviser to the Fund, is registered as an investment adviser with the Securities and Exchange Commission ("SEC") and as a Commodity Pool Operator with the Commodity Futures Trading Commission. UBS Asset Management (US) Inc. ("UBS AM (US)") serves as the principal underwriter for the Fund. UBS AM and UBS AM (US) are indirect wholly owned subsidiaries of UBS Group AG. UBS Group AG is an internationally diversified organization with headquarters in Zurich, Switzerland. UBS Group AG operates in many areas of the financial services industry.
The Fund offers three classes of shares: Class I shares, Class A shares and Class C shares. Each class of shares represents an equal pro rata interest in the Fund, except the share classes bear different expenses. Class A shares are sold subject to a front-end sales charge of up to 4.75%. Class C shares are sold subject to a contingent deferred sales charge ("CDSC") of 1.00% if the shares are redeemed within the first year of purchase. Class I shares are sold without a sales charge. Effective June 30, 2021, Class C shares, upon the eight year anniversary of purchase, will convert to Class A shares.
In October 2022, the SEC adopted the Tailored Shareholder Reports for Mutual Funds and Exchange-Traded Funds rule and reform amendments requiring open-end management investment companies, including mutual funds and exchange-traded funds, to transmit concise and visually engaging semi-annual and annual tailored shareholder reports that highlight key information, including fund expenses, performance, and holdings to shareholders. Certain information from the Fund's prior shareholder reports, including the Fund's investment portfolio, financial statements and financial highlights, does not appear in the tailored shareholder report but will be filed on a semiannual basis on Form N-CSR. This information will be available online, mailed upon request and filed on a semiannual basis. The rule and form amendments had a compliance date of July 24, 2024.
Note 2. Significant accounting policies
The following is a summary of significant accounting policies followed by the Fund in the preparation of its financial statements. The policies are in accordance with generally accepted accounting principles in the United States of America ("GAAP"). The preparation of financial statements requires management to make estimates and assumptions that affect the reported amounts and disclosures in the financial statements. Actual results could differ from those estimates. The Fund is considered an investment company for financial reporting purposes under GAAP and follows the accounting and reporting guidance in Financial Accounting Standards Board ("FASB") Accounting Standards Codification ("ASC") Topic 946—Financial Services—Investment Companies.
A) SECURITY VALUATION—The Board of Trustees (the "Board") is responsible for the Fund's valuation process. The Board has delegated the supervision of the daily valuation process to the adviser, who has established a Pricing Committee and a Pricing Group, which, pursuant to the policies adopted by the Board, are responsible for making fair valuation determinations and overseeing the Fund's pricing policies. The net asset value ("NAV") of the Fund is determined daily as of the close of regular trading on the New York Stock Exchange, Inc. (the "Exchange") on each day the Exchange is open for business. The valuations for fixed income securities (which may include, but are not limited to, corporate, government, municipal, mortgage-backed, collateralized mortgage obligations and asset-backed securities) and certain derivative instruments are typically the prices supplied by independent third party pricing services, which may use market prices or broker/dealer quotations or a variety of valuation techniques and methodologies. The independent third party pricing services use inputs that are observable such as issuer details, interest rates, yield curves, prepayment speeds, credit risks/spreads, default rates and quoted prices for similar securities. These pricing services generally price fixed income securities assuming orderly transactions of an institutional
26
Credit Suisse Strategic Income Fund
Notes to Financial Statements
October 31, 2024
"round lot" size, but some trades occur in smaller "odd lot" sizes which may be effected at lower prices than institutional round lot trades. Structured note agreements are valued in accordance with a dealer-supplied valuation based on changes in the value of the underlying index. Futures contracts are valued daily at the settlement price established by the board of trade or exchange on which they are traded. Forward contracts are valued at the London closing spot rates and the London closing forward point rates on a daily basis. The currency forward contract pricing model derives the differential in point rates to the expiration date of the forward and calculates its present value. Equity securities for which market quotations are available are valued at the last reported sales price or official closing price on the primary market or exchange on which they trade. Investments in open-ended mutual funds are valued at the NAV as reported on each business day and under normal circumstances. Securities for which market quotations are not readily available are valued at their fair value as determined in good faith by the Adviser, as the Board's valuation designee (as defined in Rule 2a-5 under the 1940 Act), in accordance with the Adviser's procedures. The Board oversees the Adviser in its role as valuation designee in accordance with the requirements of Rule 2a-5 under the 1940 Act. The Fund may utilize a service provided by an independent third party to fair value certain securities. When fair value pricing is employed, the prices of securities used by the Fund to calculate its NAV may differ from quoted or published prices for the same securities. If independent third party pricing services are unable to supply prices for a portfolio investment, or if the prices supplied are deemed by the Adviser to be unreliable, the market price may be determined by the Adviser using quotations from one or more brokers/dealers or at the transaction price if the security has recently been purchased and no value has yet been obtained from a pricing service or pricing broker. When reliable prices are not readily available, such as when the value of a security has been significantly affected by events after the close of the exchange or market on which the security is principally traded, but before the Fund calculates its NAV, these securities will be fair valued in good faith by the Pricing Group, in accordance with procedures established by the Adviser.
The Fund uses valuation techniques to measure fair value that are consistent with the market approach and/or income approach, depending on the type of security and the particular circumstance. The market approach uses prices and other relevant information generated by market transactions involving identical or comparable securities. The income approach uses valuation techniques to discount estimated future cash flows to present value.
GAAP established a disclosure hierarchy that categorizes the inputs to valuation techniques used to value assets and liabilities at each measurement date. These inputs are summarized in the three broad levels listed below:
Level 1—quoted prices in active markets for identical investments
Level 2—other significant observable inputs (including quoted prices for similar investments, interest rates, prepayment speeds, credit risk, etc.)
Level 3—significant unobservable inputs (including the Fund's own assumptions in determining the fair value of investments)
The inputs or methodologies used to value securities are not necessarily an indication of the risk associated with investing in those securities.
The following is a summary of the inputs used as of October 31, 2024 in valuing the Fund's assets and liabilities carried at fair value:
Assets | | Level 1 | | Level 2 | | Level 3 | | Total | |
Investments in Securities | | | | | | | | | |
Corporate Bonds | | $ | — | | | $ | 335,841,229 | | | $ | 308,424 | | | $ | 336,149,653 | | |
Bank Loans | | | — | | | | 431,456,113 | | | | 35,816,310 | | | | 467,272,423 | | |
Asset Backed Securities | | | — | | | | 26,042,203 | | | | — | | | | 26,042,203 | | |
27
Credit Suisse Strategic Income Fund
Notes to Financial Statements
October 31, 2024
Assets | | Level 1 | | Level 2 | | Level 3 | | Total | |
Common Stocks | | $ | — | | | $ | 7,743,311 | | | $ | 877 | | | $ | 7,744,188 | | |
Warrants | | | — | | | | 555 | | | | 3,395 | | | | 3,950 | | |
Short-term Investments | | | 75,840,411 | | | | — | | | | — | | | | 75,840,411 | | |
| | | $ | 75,840,411 | | | $ | 801,083,411 | | | $ | 36,129,006 | | | $ | 913,052,828 | | |
Other Financial Instruments* | | | | | | | | | |
Forward Foreign Currency Contracts | | $ | — | | | $ | 120,185 | | | $ | — | | | $ | 120,185 | | |
Liabilities | | | | | | | | | |
Other Financial Instruments* | |
Forward Foreign Currency Contracts | | $ | — | | | $ | 3,067 | | | $ | — | | | $ | 3,067 | | |
* Other financial instruments include unrealized appreciation (depreciation) on forward foreign currency contracts.
The following is a reconciliation of investments as of October 31, 2024 for which significant unobservable inputs were used in determining fair value.
| | | Corporate bonds | | Bank loans | | Common stocks | | Warrants | | Total | |
Balance as of October 31, 2023 | | $ | 71,931 | | | $ | 12,193,802 | | | $ | 255,199 | | | $ | 8,996 | | | $ | 12,529,928 | | |
Accrued discounts (premiums) | | | — | | | | 125,249 | | | | — | | | | — | | | | 125,249 | | |
Purchases | | | 244,021 | | | | 37,549,084 | | | | — | | | | — | | | | 37,793,105 | | |
Sales | | | (3,750 | ) | | | (7,704,667 | ) | | | (38 | ) | | | — | | | | (7,708,455 | ) | |
Realized gain (loss) | | | 3,750 | | | | (650,816 | ) | | | (4,876 | ) | | | — | | | | (651,942 | ) | |
Change in unrealized appreciation (depreciation) | | | (7,528 | ) | | | 528,983 | | | | (38,131 | ) | | | (5,608 | ) | | | 477,716 | | |
Transfers into Level 3 | | | — | | | | 612,665 | | | | — | | | | 7 | | | | 612,672 | | |
Transfers out of Level 3 | | | — | | | | (6,837,990 | ) | | | (211,277 | ) | | | — | | | | (7,049,267 | ) | |
Balance as of October 31, 2024 | | $ | 308,424 | | | $ | 35,816,310 | | | $ | 877 | | | $ | 3,395 | | | $ | 36,129,006 | | |
Net change in unrealized appreciation (depreciation)
from investments still held as of October 31, 2024 | | $ | (1,902 | ) | | $ | 166,644 | | | $ | — | | | $ | (5,608 | ) | | $ | 159,134 | | |
| | Quantitative disclosure about significant unobservable inputs | |
Asset class | | Fair value
at October 31, 2024 | | Valuation
technique | | Unobservable
input | | Price range
(Weighted average)* | |
Corporate Bonds | | $ | 235,437 | | | Income Approach | | Expected Remaining Distribution | | $0.54 – $1.09 ($0.95) | |
| | | 72,987 | | | Recent Transactions | | Trade Price | | 1.09 (1.09) | |
Bank Loans | | | 0 | | | Income Approach | | Expected Remaining Distribution | | 0.00 (N/A) | |
| | | 35,816,310 | | | Vendor Pricing | | Single Broker Quote | | 0.01 – 1.01 (1.00) | |
Common Stocks | | | 877 | | | Income Approach | | Expected Remaining Distribution | | 0.00 – 0.02 (0.02) | |
Warrants | | | 3,395 | | | Income Approach | | Expected Remaining Distribution | | 0.00 – 1.19 (1.19) | |
* Weighted by relative fair value
Each fair value determination is based on a consideration of relevant factors, including both observable and unobservable inputs. Observable and unobservable inputs that UBS AM considers may include (i) the existence of any contractual restrictions on the disposition of securities; (ii) information obtained from the company, which may include an analysis of the company's financial statements, the company's products or intended markets or the company's technologies; (iii) the price of the same or similar security negotiated at arm's length in an issuer's completed subsequent round of financing; (iv) the price and extent of public trading in similar securities of the issuer or of comparable companies; or (v) a probability and time value adjusted analysis of contractual term. Where available and appropriate, multiple valuation methodologies are applied to confirm fair value. To the extent that valuation is based on models or inputs that are less observable or unobservable in the market, determining fair value requires more judgment. Because of the inherent uncertainty of valuation, those estimated values may be materially higher or lower than the values that would have been used had a ready market for the investments existed. Accordingly,
28
Credit Suisse Strategic Income Fund
Notes to Financial Statements
October 31, 2024
the degree of judgment exercised by the Fund in determining fair value is greatest for investments categorized in Level 3. In some circumstances, the inputs used to measure fair value might be categorized within different levels of the fair value hierarchy. In those instances, the fair value measurement is categorized in its entirety in the fair value hierarchy based on the least observable input that is significant to the fair value measurement. Additionally, changes in the market environment and other events that may occur over the life of the investments may cause the gains or losses ultimately realized on these investments to be different from the valuations used at the date of these financial statements.
For the year ended October 31, 2024, $612,672 was transferred from Level 2 to Level 3 due to a lack of a pricing source supported by observable inputs and $7,049,267 was transferred from Level 3 to Level 2 as a result of the availability of a pricing source supported by observable inputs. All transfers, if any, are assumed to occur at the end of the reporting period.
B) DERIVATIVE INSTRUMENTS AND HEDGING ACTIVITIES—The Fund adopted amendments to authoritative guidance on disclosures about derivative instruments and hedging activities which require that a fund disclose (a) how and why an entity uses derivative instruments, (b) how derivative instruments and hedging activities are accounted for and (c) how derivative instruments and related hedging activities affect a fund's financial position, financial performance and cash flows.
The following table presents the fair value and the location of derivatives within the Statement of Assets and Liabilities at October 31, 2024 and the effect of these derivatives on the Statement of Operations for the year ended October 31, 2024.
Primary underlying risk | | Derivative
assets | | Derivative
liabilities | | Realized
gain (Loss) | | Net change in
unrealized
appreciation
(depreciation) | |
Foreign currency exchange rate | |
Forward contracts | | $ | 120,185 | | | $ | 3,067 | | | $ | (62,015 | ) | | $ | 117,273 | | |
For the year ended October 31, 2024, the Fund held an average monthly value on a net basis of $7,915,293 in forward foreign currency contracts.
The Fund is a party to International Swap and Derivatives Association, Inc. ("ISDA") Master Agreements ("Master Agreements") with certain counterparties that govern over-the-counter derivative (including total return, credit default and interest rate swaps) and foreign exchange contracts entered into by the Fund. The Master Agreements may contain provisions regarding, among other things, the parties' general obligations, representations, agreements, collateral requirements, events of default and early termination. Termination events applicable to the Fund may occur upon a decline in the Fund's net assets below a specified threshold over a certain period of time.
The following table presents by counterparty the Fund's derivative assets, net of related collateral held by the Fund, at October 31, 2024:
Counterparty | | Gross amount of derivative
assets presented in the
statement of assets
and liabilitiesa | | Financial
instruments
and derivatives
available for offset | | Non-cash
collateral
received | | Cash
collateral
received | | Net amount
of derivative
assets | |
Deutsche Bank AG | | $ | 72,450 | | | $ | (3,067 | ) | | $ | — | | | $ | — | | | $ | 69,383 | | |
Morgan Stanley | | | 47,735 | | | | — | | | | — | | | | — | | | | 47,735 | | |
| | | $ | 120,185 | | | $ | (3,067 | ) | | $ | — | | | $ | — | | | $ | 117,118 | | |
29
Credit Suisse Strategic Income Fund
Notes to Financial Statements
October 31, 2024
The following table presents by counterparty the Fund's derivative liabilities, net of related collateral pledged by the Fund, at October 31, 2024:
Counterparty | | Gross amount of derivative
liabilities presented in the
statement of assets
and liabilitiesa | | Financial
instruments
and derivatives
available for offset | | Non-cash
collateral
pledged | | Cash
collateral
pledged | | Net amount
of derivative
liabilities | |
Deutsche Bank AG | | $ | 3,067 | | | $ | (3,067 | ) | | $ | — | | | $ | — | | | $ | — | | |
a Forward foreign currency contracts are included.
C) FOREIGN CURRENCY TRANSACTIONS—The books and records of the Fund are maintained in U.S. dollars. Transactions denominated in foreign currencies are recorded at the current prevailing exchange rates. All assets and liabilities denominated in foreign currencies, including purchases and sales of investments, and income and expenses, are translated into U.S. dollar amounts on the date of those transactions.
Reported net realized gain (loss) from foreign currency transactions arises from sales of foreign currencies; currency gains or losses realized between the trade and settlement dates on securities transactions; and the difference between the amounts of dividends, interest, and foreign withholding taxes recorded on the Fund's books and the U.S. dollar equivalent of the amounts actually received or paid. Net change in unrealized gains and losses on translation of assets and liabilities denominated in foreign currencies arises from changes in the fair values of assets and liabilities, other than investments, at the end of the period, resulting from changes in exchange rates.
The Fund does not isolate that portion of the results of operations resulting from fluctuations in foreign exchange rates on investments from the fluctuations arising from changes in market prices of investments held. Such fluctuations are included with net realized and unrealized gain or loss from investments in the Statement of Operations.
D) SECURITY TRANSACTIONS AND INVESTMENT INCOME/EXPENSE—Security transactions are accounted for on a trade date basis. Interest income/expense is recorded on the accrual basis. The Fund amortizes premiums and accretes discounts using the effective interest method. Dividend income/expense is recorded on the ex-dividend date. Certain expenses are class-specific expenses, vary by class and are charged only to that class. Income, expenses (excluding class-specific expenses) and realized/unrealized gains/losses are allocated proportionately to each class of shares based upon the relative NAV of the outstanding shares of that class. The cost of investments sold is determined by use of the specific identification method for both financial reporting and income tax purposes. To the extent any issuer defaults or a credit event occurs that impacts the issuer, the Fund may halt any additional interest income accruals and consider the realizability of interest accrued up to the date of default or credit event.
E) DIVIDENDS AND DISTRIBUTIONS TO SHAREHOLDERS—Dividends from net investment income, if any, are declared daily and paid monthly. Distributions of net realized capital gains, if any, are declared and paid at least annually. However, to the extent that a net realized capital gain can be reduced by a capital loss carryforward, such gain will not be distributed. Dividends and distributions to shareholders of the Fund are recorded on the ex-dividend date and are determined in accordance with federal income tax regulations, which may differ from GAAP.
F) FEDERAL AND OTHER TAXES—No provision is made for federal taxes as it is the Fund's intention to continue to qualify as a regulated investment company ("RIC") under the Internal Revenue Code of 1986, as amended (the "Code"), and to make the requisite distributions to its shareholders, which will be sufficient to relieve it from federal income and excise taxes.
In order to qualify as a RIC under the Code, the Fund must meet certain requirements regarding the source of its income, the diversification of its assets and the distribution of its income. One of these requirements is that the
30
Credit Suisse Strategic Income Fund
Notes to Financial Statements
October 31, 2024
Fund derive at least 90% of its gross income for each taxable year from dividends, interest, payments with respect to certain securities loans, gains from the sale or other disposition of stock, securities or foreign currencies, other income derived with respect to its business of investing in such stock, securities or currencies or net income derived from interests in certain publicly-traded partnerships ("Qualifying Income"). The Fund adopted the authoritative guidance for uncertainty in income taxes and recognizes a tax benefit or liability from an uncertain position only if it is more likely than not that the position is sustainable based solely on its technical merits and consideration of the relevant taxing authority's widely understood administrative practices and procedures. The Fund has reviewed its current tax positions and has determined that no provision for income tax is required in the Fund's financial statements. The Fund's federal and state income and federal excise tax returns for each of the tax years in the four year period ended October 31, 2024, for which the applicable statutes of limitations have not expired are subject to examination by the Internal Revenue Service and state departments of revenue.
G) CASH—The Fund's uninvested cash balance is held in an interest bearing variable rate demand deposit account at State Street Bank and Trust Company ("SSB"), the Fund's custodian.
H) FUTURES—The Fund may enter into futures contracts to the extent permitted by its investment policies and objectives. The Fund may use futures contracts to gain exposure to or hedge against changes in interest rates, equity and market price movements and/or currency risks. Upon entering into a futures contract, the Fund is required to deposit cash and/or pledge U.S. Government securities as initial margin with a Futures Commission Merchant ("FCM"). Subsequent payments, which are dependent on the daily fluctuations in the value of the underlying instrument, are made or received by the Fund each day (daily variation margin) and are recorded as unrealized gains or losses until the contracts are closed. When the contracts are closed, the Fund records a realized gain or loss equal to the difference between the proceeds from (or cost of) the closing transaction and the Fund's basis in the contract. Risks of entering into futures contracts for hedging purposes include the possibility that a change in the value of the contract may not correlate with the changes in the value of the underlying instruments. Futures have minimal counterparty credit risk because futures are exchange traded and the exchange's clearinghouse, as counterparty to all exchange-traded futures, guarantees the futures against default. In addition, the purchase of a futures contract involves the risk that the Fund could lose more than the original margin deposit and subsequent payments may be required for a futures transaction. The Fund's open futures contracts are disclosed in the Schedule of Investments. At October 31, 2024, the Fund had no open futures contracts.
The Commodity Exchange Act requires an FCM to segregate all customer transactions and assets from the FCM's proprietary activities. A customer's cash and other equity deposited with an FCM are considered commingled with all other customer funds subject to the FCM's segregation requirements. In the event of an FCM's insolvency, recovery may be limited to the Fund's pro-rata share of segregated customer funds available. It is possible that the recovery amount could be less than the total of cash and other equity deposited.
I) FORWARD FOREIGN CURRENCY CONTRACTS—A forward foreign currency exchange contract ("forward currency contract") is a commitment to purchase or sell a foreign currency at the settlement date at a negotiated rate. The Fund will enter into forward currency contracts primarily for hedging foreign currency risk. Forward currency contracts are valued at the prevailing forward exchange rate of the underlying currencies and unrealized gain/loss is recorded daily. On the settlement date of the forward currency contract, the Fund records a realized gain or loss equal to the difference between the value of the contract at the time it was opened and the value of the contract at the time it was closed. Certain risks may arise upon entering into forward currency contracts from the potential inability of counterparties to meet the terms of their contracts. The maximum counterparty credit risk to the Fund is measured by the unrealized gain on appreciated contracts. Additionally, when utilizing forward currency contracts to hedge, the Fund forgoes the opportunity to profit from favorable exchange rate movements during the term of the contract. The Fund's open forward currency contracts at October 31, 2024 are disclosed in the Schedule of Investments.
31
Credit Suisse Strategic Income Fund
Notes to Financial Statements
October 31, 2024
J) UNFUNDED LOAN COMMITMENTS—The Fund enters into certain agreements, all or a portion of which may be unfunded. The Fund is obligated to fund these loan commitments at the borrowers' discretion. Funded and unfunded portions of credit agreements are presented in the Schedule of Investments. As of October 31, 2024, unfunded commitments were as follows:
Borrower | | Maturity | | Rate | | Unfunded
commitment | |
Focus Financial Partners LLC | | 09/15/31 | | | 0.000 | % | | $ | 165,256 | | |
The Action Environmental Group, Inc. | | 10/24/30 | | | 2.000 | | | | 178,696 | | |
Unfunded loan commitments and funded portions of credit agreements are marked to market daily and any unrealized appreciation or depreciation is included in the Statement of Assets and Liabilities and the Statement of Operations.
K) SECURITIES LENDING—The initial collateral received by the Fund is required to have a value of at least 102% of the market value of domestic securities on loan (including any accrued interest thereon) and 105% of the market value of foreign securities on loan (including any accrued interest thereon). The collateral is maintained thereafter at a value equal to at least 102% of the current market value of the securities on loan. The market value of loaned securities is determined at the close of each business day of the Fund and any additional required collateral is delivered to the Fund, or excess collateral returned by the Fund, on the next business day. Cash collateral received by the Fund in connection with securities lending activity may be pooled together with cash collateral for other funds/portfolios advised by UBS AM and may be invested in a variety of investments, including funds advised by SSB or an affiliate, the Fund's securities lending agent, or money market instruments. However, in the event of default or bankruptcy by the other party to the agreement, realization and/or retention of the collateral may be subject to legal proceedings. The remaining maturities of the securities lending transactions are considered overnight and continuous. Loans are subject to termination by the Fund or the borrower at any time.
SSB has been engaged by the Fund to act as the Fund's securities lending agent. As of October 31, 2024, the Fund had outstanding loans of securities to certain approved brokers for which the Fund received collateral:
Market value of loaned
securities | | Market value of cash
collateral | |
| $ | 29,798,551 | | | $ | 30,499,255 | | |
The following table presents financial instruments that are subject to enforceable netting arrangements as of October 31, 2024.
Gross amounts not offset in the statement of assets and liabilities
Gross asset amounts presented
in the statement
of assets and liabilitiesa | | Collateral receivedb | | Net amount | |
| $ | 29,798,551 | | | $ | (29,798,551 | ) | | $ | — | | |
a Represents market value of loaned securities at year end.
b The actual collateral received is greater than the amount shown here due to collateral requirements of the security lending agreement.
The Fund's securities lending arrangement provides that the Fund and SSB will share the net income earned from securities lending activities. Securities lending income is accrued as earned. For the year ended October 31, 2024, total earnings received in connection with securities lending arrangements was $658,249, of which $498,339 was
32
Credit Suisse Strategic Income Fund
Notes to Financial Statements
October 31, 2024
rebated to borrowers (brokers). The Fund retained $119,981 in income, and SSB, as lending agent, was paid $39,929.
L) OTHER—The high yield, fixed income securities in which the Fund invests will primarily consist of senior secured floating rate loans ("Senior Loans") issued by non-investment grade companies. Senior Loans are typically secured by specific collateral of the issuer and hold the most senior position in the issuer's capital structure. The interest rate on Senior Loans is periodically adjusted to a recognized base rate. While these characteristics may reduce interest rate risk and mitigate losses in the event of borrower default, the Senior Loans in which the Fund invests have below investment grade credit ratings and thereby are considered speculative because of the significant credit risk of their issuers.
The United Kingdom's Financial Conduct Authority (the "FCA"), which regulates LIBOR, has ceased publishing all LIBOR settings. In April 2023, however, the FCA announced that some USD LIBOR settings would continue to be published under a synthetic methodology until September 30, 2024 for certain legacy contracts. After September 30, 2024, the remaining synthetic LIBOR settings ceased to be published, and all LIBOR settings have permanently ceased. The Secured Overnight Financing Rate, or "SOFR," is a broad measure of the cost of borrowing cash overnight collateralized by U.S. Treasury securities in the purchase agreement ("repo") market and has been used increasingly on a voluntary basis in new instruments and transactions. On March 15, 2022, the Adjustable Interest Rate Act was signed into law, providing a statutory fallback mechanism to replace LIBOR with a benchmark rate that is selected by the Federal Reserve Board and based on SOFR for certain contracts that reference LIBOR without adequate fallback provisions. On December 16, 2022, the Federal Reserve Board adopted regulations implementing the Adjustable Interest Rate Act by identifying benchmark rates based on SOFR that replaced LIBOR in different categories of financial contracts after June 30, 2023. These regulations apply only to contracts governed by U.S. law, among other limitations. Neither the effect of the LIBOR transition process nor its ultimate success can yet be known. Not all existing LIBOR-based instruments may have alternative rate-setting provisions and there remains uncertainty regarding the willingness and ability of issuers to add alternative rate-setting provisions in certain existing instruments. Parties to contracts, securities or other instruments using LIBOR may disagree on transition rates or the application of applicable transition regulation, potentially resulting in uncertainty of performance and the possibility of litigation. The Fund may have instruments linked to other interbank offered rates that may also cease to be published in the future.
Lower-rated debt securities (commonly known as "junk bonds") possess speculative characteristics and are subject to greater market fluctuations and risk of lost income and principal than higher-rated debt securities for a variety of reasons. Also, during an economic downturn or substantial period of rising interest rates, highly leveraged issuers may experience financial stress which would adversely affect their ability to service their principal and interest payment obligations, to meet projected business goals and to obtain additional financing.
In addition, periods of economic uncertainty and changes can be expected to result in increased volatility of market prices of lower-rated debt securities and the Fund's NAV.
In the normal course of business, the Fund trades financial instruments and enters into financial transactions for which risk of potential loss exists due to changes in the market (market risk) or failure of the other party to a transaction to perform (credit risk). Similar to credit risk, the Fund may be exposed to counterparty risk, including with respect to securities lending, or the risk that an institution or other entity with which the Fund has unsettled or open transactions will default. The potential loss could exceed the value of the financial assets recorded in the financial statements. Financial assets, which potentially expose the Fund to credit risk, consist principally of cash due from counterparties and investments. The extent of the Fund's exposure to credit and counterparty risks in respect to these financial assets approximates their carrying value as recorded in the Fund's Statement of Assets and Liabilities.
33
Credit Suisse Strategic Income Fund
Notes to Financial Statements
October 31, 2024
Note 3. Transactions with affiliates and related parties
Credit Suisse Asset Management, LLC ("Credit Suisse") served as investment adviser and co-administrator for the Fund through April 30, 2024. On May 1, 2024, Credit Suisse merged into UBS AM, with UBS AM as the surviving entity, and UBS AM became the investment manager to the Fund. For its investment advisory and administration services, UBS AM is entitled to receive a fee from the Fund at an annualized rate of 0.84% of the Fund's average daily net assets. For the year ended October 31, 2024, investment advisory and administration fees earned and fees waived/expenses reimbursed by UBS AM were $5,115,342 and $1,687,671, respectively. Effective November 12, 2019, UBS AM contractually agreed to limit expenses so that the Fund's annual operating expenses do not exceed 0.79% of the Fund's average daily net assets for Class I shares, 1.04% of the Fund's average daily net assets for Class A shares, and 1.79% of the Fund's average daily net assets for Class C shares. The Fund is authorized to reimburse UBS AM for management fees previously waived and/or for expenses previously paid by UBS AM, provided, however, that any reimbursement must be paid at a date not more than thirty-six months following the applicable month during which such fees were waived or expenses were paid by UBS AM and the reimbursement does not cause the applicable class's aggregate expenses, on an annualized basis, to exceed either (i) the applicable expense limitation in effect at the time such fees were waived or such expenses were paid by UBS AM or (ii) the applicable expense limitation in effect at the time of such reimbursement. This contract may not be terminated before February 28, 2026. For the year ended October 31, 2024, there was no recoupment.
The amounts waived and reimbursed by UBS AM, which are available for potential future recoupment by UBS AM, and the expiration schedule at October 31, 2024 are as follows:
| | | Fee waivers/
expense
reimbursements
subject to
recoupment | | Expires
October 31,
2025 | | Expires
October 31,
2026 | | Expires
October 31,
2027 | |
Class I | | $ | 3,427,094 | | | $ | 1,142,709 | | | $ | 821,815 | | | $ | 1,462,570 | | |
Class A | | | 265,022 | | | | 78,116 | | | | 68,421 | | | | 118,485 | | |
Class C | | | 300,554 | | | | 102,580 | | | | 91,358 | | | | 106,616 | | |
Totals | | $ | 3,992,670 | | | $ | 1,323,405 | | | $ | 981,594 | | | $ | 1,687,671 | | |
Credit Suisse Asset Management Limited ("Credit Suisse U.K."), an affiliate of Credit Suisse, served as sub-investment advisor to the Fund directly through April 30, 2024. Credit Suisse U.K.'s sub-investment advisor fees are paid by Credit Suisse.
Credit Suisse Securities (USA) LLC ("CSSU"), an affiliate of Credit Suisse, served as the distributor of the Fund's shares through April 30, 2024. On May 1, 2024, UBS AM (US) replaced CSSU as the Fund's underwriter and distributor. Pursuant to a distribution plan adopted by the Fund pursuant to Rule 12b-1 under the 1940 Act, UBS AM (US) receives fees for its distribution services. These fees are calculated at an annual rate of 0.25% of the average daily net assets of the Class A shares. For the Class C shares, the fee is calculated at an annual rate of 1.00% of the average daily net assets. For the year ended October 31, 2024, the Fund paid Rule 12b-1 distribution fees of $106,919 for Class A shares and $382,898 for Class C shares. Class I shares are not subject to Rule 12b-1 distribution fees.
For the year ended October 31, 2024, UBS AM (US) and its affiliates advised the Fund that they retained $29,972 from commissions earned on the sale of the Fund's Class A shares. There were no commissions earned on the sale of Class C shares.
The Fund from time to time purchases or sells loan investments in the secondary market through UBS AM or its affiliates acting in the capacity as broker-dealer. UBS AM or its affiliates may have acted in some type of agent capacity to the initial loan offering prior to such loan trading in the secondary market.
34
Credit Suisse Strategic Income Fund
Notes to Financial Statements
October 31, 2024
Note 4. Line of credit
The Fund, together with other funds/portfolios advised by UBS AM (collectively, the "Participating Funds"), participates in a committed, unsecured line of credit facility ("Credit Facility"), with SSB in an aggregated amount of $125 million for temporary or emergency purposes under a first-come, first-served basis. Under the terms of the Credit Facility, the Participating Funds pay an aggregate commitment fee on the average unused amount of the Credit Facility, which is allocated among the Participating Funds in such manner as is determined by the governing boards of the Participating Funds. In addition, the Participating Funds pay interest on borrowings at either the Federal Funds Effective rate or the Overnight Bank Funding rate plus a spread. At October 31, 2024 and for the year ended October 31, 2024, the Fund had no borrowings outstanding under the Credit Facility. Additionally, the Fund and another Participating Fund are parties to a joint uncommitted line of credit facility with SSB in an aggregated amount of $200 million. For the year ended October 31, 2024, the line was not drawn upon and no fees were incurred.
Note 5. Purchases and sales of securities
For the year ended October 31, 2024, purchases and sales of investment securities and U.S. Government and Agency Obligations (excluding short-term investments) were as follows:
Investment securities | | U.S. Government/
agency obligations | |
| Purchases | | Sales | | Purchases | | Sales | |
| $ | 683,622,047 | | | $ | 251,543,019 | | | $ | 0 | | | $ | 0 | | |
Note 6. Capital share transactions
The Fund is authorized to issue an unlimited number of full and fractional shares of beneficial interest, $0.001 par value per share. The Fund offers Class I, Class A and Class C shares. Transactions in capital shares for each class of the Fund were as follows:
| | | Class I | |
| | | For the year ended
October 31, 2024 | | For the year ended
October 31, 2023 | |
| | | Shares | | Value | | Shares | | Value | |
Shares sold | | | 57,879,665 | | | $ | 547,749,627 | | | | 22,998,520 | | | $ | 210,846,122 | | |
Shares issued in reinvestment of distributions | | | 3,470,502 | | | | 32,917,961 | | | | 2,133,728 | | | | 19,560,498 | | |
Shares redeemed | | | (18,576,880 | ) | | | (176,246,445 | ) | | | (31,089,579 | ) | | | (282,854,090 | ) | |
Net increase (decrease) | | | 42,773,287 | | | $ | 404,421,143 | | | | (5,957,331 | ) | | $ | (52,447,470 | ) | |
| | | Class A | |
| | | For the year ended
October 31, 2024 | | For the year ended
October 31, 2023 | |
| | | Shares | | Value | | Shares | | Value | |
Shares sold | | | 5,862,804 | | | $ | 55,519,580 | | | | 3,808,781 | | | $ | 35,081,977 | | |
Shares issued in reinvestment of distributions | | | 302,621 | | | | 2,870,995 | | | | 175,926 | | | | 1,613,666 | | |
Shares redeemed | | | (2,830,860 | ) | | | (26,836,335 | ) | | | (3,603,778 | ) | | | (33,123,535 | ) | |
Net increase | | | 3,334,565 | | | $ | 31,554,240 | | | | 380,929 | | | $ | 3,572,108 | | |
35
Credit Suisse Strategic Income Fund
Notes to Financial Statements
October 31, 2024
| | | Class C | |
| | | For the year ended
October 31, 2024 | | For the year ended
October 31, 2023 | |
| | | Shares | | Value | | Shares | | Value | |
Shares sold | | | 2,207,015 | | | $ | 20,958,685 | | | | 785,243 | | | $ | 7,204,646 | | |
Shares issued in reinvestment of distributions | | | 256,397 | | | | 2,432,005 | | | | 228,207 | | | | 2,093,844 | | |
Shares redeemed | | | (700,475 | ) | | | (6,628,686 | ) | | | (922,901 | ) | | | (8,442,036 | ) | |
Net increase | | | 1,762,937 | | | $ | 16,762,004 | | | | 90,549 | | | $ | 856,454 | | |
On October 31, 2024, the number of shareholders that held 5% or more of the outstanding shares of each class of the Fund was as follows:
| | | Number of
shareholders | | Approximate percentage
of outstanding shares | |
Class I | | | 6 | | | | 78 | % | |
Class A | | | 5 | | | | 70 | % | |
Class C | | | 6 | | | | 93 | % | |
The Fund's performance may be negatively impacted in the event one or more of the Fund's greater than 5% shareholders were to redeem at a given time. Some of the shareholders may be omnibus accounts, which hold shares on behalf of individual shareholders.
Note 7. Income tax information and distributions to shareholders
Income and capital gain distributions are determined in accordance with federal income tax regulations, which may differ from GAAP.
The tax character of dividends paid by the Fund during the fiscal years ended October 31, 2024 and 2023, respectively, was as follows:
Ordinary income | |
2024 | | 2023 | |
$ | 46,821,684 | | | $ | 25,774,651 | | |
The tax basis components of distributable earnings differ from book basis by temporary book/tax differences. These differences are primarily due to differing treatments of wash sales, forward contracts marked to market, and premium amortization accruals.
At October 31, 2024, the components of distributable earnings on a tax basis were as follows:
Accumulated net realized loss | | $ | (39,330,286 | ) | |
Undistributed ordinary income | | | 1,180,849 | | |
Unrealized depreciation | | | (4,682,351 | ) | |
Other Temporary Differences | | | (1,315,544 | ) | |
| | | $ | (44,147,332 | ) | |
At October 31, 2024, the Fund had $2,111,461 of unlimited short-term capital loss carryforwards and $37,218,825 of unlimited long-term capital loss carryforwards available to offset possible future capital gains.
36
Credit Suisse Strategic Income Fund
Notes to Financial Statements
October 31, 2024
At October 31, 2024, the cost and net unrealized appreciation (depreciation) of investments and derivatives for income tax purposes were as follows:
Cost of Investments | | $ | 917,854,383 | | |
Unrealized appreciation | | $ | 12,649,879 | | |
Unrealized depreciation | | | (17,449,628 | ) | |
Net unrealized appreciation (depreciation) | | $ | (4,799,749 | ) | |
Note 8. Contingencies
In the normal course of business, the Fund may provide general indemnifications pursuant to certain contracts and organizational documents. The Fund's maximum exposure under these arrangements is dependent on future claims that may be made against the Fund and, therefore, cannot be estimated; however, based on experience, the risk of loss from such claims is considered remote.
Note 9. Subsequent events
In preparing the financial statements as of October 31, 2024, management considered the impact of subsequent events for potential recognition or disclosure in these financial statements through the date of release of this report. No such events requiring recognition or disclosure were identified through the date of the release of this report.
37
Credit Suisse Strategic Income Fund
Report of independent registered public accounting firm
To the Shareholders and the Board of Trustees of Credit Suisse Strategic Income Fund
Opinion on the Financial Statements
We have audited the accompanying statement of assets and liabilities of Credit Suisse Strategic Income Fund (the "Fund") (one of the funds constituting Credit Suisse Opportunity Funds (the "Trust")), including the schedule of investments, as of October 31, 2024, and the related statements of operations and changes in net assets, the financial highlights for the year then ended and the related notes (collectively referred to as the "financial statements"). In our opinion, the financial statements present fairly, in all material respects, the financial position of the Fund (one of the funds constituting Credit Suisse Opportunity Funds) at October 31, 2024, the results of its operations, the changes in its net assets and its financial highlights for the year then ended, in conformity with U.S. generally accepted accounting principles.
The statement of changes in net assets for the year ended October 31, 2023, and the financial highlights for each of the years in the four year period then ended, were audited by another independent registered public accounting firm whose report, dated December 27, 2023, expressed an unqualified opinion on that statement of changes in net assets and those financial highlights.
Basis for Opinion
These financial statements are the responsibility of the Trust's management. Our responsibility is to express an opinion on the Fund's financial statements based on our audit. We are a public accounting firm registered with the Public Company Accounting Oversight Board (United States) ("PCAOB") and are required to be independent with respect to the Trust in accordance with the U.S. federal securities laws and the applicable rules and regulations of the Securities and Exchange Commission and the PCAOB.
We conducted our audit in accordance with the standards of the PCAOB. Those standards require that we plan and perform the audit to obtain reasonable assurance about whether the financial statements are free of material misstatement, whether due to error or fraud. The Trust is not required to have, nor were we engaged to perform, an audit of the Trust's internal control over financial reporting. As part of our audit, we are required to obtain an understanding of internal control over financial reporting but not for the purpose of expressing an opinion on the effectiveness of the Trust's internal control over financial reporting. Accordingly, we express no such opinion.
Our audit included performing procedures to assess the risks of material misstatement of the financial statements, whether due to error or fraud, and performing procedures that respond to those risks. Such procedures included examining, on a test basis, evidence regarding the amounts and disclosures in the financial statements. Our procedures included confirmation of securities owned as of October 31, 2024, by correspondence with the custodian, brokers and others; when replies were not received from brokers and others, we performed other auditing procedures. Our audit also included evaluating the accounting principles used and significant estimates made by management, as well as evaluating the overall presentation of the financial statements. We believe that our audit provides a reasonable basis for our opinion.

We have served as the auditor of one or more UBS investment companies since 1978.
New York, New York
December 26, 2024
38
Credit Suisse Strategic Income Fund
Proxy voting and portfolio holdings information (unaudited)
Information regarding how the Fund voted proxies related to its portfolio securities during the 12-month period ended June 30 of each year, as well as the policies and procedures that the Fund uses to determine how to vote proxies relating to its portfolio securities are available:
• By calling 1-877-870-2874
• On the Fund's website, www.credit-suisse.com/us/funds
• On the website of the Securities and Exchange Commission, www.sec.gov
The Fund files a complete schedule of its portfolio holdings for the first and third quarters of its fiscal year with the SEC as an exhibit to its reports on Form N-PORT, and for reporting periods ended prior to March 31, 2019, filed such information on Form N-Q. The Fund's Forms N-PORT and N-Q are available on the SEC's website at www.sec.gov.

UBS Asset Management (US) Inc., DISTRIBUTOR.
P.O. Box 219916, Kansas City, Mo 64121-9916
877-870-2874 ◼ www.credit-suisse.com/us/funds

Credit Suisse Multialternative Strategy Fund
Annual Financial Statements | October 31, 2024
The Fund's investment objectives, risks, charges and expenses (which should be considered carefully before investing), and more complete information about the Fund, are provided in the Prospectus, which should be read carefully before investing. You may obtain additional copies by calling 877-870-2874 or by visiting our website at www.credit-suisse.com/us/funds.
Credit Suisse Securities (USA) LLC, the Distributor for the six months ended April 30, 2024, is located at Eleven Madison Avenue, New York, NY 10010. UBS Asset Management (US) Inc. became the distributor as of May 1, 2024. The Credit Suisse Funds were advised by Credit Suisse Asset Management, LLC for the six months ended April 30, 2024. UBS Asset Management (Americas) LLC became the investment manager on May 1, 2024 pursuant to an internal merger between Credit Suisse Asset Management, LLC and UBS Asset Management (Americas) LLC.
Investors in the Credit Suisse Funds should be aware that they may be eligible to purchase Class I shares (where offered) directly or through certain intermediaries. Such shares are not subject to a sales charge. Investors in the Credit Suisse Funds should also be aware that they may be eligible for a reduction or waiver of the sales charge with respect to Class A or C shares (where offered). For more information, please review the relevant prospectuses or consult your financial representative.
Fund shares are not deposits or other obligations of UBS Asset Management (Americas) LLC or any affiliate, are not FDIC-insured and are not guaranteed by UBS Asset Management (Americas) LLC or any affiliate. Fund investments are subject to investment risks, including loss of your investment.
Credit Suisse Multialternative Strategy Fund
Consolidated schedule of investments
| | | Shares | | Value | |
Common stocks: (9.4%) | |
Austria: (0.1%) | |
Banks: (0.1%) | |
BAWAG Group AG1 | | | 2,083 | | | $ | 161,141 | | |
Belgium: (0.1%) | |
Consumer Staples Distribution & Retail: (0.1%) | |
Colruyt Group NV | | | 3,464 | | | | 161,334 | | |
Financial Services: (0.0%) | |
Groupe Bruxelles Lambert NV | | | 2,071 | | | | 149,350 | | |
| | | | | | 310,684 | | |
Bermuda: (0.1%) | |
Insurance: (0.1%) | |
Aegon Ltd. | | | 25,115 | | | | 158,215 | | |
Canada: (1.3%) | |
Banks: (0.3%) | |
Canadian Western Bank | | | 14,067 | | | | 577,736 | | |
Insurance: (0.1%) | |
iA Financial Corp., Inc. | | | 1,854 | | | | 150,879 | | |
Metals & Mining—Excluding Steel: (0.8%) | |
SilverCrest Metals, Inc.2 | | | 107,930 | | | | 1,097,648 | | |
Stelco Holdings, Inc. | | | 17,183 | | | | 839,828 | | |
| | | | | | 1,937,476 | | |
Oil, Gas & Consumable Fuels: (0.1%) | |
Imperial Oil Ltd. | | | 2,102 | | | | 156,676 | | |
MEG Energy Corp. | | | 8,259 | | | | 150,788 | | |
| | | | | | 307,464 | | |
| | | | | | 2,973,555 | | |
Denmark: (0.1%) | |
Marine Transportation: (0.1%) | |
AP Moller—Maersk AS, Class B | | | 96 | | | | 151,580 | | |
Textiles, Apparel & Luxury Goods: (0.0%) | |
Pandora AS | | | 980 | | | | 147,909 | | |
| | | | | | 299,489 | | |
France: (1.0%) | |
Consumer Staples Distribution & Retail: (0.1%) | |
Carrefour SA3 | | | 9,462 | | | | 149,975 | | |
Financial Services: (0.1%) | |
Eurazeo SE | | | 1,964 | | | | 149,511 | | |
Hotels, Restaurants & Leisure: (0.1%) | |
Accor SA | | | 3,714 | | | | 168,168 | | |
Independent Power and Renewable Electricity Producers: (0.7%) | |
Neoen SA1 | | | 40,592 | | | | 1,743,031 | | |
| | | | | | 2,210,685 | | |
| | | Shares | | Value | |
Common stocks—(continued) | |
Germany: (0.3%) | |
Automobiles: (0.1%) | |
Mercedes-Benz Group AG | | | 2,532 | | | $ | 153,524 | | |
Banks: (0.1%) | |
Commerzbank AG | | | 8,777 | | | | 155,365 | | |
Machinery: (0.1%) | |
GEA Group AG | | | 3,067 | | | | 150,776 | | |
Trading Companies & Distributors: (0.0%) | |
Brenntag SE | | | 2,247 | | | | 146,296 | | |
| | | | | | 605,961 | | |
Ireland: (0.1%) | |
Banks: (0.1%) | |
AIB Group PLC | | | 28,220 | | | | 150,997 | | |
Bank of Ireland Group PLC | | | 14,486 | | | | 134,000 | | |
| | | | | | 284,997 | | |
Italy: (0.1%) | |
Banks: (0.1%) | |
UniCredit SpA | | | 5,452 | | | | 240,726 | | |
Netherlands: (0.3%) | |
Automobiles: (0.1%) | |
Stellantis NV | | | 11,675 | | | | 159,666 | | |
Banks: (0.0%) | |
ING Groep NV | | | 8,902 | | | | 150,779 | | |
Consumer Staples Distribution & Retail: (0.0%) | |
Koninklijke Ahold Delhaize NV | | | 4,669 | | | | 153,772 | | |
Financial Services: (0.1%) | |
EXOR NV | | | 1,507 | | | | 158,861 | | |
Professional Services: (0.1%) | |
Wolters Kluwer NV | | | 957 | | | | 160,545 | | |
| | | | | | 783,623 | | |
Norway: (0.1%) | |
Food Products: (0.1%) | |
Salmar ASA | | | 3,083 | | | | 156,343 | | |
Oil, Gas & Consumable Fuels: (0.0%) | |
Equinor ASA | | | 6,399 | | | | 151,638 | | |
| | | | | | 307,981 | | |
Portugal: (0.1%) | |
Oil, Gas & Consumable Fuels: (0.1%) | |
Galp Energia SGPS SA, B Shares | | | 8,623 | | | | 147,099 | | |
Spain: (0.1%) | |
Banks: (0.0%) | |
Banco Santander SA3 | | | 31,261 | | | | 152,428 | | |
Oil, Gas & Consumable Fuels: (0.1%) | |
Repsol SA | | | 12,392 | | | | 154,828 | | |
| | | | | | 307,256 | | |
1
Credit Suisse Multialternative Strategy Fund
Consolidated schedule of investments
| | | Shares | | Value | |
Common stocks—(continued) | |
Sweden: (0.1%) | |
Machinery: (0.1%) | |
Trelleborg AB Class B | | | 4,199 | | | $ | 139,086 | | |
United Kingdom: (0.9%) | |
Aerospace & Defense: (0.1%) | |
Melrose Industries PLC | | | 26,466 | | | | 161,610 | | |
Banks: (0.1%) | |
Barclays PLC | | | 53,710 | | | | 164,163 | | |
HSBC Holdings PLC | | | 18,022 | | | | 164,919 | | |
NatWest Group PLC | | | 35,070 | | | | 165,681 | | |
Standard Chartered PLC | | | 15,209 | | | | 175,849 | | |
| | | | | | 670,612 | | |
Diversified Consumer Services: (0.1%) | |
Pearson PLC | | | 11,900 | | | | 174,228 | | |
Hotels, Restaurants & Leisure: (0.1%) | |
Whitbread PLC | | | 3,848 | | | | 149,273 | | |
Household Durables: (0.1%) | |
Berkeley Group Holdings PLC | | | 2,555 | | | | 145,371 | | |
Media: (0.1%) | |
Informa PLC | | | 14,705 | | | | 153,168 | | |
Multi-Utilities: (0.1%) | |
Centrica PLC | | | 104,729 | | | | 158,069 | | |
Oil, Gas & Consumable Fuels: (0.1%) | |
| BP PLC | | | 30,791 | | | | 150,150 | | |
Shell PLC | | | 4,900 | | | | 164,600 | | |
| | | | | | 314,750 | | |
Tobacco: (0.1%) | |
Imperial Brands PLC | | | 5,550 | | | | 166,994 | | |
| | | | | | 2,094,075 | | |
| | | Shares | | Value | |
Common stocks—(concluded) | |
United States: (4.6%) | |
Banks: (1.6%) | |
CrossFirst Bankshares, Inc.2 | | | 19,919 | | | $ | 312,728 | | |
First Bancshares, Inc. | | | 10,791 | | | | 361,175 | | |
Heartland Financial USA, Inc. | | | 24,326 | | | | 1,447,397 | | |
Independent Bank Group, Inc. | | | 21,210 | | | | 1,237,816 | | |
Premier Financial Corp. | | | 13,513 | | | | 333,230 | | |
| | | | | | 3,692,346 | | |
Consumer Finance: (0.5%) | |
Discover Financial Services | | | 7,724 | | | | 1,146,473 | | |
Energy Equipment & Services: (0.5%) | |
ChampionX Corp. | | | 43,859 | | | | 1,237,701 | | |
Healthcare Equipment & Supplies: (0.7%) | |
Axonics, Inc.2 | | | 24,134 | | | | 1,696,620 | | |
Metals & Mining—Excluding Steel: (0.2%) | |
U.S. Steel Corp. | | | 12,490 | | | | 485,237 | | |
Oil, Gas & Consumable Fuels: (0.7%) | |
Marathon Oil Corp. | | | 57,700 | | | | 1,598,290 | | |
Software: (0.4%) | |
ANSYS, Inc.2 | | | 2,721 | | | | 871,836 | | |
| | | | | | 10,728,503 | | |
Total common stocks
(cost $20,976,918) | | | | | 21,753,076 | | |
Exchange-Traded Funds: (0.1%) | |
United States: (0.1%) | |
Commingled Fund: (0.0%) | |
iShares 7-10 Year Treasury Bond ETF | | | 79 | | | | 7,467 | | |
Financial Services: (0.1%) | |
iShares MSCI U.K. ETF3 | | | 8,483 | | | | 301,571 | | |
Total exchange-traded funds
(cost $324,331) | | | | | 309,038 | | |
Par
(000) | | | | Ratings†
(S&P/Moody's) | | Maturity | | Rate% | | | |
United States Treasury obligations: (48.8%) | | | |
$ | 15,000 | | | U.S. Treasury Bills4 | | (AA+, Aaa) | | 11/29/24 | | | 4.831 | | | $ | 14,946,316 | | |
| | 7,000 | | | U.S. Treasury Bills4 | | (AA+, Aaa) | | 12/26/24 | | | 4.615 | | | | 6,951,203 | | |
| | 7,000 | | | U.S. Treasury Bills4 | | (AA+, Aaa) | | 01/23/25 | | | 4.710 | | | | 6,928,424 | | |
| | 15,000 | | | U.S. Treasury Bills4 | | (AA+, Aaa) | | 02/20/25 | | | 4.830 | | | | 14,795,459 | | |
| | 7,000 | | | U.S. Treasury Bills3,4 | | (AA+, Aaa) | | 03/20/25 | | | 4.909 | | | | 6,882,108 | | |
| | 7,000 | | | U.S. Treasury Bills4 | | (AA+, Aaa) | | 04/17/25 | | | 4.881 | | | | 6,859,860 | | |
| | 15,000 | | | U.S. Treasury Bills4 | | (AA+, Aaa) | | 05/15/25 | | | 4.848 | | | | 14,658,242 | | |
| | 7,000 | | | U.S. Treasury Bills4 | | (AA+, Aaa) | | 06/12/25 | | | 4.790 | | | | 6,819,813 | | |
| | 7,000 | | | U.S. Treasury Bills4 | | (AA+, Aaa) | | 07/10/25 | | | 4.301 | | | | 6,799,141 | | |
| | 15,000 | | | U.S. Treasury Bills4 | | (AA+, Aaa) | | 08/07/25 | | | 4.090 | | | | 14,518,493 | | |
2
Credit Suisse Multialternative Strategy Fund
Consolidated schedule of investments
Par
(000) | | | | Ratings†
(S&P/Moody's) | | Maturity | | Rate% | | Value | |
United States Treasury obligations—(concluded) | |
$ | 7,000 | | | U.S. Treasury Bills4 | | (AA+, Aaa) | | 09/04/25 | | | 3.816 | | | $ | 6,753,402 | | |
| | 7,000 | | | U.S. Treasury Bills4 | | (AA+, Aaa) | | 10/02/25 | | | 4.084 | | | | 6,733,777 | | |
| | | Total United States Treasury obligations
(Cost $113,522,909) | | | | | | | | $ | 113,646,238 | | |
| | | | | | | | | Shares | | | |
Short-term investments: (15.9%) | |
| | | State Street Institutional U.S. Government Money Market Fund—Premier Class, 4.81% | | | | | | | 31,468,544 | | | | 31,468,544 | | |
| | | State Street Navigator Securities Lending Government Money Market Portfolio, 4.86%5 | | | | | | | 5,458,410 | | | | 5,458,410 | | |
| | | Total short-term investments
(Cost $36,926,954) | | | | | | | | | 36,926,954 | | |
| | | Total investments at value (74.2%)
(Cost $171,751,112) | | | | | | | | | 172,635,306 | | |
| | | Other Assets In Excess of Liabilities (25.8%) | | | | | | | | | 60,074,846 | | |
| | | Net assets (100.0%) | | | | | | | | $ | 232,710,152 | | |
† Credit ratings given by the S&P Global Ratings Division of S&P Global Inc. ("S&P") and Moody's Investors Service, Inc. ("Moody's") are unaudited.
1 Security exempt from registration under Rule 144A of the Securities Act of 1933, as amended. These securities may be resold in transactions exempt from registration, normally to qualified institutional buyers. At October 31, 2024, these securities amounted to a value of $1,904,172 or 0.8% of net assets.
2 Non-income producing security.
3 Security or portion thereof is out on loan (See Note 2-M).
4 Securities are zero coupon. Rate presented is cost yield as of October 31, 2024.
5 Represents security purchased with cash collateral received for securities on loan.
Forward foreign currency contracts
Forward
currency to be
purchased | | Forward
currency to be
sold | | Settlement
date | | Counterparty | | Value on
settlement date | | Current
value/notional | | Unrealized
appreciation | |
CHF | 2,506,732 | | | USD | 2,900,136 | | | 11/20/24 | | JPMorgan Chase | | $ | 2,900,136 | | | $ | 2,904,000 | | | $ | 3,864 | | |
EUR | 968,266 | | | USD | 1,045,007 | | | 11/20/24 | | BNP Paribas | | | 1,045,007 | | | | 1,051,892 | | | | 6,885 | | |
USD | 1,233,030 | | | AUD | 1,849,461 | | | 11/20/24 | | Goldman Sachs | | | (1,233,030 | ) | | | (1,211,609 | ) | | | 21,421 | | |
USD | 2,179,722 | | | CAD | 2,999,001 | | | 11/19/24 | | BNP Paribas | | | (2,179,722 | ) | | | (2,152,654 | ) | | | 27,068 | | |
USD | 2,911,012 | | | CHF | 2,506,732 | | | 11/20/24 | | JPMorgan Chase | | | (2,911,012 | ) | | | (2,904,000 | ) | | | 7,012 | | |
USD | 1,054,289 | | | EUR | 968,266 | | | 11/20/24 | | JPMorgan Chase | | | (1,054,289 | ) | | | (1,051,892 | ) | | | 2,397 | | |
USD | 1,780,301 | | | GBP | 1,376,042 | | | 11/20/24 | | JPMorgan Chase | | | (1,780,301 | ) | | | (1,769,064 | ) | | | 11,237 | | |
USD | 594,061 | | | NOK | 6,535,519 | | | 11/20/24 | | BNP Paribas | | | (594,061 | ) | | | (592,566 | ) | | | 1,495 | | |
USD | 928,879 | | | NZD | 1,546,789 | | | 11/20/24 | | BNP Paribas | | | (928,879 | ) | | | (920,664 | ) | | | 8,215 | | |
USD | 90,841 | | | SEK | 961,476 | | | 11/20/24 | | BNP Paribas | | | (90,841 | ) | | | (89,925 | ) | | | 916 | | |
Total unrealized appreciation | | | | | | | | | | | | $ | 90,510 | | |
3
Credit Suisse Multialternative Strategy Fund
Consolidated schedule of investments
Forward foreign currency contracts—(concluded)
Forward
currency to be
purchased | | Forward
currency to be
sold | | Settlement
date | | Counterparty | | Value on
settlement date | | Current
value/notional | | Unrealized
depreciation | |
AUD | 1,849,461 | | | USD | 1,226,380 | | | 11/20/24 | | JPMorgan Chase | | $ | 1,226,380 | | | $ | 1,211,609 | | | $ | (14,771 | ) | |
CAD | 2,999,001 | | | USD | 2,167,462 | | | 11/19/24 | | JPMorgan Chase | | | 2,167,462 | | | | 2,152,654 | | | | (14,808 | ) | |
GBP | 1,376,042 | | | USD | 1,788,661 | | | 11/20/24 | | BNP Paribas | | | 1,788,661 | | | | 1,769,064 | | | | (19,597 | ) | |
JPY | 66,960,565 | | | USD | 449,098 | | | 11/20/24 | | JPMorgan Chase | | | 449,098 | | | | 440,439 | | | | (8,659 | ) | |
NOK | 6,535,519 | | | USD | 598,521 | | | 11/20/24 | | BNP Paribas | | | 598,521 | | | | 592,566 | | | | (5,955 | ) | |
NZD | 1,546,789 | | | USD | 937,058 | | | 11/20/24 | | JPMorgan Chase | | | 937,058 | | | | 920,664 | | | | (16,394 | ) | |
SEK | 961,476 | | | USD | 91,748 | | | 11/20/24 | | BNP Paribas | | | 91,748 | | | | 89,925 | | | | (1,823 | ) | |
USD | 439,651 | | | JPY | 66,960,565 | | | 11/20/24 | | JPMorgan Chase | | | (439,651 | ) | | | (440,439 | ) | | | (788 | ) | |
Total unrealized depreciation | | | | | | | | | | | | $ | (82,795 | ) | |
Total net unrealized appreciation/(depreciation) | | | | | | | | | | | | $ | 7,715 | | |
Futures contracts
Contract description | | Currency | | Expiration
date | | Number of
contracts | | Notional
amount | | Notional value | | Net unrealized
appreciation
(depreciation) | |
Contracts to purchase | |
Agriculture | |
Coffee "C" Futures | | USD | | | | Mar 2025 | | | 5 | | | $ | 465,335 | | | $ | 460,312 | | | $ | (5,023 | ) | |
Corn Futures | | USD | | | | Mar 2025 | | | 26 | | | | 557,610 | | | | 553,800 | | | | (3,810 | ) | |
Cotton No. 2 Futures | | USD | | | | Mar 2025 | | | 4 | | | | 144,688 | | | | 143,660 | | | | (1,028 | ) | |
Wheat Futures | | USD | | | | Mar 2025 | | | 16 | | | | 472,715 | | | | 472,200 | | | | (515 | ) | |
| | | $ | (10,376 | ) | |
Energy | |
Brent Crude Oil Futures | | USD | | | | Jan 2025 | | | 11 | | | | 790,797 | | | | 794,200 | | | $ | 3,403 | | |
Foreign Exchange Contracts | |
| GBP Currency Futures | | USD | | | | Dec 2024 | | | 28 | | | | 2,283,959 | | | | 2,254,175 | | | $ | (29,784 | ) | |
Index Contracts | |
E-Mini S&P Consumer Discretionary Sector | | USD | | | | Dec 2024 | | | 2 | | | | 407,415 | | | | 400,280 | | | $ | (7,135 | ) | |
E-Mini Utilities Select Sector Futures | | USD | | | | Dec 2024 | | | 6 | | | | 497,555 | | | | 486,300 | | | | (11,255 | ) | |
EURO Stoxx 50 Index Dividend Futures | | EUR | | | | Dec 2024 | | | 12 | | | | 208,605 | | | | 209,357 | | | | 752 | | |
EURO Stoxx 50 Index Dividend Futures | | EUR | | | | Dec 2025 | | | 131 | | | | 2,254,414 | | | | 2,249,923 | | | | (4,491 | ) | |
FTSE 100 Index Futures | | GBP | | | | Dec 2024 | | | 9 | | | | 966,866 | | | | 940,363 | | | | (26,503 | ) | |
Hang Seng Index Futures | | HKD | | | | Nov 2024 | | | 9 | | | | 1,194,218 | | | | 1,177,904 | | | | (16,314 | ) | |
MSCI Emerging Markets Index Futures | | USD | | | | Dec 2024 | | | 11 | | | | 649,119 | | | | 619,575 | | | | (29,544 | ) | |
Nikkei 225 Index Futures OSE | | JPY | | | | Dec 2024 | | | 2 | | | | 507,910 | | | | 512,851 | | | | 4,941 | | |
Russell 2000 E-Mini Index Futures | | USD | | | | Dec 2024 | | | 41 | | | | 4,564,850 | | | | 4,527,630 | | | | (37,220 | ) | |
| | | $ | (126,769 | ) | |
4
Credit Suisse Multialternative Strategy Fund
Consolidated schedule of investments
Futures contracts—(continued)
Contract description | | Currency | | Expiration
date | | Number of
contracts | | Notional
amount | | Notional value | | Net unrealized
appreciation
(depreciation) | |
Contracts to purchase (concluded) | |
Industrial Metals | |
LME Lead Futures | | USD | | | | Nov 2024 | | | 47 | | | $ | 2,430,452 | | | $ | 2,338,415 | | | $ | (92,037 | ) | |
LME Lead Futures | | USD | | | | Jan 2025 | | | 13 | | | | 685,609 | | | | 655,057 | | | | (30,552 | ) | |
LME Nickel Futures | | USD | | | | Nov 2024 | | | 74 | | | | 7,319,115 | | | | 6,885,392 | | | | (433,723 | ) | |
LME Nickel Futures | | USD | | | | Jan 2025 | | | 21 | | | | 2,138,964 | | | | 1,974,478 | | | | (164,486 | ) | |
LME Primary Aluminum Futures | | USD | | | | Nov 2024 | | | 203 | | | | 11,965,152 | | | | 13,200,988 | | | | 1,235,836 | | |
LME Primary Aluminum Futures | | USD | | | | Jan 2025 | | | 57 | | | | 3,699,532 | | | | 3,724,294 | | | | 24,762 | | |
LME Zinc Futures | | USD | | | | Nov 2024 | | | 109 | | | | 7,593,917 | | | | 8,268,277 | | | | 674,360 | | |
LME Zinc Futures | | USD | | | | Jan 2025 | | | 30 | | | | 2,295,295 | | | | 2,272,808 | | | | (22,487 | ) | |
| | | $ | 1,191,673 | | |
Interest Rate Contracts | |
10YR AUD Bond Futures | | AUD | | | | Dec 2024 | | | 489 | | | | 36,069,898 | | | | 35,823,246 | | | $ | (246,652 | ) | |
10YR CAD Bond Futures | | CAD | | | | Dec 2024 | | | 236 | | | | 20,727,938 | | | | 20,653,280 | | | | (74,658 | ) | |
| EURO Bund Futures | | EUR | | | | Dec 2024 | | | 367 | | | | 52,924,482 | | | | 52,513,552 | | | | (410,930 | ) | |
U.S. Treasury 5 Year Note Futures | | USD | | | | Dec 2024 | | | 21 | | | | 2,254,965 | | | | 2,251,922 | | | | (3,043 | ) | |
| | | $ | (735,283 | ) | |
Livestock | |
Lean Hogs Futures | | USD | | | | Feb 2025 | | | 7 | | | | 237,403 | | | | 238,560 | | | $ | 1,157 | | |
Live Cattle Futures | | USD | | | | Feb 2025 | | | 5 | | | | 377,016 | | | | 373,550 | | | | (3,466 | ) | |
| | | $ | (2,309 | ) | |
Precious Metals | |
Copper Futures | | USD | | | | Mar 2025 | | | 6 | | | | 660,604 | | | | 658,125 | | | $ | (2,479 | ) | |
Gold 100 oz. Futures | | USD | | | | Feb 2025 | | | 8 | | | | 2,234,532 | | | | 2,219,200 | | | | (15,332 | ) | |
Silver Futures | | USD | | | | Mar 2025 | | | 4 | | | | 682,276 | | | | 664,780 | | | | (17,496 | ) | |
| | | $ | (35,307 | ) | |
Contracts to sell | |
Agriculture | |
Coffee "C" Futures | | USD | | | | Dec 2024 | | | (5 | ) | | | (466,689 | ) | | | (461,062 | ) | | $ | 5,627 | | |
Corn Futures | | USD | | | | Dec 2024 | | | (26 | ) | | | (538,790 | ) | | | (533,975 | ) | | | 4,815 | | |
Cotton No. 2 Futures | | USD | | | | Dec 2024 | | | (4 | ) | | | (140,207 | ) | | | (139,140 | ) | | | 1,067 | | |
Wheat Futures | | USD | | | | Dec 2024 | | | (16 | ) | | | (456,423 | ) | | | (456,400 | ) | | | 23 | | |
| | | $ | 11,532 | | |
Energy | |
Brent Crude Oil Futures | | USD | | | | Nov 2024 | | | (11 | ) | | | (797,428 | ) | | | (800,910 | ) | | $ | (3,482 | ) | |
5
Credit Suisse Multialternative Strategy Fund
Consolidated schedule of investments
Futures contracts—(concluded)
Contract description | | Currency | | Expiration
date | | Number of
contracts | | Notional
amount | | Notional value | | Net unrealized
appreciation
(depreciation) | |
Contracts to sell (concluded) | |
Foreign Exchange Contracts | |
| AUD Currency Futures | | USD | | | | Dec 2024 | | | (32 | ) | | $ | (2,102,584 | ) | | $ | (2,104,800 | ) | | $ | (2,216 | ) | |
| CAD Currency Futures | | USD | | | | Dec 2024 | | | (59 | ) | | | (4,290,050 | ) | | | (4,248,000 | ) | | | 42,050 | | |
| EUR Currency Futures | | USD | | | | Dec 2024 | | | (25 | ) | | | (3,402,494 | ) | | | (3,403,125 | ) | | | (631 | ) | |
| JPY Currency Futures | | USD | | | | Dec 2024 | | | (16 | ) | | | (1,342,023 | ) | | | (1,322,600 | ) | | | 19,423 | | |
| | | $ | 58,626 | | |
Index Contracts | |
S&P 500 E Mini Index Futures | | USD | | | | Dec 2024 | | | (106 | ) | | | (30,576,706 | ) | | | (30,414,050 | ) | | $ | 162,656 | | |
EURO Stoxx 50 Index Futures | | EUR | | | | Dec 2024 | | | (108 | ) | | | (5,730,924 | ) | | | (5,667,876 | ) | | | 63,048 | | |
| | | $ | 225,704 | | |
Industrial Metals | |
LME Lead Futures | | USD | | | | Nov 2024 | | | (47 | ) | | | (2,384,182 | ) | | | (2,338,414 | ) | | $ | 45,768 | | |
LME Lead Futures | | USD | | | | Jan 2025 | | | (13 | ) | | | (681,634 | ) | | | (655,057 | ) | | | 26,577 | | |
LME Nickel Futures | | USD | | | | Nov 2024 | | | (74 | ) | | | (7,296,952 | ) | | | (6,885,392 | ) | | | 411,560 | | |
LME Nickel Futures | | USD | | | | Jan 2025 | | | (21 | ) | | | (2,220,240 | ) | | | (1,974,478 | ) | | | 245,762 | | |
LME Primary Aluminum Futures | | USD | | | | Nov 2024 | | | (203 | ) | | | (12,077,452 | ) | | | (13,200,989 | ) | | | (1,123,537 | ) | |
LME Primary Aluminum Futures | | USD | | | | Jan 2025 | | | (57 | ) | | | (3,693,967 | ) | | | (3,724,295 | ) | | | (30,328 | ) | |
LME Zinc Futures | | USD | | | | Nov 2024 | | | (109 | ) | | | (7,592,978 | ) | | | (8,268,277 | ) | | | (675,299 | ) | |
LME Zinc Futures | | USD | | | | Jan 2025 | | | (30 | ) | | | (2,322,215 | ) | | | (2,272,807 | ) | | | 49,408 | | |
| | | $ | (1,050,089 | ) | |
Interest Rate Contracts | |
10YR JGB Mini Futures | | JPY | | | | Dec 2024 | | | (183 | ) | | | (17,312,694 | ) | | | (17,301,054 | ) | | $ | 11,640 | | |
10YR U.S. Treasury Note Futures | | USD | | | | Dec 2024 | | | (354 | ) | | | (39,191,877 | ) | | | (39,105,937 | ) | | | 85,940 | | |
Long Gilt Futures | | GBP | | | | Dec 2024 | | | (432 | ) | | | (53,484,045 | ) | | | (52,229,869 | ) | | | 1,254,176 | | |
| | | $ | 1,351,756 | | |
Livestock | |
Lean Hogs Futures | | USD | | | | Dec 2024 | | | (7 | ) | | | (230,297 | ) | | | (234,640 | ) | | $ | (4,343 | ) | |
Live Cattle Futures | | USD | | | | Dec 2024 | | | (5 | ) | | | (375,624 | ) | | | (372,600 | ) | | | 3,024 | | |
| | | $ | (1,319 | ) | |
Precious Metals | |
Copper Futures | | USD | | | | Dec 2024 | | | (6 | ) | | | (653,571 | ) | | | (651,000 | ) | | $ | 2,571 | | |
Gold 100 oz. Futures | | USD | | | | Dec 2024 | | | (8 | ) | | | (2,214,708 | ) | | | (2,199,440 | ) | | | 15,268 | | |
Silver Futures | | USD | | | | Dec 2024 | | | (4 | ) | | | (673,164 | ) | | | (655,920 | ) | | | 17,244 | | |
| | | $ | 35,083 | | |
Total net unrealized appreciation (depreciation) | | $ | 883,059 | | |
6
Credit Suisse Multialternative Strategy Fund
Consolidated schedule of investments
Total return swap contracts
Currency | | Notional
amount | | Expiration
date | | Counterparty | | Receive | | Pay | | Periodic
payment
frequency | | Upfront
premiums
paid/
(received) | | Value | | Unrealized
appreciation | |
USD | | | | $ | 22,746,611 | | | 01/24/25 | | Bank of America | | Bank of America Equities
US Volatility Carry
Hourly Hedged Index | | 0.00% | | Monthly | | $ | — | | | $ | 23,203 | | | $ | 23,203 | | |
USD | | | | | 666,143 | | | 01/27/25 | | Bank of America | | (0.06)% | | Bloomberg
Agriculture
Index | | At Maturity | | | — | | | | 5,432 | | | | 5,432 | | |
USD | | | | | 26,921,441 | | | 01/27/25 | | Bank of America | | (4.62)% | | ML Most
Shorted REIT
CS Custom
Basket | | Monthly | | | — | | | | 666,317 | | | | 666,317 | | |
USD | | | | | 172,321 | | | 01/27/25 | | Bank of America | | ML Least Shorted REIT CS
Custom Basket | | 5.11% | | Monthly | | | — | | | | 0 | | | | 0 | | |
USD | | | | | 28,842,812 | | | 01/24/25 | | Barclays Bank PLC | | Barclays EFS Custom
Commodity Basket 18 | | 0.00% | | At Maturity | | | — | | | | 531,701 | | | | 531,701 | | |
USD | | | | | 28,397,844 | | | 01/24/25 | | Barclays Bank PLC | | Shiller Barclays CAPE
US Mid—
Month Sector Market
Hedged ER Index | | 0.60% | | At Maturity | | | — | | | | 122,924 | | | | 122,924 | | |
USD | | | | | 17,600,000 | | | 12/20/24 | | BNP Paribas | | iBoxx $ Liquid
High Yield Index | | 4.81% | | Quarterly | | | — | | | | 72,694 | | | | 72,694 | | |
USD | | | | | 29,035,756 | | | 01/24/25 | | BNP Paribas | | BNP Paribas Buy
Write Call Gold
Daily Index | | 0.50% | | At Maturity | | | — | | | | 245,796 | | | | 245,796 | | |
USD | | | | | 17,410,861 | | | 01/24/25 | | BNP Paribas | | BNP Paribas VOLA
Index ER | | 0.35% | | At Maturity | | | — | | | | 20,882 | | | | 20,882 | | |
USD | | | | | 13,985,445 | | | 01/24/25 | | BNP Paribas | | BNP Alpha Momentum
ex-Agriculture and
Livestock Net Index | | 0.30% | | At Maturity | | | — | | | | 77,950 | | | | 77,950 | | |
USD | | | | | 2,557,507 | | | 02/14/25 | | Citigroup | | (4.71)% | | Expand
Energy Corp. | | Monthly | | | — | | | | 55,810 | | | | 55,810 | | |
USD | | | | | 1,032,251 | | | 02/14/25 | | Citigroup | | Juniper Networks, Inc. | | 5.16% | | Monthly | | | — | | | | 3,461 | | | | 3,461 | | |
USD | | | | | 482,437 | | | 02/24/25 | | Citigroup | | (4.71)% | | Synopsys,
Inc. | | Monthly | | | — | | | | 17,620 | | | | 17,620 | | |
USD | | | | | 319,684 | | | 03/07/25 | | Citigroup | | Haynes International, Inc. | | 5.16% | | Monthly | | | — | | | | 2,940 | | | | 2,940 | | |
USD | | | | | 6,271,094 | | | 03/24/25 | | Citigroup | | (4.71)% | | Vanguard FTSE
Emerging
Market | | Monthly | | | — | | | | 162,647 | | | | 162,647 | | |
USD | | | | | 144,625 | | | 03/28/25 | | Citigroup | | (4.71)% | | Vanguard FTSE
Emerging
Market | | Monthly | | | — | | | | 3,751 | | | | 3,751 | | |
USD | | | | | 12,096 | | | 04/23/25 | | Citigroup | | (4.71)% | | Vanguard FTSE
Emerging
Market | | Monthly | | | — | | | | 314 | | | | 314 | | |
7
Credit Suisse Multialternative Strategy Fund
Consolidated schedule of investments
Total return swap contracts—(continued)
Currency | | Notional
amount | | Expiration
date | | Counterparty | | Receive | | Pay | | Periodic
payment
frequency | | Upfront
premiums
paid/
(received) | | Value | | Unrealized
appreciation | |
USD | | | | $ | 1,371,481 | | | 05/05/25 | | Citigroup | | Nuvei Corp.
Subordinate VTG | | 5.16% | | Monthly | | $ | — | | | $ | 9,852 | | | $ | 9,852 | | |
USD | | | | | 1,778,182 | | | 05/12/25 | | Citigroup | | Endeavor Group Holding | | 5.16% | | Monthly | | | — | | | | 13,365 | | | | 13,365 | | |
USD | | | | | 1,385,410 | | | 05/12/25 | | Citigroup | | (4.71)% | | Schlumberger,
Ltd. | | Monthly | | | — | | | | 140,715 | | | | 140,715 | | |
USD | | | | | 1,312,948 | | | 07/07/25 | | Citigroup | | Stericycle, Inc. | | 5.16% | | Monthly | | | — | | | | 11,854 | | | | 11,854 | | |
USD | | | | | 1,585,839 | | | 07/07/25 | | Citigroup | | (4.71)% | | ConocoPhillips | | Monthly | | | — | | | | 32,891 | | | | 32,891 | | |
USD | | | | | 885,073 | | | 08/11/25 | | Citigroup | | Paramount Global | | 5.16% | | Monthly | | | — | | | | 51,358 | | | | 51,358 | | |
USD | | | | | 338,165 | | | 09/01/25 | | Citigroup | | Everi Holdings, Inc. | | 5.16% | | Monthly | | | — | | | | 3,589 | | | | 3,589 | | |
USD | | | | | 1,672,485 | | | 09/08/25 | | Citigroup | | R1 RCM, Inc. | | 5.16% | | Monthly | | | — | | | | 4,705 | | | | 4,705 | | |
USD | | | | | 33,429 | | | 09/19/25 | | Citigroup | | Paramount Global | | 5.16% | | Monthly | | | — | | | | 1,940 | | | | 1,940 | | |
USD | | | | | 59,957 | | | 09/19/25 | | Citigroup | | (4.71)% | | ConocoPhillips | | Monthly | | | — | | | | 1,243 | | | | 1,243 | | |
USD | | | | | 52,316 | | | 09/19/25 | | Citigroup | | (4.71)% | | Schlumberger,
Ltd. | | Monthly | | | — | | | | 5,314 | | | | 5,314 | | |
USD | | | | | 12,082 | | | 09/19/25 | | Citigroup | | Haynes International, Inc. | | 5.16% | | Monthly | | | — | | | | 111 | | | | 111 | | |
USD | | | | | 51,819 | | | 09/19/25 | | Citigroup | | Nuvei Corp.
Subordinate VTG | | 5.16% | | Monthly | | | — | | | | 372 | | | | 372 | | |
USD | | | | | 239,385 | | | 09/19/25 | | Citigroup | | (4.71)% | | Vanguard FTSE
Emerging
Market | | Monthly | | | — | | | | 6,209 | | | | 6,209 | | |
USD | | | | | 18,125 | | | 09/19/25 | | Citigroup | | (4.71)% | | Synopsys, Inc. | | Monthly | | | — | | | | 662 | | | | 662 | | |
USD | | | | | 49,589 | | | 09/19/25 | | Citigroup | | Stericycle, Inc. | | 5.16% | | Monthly | | | — | | | | 448 | | | | 448 | | |
USD | | | | | 13,150 | | | 09/19/25 | | Citigroup | | Everi Holdings, Inc. | | 5.16% | | Monthly | | | — | | | | 140 | | | | 140 | | |
USD | | | | | 39,003 | | | 09/19/25 | | Citigroup | | Juniper Networks, Inc. | | 5.16% | | Monthly | | | — | | | | 131 | | | | 131 | | |
USD | | | | | 61,018 | | | 09/19/25 | | Citigroup | | R1 RCM, Inc. | | 5.16% | | Monthly | | | — | | | | 172 | | | | 172 | | |
USD | | | | | 67,175 | | | 09/19/25 | | Citigroup | | Endeavor Group Holding | | 5.16% | | Monthly | | | — | | | | 505 | | | | 505 | | |
USD | | | | | 1,449,317 | | | 09/22/25 | | Citigroup | | Kellanova | | 5.16% | | Monthly | | | — | | | | 1,979 | | | | 1,979 | | |
USD | | | | | 972,653 | | | 10/13/25 | | Citigroup | | Frontier Communications
Parent, Inc. | | 5.16% | | Monthly | | | — | | | | 13,245 | | | | 13,245 | | |
USD | | | | | 1,755,631 | | | 11/03/25 | | Citigroup | | Smartsheet, Inc. | | 5.16% | | Monthly | | | — | | | | 29,102 | | | | 29,102 | | |
USD | | | | | 1,771,793 | | | 11/10/25 | | Citigroup | | Barnes Group, Inc. | | 5.16% | | Monthly | | | — | | | | 5,321 | | | | 5,321 | | |
USD | | | | | 353,613 | | | 11/10/25 | | Citigroup | | Duckhorn Portfolio, Inc. | | 5.16% | | Monthly | | | — | | | | 0 | | | | 0 | | |
USD | | | | | 1,055,588 | | | 11/17/25 | | Citigroup | | Longboard
Pharmaceuticals, Inc. | | 5.16% | | Monthly | | | — | | | | 9,041 | | | | 9,041 | | |
USD | | | | | 1,052,113 | | | 11/24/25 | | Citigroup | | Zuora, Inc. | | 5.16% | | Monthly | | | — | | | | 2,326 | | | | 2,326 | | |
USD | | | | | 334,034 | | | 12/01/25 | | Citigroup | | (4.71)% | | First Busey
Corp. | | Monthly | | | — | | | | 10,808 | | | | 10,808 | | |
8
Credit Suisse Multialternative Strategy Fund
Consolidated schedule of investments
Total return swap contracts—(continued)
Currency | | Notional
amount | | Expiration
date | | Counterparty | | Receive | | Pay | | Periodic
payment
frequency | | Upfront
premiums
paid/
(received) | | Value | | Unrealized
appreciation | |
USD | | | | $ | 34,326,101 | | | 01/27/25 | | Goldman Sachs | | Goldman Sachs Tactical
Factor Suite Value
World Top USD Excess
Return Strategy | | 0.40% | | At Maturity | | $ | — | | | $ | 64,514 | | | $ | 64,514 | | |
USD | | | | | 30,064,382 | | | 01/27/25 | | Goldman Sachs | | Goldman Sachs
Commodities
Seasonality Index | | 0.00% | | At Maturity | | | — | | | | 88,008 | | | | 88,008 | | |
USD | | | | | 29,319,826 | | | 01/27/25 | | Goldman Sachs | | Goldman Sachs
Commodity Strategy
Index | | 0.00% | | At Maturity | | | — | | | | 20,045 | | | | 20,045 | | |
USD | | | | | 28,144,181 | | | 01/27/25 | | Goldman Sachs | | Goldman Sachs
Commodity COT
Strategy COT3 | | 0.00% | | At Maturity | | | — | | | | 113,022 | | | | 113,022 | | |
USD | | | | | 14,040,246 | | | 01/27/25 | | Goldman Sachs | | Goldman Sachs RP 112
Long Short Series SR
Excess Return Strategy | | (0.60)% | | At Maturity | | | — | | | | 160,558 | | | | 160,558 | | |
USD | | | | | 26,146,891 | | | 01/27/25 | | JPMorgan Chase | | J.P. Morgan Seasonal
Spreads Portfolio
Commodity Index | | 0.60% | | At Maturity | | | — | | | | 60,785 | | | | 60,785 | | |
USD | | | | | 29,135,417 | | | 01/27/25 | | JPMorgan Chase | | J.P. Morgan Helix 3
Index | | 0.60% | | At Maturity | | | — | | | | 252,839 | | | | 252,839 | | |
USD | | | | | 10,245,971 | | | 01/27/25 | | JPMorgan Chase | | J.P. Morgan Equities
Turn-of the Month
Seasonality Index | | 0.00% | | At Maturity | | | — | | | | 218,668 | | | | 218,668 | | |
USD | | | | | 28,389,059 | | | 01/27/25 | | JPMorgan Chase | | J.P. Morgan Commodities
Fundamental
Value Index | | 0.80% | | At Maturity | | | — | | | | 53,245 | | | | 53,245 | | |
USD | | | | | 4,800,000 | | | 01/27/25 | | JPMorgan Chase | | J.P. Morgan EMBI
Global Core | | 5.61% | | At Maturity | | | — | | | | 18,969 | | | | 18,969 | | |
USD | | | | | 11,400,000 | | | 01/27/25 | | JPMorgan Chase | | J.P. Morgan EMBI
Global Core | | 5.66% | | At Maturity | | | — | | | | 63,959 | | | | 63,959 | | |
USD | | | | | 10,100,000 | | | 12/20/24 | | Morgan Stanley | | iBoxx $ Liquid High
Yield Index | | 4.81% | | Quarterly | | | — | | | | 22,016 | | | | 22,016 | | |
USD | | | | | 28,912,941 | | | 01/22/25 | | Morgan Stanley | | Morgan Stanley
Commodities
Curve Carry Index | | 0.35% | | At Maturity | | | — | | | | 83,069 | | | | 83,069 | | |
USD | | | | | 17,415,563 | | | 01/22/25 | | Morgan Stanley | | GC Intraday Momentum
Index(b) | | 0.10% | | At Maturity | | | — | | | | 40,330 | | | | 40,330 | | |
USD | | | | | 21,580,059 | | | 01/22/25 | | Morgan Stanley | | CL Intraday Momentum
Index | | 0.10% | | At Maturity | | | — | | | | 156,942 | | | | 156,942 | | |
USD | | | | | 27,348,885 | | | 01/27/25 | | Societe Generale | | SG US Trend Index(a) | | 0.30% | | At Maturity | | | — | | | | 67,575 | | | | 67,575 | | |
9
Credit Suisse Multialternative Strategy Fund
Consolidated schedule of investments
Total return swap contracts—(continued)
Currency | | Notional
amount | | Expiration
date | | Counterparty | | Receive | | Pay | | Periodic
payment
frequency | | Upfront
premiums
paid/
(received) | | Value | | Unrealized
appreciation | |
USD | | | | $ | 29,153,229 | | | 01/27/25 | | Societe Generale | | SGI Coda Index | | 0.25% | | At Maturity | | $ | — | | | $ | 21,634 | | | $ | 21,634 | | |
USD | | | | | 29,133,056 | | | 01/27/25 | | Societe Generale | | SGI VRR US Index—Vol
Roll on Rates (USD—
Excess Return) | | 0.25% | | At Maturity | | | — | | | | 162,300 | | | | 162,300 | | |
| | | | | | | | | | | | | | | | | $ | — | | | $ | 4,039,318 | | | $ | 4,039,318 | | |
Currency | | Notional
amount | | Expiration
date | | Counterparty | | Receive | | Pay | | Periodic
payment
frequency | | Upfront
premiums
paid/
(received) | | Value | | Unrealized
depreciation | |
USD | | | | $ | 23,372,785 | | | 01/27/25 | | Bank of America | | BAML USD Custom
Equity Basket | | 5.37% | | Monthly | | $ | — | | | $ | (992,966 | ) | | $ | (992,966 | ) | |
USD | | | | | 9,863,198 | | | 01/27/25 | | Bank of America | | BAML Equity Buyback
USD Basket | | 5.37% | | Monthly | | | — | | | | (177,332 | ) | | | (177,332 | ) | |
USD | | | | | 26,818,610 | | | 01/27/25 | | Bank of America | | ML Least Shorted REIT
CS Custom Basket | | 5.22% | | Monthly | | | — | | | | (575,576 | ) | | | (575,576 | ) | |
USD | | | | | 660,949 | | | 01/27/25 | | Bank of America | | (0.06)% | | Bloomberg
Energy Index | | At Maturity | | | — | | | | (2,190 | ) | | | (2,190 | ) | |
USD | | | | | 29,033,920 | | | 01/24/25 | | Barclays Bank PLC | | Barclays Month End
Rebalancing
Currency Index | | 0.20% | | At Maturity | | | — | | | | (113,312 | ) | | | (113,312 | ) | |
USD | | | | | 25,480,289 | | | 01/24/25 | | Barclays Bank PLC | | Barclays Commodity
Hedging Insights 2
Index | | 0.15% | | At Maturity | | | — | | | | (19,931 | ) | | | (19,931 | ) | |
USD | | | | | 28,755,236 | | | 01/24/25 | | Barclays Bank PLC | | Barclays Trend Star Index | | 0.60% | | At Maturity | | | — | | | | (137,945 | ) | | | (137,945 | ) | |
EUR | | | | | 29,850,212 | | | 01/24/25 | | BNP Paribas | | BNP Paribas Equity
Low Vol Europe Index | | 0.00% | | At Maturity | | | — | | | | (233,909 | ) | | | (233,909 | ) | |
USD | | | | | 29,138,999 | | | 01/24/25 | | BNP Paribas | | BNP Paribas Dynamic
Pre Roll Alpha
ex Agriculture and
Livestock Index | | 0.08% | | At Maturity | | | — | | | | (97 | ) | | | (97 | ) | |
USD | | | | | 22,733,184 | | | 01/24/25 | | BNP Paribas | | BNP Paribas PPP
Long Term Value
G10 USD Index | | 0.00% | | At Maturity | | | — | | | | (50,357 | ) | | | (50,357 | ) | |
USD | | | | | 22,829,113 | | | 01/27/25 | | BNP Paribas | | Alerian MLP
Infrastructure Index (TR) | | 6.17% | | Monthly | | | — | | | | (65,963 | ) | | | (65,963 | ) | |
USD | | | | | 511,350 | | | 12/02/24 | | Citigroup | | Invesco FTSE RAFI
Emerging Market ETF | | 5.16% | | Monthly | | | — | | | | (16,241 | ) | | | (16,241 | ) | |
USD | | | | | 19,139,300 | | | 01/27/25 | | Citigroup | | Citi Equity US Tech
Congestion Index
Series 1(d) | | 0.00% | | At Maturity | | | — | | | | (5,051 | ) | | | (5,051 | ) | |
USD | | | | | 2,557,507 | | | 02/14/25 | | Citigroup | | Expand Energy Corp. | | 5.16% | | Monthly | | | — | | | | (55,810 | ) | | | (55,810 | ) | |
USD | | | | | 1,200,965 | | | 03/07/25 | | Citigroup | | Catalent, Inc. | | 5.16% | | Monthly | | | — | | | | (41,740 | ) | | | (41,740 | ) | |
10
Credit Suisse Multialternative Strategy Fund
Consolidated schedule of investments
Total return swap contracts—(continued)
Currency | | Notional
amount | | Expiration
date | | Counterparty | | Receive | | Pay | | Periodic
payment
frequency | | Upfront
premiums
paid/
(received) | | Value | | Unrealized
depreciation | |
USD | | | | $ | 9,212,720 | | | 03/24/25 | | Citigroup | | Invesco FTSE RAFI
Emerging Market ETF | | 5.16% | | Monthly | | $ | — | | | $ | (292,600 | ) | | $ | (292,600 | ) | |
USD | | | | | 193,930 | | | 03/28/25 | | Citigroup | | Invesco FTSE RAFI
Emerging Market ETF | | 5.16% | | Monthly | | | — | | | | (6,159 | ) | | | (6,159 | ) | |
USD | | | | | 1,146,623 | | | 03/28/25 | | Citigroup | | (4.71)% | | Capital One
Financial Corp. | | Monthly | | | — | | | | (88,464 | ) | | | (88,464 | ) | |
USD | | | | | 877,593 | | | 03/28/25 | | Citigroup | | Vizio Holding Corp. | | 5.16% | | Monthly | | | — | | | | (10,132 | ) | | | (10,132 | ) | |
USD | | | | | 971,406 | | | 06/02/25 | | Citigroup | | HashiCorp., Inc. | | 5.16% | | Monthly | | | — | | | | (3,146 | ) | | | (3,146 | ) | |
USD | | | | | 1,360,493 | | | 06/02/25 | | Citigroup | | (4.71)% | | UMB
Financial Corp. | | Monthly | | | — | | | | (54,146 | ) | | | (54,146 | ) | |
USD | | | | | 1,641,373 | | | 06/09/25 | | Citigroup | | Allete, Inc. | | 5.16% | | Monthly | | | — | | | | (11,476 | ) | | | (11,476 | ) | |
USD | | | | | 1,174,550 | | | 06/23/25 | | Citigroup | | (4.71)% | | Southstate
Corp. | | Monthly | | | — | | | | (21,460 | ) | | | (21,460 | ) | |
USD | | | | | 296,870 | | | 07/07/25 | | Citigroup | | Surmodics, Inc. | | 5.16% | | Monthly | | | — | | | | (8,754 | ) | | | (8,754 | ) | |
USD | | | | | 144,920 | | | 08/25/25 | | Citigroup | | (4.71)% | | Cleveland-Cliffs,
Inc. | | Monthly | | | — | | | | (3,195 | ) | | | (3,195 | ) | |
USD | | | | | 333,954 | | | 09/01/25 | | Citigroup | | Bally's Corp. | | 5.16% | | Monthly | | | — | | | | (764 | ) | | | (764 | ) | |
USD | | | | | 305,075 | | | 09/01/25 | | Citigroup | | (4.71)% | | Wesbanco, Inc. | | Monthly | | | — | | | | (22,163 | ) | | | (22,163 | ) | |
USD | | | | | 329,820 | | | 09/08/25 | | Citigroup | | (4.71)% | | Renasant Corp. | | Monthly | | | — | | | | (25,299 | ) | | | (25,299 | ) | |
USD | | | | | 44,346 | | | 09/19/25 | | Citigroup | | (4.71)% | | Southstate
Corp. | | Monthly | | | — | | | | (810 | ) | | | (810 | ) | |
USD | | | | | 11,875 | | | 09/19/25 | | Citigroup | | (4.71)% | | Wesbanco, Inc. | | Monthly | | | — | | | | (863 | ) | | | (863 | ) | |
USD | | | | | 36,688 | | | 09/19/25 | | Citigroup | | HashiCorp., Inc. | | 5.16% | | Monthly | | | — | | | | (119 | ) | | | (119 | ) | |
USD | | | | | 199,991 | | | 09/19/25 | | Citigroup | | Invesco FTSE RAFI
Emerging Market ETF | | 5.16% | | Monthly | | | — | | | | (6,352 | ) | | | (6,352 | ) | |
USD | | | | | 61,979 | | | 09/19/25 | | Citigroup | | Allete, Inc. | | 5.16% | | Monthly | | | — | | | | (433 | ) | | | (433 | ) | |
USD | | | | | 12,995 | | | 09/19/25 | | Citigroup | | Bally's Corp. | | 5.16% | | Monthly | | | — | | | | (30 | ) | | | (30 | ) | |
USD | | | | | 11,211 | | | 09/19/25 | | Citigroup | | Surmodics, Inc. | | 5.16% | | Monthly | | | — | | | | (331 | ) | | | (331 | ) | |
USD | | | | | 51,393 | | | 09/19/25 | | Citigroup | | (4.71)% | | UMB Financial
Corp. | | Monthly | | | — | | | | (2,045 | ) | | | (2,045 | ) | |
USD | | | | | 12,038 | | | 09/19/25 | | Citigroup | | (4.71)% | | Renasant Corp. | | Monthly | | | — | | | | (923 | ) | | | (923 | ) | |
USD | | | | | 33,161 | | | 09/19/25 | | Citigroup | | Vizio Holding Corp. | | 5.16% | | Monthly | | | — | | | | (383 | ) | | | (383 | ) | |
USD | | | | | 43,223 | | | 09/19/25 | | Citigroup | | (4.71)% | | Capital One
Financial Corp. | | Monthly | | | — | | | | (3,335 | ) | | | (3,335 | ) | |
USD | | | | | 45,411 | | | 09/19/25 | | Citigroup | | Catalent, Inc. | | 5.16% | | Monthly | | | — | | | | (1,578 | ) | | | (1,578 | ) | |
USD | | | | | 18,425 | | | 09/22/25 | | Citigroup | | Invesco FTSE RAFI
Emerging Market ETF | | 5.16% | | Monthly | | | — | | | | (585 | ) | | | (585 | ) | |
USD | | | | | 1,102,310 | | | 11/10/25 | | Citigroup | | (4.71)% | | Coeur Mining,
Inc. | | Monthly | | | — | | | | (6,889 | ) | | | (6,889 | ) | |
11
Credit Suisse Multialternative Strategy Fund
Consolidated schedule of investments
Total return swap contracts—(concluded)
Currency | | Notional
amount | | Expiration
date | | Counterparty | | Receive | | Pay | | Periodic
payment
frequency | | Upfront
premiums
paid/
(received) | | Value | | Unrealized
depreciation | |
| USD | | $ | 650,591 | | | 11/17/25 | | Citigroup | | Arcadium Lithium PLC | | 5.16% | | Monthly | | $ | — | | | $ | (18,182 | ) | | $ | (18,182 | ) | |
| USD | | | 983,795 | | | 01/27/25 | | Goldman Sachs | | Bloomberg Industrial
Metals Index | | 0.10% | | At Maturity | | | — | | | | (14,699 | ) | | | (14,699 | ) | |
| USD | | | 29,003,076 | | | 01/27/25 | | Goldman Sachs | | Goldman Sachs
DISP U.S. Index | | 0.00% | | At Maturity | | | — | | | | (52,017 | ) | | | (52,017 | ) | |
| USD | | | 1,664,373 | | | 01/27/25 | | Goldman Sachs | | Bloomberg Precious
Metals Index | | 0.07% | | At Maturity | | | — | | | | (17,895 | ) | | | (17,895 | ) | |
| USD | | | 16,739,034 | | | 01/27/25 | | Goldman Sachs | | Goldman Sachs
VVOL Carry ER | | 0.00% | | At Maturity | | | — | | | | (58,823 | ) | | | (58,823 | ) | |
| GBP | | | 55,024 | | | 04/10/25 | | Goldman Sachs | | Spirent
Communications PLC | | 5.43% | | Monthly | | | — | | | | (1,350 | ) | | | (1,350 | ) | |
| GBP | | | 257,361 | | | 04/11/25 | | Goldman Sachs | | Spirent
Communications PLC | | 5.43% | | Monthly | | | — | | | | (6,314 | ) | | | (6,314 | ) | |
| GBP | | | 353,389 | | | 04/14/25 | | Goldman Sachs | | Spirent
Communications PLC | | 5.43% | | Monthly | | | — | | | | (8,670 | ) | | | (8,670 | ) | |
| GBP | | | 249,357 | | | 04/15/25 | | Goldman Sachs | | Spirent
Communications PLC | | 5.43% | | Monthly | | | — | | | | (6,117 | ) | | | (6,117 | ) | |
| CAD | | | 572,826 | | | 06/20/25 | | Goldman Sachs | | (3.71)% | | National Bank
of Canada | | Monthly | | | — | | | | (21,793 | ) | | | (21,793 | ) | |
| CAD | | | 21,598 | | | 08/19/25 | | Goldman Sachs | | (3.71)% | | National Bank
of Canada | | Monthly | | | — | | | | (822 | ) | | | (822 | ) | |
| GBP | | | 34,570 | | | 08/19/25 | | Goldman Sachs | | Spirent
Communications PLC | | 5.43% | | Monthly | | | — | | | | (848 | ) | | | (848 | ) | |
| USD | | | 18,374,669 | | | 01/27/25 | | Macquarie Bank Ltd. | | Macquarie WTI Intraday
Mean Reversion(c) | | 0.15% | | At Maturity | | | — | | | | (8,107 | ) | | | (8,107 | ) | |
| USD | | | 29,586,780 | | | 01/22/25 | | Morgan Stanley | | Morgan Stanley Soy
Dynamic Congestion
Index | | 0.25% | | At Maturity | | | — | | | | (691 | ) | | | (691 | ) | |
| USD | | | 28,528,741 | | | 01/22/25 | | Morgan Stanley | | Morgan Stanley LTC0 4%
volatility target | | 0.10% | | At Maturity | | | — | | | | (102,382 | ) | | | (102,382 | ) | |
| | | | | | | | | | | | | | | $ | — | | | $ | (3,379,564 | ) | | $ | (3,379,564 | ) | |
Total | | | | | | | | | | | | | | | | | | | | | | | | | | $ | — | | | $ | 659,754 | | | $ | 659,754 | | |
(a) The Index intends to track the performance of a strategy that trades the daily trend of the S&P 500 (the Underlying Index).
(b) The index intends to track the performance of a strategy that trades the daily trend of the GC COMEX Gold.
(c) The index intends to track the performance of a strategy that trades the daily trend of crude oil futures.
(d) The index intends to track the performance of a strategy that trades the daily trend of the Nasdaq Global Index.
12
Credit Suisse Multialternative Strategy Fund
Consolidated schedule of investments
Written options
Number of
contracts | | Counterparty | | Put
options | | Expiration
date | | Notional
amount | | Premiums
received | | Current
value | | Net unrealized
appreciation
(depreciation) | |
| | 12 | | | Goldman Sachs | | S&P 500 Index, strike @ $5,840 | | 11/15/24 | | $ | (1,200 | ) | | $ | (98,029 | ) | | $ | (187,740 | ) | | $ | (89,711 | ) | |
Currency abbreviations:
AUD = Australian Dollar
CAD = Canadian Dollar
CHF = Swiss Franc
EUR = Euro
GBP = British Pound
HKD = Hong Kong Dollar
JPY = Japanese Yen
NOK = Norwegian Krone
NZD = New Zealand Dollar
SEK = Swedish Krona
USD = United States Dollar
See accompanying notes to consolidated financial statements.
13
Credit Suisse Multialternative Strategy Fund
Consolidated statement of assets and liabilities
October 31, 2024
Assets: | |
Investments at value, including collateral for securities on loan of $5,458,410 (Cost $171,751,112) (Note 2) | | $ | 172,635,3061 | | |
Cash | | | 161 | | |
Foreign currency at value (Cost $749,351) | | | 748,839 | | |
Cash segregated at brokers for futures contracts, swap contracts and written options (Note 2) | | | 67,999,591 | | |
Unrealized appreciation on open swap contracts (Note 2) | | | 4,039,318 | | |
Variation margin receivable on futures contracts (Note 2) | | | 985,409 | | |
Dividend and interest receivable | | | 244,962 | | |
Unrealized appreciation on forward foreign currency contracts (Note 2) | | | 90,510 | | |
Receivable for Fund shares sold | | | 64,489 | | |
Receivable for investments sold | | | 629 | | |
Prepaid expenses and other assets | | | 37,447 | | |
Total assets | | | 246,846,661 | | |
Liabilities: | |
Investment advisory fee payable (Note 3) | | | 280,498 | | |
Administrative services fee payable (Note 3) | | | 48,691 | | |
Shareholder servicing/Distribution fee payable (Note 3) | | | 460 | | |
Payable upon return of securities loaned (Note 2) | | | 5,458,410 | | |
Net payable for open swap contracts | | | 4,518,597 | | |
Unrealized depreciation on open swap contracts (Note 2) | | | 3,379,564 | | |
Outstanding written options, at value (Proceeds $98,029) (Note 2) | | | 187,740 | | |
Unrealized depreciation on forward foreign currency contracts (Note 2) | | | 82,795 | | |
Trustees' fee payable | | | 10,052 | | |
Payable for Fund shares redeemed | | | 842 | | |
Accrued expenses | | | 168,860 | | |
Total liabilities | | | 14,136,509 | | |
Net assets: | |
Capital stock, $.001 par value (Note 6) | | | 25,656 | | |
Paid-in capital (Note 6) | | | 234,590,214 | | |
Total distributable earnings (loss) | | | (1,905,718 | ) | |
Net assets | | $ | 232,710,152 | | |
I Shares | |
Net assets | | $ | 230,541,425 | | |
Shares outstanding | | | 25,412,338 | | |
Net asset value, offering price and redemption price per share | | $ | 9.07 | | |
A Shares | |
Net assets | | $ | 2,168,727 | | |
Shares outstanding | | | 243,346 | | |
Net asset value and redemption price per share | | $ | 8.91 | | |
Maximum offering price per share (net asset value/(1-5.25%)) | | $ | 9.40 | | |
1 Includes $5,345,152 of securities on loan.
See accompanying notes to consolidated financial statements.
14
Credit Suisse Multialternative Strategy Fund
Consolidated statement of operations
For the year ended October 31, 2024
Investment income: | |
Interest | | $ | 14,596,946 | | |
Dividends (net of foreign taxes withheld of $72,414) | | | 1,082,110 | | |
Securities lending (net of rebates) | | | 116,428 | | |
Total investment income | | | 15,795,484 | | |
Expenses: | |
Investment advisory fees (Note 3) | | | 4,019,638 | | |
Administrative services fees (Note 3) | | | 84,496 | | |
Shareholder servicing/Distribution fees (Note 3) | |
Class A | | | 116,016 | | |
Transfer agent fees | | | 241,804 | | |
Legal fees | | | 111,504 | | |
Custodian fees | | | 106,549 | | |
Trustees' fees | | | 91,521 | | |
Registration fees | | | 57,579 | | |
Audit and tax fees | | | 48,815 | | |
Commitment fees (Note 4) | | | 31,655 | | |
Printing fees | | | 21,977 | | |
Insurance expense | | | 12,378 | | |
Miscellaneous expense | | | 7,864 | | |
Total expenses | | | 4,951,796 | | |
Less: fees waived and expenses reimbursed (Note 3) | | | (1,550,229 | ) | |
Net expenses | | | 3,401,567 | | |
Net investment income | | | 12,393,917 | | |
Net realized and unrealized gain (loss) from investments, futures contracts, swap contracts, written options, securities sold short,
foreign currency and forward foreign currency contracts, and income from payments by affiliates: | |
Net realized gain from investments | | | 5,562,239 | | |
Net realized loss from futures contracts | | | (25,352,688 | ) | |
Net realized gain from swap contracts | | | 13,117,400 | | |
Net realized gain from written options | | | 2,739,783 | | |
Net realized gain from securities sold short | | | 30,209 | | |
Net increase from payments by affiliates (see Note 3) | | | 1,091,024 | | |
Net realized loss from foreign currency transactions | | | (75,898 | ) | |
Net realized loss from forward foreign currency contracts | | | (691,309 | ) | |
Net change in unrealized appreciation (depreciation) from investments | | | 1,939,166 | | |
Net change in unrealized appreciation (depreciation) from futures contracts | | | (3,262,394 | ) | |
Net change in unrealized appreciation (depreciation) from swap contracts | | | 426,223 | | |
Net change in unrealized appreciation (depreciation) from written options | | | 123,262 | | |
Net change in unrealized appreciation (depreciation) from foreign currency translations | | | 263,525 | | |
Net change in unrealized appreciation (depreciation) from forward foreign currency contracts | | | 7,715 | | |
Net realized and unrealized loss from investments, futures contracts, swap contracts, written options, securities sold short,
foreign currency and forward foreign currency contracts, and income from payments by affiliates | | | (4,081,743 | ) | |
Net increase in net assets resulting from operations | | $ | 8,312,174 | | |
See accompanying notes to consolidated financial statements.
15
Credit Suisse Multialternative Strategy Fund
Consolidated statements of changes in net assets
| | | For the
year ended
October 31, 2024 | | For the
year ended
October 31, 2023 | |
From operations: | |
Net investment income | | $ | 12,393,917 | | | $ | 10,240,807 | | |
Net realized loss from investments, futures contracts, swap contracts, written options, securities sold short,
foreign currency transactions and forward foreign currency contracts | | | (4,670,264 | ) | | | (8,463,762 | ) | |
Net increase from payments by affiliates | | | 1,091,024 | | | | — | | |
Net change in unrealized appreciation (depreciation) from investments, futures contracts, swap contracts,
written options, foreign currency translations and forward foreign currency contracts | | | (502,503 | ) | | | 879,050 | | |
Net increase in net assets resulting from operations | | | 8,312,174 | | | | 2,656,095 | | |
From distributions: | |
From distributable earnings | |
Class I | | | (9,486,775 | ) | | | (7,402,872 | ) | |
Class A | | | (1,903,266 | ) | | | (237,778 | ) | |
Net decrease in net assets resulting from distributions | | | (11,390,041 | ) | | | (7,640,650 | ) | |
From capital share transactions (Note 6): | |
Proceeds from sale of shares | | | 45,951,702 | | | | 190,835,112 | | |
Reinvestment of distributions | | | 11,378,505 | | | | 7,532,720 | | |
Net asset value of shares redeemed | | | (218,202,485 | ) | | | (67,177,534 | ) | |
Net increase (decrease) in net assets from capital share transactions | | | (160,872,278 | ) | | | 131,190,298 | | |
Net increase (decrease) in net assets | | | (163,950,145 | ) | | | 126,205,743 | | |
Net assets: | |
Beginning of year | | | 396,660,297 | | | | 270,454,554 | | |
End of year | | $ | 232,710,152 | | | $ | 396,660,297 | | |
See accompanying notes to consolidated financial statements.
16
Credit Suisse Multialternative Strategy Fund
Consolidated financial highlights
(For a Class I share of the Fund outstanding throughout each year)
| | | For the year ended October 31, | |
| | | 2024 | | 2023 | | 2022 | | 2021 | | 2020 | |
Per share data: | |
Net asset value, beginning of year | | $ | 9.191 | | | $ | 9.32 | | | $ | 9.581 | | | $ | 9.531 | | | $ | 9.86 | | |
Investment operations: | |
Net investment income (loss)2 | | | 0.30 | | | | 0.28 | | | | 0.10 | | | | (0.02 | ) | | | 0.04 | | |
Net gain (loss) from investments, futures contracts, swap contracts, written options,
securities sold short, foreign currency transactions and forward foreign
currency contracts (both realized and unrealized) | | | (0.19 | ) | | | (0.15 | ) | | | 0.46 | | | | 1.25 | | | | 0.10 | | |
Net increase from payments by affiliates | | | 0.03 | | | | — | | | | — | | | | — | | | | — | | |
Total from investment operations | | | 0.14 | | | | 0.13 | | | | 0.56 | | | | 1.23 | | | | 0.14 | | |
Less dividends and distributions: | |
Dividends from net investment income | | | (0.14 | ) | | | (0.15 | ) | | | (0.82 | ) | | | (1.18 | ) | | | (0.47 | ) | |
Distributions from net realized gains | | | (0.12 | ) | | | (0.11 | ) | | | — | | | | — | | | | — | | |
Total dividends and distributions | | | (0.26 | ) | | | (0.26 | ) | | | (0.82 | ) | | | (1.18 | ) | | | (0.47 | ) | |
Net asset value, end of year | | $ | 9.07 | | | $ | 9.191 | | | $ | 9.32 | | | $ | 9.581 | | | $ | 9.531 | | |
Total return3 | | | 1.62 | %4 | | | 1.39 | % | | | 6.25 | % | | | 13.87 | % | | | 1.46 | % | |
Ratios and supplemental data: | |
Net assets, end of year (000s omitted) | | $ | 230,541 | | | $ | 326,370 | | | $ | 262,187 | | | $ | 18,749 | | | $ | 47,382 | | |
Ratio of net expenses to average net assets | | | 0.85 | % | | | 0.85 | % | | | 0.85 | % | | | 0.85 | % | | | 0.85 | % | |
Ratio of net investment income (loss) to average net assets | | | 3.24 | % | | | 3.06 | % | | | 1.13 | % | | | (0.16 | )% | | | 0.38 | % | |
Decrease reflected in above operating expense ratios due to waivers/reimbursements | | | 0.40 | % | | | 0.38 | % | | | 0.58 | % | | | 1.41 | % | | | 1.09 | % | |
Portfolio turnover rate5 | | | 214 | % | | | 375 | % | | | 482 | % | | | 532 | % | | | 571 | % | |
1 Includes adjustments in accordance with accounting principles generally accepted in the United States of America and as such, the net asset values for financial reporting purposes and the returns based upon net asset values may differ from the net asset values and returns for shareholder transactions.
2 Per share information is calculated using the average shares outstanding method.
3 Total returns are historical and include change in share price and reinvestment of all distributions. Had certain expenses not been reduced during the years shown, total returns would have been lower.
4 During the year ended October 31, 2024, the Advisor reimbursed the Fund for a trading error in the amount of $1,091,024. If payment from Advisor was not made, total return would have been 1.17% for Class I.
5 Portfolio turnover is calculated by dividing the lesser of total purchases or sales of portfolio securities for the reporting period by the monthly average of portfolio securities owned during the reporting period. Excluded from both the numerator and denominator are amounts relating to derivatives and securities whose maturities or expiration dates at the time of acquisition were one year or less.
See accompanying notes to consolidated financial statements.
17
Credit Suisse Multialternative Strategy Fund
Consolidated financial highlights
(For a Class A share of the Fund outstanding throughout each year)
| | | For the year ended October 31, | |
| | | 2024 | | 2023 | | 2022 | | 2021 | | 2020 | |
Per share data: | |
Net asset value, beginning of year | | $ | 9.031 | | | $ | 9.161 | | | $ | 9.431 | | | $ | 9.391 | | | $ | 9.73 | | |
Investment operations: | |
Net investment income (loss)2 | | | 0.27 | | | | 0.25 | | | | 0.04 | | | | (0.04 | ) | | | (0.00 | )3 | |
Net gain (loss) from investments, futures contracts, swap contracts, written options,
securities sold short, foreign currency transactions and forward foreign
currency contracts (both realized and unrealized) | | | (0.17 | ) | | | (0.15 | ) | | | 0.49 | | | | 1.24 | | | | 0.10 | | |
Net increase from payments by affiliates | | | 0.02 | | | | — | | | | — | | | | — | | | | — | | |
Total from investment operations | | | 0.12 | | | | 0.10 | | | | 0.53 | | | | 1.20 | | | | 0.10 | | |
Less dividends and distributions: | |
Dividends from net investment income | | | (0.12 | ) | | | (0.12 | ) | | | (0.80 | ) | | | (1.16 | ) | | | (0.44 | ) | |
Distributions from net realized gains | | | (0.12 | ) | | | (0.11 | ) | | | — | | | | — | | | | — | | |
Total dividends and distributions | | | (0.24 | ) | | | (0.23 | ) | | | (0.80 | ) | | | (1.16 | ) | | | (0.44 | ) | |
Net asset value, end of year | | $ | 8.91 | | | $ | 9.031 | | | $ | 9.161 | | | $ | 9.431 | | | $ | 9.391 | | |
Total return4 | | | 1.38 | %5 | | | 1.15 | % | | | 5.94 | % | | | 13.64 | % | | | 1.10 | % | |
Ratios and supplemental data: | |
Net assets, end of year (000s omitted) | | $ | 2,169 | | | $ | 70,290 | | | $ | 8,267 | | | $ | 5,763 | | | $ | 4,350 | | |
Ratio of net expenses to average net assets | | | 1.10 | % | | | 1.10 | % | | | 1.10 | % | | | 1.10 | % | | | 1.10 | % | |
Ratio of net investment income (loss) to average net assets | | | 2.98 | % | | | 2.79 | % | | | 0.47 | % | | | (0.42 | )% | | | (0.04 | )% | |
Decrease reflected in above operating expense ratios due to waivers/reimbursements | | | 0.40 | % | | | 0.38 | % | | | 0.58 | % | | | 1.41 | % | | | 1.09 | % | |
Portfolio turnover rate6 | | | 214 | % | | | 375 | % | | | 482 | % | | | 532 | % | | | 571 | % | |
1 Includes adjustments in accordance with accounting principles generally accepted in the United States of America and as such, the net asset values for financial reporting purposes and the returns based upon net asset values may differ from the net asset values and returns for shareholder transactions.
2 Per share information is calculated using the average shares outstanding method.
3 This amount represents less than $0.01 per share.
4 Total returns are historical and include change in share price, reinvestment of all distributions and no sales charge. Had certain expenses not been reduced during the years shown, total returns would have been lower.
5 During the year ended October 31, 2024, the Advisor reimbursed the Fund for a trading error in the amount of $1,091,024. If payment from Advisor was not made, total return would have been (4.42)% for Class A.
6 Portfolio turnover is calculated by dividing the lesser of total purchases or sales of portfolio securities for the reporting period by the monthly average of portfolio securities owned during the reporting period. Excluded from both the numerator and denominator are amounts relating to derivatives and securities whose maturities or expiration dates at the time of acquisition were one year or less.
See accompanying notes to consolidated financial statements.
18
Credit Suisse Multialternative Strategy Fund
Notes to consolidated financial statements
October 31, 2024
Note 1. Organization
Credit Suisse Multialternative Strategy Fund (the "Fund"), a series of Credit Suisse Opportunity Funds (the "Trust"), a Delaware statutory trust, is registered under the Investment Company Act of 1940, as amended (the "1940 Act"), as a non-diversified open-end management investment company that seeks positive absolute returns. The Trust was organized under the laws of the State of Delaware as a business trust on May 31, 1995.
UBS Asset Management (Americas) LLC ("UBS AM" or the "Adviser"), the investment adviser to the Fund, is registered as an investment adviser with the Securities and Exchange Commission ("SEC") and as a Commodity Pool Operator with the Commodity Futures Trading Commission. UBS Asset Management (US) Inc. ("UBS AM (US)") serves as the principal underwriter for the Fund. UBS AM and UBS AM (US) are indirect wholly owned subsidiaries of UBS Group AG. UBS Group AG is an internationally diversified organization with headquarters in Zurich, Switzerland. UBS Group AG operates in many areas of the financial services industry. The Fund intends to gain exposure to commodity derivatives through investing in a wholly-owned subsidiary, Credit Suisse Cayman Multialternative Strategy Fund, Ltd. (the "Subsidiary"), organized under the laws of the Cayman Islands. The Subsidiary invests in commodity-linked derivative instruments, such as swaps and futures. The Subsidiary may also invest in debt securities, some of which are intended to serve as margin or collateral for the Subsidiary's derivatives positions.
The Subsidiary is managed by the same portfolio managers that manage the Fund and the accompanying financial statements reflect the financial position of the Fund and the Subsidiary and the results of operations on a consolidated basis. The consolidated financial statements include portfolio holdings of the Fund and the Subsidiary and all intercompany transactions and balances have been eliminated. The Fund may invest up to 25% of its total assets in the Subsidiary. As of October 31, 2024, the Fund held $44,719,883 in the Subsidiary, representing 19.2% of the Fund's consolidated net assets. For the year ended October 31, 2024, the net realized gain on securities and other financial instruments held in the Subsidiary was $4,262,236.
Subsequent references to the Fund within the Notes to Consolidated Financial Statements collectively refer to the Fund and the Subsidiary, unless the context otherwise requires.
The Fund offers two classes of shares: Class I shares and Class A shares. Each class of shares represents an equal pro rata interest in the Fund, except the share classes bear different expenses. Class A shares are sold subject to a front-end sales charge of up to 5.25%. Class I shares are sold without a sales charge.
In October 2022, the SEC adopted the Tailored Shareholder Reports for Mutual Funds and Exchange-Traded Funds rule and reform amendments requiring open-end management investment companies, including mutual funds and exchange-traded funds, to transmit concise and visually engaging semi-annual and annual tailored shareholder reports that highlight key information, including fund expenses, performance, and holdings to shareholders. Certain information from the Fund's prior shareholder reports, including the Fund's investment portfolio, financial statements and financial highlights, does not appear in the tailored shareholder report but will be filed on a semiannual basis on Form N-CSR. This information will be available online, mailed upon request and filed on a semiannual basis. The rule and form amendments had a compliance date of July 24, 2024.
Note 2. Significant accounting policies
The following is a summary of significant accounting policies followed by the Fund in the preparation of its consolidated financial statements. The policies are in accordance with generally accepted accounting principles in the United States of America ("GAAP"). The preparation of consolidated financial statements requires management to make estimates and assumptions that affect the reported amounts and disclosures in the consolidated financial statements. Actual results could differ from those estimates. The Fund is considered an investment company for financial reporting purposes under GAAP and follows the accounting and reporting guidance in Financial
19
Credit Suisse Multialternative Strategy Fund
Notes to consolidated financial statements
October 31, 2024
Accounting Standards Board ("FASB") Accounting Standards Codification ("ASC") Topic 946—Financial Services—Investment Companies.
A) SECURITY VALUATION—The Board of Trustees (the "Board") is responsible for the Fund's valuation process. The Board has delegated the supervision of the daily valuation process to the Adviser, who has established a Pricing Committee and a Pricing Group, which, pursuant to the policies adopted by the Board, are responsible for making fair valuation determinations and overseeing the Fund's pricing policies. The net asset value ("NAV") of the Fund is determined daily as of the close of regular trading on the New York Stock Exchange, Inc. (the "Exchange") on each day the Exchange is open for business. For certain international equity securities, in order to adjust for events which may occur between the close of the foreign exchanges and the close of the Exchange, a fair valuation model may be used. This fair valuation model takes into account comparisons to the valuation of American Depository Receipts (ADRs), exchange-traded funds, futures contracts and certain indices and these securities are categorized as Level 2. The valuations for fixed income securities (which may include, but are not limited to, corporate, government, municipal, mortgage-backed, collateralized mortgage obligations and asset-backed securities) and certain derivative instruments are typically the prices supplied by independent third party pricing services, which may use market prices or broker/dealer quotations or a variety of valuation techniques and methodologies. The independent third party pricing services use inputs that are observable such as issuer details, interest rates, yield curves, prepayment speeds, credit risks/spreads, default rates and quoted prices for similar securities. These pricing services generally price fixed income securities assuming orderly transactions of an institutional "round lot" size, but some trades occur in smaller "odd lot" sizes which may be effected at lower prices than institutional round lot trades. Structured note agreements are valued in accordance with a dealer-supplied valuation based on changes in the value of the underlying index. Option contracts on securities, currencies, indices, futures contracts, swaps and other instruments are valued at the mid-point between the last bid and ask quotations as of the close of trading on the exchange on which the option is traded. Futures contracts are valued daily at the settlement price established by the board of trade or exchange on which they are traded. Forward contracts are valued at the London closing spot rates and the London closing forward point rates on a daily basis. The currency forward contract pricing model derives the differential in point rates to the expiration date of the forward and calculates its present value. Over the counter derivative financial instruments, such as swap agreements, generally derive their value from underlying asset prices, indices, reference rates, and other inputs or a combination of these factors. Equity securities for which market quotations are available are valued at the last reported sales price or official closing price on the primary market or exchange on which they trade. Investments in open-ended mutual funds are valued at the NAV as reported on each business day and under normal circumstances. Securities for which market quotations are not readily available are valued at their fair value as determined in good faith by the Adviser, as the Board's valuation designee (as defined in Rule 2a-5 under the 1940 Act), in accordance with the Adviser's procedures. The Board oversees the Adviser in its role as valuation designee in accordance with the requirements of Rule 2a-5 under the 1940 Act. The Fund may utilize a service provided by an independent third party to fair value certain securities. When fair value pricing is employed, the prices of securities used by the Fund to calculate its NAV may differ from quoted or published prices for the same securities. If independent third party pricing services are unable to supply prices for a portfolio investment, or if the prices supplied are deemed by the Adviser to be unreliable, the market price may be determined by the Adviser using quotations from one or more brokers/dealers or at the transaction price if the security has recently been purchased and no value has yet been obtained from a pricing service or pricing broker. When reliable prices are not readily available, such as when the value of a security has been significantly affected by events after the close of the exchange or market on which the security is principally traded, but before the Fund calculates its NAV, these securities will be fair valued in good faith by the Pricing Group, in accordance with procedures established by the Adviser.
The Fund uses valuation techniques to measure fair value that are consistent with the market approach and/or income approach, depending on the type of security and the particular circumstance. The market approach uses prices and other relevant information generated by market transactions involving identical or comparable securities. The income approach uses valuation techniques to discount estimated future cash flows to present value.
20
Credit Suisse Multialternative Strategy Fund
Notes to consolidated financial statements
October 31, 2024
GAAP established a disclosure hierarchy that categorizes the inputs to valuation techniques used to value assets and liabilities at each measurement date. These inputs are summarized in the three broad levels listed below:
Level 1—quoted prices in active markets for identical investments
Level 2—other significant observable inputs (including quoted prices for similar investments, interest rates, prepayment speeds, credit risk, etc.)
Level 3—significant unobservable inputs (including the Fund's own assumptions in determining the fair value of investments)
The inputs or methodologies used to value securities are not necessarily an indication of the risk associated with investing in those securities.
The following is a summary of the inputs used as of October 31, 2024 in valuing the Fund's assets and liabilities carried at fair value:
Assets | | Level 1 | | Level 2 | | Level 3 | | Total | |
Investments in Securities | |
Common Stocks | | $ | 14,609,067 | | | $ | 7,144,009 | | | $ | — | | | $ | 21,753,076 | | |
Exchange-traded Funds | | | 309,038 | | | | — | | | | — | | | | 309,038 | | |
United States Treasury Obligations | | | — | | | | 113,646,238 | | | | — | | | | 113,646,238 | | |
Short-term Investments | | | 36,926,954 | | | | — | | | | — | | | | 36,926,954 | | |
| | | $ | 51,845,059 | | | $ | 120,790,247 | | | $ | — | | | $ | 172,635,306 | | |
Other Financial Instruments* | |
Forward Foreign Currency Contracts | | $ | — | | | $ | 90,510 | | | $ | — | | | $ | 90,510 | | |
Futures Contracts | | | 4,412,858 | | | | — | | | | — | | | | 4,412,858 | | |
Swap Contracts | | | — | | | | 4,039,318 | | | | — | | | | 4,039,318 | | |
| | | $ | 4,412,858 | | | $ | 4,129,828 | | | $ | — | | | $ | 8,542,686 | | |
Liabilities | |
Other Financial Instruments* | |
Forward Foreign Currency Contracts | | $ | — | | | $ | 82,795 | | | $ | — | | | $ | 82,795 | | |
Futures Contracts | | | 3,529,799 | | | | — | | | | — | | | | 3,529,799 | | |
Swap Contracts | | | — | | | | 3,379,564 | | | | — | | | | 3,379,564 | | |
Written Options | | | 187,740 | | | | — | | | | — | | | | 187,740 | | |
| | | $ | 3,717,539 | | | $ | 3,462,359 | | | $ | — | | | $ | 7,179,898 | | |
* Other financial instruments include unrealized appreciation (depreciation) on forwards, futures, and swaps. Written options are reported at value.
For the year ended October 31, 2024, there were no transfers in or out of Level 3. All transfers, if any, are assumed to occur at the end of the reporting period.
B) DERIVATIVE INSTRUMENTS AND HEDGING ACTIVITIES—The Fund has adopted a derivatives risk management program pursuant to Rule 18f-4 under the 1940 Act in order to assess and manage the Fund's derivatives risk, taking into account the Fund's derivatives transactions and how these transactions interact with the Fund's other investments. Because the Fund engages in derivatives transactions beyond a certain amount in order to pursue its investment objectives and policies, the Fund is required to comply with value at risk ("VaR") based limits on its leverage risk. The Fund adopted amendments to authoritative guidance on disclosures about derivative instruments and hedging activities which require that a fund disclose (a) how and why an entity uses derivative instruments, (b) how
21
Credit Suisse Multialternative Strategy Fund
Notes to consolidated financial statements
October 31, 2024
derivative instruments and hedging activities are accounted for and (c) how derivative instruments and related hedging activities affect a fund's financial position, financial performance and cash flows.
The following table presents the fair value and the location of derivatives within the Consolidated Statement of Assets and Liabilities at October 31, 2024 and the effect of these derivatives on the Consolidated Statement of Operations for the year ended October 31, 2024.
Primary underlying risk | | Derivative
assets1 | | Derivative
liabilities1 | | Realized
gain (loss) | | Net change in
unrealized
appreciation
(depreciation) | |
Foreign currency exchange rate | |
Forward contracts | | $ | 90,510 | | | $ | 82,795 | | | $ | (691,309 | ) | | $ | 7,715 | | |
Futures contracts2 | | | 61,473 | | | | 32,631 | | | | (1,827,267 | ) | | | (342,534 | ) | |
Swap contracts | | | — | | | | 113,312 | | | | 598,309 | | | | (355,882 | ) | |
Interest rate | |
Futures contracts2 | | | 1,351,756 | | | | 735,283 | | | | (12,673,756 | ) | | | 1,611,537 | | |
Swap contracts | | | 498,067 | | | | — | | | | (1,271,970 | ) | | | 1,755,929 | | |
Equity price | |
Futures contracts2 | | | 231,397 | | | | 132,462 | | | | (10,286,041 | ) | | | (4,857,595 | ) | |
Swap contracts | | | 1,303,899 | | | | 2,524,684 | | | | 8,163,940 | | | | (1,356,786 | ) | |
Written options | | | — | | | | 187,740 | | | | 2,739,783 | | | | 123,262 | | |
Credit risk | |
Swap contracts | | | 94,710 | | | | — | | | | 2,368,684 | | | | 514,085 | | |
Commodity price | |
Futures contracts2 | | | 2,768,232 | | | | 2,629,423 | | | | (565,624 | ) | | | 326,198 | | |
Swap contracts | | | 2,142,642 | | | | 741,568 | | | | 3,258,437 | | | | (131,123 | ) | |
Total | | $ | 8,542,686 | | | $ | 7,179,898 | | | $ | (10,186,814 | ) | | $ | (2,705,194 | ) | |
1 Generally, the balance sheet location for asset derivatives is receivables/net unrealized appreciation (depreciation) and for liability derivatives is payables/net unrealized appreciation (depreciation).
2 Includes cumulative appreciation (depreciation) of futures contracts as reported in the Consolidated Schedule of Investments. Only variation margin is reported within the receivables and/or payables on the Consolidated Statement of Assets and Liabilities.
For the year ended October 31, 2024, the Fund held average monthly value on a net basis of $17,056,377 in forward foreign currency contracts and average monthly notional values of $235,414,571 and $259,134,310 in long futures contracts and short futures contracts, respectively, and $1,412,569,553 in swap contracts. For the year ended October 31, 2024, the Fund received average monthly premiums of $259,940 from written put options.
The Fund is a party to International Swap and Derivatives Association, Inc. ("ISDA") Master Agreements ("Master Agreements") with certain counterparties that govern over-the-counter derivative (including total return, credit default and interest rate swaps) and foreign exchange contracts entered into by the Fund. The Master Agreements may contain provisions regarding, among other things, the parties' general obligations, representations, agreements, collateral requirements, events of default and early termination. Termination events applicable to the Fund may occur upon a decline in the Fund's net assets below a specified threshold over a certain period of time.
22
Credit Suisse Multialternative Strategy Fund
Notes to consolidated financial statements
October 31, 2024
The following table presents by counterparty the Fund's derivative assets, net of related collateral held by the Fund, at October 31, 2024:
Counterparty | | Gross amount of derivative
assets presented in
the consolidated
statement of assets
and liabilitiesa | | Financial
instruments
and derivatives
available for offset | | Non-Cash
collateral
received | | Cash
collateral
receivedb | | Net amount
of derivative
assets | |
Bank of America | | $ | 694,952 | | | $ | (694,952 | ) | | $ | — | | | $ | — | | | $ | — | | |
Barclays Bank PLC | | | 654,625 | | | | (271,188 | ) | | | — | | | | — | | | | 383,437 | | |
BNP Paribas | | | 461,901 | | | | (377,701 | ) | | | — | | | | — | | | | 84,200 | | |
Citigroup | | | 603,941 | | | | (603,941 | ) | | | — | | | | — | | | | — | | |
Goldman Sachs | | | 467,568 | | | | (377,088 | ) | | | — | | | | — | | | | 90,480 | | |
JPMorgan Chase | | | 692,975 | | | | (55,420 | ) | | | — | | | | — | | | | 637,555 | | |
Morgan Stanley | | | 302,357 | | | | (103,073 | ) | | | — | | | | — | | | | 199,284 | | |
Societe Generale | | | 251,509 | | | | — | | | | — | | | | — | | | | 251,509 | | |
| | | $ | 4,129,828 | | | $ | (2,483,363 | ) | | $ | — | | | $ | — | | | $ | 1,646,465 | | |
The following table presents by counterparty the Fund's derivative liabilities, net of related collateral pledged by the Fund, at October 31, 2024:
Counterparty | | Gross amount of derivative
liabilities presented in
the consolidated
statement of assets
and liabilitiesa | | Financial
instruments
and derivatives
available for offset | | Non-Cash
collateral
pledged | | Cash
collateral
pledgedb | | Net amount
of derivative
liabilities | |
Bank of America | | $ | 1,748,064 | | | $ | (694,952 | ) | | $ | — | | | $ | (251 | ) | | $ | 1,052,861 | | |
Barclays Bank PLC | | | 271,188 | | | | (271,188 | ) | | | — | | | | — | | | | — | | |
BNP Paribas | | | 377,701 | | | | (377,701 | ) | | | — | | | | — | | | | — | | |
Citigroup | | | 709,458 | | | | (603,941 | ) | | | — | | | | (105,517 | ) | | | — | | |
Goldman Sachs | | | 377,088 | | | | (377,088 | ) | | | — | | | | — | | | | — | | |
JPMorgan Chase | | | 55,420 | | | | (55,420 | ) | | | — | | | | — | | | | — | | |
Macquarie Bank Ltd. | | | 8,107 | | | | — | | | | — | | | | (8,107 | ) | | | — | | |
Morgan Stanley | | | 103,073 | | | | (103,073 | ) | | | — | | | | — | | | | — | | |
| | | $ | 3,650,099 | | | $ | (2,483,363 | ) | | $ | — | | | $ | (113,875 | ) | | $ | 1,052,861 | | |
a Forward foreign currency contracts, swap contracts and written options are included. Written options are reported at market value.
b The actual collateral pledged may be more than the amounts shown.
C) FOREIGN CURRENCY TRANSACTIONS—The books and records of the Fund are maintained in U.S. dollars. Transactions denominated in foreign currencies are recorded at the current prevailing exchange rates. All assets and liabilities denominated in foreign currencies, including purchases and sales of investments, and income and expenses, are translated into U.S. dollar amounts on the date of those transactions.
Reported net realized gain (loss) from foreign currency transactions arises from sales of foreign currencies; currency gains or losses realized between the trade and settlement dates on securities transactions; and the difference between the amounts of dividends, interest, and foreign withholding taxes recorded on the Fund's books and the U.S. dollar equivalent of the amounts actually received or paid. Net change in unrealized gains and losses on translation of assets and liabilities denominated in foreign currencies arises from changes in the fair values of assets and liabilities, other than investments, at the end of the period, resulting from changes in exchange rates.
23
Credit Suisse Multialternative Strategy Fund
Notes to consolidated financial statements
October 31, 2024
The Fund does not isolate that portion of the results of operations resulting from fluctuations in foreign exchange rates on investments from the fluctuations arising from changes in market prices of investments held. Such fluctuations are included with net realized and unrealized gain or loss from investments in the Consolidated Statement of Operations.
D) SECURITY TRANSACTIONS AND INVESTMENT INCOME/EXPENSE—Security transactions are accounted for on a trade date basis. Interest income/expense is recorded on the accrual basis. The Fund amortizes premiums and accretes discounts using the effective interest method. Dividend income/expense is recorded on the ex-dividend date. Foreign dividend income is recorded on the ex-dividend date or as soon as practicable after the Fund determines the existence of a dividend declaration after exercising reasonable due diligence. Certain expenses are class-specific expenses, vary by class and are charged only to that class. Income, expenses (excluding class-specific expenses) and realized/unrealized gains/losses are allocated proportionately to each class of shares based upon the relative NAV of the outstanding shares of that class. The cost of investments sold is determined by use of the specific identification method for both financial reporting and income tax purposes. To the extent any issuer defaults or a credit event occurs that impacts the issuer, the Fund may halt any additional interest income accruals and consider the realizability of interest accrued up to the date of default or credit event.
E) DIVIDENDS AND DISTRIBUTIONS TO SHAREHOLDERS—Dividends from net investment income, if any, are declared and paid quarterly. Distributions of net realized capital gains, if any, are declared and paid at least annually. However, to the extent that a net realized capital gain can be reduced by a capital loss carryforward, such gain will not be distributed. Dividends and distributions to shareholders of the Fund are recorded on the ex-dividend date and are determined in accordance with federal income tax regulations, which may differ from GAAP.
F) FEDERAL AND OTHER TAXES—No provision is made for federal taxes as it is the Fund's intention to continue to qualify as a regulated investment company ("RIC") under the Internal Revenue Code of 1986, as amended (the "Code"), and to make the requisite distributions to its shareholders, which will be sufficient to relieve it from federal income and excise taxes.
In order to qualify as a RIC under the Code, the Fund must meet certain requirements regarding the source of its income, the diversification of its assets and the distribution of its income. One of these requirements is that the Fund derive at least 90% of its gross income for each taxable year from dividends, interest, payments with respect to certain securities loans, gains from the sale or other disposition of stock, securities or foreign currencies, other income derived with respect to its business of investing in such stock, securities or currencies or net income derived from interests in certain publicly-traded partnerships ("Qualifying Income"). The Internal Revenue Service ("IRS") has issued a ruling that income realized from certain types of commodity-linked derivatives would not be Qualifying Income. As a result, the Fund's ability to realize income from investments in such commodity-linked derivatives as part of its investment strategy would be limited to a maximum of 10% of its gross income.
If the Fund is unable to ensure continued qualification as a RIC, the Fund may be required to change its investment objective, policies or techniques, or may be liquidated. If the Fund fails to qualify as a RIC, the Fund will be subject to federal income tax on its net income and capital gains at regular corporate rates (without reduction for distributions to shareholders). If the Fund were to fail to qualify as a RIC and become subject to federal income tax, shareholders of the Fund would be subject to the risk of diminished returns. The Fund adopted the authoritative guidance for uncertainty in income taxes and recognizes a tax benefit or liability from an uncertain position only if it is more likely than not that the position is sustainable based solely on its technical merits and consideration of the relevant taxing authority's widely understood administrative practices and procedures. The Fund has reviewed its current tax positions and has determined that no provision for income tax is required in the Fund's financial statements. The Fund's federal and state income and federal excise tax returns for each of the tax years in the four year period ended October 31, 2024, for which the applicable statutes of limitations have not expired are subject to examination by the IRS and state departments of revenue.
24
Credit Suisse Multialternative Strategy Fund
Notes to consolidated financial statements
October 31, 2024
G) CASH—The Fund's uninvested cash balance is held in an interest bearing variable rate demand deposit account at State Street Bank and Trust Company ("SSB"), the Fund's custodian.
H) SHORT SALES—When the Fund engages in a short sale, the collateral for the short position will be maintained by the Fund's custodian or qualified sub-custodian. While the short sale is open, the Fund will maintain in a segregated account an amount of liquid securities equal in value to its obligation to the securities sold short. The collateral amounts required are determined daily by reference to the market value of the short positions. Short sales expose the Fund to the risk that it will be required to cover its short position at a time when the securities have appreciated in value, thus resulting in a loss to the Fund. The Fund's loss on a short sale could theoretically be unlimited in a case where the Fund is unable, for whatever reason, to close out its short position. Short sales also involve transaction and other costs that will reduce potential gains and increase potential Fund losses. The use by the Fund of short sales in combination with long positions in the Fund in an attempt to improve performance may not be successful and may result in greater losses or lower positive returns than if the Fund held only long positions. It is possible that the Fund's long equity positions will decline in value at the same time that the value of the securities it has sold short increases, thereby increasing potential losses to the Fund. In addition, the Fund's short selling strategies may limit its ability to fully benefit from increases in the equity markets. Short selling also involves a form of financial leverage that may exaggerate any losses realized by the Fund. Also, there is the risk that the counterparty to a short sale may fail to honor its contractual terms, causing a loss to the Fund. At October 31, 2024, the Fund had no open short positions.
I) FUTURES—The Fund may enter into futures contracts to the extent permitted by its investment policies and objectives. The Fund may use futures contracts to gain exposure to or hedge against changes in interest rates, equity and market price movements and/or currency risks. Upon entering into a futures contract, the Fund is required to deposit cash and/or pledge U.S. Government securities as initial margin with a Futures Commission Merchant ("FCM"). Subsequent payments, which are dependent on the daily fluctuations in the value of the underlying instrument, are made or received by the Fund each day (daily variation margin) and are recorded as unrealized gains or losses in the Consolidated Statement of Operations until the contracts are closed. When the contracts are closed, the Fund records a realized gain or loss equal to the difference between the proceeds from (or cost of) the closing transaction and the Fund's basis in the contract. Risks of entering into futures contracts for hedging purposes include the possibility that a change in the value of the contract may not correlate with the changes in the value of the underlying instruments. Futures have minimal counterparty credit risk because futures are exchange traded and the exchange's clearinghouse, as counterparty to all exchange-traded futures, guarantees the futures against default. In addition, the purchase of a futures contract involves the risk that the Fund could lose more than the original margin deposit and subsequent payments may be required for a futures transaction. The Fund's open futures contracts are disclosed in the Consolidated Schedule of Investments. At October 31, 2024, the amount of restricted cash held at brokers related to open futures contracts was $17,024,976.
The Commodity Exchange Act requires an FCM to segregate all customer transactions and assets from the FCM's proprietary activities. A customer's cash and other equity deposited with an FCM are considered commingled with all other customer funds subject to the FCM's segregation requirements. In the event of an FCM's insolvency, recovery may be limited to the Fund's pro-rata share of segregated customer funds available. It is possible that the recovery amount could be less than the total of cash and other equity deposited.
J) FORWARD FOREIGN CURRENCY CONTRACTS—A forward foreign currency exchange contract ("forward currency contract") is a commitment to purchase or sell a foreign currency at the settlement date at a negotiated rate. The Fund will enter into forward currency contracts primarily for hedging foreign currency risk. Forward currency contracts are valued at the prevailing forward exchange rate of the underlying currencies and unrealized gain/loss is recorded daily. On the settlement date of the forward currency contract, the Fund records a realized gain or loss equal to the difference between the value of the contract at the time it was opened and the value of the contract at the time it was closed. Certain risks may arise upon entering into forward currency contracts from the potential
25
Credit Suisse Multialternative Strategy Fund
Notes to consolidated financial statements
October 31, 2024
inability of counterparties to meet the terms of their contracts. The maximum counterparty credit risk to the Fund is measured by the unrealized gain on appreciated contracts. Additionally, when utilizing forward currency contracts to hedge, the Fund forgoes the opportunity to profit from favorable exchange rate movements during the term of the contract. The Fund's open forward currency contracts at October 31, 2024 are disclosed in the Consolidated Schedule of Investments.
K) SWAPS—The Fund may enter into swaps either for hedging purposes or to seek to increase total return. A swap contract is an agreement that obligates two parties to exchange a series of cash flows at specified intervals based upon or calculated by reference to changes in specified prices or rates for a specified amount of an underlying asset or notional principal amount. A centrally cleared swap is a transaction executed between the Fund and a counterparty, then cleared by a clearing member through a central clearinghouse. The central clearinghouse serves as the counterparty, with whom the Fund exchanges cash flows. The Fund will enter into swap contracts only on a net basis, which means that the two payment streams are netted out, with the Fund receiving or paying, as the case may be, only the net amount of the two payments. Risks may arise as a result of the failure of the counterparty to the swap contract to comply with the terms of the swap contract. The extent of the Fund's exposure to credit and counterparty risks is the discounted net value of the cash flows to be received from the counterparty over the contract's remaining life, to the extent that the amount is positive. These risks are mitigated by having a master netting arrangement between the Fund and the counterparty and by the posting of collateral by the counterparty to the Fund to cover the Fund's exposure to the counterparty. Therefore, the Fund considers the creditworthiness of each counterparty as well as the amounts posted by the counterparty pursuant to the master netting agreement to a swap contract in evaluating potential credit risk. Additionally, risks may arise from unanticipated movements in interest rates or in the value of the underlying reference asset or index.
The Fund may enter into total return swap contracts, involving commitments to pay interest in exchange for a market-linked return, both based on notional amounts. The Fund may invest in total return swap contracts for hedging purposes or to seek to increase total return. To the extent the total return of the security or index underlying the transaction exceeds or falls short of the offsetting interest rate obligation, the Fund will receive a payment from or make a payment to the counterparty.
The Fund may enter into credit default swap agreements either as a buyer or seller. The Fund may buy a credit default swap to attempt to mitigate the risk of default or credit quality deterioration in one or more individual holdings or in a segment of the fixed income securities market. The Fund may sell a credit default swap in an attempt to gain exposure to an underlying issuer's credit quality characteristics without investing directly in that issuer.
The Fund bears the risk of loss of the amount expected to be received under a credit default swap agreement in the event of the default or bankruptcy of the counterparty. The Fund will enter into swap agreements only with counterparties that meet certain standards of creditworthiness (generally, such counterparties would have to be eligible counterparties under the terms of the Fund's repurchase agreement guidelines). Credit default swap agreements are generally valued at a price at which the counterparty to such agreement would terminate the agreement.
The Fund records unrealized gains or losses on a daily basis representing the value and the current net receivable or payable relating to open swap contracts. Net amounts received or paid on the swap contract are recorded as realized gains or losses. Fluctuations in the value of swap contracts are recorded for financial statement purposes as unrealized appreciation or depreciation from swap contracts. Realized gains and losses from terminated swaps are included in net realized gains/losses from swap contracts. Upon entering into a centrally cleared swap, the Fund is required to deposit with a financial intermediary cash or securities ("initial margin") in an amount equal to a certain percentage of the notional amount of the swap. Subsequent payments ("variation margin") are made or received by the Fund dependent upon the daily fluctuations in the value of the swap. In a cleared swap transaction, counterparty risk is minimized as the central clearinghouse acts as the counterparty. The Fund's open swap contracts are
26
Credit Suisse Multialternative Strategy Fund
Notes to consolidated financial statements
October 31, 2024
disclosed in the Consolidated Schedule of Investments. At October 31, 2024, the amount of restricted cash held at brokers related to open swap contracts for the Fund was $36,908,598.
L) OPTION CONTRACTS—The Fund will enter into option contracts to gain exposure to risk volatility based assets. When the Fund purchases an option, it pays a premium and the option is subsequently marked to market to reflect current value. Premiums paid for purchasing options which expire are treated as realized losses. Premiums paid for purchasing options which are exercised or closed are added to the cost or deducted from the proceeds on the underlying instrument to determine the realized gain or loss. The risk associated with purchasing options is limited to the premium paid.
When the Fund writes an option, an amount equal to the net premium received (the premium less commission) is recorded as a liability and is subsequently adjusted to the current value. Net premiums received for written options which expire are treated as realized gains. Net premiums received for written options which are exercised or closed are deducted from the cost or added to the proceeds on the underlying instrument or closing purchase transaction to determine the realized gain or loss. The Fund, as writer of a written option, bears the risk of an unfavorable change in the market value of the instrument underlying the written option.
Exchange-traded options have standardized contracts and are settled through a clearinghouse with fulfillment guaranteed by the credit of the exchange. Therefore, counterparty credit risks to the Fund are limited. Over-the-counter options are subject to the risk that the counterparty is unable or unwilling to meet its obligations under the option. At October 31, 2024, the Fund's open written option contracts are disclosed in the Consolidated Schedule of Investments. At October 31, 2024, the amount of restricted cash held at brokers related to option contracts was $14,066,017.
M) SECURITIES LENDING—The initial collateral received by the Fund is required to have a value of at least 102% of the market value of domestic securities on loan (including any accrued interest thereon) and 105% of the market value of foreign securities on loan (including any accrued interest thereon). The collateral is maintained thereafter at a value equal to at least 102% of the current market value of the securities on loan. The market value of loaned securities is determined at the close of each business day of the Fund and any additional required collateral is delivered to the Fund, or excess collateral returned by the Fund, on the next business day. Cash collateral received by the Fund in connection with securities lending activity may be pooled together with cash collateral for other funds/portfolios advised by UBS AM and may be invested in a variety of investments, including funds advised by SSB or an affiliate, the Fund's securities lending agent, or money market instruments. However, in the event of default or bankruptcy by the other party to the agreement, realization and/or retention of the collateral may be subject to legal proceedings. The remaining maturities of the securities lending transactions are considered overnight and continuous. Loans are subject to termination by the Fund or the borrower at any time.
SSB has been engaged by the Fund to act as the Fund's securities lending agent. As of October 31, 2024, the Fund had outstanding loans of securities to certain approved brokers for which the Fund received collateral:
Market value of loaned
Securities | | Market value of cash
collateral | |
| $ | 5,345,152 | | | $ | 5,458,410 | | |
27
Credit Suisse Multialternative Strategy Fund
Notes to consolidated financial statements
October 31, 2024
The following table presents financial instruments that are subject to enforceable netting arrangements as of October 31, 2024.
Gross amounts not offset in the consolidated statement of assets and liabilities
Gross asset amounts presented
in the consolidated statement
of assets and liabilitiesa | | Collateral receivedb | | Net amount | |
| $ | 5,345,152 | | | $ | (5,345,152 | ) | | $ | — | | |
a Represents market value of loaned securities at year end.
b The actual collateral received is greater than the amount shown here due to collateral requirements of the security lending agreement.
The Fund's securities lending arrangement provides that the Fund and SSB will share the net income earned from securities lending activities. Securities lending income is accrued as earned. For the year ended October 31, 2024, total earnings received in connection with securities lending arrangements was $561,465, of which $406,109 was rebated to borrowers (brokers). The Fund retained $116,428 in income, and SSB, as lending agent, was paid $38,928.
N) OTHER—In the normal course of business, the Fund trades financial instruments and enters into financial transactions for which risk of potential loss exists due to changes in the market (market risk) or failure of the other party to a transaction to perform (credit risk). Similar to credit risk, the Fund may be exposed to counterparty risk, including with respect to securities lending, or the risk that an institution or other entity with which the Fund has unsettled or open transactions will default. The potential loss could exceed the value of the financial assets recorded in the consolidated financial statements. Financial assets, which potentially expose the Fund to credit risk, consist principally of cash due from counterparties and investments. The extent of the Fund's exposure to credit and counterparty risks in respect to these financial assets approximates their carrying value as recorded in the Fund's Consolidated Statement of Assets and Liabilities.
O) FOREIGN INVESTMENTS RISK—The Fund may have elements of risk not typically associated with investments in the U.S. due to concentrated investments in a limited number of countries or regions, which may vary throughout the year. Such concentrations may subject the Fund to additional risks resulting from political or economic conditions in such countries or regions and the possible imposition of adverse governmental laws or currency exchange restrictions could cause the securities and their markets to be less liquid and their prices to be more volatile than those of comparable U.S. securities.
Because the Fund may invest a significant portion of its assets in these markets, it is subject to greater risks of adverse events that occur in those markets and may experience greater volatility than a Fund that is more broadly diversified geographically.
Note 3. Transactions with affiliates and related parties
Credit Suisse served as investment adviser and co-administrator for the Fund through April 30, 2024. On May 1, 2024, Credit Suisse merged into UBS AM, with UBS AM as the surviving entity, and UBS AM became the investment manager to the Fund. For its investment advisory and administration services, UBS AM is entitled to receive a fee from the Fund at an annual rate of 1.04% of the Fund's average daily net assets. For the year ended October 31, 2024, investment advisory and administration fees earned and fees waived/expenses reimbursed by UBS AM were $4,019,638 and $1,550,229, respectively. UBS AM has contractually agreed to limit expenses so that the Fund's annual operating expenses do not exceed 0.85% of the Fund's average daily net assets for Class I shares and 1.10% of the Fund's average daily net assets for Class A shares. The Fund is authorized to reimburse UBS AM for management fees previously waived and/or for expenses previously paid by UBS AM, provided, however, that any
28
Credit Suisse Multialternative Strategy Fund
Notes to consolidated financial statements
October 31, 2024
reimbursement must be paid at a date not more than thirty-six months following the applicable month during which such fees were waived or expenses were paid by UBS AM and the reimbursement does not cause the applicable class's aggregate expenses, on an annualized basis, to exceed either (i) the applicable expense limitation in effect at the time such fees were waived or such expenses were paid by UBS AM or (ii) the applicable expense limitation in effect at the time of such reimbursement. This contract may not be terminated before February 28, 2026. For the year ended October 31, 2024, there was no recoupment.
The amounts waived and reimbursed by UBS AM, which are available for potential future recoupment by UBS AM, and the expiration schedule at October 31, 2024 are as follows:
| | | Fee waivers/
expense
reimbursements
subject to
recoupment | | Expires
October 31,
2025 | | Expires
October 31,
2026 | | Expires
October 31,
2027 | |
Class I | | $ | 2,959,609 | | | $ | 542,432 | | | $ | 1,053,076 | | | $ | 1,364,101 | | |
Class A | | | 501,413 | | | | 77,569 | | | | 237,716 | | | | 186,128 | | |
Totals | | $ | 3,461,022 | | | $ | 620,001 | | | $ | 1,290,792 | | | $ | 1,550,229 | | |
Credit Suisse Securities (USA) LLC ("CSSU"), an affiliate of Credit Suisse, served as the distributor of the Fund's shares through April 30, 2024. On May 1, 2024, UBS AM (US) replaced CSSU as the Fund's underwriter and distributor. Pursuant to a distribution plan adopted by the Fund pursuant to Rule 12b-1 under the 1940 Act, UBS AM (US) receives fees for its distribution services. These fees are calculated at an annual rate of 0.25% of the average daily net assets of the Class A shares. For the year ended October 31, 2024, the Fund paid Rule 12b-1 distribution fees of $116,016 for Class A shares. Class I shares are not subject to Rule 12b-1 distribution fees.
For the year ended October 31, 2024, UBS AM (US) and its affiliates advised the Fund that they didn't retain commissions on the sale of the Fund's Class A shares.
During the year ended October 31, 2024, the Adviser reimbursed the Fund $1,091,024 for trading error.
Note 4. Line of credit
The Fund, together with other funds/portfolios advised by UBS AM (collectively, the "Participating Funds"), participates in a committed, unsecured line of credit facility ("Credit Facility"), with SSB in an aggregated amount of $125 million for temporary or emergency purposes under a first-come, first-served basis. Under the terms of the Credit Facility, the Participating Funds pay an aggregate commitment fee on the average unused amount of the Credit Facility, which is allocated among the Participating Funds in such manner as is determined by the governing boards of the Participating Funds. In addition, the Participating Funds pay interest on borrowings at either the Federal Funds Effective rate or the Overnight Bank Funding rate plus a spread. At October 31, 2024 and for the year ended October 31, 2024, the Fund had no borrowings outstanding under the Credit Facility.
Note 5. Purchases and sales of securities
For the year ended October 31, 2024, purchases and sales of investment securities and U.S. Government and Agency Obligations (excluding short-term investments) were as follows:
Investment securities | | U.S. Government/
agency obligations | |
| Purchases | | Sales | | Purchases | | Sales | |
| $ | 108,077,340 | | | $ | 152,065,906 | | | $ | 0 | | | $ | 0 | | |
29
Credit Suisse Multialternative Strategy Fund
Notes to consolidated financial statements
October 31, 2024
Note 6. Capital share transactions
The Fund is authorized to issue an unlimited number of full and fractional shares of beneficial interest, $0.001 par value per share. The Fund offers Class I and Class A shares. Transactions in capital shares for each class of the Fund were as follows:
| | | Class I | |
| | | For the year ended
October 31, 2024 | | For the year ended
October 31, 2023 | |
| | | Shares | | Value | | Shares | | Value | |
Shares sold | | | 4,940,512 | | | $ | 45,260,714 | | | | 12,852,027 | | | $ | 117,455,361 | | |
Shares issued in reinvestment of distributions | | | 1,045,951 | | | | 9,486,775 | | | | 799,167 | | | | 7,304,387 | | |
Shares redeemed | | | (16,106,968 | ) | | | (146,260,685 | ) | | | (6,256,423 | ) | | | (56,312,623 | ) | |
Net increase (decrease) | | | (10,120,505 | ) | | $ | (91,513,196 | ) | | | 7,394,771 | | | $ | 68,447,125 | | |
| | | Class A | |
| | | For the year ended
October 31, 2024 | | For the year ended
October 31, 2023 | |
| | | Shares | | Value | | Shares | | Value | |
Shares sold | | | 76,553 | | | $ | 690,988 | | | | 8,098,012 | | | $ | 73,379,751 | | |
Shares issued in reinvestment of distributions | | | 211,840 | | | | 1,891,730 | | | | 25,370 | | | | 228,333 | | |
Shares redeemed | | | (7,831,434 | ) | | | (71,941,800 | ) | | | (1,239,129 | ) | | | (10,864,911 | ) | |
Net increase (decrease) | | | (7,543,041 | ) | | $ | (69,359,082 | ) | | | 6,884,253 | | | $ | 62,743,173 | | |
On October 31, 2024, the number of shareholders that held 5% or more of the outstanding shares of each class of the Fund was as follows:
| | | Number of
shareholders | | Approximate percentage
of outstanding shares | |
Class I | | | 3 | | | | 95 | % | |
Class A | | | 3 | | | | 88 | % | |
The Fund's performance may be negatively impacted in the event one or more of the Fund's greater than 5% shareholders were to redeem at a given time. Some of the shareholders may be omnibus accounts, which hold shares on behalf of individual shareholders.
Note 7. Income tax information and distributions to shareholders
Income and capital gain distributions are determined in accordance with federal income tax regulations, which may differ from GAAP.
The tax character of dividends paid by the Fund during the fiscal years ended October 31, 2024 and 2023, respectively, was as follows:
Ordinary income | | Long term
capital gains | |
| 2024 | | 2023 | | 2024 | | 2023 | |
| $ | 11,390,041 | | | $ | 6,240,654 | | | $ | 0 | | | $ | 1,399,996 | | |
The tax basis components of distributable earnings differ from book basis by temporary book/tax differences. These differences are primarily due to differing treatments of wash sales, marked to market of options contracts, forward contracts, futures contracts, swap contracts, Subsidiary adjustments and deferred organizational expenses.
30
Credit Suisse Multialternative Strategy Fund
Notes to consolidated financial statements
October 31, 2024
At October 31, 2024, the components of distributable earnings on a tax basis were as follows:
Accumulated net realized loss | | $ | (22,553,760 | ) | |
Undistributed ordinary income | | | 25,501,430 | | |
Unrealized depreciation | | | (4,708,418 | ) | |
Other temporary differences | | | (144,970 | ) | |
| | | $ | (1,905,718 | ) | |
At October 31, 2024, the Fund had $7,838,875 of unlimited short-term capital loss carryforwards and $14,714,885 of unlimited long-term capital loss carryforwards available to offset possible future capital gains.
At October 31, 2024, the cost and net unrealized appreciation (depreciation) of investments and derivatives for income tax purposes were as follows:
Cost of Investments | | $ | 200,057,479 | | |
Unrealized appreciation | | $ | 6,537,538 | | |
Unrealized depreciation | | | (11,238,474 | ) | |
Net unrealized appreciation (depreciation) | | $ | (4,700,936 | ) | |
To adjust for current period permanent book/tax differences which arose principally from differing book/tax treatment of Subsidiary cumulative income/loss, and equalization distributions, paid-in capital was credited $409,181 and distributable earnings/loss was charged $409,181. Net assets were not affected by this reclassification.
Note 8. Contingencies
In the normal course of business, the Fund may provide general indemnifications pursuant to certain contracts and organizational documents. The Fund's maximum exposure under these arrangements is dependent on future claims that may be made against the Fund and, therefore, cannot be estimated; however, based on experience, the risk of loss from such claims is considered remote.
Note 9. Subsequent events
In preparing the consolidated financial statements as of October 31, 2024, management considered the impact of subsequent events for potential recognition or disclosure in these financial statements through the date of release of this report.
On August 16, 2024, UBS AM entered into an agreement with Manteio Scalable Technologies LLC ("Manteio"), Manteio Capital LLC and Manteio Partners LLC to transfer management of UBS AM's Quantitative Investment Strategies business, including the portfolio management team of the Fund, to Manteio (the "Transaction").
At a meeting held on August 15, 2024, the Board of the Trust approved an Agreement and Plan of Reorganization (the "Agreement and Plan") pursuant to which the Fund would be reorganized into Manteio Multialternative Strategy Fund, a newly created mutual fund advised by Manteio (the "Reorganization"). At a Special Meeting of Shareholders of the Fund on November 15, 2024, shareholders of the Fund approved the Agreement and Plan. The Reorganization closed on November 22, 2024 (the "Closing Date"). As a result of the Reorganization, the Manteio Multialternative Strategy Fund acquired the assets, subject to the liabilities, of the Fund, and shareholders of the Fund became shareholders of the Manteio Multialternative Strategy Fund as of the Closing Date.
31
Credit Suisse Multialternative Strategy Fund
Report of independent registered public accounting firm
To the Shareholders and the Board of Trustees of Credit Suisse Multialternative Strategy Fund
Opinion on the Financial Statements
We have audited the accompanying consolidated statement of assets and liabilities of Credit Suisse Multialternative Strategy Fund (the "Fund") (one of the funds constituting Credit Suisse Opportunity Funds (the "Trust")), including the consolidated schedule of investments, as of October 31, 2024, and the related consolidated statements of operations and changes in net assets, the consolidated financial highlights for the year then ended and the related notes (collectively referred to as the "financial statements"). In our opinion, the financial statements present fairly, in all material respects, the consolidated financial position of the Fund (one of the funds constituting Credit Suisse Opportunity Funds) at October 31, 2024, the consolidated results of its operations, the consolidated changes in its net assets and its consolidated financial highlights for the year then ended, in conformity with U.S. generally accepted accounting principles.
The consolidated statement of changes in net assets for the year ended October 31, 2023, and the consolidated financial highlights for each of the years in the four year period then ended, were audited by another independent registered public accounting firm whose report, dated December 27, 2023, expressed an unqualified opinion on that consolidated statement of changes in net assets and those consolidated financial highlights.
Basis for Opinion
These financial statements are the responsibility of the Trust's management. Our responsibility is to express an opinion on the Fund's financial statements based on our audit. We are a public accounting firm registered with the Public Company Accounting Oversight Board (United States) ("PCAOB") and are required to be independent with respect to the Trust in accordance with the U.S. federal securities laws and the applicable rules and regulations of the Securities and Exchange Commission and the PCAOB.
We conducted our audit in accordance with the standards of the PCAOB. Those standards require that we plan and perform the audit to obtain reasonable assurance about whether the financial statements are free of material misstatement, whether due to error or fraud. The Trust is not required to have, nor were we engaged to perform, an audit of the Trust's internal control over financial reporting. As part of our audit, we are required to obtain an understanding of internal control over financial reporting but not for the purpose of expressing an opinion on the effectiveness of the Trust's internal control over financial reporting. Accordingly, we express no such opinion.
Our audit included performing procedures to assess the risks of material misstatement of the financial statements, whether due to error or fraud, and performing procedures that respond to those risks. Such procedures included examining, on a test basis, evidence regarding the amounts and disclosures in the financial statements. Our procedures included confirmation of securities owned as of October 31, 2024, by correspondence with the custodian, brokers and others; when replies were not received from brokers and others, we performed other auditing procedures. Our audit also included evaluating the accounting principles used and significant estimates made by management, as well as evaluating the overall presentation of the financial statements. We believe that our audit provides a reasonable basis for our opinion.

We have served as the auditor of one or more UBS investment companies since 1978.
New York, New York
December 26, 2024
32
Credit Suisse Multialternative Strategy Fund
Tax information (unaudited)
The following information is provided pursuant to provisions of the Internal Revenue Code:
The Fund hereby designates $789,352 of ordinary dividends paid during the year that are considered qualified dividend income for the year ended October 31, 2024.
The Fund hereby designates 0.72% of ordinary dividends paid during the year that are eligible for the dividends received deduction available to certain corporate shareholders.
33
Credit Suisse Multialternative Strategy Fund
Proxy voting and portfolio holdings information (unaudited)
Information regarding how the Fund voted proxies related to its portfolio securities during the 12-month period ended June 30 of each year, as well as the policies and procedures that the Fund uses to determine how to vote proxies relating to its portfolio securities are available:
• By calling 1-877-870-2874
• On the Fund's website, www.credit-suisse.com/us/funds
• On the website of the Securities and Exchange Commission, www.sec.gov
The Fund files a complete schedule of its portfolio holdings for the first and third quarters of its fiscal year with the SEC as an exhibit to its reports on Form N-PORT, and for reporting periods ended prior to March 31, 2019, filed such information on Form N-Q. The Fund's Forms N-PORT and N-Q are available on the SEC's website at www.sec.gov.

UBS Asset Management (Americas) LLC
787 Seventh Avenue
New York, New York 10019-6028

Credit Suisse Managed Futures
Strategy Fund
Annual Financial Statements | October 31, 2024
The Fund's investment objectives, risks, charges and expenses (which should be considered carefully before investing), and more complete information about the Fund, are provided in the Prospectus, which should be read carefully before investing. You may obtain additional copies by calling 877-870-2874 or by visiting our website at www.credit-suisse.com/us/funds.
Credit Suisse Securities (USA) LLC, the Distributor for the six months ended April 30, 2024, is located at Eleven Madison Avenue, New York, NY 10010. UBS Asset Management (US) Inc. became the distributor as of May 1, 2024. The Credit Suisse Funds were advised by Credit Suisse Asset Management, LLC for the six months ended April 30, 2024. UBS Asset Management (Americas) LLC became the investment manager on May 1, 2024 pursuant to an internal merger between Credit Suisse Asset Management, LLC and UBS Asset Management (Americas) LLC.
Investors in the Credit Suisse Funds should be aware that they may be eligible to purchase Class I shares (where offered) directly or through certain intermediaries. Such shares are not subject to a sales charge. Investors in the Credit Suisse Funds should also be aware that they may be eligible for a reduction or waiver of the sales charge with respect to Class A or C shares (where offered). For more information, please review the relevant prospectuses or consult your financial representative.
Fund shares are not deposits or other obligations of UBS Asset Management (Americas) LLC or any affiliate, are not FDIC-insured and are not guaranteed by UBS Asset Management (Americas) LLC or any affiliate. Fund investments are subject to investment risks, including loss of your investment.
Credit Suisse Managed Futures Strategy Fund
Consolidated schedule of investments
Par
(000) | | | | Ratings†
(S&P/Moody's) | | Maturity | | Rate% | | Value | |
United States Treasury obligations (73.8%) | | | |
$ | 18,000 | | | U.S. Treasury Bills1 | | (AA+, Aaa) | | 11/29/24 | | | 4.590 | | | $ | 17,935,579 | | |
| | 10,000 | | | U.S. Treasury Bills1 | | (AA+, Aaa) | | 12/26/24 | | | 4.615 | | | | 9,930,291 | | |
| | 10,000 | | | U.S. Treasury Bills1 | | (AA+, Aaa) | | 01/23/25 | | | 4.710 | | | | 9,897,749 | | |
| | 18,000 | | | U.S. Treasury Bills1 | | (AA+, Aaa) | | 02/20/25 | | | 4.823 | | | | 17,754,551 | | |
| | 10,000 | | | U.S. Treasury Bills1 | | (AA+, Aaa) | | 03/20/25 | | | 4.909 | | | | 9,831,583 | | |
| | 10,000 | | | U.S. Treasury Bills1 | | (AA+, Aaa) | | 04/17/25 | | | 4.881 | | | | 9,799,799 | | |
| | 18,000 | | | U.S. Treasury Bills1 | | (AA+, Aaa) | | 05/15/25 | | | 4.850 | | | | 17,589,891 | | |
| | 10,000 | | | U.S. Treasury Bills1 | | (AA+, Aaa) | | 06/12/25 | | | 4.790 | | | | 9,742,590 | | |
| | 10,000 | | | U.S. Treasury Bills1 | | (AA+, Aaa) | | 07/10/25 | | | 4.300 | | | | 9,713,058 | | |
| | 18,000 | | | U.S. Treasury Bills1 | | (AA+, Aaa) | | 08/07/25 | | | 4.090 | | | | 17,422,191 | | |
| | 10,000 | | | U.S. Treasury Bills1 | | (AA+, Aaa) | | 09/04/25 | | | 3.816 | | | | 9,647,717 | | |
| | 10,000 | | | U.S. Treasury Bills1 | | (AA+, Aaa) | | 10/02/25 | | | 4.084 | | | | 9,619,682 | | |
| | | | | Total United States Treasury obligations
(Cost $148,727,529) | | | | | | | | | 148,884,681 | | |
Shares | | | | | | | | | | | |
Short-term investments (15.4%) | | | |
| | 30,990,187 | | | State Street Institutional U.S. Government Money Market Fund—Premier Class, 4.81%
(Cost $30,990,187) | | | | | | | | | | | | | | | 30,990,187 | | |
| | | | | Total investments at value (89.2%)
(Cost $179,717,716) | | | | | | | | | 179,874,868 | | |
| | | | | Other Assets in Excess of Liabilities (10.8%) | | | | | | | | | 21,677,539 | | |
| | | | | Net assets (100.0%) | | | | | | | | $ | 201,552,407 | | |
† Credit ratings given by the S&P Global Ratings Division of S&P Global Inc. ("S&P") and Moody's Investors Service, Inc. ("Moody's") are unaudited.
1 Securities are zero coupon. Rate presented is cost yield as of October 31, 2024.
Futures contracts
Contract description | | Currency | | Expiration
date | | Number of
contracts | | Notional
amount | | Notional
value | | Net unrealized
appreciation
(depreciation) | |
Contracts to purchase | |
Foreign Exchange Contracts | |
| GBP Currency Futures | | USD | | | | Dec 2024 | | | 544 | | | $ | 44,389,496 | | | $ | 43,795,400 | | | $ | (594,096 | ) | |
Index Contracts | |
EURO Stoxx 50 Index Futures | | EUR | | | | Dec 2024 | | | 246 | | | | 13,380,212 | | | | 12,910,162 | | | $ | (470,050 | ) | |
FTSE 100 Index Futures | | GBP | | | | Dec 2024 | | | 175 | | | | 18,845,474 | | | | 18,284,828 | | | | (560,646 | ) | |
Hang Seng Index Futures | | HKD | | | | Nov 2024 | | | 166 | | | | 22,026,685 | | | | 21,725,792 | | | | (300,893 | ) | |
Nikkei 225 Index Futures OSE | | JPY | | | | Dec 2024 | | | 39 | | | | 9,884,013 | | | | 10,000,591 | | | | 116,578 | | |
S&P 500 E Mini Index Futures | | USD | | | | Dec 2024 | | | 111 | | | | 31,642,558 | | | | 31,848,675 | | | | 206,117 | | |
| | | $ | (1,008,894 | ) | |
Interest Rate Contracts | |
10YR Japanese Bond Futures | | JPY | | | | Dec 2024 | | | 70 | | | | 66,258,411 | | | | 66,261,612 | | | $ | 3,201 | | |
| EURO Bund Futures | | EUR | | | | Dec 2024 | | | 193 | | | | 27,966,506 | | | | 27,616,118 | | | | (350,388 | ) | |
| | | $ | (347,187 | ) | |
1
Credit Suisse Managed Futures Strategy Fund
Consolidated schedule of investments
Futures contracts—(concluded)
Contract description | | Currency | | Expiration
date | | Number of
contracts | | Notional
amount | | Notional
value | | Net unrealized
appreciation
(depreciation) | |
Contracts to sell | |
Foreign Exchange Contracts | |
| AUD Currency Futures | | USD | | | | Dec 2024 | | | (618 | ) | | $ | (40,607,699 | ) | | $ | (40,648,950 | ) | | $ | (41,251 | ) | |
| CAD Currency Futures | | USD | | | | Dec 2024 | | | (1,130 | ) | | | (82,202,798 | ) | | | (81,360,000 | ) | | | 842,798 | | |
| EUR Currency Futures | | USD | | | | Dec 2024 | | | (468 | ) | | | (63,653,684 | ) | | | (63,706,500 | ) | | | (52,816 | ) | |
| JPY Currency Futures | | USD | | | | Dec 2024 | | | (311 | ) | | | (26,106,317 | ) | | | (25,708,038 | ) | | | 398,279 | | |
| | | $ | 1,147,010 | | |
Interest Rate Contracts | |
10YR U.S. Treasury Note Futures | | USD | | | | Dec 2024 | | | (541 | ) | | | (60,026,543 | ) | | | (59,763,594 | ) | | $ | 262,949 | | |
Long Gilt Futures | | GBP | | | | Dec 2024 | | | (365 | ) | | | (45,129,171 | ) | | | (44,129,403 | ) | | | 999,768 | | |
| | | $ | 1,262,717 | | |
Total net unrealized appreciation (depreciation) | | $ | 459,550 | | |
Total return swap contracts
Currency | | Notional
amount | | Expiration
date | | Counterparty | | Receive | | Pay | | Periodic
payment
frequency | | Upfront
premiums
paid/
(received) | | Value | | Unrealized
appreciation | |
| USD | | $ | 12,701,029 | | | 01/27/25 | | Bank of America | | (0.06)% | | Bloomberg Agriculture Index | | At Maturity | | $ | — | | | $ | 128,547 | | | $ | 128,547 | | |
| | | | | | | | | | | | | | | $ | — | | | $ | 128,547 | | | $ | 128,547 | | |
Total return swap contracts
Currency | | Notional
amount | | Expiration
date | | Counterparty | | Receive | | Pay | | Periodic
payment
frequency | | Upfront
premiums
paid/
(received) | | Value | | Unrealized
depreciation | |
| USD | | $ | 12,644,309 | | | 01/27/25 | | Bank of America | | (0.06)% | | Bloomberg Energy Index | | At Maturity | | $ | — | | | $ | (33,059 | ) | | $ | (33,059 | ) | |
| USD | | | 18,807,545 | | | 01/27/25 | | Goldman Sachs | | Bloomberg Industrial
Metals Index | | 0.10% | | At Maturity | | | — | | | | (281,119 | ) | | | (281,119 | ) | |
| USD | | | 31,816,192 | | | 01/27/25 | | Goldman Sachs | | Bloomberg Precious
Metals Index | | 0.07% | | At Maturity | | | — | | | | (342,081 | ) | | | (342,081 | ) | |
| | | | | | | | | | | | | | | $ | — | | | $ | (656,259 | ) | | $ | (656,259 | ) | |
Total | | | | | | | | | | | | | | $ | — | | | $ | (527,712 | ) | | $ | (527,712 | ) | |
2
Credit Suisse Managed Futures Strategy Fund
Consolidated schedule of investments
Currency abbreviations:
AUD = Australian Dollar
CAD = Canadian Dollar
EUR = Euro
GBP = British Pound
HKD = Hong Kong Dollar
JPY = Japanese Yen
USD = United States Dollar
See accompanying notes to consolidated financial statements.
3
Credit Suisse Managed Futures Strategy Fund
Consolidated statement of assets and liabilities
October 31, 2024
Assets: | |
Investments at value (Cost $179,717,716) (Note 2) | | $ | 179,874,868 | | |
Cash | | | 4 | | |
Cash segregated at brokers for futures contracts and swap contracts (Note 2) | | | 23,144,668 | | |
Unrealized appreciation on open swap contracts (Note 2) | | | 128,547 | | |
Interest receivable | | | 127,601 | | |
Receivable for Fund shares sold | | | 107,717 | | |
Prepaid expenses | | | 41,499 | | |
Total assets | | | 203,424,904 | | |
Liabilities: | |
Investment advisory fee payable (Note 3) | | | 44,629 | | |
Administrative services fee payable (Note 3) | | | 20,717 | | |
Shareholder servicing/Distribution fee payable (Note 3) | | | 1,763 | | |
Variation margin payable on futures contracts (Note 2) | | | 816,069 | | |
Unrealized depreciation on open swap contracts (Note 2) | | | 656,259 | | |
Payable for Fund shares redeemed | | | 121,464 | | |
Transfer agent fees payable | | | 99,557 | | |
Audit fees payable | | | 60,468 | | |
Trustees' fee payable | | | 10,052 | | |
Net payable for open swap contracts | | | 1,053 | | |
Due to custodian for foreign currency at value | | | 150 | | |
Accrued expenses | | | 40,316 | | |
Total liabilities | | | 1,872,497 | | |
Net assets: | |
Capital stock, $.001 par value (Note 6) | | | 23,347 | | |
Paid-in capital (Note 6) | | | 237,936,370 | | |
Total distributable earnings (loss) | | | (36,407,310 | ) | |
Net assets | | $ | 201,552,407 | | |
I Shares | |
Net assets | | $ | 193,408,596 | | |
Shares outstanding | | | 22,385,826 | | |
Net asset value, offering price and redemption price per share | | $ | 8.64 | | |
A Shares | |
Net assets | | $ | 8,125,267 | | |
Shares outstanding | | | 958,605 | | |
Net asset value and redemption price per share | | $ | 8.48 | | |
Maximum offering price per share (net asset value/(1-5.25%)) | | $ | 8.95 | | |
C Shares | |
Net assets | | $ | 18,544 | | |
Shares outstanding | | | 2,360 | | |
Net asset value and offering price per share | | $ | 7.86 | | |
See accompanying notes to consolidated financial statements.
4
Credit Suisse Managed Futures Strategy Fund
Consolidated statement of operations
For the year ended October 31, 2024
Investment income: | |
Interest | | $ | 10,265,671 | | |
Total investment income | | | 10,265,671 | | |
Expenses: | |
Investment advisory fees (Note 3) | | | 2,151,536 | | |
Administrative services fees (Note 3) | | | 46,005 | | |
Shareholder servicing/Distribution fees (Note 3) | |
Class A | | | 20,553 | | |
Class C | | | 225 | | |
Transfer agent fees | | | 337,577 | | |
Trustees' fees | | | 91,521 | | |
Registration fees | | | 72,552 | | |
Audit and tax fees | | | 67,859 | | |
Legal fees | | | 60,187 | | |
Printing fees | | | 45,237 | | |
Custodian fees | | | 45,085 | | |
Commitment fees (Note 4) | | | 28,796 | | |
Insurance expense | | | 9,727 | | |
Miscellaneous expense | | | 6,564 | | |
Total expenses | | | 2,983,424 | | |
Less: fees waived and expenses reimbursed (Note 3) | | | (273,226 | ) | |
Net expenses | | | 2,710,198 | | |
Net investment income | | | 7,555,473 | | |
Net realized and unrealized gain (loss) from investments, futures contracts, swap contracts and foreign currency: | |
Net realized loss from investments | | | (45,011 | ) | |
Net realized loss from futures contracts | | | (21,482,779 | ) | |
Net realized gain from swap contracts | | | 1,174,458 | | |
Net realized loss from foreign currency transactions | | | (250,403 | ) | |
Net change in unrealized appreciation (depreciation) from investments | | | 394,539 | | |
Net change in unrealized appreciation (depreciation) from futures contracts | | | (7,588,378 | ) | |
Net change in unrealized appreciation (depreciation) from swap contracts | | | (362,081 | ) | |
Net change in unrealized appreciation (depreciation) from foreign currency translations | | | 102,776 | | |
Net realized and unrealized loss from investments, futures contracts, swap contracts and foreign currency transactions | | | (28,056,879 | ) | |
Net decrease in net assets resulting from operations | | $ | (20,501,406 | ) | |
See accompanying notes to consolidated financial statements.
5
Credit Suisse Managed Futures Strategy Fund
Consolidated statements of changes in net assets
| | | For the
year ended
October 31, 2024 | | For the
year ended
October 31, 2023 | |
From operations: | |
Net investment income | | $ | 7,555,473 | | | $ | 8,806,352 | | |
Net realized loss from investments, futures contracts, swap contracts and foreign currency transactions | | | (20,603,735 | ) | | | (33,937,885 | ) | |
Net change in unrealized appreciation (depreciation) from investments, futures contracts, swap contracts
and foreign currency translations | | | (7,453,144 | ) | | | (4,577,508 | ) | |
Net decrease in net assets resulting from operations | | | (20,501,406 | ) | | | (29,709,041 | ) | |
From distributions: | |
From distributable earnings | |
Class I | | | (1,016,487 | ) | | | (65,142,642 | ) | |
Class A | | | (22,549 | ) | | | (3,766,377 | ) | |
Class C | | | — | | | | (109,416 | ) | |
Net decrease in net assets resulting from distributions | | | (1,039,036 | ) | | | (69,018,435 | ) | |
From capital share transactions (Note 6): | |
Proceeds from sale of shares | | | 78,575,901 | | | | 99,232,556 | | |
Reinvestment of distributions | | | 980,256 | | | | 66,170,622 | | |
Net asset value of shares redeemed | | | (113,797,506 | ) | | | (272,315,569 | ) | |
Net decrease in net assets from capital share transactions | | | (34,241,349 | ) | | | (106,912,391 | ) | |
Net decrease in net assets | | | (55,781,791 | ) | | | (205,639,867 | ) | |
Net assets: | |
Beginning of year | | | 257,334,198 | | | | 462,974,065 | | |
End of year | | $ | 201,552,407 | | | $ | 257,334,198 | | |
See accompanying notes to consolidated financial statements.
6
Credit Suisse Managed Futures Strategy Fund
Consolidated financial highlights
(For a Class I share of the Fund outstanding throughout each year)
| | | For the year ended October 31, | |
| | | 2024 | | 2023 | | 2022 | | 2021 | | 2020 | |
Per share data: | |
Net asset value, beginning of year | | $ | 9.53 | | | $ | 12.31 | | | $ | 11.05 | | | $ | 9.26 | | | $ | 9.94 | | |
Investment operations: | |
Net investment income (loss)1 | | | 0.34 | | | | 0.28 | | | | (0.06 | ) | | | (0.13 | ) | | | (0.03 | ) | |
Net gain (loss) from investments, futures contracts, swap contracts and
foreign currency transactions (both realized and unrealized) | | | (1.18 | ) | | | (1.19 | ) | | | 2.18 | | | | 1.92 | | | | (0.48 | ) | |
Total from investment operations | | | (0.84 | ) | | | (0.91 | ) | | | 2.12 | | | | 1.79 | | | | (0.51 | ) | |
Less dividends and distributions: | |
Dividends from net investment income | | | (0.05 | ) | | | (0.45 | ) | | | (0.86 | ) | | | — | | | | (0.17 | ) | |
Distributions from net realized gains | | | — | | | | (1.42 | ) | | | — | | | | — | | | | — | | |
Total dividends and distributions | | | (0.05 | ) | | | (1.87 | ) | | | (0.86 | ) | | | — | | | | (0.17 | ) | |
Net asset value, end of year | | $ | 8.64 | | | $ | 9.53 | | | $ | 12.31 | | | $ | 11.05 | | | $ | 9.26 | | |
Total return2 | | | (8.87 | )% | | | (7.92 | )% | | | 21.09 | % | | | 19.33 | % | | | (5.22 | )% | |
Ratios and supplemental data: | |
Net assets, end of year (000s omitted) | | $ | 193,409 | | | $ | 247,916 | | | $ | 434,818 | | | $ | 382,293 | | | $ | 282,365 | | |
Ratio of net expenses to average net assets | | | 1.30 | % | | | 1.30 | % | | | 1.30 | % | | | 1.30 | % | | | 1.30 | % | |
Ratio of net investment income (loss) to average net assets | | | 3.66 | % | | | 2.76 | % | | | (0.52 | )% | | | (1.28 | )% | | | (0.34 | )% | |
Decrease reflected in above operating expense ratios due to
waivers/reimbursements | | | 0.13 | % | | | 0.02 | % | | | — | % | | | 0.02 | % | | | 0.05 | % | |
Portfolio turnover rate3 | | | — | % | | | — | % | | | — | % | | | — | % | | | — | % | |
1 Per share information is calculated using the average shares outstanding method.
2 Total returns are historical and include change in share price and reinvestment of all distributions. Had certain expenses not been reduced during the years shown, total returns would have been lower.
3 Portfolio turnover is calculated by dividing the lesser of total purchases or sales of portfolio securities for the reporting period by the monthly average of portfolio securities owned during the reporting period. Excluded from both the numerator and denominator are amounts relating to derivatives and securities whose maturities or expiration dates at the time of acquisition were one year or less.
See accompanying notes to consolidated financial statements.
7
Credit Suisse Managed Futures Strategy Fund
Consolidated financial highlights
(For a Class A share of the Fund outstanding throughout each year)
| | | For the year ended October 31, | |
| | | 2024 | | 2023 | | 2022 | | 2021 | | 2020 | |
Per share data: | |
Net asset value, beginning of year | | $ | 9.35 | | | $ | 12.11 | | | $ | 10.88 | | | $ | 9.14 | | | $ | 9.82 | | |
Investment operations: | |
Net investment income (loss)1 | | | 0.31 | | | | 0.24 | | | | (0.08 | ) | | | (0.16 | ) | | | (0.05 | ) | |
Net gain (loss) from investments, futures contracts, swap contracts and
foreign currency transactions (both realized and unrealized) | | | (1.16 | ) | | | (1.16 | ) | | | 2.14 | | | | 1.90 | | | | (0.49 | ) | |
Total from investment operations | | | (0.85 | ) | | | (0.92 | ) | | | 2.06 | | | | 1.74 | | | | (0.54 | ) | |
Less dividends and distributions: | |
Dividends from net investment income | | | (0.02 | ) | | | (0.42 | ) | | | (0.83 | ) | | | — | | | | (0.14 | ) | |
Distributions from net realized gains | | | — | | | | (1.42 | ) | | | — | | | | — | | | | — | | |
Total dividends and distributions | | | (0.02 | ) | | | (1.84 | ) | | | (0.83 | ) | | | — | | | | (0.14 | ) | |
Net asset value, end of year | | $ | 8.48 | | | $ | 9.35 | | | $ | 12.11 | | | $ | 10.88 | | | $ | 9.14 | | |
Total return2 | | | (9.06 | )% | | | (8.15 | )% | | | 20.83 | % | | | 19.04 | % | | | (5.53 | )% | |
Ratios and supplemental data: | |
Net assets, end of year (000s omitted) | | $ | 8,125 | | | $ | 9,350 | | | $ | 27,406 | | | $ | 15,682 | | | $ | 12,506 | | |
Ratio of net expenses to average net assets | | | 1.55 | % | | | 1.55 | % | | | 1.55 | % | | | 1.55 | % | | | 1.55 | % | |
Ratio of net investment income (loss) to average net assets | | | 3.41 | % | | | 2.45 | % | | | (0.68 | )% | | | (1.53 | )% | | | (0.51 | )% | |
Decrease reflected in above operating expense ratios due to
waivers/reimbursements | | | 0.13 | % | | | 0.02 | % | | | — | % | | | 0.02 | % | | | 0.05 | % | |
Portfolio turnover rate3 | | | — | % | | | — | % | | | — | % | | | — | % | | | — | % | |
1 Per share information is calculated using the average shares outstanding method.
2 Total returns are historical and include change in share price, reinvestment of all distributions and no sales charge. Had certain expenses not been reduced during the years shown, total returns would have been lower.
3 Portfolio turnover is calculated by dividing the lesser of total purchases or sales of portfolio securities for the reporting period by the monthly average of portfolio securities owned during the reporting period. Excluded from both the numerator and denominator are amounts relating to derivatives and securities whose maturities or expiration dates at the time of acquisition were one year or less.
See accompanying notes to consolidated financial statements.
8
Credit Suisse Managed Futures Strategy Fund
Consolidated financial highlights
(For a Class C share of the Fund outstanding throughout each year)
| | | For the year ended October 31, | |
| | | 2024 | | 2023 | | 2022 | | 2021 | | 2020 | |
Per share data: | |
Net asset value, beginning of year | | $ | 8.71 | | | $ | 11.39 | | | $ | 10.28 | | | $ | 8.70 | | | $ | 9.351 | | |
Investment operations: | |
Net investment income (loss)2 | | | 0.23 | | | | 0.17 | | | | (0.16 | ) | | | (0.22 | ) | | | (0.14 | ) | |
Net gain (loss) from investments, futures contracts, swap contracts and
foreign currency transactions (both realized and unrealized) | | | (1.08 | ) | | | (1.10 | ) | | | 2.02 | | | | 1.80 | | | | (0.44 | ) | |
Total from investment operations | | | (0.85 | ) | | | (0.93 | ) | | | 1.86 | | | | 1.58 | | | | (0.58 | ) | |
Less dividends and distributions: | |
Dividends from net investment income | | | — | | | | (0.33 | ) | | | (0.75 | ) | | | — | | | | (0.07 | ) | |
Distributions from net realized gains | | | — | | | | (1.42 | ) | | | — | | | | — | | | | — | | |
Total dividends and distributions | | | — | | | | (1.75 | ) | | | (0.75 | ) | | | — | | | | (0.07 | ) | |
Net asset value, end of year | | $ | 7.86 | | | $ | 8.71 | | | $ | 11.39 | | | $ | 10.28 | | | $ | 8.70 | | |
Total return3 | | | (9.76 | )% | | | (8.80 | )% | | | 19.83 | % | | | 18.16 | % | | | (6.24 | )% | |
Ratios and supplemental data: | |
Net assets, end of year (000s omitted) | | $ | 19 | | | $ | 68 | | | $ | 750 | | | $ | 820 | | | $ | 880 | | |
Ratio of net expenses to average net assets | | | 2.30 | % | | | 2.30 | % | | | 2.30 | % | | | 2.30 | % | | | 2.30 | % | |
Ratio of net investment income (loss) to average net assets | | | 2.69 | % | | | 1.81 | % | | | (1.52 | )% | | | (2.28 | )% | | | (1.56 | )% | |
Decrease reflected in above operating expense ratios due to
waivers/reimbursements | | | 0.13 | % | | | 0.02 | % | | | — | % | | | 0.02 | % | | | 0.05 | % | |
Portfolio turnover rate4 | | | — | % | | | — | % | | | — | % | | | — | % | | | — | % | |
1 Includes adjustments in accordance with accounting principles generally accepted in the United States of America and as such, the net asset values for financial reporting purposes and the returns based upon net asset values may differ from the net asset values and returns for shareholder transactions.
2 Per share information is calculated using the average shares outstanding method.
3 Total returns are historical and include change in share price, reinvestment of all distributions and no sales charge. Had certain expenses not been reduced during the years shown, total returns would have been lower.
4 Portfolio turnover is calculated by dividing the lesser of total purchases or sales of portfolio securities for the reporting period by the monthly average of portfolio securities owned during the reporting period. Excluded from both the numerator and denominator are amounts relating to derivatives and securities whose maturities or expiration dates at the time of acquisition were one year or less.
See accompanying notes to consolidated financial statements.
9
Credit Suisse Managed Futures Strategy Fund
Notes to consolidated financial statements
October 31, 2024
Note 1. Organization
Credit Suisse Managed Futures Strategy Fund (the "Fund"), a series of Credit Suisse Opportunity Funds (the "Trust"), a Delaware statutory trust, is registered under the Investment Company Act of 1940, as amended (the "1940 Act"), as a non-diversified open-end management investment company that seeks to achieve investment results that correspond generally to the risk and return patterns of managed futures funds. The Trust was organized under the laws of the State of Delaware as a business trust on May 31, 1995.
UBS Asset Management (Americas) LLC ("UBS AM" or the "Adviser"), the investment adviser to the Fund, is registered as an investment adviser with the Securities and Exchange Commission ("SEC") and as a Commodity Pool Operator with the Commodity Futures Trading Commission. UBS Asset Management (US) Inc. ("UBS AM (US)") serves as the principal underwriter for the Fund. UBS AM and UBS AM (US) are indirect wholly owned subsidiaries of UBS Group AG. UBS Group AG is an internationally diversified organization with headquarters in Zurich, Switzerland. UBS Group AG operates in many areas of the financial services industry. The Fund seeks to achieve its investment objective by investing directly and/or indirectly through the Credit Suisse Cayman Managed Futures Strategy Fund, Ltd. (the "Subsidiary"), a wholly-owned subsidiary of the Fund organized under the laws of the Cayman Islands, in a combination of securities and derivative instruments. The Subsidiary invests in commodity-linked derivative instruments, such as swaps and futures, as well as other types of futures, swaps and options. The Subsidiary may also invest in debt securities, some of which are intended to serve as margin or collateral for the Subsidiary's derivatives positions.
The Subsidiary is managed by the same portfolio managers that manage the Fund and the accompanying financial statements reflect the financial position of the Fund and the Subsidiary and the results of operations on a consolidated basis. The consolidated financial statements include portfolio holdings of the Fund and the Subsidiary and all intercompany transactions and balances have been eliminated. The Fund may invest up to 25% of its total assets in the Subsidiary. As of October 31, 2024, the Fund held $36,076,835 in the Subsidiary, representing 17.9% of the Fund's consolidated net assets. For the year ended October 31, 2024, the net realized loss on securities and other financial instruments held in the Subsidiary was $1,166,596.
Subsequent references to the Fund within the Notes to Consolidated Financial Statements collectively refer to the Fund and the Subsidiary, unless the context otherwise requires.
The Fund offers three classes of shares: Class I shares, Class A shares and Class C shares. Each class of shares represents an equal pro rata interest in the Fund, except the share classes bear different expenses. Class A shares are sold subject to a front-end sales charge of up to 5.25%. Class C shares are sold subject to a contingent deferred sales charge ("CDSC") of 1.00% if the shares are redeemed within the first year of purchase. Class I shares are sold without a sales charge. Effective June 30, 2021, Class C shares, upon the eight year anniversary of purchase, will convert to Class A shares.
In October 2022, the SEC adopted the Tailored Shareholder Reports for Mutual Funds and Exchange-Traded Funds rule and reform amendments requiring open-end management investment companies, including mutual funds and exchange-traded funds, to transmit concise and visually engaging semi-annual and annual tailored shareholder reports that highlight key information, including fund expenses, performance, and holdings to shareholders. Certain information from the Fund's prior shareholder reports, including the Fund's investment portfolio, financial statements and financial highlights, does not appear in the tailored shareholder report but will be filed on a semiannual basis on Form N-CSR. This information will be available online, mailed upon request and filed on a semiannual basis. The rule and form amendments had a compliance date of July 24, 2024.
Note 2. Significant accounting policies
The following is a summary of significant accounting policies followed by the Fund in the preparation of its consolidated financial statements. The policies are in accordance with generally accepted accounting principles in the
10
Credit Suisse Managed Futures Strategy Fund
Notes to consolidated financial statements
October 31, 2024
United States of America ("GAAP"). The preparation of consolidated financial statements requires management to make estimates and assumptions that affect the reported amounts and disclosures in the consolidated financial statements. Actual results could differ from those estimates. The Fund is considered an investment company for financial reporting purposes under GAAP and follows the accounting and reporting guidance in Financial Accounting Standards Board ("FASB") Accounting Standards Codification ("ASC") Topic 946—Financial Services—Investment Companies.
A) SECURITY VALUATION—The Board of Trustees (the "Board") is responsible for the Fund's valuation process. The Board has delegated the supervision of the daily valuation process to the Adviser, who has established a Pricing Committee and a Pricing Group, which, pursuant to the policies adopted by the Board, are responsible for making fair valuation determinations and overseeing the Fund's pricing policies. The net asset value ("NAV") of the Fund is determined daily as of the close of regular trading on the New York Stock Exchange, Inc. (the "Exchange") on each day the Exchange is open for business. The valuations for fixed income securities (which may include, but are not limited to, corporate, government, municipal, mortgage-backed, collateralized mortgage obligations and asset-backed securities) and certain derivative instruments are typically the prices supplied by independent third party pricing services, which may use market prices or broker/dealer quotations or a variety of valuation techniques and methodologies. The independent third party pricing services use inputs that are observable such as issuer details, interest rates, yield curves, prepayment speeds, credit risks/spreads, default rates and quoted prices for similar securities. These pricing services generally price fixed income securities assuming orderly transactions of an institutional "round lot" size, but some trades occur in smaller "odd lot" sizes which may be effected at lower prices than institutional round lot trades. Structured note agreements are valued in accordance with a dealer-supplied valuation based on changes in the value of the underlying index. Futures contracts are valued daily at the settlement price established by the board of trade or exchange on which they are traded. Forward contracts are valued at the London closing spot rates and the London closing forward point rates on a daily basis. The currency forward contract pricing model derives the differential in point rates to the expiration date of the forward and calculates its present value. Over the counter derivative financial instruments, such as swap agreements, generally derive their value from underlying asset prices, indices, reference rates, and other inputs or a combination of these factors. Equity securities for which market quotations are available are valued at the last reported sales price or official closing price on the primary market or exchange on which they trade. Investments in open-ended mutual funds are valued at the NAV as reported on each business day and under normal circumstances. Securities for which market quotations are not readily available are valued at their fair value as determined in good faith by the Adviser, as the Board's valuation designee (as defined in Rule 2a-5 under the 1940 Act), in accordance with the Adviser's procedures. The Board oversees the Adviser in its role as valuation designee in accordance with the requirements of Rule 2a-5 under the 1940 Act. The Fund may utilize a service provided by an independent third party to fair value certain securities. When fair value pricing is employed, the prices of securities used by the Fund to calculate its NAV may differ from quoted or published prices for the same securities. If independent third party pricing services are unable to supply prices for a portfolio investment, or if the prices supplied are deemed by the Adviser to be unreliable, the market price may be determined by the Adviser using quotations from one or more brokers/dealers or at the transaction price if the security has recently been purchased and no value has yet been obtained from a pricing service or pricing broker. When reliable prices are not readily available, such as when the value of a security has been significantly affected by events after the close of the exchange or market on which the security is principally traded, but before the Fund calculates its NAV, these securities will be fair valued in good faith by the Pricing Group, in accordance with procedures established by the Adviser.
The Fund uses valuation techniques to measure fair value that are consistent with the market approach and/or income approach, depending on the type of security and the particular circumstance. The market approach uses prices and other relevant information generated by market transactions involving identical or comparable securities. The income approach uses valuation techniques to discount estimated future cash flows to present value.
11
Credit Suisse Managed Futures Strategy Fund
Notes to consolidated financial statements
October 31, 2024
GAAP established a disclosure hierarchy that categorizes the inputs to valuation techniques used to value assets and liabilities at each measurement date. These inputs are summarized in the three broad levels listed below:
Level 1—quoted prices in active markets for identical investments
Level 2—other significant observable inputs (including quoted prices for similar investments, interest rates, prepayment speeds, credit risk, etc.)
Level 3—significant unobservable inputs (including the Fund's own assumptions in determining the fair value of investments)
The inputs or methodologies used to value securities are not necessarily an indication of the risk associated with investing in those securities.
The following is a summary of the inputs used as of October 31, 2024 in valuing the Fund's assets and liabilities carried at fair value:
Assets | | Level 1 | | Level 2 | | Level 3 | | Total | |
Investments in Securities | | | | | | | | | |
United States Treasury Obligations | | $ | — | | | $ | 148,884,681 | | | $ | — | | | $ | 148,884,681 | | |
Short-term Investments | | | 30,990,187 | | | | — | | | | — | | | | 30,990,187 | | |
| | | $ | 30,990,187 | | | $ | 148,884,681 | | | $ | — | | | $ | 179,874,868 | | |
Other Financial Instruments* | | | | | | | | | |
Futures Contracts | | $ | 2,829,690 | | | $ | — | | | $ | — | | | $ | 2,829,690 | | |
Swap Contracts | | | — | | | | 128,547 | | | | — | | | | 128,547 | | |
| | | $ | 2,829,690 | | | $ | 128,547 | | | $ | — | | | $ | 2,958,237 | | |
Liabilities | |
Other Financial Instruments* | | | | | | | | | |
Futures Contracts | | $ | 2,370,140 | | | $ | — | | | $ | — | | | $ | 2,370,140 | | |
Swap Contracts | | | — | | | | 656,259 | | | | — | | | | 656,259 | | |
| | | $ | 2,370,140 | | | $ | 656,259 | | | $ | — | | | $ | 3,026,399 | | |
* Other financial instruments include unrealized appreciation (depreciation) on futures and swap contracts.
For the year ended October 31, 2024, there were no transfers in or out of Level 3. All transfers, if any, are assumed to occur at the end of the reporting period.
B) DERIVATIVE INSTRUMENTS AND HEDGING ACTIVITIES—The Fund has adopted a derivatives risk management program pursuant to Rule 18f-4 under the 1940 Act in order to assess and manage the Fund's derivatives risk, taking into account the Fund's derivatives transactions and how these transactions interact with the Fund's other investments. Because the Fund engages in derivatives transactions beyond a certain amount in order to pursue its investment objectives and policies, the Fund is required to comply with value at risk ("VaR") based limits on its leverage risk. The Fund adopted amendments to authoritative guidance on disclosures about derivative instruments and hedging activities which require that a fund disclose (a) how and why an entity uses derivative instruments, (b) how derivative instruments and hedging activities are accounted for and (c) how derivative instruments and related hedging activities affect a fund's financial position, financial performance and cash flows.
12
Credit Suisse Managed Futures Strategy Fund
Notes to consolidated financial statements
October 31, 2024
The following table presents the fair value and the location of derivatives within the Consolidated Statement of Assets and Liabilities at October 31, 2024 and the effect of these derivatives on the Consolidated Statement of Operations for the year ended October 31, 2024.
Primary underlying risk | | Derivative
assets1 | | Derivative
liabilities1 | | Realized
gain (loss) | | Net change in
unrealized
appreciation
(depreciation) | |
Foreign currency exchange rate | | | | | | | | | |
Futures contracts2 | | $ | 1,241,077 | | | $ | 688,163 | | | $ | (14,673,743 | ) | | $ | (3,978,889 | ) | |
Index Contracts | | | | | | | | | |
Futures contracts2 | | | 322,695 | | | | 1,331,589 | | | | 4,409,266 | | | | (915,496 | ) | |
Swap contracts | | | 128,547 | | | | 656,259 | | | | 1,174,458 | | | | (362,081 | ) | |
Interest rate | | | | | | | | | |
Futures contracts2 | | | 1,265,918 | | | | 350,388 | | | | (11,218,302 | ) | | | (2,693,993 | ) | |
Total | | $ | 2,958,237 | | | $ | 3,026,399 | | | $ | (20,308,321 | ) | | $ | (7,950,459 | ) | |
1 Generally, the balance sheet location for asset derivatives is receivables/net unrealized appreciation (depreciation) and for liability derivatives is payables/net unrealized appreciation (depreciation).
2 Includes cumulative appreciation (depreciation) of futures contracts as reported in the Consolidated Schedule of Investments. Only variation margin is reported within the receivables and/or payables on the Consolidated Statement of Assets and Liabilities.
The notional amount of futures contracts and swap contracts open at October 31, 2024 is reflected in the Consolidated Schedule of Investments. For the year ended October 31, 2024, the Fund held average monthly notional values of $299,853,759 and $247,464,295 in long futures contracts and short futures contracts, respectively, and $63,916,089 in swap contracts.
The Fund is a party to International Swap and Derivatives Association, Inc. ("ISDA") Master Agreements ("Master Agreements") with certain counterparties that govern over-the-counter derivative (including total return, credit default and interest rate swaps) and foreign exchange contracts entered into by the Fund. The Master Agreements may contain provisions regarding, among other things, the parties' general obligations, representations, agreements, collateral requirements, events of default and early termination. Termination events applicable to the Fund may occur upon a decline in the Fund's net assets below a specified threshold over a certain period of time.
The following table presents by counterparty the Fund's derivative assets, net of related collateral held by the Fund, at October 31, 2024:
Counterparty | | Gross amount of derivative
assets presented in
the consolidated
statement of assets
and liabilitiesa | | Financial
instruments
and derivatives
available for offset | | Non-cash
collateral
received | | Cash
collateral
receivedb | | Net amount
of derivative
assets | |
Bank of America | | $ | 128,547 | | | $ | (33,059 | ) | | $ | — | | | $ | — | | | $ | 95,488 | | |
13
Credit Suisse Managed Futures Strategy Fund
Notes to consolidated financial statements
October 31, 2024
The following table presents by counterparty the Fund's derivative liabilities, net of related collateral pledged by the Fund, October 31, 2024:
Counterparty | | Gross amount of derivative
liabilities presented in
the consolidated
statement of assets
and liabilitiesa | | Financial
instruments
and derivatives
available for offset | | Non-cash
collateral
pledged | | Cash
collateral
pledgedb | | Net amount
of derivative
liabilities | |
Bank of America | | $ | 33,059 | | | $ | (33,059 | ) | | $ | — | | | $ | — | | | $ | — | | |
Goldman Sachs | | | 623,200 | | | | — | | | | — | | | | (623,200 | ) | | | — | | |
| | | $ | 656,259 | | | $ | (33,059 | ) | | $ | — | | | $ | (623,200 | ) | | $ | — | | |
a Swap contracts are included.
b The actual collateral pledged may be more than the amounts shown.
C) FOREIGN CURRENCY TRANSACTIONS—The books and records of the Fund are maintained in U.S. dollars. Transactions denominated in foreign currencies are recorded at the current prevailing exchange rates. All assets and liabilities denominated in foreign currencies, including purchases and sales of investments, and income and expenses, are translated into U.S. dollar amounts on the date of those transactions.
Reported net realized gain (loss) from foreign currency transactions arises from sales of foreign currencies; currency gains or losses realized between the trade and settlement dates on securities transactions; and the difference between the amounts of dividends, interest, and foreign withholding taxes recorded on the Fund's books and the U.S. dollar equivalent of the amounts actually received or paid. Net change in unrealized gains and losses on translation of assets and liabilities denominated in foreign currencies arises from changes in the fair values of assets and liabilities, other than investments, at the end of the period, resulting from changes in exchange rates.
The Fund does not isolate that portion of the results of operations resulting from fluctuations in foreign exchange rates on investments from the fluctuations arising from changes in market prices of investments held. Such fluctuations are included with net realized and unrealized gain or loss from investments in the Consolidated Statement of Operations.
D) SECURITY TRANSACTIONS AND INVESTMENT INCOME/EXPENSE—Security transactions are accounted for on a trade date basis. Interest income/expense is recorded on the accrual basis. The Fund amortizes premiums and accretes discounts using the effective interest method. Dividend income/expense is recorded on the ex-dividend date. Certain expenses are class-specific expenses, vary by class and are charged only to that class. Income, expenses (excluding class-specific expenses) and realized/unrealized gains/losses are allocated proportionately to each class of shares based upon the relative NAV of the outstanding shares of that class. The cost of investments sold is determined by use of the specific identification method for both financial reporting and income tax purposes. To the extent any issuer defaults or a credit event occurs that impacts the issuer, the Fund may halt any additional interest income accruals and consider the realizability of interest accrued up to the date of default or credit event.
E) DIVIDENDS AND DISTRIBUTIONS TO SHAREHOLDERS—Dividends from net investment income, if any, are declared and paid quarterly. Distributions of net realized capital gains, if any, are declared and paid at least annually. However, to the extent that a net realized capital gain can be reduced by a capital loss carryforward, such gain will not be distributed. Dividends and distributions to shareholders of the Fund are recorded on the ex-dividend date and are determined in accordance with federal income tax regulations, which may differ from GAAP.
F) FEDERAL AND OTHER TAXES—No provision is made for federal taxes as it is the Fund's intention to continue to qualify as a regulated investment company ("RIC") under the Internal Revenue Code of 1986, as amended (the "Code"), and to make the requisite distributions to its shareholders, which will be sufficient to relieve it from federal income and excise taxes.
14
Credit Suisse Managed Futures Strategy Fund
Notes to consolidated financial statements
October 31, 2024
In order to qualify as a RIC under the Code, the Fund must meet certain requirements regarding the source of its income, the diversification of its assets and the distribution of its income. One of these requirements is that the Fund derive at least 90% of its gross income for each taxable year from dividends, interest, payments with respect to certain securities loans, gains from the sale or other disposition of stock, securities or foreign currencies, other income derived with respect to its business of investing in such stock, securities or currencies or net income derived from interests in certain publicly-traded partnerships ("Qualifying Income"). The Internal Revenue Service ("IRS") has issued a ruling that income realized from certain types of commodity-linked derivatives would not be Qualifying Income. As a result, the Fund's ability to realize income from investments in such commodity-linked derivatives as part of its investment strategy would be limited to a maximum of 10% of its gross income.
If the Fund is unable to ensure continued qualification as a RIC, the Fund may be required to change its investment objective, policies or techniques, or may be liquidated. If the Fund fails to qualify as a RIC, the Fund will be subject to federal income tax on its net income and capital gains at regular corporate rates (without reduction for distributions to shareholders). If the Fund were to fail to qualify as a RIC and become subject to federal income tax, shareholders of the Fund would be subject to the risk of diminished returns.
The Fund adopted the authoritative guidance for uncertainty in income taxes and recognizes a tax benefit or liability from an uncertain position only if it is more likely than not that the position is sustainable based solely on its technical merits and consideration of the relevant taxing authority's widely understood administrative practices and procedures. The Fund has reviewed its current tax positions and has determined that no provision for income tax is required in the Fund's financial statements. The Fund's federal and state income and federal excise tax returns for each of the tax years in the four year period ended October 31, 2024, for which the applicable statutes of limitations have not expired are subject to examination by the IRS and state departments of revenue.
G) CASH—The Fund's uninvested cash balance is held in an interest bearing variable rate demand deposit account at State Street Bank and Trust Company ("SSB"), the Fund's custodian.
H) FUTURES—The Fund may enter into futures contracts to the extent permitted by its investment policies and objectives. The Fund may use futures contracts to gain exposure to or hedge against changes in interest rates, equity and market price movements and/or currency risks. Upon entering into a futures contract, the Fund is required to deposit cash and/or pledge U.S. Government securities as initial margin with a Futures Commission Merchant ("FCM"). Subsequent payments, which are dependent on the daily fluctuations in the value of the underlying instrument, are made or received by the Fund each day (daily variation margin) and are recorded as unrealized gains or losses in the Consolidated Statement of Operations until the contracts are closed. When the contracts are closed, the Fund records a realized gain or loss equal to the difference between the proceeds from (or cost of) the closing transaction and the Fund's basis in the contract. Risks of entering into futures contracts for hedging purposes include the possibility that a change in the value of the contract may not correlate with the changes in the value of the underlying instruments. Futures have minimal counterparty credit risk because futures are exchange traded and the exchange's clearinghouse, as counterparty to all exchange-traded futures, guarantees the futures against default. In addition, the purchase of a futures contract involves the risk that the Fund could lose more than the original margin deposit and subsequent payments may be required for a futures transaction. The Fund's open futures contracts are disclosed in the Consolidated Schedule of Investments. At October 31, 2024, the amount of restricted cash held at brokers related to open futures contracts was $17,190,425.
The Commodity Exchange Act requires an FCM to segregate all customer transactions and assets from the FCM's proprietary activities. A customer's cash and other equity deposited with an FCM are considered commingled with all other customer funds subject to the FCM's segregation requirements. In the event of an FCM's insolvency, recovery may be limited to the Fund's pro-rata share of segregated customer funds available. It is possible that the recovery amount could be less than the total of cash and other equity deposited.
I) SWAPS—The Fund may enter into swap contracts either for hedging purposes or to seek to increase total return. A swap contract is an agreement that obligates two parties to exchange a series of cash flows at specified intervals
15
Credit Suisse Managed Futures Strategy Fund
Notes to consolidated financial statements
October 31, 2024
based upon or calculated by reference to changes in specified prices or rates for a specified amount of an underlying asset or notional principal amount. The Fund will enter into swap contracts only on a net basis, which means that the two payment streams are netted out, with the Fund receiving or paying, as the case may be, only the net amount of the two payments. Risks may arise as a result of the failure of the counterparty to the swap contract to comply with the terms of the swap contract. The extent of the Fund's exposure to credit and counterparty risks is the discounted net value of the cash flows to be received from the counterparty over the contract's remaining life, to the extent that the amount is positive. These risks are mitigated by having a master netting arrangement between the Fund and the counterparty and by the posting of collateral by the counterparty to the Fund to cover the Fund's exposure to the counterparty. Therefore, the Fund considers the creditworthiness of each counterparty as well as the amounts posted by the counterparty pursuant to the master netting agreement to a swap contract in evaluating potential credit risk. Additionally, risks may arise from unanticipated movements in interest rates or in the value of the underlying reference asset or index.
The Fund may enter into total return swap contracts, involving commitments to pay interest in exchange for a market-linked return, both based on notional amounts. The Fund may invest in total return swap contracts for hedging purposes or to seek to increase total return. To the extent the total return of the security or index underlying the transaction exceeds or falls short of the offsetting interest rate obligation, the Fund will receive a payment from or make a payment to the counterparty.
The Fund records unrealized gains or losses on a daily basis representing the value and the current net receivable or payable relating to open swap contracts. Net amounts received or paid on the swap contract are recorded as realized gains or losses. Fluctuations in the value of swap contracts are recorded for financial statement purposes as unrealized appreciation or depreciation from swap contracts. Realized gains and losses from terminated swaps are included in net realized gains/losses from swap contracts. The Fund's open swap contracts are disclosed in the Consolidated Schedule of Investments. At October 31, 2024, the amount of restricted cash held at brokers related to open swap contracts was $5,954,243.
J) SECURITIES LENDING—The initial collateral received by the Fund is required to have a value of at least 102% of the market value of domestic securities on loan (including any accrued interest thereon) and 105% of the market value of foreign securities on loan (including any accrued interest thereon). The collateral is maintained thereafter at a value equal to at least 102% of the current market value of the securities on loan. The market value of loaned securities is determined at the close of each business day of the Fund and any additional required collateral is delivered to the Fund, or excess collateral returned by the Fund, on the next business day. Cash collateral received by the Fund in connection with securities lending activity may be pooled together with cash collateral for other funds/portfolios advised by UBS AM and may be invested in a variety of investments, including funds advised by SSB or an affiliate, the Fund's securities lending agent, or money market instruments. However, in the event of default or bankruptcy by the other party to the agreement, realization and/or retention of the collateral may be subject to legal proceedings. SSB has been engaged by the Fund to act as the Fund's securities lending agent. The Fund's securities lending arrangement provides that the Fund and SSB will share the net income earned from securities lending activities. Securities lending income is accrued as earned. At October 31, 2024 and for the year ended October 31, 2024, there were no securities out on loan.
K) OTHER—In the normal course of business, the Fund trades financial instruments and enters into financial transactions for which risk of potential loss exists due to changes in the market (market risk) or failure of the other party to a transaction to perform (credit risk). Similar to credit risk, the Fund may be exposed to counterparty risk, including with respect to securities lending, or the risk that an institution or other entity with which the Fund has unsettled or open transactions will default. The potential loss could exceed the value of the financial assets recorded in the consolidated financial statements. Financial assets, which potentially expose the Fund to credit risk, consist principally of cash due from counterparties and investments. The extent of the Fund's exposure to credit and counterparty risks in respect to these financial assets approximates their carrying value as recorded in the Fund's Consolidated Statement of Assets and Liabilities.
16
Credit Suisse Managed Futures Strategy Fund
Notes to consolidated financial statements
October 31, 2024
Note 3. Transactions with affiliates and related parties
Credit Suisse served as investment adviser and co-administrator for the Fund through April 30, 2024. On May 1, 2024, Credit Suisse merged into UBS AM, with UBS AM as the surviving entity, and UBS AM became the investment manager to the Fund. For its investment advisory and administration services, UBS AM is entitled to receive a fee from the Fund at an annualized rate of 1.04% of the Fund's average daily net assets. For the year ended October 31, 2024, investment advisory and administration fees earned and fees waived/expenses reimbursed by UBS AM were $2,151,536 and $273,226, respectively. UBS AM has contractually agreed to limit expenses so that the Fund's annual operating expenses do not exceed 1.30% of the Fund's average daily net assets for Class I shares, 1.55% of the Fund's average daily net assets for Class A shares, and 2.30% of the Fund's average daily net assets for Class C shares. The Fund is authorized to reimburse UBS AM for management fees previously waived and/or for expenses previously paid by UBS AM, provided, however, that any reimbursement must be paid at a date not more than thirty-six months following the applicable month during which such fees were waived or expenses were paid by UBS AM and the reimbursement does not cause the applicable class's aggregate expenses, on an annualized basis, to exceed either (i) the applicable expense limitation in effect at the time such fees were waived or such expenses were paid by UBS AM or (ii) the applicable expense limitation in effect at the time of such reimbursement. This contract may not be terminated before February 28, 2026. For the year ended October 31, 2024, there was no recoupment.
The amounts waived and reimbursed by UBS AM, which are available for potential future recoupment by UBS AM, and the expiration schedule at October 31, 2024 are as follows:
| | | Fee waivers/
expense
reimbursements
subject to
recoupment | | Expires
October 31,
2025 | | Expires
October 31,
2026 | | Expires
October 31,
2027 | |
Class I | | $ | 396,382 | | | $ | 22,762 | | | $ | 111,307 | | | $ | 262,313 | | |
Class A | | | 18,361 | | | | 1,439 | | | | 6,038 | | | | 10,884 | | |
Class C | | | 317 | | | | 47 | | | | 241 | | | | 29 | | |
Totals | | $ | 415,060 | | | $ | 24,248 | | | $ | 117,586 | | | $ | 273,226 | | |
Credit Suisse Securities (USA) LLC ("CSSU"), an affiliate of Credit Suisse, served as the distributor of the Fund's shares through April 30, 2024. On May 1, 2024, UBS AM (US) replaced CSSU as the Fund's underwriter and distributor. Pursuant to a distribution plan adopted by the Fund pursuant to Rule 12b-1 under the 1940 Act, UBS AM (US) receives fees for its distribution services. These fees are calculated at an annual rate of 0.25% of the average daily net assets of the Class A shares. For the Class C shares, the fee is calculated at an annual rate of 1.00% of the average daily net assets. For the year ended October 31, 2024, the Fund paid Rule 12b-1 distribution fees of $20,553 for Class A shares and $225 for Class C shares. Class I shares are not subject to Rule 12b-1 distribution fees.
For the year ended October 31, 2024, UBS AM (US) and its affiliates advised the Fund that they didn't retain commissions on the sale of Fund's Class A shares.
Note 4. Line of credit
The Fund, together with other funds/portfolios advised by UBS AM (collectively, the "Participating Funds"), participates in a committed, unsecured line of credit facility ("Credit Facility"), with SSB in an aggregated amount of $125 million for temporary or emergency purposes under a first-come, first-served basis. Under the terms of the Credit Facility, the Participating Funds pay an aggregate commitment fee on the average unused amount of the Credit Facility, which is allocated among the Participating Funds in such manner as is determined by the governing boards of the Participating Funds. In addition, the Participating Funds pay interest on borrowings at either the Federal Funds Effective rate or the Overnight Bank Funding rate plus a spread. At October 31, 2024 and for the year ended October 31, 2024, the Fund had no borrowings outstanding under the Credit Facility.
17
Credit Suisse Managed Futures Strategy Fund
Notes to consolidated financial statements
October 31, 2024
Note 5. Purchases and sales of securities
For the year ended October 31, 2024, there were no purchases and sales of investment securities and US Government /agency obligations other than short term investments.
Note 6. Capital share transactions
The Fund is authorized to issue an unlimited number of full and fractional shares of beneficial interest, $0.001 par value per share. The Fund offers Class I, Class A and Class C shares. Transactions in capital shares for each class of the Fund were as follows:
| | | Class I | |
| | | For the year ended
October 31, 2024 | | for the year ended
October 31, 2023 | |
| | | Shares | | Value | | Shares | | Value | |
Shares sold | | | 8,213,885 | | | $ | 75,145,730 | | | | 9,444,889 | | | $ | 93,693,073 | | |
Shares issued in reinvestment of distributions | | | 103,640 | | | | 958,671 | | | | 6,324,027 | | | | 62,418,151 | | |
Shares redeemed | | | (11,944,714 | ) | | | (109,906,892 | ) | | | (25,069,492 | ) | | | (250,095,598 | ) | |
Net decrease | | | (3,627,189 | ) | | $ | (33,802,491 | ) | | | (9,300,576 | ) | | $ | (93,984,374 | ) | |
| | | Class A | |
| | | For the year ended
October 31, 2024 | | for the year ended
October 31, 2023 | |
| | | Shares | | Value | | Shares | | Value | |
Shares sold | | | 361,790 | | | $ | 3,263,962 | | | | 534,738 | | | $ | 5,472,987 | | |
Shares issued in reinvestment of distributions | | | 2,375 | | | | 21,585 | | | | 375,660 | | | | 3,643,900 | | |
Shares redeemed | | | (405,542 | ) | | | (3,679,368 | ) | | | (2,173,693 | ) | | | (21,538,722 | ) | |
Net decrease | | | (41,377 | ) | | $ | (393,821 | ) | | | (1,263,295 | ) | | $ | (12,421,835 | ) | |
| | | Class C | |
| | | For the year ended
October 31, 2024 | | for the year ended
October 31, 2023 | |
| | | Shares | | Value | | Shares | | Value | |
Shares sold | | | 19,835 | | | $ | 166,209 | | | | 7,301 | | | $ | 66,497 | | |
Shares issued in reinvestment of distributions | | | — | | | | — | | | | 11,944 | | | | 108,570 | | |
Shares redeemed | | | (25,280 | ) | | | (211,246 | ) | | | (77,219 | ) | | | (681,249 | ) | |
Net decrease | | | (5,445 | ) | | $ | (45,037 | ) | | | (57,974 | ) | | $ | (506,182 | ) | |
On October 31, 2024, the number of shareholders that held 5% or more of the outstanding shares of each class of the Fund was as follows:
| | | Number of
shareholders | | Approximate percentage
of outstanding shares | |
Class I | | | 4 | | | | 88 | % | |
Class A | | | 1 | | | | 73 | % | |
Class C | | | 3 | | | | 100 | % | |
The Fund's performance may be negatively impacted in the event one or more of the Fund's greater than 5% shareholders were to redeem at a given time. Some of the shareholders may be omnibus accounts, which hold shares on behalf of individual shareholders.
Note 7. Income tax information and distributions to shareholders
Income and capital gain distributions are determined in accordance with federal income tax regulations, which may differ from GAAP.
18
Credit Suisse Managed Futures Strategy Fund
Notes to consolidated financial statements
October 31, 2024
The tax character of dividends paid by the Fund during the fiscal years ended October 31, 2024 and 2023, respectively, was as follows:
Ordinary income | | Long-term
capital gains | |
| 2024 | | 2023 | | 2024 | | 2023 | |
| $ | 1,039,036 | | | $ | 36,781,911 | | | $ | 0 | | | $ | 32,236,524 | | |
The tax basis components of distributable earnings differ from book basis by temporary book/tax differences. These differences are primarily due to differing treatments of futures contracts marked to market, Subsidiary adjustments, organization costs, straddle deferral.
At October 31, 2024, the components of distributable earnings on a tax basis were as follows:
Accumulated net realized loss | | $ | (39,940,399 | ) | |
Undistributed ordinary income | | | 4,248,555 | | |
Unrealized depreciation | | | (427,322 | ) | |
Other temporary differences | | | (288,144 | ) | |
| | | $ | (36,407,310 | ) | |
At October 31, 2024, the Fund had $16,396,089 of unlimited short-term capital loss carryforwards and $23,544,310 of unlimited long-term capital loss carryforwards available to offset possible future capital gains.
At October 31, 2024, the cost and net unrealized appreciation (depreciation) of investments and derivatives for income tax purposes were as follows:
Cost of Investments | | $ | 186,240,678 | | |
Unrealized appreciation | | $ | 2,866,173 | | |
Unrealized depreciation | | | (3,336,658 | ) | |
Net unrealized appreciation (depreciation) | | $ | (470,485 | ) | |
To adjust for current period permanent book/tax differences which arose principally from differing book/tax treatment of equalization distributions, and Subsidiary cumulative income (loss), paid-in capital was credited $697,531 and distributable earnings (loss) was charged $697,531. Net assets were not affected by this reclassification.
Note 8. Contingencies
In the normal course of business, the Fund may provide general indemnifications pursuant to certain contracts and organizational documents. The Fund's maximum exposure under these arrangements is dependent on future claims that may be made against the Fund and, therefore, cannot be estimated; however, based on experience, the risk of loss from such claims is considered remote.
Note 9. Subsequent events
In preparing the consolidated financial statements as of October 31, 2024, management considered the impact of subsequent events for potential recognition or disclosure in these financial statements through the date of release of this report.
On August 16, 2024, UBS AM entered into an agreement with Manteio Scalable Technologies LLC ("Manteio"), Manteio Capital LLC and Manteio Partners LLC to transfer management of UBS AM's Quantitative Investment Strategies business, including the portfolio management team of the Fund, to Manteio (the "Transaction").
19
Credit Suisse Managed Futures Strategy Fund
Notes to consolidated financial statements
October 31, 2024
At a meeting held on August 15, 2024, the Board of the Trust approved an Agreement and Plan of Reorganization (the "Agreement and Plan") pursuant to which the Fund would be reorganized into Manteio Managed Futures Strategy Fund, a newly created mutual fund advised by Manteio (the "Reorganization"). At a Special Meeting of Shareholders of the Fund on November 15, 2024, shareholders of the Fund approved the Agreement and Plan. The Reorganization closed on November 22, 2024 (the "Closing Date"). As a result of the Reorganization, the Manteio Managed Futures Strategy Fund acquired the assets, subject to the liabilities, of the Fund, and shareholders of the Fund became shareholders of the Manteio Managed Futures Strategy Fund as of the Closing Date.
20
Credit Suisse Managed Futures Strategy Fund
Report of independent registered public accounting firm
To the Shareholders and the Board of Trustees of Credit Suisse Managed Futures Strategy Fund
Opinion on the Financial Statements
We have audited the accompanying consolidated statement of assets and liabilities of Credit Suisse Managed Futures Strategy Fund (the "Fund") (one of the funds constituting Credit Suisse Opportunity Funds (the "Trust")), including the consolidated schedule of investments, as of October 31, 2024, and the related consolidated statements of operations and changes in net assets, the consolidated financial highlights for the year then ended and the related notes (collectively referred to as the "financial statements"). In our opinion, the financial statements present fairly, in all material respects, the consolidated financial position of the Fund (one of the funds constituting Credit Suisse Opportunity Funds) at October 31, 2024, the consolidated results of its operations, the consolidated changes in its net assets and its consolidated financial highlights for the year then ended, in conformity with U.S. generally accepted accounting principles.
The consolidated statement of changes in net assets for the year ended October 31, 2023, and the consolidated financial highlights for each of the years in the four year period then ended, were audited by another independent registered public accounting firm whose report, dated December 27, 2023, expressed an unqualified opinion on that consolidated statement of changes in net assets and those consolidated financial highlights.
Basis for Opinion
These financial statements are the responsibility of the Trust's management. Our responsibility is to express an opinion on the Fund's financial statements based on our audit. We are a public accounting firm registered with the Public Company Accounting Oversight Board (United States) ("PCAOB") and are required to be independent with respect to the Trust in accordance with the U.S. federal securities laws and the applicable rules and regulations of the Securities and Exchange Commission and the PCAOB.
We conducted our audit in accordance with the standards of the PCAOB. Those standards require that we plan and perform the audit to obtain reasonable assurance about whether the financial statements are free of material misstatement, whether due to error or fraud. The Trust is not required to have, nor were we engaged to perform, an audit of the Trust's internal control over financial reporting. As part of our audit, we are required to obtain an understanding of internal control over financial reporting but not for the purpose of expressing an opinion on the effectiveness of the Trust's internal control over financial reporting. Accordingly, we express no such opinion.
Our audit included performing procedures to assess the risks of material misstatement of the financial statements, whether due to error or fraud, and performing procedures that respond to those risks. Such procedures included examining, on a test basis, evidence regarding the amounts and disclosures in the financial statements. Our procedures included confirmation of securities owned as of October 31, 2024, by correspondence with the custodian, brokers and others; when replies were not received from brokers and others, we performed other auditing procedures. Our audit also included evaluating the accounting principles used and significant estimates made by management, as well as evaluating the overall presentation of the financial statements. We believe that our audit provides a reasonable basis for our opinion.

We have served as the auditor of one or more UBS investment companies since 1978.
New York, New York
December 26, 2024
21
Credit Suisse Managed Futures Strategy Fund
Proxy voting and portfolio holdings information (unaudited)
Information regarding how the Fund voted proxies related to its portfolio securities during the 12-month period ended June 30 of each year, as well as the policies and procedures that the Fund uses to determine how to vote proxies relating to its portfolio securities are available:
• By calling 1-877-870-2874
• On the Fund's website, www.credit-suisse.com/us/funds
• On the website of the Securities and Exchange Commission, www.sec.gov
The Fund files a complete schedule of its portfolio holdings for the first and third quarters of its fiscal year with the SEC as an exhibit to its reports on Form N-PORT, and for reporting periods ended prior to March 31, 2019, filed such information on Form N-Q. The Fund's Forms N-PORT and N-Q are available on the SEC's website at www.sec.gov.
22

UBS Asset Management (Americas) LLC
787 Seventh Avenue
New York, New York 10019-6028
(b) Included as part of the financial statements to shareholders filed under Item 7(a) of this form.
Item 8. Changes in and Disagreements with Accountants for Open-End Management Investment Companies.
On April 23, 2024, the Fund's Board approved the dismissal of PricewaterhouseCoopers LLP ("PwC") as the independent registered public accounting firm for the Fund, due to PwC's ceasing to be deemed an independent registered public accounting firm with respect to the Fund after April 30, 2024. The Board's decision to approve the dismissal of PwC was recommended by the Audit Committee of the Board. PwC's reports on the Fund's financial statements for the fiscal periods ended December 31, 2023 and December 31, 2022 contained no adverse opinion or disclaimer of opinion nor were they qualified or modified as to uncertainty, audit scope or accounting principle. During the Fund's fiscal periods ended December 31, 2023 and December 31, 2022 and the subsequent interim period through April 23, 2024, (i) there were no disagreements with PwC on any matter of accounting principles or practices, financial statement disclosure or auditing scope or procedure, which disagreements, if not resolved to the satisfaction of PwC, would have caused them to make reference to the subject matter of the disagreements in connection with their reports on the Fund's financial statements for such periods, and (ii) there were no "reportable events" of the kind described in Item 304(a)(1)(v) of Regulation S-K under the Securities Exchange Act of 1934, as amended. The Fund provided PwC with a copy of the foregoing disclosures and requested that PwC furnish the Fund with a letter addressed to the SEC stating whether or not it agrees with the above disclosures. A copy of the letter furnished pursuant to that request is attached as Exhibit 99(a)(5) to this Form N-CSR.
Effective June 19, 2024, Ernst & Young LLP ("EY") was engaged as the independent registered public accounting firm following the recommendation of the Audit Committee of the Portfolio's Board and approval by the Fund's Board. During the Fund's fiscal periods ended December 31, 2023 and December 31, 2022 and the subsequent interim period through June 19, 2024, neither the Fund, nor anyone on its behalf, consulted with EY on items which: (i) concerned the application of accounting principles to a specified transaction, either completed or proposed, or the type of audit opinion that might be rendered on the Fund's financial statements; or (ii) concerned the subject of a disagreement (as defined in paragraph (a)(1)(iv) of Item 304 of Regulation S-K) or reportable events (as described in paragraph (a)(1)(v) of said Item 304).
Item 9. Proxy Disclosures for Open-End Management Investment Companies.
Shareholder meeting results
A Joint Special Meeting of Shareholders of the series of the Credit Suisse Managed Futures Strategy Fund and Credit Suisse Multialternative Strategy Fund, each a series of Credit Suisse Opportunity Funds, was held on November 15, 2024 (the "Meeting"). The Meeting was held to Approve the Agreement and Plan of Reorganization providing for (i) the transfer of all assets of the of the Credit Suisse Managed Futures Strategy Fund and Credit Suisse Multialternative Strategy Fund (the "Acquired Funds") to the Manteio Managed Futures Strategy Fund and Manteio Multialternative Strategy Fund (the "Acquiring Funds"), a newly created series of Investment Managers Series Trust III, in exchange for (a) shares of the Acquiring Funds with an aggregate net asset value ("NAV") per class equal to the aggregate NAV of the corresponding class of shares of the Acquired Funds, and (b) the Acquiring Funds' assumption of all of the liabilities of the Acquired Funds, followed by (ii) the liquidating distribution by the Acquired Funds to its shareholders of the shares of the Acquiring Funds received in the exchange in proportion, on a class-by-class basis, to the shareholders' respective holdings of shares of the Acquired Funds.
The results of voting were as follows:
| | | Credit Suisse
Managed Futures
Strategy Fund | | Credit Suisse
Multialternative
Strategy Fund | |
For | | | 16,640,247 | | | | 27,555,562 | | |
Against | | | 22,765 | | | | — | | |
Abstain | | | 13,782 | | | | 5,182 | | |
Item 10. Remuneration Paid to Directors, Officers, and Others of Open-End Management Investment Companies.
(1) All board members and all members of any advisory board for regular compensation: $333,566
(2) Each board member and each member of an advisory board for special compensation: $50,000
(3) All officers: Not applicable.
(4) Each person of whom any officer or director of the registrant is an affiliated person: Not applicable.
Item 11. Statement Regarding Basis for Approval of Investment Advisory Contract.
Not applicable.
SIGNATURES
Pursuant to the requirements of the Securities Exchange Act of 1934 and the Investment Company Act of 1940, the registrant has duly caused this report to be signed on its behalf by the undersigned, thereunto duly authorized.
| | CREDIT SUISSE OPPORTUNITY FUNDS | |
| | | |
| | /s/ Omar Tariq | |
| | Name: | Omar Tariq | |
| | Title: | Chief Executive Officer and President | |
| | (Principal Executive Officer) | |
| | Date: | January 10, 2025 | |
Pursuant to the requirements of the Securities Exchange Act of 1934 and the Investment Company Act of 1940, this report has been signed below by the following persons on behalf of the registrant and in the capacities and on the dates indicated.
| | /s/ Omar Tariq | |
| | Name: | Omar Tariq | |
| | Title: | Chief Executive Officer and President | |
| | (Principal Executive Officer) | |
| | Date: | January 10, 2025 | |
| | | |
| | /s/ Rose Ann Bubloski | |
| | Name: | Rose Ann Bubloski | |
| | Title: | Chief Financial Officer and Treasurer | |
| | (Principal Financial Officer) | |
| | Date: | January 10, 2025 | |