UNITED STATES
SECURITIES AND EXCHANGE COMMISSION
Washington, D.C. 20549
FORM N-CSR
CERTIFIED SHAREHOLDER REPORT OF REGISTERED
MANAGEMENT INVESTMENT COMPANIES
| | |
| Investment Company Act file number: | | 811-07343 |
| |
| Exact name of registrant as specified in charter: | | The Prudential Investment Portfolios, Inc. |
| |
| Address of principal executive offices: | | Gateway Center 3, 100 Mulberry Street, Newark, New Jersey 07102 |
| |
| Name and address of agent for service: | | Deborah A. Docs Gateway Center 3, 100 Mulberry Street, Newark, New Jersey 07102 |
| |
| Registrant’s telephone number, including area code: | | 973-367-7521 |
| |
| Date of fiscal year end: | | 9/30/2006 |
| |
| Date of reporting period: | | 3/31/2006 |
Item 1 – Reports to Stockholders

Jennison Growth Fund
| | |
| MARCH 31, 2006 | | SEMIANNUAL REPORT |

FUND TYPE
Medium- to large- capitalization stock
OBJECTIVE
Long-term growth of capital
This report is not authorized for distribution to prospective investors unless preceded or accompanied by a current prospectus.
The views expressed in this report and information about the Fund’s portfolio holdings are for the period covered by this report and are subject to change thereafter.
The accompanying financial statements as of March 31, 2006, were not audited, and accordingly, no auditor’s opinion is expressed on them.
JennisonDryden is a registered trademark of The Prudential Insurance Company of America.

May 15, 2006
Dear Shareholder:
We hope you find the semiannual report for the Jennison Growth Fund informative and useful. As a JennisonDryden mutual fund shareholder, you may be thinking about where you can find additional growth opportunities. You could invest in last year’s top-performing asset class and hope history repeats itself or you could stay in cash while waiting for the “right moment” to invest.
Instead, we believe it is better to take advantage of developing domestic and global investment opportunities through a diversified portfolio of stock and bond mutual funds. A diversified asset allocation offers two potential advantages. It helps you manage downside risk by not being overly exposed to any particular asset class, plus it gives you a better opportunity to have at least some of your assets in the right place at the right time. Your financial professional can help you create a diversified investment plan that may include mutual funds covering all the basic asset classes and that reflects your personal investor profile and tolerance for risk.
JennisonDryden Mutual Funds gives you a wide range of choices that can help you make progress toward your financial goals. Our funds offer the experience, resources, and professional discipline of three leading asset managers. They are recognized and respected in the institutional market and by discerning investors for excellence in their respective strategies. JennisonDryden equity funds are advised by Jennison Associates LLC or Quantitative Management Associates LLC (QMA). Prudential Investment Management, Inc. (PIM) advises the JennisonDryden fixed income and money market funds. Jennison Associates, QMA, and PIM are registered investment advisors and Prudential Financial companies.
Thank you for choosing JennisonDryden Mutual Funds.
Sincerely,

Judy A. Rice, President
The Prudential Investment Portfolios, Inc./Jennison Growth Fund
| | |
| The Prudential Investment Portfolios, Inc./Jennison Growth Fund | | 1 |
Your Fund’s Performance
Fund objective
The investment objective of the Jennison Growth Fund (the Fund) is long-term growth of capital. There can be no assurance that the Fund will achieve its investment objective.
Performance data quoted represent past performance. Past performance does not guarantee future results. The investment return and principal value of an investment will fluctuate, so that an investor’s shares, when redeemed, may be worth more or less than their original cost. Current performance may be lower or higher than the past performance data quoted. An investor may obtain performance data as of the most recent month-end by visiting our website at www.jennisondryden.com or by calling (800) 225-1852. The maximum initial sales charge is 5.50% (Class A shares).
| | | | | | | | | | | | | | | |
| Cumulative Total Returns1 as of 3/31/06 | | | | | | | | | | | | | |
| | | Six Months | | | One Year | | | Five Years | | | Ten Years | | | Since Inception2 | |
Class A | | 6.99 | % | | 21.78 | % | | 9.57 | % | | 110.35 | % | | 118.55 | % |
Class B | | 6.60 | | | 20.84 | | | 5.55 | | | 95.20 | | | 102.22 | |
Class C | | 6.60 | | | 20.84 | | | 5.55 | | | 95.20 | | | 102.22 | |
Class R | | 6.86 | | | 21.46 | | | N/A | | | N/A | | | 16.50 | |
Class Z | | 7.12 | | | 22.12 | | | 10.94 | | | N/A | | | 117.16 | |
S&P 500 Index3 | | 6.38 | | | 11.72 | | | 21.46 | | | 135.71 | | | *** | |
Russell 1000 Growth Index4 | | 6.16 | | | 13.14 | | | 8.59 | | | 87.65 | | | **** | |
Lipper Large-Cap Growth Funds Avg.5 | | 6.35 | | | 14.24 | | | 5.33 | | | 91.22 | | | ***** | |
| | | | | | | | | | | | | | | | |
| Average Annual Total Returns1 as of 3/31/06 | | | | | | | | | | | | | |
| | | | | | One Year | | | Five Years | | | Ten Years | | | Since Inception2 | |
Class A | | | | | 15.09 | % | | 0.70 | % | | 7.11 | % | | 7.21% | |
Class B | | | | | 15.84 | | | 0.89 | | | 6.92 | | | 7.00 | |
Class C | | | | | 19.84 | | | 1.09 | | | 6.92 | | | 7.00 | |
Class R | | | | | 21.46 | | | N/A | | | N/A | | | 12.60 | |
Class Z | | | | | 22.12 | | | 2.10 | | | N/A | | | 8.10 | |
S&P 500 Index3 | | | | | 11.72 | | | 3.97 | | | 8.95 | | | *** | |
Russell 1000 Growth Index4 | | | | | 13.14 | | | 1.66 | | | 6.50 | | | **** | |
Lipper Large-Cap Growth Funds Avg.5 | | | | | 14.24 | | | 0.93 | | | 6.53 | | | ***** | |
The cumulative total returns do not reflect the deduction of applicable sales charges. If reflected, the applicable sales charges would reduce the cumulative total returns performance quoted. Class A shares are subject to a maximum front-end sales charge of 5.50%. Under certain circumstances, Class A shares may be subject to a contingent deferred sales charge (CDSC) of 1%. Class B and Class C shares are subject to a maximum CDSC of 5% and 1%, respectively. Class R and Class Z shares are not subject to a sales charge.
| | |
| 2 | | Visit our website at www.jennisondryden.com |
1Source: Prudential Investments LLC and Lipper Inc. The average annual total returns take into account applicable sales charges. During certain periods shown, fee waivers and/or expense reimbursements were in effect. Without such fee waivers and expense reimbursements, the returns for the share classes would have been lower. Class A, Class B, and Class C shares are subject to an annual distribution and service (12b-1) fee of up to 0.30%, 1.00%, and 1.00%, respectively. Approximately seven years after purchase, Class B shares will automatically convert to Class A shares on a quarterly basis. Class Z shares are not subject to a 12b-1 fee. The returns in the tables do not reflect the deduction of taxes that a shareholder would pay on Fund distributions or following the redemption of Fund shares.
2Inception dates: Class A, B, and C, 11/2/95; Class R, 12/17/04; and Class Z, 4/15/96. On 9/20/96, The Prudential Institutional Fund/Growth Stock Fund merged into Jennison Growth Fund, Class Z shares. Performance for Class Z shares prior to 9/20/96 is for the Growth Stock Fund, which had an inception date of 11/5/92.
3The Standard & Poor’s 500 Composite Stock Price Index (S&P 500 Index) is an unmanaged index of 500 stocks of large U.S. public companies. It gives a broad look at how U.S. stock prices have performed.
4The Russell 1000 Growth Index is an unmanaged index comprising those securities in the Russell 1000 Index with a greater-than-average growth orientation. Companies in this index tend to exhibit relatively high price-to-book ratios, price-to-earnings ratios and forecasted growth rates, and relatively low dividend yields.
5The Lipper Large-Cap Growth Funds Average (Lipper Average) represents returns based on the average return of all funds in the Lipper Large-Cap Growth Funds category for the periods noted. Funds in the Lipper Average invest at least 75% of their equity assets in companies with market capitalizations (on a three-year weighted basis) greater than 300% of the dollar-weighted median market capitalization of the middle 1,000 securities of the S&P SuperComposite 1500 Index. Large-cap growth funds typically have an above-average price-to-earnings ratio, price-to-book ratio, and three-year sales-per-share growth value compared with the S&P 500 Index.
Investors cannot invest directly in an index. The returns for the S&P 500 Index and the Russell 1000 Growth Index would be lower if they included the effects of sales charges, operating expenses of a mutual fund, or taxes. Returns for the Lipper Average reflect the deduction of operating expenses, but not sales charges or taxes.
***S&P 500 Index Closest Month-End to Inception cumulative total returns are 164.24% for Class A, B, and C; 9.32% for Class R; and 298.62% for Class Z. S&P 500 Index Closest Month-End to Inception average annual total returns are 9.78% for Class A, B, and C; 7.39% for Class R; and 10.86% for Class Z.
****Russell 1000 Growth Index Closest Month-End to Inception cumulative total returns are 106.59% for Class A, B, and C; 8.52% for Class R; and 201.76% for Class Z. Russell 1000 Growth Index Closest Month-End to Inception average annual total returns are 7.21% for Class A, B, and C; 6.76% for Class R; and 8.58% for Class Z.
*****Lipper Average Closest Month-End to Inception cumulative total returns are 106.43% for Class A, B, and C; 9.05% for Class R; and 208.39% for Class Z. Lipper Average Closest Month-End to Inception average annual total returns are 7.05% for Class A, B, and C; 7.16% for Class R; and 8.61% for Class Z.
| | |
| The Prudential Investment Portfolios, Inc./Jennison Growth Fund | | 3 |
Your Fund’s Performance (continued)
| | | |
Five Largest Holdings expressed as a percentage of net assets as of 3/31/06
(excluding short-term investments) | | | |
Google, Inc. (Class “A” Stock), Internet Software & Services | | 4.4 | % |
eBay, Inc., Internet Software & Services | | 3.2 | |
Procter & Gamble Co., Household Products | | 3.0 | |
Microsoft Corp., Software | | 2.4 | |
Schlumberger Ltd., Energy Equipment & Services | | 2.4 | |
Holdings are subject to change.
| | | |
Five Largest Industries expressed as a percentage of net assets as of 3/31/06
(excluding short-term investments) | | | |
Internet Software & Services | | 9.9 | % |
Software | | 8.9 | |
Semiconductors & Semiconductor Equipment | | 8.7 | |
Capital Markets | | 8.3 | |
Biotechnology | | 6.2 | |
Industry weightings are subject to change.
| | |
| 4 | | Visit our website at www.jennisondryden.com |
Fees and Expenses (Unaudited)
As a shareholder of the Fund, you incur two types of costs: (1) transaction costs, including sales charges (loads) on purchase payments and redemptions, as applicable, and (2) ongoing costs, including management fees, distribution and/or service (12b-1) fees, and other Fund expenses, as applicable. This example is intended to help you understand your ongoing costs (in dollars) of investing in the Fund and to compare these costs with the ongoing costs of investing in other mutual funds.
The example is based on an investment of $1,000 invested on October 1, 2005, at the beginning of the period, and held through the six-month period ended March 31, 2006.
The Fund’s transfer agent may charge additional fees to holders of certain accounts that are not included in the expenses shown in the table on the following page. These fees apply to Individual Retirement Accounts (IRAs) and Section 403(b) accounts. As of the close of the six-month period covered by the table, IRA fees included an annual maintenance fee of $15 per account (subject to a maximum annual maintenance fee of $25 for all accounts held by the same shareholder). Section 403(b) accounts are charged an annual $25 fiduciary maintenance fee. Some of the fees may vary in amount, or may be waived, based on your total account balance or the number of JennisonDryden or Strategic Partners Funds, including the Fund, that you own. You should consider the additional fees that were charged to your Fund account over the six-month period when you estimate the total ongoing expenses paid over the period and the impact of these fees on your ending account value, as these additional expenses are not reflected in the information provided in the expense table. Additional fees have the effect of reducing investment returns.
Actual Expenses
The first line for each share class in the table on the following page provides information about actual account values and actual expenses. You may use the information on this line, together with the amount you invested, to estimate the expenses that you paid over the period. Simply divide your account value by $1,000 (for example, an $8,600 account value ÷ $1,000 = 8.6), then multiply the result by the number on the first line under the heading “Expenses Paid During the Six-Month Period” to estimate the expenses you paid on your account during this period.
Hypothetical Example for Comparison Purposes
The second line for each share class in the table on the following page provides information about hypothetical account values and hypothetical expenses based on the Fund’s actual expense ratio and an assumed rate of return of 5% per year before
| | |
| The Prudential Investment Portfolios, Inc./Jennison Growth Fund | | 5 |
Fees and Expenses (continued)
expenses, which is not the Fund’s actual return. The hypothetical account values and
expenses may not be used to estimate the actual ending account balance or expenses you paid for the period. You may use this information to compare the ongoing costs of investing in the Fund and other funds. To do so, compare this 5% hypothetical example with the 5% hypothetical examples that appear in the shareholder reports of the other funds.
Please note that the expenses shown in the table are meant to highlight your ongoing costs only, and do not reflect any transactional costs such as sales charges (loads). Therefore the second line for each share class in the table is useful in comparing ongoing costs only, and will not help you determine the relative total costs of owning different funds. In addition, if these transactional costs were included, your costs would have been higher.
| | | | | | | | | | | | | | |
Jennison
Growth Fund | | Beginning Account Value October 1, 2005 | | Ending Account
Value March 31, 2006 | | Annualized Expense Ratio
Based on the
Six-Month
Period | | | Expenses Paid
During the Six-
Month Period* |
| | | | | | | | | | | | | | | |
| Class A | | Actual | | $ | 1,000.00 | | $ | 1,069.90 | | 1.04 | % | | $ | 5.37 |
| | | Hypothetical | | $ | 1,000.00 | | $ | 1,019.75 | | 1.04 | % | | $ | 5.24 |
| | | | | | | | | | | | | | | |
| Class B | | Actual | | $ | 1,000.00 | | $ | 1,066.00 | | 1.79 | % | | $ | 9.22 |
| | | Hypothetical | | $ | 1,000.00 | | $ | 1,016.01 | | 1.79 | % | | $ | 9.00 |
| | | | | | | | | | | | | | | |
| Class C | | Actual | | $ | 1,000.00 | | $ | 1,066.00 | | 1.79 | % | | $ | 9.22 |
| | | Hypothetical | | $ | 1,000.00 | | $ | 1,016.01 | | 1.79 | % | | $ | 9.00 |
| | | | | | | | | | | | | | | |
| Class R | | Actual | | $ | 1,000.00 | | $ | 1,067.80 | | 1.29 | % | | $ | 6.65 |
| | | Hypothetical | | $ | 1,000.00 | | $ | 1,018.50 | | 1.29 | % | | $ | 6.49 |
| | | | | | | | | | | | | | | |
| Class Z | | Actual | | $ | 1,000.00 | | $ | 1,071.20 | | 0.79 | % | | $ | 4.08 |
| | | Hypothetical | | $ | 1,000.00 | | $ | 1,020.99 | | 0.79 | % | | $ | 3.98 |
* Fund expenses (net of fee waivers or subsidies, if any) for each share class are equal to the annualized expense ratio for each share class (provided in the table), multiplied by the average account value over the period, multiplied by the 182 days in the six-month period ended March 31, 2006, and divided by the 365 days in the Fund’s fiscal year ending September 30, 2006 (to reflect the six-month period).
| | |
| 6 | | Visit our website at www.jennisondryden.com |
Portfolio of Investments
as of March 31, 2006 (Unaudited)
| | | | | |
| Shares | | Description | | Value (Note 1) |
| | | | | | |
LONG-TERM INVESTMENTS 98.3% | | | |
COMMON STOCKS | | | |
| |
Beverages 1.7% | | | |
| 896,400 | | PepsiCo, Inc. | | $ | 51,802,956 |
| |
Biotechnology 6.2% | | | |
| 931,800 | | Amgen, Inc.(a)(b) | | | 67,788,450 |
| 695,400 | | Genentech, Inc.(a) | | | 58,768,254 |
| 1,004,000 | | Gilead Sciences, Inc.(a) | | | 62,468,880 |
| | | | |
|
|
| | | | | | 189,025,584 |
| |
Capital Markets 8.3% | | | |
| 3,270,500 | | Charles Schwab Corp. (The) | | | 56,285,305 |
| 303,400 | | Goldman Sachs Group, Inc. | | | 47,621,664 |
| 247,100 | | Legg Mason, Inc. | | | 30,969,043 |
| 788,400 | | Merrill Lynch & Co., Inc. | | | 62,094,384 |
| 518,000 | | UBS AG | | | 56,964,460 |
| | | | |
|
|
| | | | | | 253,934,856 |
| |
Communications Equipment 5.1% | | | |
| 2,886,200 | | Cisco Systems, Inc.(a) | | | 62,543,954 |
| 1,914,500 | | Nokia OYJ ADR (Finland) | | | 39,668,440 |
| 1,057,300 | | QUALCOMM, Inc. | | | 53,509,953 |
| | | | |
|
|
| | | | | | 155,722,347 |
| |
Computers & Peripherals 1.4% | | | |
| 677,500 | | Apple Computer, Inc.(a) | | | 42,492,800 |
| |
Consumer Finance 2.3% | | | |
| 1,352,500 | | American Express Co. | | | 71,073,875 |
| |
Electronic Equipment & Instruments 1.5% | | | |
| 1,264,200 | | Agilent Technologies, Inc.(a) | | | 47,470,710 |
| |
Energy Equipment & Services 2.4% | | | |
| 576,300 | | Schlumberger Ltd. | | | 72,942,291 |
| |
Food & Staples Retailing 1.7% | | | |
| 762,800 | | Whole Foods Market, Inc.(b) | | | 50,680,432 |
| |
Health Care Equipment & Supplies 3.2% | | | |
| 536,300 | | Alcon, Inc. | | | 55,914,638 |
| 1,001,600 | | St. Jude Medical, Inc.(a) | | | 41,065,600 |
| | | | |
|
|
| | | | | | 96,980,238 |
See Notes to Financial Statements.
| | |
| The Prudential Investment Portfolios, Inc./Jennison Growth Fund | | 7 |
Portfolio of Investments
as of March 31, 2006 (Unaudited) Cont’d.
| | | | | |
| Shares | | Description | | Value (Note 1) |
| | | | | | |
Health Care Providers & Services 5.7% | | | |
| 955,600 | | Caremark Rx, Inc.(a) | | $ | 46,996,408 |
| 200,900 | | CIGNA Corp. | | | 26,241,558 |
| 1,095,500 | | UnitedHealth Group, Inc. | | | 61,194,630 |
| 507,400 | | WellPoint, Inc.(a) | | | 39,287,982 |
| | | | |
|
|
| | | | | | 173,720,578 |
| |
Hotels, Restaurants & Leisure 2.3% | | | |
| 676,100 | | Cheesecake Factory (The)(a)(b) | | | 25,319,945 |
| 638,100 | | Marriott International, Inc. (Class A) | | | 43,773,660 |
| | | | |
|
|
| | | | | | 69,093,605 |
| |
Household Products 3.0% | | | |
| 1,588,790 | | Procter & Gamble Co. | | | 91,546,080 |
| |
Industrial Conglomerates 1.8% | | | |
| 1,624,200 | | General Electric Co. | | | 56,489,676 |
| |
Insurance 2.0% | | | |
| 920,600 | | American International Group, Inc. | | | 60,842,454 |
| |
Internet Software & Services 9.9% | | | |
| 2,530,800 | | eBay, Inc.(a)(b) | | | 98,853,048 |
| 343,100 | | Google, Inc. (Class A)(a) | | | 133,809,000 |
| 2,217,800 | | Yahoo!, Inc.(a)(b) | | | 71,546,228 |
| | | | |
|
|
| | | | | | 304,208,276 |
| |
Media 2.7% | | | |
| 2,179,200 | | Disney (Walt) Co. | | | 60,777,888 |
| 275,000 | | Getty Images, Inc.(a)(b) | | | 20,592,000 |
| | | | |
|
|
| | | | | | 81,369,888 |
| |
Multiline Retail 3.2% | | | |
| 733,500 | | Federated Department Stores, Inc. | | | 53,545,500 |
| 850,800 | | Target Corp. | | | 44,250,108 |
| | | | |
|
|
| | | | | | 97,795,608 |
| |
Oil, Gas & Consumable Fuels 2.5% | | | |
| 409,400 | | Occidental Petroleum Corp. | | | 37,930,910 |
| 492,200 | | Suncor Energy, Inc. | | | 37,909,244 |
| | | | |
|
|
| | | | | | 75,840,154 |
See Notes to Financial Statements.
| | |
| 8 | | Visit our website at www.jennisondryden.com |
| | | | | |
| Shares | | Description | | Value (Note 1) |
| | | | | | |
Pharmaceuticals 5.5% | | | |
| 1,092,600 | | Novartis AG ADR (Switzerland) | | $ | 60,573,744 |
| 872,600 | | Roche Holdings AG ADR (Switzerland) | | | 64,801,458 |
| 454,700 | | Sanofi-Aventis (France) | | | 43,255,956 |
| 2,800 | | Sanofi-Aventis ADR (France) | | | 132,860 |
| | | | |
|
|
| | | | | | 168,764,018 |
| |
Semiconductors & Semiconductor Equipment 8.7% | | | |
| 1,627,900 | | Broadcom Corp. (Class A)(a)(b) | | | 70,260,164 |
| 1,186,100 | | Marvell Technology Group Ltd.(a)(b) | | | 64,168,010 |
| 1,819,900 | | Maxim Integrated Products, Inc. | | | 67,609,285 |
| 2,022,900 | | Texas Instruments, Inc.(b) | | | 65,683,563 |
| | | | |
|
|
| | | | | | 267,721,022 |
| |
Software 8.9% | | | |
| 1,980,000 | | Adobe Systems, Inc. | | | 69,141,600 |
| 950,700 | | Electronic Arts, Inc.(a) | | | 52,022,304 |
| 2,742,200 | | Microsoft Corp. | | | 74,615,262 |
| 348,100 | | NAVTEQ Corp.(a)(b) | | | 17,631,265 |
| 1,089,000 | | SAP AG ADR (Germany) | | | 59,154,480 |
| | | | |
|
|
| | | | | | 272,564,911 |
| |
Specialty Retail 5.3% | | | |
| 1,151,400 | | Chico’s FAS, Inc.(a)(b) | | | 46,792,896 |
| 714,900 | | Home Depot, Inc. | | | 30,240,270 |
| 683,900 | | Lowe’s Cos., Inc. | | | 44,070,516 |
| 657,100 | | Urban Outfitters, Inc.(a)(b) | | | 16,125,234 |
| 616,400 | | Williams-Sonoma, Inc.(a)(b) | | | 26,135,360 |
| | | | |
|
|
| | | | | | 163,364,276 |
| |
Textiles, Apparel & Luxury Goods 3.0% | | | |
| 1,319,500 | | Coach, Inc.(a) | | | 45,628,310 |
| 533,800 | | Nike, Inc. (Class B)(b) | | | 45,426,380 |
| | | | |
|
|
| | | | | | 91,054,690 |
| | | | |
|
|
| | | Total long-term investments
(cost $2,169,534,909) | | | 3,006,501,325 |
| | | | |
|
|
See Notes to Financial Statements.
| | |
| The Prudential Investment Portfolios, Inc./Jennison Growth Fund | | 9 |
Portfolio of Investments
as of March 31, 2006 (Unaudited) Cont’d.
| | | | | | |
| Shares | | Description | | Value (Note 1) | |
| | | | | | | |
SHORT-TERM INVESTMENT 8.9% | | | | |
| |
Affiliated Money Market Mutual Fund | | | | |
| | | Dryden Core Investment Fund - Taxable Money Market Series | | | | |
| 272,807,844 | | (cost $272,807,844; includes $237,871,019 of cash collateral received for securities on loan)(Note 3)(c)(d) | | $ | 272,807,844 | |
| | | | |
|
|
|
| | | Total Investments 107.2%
(cost $2,442,342,753; Note 5) | | | 3,279,309,169 | |
| | | Liabilities in excess of other assets (7.2%) | | | (219,326,569 | ) |
| | | | |
|
|
|
| | | Net Assets 100.0% | | $ | 3,059,982,600 | |
| | | | |
|
|
|
The following abbreviation is used in portfolio descriptions:
ADR—American Depositary Receipt
| (a) | Non-income producing security. |
| (b) | All or portion of security on loan. The aggregate market value of such securities is $228,031,571; cash collateral of $237,871,019 (included in liabilities) was received with which the Fund purchased highly liquid short-term investments. |
| (c) | Represents security, or a portion thereof, purchased with cash collateral received for securities on loan. |
| (d) | Prudential Investments LLC, the manager of the Fund, also serves as manager of the Dryden Core Investment Fund-Taxable Money Market Series. |
See Notes to Financial Statements.
| | |
| 10 | | Visit our website at www.jennisondryden.com |
The industry classification of portfolio holdings and liabilities in excess of other assets shown as a percentage of net assets as of March 31, 2006 were as follows:
| | | |
Internet Software & Services | | 9.9 | % |
Affiliated Money Market Mutual Fund | | 8.9 | |
Software | | 8.9 | |
Semiconductors & Semiconductor Equipment | | 8.7 | |
Capital Markets | | 8.3 | |
Biotechnology | | 6.2 | |
Health Care Providers & Services | | 5.7 | |
Pharmaceuticals | | 5.5 | |
Specialty Retail | | 5.3 | |
Communications Equipment | | 5.1 | |
Health Care Equipment & Supplies | | 3.2 | |
Multiline Retail | | 3.2 | |
Household Products | | 3.0 | |
Textiles, Apparel & Luxury Goods | | 3.0 | |
Media | | 2.7 | |
Oil, Gas & Consumable Fuels | | 2.5 | |
Energy Equipment & Services | | 2.4 | |
Consumer Finance | | 2.3 | |
Hotels, Restaurants & Leisure | | 2.3 | |
Insurance | | 2.0 | |
Industrial Conglomerates | | 1.8 | |
Beverages | | 1.7 | |
Food & Staples Retailing | | 1.7 | |
Electronic Equipment & Instruments | | 1.5 | |
Computers & Peripherals | | 1.4 | |
| | |
|
|
Total Investments | | 107.2 | |
Liabilities in excess of other assets | | (7.2 | ) |
| | |
|
|
Total Net Assets | | 100.0 | % |
| | |
|
|
See Notes to Financial Statements.
| | |
| The Prudential Investment Portfolios, Inc./Jennison Growth Fund | | 11 |
Statement of Assets and Liabilities
as of March 31, 2006 (Unaudited)
| | | | |
Assets | | | | |
Investments at value, including securities on loan of $228,031,571: | | | | |
Unaffiliated investments (cost $2,169,534,909) | | $ | 3,006,501,325 | |
Affiliated investments (cost $272,807,844) | | | 272,807,844 | |
Receivable for investments sold | | | 31,374,706 | |
Receivable for Series shares sold | | | 6,438,402 | |
Dividends receivable | | | 3,447,079 | |
Foreign tax reclaim receivable | | | 490,874 | |
Prepaid expenses | | | 6,168 | |
| | |
|
|
|
Total assets | | | 3,321,066,398 | |
| | |
|
|
|
| |
Liabilities | | | | |
Payable to broker for collateral for securities on loan (Note 4) | | | 237,871,019 | |
Payable for investments purchased | | | 11,039,249 | |
Payable for Series shares reacquired | | | 7,751,755 | |
Management fee payable | | | 1,595,542 | |
Transfer agent fee payable | | | 1,149,899 | |
Accrued expenses | | | 868,250 | |
Distribution fee payable | | | 665,265 | |
Payable to custodian | | | 130,759 | |
Deferred directors’ fees | | | 12,060 | |
| | |
|
|
|
Total liabilities | | | 261,083,798 | |
| | |
|
|
|
| |
Net Assets | | $ | 3,059,982,600 | |
| | |
|
|
|
| | | | | |
Net assets were comprised of: | | | | |
Common stock, at par | | $ | 187,066 | |
Paid-in capital in excess of par | | | 3,856,973,432 | |
| | |
|
|
|
| | | | 3,857,160,498 | |
Accumulated net investment loss | | | (2,808,345 | ) |
Accumulated net realized loss on investments and foreign currency transactions | | | (1,631,335,969 | ) |
Net unrealized appreciation on investments and foreign currencies | | | 836,966,416 | |
| | |
|
|
|
Net assets, March 31, 2006 | | $ | 3,059,982,600 | |
| | |
|
|
|
See Notes to Financial Statements.
| | |
| 12 | | Visit our website at www.jennisondryden.com |
| | | |
Class A | | | |
Net asset value and redemption price per share | | | |
($1,408,681,811 ÷ 86,000,993 shares of common stock issued and outstanding) | | $ | 16.38 |
Maximum sales charge (5.50% of offering price) | | | .95 |
| | |
|
|
Maximum offering price to public | | $ | 17.33 |
| | |
|
|
| |
Class B | | | |
Net asset value, offering price and redemption price per share | | | |
($328,983,516 ÷ 21,898,534 shares of common stock issued and outstanding) | | $ | 15.02 |
| | |
|
|
| |
Class C | | | |
Net asset value, offering price and redemption price per share | | | |
($91,372,864 ÷ 6,081,821 shares of common stock issued and outstanding) | | $ | 15.02 |
| | |
|
|
| |
Class R | | | |
Net asset value, offering price and redemption price per share | | | |
($3,208 ÷ 212.16 shares of common stock issued and outstanding) | | $ | 15.12 |
| | |
|
|
| |
Class Z | | | |
Net asset value, offering price and redemption price per share | | | |
($1,230,941,201 ÷ 73,084,541 shares of common stock issued and outstanding) | | $ | 16.84 |
| | |
|
|
See Notes to Financial Statements.
| | |
| The Prudential Investment Portfolios, Inc./Jennison Growth Fund | | 13 |
Statement of Operations
Six Months Ended March 31, 2006 (Unaudited)
| | | | |
Net Investment Loss | | | | |
Income | | | | |
Unaffiliated dividend income (net of foreign withholding taxes of $431,994) | | $ | 13,361,551 | |
Affiliated dividend income | | | 811,112 | |
Affiliated income from securities loaned, net | | | 198,915 | |
| | |
|
|
|
Total income | | | 14,371,578 | |
| | |
|
|
|
| |
Expenses | | | | |
Management fee | | | 9,440,213 | |
Distribution fee—Class A | | | 1,699,040 | |
Distribution fee—Class B | | | 1,826,209 | |
Distribution fee—Class C | | | 452,696 | |
Distribution fee—Class R | | | 13 | |
Transfer agent’s fee and expenses (including affiliated expense of $2,629,300) | | | 3,034,000 | |
Reports to shareholders | | | 173,000 | |
Custodian’s fees and expenses | | | 126,000 | |
Insurance | | | 91,000 | |
Registration fees | | | 45,000 | |
Legal fees and expenses | | | 40,000 | |
Directors’ fees | | | 32,000 | |
Commitment fees | | | 12,000 | |
Audit fee | | | 8,000 | |
Miscellaneous | | | 4,655 | |
| | |
|
|
|
Total expenses | | | 16,983,826 | |
| | |
|
|
|
Net investment loss | | | (2,612,248 | ) |
| | |
|
|
|
| |
Realized And Unrealized Gain (Loss) On Investments And Foreign Currencies | | | | |
Net realized gain (loss) on: | | | | |
Investment transactions | | | 190,918,921 | |
Foreign currency transactions | | | (87,058 | ) |
| | |
|
|
|
| | | | 190,831,863 | |
| | |
|
|
|
Net change in unrealized appreciation (depreciation) on: | | | | |
Investments | | | 29,540,563 | |
Foreign currencies | | | 9,951 | |
| | |
|
|
|
| | | | 29,550,514 | |
| | |
|
|
|
Net gain on investments and foreign currencies | | | 220,382,377 | |
| | |
|
|
|
Net Increase In Net Assets Resulting From Operations | | $ | 217,770,129 | |
| | |
|
|
|
See Notes to Financial Statements.
| | |
| 14 | | Visit our website at www.jennisondryden.com |
Statement of Changes in Net Assets
(Unaudited)
| | | | | | | | |
| | | Six Months
Ended
March 31, 2006 | | | Year
Ended
September 30, 2005 | |
Increase (Decrease) In Net Assets | | | | | | | | |
Operations | | | | | | | | |
Net investment income (loss) | | $ | (2,612,248 | ) | | $ | 743,412 | |
Net realized gain on investments and foreign currency transactions | | | 190,831,863 | | | | 218,340,747 | |
Net change in unrealized appreciation (depreciation) on investments and foreign currencies | | | 29,550,514 | | | | 326,036,307 | |
| | |
|
|
| |
|
|
|
Net increase in net assets resulting from operations | | | 217,770,129 | | | | 545,120,466 | |
| | |
|
|
| |
|
|
|
| | |
Series share transactions (net of share conversions) (Note 6) | | | | | | | | |
Net proceeds from shares sold | | | 364,164,236 | | | | 556,475,402 | |
Net asset value of shares issued in connection with merger (Note 7) | | | — | | | | 1,510,490 | |
Cost of shares reacquired | | | (721,118,059 | ) | | | (956,691,647 | ) |
| | |
|
|
| |
|
|
|
Net decrease in net assets from Series share transactions | | | (356,953,823 | ) | | | (398,705,755 | ) |
| | |
|
|
| |
|
|
|
Total increase (decrease) | | | (139,183,694 | ) | | | 146,414,711 | |
| | |
Net Assets | | | | | | | | |
Beginning of period | | | 3,199,166,294 | | | | 3,052,751,583 | |
| | |
|
|
| |
|
|
|
End of period | | $ | 3,059,982,600 | | | $ | 3,199,166,294 | |
| | |
|
|
| |
|
|
|
See Notes to Financial Statements.
| | |
| The Prudential Investment Portfolios, Inc./Jennison Growth Fund | | 15 |
Notes to Financial Statements
(Unaudited)
The Prudential Investment Portfolios, Inc. (the “Company”) is registered under the Investment Company Act of 1940 as a diversified, open-end management investment company. The Company was incorporated in Maryland on August 10, 1995 and consists of six series: Jennison Growth Fund (the “Series”), Jennison Equity Opportunity Fund, Dryden Active Allocation Fund, JennisonDryden Growth Allocation Fund, JennisonDryden Moderate Allocation Fund and JennisonDryden Conservative Allocation Fund. These financial statements relate to the Jennison Growth Fund. The financial statements of the other series are not presented herein. The Series commenced investment operations on November 2, 1995.
The Series’ investment objective is to achieve long-term growth of capital. The Series seeks to achieve its objective by investing primarily in equity securities (common stock, preferred stock and securities convertible into common stock) of established companies with above-average growth prospects.
Note 1. Accounting Policies
The following is a summary of significant accounting policies followed by the Series in the preparation of its financial statements.
Securities Valuation: Securities listed on a securities exchange are valued at the last sale price on such exchange on the day of valuation or, if there was no sale on such day, at the mean between the last reported bid and asked prices, or at the last bid price on such day in the absence of an asked price. Securities traded via NASDAQ are valued at the NASDAQ official closing price (“NOCP”) on the day of valuation, or if there was no NOCP, at the last sale price. Securities that are actively traded in the over-the-counter market, including listed securities for which the primary market is believed by Prudential Investments LLC (“PI” or “Manager”), in consultation with the subadviser; to be over-the-counter, are valued at market value using prices provided by an independent pricing agent or principal market maker. Securities for which reliable market quotations are not readily available, or whose values have been effected by events occurring after the close of the security’s foreign market and before the Series’ normal pricing time, are valued at fair value in accordance with the Board of Directors’ approved fair valuation procedures. When determining the fair valuation of securities some of the factors influencing the valuation include, the nature of any restrictions on disposition of the securities; assessment of the general liquidity of the securities; the issuer’s financial condition and the markets in which it does business; the cost of the investment; the size of the holding and the capitalization of issuer; the
| | |
| 16 | | Visit our website at www.jennisondryden.com |
prices of any recent transactions or bids/offers for such securities or any comparable securities; any available analyst media or other reports or information deemed reliable by the investment adviser regarding the issuer or the markets or industry in which it operates. Using fair value to price securities may result in a value that is different from a security’s most recent closing price and from the price used by other mutual funds to calculate their net asset values. As of March 31, 2006, there were no securities valued in accordance with such procedures.
Investments in mutual funds are valued at the net asset value as of the close of the New York Stock Exchange on the date of valuation.
Short-term securities which mature in sixty days or less are valued at amortized cost, which approximates market value. The amortized cost method involves valuing a security at its cost on the date of purchase and thereafter assuming a constant amortization to maturity of the difference between the principal amount due at maturity and cost. Short-term securities which mature in more than sixty days are valued at current market quotations.
Securities Lending: The Series may lend its portfolio securities to qualified institutions. The loans are secured by collateral at least equal, at all times, to the market value of the securities loaned. The Series may bear the risk of delay in recovery of, or even loss of rights in, the securities loaned should the borrower of the securities fail financially. The Series receives compensation, net of any rebate, for lending its securities in the form of interest or dividends on the collateral received on the securities loaned, and any gain or loss in the market price of the securities loaned that may occur during the term of the loan.
Foreign Currency Translation: The books and records of the Series are maintained in U.S. dollars. Foreign currency amounts are translated into U.S. dollars on the following basis:
(i) market value of investment securities, other assets and liabilities-at the current rates of exchange;
(ii) purchases and sales of investment securities, income and expenses-at the rates of exchange prevailing on the respective dates of such transactions.
Although the net assets of the Series are presented at the foreign exchange rates and market values at the close of the fiscal period, the Series does not isolate that portion of the results of operations arising as a result of changes in the foreign exchange rates from the fluctuations arising from changes in the market prices of long-term portfolio securities held at the end of the fiscal period. Similarly, the Series does not isolate the
| | |
| The Prudential Investment Portfolios, Inc./Jennison Growth Fund | | 17 |
Notes to Financial Statements
(Unaudited) Cont’d
effect of changes in foreign exchange rates from the fluctuations arising from changes in the market prices of long-term portfolio securities sold during the fiscal period. Accordingly, these realized foreign currency gains or losses are included in the reported net realized gains or losses on investment transactions.
Net realized gains or losses on foreign currency transactions represent net foreign exchange gains or losses from the holding of foreign currencies, currency gains or losses realized between the trade date and settlement dates on security transactions, and the difference between the amounts of dividends, interest and foreign withholding taxes recorded on the Series’ books and the U.S. dollar equivalent amounts actually received or paid. Net unrealized currency gains or losses from valuing foreign currency denominated assets and liabilities (other than investments) at period end exchange rates are reflected as a component of net unrealized appreciation (depreciation) on foreign currencies.
Foreign security and currency transactions may involve certain considerations and risks not typically associated with those of domestic origin as a result of, among other factors, the possibility of political and economic instability and the level of governmental supervision and regulation of foreign securities markets.
Securities Transactions and Net Investment Income: Securities transactions are recorded on the trade date. Realized gains or losses on sales of securities are calculated on the identified cost basis. Dividend income is recorded on the ex-dividend date and interest income, including amortization of premium and accretion of discount on debt securities, as required, is recorded on the accrual basis.
Net investment income or loss (other than distribution fees which are charged directly to the respective class), realized and unrealized gains or losses, are allocated daily to each class of shares based upon the relative proportion of net assets of each class at the beginning of the day. The Company’s expenses are allocated to the respective Series on the basis of relative net assets except for expenses that are charged directly to the Series level.
Dividends and Distributions: The Series expects to pay dividends of net investment income, if any, semi-annually. Distributions of net realized capital and currency gains, if any, annually.
| | |
| 18 | | Visit our website at www.jennisondryden.com |
Dividends and distributions, which are determined in accordance with federal income tax regulations and which may differ from generally accepted accounting principles, are recorded on the ex-dividend date. Permanent book/tax differences relating to income and gains are reclassified amongst undistributed net investment income, accumulated net realized gain or loss and paid-in capital in excess of par, as appropriate.
Taxes: For federal income tax purposes, each Series in the Company is treated as a separate tax-paying entity. It is the Series’ policy to continue to meet the requirements of the Internal Revenue Code applicable to regulated investment companies and to distribute all of its taxable net income and capital gains, if any, to shareholders. Therefore, no federal income tax provision is required.
Withholding taxes on foreign dividends are recorded net of reclaimable amounts, at the time the related income is earned.
Estimates: The preparation of the financial statements requires management to make estimates and assumptions that affect the reported amounts and disclosures in the financial statements. Actual results could differ from those estimates.
Note 2. Agreements
The Company has a management agreement for the Series with PI. Pursuant to this agreement, PI has responsibility for all investment advisory services and supervises the subadvisor’s performance of such services. PI has entered into a subadvisory agreement with Jennison Associates LLC (“Jennison”). The subadvisory agreement provides that Jennison furnishes investment advisory services in connection with the management of the Series. In the connection therewith, Jennison is obligated to keep certain books and records of the Series. PI pays for the services of Jennison, the cost of compensation of officers and employees of the Series, occupancy and certain clerical and bookkeeping costs of the Series. The Series bears all other costs and expenses.
The management fee paid to PI is computed daily and payable monthly at an annual rate of .600 of 1% of the Series’ average daily net assets up to $300 million, .575 of 1% of the next $2.7 billion and .550 of 1% of the Series’ average daily net assets in excess of $3 billion. The effective management fee rate was .575 of 1% of the Series’ average daily net assets for the six months ended March 31, 2006.
The Series has a distribution agreement with Prudential Investment Management Services LLC (“PIMS”), which acts as the distributor of the Class A, Class B, Class C, Class R and Class Z shares of the Series. The Series compensates PIMS for distributing
| | |
| The Prudential Investment Portfolios, Inc./Jennison Growth Fund | | 19 |
Notes to Financial Statements
(Unaudited) Cont’d
and servicing the Series’ Class A, Class B, Class C and Class R shares, pursuant to plans of distribution (the “Class A, B, C and R Plans”), regardless of expenses actually incurred by PIMS. The distribution fees are accrued daily and payable monthly. No distribution or service fees are paid to PIMS as distributor of the Class Z shares of the Series.
Pursuant to the Class A, B, C and R Plans, the Series compensates PIMS for distribution related activities at an annual rate of up to .30 of 1%, 1%, 1% and .75 of 1% of the average daily net assets of the Class A, B, C and R shares, respectively. PIMS contractually agreed to limit such fees to .25 of 1% of the average daily net assets of the Class A shares and .50 of 1% of the average daily net assets of the Class R shares.
PIMS has advised the Series that it received approximately $465,100 in front-end sales charges resulting from sales of Class A shares during the six months ended March 31, 2006. From these fees, PIMS paid such sales charges to affiliated broker/dealers, which in turn paid commissions to salespersons and incurred other distribution costs.
PIMS has advised the Series that for the six months ended March 31, 2006, it received approximately $11, $224,300 and $1,800 in contingent deferred sales charges imposed upon redemptions by certain Class A, Class B and C shareholders, respectively.
PI, PIMS and Jennison are indirect, wholly-owned subsidiaries of Prudential Financial, Inc. (“Prudential”).
The Series, along with other affiliated registered investment companies (the “Funds”), is a party to a syndicated credit agreement (“SCA”) with two banks. The SCA provides for a commitment of $500 million. Interest on any borrowings under the SCA would be incurred at market rates. For the period from October 29, 2004 through October 28, 2005, the Funds paid a commitment fee of .075 of 1% of the unused portion of the agreement. Effective October 29, 2005, the Funds renewed the SCA with the banks. The commitment under the renewed SCA continues to be $500 million. The Funds pays a commitment fee of .0725 of 1% of the unused portion of the renewed SCA. The commitment fee is accrued daily and paid quarterly and is allocated to the Funds pro-rata based on net assets. The purpose of the SCA is to serve
| | |
| 20 | | Visit our website at www.jennisondryden.com |
as an alternative source of funding for capital share redemptions. The expiration date of the renewed SCA is October 27, 2006. The Series did not borrow any amounts pursuant to the SCA during the six months ended March 31, 2006.
Note 3. Other Transactions with Affiliates
Prudential Mutual Fund Services LLC (“PMFS”), an affiliate of PI and an indirect, wholly-owned subsidiary of Prudential, serves as the Series’ transfer agent. Transfer agent’s fees and expenses in the Statement of Operations include certain out-of-pocket expenses paid to non-affiliates, where applicable.
The Series pays networking fees to affiliated and unaffiliated broker/dealers. These networking fees are payments made to broker/dealers that clear mutual fund transactions through a national clearing system. First Clearing Corporation, an affiliate of PI, serves as broker/dealer. For the six months ended March 31, 2006, the Series incurred approximately $376,300 in total networking fees. These amounts are included in transfer agent’s fees and expenses in the Statement of Operations.
For the six months ended March 31, 2006, Prudential Equity Group, LLC, an indirect, wholly-owned subsidiary of Prudential, and Wachovia Securities, LLC, an affiliate of PI, earned approximately $58,000 and $11,000, respectively, in broker commissions from portfolio transactions executed on behalf of the Series.
Prudential Investment Management, Inc. (“PIM”), an indirect, wholly-owned subsidiary of Prudential, is the Series’ security lending agent. For the six months ended March 31, 2006, PIM has been compensated approximately $87,200 for these services.
The Series invests in the Taxable Money Market Series (the “Portfolio”), a portfolio of the Dryden Core Investment Fund, pursuant to an exemptive order received from the Securities and Exchange Commission. The portfolio is a money market mutual fund registered under the Investment Company Act of 1940, as amended, and managed by PI.
Note 4. Portfolio Securities
Purchases and sales of investment securities, other than short-term investments, for the six months ended March 31, 2006 were $1,004,592,196 and $1,402,030,427, respectively.
As of March 31, 2006, the Series had securities on loan with an aggregate market value of $228,031,571. The Series received $237,871,019 in cash as collateral for securities on loan which was used to purchase highly liquid short-term investments in accordance with the Series’ securities lending procedures.
| | |
| The Prudential Investment Portfolios, Inc./Jennison Growth Fund | | 21 |
Notes to Financial Statements
(Unaudited) Cont’d
Note 5. Tax Information
The United States federal income tax basis of the Series’ investments and net unrealized appreciation as of March 31, 2006 were as follows:
| | | | | | |
Tax Basis
| | Appreciation
| | Depreciation
| | Net Unrealized
Appreciation
|
| $2,478,437,484 | | $814,197,701 | | $(13,326,016) | | $800,871,685 |
The differences between book and tax basis are primarily attributable to deferred losses on wash sales.
For federal income tax purposes, the Series had a capital loss carryforwards as of September 30, 2005 of approximately $ 1,794,618,000 of which $898,999,000 expires in 2010, $827,429,000 expires in 2011 and $68,190,000 expires in 2012. In addition, the Series utilized $180,537,000 of its prior year capital loss carryforward to offset net taxable gains realized in the fiscal year ended September 30, 2005.
Accordingly, no capital gains distribution is expected to be paid to shareholders until net gains have been realized in excess of such amounts. The Series has elected to treat post-October currency losses of approximately $184,000 incurred in the eleven months ended September 30, 2005 as having been incurred in the next fiscal year.
Note 6. Capital
The Series offers Class A, Class B, Class C, Class R and Class Z shares. Class A shares are subject to a maximum front-end sales charge of 5.50%. Investors who purchase Class A shares in an amount of $1 million or more and sell these shares within 12 months of purchase are not subject to an initial sales charge but are subject to a contingent deferred sales charge (CDSC) of 1%, including investors who purchase their shares through broker-dealers affiliated with Prudential. Class B shares are subject to a CDSC of 5%, which decreases by 1% annually to 1% in the fifth and sixth years and 0% in the seventh year. The CDSC for Class C shares is 1% for shares redeemed within 12 months of purchase. Class B shares automatically convert to Class A shares on a quarterly basis approximately seven years after purchase. A special exchange privilege is also available for shareholders who qualified to purchase Class A shares at net asset value. Class R and Class Z shares are not subject to any sales or redemption charge and are offered exclusively for sale to a limited group of investors.
| | |
| 22 | | Visit our website at www.jennisondryden.com |
There are 3.25 billion shares of $.001 par value common stock of the Company authorized which are divided into six series, three of which offer five classes, designated Class A, Class B, Class C, Class R and Class Z, each of which consists of 250 million authorized shares and the Series also may offer Class I shares, of which 250 million shares are authorized, but none are currently issued and outstanding. As of March 31, 2006, Prudential Investments Fund Management LLC owned 8 Class A shares, 8 Class B shares and 193 Class R shares of the Series.
Transactions in shares of common stock were as follows:
| | | | | | | |
Class A
| | Shares
| | | Amount
| |
Six months ended March 31, 2006: | | | | | | | |
Shares sold | | 11,695,114 | | | $ | 189,851,221 | |
Shares reacquired | | (16,443,856 | ) | | | (260,059,972 | ) |
| | |
|
| |
|
|
|
Net increase (decrease) in shares outstanding before conversion | | (4,748,742 | ) | | | (70,208,751 | ) |
Shares issued upon conversion from Class B | | 2,686,474 | | | | 43,759,016 | |
| | |
|
| |
|
|
|
Net increase (decrease) in shares outstanding | | (2,062,268 | ) | | $ | (26,449,735 | ) |
| | |
|
| |
|
|
|
Year ended September 30, 2005: | | | | | | | |
Shares sold | | 15,519,269 | | | $ | 217,671,367 | |
Shares issued in connection with the merger | | 31,573 | | | | 442,212 | |
Shares reacquired | | (27,925,177 | ) | | | (391,108,978 | ) |
| | |
|
| |
|
|
|
Net increase (decrease) in shares outstanding before conversion | | (12,374,335 | ) | | | (172,995,399 | ) |
Shares issued upon conversion from Class B | | 6,944,689 | | | | 99,654,807 | |
| | |
|
| |
|
|
|
Net increase (decrease) in shares outstanding | | (5,429,646 | ) | | $ | (73,340,592 | ) |
| | |
|
| |
|
|
|
Class B
| | | | | | |
Six months ended March 31, 2006: | | | | | | | |
Shares sold | | 754,160 | | | $ | 11,242,787 | |
Shares reacquired | | (2,295,963 | ) | | | (34,040,291 | ) |
| | |
|
| |
|
|
|
Net increase (decrease) in shares outstanding before conversion | | (1,541,803 | ) | | | (22,797,504 | ) |
Shares reacquired upon conversion into Class A | | (2,925,347 | ) | | | (43,759,016 | ) |
| | |
|
| |
|
|
|
Net increase (decrease) in shares outstanding | | (4,467,150 | ) | | $ | (66,556,520 | ) |
| | |
|
| |
|
|
|
Year ended September 30, 2005: | | | | | | | |
Shares sold | | 1,357,829 | | | $ | 17,347,458 | |
Shares issued in connection with the merger | | 69,002 | | | | 857,320 | |
Shares reacquired | | (8,017,108 | ) | | | (103,292,759 | ) |
| | |
|
| |
|
|
|
Net increase (decrease) in shares outstanding before conversion | | (6,590,277 | ) | | | (85,087,981 | ) |
Shares reacquired upon conversion into Class A | | (7,521,116 | ) | | | (99,654,807 | ) |
| | |
|
| |
|
|
|
Net increase (decrease) in shares outstanding | | (14,111,393 | ) | | $ | (184,742,788 | ) |
| | |
|
| |
|
|
|
| | |
| The Prudential Investment Portfolios, Inc./Jennison Growth Fund | | 23 |
Notes to Financial Statements
(Unaudited) Cont’d
| | | | | | | |
Class C
| | Shares
| | | Amount
| |
Six months ended March 31, 2006: | | | | | | | |
Shares sold | | 817,943 | | | $ | 12,217,385 | |
Shares reacquired | | (852,735 | ) | | | (12,658,836 | ) |
| | |
|
| |
|
|
|
Net increase (decrease) in shares outstanding | | (34,792 | ) | | $ | (441,451 | ) |
| | |
|
| |
|
|
|
Year ended September 30, 2005: | | | | | | | |
Shares sold | | 597,689 | | | $ | 7,763,311 | |
Shares issued in connection with the merger | | 19,988 | | | | 210,958 | |
Shares reacquired | | (2,586,238 | ) | | | (33,443,434 | ) |
| | |
|
| |
|
|
|
Net increase (decrease) in shares outstanding | | (1,968,561 | ) | | $ | (25,469,165 | ) |
| | |
|
| |
|
|
|
Class R
| | | | | | |
Six months ended March 31, 2006: | | | | | | | |
Shares sold | | 1,558 | | | $ | 23,946 | |
Shares reacquired | | (1,539 | ) | | | (23,292 | ) |
| | |
|
| |
|
|
|
Net increase (decrease) in shares outstanding | | 19 | | | $ | 654 | |
| | |
|
| |
|
|
|
Period ended September 30, 2005*: | | | | | | | |
Shares sold | | 193 | | | $ | 2,500 | |
Shares reacquired | | — | | | | — | |
| | |
|
| |
|
|
|
Net increase (decrease) in shares outstanding | | 193 | | | $ | 2,500 | |
| | |
|
| |
|
|
|
* Commencement of operations on December 17, 2004. | | | | | | | |
Class Z
| | | | | | |
Six months ended March 31, 2006: | | | | | | | |
Shares sold | | 9,096,582 | | | $ | 150,828,897 | |
Shares reacquired | | (24,646,171 | ) | | | (414,335,668 | ) |
| | |
|
| |
|
|
|
Net increase (decrease) in shares outstanding | | (15,549,589 | ) | | $ | (263,506,771 | ) |
| | |
|
| |
|
|
|
Year ended September 30, 2005: | | | | | | | |
Shares sold | | 21,785,045 | | | $ | 313,690,766 | |
Shares reacquired | | (30,088,424 | ) | | | (428,846,476 | ) |
| | |
|
| |
|
|
|
Net increase (decrease) in shares outstanding | | (8,303,379 | ) | | $ | (115,155,710 | ) |
| | |
|
| |
|
|
|
Note 7. Reorganization
On October 29, 2004, Jennison Growth Fund acquired all of the net assets of Strategic Partners Managed Large Cap Growth Fund pursuant to a plan of reorganization approved by the Strategic Partners Managed Large Cap Growth Fund shareholders on January 23, 2004. The acquisition was accomplished by a tax-free issue of Class A, Class B, Class C and Class Z shares for corresponding classes of
| | |
| 24 | | Visit our website at www.jennisondryden.com |
Strategic Partners Managed Large Cap Growth and Class L being exchanged for Class A and Classes M and X for Class B of Jennison Growth Fund.
| | | | | | | | |
Strategic Partners Managed
Large Cap Growth Fund
| | Jennison
Growth Fund
|
Class
| | Shares
| | Class
| | Shares
| | Value
|
A | | 7,878 | | A | | 31,573 | | $442,212 |
B | | 1,413 | | B | | 69,002 | | 857,320 |
C | | 27,712 | | C | | 19,988 | | 210,958 |
L | | 38,655 | | | | | | |
M | | 79,801 | | | | | | |
X | | 14,618 | | | | | | |
The aggregate net assets and unrealized appreciation of Strategic Partners Managed Large Cap Growth Fund immediately before the acquisition was $1,510,490 and $112,267, respectively. The aggregate net assets of Jennison Growth Fund immediately before the acquisition were $3,115,007,120.
Note 8. In-Kind Redemption
During the six months ended March 31, 2006, shareholders redeemed fund shares in exchange for Series’ portfolio securities valued at $122,469,608. The Fund realized a gain of $13,924,737 related to the in-kind redemption transactions. This gain is not taxable for Federal Income Tax purposes.
| | |
| The Prudential Investment Portfolios, Inc./Jennison Growth Fund | | 25 |
Financial Highlights
(Unaudited)
| | | | |
| | | Class A
| |
| | | Six Months Ended
March 31, 2006 | |
Per Share Operating Performance: | | | | |
Net Asset Value, Beginning Of Period | | $ | 15.31 | |
| | |
|
|
|
Income (loss) from investment operations: | | | | |
Net investment income (loss)(a) | | | (.01 | ) |
Net realized and unrealized gain (loss) on investment and foreign currency transactions | | | 1.08 | |
| | |
|
|
|
Total from investment operations | | | 1.07 | |
| | |
|
|
|
Less Distributions: | | | | |
Distributions from net realized gains | | | — | |
| | |
|
|
|
Net asset value, end of period | | $ | 16.38 | |
| | |
|
|
|
Total Return(b): | | | 6.99 | % |
Ratios/Supplemental Data: | | | | |
Net assets, end of period (000) | | $ | 1,408,682 | |
Average net assets (000) | | $ | 1,362,967 | |
Ratios to average net assets: | | | | |
Expenses, including distribution and service (12b-1) fees(c) | | | 1.04 | %(d) |
Expenses, excluding distribution and service (12b-1) fees | | | .79 | %(d) |
Net investment income (loss) | | | (.16 | )%(d) |
For Class A, B, C, R and Z shares: | | | | |
Portfolio turnover rate | | | 31 | %(e) |
| (a) | Calculated based upon average shares outstanding during the period. |
| (b) | Total return does not consider the effects of sales loads. Total return is calculated assuming a purchase of shares on the first day and a sale on the last day of each period reported, and includes reinvestment of dividends and distributions. Total returns for periods less than a full year are not annualized. |
| (c) | The distributor of the Series has contractually agreed to limit its distribution and service 12b-1 fees to .25 of 1% of the average daily net assets of the Class A shares. |
See Notes to Financial Statements.
| | |
| 26 | | Visit our website at www.jennisondryden.com |
| | | | | | | | | | | | | | | | | | |
| Class A | |
| Year Ended September 30, | |
| 2005 | | | 2004 | | | 2003 | | | 2002 | | | 2001 | |
| | | | | | | | | | | | | | | | | | | |
| $ | 12.84 | | | $ | 11.77 | | | $ | 9.73 | | | $ | 12.50 | | | $ | 24.20 | |
|
|
| |
|
|
| |
|
|
| |
|
|
| |
|
|
|
| | | | | | | | | | | | | | | | | | | |
| | .01 | | | | (.04 | ) | | | (.02 | ) | | | (.04 | ) | | | (.05 | ) |
| | 2.46 | | | | 1.11 | | | | 2.06 | | | | (2.73 | ) | | | (9.50 | ) |
|
|
| |
|
|
| |
|
|
| |
|
|
| |
|
|
|
| | 2.47 | | | | 1.07 | | | | 2.04 | | | | (2.77 | ) | | | (9.55 | ) |
|
|
| |
|
|
| |
|
|
| |
|
|
| |
|
|
|
| | | | | | | | | | | | | | | | | | | |
| | — | | | | — | | | | — | | | | — | | | | (2.15 | ) |
|
|
| |
|
|
| |
|
|
| |
|
|
| |
|
|
|
| $ | 15.31 | | | $ | 12.84 | | | $ | 11.77 | | | $ | 9.73 | | | $ | 12.50 | |
|
|
| |
|
|
| |
|
|
| |
|
|
| |
|
|
|
| | 19.24 | % | | | 9.09 | % | | | 20.97 | % | | | (22.16 | )% | | | (42.32 | )% |
| | | | | | | | | | | | | | | | | | | |
| $ | 1,348,039 | | | $ | 1,200,078 | | | $ | 1,134,839 | | | $ | 1,011,241 | | | $ | 1,286,009 | |
| $ | 1,258,500 | | | $ | 1,237,249 | | | $ | 1,034,231 | | | $ | 1,358,013 | | | $ | 1,513,253 | |
| | | | | | | | | | | | | | | | | | | |
| | 1.06 | % | | | 1.05 | % | | | 1.17 | % | | | 1.08 | % | | | 1.06 | % |
| | .81 | % | | | .80 | % | | | .92 | % | | | .83 | % | | | .81 | % |
| | .04 | % | | | (.27 | )% | | | (.21 | )% | | | (.28 | )% | | | (.27 | )% |
| | | | | | | | | | | | | | | | | | | |
| | 57 | % | | | 68 | % | | | 64 | % | | | 71 | % | | | 98 | % |
See Notes to Financial Statements.
| | |
| The Prudential Investment Portfolios, Inc./Jennison Growth Fund | | 27 |
Financial Highlights
(Unaudited) Cont’d
| | | | |
| | | Class B
| |
| | | Six Months Ended
March 31, 2006 | |
Per Share Operating Performance: | | | | |
Net Asset Value, Beginning Of Period | | $ | 14.09 | |
| | |
|
|
|
Income (loss) from investment operations: | | | | |
Net investment loss(a) | | | (.07 | ) |
Net realized and unrealized gain (loss) on investment and foreign currency transactions | | | 1.00 | |
| | |
|
|
|
Total from investment operations | | | .93 | |
| | |
|
|
|
Less Distributions: | | | | |
Distributions from net realized gains | | | — | |
| | |
|
|
|
Net asset value, end of period | | $ | 15.02 | |
| | |
|
|
|
Total Return(b): | | | 6.60 | % |
Ratios/Supplemental Data: | | | | |
Net assets, end of period (000) | | $ | 328,984 | |
Average net assets (000) | | $ | 366,245 | |
Ratios to average net assets: | | | | |
Expenses, including distribution and service (12b-1) fees | | | 1.79 | %(c) |
Expenses, excluding distribution and service (12b-1) fees | | | .79 | %(c) |
Net investment loss | | | (.92 | )%(c) |
| (a) | Calculated based upon average shares outstanding during the period. |
| (b) | Total return does not consider the effects of sales loads. Total return is calculated assuming a purchase of shares on the first day and a sale on the last day of each period reported, and includes reinvestment of dividends and distributions. Total returns for periods less than a full year are not annualized. |
See Notes to Financial Statements.
| | |
| 28 | | Visit our website at www.jennisondryden.com |
| | | | | | | | | | | | | | | | | | |
| Class B | |
| Year Ended September 30, | |
| 2005 | | | 2004 | | | 2003 | | | 2002 | | | 2001 | |
| | | | | | | | | | | | | | | | | | | |
| $ | 11.90 | | | $ | 11.00 | | | $ | 9.16 | | | $ | 11.86 | | | $ | 23.23 | |
|
|
| |
|
|
| |
|
|
| |
|
|
| |
|
|
|
| | | | | | | | | | | | | | | | | | | |
| | (.09 | ) | | | (.12 | ) | | | (.10 | ) | | | (.13 | ) | | | (.17 | ) |
| | 2.28 | | | | 1.02 | | | | 1.94 | | | | (2.57 | ) | | | (9.05 | ) |
|
|
| |
|
|
| |
|
|
| |
|
|
| |
|
|
|
| | 2.19 | | | | .90 | | | | 1.84 | | | | (2.70 | ) | | | (9.22 | ) |
|
|
| |
|
|
| |
|
|
| |
|
|
| |
|
|
|
| | | | | | | | | | | | | | | | | | | |
| | — | | | | — | | | | — | | | | — | | | | (2.15 | ) |
|
|
| |
|
|
| |
|
|
| |
|
|
| |
|
|
|
| $ | 14.09 | | | $ | 11.90 | | | $ | 11.00 | | | $ | 9.16 | | | $ | 11.86 | |
|
|
| |
|
|
| |
|
|
| |
|
|
| |
|
|
|
| | 18.40 | % | | | 8.18 | % | | | 20.09 | % | | | (22.77 | )% | | | (42.70 | )% |
| | | | | | | | | | | | | | | | | | | |
| $ | 371,561 | | | $ | 481,876 | | | $ | 565,727 | | | $ | 653,338 | | | $ | 1,046,581 | |
| $ | 439,078 | | | $ | 560,217 | | | $ | 602,105 | | | $ | 1,007,499 | | | $ | 1,576,226 | |
| | | | | | | | | | | | | | | | | | | |
| | 1.81 | % | | | 1.80 | % | | | 1.92 | % | | | 1.83 | % | | | 1.81 | % |
| | .81 | % | | | .80 | % | | | .92 | % | | | .83 | % | | | .81 | % |
| | (.66 | )% | | | (1.02 | )% | | | (.95 | )% | | | (1.03 | )% | | | (1.02 | )% |
See Notes to Financial Statements.
| | |
| The Prudential Investment Portfolios, Inc./Jennison Growth Fund | | 29 |
Financial Highlights
(Unaudited) Cont’d
| | | | |
| | | Class C
| |
| | | Six Months Ended
March 31, 2006 | |
Per Share Operating Performance: | | | | |
Net Asset Value, Beginning Of Period | | $ | 14.09 | |
| | |
|
|
|
Income (loss) from investment operations: | | | | |
Net investment loss(a) | | | (.07 | ) |
Net realized and unrealized gain (loss) on investment and foreign currency transactions | | | 1.00 | |
| | |
|
|
|
Total from investment operations | | | .93 | |
| | |
|
|
|
Less Distributions: | | | | |
Distributions from net realized gains | | | — | |
| | |
|
|
|
Net asset value, end of period | | $ | 15.02 | |
| | |
|
|
|
Total Return(b): | | | 6.60 | % |
Ratios/Supplemental Data: | | | | |
Net assets, end of period (000) | | $ | 91,373 | |
Average net assets (000) | | $ | 90,788 | |
Ratios to average net assets: | | | | |
Expenses, including distribution and service (12b-1) fees | | | 1.79 | %(c) |
Expenses, excluding distribution and service (12b-1) fees | | | .79 | %(c) |
Net investment loss | | | (.91 | )%(c) |
| (a) | Calculated based upon average shares outstanding during the period. |
| (b) | Total return does not consider the effects of sales loads. Total return is calculated assuming a purchase of shares on the first day and a sale on the last day of each period reported, and includes reinvestment of dividends and distributions. Total returns for periods less than a full year are not annualized. |
See Notes to Financial Statements.
| | |
| 30 | | Visit our website at www.jennisondryden.com |
| | | | | | | | | | | | | | | | | | |
| Class C | |
| Year Ended September 30, | |
| 2005 | | | 2004 | | | 2003 | | | 2002 | | | 2001 | |
| | | | | | | | | | | | | | | | | | | |
| $ | 11.90 | | | $ | 11.00 | | | $ | 9.16 | | | $ | 11.86 | | | $ | 23.23 | |
|
|
| |
|
|
| |
|
|
| |
|
|
| |
|
|
|
| | | | | | | | | | | | | | | | | | | |
| | (.08 | ) | | | (.12 | ) | | | (.10 | ) | | | (.13 | ) | | | (.17 | ) |
| | 2.27 | | | | 1.02 | | | | 1.94 | | | | (2.57 | ) | | | (9.05 | ) |
|
|
| |
|
|
| |
|
|
| |
|
|
| |
|
|
|
| | 2.19 | | | | .90 | | | | 1.84 | | | | (2.70 | ) | | | (9.22 | ) |
|
|
| |
|
|
| |
|
|
| |
|
|
| |
|
|
|
| | | | | | | | | | | | | | | | | | | |
| | — | | | | — | | | | — | | | | — | | | | (2.15 | ) |
|
|
| |
|
|
| |
|
|
| |
|
|
| |
|
|
|
| $ | 14.09 | | | $ | 11.90 | | | $ | 11.00 | | | $ | 9.16 | | | $ | 11.86 | |
|
|
| |
|
|
| |
|
|
| |
|
|
| |
|
|
|
| | 18.40 | % | | | 8.18 | % | | | 20.09 | % | | | (22.77 | )% | | | (42.70 | )% |
| | | | | | | | | | | | | | | | | | | |
| $ | 86,198 | | | $ | 96,253 | | | $ | 106,850 | | | $ | 103,956 | | | $ | 164,216 | |
| $ | 91,313 | | | $ | 107,401 | | | $ | 105,518 | | | $ | 159,096 | | | $ | 226,607 | |
| | | | | | | | | | | | | | | | | | | |
| | 1.81 | % | | | 1.80 | % | | | 1.92 | % | | | 1.83 | % | | | 1.81 | % |
| | .81 | % | | | .80 | % | | | .92 | % | | | .83 | % | | | .81 | % |
| | (.61 | )% | | | (1.02 | )% | | | (.96 | )% | | | (1.03 | )% | | | (1.02 | )% |
See Notes to Financial Statements.
| | |
| The Prudential Investment Portfolios, Inc./Jennison Growth Fund | | 31 |
Financial Highlights
(Unaudited) Cont’d
| | | | | | | | |
| | | Class R
| |
| | | Six Months Ended
March 31, 2006 | | | December 17, 2004(a)
Through
September 30, 2005 | |
Per Share Operating Performance: | | | | | | | | |
Net Asset Value, Beginning Of Period | | $ | 14.15 | | | $ | 12.97 | |
| | |
|
|
| |
|
|
|
Income (loss) from investment operations: | | | | | | | | |
Net investment loss(b) | | | (.03 | ) | | | (.05 | ) |
Net realized and unrealized gain on investment and foreign currency transactions | | | 1.00 | | | | 1.23 | |
| | |
|
|
| |
|
|
|
Total from investment operations | | | .97 | | | | 1.18 | |
| | |
|
|
| |
|
|
|
Net asset value, end of period | | $ | 15.12 | | | $ | 14.15 | |
| | |
|
|
| |
|
|
|
Total Return(c): | | | 6.86 | % | | | 9.10 | % |
Ratios/Supplemental Data: | | | | | | | | |
Net assets, end of period(d) | | $ | 3,208 | | | $ | 2,727 | |
Average net assets(d) | | $ | 5,072 | | | $ | 2,528 | |
Ratios to average net assets: | | | | | | | | |
Expenses, including distribution and service (12b-1) fees(e)(f) | | | 1.29 | % | | | 1.31 | % |
Expenses, excluding distribution and service (12b-1) fees(f) | | | .79 | % | | | .81 | % |
Net investment loss(f) | | | (.43 | )% | | | (.52 | )% |
| (a) | Inception date of Class R shares. |
| (b) | Calculated based on average shares outstanding during the period. |
| (c) | Total return does not consider the effects of sales loads. Total return is calculated assuming a purchase of shares on the first day and a sale on the last day of each period reported, and includes reinvestment of dividends and distributions. Total returns for periods less than a full year are not annualized. |
| (d) | Amount is actual and not rounded. |
| (e) | The distributor of the Series has contractually agreed to limit its distribution and service 12b-1 fees to .50 of 1% of the average daily net assets of the Class R shares. |
See Notes to Financial Statements.
| | |
| 32 | | Visit our website at www.jennisondryden.com |
This Page Intentionally Left Blank
Financial Highlights
(Unaudited) Cont’d
| | | | |
| | | Class Z
| |
| | | Six Months Ended
March 31, 2006 | |
Per Share Operating Performance: | | | | |
Net Asset Value, Beginning Of Period | | $ | 15.72 | |
| | |
|
|
|
Income (loss) from investment operations: | | | | |
Net investment income (loss)(a) | | | .01 | |
Net realized and unrealized gain (loss) on investments and foreign currency transactions | | | 1.11 | |
| | |
|
|
|
Total from investment operations | | | 1.12 | |
| | |
|
|
|
Less Distributions: | | | | |
Distributions from net realized gains | | | — | |
| | |
|
|
|
Net asset value, end of period | | $ | 16.84 | |
| | |
|
|
|
Total Return(c): | | | 7.12 | % |
Ratios/Supplemental Data: | | | | |
Net assets, end of period (000) | | $ | 1,230,941 | |
Average net assets (000) | | $ | 1,472,231 | |
Ratios to average net assets: | | | | |
Expenses, including distribution and service (12b-1) fees | | | .79 | %(d) |
Expenses, excluding distribution and service (12b-1) fees | | | .79 | %(d) |
Net investment income (loss) | | | .08 | %(d) |
| (a) | Calculated based upon average shares outstanding during the period. |
| (b) | Less than $.005 per share. |
| (c) | Total return is calculated assuming a purchase of shares on the first day and a sale on the last day of each period reported, and includes reinvestment of dividends and distributions. Total returns for periods less than a full year are not annualized. |
See Notes to Financial Statements.
| | |
| 34 | | Visit our website at www.jennisondryden.com |
| | | | | | | | | | | | | | | | | | |
| Class Z | |
| Year Ended September 30, | |
| 2005 | | | 2004 | | | 2003 | | | 2002 | | | 2001 | |
| | | | | | | | | | | | | | | | | | | |
| $ | 13.15 | | | $ | 12.03 | | | $ | 9.92 | | | $ | 12.71 | | | $ | 24.50 | |
|
|
| |
|
|
| |
|
|
| |
|
|
| |
|
|
|
| | | | | | | | | | | | | | | | | | | |
| | .04 | | | | — | (b) | | | — | (b) | | | — | (b) | | | — | (b) |
| | 2.53 | | | | 1.12 | | | | 2.11 | | | | (2.79 | ) | | | (9.64 | ) |
|
|
| |
|
|
| |
|
|
| |
|
|
| |
|
|
|
| | 2.57 | | | | 1.12 | | | | 2.11 | | | | (2.79 | ) | | | (9.64 | ) |
|
|
| |
|
|
| |
|
|
| |
|
|
| |
|
|
|
| | | | | | | | | | | | | | | | | | | |
| | — | | | | — | | | | — | | | | — | | | | (2.15 | ) |
|
|
| |
|
|
| |
|
|
| |
|
|
| |
|
|
|
| $ | 15.72 | | | $ | 13.15 | | | $ | 12.03 | | | $ | 9.92 | | | $ | 12.71 | |
|
|
| |
|
|
| |
|
|
| |
|
|
| |
|
|
|
| | 19.54 | % | | | 9.31 | % | | | 21.27 | % | | | (21.95 | )% | | | (42.15 | )% |
| | | | | | | | | | | | | | | | | | | |
| $ | 1,393,365 | | | $ | 1,274,544 | | | $ | 1,360,076 | | | $ | 1,108,026 | | | $ | 1,524,028 | |
| $ | 1,324,754 | | | $ | 1,441,730 | | | $ | 1,226,178 | | | $ | 1,545,628 | | | $ | 2,191,554 | |
| | | | | | | | | | | | | | | | | | | |
| | .81 | % | | | .80 | % | | | .92 | % | | | .83 | % | | | .81 | % |
| | .81 | % | | | .80 | % | | | .92 | % | | | .83 | % | | | .81 | % |
| | .28 | % | | | (.02 | )% | | | .03 | % | | | (.03 | )% | | | (.02 | )% |
See Notes to Financial Statements.
| | |
| The Prudential Investment Portfolios, Inc./Jennison Growth Fund | | 35 |
| | | | |
| n MAIL | | n TELEPHONE | | n WEBSITE |
Gateway Center Three 100 Mulberry Street Newark, NJ 07102 | | (800) 225-1852 | | www.jennisondryden.com |
|
| PROXY VOTING |
| The Board of Directors of the Fund has delegated to the Fund’s investment subadvisor the responsibility for voting any proxies and maintaining proxy recordkeeping with respect to the Fund. A description of these proxy voting policies and procedures is available without charge, upon request, by calling (800) 225-1852 or by visiting the Securities and Exchange Commission’s website at www.sec.gov. Information regarding how the Fund voted proxies relating to portfolio securities during the most recent 12-month period ended June 30 is available on the Fund’s website and on the Commission’s website. |
|
| DIRECTORS |
| Linda W. Bynoe • David E.A. Carson • Robert F. Gunia • Robert E. La Blanc • Douglas H. McCorkindale • Richard A. Redeker • Judy A. Rice • Robin B. Smith • Stephen G. Stoneburn • Clay T. Whitehead |
|
| OFFICERS |
| Judy A. Rice, President • Robert F. Gunia, Vice President • Grace C. Torres, Treasurer and Principal Financial and Accounting Officer • Jack Benintende, Assistant Treasurer • M. Sadiq Peshimam, Assistant Treasurer • Kathryn L. Quirk, Chief Legal Officer • Deborah A. Docs, Secretary • Jonathan D. Shain, Assistant Secretary • Claudia DiGiacomo, Assistant Secretary • John P. Schwartz, Assistant Secretary • Helene Gurian, Acting Anti-Money Laundering Compliance Officer • Lee D. Augsburger, Chief Compliance Officer |
| | | | |
| MANAGER | | Prudential Investments LLC | | Gateway Center Three
100 Mulberry Street
Newark, NJ 07102 |
|
| INVESTMENT SUBADVISOR | | Jennison Associates LLC | | 466 Lexington Avenue
New York, NY 10017 |
|
| DISTRIBUTOR | | Prudential Investment
Management Services LLC | | Gateway Center Three
100 Mulberry Street
Newark, NJ 07102 |
|
| CUSTODIAN | | The Bank of New York | | One Wall Street
New York, NY 10286 |
|
| TRANSFER AGENT | | Prudential Mutual Fund
Services LLC | | PO Box 8098
Philadelphia, PA 19176 |
|
INDEPENDENT REGISTERED
PUBLIC ACCOUNTING FIRM | | KPMG LLP | | 345 Park Avenue
New York, NY 10154 |
|
| FUND COUNSEL | | Sullivan & Cromwell LLP | | 125 Broad Street
New York, NY 10004 |
|
| An investor should consider the investment objectives, risks, charges, and expenses of the Fund carefully before investing. The prospectus for the Fund contains this and other information about the Fund. An investor may obtain a prospectus by visiting our website at www.jennisondryden.com or by calling (800) 225-1852. The prospectus should be read carefully before investing. |
|
| E-DELIVERY |
| To receive your mutual fund documents on-line, go to www.icsdelivery.com/prudential/funds and enroll. Instead of receiving printed documents by mail, you will receive notification via e-mail when new materials are available. You can cancel your enrollment or change your e-mail address at any time by clicking on the change/cancel enrollment option at the icsdelivery website address. |
|
| SHAREHOLDER COMMUNICATIONS WITH DIRECTORS |
| Shareholders can communicate directly with the Board of Directors by writing to the Chair of the Board, Jennison Growth Fund, PO Box 13964, Philadelphia, PA 19176. Shareholders can communicate directly with an individual Director by writing to the same address. Communications are not screened before being delivered to the addressee. |
|
| AVAILABILITY OF PORTFOLIO SCHEDULE |
| The Fund files its complete schedule of portfolio holdings with the Securities and Exchange Commission for the first and third quarters of each fiscal year on Form N-Q under the Prudential Investment Portfolios, Inc. name. The Fund’s Forms N-Q are available on the Commission’s website at www.sec.gov. The Fund’s Forms N-Q may also be reviewed and copied at the Commission’s Public Reference Room in Washington, D.C. Information on the operation and location of the Public Reference Room may be obtained by calling (800) SEC-0330 (732-0330). The Fund’s schedule of portfolio holdings is also available on the Fund’s website as of the end of each fiscal quarter. |
Mutual Funds:
| | | | |
ARE NOT INSURED BY THE FDIC OR ANY
FEDERAL GOVERNMENT AGENCY | | MAY LOSE VALUE | | ARE NOT A DEPOSIT OF OR GUARANTEED
BY ANY BANK OR ANY BANK AFFILIATE |

| | | | | | | | | | | | | | |
| Jennison Growth Fund | | |
| | | Share Class | | A | | B | | C | | R | | Z | | |
| | | NASDAQ | | PJFAX | | PJFBX | | PJFCX | | JGRCR | | PJFZX | | |
| | | CUSIP | | 74437E107 | | 74437E206 | | 74437E305 | | 74437E651 | | 74437E404 | | |
| | | | | | | | | | | | | | | |
MF168E2 IFS-A118929 Ed. 05/2006

Jennison Equity Opportunity Fund
| | |
| MARCH 31, 2006 | | SEMIANNUAL REPORT |

FUND TYPE
Small- to mid-capitalization stock
OBJECTIVE
Long-term growth of capital
This report is not authorized for distribution to prospective investors unless preceded or accompanied by a current prospectus.
The views expressed in this report and information about the Fund’s portfolio holdings are for the period covered by this report and are subject to change thereafter.
The accompanying financial statements as of March 31, 2006, were not audited, and accordingly, no auditor’s opinion is expressed on them.
JennisonDryden is a registered trademark of The Prudential Insurance Company of America.

May 15, 2006
Dear Shareholder:
We hope you find the semiannual report for the Jennison Equity Opportunity Fund informative and useful. As a JennisonDryden mutual fund shareholder, you may be thinking about where you can find additional growth opportunities. You could invest in last year’s top-performing asset class and hope history repeats itself or you could stay in cash while waiting for the “right moment” to invest.
We believe it is better to take advantage of developing domestic and global investment opportunities through a diversified portfolio of stock and bond mutual funds. A diversified asset allocation offers two potential advantages. It helps you manage downside risk by not being overly exposed to any particular asset class, plus it gives you a better opportunity to have at least some of your assets in the right place at the right time. Your financial professional can help you create a diversified investment plan that may include mutual funds covering all the basic asset classes and that reflects your personal investor profile and tolerance for risk.
JennisonDryden Mutual Funds gives you a wide range of choices that can help you make progress toward your financial goals. Our funds offer the experience, resources, and professional discipline of three leading asset managers. They are recognized and respected in the institutional market and by discerning investors for excellence in their respective strategies. JennisonDryden equity funds are advised by Jennison Associates LLC or Quantitative Management Associates LLC (QMA). Prudential Investment Management, Inc. (PIM) advises the JennisonDryden fixed income and money market funds. Jennison Associates, QMA, and PIM are registered investment advisors and Prudential Financial companies.
Thank you for choosing JennisonDryden Mutual Funds.
Sincerely,

Judy A. Rice, President
The Prudential Investment Portfolios, Inc./Jennison Equity Opportunity Fund
| | |
| The Prudential Investment Portfolios, Inc./Jennison Equity Opportunity Fund | | 1 |
Your Fund’s Performance
Fund objective
The investment objective of the Jennison Equity Opportunity Fund (the Fund) is long-term growth of capital. There can be no assurance that the Fund will achieve its investment objective.
Performance data quoted represent past performance. Past performance does not guarantee future results. The investment return and principal value of an investment will fluctuate, so that an investor’s shares, when redeemed, may be worth more or less than their original cost. Current performance may be lower or higher than the past performance data quoted. An investor may obtain performance data as of the most recent month-end by visiting our website at www.jennisondryden.com or by calling (800) 225-1852. The maximum initial sales charge is 5.50% (Class A shares).
| | | | | | | | | | | | |
| Cumulative Total Returns1 as of 3/31/06 | | | | | | | | | | | | |
| | | Six Months | | | One Year | | | Five Years | | | Since Inception2 | |
Class A | | 9.42 | % | | 16.69 | % | | 47.35 | % | | 216.77 | % |
Class B | | 9.02 | | | 15.82 | | | 41.91 | | | 195.39 | |
Class C | | 9.02 | | | 15.82 | | | 41.91 | | | 195.39 | |
Class R | | 8.98 | | | 16.48 | | | N/A | | | 15.30 | |
Class Z | | 9.55 | | | 16.98 | | | 49.16 | | | 224.60 | |
S&P 500 Index3 | | 6.38 | | | 11.72 | | | 21.46 | | | *** | |
Lipper Multi-Cap Core Funds Avg.4 | | 7.77 | | | 14.56 | | | 29.49 | | | **** | |
| | | | | | | | | | | | | |
| Average Annual Total Returns1 as of 3/31/06 | | | | | | | | | | | | |
| | | | | | One Year | | | Five Years | | | Since Inception2 | |
Class A | | | | | 10.27 | % | | 6.85 | % | | 12.38 | % |
Class B | | | | | 10.91 | | | 7.10 | | | 12.22 | |
Class C | | | | | 14.84 | | | 7.25 | | | 12.22 | |
Class R | | | | | 16.48 | | | N/A | | | 11.70 | |
Class Z | | | | | 16.98 | | | 8.33 | | | 13.35 | |
S&P 500 Index3 | | | | | 11.72 | | | 3.97 | | | *** | |
Lipper Multi-Cap Core Funds Avg.4 | | | | | 14.56 | | | 5.03 | | | **** | |
The cumulative total returns do not reflect the deduction of applicable sales charges. If reflected, the applicable sales charges would reduce the cumulative total returns performance quoted. Class A shares are subject to a maximum front-end sales charge of 5.50%. Under certain circumstances, Class A shares may be subject to a contingent deferred sales charge (CDSC) of 1%. Class B and Class C shares are subject to a maximum CDSC of 5% and 1%, respectively. Class R and Class Z shares are not subject to a sales charge.
| | |
| 2 | | Visit our website at www.jennisondryden.com |
1Source: Prudential Investments LLC and Lipper Inc. The average annual total returns take into account applicable sales charges. During certain periods shown, fee waivers and/or expense reimbursements were in effect. Without such fee waivers and expense reimbursements, the returns for the share classes would have been lower. Class A, Class B, Class C, and Class R shares are subject to an annual distribution and service (12b-1) fee of up to 0.30%, 1.00%, 1.00%, and 0.75%, respectively. Approximately seven years after purchase, Class B shares will automatically convert to Class A shares on a quarterly basis. Class Z shares are not subject to a 12b-1 fee. The returns in the tables do not reflect the deduction of taxes that a shareholder would pay on Fund distributions or following the redemption of Fund shares.
2Inception dates: Class A, Class B, Class C, and Class Z, 11/7/96; and Class R, 12/17/04.
3The Standard & Poor’s 500 Composite Stock Price Index (S&P 500 Index) is an unmanaged index of 500 stocks of large U.S. public companies. It gives a broad look at how U.S. stock prices have performed.
4The Lipper Multi-Cap Core Funds Average (Lipper Average) represents returns based on the average return of all funds in the Lipper Multi-Cap Core Funds category for the periods noted. Funds in the Lipper Average invest in a variety of market capitalization ranges without concentrating 75% of their equity assets in any one market capitalization range over an extended period of time. Multi-cap funds in the Lipper Average typically have between 25% and 75% of their assets invested in companies with market capitalizations (on a three-year weighted basis) above 300% of the dollar-weighted median market capitalization of the middle 1,000 securities of the S&P SuperComposite 1500 Index. Multi-cap core funds have more latitude in the companies in which they invest. These funds typically have an average price-to-earnings ratio, price-to-book ratio, and three-year sales-per-share growth value compared with the S&P SuperComposite 1500 Index.
Investors cannot invest directly in an index. The returns for the S&P 500 Index would be lower if they included the effects of sales charges, operating expenses of a mutual fund, or taxes. Returns for the Lipper Average reflect the deduction of operating expenses, but not sales charges or taxes.
***S&P 500 Index Closest Month-End to inception cumulative total returns are 112.96% for Class A, B, C, and Z, and 9.32% for Class R. S&P 500 Index Closest Month-End to Inception average annual total returns are 8.36% for Class A, B, C, and Z and 7.39% for Class R.
****Lipper Average Closest Month-End to Inception cumulative total returns are 128.44% for Class A, B, C, and Z, and 12.13% for Class R. Lipper Average Closest Month-End to Inception average annual total returns are 8.59% for Class A, B, C, and Z and 9.57% for Class R.
| | | |
| Five Largest Holdings expressed as a percentage of net assets as of 3/31/06 | | | |
Kroger Co. (The), Food & Staples Retailing | | 2.3 | % |
E.I. du Pont de Nemours & Co., Chemicals | | 2.2 | |
Manpower, Inc., Commercial Services and Supplies | | 2.2 | |
CSX Corp., Road & Rail | | 2.2 | |
American International Group, Inc., Insurance | | 2.2 | |
Holdings are subject to change.
| | | |
| Five Largest Long-Term Industries expressed as a percentage of net assets as of 3/31/06 | | | |
Media | | 8.8 | % |
Pharmaceuticals | | 7.8 | |
Commercial Services & Supplies | | 7.3 | |
Software | | 7.0 | |
Food & Staples Retailing | | 5.7 | |
Industry weightings are subject to change.
| | |
| The Prudential Investment Portfolios, Inc./Jennison Equity Opportunity Fund | | 3 |
Fees and Expenses (Unaudited)
As a shareholder of the Fund, you incur two types of costs: (1) transaction costs, including sales charges (loads) on purchase payments and redemptions, as applicable, and (2) ongoing costs, including management fees, distribution and/or service (12b-1) fees, and other Fund expenses, as applicable. This example is intended to help you understand your ongoing costs (in dollars) of investing in the Fund and to compare these costs with the ongoing costs of investing in other mutual funds.
The example is based on an investment of $1,000 invested on October 1, 2005, at the beginning of the period, and held through the six-month period ended March 31, 2006.
The Fund’s transfer agent may charge additional fees to holders of certain accounts that are not included in the expenses shown in the table on the following page. These fees apply to Individual Retirement Accounts (IRAs) and Section 403(b) accounts. As of the close of the six-month period covered by the table, IRA fees included an annual maintenance fee of $15 per account (subject to a maximum annual maintenance fee of $25 for all accounts held by the same shareholder). Section 403(b) accounts are charged an annual $25 fiduciary maintenance fee. Some of the fees may vary in amount, or may be waived, based on your total account balance or the number of JennisonDryden or Strategic Partners Funds, including the Fund, that you own. You should consider the additional fees that were charged to your Fund account over the six-month period when you estimate the total ongoing expenses paid over the period and the impact of these fees on your ending account value, as these additional expenses are not reflected in the information provided in the expense table. Additional fees have the effect of reducing investment returns.
Actual Expenses
The first line for each share class in the table on the following page provides information about actual account values and actual expenses. You may use the information on this line, together with the amount you invested, to estimate the expenses that you paid over the period. Simply divide your account value by $1,000 (for example, an $8,600 account value ÷ $1,000 = 8.6), then multiply the result by the number on the first line under the heading “Expenses Paid During the Six-Month Period” to estimate the expenses you paid on your account during this period.
Hypothetical Example for Comparison Purposes
The second line for each share class in the table on the following page provides information about hypothetical account values and hypothetical expenses based on the Fund’s actual expense ratio and an assumed rate of return of 5% per year before expenses, which is not the Fund’s actual return. The hypothetical account values and
| | |
| 4 | | Visit our website at www.jennisondryden.com |
expenses may not be used to estimate the actual ending account balance or expenses you paid for the period. You may use this information to compare the ongoing costs of investing in the Fund and other funds. To do so, compare this 5% hypothetical example with the 5% hypothetical examples that appear in the shareholder reports of the other funds.
Please note that the expenses shown in the table are meant to highlight your ongoing costs only, and do not reflect any transactional costs such as sales charges (loads). Therefore the second line for each share class in the table is useful in comparing ongoing costs only, and will not help you determine the relative total costs of owning different funds. In addition, if these transactional costs were included, your costs would have been higher.
| | | | | | | | | | | | | | |
Jennison Equity
Opportunity Fund | | Beginning Account Value October 1, 2005 | | Ending Account
Value March 31, 2006 | | Annualized Expense Ratio
Based on the
Six-Month
Period | | | Expenses Paid
During the Six-
Month Period* |
| | | | | | | | | | | | | | | |
| Class A | | Actual | | $ | 1,000.00 | | $ | 1,094.20 | | 1.16 | % | | $ | 6.06 |
| | | Hypothetical | | $ | 1,000.00 | | $ | 1,019.15 | | 1.16 | % | | $ | 5.84 |
| | | | | | | | | | | | | | | |
| Class B | | Actual | | $ | 1,000.00 | | $ | 1,090.20 | | 1.91 | % | | $ | 9.95 |
| | | Hypothetical | | $ | 1,000.00 | | $ | 1,015.41 | | 1.91 | % | | $ | 9.60 |
| | | | | | | | | | | | | | | |
| Class C | | Actual | | $ | 1,000.00 | | $ | 1,090.20 | | 1.91 | % | | $ | 9.95 |
| | | Hypothetical | | $ | 1,000.00 | | $ | 1,015.41 | | 1.91 | % | | $ | 9.60 |
| | | | | | | | | | | | | | | |
| Class R | | Actual | | $ | 1,000.00 | | $ | 1,089.80 | | 1.41 | % | | $ | 7.35 |
| | | Hypothetical | | $ | 1,000.00 | | $ | 1,017.90 | | 1.41 | % | | $ | 7.09 |
| | | | | | | | | | | | | | | |
| Class Z | | Actual | | $ | 1,000.00 | | $ | 1,095.50 | | 0.91 | % | | $ | 4.75 |
| | | Hypothetical | | $ | 1,000.00 | | $ | 1,020.39 | | 0.91 | % | | $ | 4.58 |
* Fund expenses (net of fee waivers or subsidies, if any) for each share class are equal to the annualized expense ratio for each share class (provided in the table), multiplied by the average account value over the period, multiplied by the 182 days in the six-month period ended March 31, 2006, and divided by the 365 days in the Fund’s fiscal year ending September 30, 2006 (to reflect the six-month period).
| | |
| The Prudential Investment Portfolios, Inc./Jennison Equity Opportunity Fund | | 5 |
Portfolio of Investments
as of March 31, 2006 (Unaudited)
| | | | | |
| Shares | | Description | | Value (Note 1) |
| | | | | | |
LONG-TERM INVESTMENTS 95.1% | | | |
COMMON STOCKS | | | |
| |
Aerospace & Defense 1.5% | | | |
| 259,500 | | Honeywell International, Inc. | | $ | 11,098,815 |
| |
Biotechnology 1.7% | | | |
| 362,700 | | ImClone Systems, Inc.(a)(b) | | | 12,339,054 |
| |
Capital Markets 5.5% | | | |
| 183,400 | | Bank of New York Co., Inc. (The) | | | 6,609,736 |
| 792,500 | | Charles Schwab Corp. (The) | | | 13,638,925 |
| 202,500 | | Lazard Ltd., “Class A”(b) | | | 8,960,625 |
| 214,900 | | Nuveen Investments, Inc., “Class A”(b) | | | 10,347,435 |
| | | | |
|
|
| | | | | | 39,556,721 |
| |
Chemicals 5.3% | | | |
| 373,600 | | E.I. du Pont de Nemours & Co. | | | 15,769,656 |
| 348,600 | | Huntsman Corp.(a) | | | 6,727,980 |
| 563,800 | | Nalco Holdings Co.(a) | | | 9,979,260 |
| 254,300 | | Rockwood Holdings, Inc.(a) | | | 5,853,986 |
| | | | |
|
|
| | | | | | 38,330,882 |
| |
Commercial Banks 1.7% | | | |
| 379,955 | | Royal Bank of Scotland Group PLC (United Kingdom) | | | 12,364,364 |
| |
Commercial Services & Supplies 7.3% | | | |
| 1,152,800 | | Allied Waste Industries, Inc.(a)(b) | | | 14,110,272 |
| 381,400 | | Aramark Corp., “Class B”(b) | | | 11,266,556 |
| 275,700 | | Manpower, Inc. | | | 15,764,526 |
| 201,700 | | Navigant Consulting, Inc.(a)(b) | | | 4,306,295 |
| 211,000 | | Waste Management, Inc. | | | 7,448,300 |
| | | | |
|
|
| | | | | | 52,895,949 |
| |
Communications Equipment 1.6% | | | |
| 546,600 | | Nokia Corp. (ADR) (Finland) | | | 11,325,552 |
| |
Computers & Peripherals 0.7% | | | |
| 129,600 | | Diebold, Inc. | | | 5,326,560 |
| |
Containers & Packaging 1.2% | | | |
| 194,400 | | Temple-Inland, Inc. | | | 8,660,520 |
See Notes to Financial Statements.
| | |
| Jennison Equity Opportunity Fund | | 7 |
Portfolio of Investments
as of March 31, 2006 (Unaudited) Cont’d.
| | | | | |
| Shares | | Description | | Value (Note 1) |
| | | | | | |
Diversified Consumer Services 2.0% | | | |
| 210,800 | | Career Education Corp.(a)(b) | | $ | 7,953,484 |
| 280,600 | | DeVry, Inc.(a)(b) | | | 6,389,262 |
| | | | |
|
|
| | | | | | 14,342,746 |
| |
Diversified Financial Services 2.7% | | | |
| 228,100 | | Citigroup, Inc. | | | 10,773,163 |
| 209,572 | | J.P. Morgan Chase & Co. | | | 8,726,578 |
| | | | |
|
|
| | | | | | 19,499,741 |
| |
Diversified Telecommunication Services 2.5% | | | |
| 826,900 | | Citizens Communications Co.(b) | | | 10,972,963 |
| 616,500 | | IDT Corp., “Class B”(a)(b) | | | 6,824,655 |
| | | | |
|
|
| | | | | | 17,797,618 |
| |
Electronic Equipment & Instruments 0.8% | | | |
| 149,315 | | Agilent Technologies, Inc.(a) | | | 5,606,778 |
| |
Energy Equipment & Services 1.5% | | | |
| 87,300 | | Schlumberger Ltd. | | | 11,049,561 |
| |
Food & Staples Retailing 5.7% | | | |
| 798,900 | | Kroger Co. (The)(a) | | | 16,265,604 |
| 478,200 | | Performance Food Group Co.(a)(b) | | | 14,915,058 |
| 210,900 | | Wal-Mart Stores, Inc. | | | 9,962,916 |
| | | | |
|
|
| | | | | | 41,143,578 |
| |
Food Products 1.5% | | | |
| 1,083,300 | | Cadbury Schweppes PLC (United Kingdom) | | | 10,765,808 |
| |
Health Care Providers & Services 2.1% | | | |
| 203,100 | | Community Health Systems, Inc.(a) | | | 7,342,065 |
| 129,300 | | Medco Health Solutions, Inc.(a) | | | 7,398,546 |
| | | | |
|
|
| | | | | | 14,740,611 |
| |
Hotels, Restaurants & Leisure 2.5% | | | |
| 349,400 | | Bally Technologies Inc.(a) | | | 5,936,306 |
| 156,900 | | Outback Steakhouse, Inc. | | | 6,903,600 |
| 176,500 | | Pinnacle Entertainment, Inc.(a)(b) | | | 4,972,005 |
| | | | |
|
|
| | | | | | 17,811,911 |
See Notes to Financial Statements.
| | |
| 8 | | Visit our website at www.jennisondryden.com |
| | | | | |
| Shares | | Description | | Value (Note 1) |
| | | | | | |
Insurance 5.6% | | | |
| 237,900 | | American International Group, Inc. | | $ | 15,722,811 |
| 378,800 | | Axis Capital Holdings Ltd. | | | 11,326,120 |
| 1,081,000 | | Benfield Group Ltd. (United Kingdom) | | | 7,080,581 |
| 379,700 | | Montpelier Re Holdings Ltd. | | | 6,189,110 |
| | | | |
|
|
| | | | | | 40,318,622 |
| |
Internet & Catalog Retail 2.4% | | | |
| 315,500 | | Expedia, Inc.(a)(b) | | | 6,395,185 |
| 380,600 | | IAC/InterActiveCorp(a)(b) | | | 11,216,282 |
| | | | |
|
|
| | | | | | 17,611,467 |
| |
Machinery 2.0% | | | |
| 300,900 | | Dover Corp. | | | 14,611,704 |
| |
Media 8.7% | | | |
| 591,000 | | Discovery Holding Co., “Class A”(a)(b) | | | 8,865,000 |
| 2,839,600 | | Gemstar-TV Guide International, Inc.(a) | | | 8,774,364 |
| 365,700 | | Liberty Global, Inc. “Class C”(a) | | | 7,222,575 |
| 882,200 | | Pearson PLC (United Kingdom) | | | 12,231,277 |
| 961,000 | | Radio One, Inc., “Class D”(a) | | | 7,169,060 |
| 211,200 | | Verenigde Nederlandse Uitgeversbedrijven NV (Netherlands) | | | 6,866,982 |
| 294,743 | | Viacom, Inc. “Class B”(a) | | | 11,436,028 |
| | | | |
|
|
| | | | | | 62,565,286 |
| |
Metals & Mining 2.6% | | | |
| 247,200 | | Alpha Natural Resources, Inc.(a) | | | 5,720,208 |
| 204,700 | | Harmony Gold Mining Co. Ltd. (ADR) (South Africa)(a) | | | 3,250,636 |
| 271,800 | | Massey Energy Co. | | | 9,803,826 |
| | | | |
|
|
| | | | | | 18,774,670 |
| |
Multi-Utilities 2.3% | | | |
| 1,167,400 | | Aquila, Inc.(a) | | | 4,657,926 |
| 262,500 | | Sempra Energy | | | 12,195,750 |
| | | | |
|
|
| | | | | | 16,853,676 |
| |
Oil, Gas & Consumable Fuels 3.4% | | | |
| 178,300 | | Exxon Mobil Corp. | | | 10,851,338 |
| 93,600 | | Occidental Petroleum Corp. | | | 8,672,040 |
| 190,800 | | Range Resources Corp. | | | 5,210,748 |
| | | | |
|
|
| | | | | | 24,734,126 |
See Notes to Financial Statements.
| | |
| Jennison Equity Opportunity Fund | | 9 |
Portfolio of Investments
as of March 31, 2006 (Unaudited) Cont’d.
| | | | | |
| Shares | | Description | | Value (Note 1) |
| | | | | | |
Paper & Forest Products 1.3% | | | |
| 328,600 | | MeadWestvaco Corp. | | $ | 8,974,066 |
| |
Pharmaceuticals 7.7% | | | |
| 297,500 | | Abbott Laboratories | | | 12,634,825 |
| 100,500 | | Endo Pharmaceuticals Holdings(a) | | | 3,297,405 |
| 73,600 | | Kos Pharmaceuticals, Inc.(a) | | | 3,515,872 |
| 417,400 | | Pfizer, Inc. | | | 10,401,608 |
| 140,600 | | Sanofi-Aventis (France) | | | 13,375,385 |
| 425,800 | | Watson Pharmaceuticals, Inc.(a)(b) | | | 12,237,492 |
| | | | |
|
|
| | | | | | 55,462,587 |
| |
Road & Rail 2.2% | | | |
| 263,200 | | CSX Corp. | | | 15,739,360 |
| |
Semiconductors & Semiconductor Equipment 1.5% | | | |
| 290,200 | | Intel Corp. | | | 5,615,370 |
| 132,300 | | Maxim Integrated Products, Inc.(b) | | | 4,914,945 |
| | | | |
|
|
| | | | | | 10,530,315 |
| |
Software 7.0% | | | |
| 899,500 | | BEA Systems, Inc.(a) | | | 11,810,435 |
| 331,000 | | Computer Associates International, Inc. | | | 9,006,510 |
| 432,800 | | Manhattan Associates, Inc.(a) | | | 9,521,600 |
| 535,700 | | Microsoft Corp. | | | 14,576,397 |
| 652,400 | | TIBCO Software, Inc.(a) | | | 5,454,064 |
| | | | |
|
|
| | | | | | 50,369,006 |
| |
Specialty Retail 0.6% | | | |
| 1,121,500 | | Blockbuster, Inc., “Class A”(b) | | | 4,452,355 |
| | | | |
|
|
| | | Total long-term investments
(cost $607,229,795) | | | 685,654,009 |
| | | | |
|
|
SHORT-TERM INVESTMENTS 19.5% | | | |
| |
Affiliated Money Market Mutual Fund 19.0% | | | |
| | | Dryden Core Investment Fund - Taxable Money Market Series | | | |
| 136,831,018 | | (cost $136,831,018; includes $103,316,227 of cash collateral for securities on loan) (Note 3)(c)(e) | | | 136,831,018 |
| | | | |
|
|
See Notes to Financial Statements.
| | |
| 10 | | Visit our website at www.jennisondryden.com |
| | | | | | |
Principal
Amount (000) | | Description | | Value (Note 1) | |
| | | | | | | |
U.S. Government Security 0.5% | | | | |
| | | United States Treasury Bill, 4.17%, 6/22/06(d) | | | | |
| $ 3,905 | | (cost $3,866,542) | | $ | 3,866,270 | |
| | | | |
|
|
|
| | | Total short-term investments
(cost $140,697,560) | | | 140,697,288 | |
| | | | |
|
|
|
| | | Total Investments, Before Securities Sold Short 114.6%
(cost $747,927,355) | | | 826,351,297 | |
| | | | |
|
|
|
| | |
Shares
| | | | | |
Securities Sold Short (1.1%) | | | | |
| |
Oil, Gas & Consumable Fuels | | | | |
| 128,700 | | Devon Energy Corp. (proceeds $8,509,550) | | | (7,872,579 | ) |
| | | | |
|
|
|
| | | Total Investments, Net of Securities Sold Short 113.5%
(cost $739,417,805; Note 5) | | | 818,478,718 | |
| | | Liabilities in excess of other assets (13.5%) | | | (97,482,945 | ) |
| | | | |
|
|
|
| | | Net Assets 100% | | $ | 720,995,773 | |
| | | | |
|
|
|
The following abbreviation is used in portfolio descriptions:
ADR—American Depositary Receipt
| (a) | Non-income producing security. |
| (b) | All or portion of security on loan. The aggregate market value of such securities is $98,938,030; cash collateral of $103,316,227 (included in liabilities) was received with which the portfolio purchased highly liquid short-term investments. |
| (c) | Represents security, or a portion thereof, purchased with cash collateral received for securities on loan. |
| (d) | Rate quoted represents yield-to-maturity as of purchase date. |
| (e) | Prudential Investments LLC, the manager of the Fund, also serves as the manager of the Dryden Core Investment Fund - Taxable Money Market Series. |
See Notes to Financial Statements.
| | |
| Jennison Equity Opportunity Fund | | 11 |
Portfolio of Investments
as of March 31, 2006 (Unaudited) Cont’d.
The Industry classification of portfolio holdings and liabilities in excess of other assets shown as a percentage of net assets as of March 31, 2006 were as follows:
| | | |
Affiliated Money Market Mutual Fund (including 14.3% of collateral received for securities on loan) | | 19.0 | % |
Media | | 8.8 | |
Pharmaceuticals | | 7.8 | |
Commercial Services & Supplies | | 7.3 | |
Software | | 7.0 | |
Food & Staples Retailing | | 5.7 | |
Insurance | | 5.6 | |
Capital Markets | | 5.5 | |
Chemicals | | 5.3 | |
Oil, Gas & Consumable Fuels | | 3.4 | |
Diversified Financial Services | | 2.7 | |
Metals & Mining | | 2.6 | |
Diversified Telecommunication Services | | 2.5 | |
Hotels, Restaurants & Leisure | | 2.5 | |
Internet & Catalog Retail | | 2.4 | |
Multi-Utilities | | 2.3 | |
Road & Rail | | 2.2 | |
Diversified Consumer Services | | 2.0 | |
Health Care Providers & Services | | 2.0 | |
Machinery | | 2.0 | |
Biotechnology | | 1.7 | |
Commercial Banks | | 1.7 | |
Communications Equipment | | 1.6 | |
Aerospace & Defense | | 1.5 | |
Energy Equipment & Services | | 1.5 | |
Food Products | | 1.5 | |
Semiconducotrs & Semiconductor Equipment | | 1.5 | |
Containers & Packaging | | 1.2 | |
Paper & Forest Products | | 1.2 | |
Electronic Equipment & Instruments | | 0.8 | |
Computers & Peripherals | | 0.7 | |
Specialty Retail | | 0.6 | |
U.S. Government Security | | 0.5 | |
| | |
|
|
| | | 114.6 | |
Securities sold short | | (1.1 | ) |
Liabilities in excess of other assets | | (13.5 | ) |
| | |
|
|
| | | 100.0 | % |
| | |
|
|
See Notes to Financial Statements.
| | |
| 12 | | Visit our website at www.jennisondryden.com |
Financial Statements
(Unaudited)
| | |
| MARCH 31, 2006 | | SEMIANNUAL REPORT |
Jennison Equity Opportunity Fund
Statement of Assets and Liabilities
as of March 31, 2006 (Unaudited)
| | | |
Assets | | | |
Investments at value, including securities on loan of $98,938,030: | | | |
Unaffiliated investments (cost $611,096,337) | | $ | 689,520,279 |
Affiliated investments (cost $136,831,018) | | | 136,831,018 |
Foreign currency, at value (cost $1,153) | | | 1,154 |
Receivable for investments sold | | | 5,895,283 |
Receivable for Series shares sold | | | 1,205,223 |
Dividends receivable | | | 1,047,030 |
Due from broker-variation margin | | | 178,893 |
Receivable from securities lending, net | | | 15,862 |
Prepaid expenses | | | 883 |
| | |
|
|
Total assets | | | 834,695,625 |
| | |
|
|
| |
Liabilities | | | |
Payable to broker for collateral for securities on loan (Note 4) | | | 103,316,227 |
Payable for Series shares reacquired | | | 4,440,142 |
Payable for investments purchased | | | 4,138,993 |
Accrued expenses | | | 833,765 |
Management fee payable | | | 359,417 |
Distribution fee payable | | | 257,814 |
Payable to custodian | | | 257,452 |
Transfer agent fee payable | | | 93,086 |
Deferred directors’ fees | | | 2,956 |
| | |
|
|
Total liabilities | | | 113,699,852 |
| | |
|
|
| |
Net Assets | | $ | 720,995,773 |
| | |
|
|
| | | | |
Net assets were comprised of: | | | |
Common stock, at par | | $ | 42,540 |
Paid-in capital in excess of par | | | 591,466,258 |
| | |
|
|
| | | | 591,508,798 |
Undistributed net investment income | | | 127,027 |
Accumulated net realized gain on investment and foreign currency transactions | | | 50,298,790 |
Net unrealized appreciation on investments and foreign currencies | | | 79,061,158 |
| | |
|
|
Net assets, March 31, 2006 | | $ | 720,995,773 |
| | |
|
|
See Notes to Financial Statements.
| | |
| 14 | | Visit our website at www.jennisondryden.com |
| | | |
Class A | | | |
Net asset value and redemption price per share
($328,954,252 ÷ 19,134,129 shares of common stock issued and outstanding) | | $ | 17.19 |
Maximum sales charge (5.50% of offering price) | | | 1.00 |
| | |
|
|
Maximum offering price to public | | $ | 18.19 |
| | |
|
|
| |
Class B | | | |
Net asset value, offering price and redemption price per share
($165,509,873 ÷ 10,201,455 shares of common stock issued and outstanding) | | $ | 16.22 |
| | |
|
|
| |
Class C | | | |
Net asset value, offering price and redemption price per share
($54,879,205 ÷ 3,382,741 shares of common stock issued and outstanding) | | $ | 16.22 |
| | |
|
|
| |
Class R | | | |
Net asset value, offering price and redemption price per share
($2,884 ÷ 176.73 shares of common stock issued and outstanding) | | $ | 16.32 |
| | |
|
|
| |
Class Z | | | |
Net asset value, offering price and redemption price per share
($171,649,559 ÷ 9,821,890 shares of common stock issued and outstanding) | | $ | 17.48 |
| | |
|
|
See Notes to Financial Statements.
| | |
| Jennison Equity Opportunity Fund | | 15 |
Statement of Operations
Six Months Ended March 31, 2006 (Unaudited)
| | | | |
Net Investment Income | | | | |
Income | | | | |
Unaffiliated dividend income (net of foreign withholding taxes of $49,190) | | $ | 4,509,705 | |
Affiliated dividend income | | | 553,292 | |
Affiliated income from securities loaned, net | | | 102,624 | |
Unaffiliated interest | | | 35,361 | |
| | |
|
|
|
Total income | | | 5,200,982 | |
| | |
|
|
|
| |
Expenses | | | | |
Management fee | | | 2,277,841 | |
Distribution fee—Class A | | | 401,360 | |
Distribution fee—Class B | | | 853,439 | |
Distribution fee—Class C | | | 281,748 | |
Distribution fee—Class R | | | 7 | |
Transfer agent’s fee and expenses (including affiliated expense of $593,900) | | | 1,024,000 | |
Custodian’s fees and expenses | | | 73,000 | |
Reports to shareholders | | | 50,000 | |
Registration fees | | | 39,000 | |
Insurance | | | 26,000 | |
Legal fees and expenses | | | 19,000 | |
Directors’ fees | | | 13,000 | |
Audit fee | | | 8,000 | |
Miscellaneous | | | 9,750 | |
| | |
|
|
|
Total expenses | | | 5,076,145 | |
| | |
|
|
|
Net investment income | | | 124,837 | |
| | |
|
|
|
| |
Realized And Unrealized Gain (Loss) On Investment and Foreign Currency Transactions | | | | |
Net realized gain (loss) on: | | | | |
Investment transactions | | | 58,323,562 | |
Foreign currency transactions | | | (18,100 | ) |
| | |
|
|
|
| | | | 58,305,462 | |
| | |
|
|
|
Net change in unrealized appreciation on: | | | | |
Investments | | | 9,924,614 | |
Foreign currencies | | | 3,122 | |
Short Sales | | | 636,971 | |
| | |
|
|
|
| | | | 10,564,707 | |
| | |
|
|
|
Net gain on investment and foreign currency transactions | | | 68,870,169 | |
| | |
|
|
|
Net Increase In Net Assets Resulting From Operations | | $ | 68,995,006 | |
| | |
|
|
|
See Notes to Financial Statements.
| | |
| 16 | | Visit our website at www.jennisondryden.com |
Statement of Changes in Net Assets
(Unaudited)
| | | | | | | | |
| | | Six Months
Ended
March 31, 2006 | | | Year
Ended
September 30, 2005 | |
Increase (Decrease) In Net Assets | | | | | | | | |
Operations | | | | | | | | |
Net investment income | | $ | 124,837 | | | $ | 5,204,720 | |
Net realized gain on investment and foreign currency transactions | | | 58,305,462 | | | | 123,530,427 | |
Net change in unrealized appreciation (depreciation) on investments and foreign currencies | | | 10,564,707 | | | | (9,584,465 | ) |
| | |
|
|
| |
|
|
|
Net increase in net assets resulting from operations | | | 68,995,006 | | | | 119,150,682 | |
| | |
|
|
| |
|
|
|
Dividends and Distributions (Note 1) | | | | | | | | |
Dividends from net investment income | | | | | | | | |
Class A | | | (1,410,227 | ) | | | (640,443 | ) |
Class B | | | — | | | | — | |
Class C | | | — | | | | — | |
Class R | | | (7 | ) | | | — | |
Class Z | | | (1,683,304 | ) | | | (1,463,623 | ) |
| | |
|
|
| |
|
|
|
| | | | (3,093,538 | ) | | | (2,104,066 | ) |
| | |
|
|
| |
|
|
|
Distributions from net realized gains | | | | | | | | |
Class A | | | (47,030,702 | ) | | | (7,429,109 | ) |
Class B | | | (27,242,728 | ) | | | (4,847,431 | ) |
Class C | | | (8,923,183 | ) | | | (1,477,210 | ) |
Class R | | | (407 | ) | | | — | |
Class Z | | | (39,374,021 | ) | | | (7,386,849 | ) |
| | |
|
|
| |
|
|
|
| | | | (122,571,041 | ) | | | (21,140,599 | ) |
| | |
|
|
| |
|
|
|
| | |
Series share transactions (Net of share conversions) (Note 6) | | | | | | | | |
Net proceeds from shares sold | | | 50,545,235 | | | | 165,985,562 | |
Net asset value of shares issued in reinvestment of dividends and distributions | | | 121,005,928 | | | | 22,350,003 | |
Cost of shares reacquired | | | (237,676,609 | ) | | | (404,867,626 | ) |
| | |
|
|
| |
|
|
|
Net decrease in net assets from Series share transactions | | | (66,125,446 | ) | | | (216,532,061 | ) |
| | |
|
|
| |
|
|
|
Total decrease | | | (122,795,019 | ) | | | (120,626,044 | ) |
| | |
Net Assets | | | | | | | | |
Beginning of period | | | 843,790,792 | | | | 964,416,836 | |
| | |
|
|
| |
|
|
|
End of period(a) | | $ | 720,995,773 | | | $ | 843,790,792 | |
| | |
|
|
| |
|
|
|
(a) Includes undistributed net investment income of: | | $ | 127,027 | | | $ | 3,095,728 | |
| | |
|
|
| |
|
|
|
See Notes to Financial Statements.
| | |
| Jennison Equity Opportunity Fund | | 17 |
Notes to Financial Statements
(Unaudited)
The Prudential Investment Portfolios, Inc. (the “Fund”) is registered under the Investment Company Act of 1940 as a diversified, open-end management investment company. The Fund was incorporated in Maryland on August 10, 1995 and consists of six series: Jennison Equity Opportunity Fund (the “Series”), Jennison Growth Fund, Dryden Active Allocation Fund, (formerly Dryden Active Balanced Fund), JennisonDryden Growth Allocation Fund, JennisonDryden Moderate Allocation Fund and JennisonDryden Conservative Allocation Fund. These financial statements relate to Jennison Equity Opportunity Fund. The financial statements of the other series are not presented herein. The Series commenced investment operations on November 7, 1996.
The Series’ investment objective is to achieve long-term growth of capital. The Series seeks to achieve its objectives by investing primarily in common stocks of established companies with growth prospects believed to be underappreciated by the market.
Note 1. Accounting Policies
The following is a summary of significant accounting policies followed by the Series in the preparation of its financial statements.
Securities Valuation: Securities listed on a securities exchange are valued at the last sales price on such exchange on the day of valuation or, if there was no sale on such day, at the mean between the last reported bid and asked prices, or at the last bid price on such day in the absence of an asked price. Securities traded via Nasdaq are valued at the official closing price as provided by Nasdaq. Securities that are actively traded in the over-the-counter market, including listed securities for which the primary market is believed by Prudential Investments LLC (“PI” or “Manager”), in consultation with the subadvisor; to be over-the-counter, are valued at market value by an independent pricing agent or principal market maker. Any security for which a reliable market quotation is unavailable is valued at fair value in accordance with the Board of Director’s approved fair valuation procedures. When determining the fair valuation of securities some of the factors influencing the valuation include, the nature of any restrictions on disposition of the securities; assessment of the general liquidity of the securities; the issuer’s financial condition and the markets in which it does business; the cost of the investment; the size of the holding and the capitalization of issuer; the prices of any recent transactions or bids/offers for such securities or any comparable securities; any available analyst media or other reports or information deemed reliable by the investment adviser regarding the issuer or the
| | |
| 18 | | Visit our website at www.jennisondryden.com |
markets or industry in which it operates. Using fair value to price securities may result in a value that is different from a security’s most recent closing price and from the price used by other mutual funds to calculate their net asset values. As of March 31, 2006, there were no securities valued in accordance with such procedures.
Investments in mutual funds are valued at their net asset value as of the close of the New York Stock Exchange on the date of valuation.
Short-term securities which mature in 60 days or less are valued at amortized cost, which approximates market value. Short-term securities which mature in more than sixty days are valued at current market quotations. The amortized cost method involves valuing a security at its cost on the date of purchase and thereafter assuming a constant amortization to maturity of the difference between the principal amount due at maturity and cost.
Foreign Currency Translation: The books and records of the Series are maintained in U.S. dollars. Foreign currency amounts are translated into U.S. dollars on the following basis:
(i) market value of investment securities, other assets and liabilities-at the current rates of exchange.
(ii) Purchases and sales of investment securities, income and expenses-at the rates of exchange prevailing on the respective dates of such transactions.
Although the net assets of the Series are presented at the foreign exchange rates and market values at the close of the fiscal period, the Series does not isolate that portion of the results of operations arising as a result of changes in the foreign exchange rates from the fluctuations arising from changes in the market prices of long-term securities held at the end of the fiscal period. Similarly, the Series does not isolate the effect of changes in foreign exchange rates from the fluctuations arising from changes in the market prices of long-term portfolio securities sold during the fiscal period. Accordingly, realized foreign currency gains or losses are included in the reported net realized gains or losses on investment transactions.
Net realized gains or losses on foreign currency transactions represent net foreign exchange gains or losses from the holding of foreign currencies, currency gains or losses realized between the trade date and settlement date on securities transactions, and the difference between the amounts of dividends, interest and foreign withholding taxes recorded on the Series’ books and the U.S. dollar equivalent amounts actually received or paid. Net unrealized currency gains or losses from valuing foreign currency denominated assets and liabilities (other than investments) at
| | |
| Jennison Equity Opportunity Fund | | 19 |
Notes to Financial Statements
(Unaudited) Cont’d
period end exchange rates are reflected as a component of net unrealized appreciation (depreciation) on investments and foreign currencies. Foreign security and currency transactions may involve certain considerations and risks not typically associated with those of domestic origin as a result of, among other factors, the possibility of political and economic instability or the level of governmental supervision and regulation of foreign securities markets.
Short Sales: The Series may sell a security it does not own in anticipation of a decline in the market value of that security (short sale). When the Series makes a short sale, it must borrow the security sold short and deliver it to the broker-dealer through which it made the short sale as collateral for its obligation to deliver the security upon conclusion of the transaction. The Series may have to pay a fee to borrow the particular security and may be obligated to remit any interest or dividends received on such borrowed securities. Dividends declared on short positions open on record date are recorded on the ex-date as an expense. A gain, limited to the price at which the Series sold the security short, or a loss, unlimited in magnitude, will be recognized upon the termination of a short sale if the market price at termination is less than or greater than, respectively, the proceeds originally received. The Series maintains a segregated account of securities or other liquid assets, the dollar value of which is at least equal to its obligation with respect to short sales.
Securities Lending: The Series may lend its portfolio securities to qualified institutions. The loans are secured by collateral at least equal at all times, to the market value of the securities loaned. The Series may bear the risk of delay in recovery of, or even loss of rights in, the securities loaned should the borrower of the securities fail financially. The Series receives compensation, net of any rebate, for lending its securities in the form of interest or dividends on the collateral received for the securities loaned, and any gain or loss in the market price of the securities loaned that may occur during the term of the loan.
Securities Transactions and Net Investment Income: Securities transactions are recorded on the trade date. Realized gains or losses on sales of securities are calculated on the identified cost basis. Dividend income is recorded on the ex-dividend date and interest income, including amortization of premiums and accretion of discounts on debt securities, as required, is recorded on the accrual basis. Expenses are recorded on an accrual basis. Net investment income or (loss) (other than distribution fees which are charged directly to the respective class), and realized and
| | |
| 20 | | Visit our website at www.jennisondryden.com |
unrealized gains and losses are allocated daily to each class of shares based upon the relative proportion of net assets of each class at the beginning of the day.
Dividends and Distributions: The Series expects to pay dividends of net investment income, if any, semi-annually and distributions of net realized capital gains, if any, at least annually. Dividends and distributions, which are determined in accordance with federal income tax regulations and which may differ from generally accepted accounting principles, are recorded on the ex-dividend date. Permanent book/tax differences relating to income and gains are reclassified to paid-in capital when they arise.
Taxes: For federal income tax purposes, each Series in the Fund is treated as a separate tax paying entity. It is the Series’ policy to continue to meet the requirements of the Internal Revenue Code applicable to regulated investment companies and to distribute all of its taxable net income and capital gains, if any, to shareholders. Therefore, no federal tax provision is required. Withholding taxes on foreign dividends are recorded net of reclaimable amounts, at the time the related income is earned.
Estimates: The preparation of the financial statements requires management to make estimates and assumptions that affect the reported amounts and disclosures in the financial statements. Actual results could differ from those estimates.
Note 2. Agreements
The Fund has a management agreement for the Series with PI. Pursuant to this agreement PI has responsibility for all investment advisory services and supervises the subadvisor’s performance of such services. PI has entered into a subadvisory agreement with Jennison Associates LLC (“Jennison”). The subadvisory agreement provides that Jennison furnishes investment advisory services in connection with the management of the Series. In connection therewith, Jennison is obligated to keep certain books and records of the Series. PI pays for the services of Jennison, the cost of compensation of officers and employees of the Series, occupancy and certain clerical and bookkeeping costs of the Series. The Series bears all other costs and expenses.
The management fee paid to PI is computed daily and payable monthly, at an annual rate of .60 of 1% of the average daily net assets of the Series up to $300 million and .575 of 1% of the average daily net assets of the Series over $300 million. The effective management fee rate was .585 of 1% of the Series average daily net assets for the six months ended March 31, 2006.
The Series has a distribution agreement with Prudential Investment Management Services LLC (“PIMS”), which acts as the distributor of the Class A, Class B, Class C,
| | |
| Jennison Equity Opportunity Fund | | 21 |
Notes to Financial Statements
(Unaudited) Cont’d
Class R and Class Z shares of the Series. The Series compensates PIMS for distributing and servicing the Series’ Class A, Class B, Class C and Class R shares, pursuant to plans of distribution (the “Class A, B, C and R Plans”), regardless of expenses actually incurred by PIMS. The distribution fees are accrued daily and payable monthly. No distribution or service fees are paid to PIMS as distributor of the Class Z shares of the Series.
Pursuant to the Class A, B, C and R Plans, the Series compensates PIMS for distribution related activities at an annual rate of up to .30 of 1%, 1%, 1% and .75 of 1% of the average daily net assets of the Class A, B, C and R shares, respectively. PIMS contractually agreed to limit such fees to .25 of 1% and .50 of 1% of the Class A and Class R shares, respectively.
PIMS has advised the Series that it received approximately $76,000 in front-end sales charges resulting from sales of Class A shares during the six months ended March 31, 2006. From these fees PIMS paid such sales charges to affiliated brokers/dealers, which in turn paid commissions to salespersons and incurred other distribution costs.
PIMS has advised the Series that for the six months ended March 31, 2006, it received approximately $147,800 and $1,600 in contingent deferred sales charges imposed upon redemptions by certain Class B and Class C shareholders, respectively.
PI, PIMS, and Jennison are indirect, wholly-owned subsidiaries of Prudential Financial, Inc. (“Prudential”).
The Series, along with other affiliated registered investment companies (the “Funds”), is a party to a syndicated credit agreement (“SCA”) with two banks. The SCA provides for a commitment of $500 million. Interest on any borrowings under the SCA would be incurred at market rates. For the period from October 29, 2004 through October 28, 2005, the Fund paid a commitment fee of .075 of 1% of the unused portion of the agreement. Effective October 29, 2005, the Funds renewed the SCA with the banks. The commitment under the renewed SCA continues to be $500 million. The Fund pays a commitment fee of .0725 of 1% of the unused portion of the renewed SCA. The commitment fee is accrued daily and paid quarterly and is allocated to the Funds pro-rata based on net assets. The purpose of the SCA is to serve as an alternative source of funding for capital share redemptions. The expiration date of the renewed SCA is October 27, 2006. The Fund did not borrow any amounts pursuant to the SCA during the six months ended March 31, 2006.
| | |
| 22 | | Visit our website at www.jennisondryden.com |
Note 3. Other Transactions with Affiliates
Prudential Mutual Fund Services LLC (“PMFS”), an affiliate of PI and an indirect, wholly-owned subsidiary of Prudential, serves as the Fund’s transfer agent. Transfer agent’s fees and expenses in the Statement of Operations include certain out-of-pocket expenses paid to non-affiliates, where applicable.
The Fund pays networking fees to affiliated and unaffiliated broker/dealers. These networking fees are payments made to broker/dealers that clear mutual fund transactions through a national clearing system. For the six months ended March 31, 2006, the Series incurred approximately $129,900 in total networking fees. These amounts are included in transfer agent’s fees and expenses in the Statement of Operations.
For the six months ended March 31, 2006, Prudential Equity Group, LLC, a wholly-owned subsidiary of Prudential, earned approximately $29,600 in broker commissions from portfolio transactions executed on behalf of the Fund.
Prudential Investment Management, Inc., (“PIM”), an indirect wholly-owned subsidiary of Prudential, is the Series’ security lending agent. For the six months ended March 31, 2006, PIM has been compensated approximately $43,900 for these services.
The Series invests in the Taxable Money Market Series (the “portfolio”), a portfolio of the Dryden Core Investment Fund, pursuant to an exemptive order received from the Securities and Exchange Commission. The portfolio is a money market mutual fund registered under the Investment Company Act of 1940, as amended, and managed by PI.
Note 4. Portfolio Securities
Purchases and sales of investment securities, other than short-term investments, for the six months ended March 31, 2006 were $293,824,667 and $480,930,639 respectively.
As of March 31, 2006, the Series had securities on loan with an aggregate market value of $98,938,030. The Series received $103,316,227 in cash as collateral for securities on loan which was used to purchase highly liquid short-term investments in accordance with the Fund’s securities lending procedures.
| | |
| Jennison Equity Opportunity Fund | | 23 |
Notes to Financial Statements
(Unaudited) Cont’d
Note 5. Tax Information
The United States federal income tax basis of the Series’ investments and the net unrealized appreciation as of March 31, 2006 were as follows:
| | | | | | |
Tax Basis
of Investments
| | Appreciation
| | Depreciation
| | Net Unrealized
Appreciation
|
| $752,571,715 | | $90,476,102 | | $16,696,520 | | $73,779,582 |
The differences between book and tax basis are primarily attributable to deferred losses on wash sales.
Note 6. Capital
The Series offers Class A, Class B, Class C, Class R and Class Z shares. Class A shares are subject to a maximum front-end sales charge of 5.5%. Investors who purchase Class A shares in an amount of $1 million or more and sell these shares within 12 months of purchase are not subject to an initial sales charge but are subject to a contingent deferred sales charge (CDSC) of 1%, including investors who purchase their shares through broker-dealers affiliated with Prudential Financial, Inc. Class B shares are subject to a CDSC of 5%, which decreases by 1% annually to 1% in the fifth and sixth years and 0% in the seventh year. The CDSC for Class C shares is 1% for shares redeemed within 12 months of purchase. Class B shares automatically convert to Class A shares on a quarterly basis approximately seven years after purchase. A special exchange privilege is also available for shareholders who qualified to purchase Class A shares at net asset value. Class R and Class Z shares are not subject to any sales or redemption charge and are offered exclusively for sale to a limited group of investors.
There are 1 billion shares of $.001 par value common stock of the Series, designated Class A, Class B, Class C, Class R and Class Z, each of which consists of 200 million authorized shares. As of March 31, 2006 Prudential owned 177 Class R shares of the Series.
| | |
| 24 | | Visit our website at www.jennisondryden.com |
Transactions in shares of common stock were as follows:
| | | | | | | |
Class A
| | Shares
| | | Amount
| |
Six months ended March 31, 2006: | | | | | | | |
Shares sold | | 1,811,881 | | | $ | 30,639,846 | |
Shares issued in reinvestment of dividends and distributions | | 2,874,543 | | | | 45,906,455 | |
Shares reacquired | | (3,755,460 | ) | | | (63,475,880 | ) |
| | |
|
| |
|
|
|
Net increase (decrease) in shares outstanding before conversion | | 930,964 | | | | 13,070,421 | |
Shares issued upon conversion from Class B | | 527,503 | | | | 8,648,511 | |
| | |
|
| |
|
|
|
Net increase (decrease) in shares outstanding | | 1,458,467 | | | $ | 21,718,932 | |
| | |
|
| |
|
|
|
Year ended September 30, 2005: | | | | | | | |
Shares sold | | 4,108,177 | | | $ | 71,382,443 | |
Shares issued in reinvestment of dividends and distributions | | 440,194 | | | | 7,544,923 | |
Shares reacquired | | (8,789,869 | ) | | | (153,356,495 | ) |
| | |
|
| |
|
|
|
Net increase (decrease) in shares outstanding before conversion | | (4,241,498 | ) | | | (74,429,129 | ) |
Shares issued upon conversion from Class B | | 1,537,272 | | | | 27,205,176 | |
| | |
|
| |
|
|
|
Net increase (decrease) in shares outstanding | | (2,704,226 | ) | | $ | (47,223,953 | ) |
| | |
|
| |
|
|
|
Class B
| | | | | | |
Six months ended March 31, 2006: | | | | | | | |
Shares sold | | 170,227 | | | $ | 2,742,517 | |
Shares issued in reinvestment of distributions | | 1,709,368 | | | | 25,828,554 | |
Shares reacquired | | (1,396,445 | ) | | | (22,302,056 | ) |
| | |
|
| |
|
|
|
Net increase (decrease) in shares outstanding before conversion | | 483,150 | | | | 6,269,015 | |
Shares reacquired upon conversion into Class A | | (558,169 | ) | | | (8,648,511 | ) |
| | |
|
| |
|
|
|
Net increase (decrease) in shares outstanding | | (75,019 | ) | | $ | (2,379,496 | ) |
| | |
|
| |
|
|
|
Year ended September 30, 2005: | | | | | | | |
Shares sold | | 702,740 | | | $ | 11,611,254 | |
Shares issued in reinvestment of distributions | | 279,826 | | | | 4,586,347 | |
Shares reacquired | | (2,542,350 | ) | | | (42,288,527 | ) |
| | |
|
| |
|
|
|
Net increase (decrease) in shares outstanding before conversion | | (1,559,784 | ) | | | (26,090,926 | ) |
Shares reacquired upon conversion into Class A | | (1,613,037 | ) | | | (27,205,176 | ) |
| | |
|
| |
|
|
|
Net increase (decrease) in shares outstanding | | (3,172,821 | ) | | $ | (53,296,102 | ) |
| | |
|
| |
|
|
|
Class C
| | | | | | |
Six months ended March 31, 2006: | | | | | | | |
Shares sold | | 106,290 | | | $ | 1,706,083 | |
Shares issued in reinvestment of distributions | | 560,702 | | | | 8,472,207 | |
Shares reacquired | | (666,776 | ) | | | (10,636,402 | ) |
| | |
|
| |
|
|
|
Net increase (decrease) in shares outstanding | | 216 | | | $ | (458,112 | ) |
| | |
|
| |
|
|
|
Year ended September 30, 2005: | | | | | | | |
Shares sold | | 282,336 | | | $ | 4,678,785 | |
Shares issued in reinvestment of distributions | | 85,347 | | | | 1,398,834 | |
Shares reacquired | | (1,160,978 | ) | | | (19,338,342 | ) |
| | |
|
| |
|
|
|
Net increase (decrease) in shares outstanding | | (793,295 | ) | | $ | (13,260,723 | ) |
| | |
|
| |
|
|
|
| | |
| Jennison Equity Opportunity Fund | | 25 |
Notes to Financial Statements
(Unaudited) Cont’d
| | | | | | | |
Class R
| | Shares
| | | Amount
| |
Six months ended March 31, 2006: | | | | | | | |
Shares sold | | — | | | $ | — | |
Shares issued in reinvestment of dividends and distributions | | 28 | | | | 414 | |
Shares reacquired | | — | | | | — | |
| | |
|
| |
|
|
|
Net increase (decrease) in shares outstanding | | 28 | | | $ | 414 | |
| | |
|
| |
|
|
|
Period ended September 30, 2005*: | | | | | | | |
Shares sold | | 149 | | | $ | 2,500 | |
Shares issued in reinvestment of dividends | | — | | | | — | |
Shares reacquired | | — | | | | — | |
| | |
|
| |
|
|
|
Net increase (decrease) in shares outstanding | | 149 | | | $ | 2,500 | |
| | |
|
| |
|
|
|
Class Z
| | | | | | |
Six months ended March 31, 2006: | | | | | | | |
Shares sold | | 895,093 | | | $ | 15,456,789 | |
Shares issued in reinvestment of dividends and distributions | | 2,515,308 | | | | 40,798,298 | |
Shares reacquired | | (8,386,815 | ) | | | (141,262,271 | ) |
| | |
|
| |
|
|
|
Net increase (decrease) in shares outstanding | | (4,976,414 | ) | | $ | (85,007,184 | ) |
| | |
|
| |
|
|
|
Year ended September 30, 2005: | | | | | | | |
Shares sold | | 4,451,463 | | | $ | 78,310,580 | |
Shares issued in reinvestment of dividends and distributions | | 508,352 | | | | 8,819,899 | |
Shares reacquired | | (10,733,093 | ) | | | (189,884,262 | ) |
| | |
|
| |
|
|
|
Net increase (decrease) in shares outstanding | | (5,773,278 | ) | | $ | (102,753,783 | ) |
| | |
|
| |
|
|
|
| * | Commenced operations on December 17, 2004. |
| | |
| 26 | | Visit our website at www.jennisondryden.com |
Financial Highlights
(Unaudited)
| | |
| MARCH 31, 2006 | | SEMIANNUAL REPORT |
Jennison Equity Opportunity Fund
Financial Highlights
(Unaudited) Cont’d
| | | | |
| | | Class A
| |
| | | Six Months Ended
March 31, 2006 | |
Per Share Operating Performance: | | | | |
Net Asset Value, Beginning Of Period | | $ | 18.47 | |
| | |
|
|
|
Income (loss) from investment operations | | | | |
Net investment income | | | .01 | |
Net realized and unrealized gain (loss) on investment and foreign currency transactions | | | 1.51 | |
| | |
|
|
|
Total from investment operations | | | 1.52 | |
| | |
|
|
|
Less Dividends and Distributions | | | | |
Dividends from net investment income | | | (.08 | ) |
Distributions from net realized gains | | | (2.72 | ) |
| | |
|
|
|
Total dividends and distributions | | | (2.80 | ) |
| | |
|
|
|
Net asset value, end of period | | $ | 17.19 | |
| | |
|
|
|
Total Return(b): | | | 9.42 | % |
Ratios/Supplemental Data: | | | | |
Net assets, end of period (000) | | $ | 328,954 | |
Average net assets (000) | | $ | 321,970 | |
Ratios to average net assets: | | | | |
Expenses, including distribution and service (12b-1) fees(c) | | | 1.16 | %(d) |
Expenses, excluding distribution and service (12b-1) fees | | | .91 | %(d) |
Net investment income | | | .20 | %(d) |
For Class A, B, C, R and Z shares: | | | | |
Portfolio turnover rate | | | 39 | %(e) |
| (a) | Calculated based upon average shares outstanding during the period. |
| (b) | Total return does not consider the effects of sales loads. Total return is calculated assuming a purchase of shares on the first day and a sale on the last day of each period reported, and includes reinvestment of dividends and distributions. Total returns for periods less than a full year are not annualized. |
| (c) | The distributor of the Series has contractually agreed to limit its distribution and service (12b-1) fees to .25 of 1% of the average daily net assets of the Class A shares. |
See Notes to Financial Statements.
| | |
| 28 | | Visit our website at www.jennisondryden.com |
| | | | | | | | | | | | | | | | | | |
| Class A | |
| Year Ended September 30, | |
| 2005 | | | 2004 | | | 2003 | | | 2002(a) | | | 2001(a) | |
| | | | | | | | | | | | | | | | | | | |
| $ | 16.60 | | | $ | 14.22 | | | $ | 11.48 | | | $ | 14.03 | | | $ | 14.82 | |
|
|
| |
|
|
| |
|
|
| |
|
|
| |
|
|
|
| | | | | | | | | | | | | | | | | | | |
| | .13 | | | | .02 | | | | .01 | | | | .02 | | | | .07 | |
| | 2.14 | | | | 2.36 | | | | 2.73 | | | | (1.92 | ) | | | .96 | |
|
|
| |
|
|
| |
|
|
| |
|
|
| |
|
|
|
| | 2.27 | | | | 2.38 | | | | 2.74 | | | | (1.90 | ) | | | 1.03 | |
|
|
| |
|
|
| |
|
|
| |
|
|
| |
|
|
|
| | | | | | | | | | | | | | | | | | | |
| | (.03 | ) | | | — | | | | — | | | | — | | | | (.05 | ) |
| | (.37 | ) | | | — | | | | — | | | | (.65 | ) | | | (1.77 | ) |
|
|
| |
|
|
| |
|
|
| |
|
|
| |
|
|
|
| | (.40 | ) | | | — | | | | — | | | | (.65 | ) | | | (1.82 | ) |
|
|
| |
|
|
| |
|
|
| |
|
|
| |
|
|
|
| $ | 18.47 | | | $ | 16.60 | | | $ | 14.22 | | | $ | 11.48 | | | $ | 14.03 | |
|
|
| |
|
|
| |
|
|
| |
|
|
| |
|
|
|
| | 13.91 | % | | | 16.74 | % | | | 23.87 | % | | | (14.59 | )% | | | 7.61 | % |
| | | | | | | | | | | | | | | | | | | |
| $ | 326,512 | | | $ | 338,249 | | | $ | 261,252 | | | $ | 205,215 | | | $ | 169,393 | |
| $ | 336,880 | | | $ | 318,726 | | | $ | 232,395 | | | $ | 227,305 | | | $ | 123,058 | |
| | | | | | | | | | | | | | | | | | | |
| | 1.12 | % | | | 1.07 | % | | | 1.15 | % | | | 1.09 | % | | | 1.13 | % |
| | .87 | % | | | .82 | % | | | .90 | % | | | .84 | % | | | .88 | % |
| | .68 | % | | | .11 | % | | | .07 | % | | | .11 | % | | | .44 | % |
| | | | | | | | | | | | | | | | | | | |
| | 93 | % | | | 102 | % | | | 115 | % | | | 94 | % | | | 144 | % |
See Notes to Financial Statements.
| | |
| Jennison Equity Opportunity Fund | | 29 |
Financial Highlights
(Unaudited) Cont’d
| | | | |
| | | Class B
| |
| | | Six Months Ended
March 31, 2006 | |
Per Share Operating Performance: | | | | |
Net Asset Value, Beginning Of Period | | $ | 17.56 | |
| | |
|
|
|
Income (loss) from investment operations | | | | |
Net investment loss | | | (.05 | ) |
Net realized and unrealized gain (loss) on investment and foreign currency transactions | | | 1.43 | |
| | |
|
|
|
Total from investment operations | | | 1.38 | |
| | |
|
|
|
Less Dividends and Distributions | | | | |
Dividends from net investment income | | | — | |
Distributions from net realized gains | | | (2.72 | ) |
| | |
|
|
|
Total dividends and distributions | | | (2.72 | ) |
| | |
|
|
|
Net asset value, end of period | | $ | 16.22 | |
| | |
|
|
|
Total Return(b): | | | 9.02 | % |
Ratios/Supplemental Data: | | | | |
Net assets, end of period (000) | | $ | 165,510 | |
Average net assets (000) | | $ | 171,157 | |
Ratios to average net assets: | | | | |
Expenses, including distribution and service (12b-1) fees | | | 1.91 | %(c) |
Expenses, excluding distribution and service (12b-1) fees | | | .91 | %(c) |
Net investment loss | | | (.56 | )%(c) |
| (a) | Calculated based upon average shares outstanding during the period. |
| (b) | Total return does not consider the effects of sales loads. Total return is calculated assuming a purchase of shares on the first day and a sale on the last day of each period reported, and includes reinvestment of dividends and distributions. Total returns for less than a full year are not annualized. |
See Notes to Financial Statements.
| | |
| 30 | | Visit our website at www.jennisondryden.com |
| | | | | | | | | | | | | | | | | | |
| Class B | |
| Year Ended September 30, | |
| 2005 | | | 2004 | | | 2003 | | | 2002(a) | | | 2001(a) | |
| | | | | | | | | | | | | | | | | | | |
| $ | 15.88 | | | $ | 13.71 | | | $ | 11.15 | | | $ | 13.74 | | | $ | 14.61 | |
|
|
| |
|
|
| |
|
|
| |
|
|
| |
|
|
|
| | | | | | | | | | | | | | | | | | | |
| | (.01 | ) | | | (.11 | ) | | | (.09 | ) | | | (.09 | ) | | | (.04 | ) |
| | 2.06 | | | | 2.28 | | | | 2.65 | | | | (1.85 | ) | | | .94 | |
|
|
| |
|
|
| |
|
|
| |
|
|
| |
|
|
|
| | 2.05 | | | | 2.17 | | | | 2.56 | | | | (1.94 | ) | | | .90 | |
|
|
| |
|
|
| |
|
|
| |
|
|
| |
|
|
|
| | | | | | | | | | | | | | | | | | | |
| | — | | | | — | | | | — | | | | — | | | | — | |
| | (.37 | ) | | | — | | | | — | | | | (.65 | ) | | | (1.77 | ) |
|
|
| |
|
|
| |
|
|
| |
|
|
| |
|
|
|
| | (.37 | ) | | | — | | | | — | | | | (.65 | ) | | | (1.77 | ) |
|
|
| |
|
|
| |
|
|
| |
|
|
| |
|
|
|
| $ | 17.56 | | | $ | 15.88 | | | $ | 13.71 | | | $ | 11.15 | | | $ | 13.74 | |
|
|
| |
|
|
| |
|
|
| |
|
|
| |
|
|
|
| | 13.12 | % | | | 15.83 | % | | | 22.96 | % | | | (15.21 | )% | | | 6.76 | % |
| | | | | | | | | | | | | | | | | | | |
| $ | 180,496 | | | $ | 213,606 | | | $ | 234,421 | | | $ | 220,609 | | | $ | 212,264 | |
| $ | 202,371 | | | $ | 235,162 | | | $ | 225,579 | | | $ | 272,070 | | | $ | 165,575 | |
| | | | | | | | | | | | | | | | | | | |
| | 1.87 | % | | | 1.82 | % | | | 1.90 | % | | | 1.84 | % | | | 1.88 | % |
| | .87 | % | | | .82 | % | | | .90 | % | | | .84 | % | | | .88 | % |
| | (.05 | )% | | | (.63 | )% | | | (.68 | )% | | | (.63 | )% | | | (.29 | )% |
See Notes to Financial Statements.
| | |
| Jennison Equity Opportunity Fund | | 31 |
Financial Highlights
(Unaudited) Cont’d
| | | | |
| | | Class C
| |
| | | Six Months Ended
March 31, 2006 | |
Per Share Operating Performance: | | | | |
Net Asset Value, Beginning Of Period | | $ | 17.56 | |
| | |
|
|
|
Income (loss) from investment operations | | | | |
Net investment loss | | | (.05 | ) |
Net realized and unrealized gain (loss) on investment and foreign currency transactions | | | 1.43 | |
| | |
|
|
|
Total from investment operations | | | 1.38 | |
| | |
|
|
|
Less Dividends and Distributions | | | | |
Dividends from net investment income | | | — | |
Distributions from net realized gains | | | (2.72 | ) |
| | |
|
|
|
Total dividends and distributions | | | (2.72 | ) |
| | |
|
|
|
Net asset value, end of period | | $ | 16.22 | |
| | |
|
|
|
Total Return(b): | | | 9.02 | % |
Ratios/Supplemental Data: | | | | |
Net assets, end of period (000) | | $ | 54,879 | |
Average net assets (000) | | $ | 56,504 | |
Ratios to average net assets: | | | | |
Expenses, including distribution and service (12b-1) fees | | | 1.91 | %(c) |
Expenses, excluding distribution and service (12b-1) fees | | | .91 | %(c) |
Net investment loss | | | (.56 | )%(c) |
| (a) | Calculated based upon average shares outstanding during the period. |
| (b) | Total return does not consider the effects of sales loads. Total return is calculated assuming a purchase of shares on the first day and a sale on the last day of each period reported, and includes reinvestment of dividends and distributions. Total returns for periods less than a full year are not annualized. |
See Notes to Financial Statements.
| | |
| 32 | | Visit our website at www.jennisondryden.com |
| | | | | | | | | | | | | | | | | | |
| Class C | |
| Year Ended September 30, | |
| 2005 | | | 2004 | | | 2003 | | | 2002(a) | | | 2001(a) | |
| | | | | | | | | | | | | | | | | | | |
| $ | 15.88 | | | $ | 13.71 | | | $ | 11.15 | | | $ | 13.74 | | | $ | 14.61 | |
|
|
| |
|
|
| |
|
|
| |
|
|
| |
|
|
|
| | | | | | | | | | | | | | | | | | | |
| | (.01 | ) | | | (.11 | ) | | | (.09 | ) | | | (.09 | ) | | | (.05 | ) |
| | 2.06 | | | | 2.28 | | | | 2.65 | | | | (1.85 | ) | | | .95 | |
|
|
| |
|
|
| |
|
|
| |
|
|
| |
|
|
|
| | 2.05 | | | | 2.17 | | | | 2.56 | | | | (1.94 | ) | | | .90 | |
|
|
| |
|
|
| |
|
|
| |
|
|
| |
|
|
|
| | | | | | | | | | | | | | | | | | | |
| | — | | | | — | | | | — | | | | — | | | | — | |
| | (.37 | ) | | | — | | | | — | | | | (.65 | ) | | | (1.77 | ) |
|
|
| |
|
|
| |
|
|
| |
|
|
| |
|
|
|
| | (.37 | ) | | | — | | | | — | | | | (.65 | ) | | | (1.77 | ) |
|
|
| |
|
|
| |
|
|
| |
|
|
| |
|
|
|
| $ | 17.56 | | | $ | 15.88 | | | $ | 13.71 | | | $ | 11.15 | | | $ | 13.74 | |
|
|
| |
|
|
| |
|
|
| |
|
|
| |
|
|
|
| | 13.12 | % | | | 15.83 | % | | | 22.96 | % | | | (15.21 | )% | | | 6.76 | % |
| | | | | | | | | | | | | | | | | | | |
| $ | 59,409 | | | $ | 66,322 | | | $ | 66,683 | | | $ | 65,417 | | | $ | 58,424 | |
| $ | 63,559 | | | $ | 70,174 | | | $ | 65,790 | | | $ | 78,162 | | | $ | 32,629 | |
| | | | | | | | | | | | | | | | | | | |
| | 1.87 | % | | | 1.82 | % | | | 1.90 | % | | | 1.84 | % | | | 1.88 | % |
| | .87 | % | | | .82 | % | | | .90 | % | | | .84 | % | | | .88 | % |
| | (.06 | )% | | | (.64 | )% | | | (.68 | )% | | | (.63 | )% | | | (.36 | )% |
See Notes to Financial Statements.
| | |
| Jennison Equity Opportunity Fund | | 33 |
Financial Highlights
(Unaudited) Cont’d
| | | | | | | | |
| | | Class R
| |
| | | Six Months Ended
March 31, 2006 | | | December 17, 2004(a)
Through
September 30, 2005 | |
Per Share Operating Performance: | | | | | | | | |
Net Asset Value, Beginning Of Period | | $ | 17.70 | | | $ | 16.73 | |
| | |
|
|
| |
|
|
|
Income (loss) from investment operations | | | | | | | | |
Net investment income (loss) | | | — | (b) | | | .04 | |
Net realized and unrealized gain on investment and foreign currency transactions | | | 1.39 | | | | .93 | |
| | |
|
|
| |
|
|
|
Total from investment operations | | | 1.39 | | | | .97 | |
| | |
|
|
| |
|
|
|
Less Dividends and Distributions | | | | | | | | |
Dividends from net investment income | | | (.05 | ) | | | — | |
Distributions from net realized gains | | | (2.72 | ) | | | — | |
| | |
|
|
| |
|
|
|
Total dividends and distributions | | | (2.77 | ) | | | — | |
| | |
|
|
| |
|
|
|
Net asset value, end of period | | $ | 16.32 | | | $ | 17.70 | |
| | |
|
|
| |
|
|
|
Total Return(c): | | | 8.98 | % | | | 5.80 | % |
Ratios/Supplemental Data: | | | | | | | | |
Net assets, end of period (000) | | $ | 3 | | | $ | 3 | |
Average net assets (000) | | $ | 3 | | | $ | 3 | |
Ratios to average net assets: | | | | | | | | |
Expenses, including distribution and service (12b-1) fees(d)(e) | | | 1.41 | % | | | 1.37 | % |
Expenses, excluding distribution and service (12b-1) fees(e) | | | .91 | % | | | .87 | % |
Net investment income (loss)(e) | | | (.04 | )% | | | .27 | % |
| (a) | Commencement of operations. |
| (b) | Less than $.005 per share. |
| (c) | Total return does not consider the effects of sales loads. Total return is calculated assuming a purchase of shares on the first day and a sale on the last day of each period reported, and includes reinvestment of dividends and distributions. Total returns for periods less than a full year are not annualized. |
| (d) | During the period, the distributor of the Series has contractually agreed to limit its distribution and service (12b-1) fees to .50 of 1% of the average daily net assets of the Class R shares. |
See Notes to Financial Statements.
| | |
| 34 | | Visit our website at www.jennisondryden.com |
This Page Intentionally Left Blank
Financial Highlights
(Unaudited) Cont’d
| | | | |
| | | Class Z
| |
| | | Six Months Ended
March 31, 2006 | |
Per Share Operating Performance: | | | | |
Net Asset Value, Beginning Of Period | | $ | 18.74 | |
| | |
|
|
|
Income (loss) from investment operations | | | | |
Net investment income | | | .08 | |
Net realized and unrealized gain (loss) on investment and foreign currency transactions | | | 1.50 | |
| | |
|
|
|
Total from investment operations | | | 1.58 | |
| | |
|
|
|
Less Dividends and Distributions | | | | |
Dividends from net investment income | | | (.12 | ) |
Distributions from net realized gains | | | (2.72 | ) |
| | |
|
|
|
Total dividends and distributions | | | (2.84 | ) |
| | |
|
|
|
Net asset value, end of period | | $ | 17.48 | |
| | |
|
|
|
Total Return(b): | | | 9.55 | % |
Ratios/Supplemental Data: | | | | |
Net assets, end of period (000) | | $ | 171,650 | |
Average net assets (000) | | $ | 231,792 | |
Ratios to average net assets: | | | | |
Expenses, including distribution and service (12b-1) fees | | | .91 | %(c) |
Expenses, excluding distribution and service (12b-1) fees | | | .91 | %(c) |
Net investment income | | | .38 | %(c) |
| (a) | Calculated based upon average shares outstanding during the period. |
| (b) | Total return is calculated assuming a purchase of shares on the first day and a sale on the last day of each period reported, and includes reinvestment of dividends and distributions. Total returns for periods less than a full year are not annualized. |
See Notes to Financial Statements.
| | |
| 36 | | Visit our website at www.jennisondryden.com |
| | | | | | | | | | | | | | | | | | |
| Class Z | |
| Year Ended September 30, | |
| 2005 | | | 2004 | | | 2003 | | | 2002(a) | | | 2001(a) | |
| | | | | | | | | | | | | | | | | | | |
| $ | 16.83 | | | $ | 14.38 | | | $ | 11.59 | | | $ | 14.12 | | | $ | 14.92 | |
|
|
| |
|
|
| |
|
|
| |
|
|
| |
|
|
|
| | | | | | | | | | | | | | | | | | | |
| | .18 | | | | .06 | | | | .04 | | | | .05 | | | | .10 | |
| | 2.17 | | | | 2.39 | | | | 2.75 | | | | (1.93 | ) | | | .97 | |
|
|
| |
|
|
| |
|
|
| |
|
|
| |
|
|
|
| | 2.35 | | | | 2.45 | | | | 2.79 | | | | (1.88 | ) | | | 1.07 | |
|
|
| |
|
|
| |
|
|
| |
|
|
| |
|
|
|
| | | | | | | | | | | | | | | | | | | |
| | (.07 | ) | | | — | | | | — | | | | — | | | | (.10 | ) |
| | (.37 | ) | | | — | | | | — | | | | (.65 | ) | | | (1.77 | ) |
|
|
| |
|
|
| |
|
|
| |
|
|
| |
|
|
|
| | (.44 | ) | | | — | | | | — | | | | (.65 | ) | | | (1.87 | ) |
|
|
| |
|
|
| |
|
|
| |
|
|
| |
|
|
|
| $ | 18.74 | | | $ | 16.83 | | | $ | 14.38 | | | $ | 11.59 | | | $ | 14.12 | |
|
|
| |
|
|
| |
|
|
| |
|
|
| |
|
|
|
| | 14.23 | % | | | 17.04 | % | | | 24.07 | % | | | (14.34 | )% | | | 7.85 | % |
| | | | | | | | | | | | | | | | | | | |
| $ | 277,372 | | | $ | 346,241 | | | $ | 265,048 | | | $ | 208,615 | | | $ | 137,620 | |
| $ | 313,971 | | | $ | 323,831 | | | $ | 232,369 | | | $ | 228,798 | | | $ | 87,301 | |
| | | | | | | | | | | | | | | | | | | |
| | .87 | % | | | .82 | % | | | .90 | % | | | .84 | % | | | .88 | % |
| | .87 | % | | | .82 | % | | | .90 | % | | | .84 | % | | | .88 | % |
| | .96 | % | | | .36 | % | | | .33 | % | | | .37 | % | | | .66 | % |
See Notes to Financial Statements.
| | |
| Jennison Equity Opportunity Fund | | 37 |
| | | | |
| n MAIL | | n TELEPHONE | | n WEBSITE |
Gateway Center Three 100 Mulberry Street Newark, NJ 07102 | | (800) 225-1852 | | www.jennisondryden.com |
|
| PROXY VOTING |
| The Board of Directors of the Fund has delegated to the Fund’s investment subadvisor the responsibility for voting any proxies and maintaining proxy recordkeeping with respect to the Fund. A description of these proxy voting policies and procedures is available without charge, upon request, by calling (800) 225-1852 or by visiting the Securities and Exchange Commission’s website at www.sec.gov. Information regarding how the Fund voted proxies relating to portfolio securities during the most recent 12-month period ended June 30 is available on the Fund’s website and on the Commission’s website. |
|
| DIRECTORS |
Linda W. Bynoe • David E.A. Carson • Robert F. Gunia • Robert E. La Blanc •
Douglas H. McCorkindale • Richard A. Redeker • Judy A. Rice • Robin B. Smith •
Stephen G. Stoneburn • Clay T. Whitehead |
|
| OFFICERS |
Judy A. Rice, President • Robert F. Gunia, Vice President • Grace C. Torres, Treasurer and Principal Financial and Accounting Officer • Jack Benintende, Assistant Treasurer •
M. Sadiq Peshimam, Assistant Treasurer • Kathryn L. Quirk, Chief Legal Officer •
Deborah A. Docs, Secretary • Jonathan D. Shain, Assistant Secretary • Claudia DiGiacomo, Assistant Secretary • John P. Schwartz, Assistant Secretary • Helene Gurian, Acting Anti-Money Laundering Compliance Officer • Lee D. Augsburger, Chief Compliance Officer |
| | | | |
| MANAGER | | Prudential Investments LLC | | Gateway Center Three
100 Mulberry Street
Newark, NJ 07102 |
|
| INVESTMENT SUBADVISOR | | Jennison Associates LLC | | 466 Lexington Avenue
New York, NY 10017 |
|
| DISTRIBUTOR | | Prudential Investment
Management Services LLC | | Gateway Center Three
100 Mulberry Street
Newark, NJ 07102 |
|
| CUSTODIAN | | The Bank of New York | | One Wall Street
New York, NY 10286 |
|
| TRANSFER AGENT | | Prudential Mutual Fund
Services LLC | | PO Box 8098
Philadelphia, PA 19176 |
|
INDEPENDENT REGISTERED
PUBLIC ACCOUNTING FIRM | | KPMG LLP | | 345 Park Avenue
New York, NY 10154 |
|
| FUND COUNSEL | | Sullivan & Cromwell LLP | | 125 Broad Street
New York, NY 10004 |
|
| An investor should consider the investment objectives, risks, charges, and expenses of the Fund carefully before investing. The prospectus for the Fund contains this and other information about the Fund. An investor may obtain a prospectus by visiting our website at www.jennisondryden.com or by calling (800) 225-1852. The prospectus should be read carefully before investing. |
|
| E-DELIVERY |
| To receive your mutual fund documents on-line, go to www.icsdelivery.com/prudential/funds and enroll. Instead of receiving printed documents by mail, you will receive notification via e-mail when new materials are available. You can cancel your enrollment or change your e-mail address at any time by clicking on the change/cancel enrollment option at the icsdelivery website address. |
|
| SHAREHOLDER COMMUNICATIONS WITH DIRECTORS |
| Shareholders can communicate directly with the Board of Directors by writing to the Chair of the Board, Jennison Equity Opportunity Fund, PO Box 13964, Philadelphia, PA 19176. Shareholders can communicate directly with an individual Director by writing to the same address. Communications are not screened before being delivered to the addressee. |
|
| AVAILABILITY OF PORTFOLIO SCHEDULE |
| The Fund files its complete schedule of portfolio holdings with the Securities and Exchange Commission for the first and third quarters of each fiscal year on Form N-Q under the Prudential Investment Portfolios, Inc. name. The Fund’s Forms N-Q are available on the Commission’s website at www.sec.gov. The Fund’s Forms N-Q may also be reviewed and copied at the Commission’s Public Reference Room in Washington, D.C. Information on the operation and location of the Public Reference Room may be obtained by calling (800) SEC-0330 (732-0330). The Fund’s schedule of portfolio holdings is also available on the Fund’s website as of the end of each fiscal quarter. |
Mutual Funds:
| | | | |
| ARE NOT INSURED BY THE FDIC OR ANY FEDERAL GOVERNMENT AGENCY | | MAY LOSE VALUE | | ARE NOT A DEPOSIT OF OR GUARANTEED BY ANY BANK OR ANY BANK AFFILIATE |

| | | | | | | | | | | | | | |
| Jennison Equity Opportunity Fund | | | | | | |
| | | Share Class | | A | | B | | C | | R | | Z | | |
| | | NASDAQ | | PJIAX | | PJIBX | | PJGCX | | JEOPR | | PJGZX | | |
| | | CUSIP | | 74437E503 | | 74437E602 | | 74437E701 | | 74437E644 | | 74437E800 | | |
| | | | | | | | | | | | | | | |
MF172E2 IFS-A118939 Ed. 05/2006

Dryden Active Allocation Fund
| | |
| MARCH 31, 2006 | | SEMIANNUAL REPORT |

FUND TYPE
Balanced/allocation
OBJECTIVE
Income and long-term growth of capital
This report is not authorized for distribution to prospective investors unless preceded or accompanied by a current prospectus.
The views expressed in this report and information about the Fund’s portfolio holdings are for the period covered by this report and are subject to change thereafter.
The accompanying financial statements as of March 31, 2006, were not audited, and accordingly, no auditor’s opinion is expressed on them.
JennisonDryden is a registered trademark of The Prudential Insurance Company of America.

May 15, 2006
Dear Shareholder:
We hope you find the semiannual report for the Dryden Active Allocation Fund informative and useful. As a JennisonDryden mutual fund shareholder, you may be thinking about where you can find additional growth opportunities. You could invest in last year’s top-performing asset class and hope history repeats itself or you could stay in cash while waiting for the “right moment” to invest.
Instead, we believe it is better to take advantage of developing domestic and global investment opportunities through a diversified portfolio of stock and bond mutual funds. A diversified asset allocation offers two potential advantages. It helps you manage downside risk by not being overly exposed to any particular asset class, plus it gives you a better opportunity to have at least some of your assets in the right place at the right time. Your financial professional can help you create a diversified investment plan that may include mutual funds covering all the basic asset classes and that reflects your personal investor profile and tolerance for risk.
JennisonDryden Mutual Funds gives you a wide range of choices that can help you make progress toward your financial goals. Our funds offer the experience, resources, and professional discipline of three leading asset managers. They are recognized and respected in the institutional market and by discerning investors for excellence in their respective strategies. JennisonDryden equity funds are advised by Jennison Associates LLC or Quantitative Management Associates LLC (QMA). Prudential Investment Management, Inc. (PIM) advises the JennisonDryden fixed income and money market funds. Jennison Associates, QMA, and PIM are registered investment advisors and Prudential Financial companies.
Thank you for choosing JennisonDryden Mutual Funds.
Sincerely,

Judy A. Rice, President
The Prudential Investment Portfolios, Inc./Dryden Active Allocation Fund
| | |
| The Prudential Investment Portfolios, lnc./Dryden Active Allocation Fund | | 1 |
Your Fund’s Performance
Fund objective
The investment objective of the Dryden Active Allocation Fund (the Fund) is income and long-term growth of capital. There can be no assurance that the Fund will achieve its investment objective.
Performance data quoted represent past performance. Past performance does not guarantee future results. The investment return and principal value of an investment will fluctuate, so that an investor’s shares, when redeemed, may be worth more or less than their original cost. Current performance may be lower or higher than the past performance data quoted. An investor may obtain performance data as of the most recent month-end by visiting our website at www.jennisondryden.com or by calling (800) 225-1852. The maximum initial sales charge is 5.50% (Class A shares).
| | | | | | | | | | | | | | |
| Cumulative Total Returns1 as of 3/31/06 | | | | | | | | | | | | |
| | | Six Months | | | One Year | | | Five Years | | | Ten Years | | | Since Inception2 |
Class A | | 4.93 | % | | 8.89 | % | | 34.43 | % | | N/A | | | 87.61% |
Class B | | 4.55 | | | 8.12 | | | 29.61 | | | N/A | | | 75.32 |
Class C | | 4.55 | | | 8.12 | | | 29.61 | | | N/A | | | 75.32 |
Class R | | 4.89 | | | 8.69 | | | N/A | | | N/A | | | 8.45 |
Class Z | | 5.17 | | | 9.29 | | | 36.21 | | | 105.24 | % | | 184.55 |
S&P 500 Index3 | | 6.38 | | | 11.72 | | | 21.46 | | | 135.71 | | | *** |
Lehman Brothers U.S. Aggregate Bond Index4 | | –0.06 | | | 2.26 | | | 28.27 | | | 83.98 | | | **** |
Customized Blend Index5 | | 3.67 | | | 7.72 | | | 25.79 | | | 117.86 | | | ***** |
Lipper Balanced Funds Avg.6 | | 4.77 | | | 9.48 | | | 24.61 | | | 101.63 | | | ****** |
| | | | | | | | | | | | | | | |
| Average Annual Total Returns1 as of 3/31/06 | | | | | | | | | | | | |
| | | | | | One Year | | | Five Years | | | Ten Years | | | Since Inception2 |
Class A | | | | | 2.91 | % | | 4.90 | % | | N/A | | | 6.28% |
Class B | | | | | 3.12 | | | 5.16 | | | N/A | | | 6.16 |
Class C | | | | | 7.12 | | | 5.32 | | | N/A | | | 6.16 |
Class R | | | | | 8.69 | | | N/A | | | N/A | | | 6.51 |
Class Z | | | | | 9.29 | | | 6.38 | | | 7.46 | % | | 8.22 |
S&P 500 Index3 | | | | | 11.72 | | | 3.97 | | | 8.95 | | | *** |
Lehman Brothers U.S. Aggregate Bond Index4 | | | | | 2.26 | | | 5.11 | | | 6.29 | | | **** |
Customized Blend Index5 | | | | | 7.72 | | | 4.70 | | | 8.10 | | | ***** |
Lipper Balanced Funds Avg.6 | | | | | 9.48 | | | 4.42 | | | 7.10 | | | ****** |
The cumulative total returns do not reflect the deduction of applicable sales charges. If reflected, the applicable sales charges would reduce the cumulative total returns performance quoted. Class A shares are subject to a maximum front-end sales charge of 5.50%. Under certain circumstances, Class A shares may be subject
| | |
| 2 | | Visit our website at www.jennisondryden.com |
to a contingent deferred sales charge (CDSC) of 1%. Class B and Class C shares are subject to a maximum CDSC of 5% and 1%, respectively. Class R and Class Z shares are not subject to a sales charge.
1Source: Prudential Investments LLC and Lipper Inc. The average annual total returns take into account applicable sales charges. During certain periods shown, fee waivers and/or expense reimbursements were in effect. Without such fee waivers and expense reimbursements, the returns for the share classes would have been lower. Class A, Class B, Class C, and Class R shares are subject to an annual distribution and service (12b-1) fee of up to 0.30%, 1.00%, 1.00%, and 0.75%, respectively. Approximately seven years after purchase, Class B shares will automatically convert to Class A shares on a quarterly basis. Class Z shares are not subject to a 12b-1 fee. The returns in the tables do not reflect the deduction of taxes that a shareholder would pay on Fund distributions or following the redemption of Fund shares.
2Inception dates: Class A, B, and C, 11/7/96; Class R, 12/17/04; and Class Z, 1/4/93.
3The Standard & Poor’s 500 Composite Stock Price Index (S&P 500 Index) is an unmanaged index of 500 stocks of large U.S. public companies. It gives a broad look at how U.S. stock prices have performed.
4The Lehman Brothers U.S. Aggregate Bond Index is an unmanaged index of investment-grade securities issued by the U.S. government and its agencies, and by corporations with between 1 and 10 years remaining to maturity on the securities. It gives a broad look at how short- and intermediate-term bonds have performed.
5The Customized Blend Index is made up of the S&P 500 Index (57.5%), the Lehman Brothers U.S. Aggregate Bond Index (40.0%), and the T-Bill 3-Month Blend (2.5%).
6The Lipper Balanced Funds Average (Lipper Average) represents returns based on the average return of all funds in the Lipper Balanced Funds category for the periods noted. Funds in the Lipper Average are funds whose primary objective is to conserve principal by maintaining at all times a balanced portfolio of both stocks and bonds. Typically, the stock:bond ratio ranges around 60%:40%.
Investors cannot invest directly in an index. The returns for the S&P 500 Index, the Lehman Brothers U.S. Aggregate Bond Index, and the Customized Blend Index would be lower if they included the effects of sales charges, operating expenses of a mutual fund, or taxes. Returns for the Lipper Average reflect the deduction of operating expenses, but not sales charges or taxes.
***S&P 500 Index Closest Month-End to Inception cumulative total returns are 112.96% for Class A, B, and C; 9.32% for Class R; and 280.86% for Class Z. S&P 500 Index Closest Month-End to Inception average annual total returns are 8.36% for Class A, B, and C; 7.39% for Class R; and 10.62% for Class Z.
****Lehman Brothers U.S. Aggregate Bond Index Closest Month-End to Inception cumulative total returns are 75.72% for Class A, B, and C; 1.77% for Class R; and 128.12% for Class Z. Lehman Brothers U.S. Aggregate Bond Index Closest Month-End to Inception average annual total returns are 6.17% for Class A, B, and C; 1.41% for Class R; and 6.42% for Class Z.
*****Customized Blend Index Closest Month-End to Inception cumulative total returns are 101.48% for Class A, B, and C; 6.21% for Class R; and 214.57% for Class Z. Customized Blend Index Closest Month-End to Inception average annual total returns are 7.72% for Class A, B, and C; 4.94% for Class R; and 9.03% for Class Z.
******Lipper Average Closest Month-End to Inception cumulative total returns are 87.26% for Class A, B, and C; 7.95% for Class R; and 189.58% for Class Z. Lipper Average Closest Month-End to Inception average annual total returns are 6.74% for Class A, B, and C; 6.31% for Class R; and 8.19% for Class Z.
| | |
| The Prudential Investment Portfolios, Inc./Dryden Active Allocation Fund | | 3 |
Your Fund’s Performance (continued)
| | | |
| Five Largest Equity Holdings expressed as a percentage of net assets as of 3/31/06 | | | |
Exxon Mobil Corp., Oil & Gas Exploration & Production | | 2.0 | % |
General Electric Co., Industrial Conglomerates | | 1.4 | |
Microsoft Corp., Software | | 1.3 | |
Citigroup, Inc., Financial Services | | 1.3 | |
Johnson & Johnson Co., Medical Products & Services | | 1.1 | |
Holdings reflect only long-term investments and are subject to change.
| | | |
| Five Largest Equity Industries expressed as a percentage of net assets as of 3/31/06 | | | |
Oil & Gas Exploration & Production | | 5.4 | % |
Financial Services | | 3.8 | |
Retail | | 3.8 | |
Insurance | | 3.0 | |
Banking | | 2.7 | |
Industry weightings reflect only long-term investments and are subject to change.
| | |
| 4 | | Visit our website at www.jennisondryden.com |
Fees and Expenses (Unaudited)
As a shareholder of the Fund, you incur two types of costs: (1) transaction costs, including sales charges (loads) on purchase payments and redemptions, as applicable, and (2) ongoing costs, including management fees, distribution and/or service (12b-1) fees, and other Fund expenses, as applicable. This example is intended to help you understand your ongoing costs (in dollars) of investing in the Fund and to compare these costs with the ongoing costs of investing in other mutual funds.
The example is based on an investment of $1,000 invested on October 1, 2005, at the beginning of the period, and held through the six-month period ended March 31, 2006.
The Fund’s transfer agent may charge additional fees to holders of certain accounts that are not included in the expenses shown in the table on the following page. These fees apply to Individual Retirement Accounts (IRAs) and Section 403(b) accounts. As of the close of the six-month period covered by the table, IRA fees included an annual maintenance fee of $15 per account (subject to a maximum annual maintenance fee of $25 for all accounts held by the same shareholder). Section 403(b) accounts are charged an annual $25 fiduciary maintenance fee. Some of the fees may vary in amount, or may be waived, based on your total account balance or the number of JennisonDryden or Strategic Partners Funds, including the Fund, that you own. You should consider the additional fees that were charged to your Fund account over the six-month period when you estimate the total ongoing expenses paid over the period and the impact of these fees on your ending account value, as these additional expenses are not reflected in the information provided in the expense table. Additional fees have the effect of reducing investment returns.
Actual Expenses
The first line for each share class in the table on the following page provides information about actual account values and actual expenses. You may use the information on this line, together with the amount you invested, to estimate the expenses that you paid over the period. Simply divide your account value by $1,000 (for example, an $8,600 account value ÷ $1,000 = 8.6), then multiply the result by the number on the first line under the heading “Expenses Paid During the Six-Month Period” to estimate the expenses you paid on your account during this period.
Hypothetical Example for Comparison Purposes
The second line for each share class in the table on the following page provides information about hypothetical account values and hypothetical expenses based on the Fund’s actual expense ratio and an assumed rate of return of 5% per year before expenses, which is not the Fund’s actual return. The hypothetical account values and
| | |
| The Prudential Investment Portfolios, Inc./Dryden Active Allocation Fund | | 5 |
Fees and Expenses (continued)
expenses may not be used to estimate the actual ending account balance or expenses you paid for the period. You may use this information to compare the ongoing costs of investing in the Fund and other funds. To do so, compare this 5% hypothetical example with the 5% hypothetical examples that appear in the shareholder reports of the other funds.
Please note that the expenses shown in the table are meant to highlight your ongoing costs only, and do not reflect any transactional costs such as sales charges (loads). Therefore the second line for each share class in the table is useful in comparing ongoing costs only, and will not help you determine the relative total costs of owning different funds. In addition, if these transactional costs were included, your costs would have been higher.
| | | | | | | | | | | | | | |
Dryden Active
Allocation Fund | | Beginning Account
Value
October 1, 2005 | | Ending Account
Value March 31, 2006 | | Annualized
Expense Ratio
Based on the
Six-Month Period | | | Expenses Paid
During the Six-
Month Period* |
| | | | | | | | | | | | | | | |
| Class A | | Actual | | $ | 1,000.00 | | $ | 1,049.30 | | 1.08 | % | | $ | 5.52 |
| | | Hypothetical | | $ | 1,000.00 | | $ | 1,019.55 | | 1.08 | % | | $ | 5.44 |
| | | | | | | | | | | | | | | |
| Class B | | Actual | | $ | 1,000.00 | | $ | 1,045.50 | | 1.83 | % | | $ | 9.33 |
| | | Hypothetical | | $ | 1,000.00 | | $ | 1,015.81 | | 1.83 | % | | $ | 9.20 |
| | | | | | | | | | | | | | | |
| Class C | | Actual | | $ | 1,000.00 | | $ | 1,045.50 | | 1.83 | % | | $ | 9.33 |
| | | Hypothetical | | $ | 1,000.00 | | $ | 1,015.81 | | 1.83 | % | | $ | 9.20 |
| | | | | | | | | | | | | | | |
| Class R | | Actual | | $ | 1,000.00 | | $ | 1,048.90 | | 1.33 | % | | $ | 6.79 |
| | | Hypothetical | | $ | 1,000.00 | | $ | 1,018.30 | | 1.33 | % | | $ | 6.69 |
| | | | | | | | | | | | | | | |
| Class Z | | Actual | | $ | 1,000.00 | | $ | 1,051.70 | | 0.83 | % | | $ | 4.25 |
| | | Hypothetical | | $ | 1,000.00 | | $ | 1,020.79 | | 0.83 | % | | $ | 4.18 |
| | | | | | | | | | | | | | | |
* Fund expenses (net of fee waivers or subsidies, if any) for each share class are equal to the annualized expense ratio for each share class (provided in the table), multiplied by the average account value over the period, multiplied by the 182 days in the six-month period ended March 31, 2006, and divided by the 365 days in the Fund’s fiscal year ending September 30, 2006 (to reflect the six-month period).
| | |
| 6 | | Visit our website at www.jennisondryden.com |
Portfolio of Investments
as of March 31, 2006 (Unaudited)
| | | | | |
| Shares | | Description | | Value (Note 1) |
| | | | | |
LONG-TERM INVESTMENTS 91.7% |
COMMON STOCKS 64.9% |
| |
Aerospace/Defense 1.9% | | | |
| 14,200 | | Armor Holdings, Inc.(a) | | $ | 827,718 |
| 17,000 | | General Dynamics Corp. | | | 1,087,660 |
| 50,900 | | Lockheed Martin Corp. | | | 3,824,117 |
| 52,200 | | Northrop Grumman Corp. | | | 3,564,738 |
| 6,600 | | Raytheon Co. | | | 302,544 |
| 1,900 | | United Industrial Corp. | | | 115,767 |
| 50,600 | | United Technologies Corp. | | | 2,933,282 |
| | | | |
|
|
| | | | | | 12,655,826 |
| |
Apparel 0.2% | | | |
| 2,000 | | Carter’s, Inc.(a) | | | 134,980 |
| 17,200 | | Jones Apparel Group, Inc. | | | 608,364 |
| 4,700 | | Liz Claiborne, Inc. | | | 192,606 |
| 10,600 | | Steven Madden Ltd.(a) | | | 376,300 |
| 4,400 | �� | VF Corp. | | | 250,360 |
| | | | |
|
|
| | | | | | 1,562,610 |
| |
Automobiles 0.9% | | | |
| 59,800 | | Ford Motor Co.(g) | | | 476,008 |
| 45,700 | | Harley-Davidson, Inc.(g) | | | 2,370,916 |
| 40,700 | | PACCAR, Inc. | | | 2,868,536 |
| 800 | | Thor Industries, Inc. | | | 42,688 |
| | | | |
|
|
| | | | | | 5,758,148 |
| |
Banking 2.7% | | | |
| 3,600 | | AmSouth Bancorporation | | | 97,380 |
| 42,200 | | BB&T Corp. | | | 1,654,240 |
| 600 | | City Holding Co. | | | 22,074 |
| 18,200 | | Comerica, Inc. | | | 1,055,054 |
| 58,900 | | First Bancorp (Puerto Rico) | | | 728,004 |
| 4,900 | | Hanmi Financial Corp. | | | 88,494 |
| 5,700 | | Huntington Bancshares, Inc.(g) | | | 137,541 |
| 59,600 | | KeyCorp | | | 2,193,280 |
| 46,200 | | National City Corp. | | | 1,612,380 |
| 15,600 | | North Fork Bancorporation, Inc. | | | 449,748 |
| 52,100 | | Popular, Inc. (Puerto Rico) | | | 1,081,596 |
| 5,300 | | SunTrust Banks, Inc. | | | 385,628 |
| 10,400 | | TD Banknorth, Inc.(g) | | | 305,240 |
| 92,156 | | U.S. Bancorp. | | | 2,810,758 |
See Notes to Financial Statements.
| | |
| The Prudential Investment Portfolios, Inc./Dryden Active Allocation Fund | | 7 |
Portfolio of Investments
as of March 31, 2006 (Unaudited) Cont’d.
| | | | | |
| Shares | | Description | | Value (Note 1) |
| | | | | |
| 3,200 | | UnionBanCal Corp. | | $ | 224,512 |
| 62,000 | | Wachovia Corp. | | | 3,475,100 |
| 30,000 | | Wells Fargo & Co. | | | 1,916,100 |
| | | | |
|
|
| | | | | | 18,237,129 |
| |
Beverages 1.6% | | | |
| 100,100 | | Coca-Cola Co. (The) | | | 4,191,187 |
| 34,200 | | Coca-Cola Enterprises, Inc. | | | 695,628 |
| 89,300 | | Pepsi Bottling Group, Inc. | | | 2,713,827 |
| 4,700 | | PepsiAmericas, Inc. | | | 114,915 |
| 47,400 | | PepsiCo, Inc. | | | 2,739,246 |
| | | | |
|
|
| | | | | | 10,454,803 |
| |
Biotechnology 1.0% | | | |
| 8,576 | | Amgen, Inc.(a) | | | 623,904 |
| 41,100 | | Biogen Idec, Inc.(a) | | | 1,935,810 |
| 18,700 | | Digene Corp.(a) | | | 731,170 |
| 12,900 | | Enzon Pharmaceuticals, Inc.(a) | | | 104,490 |
| 39,200 | | Genentech, Inc.(a) | | | 3,312,792 |
| | | | |
|
|
| | | | | | 6,708,166 |
| |
Building & Construction 0.8% | | | |
| 42,600 | | Eagle Materials, Inc.(g) | | | 2,716,176 |
| 1,400 | | Granite Construction Inc. | | | 68,152 |
| 3,700 | | Griffon Corp.(a) | | | 91,908 |
| 13,500 | | Martin Marietta Materials, Inc.(g) | | | 1,444,905 |
| 12,500 | | NCI Buildings Systems Inc.(a)(g) | | | 747,125 |
| 2,900 | | USG Corp.(a) | | | 275,384 |
| | | | |
|
|
| | | | | | 5,343,650 |
| |
Business Services 0.3% | | | |
| 123,500 | | Xerox Corp.(a) | | | 1,877,200 |
| |
Capital Markets 2.0% | | | |
| 1,300 | | A.G. Edwards, Inc. | | | 64,818 |
| 31,100 | | Goldman Sachs Group, Inc. | | | 4,881,456 |
| 1,300 | | Greenhill & Co., Inc. | | | 85,943 |
| 31,000 | | Lehman Brothers Holdings, Inc. | | | 4,480,430 |
| 46,500 | | Merrill Lynch & Co., Inc. | | | 3,662,340 |
| 2,200 | | SEI Investments Co. | | | 89,166 |
| | | | |
|
|
| | | | | | 13,264,153 |
See Notes to Financial Statements.
| | |
| 8 | | Visit our website at www.jennisondryden.com |
| | | | | |
| Shares | | Description | | Value (Note 1) |
| | | | | |
Chemicals 0.6% | | | |
| 16,600 | | CF Industries Holdings, Inc. | | $ | 282,034 |
| 51,800 | | Dow Chemical Co. (The) | | | 2,103,080 |
| 12,700 | | Eastman Chemical Co. | | | 649,986 |
| 35,700 | | Lyondell Chemical Co. | | | 710,430 |
| 2,300 | | Mosaic Co. (The)(a) | | | 33,005 |
| 1,200 | | Wellman, Inc. | | | 7,632 |
| | | | |
|
|
| | | | | | 3,786,167 |
| |
Commercial Services 0.8% | | | |
| 53,600 | | Career Education Corp.(a) | | | 2,022,328 |
| 43,700 | | Cendant Corp. | | | 758,195 |
| 4,300 | | Corinthian Colleges, Inc.(a) | | | 61,920 |
| 8,700 | | Corporate Executive Board Co. | | | 877,830 |
| 9,200 | | Jackson Hewitt Tax Service, Inc. | | | 290,536 |
| 2,000 | | Pegasus Solutions, Inc.(a) | | | 18,820 |
| 25,600 | | R. R. Donnelley & Sons Co. | | | 837,632 |
| 22,400 | | Spherion Corp.(a) | | | 232,960 |
| | | | |
|
|
| | | | | | 5,100,221 |
| |
Communications Equipment 1.4% | | | |
| 205,900 | | Cisco Systems, Inc.(a) | | | 4,461,853 |
| 95,000 | | Qualcomm, Inc. | | | 4,807,950 |
| | | | |
|
|
| | | | | | 9,269,803 |
| |
Computer Software & Services 0.7% | | | |
| 8,700 | | Computer Sciences Corp.(a) | | | 483,285 |
| 44,300 | | EarthLink, Inc.(a) | | | 423,065 |
| 8,600 | | John H. Harland Co. | | | 337,980 |
| 10,600 | | MicroStrategy, Inc., Class A(a) | | | 1,116,074 |
| 167,100 | | Oracle Corp.(a)(g) | | | 2,287,599 |
| | | | |
|
|
| | | | | | 4,648,003 |
| |
Computer Systems/Peripherals 2.6% | | | |
| 26,300 | | Agilysys, Inc. | | | 396,078 |
| 7,400 | | Black Box Corp. | | | 355,570 |
| 48,700 | | Dell, Inc.(a) | | | 1,449,312 |
| 216,100 | | EMC Corp.(a) | | | 2,945,443 |
| 90,193 | | Hewlett-Packard Co. | | | 2,967,350 |
| 81,100 | | International Business Machines Corp. | | | 6,688,317 |
| 2,600 | | Lexmark International, Inc.(a)(g) | | | 117,988 |
| 59,800 | | QLogic Corp.(a) | | | 1,157,130 |
See Notes to Financial Statements.
| | |
| The Prudential Investment Portfolios, Inc./Dryden Active Allocation Fund | | 9 |
Portfolio of Investments
as of March 31, 2006 (Unaudited) Cont’d.
| | | | | |
| Shares | | Description | | Value (Note 1) |
| | | | | |
| 39,500 | | Synaptics, Inc.(a) | | $ | 868,605 |
| 11,000 | | Western Digital Corp.(a) | | | 213,730 |
| | | | |
|
|
| | | | | | 17,159,523 |
| |
Consumer Finance 0.1% | | | |
| 5,500 | | Capital One Financial Corp.(g) | | | 442,860 |
| |
Containers 0.2% | | | |
| 29,300 | | Ball Corp. | | | 1,284,219 |
| |
Cosmetics/Toiletries 0.2% | | | |
| 4,700 | | Alberto-Culver Co., Class B | | | 207,881 |
| 25,400 | | Parlux Fragrances, Inc.(a)(g) | | | 819,150 |
| | | | |
|
|
| | | | | | 1,027,031 |
| |
Data Processing/Management 0.4% | | | |
| 60,300 | | Fiserv, Inc.(a) | | | 2,565,765 |
| |
Distribution/Wholesale 0.3% | | | |
| 25,800 | | Building Materials Holding Corp.(g) | | | 919,512 |
| 17,000 | | Fastenal Co. | | | 804,780 |
| | | | |
|
|
| | | | | | 1,724,292 |
| |
Diversified Financial Services 0.8% | | | |
| 107,630 | | J.P. Morgan Chase & Co. | | | 4,481,713 |
| 16,700 | | Moody’s Corp.(g) | | | 1,193,382 |
| | | | |
|
|
| | | | | | 5,675,095 |
| |
Diversified Manufacturing 1.6% | | | |
| 40,400 | | 3M Co. | | | 3,057,876 |
| 22,600 | | Cooper Industries Ltd., Class A | | | 1,963,940 |
| 29,600 | | Eaton Corp. | | | 2,159,912 |
| 18,600 | | Energizer Holdings, Inc.(a) | | | 985,800 |
| 56,300 | | Ingersoll-Rand Co., Class A (Bermuda) | | | 2,352,777 |
| | | | |
|
|
| | | | | | 10,520,305 |
| |
Electrical Utilities 0.7% | | | |
| 40,500 | | Alliant Energy Corp. | | | 1,274,535 |
| 60,600 | | American Electric Power Co., Inc. | | | 2,061,612 |
| 2,000 | | American States Water Co. | | | 74,720 |
| 9,300 | | DTE Energy Co. | | | 372,837 |
| 10,800 | | Edison International | | | 444,744 |
| 1,200 | | Pepco Holdings, Inc. | | | 27,348 |
| 5,600 | | Pinnacle West Capital Corp. | | | 218,960 |
See Notes to Financial Statements.
| | |
| 10 | | Visit our website at www.jennisondryden.com |
| | | | | |
| Shares | | Description | | Value (Note 1) |
| | | | | |
| 9,900 | | Progress Energy, Inc. | | $ | 435,402 |
| 2,200 | | Westar Energy, Inc. | | | 45,782 |
| | | | |
|
|
| | | | | | 4,955,940 |
| |
Electronic Components 1.1% | | | |
| 32,100 | | Agilent Technologies, Inc.(a) | | | 1,205,355 |
| 6,000 | | Arrow Electronics, Inc.(b) | | | 193,620 |
| 500 | | Belden CDT, Inc.(g) | | | 13,615 |
| 19,600 | | Emerson Electric Co. | | | 1,639,148 |
| 21,300 | | Harman International Industries, Inc. | | | 2,367,069 |
| 2,000 | | Jabil Circuit, Inc.(a) | | | 85,720 |
| 2,400 | | Molecular Devices Corp.(a) | | | 79,584 |
| 30,700 | | Tech Data Corp.(a) | | | 1,133,137 |
| 16,300 | | Thomas & Betts Corp.(a) | | | 837,494 |
| 8,800 | | Vishay Intertechnology, Inc.(a) | | | 125,312 |
| | | | |
|
|
| | | | | | 7,680,054 |
| |
Energy Equipment & Services 0.7% | | | |
| 7,300 | | Helix Energy Solutions Group, Inc.(a)(g) | | | 276,670 |
| 13,400 | | Helmerich & Payne, Inc. | | | 935,588 |
| 8,200 | | Nabors Industries Ltd. (Barbados)(a) | | | 586,956 |
| 15,900 | | Oil States International, Inc.(a) | | | 585,915 |
| 13,900 | | Patterson-UTI Energy, Inc.(b) | | | 444,244 |
| 12,200 | | Schlumberger Ltd. | | | 1,544,154 |
| 4,900 | | Smith International, Inc. | | | 190,904 |
| | | | |
|
|
| | | | | | 4,564,431 |
| |
Financial Services 3.8% | | | |
| 130,520 | | Bank of America Corp. | | | 5,943,881 |
| 9,700 | | Bear Stearns Cos., Inc. (The) | | | 1,345,390 |
| 16,000 | | CharterMac | | | 324,800 |
| 39,600 | | CIT Group, Inc. | | | 2,119,392 |
| 185,360 | | Citigroup, Inc. | | | 8,754,552 |
| 44,098 | | Countrywide Financial Corp. | | | 1,618,397 |
| 33,000 | | Freddie Mac | | | 2,013,000 |
| 77,500 | | Friedman Billings Ramsey Group, Inc. | | | 726,950 |
| 49,500 | | Morgan Stanley | | | 3,109,590 |
| | | | |
|
|
| | | | | | 25,955,952 |
| |
Foods 1.0% | | | |
| 58,000 | | Chiquita Brands International, Inc. | | | 972,660 |
| 1,400 | | Costco Wholesale Corp. | | | 75,824 |
| 3,200 | | Gold Kist, Inc.(a) | | | 40,448 |
See Notes to Financial Statements.
| | |
| The Prudential Investment Portfolios, Inc./Dryden Active Allocation Fund | | 11 |
Portfolio of Investments
as of March 31, 2006 (Unaudited) Cont’d.
| | | | | |
| Shares | | Description | | Value (Note 1) |
| | | | | |
| 1,700 | | Hormel Foods Corp. | | $ | 57,460 |
| 3,200 | | Kraft Foods, Inc., Class A | | | 96,992 |
| 97,400 | | Kroger Co. (The) | | | 1,983,064 |
| 2,200 | | Nash Finch Co. | | | 65,780 |
| 65,500 | | Pilgrim’s Pride Corp.(g) | | | 1,419,385 |
| 16,600 | | Safeway, Inc. | | | 416,992 |
| 29,400 | | Smithfield Foods, Inc.(a) | | | 862,596 |
| 22,300 | | SUPERVALU, Inc. | | | 687,286 |
| | | | |
|
|
| | | | | | 6,678,487 |
| |
Health Care Equipment & Supplies 0.6% | | | |
| 80,100 | | Boston Scientific Corp.(a)(g) | | | 1,846,305 |
| 3,600 | | Dentsply International, Inc. | | | 209,340 |
| 1,400 | | IDEXX Laboratories, Inc.(a) | | | 120,904 |
| 6,100 | | Kinetic Concepts, Inc.(a) | | | 251,137 |
| 6,600 | | Medtronic, Inc. | | | 334,950 |
| 2,100 | | PerkinElmer, Inc. | | | 49,287 |
| 12,000 | | Polymedica Corp. | | | 508,320 |
| 3,500 | | Varian, Inc.(a) | | | 144,130 |
| 9,500 | | Ventana Medical Systems, Inc.(a) | | | 396,815 |
| | | | |
|
|
| | | | | | 3,861,188 |
| |
Health Care Products 0.4% | | | |
| 52,300 | | Baxter International, Inc. | | | 2,029,763 |
| 5,700 | | Neurometrix, Inc.(a) | | | 221,958 |
| 22,500 | | Palomar Medical Technologies, Inc.(a) | | | 752,625 |
| | | | |
|
|
| | | | | | 3,004,346 |
| |
Health Care Providers & Services 1.4% | | | |
| 2,000 | | Apria Healthcare Group, Inc.(a) | | | 45,960 |
| 1,600 | | Brookdale Senior Living, Inc. | | | 60,400 |
| 19,800 | | Cigna Corp. | | | 2,586,276 |
| 16,700 | | Emdeon Corp.(a) | | | 180,360 |
| 13,700 | | eResearch Technology, Inc.(a) | | | 197,143 |
| 43,400 | | HCA, Inc. | | | 1,987,286 |
| 34,400 | | Health Net, Inc.(a) | | | 1,748,208 |
| 15,800 | | Laboratory Corp. of America Holdings(a)(g) | | | 923,984 |
| 600 | | Pediatrix Medical Group, Inc.(a) | | | 61,584 |
| 30,700 | | Trizetto Group, Inc.(a) | | | 540,013 |
| 2,300 | | UnitedHealth Group, Inc. | | | 128,478 |
| 5,500 | | Universal Health Services, Inc., Class B | | | 279,345 |
| 5,100 | | WellPoint, Inc.(a) | | | 394,893 |
| | | | |
|
|
| | | | | | 9,133,930 |
See Notes to Financial Statements.
| | |
| 12 | | Visit our website at www.jennisondryden.com |
| | | | | |
| Shares | | Description | | Value (Note 1) |
| | | | | |
Health Care Services 0.2% | | | |
| 400 | | Chemed Corp. | | $ | 23,736 |
| 30,100 | | Quest Diagnostics, Inc. | | | 1,544,130 |
| | | | |
|
|
| | | | | | 1,567,866 |
| |
Hotels, Restaurants & Leisure 0.3% | | | |
| 7,100 | | Boyd Gaming Corp. | | | 354,574 |
| 16,800 | | Brinker International, Inc. | | | 709,800 |
| 33,400 | | Starbucks Corp.(a) | | | 1,257,176 |
| | | | |
|
|
| | | | | | 2,321,550 |
| |
Household Durables 0.3% | | | |
| 24,200 | | Pulte Homes, Inc. | | | 929,764 |
| 8,700 | | Standard Pacific Corp. | | | 292,494 |
| 42,600 | | Tempur-Pedic International, Inc.(a)(g) | | | 602,790 |
| | | | |
|
|
| | | | | | 1,825,048 |
| |
Household Products 0.9% | | | |
| 42,200 | | Kimberly-Clark Corp. | | | 2,439,160 |
| 60,775 | | Procter & Gamble Co. | | | 3,501,856 |
| | | | |
|
|
| | | | | | 5,941,016 |
| |
Independent Power Producers & Energy Traders 0.7% | | | |
| 70,400 | | Duke Energy Corp. | | | 2,052,160 |
| 9,400 | | NRG Energy, Inc.(a) | | | 425,068 |
| 49,900 | | TXU Corp. | | | 2,233,524 |
| | | | |
|
|
| | | | | | 4,710,752 |
| |
Industrial Conglomerates 1.4% | | | |
| 265,250 | | General Electric Co. | | | 9,225,395 |
| |
Insurance 3.0% | | | |
| 14,900 | | ACE Ltd. | | | 774,949 |
| 55,700 | | Allstate Corp. | | | 2,902,527 |
| 30,700 | | American Financial Group, Inc. | | | 1,277,427 |
| 42,359 | | American International Group, Inc. | | | 2,799,506 |
| 13,200 | | Assurant, Inc.(g) | | | 650,100 |
| 20,300 | | CNA Financial Corp.(a) | | | 646,352 |
| 300 | | Commerce Group, Inc. | | | 15,852 |
| 4,700 | | Fidelity National Financial, Inc. | | | 166,991 |
| 2,800 | | Genworth Financial, Inc., Class A | | | 93,604 |
| 16,300 | | Hartford Financial Services Group, Inc. | | | 1,312,965 |
See Notes to Financial Statements.
| | |
| The Prudential Investment Portfolios, Inc./Dryden Active Allocation Fund | | 13 |
Portfolio of Investments
as of March 31, 2006 (Unaudited) Cont’d.
| | | | | |
| Shares | | Description | | Value (Note 1) |
| | | | | |
| 12,300 | | LandAmerica Financial Group, Inc. | | $ | 834,555 |
| 5,200 | | Lincoln National Corp. | | | 283,868 |
| 8,500 | | Loews Corp. | | | 860,200 |
| 13,300 | | MBIA, Inc.(g) | | | 799,729 |
| 8,800 | | MetLife, Inc.(g) | | | 425,656 |
| 23,700 | | MGIC Investment Corp.(g) | | | 1,579,131 |
| 15,800 | | PMI Group, Inc. (The) | | | 725,536 |
| 16,100 | | Radian Group, Inc. | | | 970,025 |
| 7,600 | | SAFECO Corp. | | | 381,596 |
| 68,600 | | St. Paul Travelers Cos., Inc. (The) | | | 2,866,794 |
| | | | |
|
|
| | | | | | 20,367,363 |
| |
Internet Software & Services 0.3% | | | |
| 31,500 | | Digital Insight Corp.(a) | | | 1,146,600 |
| 19,400 | | Internet Security Systems, Inc.(a)(g) | | | 465,212 |
| 43,100 | | RealNetworks, Inc.(a) | | | 355,575 |
| 4,400 | | Websense, Inc.(a) | | | 121,352 |
| | | | |
|
|
| | | | | | 2,088,739 |
| |
Machinery 0.3% | | | |
| 11,600 | | Dover Corp. | | | 563,296 |
| 1,500 | | Mueller Industries, Inc. | | | 53,535 |
| 3,700 | | Parker Hannifin Corp. | | | 298,257 |
| 17,400 | | Rockwell Automation, Inc. | | | 1,251,234 |
| | | | |
|
|
| | | | | | 2,166,322 |
| |
Machinery & Equipment 0.2% | | | |
| 8,300 | | Applied Industrial Technologies, Inc. | | | 370,180 |
| 11,500 | | Deere & Co. | | | 909,075 |
| | | | |
|
|
| | | | | | 1,279,255 |
| |
Media 1.3% | | | |
| 104,250 | | CBS Corp., Class B | | | 2,499,915 |
| 62,000 | | Comcast Corp., Class A(a)(g) | | | 1,621,920 |
| 10,800 | | Journal Communications, Inc. | | | 133,920 |
| 11,000 | | Liberty Media Corp., Class A(a) | | | 90,310 |
| 2,800 | | Media General, Inc., Class A | | | 130,536 |
| 54,400 | | Tribune Co. | | | 1,492,192 |
| 73,700 | | Univision Communications, Inc.(a)(g) | | | 2,540,439 |
| | | | |
|
|
| | | | | | 8,509,232 |
See Notes to Financial Statements.
| | |
| 14 | | Visit our website at www.jennisondryden.com |
| | | | | |
| Shares | | Description | | Value (Note 1) |
| | | | | |
Media & Entertainment 0.5% | | | |
| 43,700 | | Gannett Co., Inc.(g) | | $ | 2,618,504 |
| 48,900 | | Time Warner, Inc. | | | 821,031 |
| | | | |
|
|
| | | | | | 3,439,535 |
| |
Medical Products & Services 2.1% | | | |
| 49,400 | | Becton, Dickinson & Co. | | | 3,042,052 |
| 14,400 | | C.R. Bard, Inc. | | | 976,464 |
| 126,500 | | Johnson & Johnson Co. | | | 7,491,330 |
| 5,900 | | Sybron Dental Specialties, Inc.(a) | | | 243,316 |
| 49,900 | | Waters Corp.(a) | | | 2,153,185 |
| | | | |
|
|
| | | | | | 13,906,347 |
| |
Metals 0.9% | | | |
| 13,000 | | Cleveland-Cliffs, Inc.(g) | | | 1,132,560 |
| 2,500 | | Freeport-McMoRan Copper & Gold, Inc., Class B | | | 149,425 |
| 13,600 | | Phelps Dodge Corp. | | | 1,095,208 |
| 21,400 | | Quanex Corp. | | | 1,425,882 |
| 25,800 | | Reliance Steel & Aluminum Co. | | | 2,423,136 |
| | | | |
|
|
| | | | | | 6,226,211 |
| |
Miscellaneous Manufacturing 0.1% | | | |
| 7,000 | | Illinois Tool Works, Inc. | | | 674,170 |
| |
Oil & Gas Equipment & Services 0.1% | | | |
| 2,200 | | National Fuel Gas Company | | | 71,984 |
| 15,200 | | Sempra Energy | | | 706,192 |
| | | | |
|
|
| | | | | | 778,176 |
| |
Oil & Gas Exploration & Production 5.4% | | | |
| 20,400 | | Apache Corp. | | | 1,336,404 |
| 2,100 | | Atmos Energy Corp. | | | 55,293 |
| 21,600 | | Chesapeake Energy Corp. | | | 678,456 |
| 108,460 | | Chevron Corp. | | | 6,287,426 |
| 94,800 | | ConocoPhillips(g) | | | 5,986,620 |
| 26,700 | | Devon Energy Corp.(g) | | | 1,633,239 |
| 6,400 | | Energen Corp. | | | 224,000 |
| 215,064 | | Exxon Mobil Corp. | | | 13,088,794 |
| 13,100 | | Harvest Natural Resources, Inc.(a) | | | 127,332 |
| 16,400 | | Marathon Oil Corp. | | | 1,249,188 |
| 7,700 | | Newfield Exploration Co.(a) | | | 322,630 |
| 25,100 | | Oneok, Inc. | | | 809,475 |
| 54,500 | | Parker Drilling Co.(a) | | | 505,215 |
See Notes to Financial Statements.
| | |
| The Prudential Investment Portfolios, Inc./Dryden Active Allocation Fund | | 15 |
Portfolio of Investments
as of March 31, 2006 (Unaudited) Cont’d.
| | | | | |
| Shares | | Description | | Value (Note 1) |
| | | | | |
| 23,100 | | Southern Union Company | | $ | 573,573 |
| 36,600 | | Tidewater, Inc. | | | 2,021,418 |
| 28,600 | | Unit Corp.(a) | | | 1,594,450 |
| 2,800 | | XTO Energy, Inc. | | | 121,996 |
| | | | |
|
|
| | | | | | 36,615,509 |
| |
Paper & Forest Products 0.1% | | | |
| 14,700 | | Louisiana-Pacific Corp.(g) | | | 399,840 |
| |
Pharmaceuticals 2.5% | | | |
| 54,300 | | Abbott Laboratories | | | 2,306,121 |
| 15,200 | | Allergan, Inc.(g) | | | 1,649,200 |
| 19,000 | | Alpharma, Inc., Class A | | | 509,580 |
| 7,800 | | CNS, Inc. | | | 168,012 |
| 1,900 | | Forest Laboratories, Inc.(a) | | | 84,797 |
| 49,200 | | King Pharmaceuticals, Inc.(a) | | | 848,700 |
| 72,000 | | Merck & Co., Inc. | | | 2,536,560 |
| 29,500 | | Neurocrine Biosciences, Inc.(a)(g) | | | 1,903,930 |
| 168,453 | | Pfizer, Inc. | | | 4,197,849 |
| 56,000 | | Wyeth | | | 2,717,120 |
| | | | |
|
|
| | | | | | 16,921,869 |
| |
Real Estate Investment Trust 1.0% | | | |
| 52,600 | | American Home Mortgage Investment Corp.(g) | | | 1,641,646 |
| 17,400 | | Annaly Mortgage Management, Inc.(g) | | | 211,236 |
| 44,000 | | Anthracite Capital, Inc. | | | 483,120 |
| 6,500 | | Arbor Realty Trust, Inc. | | | 175,435 |
| 17,700 | | Ashford Hospitality Trust, Inc. | | | 219,480 |
| 4,700 | | Capital Lease Funding, Inc. | | | 52,123 |
| 1,900 | | Entertainment Properties Trust | | | 79,762 |
| 11,100 | | FelCor Lodging Trust, Inc. | | | 234,210 |
| 14,400 | | Fieldstone Investment Corp. | | | 169,920 |
| 3,300 | | First Industrial Realty Trust, Inc. | | | 140,877 |
| 10,800 | | Hospitality Properties Trust | | | 471,636 |
| 8,200 | | HRPT Properties Trust | | | 96,268 |
| 7,100 | | Lexington Corporate Properties Trust | | | 148,035 |
| 7,500 | | Luminent Mortgage Capital, Inc. | | | 60,825 |
| 5,300 | | National Health Investors, Inc. | | | 134,620 |
| 4,450 | | New Century Financial Corp.(g) | | | 204,789 |
| 11,000 | | Newcastle Investment Corp. | | | 263,120 |
| 11,700 | | Ramco-Gershenson Properties | | | 354,159 |
| 20,800 | | Saxon Capital, Inc. | | | 217,152 |
| 2,900 | | Senior Housing Properties Trust | | | 52,490 |
| 57,400 | | Thornburg Mortgage, Inc.(g) | | | 1,553,244 |
| | | | |
|
|
| | | | | | 6,964,147 |
See Notes to Financial Statements.
| | |
| 16 | | Visit our website at www.jennisondryden.com |
| | | | | |
| Shares | | Description | | Value (Note 1) |
| | | | | |
Restaurants 0.7% | | | |
| 14,750 | | CEC Entertainment, Inc.(a) | | $ | 495,895 |
| 17,000 | | Darden Restaurants, Inc. | | | 697,510 |
| 12,300 | | Jack in the Box, Inc.(a) | | | 535,050 |
| 43,700 | | McDonald’s Corp. | | | 1,501,532 |
| 26,800 | | YUM! Brands, Inc.(g) | | | 1,309,448 |
| | | | |
|
|
| | | | | | 4,539,435 |
| |
Retail 3.8% | | | |
| 40,200 | | Aeropostale, Inc.(a) | | | 1,212,432 |
| 90,000 | | American Eagle Outfitters, Inc. | | | 2,687,400 |
| 4,800 | | AutoNation, Inc.(a) | | | 103,440 |
| 87,200 | | Dollar General Corp. | | | 1,540,824 |
| 5,800 | | Genesco, Inc.(a)(g) | | | 225,562 |
| 47,000 | | Herman Miller, Inc. | | | 1,523,270 |
| 2,800 | | Hibbett Sporting Goods, Inc.(a) | | | 92,372 |
| 115,800 | | Home Depot, Inc. | | | 4,898,340 |
| 58,400 | | J.C. Penney Co., Inc.(g) | | | 3,527,944 |
| 21,900 | | JAKKS Pacific, Inc.(a) | | | 585,606 |
| 35,100 | | Lowe’s Cos., Inc. | | | 2,261,844 |
| 18,500 | | Pacific Sunwear Of California, Inc.(a) | | | 409,960 |
| 26,200 | | Petsmart, Inc. | | | 737,268 |
| 49,100 | | Select Comfort Corp.(a)(g) | | | 1,941,905 |
| 9,000 | | Smart & Final, Inc.(a) | | | 147,510 |
| 67,900 | | Wal-Mart Stores, Inc. | | | 3,207,596 |
| | | | |
|
|
| | | | | | 25,103,273 |
| |
Semiconductors & Semiconductor Equipment 2.6% | | | |
| 45,800 | | Altera Corp.(a)(g) | | | 945,312 |
| 27,600 | | Analog Devices, Inc. | | | 1,056,804 |
| 172,000 | | Applied Materials, Inc.(g) | | | 3,011,720 |
| 11,000 | | Cirrus Logic, Inc.(a) | | | 93,280 |
| 45,700 | | Emulex Corp.(a) | | | 781,013 |
| 3,800 | | Exar Corp.(a) | | | 54,264 |
| 23,600 | | Freescale Semiconductor, Inc.(a) | | | 655,372 |
| 80,700 | | Intel Corp. | | | 1,561,545 |
| 98,500 | | Micrel, Inc.(a) | | | 1,459,770 |
| 8,600 | | Micron Technology, Inc.(g) | | | 126,592 |
| 89,300 | | National Semiconductor Corp. | | | 2,486,112 |
| 32,800 | | Novellus Systems, Inc.(a) | | | 787,200 |
| 1,600 | | Sirf Technology Holdings, Inc.(a) | | | 56,656 |
| 82,500 | | Texas Instruments, Inc. | | | 2,678,775 |
See Notes to Financial Statements.
| | |
| The Prudential Investment Portfolios, Inc./Dryden Active Allocation Fund | | 17 |
Portfolio of Investments
as of March 31, 2006 (Unaudited) Cont’d.
| | | | | |
| Shares | | Description | | Value (Note 1) |
| | | | | |
| 58,200 | | Xilinx, Inc.(g) | | $ | 1,481,772 |
| 15,900 | | Zoran Corp.(a) | | | 347,892 |
| | | | |
|
|
| | | | | | 17,584,079 |
| |
Software 1.5% | | | |
| 3,200 | | Automatic Data Processing, Inc. | | | 146,176 |
| 13,300 | | Informatica Corp.(a) | | | 206,815 |
| 326,300 | | Microsoft Corp. | | | 8,878,623 |
| 40,600 | | Synopsys, Inc.(a) | | | 907,410 |
| | | | |
|
|
| | | | | | 10,139,024 |
| |
Telecommunication Equipment 0.7% | | | |
| 30,100 | | Crown Castle International Corp.(a)(g) | | | 853,335 |
| 177,600 | | Motorola, Inc. | | | 4,068,816 |
| | | | |
|
|
| | | | | | 4,922,151 |
| |
Telecommunication Services 1.6% | | | |
| 161,417 | | AT&T Corp.(g) | | | 4,364,716 |
| 17,100 | | BellSouth Corp. | | | 592,515 |
| 4,500 | | Cbeyond Communications, Inc.(a) | | | 79,425 |
| 21,800 | | Citizens Communications Co. | | | 289,286 |
| 15,700 | | Foundry Networks, Inc.(a) | | | 285,112 |
| 24,700 | | Harris Corp. | | | 1,168,063 |
| 10,900 | | Iowa Telecommunications Services, Inc. | | | 207,972 |
| 6,200 | | Syniverse Holdings, Inc.(a) | | | 97,960 |
| 104,652 | | Verizon Communications, Inc. | | | 3,564,447 |
| | | | |
|
|
| | | | | | 10,649,496 |
| |
Textiles, Apparel & Luxury Goods 0.4% | | | |
| 73,400 | | Coach, Inc.(a) | | | 2,538,172 |
| |
Tobacco 0.5% | | | |
| 33,300 | | Altria Group, Inc. | | | 2,359,638 |
| 7,300 | | Reynolds American, Inc.(g) | | | 770,150 |
| | | | |
|
|
| | | | | | 3,129,788 |
| |
Transportation 0.7% | | | |
| 20,200 | | FedEx Corp. | | | 2,281,388 |
| 20,600 | | J.B. Hunt Transport Services, Inc. | | | 443,724 |
| 5,100 | | Pacer International, Inc. | | | 166,668 |
| 8,100 | | Swift Transportation Co., Inc.(a) | | | 176,013 |
| 22,800 | | United Parcel Service, Inc. | | | 1,809,864 |
| | | | |
|
|
| | | Total common stocks
(cost $369,569,510) | | | 434,310,714 |
| | | | |
|
|
See Notes to Financial Statements.
| | |
| 18 | | Visit our website at www.jennisondryden.com |
| | | | | | | | |
Moody’s
Rating | | Principal Amount (000) | | Description | | Value (Note 1) |
| | | | | | | | | |
| CORPORATE BONDS 7.2% | | | |
| |
| Aerospace/Defense 0.4% | | | |
| Baa2 | | $ | 370 | | BAE Systems Holdings, Inc., Notes, 144A,
4.75%, 8/15/10 | | $ | 356,708 |
| Baa2 | | | 220 | | 5.20%, 8/15/15 | | | 208,724 |
| A2 | | | 190 | | Boeing Capital Corp., Sr. Notes,
6.10%, 3/1/11 | | | 195,846 |
| Baa3 | | | 260 | | Goodrich Corp., Notes,
7.625%, 12/15/12 | | | 286,936 |
| Baa1 | | | 110 | | Lockheed Martin Corp., Bonds,
8.50%, 12/1/29 | | | 142,817 |
| Baa2 | | | 500 | | Northrop Grumman Corp., Gtd. Notes,
7.125%, 2/15/11 | | | 532,429 |
| Baa3 | | | 195 | | Raytheon Co., Debs.,
6.00%, 12/15/10 | | | 198,819 |
| Baa3 | | | 29 | | Raytheon Co., Notes,
4.50%, 11/15/07 | | | 28,611 |
| Baa3 | | | 270 | | Raytheon Co., Sr. Notes,
6.55%, 3/15/10 | | | 279,930 |
| Baa3 | | | 140 | | 5.50%, 11/15/12 | | | 139,318 |
| | | | | | | |
|
|
| | | | | | | | | 2,370,138 |
| | | |
| Airlines | | | | | | | | |
| Baa3 | | | 48 | | Continental Airlines, Inc., Pass-Thru Certs., Ser. 01-1,
6.703%, 6/15/21 | | | 48,472 |
| Baa1 | | | 200 | | Southwest Airlines Co., Notes,
6.50%, 3/1/12 | | | 204,495 |
| | | | | | | |
|
|
| | | | | | | | | 252,967 |
| | |
| Automotive 0.1% | | | | | |
| A3 | | | 105 | | Auburn Hills Trust, Debs.,
12.375%, 5/1/20 | | | 152,564 |
| A3 | | | 65 | | DaimlerChrysler NA Holding Corp., Gtd. Notes,
8.50%, 1/18/31 | | | 76,042 |
| Baa3 | | | 60 | | Equus Cayman Finance Ltd., Notes, 144A,
5.50%, 9/12/08 | | | 59,559 |
| Baa3 | | | 90 | | Hyundai Motor Manufacturing LLC, Gtd. Notes, 144A,
5.30%, 12/19/08 | | | 88,822 |
See Notes to Financial Statements.
| | |
| The Prudential Investment Portfolios, Inc./Dryden Active Allocation Fund | | 19 |
Portfolio of Investments
as of March 31, 2006 (Unaudited) Cont’d.
| | | | | | | | |
Moody’s
Rating | | Principal Amount (000) | | Description | | Value (Note 1) |
| Baa1 | | $ | 60 | | Johnson Controls, Inc., Sr. Notes,
5.50%, 1/15/16 | | $ | 58,187 |
| | | | | | | |
|
|
| | | | | | | | | 435,174 |
| |
| Banking 0.6% | | | |
| Aa2 | | | 400 | | Bank of America Corp., Sr. Unsec. Notes,
4.75%, 8/1/15(g) | | | 375,714 |
| A1 | | | 400 | | Bank One Corp., Sub. Notes,
7.875%, 8/1/10 | | | 436,166 |
| Aa2 | | | 400 | | Citigroup, Inc., Sub. Notes,
5.625%, 8/27/12 | | | 402,173 |
| Aa2 | | | 82 | | 5.00%, 9/15/14 | | | 78,482 |
| Aa2 | | | 250 | | 6.625%, 6/15/32 | | | 267,713 |
| Aa2 | | | 125 | | 6.00%, 10/31/33 | | | 123,499 |
| Aa3 | | | 230 | | Credit Suisse First Boston USA, Inc., Notes,
5.125%, 8/15/15 | | | 220,070 |
| Baa3 | | | 220 | | ICICI Bank Ltd. (Singapore), Notes, 144A,
5.75%, 11/16/10 | | | 217,048 |
| Aa3 | | | 190 | | J.P. Morgan Chase & Co., Notes,
4.60%, 1/17/11 | | | 183,312 |
| Aa3 | | | 270 | | J.P. Morgan Chase & Co., Sr. Notes,
5.25%, 5/30/07 | | | 269,575 |
| A1 | | | 305 | | J.P. Morgan Chase & Co., Sub. Notes,
5.15%, 10/1/15 | | | 291,864 |
| A2 | | | 160 | | Mizuho Finance Group (Cayman Islands), Bank Gtd. Notes, 144A,
5.79%, 4/15/14 | | | 160,404 |
| A1 | | | 140 | | Santander Central Hispano Issuances (Cayman Islands), Gtd. Notes,
7.625%, 9/14/10 | | | 151,689 |
| Aa3 | | | 450 | | Wachovia Bank NA., Sub. Notes,
7.80%, 8/18/10 | | | 490,347 |
| A3 | | | 60 | | Washington Mutual Bank, Sub. Notes,
5.65%, 8/15/14 | | | 58,948 |
| Aa2 | | | 300 | | Wells Fargo & Co., Sub. Notes,
5.125%, 9/15/16 | | | 286,903 |
| | | | | | | |
|
|
| | | | | | | | | 4,013,907 |
| |
| Brokerage 0.3% | | | |
| A1 | | | 100 | | Bear Stearns Companies Inc. (The), Unsec. Notes,
5.30%, 10/30/15 | | | 96,677 |
See Notes to Financial Statements.
| | |
| 20 | | Visit our website at www.jennisondryden.com |
| | | | | | | | |
Moody’s
Rating | | Principal Amount (000) | | Description | | Value (Note 1) |
| A1 | | $ | 185 | | Goldman Sachs Group, Inc., Gtd. Notes,
6.345%, 2/15/34(g) | | $ | 183,457 |
| Aa3 | | | 5 | | Goldman Sachs Group, Inc., Notes,
5.00%, 10/1/14 | | | 4,746 |
| Aa3 | | | 380 | | Goldman Sachs Group, Inc., Sr. Notes,
5.35%, 1/15/16 | | | 367,028 |
| A1 | | | 335 | | Lehman Brothers Holdings, Inc., Notes,
6.625%, 1/18/12 | | | 352,434 |
| Aa3 | | | 60 | | Merrill Lynch & Co., Inc., Notes,
4.79%, 8/4/10 | | | 58,339 |
| Aa3 | | | 35 | | 5.45%, 7/15/14 | | | 34,516 |
| Aa3 | | | 240 | | Merrill Lynch & Co., Inc., Notes, MTN,
4.25%, 2/8/10 | | | 230,444 |
| Aa3 | | | 90 | | 5.00%, 1/15/15 | | | 85,867 |
| Aa3 | | | 25 | | Morgan Stanley, Notes,
5.30%, 3/1/13 | | | 24,450 |
| Aa3 | | | 250 | | 5.375%, 10/15/15 | | | 242,146 |
| A1 | | | 140 | | Morgan Stanley, Sub. Notes,
4.75%, 4/1/14 | | | 130,619 |
| | | | | | | |
|
|
| | | | | | | | | 1,810,723 |
| |
| Building Materials & Construction 0.1% | | | |
| Baa3 | | | 160 | | American Standard, Inc., Gtd. Notes,
7.625%, 2/15/10 | | | 168,882 |
| Baa1 | | | 170 | | Hanson PLC, Sr. Unsub.,
7.875%, 9/27/10 | | | 184,038 |
| Baa3 | | | 90 | | Ryland Group, Inc. (The), Sr. Notes,
5.375%, 6/1/08 | | | 89,094 |
| | | | | | | |
|
|
| | | | | | | | | 442,014 |
| |
| Cable 0.2% | | | |
| Baa2 | | | 55 | | Comcast Cable Communications Holdings, Inc., Gtd. Notes,
9.455%, 11/15/22 | | | 69,382 |
| Baa2 | | | 250 | | Comcast Corp., Bonds,
5.65%, 6/15/35 | | | 217,889 |
| Baa2 | | | 135 | | Comcast Corp., Gtd. Notes,
6.45%, 3/15/37(g) | | | 129,897 |
| Baa3 | | | 270 | | Cox Communications, Inc., Notes,
7.875%, 8/15/09 | | | 285,887 |
| Baa3 | | | 185 | | 6.75%, 3/15/11 | | | 189,741 |
See Notes to Financial Statements.
| | |
| The Prudential Investment Portfolios, Inc./Dryden Active Allocation Fund | | 21 |
Portfolio of Investments
as of March 31, 2006 (Unaudited) Cont’d.
| | | | | | | | |
Moody’s
Rating | | Principal Amount (000) | | Description | | Value (Note 1) |
| B2 | | $ | 385 | | CSC Holdings, Inc., Sr. Notes
7.875%, 12/15/07 | | $ | 392,700 |
| | | | | | | |
|
|
| | | | | | | | | 1,285,496 |
| |
| Capital Goods 0.4% | | | |
| A2 | | | 50 | | Caterpillar Financial Services Corp., MTN,
5.50%, 3/15/16 | | | 49,561 |
| A2 | | | 400 | | Caterpillar, Inc., Debs.,
7.25%, 9/15/09 | | | 423,404 |
| Baa1 | | | 65 | | Cooper Cameron Corp., Sr. Notes,
2.65%, 4/15/07 | | | 62,856 |
| Baa1 | | | 400 | | Erac USA Finance Co., Gtd. Notes, 144A,
7.35%, 6/15/08 | | | 415,349 |
| Baa2 | | | 75 | | FedEx Corp., Gtd. Notes,
7.25%, 2/15/11 | | | 80,097 |
| Baa2 | | | 330 | | FedEx Corp., Notes,
2.65%, 4/1/07 | | | 320,795 |
| A2 | | | 135 | | Honeywell International, Inc. Sr. Unsec. Notes,
5.70%, 3/15/36 | | | 131,220 |
| A2 | | | 215 | | Honeywell International, Inc., Bonds,
6.125%, 11/1/11 | | | 221,926 |
| Baa3 | | | 250 | | Tyco International Group SA (Luxembourg), Gtd. Notes,
6.00%, 11/15/13 | | | 251,136 |
| A2 | | | 90 | | United Technologies Corp., Debs.,
8.875%, 11/15/19 | | | 115,471 |
| A2 | | | 165 | | United Technologies Corp., Notes,
6.35%, 3/1/11 | | | 171,450 |
| A2 | | | 225 | | United Technologies Corp., Sr. Notes,
4.875%, 5/1/15 | | | 214,910 |
| Baa3 | | | 110 | | Waste Management, Inc., Gtd. Notes,
7.75%, 5/15/32 | | | 129,027 |
| | | | | | | |
|
|
| | | | | | | | | 2,587,202 |
| | |
| Chemicals 0.3% | | | | | |
| A3 | | | 60 | | Dow Chemical Co. (The), Debs.,
5.97%, 1/15/09 | | | 60,974 |
| A3 | | | 110 | | 7.375%, 11/1/29 | | | 126,951 |
See Notes to Financial Statements.
| | |
| 22 | | Visit our website at www.jennisondryden.com |
| | | | | | | | |
Moody’s
Rating | | Principal Amount (000) | | Description | | Value (Note 1) |
| A3 | | $ | 135 | | Dow Chemical Co. (The), Notes,
6.125%, 2/1/11 | | $ | 138,576 |
| B2 | | | 350 | | Huntsman International LLC, Gtd. Notes,
9.875%, 3/1/09 | | | 365,749 |
| Baa3 | | | 75 | | ICI Wilmington, Inc., Gtd. Notes,
5.625%, 12/1/13 | | | 72,603 |
| Ba3 | | | 350 | | IMC Global, Inc., Gtd. Notes, Ser. B,
11.25%, 6/1/11 | | | 372,312 |
| Baa3 | | | 75 | | Lubrizol Corp. (The), Debs.,
6.50%, 10/1/34 | | | 74,042 |
| Baa3 | | | 170 | | Lubrizol Corp. (The), Sr. Notes,
4.625%, 10/1/09 | | | 164,707 |
| B1 | | | 267 | | Lyondell Chemical Co., Gtd. Notes,
9.50%, 12/15/08 | | | 277,680 |
| Baa1 | | | 100 | | Monsanto Co., Bonds, Ser. 1,
5.50%, 7/30/35 | | | 90,336 |
| Ba2 | | | 100 | | Union Carbide Corp., Debs,
7.50%, 6/1/25 | | | 106,953 |
| | | | | | | |
|
|
| | | | | | | | | 1,850,883 |
| | | |
| Consumer | | | | | | | | |
| Baa1 | | | 185 | | Cendant Corp., Sr. Notes,
6.25%, 1/15/08 | | | 187,163 |
| | | | | | | |
|
|
| | |
| Electric 0.6% | | | | | |
| Baa2 | | | 125 | | Appalachian Power Co., Sr. Notes,
4.40%, 6/1/10 | | | 119,338 |
| A1 | | | 110 | | Boston Edison Co., Debs.,
4.875%, 4/15/14 | | | 105,571 |
| A3 | | | 105 | | Carolina Power & Light Co., First Mtge. Bonds,
5.25%, 12/15/15 | | | 101,569 |
| Baa2 | | | 160 | | CenterPoint Energy Houston Electric LLC, Gen. Refi. Mtge.,
5.70%, 3/15/13 | | | 160,066 |
| Baa2 | | | 120 | | 6.95%, 3/15/33 | | | 131,173 |
| A1 | | | 145 | | Consolidated Edison Co. of New York, Sr. Unsec. Notes ,
5.375%, 12/15/15 | | | 142,126 |
See Notes to Financial Statements.
| | |
| The Prudential Investment Portfolios, Inc./Dryden Active Allocation Fund | | 23 |
Portfolio of Investments
as of March 31, 2006 (Unaudited) Cont’d.
| | | | | | | | |
Moody’s
Rating | | Principal Amount (000) | | Description | | Value (Note 1) |
| Baa3 | | $ | 65 | | Consumers Energy Co., First Mtge. Bonds, Ser. B,
5.375%, 4/15/13 | | $ | 63,415 |
| Baa2 | | | 190 | | Dominion Resources, Inc., Sr. Notes, Ser. D,
5.125%, 12/15/09 | | | 187,351 |
| Baa3 | | | 45 | | Duke Capital LLC, Sr. Notes,
6.25%, 2/15/13 | | | 46,134 |
| Baa3 | | | 45 | | 8.00%, 10/1/19 | | | 52,555 |
| Baa3 | | | 135 | | El Paso Electric Co., Sr. Unsec. Notes,
6.00%, 5/15/35 | | | 127,021 |
| Ba1 | | | 220 | | Empresa Nacional de Electricidad SA (Chile), Bonds, Ser. B,
8.50%, 4/1/09 | | | 235,923 |
| Ba1 | | | 65 | | Empresa Nacional de Electricidad SA (Chile), Notes,
8.625%, 8/1/15 | | | 74,134 |
| Baa2 | | | 125 | | Energy East Corp., Notes,
6.75%, 9/15/33 | | | 129,756 |
| Baa2 | | | 30 | | Exelon Corp., Notes,
4.90%, 6/15/15 | | | 27,868 |
| Baa3 | | | 155 | | FirstEnergy Corp., Notes, Ser. C,
7.375%, 11/15/31(g) | | | 172,170 |
| Aa3 | | | 60 | | Florida Power & Light Co., First Mtge. Bonds,
5.95%, 10/1/33 | | | 59,662 |
| Baa2 | | | 90 | | Indiana Michigan Power Co., Sr. Notes,
Ser. INDF,
5.05%, 11/15/14 | | | 85,108 |
| A2 | | | 35 | | Natural Rural Utilities Cooperative Finance Corp., Notes,
7.25%, 3/1/12 | | | 37,809 |
| Baa3 | | | 130 | | NiSource Finance Corp., Gtd. Notes,
5.25%, 9/15/17 | | | 122,006 |
| Baa3 | | | 280 | | 5.45%, 9/15/20 | | | 259,558 |
| Baa2 | | | 120 | | Oncor Electric Delivery, Debs.,
7.00%, 9/1/22 | | | 128,224 |
| Baa2 | | | 45 | | Oncor Electric Delivery, Sec’d. Notes,
7.25%, 1/15/33 | | | 50,163 |
| Baa1 | | | 315 | | Pacific Gas & Electric Co., First Mtge. Bonds,
6.05%, 3/1/34 | | | 308,253 |
See Notes to Financial Statements.
| | |
| 24 | | Visit our website at www.jennisondryden.com |
| | | | | | | | |
Moody’s
Rating | | Principal Amount (000) | | Description | | Value (Note 1) |
| Baa2 | | $ | 110 | | Pepco Holdings, Inc., Notes,
5.50%, 8/15/07 | | $ | 110,012 |
| A3 | | | 400 | | PPL Electric Utilities Corp., Sec’d. Notes,
6.25%, 8/15/09 | | | 408,751 |
| A3 | | | 100 | | Southern California Edison Co., First Mtge. Bonds,
4.65%, 4/1/15 | | | 93,280 |
| A3 | | | 70 | | 5.625%, 2/1/36 | | | 65,523 |
| Baa1 | | | 120 | | Xcel Energy, Inc., Sr. Notes,
3.40%, 7/1/08 | | | 114,813 |
| Baa1 | | | 35 | | 7.00%, 12/1/10 | | | 36,884 |
| | | | | | | |
|
|
| | | | | | | | | 3,756,216 |
| |
| Energy—Integrated 0.1% | | | |
| Ba1 | | | 145 | | Amerada Hess Corp., Bonds,
7.875%, 10/1/29 | | | 168,844 |
| Baa1 | | | 60 | | Marathon Oil Corp., Notes,
6.125%, 3/15/12 | | | 61,756 |
| A1 | | | 500 | | Phillips Petroleum Co., Notes,
8.75%, 5/25/10 | | | 561,134 |
| A1 | | | 130 | | Union Oil Co. of California, Gtd. Notes,
7.35%, 6/15/09 | | | 138,111 |
| | | | | | | |
|
|
| | | | | | | | | 929,845 |
| |
| Energy—Other 0.1% | | | |
| Baa2 | | | 45 | | Devon Financing Corp., ULC, Gtd. Notes,
7.875%, 9/30/31 | | | 54,327 |
| Baa2 | | | 55 | | Encana Corp., Bonds,
6.50%, 8/15/34 | | | 57,548 |
| Baa1 | | | 30 | | Halliburton Co., Notes,
5.50%, 10/15/10 | | | 30,071 |
| A3 | | | 340 | | Occidental Petroleum Corp., Sr. Notes,
6.75%, 1/15/12(g) | | | 363,782 |
| Baa1 | | | 120 | | Talisman Energy, Inc., Notes,
5.125%, 5/15/15 | | | 114,960 |
| Baa3 | | | 30 | | Valero Energy Corp., Sr. Unsec. Notes,
7.50%, 4/15/32 | | | 34,491 |
| Baa1 | | | 265 | | Woodside Petroleum Ltd. (Australia), Gtd. Notes, 144A,
5.00%, 11/15/13 | | | 257,214 |
| | | | | | | |
|
|
| �� | | | | | | | | 912,393 |
See Notes to Financial Statements.
| | |
| The Prudential Investment Portfolios, Inc./Dryden Active Allocation Fund | | 25 |
Portfolio of Investments
as of March 31, 2006 (Unaudited) Cont’d.
| | | | | | | | |
Moody’s
Rating | | Principal Amount (000) | | Description | | Value (Note 1) |
| |
| Foods 0.5% | | | |
| A1 | | $ | 160 | | Anheuser-Busch Cos., Inc., Sr. Notes,
6.00%, 4/15/11 | | $ | 164,030 |
| A2 | | | 60 | | Archer-Daniels-Midland Co., Debs.,
8.125%, 6/1/12 | | | 67,951 |
| A3 | | | 250 | | Bottling Group LLC, Notes,
5.50%, 4/1/16 | | | 246,789 |
| Baa2 | | | 160 | | Cadbury Schweppes US Finance LLC, Notes, 144A,
3.875%, 10/1/08 | | | 154,279 |
| A2 | | | 375 | | Cargill, Inc., Notes, 144A,
3.625%, 3/4/09 | | | 357,456 |
| Baa2 | | | 130 | | ConAgra Foods, Inc., Notes,
7.875%, 9/15/10 | | | 140,271 |
| Baa1 | | | 260 | | HJ Heinz Co., Notes, 144A,
6.428%, 12/1/20 | | | 264,594 |
| Baa1 | | | 375 | | Kellogg Co., Notes, Ser. B,
6.60%, 4/1/11 | | | 392,118 |
| A3 | | | 50 | | Kraft Foods, Inc., Notes,
5.25%, 6/1/07 | | | 49,896 |
| A3 | | | 185 | | Kraft Foods, Inc., Sr. Unsec. Notes,
5.625%, 11/1/11 | | | 185,246 |
| Baa2 | | | 35 | | Kroger Co. (The), Gtd. Notes,
6.80%, 4/1/11 | | | 36,466 |
| Baa2 | | | 250 | | Kroger Co. (The), Notes,
7.80%, 8/15/07 | | | 257,439 |
| Baa2 | | | 140 | | Kroger Co. (The), Sr. Notes,
7.00%, 5/1/18 | | | 146,500 |
| Baa1 | | | 295 | | PepsiAmericas, Inc., Notes,
6.375%, 5/1/09 | | | 302,957 |
| Baa1 | | | 115 | | 4.875%, 1/15/15 | | | 109,255 |
| Baa2 | | | 25 | | Safeway, Inc., Sr. Unsec. Notes,
7.25%, 2/1/31 | | | 26,492 |
| Baa3 | | | 35 | | Tricon Global Restaurants, Inc., Sr. Notes,
8.875%, 4/15/11 | | | 39,423 |
| Baa3 | | | 20 | | Tyson Foods, Inc., Sr. Unsec. Notes,
8.25%, 10/1/11 | | | 21,352 |
| Baa3 | | | 150 | | 6.60%, 4/1/16 | | | 148,157 |
| | | | | | | |
|
|
| | | | | | | | | 3,110,671 |
See Notes to Financial Statements.
| | |
| 26 | | Visit our website at www.jennisondryden.com |
| | | | | | | | |
Moody’s
Rating | | Principal Amount (000) | | Description | | Value (Note 1) |
| |
| Gaming 0.1% | | | |
| Baa3 | | $ | 55 | | Harrah’s Operating Co., Inc., Gtd. Notes,
7.125%, 6/1/07 | | $ | 55,932 |
| Baa3 | | | 150 | | 5.50%, 7/1/10 | | | 148,482 |
| Baa3 | | | 195 | | 5.75%, 10/1/17 | | | 184,646 |
| Ba3 | | | 1 | | Mandalay Resort Group, Sr. Sub. Notes,
9.375%, 2/15/10 | | | 1,085 |
| Ba3 | | | 300 | | Station Casinos, Inc., Sr. Sub. Notes, 144A,
6.625%, 3/15/18 | | | 293,249 |
| | | | | | | |
|
|
| | | | | | | | | 683,394 |
| |
| Health Care & Pharmaceutical 0.3% | | | |
| Baa1 | | | 170 | | Baxter International, Inc., Sr. Unsec. Notes,
5.196%, 2/16/08 | | | 169,318 |
| A1 | | | 110 | | Bristol-Myers Squibb Co., Notes,
5.75%, 10/1/11 | | | 111,209 |
| Baa3 | | | 260 | | Cardinal Health, Inc., Unsub. Notes,
5.85%, 12/15/17 | | | 256,729 |
| Ba1 | | | 190 | | Coventry Health Care, Inc., Sr. Notes,
6.125%, 1/15/15 | | | 188,999 |
| A1 | | | 180 | | Genentech, Inc., Sr. Notes,
4.75%, 7/15/15 | | | 169,031 |
| Baa3 | | | 145 | | Laboratory Corp., of America Holdings, Sr. Unsec. Notes,
5.625%, 12/15/15 | | | 142,388 |
| Aa3 | | | 30 | | Merck & Co., Inc., Debs.,
5.95%, 12/1/28 | | | 29,161 |
| Aaa | | | 40 | | Pharmacia Corp., Debs.,
6.60%, 12/1/28 | | | 44,272 |
| Baa1 | | | 315 | | Schering-Plough Corp., Sr. Notes,
5.55%, 12/1/13 | | | 311,653 |
| Baa2 | | | 255 | | Teva Pharmaceutical Finance LLC, Bonds,
6.15%, 2/1/36 | | | 240,344 |
| Baa1 | | | 405 | | Wyeth, Unsub. Notes,
5.50%, 3/15/13 - 2/1/14 | | | 400,141 |
| Baa1 | | | 95 | | 6.45%, 2/1/24 | | | 98,258 |
| | | | | | | |
|
|
| | | | | | | | | 2,161,503 |
| |
| Insurance 0.4% | | | |
| A1 | | | 200 | | Allstate Corp. (The), Sr. Notes,
7.20%, 12/1/09 | | | 211,364 |
See Notes to Financial Statements.
| | |
| The Prudential Investment Portfolios, Inc./Dryden Active Allocation Fund | | 27 |
Portfolio of Investments
as of March 31, 2006 (Unaudited) Cont’d.
| | | | | | | | |
Moody’s
Rating | | Principal Amount (000) | | Description | | Value (Note 1) |
| A1 | | $ | 15 | | 5.55%, 5/9/35 | | $ | 13,895 |
| A1 | | | 65 | | 5.95%, 4/1/36 | | | 63,313 |
| Aa2 | | | 210 | | American International Group, Inc., Notes,
4.25%, 5/15/13 | | | 194,187 |
| Aa2 | | | 40 | | American International Group, Inc., Notes, 144A,
5.05%, 10/1/15 | | | 38,141 |
| Baa1 | | | 310 | | Anthem, Inc., Notes,
3.50%, 9/1/07 | | | 301,455 |
| A3 | | | 35 | | AXA SA (France), Sub. Notes,
8.60%, 12/15/30 | | | 44,737 |
| A3 | | | 120 | | Everest Reinsurance Holdings, Inc., Notes,
5.40%, 10/15/14 | | | 115,423 |
| Baa3 | | | 145 | | Liberty Mutual Group, Inc., Bonds, 144A,
7.00%, 3/15/34 | | | 147,320 |
| Baa2 | | | 50 | | Marsh & Mclennan Cos., Inc., Sr. Unsec. Notes,
5.15%, 9/15/10 | | | 48,873 |
| A2 | | | 70 | | MetLife, Inc., Sr. Notes,
6.125%, 12/1/11 | | | 72,206 |
| A2 | | | 15 | | 6.375%, 6/15/34 | | | 15,478 |
| A2 | | | 205 | | 5.70%, 6/15/35 | | | 193,166 |
| A2 | | | 95 | | United Health Group, Inc., Sr. Unsec. Notes,
5.375%, 3/15/16 | | | 92,884 |
| A2 | | | 130 | | United Health Group, Sr. Unsec. Notes,
5.80%, 3/15/36 | | | 123,795 |
| A2 | | | 290 | | UnitedHealth Group, Inc., Sr. Unsec. Notes,
5.25%, 3/15/11 | | | 287,616 |
| Baa2 | | | 110 | | W.R. Berkley Corp., Sr. Notes,
5.60%, 5/15/15 | | | 106,116 |
| Baa2 | | | 90 | | 6.15%, 8/15/19 | | | 87,991 |
| Baa1 | | | 170 | | WellPoint, Inc., Notes,
5.00%, 12/15/14 | | | 162,140 |
| Baa1 | | | 105 | | 5.95%, 12/15/34 | | | 101,081 |
| A3 | | | 15 | | XL Capital Ltd., Sr. Notes,
5.25%, 9/15/14 | | | 14,196 |
| | | | | | | |
|
|
| | | | | | | | | 2,435,377 |
| |
| Lodging 0.1% | | | |
| A3 | | | 440 | | Carnival Corp. (Panama), Gtd. Notes,
3.75%, 11/15/07 | | | 428,871 |
See Notes to Financial Statements.
| | |
| 28 | | Visit our website at www.jennisondryden.com |
| | | | | | | | |
Moody’s
Rating | | Principal Amount (000) | | Description | | Value (Note 1) |
| A3 | | $ | 50 | | Carnival PLC (United Kingdom), Notes,
7.30%, 6/1/07 | | $ | 50,976 |
| Ba1 | | | 355 | | Royal Caribbean Cruises Ltd. (Liberia), Sr. Notes,
8.00%, 5/15/10 | | | 379,617 |
| | | | | | | |
|
|
| | | | | | | | | 859,464 |
| |
| Media & Entertainment 0.2% | | | |
| Baa3 | | | 115 | | AMFM, Inc., Gtd. Notes,
8.00%, 11/1/08 | | | 120,720 |
| Baa3 | | | 75 | | CBS Corp., Gtd. Notes,
7.875%, 7/30/30 | | | 81,674 |
| Baa3 | | | 45 | | Clear Channel Communications, Inc., Sr. Unsec. Notes,
6.25%, 3/15/11 | | | 44,648 |
| A3 | | | 50 | | Disney (Walt) Co., Notes,
5.375%, 6/1/07 | | | 50,011 |
| Baa2 | | | 125 | | News America, Inc., Gtd. Notes,
7.625%, 11/30/28 | | | 134,247 |
| Baa2 | | | 100 | | Time Warner, Inc., Debs.,
9.15%, 2/1/23 | | | 120,238 |
| Baa2 | | | 315 | | Time Warner, Inc., Gtd. Notes,
6.75%, 4/15/11 | | | 326,688 |
| Baa2 | | | 160 | | 7.25%, 10/15/17 | | | 171,209 |
| Baa2 | | | 50 | | 7.70%, 5/1/32 | | | 54,986 |
| | | | | | | |
|
|
| | | | | | | | | 1,104,421 |
| |
| Metals 0.1% | | | |
| Baa1 | | | 20 | | Alcan, Inc. (Canada), Notes,
5.20%, 1/15/14 | | | 19,277 |
| Baa1 | | | 115 | | 5.00%, 6/1/15 | | | 108,449 |
| Baa1 | | | 35 | | 6.125%, 12/15/33 | | | 34,333 |
| Baa3 | | | 165 | | Noranda, Inc., Notes
6.20%, 6/15/35 | | | 150,512 |
| Baa3 | | | 30 | | Vale Overseas Ltd., Gtd. Notes,
8.25%, 1/17/34 | | | 34,425 |
| | | | | | | |
|
|
| | | | | | | | | 346,996 |
| |
| Non Captive Finance 0.4% | | | |
| Aaa | | | 165 | | Berkshire Hathaway Finance Corp., Gtd. Notes,
4.75%, 5/15/12 | | | 159,201 |
See Notes to Financial Statements.
| | |
| The Prudential Investment Portfolios, Inc./Dryden Active Allocation Fund | | 29 |
Portfolio of Investments
as of March 31, 2006 (Unaudited) Cont’d.
| | | | | | | | |
Moody’s
Rating | | Principal Amount (000) | | Description | | Value (Note 1) |
| Baa1 | | $ | 5 | | Capital One Bank, Sub. Notes,
6.50%, 6/13/13 | | $ | 5,203 |
| Baa1 | | | 55 | | Capital One Financial Corp., Notes,
5.50%, 6/1/15 | | | 53,380 |
| A2 | | | 240 | | CIT Group Funding Co. of Canada, Gtd. Notes,
5.20%, 6/1/15 | | | 228,970 |
| A2 | | | 195 | | CIT Group, Inc., Sr. Notes,
5.50%, 11/30/07 | | | 195,513 |
| A2 | | | 80 | | 4.25%, 2/1/10 | | | 76,597 |
| Aaa | | | 110 | | General Electric Capital Corp., Notes,
4.875%, 10/21/10 | | | 107,752 |
| Aaa | | | 205 | | General Electric Capital Corp., Notes, Ser. MTN,
6.125%, 2/22/11 | | | 211,211 |
| Aaa | | | 500 | | 6.75%, 3/15/32 | | | 556,789 |
| Aa3 | | | 130 | | Household Finance Corp., Notes,
4.75%, 5/15/09(g) | | | 127,629 |
| Aa3 | | | 185 | | 6.375%, 10/15/11 - 11/27/12 | | | 191,938 |
| Aa3 | | | 85 | | HSBC Finance Corp., Notes,
6.75%, 5/15/11 | | | 89,486 |
| Aa3 | | | 165 | | 5.00%, 6/30/15 | | | 155,734 |
| Aa3 | | | 145 | | 5.50%, 1/19/16 | | | 141,664 |
| A1 | | | 120 | | International Lease Finance Corp., Unsub. Notes,
3.50%, 4/1/09 | | | 113,719 |
| Baa2 | | | 150 | | MUFG Capital Finance 1 Ltd. (Cayman Islands), Gtd. Notes,
6.346%, 7/29/49 | | | 147,606 |
| Baa3 | | | 350 | | Residential Capital Corp., Gtd. Notes,
6.00%, 2/15/11 | | | 347,205 |
| Baa3 | | | 100 | | Residential Capital Corp., Sr. Unsec. Notes,
6.375%, 6/30/10 | | | 100,742 |
| | | | | | | |
|
|
| | | | | | | | | 3,010,339 |
| |
| Non-Corporate 0.1% | | | |
| A3 | | | 170 | | Export-Import Bank of Korea (South Korea), Notes, 144A,
4.125%, 2/10/09 | | | 164,140 |
| A3 | | | 240 | | Korea Development Bank, Notes,
4.75%, 7/20/09 | | | 234,586 |
See Notes to Financial Statements.
| | |
| 30 | | Visit our website at www.jennisondryden.com |
| | | | | | | | |
Moody’s
Rating | | Principal Amount (000) | | Description | | Value (Note 1) |
| Baa2 | | $ | 85 | | Petrobras International Finance Co., Bonds,
8.375%, 12/10/18 | | $ | 96,263 |
| A2 | | | 44 | | Petrobras International Finance Co., Sr. Notes,
9.75%, 7/6/11 | | | 51,590 |
| | | | | | | |
|
|
| | | | | | | | | 546,579 |
| |
| Paper | | | |
| Baa2 | | | 145 | | Weyerhaeuser Co., Debs.,
7.375%, 3/15/32 | | | 154,834 |
| | | | | | | |
|
|
| |
| Pipelines & Other 0.2% | | | |
| Baa3 | | | 330 | | Atmos Energy Corp., Notes,
4.00%, 10/15/09 | | | 313,051 |
| Baa2 | | | 365 | | Duke Energy Field Services LLC,
Notes,
7.875%, 8/16/10 | | | 396,190 |
| Baa3 | | | 35 | | Enterprise Products Operating LP, Gtd. Notes,
6.875%, 3/1/33 | | | 35,756 |
| Baa3 | | | 150 | | Enterprise Products Operating LP, Sr. Notes,
4.00%, 10/15/07 | | | 146,745 |
| Baa2 | | | 190 | | Kinder Morgan Finance Co. ULC, Gtd. Notes,
6.40%, 1/5/36 | | | 185,004 |
| Baa2 | | | 250 | | Oneok, Inc., Sr. Unsec. Notes,
5.51%, 2/16/08 | | | 249,616 |
| Baa1 | | | 120 | | Sempra Energy, Sr. Notes,
4.621%, 5/17/07 | | | 118,932 |
| Baa1 | | | 15 | | Sempra Energy, Sr. Unsec. Notes,
6.00%, 2/1/13 | | | 15,206 |
| | | | | | | |
|
|
| | | | | | | | | 1,460,500 |
| |
| Railroads 0.1% | | | |
| Baa2 | | | 135 | | Burlington Northern Santa Fe Corp., Debs.,
6.70%, 8/1/28 | | | 145,654 |
| Baa1 | | | 4 | | Norfolk Southern Corp., Sr. Notes,
7.80%, 5/15/27 | | | 4,800 |
| Baa1 | | | 96 | | Norfolk Southern Corp., Sr. Unsec. Notes,
5.64%, 5/17/29 | | | 91,227 |
See Notes to Financial Statements.
| | |
| The Prudential Investment Portfolios, Inc./Dryden Active Allocation Fund | | 31 |
Portfolio of Investments
as of March 31, 2006 (Unaudited) Cont’d.
| | | | | | | | |
Moody’s
Rating | | Principal Amount (000) | | Description | | Value (Note 1) |
| Baa2 | | $ | 275 | | Union Pacific Corp., Notes
6.625%, 2/1/08 | | $ | 280,705 |
| Baa2 | | | 377 | | 6.65%, 1/15/11 | | | 392,933 |
| | | | | | | |
|
|
| | | | | | | | | 915,319 |
| |
| Real Estate Investment Trust 0.2% | | | |
| Baa3 | | | 265 | | Brandywine Operating Partnership, Notes,
5.75%, 4/1/12 | | | 263,142 |
| Baa2 | | | 350 | | EOP Operating LP, Sr. Notes,
6.75%, 2/15/08 | | | 357,034 |
| Baa1 | | | 70 | | EOP Operating LP, Notes,
5.125%, 3/15/16 | | | 66,402 |
| Baa2 | | | 50 | | First Industrial LP, Sr. Notes,
5.75%, 1/15/16 | | | 48,653 |
| Baa2 | | | 250 | | Mack-Cali Realty LP, Notes,
7.25%, 3/15/09 | | | 259,671 |
| Baa3 | | | 90 | | Post Apartment Homes LP, Sr. Notes,
5.45%, 6/1/12 | | | 86,436 |
| | | | | | | |
|
|
| | | | | | | | | 1,081,338 |
| |
| Retail 0.3% | | | |
| Baa3 | | | 250 | | Gap, Inc. (The), Notes,
6.90%, 9/15/07 | | | 253,873 |
| Aa3 | | | 590 | | Home Depot, Inc., Sr. Notes,
5.40%, 3/1/16 | | | 582,896 |
| Baa3 | | | 175 | | JC Penney Corp., Inc., Debs,
7.95%, 4/1/17 | | | 198,363 |
| Baa1 | | | 45 | | May Department Stores Co. (The), Gtd. Notes,
8.50%, 6/1/19 | | | 53,357 |
| Baa1 | | | 85 | | May Department Stores Co. (The), Notes,
6.65%, 7/15/24 | | | 86,250 |
| Baa1 | | | 115 | | 6.70%, 7/15/34(g) | | | 116,894 |
| A2 | | | 140 | | Target Corp., Sr. Unsec. Notes,
7.50%, 8/15/10 | | | 151,451 |
| Aa2 | | | 260 | | Wal-Mart Stores, Inc., Bonds,
5.25%, 9/1/35 | | | 235,852 |
| | | | | | | |
|
|
| | | | | | | | | 1,678,936 |
See Notes to Financial Statements.
| | |
| 32 | | Visit our website at www.jennisondryden.com |
| | | | | | | | |
Moody’s
Rating | | Principal Amount (000) | | Description | | Value (Note 1) |
| |
| Technology 0.4% | | | |
| A1 | | $ | 100 | | Cisco Systems, Inc., Notes,
5.50%, 2/22/16 | | $ | 98,498 |
| Ba1 | | | 225 | | Computer Associates International, Inc., Sr. Notes, 144A,
5.25%, 12/1/09 | | | 219,013 |
| Baa1 | | | 165 | | Equifax, Inc., Notes,
4.95%, 11/1/07 | | | 163,691 |
| A2 | | | 110 | | First Data Corp., Notes,
4.85%, 10/1/14 | | | 103,001 |
| Ba1 | | | 375 | | Freescale Semiconductor, Inc., Sr. Notes
6.875%, 7/15/11 | | | 383,437 |
| A1 | | | 185 | | International Business Machines Corp., Debs.,
5.875%, 11/29/32 | | | 182,896 |
| Baa3 | | | 150 | | Jabil Circuit, Inc., Sr. Notes,
5.875%, 7/15/10 | | | 150,181 |
| Baa2 | | | 190 | | Motorola, Inc., Notes,
4.608%, 11/16/07 | | | 187,871 |
| Baa2 | | | 24 | | 7.625%, 11/15/10 | | | 26,177 |
| A3 | | | 200 | | Oracle Corp. and Ozark Holding, Inc., Notes, 144A,
5.00%, 1/15/11 | | | 195,339 |
| Ba2 | | | 245 | | Seagate Technology, HDD Holdings, Gtd. Notes,
8.00%, 5/15/09 | | | 254,494 |
| Ba2 | | | 380 | | Xerox Corp., Sr. Unsec. Notes,
6.40%, 3/15/16 | | | 377,150 |
| | | | | | | |
|
|
| | | | | | | | | 2,341,748 |
| |
| Telecommunications 0.6% | | | |
| A2 | | | 135 | | ALLTEL Ohio LP, Gtd. Notes, 144A,
8.00%, 8/15/10 | | | 146,902 |
| A3 | | | 115 | | America Movil SA de CV (Mexico), Unsec. Notes,
6.375%, 3/1/35 | | | 108,127 |
| A2 | | | 120 | | AT&T Corp., Sr. Notes,
9.75%, 11/15/31 | | | 143,288 |
| A2 | | | 220 | | AT&T, Inc., Notes,
4.125%, 9/15/09 | | | 210,379 |
| A2 | | | 240 | | 5.30%, 11/15/10 | | | 236,845 |
See Notes to Financial Statements.
| | |
| The Prudential Investment Portfolios, Inc./Dryden Active Allocation Fund | | 33 |
Portfolio of Investments
as of March 31, 2006 (Unaudited) Cont’d.
| | | | | | | | |
Moody’s
Rating | | Principal Amount (000) | | Description | | Value (Note 1) |
| A2 | | $ | 245 | | BellSouth Corp., Notes,
4.20%, 9/15/09 | | $ | 235,078 |
| Baa1 | | | 45 | | British Telecommunications PLC (United Kingdom), Bonds,
8.875%, 12/15/30 | | | 57,568 |
| Baa1 | | | 220 | | British Telecommunications PLC (United Kingdom), Unsub. Notes,
7.00%, 5/23/07 | | | 223,567 |
| Baa2 | | | 100 | | Cingular Wireless LLC, Sr. Notes,
7.125%, 12/15/31 | | | 108,245 |
| A3 | | | 60 | | Deutsche Telekom International Finance BV (Netherlands), Gtd. Notes,
8.25%, 6/15/30 | | | 71,774 |
| A3 | | | 75 | | France Telecom SA (France), Notes,
8.50%, 3/1/31 | | | 93,683 |
| Baa2 | | | 105 | | Koninklijke (Royal) KPN NV (Netherlands), Sr. Unsub. Notes,
8.00%, 10/1/10 | | | 112,705 |
| Baa2 | | | 150 | | New Cingular Wireless Services, Inc., Sr. Notes,
7.875%, 3/1/11 | | | 164,410 |
| Baa2 | | | 110 | | 8.75%, 3/1/31 | | | 139,320 |
| Baa2 | | | 240 | | Nextel Communications, Inc., Sr. Notes,
5.95%, 3/15/14 | | | 237,606 |
| Baa2 | | | 440 | | Sprint Capital Corp., Gtd. Notes,
6.90%, 5/1/19 | | | 470,058 |
| Baa2 | | | 90 | | 8.75%, 3/15/32 | | | 112,523 |
| Baa2 | | | 90 | | Telecom Italia Capital SA (Luxembourg), Gtd. Notes,
5.25%, 11/15/13 | | | 85,276 |
| Baa2 | | | 130 | | 6.375%, 11/15/33 | | | 122,500 |
| Baa1 | | | 420 | | Telecomunicaciones de Puerto Rico, Inc. (Puerto Rico), Gtd. Notes,
6.80%, 5/15/09 | | | 425,387 |
| Baa2 | | | 250 | | TELUS Corp. (Canada), Notes,
8.00%, 6/1/11 | | | 275,744 |
| Baa3 | | | 95 | | US Cellular Corp., Sr. Notes,
6.70%, 12/15/33 | | | 90,498 |
| A3 | | | 170 | | Verizon Global Funding Corp., Bonds,
5.85%, 9/15/35 | | | 152,480 |
| A3 | | | 55 | | Verizon Global Funding Corp., Notes,
7.75%, 12/1/30 | | | 60,761 |
See Notes to Financial Statements.
| | |
| 34 | | Visit our website at www.jennisondryden.com |
| | | | | | | | |
Moody’s
Rating | | Principal Amount (000) | | Description | | Value (Note 1) |
| A2 | | $ | 50 | | Vodafone Group PLC (United Kingdom), Notes,
5.75%, 3/15/16 | | $ | 49,028 |
| A2 | | | 200 | | Vodafone Group PLC (United Kingdom), Sr. Notes,
7.75%, 2/15/10 | | | 214,324 |
| | | | | | | |
|
|
| | | | | | | | | 4,348,076 |
| | |
| Tobacco | | | | | |
| Baa2 | | | 60 | | Altria Group, Inc., Debs.,
7.75%, 1/15/27 | | | 68,656 |
| Baa2 | | | 120 | | Altria Group, Inc., Notes,
7.65%, 7/1/08 | | | 125,389 |
| | | | | | | |
|
|
| | | | | | | | | 194,045 |
| | | | | | | |
|
|
| | | | | | Total corporate bonds
(cost $48,268,530) | | | 47,267,661 |
| | | | | | | |
|
|
| |
| ASSET BACKED SECURITIES 1.3% | | | |
| Baa2 | | | 230 | | American Express Credit Account Master Trust, Ser. 2004-4, Class C, 144A,
5.219%, 3/15/12(h) | | | 231,114 |
| Baa2 | | | 190 | | American Express Credit Account Master Trust, Ser. 2004-C, Class C, 144A,
5.249%, 2/15/12(h) | | | 190,037 |
| AA+(d) | | | 220 | | Amortizing Residential Collateral Trust, Ser. 2002-BC7, Class M2,
5.718%, 10/25/32(h) | | | 220,418 |
| Aa2 | | | 500 | | Amortizing Residential Collateral Trust, Series 2002-BC9, Class M1,
5.918%, 12/25/32(h) | | | 501,608 |
| Baa2 | | | 397 | | Bank One Issuance Trust, Ser. 2003-C1, Class C1,
4.54%, 9/15/10 | | | 390,787 |
| Aa2 | | | 248 | | CDC Mortgage Capital Trust,
Ser. 2002-HE3, Class M1,
5.918%, 3/25/33(h) | | | 249,434 |
| Aa2 | | | 360 | | Centex Home Equity, Ser. 2005-A, Class M2,
5.318%, 1/25/35(h) | | | 361,333 |
| Aaa | | | 650 | | Chase Issuance Trust, Ser. 2005-A4, Class A4,
4.23%, 1/15/13 | | | 627,039 |
See Notes to Financial Statements.
| | |
| The Prudential Investment Portfolios, Inc./Dryden Active Allocation Fund | | 35 |
Portfolio of Investments
as of March 31, 2006 (Unaudited) Cont’d.
| | | | | | | | |
Moody’s
Rating | | Principal Amount (000) | | Description | | Value (Note 1) |
| Aaa | | $ | 270 | | Credit-Based Asset Servicing and Securitization, Ser. 2005-CB6, Class AF3,
5.12%, 7/25/35 | | $ | 266,657 |
| Aa2 | | | 260 | | Equity One ABS, Inc., Ser. 2004-3, Class M1,
5.70%, 7/25/34 | | | 257,375 |
| Aa2 | | | 300 | | First Franklin Mortgage Loan Asset Backed Certs., Ser. 2005-FFH1, Class M2,
5.338%, 6/25/36(h) | | | 302,226 |
| Aa1 | | | 210 | | HFC Home Equity Loan Asset Backed Certs., Ser. 2005-2, Class M2,
5.266%, 1/20/35(h) | | | 210,988 |
| Aaa | | | 220 | | Home Equity Asset Trust, Ser. 2005-7, Class 2A4,
5.198%, 1/25/36(h) | | | 220,407 |
| Aa2 | | | 56 | | Household Mortgage Loan Trust,
Ser. 2003-HC2, Class M,
5.376%, 6/20/33(h) | | | 55,590 |
| Aa2 | | | 53 | | Household Mortgage Loan Trust,
Ser. 2004-HC1, Class M,
5.276%, 2/20/34(h) | | | 52,796 |
| Aaa | | | 2,400 | | MBNA Master Credit Card Trust,
Ser. 1999-J, Class A,
7.00%, 2/15/12 | | | 2,537,701 |
| A2 | | | 290 | | Morgan Stanley ABS Capital I,
Ser. 2004-N3, Class M2,
5.918%, 3/25/34(h) | | | 293,018 |
| Aaa | | | 268 | | Morgan Stanley Dean Witter Capital I,
Ser. 2002-NC4, Class M1,
5.668%, 9/25/32(h) | | | 269,892 |
| Aa2 | | | 350 | | Morgan Stanley Dean Witter Capital I, Series 2002-HE1, Class M1,
5.418%, 7/25/32(h) | | | 353,462 |
| Aaa | | | 176 | | Prestige Auto Receivables Trust, Ser. 2004-1, Class A2, 144A,
3.69%, 6/15/11 | | | 173,871 |
| Aa2 | | | 240 | | Saxon Asset Securities Trust, Ser. 2005-2, Class M2,
5.258%, 9/25/35(h) | | | 241,445 |
| Aa2 | | | 280 | | Securitized Asset Bank Receivables LLC Trust, Ser. 2004-OP1, Class M1,
5.091%, 2/25/34(h) | | | 280,984 |
See Notes to Financial Statements.
| | |
| 36 | | Visit our website at www.jennisondryden.com |
| | | | | | | | |
Moody’s
Rating | | Principal Amount (000) | | Description | | Value (Note 1) |
| AAA(d) | | $ | 220 | | Structured Asset Securities Corp., Ser. 2005-RMS1, Class A3,
5.118%, 2/25/35(h) | | $ | 220,707 |
| A3 | | | 176 | | WFS Financial Owner Trust, Ser. 2004-4, Class D,
3.58%, 5/17/12 | | | 172,139 |
| | | | | | | |
|
|
| | | | | | Total asset backed securities
(cost $8,819,859) | | | 8,681,028 |
| | | | | | | |
|
|
| |
| COMMERCIAL MORTGAGE BACKED SECURITIES 2.6% | | | |
| AAA(d) | | | 400 | | Banc of America Commercial Mortgage, Inc., Ser. 2003-2, Class A3,
4.873%, 3/11/41 | | | 387,178 |
| Aaa | | | 560 | | Banc of America Commercial Mortgage, Inc., Ser. 2004-2, Class A4,
4.153%, 11/10/38 | | | 527,007 |
| Aaa | | | 1,000 | | Banc of America Commercial Mortgage, Inc., Ser. 2005-3, Class A4,
4.668%, 7/10/43 | | | 936,253 |
| Aaa | | | 1,400 | | Banc of America Commercial Mortgage, Inc., Ser. 2005-6, Class A4,
5.182%, 9/10/47 | | | 1,365,668 |
| Aaa | | | 350 | | Bear Stearns Commercial Mortgage Securities, Ser. 2005-T18, Class AAB,
4.823%, 2/13/42 | | | 335,313 |
| Aaa | | | 500 | | Bear Stearns Commercial Mortgage Securities, Ser. 2005-T20, Class AAB,
5.14%, 10/12/42 | | | 491,396 |
| Aaa | | | 78 | | Commercial Mortgage Asset Trust, Ser. 1999-C2, Class A1,
7.285%, 11/17/32 | | | 79,660 |
| AAA(d) | | | 2,648 | | Commercial Mortgage Pass-Through Certs., Ser. 2004-LB2A, Class X2, 144A,
1.157%, 3/10/39 | | | 86,051 |
| Aaa | | | 300 | | Credit Suisse First Boston Mortgage Securities Corp., Ser. 2004-C4, Class A4,
4.283%, 10/15/39 | | | 283,632 |
| AAA(d) | | | 800 | | Credit Suisse Mtge. Capital Certs., Series 2006-C1, Class A4,
5.609%, 12/15/15 | | | 798,229 |
| AAA(d) | | | 600 | | DLJ Commercial Mortgage Corp., Ser. 2000-CF1, Class A1B,
7.62%, 6/10/33 | | | 646,066 |
See Notes to Financial Statements.
| | |
| The Prudential Investment Portfolios, Inc./Dryden Active Allocation Fund | | 37 |
Portfolio of Investments
as of March 31, 2006 (Unaudited) Cont’d.
| | | | | | | | |
Moody’s
Rating | | Principal Amount (000) | | Description | | Value (Note 1) |
| Aaa | | $ | 4,917 | | GE Commercial Mortgage Corp.,
Ser. 2004-C2, Class X2,
0.64%, 3/10/40 | | $ | 108,987 |
| Aaa | | | 1,300 | | Greenwich Capital Commercial Funding Corp., Ser. 2003-C1, Class A4,
4.111%, 7/5/35 | | | 1,195,387 |
| Aaa | | | 610 | | Greenwich Capital Commercial Funding Corp., Ser. 2003-C2, Class A3,
4.533%, 1/5/36 | | | 587,735 |
| AAA(d) | | | 1,300 | | GS Mtge. Securities Corp. II,
Series 2006-GG6, Class AAB,
5.587%, 4/10/38 | | | 1,299,577 |
| Aaa | | | 1,250 | | J.P. Morgan Chase Commercial Mortgage Securities Corp., Ser. 2004-C2, Class A3,
5.213%, 5/15/41 | | | 1,224,733 |
| Aaa | | | 700 | | J.P. Morgan Chase Commercial Mortgage Securities Corp., Ser. 2005-LDP5, Class A4,
5.179%, 12/15/44 | | | 683,875 |
| Aaa | | | 455 | | J.P. Morgan Chase Commercial Mortgage Securities, Ser. 2005-CB13, Class A4,
5.295%, 1/12/43 | | | 447,047 |
| Aaa | | | 1,000 | | J.P. Morgan Chase Commercial Mortgage Securities, Ser. 2005-LDP2, Class ASB,
4.659%, 7/15/42 | | | 954,858 |
| Aaa | | | 520 | | J.P. Morgan Chase Commercial Mortgage Securities, Ser. 2005-LDP4, Class A4,
4.918%, 10/15/42 | | | 494,801 |
| Aaa | | | 30,000 | | J.P. Morgan Chase Commercial Mtge. Securities, Series 2006-LDP6, Class X2,
0.26%, 4/15/43 | | | 200,100 |
| Aaa | | | 1,675 | | KeyCorp, Ser. 2000-C1, Class A2,
7.727%, 5/17/32 | | | 1,793,804 |
| AAA(d) | | | 800 | | LB-UBS Commercial Mortgage Trust, Ser. 2004-C6, Class A5,
4.826%, 8/15/29 | | | 770,840 |
| Aaa | | | 430 | | LB-UBS Commercial Mortgage Trust, Ser. 2005-C3, Class A5,
4.739%, 7/15/30 | | | 405,096 |
| Aaa | | | 400 | | Merrill Lynch Mortgage Trust,
Ser. 2004-Key2, Class A3,
4.615%, 8/12/39 | | | 381,534 |
See Notes to Financial Statements.
| | |
| 38 | | Visit our website at www.jennisondryden.com |
| | | | | | | | |
Moody’s
Rating | | Principal Amount (000) | | Description | | Value (Note 1) |
| AAA(d) | | $ | 1,100 | | Wachovia Bank Commercial Mortgage Trust, Ser. 2003-C3, Class A-2,
4.867%, 2/15/35 | | $ | 1,060,343 |
| | | | | | | |
|
|
| | | | | | Total commercial mortgage backed securities
(cost $18,172,565) | | | 17,545,170 |
| | | | | | | |
|
|
| |
| COLLATERALIZED MORTGAGE OBLIGATIONS 0.5% | | | |
| Aaa | | | 259 | | Banc of America Mortgage Securities, Inc., Ser. 2005-A, Class 2A1,
4.464%, 2/25/35(h) | | | 251,595 |
| Aaa | | | 258 | | Banc of America Mortgage Securities, Inc., Ser. 2005-B, Class 2A1,
4.396%, 3/25/35(h) | | | 250,645 |
| Aaa | | | 978 | | Bank of America Alternative Loan Trust, Series 2005-12, Class 3CB1,
6.00%, 1/25/36 | | | 971,740 |
| Aaa | | | 428 | | Countrywide Alternative Loan Trust, Ser. 2004-18CB, Class 3A1,
5.25%, 9/25/19 | | | 413,938 |
| Aaa | | | 244 | | Federal National Mortgage Association, Ser. 1993-55, Class K,
6.50%, 5/25/08 | | | 245,756 |
| Aaa | | | 505 | | Master Alternative Loan Trust,
Ser. 2004-4, Class 4A1,
5.00%, 4/25/19 | | | 488,968 |
| Aaa | | | 360 | | Structured Adjustable Rate Mortgage Loan Trust, Ser. 2004-1, Class 4A-3,
4.17%, 2/25/34 | | | 352,857 |
| Aaa | | | 181 | | Washington Mutual Alternative Mortgage Pass-Through Certs., Ser. 2005-1, Class 3A,
5.00%, 3/25/20 | | | 176,382 |
| | | | | | | |
|
|
| | | | | | Total collateralized mortgage obligations
(cost $3,240,938) | | | 3,151,881 |
| | | | | | | |
|
|
| |
| MORTGAGE BACKED SECURITIES 10.7% | | | |
| | | | 2,693 | | Federal Home Loan Mortgage Corp.,
4.50%, 11/1/18 - 7/1/20 | | | 2,572,365 |
| | | | 2,963 | | 5.00%, 7/1/18 - 4/1/34 | | | 2,873,051 |
| | | | 817 | | 5.28%, 12/1/35(h) | | | 806,762 |
| | | | 1,928 | | 5.50%, 5/1/34 - 7/1/34 | | | 1,886,011 |
| | | | 739 | | 6.00%, 1/1/34 | | | 739,423 |
| | | | 859 | | 7.00%, 10/1/31 - 11/1/33 | | | 883,845 |
See Notes to Financial Statements.
| | |
| The Prudential Investment Portfolios, Inc./Dryden Active Allocation Fund | | 39 |
Portfolio of Investments
as of March 31, 2006 (Unaudited) Cont’d.
| | | | | |
Principal Amount (000) | | Description | | Value (Note 1) |
| $1,000 | | Federal Home Loan Mortgage Corp.,
5.00%, TBA(c) | | $ | 951,250 |
| 1,500 | | 6.00%, TBA(c) | | | 1,499,063 |
| 417 | | Federal National Mortgage Association,
4.00%, 5/1/19 | | | 390,716 |
| 5,184 | | 4.50%, 11/1/18 - 3/1/34 | | | 4,929,172 |
| 9,658 | | 5.00%, 1/1/19 - 7/1/35 | | | 9,236,070 |
| 10,190 | | 5.50%, 12/1/16 - 2/1/34 | | | 9,970,036 |
| 5,586 | | 6.00%, 9/1/17 - 1/1/35 | | | 5,594,805 |
| 1,498 | | 6.50%, 5/1/13 - 1/1/34 | | | 1,530,887 |
| 119 | | 7.50%, 12/1/07 | | | 119,220 |
| 33 | | 8.00%, 12/1/23 | | | 35,060 |
| 24 | | 8.50%, 2/1/28 | | | 25,454 |
| 6,500 | | Federal National Mortgage Association,
5.00%, TBA(c) | | | 6,198,594 |
| 12,000 | | 5.50%, TBA(c) | | | 11,737,974 |
| 5,000 | | 6.00%, TBA(c) | | | 5,017,346 |
| 1,168 | | Government National Mortgage Association,
5.50%, 12/15/33 - 9/15/34 | | | 1,157,462 |
| 1,117 | | 6.50%, 11/15/23 - 8/15/32 | | | 1,155,422 |
| 166 | | 7.00%, 6/15/24 | | | 172,769 |
| 23 | | 7.50%, 4/15/29 - 5/15/31 | | | 23,952 |
| 209 | | 8.00%, 12/15/22 - 6/15/25 | | | 222,479 |
| 1,500 | | Government National Mortgage Association,
5.50%, TBA(c) | | | 1,485,000 |
| | | | |
|
|
| | | Total mortgage backed securities
(cost $72,525,235) | | | 71,214,188 |
| | | | |
|
|
| |
U.S. GOVERNMENT AGENCY OBLIGATIONS 1.8% | | | |
| 265 | | Federal Home Loan Bank,
4.25%, 4/16/07 | | | 262,651 |
| 775 | | 4.50%, 5/13/11 | | | 751,183 |
| 60 | | Federal Home Loan Mortgage Corp.,
4.75%, 1/18/11 | | | 58,973 |
| 675 | | 4.75%, 1/19/16(g) | | | 651,652 |
| 1,170 | | 4.90%, 11/3/08 | | | 1,159,525 |
| 1,755 | | 5.125%, 4/18/11 | | | 1,752,259 |
| 2,790 | | 5.75%, 1/15/12(g) | | | 2,868,935 |
| 108 | | Federal National Mortgage Association,
4.25%, 7/27/07 | | | 106,786 |
| 3,415 | | 4.50%, 2/15/11 | | | 3,320,841 |
| 1,305 | | 5.25%, 8/1/12 | | | 1,291,771 |
See Notes to Financial Statements.
| | |
| 40 | | Visit our website at www.jennisondryden.com |
| | | | | | | | |
Moody’s
Rating | | Principal Amount (000) | | Description | | Value (Note 1) |
| | | $ | 200 | | Tennessee Valley Authority,
5.88%, 4/1/36 | | $ | 214,179 |
| | | | | | | |
|
|
| | | | | | Total U.S. government agency obligations
(cost $12,701,219) | | | 12,438,755 |
| | | | | | | |
|
|
|
| U.S. GOVERNMENT SECURITIES 2.4% |
| | | | 3,190 | | United States Treasury Bonds,
4.50%, 2/15/36(g) | | | 2,993,115 |
| | | | 509 | | 5.375%, 2/15/31(g) | | | 535,802 |
| | | | 1,398 | | 6.00%, 2/15/26 | | | 1,559,862 |
| | | | 240 | | 6.125%, 8/15/29 | | | 275,156 |
| | | | 295 | | 7.875%, 2/15/21 | | | 380,827 |
| | | | 1,365 | | 8.125%, 8/15/19 | | | 1,771,300 |
| | | | 250 | | 8.125%, 5/15/21(g) | | | 820,532 |
| | | | 620 | | 8.125%, 8/15/21 | | | 330,059 |
| | | | 250 | | 8.75%, 5/15/20(g) | | | 342,500 |
| | | | 1,214 | | 8.875%, 2/15/19(b) | | | 1,652,652 |
| | | | 39 | | 9.00%, 11/15/18 | | | 53,400 |
| | | | 120 | | United States Treasury Inflation Index,
2.00%, 1/15/26 | | | 113,632 |
| | | | 1,480 | | United States Treasury Notes,
2.75%, 8/15/07 | | | 1,438,664 |
| | | | 26 | | 4.125%, 8/15/10 | | | 25,284 |
| | | | 2,886 | | 4.50%, 2/28/11(g) | | | 2,843,951 |
| | | | 500 | | 4.50%, 2/15/16 | | | 486,289 |
| | | | 1,225 | | United States Treasury Strips, Zero Coupon,
5/15/19 | | | 631,170 |
| | | | | | | |
|
|
| | | | | | Total U.S. government securities
(cost $16,517,853) | | | 16,254,195 |
| | | | | | | |
|
|
| | |
| MUNICIPAL BOND | | | | | |
| Aa3 | | | 195 | | Illinois State Taxable Pension, GO,
5.10%, 6/1/33
(cost $167,248) | | | 182,440 |
| | | | | | | |
|
|
| |
| FOREIGN GOVERNMENT OBLIGATIONS 0.3% | | | |
| A3 | | | 55 | | Government of Malaysia, Bonds,
7.50%, 7/15/11 | | | 59,800 |
| Aa2 | | | 160 | | Italy Government International Bond (Italy), Notes,
5.375%, 6/15/33 | | | 154,082 |
See Notes to Financial Statements.
| | |
| The Prudential Investment Portfolios, Inc./Dryden Active Allocation Fund | | 41 |
Portfolio of Investments
as of March 31, 2006 (Unaudited) Cont’d.
| | | | | | | | |
Moody’s
Rating | | Principal Amount (000) | | Description | | Value (Note 1) |
| Baa1 | | $ | 190 | | Mexico Government International Bond (Mexico), Bonds,
8.30%, 8/15/31 | | $ | 229,615 |
| Baa1 | | | 310 | | Mexico Government International Bond (Mexico), Notes,
8.375%, 1/14/11 | | | 343,480 |
| Baa1 | | | 620 | | 5.625%, 1/15/17(g) | | | 600,470 |
| Baa1 | | | 185 | | 8.125%, 12/30/19 | | | 217,375 |
| A1 | | | 115 | | Province of Quebec (Canada), Notes,
4.60%, 5/26/15(g) | | | 108,566 |
| A1 | | | 390 | | Province of Quebec (Canada), Sr. Unsub. Notes,
5.75%, 2/15/09 | | | 395,234 |
| Baa1 | | | 100 | | South Africa Government International Bond (South Africa), Notes,
6.50%, 6/2/14 | | | 105,125 |
| | | | | | | |
|
|
| | | | | | Total foreign government obligations
(cost $2,227,143) | | | 2,213,747 |
| | | | | | | |
|
|
| | | | | | Total long-term investments
(cost $552,210,100) | | | 613,259,779 |
| | | | | | | |
|
|
| |
| SHORT-TERM INVESTMENTS 22.5% | | | |
| |
| CORPORATE BONDS 0.8% | | | |
| |
| Brokerage 0.1% | | | |
| Aa3 | | | 1,200 | | Morgan Stanley, Unsub. Notes,
6.10%, 4/15/06 | | | 1,200,527 |
| | | | | | | |
|
|
| |
| Cable 0.2% | | | |
| Baa2 | | | 1,000 | | Continental Cablevision, Inc., Sr. Notes,
8.30%, 5/15/06 | | | 1,003,352 |
| | | | | | | |
|
|
| | | |
| Consumer | | | | | | | | |
| Baa1 | | | 260 | | Cendant Corp., Notes,
6.875%, 8/15/06 | | | 261,245 |
| | | | | | | |
|
|
| | | |
| Electric | | | | | | | | |
| Baa3 | | | 140 | | Duke Capital LLC, Sr. Notes,
4.331%, 11/16/06 | | | 139,209 |
| | | | | | | |
|
|
See Notes to Financial Statements.
| | |
| 42 | | Visit our website at www.jennisondryden.com |
| | | | | | | | |
Moody’s
Rating | | Principal Amount (000) | | Description | | Value (Note 1) |
| |
| Energy—Other 0.1% | | | |
| Baa2 | | $ | 480 | | Devon Energy Corp., Sr. Notes,
2.75%, 8/1/06 | | $ | 475,853 |
| Ba3 | | | 260 | | Kerr-McGee Corp., Sec’d. Notes,
5.875%, 9/15/06 | | | 260,328 |
| | | | | | | |
|
|
| | | | | | | | | 736,181 |
| |
| Foods 0.1% | | | |
| A3 | | | 510 | | Kraft Foods, Inc., Notes,
4.625%, 11/1/06 | | | 508,173 |
| Baa3 | | | 75 | | Tyson Foods, Inc., Sr. Notes,
7.25%, 10/1/06 | | | 75,649 |
| | | | | | | |
|
|
| | | | | | | | | 583,822 |
| |
| Media & Entertainment | | | |
| Baa2 | | | 130 | | British Sky Broadcasting PLC, Gtd. Notes,
7.30%, 10/15/06 | | | 131,187 |
| | | | | | | |
|
|
| |
| Real Estate Investment Trust 0.1% | | | |
| Baa1 | | | 380 | | Simon Property Group LP, Gtd. Notes,
6.875%, 11/15/06 | | | 383,202 |
| | | | | | | |
|
|
| |
| Retail | | | |
| A2 | | | 220 | | Target Corp., Sr. Unsec. Notes,
5.95%, 5/15/06 | | | 220,186 |
| | | | | | | |
|
|
| |
| Telecommunications 0.2% | | | |
| Ba3 | | | 220 | | Citizens Communications Co., Debs.,
7.60%, 6/1/06 | | | 220,825 |
| Baa1 | | | 800 | | Telecomunicaciones de Puerto Rico, Inc. (Puerto Rico), Gtd. Notes,
6.65%, 5/15/06 | | | 801,012 |
| | | | | | | |
|
|
| | | | | | | | | 1,021,837 |
| | | | | | | |
|
|
| | | | | | Total corporate bonds
(cost $5,705,349) | | | 5,680,748 |
| | | | | | | |
|
|
| |
| U.S. GOVERNMENT SECURITIES 0.1% | | | |
| | | | 400 | | United States Treasury Bills, 6/15/06
(cost $396,235) | | | 396,375 |
| | | | | | | |
|
|
See Notes to Financial Statements.
| | |
| The Prudential Investment Portfolios, Inc./Dryden Active Allocation Fund | | 43 |
Portfolio of Investments
as of March 31, 2006 (Unaudited) Cont’d.
| | | | | | |
| Shares | | Description | | Value (Note 1) | |
AFFILIATED MUTUAL FUNDS 21.6% | | | | |
| 4,354,570 | | Dryden Core Investment Fund - Short Term Bond Series (Note 3)(f) | | $ | 43,545,698 | |
| 100,865,009 | | Dryden Core Investment Fund - Taxable Money Market Series
(includes $67,604,022 of cash collateral for securities on loan)
(Note 3)(e)(f) | | | 100,865,009 | |
| | | | |
|
|
|
| | | Total affiliated mutual funds
(cost $144,410,707) | | | 144,410,707 | |
| | | | |
|
|
|
| | | Total short-term investments
(cost $150,512,291) | | | 150,487,830 | |
| | | | |
|
|
|
| | |
Contracts
| | | | | |
OUTSTANDING OPTION PURCHASED(a) | | | | |
| | |
Call Option | | | | | | |
| 10 | | 90 Day Eurodollar, expiring 9/18/06 @ $95.25
(cost $11,579) | | | 500 | |
| | | | |
|
|
|
| | | Total Investments, Before Outstanding Option Written 114.2%
(cost $702,733,970) | | | 763,748,109 | |
| | | | |
|
|
|
OUTSTANDING OPTION WRITTEN(a) | | | | |
| | |
Call Option | | | | | | |
| 10 | | 90 Day Eurodollar, expiring 9/18/06 @ $95.75
(premiums received $5,271) | | | (125 | ) |
| | | | |
|
|
|
| | | Total Investments, Net of Outstanding Option Written 114.2%
(cost $702,728,699; Note 5) | | | 763,747,984 | |
| | | Liabilities in excess of other assets(i) (14.2%) | | | (94,910,381 | ) |
| | | | |
|
|
|
| | | Net Assets 100.0% | | $ | 668,837,603 | |
| | | | |
|
|
|
144A—Security was purchased pursuant to Rule 144A under the Securities Act of 1933 and may not be resold subject to that rule except to qualified institutional buyers. Unless otherwise noted, 144A securities are deemed to liquid.
GO—General Obligation
LLC—Limited Liability Company
M.T.N.—Medium Term Notes
NA—National Association
PAC—Planned Amortization Class
ULC—Unlimited Liability Corporation
| (a) | Non-income producing security. |
| (b) | All or partial amount of security is segregated as initial margin for financial futures transactions. |
| (c) | Partial principal amount of $27,000,000 represents a to-be-announced (“TBA”) mortgage dollar roll. |
| (d) | Standard and Poor’s Rating. |
See Notes to Financial Statements.
| | |
| 44 | | Visit our website at www.jennisondryden.com |
| (e) | Represents security, or a portion thereof, purchased with cash collateral received for securities on loan. |
| (f) | Prudential Investments LLC, the manager of the Fund, also serves as manager of the Dryden Core Investment Fund-Dryden Short-Term Core Bond Series and Taxable Money Market Series. |
| (g) | Portion of securities on loan with an aggregate market value of $64,701,622; cash collateral of $67,604,022 was received with which the Portfolio purchased highly liquid short-term investments. |
| (h) | Variable rate instrument. |
| (i) | Liabilities in excess of other assets include net unrealized depreciation on financial futures as follows: |
Open futures contracts outstanding at March 31, 2006:
| | | | | | | | | | | | | | |
Number of
Contracts
| | Type
| | Expiration
Date
| | Value at
March 31,
2006
| | Value at
Trade
Date
| | Unrealized
Appreciation
(Depreciation)
| |
| Long Positions: | | | | | | | | | | | | | | |
| 19 | | 90 Day Eurodollar | | Sept. 06 | | $ | 4,499,913 | | $ | 4,505,218 | | $ | (5,305 | ) |
| 10 | | Fed Funds 30 Day | | May 06 | | | 13,448,784 | | | 13,465,684 | | | (16,900 | ) |
| 34 | | Fed Funds 30 Day | | July 06 | | | 3,961,984 | | | 3,963,674 | | | (1,690 | ) |
| 8 | | U.S. Long Bond | | June 06 | | | 873,250 | | | 872,009 | | | 1,241 | |
| 254 | | 5-Yr. U.S. T-Notes | | June 06 | | | 26,527,125 | | | 26,662,008 | | | (134,883 | ) |
| 16 | | S&P 500 Index | | June 06 | | | 5,213,200 | | | 5,161,600 | | | 51,600 | |
| | | | | | | | | | | | |
|
|
|
| | | | | | | | | | | | | | (105,937 | ) |
| | | | | | | | | | | | |
|
|
|
| Short Positions: | | | | | | | | | | | | | | |
| 26 | | 2-Yr. U.S. T-Notes | | June 06 | | | 5,300,344 | | | 5,308,808 | | | 8,464 | |
| 43 | | 10-Yr. U.S. T-Notes | | June 06 | | | 4,574,797 | | | 4,626,475 | | | 51,678 | |
| | | | | | | | | | | | |
|
|
|
| | | | | | | | | | | | | | 60,142 | |
| | | | | | | | | | | | |
|
|
|
| | | | | | | | | | | | | $ | (45,795 | ) |
| | | | | | | | | | | | |
|
|
|
See Notes to Financial Statements.
| | |
| The Prudential Investment Portfolios, Inc./Dryden Active Allocation Fund | | 45 |
Portfolio of Investments
as of March 31, 2006 (Unaudited) Cont’d.
The industry classification of portfolio holdings and liabilities in excess of other assets shown as a percentage of net assets as of March 31, 2006 were as follows:
| | | |
Affiliated Mutual Funds (including 10.1% of collateral received for securities on loan) | | 21.6 | % |
Mortgage Backed Securities | | 10.7 | |
Oil & Gas Exploration & Production | | 5.4 | |
Retail | | 4.1 | |
Financial Services | | 3.8 | |
Insurance | | 3.4 | |
Banking | | 3.3 | |
Commercial Mortgage Backed Securities | | 2.6 | |
Computer Systems/Peripherals | | 2.6 | |
Semiconductors & Semiconductor Equipment | | 2.6 | |
Pharmaceuticals | | 2.5 | |
U.S. Government Securities | | 2.5 | |
Aerospace/Defense | | 2.3 | |
Medical Products & Services | | 2.1 | |
Capital Markets | | 2.0 | |
U.S. Government Agency Obligations | | 1.9 | |
Beverages | | 1.6 | |
Diversified Manufacturing | | 1.6 | |
Foods | | 1.6 | |
Telecommunication Services | | 1.6 | |
Software | | 1.5 | |
Communications Equipment | | 1.4 | |
Health Care Providers & Services | | 1.4 | |
Industrial Conglomerates | | 1.4 | |
Asset Backed Securities | | 1.3 | |
Media | | 1.3 | |
Real Estate Investment Trust | | 1.3 | |
Electronic Components | | 1.1 | |
Biotechnology | | 1.0 | |
Metals | | 1.0 | |
Automobiles | | 0.9 | |
Chemicals | | 0.9 | |
Household Products | | 0.9 | |
Building & Construction | | 0.8 | |
Commercial Services | | 0.8 | |
Diversified Financial Services | | 0.8 | |
Telecommunications | | 0.8 | |
Computer Software & Services | | 0.7 | |
Electrical Utilities | | 0.7 | |
Energy Equipment & Services | | 0.7 | |
Independent Power Producers & Energy Traders | | 0.7 | |
Media & Entertainment | | 0.7 | |
Restaurants | | 0.7 | |
Telecommunication Equipment | | 0.7 | |
Transportation | | 0.7 | |
Electric | | 0.6 | |
See Notes to Financial Statements.
| | |
| 46 | | Visit our website at www.jennisondryden.com |
| | | |
Health Care Equipment & Supplies | | 0.6 | % |
Tobacco | | 0.5 | |
Brokerage | | 0.4 | |
Cable | | 0.4 | |
Capital Goods | | 0.4 | |
Collateralized Mortgage Obligations | | 0.4 | |
Data Processing/Management | | 0.4 | |
Health Care Products | | 0.4 | |
Non Captive Finance | | 0.4 | |
Technology | | 0.4 | |
Textiles, Apparel & Luxury Goods | | 0.4 | |
Business Services | | 0.3 | |
Distribution/Wholesale | | 0.3 | |
Foreign Government Obligations | | 0.3 | |
Health Care & Pharmaceutical | | 0.3 | |
Hotels, Restaurants & Leisure | | 0.3 | |
Household Durables | | 0.3 | |
Internet Software & Services | | 0.3 | |
Machinery | | 0.3 | |
Apparel | | 0.2 | |
Containers | | 0.2 | |
Cosmetics/Toiletries | | 0.2 | |
Health Care Services | | 0.2 | |
Machinery & Equipment | | 0.2 | |
Pipelines & Other | | 0.2 | |
Energy—Other | | 0.2 | |
Automotive | | 0.1 | |
Building Materials & Construction | | 0.1 | |
Consumer Finance | | 0.1 | |
Energy—Integrated | | 0.1 | |
Gaming | | 0.1 | |
Lodging | | 0.1 | |
Miscellaneous Manufacturing | | 0.1 | |
Non-Corporate | | 0.1 | |
Oil & Gas Equipment & Services | | 0.1 | |
Paper & Forest Products | | 0.1 | |
Railroads | | 0.1 | |
| | |
|
|
| | | 114.2 | |
Liabilities in excess of other assets | | (14.2 | ) |
| | |
|
|
| | | 100.0 | % |
| | |
|
|
See Notes to Financial Statements.
| | |
| The Prudential Investment Portfolios, Inc./Dryden Active Allocation Fund | | 47 |
Statement of Assets and Liabilities
as of March 31, 2006 (Unaudited)
| | | |
Assets | | | |
Investments at value, including securities on loan of $64,701,622 | | | |
Unaffiliated Investments (cost $558,323,265) | | $ | 619,337,402 |
Affiliated Investments (cost $144,410,707) | | | 144,410,707 |
Receivable for investments sold | | | 4,838,374 |
Dividends and interest receivable | | | 2,091,906 |
Receivable for Series shares sold | | | 332,110 |
Prepaid expenses | | | 17,162 |
Interest receivable from closed swaps | | | 3,135 |
| | |
|
|
Total assets | | | 771,030,796 |
| | |
|
|
| |
Liabilities | | | |
Payable to broker for collateral for securities on loan (Note 4) | | | 67,604,022 |
Payable for investments purchased | | | 31,927,907 |
Payable for Series shares reacquired | | | 1,215,435 |
Accrued expenses and other liabilities | | | 437,903 |
Payable to custodian | | | 412,743 |
Management fee payable | | | 372,971 |
Distribution fee payable | | | 157,525 |
Transfer agent fee payable | | | 48,885 |
Due to broker—variation margin | | | 10,158 |
Interest payable from closed swaps | | | 2,968 |
Deferred directors’ fees | | | 2,551 |
Outstanding call options written, at value (premiums received $5,271) | | | 125 |
| | |
|
|
Total liabilities | | | 102,193,193 |
| | |
|
|
| |
Net Assets | | $ | 668,837,603 |
| | |
|
|
| | | | |
Net assets were comprised of: | | | |
Common stock, at par | | $ | 48,503 |
Paid-in capital in excess of par | | | 589,065,603 |
| | |
|
|
| | | | 589,114,106 |
Undistributed net investment income | | | 3,153,938 |
Accumulated net realized gain on investments and financial futures transactions | | | 15,596,070 |
Net unrealized appreciation on investments and financial futures contracts | | | 60,973,489 |
| | |
|
|
Net assets, March 31, 2006 | | $ | 668,837,603 |
| | |
|
|
See Notes to Financial Statements.
| | |
| 48 | | Visit our website at www.jennisondryden.com |
| | | |
Class A | | | |
Net asset value and redemption price per share | | | |
($421,971,303 ÷ 30,635,331 shares of common stock issued and outstanding) | | $ | 13.77 |
Maximum sales charge (5.50% of offering price) | | | .80 |
| | |
|
|
Maximum offering price to public | | $ | 14.57 |
| | |
|
|
| |
Class B | | | |
Net asset value, offering price and redemption price per share | | | |
($64,091,968 ÷ 4,653,001 shares of common stock issued and outstanding) | | $ | 13.77 |
| | |
|
|
| |
Class C | | | |
Net asset value, offering price and redemption price per share | | | |
($13,510,310 ÷ 980,832 shares of common stock issued and outstanding) | | $ | 13.77 |
| | |
|
|
| |
Class R | | | |
Net asset value, offering price and redemption price per share | | | |
($234,457 ÷ 17,003 shares of common stock issued and outstanding) | | $ | 13.79 |
| | |
|
|
| |
Class Z | | | |
Net asset value, offering price and redemption price per share | | | |
($169,029,565 ÷ 12,216,794 shares of common stock issued and outstanding) | | $ | 13.84 |
| | |
|
|
See Notes to Financial Statements.
| | |
| The Prudential Investment Portfolios, Inc./Dryden Active Allocation Fund | | 49 |
Statement of Operations
Six Months Ended March 31, 2006 (Unaudited)
| | | | |
Net Investment Income | | | | |
Income | | | | |
Unaffiliated dividends (net of foreign withholding taxes of $1,645) | | $ | 4,512,831 | |
Interest | | | 3,907,275 | |
Affiliated dividend income | | | 1,523,621 | |
Income from securities loaned, net | | | 87,796 | |
| | |
|
|
|
Total income | | | 10,031,523 | |
| | |
|
|
|
| |
Expenses | | | | |
Management fee | | | 2,189,999 | |
Distribution fee—Class A | | | 523,622 | |
Distribution fee—Class B | | | 347,441 | |
Distribution fee—Class C | | | 68,290 | |
Distribution fee—Class R | | | 268 | |
Transfer agent’s fees and expenses (including affiliated expense of $334,700) | | | 439,000 | |
Custodian’s fees and expenses | | | 150,000 | |
Reports to shareholders | | | 60,000 | |
Legal fees and expenses | | | 36,000 | |
Registration fees | | | 35,000 | |
Insurance | | | 20,000 | |
Directors’ fees | | | 12,000 | |
Audit fee | | | 11,000 | |
Miscellaneous | | | 15,055 | |
| | |
|
|
|
Total expenses | | | 3,907,675 | |
| | |
|
|
|
Net investment income | | | 6,123,848 | |
| | |
|
|
|
| |
Realized And Unrealized Gain (Loss) On Investments | | | | |
Net realized gain (loss) on: | | | | |
Investment transactions | | | 21,165,825 | |
Financial futures transactions | | | (730,754 | ) |
Options written | | | 1,469 | |
Swaps | | | (48,265 | ) |
| | |
|
|
|
| | | | 20,388,275 | |
| | |
|
|
|
Net change in unrealized appreciation (depreciation) on: | | | | |
Investments | | | 6,024,827 | |
Financial futures contracts | | | 29,197 | |
Options written | | | 2,406 | |
| | |
|
|
|
| | | | 6,056,430 | |
| | |
|
|
|
Net gain on investments | | | 26,444,705 | |
| | |
|
|
|
Net Increase In Net Assets Resulting From Operations | | $ | 32,568,553 | |
| | |
|
|
|
See Notes to Financial Statements.
| | |
| 50 | | Visit our website at www.jennisondryden.com |
Statement of Changes in Net Assets
(Unaudited)
| | | | | | | | |
| | | Six Months Ended
March 31, 2006 | | | Year
Ended
September 30, 2005 | |
Increase (Decrease) In Net Assets | | | | | | | | |
Operations | | | | | | | | |
Net investment income | | $ | 6,123,848 | | | $ | 10,406,689 | |
Net realized gain on investment transactions and financial futures contracts | | | 20,388,275 | | | | 55,882,882 | |
Net change in unrealized appreciation on investments and financial futures contracts | | | 6,056,430 | | | | 3,603,235 | |
| | |
|
|
| |
|
|
|
Net increase in net assets resulting from operations | | | 32,568,553 | | | | 69,892,806 | |
| | |
|
|
| |
|
|
|
Dividends and distributions (Note 1) | | | | | | | | |
Dividends from net investment income | | | | | | | | |
Class A | | | (6,532,470 | ) | | | (5,121,185 | ) |
Class B | | | (570,979 | ) | | | (379,484 | ) |
Class C | | | (108,450 | ) | | | (58,070 | ) |
Class R | | | (34 | ) | | | — | |
Class Z | | | (3,092,429 | ) | | | (2,510,153 | ) |
| | |
|
|
| |
|
|
|
| | | | (10,304,362 | ) | | | (8,068,892 | ) |
| | |
|
|
| |
|
|
|
Distributions from net realized gains | | | | | | | | |
Class A | | | (20,133,621 | ) | | | — | |
Class B | | | (3,512,317 | ) | | | — | |
Class C | | | (651,364 | ) | | | — | |
Class R | | | (125 | ) | | | — | |
Class Z | | | (8,207,672 | ) | | | — | |
| | |
|
|
| |
|
|
|
| | | | (32,505,099 | ) | | | — | |
| | |
|
|
| |
|
|
|
| | |
Series share transactions (Net of share conversions) (Note 6) | | | | | | | | |
Net proceeds from shares sold | | | 22,008,670 | | | | 52,155,333 | |
Net asset value of shares issued in reinvestment of dividends | | | 40,940,668 | | | | 7,702,120 | |
Cost of shares reacquired | | | (68,885,953 | ) | | | (141,029,407 | ) |
| | |
|
|
| |
|
|
|
Net decrease in net assets from Series share transactions | | | (5,936,615 | ) | | | (81,171,954 | ) |
| | |
|
|
| |
|
|
|
Total decrease | | | (16,177,523 | ) | | | (19,348,040 | ) |
| | |
Net Assets | | | | | | | | |
Beginning of period | | | 685,015,126 | | | | 704,363,166 | |
| | |
|
|
| |
|
|
|
End of period(a) | | $ | 668,837,603 | | | $ | 685,015,126 | |
| | |
|
|
| |
|
|
|
(a) Includes undistributed net investment income of: | | $ | 3,153,938 | | | $ | 7,334,452 | |
| | |
|
|
| |
|
|
|
See Notes to Financial Statements.
| | |
| The Prudential Investment Portfolios, Inc./Dryden Active Allocation Fund | | 51 |
Notes to Financial Statements
(Unaudited)
The Prudential Investment Portfolios, Inc. (the “Fund”) is registered under the Investment Company Act of 1940 as a diversified, open-end management investment company. The Fund was incorporated in Maryland on August 10, 1995 and currently consists of six series: Dryden Active Allocation Fund (the “Series”), Jennison Growth Fund, Jennison Equity Opportunity Fund, Jennison Dryden Growth Allocation Fund, Jennison Dryden Moderate Allocation Fund and Jennison Dryden Conservative Allocation Fund. These financial statements relate to Dryden Active Allocation Fund. The financial statements of the other series are not presented herein. The Series commenced investment operations on November 7, 1996.
The Series’ investment objective is to seek income and long-term growth of capital by investing in a portfolio of equity, fixed-income and money market securities which is actively managed to capitalize on opportunities created by perceived misvaluation.
Note 1. Accounting Policies
The following is a summary of significant accounting policies followed by the Fund and the Series, in the preparation of its financial statements.
Securities Valuation: Securities listed on a securities exchange (other than options on securities and indices) are valued at the last sale price on such exchange on the day of valuation or, if there was no sale on such day, at the mean between the last reported bid and asked prices, or at the last bid price on such day in the absence of an asked price. Securities traded via Nasdaq are valued at the Nasdaq official closing price (“NOCP”) on the day of valuation, or if there was no NOCP, at the last sale price. Securities that are actively traded in the over-the-counter market, including listed securities for which the primary market is believed by Prudential Investments LLC (“PI” or “Manager”), in consultation with the subadviser, to be over-the-counter, are valued at market value using prices provided by an independent pricing agent or principal market maker. Options on securities and indices traded on an exchange are valued at their last sale price as of the close of trading on the applicable exchange or, if there was no sale, at the mean between the most recently quoted bid and asked prices on such exchange. Futures contracts and options thereon traded on a commodities exchange or board of trade are valued at the last sale price at the close of trading on such exchange or board of trade or, if there was no sale on the applicable commodities exchange or board of trade on such day, at the mean between the most recently quoted bid and asked prices on such exchange or board of trade or at the last bid price in the absence of an asked price. Prices may be obtained from independent pricing services which use information provided by market makers or estimates of market values obtained from
| | |
| 52 | | Visit our website at www.jennisondryden.com |
yield data relating to investments or securities with similar characteristics. Securities for which reliable market quotations are not readily available, or whose values have been affected by events occurring after the close of the security’s foreign market and before the Fund’s normal pricing time, are valued at fair value in accordance with the Board of Director’s approved fair valuation procedures. When determining the fair valuation of securities some of the factors influencing the valuation include, the nature of any restrictions on disposition of the securities; assessment of the general liquidity of the securities; the issuer’s financial condition and the markets in which it does business; the cost of the investment; the size of the holding and the capitalization of issuer; the prices of any recent transactions or bids/offers for such securities or any comparable securities; any available analyst media or other reports or information deemed reliable by the investment adviser regarding the issuer or the markets or industry in which it operates. Using fair value to price securities may result in a value that is different from a security’s most recent closing price and from the price used by other mutual funds to calculate their net asset values.
Investments in mutual funds are valued at their net asset value as of the close of the New York Stock Exchange on the date of valuation.
Short-term securities which mature in sixty days or less are valued at amortized cost, which approximates market-value. The amortized cost method involves valuing a security at its cost on the date of purchase and thereafter assuming a constant amortization to maturity of the difference between the principal amount due at maturity and cost. Short-term securities which mature in more than sixty days are valued at current market quotations.
Financial Futures Contracts: A financial futures contract is an agreement to purchase (long) or sell (short) an agreed amount of securities at a set price for delivery on a future date. Upon entering into a financial futures contract, the Series is required to pledge to the broker an amount of cash and/or other assets equal to a certain percentage of the contract amount. This amount is known as the “initial margin.” Subsequent payments, known as “variation margin,” are made or received by the Series each day, depending on the daily fluctuations in the value of the underlying security. Such variation margin is recorded for financial statement purposes on a daily basis as unrealized gain or loss. When the contract expires or is closed, the gain or loss is realized and is presented in the Statement of Operations as net realized gain or loss on financial futures transactions.
The Series invests in financial futures contracts in order to hedge its existing portfolio securities, or securities the Series intends to purchase, against fluctuations in value caused by changes in prevailing interest rates or market conditions. Should interest rates move unexpectedly, the Series may not achieve the anticipated benefits of the financial futures contracts and may realize a loss. The use of futures transactions
| | |
| The Prudential Investment Portfolios, Inc./Dryden Active Allocation Fund | | 53 |
Notes to Financial Statements
(Unaudited) Cont’d
involves the risk of imperfect correlation in movements in the price of futures contracts, interest rates and the underlying hedged assets.
Financial futures contracts involve elements of both market and credit risk in excess of the amounts reflected on the Statement of Assets and Liabilities.
Options: The Series may either purchase or write options in order to hedge against adverse market movements or fluctuations in value caused by changes in prevailing interest rates or foreign currency exchange rates with respect to securities or currencies which the Fund currently owns or intends to purchase.
The Series’ principal reason for writing options is to realize, through receipt of premiums, greater current return than would be realized on the underlying security alone. When the Series purchases an option, it pays a premium and an amount equal to that premium is recorded as an asset. When the Series writes an option, it receives a premium and an amount equal to that premium is recorded as a liability. The asset or liability is adjusted daily to reflect the current market value of the options.
If an option expires unexercised, the Series realizes a gain or loss to the extent of the premium received or paid. If an option is exercised, the premium received or paid is recorded as an adjustment to the proceeds from the sale or the cost of the purchase in determining whether the Series has realized a gain or loss. The difference between the premium and the amount received or paid on effecting a closing purchase or sale transaction is also treated as a realized gain or loss. Gain or loss on purchased options is included in net realized gain or loss on investment transactions. Gain or loss on written options is presented separately as net realized gain or loss on written options transactions.
The Series, as a writer of an option, has no control over whether the underlying securities or currencies may be sold (called) or purchased (put). As a result, the Series bears the market risk of an unfavorable change in the price of the security or currency underlying the written option. The Series, as purchaser of an option, bears the risk of the potential inability of the counterparties to meet the terms of their contracts.
Dollar Rolls: The Series may enter into mortgage dollar rolls in which the Series sells mortgage-backed securities for delivery in the current month and simultaneously contracts to repurchase substantially similar (same type, coupon and maturity) securities on a specified future date. During the roll period, the Series forgoes principal and interest paid on the securities. The Series’ policy is to record the
| | |
| 54 | | Visit our website at www.jennisondryden.com |
components of dollar rolls as purchase and sale transactions. The Series had dollar rolls outstanding as of March 31, 2006, which are included in Receivable for Investments Sold and Payable for Investments Purchased in the Statement of Assets and Liabilities. The Series maintains a segregated account of U.S. government securities or other liquid assets, the dollar value of which is at least equal to its obligation with respect to dollar rolls.
The Series is subject to the risk that the market value of the securities the Series is obligated to repurchase under the agreement may decline below the repurchase price.
Securities Lending: The Series may lend its portfolio securities to broker-dealers. The loans are secured by collateral at least equal, at all times, to the market value of the securities loaned. Loans are subject to termination at the option of the borrower or the Series. Upon termination of the loan, the borrower will return to the lender securities identical to the loaned securities. Should the borrower of the securities fail financially, the Series has the right to repurchase the securities using the collateral in the open market. The Series recognizes income, net of any rebate and securities lending agent fees, for lending its securities in the form of fees or interest on the investment of any cash received as collateral. The Series also continues to receive interest and dividends or amounts equivalent thereto, on the securities loaned and recognizes any unrealized gain or loss in the market price of the securities loaned that may occur during the term of the loan.
When-Issued/Delayed Delivery Securities: Securities purchased or sold on a when-issued or delayed-delivery basis may be settled a month or more after trade date; interest income is not accrued until settlement date. At the time a Portfolio enters into such transactions, it instructs the custodian to segregate assets with a current value at least equal to the amount of its when-issued or delayed-delivery purchase commitments.
Securities Transactions and Net Investment Income: Securities transactions are recorded on the trade date. Realized gains or losses on sales of investments are calculated on the identified cost basis. Interest income, including amortization of premium and accretion of discount on debt securities, as required, is recorded on an accrual basis. Dividend income is recorded on the ex-dividend date.
Net Investment income or loss (other than distribution fees which are charged directly to the respective class) and unrealized and realized gains or losses are allocated daily to each class of shares based upon the relative proportion of net assets of each class at the beginning of the day.
| | |
| The Prudential Investment Portfolios, Inc./Dryden Active Allocation Fund | | 55 |
Notes to Financial Statements
(Unaudited) Cont’d
Dividends and Distributions: The Series expects to pay dividends of net investment income and distributions of net realized capital gains, if any, annually. Dividends and distributions to shareholders, which are determined in accordance with federal income tax regulations and which may differ from generally accepted accounting principles, are recorded on the ex-dividend date. Permanent book/tax differences relating to income and gains are reclassified amongst undistributed net investment income, accumulated net realized gain or loss and paid-in capital in excess of par, as appropriate.
Taxes: For federal income tax purposes, each Series in the Fund is treated as a separate taxpaying entity. It is the Series’ policy to continue to meet the requirements of the Internal Revenue Code applicable to regulated investment companies and to distribute all of its net investment income and capital gains, if any, to its shareholders. Therefore, no federal income tax provision is required.
Withholding taxes on foreign dividends are recorded net of reclaimable amounts, at the time the related income is earned.
Estimates: The preparation of the financial statements requires management to make estimates and assumptions that affect the reported amounts and disclosures in the financial statements. Actual results could differ from those estimates.
Note 2. Agreements
The Fund has a management agreement for the Series with PI. Pursuant to this agreement, PI has responsibility for all investment advisory services and supervises the subadvisor’s performance of such services. PI has entered into a subadvisory agreement with Prudential Investment Management, Inc. (“PIM”). The subadvisory agreement provides that PIM furnishes investment advisory services in connection with the management of the Series. In connection therewith, PIM is obligated to keep certain books and records of the Series. PI pays for the services of PIM, the compensation of officers of the Series, occupancy and certain clerical and bookkeeping costs of the Series. The Series bears all other costs and expenses.
The management fee paid to PI is computed daily and payable monthly at an annual rate of .65 of 1% of the Series’ daily average net assets up to $1 billion and .60 of 1% of the average net assets of the Series in excess of $1 billion. The effective management fee rate was .65 of 1% for the six months ended March 31, 2006.
| | |
| 56 | | Visit our website at www.jennisondryden.com |
The Series has a distribution agreement with Prudential Investment Management Services LLC (“PIMS”), which acts as the distributor of the Class A, Class B, Class C, Class R and Class Z shares of the Series. The Series compensates PIMS for distributing and servicing the Series’ Class A, Class B, Class C and Class R shares, pursuant to plans of distribution (the “Class A, B, C and R Plans”), regardless of expenses actually incurred by PIMS. The distribution fees are accrued daily and payable monthly. No distribution or service fees are paid to PIMS as distributor of the Class Z shares of the Series.
Pursuant to the Class A, B, C and R Plans, the Series compensates PIMS for distribution-related activities at an annual rate of up to .30 of 1%, 1%, 1% and .75% of 1% of the average daily net assets of the Class A, B, C and R shares, respectively. For the six months ended March 31, 2006, PIMS contractually agreed to limit such fees to .25 of 1% and .50% of 1% of the average daily net assets of the Class A shares and Class R shares, respectively.
PIMS has advised the Series that it received approximately $103,300 in front-end sales charges resulting from sales of Class A shares during the six months ended March 31, 2006. From these fees, PIMS paid such sales charges to dealers, which in turn paid commissions to salespersons and incurred other distribution costs.
PIMS has advised the Series that for the six months ended March 31, 2006, it received approximately $51,600 and $400 in contingent deferred sales charges imposed upon certain redemptions by Class B and Class C shareholders, respectively. PI, PIM and PIMS are indirect, wholly-owned subsidiaries of Prudential Financial, Inc. (“Prudential”).
The Series, along with other affiliated registered investment companies (the “Funds”), is a party to a syndicated credit agreement (“SCA”) with two banks. The SCA provides for a commitment of $500 million. Interest on any borrowings under the SCA would be incurred at market rates. For the period from October 29, 2004 through October 28, 2005, the Series paid a commitment fee of .075 of 1% of the unused portion of the agreement. Effective October 29, 2005, the Funds renewed the SCA with the banks. The commitment under the renewed SCA continues to be $500 million. The Series pays a commitment fee of .0725 of 1% of the unused portion of the renewed SCA. The commitment fee is accrued daily and paid quarterly and is allocated to the Funds pro-rata based on net assets. The purpose of the SCA is to serve as an alternative source of funding for capital share redemptions. The expiration date of the renewed SCA is October 27, 2006. The Series did not borrow any amounts pursuant to the SCA during the six months ended March 31, 2006.
| | |
| The Prudential Investment Portfolios, Inc./Dryden Active Allocation Fund | | 57 |
Notes to Financial Statements
(Unaudited) Cont’d
Note 3. Other Transactions With Affiliates
Prudential Mutual Fund Services LLC (“PMFS”), an affiliate of PI and an indirect, wholly-owned subsidiary of Prudential, serves as the Fund’s transfer agent. Transfer agent fees and expenses in the Statement of Operations include certain out-of-pocket expenses paid to non-affiliates, where applicable.
The Series pays networking fees to affiliated and unaffiliated broker/dealers. These networking fees are payments made to broker/dealers that clear mutual fund transactions through a national clearing system. For the six months ended March 31, 2006, the Series incurred approximately $42,700 in total networking fees. These amounts are included in transfer agent’s fees and expenses in the Statement of Operations.
PIM is the securities lending agent for the Series. For the six months ended March 31, 2006, PIM has been compensated by the Series approximately $33,500 for these services.
The Series invests in the Taxable Money Market Series and Short-Term Bond Series (the “Portfolios”), portfolios of Dryden Core Investment Fund, pursuant to an exemptive order received from the Securities and Exchange Commission. The Portfolios are a money market mutual fund and short term bond fund, respectively, registered under the Investment Company Act of 1940, as amended, and managed by PI.
Note 4. Portfolio Securities
Purchases and sales of investment securities other than short-term investments and U.S. Government Securities, for the six months ended March 31, 2006 were $203,953,668 and $270,202,604 respectively.
Transactions in call options written during the six months ended March 31, 2006 were as follows:
| | | | | | | |
| | | Number of
Contracts/
Notional
Amount
| | | Premiums
Received
| |
Balance as of September 30, 2005 | | 22 | | | $ | 6,740 | |
Options expired | | (12 | ) | | | (1,469 | ) |
| | |
|
| |
|
|
|
Balance as of March 31, 2006 | | 10 | | | $ | 5,271 | |
| | |
|
| |
|
|
|
| | |
| 58 | | Visit our website at www.jennisondryden.com |
The amount of dollar rolls outstanding at March 31, 2006 was $26,889,226 (principal $27,500,000), which was 4.02% of total net assets.
As of March 31, 2006, the Series had securities on loan with an aggregate market value of $64,701,622. The Series received $67,604,022 in cash as collateral for securities on loan which was used to purchase highly liquid short-term investments in accordance with the Series’s securities lending procedures.
Note 5. Distributions and Tax Information
The United States federal income tax basis of the Series’ investments and the net unrealized appreciation as of March 31, 2006 were as follows:
| | | | | | |
Tax Basis of Investments
| | Gross Appreciation
| | Gross Depreciation
| | Net Unrealized Appreciation
|
| $703,104,923 | | $75,534,545 | | $14,891,484 | | $60,643,061 |
The difference between book basis and tax basis was attributable to deferred losses on wash sales.
Note 6. Capital
The Series offers Class A, Class B, Class C, Class R and Class Z shares. Class A shares are sold with a front-end sales charge of up to 5.50%. All investors who purchase Class A shares in an amount of $1 million or more and sell these shares within 12 months of purchase are subject to a contingent deferred sales charge (CDSC) of 1%, including investors who purchase their shares through broker-dealers affiliated with Prudential. Class B shares are sold with a CDSC which declines from 5% to zero depending on the period of time the shares are held. Class C shares have a CDSC of 1% during the first 12 months. Class B shares will automatically convert to Class A shares on a quarterly basis approximately seven years after purchase. A special exchange privilege is also available for shareholders who qualified to purchase Class A shares at net asset value. Class R and Class Z shares are not subject to any sales or redemption charge and are offered exclusively for sale to a limited group of investors. There are 3.25 billion shares of $.001 par value common stock of the Fund authorized which are divided into six series, three of which offer five classes, designated Class A, Class B, Class C, Class R and Class Z, each of which consists of 250 million authorized shares and the Series also may offer Class I shares, of which 250 million shares are authorized, but none are currently issued and outstanding. As of March 31, 2006 Prudential owned 197 Class R shares of the Series.
| | |
| The Prudential Investment Portfolios, Inc./Dryden Active Allocation Fund | | 59 |
Notes to Financial Statements
(Unaudited) Cont’d
Transactions in shares of common stock were as follows:
| | | | | | | |
Class A
| | Shares
| | | Amount
| |
Six months ended March 31, 2006: | | | | | | | |
Shares sold | | 665,203 | | | $ | 9,087,174 | |
Shares issued in reinvestment of dividends | | 1,871,525 | | | | 25,115,868 | |
Shares reacquired | | (2,843,026 | ) | | | (38,789,551 | ) |
| | |
|
| |
|
|
|
Net increase (decrease) in shares outstanding before conversion | | (306,298 | ) | | | (4,586,509 | ) |
Shares issued upon conversion from Class B | | 634,200 | | | | 8,560,998 | |
| | |
|
| |
|
|
|
Net increase (decrease) in shares outstanding | | 327,902 | | | $ | 3,974,489 | |
| | |
|
| |
|
|
|
Year ended September 30, 2005: | | | | | | | |
Shares sold | | 1,209,573 | | | $ | 16,429,897 | |
Shares issued in reinvestment of dividends | | 358,065 | | | | 4,776,588 | |
Shares reacquired | | (5,961,132 | ) | | | (80,969,767 | ) |
| | |
|
| |
|
|
|
Net increase (decrease) in shares outstanding before conversion | | (4,393,494 | ) | | | (59,763,282 | ) |
Shares issued upon conversion from Class B | | 1,537,386 | | | | 21,156,164 | |
| | |
|
| |
|
|
|
Net increase (decrease) in shares outstanding | | (2,856,108 | ) | | $ | (38,607,118 | ) |
| | |
|
| |
|
|
|
Class B
| | | | | | |
Six months ended March 31, 2006: | | | | | | | |
Shares sold | | 168,580 | | | $ | 2,303,754 | |
Shares issued in reinvestment of dividends | | 292,092 | | | | 3,931,553 | |
Shares reacquired | | (480,240 | ) | | | (6,552,951 | ) |
| | |
|
| |
|
|
|
Net increase (decrease) in shares outstanding before conversion | | (19,568 | ) | | | (317,644 | ) |
Shares reacquired upon conversion into Class A | | (633,234 | ) | | | (8,560,998 | ) |
| | |
|
| |
|
|
|
Net increase (decrease) in shares outstanding | | (652,802 | ) | | $ | (8,878,642 | ) |
| | |
|
| |
|
|
|
Year ended September 30, 2005: | | | | | | | |
Shares sold | | 639,726 | | | $ | 8,653,946 | |
Shares issued in reinvestment of dividends | | 27,284 | | | | 364,781 | |
Shares reacquired | | (1,231,741 | ) | | | (16,680,645 | ) |
| | |
|
| |
|
|
|
Net increase (decrease) in shares outstanding before conversion | | (564,731 | ) | | | (7,661,918 | ) |
Shares reacquired upon conversion into Class A | | (1,539,246 | ) | | | (21,156,164 | ) |
| | |
|
| |
|
|
|
Net increase (decrease) in shares outstanding | | (2,103,977 | ) | | $ | (28,818,082 | ) |
| | |
|
| |
|
|
|
| | |
| 60 | | Visit our website at www.jennisondryden.com |
| | | | | | | |
Class C
| | Shares
| | | Amount
| |
Six months ended March 31, 2006: | | | | | | | |
Shares sold | | 105,036 | | | $ | 1,426,553 | |
Shares issued in reinvestment of dividends | | 44,408 | | | | 597,728 | |
Shares reacquired | | (136,620 | ) | | | (1,873,727 | ) |
| | |
|
| |
|
|
|
Net increase (decrease) in shares outstanding | | 12,824 | | | $ | 150,554 | |
| | |
|
| |
|
|
|
Year ended September 30, 2005: | | | | | | | |
Shares sold | | 275,525 | | | $ | 3,730,608 | |
Shares issued in reinvestment of dividends | | 3,805 | | | | 50,876 | |
Shares reacquired | | (435,023 | ) | | | (5,886,259 | ) |
| | |
|
| |
|
|
|
Net increase (decrease) in shares outstanding | | (155,693 | ) | | $ | (2,104,775 | ) |
| | |
|
| |
|
|
|
Class R
| | | | | | |
Six months ended March 31, 2006: | | | | | | | |
Shares sold | | 16,806 | | | $ | 226,900 | |
Shares issued in reinvestment of dividends | | 12 | | | | 159 | |
Shares reacquired | | — | | | | — | |
| | |
|
| |
|
|
|
Net increase (decrease) in shares outstanding | | 16,818 | | | $ | 227,059 | |
| | |
|
| |
|
|
|
Period ended September 30, 2005*: | | | | | | | |
Shares sold | | 185 | | | $ | 2,500 | |
| | |
|
| |
|
|
|
Net increase (decrease) in shares outstanding | | 185 | | | $ | 2,500 | |
| | |
|
| |
|
|
|
Class Z
| | | | | | |
Six months ended March 31, 2006: | | | | | | | |
Shares sold | | 654,134 | | | $ | 8,964,289 | |
Shares issued in reinvestment of dividends | | 838,557 | | | | 11,295,360 | |
Shares reacquired | | (1,578,149 | ) | | | (21,669,724 | ) |
| | |
|
| |
|
|
|
Net increase (decrease) in shares outstanding | | (85,458 | ) | | $ | (1,410,075 | ) |
| | |
|
| |
|
|
|
Year ended September 30, 2005: | | | | | | | |
Shares sold | | 1,713,034 | | | $ | 23,338,382 | |
Shares issued in reinvestment of dividends | | 187,584 | | | | 2,509,875 | |
Shares reacquired | | (2,751,402 | ) | | | (37,492,736 | ) |
| | |
|
| |
|
|
|
Net increase (decrease) in shares outstanding | | (850,784 | ) | | $ | (11,644,479 | ) |
| | |
|
| |
|
|
|
| * | Commenced operations on December 17, 2004. |
| | |
| The Prudential Investment Portfolios, Inc./Dryden Active Allocation Fund | | 61 |
Financial Highlights
(Unaudited)
| | | | |
| | | Class A
| |
| | | Six Months Ended
March 31, 2006(a) | |
Per Share Operating Performance: | | | | |
Net Asset Value, Beginning Of Period | | $ | 14.00 | |
| | |
|
|
|
Income (loss) from investment operations | | | | |
Net investment income | | | .13 | |
Net realized and unrealized gain (loss) on investment transactions | | | .54 | |
| | |
|
|
|
Total from investment operations | | | .67 | |
| | |
|
|
|
Less Distributions | | | | |
Dividends from net investment income | | | (.22 | ) |
Distributions from net realized gains | | | (.68 | ) |
| | |
|
|
|
Total distributions | | | (.90 | ) |
| | |
|
|
|
Net asset value, end of period | | $ | 13.77 | |
| | |
|
|
|
Total Return(c): | | | 4.93 | % |
Ratios/Supplemental Data: | | | | |
Net assets, end of period (000) | | $ | 421,971 | |
Average net assets (000) | | $ | 420,049 | |
Ratios to average net assets: | | | | |
Expenses, including distribution and service (12b-1) fees(d) | | | 1.13 | %(e) |
Expenses, excluding distribution and service (12b-1) fees | | | .88 | %(e) |
Net investment income | | | 1.85 | %(e) |
For Class A, B, C, R and Z shares: | | | | |
Portfolio turnover rate | | | 68 | %(f) |
| (a) | Calculations are based on average shares outstanding during the period. |
| (b) | Effective October 1, 2001, the Series adopted the provisions of the AICPA Audit and Accounting Guide for Investment Companies and began amortizing premiums on debt securities. There were no per share or ratio effect because of this change for the year ended September 30, 2002. Per share amounts and ratios for the years ended prior to September 30, 2002 have not been restated to reflect this change in presentation. |
| (c) | Total return does not consider the effects of sales loads. Total return in calculated assuming a purchase of shares on the first day and a sale on the last day of each period reported and includes reinvestment of dividends and distributions. Total returns for periods of less than one full year are not annualized. |
| (d) | The distributor of the Series contractually agreed to limit its distribution and service (12b-1) fees to .25 of 1% on the average daily net assets of the Class A shares. |
See Notes to Financial Statements.
| | |
| 62 | | Visit our website at www.jennisondryden.com |
| | | | | | | | | | | | | | | | | | |
| Class A | |
| Year Ended September 30, | |
| 2005(a) | | | 2004(a) | | | 2003(a) | | | 2002(b) | | | 2001 | |
| | | | | | | | | | | | | | | | | | | |
| $ | 12.83 | | | $ | 11.47 | | | $ | 9.60 | | | $ | 11.08 | | | $ | 13.76 | |
|
|
| |
|
|
| |
|
|
| |
|
|
| |
|
|
|
| | | | | | | | | | | | | | | | | | | |
| | .21 | | | | .14 | | | | .12 | | | | .18 | | | | .44 | |
| | 1.12 | | | | 1.31 | | | | 1.96 | | | | (1.37 | ) | | | (2.31 | ) |
|
|
| |
|
|
| |
|
|
| |
|
|
| |
|
|
|
| | 1.33 | | | | 1.45 | | | | 2.08 | | | | (1.19 | ) | | | (1.87 | ) |
|
|
| |
|
|
| |
|
|
| |
|
|
| |
|
|
|
| | | | | | | | | | | | | | | | | | | |
| | (.16 | ) | | | (.09 | ) | | | (.21 | ) | | | (.29 | ) | | | (.38 | ) |
| | — | | | | — | | | | — | | | | — | | | | (.43 | ) |
|
|
| |
|
|
| |
|
|
| |
|
|
| |
|
|
|
| | (.16 | ) | | | (.09 | ) | | | (.21 | ) | | | (.29 | ) | | | (.81 | ) |
|
|
| |
|
|
| |
|
|
| |
|
|
| |
|
|
|
| $ | 14.00 | | | $ | 12.83 | | | $ | 11.47 | | | $ | 9.60 | | | $ | 11.08 | |
|
|
| |
|
|
| |
|
|
| |
|
|
| |
|
|
|
| | 10.41 | % | | | 12.68 | % | | | 21.91 | % | | | (11.18 | )% | | | (14.40 | )% |
| | | | | | | | | | | | | | | | | | | |
| $ | 424,341 | | | $ | 425,614 | | | $ | 410,597 | | | $ | 369,410 | | | $ | 474,409 | |
| $ | 428,897 | | | $ | 429,046 | | | $ | 385,242 | | | $ | 461,051 | | | $ | 456,359 | |
| | | | | | | | | | | | | | | | | | | |
| | 1.09 | % | | | 1.07 | % | | | 1.11 | % | | | 1.11 | % | | | 1.21 | % |
| | .84 | % | | | .82 | % | | | .86 | % | | | .86 | % | | | .96 | % |
| | 1.52 | % | | | 1.13 | % | | | 1.12 | % | | | 1.51 | % | | | 2.21 | % |
| | | | | | | | | | | | | | | | | | | |
| | 119 | % | | | 170 | % | | | 212 | % | | | 215 | % | | | 134 | % |
See Notes to Financial Statements.
| | |
| The Prudential Investment Portfolios, Inc./Dryden Active Allocation Fund | | 63 |
Financial Highlights
(Unaudited) Cont’d
| | | | |
| | | Class B
| |
| | | Six Months Ended
March 31, 2006(a) | |
Per Share Operating Performance: | | | | |
Net Asset Value, Beginning Of Period | | $ | 13.94 | |
| | |
|
|
|
Income (loss) from investment operations | | | | |
Net investment income | | | .08 | |
Net realized and unrealized gain (loss) on investment transactions | | | .54 | |
| | |
|
|
|
Total from investment operations | | | .62 | |
| | |
|
|
|
Less Distributions | | | | |
Dividends from net investment income | | | (.11 | ) |
Distributions from net realized gains | | | (.68 | ) |
| | |
|
|
|
Total distributions | | | (.79 | ) |
| | |
|
|
|
Net asset value, end of period | | $ | 13.77 | |
| | |
|
|
|
Total Return(c): | | | 4.55 | % |
Ratios/Supplemental Data: | | | | |
Net assets, end of period (000) | | $ | 64,092 | |
Average net assets (000) | | $ | 69,679 | |
Ratios to average net assets: | | | | |
Expenses, including distribution and service (12b-1) fees | | | 1.88 | %(d) |
Expenses, excluding distribution and service (12b-1) fees | | | .88 | %(d) |
Net investment income | | | 1.10 | %(d) |
| (a) | Calculations are based on average shares outstanding during the period. |
| (b) | Effective October 1, 2001, the Series adopted the provisions of the AICPA Audit and Accounting Guide for Investment Companies and began amortizing premiums on debt securities. There were no per share or ratio effect because of this change for the year ended September 30, 2002. Per share amounts and ratios for the years ended prior to September 30, 2002 have not been restated to reflect this change in presentation. |
| (c) | Total return does not consider the effects of sales loads. Total return in calculated assuming a purchase of shares on the first day and a sale on the last day of each period reported and includes reinvestment of dividends and distributions. Total returns for periods of less than one full year are not annualized. |
See Notes to Financial Statements.
| | |
| 64 | | Visit our website at www.jennisondryden.com |
| | | | | | | | | | | | | | | | | | |
| Class B | |
| Year Ended September 30, | |
| 2005(a) | | | 2004(a) | | | 2003(a) | | | 2002(b) | | | 2001 | |
| | | | | | | | | | | | | | | | | | | |
| $ | 12.78 | | | $ | 11.42 | | | $ | 9.56 | | | $ | 11.00 | | | $ | 13.68 | |
|
|
| |
|
|
| |
|
|
| |
|
|
| |
|
|
|
| | | | | | | | | | | | | | | | | | | |
| | .11 | | | | .05 | | | | .04 | | | | .10 | | | | .40 | |
| | 1.10 | | | | 1.31 | | | | 1.95 | | | | (1.36 | ) | | | (2.35 | ) |
|
|
| |
|
|
| |
|
|
| |
|
|
| |
|
|
|
| | 1.21 | | | | 1.36 | | | | 1.99 | | | | (1.26 | ) | | | (1.95 | ) |
|
|
| |
|
|
| |
|
|
| |
|
|
| |
|
|
|
| | | | | | | | | | | | | | | | | | | |
| | (.05 | ) | | | — | | | | (.13 | ) | | | (.18 | ) | | | (.30 | ) |
| | — | | | | — | | | | — | | | | — | | | | (.43 | ) |
|
|
| |
|
|
| |
|
|
| |
|
|
| |
|
|
|
| | (0.05 | ) | | | — | | | | (.13 | ) | | | (.18 | ) | | | (.73 | ) |
|
|
| |
|
|
| |
|
|
| |
|
|
| |
|
|
|
| $ | 13.94 | | | $ | 12.78 | | | $ | 11.42 | | | $ | 9.56 | | | $ | 11.00 | |
|
|
| |
|
|
| |
|
|
| |
|
|
| |
|
|
|
| | 9.50 | % | | | 11.91 | % | | | 20.96 | % | | | (11.73 | )% | | | (14.99 | )% |
| | | | | | | | | | | | | | | | | | | |
| $ | 73,983 | | | $ | 94,667 | | | $ | 104,308 | | | $ | 124,201 | | | $ | 181,313 | |
| $ | 88,854 | | | $ | 104,847 | | | $ | 113,112 | | | $ | 169,928 | | | $ | 225,621 | |
| | | | | | | | | | | | | | | | | | | |
| | 1.84 | % | | | 1.82 | % | | | 1.86 | % | | | 1.86 | % | | | 1.96 | % |
| | .84 | % | | | .82 | % | | | .86 | % | | | .86 | % | | | .96 | % |
| | .77 | % | | | .38 | % | | | .38 | % | | | .77 | % | | | 1.55 | % |
See Notes to Financial Statements.
| | |
| The Prudential Investment Portfolios, Inc./Dryden Active Allocation Fund | | 65 |
Financial Highlights
(Unaudited) Cont’d
| | | | |
| | | Class C
| |
| | | Six Months Ended
March 31, 2006(a) | |
Per Share Operating Performance: | | | | |
Net Asset Value, Beginning Of Period | | $ | 13.95 | |
| | |
|
|
|
Income (loss) from investment operations | | | | |
Net investment income | | | .08 | |
Net realized and unrealized gain (loss) on investment transactions | | | .53 | |
| | |
|
|
|
Total from investment operations | | | .61 | |
| | |
|
|
|
Less Distributions | | | | |
Dividends from net investment income | | | (.11 | ) |
Distributions from net realized gains | | | (.68 | ) |
| | |
|
|
|
Total distributions | | | (.79 | ) |
| | |
|
|
|
Net asset value, end of period | | $ | 13.77 | |
| | |
|
|
|
Total Return(c): | | | 4.55 | % |
Ratios/Supplemental Data: | | | | |
Net assets, end of period (000) | | $ | 13,510 | |
Average net assets (000) | | $ | 13,696 | |
Ratios to average net assets: | | | | |
Expenses, including distribution and service (12b-1) fees | | | 1.88 | %(d) |
Expenses, excluding distribution and service (12b-1) fees | | | .88 | %(d) |
Net investment income | | | 1.10 | %(d) |
| (a) | Calculations are based on average shares outstanding during the period. |
| (b) | Effective October 1, 2001, the Series adopted the provisions of the AICPA Audit and Accounting Guide for Investment Companies and began amortizing premiums on debt securities. There were no per share or ratio effect because of this change for the year ended September 30, 2002. Per share amounts and ratios for the years ended prior to September 30, 2002 have not been restated to reflect this change in presentation. |
| (c) | Total return does not consider the effects of sales loads. Total return in calculated assuming a purchase of shares on the first day and a sale on the last day of each period reported and includes reinvestment of dividends and distributions. Total returns for periods of less than one full year are not annualized. |
See Notes to Financial Statements.
| | |
| 66 | | Visit our website at www.jennisondryden.com |
| | | | | | | | | | | | | | | | | | |
| Class C | |
| Year Ended September 30, | |
| 2005(a) | | | 2004(a) | | | 2003(a) | | | 2002(b) | | | 2001 | |
| | | | | | | | | | | | | | | | | | | |
| $ | 12.78 | | | $ | 11.42 | | | $ | 9.56 | | | $ | 11.00 | | | $ | 13.68 | |
|
|
| |
|
|
| |
|
|
| |
|
|
| |
|
|
|
| | | | | | | | | | | | | | | | | | | |
| | .11 | | | | .05 | | | | .04 | | | | .08 | | | | .32 | |
| | 1.11 | | | | 1.31 | | | | 1.95 | | | | (1.34 | ) | | | (2.27 | ) |
|
|
| |
|
|
| |
|
|
| |
|
|
| |
|
|
|
| | 1.22 | | | | 1.36 | | | | 1.99 | | | | (1.26 | ) | | | (1.95 | ) |
|
|
| |
|
|
| |
|
|
| |
|
|
| |
|
|
|
| | | | | | | | | | | | | | | | | | | |
| | (.05 | ) | | | — | | | | (.13 | ) | | | (.18 | ) | | | (.30 | ) |
| | — | | | | — | | | | — | | | | — | | | | (.43 | ) |
|
|
| |
|
|
| |
|
|
| |
|
|
| |
|
|
|
| | (0.05 | ) | | | — | | | | (.13 | ) | | | (.18 | ) | | | (.73 | ) |
|
|
| |
|
|
| |
|
|
| |
|
|
| |
|
|
|
| $ | 13.95 | | | $ | 12.78 | | | $ | 11.42 | | | $ | 9.56 | | | $ | 11.00 | |
|
|
| |
|
|
| |
|
|
| |
|
|
| |
|
|
|
| | 9.50 | % | | | 11.91 | % | | | 20.96 | % | | | (11.73 | )% | | | (14.99 | )% |
| | | | | | | | | | | | | | | | | | | |
| $ | 13,500 | | | $ | 14,357 | | | $ | 12,655 | | | $ | 11,268 | | | $ | 16,423 | |
| $ | 14,221 | | | $ | 13,380 | | | $ | 12,132 | | | $ | 15,577 | | | $ | 14,019 | |
| | | | | | | | | | | | | | | | | | | |
| | 1.84 | % | | | 1.82 | % | | | 1.86 | % | | | 1.86 | % | | | 1.96 | % |
| | .84 | % | | | .82 | % | | | .86 | % | | | .86 | % | | | .96 | % |
| | .78 | % | | | .38 | % | | | .37 | % | | | .76 | % | | | 1.43 | % |
See Notes to Financial Statements.
| | |
| The Prudential Investment Portfolios, Inc./Dryden Active Allocation Fund | | 67 |
Financial Highlights
(Unaudited) Cont’d
| | | | | | | | |
| | | Class R
| |
| | | Six Months Ended
March 31, 2006(b) | | | December 17, 2004(a)
Through
September 30, 2005(b) | |
Per Share Operating Performance: | | | | | | | | |
Net Asset Value, Beginning Of Period | | $ | 14.00 | | | $ | 13.53 | |
| | |
|
|
| |
|
|
|
Income (loss) from investment operations | | | | | | | | |
Net investment income | | | .11 | | | | .12 | |
Net realized and unrealized loss on investment transactions | | | .55 | | | | .35 | |
| | |
|
|
| |
|
|
|
Total from investment operations | | | .66 | | | | .47 | |
| | |
|
|
| |
|
|
|
Less Distributions | | | | | | | | |
Dividends from net investment income | | | (.19 | ) | | | — | |
Distributions from net realized gains | | | (.68 | ) | | | — | |
| | |
|
|
| |
|
|
|
Total distributions | | | (.87 | ) | | | — | |
| | |
|
|
| |
|
|
|
Net asset value, end of period | | $ | 13.79 | | | $ | 14.00 | |
| | |
|
|
| |
|
|
|
Total Return(c): | | | 4.89 | % | | | 3.40 | % |
Ratios/Supplemental Data: | | | | | | | | |
Net assets, end of period (000) | | $ | 235 | | | $ | 3 | |
Average net assets (000) | | $ | 107 | | | $ | 2 | |
Ratios to average net assets: | | | | | | | | |
Expenses, including distribution and service (12b-1) fees(d) | | | 1.38 | %(e) | | | 1.34 | %(e) |
Expenses, excluding distribution and service (12b-1) fees | | | .88 | %(e) | | | .84 | %(e) |
Net investment income | | | 1.54 | %(e) | | | 1.48 | %(e) |
| (a) | Commencement of operations. |
| (b) | Calculations are based on average shares outstanding during the period. |
| (c) | Total return in calculated assuming a purchase of shares on the first day and a sale on the last day of each period reported and includes reinvestment of dividends and distributions. Total returns for periods of less than one full year are not annualized. |
| (d) | The distributor of the Series contractually agreed to limit its distribution and service (12b-1) fees to .50 of 1% on the average daily net assets of the Class R shares. |
See Notes to Financial Statements.
| | |
| 68 | | Visit our website at www.jennisondryden.com |
This Page Intentionally Left Blank
Financial Highlights
(Unaudited) Cont’d
| | | | |
| | | Class Z
| |
| | | Six Months Ended
March 31, 2006(a) | |
Per Share Operating Performance: | | | | |
Net Asset Value, Beginning Of Period | | $ | 14.08 | |
| | |
|
|
|
Income (loss) from investment operations | | | | |
Net investment income | | | .14 | |
Net realized and unrealized gain (loss) on investment transactions | | | .56 | |
| | |
|
|
|
Total from investment operations | | | .70 | |
| | |
|
|
|
Less Distributions | | | | |
Dividends from net investment income | | | (.26 | ) |
Distributions from net realized gains | | | (.68 | ) |
| | |
|
|
|
Total distributions | | | (.94 | ) |
| | |
|
|
|
Net asset value, end of period | | $ | 13.84 | |
| | |
|
|
|
Total Return(c): | | | 5.17 | % |
Ratios/Supplemental Data: | | | | |
Net assets, end of period (000) | | $ | 169,030 | |
Average net assets (000) | | $ | 172,166 | |
Ratios to average net assets: | | | | |
Expenses, including distribution and service (12b-1) fees | | | .88 | %(d) |
Expenses, excluding distribution and service (12b-1) fees | | | .88 | %(d) |
Net investment income | | | 2.10 | %(d) |
| (a) | Calculations are based on average shares outstanding during the period. |
| (b) | Effective October 1, 2001, the Series adopted the provisions of the AICPA Audit and Accounting Guide for Investment Companies and began amortizing premiums on debt securities. There were no per share or ratio effect because of this change for the year ended September 30, 2002. Per share amounts and ratios for the years ended prior to September 30, 2002 have not been restated to reflect this change in presentation. |
| (c) | Total return in calculated assuming a purchase of shares on the first day and a sale on the last day of each period reported and includes reinvestment of dividends and distributions. Total returns for periods of less than one full year are not annualized. |
See Notes to Financial Statements.
| | |
| 70 | | Visit our website at www.jennisondryden.com |
| | | | | | | | | | | | | | | | | | |
| Class Z | |
| Year Ended September 30, | |
| 2005(a) | | | 2004(a) | | | 2003(a) | | | 2002(b) | | | 2001 | |
| | | | | | | | | | | | | | | | | | | |
| $ | 12.90 | | | $ | 11.53 | | | $ | 9.66 | | | $ | 11.14 | | | $ | 13.79 | |
|
|
| |
|
|
| |
|
|
| |
|
|
| |
|
|
|
| | | | | | | | | | | | | | | | | | | |
| | .24 | | | | .17 | | | | .14 | | | | .21 | | | | .35 | |
| | 1.13 | | | | 1.32 | | | | 1.97 | | | | (1.37 | ) | | | (2.17 | ) |
|
|
| |
|
|
| |
|
|
| |
|
|
| |
|
|
|
| | 1.37 | | | | 1.49 | | | | 2.11 | | | | (1.16 | ) | | | (1.82 | ) |
|
|
| |
|
|
| |
|
|
| |
|
|
| |
|
|
|
| | | | | | | | | | | | | | | | | | | |
| | (.19 | ) | | | (.12 | ) | | | (.24 | ) | | | (.32 | ) | | | (.40 | ) |
| | — | | | | — | | | | — | | | | — | | | | (.43 | ) |
|
|
| |
|
|
| |
|
|
| |
|
|
| |
|
|
|
| | (.19 | ) | | | (.12 | ) | | | (.24 | ) | | | (.32 | ) | | | (.83 | ) |
|
|
| |
|
|
| |
|
|
| |
|
|
| |
|
|
|
| $ | 14.08 | | | $ | 12.90 | | | $ | 11.53 | | | $ | 9.66 | | | $ | 11.14 | |
|
|
| |
|
|
| |
|
|
| |
|
|
| |
|
|
|
| | 10.63 | % | | | 12.96 | % | | | 22.11 | % | | | (10.86 | )% | | | (13.96 | )% |
| | | | | | | | | | | | | | | | | | | |
| $ | 173,188 | | | $ | 169,725 | | | $ | 167,039 | | | $ | 166,036 | | | $ | 207,850 | |
| $ | 176,256 | | | $ | 171,470 | | | $ | 172,708 | | | $ | 206,376 | | | $ | 230,926 | |
| | | | | | | | | | | | | | | | | | | |
| | .84 | % | | | .82 | % | | | .86 | % | | | .86 | % | | | .96 | % |
| | .84 | % | | | .82 | % | | | .86 | % | | | .86 | % | | | .96 | % |
| | 1.76 | % | | | 1.38 | % | | | 1.36 | % | | | 1.76 | % | | | 2.51 | % |
See Notes to Financial Statements.
| | |
| The Prudential Investment Portfolios, Inc./Dryden Active Allocation Fund | | 71 |
| | | | |
| n MAIL | | n TELEPHONE | | n WEBSITE |
Gateway Center Three 100 Mulberry Street Newark, NJ 07102 | | (800) 225-1852 | | www.jennisondryden.com |
|
| PROXY VOTING |
| The Board of Directors of the Fund has delegated to the Fund’s investment subadvisor the responsibility for voting any proxies and maintaining proxy recordkeeping with respect to the Fund. A description of these proxy voting policies and procedures is available without charge, upon request, by calling (800) 225-1852 or by visiting the Securities and Exchange Commission’s website at www.sec.gov. Information regarding how the Fund voted proxies relating to portfolio securities during the most recent 12-month period ended June 30 is available on the Fund’s website and on the Commission’s website. |
|
| DIRECTORS |
| Linda W. Bynoe • David E.A. Carson • Robert F. Gunia • Robert E. La Blanc • Douglas H. McCorkindale • Richard A. Redeker • Judy A. Rice • Robin B. Smith • Stephen G. Stoneburn • Clay T. Whitehead |
|
| OFFICERS |
| Judy A. Rice, President • Robert F. Gunia, Vice President • Grace C. Torres, Treasurer and Principal Financial and Accounting Officer • Jack Benintende, Assistant Treasurer • M. Sadiq Peshimam, Assistant Treasurer • Kathryn L. Quirk, Chief Legal Officer • Deborah A. Docs, Secretary • Jonathan D. Shain, Assistant Secretary • Claudia DiGiacomo, Assistant Secretary • John P. Schwartz, Assistant Secretary • Helene Gurian, Acting Anti-Money Laundering Compliance Officer • Lee D. Augsburger, Chief Compliance Officer |
| | | | |
| MANAGER | | Prudential Investments LLC | | Gateway Center Three
100 Mulberry Street
Newark, NJ 07102 |
|
| INVESTMENT SUBADVISOR | | Prudential Investment
Management, Inc. | | Gateway Center Two
100 Mulberry Street
Newark, NJ 07102 |
|
| DISTRIBUTOR | | Prudential Investment
Management Services LLC | | Gateway Center Three
100 Mulberry Street
Newark, NJ 07102 |
|
| CUSTODIAN | | The Bank of New York | | One Wall Street
New York, NY 10286 |
|
| TRANSFER AGENT | | Prudential Mutual Fund
Services LLC | | PO Box 8098
Philadelphia, PA 19176 |
|
INDEPENDENT REGISTERED
PUBLIC ACCOUNTING FIRM | | KPMG LLP | | 345 Park Avenue
New York, NY 10154 |
|
| FUND COUNSEL | | Sullivan & Cromwell LLP | | 125 Broad Street
New York, NY 10004 |
|
An investor should consider the investment objectives, risks, charges, and expenses of the Fund carefully before investing. The prospectus for the Fund contains this and other information about the Fund. An investor may obtain a prospectus by visiting our website at www.jennisondryden.com or by calling (800) 225-1852. The prospectus should be read carefully before investing. |
|
| E-DELIVERY |
| To receive your mutual fund documents on-line, go to www.icsdelivery.com/prudential/funds and enroll. Instead of receiving printed documents by mail, you will receive notification via e-mail when new materials are available. You can cancel your enrollment or change your e-mail address at any time by clicking on the change/cancel enrollment option at the icsdelivery website address. |
|
| SHAREHOLDER COMMUNICATIONS WITH DIRECTORS |
| Shareholders can communicate directly with the Board of Directors by writing to the Chair of the Board, Dryden Active Allocation Fund, PO Box 13964, Philadelphia, PA 19176. Shareholders can communicate directly with an individual Director by writing to the same address. Communications are not screened before being delivered to the addressee. |
|
| AVAILABILITY OF PORTFOLIO SCHEDULE |
| The Fund files its complete schedule of portfolio holdings with the Securities and Exchange Commission for the first and third quarters of each fiscal year on Form N-Q under The Prudential Investment Portfolios, Inc. name. The Fund’s Forms N-Q are available on the Commission’s website at www.sec.gov. The Fund’s Forms N-Q may also be reviewed and copied at the Commission’s Public Reference Room in Washington, D.C. Information on the operation and location of the Public Reference Room may be obtained by calling (800) SEC-0330 (732-0330). The Fund’s schedule of portfolio holdings is also available on the Fund’s website as of the end of each fiscal quarter. |
Mutual Funds:
| | | | |
| ARE NOT INSURED BY THE FDIC OR ANY FEDERAL GOVERNMENT AGENCY | | MAY LOSE VALUE | | ARE NOT A DEPOSIT OF OR GUARANTEED BY ANY BANK OR ANY BANK AFFILIATE |

| | | | | | | | | | | | | | |
| Dryden Active Allocation Fund | | | | | | |
| | | Share Class | | A | | B | | C | | R | | Z | | |
| | | NASDAQ | | PIBAX | | PBFBX | | PABCX | | PALRX | | PABFX | | |
| | | CUSIP | | 74437E883 | | 74437E875 | | 74437E867 | | 74437E636 | | 74437E859 | | |
| | | | | | | | | | | | | | | |
MF185E2 IFS-A119077 Ed. 05/2006

JennisonDryden Asset Allocation Funds
| | |
| MARCH 31, 2006 | | SEMIANNUAL REPORT |

JennisonDryden Conservative Allocation Fund
Objective: Current income and a reasonable level of capital appreciation
JennisonDryden Moderate Allocation Fund
Objective: Capital appreciation and a reasonable level of current income
JennisonDryden Growth Allocation Fund
Objective: Long-term capital appreciation
FUND TYPE
Balanced/allocation
This report is not authorized for distribution to prospective investors unless preceded or accompanied by a current prospectus.
The views expressed in this report and information about the Funds’ portfolio holdings are for the period covered by this report and are subject to change thereafter.
The accompanying financial statements as of March 31, 2006 were not audited, and accordingly, no auditor’s opinion is expressed on them.
JennisonDryden is a registered trademark of The Prudential Insurance Company of America.

JENNISONDRYDEN ASSET ALLOCATION FUNDS
TABLE OF CONTENTS
May 15, 2006
Dear Shareholder:
We hope you find the semiannual report for the JennisonDryden Asset Allocation Funds informative and useful. As a JennisonDryden mutual fund shareholder, you may be thinking about where you can find additional growth opportunities. You could invest in last year’s top-performing asset class and hope history repeats itself or you could stay in cash while waiting for the “right moment” to invest.
Instead, we believe it is better to take advantage of developing domestic and global investment opportunities through a diversified portfolio of stock and bond mutual funds. A diversified asset allocation offers two potential advantages. It helps you manage downside risk by not being overly exposed to any particular asset class, plus it gives you a better opportunity to have at least some of your assets in the right place at the right time. Your financial professional can help you create a diversified investment plan that may include mutual funds covering all the basic asset classes and that reflects your personal investor profile and tolerance for risk.
JennisonDryden Mutual Funds gives you a wide range of choices that can help you make progress toward your financial goals. Our funds offer the experience, resources, and professional discipline of three leading asset managers. They are recognized and respected in the institutional market and by discerning investors for excellence in their respective strategies. JennisonDryden equity funds are advised by Jennison Associates LLC or Quantitative Management Associates LLC (QMA). Prudential Investment Management, Inc. (PIM) advises the JennisonDryden fixed income and money market funds. Jennison Associates, QMA, and PIM are registered investment advisors and Prudential Financial companies.
Thank you for choosing JennisonDryden Mutual Funds.
Sincerely,

Judy A. Rice, President
JennisonDryden Asset Allocation Funds
| | |
| JennisonDryden Asset Allocation Funds | | 1 |
This Page Intentionally Left Blank
Your Fund’s Performance
| | |
| MARCH 31, 2006 | | SEMIANNUAL REPORT |
JennisonDryden Conservative Allocation Fund
Your Fund’s Performance
Fund objective
The investment objective of the JennisonDryden Conservative Allocation Fund (the Fund) is current income and a reasonable level of capital appreciation. There can be no assurance that the Fund will achieve its investment objective.
Performance data quoted represent past performance. Past performance does not guarantee future results. The investment return and principal value of an investment will fluctuate, so that an investor’s shares, when redeemed, may be worth more or less than their original cost. Current performance may be lower or higher than the past performance data quoted. An investor may obtain performance data as of the most recent month-end by visiting our website at www.jennisondryden.com or by calling (800) 225-1852. The maximum initial sales charge is 5.50% (Class A shares).
| | | | | | | | | |
| Cumulative Total Returns1 as of 3/31/06 | | | | | | | | | |
| | | Six Months | | | One Year | | | Since Inception2 | |
Class A | | 4.30 | % | | 10.10 | % | | 14.76 | % |
Class B | | 3.81 | | | 9.19 | | | 12.93 | |
Class C | | 3.90 | | | 9.29 | | | 13.03 | |
Class Z | | 4.51 | | | 10.52 | | | 15.49 | |
S&P 500 Index3 | | 6.38 | | | 11.72 | | | 19.19 | |
Russell 1000 Index4 | | 6.71 | | | 13.20 | | | 21.39 | |
JDAA Conservative Custom Blend5 | | 4.31 | | | 8.30 | | | 12.66 | |
Lipper Income Funds Avg.6 | | 3.16 | | | 6.98 | | | 11.86 | |
| | | | | | | | | | |
| Average Annual Total Returns1 as of 3/31/06 | | | | | | | | | |
| | | | | | One Year | | | Since Inception2 | |
Class A | | | | | 4.04 | % | | 4.13 | % |
Class B | | | | | 4.19 | | | 4.84 | |
Class C | | | | | 8.29 | | | 6.30 | |
Class Z | | | | | 10.52 | | | 7.45 | |
S&P 500 Index3 | | | | | 11.72 | | | 9.17 | |
Russell 1000 Index4 | | | | | 13.20 | | | 10.18 | |
JDAA Conservative Custom Blend5 | | | | | 8.30 | | | 6.14 | |
Lipper Income Funds Avg.6 | | | | | 6.98 | | | 5.73 | |
The cumulative total returns do not reflect the deduction of applicable sales charges. If reflected, the applicable sales charges would reduce the cumulative total returns performance quoted. Class A shares are subject to a maximum front-end sales charge of 5.50%. Under certain circumstances, Class A shares may be subject to a contingent deferred sales charge (CDSC) of 1%. Class B and Class C shares are subject to a maximum CDSC of 5% and 1%, respectively. Class Z shares are not subject to a sales charge.
| | |
| 4 | | Visit our website at www.jennisondryden.com |
1Sources: Prudential Investments LLC, Lipper Inc., and Ibbotson Associates, Inc. The average annual total returns take into account applicable sales charges. During certain periods shown, fee waivers and/or expense reimbursements were in effect. Without such fee waivers and expense reimbursements, the returns for the share classes would have been lower. Class A, Class B, and Class C shares are subject to an annual distribution and service (12b-1) fee of up to 0.30%, 1.00%, and 1.00%, respectively. Approximately seven years after purchase, Class B shares will automatically convert to Class A shares on a quarterly basis. Class Z shares are not subject to a 12b-1 fee. The returns in the tables do not reflect the deduction of taxes that a shareholder would pay on Fund distributions or following the redemption of Fund shares.
2Inception date: 3/30/04. The Since Inception returns for the S&P 500 Index, Russell 1000 Index, JDAA Conservative Custom Blend, and Lipper Income Funds Average (Lipper Average) are measured from the closest month-end to inception date, and not from the Fund’s actual inception date.
3The Standard & Poor’s 500 Composite Stock Price Index (S&P 500 Index) is an unmanaged index of 500 stocks of large U.S. public companies. It gives a broad look at how stock prices in the United States have performed.
4The Russell 1000 Index is an unmanaged index that consists of the 1,000 largest securities in the Russell 3000 Index.
5The JennisonDryden Asset Allocation (JDAA) Conservative Custom Blend is a model portfolio consisting of the S&P 500 Index (5%), the S&P 500/Citigroup Growth Index (10%), the S&P 500/Citigroup Value Index (10%), the Russell 2500 Index (5%), the MSCI EAFE Index (10%), the Lehman Brothers U.S. Corporate High Yield Index (5%), the Lehman Brothers Intermediate Government Index (25%), the Merrill Lynch (ML) 1-3 Year Corporate Index (20%), and the 90-Day Treasury-Bill (10%). Each component of the JDAA Conservative Custom Blend is an unmanaged index generally considered as representing the performance of its asset class. The JDAA Conservative Custom Blend is intended to provide a theoretical comparison to the Fund’s performance, based on the amounts allocated to each asset class. The JDAA Conservative Custom Blend does not reflect deductions for any sales charges, operating expenses of a mutual fund, or taxes.
6The Lipper Average represents returns based on the average return of all funds in the Lipper Income Funds category. Funds in the Lipper Average normally seek a high level of current income through investing in income-producing stocks, bonds, and money market instruments.
Investors cannot invest directly in an index. The returns for the S&P 500 Index, Russell 1000 Index, and JDAA Conservative Custom Blend would be lower if they included the effects of sales charges, operating expenses of a mutual fund, or taxes. Returns for the Lipper Average reflect the deduction of operating expenses, but not sales charges or taxes.
| | |
| JennisonDryden Asset Allocation Funds | | 5 |
Performance Target—JDAA Conservative Custom Blend
The JennisonDryden Conservative Allocation Fund seeks to exceed a performance target—the JDAA Conservative Custom Blend—consisting of a weighted average return of nine securities indexes that are generally considered representative of the asset classes in which the Fund may invest. The chart below shows both the total returns of these indexes for the six-month period ended March 31, 2006, and their weightings in the JennisonDryden Conservative Custom Blend. Index returns do not reflect sales charges, a mutual fund’s operating expenses, or taxes, and investors cannot invest directly in an index. The JennisonDryden Conservative Allocation Fund seeks to exceed this target by holding positions in specific JennisonDryden Mutual Funds. In response to market developments, the Fund’s Investment advisor may vary its holdings in those funds (within specified ranges). Past performance is not indicative of future results.
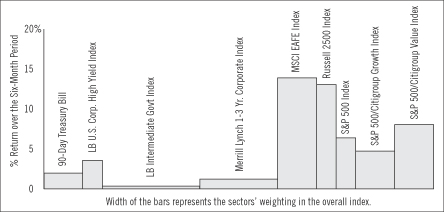
Source: Lipper Inc.
The S&P 500/Citigroup Value Index contains the market-weighted half of the S&P 500 Index with lower book-to-price ratios.
The S&P 500/Citigroup Growth Index contains the market-weighted half of the S&P 500 Index with higher book-to-price ratios.
The S&P 500 Index is an unmanaged index of 500 stocks of large U.S. public companies. It gives a broad look at how U.S. stock prices have performed.
The Russell 2500 Index includes the smallest 2,500 securities in the Russell 3000 Index. The Russell 3000 Index represents approximately 98% of the U.S. equity market.
The Morgan Stanley Capital International Europe, Australasia, and Far East Index (MSCI EAFE Index) is an unmanaged, weighted index that reflects stock price movements in Europe, Australasia, and the Far East. It gives a broad look at how foreign stock prices have performed.
The Lehman Brothers Intermediate Government Index is an unmanaged index of investment-grade securities issued by the U.S. government and its agencies with between 1 and less than 10 years remaining to maturity. It gives a broad look at how short- and intermediate-term bonds have performed.
The Lehman Brothers U.S. Corporate High Yield Index is an unmanaged index of fixed-rate, below-investment-grade debt securities with at least one year remaining to maturity. The Lehman Brothers U.S. Corporate High Yield Index gives a broad look at how high yield (“junk”) bonds have performed.
The Merrill Lynch 1-3 Year Corporate Index consists of fixed-rate, coupon-bearing corporate bonds with a maturity of one to three years and a rating of BBB/Baa3 and above.
The 90-Day Treasury Bill is derived from secondary market interest rates as published by the Federal Reserve Bank in release H.15 and reflects the return of a constant maturity 90-Day Treasury Bill.
| | |
| 6 | | Visit our website at www.jennisondryden.com |
Your Fund’s Performance
| | |
| MARCH 31, 2006 | | SEMIANNUAL REPORT |
JennisonDryden Moderate Allocation Fund
Your Fund’s Performance
Fund objective
The investment objective of the JennisonDryden Moderate Allocation Fund (the Fund) is capital appreciation and a reasonable level of current income. There can be no assurance that the Fund will achieve its investment objective.
Performance data quoted represent past performance. Past performance does not guarantee future results. The investment return and principal value of an investment will fluctuate, so that an investor’s shares, when redeemed, may be worth more or less than their original cost. Current performance may be lower or higher than the past performance data quoted. An investor may obtain performance data as of the most recent month-end by visiting our website at www.jennisondryden.com or by calling (800) 225-1852. The maximum initial sales charge is 5.50% (Class A shares).
| | | | | | | | | |
| Cumulative Total Returns1 as of 3/31/06 | | | | | | | | | |
| | | Six Months | | | One Year | | | Since Inception2 | |
Class A | | 6.75 | % | | 15.00 | % | | 22.89 | % |
Class B | | 6.29 | | | 14.18 | | | 21.00 | |
Class C | | 6.29 | | | 14.27 | | | 21.10 | |
Class Z | | 6.77 | | | 15.36 | | | 23.47 | |
S&P 500 Index3 | | 6.38 | | | 11.72 | | | 19.19 | |
Russell 1000 Index4 | | 6.71 | | | 13.20 | | | 21.39 | |
JDAA Moderate Custom Blend5 | | 6.67 | | | 12.34 | | | 19.53 | |
Lipper Balanced Funds Avg.6 | | 4.77 | | | 9.48 | | | 14.11 | |
| | | | | | | | | | |
| Average Annual Total Returns1 as of 3/31/06 | | | | | | | | | |
| | | | | | One Year | | | Since Inception2 | |
Class A | | | | | 8.67 | % | | 7.75 | % |
Class B | | | | | 9.18 | | | 8.61 | |
Class C | | | | | 13.27 | | | 10.02 | |
Class Z | | | | | 15.36 | | | 11.09 | |
S&P 500 Index3 | | | | | 11.72 | | | 9.17 | |
Russell 1000 Index4 | | | | | 13.20 | | | 10.18 | |
JDAA Moderate Custom Blend5 | | | | | 12.34 | | | 9.33 | |
Lipper Balanced Funds Avg.6 | | | | | 9.48 | | | 6.80 | |
The cumulative total returns do not reflect the deduction of applicable sales charges. If reflected, the applicable sales charges would reduce the cumulative total returns performance quoted. Class A shares are subject to a maximum front-end sales charge of 5.50%. Under certain circumstances, Class A shares may be subject to a contingent deferred sales charge (CDSC) of 1%. Class B and Class C shares are subject to a maximum CDSC of 5% and 1%, respectively. Class Z shares are not subject to a sales charge.
| | |
| 8 | | Visit our website at www.jennisondryden.com |
1Sources: Prudential Investments LLC, Lipper Inc., and Ibbotson Associates, Inc. The average annual total returns take into account applicable sales charges. During certain periods shown, fee waivers and/or expense reimbursements were in effect. Without such fee waivers and expense reimbursements, the returns for the share classes would have been lower. Class A, Class B, and Class C shares are subject to an annual distribution and service (12b-1) fee of up to 0.30%, 1.00%, and 1.00%, respectively. Approximately seven years after purchase, Class B shares will automatically convert to Class A shares on a quarterly basis. Class Z shares are not subject to a 12b-1 fee. The returns in the tables do not reflect the deduction of taxes that a shareholder would pay on Fund distributions or following the redemption of Fund shares.
2Inception date: 3/30/04. The Since Inception returns for the S&P 500 Index, Russell 1000 Index, JDAA Moderate Custom Blend and Lipper Balanced Funds Average (Lipper Average) are measured from the closest month-end to inception date, and not from the Fund’s actual inception date.
3The Standard & Poor’s 500 Composite Stock Price Index (S&P 500 Index) is an unmanaged index of 500 stocks of large U.S. public companies. It gives a broad look at how stock prices in the United States have performed.
4The Russell 1000 Index is an unmanaged index that consists of the 1,000 largest securities in the Russell 3000 Index.
5The JennisonDryden Asset Allocation (JDAA) Moderate Custom Blend is a model portfolio consisting of the S&P 500 Index (8%), the S&P 500/Citigroup Growth Index (14%), the S&P 500/Citigroup Value Index (14%), the Russell 2500 Index (12%), the MSCI EAFE Index (17%), the Lehman Brothers U.S. Corporate High Yield Index (5%), the Lehman Brothers Intermediate Government Index (15%), the Merrill Lynch (ML) 1-3 Year Corporate Index (10%), and the 90-Day Treasury-Bill (5%). Each component of the JDAA Moderate Custom Blend is an unmanaged index generally considered as representing the performance of its asset class. The JDAA Moderate Custom Blend is intended to provide a theoretical comparison to the Fund’s performance, based on the amounts allocated to each asset class. The JDAA Moderate Custom Blend does not reflect deductions for any sales charges, operating expenses of a mutual fund, or taxes.
6The Lipper Average represents returns based on the average return of all funds in the Lipper Balanced Funds category. Funds in the Lipper Average have a primary objective to conserve principal by maintaining at all times a balanced portfolio of both stocks and bonds. Typically, the stock:bond ratio ranges around 60%:40%.
Investors cannot invest directly in an index. The returns for the S&P 500 Index, Russell 1000 Index, and JDAA Moderate Custom Blend would be lower if they included the effects of sales charges, operating expenses of a mutual fund, or taxes. Returns for the Lipper Average reflect the deduction of operating expenses, but not sales charges or taxes.
| | |
| JennisonDryden Asset Allocation Funds | | 9 |
Performance Target—JDAA Moderate Custom Blend
The JennisonDryden Moderate Allocation Fund seeks to exceed a performance target—the JDAA Moderate Custom Blend—consisting of a weighted average return of nine securities indexes that are generally considered representative of the asset classes in which the Fund may invest. The chart below shows both the total returns of these indexes for the six-month period ended March 31, 2006, and their weightings in the JennisonDryden Moderate Custom Blend. Index returns do not reflect sales charges, a mutual fund’s operating expenses, or taxes, and investors cannot invest directly in an index. The JennisonDryden Moderate Allocation Fund seeks to exceed this target by holding positions in specific JennisonDryden Mutual Funds. In response to market developments, the Fund’s Investment advisor may vary its holdings in those funds (within specified ranges). Past performance is not indicative of future results.
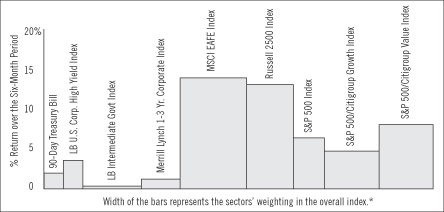
Source: Lipper Inc.
The S&P 500/Citigroup Value Index contains the market-weighted half of the S&P 500 Index with lower book-to-price ratios.
The S&P 500/Citigroup Growth Index contains the market-weighted half of the S&P 500 Index with higher book-to-price ratios.
The S&P 500 Index is an unmanaged index of 500 stocks of large U.S. public companies. It gives a broad look at how U.S. stock prices have performed.
The Russell 2500 Index includes the smallest 2,500 securities in the Russell 3000 Index. The Russell 3000 Index represents approximately 98% of the U.S. equity market.
The Morgan Stanley Capital International Europe, Australasia, and Far East Index (MSCI EAFE Index) is an unmanaged, weighted index that reflects stock price movements in Europe, Australasia, and the Far East. It gives a broad look at how foreign stock prices have performed.
The Lehman Brothers Intermediate Government Index is an unmanaged index of investment-grade securities issued by the U.S. government and its agencies with between 1 and less than 10 years remaining to maturity. It gives a broad look at how short- and intermediate-term bonds have performed.
The Lehman Brothers U.S. Corporate High Yield Index is an unmanaged index of fixed-rate, below-investment-grade debt securities with at least one year remaining to maturity. The Lehman Brothers U.S. Corporate High Yield Index gives a broad look at how high yield (“junk”) bonds have performed.
The Merrill Lynch 1-3 Year Corporate Index consists of fixed-rate, coupon-bearing corporate bonds with a maturity of one to three years and a rating of BBB/Baa3 and above.
The 90-Day Treasury Bill is derived from secondary market interest rates as published by the Federal Reserve Bank in release H.15 and reflects the return of a constant maturity 90-Day Treasury Bill.
| | |
| 10 | | Visit our website at www.jennisondryden.com |
Your Fund’s Performance
| | |
| MARCH 31, 2006 | | SEMIANNUAL REPORT |
JennisonDryden Growth Allocation Fund
Your Fund’s Performance
Fund objective
The investment objective of the JennisonDryden Growth Allocation Fund (the Fund) is long-term capital appreciation. There can be no assurance that the Fund will achieve its investment objective.
Performance data quoted represent past performance. Past performance does not guarantee future results. The investment return and principal value of an investment will fluctuate, so that an investor’s shares, when redeemed, may be worth more or less than their original cost. Current performance may be lower or higher than the past performance data quoted. An investor may obtain performance data as of the most recent month-end by visiting our website at www.jennisondryden.com or by calling (800) 225-1852. The maximum initial sales charge is 5.50% (Class A shares).
| | | | | | | | | |
| Cumulative Total Returns1 as of 3/31/06 | | | | | | | | | |
| | | Six Months | | | One Year | | | Since Inception2 | |
Class A | | 9.43 | % | | 20.17 | % | | 31.48 | % |
Class B | | 9.02 | | | 19.16 | | | 29.52 | |
Class C | | 8.93 | | | 19.25 | | | 29.62 | |
Class Z | | 9.42 | | | 20.34 | | | 32.14 | |
S&P 500 Index3 | | 6.38 | | | 11.72 | | | 19.19 | |
Russell 1000 Index4 | | 6.71 | | | 13.20 | | | 21.39 | |
JDAA Growth Custom Blend5 | | 9.09 | | | 16.55 | | | 26.61 | |
Lipper Multi-Cap Core Funds Avg.6 | | 7.77 | | | 14.56 | | | 21.20 | |
| | | | | | | | | | |
| Average Annual Total Returns1 as of 3/31/06 | | | | | | | |
| | | | | | One Year | | | Since Inception2 | |
Class A | | | | | 13.56 | % | | 11.44 | % |
Class B | | | | | 14.16 | | | 12.45 | |
Class C | | | | | 18.25 | | | 13.82 | |
Class Z | | | | | 20.34 | | | 14.92 | |
S&P 500 Index3 | | | | | 11.72 | | | 9.17 | |
Russell 1000 Index4 | | | | | 13.20 | | | 10.18 | |
JDAA Growth Custom Blend5 | | | | | 16.55 | | | 12.52 | |
Lipper Multi-Cap Core Funds Avg.6 | | | | | 14.56 | | | 10.03 | |
The cumulative total returns do not reflect the deduction of applicable sales charges. If reflected, the applicable sales charges would reduce the cumulative total returns performance quoted. Class A shares are subject to a maximum front-end sales charge of 5.50%. Under certain circumstances, Class A shares may be subject to a contingent deferred sales charge (CDSC) of 1%. Class B and Class C shares are subject to a maximum CDSC of 5% and 1%, respectively. Class Z shares are not subject to a sales charge.
| | |
| 12 | | Visit our website at www.jennisondryden.com |
1Sources: Prudential Investments LLC, Lipper Inc., and Ibbotson Associates, Inc. The average annual total returns take into account applicable sales charges. During certain periods shown, fee waivers and/or expense reimbursements were in effect. Without such fee waivers and expense reimbursements, the returns for the share classes would have been lower. Class A, Class B, and Class C shares are subject to an annual distribution and service (12b-1) fee of up to 0.30%, 1.00%, and 1.00%, respectively. Approximately seven years after purchase, Class B shares will automatically convert to Class A shares on a quarterly basis. Class Z shares are not subject to a 12b-1 fee. The returns in the tables do not reflect the deduction of taxes that a shareholder would pay on Fund distributions or following the redemption of Fund shares.
2Inception date: 3/30/04. The Since Inception returns for the S&P 500 Index, Russell 1000 Index, JDAA Growth Custom Blend, and Lipper Multi-Cap Core Funds Average (Lipper Average) are measured from the closest month-end to inception date, and not from the Fund’s actual inception date.
3The Standard & Poor’s 500 Composite Stock Price Index (S&P 500 Index) is an unmanaged index of 500 stocks of large U.S. public companies. It gives a broad look at how stock prices in the United States have performed.
4The Russell 1000 Index is an unmanaged index that consists of the 1,000 largest securities in the Russell 3000 Index.
5The JennisonDryden Asset Allocation (JDAA) Growth Custom Blend is a model portfolio consisting of the S&P 500 Index (9%), the S&P 500/Citigroup Growth Index (18%), the S&P 500/Citigroup Value Index (18%), the Russell 2500 Index (20%), the MSCI EAFE Index (25%), the Lehman Brothers U.S. Corporate High Yield Index (2%), and the Lehman Brothers Intermediate Government Index (8%). Each component of the JDAA Growth Custom Blend is an unmanaged index generally considered as representing the performance of its asset class. The JDAA Growth Custom Blend is intended to provide a theoretical comparison to the Fund’s performance, based on the amounts allocated to each asset class. The JDAA Growth Custom Blend does not reflect deductions for any sales charges, operating expenses of a mutual fund, or taxes.
6The Lipper Average represents returns based on the average return of all funds in the Lipper Multi-Cap Core Funds category. Funds in the Lipper Average invest in a variety of market capitalization ranges without concentrating 75% of their equity assets in any one market capitalization range over an extended period of time. Multi-cap funds typically have between 25% and 75% of their assets invested in companies with market capitalizations (on a three-year weighted basis) above 300% of the dollar-weighted median market capitalization of the middle 1,000 securities of the S&P SuperComposite 1500 Index. Multi-cap core funds have more latitude in the companies in which they invest. These funds typically have an average price-to-earnings ratio, price-to-book ratio, and three-year sales-per-share growth value compared to the S&P SuperComposite 1500 Index.
Investors cannot invest directly in an index. The returns for the S&P 500 Index, Russell 1000 Index, and JDAA Growth Custom Blend would be lower if they included the effects of sales charges, operating expenses of a mutual fund, or taxes. Returns for the Lipper Average reflect the deduction of operating expenses, but not sales charges or taxes.
| | |
| JennisonDryden Asset Allocation Funds | | 13 |
Performance Target—JDAA Growth Custom Blend
The JennisonDryden Growth Allocation Fund seeks to exceed a performance target—the JDAA Growth Custom Blend—consisting of a weighted average return of seven securities indexes that are generally considered representative of the asset classes in which the Fund may invest. The chart below shows both the total returns of these indexes for the six-month period ended March 31, 2006, and their weightings in the JennisonDryden Growth Custom Blend. Index returns do not reflect sales charges, a mutual fund’s operating expenses, or taxes, and investors cannot invest directly in an index. The JennisonDryden Growth Allocation Fund seeks to exceed this target by holding positions in specific JennisonDryden Mutual Funds. In response to market developments, the Fund’s Investment advisor may vary its holdings in those funds (within specified ranges). Past performance is not indicative of future results.
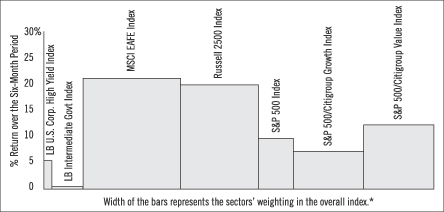
Source: Lipper Inc.
The S&P 500/Citigroup Value Index contains the market-weighted half of the S&P 500 Index with lower book-to-price ratios.
The S&P 500/Citigroup Growth Index contains the market-weighted half of the S&P 500 Index with higher book-to-price ratios.
The S&P 500 Index is an unmanaged index of 500 stocks of large U.S. public companies. It gives a broad look at how U.S. stock prices have performed.
The Russell 2500 Index includes the smallest 2,500 securities in the Russell 3000 Index. The Russell 3000 Index represents approximately 98% of the U.S. equity market.
The Morgan Stanley Capital International Europe, Australasia, and Far East Index (MSCI EAFE Index) is an unmanaged, weighted index that reflects stock price movements in Europe, Australasia, and the Far East. It gives a broad look at how foreign stock prices have performed.
The Lehman Brothers Intermediate Government Index is an unmanaged index of investment-grade securities issued by the U.S. government and its agencies with between 1 and less than 10 years remaining to maturity. It gives a broad look at how short- and intermediate-term bonds have performed.
The Lehman Brothers U.S. Corporate High Yield Index is an unmanaged index of fixed-rate, below-investment-grade debt securities with at least one year remaining to maturity. The Lehman Brothers U.S. Corporate High Yield Index gives a broad look at how high yield (“junk”) bonds have performed.
| | |
| 14 | | Visit our website at www.jennisondryden.com |
Fees and Expenses (Unaudited)
As a shareholder of a Fund, you incur two types of costs: (1) transaction costs, including sales charges (loads) on purchase payments and redemptions, as applicable, and (2) ongoing costs, including management fees, distribution and/or service (12b-1) fees, and other Fund expenses, as applicable. This example is intended to help you understand your ongoing costs (in dollars) of investing in the Funds and to compare these costs with the ongoing costs of investing in other mutual funds.
The example is based on an investment of $1,000 invested on October 1, 2005, at the beginning of the period, and held through the six-month period ended March 31, 2006.
The Fund’s transfer agent may charge additional fees to holders of certain accounts that are not included in the expenses shown in the table on the following page. These fees apply to Individual Retirement Accounts (IRAs) and Section 403(b) accounts. As of the close of the six-month period covered by the table, IRA fees included an annual maintenance fee of $15 per account (subject to a maximum annual maintenance fee of $25 for all accounts held by the same shareholder). Section 403(b) accounts are charged an annual $25 fiduciary maintenance fee. Some of the fees may vary in amount, or may be waived, based on your total account balance or the number of JennisonDryden or Strategic Partners Funds, including the Fund, that you own. You should consider the additional fees that were charged to your Fund account over the six-month period when you estimate the total ongoing expenses paid over the period and the impact of these fees on your ending account value, as these additional expenses are not reflected in the information provided in the expense table. Additional fees have the effect of reducing investment returns.
Actual Expenses
The first line for each share class in the table on the following page provides information about actual account values and actual expenses. You may use the information on this line, together with the amount you invested, to estimate the expenses that you paid over the period. Simply divide your account value by $1,000 (for example, an $8,600 account value ÷ $1,000 = 8.6), then multiply the result by the number on the first line under the heading “Expenses Paid During the Six-Month Period” to estimate the expenses you paid on your account during this period.
Hypothetical Example for Comparison Purposes
The second line for each share class in the table on the following page provides information about hypothetical account values and hypothetical expenses based on the Fund’s actual expense ratio and an assumed rate of return of 5% per year before expenses, which is not the Fund’s actual return. The hypothetical account values and
| | |
| JennisonDryden Asset Allocation Funds | | 15 |
Fees and Expenses (continued)
expenses may not be used to estimate the actual ending account balance or expenses you paid for the period. You may use this information to compare the ongoing costs of investing in the Fund and other funds. To do so, compare this 5% hypothetical example with the 5% hypothetical examples that appear in the shareholder reports of the other funds.
Please note that the expenses shown in the tables are meant to highlight your ongoing costs only, and do not reflect any transactional costs such as sales charges (loads). Therefore the second line for each share class in the table is useful in comparing ongoing costs only, and will not help you determine the relative total costs of owning different funds. In addition, if these transactional costs were included, your costs would have been higher.
| | | | | | | | | | | | | | |
JennisonDryden
Conservative
Allocation Fund | | Beginning Account
Value
October 1, 2005 | | Ending Account
Value
March 31, 2006 | | Annualized
Expense Ratio
Based on the
Six-Month Period | | | Expenses Paid
During the
Six-Month Period* |
| | | | | | | | | | | | | | | |
| Class A | | Actual | | $ | 1,000.00 | | $ | 1,043.00 | | 0.75 | % | | $ | 3.82 |
| | | Hypothetical | | $ | 1,000.00 | | $ | 1,021.19 | | 0.75 | % | | $ | 3.78 |
| | | | | | | | | | | | | | | |
| Class B | | Actual | | $ | 1,000.00 | | $ | 1,038.10 | | 1.50 | % | | $ | 7.62 |
| | | Hypothetical | | $ | 1,000.00 | | $ | 1,017.45 | | 1.50 | % | | $ | 7.54 |
| | | | | | | | | | | | | | | |
| Class C | | Actual | | $ | 1,000.00 | | $ | 1,039.00 | | 1.50 | % | | $ | 7.63 |
| | | Hypothetical | | $ | 1,000.00 | | $ | 1,017.45 | | 1.50 | % | | $ | 7.54 |
| | | | | | | | | | | | | | | |
| Class Z | | Actual | | $ | 1,000.00 | | $ | 1,045.10 | | 0.50 | % | | $ | 2.55 |
| | | Hypothetical | | $ | 1,000.00 | | $ | 1,022.44 | | 0.50 | % | | $ | 2.52 |
| | | | | | | | | | | | | | | |
| | |
| 16 | | Visit our website at www.jennisondryden.com |
| | | | | | | | | | | | | | |
JennisonDryden
Moderate
Allocation Fund | | Beginning Account
Value
October 1, 2005 | | Ending Account
Value
March 31, 2006 | | Annualized
Expense Ratio
Based on the
Six-Month Period | | | Expenses Paid
During the
Six-Month Period* |
| | | | | | | | | | | | | | | |
| Class A | | Actual | | $ | 1,000.00 | | $ | 1,067.50 | | 0.75 | % | | $ | 3.87 |
| | | Hypothetical | | $ | 1,000.00 | | $ | 1,021.19 | | 0.75 | % | | $ | 3.78 |
| | | | | | | | | | | | | | | |
| Class B | | Actual | | $ | 1,000.00 | | $ | 1,062.90 | | 1.50 | % | | $ | 7.71 |
| | | Hypothetical | | $ | 1,000.00 | | $ | 1,017.45 | | 1.50 | % | | $ | 7.54 |
| | | | | | | | | | | | | | | |
| Class C | | Actual | | $ | 1,000.00 | | $ | 1,062,90 | | 1.50 | % | | $ | 7.71 |
| | | Hypothetical | | $ | 1,000.00 | | $ | 1,017.45 | | 1.50 | % | | $ | 7.54 |
| | | | | | | | | | | | | | | |
| Class Z | | Actual | | $ | 1,000.00 | | $ | 1,067.70 | | 0.50 | % | | $ | 2.58 |
| | | Hypothetical | | $ | 1,000.00 | | $ | 1,022.44 | | 0.50 | % | | $ | 2.52 |
| | | | | | | | | | | | | | | |
| | | | | | | | | | | | | | |
JennisonDryden
Growth
Allocation Fund | | Beginning Account Value October 1, 2005 | | Ending Account
Value March 31, 2006 | | Annualized
Expense Ratio
Based on the
Six-Month Period | | | Expenses Paid
During the
Six-Month Period* |
| | | | | | | | | | | | | | | |
| Class A | | Actual | | $ | 1,000.00 | | $ | 1,094.30 | | 0.75 | % | | $ | 3.92 |
| | | Hypothetical | | $ | 1,000.00 | | $ | 1,021.19 | | 0.75 | % | | $ | 3.78 |
| | | | | | | | | | | | | | | |
| Class B | | Actual | | $ | 1,000.00 | | $ | 1,090.20 | | 1.50 | % | | $ | 7.82 |
| | | Hypothetical | | $ | 1,000.00 | | $ | 1,017.45 | | 1.50 | % | | $ | 7.54 |
| | | | | | | | | | | | | | | |
| Class C | | Actual | | $ | 1,000.00 | | $ | 1,089.30 | | 1.50 | % | | $ | 7.81 |
| | | Hypothetical | | $ | 1,000.00 | | $ | 1,017.45 | | 1.50 | % | | $ | 7.54 |
| | | | | | | | | | | | | | | |
| Class Z | | Actual | | $ | 1,000.00 | | $ | 1,094.20 | | 0.50 | % | | $ | 2.61 |
| | | Hypothetical | | $ | 1,000.00 | | $ | 1,022.44 | | 0.50 | % | | $ | 2.52 |
| | | | | | | | | | | | | | | |
* Fund expenses (net of fee waivers or subsidies, if any) for each share class are equal to the annualized expense ratio for each share class (provided in the table), multiplied by the average account value over the period, multiplied by the 182 days in the six-month period ended March 31, 2006, and divided by the 365 days in the Fund’s fiscal year ending September 30, 2006 (to reflect the six-month period).
| | |
| JennisonDryden Asset Allocation Funds | | 17 |
This Page Intentionally Left Blank
JennisonDryden Conservative Allocation Fund
Schedule of Investments
as of March 31, 2006 (Unaudited)
| | | | | | |
| Description | | Shares | | Value (Note 1) | |
LONG-TERM INVESTMENTS 96.3% | | | | | | |
| | |
Affiliated Registered Investment Companies | | | | | | |
Dryden Government Income Fund, Inc. (Class Z) | | 509,983 | | $ | 4,452,156 | |
Dryden High Yield Fund, Inc. (Class Z) | | 168,123 | | | 959,982 | |
Dryden International Equity Fund (Class Z) | | 276,460 | | | 2,203,388 | |
Dryden Large-Cap Core Equity Fund (Class Z) | | 83,457 | | | 1,028,192 | |
Dryden Short-Term Corporate Bond Fund (Class Z) | | 360,679 | | | 3,873,695 | |
Dryden Ultra Short Bond Fund (Class Z) | | 139,447 | | | 1,345,664 | |
Jennison 20/20 Focus Fund (Class Z) | | 62,820 | | | 1,014,550 | |
Jennison Equity Opportunity Fund (Class Z) | | 22,293 | | | 389,460 | |
Jennison Growth Fund (Class Z) | | 92,044 | | | 1,550,024 | |
Jennison U.S. Emerging Growth Fund, Inc. (Class Z) | | 17,099 | | | 382,677 | |
Jennison Value Fund (Class Z) | | 72,792 | | | 1,541,015 | |
| | | | |
|
|
|
Total long-term investments
(cost $17,362,740) | | | | | 18,740,803 | |
| | | | |
|
|
|
SHORT-TERM INVESTMENT 4.1% | | | | | | |
| | |
Affiliated Money Market Mutual Fund | | | | | | |
Dryden Core Investment Fund-Taxable Money Market Series
(cost $804,096; Note 3) | | 804,096 | | | 804,096 | |
| | | | |
|
|
|
Total Investments(a) 100.4%
(cost $18,166,836; Note 5) | | | | | 19,544,899 | |
Liabilities in excess of other assets (0.4%) | | | | | (78,310 | ) |
| | | | |
|
|
|
Total Net Assets 100.0% | | | | $ | 19,466,589 | |
| | | | |
|
|
|
| (a) | Prudential Investments LLC, the manager of the Fund, also serves as manager of the underlying funds in which the Fund invests. |
See Notes to Financial Statements.
| | |
| JennisonDryden Asset Allocation Funds | | 19 |
JennisonDryden Conservative Allocation Fund
Schedule of Investments
as of March 31, 2006 (Unaudited)
The investment allocation of portfolio holdings and liabilities in excess of other assets shown as a percentage of net assets as of March 31, 2006 were as follows:
| | | |
Short-Term Debt | | 26.8 | % |
U.S. Government Debt | | 22.9 | |
International | | 11.3 | |
Large-Cap Core | | 10.5 | |
Large-Cap Growth | | 8.0 | |
Large-Cap Value | | 7.9 | |
High Yield | | 4.9 | |
Multi-Cap Value | | 2.0 | |
Small/Mid-Cap Growth | | 2.0 | |
| | |
|
|
| | | 96.3 | |
Short-Term Investments | | 4.1 | |
Liabilities in excess of other assets | | (0.4 | ) |
| | |
|
|
| | | 100.0 | % |
| | |
|
|
See Notes to Financial Statements.
| | |
| 20 | | Visit our website at www.jennisondryden.com |
JennisonDryden Moderate Allocation Fund
Portfolio of Investments
as of March 31, 2006 (Unaudited)
| | | | | |
| Description | | Shares | | Value (Note 1) |
LONG-TERM INVESTMENTS 96.7% | | | | | |
| | |
Affiliated Registered Investment Companies | | | | | |
Dryden Government Income Fund, Inc. (Class Z) | | 856,932 | | $ | 7,481,018 |
Dryden High Yield Fund, Inc. (Class Z) | | 428,488 | | | 2,446,665 |
Dryden International Equity Fund (Class Z) | | 1,457,692 | | | 11,617,805 |
Dryden Large-Cap Core Equity Fund (Class Z) | | 357,233 | | | 4,401,110 |
Dryden Short-Term Corporate Bond Fund, Inc. (Class Z) | | 675,715 | | | 7,257,179 |
Dryden Small-Cap Core Equity Fund, Inc. (Class Z) | | 89,363 | | | 1,793,506 |
Dryden Ultra Short Bond Fund (Class Z) | | 61,565 | | | 594,102 |
Jennison 20/20 Focus Fund (Class Z) | | 303,522 | | | 4,901,885 |
Jennison Equity Opportunity Fund (Class Z) | | 100,861 | | | 1,762,045 |
Jennison Growth Fund (Class Z) | | 463,592 | | | 7,806,882 |
Jennison U.S. Emerging Growth Fund, Inc. (Class Z) | | 69,600 | | | 1,557,642 |
Jennison Value Fund (Class Z) | | 339,499 | | | 7,187,204 |
| | | | |
|
|
Total long-term investments
(cost $51,393,410) | | | | | 58,807,043 |
| | | | |
|
|
SHORT-TERM INVESTMENT 2.9% | | | | | |
| | |
Affiliated Money Market Mutual Fund | | | | | |
Dryden Core Investment Fund-Taxable Money Market Series
(cost $1,770,438; Note 3) | | 1,770,438 | | | 1,770,438 |
| | | | |
|
|
Total Investments(a) 99.6%
(cost $53,163,848; Note 5) | | | | | 60,577,481 |
Other assets in excess of liabilities 0.4% | | | | | 264,708 |
| | | | |
|
|
Net Assets 100.0% | | | | $ | 60,842,189 |
| | | | |
|
|
| (a) | Prudential Investments LLC, the manager of the Fund, also serves as manager of the underlying funds in which the Fund invests. |
See Notes to Financial Statements.
| | |
| JennisonDryden Asset Allocation Funds | | 21 |
JennisonDryden Moderate Allocation Fund
Portfolio of Investments
as of March 31, 2006 (Unaudited)
The investment allocation of portfolio holdings and other assets in excess of liabilities shown as a percentage of net assets as of March 31, 2006 were as follows:
| | | |
International | | 19.2 | % |
Large-Cap Core | | 15.3 | |
Short-Term Debt | | 12.9 | |
Large-Cap Growth | | 12.8 | |
U.S. Government Debt | | 12.3 | |
Large-Cap Value | | 11.8 | |
High Yield | | 4.0 | |
Multi-Cap Value | | 2.9 | |
Small-Cap Core | | 2.9 | |
Small/Mid-Cap Growth | | 2.6 | |
| | |
|
|
| | | 96.7 | |
Short-Term Investments | | 2.9 | |
Other assets in excess of liabilities | | 0.4 | |
| | |
|
|
| | | 100.0 | % |
| | |
|
|
See Notes to Financial Statements.
| | |
| 22 | | Visit our website at www.jennisondryden.com |
JennisonDryden Growth Allocation Fund
Portfolio of Investments
as of March 31, 2006 (Unaudited)
| | | | | | |
| Description | | Shares | | Value (Note 1) | |
LONG-TERM INVESTMENTS 97.5% | | | | | | |
| | |
Affiliated Registered Investment Companies | | | | | | |
Dryden International Equity Fund (Class Z) | | 1,072,599 | | $ | 8,548,610 | |
Dryden Large-Cap Core Equity Fund (Class Z) | | 235,930 | | | 2,906,653 | |
Dryden Small-Cap Core Equity Fund, Inc. (Class Z) | | 110,610 | | | 2,219,943 | |
Dryden Total Return Bond Fund, Inc. (Class Z) | | 127,541 | | | 1,585,339 | |
Jennison 20/20 Focus Fund (Class Z) | | 200,143 | | | 3,232,315 | |
Jennison Equity Opportunity Fund (Class Z) | | 90,560 | | | 1,582,092 | |
Jennison Growth Fund (Class Z) | | 333,705 | | | 5,619,589 | |
Jennison U.S. Emerging Growth Fund, Inc. (Class Z) | | 55,400 | | | 1,239,858 | |
Jennison Value Fund (Class Z) | | 194,085 | | | 4,108,775 | |
| | | | |
|
|
|
Total long-term investments
(cost $25,666,965) | | | | | 31,043,174 | |
| | | | |
|
|
|
SHORT-TERM INVESTMENT 2.9% | | | | | | |
| | |
Affiliated Money Market Mutual Fund | | | | | | |
Dryden Core Investment Fund-Taxable Money Market Series
(cost $933,336; Note 3) | | 933,336 | | | 933,336 | |
| | | | |
|
|
|
Total Investments(a) 100.4%
(cost $26,600,301; Note 5) | | | | | 31,976,510 | |
Liabilities in excess of other assets (0.4%) | | | | | (145,957 | ) |
| | | | |
|
|
|
Net Assets 100.0% | | | | $ | 31,830,553 | |
| | | | |
|
|
|
| (a) | Prudential Investments LLC, the manager of the Fund, also serves as manager of the underlying funds in which the Fund invests. |
See Notes to Financial Statements.
| | |
| JennisonDryden Asset Allocation Funds | | 23 |
JennisonDryden Growth Allocation Fund
Portfolio of Investments
as of March 31, 2006 (Unaudited)
The investment allocation of portfolio holdings and liabilities in excess of other assets shown as a percentage of net assets as of March 31, 2006 were as follows:
| | | |
International | | 26.8 | % |
Large-Cap Core | | 19.3 | |
Large-Cap Growth | | 17.6 | |
Large-Cap Value | | 12.9 | |
Small-Cap Core | | 7.0 | |
Multi-Cap Value | | 5.0 | |
Multi-Sector Debt | | 5.0 | |
Small/Mid-Cap Growth | | 3.9 | |
| | |
|
|
| | | 97.5 | |
Short-Term Investments | | 2.9 | |
Liabilities in excess of other assets | | (0.4 | ) |
| | |
|
|
| | | 100.0 | % |
| | |
|
|
See Notes to Financial Statements.
| | |
| 24 | | Visit our website at www.jennisondryden.com |
Financial Statements
| | |
| MARCH 31, 2006 | | SEMIANNUAL REPORT |
JennisonDryden Asset Allocation Funds
Statement of Assets and Liabilities
as of March 31, 2006 (Unaudited)
| | | |
| | | JennisonDryden
Conservative
Allocation Fund |
Assets | | | |
Affiliated investments, at value (cost $18,166,836) | | $ | 19,544,899 |
Receivable for Fund shares sold | | | 211,717 |
Dividends receivable | | | 13,130 |
Receivable due from Manager | | | 1,519 |
Prepaid expenses | | | 199 |
| | |
|
|
Total assets | | | 19,771,464 |
| | |
|
|
| |
Liabilities | | | |
Payable to custodian | | | 222,791 |
Accrued expenses | | | 51,361 |
Payable for Fund shares reacquired | | | 15,048 |
Distribution fee payable | | | 10,802 |
Transfer agent fee payable | | | 4,206 |
Deferred directors’ fees | | | 667 |
| | |
|
|
Total liabilities | | | 304,875 |
| | |
|
|
| |
Net Assets | | $ | 19,466,589 |
| | |
|
|
| | | | |
Net assets were comprised of: | | | |
Common stock, at par | | $ | 1,762 |
Paid-in capital in excess of par | | | 17,929,595 |
| | |
|
|
| | | | 17,931,357 |
Undistributed net investment income | | | 48,239 |
Accumulated net realized gain on investment transactions | | | 108,930 |
Net unrealized appreciation on investments | | | 1,378,063 |
| | |
|
|
Net assets, March 31, 2006 | | $ | 19,466,589 |
| | |
|
|
See Notes to Financial Statements.
| | |
| 26 | | Visit our website at www.jennisondryden.com |
| | | |
| | | JennisonDryden
Conservative
Allocation Fund |
Class A | | | |
Net asset value and redemption price per share ($8,534,361 ÷ 771,253 shares of common stock issued and outstanding) | | $ | 11.07 |
Maximum sales charge (5.50% of offering price) | | | .64 |
| | |
|
|
Maximum offering price to public | | $ | 11.71 |
| | |
|
|
| |
Class B | | | |
Net asset value, offering price and redemption price per share ($8,970,700 ÷ 812,984 shares of common stock issued and outstanding) | | $ | 11.03 |
| | |
|
|
| |
Class C | | | |
Net asset value, offering price and redemption price per share ($1,916,879 ÷ 173,718 shares of common stock issued and outstanding) | | $ | 11.03 |
| | |
|
|
| |
Class Z | | | |
Net asset value, offering price and redemption price per share ($44,649 ÷ 4,022 shares of common stock issued and outstanding) | | $ | 11.10 |
| | |
|
|
See Notes to Financial Statements.
| | |
| JennisonDryden Asset Allocation Funds | | 27 |
Statement of Assets and Liabilities
as of March 31, 2006 (Unaudited)
| | | | |
| | | JennisonDryden
Moderate
Allocation Fund | |
Assets | | | | |
Affiliated investments, at value (cost $53,163,848) | | $ | 60,577,481 | |
Cash | | | 1 | |
Receivable for Fund shares sold | | | 499,429 | |
Dividends receivable | | | 23,921 | |
Prepaid expenses | | | 618 | |
| | |
|
|
|
Total assets | | | 61,101,450 | |
| | |
|
|
|
| |
Liabilities | | | | |
Accrued expenses | | | 101,096 | |
Payable for Fund shares reacquired | | | 97,844 | |
Distribution fee payable | | | 34,296 | |
Transfer agent fee payable | | | 14,549 | |
Management fee payable | | | 10,807 | |
Deferred directors’ fees | | | 669 | |
| | |
|
|
|
Total liabilities | | | 259,261 | |
| | |
|
|
|
| |
Net Assets | | $ | 60,842,189 | |
| | |
|
|
|
| | | | | |
Net assets were comprised of: | | | | |
Common stock, at par | | $ | 50,933 | |
Paid-in capital in excess of par | | | 52,842,034 | |
| | |
|
|
|
| | | | 52,892,967 | |
Distributions in excess of net investment income | | | (152,638 | ) |
Accumulated net realized gain on investment transactions | | | 688,227 | |
Net unrealized appreciation on investments | | | 7,413,633 | |
| | |
|
|
|
Net assets, March 31, 2006 | | $ | 60,842,189 | |
| | |
|
|
|
See Notes to Financial Statements.
| | |
| 28 | | Visit our website at www.jennisondryden.com |
| | | |
| | | JennisonDryden
Moderate
Allocation Fund |
Class A | | | |
Net asset value and redemption price per share
($24,382,654 ÷ 2,040,530 shares of common stock issued and outstanding) | | $ | 11.95 |
Maximum sales charge (5.50% of offering price) | | | .70 |
| | |
|
|
Maximum offering price to public | | $ | 12.65 |
| | |
|
|
| |
Class B | | | |
Net asset value, offering price and redemption price per share
($28,348,386 ÷ 2,374,079 shares of common stock issued and outstanding) | | $ | 11.94 |
| | |
|
|
| |
Class C | | | |
Net asset value, offering price and redemption price per share
($6,716,487 ÷ 562,080 shares of common stock issued and outstanding) | | $ | 11.95 |
| | |
|
|
| |
Class Z | | | |
Net asset value, offering price and redemption price per share
($1,394,662 ÷ 116,627 shares of common stock issued and outstanding) | | $ | 11.96 |
| | |
|
|
See Notes to Financial Statements.
| | |
| JennisonDryden Asset Allocation Funds | | 29 |
Statement of Assets and Liabilities
as of March 31, 2006 (Unaudited)
| | | | |
| | | JennisonDryden
Growth
Allocation Fund | |
Assets | | | | |
Affiliated Investments, at value (cost $26,600,301) | | $ | 31,976,510 | |
Receivable for Fund shares sold | | | 182,188 | |
Dividends receivable | | | 2,907 | |
Prepaid expenses | | | 454 | |
| | |
|
|
|
Total assets | | | 32,162,059 | |
| | |
|
|
|
| |
Liabilities | | | | |
Payable to custodian | | | 183,843 | |
Accrued expenses | | | 59,273 | |
Payable for Fund shares reacquired | | | 58,107 | |
Distribution fee payable | | | 19,062 | |
Transfer agent fee payable | | | 5,333 | |
Management fee payable | | | 5,221 | |
Deferred directors’ fees | | | 667 | |
| | |
|
|
|
Total liabilities | | | 331,506 | |
| | |
|
|
|
| |
Net Assets | | $ | 31,830,553 | |
| | |
|
|
|
| | | | | |
Net assets were comprised of: | | | | |
Common stock, at par | | $ | 2,455 | |
Paid-in capital in excess of par | | | 26,139,267 | |
| | |
|
|
|
| | | | 26,141,722 | |
Accumulated net investment loss | | | (85,114 | ) |
Accumulated net realized gain on investment transactions | | | 397,736 | |
Net unrealized appreciation on investments | | | 5,376,209 | |
| | |
|
|
|
Net assets, March 31, 2006 | | $ | 31,830,553 | |
| | |
|
|
|
See Notes to Financial Statements.
| | |
| 30 | | Visit our website at www.jennisondryden.com |
| | | |
| | | JennisonDryden
Growth
Allocation Fund |
Class A | | | |
Net asset value and redemption price per share | | | |
($11,006,620 ÷ 846,185 shares of common stock issued and outstanding) | | $ | 13.01 |
Maximum sales charge (5.50% of offering price) | | | .75 |
| | |
|
|
Maximum offering price to public | | $ | 13.76 |
| | |
|
|
| |
Class B | | | |
Net asset value, offering price and redemption price per share
($16,745,208 ÷ 1,293,616 shares of common stock issued and outstanding) | | $ | 12.94 |
| | |
|
|
| |
Class C | | | |
Net asset value, offering price and redemption price per share
($3,668,178 ÷ 283,197 shares of common stock issued and outstanding) | | $ | 12.95 |
| | |
|
|
| |
Class Z | | | |
Net asset value, offering price and redemption price per share
($410,547 ÷ 31,526 shares of common stock issued and outstanding) | | $ | 13.02 |
| | |
|
|
See Notes to Financial Statements.
| | |
| JennisonDryden Asset Allocation Funds | | 31 |
Statement of Operations
Six Months Ended March 31, 2006 (Unaudited)
| | | | |
| | | JennisonDryden
Conservative
Allocation Fund | |
Net Investment Income | | | | |
Income | | | | |
Affiliated dividend income | | $ | 270,041 | |
| | |
|
|
|
| |
Expenses | | | | |
Management fee | | | 17,557 | |
Distribution fee—Class A | | | 9,022 | |
Distribution fee—Class B | | | 42,307 | |
Distribution fee—Class C | | | 9,187 | |
Custodian’s fees and expenses | | | 25,000 | |
Transfer agent’s fees and expenses (including affiliated expense of $8,000) | | | 9,000 | |
Audit fee | | | 8,000 | |
Reports to shareholders | | | 5,000 | |
Directors’ fees | | | 5,000 | |
Legal fees and expenses | | | 2,000 | |
Miscellaneous | | | 1,846 | |
| | |
|
|
|
Total expenses | | | 133,919 | |
Less: Expense subsidy (Note 2) | | | (29,323 | ) |
| | |
|
|
|
Net expenses | | | 104,596 | |
| | |
|
|
|
Net investment income | | | 165,445 | |
| | |
|
|
|
| |
Net Realized And Unrealized Gain On Investments | | | | |
Net realized gain on investment transactions | | | 15,060 | |
Net capital gain distributions received | | | 112,081 | |
| | |
|
|
|
| | | | 127,141 | |
| | |
|
|
|
Net change in unrealized appreciation on investments | | | 409,013 | |
| | |
|
|
|
Net gain on investments | | | 536,154 | |
| | |
|
|
|
Net Increase In Net Assets Resulting From Operations | | $ | 701,599 | |
| | |
|
|
|
See Notes to Financial Statements.
| | |
| 32 | | Visit our website at www.jennisondryden.com |
Statement of Operations
Six Months Ended March 31, 2006 (Unaudited)
| | | | |
| | | JennisonDryden
Moderate
Allocation Fund | |
Net Investment Income | | | | |
Income | | | | |
Affiliated dividend income | | $ | 584,134 | |
| | |
|
|
|
| |
Expenses | | | | |
Management fee | | | 54,208 | |
Distribution fee—Class A | | | 26,750 | |
Distribution fee—Class B | | | 129,431 | |
Distribution fee—Class C | | | 29,550 | |
Transfer agent’s fees and expenses (including affiliated expense of $27,700) | | | 29,000 | |
Custodian’s fees and expenses | | | 27,000 | |
Legal fees and expenses | | | 9,000 | |
Audit fee | | | 8,000 | |
Directors’ fees | | | 6,000 | |
Reports to shareholders | | | 3,000 | |
Miscellaneous | | | 2,242 | |
| | |
|
|
|
Total expenses | | | 324,181 | |
Less: Expense subsidy (Note 2) | | | (2,941 | ) |
| | |
|
|
|
Net expenses | | | 321,240 | |
| | |
|
|
|
Net investment income | | | 262,894 | |
| | |
|
|
|
| |
Net Realized And Unrealized Gain On Investments | | | | |
Net realized gain on investment transactions | | | 29,112 | |
Net capital gain distributions received | | | 713,899 | |
| | |
|
|
|
| | | | 743,011 | |
| | |
|
|
|
Net change in unrealized appreciation on investments | | | 2,481,797 | |
| | |
|
|
|
Net gain on investments | | | 3,224,808 | |
| | |
|
|
|
Net Increase In Net Assets Resulting From Operations | | $ | 3,487,702 | |
| | |
|
|
|
See Notes to Financial Statements.
| | |
| JennisonDryden Asset Allocation Funds | | 33 |
Statement of Operations
Six Months Ended March 31, 2006 (Unaudited)
| | | | |
| | | JennisonDryden
Growth
Allocation Fund | |
Net Investment Loss | | | | |
Income | | | | |
Affiliated dividend income | | $ | 146,292 | |
| | |
|
|
|
| |
Expenses | | | | |
Management fee | | | 27,231 | |
Distribution fee—Class A | | | 11,148 | |
Distribution fee—Class B | | | 73,524 | |
Distribution fee—Class C | | | 15,912 | |
Custodian’s fees and expenses | | | 22,000 | |
Transfer agent’s fees and expenses (including affiliated expense of $16,327) | | | 17,000 | |
Audit fee | | | 8,000 | |
Directors’ fees | | | 5,000 | |
Legal fees and expenses | | | 5,000 | |
Reports to shareholders | | | 5,000 | |
Miscellaneous | | | 764 | |
| | |
|
|
|
Total expenses | | | 190,579 | |
Less: Expense subsidy (Note 2) | | | (21,914 | ) |
| | |
|
|
|
Net expenses | | | 168,665 | |
| | |
|
|
|
Net investment loss | | | (22,373 | ) |
| | |
|
|
|
| |
Net Realized And Unrealized Gain On Investments | | | | |
Net realized gain on investment transactions | | | 9,347 | |
Net capital gain distributions received | | | 403,227 | |
| | |
|
|
|
| | | | 412,574 | |
| | |
|
|
|
Net change in unrealized appreciation on investments | | | 2,004,833 | |
| | |
|
|
|
Net gain on investments | | | 2,417,407 | |
| | |
|
|
|
Net Increase In Net Assets Resulting From Operations | | $ | 2,395,034 | |
| | |
|
|
|
See Notes to Financial Statements.
| | |
| 34 | | Visit our website at www.jennisondryden.com |
Statement of Changes in Net Assets
(Unaudited)
| | | | | | | | |
| | | JennisonDryden Conservative Allocation Fund
| |
| | | Six Months
Ended
March 31, 2006 | | | Year Ended
September 30,
2005 | |
Increase (Decrease) In Net Assets | | | | | | | | |
Operations | | | | | | | | |
Net investment income | | $ | 165,445 | | | $ | 188,187 | |
Net realized gain on investment transactions | | | 127,141 | | | | 48,938 | |
Net change in unrealized appreciation on investments | | | 409,013 | | | | 927,770 | |
| | |
|
|
| |
|
|
|
Net increase in net assets resulting from operations | | | 701,599 | | | | 1,164,895 | |
| | |
|
|
| |
|
|
|
Dividends and distributions (Note 1) | | | | | | | | |
Dividends from net investment income | | | | | | | | |
Class A | | | (83,602 | ) | | | (75,002 | ) |
Class B | | | (66,731 | ) | | | (78,279 | ) |
Class C | | | (14,374 | ) | | | (19,723 | ) |
Class Z | | | (475 | ) | | | (7,987 | ) |
| | |
|
|
| |
|
|
|
| | | | (165,182 | ) | | | (180,991 | ) |
| | |
|
|
| |
|
|
|
Distributions from net realized gains | | | | | | | | |
Class A | | | (27,631 | ) | | | — | |
Class B | | | (30,267 | ) | | | — | |
Class C | | | (6,401 | ) | | | — | |
Class Z | | | (121 | ) | | | — | |
| | |
|
|
| |
|
|
|
| | | | (64,420 | ) | | | — | |
| | |
|
|
| |
|
|
|
| | |
Fund share transactions (Net of share conversions) (Note 6) | | | | | | | | |
Net proceeds from shares sold | | | 4,517,068 | | | | 8,484,987 | |
Net asset value of shares issued in reinvestment of dividends and distributions | | | 221,795 | | | | 174,274 | |
Cost of shares reacquired | | | (1,835,170 | ) | | | (2,956,426 | ) |
| | |
|
|
| |
|
|
|
Net increase in net assets from Fund share transactions | | | 2,903,693 | | | | 5,702,835 | |
| | |
|
|
| |
|
|
|
Total increase | | | 3,375,690 | | | | 6,686,739 | |
| | |
Net Assets | | | | | | | | |
Beginning of period | | | 16,090,899 | | | | 9,404,160 | |
| | |
|
|
| |
|
|
|
End of period(a) | | $ | 19,466,589 | | | $ | 16,090,899 | |
| | |
|
|
| |
|
|
|
(a) Includes undistributed net investment income of: | | $ | 48,239 | | | $ | 47,976 | |
| | |
|
|
| |
|
|
|
See Notes to Financial Statements.
| | |
| JennisonDryden Asset Allocation Funds | | 35 |
Statement of Changes in Net Assets
(Unaudited)
| | | | | | | | |
| | | JennisonDryden Moderate Allocation Fund
| |
| | | Six Months
Ended
March 31, 2006 | | | Year Ended
September 30,
2005 | |
Increase (Decrease) In Net Assets | | | | | | | | |
Operations | | | | | | | | |
Net investment income | | $ | 262,894 | | | $ | 242,322 | |
Net realized gain on investment transactions | | | 743,011 | | | | 151,494 | |
Net change in unrealized appreciation on investments | | | 2,481,797 | | | | 4,649,900 | |
| | |
|
|
| |
|
|
|
Net increase in net assets resulting from operations | | | 3,487,702 | | | | 5,043,716 | |
| | |
|
|
| |
|
|
|
Dividends and distributions (Note 1) | | | | | | | | |
Dividends from net investment income | | | | | | | | |
Class A | | | (208,785 | ) | | | (195,937 | ) |
Class B | | | (161,921 | ) | | | (72,492 | ) |
Class C | | | (36,946 | ) | | | (15,917 | ) |
Class Z | | | (7,211 | ) | | | (9,550 | ) |
| | |
|
|
| |
|
|
|
| | | | (414,863 | ) | | | (293,896 | ) |
| | |
|
|
| |
|
|
|
Distributions from net realized gains | | | | | | | | |
Class A | | | (67,763 | ) | | | — | |
Class B | | | (82,070 | ) | | | — | |
Class C | | | (18,726 | ) | | | — | |
Class Z | | | (2,101 | ) | | | — | |
| | |
|
|
| |
|
|
|
| | | | (170,660 | ) | | | — | |
| | |
|
|
| |
|
|
|
| | |
Fund share transactions (Net of share conversions) (Note 6) | | | | | | | | |
Net proceeds from shares sold | | | 12,843,377 | | | | 23,275,283 | |
Net asset value of shares issued in reinvestment of dividends and distributions | | | 569,814 | | | | 285,069 | |
Cost of shares reacquired | | | (4,652,840 | ) | | | (5,948,117 | ) |
| | |
|
|
| |
|
|
|
Net increase in net assets from Fund share transactions | | | 8,760,351 | | | | 17,612,235 | |
| | |
|
|
| |
|
|
|
Total increase | | | 11,662,530 | | | | 22,362,055 | |
| | |
Net Assets | | | | | | | | |
Beginning of period | | | 49,179,659 | | | | 26,817,604 | |
| | |
|
|
| |
|
|
|
End of period | | $ | 60,842,189 | | | $ | 49,179,659 | |
| | |
|
|
| |
|
|
|
See Notes to Financial Statements.
| | |
| 36 | | Visit our website at www.jennisondryden.com |
Statement of Changes in Net Assets
(Unaudited)
| | | | | | | | |
| | | JennisonDryden Growth Allocation Fund
| |
| | | Six Months
Ended
March 31, 2006 | | | Year Ended
September 30,
2005 | |
Increase (Decrease) In Net Assets | | | | | | | | |
Operations | | | | | | | | |
Net investment loss | | $ | (22,373 | ) | | $ | (97,673 | ) |
Net realized gain on investment transactions | | | 412,574 | | | | 73,525 | |
Net change in unrealized appreciation on investments | | | 2,004,833 | | | | 3,200,398 | |
| | |
|
|
| |
|
|
|
Net increase in net assets resulting from operations | | | 2,395,034 | | | | 3,176,250 | |
| | |
|
|
| |
|
|
|
Dividends and distributions (Note 1) | | | | | | | | |
Dividends from net investment income | | | | | | | | |
Class A | | | (57,726 | ) | | | (12,865 | ) |
Class Z | | | (4,348 | ) | | | (1,361 | ) |
| | |
|
|
| |
|
|
|
| | | | (62,074 | ) | | | (14,226 | ) |
| | |
|
|
| |
|
|
|
Distributions from net realized gains | | | | | | | | |
Class A | | | (7,999 | ) | | | — | |
Class B | | | (13,800 | ) | | | — | |
Class C | | | (2,948 | ) | | | — | |
Class Z | | | (440 | ) | | | — | |
| | |
|
|
| |
|
|
|
| | | | (25,187 | ) | | | — | |
| | |
|
|
| |
|
|
|
| | |
Fund share transactions (Net of share conversions) (Note 6) | | | | | | | | |
Net proceeds from shares sold | | | 6,936,985 | | | | 11,769,960 | |
Net asset value of shares issued in reinvestment of dividends | | | 86,831 | | | | 14,127 | |
Cost of shares reacquired | | | (1,815,430 | ) | | | (2,627,612 | ) |
| | |
|
|
| |
|
|
|
Net increase in net assets from Fund share transactions | | | 5,208,386 | | | | 9,156,475 | |
| | |
|
|
| |
|
|
|
Total increase | | | 7,516,159 | | | | 12,318,499 | |
| | |
Net Assets | | | | | | | | |
Beginning of period | | | 24,314,394 | | | | 11,995,895 | |
| | |
|
|
| |
|
|
|
End of period | | $ | 31,830,553 | | | $ | 24,314,394 | |
| | |
|
|
| |
|
|
|
See Notes to Financial Statements.
| | |
| JennisonDryden Asset Allocation Funds | | 37 |
Notes to Financial Statements
(Unaudited)
The Prudential Investment Portfolios, Inc. (the “Company”) is registered under the Investment Company Act of 1940 as an open-end management investment company. The Company was incorporated in Maryland on August 10, 1995 and consists of six series (“Fund” or “Funds”): Jennison Equity Opportunity Fund, Jennison Growth Fund, and Dryden Active Allocation Fund which are diversified funds and JennisonDryden Conservative Allocation Fund (“Conservative Allocation Portfolio”), JennisonDryden Moderate Allocation Fund (“Moderate Allocation Portfolio”) and JennisonDryden Growth Allocation Fund (“Growth Allocation Portfolio”) which are non-diversified. The inception date of the Conservative Allocation Portfolio, Moderate Allocation Portfolio and Growth Allocation Portfolio (collectively referred to as “Asset Allocation Portfolios”) was March 30, 2004.
The Conservative Allocation Portfolio’s investment objective is current income and a reasonable level of capital appreciation. The Moderate Allocation Portfolio’s investment objective is capital appreciation and a reasonable level of current income. The Growth Allocation Portfolio’s investment objective is long-term capital appreciation. Each Asset Allocation Portfolio seeks to achieve its objective by investing in a combination of mutual funds in the JennisonDryden mutual fund family (each, an underlying fund). Each portfolio in the Asset Allocation Portfolios is typically referred to as a “Fund of Funds” because it invests in other mutual funds. The Asset Allocation Portfolios may also invest directly in U.S. Government securities and money market instruments for cash management purposes or when assuming a defensive position.
Note 1. Accounting Policies
The following is a summary of significant accounting policies followed by the Company and the Asset Allocation Portfolios in the preparation of their financial statements.
Securities Valuation: Investments in the underlying funds are valued at the closing net asset value per share of each underlying fund as reported on each business day. Short-term investments maturing within sixty days or less are valued at amortized cost which approximates market value. The amortized cost method involves valuing a security at its cost on the date of purchase and thereafter assuming a constant amortization to maturity of the difference between the principal amount due at maturity and cost. Short-term securities which mature in more than sixty days are valued at current market value.
| | |
| 38 | | Visit our website at www.jennisondryden.com |
Securities Transactions and Net Investment Income: Securities transactions are recorded on the trade date. Realized gains or losses on sales of investments are calculated on the identified cost basis. Dividend income is recorded on the ex-dividend date. Expenses are recorded on the accrual basis.
Net Investment income or loss (other than distribution fees which are charged directly to the respective class) and unrealized and realized gains or losses are allocated daily to each class of shares based upon the relative proportion of net assets of each class at the beginning of the day.
Dividends and Distributions: Dividends will typically be distributed quarterly by the Conservative Allocation Portfolio, semi-annually by the Moderate Allocation Portfolio and annually by the Growth Allocation Portfolio. Each Asset Allocation Portfolio declares and pays its net realized capital gains, if any, at least annually. Dividends and distributions to shareholders, which are determined in accordance with federal income tax regulations and which may differ from generally accepted accounting principles, are recorded on the ex-dividend date. Permanent book/tax differences relating to income and gains are reclassified amongst undistributed net investment income, accumulated net realized gain or loss and paid-in capital in excess of par, as appropriate.
Taxes: For federal income tax purposes, each Fund in the Company is treated as a separate taxpaying entity. It is each of the Asset Allocation Portfolios’ policy to continue to meet the requirements of the Internal Revenue Code applicable to regulated investment companies and to distribute all of its net investment income and capital gains, if any, to its shareholders. Therefore, no federal income tax provision is required.
Estimates: The preparation of the financial statements requires management to make estimates and assumptions that affect the reported amounts and disclosures in the financial statements. Actual results could differ from those estimates.
Note 2. Agreements
The Company has a management agreement for the Asset Allocation Portfolios with Prudential Investments LLC (“PI”). Pursuant to this agreement, PI has responsibility for all investment advisory services and supervises the subadvisor’s performance of such services. PI has entered into a subadvisory agreement with Prudential Investment Management, Inc. (“PIM”). The subadvisory agreement provides that PIM furnishes investment advisory services in connection with the management of the Asset Allocation Portfolios. In connection therewith, PIM is obligated to keep certain books and records of the Asset Allocation Portfolios. PI pays for the services of PIM, the
| | |
| JennisonDryden Asset Allocation Funds | | 39 |
Notes to Financial Statements
(Unaudited) Cont’d
compensation of officers of the Asset Allocation Portfolios, occupancy and certain clerical and bookkeeping costs of the Asset Allocation Portfolios. The Asset Allocation Portfolios bear all other costs and expenses.
The management fee paid to PI is computed daily and payable monthly at an annual rate of .20 of 1% of each of the Asset Allocation Portfolios’ daily average net assets. The effective management fee rate was .20 of 1% of each of the Asset Allocation Portfolio’s daily average net assets.
The Asset Allocation Portfolios have a distribution agreement with Prudential Investment Management Services LLC (“PIMS”), which acts as the distributor of the Class A, Class B, Class C and Class Z shares of the Asset Allocation Portfolios. The Asset Allocation Portfolios compensate PIMS for distributing and servicing the Asset Allocation Portfolios’ Class A, B and C shares, pursuant to plans of distribution (the “Class A, B and C Plans”), regardless of expenses actually incurred by PIMS. The distribution fees are accrued daily and payable monthly. No distribution or service fees are paid to PIMS as distributor of the Class Z shares of the Asset Allocation Portfolios.
Pursuant to the Class A, B and C Plans, the Asset Allocation Portfolios compensate PIMS for distribution-related activities at an annual rate of up to .30 of 1%, 1% and 1% of the average daily net assets of the Class A, B and C shares, respectively. PIMS contractually agreed to limit such fees to .25 of 1% of the average daily net assets of the Class A shares.
PI has contractually agreed to limit the net annual operating expenses (exclusive of distribution and service (12b-1) fees and underlying fund fees and expenses) of each class of shares of the Asset Allocation Portfolios to .50 of 1% of each Asset Allocation Portfolios’ average daily net assets for the six months ended March 31, 2006.
PIMS has advised the Asset Allocation Portfolios of its receipt of front-end sales charges resulting from sales of Class A shares during the six months ended March 31, 2006. These amounts were approximately as follows:
| | | |
Portfolio
| | Class A
|
Conservative Allocation Portfolio | | $ | 55,400 |
Moderate Allocation Portfolio | | | 171,900 |
Growth Allocation Portfolio | | | 110,300 |
| | |
| 40 | | Visit our website at www.jennisondryden.com |
From these fees, PIMS paid such sales charges to dealers, which in turn paid commissions to salespersons and incurred other distribution costs.
PIMS has advised the Asset Allocation Portfolios of its receipt of contingent deferred sales charges imposed upon certain redemptions by certain Class B and Class C shareholders for the six months ended March 31, 2006. These amounts were approximately as follows:
| | | | | | |
Portfolio
| | Class B
| | Class C
|
Conservative Allocation Portfolio | | $ | 8,000 | | $ | 900 |
Moderate Allocation Portfolio | | | 26,000 | | | 500 |
Growth Allocation Portfolio | | | 14,200 | | | 800 |
PI, PIM and PIMS are indirect, wholly-owned subsidiaries of Prudential Financial, Inc. (“Prudential”).
The Asset Allocation Portfolios, along with other affiliated registered investment companies (the “Portfolios”), is a party to a syndicated credit agreement (“SCA”) with two banks. The SCA provides for a commitment of $500 million. Interest on any borrowings under the SCA would be incurred at market rates. For the period from October 29, 2004 through October 28, 2005, the Portfolios paid a commitment fee of .075 of 1% of the unused portion of the agreement. Effective October 29, 2005, the Portfolios renewed the SCA with the banks. The commitment under the renewed SCA continues to be $500 million. The Portfolios pays a commitment fee of .0725 of 1% of the unused portion of the renewed SCA. The commitment fee is accrued daily and paid quarterly and is allocated to the Portfolios pro-rata based on net assets. The purpose of the SCA is to serve as an alternative source of funding for capital share redemptions. The expiration date of the renewed SCA is October 27, 2006. The Asset Allocation Portfolios did not borrow any amounts pursuant to the SCA during the six months ended March 31, 2006.
Note 3. Other Transactions With Affiliates
Prudential Mutual Fund Services LLC (“PMFS”), an affiliate of PI and an indirect, wholly-owned subsidiary of Prudential, serves as the Company’s transfer agent. Transfer agent fees and expenses in the Statement of Operations include certain out of pocket expenses paid to non-affiliates.
The Asset Allocation Portfolios pay networking fees to affiliated and unaffiliated broker/dealers. These networking fees are payments made to broker/dealers that clear mutual fund transactions through a national clearing system. These amounts are included in the transfer agent fees and expenses in the Statement of Operations.
| | |
| JennisonDryden Asset Allocation Funds | | 41 |
Notes to Financial Statements
(Unaudited) Cont’d
The Asset Allocation Portfolios invest in the Taxable Money Market Series (the “Series”), a portfolio of the Dryden Core Investment Fund, pursuant to an exemptive order received from the Securities and Exchange Commission. The Series is a money market mutual fund registered under the Investment Company Act of 1940, as amended, and managed by PI.
Note 4. Portfolio Securities
Purchases and sales of investment securities other than short-term investments, for the six months ended March 31, 2006 were as follows:
| | | | |
Portfolios
| | Purchases
| | Sales
|
Conservative Allocation Portfolio | | $4,847,596 | | $2,295,000 |
Moderate Allocation Portfolio | | 12,315,946 | | 4,150,000 |
Growth Allocation Portfolio | | 6,211,444 | | 920,000 |
Note 5. Tax Information
The United States federal income tax basis and unrealized appreciation of the Asset Allocation Portfolios’ investments as of March 31, 2006 were as follows:
| | | | | | | | | | | | |
Portfolios
| | Tax Basis
| | Appreciation
| | Depreciation
| | Net Unrealized
Appreciation
|
Conservative Allocation Portfolio | | $ | 18,237,728 | | $ | 1,576,465 | | $ | 269,294 | | $ | 1,307,171 |
Moderate Allocation Portfolio | | | 53,235,453 | | | 7,877,541 | | | 535,513 | | | 7,342,028 |
Growth Allocation Portfolio | | | 26,639,426 | | | 5,372,833 | | | 35,749 | | | 5,337,084 |
The difference between book basis and tax basis was primarily attributable to deferred losses on wash sales.
| | |
| 42 | | Visit our website at www.jennisondryden.com |
Note 6. Capital
The Company offers Class A, Class B, Class C and Class Z shares. There are 6.25 billion shares of $.001 par value of common stock of the Company authorized which are divided into six series and four classes, designated Class A, Class B, Class C and Class Z. Each class of par value shares represents an interest in the same assets of the Company and is identical in all respects except that (1) each class is subject to different sales charges and distribution and/or service fees (except for Class Z shares, which are not subject to any sales charges and distribution and/or services fees), which may affect performance, (2) each class has exclusive voting rights on any matter submitted to shareholders that relates solely to its arrangement and has separate voting rights on any matter submitted to shareholders in which the interests of one class differ from the interests of any other class, (3) each class has a different exchange privilege, (4) only Class B shares have a conversion feature and (5) Class Z shares are offered exclusively for sale to a limited group of investors. As of March 31, 2006 Prudential owned one share of Class A, B, C and Z shares of the Conservative Allocation Portfolio, Moderate Allocation Portfolio and Growth Allocation Portfolio.
Transactions in shares of common stock were as follows:
Conservative Allocation Portfolio:
| | | | | | | |
Class A
| | Shares
| | | Amount
| |
Six Months ended March 31, 2006: | | | | | | | |
Shares sold | | 253,368 | | | $ | 2,759,897 | |
Shares issued in reinvestment of dividends and distributions | | 9,869 | | | | 106,352 | |
Shares reacquired | | (63,413 | ) | | | (691,468 | ) |
| | |
|
| |
|
|
|
Net increase (decrease) in shares outstanding before conversion | | 199,824 | | | | 2,174,781 | |
Shares issued upon conversion from Class B | | 21,331 | | | | 233,573 | |
| | |
|
| |
|
|
|
Net increase (decrease) in shares outstanding | | 221,155 | | | $ | 2,408,354 | |
| | |
|
| |
|
|
|
Year ended September 30, 2005: | | | | | | | |
Shares sold | | 353,390 | | | $ | 3,671,482 | |
Shares issued in reinvestment of dividends | | 6,995 | | | | 71,997 | |
Shares reacquired | | (85,371 | ) | | | (892,132 | ) |
| | |
|
| |
|
|
|
Net increase (decrease) in shares outstanding before conversion | | 275,014 | | | | 2,851,347 | |
Shares issued upon conversion from Class B | | 20,682 | | | | 216,784 | |
| | |
|
| |
|
|
|
Net increase (decrease) in shares outstanding | | 295,696 | | | $ | 3,068,131 | |
| | |
|
| |
|
|
|
| | |
| JennisonDryden Asset Allocation Funds | | 43 |
Notes to Financial Statements
(Unaudited) Cont’d
| | | | | | | |
Class B
| | Shares
| | | Amount
| |
Six Months ended March 31, 2006: | | | | | | | |
Shares sold | | 122,101 | | | $ | 1,330,333 | |
Shares issued in reinvestment of dividends and distributions | | 8,779 | | | | 94,607 | |
Shares reacquired | | (63,263 | ) | | | (685,012 | ) |
| | |
|
| |
|
|
|
Net increase (decrease) in shares outstanding before conversion | | 67,617 | | | | 739,928 | |
Shares reacquired upon conversion into Class A | | (21,389 | ) | | | (233,573 | ) |
| | |
|
| |
|
|
|
Net increase (decrease) in shares outstanding | | 46,228 | | | $ | 506,355 | |
| | |
|
| |
|
|
|
Year ended September 30, 2005: | | | | | | | |
Shares sold | | 377,364 | | | $ | 3,890,082 | |
Shares issued in reinvestment of dividends | | 7,348 | | | | 75,589 | |
Shares reacquired | | (122,259 | ) | | | (1,264,356 | ) |
| | |
|
| |
|
|
|
Net increase (decrease) in shares outstanding before conversion | | 262,453 | | | | 2,701,315 | |
Shares reacquired upon conversion into Class A | | (20,675 | ) | | | (216,784 | ) |
| | |
|
| |
|
|
|
Net increase (decrease) in shares outstanding | | 241,778 | | | $ | 2,484,531 | |
| | |
|
| |
|
|
|
Class C
| | | | | | |
Six Months ended March 31, 2006: | | | | | | | |
Shares sold | | 38,403 | | | $ | 416,645 | |
Shares issued in reinvestment of dividends and distributions | | 1,879 | | | | 20,243 | |
Shares reacquired | | (41,400 | ) | | | (449,648 | ) |
| | |
|
| |
|
|
|
Net increase (decrease) in shares outstanding | | (1,118 | ) | | $ | (12,760 | ) |
| | |
|
| |
|
|
|
Year ended September 30, 2005: | | | | | | | |
Shares sold | | 78,760 | | | $ | 813,134 | |
Shares issued in reinvestment of dividends | | 1,886 | | | | 19,378 | |
Shares reacquired | | (34,247 | ) | | | (359,975 | ) |
| | |
|
| |
|
|
|
Net increase (decrease) in shares outstanding | | 46,399 | | | $ | 472,537 | |
| | |
|
| |
|
|
|
Class Z
| | | | | | |
Six Months ended March 31, 2006: | | | | | | | |
Shares sold | | 931 | | | $ | 10,193 | |
Shares issued in reinvestment of dividends and distributions | | 55 | | | | 593 | |
Shares reacquired | | (833 | ) | | | (9,042 | ) |
| | |
|
| |
|
|
|
Net increase (decrease) in shares outstanding | | 153 | | | $ | 1,744 | |
| | |
|
| |
|
|
|
Year ended September 30, 2005: | | | | | | | |
Shares sold | | 10,739 | | | $ | 110,289 | |
Shares issued in reinvestment of dividends | | 715 | | | | 7,310 | |
Shares reacquired | | (41,648 | ) | | | (439,963 | ) |
| | |
|
| |
|
|
|
Net increase (decrease) in shares outstanding | | (30,194 | ) | | $ | (322,364 | ) |
| | |
|
| |
|
|
|
| | |
| 44 | | Visit our website at www.jennisondryden.com |
Moderate Allocation Portfolio:
| | | | | | | |
Class A
| | Shares
| | | Amount
| |
Six months ended March 31, 2006: | | | | | | | |
Shares sold | | 470,124 | | | $ | 5,468,321 | |
Shares issued in reinvestment of dividends and distributions | | 23,477 | | | | 271,628 | |
Shares reacquired | | (184,309 | ) | | | (2,153,377 | ) |
| | |
|
| |
|
|
|
Net increase (decrease) in shares outstanding before conversion | | 309,292 | | | | 3,586,572 | |
Shares issued upon conversion from Class B | | 9,543 | | | | 111,853 | |
| | |
|
| |
|
|
|
Net increase (decrease) in shares outstanding | | 318,835 | | | $ | 3,698,425 | |
| | |
|
| |
|
|
|
Year ended September 30, 2005: | | | | | | | |
Shares sold | | 906,006 | | | $ | 9,705,048 | |
Shares issued in reinvestment of dividends and distributions | | 17,751 | | | | 189,875 | |
Shares reacquired | | (289,689 | ) | | | (3,082,653 | ) |
| | |
|
| |
|
|
|
Net increase (decrease) in shares outstanding before conversion | | 634,068 | | | | 6,812,270 | |
Shares issued upon conversion from Class B | | 104,143 | | | | 1,161,963 | |
| | |
|
| |
|
|
|
Net increase (decrease) in shares outstanding | | 738,211 | | | $ | 7,974,233 | |
| | |
|
| |
|
|
|
Class B
| | | | | | |
Six months ended March 31, 2006: | | | | | | | |
Shares sold | | 331,587 | | | $ | 3,848,874 | |
Shares issued in reinvestment of dividends and distributions | | 20,646 | | | | 239,078 | |
Shares reacquired | | (98,178 | ) | | | (1,144,047 | ) |
| | |
|
| |
|
|
|
Net increase (decrease) in shares outstanding before conversion | | 254,055 | | | | 2,943,905 | |
Shares reacquired upon conversion into Class A | | (9,556 | ) | | | (111,853 | ) |
| | |
|
| |
|
|
|
Net increase (decrease) in shares outstanding | | 244,499 | | | $ | 2,832,052 | |
| | |
|
| |
|
|
|
Year ended September 30, 2005: | | | | | | | |
Shares sold | | 1,042,899 | | | $ | 11,059,577 | |
Shares issued in reinvestment of dividends and distributions | | 6,621 | | | | 70,951 | |
Shares reacquired | | (130,084 | ) | | | (1,396,501 | ) |
| | |
|
| |
|
|
|
Net increase (decrease) in shares outstanding before conversion | | 919,436 | | | | 9,734,027 | |
Shares reacquired upon conversion into Class A | | (104,192 | ) | | | (1,161,963 | ) |
| | |
|
| |
|
|
|
Net increase (decrease) in shares outstanding | | 815,244 | | | $ | 8,572,064 | |
| | |
|
| |
|
|
|
Class C
| | | | | | |
Six months ended March 31, 2006: | | | | | | | |
Shares sold | | 171,875 | | | $ | 1,988,667 | |
Shares issued in reinvestment of dividends and distributions | | 4,297 | | | | 49,798 | |
Shares reacquired | | (54,045 | ) | | | (630,083 | ) |
| | |
|
| |
|
|
|
Net increase (decrease) in shares outstanding | | 122,127 | | | $ | 1,408,382 | |
| | |
|
| |
|
|
|
Year ended September 30, 2005: | | | | | | | |
Shares sold | | 189,124 | | | $ | 2,014,210 | |
Shares issued in reinvestment of dividends and distributions | | 1,371 | | | | 14,696 | |
Shares reacquired | | (76,011 | ) | | | (822,953 | ) |
| | |
|
| |
|
|
|
Net increase (decrease) in shares outstanding | | 114,484 | | | $ | 1,205,953 | |
| | |
|
| |
|
|
|
| | |
| JennisonDryden Asset Allocation Funds | | 45 |
Notes to Financial Statements
(Unaudited) Cont’d
| | | | | | | |
Class Z
| | Shares
| | | Amount
| |
Six months ended March 31, 2006: | | | | | | | |
Shares sold | | 132,128 | | | $ | 1,537,515 | |
Shares issued in reinvestment of dividends and distributions | | 805 | | | | 9,310 | |
Shares reacquired | | (61,481 | ) | | | (725,333 | ) |
| | |
|
| |
|
|
|
Net increase (decrease) in shares outstanding | | 71,452 | | | $ | 821,492 | |
| | |
|
| |
|
|
|
Year ended September 30, 2005: | | | | | | | |
Shares sold | | 45,495 | | | $ | 496,448 | |
Shares issued in reinvestment of dividends and distributions | | 894 | | | | 9,547 | |
Shares reacquired | | (59,011 | ) | | | (646,010 | ) |
| | |
|
| |
|
|
|
Net increase (decrease) in shares outstanding | | (12,622 | ) | | $ | (140,015 | ) |
| | |
|
| |
|
|
|
Growth Allocation Portfolio:
| | | | | | | |
Class A
| | | | | | |
Six Months ended March 31, 2006: | | | | | | | |
Shares sold | | 257,024 | | | $ | 3,232,336 | |
Shares issued in reinvestment of dividends | | 5,271 | | | | 65,520 | |
Shares reacquired | | (59,906 | ) | | | (754,759 | ) |
| | |
|
| |
|
|
|
Net increase (decrease) in shares outstanding before conversion | | 202,389 | | | | 2,543,097 | |
Shares issued upon conversion from Class B | | 12,262 | | | | 154,811 | |
| | |
|
| |
|
|
|
Net increase (decrease) in shares outstanding | | 214,651 | | | $ | 2,697,908 | |
| | |
|
| |
|
|
|
Year ended September 30, 2005: | | | | | | | |
Shares sold | | 360,877 | | | $ | 4,013,397 | |
Shares issued in reinvestment of dividends | | 1,162 | | | | 12,767 | |
Shares reacquired | | (100,242 | ) | | | (1,115,594 | ) |
| | |
|
| |
|
|
|
Net increase (decrease) in shares outstanding before conversion | | 261,797 | | | | 2,910,570 | |
Shares issued upon conversion from Class B | | 28,072 | | | | 324,169 | |
| | |
|
| |
|
|
|
Net increase (decrease) in shares outstanding | | 289,869 | | | $ | 3,234,739 | |
| | |
|
| |
|
|
|
| | |
| 46 | | Visit our website at www.jennisondryden.com |
| | | | | | | |
Class B
| | Shares
| | | Amount
| |
Six Months ended March 31, 2006: | | | | | | | |
Shares sold | | 214,578 | | | $ | 2,668,718 | |
Shares issued in reinvestment of dividends | | 1,100 | | | | 13,633 | |
Shares reacquired | | (48,711 | ) | | | (597,018 | ) |
| | |
|
| |
|
|
|
Net increase (decrease) in shares outstanding before conversion | | 166,967 | | | | 2,085,333 | |
Shares reacquired upon conversion into Class A | | (12,332 | ) | | | (154,811 | ) |
| | |
|
| |
|
|
|
Net increase (decrease) in shares outstanding | | 154,635 | | | $ | 1,930,522 | |
| | |
|
| |
|
|
|
Year ended September 30, 2005: | | | | | | | |
Shares sold | | 592,445 | | | $ | 6,441,264 | |
Shares reacquired | | (85,297 | ) | | | (939,164 | ) |
| | |
|
| |
|
|
|
Net increase (decrease) in shares outstanding before conversion | | 507,148 | | | | 5,502,100 | |
Shares reacquired upon conversion into Class A | | (28,253 | ) | | | (324,169 | ) |
| | |
|
| |
|
|
|
Net increase (decrease) in shares outstanding | | 478,895 | | | $ | 5,177,931 | |
| | |
|
| |
|
|
|
Class C
| | | | | | |
Six Months ended March 31, 2006: | | | | | | | |
Shares sold | | 72,713 | | | $ | 897,646 | |
Shares issued in reinvestment of dividends | | 233 | | | | 2,891 | |
Shares reacquired | | (20,366 | ) | | | (251,313 | ) |
| | |
|
| |
|
|
|
Net increase (decrease) in shares outstanding | | 52,580 | | | $ | 649,224 | |
| | |
|
| |
|
|
|
Year ended September 30, 2005: | | | | | | | |
Shares sold | | 104,646 | | | $ | 1,149,304 | |
Shares reacquired | | (45,540 | ) | | | (508,713 | ) |
| | |
|
| |
|
|
|
Net increase (decrease) in shares outstanding | | 59,106 | | | $ | 640,591 | |
| | |
|
| |
|
|
|
Class Z
| | | | | | |
Six Months ended March 31, 2006: | | | | | | | |
Shares sold | | 10,915 | | | $ | 138,285 | |
Shares issued in reinvestment of dividends | | 385 | | | | 4,787 | |
Shares reacquired | | (16,666 | ) | | | (212,340 | ) |
| | |
|
| |
|
|
|
Net increase (decrease) in shares outstanding | | (5,366 | ) | | $ | (69,268 | ) |
| | |
|
| |
|
|
|
Year ended September 30, 2005: | | | | | | | |
Shares sold | | 14,879 | | | $ | 165,995 | |
Shares issued in reinvestment of dividends | | 124 | | | | 1,360 | |
Shares reacquired | | (5,890 | ) | | | (64,141 | ) |
| | |
|
| |
|
|
|
Net increase (decrease) in shares outstanding | | 9,113 | | | $ | 103,214 | |
| | |
|
| |
|
|
|
| | |
| JennisonDryden Asset Allocation Funds | | 47 |
Financial Highlights
(Unaudited)
| | | | | | | | | | | | |
| | | JennisonDryden Conservative Allocation Fund
Class A
| |
| | | Six Months
Ended
March 31, 2006 | | | Year Ended
September 30, 2005(a) | | | March 30, 2004(b)
Through
September 30, 2004 | |
Per Share Operating Performance: | | | | | | | | | | | | |
Net Asset Value, Beginning Of Period | | $ | 10.78 | | | $ | 10.01 | | | $ | 10.00 | |
| | |
|
|
| |
|
|
| |
|
|
|
Income (loss) from investment operations | | | | | | | | | | | | |
Net investment income | | | .12 | | | | .20 | | | | .05 | |
Net realized and unrealized gain (loss) on investment transactions | | | .34 | | | | .78 | | | | (.04 | ) |
| | |
|
|
| |
|
|
| |
|
|
|
Total from investment operations | | | .46 | | | | .98 | | | | .01 | |
| | |
|
|
| |
|
|
| |
|
|
|
Less Dividends and Distributions | | | | | | | | | | | | |
Dividends from net investment income | | | (.13 | ) | | | (.21 | ) | | | — | |
Distributions from net realized gains | | | (.04 | ) | | | — | | | | — | |
| | |
|
|
| |
|
|
| |
|
|
|
Total dividends and distributions | | | (.17 | ) | | | (.21 | ) | | | — | |
| | |
|
|
| |
|
|
| |
|
|
|
Net asset value, end of period | | $ | 11.07 | | | $ | 10.78 | | | $ | 10.01 | |
| | |
|
|
| |
|
|
| |
|
|
|
Total Return(c): | | | 4.30 | % | | | 9.92 | % | | | .10 | % |
Ratios/Supplemental Data: | | | | | | | | | | | | |
Net assets, end of period (000) | | $ | 8,534 | | | $ | 5,929 | | | $ | 2,548 | |
Average net assets (000) | | $ | 7,238 | | | $ | 4,136 | | | $ | 1,535 | |
Ratios to average net assets(d): | | | | | | | | | | | | |
Expenses, including distribution and service (12b-1) fees(e) | | | .75 | %(f) | | | .75 | % | | | .75 | %(f) |
Expenses, excluding distribution and service (12b-1) fees | | | .50 | %(f) | | | .50 | % | | | .50 | %(f) |
Net investment income | | | 2.31 | %(f) | | | 1.89 | % | | | 1.69 | %(f) |
For Class A, B, C and Z shares: | | | | | | | | | | | | |
Portfolio turnover rate | | | 13 | %(g) | | | 11 | % | | | 3 | %(g) |
| (a) | Calculated based upon average shares outstanding during the year. |
| (b) | Inception date of Class A shares. |
| (c) | Total return does not consider the effects of sales loads. Total return is calculated assuming a purchase of shares on the first day and a sale on the last day of each period reported, and includes reinvestment of dividends and distributions. Total returns for periods less than a full year are not annualized. Total return includes the effect of expense subsidies. |
| (d) | Net of expense subsidy. If the investment manager had not subsidized expenses, the expense ratios including distribution and service (12b-1) fees would have been 1.09%, 1.20%, and 6.16%, for the six months ended March 31, 2006, the year ended September 30, 2005 and the period ended September 30, 2004, respectively. The investment income/(loss) ratios would have been 1.96%, 1.49%, and (5.25)%, for the six months ended March 31, 2006, the year ended September 30, 2005 and the period ended September 30, 2004, respectively. |
| (e) | The distributor of the Fund has contractually agreed to limit its distribution and service (12b-1) fees to .25 of 1% of the average daily net assets of the Class A shares. |
See Notes to Financial Statements.
| | |
| 48 | | Visit our website at www.jennisondryden.com |
| | | | | | | | | | | | |
| | | JennisonDryden Conservative Allocation Fund
Class B
| |
| | | Six Months
Ended
March 31, 2006 | | | Year Ended
September 30, 2005(a) | | | March 30, 2004(b)
Through
September 30, 2004 | |
Per Share Operating Performance: | | | | | | | | | | | | |
Net Asset Value, Beginning Of Period | | $ | 10.75 | | | $ | 9.97 | | | $ | 10.00 | |
| | |
|
|
| |
|
|
| |
|
|
|
Income (loss) from investment operations | | | | | | | | | | | | |
Net investment income | | | .09 | | | | .12 | | | | .03 | |
Net realized and unrealized gain (loss) on investment transactions | | | .32 | | | | .78 | | | | (.06 | ) |
| | |
|
|
| |
|
|
| |
|
|
|
Total from investment operations | | | .41 | | | | .90 | | | | (.03 | ) |
| | |
|
|
| |
|
|
| |
|
|
|
Less Dividends and Distributions | | | | | | | | | | | | |
Dividends from net investment income | | | (.09 | ) | | | (.12 | ) | | | — | |
Distributions from net realized gains | | | (.04 | ) | | | — | | | | — | |
| | |
|
|
| |
|
|
| |
|
|
|
Total dividends and distributions | | | (.13 | ) | | | (.12 | ) | | | — | |
| | |
|
|
| |
|
|
| |
|
|
|
Net asset value, end of period | | $ | 11.03 | | | $ | 10.75 | | | $ | 9.97 | |
| | |
|
|
| |
|
|
| |
|
|
|
Total Return(c): | | | 3.81 | % | | | 9.11 | % | | | (.30 | )% |
Ratios/Supplemental Data: | | | | | | | | | | | | |
Net assets, end of period (000) | | $ | 8,971 | | | $ | 8,241 | | | $ | 5,234 | |
Average net assets (000) | | $ | 8,485 | | | $ | 7,032 | | | $ | 3,253 | |
Ratios to average net assets(d): | | | | | | | | | | | | |
Expenses, including distribution and service (12b-1) fees | | | 1.50 | %(e) | | | 1.50 | % | | | 1.50 | %(e) |
Expenses, excluding distribution and service (12b-1) fees | | | .50 | %(e) | | | .50 | % | | | .50 | %(e) |
Net investment income | | | 1.58 | %(e) | | | 1.18 | % | | | .93 | %(e) |
| (a) | Calculated based upon average shares outstanding during the year. |
| (b) | Inception date of Class B shares. |
| (c) | Total return does not consider the effects of sales loads. Total return is calculated assuming a purchase of shares on the first day and a sale on the last day of each period reported, and includes reinvestment of dividends and distributions. Total returns for periods less than a full year are not annualized. Total return includes the effect of expense subsidies. |
| (d) | Net of expense subsidy. If the investment manager had not subsidized expenses, the expense ratios including distribution and service (12b-1) fees would have been 1.84%, 1.95% and 6.91%, for the six months ended March 31, 2006, the year ended September 30, 2005 and period ended September 30, 2004, respectively. The investment income/(loss) ratios would have been 1.22%, .71% and (6.02)%, for the six months ended March 31, 2006, the year ended September 30, 2005 and period ended September 30, 2004, respectively. |
| (e) | Annualized. See Notes to Financial Statements. |
See Notes to Financial Statements.
| | |
| JennisonDryden Asset Allocation Funds | | 49 |
Financial Highlights
(Unaudited) Cont’d
| | | | | | | | | | | | |
| | | JennisonDryden Conservative Allocation Fund
Class C
| |
| | | Six Months
Ended
March 31, 2006 | | | Year Ended
September 30, 2005(a) | | | March 30, 2004(b)
Through
September 30, 2004 | |
Per Share Operating Performance: | | | | | | | | | | | | |
Net Asset Value, Beginning Of Period | | $ | 10.75 | | | $ | 9.97 | | | $ | 10.00 | |
| | |
|
|
| |
|
|
| |
|
|
|
Income (loss) from investment operations | | | | | | | | | | | | |
Net investment income | | | .09 | | | | .12 | | | | .03 | |
Net realized and unrealized gain (loss) on investment transactions | | | .32 | | | | .78 | | | | (.06 | ) |
| | |
|
|
| |
|
|
| |
|
|
|
Total from investment operations | | | .41 | | | | .90 | | | | (.03 | ) |
| | |
|
|
| |
|
|
| |
|
|
|
Less Dividends and Distributions | | | | | | | | | | | | |
Dividends from net investment income | | | (.09 | ) | | | (.12 | ) | | | — | |
Distributions from net realized gains | | | (.04 | ) | | | — | | | | — | |
| | |
|
|
| |
|
|
| |
|
|
|
Total dividends and distributions | | | (.13 | ) | | | (.12 | ) | | | — | |
| | |
|
|
| |
|
|
| |
|
|
|
Net asset value, end of period | | $ | 11.03 | | | $ | 10.75 | | | $ | 9.97 | |
| | |
|
|
| |
|
|
| |
|
|
|
Total Return(c): | | | 3.90 | % | | | 9.11 | % | | | (.30 | )% |
Ratios/Supplemental Data: | | | | | | | | | | | | |
Net assets, end of period (000) | | $ | 1,917 | | | $ | 1,879 | | | $ | 1,281 | |
Average net assets (000) | | $ | 1,842 | | | $ | 1,737 | | | $ | 983 | |
Ratios to average net assets(d): | | | | | | | | | | | | |
Expenses, including distribution and service (12b-1) fees | | | 1.50 | %(e) | | | 1.50 | % | | | 1.50 | %(e) |
Expenses, excluding distribution and service (12b-1) fees | | | .50 | %(e) | | | .50 | % | | | .50 | %(e) |
Net investment income | | | 1.59 | %(e) | | | 1.17 | % | | | .91 | %(e) |
| (a) | Calculated based upon average shares outstanding during the year. |
| (b) | Inception date of Class C shares. |
| (c) | Total return does not consider the effects of sales loads. Total return is calculated assuming a purchase of shares on the first day and a sale on the last day of each period reported, and includes reinvestment of dividends and distributions. Total returns for periods less than a full year are not annualized. Total return includes the effect of expense subsidies. |
| (d) | Net of expense subsidy. If the investment manager had not subsidized expenses, the expense ratios including distribution and service (12b-1) fees would have been 1.84%, 1.95% and 6.91%, for the six months ended March 31, 2006, the year ended September 30, 2005 and period ended September 30, 2004, respectively. The investment income/(loss) ratios would have been 1.23%, .69% and (6.02)% for six months ended March 31, 2006, the year ended September 30, 2005 and period ended September 30, 2004, respectively. |
See Notes to Financial Statements.
| | |
| 50 | | Visit our website at www.jennisondryden.com |
| | | | | | | | | | | | |
| | | JennisonDryden Conservative Allocation Fund
Class Z
| |
| | | Six Months
Ended
March 31, 2006 | | | Year Ended
September 30, 2005(a) | | | March 30, 2004(b)
Through
September 30, 2004 | |
Per Share Operating Performance: | | | | | | | | | | | | |
Net Asset Value, Beginning Of Period | | $ | 10.80 | | | $ | 10.03 | | | $ | 10.00 | |
| | |
|
|
| |
|
|
| |
|
|
|
Income (loss) from investment operations | | | | | | | | | | | | |
Net investment income | | | .14 | | | | .24 | | | | .09 | |
Net realized and unrealized gain (loss) on investment transactions | | | .34 | | | | .77 | | | | (.06 | ) |
| | |
|
|
| |
|
|
| |
|
|
|
Total from investment operations | | | .48 | | | | 1.01 | | | | .03 | |
| | |
|
|
| |
|
|
| |
|
|
|
Less Dividends and Distributions | | | | | | | | | | | | |
Dividends from net investment income | | | (.14 | ) | | | (.24 | ) | | | — | |
Distributions from net realized gains | | | (.04 | ) | | | — | | | | — | |
| | |
|
|
| |
|
|
| |
|
|
|
Total dividends and distributions | | | (.18 | ) | | | (.24 | ) | | | — | |
| | |
|
|
| |
|
|
| |
|
|
|
Net asset value, end of period | | $ | 11.10 | | | $ | 10.80 | | | $ | 10.03 | |
| | |
|
|
| |
|
|
| |
|
|
|
Total Return(c): | | | 4.51 | % | | | 10.18 | % | | | .30 | % |
Ratios/Supplemental Data: | | | | | | | | | | | | |
Net assets, end of period (000) | | $ | 45 | | | $ | 42 | | | $ | 342 | |
Average net assets (000) | | $ | 40 | | | $ | 311 | | | $ | 312 | |
Ratios to average net assets(d): | | | | | | | | | | | | |
Expenses, including distribution and service (12b-1) fees | | | .50 | %(e) | | | .50 | % | | | .50 | %(e) |
Expenses, excluding distribution and service (12b-1) fees | | | .50 | %(e) | | | .50 | % | | | .50 | %(e) |
Net investment income | | | 2.76 | %(e) | | | 2.27 | % | | | 1.90 | %(e) |
| (a) | Calculated based upon average shares outstanding during the year. |
| (b) | Inception date of Class Z shares. |
| (c) | Total return is calculated assuming a purchase of shares on the first day and a sale on the last day of each period reported, and includes reinvestment of dividends and distributions. Total returns for periods less than a full year are not annualized. Total return includes the effect of expense subsidies. |
| (d) | Net of expense subsidy. If the investment manager had not subsidized expenses, the expense ratios including distribution and service (12b-1) fees would have been .84%, .95% and 5.91%, for the six months ended March 31, 2006, the year ended September 30, 2005 and period ended September 30, 2004, respectively. The investment income/(loss) ratios would have been 2.21%, 1.63% and (5.00)% for the six months ended March 31, 2006, the year ended September 30, 2005 and period ended September 30, 2004, respectively. |
See Notes to Financial Statements.
| | |
| JennisonDryden Asset Allocation Funds | | 51 |
Financial Highlights
(Unaudited) Cont’d
| | | | | | | | | | | | |
| | | JennisonDryden Moderate Allocation Fund
Class A
| |
| | | Six Months
Ended
March 31, 2006 | | | Year Ended
September 30, 2005 | | | March 30, 2004(a)(b)
Through
September 30, 2004 | |
Per Share Operating Performance: | | | | | | | | | | | | |
Net Asset Value, Beginning Of Period | | $ | 11.34 | | | $ | 10.03 | | | $ | 10.00 | |
| | |
|
|
| |
|
|
| |
|
|
|
Income (loss) from investment operations | | | | | | | | | | | | |
Net investment income | | | .09 | | | | .13 | | | | .04 | |
Net realized and unrealized gain (loss) on investment transactions | | | .67 | | | | 1.34 | | | | (.01 | ) |
| | |
|
|
| |
|
|
| |
|
|
|
Total from investment operations | | | .76 | | | | 1.47 | | | | .03 | |
| | |
|
|
| |
|
|
| |
|
|
|
Less Dividends and Distributions | | | | | | | | | | | | |
Dividends from net investment income | | | (.11 | ) | | | (.16 | ) | | | — | |
Distributions from net realized gains | | | (.04 | ) | | | — | | | | — | |
| | |
|
|
| |
|
|
| |
|
|
|
Total dividends and distributions | | | (.15 | ) | | | (.16 | ) | | | — | |
| | |
|
|
| |
|
|
| |
|
|
|
Net asset value, end of period | | $ | 11.95 | | | $ | 11.34 | | | $ | 10.03 | |
| | |
|
|
| |
|
|
| |
|
|
|
Total Return(c): | | | 6.75 | % | | | 14.77 | % | | | .30 | % |
Ratios/Supplemental Data: | | | | | | | | | | | | |
Net assets, end of period (000) | | $ | 24,383 | | | $ | 19,532 | | | $ | 9,863 | |
Average net assets (000) | | $ | 21,459 | | | $ | 14,172 | | | $ | 5,632 | |
Ratios to average net assets(d): | | | | | | | | | | | | |
Expenses, including distribution and service (12b-1) fees(e) | | | .75 | %(f) | | | .75 | % | | | .75 | %(f) |
Expenses, excluding distribution and service (12b-1) fees | | | .50 | %(f) | | | .50 | % | | | .50 | %(f) |
Net investment income | | | 1.41 | %(f) | | | 1.08 | % | | | .74 | %(f) |
For Class A, B, C and Z shares: | | | | | | | | | | | | |
Portfolio turnover rate | | | 8 | %(g) | | | 5 | % | | | 6 | %(g) |
| (a) | Inception date of Class A shares. |
| (b) | Calculated based upon average shares outstanding during the period. |
| (c) | Total return does not consider the effects of sales loads. Total return is calculated assuming a purchase of shares on the first day and a sale on the last day of each period reported, and includes reinvestment of dividends and distributions. Total returns for periods less than a full year are not annualized. Total return includes the effect of expense subsidies. |
| (d) | Net of expense subsidy. If the investment manager had not subsidized expenses, the expense ratios including distribution and service (12b-1) fees would have been .76%, .88% and 2.61%, for the six months ended March 31, 2006, the year ended September 30, 2005 and the period ended September 30, 2004, respectively. The investment income/(loss) ratios would have been 1.40%, .95% and (1.07)% for the six months ended March 31, 2006, the year ended September 30, 2005 and the period ended September 30, 2004, respectively. |
| (e) | The distributor of the Fund has contractually agreed to limit its distribution and service (12b-1) fees to .25 of 1% of the average daily net assets of the Class A shares. |
See Notes to Financial Statements.
| | |
| 52 | | Visit our website at www.jennisondryden.com |
| | | | | | | | | | | | |
| | | JennisonDryden Moderate Allocation Fund
Class B
| |
| | | Six Months
Ended
March 31, 2006 | | | Year Ended
September 30, 2005 | | | March 30, 2004(a)(b)
Through
September 30, 2004 | |
Per Share Operating Performance: | | | | | | | | | | | | |
Net Asset Value, Beginning Of Period | | $ | 11.34 | | | $ | 9.99 | | | $ | 10.00 | |
| | |
|
|
| |
|
|
| |
|
|
|
Income (loss) from investment operations | | | | | | | | | | | | |
Net investment income | | | .04 | | | | .04 | | | | — | (c) |
Net realized and unrealized gain (loss) on investment transactions | | | .67 | | | | 1.35 | | | | (.01 | ) |
| | |
|
|
| |
|
|
| |
|
|
|
Total from investment operations | | | .71 | | | | 1.39 | | | | (.01 | ) |
| | |
|
|
| |
|
|
| |
|
|
|
Less Dividends and Distributions | | | | | | | | | | | | |
Dividends from net investment income | | | (.07 | ) | | | (.04 | ) | | | — | |
Distributions from net realized gains | | | (.04 | ) | | | — | | | | — | |
| | |
|
|
| |
|
|
| |
|
|
|
Total dividends and distributions | | | (.11 | ) | | | (.04 | ) | | | — | |
| | |
|
|
| |
|
|
| |
|
|
|
Net asset value, end of period | | $ | 11.94 | | | $ | 11.34 | | | $ | 9.99 | |
| | |
|
|
| |
|
|
| |
|
|
|
Total Return(d): | | | 6.29 | % | | | 13.95 | % | | | (.10 | )% |
Ratios/Supplemental Data: | | | | | | | | | | | | |
Net assets, end of period (000) | | $ | 28,348 | | | $ | 24,146 | | | $ | 13,124 | |
Average net assets (000) | | $ | 25,957 | | | $ | 19,913 | | | $ | 7,614 | |
Ratios to average net assets(e): | | | | | | | | | | | | |
Expenses, including distribution and service (12b-1) fees | | | 1.50 | %(f) | | | 1.50 | % | | | 1.50 | %(f) |
Expenses, excluding distribution and service (12b-1) fees | | | .50 | %(f) | | | .50 | % | | | .50 | %(f) |
Net investment income | | | .66 | %(f) | | | .33 | % | | | — | (f)(g) |
| (a) | Inception date of Class B shares. |
| (b) | Calculated based upon average shares outstanding during the period. |
| (c) | Less than $.005 per share. |
| (d) | Total return does not consider the effects of sales loads. Total return is calculated assuming a purchase of shares on the first day and a sale on the last day of each period reported, and includes reinvestment of dividends and distributions. Total returns for periods less than a full year are not annualized. Total return includes the effect of expense subsidies. |
| (e) | Net of expense subsidy. If the investment manager had not subsidized expenses, the expense ratios including distribution and service (12b-1) fees would have been 1.51%, 1.63% and 3.36%, for the six months ended March 31, 2006, the year ended September 30, 2005 and the period ended September 30, 2004, respectively. The investment income/(loss) ratios would have been .65%, .20% and (1.84)% for the six months ended March 31, 2006, the year ended September 30, 2005 and the period ended September 30, 2004, respectively. |
See Notes to Financial Statements.
| | |
| JennisonDryden Asset Allocation Funds | | 53 |
Financial Highlights
(Unaudited) Cont’d
| | | | | | | | | | | | |
| | | JennisonDryden Moderate Allocation Fund
Class C
| |
| | | Six Months
Ended
March 31, 2006 | | | Year Ended
September 30, 2005 | | | March 30, 2004(a)(b)
Through
September 30, 2004 | |
Per Share Operating Performance: | | | | | | | | | | | | |
Net Asset Value, Beginning Of Period | | $ | 11.34 | | | $ | 9.99 | | | $ | 10.00 | |
| | |
|
|
| |
|
|
| |
|
|
|
Income (loss) from investment operations | | | | | | | | | | | | |
Net investment income | | | .04 | | | | .04 | | | | — | (c) |
Net realized and unrealized gain (loss) on investment transactions | | | .68 | | | | 1.35 | | | | (.01 | ) |
| | |
|
|
| |
|
|
| |
|
|
|
Total from investment operations | | | .72 | | | | 1.39 | | | | (.01 | ) |
| | |
|
|
| |
|
|
| |
|
|
|
Less Dividends and Distributions | | | | | | | | | | | | |
Dividends from net investment income | | | (.07 | ) | | | (.04 | ) | | | — | |
Distributions from net realized gains | | | (.04 | ) | | | — | | | | — | |
| | |
|
|
| |
|
|
| |
|
|
|
Total dividends and distributions | | | (.11 | ) | | | (.04 | ) | | | — | |
| | |
|
|
| |
|
|
| |
|
|
|
Net asset value, end of period | | $ | 11.95 | | | $ | 11.34 | | | $ | 9.99 | |
| | |
|
|
| |
|
|
| |
|
|
|
Total Return(d): | | | 6.29 | % | | | 14.05 | % | | | (.10 | )% |
Ratios/Supplemental Data: | | | | | | | | | | | | |
Net assets, end of period (000) | | $ | 6,716 | | | $ | 4,989 | | | $ | 3,250 | |
Average net assets (000) | | $ | 5,926 | | | $ | 4,321 | | | $ | 2,407 | |
Ratios to average net assets(e): | | | | | | | | | | | | |
Expenses, including distribution and service (12b-1) fees | | | 1.50 | %(f) | | | 1.50 | % | | | 1.50 | %(f) |
Expenses, excluding distribution and service (12b-1) fees | | | .50 | %(f) | | | .50 | % | | | .50 | %(f) |
Net investment income (loss) | | | .65 | %(f) | | | .35 | % | | | (.02 | )%(f) |
| (a) | Inception date of Class C shares. |
| (b) | Calculated based upon average shares outstanding during the period. |
| (c) | Less than $.005 per share. |
| (d) | Total return does not consider the effects of sales loads. Total return is calculated assuming a purchase of shares on the first day and a sale on the last day of each period reported, and includes reinvestment of dividends and distributions. Total returns for periods less than a full year are not annualized. Total return includes the effect of expense subsidies. |
| (e) | Net of expense subsidy. If the investment manager had not subsidized expenses, the expense ratios including distribution and service (12b-1) fees would have been 1.51%, 1.63% and 3.36%, for the six months ended March 31, 2006, the year ended September 30, 2005 and the period ended September 30, 2004, respectively. The investment income/(loss) ratios would have been .64%, .21% and (2.02)% for the six months ended March 31, 2006, the year ended September 30, 2005 and the period ended September 30, 2004, respectively. |
See Notes to Financial Statements.
| | |
| 54 | | Visit our website at www.jennisondryden.com |
| | | | | | | | | | | | |
| | | JennisonDryden Moderate Allocation Fund
Class Z
| |
| | | Six Months
Ended
March 31, 2006 | | | Year Ended
September 30, 2005 | | | March 30, 2004(a)(b)
Through
September 30, 2004 | |
Per Share Operating Performance: | | | | | | | | | | | | |
Net Asset Value, Beginning Of Period | | $ | 11.36 | | | $ | 10.04 | | | $ | 10.00 | |
| | |
|
|
| |
|
|
| |
|
|
|
Income (loss) from investment operations | | | | | | | | | | | | |
Net investment income | | | .11 | | | | .18 | | | | .05 | |
Net realized and unrealized gain (loss) on investment transactions | | | .66 | | | | 1.33 | | | | (.01 | ) |
| | |
|
|
| |
|
|
| |
|
|
|
Total from investment operations | | | .77 | | | | 1.51 | | | | .04 | |
| | |
|
|
| |
|
|
| |
|
|
|
Less Dividends and Distributions | | | | | | | | | | | | |
Dividends from net investment income | | | (.13 | ) | | | (.19 | ) | | | — | |
Distributions from net realized gains | | | (.04 | ) | | | — | | | | — | |
| | |
|
|
| |
|
|
| |
|
|
|
Total dividends and distributions | | | (.17 | ) | | | (.19 | ) | | | — | |
| | |
|
|
| |
|
|
| |
|
|
|
Net asset value, end of period | | $ | 11.96 | | | $ | 11.36 | | | $ | 10.04 | |
| | |
|
|
| |
|
|
| |
|
|
|
Total Return(c): | | | 6.77 | % | | | 15.18 | % | | | .40 | % |
Ratios/Supplemental Data: | | | | | | | | | | | | |
Net assets, end of period (000) | | $ | 1,395 | | | $ | 513 | | | $ | 580 | |
Average net assets (000) | | $ | 1,014 | | | $ | 600 | | | $ | 497 | |
Ratios to average net assets(d): | | | | | | | | | | | | |
Expenses, including distribution and service (12b-1) fees | | | .50 | %(e) | | | .50 | % | | | .50 | %(e) |
Expenses, excluding distribution and service (12b-1) fees | | | .50 | %(e) | | | .50 | % | | | .50 | %(e) |
Net investment income | | | 1.52 | %(e) | | | 1.43 | % | | | .97 | %(e) |
| (a) | Inception date of Class Z shares. |
| (b) | Calculated based upon average shares outstanding during the period. |
| (c) | Total return is calculated assuming a purchase of shares on the first day and a sale on the last day of each period reported, and includes reinvestment of dividends and distributions. Total returns for periods less than a full year are not annualized. Total return includes the effect of expense subsidies. |
| (d) | Net of expense subsidy. If the investment manager had not subsidized expenses, the expense ratios including distribution and service (12b-1) fees would have been .51%, .63% and 2.36%, for the six months ended March 31, 2006, the year ended September 30, 2005 and the period ended September 30, 2004, respectively. The investment income/(loss) ratios would have been 1.51%, 1.28% and (1.17)% for the six months ended March 31, 2006, the year ended September 30, 2005 and the period ended September 30, 2004, respectively. |
See Notes to Financial Statements.
| | |
| JennisonDryden Asset Allocation Funds | | 55 |
Financial Highlights
(Unaudited) Cont’d
| | | | | | | | | | | | |
| | | JennisonDryden Growth Allocation Fund
Class A
| |
| | | Six Months
Ended
March 31, 2006 | | | Year Ended
September 30, 2005 | | | March 30, 2004(a)(b)
Through
September 30, 2004 | |
Per Share Operating Performance: | | | | | | | | | | | | |
Net Asset Value, Beginning Of Period | | $ | 11.99 | | | $ | 10.01 | | | $ | 10.00 | |
| | |
|
|
| |
|
|
| |
|
|
|
Income (loss) from investment operations | | | | | | | | | | | | |
Net investment income (loss) | | | .02 | | | | .01 | | | | (.02 | ) |
Net realized and unrealized gain on investment transactions | | | 1.09 | | | | 2.00 | | | | .03 | |
| | |
|
|
| |
|
|
| |
|
|
|
Total from investment operations | | | 1.11 | | | | 2.01 | | | | .01 | |
| | |
|
|
| |
|
|
| |
|
|
|
Less Distributions | | | | | | | | | | | | |
Dividends from net investment income | | | (.08 | ) | | | (.03 | ) | | | — | |
Distributions from net realized gains | | | (.01 | ) | | | — | | | | — | |
| | |
|
|
| |
|
|
| |
|
|
|
Total distributions | | | (.09 | ) | | | (.03 | ) | | | — | |
| | |
|
|
| |
|
|
| |
|
|
|
Net asset value, end of period | | $ | 13.01 | | | $ | 11.99 | | | $ | 10.01 | |
| | |
|
|
| |
|
|
| |
|
|
|
Total Return(c): | | | 9.43 | % | | | 20.02 | % | | | .10 | % |
Ratios/Supplemental Data: | | | | | | | | | | | | |
Net assets, end of period (000) | | $ | 11,007 | | | $ | 7,573 | | | $ | 3,421 | |
Average net assets (000) | | $ | 8,943 | | | $ | 5,125 | | | $ | 2,226 | |
Ratios to average net assets(d): | | | | | | | | | | | | |
Expenses, including distribution and service (12b-1) fees(e) | | | .75 | %(f) | | | .75 | % | | | .75 | %(f) |
Expenses, excluding distribution and service (12b-1) fees | | | .50 | %(f) | | | .50 | % | | | .50 | %(f) |
Net investment income (loss) | | | .30 | %(f) | | | (.02 | )% | | | (.40 | )%(f) |
For Class A, B, C and Z shares: | | | | | | | | | | | | |
Portfolio turnover rate | | | 3 | %(g) | | | 6 | % | | | 6 | %(g) |
| (a) | Inception date of Class A shares. |
| (b) | Calculated based upon average shares outstanding during the period. |
| (c) | Total return does not consider the effects of sales loads. Total return is calculated assuming a purchase of shares on the first day and a sale on the last day of each period reported, and includes reinvestment of dividends and distributions. Total returns for periods less than a full year are not annualized. Total return includes the effect of expense subsidies. |
| (d) | Net of expense subsidy. If the investment manager had not subsidized expenses, the expense ratios including distribution and service (12b-1) fees would have been .91%, 1.20% and 4.82% for the six months ended March 31, 2006, the year ended September 30, 2005 and the period ended September 30, 2004, respectively. The investment income/(loss) ratios would have been .14%, (.47)% and (4.51)% for the six months ended March 31, 2006, the year ended September 30, 2005 and the period ended September 30, 2004, respectively. |
| (e) | The distributor of the Fund has contractually agreed to limit its distribution and service (12b-1) fees to .25 of 1% of the average daily net assets of the Class A shares. |
See Notes to Financial Statements.
| | |
| 56 | | Visit our website at www.jennisondryden.com |
| | | | | | | | | | | | |
| | | JennisonDryden Growth Allocation Fund
Class B
| |
| | | Six Months
Ended
March 31, 2006 | | | Year Ended
September 30, 2005 | | | March 30, 2004(a)(b)
Through
September 30, 2004 | |
Per Share Operating Performance: | | | | | | | | | | | | |
Net Asset Value, Beginning Of Period | | $ | 11.90 | | | $ | 9.98 | | | $ | 10.00 | |
| | |
|
|
| |
|
|
| |
|
|
|
Income (loss) from investment operations | | | | | | | | | | | | |
Net investment income (loss) | | | (.02 | ) | | | (.07 | ) | | | (.06 | ) |
Net realized and unrealized gain on investment transactions | | | 1.07 | | | | 1.99 | | | | .04 | |
| | |
|
|
| |
|
|
| |
|
|
|
Total from investment operations | | | 1.05 | | | | 1.92 | | | | (.02 | ) |
| | |
|
|
| |
|
|
| |
|
|
|
Less Distributions | | | | | | | | | | | | |
Dividends from net investment income | | | — | | | | — | | | | — | |
Distributions from net realized gains | | | (.01 | ) | | | — | | | | — | |
| | |
|
|
| |
|
|
| |
|
|
|
Total distributions | | | (.01 | ) | | | — | | | | — | |
| | |
|
|
| |
|
|
| |
|
|
|
Net asset value, end of period | | $ | 12.94 | | | $ | 11.90 | | | $ | 9.98 | |
| | |
|
|
| |
|
|
| |
|
|
|
Total Return(c): | | | 9.02 | % | | | 19.04 | % | | | (.20 | )% |
Ratios/Supplemental Data: | | | | | | | | | | | | |
Net assets, end of period (000) | | $ | 16,745 | | | $ | 13,552 | | | $ | 6,585 | |
Average net assets (000) | | $ | 14,745 | | | $ | 10,343 | | | $ | 3,987 | |
Ratios to average net assets(d): | | | | | | | | | | | | |
Expenses, including distribution and service (12b-1) fees | | | 1.50 | %(e) | | | 1.50 | % | | | 1.50 | %(e) |
Expenses, excluding distribution and service (12b-1) fees | | | .50 | %(e) | | | .50 | % | | | .50 | %(e) |
Net investment income (loss) | | | (.41 | )%(e) | | | (.80 | )% | | | (1.15 | )%(e) |
| (a) | Inception date of Class B shares. |
| (b) | Calculated based upon average shares outstanding during the period. |
| (c) | Total return does not consider the effects of sales loads. Total return is calculated assuming a purchase of shares on the first day and a sale on the last day of each period reported, and includes reinvestment of dividends and distributions. Total returns for periods less than a full year are not annualized. Total return includes the effect of expense subsidies. |
| (d) | Net of expense subsidy. If the investment manager had not subsidized expenses, the expense ratios including distribution and service (12b-1) fees would have been 1.66%, 1.95% and 5.57% for the six months ended March 31, 2006, the year ended September 30, 2005 and the period ended September 30, 2004, respectively. The investment income/(loss) ratios would have been (.57)%, (1.25)% and (5.09)% for the six months ended March 31, 2006, the year ended September 30, 2005 and the period ended September 30, 2004, respectively. |
See Notes to Financial Statements.
| | |
| JennisonDryden Asset Allocation Funds | | 57 |
Financial Highlights
(Unaudited) Cont’d
| | | | | | | | | | | | |
| | | JennisonDryden Growth Allocation Fund
Class C
| |
| | | Six Months
Ended
March 31, 2006 | | | Year Ended
September 30, 2005 | | | March 30, 2004(a)(b)
Through
September 30, 2004 | |
Per Share Operating Performance: | | | | | | | | | | | | |
Net Asset Value, Beginning Of Period | | $ | 11.91 | | | $ | 9.98 | | | $ | 10.00 | |
| | |
|
|
| |
|
|
| |
|
|
|
Income (loss) from investment operations | | | | | | | | | | | | |
Net investment income (loss) | | | (.02 | ) | | | (.07 | ) | | | (.06 | ) |
Net realized and unrealized gain on investment transactions | | | 1.07 | | | | 2.00 | | | | .04 | |
| | |
|
|
| |
|
|
| |
|
|
|
Total from investment operations | | | 1.05 | | | | 1.93 | | | | (.02 | ) |
| | |
|
|
| |
|
|
| |
|
|
|
Less Distributions | | | | | | | | | | | | |
Dividends from net investment income | | | — | | | | — | | | | — | |
Distributions from net realized gains | | | (.01 | ) | | | — | | | | — | |
| | |
|
|
| |
|
|
| |
|
|
|
Total distributions | | | (.01 | ) | | | — | | | | — | |
| | |
|
|
| |
|
|
| |
|
|
|
Net asset value, end of period | | $ | 12.95 | | | $ | 11.91 | | | $ | 9.98 | |
| | |
|
|
| |
|
|
| |
|
|
|
Total Return(c): | | | 8.93 | % | | | 19.24 | % | | | (.20 | )% |
Ratios/Supplemental Data: | | | | | | | | | | | | |
Net assets, end of period (000) | | $ | 3,668 | | | $ | 2,746 | | | $ | 1,711 | |
Average net assets (000) | | $ | 3,191 | | | $ | 2,268 | | | $ | 1,282 | |
Ratios to average net assets(d): | | | | | | | | | | | | |
Expenses, including distribution and service (12b-1) fees | | | 1.50 | %(e) | | | 1.50 | % | | | 1.50 | %(e) |
Expenses, excluding distribution and service (12b-1) fees | | | .50 | %(e) | | | .50 | % | �� | | .50 | %(e) |
Net investment income (loss) | | | (.42 | )%(e) | | | (.74 | )% | | | (1.14 | )%(e) |
| (a) | Inception date of Class C shares. |
| (b) | Calculated based upon average shares outstanding during the period. |
| (c) | Total return does not consider the effects of sales loads. Total return is calculated assuming a purchase of shares on the first day and a sale on the last day of each period reported, and includes reinvestment of dividends and distributions. Total returns for periods less than a full year are not annualized. Total return includes the effect of expense subsidies. |
| (d) | Net of expense subsidy. If the investment manager had not subsidized expenses, the expense ratios including distribution and service (12b-1) fees would have been 1.66%, 1.95% and 5.57% for the six months ended March 31, 2006, the year ended September 30, 2005 and the period ended September 30, 2004, respectively. The investment income/(loss) ratios would have been (.58)%, (1.22)% and (5.46)% for the six months ended March 31, 2006, the year ended September 30, 2005 and the period ended September 30, 2004, respectively. |
See Notes to Financial Statements.
| | |
| 58 | | Visit our website at www.jennisondryden.com |
| | | | | | | | | | | | |
| | | JennisonDryden Growth Allocation Fund
Class Z
| |
| | | Six Months
Ended
March 31, 2006 | | | Year Ended
September 30, 2005 | | | March 30, 2004(a)(b)
Through
September 30, 2004 | |
Per Share Operating Performance: | | | | | | | | | | | | |
Net Asset Value, Beginning Of Period | | $ | 12.02 | | | $ | 10.03 | | | $ | 10.00 | |
| | |
|
|
| |
|
|
| |
|
|
|
Income (loss) from investment operations | | | | | | | | | | | | |
Net investment income (loss) | | | .03 | | | | .04 | | | | (.01 | ) |
Net realized and unrealized gain on investment transactions | | | 1.10 | | | | 2.00 | | | | .04 | |
| | |
|
|
| |
|
|
| |
|
|
|
Total from investment operations | | | 1.13 | | | | 2.04 | | | | .03 | |
| | |
|
|
| |
|
|
| |
|
|
|
Less Distributions | | | | | | | | | | | | |
Dividends from net investment income | | | (.12 | ) | | | (.05 | ) | | | — | |
Distributions from net realized gains | | | (.01 | ) | | | — | | | | — | |
| | |
|
|
| |
|
|
| |
|
|
|
Total distributions | | | (.13 | ) | | | (.05 | ) | | | — | |
| | |
|
|
| |
|
|
| |
|
|
|
Net asset value, end of period | | $ | 13.02 | | | $ | 12.02 | | | $ | 10.03 | |
| | |
|
|
| |
|
|
| |
|
|
|
Total Return(c): | | | 9.42 | % | | | 20.40 | % | | | .30 | % |
Ratios/Supplemental Data: | | | | | | | | | | | | |
Net assets, end of period (000) | | $ | 411 | | | $ | 443 | | | $ | 279 | |
Average net assets (000) | | $ | 427 | | | $ | 392 | | | $ | 237 | |
Ratios to average net assets(d): | | | | | | | | | | | | |
Expenses, including distribution and service (12b-1) fees | | | .50 | %(e) | | | .50 | % | | | .50 | %(e) |
Expenses, excluding distribution and service (12b-1) fees | | | .50 | %(e) | | | .50 | % | | | .50 | %(e) |
Net investment income (loss) | | | .63 | %(e) | | | .28 | % | | | (.14 | )%(e) |
| (a) | Inception date of Class Z shares. |
| (b) | Calculated based upon average shares outstanding during the period. |
| (c) | Total return does not consider the effects of sales loads. Total return is calculated assuming a purchase of shares on the first day and a sale on the last day of each period reported, and includes reinvestment of dividends and distributions. Total returns for periods less than a full year are not annualized. Total return includes the effect of expense subsidies. |
| (d) | Net of expense subsidy. If the investment manager had not subsidized expenses, the expense ratios including distribution and service (12b-1) fees would have been .66%, .95% and 4.57% for the six months ended March 31, 2006, the year ended September 30, 2005 and the period ended September 30, 2004, respectively. The investment income/(loss) ratios would have been .47%, (.19)% and (4.67)% for the six months ended March 31, 2006, the year ended September 30, 2005 and the period ended September 30, 2004, respectively. |
See Notes to Financial Statements.
| | |
| JennisonDryden Asset Allocation Funds | | 59 |
| | | | |
| n MAIL | | n TELEPHONE | | n WEBSITE |
Gateway Center Three 100 Mulberry Street Newark, NJ 07102 | | (800) 225-1852 | | www.jennisondryden.com |
|
| PROXY VOTING |
| The Board of Directors of the Funds has delegated to each Fund’s investment subadvisor the responsibility for voting any proxies and maintaining proxy recordkeeping with respect to the Fund. A description of these proxy voting policies and procedures is available without charge, upon request, by calling (800) 225-1852 or by visiting the Securities and Exchange Commission’s website at www.sec.gov. Information regarding how the Funds voted proxies relating to portfolio securities during the most recent 12-month period ended June 30 is available on the Funds’ website and on the Commission’s website. |
|
| DIRECTORS |
| Linda W. Bynoe • David E.A. Carson • Robert F. Gunia • Robert E. La Blanc • Douglas H. McCorkindale • Richard A. Redeker • Judy A. Rice • Robin B. Smith • Stephen G. Stoneburn • Clay T. Whitehead |
|
| OFFICERS |
| Judy A. Rice, President • Robert F. Gunia, Vice President • Grace C. Torres, Treasurer and Principal Financial and Accounting Officer • Jack Benintende, Assistant Treasurer • M. Sadiq Peshimam, Assistant Treasurer • Kathryn L. Quirk, Chief Legal Officer • Deborah A. Docs, Secretary • Jonathan D. Shain, Assistant Secretary • Claudia DiGiacomo, Assistant Secretary • John P. Schwartz, Assistant Secretary • Helene Gurian, Acting Anti-Money Laundering Compliance Officer • Lee D. Augsburger, Chief Compliance Officer |
| | | | |
| MANAGER | | Prudential Investments LLC | | Gateway Center Three
100 Mulberry Street
Newark, NJ 07102 |
|
| INVESTMENT SUBADVISOR | | Quantitative Management
Associates LLC | | Gateway Center Two
100 Mulberry Street
Newark, NJ 07102 |
|
| DISTRIBUTOR | | Prudential Investment
Management Services LLC | | Gateway Center Three
100 Mulberry Street
Newark, NJ 07102 |
|
| CUSTODIAN | | The Bank of New York | | One Wall Street
New York, NY 10286 |
|
| TRANSFER AGENT | | Prudential Mutual Fund
Services LLC | | PO Box 8098
Philadelphia, PA 19176 |
|
INDEPENDENT REGISTERED
PUBLIC ACCOUNTING FIRM | | KPMG LLP | | 345 Park Avenue
New York, NY 10154 |
|
| FUND COUNSEL | | Sullivan & Cromwell LLP | | 125 Broad Street
New York, NY 10004 |
An investor should consider the investment objectives, risks, charges, and expenses of each of the JennisonDryden Asset Allocation Funds carefully before investing. The prospectus for the JennisonDryden Asset Allocation Funds contains this and other information about the JennisonDryden Asset Allocation Funds. An investor may obtain a prospectus by visiting our website at www.jennisondryden.com or by calling (800) 225-1852. The prospectus should be read carefully before investing.
E-DELIVERY
To receive your mutual fund documents on-line, go to www.icsdelivery.com/prudential/funds and enroll. Instead of receiving printed documents by mail, you will receive notification via e-mail when new materials are available. You can cancel your enrollment or change your e-mail address at any time by clicking on the change/cancel enrollment option at the icsdelivery website address.
SHAREHOLDER COMMUNICATIONS WITH DIRECTORS
Shareholders can communicate directly with the Board of Directors by writing to the Chair of the Board, JennisonDryden Asset Allocation Funds, PO Box 13964, Philadelphia, PA 19176. Shareholders can communicate directly with an individual Director by writing to the same address. Communications are not screened before being delivered to the addressee.
AVAILABILITY OF PORTFOLIO SCHEDULE
Each Fund files its complete schedule of portfolio holdings with the Securities and Exchange Commission for the first and third quarters of each fiscal year on Form N-Q under The Prudential Investment Portfolios, Inc. name. Each Fund’s Forms N-Q are available on the Commission’s website at www.sec.gov. Each Fund’s Forms N-Q may also be reviewed and copied at the Commission’s Public Reference Room in Washington, D.C. Information on the operation and location of the Public Reference Room may be obtained by calling (800) SEC-0330 (732-0330). Each Fund’s schedule of portfolio holdings is also available on the Fund’s website as of the end of each fiscal quarter.
Mutual Funds:
| | | | |
ARE NOT INSURED BY THE FDIC OR ANY
FEDERAL GOVERNMENT AGENCY | | MAY LOSE VALUE | | ARE NOT A DEPOSIT OF OR GUARANTEED
BY ANY BANK OR ANY BANK AFFILIATE |

| | | | | | | | | | | | | | | | | | | | |
| JennisonDryden Asset Allocation Funds | | | | | | | | |
| | | | | Class A | | | | Class B | | | | Class C | | | | Class Z | | | | |
| | | | NASDAQ | | CUSIP | | NASDAQ | | CUSIP | | NASDAQ | | CUSIP | | NASDAQ | | CUSIP | | |
| | | Conservative Allocation | | JDUAX | | 74437E750 | | JDABX | | 74437E743 | | JDACX | | 74437E735 | | JDAZX | | 74437E784 | | |
| | | Moderate Allocation | | JDTAX | | 74437E727 | | JDMBX | | 74437E719 | | JDMCX | | 74437E693 | | JDMZX | | 74437E776 | | |
| | | Growth Allocation | | JDAAX | | 74437E685 | | JDGBX | | 74437E677 | | JDGCX | | 74437E669 | | JDGZX | | 74437E768 | | |
| | | | | | | | | | | | | | | | | | | | | |
MF194E2 IFS-A119078 Ed. 05/2006
Item 2 – Code of Ethics – Not required, as this is not an annual filing.
Item 3 – Audit Committee Financial Expert – Not required, as this is not an annual filing.
Item 4 – Principal Accountant Fees and Services – Not required, as this is not an annual filing.
Item 5 – Audit Committee of Listed Registrants – Not required, as this is not an annual filing.
Item 6 – Schedule of Investments – The schedule is included as part of the report to shareholders filed under Item 1 of this
Form.
Item 7 – Disclosure of Proxy Voting Policies and Procedures for Closed-End Management Investment Companies – Not
applicable.
Item 8 – Portfolio Managers of Closed-End Management Investment Companies – Not applicable.
Item 9 – Purchases of Equity Securities by Closed-End Management Investment Company and Affiliated Purchasers – Not
applicable.
Item 10 – Submission of Matters to a Vote of Security Holders – Not applicable.
Item 11 – Controls and Procedures
| | (a) | It is the conclusion of the registrant’s principal executive officer and principal financial officer that the effectiveness of the registrant’s current disclosure controls and procedures (such disclosure controls and procedures having been evaluated within 90 days of the date of this filing) provide reasonable assurance that the information required to be disclosed by the registrant has been recorded, processed, summarized and reported within the time period specified in the Commission’s rules and forms and that the information required to be disclosed by the registrant has been accumulated and communicated to the registrant’s principal executive officer and principal financial officer in order to allow timely decisions regarding required disclosure. |
| | (b) | There has been no significant change in the registrant’s internal control over financial reporting that occurred during the registrant’s most recent fiscal quarter of the period covered by this report that has materially affected, or is likely to materially affect, the registrant’s internal control over financial reporting. |
Item 12 – Exhibits
| | | | |
(a) | | (1) | | Code of Ethics – Not required, as this is not an annual filing. |
| | |
| | (2) | | Certifications pursuant to Section 302 of the Sarbanes-Oxley Act – Attached hereto as Exhibit EX-99.CERT. |
| | |
| | (3) | | Any written solicitation to purchase securities under Rule 23c-1. – Not applicable. |
| |
(b) | | Certifications pursuant to Section 906 of the Sarbanes-Oxley Act – Attached hereto as Exhibit EX-99.906CERT. |
SIGNATURES
Pursuant to the requirements of the Securities Exchange Act of 1934 and the Investment Company Act of 1940, the registrant has duly caused this report to be signed on its behalf by the undersigned, thereunto duly authorized.
| | |
(Registrant) The Prudential Investment Portfolios, Inc. |
| |
By (Signature and Title) * | | /s/ Deborah A. Docs |
| | Deborah A. Docs Secretary |
Date May 30, 2006
Pursuant to the requirements of the Securities Exchange Act of 1934 and the Investment Company Act of 1940, this report has been signed below by the following persons on behalf of the registrant and in the capacities and on the dates indicated.
| | |
| |
By (Signature and Title) * | | /s/ Judy A. Rice |
| | Judy A. Rice President and Principal Executive Officer |
Date May 30, 2006
| | |
| |
By (Signature and Title) * | | /s/ Grace C. Torres |
| | Grace C. Torres Treasurer and Principal Financial Officer |
Date May 30, 2006
| * | Print the name and title of each signing officer under his or her signature. |