UNITED STATES
SECURITIES AND EXCHANGE COMMISSION
Washington, D.C. 20549
FORM N-CSR
CERTIFIED SHAREHOLDER REPORT OF REGISTERED MANAGEMENT INVESTMENT COMPANIES
| | |
Investment Company Act file number: | | 811-07343 |
| |
Exact name of registrant as specified in charter: | | The Prudential Investment |
| | Portfolios, Inc. |
| |
Address of principal executive offices: | | Gateway Center 3, |
| | 100 Mulberry Street, |
| | Newark, New Jersey 07102 |
| |
Name and address of agent for service: | | Deborah A. Docs |
| | Gateway Center 3, |
| | 100 Mulberry Street, |
| | Newark, New Jersey 07102 |
| |
Registrant’s telephone number, including area code: | | 800-225-1852 |
| |
Date of fiscal year end: | | 9/30/2007 |
| |
Date of reporting period: | | 3/31/2007 |
Item 1 – Reports to Stockholders

Dryden Active Allocation Fund
| | |
| MARCH 31, 2007 | | SEMIANNUAL REPORT |

FUND TYPE
Balanced/allocation
OBJECTIVE
Income and long-term growth of capital
This report is not authorized for distribution to prospective investors unless preceded or accompanied by a current prospectus.
The views expressed in this report and information about the Fund’s portfolio holdings are for the period covered by this report and are subject to change thereafter.
The accompanying financial statements as of March 31, 2007, were not audited, and accordingly, no auditor’s opinion is expressed on them.
JennisonDryden is a registered trademark of The Prudential Insurance Company of America.

May 16, 2007
Dear Shareholder:
We hope you find the semiannual report for the Dryden Active Allocation Fund informative and useful. As a JennisonDryden mutual fund shareholder, you may be thinking about where you can find additional growth opportunities. You could invest in last year’s top-performing asset class and hope history repeats itself or you could stay in cash while waiting for the “right moment” to invest.
Instead, we believe it is better to take advantage of developing domestic and global investment opportunities through a diversified portfolio of stock and bond mutual funds. A diversified asset allocation offers two potential advantages. It helps you manage downside risk by not being overly exposed to any particular asset class, plus it gives you a better opportunity to have at least some of your assets in the right place at the right time. Your financial professional can help you create a diversified investment plan that may include mutual funds covering all the basic asset classes and that reflects your personal investor profile and tolerance for risk.
JennisonDryden Mutual Funds gives you a wide range of choices that can help you make progress toward your financial goals. Our funds offer the experience, resources, and professional discipline of four leading asset managers. They are recognized and respected in the institutional market and by discerning investors for excellence in their respective strategies. JennisonDryden equity funds are advised by Jennison Associates LLC, Quantitative Management Associates LLC (QMA), or Prudential Real Estate Investors (PREI). Prudential Investment Management, Inc. (PIM) advises the JennisonDryden fixed income and money market funds. Jennison Associates, QMA, and PIM are registered investment advisers and Prudential Financial companies. PREI is a registered investment adviser and a unit of PIM.
Thank you for choosing JennisonDryden Mutual Funds.
Sincerely,

Judy A. Rice, President
The Prudential Investment Portfolios, Inc./Dryden Active Allocation Fund
| | |
| The Prudential Investment Portfolios, lnc./Dryden Active Allocation Fund | | 1 |
Your Fund’s Performance
Fund objective
The investment objective of the Dryden Active Allocation Fund is income and long-term growth of capital. There can be no assurance that the Fund will achieve its investment objective.
Performance data quoted represent past performance. Past performance does not guarantee future results. The investment return and principal value of an investment will fluctuate, so that an investor’s shares, when redeemed, may be worth more or less than their original cost. Current performance may be lower or higher than the past performance data quoted. An investor may obtain performance data as of the most recent month-end by visiting our website at www.jennisondryden.com or by calling (800) 225-1852. Class A and Class L shares have a maximum initial sales charge of 5.50% and 5.75%, respectively. As of March 31, 2007, the gross annualized operating expenses are 1.14%, 1.84%, 1.84%, 1.34%, 1.84%, 1.59%, 1.84% and 0.84% for Class A, B, C, L, M, R, X and Z shares, respectively. As of March 31, 2007, the annualized operating expenses net of a contractual reduction through January 31, 2008 are 1.09%, 1.84%, 1.84%, 1.34%, 1.84%, 1.34%, 1.84% and 0.84% for Class A, B, C, L, M, R, X and Z shares, respectively. These figures include the net operating expenses of the underlying portfolios in which the Fund invests. Such expenses were calculated using a weighted average of the net operating expenses of each underlying fund and when annualized amounted to less than 0.01% for each share class.
| | | | | | | | | | | | | | |
| Cumulative Total Returns as of 3/31/07 |
| | | Six Months | | | One Year | | | Five Years | | | Ten Years | | | Since Inception1 |
Class A | | 6.69 | % | | 9.79 | % | | 43.48 | % | | 102.93 | % | | — |
Class B | | 6.33 | | | 8.96 | | | 38.33 | | | 88.50 | | | — |
Class C | | 6.41 | | | 9.04 | | | 38.43 | | | 88.63 | | | — |
Class L | | N/A | | | N/A | | | N/A | | | N/A | | | -0.71% (3/23/07) |
Class M | | N/A | | | N/A | | | N/A | | | N/A | | | -0.71 (3/23/07) |
Class R | | 6.64 | | | 9.50 | | | N/A | | | N/A | | | 18.76 (12/17/04) |
Class X | | N/A | | | N/A | | | N/A | | | N/A | | | -0.78 (3/23/07) |
Class Z | | 6.86 | | | 10.02 | | | 45.17 | | | 108.53 | | | — |
S&P 500 Index2 | | 7.38 | | | 11.82 | | | 35.49 | | | 119.98 | | | ** |
Lehman Brothers U.S. Aggregate Bond Index3 | | 2.76 | | | 6.59 | | | 29.79 | | | 86.92 | | | *** |
Customized Blend Index4 | | 5.42 | | | 9.58 | | | 34.11 | | | 110.40 | | | **** |
Lipper Mixed-Asset Target Allocation Growth Funds Avg.5 | | 7.01 | | | 9.54 | | | 37.61 | | | 104.63 | | | ***** |
| | | | | | | | | | | | | | |
| | |
| 2 | | Visit our website at www.jennisondryden.com |
| | | | | | | | | | | | | |
| Average Annual Total Returns6 as of 3/31/07 | | | | | | | | | |
| | | | | One Year | | | Five Years | | | Ten Years | | | Since Inception1 |
Class A | | | | 3.75 | % | | 6.28 | % | | 6.73 | % | | — |
Class B | | | | 3.96 | | | 6.55 | | | 6.54 | | | — |
Class C | | | | 8.04 | | | 6.72 | | | 6.55 | | | — |
Class L | | | | N/A | | | N/A | | | N/A | | | N/A (3/23/07) |
Class M | | | | N/A | | | N/A | | | N/A | | | N/A (3/23/07) |
Class R | | | | 9.50 | | | N/A | | | N/A | | | 7.81% (12/17/04) |
Class X | | | | N/A | | | N/A | | | N/A | | | N/A (3/23/07) |
Class Z | | | | 10.02 | | | 7.74 | | | 7.63 | | | — |
S&P 500 Index2 | | | | 11.82 | | | 6.26 | | | 8.20 | | | ** |
Lehman Brothers U.S. Aggregate Bond Index3 | | | | 6.59 | | | 5.35 | | | 6.46 | | | *** |
Customized Blend Index4 | | | | 9.58 | | | 6.05 | | | 7.72 | | | **** |
Lipper Mixed-Asset Target Allocation Growth Funds Avg.5 | | | | 9.54 | | | 6.50 | | | 7.28 | | | ***** |
The cumulative total returns do not reflect the deduction of applicable sales charges. If reflected, the applicable sales charges would reduce the cumulative total returns performance quoted. Class A and Class L shares are subject to a maximum front-end sales charge of 5.50% and 5.75%, respectively. Under certain circumstances, Class A shares may be subject to a contingent deferred sales charge (CDSC) of 1%. Class B, Class C, Class L, Class M, and Class X shares are subject to a maximum CDSC of 5%, 1%, 1%, 6%, and 6%, respectively. Class R and Class Z shares are not subject to a sales charge. Class L shares are closed to most new purchases (with the exception of exchanges from the same class of shares offered by certain other JennisonDryden and Strategic Partners Funds).
Source: Prudential Investments LLC and Lipper Inc. Performance figures may reflect fee waivers and/or expense reimbursements. In the absence of such fee waivers and/or expense reimbursements, total returns would be lower.
1Inception dates: Class A, Class B, and Class C, 11/7/1996; Class R, 12/17/2004; Class Z, 1/4/1993; Class L, Class M, and Class X, 3/23/2007. Inception date returns are provided for any share class with less than 10 calendar years of returns. The Since Inception returns for the S&P 500 Index, Lehman Brothers U.S. Aggregate Bond Index, Customized Blend Index, and the Lipper Average are measured from the closest month-end to inception date, and not from the Fund’s actual inception date.
2The S&P 500 Index is an unmanaged index of 500 stocks of large U.S. public companies. It gives a broad look at how U.S. stock prices have performed.
3The Lehman Brothers U.S. Aggregate Bond Index is an unmanaged index of investment-grade securities issued by the U.S. government and its agencies, and by corporations with between 1 and 10 years remaining to maturity on the securities. It gives a broad look at how short- and intermediate-term bonds have performed.
4The Customized Blend Index is made up of the S&P 500 Index (57.5%), the Lehman Brothers U.S. Aggregate Bond Index (40.0%), and the T-Bill 3-Month Blend (2.5%).
5The Lipper Mixed-Asset Target Allocation Growth Funds Average (Lipper Average) represents returns based on the average return of all funds in the Lipper Mixed-Asset Target Allocation Growth Funds category for the periods
| | |
| The Prudential Investment Portfolios, lnc./Dryden Active Allocation Fund | | 3 |
Your Fund’s Performance (continued)
noted. Funds in the Lipper Average are funds whose primary objective is to conserve principal by maintaining at all times a balanced portfolio of both stocks and bonds. Typically, the stock:bond ratio ranges around 60%:40%.
6The average annual total returns take into account applicable sales charges. Class A, Class B, Class C, Class L, Class M, Class R, and Class X shares are subject to an annual distribution and service (12b-1) fee of up to 0.30%, 1.00%, 1.00%, 0.50%, 1.00%, 0.75%, and 1.00%, respectively. Approximately seven years after purchase, Class B shares will automatically convert to Class A shares on a quarterly basis. Class Z shares are not subject to a 12b-1 fee. The returns in the tables do not reflect the deduction of taxes that a shareholder would pay on Fund distributions or following the redemption of Fund shares.
Investors cannot invest directly in an index. The returns for the S&P 500 Index, the Lehman Brothers U.S. Aggregate Bond Index, and the Customized Blend Index would be lower if they included the effects of sales charges, operating expenses of a mutual fund, or taxes. Returns for the Lipper Average reflect the deduction of operating expenses, but not sales charges or taxes.
**S&P 500 Index Closest Month-End to Inception cumulative total return is 22.24% for Class R. S&P 500 Index Closest Month-End to Inception average annual total returns is 9.34% for Class R. Class L, Class M, and Class X shares are new share classes and no performance information is available for these new share classes.
***Lehman Brothers U.S. Aggregate Bond Index Closest Month-End to Inception cumulative total return is 8.47% for Class R. Lehman Brothers U.S. Aggregate Bond Index Closest Month-End to Inception average annual total return is 3.68% for Class R. Class L, Class M, and Class X shares are new share classes and no performance information is available for these new share classes.
****Customized Blend Index Closest Month-End to Inception cumulative total return is 16.39% for Class R. Customized Blend Index Closest Month-End to Inception average annual total return is 6.98% for Class R. Class L, Class M, and Class X shares are new share classes and no performance information is available for these new share classes.
*****Lipper Average Closest Month-End to Inception cumulative total return is 19.51% for Class R. Lipper Average Closest Month-End to Inception average annual total return is 8.21% for Class R. Class L, Class M, and Class X shares are new share classes and no performance information is available for these new share classes.
| | | |
| Five Largest Equity Holdings expressed as a percentage of net assets as of 3/31/07 | | | |
Exxon Mobil Corp., Oil, Gas & Consumable Fuels | | 1.9 | % |
Bank of America Corp., Diversified Financial Services | | 1.1 | |
General Electric Co., Industrial Conglomerates | | 1.1 | |
Chevron Corp., Oil, Gas & Consumable Fuels | | 1.0 | |
Microsoft Corp., Software | | 1.0 | |
Holdings reflect only long-term equity investments and are subject to change.
| | | |
| Five Largest Equity Industries expressed as a percentage of net assets as of 3/31/07 | | | |
Oil, Gas & Consumable Fuels | | 4.8 | % |
Pharmaceuticals | | 3.5 | |
Diversified Financial Services | | 3.4 | |
Insurance | | 2.8 | |
Capital Markets | | 2.7 | |
Industry weightings reflect only long-term equity investments and are subject to change.
| | |
| 4 | | Visit our website at www.jennisondryden.com |
Fees and Expenses (Unaudited)
As a shareholder of the Fund, you incur two types of costs: (1) transaction costs, including sales charges (loads) on purchase payments and redemptions, as applicable, and (2) ongoing costs, including management fees, distribution and/or service (12b-1) fees, and other Fund expenses, as applicable. This example is intended to help you understand your ongoing costs (in dollars) of investing in the Fund and to compare these costs with the ongoing costs of investing in other mutual funds.
The example is based on an investment of $1,000 invested on October 1, 2006, at the beginning of the period, and held through the six-month period ended March 31, 2007.
The Fund’s transfer agent may charge additional fees to holders of certain accounts that are not included in the expenses shown in the table on the following page. These fees apply to Individual Retirement Accounts (IRAs) and Section 403(b) accounts. As of the close of the six-month period covered by the table, IRA fees included an annual maintenance fee of $15 per account (subject to a maximum annual maintenance fee of $25 for all accounts held by the same shareholder). Section 403(b) accounts are charged an annual $25 fiduciary maintenance fee. Some of the fees may vary in amount, or may be waived, based on your total account balance or the number of JennisonDryden or Strategic Partners Funds, including the Fund, that you own. You should consider the additional fees that were charged to your Fund account over the six-month period when you estimate the total ongoing expenses paid over the period and the impact of these fees on your ending account value, as these additional expenses are not reflected in the information provided in the expense table. Additional fees have the effect of reducing investment returns.
Actual Expenses
The first line for each share class in the table on the following page provides information about actual account values and actual expenses. You may use the information on this line, together with the amount you invested, to estimate the expenses that you paid over the period. Simply divide your account value by $1,000 (for example, an $8,600 account value ÷ $1,000 = 8.6), then multiply the result by the number on the first line under the heading “Expenses Paid During the Six-Month Period” to estimate the expenses you paid on your account during this period.
Hypothetical Example for Comparison Purposes
The second line for each share class in the table on the following page provides information about hypothetical account values and hypothetical expenses based on the Fund’s actual expense ratio and an assumed rate of return of 5% per year before expenses, which is not the Fund’s actual return. The hypothetical account values and
| | |
| The Prudential Investment Portfolios, lnc./Dryden Active Allocation Fund | | 5 |
Fees and Expenses (continued)
expenses may not be used to estimate the actual ending account balance or expenses you paid for the period. You may use this information to compare the ongoing costs of investing in the Fund and other funds. To do so, compare this 5% hypothetical example with the 5% hypothetical examples that appear in the shareholder reports of the other funds.
Please note that the expenses shown in the table are meant to highlight your ongoing costs only, and do not reflect any transactional costs such as sales charges (loads). Therefore the second line for each share class in the table is useful in comparing ongoing costs only, and will not help you determine the relative total costs of owning different funds. In addition, if these transactional costs were included, your costs would have been higher.
| | | | | | | | | | | | | | |
Dryden Active
Allocation Fund | | Beginning Account
Value
October 1, 2006 | | Ending Account
Value March 31, 2007 | | Annualized
Expense Ratio
Based on the
Six-Month Period | | | Expenses Paid
During the Six-
Month Period* |
| | | | | | | | | | | | | | | |
| Class A | | Actual | | $ | 1,000.00 | | $ | 1,066.90 | | 1.09 | % | | $ | 5.62 |
| | | Hypothetical | | $ | 1,000.00 | | $ | 1,019.50 | | 1.09 | % | | $ | 5.49 |
| | | | | | | | | | | | | | | |
| Class B | | Actual | | $ | 1,000.00 | | $ | 1,063.30 | | 1.84 | % | | $ | 9.47 |
| | | Hypothetical | | $ | 1,000.00 | | $ | 1,015.76 | | 1.84 | % | | $ | 9.25 |
| | | | | | | | | | | | | | | |
| Class C | | Actual | | $ | 1,000.00 | | $ | 1,064.10 | | 1.84 | % | | $ | 9.47 |
| | | Hypothetical | | $ | 1,000.00 | | $ | 1,015.76 | | 1.84 | % | | $ | 9.25 |
| | | | | | | | | | | | | | | |
| Class L | | Actual** | | $ | 1,000.00 | | $ | 992.90 | | 1.34 | % | | $ | 0.22 |
| | | Hypothetical | | $ | 1,000.00 | | $ | 1,018.25 | | 1.34 | % | | $ | 6.74 |
| | | | | | | | | | | | | | | |
| Class M | | Actual** | | $ | 1,000.00 | | $ | 992.90 | | 1.84 | % | | $ | 0.30 |
| | | Hypothetical | | $ | 1,000.00 | | $ | 1,015.76 | | 1.84 | % | | $ | 9.25 |
| | | | | | | | | | | | | | | |
| Class R | | Actual | | $ | 1,000.00 | | $ | 1,066.40 | | 1.34 | % | | $ | 6.90 |
| | | Hypothetical | | $ | 1,000.00 | | $ | 1,018.25 | | 1.34 | % | | $ | 6.74 |
| | | | | | | | | | | | | | | |
| Class X | | Actual** | | $ | 1,000.00 | | $ | 992.20 | | 1.84 | % | | $ | 0.30 |
| | | Hypothetical | | $ | 1,000.00 | | $ | 1,015.76 | | 1.84 | % | | $ | 9.25 |
| | | | | | | | | | | | | | | |
| Class Z | | Actual | | $ | 1,000.00 | | $ | 1,068.60 | | 0.84 | % | | $ | 4.33 |
| | | Hypothetical | | $ | 1,000.00 | | $ | 1,020.74 | | 0.84 | % | | $ | 4.23 |
| | | | | | | | | | | | | | | |
* Fund expenses (net of fee waivers or subsidies, if any) for each share class are equal to the annualized expense ratio for each share class (provided in the table), multiplied
| | |
| 6 | | Visit our website at www.jennisondryden.com |
by the average account value over the period, multiplied by the 182 days in the six- month period ended March 31, 2007, and divided by the 365 days in the Fund’s fiscal year ending September 30, 2007 (to reflect the six-month period with the exception of the Class L, Class M and Class X “Actual” information which reflects the 9 day period ended March 31, 2007 due to its inception date of March 23, 2007.
** Class L, Class M, and Class X shares commenced operations on March 23, 2007.
| | |
| The Prudential Investment Portfolios, lnc./Dryden Active Allocation Fund | | 7 |
Portfolio of Investments
as of March 31, 2007 (Unaudited)
| | | | | |
| Shares | | Description | | Value (Note 1) |
| | | | | |
LONG-TERM INVESTMENTS 94.1% | | | |
COMMON STOCKS 64.2% | | | |
| |
Aerospace & Defense 1.9% | | | |
| 26,754 | | Boeing Co. | | $ | 2,378,698 |
| 20,400 | | Ceradyne, Inc.(a)(g) | | | 1,116,696 |
| 1,748 | | European Aeronautic Defense and Space Co. (Netherlands) | | | 54,220 |
| 26,000 | | Honeywell International, Inc. | | | 1,197,560 |
| 13,900 | | L-3 Communications Holdings, Inc. | | | 1,215,833 |
| 28,329 | | Lockheed Martin Corp. | | | 2,748,480 |
| 46,000 | | Northrop Grumman Corp. | | | 3,414,120 |
| 8,500 | | Raytheon Co. | | | 445,910 |
| 14,600 | | United Technologies Corp. | | | 949,000 |
| | | | | |
| | | | | 13,520,517 |
| |
Air Freight & Logistics 0.2% | | | |
| 612 | | CH Robinson Worldwide, Inc. | | | 29,223 |
| 6,144 | | FedEx Corp. | | | 660,050 |
| 18,900 | | HUB Group, Inc.(a)(g) | | | 547,911 |
| 462 | | TNT NV (Netherlands) | | | 21,187 |
| 4,141 | | United Parcel Service, Inc. | | | 290,284 |
| | | | | |
| | | | | 1,548,655 |
| |
Airlines | | | |
| 3,872 | | Air France-KLM (France) | | | 176,637 |
| 1,123 | | British Airways PLC (United Kingdom)(a) | | | 10,740 |
| 7,299 | | Qantas Airways Ltd. | | | 31,005 |
| 5,000 | | Singapore Airlines Ltd. (Singapore) | | | 54,708 |
| | | | | |
| | | | | 273,090 |
| |
Auto Components 0.2% | | | |
| 1,200 | | Aisin Seiki Co. Ltd. (Japan) | | | 42,057 |
| 389 | | Compagnie Generale des Etablissements Michelin (France) | | | 42,959 |
| 2,900 | | Denso Corp. (Japan) | | | 107,790 |
| 50,000 | | Gentex Corp. | | | 812,501 |
| 1,000 | | NGK Spark Plug Co. Ltd. (Japan) | | | 18,712 |
| 2,600 | | Stanley Electric Co. Ltd. (Japan) | | | 52,843 |
| 1,800 | | Tokai Rika Co. Ltd. (Japan) | | | 42,693 |
| 200 | | Toyota Industries Corp. (Japan) | | | 9,470 |
| | | | | |
| | | | | 1,129,025 |
See Notes to Financial Statements.
| | |
| The Prudential Investment Portfolios, lnc./Dryden Active Allocation Fund | | 9 |
Portfolio of Investments
as of March 31, 2007 (Unaudited) Cont’d.
| | | | | |
| Shares | | Description | | Value (Note 1) |
| | | | | |
Automobiles 0.2% | | | |
| 3,802 | | Fiat SpA (Italy)(a) | | $ | 95,839 |
| 5,100 | | Harley-Davidson, Inc. | | | 299,625 |
| 6,200 | | Honda Motor Co. Ltd. (Japan) | | | 216,242 |
| 363 | | Renault SA (France) | | | 42,454 |
| 800 | | Thor Industries, Inc. | | | 31,512 |
| 6,500 | | Toyota Motor Corp. (Japan) | | | 416,454 |
| 624 | | Volkswagen AG (Germany) | | | 93,860 |
| | | | | |
| | | | | 1,195,986 |
| |
Beverages 1.2% | | | |
| 91,320 | | Coca-Cola Co. (The) | | | 4,383,360 |
| 1,520 | | Coca-Cola Hellenic Bottling Co. SA (Greece) | | | 63,960 |
| 1,300 | | West Holdings Co. Ltd. (Japan) | | | 28,187 |
| 279 | | InBev NV | | | 20,144 |
| 27,500 | | Pepsi Bottling Group, Inc. | | | 876,975 |
| 45,400 | | PepsiCo, Inc. | | | 2,885,624 |
| 7,346 | | SABMiller PLC (United Kingdom) | | | 161,182 |
| | | | | |
| | | | | 8,419,432 |
| |
Biotechnology 0.6% | | | |
| 39,359 | | Biogen Idec, Inc.(a)(g) | | | 1,746,752 |
| 2,568 | | CSL Ltd. (Australia) | | | 171,146 |
| 41,000 | | United Therapeutics Corp.(a)(g) | | | 2,204,980 |
| | | | | |
| | | | | 4,122,878 |
| |
Building Products 0.1% | | | |
| 867 | | Cie de Saint-Gobain (France) | | | 84,744 |
| 34 | | Geberit AG (Switzerland) | | | 52,323 |
| 12,500 | | Goodman Global, Inc.(a) | | | 220,250 |
| 7,000 | | Sanwa Shutter Corp. | | | 43,601 |
| | | | | |
| | | | | 400,918 |
| |
Capital Markets 2.7% | | | |
| 800 | | 3i Group PLC (United Kingdom) | | | 17,884 |
| 7,500 | | Bear Stearns Cos., Inc. (The) | | | 1,127,625 |
| 3,149 | | Credit Suisse Group (Switzerland) | | | 225,974 |
| 700 | | D Carnegie AB (Sweden) | | | 14,561 |
| 2,244 | | Deutsche Bank AG (Germany) | | | 302,042 |
| 26,815 | | Goldman Sachs Group, Inc. | | | 5,540,783 |
| 16,400 | | Janus Capital Group, Inc. | | | 342,924 |
| 53,711 | | Lehman Brothers Holdings, Inc. | | | 3,763,530 |
See Notes to Financial Statements.
| | |
| 10 | | Visit our website at www.jennisondryden.com |
| | | | | |
| Shares | | Description | | Value (Note 1) |
| | | | | |
| 388 | | Macquarie Bank Ltd. | | $ | 25,978 |
| 40,277 | | Merrill Lynch & Co., Inc. | | | 3,289,423 |
| 55,662 | | Morgan Stanley | | | 4,383,939 |
| 5,919 | | UBS AG (Switzerland) | | | 351,686 |
| | | | | |
| | | | | 19,386,349 |
| |
Chemicals 0.9% | | | |
| 700 | | Air Products and Chemicals, Inc. | | | 51,772 |
| 5,000 | | Asahi Kasei Corp. (Japan) | | | 36,405 |
| 810 | | BASF AG (Germany) | | | 90,999 |
| 5,401 | | Celanese Corp. | | | 166,567 |
| 2,000 | | Dainippon Ink & Chemicals, Inc. (Japan) | | | 7,943 |
| 44,400 | | Dow Chemical Co. (The) | | | 2,036,184 |
| 3,275 | | H.B. Fuller Co. | | | 89,309 |
| 2,587 | | Koninklijke DSM NV (Netherlands) | | | 115,909 |
| 37,074 | | Lyondell Chemical Co. | | | 1,111,108 |
| 5,000 | | Mitsubishi Chemical Holdings (Japan) | | | 42,558 |
| 5,000 | | Mitsubishi Gas Chemical Co., Inc. (Japan) | | | 47,946 |
| 11,000 | | Mitsui Chemicals, Inc. (Japan) | | | 96,147 |
| 37,000 | | Mosaic Co. (The)(a) | | | 986,420 |
| 3,000 | | Nippon Shokubai Co. Ltd. (Japan) | | | 32,383 |
| 16,300 | | PolyOne Corp.(a) | | | 99,430 |
| 24,700 | | Rohm and Haas Co. | | | 1,277,484 |
| 7,000 | | Tosoh Corp. (Japan) | | | 36,057 |
| 1,100 | | Yara International ASA (Norway) | | | 30,358 |
| | | | | |
| | | | | 6,354,979 |
| |
Commercial Banks 2.7% | | | |
| 316 | | Allied Irish Banks PLC (Ireland) | | | 9,371 |
| 1,320 | | Alpha Credit Bank AE (Greece) | | | 41,791 |
| 6,577 | | Australia And New Zealand Banking Group Ltd. (Australia) | | | 158,047 |
| 7,236 | | Banco Bilbao Vizcaya Argentaria SA (Spain) | | | 177,664 |
| 2,804 | | Banco BPI SA (Portugal) | | | 24,347 |
| 10,464 | | Banco Comercial Portugues SA (Portugal) | | | 37,881 |
| 1,694 | | Banco Espirito Santo SA (Portugal) | | | 32,337 |
| 1,977 | | Banco Popolare di Verona e Nov (Italy) | | | 61,402 |
| 19,443 | | Banco Santander Central Hispano SA (Spain) | | | 346,997 |
| 16,570 | | Barclays PLC (United Kingdom) | | | 235,098 |
| 32,300 | | BB&T Corp.(g) | | | 1,324,946 |
| 3,032 | | BNP Paribas (France) | | | 316,691 |
| 18,200 | | Comerica, Inc. | | | 1,075,984 |
| 1,818 | | Commonwealth Bank of Australia (Australia) | | | 73,930 |
| 3,677 | | Credit Agricole SA (France) | | | 143,378 |
See Notes to Financial Statements.
| | |
| The Prudential Investment Portfolios, lnc./Dryden Active Allocation Fund | | 11 |
Portfolio of Investments
as of March 31, 2007 (Unaudited) Cont’d.
| | | | | |
| Shares | | Description | | Value (Note 1) |
| | | | | |
| 3,680 | | Danske Bank A/S (Denmark) | | $ | 171,209 |
| 3,000 | | DBS Group Holdings Ltd. (Singapore) | | | 42,316 |
| 5,881 | | Dexia SA (Belgium) | | | 175,505 |
| 9,300 | | DnB NOR ASA (Norway) | | | 131,277 |
| 11,000 | | Gunma Bank Ltd. (The) (Japan) | | | 77,945 |
| 3,616 | | HBOS PLC (United Kingdom) | | | 74,502 |
| 24,323 | | HSBC Holdings PLC (United Kingdom) | | | 425,749 |
| 5,700 | | Huntington Bancshares, Inc.(g) | | | 124,545 |
| 63,298 | | KeyCorp. | | | 2,371,776 |
| 10,467 | | Lloyds TSB Group PLC (United Kingdom) | | | 115,346 |
| 7 | | Mitsubishi UFJ Financial Group, Inc. (Japan) | | | 79,005 |
| 12,000 | | Mitsui Trust Holdings, Inc. (Japan) | | | 118,330 |
| 1,603 | | National Australia Bank Ltd. (Australia) | | | 52,398 |
| 47,748 | | National City Corp.(g) | | | 1,778,613 |
| 15,600 | | Oriental Financial Group (Puerto Rico) | | | 183,768 |
| 4,000 | | Pacific Capital Bancorp | | | 128,480 |
| 5,633 | | PNC Financial Services Group, Inc. | | | 405,407 |
| 22,700 | | Popular, Inc. (Puerto Rico) | | | 375,912 |
| 8,593 | | Royal Bank of Scotland Group PLC (United Kingdom) | | | 335,488 |
| 2,200 | | Skandinaviska Enskilda Banken, Class A (Sweden) | | | 70,416 |
| 1,361 | | Societe Generale (France) | | | 235,206 |
| 5,300 | | SunTrust Banks, Inc.(g) | | | 440,112 |
| 2,900 | | Svenska Handelsbanken AB, Class A (Sweden) | | | 86,176 |
| 38,408 | | U.S. Bancorp. | | | 1,343,128 |
| 20,338 | | UniCredito Italiano SpA (Italy) | | | 193,575 |
| 3,200 | | UnionBanCal Corp. | | | 202,944 |
| 42,100 | | Wachovia Corp.(g) | | | 2,317,605 |
| 105,275 | | Wells Fargo & Co. | | | 3,624,619 |
| 2,291 | | Westpac Banking Corp. (Australia) | | | 48,844 |
| | | | | |
| | | | | 19,790,060 |
| |
Commercial Services & Supplies 1.0% | | | |
| 14,000 | | Avery Dennison Corp. | | | 899,640 |
| 13,200 | | Corporate Executive Board Co. | | | 1,002,672 |
| 2,800 | | Diamond Management & Technology consultants, Inc. | | | 32,732 |
| 21,003 | | Downer EDI Ltd. (Australia) | | | 115,896 |
| 2,014 | | Hays PLC (United Kingdom) | | | 6,212 |
| 21,800 | | Herman Miller, Inc. | | | 730,082 |
| 22,000 | | IKON Office Solutions, Inc. | | | 316,140 |
| 16,900 | | John H. Harland Co. | | | 865,787 |
| 968 | | Manpower, Inc. | | | 71,409 |
| 3,116 | | Michael Page International PLC | | | 32,836 |
| 2,300 | | R. R. Donnelley & Sons Co. | | | 84,157 |
See Notes to Financial Statements.
| | |
| 12 | | Visit our website at www.jennisondryden.com |
| | | | | |
| Shares | | Description | | Value (Note 1) |
| | | | | |
| 491 | | Randstad Holding NV (Netherlands) | | $ | 38,082 |
| 61,900 | | Robert Half International, Inc.(g) | | | 2,290,920 |
| 19,800 | | Spherion Corp.(a) | | | 174,636 |
| 15,567 | | Waste Management, Inc. | | | 535,660 |
| | | | | |
| | | | | 7,196,861 |
| |
Communications Equipment 1.1% | | | |
| 192,366 | | Cisco Systems, Inc.(a) | | | 4,911,104 |
| 16,400 | | Harris Corp. | | | 835,580 |
| 19,100 | | Mastec, Inc.(a) | | | 210,291 |
| 6,600 | | Nokia Corp. (Finland) | | | 151,910 |
| 39,800 | | QUALCOMM, Inc. | | | 1,697,868 |
| 1,448 | | Telent PLC (United Kingdom)(a) | | | 13,499 |
| 1,000 | | Uniden Corp. (Japan) | | | 7,756 |
| | | | | |
| | | | | 7,828,008 |
| |
Computers & Peripherals 2.4% | | | |
| 1,050 | | Creative Technology Ltd. (Singapore) | | | 6,748 |
| 175,600 | | EMC Corp.(a)(g) | | | 2,432,060 |
| 128,811 | | Hewlett-Packard Co. | | | 5,170,474 |
| 79,241 | | International Business Machines Corp. | | | 7,469,256 |
| 8,815 | | Lexmark International, Inc.(a) | | | 515,325 |
| 43,600 | | Network Appliance, Inc.(a) | | | 1,592,272 |
| 28,400 | | Western Digital Corp.(a) | | | 477,404 |
| 528 | | Wincor Nixdorf AG (Germany) | | | 49,232 |
| | | | | |
| | | | | 17,712,771 |
| |
Construction & Engineering | | | |
| 278 | | Acciona SA (Spain) | | | 60,217 |
| 240 | | ACS Actividades Cons y Serv (Spain) | | | 14,571 |
| 5,000 | | COMSYS Holdings Corp. (Japan) | | | 53,674 |
| 16,000 | | Obayashi Corp. (Japan) | | | 103,191 |
| | | | | |
| | | | | 231,653 |
| |
Construction Materials 0.6% | | | |
| 455 | | CRH PLC (Ireland) | | | 19,450 |
| 20,900 | | Eagle Materials, Inc. | | | 932,767 |
| 15,900 | | Headwaters, Inc.(a) | | | 347,415 |
| 385 | | Holcim Ltd., Class B (Switzerland) | | | 38,559 |
| 176 | | Italcementi SpA (Italy) | | | 5,271 |
| 1,104 | | Lafarge SA (France) | | | 173,566 |
| 9,000 | | Taiheiyo Cement Corp. (Japan) | | | 39,791 |
| 21,800 | | Vulcan Materials Co. | | | 2,539,264 |
| | | | | |
| | | | | 4,096,083 |
See Notes to Financial Statements.
| | |
| The Prudential Investment Portfolios, lnc./Dryden Active Allocation Fund | | 13 |
Portfolio of Investments
as of March 31, 2007 (Unaudited) Cont’d.
| | | | | |
| Shares | | Description | | Value (Note 1) |
| | | | | |
Consumer Finance 0.4% | | | |
| 73,625 | | AmeriCredit Corp.(a)(g) | | $ | 1,683,067 |
| 53,900 | | First Cash Financial Services, Inc.(a) | | | 1,200,892 |
| 480 | | ORIX Corp. (Japan) | | | 125,051 |
| | | | | |
| | | | | 3,009,010 |
| |
Containers & Packaging | | | |
| 9,000 | | Myers Industries, Inc. | | | 168,120 |
| 5,679 | | Rock-Tenn. Co., Class A | | | 188,543 |
| | | | | |
| | | | | 356,663 |
| |
Distributors | | | |
| 10,000 | | Li & Fung Ltd. (Hong Kong) | | | 31,420 |
| 59,627 | | Pacific Brands Ltd. (Australia) | | | 148,110 |
| | | | | |
| | | | | 179,530 |
| |
Diversified Consumer Services 0.2% | | | |
| 6,100 | | ITT Educational Services, Inc.(a) | | | 497,089 |
| 12,300 | | Jackson Hewitt Tax Service, Inc. | | | 395,814 |
| 28,900 | | Universal Technical Institute, Inc.(a)(g) | | | 667,012 |
| | | | | |
| | | | | 1,559,915 |
| |
Diversified Financial Services 3.4% | | | |
| 3,393 | | Babcock & Brown Ltd. (Australia) | | | 75,413 |
| 165,403 | | Bank of America Corp. | | | 8,438,862 |
| 21,686 | | Challenger Financial Services Group Ltd. (Australia) | | | 83,695 |
| 26,900 | | CIT Group, Inc.(g) | | | 1,423,548 |
| 135,857 | | Citigroup, Inc. | | | 6,974,899 |
| 3,997 | | Fortis Group (Belgium) | | | 182,553 |
| 6,290 | | ING Groep NV (Netherlands) | | | 265,938 |
| 5,500 | | IntercontinentalExchange, Inc.(a)(g) | | | 672,155 |
| 112,830 | | JPMorgan Chase & Co. | | | 5,458,715 |
| 19,600 | | Moody’s Corp.(g) | | | 1,216,376 |
| | | | | |
| | | | | 24,792,154 |
| |
Diversified Telecommunication Services 1.5% | | | |
| 160,410 | | AT&T, Inc. | | | 6,324,967 |
| 2,955 | | Belgacom SA (Belgium) | | | 131,252 |
| 17,417 | | BT Group PLC (United Kingdom) | | | 104,107 |
| 1,257 | | CenturyTel, Inc. | | | 56,804 |
| 4,541 | | France Telecom SA (France) | | | 119,926 |
| 16 | | Nippon Telegraph & Telephone Corp. (NTT) (Japan) | | | 84,589 |
See Notes to Financial Statements.
| | |
| 14 | | Visit our website at www.jennisondryden.com |
| | | | | |
| Shares | | Description | | Value (Note 1) |
| | | | | |
| 367 | | Swisscom AG (Switzwerland) | | $ | 132,662 |
| 52,064 | | Telecom Corp. of New Zealand Ltd. (New Zealand) | | | 175,918 |
| 27,878 | | Telecom Italia SpA (Italy) | | | 68,933 |
| 6,597 | | Telefonica SA (Spain) | | | 145,407 |
| 4,500 | | TeliaSonera AB (Sweden) | | | 38,828 |
| 99,950 | | Verizon Communications, Inc. | | | 3,790,104 |
| | | | | |
| | | | | 11,173,497 |
| |
Electric Utilities 0.8% | | | |
| 9,300 | | Allegheny Energy, Inc.(a) | | | 457,002 |
| 5,500 | | Allete, Inc. | | | 256,410 |
| 55,400 | | American Electric Power Co., Inc. | | | 2,700,749 |
| 7,500 | | CLP Holdings Ltd. (Hong Kong) | | | 54,761 |
| 2,515 | | E.On AG (Germany) | | | 340,064 |
| 22,200 | | El Paso Electric Co.(a) | | | 584,970 |
| 2,104 | | Endesa SA (Spain) | | | 113,774 |
| 9,580 | | Enel SpA (Italy) | | | 102,507 |
| 18,438 | | Energias de Portugal SA (Portugal) | | | 99,014 |
| 3,800 | | Exelon Corp. | | | 261,098 |
| 9,200 | | FirstEnergy Corp.(g) | | | 609,408 |
| 2,000 | | Hokkaido Electric Power Co., Inc. (Japan) | | | 53,123 |
| 1,500 | | Pinnacle West Capital Corp. | | | 72,375 |
| 900 | | Tokyo Electric Power Co., Inc. (The) (Japan) | | | 30,779 |
| 949 | | Union Fenosa SA (Spain) | | | 51,178 |
| 4,200 | | Westar Energy, Inc. | | | 115,584 |
| | | | | |
| | | | | 5,902,796 |
| |
Electrical Equipment 0.8% | | | |
| 431 | | ABB Ltd. (Switzerland) | | | 7,378 |
| 24,902 | | Acuity Brands, Inc.(g) | | | 1,355,665 |
| 28,100 | | Cooper Industries Ltd., Class A | | | 1,264,219 |
| 39,200 | | Emerson Electric Co. | | | 1,689,127 |
| 4,200 | | Genlyte Group, Inc.(a) | | | 296,310 |
| 2,000 | | Hitachi Cable Ltd. (Japan) | | | 11,388 |
| 7,000 | | Mitsubishi Electric Corp. (Japan) | | | 72,115 |
| 7,200 | | Regal-Beloit Corp. | | | 333,936 |
| 11,900 | | Rockwell Automation, Inc. | | | 712,453 |
| | | | | |
| | | | | 5,742,591 |
| |
Electronic Equipment & Instruments 0.5% | | | |
| 72,900 | | Agilent Technologies, Inc.(a) | | | 2,456,001 |
| 4,100 | | Itron, Inc.(a)(g) | | | 266,664 |
| 900 | | Kyocera Corp. (Japan) | | | 84,852 |
See Notes to Financial Statements.
| | |
| The Prudential Investment Portfolios, lnc./Dryden Active Allocation Fund | | 15 |
Portfolio of Investments
as of March 31, 2007 (Unaudited) Cont’d.
| | | | | |
| Shares | | Description | | Value (Note 1) |
| | | | | |
| 2,100 | | Methode Electronics, Inc., Class A | | $ | 31,017 |
| 2,076 | | Mettler Toledo International, Inc. (Switzerland)(a) | | | 185,947 |
| 4,500 | | Nippon Electric Glass Co. Ltd. (Japan) | | | 78,857 |
| 2,700 | | SYNNEX Corp.(a) | | | 57,348 |
| 1,400 | | TDK Corp. (Japan) | | | 121,419 |
| 1,000 | | Venture Corp. Ltd. (Singapore) | | | 9,623 |
| 12,000 | | Yaskawa Electric Corp. (Japan) | | | 141,752 |
| | | | | |
| | | | | 3,433,480 |
| |
Energy Equipment & Services 1.1% | | | |
| 8,100 | | Baker Hughes, Inc. | | | 535,653 |
| 17,400 | | BJ Services Co. | | | 485,460 |
| 14,900 | | Grant Prideco, Inc.(a) | | | 742,616 |
| 91,663 | | Halliburton Co. | | | 2,909,384 |
| 56,600 | | Helmerich & Payne, Inc. | | | 1,717,244 |
| 26,600 | | Tidewater, Inc.(g) | | | 1,558,228 |
| 2,000 | | Transocean, Inc.(a) | | | 163,400 |
| 3,915 | | WorleyParsons Ltd. (Australia) | | | 88,028 |
| | | | | |
| | | | | 8,200,013 |
| |
Food & Staples Retailing 1.1% | | | |
| 1,500 | | Axfood AB (Sweden) | | | 59,289 |
| 489 | | Casino Guichard Perrachon SA (France) | | | 49,371 |
| 64,963 | | CVS/Caremark Corp. | | | 2,217,837 |
| 13,931 | | J Sainsbury PLC (United Kingdom) | | | 150,640 |
| 1,803 | | Jeronimo Martins SGPS SA (Portugal) | | | 46,966 |
| 69,998 | | Kroger Co. (The) | | | 1,977,444 |
| 36,678 | | Safeway, Inc. | | | 1,343,882 |
| 49,400 | | Wal-Mart Stores, Inc. | | | 2,319,329 |
| 1,817 | | Woolworths Ltd. (Australia) | | | 39,973 |
| | | | | |
| | | | | 8,204,731 |
| |
Food Products 1.1% | | | |
| 41,900 | | Archer-Daniels-Midland Co. | | | 1,537,730 |
| 11,856 | | Campbell Soup Co. | | | 461,791 |
| 104,534 | | ConAgra Foods, Inc. | | | 2,603,942 |
| 2,675 | | East Asiatic Co. Ltd. A/S (Denmark) | | | 128,529 |
| 5,612 | | Ebro Puleva SA (Spain) | | | 132,468 |
| 33,300 | | General Mills, Inc.(g) | | | 1,938,726 |
| 1,600 | | H.J. Heinz Co. | | | 75,392 |
| 4,500 | | Hormel Foods Corp. | | | 167,355 |
| 12,500 | | Kraft Foods, Inc., Class A(g) | | | 395,750 |
| 632 | | Nestle SA, Class B (Switzerland) | | | 246,138 |
See Notes to Financial Statements.
| | |
| 16 | | Visit our website at www.jennisondryden.com |
| | | | | |
| Shares | | Description | | Value (Note 1) |
| | | | | |
| 3,487 | | Suedzucker AG (Germany) | | $ | 66,750 |
| 5,912 | | Unilever NV (Netherlands) | | | 172,166 |
| 2,790 | | Unilever PLC (United Kingdom) | | | 84,056 |
| | | | | |
| | | | | 8,010,793 |
| |
Gas Utilities 0.1% | | | |
| 5,200 | | AGL Resources, Inc. | | | 222,144 |
| 1,300 | | Atmos Energy Corp. | | | 40,664 |
| 8,700 | | Energen Corp. | | | 442,743 |
| 3,253 | | Gaz de France SA (France) | | | 150,963 |
| | | | | |
| | | | | 856,514 |
| |
Health Care Equipment & Supplies 1.1% | | | |
| 4,285 | | Baxter International, Inc. | | | 225,691 |
| 51,223 | | Becton, Dickinson & Co. | | | 3,938,536 |
| 30,200 | | Haemonetics Corp.(a) | | | 1,411,850 |
| 19,700 | | ICU Medical, Inc.(a) | | | 772,240 |
| 811 | | Kinetic Concepts, Inc.(a) | | | 41,069 |
| 24,100 | | Mentor Corp. | | | 1,108,600 |
| 7,900 | | PolyMedica Corp.(g) | | | 334,407 |
| 12,200 | | STERIS Corp. | | | 324,032 |
| | | | | |
| | | | | 8,156,425 |
| |
Health Care Providers & Services 1.9% | | | |
| 64,600 | | Aetna, Inc. | | | 2,828,833 |
| 7,312 | | AMERIGROUP Corp.(a) | | | 222,285 |
| 1,400 | | Cardinal Health, Inc. | | | 102,130 |
| 6,200 | | Chemed Corp. | | | 303,552 |
| 14,300 | | CIGNA Corp. | | | 2,040,038 |
| 33,500 | | Express Scripts, Inc.(a) | | | 2,704,120 |
| 1,303 | | Healthspring, Inc.(a) | | | 30,686 |
| 14,142 | | Humana, Inc.(a) | | | 820,519 |
| 11,300 | | Laboratory Corp. of America Holdings(a)(g) | | | 820,719 |
| 3,619 | | McKesson Corp. | | | 211,856 |
| 21,980 | | UnitedHealth Group, Inc. | | | 1,164,281 |
| 8,819 | | Wellcare Health Plans, Inc.(a) | | | 751,820 |
| 24,300 | | WellPoint, Inc.(a) | | | 1,970,730 |
| | | | | |
| | | | | 13,971,569 |
| |
Health Care Technology | | | |
| 4,400 | | Eclipsys Corp.(a) | | | 84,788 |
See Notes to Financial Statements.
| | |
| The Prudential Investment Portfolios, lnc./Dryden Active Allocation Fund | | 17 |
Portfolio of Investments
as of March 31, 2007 (Unaudited) Cont’d.
| | | | | |
| Shares | | Description | | Value (Note 1) |
| | | | | |
Hotels, Restaurants & Leisure 1.4% | | | |
| 78,900 | | Brinker International, Inc. | | $ | 2,580,030 |
| 1,884 | | Carnival PLC (United Kingdom) | | | 90,795 |
| 22,800 | | Darden Restaurants, Inc. | | | 939,132 |
| 3,312 | | Enterprise Inns PLC (United Kingdom) | | | 43,570 |
| 50,168 | | McDonald’s Corp. | | | 2,260,068 |
| 17,800 | | Peet’s Coffee & Tea, Inc.(a)(g) | | | 491,636 |
| 16,900 | | Starbucks Corp.(a)(g) | | | 529,984 |
| 22,200 | | Wendy’s International, Inc. | | | 694,860 |
| 45,900 | | Yum! Brands, Inc. | | | 2,651,184 |
| | | | | |
| | | | | 10,281,259 |
| |
Household Durables 0.3% | | | |
| 5,959 | | Barratt Developments PLC (United Kingdom) | | | 129,577 |
| 728 | | Bellway PLC (United Kingdom) | | | 22,778 |
| 2,678 | | Bovis Homes Group PLC (United Kingdom) | | | 60,709 |
| 2,600 | | Ethan Allen Interiors, Inc.(g) | | | 91,884 |
| 3,331 | | George Wimpey PLC (United Kingdom) | | | 41,656 |
| 1,000 | | Makita Corp. (Japan) | | | 37,084 |
| 2,485 | | NVR, Inc.(a) | | | 1,652,526 |
| 2,600 | | Sony Corp. (Japan) | | | 132,162 |
| 5,303 | | Thomson (France) | | | 102,080 |
| | | | | |
| | | | | 2,270,456 |
| |
Household Products 0.9% | | | |
| 6,267 | | Colgate-Palmolive Co. | | | 418,573 |
| 34,300 | | Kimberly-Clark Corp. | | | 2,349,207 |
| 53,375 | | Procter & Gamble Co. | | | 3,371,165 |
| 2,086 | | Reckitt Benckiser PLC (United Kingdom) | | | 108,616 |
| | | | | |
| | | | | 6,247,561 |
| |
Independent Power Producers & Energy Traders 0.8% | | | |
| 42,800 | | Mirant Corp.(a) | | | 1,731,688 |
| 29,600 | | NRG Energy, Inc.(a) | | | 2,132,384 |
| 25,606 | | TXU Corp. | | | 1,641,345 |
| | | | | |
| | | | | 5,505,417 |
| |
Industrial Conglomerates 1.3% | | | |
| 5,600 | | Carlisle & Co., Inc. | | | 240,408 |
| 3,633 | | Cookson Group PLC (United Kingdom) | | | 44,432 |
| 232,350 | | General Electric Co. | | | 8,215,897 |
| 2,000 | | Haw Par Corp. Ltd. (Singapore) | | | 9,491 |
See Notes to Financial Statements.
| | |
| 18 | | Visit our website at www.jennisondryden.com |
| | | | | |
| Shares | | Description | | Value (Note 1) |
| | | | | |
| 9,493 | | McDermott International, Inc.(a) | | $ | 464,967 |
| 2,750 | | Orkla ASA, Class A (Norway) | | | 193,866 |
| 325 | | Siemens AG (Germany) | | | 34,736 |
| 7,700 | | Teleflex, Inc. | | | 524,139 |
| | | | | |
| | | | | 9,727,936 |
| |
Insurance 2.5% | | | |
| 16,100 | | ACE Ltd. (Bermuda) | | | 918,666 |
| 7,773 | | Aegon NV (Netherlands) | | | 154,922 |
| 1,423 | | Allianz SE (Germany) | | | 292,740 |
| 45,200 | | Allstate Corp. (The) | | | 2,714,712 |
| 12,329 | | American Financial Group, Inc. | | | 419,679 |
| 36,959 | | American International Group, Inc. | | | 2,484,384 |
| 6,893 | | Arch Capital Group Ltd. (Bermuda)(a) | | | 470,172 |
| 6,720 | | Aspen Insurance Holdings Ltd. (Bermuda) | | | 176,131 |
| 6,530 | | Aviva PLC (United Kingdom) | | | 96,182 |
| 2,920 | | AXA SA (France) | | | 123,807 |
| 15,851 | | Axis Capital Holdings Ltd. (Bermuda) | | | 536,715 |
| 14,100 | | Chubb Corp. (The) | | | 728,547 |
| 20,400 | | CNA Financial Corp.(a) | | | 879,036 |
| 14,941 | | Endurance Specialty Holdings Ltd. (Bermuda) | | | 533,991 |
| 8,200 | | First Mercury Financial Corp.(a) | | | 168,510 |
| 7,000 | | Genworth Financial, Inc., Class A | | | 244,580 |
| 10,400 | | LandAmerica Financial Group, Inc.(g) | | | 768,664 |
| 10,806 | | Legal & General Group PLC (United Kingdom) | | | 33,811 |
| 1,076 | | Muenchener Rueckversicherungs AG (Germany) | | | 181,468 |
| 9,769 | | Old Mutual PLC (United Kingdom) | | | 31,546 |
| 1,420 | | Philadelphia Consolidated Holding Co.(a) | | | 62,466 |
| 31,878 | | Royal & Sun Alliance (United Kingdom) | | | 101,624 |
| 14,500 | | SAFECO Corp. | | | 963,235 |
| 400 | | SeaBright Insurance Holdings, Inc.(a) | | | 7,360 |
| 2,147 | | Swiss Reinsurance (Switzerland) | | | 196,121 |
| 61,000 | | Travelers Cos., Inc. (The) | | | 3,157,971 |
| 250 | | TrygVesta AS (Denmark) | | | 20,685 |
| 8,405 | | W.R. Berkley Corp. | | | 278,374 |
| 20,100 | | XL Capital Ltd., Class A (Bermuda)(g) | | | 1,406,196 |
| 722 | | Zurich Financial Services AG (Switzerland) | | | 208,403 |
| | | | | |
| | | | | 18,360,698 |
| |
Internet & Catalog Retail 0.6% | | | |
| 9,600 | | Expedia, Inc.(a) | | | 222,528 |
| 1,066 | | Experian Finance PLC | | | 12,282 |
| 4,807 | | Home Retail Group (United Kingdom) | | | 42,000 |
See Notes to Financial Statements.
| | |
| The Prudential Investment Portfolios, lnc./Dryden Active Allocation Fund | | 19 |
Portfolio of Investments
as of March 31, 2007 (Unaudited) Cont’d.
| | | | | |
| Shares | | Description | | Value (Note 1) |
| | | | | |
| 36,100 | | IAC/InterActiveCorp.(a)(g) | | $ | 1,361,331 |
| 84,550 | | Liberty Media Corp.—Interactive A(a) | | | 2,013,981 |
| 18,019 | | Priceline.com, Inc.(a)(g) | | | 959,692 |
| | | | | |
| | | | | 4,611,814 |
| |
Internet Software & Services 0.7% | | | |
| 54,400 | | Ariba, Inc.(a) | | | 511,360 |
| 24,500 | | EarthLink, Inc.(a) | | | 180,075 |
| 99,363 | | eBay, Inc.(a) | | | 3,293,883 |
| 10,700 | | Interwoven, Inc.(a) | | | 180,830 |
| 21,700 | | Travelzoo, Inc.(a)(g) | | | 797,909 |
| 19,300 | | Websense, Inc.(a) | | | 443,707 |
| | | | | |
| | | | | 5,407,764 |
| |
IT Services 1.1% | | | |
| 22,766 | | Accenture Ltd., Class A (Bermuda) | | | 877,402 |
| 11,015 | | Acxiom Corp. | | | 235,611 |
| 10,600 | | Automatic Data Processing, Inc. | | | 513,040 |
| 27,300 | | CheckFree Corp.(a)(g) | | | 1,012,557 |
| 3,937 | | Computershare Ltd. (Australia) | | | 34,562 |
| 2,000 | | DST Systems, Inc.(a) | | | 150,400 |
| 23,501 | | Electronic Data Systems Corp. | | | 650,508 |
| 59,000 | | Fiserv, Inc.(a) | | | 3,130,539 |
| 30,200 | | MPS Group, Inc.(a) | | | 427,330 |
| 30 | | NTT Data Corp. (Japan) | | | 152,495 |
| 19,900 | | Talx Corp. | | | 659,287 |
| | | | | |
| | | | | 7,843,731 |
| |
Leisure Equipment & Products 0.3% | | | |
| 2,300 | | FUJIFILM Holdings Corp. (Japan) | | | 94,077 |
| 20,012 | | Hasbro, Inc. | | | 572,743 |
| 16,012 | | Mattel, Inc. | | | 441,451 |
| 4,000 | | Nikon Corp. (Japan) | | | 84,352 |
| 21,700 | | Pool Corp.(g) | | | 776,859 |
| 3,900 | | Yamaha Corp. (Japan) | | | 87,042 |
| | | | | |
| | | | | 2,056,524 |
| |
Life Sciences Tools & Services 0.6% | | | |
| 15,220 | | Applera Corp.—Applied Biosystems Group | | | 450,055 |
| 46,400 | | Charles River Laboratories International, Inc.(a) | | | 2,146,464 |
| 1,200 | | Dionex Corp.(a) | | | 81,732 |
| 37,000 | | Illumina, Inc.(a) | | | 1,084,100 |
See Notes to Financial Statements.
| | |
| 20 | | Visit our website at www.jennisondryden.com |
| | | | | |
| Shares | | Description | | Value (Note 1) |
| | | | | |
| 7,200 | | PerkinElmer, Inc. | | $ | 174,384 |
| 8,700 | | Waters Corp.(a)(g) | | | 504,600 |
| | | | | |
| | | | | 4,441,335 |
| |
Machinery 1.6% | | | |
| 7,000 | | Amada Co. Ltd. (Japan) | | | 80,015 |
| 700 | | Caterpillar, Inc. | | | 46,921 |
| 4,949 | | Cummins, Inc. | | | 716,219 |
| 3,500 | | Daifuku Co. Ltd. (Japan) | | | 50,730 |
| 22,400 | | Dover Corp. | | | 1,093,344 |
| 15,900 | | Eaton Corp. | | | 1,328,604 |
| 1,500 | | Freightcar America, Inc. | | | 72,255 |
| 50,700 | | Gardner Denver, Inc.(a) | | | 1,766,895 |
| 26,800 | | Graco, Inc. | | | 1,049,488 |
| 700 | | Hitachi Construction Machinery Co. Ltd. (Japan) | | | 18,949 |
| 44,800 | | Ingersoll-Rand Co., Ltd. Class A (Bermuda) | | | 1,942,976 |
| 10,000 | | Komatsu Ltd. (Japan) | | | 210,455 |
| 4,000 | | Komori Corp. (Japan) | | | 93,177 |
| 1,000 | | Kubota Corp. (Japan) | | | 8,766 |
| 1,167 | | MAN AG (Germany) | | | 135,627 |
| 8,000 | | Mitsubishi Heavy Industries Ltd. (Japan) | | | 51,731 |
| 1,200 | | Mueller Industries, Inc. | | | 36,120 |
| 1,000 | | NSK Ltd. (Japan) | | | 9,538 |
| 4,200 | | PACCAR, Inc. | | | 308,280 |
| 27,500 | | Parker Hannifin Corp. | | | 2,373,526 |
| 3,000 | | Sumitomo Heavy Industries Ltd. (Japan) | | | 29,888 |
| 400 | | Trelleborg AB, Class B (Sweden) | | | 10,397 |
| 700 | | Volvo AB, Class A (Sweden) | | | 58,945 |
| | | | | |
| | | | | 11,492,846 |
| |
Marine | | | |
| 15,000 | | Mitsui O.S.K. Lines Ltd. (Japan) | | | 166,497 |
| 26,000 | | Neptune Orient Lines Ltd. (Singapore) | | | 55,525 |
| 5,000 | | Nippon Yusen K K (Japan) | | | 40,097 |
| | | | | |
| | | | | 262,119 |
| |
Media 2.0% | | | |
| 61,950 | | CBS Corp., Class B | | | 1,895,051 |
| 426 | | Daily Mail & General Trust (United Kingdom) | | | 6,807 |
| 87,998 | | DIRECTV Group, Inc. (The)(a) | | | 2,030,114 |
| 133,675 | | Disney (Walt) Co. | | | 4,602,429 |
| 1,800 | | Eniro AB (Sweden) | | | 22,749 |
| 1,300 | | Gannett Co., Inc. | | | 73,177 |
See Notes to Financial Statements.
| | |
| The Prudential Investment Portfolios, lnc./Dryden Active Allocation Fund | | 21 |
Portfolio of Investments
as of March 31, 2007 (Unaudited) Cont’d.
| | | | | |
| Shares | | Description | | Value (Note 1) |
| | | | | |
| 7,650 | | Liberty Media Holding—Capital, Ser. A(a) | | $ | 846,014 |
| 11,061 | | McGraw-Hill Cos., Inc. (The) | | | 695,516 |
| 614 | | Omnicom Group, Inc. | | | 62,861 |
| 1,878 | | Reed Elsevier NV (Netherlands) | | | 33,215 |
| 6,000 | | Singapore Press Holdings Ltd. (Singapore) | | | 17,401 |
| 64,100 | | Time Warner, Inc.(g) | | | 1,264,052 |
| 60,200 | | Viacom Inc., Class B(a) | | | 2,474,822 |
| 5,938 | | Vivendi Universal SA (France) | | | 241,299 |
| | | | | |
| | | | | 14,265,507 |
| |
Metals & Mining 0.6% | | | |
| 3,000 | | Acerinox SA (Spain) | | | 76,344 |
| 4,248 | | Anglo American PLC (United Kingdom) | | | 223,781 |
| 762 | | Arcelor Mittal (Netherlands) | | | 40,482 |
| 958 | | BHP Billiton Ltd. (Australia) | | | 23,168 |
| 2,704 | | Billiton PLC (United Kingdom) | | | 60,288 |
| 632 | | Boehler-Uddeholm AG (Austria) | | | 60,786 |
| 15,117 | | Freeport-McMoRan Copper & Gold, Inc., Class B | | | 1,000,594 |
| 54,300 | | Hecla Mining Co.(a) | | | 491,958 |
| 3,100 | | JFE Holdings, Inc. (Japan) | | | 183,359 |
| 10,000 | | Nippon Steel Corp. (Japan) | | | 70,265 |
| 2,807 | | Nucor Corp. | | | 182,820 |
| 3,600 | | Outokumpu Oyj, Class A (Finland) | | | 123,737 |
| 1,800 | | Quanex Corp. | | | 76,230 |
| 500 | | Rautaruukki Oyj (Finland) | | | 23,304 |
| 1,880 | | Rio Tinto PLC (United Kingdom) | | | 107,361 |
| 30 | | Salzgitter AG (Germany) | | | 4,372 |
| 26,000 | | Sumitomo Metal Industries Ltd. (Japan) | | | 134,369 |
| 1,000 | | Sumitomo Metal Mining Co. Ltd. (Japan) | | | 19,306 |
| 3,133 | | ThyssenKrupp AG (Germany) | | | 155,020 |
| 10,290 | | United States Steel Corp. | | | 1,020,458 |
| | | | | |
| | | | | 4,078,002 |
| |
Multiline Retail 1.0% | | | |
| 2,555 | | Dollar Tree Stores, Inc.(a) | | | 97,703 |
| 32,600 | | J.C. Penney Co., Inc. | | | 2,678,416 |
| 48,265 | | Kohl’s Corp.(a) | | | 3,697,582 |
| 7,466 | | Marks & Spencer Group (United Kingdom) | | | 99,391 |
| 1,100 | | Sears Holdings Corp.(a) | | | 198,176 |
| 12,600 | | Target Corp. | | | 746,676 |
| | | | | |
| | | | | 7,517,944 |
See Notes to Financial Statements.
| | |
| 22 | | Visit our website at www.jennisondryden.com |
| | | | | |
| Shares | | Description | | Value (Note 1) |
| | | | | |
Multi-Utilities 0.5% | | | |
| 32,200 | | Ameren Corp. | | $ | 1,619,660 |
| 11,200 | | Consolidated Edison, Inc.(g) | | | 571,872 |
| 4,300 | | Energy East Corp. | | | 104,748 |
| 14,499 | | National Grid PLC (United Kingdom) | | | 227,541 |
| 7,100 | | PNM Resources, Inc. | | | 229,330 |
| 11,800 | | Sempra Energy | | | 719,918 |
| 2,500 | | Vector Ltd. (New Zealand) | | | 5,322 |
| | | | | |
| | | | | 3,478,391 |
| |
Office Electronics 0.3% | | | |
| 3,600 | | Canon, Inc. (Japan) | | | 193,381 |
| 1,500 | | Konica Minolta Holdings, Inc. (Japan) | | | 19,705 |
| 5,000 | | Ricoh Co. Ltd. (Japan) | | | 112,653 |
| 95,100 | | Xerox Corp.(a) | | | 1,606,238 |
| | | | | |
| | | | | 1,931,977 |
| |
Oil, Gas & Consumable Fuels 4.8% | | | |
| 19,700 | | Anadarko Petroleum Corp. | | | 846,706 |
| 1,518 | | BG Group PLC (United Kingdom) | | | 21,896 |
| 38,160 | | BP PLC (United Kingdom) | | | 414,513 |
| 65,900 | | Chesapeake Energy Corp. | | | 2,034,992 |
| 103,192 | | Chevron Corp. | | | 7,632,081 |
| 15,900 | | Cimarex Energy Co. | | | 588,618 |
| 42,200 | | ConocoPhillips | | | 2,884,370 |
| 11,700 | | Devon Energy Corp. | | | 809,874 |
| 6,500 | | Encore Acquisition Co.(a) | | | 157,235 |
| 7,762 | | ENI SpA (Italy) | | | 252,585 |
| 178,854 | | Exxon Mobil Corp. | | | 13,494,535 |
| 19,928 | | Marathon Oil Corp. | | | 1,969,484 |
| 2,500 | | Neste Oil Oyj (Finland) | | | 86,162 |
| 6,000 | | Nippon Oil Corp. (Japan) | | | 48,676 |
| 6,600 | | Occidental Petroleum Corp. | | | 325,446 |
| 3,700 | | Petroleum Development Corp.(a) | | | 198,209 |
| 1,318 | | Repsol YPF SA (Spain) | | | 44,439 |
| 8,904 | | Royal Dutch Shell PLC (Netherlands) | | | 296,292 |
| 8,838 | | Royal Dutch Shell PLC, Class B (Netherlands) | | | 294,096 |
| 10,100 | | Sunoco, Inc.(g) | | | 711,444 |
| 2,000 | | Swift Energy Co.(a) | | | 83,540 |
| 3,498 | | Tesoro Petroleum Corp. | | | 351,304 |
| 2,553 | | Total SA (France) | | | 178,876 |
| 17,582 | | Valero Energy Corp. | | | 1,133,863 |
| | | | | |
| | | | | 34,859,236 |
See Notes to Financial Statements.
| | |
| The Prudential Investment Portfolios, lnc./Dryden Active Allocation Fund | | 23 |
Portfolio of Investments
as of March 31, 2007 (Unaudited) Cont’d.
| | | | | |
| Shares | | Description | | Value (Note 1) |
| | | | | |
Paper & Forest Products | | | |
| 2,700 | | Svenska Cellulosa AB, Class B (Sweden) | | $ | 144,612 |
| |
Personal Products | | | |
| 5,897 | | NBTY, Inc.(a) | | | 312,777 |
| 1,000 | | Shiseido Co. Ltd. (Japan) | | | 20,324 |
| | | | | |
| | | | | 333,101 |
| |
Pharmaceuticals 3.5% | | | |
| 998 | | Altana AG (Germany) | | | 64,859 |
| 5,590 | | AstraZeneca PLC (United Kingdom) | | | 300,747 |
| 100 | | Eisai Co. Ltd. (Japan) | | | 4,795 |
| 38,500 | | Eli Lilly & Co. | | | 2,067,835 |
| 24,200 | | Forest Laboratories, Inc.(a)(g) | | | 1,244,848 |
| 15,440 | | GlaxoSmithKline PLC (United Kingdom) | | | 424,458 |
| 78,200 | | Johnson & Johnson | | | 4,712,332 |
| 52,200 | | King Pharmaceuticals, Inc.(a) | | | 1,026,774 |
| 90,593 | | Merck & Co., Inc. | | | 4,001,493 |
| 2,312 | | Novartis AG (Switzerland) | | | 132,614 |
| 100 | | Novo-Nordisk A/S, Class B (Denmark) | | | 9,126 |
| 291,668 | | Pfizer, Inc. | | | 7,367,533 |
| 1,435 | | Roche Holding AG (Switzerland) | | | 253,899 |
| 1,704 | | Sanofi-Aventis (France) | | | 148,186 |
| 23,300 | | Sciele Pharma, Inc.(a) | | | 551,744 |
| 1,200 | | Takeda Pharmaceutical Co. Ltd. (Japan) | | | 78,717 |
| 56,000 | | Wyeth | | | 2,801,680 |
| | | | | |
| | | | | 25,191,640 |
| |
Real Estate Investment Trusts 1.1% | | | |
| 2,400 | | Annaly Capital Management, Inc. | | | 37,152 |
| 35,500 | | Anthracite Capital, Inc. | | | 426,000 |
| 5,700 | | Arbor Realty Trust, Inc. | | | 173,508 |
| 29,600 | | Ashford Hospitality Trust, Inc. | | | 353,424 |
| 1,695 | | British Land Co. PLC (United Kingdom) | | | 50,966 |
| 900 | | Capital Lease Funding, Inc. | | | 9,639 |
| 14,200 | | CBRE Realty Finance, Inc. | | | 187,866 |
| 12,600 | | FelCor Lodging Trust, Inc. | | | 327,222 |
| 2,700 | | First Industrial Realty Trust, Inc. | | | 122,310 |
| 27,180 | | General Property Trust (Australia) | | | 108,637 |
| 333 | | Hammerson PLC (United Kingdom) | | | 11,356 |
| 10,800 | | Hospitality Properties Trust | | | 505,440 |
| 23,800 | | JER Investors Trust, Inc. | | | 452,676 |
| 24,200 | | KKR Financial Corp. | | | 663,806 |
See Notes to Financial Statements.
| | |
| 24 | | Visit our website at www.jennisondryden.com |
| | | | | |
| Shares | | Description | | Value (Note 1) |
| | | | | |
| 949 | | Land Securities Group PLC (United Kingdom) | | $ | 39,964 |
| 30,300 | | Lexington Realty Trust(g) | | | 640,239 |
| 30,800 | | Newcastle Investment Corp. | | | 854,084 |
| 8,900 | | Ramco-Gershenson Properties | | | 317,819 |
| 2,700 | | Resource Capital Corp. | | | 43,578 |
| 40,100 | | Spirit Finance Corp. | | | 597,490 |
| 77,300 | | Thornburg Mortgage, Inc.(g) | | | 2,009,801 |
| | | | | |
| | | | | 7,932,977 |
| |
Real Estate Management & Development 0.2% | | | |
| 50,900 | | Affordable Residential Communities LP(a) | | | 617,417 |
| 2,000 | | City Developments Ltd. | | | 19,247 |
| 8,400 | | Jones Lang LaSalle, Inc. | | | 875,951 |
| 26 | | KK DaVinci Advisors (Japan)(a) | | | 27,800 |
| 2,000 | | Sumitomo Realty & Development Co. Ltd. (Japan) | | | 75,866 |
| 3,500 | | Swire Pacific Ltd. (Hong Kong) | | | 39,285 |
| 17,000 | | Wharf Holdings Ltd. (Hong Kong) | | | 63,096 |
| 632 | | Wihlborgs Fastigheter AB (Sweden) | | | 13,576 |
| | | | | |
| | | | | 1,732,238 |
| |
Road & Rail 0.1% | | | |
| 10,205 | | Norfolk Southern Corp. | | | 516,373 |
| 10,200 | | Ryder System, Inc. | | | 503,268 |
| 4,085 | | Toll Holdings, Ltd. (Australia) | | | 67,756 |
| | | | | |
| | | | | 1,087,397 |
| |
Semiconductors & Semiconductor Equipment 1.5% | | | |
| 19,552 | | Amkor Technology, Inc.(a) | | | 244,009 |
| 160,186 | | Applied Materials, Inc. | | | 2,934,608 |
| 2,161 | | ASML Holding NV (Netherlands)(a) | | | 53,376 |
| 35,900 | | ATMI, Inc.(a)(g) | | | 1,097,463 |
| 300 | | Elpida Memory, Inc. (Japan)(a) | | | 11,634 |
| 47,600 | | Intel Corp. | | | 910,588 |
| 2,800 | | International Rectifier Corp.(a) | | | 106,988 |
| 38,800 | | Intevac, Inc.(a) | | | 1,023,156 |
| 28,695 | | Lam Research Corp.(a)(g) | | | 1,358,421 |
| 31,845 | | Novellus Systems, Inc.(a)(g) | | | 1,019,677 |
| 9,100 | | RF Micro Devices, Inc.(a) | | | 56,693 |
| 2,100 | | Tokyo Electron Ltd. (Japan) | | | 146,843 |
| 24,723 | | Varian Semiconductor Equipment Associates, Inc.(a) | | | 1,319,714 |
| 37,200 | | Xilinx, Inc. | | | 957,156 |
| | | | | |
| | | | | 11,240,326 |
See Notes to Financial Statements.
| | |
| The Prudential Investment Portfolios, lnc./Dryden Active Allocation Fund | | 25 |
Portfolio of Investments
as of March 31, 2007 (Unaudited) Cont’d.
| | | | | |
| Shares | | Description | | Value (Note 1) |
| | | | | |
Software 2.3% | | | |
| 8,100 | | Ansoft Corp.(a) | | $ | 256,284 |
| 15,250 | | BMC Software, Inc.(a) | | | 469,548 |
| 42,900 | | Cadence Design System, Inc.(a)(g) | | | 903,474 |
| 12,100 | | Kronos, Inc.(a) | | | 647,350 |
| 268,213 | | Microsoft Corp.(g) | | | 7,475,096 |
| 19,000 | | MicroStrategy, Inc., Class A(a)(g) | | | 2,401,410 |
| 100 | | Nintendo Co. Ltd. (Japan) | | | 29,065 |
| 154,900 | | Oracle Corp.(a) | | | 2,808,337 |
| 2,800 | | Smith Micro Software, Inc.(a) | | | 52,164 |
| 3,800 | | Symantec Corp.(a) | | | 65,740 |
| 49,800 | | Synopsys, Inc.(a) | | | 1,306,254 |
| | | | | |
| | | | | 16,414,722 |
| |
Specialty Retail 1.3% | | | |
| 33,700 | | Aeropostale, Inc.(a) | | | 1,355,750 |
| 30,295 | | American Eagle Outfitters, Inc. | | | 908,547 |
| 700 | | Aoyama Trading Co. Ltd. (Japan) | | | 22,217 |
| 900 | | Autobacs Seven Co. Ltd. (Japan) | | | 32,230 |
| 2,917 | | AutoZone, Inc.(a) | | | 373,784 |
| 4,500 | | DSW Inc., Class A(a) | | | 189,945 |
| 14,189 | | Group 1 Automotive, Inc. | | | 564,297 |
| 22,805 | | Gymboree Corp.(a) | | | 913,796 |
| 250 | | Hennes & Mauritz AB (H&M), B Shares (Sweden) | | | 14,393 |
| 17,400 | | Hibbett Sports, Inc.(a) | | | 497,466 |
| 26,700 | | Home Depot, Inc. | | | 980,958 |
| 4,100 | | J Crew Group, Inc.(a) | | | 164,697 |
| 16,100 | | Midas, Inc.(a) | | | 347,277 |
| 22,497 | | Office Depot, Inc.(a) | | | 790,545 |
| 496 | | OfficeMax, Inc. | | | 26,159 |
| 3,500 | | PetSmart, Inc. | | | 115,360 |
| 36,000 | | Select Comfort Corp.(a)(g) | | | 640,800 |
| 10,000 | | Sherwin-Williams Co. (The) | | | 660,400 |
| 23,300 | | TJX Cos, Inc. | | | 628,168 |
| | | | | |
| | | | | 9,226,789 |
| |
Textiles, Apparel & Luxury Goods 0.6% | | | |
| 65,100 | | Coach, Inc.(a) | | | 3,258,254 |
| 260 | | Folli—Follie SA (Greece) | | | 9,100 |
| 2,000 | | Fossil, Inc.(a)(g) | | | 52,940 |
| 17,200 | | Jones Apparel Group, Inc. | | | 528,556 |
| 3,200 | | Kellwood Co. | | | 93,856 |
| 362 | | Swatch Group AG (Switzerland) | | | 19,349 |
See Notes to Financial Statements.
| | |
| 26 | | Visit our website at www.jennisondryden.com |
| | | | | |
| Shares | | Description | | Value (Note 1) |
| | | | | |
| 200 | | Unifirst Corp. | | $ | 7,674 |
| 3,000 | | Yue Yuen Industrial Holdings Ltd. (Hong Kong) | | | 10,175 |
| | | | | |
| | | | | 3,979,904 |
| |
Thrifts & Mortgage Finance 0.7% | | | |
| 16,000 | | Centerline Holding Co. | | | 309,600 |
| 14,848 | | Countrywide Financial Corp.(g) | | | 499,487 |
| 843 | | Downey Financial Corp. | | | 54,407 |
| 5,173 | | FirstFed Financial Corp.(a) | | | 293,982 |
| 15,800 | | MGIC Investment Corp.(g) | | | 930,936 |
| 17,500 | | PMI Group, Inc. (The) | | | 791,350 |
| 27,100 | | Radian Group, Inc. | | | 1,487,248 |
| 1,200 | | Triad Guaranty, Inc.(a)(g) | | | 49,692 |
| 7,717 | | Washington Mutual, Inc. | | | 311,612 |
| | | | | |
| | | | | 4,728,314 |
| |
Tobacco 0.8% | | | |
| 36,400 | | Altria Group, Inc.(g) | | | 3,196,284 |
| 2,964 | | British American Tobacco (United Kingdom) | | | 92,682 |
| 1,229 | | Imperial Tobacco Group (United Kingdom) | | | 55,020 |
| 40,800 | | Reynolds American, Inc.(g) | | | 2,546,328 |
| 7,000 | | Swedish Match AB (Sweden) | | | 125,057 |
| | | | | |
| | | | | 6,015,371 |
| |
Trading Companies & Distributors 0.4% | | | |
| 15,600 | | Applied Industrial Technologies, Inc. | | | 382,824 |
| 9,000 | | Itochu Corp. (Japan) | | | 89,206 |
| 12,000 | | Marubeni Corp. (Japan) | | | 72,912 |
| 2,900 | | Mitsubishi Corp. (Japan) | | | 67,307 |
| 8,000 | | Mitsui & Co. Ltd. (Japan) | | | 149,355 |
| 18,800 | | MSC Industrial Direct Co. | | | 877,584 |
| 5,000 | | Sumitomo Corp. (Japan) | | | 89,952 |
| 12,000 | | W.W. Grainger, Inc. | | | 926,881 |
| | | | | |
| | | | | 2,656,021 |
| |
Transportation Infrastructure | | | |
| 22,000 | | Hopewell Holdings (Hong Kong) | | | 85,595 |
| 46,403 | | Macquarie Infrastructure Group (Australia) | | | 144,172 |
| | | | | |
| | | | | 229,767 |
| |
Wireless Telecommunication Services 0.6% | | | |
| 23,600 | | Alltel Corp. | | | 1,463,200 |
| 1,370 | | Cosmote Mobile Telecommunications SA (Greece) | | | 41,031 |
See Notes to Financial Statements.
| | |
| The Prudential Investment Portfolios, lnc./Dryden Active Allocation Fund | | 27 |
Portfolio of Investments
as of March 31, 2007 (Unaudited) Cont’d.
| | | | | | | | |
| Shares | | | | Description | | Value (Note 1) |
| | | | | | | | |
| 117,100 | | | | | Sprint Nextel Corp. | | $ | 2,220,217 |
| 1,254 | | | | | Telephone & Data Systems, Inc. | | | 74,763 |
| 112,674 | | | | | Vodafone Group PLC (United Kingdom) | | | 300,437 |
| | | | | | | | |
| | | | | | | | 4,099,648 |
| | | | | | | | |
| | | | | Total common stocks
(cost $384,268,970) | | | 466,495,078 |
| | | | | | | | |
| PREFERRED STOCK | | | | | |
| | |
| Automobiles | | | | | |
| 101 | | | | | Porsche AG (Germany)
(cost $122,609) | | | 154,151 |
| | | | | | | | |
Moody’s Rating
(Unaudited) | | Principal
Amount (000) | | | | |
| CORPORATE BONDS 7.6% |
|
| Aerospace/Defense 0.3% |
| | | | | | | | |
| Baa2 | | $ | 370 | | BAE Systems Holdings, Inc., Notes, 144A,
4.75%, 8/15/10 | | | 364,700 |
| A2 | | | 190 | | Boeing Capital Corp., Sr. Notes,
6.10%, 3/01/11(g) | | | 197,198 |
| Baa3 | | | 272 | | Goodrich Corp., Notes,
6.80%, 7/01/36 | | | 293,098 |
| Baa1 | | | 86 | | Lockheed Martin Corp., Notes,
6.15%, 9/01/36 | | | 89,225 |
| Baa2 | | | 500 | | Northrop Grumman Corp., Gtd. Notes,
7.125%, 2/15/11 | | | 534,709 |
| Baa1 | | | 195 | | Raytheon Co., Debs.,
6.00%, 12/15/10 | | | 201,897 |
| Baa1 | | | 29 | | Raytheon Co., Notes,
4.50%, 11/15/07 | | | 28,847 |
| | | | | Raytheon Co., Sr. Notes, | | | |
| Baa1 | | | 270 | | 6.55%, 3/15/10 | | | 281,786 |
| Baa1 | | | 140 | | 5.50%, 11/15/12 | | | 142,422 |
| | | | | | | | |
| | | | | | | | 2,133,882 |
| | | | | | | | |
|
| Airlines 0.1% |
| Ba1 | | | 320 | | American Airlines, Inc., Pass-Thru Certs., Ser. 01-1,
6.817%, 5/23/11 | | | 327,200 |
| Baa2 | | | 45 | | Continental Airlines, Inc., Pass-Thru Certs., Ser. 01-1,
6.703%, 6/15/21 | | | 46,581 |
| Baa1 | | | 200 | | Southwest Airlines Co., Notes,
6.50%, 3/01/12 | | | 209,013 |
| | | | | | | | |
| | | | | | | | 582,794 |
| | | | | | | | |
See Notes to Financial Statements.
| | |
| 28 | | Visit our website at www.jennisondryden.com |
| | | | | | | | |
Moody’s
Rating
(Unaudited) | | Principal
Amount (000) | | Description | | Value (Note 1) |
| | | | | | | | |
| Automotive 0.1% |
| Baa1 | | $ | 105 | | Auburn Hills Trust, Debs.,
12.375%, 5/01/20 | | $ | 165,955 |
| Baa3 | | | 60 | | Equus Cayman Finance Ltd.
(Cayman Islands), Notes, 144A,
5.50%, 9/12/08 | | | 60,081 |
| Baa3 | | | 90 | | Hyundai Motor Manufacturing LLC, Gtd. Notes, 144A,
5.30%, 12/19/08 | | | 89,894 |
| Baa1 | | | 55 | | Johnson Controls, Inc., Sr. Notes,
5.50%, 1/15/16 | | | 54,467 |
| | | | | | | | |
| | | | | | | | 370,397 |
| | | | | | | | |
|
| Banking 0.8% |
| A2 | | | 130 | | Banco Bradesco (Cayman), Notes,
8.75%, 10/24/13 | | | 149,500 |
| Aa2 | | | 355 | | Bank of America Corp., Sub. Notes,
5.75%, 8/15/16(g) | | | 361,131 |
| Aa1 | | | 375 | | Bank of America NA, Sub. Notes,
5.30%, 3/15/17 | | | 368,823 |
| Aa1 | | | 60 | | 6.00%, 10/15/36 | | | 60,081 |
| Aa3 | | | 400 | | Bank One Corp., Sub. Notes,
7.875%, 8/01/10 | | | 432,877 |
| Aa2 | | | 400 | | Citigroup, Inc., Sub. Notes,
5.625%, 8/27/12 | | | 407,246 |
| Aa2 | | | 82 | | 5.00%, 9/15/14 | | | 80,053 |
| Aa2 | | | 165 | | 6.125%, 8/25/36 | | | 167,591 |
| Aaa | | | 290 | | Depfa ACS Bank (Ireland), 144A,
5.125%, 3/16/37 | | | 276,112 |
| Baa2 | | | 220 | | ICICI Bank Ltd. (Singapore),
Notes, 144A,
5.75%, 11/16/10 | | | 221,280 |
| Baa2 | | | 495 | | ICICI Bank Ltd. (India), Bonds, 144A,
5.90%, 1/12/10(h) | | | 495,574 |
| Aa2 | | | 190 | | J.P. Morgan Chase & Co., Notes,
4.60%, 1/17/11 | | | 186,253 |
| Aa2 | | | 270 | | J.P. Morgan Chase & Co., Sr. Notes,
5.25%, 5/30/07 | | | 269,911 |
| Aa3 | | | 150 | | J.P. Morgan Chase Capital XVIII, Bonds, Ser. R,
6.95%, 8/17/36 | | | 156,337 |
See Notes to Financial Statements.
| | |
| The Prudential Investment Portfolios, lnc./Dryden Active Allocation Fund | | 29 |
Portfolio of Investments
as of March 31, 2007 (Unaudited) Cont’d.
| | | | | | | | |
Moody’s
Rating
(Unaudited) | | Principal
Amount (000) | | Description | | Value (Note 1) |
| | | | | | | | |
| A2 | | $ | 160 | | Mizuho Finance Group
(Cayman Islands),
Bank Gtd. Notes, 144A,
5.79%, 4/15/14 | | $ | 163,016 |
| Baa2 | | | 150 | | MUFG Capital Finance 1 Ltd.
(Cayman Islands), Gtd. Notes,
6.346%, 7/25/49(h) | | | 154,827 |
| A2 | | | 200 | | PNC Preferred Funding Trust I,
Sr. Unsec.
Notes, 144A,
6.113%, 12/31/49(h) | | | 198,683 |
| A1 | | | 140 | | Santander Central Hispano Issuances
(Cayman Islands), Gtd. Notes,
7.625%, 9/14/10 | | | 151,857 |
| Baa2 | | | 625 | | SMFG Preferred Capital I Ltd.
(Cayman Islands), Bonds, 144A,
6.078%, 12/25/49(h) | | | 626,212 |
| Aa2 | | | 450 | | Wachovia Bank NA., Sub. Notes,
7.80%, 8/18/10 | | | 484,131 |
| A2 | | | 60 | | Washington Mutual Bank, Sub. Notes,
5.65%, 8/15/14 | | | 59,678 |
| Aa1 | | | 140 | | Wells Fargo & Co., Sr. Unsec. Notes,
4.625%, 8/09/10 | | | 138,437 |
| Aa1 | | | 295 | | Wells Fargo Bank NA, Sub. Notes,
4.75%, 2/09/15 | | | 283,026 |
| | | | | | | | |
| | | | | | | | 5,892,636 |
| | | | | | | | |
|
| Brokerage 0.4% |
| A1 | | | 100 | | Bear Stearns Cos., Inc. (The),
Unsec. Notes,
5.30%, 10/30/15 | | | 98,475 |
| A1 | | | 195 | | Bear Stearns Cos., Inc. (The),
Sr. Notes,
5.35%, 2/01/12 | | | 195,382 |
| Aa3 | | | 5 | | Goldman Sachs Group, Inc., Notes,
5.00%, 10/01/14 | | | 4,836 |
| A1 | | | 170 | | Goldman Sachs Group, Inc.,
Sub. Notes,
5.625%, 1/15/17(g) | | | 168,385 |
| A1 | | | 385 | | 6.45%, 5/01/36 | | | 391,082 |
See Notes to Financial Statements.
| | |
| 30 | | Visit our website at www.jennisondryden.com |
| | | | | | | | |
Moody’s
Rating
(Unaudited) | | Principal
Amount (000) | | Description | | Value (Note 1) |
| | | | | | | | |
| A1 | | $ | 345 | | Lehman Brothers Holdings, Inc.,
Sr. Notes,
5.25%, 2/06/12 | | $ | 344,684 |
| Aa3 | | | 60 | | Merrill Lynch & Co., Inc., Notes,
4.79%, 8/04/10 | | | 59,396 |
| Aa3 | | | 35 | | 5.45%, 7/15/14 | | | 35,040 |
| Aa3 | | | 340 | | Merrill Lynch & Co., Inc., Notes, MTN,
4.25%, 2/08/10 | | | 331,732 |
| Aa3 | | | 170 | | 5.77%, 7/25/11 | | | 173,902 |
| Aa3 | | | 90 | | 5.00%, 1/15/15 | | | 87,232 |
| Aa3 | | | 50 | | Morgan Stanley, Notes,
4.00%, 1/15/10 | | | 48,597 |
| Aa3 | | | 150 | | 4.25%, 5/15/10 | | | 146,540 |
| Aa3 | | | 25 | | 5.30%, 3/01/13 | | | 24,969 |
| Aa3 | | | 220 | | 5.45%, 1/09/17 | | | 216,381 |
| Aa3 | | | 460 | | Morgan Stanley, Sr. Unsec. Notes, MTN,
5.75%, 10/18/16 | | | 462,671 |
| A1 | | | 140 | | Morgan Stanley, Sub. Notes,
4.75%, 4/01/14 | | | 132,970 |
| | | | | | | | |
| | | | | | | | 2,922,274 |
| | | | | | | | |
|
| Building Materials & Construction 0.3% |
| Baa3 | | | 160 | | American Standard, Inc., Gtd. Notes,
7.625%, 2/15/10 | | | 169,568 |
| Baa1 | | | 170 | | CRH America Inc., Gtd. Notes,
6.00%, 9/30/16 | | | 172,329 |
| Baa1 | | | 170 | | Hanson PLC (United Kingdom),
Sr. Unsub. Notes,
7.875%, 9/27/10 | | | 183,863 |
| Ba1 | | | 840 | | K Hovnanian Enterprises, Inc.,
Gtd. Notes,
10.50%, 10/01/07 | | | 852,600 |
| Baa2 | | | 200 | | Lafarge SA (France), Notes,
6.15%, 7/15/11 | | | 206,268 |
| Baa3 | | | 115 | | Owens Corning, Inc.,
Sr. Unsec. Notes, 144A,
6.50%, 12/01/16 | | | 117,461 |
| Baa3 | | | 90 | | Ryland Group, Inc., (The) Sr. Notes,
5.375%, 6/01/08 | | | 89,870 |
| | | | | | | | |
| | | | | | | | 1,791,959 |
| | | | | | | | |
See Notes to Financial Statements.
| | |
| The Prudential Investment Portfolios, lnc./Dryden Active Allocation Fund | | 31 |
Portfolio of Investments
as of March 31, 2007 (Unaudited) Cont’d.
| | | | | | | | |
Moody’s
Rating
(Unaudited) | | Principal
Amount (000) | | Description | | Value (Note 1) |
| | | | | | | | |
|
| Cable 0.2% |
| Baa2 | | $ | 55 | | Comcast Cable Communications Holdings, Inc., Gtd. Notes,
9.455%, 11/15/22 | | $ | 71,423 |
| Baa2 | | | 25 | | Comcast Corp., Bonds,
5.65%, 6/15/35 | | | 22,651 |
| Baa2 | | | 195 | | Comcast Corp., Gtd. Notes,
6.45%, 3/15/37 | | | 195,222 |
| Baa2 | | | 85 | | Comcast Corp., Sr. Unsec. Notes,
6.50%, 11/15/35 | | | 85,644 |
| Baa3 | | | 270 | | Cox Communications, Inc., Notes,
7.875%, 8/15/09 | | | 286,032 |
| Baa3 | | | 185 | | 6.75%, 3/15/11 | | | 194,574 |
| B2 | | | 385 | | CSC Holdings, Inc., Sr. Notes,
7.875%, 12/15/07 | | | 389,332 |
| | | | | | | | |
| | | | | | | | 1,244,878 |
| | | | | | | | |
|
| Capital Goods 0.3% |
| A2 | | | 50 | | Caterpillar Financial Services Corp., Notes, MTN,
5.50%, 3/15/16 | | | 50,133 |
| A2 | | | 400 | | Caterpillar, Inc., Debs.,
7.25%, 9/15/09 | | | 419,603 |
| Baa1 | | | 65 | | Cooper Cameron Corp., Sr. Notes,
2.65%, 4/15/07 | | | 64,923 |
| Baa1 | | | 400 | | Erac USA Finance Co.,
Gtd. Notes, 144A,
7.35%, 6/15/08 | | | 407,239 |
| Baa2 | | | 75 | | FedEx Corp., Gtd. Notes,
7.25%, 2/15/11 | | | 80,076 |
| Baa2 | | | 330 | | FedEx Corp., Notes,
2.65%, 4/01/07 | | | 329,975 |
| A2 | | | 215 | | Honeywell International, Inc., Bonds,
6.125%, 11/01/11 | | | 224,148 |
| A2 | | | 35 | | Honeywell International, Inc.,
Sr. Notes,
5.70%, 3/15/37 | | | 33,877 |
| A2 | | | 140 | | John Deere Capital Corp., Sr. Notes,
4.50%, 8/25/08 | | | 138,627 |
See Notes to Financial Statements.
| | |
| 32 | | Visit our website at www.jennisondryden.com |
| | | | | | | | |
Moody’s
Rating
(Unaudited) | | Principal
Amount (000) | | Description | | Value (Note 1) |
| | | | | | | | |
| Baa3 | | $ | 250 | | Tyco International Group SA (Luxembourg), Gtd. Notes,
6.00%, 11/15/13 | | $ | 262,798 |
| A2 | | | 90 | | United Technologies Corp., Debs.,
8.875%, 11/15/19 | | | 116,758 |
| A2 | | | 165 | | United Technologies Corp., Notes,
6.35%, 3/01/11 | | | 172,629 |
| A2 | | | 90 | | United Technologies Corp., Sr. Notes,
6.05%, 6/01/36 | | | 92,218 |
| | | | | | | | |
| | | | | | | | 2,393,004 |
| | | | | | | | |
|
| Chemicals 0.1% |
| B2 | | | 5 | | BCP Crystal U.S. Holdings Corp.,
Sr. Sub. Notes,
9.625%, 6/15/14 | | | 5,680 |
| A3 | | | 60 | | Dow Chemical Co. (The), Debs.,
5.97%, 1/15/09 | | | 60,603 |
| A3 | | | 135 | | Dow Chemical Co. (The), Notes,
6.125%, 2/01/11 | | | 138,719 |
| Baa2 | | | 75 | | ICI Wilmington, Inc., Gtd. Notes,
5.625%, 12/01/13 | | | 75,301 |
| Baa3 | | | 170 | | Lubrizol Corp. (The), Sr. Notes,
4.625%, 10/01/09 | | | 167,943 |
| Ba2 | | | 100 | | Union Carbide Corp., Debs,
7.50%, 6/01/25 | | | 107,213 |
| | | | | | | | |
| | | | | | | | 555,459 |
| | | | | | | | |
|
| Consumer 0.1% |
| Aa3 | | | 510 | | Procter & Gamble Co., Sr. Notes,
5.55%, 3/05/37 | | | 496,196 |
| Ba3 | | | 25 | | Realogy Corp., Notes, 144A,
6.15%, 10/15/11 | | | 25,563 |
| A3 | | | 115 | | Western Union Co. (The), Gtd. Notes,
5.93%, 10/01/16 | | | 115,247 |
| Baa2 | | | 195 | | Whirlpool Corp., Notes,
6.125%, 6/15/11 | | | 199,494 |
| | | | | | | | |
| | | | | | | | 836,500 |
| | | | | | | | |
|
| Containers & Packaging 0.1% |
| Ba1 | | | 400 | | Ball Corp., Gtd. Notes,
6.625%, 3/15/18 | | | 397,500 |
| | | | | | | | |
See Notes to Financial Statements.
| | |
| The Prudential Investment Portfolios, lnc./Dryden Active Allocation Fund | | 33 |
Portfolio of Investments
as of March 31, 2007 (Unaudited) Cont’d.
| | | | | | | | |
Moody’s
Rating
(Unaudited) | | Principal
Amount (000) | | Description | | Value (Note 1) |
| | | | | | | | |
|
| Electric 0.6% |
| Baa2 | | $ | 125 | | Appalachian Power Co., Sr. Notes,
4.40%, 6/01/10 | | $ | 122,064 |
| Baa2 | | | 35 | | Arizona Public Services Co.,
Unsec. Notes,
6.25%, 8/01/16 | | | 36,119 |
| Baa2 | | | 115 | | Baltimore Gas & Electric Co.,
Sr. Unsec. Notes,
144A, 6.35%, 10/01/36 | | | 116,992 |
| A3 | | | 105 | | Carolina Power & Light Co.,
First Mtge. Bonds,
5.25%, 12/15/15 | | | 103,552 |
| Baa2 | | | 160 | | CenterPoint Energy Houston Electric LLC, Gen. Refi. Mtge.,
5.70%, 3/15/13 | | | 161,276 |
| Baa2 | | | 120 | | 6.95%, 3/15/33 | | | 131,187 |
| A1 | | | 145 | | Consolidated Edison Co. of New York, Sr. Unsec. Notes,
5.375%, 12/15/15 | | | 145,237 |
| Baa2 | | | 65 | | Consumers Energy Co., First Mtge. Bonds, Ser. B,
5.375%, 4/15/13 | | | 64,916 |
| Baa2 | | | 250 | | Dominion Resources, Inc., Notes,
4.125%, 2/15/08 | | | 247,397 |
| Baa2 | | | 70 | | Dominion Resources, Inc., Sr. Notes,
4.75%, 12/15/10 | | | 69,008 |
| Baa2 | | | 190 | | Dominion Resources, Inc.,
Sr. Notes, Ser. D,
5.125%, 12/15/09 | | | 190,066 |
| Baa2 | | | 135 | | El Paso Electric Co., Sr. Unsec. Notes,
6.00%, 5/15/35 | | | 130,183 |
| Baa3 | | | 220 | | Empresa Nacional de Electricidad SA (Chile), Bonds, Ser. B,
8.50%, 4/01/09 | | | 232,936 |
| Baa3 | | | 65 | | Empresa Nacional de Electricidad SA (Chile), Notes,
8.625%, 8/01/15 | | | 76,698 |
| Baa2 | | | 30 | | Energy East Corp., Notes,
6.75%, 9/15/33 | | | 31,483 |
| Baa2 | | | 30 | | Exelon Corp., Notes,
4.90%, 6/15/15 | | | 28,033 |
See Notes to Financial Statements.
| | |
| 34 | | Visit our website at www.jennisondryden.com |
| | | | | | | | |
Moody’s
Rating
(Unaudited) | | Principal
Amount (000) | | Description | | Value (Note 1) |
| | | | | | | | |
| Baa3 | | $ | 196 | | FirstEnergy Corp., Notes, Ser. C,
7.375%, 11/15/31 | | $ | 222,669 |
| Aa3 | | | 60 | | Florida Power & Light Co.,
First Mtge. Bonds,
5.95%, 10/01/33 | | | 61,448 |
| Baa2 | | | 90 | | Indiana Michigan Power Co.,
Sr. Notes, Ser. INDF,
5.05%, 11/15/14 | | | 87,177 |
| A2 | | | 35 | | National Rural Utilities Cooperative Finance Corp., Notes,
7.25%, 3/01/12 | | | 38,136 |
| Ba1 | | | 250 | | Nevada Power Co., Mortgage
Backed Notes,
6.50%, 5/15/18 | | | 261,043 |
| Baa3 | | | 55 | | NiSource Finance Corp., Gtd. Notes,
5.25%, 9/15/17 | | | 51,945 |
| Baa3 | | | 70 | | 5.45%, 9/15/20 | | | 65,802 |
| A1 | | | 110 | | NSTAR Electric Co., Debs.,
4.875%, 4/15/14 | | | 106,970 |
| Baa2 | | | 165 | | Ohio Edison Co., Sr. Unsec. Notes,
6.40%, 7/15/16 | | | 173,825 |
| Baa2 | | | 25 | | 6.875%, 7/15/36 | | | 27,116 |
| Baa2 | | | 120 | | Oncor Electric Delivery, Debs.,
7.00%, 9/01/22 | | | 128,553 |
| Baa1 | | | 395 | | Pacific Gas & Electric Co.,
First Mtge. Bonds,
6.05%, 3/01/34 | | | 395,966 |
| Baa3 | | | 110 | | Pepco Holdings, Inc., Notes,
5.50%, 8/15/07 | | | 109,957 |
| A3 | | | 400 | | PPL Electric Utilities Corp.,
Sec’d. Notes,
6.25%, 8/15/09 | | | 409,037 |
| A2 | | | 100 | | Southern California Edison Co.,
First Mtge. Bonds,
4.65%, 4/01/15 | | | 95,371 |
| A2 | | | 150 | | 5.625%, 2/01/36 | | | 145,291 |
| Baa1 | | | 120 | | Xcel Energy, Inc., Sr. Notes,
3.40%, 7/01/08 | | | 117,403 |
| Baa1 | | | 35 | | 7.00%, 12/01/10 | | | 37,144 |
| Baa1 | | | 95 | | 6.50%, 7/01/36 | | | 99,862 |
| | | | | | | | |
| | | | | | | | 4,521,862 |
| | | | | | | | |
See Notes to Financial Statements.
| | |
| The Prudential Investment Portfolios, lnc./Dryden Active Allocation Fund | | 35 |
Portfolio of Investments
as of March 31, 2007 (Unaudited) Cont’d.
| | | | | | | | |
Moody’s
Rating
(Unaudited) | | Principal
Amount (000) | | Description | | Value (Note 1) |
| | | | | | | | |
|
| Energy—Integrated 0.2% |
| | | | | ConocoPhillips Candada Funding Co. (Canada), Gtd. Notes, | | | |
| A1 | | $ | 290 | | 5.625%, 10/15/16 | | $ | 294,805 |
| A1 | | | 40 | | 5.95%, 10/15/36 | | | 40,445 |
| A1 | | | 36 | | ConocoPhillips Holding Co., Sr. Notes,
6.95%, 4/15/29 | | | 40,819 |
| Baa1 | | | 60 | | Marathon Oil Corp., Notes,
6.125%, 3/15/12 | | | 62,154 |
| A1 | | | 500 | | Phillips Petroleum Co., Notes,
8.75%, 5/25/10 | | | 554,983 |
| Baa2 | | | 295 | | TNK-BP Finance SA (Luxembourg), Gtd. Private Placement, Notes, 144A,
7.50%, 7/18/16 | | | 311,225 |
| | | | | | | | |
| | | | | | | | 1,304,431 |
| | | | | | | | |
|
| Energy—Other 0.1% |
| Baa2 | | | 111 | | Devon Financing Corp., ULC, Gtd. Notes,
7.875%, 9/30/31 | | | 131,577 |
| Baa2 | | | 55 | | Encana Corp., (Canada), Bonds,
6.50%, 8/15/34 | | | 57,074 |
| Baa1 | | | 30 | | Halliburton Co., Notes,
5.50%, 10/15/10 | | | 30,324 |
| | | | | Talisman Energy, Inc., (Canada), Notes, | | | |
| Baa2 | | | 45 | | 5.125%, 5/15/15 | | | 42,997 |
| Baa2 | | | 110 | | 6.25%, 2/01/38 | | | 104,375 |
| Baa3 | | | 30 | | Valero Energy Corp., Sr. Unsec. Notes,
7.50%, 4/15/32 | | | 34,090 |
| Baa1 | | | 125 | | Weatherford International, Inc., Gtd. Notes,
6.50%, 8/01/36 | | | 124,985 |
| Baa1 | | | 265 | | Woodside Petroleum Ltd. (Australia), Gtd. Notes, 144A,
5.00%, 11/15/13 | | | 258,294 |
| Baa2 | | | 75 | | XTO Energy, Inc., Sr. Unsec. Notes,
5.65%, 4/01/16 | | | 74,739 |
| | | | | | | | |
| | | | | | | | 858,455 |
| | | | | | | | |
See Notes to Financial Statements.
| | |
| 36 | | Visit our website at www.jennisondryden.com |
| | | | | | | | |
Moody’s
Rating
(Unaudited) | | Principal
Amount (000) | | Description | | Value (Note 1) |
| | | | | | | | |
|
| Foods 0.4% |
| A2 | | $ | 160 | | Anheuser-Busch Cos., Inc., Sr. Notes,
6.00%, 4/15/11 | | $ | 164,832 |
| A2 | | | 60 | | Archer-Daniels-Midland Co., Debs.,
8.125%, 6/01/12 | | | 67,729 |
| A3 | | | 90 | | Bottling Group LLC, Notes,
5.50%, 4/01/16 | | | 90,507 |
| Baa2 | | | 215 | | Bunge Ltd., Notes,
5.35%, 4/15/14 | | | 207,281 |
| Baa2 | | | 250 | | Cadbury Schweppes US Finance LLC, Notes, 144A,
3.875%, 10/01/08 | | | 244,754 |
| A2 | | | 375 | | Cargill, Inc., Notes, 144A,
3.625%, 3/04/09 | | | 365,125 |
| Baa2 | | | 81 | | ConAgra Foods, Inc., Notes,
7.875%, 9/15/10 | | | 87,685 |
| Baa2 | | | 80 | | ConAgra Foods, Inc., Sr. Notes,
7.125%, 10/01/26 | | | 87,254 |
| Baa2 | | | 260 | | HJ Heinz Co., Notes, 144A,
6.428%, 12/01/08 | | | 264,492 |
| A3 | | | 375 | | Kellogg Co., Notes, Ser. B,
6.60%, 4/01/11 | | | 394,116 |
| A3 | | | 50 | | Kraft Foods, Inc., Notes,
5.25%, 6/01/07 | | | 49,971 |
| A3 | | | 185 | | Kraft Foods, Inc., Sr. Unsec. Notes,
5.625%, 11/01/11 | | | 187,256 |
| Baa2 | | | 35 | | Kroger Co. (The), Gtd. Notes,
6.80%, 4/01/11 | | | 36,713 |
| Baa2 | | | 250 | | Kroger Co. (The), Notes,
7.80%, 8/15/07 | | | 252,127 |
| | | | | Kroger Co. (The), Sr. Notes, | | | |
| Baa2 | | | 55 | | 7.00%, 5/01/18 | | | 58,258 |
| Baa1 | | | 200 | | Miller Brewing Co., Notes, 144A,
4.25%, 8/15/08 | | | 196,963 |
| Baa1 | | | 295 | | PepsiAmericas, Inc., Notes,
6.375%, 5/01/09 | | | 301,684 |
| Baa2 | | | 35 | | Tricon Global Restaurants, Inc., Sr. Notes,
8.875%, 4/15/11 | | | 39,298 |
| Ba1 | | | 150 | | Tyson Foods, Inc., Sr. Unsec. Notes,
6.85%, 4/01/16 | | | 155,597 |
| | | | | | | | |
| | | | | | | | 3,251,642 |
| | | | | | | | |
See Notes to Financial Statements.
| | |
| The Prudential Investment Portfolios, lnc./Dryden Active Allocation Fund | | 37 |
Portfolio of Investments
as of March 31, 2007 (Unaudited) Cont’d.
| | | | | | | | |
Moody’s
Rating
(Unaudited) | | Principal
Amount (000) | | Description | | Value (Note 1) |
| | | | | | | | |
|
| Gaming |
| | | | | Harrah’s Operating Co., Inc., Gtd. Notes, | | | |
| Baa3 | | $ | 55 | | 7.125%, 6/01/07 | | $ | 55,206 |
| Baa3 | | | 150 | | 5.50%, 7/01/10 | | | 147,675 |
| B1 | | | 1 | | Mandalay Resort Group, Sr. Sub. Notes,
9.375%, 2/15/10 | | | 1,078 |
| | | | | | | | |
| | | | | | | | 203,959 |
| | | | | | | | |
|
| Health Care & Pharmaceutical 0.4% |
| A1 | | | 385 | | Abbott Laboratories, Notes,
5.875%, 5/15/16 | | | 398,281 |
| Ba1 | | | 200 | | AmerisourceBergen Corp., Gtd. Notes,
5.625%, 9/15/12 | | | 200,420 |
| | | | | Baxter International, Inc., Sr. Unsec. Notes, | | | |
| Baa1 | | | 170 | | 5.196%, 2/16/08 | | | 169,865 |
| Baa1 | | | 60 | | 5.90%, 9/01/16 | | | 61,919 |
| Baa3 | | | 210 | | Boston Scientific Corp., Sr. Notes,
6.40%, 6/15/16 | | | 210,553 |
| A2 | | | 55 | | Bristol-Myers Squibb Co., Unsub. Notes,
5.875%, 11/15/36 | | | 53,900 |
| Baa2 | | | 30 | | Cardinal Health Inc., Notes, 144A,
5.80%, 10/15/16 | | | 29,891 |
| Baa2 | | | 110 | | Cardinal Health, Inc., Sr. Unsub. Notes,
5.85%, 12/15/17 | | | 109,816 |
| A1 | | | 60 | | Genentech, Inc., Sr. Notes,
4.75%, 7/15/15 | | | 57,690 |
| B2 | | | 400 | | HCA, Inc., Sec. Notes, 144A,
9.625%, 11/15/16 | | | 432,000 |
| Caa1 | | | 6 | | HCA, Inc., Sr. Unsec. Notes,
6.25%, 2/15/13 | | | 5,453 |
| Baa3 | | | 250 | | Laboratory Corp. of America Holdings, Sr. Unsec. Notes,
5.625%, 12/15/15 | | | 247,188 |
| Aa3 | | | 30 | | Merck & Co., Inc., Bonds,
5.75%, 11/15/36 | | | 29,103 |
See Notes to Financial Statements.
| | |
| 38 | | Visit our website at www.jennisondryden.com |
| | | | | | | | |
Moody’s
Rating
(Unaudited) | | Principal
Amount (000) | | Description | | Value (Note 1) |
| | | | | | | | |
| Aa3 | | $ | 30 | | Merck & Co., Inc., Debs.,
5.95%, 12/01/28 | | $ | 30,511 |
| Aa1 | | | 40 | | Pharmacia Corp., Debs.,
6.60%, 12/01/28 | | | 44,336 |
| Baa1 | | | 155 | | Schering-Plough Corp., Sr. Notes,
5.55%, 12/01/13 | | | 157,921 |
| Baa2 | | | 255 | | Teva Pharmaceutical Finance LLC, Bonds,
6.15%, 2/01/36 | | | 245,950 |
| A3 | | | 340 | | Wyeth, Notes,
5.95%, 4/01/37 | | | 334,849 |
| | | | | Wyeth, Unsub. Notes, | | | |
| A3 | | | 260 | | 5.50%, 3/15/13 - 2/01/14 | | | 262,133 |
| A3 | | | 10 | | 6.45%, 2/01/24 | | | 10,493 |
| | | | | | | | |
| | | | | | | | 3,092,272 |
| | | | | | | | |
|
| Health Care Insurance 0.2% |
| | | | | Aetna, Inc., Sr. Unsub. Notes, | | | |
| A3 | | | 80 | | 5.75%, 6/15/11 | | | 81,671 |
| A3 | | | 130 | | 6.625%, 6/15/36 | | | 139,119 |
| Baa1 | | | 310 | | Anthem, Inc., Notes,
3.50%, 9/01/07 | | | 307,428 |
| Baa2 | | | 140 | | Cigna Corp., Sr. Unsec. Notes,
6.15%, 11/15/36 | | | 138,738 |
| Ba1 | | | 190 | | Coventry Health Care, Inc., Sr. Notes,
6.125%, 1/15/15 | | | 192,356 |
| A3 | | | 290 | | United Health Group, Inc., Sr. Unsec. Notes,
5.25%, 3/15/11 | | | 291,126 |
| | | | | WellPoint, Inc., Notes, | | | |
| Baa1 | | | 170 | | 5.00%, 12/15/14 | | | 164,963 |
| Baa1 | | | 105 | | 5.95%, 12/15/34 | | | 103,033 |
| | | | | | | | |
| | | | | | | | 1,418,434 |
| | | | | | | | |
|
| Insurance 0.3% |
| A1 | | | 200 | | Allstate Corp. (The), Sr. Notes,
7.20%, 12/01/09 | | | 210,264 |
| Aa3 | | | 110 | | American International Group, Inc., Jr. Sub. Notes,
6.25%, 3/15/37(g) | | | 107,065 |
See Notes to Financial Statements.
| | |
| The Prudential Investment Portfolios, lnc./Dryden Active Allocation Fund | | 39 |
Portfolio of Investments
as of March 31, 2007 (Unaudited) Cont’d.
| | | | | | | | |
Moody’s
Rating
(Unaudited) | | Principal
Amount (000) | | Description | | Value (Note 1) |
| | | | | | | | |
| | | | | American International Group, Inc., Notes, | | | |
| Aa2 | | $ | 260 | | 4.25%, 5/15/13 | | $ | 247,253 |
| Aa2 | | | 240 | | 5.60%, 10/18/16 | | | 244,074 |
| A3 | | | 35 | | AXA SA (France), Sub. Notes,
8.60%, 12/15/30 | | | 44,623 |
| Aaa | | | 95 | | Berkshire Hathaway Finance Corp., Gtd. Notes,
4.75%, 5/15/12 | | | 93,562 |
| Baa3 | | | 180 | | Liberty Mutual Group, Inc.,
Bonds, 144A,
7.00%, 3/15/34 | | | 185,543 |
| | | | | Marsh & McLennan Cos., Inc., Sr. Unsec. Notes, | | | |
| Baa2 | | | 50 | | 5.15%, 9/15/10 | | | 49,564 |
| Baa2 | | | 40 | | 5.75%, 9/15/15 | | | 39,735 |
| | | | | MetLife, Inc., Sr. Notes, | | | |
| A2 | | | 70 | | 6.125%, 12/01/11 | | | 73,030 |
| A2 | | | 15 | | 6.375%, 6/15/34 | | | 15,776 |
| A2 | | | 205 | | 5.70%, 6/15/35 | | | 197,060 |
| A3 | | | 140 | | St. Paul Travelers Cos., Inc., (The), Sr. Unsec. Notes,
6.75%, 6/20/36 | | | 154,117 |
| | | | | W.R. Berkley Corp., Sr. Notes, | | | |
| Baa2 | | | 110 | | 5.60%, 5/15/15 | | | 108,584 |
| Baa2 | | | 90 | | 6.15%, 8/15/19 | | | 90,971 |
| | | | | XL Capital Ltd. (Cayman Islands), Sr. Notes, | | | |
| A3 | | | 15 | | 5.25%, 9/15/14 | | | 14,699 |
| | | | | | | | |
| | | | | | | | 1,875,920 |
| | | | | | | | |
|
| Lodging 0.1% |
| A3 | | | 440 | | Carnival Corp. (Panama), Gtd. Notes,
3.75%, 11/15/07 | | | 435,840 |
| A3 | | | 50 | | Carnival PLC (United Kingdom), Notes,
7.30%, 6/01/07 | | | 50,133 |
| | | | | | | | |
| | | | | | | | 485,973 |
| | | | | | | | |
See Notes to Financial Statements.
| | |
| 40 | | Visit our website at www.jennisondryden.com |
| | | | | | | | |
Moody’s
Rating
(Unaudited) | | Principal
Amount (000) | | Description | | Value (Note 1) |
| | | | | | | | |
|
| Media & Entertainment 0.2% |
| Baa3 | | $ | 115 | | AMFM, Inc., Gtd. Notes,
8.00%, 11/01/08 | | $ | 119,154 |
| Baa3 | | | 75 | | CBS Corp., Gtd. Notes,
7.875%, 7/30/30 | | | 80,847 |
| A3 | | | 50 | | Disney (Walt) Co., Notes,
5.375%, 6/01/07 | | | 50,014 |
| Ba1 | | | 15 | | McClatchy Co., Debs.,
6.875%, 3/15/29 | | | 13,937 |
| Baa2 | | | 125 | | News America, Inc., Gtd. Notes,
7.625%, 11/30/28 | | | 140,083 |
| Baa2 | | | 100 | | Time Warner, Inc., Debs.,
9.15%, 2/01/23 | | | 124,554 |
| Baa2 | | | 225 | | Time Warner, Inc., Gtd. Notes,
6.75%, 4/15/11 | | | 237,120 |
| Baa2 | | | 160 | | 7.25%, 10/15/17 | | | 176,626 |
| Baa2 | | | 36 | | 7.625%, 4/15/31 | | | 40,458 |
| Baa2 | | | 50 | | 7.70%, 5/01/32 | | | 56,687 |
| Baa3 | | | 150 | | Viacom, Inc., Sr. Notes,
6.25%, 4/30/16 | | | 152,063 |
| Baa3 | | | 160 | | 6.875%, 4/30/36 | | | 161,277 |
| | | | | | | | |
| | | | | | | | 1,352,820 |
| | | | | | | | |
|
| Metals 0.1% |
| Baa1 | | | 70 | | Alcan, Inc. (Canada), Notes,
4.50%, 5/15/13 | | | 66,307 |
| Baa1 | | | 115 | | 5.00%, 6/01/15 | | | 110,304 |
| Ba1 | | | 250 | | Peabody Energy Corp., Notes,
7.375%, 11/01/16 | | | 263,126 |
| Baa2 | | | 195 | | Southern Copper Corp., Sr. Notes,
7.50%, 7/27/35 | | | 210,186 |
| Baa3 | | | 120 | | Vale Overseas Ltd. (Cayman Islands), Gtd. Notes,
6.875%, 11/21/36 | | | 123,922 |
| Baa2 | | | 70 | | Xstrata Finance Canada Ltd. (Canada), Gtd. Notes, 144A,
5.50%, 11/16/11 | | | 70,394 |
| | | | | | | | |
| | | | | | | | 844,239 |
| | | | | | | | |
See Notes to Financial Statements.
| | |
| The Prudential Investment Portfolios, lnc./Dryden Active Allocation Fund | | 41 |
Portfolio of Investments
as of March 31, 2007 (Unaudited) Cont’d.
| | | | | | | | |
Moody’s
Rating
(Unaudited) | | Principal
Amount (000) | | Description | | Value (Note 1) |
| | | | | | | | |
|
| Non Captive Finance 0.3% |
| A3 | | $ | 5 | | Capital One Bank, Sub. Notes,
6.50%, 6/13/13 | | $ | 5,232 |
| A3 | | | 55 | | Capital One Financial Corp., Notes,
5.50%, 6/01/15 | | | 54,243 |
| A3 | | | 125 | | Capital One Financial Corp., Sr. Notes, MTN,
5.70%, 9/15/11(g) | | | 126,267 |
| Baa1 | | | 25 | | Capital One Financial Corp., Sub. Notes,
6.15%, 9/01/16(g) | | | 25,357 |
| A2 | | | 135 | | CIT Group Funding Co. of Canada, (Canada), Gtd. Notes,
5.20%, 6/01/15 | | | 130,866 |
| | | | | CIT Group, Inc., Sr. Notes, | | | |
| A2 | | | 195 | | 5.50%, 11/30/07 | | | 195,122 |
| A2 | | | 80 | | 4.25%, 2/01/10 | | | 78,224 |
| | | | | General Electric Capital Corp., Notes, | | | |
| Aaa | | | 110 | | 4.875%, 10/21/10 | | | 109,423 |
| Aaa | | | 340 | | 5.50%, 4/28/11 | | | 345,310 |
| Aaa | | | 315 | | 6.75%, 3/15/32 | | | 356,905 |
| Aaa | | | 90 | | General Electric Capital Corp., Notes, MTN,
6.125%, 2/22/11 | | | 93,272 |
| Aa3 | | | 130 | | Household Finance Corp., Notes,
4.75%, 5/15/09 | | | 128,882 |
| Aa3 | | | 100 | | HSBC Finance Corp., Sr. Notes,
5.70%, 6/01/11 | | | 101,525 |
| A1 | | | 120 | | International Lease Finance Corp., Unsub. Notes,
3.50%, 4/01/09 | | | 116,380 |
| | | | | Residential Capital LLC, Gtd. Notes, | | | |
| Baa3 | | | 100 | | 6.375%, 6/30/10 | | | 99,973 |
| Baa3 | | | 105 | | 6.00%, 2/22/11 | | | 103,574 |
| Baa3 | | | 420 | | 6.50%, 4/17/13 | | | 416,013 |
| | | | | | | | |
| | | | | | | | 2,486,568 |
| | | | | | | | |
See Notes to Financial Statements.
| | |
| 42 | | Visit our website at www.jennisondryden.com |
| | | | | | | | |
Moody’s
Rating
(Unaudited) | | Principal
Amount (000) | | Description | | Value (Note 1) |
| | | | | | | | |
|
| Non-Corporate 0.1% |
| A3 | | $ | 460 | | Gaz Capital for Gazprom (Luxembourg),
Sr. Unsec. Notes, 144A,
6.51%, 3/07/22
(cost $460,000; purchased 3/01/07)(g)(k) | | $ | 466,900 |
| Baa1 | | | 270 | | Pemex Project Funding Master Trust, Gtd. Notes,
5.75%, 12/15/15 | | | 270,540 |
| Baa2 | | | 195 | | Petrobras International Finance Co. (Cayman Islands), Bonds,
8.375%, 12/10/18 | | | 234,000 |
| | | | | | | | |
| | | | | | | | 971,440 |
| | | | | | | | |
|
| Paper |
| Baa3 | | | 140 | | Plum Creek Timberlands LP, Gtd. Notes,
5.875%, 11/15/15 | | | 139,104 |
| | | | | | | | |
|
| Pipelines & Other 0.3% |
| Baa3 | | | 330 | | Atmos Energy Corp., Notes,
4.00%, 10/15/09 | | | 320,202 |
| Baa3 | | | 90 | | CenterPoint Energy Resources Corp., Sr. Unsec. Notes,
6.25%, 2/01/37 | | | 89,376 |
| Baa3 | | | 275 | | CenterPoint Energy Resources Corp., Unsec. Notes,
6.50%, 2/01/08 | | | 277,232 |
| Baa2 | | | 365 | | Duke Energy Field Services LLC, Notes,
7.875%, 8/16/10 | | | 394,309 |
| Baa3 | | | 35 | | Enterprise Products Operating LP, Gtd. Notes, Ser. B,
6.875%, 3/01/33 | | | 36,858 |
| | | | | Enterprise Products Operating LP, Gtd. Notes, | | | |
| Baa3 | | | 145 | | 4.625%, 10/15/09 | | | 143,109 |
| Baa3 | | | 150 | | 4.00%, 10/15/07 | | | 148,907 |
| Baa3 | | | 190 | | Enterprise Products Operating LP, Sr. Notes,
4.95%, 6/01/10 | | | 188,362 |
See Notes to Financial Statements.
| | |
| The Prudential Investment Portfolios, lnc./Dryden Active Allocation Fund | | 43 |
Portfolio of Investments
as of March 31, 2007 (Unaudited) Cont’d.
| | | | | | | | |
Moody’s
Rating
(Unaudited) | | Principal
Amount (000) | | Description | | Value (Note 1) |
| | | | | | | | |
| Baa2 | | $ | 125 | | ONEOK Partners, L.P., Notes,
6.65%, 10/01/36 | | $ | 128,430 |
| Baa2 | | | 250 | | ONEOK, Inc., Sr. Unsec. Notes,
5.51%, 2/16/08 | | | 250,398 |
| Baa1 | | | 120 | | Sempra Energy, Sr. Notes,
4.621%, 5/17/07 | | | 119,872 |
| Baa1 | | | 15 | | Sr. Unsec. Notes,
6.00%, 2/01/13 | | | 15,443 |
| Baa1 | | | 22 | | Spectra Energy Capital LLC, Sr. Notes,
8.00%, 10/01/19 | | | 25,138 |
| Baa1 | | | 45 | | Sr. Unsub. Notes,
6.25%, 2/15/13 | | | 46,070 |
| | | | | | | | |
| | | | | | | | 2,183,706 |
| | | | | | | | |
|
| Railroads 0.1% |
| Baa1 | | | 135 | | Burlington Northern Santa Fe Corp., Debs.,
6.70%, 8/01/28 | | | 140,141 |
| Baa1 | | | 4 | | Norfolk Southern Corp.,
Sr. Notes,
7.80%, 5/15/27 | | | 4,673 |
| Baa1 | | | 96 | | Sr. Unsec. Notes,
5.64%, 5/17/29 | | | 88,150 |
| | | | | Union Pacific Corp., Notes, | | | |
| Baa2 | | | 275 | | 6.625%, 2/01/08 | | | 277,816 |
| Baa2 | | | 275 | | 3.625%, 6/01/10 | | | 262,035 |
| Baa2 | | | 152 | | 6.65%, 1/15/11 | | | 158,909 |
| | | | | | | | |
| | | | | | | | 931,724 |
| | | | | | | | |
|
| Real Estate Investment Trusts 0.2% |
| Baa3 | | | 265 | | Brandywine Operating Partnership, Notes,
5.75%, 4/01/12 | | | 268,894 |
| Baa1 | | | 70 | | ERP Operating LP, Notes,
5.125%, 3/15/16 | | | 68,268 |
| Baa2 | | | 250 | | Mack-Cali Realty LP, Notes,
7.25%, 3/15/09 | | | 258,895 |
| Baa3 | | | 135 | | Post Apartment Homes LP, Notes,
6.30%, 6/01/13 | | | 139,695 |
See Notes to Financial Statements.
| | |
| 44 | | Visit our website at www.jennisondryden.com |
| | | | | | | | |
Moody’s
Rating
(Unaudited) | | Principal
Amount (000) | | Description | | Value (Note 1) |
| | | | | | | | |
| Baa3 | | $ | 90 | | Post Apartment Homes LP, Sr. Notes,
5.45%, 6/01/12 | | $ | 88,949 |
| A3 | | | 280 | | Simon Property Group LP, Unsec. Notes,
5.75%, 5/01/12 | | | 286,279 |
| | | | | | | | |
| | | | | | | | 1,110,980 |
| | | | | | | | |
|
| Retail 0.1% |
| | | | | Federated Retail Holdings, Inc., Gtd. Notes, | | | |
| Baa2 | | | 175 | | 5.35%, 3/15/12 | | | 174,541 |
| Baa2 | | | 60 | | 5.90%, 12/01/16 | | | 59,776 |
| Ba1 | | | 250 | | Gap, Inc. (The), Notes,
6.90%, 9/15/07 | | | 251,437 |
| Aa3 | | | 135 | | Home Depot, Inc., Sr. Unsec. Notes,
5.875%, 12/16/36 | | | 128,713 |
| Baa2 | | | 35 | | May Department Stores Co. (The), Notes,
6.65%, 7/15/24 | | | 34,397 |
| A1 | | | 140 | | Target Corp., Sr. Unsec. Notes,
7.50%, 8/15/10 | | | 150,442 |
| Aa2 | | | 60 | | Wal-Mart Stores, Inc., Bonds,
5.25%, 9/01/35 | | | 54,501 |
| | | | | | | | |
| | | | | | | | 853,807 |
| | | | | | | | |
|
| Structured Notes |
| B1 | | | 186 | | TRAINS HY-1 2006, 144A,
7.548%, 5/01/16 | | | 189,129 |
| | | | | | | | |
|
| Technology 0.3% |
| Ba1 | | | 25 | | Electronic Data System Corp., Notes,
7.45%, 10/15/29 | | | 27,256 |
| Baa1 | | | 165 | | Equifax, Inc., Notes,
4.95%, 11/01/07 | | | 164,346 |
| B1 | | | 300 | | Freescale Semiconductor, Inc., Sr. Notes, 144A,
8.875%, 12/15/14 | | | 300,375 |
| A2 | | | 130 | | Hewlett-Packard Co., Sr. Unsec. Notes,
5.25%, 3/01/12 | | | 130,829 |
| A1 | | | 115 | | International Business Machines Corp., Debs.,
5.875%, 11/29/32 | | | 117,529 |
See Notes to Financial Statements.
| | |
| The Prudential Investment Portfolios, lnc./Dryden Active Allocation Fund | | 45 |
Portfolio of Investments
as of March 31, 2007 (Unaudited) Cont’d.
| | | | | | | | | |
Moody’s
Rating
(Unaudited) | | Principal
Amount (000) | | | Description | | Value (Note 1) |
| | | | | | | | | |
| Baa2 | | $ | 125 | | | Intuit, Inc., Sr. Unsec. Notes,
5.40%, 3/15/12 | | $ | 124,620 |
| Ba2 | | | 390 | | | Jabil Circuit, Inc., Sr. Notes,
5.875%, 7/15/10 | | | 387,963 |
| | | | | | Motorola, Inc., Notes, | | | |
| Baa1 | | | 190 | | | 4.608%, 11/16/07 | | | 188,966 |
| Baa1 | | | 20 | | | 8.00%, 11/01/11 | | | 22,057 |
| Ba2 | | | 400 | | | NXP BV (Netherlands), Sec. Notes, 144A,
7.875%, 10/15/14 | | | 413,001 |
| A2 | | | 200 | | | Oracle Corp. and Ozark Holding, Inc., Notes,
5.00%, 1/15/11 | | | 199,264 |
| Baa3 | | | 256 | | | Xerox Corp., Sr. Unsec. Notes,
6.40%, 3/15/16 | | | 263,302 |
| | | | | | | | | |
| | | | | | | | | 2,339,508 |
| | | | | | | | | |
|
| Telecommunications 0.8% |
| A2 | | | 64 | | | ALLTEL Ohio LP, Gtd. Notes, 144A,
8.00%, 8/15/10 | | | 68,666 |
| A2 | | | 33 | | | Alltell Corp., Sr. Notes,
7.00%, 7/01/12 | | | 34,705 |
| A3 | | | 115 | | | America Movil SA de CV (Mexico), Unsec. Notes,
6.375%, 3/01/35 | | | 113,282 |
| A(d) | | | 200 | (i) | | AT&T Corp., Notes,
6.00%, 3/15/09 | | | 203 |
| A2 | | | 120 | | | Sr. Notes,
8.00%, 11/15/31 | | | 148,294 |
| A2 | | | 115 | | | Sr. Unsec. Notes,
7.30%, 11/15/11 | | | 124,839 |
| | | | | | AT&T, Inc., Notes, | | | |
| A2 | | | 220 | | | 4.125%, 9/15/09 | | | 215,049 |
| A2 | | | 240 | | | 5.30%, 11/15/10 | | | 241,089 |
| A2 | | | 245 | | | BellSouth Corp., Notes,
4.20%, 9/15/09 | | | 239,904 |
| Baa1 | | | 45 | | | British Telecommunications PLC (United Kingdom), Bonds,
9.125%, 12/15/30 | | | 61,786 |
| Baa1 | | | 220 | | | Unsub. Notes,
7.00%, 5/23/07 | | | 220,318 |
See Notes to Financial Statements.
| | |
| 46 | | Visit our website at www.jennisondryden.com |
| | | | | | | | |
Moody’s
Rating
(Unaudited) | | Principal
Amount (000) | | Description | | Value (Note 1) |
| | | | | | | | |
| Baa1 | | $ | 100 | | Cingular Wireless LLC, Sr. Notes,
7.125%, 12/15/31 | | $ | 110,105 |
| A2 | | | 120 | | Cingular Wireless Services, Inc., Notes,
8.125%, 5/01/12 | | | 135,081 |
| A3 | | | 60 | | Deutsche Telekom International Finance BV(Netherlands), Gtd. Notes,
8.25%, 6/15/30 | | | 74,319 |
| | | | | Embarq Corp., Notes, | | | |
| Baa3 | | | 80 | | 7.082%, 6/01/16 | | | 81,564 |
| Baa3 | | | 200 | | 7.995%, 6/01/36 | | | 206,522 |
| A3 | | | 75 | | France Telecom SA (France), Notes,
8.50%, 3/01/31 | | | 97,475 |
| Baa2 | | | 105 | | Koninklijke (Royal) KPN NV (Netherlands), Sr. Unsub. Notes,
8.00%, 10/01/10 | | | 113,897 |
| Baa1 | | | 110 | | New Cingular Wireless Services, Inc., Sr. Notes,
8.75%, 3/01/31 | | | 141,894 |
| Baa3 | | | 500 | | Nextel Communications, Inc., Sr. Notes,
5.95%, 3/15/14 | | | 491,904 |
| Baa3 | | | 185 | | Sprint Capital Corp., Gtd. Notes,
6.90%, 5/01/19 | | | 191,583 |
| Baa3 | | | 315 | | Sprint Nextel Corp., Unsec. Notes,
6.00%, 12/01/16 | | | 309,992 |
| | | | | Telecom Italia Capiltal SA (Luxembourg), Gtd. Notes, | | | |
| Baa2 | | | 45 | | 4.00%, 1/15/10 | | | 43,476 |
| Baa2 | | | 90 | | 5.25%, 11/15/13 | | | 87,259 |
| Baa2 | | | 80 | | 6.375%, 11/15/33 | | | 75,453 |
| Baa2 | | | 160 | | 7.20%, 7/18/36 | | | 166,578 |
| Baa1 | | | 420 | | Telecomunicaciones de Puerto Rico, Inc. (Puerto Rico), Gtd. Notes,
6.80%, 5/15/09 | | | 430,150 |
| | | | | Telefonica Emisiones Sau (Spain), Gtd. Notes, | | | |
| Baa1 | | | 150 | | 6.421%, 6/20/16 | | | 156,559 |
| Baa1 | | | 265 | | 7.045%, 6/20/36 | | | 282,989 |
See Notes to Financial Statements.
| | |
| The Prudential Investment Portfolios, lnc./Dryden Active Allocation Fund | | 47 |
Portfolio of Investments
as of March 31, 2007 (Unaudited) Cont’d.
| | | | | | | | |
Moody’s
Rating
(Unaudited) | | Principal
Amount (000) | | Description | | Value (Note 1) |
| | | | | | | | |
| Baa1 | | $ | 250 | | TELUS Corp. (Canada), Notes,
8.00%, 6/01/11 | | $ | 273,806 |
| Baa3 | | | 95 | | U.S. Cellular Corp., Sr. Notes,
6.70%, 12/15/33 | | | 89,164 |
| A3 | | | 55 | | Verizon Communications, Inc., Sr. Unsec. Notes,
6.25%, 4/01/37 | | | 54,478 |
| A3 | | | 165 | | Verizon Global Funding Corp., Bonds,
5.85%, 9/15/35(g) | | | 156,037 |
| A3 | | | 200 | | Vodafone Group PLC (United Kingdom), Sr. Notes,
7.75%, 2/15/10 | | | 213,477 |
| A3 | | | 100 | | Unsec. Notes,
6.15%, 2/27/37 | | | 96,538 |
| | | | | | | | |
| | | | | | | | 5,548,435 |
| | | | | | | | |
|
| Tobacco |
| Baa1 | | | 20 | | Altria Group, Inc., Debs.,
7.75%, 1/15/27 | | | 23,904 |
| Baa1 | | | 120 | | Notes,
7.65%, 7/01/08 | | | 123,340 |
| | | | | | | | |
| | | | | | | | 147,244 |
| | | | | | | | |
| | | | | Total corporate bonds
(cost $55,060,123) | | | 55,232,935 |
| | | | | | | | |
| |
| ASSET BACKED SECURITIES 1.3% | | | |
| Aaa | | | 57 | | Accredited Mortgage Loan Trust,
Ser. 2006-1, Class A1,
5.38%, 4/25/36(h) | | | 56,582 |
| Aaa | | | 105 | | Ser. 2006-2, Class A1,
5.36%, 9/25/36(h) | | | 104,926 |
| Baa1 | | | 230 | | American Express Credit Account Master Trust, Ser. 2004-4,
Class C, 144A,
5.79%, 3/15/12(h) | | | 231,366 |
| Baa1 | | | 129 | | Master Trust, Ser. 2004-C,
Class C, 144A,
5.82%, 2/15/12(h) | | | 129,745 |
See Notes to Financial Statements.
| | |
| 48 | | Visit our website at www.jennisondryden.com |
| | | | | | | | |
Moody’s
Rating
(Unaudited) | | Principal
Amount (000) | | Description | | Value (Note 1) |
| | | | | | | | |
| Aaa | | $ | 6 | | Ameriquest Mortgage Securities, Inc.,
Ser. 2006-R1, Class A2A,
5.40%, 3/25/36(h) | | $ | 6,332 |
| AA+(d) | | | 28 | | Amortizing Residential Collateral Trust, Ser. 2002-BC7, Class M2,
6.67%, 10/25/32(h) | | | 27,835 |
| Aa2 | | | 500 | | Trust, Series 2002-BC9, Class M1,
6.97%, 12/25/32(h) | | | 499,976 |
| Baa2 | | | 397 | | Bank One Issuance Trust,
Ser. 2003-C1, Class C1,
4.54%, 9/15/10 | | | 394,192 |
| Aaa | | | 413 | | Capital One Prime Auto Receivables Trust, Ser. 2004-2, Class A4,
5.38%, 4/15/10(h) | | | 413,261 |
| Aa2 | | | 202 | | CDC Mortgage Capital Trust,
Ser. 2002-HE3, Class M1,
6.97%, 3/25/33(h) | | | 202,215 |
| Aa2 | | | 360 | | Centex Home Equity,
Ser. 2005-A, Class M2,
5.82%, 1/25/35(h) | | | 360,333 |
| Baa2 | | | 300 | | Citibank Credit Card Issuance Trust,
Ser. 2006-C1, Class C1,
5.72%, 2/20/15(h) | | | 301,364 |
| Aaa | | | 26 | | CNH Equipment Trust,
Ser. 2004-A, Class A3A,
5.39%, 10/15/08(h) | | | 26,257 |
| Aaa | | | 58 | | Countrywide Asset-Backed Certificates, Ser. 2006-6, Class 2A1,
5.39%, 9/25/36(h) | | | 58,497 |
| Aaa | | | 174 | | Certificates, Ser. 2006-BC2, Class 2A1,
5.36%, 1/25/45(h) | | | 173,735 |
| Aaa | | | 270 | | Credit-Based Asset Servicing and Securitization, Ser. 2005-CB6, Class AF3,
5.12%, 7/25/35 | | | 268,473 |
| Aaa | | | 41 | | Ser. 2006-CB3, Class AV1,
5.38%, 3/25/36(h) | | | 41,229 |
See Notes to Financial Statements.
| | |
| The Prudential Investment Portfolios, lnc./Dryden Active Allocation Fund | | 49 |
Portfolio of Investments
as of March 31, 2007 (Unaudited) Cont’d.
| | | | | | | | |
Moody’s
Rating
(Unaudited) | | Principal
Amount (000) | | Description | | Value (Note 1) |
| | | | | | | | |
| Aa2 | | $ | 260 | | Equity One ABS, Inc.,
Ser. 2004-3, Class M1,
5.70%, 7/25/34 | | $ | 258,822 |
| Aa2 | | | 300 | | First Franklin Mortgage Loan Asset Backed Certs.,
Ser. 2005-FFH1, Class M2,
5.84%, 6/25/36(h) | | | 300,689 |
| Aa1 | | | 135 | | HFC Home Equity Loan Asset Backed Certs., Ser. 2005-2, Class M2,
5.81%, 1/20/35(h) | | | 135,156 |
| Aaa | | | 43 | | Indymac Residential Asset Backed Trust, Ser. 2006-B, Class 2A1,
5.38%, 6/25/36(h) | | | 42,899 |
| Aaa | | | 40 | | Long Beach Mortgage Loan Trust,
Ser. 2006-2, Class 2A1,
5.39%, 3/25/36(h) | | | 39,933 |
| Aaa | | | 308 | | Ser. 2006-6, Class 2A1,
5.36%, 7/25/36(h) | | | 308,099 |
| Aaa | | | 2,400 | | MBNA Master Credit Card Trust,
Ser. 1999-J, Class A,
7.00%, 2/15/12 | | | 2,514,939 |
| A2 | | | 290 | | Morgan Stanley ABS Capital I,
Ser. 2004-NC3, Class M2,
6.42%, 3/25/34(h) | | | 291,136 |
| Aaa | | | 268 | | Morgan Stanley Dean Witter Capital I,
Ser. 2002-NC4, Class M1,
6.595%, 9/25/32(h) | | | 268,557 |
| Aa2 | | | 341 | | Series 2002-HE1, Class M1,
6.22%, 7/25/32(h) | | | 343,816 |
| Aaa | | | 42 | | Nomura Home Equity Loan, Inc.,
Ser. 2006-HE1, Class A1,
5.40%, 2/25/36(h) | | | 42,493 |
| Aaa | | | 86 | | Ser. 2006-HE2, Class A1,
5.38%, 3/25/36(h) | | | 85,654 |
| Aaa | | | 10 | | Novastar Home Equity Loan,
Ser. 2005-4, Class A2A,
5.41%, 1/25/36(h) | | | 10,260 |
See Notes to Financial Statements.
| | |
| 50 | | Visit our website at www.jennisondryden.com |
| | | | | | | | |
Moody’s
Rating
(Unaudited) | | Principal
Amount (000) | | Description | | Value (Note 1) |
| | | | | | | | |
| Aaa | | $ | 83 | | Prestige Auto Receivables Trust,
Ser. 2004-1, Class A2, 144A,
3.69%, 6/15/11 | | $ | 82,573 |
| Aa2 | | | 75 | | Residential Asset Securities Corp.,
Ser. 2004-KS2, Class MI1
4.71%, 3/25/34(h) | | | 73,025 |
| Aa2 | | | 240 | | Saxon Asset Securities Trust,
Ser. 2005-2, Class M2,
5.76%, 10/25/35(h) | | | 240,460 |
| Aaa | | | 300 | | Securitized Asset Backed Receivables LLC Trust, Ser. 2006-FR3, Class A3,
5.57%, 5/25/36(h) | | | 301,561 |
| Aa2 | | | 265 | | LLC Trust, Ser. 2004-OP1, Class M1,
5.83%, 2/25/34(h) | | | 265,371 |
| Aaa | | | 218 | | SLM Student Loan Trust,
Ser. 2006-7, Class A1,
5.32%, 4/25/12(h) | | | 218,101 |
| A2 | | | 100 | | WFS Financial Owner Trust, Ser. 2004-4, Class D,
3.58%, 5/17/12 | | | 98,984 |
| | | | | | | | |
| | | | | Total asset backed securities
(cost $9,320,921) | | | 9,218,846 |
| | | | | | | | |
| |
| COMMERCIAL MORTGAGE BACKED SECURITIES 3.7% | | | |
| AAA(d) | | | 400 | | Banc of America Commercial Mortgage, Inc.,
Ser. 2003-2, Class A3,
4.873%, 3/11/41 | | | 395,264 |
| AAA(d) | | | 2,180 | | Ser. 2004-1, Class XP,
0.801%, 11/10/39(h) | | | 43,672 |
| Aaa | | | 200 | | Ser. 2004-2, Class A3,
4.05%, 11/10/38 | | | 193,891 |
| Aaa | | | 560 | | Ser. 2004-2, Class A4,
4.153%, 11/10/38 | | | 540,658 |
See Notes to Financial Statements.
| | |
| The Prudential Investment Portfolios, lnc./Dryden Active Allocation Fund | | 51 |
Portfolio of Investments
as of March 31, 2007 (Unaudited) Cont’d.
| | | | | | | | |
Moody’s
Rating
(Unaudited) | | Principal
Amount (000) | | Description | | Value (Note 1) |
| | | | | | | | |
| Aaa | | $ | 1,400 | | Ser. 2005-6, Class A4,
5.354%, 9/10/47 | | $ | 1,393,682 |
| AAA(d) | | | 1,000 | | Ser. 2006-2, Class A4,
5.7405%, 5/10/45(h) | | | 1,031,946 |
| Aaa | | | 750 | | Ser. 2007-1, Class A4,
5.451%, 1/15/49 | | | 752,383 |
| Baa2 | | | 430 | | Bear Stearns Commercial Mortgage Securities,
Ser. 2001-TOP4, Class E, 144A,
6.47%, 11/15/33 | | | 447,635 |
| AAA(d) | | | 4,189 | | Ser. 2004-T16, Class X2,
0.93%, 2/13/46(h) | | | 122,920 |
| Aaa | | | 350 | | Ser. 2005-T18, Class AAB,
4.823%, 2/13/42(h) | | | 342,832 |
| Aaa | | | 500 | | Ser. 2005-T20, Class AAB,
5.1394%, 10/12/42(h) | | | 499,999 |
| Aaa | | | 190 | | Ser. 2006-BBA7, Class A1, 144A,
5.43%, 3/15/19(h) | | | 189,999 |
| AAA(d) | | | 4,815 | | Commercial Mortgage Acceptance Corporation,
Ser. 1998-C2, Class X,
0.739%, 9/15/30(h) | | | 112,850 |
| Aaa | | | 22 | | Commercial Mortgage Asset Trust,
Ser. 1999-C2, Class A1,
7.285%, 11/17/32 | | | 22,350 |
See Notes to Financial Statements.
| | |
| 52 | | Visit our website at www.jennisondryden.com |
| | | | | | | | |
Moody’s
Rating
(Unaudited) | | Principal
Amount (000) | | Description | | Value (Note 1) |
| | | | | | | | |
| AAA(d) | | $ | 2,434 | | Commercial Mortgage Pass-Through Certs.,
Ser. 2004-LB2A, Class X2,144A,
1.112%, 3/10/39 | | $ | 63,604 |
| Aaa | | | 300 | | Credit Suisse First Boston Mortgage Securities Corp.,
Ser. 2004-C4, Class A4,
4.283%, 10/15/39 | | | 290,075 |
| AAA(d) | | | 800 | | Credit Suisse Mtge. Capital Certs.,
Series 2006-C1, Class A4,
5.609%, 2/15/39(h) | | | 811,478 |
| Aaa | | | 1,000 | | Series 2006-C4, Class A3,
5.467%, 9/15/39 | | | 1,005,622 |
| Aaa | | | 435 | | Ser. 2006-C5, Class A3
5.311%, 12/15/39 | | | 432,192 |
| AAA(d) | | | 597 | | DLJ Commercial Mortgage Corp.,
Ser. 2000-CF1, Class A1B,
7.62%, 6/10/33 | | | 633,657 |
| Aaa | | | 4,583 | | GE Commercial Mortgage Corp.,
Ser. 2004-C2, Class X2, 144A,
0.76%, 3/10/40(h) | | | 83,611 |
| AAA(d) | | | 500 | | GMAC Commercial Mortgage Securities, Inc.,
Ser. 2005-C1, Class A2,
4.471%, 5/10/43 | | | 491,600 |
| Aaa | | | 1,300 | | Greenwich Capital Commercial Funding Corp.,
Ser. 2003-C1, Class A4,
4.111%, 7/05/35 | | | 1,228,115 |
| AAA(d) | | | 1,300 | | GS Mortgage Securities Corp. II,
Series 2006-GG6, Class AAB,
5.587%, 4/10/38(h) | | | 1,319,648 |
| Aaa | | | 455 | | J.P. Morgan Chase Commercial Mortgage Securities,
Ser. 2005-CB13, Class A4,
5.294%, 1/12/43(h) | | | 455,224 |
| Aaa | | | 1,000 | | Ser. 2005-LDP2, Class ASB,
4.659%, 7/15/42 | | | 974,850 |
See Notes to Financial Statements.
| | |
| The Prudential Investment Portfolios, lnc./Dryden Active Allocation Fund | | 53 |
Portfolio of Investments
as of March 31, 2007 (Unaudited) Cont’d.
| | | | | | | | |
Moody’s
Rating
(Unaudited) | | Principal
Amount (000) | | Description | | Value (Note 1) |
| | | | | | | | |
| Aaa | | $ | 520 | | Ser. 2005-LDP4, Class A4,
4.918%, 10/15/42(h) | | $ | 505,109 |
| Aaa | | | 29,393 | | Series 2006-LDP6, Class X2,
0.088%, 4/15/43(h) | | | 165,218 |
| Aaa | | | 700 | | J.P. Morgan Chase Commercial Mortgage Securities Corp.,
Ser. 2005-LDP5, Class A4,
5.1793%, 12/15/44(h) | | | 697,900 |
| Aaa | | | 700 | | Ser. 2006-CB16. Class ASB,
5.523%, 5/12/45 | | | 708,845 |
| Aaa | | | 900 | | Ser. 2006-CB17. Class A4,
5.429%, 12/12/43 | | | 902,286 |
| Aaa | | | 500 | | Ser. 2006-LDP8, Class ASB,
5.37%, 5/15/45 | | | 501,494 |
| Aaa | | | 510 | | Ser. 2006-LDP9. Class A3,
5.336%, 5/15/47 | | | 506,811 |
| Aaa | | | 1,580 | | KeyCorp, Ser. 2000-C1, Class A2,
7.727%, 5/17/32 | | | 1,669,072 |
| AAA(d) | | | 700 | | LB-UBS Commercial Mortgage Trust,
Ser. 2003-C5, Class A2,
3.478%, 7/15/27 | | | 685,181 |
| AAA(d) | | | 800 | | Ser. 2004-C6, Class A5,
4.826%, 8/15/29(h) | | | 787,256 |
| Aaa | | | 500 | | Ser. 2005-C3, Class A3,
4.647%, 7/15/30 | | | 490,494 |
See Notes to Financial Statements.
| | |
| 54 | | Visit our website at www.jennisondryden.com |
| | | | | | | | |
Moody’s
Rating
(Unaudited) | | Principal
Amount (000) | | Description | | Value (Note 1) |
| | | | | | | | |
| Aaa | | $ | 430 | | Ser. 2005-C3, Class A5,
4.739%, 7/15/30 | | $ | 413,841 |
| Aaa | | | 1,000 | | Ser. 2006-C3, Class A4,
5.661%, 3/15/39 | | | 1,021,353 |
| Aaa | | | 29 | | Lehman Brothers Floating Rate Commercial Mortgage Trust,
Ser. 2005-LLFA, Class A1, 144A
5.42%, 7/15/18(h) | | | 29,231 |
| Aaa | | | 83 | | Ser. 2006-LLFA, Class A1, 144A
5.40%, 9/15/21(h) | | | 82,830 |
| Aaa | | | 400 | | Merrill Lynch Mortgage Trust,
Ser. 2004-Key2, Class A3,
4.615%, 8/12/39 | | | 389,559 |
| Aaa | | | 430 | | Merrill Lynch/Countrywide Commercial Mortgage Trust,
Ser. 2006-2, Class A4,
5.9098%, 6/12/46(h) | | | 448,234 |
| Aaa | | | 750 | | Ser. 2007-5, Class A4,
5.378%, 8/12/48 | | | 748,053 |
| Aaa | | | 250 | | Morgan Stanley Capital I,
Ser. 2004-HQ3, Class A2,
4.05%, 1/13/41 | | | 243,710 |
| Aaa | | | 16 | | Ser. 2006-XLF, Class A1, 144A,
5.41%, 7/15/19(h) | | | 16,023 |
| Aaa | | | 1,000 | | Ser. 2007-HQ11, Class AAB,
5.444%, 2/12/44(h) | | | 1,005,661 |
| AAA(d) | | | 1,100 | | Wachovia Bank Commercial Mortgage Trust, Ser. 2003-C3, Class A-2,
4.867%, 2/15/35 | | | 1,081,672 |
| | | | | | | | |
| | | | | Total commercial mortgage backed securities
(cost $28,074,486) | | | 26,979,590 |
| | | | | | | | |
See Notes to Financial Statements.
| | |
| The Prudential Investment Portfolios, lnc./Dryden Active Allocation Fund | | 55 |
Portfolio of Investments
as of March 31, 2007 (Unaudited) Cont’d.
| | | | | | | | |
Moody’s
Rating
(Unaudited) | | Principal
Amount (000) | | Description | | Value (Note 1) |
| | | | | | | | |
|
| COLLATERALIZED MORTGAGE OBLIGATIONS 0.8% |
| Aaa | | $ | 225 | | Banc of America Mortgage Securities, Inc., Ser. 2005-A, Class 2A1,
4.461%, 2/25/35(h) | | $ | 221,155 |
| Aaa | | | 216 | | Ser. 2005-B, Class 2A1,
4.388%, 3/25/35(h) | | | 212,060 |
| Aaa | | | 348 | | Bank of America Alternative Loan Trust, Ser. 2006-5, Class 3A1,
6.00%, 6/25/46 | | | 353,416 |
| Aaa | | | 869 | | Series 2005-12, Class 3CB1,
6.00%, 1/25/36 | | | 873,231 |
| Aaa | | | 350 | | Countrywide Alternative Loan Trust,
Ser. 2004-18CB, Class 3A1,
5.25%, 9/25/19 | | | 342,545 |
| Aaa | | | 612 | | Federal Home Loan Mortgage Corp.,
Ser. 2527, Class BN,
5.00%, 2/15/16 | | | 607,534 |
| Aaa | | | 254 | | Ser. 2567, Class OD,
5.00%, 8/15/15 | | | 252,997 |
| Aaa | | | 344 | | Ser. 2937, Class KA,
4.50%, 12/15/14 | | | 341,041 |
| AAA(d) | | | 99 | | Federal National Mortgage Association, Ser. 1993-55, Class K,
6.50%, 5/25/08 | | | 99,191 |
| Aaa | | | 688 | | Ser. 2003-92, Class PD,
4.50%, 3/25/17 | | | 674,283 |
| Aaa | | | 412 | | Ser. 2005-63, Class HA,
5.00%, 4/25/23 | | | 408,799 |
| Aaa | | | 636 | | JP Morgan Mortgage Trust,
Ser. 2007-A1, Class 4A1,
4.071%, 7/25/35(h) | | | 624,482 |
| AAA(d) | | | 34 | | Master Alternative Loans Trust,
Ser. 2003-8, Class 4A1,
7.00%, 12/25/33 | | | 35,170 |
See Notes to Financial Statements.
| | |
| 56 | | Visit our website at www.jennisondryden.com |
| | | | | | | | |
Moody’s
Rating
(Unaudited) | | Principal
Amount (000) | | Description | | Value (Note 1) |
| | | | | | | | |
| Aaa | | $ | 423 | | Master Alternative Loan Trust,
Ser. 2004-4, Class 4A1,
5.00%, 4/25/19 | | $ | 413,859 |
| Aaa | | | 278 | | Structured Adjustable Rate Mortgage Loan Trust, Ser. 2004-1, Class 4A-3,
4.17%, 2/25/34(h) | | | 276,842 |
| AAA(d) | | | 157 | | Washington Mutual Alternative Mortgage Pass-Through Certs.,
Ser. 2005-1, Class 3A5,
5.00%, 3/25/20 | | | 155,719 |
| | | | | | | | |
| | | | | Total collateralized mortgage obligations
(cost $5,918,571) | | | 5,892,324 |
| | | | | | | | |
|
| MORTGAGE BACKED SECURITIES 11.5% |
| | | | | Federal Home Loan Mortgage Corp., | | | |
| | | 704 | | 5.241%, 12/01/35(h) | | | 702,466 |
| | | 2,958 | | 4.50%, 1/01/19 - 7/01/20 | | | 2,867,495 |
| | | 3,080 | | 5.00%, 7/01/18 - 5/01/34 | | | 3,029,624 |
| | | 1,000 | | 5.00%, TBA(c) 30 YR | | | 966,250 |
| | | 2,110 | | 5.50%, 12/01/33 - 7/01/34 | | | 2,091,250 |
| | | 5,500 | | 5.50%, TBA(c) 30 YR | | | 5,441,563 |
| | | 3,500 | | 6.00%, TBA(c) 30 YR | | | 3,526,250 |
| | | 687 | | 6.00%, 1/01/34 | | | 694,032 |
| | | 229 | | 6.50%, 6/01/16 - 6/01/31 | | | 235,252 |
| | | 742 | | 7.00%, 6/01/14 - 11/01/33 | | | 769,887 |
| | | | | Federal National Mortgage Association, | | | |
| | | 369 | | 4.00%, 5/01/19 | | | 348,615 |
| | | 680 | | 4.375%, 11/01/35(h) | | | 674,050 |
| | | 4,713 | | 4.50%, 11/01/18 - 3/01/34 | | | 4,543,892 |
| | | 9,725 | | 5.00%, 10/01/18 - 2/01/36 | | | 9,430,409 |
| | | 8,500 | | 5.00%, TBA(c) 30 YR | | | 8,210,473 |
| | | 8,421 | | 5.50%, 12/01/16 - 2/01/34 | | | 8,357,532 |
| | | 3,000 | | 5.50%, TBA(c) 15 YR | | | 3,006,564 |
| | | 5,750 | | 5.50%, TBA(c) 30 YR | | | 5,688,906 |
| | | 4,614 | | 6.00%, 12/01/13 - 2/01/35 | | | 4,668,084 |
| | | 1,000 | | 6.00%, TBA 15 YR | | | 1,016,250 |
| | | 7,500 | | 6.00%, TBA(c) 30 YR | | | 7,555,002 |
| | | 2,433 | | 6.50%, 5/01/13 - 10/01/36 | | | 2,491,212 |
| | | 1,000 | | 6.50%, TBA(c) 30 YR | | | 1,019,688 |
See Notes to Financial Statements.
| | |
| The Prudential Investment Portfolios, lnc./Dryden Active Allocation Fund | | 57 |
Portfolio of Investments
as of March 31, 2007 (Unaudited) Cont’d.
| | | | | | | | |
Moody’s
Rating
(Unaudited) | | Principal
Amount (000) | | Description | | Value (Note 1) |
| | | | | | | | |
| | $ | 261 | | 7.00%, 5/01/11 - 6/01/32 | | $ | 271,207 |
| | | 77 | | 7.50%, 12/01/07 - 9/01/30 | | | 79,047 |
| | | 26 | | 8.00%, 12/01/23 | | | 27,910 |
| | | 18 | | 8.50%, 2/01/28 | | | 19,749 |
| | | | | Government National Mortgage Association, | | | |
| | | 1,728 | | 5.50%, 7/15/33 - 9/15/34 | | | 1,720,309 |
| | | 2,750 | | 5.50%, TBA(c) 30 YR | | | 2,734,531 |
| | | 30 | | 6.00%, 8/15/28 | | | 30,400 |
| | | 930 | | 6.50%, 9/15/23 - 8/15/32 | | | 955,972 |
| | | 226 | | 7.00%, 6/15/24 - 5/15/31 | | | 236,267 |
| | | 43 | | 7.50%, 4/15/29 - 5/15/31 | | | 44,460 |
| | | 178 | | 8.00%, 8/15/22 - 6/15/25 | | | 188,449 |
| | | | | | | | |
| | | | | Total mortgage backed securities
(cost $84,163,912) | | | 83,643,047 |
| | | | | | | | |
|
| U.S. GOVERNMENT AGENCY OBLIGATIONS 2.2% |
| | | | | Federal Home Loan Bank, | | | |
| | | 400 | | 4.625%, 2/01/08 | | | 398,363 |
| | | 1,215 | | 4.375%, 10/03/08 | | | 1,205,251 |
| | | 460 | | 5.125%, 9/29/10 | | | 464,015 |
| | | 775 | | 4.50%, 5/13/11 | | | 764,639 |
| | | | | Federal Home Loan Mortgage Corp., | | | |
| | | 5,850 | | 4.75%, 3/05/12 - 1/19/16, MTN | | | 5,818,530 |
| | | 1,879 | | 5.00%, 9/16/08 - 12/14/18, MTN | | | 1,858,810 |
| | | 500 | | 5.30%, 5/12/20, M.T.N. | | | 486,423 |
| | | 320 | | 5.75%, 1/15/12 | | | 332,172 |
| | | | | Federal National Mortgage Association, | | | |
| | | 108 | | 4.25%, 7/27/07 | | | 107,650 |
| | | 2,555 | | 5.00%, 2/16/12 - 2/13/17 | | | 2,569,650 |
| | | 265 | | 6.125%, 3/15/12 | | | 279,601 |
| | | 400 | | 4.375%, 7/17/13 | | | 387,417 |
| | | 1,100 | | 5.80%, 2/09/26 | | | 1,097,955 |
| | | | | | | | |
| | | | | Total U.S. Government agency
(cost $15,751,070) | | | 15,770,476 |
| | | | | | | | |
|
| U.S. GOVERNMENT TREASURY SECURITIES 2.5% |
| | | | | United States Treasury Bonds, | | | |
| | | 39 | | 9.00%, 11/15/18 | | | 53,588 |
| | | 2,530 | | 8.125%, 8/15/19 - 8/15/21(b) | | | 3,332,223 |
| | | 1,080 | | 8.75%, 8/15/20 | | | 1,489,472 |
See Notes to Financial Statements.
| | |
| 58 | | Visit our website at www.jennisondryden.com |
| | | | | | | | |
Moody’s
Rating
(Unaudited) | | Principal
Amount (000) | | Description | | Value (Note 1) |
| | | | | | | | |
| | $ | 295 | | 7.875%, 2/15/21 | | $ | 383,223 |
| | | 550 | | 7.125%, 2/15/23 | | | 682,816 |
| | | 1,398 | | 6.00%, 2/15/26 | | | 1,580,067 |
| | | 1,025 | | 6.125%, 11/15/27 | | | 1,183,394 |
| | | 150 | | 6.25%, 5/15/30 | | | 177,715 |
| | | 1,174 | | 4.50%, 2/15/36(g) | | | 1,106,861 |
| | | 160 | | 4.75%, 2/15/37 | | | 157,500 |
| | | | | United States Treasury Notes, | | | |
| | | 443 | | 4.875%, 4/30/08 - 8/15/16 | | | 446,607 |
| | | 135 | | 4.00%, 6/15/09 | | | 133,355 |
| | | 5,673 | | 4.625%, 11/15/09 - 2/15/17(g) | | | 5,672,567 |
| | | 26 | | 4.125%, 8/15/10 | | | 25,673 |
| | | 1,100 | | 2.375%, 1/15/17 | | | 1,116,286 |
| | | 1,740 | | United States Treasury Strips, Zero Coupon,
2/15/19 - 5/15/20 | | | 934,266 |
| | | | | | | | |
| | | | | Total U.S. Government treasury securities
(cost $18,311,868) | | | 18,475,613 |
| | | | | | | | |
|
| MUNICIPAL BOND |
| | | | | Illinois State Taxable Pension, GO,
5.10%, 6/01/33 | | | |
| Aa3 | | | 195 | | (cost $167,660) | | | 186,225 |
| | | | | | | | |
| |
| FOREIGN GOVERNMENT OBLIGATIONS 0.3% | | | |
| A+(d) | | | 160 | | Italy Government International Bond (Italy), Notes,
5.375%, 6/15/33 | | | 156,554 |
| Baa1 | | | 265 | | Mexico Government International Bond (Mexico), Notes,
7.50%, 1/14/12 | | | 290,175 |
| Baa1 | | | 434 | | 5.625%, 1/15/17 | | | 437,471 |
| Baa1 | | | 161 | | 8.125%, 12/30/19 | | | 197,628 |
| Aa2 | | | 115 | | Province of Quebec (Canada), Notes,
4.60%, 5/26/15(g) | | | 111,125 |
| Aa2 | | | 390 | | Sr. Unsub. Notes,
5.75%, 2/15/09 | | | 396,373 |
| Baa2 | | | 160 | | Russian Federation (Russia), Unsub. Notes, 144A, Private Placement,
11.00%, 7/24/18 | | | 231,000 |
See Notes to Financial Statements.
| | |
| The Prudential Investment Portfolios, lnc./Dryden Active Allocation Fund | | 59 |
Portfolio of Investments
as of March 31, 2007 (Unaudited) Cont’d.
| | | | | | | | |
Moody’s
Rating
(Unaudited) | | Principal
Amount (000) | | Description | | Value (Note 1) | |
| | | | | | | | |
| Baa1 | | $ 220 | | United Mexican States (Mexico), Notes,
6.75%, 9/27/34(g) | | $ | 239,910 | |
| | | | | | | | |
| | | | Total foreign government obligations
(cost $1,999,488) | | | 2,060,236 | |
| | | | | | | | |
| | | | Total long-term investments
(cost $603,159,678) | | | 684,108,521 | |
| | | | | | | | |
|
| SHORT-TERM INVESTMENTS 19.8% | |
|
| U.S. GOVERNMENT SECURITY 0.1% | |
| | | | United States Treasury Bill Discount,(b)(j)
4.95%, 6/14/07 | | | | |
| | 700 | | (cost $692,928) | | | 693,059 | |
| | | | | | | | |
| | | |
| | | Shares | | | | | |
| |
| AFFILATED MUTUAL FUNDS 19.7% | | | | |
| | 3,566,132 | | Dryden Core Investment Fund—Short Term Bond Series (Note 3)(f) | | | 35,661,316 | |
| | 107,393,094 | | Dryden Core Investment Fund—Taxable Money Market Series (includes $66,164,448 of cash collateral for securities on loan) (Note3)(e)(f) | | | 107,393,094 | |
| | | | | | | | |
| | | | Total affiliated mutual funds
(cost $143,063,996) | | | 143,054,410 | |
| | | | | | | | |
| | | | Total short-term investments
(cost $143,756,924) | | | 143,747,469 | |
| | | | | | | | |
| | | | Total Investments(l) 113.9%
(cost $746,916,602; Note 5) | | | 827,855,990 | |
| | | | Liabilities in excess of
other assets(m) (13.9%) | | | (100,860,109 | ) |
| | | | | | | | |
| | | | Net Assets 100.0% | | $ | 726,995,881 | |
| | | | | | | | |
144A—Security was purchased pursuant to Rule 144A under the Securities Act of 1933 and may not be resold subject to that rule except to qualified institutional buyers. Unless otherwise noted, 144A securities are deemed to liquid.
GO—General Obligation
LLC—Limited Liability Company
MTN— Medium Term Notes
See Notes to Financial Statements.
| | |
| 60 | | Visit our website at www.jennisondryden.com |
NA—National Association
TRAINS—Targeted Return Index Securities
ULC—Unlimited Liability Corporation
| (a) | Non-income producing security. |
| (b) | All or partial amount of security is segregated as initial margin for financial futures transactions. |
| (c) | Principal amount of $38,500,000 represents a to-be announced (“TBA”) mortgage dollar roll. |
| (d) | Standard and Poor’s Rating. |
| (e) | Represents security, or a portion thereof, purchased with cash collateral received for securities on loan. |
| (f) | Prudential Investments LLC, the manager of the Fund, also serves as manager of the Dryden Core Investment Fund— Taxable Money Market Series and the Dryden Core Investment Fund— Dryden Short-Term Bond Series. |
| (g) | Portion of securities on loan with an aggregate market value of $63,544,042; cash collateral of $66,164,448 was received with which the Portfolio purchased highly liquid short-term investments. |
| (h) | Variable rate instrument. |
| (i) | Amount is actual; not rounded to thousands. |
| (j) | Rate quoted represents yield-to-maturity as of purchase date. |
| (k) | Indicates a restricted security; the aggregate cost of such security is $460,000. The aggregate value of $466,900 is approximately 0.1% of net assets. |
| (l) | As of March 31, 2007, 99 securities representing $6,762,975 and 0.9% of the net assets were fair valued in accordance with the policies adopted by the Board of Directors. |
| (m) | Liabilities in excess of other assets include net unrealized appreciation (depreciation) on financial futures contracts, interest rate swap and credit default swap agreements as follows: |
Open futures contracts outstanding at March 31, 2007:
| | | | | | | | | | | | | | |
Number of
Contracts | | Type | | Expiration
Date | | Value at
March 31,
2007 | | Value at
Trade
Date | | Unrealized
Appreciation
(Depreciation) | |
| | Long Positions: | | | | | | | | | | | | |
| 12 | | 2-Yr. U.S. T-Notes | | Jun. 07 | | $ | 2,458,688 | | $ | 2,452,898 | | $ | 5,790 | |
| 25 | | 5-Yr. U.S. T-Notes | | Jun. 07 | | | 2,644,922 | | | 2,639,866 | | | 5,056 | |
| 35 | | U.S. Long Bond | | Jun. 07 | | | 3,893,750 | | | 3,898,280 | | | (4,530 | ) |
| 19 | | S&P 500 Index | | Jun. 07 | | | 6,798,200 | | | 6,756,700 | | | 41,500 | |
| | | | | | | | | | | | | | |
| | | | | | | | | | | | | 47,816 | |
| | | | | | | | | | | | | | |
| | Short Position: | | | | | | | | | | | | |
| 19 | | 10-Yr. U.S. T-Notes | | Jun. 07 | | | 2,054,375 | | | 2,059,898 | | | 5,523 | |
| | | | | | | | | | | | | | |
| | | | | | | | | | | | $ | 53,339 | |
| | | | | | | | | | | | | | |
See Notes to Financial Statements.
| | |
| The Prudential Investment Portfolios, lnc./Dryden Active Allocation Fund | | 61 |
Portfolio of Investments
as of March 31, 2007 (Unaudited) Cont’d.
Interest rate swap agreements outstanding at March 31, 2007:
| | | | | | | | | | | | |
Counterparty | | Termination
Date | | Notional
Amount
(000) | | Fixed
Rate | | Floating
Rate | | Unrealized
(Depreciation) |
Merrill Lynch Capital Services, Inc.* | | 3/30/2009 | | $ | 1,725 | | 4.95% | | 3 month LIBOR | | $ | (1,388) |
Merrill Lynch Capital Services, Inc.* | | 2/28/2017 | | | 750 | | 5.17% | | 3 month LIBOR | | | (334) |
Merrill Lynch Capital Services, Inc.* | | 3/02/2037 | | | 290 | | 5.25% | | 3 month LIBOR | | | (5,967) |
| | | | | | | | | | | | |
| | | | | | | | | | | $ | (7,689) |
| | | | | | | | | | | | |
| * | Portfolio pays the floating rate and receives the fixed rate. |
Credit default swap agreement outstanding at March 31, 2007:
| | | | | | | | | | | | |
Counterparty | | Termination
Date | | Notional
Amount
(000) | | Fixed
Rate | | Underlying
Bond | | Unrealized
(Depreciation) |
Citibank, NA** | | 6/20/2017 | | $ | 400 | | 0.44% | | CVS Corp., | | | |
| | | | | | | | | 4.875%, due 9/15/14 | | $ | (1,382) |
| | | | | | | | | | | | |
| ** | The Portfolio pays the fixed rate and receives from the counterparty par in the event that the underlying bond defaults. |
See Notes to Financial Statements.
| | |
| 62 | | Visit our website at www.jennisondryden.com |
The industry classification of portfolio holdings and liabilities in excess of other assets shown as a percentage of net assets as of March 31, 2007 were as follows:
| | | |
Affiliated Mutual Funds (including 9.1% of collateral received for securities on loan) | | 19.7 | % |
Mortgage Backed Securities | | 11.5 | |
Oil, Gas & Consumable Fuels | | 4.8 | |
Commercial Mortgage Backed Securities | | 3.7 | |
Pharmaceuticals | | 3.5 | |
Diversified Financial Services | | 3.4 | |
Insurance | | 2.8 | |
Capital Markets | | 2.7 | |
Commercial Banks | | 2.7 | |
U.S. Government Treasury Securities | | 2.6 | |
Computers & Peripherals | | 2.4 | |
Software | | 2.3 | |
U.S. Government Agency Obligations | | 2.2 | |
Aerospace & Defense | | 2.2 | |
Media | | 2.0 | |
Health Care Providers & Services | | 1.9 | |
Machinery | | 1.6 | |
Diversified Telecommunication Services | | 1.5 | |
Semiconductors & Semiconductor Equipment | | 1.5 | |
Hotels, Restaurants & Leisure | | 1.4 | |
Asset Backed Securities | | 1.3 | |
Industrial Conglomerates | | 1.3 | |
Real Estate Investment Trusts | | 1.3 | |
Specialty Retail | | 1.3 | |
Beverages | | 1.2 | |
Communications Equipment | | 1.1 | |
Energy Equipment & Services | | 1.1 | |
Food & Staples Retailing | | 1.1 | |
Food Products | | 1.1 | |
Health Care Equipment & Supplies | | 1.1 | |
IT Services | | 1.1 | |
Chemicals | | 1.0 | |
Commercial Services & Supplies | | 1.0 | |
Multiline Retail | | 1.0 | |
Household Products | | 0.9 | |
Banking | | 0.8 | |
Collateralized Mortgage Obligations | | 0.8 | |
Electric Utilities | | 0.8 | |
Electrical Equipment | | 0.8 | |
Independent Power Producers & Energy Traders | | 0.8 | |
Telecommunications | | 0.8 | |
Tobacco | | 0.8 | |
Internet Software & Services | | 0.7 | |
Thrifts & Mortgage Finance | | 0.7 | |
Biotechnology | | 0.6 | |
Construction Materials | | 0.6 | |
See Notes to Financial Statements.
| | |
| The Prudential Investment Portfolios, lnc./Dryden Active Allocation Fund | | 63 |
Portfolio of Investments
as of March 31, 2007 (Unaudited) Cont’d.
| | | |
Electric | | 0.6 | % |
Internet & Catalog Retail | | 0.6 | |
Life Sciences, Tools & Services | | 0.6 | |
Metals & Mining | | 0.6 | |
Textiles, Apparel & Luxury Goods | | 0.6 | |
Wireless Telecommunication Services | | 0.6 | |
Electronic Equipment & Instruments | | 0.5 | |
Multi-Utilities | | 0.5 | |
Brokerage | | 0.4 | |
Consumer Finance | | 0.4 | |
Foods | | 0.4 | |
Health Care & Pharmaceutical | | 0.4 | |
Trading Companies & Distributors | | 0.4 | |
Building Materials & Construction | | 0.3 | |
Capital Goods | | 0.3 | |
Foreign Government Obligations | | 0.3 | |
Household Durables | | 0.3 | |
Leisure Equipment & Products | | 0.3 | |
Non Captive Finance | | 0.3 | |
Office Electronics | | 0.3 | |
Pipelines & Other | | 0.3 | |
Technology | | 0.3 | |
Air Freight & Logistics | | 0.2 | |
Auto Components | | 0.2 | |
Automobiles | | 0.2 | |
Cable | | 0.2 | |
Diversified Consumer Services | | 0.2 | |
Energy—Integrated | | 0.2 | |
Health Care Insurance | | 0.2 | |
Media & Entertainment | | 0.2 | |
Real Estate Management & Development | | 0.2 | |
Airlines | | 0.1 | |
Automotive | | 0.1 | |
Building Products | | 0.1 | |
Consumer | | 0.1 | |
Containers & Packaging | | 0.1 | |
Energy—Other | | 0.1 | |
Gas Utilities | | 0.1 | |
Lodging | | 0.1 | |
Metals | | 0.1 | |
Non-Corporate | | 0.1 | |
Railroads | | 0.1 | |
Retail | | 0.1 | |
Road & Rail | | 0.1 | |
| | | |
| | 113.9 | |
Liabilities in excess of other assets | | (13.9 | ) |
| | | |
| | 100.0 | % |
| | | |
See Notes to Financial Statements.
| | |
| 64 | | Visit our website at www.jennisondryden.com |
Financial Statements
(Unaudited)
| | |
| MARCH 31, 2007 | | SEMIANNUAL REPORT |
Dryden Active Allocation Fund
Statement of Assets and Liabilities
as of March 31, 2007 (Unaudited)
| | | |
Assets | | | |
Investments at value, including securities on loan of $63,544,042 | | | |
Unaffiliated Investments (cost $603,852,606) | | $ | 684,801,580 |
Affiliated Investments (cost $143,063,996) | | | 143,054,410 |
Cash | | | 4,094,655 |
Foreign currency, at value (cost $17,302) | | | 17,500 |
Receivable for investments sold | | | 44,084,273 |
Dividends and interest receivable | | | 2,337,507 |
Receivable for Series shares sold | | | 730,274 |
Foreign tax reclaim receivable | | | 21,583 |
Prepaid expenses | | | 6,845 |
| | | |
Total assets | | | 879,148,627 |
| | | |
| |
Liabilities | | | |
Payable for investments purchased | | | 83,263,510 |
Payable to broker for collateral for securities on loan | | | 66,164,448 |
Payable for Series shares reacquired | | | 1,591,787 |
Accrued expenses and other liabilities | | | 475,093 |
Management fee payable | | | 366,078 |
Distribution fee payable | | | 154,436 |
Transfer agent fee payable | | | 109,000 |
Due to broker—variation margin | | | 15,741 |
Unrealized depreciation on swaps | | | 9,071 |
Deferred directors’ fees | | | 3,582 |
| | | |
Total liabilities | | | 152,152,746 |
| | | |
| |
Net Assets | | $ | 726,995,881 |
| | | |
| | | | |
Net assets were comprised of: | | | |
Common stock, at par | | $ | 51,821 |
Paid-in capital in excess of par | | | 635,721,620 |
| | | |
| | | 635,773,441 |
Undistributed net investment income | | | 4,135,306 |
Accumulated net realized gain on investments and foreign currency transactions | | | 16,396,237 |
Net unrealized appreciation on investments and foreign currencies | | | 70,690,897 |
| | | |
Net assets, March 31, 2007 | | $ | 726,995,881 |
| | | |
See Notes to Financial Statements.
| | |
| 66 | | Visit our website at www.jennisondryden.com |
| | | |
Class A | | | |
Net asset value and redemption price per share
($434,195,283 ÷ 30,984,172 shares of common stock issued and outstanding) | | $ | 14.01 |
Maximum sales charge (5.50% of offering price) | | | .82 |
| | | |
Maximum offering price to public | | $ | 14.83 |
| | | |
| |
Class B | | | |
Net asset value, offering price and redemption price per share
($49,446,960 ÷ 3,528,286 shares of common stock issued and outstanding) | | $ | 14.01 |
| | | |
| |
Class C | | | |
Net asset value, offering price and redemption price per share
($25,344,357 ÷ 1,808,254 shares of common stock issued and outstanding) | | $ | 14.02 |
| | | |
| |
Class L | | | |
Net asset value, offering price and redemption price per share
($11,448,936 ÷ 815,979 shares of common stock issued and outstanding) | | $ | 14.03 |
| | | |
| |
Class M | | | |
Net asset value, offering price and redemption price per share
($34,521,196 ÷ 2,463,160 shares of common stock issued and outstanding) | | $ | 14.02 |
| | | |
| |
Class R | | | |
Net asset value, offering price and redemption price per share
($1,119,309 ÷ 79,775 shares of common stock issued and outstanding) | | $ | 14.03 |
| | | |
| |
Class X | | | |
Net asset value, offering price and redemption price per share
($8,410,598 ÷ 600,134 shares of common stock issued and outstanding) | | $ | 14.01 |
| | | |
| |
Class Z | | | |
Net asset value, offering price and redemption price per share
($162,509,242 ÷ 11,541,327 shares of common stock issued and outstanding) | | $ | 14.08 |
| | | |
See Notes to Financial Statements.
| | |
| The Prudential Investment Portfolios, lnc./Dryden Active Allocation Fund | | 67 |
Statement of Operations
Six Months Ended March 31, 2007 (Unaudited)
| | | | |
Net Investment Income | | | | |
Income | | | | |
Unaffiliated interest income | | $ | 4,627,444 | |
Unaffiliated dividend income (net of foreign withholding taxes of $11,588) | | | 3,985,134 | |
Affiliated dividend income | | | 1,949,314 | |
Affiliated income from securities loaned, net | | | 53,519 | |
| | | | |
Total income | | | 10,615,411 | |
| | | | |
| |
Expenses | | | | |
Management fee | | | 2,117,356 | |
Distribution fee—Class A | | | 525,032 | |
Distribution fee—Class B | | | 255,637 | |
Distribution fee—Class C | | | 71,086 | |
Distribution fee—Class L | | | 1,267 | |
Distribution fee—Class M | | | 7,629 | |
Distribution fee—Class R | | | 2,678 | |
Distribution fee—Class X | | | 1,843 | |
Transfer agent’s fees and expenses (including affiliated expense of $332,000) | | | 384,000 | |
Custodian’s fees and expenses | | | 100,000 | |
Reports to shareholders | | | 50,000 | |
Registration fees | | | 35,000 | |
Legal fees and expenses | | | 15,000 | |
Audit fee | | | 11,000 | |
Directors’ fees | | | 11,000 | |
Insurance | | | 10,000 | |
Miscellaneous | | | 10,391 | |
| | | | |
Total expenses | | | 3,608,919 | |
| | | | |
Net investment income | | | 7,006,492 | |
| | | | |
| |
Realized And Unrealized Gain (Loss) On Investments And Foreign Currencies | | | | |
Net realized gain (loss) on: | | | | |
Investment transactions | | | 21,451,698 | |
Foreign currency transactions | | | 9,960 | |
Financial futures transactions | | | (67,071 | ) |
Options written transactions | | | 9,228 | |
Swap transactions | | | 58,605 | |
| | | | |
| | | 21,462,420 | |
| | | | |
Net change in unrealized appreciation (depreciation) on: | | | | |
Investments | | | 13,533,653 | |
Foreign currencies | | | 2,636 | |
Financial futures contracts | | | (89,173 | ) |
Swaps | | | (9,629 | ) |
| | | | |
| | | 13,437,487 | |
| | | | |
Net gain on investments and foreign currencies | | | 34,899,907 | |
| | | | |
Net Increase In Net Assets Resulting From Operations | | $ | 41,906,399 | |
| | | | |
See Notes to Financial Statements.
| | |
| 68 | | Visit our website at www.jennisondryden.com |
Statement of Changes in Net Assets
(Unaudited)
| | | | | | | | |
| | | Six Months Ended March 31, 2007 | | | Year Ended September 30, 2006 | |
Increase (Decrease) In Net Assets | | | | | | | | |
Operations | | | | | | | | |
Net investment income | | $ | 7,006,492 | | | $ | 13,368,666 | |
Net realized gain on investments and foreign currency transactions | | | 21,462,420 | | | | 34,507,999 | |
Net change in unrealized appreciation (depreciation) on investments and foreign currencies | | | 13,437,487 | | | | 2,336,351 | |
| | | | | | | | |
Net increase in net assets resulting from operations | | | 41,906,399 | | | | 50,213,016 | |
| | | | | | | | |
Dividends and distributions (Note 1) | | | | | | | | |
Dividends from net investment income | | | | | | | | |
Class A | | | (8,672,700 | ) | | | (6,532,470 | ) |
Class B | | | (714,612 | ) | | | (570,979 | ) |
Class C | | | (185,286 | ) | | | (108,450 | ) |
Class R | | | (19,394 | ) | | | (34 | ) |
Class Z | | | (3,750,124 | ) | | | (3,092,429 | ) |
| | | | | | | | |
| | | (13,342,116 | ) | | | (10,304,362 | ) |
| | | | | | | | |
Distributions from net realized gains | | | | | | | | |
Class A | | | (22,380,205 | ) | | | (20,133,621 | ) |
Class B | | | (2,894,977 | ) | | | (3,512,317 | ) |
Class C | | | (750,616 | ) | | | (651,364 | ) |
Class R | | | (56,985 | ) | | | (125 | ) |
Class Z | | | (8,627,020 | ) | | | (8,207,672 | ) |
| | | | | | | | |
| | | (34,709,803 | ) | | | (32,505,099 | ) |
| | | | | | | | |
| | |
Series share transactions (Net of share conversions) (Note 6) | | | | | | | | |
Net proceeds from shares sold | | | 27,743,956 | | | | 42,587,895 | |
Net asset value of shares issued in connection with merger (Note 8) | | | 84,406,026 | | | | — | |
Net asset value of shares issued in reinvestment of dividends | | | 45,972,275 | | | | 40,940,668 | |
Cost of shares reacquired | | | (72,019,229 | ) | | | (128,908,871 | ) |
| | | | | | | | |
Net increase (decrease) in net assets from Series share transactions | | | 86,103,028 | | | | (45,380,308 | ) |
| | | | | | | | |
Total increase (decrease) | | | 79,957,508 | | | | (37,976,753 | ) |
| | |
Net Assets | | | | | | | | |
Beginning of period | | | 647,038,373 | | | | 685,015,126 | |
| | | | | | | | |
End of period(a) | | $ | 726,995,881 | | | $ | 647,038,373 | |
| | | | | | | | |
(a) Includes undistributed net investment income of: | | $ | 4,135,306 | | | $ | 10,470,930 | |
| | | | | | | | |
See Notes to Financial Statements.
| | |
| The Prudential Investment Portfolios, lnc./Dryden Active Allocation Fund | | 69 |
Notes to Financial Statements
(Unaudited)
The Prudential Investment Portfolios, Inc. (the “Fund”) is registered under the Investment Company Act of 1940 as an open-end management investment company. The Fund was incorporated in Maryland on August 10, 1995 and consists of six series: Dryden Active Allocation Fund (the “Series”), Jennison Growth Fund, and Jennison Equity Opportunity Fund which are diversified funds and JennisonDryden Growth Allocation Fund, JennisonDryden Moderate Allocation Fund and JennisonDryden Conservative Allocation Fund which are non-diversified funds. These financial statements relate to Dryden Active Allocation Fund. The financial statements of the other series are not presented herein. The Series commenced investment operations on November 7, 1996.
The Series’ investment objective is to seek income and long-term growth of capital by investing in a portfolio of equity, fixed-income and money market securities which is actively managed to capitalize on opportunities created by perceived misvaluation.
Note 1. Accounting Policies
The following is a summary of significant accounting policies followed by the Fund and the Series, in the preparation of its financial statements.
Securities Valuation: Securities listed on a securities exchange (other than options on securities and indices) are valued at the last sale price on such exchange on the day of valuation or, if there was no sale on such day, at the mean between the last reported bid and asked prices, or at the last bid price on such day in the absence of an asked price. Securities traded via Nasdaq are valued at the Nasdaq official closing price (“NOCP”) on the day of valuation, or if there was no NOCP, at the last sale price. Securities that are actively traded in the over-the-counter market, including listed securities for which the primary market is believed by Prudential Investments LLC (“PI” or “Manager”), in consultation with the subadviser, to be over-the-counter, are valued at market value using prices provided by an independent pricing agent or principal market maker. Options on securities and indices traded on an exchange are valued at their last sale price as of the close of trading on the applicable exchange or, if there was no sale, at the mean between the most recently quoted bid and asked prices on such exchange. Futures contracts and options thereon traded on a commodities exchange or board of trade are valued at the last sale price at the close of trading on such exchange or board of trade or, if there was no sale on the applicable commodities exchange or board of trade on such day, at the mean between the most recently quoted bid and asked prices on such exchange or board of
| | |
| 70 | | Visit our website at www.jennisondryden.com |
trade or at the last bid price in the absence of an asked price. Prices may be obtained from independent pricing services which use information provided by market makers or estimates of market values obtained from yield data relating to investments or securities with similar characteristics. Securities for which reliable market quotations are not readily available, or whose values have been affected by events occurring after the close of the security’s foreign market and before the Fund’s normal pricing time, are valued at fair value in accordance with the Board of Director’s approved fair valuation procedures. When determining the fair valuation of securities some of the factors influencing the valuation include, the nature of any restrictions on disposition of the securities; assessment of the general liquidity of the securities; the issuer’s financial condition and the markets in which it does business; the cost of the investment; the size of the holding and the capitalization of issuer; the prices of any recent transactions or bids/offers for such securities or any comparable securities; any available analyst media or other reports or information deemed reliable by the investment adviser regarding the issuer or the markets or industry in which it operates. Using fair value to price securities may result in a value that is different from a security’s most recent closing price and from the price used by other mutual funds to calculate their net asset values.
Investments in mutual funds are valued at their net asset value as of the close of the New York Stock Exchange on the date of valuation.
Short-term securities which mature in sixty days or less are valued at amortized cost, which approximates market-value. The amortized cost method involves valuing a security at its cost on the date of purchase and thereafter assuming a constant amortization to maturity of the difference between the principal amount due at maturity and cost. Short-term securities which mature in more than sixty days are valued at current market quotations.
Foreign Currency Translation: The books and records of the Series are maintained in U.S. dollars. Foreign currency amounts are translated into U.S. dollars on the following basis:
(i) market value of investment securities, other assets and liabilities-at the current rate of exchange;
(ii) purchases and sales of investment securities, income and expenses-at the rate of exchange prevailing on the respective dates of such transactions.
Although the net assets of the Series are presented at the foreign exchange rates and market values at the close of the fiscal year, the Series does not isolate that portion of the results of operations arising as a result of changes in the foreign exchange rates
| | |
| The Prudential Investment Portfolios, lnc./Dryden Active Allocation Fund | | 71 |
Notes to Financial Statements
(Unaudited) Cont’d
from the fluctuations arising from changes in the market prices of long-term portfolio securities held at fiscal year end. Similarly, the Series does not isolate the effect of changes in foreign exchange rates from the fluctuations arising from changes in the market prices of long-term portfolio securities sold during the fiscal year. Accordingly, these realized foreign currency gains or losses are included in the reported net realized gains or losses on investment transactions.
Net realized gains or losses on foreign currency transactions represent net foreign exchange gains or losses from holdings of foreign currencies, currency gains or losses realized between the trade and settlement dates of security transactions, and the difference between the amounts of dividends, interest and foreign withholding taxes recorded on the Series’ books and the U.S. dollar equivalent amounts actually received or paid. Net unrealized currency gains or losses from valuing foreign currency denominated assets and liabilities (other than investments) at year-end exchange rates are reflected as a component of unrealized appreciation (depreciation) on investments and foreign currencies.
Foreign security and currency transactions may involve certain considerations and risks not typically associated with those of domestic origin as a result of, among other factors, the possibility of political and economic instability or the level of governmental supervision and regulation of foreign securities markets.
Financial Futures Contracts: A financial futures contract is an agreement to purchase (long) or sell (short) an agreed amount of securities at a set price for delivery on a future date. Upon entering into a financial futures contract, the Series is required to pledge to the broker an amount of cash and/or other assets equal to a certain percentage of the contract amount. This amount is known as the “initial margin.” Subsequent payments, known as “variation margin,” are made or received by the Series each day, depending on the daily fluctuations in the value of the underlying security. Such variation margin is recorded for financial statement purposes on a daily basis as unrealized gain or loss. When the contract expires or is closed, the gain or loss is realized and is presented in the Statement of Operations as net realized gain or loss on financial futures transactions.
The Series invests in financial futures contracts in order to hedge its existing portfolio securities, or securities the Series intends to purchase, against fluctuations in value caused by changes in prevailing interest rates or market conditions. Should interest rates move unexpectedly, the Series may not achieve the anticipated benefits of the
| | |
| 72 | | Visit our website at www.jennisondryden.com |
financial futures contracts and may realize a loss. The use of futures transactions involves the risk of imperfect correlation in movements in the price of futures contracts, interest rates and the underlying hedged assets.
Financial futures contracts involve elements of both market and credit risk in excess of the amounts reflected on the Statement of Assets and Liabilities.
Options: The Series may either purchase or write options in order to hedge against adverse market movements or fluctuations in value caused by changes in prevailing interest rates or foreign currency exchange rates with respect to securities or currencies which the Fund currently owns or intends to purchase.
The Series’ principal reason for writing options is to realize, through receipt of premiums, greater current return than would be realized on the underlying security alone. When the Series purchases an option, it pays a premium and an amount equal to that premium is recorded as an asset. When the Series writes an option, it receives a premium and an amount equal to that premium is recorded as a liability. The asset or liability is adjusted daily to reflect the current market value of the options.
If an option expires unexercised, the Series realizes a gain or loss to the extent of the premium received or paid. If an option is exercised, the premium received or paid is recorded as an adjustment to the proceeds from the sale or the cost of the purchase in determining whether the Series has realized a gain or loss. The difference between the premium and the amount received or paid on effecting a closing purchase or sale transaction is also treated as a realized gain or loss. Gain or loss on purchased options is included in net realized gain or loss on investment transactions. Gain or loss on written options is presented separately as net realized gain or loss on written options transactions.
The Series, as a writer of an option, has no control over whether the underlying securities or currencies may be sold (called) or purchased (put). As a result, the Series bears the market risk of an unfavorable change in the price of the security or currency underlying the written option. The Series, as purchaser of an option, bears the risk of the potential inability of the counterparties to meet the terms of their contracts.
Forward Currency Contracts: A forward currency contract is a commitment to purchase or sell a foreign currency at a future date at a negotiated forward rate. The Series enters into forward currency contracts in order to hedge its exposure to changes in foreign currency exchange rates on its foreign portfolio holdings or on specific receivables and payables denominated in a foreign currency. The contracts are valued daily at current forward exchange rates and any unrealized gain or loss is
| | |
| The Prudential Investment Portfolios, lnc./Dryden Active Allocation Fund | | 73 |
Notes to Financial Statements
(Unaudited) Cont’d
included in net unrealized appreciation or depreciation on foreign currencies. Gain or loss is realized on the settlement date of the contract equal to the difference between the trade date and settlement value. This gain or loss, if any, is included in net realized gain or loss on foreign currency transactions. Risks may arise upon entering into these contracts from the potential inability of the counterparties to meet the terms of their contracts.
Swaps: The Series may enter into swap agreements. A swap is an agreement to exchange the return generated by one instrument for the return generated by another instrument. The Series enters into interest rate swap agreements to manage its exposure to interest rates. Interest rate swap agreements involve the exchange by the Series with another party of their respective commitments to pay or receive interest and may involve payment/receipt of a premium at the time of initiation of the swap agreement. The Series’ swap agreements involve commitments to pay interest in exchange for a market-linked return, both based on notional amounts. To the extent the total return of the security or index underlying the transaction exceeds or falls short of the offsetting interest rate obligation, the Series will receive a payment from or make a payment to the counterparty. The swaps are valued daily at current market value and any unrealized gain or loss is included in the Statement of Assets and Liabilities. Gain or loss is realized on the termination date of the swap and is equal to the difference between the Series’ cost basis in the swap and the proceeds of the closing transaction, including any fees.
During the period that the swap agreement is open, the Series may be subject to risk from the potential inability of the counterparty to meet the terms of the agreement.
Risk: Forward currency contracts, written options, financial futures contracts, and swap agreements involve elements of both market and credit risk in excess of the amounts reflected on the Statements of Assets and Liabilities. Lower rated or unrated securities are more likely to react to developments affecting market risk (general market liquidity) and credit risk (an issuer’s inability to meet principal and interest payments on its obligations) than are more highly rated securities, which react primarily to movements in the general level of interest rates. The ability of issuers of debt securities held by the Series to meet their obligations may be affected by economic developments in a specific industry or region.
Dollar Rolls: The Series may enter into mortgage dollar rolls in which the Series sells mortgage-backed securities for delivery in the current month and simultaneously
| | |
| 74 | | Visit our website at www.jennisondryden.com |
contracts to repurchase substantially similar (same type, coupon and maturity) securities on a specified future date. During the roll period, the Series forgoes principal and interest paid on the securities. The Series’ policy is to record the components of dollar rolls as purchase and sale transactions. The Series had dollar rolls outstanding as of March 31, 2007, which are included in Receivable for Investments Sold and Payable for Investments Purchased in the Statement of Assets and Liabilities. The Series maintains a segregated account of U.S. government securities or other liquid assets, the dollar value of which is at least equal to its obligation with respect to dollar rolls.
The Series is subject to the risk that the market value of the securities the Series is obligated to repurchase under the agreement may decline below the repurchase price.
Securities Lending: The Series may lend its portfolio securities to broker-dealers. The loans are secured by collateral at least equal, at all times, to the market value of the securities loaned. Loans are subject to termination at the option of the borrower or the Series. Upon termination of the loan, the borrower will return to the lender securities identical to the loaned securities. Should the borrower of the securities fail financially, the Series has the right to repurchase the securities using the collateral in the open market. The Series recognizes income, net of any rebate and securities lending agent fees, for lending its securities in the form of fees or interest on the investment of any cash received as collateral. The Series also continues to receive interest and dividends or amounts equivalent thereto, on the securities loaned and recognizes any unrealized gain or loss in the market price of the securities loaned that may occur during the term of the loan.
When-Issued/Delayed Delivery Securities: Securities purchased or sold on a when-issued or delayed-delivery basis may be settled a month or more after trade date; interest income is not accrued until settlement date. At the time a Portfolio enters into such transactions, it instructs the custodian to segregate assets with a current value at least equal to the amount of its when-issued or delayed-delivery purchase commitments.
Securities Transactions and Net Investment Income: Securities transactions are recorded on the trade date. Realized gains or losses on sales of investments are calculated on the identified cost basis. Interest income, including amortization of premium and accretion of discount on debt securities, as required, is recorded on an accrual basis. Dividend income is recorded on the ex-dividend date. Expenses are recorded on the accrual basis.
| | |
| The Prudential Investment Portfolios, lnc./Dryden Active Allocation Fund | | 75 |
Notes to Financial Statements
(Unaudited) Cont’d
Net Investment income or loss (other than distribution fees which are charged directly to the respective class) and unrealized and realized gains or losses are allocated daily to each class of shares based upon the relative proportion of net assets of each class at the beginning of the day.
Dividends and Distributions: The Series expects to pay dividends of net investment income and distributions of net realized capital gains, if any, annually. Dividends and distributions to shareholders, which are determined in accordance with federal income tax regulations and which may differ from generally accepted accounting principles, are recorded on the ex-dividend date. Permanent book/tax differences relating to income and gains are reclassified amongst undistributed net investment income, accumulated net realized gain or loss and paid-in capital in excess of par, as appropriate.
Taxes: For federal income tax purposes, each Series in the Fund is treated as a separate taxpaying entity. It is the Series’ policy to continue to meet the requirements of the Internal Revenue Code applicable to regulated investment companies and to distribute all of its net investment income and capital gains, if any, to its shareholders. Therefore, no federal income tax provision is required.
Withholding taxes on foreign dividends are recorded net of reclaimable amounts, at the time the related income is earned.
Estimates: The preparation of the financial statements requires management to make estimates and assumptions that affect the reported amounts and disclosures in the financial statements. Actual results could differ from those estimates.
Note 2. Agreements
The Fund has a management agreement for the Series with PI. Pursuant to this agreement, PI has responsibility for all investment advisory services and supervises the subadvisor’s performance of such services. PI has entered into a subadvisory agreement with Prudential Investment Management, Inc. (“PIM”). The subadvisory agreement provides that PIM furnishes investment advisory services in connection with the management of the Series. In connection therewith, PIM is obligated to keep certain books and records of the Series. PI pays for the services of PIM, the compensation of officers of the Series, occupancy and certain clerical and bookkeeping costs of the Series. The Series bears all other costs and expenses.
| | |
| 76 | | Visit our website at www.jennisondryden.com |
The management fee paid to PI is computed daily and payable monthly at an annual rate of .65 of 1% of the Series’ daily average net assets up to $1 billion and .60 of 1% of the average net assets of the Series in excess of $1 billion. The effective management fee rate was .65 of 1% for the six months ended March 31, 2007.
The Series has a distribution agreement with Prudential Investment Management Services LLC (“PIMS”), which acts as the distributor of the Class A, Class B, Class C, Class L, Class M, Class R, Class X and Class Z shares of the Series. The Series compensates PIMS for distributing and servicing the Series’ Class A, Class B, Class C, Class L, Class M, Class R and Class X shares, pursuant to plans of distribution (the “Class A, B, C, L, M, R and X Plans”), regardless of expenses actually incurred by PIMS. The distribution fees are accrued daily and payable monthly. No distribution or service fees are paid to PIMS as distributor of the Class Z shares of the Series.
Pursuant to the Class A, B, C, L, M, R and X Plans, the Series compensates PIMS for distribution-related activities at an annual rate of up to ..30 of 1%, 1%, 1%, .50 of 1%, 1%, .75 of 1% and 1% of the average daily net assets of the Class A, B, C, L, M, R and X shares, respectively. For the six months ended March 31, 2007, PIMS contractually agreed to limit such fees to .25 of 1% and .50% of 1% of the average daily net assets of the Class A shares and Class R shares, respectively.
PIMS has advised the Series that it received approximately $104,800 in front-end sales charges resulting from sales of Class A shares during the six months ended March 31, 2007. From these fees, PIMS paid such sales charges to dealers, which in turn paid commissions to salespersons and incurred other distribution costs.
PIMS has advised the Series that for the six months ended March 31, 2007, it received approximately $28,100 and $200 in contingent deferred sales charges imposed upon certain redemptions by Class B and Class C shareholders, respectively.
PI, PIM and PIMS are indirect, wholly-owned subsidiaries of Prudential Financial, Inc. (“Prudential”).
The Series, along with other affiliated registered investment companies (the “Funds”), is a party to a syndicated credit agreement (“SCA”) with two banks. The SCA provides for a commitment of $500 million. Interest on any borrowings under the SCA is incurred at contracted market rates and a commitment fee for the unused amount is accrued daily and paid quarterly. Effective October 27, 2006, the Funds renewed SCA with the banks. The commitment under the renewed SCA continues to be $500 million. The Funds pay a commitment fee of .07 of 1% of the unused portion of the renewed SCA. The expiration date of the renewed SCA will be October 26, 2007. For
| | |
| The Prudential Investment Portfolios, lnc./Dryden Active Allocation Fund | | 77 |
Notes to Financial Statements
(Unaudited) Cont’d
the period from October 29, 2005 through October 26, 2006, the Funds paid a commitment fee of .0725 of 1% of the unused portion of the agreement. The purpose of the SCA is to provide an alternative source of temporary funding for capital share redemptions. The Series did not borrow any amounts pursuant to the SCA during the six months ended March 31, 2007.
Note 3. Other Transactions With Affiliates
Prudential Mutual Fund Services LLC (“PMFS”), an affiliate of PI and an indirect, wholly-owned subsidiary of Prudential, serves as the Fund’s transfer agent. Transfer agent fees and expenses in the Statement of Operations include certain out-of-pocket expenses paid to non-affiliates, where applicable.
The Series pays networking fees to affiliated and unaffiliated broker/dealers. These networking fees are payments made to broker/dealers that clear mutual fund transactions through a national clearing system. For the six months ended March 31, 2007, the Series incurred approximately $47,700 in total networking fees. These amounts are included in transfer agent’s fees and expenses in the Statement of Operations.
PIM is the securities lending agent for the Series. For the six months ended March 31, 2007, PIM has been compensated by the Series approximately $22,900 for these services.
The Series invests in the Taxable Money Market Series and Short-Term Bond Series (the “Portfolios”), portfolios of Dryden Core Investment Fund, pursuant to an exemptive order received from the Securities and Exchange Commission. The Portfolios are a money market mutual fund and short term bond fund, respectively, registered under the Investment Company Act of 1940, as amended, and managed by PI.
Note 4. Portfolio Securities
Purchases and sales of investment securities other than short-term investments and U.S. Government Securities, for the six months ended March 31, 2007 were $177,897,658 and $230,441,086 respectively.
| | |
| 78 | | Visit our website at www.jennisondryden.com |
Transactions in options written during the six months ended March 31, 2007 were as follows:
| | | | | | | |
| | | Number of
Contracts | | | Premiums | |
Balance as of September 30, 2006 | | — | | | $ | — | |
Options written | | 12 | | | | 10,379 | |
Options closed | | (12 | ) | | | (10,379 | ) |
| | | | | | | |
Balance as of March 31, 2007 | | — | | | $ | — | |
| | | | | | | |
The amount of dollar rolls outstanding at March 31, 2007 was $38,149,227 (principal $38,500,000), which was 5.2% of total net assets.
Note 5. Tax Information
The United States federal income tax basis of the Series’ investments and the net unrealized appreciation as of March 31, 2007 were as follows:
| | | | | | | | | | |
Tax Basis
of Investments | | Gross
Appreciation | | Gross
(Depreciation) | | Net Unrealized
Appreciation | | Other
Cost Basis
Adjustments | | Total Net
Unrealized
Appreciation |
| $748,990,702 | | $86,332,525 | | $(7,467,237) | | $78,865,288 | | $1,893 | | $78,867,181 |
The difference between book basis and tax basis was attributable to deferred losses on wash sales. The other cost basis adjustments are primarily attributable to appreciation (depreciation) of foreign currency and mark to market of receivables and payables.
The Fund has elected to treat net currency losses of approximately $9,100 incurred between November 1, 2005 and September 30, 2006 as being incurred during the fiscal year ending September 30, 2007.
Note 6. Capital
The Series offers Class A, Class B, Class C, Class L, Class M, Class R, Class X and Class Z shares. Class A and Class L shares are sold with a front-end sales charge of up to 5.50% and 5.75%, respectively. All investors who purchase Class A or Class L shares in an amount of $1 million or more are not subject to a front-end sales charge but are subject to a contingent deferred sales charge (CDSC) of 1% if they sell these shares within 12 months of purchase, including investors who purchase their shares through broker-dealers affiliated with Prudential. Class B shares are sold with a CDSC
| | |
| The Prudential Investment Portfolios, lnc./Dryden Active Allocation Fund | | 79 |
Notes to Financial Statements
(Unaudited) Cont’d
which declines from 5% to zero depending on the period of time the shares are held. Class M and Class X shares are sold with a CDSC which declines from 6% to zero depending on the period of time the shares are held. Class C shares have a CDSC of 1% during the first 12 months. Class B shares will automatically convert to Class A shares on a quarterly basis approximately seven years after purchase. A special exchange privilege is also available for shareholders who qualified to purchase Class A shares at net asset value. Class M shares will automatically convert to Class A shares approximately eight years after purchase. Class L shares are closed to most new purchases (with the exception of reinvested dividends). Class L and Class M shares are only exchangeable with Class L and Class M shares, respectively, offered by certain other Strategic Partners Funds. Class X shares are closed to new purchases. Class R and Class Z shares are not subject to any sales or redemption charge and are offered exclusively for sale to a limited group of investors.
There are 1 billion shares of $.001 par value common stock of the Series, designated Class A, Class B, Class C, Class L, Class M, Class R, Class X and Class Z, each of which consists of 200 million, 125 million, 125 million, 125 million, 125 million, 75 million, 150 million, and 75 million authorized shares, respectively. As of March 31, 2007, Prudential owned 197 Class R shares of the Series.
Transactions in shares of common stock were as follows:
| | | | | | | |
Class A | | Shares | | | Amount | |
Six months ended March 31, 2007: | | | | | | | |
Shares sold | | 628,288 | | | $ | 8,881,449 | |
Shares issued in connection with the merger | | 1,063,641 | | | | 15,019,303 | |
Shares issued in reinvestment of dividends | | 2,129,541 | | | | 29,366,366 | |
Shares reacquired | | (2,701,730 | ) | | | (38,248,148 | ) |
| | | | | | | |
Net increase (decrease) in shares outstanding before conversion | | 1,119,740 | | | | 15,018,970 | |
Shares issued upon conversion from Class B | | 533,053 | | | | 7,355,205 | |
| | | | | | | |
Net increase (decrease) in shares outstanding | | 1,652,793 | | | $ | 22,374,175 | |
| | | | | | | |
Year ended September 30, 2006: | | | | | | | |
Shares sold | | 1,207,306 | | | $ | 16,530,272 | |
Shares issued in reinvestment of dividends | | 1,871,525 | | | | 25,115,868 | |
Shares reacquired | | (5,317,814 | ) | | | (72,756,694 | ) |
| | | | | | | |
Net increase (decrease) in shares outstanding before conversion | | (2,238,983 | ) | | | (31,110,554 | ) |
Shares issued upon conversion from Class B | | 1,262,933 | | | | 17,123,600 | |
| | | | | | | |
Net increase (decrease) in shares outstanding | | (976,050 | ) | | $ | (13,986,954 | ) |
| | | | | | | |
| | |
| 80 | | Visit our website at www.jennisondryden.com |
| | | | | | | |
Class B | | Shares | | | Amount | |
Six months ended March 31, 2007: | | | | | | | |
Shares sold | | 166,856 | | | $ | 2,348,221 | |
Shares issued in connection with the merger | | 218,100 | | | | 3,080,504 | |
Shares issued in reinvestment of dividends | | 251,856 | | | | 3,480,652 | |
Shares reacquired | | (303,605 | ) | | | (4,283,139 | ) |
| | | | | | | |
Net increase (decrease) in shares outstanding before conversion | | 333,207 | | | | 4,626,238 | |
Shares reacquired upon conversion into Class A | | (532,412 | ) | | | (7,355,205 | ) |
| | | | | | | |
Net increase (decrease) in shares outstanding | | (199,205 | ) | | $ | (2,728,967 | ) |
| | | | | | | |
Year ended September 30, 2006: | | | | | | | |
Shares sold | | 298,838 | | | $ | 4,089,717 | |
Shares issued in reinvestment of dividends | | 292,092 | | | | 3,931,553 | |
Shares reacquired | | (906,248 | ) | | | (12,384,879 | ) |
| | | | | | | |
Net increase (decrease) in shares outstanding before conversion | | (315,318 | ) | | | (4,363,609 | ) |
Shares reacquired upon conversion into Class A | | (1,262,994 | ) | | | (17,123,600 | ) |
| | | | | | | |
Net increase (decrease) in shares outstanding | | (1,578,312 | ) | | $ | (21,487,209 | ) |
| | | | | | | |
Class C | | | | | | |
Six months ended March 31, 2007: | | | | | | | |
Shares sold | | 144,916 | | | $ | 2,052,420 | |
Shares issued in connection with the merger | | 806,919 | | | | 11,388,083 | |
Shares issued in reinvestment of dividends | | 50,106 | | | | 692,464 | |
Shares reacquired | | (135,194 | ) | | | (1,894,704 | ) |
| | | | | | | |
Net increase (decrease) in shares outstanding | | 866,747 | | | $ | 12,238,263 | |
| | | | | | | |
Year ended September 30, 2006: | | | | | | | |
Shares sold | | 179,302 | | | $ | 2,445,244 | |
Shares issued in reinvestment of dividends | | 44,408 | | | | 597,728 | |
Shares reacquired | | (250,211 | ) | | | (3,435,760 | ) |
| | | | | | | |
Net increase (decrease) in shares outstanding | | (26,501 | ) | | $ | (392,788 | ) |
| | | | | | | |
Class L | | | | | | |
Period ended March 31, 2007*: | | | | | | | |
Shares sold | | — | | | $ | — | |
Shares issued in connection with the merger | | 819,224 | | | | 11,575,641 | |
Shares reacquired | | (3,245 | ) | | | (45,552 | ) |
| | | | | | | |
Net increase (decrease) in shares outstanding | | 815,979 | | | $ | 11,530,089 | |
| | | | | | | |
Class M | | | | | | |
Period ended March 31, 2007*: | | | | | | | |
Shares sold | | 696 | | | $ | 6,701 | |
Shares issued in connection with the merger | | 2,471,235 | | | | 34,896,956 | |
Shares reacquired | | (8,771 | ) | | | (121,888 | ) |
| | | | | | | |
Net increase (decrease) in shares outstanding | | 2,463,160 | | | $ | 34,781,769 | |
| | | | | | | |
| | |
| The Prudential Investment Portfolios, lnc./Dryden Active Allocation Fund | | 81 |
Notes to Financial Statements
(Unaudited) Cont’d
| | | | | | | |
Class R | | Shares | | | Amount | |
Six months ended March 31, 2007: | | | | | | | |
Shares sold | | 4,515 | | | $ | 63,257 | |
Shares issued in reinvestment of dividends | | 4,142 | | | | 57,200 | |
Shares reacquired | | (579 | ) | | | (8,249 | ) |
| | | | | | | |
Net increase (decrease) in shares outstanding | | 8,078 | | | $ | 112,208 | |
| | | | | | | |
Year ended September 30, 2006: | | | | | | | |
Shares sold | | 71,505 | | | $ | 975,738 | |
Shares issued in reinvestment of dividends | | 12 | | | | 159 | |
Shares reacquired | | (5 | ) | | | (75 | ) |
| | | | | | | |
Net increase (decrease) in shares outstanding | | 71,512 | | | $ | 975,822 | |
| | | | | | | |
Class X | | | | | | |
Period ended March 31, 2007*: | | | | | | | |
Shares sold | | 3,649 | | | $ | 41,204 | |
Shares issued in connection with the merger | | 597,423 | | | | 8,445,539 | |
Shares reacquired | | (938 | ) | | | (13,254 | ) |
| | | | | | | |
Net increase (decrease) in shares outstanding | | 600,134 | | | $ | 8,473,489 | |
| | | | | | | |
Class Z | | | | | | |
Six months ended March 31, 2007: | | | | | | | |
Shares sold | | 1,007,597 | | | $ | 14,350,704 | |
Shares issued in reinvestment of dividends | | 894,190 | | | | 12,375,593 | |
Shares reacquired | | (1,917,346 | ) | | | (27,404,295 | ) |
| | | | | | | |
Net increase (decrease) in shares outstanding | | (15,559 | ) | | $ | (677,998 | ) |
| | | | | | | |
Year ended September 30, 2006: | | | | | | | |
Shares sold | | 1,347,983 | | | $ | 18,546,924 | |
Shares issued in reinvestment of dividends | | 838,557 | | | | 11,295,360 | |
Shares reacquired | | (2,931,906 | ) | | | (40,331,463 | ) |
| | | | | | | |
Net increase (decrease) in shares outstanding | | (745,366 | ) | | $ | (10,489,179 | ) |
| | | | | | | |
| * | Commenced operations on March 23, 2007. |
Note 7. Reorganization
On March 23, 2007, Dryden Active Allocation Fund acquired all of the net assets of Strategic Partners Balanced Fund pursuant to a plan of reorganization approved by the Strategic Partners Balanced Fund shareholders on November 16, 2006. The acquisition was accomplished by a tax-free issue of Class A, Class B, Class C, Class L, Class M and Class X shares for corresponding classes of Strategic Partners Balanced Fund.
| | |
| 82 | | Visit our website at www.jennisondryden.com |
| | | | | | | | | |
Merged Fund | | Acquiring Fund |
Strategic Partners Balanced Fund | | Dryden Active Allocation |
Class | | Shares | | Class | | Shares | | Value |
A | | 1,049,504 | | A | | 1,063,641 | | $ | 15,019,303 |
B | | 215,205 | | B | | 218,100 | | | 3,080,504 |
C | | 796,206 | | C | | 806,919 | | | 11,388,083 |
L | | 808,920 | | L | | 819,224 | | | 11,575,641 |
M | | 2,440,128 | | M | | 2,471,235 | | | 34,896,956 |
X | | 590,316 | | X | | 597,423 | | | 8,445,539 |
The aggregate net assets and unrealized appreciation of Strategic Partners Balanced Fund immediately before the acquisition was $84,406,026 and $10,294,652, respectively. The aggregate net assets of Dryden Active Allocation Fund immediately before the acquisition were $649,344,791.
Note 8. New Accounting Pronouncements
On July 13, 2006, the Financial Accounting Standards Board (FASB) released FASB Interpretation No. 48 “Accounting for Uncertainty in Income Taxes” (FIN 48). FIN 48 provides guidance for how uncertain tax positions should be recognized, measured, presented and disclosed in the financial statements. FIN 48 requires the evaluation of tax positions taken or expected to be taken in the course of preparing the Fund’s tax returns to determine whether the tax positions are “more-likely-than-not” of being sustained by the applicable tax authority. The impact of the tax positions not deemed to meet the more-likely-than-not threshold would be recorded in the year in which they arise. On December 22, 2006 the Securities and Exchange Commission delayed the effective date until the last net asset value calculation in the first requested financial reporting period for its fiscal year beginning after December 15, 2006. At this time, management is evaluating the implications of FIN 48 and its impact, if any, in the financial statements has not yet been determined.
On September 20, 2006, the FASB released Statement of Financial Accounting Standards No. 157 “Fair Value Measurements” (FAS 157). FAS 157 establishes an authoritative definition of fair value, sets out a framework for measuring fair value, and requires additional disclosures about fair-value measurements. The application of FAS 157 is required for fiscal years beginning after November 15, 2007 and interim periods within those fiscal years. At this time, management is evaluating the implications of FAS 157 and its impact, if any, in the financial statements has not yet been determined.
| | |
| The Prudential Investment Portfolios, lnc./Dryden Active Allocation Fund | | 83 |
Financial Highlights
(Unaudited)
| | | | |
| | | Class A | |
| | | Six Months Ended
March 31, 2007(a) | |
Per Share Operating Performance: | | | | |
Net Asset Value, Beginning Of Period | | $ | 14.17 | |
| | | | |
Income (loss) from investment operations | | | | |
Net investment income | | | .15 | |
Net realized and unrealized gain (loss) on investment transactions | | | .78 | |
| | | | |
Total from investment operations | | | .93 | |
| | | | |
Less Distributions | | | | |
Dividends from net investment income | | | (.30 | ) |
Distributions from net realized gains | | | (.79 | ) |
| | | | |
Total distributions | | | (1.09 | ) |
| | | | |
Net asset value, end of period | | $ | 14.01 | |
| | | | |
Total Return(b): | | | 6.69 | % |
Ratios/Supplemental Data: | | | | |
Net assets, end of period (000) | | $ | 434,195 | |
Average net assets (000) | | $ | 421,180 | |
Ratios to average net assets: | | | | |
Expenses, including distribution and service (12b-1) fees(c) | | | 1.09 | %(d) |
Expenses, excluding distribution and service (12b-1) fees | | | .84 | %(d) |
Net investment income | | | 2.17 | %(d) |
For Class A, B, C, L, M, R, X and Z shares: | | | | |
Portfolio turnover rate | | | 84 | %(e) |
| (a) | Calculations are based on average shares outstanding during the period. |
| (b) | Total return does not consider the effects of sales loads. Total return is calculated assuming a purchase of shares on the first day and a sale on the last day of each period reported and includes reinvestment of dividends and distributions. Total returns for periods less than a full year are not annualized. |
| (c) | The distributor of the Series contractually agreed to limit its distribution and service (12b-1) fees to .25 of 1% on the average daily net assets of the Class A shares. |
See Notes to Financial Statements.
| | |
| 84 | | Visit our website at www.jennisondryden.com |
| | | | | | | | | | | | | | | | | | |
| Class A | |
| Year Ended September 30, | |
| 2006(a) | | | 2005(a) | | | 2004(a) | | | 2003(a) | | | 2002(a) | |
| | | | | | | | | | | | | | | | | | |
| $ | 14.00 | | | $ | 12.83 | | | $ | 11.47 | | | $ | 9.60 | | | $ | 11.08 | |
| | | | | | | | | | | | | | | | | | | |
| | | | | | | | | | | | | | | | | | |
| | .28 | | | | .21 | | | | .14 | | | | .12 | | | | .18 | |
| | .79 | | | | 1.12 | | | | 1.31 | | | | 1.96 | | | | (1.37 | ) |
| | | | | | | | | | | | | | | | | | | |
| | 1.07 | | | | 1.33 | | | | 1.45 | | | | 2.08 | | | | (1.19 | ) |
| | | | | | | | | | | | | | | | | | | |
| | | | | | | | | | | | | | | | | | |
| | (.22 | ) | | | (.16 | ) | | | (.09 | ) | | | (.21 | ) | | | (.29 | ) |
| | (.68 | ) | | | — | | | | — | | | | — | | | | — | |
| | | | | | | | | | | | | | | | | | | |
| | (.90 | ) | | | (.16 | ) | | | (.09 | ) | | | (.21 | ) | | | (.29 | ) |
| | | | | | | | | | | | | | | | | | | |
| $ | 14.17 | | | $ | 14.00 | | | $ | 12.83 | | | $ | 11.47 | | | $ | 9.60 | |
| | | | | | | | | | | | | | | | | | | |
| | 7.98 | % | | | 10.41 | % | | | 12.68 | % | | | 21.91 | % | | | (11.18 | )% |
| | | | | | | | | | | | | | | | | | |
| $ | 415,486 | | | $ | 424,341 | | | $ | 425,614 | | | $ | 410,597 | | | $ | 369,410 | |
| $ | 415,508 | | | $ | 428,897 | | | $ | 429,046 | | | $ | 385,242 | | | $ | 461,051 | |
| | | | | | | | | | | | | | | | | | |
| | 1.08 | % | | | 1.09 | % | | | 1.07 | % | | | 1.11 | % | | | 1.11 | % |
| | .83 | % | | | .84 | % | | | .82 | % | | | .86 | % | | | .86 | % |
| | 2.05 | % | | | 1.52 | % | | | 1.13 | % | | | 1.12 | % | | | 1.51 | % |
| | | | | | | | | | | | | | | | | | |
| | 152 | % | | | 119 | % | | | 170 | % | | | 212 | % | | | 215 | % |
See Notes to Financial Statements.
| | |
| The Prudential Investment Portfolios, lnc./Dryden Active Allocation Fund | | 85 |
Financial Highlights
(Unaudited) Cont’d
| | | | |
| | | Class B | |
| | | Six Months Ended
March 31, 2007(a) | |
Per Share Operating Performance: | | | | |
Net Asset Value, Beginning Of Period | | $ | 14.11 | |
| | | | |
Income (loss) from investment operations | | | | |
Net investment income | | | .10 | |
Net realized and unrealized gain (loss) on investment transactions | | | .78 | |
| | | | |
Total from investment operations | | | .88 | |
| | | | |
Less Distributions | | | | |
Dividends from net investment income | | | (.19 | ) |
Distributions from net realized gains | | | (.79 | ) |
| | | | |
Total distributions | | | (.98 | ) |
| | | | |
Net asset value, end of period | | $ | 14.01 | |
| | | | |
Total Return(b): | | | 6.33 | % |
Ratios/Supplemental Data: | | | | |
Net assets, end of period (000) | | $ | 49,447 | |
Average net assets (000) | | $ | 51,268 | |
Ratios to average net assets: | | | | |
Expenses, including distribution and service (12b-1) fees | | | 1.84 | %(c) |
Expenses, excluding distribution and service (12b-1) fees | | | .84 | %(c) |
Net investment income | | | 1.41 | %(c) |
| (a) | Calculations are based on average shares outstanding during the period. |
| (b) | Total return does not consider the effects of sales loads. Total return is calculated assuming a purchase of shares on the first day and a sale on the last day of each period reported and includes reinvestment of dividends and distributions. Total returns for periods less than a full year are not annualized. |
See Notes to Financial Statements.
| | |
| 86 | | Visit our website at www.jennisondryden.com |
| | | | | | | | | | | | | | | | | | |
| Class B | |
| Year Ended September 30, | |
| 2006(a) | | | 2005(a) | | | 2004(a) | | | 2003(a) | | | 2002(a) | |
| | | | | | | | | | | | | | | | | | |
| $ | 13.94 | | | $ | 12.78 | | | $ | 11.42 | | | $ | 9.56 | | | $ | 11.00 | |
| | | | | | | | | | | | | | | | | | | |
| | | | | | | | | | | | | | | | | | |
| | .18 | | | | .11 | | | | .05 | | | | .04 | | | | .10 | |
| | .78 | | | | 1.10 | | | | 1.31 | | | | 1.95 | | | | (1.36 | ) |
| | | | | | | | | | | | | | | | | | | |
| | .96 | | | | 1.21 | | | | 1.36 | | | | 1.99 | | | | (1.26 | ) |
| | | | | | | | | | | | | | | | | | | |
| | | | | | | | | | | | | | | | | | |
| | (.11 | ) | | | (.05 | ) | | | — | | | | (.13 | ) | | | (.18 | ) |
| | (.68 | ) | | | — | | | | — | | | | — | | | | — | |
| | | | | | | | | | | | | | | | | | | |
| | (.79 | ) | | | (.05 | ) | | | — | | | | (.13 | ) | | | (.18 | ) |
| | | | | | | | | | | | | | | | | | | |
| $ | 14.11 | | | $ | 13.94 | | | $ | 12.78 | | | $ | 11.42 | | | $ | 9.56 | |
| | | | | | | | | | | | | | | | | | | |
| | 7.14 | % | | | 9.50 | % | | | 11.91 | % | | | 20.96 | % | | | (11.73 | )% |
| | | | | | | | | | | | | | | | | | |
| $ | 52,601 | | | $ | 73,983 | | | $ | 94,667 | | | $ | 104,308 | | | $ | 124,201 | |
| $ | 64,048 | | | $ | 88,854 | | | $ | 104,847 | | | $ | 113,112 | | | $ | 169,928 | |
| | | | | | | | | | | | | | | | | | |
| | 1.83 | % | | | 1.84 | % | | | 1.82 | % | | | 1.86 | % | | | 1.86 | % |
| | .83 | % | | | .84 | % | | | .82 | % | | | .86 | % | | | .86 | % |
| | 1.29 | % | | | .77 | % | | | .38 | % | | | .38 | % | | | .77 | % |
See Notes to Financial Statements.
| | |
| The Prudential Investment Portfolios, lnc./Dryden Active Allocation Fund | | 87 |
Financial Highlights
(Unaudited) Cont’d
| | | | |
| | | Class C | |
| | | Six Months Ended
March 31, 2007(a) | |
Per Share Operating Performance: | | | | |
Net Asset Value, Beginning Of Period | | $ | 14.11 | |
| | | | |
Income (loss) from investment operations | | | | |
Net investment income | | | .09 | |
Net realized and unrealized gain (loss) on investment transactions | | | .80 | |
| | | | |
Total from investment operations | | | .89 | |
| | | | |
Less Distributions | | | | |
Dividends from net investment income | | | (.19 | ) |
Distributions from net realized gains | | | (.79 | ) |
| | | | |
Total distributions | | | (.98 | ) |
| | | | |
Net asset value, end of period | | $ | 14.02 | |
| | | | |
Total Return(b): | | | 6.41 | % |
Ratios/Supplemental Data: | | | | |
Net assets, end of period (000) | | $ | 25,344 | |
Average net assets (000) | | $ | 14,256 | |
Ratios to average net assets: | | | | |
Expenses, including distribution and service (12b-1) fees | | | 1.84 | %(d) |
Expenses, excluding distribution and service (12b-1) fees | | | .84 | %(d) |
Net investment income | | | 1.43 | %(d) |
| (a) | Calculations are based on average shares outstanding during the period. |
| (b) | Total return does not consider the effects of sales loads. Total return is calculated assuming a purchase of shares on the first day and a sale on the last day of each period reported and includes reinvestment of dividends and distributions. Total returns for periods less than a full year are not annualized. |
See Notes to Financial Statements.
| | |
| 88 | | Visit our website at www.jennisondryden.com |
| | | | | | | | | | | | | | | | | | |
| Class C | |
| Year Ended September 30, | |
| 2006(a) | | | 2005(a) | | | 2004(a) | | | 2003(a) | | | 2002(a) | |
| | | | | | | | | | | | | | | | | | |
| $ | 13.95 | | | $ | 12.78 | | | $ | 11.42 | | | $ | 9.56 | | | $ | 11.00 | |
| | | | | | | | | | | | | | | | | | | |
| | | | | | | | | | | | | | | | | | |
| | .18 | | | | .11 | | | | .05 | | | | .04 | | | | .08 | |
| | .77 | | | | 1.11 | | | | 1.31 | | | | 1.95 | | | | (1.34 | ) |
| | | | | | | | | | | | | | | | | | | |
| | .95 | | | | 1.22 | | | | 1.36 | | | | 1.99 | | | | (1.26 | ) |
| | | | | | | | | | | | | | | | | | | |
| | | | | | | | | | | | | | | | | | |
| | (.11 | ) | | | (.05 | ) | | | — | | | | (.13 | ) | | | (.18 | ) |
| | (.68 | ) | | | — | | | | — | | | | — | | | | — | |
| | | | | | | | | | | | | | | | | | | |
| | (.79 | ) | | | (.05 | ) | | | — | | | | (.13 | ) | | | (.18 | ) |
| | | | | | | | | | | | | | | | | | | |
| $ | 14.11 | | | $ | 13.95 | | | $ | 12.78 | | | $ | 11.42 | | | $ | 9.56 | |
| | | | | | | | | | | | | | | | | | | |
| | 7.14 | % | | | 9.50 | % | | | 11.91 | % | | | 20.96 | % | | | (11.73 | )% |
| | | | | | | | | | | | | | | | | | |
| $ | 13,287 | | | $ | 13,500 | | | $ | 14,357 | | | $ | 12,655 | | | $ | 11,268 | |
| $ | 13,413 | | | $ | 14,221 | | | $ | 13,380 | | | $ | 12,132 | | | $ | 15,577 | |
| | | | | | | | | | | | | | | | | | |
| | 1.83 | % | | | 1.84 | % | | | 1.82 | % | | | 1.86 | % | | | 1.86 | % |
| | .83 | % | | | .84 | % | | | .82 | % | | | .86 | % | | | .86 | % |
| | 1.30 | % | | | .78 | % | | | .38 | % | | | .37 | % | | | .76 | % |
See Notes to Financial Statements.
| | |
| The Prudential Investment Portfolios, lnc./Dryden Active Allocation Fund | | 89 |
Financial Highlights
Cont’d
| | | | |
| | | Class L | |
| | | March 23, 2007(a)
Through
March 31, 2007(b) | |
Per Share Operating Performance: | | | | |
Net Asset Value, Beginning Of Period | | $ | 14.13 | |
| | | | |
Loss from investment operations | | | | |
Net investment income | | | .01 | |
Net realized and unrealized loss on investment transactions | | | (.11 | ) |
| | | | |
Total from investment operations | | | (.10 | ) |
| | | | |
Net asset value, end of period | | $ | 14.03 | |
| | | | |
Total Return(c): | | | (.71 | )% |
Ratios/Supplemental Data: | | | | |
Net assets, end of period (000) | | $ | 11,449 | |
Average net assets (000) | | $ | 11,562 | |
Ratios to average net assets: | | | | |
Expenses, including distribution and service (12b-1) fees | | | 1.34 | %(d) |
Expenses, excluding distribution and service (12b-1) fees | | | .84 | %(d) |
Net investment income | | | 1.75 | %(d) |
| (a) | Commencement of operations. |
| (b) | Calculations are based on average shares outstanding during the period. |
| (c) | Total return does not consider the effects of sales loads. Total return is calculated assuming a purchase of shares on the first day and a sale on the last day of each period reported and includes reinvestment of dividends and distributions. Total returns for periods less than a full year are not annualized. |
See Notes to Financial Statements.
| | |
| 90 | | Visit our website at www.jennisondryden.com |
| | | | |
| | | Class M | |
| | | March 23, 2007(a)
Through March 31, 2007(b) | |
Per Share Operating Performance: | | | | |
Net Asset Value, Beginning Of Period | | $ | 14.12 | |
| | | | |
Loss from investment operations | | | | |
Net investment income | | | — | (c) |
Net realized and unrealized loss on investment transactions | | | (.10 | ) |
| | | | |
Total from investment operations | | | (.10 | ) |
| | | | |
Net asset value, end of period | | $ | 14.02 | |
| | | | |
Total Return(d): | | | (.71 | )% |
Ratios/Supplemental Data: | | | | |
Net assets, end of period (000) | | $ | 34,521 | |
Average net assets (000) | | $ | 34,808 | |
Ratios to average net assets: | | | | |
Expenses, including distribution and service (12b-1) fees | | | 1.84 | %(e) |
Expenses, excluding distribution and service (12b-1) fees | | | .84 | %(e) |
Net investment income | | | 1.25 | %(e) |
| (a) | Commencement of operations. |
| (b) | Calculations are based on average shares outstanding during the period. |
| (c) | Less than $.005 per share. |
| (d) | Total return does not consider the effects of sales loads. Total return is calculated assuming a purchase of shares on the first day and a sale on the last day of each period reported and includes reinvestment of dividends and distributions. Total returns for periods less than a full year are not annualized. |
See Notes to Financial Statements.
| | |
| The Prudential Investment Portfolios, lnc./Dryden Active Allocation Fund | | 91 |
Financial Highlights
Cont’d
| | | | |
| | | Class R | |
| | | Six Months Ended
March 31, 2007(b) | |
Per Share Operating Performance: | | | | |
Net Asset Value, Beginning Of Period | | $ | 14.16 | |
| | | | |
Income from investment operations | | | | |
Net investment income | | | .14 | |
Net realized and unrealized gain on investment transactions | | | .79 | |
| | | | |
Total from investment operations | | | .93 | |
| | | | |
Less Distributions | | | | |
Dividends from net investment income | | | (.27 | ) |
Distributions from net realized gains | | | (.79 | ) |
| | | | |
Total distributions | | | (1.06 | ) |
| | | | |
Net asset value, end of period | | $ | 14.03 | |
| | | | |
Total Return(c): | | | 6.64 | % |
Ratios/Supplemental Data: | | | | |
Net assets, end of period (000) | | $ | 1,119 | |
Average net assets (000) | | $ | 1,074 | |
Ratios to average net assets: | | | | |
Expenses, including distribution and service (12b-1) fees(d) | | | 1.34 | %(e) |
Expenses, excluding distribution and service (12b-1) fees | | | .84 | %(e) |
Net investment income | | | 1.93 | %(e) |
| (a) | Commencement of operations. |
| (b) | Calculations are based on average shares outstanding during the period. |
| (c) | Total return is calculated assuming a purchase of shares on the first day and a sale on the last day of each period reported and includes reinvestment of dividends and distributions. Total returns for periods less than a full year are not annualized. |
| (d) | The distributor of the Series contractually agreed to limit its distribution and service (12b-1) fees to .50 of 1% on the average daily net assets of the Class R shares. |
See Notes to Financial Statements.
| | |
| 92 | | Visit our website at www.jennisondryden.com |
| | | | | | |
| Class R | |
Year Ended
September 30, 2006(b) | | | December 17, 2004(a)
Through
September 30, 2005(b) | |
| | | | | | |
| $ | 14.00 | | | $ | 13.53 | |
| | | | | | | |
| | | | | | |
| | .24 | | | | .12 | |
| | .78 | | | | .35 | |
| | | | | | | |
| | 1.02 | | | | .47 | |
| | | | | | | |
| | | | | | |
| | (.18 | ) | | | — | |
| | (.68 | ) | | | — | |
| | | | | | | |
| | (.86 | ) | | | — | |
| | | | | | | |
| $ | 14.16 | | | $ | 14.00 | |
| | | | | | | |
| | 7.70 | % | | | 3.40 | % |
| | | | | | |
| $ | 1,015 | | | $ | 3 | |
| $ | 293 | | | $ | 2 | |
| | | | | | |
| | 1.33 | % | | | 1.34 | %(e) |
| | .83 | % | | | .84 | %(e) |
| | 1.94 | % | | | 1.48 | %(e) |
See Notes to Financial Statements.
| | |
| The Prudential Investment Portfolios, lnc./Dryden Active Allocation Fund | | 93 |
Financial Highlights
Cont’d
| | | | |
| | | Class X | |
| | | March 23, 2007(a)
Through
March 31, 2007(b) | |
Per Share Operating Performance: | | | | |
Net Asset Value, Beginning Of Period | | $ | 14.12 | |
| | | | |
Loss from investment operations | | | | |
Net investment income | | | — | (c) |
Net realized and unrealized loss on investment transactions | | | (.11 | ) |
| | | | |
Total from investment operations | | | (.11 | ) |
| | | | |
Net asset value, end of period | | $ | 14.01 | |
| | | | |
Total Return(c): | | | (.78 | )% |
Ratios/Supplemental Data: | | | | |
Net assets, end of period (000) | | $ | 8,411 | |
Average net assets (000) | | $ | 8,410 | |
Ratios to average net assets: | | | | |
Expenses, including distribution and service (12b-1) fees | | | 1.84 | %(d) |
Expenses, excluding distribution and service (12b-1) fees | | | .84 | %(d) |
Net investment income | | | 1.25 | %(d) |
| (a) | Commencement of operations. |
| (b) | Calculations are based on average shares outstanding during the period. |
| (c) | Less than $.005 per share. |
| (d) | Total return does not consider the effects of sales loads. Total return is calculated assuming a purchase of shares on the first day and a sale on the last day of each period reported and includes reinvestment of dividends and distributions. Total returns for periods less than a full year are not annualized. |
See Notes to Financial Statements.
| | |
| 94 | | Visit our website at www.jennisondryden.com |
This Page Intentionally Left Blank
Financial Highlights
(Unaudited) Cont’d
| | | | |
| | | Class Z | |
| | | Six Months Ended
March 31, 2007(a) | |
Per Share Operating Performance: | | | | |
Net Asset Value, Beginning Of Period | | $ | 14.25 | |
| | | | |
Income (loss) from investment operations | | | | |
Net investment income | | | .17 | |
Net realized and unrealized gain (loss) on investment transactions | | | .79 | |
| | | | |
Total from investment operations | | | .96 | |
| | | | |
Less Distributions | | | | |
Dividends from net investment income | | | (.34 | ) |
Distributions from net realized gains | | | (.79 | ) |
| | | | |
Total distributions | | | (1.13 | ) |
| | | | |
Net asset value, end of period | | $ | 14.08 | |
| | | | |
Total Return(b): | | | 6.86 | % |
Ratios/Supplemental Data: | | | | |
Net assets, end of period (000) | | $ | 162,509 | |
Average net assets (000) | | $ | 163,098 | |
Ratios to average net assets: | | | | |
Expenses, including distribution and service (12b-1) fees | | | .84 | %(c) |
Expenses, excluding distribution and service (12b-1) fees | | | .84 | %(c) |
Net investment income | | | 2.41 | %(c) |
| (a) | Calculations are based on average shares outstanding during the period. |
| (b) | Total return does not consider the effects of sales loads. Total return is calculated assuming a purchase of shares on the first day and a sale on the last day of each period reported and includes reinvestment of dividends and distributions. Total returns for periods less than a full year are not annualized. |
See Notes to Financial Statements.
| | |
| 96 | | Visit our website at www.jennisondryden.com |
| | | | | | | | | | | | | | | | | | |
| Class Z | |
| Year Ended September 30, | |
| 2006(a) | | | 2005(a) | | | 2004(a) | | | 2003(a) | | | 2002(a) | |
| | | | | | | | | | | | | | | | | | |
| $ | 14.08 | | | $ | 12.90 | | | $ | 11.53 | | | $ | 9.66 | | | $ | 11.14 | |
| | | | | | | | | | | | | | | | | | | |
| | | | | | | | | | | | | | | | | | |
| | .32 | | | | .24 | | | | .17 | | | | .14 | | | | .21 | |
| | .78 | | | | 1.13 | | | | 1.32 | | | | 1.97 | | | | (1.37 | ) |
| | | | | | | | | | | | | | | | | | | |
| | 1.10 | | | | 1.37 | | | | 1.49 | | | | 2.11 | | | | (1.16 | ) |
| | | | | | | | | | | | | | | | | | | |
| | | | | | | | | | | | | | | | | | |
| | (.25 | ) | | | (.19 | ) | | | (.12 | ) | | | (.24 | ) | | | (.32 | ) |
| | (.68 | ) | | | — | | | | — | | | | — | | | | — | |
| | | | | | | | | | | | | | | | | | | |
| | (.93 | ) | | | (.19 | ) | | | (.12 | ) | | | (.24 | ) | | | (.32 | ) |
| | | | | | | | | | | | | | | | | | | |
| $ | 14.25 | | | $ | 14.08 | | | $ | 12.90 | | | $ | 11.53 | | | $ | 9.66 | |
| | | | | | | | | | | | | | | | | | | |
| | 8.29 | % | | | 10.63 | % | | | 12.96 | % | | | 22.11 | % | | | (10.86 | )% |
| | | | | | | | | | | | | | | | | | |
| $ | 164,649 | | | $ | 173,188 | | | $ | 169,725 | | | $ | 167,039 | | | $ | 166,036 | |
| $ | 168,165 | | | $ | 176,256 | | | $ | 171,470 | | | $ | 172,708 | | | $ | 206,376 | |
| | | | | | | | | | | | | | | | | | |
| | .83 | % | | | .84 | % | | | .82 | % | | | .86 | % | | | .86 | % |
| | .83 | % | | | .84 | % | | | .82 | % | | | .86 | % | | | .86 | % |
| | 2.30 | % | | | 1.76 | % | | | 1.38 | % | | | 1.36 | % | | | 1.76 | % |
See Notes to Financial Statements.
| | |
| The Prudential Investment Portfolios, lnc./Dryden Active Allocation Fund | | 97 |
| | | | |
| n MAIL | | n TELEPHONE | | n WEBSITE |
Gateway Center Three 100 Mulberry Street Newark, NJ 07102 | | (800) 225-1852 | | www.jennisondryden.com |
|
| PROXY VOTING |
| The Board of Directors of the Fund has delegated to the Fund’s investment subadvisers the responsibility for voting any proxies and maintaining proxy recordkeeping with respect to the Fund. A description of these proxy voting policies and procedures is available without charge, upon request, by calling (800) 225-1852 or by visiting the Securities and Exchange Commission’s website at www.sec.gov. Information regarding how the Fund voted proxies relating to portfolio securities during the most recent 12-month period ended June 30 is available on the Fund’s website and on the Commission’s website. |
|
| DIRECTORS |
| Linda W. Bynoe • David E.A. Carson • Robert F. Gunia • Robert E. La Blanc • Douglas H. McCorkindale • Richard A. Redeker • Judy A. Rice • Robin B. Smith • Stephen G. Stoneburn • Clay T. Whitehead |
|
| OFFICERS |
Judy A. Rice, President • Robert F. Gunia, Vice President • Grace C. Torres, Treasurer and Principal Financial and Accounting Officer • Kathryn L. Quirk, Chief Legal Officer • Deborah A. Docs, Secretary • Lee D. Augsburger, Chief Compliance Officer • Valerie Simpson, Deputy Chief Compliance Officer • Noreen M. Fierro, Anti-Money Laundering Compliance
Officer • Jonathan D. Shain, Assistant Secretary • Claudia DiGiacomo, Assistant Secretary •
John P. Schwartz, Assistant Secretary • Andrew R. French, Assistant Secretary •
M. Sadiq Peshimam, Assistant Treasurer |
| | | | |
| MANAGER | | Prudential Investments LLC | | Gateway Center Three
100 Mulberry Street
Newark, NJ 07102 |
|
| INVESTMENT SUBADVISERS | | Prudential Investment
Management, Inc. Quantitative Management
Associates LLC | | Gateway Center Two
100 Mulberry Street
Newark, NJ 07102 Gateway Center Two
100 Mulberry Street
Newark, NJ 07102 |
|
| DISTRIBUTOR | | Prudential Investment
Management Services LLC | | Gateway Center Three
100 Mulberry Street
Newark, NJ 07102 |
|
| CUSTODIAN | | The Bank of New York | | One Wall Street
New York, NY 10286 |
|
| TRANSFER AGENT | | Prudential Mutual Fund
Services LLC | | PO Box 8098
Philadelphia, PA 19176 |
|
INDEPENDENT REGISTERED
PUBLIC ACCOUNTING FIRM | | KPMG LLP | | 345 Park Avenue
New York, NY 10154 |
|
| FUND COUNSEL | | Sullivan & Cromwell LLP | | 125 Broad Street
New York, NY 10004 |
|
| An investor should consider the investment objectives, risks, charges, and expenses of the Fund carefully before investing. The prospectus for the Fund contains this and other information about the Fund. An investor may obtain a prospectus by visiting our website at www.jennisondryden.com or by calling (800) 225-1852. The prospectus should be read carefully before investing. |
|
| E-DELIVERY |
| To receive your mutual fund documents on-line, go to www.icsdelivery.com/prudential/funds and enroll. Instead of receiving printed documents by mail, you will receive notification via e-mail when new materials are available. You can cancel your enrollment or change your e-mail address at any time by clicking on the change/cancel enrollment option at the icsdelivery website address. |
|
| SHAREHOLDER COMMUNICATIONS WITH DIRECTORS |
| Shareholders can communicate directly with the Board of Directors by writing to the Chair of the Board, Dryden Active Allocation Fund, Prudential Investments, Attn: Board of Directors, 100 Mulberry Street, Gateway Center Three, Newark, NJ 07102. Shareholders can communicate directly with an individual Director by writing to the same address. Communications are not screened before being delivered to the addressee. |
|
| AVAILABILITY OF PORTFOLIO SCHEDULE |
| The Fund files its complete schedule of portfolio holdings with the Securities and Exchange Commission for the first and third quarters of each fiscal year on Form N-Q under The Prudential Investment Portfolios, Inc. name. The Fund’s Forms N-Q are available on the Commission’s website at www.sec.gov. The Fund’s Forms N-Q may also be reviewed and copied at the Commission’s Public Reference Room in Washington, D.C. Information on the operation and location of the Public Reference Room may be obtained by calling (800) SEC-0330 (732-0330). The Fund’s schedule of portfolio holdings is also available on the Fund’s website as of the end of each fiscal quarter. |
Mutual Funds:
| | | | |
| ARE NOT INSURED BY THE FDIC OR ANY FEDERAL GOVERNMENT AGENCY | | MAY LOSE VALUE | | ARE NOT A DEPOSIT OF OR GUARANTEED BY ANY BANK OR ANY BANK AFFILIATE |

| | | | | | | | | | | | | | | | | | | | |
| Dryden Active Allocation Fund | | | | | | | | | | | | |
| | | Share Class | | A | | B | | C | | L | | M | | R | | X | | Z | | |
| | NASDAQ | | PIBAX | | PBFBX | | PABCX | | DAACL | | DAACM | | PALRX | | DAACX | | PABFX | | |
| | CUSIP | | 74437E883 | | 74437E875 | | 74437E867 | | 74437E586 | | 74437E578 | | 74437E636 | | 74437E560 | | 74437E859 | | |
| | | | | | | | | | | | | | | | | | | | |
MF185E2 IFS-A133520 Ed. 05/2007

Jennison Growth Fund
| | |
| MARCH 31, 2007 | | SEMIANNUAL REPORT |

FUND TYPE
Medium- to large- capitalization stock
OBJECTIVE
Long-term growth of capital
This report is not authorized for distribution to prospective investors unless preceded or accompanied by a current prospectus.
The views expressed in this report and information about the Fund’s portfolio holdings are for the period covered by this report and are subject to change thereafter.
The accompanying financial statements as of March 31, 2007, were not audited, and accordingly, no auditor’s opinion is expressed on them.
JennisonDryden is a registered trademark of The Prudential Insurance Company of America.

May 16, 2007
Dear Shareholder:
We hope you find the semiannual report for the Jennison Growth Fund informative and useful. As a JennisonDryden mutual fund shareholder, you may be thinking about where you can find additional growth opportunities. You could invest in last year’s top-performing asset class and hope history repeats itself or you could stay in cash while waiting for the “right moment” to invest.
Instead, we believe it is better to take advantage of developing domestic and global investment opportunities through a diversified portfolio of stock and bond mutual funds. A diversified asset allocation offers two potential advantages. It helps you manage downside risk by not being overly exposed to any particular asset class, plus it gives you a better opportunity to have at least some of your assets in the right place at the right time. Your financial professional can help you create a diversified investment plan that may include mutual funds covering all the basic asset classes and that reflects your personal investor profile and tolerance for risk.
JennisonDryden Mutual Funds gives you a wide range of choices that can help you make progress toward your financial goals. Our funds offer the experience, resources, and professional discipline of four leading asset managers. They are recognized and respected in the institutional market and by discerning investors for excellence in their respective strategies. JennisonDryden equity funds are advised by Jennison Associates LLC, Quantitative Management Associates LLC (QMA), or Prudential Real Investors (PREI). Prudential Investment Management, Inc. (PIM) advises the JennisonDryden fixed income and money market funds. Jennison Associates, QMA, and PIM are registered investment advisers and Prudential Financial companies. PREI is a registered investment adviser and a unit of PIM.
Thank you for choosing JennisonDryden Mutual Funds.
Sincerely,

Judy A. Rice, President
The Prudential Investment Portfolios, Inc./Jennison Growth Fund
| | |
| The Prudential Investment Portfolios, Inc./Jennison Growth Fund | | 1 |
Your Fund’s Performance
Fund objective
The investment objective of the Jennison Growth Fund is long-term growth of capital. There can be no assurance that the Fund will achieve its investment objective.
Performance data quoted represent past performance. Past performance does not guarantee future results. The investment return and principal value of an investment will fluctuate, so that an investor’s shares, when redeemed, may be worth more or less than their original cost. Current performance may be lower or higher than the past performance data quoted. An investor may obtain performance data as of the most recent month-end by visiting our website at www.jennisondryden.com or by calling (800) 225-1852. The maximum initial sales charge is 5.50% (Class A shares). As of March 31, 2007, the gross annualized operating expenses are 1.07%, 1.77%, 1.77%, 1.52% and 0.77% for Class A, B, C, R and Z shares, respectively. As of March 31, 2007, the annualized operating expenses net of a contractual reduction through January 31, 2008 are 1.02%, 1.77%, 1.77%, 1.27% and 0.77% for Class A, B, C, R and Z shares, respectively. These figures include the net operating expenses of the underlying portfolios in which the Fund invests. Such expenses were calculated using a weighted average of the net operating expenses of each underlying fund and when annualized amounted to less than 0.005% for each share class.
| | | | | | | | | | | | | | |
| Cumulative Total Returns as of 3/31/07 | | | | | | | | | | | | |
| | | Six Months | | | One Year | | | Five Years | | | Ten Years | | | Since Inception1 |
.Class A | | 5.39 | % | | 1.53 | % | | 17.03 | % | | 98.83 | % | | — |
Class B | | 4.99 | | | 0.80 | | | 12.73 | | | 84.64 | | | — |
Class C | | 4.99 | | | 0.80 | | | 12.73 | | | 84.64 | | | — |
Class R | | 5.28 | | | 1.65 | | | N/A | | | N/A | | | 18.43% (12/17/04) |
Class Z | | 5.54 | | | 1.84 | | | 18.60 | | | 103.96 | | | — |
S&P 500 Index2 | | 7.38 | | | 11.82 | | | 35.49 | | | 119.98 | | | ** |
Russell 1000® Growth Index3 | | 7.19 | | | 7.06 | | | 18.63 | | | 71.01 | | | *** |
Lipper Large-Cap Growth Funds Avg.4 | | 6.38 | | | 3.64 | | | 15.29 | | | 80.02 | | | **** |
| | | | | | | | | | | | | | |
| | | | | | | | | | | |
| Average Annual Total Returns5 as of 3/31/07 | | | | | | | | | |
| | | One Year | | | Five Years | | | Ten Years | | | Since Inception1 |
Class A | | –4.06 | % | | 2.03 | % | | 6.51 | % | | — |
Class B | | –4.20 | | | 2.24 | | | 6.32 | | | — |
Class C | | –0.20 | | | 2.43 | | | 6.32 | | | — |
Class R | | 1.65 | | | N/A | | | N/A | | | 7.68% (12/17/04) |
Class Z | | 1.84 | | | 3.47 | | | 7.39 | | | — |
S&P 500 Index2 | | 11.82 | | | 6.26 | | | 8.20 | | | ** |
Russell 1000® Growth Index3 | | 7.06 | | | 3.48 | | | 5.51 | | | *** |
Lipper Large-Cap Growth Funds Avg.4 | | 3.64 | | | 2.81 | | | 5.89 | | | **** |
| | |
| 2 | | Visit our website at www.jennisondryden.com |
The cumulative total returns do not reflect the deduction of applicable sales charges. If reflected, the applicable sales charges would reduce the cumulative total returns performance quoted. Class A shares are subject to a maximum front-end sales charge of 5.50%. Under certain circumstances, Class A shares may be subject to a contingent deferred sales charge (CDSC) of 1%. Class B and Class C shares are subject to a maximum CDSC of 5% and 1%, respectively. Class R and Class Z shares are not subject to a sales charge.
Source: Prudential Investments LLC and Lipper Inc. Performance figures may reflect fee waivers and/or expense reimbursements. In the absence of such fee waivers and/or expense reimbursements, total returns would be lower.
1Inception date returns are provided for any share class with less than 10 calendar years of returns.
2The S&P 500 Index is an unmanaged index of 500 stocks of large U.S. public companies. It gives a broad look at how U.S. stock prices have performed.
3The Russell 1000 Growth Index is an unmanaged index comprising those securities in the Russell 1000 Index with a greater-than-average growth orientation. Companies in this index tend to exhibit relatively high price-to-book ratios, price-to-earnings ratios, forecasted growth rates, and relatively low dividend yields.
4The Lipper Large-Cap Growth Funds Average (Lipper Average) represents returns based on the average return of all funds in the Lipper Large-Cap Growth Funds category for the periods noted. Funds in the Lipper Average invest at least 75% of their equity assets in companies with market capitalizations (on a three-year weighted basis) greater than 300% of the dollar-weighted median market capitalization of the middle 1,000 securities of the S&P SuperComposite 1500 Index. Large-cap growth funds typically have an above-average price-to-earnings ratio, price-to-book ratio, and three-year sales-per-share growth value compared with the S&P 500 Index.
5The average annual total returns take into account applicable sales charges. Class A, Class B, Class C, and Class R shares are subject to an annual distribution and service (12b-1) fee of up to 0.30%, 1.00%, 1.00%, and 0.75%, respectively. Approximately seven years after purchase, Class B shares will automatically convert to Class A shares on a quarterly basis. Class Z shares are not subject to a 12b-1 fee. The returns in the tables do not reflect the deduction of taxes that a shareholder would pay on Fund distributions or following the redemption of Fund shares.
Investors cannot invest directly in an index. The returns for the S&P 500 Index and the Russell 1000 Growth Index would be lower if they included the effects of sales charges, operating expenses of a mutual fund, or taxes. Returns for the Lipper Average reflect the deduction of operating expenses, but not sales charges or taxes.
**S&P 500 Index Closest Month-End to Inception cumulative total return is 22.24% for Class R. S&P 500 Index Closest Month-End to Inception average annual total return is 9.34% for Class R.
***Russell 1000 Growth Index Closest Month-End to Inception cumulative total return is 16.18% for Class R. Russell 1000 Growth Index Closest Month-End to Inception average annual total return is 6.89% for Class R.
****Lipper Average Closest Month-End to Inception cumulative total return is 13.18% for Class R. Lipper Average Closest Month-End to Inception average annual total return is 5.62% for Class R.
| | |
| The Prudential Investment Portfolios, Inc./Jennison Growth Fund | | 3 |
Your Fund’s Performance (continued)
| | | |
Five Largest Holdings expressed as a percentage of net assets as of 3/31/07
(excluding short-term investments) | | | |
Google, Inc. (Class A Stock), Internet Software & Services | | 4.4 | % |
Gilead Sciences, Inc., Biotechnology | | 3.4 | |
Adobe Systems, Inc., Software | | 3.2 | |
Disney (Walt) Co. (The), Media | | 3.2 | |
QUALCOMM, Inc., Communications Equipment | | 3.2 | |
Holdings are subject to change.
| | | |
Five Largest Industries expressed as a percentage of net assets as of 3/31/07
(excluding short-term investments) | | | |
Pharmaceuticals | | 8.0 | % |
Communications Equipment | | 7.5 | |
Software | | 7.2 | |
Internet Software & Services | | 6.4 | |
Biotechnology | | 5.7 | |
Industry weightings are subject to change.
| | |
| 4 | | Visit our website at www.jennisondryden.com |
Fees and Expenses (Unaudited)
As a shareholder of the Fund, you incur two types of costs: (1) transaction costs, including sales charges (loads) on purchase payments and redemptions, as applicable, and (2) ongoing costs, including management fees, distribution and/or service (12b-1) fees, and other Fund expenses, as applicable. This example is intended to help you understand your ongoing costs (in dollars) of investing in the Fund and to compare these costs with the ongoing costs of investing in other mutual funds.
The example is based on an investment of $1,000 invested on October 1, 2006, at the beginning of the period, and held through the six-month period ended March 31, 2007.
The Fund’s transfer agent may charge additional fees to holders of certain accounts that are not included in the expenses shown in the table on the following page. These fees apply to Individual Retirement Accounts (IRAs) and Section 403(b) accounts. As of the close of the six-month period covered by the table, IRA fees included an annual maintenance fee of $15 per account (subject to a maximum annual maintenance fee of $25 for all accounts held by the same shareholder). Section 403(b) accounts are charged an annual $25 fiduciary maintenance fee. Some of the fees may vary in amount, or may be waived, based on your total account balance or the number of JennisonDryden or Strategic Partners Funds, including the Fund, that you own. You should consider the additional fees that were charged to your Fund account over the six-month period when you estimate the total ongoing expenses paid over the period and the impact of these fees on your ending account value, as these additional expenses are not reflected in the information provided in the expense table. Additional fees have the effect of reducing investment returns.
Actual Expenses
The first line for each share class in the table on the following page provides information about actual account values and actual expenses. You may use the information on this line, together with the amount you invested, to estimate the expenses that you paid over the period. Simply divide your account value by $1,000 (for example, an $8,600 account value ÷ $1,000 = 8.6), then multiply the result by the number on the first line under the heading “Expenses Paid During the Six-Month Period” to estimate the expenses you paid on your account during this period.
Hypothetical Example for Comparison Purposes
The second line for each share class in the table on the following page provides information about hypothetical account values and hypothetical expenses based on the Fund’s actual expense ratio and an assumed rate of return of 5% per year before
| | |
| The Prudential Investment Portfolios, Inc./Jennison Growth Fund | | 5 |
expenses, which is not the Fund’s actual return. The hypothetical account values and
expenses may not be used to estimate the actual ending account balance or expenses you paid for the period. You may use this information to compare the ongoing costs of investing in the Fund and other funds. To do so, compare this 5% hypothetical example with the 5% hypothetical examples that appear in the shareholder reports of the other funds.
Please note that the expenses shown in the table are meant to highlight your ongoing costs only, and do not reflect any transactional costs such as sales charges (loads). Therefore the second line for each share class in the table is useful in comparing ongoing costs only, and will not help you determine the relative total costs of owning different funds. In addition, if these transactional costs were included, your costs would have been higher.
| | | | | | | | | | | | | | |
Jennison
Growth Fund | | Beginning Account Value October 1, 2006 | | Ending Account
Value March 31, 2007 | | Annualized Expense Ratio
Based on the
Six-Month
Period | | | Expenses Paid
During the Six-
Month Period* |
| | | | | | | | | | | | | | | |
| Class A | | Actual | | $ | 1,000.00 | | $ | 1,053.90 | | 1.02 | % | | $ | 5.22 |
| | | Hypothetical | | $ | 1,000.00 | | $ | 1,023.68 | | 1.02 | % | | $ | 5.14 |
| | | | | | | | | | | | | | | |
| Class B | | Actual | | $ | 1,000.00 | | $ | 1,049.90 | | 1.77 | % | | $ | 9.05 |
| | | Hypothetical | | $ | 1,000.00 | | $ | 1,019.95 | | 1.77 | % | | $ | 8.90 |
| | | | | | | | | | | | | | | |
| Class C | | Actual | | $ | 1,000.00 | | $ | 1,049.90 | | 1.77 | % | | $ | 9.05 |
| | | Hypothetical | | $ | 1,000.00 | | $ | 1,019.95 | | 1.77 | % | | $ | 8.90 |
| | | | | | | | | | | | | | | |
| Class R | | Actual | | $ | 1,000.00 | | $ | 1,052.80 | | 1.27 | % | | $ | 6.50 |
| | | Hypothetical | | $ | 1,000.00 | | $ | 1,022.44 | | 1.27 | % | | $ | 6.39 |
| | | | | | | | | | | | | | | |
| Class Z | | Actual | | $ | 1,000.00 | | $ | 1,055.40 | | 0.77 | % | | $ | 3.95 |
| | | Hypothetical | | $ | 1,000.00 | | $ | 1,024.93 | | 0.77 | % | | $ | 3.88 |
* Fund expenses (net of fee waivers or subsidies, if any) for each share class are equal to the annualized expense ratio for each share class (provided in the table), multiplied by the average account value over the period, multiplied by the 182 days in the six-month period ended March 31, 2007, and divided by the 365 days in the Fund’s fiscal year ending September 30, 2007 (to reflect the six-month period).
| | |
| 6 | | Visit our website at www.jennisondryden.com |
Portfolio of Investments
as of March 31, 2007 (Unaudited)
| | | | | |
| Shares | | Description | | Value (Note 1) |
| | | | | |
LONG-TERM INVESTMENTS 99.2% | | | |
COMMON STOCKS | | | |
| |
Aerospace & Defense 3.7% | | | |
| 670,500 | | Boeing Co. | | $ | 59,614,155 |
| 750,800 | | United Technologies Corp. | | | 48,802,000 |
| | | | | |
| | | | | 108,416,155 |
| |
Beverages 2.3% | | | |
| 1,053,100 | | PepsiCo, Inc. | | | 66,935,036 |
| |
Biotechnology 5.7% | | | |
| 835,500 | | Genentech, Inc.(a) | | | 68,611,260 |
| 1,286,600 | | Gilead Sciences, Inc.(a) | | | 98,424,900 |
| | | | | |
| | | | | 167,036,160 |
| |
Capital Markets 5.1% | | | |
| 1,949,100 | | Charles Schwab Corp. (The) | | | 35,649,039 |
| 282,000 | | Goldman Sachs Group, Inc. | | | 58,269,660 |
| 910,500 | | UBS AG | | | 54,111,015 |
| | | | | |
| | | | | 148,029,714 |
| |
Chemicals 1.3% | | | |
| 695,900 | | Monsanto Co. | | | 38,246,664 |
| |
Communications Equipment 7.5% | | | |
| 3,377,300 | | Cisco Systems, Inc.(a) | | | 86,222,469 |
| 2,176,900 | | QUALCOMM, Inc.(b) | | | 92,866,554 |
| 284,500 | | Research In Motion Ltd.(a)(b) | | | 38,831,405 |
| | | | | |
| | | | | 217,920,428 |
| |
Computers & Peripherals 4.5% | | | |
| 818,100 | | Apple, Inc.(a) | | | 76,009,671 |
| 1,389,200 | | Hewlett-Packard Co. | | | 55,762,488 |
| | | | | |
| | | | | 131,772,159 |
| |
Consumer Finance 1.4% | | | |
| 696,300 | | American Express Co. | | | 39,271,320 |
| |
Diversified Financial Services 2.6% | | | |
| 119,100 | | IntercontinentalExchange, Inc.(a)(b) | | | 14,555,211 |
| 638,800 | | NYSE Group, Inc.(a)(b) | | | 59,887,500 |
| | | | | |
| | | | | 74,442,711 |
See Notes to Financial Statements.
| | |
| The Prudential Investment Portfolios, Inc./Jennison Growth Fund | | 7 |
Portfolio of Investments
as of March 31, 2007 (Unaudited) Cont’d.
| | | | | |
| Shares | | Description | | Value (Note 1) |
| | | | | |
Electrical Equipment 0.8% | | | |
| 688,500 | | Suntech Power Holdings Co., Ltd. ADR (China)(a)(b) | | $ | 23,828,985 |
| |
Electronic Equipment & Instruments 0.9% | | | |
| 504,500 | | Sony Corp. ADR (Japan) | | | 25,472,205 |
| |
Energy Equipment & Services 0.9% | | | |
| 394,400 | | Schlumberger Ltd.(b) | | | 27,253,040 |
| |
Food & Staples Retailing 0.4% | | | |
| 277,400 | | Whole Foods Market, Inc.(b) | | | 12,441,390 |
| |
Health Care Equipment & Supplies 4.2% | | | |
| 394,300 | | Alcon, Inc. | | | 51,976,626 |
| 601,400 | | Baxter International, Inc. | | | 31,675,738 |
| 1,053,700 | | St. Jude Medical, Inc.(a) | | | 39,629,657 |
| | | | | |
| | | | | 123,282,021 |
| |
Health Care Providers & Services 0.8% | | | |
| 293,900 | | WellPoint, Inc.(a) | | | 23,835,290 |
| |
Hotels, Restaurants & Leisure 4.1% | | | |
| 1,026,500 | | International Game Technology | | | 41,450,070 |
| 898,200 | | Marriott International, Inc. (Class A Stock)(b) | | | 43,975,872 |
| 1,091,300 | | Starbucks Corp.(a)(b) | | | 34,223,168 |
| | | | | |
| | | | | 119,649,110 |
| |
Household Products 3.4% | | | |
| 607,000 | | Colgate-Palmolive Co. | | | 40,541,530 |
| 920,490 | | Procter & Gamble Co. | | | 58,138,148 |
| | | | | |
| | | | | 98,679,678 |
| |
Industrial Conglomerates 2.0% | | | |
| 1,644,300 | | General Electric Co. | | | 58,142,448 |
| |
Insurance 2.8% | | | |
| 1,206,500 | | American International Group, Inc. | | | 81,100,930 |
| |
Internet Software & Services 6.4% | | | |
| 881,500 | | eBay, Inc.(a) | | | 29,221,725 |
| 279,000 | | Google, Inc. (Class A Stock)(a) | | | 127,826,640 |
| 931,000 | | Yahoo!, Inc.(a)(b) | | | 29,130,990 |
| | | | | |
| | | | | 186,179,355 |
See Notes to Financial Statements.
| | |
| 8 | | Visit our website at www.jennisondryden.com |
| | | | | |
| Shares | | Description | | Value (Note 1) |
| | | | | |
IT Services 1.0% | | | |
| 570,700 | | Infosys Technologies Ltd. ADR (India) | | $ | 28,677,675 |
| |
Media 5.4% | | | |
| 2,700,500 | | Disney (Walt) Co. (The) | | | 92,978,215 |
| 2,835,500 | | News Corp. (Class A Stock) | | | 65,556,760 |
| | | | | |
| | | | | 158,534,975 |
| |
Multiline Retail 4.5% | | | |
| 978,800 | | Federated Department Stores, Inc. | | | 44,094,940 |
| 363,400 | | J.C. Penny Co., Inc. | | | 29,856,944 |
| 185,100 | | Kohl’s Corp.(a) | | | 14,180,511 |
| 706,700 | | Target Corp. | | | 41,879,042 |
| | | | | |
| | | | | 130,011,437 |
| |
Oil, Gas & Consumable Fuels 1.3% | | | |
| 538,600 | | Occidental Petroleum Corp. | | | 26,558,366 |
| 154,200 | | Suncor Energy, Inc. | | | 11,773,170 |
| | | | | |
| | | | | 38,331,536 |
| |
Pharmaceuticals 8.0% | | | |
| 1,091,400 | | Abbott Laboratories | | | 60,900,120 |
| 880,500 | | Novartis AG ADR (Switzerland) | | | 48,101,715 |
| 1,010,600 | | Roche Holding AG ADR (Switzerland)(b) | | | 89,438,100 |
| 699,600 | | Wyeth | | | 35,000,988 |
| | | | | |
| | | | | 233,440,923 |
| |
Semiconductors & Semiconductor Equipment 2.8% | | | |
| 1,313,600 | | Broadcom Corp. (Class A Stock)(a)(b) | | | 42,127,152 |
| 2,379,000 | | Marvell Technology Group Ltd.(a) | | | 39,990,990 |
| | | | | |
| | | | | 82,118,142 |
| |
Software 7.2% | | | |
| 2,265,900 | | Adobe Systems, Inc.(a)(b) | | | 94,488,030 |
| 537,900 | | Electronic Arts, Inc.(a)(b) | | | 27,088,644 |
| 2,621,600 | | Microsoft Corp.(b) | | | 73,063,992 |
| 344,600 | | SAP AG ADR (Germany)(b) | | | 15,386,390 |
| | | | | |
| | | | | 210,027,056 |
| |
Specialty Retail 2.5% | | | |
| 595,500 | | Best Buy Co., Inc. | | | 29,012,760 |
| 1,342,300 | | Lowe’s Cos., Inc.(b) | | | 42,269,027 |
| | | | | |
| | | | | 71,281,787 |
See Notes to Financial Statements.
| | |
| The Prudential Investment Portfolios, Inc./Jennison Growth Fund | | 9 |
Portfolio of Investments
as of March 31, 2007 (Unaudited) Cont’d.
| | | | | | |
| Shares | | Description | | Value (Note 1) | |
| | | | | | |
Textiles, Apparel & Luxury Goods 4.1% | | | | |
| 1,537,200 | | Coach, Inc.(a) | | $ | 76,936,860 | |
| 399,800 | | Nike, Inc. (Class B Stock)(b) | | | 42,482,748 | |
| | | | | | |
| | | | | 119,419,608 | |
| |
Wireless Telecommunication Services 1.6% | | | | |
| 626,000 | | NII Holdings, Inc.(a)(b) | | | 46,436,680 | |
| | | | | | |
| | Total long-term investments
(cost $2,182,138,023) | | | 2,890,214,618 | |
| | | | | | |
SHORT-TERM INVESTMENT 16.9% | | | | |
| |
Affiliated Money Market Mutual Fund | | | | |
| | Dryden Core Investment Fund - Taxable Money Market Series | | | | |
| | (cost $492,957,751; includes $475,776,676 of cash collateral | | | | |
| 492,957,751 | | received from securities on loan) (Note 3)(c)(d) | | | 492,957,751 | |
| | | | | | |
| | Total Investments 116.1%
(cost $2,675,095,774; Note 5) | | | 3,383,172,369 | |
| | Liabilities in excess of other assets (16.1%) | | | (468,856,921 | ) |
| | | | | | |
| | Net Assets 100.0% | | $ | 2,914,315,448 | |
| | | | | | |
The following abbreviation is used in portfolio descriptions:
ADR—American Depositary Receipt
| (a) | Non-income producing security. |
| (b) | All or portion of security on loan. The aggregate market value of such securities is $460,278,704; cash collateral of $475,776,676 (included in liabilities) was received with which the Fund purchased highly liquid short-term investments. |
| (c) | Represents security, or a portion thereof, purchased with cash collateral received for securities on loan. |
| (d) | Prudential Investment LLC, the manager of the Fund, also serves as manager of the Dryden Core Investment Fund-Taxable Money Market Series. |
See Notes to Financial Statements.
| | |
| 10 | | Visit our website at www.jennisondryden.com |
The industry classification of portfolio holdings and liabilities in excess of other assets shown as a percentage of net assets as of March 31, 2007 were as follows:
| | | |
Affiliated Money Market Mutual Fund | | 16.9 | % |
Pharmaceuticals | | 8.0 | |
Communications Equipment | | 7.5 | |
Software | | 7.2 | |
Internet Software & Services | | 6.4 | |
Biotechnology | | 5.7 | |
Media | | 5.4 | |
Capital Markets | | 5.1 | |
Computers & Peripherals | | 4.5 | |
Multiline Retail | | 4.5 | |
Health Care Equipment & Supplies | | 4.2 | |
Hotels, Restaurants & Leisure | | 4.1 | |
Textiles, Apparel & Luxury Goods | | 4.1 | |
Aerospace & Defense | | 3.7 | |
Household Products | | 3.4 | |
Insurance | | 2.8 | |
Semiconductors & Semiconductor Equipment | | 2.8 | |
Diversified Financial Services | | 2.6 | |
Specialty Retail | | 2.5 | |
Beverages | | 2.3 | |
Industrial Conglomerates | | 2.0 | |
Wireless Telecommunication Services | | 1.6 | |
Consumer Finance | | 1.4 | |
Chemicals | | 1.3 | |
Oil, Gas & Consumable Fuels | | 1.3 | |
IT Services | | 1.0 | |
Electronic Equipment & Instruments | | 0.9 | |
Energy Equipment & Services | | 0.9 | |
Electrical Equipment | | 0.8 | |
Health Care Providers & Services | | 0.8 | |
Food & Staples Retailing | | 0.4 | |
| | | |
| | 116.1 | |
Liabilities in excess of other assets | | (16.1 | ) |
| | | |
| | 100.0 | % |
| | | |
See Notes to Financial Statements.
| | |
| The Prudential Investment Portfolios, Inc./Jennison Growth Fund | | 11 |
Statement of Assets and Liabilities
as of March 31, 2007 (Unaudited)
| | | | |
Assets | | | | |
Investments at value, including securities on loan of $460,278,704: | | | | |
Unaffiliated investments (cost $2,182,138,023) | | $ | 2,890,214,618 | |
Affiliated investments (cost $492,957,751) | | | 492,957,751 | |
Cash | | | 54,627 | |
Receivable for Series shares sold | | | 20,982,589 | |
Receivable for investments sold | | | 18,574,700 | |
Dividends receivable | | | 3,618,459 | |
Foreign tax reclaim receivable | | | 631,357 | |
Prepaid expenses | | | 30,837 | |
| | | | |
Total assets | | | 3,427,064,938 | |
| | | | |
| |
Liabilities | | | | |
Payable to broker for collateral for securities on loan (Note 4) | | | 475,776,676 | |
Payable for investments purchased | | | 27,121,346 | |
Payable for Series shares reacquired | | | 6,010,829 | |
Management fee payable | | | 1,423,567 | |
Transfer agent fee payable | | | 941,837 | |
Accrued expenses | | | 906,179 | |
Distribution fee payable | | | 557,438 | |
Deferred directors’ fees | | | 11,618 | |
| | | | |
Total liabilities | | | 512,749,490 | |
| | | | |
| |
Net Assets | | $ | 2,914,315,448 | |
| | | | |
| | | | | |
Net assets were comprised of: | | | | |
Common stock, at par | | $ | 174,814 | |
Paid-in capital in excess of par | | | 3,681,600,927 | |
| | | | |
| | | 3,681,775,741 | |
Accumulated net investment loss | | | (179,306 | ) |
Accumulated net realized loss on investments and foreign currency transactions | | | (1,475,358,840 | ) |
Net unrealized appreciation on investments and foreign currencies | | | 708,077,853 | |
| | | | |
Net assets, March 31, 2007 | | $ | 2,914,315,448 | |
| | | | |
See Notes to Financial Statements.
| | |
| 12 | | Visit our website at www.jennisondryden.com |
| | | |
Class A | | | |
Net asset value and redemption price per share
($1,523,177,178 ÷ 91,575,099 shares of common stock issued and outstanding) | | $ | 16.63 |
Maximum sales charge (5.50% of offering price) | | | .97 |
| | | |
Maximum offering price to public | | $ | 17.60 |
| | | |
| |
Class B | | | |
Net asset value, offering price and redemption price per share
($193,709,827 ÷ 12,792,568 shares of common stock issued and outstanding) | | $ | 15.14 |
| | | |
| |
Class C | | | |
Net asset value, offering price and redemption price per share
($77,136,650 ÷ 5,093,964 shares of common stock issued and outstanding) | | $ | 15.14 |
| | | |
| |
Class R | | | |
Net asset value, offering price and redemption price per share
($2,278,265 ÷ 148,350 shares of common stock issued and outstanding) | | $ | 15.36 |
| | | |
| |
Class Z | | | |
Net asset value, offering price and redemption price per share
($1,118,013,528 ÷ 65,204,377 shares of common stock issued and outstanding) | | $ | 17.15 |
| | | |
See Notes to Financial Statements.
| | |
| The Prudential Investment Portfolios, Inc./Jennison Growth Fund | | 13 |
Statement of Operations
Six Months Ended March 31, 2007 (Unaudited)
| | | | |
Net Investment Loss | | | | |
Income | | | | |
Unaffiliated dividend income (net of foreign withholding taxes of $289,742) | | $ | 12,159,747 | |
Affiliated income from securities loaned, net | | | 2,084,165 | |
Affiliated dividend income | | | 582,063 | |
| | | | |
Total income | | | 14,825,975 | |
| | | | |
| |
Expenses | | | | |
Management fee | | | 8,628,613 | |
Distribution fee—Class A | | | 1,893,677 | |
Distribution fee—Class B | | | 1,146,567 | |
Distribution fee—Class C | | | 410,692 | |
Distribution fee—Class R | | | 2,808 | |
Transfer agent’s fee and expenses (including affiliated expense of $1,902,000) | | | 2,418,000 | |
Custodian’s fees and expenses | | | 159,000 | |
Reports to shareholders | | | 104,000 | |
Registration fees | | | 65,000 | |
Insurance | | | 43,000 | |
Directors’ fees | | | 35,000 | |
Legal fees and expenses | | | 16,000 | |
Loan interest expense (Note 2) | | | 13,555 | |
Interest expense | | | 11,995 | |
Audit fee | | | 8,000 | |
Commitment fees | | | 7,000 | |
Miscellaneous | | | 5,219 | |
| | | | |
Total expenses | | | 14,968,126 | |
| | | | |
Net investment loss | | | (142,151 | ) |
| | | | |
| |
Realized And Unrealized Gain (Loss) On Investments And Foreign Currencies | | | | |
Net realized gain (loss) on: | | | | |
Investment transactions | | | 155,570,358 | |
Foreign currency transactions | | | (58,602 | ) |
| | | | |
| | | 155,511,756 | |
| | | | |
Net change in unrealized appreciation (depreciation) on: | | | | |
Investments | | | 3,378,814 | |
Foreign currencies | | | 1,258 | |
| | | | |
| | | 3,380,072 | |
| | | | |
Net gain on investments and foreign currencies | | | 158,891,828 | |
| | | | |
Net Increase In Net Assets Resulting From Operations | | $ | 158,749,677 | |
| | | | |
See Notes to Financial Statements.
| | |
| 14 | | Visit our website at www.jennisondryden.com |
Statement of Changes in Net Assets
(Unaudited)
| | | | | | | | |
| | | Six Months
Ended
March 31, 2007 | | | Year
Ended
September 30, 2006 | |
Increase (Decrease) In Net Assets | | | | | | | | |
Operations | | | | | | | | |
Net investment loss | | $ | (142,151 | ) | | $ | (5,152,081 | ) |
Net realized gain on investments and foreign currency transactions | | | 155,511,756 | | | | 205,177,866 | |
Net change in unrealized appreciation (depreciation) on investments and foreign currencies | | | 3,380,072 | | | | (102,718,121 | ) |
| | | | | | | | |
Net increase in net assets resulting from operations | | | 158,749,677 | | | | 97,307,664 | |
| | | | | | | | |
| | |
Series share transactions (net of share conversions) (Note 6) | | | | | | | | |
Net proceeds from shares sold | | | 262,844,905 | | | | 815,349,963 | |
Cost of shares reacquired | | | (498,485,199 | ) | | | (1,120,617,856 | ) |
| | | | | | | | |
Net decrease in net assets from Series share transactions | | | (235,640,294 | ) | | | (305,267,893 | ) |
| | | | | | | | |
Total decrease | | | (76,890,617 | ) | | | (207,960,229 | ) |
| | |
Net Assets | | | | | | | | |
Beginning of period | | | 2,991,206,065 | | | | 3,199,166,294 | |
| | | | | | | | |
End of period | | $ | 2,914,315,448 | | | $ | 2,991,206,065 | |
| | | | | | | | |
See Notes to Financial Statements.
| | |
| The Prudential Investment Portfolios, Inc./Jennison Growth Fund | | 15 |
Notes to Financial Statements
(Unaudited)
The Prudential Investment Portfolios, Inc. (the “Company”) is registered under the Investment Company Act of 1940 as an open-end management investment company. The Company was incorporated in Maryland on August 10, 1995 and consists of six series: Jennison Growth Fund (the “Series”), Jennison Equity Opportunity Fund and Dryden Active Allocation Fund which are diversified funds and JennisonDryden Growth Allocation Fund, JennisonDryden Moderate Allocation Fund and JennisonDryden Conservative Allocation Fund which are non-diversified funds. These financial statements relate to the Jennison Growth Fund. The financial statements of the other series are not presented herein. The Series commenced investment operations on November 2, 1995.
The Series’ investment objective is to achieve long-term growth of capital. The Series seeks to achieve its objective by investing primarily in equity securities (common stock, preferred stock and securities convertible into common stock) of established companies with above-average growth prospects.
Note 1. Accounting Policies
The following is a summary of significant accounting policies followed by the Series in the preparation of its financial statements.
Securities Valuation: Securities listed on a securities exchange are valued at the last sale price on such exchange on the day of valuation or, if there was no sale on such day, at the mean between the last reported bid and asked prices, or at the last bid price on such day in the absence of an asked price. Securities traded via NASDAQ are valued at the NASDAQ official closing price (“NOCP”) on the day of valuation, or if there was no NOCP, at the last sale price. Securities that are actively traded in the over-the-counter market, including listed securities for which the primary market is believed by Prudential Investments LLC (“PI” or “Manager”), in consultation with the subadviser; to be over-the-counter, are valued at market value using prices provided by an independent pricing agent or principal market maker. Securities for which reliable market quotations are not readily available, or whose values have been effected by events occurring after the close of the security’s foreign market and before the Series’ normal pricing time, are valued at fair value in accordance with the Board of Directors’ approved fair valuation procedures. When determining the fair valuation of securities some of the factors influencing the valuation include, the nature of any restrictions on disposition of the securities; assessment of the general liquidity of the
| | |
| 16 | | Visit our website at www.jennisondryden.com |
securities; the issuer’s financial condition and the markets in which it does business; the cost of the investment; the size of the holding and the capitalization of issuer; the prices of any recent transactions or bids/offers for such securities or any comparable securities; any available analyst media or other reports or information deemed reliable by the investment adviser regarding the issuer or the markets or industry in which it operates. Using fair value to price securities may result in a value that is different from a security’s most recent closing price and from the price used by other mutual funds to calculate their net asset values. As of March 31, 2007, there were no securities valued in accordance with such procedures.
Investments in mutual funds are valued at the net asset value as of the close of the New York Stock Exchange on the date of valuation.
Short-term securities which mature in sixty days or less are valued at amortized cost, which approximates market value. The amortized cost method involves valuing a security at its cost on the date of purchase and thereafter assuming a constant amortization to maturity of the difference between the principal amount due at maturity and cost. Short-term securities which mature in more than sixty days are valued at current market quotations.
Securities Lending: The Series may lend its portfolio securities to qualified institutions. The loans are secured by collateral at least equal, at all times, to the market value of the securities loaned. The Series may bear the risk of delay in recovery of, or even loss of rights in, the securities loaned should the borrower of the securities fail financially. The Series receives compensation, net of any rebate, for lending its securities in the form of interest or dividends on the collateral received on the securities loaned, and any gain or loss in the market price of the securities loaned that may occur during the term of the loan.
Foreign Currency Translation: The books and records of the Series are maintained in U.S. dollars. Foreign currency amounts are translated into U.S. dollars on the following basis:
(i) market value of investment securities, other assets and liabilities-at the current rates of exchange;
(ii) purchases and sales of investment securities, income and expenses-at the rates of exchange prevailing on the respective dates of such transactions.
Although the net assets of the Series are presented at the foreign exchange rates and market values at the close of the fiscal period, the Series does not isolate that portion of the results of operations arising as a result of changes in the foreign exchange rates
| | |
| The Prudential Investment Portfolios, Inc./Jennison Growth Fund | | 17 |
Notes to Financial Statements
(Unaudited) Cont’d
from the fluctuations arising from changes in the market prices of long-term portfolio securities held at the end of the fiscal period. Similarly, the Series does not isolate the effect of changes in foreign exchange rates from the fluctuations arising from changes in the market prices of long-term portfolio securities sold during the fiscal period. Accordingly, these realized foreign currency gains or losses are included in the reported net realized gains or losses on investment transactions.
Net realized gains or losses on foreign currency transactions represent net foreign exchange gains or losses from the holding of foreign currencies, currency gains or losses realized between the trade date and settlement dates on security transactions, and the difference between the amounts of dividends, interest and foreign withholding taxes recorded on the Series’ books and the U.S. dollar equivalent amounts actually received or paid. Net unrealized currency gains or losses from valuing foreign currency denominated assets and liabilities (other than investments) at period end exchange rates are reflected as a component of net unrealized appreciation (depreciation) on foreign currencies.
Foreign security and currency transactions may involve certain considerations and risks not typically associated with those of domestic origin as a result of, among other factors, the possibility of political and economic instability and the level of governmental supervision and regulation of foreign securities markets.
Securities Transactions and Net Investment Income: Securities transactions are recorded on the trade date. Realized gains or losses on sales of securities are calculated on the identified cost basis. Dividend income is recorded on the ex-dividend date and interest income, including amortization of premium and accretion of discount on debt securities, as required, is recorded on the accrual basis.
Net investment income or loss (other than distribution fees which are charged directly to the respective class), realized and unrealized gains or losses, are allocated daily to each class of shares based upon the relative proportion of net assets of each class at the beginning of the day. The Company’s expenses are allocated to the respective Series on the basis of relative net assets except for expenses that are charged directly to the Series level.
Dividends and Distributions: The Series expects to pay dividends of net investment income, if any, semi-annually. Distributions of net realized capital and currency
| | |
| 18 | | Visit our website at www.jennisondryden.com |
gains, if any, annually. Dividends and distributions, which are determined in accordance with federal income tax regulations and which may differ from generally accepted accounting principles, are recorded on the ex-dividend date. Permanent book/tax differences relating to income and gains are reclassified amongst undistributed net investment income, accumulated net realized gain or loss and paid-in capital in excess of par, as appropriate.
Taxes: For federal income tax purposes, each Series in the Company is treated as a separate tax-paying entity. It is the Series’ policy to continue to meet the requirements of the Internal Revenue Code applicable to regulated investment companies and to distribute all of its taxable net income and capital gains, if any, to shareholders. Therefore, no federal income tax provision is required.
Withholding taxes on foreign dividends are recorded net of reclaimable amounts, at the time the related income is earned.
Estimates: The preparation of the financial statements requires management to make estimates and assumptions that affect the reported amounts and disclosures in the financial statements. Actual results could differ from those estimates.
Note 2. Agreements
The Company has a management agreement for the Series with PI. Pursuant to this agreement, PI has responsibility for all investment advisory services and supervises the subadvisor’s performance of such services. PI has entered into a subadvisory agreement with Jennison Associates LLC (“Jennison”). The subadvisory agreement provides that Jennison furnishes investment advisory services in connection with the management of the Series. In the connection therewith, Jennison is obligated to keep certain books and records of the Series. PI pays for the services of Jennison, the cost of compensation of officers and employees of the Series, occupancy and certain clerical and bookkeeping costs of the Series. The Series bears all other costs and expenses.
The management fee paid to PI is computed daily and payable monthly at an annual rate of .600 of 1% of the Series’ average daily net assets up to $300 million, .575 of 1% of the next $2.7 billion and .550 of 1% of the Series’ average daily net assets in excess of $3 billion. The effective management fee rate was .578 of 1% of the Series’ average daily net assets for the six months ended March 31, 2007.
The Series has a distribution agreement with Prudential Investment Management Services LLC (“PIMS”), which acts as the distributor of the Class A, Class B, Class C, Class R and Class Z shares of the Series. The Series compensates PIMS for distributing
| | |
| The Prudential Investment Portfolios, Inc./Jennison Growth Fund | | 19 |
Notes to Financial Statements
(Unaudited) Cont’d
and servicing the Series’ Class A, Class B, Class C and Class R shares, pursuant to plans of distribution (the “Class A, B, C and R Plans”), regardless of expenses actually incurred by PIMS. The distribution fees are accrued daily and payable monthly. No distribution or service fees are paid to PIMS as distributor of the Class Z shares of the Series.
Pursuant to the Class A, B, C and R Plans, the Series compensates PIMS for distribution related activities at an annual rate of up to .30 of 1%, 1%, 1% and .75 of 1% of the average daily net assets of the Class A, B, C and R shares, respectively. PIMS contractually agreed to limit such fees to .25 of 1% of the average daily net assets of the Class A shares and .50 of 1% of the average daily net assets of the Class R shares.
PIMS has advised the Series that it received approximately $209,500 in front-end sales charges resulting from sales of Class A shares during the six months ended March 31, 2007. From these fees, PIMS paid such sales charges to affiliated broker/dealers, which in turn paid commissions to salespersons and incurred other distribution costs.
PIMS has advised the Series that for the six months ended March 31, 2007, it received approximately $141,400 and $3,500 in contingent deferred sales charges imposed upon redemptions by certain Class B and C shareholders, respectively.
PI, PIMS and Jennison are indirect, wholly-owned subsidiaries of Prudential Financial, Inc. (“Prudential”).
The Series, along with other affiliated registered investment companies (the “Funds”), is a party to a Syndicated Credit Agreement (“SCA”) with two banks. The SCA provides for a commitment of $500 million. Interest on any borrowings under the SCA is incurred at contracted market rates and a commitment fee for the unused amount is accrued daily and paid quarterly. Effective October 27, 2006, the Funds renewed the SCA with the banks. The commitment under the renewed SCA continues to be $500 million. The Funds pay a commitment fee of .07 of 1% of the unused portion of the renewed SCA. The expiration date of the renewed SCA will be October 26, 2007. For the period October 29, 2005 through October 26, 2006, the Funds paid a commitment fee of .0725 of 1% of the unused portion of the agreement. The purpose of the SCA is to provide an alternative source of temporary funding for capital share redemption.
| | |
| 20 | | Visit our website at www.jennisondryden.com |
The Series utilized the line of credit during the six months ended March 31, 2007. The average balance is for the number of days the Fund had an outstanding balance.
| | | | |
Average Balance Outstanding | | Number of Days Outstanding | | Weighted Average Interest Rate |
| $3,698,600 | | 23 | | 5.7363% |
The Series did not have any loans outstanding at March 31, 2007.
Note 3. Other Transactions with Affiliates
Prudential Mutual Fund Services LLC (“PMFS”), an affiliate of PI and an indirect, wholly-owned subsidiary of Prudential, serves as the Series’ transfer agent. Transfer agent’s fees and expenses in the Statement of Operations include certain out-of-pocket expenses paid to non-affiliates, where applicable.
The Series pays networking fees to affiliated and unaffiliated broker/dealers. These networking fees are payments made to broker/dealers that clear mutual fund transactions through a national clearing system. First Clearing Corporation, an affiliate of PI, serves as broker/dealer. For the six months ended March 31, 2007, the Series incurred approximately $477,600 in total networking fees. These amounts are included in transfer agent’s fees and expenses in the Statement of Operations.
For the six months ended March 31, 2007, Prudential Equity Group, LLC, an indirect, wholly-owned subsidiary of Prudential, earned approximately $3,500 in broker commissions from portfolio transactions executed on behalf of the Series.
Prudential Investment Management, Inc. (“PIM”), an indirect, wholly-owned subsidiary of Prudential, is the Series’ security lending agent. For the six months ended March 31, 2007, PIM has been compensated approximately $893,200 for these services.
The Series invests in the Taxable Money Market Series (the “Portfolio”), a portfolio of the Dryden Core Investment Fund, pursuant to an exemptive order received from the Securities and Exchange Commission. The portfolio is a money market mutual fund registered under the Investment Company Act of 1940, as amended, and managed by PI.
Note 4. Portfolio Securities
Purchases and sales of investment securities, other than short-term investments, for the six months ended March 31, 2007 were $959,869,260 and $1,219,313,329, respectively.
| | |
| The Prudential Investment Portfolios, Inc./Jennison Growth Fund | | 21 |
Notes to Financial Statements
(Unaudited) Cont’d
Note 5. Tax Information
The United States federal income tax basis of the Series’ investments and net unrealized appreciation as of March 31, 2007 were as follows:
| | | | | | |
Tax Basis | | Appreciation | | Depreciation | | Net Unrealized
Appreciation |
| $2,695,767,900 | | $707,849,677 | | $(20,445,208) | | $687,404,469 |
The differences between book and tax basis are primarily attributable to deferred losses on wash sales.
For federal income tax purposes, the Series had a capital loss carryforward as of September 30, 2006 of approximately $1,609,198,000 of which $713,580,000 expires in 2010, $827,428,000 expires in 2011 and $68,190,000 expires in 2012. In addition, the Series utilized approximately $185,420,000 of its prior year capital loss carryforward to offset net taxable gains realized in the fiscal year ended September 30, 2006. Accordingly, no capital gains distribution is expected to be paid to shareholders until net gains have been realized in excess of such amounts. The Series has elected to treat post-October currency losses of approximately $25,000 incurred in the eleven months ended September 30, 2006 as having been incurred in the next fiscal year.
Note 6. Capital
The Series offers Class A, Class B, Class C, Class R and Class Z shares. Class A shares are subject to a maximum front-end sales charge of 5.50%. Investors who purchase Class A shares in an amount of $1 million or more and sell these shares within 12 months of purchase are not subject to an initial sales charge but are subject to a contingent deferred sales charge (CDSC) of 1%, including investors who purchase their shares through broker-dealers affiliated with Prudential. Class B shares are subject to a CDSC of 5%, which decreases by 1% annually to 1% in the fifth and sixth years and 0% in the seventh year. The CDSC for Class C shares is 1% for shares redeemed within 12 months of purchase. Class B shares automatically convert to Class A shares on a quarterly basis approximately seven years after purchase. A special exchange privilege is also available for shareholders who qualified to purchase Class A shares at net asset value. Class R and Class Z shares are not subject to any sales or redemption charge and are offered exclusively for sale to a limited group of investors.
| | |
| 22 | | Visit our website at www.jennisondryden.com |
There are 6.25 billion shares of $.001 par value common stock of the Company authorized which are divided into six series. There are 1.25 billion shares authorized for the Series divided into five classes, designated Class A, Class B, Class C, Class R and Class Z, each of which consists of 208,333,333 million authorized shares. The Series also may offer Class I shares, of which 208,333,333 million shares are authorized, but none are currently issued and outstanding. As of March 31, 2007, Prudential Investments Fund Management LLC owned 8 Class A shares and 193 Class R shares of the Series.
Transactions in shares of common stock were as follows:
| | | | | | | |
Class A | | Shares | | | Amount | |
Six months ended March 31, 2007: | | | | | | | |
Shares sold | | 8,619,552 | | | $ | 141,951,579 | |
Shares reacquired | | (13,259,790 | ) | | | (218,708,060 | ) |
| | | | | | | |
Net increase (decrease) in shares outstanding before conversion | | (4,640,238 | ) | | | (76,756,481 | ) |
Shares issued upon conversion from Class B | | 2,330,458 | | | | 38,438,336 | |
| | | | | | | |
Net increase (decrease) in shares outstanding | | (2,309,780 | ) | | $ | (38,318,145 | ) |
| | | | | | | |
Year ended September 30, 2006: | | | | | | | |
Shares sold | | 30,179,573 | | | $ | 482,718,582 | |
Shares reacquired | | (30,064,684 | ) | | | (468,190,279 | ) |
| | | | | | | |
Net increase (decrease) in shares outstanding before conversion | | 114,889 | | | | 14,528,303 | |
Shares issued upon conversion from Class B | | 5,706,729 | | | | 88,832,209 | |
| | | | | | | |
Net increase (decrease) in shares outstanding | | 5,821,618 | | | $ | 103,360,512 | |
| | | | | | | |
Class B | | | | | | |
Six months ended March 31, 2007: | | | | | | | |
Shares sold | | 397,673 | | | $ | 5,962,851 | |
Shares reacquired | | (1,961,905 | ) | | | (29,444,811 | ) |
| | | | | | | |
Net increase (decrease) in shares outstanding before conversion | | (1,564,232 | ) | | | (23,481,960 | ) |
Shares reacquired upon conversion into Class A | | (2,557,044 | ) | | | (38,438,336 | ) |
| | | | | | | |
Net increase (decrease) in shares outstanding | | (4,121,276 | ) | | $ | (61,920,296 | ) |
| | | | | | | |
Year ended September 30, 2006: | | | | | | | |
Shares sold | | 1,246,990 | | | $ | 18,234,865 | |
Shares reacquired | | (4,472,560 | ) | | | (64,515,718 | ) |
| | | | | | | |
Net increase (decrease) in shares outstanding before conversion | | (3,225,570 | ) | | | (46,280,853 | ) |
Shares reacquired upon conversion into Class A | | (6,226,270 | ) | | | (88,832,209 | ) |
| | | | | | | |
Net increase (decrease) in shares outstanding | | (9,451,840 | ) | | $ | (135,113,062 | ) |
| | | | | | | |
| | |
| The Prudential Investment Portfolios, Inc./Jennison Growth Fund | | 23 |
Notes to Financial Statements
(Unaudited) Cont’d
| | | | | | | |
Class C | | Shares | | | Amount | |
Six months ended March 31, 2007: | | | | | | | |
Shares sold | | 359,189 | | | $ | 5,385,039 | |
Shares reacquired | | (1,028,158 | ) | | | (15,465,671 | ) |
| | | | | | | |
Net increase (decrease) in shares outstanding | | (668,969 | ) | | $ | (10,080,632 | ) |
| | | | | | | |
Year ended September 30, 2006: | | | | | | | |
Shares sold | | 1,274,795 | | | $ | 18,683,730 | |
Shares reacquired | | (1,628,475 | ) | | | (23,497,600 | ) |
| | | | | | | |
Net increase (decrease) in shares outstanding | | (353,680 | ) | | $ | (4,813,870 | ) |
| | | | | | | |
Class R | | | | | | |
Six months ended March 31, 2007: | | | | | | | |
Shares sold | | 146,643 | | | $ | 2,242,616 | |
Shares reacquired | | (10,578 | ) | | | (162,983 | ) |
| | | | | | | |
Net increase (decrease) in shares outstanding | | 136,065 | | | $ | 2,079,633 | |
| | | | | | | |
Year ended September 30, 2006: | | | | | | | |
Shares sold | | 14,438 | | | $ | 213,159 | |
Shares reacquired | | (2,346 | ) | | | (34,136 | ) |
| | | | | | | |
Net increase (decrease) in shares outstanding | | 12,092 | | | $ | 179,023 | |
| | | | | | | |
Class Z | | | | | | |
Six months ended March 31, 2007: | | | | | | | |
Shares sold | | 6,318,620 | | | $ | 107,302,820 | |
Shares reacquired | | (13,850,112 | ) | | | (234,703,674 | ) |
| | | | | | | |
Net increase (decrease) in shares outstanding | | (7,531,492 | ) | | $ | (127,400,854 | ) |
| | | | | | | |
Year ended September 30, 2006: | | | | | | | |
Shares sold | | 18,239,433 | | | $ | 295,499,627 | |
Shares reacquired | | (34,137,694 | ) | | | (564,380,123 | ) |
| | | | | | | |
Net increase (decrease) in shares outstanding | | (15,898,261 | ) | | $ | (268,880,496 | ) |
| | | | | | | |
Note 7. New Accounting Pronouncements
On July 13, 2006, the Financial Accounting Standards Board (FASB) released FASB Interpretation No. 48 “Accounting for Uncertainty in Income Taxes” (FIN 48). FIN 48 provides guidance for how uncertain tax positions should be recognized, measured, presented and disclosed in the financial statements. FIN 48 requires the evaluation of tax positions taken or expected to be taken in the course of preparing the Fund’s tax returns to determine whether the tax positions are “more-likely-than-not” of being
| | |
| 24 | | Visit our website at www.jennisondryden.com |
sustained by the applicable tax authority. Tax benefits or expenses resulting from tax positions not deemed to meet the more-likely-than-not threshold would be recorded in the year in which they arise. On December 22, 2006, the Securities and Exchange Commission delayed the effective date until the last net asset value calculation in the first required financial reporting period for its fiscal year beginning after December 15, 2006. At this time, management is evaluating the implications of FIN 48 and its impact, if any, in the financial statements has not yet been determined.
On September 20, 2006, the FASB released Statement of Financial Accounting Standards No. 157 “Fair Value Measurements” (FAS 157). FAS 157 establishes an authoritative definition of fair value, sets out a framework for measuring fair value, and requires additional disclosures about fair-value measurements. The application of FAS 157 is required for fiscal years beginning after November 15, 2007 and interim periods within those fiscal years. At this time, management is evaluating the implications of FAS 157 and its impact, if any, in the financial statements has not yet been determined.
| | |
| The Prudential Investment Portfolios, Inc./Jennison Growth Fund | | 25 |
Financial Highlights
(Unaudited)
| | | | |
| | | Class A | |
| | | Six Months Ended
March 31, 2007 | |
Per Share Operating Performance: | | | | |
Net Asset Value, Beginning Of Period | | $ | 15.78 | |
| | | | |
Income (loss) from investment operations: | | | | |
Net investment income (loss)(a) | | | — | (b) |
Net realized and unrealized gain (loss) on investment and foreign currency transactions | | | .85 | |
| | | | |
Total from investment operations | | | .85 | |
| | | | |
Net asset value, end of period | | $ | 16.63 | |
| | | | |
Total Return(c): | | | 5.39 | % |
Ratios/Supplemental Data: | | | | |
Net assets, end of period (000) | | $ | 1,523,177 | |
Average net assets (000) | | $ | 1,519,104 | |
Ratios to average net assets: | | | | |
Expenses, including distribution and service (12b-1) fees(d) | | | 1.02 | %(e) |
Expenses, excluding distribution and service (12b-1) fees | | | .77 | %(e) |
Net investment income (loss) | | | (.03 | )%(e) |
For Class A, B, C, R and Z shares: | | | | |
Portfolio turnover rate | | | 32 | %(f) |
| (a) | Calculated based upon average shares outstanding during the period. |
| (b) | Less than $.005 per share. |
| (c) | Total return does not consider the effects of sales loads. Total return is calculated assuming a purchase of shares on the first day and a sale on the last day of each period reported, and includes reinvestment of dividends and distributions. Total returns for periods less than a full year are not annualized. |
| (d) | The distributor of the Series has contractually agreed to limit its distribution and service (12b-1) fees to .25 of 1% of the average daily net assets of the Class A shares. |
See Notes to Financial Statements.
| | |
| 26 | | Visit our website at www.jennisondryden.com |
| | | | | | | | | | | | | | | | | | |
| Class A | |
| Year Ended September 30, | |
| 2006 | | | 2005 | | | 2004 | | | 2003 | | | 2002 | |
| | | | | | | | | | | | | | | | | | |
| $ | 15.31 | | | $ | 12.84 | | | $ | 11.77 | | | $ | 9.73 | | | $ | 12.50 | |
| | | | | | | | | | | | | | | | | | | |
| | | | | | | | | | | | | | | | | | |
| | (.03 | ) | | | .01 | | | | (.04 | ) | | | (.02 | ) | | | (.04 | ) |
| | .50 | | | | 2.46 | | | | 1.11 | | | | 2.06 | | | | (2.73 | ) |
| | | | | | | | | | | | | | | | | | | |
| | .47 | | | | 2.47 | | | | 1.07 | | | | 2.04 | | | | (2.77 | ) |
| | | | | | | | | | | | | | | | | | | |
| $ | 15.78 | | | $ | 15.31 | | | $ | 12.84 | | | $ | 11.77 | | | $ | 9.73 | |
| | | | | | | | | | | | | | | | | | | |
| | 3.07 | % | | | 19.24 | % | | | 9.09 | % | | | 20.97 | % | | | (22.16 | )% |
| | | | | | | | | | | | | | | | | | |
| $ | 1,481,913 | | | $ | 1,348,039 | | | $ | 1,200,078 | | | $ | 1,134,839 | | | $ | 1,011,241 | |
| $ | 1,393,481 | | | $ | 1,258,500 | | | $ | 1,237,249 | | | $ | 1,034,231 | | | $ | 1,358,013 | |
| | | | | | | | | | | | | | | | | | |
| | 1.04 | % | | | 1.06 | % | | | 1.05 | % | | | 1.17 | % | | | 1.08 | % |
| | .79 | % | | | .81 | % | | | .80 | % | | | .92 | % | | | .83 | % |
| | (.18 | )% | | | .04 | % | | | (.27 | )% | | | (.21 | )% | | | (.28 | )% |
| | | | | | | | | | | | | | | | | | |
| | 72 | % | | | 57 | % | | | 68 | % | | | 64 | % | | | 71 | % |
See Notes to Financial Statements.
| | |
| The Prudential Investment Portfolios, Inc./Jennison Growth Fund | | 27 |
Financial Highlights
(Unaudited) Cont’d
| | | | |
| | | Class B | |
| | | Six Months Ended
March 31, 2007 | |
Per Share Operating Performance: | | | | |
Net Asset Value, Beginning Of Period | | $ | 14.42 | |
| | | | |
Income (loss) from investment operations: | | | | |
Net investment loss(a) | | | (.06 | ) |
Net realized and unrealized gain (loss) on investment and foreign currency transactions | | | .78 | |
| | | | |
Total from investment operations | | | .72 | |
| | | | |
Net asset value, end of period | | $ | 15.14 | |
| | | | |
Total Return(b): | | | 4.99 | % |
Ratios/Supplemental Data: | | | | |
Net assets, end of period (000) | | $ | 193,710 | |
Average net assets (000) | | $ | 229,943 | |
Ratios to average net assets: | | | | |
Expenses, including distribution and service (12b-1) fees | | | 1.77 | %(c) |
Expenses, excluding distribution and service (12b-1) fees | | | .77 | %(c) |
Net investment loss | | | (.78 | )%(c) |
| (a) | Calculated based upon average shares outstanding during the period. |
| (b) | Total return does not consider the effects of sales loads. Total return is calculated assuming a purchase of shares on the first day and a sale on the last day of each period reported, and includes reinvestment of dividends and distributions. Total returns for periods less than a full year are not annualized. |
See Notes to Financial Statements.
| | |
| 28 | | Visit our website at www.jennisondryden.com |
| | | | | | | | | | | | | | | | | | |
| Class B | |
| Year Ended September 30, | |
| 2006 | | | 2005 | | | 2004 | | | 2003 | | | 2002 | |
| | | | | | | | | | | | | | | | | | |
| $ | 14.09 | | | $ | 11.90 | | | $ | 11.00 | | | $ | 9.16 | | | $ | 11.86 | |
| | | | | | | | | | | | | | | | | | | |
| | | | | | | | | | | | | | | | | | |
| | (.13 | ) | | | (.09 | ) | | | (.12 | ) | | | (.10 | ) | | | (.13 | ) |
| | .46 | | | | 2.28 | | | | 1.02 | | | | 1.94 | | | | (2.57 | ) |
| | | | | | | | | | | | | | | | | | | |
| | .33 | | | | 2.19 | | | | .90 | | | | 1.84 | | | | (2.70 | ) |
| | | | | | | | | | | | | | | | | | | |
| $ | 14.42 | | | $ | 14.09 | | | $ | 11.90 | | | $ | 11.00 | | | $ | 9.16 | |
| | | | | | | | | | | | | | | | | | | |
| | 2.34 | % | | | 18.40 | % | | | 8.18 | % | | | 20.09 | % | | | (22.77 | )% |
| | | | | | | | | | | | | | | | | | |
| $ | 243,951 | | | $ | 371,561 | | | $ | 481,876 | | | $ | 565,727 | | | $ | 653,338 | |
| $ | 322,042 | | | $ | 439,078 | | | $ | 560,217 | | | $ | 602,105 | | | $ | 1,007,499 | |
| | | | | | | | | | | | | | | | | | |
| | 1.79 | % | | | 1.81 | % | | | 1.80 | % | | | 1.92 | % | | | 1.83 | % |
| | .79 | % | | | .81 | % | | | .80 | % | | | .92 | % | | | .83 | % |
| | (.91 | )% | | | (.66 | )% | | | (1.02 | )% | | | (.95 | )% | | | (1.03 | )% |
See Notes to Financial Statements.
| | |
| The Prudential Investment Portfolios, Inc./Jennison Growth Fund | | 29 |
Financial Highlights
(Unaudited) Cont’d
| | | | |
| | | Class C | |
| | | Six Months Ended
March 31, 2007 | |
Per Share Operating Performance: | | | | |
Net Asset Value, Beginning Of Period | | $ | 14.42 | |
| | | | |
Income (loss) from investment operations: | | | | |
Net investment loss(a) | | | (.06 | ) |
Net realized and unrealized gain (loss) on investment and foreign currency transactions | | | .78 | |
| | | | |
Total from investment operations | | | .72 | |
| | | | |
Net asset value, end of period | | $ | 15.14 | |
| | | | |
Total Return(b): | | | 4.99 | % |
Ratios/Supplemental Data: | | | | |
Net assets, end of period (000) | | $ | 77,137 | |
Average net assets (000) | | $ | 82,364 | |
Ratios to average net assets: | | | | |
Expenses, including distribution and service (12b-1) fees | | | 1.77 | %(c) |
Expenses, excluding distribution and service (12b-1) fees | | | .77 | %(c) |
Net investment loss | | | (.78 | )%(c) |
| (a) | Calculated based upon average shares outstanding during the period. |
| (b) | Total return does not consider the effects of sales loads. Total return is calculated assuming a purchase of shares on the first day and a sale on the last day of each period reported, and includes reinvestment of dividends and distributions. Total returns for periods less than a full year are not annualized. |
See Notes to Financial Statements.
| | |
| 30 | | Visit our website at www.jennisondryden.com |
| | | | | | | | | | | | | | | | | | |
| Class C | |
| Year Ended September 30, | |
| 2006 | | | 2005 | | | 2004 | | | 2003 | | | 2002 | |
| | | | | | | | | | | | | | | | | | |
| $ | 14.09 | | | $ | 11.90 | | | $ | 11.00 | | | $ | 9.16 | | | $ | 11.86 | |
| | | | | | | | | | | | | | | | | | | |
| | | | | | | | | | | | | | | | | | |
| | (.14 | ) | | | (.08 | ) | | | (.12 | ) | | | (.10 | ) | | | (.13 | ) |
| | .47 | | | | 2.27 | | | | 1.02 | | | | 1.94 | | | | (2.57 | ) |
| | | | | | | | | | | | | | | | | | | |
| | .33 | | | | 2.19 | | | | .90 | | | | 1.84 | | | | (2.70 | ) |
| | | | | | | | | | | | | | | | | | | |
| $ | 14.42 | | | $ | 14.09 | | | $ | 11.90 | | | $ | 11.00 | | | $ | 9.16 | |
| | | | | | | | | | | | | | | | | | | |
| | 2.34 | % | | | 18.40 | % | | | 8.18 | % | | | 20.09 | % | | | (22.77 | )% |
| | | | | | | | | | | | | | | | | | |
| $ | 83,123 | | | $ | 86,198 | | | $ | 96,253 | | | $ | 106,850 | | | $ | 103,956 | |
| $ | 87,385 | | | $ | 91,313 | | | $ | 107,401 | | | $ | 105,518 | | | $ | 159,096 | |
| | | | | | | | | | | | | | | | | | |
| | 1.79 | % | | | 1.81 | % | | | 1.80 | % | | | 1.92 | % | | | 1.83 | % |
| | .79 | % | | | .81 | % | | | .80 | % | | | .92 | % | | | .83 | % |
| | (.99 | )% | | | (.61 | )% | | | (1.02 | )% | | | (.96 | )% | | | (1.03 | )% |
See Notes to Financial Statements.
| | |
| The Prudential Investment Portfolios, Inc./Jennison Growth Fund | | 31 |
Financial Highlights
(Unaudited) Cont’d
| | | | |
| | | Class R | |
| |
| | | Six Months Ended
March 31, 2007 | |
Per Share Operating Performance: | | | | |
Net Asset Value, Beginning Of Period | | $ | 14.59 | |
| | | | |
Income (loss) from investment operations: | | | | |
Net investment loss(b) | | | (.01 | ) |
Net realized and unrealized gain on investment and foreign currency transactions | | | .78 | |
| | | | |
Total from investment operations | | | .77 | |
| | | | |
Net asset value, end of period | | $ | 15.36 | |
| | | | |
Total Return(c): | | | 5.28 | % |
Ratios/Supplemental Data: | | | | |
Net assets, end of period (000) | | $ | 2,278 | |
Average net assets (000) | | $ | 1,126 | |
Ratios to average net assets: | | | | |
Expenses, including distribution and service (12b-1) fees(e) | | | 1.27 | %(f) |
Expenses, excluding distribution and service (12b-1) fees | | | .77 | %(f) |
Net investment loss | | | (.11 | )%(f) |
| (a) | Inception date of Class R shares. |
| (b) | Calculated based upon average shares outstanding during the period. |
| (c) | Total return is calculated assuming a purchase of shares on the first day and a sale on the last day of each period reported, and includes reinvestment of dividends and distributions. Total returns for periods less than a full year are not annualized. |
| (d) | Amount is actual and not rounded. |
| (e) | The distributor of the Series has contractually agreed to limit its distribution and service (12b-1) fees to .50 of 1% of the average daily net assets of the Class R shares. |
See Notes to Financial Statements.
| | |
| 32 | | Visit our website at www.jennisondryden.com |
| | | | | | |
| Class R | |
Year Ended
September 30, 2006 | | | December 17, 2004(a)
Through
September 30, 2005 | |
| | | | | | |
| $ | 14.15 | | | $ | 12.97 | |
| | | | | | | |
| | | | | | |
| | (.06 | ) | | | (.05 | ) |
| | .50 | | | | 1.23 | |
| | | | | | | |
| | .44 | | | | 1.18 | |
| | | | | | | |
| $ | 14.59 | | | $ | 14.15 | |
| | | | | | | |
| | 3.11 | % | | | 9.10 | % |
| | | | | | |
| $ | 179,270 | (d) | | $ | 2,727 | (d) |
| $ | 54,657 | (d) | | $ | 2,528 | (d) |
| | | | | | |
| | 1.29 | % | | | 1.31 | %(f) |
| | .79 | % | | | .81 | %(f) |
| | (.47 | )% | | | (.52 | )%(f) |
See Notes to Financial Statements.
| | |
| The Prudential Investment Portfolios, Inc./Jennison Growth Fund | | 33 |
Financial Highlights
(Unaudited) Cont’d
| | | | |
| | | Class Z | |
| | | Six Months Ended
March 31, 2007 | |
Per Share Operating Performance: | | | | |
Net Asset Value, Beginning Of Period | | $ | 16.25 | |
| | | | |
Income (loss) from investment operations: | | | | |
Net investment income (loss)(a) | | | .02 | |
Net realized and unrealized gain (loss) on investment and foreign currency transactions | | | .88 | |
| | | | |
Total from investment operations | | | .90 | |
| | | | |
Net asset value, end of period | | $ | 17.15 | |
| | | | |
Total Return(c): | | | 5.54 | % |
Ratios/Supplemental Data: | | | | |
Net assets, end of period (000) | | $ | 1,118,013 | |
Average net assets (000) | | $ | 1,163,921 | |
Ratios to average net assets: | | | | |
Expenses, including distribution and service (12b-1) fees | | | .77 | %(d) |
Expenses, excluding distribution and service (12b-1) fees | | | .77 | %(d) |
Net investment income (loss) | | | .22 | %(d) |
| (a) | Calculated based upon average shares outstanding during the period. |
| (b) | Less than $.005 per share. |
| (c) | Total return is calculated assuming a purchase of shares on the first day and a sale on the last day of each period reported, and includes reinvestment of dividends and distributions. Total returns for periods less than a full year are not annualized. |
See Notes to Financial Statements.
| | |
| 34 | | Visit our website at www.jennisondryden.com |
| | | | | | | | | | | | | | | | | | |
| Class Z | |
| Year Ended September 30, | |
| 2006 | | | 2005 | | | 2004 | | | 2003 | | | 2002 | |
| | | | | | | | | | | | | | | | | | |
| $ | 15.72 | | | $ | 13.15 | | | $ | 12.03 | | | $ | 9.92 | | | $ | 12.71 | |
| | | | | | | | | | | | | | | | | | | |
| | | | | | | | | | | | | | | | | | |
| | .01 | | | | .04 | | | | — | (b) | | | — | (b) | | | — | (b) |
| | .52 | | | | 2.53 | | | | 1.12 | | | | 2.11 | | | | (2.79 | ) |
| | | | | | | | | | | | | | | | | | | |
| | .53 | | | | 2.57 | | | | 1.12 | | | | 2.11 | | | | (2.79 | ) |
| | | | | | | | | | | | | | | | | | | |
| $ | 16.25 | | | $ | 15.72 | | | $ | 13.15 | | | $ | 12.03 | | | $ | 9.92 | |
| | | | | | | | | | | | | | | | | | | |
| | 3.37 | % | | | 19.54 | % | | | 9.31 | % | | | 21.27 | % | | | (21.95 | )% |
| | | | | | | | | | | | | | | | | | |
| $ | 1,182,040 | | | $ | 1,393,365 | | | $ | 1,274,544 | | | $ | 1,360,076 | | | $ | 1,108,026 | |
| $ | 1,305,889 | | | $ | 1,324,754 | | | $ | 1,441,730 | | | $ | 1,226,178 | | | $ | 1,545,628 | |
| | | | | | | | | | | | | | | | | | |
| | .79 | % | | | .81 | % | | | .80 | % | | | .92 | % | | | .83 | % |
| | .79 | % | | | .81 | % | | | .80 | % | | | .92 | % | | | .83 | % |
| | .08 | % | | | .28 | % | | | (.02 | )% | | | .03 | % | | | (.03 | )% |
See Notes to Financial Statements.
| | |
| The Prudential Investment Portfolios, Inc./Jennison Growth Fund | | 35 |
| | | | |
| n MAIL | | n TELEPHONE | | n WEBSITE |
Gateway Center Three 100 Mulberry Street Newark, NJ 07102 | | (800) 225-1852 | | www.jennisondryden.com |
|
| PROXY VOTING |
| The Board of Directors of the Fund has delegated to the Fund’s investment subadviser the responsibility for voting any proxies and maintaining proxy recordkeeping with respect to the Fund. A description of these proxy voting policies and procedures is available without charge, upon request, by calling (800) 225-1852 or by visiting the Securities and Exchange Commission’s website at www.sec.gov. Information regarding how the Fund voted proxies relating to portfolio securities during the most recent 12-month period ended June 30 is available on the Fund’s website and on the Commission’s website. |
|
| DIRECTORS |
| Linda W. Bynoe • David E.A. Carson • Robert F. Gunia • Robert E. La Blanc • Douglas H. McCorkindale • Richard A. Redeker • Judy A. Rice • Robin B. Smith • Stephen G. Stoneburn • Clay T. Whitehead |
|
| OFFICERS |
Judy A. Rice, President • Robert F. Gunia, Vice President • Grace C. Torres, Treasurer and Principal Financial and Accounting Officer • Kathryn L. Quirk, Chief Legal Officer • Deborah A. Docs, Secretary • Lee D. Augsburger, Chief Compliance Officer • Valerie Simpson, Deputy Chief Compliance Officer • Noreen M. Fierro, Anti-Money Laundering Compliance Officer • Jonathan D. Shain, Assistant Secretary • Claudia DiGiacomo, Assistant Secretary • John P. Schwartz, Assistant Secretary • Andrew R. French, Assistant Secretary • M. Sadiq Peshimam, Assistant Treasurer |
| | | | |
| MANAGER | | Prudential Investments LLC | | Gateway Center Three
100 Mulberry Street
Newark, NJ 07102 |
|
| INVESTMENT SUBADVISER | | Jennison Associates LLC | | 466 Lexington Avenue
New York, NY 10017 |
|
| DISTRIBUTOR | | Prudential Investment
Management Services LLC | | Gateway Center Three
100 Mulberry Street
Newark, NJ 07102 |
|
| CUSTODIAN | | The Bank of New York | | One Wall Street
New York, NY 10286 |
|
| TRANSFER AGENT | | Prudential Mutual Fund
Services LLC | | PO Box 8098
Philadelphia, PA 19176 |
|
INDEPENDENT REGISTERED
PUBLIC ACCOUNTING FIRM | | KPMG LLP | | 345 Park Avenue
New York, NY 10154 |
|
| FUND COUNSEL | | Sullivan & Cromwell LLP | | 125 Broad Street
New York, NY 10004 |
|
| An investor should consider the investment objectives, risks, charges, and expenses of the Fund carefully before investing. The prospectus for the Fund contains this and other information about the Fund. An investor may obtain a prospectus by visiting our website at www.jennisondryden.com or by calling (800) 225-1852. The prospectus should be read carefully before investing. |
|
| E-DELIVERY |
| To receive your mutual fund documents on-line, go to www.icsdelivery.com/prudential/funds and enroll. Instead of receiving printed documents by mail, you will receive notification via e-mail when new materials are available. You can cancel your enrollment or change your e-mail address at any time by clicking on the change/cancel enrollment option at the icsdelivery website address. |
|
| SHAREHOLDER COMMUNICATIONS WITH DIRECTORS |
| Shareholders can communicate directly with the Board of Directors by writing to the Chair of the Board, Jennison Growth Fund, Prudential Investments, Attn: Board of Directors, 100 Mulberry Street, Gateway Center Three, Newark, NJ 07102. Shareholders can communicate directly with an individual Director by writing to the same address. Communications are not screened before being delivered to the addressee. |
|
| AVAILABILITY OF PORTFOLIO SCHEDULE |
| The Fund files its complete schedule of portfolio holdings with the Securities and Exchange Commission for the first and third quarters of each fiscal year on Form N-Q under The Prudential Investment Portfolios, Inc. name. The Fund’s Forms N-Q are available on the Commission’s website at www.sec.gov. The Fund’s Forms N-Q may also be reviewed and copied at the Commission’s Public Reference Room in Washington, D.C. Information on the operation and location of the Public Reference Room may be obtained by calling (800) SEC-0330 (732-0330). The Fund’s schedule of portfolio holdings is also available on the Fund’s website as of the end of each fiscal quarter. |
Mutual Funds:
| | | | |
ARE NOT INSURED BY THE FDIC OR ANY
FEDERAL GOVERNMENT AGENCY | | MAY LOSE VALUE | | ARE NOT A DEPOSIT OF OR GUARANTEED
BY ANY BANK OR ANY BANK AFFILIATE |

| | | | | | | | | | | | | | |
| Jennison Growth Fund | | |
| | | Share Class | | A | | B | | C | | R | | Z | | |
| | NASDAQ | | PJFAX | | PJFBX | | PJFCX | | JGRCR | | PJFZX | | |
| | CUSIP | | 74437E107 | | 74437E206 | | 74437E305 | | 74437E651 | | 74437E404 | | |
| | | | | | | | | | | | | | |
MF168E2 IFS-A133582 Ed. 05/2007

Jennison Equity Opportunity Fund
| | |
| MARCH 31, 2007 | | SEMIANNUAL REPORT |

FUND TYPE
Small-, mid-, and large-capitalization stock
OBJECTIVE
Long-term growth of capital
This report is not authorized for distribution to prospective investors unless preceded or accompanied by a current prospectus.
The views expressed in this report and information about the Fund’s portfolio holdings are for the period covered by this report and are subject to change thereafter.
The accompanying financial statements as of March 31, 2007, were not audited, and accordingly, no auditor’s opinion is expressed on them.
JennisonDryden is a registered trademark of The Prudential Insurance Company of America.

May 16, 2007
Dear Shareholder:
We hope you find the semiannual report for the Jennison Equity Opportunity Fund informative and useful. As a JennisonDryden mutual fund shareholder, you may be thinking about where you can find additional growth opportunities. You could invest in last year’s top-performing asset class and hope history repeats itself or you could stay in cash while waiting for the “right moment” to invest.
We believe it is better to take advantage of developing domestic and global investment opportunities through a diversified portfolio of stock and bond mutual funds. A diversified asset allocation offers two potential advantages. It helps you manage downside risk by not being overly exposed to any particular asset class, plus it gives you a better opportunity to have at least some of your assets in the right place at the right time. Your financial professional can help you create a diversified investment plan that may include mutual funds covering all the basic asset classes and that reflects your personal investor profile and tolerance for risk.
JennisonDryden Mutual Funds gives you a wide range of choices that can help you make progress toward your financial goals. Our funds offer the experience, resources, and professional discipline of four leading asset managers. They are recognized and respected in the institutional market and by discerning investors for excellence in their respective strategies. JennisonDryden equity funds are advised by Jennison Associates LLC, Quantitative Management Associates LLC (QMA), or Prudential Real Estate Investors (PREI). Prudential Investment Management, Inc. (PIM) advises the JennisonDryden fixed income and money market funds. Jennison Associates, QMA, and PIM are registered investment advisers and Prudential Financial companies. PREI is a registered investment adviser and a unit of PIM.
Thank you for choosing JennisonDryden Mutual Funds.
Sincerely,

Judy A. Rice, President
The Prudential Investment Portfolios, Inc./Jennison Equity Opportunity Fund
| | |
| The Prudential Investment Portfolios, Inc./Jennison Equity Opportunity Fund | | 1 |
Your Fund’s Performance
Fund objective
The investment objective of the Jennison Equity Opportunity Fund is long-term growth of capital. There can be no assurance that the Fund will achieve its investment objective.
Performance data quoted represent past performance. Past performance does not guarantee future results. The investment return and principal value of an investment will fluctuate, so that an investor’s shares, when redeemed, may be worth more or less than their original cost. Current performance may be lower or higher than the past performance data quoted. An investor may obtain performance data as of the most recent month-end by visiting our website at www.jennisondryden.com or by calling (800) 225-1852. The maximum initial sales charge is 5.50% (Class A shares).
As of March 31, 2007, the gross annualized operating expenses are 1.18%, 1.88%, 1.88%, 1.88% and 0.88% for Class A, B, C, R and Z shares, respectively. As of March 31, 2007, the annualized operating expenses net of a contractual reduction through January 31, 2008 are 1.13%, 1.88%, 1.88%, 1.38% and 0.88% for Class A, B, C, R and Z shares, respectively. These figures include the net operating expenses of the underlying portfolios in which the Fund invests. Such expenses were calculated using a weighted average of the net operating expenses of each underlying fund and when annualized amounted to less than 0.005% for each share class.
| | | | | | | | | | | |
| Cumulative Total Returns as of 3/31/07 | | | | | | | | | | | |
| | | Six Months | | | One Year | | | Five Years | | | Since Inception1 |
Class A | | 11.37 | % | | 12.65 | % | | 46.96 | % | | — |
Class B | | 11.01 | | | 11.84 | | | 41.67 | | | — |
Class C | | 11.01 | | | 11.84 | | | 41.67 | | | — |
Class R | | 11.18 | | | 12.34 | | | N/A | | | 29.53% (12/17/04) |
Class Z | | 11.57 | | | 12.97 | | | 48.89 | | | — |
S&P 500 Index2 | | 7.38 | | | 11.82 | | | 35.49 | | | ** |
Lipper Multi-Cap Core Funds Avg.3 | | 8.52 | | | 9.34 | | | 39.72 | | | *** |
| | | | | | | | | | | |
| Average Annual Total Returns4 as of 3/31/07 | | | | | | |
| | | | | | One Year | | | Five Years | | | Since Inception1 |
Class A | | | | | 6.45 | % | | 6.79 | % | | — |
Class B | | | | | 7.01 | | | 7.06 | | | — |
Class C | | | | | 10.87 | | | 7.21 | | | — |
Class R | | | | | 12.34 | | | N/A | | | 11.98% (12/17/04) |
Class Z | | | | | 12.97 | | | 8.29 | | | — |
S&P 500 Index2 | | | | | 11.82 | | | 6.26 | | | ** |
Lipper Multi-Cap Core Funds Avg.3 | | | | | 9.34 | | | 6.74 | | | *** |
The cumulative total returns do not reflect the deduction of applicable sales charges. If reflected, the applicable sales charges would reduce the cumulative total returns performance quoted. Class A shares are subject to a maximum front-end sales charge of 5.50%. Under certain circumstances, Class A shares may be subject to a contingent
| | |
| 2 | | Visit our website at www.jennisondryden.com |
deferred sales charge (CDSC) of 1%. Class B and Class C shares are subject to a maximum CDSC of 5% and 1%, respectively. Class R and Class Z shares are not subject to a sales charge.
Source: Prudential Investments LLC and Lipper Inc. Performance figures may reflect fee waivers and/or expense reimbursements. In the absence of such fee waivers and/or expense reimbursements, total returns would be lower.
1Inception date returns are provided for any share class with less than 10 calendar years of returns.
2The S&P 500 Index is an unmanaged index of 500 stocks of large U.S. public companies. It gives a broad look at how U.S. stock prices have performed.
3The Lipper Multi-Cap Core Funds Average (Lipper Average) represents returns based on the average return of all funds in the Lipper Multi-Cap Core Funds category for the periods noted. Funds in the Lipper Average invest in a variety of market capitalization ranges without concentrating 75% of their equity assets in any one market capitalization range over an extended period of time. Multi-cap funds in the Lipper Average typically have between 25% and 75% of their assets invested in companies with market capitalizations (on a three-year weighted basis) above 300% of the dollar-weighted median market capitalization of the middle 1,000 securities of the S&P SuperComposite 1500 Index. Multi-cap core funds have more latitude in the companies in which they invest. These funds typically have an average price-to-earnings ratio, price-to-book ratio, and three-year sales-per-share growth value compared with the S&P SuperComposite 1500 Index.
4The average annual total returns take into account applicable sales charges. Class A, Class B, Class C, and Class R shares are subject to an annual distribution and service (12b-1) fee of up to 0.30%, 1.00%, 1.00%, and 0.75%, respectively. Approximately seven years after purchase, Class B shares will automatically convert to Class A shares on a quarterly basis. Class Z shares are not subject to a 12b-1 fee. The returns in the tables do not reflect the deduction of taxes that a shareholder would pay on Fund distributions or following the redemption of Fund shares.
Investors cannot invest directly in an index. The returns for the S&P 500 Index would be lower if they included the effects of sales charges, operating expenses of a mutual fund, or taxes. Returns for the Lipper Average reflect the deduction of operating expenses, but not sales charges or taxes.
**S&P 500 Index Closest Month-End to inception cumulative total returns are 138.13% for Class A, B, C, and Z, and 22.24% for Class R. S&P 500 Index Closest Month-End to Inception average annual total returns are 8.69% for Class A, B, C, and Z and 9.34% for Class R.
***Lipper Average Closest Month-End to Inception cumulative total returns are 157.24% for Class A, B, C, and Z, and 22.87% for Class R. Lipper Average Closest Month-End to Inception average annual total returns are 8.93% for Class A, B, C, and Z, and 9.52% for Class R.
| | | |
| Five Largest Holdings expressed as a percentage of net assets as of 3/31/07 | | | |
American International Group Inc., Insurance | | 2.6 | % |
Allied Waste Industries, Inc., Commercial Services & Supplies | | 2.1 | |
Pearson PLC (United Kingdom), Media | | 2.0 | |
Bank of New York Co., Inc. (The), Capital Markets | | 1.9 | |
Royal Bank of Scotland Group PLC (United Kingdom), Commercial Banks | | 1.9 | |
Holdings are subject to change.
| | | |
| Five Largest Long-Term Industries expressed as a percentage of net assets as of 3/31/07 | | | |
Media | | 10.7 | % |
Pharmaceuticals | | 9.2 | |
Capital Markets | | 6.9 | |
Software | | 5.8 | |
Food & Staples Retailing | | 5.2 | |
Industry weightings are subject to change.
| | |
| The Prudential Investment Portfolios, Inc./Jennison Equity Opportunity Fund | | 3 |
Fees and Expenses (Unaudited)
As a shareholder of the Fund, you incur two types of costs: (1) transaction costs, including sales charges (loads) on purchase payments and redemptions, as applicable, and (2) ongoing costs, including management fees, distribution and/or service (12b-1) fees, and other Fund expenses, as applicable. This example is intended to help you understand your ongoing costs (in dollars) of investing in the Fund and to compare these costs with the ongoing costs of investing in other mutual funds.
The example is based on an investment of $1,000 invested on October 1, 2006, at the beginning of the period, and held through the six-month period ended March 31, 2007.
The Fund’s transfer agent may charge additional fees to holders of certain accounts that are not included in the expenses shown in the table on the following page. These fees apply to Individual Retirement Accounts (IRAs) and Section 403(b) accounts. As of the close of the six-month period covered by the table, IRA fees included an annual maintenance fee of $15 per account (subject to a maximum annual maintenance fee of $25 for all accounts held by the same shareholder). Section 403(b) accounts are charged an annual $25 fiduciary maintenance fee. Some of the fees may vary in amount, or may be waived, based on your total account balance or the number of JennisonDryden or Strategic Partners Funds, including the Fund, that you own. You should consider the additional fees that were charged to your Fund account over the six-month period when you estimate the total ongoing expenses paid over the period and the impact of these fees on your ending account value, as these additional expenses are not reflected in the information provided in the expense table. Additional fees have the effect of reducing investment returns.
Actual Expenses
The first line for each share class in the table on the following page provides information about actual account values and actual expenses. You may use the information on this line, together with the amount you invested, to estimate the expenses that you paid over the period. Simply divide your account value by $1,000 (for example, an $8,600 account value ÷ $1,000 = 8.6), then multiply the result by the number on the first line under the heading “Expenses Paid During the Six-Month Period” to estimate the expenses you paid on your account during this period.
Hypothetical Example for Comparison Purposes
The second line for each share class in the table on the following page provides information about hypothetical account values and hypothetical expenses based on the Fund’s actual expense ratio and an assumed rate of return of 5% per year before expenses, which is not the Fund’s actual return. The hypothetical account values and
| | |
| 4 | | Visit our website at www.jennisondryden.com |
expenses may not be used to estimate the actual ending account balance or expenses you paid for the period. You may use this information to compare the ongoing costs of investing in the Fund and other funds. To do so, compare this 5% hypothetical example with the 5% hypothetical examples that appear in the shareholder reports of the other funds.
Please note that the expenses shown in the table are meant to highlight your ongoing costs only, and do not reflect any transactional costs such as sales charges (loads). Therefore the second line for each share class in the table is useful in comparing ongoing costs only, and will not help you determine the relative total costs of owning different funds. In addition, if these transactional costs were included, your costs would have been higher.
| | | | | | | | | | | | | | |
Jennison Equity
Opportunity Fund | | Beginning Account Value October 1, 2006 | | Ending Account
Value March 31, 2007 | | Annualized Expense Ratio
Based on the
Six-Month
Period | | | Expenses Paid
During the Six-
Month Period* |
| | | | | | | | | | | | | | | |
| Class A | | Actual | | $ | 1,000.00 | | $ | 1,113.70 | | 1.13 | % | | $ | 5.95 |
| | | Hypothetical | | $ | 1,000.00 | | $ | 1,019.30 | | 1.13 | % | | $ | 5.69 |
| | | | | | | | | | | | | | | |
| Class B | | Actual | | $ | 1,000.00 | | $ | 1,110.10 | | 1.88 | % | | $ | 9.89 |
| | | Hypothetical | | $ | 1,000.00 | | $ | 1,015.56 | | 1.88 | % | | $ | 9.45 |
| | | | | | | | | | | | | | | |
| Class C | | Actual | | $ | 1,000.00 | | $ | 1,110.10 | | 1.88 | % | | $ | 9.89 |
| | | Hypothetical | | $ | 1,000.00 | | $ | 1,015.56 | | 1.88 | % | | $ | 9.45 |
| | | | | | | | | | | | | | | |
| Class R | | Actual | | $ | 1,000.00 | | $ | 1,111.80 | | 1.38 | % | | $ | 7.27 |
| | | Hypothetical | | $ | 1,000.00 | | $ | 1,018.05 | | 1.38 | % | | $ | 6.94 |
| | | | | | | | | | | | | | | |
| Class Z | | Actual | | $ | 1,000.00 | | $ | 1,115.70 | | 0.88 | % | | $ | 4.64 |
| | | Hypothetical | | $ | 1,000.00 | | $ | 1,020.54 | | 0.88 | % | | $ | 4.43 |
* Fund expenses (net of fee waivers or subsidies, if any) for each share class are equal to the annualized expense ratio for each share class (provided in the table), multiplied by the average account value over the period, multiplied by the 182 days in the six-month period ended March 31, 2007, and divided by the 365 days in the Fund’s fiscal year ending September 30, 2007 (to reflect the six-month period).
| | |
| The Prudential Investment Portfolios, Inc./Jennison Equity Opportunity Fund | | 5 |
Portfolio of Investments
as of March 31, 2007 (Unaudited)
| | | | | |
| Shares | | Description | | Value (Note 1) |
| | | | | |
LONG-TERM INVESTMENTS 99.1% | | | |
COMMON STOCKS | | | |
| |
Aerospace & Defense 1.4% | | | |
| 182,800 | | Honeywell International, Inc. | | $ | 8,419,768 |
| |
Biotechnology 1.4% | | | |
| 64,000 | | Amgen, Inc.(a) | | | 3,576,320 |
| 109,400 | | ImClone Systems, Inc.(a)(b) | | | 4,460,238 |
| | | | | |
| | | | | 8,036,558 |
| |
Capital Markets 6.9% | | | |
| 279,900 | | Bank of New York Co., Inc. (The) | | | 11,349,945 |
| 565,600 | | Charles Schwab Corp. (The) | | | 10,344,824 |
| 99,400 | | Eaton Vance Corp. | | | 3,542,616 |
| 89,600 | | Lazard Ltd., “Class A”(b) | | | 4,496,128 |
| 100,400 | | Nuveen Investments, Inc. “Class A” | | | 4,748,920 |
| 92,200 | | State Street Corp. | | | 5,969,950 |
| | | | | |
| | | | | 40,452,383 |
| |
Chemicals 3.3% | | | |
| 171,600 | | E.I. du Pont de Nemours & Co. | | | 8,482,188 |
| 223,600 | | Huntsman Corp. | | | 4,268,524 |
| 284,200 | | Nalco Holdings Co. | | | 6,792,380 |
| | | | | |
| | | | | 19,543,092 |
| |
Commercial Banks 1.9% | | | |
| 283,355 | | Royal Bank of Scotland Group PLC (United Kingdom) | | | 11,062,761 |
| |
Commercial Services & Supplies 4.7% | | | |
| 992,800 | | Allied Waste Industries, Inc.(a) | | | 12,499,352 |
| 333,000 | | Navigant Consulting, Inc.(a)(b) | | | 6,580,080 |
| 239,800 | | Waste Management, Inc. | | | 8,251,518 |
| | | | | |
| | | | | 27,330,950 |
| |
Communications Equipment 2.8% | | | |
| 309,900 | | Corning, Inc.(a) | | | 7,047,126 |
| 218,800 | | QUALCOMM, Inc. | | | 9,334,008 |
| | | | | |
| | | | | 16,381,134 |
| |
Computers & Peripherals 1.8% | | | |
| 225,700 | | Diebold, Inc.(b) | | | 10,768,147 |
See Notes to Financial Statements.
| | |
| The Prudential Investment Portfolios, Inc./Jennison Equity Opportunity Fund | | 7 |
Portfolio of Investments
as of March 31, 2007 (Unaudited) Cont’d.
| | | | | |
| Shares | | Description | | Value (Note 1) |
| | | | | |
Containers & Packaging 1.0% | | | |
| 99,800 | | Temple-Inland, Inc. | | $ | 5,962,052 |
| |
Diversified Consumer Services 3.4% | | | |
| 339,700 | | Career Education Corp.(a)(b) | | | 10,360,850 |
| 460,200 | | H&R Block, Inc.(b) | | | 9,682,608 |
| | | | | |
| | | | | 20,043,458 |
| |
Diversified Financial Services 2.3% | | | |
| 166,500 | | Citigroup, Inc. | | | 8,548,110 |
| 196,300 | | KKR Private Equity Investors LLP, RDU, Private Placement 144A
(cost $4,892,132; purchased 5/03/06 – 05/05/06)(f)(g) | | | 4,760,275 |
| | | | | |
| | | | | 13,308,385 |
| |
Diversified Telecommunication Services 0.2% | | | |
| 90,400 | | IDT Corp., “Class B”(b) | | | 1,026,040 |
| |
Electronic Equipment & Instruments 0.9% | | | |
| 99,600 | | Sony Corp. ADR (Japan) | | | 5,028,804 |
| |
Energy Equipment & Services 4.5% | | | |
| 165,500 | | Baker Hughes, Inc. | | | 10,944,515 |
| 102,000 | | National-Oilwell Varco, Inc.(a) | | | 7,934,580 |
| 111,600 | | Schlumberger Ltd.(b) | | | 7,711,560 |
| | | | | |
| | | | | 26,590,655 |
| |
Food & Staples Retailing 5.2% | | | |
| 316,600 | | Kroger Co. (The) | | | 8,943,950 |
| 357,300 | | Performance Food Group Co.(a)(b) | | | 11,029,851 |
| 220,100 | | Wal-Mart Stores, Inc. | | | 10,333,695 |
| | | | | |
| | | | | 30,307,496 |
| |
Food Products 2.9% | | | |
| 642,100 | | Cadbury Schweppes PLC (United Kingdom) | | | 8,238,369 |
| 354,300 | | ConAgra Foods, Inc. | | | 8,825,613 |
| | | | | |
| | | | | 17,063,982 |
| |
Health Care Equipment & Supplies 1.3% | | | |
| 199,200 | | St. Jude Medical, Inc.(a) | | | 7,491,912 |
| |
Health Care Providers & Services 1.1% | | | |
| 163,000 | | Omnicare, Inc. | | | 6,482,510 |
See Notes to Financial Statements.
| | |
| 8 | | Visit our website at www.jennisondryden.com |
| | | | | |
| Shares | | Description | | Value (Note 1) |
| | | | | |
Hotels, Restaurants & Leisure 1.9% | | | |
| 299,700 | | Bally Technologies, Inc.(a)(b) | | $ | 7,066,926 |
| 88,400 | | Boyd Gaming Corp. | | | 4,211,376 |
| | | | | |
| | | | | 11,278,302 |
| |
Household Products 1.1% | | | |
| 97,600 | | Kimberly-Clark Corp. | | | 6,684,624 |
| |
Independent Power Producers & Energy Traders 0.8% | | | |
| 65,800 | | NRG Energy, Inc.(a) | | | 4,740,232 |
| |
Insurance 4.9% | | | |
| 224,800 | | American International Group, Inc. | | | 15,111,056 |
| 135,200 | | Axis Capital Holdings Ltd. | | | 4,577,872 |
| 182,500 | | StanCorp Financial Group, Inc. | | | 8,973,525 |
| | | | | |
| | | | | 28,662,453 |
| |
Internet & Catalog Retail 1.2% | | | |
| 182,000 | | IAC/InterActiveCorp.(a)(b) | | | 6,863,220 |
| |
IT Services 0.7% | | | |
| 85,300 | | CACI International, Inc. “Class A”(a) | | | 3,997,158 |
| |
Machinery 2.8% | | | |
| 134,500 | | Actuant Corp. “Class A” | | | 6,833,945 |
| 195,400 | | Dover Corp. | | | 9,537,474 |
| | | | | |
| | | | | 16,371,419 |
| |
Media 10.7% | | | |
| 486,700 | | Discovery Holding Co., “Class A”(a)(b) | | | 9,310,571 |
| 1,138,700 | | Gemstar-TV Guide International, Inc.(a) | | | 4,771,153 |
| 306,437 | | Liberty Global Inc., Series C(a) | | | 9,389,230 |
| 698,300 | | Pearson PLC (United Kingdom) | | | 11,982,556 |
| 665,100 | | Radio One, Inc., “Class D”(a) | | | 4,296,546 |
| 147,700 | | Tribune Co.(b) | | | 4,742,647 |
| 203,543 | | Viacom, Inc. “Class B”(a) | | | 8,367,653 |
| 58,300 | | Warner Music Group, Corp. | | | 994,598 |
| 304,000 | | Xinhua Finance Media Ltd. ADR (China)(a)(b) | | | 3,334,880 |
| 441,600 | | XM Satellite Radio Holdings, Inc. “Class A”(a) | | | 5,705,472 |
| | | | | |
| | | | | 62,895,306 |
See Notes to Financial Statements.
| | |
| The Prudential Investment Portfolios, Inc./Jennison Equity Opportunity Fund | | 9 |
Portfolio of Investments
as of March 31, 2007 (Unaudited) Cont’d.
| | | | | |
| Shares | | Description | | Value (Note 1) |
| | | | | |
Metals & Mining 2.8% | | | |
| 145,600 | | Alcoa, Inc. | | $ | 4,935,840 |
| 295,300 | | Alpha Natural Resources, Inc.(a) | | | 4,615,539 |
| 292,600 | | Massey Energy, Co. | | | 7,019,474 |
| | | | | |
| | | | | 16,570,853 |
| |
Multi-Utilities 1.1% | | | |
| 109,100 | | Sempra Energy | | | 6,656,191 |
| |
Oil, Gas & Consumable Fuels 2.8% | | | |
| 191,100 | | Occidental Petroleum Corp. | | | 9,423,141 |
| 200,400 | | Range Resources Corp. | | | 6,693,360 |
| | | | | |
| | | | | 16,116,501 |
| |
Pharmaceuticals 9.2% | | | |
| 180,200 | | Abbott Laboratories | | | 10,055,160 |
| 263,400 | | Endo Pharmaceuticals Holdings, Inc.(a) | | | 7,743,960 |
| 268,300 | | Medicis Pharmaceutical Corp. “Class A”(b) | | | 8,269,006 |
| 97,400 | | Novartis AG, ADR (Switzerland) | | | 5,320,962 |
| 290,300 | | Pfizer, Inc. | | | 7,332,978 |
| 291,600 | | Watson Pharmaceuticals, Inc.(a) | | | 7,706,988 |
| 156,100 | | Wyeth | | | 7,809,683 |
| | | | | |
| | | | | 54,238,737 |
| |
Road & Rail 1.1% | | | |
| 157,000 | | CSX Corp. | | | 6,287,850 |
| |
Semiconductors & Semiconductor Equipment 2.1% | | | |
| 469,000 | | Integrated Device Technology, Inc.(a) | | | 7,231,980 |
| 304,900 | | Marvell Technology Group, Ltd.(a) | | | 5,125,369 |
| | | | | |
| | | | | 12,357,349 |
| |
Software 5.8% | | | |
| 412,200 | | BEA Systems, Inc.(a) | | | 4,777,398 |
| 260,300 | | Check Point Software Technologies Ltd.(a) | | | 5,799,484 |
| 200,200 | | Fair Isaac Corp. | | | 7,743,736 |
| 186,400 | | Manhattan Associates, Inc.(a) | | | 5,112,952 |
| 154,200 | | Microsoft Corp.(b) | | | 4,297,554 |
| 717,400 | | TIBCO Software, Inc.(a) | | | 6,112,248 |
| | | | | |
| | | | | 33,843,372 |
See Notes to Financial Statements.
| | |
| 10 | | Visit our website at www.jennisondryden.com |
| | | | | | |
| Shares | | Description | | Value (Note 1) | |
Specialty Retail 2.0% | | | | |
| 92,400 | | Best Buy Co., Inc. | | $ | 4,501,728 | |
| 279,400 | | Urban Outfitters, Inc.(a)(b) | | | 7,406,894 | |
| | | | | | |
| | | | | 11,908,622 | |
| |
Wireless Telecommunication Services 1.1% | | | | |
| 345,300 | | Sprint Nextel Corp.(b) | | | 6,546,888 | |
| | | | | | |
| | Total long-term investments
(cost $495,027,173) | | | 581,319,164 | |
| | | | | | |
SHORT-TERM INVESTMENTS 17.5% | | | | |
| | |
Principal
Amount (000) | | | | | |
| |
U.S. Government Security | | | | |
| $105 | | United States Treasury Bill
4.87% 06/21/07(d) (cost $103,849) | | | 103,856 | |
| | | | | | |
| | |
Shares | | | | | |
| |
Affiliated Money Market Mutual Fund 17.5% | | | | |
| 102,625,065 | | Dryden Core Investment Fund - Taxable Money Market Series
(Cost $102,625,065; includes $94,788,123 of cash collateral received for securities on loan)(c)(e) | | | 102,625,065 | |
| | | | | | |
| | Total short-term investments
(cost $102,728,914) | | | 102,728,921 | |
| | | | | | |
| | Total Investments(h) 116.6%
(cost $597,756,087; Note 5) | | | 684,048,085 | |
| | Liabilities in excess of other assets (16.6%) | | | (97,190,366 | ) |
| | | | | | |
| | Net Assets 100% | | $ | 586,857,719 | |
| | | | | | |
The following abbreviations are used in portfolio descriptions:
ADR—American Depositary Receipt
RDU—Restricted Depository Unit
| (a) | Non-income producing security. |
| (b) | All or portion of security on loan. The aggregate market value of such securities is $90,336,799; cash collateral of $94,788,123 (included in liabilities) was received with which the Portfolio purchased highly liquid short-term investments. |
| (c) | Represents security, or a portion thereof, purchased with cash collateral received for securities on loan. |
| (d) | Rate quoted represents yield-to-maturity as of purchase date. |
| (e) | Prudential Investments LLC, the manager of the Fund, also serves as the manager of the Dryden Core Investment Fund—Taxable Money Market Series. |
| (f) | Security was purchased pursuant to Rule 144A under the Securities Act of 1933 and may not be resold subject to that rule except to qualified institutional buyers. Unless otherwise noted, 144A securities are deemed to be liquid. |
See Notes to Financial Statements.
| | |
| The Prudential Investment Portfolios, Inc./Jennison Equity Opportunity Fund | | 11 |
Portfolio of Investments
as of March 31, 2007 (Unaudited) Cont’d.
| (g) | Indicates a restricted security. The aggregate cost of the security is $4,892,132. The aggregate market value of $4,760,275 represents 0.8% of net assets. |
| (h) | As of March 31, 2007, one security representing $4,760,275 and 0.7% of the total market value of the Portfolio was fair valued in accordance with the policies adopted by the Board of Directors. |
The Industry classification of portfolio holdings and liabilities in excess of other assets shown as a percentage of net assets as of March 31, 2007 were as follows:
| | | |
Affiliated Money Market Mutual Fund (including 16.2% of collateral received for securities on loan) | | 17.5 | % |
Media | | 10.7 | |
Pharmaceuticals | | 9.2 | |
Capital Markets | | 6.9 | |
Software | | 5.8 | |
Food & Staples Retailing | | 5.2 | |
Insurance | | 4.9 | |
Commercial Services & Supplies | | 4.7 | |
Energy Equipment & Services | | 4.5 | |
Diversified Consumer Services | | 3.4 | |
Chemicals | | 3.3 | |
Food Products | | 2.9 | |
Communications Equipment | | 2.8 | |
Machinery | | 2.8 | |
Metals & Mining | | 2.8 | |
Oil, Gas & Consumable Fuels | | 2.8 | |
Diversified Financial Services | | 2.3 | |
Semiconductors & Semiconductor Equipment | | 2.1 | |
Specialty Retail | | 2.0 | |
Commercial Banks | | 1.9 | |
Hotels, Restaurants & Leisure | | 1.9 | |
Computers & Peripherals | | 1.8 | |
Aerospace & Defense | | 1.4 | |
Biotechnology | | 1.4 | |
Health Care Equipment & Supplies | | 1.3 | |
Internet & Catalog Retail | | 1.2 | |
Health Care Providers & Services | | 1.1 | |
Household Products | | 1.1 | |
Multi-Utilities | | 1.1 | |
Road & Rail | | 1.1 | |
Wireless Telecommunication Services | | 1.1 | |
Containers & Packaging | | 1.0 | |
Electronic Equipment & Instruments | | 0.9 | |
Independent Power Producers & Energy Traders | | 0.8 | |
IT Services | | 0.7 | |
Diversified Telecommunication Services | | 0.2 | |
| | | |
| | 116.6 | |
Liabilities in excess of other assets | | (16.6 | ) |
| | | |
| | 100.0 | % |
| | | |
See Notes to Financial Statements.
| | |
| 12 | | Visit our website at www.jennisondryden.com |
Financial Statements
(Unaudited)
| | |
| MARCH 31, 2007 | | SEMIANNUAL REPORT |
The Prudential Investment Portfolios, Inc./Jennison Equity Opportunity Fund
Statement of Assets and Liabilities
as of March 31, 2007 (Unaudited)
| | | | |
Assets | | | | |
Investments at value, including securities on loan of $90,336,799: | | | | |
Unaffiliated investments (cost $495,131,022) | | $ | 581,423,020 | |
Affiliated investments (cost $102,625,065) | | | 102,625,065 | |
Foreign currency, at value (cost $1,863) | | | 1,863 | |
Receivable for investments sold | | | 6,035,166 | |
Dividends receivable | | | 804,295 | |
Receivable for Series shares sold | | | 253,907 | |
Foreign tax reclaim receivable | | | 21,064 | |
Receivable from securities lending, net | | | 13,199 | |
Prepaid expenses | | | 6,953 | |
| | | | |
Total assets | | | 691,184,532 | |
| | | | |
| |
Liabilities | | | | |
Payable to broker for collateral for securities on loan (Note 4) | | | 94,788,123 | |
Payable for investments purchased | | | 6,304,840 | |
Payable for Series shares reacquired | | | 1,557,219 | |
Accrued expenses | | | 743,520 | |
Payable to custodian | | | 293,558 | |
Management fee payable | | | 291,067 | |
Distribution fee payable | | | 226,747 | |
Transfer agent fee payable | | | 118,627 | |
Deferred directors’ fees | | | 3,112 | |
| | | | |
Total liabilities | | | 104,326,813 | |
| | | | |
| |
Net Assets | | $ | 586,857,719 | |
| | | | |
| | | | | |
Net assets were comprised of: | | | | |
Common stock, at par | | $ | 35,565 | |
Paid-in capital in excess of par | | | 473,759,409 | |
| | | | |
| | | 473,794,974 | |
Accumulated net investment loss | | | (69,012 | ) |
Accumulated net realized gain on investment and foreign currency transactions | | | 26,833,281 | |
Net unrealized appreciation on investments and foreign currencies | | | 86,298,476 | |
| | | | |
Net assets, March 31, 2007 | | $ | 586,857,719 | |
| | | | |
See Notes to Financial Statements.
| | |
| 14 | | Visit our website at www.jennisondryden.com |
| | | |
Class A | | | |
Net asset value and redemption price per share | | | |
($325,918,946 ÷ 19,330,419 shares of common stock issued and outstanding) | | $ | 16.86 |
Maximum sales charge (5.50% of offering price) | | | 0.98 |
| | | |
Maximum offering price to public | | $ | 17.84 |
| | | |
| |
Class B | | | |
Net asset value, offering price and redemption price per share | | | |
($134,994,062 ÷ 8,616,458 shares of common stock issued and outstanding) | | $ | 15.67 |
| | | |
| |
Class C | | | |
Net asset value, offering price and redemption price per share | | | |
($50,477,012 ÷ 3,221,955 shares of common stock issued and outstanding) | | $ | 15.67 |
| | | |
| |
Class R | | | |
Net asset value, offering price and redemption price per share | | | |
($3,235 ÷ 204 shares of common stock issued and outstanding) | | $ | 15.85 |
| | | |
| |
Class Z | | | |
Net asset value, offering price and redemption price per share | | | |
($75,464,464 ÷ 4,395,817 shares of common stock issued and outstanding) | | $ | 17.17 |
| | | |
See Notes to Financial Statements.
| | |
| The Prudential Investment Portfolios, Inc./Jennison Equity Opportunity Fund | | 15 |
Statement of Operations
Six Months Ended March 31, 2007 (Unaudited)
| | | |
Net Investment Income | | | |
Income | | | |
Unaffiliated dividend income (net of foreign withholding taxes of $9,596) | | $ | 3,371,127 |
Affiliated dividend income | | | 523,444 |
Affiliated income from securities loaned, net | | | 69,397 |
Unaffiliated interest | | | 14,122 |
| | | |
Total income | | | 3,978,090 |
| | | |
| |
Expenses | | | |
Management fee | | | 1,741,112 |
Distribution fee—Class A | | | 397,073 |
Distribution fee—Class B | | | 708,524 |
Distribution fee—Class C | | | 255,285 |
Distribution fee—Class R | | | 8 |
Transfer agent’s fee and expenses (including affiliated expense of $375,800) | | | 698,000 |
Custodian’s fees and expenses | | | 47,000 |
Reports to shareholders | | | 42,000 |
Registration fees | | | 33,000 |
Legal fees and expenses | | | 12,000 |
Directors’ fees | | | 12,000 |
Insurance | | | 10,000 |
Audit fee | | | 8,000 |
Miscellaneous | | | 8,688 |
| | | |
Total expenses | | | 3,972,690 |
| | | |
Net investment income | | | 5,400 |
| | | |
| |
Realized And Unrealized Gain (Loss) On Investment and Foreign Currencies | | | |
Net realized gain on: | | | |
Investment transactions | | | 42,846,584 |
Foreign currency transactions | | | 2,588 |
| | | |
| | | 42,849,172 |
| | | |
Net change in unrealized appreciation (depreciation) on: | | | |
Investments | | | 20,750,144 |
Foreign currencies | | | 9,037 |
| | | |
| | | 20,759,181 |
| | | |
Net gain on investment and foreign currencies | | | 63,608,353 |
| | | |
Net Increase In Net Assets Resulting From Operations | | $ | 63,613,753 |
| | | |
See Notes to Financial Statements.
| | |
| 16 | | Visit our website at www.jennisondryden.com |
Statement of Changes in Net Assets
(Unaudited)
| | | | | | | | |
| | | Six Months
Ended
March 31, 2007 | | | Year Ended
September 30, 2006 | |
Increase (Decrease) In Net Assets | | | | | | | | |
Operations | | | | | | | | |
Net investment income | | $ | 5,400 | | | $ | 974,598 | |
Net realized gain on investment and foreign currency transactions | | | 42,849,172 | | | | 75,135,378 | |
Net change in unrealized appreciation (depreciation) on investments and foreign currencies | | | 20,759,181 | | | | (2,957,156 | ) |
| | | | | | | | |
Net increase in net assets resulting from operations | | | 63,613,753 | | | | 73,152,820 | |
| | | | | | | | |
Dividends and Distributions (Note 1) | | | | | | | | |
Dividends from net investment income | | | | | | | | |
Class A | | | (324,175 | ) | | | (1,531,153 | ) |
Class B | | | — | | | | — | |
Class C | | | — | | | | — | |
Class R | | | — | | | | (7 | ) |
Class Z | | | (198,423 | ) | | | (1,996,423 | ) |
| | | | | | | | |
| | | (522,598 | ) | | | (3,527,583 | ) |
| | | | | | | | |
| | |
Distributions from net realized gains | | | | | | | | |
Class A | | | (40,656,104 | ) | | | (47,030,702 | ) |
Class B | | | (19,865,797 | ) | | | (27,242,728 | ) |
Class C | | | (7,016,398 | ) | | | (8,923,183 | ) |
Class R | | | (412 | ) | | | (407 | ) |
Class Z | | | (11,180,238 | ) | | | (39,374,021 | ) |
| | | | | | | | |
| | | (78,718,949 | ) | | | (122,571,041 | ) |
| | | | | | | | |
| | |
Series share transactions (Net of share conversions) (Note 6) | | | | | | | | |
Net proceeds from shares sold | | | 34,134,540 | | | | 90,684,853 | |
Net asset value of shares issued in reinvestment of dividends and distributions | | | 75,829,793 | | | | 121,430,386 | |
Cost of shares reacquired | | | (104,302,720 | ) | | | (406,136,327 | ) |
| | | | | | | | |
Net decrease in net assets from Series share transactions | | | 5,661,613 | | | | (194,021,088 | ) |
| | | | | | | | |
Total decrease | | | (9,966,181 | ) | | | (246,966,892 | ) |
| | |
Net Assets | | | | | | | | |
Beginning of period | | | 596,823,900 | | | | 843,790,792 | |
End of period (a) | | $ | 586,857,719 | | | $ | 596,823,900 | |
| | | | | | | | |
(a) Includes undistributed net investment income of: | | $ | — | | | $ | 448,186 | |
| | | | | | | | |
See Notes to Financial Statements.
| | |
| The Prudential Investment Portfolios, Inc./Jennison Equity Opportunity Fund | | 17 |
Notes to Financial Statements
(Unaudited)
The Prudential Investment Portfolios, Inc. (the “Fund”) is registered under the Investment Company Act of 1940 as an open-end management investment company. The Fund was incorporated in Maryland on August 10, 1995 and consists of six series: Jennison Equity Opportunity Fund (the “Series”), Jennison Growth Fund and Dryden Active Allocation Fund which are diversified funds and JennisonDryden Growth Allocation Fund, JennisonDryden Moderate Allocation Fund and JennisonDryden Conservative Allocation Fund which are non-diversified funds. These financial statements relate to Jennison Equity Opportunity Fund. The financial statements of the other series are not presented herein. The Series commenced investment operations on November 7, 1996.
The Series’ investment objective is to achieve long-term growth of capital. The Series seeks to achieve its objectives by investing primarily in common stocks of established companies with growth prospects believed to be underappreciated by the market.
Note 1. Accounting Policies
The following is a summary of significant accounting policies followed by the Series in the preparation of its financial statements.
Securities Valuation: Securities listed on a securities exchange are valued at the last sales price on such exchange on the day of valuation or, if there was no sale on such day, at the mean between the last reported bid and asked prices, or at the last bid price on such day in the absence of an asked price. Securities traded via Nasdaq are valued at the official closing price (“NOCP”) on the day of valuation or if there was no NOCP at the last sale price. Securities that are actively traded in the over-the- counter market, including listed securities for which the primary market is believed by Prudential Investments LLC (“PI” or “Manager”), in consultation with the subadvisor; to be over-the-counter, are valued at market value by an independent pricing agent or principal market maker. Securities for which reliable market quotations are not readily available, or whose values have been affected by events occurring after the close of the security’s foreign market and before the Fund’s normal pricing time, are valued at fair value in accordance with the Board of Director’s approved fair valuation procedures. When determining the fair valuation of securities some of the factors influencing the valuation include, the nature of any restrictions on disposition of the securities; assessment of the general liquidity of the securities; the issuer’s financial condition and the markets in which it does business; the cost of the investment; the size of the holding and the capitalization of issuer; the prices of any recent transactions or bids/offers for such securities or any comparable securities; any
| | |
| 18 | | Visit our website at www.jennisondryden.com |
available analyst media or other reports or information deemed reliable by the investment adviser regarding the issuer or the markets or industry in which it operates. Using fair value to price securities may result in a value that is different from a security’s most recent closing price and from the price used by other mutual funds to calculate their net asset values. As of March 31, 2007, there were no securities valued in accordance with such procedures.
Investments in mutual funds are valued at their net asset value as of the close of the New York Stock Exchange on the date of valuation.
Short-term securities which mature in 60 days or less are valued at amortized cost, which approximates market value. Short-term securities which mature in more than sixty days are valued at current market quotations. The amortized cost method involves valuing a security at its cost on the date of purchase and thereafter assuming a constant amortization to maturity of the difference between the principal amount due at maturity and cost.
Foreign Currency Translation: The books and records of the Series are maintained in U.S. dollars. Foreign currency amounts are translated into U.S. dollars on the following basis:
(i) market value of investment securities, other assets and liabilities-at the current rates of exchange.
(ii) Purchases and sales of investment securities, income and expenses-at the rates of exchange prevailing on the respective dates of such transactions.
Although the net assets of the Series are presented at the foreign exchange rates and market values at the close of the fiscal period, the Series does not isolate that portion of the results of operations arising as a result of changes in the foreign exchange rates from the fluctuations arising from changes in the market prices of long-term securities held at the end of the fiscal period. Similarly, the Series does not isolate the effect of changes in foreign exchange rates from the fluctuations arising from changes in the market prices of long-term portfolio securities sold during the fiscal period. Accordingly, unrealized and realized foreign currency gains or losses are included in the reported net unrealized and realized gains or losses on investments and investment transactions, respectively.
Net realized gains or losses on foreign currency transactions represent net foreign exchange gains or losses from the holding of foreign currencies, currency gains or losses realized between the trade date and settlement date on securities transactions, and the difference between the amounts of dividends, interest and foreign
| | |
| The Prudential Investment Portfolios, Inc./Jennison Equity Opportunity Fund | | 19 |
Notes to Financial Statements
(Unaudited) Cont’d
withholding taxes recorded on the Series’ books and the U.S. dollar equivalent amounts actually received or paid. Net unrealized currency gains or losses from valuing foreign currency denominated assets and liabilities (other than investments) at period end exchange rates are reflected as a component of net unrealized appreciation (depreciation) on investments and foreign currencies. Foreign security and currency transactions may involve certain considerations and risks not typically associated with those of domestic origin as a result of, among other factors, the possibility of political and economic instability or the level of governmental supervision and regulation of foreign securities markets.
Securities Lending: The Series may lend its portfolio securities to qualified institutions. The loans are secured by collateral at least equal at all times, to the market value of the securities loaned. The Series may bear the risk of delay in recovery of, or even loss of rights in, the securities loaned should the borrower of the securities fail financially. The Series receives compensation, net of any rebate, for lending its securities in the form of interest or dividends on the collateral received for the securities loaned, and any gain or loss in the market price of the securities loaned that may occur during the term of the loan.
Securities Transactions and Net Investment Income: Securities transactions are recorded on the trade date. Realized gains or losses on sales of securities are calculated on the identified cost basis. Dividend income is recorded on the ex-dividend date and interest income, including amortization of premiums and accretion of discounts on debt securities, as required, is recorded on the accrual basis. Expenses are recorded on an accrual basis. Net investment income or (loss) (other than distribution fees which are charged directly to the respective class), and realized and unrealized gains and losses are allocated daily to each class of shares based upon the relative proportion of net assets of each class at the beginning of the day.
Dividends and Distributions: The Series expects to pay dividends of net investment income, if any, semi-annually and distributions of net realized capital gains, if any, at least annually. Dividends and distributions, which are determined in accordance with federal income tax regulations and which may differ from generally accepted accounting principles, are recorded on the ex-dividend date. Permanent book/tax differences relating to income and gains are reclassified amongst undistributed net investment income, accumulated net realized gain or loss and paid-in capital in excess of par, as appropriate.
| | |
| 20 | | Visit our website at www.jennisondryden.com |
Taxes: For federal income tax purposes, each Series in the Fund is treated as a separate tax paying entity. It is the Series’ policy to continue to meet the requirements of the Internal Revenue Code applicable to regulated investment companies and to distribute all of its taxable net income and capital gains, if any, to shareholders. Therefore, no federal tax provision is required. Withholding taxes on foreign dividends are recorded net of reclaimable amounts, at the time the related income is earned.
Estimates: The preparation of the financial statements requires management to make estimates and assumptions that affect the reported amounts and disclosures in the financial statements. Actual results could differ from those estimates.
Note 2. Agreements
The Fund has a management agreement for the Series with PI. Pursuant to this agreement PI has responsibility for all investment advisory services and supervises the subadvisor’s performance of such services. PI has entered into a subadvisory agreement with Jennison Associates LLC (“Jennison”). The subadvisory agreement provides that Jennison furnishes investment advisory services in connection with the management of the Series. In connection therewith, Jennison is obligated to keep certain books and records of the Series. PI pays for the services of Jennison, the cost of compensation of officers and employees of the Series, occupancy and certain clerical and bookkeeping costs of the Series. The Series bears all other costs and expenses.
The management fee paid to PI is computed daily and payable monthly, at an annual rate of .60 of 1% of the average daily net assets of the Series up to $300 million and .575 of 1% of the average daily net assets of the Series over $300 million. The effective management fee rate was .588 of 1% of the Series average daily net assets for the six months ended March 31, 2007.
The Series has a distribution agreement with Prudential Investment Management Services LLC (“PIMS”), which acts as the distributor of the Class A, Class B, Class C, Class R and Class Z shares of the Series. The Series compensates PIMS for distributing and servicing the Series’ Class A, Class B, Class C and Class R shares, pursuant to plans of distribution (the “Class A, B, C and R Plans”), regardless of expenses actually incurred by PIMS. The distribution fees are accrued daily and payable monthly. No distribution or service fees are paid to PIMS as distributor of the Class Z shares of the Series.
Pursuant to the Class A, B, C and R Plans, the Series compensates PIMS for distribution related activities at an annual rate of up to .30 of 1%, 1%, 1% and .75 of 1% of the average daily net assets of the Class A, B, C and R shares, respectively. PIMS contractually agreed to limit such fees to .25 of 1% and .50 of 1% of the Class A and Class R shares, respectively.
| | |
| The Prudential Investment Portfolios, Inc./Jennison Equity Opportunity Fund | | 21 |
Notes to Financial Statements
(Unaudited) Cont’d
PIMS has advised the Series that it received approximately $76,300 in front-end sales charges resulting from sales of Class A shares during the six months ended March 31, 2007. From these fees PIMS paid such sales charges to affiliated brokers/dealers, which in turn paid commissions to salespersons and incurred other distribution costs.
PIMS has advised the Series that for the six months ended March 31, 2007, it received approximately $83,400 and $700 in contingent deferred sales charges imposed upon redemptions by certain Class B and Class C shareholders, respectively.
PI, PIMS, and Jennison are indirect, wholly-owned subsidiaries of Prudential Financial, Inc. (“Prudential”).
The Series, along with other affiliated registered investment companies (the “Funds”), is a party to a Syndicated Credit Agreement (“SCA”) with two banks. The SCA provides for a commitment of $500 million. Interest on any borrowings under the SCA is incurred at contracted market rates and a commitment fee for the unused amount is accrued daily and paid quarterly. Effective October 27, 2006, the Funds renewed SCA with the banks. The commitment under the renewed SCA continues to be $500 million. The Funds pay a commitment fee of .07 of 1% of the unused portion of the renewed SCA. The expiration date of the renewed SCA will be October 26, 2007. For the period from October 29, 2005 through October 26, 2006, the Funds paid a commitment fee of .0725 of 1% of the unused portion of the agreement. The purpose of the SCA is to provide an alternative source of temporary funding for capital share redemptions. The Series did not borrow any amount pursuant to the SCA during the six months ended March 31, 2007.
Note 3. Other Transactions with Affiliates
Prudential Mutual Fund Services LLC (“PMFS”), an affiliate of PI and an indirect, wholly-owned subsidiary of Prudential, serves as the Fund’s transfer agent. Transfer agent’s fees and expenses in the Statement of Operations include certain out-of- pocket expenses paid to non-affiliates, where applicable.
The Fund pays networking fees to affiliated and unaffiliated broker/dealers. These networking fees are payments made to broker/dealers that clear mutual fund transactions through a national clearing system. For the six months ended March 31, 2007, the Series incurred approximately $147,300 in total networking fees. These amounts are included in transfer agent’s fees and expenses in the Statement of Operations.
| | |
| 22 | | Visit our website at www.jennisondryden.com |
Prudential Investment Management, Inc., (“PIM”), an indirect wholly-owned subsidiary of Prudential, is the Series’ security lending agent. For the six months ended March 31, 2007, PIM has been compensated approximately $29,700 for these services.
The Series invests in the Taxable Money Market Series (the “portfolio”), a portfolio of the Dryden Core Investment Fund, pursuant to an exemptive order received from the Securities and Exchange Commission. The portfolio is a money market mutual fund registered under the Investment Company Act of 1940, as amended, and managed by PI.
Note 4. Portfolio Securities
Purchases and sales of investment securities, other than short-term investments, for the six months ended March 31, 2007 were $271,357,941 and $308,007,440 respectively.
Note 5. Tax Information
The United States federal income tax basis of the Series’ investments and the net unrealized appreciation as of March 31, 2007 were as follows:
| | | | | | |
Tax Basis
of Investments | | Appreciation | | Depreciation | | Net Unrealized
Appreciation |
| $601,124,777 | | $90,729,776 | | $7,806,468 | | $82,923,308 |
The differences between book and tax basis are primarily attributable to deferred losses on wash sales and market to market on open foreign currency, receivables and payables.
Note 6. Capital
The Series offers Class A, Class B, Class C, Class R and Class Z shares. Class A shares are subject to a maximum front-end sales charge of 5.5%. Investors who purchase Class A shares in an amount of $1 million or more and sell these shares within 12 months of purchase are not subject to an initial sales charge but are subject to a contingent deferred sales charge (CDSC) of 1%, including investors who purchase their shares through broker-dealers affiliated with Prudential Financial, Inc. Class B shares are subject to a CDSC of 5%, which decreases by 1% annually to 1% in the fifth and sixth years and 0% in the seventh year. The CDSC for Class C shares is 1% for shares redeemed within 12 months of purchase. Class B shares automatically convert to Class A shares on a quarterly basis approximately seven years after purchase. A special exchange privilege is also available for shareholders who qualified to purchase Class A shares at net asset value. Class R and Class Z shares are not subject to any sales or redemption charge and are offered exclusively for sale to a limited group of investors.
| | |
| The Prudential Investment Portfolios, Inc./Jennison Equity Opportunity Fund | | 23 |
Notes to Financial Statements
(Unaudited) Cont’d
There are 1 billion shares of $.001 par value common stock of the Series, designated Class A, Class B, Class C, Class R and Class Z, each of which consists of 200 million authorized shares. As of March 31, 2007 Prudential owned 177 Class R shares of the Series.
Transactions in shares of common stock were as follows:
| | | | | | | |
Class A | | Shares | | | Amount | |
Six months ended March 31, 2007: | | | | | | | |
Shares sold | | 1,404,608 | | | $ | 23,838,790 | |
Shares issued in reinvestment of dividends and distributions | | 2,457,565 | | | | 39,026,136 | |
Shares reacquired | | (2,710,985 | ) | | | (45,651,426 | ) |
| | | | | | | |
Net increase (decrease) in shares outstanding before conversion | | 1,151,188 | | | | 17,213,500 | |
Shares issued upon conversion from Class B | | 545,970 | | | | 8,924,975 | |
| | | | | | | |
Net increase (decrease) in shares outstanding | | 1,697,158 | | | $ | 26,138,475 | |
| | | | | | | |
Year ended September 30, 2006: | | | | | | | |
Shares sold | | 3,459,635 | | | $ | 58,557,989 | |
Shares issued in reinvestment of dividends and distributions | | 2,881,469 | | | | 46,020,666 | |
Shares reacquired | | (7,370,017 | ) | | | (124,945,112 | ) |
| | | | | | | |
Net increase (decrease) in shares outstanding before conversion | | (1,028,913 | ) | | | (20,366,457 | ) |
Shares issued upon conversion from Class B | | 986,512 | | | | 16,309,114 | |
| | | | | | | |
Net increase (decrease) in shares outstanding | | (42,401 | ) | | $ | (4,057,343 | ) |
| | | | | | | |
Class B | | | | | | |
Six months ended March 31, 2007: | | | | | | | |
Shares sold | | 148,648 | | | $ | 2,345,625 | |
Shares issued in reinvestment of distributions | | 1,281,630 | | | | 18,968,127 | |
Shares reacquired | | (979,697 | ) | | | (15,390,036 | ) |
| | | | | | | |
Net increase (decrease) in shares outstanding before conversion | | 450,581 | | | | 5,923,716 | |
Shares reacquired upon conversion into Class A | | (586,784 | ) | | | (8,924,975 | ) |
| | | | | | | |
Net increase (decrease) in shares outstanding | | (136,203 | ) | | $ | (3,001,259 | ) |
| | | | | | | |
Year ended September 30, 2006: | | | | | | | |
Shares sold | | 319,502 | | | $ | 5,125,849 | |
Shares issued in reinvestment of distributions | | 1,709,368 | | | | 25,828,553 | |
Shares reacquired | | (2,507,055 | ) | | | (39,982,484 | ) |
| | | | | | | |
Net increase (decrease) in shares outstanding before conversion | | (478,185 | ) | | | (9,028,082 | ) |
Shares reacquired upon conversion into Class A | | (1,045,628 | ) | | | (16,309,114 | ) |
| | | | | | | |
Net increase (decrease) in shares outstanding | | (1,523,813 | ) | | $ | (25,337,196 | ) |
| | | | | | | |
| | |
| 24 | | Visit our website at www.jennisondryden.com |
| | | | | | | |
Class C | | Shares | | | Amount | |
Six months ended March 31, 2007: | | | | | | | |
Shares sold | | 95,668 | | | $ | 1,488,828 | |
Shares issued in reinvestment of distributions | | 447,653 | | | | 6,625,258 | |
Shares reacquired | | (424,622 | ) | | | (6,664,140 | ) |
| | | | | | | |
Net increase (decrease) in shares outstanding | | 118,699 | | | $ | 1,449,946 | |
| | | | | | | |
Year ended September 30, 2006: | | | | | | | |
Shares sold | | 239,767 | | | $ | 3,851,189 | |
Shares issued in reinvestment of distributions | | 560,702 | | | | 8,472,207 | |
Shares reacquired | | (1,079,738 | ) | | | (17,235,091 | ) |
| | | | | | | |
Net increase (decrease) in shares outstanding | | (279,269 | ) | | $ | (4,911,695 | ) |
| | | | | | | |
Class R | | | | | | |
Six months ended March 31, 2007: | | | | | | | |
Shares sold | | 5 | | | $ | 75 | |
Shares issued in reinvestment of dividends and distributions | | 27 | | | | 412 | |
Shares reacquired | | (5 | ) | | | (75 | ) |
| | | | | | | |
Net increase (decrease) in shares outstanding | | 27 | | | $ | 412 | |
| | | | | | | |
Year ended September 30, 2006: | | | | | | | |
Shares sold | | 4 | | | $ | 75 | |
Shares issued in reinvestment of dividends | | 28 | | | | 414 | |
Shares reacquired | | (4 | ) | | | (75 | ) |
| | | | | | | |
Net increase (decrease) in shares outstanding | | 28 | | | $ | 414 | |
| | | | | | | |
Class Z | | | | | | |
Six months ended March 31, 2007: | | | | | | | |
Shares sold | | 375,658 | | | $ | 6,461,222 | |
Shares issued in reinvestment of dividends and distributions | | 693,680 | | | | 11,209,860 | |
Shares reacquired | | (2,146,675 | ) | | | (36,597,043 | ) |
| | | | | | | |
Net increase (decrease) in shares outstanding | | (1,077,337 | ) | | $ | (18,925,961 | ) |
| | | | | | | |
Year ended September 30, 2006: | | | | | | | |
Shares sold | | 1,341,443 | | | $ | 23,149,751 | |
Shares issued in reinvestment of dividends and distributions | | 2,533,841 | | | | 41,108,546 | |
Shares reacquired | | (13,200,434 | ) | | | (223,973,565 | ) |
| | | | | | | |
Net increase (decrease) in shares outstanding | | (9,325,150 | ) | | $ | (159,715,268 | ) |
| | | | | | | |
Note 7. New Accounting Pronouncements
On July 13, 2006, the Financial Accounting Standards Board (FASB) released FASB Interpretation No. 48 “Accounting for Uncertainty in Income Taxes” (FIN 48). FIN 48 provides guidance for how uncertain tax positions should be recognized, measured, presented and disclosed in the financial statements. FIN 48 requires the evaluation of tax positions taken or expected to be taken in the course of preparing the Fund’s tax
| | |
| The Prudential Investment Portfolios, Inc./Jennison Equity Opportunity Fund | | 25 |
Notes to Financial Statements
(Unaudited) Cont’d
returns to determine whether the tax positions are “more-likely-than-not” of being sustained by the applicable tax authority. The impact of the tax positions not deemed to meet the more-likely-than-not threshold would be recorded in the year in which they arise. On December 22, 2006 the Securities and Exchange Commission delayed the effective date until the last net asset value calculation in the first required financial reporting period for its fiscal year beginning after December 15, 2006. At this time, management is evaluating the implications of FIN 48 and its impact, if any, in the financial statements has not yet been determined.
On September 20, 2006, the FASB released Statement of Financial Accounting Standards No. 157 “Fair Value Measurements” (FAS 157). FAS 157 establishes an authoritative definition of fair value, sets out a framework for measuring fair value, and requires additional disclosures about fair-value measurements. The application of FAS 157 is required for fiscal years beginning after November 15, 2007 and interim periods within those fiscal years. At this time, management is evaluating the implications of FAS 157 and its impact, if any, in the financial statements has not yet been determined.
| | |
| 26 | | Visit our website at www.jennisondryden.com |
Financial Highlights
(Unaudited)
| | |
| MARCH 31, 2007 | | SEMIANNUAL REPORT |
The Prudential Investment Portfolios, Inc./Jennison Equity Opportunity Fund
Financial Highlights
(Unaudited)
| | | | |
| | | Class A | |
| | | Six Months Ended
March 31,
2007(a) | |
Per Share Operating Performance: | | | | |
Net Asset Value, Beginning Of Period | | $ | 17.38 | |
| | | | |
Income (loss) from investment operations | | | | |
Net investment income | | | .02 | |
Net realized and unrealized gain (loss) on investment and foreign currency transactions | | | 1.81 | |
| | | | |
Total from investment operations | | | 1.83 | |
| | | | |
Less Dividends and Distributions | | | | |
Dividends from net investment income | | | (.02 | ) |
Distributions from net realized gains | | | (2.33 | ) |
| | | | |
Total dividends and distributions | | | (2.35 | ) |
| | | | |
Net asset value, end of period | | $ | 16.86 | |
| | | | |
Total Return(b): | | | 11.37 | % |
Ratios/Supplemental Data: | | | | |
Net assets, end of period (000) | | $ | 325,919 | |
Average net assets (000) | | $ | 318,531 | |
Ratios to average net assets: | | | | |
Expenses, including distribution and service (12b-1) fees(c) | | | 1.13 | %(d) |
Expenses, excluding distribution and service (12b-1) fees | | | .88 | %(d) |
Net investment income | | | .21 | %(d) |
For Class A, B, C, R and Z shares: | | | | |
Portfolio turnover rate | | | 47 | %(e) |
| (a) | Calculated based upon average shares outstanding during the period. |
| (b) | Total return does not consider the effects of sales loads. Total return is calculated assuming a purchase of shares on the first day and a sale on the last day of each period reported, and includes reinvestment of dividends and distributions. Total returns for periods less than a full year are not annualized. |
| (c) | The distributor of the Series has contractually agreed to limit its distribution and service (12b-1) fees to .25 of 1% of the average daily net assets of the Class A shares. |
See Notes to Financial Statements.
| | |
| 28 | | Visit our website at www.jennisondryden.com |
| | | | | | | | | | | | | | | | | | |
| Class A | |
| Year Ended September 30, | |
| 2006(a) | | | 2005 | | | 2004 | | | 2003 | | | 2002(a) | |
| | | | | | | | | | | | | | | | | | |
| $ | 18.47 | | | $ | 16.60 | | | $ | 14.22 | | | $ | 11.48 | | | $ | 14.03 | |
| | | | | | | | | | | | | | | | | | | |
| | | | | | | | | | | | | | | | | | |
| | .02 | | | | .13 | | | | .02 | | | | .01 | | | | .02 | |
| | 1.70 | | | | 2.14 | | | | 2.36 | | | | 2.73 | | | | (1.92 | ) |
| | | | | | | | | | | | | | | | | | | |
| | 1.72 | | | | 2.27 | | | | 2.38 | | | | 2.74 | | | | (1.90 | ) |
| | | | | | | | | | | | | | | | | | | |
| | | | | | | | | | | | | | | | | | |
| | (.09 | ) | | | (.03 | ) | | | — | | | | — | | | | — | |
| | (2.72 | ) | | | (.37 | ) | | | — | | | | — | | | | (.65 | ) |
| | | | | | | | | | | | | | | | | | | |
| | (2.81 | ) | | | (.40 | ) | | | — | | | | — | | | | (.65 | ) |
| | | | | | | | | | | | | | | | | | | |
| $ | 17.38 | | | $ | 18.47 | | | $ | 16.60 | | | $ | 14.22 | | | $ | 11.48 | |
| | | | | | | | | | | | | | | | | | | |
| | 10.68 | % | | | 13.91 | % | | | 16.74 | % | | | 23.87 | % | | | (14.59 | )% |
| | | | | | | | | | | | | | | | | | |
| $ | 306,424 | | | $ | 326,512 | | | $ | 338,249 | | | $ | 261,252 | | | $ | 205,215 | |
| $ | 314,651 | | | $ | 336,880 | | | $ | 318,726 | | | $ | 232,395 | | | $ | 227,305 | |
| | | | | | | | | | | | | | | | | | |
| | 1.11 | % | | | 1.12 | % | | | 1.07 | % | | | 1.15 | % | | | 1.09 | % |
| | .86 | % | | | .87 | % | | | .82 | % | | | .90 | % | | | .84 | % |
| | .10 | % | | | .68 | % | | | .11 | % | | | .07 | % | | | .11 | % |
| | | | | | | | | | | | | | | | | | |
| | 75 | % | | | 93 | % | | | 102 | % | | | 115 | % | | | 94 | % |
See Notes to Financial Statements.
| | |
| The Prudential Investment Portfolios, Inc./Jennison Equity Opportunity Fund | | 29 |
Financial Highlights
(Unaudited) Cont’d
| | | | |
| | | Class B | |
| | | Six Months Ended
March 31,
2007(a) | |
Per Share Operating Performance: | | | | |
Net Asset Value, Beginning Of Period | | $ | 16.34 | |
| | | | |
Income (loss) from investment operations | | | | |
Net investment income (loss) | | | (.04 | ) |
Net realized and unrealized gain (loss) on investment and foreign currency transactions | | | 1.70 | |
| | | | |
Total from investment operations | | | 1.66 | |
| | | | |
Less Dividends and Distributions | | | | |
Dividends from net investment income | | | — | |
Distributions from net realized gains | | | (2.33 | ) |
| | | | |
Total dividends and distributions | | | (2.33 | ) |
| | | | |
Net asset value, end of period | | $ | 15.67 | |
| | | | |
Total Return(b): | | | 11.01 | % |
Ratios/Supplemental Data: | | | | |
Net assets, end of period (000) | | $ | 134,994 | |
Average net assets (000) | | $ | 142,094 | |
Ratios to average net assets: | | | | |
Expenses, including distribution and service (12b-1) fees | | | 1.88 | %(c) |
Expenses, excluding distribution and service (12b-1) fees | | | .88 | %(c) |
Net investment loss | | | (.53 | )%(c) |
| (a) | Calculated based upon average shares outstanding during the period. |
| (b) | Total return does not consider the effects of sales loads. Total return is calculated assuming a purchase of shares on the first day and a sale on the last day of each period reported, and includes reinvestment of dividends and distributions. Total returns for periods less than a full year are not annualized. |
See Notes to Financial Statements.
| | |
| 30 | | Visit our website at www.jennisondryden.com |
| | | | | | | | | | | | | | | | | | |
| Class B | |
| Year Ended September 30, | |
| 2006(a) | | | 2005 | | | 2004 | | | 2003 | | | 2002(a) | |
| | | | | | | | | | | | | | | | | | |
| $ | 17.56 | | | $ | 15.88 | | | $ | 13.71 | | | $ | 11.15 | | | $ | 13.74 | |
| | | | | | | | | | | | | | | | | | | |
| | | | | | | | | | | | | | | | | | |
| | (.04 | ) | | | (.01 | ) | | | (.11 | ) | | | (.09 | ) | | | (.09 | ) |
| | 1.54 | | | | 2.06 | | | | 2.28 | | | | 2.65 | | | | (1.85 | ) |
| | | | | | | | | | | | | | | | | | | |
| | 1.50 | | | | 2.05 | | | | 2.17 | | | | 2.56 | | | | (1.94 | ) |
| | | | | | | | | | | | | | | | | | | |
| | | | | | | | | | | | | | | | | | |
| | — | | | | — | | | | — | | | | — | | | | — | |
| | (2.72 | ) | | | (.37 | ) | | | — | | | | — | | | | (.65 | ) |
| | | | | | | | | | | | | | | | | | | |
| | (2.72 | ) | | | (.37 | ) | | | — | | | | — | | | | (.65 | ) |
| | | | | | | | | | | | | | | | | | | |
| $ | 16.34 | | | $ | 17.56 | | | $ | 15.88 | | | $ | 13.71 | | | $ | 11.15 | |
| | | | | | | | | | | | | | | | | | | |
| | 9.83 | % | | | 13.12 | % | | | 15.83 | % | | | 22.96 | % | | | (15.21 | )% |
| | | | | | | | | | | | | | | | | | |
| $ | 143,053 | | | $ | 180,496 | | | $ | 213,606 | | | $ | 234,421 | | | $ | 220,609 | |
| $ | 161,565 | | | $ | 202,371 | | | $ | 235,162 | | | $ | 225,579 | | | $ | 272,070 | |
| | | | | | | | | | | | | | | | | | |
| | 1.86 | % | | | 1.87 | % | | | 1.82 | % | | | 1.90 | % | | | 1.84 | % |
| | .86 | % | | | .87 | % | | | .82 | % | | | .90 | % | | | .84 | % |
| | (.26 | )% | | | (.05 | )% | | | (.63 | )% | | | (.68 | )% | | | (.63 | )% |
See Notes to Financial Statements.
| | |
| The Prudential Investment Portfolios, Inc./Jennison Equity Opportunity Fund | | 31 |
Financial Highlights
(Unaudited) Cont’d
| | | | |
| | | Class C | |
| | | Six Months Ended
March 31,
2007(a) | |
Per Share Operating Performance: | | | | |
Net Asset Value, Beginning Of Period | | $ | 16.34 | |
| | | | |
Income (loss) from investment operations | | | | |
Net investment income (loss) | | | (.04 | ) |
Net realized and unrealized gain (loss) on investment and foreign currency transactions | | | 1.70 | |
| | | | |
Total from investment operations | | | 1.66 | |
| | | | |
Less Dividends and Distributions | | | | |
Dividends from net investment income | | | — | |
Distributions from net realized gains | | | (2.33 | ) |
| | | | |
Total dividends and distributions | | | (2.33 | ) |
| | | | |
Net asset value, end of period | | $ | 15.67 | |
| | | | |
Total Return(b): | | | 11.01 | % |
Ratios/Supplemental Data: | | | | |
Net assets, end of period (000) | | $ | 50,477 | |
Average net assets (000) | | $ | 51,197 | |
Ratios to average net assets: | | | | |
Expenses, including distribution and service (12b-1) fees | | | 1.88 | %(c) |
Expenses, excluding distribution and service (12b-1) fees | | | .88 | %(c) |
Net investment loss | | | (.54 | )%(c) |
| (a) | Calculated based upon average shares outstanding during the period. |
| (b) | Total return does not consider the effects of sales loads. Total return is calculated assuming a purchase of shares on the first day and a sale on the last day of each period reported, and includes reinvestment of dividends and distributions. Total returns for periods less than a full year are not annualized. |
See Notes to Financial Statements.
| | |
| 32 | | Visit our website at www.jennisondryden.com |
| | | | | | | | | | | | | | | | | | |
| Class C | |
| Year Ended September 30, | |
| 2006(a) | | | 2005 | | | 2004 | | | 2003 | | | 2002(a) | |
| | | | | | | | | | | | | | | | | | |
| $ | 17.56 | | | $ | 15.88 | | | $ | 13.71 | | | $ | 11.15 | | | $ | 13.74 | |
| | | | | | | | | | | | | | | | | | | |
| | | | | | | | | | | | | | | | | | |
| | (.05 | ) | | | (.01 | ) | | | (.11 | ) | | | (.09 | ) | | | (.09 | ) |
| | 1.55 | | | | 2.06 | | | | 2.28 | | | | 2.65 | | | | (1.85 | ) |
| | | | | | | | | | | | | | | | | | | |
| | 1.50 | | | | 2.05 | | | | 2.17 | | | | 2.56 | | | | (1.94 | ) |
| | | | | | | | | | | | | | | | | | | |
| | | | | | | | | | | | | | | | | | |
| | — | | | | — | | | | — | | | | — | | | | — | |
| | (2.72 | ) | | | (.37 | ) | | | — | | | | — | | | | (.65 | ) |
| | | | | | | | | | | | | | | | | | | |
| | (2.72 | ) | | | (.37 | ) | | | — | | | | — | | | | (.65 | ) |
| | | | | | | | | | | | | | | | | | | |
| $ | 16.34 | | | $ | 17.56 | | | $ | 15.88 | | | $ | 13.71 | | | $ | 11.15 | |
| | | | | | | | | | | | | | | | | | | |
| | 9.83 | % | | | 13.12 | % | | | 15.83 | % | | | 22.96 | % | | | (15.21 | )% |
| | | | | | | | | | | | | | | | | | |
| $ | 50,717 | | | $ | 59,409 | | | $ | 66,322 | | | $ | 66,683 | | | $ | 65,417 | |
| $ | 54,051 | | | $ | 63,559 | | | $ | 70,174 | | | $ | 65,790 | | | $ | 78,162 | |
| | | | | | | | | | | | | | | | | | |
| | 1.86 | % | | | 1.87 | % | | | 1.82 | % | | | 1.90 | % | | | 1.84 | % |
| | .86 | % | | | .87 | % | | | .82 | % | | | .90 | % | | | .84 | % |
| | (.35 | )% | | | (.06 | )% | | | (.64 | )% | | | (.68 | )% | | | (.63 | )% |
See Notes to Financial Statements.
| | |
| The Prudential Investment Portfolios, Inc./Jennison Equity Opportunity Fund | | 33 |
Financial Highlights
(Unaudited) Cont’d
| | | | |
| | | Class R | |
| | |
Six Months Ended
March 31,
2007(b) | |
Per Share Operating Performance: | | | | |
Net Asset Value, Beginning Of Period | | $ | 16.48 | |
| | | | |
Income (loss) from investment operations | | | | |
Net investment income (loss) | | | — | (c) |
Net realized and unrealized gain on investment and foreign currency transactions | | | 1.70 | |
| | | | |
Total from investment operations | | | 1.70 | |
| | | | |
Less Dividends and Distributions | | | | |
Dividends from net investment income | | | — | |
Distributions from net realized gains | | | (2.33 | ) |
| | | | |
Total dividends and distributions | | | (2.33 | ) |
| | | | |
Net asset value, end of period | | $ | 15.85 | |
| | | | |
Total Return(d): | | | 11.18 | % |
Ratios/Supplemental Data: | | | | |
Net assets, end of period (000) | | $ | 3 | |
Average net assets (000) | | $ | 3 | |
Ratios to average net assets: | | | | |
Expenses, including distribution and service (12b-1) fees(e) | | | 1.38 | %(f) |
Expenses, excluding distribution and service (12b-1) fees | | | .88 | %(f) |
Net investment income (loss) | | | (.05 | )%(f) |
| (a) | Commencement of operations. |
| (b) | Calculated based upon average shares outstanding during the period. |
| (c) | Less than $0.005 per share. |
| (d) | Total return does not consider the effects of sales loads. Total return is calculated assuming a purchase of shares on the first day and a sale on the last day of each period reported, and includes reinvestment of dividends and distributions. Total returns for periods less than a full year are not annualized. |
| (e) | During the period, the distributor of the Series has contractually agreed to limit its distribution and service (12b-1) fees to .50 of 1% of the average daily net assets of the Class R shares. |
See Notes to Financial Statements.
| | |
| 34 | | Visit our website at www.jennisondryden.com |
| | | | | | |
| Class R | |
Year Ended
September 30, 2006(b) | | | December 17, 2004(a)
Through
September 30, 2005 | |
| | | | | | |
| $ | 17.70 | | | $ | 16.73 | |
| | | | | | | |
| | | | | | |
| | .04 | | | | .04 | |
| | 1.51 | | | | .93 | |
| | | | | | | |
| | 1.55 | | | | .97 | |
| | | | | | | |
| | | | | | |
| | (.05 | ) | | | — | |
| | (2.72 | ) | | | — | |
| | | | | | | |
| | (2.77 | ) | | | — | |
| | | | | | | |
| $ | 16.48 | | | $ | 17.70 | |
| | | | | | | |
| | 10.12 | % | | | 5.80 | % |
| | | | | | |
| $ | 3 | | | $ | 3 | |
| $ | 3 | | | $ | 3 | |
| | | | | | |
| | 1.36 | % | | | 1.37 | %(f) |
| | .86 | % | | | .87 | %(f) |
| | .23 | % | | | .27 | %(f) |
See Notes to Financial Statements.
| | |
| The Prudential Investment Portfolios, Inc./Jennison Equity Opportunity Fund | | 35 |
Financial Highlights
(Unaudited) Cont’d
| | | | |
| | | Class Z | |
| | | Six Months Ended
March 31,
2007(a) | |
Per Share Operating Performance: | | | | |
Net Asset Value, Beginning Of Period | | $ | 17.65 | |
| | | | |
Income (loss) from investment operations | | | | |
Net investment income | | | .04 | |
Net realized and unrealized gain (loss) on investment and foreign currency transactions | | | 1.85 | |
| | | | |
Total from investment operations | | | 1.89 | |
| | | | |
Less Dividends and Distributions | | | | |
Dividends from net investment income | | | (.04 | ) |
Distributions from net realized gains | | | (2.33 | ) |
| | | | |
Total dividends and distributions | | | (2.37 | ) |
| | | | |
Net asset value, end of period | | $ | 17.17 | |
| | | | |
Total Return(b): | | | 11.57 | % |
Ratios/Supplemental Data: | | | | |
Net assets, end of period (000) | | $ | 75,465 | |
Average net assets (000) | | $ | 82,399 | |
Ratios to average net assets: | | | | |
Expenses, including distribution and service (12b-1) fees | | | .88 | %(c) |
Expenses, excluding distribution and service (12b-1) fees | | | .88 | %(c) |
Net investment income | | | .46 | %(c) |
| (a) | Calculated based upon average shares outstanding during the period. |
| (b) | Total return is calculated assuming a purchase of shares on the first day and a sale on the last day of each period reported, and includes reinvestment of dividends and distributions. Total returns for periods less than a full year are not annualized. |
See Notes to Financial Statements.
| | |
| 36 | | Visit our website at www.jennisondryden.com |
| | | | | | | | | | | | | | | | | | |
| Class Z | |
| Year Ended September 30, | |
| 2006(a) | | | 2005 | | | 2004 | | | 2003 | | | 2002(a) | |
| | | | | | | | | | | | | | | | | | |
| $ | 18.74 | | | $ | 16.83 | | | $ | 14.38 | | | $ | 11.59 | | | $ | 14.12 | |
| | | | | | | | | | | | | | | | | | | |
| | | | | | | | | | | | | | | | | | |
| | .12 | | | | .18 | | | | .06 | | | | .04 | | | | .05 | |
| | 1.66 | | | | 2.17 | | | | 2.39 | | | | 2.75 | | | | (1.93 | ) |
| | | | | | | | | | | | | | | | | | | |
| | 1.78 | | | | 2.35 | | | | 2.45 | | | | 2.79 | | | | (1.88 | ) |
| | | | | | | | | | | | | | | | | | | |
| | | | | | | | | | | | | | | | | | |
| | (.15 | ) | | | (.07 | ) | | | — | | | | — | | | | — | |
| | (2.72 | ) | | | (.37 | ) | | | — | | | | — | | | | (.65 | ) |
| | | | | | | | | | | | | | | | | | | |
| | (2.87 | ) | | | (.44 | ) | | | — | | | | — | | | | (.65 | ) |
| | | | | | | | | | | | | | | | | | | |
| $ | 17.65 | | | $ | 18.74 | | | $ | 16.83 | | | $ | 14.38 | | | $ | 11.59 | |
| | | | | | | | | | | | | | | | | | | |
| | 10.92 | % | | | 14.23 | % | | | 17.04 | % | | | 24.07 | % | | | (14.34 | )% |
| | | | | | | | | | | | | | | | | | |
| $ | 96,626 | | | $ | 277,372 | | | $ | 346,241 | | | $ | 265,048 | | | $ | 208,615 | |
| $ | 184,440 | | | $ | 313,971 | | | $ | 323,831 | | | $ | 232,369 | | | $ | 228,798 | |
| | | | | | | | | | | | | | | | | | |
| | .86 | % | | | .87 | % | | | .82 | % | | | .90 | % | | | .84 | % |
| | .86 | % | | | .87 | % | | | .82 | % | | | .90 | % | | | .84 | % |
| | .69 | % | | | .96 | % | | | .36 | % | | | .33 | % | | | .37 | % |
See Notes to Financial Statements.
| | |
| The Prudential Investment Portfolios, Inc./Jennison Equity Opportunity Fund | | 37 |
| | | | |
| n MAIL | | n TELEPHONE | | n WEBSITE |
Gateway Center Three 100 Mulberry Street Newark, NJ 07102 | | (800) 225-1852 | | www.jennisondryden.com |
|
| PROXY VOTING |
The Board of Directors of the Fund has delegated to the Fund’s investment subadviser the responsibility for voting any proxies and maintaining proxy recordkeeping with respect to the
Fund. A description of these proxy voting policies and procedures is available without charge, upon request, by calling (800) 225-1852 or by visiting the Securities and Exchange Commission’s website at www.sec.gov. Information regarding how the Fund voted proxies relating to portfolio securities during the most recent 12-month period ended June 30 is available on the Fund’s website and on the Commission’s website. |
|
| DIRECTORS |
Linda W. Bynoe • David E.A. Carson • Robert F. Gunia • Robert E. La Blanc •
Douglas H. McCorkindale • Richard A. Redeker • Judy A. Rice • Robin B. Smith •
Stephen G. Stoneburn • Clay T. Whitehead |
|
| OFFICERS |
Judy A. Rice, President • Robert F. Gunia, Vice President • Grace C. Torres, Treasurer and Principal Financial and Accounting Officer • Kathryn L. Quirk, Chief Legal Officer • Deborah A. Docs, Secretary • Lee D. Augsburger, Chief Compliance Officer • Valerie Simpson, Deputy Chief Compliance Officer • Noreen M. Fierro, Anti-Money Laundering Compliance
Officer • Jonathan D. Shain, Assistant Secretary • Claudia DiGiacomo, Assistant Secretary •
John P. Schwartz, Assistant Secretary • Andrew R. French, Assistant Secretary •
M. Sadiq Peshimam, Assistant Treasurer |
| | | | |
| MANAGER | | Prudential Investments LLC | | Gateway Center Three
100 Mulberry Street
Newark, NJ 07102 |
|
| INVESTMENT SUBADVISER | | Jennison Associates LLC | | 466 Lexington Avenue
New York, NY 10017 |
|
| DISTRIBUTOR | | Prudential Investment
Management Services LLC | | Gateway Center Three
100 Mulberry Street
Newark, NJ 07102 |
|
| CUSTODIAN | | The Bank of New York | | One Wall Street
New York, NY 10286 |
|
| TRANSFER AGENT | | Prudential Mutual Fund
Services LLC | | PO Box 8098
Philadelphia, PA 19176 |
|
INDEPENDENT REGISTERED
PUBLIC ACCOUNTING FIRM | | KPMG LLP | | 345 Park Avenue
New York, NY 10154 |
|
| FUND COUNSEL | | Sullivan & Cromwell LLP | | 125 Broad Street
New York, NY 10004 |
|
| An investor should consider the investment objectives, risks, charges, and expenses of the Fund carefully before investing. The prospectus for the Fund contains this and other information about the Fund. An investor may obtain a prospectus by visiting our website at www.jennisondryden.com or by calling (800) 225-1852. The prospectus should be read carefully before investing. |
|
| E-DELIVERY |
| To receive your mutual fund documents on-line, go to www.icsdelivery.com/prudential/funds and enroll. Instead of receiving printed documents by mail, you will receive notification via e-mail when new materials are available. You can cancel your enrollment or change your e-mail address at any time by clicking on the change/cancel enrollment option at the icsdelivery website address. |
|
| SHAREHOLDER COMMUNICATIONS WITH DIRECTORS |
| Shareholders can communicate directly with the Board of Directors by writing to the Chair of the Board, Jennison Equity Opportunity Fund, Prudential Investments, Attn: Board of Directors, 100 Mulberry Street, Gateway Center Three, Newark, NJ 07102. Shareholders can communicate directly with an individual Director by writing to the same address. Communications are not screened before being delivered to the addressee. |
|
| AVAILABILITY OF PORTFOLIO SCHEDULE |
| The Fund files its complete schedule of portfolio holdings with the Securities and Exchange Commission for the first and third quarters of each fiscal year on Form N-Q under The Prudential Investment Portfolios, Inc. name. The Fund’s Forms N-Q are available on the Commission’s website at www.sec.gov. The Fund’s Forms N-Q may also be reviewed and copied at the Commission’s Public Reference Room in Washington, D.C. Information on the operation and location of the Public Reference Room may be obtained by calling (800) SEC-0330 (732-0330). The Fund’s schedule of portfolio holdings is also available on the Fund’s website as of the end of each fiscal quarter. |
Mutual Funds:
| | | | |
| ARE NOT INSURED BY THE FDIC OR ANY FEDERAL GOVERNMENT AGENCY | | MAY LOSE VALUE | | ARE NOT A DEPOSIT OF OR GUARANTEED BY ANY BANK OR ANY BANK AFFILIATE |

| | | | | | | | | | | | | | |
| Jennison Equity Opportunity Fund | | | | | | |
| | | Share Class | | A | | B | | C | | R | | Z | | |
| | NASDAQ | | PJIAX | | PJIBX | | PJGCX | | JEOPR | | PJGZX | | |
| | CUSIP | | 74437E503 | | 74437E602 | | 74437E701 | | 74437E644 | | 74437E800 | | |
| | | | | | | | | | | | | | |
MF172E2 IFS-A133579 Ed. 05/2007

JennisonDryden Asset Allocation Funds
| | |
| MARCH 31, 2007 | | SEMIANNUAL REPORT |

JennisonDryden Conservative Allocation Fund
Objective: Current income and a reasonable level of capital appreciation
JennisonDryden Moderate Allocation Fund
Objective: Capital appreciation and a reasonable level of current income
JennisonDryden Growth Allocation Fund
Objective: Long-term capital appreciation
FUND TYPE
Balanced/allocation
This report is not authorized for distribution to prospective investors unless preceded or accompanied by a current prospectus.
The views expressed in this report and information about the Funds’ portfolio holdings are for the period covered by this report and are subject to change thereafter.
The accompanying financial statements as of March 31, 2007, were not audited, and accordingly, no auditor’s opinion is expressed on them.
JennisonDryden is a registered trademark of The Prudential Insurance Company of America.

JENNISONDRYDEN ASSET ALLOCATION FUNDS
TABLE OF CONTENTS
May 16, 2007
Dear Shareholder:
We hope you find the semiannual report for the JennisonDryden Asset Allocation Funds informative and useful. As a JennisonDryden mutual fund shareholder, you may be thinking about where you can find additional growth opportunities. You could invest in last year’s top-performing asset class and hope history repeats itself or you could stay in cash while waiting for the “right moment” to invest.
Instead, we believe it is better to take advantage of developing domestic and global investment opportunities through a diversified portfolio of stock and bond mutual funds. A diversified asset allocation offers two potential advantages. It helps you manage downside risk by not being overly exposed to any particular asset class, plus it gives you a better opportunity to have at least some of your assets in the right place at the right time. Your financial professional can help you create a diversified investment plan that may include mutual funds covering all the basic asset classes and that reflects your personal investor profile and tolerance for risk.
JennisonDryden Mutual Funds gives you a wide range of choices that can help you make progress toward your financial goals. Our funds offer the experience, resources, and professional discipline of four leading asset managers. They are recognized and respected in the institutional market and by discerning investors for excellence in their respective strategies. JennisonDryden equity funds are advised by Jennison Associates LLC, Quantitative Management Associates LLC (QMA), or Prudential Real Estate Investors (PREI). Prudential Investment Management, Inc. (PIM) advises the JennisonDryden fixed income and money market funds. Jennison Associates, QMA, and PIM are registered investment advisers and Prudential Financial companies. PREI is a registered investment adviser and a unit of PIM.
Thank you for choosing JennisonDryden Mutual Funds.
Sincerely,

Judy A. Rice, President
JennisonDryden Asset Allocation Funds
| | |
| JennisonDryden Asset Allocation Funds | | 1 |
This Page Intentionally Left Blank
Your Fund’s Performance
| | |
| MARCH 31, 2007 | | SEMIANNUAL REPORT |
JennisonDryden Conservative Allocation Fund
Your Fund’s Performance
Fund objective
The investment objective of the JennisonDryden Conservative Allocation Fund is current income and a reasonable level of capital appreciation. There can be no assurance that the Fund will achieve its investment objective.
Performance data quoted represent past performance. Past performance does not guarantee future results. The investment return and principal value of an investment will fluctuate, so that an investor’s shares, when redeemed, may be worth more or less than their original cost. Current performance may be lower or higher than the past performance data quoted. An investor may obtain performance data as of the most recent month-end by visiting our website at www.jennisondryden.com or by calling (800) 225-1852. The maximum initial sales charge is 5.50% (Class A shares). As of March 31, 2007, the gross annualized operating expenses are 2.55%, 3.25%, 3.25%, 3.00% and 2.25% for Class A, B, C, R and Z shares, respectively. As of March 31, 2007, the annualized operating expenses net of a contractual reduction through January 31, 2008 are 1.55%, 2.30%, 2.30%, 1.80% and 1.30% for Class A, B, C, R and Z shares, respectively. These figures include the net operating expenses of the underlying portfolios in which the Fund invests. Such expenses were calculated using a weighted average of the net operating expenses of each underlying fund and when annualized amounted to 0.79% for each share class.
| | | | | | |
| Cumulative Total Returns as of 3/31/07 | | | | | | |
| | | Six Months | | One Year | | Since Inception1 |
Class A | | 5.24% | | 7.68% | | 23.57% (3/30/04) |
Class B | | 4.85 | | 6.97 | | 20.80 (3/30/04) |
Class C | | 4.85 | | 6.88 | | 20.80 (3/30/04) |
Class R | | N/A | | N/A | | 1.50 (1/12/07) |
Class Z | | 5.35 | | 8.02 | | 24.74 (3/30/04) |
S&P 500 Index2 | | 7.38 | | 11.82 | | ** |
Russell 1000 Index3 | | 8.25 | | 11.84 | | *** |
JDAA Conservative Customized Blend4 | | 5.68 | | 9.08 | | **** |
Lipper Mixed-Asset Target Allocation Moderate Funds Avg.5 | | 6.45 | | 9.23 | | ***** |
| | | | | | |
| Average Annual Total Returns6 as of 3/31/07 | | | | | | |
| | | | | One Year | | Since Inception1 |
Class A | | | | 1.75% | | 5.30% (3/30/04) |
Class B | | | | 1.97 | | 5.90 (3/30/04) |
Class C | | | | 5.88 | | 6.49 (3/30/04) |
Class R | | | | N/A | | N/A (1/12/07) |
Class Z | | | | 8.02 | | 7.64 (3/30/04) |
S&P 500 Index2 | | | | 11.82 | | ** |
Russell 1000 Index3 | | | | 11.84 | | *** |
JDAA Conservative Customized Blend4 | | | | 9.08 | | **** |
Lipper Mixed-Asset Target Allocation Moderate Funds Avg.5 | | | | 9.23 | | ***** |
| | |
| 4 | | Visit our website at www.jennisondryden.com |
The cumulative total returns do not reflect the deduction of applicable sales charges. If reflected, the applicable sales charges would reduce the cumulative total returns quoted. Class A shares are subject to a maximum front-end sales charge of 5.50%. Under certain circumstances, Class A shares may be subject to a contingent deferred sales charge (CDSC) of 1%. Class B and Class C shares are subject to a maximum CDSC of 5% and 1%, respectively. Class R and Class Z shares are not subject to a sales charge.
Sources: Prudential Investments LLC, Lipper Inc., and Ibbotson Associates, Inc. Performance figures may reflect fee waivers and/or expense reimbursements. In the absence of such fee waivers and/or expense reimbursements, total returns would be lower.
1Inception dates: Class A, B, C, and Z, 3/30/04; Class R, 1/12/07. The Since Inception returns for the S&P 500 Index, Russell 1000 Index, JDAA Conservative Customized Blend, and Lipper Mixed-Asset Target Allocation Moderate Funds Average (Lipper Average) are measured from the closest month-end to inception date, and not from the Fund’s actual inception date.
2The S&P 500 Index is an unmanaged index of 500 stocks of large U.S. public companies. It gives a broad look at how U.S. stock prices have performed.
3The Russell 1000 Index is an unmanaged index that consists of the 1,000 largest securities in the Russell 3000 Index.
4The JennisonDryden Asset Allocation (JDAA) Conservative Customized Blend is a model portfolio consisting of the S&P 500 Index (5%), the S&P 500/Citigroup Growth Index (10%), the S&P 500/Citigroup Value Index (10%), the Russell 2500 Index (5%), the MSCI EAFE ND Index (10%), the Lehman Brothers U.S. Corporate High Yield Index (5%), the Lehman Brothers Intermediate Government Index (25%), the Merrill Lynch (ML) 1-3 Year Corporate Index (20%), and the Citigroup Three-Month U.S. Treasury Bill Index (10%). Each component of the JDAA Conservative Customized Blend is an unmanaged index generally considered as representing the performance of its asset class. The JDAA Conservative Customized Blend is intended to provide a theoretical comparison to the Fund’s performance based on the amounts allocated to each asset class. The JDAA Conservative Customized Blend does not reflect deductions for any sales charges, operating expenses of a mutual fund, or taxes.
5The Lipper Average represents returns based on the average return of all funds in the Lipper Mixed-Asset Target Allocation Moderate Funds category. Funds in the Lipper Average normally seek a high level of current income through investing in income-producing stocks, bonds, and money market instruments.
6 The average annual total returns take into account applicable sales charges. Class A, Class B, Class C, and Class R shares are subject to an annual distribution and service (12b-1) fee of up to 0.30%, 1.00%, 1.00%, and 0.75%, respectively. Approximately seven years after purchase, Class B shares will automatically convert to Class A shares on a quarterly basis. Class Z shares are not subject to a 12b-1 fee. The returns in the tables do not reflect the deduction of taxes that a shareholder would pay on Fund distributions or following the redemption of Fund shares.
**S&P 500 Index Closest Month-End to Inception cumulative total returns as of 3/31/2007 are 33.28% for Class A, Class B, Class C and Class Z; and 0.64% for Class R. S&P 500 Index Closest Month-End to Inception average annual total returns as of 3/31/2007 are 10.05% for Class A, Class B, Class C and Class Z. Class R shares are a new share class and no average annual total return performance information is available for this new share class.
***Russell 1000 Index Closest Month-End to Inception cumulative total returns as of 3/31/2007 are 35.76% for Class A, Class B, Class C and Class Z; and 1.21% for Class R. Russell 1000 Index Closest Month-End to Inception average annual total returns as of 3/31/2007 are 10.73% for Class A, Class B, Class C and Class Z. Class R shares are a new share class and no average annual total return performance information is available for this new share class.
| | |
| JennisonDryden Asset Allocation Funds | | 5 |
Your Fund’s Performance (continued)
****JDAA Conservative Customized Blend Closest Month-End to Inception cumulative total returns as of 3/31/2007 are 22.89% for Class A, Class B, Class C and Class Z; and 1.71% for Class R. JDAA Conservative Customized Blend Closest Month-End to Inception average annual total returns as of 3/31/2007 are 7.11% for Class A, Class B, Class C and Class Z. Class R shares are a new share class and no average annual total return performance information is available for this new share class.
*****Lipper Mixed-Asset Closest Month-End to Inception cumulative total returns as of 3/31/2007 are 24.58% for Class A, Class B, Class C and Class Z; and 1.62% for Class R. Lipper Mixed-Asset Closest Month-End to Inception average annual total returns as of 3/31/2007 are 7.57% for Class A, Class B, Class C and Class Z. Class R shares are a new share class and no average annual total return performance information is available for this new share class.
Investors cannot invest directly in an index. The returns for the S&P 500 Index, Russell 1000 Index, and JDAA Conservative Customized Blend would be lower if they included the effects of sales charges, operating expenses of a mutual fund, or taxes. Returns for the Lipper Average reflect the deduction of operating expenses, but not sales charges or taxes.
| | |
| 6 | | Visit our website at www.jennisondryden.com |
Performance Target—JDAA Conservative Customized Blend
The JennisonDryden Conservative Allocation Fund seeks to beat a performance target—the JDAA Conservative Customized Blend—consisting of a weighted average return of nine securities indexes that are generally considered representative of the asset classes in which the Fund may invest. The chart below shows both the total returns of these indexes for the six-month period ended March 31, 2007, and their weightings in the JennisonDryden Conservative Customized Blend. Index returns do not reflect sales charges, a mutual fund’s operating expenses, or taxes, and investors cannot invest directly in an index. The JennisonDryden Conservative Allocation Fund seeks to beat this target by holding positions in specific JennisonDryden mutual funds. In response to market developments, the Fund’s investment adviser may vary its holdings in those funds (within specified ranges). Past performance is not indicative of future results.
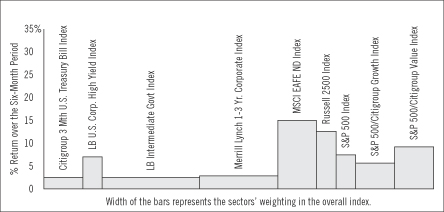
Source: Lipper Inc.
The S&P 500 Index is an unmanaged index of 500 stocks of large U.S. public companies. It gives a broad look at how U.S. stock prices have performed.
The S&P 500/Citigroup Value Index uses a multifactor methodology to calculate value style weightings for the returns of securities in the S&P 500 Index.
The S&P 500/Citigroup Growth Index uses a multifactor methodology to calculate growth style weightings for the returns of securities in the S&P 500 Index.
The Russell 2500 Index includes the smallest 2,500 securities in the Russell 3000 Index. The Russell 3000 Index represents approximately 98% of the U.S. equity market.
The Morgan Stanley Capital International Europe, Australasia, and Far East Index (MSCI EAFE ND Index) is an unmanaged, weighted index that reflects stock price movements in Europe, Australasia, and the Far East. It gives a broad look at how foreign stock prices have performed.
The Lehman Brothers Intermediate Government Index is an unmanaged index of investment-grade securities issued by the U.S. government and its agencies with between 1 and less than 10 years remaining to maturity. It gives a broad look at how short- and intermediate-term bonds have performed.
The Lehman Brothers U.S. Corporate High Yield Index is an unmanaged index of fixed-rate, below-investment-grade debt securities with at least one year remaining to maturity. The Lehman Brothers U.S. Corporate High Yield Index gives a broad look at how high yield (“junk”) bonds have performed.
The Merrill Lynch 1-3 Year Corporate Index consists of fixed-rate, coupon-bearing corporate bonds with a maturity of one to three years and a rating of BBB/Baa3 and above.
The Citigroup Three-Month U.S. Treasury Bill Index is an average of the last three three-month treasury bill month-end rates.
| | |
| JennisonDryden Asset Allocation Funds | | 7 |
This Page Intentionally Left Blank
Your Fund’s Performance
| | |
| MARCH 31, 2007 | | SEMIANNUAL REPORT |
JennisonDryden Moderate Allocation Fund
Your Fund’s Performance
Fund objective
The investment objective of the JennisonDryden Moderate Allocation Fund is capital appreciation and a reasonable level of current income. There can be no assurance that the Fund will achieve its investment objective.
Performance data quoted represent past performance. Past performance does not guarantee future results. The investment return and principal value of an investment will fluctuate, so that an investor’s shares, when redeemed, may be worth more or less than their original cost. Current performance may be lower or higher than the past performance data quoted. An investor may obtain performance data as of the most recent month-end by visiting our website at www.jennisondryden.com or by calling (800) 225-1852. The maximum initial sales charge is 5.50% (Class A shares). As of March 31, 2007, the gross annualized operating expenses are 1.90%, 2.60%, 2.60%, 2.35% and 1.60% for Class A, B, C, R and Z shares, respectively. As of March 31, 2007, the annualized operating expenses net of a contractual reduction through January 31, 2008 are 1.59%, 2.34%, 2.34%, 1.84% and 1.34% for Class A, B, C, R and Z shares, respectively. These figures include the net operating expenses of the underlying portfolios in which the Fund invests. Such expenses were calculated using a weighted average of the net operating expenses of each underlying fund and when annualized amounted to 0.83% for each share class.
| | | | | | |
| Cumulative Total Returns as of 3/31/07 | | | | | | |
| | | Six Months | | One Year | | Since Inception1 |
Class A | | 7.09% | | 9.16% | | 34.14% (3/30/04) |
Class B | | 6.62 | | 8.31 | | 31.06 (3/30/04) |
Class C | | 6.62 | | 8.14 | | 30.96 (3/30/04) |
Class R | | N/A | | N/A | | 1.69 (1/12/07) |
Class Z | | 7.26 | | 9.32 | | 34.98 (3/30/04) |
S&P 500 Index2 | | 7.38 | | 11.82 | | ** |
Russell 1000 Index3 | | 8.25 | | 11.84 | | *** |
JDAA Moderate Customized Blend4 | | 7.76 | | 11.00 | | **** |
Lipper Mixed-Asset Target Allocation Growth Funds Avg.5 | | 7.01 | | 9.54 | | ***** |
| | | | | | |
| Average Annual Total Returns6 as of 3/31/07 | | | | | | |
| | | | | One Year | | Since Inception1 |
Class A | | | | 3.15% | | 8.22% (3/30/04) |
Class B | | | | 3.31 | | 8.87 (3/30/04) |
Class C | | | | 7.14 | | 9.40 (3/30/04) |
Class R | | | | N/A | | N/A (1/12/07) |
Class Z | | | | 9.32 | | 10.50 (3/30/04) |
S&P 500 Index2 | | | | 11.82 | | ** |
Russell 1000 Index3 | | | | 11.84 | | *** |
JDAA Moderate Customized Blend4 | | | | 11.00 | | **** |
Lipper Mixed-Asset Target Allocation Growth Funds Avg.5 | | | | 9.54 | | ***** |
| | |
| 10 | | Visit our website at www.jennisondryden.com |
The cumulative total returns do not reflect the deduction of applicable sales charges. If reflected, the applicable sales charges would reduce the cumulative total returns quoted. Class A shares are subject to a maximum front-end sales charge of 5.50%. Under certain circumstances, Class A shares may be subject to a contingent deferred sales charge (CDSC) of 1%. Class B and Class C shares are subject to a maximum CDSC of 5% and 1%, respectively. Class R and Class Z shares are not subject to a sales charge.
Sources: Prudential Investments LLC, Lipper Inc., and Ibbotson Associates, Inc. Performance figures may reflect fee waivers and/or expense reimbursements. In the absence of such fee waivers and/or expense reimbursements, total returns would be lower.
1Inception dates: Class A, B, C, and Z, 3/30/04; Class R, 1/12/07. The Since Inception returns for the S&P 500 Index, Russell 1000 Index, JDAA Moderate Customized Blend and Lipper Mixed-Asset Target Allocation Growth Funds Average (Lipper Average) are measured from the closest month-end to inception date, and not from the Fund’s actual inception date.
2The S&P 500 Index is an unmanaged index of 500 stocks of large U.S. public companies. It gives a broad look at how U.S. stock prices have performed.
3The Russell 1000 Index is an unmanaged index that consists of the 1,000 largest securities in the Russell 3000 Index.
4The JennisonDryden Asset Allocation (JDAA) Moderate Customized Blend is a model portfolio consisting of the S&P 500 Index (8%), the S&P 500/Citigroup Growth Index (14%), the S&P 500/Citigroup Value Index (14%), the Russell 2500 Index (12%), the Morgan Stanley Capital International Europe, Australasia, and Far East (MSCI EAFE ND) Index (17%), the Lehman Brothers U.S. Corporate High Yield Index (5%), the Lehman Brothers Intermediate Government Index (15%), the Merrill Lynch (ML) 1-3 Year Corporate Index (10%), and the Citigroup Three-Month U.S. Treasury Bill Index (5%). Each component of the JDAA Moderate Customized Blend is an unmanaged index generally considered as representing the performance of its asset class. The JDAA Moderate Customized Blend is intended to provide a theoretical comparison to the Fund’s performance based on the amounts allocated to each asset class. The JDAA Moderate Customized Blend does not reflect deductions for any sales charges, operating expenses of a mutual fund, or taxes.
5The Lipper Average represents returns based on the average return of all funds in the Lipper Mixed-Asset Target Allocation Growth Funds category. Funds in the Lipper Average have a primary objective to conserve principal by maintaining at all times a balanced portfolio of both stocks and bonds. Typically, the stock:bond ratio ranges around 60%:40%.
6The average annual total returns take into account applicable sales charges. Class A, Class B, Class C, and Class R shares are subject to an annual distribution and service (12b-1) fee of up to 0.30%, 1.00%, 1.00%, and 0.75%, respectively. Approximately seven years after purchase, Class B shares will automatically convert to Class A shares on a quarterly basis. Class Z shares are not subject to a 12b-1 fee. The returns in the tables do not reflect the deduction of taxes that a shareholder would pay on Fund distributions or following the redemption of Fund shares.
**S&P 500 Index Closest Month-End to Inception cumulative total returns as of 3/31/2007 are 33.28% for Class A, Class B, Class C and Class Z; and 0.64% for Class R. S&P 500 Index Closest Month-End to Inception average annual total returns as of 3/31/2007 are 10.05% for Class A, Class B, Class C and Class Z. Class R shares are a new share class and no average annual total return performance information is available for this new share class.
***Russell 1000 Index Closest Month-End to Inception cumulative total returns as of 3/31/2007 are 35.76% for Class A, Class B, Class C and Class Z; and 1.21% for Class R. Russell 1000 Index Closest Month-End to Inception average annual total returns as of 3/31/2007 are 10.73% for Class A, Class B, Class C and Class Z.
| | |
| JennisonDryden Asset Allocation Funds | | 11 |
Your Fund’s Performance (continued)
Class R shares are a new share class and no average annual total return performance information is available for this new share class.
****JDAA Moderate Customized Blend Closest Month-End to Inception cumulative total returns as of 3/31/2007 are 32.69% for Class A, Class B, Class C and Class Z; and 1.94% for Class R. JDAA Moderate Customized Blend Closest Month-End to Inception average annual total returns as of 3/31/2007 are 9.89% for Class A, Class B, Class C and Class Z. Class R shares are a new share class and no average annual total return performance information is available for this new share class.
*****Lipper Mixed-Asset Closest Month-End to Inception cumulative total returns as of 3/31/2007 are 27.72% for Class A, Class B, Class C and Class Z; and 1.51% for Class R. Lipper Mixed-Asset Closest Month-End to Inception average annual total returns as of 3/31/2007 are 8.44% for Class A, Class B, Class C and Class Z. Class R shares are a new share class and no average annual total return performance information is available for this new share class.
Investors cannot invest directly in an index. The returns for the S&P 500 Index, Russell 1000 Index, and JDAA Moderate Customized Blend would be lower if they included the effects of sales charges, operating expenses of a mutual fund, or taxes. Returns for the Lipper Average reflect the deduction of operating expenses, but not sales charges or taxes.
| | |
| 12 | | Visit our website at www.jennisondryden.com |
Performance Target—JDAA Moderate Customized Blend
The JennisonDryden Moderate Allocation Fund seeks to beat a performance target—the JDAA Moderate Customized Blend—consisting of a weighted average return of nine securities indexes that are generally considered representative of the asset classes in which the Fund may invest. The chart below shows both the total returns of these indexes for the six-month period ended March 31, 2007, and their weightings in the JennisonDryden Moderate Customized Blend. Index returns do not reflect sales charges, a mutual fund’s operating expenses, or taxes, and investors cannot invest directly in an index. The JennisonDryden Moderate Allocation Fund seeks to beat this target by holding positions in specific JennisonDryden mutual funds. In response to market developments, the Fund’s investment adviser may vary its holdings in those funds (within specified ranges). Past performance is not indicative of future results.
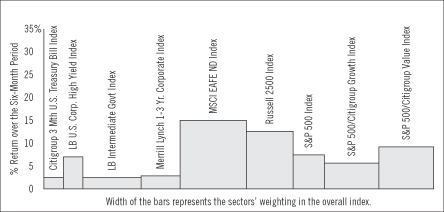
Source: Lipper Inc.
The S&P 500 Index is an unmanaged index of 500 stocks of large U.S. public companies. It gives a broad look at how U.S. stock prices have performed.
The S&P 500/Citigroup Value Index uses a multifactor methodology to calculate value style weightings for the returns of securities in the S&P 500 Index.
The S&P 500/Citigroup Growth Index uses a multifactor methodology to calculate growth style weightings for the returns of securities in the S&P 500 Index.
The Russell 2500 Index includes the smallest 2,500 securities in the Russell 3000 Index. The Russell 3000 Index represents approximately 98% of the U.S. equity market.
The Morgan Stanley Capital International Europe, Australasia, and Far East Index (MSCI EAFE ND Index) is an unmanaged, weighted index that reflects stock price movements in Europe, Australasia, and the Far East. It gives a broad look at how foreign stock prices have performed.
The Lehman Brothers Intermediate Government Index is an unmanaged index of investment-grade securities issued by the U.S. government and its agencies with between 1 and less than 10 years remaining to maturity. It gives a broad look at how short- and intermediate-term bonds have performed.
The Lehman Brothers U.S. Corporate High Yield Index is an unmanaged index of fixed-rate, below-investment-grade debt securities with at least one year remaining to maturity. The Lehman Brothers U.S. Corporate High Yield Index gives a broad look at how high yield (“junk”) bonds have performed.
The Merrill Lynch 1-3 Year Corporate Index consists of fixed-rate, coupon-bearing corporate bonds with a maturity of one to three years and a rating of BBB/Baa3 and above.
The Citigroup Three-Month U.S. Treasury Bill Index is an average of the last three three-month treasury bill month-end rates.
| | |
| JennisonDryden Asset Allocation Funds | | 13 |
This Page Intentionally Left Blank
Your Fund’s Performance
| | |
| MARCH 31, 2007 | | SEMIANNUAL REPORT |
JennisonDryden Growth Allocation Fund
Your Fund’s Performance
Fund objective
The investment objective of the JennisonDryden Growth Allocation Fund is long-term capital appreciation. There can be no assurance that the Fund will achieve its investment objective.
Performance data quoted represent past performance. Past performance does not guarantee future results. The investment return and principal value of an investment will fluctuate, so that an investor’s shares, when redeemed, may be worth more or less than their original cost. Current performance may be lower or higher than the past performance data quoted. An investor may obtain performance data as of the most recent month-end by visiting our website at www.jennisondryden.com or by calling (800) 225-1852. The maximum initial sales charge is 5.50% (Class A shares). As of March 31, 2007, the gross annualized operating expenses are 2.32%, 3.02%, 3.02%, 2.77% and 2.02% for Class A, B, C, R and Z shares, respectively. As of March 31, 2007, the annualized operating expenses net of a contractual reduction through January 31, 2008 are 1.64%, 2.39%, 2.39%, 1.89% and 1.39% for Class A, B, C, R and Z shares, respectively. These figures include the net operating expenses of the underlying portfolios in which the Fund invests. Such expenses were calculated using a weighted average of the net operating expenses of each underlying fund and when annualized amounted to 0.89% for each share class.
| | | | | | |
| Cumulative Total Returns as of 3/31/07 | | | | | | |
| | | Six Months | | One Year | | Since Inception1 |
Class A | | 8.94% | | 10.11% | | 44.77% (3/30/04) |
Class B | | 8.55 | | 9.47 | | 41.79 (3/30/04) |
Class C | | 8.63 | | 9.39 | | 41.79 (3/30/04) |
Class R | | N/A | | N/A | | 1.96 (1/12/07) |
Class Z | | 9.08 | | 10.42 | | 45.91 (3/30/04) |
S&P 500 Index2 | | 7.38 | | 11.82 | | ** |
Russell 1000 Index3 | | 8.25 | | 11.84 | | *** |
JDAA Growth Customized Blend4 | | 9.86 | | 12.80 | | **** |
Lipper Multi-Cap Core Funds Avg.5 | | 8.52 | | 9.34 | | ***** |
| | | | | | |
| Average Annual Total Returns6 as of 3/31/07 | | | | |
| | | | | One Year | | Since Inception1 |
Class A | | | | 4.06% | | 11.00% (3/30/04) |
Class B | | | | 4.47 | | 11.80 (3/30/04) |
Class C | | | | 8.39 | | 12.33 (3/30/04) |
Class R | | | | N/A | | N/A (1/12/07) |
Class Z | | | | 10.42 | | 13.41 (3/30/04) |
S&P 500 Index2 | | | | 11.82 | | ** |
Russell 1000 Index3 | | | | 11.84 | | *** |
JDAA Growth Customized Blend4 | | | | 12.80 | | **** |
Lipper Multi-Cap Core Funds Avg.5 | | | | 9.34 | | ***** |
| | |
| 16 | | Visit our website at www.jennisondryden.com |
The cumulative total returns do not reflect the deduction of applicable sales charges. If reflected, the applicable sales charges would reduce the cumulative total returns quoted. Class A shares are subject to a maximum front-end sales charge of 5.50%. Under certain circumstances, Class A shares may be subject to a contingent deferred sales charge (CDSC) of 1%. Class B and Class C shares are subject to a maximum CDSC of 5% and 1%, respectively. Class R and Class Z shares are not subject to a sales charge.
Sources: Prudential Investments LLC, Lipper Inc., and Ibbotson Associates, Inc. Performance figures may reflect fee waivers and/or expense reimbursements. In the absence of such fee waivers and/or expense reimbursements, total returns would be lower.
1Inception dates: Class A, B, C, and Z, 3/30/04; Class R, 1/12/07. The Since Inception returns for the S&P 500 Index, Russell 1000 Index, JDAA Growth Customized Blend, and Lipper Multi-Cap Core Funds Average (Lipper Average) are measured from the closest month-end to inception date, and not from the Fund’s actual inception date.
2The S&P 500 Index is an unmanaged index of 500 stocks of large U.S. public companies. It gives a broad look at how U.S. stock prices have performed.
3The Russell 1000 Index is an unmanaged index that consists of the 1,000 largest securities in the Russell 3000 Index.
4The JennisonDryden Asset Allocation (JDAA) Growth Customized Blend is a model portfolio consisting of the S&P 500 Index (9%), the S&P 500/Citigroup Growth Index (18%), the S&P 500/Citigroup Value Index (18%), the Russell 2500 Index (20%), the MSCI EAFE ND Index (25%), the Lehman Brothers U.S. Corporate High Yield Index (2%), and the Lehman Brothers Intermediate Government Index (8%). Each component of the JDAA Growth Customized Blend is an unmanaged index generally considered as representing the performance of its asset class. The JDAA Growth Customized Blend is intended to provide a theoretical comparison to the Fund’s performance based on the amounts allocated to each asset class. The JDAA Growth Customized Blend does not reflect deductions for any sales charges, operating expenses of a mutual fund, or taxes.
5The Lipper Average represents returns based on the average return of all funds in the Lipper Multi-Cap Core Funds category. Funds in the Lipper Average invest in a variety of market capitalization ranges without concentrating 75% of their equity assets in any one market capitalization range over an extended period of time. Multi-cap funds typically have between 25% and 75% of their assets invested in companies with market capitalizations (on a three-year weighted basis) above 300% of the dollar-weighted median market capitalization of the middle 1,000 securities of the S&P SuperComposite 1500 Index. Multi-cap core funds have more latitude in the companies in which they invest. These funds typically have an average price-to-earnings ratio, price-to-book ratio, and three-year sales-per-share growth value compared to the S&P SuperComposite 1500 Index.
6The average annual total returns take into account applicable sales charges. Class A, Class B, Class C, and Class R shares are subject to an annual distribution and service (12b-1) fee of up to 0.30%, 1.00%, 1.00%, and 0.75%, respectively. Approximately seven years after purchase, Class B shares will automatically convert to Class A shares on a quarterly basis. Class Z shares are not subject to a 12b-1 fee. The returns in the tables do not reflect the deduction of taxes that a shareholder would pay on Fund distributions or following the redemption of Fund shares.
**S&P 500 Index Closest Month-End to Inception cumulative total returns as of 3/31/2007 are 33.28% for Class A, Class B, Class C and Class Z; and 0.64% for Class R. S&P 500 Index Closest Month-End to Inception average annual total returns as of 3/31/2007 are 10.05% for Class A, Class B, Class C and Class Z. Class R shares are a new share class and no average annual total return performance information is available for this new share class.
| | |
| JennisonDryden Asset Allocation Funds | | 17 |
Your Fund’s Performance (continued)
***Russell 1000 Index Closest Month-End to Inception cumulative total returns as of 3/31/2007 are 35.76% for Class A, Class B, Class C and Class Z; and 1.21% for Class R. Russell 1000 Index Closest Month-End to Inception average annual total returns as of 3/31/2007 are 10.73% for Class A, Class B, Class C and Class Z. Class R shares are a new share class and no average annual total return performance information is available for this new share class.
****JDAA Growth Customized Blend Closest Month-End to Inception cumulative total returns as of 3/31/2007 are 42.82% for Class A, Class B, Class C and Class Z; and 2.21% for Class R. JDAA Growth Customized Blend Closest Month-End to Inception average annual total returns as of 3/31/2007 are 12.61% for Class A, Class B, Class C and Class Z. Class R shares are a new share class and no average annual total return performance information is available for this new share class.
*****Lipper Multi-Cap Closest Month-End to Inception cumulative total returns as of 3/31/2007 are 33.30% for Class A, Class B, Class C and Class Z; and 1.57% for Class R. Lipper Multi-Cap Closest Month-End to Inception average annual total returns as of 3/31/2007 are 9.96% for Class A, Class B, Class C and Class Z. Class R shares are a new share class and no average annual total return performance information is available for this new share class.
Investors cannot invest directly in an index. The returns for the S&P 500 Index, Russell 1000 Index, and JDAA Growth Customized Blend would be lower if they included the effects of sales charges, operating expenses of a mutual fund, or taxes. Returns for the Lipper Average reflect the deduction of operating expenses, but not sales charges or taxes.
| | |
| 18 | | Visit our website at www.jennisondryden.com |
Performance Target—JDAA Growth Customized Blend
The JennisonDryden Growth Allocation Fund seeks to exceed a performance target—the JDAA Growth Customized Blend—consisting of a weighted average return of seven securities indexes that are generally considered representative of the asset classes in which the Fund may invest. The chart below shows both the total returns of these indexes for the six-month period ended March 31, 2007, and their weightings in the JennisonDryden Growth Customized Blend. Index returns do not reflect sales charges, a mutual fund’s operating expenses, or taxes, and investors cannot invest directly in an index. The JennisonDryden Growth Allocation Fund seeks to exceed this target by holding positions in specific JennisonDryden mutual funds. In response to market developments, the Fund’s investment adviser may vary its holdings in those funds (within specified ranges). Past performance is not indicative of future results.
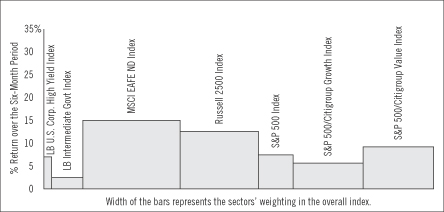
Source: Lipper Inc.
The S&P 500 Index is an unmanaged index of 500 stocks of large U.S. public companies. It gives a broad look at how U.S. stock prices have performed.
The S&P 500/Citigroup Value Index uses a multifactor methodology to calculate value style weightings for the returns of securities in the S&P 500 Index.
The S&P 500/Citigroup Growth Index uses a multifactor methodology to calculate growth style weightings for the returns of securities in the S&P 500 Index.
The Russell 2500 Index includes the smallest 2,500 securities in the Russell 3000 Index. The Russell 3000 Index represents approximately 98% of the U.S. equity market.
The Morgan Stanley Capital International Europe, Australasia, and Far East Index (MSCI EAFE ND Index) is an unmanaged, weighted index that reflects stock price movements in Europe, Australasia, and the Far East. It gives a broad look at how foreign stock prices have performed.
The Lehman Brothers Intermediate Government Index is an unmanaged index of investment-grade securities issued by the U.S. government and its agencies with between 1 and less than 10 years remaining to maturity. It gives a broad look at how short- and intermediate-term bonds have performed.
The Lehman Brothers U.S. Corporate High Yield Index is an unmanaged index of fixed-rate, below-investment-grade debt securities with at least one year remaining to maturity. The Lehman Brothers U.S. Corporate High Yield Index gives a broad look at how high yield (“junk”) bonds have performed.
| | |
| JennisonDryden Asset Allocation Funds | | 19 |
Fees and Expenses (Unaudited)
As a shareholder of a Fund, you incur two types of costs: (1) transaction costs, including sales charges (loads) on purchase payments and redemptions, as applicable, and (2) ongoing costs, including management fees, distribution and/or service (12b-1) fees, and other Fund expenses, as applicable. This example is intended to help you understand your ongoing costs (in dollars) of investing in the Funds and to compare these costs with the ongoing costs of investing in other mutual funds.
The example is based on an investment of $1,000 invested on October 1, 2006, at the beginning of the period, and held through the six-month period ended March 31, 2007.
The Fund’s transfer agent may charge additional fees to holders of certain accounts that are not included in the expenses shown in the table on the following page. These fees apply to Individual Retirement Accounts (IRAs) and Section 403(b) accounts. As of the close of the six-month period covered by the table, IRA fees included an annual maintenance fee of $15 per account (subject to a maximum annual maintenance fee of $25 for all accounts held by the same shareholder). Section 403(b) accounts are charged an annual $25 fiduciary maintenance fee. Some of the fees may vary in amount, or may be waived, based on your total account balance or the number of JennisonDryden or Strategic Partners Funds, including the Fund, that you own. You should consider the additional fees that were charged to your Fund account over the six-month period when you estimate the total ongoing expenses paid over the period and the impact of these fees on your ending account value, as these additional expenses are not reflected in the information provided in the expense table. Additional fees have the effect of reducing investment returns.
Actual Expenses
The first line for each share class in the table on the following page provides information about actual account values and actual expenses. You may use the information on this line, together with the amount you invested, to estimate the expenses that you paid over the period. Simply divide your account value by $1,000 (for example, an $8,600 account value ÷ $1,000 = 8.6), then multiply the result by the number on the first line under the heading “Expenses Paid During the Six-Month Period” to estimate the expenses you paid on your account during this period.
| | |
| 20 | | Visit our website at www.jennisondryden.com |
Hypothetical Example for Comparison Purposes
The second line for each share class in the table on the following page provides information about hypothetical account values and hypothetical expenses based on the Fund’s actual expense ratio and an assumed rate of return of 5% per year before expenses, which is not the Fund’s actual return. The hypothetical account values and expenses may not be used to estimate the actual ending account balance or expenses you paid for the period. You may use this information to compare the ongoing costs of investing in the Fund and other funds. To do so, compare this 5% hypothetical example with the 5% hypothetical examples that appear in the shareholder reports of the other funds.
Please note that the expenses shown in the tables are meant to highlight your ongoing costs only, and do not reflect any transactional costs such as sales charges (loads). Therefore the second line for each share class in the table is useful in comparing ongoing costs only, and will not help you determine the relative total costs of owning different funds. In addition, if these transactional costs were included, your costs would have been higher.
| | | | | | | | | | | | | | |
JennisonDryden
Conservative
Allocation Fund | | Beginning Account
Value
October 1, 2006 | | Ending Account
Value
March 31, 2007 | | Annualized
Expense Ratio
Based on the
Six-Month Period | | | Expenses Paid
During the
Six-Month Period* |
| | | | | | | | | | | | | | | |
| Class A | | Actual | | $ | 1,000.00 | | $ | 1,052.40 | | 1.55 | % | | $ | 7.93 |
| | | Hypothetical | | $ | 1,000.00 | | $ | 1,017.20 | | 1.55 | % | | $ | 7.80 |
| | | | | | | | | | | | | | | |
| Class B | | Actual | | $ | 1,000.00 | | $ | 1,048.50 | | 2.30 | % | | $ | 11.75 |
| | | Hypothetical | | $ | 1,000.00 | | $ | 1,013.46 | | 2.30 | % | | $ | 11.55 |
| | | | | | | | | | | | | | | |
| Class C | | Actual | | $ | 1,000.00 | | $ | 1,048.50 | | 2.30 | % | | $ | 11.75 |
| | | Hypothetical | | $ | 1,000.00 | | $ | 1,013.46 | | 2.30 | % | | $ | 11.55 |
| | | | | | | | | | | | | | | |
| Class R | | Actual** | | $ | 1,000.00 | | $ | 1,015.00 | | 1.80 | % | | $ | 3.93 |
| | | Hypothetical | | $ | 1,000.00 | | $ | 1,015.96 | | 1.80 | % | | $ | 9.05 |
| | | | | | | | | | | | | | | |
| Class Z | | Actual | | $ | 1,000.00 | | $ | 1,053.50 | | 1.30 | % | | $ | 6.66 |
| | | Hypothetical | | $ | 1,000.00 | | $ | 1,018.45 | | 1.30 | % | | $ | 6.54 |
| | |
| JennisonDryden Asset Allocation Funds | | 21 |
Fees and Expenses (continued)
| | | | | | | | | | | | | | |
JennisonDryden
Moderate
Allocation Fund | | Beginning Account
Value
October 1, 2006 | | Ending Account
Value
March 31, 2007 | | Annualized
Expense Ratio
Based on the
Six-Month Period | | | Expenses Paid
During the
Six-Month Period* |
| | | | | | | | | | | | | | | |
| Class A | | Actual | | $ | 1,000.00 | | $ | 1,070.90 | | 1.59 | % | | $ | 8.21 |
| | | Hypothetical | | $ | 1,000.00 | | $ | 1,017.00 | | 1.59 | % | | $ | 8.00 |
| | | | | | | | | | | | | | | |
| Class B | | Actual | | $ | 1,000.00 | | $ | 1,066.20 | | 2.34 | % | | $ | 12.05 |
| | | Hypothetical | | $ | 1,000.00 | | $ | 1,013.26 | | 2.34 | % | | $ | 11.75 |
| | | | | | | | | | | | | | | |
| Class C | | Actual | | $ | 1,000.00 | | $ | 1,066.20 | | 2.34 | % | | $ | 12.05 |
| | | Hypothetical | | $ | 1,000.00 | | $ | 1,013.26 | | 2.34 | % | | $ | 11.75 |
| | | | | | | | | | | | | | | |
| Class R | | Actual** | | $ | 1,000.00 | | $ | 1,016.90 | | 1.84 | % | | $ | 4.02 |
| | | Hypothetical | | $ | 1,000.00 | | $ | 1,015.76 | | 1.84 | % | | $ | 9.25 |
| | | | | | | | | | | | | | | |
| Class Z | | Actual | | $ | 1,000.00 | | $ | 1,072.60 | | 1.34 | % | | $ | 6.92 |
| | | Hypothetical | | $ | 1,000.00 | | $ | 1,018.25 | | 1.34 | % | | $ | 6.74 |
| | | | | | | | | | | | | | | |
JennisonDryden Growth
Allocation Fund | | Beginning Account Value October 1, 2006 | | Ending Account
Value March 31, 2007 | | Annualized
Expense Ratio
Based on the
Six-Month Period | | | Expenses Paid
During the
Six-Month Period* |
| | | | | | | | | | | | | | | |
| Class A | | Actual | | $ | 1,000.00 | | $ | 1,089.40 | | 1.64 | % | | $ | 8.54 |
| | | Hypothetical | | $ | 1,000.00 | | $ | 1,016.75 | | 1.64 | % | | $ | 8.25 |
| | | | | | | | | | | | | | | |
| Class B | | Actual | | $ | 1,000.00 | | $ | 1,085.50 | | 2.39 | % | | $ | 12.43 |
| | | Hypothetical | | $ | 1,000.00 | | $ | 1,013.01 | | 2.39 | % | | $ | 11.99 |
| | | | | | | | | | | | | | | |
| Class C | | Actual | | $ | 1,000.00 | | $ | 1,086.30 | | 2.39 | % | | $ | 12.43 |
| | | Hypothetical | | $ | 1,000.00 | | $ | 1,013.01 | | 2.39 | % | | $ | 11.99 |
| | | | | | | | | | | | | | | |
| Class R | | Actual** | | $ | 1,000.00 | | $ | 1,019.60 | | 1.89 | % | | $ | 4.13 |
| | | Hypothetical | | $ | 1,000.00 | | $ | 1,015.51 | | 1.89 | % | | $ | 9.50 |
| | | | | | | | | | | | | | | |
| Class Z | | Actual | | $ | 1,000.00 | | $ | 1,090.80 | | 1.39 | % | | $ | 7.25 |
| | | Hypothetical | | $ | 1,000.00 | | $ | 1,018.00 | | 1.39 | % | | $ | 6.99 |
* Fund expenses (net of fee waivers or subsidies, if any) for each share class are equal to the annualized expense ratio for each share class (provided in the table), multiplied by the average account value over the period, multiplied by the 182 days in the six-month period ended March 31, 2007, and divided by the 365 days in the Fund’s fiscal year ending September 30, 2007 (to reflect the six-month period) with the exception of the Class R ‘‘Actual’’ information which reflects the 79 day period ended March 31, 2007 due to its inception date of January 12, 2007. Expenses presented in the table include the expenses of any underlying portfolios in which the Fund may invest.
** Class R shares commenced operations on January 12, 2007.
| | |
| 22 | | Visit our website at www.jennisondryden.com |
JennisonDryden Conservative Allocation Fund
Portfolio of Investments
as of March 31, 2007 (Unaudited)
| | | | | | |
| Description | | Shares | | Value (Note 1) | |
| | | | | | |
LONG-TERM INVESTMENTS 98.5% | | | | | | |
| | |
Affiliated Registered Investment Companies | | | | | | |
Dryden Government Income Fund, Inc. (Class Z) | | 900,578 | | $ | 7,916,085 | |
Dryden High Yield Fund, Inc. (Class Z) | | 269,928 | | | 1,581,780 | |
Dryden International Equity Fund (Class Z) | | 300,991 | | | 2,808,248 | |
Dryden Large-Cap Core Equity Fund (Class Z) | | 118,973 | | | 1,631,113 | |
Dryden Short-Term Corporate Bond Fund (Class Z) | | 573,853 | | | 6,214,824 | |
Dryden Ultra Short Bond Fund (Class Z) | | 225,446 | | | 2,193,587 | |
Jennison 20/20 Focus Fund (Class Z) | | 91,004 | | | 1,531,595 | |
Jennison Equity Opportunity Fund (Class Z) | | 35,992 | | | 617,988 | |
Jennison Growth Fund (Class Z)(a) | | 143,594 | | | 2,462,637 | |
Jennison Mid-Cap Growth Fund, Inc. (Class Z)(a) | | 26,052 | | | 609,364 | |
Jennison Value Fund (Class Z) | | 143,835 | | | 3,062,247 | |
| | | | | | |
Total long-term investments
(cost $28,368,684) | | | | | 30,629,468 | |
| | | | | | |
SHORT-TERM INVESTMENT 1.7% | | | | | | |
| | |
Affiliated Money Market Mutual Fund | | | | | | |
Dryden Core Investment Fund-Taxable Money Market Series
(cost $536,114; Note 3) | | 536,114 | | | 536,114 | |
| | | | | | |
Total Investments(b) 100.2%
(cost $28,904,798; Note 5) | | | | | 31,165,582 | |
Liabilities in excess of other assets (0.2%) | | | | | (53,876 | ) |
| | | | | | |
Net Assets 100.0% | | | | $ | 31,111,706 | |
| | | | | | |
| (a) | Non-income producing security. |
| (b) | Prudential Investments LLC, the manager of the Fund, also serves as manager of the underlying funds in which the Fund invests. |
See Notes to Financial Statements.
| | |
| JennisonDryden Asset Allocation Funds | | 23 |
JennisonDryden Conservative Allocation Fund
Portfolio of Investments
as of March 31, 2007 (Unaudited) Cont’d.
The investment allocation of portfolio holdings and liabilities in excess of other assets shown as a percentage of net assets as of March 31, 2007 were as follows:
| | | |
Short-Term Debt | | 27.0 | % |
U.S. Government Debt | | 25.5 | |
Large-Cap Core | | 10.2 | |
Large-Cap Value | | 9.8 | |
International | | 9.0 | |
Large-Cap Growth | | 7.9 | |
High Yield | | 5.1 | |
Multi-Cap Value | | 2.0 | |
Small/Mid-Cap Growth | | 2.0 | |
| | | |
| | 98.5 | |
Short-Term Investments | | 1.7 | |
Liabilities in excess of other assets | | (0.2 | ) |
| | | |
| | 100.0 | % |
| | | |
See Notes to Financial Statements.
| | |
| 24 | | Visit our website at www.jennisondryden.com |
JennisonDryden Moderate Allocation Fund
Portfolio of Investments
as of March 31, 2007 (Unaudited)
| | | | | | |
| Description | | Shares | | Value (Note 1) | |
| | | | | | |
| | | | | | |
LONG-TERM INVESTMENTS 98.7% | | | | | | |
| | |
Affiliated Registered Investment Companies | | | | | | |
Dryden Government Income Fund, Inc. (Class Z) | | 1,359,791 | | $ | 11,952,559 | |
Dryden High Yield Fund, Inc. (Class Z) | | 584,044 | | | 3,422,495 | |
Dryden International Equity Fund (Class Z) | | 1,441,700 | | | 13,451,061 | |
Dryden Large-Cap Core Equity Fund (Class Z) | | 459,828 | | | 6,304,237 | |
Dryden Short-Term Corporate Bond Fund, Inc. (Class Z) | | 959,131 | | | 10,387,391 | |
Dryden Small-Cap Core Equity Fund, Inc. (Class Z)(b) | | 122,756 | | | 2,577,867 | |
Dryden Ultra Short Bond Fund (Class Z) | | 176,379 | | | 1,716,171 | |
Jennison 20/20 Focus Fund (Class Z) | | 409,648 | | | 6,894,378 | |
Jennison Equity Opportunity Fund (Class Z) | | 151,358 | | | 2,598,819 | |
Jennison Growth Fund (Class Z)(b) | | 599,174 | | | 10,275,839 | |
Jennison Mid-Cap Growth Fund (Class Z)(b) | | 75,008 | | | 1,754,449 | |
Jennison Value Fund (Class Z) | | 646,108 | | | 13,755,638 | |
| | | | | | |
Total long-term investments
(cost $74,066,379) | | | | | 85,090,904 | |
| | | | | | |
SHORT-TERM INVESTMENT 1.4% | | | | | | |
| | |
Affiliated Money Market Mutual Fund | | | | | | |
Dryden Core Investment Fund-Taxable Money Market Series
(cost $1,218,014; Note 3) | | 1,218,014 | | | 1,218,014 | |
| | | | | | |
Total Investments(a) 100.1%
(cost $75,284,393; Note 5) | | | | | 86,308,918 | |
Liabilities in excess of other assets (0.1%) | | | | | (121,606 | ) |
| | | | | | |
Net Assets 100.0% | | | | $ | 86,187,312 | |
| | | | | | |
| (a) | Prudential Investments LLC, the manager of the Fund, also serves as manager of the underlying funds in which the Fund invests. |
| (b) | Non-income producing security. |
See Notes to Financial Statements.
| | |
| JennisonDryden Asset Allocation Funds | | 25 |
JennisonDryden Moderate Allocation Fund
Portfolio of Investments
as of March 31, 2007 (Unaudited) Cont’d.
The investment allocation of portfolio holdings and liabilities in excess of other assets shown as a percentage of net assets as of March 31, 2007 were as follows:
| | | |
Large-Cap Value | | 16.0 | % |
International | | 15.6 | |
Large-Cap Core | | 15.3 | |
Short-Term Debt | | 14.0 | |
Government Debt | | 13.9 | |
Large-Cap Growth | | 11.9 | |
High Yield | | 4.0 | |
Multi-Cap Value | | 3.0 | |
Small-Cap Core | | 3.0 | |
Small/Mid-Cap Growth | | 2.0 | |
| | | |
| | 98.7 | |
Short-Term Investment | | 1.4 | |
Liabilities in excess of other assets | | (0.1 | ) |
| | | |
| | 100.0 | % |
| | | |
See Notes to Financial Statements.
| | |
| 26 | | Visit our website at www.jennisondryden.com |
JennisonDryden Growth Allocation Fund
Portfolio of Investments
as of March 31, 2007 (Unaudited)
| | | | | | |
| Description | | Shares | | Value (Note 1) | |
| | | | | | |
LONG-TERM INVESTMENTS 98.1% | | | | | | |
| | |
Affiliated Registered Investment Companies | | | | | | |
Dryden International Equity Fund (Class Z) | | 1,281,436 | | $ | 11,955,803 | |
Dryden Large-Cap Core Equity Fund (Class Z) | | 338,137 | | | 4,635,866 | |
Dryden Small-Cap Core Equity Fund, Inc. (Class Z)(b) | | 166,005 | | | 3,486,111 | |
Dryden Total Return Bond Fund, Inc. (Class Z) | | 260,662 | | | 3,284,345 | |
Jennison 20/20 Focus Fund (Class Z) | | 297,400 | | | 5,005,238 | |
Jennison Equity Opportunity Fund (Class Z) | | 117,089 | | | 2,010,423 | |
Jennison Growth Fund (Class Z)(b) | | 460,918 | | | 7,904,748 | |
Jennison Mid-Cap Growth Fund, Inc. (Class Z)(b) | | 86,375 | | | 2,020,322 | |
Jennison Value Fund (Class Z) | | 420,870 | | | 8,960,325 | |
| | | | | | |
Total long-term investments
(cost $41,141,169) | | | | | 49,263,181 | |
| | | | | | |
SHORT-TERM INVESTMENT 1.9% | | | | | | |
| | |
Affiliated Money Market Mutual Fund | | | | | | |
Dryden Core Investment Fund-Taxable Money Market Series
(cost $935,396; Note 3) | | 935,396 | | | 935,396 | |
| | | | | | |
Total Investments(a) 100%
(cost $42,076,565; Note 5) | | | | | 50,198,577 | |
Liabilities in excess of other assets 0.0% | | | | | (4,112 | ) |
| | | | | | |
Net Assets 100.0% | | | | $ | 50,194,465 | |
| | | | | | |
| (a) | Prudential Investments LLC, the manager of the Fund, also serves as manager of the underlying funds in which the Fund invests. |
| (b) | Non-income producing security. |
See Notes to Financial Statements.
| | |
| JennisonDryden Asset Allocation Funds | | 27 |
JennisonDryden Growth Allocation Fund
Portfolio of Investments
as of March 31, 2007 (Unaudited) Cont’d.
The investment allocation of portfolio holdings and liabilities in excess of other assets shown as a percentage of net assets as of March 31, 2007 were as follows:
| | | |
International | | 23.8 | % |
Large-Cap Core | | 19.2 | |
Large-Cap Value | | 17.9 | |
Large-Cap Growth | | 15.8 | |
Small-Cap Core | | 6.9 | |
Multi-Sector Debt | | 6.5 | |
Multi-Cap Value | | 4.0 | |
Small/Mid-Cap Growth | | 4.0 | |
| | | |
| | 98.1 | |
Short-Term Investment | | 1.9 | |
Liabilities in excess of other assets | | 0.0 | |
| | | |
| | 100.0 | % |
| | | |
See Notes to Financial Statements.
| | |
| 28 | | Visit our website at www.jennisondryden.com |
Financial Statements
| | |
| MARCH 31, 2007 | | SEMIANNUAL REPORT |
JennisonDryden Asset Allocation Funds
JennisonDryden Conservative Allocation Fund
Statement of Assets and Liabilities
as of March 31, 2007 (Unaudited)
| | | |
Assets | | | |
Affiliated investments, at value (cost $28,904,798) | | $ | 31,165,582 |
Receivable for Fund shares sold | | | 55,572 |
Dividends receivable | | | 18,979 |
Receivable due from manager | | | 5,665 |
Prepaid expenses | | | 236 |
| | | |
Total assets | | | 31,246,034 |
| | | |
| |
Liabilities | | | |
Accrued expenses | | | 84,422 |
Payable for Fund shares reacquired | | | 30,039 |
Distribution fee payable | | | 15,829 |
Transfer agent fee payable | | | 3,335 |
Deferred directors’ fees | | | 703 |
| | | |
Total liabilities | | | 134,328 |
| | | |
| |
Net Assets | | $ | 31,111,706 |
| | | |
| | | | |
Net assets were comprised of: | | | |
Common stock, at par | | $ | 2,709 |
Paid-in capital in excess of par | | | 28,528,454 |
| | | |
| | | 28,531,163 |
Undistributed net investment income | | | 69,775 |
Accumulated net realized gain on investment transactions | | | 249,984 |
Net unrealized appreciation on investments | | | 2,260,784 |
| | | |
Net assets, March 31, 2007 | | $ | 31,111,706 |
| | | |
See Notes to Financial Statements.
| | |
| 30 | | Visit our website at www.jennisondryden.com |
| | | |
Class A | | | |
Net asset value and redemption price per share | | | |
($15,870,777 ÷ 1,380,296 shares of common stock issued and outstanding) | | $ | 11.50 |
Maximum sales charge (5.50% of offering price) | | | .67 |
| | | |
Maximum offering price to public | | $ | 12.17 |
| | | |
| |
Class B | | | |
Net asset value, offering price and redemption price per share | | | |
($11,383,311 ÷ 992,704 shares of common stock issued and outstanding) | | $ | 11.47 |
| | | |
| |
Class C | | | |
Net asset value, offering price and redemption price per share | | | |
($3,688,304 ÷ 321,613 shares of common stock issued and outstanding) | | $ | 11.47 |
| | | |
| |
Class R | | | |
Net asset value, offering price and redemption price per share | | | |
($2,541 ÷ 221 shares of common stock issued and outstanding) | | $ | 11.50 |
| | | |
| |
Class Z | | | |
Net asset value, offering price and redemption price per share | | | |
($166,773 ÷ 14,459 shares of common stock issued and outstanding) | | $ | 11.53 |
| | | |
See Notes to Financial Statements.
| | |
| JennisonDryden Asset Allocation Funds | | 31 |
JennisonDryden Moderate Allocation Fund
Statement of Assets and Liabilities
as of March 31, 2007 (Unaudited)
| | | | |
Assets | | | | |
Affiliated investments, at value (cost $75,284,393) | | $ | 86,308,918 | |
Cash | | | 7,252 | |
Receivable for Fund shares sold | | | 286,058 | |
Dividends receivable | | | 33,251 | |
Prepaid expenses | | | 705 | |
| | | | |
Total assets | | | 86,636,184 | |
| | | | |
| |
Liabilities | | | | |
Payable for Fund shares reacquired | | | 224,686 | |
Accrued expenses | | | 154,157 | |
Distribution fee payable | | | 46,897 | |
Management fee payable | | | 12,115 | |
Transfer agent fee payable | | | 10,312 | |
Deferred directors’ fees | | | 705 | |
| | | | |
Total liabilities | | | 448,872 | |
| | | | |
| |
Net Assets | | $ | 86,187,312 | |
| | | | |
| | | | | |
Net assets were comprised of: | | | | |
Common stock, at par | | $ | 6,811 | |
Paid-in capital in excess of par | | | 73,924,555 | |
| | | | |
| | | 73,931,366 | |
Accumulated net investment loss | | | (238,053 | ) |
Accumulated net realized gain on investment transactions | | | 1,469,474 | |
Net unrealized appreciation on investments | | | 11,024,525 | |
| | | | |
Net assets, March 31, 2007 | | $ | 86,187,312 | |
| | | | |
See Notes to Financial Statements.
| | |
| 32 | | Visit our website at www.jennisondryden.com |
| | | |
Class A | | | |
Net asset value and redemption price per share
($37,794,839 ÷ 2,982,825 shares of common stock issued and outstanding) | | $ | 12.67 |
Maximum sales charge (5.50% of offering price) | | | .74 |
| | | |
Maximum offering price to public | | $ | 13.41 |
| | | |
| |
Class B | | | |
Net asset value, offering price and redemption price per share
($35,371,894 ÷ 2,797,597 shares of common stock issued and outstanding) | | $ | 12.64 |
| | | |
| |
Class C | | | |
Net asset value, offering price and redemption price per share
($11,278,610 ÷ 892,757 shares of common stock issued and outstanding) | | $ | 12.63 |
| | | |
| |
Class R | | | |
Net asset value, offering price and redemption price per share
($2,543 ÷ 200.8 shares of common stock issued and outstanding) | | $ | 12.66 |
| | | |
| |
Class Z | | | |
Net asset value, offering price and redemption price per share
($1,739,426 ÷ 137,205 shares of common stock issued and outstanding) | | $ | 12.68 |
| | | |
See Notes to Financial Statements.
| | |
| JennisonDryden Asset Allocation Funds | | 33 |
JennisonDryden Growth Allocation Fund
Statement of Assets and Liabilities
as of March 31, 2007 (Unaudited)
| | | | |
Assets | | | | |
Affiliated investments, at value (cost $42,076,565) | | $ | 50,198,577 | |
Receivable for Fund shares sold | | | 139,005 | |
Dividends receivable | | | 5,016 | |
Due from manager | | | 2,051 | |
Prepaid expenses | | | 463 | |
| | | | |
Total assets | | | 50,345,112 | |
| | | | |
| |
Liabilities | | | | |
Payable to custodian | | | 11,182 | |
Payable for Fund shares reacquired | | | 55,504 | |
Accrued expenses | | | 45,712 | |
Distribution fee payable | | | 29,183 | |
Deferred directors’ fees | | | 703 | |
Transfer agent fee payable | | | 8,363 | |
| | | | |
Total liabilities | | | 150,647 | |
| | | | |
| |
Net Assets | | $ | 50,194,465 | |
| | | | |
| | | | | |
Net assets were comprised of: | | | | |
Common stock, at par | | $ | 3,588 | |
Paid-in capital in excess of par | | | 41,324,260 | |
| | | | |
| | | 41,327,848 | |
Accumulated net investment loss | | | (212,140 | ) |
Accumulated net realized gain on investment transactions | | | 956,745 | |
Net unrealized appreciation on investments | | | 8,122,012 | |
| | | | |
Net assets, March 31, 2007 | | $ | 50,194,465 | |
| | | | |
See Notes to Financial Statements.
| | |
| 34 | | Visit our website at www.jennisondryden.com |
| | | |
Class A | | | |
Net asset value and redemption price per share
($19,286,144 ÷ 1,373,323 shares of common stock issued and outstanding) | | $ | 14.04 |
Maximum sales charge (5.50% of offering price) | | | .82 |
| | | |
Maximum offering price to public | | $ | 14.86 |
| | | |
| |
Class B | | | |
Net asset value, offering price and redemption price per share
($23,270,336 ÷ 1,667,281 shares of common stock issued and outstanding) | | $ | 13.96 |
| | | |
| |
Class C | | | |
Net asset value, offering price and redemption price per share
($7,151,898 ÷ 512,470 shares of common stock issued and outstanding) | | $ | 13.96 |
| | | |
| |
Class R | | | |
Net asset value, offering price and redemption price per share
($2,549 ÷ 181.7 shares of common stock issued and outstanding) | | $ | 14.03 |
| | | |
| |
Class Z | | | |
Net asset value, offering price and redemption price per share
($483,538 ÷ 34,388 shares of common stock issued and outstanding) | | $ | 14.06 |
| | | |
See Notes to Financial Statements.
| | |
| JennisonDryden Asset Allocation Funds | | 35 |
JennisonDryden Conservative Allocation Fund
Statement of Operations
Six Months Ended March 31, 2007 (Unaudited)
| | | | |
Net Investment Income | | | | |
Income | | | | |
Affiliated dividend income | | $ | 485,704 | |
Unaffiliated interest | | | 51 | |
| | | | |
| | | 485,755 | |
| | | | |
| |
Expenses | | | | |
Management fee | | | 27,830 | |
Distribution fee—Class A | | | 17,094 | |
Distribution fee—Class B | | | 53,311 | |
Distribution fee—Class C | | | 16,771 | |
Distribution fee—Class R | | | 3 | |
Registration fees | | | 103,000 | |
Custodian’s fees and expenses | | | 27,000 | |
Transfer agent’s fees and expenses (including affiliated expense of $9,600) (Note 3) | | | 14,000 | |
Audit fee | | | 9,000 | |
Reports to shareholders | | | 6,000 | |
Directors’ fees | | | 5,000 | |
Legal fees and expenses | | | 5,000 | |
Miscellaneous | | | 4,408 | |
Interest expense | | | 1,536 | |
| | | | |
Total expenses | | | 289,953 | |
Less: Expense subsidy (Note 2) | | | (131,671 | ) |
| | | | |
Net expenses | | | 158,282 | |
| | | | |
Net investment income | | | 327,473 | |
| | | | |
| |
Net Realized And Unrealized Gain (Loss) On Investments | | | | |
Net realized loss on investment transactions | | | (33,060 | ) |
Net capital gain distributions received | | | 364,240 | |
| | | | |
| | | 331,180 | |
| | | | |
Net change in unrealized appreciation on investments | | | 667,260 | |
| | | | |
Net gain on investments | | | 998,440 | |
| | | | |
Net Increase In Net Assets Resulting From Operations | | $ | 1,325,913 | |
| | | | |
See Notes to Financial Statements.
| | |
| 36 | | Visit our website at www.jennisondryden.com |
JennisonDryden Moderate Allocation Fund
Statement of Operations
Six Months Ended March 31, 2007 (Unaudited)
| | | | |
Net Investment Income | | | | |
Income | | | | |
Affiliated dividend income | | $ | 1,059,207 | |
| | | | |
| |
Expenses | | | | |
Management fee | | | 79,252 | |
Distribution fee—Class A | | | 42,322 | |
Distribution fee—Class B | | | 168,129 | |
Distribution fee—Class C | | | 50,013 | |
Distribution fee—Class R | | | 3 | |
Registration fees | | | 118,000 | |
Transfer agent’s fees and expenses (including affiliated expense of $29,800) | | | 41,000 | |
Custodian’s fees and expenses | | | 26,000 | |
Reports to shareholders | | | 14,000 | |
Audit fee | | | 9,000 | |
Directors’ fees | | | 6,000 | |
Legal fees and expenses | | | 5,000 | |
Interest expense | | | 3,227 | |
Miscellaneous | | | 1,687 | |
| | | | |
Total expenses | | | 563,633 | |
Less: Expense subsidy (Note 2) | | | (101,813 | ) |
| | | | |
Net expenses | | | 461,820 | |
| | | | |
Net investment income | | | 597,387 | |
| | | | |
| |
Net Realized And Unrealized Gain (Loss) On Investments | | | | |
Net realized loss on investment transactions | | | (110,429 | ) |
Net capital gain distributions received | | | 1,656,306 | |
| | | | |
| | | 1,545,877 | |
| | | | |
Net change in unrealized appreciation on investments | | | 3,008,807 | |
| | | | |
Net gain on investments | | | 4,554,684 | |
| | | | |
Net Increase In Net Assets Resulting From Operations | | $ | 5,152,071 | |
| | | | |
See Notes to Financial Statements.
| | |
| JennisonDryden Asset Allocation Funds | | 37 |
JennisonDryden Growth Allocation Fund
Statement of Operations
Six Months Ended March 31, 2007 (Unaudited)
| | | | |
Net Investment Income | | | | |
Income | | | | |
Affiliated dividend income | | $ | 392,467 | |
| | | | |
| |
Expenses | | | | |
Management fee | | | 44,784 | |
Distribution fee—Class A | | | 20,649 | |
Distribution fee—Class B | | | 106,871 | |
Distribution fee—Class C | | | 31,812 | |
Distribution fee—Class R | | | 3 | |
Registration fees | | | 109,000 | |
Transfer agent’s fees and expenses (including affiliated expense of $28,965) | | | 38,000 | |
Custodian’s fees and expenses | | | 26,000 | |
Audit fee | | | 9,000 | |
Reports to shareholders | | | 9,000 | |
Legal fees and expenses | | | 6,000 | |
Directors’ fees | | | 5,000 | |
Interest expense | | | 227 | |
Miscellaneous | | | 5,576 | |
| | | | |
Total expenses | | | 411,922 | |
Less: Expense subsidy (Note 2) | | | (140,377 | ) |
| | | | |
Net expenses | | | 271,545 | |
| | | | |
Net investment income | | | 120,922 | |
| | | | |
| |
Net Realized And Unrealized Gain On Investments | | | | |
Net realized loss on investment transactions | | | (73,596 | ) |
Net capital gain distributions received | | | 1,098,158 | |
| | | | |
| | | 1,024,562 | |
| | | | |
Net change in unrealized appreciation on investments | | | 2,427,765 | |
| | | | |
Net gain on investments | | | 3,452,327 | |
| | | | |
Net Increase In Net Assets Resulting From Operations | | $ | 3,573,249 | |
| | | | |
See Notes to Financial Statements.
| | |
| 38 | | Visit our website at www.jennisondryden.com |
JennisonDryden Conservative Allocation Fund
Statement of Changes in Net Assets (Unaudited)
| | | | | | | | |
| | | Six Months
Ended
March 31, 2007 | | | Year
Ended
September 30, 2006 | |
Increase (Decrease) In Net Assets | | | | | | | | |
Operations | | | | | | | | |
Net investment income | | $ | 327,473 | | | $ | 364,942 | |
Net realized gain (loss) on investment transactions | | | (33,060 | ) | | | 84,395 | |
Net capital gain distributions received | | | 364,240 | | | | 162,542 | |
Net change in unrealized appreciation on investments | | | 667,260 | | | | 624,474 | |
| | | | | | | | |
Net increase in net assets resulting from operations | | | 1,325,913 | | | | 1,236,353 | |
| | | | | | | | |
Dividends and distributions (Note 1) | | | | | | | | |
Dividends from net investment income | | | | | | | | |
Class A | | | (197,497 | ) | | | (180,971 | ) |
Class B | | | (119,772 | ) | | | (127,739 | ) |
Class C | | | (37,518 | ) | | | (28,564 | ) |
Class Z | | | (2,099 | ) | | | (1,052 | ) |
| | | | | | | | |
| | | (356,886 | ) | | | (338,326 | ) |
| | | | | | | | |
Distributions from net realized gains | | | | | | | | |
Class A | | | (139,400 | ) | | | (27,631 | ) |
Class B | | | (109,514 | ) | | | (30,267 | ) |
Class C | | | (35,116 | ) | | | (6,401 | ) |
Class Z | | | (1,296 | ) | | | (121 | ) |
| | | | | | | | |
| | | (285,326 | ) | | | (64,420 | ) |
| | | | | | | | |
| |
Fund share transactions (Net of share conversions) (Note 6) | | | | | |
Net proceeds from shares sold | | | 8,666,902 | | | | 11,515,312 | |
Net asset value of shares issued in reinvestment of dividends and distributions | | | 614,135 | | | | 387,947 | |
Cost of shares reacquired | | | (3,166,077 | ) | | | (4,514,720 | ) |
| | | | | | | | |
Net increase in net assets from Fund share transactions | | | 6,114,960 | | | | 7,388,539 | |
| | | | | | | | |
Total increase | | | 6,798,661 | | | | 8,222,146 | |
| | |
Net Assets | | | | | | | | |
Beginning of period | | | 24,313,045 | | | | 16,090,899 | |
| | | | | | | | |
End of period(a) | | $ | 31,111,706 | | | $ | 24,313,045 | |
| | | | | | | | |
(a) Includes undistributed net investment income of: | | $ | 69,775 | | | $ | 99,188 | |
| | | | | | | | |
See Notes to Financial Statements.
| | |
| JennisonDryden Asset Allocation Funds | | 39 |
JennisonDryden Moderate Allocation Fund
Statement of Changes in Net Assets (Unaudited)
| | | | | | | | |
| | | Six Months
Ended
March 31, 2007 | | | Year
Ended
September 30, 2006 | |
Increase (Decrease) In Net Assets | | | | | | | | |
Operations | | | | | | | | |
Net investment income | | $ | 597,387 | | | $ | 400,865 | |
Net realized gain on investment transactions | | | 1,545,877 | | | | 1,156,784 | |
Net change in unrealized appreciation on investments | | | 3,008,807 | | | | 3,083,882 | |
| | | | | | | | |
Net increase in net assets resulting from operations | | | 5,152,071 | | | | 4,641,531 | |
| | | | | | | | |
Dividends and distributions (Note 1) | | | | | | | | |
Dividends from net investment income: | | | | | | | | |
Class A | | | (551,496 | ) | | | (208,785 | ) |
Class B | | | (347,417 | ) | | | (161,921 | ) |
Class C | | | (103,347 | ) | | | (36,946 | ) |
Class Z | | | (31,907 | ) | | | (7,211 | ) |
| | | | | | | | |
| | | (1,034,167 | ) | | | (414,863 | ) |
| | | | | | | | |
Distributions from net realized gains: | | | | | | | | |
Class A | | | (408,369 | ) | | | (67,763 | ) |
Class B | | | (412,392 | ) | | | (82,070 | ) |
Class C | | | (122,676 | ) | | | (18,726 | ) |
Class Z | | | (21,572 | ) | | | (2,101 | ) |
| | | | | | | | |
| | | (965,009 | ) | | | (170,660 | ) |
| | | | | | | | |
| | |
Fund share transactions (Net of share conversions) (Note 6) | | | | | | | | |
Net proceeds from shares sold | | | 15,753,645 | | | | 27,721,446 | |
Net asset value of shares issued in reinvestment of dividends and distributions | | | 1,906,662 | | | | 569,814 | |
Cost of shares reacquired | | | (6,055,167 | ) | | | (10,097,650 | ) |
| | | | | | | | |
Net increase in net assets from Fund share transactions | | | 11,605,140 | | | | 18,193,610 | |
| | | | | | | | |
Total increase | | | 14,758,035 | | | | 22,249,618 | |
| | |
Net Assets | | | | | | | | |
Beginning of period | | | 71,429,277 | | | | 49,179,659 | |
| | | | | | | | |
End of period(a) | | $ | 86,187,312 | | | $ | 71,429,277 | |
| | | | | | | | |
(a) Includes undistributed net investment income of: | | $ | — | | | $ | 198,727 | |
| | | | | | | | |
See Notes to Financial Statements.
| | |
| 40 | | Visit our website at www.jennisondryden.com |
JennisonDryden Growth Allocation Fund
Statement of Changes in Net Assets (Unaudited)
| | | | | | | | |
| | | Six Months
Ended
March 31, 2007 | | | Year
Ended
September 30, 2006 | |
Increase (Decrease) In Net Assets | | | | | | | | |
Operations | | | | | | | | |
Net investment income (loss) | | $ | 120,922 | | | $ | (169,506 | ) |
Net realized gain on investment transactions | | | 1,024,562 | | | | 589,638 | |
Net change in unrealized appreciation on investments | | | 2,427,765 | | | | 2,322,871 | |
| | | | | | | | |
Net increase in net assets resulting from operations | | | 3,573,249 | | | | 2,743,003 | |
| | | | | | | | |
Dividends and distributions (Note 1) | | | | | | | | |
Dividends from net investment income | | | | | | | | |
Class A | | | (178,008 | ) | | | (57,726 | ) |
Class B | | | (113,620 | ) | | | — | |
Class C | | | (33,765 | ) | | | — | |
Class Z | | | (7,002 | ) | | | (4,348 | ) |
| | | | | | | | |
| | | (332,395 | ) | | | (62,074 | ) |
| | | | | | | | |
Distributions from net realized gains | | | | | | | | |
Class A | | | (149,715 | ) | | | (7,999 | ) |
Class B | | | (197,667 | ) | | | (13,800 | ) |
Class C | | | (58,742 | ) | | | (2,948 | ) |
Class Z | | | (4,913 | ) | | | (440 | ) |
| | | | | | | | |
| | | (411,037 | ) | | | (25,187 | ) |
| | | | | | | | |
| |
Fund share transactions (Net of share conversions) (Note 6) | | | | | |
Net proceeds from shares sold | | | 10,695,361 | | | | 16,300,522 | |
Net asset value of shares issued in reinvestment of dividends and distributions | | | 727,445 | | | | 86,831 | |
Cost of shares reacquired | | | (2,757,505 | ) | | | (4,658,142 | ) |
| | | | | | | | |
Net increase in net assets from Fund share transactions | | | 8,665,301 | | | | 11,729,211 | |
| | | | | | | | |
Total increase | | | 11,495,118 | | | | 14,384,953 | |
| | |
Net Assets | | | | | | | | |
Beginning of period | | | 38,699,347 | | | | 24,314,394 | |
| | | | | | | | |
End of period | | $ | 50,194,465 | | | $ | 38,699,347 | |
| | | | | | | | |
See Notes to Financial Statements.
| | |
| JennisonDryden Asset Allocation Funds | | 41 |
Notes to Financial Statements
(Unaudited)
The Prudential Investment Portfolios, Inc. (the “Company”) is registered under the Investment Company Act of 1940 as an open-end management investment company. The Company was incorporated in Maryland on August 10, 1995 and consists of six series (“Fund” or “Funds”): Jennison Equity Opportunity Fund, Jennison Growth Fund, and Dryden Active Allocation Fund which are diversified funds and JennisonDryden Conservative Allocation Fund (“Conservative Allocation Portfolio”), JennisonDryden Moderate Allocation Fund (“Moderate Allocation Portfolio”) and JennisonDryden Growth Allocation Fund (“Growth Allocation Portfolio”) which are non-diversified. These financial statements relate to the Conservative Allocation Portfolio, Moderate Allocation Portfolio, and Growth Allocation Portfolio (collectively referred to as “Asset Allocation Portfolios”). The inception date of the Asset Allocation Portfolios was March 30, 2004.
The Conservative Allocation Portfolio’s investment objective is current income and a reasonable level of capital appreciation. The Moderate Allocation Portfolio’s investment objective is capital appreciation and a reasonable level of current income. The Growth Allocation Portfolio’s investment objective is long-term capital appreciation. Each Asset Allocation Portfolio seeks to achieve its objective by investing in a combination of mutual funds in the JennisonDryden mutual fund family (each, an underlying fund). Each portfolio in the Asset Allocation Portfolios is typically referred to as a “Fund of Funds” because it invests in other mutual funds. The Asset Allocation Portfolios may also invest directly in U.S. Government securities and money market instruments for cash management purposes or when assuming a defensive position.
Note 1. Accounting Policies
The following is a summary of significant accounting policies followed by the Company and the Asset Allocation Portfolios in the preparation of their financial statements.
Securities Valuation: Investments in the underlying funds are valued at the closing net asset value per share of each underlying fund as reported on each business day. Short-term investments maturing within sixty days or less are valued at amortized cost which approximates market value. The amortized cost method involves valuing a security at its cost on the date of purchase and thereafter assuming a constant amortization to maturity of the difference between the principal amount due at maturity and cost. Short-term securities which mature in more than sixty days are valued at current market value.
| | |
| 42 | | Visit our website at www.jennisondryden.com |
Securities Transactions and Net Investment Income: Securities transactions are recorded on the trade date. Realized gains or losses on sales of investments are calculated on the identified cost basis. Dividend income is recorded on the ex-dividend date. Expenses are recorded on the accrual basis.
Net Investment income or loss (other than distribution fees which are charged directly to the respective class) and unrealized and realized gains or losses are allocated daily to each class of shares based upon the relative proportion of net assets of each class at the beginning of the day.
Dividends and Distributions: Dividends will typically be distributed quarterly by the Conservative Allocation Portfolio, semi-annually by the Moderate Allocation Portfolio and annually by the Growth Allocation Portfolio. Each Asset Allocation Portfolio declares and pays its net realized capital gains, if any, at least annually. Dividends and distributions to shareholders, which are determined in accordance with federal income tax regulations and which may differ from generally accepted accounting principles, are recorded on the ex-dividend date. Permanent book/tax differences relating to income and gains are reclassified amongst undistributed net investment income, accumulated net realized gain or loss and paid-in capital in excess of par, as appropriate.
Taxes: For federal income tax purposes, each Fund in the Company is treated as a separate taxpaying entity. It is each of the Asset Allocation Portfolios’ policy to continue to meet the requirements of the Internal Revenue Code applicable to regulated investment companies and to distribute all of its net investment income and capital gains, if any, to its shareholders. Therefore, no federal income tax provision is required.
Estimates: The preparation of the financial statements requires management to make estimates and assumptions that affect the reported amounts and disclosures in the financial statements. Actual results could differ from those estimates.
Note 2. Agreements
The Company has a management agreement for the Asset Allocation Portfolios with Prudential Investments LLC (“PI”). Pursuant to this agreement, PI has responsibility for all investment advisory services and supervises the subadvisor’s performance of such services. PI has entered into a subadvisory agreement with Quantitative Management Associates LLC (“QMA”). The subadvisory agreement provides that QMA furnishes investment advisory services in connection with the management of the Asset Allocation Portfolios. In connection therewith, QMA is obligated to keep certain
| | |
| JennisonDryden Asset Allocation Funds | | 43 |
Notes to Financial Statements
(Unaudited) Cont’d
books and records of the Asset Allocation Portfolios. PI pays for the services of QMA, the compensation of officers of the Asset Allocation Portfolios, occupancy and certain clerical and bookkeeping costs of the Asset Allocation Portfolios. The Asset Allocation Portfolios bear all other costs and expenses.
The management fee paid to PI is computed daily and payable monthly at an annual rate of .20 of 1% of each of the Asset Allocation Portfolios’ daily average net assets. The effective management fee rate was .20 of 1% of each of the Asset Allocation Portfolio’s daily average net assets.
The Asset Allocation Portfolios have a distribution agreement with Prudential Investment Management Services LLC (“PIMS”), which acts as the distributor of the Class A, Class B, Class C, Class R and Class Z shares of the Asset Allocation Portfolios. The Asset Allocation Portfolios compensate PIMS for distributing and servicing the Asset Allocation Portfolios’ Class A, B, C and R shares, pursuant to plans of distribution (the “Class A, B, C and R Plans”), regardless of expenses actually incurred by PIMS. The distribution fees are accrued daily and payable monthly. No distribution or service fees are paid to PIMS as distributor of the Class Z shares of the Asset Allocation Portfolios.
Pursuant to the Class A, B, C and R Plans, the Asset Allocation Portfolios compensate PIMS for distribution-related activities at an annual rate of up to .30 of 1%, 1%, 1% and .75% of the average daily net assets of the Class A, B, C and R shares, respectively. PIMS contractually agreed to limit such fees to .25 of 1% of the average daily net assets of the Class A shares and .50 of 1% of the average daily net assets of the Class R shares.
PI has contractually agreed to limit the net annual operating expenses (exclusive of distribution and service (12b-1) fees and underlying fund fees and expenses) of each class of shares of the Asset Allocation Portfolios to .50 of 1% of each Asset Allocation Portfolios’ average daily net assets.
PIMS has advised the Asset Allocation Portfolios of its receipt of front-end sales charges resulting from sales of Class A shares during the six months ended March 31, 2007. These amounts were approximately as follows:
| | | |
Portfolio | | Class A |
Conservative Allocation Portfolio | | $ | 117,900 |
Moderate Allocation Portfolio | | | 222,800 |
Growth Allocation Portfolio | | | 159,100 |
| | |
| 44 | | Visit our website at www.jennisondryden.com |
From these fees, PIMS paid such sales charges to dealers, which in turn paid commissions to salespersons and incurred other distribution costs.
PIMS has advised the Asset Allocation Portfolios of its receipt of contingent deferred sales charges imposed upon certain redemptions by certain Class B and Class C shareholders for the six months ended March 31, 2007. These amounts were approximately as follows:
| | | | | | |
Portfolio | | Class B | | Class C |
Conservative Allocation Portfolio | | $ | 12,300 | | $ | 800 |
Moderate Allocation Portfolio | | | 31,200 | | | 800 |
Growth Allocation Portfolio | | | 22,100 | | | 800 |
PI, QMA and PIMS are indirect, wholly-owned subsidiaries of Prudential Financial, Inc. (“Prudential”).
The Asset Allocation Portfolios, along with other affiliated registered investment companies (the “Funds”), are parties to a Syndicated Credit Agreement (“SCA”) with two banks. The SCA provides for a commitment of $500 million. Interest on any borrowings under the SCA is incurred at contracted market rates and a commitment fee for the unused amount is accrued daily and paid quarterly. Effective October 27, 2006, the Funds renewed SCA with the banks. The commitment under the renewed SCA continues to be $500 million. The Funds pay a commitment fee of .07 of 1% of the unused portion of the renewed SCA. The expiration date of the renewed SCA will be October 26, 2007. For the period from October 29, 2005 through October 26, 2006, the Funds paid a commitment fee of .0725 of 1% of the unused portion of the agreement. The purpose of the SCA is to provide an alternative source of temporary funding for capital share redemptions. The Asset Allocation Portfolios did not borrow any amounts pursuant to the SCA during the six months ended March 31, 2007.
Note 3. Other Transactions With Affiliates
Prudential Mutual Fund Services LLC (“PMFS”), an affiliate of PI and an indirect, wholly-owned subsidiary of Prudential, serves as the Company’s transfer agent. Transfer agent fees and expenses in the Statement of Operations include certain out of pocket expenses paid to non-affiliates.
The Asset Allocation Portfolios pay networking fees to affiliated and unaffiliated broker/dealers. These networking fees are payments made to broker/dealers that clear mutual fund transactions through a national clearing system. These amounts are included in the transfer agent fees and expenses in the Statement of Operations.
| | |
| JennisonDryden Asset Allocation Funds | | 45 |
Notes to Financial Statements
(Unaudited) Cont’d
The Asset Allocation Portfolios invest in the Taxable Money Market Series (the “Series”), a portfolio of the Dryden Core Investment Fund, pursuant to an exemptive order received from the Securities and Exchange Commission. The Series is a money market mutual fund registered under the Investment Company Act of 1940, as amended, and managed by PI.
Note 4. Portfolio Securities
Purchases and sales of investment securities other than short-term investments, for the six months ended March 31, 2007 were as follows:
| | | | |
Portfolios | | Purchases | | Sales |
| Conservative Allocation Portfolio | | $6,607,237 | | $1,209,240 |
| Moderate Allocation Portfolio | | $13,944,440 | | $2,275,000 |
| Growth Allocation Portfolio | | $10,094,183 | | $1,225,000 |
Note 5. Tax Information
The United States federal income tax basis and unrealized appreciation (depreciation) of the Asset Allocation Portfolios’ investments as of March 31, 2007 were as follows:
| | | | | | | | |
Portfolios | | Tax Basis | | Appreciation | | Depreciation | | Net Unrealized
Appreciation |
Conservative Allocation Portfolio | | $29,018,170 | | $2,281,013 | | $(133,601) | | $2,147,412 |
Moderate Allocation Portfolio | | $75,477,783 | | $11,122,717 | | $(291,582) | | $10,831,135 |
Growth Allocation Portfolio | | $42,216,798 | | $7,981,779 | | $— | | $7,981,779 |
The difference between book basis and tax basis was primarily attributable to deferred losses on wash sales.
Note 6. Capital
The Company offers Class A, Class B, Class C, Class R and Class Z shares. There are 6.25 billion shares of $.001 par value of common stock of the Company authorized which are divided into six series and five classes, designated Class A, Class B, Class C, Class R and Class Z. Each class of par value shares represents an interest in the same assets of the Company and is identical in all respects except that (1) each class is
| | |
| 46 | | Visit our website at www.jennisondryden.com |
subject to different sales charges and distribution and/or service fees (except for Class Z shares, which are not subject to any sales charges and distribution and/or services fees), which may affect performance, (2) each class has exclusive voting rights on any matter submitted to shareholders that relates solely to its arrangement and has separate voting rights on any matter submitted to shareholders in which the interests of one class differ from the interests of any other class, (3) each class has a different exchange privilege, (4) only Class B shares have a conversion feature and (5) Class R and Class Z shares are offered exclusively for sale to a limited group of investors.
Transactions in shares of common stock were as follows:
Conservative Allocation Portfolio:
| | | | | | | |
Class A | | Shares | | | Amount | |
Six months ended March 31, 2007: | | | | | | | |
Shares sold | | 484,506 | | | $ | 5,514,103 | |
Shares issued in reinvestment of dividends and distributions | | 28,635 | | | | 322,920 | |
Shares reacquired | | (153,092 | ) | | | (1,742,503 | ) |
| | | | | | | |
Net increase (decrease) in shares outstanding before conversion | | 360,049 | | | | 4,094,520 | |
Shares issued upon conversion from Class B | | 14,301 | | | | 163,874 | |
| | | | | | | |
Net increase (decrease) in shares outstanding | | 374,350 | | | $ | 4,258,394 | |
| | | | | | | |
Year ended September 30, 2006: | | | | | | | |
Shares sold | | 617,311 | | | $ | 6,751,175 | |
Shares issued in reinvestment of dividends | | 18,449 | | | | 199,385 | |
Shares reacquired | | (216,725 | ) | | | (2,376,660 | ) |
| | | | | | | |
Net increase (decrease) in shares outstanding before conversion | | 419,035 | | | | 4,573,900 | |
Shares issued upon conversion from Class B | | 36,813 | | | | 404,048 | |
| | | | | | | |
Net increase (decrease) in shares outstanding | | 455,848 | | | $ | 4,977,948 | |
| | | | | | | |
Class B | | | | | | |
Six months ended March 31, 2007: | | | | | | | |
Shares sold | | 179,805 | | | $ | 2,044,870 | |
Shares issued in reinvestment of dividends and distributions | | 19,720 | | | | 222,232 | |
Shares reacquired | | (82,303 | ) | | | (934,574 | ) |
| | | | | | | |
Net increase (decrease) in shares outstanding before conversion | | 117,222 | | | | 1,332,528 | |
Shares reacquired upon conversion into Class A | | (14,339 | ) | | | (163,874 | ) |
| | | | | | | |
Net increase (decrease) in shares outstanding | | 102,883 | | | $ | 1,168,654 | |
| | | | | | | |
Year ended September 30, 2006: | | | | | | | |
Shares sold | | 274,163 | | | $ | 2,996,190 | |
Shares issued in reinvestment of dividends and distributions | | 14,236 | | | | 153,720 | |
Shares reacquired | | (128,433 | ) | | | (1,398,456 | ) |
| | | | | | | |
Net increase (decrease) in shares outstanding before conversion | | 159,966 | | | | 1,751,454 | |
Shares reacquired upon conversion into Class A | | (36,901 | ) | | | (404,048 | ) |
| | | | | | | |
Net increase (decrease) in shares outstanding | | 123,065 | | | $ | 1,347,406 | |
| | | | | | | |
| | |
| JennisonDryden Asset Allocation Funds | | 47 |
Notes to Financial Statements
(Unaudited) Cont’d
| | | | | | | |
Class C | | Shares | | | Amount | |
Six months ended March 31, 2007: | | | | | | | |
Shares sold | | 93,153 | | | $ | 1,059,505 | |
Shares issued in reinvestment of dividends and distributions | | 5,820 | | | | 65,592 | |
Shares reacquired | | (41,633 | ) | | | (473,661 | ) |
| | | | | | | |
Net increase (decrease) in shares outstanding | | 57,340 | | | $ | 651,436 | |
| | | | | | | |
Year ended September 30, 2006: | | | | | | | |
Shares sold | | 152,820 | | | $ | 1,670,036 | |
Shares issued in reinvestment of dividends and distributions | | 3,120 | | | | 33,674 | |
Shares reacquired | | (66,503 | ) | | | (725,315 | ) |
| | | | | | | |
Net increase (decrease) in shares outstanding | | 89,437 | | | $ | 978,395 | |
| | | | | | | |
Class R | | | | | | |
Period ended March 31, 2007: | | | | | | | |
Shares sold | | 221 | | | $ | 2,500 | |
Shares issued in reinvestment of dividends and distributions | | — | | | | — | |
Shares reacquired | | — | | | | — | |
| | | | | | | |
Net increase (decrease) in shares outstanding | | 221 | | | $ | 2,500 | |
| | | | | | | |
Class Z | | | | | | |
Six months ended March 31, 2007: | | | | | | | |
Shares sold | | 3,999 | | | $ | 45,924 | |
Shares issued in reinvestment of dividends and distributions | | 300 | | | | 3,391 | |
Shares reacquired | | (1,350 | ) | | | (15,339 | ) |
| | | | | | | |
Net increase (decrease) in shares outstanding | | 2,949 | | | $ | 33,976 | |
| | | | | | | |
Year ended September 30, 2006: | | | | | | | |
Shares sold | | 8,849 | | | $ | 97,911 | |
Shares issued in reinvestment of dividends and distributions | | 108 | | | | 1,168 | |
Shares reacquired | | (1,316 | ) | | | (14,289 | ) |
| | | | | | | |
Net increase (decrease) in shares outstanding | | 7,641 | | | $ | 84,790 | |
| | | | | | | |
| * | Commenced operations on January 12, 2007. |
| | |
| 48 | | Visit our website at www.jennisondryden.com |
Moderate Allocation Portfolio:
| | | | | | | |
Class A | | Shares | | | Amount | |
Six months ended March 31, 2007: | | | | | | | |
Shares sold | | 651,800 | | | $ | 8,156,034 | |
Shares issued in reinvestment of dividends and distributions | | 74,894 | | | | 927,192 | |
Shares reacquired | | (279,247 | ) | | | (3,499,816 | ) |
| | | | | | | |
Net increase (decrease) in shares outstanding before conversion | | 447,447 | | | | 5,583,410 | |
Shares issued upon conversion from Class B | | 51,024 | | | | 641,310 | |
| | | | | | | |
Net increase (decrease) in shares outstanding | | 498,471 | | | $ | 6,224,720 | |
| | | | | | | |
Year ended September 30, 2006: | | | | | | | |
Shares sold | | 1,084,434 | | | $ | 12,824,790 | |
Shares issued in reinvestment of dividends and distributions | | 23,477 | | | | 271,628 | |
Shares reacquired | | (409,965 | ) | | | (4,829,548 | ) |
| | | | | | | |
Net increase (decrease) in shares outstanding before conversion | | 697,946 | | | | 8,266,870 | |
Shares issued upon conversion from Class B | | 64,713 | | | | 760,841 | |
| | | | | | | |
Net increase (decrease) in shares outstanding | | 762,659 | | | $ | 9,027,711 | |
| | | | | | | |
Class B | | | | | | |
Six months ended March 31, 2007: | | | | | | | |
Shares sold | | 360,632 | | | $ | 4,502,709 | |
Shares issued in reinvestment of dividends and distributions | | 59,818 | | | | 740,545 | |
Shares reacquired | | (134,607 | ) | | | (1,687,117 | ) |
| | | | | | | |
Net increase (decrease) in shares outstanding before conversion | | 285,843 | | | | 3,556,137 | |
Shares reacquired upon conversion into Class A | | (51,162 | ) | | | (641,310 | ) |
| | | | | | | |
Net increase (decrease) in shares outstanding | | 234,681 | | | $ | 2,914,827 | |
| | | | | | | |
Year ended September 30, 2006: | | | | | | | |
Shares sold | | 720,287 | | | $ | 8,498,646 | |
Shares issued in reinvestment of dividends and distributions | | 20,646 | | | | 239,078 | |
Shares reacquired | | (242,681 | ) | | | (2,853,210 | ) |
| | | | | | | |
Net increase (decrease) in shares outstanding before conversion | | 498,252 | | | | 5,884,514 | |
Shares reacquired upon conversion into Class A | | (64,916 | ) | | | (760,841 | ) |
| | | | | | | |
Net increase (decrease) in shares outstanding | | 433,336 | | | $ | 5,123,673 | |
| | | | | | | |
| | |
| JennisonDryden Asset Allocation Funds | | 49 |
Notes to Financial Statements
(Unaudited) Cont’d
| | | | | | | |
Class C | | Shares | | | Amount | |
Six months ended March 31, 2007: | | | | | | | |
Shares sold | | 231,708 | | | $ | 2,887,668 | |
Shares issued in reinvestment of dividends and distributions | | 14,992 | | | | 185,451 | |
Shares reacquired | | (56,276 | ) | | | (702,077 | ) |
| | | | | | | |
Net increase (decrease) in shares outstanding | | 190,424 | | | $ | 2,371,042 | |
| | | | | | | |
Year ended September 30, 2006: | | | | | | | |
Shares sold | | 384,579 | | | $ | 4,504,346 | |
Shares issued in reinvestment of dividends and distributions | | 4,297 | | | | 49,798 | |
Shares reacquired | | (126,496 | ) | | | (1,481,714 | ) |
| | | | | | | |
Net increase (decrease) in shares outstanding | | 262,380 | | | $ | 3,072,430 | |
| | | | | | | |
Class R | | | | | | |
Period ended March 31, 2007*: | | | | | | | |
Shares sold | | 201 | | | $ | 2,500 | |
Shares issued in reinvestment of dividends and distributions | | — | | | | — | |
Shares reacquired | | — | | | | — | |
| | | | | | | |
Net increase (decrease) in shares outstanding | | 201 | | | $ | 2,500 | |
| | | | | | | |
| * | Commenced operations on January 12, 2007. |
| | | | | | | |
Class Z | | | | | | |
Six months ended March 31, 2007: | | | | | | | |
Shares sold | | 16,493 | | | $ | 204,734 | |
Shares issued in reinvestment of dividends and distributions | | 4,319 | | | | 53,474 | |
Shares reacquired | | (13,186 | ) | | | (166,157 | ) |
| | | | | | | |
Net increase (decrease) in shares outstanding | | 7,626 | | | $ | 92,051 | |
| | | | | | | |
Year ended September 30, 2006: | | | | | | | |
Shares sold | | 162,361 | | | $ | 1,893,664 | |
Shares issued in reinvestment of dividends and distributions | | 805 | | | | 9,310 | |
Shares reacquired | | (78,762 | ) | | | (933,178 | ) |
| | | | | | | |
Net increase (decrease) in shares outstanding | | 84,404 | | | $ | 969,796 | |
| | | | | | | |
| | |
| 50 | | Visit our website at www.jennisondryden.com |
Growth Allocation Portfolio:
| | | | | | | |
Class A | | Shares | | | Amount | |
Six months ended March 31,2007: | | | | | | | |
Shares sold | | 372,912 | | | $ | 5,155,383 | |
Shares issued in reinvestment of dividends and distributions | | 23,862 | | | | 325,714 | |
Shares reacquired | | (82,611 | ) | | | (1,141,265 | ) |
| | | | | | | |
Net increase (decrease) in shares outstanding before conversion | | 314,163 | | | | 4,339,832 | |
Shares issued upon conversion from Class B | | 19,958 | | | | 277,019 | |
| | | | | | | |
Net increase (decrease) in shares outstanding | | 334,121 | | | $ | 4,616,851 | |
| | | | | | | |
Year ended September 30, 2006: | | | | | | | |
Shares sold | | 508,758 | | | $ | 6,466,794 | |
Shares issued in reinvestment of dividends and distributions | | 5,271 | | | | 65,520 | |
Shares reacquired | | (132,522 | ) | | | (1,675,946 | ) |
| | | | | | | |
Net increase (decrease) in shares outstanding before conversion | | 381,507 | | | | 4,856,368 | |
Shares issued upon conversion from Class B | | 26,161 | | | | 329,258 | |
| | | | | | | |
Net increase (decrease) in shares outstanding | | 407,668 | | | $ | 5,185,626 | |
| | | | | | | |
Class B | | | | | | |
Six months ended March 31, 2007: | | | | | | | |
Shares sold | | 289,229 | | | $ | 3,961,684 | |
Shares issued in reinvestment of dividends and distributions | | 22,502 | | | | 305,808 | |
Shares reacquired | | (85,455 | ) | | | (1,173,526 | ) |
| | | | | | | |
Net increase (decrease) in shares outstanding before conversion | | 226,276 | | | | 3,093,966 | |
Shares reacquired upon conversion into Class A | | (20,110 | ) | | | (277,019 | ) |
| | | | | | | |
Net increase (decrease) in shares outstanding | | 206,166 | | | $ | 2,816,947 | |
| | | | | | | |
Year ended September 30, 2006: | | | | | | | |
Shares sold | | 455,501 | | | $ | 5,757,383 | |
Shares issued in reinvestment of dividends and distributions | | 1,100 | | | | 13,633 | |
Shares reacquired | | (108,139 | ) | | | (1,334,914 | ) |
| | | | | | | |
Net increase (decrease) in shares outstanding before conversion | | 348,462 | | | | 4,436,102 | |
Shares reacquired upon conversion into Class A | | (26,328 | ) | | | (329,258 | ) |
| | | | | | | |
Net increase (decrease) in shares outstanding | | 322,134 | | | $ | 4,106,844 | |
| | | | | | | |
| | |
| JennisonDryden Asset Allocation Funds | | 51 |
Notes to Financial Statements
(Unaudited) Cont’d
| | | | | | | |
Class C | | Shares | | | Amount | |
Six months ended March 31, 2007: | | | | | | | |
Shares sold | | 113,254 | | | $ | 1,554,626 | |
Shares issued in reinvestment of dividends and distributions | | 6,183 | | | | 84,020 | |
Shares reacquired | | (21,805 | ) | | | (297,859 | ) |
| | | | | | | |
Net increase (decrease) in shares outstanding | | 97,632 | | | $ | 1,340,787 | |
| | | | | | | |
Year ended September 30, 2006: | | | | | | | |
Shares sold | | 237,998 | | | $ | 3,001,021 | |
Shares issued in reinvestment of dividends and distributions | | 233 | | | | 2,891 | |
Shares reacquired | | (54,010 | ) | | | (674,864 | ) |
| | | | | | | |
Net increase (decrease) in shares outstanding | | 184,221 | | | $ | 2,329,048 | |
| | | | | | | |
Class R | | | | | | |
Period ended March 31, 2007*: | | | | | | | |
Shares sold | | 182 | | | $ | 2,500 | |
Shares issued in reinvestment of dividends and distributions | | — | | | | — | |
Shares reacquired | | — | | | | — | |
| | | | | | | |
Net increase (decrease) in shares outstanding | | 182 | | | $ | 2,500 | |
| | | | | | | |
Class Z | | | | | | |
Six months ended March 31, 2007: | | | | | | | |
Shares sold | | 1,523 | | | $ | 21,168 | |
Shares issued in reinvestment of dividends and distributions | | 871 | | | | 11,903 | |
Shares reacquired | | (10,508 | ) | | | (144,855 | ) |
| | | | | | | |
Net increase (decrease) in shares outstanding | | (8,114 | ) | | $ | (111,784 | ) |
| | | | | | | |
Year ended September 30, 2006: | | | | | | | |
Shares sold | | 81,897 | | | $ | 1,075,324 | |
Shares issued in reinvestment of dividends and distributions | | 385 | | | | 4,787 | |
Shares reacquired | | (76,672 | ) | | | (972,418 | ) |
| | | | | | | |
Net increase (decrease) in shares outstanding | | 5,610 | | | $ | 107,693 | |
| | | | | | | |
| * | Commenced operations on January 12, 2007. |
Note 7. New Accounting Pronouncements
On July 13, 2006, the Financial Accounting Standards Board (FASB) released FASB Interpretation No. 48 “Accounting for Uncertainty in Income Taxes” (FIN 48). FIN 48 provides guidance for how uncertain tax positions should be recognized, measured, presented and disclosed in the financial statements. FIN 48 requires the evaluation of tax positions taken or expected to be taken in the course of preparing the Fund’s tax
| | |
| 52 | | Visit our website at www.jennisondryden.com |
returns to determine whether the tax positions are “more-likely-than-not” of being sustained by the applicable tax authority. The impact of the tax positions not deemed to meet the more-likely-than-not threshold would be recorded in the year in which they arise. On December 22, 2006 the Securities and Exchange Commission delayed the effective date until the last net asset value calculation in the first required financial reporting period for its fiscal year beginning after December 15, 2006. At this time, management is evaluating the implications of FIN 48 and its impact, if any, in the financial statements has not yet been determined.
On September 20, 2006, the FASB released Statement of Financial Accounting Standards No. 157 “Fair Value Measurements” (FAS 157). FAS 157 establishes an authoritative definition of fair value, sets out a framework for measuring fair value, and requires additional disclosures about fair-value measurements. The application of FAS 157 is required for fiscal years beginning after November 15, 2007 and interim periods within those fiscal years. At this time, management is evaluating the implications of FAS 157 and its impact, if any, in the financial statements has not yet been determined.
| | |
| JennisonDryden Asset Allocation Funds | | 53 |
JennisonDryden Conservative Allocation Fund
Financial Highlights
(Unaudited)
| | | | |
| | | Class A | |
| | | Six Months
Ended
March 31, 2007(a) | |
Per Share Operating Performance: | | | | |
Net Asset Value, Beginning Of Period | | $ | 11.21 | |
| | | | |
Income (loss) from investment operations: | | | | |
Net investment income | | | .15 | |
Net realized and unrealized gain (loss) on investment transactions | | | .43 | |
| | | | |
Total from investment operations | | | .58 | |
| | | | |
Less Dividends and Distributions: | | | | |
Dividends from net investment income | | | (.17 | ) |
Distributions from net realized gains | | | (.12 | ) |
| | | | |
Total dividends and distributions | | | (.29 | ) |
| | | | |
Net asset value, end of period | | $ | 11.50 | |
| | | | |
Total Return(c): | | | 5.24 | % |
Ratios/Supplemental Data: | | | | |
Net assets, end of period (000) | | $ | 15,871 | |
Average net assets (000) | | $ | 13,713 | |
Ratios to average net assets(d): | | | | |
Expenses, including distribution and service (12b-1) fees(e) | | | .76 | %(f) |
Expenses, excluding distribution and service (12b-1) fees | | | .51 | %(f) |
Net investment income | | | 2.72 | %(f) |
For Class A, B, C, R and Z shares: | | | | |
Portfolio turnover rate | | | 4 | %(g) |
| (a) | Calculated based upon average shares outstanding during the period. |
| (b) | Inception date of Class A shares. |
| (c) | Total return does not consider the effects of sales loads. Total return is calculated assuming a purchase of shares on the first day and a sale on the last day of each period reported, and includes reinvestment of dividends and distributions. Total returns for periods less than a full year are not annualized. Total return includes the effect of expense subsidies. |
| (d) | Net of expense subsidy. If the investment manager had not subsidized expenses, the expense ratios including distribution and service (12b-1) fees would have been 1.71% 1.08%, 1.20%, and 6.16%, for the six months ended March 31, 2007, the year ended September 30, 2006, the year ended September 30, 2005 and the period ended September 30, 2004, respectively. Does not include expenses of the investment companies in which the Fund invests. |
| | The net investment income (loss) ratios would have been 1.77%, 1.95%, 1.49%, and (5.25)%, for the six months ended March 31, 2007, the year ended September 30, 2006, the year ended September 30, 2005 and the period ended September 30, 2004, respectively. |
| (e) | The distributor of the Fund has contractually agreed to limit its distribution and service (12b-1) fees to .25 of 1% of the average daily net assets of the Class A shares. |
See Notes to Financial Statements.
| | |
| 54 | | Visit our website at www.jennisondryden.com |
| | | | | | | | | | |
| Class A | |
| Year Ended September 30, | | | March 30, 2004(b)
Through
September 30, 2004 | |
| 2006 | | | 2005(a) | | |
| | | | | | | | | | |
| $ | 10.78 | | | $ | 10.01 | | | $ | 10.00 | |
| | | | | | | | | | | |
| | | | | | | | | | |
| | .25 | | | | .20 | | | | .05 | |
| | .46 | | | | .78 | | | | (.04 | ) |
| | | | | | | | | | | |
| | .71 | | | | .98 | | | | .01 | |
| | | | | | | | | | | |
| | | | | | | | | | |
| | (.24 | ) | | | (.21 | ) | | | — | |
| | (.04 | ) | | | — | | | | — | |
| | | | | | | | | | | |
| | (.28 | ) | | | (.21 | ) | | | — | |
| | | | | | | | | | | |
| $ | 11.21 | | | $ | 10.78 | | | $ | 10.01 | |
| | | | | | | | | | | |
| | 6.71 | % | | | 9.92 | % | | | .10 | % |
| | | | | | | | | | |
| $ | 11,278 | | | $ | 5,929 | | | $ | 2,548 | |
| $ | 8,611 | | | $ | 4,136 | | | $ | 1,535 | |
| | | | | | | | | | |
| | .77 | % | | | .75 | % | | | .75 | %(f) |
| | .52 | % | | | .50 | % | | | .50 | %(f) |
| | 2.26 | % | | | 1.89 | % | | | 1.69 | %(f) |
| | | | | | | | | | |
| | 18 | % | | | 11 | % | | | 3 | %(g) |
See Notes to Financial Statements.
| | |
| JennisonDryden Asset Allocation Funds | | 55 |
JennisonDryden Conservative Allocation Fund
Financial Highlights
(Unaudited) Cont’d
| | | | |
| | | Class B | |
| | | Six Months
Ended
March 31, 2007(a) | |
Per Share Operating Performance: | | | | |
Net Asset Value, Beginning Of Period | | $ | 11.18 | |
| | | | |
Income (loss) from investment operations: | | | | |
Net investment income | | | .11 | |
Net realized and unrealized gain (loss) on investment transactions | | | .43 | |
| | | | |
Total from investment operations | | | .54 | |
| | | | |
Less Dividends and Distributions: | | | | |
Dividends from net investment income | | | (.13 | ) |
Distributions from net realized gains | | | (.12 | ) |
| | | | |
Total dividends and distributions | | | (.25 | ) |
| | | | |
Net asset value, end of period | | $ | 11.47 | |
| | | | |
Total Return(c): | | | 4.85 | % |
Ratios/Supplemental Data: | | | | |
Net assets, end of period (000) | | $ | 11,383 | |
Average net assets (000) | | $ | 10,691 | |
Ratios to average net assets(d): | | | | |
Expenses, including distribution and service (12b-1) fees | | | 1.51 | %(e) |
Expenses, excluding distribution and service (12b-1) fees | | | .51 | %(e) |
Net investment income | | | 1.99 | %(e) |
| (a) | Calculated based upon average shares outstanding during the period. |
| (b) | Inception date of Class B shares. |
| (c) | Total return does not consider the effects of sales loads. Total return is calculated assuming a purchase of shares on the first day and a sale on the last day of each period reported, and includes reinvestment of dividends and distributions. Total returns for periods less than a full year are not annualized. Total return includes the effect of expense subsidies. |
| (d) | Net of expense subsidy. If the investment manager had not subsidized expenses, the expense ratios including distribution and service (12b-1) fees would have been 2.46%, 1.83%, 1.95% and 6.91%, for the six months ended March 31, 2007, the year ended September 30, 2006, the year ended September 30, 2005 and period ended September 30, 2004, respectively. Does not include expenses of the investment companies in which the Fund invests. |
| | The net investment income (loss) ratios would have been 1.04%, 1.21%, .71% and (6.02)%, for the six months ended March 31, 2007, the year ended September 30, 2006, the year ended September 30, 2005 and period ended September 30, 2004, respectively. |
See Notes to Financial Statements.
| | |
| 56 | | Visit our website at www.jennisondryden.com |
| | | | | | | | | | |
| Class B | |
| Year Ended September 30, | | | March 30, 2004(b)
Through
September 30, 2004 | |
| 2006 | | | 2005(a) | | |
| | | | | | | | | | |
| $ | 10.75 | | | $ | 9.97 | | | $ | 10.00 | |
| | | | | | | | | | | |
| | | | | | | | | | |
| | .16 | | | | .12 | | | | .03 | |
| | .47 | | | | .78 | | | | (.06 | ) |
| | | | | | | | | | | |
| | .63 | | | | .90 | | | | (.03 | ) |
| | | | | | | | | | | |
| | | | | | | | | | |
| | (.16 | ) | | | (.12 | ) | | | — | |
| | (.04 | ) | | | — | | | | — | |
| | | | | | | | | | | |
| | (.20 | ) | | | (.12 | ) | | | — | |
| | | | | | | | | | | |
| $ | 11.18 | | | $ | 10.75 | | | $ | 9.97 | |
| | | | | | | | | | | |
| | 5.91 | % | | | 9.11 | % | | | (.30 | )% |
| | | | | | | | | | |
| $ | 9,950 | | | $ | 8,241 | | | $ | 5,234 | |
| $ | 9,007 | | | $ | 7,032 | | | $ | 3,253 | |
| | | | | | | | | | |
| | 1.52 | % | | | 1.50 | % | | | 1.50 | %(e) |
| | .52 | % | | | .50 | % | | | .50 | %(e) |
| | 1.52 | % | | | 1.18 | % | | | .93 | %(e) |
See Notes to Financial Statements.
| | |
| JennisonDryden Asset Allocation Funds | | 57 |
JennisonDryden Conservative Allocation Fund
Financial Highlights
(Unaudited) Cont’d
| | | | |
| | | Class C | |
| | | Six Months
Ended
March 31, 2007(a) | |
Per Share Operating Performance: | | | | |
Net Asset Value, Beginning Of Period | | $ | 11.18 | |
| | | | |
Income (loss) from investment operations: | | | | |
Net investment income | | | .11 | |
Net realized and unrealized gain (loss) on investment transactions | | | .43 | |
| | | | |
Total from investment operations | | | .54 | |
| | | | |
Less Dividends and Distributions: | | | | |
Dividends from net investment income | | | (.13 | ) |
Distributions from net realized gains | | | (.12 | ) |
| | | | |
Total dividends and distributions | | | (.25 | ) |
| | | | |
Net asset value, end of period | | $ | 11.47 | |
| | | | |
Total Return(c): | | | 4.85 | % |
Ratios/Supplemental Data: | | | | |
Net assets, end of period (000) | | $ | 3,688 | |
Average net assets (000) | | $ | 3,363 | |
Ratios to average net assets(d): | | | | |
Expenses, including distribution and service (12b-1) fees | | | 1.51 | %(e) |
Expenses, excluding distribution and service (12b-1) fees | | | .51 | %(e) |
Net investment income | | | 1.99 | %(e) |
| (a) | Calculated based upon average shares outstanding during the period. |
| (b) | Inception date of Class C shares. |
| (c) | Total return does not consider the effects of sales loads. Total return is calculated assuming a purchase of shares on the first day and a sale on the last day of each period reported, and includes reinvestment of dividends and distributions. Total returns for periods less than a full year are not annualized. Total return includes the effect of expense subsidies. |
| (d) | Net of expense subsidy. If the investment manager had not subsidized expenses, the expense ratios including distribution and service (12b-1) fees would have been 2.46%, 1.83%, 1.95% and 6.91%, for the six months ended March 31, 2007, the year ended September 30, 2006, the year ended September 30, 2005 and period ended September 30, 2004, respectively. Does not include expenses of the investment companies in which the Fund invests. |
| | The net investment income (loss) ratios would have been 1.04%, 1.21%, .69% and (6.02)% for six months ended March 31, 2007, year ended September 30, 2006, the year ended September 30, 2005 and period ended September 30, 2004, respectively. |
See Notes to Financial Statements.
| | |
| 58 | | Visit our website at www.jennisondryden.com |
| | | | | | | | | | |
| Class C | |
| Year Ended September 30, | | | March 30, 2004(b)
Through
September 30, 2004 | |
| 2006 | | | 2005(a) | | |
| | | | | | | | | | |
| $ | 10.75 | | | $ | 9.97 | | | $ | 10.00 | |
| | | | | | | | | | | |
| | | | | | | | | | |
| | .16 | | | | .12 | | | | .03 | |
| | .47 | | | | .78 | | | | (.06 | ) |
| | | | | | | | | | | |
| | .63 | | | | .90 | | | | (.03 | ) |
| | | | | | | | | | | |
| | | | | | | | | | |
| | (.16 | ) | | | (.12 | ) | | | — | |
| | (.04 | ) | | | — | | | | — | |
| | | | | | | | | | | |
| | (.20 | ) | | | (.12 | ) | | | — | |
| | | | | | | | | | | |
| $ | 11.18 | | | $ | 10.75 | | | $ | 9.97 | |
| | | | | | | | | | | |
| | 5.91 | % | | | 9.11 | % | | | (.30 | )% |
| | | | | | | | | | |
| $ | 2,955 | | | $ | 1,879 | | | $ | 1,281 | |
| $ | 2,093 | | | $ | 1,737 | | | $ | 983 | |
| | | | | | | | | | |
| | 1.52 | % | | | 1.50 | % | | | 1.50 | %(e) |
| | .52 | % | | | .50 | % | | | .50 | %(e) |
| | 1.53 | % | | | 1.17 | % | | | .91 | %(e) |
See Notes to Financial Statements.
| | |
| JennisonDryden Asset Allocation Funds | | 59 |
JennisonDryden Conservative Allocation Fund
Financial Highlights
(Unaudited) Cont’d
| | | | |
| | | Class R | |
| | | January 12, 2007(b)
Through
March 31, 2007(a) | |
Per Share Operating Performance: | | | | |
Net Asset Value, Beginning Of Period | | $ | 11.33 | |
| | | | |
Income (loss) from investment operations: | | | | |
Net investment income | | | .05 | |
Net realized and unrealized gain on investment transactions | | | .12 | |
| | | | |
Total from investment operations | | | .17 | |
| | | | |
Less Dividends and Distributions: | | | | |
Dividends from net investment income | | | — | |
Distributions from net realized gains | | | — | |
| | | | |
Total dividends and distributions | | | — | |
| | | | |
Net asset value, end of period | | $ | 11.50 | |
| | | | |
Total Return(c): | | | 1.50 | % |
Ratios/Supplemental Data: | | | | |
Net assets, end of period (000) | | $ | 3 | |
Average net assets (000) | | $ | 1 | |
Ratios to average net assets(d): | | | | |
Expenses, including distribution and service (12b-1) fees(e) | | | 1.01 | %(f) |
Expenses, excluding distribution and service (12b-1) fees | | | .51 | %(f) |
Net investment income | | | 1.94 | %(f) |
| (a) | Calculated based upon average shares outstanding during the period. |
| (b) | Inception date of Class R shares. |
| (c) | Total return does not consider the effects of sales loads. Total return is calculated assuming a purchase of shares on the first day and a sale on the last day of each period reported, and includes reinvestment of dividends and distributions. Total returns for periods less than a full year are not annualized. Total return includes the effect of expense subsidies. |
| (d) | Net of expense subsidy. If the investment manager had not subsidized expenses, the expense ratios including distribution and service (12b-1) fees would have been 1.96%, for the period ended March 31, 2007. The net investment income ratio would have been 0.99%, for the period ended March 31, 2007. Does not include expenses of the investment companies in which the Fund invests. |
| (e) | The distributor of the Fund has contractually agreed to limit its distribution and service (12b-1) fees to .50 of 1% of the average daily net assets of the Class R shares. |
See Notes to Financial Statements.
| | |
| 60 | | Visit our website at www.jennisondryden.com |
This Page Intentionally Left Blank
JennisonDryden Conservative Allocation Fund
Financial Highlights
(Unaudited) Cont’d
| | | | |
| | | Class Z | |
| | | Six Months
Ended
March 31, 2007(a) | |
Per Share Operating Performance: | | | | |
Net Asset Value, Beginning Of Period | | $ | 11.25 | |
| | | | |
Income (loss) from investment operations: | | | | |
Net investment income | | | .17 | |
Net realized and unrealized gain (loss) on investment transactions | | | .42 | |
| | | | |
Total from investment operations | | | .59 | |
| | | | |
Less Dividends and Distributions: | | | | |
Dividends from net investment income | | | (.19 | ) |
Distributions from net realized gains | | | (.12 | ) |
| | | | |
Total dividends and distributions | | | (.31 | ) |
| | | | |
Net asset value, end of period | | $ | 11.53 | |
| | | | |
Total Return(c): | | | 5.35 | % |
Ratios/Supplemental Data: | | | | |
Net assets, end of period (000) | | $ | 167 | |
Average net assets (000) | | $ | 138 | |
Ratios to average net assets(d): | | | | |
Expenses, including distribution and service (12b-1) fees | | | .51 | %(e) |
Expenses, excluding distribution and service (12b-1) fees | | | .51 | %(e) |
Net investment income | | | 2.94 | %(e) |
| (a) | Calculated based upon average shares outstanding during the period. |
| (b) | Inception date of Class Z shares. |
| (c) | Total return is calculated assuming a purchase of shares on the first day and a sale on the last day of each period reported, and includes reinvestment of dividends and distributions. Total returns for periods less than a full year are not annualized. Total return includes the effect of expense subsidies. |
| (d) | Net of expense subsidy. If the investment manager had not subsidized expenses, the expense ratios including distribution and service (12b-1) fees would have been 1.46%, .83%, .95% and 5.91%, for the six months ended March 31, 2007, the year ended September 30, 2006, the year ended September 30, 2005 and period ended September 30, 2004, respectively. Does not include expenses of the investment companies in which the Fund invests. |
| | The net investment income (loss) ratios would have been 1.99%, 2.29%, 1.63% and (5.00)% for the six months ended March 31, 2007, the year ended September 30, 2006, the year ended September 30, 2005 and period ended September 30, 2004, respectively. |
See Notes to Financial Statements.
| | |
| 62 | | Visit our website at www.jennisondryden.com |
| | | | | | | | | | |
| Class Z | |
| Year Ended September 30, | | | March 30, 2004(b)
Through
September 30, 2004 | |
| 2006 | | | 2005(a) | | |
| | | | | | | | | | |
| $ | 10.80 | | | $ | 10.03 | | | $ | 10.00 | |
| | | | | | | | | | | |
| | | | | | | | | | |
| | .27 | | | | .24 | | | | .09 | |
| | .49 | | | | .77 | | | | (.06 | ) |
| | | | | | | | | | | |
| | .76 | | | | 1.01 | | | | .03 | |
| | | | | | | | | | | |
| | | | | | | | | | |
| | (.27 | ) | | | (.24 | ) | | | — | |
| | (.04 | ) | | | — | | | | — | |
| | | | | | | | | | | |
| | (.31 | ) | | | (.24 | ) | | | — | |
| | | | | | | | | | | |
| $ | 11.25 | | | $ | 10.80 | | | $ | 10.03 | |
| | | | | | | | | | | |
| | 7.05 | % | | | 10.18 | % | | | .30 | % |
| | | | | | | | | | |
| $ | 129 | | | $ | 42 | | | $ | 342 | |
| $ | 50 | | | $ | 311 | | | $ | 312 | |
| | | | | | | | | | |
| | .52 | % | | | .50 | % | | | .50 | %(e) |
| | .52 | % | | | .50 | % | | | .50 | %(e) |
| | 2.60 | % | | | 2.27 | % | | | 1.90 | %(e) |
See Notes to Financial Statements.
| | |
| JennisonDryden Asset Allocation Funds | | 63 |
JennisonDryden Moderate Allocation Fund
Financial Highlights
(Unaudited) Cont’d
| | | | |
| | | Class A | |
| | | Six Months
Ended
March 31, 2007 | |
Per Share Operating Performance: | | | | |
Net Asset Value, Beginning Of Period | | $ | 12.18 | |
| | | | |
Income (loss) from investment operations: | | | | |
Net investment income | | | .12 | |
Net realized and unrealized gain (loss) on investment transactions | | | .74 | |
| | | | |
Total from investment operations | | | .86 | |
| | | | |
Less Dividends and Distributions: | | | | |
Dividends from net investment income | | | (.21 | ) |
Distributions from net realized gains | | | (.16 | ) |
| | | | |
Total dividends and distributions | | | (.37 | ) |
| | | | |
Net asset value, end of period | | $ | 12.67 | |
| | | | |
Total Return(c): | | | 7.09 | % |
Ratios/Supplemental Data: | | | | |
Net assets, end of period (000) | | $ | 37,795 | |
Average net assets (000) | | $ | 33,951 | |
Ratios to average net assets(d): | | | | |
Expenses, including distribution and service (12b-1) fees(e) | | | .76 | %(f) |
Expenses, excluding distribution and service (12b-1) fees | | | .51 | %(f) |
Net investment income | | | 1.91 | %(f) |
For Class A, B, C, R and Z shares: | | | | |
Portfolio turnover rate | | | 3 | %(g) |
| (a) | Inception date of Class A shares. |
| (b) | Calculated based upon average shares outstanding during the period. |
| (c) | Total return does not consider the effects of sales loads. Total return is calculated assuming a purchase of shares on the first day and a sale on the last day of each period reported, and includes reinvestment of dividends and distributions. Total returns for periods less than a full year are not annualized. Total return includes the effect of expense subsidies. |
| (d) | Net of expense subsidy. If the investment manager had not subsidized expenses, the expense ratios including distribution and service (12b-1) fees would have been 1.02%, .79%, .88% and 2.61%, for the six months ended March 31, 2007, the year ended September 30, 2006, the year ended September 30, 2005 and the period ended September 30, 2004, respectively. The net investment income/(loss) ratios would have been 1.65%, 1.06%, .95% and (1.07)%, for the six months ended March 31, 2007, the year ended September 30, 2006, the year ended September 30, 2005 and the period ended September 30, 2004, respectively. Does not include expenses of the investment companies in which the Fund invests. |
| (e) | The distributor of the Fund has contractually agreed to limit its distribution and service (12b-1) fees to .25 of 1% of the average daily net assets of the Class A shares. |
See Notes to Financial Statements.
| | |
| 64 | | Visit our website at www.jennisondryden.com |
| | | | | | | | | | |
| Class A | |
| Year Ended September 30, | | | March 30, 2004(a)(b)
Through
September 30, 2004 | |
| 2006 | | | 2005 | | |
| | | | | | | | | | |
| $ | 11.34 | | | $ | 10.03 | | | $ | 10.00 | |
| | | | | | | | | | | |
| | | | | | | | | | |
| | .14 | | | | .13 | | | | .04 | |
| | .85 | | | | 1.34 | | | | (.01 | ) |
| | | | | | | | | | | |
| | .99 | | | | 1.47 | | | | .03 | |
| | | | | | | | | | | |
| | | | | | | | | | |
| | (.11 | ) | | | (.16 | ) | | | — | |
| | (.04 | ) | | | — | | | | — | |
| | | | | | | | | | | |
| | (.15 | ) | | | (.16 | ) | | | — | |
| | | | | | | | | | | |
| $ | 12.18 | | | $ | 11.34 | | | $ | 10.03 | |
| | | | | | | | | | | |
| | 8.91 | % | | | 14.77 | % | | | .30 | % |
| | | | | | | | | | |
| $ | 30,263 | | | $ | 19,532 | | | $ | 9,863 | |
| $ | 24,284 | | | $ | 14,172 | | | $ | 5,632 | |
| | | | | | | | | | |
| | .76 | % | | | .75 | % | | | .75 | %(f) |
| | .51 | % | | | .50 | % | | | .50 | %(f) |
| | 1.09 | % | | | 1.08 | % | | | .74 | %(f) |
| | | | | | | | | | |
| | 10 | % | | | 5 | % | | | 6 | %(g) |
See Notes to Financial Statements.
| | |
| JennisonDryden Asset Allocation Funds | | 65 |
JennisonDryden Moderate Allocation Fund
Financial Highlights
(Unaudited) Cont’d
| | | | |
| | | Class B | |
| | | Six Months
Ended
March 31, 2007 | |
Per Share Operating Performance: | | | | |
Net Asset Value, Beginning Of Period | | $ | 12.13 | |
| | | | |
Income (loss) from investment operations: | | | | |
Net investment income | | | .08 | |
Net realized and unrealized gain (loss) on investment transactions | | | .72 | |
| | | | |
Total from investment operations | | | .80 | |
| | | | |
Less Dividends and Distributions: | | | | |
Dividends from net investment income | | | (.13 | ) |
Distributions from net realized gains | | | (.16 | ) |
| | | | |
Total dividends and distributions | | | (.29 | ) |
| | | | |
Net asset value, end of period | | $ | 12.64 | |
| | | | |
Total Return(d): | | | 6.62 | % |
Ratios/Supplemental Data: | | | | |
Net assets, end of period (000) | | $ | 35,372 | |
Average net assets (000) | | $ | 33,718 | |
Ratios to average net assets(e): | | | | |
Expenses, including distribution and service (12b-1) fees | | | 1.51 | %(f) |
Expenses, excluding distribution and service (12b-1) fees | | | .51 | %(f) |
Net investment income | | | 1.17 | %(f) |
| (a) | Inception date of Class B shares. |
| (b) | Calculated based upon average shares outstanding during the period. |
| (c) | Less than $.005 per share. |
| (d) | Total return does not consider the effects of sales loads. Total return is calculated assuming a purchase of shares on the first day and a sale on the last day of each period reported, and includes reinvestment of dividends and distributions. Total returns for periods less than a full year are not annualized. Total return includes the effect of expense subsidies. |
| (e) | Net of expense subsidy. If the investment manager had not subsidized expenses, the expense ratios including distribution and service (12b-1) fees would have been 1.77%, 1.54%, 1.63% and 3.36%, for the six months ended March 31, 2007, the year ended September 30, 2006, the year ended September 30, 2005 and the period ended September 30, 2004, respectively. The net investment income/(loss) ratios would have been ..91%, .32%, .20% and (1.84)%, for the six months ended March 31, 2007, the year ended September 30, 2006, the year ended September 30, 2005 and the period ended September 30, 2004, respectively. Does not include expenses of the investment companies in which the Fund invests. |
See Notes to Financial Statements.
| | |
| 66 | | Visit our website at www.jennisondryden.com |
| | | | | | | | | | |
| Class B | |
| Year Ended September 30, | | | March 30, 2004(a)(b)
Through
September 30, 2004 | |
| 2006 | | | 2005 | | |
| | | | | | | | | | |
| $ | 11.34 | | | $ | 9.99 | | | $ | 10.00 | |
| | | | | | | | | | | |
| | | | | | | | | | |
| | .05 | | | | .04 | | | | — | (c) |
| | .85 | | | | 1.35 | | | | (.01 | ) |
| | | | | | | | | | | |
| | .90 | | | | 1.39 | | | | (.01 | ) |
| | | | | | | | | | | |
| | | | | | | | | | |
| | (.07 | ) | | | (.04 | ) | | | — | |
| | (.04 | ) | | | — | | | | — | |
| | | | | | | | | | | |
| | (.11 | ) | | | (.04 | ) | | | — | |
| | | | | | | | | | | |
| $ | 12.13 | | | $ | 11.34 | | | $ | 9.99 | |
| | | | | | | | | | | |
| | 8.17 | % | | | 13.95 | % | | | (.10 | )% |
| | | | | | | | | | |
| $ | 31,077 | | | $ | 24,146 | | | $ | 13,124 | |
| $ | 27,760 | | | $ | 19,913 | | | $ | 7,614 | |
| | | | | | | | | | |
| | 1.51 | % | | | 1.50 | % | | | 1.50 | %(f) |
| | .51 | % | | | .50 | % | | | .50 | %(f) |
| | .35 | % | | | .33 | % | | | — | (f)(g) |
See Notes to Financial Statements.
| | |
| JennisonDryden Asset Allocation Funds | | 67 |
JennisonDryden Moderate Allocation Fund
Financial Highlights
(Unaudited) Cont’d
| | | | |
| | | Class C | |
| | | Six Months
Ended
March 31, 2007 | |
Per Share Operating Performance: | | | | |
Net Asset Value, Beginning Of Period | | $ | 12.12 | |
| | | | |
Income (loss) from investment operations: | | | | |
Net investment income | | | .08 | |
Net realized and unrealized gain (loss) on investment transactions | | | .72 | |
| | | | |
Total from investment operations | | | .80 | |
| | | | |
Less Dividends and Distributions: | | | | |
Dividends from net investment income | | | (.13 | ) |
Distributions from net realized gains | | | (.16 | ) |
| | | | |
Total dividends and distributions | | | (.29 | ) |
| | | | |
Net asset value, end of period | | $ | 12.63 | |
| | | | |
Total Return(d): | | | 6.62 | % |
Ratios/Supplemental Data: | | | | |
Net assets, end of period (000) | | $ | 11,279 | |
Average net assets (000) | | $ | 10,030 | |
Ratios to average net assets(e): | | | | |
Expenses, including distribution and service (12b-1) fees | | | 1.51 | %(f) |
Expenses, excluding distribution and service (12b-1) fees | | | .51 | %(f) |
Net investment income (loss) | | | 1.16 | %(f) |
| (a) | Inception date of Class C shares. |
| (b) | Calculated based upon average shares outstanding during the period. |
| (c) | Less than $.005 per share. |
| (d) | Total return does not consider the effects of sales loads. Total return is calculated assuming a purchase of shares on the first day and a sale on the last day of each period reported, and includes reinvestment of dividends and distributions. Total returns for periods less than a full year are not annualized. Total return includes the effect of expense subsidies. |
| (e) | Net of expense subsidy. If the investment manager had not subsidized expenses, the expense ratios including distribution and service (12b-1) fees would have been 1.77%, 1.54%, 1.63% and 3.36%, for the six months ended March 31, 2007, the year ended September 30, 2006, the year ended September 30, 2005 and the period ended September 30, 2004, respectively. The net investment income/(loss) ratios would have been ..90%, .30%, .21% and (2.02)%, for the six months ended March 31, 2007, the year ended September 30, 2006, the year ended September 30, 2005 and the period ended September 30, 2004, respectively. Does not include expenses of the investment companies in which the Fund invests. |
See Notes to Financial Statements.
| | |
| 68 | | Visit our website at www.jennisondryden.com |
| | | | | | | | | | |
| Class C | |
| Year Ended September 30, | | | March 30, 2004(a)(b)
Through
September 30, 2004 | |
| 2006 | | | 2005 | | |
| | | | | | | | | | |
| $ | 11.34 | | | $ | 9.99 | | | $ | 10.00 | |
| | | | | | | | | | | |
| | | | | | | | | | |
| | .05 | | | | .04 | | | | — | (c) |
| | .84 | | | | 1.35 | | | | (.01 | ) |
| | | | | | | | | | | |
| | .89 | | | | 1.39 | | | | (.01 | ) |
| | | | | | | | | | | |
| | | | | | | | | | |
| | (.07 | ) | | | (.04 | ) | | | — | |
| | (.04 | ) | | | — | | | | — | |
| | | | | | | | | | | |
| | (.11 | ) | | | (.04 | ) | | | — | |
| | | | | | | | | | | |
| $ | 12.12 | | | $ | 11.34 | | | $ | 9.99 | |
| | | | | | | | | | | |
| | 7.80 | % | | | 14.05 | % | | | (.10 | )% |
| | | | | | | | | | |
| $ | 8,509 | | | $ | 4,989 | | | $ | 3,250 | |
| $ | 6,768 | | | $ | 4,321 | | | $ | 2,407 | |
| | | | | | | | | | |
| | 1.51 | % | | | 1.50 | % | | | 1.50 | %(f) |
| | .51 | % | | | .50 | % | | | .50 | %(f) |
| | .33 | % | | | .35 | % | | | (.02 | )%(f) |
See Notes to Financial Statements.
| | |
| JennisonDryden Asset Allocation Funds | | 69 |
JennisonDryden Moderate Allocation Fund
Financial Highlights
(Unaudited) Cont’d
| | | | |
| | | Class R | |
| | | January 12, 2007(a)
Through
March 31, 2007 | |
Per Share Operating Performance: | | | | |
Net Asset Value, Beginning Of Period | | $ | 12.45 | |
| | | | |
Income (loss) from investment operations: | | | | |
Net investment income | | | .02 | |
Net realized and unrealized gain on investment transactions | | | .19 | |
| | | | |
Total from investment operations | | | .21 | |
| | | | |
Less Dividends and Distributions: | | | | |
Dividends from net investment income | | | — | |
Distributions from net realized gains | | | — | |
| | | | |
Total dividends and distributions | | | — | |
| | | | |
Net asset value, end of period | | $ | 12.66 | |
| | | | |
Total Return(b): | | | 1.69 | % |
Ratios/Supplemental Data: | | | | |
Net assets, end of period (000) | | $ | 3 | |
Average net assets (000) | | $ | 3 | |
Ratios to average net assets(c): | | | | |
Expenses, including distribution and service (12b-1) fees(d) | | | 1.01 | %(e) |
Expenses, excluding distribution and service (12b-1) fees | | | .51 | %(e) |
Net investment income | | | .73 | %(e) |
| (a) | Inception date of Class R shares. |
| (b) | Total return is calculated assuming a purchase of shares on the first day and a sale on the last day of each period reported, and includes reinvestment of dividends and distributions. Total returns for periods less than a full year are not annualized. Total return includes the effect of expense subsidies. |
| (c) | Net of expense subsidy. If the investment manager had not subsidized expenses, the expense ratio including distribution and service (12b-1) fees would have been 1.27% for the period ended March 31, 2007 and the net investment income ratio would have been .47% for the period ended March 31, 2007. Does not include expenses of the investment companies in which the Fund invests. |
| (d) | The distributor of the Fund has contractually agreed to limit its distribution and service (12b-1) fees to .50 of 1% of the average daily net assets of the Class R shares. |
See Notes to Financial Statements.
| | |
| 70 | | Visit our website at www.jennisondryden.com |
This Page Intentionally Left Blank
JennisonDryden Moderate Allocation Fund
Financial Highlights
(Unaudited) Cont’d
| | | | |
| | | Class Z | |
| | | Six Months
Ended
March 31, 2007 | |
Per Share Operating Performance: | | | | |
Net Asset Value, Beginning Of Period | | $ | 12.19 | |
| | | | |
Income (loss) from investment operations: | | | | |
Net investment income | | | .13 | |
Net realized and unrealized gain (loss) on investment transactions | | | .75 | |
| | | | |
Total from investment operations | | | .88 | |
| | | | |
Less Dividends and Distributions: | | | | |
Dividends from net investment income | | | (.23 | ) |
Distributions from net realized gains | | | (.16 | ) |
| | | | |
Total dividends and distributions | | | (.39 | ) |
| | | | |
Net asset value, end of period | | $ | 12.68 | |
| | | | |
Total Return(c): | | | 7.26 | % |
Ratios/Supplemental Data: | | | | |
Net assets, end of period (000) | | $ | 1,739 | |
Average net assets (000) | | $ | 1,769 | |
Ratios to average net assets(d): | | | | |
Expenses, including distribution and service (12b-1) fees | | | .51 | %(e) |
Expenses, excluding distribution and service (12b-1) fees | | | .51 | %(e) |
Net investment income | | | 2.19 | %(e) |
| (a) | Inception date of Class Z shares. |
| (b) | Calculated based upon average shares outstanding during the period. |
| (c) | Total return is calculated assuming a purchase of shares on the first day and a sale on the last day of each period reported, and includes reinvestment of dividends and distributions. Total returns for periods less than a full year are not annualized. Total return includes the effect of expense subsidies. |
| (d) | Net of expense subsidy. If the investment manager had not subsidized expenses, the expense ratios including distribution and service (12b-1) fees would have been .77%, .54%, .63% and 2.36%, for the six months ended March 31, 2007, the year ended September 30, 2006, the year ended September 30, 2005 and the period ended September 30, 2004, respectively. The net investment income/(loss) ratios would have been 1.93%, 1.23%, 1.28% and (1.17)%, for the six months ended March 31, 2007, the year ended September 30, 2006, the year ended September 30, 2005 and the period ended September 30, 2004, respectively. Does not include expenses of the investment companies in which the Fund invests. |
See Notes to Financial Statements.
| | |
| 72 | | Visit our website at www.jennisondryden.com |
| | | | | | | | | | |
| Class Z | |
| Year Ended September 30, | | | March 30, 2004(a)(b)
Through
September 30, 2004 | |
| 2006 | | | 2005 | | |
| | | | | | | | | | |
| $ | 11.36 | | | $ | 10.04 | | | $ | 10.00 | |
| | | | | | | | | | | |
| | | | | | | | | | |
| | .17 | | | | .18 | | | | .05 | |
| | .82 | | | | 1.33 | | | | (.01 | ) |
| | | | | | | | | | | |
| | .99 | | | | 1.51 | | | | .04 | |
| | | | | | | | | | | |
| | | | | | | | | | |
| | (.12 | ) | | | (.19 | ) | | | — | |
| | (.04 | ) | | | — | | | | — | |
| | | | | | | | | | | |
| | (.16 | ) | | | (.19 | ) | | | — | |
| | | | | | | | | | | |
| $ | 12.19 | | | $ | 11.36 | | | $ | 10.04 | |
| | | | | | | | | | | |
| | 8.83 | % | | | 15.18 | % | | | .40 | % |
| | | | | | | | | | |
| $ | 1,580 | | | $ | 513 | | | $ | 580 | |
| $ | 1,268 | | | $ | 600 | | | $ | 497 | |
| | | | | | | | | | |
| | .51 | % | | | .50 | % | | | .50 | %(e) |
| | .51 | % | | | .50 | % | | | .50 | %(e) |
| | 1.26 | % | | | 1.43 | % | | | .97 | %(e) |
See Notes to Financial Statements.
| | |
| JennisonDryden Asset Allocation Funds | | 73 |
JennisonDryden Growth Allocation Fund
Financial Highlights
(Unaudited) Cont’d
| | | | |
| | | Class A | |
| | | Six Months
Ended
March 31, 2007 | |
Per Share Operating Performance: | | | | |
Net Asset Value, Beginning Of Period | | $ | 13.15 | |
| | | | |
Income (loss) from investment operations | | | | |
Net investment income (loss) | | | .07 | |
Net realized and unrealized gain on investment transactions | | | 1.10 | |
| | | | |
Total from investment operations | | | 1.17 | |
| | | | |
Less Dividends and Distributions | | | | |
Dividends from net investment income | | | (.15 | ) |
Distributions from net realized gains | | | (.13 | ) |
| | | | |
Total dividends and distributions | | | (.28 | ) |
| | | | |
Net asset value, end of period | | $ | 14.04 | |
| | | | |
Total Return(c): | | | 8.94 | % |
Ratios/Supplemental Data: | | | | |
Net assets, end of period (000) | | $ | 19,286 | |
Average net assets (000) | | $ | 16,564 | |
Ratios to average net assets(d): | | | | |
Expenses, including distribution and service (12b-1) fees(e) | | | .75 | %(f) |
Expenses, excluding distribution and service (12b-1) fees | | | .50 | %(f) |
Net investment income (loss) | | | .98 | %(f) |
For Class A, B, C, R and Z shares: | | | | |
Portfolio turnover rate | | | 3 | %(g) |
| (a) | Inception date of Class A shares. |
| (b) | Calculated based upon average shares outstanding during the period. |
| (c) | Total return does not consider the effects of sales loads. Total return is calculated assuming a purchase of shares on the first day and a sale on the last day of each period reported, and includes reinvestment of dividends and distributions. Total returns for periods less than a full year are not annualized. Total return includes the effect of expense subsidies. |
| (d) | Net of expense subsidy. If the investment manager had not subsidized expenses, the expense ratios including distribution and service (12b-1) fees would have been 1.38%, .96%, 1.20% and 4.82% for the six months ended March 31, 2007, the years ended September 30, 2006 and September 30, 2005 and for the period ended September 30, 2004, respectively. |
| | The net investment income/(loss) ratios would have been .35%, (.27)%, (.47)% and (4.51)% for the six months ended March 31, 2007, the years ended September 30, 2006 and September 30, 2005 and for the period ended September 30, 2004, respectively. Does not include expenses of the investment companies in which the Fund invests. |
| (e) | The distributor of the Fund has contractually agreed to limit its distribution and service (12b-1) fees to .25 of 1% of the average daily net assets of the Class A shares. |
See Notes to Financial Statements.
| | |
| 74 | | Visit our website at www.jennisondryden.com |
| | | | | | | | | | |
| Class A | |
| Year Ended September 30, | | | March 30, 2004(a)(b)
Through
September 30, 2004 | |
| 2006 | | | 2005 | | |
| | | | | | | | | | |
| $ | 11.99 | | | $ | 10.01 | | | $ | 10.00 | |
| | | | | | | | | | | |
| | | | | | | | | | |
| | .01 | | | | .01 | | | | (.02 | ) |
| | 1.24 | | | | 2.00 | | | | .03 | |
| | | | | | | | | | | |
| | 1.25 | | | | 2.01 | | | | .01 | |
| | | | | | | | | | | |
| | | | | | | | | | |
| | (.08 | ) | | | (.03 | ) | | | — | |
| | (.01 | ) | | | — | | | | — | |
| | | | | | | | | | | |
| | (.09 | ) | | | (.03 | ) | | | — | |
| | | | | | | | | | | |
| $ | 13.15 | | | $ | 11.99 | | | $ | 10.01 | |
| | | | | | | | | | | |
| | 10.61 | % | | | 20.02 | % | | | .10 | % |
| | | | | | | | | | |
| $ | 13,666 | | | $ | 7,573 | | | $ | 3,421 | |
| $ | 10,479 | | | $ | 5,125 | | | $ | 2,226 | |
| | | | | | | | | | |
| | .77 | % | | | .75 | % | | | .75 | %(f) |
| | .52 | % | | | .50 | % | | | .50 | %(f) |
| | (.08 | )% | | | (.02 | )% | | | (.40 | )%(f) |
| | | | | | | | | | |
| | 8 | % | | | 6 | % | | | 6 | %(g) |
See Notes to Financial Statements.
| | |
| JennisonDryden Asset Allocation Funds | | 75 |
JennisonDryden Growth Allocation Fund
Financial Highlights
(Unaudited) Cont’d
| | | | |
| | | Class B | |
| | | Six Months
Ended
March 31, 2007 | |
Per Share Operating Performance: | | | | |
Net Asset Value, Beginning Of Period | | $ | 13.05 | |
| | | | |
Income (loss) from investment operations | | | | |
Net investment income (loss) | | | .03 | |
Net realized and unrealized gain on investment transactions | | | 1.08 | |
| | | | |
Total from investment operations | | | 1.11 | |
| | | | |
Less Dividends and Distributions | | | | |
Dividends from net investment income | | | (.07 | ) |
Distributions from net realized gains | | | (.13 | ) |
| | | | |
Total dividends and distributions | | | (.20 | ) |
| | | | |
Net asset value, end of period | | $ | 13.96 | |
| | | | |
Total Return(c): | | | 8.55 | % |
Ratios/Supplemental Data: | | | | |
Net assets, end of period (000) | | $ | 23,270 | |
Average net assets (000) | | $ | 21,433 | |
Ratios to average net assets(d): | | | | |
Expenses, including distribution and service (12b-1) fees | | | 1.50 | %(e) |
Expenses, excluding distribution and service (12b-1) fees | | | .50 | %(e) |
Net investment income (loss) | | | .27 | %(e) |
| (a) | Inception date of Class B shares. |
| (b) | Calculated based upon average shares outstanding during the period. |
| (c) | Total return does not consider the effects of sales loads. Total return is calculated assuming a purchase of shares on the first day and a sale on the last day of each period reported, and includes reinvestment of dividends and distributions. Total returns for periods less than a full year are not annualized. Total return includes the effect of expense subsidies. |
| (d) | Net of expense subsidy. If the investment manager had not subsidized expenses, the expense ratios including distribution and service (12b-1) fees would have been 2.13%, 1.71%, 1.95% and 5.57% for the six months ended March 31, 2007, the years ended September 30, 2006 and September 30, 2005 and for the period ended September 30, 2004, respectively. The net investment loss ratios would have been (.36)%, (.99)%, (1.25)% and (5.09)% for the six months ended March 31, 2007, the years ended September 30, 2006 and September 30, 2005 and for the period ended September 30, 2004, respectively. Does not include expenses of the investment companies in which the Fund invests. |
See Notes to Financial Statements.
| | |
| 76 | | Visit our website at www.jennisondryden.com |
| | | | | | | | | | |
| Class B | |
| Year Ended September 30, | | | March 30, 2004(a)(b)
Through
September 30, 2004 | |
| 2006 | | | 2005 | | |
| | | | | | | | | | |
| $ | 11.90 | | | $ | 9.98 | | | $ | 10.00 | |
| | | | | | | | | | | |
| | | | | | | | | | |
| | (.08 | ) | | | (.07 | ) | | | (.06 | ) |
| | 1.24 | | | | 1.99 | | | | .04 | |
| | | | | | | | | | | |
| | 1.16 | | | | 1.92 | | | | (.02 | ) |
| | | | | | | | | | | |
| | | | | | | | | | |
| | — | | | | — | | | | — | |
| | (.01 | ) | | | — | | | | — | |
| | | | | | | | | | | |
| | (.01 | ) | | | — | | | | — | |
| | | | | | | | | | | |
| $ | 13.05 | | | $ | 11.90 | | | $ | 9.98 | |
| | | | | | | | | | | |
| | 9.95 | % | | | 19.04 | % | | | (.20 | )% |
| | | | | | | | | | |
| $ | 19,062 | | | $ | 13,552 | | | $ | 6,585 | |
| $ | 16,203 | | | $ | 10,343 | | | $ | 3,987 | |
| | | | | | | | | | |
| | 1.52 | % | | | 1.50 | % | | | 1.50 | %(e) |
| | .52 | % | | | .50 | % | | | .50 | %(e) |
| | (.80 | )% | | | (.80 | )% | | | (1.15 | )%(e) |
See Notes to Financial Statements.
| | |
| JennisonDryden Asset Allocation Funds | | 77 |
JennisonDryden Growth Allocation Fund
Financial Highlights
(Unaudited) Cont’d
| | | | |
| | | Class C | |
| | | Six Months
Ended
March 31, 2007 | |
Per Share Operating Performance: | | | | |
Net Asset Value, Beginning Of Period | | $ | 13.04 | |
| | | | |
Income (loss) from investment operations | | | | |
Net investment loss | | | .03 | |
Net realized and unrealized gain on investment transactions | | | 1.09 | |
| | | | |
Total from investment operations | | | 1.12 | |
| | | | |
Less Dividends and Distributions | | | | |
Dividends from net investment income | | | (.07 | ) |
Distributions from net realized gains | | | (.13 | ) |
| | | | |
Total dividends and distributions | | | (.20 | ) |
| | | | |
Net asset value, end of period | | $ | 13.96 | |
| | | | |
Total Return(c): | | | 8.63 | % |
Ratios/Supplemental Data: | | | | |
Net assets, end of period (000) | | $ | 7,152 | |
Average net assets (000) | | $ | 6,380 | |
Ratios to average net assets(d): | | | | |
Expenses, including distribution and service (12b-1) fees | | | 1.50 | %(e) |
Expenses, excluding distribution and service (12b-1) fees | | | .50 | %(e) |
Net investment income (loss) | | | .26 | %(e) |
| (a) | Inception date of Class C shares. |
| (b) | Calculated based upon average shares outstanding during the period. |
| (c) | Total return does not consider the effects of sales loads. Total return is calculated assuming a purchase of shares on the first day and a sale on the last day of each period reported, and includes reinvestment of dividends and distributions. Total returns for periods less than a full year are not annualized. Total return includes the effect of expense subsidies. |
| (d) | Net of expense subsidy. If the investment manager had not subsidized expenses, the expense ratios including distribution and service (12b-1) fees would have been 2.13% 1.71%, 1.95% and 5.57% for the six months ended March 31, 2007, the years ended September 30, 2006 and September 30, 2005 and for the period ended September 30, 2004, respectively. The net investment loss ratios would have been (.37)%, (1.02)%, (1.22)% and (5.46)% for the six months ended March 31, 2007 and the years ended September 30, 2006 and September 30, 2005 and for the period ended September 30, 2004, respectively. Does not include expenses of the investment companies in which the Fund invests. |
See Notes to Financial Statements.
| | |
| 78 | | Visit our website at www.jennisondryden.com |
| | | | | | | | | | |
| Class C | |
| Year Ended September 30, | | | March 30, 2004(a)(b)
Through
September 30, 2004 | |
| 2006 | | | 2005 | | |
| | | | | | | | | | |
| $ | 11.91 | | | $ | 9.98 | | | $ | 10.00 | |
| | | | | | | | | | | |
| | | | | | | | | | |
| | (.07 | ) | | | (.07 | ) | | | (.06 | ) |
| | 1.21 | | | | 2.00 | | | | .04 | |
| | | | | | | | | | | |
| | 1.14 | | | | 1.93 | | | | (.02 | ) |
| | | | | | | | | | | |
| | | | | | | | | | |
| | — | | | | — | | | | — | |
| | (.01 | ) | | | — | | | | — | |
| | | | | | | | | | | |
| | (.01 | ) | | | — | | | | — | |
| | | | | | | | | | | |
| $ | 13.04 | | | $ | 11.91 | | | $ | 9.98 | |
| | | | | | | | | | | |
| | 9.68 | % | | | 19.24 | % | | | (.20 | )% |
| | | | | | | | | | |
| $ | 5,411 | | | $ | 2,746 | | | $ | 1,711 | |
| $ | 3,860 | | | $ | 2,268 | | | $ | 1,282 | |
| | | | | | | | | | |
| | 1.52 | % | | | 1.50 | % | | | 1.50 | %(e) |
| | .52 | % | | | .50 | % | | | .50 | %(e) |
| | (.83 | )% | | | (.74 | )% | | | (1.14 | )%(e) |
See Notes to Financial Statements.
| | |
| JennisonDryden Asset Allocation Funds | | 79 |
JennisonDryden Growth Allocation Fund
Financial Highlights
(Unaudited) Cont’d
| | | | |
| | | Class R | |
| | | January 12, 2007(a)
Through
March 31, 2007 | |
Per Share Operating Performance: | | | | |
Net Asset Value, Beginning Of Period | | $ | 13.76 | |
| | | | |
Income (loss) from investment operations | | | | |
Net investment loss | | | (.02 | ) |
Net realized and unrealized gain on investment transactions | | | .29 | |
| | | | |
Total from investment operations | | | .27 | |
| | | | |
Less Dividends and Distributions | | | | |
Dividends from net investment income | | | — | |
Distributions from net realized gains | | | — | |
| | | | |
Total dividends and distributions | | | — | |
| | | | |
Net asset value, end of period | | $ | 14.03 | |
| | | | |
Total Return(b): | | | 1.96 | % |
Ratios/Supplemental Data: | | | | |
Net assets, end of period (000) | | $ | 3 | |
Average net assets (000) | | $ | 3 | |
Ratios to average net assets(c): | | | | |
Expenses, including distribution and service (12b-1) fees(d) | | | 1.00 | %(e) |
Expenses, excluding distribution and service (12b-1) fees | | | .50 | %(e) |
Net investment loss | | | (.55 | )%(e) |
| (a) | Inception date of Class R shares. |
| (b) | Total return is calculated assuming a purchase of shares on the first day and a sale on the last day of each period reported, and includes reinvestment of dividends and distributions. Total returns for periods less than a full year are not annualized. Total return includes the effect of expense subsidies. |
| (c) | Net of expense subsidy. If the investment manager had not subsidized expenses, the expense ratios including distribution and service (12b-1) fees would have been 1.63% for the period ended March 31, 2007 and the net investment loss ratios would have been (1.18)% for the period ended March 31, 2007. Does not include expenses of the investment companies in which the Fund invests. |
| (d) | The distributor of the fund has contractually agreed to limit its distribution and service (12b-1) fee to .50% of 1% of the average net assets of the Class R shares. |
See Notes to Financial Statements.
| | |
| 80 | | Visit our website at www.jennisondryden.com |
This Page Intentionally Left Blank
JennisonDryden Growth Allocation Fund
Financial Highlights
(Unaudited) Cont’d
| | | | |
| | | Class Z | |
| | | Six Months
Ended March 31, 2007 | |
Per Share Operating Performance: | | | | |
Net Asset Value, Beginning Of Period | | $ | 13.18 | |
| | | | |
Income (loss) from investment operations | | | | |
Net investment income (loss) | | | .08 | |
Net realized and unrealized gain on investment transactions | | | 1.11 | |
| | | | |
Total from investment operations | | | 1.19 | |
| | | | |
Less Dividends and Distributions | | | | |
Dividends from net investment income | | | (.18 | ) |
Distributions from net realized gains | | | (.13 | ) |
| | | | |
Total dividends and distributions | | | (.31 | ) |
| | | | |
Net asset value, end of period | | $ | 14.06 | |
| | | | |
Total Return(c): | | | 9.08 | % |
Ratios/Supplemental Data: | | | | |
Net assets, end of period (000) | | $ | 484 | |
Average net assets (000) | | $ | 528 | |
Ratios to average net assets(d): | | | | |
Expenses, including distribution and service (12b-1) fees | | | .50 | %(e) |
Expenses, excluding distribution and service (12b-1) fees | | | .50 | %(e) |
Net investment income (loss) | | | 1.33 | %(e) |
| (a) | Inception date of Class Z shares. |
| (b) | Calculated based upon average shares outstanding during the period. |
| (c) | Total return is calculated assuming a purchase of shares on the first day and a sale on the last day of each period reported, and includes reinvestment of dividends and distributions. Total returns for periods less than a full year are not annualized. Total return includes the effect of expense subsidies. |
| (d) | Net of expense subsidy. If the investment manager had not subsidized expenses, the expense ratios including distribution and service (12b-1) fees would have been 1.03%, .71%, .95% and 4.57% for the six months ended March 31, 2007, the years ended September 30, 2006 and September 30, 2005 and for the period ended September 30, 2004, respectively. The net investment income/(loss) ratios would have been .70%, (.12)%, (.19)% and (4.67)% for the six months ended March 31, 2007, the years ended September 30, 2006 and September 30, 2005 and for the period ended September 30, 2004, respectively. Does not include expenses of the investment companies in which the Fund invests. |
See Notes to Financial Statements.
| | |
| 82 | | Visit our website at www.jennisondryden.com |
| | | | | | | | | | |
| Class Z | |
| Year Ended September 30, | | | March 30, 2004(a)(b)
Through
September 30, 2004 | |
| 2006 | | | 2005 | | |
| | | | | | | | | | |
| $ | 12.02 | | | $ | 10.03 | | | $ | 10.00 | |
| | | | | | | | | | | |
| | | | | | | | | | |
| | .02 | | | | .04 | | | | (.01 | ) |
| | 1.27 | | | | 2.00 | | | | .04 | |
| | | | | | | | | | | |
| | 1.29 | | | | 2.04 | | | | .03 | |
| | | | | | | | | | | |
| | | | | | | | | | |
| | (.12 | ) | | | (.05 | ) | | | — | |
| | (.01 | ) | | | — | | | | — | |
| | | | | | | | | | | |
| | (.13 | ) | | | (.05 | ) | | | — | |
| | | | | | | | | | | |
| $ | 13.18 | | | $ | 12.02 | | | $ | 10.03 | |
| | | | | | | | | | | |
| | 10.77 | % | | | 20.40 | % | | | .30 | % |
| | | | | | | | | | |
| $ | 560 | | | $ | 443 | | | $ | 279 | |
| $ | 662 | | | $ | 392 | | | $ | 237 | |
| | | | | | | | | | |
| | .52 | % | | | .50 | % | | | .50 | %(e) |
| | .52 | % | | | .50 | % | | | .50 | %(e) |
| | .07 | % | | | .28 | % | | | (.14 | )%(e) |
See Notes to Financial Statements.
| | |
| JennisonDryden Asset Allocation Funds | | 83 |
| | | | |
| n MAIL | | n TELEPHONE | | n WEBSITE |
Gateway Center Three 100 Mulberry Street Newark, NJ 07102 | | (800) 225-1852 | | www.jennisondryden.com |
|
| PROXY VOTING |
| The Board of Directors of the Funds has delegated to each Fund’s investment subadviser the responsibility for voting any proxies and maintaining proxy recordkeeping with respect to the Fund. A description of these proxy voting policies and procedures is available without charge, upon request, by calling (800) 225-1852 or by visiting the Securities and Exchange Commission’s website at www.sec.gov. Information regarding how the Funds voted proxies relating to portfolio securities during the most recent 12-month period ended June 30 is available on the Funds’ website and on the Commission’s website. |
|
| DIRECTORS |
| Linda W. Bynoe • David E.A. Carson • Robert F. Gunia • Robert E. La Blanc • Douglas H. McCorkindale • Richard A. Redeker • Judy A. Rice • Robin B. Smith • Stephen G. Stoneburn • Clay T. Whitehead |
|
| OFFICERS |
| Judy A. Rice, President • Robert F. Gunia, Vice President • Grace C. Torres, Treasurer and Principal Financial and Accounting Officer • Kathryn L. Quirk, Chief Legal Officer • Deborah A. Docs, Secretary • Lee D. Augsburger, Chief Compliance Officer • Valerie Simpson, Deputy Chief Compliance Officer • Noreen M. Fierro, Anti-Money Laundering Compliance Officer • Jonathan D. Shain, Assistant Secretary • Claudia DiGiacomo, Assistant Secretary • John P. Schwartz, Assistant Secretary • Andrew R. French, Assistant Secretary • M. Sadiq Peshimam, Assistant Treasurer |
| | | | |
| MANAGER | | Prudential Investments LLC | | Gateway Center Three
100 Mulberry Street
Newark, NJ 07102 |
|
| INVESTMENT SUBADVISER | | Quantitative Management
Associates LLC | | Gateway Center Two
100 Mulberry Street
Newark, NJ 07102 |
|
| DISTRIBUTOR | | Prudential Investment
Management Services LLC | | Gateway Center Three
100 Mulberry Street
Newark, NJ 07102 |
|
| CUSTODIAN | | The Bank of New York | | One Wall Street
New York, NY 10286 |
|
| TRANSFER AGENT | | Prudential Mutual Fund
Services LLC | | PO Box 8098
Philadelphia, PA 19176 |
|
INDEPENDENT REGISTERED
PUBLIC ACCOUNTING FIRM | | KPMG LLP | | 345 Park Avenue
New York, NY 10154 |
|
| FUND COUNSEL | | Sullivan & Cromwell LLP | | 125 Broad Street
New York, NY 10004 |
|
| An investor should consider the investment objectives, risks, charges, and expenses of each of the JennisonDryden Asset Allocation Funds carefully before investing. The prospectus for the JennisonDryden Asset Allocation Funds contains this and other information about the JennisonDryden Asset Allocation Funds. An investor may obtain a prospectus by visiting our website at www.jennisondryden.com or by calling (800) 225-1852. The prospectus should be read carefully before investing. |
|
| E-DELIVERY |
| To receive your mutual fund documents on-line, go to www.icsdelivery.com/prudential/funds and enroll. Instead of receiving printed documents by mail, you will receive notification via e-mail when new materials are available. You can cancel your enrollment or change your e-mail address at any time by clicking on the change/cancel enrollment option at the icsdelivery website address. |
|
| SHAREHOLDER COMMUNICATIONS WITH DIRECTORS |
| Shareholders can communicate directly with the Board of Directors by writing to the Chair of the Board, JennisonDryden Asset Allocation Funds, Prudential Investments, Attn: Board of Directors, 100 Mulberry Street, Gateway Center Three, Newark, NJ 07102. Shareholders can communicate directly with an individual Director by writing to the same address. Communications are not screened before being delivered to the addressee. |
|
| AVAILABILITY OF PORTFOLIO SCHEDULE |
| Each Fund files its complete schedule of portfolio holdings with the Securities and Exchange Commission for the first and third quarters of each fiscal year on Form N-Q under The Prudential Investment Portfolios, Inc. name. Each Fund’s Forms N-Q are available on the Commission’s website at www.sec.gov. Each Fund’s Forms N-Q may also be reviewed and copied at the Commission’s Public Reference Room in Washington, D.C. Information on the operation and location of the Public Reference Room may be obtained by calling (800) SEC-0330 (732-0330). Each Fund’s schedule of portfolio holdings is also available on the Fund’s website as of the end of each fiscal quarter. |
Mutual Funds:
| | | | |
ARE NOT INSURED BY THE FDIC OR ANY
FEDERAL GOVERNMENT AGENCY | | MAY LOSE VALUE | | ARE NOT A DEPOSIT OF OR GUARANTEED
BY ANY BANK OR ANY BANK AFFILIATE |

| | | | | | | | | | | | | | | | | | | | | | | | |
| JennisonDryden Asset Allocation Funds | | | | | | | | | | | | |
| | | | | Class A | | | | Class B | | | | Class C | | | | Class R | | | | Class Z | | | | |
| | | | NASDAQ | | CUSIP | | NASDAQ | | CUSIP | | NASDAQ | | CUSIP | | NASDAQ | | CUSIP | | NASDAQ | | CUSIP | | |
| | Conservative Allocation | | JDUAX | | 74437E750 | | JDABX | | 74437E743 | | JDACX | | 74437E735 | | JDCAR | | 74437E628 | | JDAZX | | 74437E784 | | |
| | Moderate Allocation | | JDTAX | | 74437E727 | | JDMBX | | 74437E719 | | JDMCX | | 74437E693 | | JDMAR | | 74437E610 | | JDMZX | | 74437E776 | | |
| | Growth Allocation | | JDAAX | | 74437E685 | | JDGBX | | 74437E677 | | JDGCX | | 74437E669 | | JDGAR | | 74437E594 | | JDGZX | | 74437E768 | | |
| | | | | | | | | | | | | | | | | | | | | | | | |
MF194E2 IFS-A133598 Ed. 05/2007
Item 2 – Code of Ethics – Not required, as this is not an annual filing.
Item 3 – Audit Committee Financial Expert – Not required, as this is not an annual filing.
Item 4 – Principal Accountant Fees and Services – Not required, as this is not an annual filing.
Item 5 – Audit Committee of Listed Registrants – Not applicable.
Item 6 – Schedule of Investments – The schedule is included as part of the report to shareholders filed under Item 1 of this Form.
Item 7 – Disclosure of Proxy Voting Policies and Procedures for Closed-End Management Investment Companies – Not applicable.
Item 8 – Portfolio Managers of Closed-End Management Investment Companies – Not applicable.
Item 9 – Purchases of Equity Securities by Closed-End Management Investment Company and Affiliated Purchasers – Not applicable.
Item 10 – Submission of Matters to a Vote of Security Holders – Not applicable.
Item 11 – Controls and Procedures
| | (a) | It is the conclusion of the registrant’s principal executive officer and principal financial officer that the effectiveness of the registrant’s current disclosure controls and procedures (such disclosure controls and procedures having been evaluated within 90 days of the date of this filing) provide reasonable assurance that the information required to be disclosed by the registrant has been recorded, processed, summarized and reported within the time period specified in the Commission’s rules and forms and that the information required to be disclosed by the registrant has been accumulated and communicated to the registrant’s principal executive officer and principal financial officer in order to allow timely decisions regarding required disclosure. |
| | (b) | There has been no significant change in the registrant’s internal control over financial reporting that occurred during the registrant’s most recent fiscal quarter of the period covered by this report that has materially affected, or is likely to materially affect, the registrant’s internal control over financial reporting. |
Item 12 – Exhibits
| | (a) | (1) Code of Ethics – Not required, as this is not an annual filing. |
| | (2) | Certifications pursuant to Section 302 of the Sarbanes-Oxley Act – Attached hereto as Exhibit EX-99.CERT. |
| | (3) | Any written solicitation to purchase securities under Rule 23c-1. – Not applicable. |
| | (b) | Certifications pursuant to Section 906 of the Sarbanes-Oxley Act – Attached hereto as Exhibit EX-99.906CERT. |
SIGNATURES
Pursuant to the requirements of the Securities Exchange Act of 1934 and the Investment Company Act of 1940, the registrant has duly caused this report to be signed on its behalf by the undersigned, thereunto duly authorized.
(Registrant) The Prudential Investment Portfolios, Inc.
| | |
| |
| By (Signature and Title)* | | /s/ Deborah A. Docs |
| | Deborah A. Docs Secretary |
Date May 23, 2007
Pursuant to the requirements of the Securities Exchange Act of 1934 and the Investment Company Act of 1940, this report has been signed below by the following persons on behalf of the registrant and in the capacities and on the dates indicated.
| | |
| |
| By (Signature and Title)* | | /s/ Judy A. Rice |
| | Judy A. Rice President and Principal Executive Officer |
Date May 23, 2007
| | |
| |
| By (Signature and Title)* | | /s/ Grace C. Torres |
| | Grace C. Torres Treasurer and Principal Financial Officer |
Date May 23, 2007
* Print the name and title of each signing officer under his or her signature.