UNITED STATES
SECURITIES AND EXCHANGE COMMISSION
Washington, D.C. 20549
FORM N-CSR
CERTIFIED SHAREHOLDER REPORT OF REGISTERED MANAGEMENT
INVESTMENT COMPANIES
| | |
| Investment Company Act file number: | | 811-07343 |
| |
| Exact name of registrant as specified in charter: | | The Prudential Investment Portfolios, Inc. |
| |
| Address of principal executive offices: | | Gateway Center 3, 100 Mulberry Street, Newark, New Jersey 07102 |
| |
| Name and address of agent for service: | | Deborah A. Docs Gateway Center 3, 100 Mulberry Street, Newark, New Jersey 07102 |
| |
| Registrant’s telephone number, including area code: | | 800-225-1852 |
| |
| Date of fiscal year end: | | 9/30/2008 |
| |
| Date of reporting period: | | 3/31/2008 |
Item 1 – Reports to Stockholders


| | |
| MARCH 31, 2008 | | SEMIANNUAL REPORT |
Dryden Active Allocation Fund
FUND TYPE
Balanced/allocation
OBJECTIVE
Income and long-term growth of capital
This report is not authorized for distribution to prospective investors unless preceded or accompanied by a current prospectus.
The views expressed in this report and information about the Fund’s portfolio holdings are for the period covered by this report and are subject to change thereafter.
The accompanying financial statements as of March 31, 2008, were not audited and, accordingly, no auditor’s opinion is expressed on them.
JennisonDryden, Dryden, Prudential Financial and the Rock Prudential logo are registered service marks of The Prudential Insurance Company of America, Newark, NJ, and its affiliates.

May 15, 2008
Dear Shareholder:
On the following pages, you’ll find your Fund’s semiannual report, including a table showing fund performance over the first half of the fiscal year and for longer periods. The report also contains a listing of the Fund’s holdings at period-end. The semiannual report is an interim statement furnished between the Fund’s annual reports, which include an analysis of Fund performance over the fiscal year in addition to other data.
Mutual fund prices and returns will rise or fall over time, and asset managers tend to have periods when they perform better or worse than their long-term average. The best measures of a mutual fund’s quality are its return compared to that of similar investments and the variability of its return over the long term. We recommend that you review your portfolio regularly with your financial professional.
Sincerely,

Judy A. Rice, President
The Prudential Investment Portfolios, Inc./Dryden Active Allocation Fund
| | |
| The Prudential Investment Portfolios, lnc./Dryden Active Allocation Fund | | 1 |
Your Fund’s Performance
Fund objective
The investment objective of the Dryden Active Allocation Fund is income and long-term growth of capital. There can be no assurance that the Fund will achieve its investment objective.
Performance data quoted represent past performance. Past performance does not guarantee future results. The investment return and principal value of an investment will fluctuate, so that an investor’s shares, when redeemed, may be worth more or less than their original cost. Current performance may be lower or higher than the past performance data quoted. An investor may obtain performance data as of the most recent month-end by visiting our website at www.jennisondryden.com or by calling (800) 225-1852. Class A and Class L shares have a maximum initial sales charge of 5.50% and 5.75%, respectively. Gross operating expenses: Class A, 1.18%; Class B, 1.88%; Class C, 1.88%; Class L, 1.38%; Class M, 1.88%; Class R, 1.63%; Class X, 1.88%; Class Z, 0.88%. Net operating expenses apply to: Class A, 1.15%; Class B, 1.88%; Class C, 1.88%; Class L, 1.38%; Class M, 1.88%; Class R, 1.38%; Class X, 1.88%; Class Z, 0.88%, after contractual reduction through 1/31/2008 for Class A shares and 1/31/2009 for Class R shares.
| | | | | | | | | | | | | | |
| Cumulative Total Returns as of 3/31/08 |
| | | Six Months | | | One Year | | | Five Years | | | Ten Years | | | Since Inception1 |
Class A | | –7.98 | % | | –3.98 | % | | 60.26 | % | | 58.95 | % | | — |
Class B | | –8.35 | | | –4.69 | | | 54.27 | | | 47.78 | | | — |
Class C | | –8.35 | | | –4.76 | | | 54.27 | | | 47.78 | | | — |
Class L | | –8.11 | | | –4.25 | | | N/A | | | N/A | | | –4.93% (3/26/07) |
Class M | | –8.35 | | | –4.76 | | | N/A | | | N/A | | | –5.43 (3/26/07) |
Class R | | –8.11 | | | –4.25 | | | N/A | | | N/A | | | 13.71 (12/17/04) |
Class X | | –8.35 | | | –4.69 | | | N/A | | | N/A | | | –5.43 (3/26/07) |
Class Z | | –7.90 | | | –3.78 | | | 62.21 | | | 63.31 | | | — |
Customized Blend Index2 | | –5.29 | | | 0.25 | | | 50.35 | | | 60.26 | | | ** |
Lehman Brothers U.S. Aggregate Bond Index3 | | 5.23 | | | 7.67 | | | 25.12 | | | 79.71 | | | *** |
S&P 500 Index4 | | –12.46 | | | –5.08 | | | 70.91 | | | 41.12 | | | **** |
Lipper Mixed-Asset Target Allocation Growth Funds Avg.5 | | –8.26 | | | –2.32 | | | 59.19 | | | 53.44 | | | ***** |
| | |
| 2 | | Visit our website at www.jennisondryden.com |
| | | | | | | | | | | |
| Average Annual Total Returns6 as of 3/31/08 |
| | | One Year | | | Five Years | | | Ten Years | | | Since Inception1 |
Class A | | –9.26 | % | | 8.66 | % | | 4.15 | % | | — |
Class B | | –9.03 | | | 8.92 | | | 3.98 | | | — |
Class C | | –5.62 | | | 9.06 | | | 3.98 | | | — |
Class L | | –9.76 | | | N/A | | | N/A | | | –10.22% (3/26/07) |
Class M | | –9.96 | | | N/A | | | N/A | | | –9.57 (3/26/07) |
Class R | | –4.25 | | | N/A | | | N/A | | | 3.99 (12/17/04) |
Class X | | –9.90 | | | N/A | | | N/A | | | –9.57 (3/26/07) |
Class Z | | –3.78 | | | 10.16 | | | 5.03 | | | — |
Customized Blend Index2 | | 0.25 | | | 8.50 | | | 4.83 | | | ** |
Lehman Brothers U.S. Aggregate Bond Index3 | | 7.67 | | | 4.58 | | | 6.04 | | | *** |
S&P 500 Index4 | | –5.08 | | | 11.32 | | | 3.50 | | | **** |
Lipper Mixed-Asset Target Allocation Growth Funds Avg.5 | | –2.32 | | | 9.63 | | | 4.24 | | | ***** |
The cumulative total returns do not reflect the deduction of applicable sales charges. If reflected, the applicable sales charges would reduce the cumulative total returns performance quoted. Class A and Class L shares are subject to a maximum front-end sales charge of 5.50% and 5.75%, respectively. Under certain circumstances, Class A shares may be subject to a contingent deferred sales charge (CDSC) of 1%. Class B, Class C, Class L, Class M, and Class X shares are subject to a maximum CDSC of 5%, 1%, 1%, 6%, and 6%, respectively. Class R and Class Z shares are not subject to a sales charge. Class L shares are closed to most new purchasers (with the exception of exchanges from the same class of shares offered by certain other JennisonDryden Funds).
Source: Prudential Investments LLC and Lipper Inc. Performance figures may reflect fee waivers and/or expense reimbursements. In the absence of such fee waivers and/or expense reimbursements, total returns would be lower.
1Inception date returns are provided for any share class with less than 10 calendar years of returns. The Since Inception returns for the Customized Blend Index, Lehman Brothers U.S. Aggregate Bond Index, S&P 500 Index, and the Lipper Average are measured from the closest month-end to inception date, and not from the Fund’s actual inception date.
2The Customized Blend Index is made up of the S&P 500 Index (57.5%), the Lehman Brothers U.S. Aggregate Bond Index (40.0%), and the T-Bill 3-Month Blend (2.5%).
3The Lehman Brothers U.S. Aggregate Bond Index is an unmanaged index of investment-grade securities issued by the U.S. government and its agencies, and by corporations with between one and 10 years remaining to maturity on the securities. It gives a broad look at how short- and intermediate-term bonds have performed.
4The S&P 500 Index is an unmanaged index of 500 stocks of large U.S. public companies. It gives a broad look at how U.S. stock prices have performed.
5The Lipper Mixed-Asset Target Allocation Growth Funds Average (Lipper Average) represents returns based on the average return of all funds in the Lipper Mixed-Asset Target Allocation Growth Funds category for the periods
| | |
| The Prudential Investment Portfolios, lnc./Dryden Active Allocation Fund | | 3 |
Your Fund’s Performance (continued)
noted. Funds in the Lipper Average are funds whose primary objective is to conserve principal by maintaining at all times a balanced portfolio of both stocks and bonds. Typically, the stock:bond ratio ranges around 60%:40%.
6The average annual total returns take into account applicable sales charges. Class A, Class B, Class C, Class L, Class M, Class R, and Class X shares are subject to an annual distribution and service (12b-1) fee of up to 0.30%, 1.00%, 1.00%, 0.50%, 1.00%, 0.75%, and 1.00%, respectively. Approximately seven years after purchase, Class B shares will automatically convert to Class A shares on a quarterly basis. Class Z shares are not subject to a 12b-1 fee. The returns in the tables do not reflect the deduction of taxes that a shareholder would pay on Fund distributions or following the redemption of Fund shares.
**Customized Blend Index Closest Month-End to Inception cumulative total returns are 16.68% for Class R; and 0.25% for Class L, Class M, and Class X. Customized Blend Index Closest Month-End to Inception average annual total returns are 4.86% for Class R; and 0.25% for Class L, Class M, and Class X.
***Lehman Brothers U.S. Aggregate Bond Index Closest Month-End to Inception cumulative total returns are 16.79% for Class R; and 7.67% for Class L, Class M, and Class X. Lehman Brothers U.S. Aggregate Bond Index Closest Month-End to Inception average annual total returns are 4.89% for Class R; and 7.67% for Class L, Class M, and Class X.
****S&P 500 Index Closest Month-End to Inception cumulative total returns are 16.03% for Class R; and -5.08% for Class L, Class M, and Class X. S&P 500 Index Closest Month-End to Inception average annual total returns are 4.68% for Class R; and -5.08% for Class L, Class M, and Class X.
*****Lipper Average Closest Month-End to Inception cumulative total returns are 17.10% for Class R; and -2.32% for Class L, Class M, and Class X. Lipper Average Closest Month-End to Inception average annual total returns are 4.92% for Class R; and -2.32% for Class L, Class M, and Class X.
Investors cannot invest directly in an index. The returns for the Customized Blend Index, the Lehman Brothers U.S. Aggregate Bond Index, and the S&P 500 Index would be lower if they included the effects of sales charges, operating expenses of a mutual fund, or taxes. Returns for the Lipper Average reflect the deduction of operating expenses, but not sales charges or taxes.
| | | |
| Five Largest Equity Holdings expressed as a percentage of net assets as of 3/31/08 | | | |
Exxon Mobil Corp., Oil, Gas & Consumable Fuels | | 2.5 | % |
General Electric Co., Industrial Conglomerates | | 1.8 | |
Microsoft Corp., Software | | 1.5 | |
AT&T, Inc., Diversified Telecommunication Services | | 1.4 | |
Chevron Corp., Oil, Gas & Consumable Fuels | | 1.1 | |
Holdings reflect only long-term equity investments and are subject to change.
| | | |
| Five Largest Equity Industries expressed as a percentage of net assets as of 3/31/08 | | | |
Oil, Gas & Consumable Fuels | | 7.2 | % |
Pharmaceuticals | | 4.1 | |
Insurance | | 3.0 | |
Computers & Peripherals | | 2.9 | |
Industrial Conglomerates | | 2.6 | |
Industry weightings reflect only long-term equity investments and are subject to change.
| | |
| 4 | | Visit our website at www.jennisondryden.com |
Fees and Expenses (Unaudited)
As a shareholder of the Fund, you incur two types of costs: (1) transaction costs, including sales charges (loads) on purchase payments and redemptions, as applicable, and (2) ongoing costs, including management fees, distribution and/or service (12b-1) fees, and other Fund expenses, as applicable. This example is intended to help you understand your ongoing costs (in dollars) of investing in the Fund and to compare these costs with the ongoing costs of investing in other mutual funds.
The example is based on an investment of $1,000 invested on October 1, 2007, at the beginning of the period, and held through the six-month period ended March 31, 2008. The example is for illustrative purposes only; you should consult the Prospectus for information on initial and subsequent minimum investment requirements.
The Fund’s transfer agent may charge additional fees to holders of certain accounts that are not included in the expenses shown in the table on the following page. These fees apply to individual retirement accounts (IRAs) and Section 403(b) accounts. As of the close of the six-month period covered by the table, IRA fees included an annual maintenance fee of $15 per account (subject to a maximum annual maintenance fee of $25 for all accounts held by the same shareholder). Section 403(b) accounts are charged an annual $25 fiduciary maintenance fee. Some of the fees may vary in amount, or may be waived, based on your total account balance or the number of JennisonDryden funds, including the Fund, that you own. You should consider the additional fees that were charged to your Fund account over the six-month period when you estimate the total ongoing expenses paid over the period and the impact of these fees on your ending account value, as these additional expenses are not reflected in the information provided in the expense table. Additional fees have the effect of reducing investment returns.
Actual Expenses
The first line for each share class in the table on the following page provides information about actual account values and actual expenses. You may use the information on this line, together with the amount you invested, to estimate the expenses that you paid over the period. Simply divide your account value by $1,000 (for example, an $8,600 account value ÷ $1,000 = 8.6), then multiply the result by the number on the first line under the heading “Expenses Paid During the Six-Month Period” to estimate the expenses you paid on your account during this period.
Hypothetical Example for Comparison Purposes
The second line for each share class in the table on the following page provides information about hypothetical account values and hypothetical expenses based on the Fund’s actual expense ratio and an assumed rate of return of 5% per year before expenses, which is not the Fund’s actual return. The hypothetical account values and expenses may not be used to estimate the actual ending account balance or expenses you paid for the
| | |
| The Prudential Investment Portfolios, Inc./Dryden Active Allocation Fund | | 5 |
Fees and Expenses (continued)
period. You may use this information to compare the ongoing costs of investing in the Fund and other funds. To do so, compare this 5% hypothetical example with the 5% hypothetical examples that appear in the shareholder reports of the other funds.
Please note that the expenses shown in the table are meant to highlight your ongoing costs only and do not reflect any transactional costs such as sales charges (loads). Therefore, the second line for each share class in the table is useful in comparing ongoing costs only and will not help you determine the relative total costs of owning different funds. In addition, if these transactional costs were included, your costs would have been higher.
| | | | | | | | | | | | | | |
Dryden Active
Allocation Fund | | Beginning Account
Value
October 1, 2007 | | Ending Account
Value March 31, 2008 | | Annualized
Expense Ratio
Based on the
Six-Month Period | | | Expenses Paid
During the Six-
Month Period* |
| | | | | | | | | | | | | | |
| Class A | | Actual | | $ | 1,000.00 | | $ | 920.20 | | 1.15 | % | | $ | 5.52 |
| | | Hypothetical | | $ | 1,000.00 | | $ | 1,019.25 | | 1.15 | % | | $ | 5.81 |
| | | | | | | | | | | | | | |
| Class B | | Actual | | $ | 1,000.00 | | $ | 916.50 | | 1.88 | % | | $ | 9.01 |
| | | Hypothetical | | $ | 1,000.00 | | $ | 1,015.60 | | 1.88 | % | | $ | 9.47 |
| | | | | | | | | | | | | | |
| Class C | | Actual | | $ | 1,000.00 | | $ | 916.50 | | 1.88 | % | | $ | 9.01 |
| | | Hypothetical | | $ | 1,000.00 | | $ | 1,015.60 | | 1.88 | % | | $ | 9.47 |
| | | | | | | | | | | | | | |
| Class L | | Actual | | $ | 1,000.00 | | $ | 918.90 | | 1.38 | % | | $ | 6.62 |
| | | Hypothetical | | $ | 1,000.00 | | $ | 1,018.10 | | 1.38 | % | | $ | 6.96 |
| | | | | | | | | | | | | | |
| Class M | | Actual | | $ | 1,000.00 | | $ | 916.50 | | 1.88 | % | | $ | 9.01 |
| | | Hypothetical | | $ | 1,000.00 | | $ | 1,015.60 | | 1.88 | % | | $ | 9.47 |
| | | | | | | | | | | | | | |
| Class R | | Actual | | $ | 1,000.00 | | $ | 918.90 | | 1.38 | % | | $ | 6.62 |
| | | Hypothetical | | $ | 1,000.00 | | $ | 1,018.10 | | 1.38 | % | | $ | 6.96 |
| | | | | | | | | | | | | | |
| Class X | | Actual | | $ | 1,000.00 | | $ | 916.50 | | 1.88 | % | | $ | 9.01 |
| | | Hypothetical | | $ | 1,000.00 | | $ | 1,015.60 | | 1.88 | % | | $ | 9.47 |
| | | | | | | | | | | | | | |
| Class Z | | Actual | | $ | 1,000.00 | | $ | 921.00 | | 0.88 | % | | $ | 4.23 |
| | | Hypothetical | | $ | 1,000.00 | | $ | 1,020.60 | | 0.88 | % | | $ | 4.45 |
| | | | | | | | | | | | | | |
* Fund expenses (net of fee waivers or subsidies, if any) for each share class are equal to the annualized expense ratio for each share class (provided in the table), multiplied by the average account value over the period, multiplied by the 183 days in the six-month period ended March 31, 2008, and divided by the 366 days in the Fund’s fiscal year ending September 30, 2008 (to reflect the six-month period). Expenses presented in the table include the expenses of any underlying portfolios in which the Fund may invest.
| | |
| 6 | | Visit our website at www.jennisondryden.com |
Portfolio of Investments
as of March 31, 2008 (Unaudited)
| | | | | |
| Shares | | Description | | Value (Note 1) |
| | | | | |
| | | | | |
LONG-TERM INVESTMENTS 95.5% | | | |
COMMON STOCKS 64.3% | | | |
| |
Aerospace & Defense 2.2% | | | |
| 4,919 | | BAE Systems PLC | | $ | 47,372 |
| 37,754 | | Boeing Co. | | | 2,807,765 |
| 5,606 | | European Aeronautic Defense and Space Co. (Netherlands) | | | 132,846 |
| 41,000 | | Honeywell International, Inc. | | | 2,313,220 |
| 30,029 | | Lockheed Martin Corp. | | | 2,981,880 |
| 43,500 | | Northrop Grumman Corp. | | | 3,384,735 |
| 17,500 | | Raytheon Co. | | | 1,130,675 |
| 6,300 | | United Technologies Corp. | | | 433,566 |
| | | | | |
| | | | | 13,232,059 |
| |
Air Freight & Logistics 0.2% | | | |
| 7,500 | | CH Robinson Worldwide, Inc. | | | 408,000 |
| 11,700 | | United Parcel Service, Inc. | | | 854,334 |
| | | | | |
| | | | | 1,262,334 |
| |
Airlines | | | |
| 604 | | Air France-KLM (France) | | | 17,012 |
| 2,070 | | Deutsche Lufthansa AG (Germany) | | | 56,145 |
| 34,038 | | Qantas Airways Ltd. (Australia) | | | 122,251 |
| | | | | |
| | | | | 195,408 |
| |
Auto Components | | | |
| 1,000 | | Aisin Seiki Co. Ltd. (Japan) | | | 37,319 |
| 5,000 | | Cooper Tire & Rubber Co. | | | 74,850 |
| 300 | | Denso Corp. (Japan) | | | 9,691 |
| 199 | | Nokian Renkaat OYJ (Finland) | | | 8,483 |
| 2,100 | | Tokai Rika Co. Ltd. (Japan) | | | 54,881 |
| 2,100 | | Toyoda Gosei Co. Ltd. | | | 79,003 |
| 300 | | Toyota Boshoku Corp. (Japan) | | | 8,984 |
| 1,200 | | Toyota Industries Corp. (Japan) | | | 42,616 |
| | | | | |
| | | | | 315,827 |
| |
Automobiles 0.2% | | | |
| 403 | | Bayerische Motoren Werke AG (Germany) | | | 22,294 |
| 2,277 | | Daimler AG (Germany) | | | 194,948 |
| 6,836 | | Fiat SpA (Italy) | | | 158,108 |
| 5,100 | | Harley-Davidson, Inc. | | | 191,250 |
| 900 | | Honda Motor Co. Ltd. (Japan) | | | 25,687 |
| 1,793 | | Peugeot SA (France) | | | 139,016 |
See Notes to Financial Statements.
| | |
| The Prudential Investment Portfolios, Inc./Dryden Active Allocation Fund | | 7 |
Portfolio of Investments
as of March 31, 2008 (Unaudited) continued
| | | | | |
| Shares | | Description | | Value (Note 1) |
| | | | | |
COMMON STOCKS (Continued) | | | |
| |
Automobiles (cont’d.) | | | |
| 470 | | Renault SA (France) | | $ | 52,015 |
| 4,300 | | Thor Industries, Inc.(g) | | | 128,011 |
| 4,200 | | Toyota Motor Corp. (Japan) | | | 209,410 |
| 31 | | Volkswagen AG (Germany) | | | 9,000 |
| 71 | | Volkswagen AG Pfd | | | 11,770 |
| | | | | |
| | | | | 1,141,509 |
| |
Beverages 1.5% | | | |
| 42,600 | | Anheuser-Busch Cos., Inc. | | | 2,021,370 |
| 37,520 | | Coca-Cola Co. (The)(g) | | | 2,283,842 |
| 2,449 | | Coca-Cola Hellenic Bottling Co. SA (Greece) | | | 114,058 |
| 1,028 | | Diageo PLC (United Kingdom) | | | 20,729 |
| 548 | | InBev NV (Belgium) | | | 48,224 |
| 5,300 | | Molson Coors Brewing Co. | | | 278,621 |
| 27,500 | | Pepsi Bottling Group, Inc. | | | 932,525 |
| 49,800 | | PepsiCo, Inc. | | | 3,595,560 |
| | | | | |
| | | | | 9,294,929 |
| |
Biotechnology 0.7% | | | |
| 56,700 | | Amgen, Inc.(a) | | | 2,368,926 |
| 17,000 | | Cubist Pharmaceuticals, Inc.(a)(g) | | | 313,140 |
| 8,100 | | Millennium Pharmaceuticals, Inc.(a) | | | 125,226 |
| 33,500 | | OSI Pharmaceuticals, Inc.(a)(g) | | | 1,252,565 |
| | | | | |
| | | | | 4,059,857 |
| |
Building Products | | | |
| 798 | | Cie de Saint-Gobain (France) | | | 65,070 |
| 11,000 | | Nippon Sheet Glass Co. Ltd. (Japan) | | | 48,666 |
| 4,000 | | Sanwa Holdings Corp. (Japan) | | | 17,376 |
| | | | | |
| | | | | 131,112 |
| |
Capital Markets 1.5% | | | |
| 1,278 | | 3i Group PLC (United Kingdom) | | | 21,052 |
| 9,000 | | Apollo Investment Corp. | | | 142,470 |
| 6,400 | | Bank of New York Mellon (The) Corp. | | | 267,072 |
| 2,587 | | Credit Suisse Group (Switzerland) | | | 131,681 |
| 1,016 | | Deutsche Bank AG (Germany) | | | 115,489 |
See Notes to Financial Statements.
| | |
| 8 | | Visit our website at www.jennisondryden.com |
| | | | | |
| Shares | | Description | | Value (Note 1) |
| | | | | |
COMMON STOCKS (Continued) | | | |
| |
Capital Markets (cont’d.) | | | |
| | | | | |
| 5,500 | | Franklin Resources, Inc. | | $ | 533,445 |
| 23,515 | | Goldman Sachs Group, Inc. | | | 3,889,147 |
| 15,800 | | Hercules Technology Growth Capital, Inc. | | | 171,588 |
| 4,673 | | Investec PLC (United Kingdom) | | | 31,393 |
| 17,511 | | Lehman Brothers Holdings, Inc. | | | 659,114 |
| 319 | | Macquarie Group Ltd. (Australia) | | | 15,399 |
| 1,517 | | Man Group PLC | | | 16,694 |
| 30,277 | | Merrill Lynch & Co., Inc.(g) | | | 1,233,485 |
| 4,000 | | MF Global Ltd.(a) | | | 39,640 |
| 42,862 | | Morgan Stanley | | | 1,958,793 |
| 1,617 | | UBS AG (Switzerland) | | | 46,991 |
| | | | | |
| | | | | 9,273,453 |
| |
Chemicals 1.4% | | | |
| 517 | | Akzo Nobel (Netherlands) | | | 41,480 |
| 1,414 | | BASF AG (Germany) | | | 191,179 |
| 13,001 | | Celanese Corp.(g) | | | 507,689 |
| 1,200 | | CF Industries Holdings, Inc. | | | 124,344 |
| 13,000 | | Dainippon Ink & Chemicals, Inc. (Japan) | | | 40,429 |
| 4,000 | | Denki Kagaku Kogyo K K | | | 12,600 |
| 67,700 | | Dow Chemical Co. (The) | | | 2,494,746 |
| 1,700 | | Eastman Chemical Co. | | | 106,165 |
| 2,140 | | Koninklijke DSM NV (Netherlands) | | | 103,214 |
| 18,000 | | Mitsubishi Gas Chemical Co., Inc. (Japan) | | | 128,030 |
| 8,300 | | Monsanto Co. | | | 925,450 |
| 4,400 | | Mosaic Co. (The)(a) | | | 451,440 |
| 5,000 | | Nippon Shokubai Co. Ltd. (Japan) | | | 33,156 |
| 88,200 | | Olin Corp. | | | 1,742,833 |
| 16,500 | | OM Group, Inc.(a)(g) | | | 899,910 |
| 149 | | Syngenta AG | | | 43,660 |
| 21,400 | | Terra Industries, Inc.(a)(g) | | | 760,342 |
| 450 | | Yara International ASA (Norway) | | | 26,024 |
| | | | | |
| | | | | 8,632,691 |
| |
Commercial Banks 2.1% | | | |
| 1,316 | | Allied Irish Banks PLC (Ireland) | | | 28,048 |
| 1,519 | | Alpha Credit Bank AE (Greece) | | | 50,361 |
| 10,171 | | Banco Bilbao Vizcaya Argentaria SA (Spain) | | | 224,003 |
| 17,845 | | Banco Santander Central Hispano SA (Spain) | | | 355,542 |
| 16,570 | | Barclays PLC (United Kingdom) | | | 148,971 |
See Notes to Financial Statements.
| | |
| The Prudential Investment Portfolios, Inc./Dryden Active Allocation Fund | | 9 |
Portfolio of Investments
as of March 31, 2008 (Unaudited) continued
| | | | | |
| Shares | | Description | | Value (Note 1) |
| | | | | |
COMMON STOCKS (Continued) | | | |
| |
Commercial Banks (cont’d.) | | | |
| 18,800 | | BB&T Corp.(g) | | $ | 602,728 |
| 1,869 | | BNP Paribas (France) | | | 188,520 |
| 2,200 | | Capital Corp. of The West | | | 17,644 |
| 17,800 | | Central Pacific Financial Corp. | | | 335,530 |
| 15,800 | | Comerica, Inc.(g) | | | 554,264 |
| 3,570 | | Commerzbank AG (Germany) | | | 112,385 |
| 710 | | Commonwealth Bank of Australia (Australia) | | | 27,129 |
| 1,841 | | Credit Agricole SA (France) | | | 56,967 |
| 1,780 | | Danske Bank A/S (Denmark) | | | 65,666 |
| 1,866 | | Dexia SA (Belgium) | | | 53,175 |
| 8,100 | | DnB NOR ASA (Norway) | | | 122,955 |
| 42,700 | | Fifth Third Bancorp | | | 893,284 |
| 10,246 | | HBOS PLC (United Kingdom) | | | 113,874 |
| 13,784 | | HSBC Holdings PLC (United Kingdom) | | | 227,057 |
| 9,500 | | Huntington Bancshares, Inc. | | | 102,125 |
| 154 | | Hypo Real Estate Holding AG (Germany) | | | 4,070 |
| 500 | | Jyske Bank(a) | | | 33,556 |
| 335 | | KBC Groep NV (Belgium) | | | 43,442 |
| 12,847 | | Lloyds TSB Group PLC (United Kingdom) | | | 114,990 |
| 2,900 | | Mitsubishi UFJ Financial Group, Inc. (Japan) | | | 25,020 |
| 8,000 | | Mitsui Trust Holdings, Inc. (Japan) | | | 48,395 |
| 2 | | Mizuho Financial Group, Inc. (Japan) | | | 7,323 |
| 2,567 | | National Australia Bank Ltd. (Australia) | | | 70,731 |
| 14,048 | | National City Corp. | | | 139,778 |
| 15,300 | | Oriental Financial Group (Puerto Rico) | | | 301,563 |
| 115,100 | | Regions Financial Corp.(g) | | | 2,273,224 |
| 35,690 | | Royal Bank of Scotland Group PLC (United Kingdom) | | | 238,880 |
| 3 | | Sapporo Hokuyo Holdings, Inc. (Japan) | | | 20,917 |
| 1,900 | | Skandinaviska Enskilda Banken, Class A (Sweden) | | | 49,724 |
| 833 | | Societe Generale (France) | | | 81,563 |
| 5,400 | | SunTrust Banks, Inc. | | | 297,756 |
| 1,000 | | Svenska Handelsbanken AB, Class A (Sweden) | | | 29,116 |
| 500 | | Swedbank AB (Sweden) | | | 14,011 |
| 3,800 | | Taylor Capital Group, Inc. | | | 62,396 |
| 16,008 | | U.S. Bancorp. | | | 518,019 |
| 16,297 | | UniCredito Italiano SpA (Italy) | | | 109,091 |
| 42,100 | | Wachovia Corp.(g) | | | 1,136,700 |
| 99,175 | | Wells Fargo & Co.(g) | | | 2,885,992 |
| 2,855 | | Westpac Banking Corp. (Australia) | | | 61,968 |
| | | | | |
| | | | | 12,848,453 |
See Notes to Financial Statements.
| | |
| 10 | | Visit our website at www.jennisondryden.com |
| | | | | |
| Shares | | Description | | Value (Note 1) |
| | | | | |
COMMON STOCKS (Continued) | | | |
| |
Commercial Services & Supplies 0.2% | | | |
| 1,749 | | Brambles Ltd. | | $ | 15,952 |
| 2,014 | | Hays PLC (United Kingdom) | | | 4,567 |
| 23,500 | | PeopleSupport, Inc.(a)(g) | | | 214,320 |
| 8,800 | | R. R. Donnelley & Sons Co. | | | 266,728 |
| 8,000 | | Toppan Printing Co. Ltd. | | | 92,777 |
| 10,100 | | TrueBlue, Inc.(a)(g) | | | 135,744 |
| 15,567 | | Waste Management, Inc. | | | 522,428 |
| | | | | |
| | | | | 1,252,516 |
| |
Communications Equipment 1.2% | | | |
| 5,400 | | Anaren, Inc.(a) | | | 68,364 |
| 15,400 | | Ciena Corp.(a)(g) | | | 474,782 |
| 102,666 | | Cisco Systems, Inc.(a) | | | 2,473,224 |
| 2,400 | | Corning, Inc. | | | 57,696 |
| 9,574 | | Nokia Corp. (Finland) | | | 302,905 |
| 96,100 | | QUALCOMM, Inc. | | | 3,940,100 |
| | | | | |
| | | | | 7,317,071 |
| |
Computers & Peripherals 2.9% | | | |
| 9,500 | | Apple, Inc.(a)(g) | | | 1,363,250 |
| 13,300 | | Emulex Corp.(a) | | | 215,992 |
| 123,911 | | Hewlett-Packard Co. | | | 5,657,776 |
| 46,641 | | International Business Machines Corp. | | | 5,370,245 |
| 9,100 | | Lexmark International, Inc.(a) | | | 279,552 |
| 89,600 | | NetApp, Inc.(a) | | | 1,796,480 |
| 13,300 | | QLogic Corp.(a) | | | 204,155 |
| 95,500 | | Seagate Technology (Cayaman Islands) | | | 1,999,770 |
| 19,200 | | Western Digital Corp.(a)(g) | | | 519,168 |
| 261 | | Wincor Nixdorf AG (Germany) | | | 20,829 |
| | | | | |
| | | | | 17,427,217 |
| |
Construction & Engineering 0.2% | | | |
| 92 | | Acciona SA (Spain) | | | 24,641 |
| 314 | | Bilfinger Berger AG | | | 27,017 |
| 400 | | FLSmidth & Co. | | | 39,590 |
| 6,300 | | Fluor Corp. | | | 889,308 |
| 133 | | Leighton Holdings Ltd. | | | 5,202 |
| 350 | | YIT OYJ (Finland) | | | 9,930 |
| | | | | |
| | | | | 995,688 |
See Notes to Financial Statements.
| | |
| The Prudential Investment Portfolios, Inc./Dryden Active Allocation Fund | | 11 |
Portfolio of Investments
as of March 31, 2008 (Unaudited) continued
| | | | | |
| Shares | | Description | | Value (Note 1) |
| | | | | |
COMMON STOCKS (Continued) | | | |
| |
Construction Materials 0.1% | | | |
| 16,400 | | Headwaters, Inc.(a)(g) | | $ | 216,316 |
| 952 | | Holcim Ltd., Class B (Switzerland) | | | 99,983 |
| 1,035 | | Lafarge SA (France) | | | 180,003 |
| | | | | |
| | | | | 496,302 |
| |
Consumer Finance | | | |
| 320 | | Acom Company Ltd. | | | 8,491 |
| 1,000 | | American Express Co. | | | 43,720 |
| 900 | | Capital One Financial Corp.(g) | | | 44,298 |
| 3,910 | | Takefuji Corp. (Japan) | | | 82,766 |
| | | | | |
| | | | | 179,275 |
| |
Containers & Packaging 0.2% | | | |
| 14,600 | | Ball Corp. | | | 670,724 |
| 7,600 | | Rock-Tenn. Co., Class A | | | 227,772 |
| | | | | |
| | | | | 898,496 |
| |
Distributors | | | |
| 16,000 | | Li & Fung Ltd. (Hong Kong) | | | 59,311 |
| 13,049 | | Pacific Brands Ltd. (Australia) | | | 24,090 |
| | | | | |
| | | | | 83,401 |
| |
Diversified Consumer Services 0.2% | | | |
| 23,600 | | Apollo Group, Inc., Class A(a)(g) | | | 1,019,520 |
| |
Diversified Financial Services 2.5% | | | |
| 1,617 | | Babcock & Brown Ltd. (Australia) | | | 21,753 |
| 93,803 | | Bank of America Corp.(g) | | | 3,556,071 |
| 31,207 | | Challenger Financial Services Group Ltd. (Australia) | | | 51,907 |
| 29,300 | | CIT Group, Inc.(g) | | | 347,205 |
| 236,057 | | Citigroup, Inc. | | | 5,056,340 |
| 5,000 | | CME Group, Inc.(g) | | | 2,345,500 |
| 393 | | Deutsche Boerse AG (Germany) | | | 63,702 |
| 3,628 | | Fortis Group (Belgium) | | | 91,415 |
| 3,474 | | ING Groep NV (Netherlands) | | | 130,095 |
| 2,736 | | Instituto Finanziario Industriale SpA (Italy)(a) | | | 75,332 |
| 2,400 | | Investor AB | | | 54,024 |
| 83,630 | | JPMorgan Chase & Co.(g) | | | 3,591,908 |
| 954 | | OKO Bank PLC (Finland) | | | 17,968 |
| | | | | |
| | | | | 15,403,220 |
See Notes to Financial Statements.
| | |
| 12 | | Visit our website at www.jennisondryden.com |
| | | | | |
| Shares | | Description | | Value (Note 1) |
| | | | | |
COMMON STOCKS (Continued) | | | |
| |
Diversified Telecommunication Services 2.5% | | | |
| 216,310 | | AT&T, Inc. | | $ | 8,284,673 |
| 1,171 | | Belgacom SA (Belgium) | | | 51,857 |
| 15,941 | | BT Group PLC (United Kingdom) | | | 68,732 |
| 8,457 | | CenturyTel, Inc. | | | 281,111 |
| 907 | | Deutsche Telekom AG (Germany) | | | 15,178 |
| 5,496 | | France Telecom SA (France) | | | 184,817 |
| 18 | | Nippon Telegraph & Telephone Corp. (NTT) (Japan) | | | 77,648 |
| 10,158 | | Portugal Telecom, SGPS SA (Portugal) | | | 118,032 |
| 7,192 | | Telecom Corp. of New Zealand Ltd. (New Zealand) | | | 21,147 |
| 42,006 | | Telecom Italia SpA (Italy) | | | 69,567 |
| 8,088 | | Telefonica SA (Spain) | | | 232,395 |
| 300 | | Telenor ASA (Norway) | | | 5,744 |
| 7,500 | | TeliaSonera AB (Sweden) | | | 60,209 |
| 108,450 | | Verizon Communications, Inc. | | | 3,953,003 |
| 152,100 | | Windstream Corp. | | | 1,817,595 |
| | | | | |
| | | | | 15,241,708 |
| |
Electric Utilities 1.0% | | | |
| 40,900 | | American Electric Power Co., Inc. | | | 1,702,667 |
| 2,000 | | CLP Holdings Ltd. (Hong Kong) | | | 16,460 |
| 41,900 | | Duke Energy Corp. | | | 747,915 |
| 1,599 | | E.On AG (Germany) | | | 298,388 |
| 34,400 | | Edison International | | | 1,686,288 |
| 13,400 | | El Paso Electric Co.(a)(g) | | | 286,358 |
| 12,099 | | Enel SpA (Italy) | | | 128,361 |
| 5,500 | | Hong Kong Electric Holdings Ltd. (Hong Kong) | | | 34,734 |
| 18,900 | | Portland General Electric Co. | | | 426,195 |
| 5,300 | | PPL Corp. | | | 243,376 |
| 7,100 | | Progress Energy, Inc. | | | 296,070 |
| 1,898 | | Public Power Corp. SA (Greece) | | | 83,002 |
| 1,564 | | Scottish & Southern Energy PLC (United Kingdom) | | | 43,580 |
| 97 | | Union Fenosa SA (Spain) | | | 6,519 |
| | | | | |
| | | | | 5,999,913 |
| |
Electrical Equipment 0.5% | | | |
| 4,414 | | ABB Ltd. (Switzerland) | | | 118,495 |
| 6,700 | | Acuity Brands, Inc. | | | 287,765 |
| 571 | | Alstom (France) | | | 123,790 |
| 29,600 | | Emerson Electric Co. | | | 1,523,216 |
| 5,600 | | Hubbell, Inc., Class B(g) | | | 244,664 |
See Notes to Financial Statements.
| | |
| The Prudential Investment Portfolios, Inc./Dryden Active Allocation Fund | | 13 |
Portfolio of Investments
as of March 31, 2008 (Unaudited) continued
| | | | | |
| Shares | | Description | | Value (Note 1) |
| | | | | |
COMMON STOCKS (Continued) | | | |
| |
Electrical Equipment (cont’d.) | | | |
| 12,000 | | Mitsubishi Electric Corp. (Japan) | | $ | 103,772 |
| 4,800 | | Rockwell Automation, Inc. | | | 275,616 |
| 4,800 | | Sumitomo Electric Industries Ltd. (Japan) | | | 60,770 |
| 550 | | Vestas Wind Systems A/S (Denmark)(a) | | | 60,084 |
| | | | | |
| | | | | 2,798,172 |
| |
Electronic Equipment & Instruments 0.4% | | | |
| 53,800 | | Agilent Technologies, Inc.(a) | | | 1,604,854 |
| 3,000 | | Hitachi Ltd. (Japan) | | | 17,787 |
| 60,900 | | Jabil Circuit, Inc. | | | 576,114 |
| 1,000 | | Nidec Corp. | | | 61,497 |
| | | | | |
| | | | | 2,260,252 |
| |
Energy Equipment & Services 1.3% | | | |
| 6,600 | | Dawson Geophysical Co.(a) | | | 445,500 |
| 8,800 | | ENSCO International, Inc. | | | 551,056 |
| 45,163 | | Halliburton Co. | | | 1,776,261 |
| 13,300 | | Helmerich & Payne, Inc.(g) | | | 623,371 |
| 6,200 | | Nabors Industries Ltd. (Bermuda)(a) | | | 209,374 |
| 12,900 | | Noble Corp. | | | 640,743 |
| 1,750 | | Petroleum Geo Services | | | 43,300 |
| 44,700 | | Rowan Cos., Inc. | | | 1,840,746 |
| 7,000 | | Schlumberger Ltd. | | | 609,000 |
| 10,100 | | SEACOR Holdings, Inc.(a)(g) | | | 862,136 |
| 900 | | TGS Nopec Geophysical Co., ASA (Norway)(a) | | | 13,096 |
| 10,700 | | Trico Marine Services, Inc.(a)(g) | | | 416,979 |
| | | | | |
| | | | | 8,031,562 |
| |
Exchange Traded Fund | | | |
| 100 | | iShares MSCI EAFE Index Fund | | | 7,190 |
| |
Food & Staples Retailing 1.6% | | | |
| 480 | | Carrefour SA (France) | | | 37,034 |
| 451 | | Casino Guichard Perrachon SA (France) | | | 54,071 |
| 500 | | Circle K Sunkus Co. Ltd. (Japan) | | | 8,492 |
| 33,800 | | CVS/Caremark Corp.(g) | | | 1,369,238 |
| 300 | | FamilyMart Co. Ltd. | | | 10,744 |
| 93,698 | | Kroger Co. (The) | | | 2,379,930 |
| 54,878 | | Safeway, Inc. | | | 1,610,669 |
| 11,000 | | SUPERVALU, Inc. | | | 329,780 |
See Notes to Financial Statements.
| | |
| 14 | | Visit our website at www.jennisondryden.com |
| | | | | |
| Shares | | Description | | Value (Note 1) |
| | | | | |
COMMON STOCKS (Continued) | | | |
| |
Food & Staples Retailing (cont’d.) | | | |
| 1,290 | | Tesco PLC | | $ | 9,703 |
| 74,500 | | Wal-Mart Stores, Inc. | | | 3,924,661 |
| 968 | | Wesfarmers Ltd. (Australia) | | | 35,377 |
| 256 | | Wesfarmers Ltd. (Class “P” Stock)(Australia) | | | 9,419 |
| 6,049 | | Woolworths Ltd. (Australia) | | | 160,317 |
| | | | | |
| | | | | 9,939,435 |
| |
Food Products 0.8% | | | |
| 30,600 | | Archer-Daniels-Midland Co. | | | 1,259,497 |
| 1,900 | | Bunge Ltd. | | | 165,072 |
| 350 | | Danisco A/S (Denmark) | | | 25,564 |
| 45,600 | | Del Monte Foods Co. | | | 434,568 |
| 28,130 | | Goodman Fielder Ltd. (Australia) | | | 46,274 |
| 1,600 | | H.J. Heinz Co.(g) | | | 75,152 |
| 11,800 | | Kraft Foods, Inc., Class A | | | 365,918 |
| 9 | | Lindt & Spruengli AG | | | 29,906 |
| 604 | | Nestle SA, Class B (Switzerland) | | | 301,818 |
| 4,000 | | Ralcorp Holdings, Inc.(a)(g) | | | 232,600 |
| 76,900 | | Sara Lee Corp. | | | 1,075,062 |
| 13,500 | | Treehouse Foods, Inc.(a)(g) | | | 308,610 |
| 389 | | Unilever NV (Netherlands) | | | 13,063 |
| 3,344 | | Unilever PLC (United Kingdom) | | | 112,756 |
| 47,000 | | Wilmar International Ltd. (Singapore) | | | 142,729 |
| 200 | | Yakult Honsha Co. Ltd. | | | 6,200 |
| | | | | |
| | | | | 4,594,789 |
| |
Gas Utilities 0.1% | | | |
| 4,300 | | AGL Resources, Inc. | | | 147,576 |
| 800 | | Atmos Energy Corp. | | | 20,400 |
| 408 | | Gaz de France SA (France) | | | 24,632 |
| 11,200 | | Nicor, Inc.(g) | | | 375,311 |
| 20,000 | | Osaka Gas Co. Ltd. (Japan) | | | 79,856 |
| | | | | |
| | | | | 647,775 |
| |
Health Care Equipment & Supplies 1.5% | | | |
| 10,900 | | Analogic Corp. | | | 725,286 |
| 609 | | Ansell Ltd. | | | 6,473 |
| 28,985 | | Baxter International, Inc. | | | 1,675,913 |
| 11,723 | | Becton, Dickinson & Co. | | | 1,006,420 |
| 7,600 | | Idexx Laboratories, Inc.(a) | | | 374,376 |
See Notes to Financial Statements.
| | |
| The Prudential Investment Portfolios, Inc./Dryden Active Allocation Fund | | 15 |
Portfolio of Investments
as of March 31, 2008 (Unaudited) continued
| | | | | |
| Shares | | Description | | Value (Note 1) |
| | | | | |
COMMON STOCKS (Continued) | | | |
| |
Health Care Equipment & Supplies (cont’d.) | | | |
| 5,500 | | Intuitive Surgical, Inc.(a) | | $ | 1,783,925 |
| 74,700 | | Medtronic, Inc. | | | 3,613,238 |
| 3,200 | | Merit Medical Systems, Inc.(a) | | | 50,656 |
| 1,500 | | Stryker Corp. | | | 97,575 |
| | | | | |
| | | | | 9,333,862 |
| |
Health Care Providers & Services 1.3% | | | |
| 1,300 | | Cardinal Health, Inc. | | | 68,263 |
| 19,000 | | CIGNA Corp. | | | 770,830 |
| 43,800 | | Express Scripts, Inc.(a) | | | 2,817,216 |
| 600 | | Suzuken Co., Ltd. (Japan) | | | 24,679 |
| 81,080 | | UnitedHealth Group, Inc. | | | 2,785,909 |
| 32,600 | | WellPoint, Inc.(a) | | | 1,438,638 |
| | | | | |
| | | | | 7,905,535 |
| |
Hotels, Restaurants & Leisure 1.1% | | | |
| 22,800 | | Darden Restaurants, Inc. | | | 742,140 |
| 26,100 | | Jack in the Box, Inc.(a)(g) | | | 701,307 |
| 83 | | Kuoni Reisen Holding AG (Switzerland) | | | 46,093 |
| 35,568 | | McDonald’s Corp. | | | 1,983,627 |
| 2,448 | | Thomas Cook Group PLC | | | 14,089 |
| 6,100 | | Wyndham Worldwide Corp.(g) | | | 126,148 |
| 83,600 | | Yum! Brands, Inc. | | | 3,110,756 |
| | | | | |
| | | | | 6,724,160 |
| |
Household Durables | | | |
| 200 | | Makita Corp. (Japan) | | | 6,280 |
| 10,000 | | Matsushita Electric Industrial Co. Ltd. (Japan) | | | 216,693 |
| 3,724 | | Taylor Wimpey PLC (United Kingdom) | | | 13,858 |
| | | | | |
| | | | | 236,831 |
| |
Household Products 1.5% | | | |
| 7,100 | | Clorox Co. | | | 402,144 |
| 4,967 | | Colgate-Palmolive Co.(g) | | | 386,979 |
| 41,200 | | Kimberly-Clark Corp. | | | 2,659,460 |
| 79,775 | | Procter & Gamble Co. | | | 5,589,834 |
| 2,164 | | Reckitt Benckiser PLC (United Kingdom) | | | 119,867 |
| | | | | |
| | | | | 9,158,284 |
See Notes to Financial Statements.
| | |
| 16 | | Visit our website at www.jennisondryden.com |
| | | | | |
| Shares | | Description | | Value (Note 1) |
| | | | | |
COMMON STOCKS (Continued) | | | |
| |
Independent Power Producers & Energy Traders 0.4% | | | |
| 109,900 | | AES Corp. (The)(a)(g) | | $ | 1,832,033 |
| 3,700 | | Constellation Energy Group, Inc. | | | 326,599 |
| | | | | |
| | | | | 2,158,632 |
| |
Industrial Conglomerates 2.6% | | | |
| 20,300 | | 3M Co. | | | 1,606,745 |
| 298,450 | | General Electric Co. | | | 11,045,634 |
| 1,745 | | Philips Electronics NV | | | 66,752 |
| 478 | | Siemens AG (Germany) | | | 52,214 |
| 60,400 | | Tyco International Ltd. (Bermuda) | | | 2,660,620 |
| 704 | | Wendel Investissement (France) | | | 88,382 |
| | | | | |
| | | | | 15,520,347 |
| |
Insurance 3.0% | | | |
| 16,100 | | ACE Ltd. (Bermuda) | | | 886,466 |
| 6,881 | | Aegon NV (Netherlands) | | | 101,247 |
| 1,084 | | Allianz SE (Germany) | | | 215,256 |
| 38,000 | | Allstate Corp. (The) | | | 1,826,280 |
| 57,129 | | American Financial Group, Inc. | | | 1,460,217 |
| 51,859 | | American International Group, Inc. | | | 2,242,902 |
| 9,093 | | Arch Capital Group Ltd. (Bermuda)(a) | | | 624,416 |
| 9,900 | | Assured Guaranty Ltd. | | | 235,026 |
| 7,020 | | Aviva PLC (United Kingdom) | | | 86,031 |
| 1,459 | | AXA SA (France) | | | 52,955 |
| 32,851 | | Axis Capital Holdings Ltd. (Bermuda) | | | 1,116,277 |
| 14,100 | | Chubb Corp. (The) | | | 697,668 |
| 9,959 | | Corporacion Mapfre | | | 49,999 |
| 15,141 | | Endurance Specialty Holdings Ltd. (Bermuda) | | | 554,161 |
| 3,800 | | Everest Re Group, Ltd. (Bermuda) | | | 340,214 |
| 8,900 | | Genworth Financial, Inc., Class A | | | 201,496 |
| 20,000 | | Hartford Financial Services Group, Inc. | | | 1,515,400 |
| 20,785 | | Legal & General Group PLC (United Kingdom) | | | 52,141 |
| 894 | | Muenchener Rueckversicherungs AG (Germany) | | | 175,015 |
| 30,227 | | Old Mutual PLC (United Kingdom) | | | 66,289 |
| 4,300 | | PartnerRe Ltd. (Bermuda) | | | 328,090 |
| 36,000 | | Platinum Underwriters Holdings Ltd. | | | 1,168,560 |
| 10,370 | | Royal & Sun Alliance Insurance Group (United Kingdom) | | | 26,487 |
| 984 | | SCOR (France) | | | 23,489 |
| 6,200 | | SeaBright Insurance Holdings, Inc.(a) | | | 91,326 |
| 965 | | Suncorp-Metway Ltd. | | | 11,350 |
See Notes to Financial Statements.
| | |
| The Prudential Investment Portfolios, Inc./Dryden Active Allocation Fund | | 17 |
Portfolio of Investments
as of March 31, 2008 (Unaudited) continued
| | | | | |
| Shares | | Description | | Value (Note 1) |
| | | | | |
COMMON STOCKS (Continued) | | | |
| |
Insurance (cont’d.) | | | |
| 1,234 | | Swiss Reinsurance (Switzerland) | | $ | 107,793 |
| 61,000 | | Travelers Cos., Inc. (The) | | | 2,918,850 |
| 3,237 | | Unipol Spa | | | 10,057 |
| 2,500 | | United America Indemnity Ltd. (Class “A” Stock)(Cayman Islands)(a) | | | 48,150 |
| 28,100 | | XL Capital Ltd., Class A (Bermuda) | | | 830,355 |
| 498 | | Zurich Financial Services AG (Switzerland) | | | 156,832 |
| | | | | |
| | | | | 18,220,795 |
| |
Internet & Catalog Retail 0.3% | | | |
| 14,360 | | Home Retail Group (United Kingdom) | | | 74,455 |
| 75,600 | | IAC/InterActiveCorp.(a) | | | 1,569,456 |
| | | | | |
| | | | | 1,643,911 |
| |
Internet Software & Services 0.6% | | | |
| 29,500 | | EarthLink, Inc.(a)(g) | | | 222,725 |
| 98,363 | | eBay, Inc.(a) | | | 2,935,152 |
| 1,400 | | Google, Inc. Class A(a) | | | 616,658 |
| 201 | | Yahoo! Japan Corp. (Japan) | | | 104,452 |
| | | | | |
| | | | | 3,878,987 |
| |
IT Services 0.7% | | | |
| 24,866 | | Accenture Ltd., Class A (Bermuda) | | | 874,537 |
| 60,500 | | Automatic Data Processing, Inc. | | | 2,564,596 |
| 4,389 | | Computershare Ltd. (Australia) | | | 35,097 |
| 300 | | CSK Holdings Corp. (Japan) | | | 6,922 |
| 15 | | NTT Data Corp. (Japan) | | | 65,610 |
| 27,900 | | SYKES Enterprises, Inc.(a)(g) | | | 490,761 |
| | | | | |
| | | | | 4,037,523 |
| |
Leisure Equipment & Products | | | |
| 2,000 | | Nikon Corp. (Japan) | | | 53,270 |
| 200 | | Sankyo Co. Ltd. (Japan) | | | 11,878 |
| | | | | |
| | | | | 65,148 |
| |
Life Science Tools & Services 0.2% | | | |
| 4,900 | | Applera Corp. - Applied Biosystems Group | | | 161,014 |
| 14,100 | | Dionex Corp.(a) | | | 1,085,559 |
| 349 | | Lonza Group AG-REG | | | 46,283 |
| | | | | |
| | | | | 1,292,856 |
See Notes to Financial Statements.
| | |
| 18 | | Visit our website at www.jennisondryden.com |
| | | | | |
| Shares | | Description | | Value (Note 1) |
| | | | | |
COMMON STOCKS (Continued) | | | |
| |
Machinery 1.3% | | | |
| 1,200 | | Atlas Copco AB-A Shs | | $ | 20,499 |
| 7,791 | | Charter PLC (United Kingdom) | | | 131,430 |
| 42,000 | | Cummins, Inc.(g) | | | 1,966,440 |
| 2,600 | | Deere & Co. | | | 209,144 |
| 15,900 | | Eaton Corp. | | | 1,266,753 |
| 21,100 | | Illinois Tool Works, Inc. | | | 1,017,653 |
| 51,800 | | Ingersoll-Rand Co., Ltd. Class A (Bermuda) | | | 2,309,244 |
| 500 | | Komatsu Ltd. (Japan) | | | 13,869 |
| 4,000 | | Komori Corp. (Japan) | | | 83,066 |
| 1,994 | | Konecranes Oyj (Finland) | | | 76,812 |
| 1,005 | | MAN AG (Germany) | | | 134,151 |
| 8,750 | | Parker Hannifin Corp. | | | 606,113 |
| 64 | | Vallourec (France) | | | 15,537 |
| | | | | |
| | | | | 7,850,711 |
| |
Marine | | | |
| 2,000 | | Kawasaki Kisen Kaisha Ltd. (Japan) | | | 19,442 |
| 8,000 | | Mitsui O.S.K. Lines Ltd. (Japan) | | | 96,710 |
| 15,000 | | Neptune Orient Lines Ltd. (Singapore) | | | 35,417 |
| 9,000 | | Nippon Yusen KK (Japan) | | | 84,510 |
| 1,500 | | Orient Overseas International Ltd. (Hong Kong) | | | 8,779 |
| | | | | |
| | | | | 244,858 |
| |
Media 2.1% | | | |
| 57,350 | | CBS Corp., Class B(g) | | | 1,266,288 |
| 3 | | Dentsu, Inc. | | | 6,832 |
| 105,500 | | DIRECTV Group, Inc. (The)(a) | | | 2,615,344 |
| 115,375 | | Disney (Walt) Co.(g) | | | 3,620,467 |
| 1,300 | | Eniro AB (Sweden) | | | 9,452 |
| 18,200 | | Gannett Co., Inc. | | | 528,710 |
| 1,051 | | Gestevision Telecinco SA (Spain) | | | 21,388 |
| 76 | | Lagardere SCA (France) | | | 5,683 |
| 3,900 | | Lee Enterprises, Inc.(g) | | | 39,039 |
| 13,861 | | McGraw-Hill Cos., Inc. (The) | | | 512,164 |
| 4,028 | | Omnicom Group, Inc. | | | 177,957 |
| 83,300 | | Time Warner, Inc.(g) | | | 1,167,866 |
| 7,368 | | Trinity Mirror PLC (United Kingdom) | | | 43,137 |
| 16,400 | | Valassis Communications, Inc.(a)(g) | | | 177,940 |
| 53,900 | | Viacom Inc., Class B(a) | | | 2,135,518 |
| 3,281 | | Vivendi Universal SA (France) | | | 128,203 |
| 1,436 | | Yell Group PLC (United Kingdom) | | | 4,389 |
| | | | | |
| | | | | 12,460,377 |
See Notes to Financial Statements.
| | |
| The Prudential Investment Portfolios, Inc./Dryden Active Allocation Fund | | 19 |
Portfolio of Investments
as of March 31, 2008 (Unaudited) continued
| | | | | |
| Shares | | Description | | Value (Note 1) |
| | | | | |
COMMON STOCKS (Continued) | | | |
| |
Metals & Mining 0.7% | | | |
| 75,500 | | Alcoa, Inc. | | $ | 2,722,530 |
| 387 | | Anglo American PLC (United Kingdom) | | | 23,257 |
| 1,119 | | Arcelor (Luxemburg) | | | 91,246 |
| 7,736 | | BHP Billiton Ltd. (Australia) | | | 253,175 |
| 754 | | Billiton PLC (United Kingdom) | | | 22,371 |
| 3,000 | | Hitachi Metals Ltd. | | | 44,181 |
| 6,000 | | Nippon Steel Corp. (Japan) | | | 30,397 |
| 21,000 | | Nisshin Steel Co. Ltd. (Japan) | | | 72,683 |
| 2,807 | | Nucor Corp. | | | 190,146 |
| 4,061 | | OneSteel Ltd. | | | 23,716 |
| 1,953 | | Outokumpu Oyj, Class A (Finland) | | | 88,830 |
| 1,027 | | Rio Tinto Ltd. | | | 114,976 |
| 1,970 | | Rio Tinto PLC (United Kingdom) | | | 204,597 |
| 418 | | Salzgitter AG (Germany) | | | 73,185 |
| 900 | | Ssab Svenskt Stal AB-SER B | | | 23,099 |
| 2,309 | | ThyssenKrupp AG (Germany) | | | 132,107 |
| 680 | | Vedanta Resources Ltd | | | 28,287 |
| 771 | | Voestalpine AG (Austria) | | | 53,558 |
| 1,700 | | Yamato Kogyo Co. Ltd. (Japan) | | | 68,559 |
| | | | | |
| | | | | 4,260,900 |
| |
Multiline Retail 0.1% | | | |
| 8,900 | | Big Lots, Inc.(a)(g) | | | 198,470 |
| 2,100 | | Isetan Co. Ltd. | | | 24,396 |
| 1,752 | | Karstart AG(a) | | | 35,239 |
| 8,200 | | Macy’s, Inc. | | | 189,092 |
| 6,384 | | Marks & Spencer Group (United Kingdom) | | | 49,064 |
| 274 | | Next PLC (United Kingdom) | | | 6,194 |
| | | | | |
| | | | | 502,455 |
| |
Multi-Utilities 0.6% | | | |
| 2,699 | | A2A SpA | | | 9,918 |
| 6,582 | | AGL Energy Ltd. (Australia) | | | 66,409 |
| 17,085 | | Centrica PLC (United Kingdom) | | | 101,129 |
| 35,800 | | CMS Energy Corp.(g) | | | 484,732 |
| 21,600 | | Consolidated Edison, Inc.(g) | | | 857,520 |
| 47,500 | | Dominion Resources, Inc. | | | 1,939,900 |
| 6,000 | | DTE Energy Co. | | | 233,340 |
| 9,371 | | National Grid PLC (United Kingdom) | | | 128,606 |
| 338 | | RWE AG (Germany) | | | 41,750 |
| 193 | | Suez SA (France) | | | 12,666 |
| | | | | |
| | | | | 3,875,970 |
See Notes to Financial Statements.
| | |
| 20 | | Visit our website at www.jennisondryden.com |
| | | | | |
| Shares | | Description | | Value (Note 1) |
| | | | | |
COMMON STOCKS (Continued) | | | |
| |
Office Electronics 0.4% | | | |
| 1,600 | | Canon, Inc. (Japan) | | $ | 73,676 |
| 2,000 | | Ricoh Co. Ltd. (Japan) | | | 32,865 |
| 154,400 | | Xerox Corp. | | | 2,311,368 |
| 6,700 | | Zebra Technologies Corp.(a) | | | 223,244 |
| | | | | |
| | | | | 2,641,153 |
| |
Oil, Gas & Consumable Fuels 7.2% | | | |
| 10,600 | | Apache Corp. | | | 1,280,692 |
| 32,731 | | BP PLC (United Kingdom) | | | 332,591 |
| 73,600 | | Chesapeake Energy Corp.(g) | | | 3,396,640 |
| 77,192 | | Chevron Corp. | | | 6,589,109 |
| 73,300 | | ConocoPhillips | | | 5,586,193 |
| 14,100 | | Devon Energy Corp. | | | 1,471,053 |
| 5,292 | | ENI SpA (Italy) | | | 180,463 |
| 179,654 | | Exxon Mobil Corp. | | | 15,195,136 |
| 3,100 | | Hess Corp. | | | 273,358 |
| 4 | | Inpex Holdings, Inc. | | | 44,543 |
| 48,556 | | Marathon Oil Corp. | | | 2,214,154 |
| 11,000 | | Murphy Oil Corp. | | | 903,540 |
| 7,000 | | Nippon Oil Corp. (Japan) | | | 43,680 |
| 30,500 | | Occidental Petroleum Corp. | | | 2,231,685 |
| 1,113 | | OMV AG (Austria) | | | 73,555 |
| 2,487 | | Repsol YPF SA (Spain) | | | 85,830 |
| 9,071 | | Royal Dutch Shell PLC (Netherlands) | | | 312,706 |
| 4,926 | | Royal Dutch Shell PLC, Class B (Netherlands) | | | 165,807 |
| 10,000 | | Singapore Petroleum Co. Ltd. (Singapore) | | | 49,112 |
| 33,300 | | Sunoco, Inc. | | | 1,747,251 |
| 3,737 | | Total SA (France) | | | 277,527 |
| 27,700 | | Williams Cos., Inc. | | | 913,546 |
| 1,116 | | Woodside Petroleum Ltd. (Australia) | | | 55,585 |
| | | | | |
| | | | | 43,423,756 |
| |
Paper & Forest Products 0.2% | | | |
| 30,500 | | International Paper Co.(g) | | | 829,599 |
| 6,517 | | Sonae Industria Sgps SA(a) | | | 45,271 |
| 1,400 | | Svenska Cellulosa AB, Class B (Sweden) | | | 25,506 |
| | | | | |
| | | | | 900,376 |
See Notes to Financial Statements.
| | |
| The Prudential Investment Portfolios, Inc./Dryden Active Allocation Fund | | 21 |
Portfolio of Investments
as of March 31, 2008 (Unaudited) continued
| | | | | |
| Shares | | Description | | Value (Note 1) |
| | | | | |
COMMON STOCKS (Continued) | | | |
| |
Personal Products | | | |
| 3,800 | | Nu Skin Enterprises, Inc., (Class “A” Stock) | | $ | 68,476 |
| 450 | | Oriflame Cosmetics SA (Luxembourg) | | | 29,877 |
| | | | | |
| | | | | 98,353 |
| |
Pharmaceuticals 4.1% | | | |
| 10,500 | | Abbott Laboratories | | | 579,075 |
| 2,600 | | Astellas Pharma, Inc. (Japan) | | | 100,682 |
| 4,009 | | AstraZeneca PLC (United Kingdom) | | | 149,899 |
| 100,500 | | Bristol-Myers Squibb Co. | | | 2,140,650 |
| 600 | | Daiichi Sankyo CO Ltd. | | | 17,727 |
| 50,000 | | Eli Lilly & Co. | | | 2,579,500 |
| 1,400 | | Forest Laboratories, Inc.(a) | | | 56,014 |
| 6,773 | | GlaxoSmithKline PLC (United Kingdom) | | | 143,291 |
| 81,300 | | Johnson & Johnson | | | 5,273,931 |
| 102,700 | | King Pharmaceuticals, Inc.(a) | | | 893,490 |
| 101,193 | | Merck & Co., Inc. | | | 3,840,274 |
| 5,000 | | Mitsubishi Tanabe Pharma Corp. (Japan) | | | 58,236 |
| 2,312 | | Novartis AG (Switzerland) | | | 118,498 |
| 550 | | Novo-Nordisk A/S, Class B (Denmark) | | | 37,611 |
| 22,700 | | Par Pharmaceutical Cos., Inc.(a) | | | 394,753 |
| 291,668 | | Pfizer, Inc. | | | 6,104,612 |
| 562 | | Roche Holding AG (Switzerland) | | | 105,768 |
| 2,964 | | Sanofi-Aventis (France) | | | 222,367 |
| 4,000 | | Taisho Pharmaceutical Co. Ltd. | | | 79,334 |
| 1,000 | | Takeda Pharmaceutical Co. Ltd. (Japan) | | | 50,060 |
| 45,500 | | Wyeth | | | 1,900,080 |
| | | | | |
| | | | | 24,845,852 |
| |
Real Estate Investment Trusts 0.7% | | | |
| 31,900 | | Anthracite Capital, Inc.(g) | | | 210,540 |
| 6,400 | | Ashford Hospitality Trust, Inc. | | | 36,352 |
| 73,600 | | Brandywine Realty Trust(g) | | | 1,248,257 |
| 1,695 | | British Land Co. PLC (United Kingdom) | | | 30,864 |
| 22,900 | | Capital Lease Funding, Inc. | | | 177,933 |
| 9,900 | | CBL & Associates Properties, Inc.(g) | | | 232,947 |
| 10,600 | | Crystal River Capital, Inc.(g) | | | 94,658 |
| 4,800 | | First Industrial Realty Trust, Inc. | | | 148,272 |
| 67,900 | | Host Marriot Corp. (REIT)(g) | | | 1,080,968 |
| 41,874 | | ING Industrial Fund (Australia) | | | 81,512 |
| 7,754 | | Mirvac Group (Australia) | | | 28,487 |
See Notes to Financial Statements.
| | |
| 22 | | Visit our website at www.jennisondryden.com |
| | | | | |
| Shares | | Description | | Value (Note 1) |
| | | | | |
COMMON STOCKS (Continued) | | | |
| |
Real Estate Investment Trusts (cont’d.) | | | |
| 48,800 | | NorthStar Realty Finance Corp.(g) | | $ | 398,696 |
| 8,500 | | Parkway Properties, Inc. | | | 314,160 |
| 26,600 | | Resource Capital Corp.(g) | | | 201,362 |
| 2,600 | | Sunstone Hotel Investors, Inc. | | | 41,626 |
| | | | | |
| | | | | 4,326,634 |
| |
Real Estate Management & Development 0.1% | | | |
| 7,000 | | Cheung Kong Holdings Ltd. (Hong Kong) | | | 99,388 |
| 8,000 | | Hang Lung Properties Ltd. (Hong Kong) | | | 28,319 |
| 3,000 | | Henderson Land Development Co. Ltd. | | | 21,317 |
| 1,497 | | Immofinanz Immobilien Anlagen | | | 16,213 |
| 146 | | KK DaVinci Advisors (Japan)(a) | | | 111,755 |
| 5,100 | | Leopalace21 Corp. (Japan) | | | 82,425 |
| 3,190 | | Meinl European Land Ltd. (Australia)(a) | | | 36,311 |
| 400 | | Nomura Real Estate Holdings, Inc. | | | 6,661 |
| 1,000 | | Tokyu Land Corp. | | | 6,270 |
| 3,000 | | Wharf Holdings Ltd. (Hong Kong) | | | 14,128 |
| | | | | |
| | | | | 422,787 |
| |
Road & Rail 1.0% | | | |
| 29,000 | | Burlington Northern Santa Fe Corp. | | | 2,674,380 |
| 6 | | Central Japan Railway Co. (Japan) | | | 61,998 |
| 17,200 | | CSX Corp.(g) | | | 964,404 |
| 3 | | East Japan Railway Co. (Japan) | | | 24,950 |
| 46,100 | | Norfolk Southern Corp. | | | 2,504,152 |
| | | | | |
| | | | | 6,229,884 |
| |
Semiconductors & Semiconductor Equipment 1.2% | | | |
| 99,300 | | Intel Corp. | | | 2,103,174 |
| 18,900 | | MEMC Electronic Materials, Inc.(a) | | | 1,340,010 |
| 88,400 | | Nvidia Corp.(a) | | | 1,749,436 |
| 70,300 | | Texas Instruments, Inc.(g) | | | 1,987,381 |
| 87 | | Unaxis Holding AG(a) | | | 30,618 |
| | | | | |
| | | | | 7,210,619 |
| |
Software 2.6% | | | |
| 41,500 | | Adobe Systems, Inc.(a) | | | 1,476,985 |
| 15,250 | | BMC Software, Inc.(a) | | | 495,930 |
| 323,513 | | Microsoft Corp. | | | 9,181,299 |
| 300 | | Nintendo Co. Ltd. (Japan) | | | 154,695 |
See Notes to Financial Statements.
| | |
| The Prudential Investment Portfolios, Inc./Dryden Active Allocation Fund | | 23 |
Portfolio of Investments
as of March 31, 2008 (Unaudited) continued
| | | | | |
| Shares | | Description | | Value (Note 1) |
| | | | | |
COMMON STOCKS (Continued) | | | |
| |
Software (cont’d.) | | | |
| 104,500 | | Oracle Corp.(a) | | $ | 2,044,020 |
| 132,700 | | Symantec Corp.(a)(g) | | | 2,205,474 |
| | | | | |
| | | | | 15,558,403 |
| |
Specialty Retail 0.9% | | | |
| 34,100 | | Asbury Automotive Group, Inc. | | | 469,216 |
| 6,000 | | Belle International Holdings Ltd. (Hong Kong) | | | 6,222 |
| 17,100 | | Best Buy Co., Inc.(g) | | | 708,966 |
| 9,800 | | Cache, Inc.(a) | | | 110,642 |
| 28,600 | | Christopher & Banks Corp. | | | 285,714 |
| 5,300 | | Esprit Holdings Ltd. (Hong Kong) | | | 63,606 |
| 900 | | Fast Retailing Co. Ltd. (Japan) | | | 79,364 |
| 5,200 | | Gamestop Corp.(a) | | | 268,892 |
| 41,405 | | Gymboree Corp.(a) | | | 1,651,231 |
| 575 | | Hennes & Mauritz AB (H&M), Class B (Sweden) | | | 35,321 |
| 50,300 | | Home Depot, Inc. | | | 1,406,891 |
| 34,100 | | Rent-A-Center, Inc.(a)(g) | | | 625,735 |
| 500 | | Shimachu Co. Ltd. (Japan) | | | 15,023 |
| | | | | |
| | | | | 5,726,823 |
| |
Textiles, Apparel & Luxury Goods 0.5% | | | |
| 58,300 | | Coach, Inc.(a) | | | 1,757,745 |
| 18,800 | | Jones Apparel Group, Inc. | | | 252,296 |
| 4,000 | | Nisshinbo Industries, Inc. (Japan) | | | 37,159 |
| 8,400 | | Steven Madden Ltd.(a) | | | 143,892 |
| 795 | | Swatch Group AG (Switzerland) | | | 40,827 |
| 14,300 | | Warnaco Group, Inc. (The)(a)(g) | | | 563,992 |
| 3,900 | | Wolverine World Wide, Inc. | | | 113,139 |
| | | | | |
| | | | | 2,909,050 |
| |
Thrifts & Mortgage Finance 0.7% | | | |
| 68,700 | | Federal National Mortgage Association(g) | | | 1,808,184 |
| 131,600 | | Hudson City Bancorp, Inc. | | | 2,326,688 |
| 3,600 | | Imperial Capital Bancorp, Inc. | | | 77,832 |
| 20,417 | | Washington Mutual, Inc.(g) | | | 210,295 |
| | | | | |
| | | | | 4,422,999 |
| |
Tobacco 0.9% | | | |
| 38,700 | | Altria Group, Inc. | | | 859,140 |
| 2,964 | | British American Tobacco (United Kingdom) | | | 111,238 |
See Notes to Financial Statements.
| | |
| 24 | | Visit our website at www.jennisondryden.com |
| | | | | |
| Shares | | Description | | Value (Note 1) |
| | | | | |
COMMON STOCKS (Continued) | | | |
| |
Tobacco 0.9% | | | |
| 4,004 | | Imperial Tobacco Group (United Kingdom) | | $ | 184,200 |
| 38,700 | | Philip Morris International, Inc.(a) | | | 1,957,446 |
| 40,800 | | Reynolds American, Inc.(g) | | | 2,408,423 |
| 2,000 | | Swedish Match AB (Sweden) | | | 43,589 |
| | | | | |
| | | | | 5,564,036 |
| |
Trading Companies & Distributors 0.1% | | | |
| 4,000 | | Itochu Corp. (Japan) | | | 39,486 |
| 8,000 | | Marubeni Corp. (Japan) | | | 58,266 |
| 3,400 | | Mitsubishi Corp. (Japan) | | | 102,669 |
| 6,000 | | Mitsui & Co. Ltd. (Japan) | | | 121,589 |
| 1,600 | | Sojitz Corp. | | | 5,297 |
| 3,900 | | Sumitomo Corp. (Japan) | | | 51,371 |
| 11,600 | | WESCO International, Inc.(a) | | | 423,285 |
| | | | | |
| | | | | 801,963 |
| |
Transportation Infrastructure | | | |
| 12,000 | | Hopewell Holdings (Hong Kong) | | | 45,563 |
| |
Wireless Telecommunication Services 0.2% | | | |
| 220 | | Bouygues SA (France) | | | 13,976 |
| 175 | | Millicom Intl Cellular S.A.(a) | | | 16,670 |
| 103,500 | | Sprint Nextel Corp.(g) | | | 692,415 |
| 127,811 | | Vodafone Group PLC (United Kingdom) | | | 382,771 |
| | | | | |
| | | | | 1,105,832 |
| | | | | |
| | Total common stocks
(cost $370,152,802) | | | 390,587,359 |
| | | | | |
See Notes to Financial Statements.
| | |
| The Prudential Investment Portfolios, Inc./Dryden Active Allocation Fund | | 25 |
Portfolio of Investments
as of March 31, 2008 (Unaudited)
| | | | | | | | |
Moody’s
Rating† | | Principal
Amount (000) | | Description | | Value (Note 1) |
| | | | | | | | |
| CORPORATE BONDS 8.5% |
|
| Aerospace/Defense 0.1% |
| | | | | BAE Systems Holdings, Inc., Notes, 144A, | | | |
| Baa2 | | $ | 370 | | 4.75%, 8/15/10 | | $ | 383,472 |
| | | | | Goodrich Corp., Notes, | | | |
| Baa2 | | | 202 | | 6.80%, 7/01/36 | | | 222,072 |
| | | | | | | | |
| | | | | | | | 605,544 |
|
| Airlines 0.1% |
| | | | | American Airlines, Inc., Pass-Thru Certs., Ser. 01-1, | | | |
| Ba1 | | | 560 | | 6.817%, 5/23/11 | | | 527,801 |
| | | | | Continental Airlines, Inc., Pass-Thru Certs., Ser. 01-1, | | | |
| Baa2 | | | 41 | | 6.703%, 6/15/21 | | | 39,576 |
| | | | | Delta Air Lines, Inc., Pass-Thru Certs., 144A | | | |
| Baa1 | | | 107 | | 6.821%, 8/10/22 | | | 101,433 |
| | | | | Southwest Airlines Co., Notes, | | | |
| Baa1 | | | 200 | | 6.50%, 3/01/12 | | | 206,708 |
| | | | | | | | |
| | | | | | | | 875,518 |
|
| Automotive |
| | | | | Johnson Controls, Inc., Sr. Notes, | | | |
| A3 | | | 55 | | 5.50%, 1/15/16 | | | 56,052 |
| | | | | | | | |
|
| Banking 0.8% |
| | | | | Banco Bradesco
(Cayman Islands), Notes, | | | |
| A2 | | | 430 | | 8.75%, 10/24/13 | | | 496,650 |
| | | | | Bank of America Corp., Jr. Sub. Notes, | | | |
| Aa3 | | | 500 | | 8.00%, 12/29/49(h) | | | 500,599 |
| | | | | Bank of America Corp., Sub. Notes, | | | |
| Aa2 | | | 355 | | 5.75%, 8/15/16 | | | 362,112 |
| | | | | Bank of America NA, Sub. Notes, | | | |
| Aa1 | | | 60 | | 6.00%, 10/15/36 | | | 57,399 |
| | | | | Bank One Corp., Sub. Notes, | | | |
| Aa3 | | | 400 | | 7.875%, 8/01/10 | | | 427,444 |
| | | | | Citigroup Inc., Sub. Notes, | | | |
| A1 | | | 165 | | 6.125%, 8/25/36 | | | 144,909 |
See Notes to Financial Statements.
| | |
| 26 | | Visit our website at www.jennisondryden.com |
| | | | | | | | |
Moody’s
Rating† | | Principal
Amount (000) | | Description | | Value (Note 1) |
| | | | | | | | |
| CORPORATE BONDS (Continued) |
|
| Banking (cont’d.) |
| | | | | Citigroup, Inc., Sr. Unsec. Notes, | | | |
| Aa3 | | $ | 125 | | 6.875%, 3/05/38 | | $ | 124,912 |
| | | | | Citigroup, Inc., Sub. Notes, | | | |
| A1 | | | 82 | | 5.00%, 9/15/14 | | | 77,279 |
| A1 | | | 400 | | 5.625%, 8/27/12 | | | 396,040 |
| | | | | Depfa ACS Bank (Ireland), 144A, | | | |
| Aaa | | | 290 | | 5.125%, 3/16/37 | | | 283,235 |
| | | | | ICICI Bank Ltd. (India), Bonds, 144A, | | | |
| Baa2 | | | 495 | | 4.9169%, 1/12/10(h) | | | 473,666 |
| | | | | ICICI Bank Ltd. (Singapore), Notes, 144A, | | | |
| Baa2 | | | 380 | | 5.75%, 11/16/10 | | | 380,191 |
| | | | | J.P. Morgan Chase & Co., Notes, | | | |
| Aa2 | | | 190 | | 4.60%, 1/17/11 | | | 192,642 |
| | | | | MUFG Capital Finance 1 Ltd. (Cayman Islands), Gtd. Notes, | | | |
| A2 | | | 150 | | 6.346%, 7/25/49(h) | | | 122,235 |
| | | | | Santander Central Hispano Issuances (Cayman Islands), Gtd. Notes, | | | |
| Aa2 | | | 140 | | 7.625%, 9/14/10 | | | 153,989 |
| | | | | Wachovia Bank NA., Sub. Notes, | | | |
| Aa2 | | | 450 | | 7.80%, 8/18/10 | | | 484,398 |
| | | | | Wells Fargo & Co., Sr. Unsec. Notes, | | | |
| Aa1 | | | 140 | | 4.625%, 8/09/10 | | | 143,759 |
| | | | | | | | |
| | | | | | | | 4,821,459 |
|
| Brokerage 0.6% |
| | | | | Bear Stearns Cos., Inc, (The), Sr. Unsec. Notes, | | | |
| Baa1 | | | 220 | | 7.25%, 2/01/18 | | | 227,346 |
| Baa1 | | | 90 | | 6.40%, 10/02/17 | | | 88,866 |
| | | | | Bear Stearns Cos., Inc. (The), Unsec. Notes, | | | |
| Baa1 | | | 100 | | 5.30%, 10/30/15 | | | 93,874 |
| | | | | Goldman Sachs Group, Inc. Sub. Notes, | | | |
| A1 | | | 170 | | 5.625%, 1/15/17 | | | 163,085 |
| A1 | | | 385 | | 6.45%, 5/01/36 | | | 346,971 |
| A1 | | | 162 | | 6.75%, 10/01/37 | | | 150,714 |
See Notes to Financial Statements.
| | |
| The Prudential Investment Portfolios, Inc./Dryden Active Allocation Fund | | 27 |
Portfolio of Investments
as of March 31, 2008 (Unaudited) continued
| | | | | | | | |
Moody’s
Rating† | | Principal
Amount (000) | | Description | | Value (Note 1) |
| | | | | | | | |
| CORPORATE BONDS (Continued) |
|
| Brokerage (cont’d.) |
| | | | | Goldman Sachs Group, Inc., Notes, | | | |
| Aa3 | | $ | 5 | | 5.125%, 1/15/15 | | $ | 4,860 |
| | | | | Goldman Sachs Group, Inc., Sr. Notes, | | | |
| Aa3 | | | 140 | | 5.45%, 11/01/12 | | | 141,793 |
| | | | | Lehman Brothers Holdings, Inc., Sr. Notes, | | | |
| A1 | | | 345 | | 5.25%, 2/06/12 | | | 332,903 |
| | | | | Lehman Brothers Holdings, Inc., Sub. Notes, | | | |
| A2 | | | 155 | | 6.50%, 7/19/17 | | | 147,195 |
| | | | | Merrill Lynch & Co., Inc., Notes, | | | |
| A1 | | | 60 | | 4.79%, 8/04/10 | | | 59,810 |
| | | | | Merrill Lynch & Co., Inc., Notes, MTN, | | | |
| A1 | | | 340 | | 4.25%, 2/08/10 | | | 331,935 |
| A1 | | | 125 | | 5.00%, 1/15/15 | | | 116,162 |
| A1 | | | 170 | | 5.77%, 7/25/11 | | | 172,202 |
| | | | | Morgan Stanley, Notes, | | | |
| Aa3 | | | 50 | | 4.00%, 1/15/10 | | | 49,401 |
| Aa3 | | | 150 | | 4.25%, 5/15/10 | | | 147,846 |
| Aa3 | | | 25 | | 5.30%, 3/01/13 | | | 24,916 |
| Aa3 | | | 325 | | 5.45%, 1/09/17 | | | 304,034 |
| | | | | Morgan Stanley, Sr. Notes, MTN, | | | |
| Aa3 | | | 105 | | 5.25%, 11/02/12(g) | | | 104,874 |
| | | | | Morgan Stanley, Sr. Unsec. Notes, MTN, | | | |
| Aa3 | | | 460 | | 5.75%, 10/18/16 | | | 444,821 |
| | | | | Morgan Stanley, Sub. Notes, | | | |
| A1 | | | 140 | | 4.75%, 4/01/14 | | | 129,959 |
| | | | | | | | |
| | | | | | | | 3,583,567 |
|
| Building Materials & Construction 0.1% |
| | | | | American Standard, Inc., Gtd. Notes, | | | |
| Baa3 | | | 160 | | 7.625%, 2/15/10 | | | 171,402 |
| | | | | Hanson PLC (United Kingdom), Sr. Unsub. Notes, | | | |
| Baa3 | | | 170 | | 7.875%, 9/27/10 | | | 184,269 |
| | | | | Lafarge SA (France), Notes, | | | |
| Baa2 | | | 200 | | 6.15%, 7/15/11 | | | 204,028 |
| | | | | Ryland Group, Inc., (The) Sr. Notes, | | | |
| Ba1 | | | 27 | | 5.375%, 6/01/08 | | | 26,995 |
| | | | | | | | |
| | | | | | | | 586,694 |
See Notes to Financial Statements.
| | |
| 28 | | Visit our website at www.jennisondryden.com |
| | | | | | | | |
Moody’s
Rating† | | Principal
Amount (000) | | Description | | Value (Note 1) |
| | | | | | | | |
| CORPORATE BONDS (Continued) |
|
| Cable 0.2% |
| | | | | Comcast Cable Communications Holdings, Inc., Gtd. Notes, | | | |
| Baa2 | | $ | 55 | | 9.455%, 11/15/22 | | $ | 66,939 |
| | | | | Comcast Corp., Bonds, | | | |
| Baa2 | | | 25 | | 5.65%, 6/15/35 | | | 21,229 |
| | | | | Comcast Corp., Gtd. Notes, | | | |
| Baa2 | | | 60 | | 6.45%, 3/15/37 | | | 56,540 |
| | | | | Comcast Corp., Sr. Unsec. Notes, | | | |
| Baa2 | | | 85 | | 6.50%, 11/15/35 | | | 80,392 |
| | | | | Cox Communications, Inc., Notes, | | | |
| Baa3 | | | 185 | | 6.75%, 3/15/11 | | | 192,729 |
| Baa3 | | | 270 | | 7.875%, 8/15/09 | | | 282,589 |
| | | | | Time Warner Cable, Inc., Gtd. Notes, | | | |
| Baa2 | | | 590 | | 5.40%, 7/02/12 | | | 579,695 |
| | | | | | | | |
| | | | | | | | 1,280,113 |
|
| Capital Goods 0.2% |
| | | | | Caterpillar Financial Services Corp., Notes, MTN, | | | |
| A2 | | | 50 | | 5.50%, 3/15/16 | | | 51,313 |
| | | | | Erac USA Finance Co., Gtd. Notes, 144A, | | | |
| Baa2 | | | 110 | | 5.80%, 10/15/12 | | | 104,838 |
| Baa2 | | | 296 | | 6.375%, 10/15/17 | | | 264,472 |
| Baa2 | | | 110 | | 7.00%, 10/15/37 | | | 90,428 |
| Baa2 | | | 400 | | 7.35%, 6/15/08 | | | 402,818 |
| | | | | FedEx Corp., Gtd. Notes, | | | |
| Baa2 | | | 75 | | 7.25%, 2/15/11 | | | 81,555 |
| | | | | Honeywell International, Inc., Sr. Notes, | | | |
| A2 | | | 35 | | 5.70%, 3/15/37 | | | 34,607 |
| | | | | John Deere Capital Corp., Sr. Notes, | | | |
| A2 | | | 140 | | 4.50%, 8/25/08 | | | 140,683 |
| | | | | United Technologies Corp., Sr. Notes, | | | |
| A2 | | | 90 | | 6.05%, 6/01/36 | | | 92,968 |
| | | | | | | | |
| | | | | | | | 1,263,682 |
|
| Chemicals 0.3% |
| | | | | Dow Chemical Co. (The), Debs., | | | |
| A3 | | | 60 | | 5.97%, 1/15/09 | | | 61,141 |
See Notes to Financial Statements.
| | |
| The Prudential Investment Portfolios, Inc./Dryden Active Allocation Fund | | 29 |
Portfolio of Investments
as of March 31, 2008 (Unaudited) continued
| | | | | | | | |
Moody’s
Rating† | | Principal
Amount (000) | | Description | | Value (Note 1) |
| | | | | | | | |
| CORPORATE BONDS (Continued) |
|
| Chemicals (cont’d.) |
| | | | | Dow Chemical Co. (The), Notes, | | | |
| A3 | | $ | 135 | | 6.125%, 2/01/11 | | $ | 141,910 |
| | | | | Huntsman International LLC, Gtd. Notes, | | | |
| Ba1 | | | 400 | | 11.625%, 10/15/10 | | | 423,000 |
| | | | | ICI Wilmington, Inc., Gtd. Notes, | | | |
| Baa2 | | | 75 | | 5.625%, 12/01/13 | | | 78,851 |
| | | | | Lubrizol Corp. (The), Sr. Notes, | | | |
| Baa3 | | | 170 | | 4.625%, 10/01/09 | | | 170,619 |
| | | | | PPG Industries, Inc., Sr. Unsec. Notes, | | | |
| A3 | | | 1,000 | | 5.75%, 3/15/13 | | | 1,031,624 |
| | | | | Union Carbide Corp., Debs., | | | |
| Ba2 | | | 100 | | 7.50%, 6/01/25 | | | 98,912 |
| | | | | | | | |
| | | | | | | | 2,006,057 |
|
| Consumer 0.2% |
| | | | | Avon Products, Inc., Sr. Unsec. Notes, | | | |
| A2 | | | 300 | | 5.75%, 3/01/18 | | | 305,428 |
| | | | | Koninklijke Philips Electronics NV, Notes, | | | |
| A3 | | | 135 | | 6.875%, 3/11/38 | | | 144,001 |
| | | | | Newell Rubbermaid, Inc., Sr. Unsec. Notes, | | | |
| Baa2 | | | 300 | | 6.25%, 4/15/18 | | | 305,956 |
| | | | | Whirlpool Corp., Notes, | | | |
| Baa2 | | | 195 | | 6.125%, 6/15/11 | | | 204,194 |
| | | | | | | | |
| | | | | | | | 959,579 |
|
| Electric 0.8% |
| | | | | Appalachian Power Co., Sr. Notes, | | | |
| Baa2 | | | 125 | | 4.40%, 6/01/10 | | | 125,695 |
| | | | | Arizona Public Services Co., Sr. Unsec. Notes, | | | |
| Baa2 | | | 320 | | 6.375%, 10/15/11 | | | 331,799 |
| | | | | Arizona Public Services Co., Unsec. Notes, | | | |
| Baa2 | | | 35 | | 6.25%, 8/01/16 | | | 34,595 |
| | | | | Baltimore Gas & Electric Co., Sr. Unsec. Notes, | | | |
| Baa2 | | | 115 | | 6.35%, 10/01/36 | | | 104,089 |
See Notes to Financial Statements.
| | |
| 30 | | Visit our website at www.jennisondryden.com |
| | | | | | | | |
Moody’s
Rating† | | Principal
Amount (000) | | Description | | Value (Note 1) |
| | | | | | | | |
| CORPORATE BONDS (Continued) |
|
| Electric (cont’d.) |
| | | | | Carolina Power & Light Co., First Mtge. Bonds, | | | |
| A2 | | $ | 105 | | 5.25%, 12/15/15 | | $ | 107,732 |
| | | | | CenterPoint Energy Houston Electric LLC, Gen. Refi. Mtge., | | | |
| Baa2 | | | 160 | | 5.70%, 3/15/13 | | | 167,219 |
| Baa2 | | | 120 | | 6.95%, 3/15/33 | | | 126,879 |
| | | | | Consolidated Edison Co. of New York, Sr. Unsec. Notes, | | | |
| A1 | | | 145 | | 5.375%, 12/15/15 | | | 148,150 |
| | | | | Consumers Energy Co., First Mtge. Bonds, Ser. B, | | | |
| Baa1 | | | 65 | | 5.375%, 4/15/13 | | | 67,039 |
| | | | | Dominion Resources, Inc., Sr. Notes, | | | |
| Baa2 | | | 70 | | 4.75%, 12/15/10 | | | 71,641 |
| | | | | Dominion Resources, Inc., Sr. Notes, Ser. D, | | | |
| Baa2 | | | 190 | | 5.125%, 12/15/09 | | | 194,486 |
| | | | | Duke Energy Carolinas LLC, Sr. Unsub. Notes, | | | |
| A3 | | | 225 | | 6.10%, 6/01/37 | | | 223,975 |
| | | | | El Paso Electric Co., Sr. Unsec. Notes, | | | |
| Baa2 | | | 135 | | 6.00%, 5/15/35 | | | 119,682 |
| | | | | Empresa Nacional de Electricidad SA (Chile), Bonds, Ser. B, | | | |
| Baa3 | | | 220 | | 8.50%, 4/01/09 | | | 229,962 |
| | | | | Empresa Nacional de Electricidad SA (Chile), Notes, | | | |
| Baa3 | | | 310 | | 8.625%, 8/01/15 | | | 364,267 |
| | | | | Energy East Corp., Notes, | | | |
| Baa2 | | | 30 | | 6.75%, 9/15/33 | | | 29,346 |
| | | | | Exelon Corp., Notes, | | | |
| Baa1 | | | 30 | | 4.90%, 6/15/15 | | | 28,579 |
| | | | | Florida Power & Light Co., First Mtge. Bonds, | | | |
| Aa3 | | | 60 | | 5.95%, 10/01/33 | | | 60,211 |
| | | | | Georgia Power Co., Unsub. Notes, Ser. B, | | | |
| A2 | | | 170 | | 5.70%, 6/01/17 | | | 176,370 |
See Notes to Financial Statements.
| | |
| The Prudential Investment Portfolios, Inc./Dryden Active Allocation Fund | | 31 |
Portfolio of Investments
as of March 31, 2008 (Unaudited) continued
| | | | | | | | |
Moody’s
Rating† | | Principal
Amount (000) | | Description | | Value (Note 1) |
| | | | | | | | |
| CORPORATE BONDS (Continued) |
|
| Electric (cont’d.) |
| | | | | Indiana Michigan Power Co., Sr. Notes, Ser. INDF, | | | |
| Baa2 | | $ | 90 | | 5.05%, 11/15/14 | | $ | 85,948 |
| | | | | Midamerican Energy Holdings Co., Sr. Unsec. Notes, | | | |
| Baa1 | | | 160 | | 5.95%, 5/15/37 | | | 149,875 |
| | | | | National Rural Utilities Cooperative Finance Corp., Notes, | | | |
| A2 | | | 35 | | 7.25%, 3/01/12 | | | 38,064 |
| | | | | Nevada Power Co., Mortgage Backed Notes, | | | |
| Baa3 | | | 280 | | 6.50%, 5/15/18 | | | 285,586 |
| | | | | NiSource Finance Corp., Gtd. Notes, | | | |
| Baa3 | | | 55 | | 5.25%, 9/15/17 | | | 50,074 |
| Baa3 | | | 70 | | 5.45%, 9/15/20 | | | 62,112 |
| | | | | NSTAR Electric Co., Debs., | | | |
| A1 | | | 110 | | 4.875%, 4/15/14 | | | 110,540 |
| | | | | Oncor Electric Delivery Co., Debs., | | | |
| Ba1 | | | 120 | | 7.00%, 9/01/22 | | | 114,930 |
| | | | | Pacific Gas & Electric Co., First Mtge. Bonds, | | | |
| A3 | | | 395 | | 6.05%, 3/01/34 | | | 387,232 |
| | | | | PPL Electric Utilities Corp., Sec. Notes, | | | |
| A3 | | | 400 | | 6.25%, 8/15/09 | | | 412,769 |
| | | | | Public Service Electric & Gas Co., First Mtge. Bonds, MTN, | | | |
| A3 | | | 125 | | 5.80%, 5/01/37 | | | 121,023 |
| | | | | Southern California Edison Co., First Mtge. Bonds, | | | |
| A2 | | | 100 | | 4.65%, 4/01/15 | | | 99,117 |
| | | | | Virginia Electric and Power Co., Sr. Unsec. Notes, Ser. A, | | | |
| Baa1 | | | 165 | | 6.00%, 5/15/37 | | | 160,932 |
| | | | | Xcel Energy, Inc., Sr. Notes, | | | |
| Baa1 | | | 120 | | 3.40%, 7/01/08 | | | 119,764 |
| Baa1 | | | 95 | | 6.50%, 7/01/36 | | | 93,384 |
| | | | | Xcel Energy, Inc., Sr. Unsec. Notes, | | | |
| Baa1 | | | 36 | | 5.613%, 4/01/17 | | | 36,083 |
| | | | | | | | |
| | | | | | | | 5,039,149 |
See Notes to Financial Statements.
| | |
| 32 | | Visit our website at www.jennisondryden.com |
| | | | | | | | |
Moody’s
Rating† | | Principal
Amount (000) | | Description | | Value (Note 1) |
| | | | | | | | |
| CORPORATE BONDS (Continued) |
|
| Energy - Integrated 0.1% |
| | | | | ConocoPhillips Holding Co., Sr. Notes, | | | |
| A1 | | $ | 36 | | 6.95%, 4/15/29 | | $ | 40,992 |
| | | | | Lukoil International Finance BV (Netherlands), Gtd. Notes, 144A, | | | |
| Baa2 | | | 130 | | 6.356%, 6/07/17 | | | 120,413 |
| | | | | TNK-BP Finance SA (Luxembourg), Gtd. Private Placement, Notes, 144A, | | | |
| Baa2 | | | 295 | | 7.50%, 7/18/16 | | | 273,981 |
| | | | | | | | |
| | | | | | | | 435,386 |
|
| Energy - Other 0.2% |
| | | | | Devon Financing Corp., ULC, Gtd. Notes, | | | |
| Baa1 | | | 71 | | 7.875%, 9/30/31 | | | 87,239 |
| | | | | Halliburton Co., Notes, | | | |
| A2 | | | 30 | | 5.50%, 10/15/10 | | | 31,586 |
| | | | | Nexen, Inc. (Canada), Sr. Unsec. Notes, | | | |
| Baa2 | | | 25 | | 6.40%, 5/15/37 | | | 23,941 |
| | | | | Pioneer Natural Resource Co., Bonds, | | | |
| Ba1 | | | 330 | | 6.875%, 5/01/18 | | | 312,672 |
| | | | | Valero Energy Corp., Sr. Notes, | | | |
| Baa3 | | | 160 | | 6.625%, 6/15/37 | | | 152,938 |
| | | | | Weatherford International, Inc., Gtd. Notes, | | | |
| Baa1 | | | 230 | | 6.35%, 6/15/17 | | | 237,902 |
| | | | | Western Oil Sands, Inc. (Canada), Sec. Notes, | | | |
| Baa1 | | | 55 | | 8.375%, 5/01/12 | �� | | 61,789 |
| | | | | Woodside Petroleum Ltd. (Australia), Gtd. Notes, 144A, | | | |
| Baa1 | | | 265 | | 5.00%, 11/15/13 | | | 265,271 |
| | | | | XTO Energy, Inc., Sr. Unsec. Notes, | | | |
| Baa2 | | | 135 | | 6.25%, 8/01/17 | | | 143,921 |
| | | | | | | | |
| | | | | | | | 1,317,259 |
|
| Foods 0.6% |
| | | | | Bunge Ltd., Notes, | | | |
| Baa2 | | | 215 | | 5.35%, 4/15/14 | | | 217,869 |
See Notes to Financial Statements.
| | |
| The Prudential Investment Portfolios, Inc./Dryden Active Allocation Fund | | 33 |
Portfolio of Investments
as of March 31, 2008 (Unaudited) continued
| | | | | | | | |
Moody’s
Rating† | | Principal
Amount (000) | | Description | | Value (Note 1) |
| | | | | | | | |
| CORPORATE BONDS (Continued) |
|
| Foods (cont’d.) |
| | | | | Cadbury Schweppes US Finance LLC, Notes, 144A, | | | |
| Baa2 | | $ | 250 | | 3.875%, 10/01/08 | | $ | 249,462 |
| | | | | Cargill, Inc., Notes, 144A, | | | |
| A2 | | | 375 | | 3.625%, 3/04/09 | | | 373,841 |
| | | | | Cargill, Inc., Sr. Unsec. Notes, 144A, | | | |
| A2 | | | 150 | | 6.00%, 11/27/17 | | | 151,298 |
| | | | | ConAgra Foods, Inc., Notes, | | | |
| Baa2 | | | 81 | | 7.875%, 9/15/10 | | | 88,491 |
| | | | | Delhaize Group (Belgium), Sr. Unsub. Notes, | | | |
| Baa3 | | | 110 | | 6.50%, 6/15/17 | | | 113,597 |
| | | | | Diageo Capital PLC (United Kingdom), Gtd. Notes, | | | |
| A3 | | | 230 | | 5.75%, 10/23/17 | | | 235,551 |
| | | | | HJ Heinz Co., Notes, 144A, | | | |
| Baa2 | | | 260 | | 6.428%, 12/01/08 | | | 264,399 |
| | | | | Kellogg Co., Notes, Ser. B, | | | |
| A3 | | | 375 | | 6.60%, 4/01/11 | | | 404,119 |
| | | | | Kraft Foods, Inc., Sr. Unsec. Notes, | | | |
| Baa2 | | | 185 | | 5.625%, 11/01/11 | | | 188,497 |
| Baa2 | | | 220 | | 6.125%, 2/01/18 | | | 219,861 |
| | | | | Kroger Co. (The), Gtd. Notes, | | | |
| Baa2 | | | 35 | | 6.80%, 4/01/11 | | | 37,221 |
| | | | | McDonald’s Corp., Sr. Unsec. Notes, | | | |
| A3 | | | 160 | | 5.80%, 10/15/17 | | | 168,000 |
| | | | | McDonald’s Corp., Sr. Unsec. Notes, MTN, | | | |
| A3 | | | 225 | | 6.30%, 3/01/38 | | | 230,197 |
| | | | | Miller Brewing Co., 144A, | | | |
| Baa1 | | | 200 | | 4.25%, 8/15/08 | | | 200,806 |
| | | | | Tricon Global Restaurants, Inc., Sr. Notes, | | | |
| Baa2 | | | 35 | | 8.875%, 4/15/11 | | | 38,572 |
| | | | | Tyson Foods, Inc., Sr. Unsec. Notes, | | | |
| Ba1 | | | 150 | | 6.85%, 4/01/16 | | | 150,182 |
| | | | | | | | |
| | | | | | | | 3,331,963 |
See Notes to Financial Statements.
| | |
| 34 | | Visit our website at www.jennisondryden.com |
| | | | | | | | |
Moody’s
Rating† | | Principal
Amount (000) | | Description | | Value (Note 1) |
| | | | | | | | |
| CORPORATE BONDS (Continued) |
|
| Gaming 0.1% |
| | | | | Harrah’s Operating Co., Inc., Gtd. Notes, | | | |
| Caa1 | | $ | 150 | | 5.50%, 7/01/10 | | $ | 131,250 |
| | | | | Mandalay Resort Group, Sr. Sub. Notes, | | | |
| B1 | | | 1 | | 9.375%, 2/15/10 | | | 1,030 |
| | | | | Wynn Las Vegas Capital Corp., First Mtge. Bonds, 144A, | | | |
| Ba2 | | | 600 | | 6.625%, 12/01/14 | | | 577,500 |
| | | | | | | | |
| | | | | | | | 709,780 |
|
| Health Care & Pharmaceutical 0.5% |
| | | | | AmerisourceBergen Corp., Gtd. Notes, | | | |
| Ba1 | | | 200 | | 5.625%, 9/15/12 | | | 206,794 |
| | | | | AstraZeneca PLC (United Kingdom), Sr. Unsub. Notes, | | | |
| A1 | | | 110 | | 6.45%, 9/15/37 | | | 118,028 |
| | | | | Baxter International, Inc., Sr. Unsec. Notes, | | | |
| A3 | | | 60 | | 5.90%, 9/01/16 | | | 63,331 |
| | | | | Bristol-Myers Squibb Co., Unsub. Notes, | | | |
| A2 | | | 55 | | 5.875%, 11/15/36 | | | 53,186 |
| | | | | Community Health Systems, Inc., Gtd. Notes, | | | |
| B3 | | | 400 | | 8.875%, 7/15/15(g) | | | 401,500 |
| | | | | Covidien International Finance SA (Luxembourg), Gtd. Notes, 144A, | | | |
| Baa1 | | | 260 | | 6.00%, 10/15/17 | | | 267,983 |
| | | | | Genentech, Inc., Sr. Notes, | | | |
| A1 | | | 60 | | 4.75%, 7/15/15 | | | 60,273 |
| | | | | HCA, Inc., Sec. Notes, | | | |
| B2 | | | 500 | | 9.25%, 11/15/16 | | | 518,750 |
| | | | | Laboratory Corp. of America Holdings, Sr. Unsec. Notes, | | | |
| Baa3 | | | 250 | | 5.625%, 12/15/15 | | | 247,251 |
| | | | | Merck & Co., Inc., Bonds, | | | |
| Aa3 | | | 30 | | 5.75%, 11/15/36 | | | 30,251 |
| | | | | Merck & Co., Inc., Debs., | | | |
| Aa3 | | | 30 | | 5.95%, 12/01/28 | | | 30,198 |
| | | | | Schering-Plough Corp., Sr. Notes, | | | |
| Baa1 | | | 155 | | 5.55%, 12/01/13 | | | 160,087 |
See Notes to Financial Statements.
| | |
| The Prudential Investment Portfolios, Inc./Dryden Active Allocation Fund | | 35 |
Portfolio of Investments
as of March 31, 2008 (Unaudited) continued
| | | | | | | | |
Moody’s
Rating† | | Principal
Amount (000) | | Description | | Value (Note 1) |
| | | | | | | | |
| CORPORATE BONDS (Continued) |
|
| Health Care & Pharmaceutical (cont’d.) |
| | | | | Schering-Plough Corp., Sr. Unsec. Notes, | | | |
| Baa1 | | $ | 194 | | 6.00%, 9/15/17 | | $ | 194,964 |
| Baa1 | | | 70 | | 6.55%, 9/15/37 | | | 67,413 |
| | | | | Teva Pharmaceutical Finance LLC, Bonds, | | | |
| Baa2 | | | 30 | | 6.15%, 2/01/36 | | | 29,245 |
| | | | | Wyeth, Notes, | | | |
| A3 | | | 415 | | 5.95%, 4/01/37 | | | 405,478 |
| | | | | Wyeth, Unsub. Notes, | | | |
| A3 | | | 225 | | 5.50%, 3/15/13 | | | 238,254 |
| A3 | | | 35 | | 5.50%, 2/01/14 | | | 36,253 |
| A3 | | | 10 | | 6.45%, 2/01/24 | | | 10,667 |
| | | | | | | | |
| | | | | | | | 3,139,906 |
|
| Health Care Insurance 0.3% |
| | | | | Aetna, Inc., Sr. Unsub. Notes, | | | |
| A3 | | | 80 | | 5.75%, 6/15/11 | | | 83,829 |
| A3 | | | 110 | | 6.625%, 6/15/36 | | | 106,830 |
| | | | | Cigna Corp., Sr. Unsec. Notes, | | | |
| Baa2 | | | 140 | | 6.15%, 11/15/36 | | | 121,869 |
| | | | | Coventry Health Care, Inc., Sr. Notes, | | | |
| Ba1 | | | 540 | | 6.125%, 1/15/15 | | | 536,246 |
| | | | | UnitedHealth Group, Inc., Bonds, | | | |
| Baa1 | | | 65 | | 6.875%, 2/15/38 | | | 62,105 |
| | | | | UnitedHealth Group, Inc., Sr. Unsec. Notes, | | | |
| Baa1 | | | 290 | | 5.25%, 3/15/11 | | | 295,837 |
| Baa1 | | | 60 | | 6.00%, 6/15/17 | | | 58,628 |
| Baa1 | | | 100 | | 6.50%, 6/15/37 | | | 91,496 |
| Baa1 | | | 80 | | 6.625%, 11/15/37 | | | 74,023 |
| | | | | WellPoint, Inc., Notes, | | | |
| Baa1 | | | 170 | | 5.00%, 12/15/14 | | | 159,915 |
| Baa1 | | | 105 | | 5.95%, 12/15/34 | | | 92,778 |
| | | | | | | | |
| | | | | | | | 1,683,556 |
|
| Insurance 0.3% |
| | | | | Allstate Corp. (The), Sr. Notes, | | | |
| A1 | | | 200 | | 7.20%, 12/01/09 | | | 211,571 |
See Notes to Financial Statements.
| | |
| 36 | | Visit our website at www.jennisondryden.com |
| | | | | | | | |
Moody’s
Rating† | | Principal
Amount (000) | | Description | | Value (Note 1) |
| | | | | | | | |
| CORPORATE BONDS (Continued) |
|
| Insurance (cont’d.) |
| | | | | American International Group, Inc., Notes, | | | |
| Aa2 | | $ | 260 | | 4.25%, 5/15/13 | | $ | 246,637 |
| | | | | American International Group, Inc., Sr. Unsec. Notes, MTN, | | | |
| Aa2 | | | 540 | | 5.85%, 1/16/18 | | | 529,923 |
| | | | | AXA SA (France), Sub. Notes, | | | |
| A3 | | | 35 | | 8.60%, 12/15/30 | | | 37,665 |
| | | | | Berkshire Hathaway Finance Corp., Gtd. Notes, | | | |
| Aaa | | | 95 | | 4.75%, 5/15/12 | | | 98,737 |
| | | | | Liberty Mutual Group, Inc., Bonds, 144A, | | | |
| Baa2 | | | 180 | | 7.00%, 3/15/34 | | | 175,788 |
| | | | | Lincoln National Corp., Sr. Unsec. Notes, | | | |
| A3 | | | 110 | | 6.30%, 10/09/37 | | | 99,434 |
| | | | | Marsh & Mclennan Cos., Inc., Sr. Unsec. Notes, | | | |
| Baa2 | | | 50 | | 5.15%, 9/15/10 | | | 49,885 |
| | | | | MetLife, Inc., Sr. Notes, | | | |
| A2 | | | 205 | | 5.70%, 6/15/35 | | | 182,363 |
| A2 | | | 70 | | 6.125%, 12/01/11 | | | 75,109 |
| A2 | | | 15 | | 6.375%, 6/15/34 | | | 14,533 |
| | | | | St. Paul Travelers Cos., Inc., (The), Sr. Unsec. Notes, | | | |
| A3 | | | 140 | | 6.75%, 6/20/36 | | | 138,722 |
| | | | | W.R. Berkley Corp., Sr. Notes, | | | |
| Baa2 | | | 110 | | 5.60%, 5/15/15 | | | 104,675 |
| Baa2 | | | 90 | | 6.15%, 8/15/19 | | | 89,124 |
| | | | | XL Capital Ltd. (Cayman Islands), Sr. Notes, | | | |
| Baa1 | | | 15 | | 5.25%, 9/15/14 | | | 13,663 |
| | | | | | | | |
| | | | | | | | 2,067,829 |
|
| Lodging |
| | | | | Starwood Hotels & Resorts Worldwide, Inc., Sr. Unsec. Notes, | | | |
| Baa3 | | | 85 | | 6.25%, 2/15/13 | | | 84,894 |
| | | | | | | | |
See Notes to Financial Statements.
| | |
| The Prudential Investment Portfolios, Inc./Dryden Active Allocation Fund | | 37 |
Portfolio of Investments
as of March 31, 2008 (Unaudited) continued
| | | | | | | | |
Moody’s
Rating† | | Principal
Amount (000) | | Description | | Value (Note 1) |
| | | | | | | | |
| CORPORATE BONDS (Continued) |
|
| Media & Entertainment 0.2% |
| | | | | AMFM, Inc., Gtd. Notes, | | | |
| Baa3 | | $ | 115 | | 8.00%, 11/01/08 | | $ | 118,686 |
| | | | | News America, Inc., Gtd. Notes, | | | |
| Baa2 | | | 125 | | 7.625%, 11/30/28 | | | 136,725 |
| | | | | Time Warner, Inc., Debs., | | | |
| Baa2 | | | 100 | | 9.15%, 2/01/23 | | | 115,746 |
| | | | | Time Warner, Inc., Gtd. Notes, | | | |
| Baa2 | | | 225 | | 6.75%, 4/15/11(b) | | | 231,377 |
| Baa2 | | | 160 | | 7.25%, 10/15/17 | | | 165,665 |
| Baa2 | | | 36 | | 7.625%, 4/15/31 | | | 37,653 |
| | | | | Viacom, Inc., Sr. Notes, | | | |
| Baa3 | | | 205 | | 6.875%, 4/30/36 | | | 197,406 |
| | | | | | | | |
| | | | | | | | 1,003,258 |
|
| Metals 0.1% |
| | | | | Alcan, Inc. (Canada), Notes, | | | |
| A3 | | | 70 | | 4.50%, 5/15/13 | | | 68,650 |
| A3 | | | 115 | | 5.00%, 6/01/15 | | | 112,976 |
| | | | | Alcoa, Inc., Sr. Notes, | | | |
| Baa1 | | | 20 | | 5.90%, 2/01/27 | | | 18,024 |
| | | | | Peabody Energy Corp., Notes, | | | |
| Ba1 | | | 250 | | 7.375%, 11/01/16 | | | 258,750 |
| | | | | Southern Copper Corp., Sr. Notes, | | | |
| Baa2 | | | 95 | | 7.50%, 7/27/35 | | | 97,415 |
| | | | | United States Steel Corp., Sr. Unsub. Notes, | | | |
| Baa3 | | | 250 | | 5.65%, 6/01/13 | | | 242,126 |
| | | | | Xstrata Finance Canada Ltd. (Canada), Gtd. Notes, 144A, | | | |
| Baa2 | | | 70 | | 5.50%, 11/16/11 | | | 71,821 |
| | | | | | | | |
| | | | | | | | 869,762 |
|
| Non Captive Finance 0.3% |
| | | | | Capital One Bank, Sub. Notes, | | | |
| A3 | | | 5 | | 6.50%, 6/13/13 | | | 4,719 |
| | | | | Capital One Financial Corp., Sr. Notes, MTN, | | | |
| A3 | | | 125 | | 5.70%, 9/15/11 | | | 117,910 |
See Notes to Financial Statements.
| | |
| 38 | | Visit our website at www.jennisondryden.com |
| | | | | | | | |
Moody’s
Rating† | | Principal
Amount (000) | | Description | | Value (Note 1) |
| | | | | | | | |
| CORPORATE BONDS (Continued) |
|
| Non Captive Finance (cont’d.) |
| | | | | CIT Group Funding Co. of Canada (Canada), Gtd. Notes, | | | |
| A3 | | $ | 135 | | 5.20%, 6/01/15 | | $ | 100,978 |
| | | | | Countrywide Financial Corp., Gtd. Notes, MTN, | | | |
| Baa3 | | | 280 | | 5.80%, 6/07/12(g) | | | 253,676 |
| | | | | General Electric Capital Corp., Notes, | | | |
| Aaa | | | 440 | | 5.55%, 5/04/20 | | | 459,437 |
| | | | | General Electric Capital Corp., Notes, MTN, | | | |
| Aaa | | | 90 | | 6.125%, 2/22/11 | | | 95,663 |
| | | | | General Electric Capital Corp., Sr. Unsec. Notes, MTN | | | |
| Aaa | | | 90 | | 5.875%, 1/14/38 | | | 86,747 |
| | | | | GMAC LLC, Unsub. Notes, | | | |
| B1 | | | 160 | | 4.315%, 5/15/09(h) | | | 136,746 |
| | | | | Household Finance Corp., Notes, | | | |
| Aa3 | | | 130 | | 4.750%, 5/15/09 | | | 129,940 |
| | | | | HSBC Finance Corp., Sr. Notes, | | | |
| Aa3 | | | 100 | | 5.70%, 6/01/11 | | | 100,602 |
| | | | | International Lease Finance Corp., Unsub. Notes, | | | |
| A1 | | | 120 | | 3.50%, 4/01/09 | | | 118,199 |
| A1 | | | 400 | | 6.375%, 3/25/13 | | | 399,693 |
| | | | | Residential Capital LLC, Gtd. Notes, | | | |
| B2 | | | 95 | | 8.50%, 4/17/13 | | | 46,075 |
| | | | | Residential Capital, Gtd. Notes, | | | |
| B2 | | | 105 | | 8.00%, 2/22/11 | | | 51,450 |
| | | | | | | | |
| | | | | | | | 2,101,835 |
|
| Non-Corporate 0.2% |
| | | | | Gaz Capital for Gazprom (Luxembourg), Sr. Unsec. Notes, 144A, | | | |
| A3 | | | 300 | | 7.288%, 8/16/37 | | | 273,645 |
| | | | | Pemex Project Funding Master Trust, | | | |
| Baa1 | | | 110 | | 6.625%, 6/15/35 | | | 113,836 |
| | | | | Petrobras International Finance Co. (Cayman Islands), Bonds, | | | |
| Baa1 | | | 280 | | 8.375%, 12/10/18 | | | 320,600 |
See Notes to Financial Statements.
| | |
| The Prudential Investment Portfolios, Inc./Dryden Active Allocation Fund | | 39 |
Portfolio of Investments
as of March 31, 2008 (Unaudited) continued
| | | | | | | | |
Moody’s
Rating† | | Principal
Amount (000) | | Description | | Value (Note 1) |
| | | | | | | | |
| CORPORATE BONDS (Continued) |
|
| Non-Corporate (cont’d.) |
| | | | | Petrobras International Finance Co. (Cayman Islands), Gtd. Notes, | | | |
| Baa1 | | $ | 10 | | 5.875%, 3/01/18 | | $ | 9,625 |
| | | | | RSHB Capital SA for OJSC Russian Agricultural Bank (Luxembourg), Bonds, 144A, | | | |
| A3 | | | 460 | | 6.299%, 5/15/17 | | | 426,076 |
| | | | | | | | |
| | | | | | | | 1,143,782 |
|
| Paper |
| | | | | Plum Creek Timberlands LP, Gtd. Notes, | | | |
| Baa3 | | | 120 | | 5.875%, 11/15/15 | | | 124,270 |
| | | | | | | | |
|
| Pipelines & Other 0.2% |
| | | | | Atmos Energy Corp., Notes, | | | |
| Baa3 | | | 330 | | 4.00%, 10/15/09 | | | 328,416 |
| | | | | CenterPoint Energy Resources Corp., Sr. Unsec. Notes, | | | |
| Baa3 | | | 90 | | 6.25%, 2/01/37 | | | 83,951 |
| | | | | Duke Energy Field Services LLC, Notes, | | | |
| Baa2 | | | 365 | | 7.875%, 8/16/10 | | | 391,295 |
| | | | | Enbridge Energy Partners LP, 144A | | | |
| Baa2 | | | 50 | | 7.50%, 4/15/38 | | | 49,856 |
| | | | | Enterprise Products Operating LP, Gtd. Notes, | | | |
| Baa3 | | | 145 | | 4.625%, 10/15/09 | | | 146,769 |
| | | | | Enterprise Products Operating LP, Gtd. Notes, Ser. B, | | | |
| Baa3 | | | 35 | | 6.875%, 3/01/33 | | | 34,770 |
| | | | | Enterprise Products Operating LP, Sr. Notes, | | | |
| Baa3 | | | 190 | | 4.95%, 6/01/10 | | | 193,849 |
| | | | | ONEOK Partners LP, Notes, | | | |
| Baa2 | | | 85 | | 6.65%, 10/01/36 | | | 82,027 |
| | | | | Sempra Energy, Sr. Unsec. Notes, | | | |
| Baa1 | | | 15 | | 6.00%, 2/01/13 | | | 15,927 |
See Notes to Financial Statements.
| | |
| 40 | | Visit our website at www.jennisondryden.com |
| | | | | | | | |
Moody’s
Rating† | | Principal
Amount (000) | | Description | | Value (Note 1) |
| | | | | | | | |
| CORPORATE BONDS (Continued) |
|
| Pipelines & Other (cont’d.) |
| | | | | Spectra Energy Capital LLC, Sr. Unsub. Notes, | | | |
| Baa1 | | $ | 45 | | 6.25%, 2/15/13 | | $ | 46,643 |
| | | | | | | | |
| | | | | | | | 1,373,503 |
|
| Railroads 0.2% |
| | | | | Burlington Northern Santa Fe Corp., Debs., | | | |
| Baa1 | | | 135 | | 6.70%, 8/01/28 | | | 138,313 |
| | | | | CSX Corp., Sr. Notes, | | | |
| Baa3 | | | 75 | | 6.25%, 3/15/18 | | | 74,016 |
| | | | | CSX Corp., Sr. Unsub. Notes, | | | |
| Baa3 | | | 170 | | 6.15%, 5/01/37 | | | 149,669 |
| | | | | Norfolk Southern Corp., Sr. Notes, | | | |
| Baa1 | | | 4 | | 7.80%, 5/15/27 | | | 4,645 |
| | | | | Norfolk Southern Corp., Sr. Unsec. Notes, | | | |
| Baa1 | | | 105 | | 5.59%, 5/17/25 | | | 96,119 |
| | | | | Union Pacific Corp., Notes, | | | |
| Baa2 | | | 275 | | 3.625%, 6/01/10 | | | 275,246 |
| Baa2 | | | 152 | | 6.65%, 1/15/11 | | | 160,571 |
| | | | | | | | |
| | | | | | | | 898,579 |
|
| Real Estate Investment Trusts 0.2% |
| | | | | Brandywine Operating Partnership, Notes, | | | |
| Baa3 | | | 265 | | 5.75%, 4/01/12 | | | 246,056 |
| | | | | Mack-Cali Realty LP, Notes, | | | |
| Baa2 | | | 250 | | 7.25%, 3/15/09 | | | 253,061 |
| | | | | Post Apartment Homes LP, Notes, | | | |
| Baa3 | | | 135 | | 6.30%, 6/01/13 | | | 133,553 |
| | | | | Post Apartment Homes LP, Sr. Notes, | | | |
| Baa3 | | | 90 | | 5.45%, 6/01/12 | | | 86,414 |
| | | | | Simon Property Group LP, Unsec. Notes, | | | |
| A3 | | | 280 | | 5.75%, 5/01/12 | | | 279,884 |
| | | | | | | | |
| | | | | | | | 998,968 |
|
| Retail 0.2% |
| | | | | CVS Caremark Corp., Sr. Unsec. Notes, | | | |
| Baa2 | | | 260 | | 5.75%, 8/15/11 | | | 271,985 |
See Notes to Financial Statements.
| | |
| The Prudential Investment Portfolios, Inc./Dryden Active Allocation Fund | | 41 |
Portfolio of Investments
as of March 31, 2008 (Unaudited) continued
| | | | | | | | |
Moody’s
Rating† | | Principal
Amount (000) | | Description | | Value (Note 1) |
| | | | | | | | |
| CORPORATE BONDS (Continued) |
|
| Retail (cont’d.) |
| | | | | Federated Retail Holdings, Inc., Gtd. Notes, | | | |
| Baa2 | | $ | 175 | | 5.35%, 3/15/12 | | $ | 166,739 |
| Baa2 | | | 20 | | 5.90%, 12/01/16 | | | 17,775 |
| | | | | Home Depot, Inc., Sr. Unsec. Notes, | | | |
| Baa1 | | | 80 | | 5.875%, 12/16/36 | | | 65,309 |
| | | | | May Department Stores Co. (The), Notes, | | | |
| Baa2 | | | 30 | | 6.65%, 7/15/24 | | | 25,499 |
| | | | | Target Corp., Sr. Unsec. Notes, | | | |
| A2 | | | 300 | | 7.00%, 1/15/38 | | | 308,358 |
| | | | | Wal-Mart Stores, Inc., Bonds, | | | |
| Aa2 | | | 60 | | 5.25%, 9/01/35 | | | 53,101 |
| | | | | | | | |
| | | | | | | | 908,766 |
|
| Structured Notes 0.2% |
| | | | | CDX North America High Yield, Pass-Thru Certs., Ser. 9-T1, 144A | | | |
| B3 | | | 1,500 | | 8.75%, 12/29/12(g) | | | 1,426,875 |
| | | | | | | | |
|
| Technology 0.2% |
| | | | | Computer Sciences Corp., Sr. Unsec. Notes, 144A, | | | |
| Baa1 | | | 300 | | 6.50%, 3/15/18 | | | 304,798 |
| | | | | Electronic Data System Corp., Notes, | | | |
| Baa3 | | | 25 | | 7.45%, 10/15/29 | | | 23,646 |
| | | | | Fiserv, Inc., Gtd. Notes, | | | |
| Baa2 | | | 220 | | 6.125%, 11/20/12 | | | 226,713 |
| | | | | Intuit, Inc., Sr. Unsec. Notes, | | | |
| Baa2 | | | 125 | | 5.40%, 3/15/12 | | | 127,263 |
| | | | | Jabil Circuit, Inc., Sr. Notes, | | | |
| Ba1 | | | 390 | | 5.875%, 7/15/10 | | | 385,182 |
| | | | | Motorola, Inc., Notes, | | | |
| Baa1 | | | 20 | | 8.00%, 11/01/11 | | | 20,327 |
| | | | | | | | |
| | | | | | | | 1,087,929 |
|
| Telecommunications 0.9% |
| | | | | America Movil SA de CV (Mexico), Unsec. Notes, | | | |
| A3 | | | 115 | | 6.375%, 3/01/35 | | | 111,291 |
See Notes to Financial Statements.
| | |
| 42 | | Visit our website at www.jennisondryden.com |
| | | | | | | | | |
Moody’s
Rating† | | Principal
Amount (000) | | | Description | | Value (Note 1) |
| | | | | | | | | |
| CORPORATE BONDS (Continued) |
|
| Telecommunications (cont’d.) |
| | | | | | AT&T Corp., Notes, | | | |
| NR | | $ | 200 | (i) | | 6.00%, 3/15/09 | | $ | 204 |
| | | | | | AT&T Corp., Sr. Notes, | | | |
| A2 | | | 440 | | | 8.00%, 11/15/31 | | | 514,144 |
| | | | | | AT&T Corp., Sr. Unsec. Notes, | | | |
| A2 | | | 115 | | | 7.30%, 11/15/11 | | | 124,560 |
| | | | | | AT&T, Inc., Notes, | | | |
| A2 | | | 220 | | | 4.125%, 9/15/09 | | | 221,224 |
| | | | | | British Telecommunications PLC (United Kingdom), Bonds, | | | |
| Baa1 | | | 350 | | | 9.125%, 12/15/30 | | | 434,692 |
| | | | | | Cingular Wireless LLC, Sr. Notes, | | | |
| A2 | | | 100 | | | 7.125%, 12/15/31 | | | 105,207 |
| | | | | | Cingular Wireless Services, Inc., Notes, | | | |
| A2 | | | 120 | | | 8.125%, 5/01/12 | | | 134,291 |
| | | | | | Deutsche Telekom International Finance BV(Netherlands), Gtd. Notes, | | | |
| A3 | | | 60 | | | 8.25%, 6/15/30 | | | 71,975 |
| | | | | | Embarq Corp., Notes, | | | |
| Baa3 | | | 80 | | | 7.082%, 6/01/16 | | | 75,739 |
| Baa3 | | | 400 | | | 7.995%, 6/01/36 | | | 365,303 |
| | | | | | France Telecom SA (France), Notes, | | | |
| A3 | | | 75 | | | 8.50%, 3/01/31 | | | 92,917 |
| | | | | | Koninklijke (Royal) KPN NV (Netherlands), Sr. Unsub. Notes, | | | |
| Baa2 | | | 105 | | | 8.00%, 10/01/10 | | | 112,744 |
| | | | | | New Cingular Wireless Services, Inc., Sr. Notes, | | | |
| A2 | | | 380 | | | 8.75%, 3/01/31 | | | 461,166 |
| | | | | | Nextel Communications, Inc., Sr. Notes, | | | |
| Baa3 | | | 500 | | | 5.95%, 3/15/14 | | | 370,000 |
| | | | | | PCCW HKT Capital Ltd. (British Virgin Islands), Gtd. Notes, 144A, | | | |
| Baa2 | | | 555 | | | 8.00%, 11/15/11 | | | 602,580 |
| | | | | | Qwest Capital Funding, Inc., Gtd. Notes, | | | |
| B1 | | | 400 | | | 7.00%, 8/03/09 | | | 398,000 |
| | | | | | Qwest Corp., Notes, | | | |
| Ba1 | | | 400 | | | 8.875%, 3/15/12 | | | 408,000 |
See Notes to Financial Statements.
| | |
| The Prudential Investment Portfolios, Inc./Dryden Active Allocation Fund | | 43 |
Portfolio of Investments
as of March 31, 2008 (Unaudited) continued
| | | | | | | | |
Moody’s
Rating† | | Principal
Amount (000) | | Description | | Value (Note 1) |
| | | | | | | | |
| CORPORATE BONDS (Continued) |
|
| Telecommunications (cont’d.) |
| | | | | Sprint Capital Corp., Gtd. Notes, | | | |
| Baa3 | | $ | 185 | | 6.90%, 5/01/19 | | $ | 145,688 |
| | | | | Telecom Italia Capital SA (Luxembourg), Gtd. Notes, | | | |
| Baa2 | | | 45 | | 4.00%, 1/15/10 | | | 44,144 |
| Baa2 | | | 90 | | 5.25%, 11/15/13 | | | 84,095 |
| | | | | TELUS Corp. (Canada), Notes, | | | |
| Baa1 | | | 250 | | 8.00%, 6/01/11 | | | 271,897 |
| | | | | U.S. Cellular Corp., Sr. Notes, | | | |
| Baa3 | | | 95 | | 6.70%, 12/15/33 | | | 82,219 |
| | | | | Verizon Communications, Inc., Sr. Unsec. Notes, | | | |
| A3 | | | 150 | | 5.50%, 2/15/18 | | | 146,095 |
| | | | | Vodafone Group PLC (United Kingdom), Sr. Notes, | | | |
| Baa1 | | | 200 | | 7.75%, 2/15/10 | | | 211,954 |
| | | | | Vodafone Group PLC (United Kingdom), Unsec. Notes, | | | |
| Baa1 | | | 100 | | 6.15%, 2/27/37 | | | 93,210 |
| | | | | | | | |
| | | | | | | | 5,683,339 |
|
| Tobacco 0.1% |
| | | | | Reynolds American, Inc., Bonds, | | | |
| Ba1 | | | 220 | | 6.75%, 6/15/17 | | | 222,521 |
| Ba1 | | | 100 | | 7.25%, 6/15/37 | | | 98,991 |
| | | | | | | | |
| | | | | | | | 321,512 |
| | | | | | | | |
| | | | | Total corporate bonds
(cost $53,132,825) | | | 51,790,365 |
| | | | | | | | |
| ASSET BACKED SECURITIES 1.0% |
| | | | | Accredited Mortgage Loan Trust, Ser. 2006-2, Class A1, | | | |
| Aaa | | | 42 | | 2.639%, 9/25/36(h) | | | 41,286 |
| | | | | American Express Credit Account Master Trust, Ser. 2004-4, Class C, 144A, | | | |
| Baa1 | | | 230 | | 3.288%, 3/15/12(h) | | | 218,903 |
| | | | | Ser. 2004-C, Class C, 144A, | | | |
| Baa1 | | | 37 | | 3.318%, 2/15/12(h) | | | 36,356 |
See Notes to Financial Statements.
| | |
| 44 | | Visit our website at www.jennisondryden.com |
| | | | | | | | | |
Moody’s
Rating† | | Principal
Amount (000) | | | Description | | Value (Note 1) |
| | | | | | | | | |
| ASSET BACKED SECURITIES (Continued) |
| | | | | | Amortizing Residential Collateral Trust, | | | |
| | | | | | Ser. 2002-BC7, Class M2, | | | |
| BB(d) | | $ | 23 | | | 3.949%, 10/25/32(h) | | $ | 16,322 |
| | | | | | Series 2002-BC9, Class M1, | | | |
| Aa2 | | | 497 | | | 4.249%, 12/25/32(h) | | | 382,586 |
| | | | | | CDC Mortgage Capital Trust,
Ser. 2002-HE3, Class M1, | | | |
| A1 | | | 146 | | | 4.249%, 3/25/33(h) | | | 114,466 |
| | | | | | Centex Home Equity,
Ser. 2005-A, Class M2, | | | |
| Aa2 | | | 360 | | | 3.099%, 1/25/35(h) | | | 299,790 |
| | | | | | Citibank Credit Card Issuance Trust,
Ser. 2006-C1, Class C1, | | | |
| Baa2 | | | 300 | | | 2.936%, 2/20/15(h) | | | 238,732 |
| | | | | | Countrywide Asset-Backed Certificates,
Ser. 2006-BC2, Class 2A1, | | | |
| Aaa | | | 6 | | | 2.639%, 1/25/45(h) | | | 5,968 |
| | | | | | Credit-Based Asset Servicing and Securitization, | | | |
| | | | | | Ser. 2005-CB6, Class A3, | | | |
| Aaa | | | 270 | | | 5.120%, 7/25/35 | | | 265,487 |
| | | | | | Ser. 2006-CB3, Class AV1, | | | |
| Aaa | | | 189 | (i) | | 2.659%, 3/25/36(h) | | | 189 |
| | | | | | Equity One ABS, Inc.,
Ser. 2004-3, Class M1, | | | |
| Aa2 | | | 260 | | | 5.70%, 7/25/34 | | | 206,084 |
| | | | | | First Franklin Mortgage Loan Asset Backed Certs.,
Ser. 2005-FFH1, Class M2, | | | |
| Aa2 | | | 300 | | | 3.119%, 6/25/36(h) | | | 211,426 |
| | | | | | HFC Home Equity Loan Asset Backed Certs.,
Ser. 2005-2, Class M2, | | | |
| Aa1 | | | 104 | | | 3.026%, 1/20/35(h) | | | 80,160 |
| | | | | | Long Beach Mortgage Loan Trust,
Ser. 2006-6, Class 2A1, | | | |
| Aaa | | | 139 | | | 2.639%, 7/25/36(h) | | | 137,745 |
| | | | | | MBNA Master Credit Card Trust, Ser. 1999-J, Class A, | | | |
| Aaa | | | 2,400 | | | 7.00%, 2/15/12 | | | 2,527,905 |
See Notes to Financial Statements.
| | |
| The Prudential Investment Portfolios, Inc./Dryden Active Allocation Fund | | 45 |
Portfolio of Investments
as of March 31, 2008 (Unaudited) continued
| | | | | | | | |
Moody’s
Rating† | | Principal
Amount (000) | | Description | | Value (Note 1) |
| | | | | | | | |
| ASSET BACKED SECURITIES (Continued) |
| | | | | Morgan Stanley ABS Capital I, Ser. 2004-NC3, Class M2, | | | |
| A2 | | $ | 166 | | 3.699%, 3/25/34(h) | | $ | 118,453 |
| | | | | Morgan Stanley Dean Witter Capital I, | | | |
| | | | | Ser. 2002-NC4, Class M1, | | | |
| Aaa | | | 211 | | 3.874%, 9/25/32(h) | | | 178,038 |
| | | | | Series 2002-HE1, Class M1, | | | |
| Aa2 | | | 294 | | 3.499%, 7/25/32(h) | | | 232,605 |
| | | | | Nomura Home Equity Loan, Inc., | | | |
| | | | | Ser. 2006-HE2, Class A1, | | | |
| Aaa | | | 20 | | 2.659%, 3/25/36(h) | | | 20,077 |
| | | | | Residential Asset Securities Corp., | | | |
| | | | | Ser. 2004-KS2, Class MI1, | | | |
| Aa2 | | | 50 | | 4.710%, 3/25/34(h) | | | 40,767 |
| | | | | Saxon Asset Securities Trust, | | | |
| | | | | Ser. 2005-2, Class M2, | | | |
| Aa2 | | | 240 | | 3.039%, 10/25/35(h) | | | 227,761 |
| | | | | Securitized Asset Backed Receivables LLC Trust, | | | |
| | | | | Ser. 2006-FR3, Class A3, | | | |
| Aaa | | | 300 | | 2.849%, 5/25/36(h) | | | 234,000 |
| | | | | Ser. 2004-OP1, Class M1, | | | |
| Aa2 | | | 265 | | 3.109%, 2/25/34(h) | | | 197,126 |
| | | | | WFS Financial Owner Trust, | | | |
| | | | | Ser. 2004-4, Class D, | | | |
| A2 | | | 22 | | 3.580%, 5/17/12 | | | 22,295 |
| | | | | | | | |
| | | | | Total asset backed securities
(cost $6,856,776) | | | 6,054,527 |
| | | | | | | | |
| COLLATERALIZED MORTGAGE OBLIGATIONS 0.6% |
| | | | | Banc of America Mortgage Securities, Inc., | | | |
| | | | | Ser. 2005-A, Class 2A1, | | | |
| Aaa | | | 196 | | 4.457%, 2/25/35(h) | | | 186,231 |
| | | | | Ser. 2005-B, Class 2A1, | | | |
| Aaa | | | 186 | | 4.377%, 3/25/35(h) | | | 186,747 |
| | | | | Bank of America Alternative Loan Trust, | | | |
| | | | | Ser. 2006-5, Class 3A1, | | | |
| Aaa | | | 285 | | 6.00%, 6/25/46 | | | 277,785 |
| | | | | Series 2005-12, Class 3CB1, | | | |
| Aaa | | | 760 | | 6.00%, 1/25/36 | | | 681,717 |
See Notes to Financial Statements.
| | |
| 46 | | Visit our website at www.jennisondryden.com |
| | | | | | | | |
Moody’s
Rating† | | Principal
Amount (000) | | Description | | Value (Note 1) |
| | | | | | | | |
| COLLATERALIZED MORTGAGE OBLIGATIONS (Continued) |
| | | | | Chase Mortgage Finance Corp., | | | |
| | | | | Ser. 2007-A1, Class 1A5, | | | |
| Aaa | | $ | 966 | | 4.35%, 2/25/37(h) | | $ | 958,175 |
| | | | | Countrywide Alternative Loan Trust, | | | |
| | | | | Ser. 2004-18CB, Class 3A1, | | | |
| Aaa | | | 283 | | 5.25%, 9/25/19 | | | 261,484 |
| | | | | Federal National Mortgage Association, | | | |
| | | | | Ser. 1993-55, Class K, | | | |
| Aaa | | | 7 | | 6.50%, 5/25/08 | | | 6,946 |
| | | | | JP Morgan Mortgage Trust, | | | |
| | | | | Ser. 2007-A1, Class 4A1, | | | |
| Aaa | | | 561 | | 4.071%, 7/25/35(h) | | | 536,205 |
| | | | | Master Alternative Loan Trust, | | | |
| | | | | Ser. 2004-4, Class 4A1, | | | |
| Aaa | | | 358 | | 5.00%, 4/25/19 | | | 359,357 |
| | | | | Ser. 2003-8, Class 4A1, | | | |
| AAA(d) | | | 25 | | 7.00%, 12/25/33 | | | 24,856 |
| | | | | Structured Adjustable Rate Mortgage Loan Trust, | | | |
| | | | | Ser. 2004-1, Class 4A-3, | | | |
| Aaa | | | 222 | | 4.17%, 2/25/34(h) | | | 211,517 |
| | | | | Washington Mutual Alternative Mortgage Pass-Through Certs., | | | |
| | | | | Ser. 2005-1, Class 3A, | | | |
| AAA(d) | | | 135 | | 5.00%, 3/25/20 | | | 129,941 |
| | | | | | | | |
| | | | | Total collateralized mortgage obligations
(cost $3,982,755) | | | 3,820,961 |
| | | | | | | | |
| COMMERCIAL MORTGAGE BACKED SECURITIES 4.3% | | | |
| | | | | Banc of America Commercial Mortgage, Inc., | | | |
| | | | | Ser. 2003-2, Class A3, | | | |
| AAA(d) | | | 400 | | 4.873%, 3/11/41(h) | | | 389,247 |
| | | | | Ser. 2004-1, Class XP, | | | |
| AAA(d) | | | 1,905 | | 0.631%, 11/10/39(h) | | | 29,974 |
| | | | | Ser. 2004-2, Class A3, | | | |
| Aaa | | | 200 | | 4.050%, 11/10/38 | | | 194,912 |
| | | | | Ser. 2004-2, Class A4, | | | |
| Aaa | | | 560 | | 4.153%, 11/10/38 | | | 538,613 |
| | | | | Ser. 2005-6, Class A4, | | | |
| AAA(d) | | | 1,400 | | 3.353%, 9/10/47(h) | | | 1,392,845 |
See Notes to Financial Statements.
| | |
| The Prudential Investment Portfolios, Inc./Dryden Active Allocation Fund | | 47 |
Portfolio of Investments
as of March 31, 2008 (Unaudited) continued
| | | | | | | | |
Moody’s
Rating† | | Principal
Amount (000) | | Description | | Value (Note 1) |
| | | | | | | | |
| COMMERCIAL MORTGAGE BACKED SECURITIES (Continued) |
| | | | | Bear Stearns Commercial Mortgage Securities, | | | |
| | | | | Ser. 2001-TOP4, Class E, 144A, | | | |
| Baa1 | | $ | 430 | | 6.47%, 11/15/33(h) | | $ | 393,131 |
| | | | | Ser. 2004-T16, Class X2, | | | |
| AAA(d) | | | 3,883 | | 0.913%, 2/13/46(h) | | | 92,682 |
| | | | | Ser. 2005-T18, Class AAB, | | | |
| Aaa | | | 350 | | 4.823%, 2/13/42(h) | | | 331,684 |
| | | | | Ser. 2005-T20, Class AAB, | | | |
| Aaa | | | 500 | | 5.139%, 10/12/42(h) | | | 483,355 |
| | | | | Ser. 2006-BBA7, Class A1, 144A, | | | |
| Aaa | | | 144 | | 2.928%, 3/15/19(h) | | | 131,682 |
| | | | | C.W. Capital Cobalt Ltd., Ser. 2007-C3, Class A3, | | | |
| AAA(d) | | | 500 | | 5.820%, 5/15/46(h) | | | 483,563 |
| | | | | Citigroup Commercial Mortgage Trust, Ser. 2006-C5, Class ASB, | | | |
| Aaa | | | 740 | | 5.413%, 10/15/49 | | | 733,646 |
| | | | | Commercial Mortgage Acceptance Corporation, Ser. 1998-C2, Class X, | | | |
| AAA(d) | | | 2,712 | | 0.892%, 9/15/30(h) | | | 71,849 |
| | | | | Commercial Mortgage Pass-Through Certs., Ser. 2004-LB2A, Class X2, 144A, | | | |
| AAA(d) | | | 2,136 | | 1.03%, 3/10/39(h) | | | 41,440 |
| | | | | Credit Suisse First Boston Mortgage Securities Corp., Ser. 2004-C4, Class A4, | | | |
| Aaa | | | 300 | | 4.283%, 10/15/39 | | | 288,318 |
| | | | | Credit Suisse Mortgage Capital Certs., | | | |
| | | | | Ser. 2006-C5, Class A3, | | | |
| Aaa | | | 435 | | 5.311%, 12/15/39 | | | 422,532 |
| | | | | Series 2006-C1, Class A4, | | | |
| AAA(d) | | | 800 | | 5.55%, 2/15/39(h) | | | 797,287 |
| | | | | DLJ Commercial Mortgage Corp., Ser. 2000-CF1, Class A1B, | | | |
| AAA(d) | | | 581 | | 7.62%, 6/10/33 | | | 604,588 |
| | | | | GE Commercial Mortgage Corp., Ser. 2004-C2, Class X2, 144A, | | | |
| Aaa | | | 4,231 | | 0.742%, 3/10/40(h) | | | 57,349 |
See Notes to Financial Statements.
| | |
| 48 | | Visit our website at www.jennisondryden.com |
| | | | | | | | |
Moody’s
Rating† | | Principal
Amount (000) | | Description | | Value (Note 1) |
| | | | | | | | |
| COMMERCIAL MORTGAGE BACKED SECURITIES (Continued) |
| | | | | GMAC Commercial Mortgage Securities, Inc., | | | |
| | | | | Ser. 2005-C1, Class A2, | | | |
| AAA(d) | | $ | 496 | | 4.471%, 5/10/43 | | $ | 489,916 |
| | | | | Ser. 2005-C1, Class A5, | | | |
| AAA(d) | | | 645 | | 4.697%, 5/10/43 | | | 625,362 |
| | | | | Greenwich Capital Commercial Funding Corp., | | | |
| | | | | Ser. 2003-C1, Class A4, | | | |
| Aaa | | | 1,300 | | 4.111%, 7/05/35 | | | 1,203,687 |
| | | | | Ser. 2005-GG5, Class A5 | | | |
| Aaa | | | 2,060 | | 5.224%, 4/10/37(h) | | | 2,047,801 |
| | | | | GS Mortgage Securities Corp. II, Series 2006-GG6, Class AAB, | | | |
| AAA(d) | | | 1,300 | | 5.587%, 4/10/38(h) | | | 1,272,139 |
| | | | | J.P. Morgan Chase Commercial Mortgage Securities Corp., | | | |
| | | | | Ser. 2005-CB12, Class A4, | | | |
| Aaa | | | 500 | | 4.895%, 9/12/37 | | | 488,232 |
| | | | | Ser. 2005-LDP5, Class A4, | | | |
| Aaa | | | 700 | | 5.1794%, 12/15/44(h) | | | 697,870 |
| | | | | Ser. 2006-CB16. Class ASB, | | | |
| Aaa | | | 700 | | 5.523%, 5/12/45 | | | 690,936 |
| | | | | Ser. 2006-LDP8, Class ASB, | | | |
| Aaa | | | 500 | | 5.370%, 5/15/45 | | | 485,701 |
| | | | | Ser. 2005-CB13, Class A4, | | | |
| Aaa | | | 455 | | 5.472 %, 1/12/43(h) | | | 455,266 |
| | | | | Ser. 2005-LDP2, Class ASB, | | | |
| Aaa | | | 1,000 | | 4.659%, 7/15/42 | | | 951,305 |
| | | | | Ser. 2005-LDP4, Class A4, | | | |
| Aaa | | | 520 | | 4.918%, 10/15/42(h) | | | 507,674 |
| | | | | Series 2006-LDP6, Class X2, | | | |
| Aaa | | | 27,052 | | 0.234%, 4/15/43(h) | | | 121,455 |
| | | | | KeyCorp, Ser. 2000-C1, Class A2, | | | |
| Aaa | | | 1,482 | | 7.727%, 5/17/32(h) | | | 1,533,225 |
| | | | | LB-UBS Commercial Mortgage Trust, | | | |
| | | | | Ser. 2003-C5, Class A2, | | | |
| AAA(d) | | | 437 | | 3.478%, 7/15/27 | | | 434,451 |
| | | | | Ser. 2004-C6, Class A5, | | | |
| AAA(d) | | | 800 | | 4.826%, 8/15/29(h) | | | 772,706 |
| | | | | Ser. 2005-C3, Class A3 | | | |
See Notes to Financial Statements.
| | |
| The Prudential Investment Portfolios, Inc./Dryden Active Allocation Fund | | 49 |
Portfolio of Investments
as of March 31, 2008 (Unaudited) continued
| | | | | | | | |
Moody’s
Rating† | | Principal
Amount (000) | | Description | | Value (Note 1) |
| | | | | | | | |
| COMMERCIAL MORTGAGE BACKED SECURITIES (Continued) |
| | | | | LB-UBS Commercial Mortgage Trust (cont’d.) | | | |
| Aaa | | $ | 500 | | 4.647%, 7/15/30 | | $ | 485,135 |
| | | | | Ser. 2005-C3, Class A5, | | | |
| Aaa | | | 430 | | 4.739%, 7/15/30 | | | 416,976 |
| | | | | Lehman Brothers Floating Rate Commercial Mortgage Trust, | | | |
| | | | | Ser. 2006-LLFA, Class A1, 144A, | | | |
| Aaa | | | 33 | | 2.898%, 9/15/21(h) | | | 31,270 |
| | | | | Merrill Lynch Mortgage Trust, Ser. 2004-Key2, Class A3, | | | |
| Aaa | | | 400 | | 4.615%, 8/12/39 | | | 384,342 |
| | | | | Merrill Lynch/Countrywide Commercial Mortgage Trust, | | | |
| | | | | Ser. 2006-2, Class A4, | | | |
| Aaa | | | 430 | | 2.910%, 6/12/46(h) | | | 438,336 |
| | | | | Ser. 2007-7, Class ASB, | | | |
| Aaa | | | 1,500 | | 5.745%, 6/12/50(h) | | | 1,498,258 |
| | | | | Morgan Stanley Capital I, | | | |
| | | | | Ser. 2004-HQ3, Class A2, | | | |
| Aaa | | | 234 | | 4.05%, 1/13/41 | | | 229,511 |
| | | | | Ser. 2007-HQ11, Class AAB, | | | |
| Aaa | | | 1,000 | | 5.444%, 2/12/44 | | | 984,314 |
| | | | | Ser. 2007-T27, Class AAB, | | | |
| AAA(d) | | | 260 | | 5.803%, 6/11/42(h) | | | 257,468 |
| | | | | Wachovia Bank Commercial Mortgage Trust, Ser. 2003-C3, Class A-2, | | | |
| AAA(d) | | | 1,100 | | 4.867%, 2/15/35 | | | 1,078,835 |
| | | | | | | | |
| | | | | Total commercial mortgage backed securities
(cost $26,695,416) | | | 26,060,868 |
| | | | | | | | |
|
| MORTGAGE BACKED SECURITIES 12.7% |
| | | | | Federal Home Loan Mortgage Corp., | | | |
| | | 2,556 | | 4.50%, 1/01/19 - 7/01/20 | | | 2,548,904 |
| | | 2,684 | | 5.00%, 7/01/18 - 5/01/34 | | | 2,708,229 |
| | | 548 | | 5.228%, 12/01/35(h) | | | 554,154 |
| | | 1,833 | | 5.50%, 12/01/33 - 7/01/34 | | | 1,856,334 |
| | | 6,500 | | 5.50%, TBA(c) 30 YR | | | 6,562,971 |
| | | 657 | | 6.00%, 1/01/34 | | | 676,448 |
| | | 5,000 | | 6.00%, TBA(c) 30 YR | | | 5,126,559 |
See Notes to Financial Statements.
| | |
| 50 | | Visit our website at www.jennisondryden.com |
| | | | | | | | |
Moody’s
Rating† | | Principal
Amount (000) | | Description | | Value (Note 1) |
| | | | | | | | |
| MORTGAGE BACKED SECURITIES (Continued) |
| | | | | Federal Home Loan Mortgage Corp., (cont’d.) | | | |
| | $ | 571 | | 7.00%, 6/01/14 - 11/01/33 | | $ | 604,901 |
| | | | | Federal National Mortgage Association, | | | |
| | | 324 | | 4.00%, 5/01/19 | | | 317,039 |
| | | 570 | | 4.36%, 11/01/35(h) | | | 573,479 |
| | | | | Federal National Mortgage Association (Cont’d.) | | | |
| | | 4,179 | | 4.50%, 11/01/18 - 3/01/34 | | | 4,143,641 |
| | | 2,429 | | 5.00%, 10/01/18 - 2/01/36 | | | 2,420,962 |
| | | 2,500 | | 5.00%, TBA(c) 30 YR | | | 2,474,219 |
| | | 8,688 | | 5.50%, 12/01/16 - 6/01/37 | | | 8,810,183 |
| | | 1,500 | | 5.50%, TBA 15 YR | | | 1,530,938 |
| | | 5,500 | | 5.50%, TBA(c) 30 YR | | | 5,551,563 |
| | | 2,301 | | 5.97%, 7/01/37(h) | | | 2,354,018 |
| | | 4,671 | | 6.00%, 9/01/13 - 2/01/35 | | | 4,807,708 |
| | | 2,000 | | 6.00%, TBA 30 YR | | | 2,048,750 |
| | | 5,784 | | 6.50%, 5/01/13 - 10/01/37 | | | 6,003,383 |
| | | 7,000 | | 6.50%, TBA 30 YR | | | 7,249,374 |
| | | 101 | | 7.00%, 6/01/32 | | | 107,165 |
| | | 9 | | 7.50%, 9/01/30 | | | 9,344 |
| | | 21 | | 8.00%, 12/01/23 | | | 22,883 |
| | | 15 | | 8.50%, 2/01/28 | | | 16,848 |
| | | | | Government National Mortgage Association, | | | |
| | | 3,817 | | 5.50%, 7/15/33 - 2/15/36 | | | 3,899,504 |
| | | 3,000 | | 6.00%, TBA(c) 30 YR | | | 3,095,624 |
| | | 766 | | 6.50%, 9/15/23 - 8/15/32 | | | 800,356 |
| | | 160 | | 7.00%, 6/15/24 - 5/15/31 | | | 171,517 |
| | | 22 | | 7.50%, 4/15/29 - 5/15/31 | | | 23,843 |
| | | 159 | | 8.00%, 8/15/22 - 6/15/25 | | | 173,931 |
| | | | | | | | |
| | | | | Total mortgage backed securities
(cost $76,108,823) | | | 77,244,772 |
| | | | | | | | |
| |
| U.S. GOVERNMENT AGENCY OBLIGATIONS 2.0% | | | |
| | | | | Federal Home Loan Bank, | | | |
| | | 1,680 | | 2.375%, 4/30/10 | | | 1,682,871 |
| | | 205 | | 3.375%, 2/27/13 | | | 205,747 |
| | | 1,215 | | 4.375%, 10/03/08 | | | 1,226,195 |
| | | 775 | | 4.50%, 5/13/11 | | | 814,166 |
See Notes to Financial Statements.
| | |
| The Prudential Investment Portfolios, Inc./Dryden Active Allocation Fund | | 51 |
Portfolio of Investments
as of March 31, 2008 (Unaudited) continued
| | | | | | | | |
Moody’s
Rating† | | Principal
Amount (000) | | Description | | Value (Note 1) |
| | | | | | | | |
| U.S. GOVERNMENT AGENCY OBLIGATIONS (Continued) |
| | | | | Federal Home Loan Mortgage Corp., | | | |
| | $ | 710 | | 3.25%, 2/25/11 | | $ | 720,365 |
| | | 560 | | 4.75%, 1/18/11 - 1/19/16 | | | 591,036 |
| | | 879 | | 5.00%, 9/16/08 | | | 889,479 |
| | | | | Federal National Mortgage Association, | | | |
| | | 725 | | 2.75%, 4/11/11 | | | 724,561 |
| | | 2,145 | | 3.25%, 4/09/13(g) | | | 2,142,373 |
| | | 2,035 | | 5.00%, 2/16/12 - 3/15/16(g) | | | 2,184,694 |
| | | 95 | | 5.375%, 6/12/17 | | | 104,335 |
| | | 265 | | 6.125%, 3/15/12 | | | 295,669 |
| | | | | Tennessee Valley Authority, Notes, | | | |
| | | 280 | | 4.50%, 4/01/18 | | | 288,413 |
| | | | | | | | |
| | | | | Total U.S. government agency obligations
(cost $11,510,817) | | | 11,869,904 |
| | | | | | | | |
|
| U.S. GOVERNMENT TREASURY SECURITIES 1.8% |
| | | | | United States Treasury Bonds, | | | |
| | | 16 | | 5.00%, 5/15/37 | | | 17,899 |
| | | 180 | | 6.25%, 8/15/23 | | | 221,555 |
| | | 860 | | 7.25%, 8/15/22 | | | 1,149,242 |
| | | 50 | | 7.625%, 2/15/25 | | | 70,375 |
| | | 2,535 | | 8.125%, 8/15/19 - 8/15/21(b)(g) | | | 3,562,410 |
| | | 1,265 | | 8.875%, 8/15/17(g) | | | 1,802,032 |
| | | 39 | | 9.00%, 11/15/18 | | | 57,022 |
| | | | | United States Treasury Inflation Index, | | | |
| | | 1,151 | | 2.375%, 1/15/17 | | | 1,284,816 |
| | | 213 | | 2.375%, 1/15/25 | | | 231,348 |
| | | | | United States Treasury Notes, | | | |
| | | 645 | | 2.50%, 3/31/13 | | | 645,957 |
| | | 350 | | 3.50%, 2/15/18(g) | | | 352,023 |
| | | 15 | | 4.00%, 9/30/09 | | | 15,540 |
| | | 10 | | 4.50%, 9/30/11 | | | 10,838 |
| | | | | United States Treasury Strips, | | | |
| | | 2,015 | | Zero Coupon, 2/15/19 - 5/15/20(g) | | | 1,226,718 |
| | | | | | | | |
| | | | | Total U.S. government treasury securities
(cost $9,888,782) | | | 10,647,775 |
| | | | | | | | |
See Notes to Financial Statements.
| | |
| 52 | | Visit our website at www.jennisondryden.com |
| | | | | | | | |
Moody’s
Rating† | | Principal
Amount (000) | | Description | | Value (Note 1) | |
| | | | | | | | |
| FOREIGN GOVERNMENT OBLIGATIONS 0.3% | |
| | | | DP World Ltd., Bonds, 144A, | | | | |
| A1 | | $ 390 | | 6.85%, 7/02/37 | | $ | 324,308 | |
| | | | Mexico Government International Bond (Mexico), Notes, | | | | |
| Baa1 | | 265 | | 7.50%, 1/14/12 | | | 298,125 | |
| | | | United Mexican States (Mexico), Notes, | | | | |
| Baa1 | | 860 | | 5.875%, 1/15/14 | | | 920,200 | |
| | | | | | | | |
| | | | Total foreign government obligations (cost $1,146,138) | | | 1,542,633 | |
| | | | | | | | |
| | | | Total long-term investments
(cost $559,475,134) | | | 579,619,164 | |
| | | | | | | | |
| SHORT-TERM INVESTMENTS 22.4% | |
| U.S. GOVERNMENT TREASURY SECURITY 0.1% | |
| | | | United States Treasury Bill,(b)(j) | | | | |
| | 725 | | 0.84%, 6/19/08 | | | 723,093 | |
| | | | | | | | |
| | | | (cost $723,680) | | | | |
| | | |
| | | Shares | | | | | |
| AFFILIATED MUTUAL FUNDS 22.3% | |
| | | | Dryden Core Investment Fund-Short Term Bond Series | | | | |
| | 3,517,236 | | (cost $35,020,084) | | | 31,057,194 | |
| | 104,490,825 | | Dryden Core Investment Fund-Taxable Money Market Series
(cost $104,490,825; includes $76,918,820 of cash collateral for securities on loan)(Note3)(e)(f) | | | 104,490,825 | |
| | | | | | | | |
| | | | Total affiliated mutual funds
(cost $139,510,910) | | | 135,548,019 | |
| | | | | | | | |
| | | | Total short-term investments
(cost $140,234,590) | | | 136,271,112 | |
| | | | | | | | |
| | | | Total Investments(k) 117.9%
(cost $699,709,724; Note 5) | | | 715,890,276 | |
| | | | Liabilities in excess of
other assets(l) (17.9%) | | | (108,599,799 | ) |
| | | | | | | | |
| | | | Net Assets 100.0% | | $ | 607,290,477 | |
| | | | | | | | |
See Notes to Financial Statements.
| | |
| The Prudential Investment Portfolios, Inc./Dryden Active Allocation Fund | | 53 |
Portfolio of Investments
as of March 31, 2008 (Unaudited) continued
144A—Security was purchased pursuant to Rule 144A under the Securities Act of 1933 and may not be resold subject to that rule except to qualified institutional buyers. Unless otherwise noted, 144A securities are deemed to liquid.
GO—General Obligation
MTN—Medium Term Notes
NA—National Association
ULC—Unlimited Liability Corporation
| † | The ratings reflected are as of March 31, 2008. Ratings of certain bonds may have changed subsequent to that date. |
| (a) | Non-income producing security. |
| (b) | All or partial amount of security is segregated as initial margin for financial futures transactions. |
| (c) | Principal amount of $24,000,000 represents a to-be announced (“TBA”) mortgage dollar roll. |
| (d) | Standard and Poor’s Rating. |
| (e) | Represents security, or a portion thereof, purchased with cash collateral received for securities on loan. |
| (f) | Prudential Investments LLC, the manager of the Fund, also serves as manager of the Dryden Core Investment Fund—Taxable Money Market Series and the Dryden Core Investment Fund—Dryden Short-Term Bond Series. |
| (g) | Portion of securities on loan with an aggregate market value of $72,673,530; cash collateral of $76,918,820 was received with which the Portfolio purchased highly liquid short-term investments. |
| (h) | Variable rate instrument. |
| (i) | Amount is actual; not rounded to thousands. |
| (j) | Rate quoted represents yield-to-maturity as of purchase date. |
| (k) | As of March 31, 2008, 6 securities representing $1,237,206 and 0.2% of the net assets were fair valued in accordance with the policies adopted by the Board of Directors. |
| (l) | Liabilities in excess of other assets include net unrealized appreciation (depreciation) on financial futures contracts, interest rate swaps and credit default swaps as follows: |
Open future contracts outstanding at March 31, 2008:
| | | | | | | | | | | | | | |
Number of
Contracts | | Type | | Expiration
Date | | Value at
Trade
Date | | Value at
March 31, 2008 | | Unrealized
Appreciation
(Depreciation) | |
| | Long Positions: | | | | | | | | | | | | |
| 8 | | 10-Yr. U.S. T-Notes | | Jun-08 | | $ | 951,885.00 | | $ | 951,625.00 | | $ | (260 | ) |
| 16 | | 2-Yr. U.S. T-Notes | | Jun-08 | | | 3,415,409 | | | 3,434,500 | | | 19,091 | |
| 37 | | S&P 500 Index | | Jun-08 | | | 12,140,788 | | | 12,247,000 | | | 106,212 | |
| 51 | | U.S. Long Bond | | Jun-08 | | | 6,038,668 | | | 6,058,641 | | | 19,973 | |
| 53 | | 5-Yr. U.S. T-Notes | | Jun-08 | | | 5,990,331 | | | 6,054,422 | | | 64,091 | |
| | | | | | | | | | | | | | |
| | | | | | | | | | | | $ | 209,107 | |
| | | | | | | | | | | | | | |
See Notes to Financial Statements.
| | |
| 54 | | Visit our website at www.jennisondryden.com |
Interest rate swap agreements outstanding at March 31, 2008:
| | | | | | | | | | | | | | |
Counterparty | | Termination
Date | | Notional
Amount
(000) | | Fixed
Rate | | | Floating
Rate | | Unrealized
Appreciation/
Depreciation | |
Merrill Lynch Capital Services, Inc.(b) | | 3/20/2038 | | $ | 245 | | 4.650 | % | | 3 month LIBOR | | $ | (801 | ) |
Morgan Stanley Capital Services(a) | | 2/28/2013 | | | 1,455 | | 3.815 | % | | 3 month LIBOR | | | 35,022 | |
| | | | | | | | | | | | | | |
| | | | | | | | | | | | $ | 34,221 | |
| | | | | | | | | | | | | | |
| (a) | Portfolio pays the floating rate and receives the fixed rate. |
| (b) | Portfolio pays the fixed rate and receives the floating rate. |
Credit default swap agreements outstanding at March 31, 2008:
| | | | | | | | | | | | | | |
Counterparty | | Termination
Date | | Notional
Amount
(000) | | Fixed
Rate | | | Underlying
Bond | | Unrealized
Appreciation/
(Depreciation) | |
Citibank, NA(b) | | 9/20/2012 | | $ | 700 | | 0.32 | % | | Altria Group, Inc. | | | | |
| | | | | | | | | | 7.00%, due 11/04/13 | | $ | 10,918 | |
JPMorgan Chase Bank(b) | | 6/20/2012 | | | 1,000 | | 0.30 | % | | PPG Industries, Inc. | | | | |
| | | | | | | | | | 7.05%, due 11/04/13 | | | 23,274 | |
Barclays Bank PLC(b) | | 9/20/2012 | | | 700 | | 0.60 | % | | Fortune Brands, Inc. | | | | |
| | | | | | | | | | 6.25%, due 04/01/08 | | | 40,210 | |
JPMorgan Chase Bank(b) | | 9/20/2012 | | | 470 | | 1.52 | % | | Residential Capital LLC, | | | | |
| | | | | | | | | | 6.50%, due 04/17/13 | | | 273,402 | |
JPMorgan Chase Bank(b) | | 6/20/2014 | | | 240 | | 0.65 | % | | Bunge Ltd. Finance Corp., | | | | |
| | | | | | | | | | 5.35, due 04/15/14 | | | 14,466 | |
Credit Suisse International(b) | | 9/20/2017 | | | 750 | | 0.99 | % | | Gannett Co., Inc.
6.375%, due 04/01/12 | | | 40,177 | |
Merrill Lynch Capital Services, Inc.(b) | | 9/20/2016 | | | 150 | | 1.73 | % | | Tyson Foods, Inc.
6.85%, due 04/01/16 | | | 5,332 | |
Morgan Stanley Capital Services, Inc.(b) | | 3/20/2018 | | | 300 | | 0.70 | % | | Avon Products, Inc.
7.15%, due 11/15/09 | | | (4,175 | ) |
Barclays Bank, PLC(b) | | 3/20/2018 | | | 300 | | 1.22 | % | | Computer Science Corp. | | | | |
| | | | | | | | | | 5.00%, due 02/15/13 | | | (3,373 | ) |
Deutsche Bank AG(b) | | 6/20/2013 | | | 400 | | 2.00 | % | | International Lease
Finance Corp. | | | | |
| | | | | | | | | | 4.15%, due 01/20/15 | | | (3,005 | ) |
Morgan Stanley Capital Services, Inc.(b) | | 6/20/2018 | | | 300 | | 1.00 | % | | Newell Rubbermaid, Inc.
6.35%, due 07/15/28 | | | (2,480 | ) |
| | | | | | | | | | | | | | |
| | | | | | | | | | | | $ | 394,746 | |
| | | | | | | | | | | | | | |
| (a) | The Portfolio receives the fixed rate and pays the counterparty par in the event that the underlying bond defaults. |
| (b) | The Portfolio pays the fixed rate and receives from the counterparty par in the event that the underlying bond defaults. |
See Notes to Financial Statements.
| | |
| The Prudential Investment Portfolios, Inc./Dryden Active Allocation Fund | | 55 |
Portfolio of Investments
as of March 31, 2008 (Unaudited) continued
The industry classification of portfolio holdings and liabilities in excess of other assets shown as a percentage of net assets as of March 31, 2008 were as follows:
| | | |
Affiliated Mutual Funds (including 12.7% of collateral received for securities on loan) | | 22.3 | % |
Mortgage Backed Securities | | 12.7 | |
Oil, Gas & Consumable Fuels | | 7.2 | |
Commercial Mortgage Backed Securities | | 4.3 | |
Pharmaceuticals | | 4.1 | |
Insurance | | 3.3 | |
Computers & Peripherals | | 2.9 | |
Industrial Conglomerates | | 2.6 | |
Software | | 2.6 | |
Diversified Financial Services | | 2.5 | |
Diversified Telecommunication Services | | 2.5 | |
Aerospace & Defense | | 2.3 | |
Commercial Banks | | 2.1 | |
Media | | 2.1 | |
U.S. Government Agency Obligations | | 2.0 | |
U.S. Government Treasury Securities | | 1.9 | |
Chemicals | | 1.7 | |
Food & Staples Retailing | | 1.6 | |
Beverages | | 1.5 | |
Capital Markets | | 1.5 | |
Health Care Equipment & Supplies | | 1.5 | |
Household Products | | 1.5 | |
Energy Equipment & Services | | 1.3 | |
Health Care Providers & Services | | 1.3 | |
Machinery | | 1.3 | |
Communications Equipment | | 1.2 | |
Semiconductors & Semiconductor Equipment | | 1.2 | |
Hotels, Restaurants & Leisure | | 1.1 | |
Asset Backed Securities | | 1.0 | |
Electric Utilities | | 1.0 | |
Road & Rail | | 1.0 | |
Tobacco | | 1.0 | |
Real Estate Investment Trusts | | 0.9 | |
Specialty Retail | | 0.9 | |
Telecommunications | | 0.9 | |
Banking | | 0.8 | |
Electric | | 0.8 | |
Food Products | | 0.8 | |
Biotechnology | | 0.7 | |
IT Services | | 0.7 | |
Metals & Mining | | 0.7 | |
Thrifts & Mortgage Finance | | 0.7 | |
Brokerage | | 0.6 | |
Collateralized Mortgage Obligations | | 0.6 | |
Foods | | 0.6 | |
Internet Software & Services | | 0.6 | |
See Notes to Financial Statements.
| | |
| 56 | | Visit our website at www.jennisondryden.com |
| | | |
Multi-Utilities | | 0.6 | % |
Electrical Equipment | | 0.5 | |
Health Care & Pharmaceutical | | 0.5 | |
Textiles, Apparel & Luxury Goods | | 0.5 | |
Electronic Equipment & Instruments | | 0.4 | |
Independent Power Producers & Energy Traders | | 0.4 | |
Office Electronics | | 0.4 | |
Foreign Government Obligations | | 0.3 | |
Health Care Insurance | | 0.3 | |
Internet & Catalog Retail | | 0.3 | |
Non—Captive Finance | | 0.3 | |
Air Freight & Logistics | | 0.2 | |
Automobiles | | 0.2 | |
Cable | | 0.2 | |
Capital Goods | | 0.2 | |
Commercial Services & Supplies | | 0.2 | |
Construction & Engineering | | 0.2 | |
Consumer | | 0.2 | |
Containers & Packaging | | 0.2 | |
Diversified Consumer Services | | 0.2 | |
Energy—Other | | 0.2 | |
Life Sciences, Tools & Services | | 0.2 | |
Media & Entertainment | | 0.2 | |
Non—Corporate | | 0.2 | |
Paper & Forest Products | | 0.2 | |
Pipelines & Other | | 0.2 | |
Railroads | | 0.2 | |
Retail | | 0.2 | |
Structured Notes | | 0.2 | |
Technology | | 0.2 | |
Wireless Telecommunication Services | | 0.2 | |
Airlines | | 0.1 | |
Building Materials & Construction | | 0.1 | |
Construction Materials | | 0.1 | |
Energy—Integrated | | 0.1 | |
Gaming | | 0.1 | |
Gas Utilities | | 0.1 | |
Metals | | 0.1 | |
Multiline Retail | | 0.1 | |
Real Estate Management & Development | | 0.1 | |
Trading Companies & Distributors | | 0.1 | |
| | | |
| | 117.9 | |
Liabilities in excess of other assets | | (17.9 | ) |
| | | |
| | 100.0 | % |
| | | |
See Notes to Financial Statements.
| | |
| The Prudential Investment Portfolios, Inc./Dryden Active Allocation Fund | | 57 |
Statement of Assets and Liabilities
as of March 31, 2008 (Unaudited)
| | | | |
Assets | | | | |
Investments at value, including securities on loan of $72,673,530 | | | | |
Unaffiliated Investments (cost $560,198,814) | | $ | 580,342,257 | |
Affiliated Investments (cost $139,510,910) | | | 135,548,019 | |
Foreign currency, at value (cost $30,394) | | | 30,579 | |
Receivable for investments Sold | | | 42,587,736 | |
Dividends and interest receivable | | | 2,346,292 | |
Unrealized appreciation on swaps | | | 442,801 | |
Receivable for Series shares Sold | | | 178,420 | |
Due from broker—variation margin | | | 71,595 | |
Foreign tax reclaim receivable | | | 34,577 | |
Prepaid expenses | | | 7,301 | |
| | | | |
Total assets | | | 761,589,577 | |
| | | | |
| |
Liabilities | | | | |
Payable to broker for collateral for securities on loan | | | 76,918,820 | |
Payable for investments Purchased | | | 75,728,659 | |
Payable for Series shares Reacquired | | | 690,261 | |
Management fee payable | | | 317,412 | |
Accrued expenses and other liabilities | | | 282,401 | |
Distribution fee payable | | | 168,519 | |
Transfer agent fee payable | | | 167,902 | |
Unrealized depreciation on swaps | | | 13,834 | |
Payable to custodian | | | 6,864 | |
Deferred directors’ fees | | | 4,428 | |
| | | | |
Total liabilities | | | 154,299,100 | |
| | | | |
| |
Net Assets | | $ | 607,290,477 | |
| | | | |
| | | | | |
Net assets were comprised of: | | | | |
Common stock, at par | | $ | 49,890 | |
Paid-in capital in excess of par | | | 594,960,257 | |
| | | | |
| | | 595,010,147 | |
Undistributed net investment income | | | 3,753,516 | |
Accumulated net realized loss on investments and foreign currency transactions | | | (8,297,672 | ) |
Net unrealized appreciation on investments and foreign currencies | | | 16,824,486 | |
| | | | |
Net assets, March 31, 2008 | | $ | 607,290,477 | |
| | | | |
See Notes to Financial Statements.
| | |
| 58 | | Visit our website at www.jennisondryden.com |
| | | |
Class A | | | |
Net asset value and redemption price per share | | | |
($382,579,707 ÷ 31,468,767 shares of common stock issued and outstanding) | | $ | 12.16 |
Maximum sales charge (5.50% of offering price) | | | .71 |
| | | |
Maximum offering price to public | | $ | 12.87 |
| | | |
| |
Class B | | | |
Net asset value, offering price and redemption price per share | | | |
($35,743,638 ÷ 2,939,589 shares of common stock issued and outstanding) | | $ | 12.16 |
| | | |
| |
Class C | | | |
Net asset value, offering price and redemption price per share | | | |
($20,269,509 ÷ 1,666,923 shares of common stock issued and outstanding) | | $ | 12.16 |
| | | |
| |
Class L | | | |
Net asset value, offering price and redemption price per share | | | |
($9,954,976 ÷ 817,286 shares of common stock issued and outstanding) | | $ | 12.18 |
| | | |
| |
Class M | | | |
Net asset value, offering price and redemption price per share | | | |
($14,468,256 ÷ 1,189,810 shares of common stock issued and outstanding) | | $ | 12.16 |
| | | |
| |
Class R | | | |
Net asset value, offering price and redemption price per share | | | |
($973,994 ÷ 79,958 shares of common stock issued and outstanding) | | $ | 12.18 |
| | | |
| |
Class X | | | |
Net asset value, offering price and redemption price per share | | | |
($5,702,568 ÷ 468,987 shares of common stock issued and outstanding) | | $ | 12.16 |
| | | |
| |
Class Z | | | |
Net asset value, offering price and redemption price per share | | | |
($137,597,829 ÷ 11,258,808 shares of common stock issued and outstanding) | | $ | 12.22 |
| | | |
See Notes to Financial Statements.
| | |
| The Prudential Investment Portfolios, Inc./Dryden Active Allocation Fund | | 59 |
Statement of Operations
Six Months Ended March 31, 2008 (Unaudited)
| | | | |
Net Investment Income | | | | |
Income | | | | |
Unaffiliated interest income (net of foreign withholding taxes of $534) | | $ | 4,755,439 | |
Unaffiliated dividend income (net of foreign withholding taxes of $24,845) | | | 4,347,936 | |
Affiliated dividend income | | | 1,581,201 | |
Affiliated income from securities loaned, net | | | 209,939 | |
| | | | |
Total income | | | 10,894,515 | |
| | | | |
| |
Expenses | | | | |
Management fee | | | 2,147,465 | |
Distribution fee—Class A | | | 542,742 | |
Distribution fee—Class B | | | 212,451 | |
Distribution fee—Class C | | | 114,479 | |
Distribution fee—Class L | | | 27,293 | |
Distribution fee—Class M | | | 99,623 | |
Distribution fee—Class R | | | 2,602 | |
Distribution fee—Class X | | | 32,515 | |
Transfer agent’s fees and expenses (including affiliated expense of $231,000) | | | 591,000 | |
Custodian’s fees and expenses | | | 95,000 | |
Registration fees | | | 43,000 | |
Reports to shareholders | | | 40,000 | |
Audit fee | | | 14,000 | |
Directors’ fees | | | 13,000 | |
Insurance | | | 8,000 | |
Legal fees and expenses | | | 8,000 | |
Miscellaneous | | | 21,634 | |
| | | | |
Total expenses | | | 4,012,804 | |
Less: Expense waiver (Note 2) | | | (66,076 | ) |
| | | | |
Net expenses | | | 3,946,728 | |
| | | | |
Net investment income | | | 6,947,787 | |
| | | | |
| |
Realized And Unrealized Gain (Loss) On Investments And Foreign Currencies | | | | |
Net realized gain (loss) on: | | | | |
Investment transactions | | | (2,291,012 | ) |
Foreign currency transactions | | | (1,517 | ) |
Financial futures transactions | | | (20,576 | ) |
Short sales | | | (97,969 | ) |
Swap transactions | | | 209,692 | |
| | | | |
| | | (2,201,382 | ) |
| | | | |
Net change in unrealized appreciation (depreciation) on: | | | | |
Investments | | | (60,698,755 | ) |
Foreign currencies | | | 1,442 | |
Financial futures contracts | | | 67,043 | |
Swaps | | | 293,085 | |
Short sales | | | 1,367 | |
| | | | |
| | | (60,335,818 | ) |
| | | | |
Net loss on investments and foreign currencies | | | (62,537,200 | ) |
| | | | |
Net Decrease In Net Assets Resulting From Operations | | $ | (55,589,413 | ) |
| | | | |
See Notes to Financial Statements.
| | |
| 60 | | Visit our website at www.jennisondryden.com |
Statement of Changes in Net Assets
(Unaudited)
| | | | | | | | |
| | | Six Months
Ended
March 31, 2008 | | | Year
Ended
September 30, 2007 | |
Increase (Decrease) In Net Assets | | | | | | | | |
Operations | | | | | | | | |
Net investment income | | $ | 6,947,787 | | | $ | 13,487,590 | |
Net realized gain (loss) on investments and foreign currency transactions | | | (2,201,382 | ) | | | 49,454,411 | |
Net change in unrealized appreciation (depreciation) on investments and foreign currencies | | | (60,335,818 | ) | | | 9,613,437 | |
| | | | | | | | |
Net increase (decrease) in net assets resulting from operations | | | (55,589,413 | ) | | | 72,555,438 | |
| | | | | | | | |
Dividends and distributions (Note 1) | | | | | | | | |
Dividends from net investment income | | | | | | | | |
Class A | | | (8,785,932 | ) | | | (8,672,700 | ) |
Class B | | | (597,330 | ) | | | (714,612 | ) |
Class C | | | (328,173 | ) | | | (185,286 | ) |
Class L | | | (201,963 | ) | | | — | |
Class M | | | (286,234 | ) | | | — | |
Class R | | | (18,596 | ) | | | (19,394 | ) |
Class X | | | (92,198 | ) | | | — | |
Class Z | | | (3,565,022 | ) | | | (3,750,124 | ) |
| | | | | | | | |
| | | (13,875,448 | ) | | | (13,342,116 | ) |
| | | | | | | | |
Distributions from net realized gains | | | | | | | | |
Class A | | | (31,079,987 | ) | | | (22,380,205 | ) |
Class B | | | (3,217,556 | ) | | | (2,894,977 | ) |
Class C | | | (1,767,727 | ) | | | (750,616 | ) |
Class L | | | (827,042 | ) | | | — | |
Class M | | | (1,541,821 | ) | | | — | |
Class R | | | (76,149 | ) | | | (56,985 | ) |
Class X | | | (496,629 | ) | | | — | |
Class Z | | | (11,226,392 | ) | | | (8,627,020 | ) |
| | | | | | | | |
| | | (50,233,303 | ) | | | (34,709,803 | ) |
| | | | | | | | |
Series share transactions (Net of share conversions) (Note 6) | | | | | | | | |
Net proceeds from shares sold | | | 20,035,439 | | | | 53,584,520 | |
Net asset value of shares issued in connection with merger | | | — | | | | 84,406,026 | |
Net asset value of shares issued in reinvestment of dividends | | | 61,446,735 | | | | 45,972,274 | |
Cost of shares reacquired | | | (64,784,008 | ) | | | (145,214,237 | ) |
| | | | | | | | |
Net increase in net assets from Series share transactions | | | 16,698,166 | | | | 38,748,583 | |
| | | | | | | | |
Total increase (decrease) | | | (102,999,998 | ) | | | 63,252,102 | |
| | |
Net Assets | | | | | | | | |
Beginning of period | | | 710,290,475 | | | | 647,038,373 | |
| | | | | | | | |
End of period(a) | | $ | 607,290,477 | | | $ | 710,290,475 | |
| | | | | | | | |
(a) Includes undistributed net investment income of: | | $ | 3,753,516 | | | $ | 10,681,177 | |
| | | | | | | | |
See Notes to Financial Statements.
| | |
| The Prudential Investment Portfolios, Inc./Dryden Active Allocation Fund | | 61 |
Notes to Financial Statements
(Unaudited)
The Prudential Investment Portfolios, Inc. (the “Fund”) is registered under the Investment Company Act of 1940 as an open-end management investment company. The Fund was incorporated in Maryland on August 10, 1995 and consists of six series: Dryden Active Allocation Fund (the “Series”), Jennison Growth Fund, and Jennison Equity Opportunity Fund which are diversified funds and JennisonDryden Growth Allocation Fund, JennisonDryden Moderate Allocation Fund and JennisonDryden Conservative Allocation Fund which are non-diversified funds. These financial statements relate to Dryden Active Allocation Fund. The financial statements of the other series are not presented herein. The Series commenced investment operations on November 7, 1996.
The Series’ investment objective is to seek income and long-term growth of capital by investing in a portfolio of equity, fixed-income and money market securities which is actively managed to capitalize on opportunities created by perceived misvaluation.
Note 1. Accounting Policies
The following is a summary of significant accounting policies followed by the Fund and the Series, in the preparation of its financial statements.
Securities Valuation: Securities listed on a securities exchange (other than options on securities and indices) are valued at the last sale price on such exchange on the day of valuation or, if there was no sale on such day, at the mean between the last reported bid and asked prices, or at the last bid price on such day in the absence of an asked price. Securities traded via Nasdaq are valued at the Nasdaq official closing price (“NOCP”) on the day of valuation, or if there was no NOCP, at the last sale price. Securities that are actively traded in the over-the-counter market, including listed securities for which the primary market is believed by Prudential Investments LLC (“PI” or “Manager”), in consultation with the subadviser, to be over-the-counter, are valued at market value using prices provided by an independent pricing agent or principal market maker. Options on securities and indices traded on an exchange are valued at their last sale price as of the close of trading on the applicable exchange or, if there was no sale, at the mean between the most recently quoted bid and asked prices on such exchange. Futures contracts and options thereon traded on a commodities exchange or board of trade are valued at the last sale price at the close of trading on such exchange or board of trade or, if there was no sale on the applicable commodities exchange or board of trade on such day, at the mean between the most recently quoted bid and asked prices on such exchange or board of
| | |
| 62 | | Visit our website at www.jennisondryden.com |
trade or at the last bid price in the absence of an asked price. Prices may be obtained from independent pricing services which use information provided by market makers or estimates of market values obtained from yield data relating to investments or securities with similar characteristics. Securities for which reliable market quotations are not readily available, or whose values have been affected by events occurring after the close of the security’s foreign market and before the Fund’s normal pricing time, are valued at fair value in accordance with the Board of Director’s approved fair valuation procedures. When determining the fair valuation of securities some of the factors influencing the valuation include, the nature of any restrictions on disposition of the securities; assessment of the general liquidity of the securities; the issuer’s financial condition and the markets in which it does business; the cost of the investment; the size of the holding and the capitalization of issuer; the prices of any recent transactions or bids/offers for such securities or any comparable securities; any available analyst media or other reports or information deemed reliable by the investment adviser regarding the issuer or the markets or industry in which it operates. Using fair value to price securities may result in a value that is different from a security’s most recent closing price and from the price used by other mutual funds to calculate their net asset values.
Investments in mutual funds are valued at their net asset value as of the close of the New York Stock Exchange on the date of valuation.
Short-term securities which mature in sixty days or less are valued at amortized cost, which approximates market-value. The amortized cost method involves valuing a security at its cost on the date of purchase and thereafter assuming a constant amortization to maturity of the difference between the principal amount due at maturity and cost. Short-term securities which mature in more than sixty days are valued at current market quotations.
Foreign Currency Translation: The books and records of the Series are maintained in U.S. dollars. Foreign currency amounts are translated into U.S. dollars on the following basis:
(i) market value of investment securities, other assets and liabilities-at the current rate of exchange;
(ii) purchases and sales of investment securities, income and expenses-at the rate of exchange prevailing on the respective dates of such transactions.
Although the net assets of the Series are presented at the foreign exchange rates and market values at the close of the fiscal year, the Series does not isolate that portion of the results of operations arising as a result of changes in the foreign exchange rates
| | |
| The Prudential Investment Portfolios, Inc./Dryden Active Allocation Fund | | 63 |
Notes to Financial Statements
(Unaudited) continued
from the fluctuations arising from changes in the market prices of long-term portfolio securities held at fiscal year end. Similarly, the Series does not isolate the effect of changes in foreign exchange rates from the fluctuations arising from changes in the market prices of long-term portfolio securities sold during the fiscal year. Accordingly, these realized foreign currency gains or losses are included in the reported net realized gains or losses on investment transactions.
Net realized gains or losses on foreign currency transactions represent net foreign exchange gains or losses from holdings of foreign currencies, currency gains or losses realized between the trade and settlement dates of security transactions, and the difference between the amounts of dividends, interest and foreign withholding taxes recorded on the Series’ books and the U.S. dollar equivalent amounts actually received or paid. Net unrealized currency gains or losses from valuing foreign currency denominated assets and liabilities (other than investments) at year-end exchange rates are reflected as a component of unrealized appreciation (depreciation) on investments and foreign currencies.
Foreign security and currency transactions may involve certain considerations and risks not typically associated with those of domestic origin as a result of, among other factors, the possibility of political and economic instability or the level of governmental supervision and regulation of foreign securities markets.
Financial Futures Contracts: A financial futures contract is an agreement to purchase (long) or sell (short) an agreed amount of securities at a set price for delivery on a future date. Upon entering into a financial futures contract, the Series is required to pledge to the broker an amount of cash and/or other assets equal to a certain percentage of the contract amount. This amount is known as the “initial margin.” Subsequent payments, known as “variation margin,” are made or received by the Series each day, depending on the daily fluctuations in the value of the underlying security. Such variation margin is recorded for financial statement purposes on a daily basis as unrealized gain or loss. When the contract expires or is closed, the gain or loss is realized and is presented in the Statement of Operations as net realized gain or loss on financial futures transactions.
The Series invests in financial futures contracts in order to hedge its existing portfolio securities, or securities the Series intends to purchase, against fluctuations in value caused by changes in prevailing interest rates or market conditions. Should interest rates move unexpectedly, the Series may not achieve the anticipated benefits of the
| | |
| 64 | | Visit our website at www.jennisondryden.com |
financial futures contracts and may realize a loss. The use of futures transactions involves the risk of imperfect correlation in movements in the price of futures contracts, interest rates and the underlying hedged assets.
Financial futures contracts involve elements of both market and credit risk in excess of the amounts reflected on the Statement of Assets and Liabilities.
Forward Currency Contracts: A forward currency contract is a commitment to purchase or sell a foreign currency at a future date at a negotiated forward rate. The Series enters into forward currency contracts in order to hedge its exposure to changes in foreign currency exchange rates on its foreign portfolio holdings or on specific receivables and payables denominated in a foreign currency. The contracts are valued daily at current forward exchange rates and any unrealized gain or loss is included in net unrealized appreciation or depreciation on foreign currencies. Gain or loss is realized on the settlement date of the contract equal to the difference between the trade date and settlement value. This gain or loss, if any, is included in net realized gain or loss on foreign currency transactions. Risks may arise upon entering into these contracts from the potential inability of the counterparties to meet the terms of their contracts.
Short Sales: The Series may make short sales of securities as a method of hedging potential price declines in similar securities owned. The Series may sell a security it does not own in anticipation of a decline in the market value of that security (short sale). When the Series makes a short sale, it will borrow the security sold short and deliver it to the broker-dealer through which it made the short sale as collateral for its obligation to deliver the security upon conclusion of the sale. The Series may have to pay a fee to borrow the particular securities and may be obligated to return any interest or dividends received on such borrowed securities.
A gain, limited to the price at which the Series sold the security short, or a loss, unlimited as to dollar amount, will be recognized upon the termination of a short sale if the market price is less or greater than the proceeds originally received, respectively, and is presented in the Statement of Operations as net realized gain or loss on short sales.
Swaps: The Series may enter into swap agreements. A swap is an agreement to exchange the return generated by one instrument for the return generated by another instrument. The Series enters into interest rate swap agreements to manage its exposure to interest rates. Interest rate swap agreements involve the exchange by the Series with another party of their respective commitments to pay or receive interest and may involve payment/receipt of a premium at the time of initiation of the swap agreement. The Series’ swap agreements involve commitments to pay interest in
| | |
| The Prudential Investment Portfolios, Inc./Dryden Active Allocation Fund | | 65 |
Notes to Financial Statements
(Unaudited) continued
exchange for a market-linked return, both based on notional amounts. To the extent the total return of the security or index underlying the transaction exceeds or falls short of the offsetting interest rate obligation, the Series will receive a payment from or make a payment to the counterparty. The swaps are valued daily at current market value and any unrealized gain or loss is included in the Statement of Assets and Liabilities. Gain or loss is realized on the termination date of the swap and is equal to the difference between the Series’ cost basis in the swap and the proceeds of the closing transaction, including any fees.
During the period that the swap agreement is open, the Series may be subject to risk from the potential inability of the counterparty to meet the terms of the agreement.
Risk: Forward currency contracts, written options, financial futures contracts, and swap agreements involve elements of both market and credit risk in excess of the amounts reflected on the Statements of Assets and Liabilities. Lower rated or unrated securities are more likely to react to developments affecting market risk (general market liquidity) and credit risk (an issuer’s inability to meet principal and interest payments on its obligations) than are more highly rated securities, which react primarily to movements in the general level of interest rates. The ability of issuers of debt securities held by the Series to meet their obligations may be affected by economic developments in a specific industry or region.
Dollar Rolls: The Series may enter into mortgage dollar rolls in which the Series sells mortgage-backed securities for delivery in the current month and simultaneously contracts to repurchase substantially similar (same type, coupon and maturity) securities on a specified future date. During the roll period, the Series forgoes principal and interest paid on the securities. The Series’ policy is to record the components of dollar rolls as purchase and sale transactions. The Series had dollar rolls outstanding as of March 31, 2008, which are included in Receivable for Investments Sold and Payable for Investments Purchased in the Statement of Assets and Liabilities. The Series maintains a segregated account of U.S. government securities or other liquid assets, the dollar value of which is at least equal to its obligation with respect to dollar rolls.
The Series is subject to the risk that the market value of the securities the Series is obligated to repurchase under the agreement may decline below the repurchase price.
| | |
| 66 | | Visit our website at www.jennisondryden.com |
Securities Lending: The Series may lend its portfolio securities to broker-dealers. The loans are secured by collateral at least equal, at all times, to the market value of the securities loaned. Loans are subject to termination at the option of the borrower or the Series. Upon termination of the loan, the borrower will return to the lender securities identical to the loaned securities. Should the borrower of the securities fail financially, the Series has the right to repurchase the securities using the collateral in the open market. The Series recognizes income, net of any rebate and securities lending agent fees, for lending its securities in the form of fees or interest on the investment of any cash received as collateral. The Series also continues to receive interest and dividends or amounts equivalent thereto, on the securities loaned and recognizes any unrealized gain or loss in the market price of the securities loaned that may occur during the term of the loan.
When-Issued/Delayed Delivery Securities: Securities purchased or sold on a when-issued or delayed-delivery basis may be settled a month or more after trade date; interest income is not accrued until settlement date. At the time a Portfolio enters into such transactions, it instructs the custodian to segregate assets with a current value at least equal to the amount of its when-issued or delayed-delivery purchase commitments.
Securities Transactions and Net Investment Income: Securities transactions are recorded on the trade date. Realized gains or losses on sales of investments are calculated on the identified cost basis. Interest income, including amortization of premium and accretion of discount on debt securities, as required, is recorded on an accrual basis. Dividend income is recorded on the ex-dividend date. Expenses are recorded on the accrual basis. Net Investment income or loss (other than distribution fees which are charged directly to the respective class) and unrealized and realized gains or losses are allocated daily to each class of shares based upon the relative proportion of net assets of each class at the beginning of the day.
Dividends and Distributions: The Series expects to pay dividends of net investment income and distributions of net realized capital gains, if any, annually. Dividends and distributions to shareholders, which are determined in accordance with federal income tax regulations and which may differ from generally accepted accounting principles, are recorded on the ex-dividend date. Permanent book/tax differences relating to income and gains are reclassified amongst undistributed net investment income, accumulated net realized gain or loss and paid-in capital in excess of par, as appropriate.
Taxes: For federal income tax purposes, each Series in the Fund is treated as a separate taxpaying entity. It is the Series’ policy to continue to meet the requirements of the Internal Revenue Code applicable to regulated investment companies and to
| | |
| The Prudential Investment Portfolios, Inc./Dryden Active Allocation Fund | | 67 |
Notes to Financial Statements
(Unaudited) continued
distribute all of its net investment income and capital gains, if any, to its shareholders. Therefore, no federal income tax provision is required.
Withholding taxes on foreign dividends are recorded net of reclaimable amounts, at the time the related income is earned.
Estimates: The preparation of the financial statements requires management to make estimates and assumptions that affect the reported amounts and disclosures in the financial statements. Actual results could differ from those estimates.
Note 2. Agreements
The Fund has a management agreement for the Series with PI. Pursuant to this agreement, PI has responsibility for all investment advisory services and supervises the subadvisor’s performance of such services. PI has entered into a subadvisory agreement with Prudential Investment Management, Inc. (“PIM”). The subadvisory agreement provides that PIM furnishes investment advisory services in connection with the management of the Series. In connection therewith, PIM is obligated to keep certain books and records of the Series. PI pays for the services of PIM, the compensation of officers of the Series, occupancy and certain clerical and bookkeeping costs of the Series. The Series bears all other costs and expenses.
The management fee paid to PI is computed daily and payable monthly at an annual rate of .65 of 1% of the Series’ daily average net assets up to $1 billion and .60 of 1% of the average net assets of the Series in excess of $1 billion. The effective management fee rate was .65 of 1% for the six months ended March 31, 2008.
Effective, March 23, 2007, PI has contractually agreed to waive up to .02% of the Series’ management fee on an annualized basis until March 31, 2008, to the extent the Series’ net operating expenses, exclusive of taxes, interest, distribution (12b-1) fees and certain extraordinary expenses, exceed .86%.
The Series has a distribution agreement with Prudential Investment Management Services LLC (“PIMS”), which acts as the distributor of the Class A, Class B, Class C, Class L, Class M, Class R, Class X and Class Z shares of the Series. The Series compensates PIMS for distributing and servicing the Series’ Class A, Class B, Class C, Class L, Class M, Class R and Class X shares, pursuant to plans of distribution (the
| | |
| 68 | | Visit our website at www.jennisondryden.com |
“Class A, B, C, L, M, R and X Plans”), regardless of expenses actually incurred by PIMS. The distribution fees are accrued daily and payable monthly. No distribution or service fees are paid to PIMS as distributor of the Class Z shares of the Series.
Pursuant to the Class A, B, C, L, M, R and X Plans, the Series compensates PIMS for distribution-related activities at an annual rate of up to .30 of 1%, 1%, 1%, .50 of 1%, 1%, .75 of 1% and 1% of the average daily net assets of the Class A, B, C, L, M, R and X shares, respectively. For the six months ended March 31, 2008, PIMS contractually agreed to limit such fees to .50% of 1% of the average daily net assets of the Class R shares. For the period ended January 31, 2008, PIMS contractually agreed to limit such fees to .25 of 1% of the average daily net assets of the Class A shares.
PIMS has advised the Series that it received approximately $45,100 in front-end sales charges resulting from sales of Class A shares during the six months ended March 31, 2008. From these fees, PIMS paid such sales charges to dealers, which in turn paid commissions to salespersons and incurred other distribution costs.
PIMS has advised the Series that for the six months ended March 31, 2008, it received approximately $30,800, $1,700, $26,000 and $4,000 in contingent deferred sales charges imposed upon certain redemptions by Class B, Class C, Class M and Class X shareholders, respectively.
PI, PIM and PIMS are indirect, wholly-owned subsidiaries of Prudential Financial, Inc. (“Prudential”).
The Series, along with other affiliated registered investment companies (the “Funds”), is a party to a syndicated credit agreement (“SCA”) with two banks. The SCA provides for a commitment of $500 million. Interest on any borrowings under the SCA is incurred at contracted market rates and a commitment fee for the unused amount is accrued daily and paid quarterly. Effective October 26, 2007, the Funds renewed the SCA with the banks. The commitment under the renewed SCA continues to be $500 million. The Funds pay a commitment fee of .06 of 1% of the unused portion of the renewed SCA. The expiration date of the renewed SCA will be October 24, 2008. For the period from October 27, 2006 through October 26, 2007, the Funds paid a commitment fee of .07 of 1% of the unused portion of the agreement. The purpose of the SCA is to provide an alternative source of temporary funding for capital share redemptions.
The Series did not borrow any amounts pursuant to the SCA during the six months ended March 31, 2008.
| | |
| The Prudential Investment Portfolios, Inc./Dryden Active Allocation Fund | | 69 |
Notes to Financial Statements
(Unaudited) continued
Note 3. Other Transactions with Affiliates
Prudential Mutual Fund Services LLC (“PMFS”), an affiliate of PI and an indirect, wholly-owned subsidiary of Prudential, serves as the Fund’s transfer agent. Transfer agent fees and expenses in the Statement of Operations include certain out-of-pocket expenses paid to non-affiliates, where applicable.
The Series pays networking fees to affiliated and unaffiliated broker/dealers, including fees relating to the services of First Clearing, LLC (“First Clearing”), affiliates of PI. These networking fees are payments made to broker/dealers that clear mutual fund transactions through a national clearing system. For the six months ended March 31, 2008, the Series incurred approximately $57,800 in total networking fees, of which approximately $28,400 was paid to First Clearing. These amounts are included in transfer agent’s fees and expenses in the Statement of Operations.
PIM is the securities lending agent for the Series. For the six months ended March 31, 2008, PIM has been compensated by the Series approximately $90,000 for these services.
The Series invests in the Taxable Money Market Series and Short-Term Bond Series (the “Portfolios”), portfolios of Dryden Core Investment Fund, pursuant to an exemptive order received from the Securities and Exchange Commission. The Portfolios are a money market mutual fund and short term bond fund, respectively, registered under the Investment Company Act of 1940, as amended, and managed by PI.
Note 4. Portfolio Securities
Purchases and sales of investment securities other than short-term investments and U.S. Government Securities, for the six months ended March 31, 2008 were $249,241,699 and $260,791,840 respectively.
The amount of dollar rolls outstanding at March 31, 2008 was $24,508,752 (principal $24,000,000), which was 4.0% of total net assets.
| | |
| 70 | | Visit our website at www.jennisondryden.com |
Note 5. Distributions and Tax Information
Distributions to shareholders, which are determined in accordance with federal income tax regulations and which may differ from generally accepted accounting principles, are recorded on the ex-dividends date.
The United States federal income tax basis of the Series’ investments and the net unrealized appreciation as of March 31, 2008 were as follows:
| | | | | | |
Tax Basis
of Investments | | Appreciation | | (Depreciation) | | Net Unrealized
Appreciation |
| $701,065,880 | | $53,463,717 | | $(38,639,321) | | $14,824,396 |
The difference between book basis and tax basis was attributable to deferred losses on wash sales.
Management has analyzed the Fund’s tax positions taken on federal income tax returns for all open tax years and has concluded that as of March 31, 2008, no provision for income tax would be required in the Fund’s financial statements. The Fund’s federal and state income and federal excise tax returns for tax years for which the applicable statutes of limitations have not expired are subject to examination by the Internal Revenue Service and state departments of revenue.
Note 6. Capital
The Series offers Class A, Class B, Class C, Class L, Class M, Class R, Class X and Class Z shares. Class A and Class L shares are sold with a front-end sales charge of up to 5.50% and 5.75%, respectively. All investors who purchase Class A or Class L shares in an amount of $1 million or more are not subject to a front-end sales charge but are subject to a contingent deferred sales charge (CDSC) of 1% if they sell these shares within 12 months of purchase, including investors who purchase their shares through broker-dealers affiliated with Prudential. Class B shares are sold with a CDSC which declines from 5% to zero depending on the period of time the shares are held. Class M and Class X shares are sold with a CDSC which declines from 6% to zero depending on the period of time the shares are held. Class C shares have a CDSC of 1% during the first 12 months. Class B shares will automatically convert to Class A shares on a quarterly basis approximately seven years after purchase. A special exchange privilege is also available for shareholders who qualified to purchase Class A shares at net asset value. Class M shares will automatically convert to Class A shares approximately eight years after purchase. Class L shares are closed to most new purchases (with the exception of reinvested dividends). Class L and Class M
| | |
| The Prudential Investment Portfolios, Inc./Dryden Active Allocation Fund | | 71 |
Notes to Financial Statements
(Unaudited) continued
shares are only exchangeable with Class L and Class M shares, respectively, offered by certain other Strategic Partners Funds. Class X shares are closed to new purchases. Class R and Class Z shares are not subject to any sales or redemption charge and are offered exclusively for sale to a limited group of investors.
There are 1 billion shares of $.001 par value common stock of the Series, designated Class A, Class B, Class C, Class L, Class M, Class R, Class X and Class Z, each of which consists of 200 million, 125 million, 125 million, 125 million, 125 million, 75 million, 150 million, and 75 million authorized shares, respectively. As of March 31, 2008, Prudential owned 233 Class R shares of the Series.
Transactions in shares of common stock were as follows:
| | | | | | | |
Class A | | Shares | | | Amount | |
Six months ended March 31, 2008: | | | | | | | |
Shares sold | | 468,306 | | | $ | 6,203,441 | |
Shares issued in reinvestment of dividends | | 2,938,250 | | | | 37,932,808 | |
Shares reacquired | | (2,470,013 | ) | | | (32,871,623 | ) |
| | | | | | | |
Net increase (decrease) in shares outstanding before conversion | | 936,543 | | | | 11,264,626 | |
Shares issued upon conversion from Class B, M and X | | 695,494 | | | | 9,090,050 | |
| | | | | | | |
Net increase (decrease) in shares outstanding | | 1,632,037 | | | $ | 20,354,676 | |
| | | | | | | |
Year ended September 30, 2007: | | | | | | | |
Shares sold | | 1,245,776 | | | $ | 17,764,033 | |
Shares issued in connection with the merger | | 1,063,641 | | | | 15,019,303 | |
Shares issued in reinvestment of dividends | | 2,129,540 | | | | 29,366,366 | |
Shares reacquired | | (5,115,160 | ) | | | (73,023,265 | ) |
| | | | | | | |
Net increase (decrease) in shares outstanding before conversion | | (676,203 | ) | | | (10,873,563 | ) |
Shares issued upon conversion from Class B, M and X | | 1,181,554 | | | | 16,700,744 | |
| | | | | | | |
Net increase (decrease) in shares outstanding | | 505,351 | | | $ | 5,827,181 | |
| | | | | | | |
| | |
| 72 | | Visit our website at www.jennisondryden.com |
| | | | | | | |
Class B | | Shares | | | Amount | |
Six months ended March 31, 2008: | | | | | | | |
Shares sold | | 113,914 | | | $ | 1,519,239 | |
Shares issued in reinvestment of dividends | | 285,081 | | | | 3,688,937 | |
Shares reacquired | | (336,680 | ) | | | (4,390,860 | ) |
| | | | | | | |
Net increase (decrease) in shares outstanding before conversion | | 62,315 | | | | 817,316 | |
Shares reacquired upon conversion into Class A | | (312,862 | ) | | | (3,979,335 | ) |
| | | | | | | |
Net increase (decrease) in shares outstanding | | (250,547 | ) | | $ | (3,162,019 | ) |
| | | | | | | |
Year ended September 30, 2007: | | | | | | | |
Shares sold | | 346,520 | | | $ | 4,931,401 | |
Shares issued in connection with the merger | | 218,100 | | | | 3,080,504 | |
Shares issued in reinvestment of dividends | | 251,856 | | | | 3,480,652 | |
Shares reacquired | | (571,249 | ) | | | (8,132,177 | ) |
| | | | | | | |
Net increase (decrease) in shares outstanding before conversion | | 245,227 | | | | 3,360,380 | |
Shares reacquired upon conversion into Class A | | (782,582 | ) | | | (10,952,974 | ) |
| | | | | | | |
Net increase (decrease) in shares outstanding | | (537,355 | ) | | $ | (7,592,594 | ) |
| | | | | | | |
Class C | | | | | | |
Six months ended March 31, 2008: | | | | | | | |
Shares sold | | 89,705 | | | $ | 1,202,627 | |
Shares issued in reinvestment of dividends | | 131,171 | | | | 1,697,357 | |
Shares reacquired | | (295,592 | ) | | | (3,913,325 | ) |
| | | | | | | |
Net increase (decrease) in shares outstanding | | (74,716 | ) | | $ | (1,013,341 | ) |
| | | | | | | |
Year ended September 30, 2007: | | | | | | | |
Shares sold | | 274,666 | | | $ | 3,920,922 | |
Shares issued in connection with the merger | | 806,919 | | | | 11,388,083 | |
Shares issued in reinvestment of dividends | | 50,106 | | | | 692,464 | |
Shares reacquired | | (331,559 | ) | | | (4,718,615 | ) |
| | | | | | | |
Net increase (decrease) in shares outstanding | | 800,132 | | | $ | 11,282,854 | |
| | | | | | | |
Class L | | | | | | |
Six months ended March 31, 2008: | | | | | | | |
Shares sold | | 2,800 | | | $ | 34,279 | |
Shares issued in reinvestment of dividends | | 76,763 | | | | 993,316 | |
Shares reacquired | | (74,244 | ) | | | (991,059 | ) |
| | | | | | | |
Net increase (decrease) in shares outstanding | | 5,319 | | | $ | 36,536 | |
| | | | | | | |
Period ended September 30, 2007*: | | | | | | | |
Shares sold | | 87,100 | | | $ | 1,272,439 | |
Shares issued in connection with the merger | | 819,224 | | | | 11,575,641 | |
Shares reacquired | | (94,357 | ) | | | (1,355,511 | ) |
| | | | | | | |
Net increase (decrease) in shares outstanding | | 811,967 | | | $ | 11,492,569 | |
| | | | | | | |
| | |
| The Prudential Investment Portfolios, Inc./Dryden Active Allocation Fund | | 73 |
Notes to Financial Statements
(Unaudited) continued
| | | | | | | |
Class M | | Shares | | | Amount | |
Six months ended March 31, 2008: | | | | | | | |
Shares sold | | 22,696 | | | $ | 304,180 | |
Shares issued in reinvestment of dividends | | 131,756 | | | | 1,704,923 | |
Shares reacquired | | (316,004 | ) | | | (4,158,600 | ) |
| | | | | | | |
Net increase (decrease) in shares outstanding before conversion | | (161,552 | ) | | | (2,149,497 | ) |
Shares reacquired upon conversion into Class A | | (383,582 | ) | | | (5,110,678 | ) |
| | | | | | | |
Net increase (decrease) in shares outstanding | | (545,134 | ) | | $ | (7,260,175 | ) |
| | | | | | | |
Period ended September 30, 2007*: | | | | | | | |
Shares sold | | 38,282 | | | $ | 541,260 | |
Shares issued in connection with the merger | | 2,471,235 | | | | 34,896,956 | |
Shares reacquired | | (376,754 | ) | | | (5,419,115 | ) |
| | | | | | | |
Net increase (decrease) in shares outstanding before conversion | | 2,132,763 | | | | 30,019,101 | |
Shares reacquired upon conversion into Class A | | (397,819 | ) | | | (5,722,680 | ) |
| | | | | | | |
Net increase (decrease) in shares outstanding | | 1,734,944 | | | $ | 24,296,421 | |
| | | | | | | |
Class R | | | | | | |
Six months ended March 31, 2008: | | | | | | | |
Shares sold | | 5,019 | | | $ | 67,238 | |
Shares issued in reinvestment of dividends | | 5,265 | | | | 68,131 | |
Shares reacquired | | (11,063 | ) | | | (158,108 | ) |
| | | | | | | |
Net increase (decrease) in shares outstanding | | (779 | ) | | $ | (22,739 | ) |
| | | | | | | |
Year ended September 30, 2007: | | | | | | | |
Shares sold | | 9,046 | | | $ | 128,533 | |
Shares issued in reinvestment of dividends | | 4,142 | | | | 57,199 | |
Shares reacquired | | (4,148 | ) | | | (59,261 | ) |
| | | | | | | |
Net increase (decrease) in shares outstanding | | 9,040 | | | $ | 126,471 | |
| | | | | | | |
Class X | | | | | | |
Six months ended March 31, 2008: | | | | | | | |
Shares sold | | 8,686 | | | $ | 125,791 | |
Shares issued in reinvestment of dividends | | 44,094 | | | | 570,578 | |
Shares reacquired | | (74,972 | ) | | | (993,809 | ) |
| | | | | | | |
Net increase (decrease) in shares outstanding before conversion | | (22,192 | ) | | | (297,440 | ) |
Shares reacquired upon conversion into Class A | | (2 | ) | | | (37 | ) |
| | | | | | | |
Net increase (decrease) in shares outstanding | | (22,194 | ) | | $ | (297,477 | ) |
| | | | | | | |
Period ended September 30, 2007*: | | | | | | | |
Shares sold | | 17,955 | | | $ | 245,612 | |
Shares issued in connection with the merger | | 597,423 | | | | 8,445,539 | |
Shares reacquired | | (122,456 | ) | | | (1,755,458 | ) |
| | | | | | | |
Net increase (decrease) in shares outstanding before conversion | | 492,922 | | | | 6,935,693 | |
Shares reacquired upon conversion into Class A | | (1,741 | ) | | | (25,090 | ) |
| | | | | | | |
Net increase (decrease) in shares outstanding | | 491,181 | | | $ | 6,910,603 | |
| | | | | | | |
| | |
| 74 | | Visit our website at www.jennisondryden.com |
| | | | | | | |
| | | Shares | | | Amount | |
Class Z | | | | | | |
Six months ended March 31, 2008: | | | | | | | |
Shares sold | | 799,737 | | | $ | 10,578,644 | |
Shares issued in reinvestment of dividends | | 1,140,377 | | | | 14,790,685 | |
Shares reacquired | | (1,325,072 | ) | | | (17,306,624 | ) |
| | | | | | | |
Net increase (decrease) in shares outstanding | | 615,042 | | | $ | 8,062,705 | |
| | | | | | | |
Year ended September 30, 2007: | | | | | | | |
Shares sold | | 1,725,843 | | | $ | 24,780,320 | |
Shares issued in reinvestment of dividends | | 894,190 | | | | 12,375,593 | |
Shares reacquired | | (3,533,153 | ) | | | (50,750,835 | ) |
| | | | | | | |
Net increase (decrease) in shares outstanding | | (913,120 | ) | | $ | (13,594,922 | ) |
| | | | | | | |
| * | Commenced operations on March 26, 2007. |
Note 7. New Accounting Pronouncements
On September 20, 2006, the FASB released Statement of Financial Accounting Standards No. 157 “Fair Value Measurements” (FAS 157). FAS 157 establishes an authoritative definition of fair value, sets out a framework for measuring fair value, and requires additional disclosures about fair-value measurements. The application of FAS 157 is required for fiscal years beginning after November 15, 2007 and interim periods within those fiscal years. At this time, management is evaluating the implications of FAS 157 and its impact, if any, in the financial statements has not yet been determined.
In March 2008, the FASB released Statement of Financial Accounting Standards No. 161, Disclosures about Derivative Instruments and Hedging Activities (FAS 161). FAS 161 requires qualitative disclosures about objectives and strategies for using derivatives, quantitative disclosures about fair value amounts of and gains and losses on derivative instruments, and disclosures about credit-risk-related contingent features in derivative agreements. The application of FAS 161 is required for fiscal years beginning after November 15, 2008 and interim periods within those fiscal years. At this time, management is evaluating the implications of FAS 161 and its impact on the financial statements has not yet been determined.
| | |
| The Prudential Investment Portfolios, Inc./Dryden Active Allocation Fund | | 75 |
Financial Highlights
(Unaudited)
| | | | |
| | | Class A | |
| | | Six Months Ended
March 31, 2008(a) | |
Per Share Operating Performance: | | | | |
Net Asset Value, Beginning Of Period | | $ | 14.62 | |
| | | | |
Income (loss) from investment operations | | | | |
Net investment income | | | .14 | |
Net realized and unrealized gain (loss) on investment transactions | | | (1.24 | ) |
| | | | |
Total from investment operations | | | (1.10 | ) |
| | | | |
Less Distributions | | | | |
Dividends from net investment income | | | (.30 | ) |
Distributions from net realized gains | | | (1.06 | ) |
| | | | |
Total distributions | | | (1.36 | ) |
| | | | |
Net asset value, end of period | | $ | 12.16 | |
| | | | |
Total Return(b): | | | (7.98 | )% |
Ratios/Supplemental Data: | | | | |
Net assets, end of period (000) | | $ | 382,580 | |
Average net assets (000) | | $ | 408,829 | |
Ratios to average net assets(c): | | | | |
Expenses, including distribution and service (12b-1) fees(d) | | | 1.15 | %(e)(f) |
Expenses, excluding distribution and service (12b-1) fees | | | .88 | %(e)(f) |
Net investment income | | | 2.15 | %(e)(f) |
For Class A, B, C, L, M, R, X and Z shares: | | | | |
Portfolio turnover rate | | | 147 | %(g) |
| (a) | Calculations are based on average shares outstanding during the period. |
| (b) | Total return does not consider the effects of sales loads. Total return is calculated assuming a purchase of a share on the first day and a sale on the last day of each period reported and includes reinvestment of dividends and distributions. Total returns may reflect adjustments to conform to U.S. generally accepted accounting principles. Total returns for periods less than one full year are not annualized. |
| (c) | Does not include expenses of the underlying portfolios in which the Portfolio invests. |
| (d) | Prior to January 31, 2008, the distributor of the Series contractually agreed to limit its distribution and service (12b-1) fees to .25 of 1% on the average daily net assets of the Class A shares. |
| (f) | As of March 23, 2007, the Manager of the Fund has agreed to reimburse the Fund in order to limit operating expenses (excluding interest, taxes, brokerage commissions, 12B-1 fees and certain extraordinary expenses) to 0.86% of the average daily net assets of Class A. If the manager had not reimbursed the Fund, the annual expenses (both including and excluding distribution and service (12B-1) fees) and net investment loss ratios would be 1.17%, 0.90% and 2.13%, respectively, for the period ended March 31, 2008. |
See Notes to Financial Statements.
| | |
| 76 | | Visit our website at www.jennisondryden.com |
| | | | | | | | | | | | | | | | | | |
| Class A | |
| Year Ended September 30, | |
| 2007(a) | | | 2006(a) | | | 2005(a) | | | 2004(a) | | | 2003(a) | |
| | | | | | | | | | | | | | | | | | |
| $ | 14.17 | | | $ | 14.00 | | | $ | 12.83 | | | $ | 11.47 | | | $ | 9.60 | |
| | | | | | | | | | | | | | | | | | | |
| | | | | | | | | | | | | | | | | | |
| | .29 | | | | .28 | | | | .21 | | | | .14 | | | | .12 | |
| | 1.25 | | | | .79 | | | | 1.12 | | | | 1.31 | | | | 1.96 | |
| | | | | | | | | | | | | | | | | | | |
| | 1.54 | | | | 1.07 | | | | 1.33 | | | | 1.45 | | | | 2.08 | |
| | | | | | | | | | | | | | | | | | | |
| | | | | | | | | | | | | | | | | | |
| | (.30 | ) | | | (.22 | ) | | | (.16 | ) | | | (.09 | ) | | | (.21 | ) |
| | (.79 | ) | | | (.68 | ) | | | — | | | | — | | | | — | |
| | | | | | | | | | | | | | | | | | | |
| | (1.09 | ) | | | (.90 | ) | | | (.16 | ) | | | (.09 | ) | | | (.21 | ) |
| | | | | | | | | | | | | | | | | | | |
| $ | 14.62 | | | $ | 14.17 | | | $ | 14.00 | | | $ | 12.83 | | | $ | 11.47 | |
| | | | | | | | | | | | | | | | | | | |
| | 11.34 | % | | | 7.98 | % | | | 10.41 | % | | | 12.68 | % | | | 21.91 | % |
| | | | | | | | | | | | | | | | | | |
| $ | 436,337 | | | $ | 415,486 | | | $ | 424,341 | | | $ | 425,614 | | | $ | 410,597 | |
| $ | 430,168 | | | $ | 415,508 | | | $ | 428,897 | | | $ | 429,046 | | | $ | 385,242 | |
| | | | | | | | | | | | | | | | | | |
| | 1.10 | % | | | 1.08 | % | | | 1.09 | % | | | 1.07 | % | | | 1.11 | % |
| | .85 | % | | | .83 | % | | | .84 | % | | | .82 | % | | | .86 | % |
| | 2.00 | % | | | 2.05 | % | | | 1.52 | % | | | 1.13 | % | | | 1.12 | % |
| | | | | | | | | | | | | | | | | | |
| | 226 | % | | | 152 | % | | | 119 | % | | | 170 | % | | | 212 | % |
See Notes to Financial Statements.
| | |
| The Prudential Investment Portfolios, Inc./Dryden Active Allocation Fund | | 77 |
Financial Highlights
(Unaudited) continued
| | | | |
| | | Class B | |
| | | Six Months Ended
March 31, 2008(a) | |
Per Share Operating Performance: | | | | |
Net Asset Value, Beginning Of Period | | $ | 14.57 | |
| | | | |
Income (loss) from investment operations | | | | |
Net investment income | | | .09 | |
Net realized and unrealized gain (loss) on investment transactions | | | (1.24 | ) |
| | | | |
Total from investment operations | | | (1.15 | ) |
| | | | |
Less Distributions | | | | |
Dividends from net investment income | | | (.20 | ) |
Distributions from net realized gains | | | (1.06 | ) |
| | | | |
Total distributions | | | (1.26 | ) |
| | | | |
Net asset value, end of period | | $ | 12.16 | |
| | | | |
Total Return(b): | | | (8.35 | )% |
Ratios/Supplemental Data: | | | | |
Net assets, end of period (000) | | $ | 35,744 | |
Average net assets (000) | | $ | 42,489 | |
Ratios to average net assets(c): | | | | |
Expenses, including distribution and service (12b-1) fees | | | 1.88 | %(d)(e) |
Expenses, excluding distribution and service (12b-1) fees | | | .88 | %(d)(e) |
Net investment income | | | 1.41 | %(d)(e) |
| (a) | Calculations are based on average shares outstanding during the period. |
| (b) | Total return does not consider the effects of sales loads. Total return is calculated assuming a purchase of a share on the first day and a sale on the last day of each period reported and includes reinvestment of dividends and distributions. Total returns may reflect adjustments to conform to U.S. generally accepted accounting principles. Total returns for periods less than one full year are not annualized. |
| (c) | Does not include expenses of the underlying portfolios in which the Portfolio invests. |
| (e) | As of March 23, 2007, the Manager of the Fund has agreed to reimburse the Fund in order to limit operating expenses (excluding interest, taxes, brokerage commissions, 12B-1 fees and certain extraordinary expenses) to 0.86% of the average daily net assets of Class B. If the manager had not reimbursed the Fund, the annual expenses (both including and excluding distribution and service (12B-1) fees) and net investment loss ratios would be 1.90%, 0.90% and 1.39%, respectively, for the period ended March 31, 2008. |
See Notes to Financial Statements.
| | |
| 78 | | Visit our website at www.jennisondryden.com |
| | | | | | | | | | | | | | | | | | |
| Class B | |
| Year Ended September 30, | |
| 2007(a) | | | 2006(a) | | | 2005(a) | | | 2004(a) | | | 2003(a) | |
| | | | | | | | | | | | | | | | | | |
| $ | 14.11 | | | $ | 13.94 | | | $ | 12.78 | | | $ | 11.42 | | | $ | 9.56 | |
| | | | | | | | | | | | | | | | | | | |
| | | | | | | | | | | | | | | | | | |
| | .18 | | | | .18 | | | | .11 | | | | .05 | | | | .04 | |
| | 1.26 | | | | .78 | | | | 1.10 | | | | 1.31 | | | | 1.95 | |
| | | | | | | | | | | | | | | | | | | |
| | 1.44 | | | | .96 | | | | 1.21 | | | | 1.36 | | | | 1.99 | |
| | | | | | | | | | | | | | | | | | | |
| | | | | | | | | | | | | | | | | | |
| | (.19 | ) | | | (.11 | ) | | | (.05 | ) | | | — | | | | (.13 | ) |
| | (.79 | ) | | | (.68 | ) | | | — | | | | — | | | | — | |
| | | | | | | | | | | | | | | | | | | |
| | (.98 | ) | | | (.79 | ) | | | (.05 | ) | | | — | | | | (.13 | ) |
| | | | | | | | | | | | | | | | | | | |
| $ | 14.57 | | | $ | 14.11 | | | $ | 13.94 | | | $ | 12.78 | | | $ | 11.42 | |
| | | | | | | | | | | | | | | | | | | |
| | 10.58 | % | | | 7.14 | % | | | 9.50 | % | | | 11.91 | % | | | 20.96 | % |
| | | | | | | | | | | | | | | | | | |
| $ | 46,486 | | | $ | 52,601 | | | $ | 73,983 | | | $ | 94,667 | | | $ | 104,308 | |
| $ | 50,122 | | | $ | 64,048 | | | $ | 88,854 | | | $ | 104,847 | | | $ | 113,112 | |
| | | | | | | | | | | | | | | | | | |
| | 1.85 | % | | | 1.83 | % | | | 1.84 | % | | | 1.82 | % | | | 1.86 | % |
| | .85 | % | | | .83 | % | | | .84 | % | | | .82 | % | | | .86 | % |
| | 1.25 | % | | | 1.29 | % | | | .77 | % | | | .38 | % | | | .38 | % |
See Notes to Financial Statements.
| | |
| The Prudential Investment Portfolios, Inc./Dryden Active Allocation Fund | | 79 |
Financial Highlights
(Unaudited) continued
| | | | |
| | | Class C | |
| | | Six Months Ended
March 31, 2008(a) | |
Per Share Operating Performance: | | | | |
Net Asset Value, Beginning Of Period | | $ | 14.57 | |
| | | | |
Income (loss) from investment operations | | | | |
Net investment income | | | .09 | |
Net realized and unrealized gain (loss) on investment transactions | | | (1.24 | ) |
| | | | |
Total from investment operations | | | (1.15 | ) |
| | | | |
Less Distributions | | | | |
Dividends from net investment income | | | (.20 | ) |
Distributions from net realized gains | | | (1.06 | ) |
| | | | |
Total distributions | | | (1.26 | ) |
| | | | |
Net asset value, end of period | | $ | 12.16 | |
| | | | |
Total Return(b): | | | (8.35 | )% |
Ratios/Supplemental Data: | | | | |
Net assets, end of period (000) | | $ | 20,269 | |
Average net assets (000) | | $ | 22,895 | |
Ratios to average net assets(c): | | | | |
Expenses, including distribution and service (12b-1) fees | | | 1.88 | %(d)(e) |
Expenses, excluding distribution and service (12b-1) fees | | | .88 | %(d)(e) |
Net investment income | | | 1.41 | %(d)(e) |
| (a) | Calculations are based on average shares outstanding during the period. |
| (b) | Total return does not consider the effects of sales loads. Total return is calculated assuming a purchase of a share on the first day and a sale on the last day of each period reported and includes reinvestment of dividends and distributions. Total returns may reflect adjustments to conform to U.S. generally accepted accounting principles. Total returns for periods less than one full year are not annualized. |
| (c) | Does not include expenses of the underlying portfolios in which the Portfolio invests. |
| (e) | As of March 23, 2007, the Manager of the Fund has agreed to reimburse the Fund in order to limit operating expenses (excluding interest, taxes, brokerage commissions, 12B-1 fees and certain extraordinary expenses) to 0.86% of the average daily net assets of Class C. If the manager had not reimbursed the Fund, the annual expenses (both including and excluding distribution and service (12B-1) fees) and net investment loss ratios would be 1.90%, 0.90% and 1.39%, respectively, for the period ended March 31, 2008. |
See Notes to Financial Statements.
| | |
| 80 | | Visit our website at www.jennisondryden.com |
| | | | | | | | | | | | | | | | | | |
| Class C | |
| Year Ended September 30, | |
| 2007(a) | | | 2006(a) | | | 2005(a) | | | 2004(a) | | | 2003(a) | |
| | | | | | | | | | | | | | | | | | |
| $ | 14.11 | | | $ | 13.95 | | | $ | 12.78 | | | $ | 11.42 | | | $ | 9.56 | |
| | | | | | | | | | | | | | | | | | | |
| | | | | | | | | | | | | | | | | | |
| | .17 | | | | .18 | | | | .11 | | | | .05 | | | | .04 | |
| | 1.27 | | | | .77 | | | | 1.11 | | | | 1.31 | | | | 1.95 | |
| | | | | | | | | | | | | | | | | | | |
| | 1.44 | | | | .95 | | | | 1.22 | | | | 1.36 | | | | 1.99 | |
| | | | | | | | | | | | | | | | | | | |
| | | | | | | | | | | | | | | | | | |
| | (.19 | ) | | | (.11 | ) | | | (.05 | ) | | | — | | | | (.13 | ) |
| | (.79 | ) | | | (.68 | ) | | | — | | | | — | | | | — | |
| | | | | | | | | | | | | | | | | | | |
| | (.98 | ) | | | (.79 | ) | | | (.05 | ) | | | — | | | | (.13 | ) |
| | | | | | | | | | | | | | | | | | | |
| $ | 14.57 | | | $ | 14.11 | | | $ | 13.95 | | | $ | 12.78 | | | $ | 11.42 | |
| | | | | | | | | | | | | | | | | | | |
| | 10.58 | % | | | 7.14 | % | | | 9.50 | % | | | 11.91 | % | | | 20.96 | % |
| | | | | | | | | | | | | | | | | | |
| $ | 25,379 | | | $ | 13,287 | | | $ | 13,500 | | | $ | 14,357 | | | $ | 12,655 | |
| $ | 19,954 | | | $ | 13,413 | | | $ | 14,221 | | | $ | 13,380 | | | $ | 12,132 | |
| | | | | | | | | | | | | | | | | | |
| | 1.85 | % | | | 1.83 | % | | | 1.84 | % | | | 1.82 | % | | | 1.86 | % |
| | .85 | % | | | .83 | % | | | .84 | % | | | .82 | % | | | .86 | % |
| | 1.21 | % | | | 1.30 | % | | | .78 | % | | | .38 | % | | | .37 | % |
See Notes to Financial Statements.
| | |
| The Prudential Investment Portfolios, Inc./Dryden Active Allocation Fund | | 81 |
Financial Highlights
(Unaudited) continued
| | | | | | | | |
| | | Class L | |
| | | Six Months Ended
March 31, 2008(a) | | | March 26, 2007(a)
Through
September 30, 2007(b) | |
Per Share Operating Performance: | | | | | | | | |
Net Asset Value, Beginning Of Period | | $ | 14.62 | | | $ | 14.13 | |
| | | | | | | | |
Loss from investment operations | | | | | | | | |
Net investment income | | | .13 | | | | .12 | |
Net realized and unrealized gain (loss) on investment transactions | | | (1.25 | ) | | | .37 | |
| | | | | | | | |
Total from investment operations | | | (1.12 | ) | | | .49 | |
| | | | �� | | | | |
Less Distributions | | | | | | | | |
Dividends from net investment income | | | (.26 | ) | | | — | |
Distributions from net realized gains | | | (1.06 | ) | | | — | |
| | | | | | | | |
Total distributions | | | (1.32 | ) | | | — | |
| | | | | | | | |
Net asset value, end of period | | $ | 12.18 | | | $ | 14.62 | |
| | | | | | | | |
Total Return(c): | | | (8.11 | )% | | | 3.47 | % |
Ratios/Supplemental Data: | | | | | | | | |
Net assets, end of period (000) | | $ | 9,955 | | | $ | 11,874 | |
Average net assets (000) | | $ | 10,917 | | | $ | 11,940 | |
Ratios to average net assets(d): | | | | | | | | |
Expenses, including distribution and service (12b-1) fees | | | 1.38 | %(e)(f) | | | 1.35 | %(e) |
Expenses, excluding distribution and service (12b-1) fees | | | .88 | %(e)(f) | | | .85 | %(e) |
Net investment income | | | 1.91 | %(e)(f) | | | 1.62 | %(e) |
| (a) | Commencement of operations. |
| (b) | Calculations are based on average shares outstanding during the period. |
| (c) | Total return does not consider the effects of sales loads. Total return is calculated assuming a purchase of a share on the first day and a sale on the last day of each period reported and includes reinvestment of dividends and distributions. Total returns may reflect adjustments to conform to U.S. generally accepted accounting principles. Total returns for periods less than one full year are not annualized. |
| (d) | Does not include expenses of the underlying portfolios in which the Portfolio invests. |
| (f) | As of March 23, 2007, the Manager of the Fund has agreed to reimburse the Fund in order to limit operating expenses (excluding interest, taxes, brokerage commissions, 12B-1 fees and certain extraordinary expenses) to 0.86% of the average daily net assets of Class L. If the manager had not reimbursed the Fund, the annual expenses (both including and excluding distribution and service (12B-1) fees) and net investment loss ratios would be 1.40%, 0.90% and 1.89%, respectively, for the period ended March 31, 2008. |
See Notes to Financial Statements.
| | |
| 82 | | Visit our website at www.jennisondryden.com |
Financial Highlights
(Unaudited) continued
| | | | | | | | |
| | | Class M | |
| | | Six Months Ended
March 31, 2008(a) | | | March 26, 2007(a)
Through
September 30, 2007(b) | |
Per Share Operating Performance: | | | | | | | | |
Net Asset Value, Beginning Of Period | | $ | 14.57 | | | $ | 14.12 | |
| | | | | | | | |
Loss from investment operations | | | | | | | | |
Net investment income | | | .09 | | | | .08 | |
Net realized and unrealized gain (loss) on investment transactions | | | (1.24 | ) | | | .37 | |
| | | | | | | | |
Total from investment operations | | | (1.15 | ) | | | .45 | |
| | | | | | | | |
Less Distributions | | | | | | | | |
Dividends from net investment income | | | (.20 | ) | | | — | |
Distributions from net realized gains | | | (1.06 | ) | | | — | |
| | | | | | | | |
Total distributions | | | (1.26 | ) | | | — | |
| | | | | | | | |
Net asset value, end of period | | $ | 12.16 | | | $ | 14.57 | |
| | | | | | | | |
Total Return(c): | | | (8.35 | )% | | | 3.19 | % |
Ratios/Supplemental Data: | | | | | | | | |
Net assets, end of period (000) | | $ | 14,468 | | | $ | 25,279 | |
Average net assets (000) | | $ | 19,926 | | | $ | 29,898 | |
Ratios to average net assets(d): | | | | | | | | |
Expenses, including distribution and service (12b-1) fees | | | 1.88 | %(e)(f) | | | 1.85 | %(e) |
Expenses, excluding distribution and service (12b-1) fees | | | .88 | %(e)(f) | | | .85 | %(e) |
Net investment income | | | 1.40 | %(e)(f) | | | 1.08 | %(e) |
| (a) | Commencement of operations. |
| (b) | Calculations are based on average shares outstanding during the period. |
| (c) | Total return does not consider the effects of sales loads. Total return is calculated assuming a purchase of a share on the first day and a sale on the last day of each period reported and includes reinvestment of dividends and distributions. Total returns may reflect adjustments to conform to U.S. generally accepted accounting principles. Total returns for periods less than one full year are not annualized. |
| (d) | Does not include expenses of the underlying portfolios in which the Portfolio invests. |
| (f) | As of March 23, 2007, the Manager of the Fund has agreed to reimburse the Fund in order to limit operating expenses (excluding interest, taxes, brokerage commissions, 12B-1 fees and certain extraordinary expenses) to 0.86% of the average daily net assets of Class M. If the manager had not reimbursed the Fund, the annual expenses (both including and excluding distribution and service (12B-1) fees) and net investment loss ratios would be 1.90%, 0.90% and 1.38%, respectively, for the period ended March 31, 2008. |
See Notes to Financial Statements.
| | |
| The Prudential Investment Portfolios, Inc./Dryden Active Allocation Fund | | 83 |
Financial Highlights
(Unaudited) continued
| | | | |
| | | Class R | |
| |
| | | Six Months Ended
March 31, 2008(b) | |
Per Share Operating Performance: | | | | |
Net Asset Value, Beginning Of Period | | $ | 14.62 | |
| | | | |
Income from investment operations | | | | |
Net investment income | | | .13 | |
Net realized and unrealized (loss) on investment transactions | | | (1.25 | ) |
| | | | |
Total from investment operations | | | (1.12 | ) |
| | | | |
Less Distributions | | | | |
Dividends from net investment income | | | (.26 | ) |
Distributions from net realized gains | | | (1.06 | ) |
| | | | |
Total distributions | | | (1.32 | ) |
| | | | |
Net asset value, end of period | | $ | 12.18 | |
| | | | |
Total Return(c): | | | (8.11 | )% |
Ratios/Supplemental Data: | | | | |
Net assets, end of period (000) | | $ | 974 | |
Average net assets (000) | | $ | 1,041 | |
Ratios to average net assets(d): | | | | |
Expenses, including distribution and service (12b-1) fees(e) | | | 1.38 | %(f)(g) |
Expenses, excluding distribution and service (12b-1) fees | | | .88 | %(f)(g) |
Net investment income | | | 1.91 | %(f)(g) |
| (a) | Commencement of operations. |
| (b) | Calculations are based on average shares outstanding during the period. |
| (c) | Total return does not consider the effects of sales loads. Total return is calculated assuming a purchase of a share on the first day and a sale on the last day of each period reported and includes reinvestment of dividends and distributions. Total returns may reflect adjustments to conform to U.S. generally accepted accounting principles. Total returns for periods less than one full year are not annualized. |
| (d) | Does not include expenses of the underlying portfolios in which the Portfolio invests. |
| (e) | The distributor of the Series contractually agreed to limit its distribution and service (12b-1) fees to .50 of 1% on the average daily net assets of the Class R shares. |
| (g) | As of March 23, 2007, the Manager of the Fund has agreed to reimburse the Fund in order to limit operating expenses (excluding interest, taxes, brokerage commissions, 12B-1 fees and certain extraordinary expenses) to 0.86% of the average daily net assets of Class R. If the manager had not reimbursed the Fund, the annual expenses (both including and excluding distribution and service (12B-1) fees) and net investment loss ratios would be 1.40%, 0.90% and 1.89%, respectively, for the period ended March 31, 2008. |
See Notes to Financial Statements.
| | |
| 84 | | Visit our website at www.jennisondryden.com |
| | | | | | | | | | |
| Class R | |
| Year Ended September 30, | | | December 17, 2004(a)
Through
September 30, 2005(b) | |
| 2007(b) | | | 2006(b) | | |
| | | | | | | | | | |
| $ | 14.16 | | | $ | 14.00 | | | $ | 13.53 | |
| | | | | | | | | | | |
| | | | | | | | | | |
| | .25 | | | | .24 | | | | .12 | |
| | 1.27 | | | | .78 | | | | .35 | |
| | | | | | | | | | | |
| | 1.52 | | | | 1.02 | | | | .47 | |
| | | | | | | | | | | |
| | | | | | | | | | |
| | (.27 | ) | | | (.18 | ) | | | — | |
| | (.79 | ) | | | (.68 | ) | | | — | |
| | | | | | | | | | | |
| | (1.06 | ) | | | (.86 | ) | | | — | |
| | | | | | | | | | | |
| $ | 14.62 | | | $ | 14.16 | | | $ | 14.00 | |
| | | | | | | | | | | |
| | 11.13 | % | | | 7.70 | % | | | 3.40 | % |
| | | | | | | | | | |
| $ | 1,181 | | | $ | 1,015 | | | $ | 3 | |
| $ | 1,105 | | | $ | 293 | | | $ | 2 | |
| | | | | | | | | | |
| | 1.35 | % | | | 1.33 | % | | | 1.34 | %(f) |
| | .85 | % | | | .83 | % | | | .84 | %(f) |
| | 1.76 | % | | | 1.94 | % | | | 1.48 | %(f) |
See Notes to Financial Statements.
| | |
| The Prudential Investment Portfolios, Inc./Dryden Active Allocation Fund | | 85 |
Financial Highlights
(Unaudited) continued
| | | | | | | | |
| | | Class X | |
| | | Six Months Ended
March 31, 2008(a) | | | March 26, 2007(a)
Through
September 30, 2007(b) | |
Per Share Operating Performance: | | | | | | | | |
Net Asset Value, Beginning Of Period | | $ | 14.57 | | | $ | 14.12 | |
| | | | | | | | |
Loss from investment operations | | | | | | | | |
Net investment income | | | .09 | | | | .08 | |
Net realized and unrealized gain (loss) on investment transactions | | | (1.24 | ) | | | .37 | |
| | | | | | | | |
Total from investment operations | | | (1.15 | ) | | | .45 | |
| | | | | | | | |
Less Distributions | | | | | | | | |
Dividends from net investment income | | | (.20 | ) | | | — | |
Distributions from net realized gains | | | (1.06 | ) | | | — | |
| | | | | | | | |
Total distributions | | | (1.26 | ) | | | — | |
| | | | | | | | |
Net asset value, end of period | | $ | 12.16 | | | $ | 14.57 | |
| | | | | | | | |
Total Return(c): | | | (8.35 | )% | | | 3.19 | % |
Ratios/Supplemental Data: | | | | | | | | |
Net assets, end of period (000) | | $ | 5,702 | | | $ | 7,157 | |
Average net assets (000) | | $ | 6,503 | | | $ | 7,694 | |
Ratios to average net assets(d): | | | | | | | | |
Expenses, including distribution and service (12b-1) fees | | | 1.88 | %(e)(f) | | | 1.85 | %(e) |
Expenses, excluding distribution and service (12b-1) fees | | | .88 | %(e)(f) | | | .85 | %(e) |
Net investment income | | | 1.41 | %(e)(f) | | | 1.09 | %(e) |
| (a) | Commencement of operations. |
| (b) | Calculations are based on average shares outstanding during the period. |
| (c) | Total return does not consider the effects of sales loads. Total return is calculated assuming a purchase of a share on the first day and a sale on the last day of each period reported and includes reinvestment of dividends and distributions. Total returns may reflect adjustments to conform to U.S. generally accepted accounting principles. Total returns for periods less than one full year are not annualized. |
| (d) | Does not include expenses of the underlying portfolios in which the Portfolio invests. |
| (f) | As of March 23, 2007, the Manager of the Fund has agreed to reimburse the Fund in order to limit operating expenses (excluding interest, taxes, brokerage commissions, 12B-1 fees and certain extraordinary expenses) to 0.86% of the average daily net assets of Class X. If the manager had not reimbursed the Fund, the annual expenses (both including and excluding distribution and service (12B-1) fees) and net investment loss ratios would be 1.90%, 0.90% and 1.39%, respectively, for the period ended March 31, 2008. |
See Notes to Financial Statements.
| | |
| 86 | | Visit our website at www.jennisondryden.com |
This Page Intentionally Left Blank
Financial Highlights
(Unaudited) continued
| | | | |
| | | Class Z | |
| | | Six Months Ended
March 31, 2008(a) | |
Per Share Operating Performance: | | | | |
Net Asset Value, Beginning Of Period | | $ | 14.71 | |
| | | | |
Income (loss) from investment operations | | | | |
Net investment income | | | .16 | |
Net realized and unrealized gain (loss) on investment transactions | | | (1.25 | ) |
| | | | |
Total from investment operations | | | (1.09 | ) |
| | | | |
Less Distributions | | | | |
Dividends from net investment income | | | (.34 | ) |
Distributions from net realized gains | | | (1.06 | ) |
| | | | |
Total distributions | | | (1.40 | ) |
| | | | |
Net asset value, end of period | | $ | 12.22 | |
| | | | |
Total Return(b): | | | (7.90 | )% |
Ratios/Supplemental Data: | | | | |
Net assets, end of period (000) | | $ | 137,598 | |
Average net assets (000) | | $ | 148,143 | |
Ratios to average net assets(c): | | | | |
Expenses, including distribution and service (12b-1) fees | | | .88 | %(d)(e) |
Expenses, excluding distribution and service (12b-1) fees | | | .88 | %(d)(e) |
Net investment income | | | 2.42 | %(d)(e) |
| (a) | Calculations are based on average shares outstanding during the period. |
| (b) | Total return does not consider the effects of sales loads. Total return is calculated assuming a purchase of a share on the first day and a sale on the last day of each period reported and includes reinvestment of dividends and distributions. Total returns may reflect adjustments to conform to U.S. generally accepted accounting principles. Total returns for periods less than one full year are not annualized. |
| (c) | Does not include expenses of the underlying portfolios in which the Portfolio invests. |
| (e) | As of March 23, 2007, the Manager of the Fund has agreed to reimburse the Fund in order to limit operating expenses (excluding interest, taxes, brokerage commissions, 12B-1 fees and certain extraordinary expenses) to 0.86% of the average daily net assets of Class Z. If the manager had not reimbursed the Fund, the annual expenses (both including and excluding distribution and service (12B-1) fees) and net investment loss ratios would be 0.90%, 0.90% and 2.40%, respectively, for the period ended March 31, 2008. |
See Notes to Financial Statements.
| | |
| 88 | | Visit our website at www.jennisondryden.com |
| | | | | | | | | | | | | | | | | | |
| Class Z | |
| Year Ended September 30, | |
| 2007(a) | | | 2006(a) | | | 2005(a) | | | 2004(a) | | | 2003(a) | |
| | | | | | | | | | | | | | | | | | |
| $ | 14.25 | | | $ | 14.08 | | | $ | 12.90 | | | $ | 11.53 | | | $ | 9.66 | |
| | | | | | | | | | | | | | | | | | | |
| | | | | | | | | | | | | | | | | | |
| | .32 | | | | .32 | | | | .24 | | | | .17 | | | | .14 | |
| | 1.27 | | | | .78 | | | | 1.13 | | | | 1.32 | | | | 1.97 | |
| | | | | | | | | | | | | | | | | | | |
| | 1.59 | | | | 1.10 | | | | 1.37 | | | | 1.49 | | | | 2.11 | |
| | | | | | | | | | | | | | | | | | | |
| | | | | | | | | | | | | | | | | | |
| | (.34 | ) | | | (.25 | ) | | | (.19 | ) | | | (.12 | ) | | | (.24 | ) |
| | (.79 | ) | | | (.68 | ) | | | — | | | | — | | | | — | |
| | | | | | | | | | | | | | | | | | | |
| | (1.13 | ) | | | (.93 | ) | | | (.19 | ) | | | (.12 | ) | | | (.24 | ) |
| | | | | | | | | | | | | | | | | | | |
| $ | 14.71 | | | $ | 14.25 | | | $ | 14.08 | | | $ | 12.90 | | | $ | 11.53 | |
| | | | | | | | | | | | | | | | | | | |
| | 11.64 | % | | | 8.29 | % | | | 10.63 | % | | | 12.96 | % | | | 22.11 | % |
| | | | | | | | | | | | | | | | | | |
| $ | 156,599 | | | $ | 164,649 | | | $ | 173,188 | | | $ | 169,725 | | | $ | 167,039 | |
| $ | 163,110 | | | $ | 168,165 | | | $ | 176,256 | | | $ | 171,470 | | | $ | 172,708 | |
| | | | | | | | | | | | | | | | | | |
| | .85 | % | | | .83 | % | | | .84 | % | | | .82 | % | | | .86 | % |
| | .85 | % | | | .83 | % | | | .84 | % | | | .82 | % | | | .86 | % |
| | 2.25 | % | | | 2.30 | % | | | 1.76 | % | | | 1.38 | % | | | 1.36 | % |
See Notes to Financial Statements.
| | |
| The Prudential Investment Portfolios, Inc./Dryden Active Allocation Fund | | 89 |
| | | | |
| n MAIL | | n TELEPHONE | | n WEBSITE |
Gateway Center Three 100 Mulberry Street Newark, NJ 07102 | | (800) 225-1852 | | www.jennisondryden.com |
|
| PROXY VOTING |
| The Board of Directors of the Fund has delegated to the Fund’s investment subadvisers the responsibility for voting any proxies and maintaining proxy recordkeeping with respect to the Fund. A description of these proxy voting policies and procedures is available without charge, upon request, by calling (800) 225-1852 or by visiting the Securities and Exchange Commission’s website at www.sec.gov. Information regarding how the Fund voted proxies relating to portfolio securities during the most recent 12-month period ended June 30 is available on the Fund’s website and on the Commission’s website. |
|
| DIRECTORS |
| Linda W. Bynoe • David E.A. Carson • Robert F. Gunia • Robert E. La Blanc • Douglas H. McCorkindale • Richard A. Redeker • Judy A. Rice • Robin B. Smith • Stephen G. Stoneburn • Clay T. Whitehead |
|
| OFFICERS |
| Judy A. Rice, President • Robert F. Gunia, Vice President • Grace C. Torres, Treasurer and Principal Financial and Accounting Officer • Kathryn L. Quirk, Chief Legal Officer • Deborah A. Docs, Secretary • Timothy J. Knierim, Chief Compliance Officer • Valerie M. Simpson, Deputy Chief Compliance Officer • Noreen M. Fierro, Anti-Money Laundering Compliance Officer • Jonathan D. Shain, Assistant Secretary • Claudia DiGiacomo, Assistant Secretary • John P. Schwartz, Assistant Secretary • Andrew R. French, Assistant Secretary • M. Sadiq Peshimam, Assistant Treasurer • Peter Parrella, Assistant Treasurer |
| | | | |
| MANAGER | | Prudential Investments LLC | | Gateway Center Three
100 Mulberry Street
Newark, NJ 07102 |
|
| INVESTMENT SUBADVISERS | | Prudential Investment
Management, Inc. Quantitative Management
Associates LLC | | Gateway Center Two
100 Mulberry Street
Newark, NJ 07102 Gateway Center Two
100 Mulberry Street
Newark, NJ 07102 |
|
| DISTRIBUTOR | | Prudential Investment
Management Services LLC | | Gateway Center Three
100 Mulberry Street
Newark, NJ 07102 |
|
| CUSTODIAN | | The Bank of New York | | One Wall Street
New York, NY 10286 |
|
| TRANSFER AGENT | | Prudential Mutual Fund
Services LLC | | PO Box 9658
Providence, RI 02940 |
|
INDEPENDENT REGISTERED
PUBLIC ACCOUNTING FIRM | | KPMG LLP | | 345 Park Avenue
New York, NY 10154 |
|
| FUND COUNSEL | | Sullivan & Cromwell LLP | | 125 Broad Street
New York, NY 10004 |
|
| An investor should consider the investment objectives, risks, charges, and expenses of the Fund carefully before investing. The prospectus for the Fund contains this and other information about the Fund. An investor may obtain a prospectus by visiting our website at www.jennisondryden.com or by calling (800) 225-1852. The prospectus should be read carefully before investing. |
|
| E-DELIVERY |
| To receive your mutual fund documents on-line, go to www.icsdelivery.com/prudential/funds and enroll. Instead of receiving printed documents by mail, you will receive notification via e-mail when new materials are available. You can cancel your enrollment or change your e-mail address at any time by clicking on the change/cancel enrollment option at the icsdelivery website address. |
|
| SHAREHOLDER COMMUNICATIONS WITH DIRECTORS |
| Shareholders can communicate directly with the Board of Directors by writing to the Chair of the Board, Dryden Active Allocation Fund, Prudential Investments, Attn: Board of Directors, 100 Mulberry Street, Gateway Center Three, Newark, NJ 07102. Shareholders can communicate directly with an individual Director by writing to the same address. Communications are not screened before being delivered to the addressee. |
|
| AVAILABILITY OF PORTFOLIO SCHEDULE |
| The Fund files its complete schedule of portfolio holdings with the Securities and Exchange Commission for the first and third quarters of each fiscal year on Form N-Q under The Prudential Investment Portfolios, Inc. name. The Fund’s Forms N-Q are available on the Commission’s website at www.sec.gov. The Fund’s Forms N-Q may also be reviewed and copied at the Commission’s Public Reference Room in Washington, D.C. Information on the operation and location of the Public Reference Room may be obtained by calling (800) SEC-0330 (732-0330). The Fund’s schedule of portfolio holdings is also available on the Fund’s website as of the end of each fiscal quarter. |
Mutual Funds:
| | | | |
| ARE NOT INSURED BY THE FDIC OR ANY FEDERAL GOVERNMENT AGENCY | | MAY LOSE VALUE | | ARE NOT A DEPOSIT OF OR GUARANTEED BY ANY BANK OR ANY BANK AFFILIATE |

| | | | | | | | | | | | | | | | | | | | |
| Dryden Active Allocation Fund | | | | | | | | | | | | |
| | | Share Class | | A | | B | | C | | L | | M | | R | | X | | Z | | |
| | NASDAQ | | PIBAX | | PBFBX | | PABCX | | DAACL | | DAACM | | PALRX | | DAACX | | PABFX | | |
| | CUSIP | | 74437E883 | | 74437E875 | | 74437E867 | | 74437E586 | | 74437E578 | | 74437E636 | | 74437E560 | | 74437E859 | | |
| | | | | | | | | | | | | | | | | | | | |
MF185E2 IFS-A148077 Ed. 05/2008


| | |
| MARCH 31, 2008 | | SEMIANNUAL REPORT |
Jennison Growth Fund
FUND TYPE
Medium- to large- capitalization stock
OBJECTIVE
Long-term growth of capital
This report is not authorized for distribution to prospective investors unless preceded or accompanied by a current prospectus.
The views expressed in this report and information about the Fund’s portfolio holdings are for the period covered by this report and are subject to change thereafter.
The accompanying financial statements as of March 31, 2008, were not audited and, accordingly, no auditor’s opinion is expressed on them.
JennisonDryden, Jennison, Prudential Financial and the Rock Prudential logo are registered service marks of The Prudential Insurance Company of America, Newark, NJ, and its affiliates.

May 15, 2008
Dear Shareholder:
On the following pages, you’ll find your Fund’s semiannual report, including a table showing fund performance over the first half of the fiscal year and for longer periods. The report also contains a listing of the Fund’s holdings at period-end. The semiannual report is an interim statement furnished between the Fund’s annual reports, which include an analysis of Fund performance over the fiscal year in addition to other data.
Mutual fund prices and returns will rise or fall over time, and asset managers tend to have periods when they perform better or worse than their long-term average. The best measures of a mutual fund’s quality are its return compared to that of similar investments and the variability of its return over the long term. We recommend that you review your portfolio regularly with your financial professional.
Sincerely,

Judy A. Rice, President
The Prudential Investment Portfolios, Inc./Jennison Growth Fund
| | |
| The Prudential Investment Portfolios, Inc./Jennison Growth Fund | | 1 |
Your Fund’s Performance
Fund objective
The investment objective of the Jennison Growth Fund is long-term growth of capital. There can be no assurance that the Fund will achieve its investment objective.
Performance data quoted represent past performance. Past performance does not guarantee future results. The investment return and principal value of an investment will fluctuate, so that an investor’s shares, when redeemed, may be worth more or less than their original cost. Current performance may be lower or higher than the past performance data quoted. An investor may obtain performance data as of the most recent month-end by visiting our website at www.jennisondryden.com or by calling (800) 225-1852. The maximum initial sales charge is 5.50% (Class A shares). Gross operating expenses: Class A, 1.08%; Class B, 1.80%; Class C, 1.80%; Class R, 1.55%; Class Z, 0.80%. Net operating expenses apply to: Class A, 1.06%; Class B, 1.80%; Class C, 1.80%; Class R, 1.30%; Class Z, 0.80%, after contractual reduction through 1/31/2008 for Class A shares and 1/31/2009 for Class R shares.
| | | | | | | | | | | | | | |
| Cumulative Total Returns as of 3/31/08 | | | | | | | | | |
| | | Six Months | | | One Year | | | Five Years | | | Ten Years | | | Since Inception1 |
Class A | | –10.76 | % | | –2.22 | % | | 65.75 | % | | 26.42 | % | | — |
Class B | | –11.13 | | | –2.97 | | | 59.67 | | | 17.33 | | | — |
Class C | | –11.13 | | | –2.97 | | | 59.67 | | | 17.33 | | | — |
Class R | | –10.83 | | | –2.47 | | | N/A | | | N/A | | | 15.50% (12/17/04) |
Class Z | | –10.61 | | | –2.01 | | | 67.88 | | | 29.70 | | | — |
Russell 1000® Growth Index2 | | –10.87 | | | –0.75 | | | 60.75 | | | 13.56 | | | ** |
S&P 500 Index3 | | –12.46 | | | –5.08 | | | 70.91 | | | 41.12 | | | *** |
Lipper Large-Cap Growth Funds Avg.4 | | –11.66 | | | –0.12 | | | 56.69 | | | 27.89 | | | **** |
| | | | | | | | | | | | | | |
| Average Annual Total Returns5 as of 3/31/08 | | | | | | |
| | | | | | One Year | | | Five Years | | | Ten Years | | | Since Inception1 |
Class A | | | | | –7.60 | % | | 9.39 | % | | 1.79 | % | | — |
Class B | | | | | –7.82 | | | 9.67 | | | 1.61 | | | — |
Class C | | | | | –3.94 | | | 9.81 | | | 1.61 | | | — |
Class R | | | | | –2.47 | | | N/A | | | N/A | | | 4.48% (12/17/04) |
Class Z | | | | | –2.01 | | | 10.92 | | | 2.63 | | | — |
Russell 1000® Growth Index2 | | | | | –0.75 | | | 9.96 | | | 1.28 | | | ** |
S&P 500 Index3 | | | | | –5.08 | | | 11.32 | | | 3.50 | | | *** |
Lipper Large-Cap Growth Funds Avg.4 | | | | | –0.12 | | | 9.31 | | | 2.29 | | | **** |
| | |
| 2 | | Visit our website at www.jennisondryden.com |
The cumulative total returns do not reflect the deduction of applicable sales charges. If reflected, the applicable sales charges would reduce the cumulative total returns performance quoted. Class A shares are subject to a maximum front-end sales charge of 5.50%. Under certain circumstances, Class A shares may be subject to a contingent deferred sales charge (CDSC) of 1%. Class B and Class C shares are subject to a maximum CDSC of 5% and 1%, respectively. Class R and Class Z shares are not subject to a sales charge.
Source: Prudential Investments LLC and Lipper Inc. Performance figures may reflect fee waivers and/or expense reimbursements. In the absence of such fee waivers and/or expense reimbursements, total returns would be lower.
1Inception date returns are provided for any share class with less than 10 calendar years of returns.
2The Russell 1000 Growth Index is an unmanaged index comprising those securities in the Russell 1000 Index with a greater-than-average growth orientation. Companies in this index tend to exhibit relatively high price-to-book ratios, price-to-earnings ratios, forecasted growth rates, and relatively low dividend yields.
3The S&P 500 Index is an unmanaged index of 500 stocks of large U.S. public companies. It gives a broad look at how U.S. stock prices have performed.
4The Lipper Large-Cap Growth Funds Average (Lipper Average) represents returns based on the average return of all funds in the Lipper Large-Cap Growth Funds category for the periods noted. Funds in the Lipper Average invest at least 75% of their equity assets in companies with market capitalizations (on a three-year weighted basis) greater than 300% of the dollar-weighted median market capitalization of the middle 1,000 securities of the S&P SuperComposite 1500 Index. Large-cap growth funds typically have an above-average price-to-earnings ratio, price-to-book ratio, and three-year sales-per-share growth value compared with the S&P 500 Index.
5The average annual total returns take into account applicable sales charges. Class A, Class B, Class C, and Class R shares are subject to an annual distribution and service (12b-1) fee of up to 0.30%, 1.00%, 1.00%, and 0.75%, respectively. Approximately seven years after purchase, Class B shares will automatically convert to Class A shares on a quarterly basis. Class Z shares are not subject to a 12b-1 fee. The returns in the tables do not reflect the deduction of taxes that a shareholder would pay on Fund distributions or following the redemption of Fund shares.
**Russell 1000 Growth Index Closest Month-End to Inception cumulative total return is 15.31% for Class R. Russell 1000 Growth Index Closest Month-End to Inception average annual total return is 4.48% for Class R.
***S&P 500 Index Closest Month-End to Inception cumulative total return is 16.03% for Class R. S&P 500 Index Closest Month-End to Inception average annual total return is 4.68% for Class R.
****Lipper Average Closest Month-End to Inception cumulative total return is 13.60% for Class R. Lipper Average Closest Month-End to Inception average annual total return is 3.93% for Class R.
Investors cannot invest directly in an index. The returns for the Russell 1000 Growth Index and the S&P 500 Index would be lower if they included the effects of sales charges, operating expenses of a mutual fund, or taxes. Returns for the Lipper Average reflect the deduction of operating expenses, but not sales charges or taxes.
| | |
| The Prudential Investment Portfolios, Inc./Jennison Growth Fund | | 3 |
Your Fund’s Performance (continued)
| | | |
Five Largest Holdings expressed as a percentage of net assets as of 3/31/08
(excluding short-term investments) | | | |
Gilead Sciences, Inc., Biotechnology | | 5.0 | % |
Google, Inc. (Class A Stock), Internet Software & Services | | 3.5 | |
Monsanto Co., Chemicals | | 3.2 | |
Microsoft Corp., Software | | 3.2 | |
Research in Motion Ltd., Communications Equipment | | 3.1 | |
Holdings are subject to change.
| | | |
Five Largest Industries expressed as a percentage of net assets as of 3/31/08
(excluding short-term investments) | | | |
Pharmaceuticals | | 11.7 | % |
Communications Equipment | | 9.4 | |
Biotechnology | | 7.4 | |
Healthcare Equipment & Supplies | | 6.1 | |
Software | | 4.9 | |
Industry weightings are subject to change.
| | |
| 4 | | Visit our website at www.jennisondryden.com |
Fees and Expenses (Unaudited)
As a shareholder of the Fund, you incur two types of costs: (1) transaction costs, including sales charges (loads) on purchase payments and redemptions, as applicable, and (2) ongoing costs, including management fees, distribution and/or service (12b-1) fees, and other Fund expenses, as applicable. This example is intended to help you understand your ongoing costs (in dollars) of investing in the Fund and to compare these costs with the ongoing costs of investing in other mutual funds.
The example is based on an investment of $1,000 invested on October 1, 2007, at the beginning of the period, and held through the six-month period ended March 31, 2008. The example is for illustrative purposes only; you should consult the Prospectus for information on initial and subsequent minimum investment requirements.
The Fund’s transfer agent may charge additional fees to holders of certain accounts that are not included in the expenses shown in the table on the following page. These fees apply to individual retirement accounts (IRAs) and Section 403(b) accounts. As of the close of the six-month period covered by the table, IRA fees included an annual maintenance fee of $15 per account (subject to a maximum annual maintenance fee of $25 for all accounts held by the same shareholder). Section 403(b) accounts are charged an annual $25 fiduciary maintenance fee. Some of the fees may vary in amount, or may be waived, based on your total account balance or the number of JennisonDryden funds, including the Fund, that you own. You should consider the additional fees that were charged to your Fund account over the six-month period when you estimate the total ongoing expenses paid over the period and the impact of these fees on your ending account value, as these additional expenses are not reflected in the information provided in the expense table. Additional fees have the effect of reducing investment returns.
Actual Expenses
The first line for each share class in the table on the following page provides information about actual account values and actual expenses. You may use the information on this line, together with the amount you invested, to estimate the expenses that you paid over the period. Simply divide your account value by $1,000 (for example, an $8,600 account value ÷ $1,000 = 8.6), then multiply the result by the number on the first line under the heading “Expenses Paid During the Six-Month Period” to estimate the expenses you paid on your account during this period.
Hypothetical Example for Comparison Purposes
The second line for each share class in the table on the following page provides information about hypothetical account values and hypothetical expenses based on
| | |
| The Prudential Investment Portfolios, Inc./Jennison Growth Fund | | 5 |
Fees and Expenses (continued)
the Fund’s actual expense ratio and an assumed rate of return of 5% per year before expenses, which is not the Fund’s actual return. The hypothetical account values and expenses may not be used to estimate the actual ending account balance or expenses you paid for the period. You may use this information to compare the ongoing costs of investing in the Fund and other funds. To do so, compare this 5% hypothetical example with the 5% hypothetical examples that appear in the shareholder reports of the other funds.
Please note that the expenses shown in the table are meant to highlight your ongoing costs only and do not reflect any transactional costs such as sales charges (loads). Therefore, the second line for each share class in the table is useful in comparing ongoing costs only and will not help you determine the relative total costs of owning different funds. In addition, if these transactional costs were included, your costs would have been higher.
| | | | | | | | | | | | | | |
Jennison
Growth Fund | | Beginning Account Value October 1, 2007 | | Ending Account
Value March 31, 2008 | | Annualized Expense Ratio
Based on the
Six-Month
Period | | | Expenses Paid
During the Six-
Month Period* |
| | | | | | | | | | | | | | |
| Class A | | Actual | | $ | 1,000.00 | | $ | 892.40 | | 1.06 | % | | $ | 5.01 |
| | | Hypothetical | | $ | 1,000.00 | | $ | 1,019.70 | | 1.06 | % | | $ | 5.35 |
| | | | | | | | | | | | | | |
| Class B | | Actual | | $ | 1,000.00 | | $ | 888.70 | | 1.80 | % | | $ | 8.50 |
| | | Hypothetical | | $ | 1,000.00 | | $ | 1,016.00 | | 1.80 | % | | $ | 9.07 |
| | | | | | | | | | | | | | |
| Class C | | Actual | | $ | 1,000.00 | | $ | 888.70 | | 1.80 | % | | $ | 8.50 |
| | | Hypothetical | | $ | 1,000.00 | | $ | 1,016.00 | | 1.80 | % | | $ | 9.07 |
| | | | | | | | | | | | | | |
| Class R | | Actual | | $ | 1,000.00 | | $ | 891.70 | | 1.30 | % | | $ | 6.15 |
| | | Hypothetical | | $ | 1,000.00 | | $ | 1,018.50 | | 1.30 | % | | $ | 6.56 |
| | | | | | | | | | | | | | |
| Class Z | | Actual | | $ | 1,000.00 | | $ | 893.90 | | 0.80 | % | | $ | 3.79 |
| | | Hypothetical | | $ | 1,000.00 | | $ | 1,021.00 | | 0.80 | % | | $ | 4.04 |
* Fund expenses (net of fee waivers or subsidies, if any) for each share class are equal to the annualized expense ratio for each share class (provided in the table), multiplied by the average account value over the period, multiplied by the 183 days in the six-month period ended March 31, 2008, and divided by the 366 days in the Fund’s fiscal year ending September 30, 2008 (to reflect the six-month period). Expenses presented in the table include the expenses of any underlying portfolios in which the Fund may invest.
| | |
| 6 | | Visit our website at www.jennisondryden.com |
Portfolio of Investments
as of March 31, 2008 (Unaudited)
| | | | | |
| Shares | | Description | | Value (Note 1) |
| | | | | |
LONG-TERM INVESTMENTS 97.0% | | | |
COMMON STOCKS | | | |
| |
Aerospace & Defense 3.3% | | | |
| 485,200 | | Raytheon Co.(b) | | $ | 31,348,772 |
| 714,300 | | United Technologies Corp. | | | 49,158,126 |
| | | | | |
| | | | | 80,506,898 |
| |
Beverages 3.6% | | | |
| 846,000 | | Coca-Cola Co. (The) | | | 51,496,020 |
| 514,900 | | PepsiCo, Inc.(b) | | | 37,175,780 |
| | | | | |
| | | | | 88,671,800 |
| |
Biotechnology 7.4% | | | |
| 748,100 | | Genentech, Inc.(a) | | | 60,730,758 |
| 2,384,700 | | Gilead Sciences, Inc.(a) | | | 122,883,591 |
| | | | | |
| | | | | 183,614,349 |
| |
Capital Markets 4.6% | | | |
| 2,293,400 | | Charles Schwab Corp. (The)(b) | | | 43,184,722 |
| 150,300 | | Goldman Sachs Group, Inc. (The) | | | 24,858,117 |
| 706,300 | | Lazard Ltd. (Class A Stock)(b) | | | 26,980,660 |
| 433,700 | | Merrill Lynch & Co., Inc.(b) | | | 17,668,938 |
| | | | | |
| | | | | 112,692,437 |
| |
Chemicals 3.2% | | | |
| 715,700 | | Monsanto Co.(b) | | | 79,800,550 |
| |
Communications Equipment 9.4% | | | |
| 3,031,900 | | Cisco Systems, Inc.(a) | | | 73,038,471 |
| 1,130,900 | | Nokia Oyj, ADR (Finland) | | | 35,996,547 |
| 1,182,500 | | QUALCOMM, Inc. | | | 48,482,500 |
| 678,900 | | Research In Motion Ltd.(a) | | | 76,192,947 |
| | | | | |
| | | | | 233,710,465 |
| |
Computers & Peripherals 4.5% | | | |
| 345,400 | | Apple, Inc.(a) | | | 49,564,900 |
| 1,335,200 | | Hewlett-Packard Co.(b) | | | 60,965,232 |
| | | | | |
| | | | | 110,530,132 |
| |
Diversified Consumer Services 1.5% | | | |
| 614,800 | | Visa, Inc. (Class A Stock)(a) | | | 38,338,928 |
See Notes to Financial Statements.
| | |
| The Prudential Investment Portfolios, Inc./Jennison Growth Fund | | 7 |
Portfolio of Investments
as of March 31, 2008 (Unaudited) continued
| | | | | |
| Shares | | Description | | Value (Note 1) |
| | | | | |
COMMON STOCKS (Continued) | | | |
| |
Diversified Financial Services 0.9% | | | |
| 357,900 | | NYSE Euronext | | $ | 22,086,009 |
| |
Electrical Equipment 1.0% | | | |
| 903,700 | | ABB Ltd., ADR (Switzerland) | | | 24,327,604 |
| |
Energy Equipment & Services 3.8% | | | |
| 183,900 | | First Solar, Inc.(a) | | | 42,506,646 |
| 591,300 | | Schlumberger Ltd.(b) | | | 51,443,100 |
| | | | | |
| | | | | 93,949,746 |
| |
Food & Staples Retailing 4.1% | | | |
| 572,300 | | Costco Wholesale Corp.(b) | | | 37,182,331 |
| 976,800 | | CVS/Caremark Corp. | | | 39,570,168 |
| 744,000 | | Whole Foods Market, Inc.(b) | | | 24,529,680 |
| | | | | |
| | | | | 101,282,179 |
| |
Healthcare Equipment & Supplies 6.1% | | | |
| 371,100 | | Alcon, Inc. | | | 52,788,975 |
| 829,500 | | Baxter International, Inc. | | | 47,961,690 |
| 272,400 | | Holologic, Inc.(a)(b) | | | 15,145,440 |
| 832,300 | | St. Jude Medical, Inc.(a) | | | 35,947,037 |
| | | | | |
| | | | | 151,843,142 |
| |
Hotels, Restaurants & Leisure 1.9% | | | |
| 148,000 | | Las Vegas Sands Corp.(a)(b) | | | 10,898,720 |
| 1,073,800 | | Marriott International, Inc. (Class A Stock)(b) | | | 36,895,768 |
| | | | | |
| | | | | 47,794,488 |
| |
Household Products 2.2% | | | |
| 691,600 | | Colgate-Palmolive Co. | | | 53,882,556 |
| |
Industrial Conglomerates 2.5% | | | |
| 1,319,100 | | General Electric Co.(b) | | | 48,819,891 |
| 194,600 | | Veolia Environment, ADR (France)(b) | | | 13,608,378 |
| | | | | |
| | | | | 62,428,269 |
| |
Internet & Catalog Retail 1.8% | | | |
| 611,200 | | Amazon.com, Inc.(a)(b) | | | 43,578,560 |
See Notes to Financial Statements.
| | |
| 8 | | Visit our website at www.jennisondryden.com |
| | | | | |
| Shares | | Description | | Value (Note 1) |
| | | | | |
COMMON STOCKS (Continued) | | | |
| |
Internet Software & Services 4.5% | | | |
| 861,100 | | Akamai Technologies, Inc.(a)(b) | | $ | 24,248,576 |
| 196,800 | | Google, Inc. (Class A Stock)(a) | | | 86,684,496 |
| | | | | |
| | | | | 110,933,072 |
| |
IT Services 1.3% | | | |
| 886,200 | | Infosys Technologies Ltd., ADR (India)(b) | | | 31,699,374 |
| |
Life Sciences, Tools & Services 2.0% | | | |
| 863,600 | | Thermo Fisher Scientific, Inc.(a) | | | 49,087,024 |
| |
Media 4.0% | | | |
| 2,128,200 | | News Corp. (Class A Stock)(b) | | | 39,903,750 |
| 1,890,000 | | Disney (Walt) Co.(The)(b) | | | 59,308,200 |
| | | | | |
| | | | | 99,211,950 |
| |
Multiline Retail 0.5% | | | |
| 915,000 | | Saks, Inc.(a)(b) | | | 11,410,050 |
| |
Oil, Gas & Consumable Fuels 3.6% | | | |
| 784,100 | | Marathon Oil Corp. | | | 35,754,960 |
| 457,700 | | Occidental Petroleum Corp. | | | 33,489,909 |
| 599,900 | | Southwestern Energy Co.(a)(b) | | | 20,210,631 |
| | | | | |
| | | | | 89,455,500 |
| | |
Pharmaceuticals 11.7% | | | | | |
| 1,247,600 | | Abbott Laboratories | | | 68,805,140 |
| 714,800 | | Elan Corp. PLC, ADR (Ireland)(a)(b) | | | 14,910,728 |
| 1,037,700 | | Merck & Co., Inc. | | | 39,380,715 |
| 1,182,100 | | Mylan Laboratories, Inc.(b) | | | 13,712,360 |
| 573,400 | | Roche Holding AG, ADR (Switzerland) | | | 54,100,290 |
| 1,395,500 | | Schering-Plough Corp. | | | 20,109,155 |
| 1,067,200 | | Teva Pharmaceutical Industries Ltd., ADR (Israel)(b) | | | 49,293,968 |
| 716,200 | | Wyeth | | | 29,908,512 |
| | | | | |
| | | | | 290,220,868 |
| | |
Software 4.9% | | | | | |
| 1,208,500 | | Adobe Systems, Inc.(a) | | | 43,010,515 |
| 2,791,100 | | Microsoft Corp. | | | 79,211,418 |
| | | | | |
| | | | | 122,221,933 |
See Notes to Financial Statements.
| | |
| The Prudential Investment Portfolios, Inc./Jennison Growth Fund | | 9 |
Portfolio of Investments
as of March 31, 2008 (Unaudited) continued
| | | | | | |
| Shares | | Description | | Value (Note 1) | |
COMMON STOCKS (Continued) | | | | |
| | | | | | |
| |
Textiles, Apparel & Luxury Goods 2.7% | | | | |
| 678,400 | | Coach, Inc.(a)(b) | | $ | 20,453,760 | |
| 664,800 | | Nike, Inc. (Class B Stock)(b) | | | 45,206,400 | |
| | | | | | |
| | | | | 65,660,160 | |
| | | | | | |
| | TOTAL LONG-TERM INVESTMENTS
(cost $1,900,629,659) | | | 2,398,938,043 | |
| | | | | | |
SHORT-TERM INVESTMENT 21.3% | | | | |
| |
Affiliated Money Market Mutual Fund | | | | |
| | Dryden Core Investment Fund - Taxable Money Market Series | | | | |
525,670,211 | | (cost $525,670,211; includes $462,753,744 of cash collateral received from securities on loan)(c)(d) | | | 525,670,211 | |
| | | | | | |
| | TOTAL INVESTMENTS 118.3%
(cost $2,426,299,870; Note 5) | | | 2,924,608,254 | |
| | Liabilities in excess of other assets (18.3%) | | | (452,917,270 | ) |
| | | | | | |
| | NET ASSETS 100% | | $ | 2,471,690,984 | |
| | | | | | |
The following abbreviations are used in portfolio descriptions:
ADR—American Depositary Receipt
| (a) | Non-income producing security. |
| (b) | All or a portion of security is on loan. The aggregate market value of such securities is $452,274,675; cash collateral of $462,753,744 (included in liabilities) was received with which the Fund purchased highly liquid short-term investments. |
| (c) | Represents security, or portion thereof, purchased with cash collateral received for securities on loan. |
| (d) | Prudential Investments LLC, the manager of the Fund, also serves as manager of the Dryden Core Investment Fund—Taxable Money Market Series. |
See Notes to Financial Statements.
| | |
| 10 | | Visit our website at www.jennisondryden.com |
The Industry classification of portfolio holdings and liabilities in excess of other assets shown as a percentage of net assets as of March 31, 2008 were as follows:
| | | |
Affiliated Money Market Mutual Fund (including 18.7% of collateral received for securities on loan) | | 21.3 | % |
Pharmaceuticals | | 11.7 | |
Communications Equipment | | 9.4 | |
Biotechnology | | 7.4 | |
Healthcare Equipment & Supplies | | 6.1 | |
Software | | 4.9 | |
Capital Markets | | 4.6 | |
Computers & Peripherals | | 4.5 | |
Internet Software Services | | 4.5 | |
Food & Staples Retailing | | 4.1 | |
Media | | 4.0 | |
Energy Equipment & Services | | 3.8 | |
Beverages | | 3.6 | |
Oil, Gas & Consumable Fuels | | 3.6 | |
Aerospace & Defense | | 3.3 | |
Chemicals | | 3.2 | |
Textiles, Apparel & Luxury Goods | | 2.7 | |
Industrial Conglomerates | | 2.5 | |
Household Products | | 2.2 | |
Life Sciences Tools & Services | | 2.0 | |
Hotels, Restaurants & Leisure | | 1.9 | |
Internet & Catalog Retail | | 1.8 | |
Diversified Consumer Services | | 1.5 | |
IT Services | | 1.3 | |
Electrical Equipment | | 1.0 | |
Diversified Financial Services | | 0.9 | |
Multiline Retail | | 0.5 | |
| | | |
| | 118.3 | |
Liabilities in excess of other assets | | (18.3 | ) |
| | | |
| | 100.0 | % |
| | | |
See Notes to Financial Statements.
| | |
| The Prudential Investment Portfolios, Inc./Jennison Growth Fund | | 11 |
Statement of Assets and Liabilities
as of March 31, 2008 (Unaudited)
| | | | |
Assets | | | | |
Investments at value, including securities on loan of $452,274,675: | | | | |
Unaffiliated investments (cost $1,900,629,659) | | $ | 2,398,938,043 | |
Affiliated investments (cost $ 525,670,211) | | | 525,670,211 | |
Cash | | | 68,751 | |
Receivable for investments sold | | | 22,378,511 | |
Dividends receivable | | | 3,119,485 | |
Receivable for Series shares sold | | | 1,257,287 | |
Foreign tax reclaim receivable | | | 646,747 | |
Prepaid expenses | | | 20,577 | |
| | | | |
Total assets | | | 2,952,099,612 | |
| | | | |
| |
Liabilities | | | | |
Payable to broker for collateral for securities on loan | | | 462,753,744 | |
Payable for investments purchased | | | 9,967,404 | |
Payable for Series shares reacquired | | | 4,316,248 | |
Management fee payable | | | 1,198,367 | |
Accrued expenses | | | 908,209 | |
Affiliated transfer agent fee payable | | | 763,938 | |
Distribution fee payable | | | 491,873 | |
Deferred directors’ fees | | | 8,845 | |
| | | | |
Total liabilities | | | 480,408,628 | |
| | | | |
| |
Net Assets | | $ | 2,471,690,984 | |
| | | | |
| | | | | |
Net assets were comprised of: | | | | |
Common stock, at par | | $ | 151,341 | |
Paid-in capital in excess of par | | | 3,280,671,579 | |
| | | | |
| | | 3,280,822,920 | |
Distributions in excess of net investment income | | | (178,789 | ) |
Accumulated net realized loss on investments and foreign currency transactions | | | (1,307,261,531 | ) |
Net unrealized appreciation on investments and foreign currencies | | | 498,308,384 | |
| | | | |
Net assets, March 31, 2008 | | $ | 2,471,690,984 | |
| | | | |
See Notes to Financial Statements.
| | |
| 12 | | Visit our website at www.jennisondryden.com |
| | | |
Class A | | | |
Net asset value and redemption price per share
($1,309,219,452 ÷ 80,514,200 shares of common stock issued and outstanding) | | $ | 16.26 |
Maximum sales charge (5.50% of offering price) | | | .95 |
| | | |
Maximum offering price to public | | $ | 17.21 |
| | | |
| |
Class B | | | |
Net asset value, offering price and redemption price per share
($117,512,978 ÷ 7,997,563 shares of common stock issued and outstanding) | | $ | 14.69 |
| | | |
| |
Class C | | | |
Net asset value, offering price and redemption price per share
($67,523,911 ÷ 4,595,127 shares of common stock issued and outstanding) | | $ | 14.69 |
| | | |
| |
Class R | | | |
Net asset value, offering price and redemption price per share
($3,006,897 ÷ 200,722 shares of common stock issued and outstanding) | | $ | 14.98 |
| | | |
| |
Class Z | | | |
Net asset value, offering price and redemption price per share
($974,427,746 ÷ 58,033,052 shares of common stock issued and outstanding) | | $ | 16.79 |
| | | |
See Notes to Financial Statements.
| | |
| The Prudential Investment Portfolios, Inc./Jennison Growth Fund | | 13 |
Statement of Operations
Six Months Ended March 31, 2008 (Uaudited)
| | | | |
Net Investment Loss | | | | |
Income | | | | |
Unaffiliated dividend income (net of foreign withholding taxes of $353,602) | | $ | 12,278,069 | |
Affiliated dividend income | | | 796,751 | |
Affiliated income from securities loaned, net | | | 1,196,658 | |
| | | | |
Total income | | | 14,271,478 | |
| | | | |
| |
Expenses | | | | |
Management fee | | | 7,902,071 | |
Distribution fee—Class A | | | 1,933,839 | |
Distribution fee—Class B | | | 726,445 | |
Distribution fee—Class C | | | 374,915 | |
Distribution fee—Class R | | | 7,580 | |
Transfer agent’s fee and expenses (including affiliated expense of $1,225,600) | | | 2,577,000 | |
Custodian’s fees and expenses | | | 147,000 | |
Reports to shareholders | | | 123,000 | |
Registration fees | | | 48,000 | |
Directors’ fees | | | 40,000 | |
Insurance | | | 31,000 | |
Legal fees and expenses | | | 13,000 | |
Interest Expense | | | 10,774 | |
Audit fee | | | 10,000 | |
Loan interest expense (Note 7) | | | 9,164 | |
Commitment fees | | | 4,000 | |
Miscellaneous | | | 7,456 | |
| | | | |
Total expenses | | | 13,965,244 | |
| | | | |
Net investment income | | | 306,234 | |
| | | | |
| |
Realized And Unrealized Gain (Loss) On Investments And Foreign Currencies | | | | |
Net realized gain (loss) on: | | | | |
Investment transactions | | | 77,158,775 | |
Foreign currency transactions | | | (105,867 | ) |
| | | | |
| | | 77,052,908 | |
| | | | |
Net change in unrealized appreciation (depreciation) on: | | | | |
Investments | | | (383,049,289 | ) |
Foreign currencies | | | (685 | ) |
| | | | |
| | | (383,049,974 | ) |
| | | | |
Net loss on investments and foreign currencies | | | (305,997,066 | ) |
| | | | |
Net Decrease In Net Assets Resulting From Operations | | $ | (305,690,832 | ) |
| | | | |
See Notes to Financial Statements.
| | |
| 14 | | Visit our website at www.jennisondryden.com |
Statement of Changes in Net Assets
(Unaudited)
| | | | | | | | |
| | | Six Months
Ended
March 31, 2008 | | | Year
Ended
September 30, 2007 | |
Increase (Decrease) In Net Assets | | | | | | | | |
Operations | | | | | | | | |
Net investment income | | $ | 306,234 | | | $ | 598,765 | |
Net realized gain on investment and foreign currency transactions | | | 77,052,908 | | | | 246,503,341 | |
Net change in unrealized appreciation (depreciation) on investments and foreign currencies | | | (383,049,974 | ) | | | 176,660,577 | |
| | | | | | | | |
Net increase (decrease) in net assets resulting from operations | | | (305,690,832 | ) | | | 423,762,683 | |
| | | | | | | | |
Dividends (Note 1) | | | | | | | | |
Dividends from net investment income: | | | | | | | | |
Class Z | | | (993,817 | ) | | | — | |
| | |
Series share transactions (Net of share conversions) (Note 6) | | | | | | | | |
Net proceeds from shares sold | | | 222,362,501 | | | | 446,836,180 | |
Net asset value of shares issued in reinvestment of dividends | | | 991,311 | | | | — | |
Cost of shares reacquired | | | (357,240,700 | ) | | | (949,542,407 | ) |
| | | | | | | | |
Net decrease in net assets from Series share transactions | | | (133,886,888 | ) | | | (502,706,227 | ) |
| | | | | | | | |
Total decrease | | | (440,571,537 | ) | | | (78,943,544 | ) |
| | |
Net Assets | | | | | | | | |
Beginning of period | | | 2,912,262,521 | | | | 2,991,206,065 | |
| | | | | | | | |
End of period | | $ | 2,471,690,984 | | | $ | 2,912,262,521 | |
| | | | | | | | |
(a) Includes undistributed net investment income of: | | $ | — | | | $ | 508,794 | |
| | | | | | | | |
See Notes to Financial Statements.
| | |
| The Prudential Investment Portfolios, Inc./Jennison Growth Fund | | 15 |
Notes to Financial Statements
(Unaudited)
The Prudential Investment Portfolios, Inc. (the “Company”) is registered under the Investment Company Act of 1940 as an open-end management investment company. The Company was incorporated in Maryland on August 10, 1995 and consists of six series: Jennison Growth Fund (the “Series”), Jennison Equity Opportunity Fund and Dryden Active Allocation Fund which are diversified funds and JennisonDryden Growth Allocation Fund, JennisonDryden Moderate Allocation Fund and JennisonDryden Conservative Allocation Fund which are non-diversified funds. These financial statements relate to the Jennison Growth Fund. The financial statements of the other series are not presented herein. The Series commenced investment operations on November 2, 1995.
The Series’ investment objective is to achieve long-term growth of capital. The Series seeks to achieve its objective by investing primarily in equity securities (common stock, preferred stock and securities convertible into common stock) of established companies with above-average growth prospects.
Note 1. Accounting Policies
The following is a summary of significant accounting policies followed by the Series in the preparation of its financial statements.
Securities Valuation: Securities listed on a securities exchange are valued at the last sale price on such exchange on the day of valuation or, if there was no sale on such day, at the mean between the last reported bid and asked prices, or at the last bid price on such day in the absence of an asked price. Securities traded via NASDAQ are valued at the NASDAQ official closing price (“NOCP”) on the day of valuation, or if there was no NOCP, at the last sale price. Securities that are actively traded in the over-the-counter market, including listed securities for which the primary market is believed by Prudential Investments LLC (“PI” or “Manager”), in consultation with the subadviser; to be over-the-counter, are valued at market value using prices provided by an independent pricing agent or principal market maker. Securities for which reliable market quotations are not readily available, or whose values have been effected by events occurring after the close of the security’s foreign market and before the Series’ normal pricing time, are valued at fair value in accordance with the Board of Directors’ approved fair valuation procedures. When determining the fair valuation of securities some of the factors influencing the valuation include, the nature of any restrictions on disposition of the securities; assessment of the general liquidity of the
| | |
| 16 | | Visit our website at www.jennisondryden.com |
securities; the issuer’s financial condition and the markets in which it does business; the cost of the investment; the size of the holding and the capitalization of issuer; the prices of any recent transactions or bids/offers for such securities or any comparable securities; any available analyst media or other reports or information deemed reliable by the investment adviser regarding the issuer or the markets or industry in which it operates. Using fair value to price securities may result in a value that is different from a security’s most recent closing price and from the price used by other mutual funds to calculate their net asset values. As of March 31, 2008, there were no securities valued in accordance with such procedures.
Investments in mutual funds are valued at the net asset value as of the close of the New York Stock Exchange on the date of valuation.
Short-term debt securities which mature in sixty days or less are valued at amortized cost, which approximates market value. The amortized cost method involves valuing a security at its cost on the date of purchase and thereafter assuming a constant amortization to maturity of the difference between the principal amount due at maturity and cost. Short-term debt securities which mature in more than sixty days are valued at current market quotations.
Securities Lending: The Series may lend its portfolio securities to qualified institutions. The loans are secured by collateral at least equal, at all times, to the market value of the securities loaned. The Series may bear the risk of delay in recovery of, or even loss of rights in, the securities loaned should the borrower of the securities fail financially. The Series receives compensation, net of any rebate, for lending its securities in the form of interest or dividends on the collateral received on the securities loaned, and any gain or loss in the market price of the securities loaned that may occur during the term of the loan.
Foreign Currency Translation: The books and records of the Series are maintained in U.S. dollars. Foreign currency amounts are translated into U.S. dollars on the following basis:
(i) market value of investment securities, other assets and liabilities-at the current rates of exchange;
(ii) purchases and sales of investment securities, income and expenses-at the rates of exchange prevailing on the respective dates of such transactions.
Although the net assets of the Series are presented at the foreign exchange rates and market values at the close of the fiscal period, the Series does not isolate that portion of the results of operations arising as a result of changes in the foreign exchange rates
| | |
| The Prudential Investment Portfolios, Inc./Jennison Growth Fund | | 17 |
Notes to Financial Statements
(Unaudited) continued
from the fluctuations arising from changes in the market prices of long-term portfolio securities held at the end of the fiscal period. Similarly, the Series does not isolate the effect of changes in foreign exchange rates from the fluctuations arising from changes in the market prices of long-term portfolio securities sold during the fiscal period. Accordingly, these realized foreign currency gains or losses are included in the reported net realized gains or losses on investment transactions.
Net realized gains or losses on foreign currency transactions represent net foreign exchange gains or losses from the holding of foreign currencies, currency gains or losses realized between the trade date and settlement dates on security transactions, and the difference between the amounts of dividends, interest and foreign withholding taxes recorded on the Series’ books and the U.S. dollar equivalent amounts actually received or paid. Net unrealized currency gains or losses from valuing foreign currency denominated assets and liabilities (other than investments) at period end exchange rates are reflected as a component of net unrealized appreciation (depreciation) on foreign currencies.
Foreign security and currency transactions may involve certain considerations and risks not typically associated with those of domestic origin as a result of, among other factors, the possibility of political and economic instability and the level of governmental supervision and regulation of foreign securities markets.
Securities Transactions and Net Investment Income: Securities transactions are recorded on the trade date. Realized gains or losses on sales of securities are calculated on the identified cost basis. Dividend income is recorded on the ex-dividend date and interest income, including amortization of premium and accretion of discount on debt securities, as required, is recorded on the accrual basis.
Net investment income or loss (other than distribution fees which are charged directly to the respective class), realized and unrealized gains or losses, are allocated daily to each class of shares based upon the relative proportion of net assets of each class at the beginning of the day. The Company’s expenses are allocated to the respective Series on the basis of relative net assets except for expenses that are charged directly to the Series level.
Dividends and Distributions: The Series expects to pay dividends of net investment income, if any, semi-annually. Distributions of net realized capital and currency
| | |
| 18 | | Visit our website at www.jennisondryden.com |
gains, if any, annually. Dividends and distributions, which are determined in accordance with federal income tax regulations and which may differ from generally accepted accounting principles, are recorded on the ex-dividend date. Permanent book/tax differences relating to income and gains are reclassified amongst undistributed net investment income, accumulated net realized gain or loss and paid-in capital in excess of par, as appropriate.
Taxes: For federal income tax purposes, each Series in the Company is treated as a separate tax-paying entity. It is the Series’ policy to continue to meet the requirements of the Internal Revenue Code applicable to regulated investment companies and to distribute all of its taxable net income and capital gains, if any, to shareholders. Therefore, no federal income tax provision is required.
Withholding taxes on foreign dividends are recorded net of reclaimable amounts, at the time the related income is earned.
Estimates: The preparation of the financial statements requires management to make estimates and assumptions that affect the reported amounts and disclosures in the financial statements. Actual results could differ from those estimates.
Note 2. Agreements
The Company has a management agreement for the Series with PI. Pursuant to this agreement, PI has responsibility for all investment advisory services and supervises the subadvisor’s performance of such services. PI has entered into a subadvisory agreement with Jennison Associates LLC (“Jennison”). The subadvisory agreement provides that Jennison furnishes investment advisory services in connection with the management of the Series. In the connection therewith, Jennison is obligated to keep certain books and records of the Series. PI pays for the services of Jennison, the cost of compensation of officers and employees of the Series, occupancy and certain clerical and bookkeeping costs of the Series. The Series bears all other costs and expenses.
The management fee paid to PI is computed daily and payable monthly at an annual rate of .600 of 1% of the Series’ average daily net assets up to $300 million, .575 of 1% of the next $2.7 billion and .550 of 1% of the Series’ average daily net assets in excess of $3 billion. The effective management fee rate was .58 of 1% of the Series’ average daily net assets for the six months ended March 31, 2008.
The Series has a distribution agreement with Prudential Investment Management Services LLC (“PIMS”), which acts as the distributor of the Class A, Class B, Class C, Class R and Class Z shares of the Series. The Series compensates PIMS for distributing
| | |
| The Prudential Investment Portfolios, Inc./Jennison Growth Fund | | 19 |
Notes to Financial Statements
(Unaudited) continued
and servicing the Series’ Class A, Class B, Class C and Class R shares, pursuant to plans of distribution (the “Class A, B, C and R Plans”), regardless of expenses actually incurred by PIMS. The distribution fees are accrued daily and payable monthly. No distribution or service fees are paid to PIMS as distributor of the Class Z shares of the Series.
Pursuant to the Class A, B, C and R Plans, the Series compensates PIMS for distribution related activities at an annual rate of up to .30 of 1%, 1%, 1% and .75 of 1% of the average daily net assets of the Class A, B, C and R shares, respectively. PIMS contractually agreed to limit such fees to .25 of 1% of the average daily net assets of the Class A shares through January 31, 2008 and .50 of 1% of the average daily net assets of the Class R shares.
PIMS has advised the Series that it received approximately $177,800 in front-end sales charges resulting from sales of Class A shares during the six months ended March 31, 2008. From these fees, PIMS paid such sales charges to affiliated broker/dealers, which in turn paid commissions to salespersons and incurred other distribution costs.
PIMS has advised the Series that for the six months ended March 31, 2008, it received approximately $800, $90,200 and $2,200 in contingent deferred sales charges imposed upon redemptions by certain Class A, Class B and C shareholders, respectively.
PI, PIMS and Jennison are indirect, wholly-owned subsidiaries of Prudential Financial, Inc. (“Prudential”).
Note 3. Other Transactions with Affiliates
Prudential Mutual Fund Services LLC (“PMFS”), an affiliate of PI and an indirect, wholly-owned subsidiary of Prudential, serves as the Series’ transfer agent. Transfer agent’s fees and expenses in the Statement of Operations include certain out-of-pocket expenses paid to non-affiliates, where applicable.
The Series pays networking fees to affiliated and unaffiliated broker/dealers, including fees relating to the services of First Clearing, LLC (“First Clearing”) and Wachovia Securities, LLC (“Wachovia”), affiliates of PI. These networking fees are payments made to broker/dealers that clear mutual fund transactions through a national clearing system. For the six months ended March 31, 2008, the Series incurred approximately $830,900
| | |
| 20 | | Visit our website at www.jennisondryden.com |
in total networking fees, of which $177,900 was paid to First Clearing. These amounts are included in transfer agent’s fees and expenses in the Statement of Operations.
Prudential Investment Management, Inc. (“PIM”), an indirect, wholly-owned subsidiary of Prudential, is the Series’ security lending agent. For the six months ended March 31, 2008, PIM has been compensated approximately $512,900 for these services.
The Series invests in the Taxable Money Market Series (the “Portfolio”), a portfolio of the Dryden Core Investment Fund, pursuant to an exemptive order received from the Securities and Exchange Commission. The portfolio is a money market mutual fund registered under the Investment Company Act of 1940, as amended, and managed by PI.
Note 4. Portfolio Securities
Purchases and sales of investment securities, other than short-term investments, for the six months ended March 31, 2008 were $1,214,189,272 and $1,397,123,471, respectively.
Note 5. Tax Information
The United States federal income tax basis of the Series’ investments and net unrealized appreciation as of March 31, 2008 were as follows:
| | | | | | |
Tax Basis | | Appreciation | | Depreciation | | Net Unrealized
Appreciation |
| $2,457,119,537 | | $576,610,402 | | $(109,121,685) | | $467,488,717 |
The differences between book and tax basis are primarily attributable to deferred losses on wash sales.
For federal income tax purposes, the Series had a capital loss carryforward as of September 30, 2007 of approximately $1,363,266,000 of which $467,648,000 expires in 2010, $827,428,000 expires in 2011 and $68,190,000 expires in 2012. In addition, the Series utilized approximately $245,932,000 of its prior year capital loss carryforward to offset net taxable gains realized in the fiscal six months ended March 31, 2008. Accordingly, no capital gains distribution is expected to be paid to shareholders until net gains have been realized in excess of such amounts. The Series has elected to treat post-October currency losses of approximately $53,000 incurred in the eleven months ended September 30, 2007 as having been incurred in the next fiscal year.
| | |
| The Prudential Investment Portfolios, Inc./Jennison Growth Fund | | 21 |
Notes to Financial Statements
(Unaudited) continued
Management has analyzed the Company’s tax positions taken on federal income tax returns for all open tax years and has concluded that as of March 31, 2008, no provision for income tax would be required in the Company’s financial statements. The Company’s federal and state income and federal excise tax returns for tax years for which the applicable statutes of limitations have not expired are subject to examination by the Internal Revenue Service and state departments of revenue.
Note 6. Capital
The Series offers Class A, Class B, Class C, Class R and Class Z shares. Class A shares are subject to a maximum front-end sales charge of 5.50%. Investors who purchase Class A shares in an amount of $1 million or more and sell these shares within 12 months of purchase are not subject to an initial sales charge but are subject to a contingent deferred sales charge (CDSC) of 1%, including investors who purchase their shares through broker-dealers affiliated with Prudential. Class B shares are subject to a CDSC of 5%, which decreases by 1% annually to 1% in the fifth and sixth years and 0% in the seventh year. The CDSC for Class C shares is 1% for shares redeemed within 12 months of purchase. Class B shares automatically convert to Class A shares on a quarterly basis approximately seven years after purchase. A special exchange privilege is also available for shareholders who qualified to purchase Class A shares at net asset value. Class R and Class Z shares are not subject to any sales or redemption charge and are offered exclusively for sale to a limited group of investors.
There are 6.25 billion shares of $.001 par value common stock of the Company authorized which are divided into six series. There are 1.25 billion shares authorized for the Series. Class A, Class B, Class C, Class R and Class Z shares each consist of 208,333,333 million authorized shares. The Series also may offer Class I shares, of which 208,333,333 million shares are authorized, but none are currently issued and outstanding. As of March 31, 2008, Prudential Investments Fund Management LLC owned 193 shares of Class R shares of the Series.
| | |
| 22 | | Visit our website at www.jennisondryden.com |
Transactions in shares of common stock were as follows:
| | | | | | | |
Class A | | Shares | | | Amount | |
Six months ended March 31, 2008: | | | | | | | |
Shares sold | | 5,021,405 | | | $ | 87,065,591 | |
Shares reacquired | | (11,718,097 | ) | | | (202,716,683 | ) |
| | | | | | | |
Net increase (decrease) in shares outstanding before conversion | | (6,696,692 | ) | | | (115,651,092 | ) |
Shares issued upon conversion from Class B | | 1,225,403 | | | | 20,843,634 | |
| | | | | | | |
Net increase (decrease) in shares outstanding | | (5,471,289 | ) | | $ | (94,807,458 | ) |
| | | | | | | |
Year ended September 30, 2007: | | | | | | | |
Shares sold | | 13,061,643 | | | $ | 218,632,010 | |
Shares reacquired | | (25,026,922 | ) | | | (421,829,141 | ) |
| | | | | | | |
Net increase (decrease) in shares outstanding before conversion | | (11,965,279 | ) | | | (203,197,131 | ) |
Shares issued upon conversion from Class B | | 4,065,889 | | | | 68,561,673 | |
| | | | | | | |
Net increase (decrease) in shares outstanding | | (7,899,390 | ) | | $ | (134,635,458 | ) |
| | | | | | | |
Class B | | | | | | |
Six months ended March 31, 2008: | | | | | | | |
Shares sold | | 263,666 | | | $ | 4,173,417 | |
Shares reacquired | | (788,640 | ) | | | (12,432,789 | ) |
| | | | | | | |
Net increase (decrease) in shares outstanding before conversion | | (524,974 | ) | | | (8,259,372 | ) |
Shares reacquired upon conversion into Class A | | (1,354,561 | ) | | | (20,843,634 | ) |
| | | | | | | |
Net increase (decrease) in shares outstanding | | (1,879,535 | ) | | $ | (29,103,006 | ) |
| | | | | | | |
Year ended September 30, 2007: | | | | | | | |
Shares sold | | 662,314 | | | $ | 10,108,923 | |
Shares reacquired | | (3,230,934 | ) | | | (49,345,343 | ) |
| | | | | | | |
Net increase (decrease) in shares outstanding before conversion | | (2,568,620 | ) | | | (39,236,420 | ) |
Shares reacquired upon conversion into Class A | | (4,468,126 | ) | | | (68,561,673 | ) |
| | | | | | | |
Net increase (decrease) in shares outstanding | | (7,036,746 | ) | | $ | (107,798,093 | ) |
| | | | | | | |
Class C | | | | | | |
Six months ended March 31, 2008: | | | | | | | |
Shares sold | | 366,913 | | | $ | 5,937,761 | |
Shares reacquired | | (508,270 | ) | | | (7,957,121 | ) |
| | | | | | | |
Net increase (decrease) in shares outstanding | | (141,357 | ) | | $ | (2,019,360 | ) |
| | | | | | | |
Year ended September 30, 2007: | | | | | | | |
Shares sold | | 626,438 | | | $ | 9,575,189 | |
Shares reacquired | | (1,652,887 | ) | | | (25,246,555 | ) |
| | | | | | | |
Net increase (decrease) in shares outstanding | | (1,026,449 | ) | | $ | (15,671,366 | ) |
| | | | | | | |
| | |
| The Prudential Investment Portfolios, Inc./Jennison Growth Fund | | 23 |
Notes to Financial Statements
(Unaudited) continued
| | | | | | | |
Class R | | Shares | | | Amount | |
Six months ended March 31, 2008: | | | | | | | |
Shares sold | | 46,037 | | | $ | 738,651 | |
Shares reacquired | | (22,496 | ) | | | (356,201 | ) |
| | | | | | | |
Net increase (decrease) in shares outstanding | | 23,541 | | | $ | 382,450 | |
| | | | | | | |
Year ended September 30, 2007: | | | | | | | |
Shares sold | | 185,676 | | | $ | 2,859,896 | |
Shares reacquired | | (20,780 | ) | | | (322,654 | ) |
| | | | | | | |
Net increase (decrease) in shares outstanding | | 164,896 | | | $ | 2,537,242 | |
| | | | | | | |
Class Z | | | | | | |
Six months ended March 31, 2008 | | | | | | | |
Shares sold | | 6,926,306 | | | $ | 124,447,081 | |
Shares issued in reinvestment of dividends | | 52,257 | | | | 991,311 | |
Shares reacquired | | (7,495,005 | ) | | | (133,777,906 | ) |
| | | | | | | |
Net increase (decrease) in shares outstanding | | (516,442 | ) | | $ | (8,339,514 | ) |
| | | | | | | |
Year ended September 30, 2007: | | | | | | | |
Shares sold | | 11,845,817 | | | $ | 205,660,162 | |
Shares reacquired | | (26,032,192 | ) | | | (452,798,714 | ) |
| | | | | | | |
Net increase (decrease) in shares outstanding | | (14,186,375 | ) | | $ | (247,138,552 | ) |
| | | | | | | |
Note 7. Borrowings
The Series, along with other affiliated registered investment companies (the “Funds”), is a party to a syndicated credit agreement (“SCA”) with two banks. The SCA provides for a commitment of $500 million. Interest on any borrowings under the SCA is incurred at contracted market rates and a commitment fee for the unused amount is accrued daily and paid quarterly. Effective October 26, 2007, the Funds renewed the SCA with the banks. The commitment under the renewed SCA continues to be $500 million. The Funds pay a commitment fee of .06 of 1% of the unused portion of the renewed SCA. The expiration date of the renewed SCA will be October 24, 2008. For the period October 27, 2006 through October 26, 2007, the Funds paid a commitment fee of .07 of 1% of the unused portion of the agreement. The purpose of the SCA is to provide an alternative source of temporary funding for capital share redemptions.
The Series utilized the line of credit during the six months ended March 31, 2008. The average daily balance for the 12 days the Series had an outstanding balance was approximately $5,692,000 at a weighted average interest rate of approximately 4.83%.
| | |
| 24 | | Visit our website at www.jennisondryden.com |
Note 8. New Accounting Pronouncements
On September 20, 2006, the Financial Accounting Standards Board (“FASB”) released Statement of Financial Accounting Standards No. 157 “Fair Value Measurements” (FAS 157). FAS 157 establishes an authoritative definition of fair value, sets out a framework for measuring fair value, and requires additional disclosures about fair-value measurements. The application of FAS 157 is required for fiscal years beginning after November 15, 2007 and interim periods within those fiscal years. At this time, management is evaluating the implications of FAS 157 and its impact, if any, in the financial statements has not yet been determined.
In addition, in March 2008, the FASB released Statement of Financial Accounting Standards No. 161, Disclosures about Derivative Instruments and Hedging Activities (FAS 161). FAS 161 requires qualitative disclosures about objectives and strategies for using derivatives, quantitative disclosures about fair value amounts of and gains and losses on derivative instruments, and disclosures about credit-risk-related contingent features in derivative agreements. The application of FAS 161 is required for fiscal years beginning after November 15, 2008 and interim periods within those fiscal years. At this time, management is evaluating the implications of FAS 161 and its impact on the financial statements has not yet been determined.
| | |
| The Prudential Investment Portfolios, Inc./Jennison Growth Fund | | 25 |
Financial Highlights
(Unaudited)
| | | | |
| | | Class A | |
| | | Six Months Ended
March 31, 2008 | |
Per Share Operating Performance(a): | | | | |
Net Asset Value, Beginning Of Period | | $ | 18.22 | |
| | | | |
Income (loss) from investment operations: | | | | |
Net investment income (loss) | | | — | (b) |
Net realized and unrealized gain (loss) on investment and foreign currency transactions | | | (1.96 | ) |
| | | | |
Total from investment operations | | | (1.96 | ) |
| | | | |
Net asset value, end of period | | $ | 16.26 | |
| | | | |
Total Return(c): | | | (10.76 | )% |
Ratios/Supplemental Data: | | | | |
Net assets, end of period (000) | | $ | 1,309,219 | |
Average net assets (000) | | $ | 1,460,416 | |
Ratios to average net assets(e): | | | | |
Expenses, including distribution and service (12b-1) fees(d) | | | 1.06 | %(g) |
Expenses, excluding distribution and service (12b-1) fees | | | .80 | %(g) |
Net investment income (loss) | | | (.02 | )%(g) |
Portfolio turnover rate | | | 44 | %(h) |
| (a) | Calculated based upon average shares outstanding during the period. |
| (b) | Less than $.005 per share. |
| (c) | Total return does not consider the effects of sales loads. Total return is calculated assuming a purchase of a share on the first day and a sale on the last day of each period reported, and includes reinvestment of dividends and distributions. Total returns may reflect adjustments to conform to generally accepted accounting principles. Total returns for periods less than one full year are not annualized. |
| (d) | The distributor of the Series has contractually agreed to limit its distribution and service 12b-1 fees to .25 of 1% of the average daily net assets of the Class A shares through January 31, 2008. |
| (e) | Does not include expenses of the underlying portfolios in which the Fund invests. |
See Notes to Financial Statements.
| | |
| 26 | | Visit our website at www.jennisondryden.com |
| | | | | | | | | | | | | | | | | | |
| Class A | |
| Year Ended September 30, | |
| 2007 | | | 2006 | | | 2005 | | | 2004 | | | 2003 | |
| | | | | | | | | | | | | | | | | | |
| $ | 15.78 | | | $ | 15.31 | | | $ | 12.84 | | | $ | 11.77 | | | $ | 9.73 | |
| | | | | | | | | | | | | | | | | | | |
| | | | | | | | | | | | | | | | | | |
| | — | (b) | | | (.03 | ) | | | .01 | | | | (.04 | ) | | | (.02 | ) |
| | 2.44 | | | | .50 | | | | 2.46 | | | | 1.11 | | | | 2.06 | |
| | | | | | | | | | | | | | | | | | | |
| | 2.44 | | | | .47 | | | | 2.47 | | | | 1.07 | | | | 2.04 | |
| | | | | | | | | | | | | | | | | | | |
| $ | 18.22 | | | $ | 15.78 | | | $ | 15.31 | | | $ | 12.84 | | | $ | 11.77 | |
| | | | | | | | | | | | | | | | | | | |
| | 15.46 | % | | | 3.07 | % | | | 19.24 | % | | | 9.09 | % | | | 20.97 | % |
| | | | | | | | | | | | | | | | | | |
| $ | 1,566,814 | | | $ | 1,481,913 | | | $ | 1,348,039 | | | $ | 1,200,078 | | | $ | 1,134,839 | |
| $ | 1,525,634 | | | $ | 1,393,481 | | | $ | 1,258,500 | | | $ | 1,237,249 | | | $ | 1,034,231 | |
| | | | | | | | | | | | | | | | | | |
| | 1.02 | % | | | 1.04 | % | | | 1.06 | % | | | 1.05 | % | | | 1.17 | % |
| | .77 | % | | | .79 | % | | | .81 | % | | | .80 | % | | | .92 | % |
| | — | %(f) | | | (.18 | )% | | | .04 | % | | | (.27 | )% | | | (.21 | )% |
| | 63 | % | | | 72 | % | | | 57 | % | | | 68 | % | | | 64 | % |
See Notes to Financial Statements.
| | |
| The Prudential Investment Portfolios, Inc./Jennison Growth Fund | | 27 |
Financial Highlights
(Unaudited) continued
| | | | |
| | | Class B | |
| | | Six Months Ended
March 31, 2008 | |
Per Share Operating Performance(a): | | | | |
Net Asset Value, Beginning Of Period | | $ | 16.53 | |
| | | | |
Income (loss) from investment operations: | | | | |
Net investment loss | | | (.06 | ) |
Net realized and unrealized gain (loss) on investment and foreign currency transactions | | | (1.78 | ) |
| | | | |
Total from investment operations | | | (1.84 | ) |
| | | | |
Net asset value, end of period | | $ | 14.69 | |
| | | | |
Total Return(b): | | | (11.13 | )% |
Ratios/Supplemental Data: | | | | |
Net assets, end of period (000) | | $ | 117,513 | |
Average net assets (000) | | $ | 145,282 | |
Ratios to average net assets(c): | | | | |
Expenses, including distribution and service (12b-1) fees | | | 1.80 | %(d) |
Expenses, excluding distribution and service (12b-1) fees | | | .80 | %(d) |
Net investment loss | | | (.75 | )%(d) |
| (a) | Calculated based upon average shares outstanding during the period. |
| (b) | Total return does not consider the effects of sales loads. Total return is calculated assuming a purchase of a share on the first day and a sale on the last day of each period reported, and includes reinvestment of dividends and distributions. Total returns may reflect adjustments to conform to generally accepted accounting principles. Total returns for periods less than one full year are not annualized. |
| (c) | Does not include expenses of the underlying portfolios in which the Fund invests. |
See Notes to Financial Statements.
| | |
| 28 | | Visit our website at www.jennisondryden.com |
| | | | | | | | | | | | | | | | | | |
| Class B | |
| Year Ended September 30, | |
| 2007 | | | 2006 | | | 2005 | | | 2004 | | | 2003 | |
| | | | | | | | | | | | | | | | | | |
| $ | 14.42 | | | $ | 14.09 | | | $ | 11.90 | | | $ | 11.00 | | | $ | 9.16 | |
| | | | | | | | | | | | | | | | | | | |
| | | | | | | | | | | | | | | | | | |
| | (.12 | ) | | | (.13 | ) | | | (.09 | ) | | | (.12 | ) | | | (.10 | ) |
| | 2.23 | | | | .46 | | | | 2.28 | | | | 1.02 | | | | 1.94 | |
| | | | | | | | | | | | | | | | | | | |
| | 2.11 | | | | .33 | | | | 2.19 | | | | .90 | | | | 1.84 | |
| | | | | | | | | | | | | | | | | | | |
| $ | 16.53 | | | $ | 14.42 | | | $ | 14.09 | | | $ | 11.90 | | | $ | 11.00 | |
| | | | | | | | | | | | | | | | | | | |
| | 14.63 | % | | | 2.34 | % | | | 18.40 | % | | | 8.18 | % | | | 20.09 | % |
| | | | | | | | | | | | | | | | | | |
| $ | 163,232 | | | $ | 243,951 | | | $ | 371,561 | | | $ | 481,876 | | | $ | 565,727 | |
| $ | 205,950 | | | $ | 322,042 | | | $ | 439,078 | | | $ | 560,217 | | | $ | 602,105 | |
| | | | | | | | | | | | | | | | | | |
| | 1.77 | % | | | 1.79 | % | | | 1.81 | % | | | 1.80 | % | | | 1.92 | % |
| | .77 | % | | | .79 | % | | | .81 | % | | | .80 | % | | | .92 | % |
| | (.75 | )% | | | (.91 | )% | | | (.66 | )% | | | (1.02 | )% | | | (.95 | )% |
See Notes to Financial Statements.
| | |
| The Prudential Investment Portfolios, Inc./Jennison Growth Fund | | 29 |
Financial Highlights
(Unaudited) continued
| | | | |
| | | Class C | |
| | | Six Months Ended
March 31, 2008 | |
Per Share Operating Performance(a): | | | | |
Net Asset Value, Beginning Of Period | | $ | 16.53 | |
| | | | |
Income (loss) from investment operations: | | | | |
Net investment loss | | | (.06 | ) |
Net realized and unrealized gain (loss) on investment and foreign currency transactions | | | (1.78 | ) |
| | | | |
Total from investment operations | | | (1.84 | ) |
| | | | |
Net asset value, end of period | | $ | 14.69 | |
| | | | |
Total Return(b): | | | (11.13 | )% |
Ratios/Supplemental Data: | | | | |
Net assets, end of period (000) | | $ | 67,524 | |
Average net assets (000) | | $ | 74,979 | |
Ratios to average net assets(c): | | | | |
Expenses, including distribution and service (12b-1) fees | | | 1.80 | %(d) |
Expenses, excluding distribution and service (12b-1) fees | | | .80 | %(d) |
Net investment loss | | | (.75 | )%(d) |
| (a) | Calculated based upon average shares outstanding during the period. |
| (b) | Total return does not consider the effects of sales loads. Total return is calculated assuming a purchase of a share on the first day and a sale on the last day of each period reported, and includes reinvestment of dividends and distributions. Total returns may reflect adjustments to conform to generally accepted accounting principles. Total returns for periods less than one full year are not annualized. |
| (c) | Does not include expenses of the underlying portfolios in which the Fund invests. |
See Notes to Financial Statements.
| | |
| 30 | | Visit our website at www.jennisondryden.com |
| | | | | | | | | | | | | | | | | | |
| Class C | |
| Year Ended September 30, | |
| 2007 | | | 2006 | | | 2005 | | | 2004 | | | 2003 | |
| | | | | | | | | | | | | | | | | | |
| $ | 14.42 | | | $ | 14.09 | | | $ | 11.90 | | | $ | 11.00 | | | $ | 9.16 | |
| | | | | | | | | | | | | | | | | | | |
| | | | | | | | | | | | | | | | | | |
| | (.12 | ) | | | (.14 | ) | | | (.08 | ) | | | (.12 | ) | | | (.10 | ) |
| | 2.23 | | | | .47 | | | | 2.27 | | | | 1.02 | | | | 1.94 | |
| | | | | | | | | | | | | | | | | | | |
| | 2.11 | | | | .33 | | | | 2.19 | | | | .90 | | | | 1.84 | |
| | | | | | | | | | | | | | | | | | | |
| $ | 16.53 | | | $ | 14.42 | | | $ | 14.09 | | | $ | 11.90 | | | $ | 11.00 | |
| | | | | | | | | | | | | | | | | | | |
| | 14.63 | % | | | 2.34 | % | | | 18.40 | % | | | 8.18 | % | | | 20.09 | % |
| | | | | | | | | | | | | | | | | | |
| $ | 78,280 | | | $ | 83,123 | | | $ | 86,198 | | | $ | 96,253 | | | $ | 106,850 | |
| $ | 79,797 | | | $ | 87,385 | | | $ | 91,313 | | | $ | 107,401 | | | $ | 105,518 | |
| | | | | | | | | | | | | | | | | | |
| | 1.77 | % | | | 1.79 | % | | | 1.81 | % | | | 1.80 | % | | | 1.92 | % |
| | .77 | % | | | .79 | % | | | .81 | % | | | .80 | % | | | .92 | % |
| | (.75 | )% | | | (.99 | )% | | | (.61 | )% | | | (1.02 | )% | | | (.96 | )% |
See Notes to Financial Statements.
| | |
| The Prudential Investment Portfolios, Inc./Jennison Growth Fund | | 31 |
Financial Highlights
(Unaudited) continued
| | | | |
| | | Class R | |
| |
| | | Six Months Ended
March 31, 2008 | |
Per Share Operating Performance(b): | | | | |
Net Asset Value, Beginning Of Period | | $ | 16.80 | |
| | | | |
Income (loss) from investment operations: | | | | |
Net investment loss | | | (.02 | ) |
Net realized and unrealized gain on investment and foreign currency transactions | | | (1.80 | ) |
| | | | |
Total from investment operations | | | (1.82 | ) |
| | | | |
Net asset value, end of period | | $ | 14.98 | |
| | | | |
Total Return(c): | | | (10.83 | )% |
Ratios/Supplemental Data: | | | | |
Net assets, end of period | | $ | 3,007 | |
Average net assets | | $ | 3,032 | |
Ratios to average net assets(e): | | | | |
Expenses, including distribution and service (12b-1) fees(f) | | | 1.30 | %(g) |
Expenses, excluding distribution and service (12b-1) fees | | | .80 | %(g) |
Net investment loss | | | (.25 | )%(g) |
| (a) | Inception date of Class R shares. |
| (b) | Calculated based upon average shares outstanding during the period. |
| (c) | Total return is calculated assuming a purchase of a share on the first day and a sale on the last day of each period reported, and includes reinvestment of dividends and distributions. Total returns may reflect adjustments to conform to generally accepted accounting principles. Total returns for periods less than one full year are not annualized. |
| (d) | Amount is actual and not rounded. |
| (e) | Does not include expenses of the underlying portfolios in which the Fund invests. |
| (f) | The distributor of the Series has contractually agreed to limit its distribution and service 12b-1 fees to .50 of 1% of the average daily net assets of the Class R shares. |
See Notes to Financial Statements.
| | |
| 32 | | Visit our website at www.jennisondryden.com |
| | | | | | | | | | |
| Class R | |
| Year Ended September 30, | | | December 17, 2004(a)
Through September 30, 2005 | |
| 2007 | | | 2006 | | |
| | | | | | | | | | |
| $ | 14.59 | | | $ | 14.15 | | | $ | 12.97 | |
| | | | | | | | | | | |
| | | | | | | | | | |
| | (.03 | ) | | | (.06 | ) | | | (.05 | ) |
| | 2.24 | | | | .50 | | | | 1.23 | |
| | | | | | | | | | | |
| | 2.21 | | | | .44 | | | | 1.18 | |
| | | | | | | | | | | |
| $ | 16.80 | | | $ | 14.59 | | | $ | 14.15 | |
| | | | | | | | | | | |
| | 15.15 | % | | | 3.11 | % | | | 9.10 | % |
| | | | | | | | | | |
| $ | 2,977 | | | $ | 179,270 | (d) | | $ | 2,727 | (d) |
| $ | 1,849 | | | $ | 54,657 | (d) | | $ | 2,528 | (d) |
| | | | | | | | | | |
| | 1.27 | % | | | 1.29 | % | | | 1.31 | %(g) |
| | .77 | % | | | .79 | % | | | .81 | %(g) |
| | (.20 | )% | | | (.47 | )% | | | (.52 | )%(g) |
See Notes to Financial Statements.
| | |
| The Prudential Investment Portfolios, Inc./Jennison Growth Fund | | 33 |
Financial Highlights
(Unaudited) continued
| | | | |
| | | Class Z | |
| | | Six Months Ended
March 31, 2008 | |
Per Share Operating Performance(a): | | | | |
Net Asset Value, Beginning Of Period | | $ | 18.80 | |
| | | | |
Income (loss) from investment operations: | | | | |
Net investment income (loss) | | | .02 | |
Net realized and unrealized gain (loss) on investment and foreign currency transactions | | | (2.01 | ) |
| | | | |
Total from investment operations | | | (1.99 | ) |
| | | | |
Less Dividends: | | | | |
Dividends from net investment income | | | (.02 | ) |
| | | | |
Net asset value, end of period | | $ | 16.79 | |
| | | | |
Total Return(c): | | | (10.61 | )% |
Ratios/Supplemental Data: | | | | |
Net assets, end of period (000) | | $ | 974,428 | |
Average net assets (000) | | $ | 1,051,654 | |
Ratios to average net assets(d): | | | | |
Expenses, including distribution and service (12b-1) fees | | | .80 | %(e) |
Expenses, excluding distribution and service (12b-1) fees | | | .80 | %(e) |
Net investment income (loss) | | | .25 | %(e) |
| (a) | Calculated based upon average shares outstanding during the period. |
| (b) | Less than $.005 per share. |
| (c) | Total return is calculated assuming a purchase of a share on the first day and a sale on the last day of each period reported, and includes reinvestment of dividends and distributions. Total returns may reflect adjustments to conform to generally accepted accounting principles. Total returns for periods less than one full year are not annualized. |
| (d) | Does not include expenses of the underlying portfolios in which the Fund invests. |
See Notes to Financial Statements.
| | |
| 34 | | Visit our website at www.jennisondryden.com |
| | | | | | | | | | | | | | | | | | |
| Class Z | |
| Year Ended September 30, | |
| 2007 | | | 2006 | | | 2005 | | | 2004 | | | 2003 | |
| | | | | | | | | | | | | | | | | | |
| $ | 16.25 | | | $ | 15.72 | | | $ | 13.15 | | | $ | 12.03 | | | $ | 9.92 | |
| | | | | | | | | | | | | | | | | | | |
| | | | | | | | | | | | | | | | | | |
| | .04 | | | | .01 | | | | .04 | | | | — | (b) | | | — | (b) |
| | 2.51 | | | | .52 | | | | 2.53 | | | | 1.12 | | | | 2.11 | |
| | | | | | | | | | | | | | | | | | | |
| | 2.55 | | | | .53 | | | | 2.57 | | | | 1.12 | | | | 2.11 | |
| | | | | | | | | | | | | | | | | | | |
| | | | | | | | | | | | | | | | | | |
| | — | | | | — | | | | — | | | | — | | | | — | |
| | | | | | | | | | | | | | | | | | | |
| $ | 18.80 | | | $ | 16.25 | | | $ | 15.72 | | | $ | 13.15 | | | $ | 12.03 | |
| | | | | | | | | | | | | | | | | | | |
| | 15.69 | % | | | 3.37 | % | | | 19.54 | % | | | 9.31 | % | | | 21.27 | % |
| | | | | | | | | | | | | | | | | | |
| $ | 1,100,959 | | | $ | 1,182,040 | | | $ | 1,393,365 | | | $ | 1,274,544 | | | $ | 1,360,076 | |
| $ | 1,134,856 | | | $ | 1,305,889 | | | $ | 1,324,754 | | | $ | 1,441,730 | | | $ | 1,226,178 | |
| | | | | | | | | | | | | | | | | | |
| | .77 | % | | | .79 | % | | | .81 | % | | | .80 | % | | | .92 | % |
| | .77 | % | | | .79 | % | | | .81 | % | | | .80 | % | | | .92 | % |
| | .25 | % | | | .08 | % | | | .28 | % | | | (.02 | )% | | | .03 | % |
See Notes to Financial Statements.
| | |
| The Prudential Investment Portfolios, Inc./Jennison Growth Fund | | 35 |
| | | | |
| n MAIL | | n TELEPHONE | | n WEBSITE |
Gateway Center Three 100 Mulberry Street Newark, NJ 07102 | | (800) 225-1852 | | www.jennisondryden.com |
|
| PROXY VOTING |
| The Board of Directors of the Fund has delegated to the Fund’s investment subadviser the responsibility for voting any proxies and maintaining proxy recordkeeping with respect to the Fund. A description of these proxy voting policies and procedures is available without charge, upon request, by calling (800) 225-1852 or by visiting the Securities and Exchange Commission’s website at www.sec.gov. Information regarding how the Fund voted proxies relating to portfolio securities during the most recent 12-month period ended June 30 is available on the Fund’s website and on the Commission’s website. |
|
| DIRECTORS |
| Linda W. Bynoe • David E.A. Carson • Robert F. Gunia • Robert E. La Blanc • Douglas H. McCorkindale • Richard A. Redeker • Judy A. Rice • Robin B. Smith • Stephen G. Stoneburn • Clay T. Whitehead |
|
| OFFICERS |
| Judy A. Rice, President • Robert F. Gunia, Vice President • Grace C. Torres, Treasurer and Principal Financial and Accounting Officer • Kathryn L. Quirk, Chief Legal Officer • Deborah A. Docs, Secretary • Timothy J. Knierim, Chief Compliance Officer • Valerie M. Simpson, Deputy Chief Compliance Officer • Noreen M. Fierro, Anti-Money Laundering Compliance Officer • Jonathan D. Shain, Assistant Secretary • Claudia DiGiacomo, Assistant Secretary • John P. Schwartz, Assistant Secretary • Andrew R. French, Assistant Secretary • M. Sadiq Peshimam, Assistant Treasurer • Peter Parrella, Assistant Treasurer |
| | | | |
| MANAGER | | Prudential Investments LLC | | Gateway Center Three
100 Mulberry Street
Newark, NJ 07102 |
|
| INVESTMENT SUBADVISER | | Jennison Associates LLC | | 466 Lexington Avenue New York, NY 10017 |
|
| DISTRIBUTOR | | Prudential Investment
Management Services LLC | | Gateway Center Three
100 Mulberry Street
Newark, NJ 07102 |
|
| CUSTODIAN | | The Bank of New York | | One Wall Street New York, NY 10286 |
|
| TRANSFER AGENT | | Prudential Mutual Fund
Services LLC | | PO Box 9658 Providence, RI 02940 |
|
INDEPENDENT REGISTERED
PUBLIC ACCOUNTING FIRM | | KPMG LLP | | 345 Park Avenue New York, NY 10154 |
|
| FUND COUNSEL | | Sullivan & Cromwell LLP | | 125 Broad Street New York, NY 10004 |
|
| An investor should consider the investment objectives, risks, charges, and expenses of the Fund carefully before investing. The prospectus for the Fund contains this and other information about the Fund. An investor may obtain a prospectus by visiting our website at www.jennisondryden.com or by calling (800) 225-1852. The prospectus should be read carefully before investing. |
|
| E-DELIVERY |
| To receive your mutual fund documents on-line, go to www.icsdelivery.com/prudential/funds and enroll. Instead of receiving printed documents by mail, you will receive notification via e-mail when new materials are available. You can cancel your enrollment or change your e-mail address at any time by clicking on the change/cancel enrollment option at the icsdelivery website address. |
|
| SHAREHOLDER COMMUNICATIONS WITH DIRECTORS |
| Shareholders can communicate directly with the Board of Directors by writing to the Chair of the Board, Jennison Growth Fund, Prudential Investments, Attn: Board of Directors, 100 Mulberry Street, Gateway Center Three, Newark, NJ 07102. Shareholders can communicate directly with an individual Director by writing to the same address. Communications are not screened before being delivered to the addressee. |
|
| AVAILABILITY OF PORTFOLIO SCHEDULE |
| The Fund files its complete schedule of portfolio holdings with the Securities and Exchange Commission for the first and third quarters of each fiscal year on Form N-Q under The Prudential Investment Portfolios, Inc. name. The Fund’s Forms N-Q are available on the Commission’s website at www.sec.gov. The Fund’s Forms N-Q may also be reviewed and copied at the Commission’s Public Reference Room in Washington, D.C. Information on the operation and location of the Public Reference Room may be obtained by calling (800) SEC-0330 (732-0330). The Fund’s schedule of portfolio holdings is also available on the Fund’s website as of the end of each fiscal quarter. |
Mutual Funds:
| | | | |
ARE NOT INSURED BY THE FDIC OR ANY
FEDERAL GOVERNMENT AGENCY | | MAY LOSE VALUE | | ARE NOT A DEPOSIT OF OR GUARANTEED
BY ANY BANK OR ANY BANK AFFILIATE |

| | | | | | | | | | | | | | |
| Jennison Growth Fund | | |
| | | Share Class | | A | | B | | C | | R | | Z | | |
| | NASDAQ | | PJFAX | | PJFBX | | PJFCX | | JGRCR | | PJFZX | | |
| | CUSIP | | 74437E107 | | 74437E206 | | 74437E305 | | 74437E651 | | 74437E404 | | |
| | | | | | | | | | | | | | |
MF168E2 IFS-A148144 Ed. 05/2008


| | |
| MARCH 31, 2008 | | SEMIANNUAL REPORT |
Jennison Equity Opportunity Fund
FUND TYPE
Small-, mid-, and large-capitalization stock
OBJECTIVE
Long-term growth of capital
This report is not authorized for distribution to prospective investors unless preceded or accompanied by a current prospectus.
The views expressed in this report and information about the Fund’s portfolio holdings are for the period covered by this report and are subject to change thereafter.
The accompanying financial statements as of March 31, 2008, were not audited and, accordingly, no auditor’s opinion is expressed on them.
JennisonDryden, Jennison, Prudential Financial and the Rock Prudential logo are registered service marks of The Prudential Insurance Company of America, Newark, NJ, and its affiliates.

May 15, 2008
Dear Shareholder:
On the following pages, you’ll find your Fund’s semiannual report, including a table showing fund performance over the first half of the fiscal year and for longer periods. The report also contains a listing of the Fund’s holdings at period-end. The semiannual report is an interim statement furnished between the Fund’s annual reports, which include an analysis of Fund performance over the fiscal year in addition to other data.
Mutual fund prices and returns will rise or fall over time, and asset managers tend to have periods when they perform better or worse than their long-term average. The best measures of a mutual fund’s quality are its return compared to that of similar investments and the variability of its return over the long term. We recommend that you review your portfolio regularly with your financial professional.
Sincerely,

Judy A. Rice, President
The Prudential Investment Portfolios, Inc./Jennison Equity Opportunity Fund
| | |
| The Prudential Investment Portfolios, Inc./Jennison Equity Opportunity Fund | | 1 |
Your Fund’s Performance
Fund objective
The investment objective of the Jennison Equity Opportunity Fund is long-term growth of capital. There can be no assurance that the Fund will achieve its investment objective.
Performance data quoted represent past performance. Past performance does not guarantee future results. The investment return and principal value of an investment will fluctuate, so that an investor’s shares, when redeemed, may be worth more or less than their original cost. Current performance may be lower or higher than the past performance data quoted. An investor may obtain performance data as of the most recent month-end by visiting our website at www.jennisondryden.com or by calling (800) 225-1852. The maximum initial sales charge is 5.50% (Class A shares). Gross operating expenses: Class A, 1.16%; Class B, 1.85%; Class C, 1.85%; Class R, 1.60%; Class Z, 0.85%. Net operating expenses apply to: Class A, 1.11%; Class B, 1.85%; Class C, 1.85%; Class R, 1.35%; Class Z, 0.85%, after contractual reduction through 1/31/2008 for Class A shares and 1/31/2009 for Class R shares.
| | | | | | | | | | | | | | |
| Cumulative Total Returns as of 3/31/08 | | | | | | | | | |
| | | Six Months | | | One Year | | | Five Years | | | Ten Years | | | Since Inception1 |
Class A | | –14.42 | % | | –9.93 | % | | 81.96 | % | | 134.72 | % | | — |
Class B | | –14.80 | | | –10.66 | | | 75.37 | | | 117.82 | | | — |
Class C | | –14.72 | | | –10.59 | | | 75.52 | | | 118.01 | | | — |
Class R | | –14.56 | | | –10.14 | | | N/A | | | N/A | | | 16.40% (12/17/04) |
Class Z | | –14.31 | | | ���9.75 | | | 84.21 | | | 140.18 | | | — |
S&P 500 Index2 | | –12.46 | | | –5.08 | | | 70.91 | | | 41.12 | | | ** |
Lipper Multi-Cap Core Funds Avg.3 | | –12.40 | | | –5.57 | | | 75.95 | | | 64.34 | | | *** |
| | | | | | | | | | | | | | |
| Average Annual Total Returns4 as of 3/31/08 | | | | | | |
| | | | | | One Year | | | Five Years | | | Ten Years | | | Since Inception1 |
Class A | | | | | –14.89 | % | | 11.45 | % | | 8.29 | % | | — |
Class B | | | | | –14.35 | | | 11.76 | | | 8.10 | | | — |
Class C | | | | | –11.32 | | | 11.91 | | | 8.11 | | | — |
Class R | | | | | –10.14 | | | N/A | | | N/A | | | 4.73% (12/17/04) |
Class Z | | | | | –9.75 | | | 13.00 | | | 9.16 | | | — |
S&P 500 Index2 | | | | | –5.08 | | | 11.32 | | | 3.50 | | | ** |
Lipper Multi-Cap Core Funds Avg.3 | | | | | –5.57 | | | 11.76 | | | 4.60 | | | *** |
The cumulative total returns do not reflect the deduction of applicable sales charges. If reflected, the applicable sales charges would reduce the cumulative total returns performance quoted. Class A shares are subject to a maximum front-end sales charge of 5.50%. Under certain circumstances, Class A shares may be subject to a contingent deferred sales charge (CDSC) of 1%. Class B and Class C shares are subject to a maximum CDSC of 5% and 1%, respectively. Class R and Class Z shares are not subject to a sales charge.
| | |
| 2 | | Visit our website at www.jennisondryden.com |
Source: Prudential Investments LLC and Lipper Inc. Performance figures may reflect fee waivers and/or expense reimbursements. In the absence of such fee waivers and/or expense reimbursements, total returns would be lower.
1Inception date returns are provided for any share class with less than 10 calendar years of returns.
2The S&P 500 Index is an unmanaged index of 500 stocks of large U.S. public companies. It gives a broad look at how U.S. stock prices have performed.
3The Lipper Multi-Cap Core Funds Average (Lipper Average) represents returns based on the average return of all funds in the Lipper Multi-Cap Core Funds category for the periods noted. Funds in the Lipper Average invest in a variety of market capitalization ranges without concentrating 75% of their equity assets in any one market capitalization range over an extended period of time. Multi-cap funds in the Lipper Average typically have between 25% and 75% of their assets invested in companies with market capitalizations (on a three-year weighted basis) above 300% of the dollar-weighted median market capitalization of the middle 1,000 securities of the S&P SuperComposite 1500 Index. Multi-cap core funds have more latitude in the companies in which they invest. These funds typically have an average price-to-earnings ratio, price-to-book ratio, and three-year sales-per-share growth value compared with the S&P SuperComposite 1500 Index.
4The average annual total returns take into account applicable sales charges. Class A, Class B, Class C, and Class R shares are subject to an annual distribution and service (12b-1) fee of up to 0.30%, 1.00%, 1.00%, and 0.75%, respectively. Approximately seven years after purchase, Class B shares will automatically convert to Class A shares on a quarterly basis. Class Z shares are not subject to a 12b-1 fee. The returns in the tables do not reflect the deduction of taxes that a shareholder would pay on Fund distributions or following the redemption of Fund shares.
**S&P 500 Index Closest Month-End to Inception cumulative total return is 16.03% for Class R. S&P 500 Index Closest Month-End to Inception average annual total return is 4.68% for Class R.
***Lipper Average Closest Month-End to Inception cumulative total return is 16.32% for Class R. Lipper Average Closest Month-End to Inception average annual total return is 4.64% for Class R.
Investors cannot invest directly in an index. The returns for the S&P 500 Index would be lower if they included the effects of sales charges, operating expenses of a mutual fund, or taxes. Returns for the Lipper Average reflect the deduction of operating expenses, but not sales charges or taxes.
| | | |
| Five Largest Holdings expressed as a percentage of net assets as of 3/31/08 | | | |
Allied Waste Industries, Inc., Commercial Services & Supplies | | 2.6 | % |
Wyeth, Pharmaceuticals | | 2.4 | |
Abbott Laboratories, Pharmaceuticals | | 2.0 | |
Microsoft Corp., Software | | 2.0 | |
H&R Block, Inc., Diversified Consumer Services | | 2.0 | |
Holdings reflect only long-term investments and are subject to change.
| | | |
| Five Largest Long-Term Industries expressed as a percentage of net assets as of 3/31/08 | | | |
Pharmaceuticals | | 11.8 | % |
Media | | 9.2 | |
Software | | 7.1 | |
Oil, Gas & Consumable Fuels | | 7.1 | |
Capital Markets | | 6.2 | |
Industry weightings reflect only long-term investments and are subject to change.
| | |
| The Prudential Investment Portfolios, Inc./Jennison Equity Opportunity Fund | | 3 |
Fees and Expenses (Unaudited)
As a shareholder of the Fund, you incur two types of costs: (1) transaction costs, including sales charges (loads) on purchase payments and redemptions, as applicable, and (2) ongoing costs, including management fees, distribution and/or service (12b-1) fees, and other Fund expenses, as applicable. This example is intended to help you understand your ongoing costs (in dollars) of investing in the Fund and to compare these costs with the ongoing costs of investing in other mutual funds.
The example is based on an investment of $1,000 invested on October 1, 2007, at the beginning of the period, and held through the six-month period ended March 31, 2008. The example is for illustrative purposes only; you should consult the Prospectus for information on initial and subsequent minimum investment requirements.
The Fund’s transfer agent may charge additional fees to holders of certain accounts that are not included in the expenses shown in the table on the following page. These fees apply to individual retirement accounts (IRAs) and Section 403(b) accounts. As of the close of the six-month period covered by the table, IRA fees included an annual maintenance fee of $15 per account (subject to a maximum annual maintenance fee of $25 for all accounts held by the same shareholder). Section 403(b) accounts are charged an annual $25 fiduciary maintenance fee. Some of the fees may vary in amount, or may be waived, based on your total account balance or the number of JennisonDryden funds, including the Fund, that you own. You should consider the additional fees that were charged to your Fund account over the six-month period when you estimate the total ongoing expenses paid over the period and the impact of these fees on your ending account value, as these additional expenses are not reflected in the information provided in the expense table. Additional fees have the effect of reducing investment returns.
Actual Expenses
The first line for each share class in the table on the following page provides information about actual account values and actual expenses. You may use the information on this line, together with the amount you invested, to estimate the expenses that you paid over the period. Simply divide your account value by $1,000 (for example, an $8,600 account value ÷ $1,000 = 8.6), then multiply the result by the number on the first line under the heading “Expenses Paid During the Six-Month Period” to estimate the expenses you paid on your account during this period.
Hypothetical Example for Comparison Purposes
The second line for each share class in the table on the following page provides information about hypothetical account values and hypothetical expenses based on
| | |
| 4 | | Visit our website at www.jennisondryden.com |
the Fund’s actual expense ratio and an assumed rate of return of 5% per year before expenses, which is not the Fund’s actual return. The hypothetical account values and expenses may not be used to estimate the actual ending account balance or expenses you paid for the period. You may use this information to compare the ongoing costs of investing in the Fund and other funds. To do so, compare this 5% hypothetical example with the 5% hypothetical examples that appear in the shareholder reports of the other funds.
Please note that the expenses shown in the table are meant to highlight your ongoing costs only and do not reflect any transactional costs such as sales charges (loads). Therefore, the second line for each share class in the table is useful in comparing ongoing costs only and will not help you determine the relative total costs of owning different funds. In addition, if these transactional costs were included, your costs would have been higher.
| | | | | | | | | | | | | | |
Jennison Equity
Opportunity Fund | | Beginning Account Value October 1, 2007 | | Ending Account
Value March 31, 2008 | | Annualized Expense Ratio
Based on the
Six-Month Period | | | Expenses Paid
During the
Six-Month Period* |
| | | | | | | | | | | | | | |
| Class A | | Actual | | $ | 1,000.00 | | $ | 855.80 | | 1.11 | % | | $ | 5.15 |
| | | Hypothetical | | $ | 1,000.00 | | $ | 1,019.45 | | 1.11 | % | | $ | 5.60 |
| | | | | | | | | | | | | | |
| Class B | | Actual | | $ | 1,000.00 | | $ | 852.00 | | 1.85 | % | | $ | 8.57 |
| | | Hypothetical | | $ | 1,000.00 | | $ | 1,015.75 | | 1.85 | % | | $ | 9.32 |
| | | | | | | | | | | | | | |
| Class C | | Actual | | $ | 1,000.00 | | $ | 852.80 | | 1.85 | % | | $ | 8.57 |
| | | Hypothetical | | $ | 1,000.00 | | $ | 1,015.75 | | 1.85 | % | | $ | 9.32 |
| | | | | | | | | | | | | | |
| Class R | | Actual | | $ | 1,000.00 | | $ | 854.40 | | 1.35 | % | | $ | 6.26 |
| | | Hypothetical | | $ | 1,000.00 | | $ | 1,018.25 | | 1.35 | % | | $ | 6.81 |
| | | | | | | | | | | | | | |
| Class Z | | Actual | | $ | 1,000.00 | | $ | 856.90 | | 0.85 | % | | $ | 3.95 |
| | | Hypothetical | | $ | 1,000.00 | | $ | 1,020.75 | | 0.85 | % | | $ | 4.29 |
* Fund expenses (net of fee waivers or subsidies, if any) for each share class are equal to the annualized expense ratio for each share class (provided in the table), multiplied by the average account value over the period, multiplied by the 183 days in the six-month period ended March 31, 2008, and divided by the 366 days in the Fund’s fiscal year ending September 30, 2008 (to reflect the six-month period). Expenses presented in the table include the expenses of any underlying portfolios in which the Fund may invest.
| | |
| The Prudential Investment Portfolios, Inc./Jennison Equity Opportunity Fund | | 5 |
Portfolio of Investments
as of March 31, 2008 (Unaudited)
| | | | | |
| Shares | | Description | | Value (Note 1) |
| | | | | |
| | | | | |
LONG-TERM INVESTMENTS 99.5% | | | |
COMMON STOCKS 98.3% | | | |
| |
Aerospace & Defense 0.8% | | | |
| 62,300 | | Honeywell International, Inc. | | $ | 3,514,966 |
| |
Airlines 1.5% | | | |
| 664,600 | | JetBlue Airways Corp.(a)(b) | | | 3,854,680 |
| 274,900 | | Northwest Airlines Corp.(a)(b) | | | 2,471,351 |
| | | | | |
| | | | | 6,326,031 |
| |
Biotechnology 1.2% | | | |
| 124,100 | | Amgen, Inc.(a) | | | 5,184,898 |
| |
Capital Markets 6.2% | | | |
| 112,704 | | Bank of New York Mellon Corp. (The) | | | 4,703,138 |
| 451,000 | | Charles Schwab Corp. (The) | | | 8,492,330 |
| 96,000 | | Eaton Vance Corp. | | | 2,928,960 |
| 132,400 | | Lazard Ltd., “Class A”(b) | | | 5,057,680 |
| 136,100 | | Merrill Lynch & Co., Inc.(b) | | | 5,544,714 |
| | | | | |
| | | | | 26,726,822 |
| |
Chemicals 3.0% | | | |
| 181,100 | | E.I. du Pont de Nemours & Co.(b) | | | 8,468,236 |
| 218,500 | | Nalco Holding Co.(b) | | | 4,621,275 |
| | | | | |
| | | | | 13,089,511 |
| |
Commercial Banks 1.3% | | | |
| 868,565 | | Royal Bank of Scotland Group PLC (United Kingdom) | | | 5,813,475 |
| |
Commercial Services & Supplies 5.9% | | | |
| 1,040,500 | | Allied Waste Industries, Inc.(a) | | | 11,247,805 |
| 83,800 | | Manpower, Inc. | | | 4,714,588 |
| 425,600 | | RSC Holdings, Inc.(a)(b) | | | 4,639,040 |
| 149,700 | | Waste Management, Inc. | | | 5,023,932 |
| | | | | |
| | | | | 25,625,365 |
| |
Communications Equipment 3.0% | | | |
| 376,200 | | Motorola, Inc.(b) | | | 3,498,660 |
| 160,400 | | Nokia OYJ, ADR (Finland) | | | 5,105,532 |
| 108,100 | | QUALCOMM, Inc. | | | 4,432,100 |
| | | | | |
| | | | | 13,036,292 |
See Notes to Financial Statements.
| | |
| The Prudential Investment Portfolios, Inc./Jennison Equity Opportunity Fund | | 7 |
Portfolio of Investments
as of March 31, 2008 (Unaudited) continued
| | | | | |
| Shares | | Description | | Value (Note 1) |
| | | | | |
COMMON STOCKS (Continued) | | | |
| |
Computers & Peripherals 0.8% | | | |
| 95,600 | | Diebold, Inc. | | $ | 3,589,780 |
| |
Consumer Finance 1.3% | | | |
| 376,700 | | SLM Corp.(b) | | | 5,782,345 |
| |
Containers & Packaging 1.7% | | | |
| 947,600 | | Smurfit-Stone Container Corp.(a)(b) | | | 7,296,520 |
| |
Diversified Consumer Services 3.5% | | | |
| 189,300 | | Career Education Corp.(a)(b) | | | 2,407,896 |
| 417,300 | | H&R Block, Inc.(b) | | | 8,663,148 |
| 85,900 | | Weight Watchers International, Inc. | | | 3,979,747 |
| | | | | |
| | | | | 15,050,791 |
| |
Diversified Financial Services 0.6% | | | |
| | KKR Private Equity Investors LP, RDU, Private Placement, 144A | | | |
| 196,300 | | (original cost $4,892,132; purchased 05/03/06 - 05/05/06)(e)(f) | | | 2,424,305 |
| |
Electronic Equipment & Instruments 1.0% | | | |
| 105,300 | | Sony Corp., ADR (Japan) | | | 4,219,371 |
| |
Energy Equipment & Services 1.7% | | | |
| 53,500 | | Exterran Holdings, Inc.(a)(b) | | | 3,452,890 |
| 46,700 | | Schlumberger Ltd. | | | 4,062,900 |
| | | | | |
| | | | | 7,515,790 |
| |
Food & Staples Retailing 3.5% | | | |
| 272,600 | | Kroger Co. (The) | | | 6,924,040 |
| 154,400 | | Wal-Mart Stores, Inc.(b) | | | 8,133,792 |
| | | | | |
| | | | | 15,057,832 |
| |
Food Products 3.5% | | | |
| 646,000 | | Cadbury Schweppes PLC (United Kingdom) | | | 7,096,295 |
| 339,500 | | ConAgra Foods, Inc. | | | 8,131,025 |
| | | | | |
| | | | | 15,227,320 |
| |
Hotels, Restaurants & Leisure 1.0% | | | |
| 335,400 | | Pinnacle Entertainment, Inc.(a)(b) | | | 4,293,120 |
| |
Household Durables 1.7% | | | |
| 219,600 | | Ryland Group, Inc. | | | 7,222,644 |
See Notes to Financial Statements.
| | |
| 8 | | Visit our website at www.jennisondryden.com |
| | | | | |
| Shares | | Description | | Value (Note 1) |
| | | | | |
COMMON STOCKS (Continued) | | | |
| |
Household Products 1.3% | | | |
| 86,200 | | Kimberly-Clark Corp. | | $ | 5,564,210 |
| |
Independent Power Producers & Energy Traders 1.5% | | | |
| 164,200 | | NRG Energy, Inc.(a)(b) | | | 6,402,158 |
| |
Insurance 4.3% | | | |
| 98,300 | | American International Group, Inc.(b) | | | 4,251,475 |
| 91,900 | | Axis Capital Holdings Ltd. | | | 3,122,762 |
| 142,000 | | StanCorp Financial Group, Inc. | | | 6,774,820 |
| 9,418 | | White Mountains Insurance Group Ltd. | | | 4,520,640 |
| | | | | |
| | | | | 18,669,697 |
Internet & Catalog Retail 1.5% | | | |
| 317,300 | | IAC/InterActiveCorp.(a) | | | 6,587,148 |
| |
IT Services 1.2% | | | |
| 110,400 | | CACI International, Inc., “Class A”(a)(b) | | | 5,028,720 |
| |
Machinery 4.4% | | | |
| 158,900 | | Actuant Corp., “Class A”(b) | | | 4,800,369 |
| 154,100 | | Dover Corp.(b) | | | 6,438,298 |
| 98,800 | | IDEX Corp. | | | 3,032,172 |
| 87,600 | | Nordson Corp.(b) | | | 4,717,260 |
| | | | | |
| | | | | 18,988,099 |
| |
Media 9.2% | | | |
| 322,900 | | Comcast Corp., “Class A”(a) | | | 6,125,413 |
| 228,900 | | Discovery Holding Co., “Class A”(a)(b) | | | 4,857,258 |
| 127,537 | | Liberty Global, Inc., “Series C”(a) | | | 4,142,402 |
| 607,800 | | Pearson PLC (United Kingdom) | | | 8,220,686 |
| 591,600 | | Radio One, Inc., “Class D”(a)(b) | | | 899,232 |
| 199,643 | | Viacom, Inc., “Class B”(a) | | | 7,909,855 |
| 669,200 | | Warner Music Group Corp. | | | 3,332,616 |
| 370,400 | | XM Satellite Radio Holdings, Inc., “Class A”(a)(b) | | | 4,304,048 |
| | | | | |
| | | | | 39,791,510 |
| |
Metals & Mining 1.3% | | | |
| 114,400 | | Peabody Energy Corp.(b) | | | 5,834,400 |
| |
Oil, Gas & Consumable Fuels 7.1% | | | |
| 180,000 | | Marathon Oil Corp. | | | 8,208,000 |
| 156,400 | | Newfield Exploration Co.(a) | | | 8,265,740 |
See Notes to Financial Statements.
| | |
| The Prudential Investment Portfolios, Inc./Jennison Equity Opportunity Fund | | 9 |
Portfolio of Investments
as of March 31, 2008 (Unaudited) continued
| | | | | |
| Shares | | Description | | Value (Note 1) |
| | | | | |
COMMON STOCKS (Continued) | | | |
| |
Oil, Gas & Consumable Fuels (cont’d.) | | | |
| 110,800 | | Occidental Petroleum Corp. | | $ | 8,107,236 |
| 341,000 | | Talisman Energy, Inc. | | | 6,035,700 |
| | | | | |
| | | | | 30,616,676 |
| |
Paper & Forest Products 1.2% | | | |
| 731,500 | | Domtar Corp.(a)(b) | | | 4,996,145 |
| |
Pharmaceuticals 10.6% | | | |
| 158,700 | | Abbott Laboratories | | | 8,752,305 |
| 111,700 | | Forest Laboratories, Inc.(a)(b) | | | 4,469,117 |
| 144,600 | | Merck & Co., Inc. | | | 5,487,570 |
| 59,800 | | Novartis AG, ADR (Switzerland)(b) | | | 3,063,554 |
| 242,700 | | Pfizer, Inc. | | | 5,079,711 |
| 295,000 | | Watson Pharmaceuticals, Inc.(a) | | | 8,649,400 |
| 253,500 | | Wyeth | | | 10,586,160 |
| | | | | |
| | | | | 46,087,817 |
| |
Real Estate Management & Development 1.1% | | | |
| 189,500 | | Forestar Real Estate Group, Inc.(a)(b) | | | 4,720,445 |
| |
Software 7.1% | | | |
| 292,200 | | Check Point Software Technologies Ltd.(a)(b) | | | 6,545,280 |
| 243,900 | | Fair Isaac Corp.(b) | | | 5,248,728 |
| 233,700 | | Manhattan Associates, Inc.(a)(b) | | | 5,358,741 |
| 306,600 | | Microsoft Corp. | | | 8,701,308 |
| 303,500 | | Symantec Corp.(a)(b) | | | 5,044,170 |
| | | | | |
| | | | | 30,898,227 |
| |
Specialty Retail 1.7% | | | |
| 206,100 | | Gap, Inc. (The)(b) | | | 4,056,048 |
| 106,600 | | Urban Outfitters, Inc.(a)(b) | | | 3,341,910 |
| | | | | |
| | | | | 7,397,958 |
| |
Thrifts & Mortgage Finance 0.5% | | | |
| 124,200 | | Downey Financial Corp.(b) | | | 2,282,796 |
| |
Wireless Telecommunication Services 1.1% | | | |
| 680,000 | | Sprint Nextel Corp.(b) | | | 4,549,200 |
| | | | | |
| | Total common stocks
(cost $439,918,747) | | | 425,412,384 |
| | | | | |
See Notes to Financial Statements.
| | |
| 10 | | Visit our website at www.jennisondryden.com |
| | | | | | |
| Shares | | Description | | Value (Note 1) | |
| | | | | | |
PREFERRED STOCK 1.2% | | | | |
| |
Pharmaceuticals | | | | |
| 5,900 | | Mylan, Inc.
(cost $5,660,630) | | $ | 5,099,724 | |
| | | | | | |
| | Total long-term investments
(cost $445,579,377) | | | 430,512,108 | |
| | | | | | |
SHORT-TERM INVESTMENT 30.9% | | | | |
| |
Affiliated Money Market Mutual Fund | | | | |
| | Dryden Core Investment Fund - Taxable Money Market Series | | | | |
| 133,471,927 | | (cost $133,471,927; includes $128,919,712 of cash collateral received for securities on loan)(c)(d) | | | 133,471,927 | |
| | | | | | |
| | Total Investments(g) 130.4%
(cost $579,051,304; Note 5) | | | 563,984,035 | |
| | Liabilities in excess of other assets (30.4%) | | | (131,436,962 | ) |
| | | | | | |
| | Net Assets 100.0% | | $ | 432,547,073 | |
| | | | | | |
The following abbreviations are used in portfolio descriptions:
ADR—American Depositary Receipt
RDU—Restricted Depository Unit
| (a) | Non-income producing security. |
| (b) | All or portion of security on loan. The aggregate market value of such securities is $123,913,382; cash collateral of $128,919,712 (included in liabilities) was received with which the Portfolio purchased highly liquid short-term investments. |
| (c) | Represents security, or a portion thereof, purchased with cash collateral received for securities on loan. |
| (d) | Prudential Investments LLC, the manager of the Fund, also serves as the manager of the Dryden Core Investment Fund—Taxable Money Market Series. |
| (e) | Security was purchased pursuant to Rule 144A under the Securities Act of 1933 and may not be resold subject to that rule except to qualified institutional buyers. Unless otherwise noted, 144A securities are deemed to be liquid. |
| (f) | Indicates a restricted security. The aggregate cost of the security is $4,892,132. The aggregate market value of $2,424,305 represents 0.6% of net assets. |
| (g) | As of March 31, 2008, one security representing $2,424,305 and 0.6% of the total market value of the Portfolio was fair valued in accordance with the policies adopted by the Board of Directors. |
See Notes to Financial Statements.
| | |
| The Prudential Investment Portfolios, Inc./Jennison Equity Opportunity Fund | | 11 |
Portfolio of Investments
as of March 31, 2008 (Unaudited) continued
The industry classification of portfolio holdings and liabilities in excess of other assets shown as a percentage of net assets as of March 31, 2008 were as follows:
| | | |
Affiliated Money Market Mutual Fund (including 29.8% of collateral received for securities on loan) | | 30.9 | % |
Pharmaceuticals | | 11.8 | |
Media | | 9.2 | |
Oil, Gas & Consumable Fuels | | 7.1 | |
Software | | 7.1 | |
Capital Markets | | 6.2 | |
Commercial Services & Supplies | | 5.9 | |
Machinery | | 4.4 | |
Insurance | | 4.3 | |
Diversified Consumer Services | | 3.5 | |
Food & Staples Retailing | | 3.5 | |
Food Products | | 3.5 | |
Chemicals | | 3.0 | |
Communications Equipment | | 3.0 | |
Containers & Packaging | | 1.7 | |
Energy Equipment & Services | | 1.7 | |
Household Durables | | 1.7 | |
Specialty Retail | | 1.7 | |
Airlines | | 1.5 | |
Independent Power Producers & Energy Traders | | 1.5 | |
Internet & Catalog Retail | | 1.5 | |
Commercial Banks | | 1.3 | |
Consumer Finance | | 1.3 | |
Household Products | | 1.3 | |
Metals & Mining | | 1.3 | |
Biotechnology | | 1.2 | |
IT Services | | 1.2 | |
Paper & Forest Products | | 1.2 | |
Real Estate Management & Development | | 1.1 | |
Wireless Telecommunication Services | | 1.1 | |
Electronic Equipment & Instruments | | 1.0 | |
Hotels, Restaurants & Leisure | | 1.0 | |
Aerospace & Defense | | 0.8 | |
Computers & Peripherals | | 0.8 | |
Diversified Financial Services | | 0.6 | |
Thrifts & Mortgage Finance | | 0.5 | |
| | | |
| | 130.4 | |
Liabilities in excess of other assets | | (30.4 | ) |
| | | |
| | 100.0 | % |
| | | |
See Notes to Financial Statements.
| | |
| 12 | | Visit our website at www.jennisondryden.com |
Financial Statements
(Unaudited)
| | |
| MARCH 31, 2008 | | SEMIANNUAL REPORT |
Jennison Equity Opportunity Fund
Statement of Assets and Liabilities
as of March 31, 2008 (Unaudited)
| | | | |
Assets | | | | |
Investments at value, including securities on loan of $123,913,382: | | | | |
Unaffiliated investments (cost $445,579,377) | | $ | 430,512,108 | |
Affiliated investments (cost $133,471,927) | | | 133,471,927 | |
Cash | | | 131,006 | |
Receivable for investments sold | | | 2,179,200 | |
Dividends receivable | | | 754,601 | |
Receivable for Series shares sold | | | 307,995 | |
Receivable from securities lending, net | | | 46,557 | |
Foreign tax reclaim receivable | | | 26,907 | |
Prepaid expenses | | | 4,281 | |
| | | | |
Total assets | | | 567,434,582 | |
| | | | |
| |
Liabilities | | | | |
Payable to broker for collateral for securities on loan (Note 4) | | | 128,919,712 | |
Payable for investments purchased | | | 4,156,437 | |
Payable for Series shares reacquired | | | 767,044 | |
Accrued expenses | | | 519,191 | |
Management fee payable | | | 218,510 | |
Distribution fee payable | | | 170,565 | |
Transfer agent fee payable | | | 131,422 | |
Deferred directors’ fees | | | 3,190 | |
Payable to foreign custodian (cost $1,459) | | | 1,438 | |
| | | | |
Total liabilities | | | 134,887,509 | |
| | | | |
| |
Net Assets | | $ | 432,547,073 | |
| | | | |
| | | | | |
Net assets were comprised of: | | | | |
Common stock, at par | | $ | 34,893 | |
Paid-in capital in excess of par | | | 453,450,058 | |
| | | | |
| | | 453,484,951 | |
Undistributed net investment income | | | 621,596 | |
Accumulated net realized loss on investment and foreign currency transactions | | | (6,490,989 | ) |
Net unrealized depreciation on investments and foreign currencies | | | (15,068,485 | ) |
| | | | |
Net assets, March 31, 2008 | | $ | 432,547,073 | |
| | | | |
See Notes to Financial Statements.
| | |
| 14 | | Visit our website at www.jennisondryden.com |
| | | |
Class A | | | |
Net asset value and redemption price per share
($255,005,473 ÷ 20,063,380 shares of common stock issued and outstanding) | | $ | 12.71 |
Maximum sales charge (5.50% of offering price) | | | 0.74 |
| | | |
Maximum offering price to public | | $ | 13.45 |
| | | |
| |
Class B | | | |
Net asset value, offering price and redemption price per share
($85,291,068 ÷ 7,381,510 shares of common stock issued and outstanding) | | $ | 11.55 |
| | | |
| |
Class C | | | |
Net asset value, offering price and redemption price per share
($35,626,415 ÷ 3,083,193 shares of common stock issued and outstanding) | | $ | 11.56 |
| | | |
| |
Class R | | | |
Net asset value, offering price and redemption price per share
($2,911 ÷ 247 shares of common stock issued and outstanding) | | $ | 11.79 |
| | | |
| |
Class Z | | | |
Net asset value, offering price and redemption price per share
($56,621,206 ÷ 4,364,288 shares of common stock issued and outstanding) | | $ | 12.97 |
| | | |
See Notes to Financial Statements.
| | |
| The Prudential Investment Portfolios, Inc./Jennison Equity Opportunity Fund | | 15 |
Statement of Operations
Six Months Ended March 31, 2008 (Unaudited)
| | | | |
Net Investment Income | | | | |
Income | | | | |
Unaffiliated dividend income (net of foreign withholding taxes of $20,284) | | $ | 3,091,741 | |
Affiliated dividend income | | | 417,708 | |
Affiliated income from securities loaned, net | | | 367,760 | |
Unaffiliated interest | | | 1,240 | |
| | | | |
Total income | | | 3,878,449 | |
| | | | |
| |
Expenses | | | | |
Management fee | | | 1,479,640 | |
Distribution fee—Class A | | | 379,845 | |
Distribution fee—Class B | | | 534,912 | |
Distribution fee—Class C | | | 211,464 | |
Distribution fee—Class R | | | 8 | |
Transfer agent’s fee and expenses (including affiliated expense of $278,000) | | | 492,000 | |
Reports to shareholders | | | 43,000 | |
Custodian’s fees and expenses | | | 34,000 | |
Registration fees | | | 32,000 | |
Directors’ fees | | | 11,000 | |
Audit fee | | | 10,000 | |
Legal fees and expenses | | | 9,000 | |
Insurance | | | 6,000 | |
Loan interest expense (Note 7) | | | 237 | |
Miscellaneous | | | 10,241 | |
| | | | |
Total expenses | | | 3,253,347 | |
| | | | |
Net investment income | | | 625,102 | |
| | | | |
| |
Realized And Unrealized Gain (Loss) On Investment and Foreign Currencies | | | | |
Net realized gain (loss) on: | | | | |
Investment transactions | | | 11,259,147 | |
Foreign currency transactions | | | (5,769 | ) |
Short sales | | | 1,675,310 | |
| | | | |
| | | 12,928,688 | |
| | | | |
Net change in unrealized appreciation (depreciation) on: | | | | |
Investments | | | (91,749,080 | ) |
Foreign currencies | | | (8,684 | ) |
| | | | |
| | | (91,757,764 | ) |
| | | | |
Net gain on investment and foreign currencies | | | (78,829,076 | ) |
| | | | |
Net Increase In Net Assets Resulting From Operations | | $ | (78,203,974 | ) |
| | | | |
See Notes to Financial Statements.
| | |
| 16 | | Visit our website at www.jennisondryden.com |
Statement of Changes in Net Assets
(Unaudited)
| | | | | | | | |
| | | Six Months
Ended
March 31, 2008 | | | Year
Ended
September 30, 2007 | |
Increase (Decrease) In Net Assets | | | | | | | | |
Operations | | | | | | | | |
Net investment income | | $ | 625,102 | | | $ | 745,300 | |
Net realized gain on investment and foreign currency transactions | | | 12,928,688 | | | | 81,701,183 | |
Net change in unrealized appreciation (depreciation) on investments and foreign currencies | | | (91,757,764 | ) | | | 11,149,984 | |
| | | | | | | | |
Net increase (decrease) in net assets resulting from operations | | | (78,203,974 | ) | | | 93,596,467 | |
| | | | | | | | |
Dividends and distributions (Note 1) | | | | | | | | |
Dividends from net investment income | | | | | | | | |
Class A | | | (304,751 | ) | | | (395,173 | ) |
Class Z | | | (168,394 | ) | | | (351,711 | ) |
| | | | | | | | |
| | | (473,145 | ) | | | (746,884 | ) |
| | | | | | | | |
Distributions from net realized gains | | | | | | | | |
Class A | | | (47,081,407 | ) | | | (40,656,104 | ) |
Class B | | | (19,645,048 | ) | | | (19,865,797 | ) |
Class C | | | (7,702,370 | ) | | | (7,016,398 | ) |
Class R | | | (543 | ) | | | (412 | ) |
Class Z | | | (10,652,564 | ) | | | (11,180,238 | ) |
| | | | | | | | |
| | | (85,081,932 | ) | | | (78,718,949 | ) |
| | | | | | | | |
| | |
Series share transactions (Net of share conversions) (Note 6) | | | | | | | | |
Net proceeds from shares sold | | | 21,153,304 | | | | 60,350,647 | |
Net asset value of shares issued in reinvestment of dividends and distributions | | | 81,726,020 | | | | 76,047,624 | |
Cost of shares reacquired | | | (78,481,258 | ) | | | (175,444,747 | ) |
| | | | | | | | |
Net increase (decrease) in net assets from Series share transactions | | | 24,398,066 | | | | (39,046,476 | ) |
| | | | | | | | |
Total decrease | | | (139,360,985 | ) | | | (24,915,842 | ) |
| | |
Net Assets | | | | | | | | |
Beginning of period | | | 571,908,058 | | | | 596,823,900 | |
| | | | | | | | |
End of period(a) | | $ | 432,547,073 | | | $ | 571,908,058 | |
| | | | | | | | |
(a) Includes undistributed net investment income of: | | $ | 621,596 | | | $ | 469,639 | |
| | | | | | | | |
See Notes to Financial Statements.
| | |
| The Prudential Investment Portfolios, Inc./Jennison Equity Opportunity Fund | | 17 |
Notes to Financial Statements
(Unaudited)
The Prudential Investment Portfolios, Inc. (the “Fund”) is registered under the Investment Company Act of 1940 as an open-end management investment company. The Fund was incorporated in Maryland on August 10, 1995 and consists of six series: Jennison Equity Opportunity Fund (the “Series”), Jennison Growth Fund and Dryden Active Allocation Fund which are diversified funds and JennisonDryden Growth Allocation Fund, JennisonDryden Moderate Allocation Fund and JennisonDryden Conservative Allocation Fund which are non-diversified funds. These financial statements relate to Jennison Equity Opportunity Fund. The financial statements of the other series are not presented herein. The Series commenced investment operations on November 7, 1996.
The Series’ investment objective is to achieve long-term growth of capital. The Series seeks to achieve its objectives by investing primarily in common stocks of established companies with growth prospects believed to be underappreciated by the market.
Note 1. Accounting Policies
The following is a summary of significant accounting policies followed by the Series in the preparation of its financial statements.
Securities Valuation: Securities listed on a securities exchange are valued at the last sale price on such exchange on the day of valuation or, if there was no sale on such day, at the mean between the last reported bid and asked prices, or at the last bid price on such day in the absence of an asked price. Securities traded via Nasdaq are valued at the official closing price provided by Nasdaq. Securities that are actively traded in the over-the-counter market, including listed securities for which the primary market is believed by Prudential Investments LLC (“PI” or “Manager”), in consultation with the subadvisor; to be over-the-counter, are valued at market value using prices provided by an independent pricing agent or principal market maker. Securities for which reliable market quotations are not readily available, or whose values have been affected by events occurring after the close of the security’s foreign market and before the Fund’s normal pricing time, are valued at fair value in accordance with The Board of Directors’ approved fair valuation procedures. When determining the fair valuation of securities some of the factors influencing the valuation include, the nature of any restrictions on disposition of the securities; assessment of the general liquidity of the securities; the issuer’s financial condition and the markets in which it does business; the cost of the investment; the size of the holding and the capitalization of issuer; the prices of any recent transactions or bids/
| | |
| 18 | | Visit our website at www.jennisondryden.com |
offers for such securities or any comparable securities; any available analyst media or other reports or information deemed reliable by the investment adviser regarding the issuer or the markets or industry in which it operates. Using fair value to price securities may result in a value that is different from a security’s most recent closing price and from the price used by other mutual funds to calculate their net asset values. As of March 31, 2008, there were no securities whose values were impacted by events occurring after the close of the security’s foreign market.
Investments in mutual funds are valued at their net asset value as of the close of the New York Stock Exchange on the date of valuation.
Short-term debt securities which mature in 60 days or less are valued at amortized cost, which approximates market-value. The amortized cost method includes valuing a security at its cost on the date of purchase and thereafter assuming a constant amortization to maturity of the difference between the principal amount due at maturity and cost. Short-term debt securities which mature in more than 60 days are valued at current market quotations.
Restricted Securities: The Series may hold up to 15% of its net assets in illiquid securities, including those which are restricted as to disposition under securities law (“restricted securities”). Restricted securities held by the Series at the end of the fiscal period may include registration rights under which the Series may demand registration by the issuers, of which the Series may bear the cost of such registration. Restricted securities, are valued pursuant to the valuation procedures noted above.
Foreign Currency Translation: The books and records of the Series are maintained in U.S. dollars. Foreign currency amounts are translated into U.S. dollars on the following basis:
(i) market value of investment securities, other assets and liabilities-at the current rates of exchange.
(ii) purchases and sales of investment securities, income and expenses-at the rates of exchange prevailing on the respective dates of such transactions.
The Series does not isolate that portion of the results of operations arising as a result of changes in the foreign exchange rates from the fluctuations arising from changes in the market prices of long term securities held at the end of the fiscal year. Similarly, the Series does not isolate the effect of changes in foreign exchange rates from the fluctuations arising from changes in the market prices of portfolio securities sold during the fiscal year. Accordingly, realized foreign currency gains or losses are included in the reported net realized gains or losses on investment transactions.
| | |
| The Prudential Investment Portfolios, Inc./Jennison Equity Opportunity Fund | | 19 |
Notes to Financial Statements
continued
Net realized gains or losses on foreign currency transactions represent net foreign exchange gains or losses from the holding of foreign currencies, currency gains or losses realized between the trade and settlement dates on securities transactions, and the difference between the amounts of dividends, interest and foreign withholding taxes recorded on the Series’ books and the U.S. dollar equivalent amounts actually received or paid. Net unrealized currency gains or losses from valuing foreign currency denominated assets and liabilities (other than investments) at fiscal year end exchange rates are reflected as a component of net unrealized appreciation (depreciation) on investments and foreign currencies.
Foreign security and currency transactions may involve certain considerations and risks not typically associated with those of domestic origin as a result of, among other factors, the possibility of political and economic instability or the level of governmental supervision and regulation of foreign securities markets.
Securities Lending: The Series may lend its portfolio securities to broker-dealers. The loans are secured by collateral, at least equal, at all times to the market value of the securities loaned. Loans are subject to termination at the option of the borrower or the Series. Upon termination of the loan, the borrower will return to the lender securities identical to the loaned securities. Should the borrower of the securities fail financially, the Series has the right to repurchase the securities using the collateral in the open market. The Series recognizes income, net of any rebate and securities lending agent fees, for lending its securities in the form of fees or interest on the investment of any cash received as collateral. The Series also continues to receive interest and dividends or amounts equivalent thereto, on the securities loaned and recognizes any unrealized gain or loss in the market price of the securities loaned that may occur during the term of the loan.
Short Sales: The Series may make short sales of securities as a method of hedging potential price declines in similar securities owned. The Series may sell a security it does not own in anticipation of a decline in the market value of that security (short sale). When the Series makes a short sale, it will borrow the security sold short and deliver it to the broker-dealer through which it made the short sale as collateral for its obligation to deliver the security upon conclusion of the sale. The Series may have to pay a fee to borrow the particular securities and may be obligated to return any interest or dividends received on such borrowed securities. A gain, limited to the price at which the Series sold the security short, or a loss, unlimited as to dollar
| | |
| 20 | | Visit our website at www.jennisondryden.com |
amount, will be recognized upon the termination of a short sale if the market price is less or greater than the proceeds originally received, respectively, and is presented in the Statement of Operations as net realized gain or loss on short sales.
Securities Transactions and Net Investment Income: Securities transactions are recorded on the trade date. Realized gains or losses from investment and currency transactions are calculated on the identified cost basis. Dividend income is recorded on the ex-dividend date and interest income, including amortization of premiums and accretion of discounts on debt securities, as required, is recorded on the accrual basis. Expenses are recorded on an accrual basis.
Net investment income or loss (other than distribution fees which are charged directly to the respective class) and realized and unrealized gains and losses are allocated daily to each class of shares based upon the relative proportion of net assets of each class at the beginning of the day.
Dividends and Distributions: The Series expects to pay dividends of net investment income, if any, semi-annually and distributions of net realized capital gains, if any, at least annually. Dividends and distributions, which are determined in accordance with federal income tax regulations and which may differ from generally accepted accounting principles, are recorded on the ex-dividend date.
Taxes: For federal income tax purposes, each Series in the Fund is treated as a separate tax paying entity. It is the Series’ policy to continue to meet the requirements of the Internal Revenue Code applicable to regulated investment companies and to distribute all of its taxable net income and capital gains, if any, to shareholders. Therefore, no federal tax provision is required.
Withholding taxes on foreign dividends are recorded net of reclaimable amounts, at the time the related income is earned.
Estimates: The preparation of the financial statements requires management to make estimates and assumptions that affect the reported amounts and disclosures in the financial statements. Actual results could differ from those estimates.
Note 2. Agreements
The Fund has a management agreement for the Series with PI. Pursuant to this agreement PI has responsibility for all investment advisory services and supervises the subadvisor’s performance of such services. PI has entered into a subadvisory agreement with Jennison Associates LLC (“Jennison”). The subadvisory agreement
| | |
| The Prudential Investment Portfolios, Inc./Jennison Equity Opportunity Fund | | 21 |
Notes to Financial Statements
continued
provides that Jennison furnishes investment advisory services in connection with the management of the Series. In connection therewith, Jennison is obligated to keep certain books and records of the Series. PI pays for the services of Jennison, the cost of compensation of officers and employees of the Series, occupancy and certain clerical and bookkeeping costs of the Series. The Series bears all other costs and expenses.
The management fee paid to PI is computed daily and payable monthly, at an annual rate of .60 of 1% of the average daily net assets of the Series up to $300 million and .575 of 1% of the average daily net assets of the Series over $300 million. The effective management fee rate was .59 of 1% of the Series average daily net assets for the six months ended March 31, 2008.
The Series has a distribution agreement with Prudential Investment Management Services LLC (“PIMS”), which acts as the distributor of the Class A, Class B, Class C, Class R and Class Z shares of the Series. The Series compensates PIMS for distributing and servicing the Series’ Class A, Class B, Class C and Class R shares, pursuant to plans of distribution (the “Class A, B, C and R Plans”), regardless of expenses actually incurred by PIMS. The distribution fees are accrued daily and payable monthly. No distribution or service fees are paid to PIMS as distributor of the Class Z shares of the Series.
Pursuant to the Class A, B, C and R Plans, the Series compensates PIMS for distribution related activities at an annual rate of up to .30 of 1%, 1%, 1% and .75 of 1% of the average daily net assets of the Class A, B, C and R shares, respectively. PIMS contractually agreed to limit such fees to .25 of 1% (through January 31, 2008) and .50 of 1% of the Class A and Class R shares, respectively.
PIMS has advised the Series that it received approximately $59,400 in front-end sales charges resulting from sales of Class A shares during the six months ended March 31, 2008. From these fees PIMS paid such sales charges to affiliated brokers/dealers, which in turn paid commissions to salespersons and incurred other distribution costs.
PIMS has advised the Series that for the six months ended March 31, 2008, it received approximately $200, $51,900 and $2,800 in contingent deferred sales charges imposed upon redemptions by certain Class A, Class B and Class C shareholders, respectively.
| | |
| 22 | | Visit our website at www.jennisondryden.com |
PI, PIMS, and Jennison are indirect, wholly-owned subsidiaries of Prudential Financial, Inc. (“Prudential”).
Note 3. Other Transactions with Affiliates
Prudential Mutual Fund Services LLC (“PMFS”), an affiliate of PI and an indirect, wholly-owned subsidiary of Prudential, serves as the Fund’s transfer agent. Transfer agent’s fees and expenses in the Statement of Operations include certain out-of-pocket expenses paid to non-affiliates, where applicable.
The Series pays networking fees to affiliated and unaffiliated broker/dealers including fees relating to the services of First Clearing, LLC (“First Clearing”), an affiliate of PI. These networking fees are payments made to broker/dealers that clear mutual fund transactions through a national clearing system. For the six months ended March 31, 2008, the Series incurred approximately $146,600 in total networking fees, of which approximately $69,300 was paid to First Clearing. These amounts are included in transfer agent’s fees and expenses in the Statement of Operations.
Prudential Investment Management, Inc., (“PIM”), an indirect wholly-owned subsidiary of Prudential, is the Series’ security lending agent. For the six months ended March 31, 2008, PIM has been compensated approximately $157,600 for these services.
The Series invests in the Taxable Money Market Series (the “portfolio”), a portfolio of the Dryden Core Investment Fund, pursuant to an exemptive order received from the Securities and Exchange Commission. The portfolio is a money market mutual fund registered under the Investment Company Act of 1940, as amended, and managed by PI.
Note 4. Portfolio Securities
Purchases and sales of investment securities, other than short-term investments, for the six months ended March 31, 2008 were $175,466,369 and $230,298,931, respectively.
Note 5. Tax Information
The United States federal income tax basis of the Series’ investments and the net unrealized appreciation as of March 31, 2007 were as follows:
| | | | | | | | | | |
Tax Basis of
Investments | | Appreciation | | Depreciation | | Net
Unrealized
Depreciation | | Other Cost
Basis
Adjustments | | Total Net
Unrealized
Depreciation |
| $583,266,028 | | $37,269,551 | | $56,551,544 | | $19,281,993 | | $(1,216) | | $19,283,209 |
| | |
| The Prudential Investment Portfolios, Inc./Jennison Equity Opportunity Fund | | 23 |
Notes to Financial Statements
continued
The differences between book and tax basis are primarily attributable to deferred losses on wash sales. The other cost basis adjustments are primarily attributable to market to market on open foreign currency, receivables and payables.
Management has analyzed the Funds’ tax positions taken on federal income tax returns for all open tax years and has concluded that as of March 31, 2008, no provision for income tax would be required in the Funds’ financial statements. The Fund’s federal and state income and federal excise tax returns for tax years for which the applicable statutes of limitations have not expired are subject to examination by the Internal Revenue Service and state departments of revenue.
Note 6. Capital
The Series offers Class A, Class B, Class C, Class R and Class Z shares. Class A shares are subject to a maximum front-end sales charge of 5.5%. Investors who purchase Class A shares in an amount of $1 million or more and sell these shares within 12 months of purchase are subject to a contingent deferred sales charge (CDSC) of 1%, including investors who purchase their shares through broker-dealers affiliated with Prudential Financial, Inc. Class B shares are sold with a contingent deferred sales charge which declines from 5% to zero depending on the period of time the shares are held. Class C shares are sold with a contingent deferred sales charge of 1% during the first 12 months. Class B shares automatically convert to Class A shares on a quarterly basis approximately seven years after purchase. A special exchange privilege is also available for shareholders who qualified to purchase Class A shares at net asset value. Class R and Class Z shares are not subject to any sales or redemption charge and are offered exclusively for sale to a limited group of investors.
There are 1 billion shares of $.001 par value common stock of the Series, designated Class A, Class B, Class C, Class R and Class Z, each of which consists of 200 million authorized shares. As of March 31, 2008 Prudential owned 138 Class R shares of the Series.
| | |
| 24 | | Visit our website at www.jennisondryden.com |
Transactions in shares of common stock were as follows:
| | | | | | | |
Class A | | Shares | | | Amount | |
Six months ended March 31, 2008: | | | | | | | |
Shares sold | | 941,450 | | | $ | 13,373,609 | |
Shares issued in reinvestment of dividends and distributions | | 3,284,937 | | | | 45,167,914 | |
Shares reacquired | | (3,111,902 | ) | | | (45,009,866 | ) |
| | | | | | | |
Net increase (decrease) in shares outstanding before conversion | | 1,114,485 | | | | 13,531,657 | |
Shares issued upon conversion from Class B | | 637,712 | | | | 8,394,730 | |
| | | | | | | |
Net increase (decrease) in shares outstanding | | 1,752,197 | | | $ | 21,926,387 | |
| | | | | | | |
Year ended September 30, 2007: | | | | | | | |
Shares sold | | 2,420,919 | | | $ | 41,826,070 | |
Shares issued in reinvestment of dividends and distributions | | 2,461,266 | | | | 39,093,403 | |
Shares reacquired | | (5,113,190 | ) | | | (88,131,634 | ) |
| | | | | | | |
Net increase (decrease) in shares outstanding before conversion | | (231,005 | ) | | | (7,212,161 | ) |
Shares issued upon conversion from Class B | | 908,927 | | | | 15,304,505 | |
| | | | | | | |
Net increase (decrease) in shares outstanding | | 677,922 | | | $ | 8,092,344 | |
| | | | | | | |
Class B | | | | | | |
Six months ended March 31, 2008: | | | | | | | |
Shares sold | | 119,327 | | | $ | 1,595,577 | |
Shares issued in reinvestment of distributions | | 1,499,642 | | | | 18,790,513 | |
Shares reacquired | | (1,114,997 | ) | | | (14,453,294 | ) |
| | | | | | | |
Net increase (decrease) in shares outstanding before conversion | | 503,972 | | | | 5,932,796 | |
Shares reacquired upon conversion into Class A | | (700,804 | ) | | | (8,394,730 | ) |
| | | | | | | |
Net increase (decrease) in shares outstanding | | (196,832 | ) | | $ | (2,461,934 | ) |
| | | | | | | |
Year ended September 30, 2007: | | | | | | | |
Shares sold | | 312,142 | | | $ | 5,015,858 | |
Shares issued in reinvestment of distributions | | 1,281,630 | | | | 18,968,127 | |
Shares reacquired | | (1,789,640 | ) | | | (28,669,831 | ) |
| | | | | | | |
Net increase (decrease) in shares outstanding before conversion | | (195,868 | ) | | | (4,685,846 | ) |
Shares reacquired upon conversion into Class A | | (978,451 | ) | | | (15,304,505 | ) |
| | | | | | | |
Net increase (decrease) in shares outstanding | | (1,174,319 | ) | | $ | (19,990,351 | ) |
| | | | | | | |
Class C | | | | | | |
Six months ended March 31, 2008: | | | | | | | |
Shares sold | | 119,332 | | | $ | 1,605,029 | |
Shares issued in reinvestment of distributions | | 573,902 | | | | 7,190,996 | |
Shares reacquired | | (559,486 | ) | | | (7,200,324 | ) |
| | | | | | | |
Net increase (decrease) in shares outstanding | | 133,748 | | | $ | 1,595,701 | |
| | | | | | | |
Year ended September 30, 2007: | | | | | | | |
Shares sold | | 209,738 | | | $ | 3,362,173 | |
Shares issued in reinvestment of distributions | | 447,653 | | | | 6,625,258 | |
Shares reacquired | | (811,202 | ) | | | (12,983,149 | ) |
| | | | | | | |
Net increase (decrease) in shares outstanding | | (153,811 | ) | | $ | (2,995,718 | ) |
| | | | | | | |
| | |
| The Prudential Investment Portfolios, Inc./Jennison Equity Opportunity Fund | | 25 |
Notes to Financial Statements
continued
| | | | | | | |
Class R | | Shares | | | Amount | |
Six months ended March 31, 2008: | | | | | | | |
Shares sold | | — | | | $ | — | |
Shares issued in reinvestment of dividends and distributions | | 43 | | | | 543 | |
Shares reacquired | | — | | | | — | |
| | | | | | | |
Net increase (decrease) in shares outstanding | | 43 | | | $ | 543 | |
| | | | | | | |
Year ended September 30, 2007: | | | | | | | |
Shares sold | | 9 | | | $ | 150 | |
Shares issued in reinvestment of dividends and distributions | | 27 | | | | 412 | |
Shares reacquired | | (9 | ) | | | (152 | ) |
| | | | | | | |
Net increase (decrease) in shares outstanding | | 27 | | | $ | 410 | |
| | | | | | | |
Class Z | | | | | | |
Six months ended March 31, 2008: | | | | | | | |
Shares sold | | 321,453 | | | $ | 4,579,089 | |
Shares issued in reinvestment of dividends and distributions | | 754,355 | | | | 10,576,054 | |
Shares reacquired | | (818,823 | ) | | | (11,817,774 | ) |
| | | | | | | |
Net increase (decrease) in shares outstanding | | 256,985 | | | $ | 3,337,369 | |
| | | | | | | |
Year ended September 30, 2007: | | | | | | | |
Shares sold | | 580,512 | | | $ | 10,146,396 | |
Shares issued in reinvestment of dividends and distributions | | 701,822 | | | | 11,360,424 | |
Shares reacquired | | (2,648,185 | ) | | | (45,659,981 | ) |
| | | | | | | |
Net increase (decrease) in shares outstanding | | (1,365,851 | ) | | $ | (24,153,161 | ) |
| | | | | | | |
Note 7. Borrowings
The Fund, along with other affiliated registered investment companies (the “Funds”), is a party to a Syndicated Credit Agreement (“SCA”) with two banks. The SCA provides for a commitment of $500 million. Interest on any borrowings under the SCA is incurred at contracted market rates and a commitment fee for the unused amount is accrued daily and paid quarterly. Effective October 26, 2007, the Funds renewed the SCA with the banks. The commitment under the renewed SCA continues to be $500 million. The Funds pay a commitment fee of .06 of 1% of the unused portion of the renewed SCA. The expiration date of the renewed SCA will be October 24, 2008. For the period from October 27, 2006 through October 26, 2007, the Funds paid a commitment fee of .07 of 1% of the unused portion of the agreement. The purpose of the SCA is to provide an alternative source of temporary funding for capital share redemptions. The Fund utilized the line of credit during the six months ended March 31, 2008. The average daily balance for the 4 days the Fund
| | |
| 26 | | Visit our website at www.jennisondryden.com |
had loans outstanding during the year was approximately $628,000 at a weighted average interest rate of 3.40%.
Note 8. New Accounting Pronouncements
On September 20, 2006, the FASB released Statement of Financial Accounting Standards No. 157 “Fair Value Measurements” (FAS 157). FAS 157 establishes an authoritative definition of fair value, sets out a framework for measuring fair value, and requires additional disclosures about fair-value measurements. The application of FAS 157 is required for fiscal years beginning after November 15, 2007 and interim periods within those fiscal years. At this time, management is evaluating the implications of FAS 157 and its impact, if any, in the financial statements has not yet been determined.
In addition, in March 2008, the FASB released Statement of Financial Accounting Standards No. 161, Disclosures about Derivative Instruments and Hedging Activities (FAS 161). FAS 161 requires qualitative disclosures about objectives and strategies for using derivatives, quantitative disclosures about fair value amounts of and gains and losses on derivative instruments, and disclosures about credit-risk-related contingent features in derivative agreements. The application of FAS 161 is required for fiscal years beginning after November 15, 2008 and interim periods within those fiscal years. At this time, management is evaluating the implications of FAS 161 and its impact on the financial statements has not yet been determined.
| | |
| The Prudential Investment Portfolios, Inc./Jennison Equity Opportunity Fund | | 27 |
Financial Highlights
(Unaudited)
| | | | |
| | | Class A | |
| | | Six Months Ended
March 31, 2008 | |
Per Share Operating Performance: | | | | |
Net Asset Value, Beginning Of Period | | $ | 17.74 | |
| | | | |
Income (loss) from investment operations | | | | |
Net investment income | | | .02 | |
Net realized and unrealized gain (loss) on investment and foreign currency transactions | | | (2.37 | ) |
| | | | |
Total from investment operations | | | (2.35 | ) |
| | | | |
Less Dividends and Distributions | | | | |
Dividends from net investment income | | | (.02 | ) |
Distributions from net realized gains | | | (2.66 | ) |
| | | | |
Total dividends and distributions | | | (2.68 | ) |
| | | | |
Net asset value, end of period | | $ | 12.71 | |
| | | | |
Total Return(b): | | | (14.42 | )% |
Ratios/Supplemental Data: | | | | |
Net assets, end of period (000) | | $ | 255,005 | |
Average net assets (000) | | $ | 286,906 | |
Ratios to average net assets(d): | | | | |
Expenses, including distribution and service (12b-1) fees(c) | | | 1.11 | %(e) |
Expenses, excluding distribution and service (12b-1) fees | | | .85 | %(e) |
Net investment income | | | .43 | %(e) |
For Class A, B, C, R and Z shares: | | | | |
Portfolio turnover rate | | | 36 | %(f) |
| (a) | Calculated based upon average shares outstanding during the period. |
| (b) | Total return does not consider the effects of sales loads. Total return is calculated assuming a purchase of a share on the first day and a sale on the last day of each period reported and includes reinvestment of dividends and distributions. Total return may reflect adjustments to conform to generally accepted accounting principles. Total returns for periods less than a full year are not annualized. |
| (c) | The distributor of the Series has contractually agreed to limit its distribution and service (12b-1) fees to .25 of 1% of the average daily net assets of the Class A shares for the period October 1, 2007 to January 31, 2008. |
| (d) | Does not include the expenses of the underlying funds in which the Fund invests. |
See Notes to Financial Statements.
| | |
| 28 | | Visit our website at www.jennisondryden.com |
| | | | | | | | | | | | | | | | | | |
| Class A | |
| Year Ended September 30, | |
| 2007(a) | | | 2006(a) | | | 2005 | | | 2004 | | | 2003 | |
| | | | | | | | | | | | | | | | | | |
| $ | 17.38 | | | $ | 18.47 | | | $ | 16.60 | | | $ | 14.22 | | | $ | 11.48 | |
| | | | | | | | | | | | | | | | | | | |
| | | | | | | | | | | | | | | | | | |
| | .06 | | | | .02 | | | | .13 | | | | .02 | | | | .01 | |
| | 2.65 | | | | 1.70 | | | | 2.14 | | | | 2.36 | | | | 2.73 | |
| | | | | | | | | | | | | | | | | | | |
| | 2.71 | | | | 1.72 | | | | 2.27 | | | | 2.38 | | | | 2.74 | |
| | | | | | | | | | | | | | | | | | | |
| | | | | | | | | | | | | | | | | | |
| | (.02 | ) | | | (.09 | ) | | | (.03 | ) | | | — | | | | — | |
| | (2.33 | ) | | | (2.72 | ) | | | (.37 | ) | | | — | | | | — | |
| | | | | | | | | | | | | | | | | | | |
| | (2.35 | ) | | | (2.81 | ) | | | (.40 | ) | | | — | | | | — | |
| | | | | | | | | | | | | | | | | | | |
| $ | 17.74 | | | $ | 17.38 | | | $ | 18.47 | | | $ | 16.60 | | | $ | 14.22 | |
| | | | | | | | | | | | | | | | | | | |
| | 17.21 | % | | | 10.68 | % | | | 13.91 | % | | | 16.74 | % | | | 23.87 | % |
| | | | | | | | | | | | | | | | | | |
| $ | 324,835 | | | $ | 306,424 | | | $ | 326,512 | | | $ | 338,249 | | | $ | 261,252 | |
| $ | 324,483 | | | $ | 314,651 | | | $ | 336,880 | | | $ | 318,726 | | | $ | 232,395 | |
| | | | | | | | | | | | | | | | | | |
| | 1.06 | % | | | 1.11 | % | | | 1.12 | % | | | 1.07 | % | | | 1.15 | % |
| | .81 | % | | | .86 | % | | | .87 | % | | | .82 | % | | | .90 | % |
| | .33 | % | | | .10 | % | | | .68 | % | | | .11 | % | | | .07 | % |
| | | | | | | | | | | | | | | | | | |
| | 77 | % | | | 75 | % | | | 93 | % | | | 102 | % | | | 115 | % |
See Notes to Financial Statements.
| | |
| The Prudential Investment Portfolios, Inc./Jennison Equity Opportunity Fund | | 29 |
Financial Highlights
(Unaudited) continued
| | | | |
| | | Class B | |
| | | Six Months Ended
March 31, 2008 | |
Per Share Operating Performance: | | | | |
Net Asset Value, Beginning Of Period | | $ | 16.43 | |
| | | | |
Income (loss) from investment operations | | | | |
Net investment loss | | | (.03 | ) |
Net realized and unrealized gain (loss) on investment and foreign currency transactions | | | (2.19 | ) |
| | | | |
Total from investment operations | | | (2.22 | ) |
| | | | |
Less Dividends and Distributions | | | | |
Dividends from net investment income | | | — | |
Distributions from net realized gains | | | (2.66 | ) |
| | | | |
Total dividends and distributions | | | (2.66 | ) |
| | | | |
Net asset value, end of period | | $ | 11.55 | |
| | | | |
Total Return(b): | | | (14.80 | )% |
Ratios/Supplemental Data: | | | | |
Net assets, end of period (000) | | $ | 85,291 | |
Average net assets (000) | | $ | 106,982 | |
Ratios to average net assets(c): | | | | |
Expenses, including distribution and service (12b-1) fees | | | 1.85 | %(d) |
Expenses, excluding distribution and service (12b-1) fees | | | .85 | %(d) |
Net investment loss | | | (.30 | )%(d) |
| (a) | Calculated based upon average shares outstanding during the period. |
| (b) | Total return does not consider the effects of sales loads. Total return is calculated assuming a purchase of a share on the first day and a sale on the last day of each period reported and includes reinvestment of dividends and distributions. Total return may reflect adjustments to conform to generally accepted accounting principles. Total returns for periods less than a full year are not annualized. |
| (c) | Does not include the expenses of the underlying funds in which the Fund invests. |
See Notes to Financial Statements.
| | |
| 30 | | Visit our website at www.jennisondryden.com |
| | | | | | | | | | | | | | | | | | |
| Class B | |
| Year Ended September 30, | |
| 2007(a) | | | 2006(a) | | | 2005 | | | 2004 | | | 2003 | |
| | | | | | | | | | | | | | | | | | |
| $ | 16.34 | | | $ | 17.56 | | | $ | 15.88 | | | $ | 13.71 | | | $ | 11.15 | |
| | | | | | | | | | | | | | | | | | | |
| | | | | | | | | | | | | | | | | | |
| | (.07 | ) | | | (.04 | ) | | | (.01 | ) | | | (.11 | ) | | | (.09 | ) |
| | 2.49 | | | | 1.54 | | | | 2.06 | | | | 2.28 | | | | 2.65 | |
| | | | | | | | | | | | | | | | | | | |
| | 2.42 | | | | 1.50 | | | | 2.05 | | | | 2.17 | | | | 2.56 | |
| | | | | | | | | | | | | | | | | | | |
| | | | | | | | | | | | | | | | | | |
| | — | | | | — | | | | — | | | | — | | | | — | |
| | (2.33 | ) | | | (2.72 | ) | | | (.37 | ) | | | — | | | | — | |
| | | | | | | | | | | | | | | | | | | |
| | (2.33 | ) | | | (2.72 | ) | | | (0.37 | ) | | | — | | | | — | |
| | | | | | | | | | | | | | | | | | | |
| $ | 16.43 | | | $ | 16.34 | | | $ | 17.56 | | | $ | 15.88 | | | $ | 13.71 | |
| | | | | | | | | | | | | | | | | | | |
| | 16.40 | % | | | 9.83 | % | | | 13.12 | % | | | 15.83 | % | | | 22.96 | % |
| | | | | | | | | | | | | | | | | | |
| $ | 124,475 | | | $ | 143,053 | | | $ | 180,496 | | | $ | 213,606 | | | $ | 234,421 | |
| $ | 137,977 | | | $ | 161,565 | | | $ | 202,371 | | | $ | 235,162 | | | $ | 225,579 | |
| | | | | | | | | | | | | | | | | | |
| | 1.81 | % | | | 1.86 | % | | | 1.87 | % | | | 1.82 | % | | | 1.90 | % |
| | .81 | % | | | .86 | % | | | .87 | % | | | .82 | % | | | .90 | % |
| | (.42 | )% | | | (.26 | )% | | | (.05 | )% | | | (.63 | )% | | | (.68 | )% |
See Notes to Financial Statements.
| | |
| The Prudential Investment Portfolios, Inc./Jennison Equity Opportunity Fund | | 31 |
Financial Highlights
(Unaudited) continued
| | | | |
| | | Class C | |
| | | Six Months
Ended
March 31, 2008 | |
Per Share Operating Performance: | | | | |
Net Asset Value, Beginning Of Period | | $ | 16.43 | |
| | | | |
Income (loss) from investment operations | | | | |
Net investment loss | | | (.01 | ) |
Net realized and unrealized gain (loss) on investment and foreign currency transactions | | | (2.20 | ) |
| | | | |
Total from investment operations | | | (2.21 | ) |
| | | | |
Less Dividends and Distributions | | | | |
Dividends from net investment income | | | — | |
Distributions from net realized gains | | | (2.66 | ) |
| | | | |
Total dividends and distributions | | | (2.66 | ) |
| | | | |
Net asset value, end of period | | $ | 11.56 | |
| | | | |
Total Return(b): | | | (14.72 | )% |
Ratios/Supplemental Data: | | | | |
Net assets, end of period (000) | | $ | 35,626 | |
Average net assets (000) | | $ | 42,293 | |
Ratios to average net assets(c): | | | | |
Expenses, including distribution and service (12b-1) fees | | | 1.85 | %(d) |
Expenses, excluding distribution and service (12b-1) fees | | | .85 | %(d) |
Net investment loss | | | (.31 | )%(d) |
| (a) | Calculated based upon average shares outstanding during the period. |
| (b) | Total return does not consider the effects of sales loads. Total return is calculated assuming a purchase of a share on the first day and a sale on the last day of each period reported and includes reinvestment of dividends and distributions. Total return may reflect adjustments to conform to generally accepted accounting principles. Total returns for periods less than a full year are not annualized. |
| (c) | Does not include the expenses of the underlying funds in which the Fund invests. |
See Notes to Financial Statements.
| | |
| 32 | | Visit our website at www.jennisondryden.com |
| | | | | | | | | | | | | | | | | | |
|
| Class C | |
| Year Ended September 30, | |
| 2007(a) | | | 2006(a) | | | 2005 | | | 2004 | | | 2003 | |
| | | | | | | | | | | | | | | | | | |
| $ | 16.34 | | | $ | 17.56 | | | $ | 15.88 | | | $ | 13.71 | | | $ | 11.15 | |
| | | | | | | | | | | | | | | | | | | |
| | | | | | | | | | | | | | | | | | |
| | (.07 | ) | | | (.05 | ) | | | (.01 | ) | | | (.11 | ) | | | (.09 | ) |
| | 2.49 | | | | 1.55 | | | | 2.06 | | | | 2.28 | | | | 2.65 | |
| | | | | | | | | | | | | | | | | | | |
| | 2.42 | | | | 1.50 | | | | 2.05 | | | | 2.17 | | | | 2.56 | |
| | | | | | | | | | | | | | | | | | | |
| | | | | | | | | | | | | | | | | | |
| | — | | | | — | | | | — | | | | — | | | | — | |
| | (2.33 | ) | | | (2.72 | ) | | | (.37 | ) | | | — | | | | — | |
| | | | | | | | | | | | | | | | | | | |
| | (2.33 | ) | | | (2.72 | ) | | | (.37 | ) | | | — | | | | — | |
| | | | | | | | | | | | | | | | | | | |
| $ | 16.43 | | | $ | 16.34 | | | $ | 17.56 | | | $ | 15.88 | | | $ | 13.71 | |
| | | | | | | | | | | | | | | | | | | |
| | 16.40 | % | | | 9.83 | % | | | 13.12 | % | | | 15.83 | % | | | 22.96 | % |
| | | | | | | | | | | | | | | | | | |
| $ | 48,445 | | | $ | 50,717 | | | $ | 59,409 | | | $ | 66,322 | | | $ | 66,683 | |
| $ | 50,851 | | | $ | 54,051 | | | $ | 63,559 | | | $ | 70,174 | | | $ | 65,790 | |
| | | | | | | | | | | | | | | | | | |
| | 1.81 | % | | | 1.86 | % | | | 1.87 | % | | | 1.82 | % | | | 1.90 | % |
| | .81 | % | | | .86 | % | | | .87 | % | | | .82 | % | | | .90 | % |
| | (.42 | )% | | | (.35 | )% | | | (.06 | )% | | | (.64 | )% | | | (.68 | )% |
See Notes to Financial Statements.
| | |
| The Prudential Investment Portfolios, Inc./Jennison Equity Opportunity Fund | | 33 |
Financial Highlights
(Unaudited) continued
| | | | |
| |
| | | Class R | |
| | | Six Months Ended
March 31, 2008 | |
Per Share Operating Performance: | | | | |
Net Asset Value, Beginning Of Period | | $ | 16.67 | |
| | | | |
Income (loss) from investment operations | | | | |
Net investment income | | | .01 | |
Net realized and unrealized gain (loss) on investment and foreign currency transactions | | | (2.23 | ) |
| | | | |
Total from investment operations | | | (2.22 | ) |
| | | | |
Less Dividends and Distributions | | | | |
Dividends from net investment income | | | — | |
Distributions from net realized gains | | | (2.66 | ) |
| | | | |
Total dividends and distributions | | | (2.66 | ) |
| | | | |
Net asset value, end of period | | $ | 11.79 | |
| | | | |
Total Return(c): | | | (14.56 | )% |
Ratios/Supplemental Data: | | | | |
Net assets, end of period (000) | | $ | 3 | |
Average net assets (000) | | $ | 3 | |
Ratios to average net assets(f): | | | | |
Expenses, including distribution and service (12b-1) fees(d) | | | 1.35 | %(e) |
Expenses, excluding distribution and service (12b-1) fees | | | .85 | %(e) |
Net investment income | | | .25 | %(e) |
| (a) | Commencement of operations. |
| (b) | Calculated based upon average shares outstanding during the period. |
| (c) | Total return is calculated assuming a purchase of a share on the first day and a sale on the last day of each period reported and includes reinvestment of dividends and distributions. Total return may reflect adjustments to conform to generally accepted accounting principles. Total returns for periods less than a full year are not annualized. |
| (d) | During the period, the distributor of the Series has contractually agreed to limit its distribution and service (12b-1) fees to .50 of 1% of the average daily net assets of the Class R shares. |
| (f) | Does not include the expenses of the underlying funds in which the Fund invests. |
See Notes to Financial Statements.
| | |
| 34 | | Visit our website at www.jennisondryden.com |
| | | | | | | | | | |
| Class R | |
| Year Ended September 30, | | | December 17, 2004(a)
Through
September 30, 2005 | |
| 2007(b) | | | 2006(b) | | |
| | | | | | | | | | |
| $ | 16.48 | | | $ | 17.70 | | | $ | 16.73 | |
| | | | | | | | | | | |
| | | | | | | | | | |
| | .02 | | | | .04 | | | | .04 | |
| | 2.50 | | | | 1.51 | | | | .93 | |
| | | | | | | | | | | |
| | 2.52 | | | | 1.55 | | | | .97 | |
| | | | | | | | | | | |
| | | | | | | | | | |
| | — | | | | (.05 | ) | | | — | |
| | (2.33 | ) | | | (2.72 | ) | | | — | |
| | | | | | | | | | | |
| | (2.33 | ) | | | (2.77 | ) | | | — | |
| | | | | | | | | | | |
| $ | 16.67 | | | $ | 16.48 | | | $ | 17.70 | |
| | | | | | | | | | | |
| | 16.94 | % | | | 10.12 | % | | | 5.80 | % |
| | | | | | | | | | |
| $ | 3 | | | $ | 3 | | | $ | 3 | |
| $ | 3 | | | $ | 3 | | | $ | 3 | |
| | | | | | | | | | |
| | 1.31 | % | | | 1.36 | % | | | 1.37 | %(e) |
| | .81 | % | | | .86 | % | | | .87 | %(e) |
| | .10 | % | | | .23 | % | | | .27 | %(e) |
See Notes to Financial Statements.
| | |
| The Prudential Investment Portfolios, Inc./Jennison Equity Opportunity Fund | | 35 |
Financial Highlights
(Unaudited) continued
| | | | |
| | | Class Z | |
| | | Six Months Ended
March 31, 2008 | |
Per Share Operating Performance: | | | | |
Net Asset Value, Beginning Of Period | | $ | 18.05 | |
| | | | |
Income (loss) from investment operations | | | | |
Net investment income | | | .03 | |
Net realized and unrealized gain (loss) on investment and foreign currency transactions | | | (2.41 | ) |
| | | | |
Total from investment operations | | | (2.38 | ) |
| | | | |
Less Dividends and Distributions | | | | |
Dividends from net investment income | | | (.04 | ) |
Distributions from net realized gains | | | (2.66 | ) |
| | | | |
Total dividends and distributions | | | (2.70 | ) |
| | | | |
Net asset value, end of period | | $ | 12.97 | |
| | | | |
Total Return(b): | | | (14.31 | )% |
Ratios/Supplemental Data: | | | | |
Net assets, end of period (000) | | $ | 56,621 | |
Average net assets (000) | | $ | 65,429 | |
Ratios to average net assets(c): | | | | |
Expenses, including distribution and service (12b-1) fees | | | .85 | %(d) |
Expenses, excluding distribution and service (12b-1) fees | | | .85 | %(d) |
Net investment income | | | .70 | %(d) |
| (a) | Calculated based upon average shares outstanding during the period. |
| (b) | Total return is calculated assuming a purchase of a share on the first day and a sale on the last day of each period reported and includes reinvestment of dividends and distributions. Total return may reflect adjustments to conform to generally accepted accounting principles. Total returns for periods less than a full year are not annualized. |
| (c) | Does not include the expenses of the underlying funds in which the Fund invests. |
See Notes to Financial Statements.
| | |
| 36 | | Visit our website at www.jennisondryden.com |
| | | | | | | | | | | | | | | | | | |
| Class Z | |
| Year Ended September 30, | |
| 2007(a) | | | 2006(a) | | | 2005 | | | 2004 | | | 2003 | |
| | | | | | | | | | | | | | | | | | |
| $ | 17.65 | | | $ | 18.74 | | | $ | 16.83 | | | $ | 14.38 | | | $ | 11.59 | |
| | | | | | | | | | | | | | | | | | | |
| | | | | | | | | | | | | | | | | | |
| | .10 | | | | .12 | | | | .18 | | | | .06 | | | | .04 | |
| | 2.71 | | | | 1.66 | | | | 2.17 | | | | 2.39 | | | | 2.75 | |
| | | | | | | | | | | | | | | | | | | |
| | 2.81 | | | | 1.78 | | | | 2.35 | | | | 2.45 | | | | 2.79 | |
| | | | | | | | | | | | | | | | | | | |
| | | | | | | | | | | | | | | | | | |
| | (.08 | ) | | | (.15 | ) | | | (.07 | ) | | | — | | | | — | |
| | (2.33 | ) | | | (2.72 | ) | | | (.37 | ) | | | — | | | | — | |
| | | | | | | | | | | | | | | | | | | |
| | (2.41 | ) | | | (2.87 | ) | | | (.44 | ) | | | — | | | | — | |
| | | | | | | | | | | | | | | | | | | |
| $ | 18.05 | | | $ | 17.65 | | | $ | 18.74 | | | $ | 16.83 | | | $ | 14.38 | |
| | | | | | | | | | | | | | | | | | | |
| | 17.52 | % | | | 10.92 | % | | | 14.23 | % | | | 17.04 | % | | | 24.07 | % |
| | | | | | | | | | | | | | | | | | |
| $ | 74,149 | | | $ | 96,626 | | | $ | 277,372 | | | $ | 346,241 | | | $ | 265,048 | |
| $ | 79,338 | | | $ | 184,440 | | | $ | 313,971 | | | $ | 323,831 | | | $ | 232,369 | |
| | | | | | | | | | | | | | | | | | |
| | .81 | % | | | .86 | % | | | .87 | % | | | .82 | % | | | .90 | % |
| | .81 | % | | | .86 | % | | | .87 | % | | | .82 | % | | | .90 | % |
| | .58 | % | | | .69 | % | | | .96 | % | | | .36 | % | | | .33 | % |
See Notes to Financial Statements.
| | |
| The Prudential Investment Portfolios, Inc./Jennison Equity Opportunity Fund | | 37 |
| | | | |
| n MAIL | | n TELEPHONE | | n WEBSITE |
Gateway Center Three 100 Mulberry Street Newark, NJ 07102 | | (800) 225-1852 | | www.jennisondryden.com |
|
| PROXY VOTING |
The Board of Directors of the Fund has delegated to the Fund’s investment subadviser the responsibility for voting any proxies and maintaining proxy recordkeeping with respect to the
Fund. A description of these proxy voting policies and procedures is available without charge, upon request, by calling (800) 225-1852 or by visiting the Securities and Exchange Commission’s website at www.sec.gov. Information regarding how the Fund voted proxies relating to portfolio securities during the most recent 12-month period ended June 30 is available on the Fund’s website and on the Commission’s website. |
|
| DIRECTORS |
Linda W. Bynoe • David E.A. Carson • Robert F. Gunia • Robert E. La Blanc •
Douglas H. McCorkindale • Richard A. Redeker • Judy A. Rice • Robin B. Smith •
Stephen G. Stoneburn • Clay T. Whitehead |
|
| OFFICERS |
Judy A. Rice, President • Robert F. Gunia, Vice President • Grace C. Torres, Treasurer and Principal Financial and Accounting Officer • Kathryn L. Quirk, Chief Legal Officer •
Deborah A. Docs, Secretary • Timothy J. Knierim, Chief Compliance Officer • Valerie M. Simpson, Deputy Chief Compliance Officer • Noreen M. Fierro, Anti-Money Laundering Compliance Officer • Jonathan D. Shain, Assistant Secretary • Claudia DiGiacomo, Assistant Secretary •
John P. Schwartz, Assistant Secretary • Andrew R. French, Assistant Secretary •
M. Sadiq Peshimam, Assistant Treasurer • Peter Parrella, Assistant Treasurer |
| | | | |
| MANAGER | | Prudential Investments LLC | | Gateway Center Three 100 Mulberry Street Newark, NJ 07102 |
|
| INVESTMENT SUBADVISER | | Jennison Associates LLC | | 466 Lexington Avenue New York, NY 10017 |
|
| DISTRIBUTOR | | Prudential Investment
Management Services LLC | | Gateway Center Three 100 Mulberry Street Newark, NJ 07102 |
|
| CUSTODIAN | | The Bank of New York | | One Wall Street New York, NY 10286 |
|
| TRANSFER AGENT | | Prudential Mutual Fund
Services LLC | | PO Box 9658 Providence, RI 02940 |
|
INDEPENDENT REGISTERED
PUBLIC ACCOUNTING FIRM | | KPMG LLP | | 345 Park Avenue New York, NY 10154 |
|
| FUND COUNSEL | | Sullivan & Cromwell LLP | | 125 Broad Street New York, NY 10004 |
|
| An investor should consider the investment objectives, risks, charges, and expenses of the Fund carefully before investing. The prospectus for the Fund contains this and other information about the Fund. An investor may obtain a prospectus by visiting our website at www.jennisondryden.com or by calling (800) 225-1852. The prospectus should be read carefully before investing. |
|
| E-DELIVERY |
| To receive your mutual fund documents on-line, go to www.icsdelivery.com/prudential/funds and enroll. Instead of receiving printed documents by mail, you will receive notification via e-mail when new materials are available. You can cancel your enrollment or change your e-mail address at any time by clicking on the change/cancel enrollment option at the icsdelivery website address. |
|
| SHAREHOLDER COMMUNICATIONS WITH DIRECTORS |
| Shareholders can communicate directly with the Board of Directors by writing to the Chair of the Board, Jennison Equity Opportunity Fund, Prudential Investments, Attn: Board of Directors, 100 Mulberry Street, Gateway Center Three, Newark, NJ 07102. Shareholders can communicate directly with an individual Director by writing to the same address. Communications are not screened before being delivered to the addressee. |
|
| AVAILABILITY OF PORTFOLIO SCHEDULE |
| The Fund files its complete schedule of portfolio holdings with the Securities and Exchange Commission for the first and third quarters of each fiscal year on Form N-Q under The Prudential Investment Portfolios, Inc. name. The Fund’s Forms N-Q are available on the Commission’s website at www.sec.gov. The Fund’s Forms N-Q may also be reviewed and copied at the Commission’s Public Reference Room in Washington, D.C. Information on the operation and location of the Public Reference Room may be obtained by calling (800) SEC-0330 (732-0330). The Fund’s schedule of portfolio holdings is also available on the Fund’s website as of the end of each fiscal quarter. |
Mutual Funds:
| | | | |
| ARE NOT INSURED BY THE FDIC OR ANY FEDERAL GOVERNMENT AGENCY | | MAY LOSE VALUE | | ARE NOT A DEPOSIT OF OR GUARANTEED BY ANY BANK OR ANY BANK AFFILIATE |

| | | | | | | | | | | | | | |
| Jennison Equity Opportunity Fund | | | | |
| | | Share Class | | A | | B | | C | | R | | Z | | |
| | NASDAQ | | PJIAX | | PJIBX | | PJGCX | | JEOPR | | PJGZX | | |
| | CUSIP | | 74437E503 | | 74437E602 | | 74437E701 | | 74437E644 | | 74437E800 | | |
| | | | | | | | | | | | | | |
MF172E2 IFS-A148044 Ed. 05/2008


| | |
| MARCH 31, 2008 | | SEMIANNUAL REPORT |
JennisonDryden Asset Allocation Funds
JennisonDryden Conservative Allocation Fund
Objective: Current income and a reasonable level of capital appreciation
JennisonDryden Moderate Allocation Fund
Objective: Capital appreciation and a reasonable level of current income
JennisonDryden Growth Allocation Fund
Objective: Long-term capital appreciation
FUND TYPE
Balanced/allocation
This report is not authorized for distribution to prospective investors unless preceded or accompanied by a current prospectus.
The views expressed in this report and information about the Funds’ portfolio holdings are for the period covered by this report and are subject to change thereafter.
The accompanying financial statements as of March 31, 2008, were not audited and, accordingly, no auditor’s opinion is expressed on them.
JennisonDryden, Prudential Financial and the Rock Prudential logo are registered service marks of The Prudential Insurance Company of America, Newark, NJ, and its affiliates.

JENNISONDRYDEN ASSET ALLOCATION FUNDS
TABLE OF CONTENTS
May 15, 2008
Dear Shareholder:
On the following pages, you’ll find your Fund’s semiannual report, including a table showing fund performance over the first half of the fiscal year and for longer periods. The report also contains a listing of the Fund’s holdings at period-end. The semiannual report is an interim statement furnished between the Fund’s annual reports, which include an analysis of Fund performance over the fiscal year in addition to other data.
Mutual fund prices and returns will rise or fall over time, and asset managers tend to have periods when they perform better or worse than their long-term average. The best measures of a mutual fund’s quality are its return compared to that of similar investments and the variability of its return over the long term. We recommend that you review your portfolio regularly with your financial professional.
Sincerely,

Judy A. Rice, President
JennisonDryden Asset Allocation Funds
| | |
| JennisonDryden Asset Allocation Funds | | 1 |
Your Fund’s Performance
Fund objective
The investment objective of the JennisonDryden Conservative Allocation Fund is current income and a reasonable level of capital appreciation. There can be no assurance that the Fund will achieve its investment objective.
Performance data quoted represent past performance. Past performance does not guarantee future results. The investment return and principal value of an investment will fluctuate, so that an investor’s shares, when redeemed, may be worth more or less than their original cost. Current performance may be lower or higher than the past performance data quoted. An investor may obtain performance data as of the most recent month-end by visiting our website at www.jennisondryden.com or by calling (800) 225-1852. The maximum initial sales charge is 5.50% (Class A shares). Gross operating expenses: Class A, 1.86%; Class B, 2.56%; Class C, 2.56%; Class R, 2.31%; Class Z, 1.56%. Net operating expenses apply to: Class A, 1.46%; Class B, 2.21%; Class C, 2.21%; Class R, 1.71%; Class Z, 1.21%, after contractual reduction through 1/31/2009. These figures include a weighted average of the net operating expenses of the underlying funds in which the fund invests. Such expenses, annualized, amounted to 0.71% for each share class.
| | | | | | | | | |
| Cumulative Total Returns as of 3/31/08 | | | | | | | | | |
| | | Six Months | | | One Year | | | Since Inception1 | |
Class A | | –3.09 | % | | 1.20 | % | | 25.05 | % |
Class B | | –3.45 | | | 0.45 | | | 21.34 | |
Class C | | –3.45 | | | 0.45 | | | 21.34 | |
Class R | | –2.95 | | | 1.22 | | | 2.74 | |
Class Z | | –2.97 | | | 1.44 | | | 26.53 | |
JDAA Conservative Customized Blend2 | | –2.60 | | | 1.29 | | | ** | |
Russell 1000 Index3 | | –12.41 | | | –5.40 | | | *** | |
S&P 500 Index4 | | –12.46 | | | –5.08 | | | **** | |
Lipper Mixed-Asset Target Allocation Moderate Funds Avg.5 | | –6.29 | | | –1.68 | | | ***** | |
| | | | | | | | | |
| Average Annual Total Returns6 as of 3/31/08 | | | | | | | |
| | | | | | One Year | | | Since Inception1 | |
Class A | | | | | –4.37 | % | | 4.26 | % |
Class B | | | | | –4.40 | | | 4.73 | |
Class C | | | | | –0.52 | | | 4.95 | |
Class R | | | | | 1.22 | | | 2.24 | |
Class Z | | | | | 1.44 | | | 6.05 | |
JDAA Conservative Customized Blend2 | | | | | 1.29 | | | ** | |
Russell 1000 Index3 | | | | | –5.40 | | | *** | |
S&P 500 Index4 | | | | | –5.08 | | | **** | |
Lipper Mixed-Asset Target Allocation Moderate Funds Avg.5 | | | | | –1.68 | | | ***** | |
| | |
| 2 | | Visit our website at www.jennisondryden.com |
The cumulative total returns do not reflect the deduction of applicable sales charges. If reflected, the applicable sales charges would reduce the cumulative total returns quoted. Class A shares are subject to a maximum front-end sales charge of 5.50%. Under certain circumstances, Class A shares may be subject to a contingent deferred sales charge (CDSC) of 1%. Class B and Class C shares are subject to a maximum CDSC of 5% and 1%, respectively. Class R and Class Z shares are not subject to a sales charge.
Sources: Prudential Investments LLC, Lipper Inc., and Ibbotson Associates, Inc. Performance figures may reflect fee waivers and/or expense reimbursements. In the absence of such fee waivers and/or expense reimbursements, total returns would be lower.
1Inception dates: Class A, B, C, and Z, 3/30/04; Class R, 1/12/07. The Since Inception returns for the JDAA Conservative Customized Blend, Russell 1000 Index, S&P 500 Index, and Lipper Mixed-Asset Target Allocation Moderate Funds Average (Lipper Average) are measured from the closest month-end to inception date, and not from the Fund’s actual inception date.
2The JennisonDryden Asset Allocation (JDAA) Conservative Customized Blend is a model portfolio consisting of the Russell 3000 Index (25%), the Morgan Stanley Capital International Europe, Australasia, and Far East (MSCI EAFE ND) Index (10%), the Lehman Brothers U.S. Aggregate Index (30%), the Merrill Lynch 1-3 Year Corporate Index (30%), and the Standard & Poor’s (S&P) 500/Citigroup BMI World Property Net Index (5%). Each component of the JDAA Conservative Customized Blend is an unmanaged index generally considered as representing the performance of its asset class. The JDAA Conservative Customized Blend is intended to provide a theoretical comparison to the Fund’s performance based on the amounts allocated to each asset class. The JDAA Conservative Customized Blend does not reflect deductions for any sales charges, operating expenses of a mutual fund, or taxes.
3The Russell 1000 Index is an unmanaged index that consists of the 1,000 largest securities in the Russell 3000 Index.
4The S&P 500 Index is an unmanaged index of 500 stocks of large U.S. public companies. It gives a broad look at how U.S. stock prices have performed.
5The Lipper Average represents returns based on the average return of all funds in the Lipper Mixed-Asset Target Allocation Moderate Funds category. Funds in the Lipper Average normally seek a high level of current income through investing in income-producing stocks, bonds, and money market instruments.
6The average annual total returns take into account applicable sales charges. Class A, Class B, Class C, and Class R shares are subject to an annual distribution and service (12b-1) fee of up to 0.30%, 1.00%, 1.00%, and 0.75%, respectively. Approximately seven years after purchase, Class B shares will automatically convert to Class A shares on a quarterly basis. Class Z shares are not subject to a 12b-1 fee. The returns in the tables do not reflect the deduction of taxes that a shareholder would pay on Fund distributions or following the redemption of Fund shares.
**JDAA Conservative Customized Blend Closest Month-End to Inception cumulative total returns are 26.86% for Class A, Class B, Class C, and Class Z; and 3.29% for Class R. JDAA Conservative Customized Blend Closest Month-End to Inception average annual total returns are 6.13% for Class A, Class B, Class C, and Class Z; and 2.62% for Class R.
***Russell 1000 Index Closest Month-End to Inception cumulative total returns are 28.42% for Class A, Class B, Class C, and Class Z; and –4.26% for Class R. Russell 1000 Index Closest Month-End to Inception average annual total returns are 6.45% for Class A, Class B, Class C, and Class Z; and –3.42% for Class R.
****S&P 500 Index Closest Month-End to Inception cumulative total returns are 26.51% for Class A, Class B, Class C, and Class Z; and –4.47% for Class R. S&P 500 Index Closest Month-End to Inception average annual total returns are 6.05% for Class A, Class B, Class C, and Class Z; and –3.59% for Class R.
| | |
| JennisonDryden Asset Allocation Funds | | 3 |
Your Fund’s Performance (continued)
*****Lipper Mixed-Asset Closest Month-End to Inception cumulative total returns are 22.13% for Class A, Class B, Class C, and Class Z; and –0.17% for Class R. Lipper Mixed-Asset Closest Month-End to Inception average annual total returns are 5.08% for Class A, Class B, Class C, and Class Z; and –0.14% for Class R.
Investors cannot invest directly in an index. The returns for the JDAA Conservative Customized Blend, Russell 1000 Index, and S&P 500 Index would be lower if they included the effects of sales charges, operating expenses of a mutual fund, or taxes. Returns for the Lipper Average reflect the deduction of operating expenses, but not sales charges or taxes.
| | |
| 4 | | Visit our website at www.jennisondryden.com |
Performance Target—JDAA Conservative Customized Blend
The JennisonDryden Conservative Allocation Fund seeks to beat a performance target—the JDAA Conservative Customized Blend—consisting of a weighted average return of five securities indexes that are generally considered representative of the asset classes in which the Fund may invest. The chart below shows both the total returns of these indexes for the six-month period ended March 31, 2008, and their weightings in the JennisonDryden Conservative Customized Blend. Index returns do not reflect sales charges, a mutual fund’s operating expenses, or taxes, and investors cannot invest directly in an index. The JennisonDryden Conservative Allocation Fund seeks to beat this target by holding positions in specific JennisonDryden mutual funds. In response to market developments, the Fund’s investment adviser may vary its holdings in those funds (within specified ranges). Past performance is not indicative of future results.
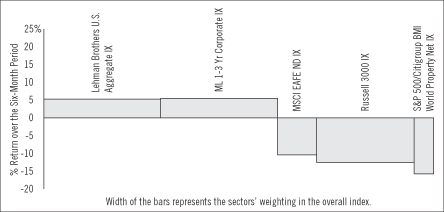
Source: Lipper Inc.
The Lehman Brothers U.S. Aggregate Index is an index of investment grade securities issued by the U.S. government and its agencies and by corporations with between one and 10 years remaining to maturity. It gives a broad look at how bond prices of short and intermediate-term bonds have performed.
The Merrill Lynch 1-3 Year Corporate Index consists of fixed-rate, coupon-bearing corporate bonds with a maturity of one to three years and a rating of BBB/Baa3 and above.
The Morgan Stanley Capital International Europe, Australasia, and Far East Index (MSCI EAFE ND Index) is an unmanaged, weighted index that reflects stock price movements in Europe, Australasia, and the Far East. It gives a broad look at how foreign stock prices have performed.
The Russell 3000 Index represents the U.S. equity market—it covers about 98% of all investable stocks in the U.S.
The Standard & Poor’s (S&P) 500/Citigroup BMI World Property Net Index is a broad market index of more than 400 companies from 21 countries, and is available for a wide range of regions (including ex-U.S.) as well as by country.
| | |
| JennisonDryden Asset Allocation Funds | | 5 |
Your Fund’s Performance
Fund objective
The investment objective of the JennisonDryden Moderate Allocation Fund is capital appreciation and a reasonable level of current income. There can be no assurance that the Fund will achieve its investment objective.
Performance data quoted represent past performance. Past performance does not guarantee future results. The investment return and principal value of an investment will fluctuate, so that an investor’s shares, when redeemed, may be worth more or less than their original cost. Current performance may be lower or higher than the past performance data quoted. An investor may obtain performance data as of the most recent month-end by visiting our website at www.jennisondryden.com or by calling (800) 225-1852. The maximum initial sales charge is 5.50% (Class A shares). Gross operating expenses: Class A, 1.62%; Class B, 2.32%; Class C, 2.32%; Class R, 2.07%; Class Z, 1.32%. Net operating expenses apply to: Class A, 1.54%; Class B, 2.29%; Class C, 2.29%; Class R, 1.79%; Class Z, 1.29%, after contractual reduction through 1/31/2009. These figures include a weighted average of the net operating expenses of the underlying funds in which the fund invests. Such expenses, annualized, amounted to 0.78% for each share class.
| | | | | | | | | |
| Cumulative Total Returns as of 3/31/08 | | | | | | | | | |
| | | Six Months | | | One Year | | | Since Inception1 | |
Class A | | –7.42 | % | | –1.79 | % | | 31.74 | % |
Class B | | –7.80 | | | –2.55 | | | 27.72 | |
Class C | | –7.73 | | | –2.47 | | | 27.73 | |
Class R | | –7.48 | | | –1.93 | | | –0.27 | |
Class Z | | –7.26 | | | –1.55 | | | 32.88 | |
JDAA Moderate Customized Blend2 | | –6.64 | | | –1.67 | | | ** | |
Russell 1000 Index3 | | –12.41 | | | –5.40 | | | *** | |
S&P 500 Index4 | | –12.46 | | | –5.08 | | | **** | |
Lipper Mixed-Asset Target Allocation Growth Funds Avg.5 | | –8.26 | | | –2.32 | | | ***** | |
| | | | | | | | | |
| Average Annual Total Returns6 as of 3/31/08 | |
| | | | | | One Year | | | Since Inception1 | |
Class A | | | | | –7.19 | % | | 5.62 | % |
Class B | | | | | –7.21 | | | 6.09 | |
Class C | | | | | –3.40 | | | 6.30 | |
Class R | | | | | –1.93 | | | –0.22 | |
Class Z | | | | | –1.55 | | | 7.36 | |
JDAA Moderate Customized Blend2 | | | | | –1.67 | | | ** | |
Russell 1000 Index3 | | | | | –5.40 | | | *** | |
S&P 500 Index4 | | | | | –5.08 | | | **** | |
Lipper Mixed-Asset Target Allocation Growth Funds Avg.5 | | | | | –2.32 | | | ***** | |
| | |
| 6 | | Visit our website at www.jennisondryden.com |
The cumulative total returns do not reflect the deduction of applicable sales charges. If reflected, the applicable sales charges would reduce the cumulative total returns quoted. Class A shares are subject to a maximum front-end sales charge of 5.50%. Under certain circumstances, Class A shares may be subject to a contingent deferred sales charge (CDSC) of 1%. Class B and Class C shares are subject to a maximum CDSC of 5% and 1%, respectively. Class R and Class Z shares are not subject to a sales charge.
Sources: Prudential Investments LLC, Lipper Inc., and Ibbotson Associates, Inc. Performance figures may reflect fee waivers and/or expense reimbursements. In the absence of such fee waivers and/or expense reimbursements, total returns would be lower.
1Inception dates: Class A, B, C, and Z, 3/30/04; Class R, 1/12/07. The Since Inception returns for the S&P 500 Index, Russell 1000 Index, JDAA Moderate Customized Blend and Lipper Mixed-Asset Target Allocation Growth Funds Average (Lipper Average) are measured from the closest month-end to inception date, and not from the Fund’s actual inception date.
2The JennisonDryden Asset Allocation (JDAA) Moderate Customized Blend is a model portfolio consisting of the Russell 3000 Index (45%), the Morgan Stanley Capital International Europe, Australasia, and Far East (MSCI EAFE ND) Index (15%), the Lehman Brothers U.S. Aggregate Index (20%), the Merrill Lynch 1-3 Year Corporate Index (15%), and the Standard & Poor’s (S&P) 500/Citigroup BMI World Property Net Index (5%). Each component of the JDAA Moderate Customized Blend is an unmanaged index generally considered as representing the performance of its asset class. The JDAA Moderate Customized Blend is intended to provide a theoretical comparison to the Fund’s performance based on the amounts allocated to each asset class. The JDAA Moderate Customized Blend does not reflect deductions for any sales charges, operating expenses of a mutual fund, or taxes.
3The Russell 1000 Index is an unmanaged index that consists of the 1,000 largest securities in the Russell 3000 Index.
4The S&P 500 Index is an unmanaged index of 500 stocks of large U.S. public companies. It gives a broad look at how U.S. stock prices have performed.
5The Lipper Average represents returns based on the average return of all funds in the Lipper Mixed-Asset Target Allocation Growth Funds category. Funds in the Lipper Average have a primary objective to conserve principal by maintaining at all times a balanced portfolio of both stocks and bonds. Typically, the stock:bond ratio ranges around 60%:40%.
6The average annual total returns take into account applicable sales charges. Class A, Class B, Class C, and Class R shares are subject to an annual distribution and service (12b-1) fee of up to 0.30%, 1.00%, 1.00%, and 0.75%, respectively. Approximately seven years after purchase, Class B shares will automatically convert to Class A shares on a quarterly basis. Class Z shares are not subject to a 12b-1 fee. The returns in the tables do not reflect the deduction of taxes that a shareholder would pay on Fund distributions or following the redemption of Fund shares.
**JDAA Moderate Customized Blend Closest Month-End to Inception cumulative total returns are 31.62% for Class A, Class B, Class C, and Class Z; and 0.34% for Class R. JDAA Moderate Customized Blend Closest Month-End to Inception average annual total returns are 7.11% for Class A, Class B, Class C, and Class Z; and 0.27% for Class R.
***Russell 1000 Index Closest Month-End to Inception cumulative total returns are 28.42% for Class A, Class B, Class C, and Class Z; and –4.26% for Class R. Russell 1000 Index Closest Month-End to Inception average annual total returns are 6.45% for Class A, Class B, Class C, and Class Z; and –3.42% for Class R.
| | |
| JennisonDryden Asset Allocation Funds | | 7 |
Your Fund’s Performance (continued)
****S&P 500 Index Closest Month-End to Inception cumulative total returns are 26.51% for Class A, Class B, Class C, and Class Z; and –4.47% for Class R. S&P 500 Index Closest Month-End to Inception average annual total returns are 6.05% for Class A, Class B, Class C, and Class Z; and –3.59% for Class R.
*****Lipper Mixed-Asset Closest Month-End to Inception cumulative total returns are 25.16% for Class A, Class B, Class C, and Class Z; and –0.85% for Class R. Lipper Mixed-Asset Closest Month-End to Inception average annual total returns are 5.70% for Class A, Class B, Class C, and Class Z; and –0.70% for Class R.
Investors cannot invest directly in an index. The returns for the JDAA Moderate Customized Blend, Russell 1000 Index, and S&P 500 Index would be lower if they included the effects of sales charges, operating expenses of a mutual fund, or taxes. Returns for the Lipper Average reflect the deduction of operating expenses, but not sales charges or taxes.
| | |
| 8 | | Visit our website at www.jennisondryden.com |
Performance Target—JDAA Moderate Customized Blend
The JennisonDryden Moderate Allocation Fund seeks to beat a performance target—the JDAA Moderate Customized Blend—consisting of a weighted average return of five securities indexes that are generally considered representative of the asset classes in which the Fund may invest. The chart below shows both the total returns of these indexes for the six-month period ended March 31, 2008, and their weightings in the JennisonDryden Moderate Customized Blend. Index returns do not reflect sales charges, a mutual fund’s operating expenses, or taxes, and investors cannot invest directly in an index. The JennisonDryden Moderate Allocation Fund seeks to beat this target by holding positions in specific JennisonDryden mutual funds. In response to market developments, the Fund’s investment adviser may vary its holdings in those funds (within specified ranges). Past performance is not indicative of future results.
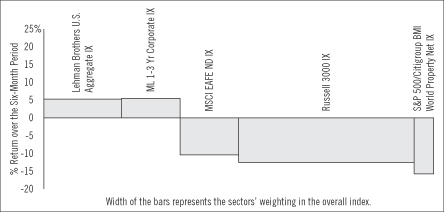
Source: Lipper Inc.
The Lehman Brothers U.S. Aggregate Index is an index of investment grade securities issued by the U.S. government and its agencies and by corporations with between one and 10 years remaining to maturity. It gives a broad look at how bond prices of short and intermediate-term bonds have performed.
The Merrill Lynch 1-3 Year Corporate Index consists of fixed-rate, coupon-bearing corporate bonds with a maturity of one to three years and a rating of BBB/Baa3 and above.
The Morgan Stanley Capital International Europe, Australasia, and Far East Index (MSCI EAFE ND Index) is an unmanaged, weighted index that reflects stock price movements in Europe, Australasia, and the Far East. It gives a broad look at how foreign stock prices have performed.
The Russell 3000 Index represents the U.S. equity market—it covers about 98% of all investable stocks in the U.S.
The Standard & Poor’s (S&P) 500/Citigroup BMI World Property Net Index is a broad market index of more than 400 companies from 21 countries, and is available for a wide range of regions (including ex-U.S.) as well as by country.
| | |
| JennisonDryden Asset Allocation Funds | | 9 |
Your Fund’s Performance
Fund objective
The investment objective of the JennisonDryden Growth Allocation Fund is long-term capital appreciation. There can be no assurance that the Fund will achieve its investment objective.
Performance data quoted represent past performance. Past performance does not guarantee future results. The investment return and principal value of an investment will fluctuate, so that an investor’s shares, when redeemed, may be worth more or less than their original cost. Current performance may be lower or higher than the past performance data quoted. An investor may obtain performance data as of the most recent month-end by visiting our website at www.jennisondryden.com or by calling (800) 225-1852. The maximum initial sales charge is 5.50% (Class A shares). Gross operating expenses: Class A, 1.89%; Class B, 2.59%; Class C, 2.59%; Class R, 2.34%; Class Z, 1.59%. Net operating expenses apply to: Class A, 1.57%; Class B, 2.32%; Class C, 2.32%; Class R, 1.82%; Class Z, 1.32%, after contractual reduction through 1/31/2009. These figures include a weighted average of the net operating expenses of the underlying funds in which the fund invests. Such expenses, annualized, amounted to 0.81% for each share class.
| | | | | | | | | |
| Cumulative Total Returns as of 3/31/08 | | | | | | | | | |
| | | Six Months | | | One Year | | | Since Inception1 | |
Class A | | –11.63 | % | | –5.09 | % | | 37.41 | % |
Class B | | –11.98 | | | –5.86 | | | 33.48 | |
Class C | | –11.85 | | | –5.79 | | | 33.58 | |
Class R | | –11.69 | | | –5.34 | | | –3.48 | |
Class Z | | –11.49 | | | –4.88 | | | 38.79 | |
JDAA Growth Customized Blend2 | | –10.47 | | | –4.47 | | | ** | |
Russell 1000 Index3 | | –12.41 | | | –5.40 | | | *** | |
S&P 500 Index4 | | –12.46 | | | –5.08 | | | **** | |
Lipper Multi-Cap Core Funds Avg.5 | | –12.40 | | | –5.57 | | | ***** | |
| | | | | | | | | |
| Average Annual Total Returns6 as of 3/31/08 | | | | |
| | | | | | One Year | | | Since Inception1 | |
Class A | | | | | –10.31 | % | | 6.74 | % |
Class B | | | | | –10.41 | | | 7.27 | |
Class C | | | | | –6.70 | | | 7.50 | |
Class R | | | | | –5.34 | | | –2.86 | |
Class Z | | | | | –4.88 | | | 8.53 | |
JDAA Growth Customized Blend2 | | | | | –4.47 | | | ** | |
Russell 1000 Index3 | | | | | –5.40 | | | *** | |
S&P 500 Index4 | | | | | –5.08 | | | **** | |
Lipper Multi-Cap Core Funds Avg.5 | | | | | –5.57 | | | ***** | |
| | |
| 10 | | Visit our website at www.jennisondryden.com |
The cumulative total returns do not reflect the deduction of applicable sales charges. If reflected, the applicable sales charges would reduce the cumulative total returns quoted. Class A shares are subject to a maximum front-end sales charge of 5.50%. Under certain circumstances, Class A shares may be subject to a contingent deferred sales charge (CDSC) of 1%. Class B and Class C shares are subject to a maximum CDSC of 5% and 1%, respectively. Class R and Class Z shares are not subject to a sales charge.
Sources: Prudential Investments LLC, Lipper Inc., and Ibbotson Associates, Inc. Performance figures may reflect fee waivers and/or expense reimbursements. In the absence of such fee waivers and/or expense reimbursements, total returns would be lower.
1Inception dates: Class A, B, C, and Z, 3/30/04; Class R, 1/12/07. The Since Inception returns for the S&P 500 Index, Russell 1000 Index, JDAA Growth Customized Blend, and Lipper Multi-Cap Core Funds Average (Lipper Average) are measured from the closest month-end to inception date, and not from the Fund’s actual inception date.
2The JennisonDryden Asset Allocation (JDAA) Growth Customized Blend is a model portfolio consisting of the Russell 3000 Index (60%), the Morgan Stanley Capital International Europe, Australasia, and Far East (MSCI EAFE ND) Index (25%), the Lehman Brothers U.S. Aggregate Index (10%), and the Standard & Poor’s (S&P) 500/Citigroup BMI World Property Net Index (5%). Each component of the JDAA Growth Customized Blend is an unmanaged index generally considered as representing the performance of its asset class. The JDAA Growth Customized Blend is intended to provide a theoretical comparison to the Fund’s performance based on the amounts allocated to each asset class. The JDAA Growth Customized Blend does not reflect deductions for any sales charges, operating expenses of a mutual fund, or taxes.
3The Russell 1000 Index is an unmanaged index that consists of the 1,000 largest securities in the Russell 3000 Index.
4The S&P 500 Index is an unmanaged index of 500 stocks of large U.S. public companies. It gives a broad look at how U.S. stock prices have performed.
5The Lipper Average represents returns based on the average return of all funds in the Lipper Multi-Cap Core Funds category. Funds in the Lipper Average invest in a variety of market capitalization ranges without concentrating 75% of their equity assets in any one market capitalization range over an extended period of time. Multi-cap funds typically have between 25% and 75% of their assets invested in companies with market capitalizations (on a three-year weighted basis) above 300% of the dollar-weighted median market capitalization of the middle 1,000 securities of the S&P SuperComposite 1500 Index. Multi-cap core funds have more latitude in the companies in which they invest. These funds typically have an average price-to-earnings ratio, price-to-book ratio, and three-year sales-per-share growth value compared to the S&P SuperComposite 1500 Index.
6The average annual total returns take into account applicable sales charges. Class A, Class B, Class C, and Class R shares are subject to an annual distribution and service (12b-1) fee of up to 0.30%, 1.00%, 1.00%, and 0.75%, respectively. Approximately seven years after purchase, Class B shares will automatically convert to Class A shares on a quarterly basis. Class Z shares are not subject to a 12b-1 fee. The returns in the tables do not reflect the deduction of taxes that a shareholder would pay on Fund distributions or following the redemption of Fund shares.
**JDAA Growth Customized Blend Closest Month-End to Inception cumulative total returns are 38.11% for Class A, Class B, Class C, and Class Z; and –2.31% for Class R. JDAA Growth Customized Blend Closest Month-End to Inception average annual total returns are 8.41% for Class A, Class B, Class C, and Class Z; and –1.86% for Class R.
| | |
| JennisonDryden Asset Allocation Funds | | 11 |
Your Fund’s Performance (continued)
***Russell 1000 Index Closest Month-End to Inception cumulative total returns are 28.42% for Class A, Class B, Class C, and Class Z; and –4.26% for Class R. Russell 1000 Index Closest Month-End to Inception average annual total returns are 6.45% for Class A, Class B, Class C, and Class Z; and –3.42% for Class R.
****S&P 500 Index Closest Month-End to Inception cumulative total returns are 26.51% for Class A, Class B, Class C, and Class Z; and –4.47% for Class R. S&P 500 Index Closest Month-End to Inception average annual total returns are 6.05% for Class A, Class B, Class C, and Class Z; and –3.59% for Class R.
*****Lipper Multi-Cap Closest Month-End to Inception cumulative total returns are 26.39% for Class A, Class B, Class C, and Class Z; and –3.98% for Class R. Lipper Multi-Cap Closest Month-End to Inception average annual total returns are 5.90% for Class A, Class B, Class C, and Class Z; and –3.23% for Class R.
Investors cannot invest directly in an index. The returns for the JDAA Growth Customized Blend, Russell 1000 Index, and S&P 500 Index would be lower if they included the effects of sales charges, operating expenses of a mutual fund, or taxes. Returns for the Lipper Average reflect the deduction of operating expenses, but not sales charges or taxes.
| | |
| 12 | | Visit our website at www.jennisondryden.com |
Performance Target—JDAA Growth Customized Blend
The JennisonDryden Growth Allocation Fund seeks to exceed a performance target—the JDAA Growth Customized Blend—consisting of a weighted average return of four securities indexes that are generally considered representative of the asset classes in which the Fund may invest. The chart below shows both the total returns of these indexes for the six-month period ended March 31, 2008, and their weightings in the JennisonDryden Growth Customized Blend. Index returns do not reflect sales charges, a mutual fund’s operating expenses, or taxes, and investors cannot invest directly in an index. The JennisonDryden Growth Allocation Fund seeks to exceed this target by holding positions in specific JennisonDryden mutual funds. In response to market developments, the Fund’s investment adviser may vary its holdings in those funds (within specified ranges). Past performance is not indicative of future results.
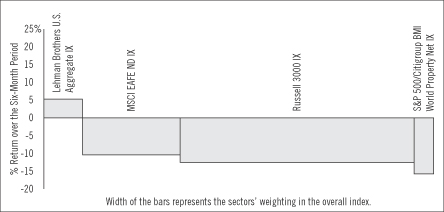
Source: Lipper Inc.
The Lehman Brothers U.S. Aggregate Index is an index of investment grade securities issued by the U.S. government and its agencies and by corporations with between one and 10 years remaining to maturity. It gives a broad look at how bond prices of short and intermediate-term bonds have performed.
The Morgan Stanley Capital International Europe, Australasia, and Far East Index (MSCI EAFE ND Index) is an unmanaged, weighted index that reflects stock price movements in Europe, Australasia, and the Far East. It gives a broad look at how foreign stock prices have performed.
The Russell 3000 Index represents the U.S. equity market—it covers about 98% of all investable stocks in the U.S.
The Standard & Poor’s (S&P) 500/Citigroup BMI World Property Net Index is a broad market index of more than 400 companies from 21 countries, and is available for a wide range of regions (including ex-U.S.) as well as by country.
| | |
| JennisonDryden Asset Allocation Funds | | 13 |
Fees and Expenses (Unaudited)
As a shareholder of a Fund, you incur two types of costs: (1) transaction costs, including sales charges (loads) on purchase payments and redemptions, as applicable, and (2) ongoing costs, including management fees, distribution and/or service (12b-1) fees, and other Fund expenses, as applicable. These examples are intended to help you understand your ongoing costs (in dollars) of investing in the Funds and to compare these costs with the ongoing costs of investing in other mutual funds.
These examples are based on an investment of $1,000 invested on October 1, 2007, at the beginning of the period, and held through the six-month period ended March 31, 2008. These examples are for illustrative purposes only; you should consult the Prospectus for information on initial and subsequent minimum investment requirements.
The Fund’s transfer agent may charge additional fees to holders of certain accounts that are not included in the expenses shown in the tables on the following pages. These fees apply to individual retirement accounts (IRAs) and Section 403(b) accounts. As of the close of the six-month period covered by the tables, IRA fees included an annual maintenance fee of $15 per account (subject to a maximum annual maintenance fee of $25 for all accounts held by the same shareholder). Section 403(b) accounts are charged an annual $25 fiduciary maintenance fee. Some of the fees may vary in amount, or may be waived, based on your total account balance or the number of JennisonDryden funds, including the Fund, that you own. You should consider the additional fees that were charged to your Fund account over the six-month period when you estimate the total ongoing expenses paid over the period and the impact of these fees on your ending account value, as these additional expenses are not reflected in the information provided in the expense tables. Additional fees have the effect of reducing investment returns.
Actual Expenses
The first line for each share class in the tables on the following pages provides information about actual account values and actual expenses. You may use the information on this line, together with the amount you invested, to estimate the expenses that you paid over the period. Simply divide your account value by $1,000 (for example, an $8,600 account value ÷ $1,000 = 8.6), then multiply the result by the number on the first line under the heading “Expenses Paid During the Six-Month Period” to estimate the expenses you paid on your account during this period.
| | |
| 14 | | Visit our website at www.jennisondryden.com |
Hypothetical Example for Comparison Purposes
The second line for each share class in the tables below provides information about hypothetical account values and hypothetical expenses based on the Fund’s actual expense ratio and an assumed rate of return of 5% per year before expenses, which is not the Fund’s actual return. The hypothetical account values and expenses may not be used to estimate the actual ending account balance or expenses you paid for the period. You may use this information to compare the ongoing costs of investing in the Fund and other funds. To do so, compare this 5% hypothetical example with the 5% hypothetical examples that appear in the shareholder reports of the other funds.
Please note that the expenses shown in the tables are meant to highlight your ongoing costs only and do not reflect any transactional costs such as sales charges (loads). Therefore, the second line for each share class in the tables is useful in comparing ongoing costs only and will not help you determine the relative total costs of owning different funds. In addition, if these transactional costs were included, your costs would have been higher.
| | | | | | | | | | | | | | |
JennisonDryden
Conservative
Allocation Fund | | Beginning Account
Value
October 1, 2007 | | Ending Account
Value
March 31, 2008 | | Annualized
Expense Ratio
Based on the
Six-Month Period | | | Expenses Paid
During the
Six-Month Period* |
| | | | | | | | | | | | | | |
| Class A | | Actual | | $ | 1,000.00 | | $ | 969.10 | | 1.46 | % | | $ | 7.19 |
| | | Hypothetical | | $ | 1,000.00 | | $ | 1,017.70 | | 1.46 | % | | $ | 7.36 |
| | | | | | | | | | | | | | |
| Class B | | Actual | | $ | 1,000.00 | | $ | 965.50 | | 2.21 | % | | $ | 10.86 |
| | | Hypothetical | | $ | 1,000.00 | | $ | 1,013.95 | | 2.21 | % | | $ | 11.13 |
| | | | | | | | | | | | | | |
| Class C | | Actual | | $ | 1,000.00 | | $ | 965.50 | | 2.21 | % | | $ | 10.86 |
| | | Hypothetical | | $ | 1,000.00 | | $ | 1,013.95 | | 2.21 | % | | $ | 11.13 |
| | | | | | | | | | | | | | |
| Class R | | Actual | | $ | 1,000.00 | | $ | 970.50 | | 1.71 | % | | $ | 8.42 |
| | | Hypothetical | | $ | 1,000.00 | | $ | 1,016.45 | | 1.71 | % | | $ | 8.62 |
| | | | | | | | | | | | | | |
| Class Z | | Actual | | $ | 1,000.00 | | $ | 970.30 | | 1.21 | % | | $ | 5.96 |
| | | Hypothetical | | $ | 1,000.00 | | $ | 1,018.95 | | 1.21 | % | | $ | 6.11 |
| | |
| JennisonDryden Asset Allocation Funds | | 15 |
Fees and Expenses (continued)
| | | | | | | | | | | | | | |
JennisonDryden
Moderate
Allocation Fund | | Beginning Account
Value
October 1, 2007 | | Ending Account
Value
March 31, 2008 | | Annualized
Expense Ratio
Based on the
Six-Month Period | | | Expenses Paid
During the
Six-Month Period* |
| | | | | | | | | | | | | | |
| Class A | | Actual | | $ | 1,000.00 | | $ | 925.80 | | 1.54 | % | | $ | 7.41 |
| | | Hypothetical | | $ | 1,000.00 | | $ | 1,017.30 | | 1.54 | % | | $ | 7.77 |
| | | | | | | | | | | | | | |
| Class B | | Actual | | $ | 1,000.00 | | $ | 922.00 | | 2.29 | % | | $ | 11.00 |
| | | Hypothetical | | $ | 1,000.00 | | $ | 1,013.55 | | 2.29 | % | | $ | 11.53 |
| | | | | | | | | | | | | | |
| Class C | | Actual | | $ | 1,000.00 | | $ | 922.70 | | 2.29 | % | | $ | 11.01 |
| | | Hypothetical | | $ | 1,000.00 | | $ | 1,013.55 | | 2.29 | % | | $ | 11.53 |
| | | | | | | | | | | | | | |
| Class R | | Actual | | $ | 1,000.00 | | $ | 925.20 | | 1.79 | % | | $ | 8.62 |
| | | Hypothetical | | $ | 1,000.00 | | $ | 1,016.05 | | 1.79 | % | | $ | 9.02 |
| | | | | | | | | | | | | | |
| Class Z | | Actual | | $ | 1,000.00 | | $ | 927.40 | | 1.29 | % | | $ | 6.22 |
| | | Hypothetical | | $ | 1,000.00 | | $ | 1,018.55 | | 1.29 | % | | $ | 6.51 |
| | | | | | | | | | | | | | |
| | | | | | | | | | | | | | |
JennisonDryden
Growth
Allocation Fund | | Beginning Account Value October 1, 2007 | | Ending Account
Value
March 31, 2008 | | Annualized
Expense Ratio
Based on the
Six-Month Period | | | Expenses Paid
During the
Six-Month Period* |
| | | | | | | | | | | | | | |
| Class A | | Actual | | $ | 1,000.00 | | $ | 883.70 | | 1.57 | % | | $ | 7.39 |
| | | Hypothetical | | $ | 1,000.00 | | $ | 1,017.15 | | 1.57 | % | | $ | 7.92 |
| | | | | | | | | | | | | | |
| Class B | | Actual | | $ | 1,000.00 | | $ | 880.20 | | 2.32 | % | | $ | 10.91 |
| | | Hypothetical | | $ | 1,000.00 | | $ | 1,013.40 | | 2.32 | % | | $ | 11.68 |
| | | | | | | | | | | | | | |
| Class C | | Actual | | $ | 1,000.00 | | $ | 881.50 | | 2.32 | % | | $ | 10.91 |
| | | Hypothetical | | $ | 1,000.00 | | $ | 1,013.40 | | 2.32 | % | | $ | 11.68 |
| | | | | | | | | | | | | | |
| Class R | | Actual | | $ | 1,000.00 | | $ | 883.10 | | 1.82 | % | | $ | 8.57 |
| | | Hypothetical | | $ | 1,000.00 | | $ | 1,015.90 | | 1.82 | % | | $ | 9.17 |
| | | | | | | | | | | | | | |
| Class Z | | Actual | | $ | 1,000.00 | | $ | 885.10 | | 1.32 | % | | $ | 6.22 |
| | | Hypothetical | | $ | 1,000.00 | | $ | 1,018.40 | | 1.32 | % | | $ | 6.66 |
* Fund expenses (net of fee waivers or subsidies, if any) for each share class are equal to the annualized expense ratio for each share class (provided in the table), multiplied by the average account value over the period, multiplied by the 183 days in the six-month period ended March 31, 2008, and divided by the 366 days in the Fund’s fiscal year ending September 30, 2008 (to reflect the six-month period). Expenses presented in the table include the expenses of any underlying portfolios in which the Fund may invest.
| | |
| 16 | | Visit our website at www.jennisondryden.com |
JennisonDryden Conservative Allocation Fund
Portfolio of Investments
as of March 31, 2008 (Unaudited)
| | | | | |
| Description | | Shares | | Value (Note 1) |
LONG-TERM INVESTMENTS 98.1% | | | | | |
| | |
Affiliated Registered Investment Companies | | | | | |
Dryden Global Real Estate Fund (Class Z) | | 69,223 | | $ | 1,479,983 |
Dryden Government Income Fund, Inc. (Class Z) | | 1,555,446 | | | 13,874,582 |
Dryden High Yield Fund, Inc. (Class Z) | | 286,729 | | | 1,508,193 |
Dryden International Equity Fund (Class Z) | | 371,251 | | | 3,088,805 |
Dryden Mid-Cap Value Fund (Class Z) | | 70,722 | | | 882,607 |
Dryden Short-Term Corporate Bond Fund (Class Z) | | 1,206,592 | | | 13,272,507 |
Dryden US Equity Active Extension Fund (Class Z)(a) | | 251,052 | | | 2,254,074 |
Jennison 20/20 Focus Fund (Class Z) | | 172,259 | | | 2,492,592 |
Jennison Growth Fund (Class Z) | | 181,134 | | | 3,041,232 |
Jennison Mid-Cap Growth Fund, Inc. (Class Z)(a) | | 43,731 | | | 1,027,244 |
Jennison Natural Resources Fund, Inc. (Class Z) | | 15,575 | | | 947,441 |
Jennison Value Fund (Class Z) | | 299,036 | | | 4,790,559 |
| | | | | |
TOTAL LONG-TERM INVESTMENTS
(cost $48,673,158) | | | | | 48,659,819 |
| | | | | |
SHORT-TERM INVESTMENT 1.9% | | | | | |
| | |
Affiliated Money Market Mutual Fund | | | | | |
Dryden Core Investment Fund - Taxable Money Market Series
(cost $939,906; Note 3) | | 939,906 | | | 939,906 |
| | | | | |
TOTAL INVESTMENTS(b) 100.0%
(cost $49,613,064; Note 5) | | | | | 49,599,725 |
Other assets in excess of liabilities | | | | | 19,678 |
| | | | | |
NET ASSETS 100.0% | | | | $ | 49,619,403 |
| | | | | |
| (a) | Non-income producing security. |
| (b) | Prudential Investments LLC, the manager of the Fund, also serves as manager of the underlying funds in which the Fund invests. |
See Notes to Financial Statements.
| | |
| JennisonDryden Asset Allocation Funds | | 17 |
JennisonDryden Conservative Allocation Fund
Portfolio of Investments
as of March 31, 2008 (Unaudited) continued
The investment allocation of portfolio holdings and other assets in excess of liabilities shown as a percentage of net assets as of March 31, 2008 were as follows:
| | | |
U.S. Government Debt | | 28.0 | % |
Short-Term Debt | | 26.7 | |
Large-Cap Value | | 9.7 | |
Large-Cap Core | | 9.6 | |
International | | 6.2 | |
Large-Cap Growth | | 6.1 | |
High Yield | | 3.0 | |
Real Estate | | 3.0 | |
Small/Mid-Cap Growth | | 2.1 | |
Sector | | 1.9 | |
Small/Mid-Cap Value | | 1.8 | |
| | | |
| | 98.1 | |
Short-Term Investment | | 1.9 | |
Other assets in excess of liabilities | | — | (a) |
| | | |
| | 100.0 | % |
| | | |
See Notes to Financial Statements.
| | |
| 18 | | Visit our website at www.jennisondryden.com |
JennisonDryden Moderate Allocation Fund
Portfolio of Investments
as of March 31, 2008 (Unaudited)
| | | | | |
| Description | | Shares | | Value (Note 1) |
LONG-TERM INVESTMENTS 98.9% | | | | | |
| | |
Affiliated Registered Investment Companies | | | | | |
Dryden Global Real Estate Fund (Class Z) | | 209,723 | | $ | 4,483,873 |
Dryden Government Income Fund, Inc. (Class Z) | | 1,844,934 | | | 16,456,812 |
Dryden High Yield Fund, Inc. (Class Z) | | 495,415 | | | 2,605,881 |
Dryden International Equity Fund (Class Z) | | 1,640,099 | | | 13,645,624 |
Dryden Mid Cap Value Fund (Class Z) | | 155,192 | | | 1,936,795 |
Dryden Short-Term Corporate Bond Fund, Inc. (Class Z) | | 1,478,678 | | | 16,265,460 |
Dryden Small-Cap Core Equity Fund, Inc. (Class Z)(a) | | 205,849 | | | 3,756,745 |
Dryden US Equity Active Extension Fund (Class Z)(a) | | 860,596 | | | 7,726,862 |
Jennison 20/20 Focus Fund (Class Z) | | 599,275 | | | 8,671,504 |
Jennison Equity Opportunity Fund (Class Z) | | 163,120 | | | 2,115,661 |
Jennison Growth Fund (Class Z) | | 529,792 | | | 8,895,213 |
Jennison Mid-Cap Growth Fund, Inc. (Class Z)(a) | | 183,251 | | | 4,304,561 |
Jennison Natural Resources Fund, Inc. (Class Z) | | 51,883 | | | 3,156,045 |
Jennison Value Fund (Class Z) | | 798,021 | | | 12,784,295 |
| | | | | |
TOTAL LONG-TERM INVESTMENTS
(cost $105,536,309) | | | | | 106,805,331 |
| | | | | |
SHORT-TERM INVESTMENT 1.1% | | | | | |
| | |
Affiliated Money Market Mutual Fund | | | | | |
Dryden Core Investment Fund - Taxable Money Market Series
(cost $1,184,279; Note 3) | | 1,184,279 | | | 1,184,279 |
| | | | | |
TOTAL INVESTMENTS(b) 100.0%
(cost $106,720,588; Note 5) | | | | | 107,989,610 |
Other assets in excess of liabilities | | | | | 23,543 |
| | | | | |
NET ASSETS 100.0% | | | | $ | 108,013,153 |
| | | | | |
| (a) | Non-income producing security. |
| (b) | Prudential Investments LLC, the manager of the Fund, also serves as manager of the underlying funds in which the Fund invests. |
See Notes to Financial Statements.
| | |
| JennisonDryden Asset Allocation Funds | | 19 |
JennisonDryden Moderate Allocation Fund
Portfolio of Investments
as of March 31, 2008 (Unaudited) continued
The investment allocation of portfolio holdings and other assets in excess of liabilities shown as a percentage of net assets as of March 31, 2008 were as follows:
| | | |
Large-Cap Core | | 15.2 | % |
U.S. Government Debt | | 15.2 | |
Short-Term Debt | | 15.1 | |
International | | 12.6 | |
Large/Mid-Cap Growth | | 12.2 | |
Large Cap Value | | 11.8 | |
Global Real Estate | | 4.2 | |
Small-Cap Core | | 3.5 | |
Natural Resources | | 2.9 | |
High Yield | | 2.4 | |
Multi-Cap Value | | 2.0 | |
Small/Mid-Cap Value | | 1.8 | |
| | | |
| | 98.9 | |
Short-Term Investment | | 1.1 | |
Other assets in excess of liabilities | | (0.0 | ) |
| | | |
| | 100.0 | % |
| | | |
See Notes to Financial Statements.
| | |
| 20 | | Visit our website at www.jennisondryden.com |
JennisonDryden Growth Allocation Fund
Portfolio of Investments
as of March 31, 2008 (Unaudited)
| | | | | | |
| Description | | Shares | | Value (Note 1) | |
LONG-TERM INVESTMENTS 98.9% | | | | | | |
| | |
Affiliated Registered Investment Companies | | | | | | |
Dryden Global Real Estate Fund (Class Z) | | 192,384 | | $ | 4,113,179 | |
Dryden International Equity Fund (Class Z) | | 1,621,244 | | | 13,488,754 | |
Dryden Mid Cap Value (Class Z) | | 99,414 | | | 1,240,689 | |
Dryden Small-Cap Core Equity Fund, Inc. (Class Z)(a) | | 303,561 | | | 5,539,994 | |
Dryden Total Return Bond Fund, Inc. (Class Z) | | 384,103 | | | 4,808,971 | |
Dryden US Equity Active Extension (Class Z)(a) | | 715,799 | | | 6,426,800 | |
Jennison 20/20 Focus Fund (Class Z)(b) | | 466,194 | | | 6,745,832 | |
Jennison Equity Opportunity Fund (Class Z) | | 154,601 | | | 2,005,177 | |
Jennison Growth Fund (Class Z) | | 448,089 | | | 7,523,415 | |
Jennison Mid-Cap Growth Fund, Inc. (Class Z)(a) | | 114,272 | | | 2,684,242 | |
Jennison Natural Resources Fund, Inc. (Class Z) | | 43,859 | | | 2,667,971 | |
Jennison Value Fund (Class Z) | | 580,846 | | | 9,305,158 | |
| | | | | | |
TOTAL LONG-TERM INVESTMENTS
(cost $66,741,657) | | | | | 66,550,182 | |
| | | | | | |
SHORT-TERM INVESTMENT 1.3% | | | | | | |
| | |
Affiliated Money Market Mutual Fund | | | | | | |
Dryden Core Investment Fund - Taxable Money Market Series
(cost $906,831; Note 3) | | 906,831 | | | 906,831 | |
| | | | | | |
TOTAL INVESTMENTS(b) 100.2%
(cost $67,648,488; Note 5) | | | | | 67,457,013 | |
Liabilities in excess of other assets (0.2%) | | | | | (166,970 | ) |
| | | | | | |
NET ASSETS 100.0% | | | | $ | 67,290,043 | |
| | | | | | |
| (a) | Non-income producing security. |
| (b) | Prudential Investments LLC, the manager of the Fund, also serves as manager of the underlying funds in which the Fund invests. |
See Notes to Financial Statements.
| | |
| JennisonDryden Asset Allocation Funds | | 21 |
JennisonDryden Growth Allocation Fund
Portfolio of Investment
as of March 31, 2008 (Unaudited) continued
The investment allocation of portfolio holdings and liabilities in excess of other assets shown as a percentage of net assets as of March 31, 2008 were as follows:
| | | |
Large-Cap Value | | 23.4 | % |
International | | 20.0 | |
Large-Cap Growth | | 11.2 | |
Large-Cap Core | | 10.0 | |
Small-Cap Core | | 8.2 | |
Multi-Sector Debt | | 7.2 | |
Real Estate | | 6.1 | |
Sector | | 4.0 | |
Small/Mid-Cap Growth | | 4.0 | |
Multi-Cap Value | | 3.0 | |
Small/Mid-Cap Value | | 1.8 | |
| | | |
| | 98.9 | |
Short-Term Investment | | 1.3 | |
Liabilities in excess of other assets | | (0.2 | ) |
| | | |
| | 100.0 | % |
| | | |
See Notes to Financial Statements.
| | |
| 22 | | Visit our website at www.jennisondryden.com |
Financial Statements
(Unaudited)
| | |
| March 31, 2008 | | SEMIANNUAL REPORT |
JennisonDryden Asset Allocation Funds
JennisonDryden Conservative Allocation Fund
Statement of Assets and Liabilities
as of March 31, 2008 (Unaudited)
| | | | |
Assets | | | | |
Affiliated investments, at value (cost $49,613,064) | | $ | 49,599,725 | |
Receivable for Fund shares sold | | | 446,207 | |
Dividends receivable | | | 25,403 | |
Receivable due from manager | | | 2,834 | |
Prepaid expenses | | | 255 | |
| | | | |
Total assets | | | 50,074,424 | |
| | | | |
| |
Liabilities | | | | |
Payable for investments purchased | | | 350,000 | |
Accrued expenses | | | 56,964 | |
Distribution fee payable | | | 23,740 | |
Payable for Fund shares reacquired | | | 17,342 | |
Affiliated transfer agent fee payable | | | 6,255 | |
Deferred directors’ fees | | | 720 | |
| | | | |
Total liabilities | | | 455,021 | |
| | | | |
| |
Net Assets | | $ | 49,619,403 | |
| | | | |
| | | | | |
Net assets were comprised of: | | | | |
Common stock, at par | | $ | 4,460 | |
Paid-in capital in excess of par | | | 48,773,825 | |
| | | | |
| | | 48,778,285 | |
Distributions in excess of net investment income | | | (36,412 | ) |
Accumulated net realized gain on investment transactions | | | 890,869 | |
Net unrealized depreciation on investments | | | (13,339 | ) |
| | | | |
Net assets, March 31, 2008 | | $ | 49,619,403 | |
| | | | |
See Notes to Financial Statements.
| | |
| 24 | | Visit our website at www.jennisondryden.com |
| | | |
Class A | | | |
Net asset value and redemption price per share | | | |
($27,150,888 ÷ 2,437,611 shares of common stock issued and outstanding) | | $ | 11.14 |
Maximum sales charge (5.50% of offering price) | | | .65 |
| | | |
Maximum offering price to public | | $ | 11.79 |
| | | |
| |
Class B | | | |
Net asset value, offering price and redemption price per share | | | |
($14,686,024 ÷ 1,322,445 shares of common stock issued and outstanding) | | $ | 11.11 |
| | | |
| |
Class C | | | |
Net asset value, offering price and redemption price per share | | | |
($7,160,331 ÷ 644,619 shares of common stock issued and outstanding) | | $ | 11.11 |
| | | |
| |
Class R | | | |
Net asset value, offering price and redemption price per share | | | |
($2,466 ÷ 220.6 shares of common stock issued and outstanding) | | $ | 11.18 |
| | | |
| |
Class Z | | | |
Net asset value, offering price and redemption price per share | | | |
($619,694 ÷ 55,453 shares of common stock issued and outstanding) | | $ | 11.18 |
| | | |
See Notes to Financial Statements.
| | |
| JennisonDryden Asset Allocation Funds | | 25 |
JennisonDryden Moderate Allocation Fund
Statement of Assets and Liabilities
as of March 31, 2008 (Unaudited)
| | | | |
Assets | | | | |
Affiliated investments, at value (cost $106,720,588) | | $ | 107,989,610 | |
Cash | | | 1,141 | |
Receivable for Fund shares sold | | | 428,133 | |
Dividends receivable | | | 32,491 | |
Prepaid expenses | | | 670 | |
| | | | |
Total assets | | | 108,452,045 | |
| | | | |
| |
Liabilities | | | | |
Payable for Fund shares reacquired | | | 230,893 | |
Accrued expenses | | | 110,811 | |
Distribution fee payable | | | 57,011 | |
Affiliated transfer agent fee payable | | | 21,339 | |
Management fee payable | | | 18,133 | |
Deferred directors’ fees | | | 705 | |
| | | | |
Total liabilities | | | 438,892 | |
| | | | |
| |
Net Assets | | $ | 108,013,153 | |
| | | | |
| | | | | |
Net assets were comprised of: | | | | |
Common stock, at par | | $ | 9,142 | |
Paid-in capital in excess of par | | | 103,838,706 | |
| | | | |
| | | 103,847,848 | |
Distributions in excess of net investment income | | | (815,463 | ) |
Accumulated net realized gain on investment transactions | | | 3,711,746 | |
Net unrealized appreciation on investments | | | 1,269,022 | |
| | | | |
Net assets, March 31, 2008 | | $ | 108,013,153 | |
| | | | |
See Notes to Financial Statements.
| | |
| 26 | | Visit our website at www.jennisondryden.com |
| | | |
Class A | | | |
Net asset value and redemption price per share | | | |
($49,654,985 ÷ 4,194,020 shares of common stock issued and outstanding) | | $ | 11.84 |
Maximum sales charge (5.50% of offering price) | | | .69 |
| | | |
Maximum offering price to public | | $ | 12.53 |
| | | |
| |
Class B | | | |
Net asset value, offering price and redemption price per share | | | |
($39,467,121 ÷ 3,346,689 shares of common stock issued and outstanding) | | $ | 11.79 |
| | | |
| |
Class C | | | |
Net asset value, offering price and redemption price per share | | | |
($15,956,841 ÷ 1,353,309 shares of common stock issued and outstanding) | | $ | 11.79 |
| | | |
| |
Class R | | | |
Net asset value, offering price and redemption price per share | | | |
($2,377 ÷ 200.8 shares of common stock issued and outstanding) | | $ | 11.84 |
| | | |
| |
Class Z | | | |
Net asset value, offering price and redemption price per share | | | |
($2,931,829 ÷ 247,479 shares of common stock issued and outstanding) | | $ | 11.85 |
| | | |
See Notes to Financial Statements.
| | |
| JennisonDryden Asset Allocation Funds | | 27 |
JennisonDryden Growth Allocation Fund
Statement of Assets and Liabilities
as of March 31, 2008 (Unaudited)
| | | | |
Assets | | | | |
Affiliated investments, at value (cost $67,648,488) | | $ | 67,457,013 | |
Receivable for Fund shares sold | | | 235,354 | |
Dividends receivable | | | 5,834 | |
Prepaid expenses | | | 502 | |
| | | | |
Total assets | | | 67,698,703 | |
| | | | |
| |
Liabilities | | | | |
Payable for investments purchased | | | 150,000 | |
Payable for Fund shares reacquired | | | 115,219 | |
Accrued expenses | | | 72,890 | |
Distribution fee payable | | | 38,280 | |
Affiliated transfer agent payable | | | 20,362 | |
Management fee payable | | | 11,206 | |
Deferred directors’ fees | | | 703 | |
| | | | |
Total liabilities | | | 408,660 | |
| | | | |
| |
Net Assets | | $ | 67,290,043 | |
| | | | |
| | | | | |
Net assets were comprised of: | | | | |
Common stock, at par | | $ | 5,285 | |
Paid-in capital in excess of par | | | 65,542,993 | |
| | | | |
| | | 65,548,278 | |
Distributions in excess of net investment income | | | (788,772 | ) |
Accumulated net realized gain on investment transactions | | | 2,722,012 | |
Net unrealized depreciation on investments | | | (191,475 | ) |
| | | | |
Net assets, March 31, 2008 | | $ | 67,290,043 | |
| | | | |
See Notes to Financial Statements.
| | |
| 28 | | Visit our website at www.jennisondryden.com |
| | | |
Class A | | | |
Net asset value and redemption price per share | | | |
($28,091,827 ÷ 2,196,555 shares of common stock issued and outstanding) | | $ | 12.79 |
Maximum sales charge (5.50% of offering price) | | | .74 |
| | | |
Maximum offering price to public | | $ | 13.53 |
| | | |
| |
Class B | | | |
Net asset value, offering price and redemption price per share | | | |
($30,075,313 ÷ 2,369,899 shares of common stock issued and outstanding) | | $ | 12.69 |
| | | |
| |
Class C | | | |
Net asset value, offering price and redemption price per share | | | |
($8,786,457 ÷ 691,870 shares of common stock issued and outstanding) | | $ | 12.70 |
| | | |
| |
Class R | | | |
Net asset value, offering price and redemption price per share | | | |
($2,325 ÷ 181.7 shares of common stock issued and outstanding) | | $ | 12.80 |
| | | |
| |
Class Z | | | |
Net asset value, offering price and redemption price per share | | | |
($334,121 ÷ 26,084 shares of common stock issued and outstanding) | | $ | 12.81 |
| | | |
See Notes to Financial Statements.
| | |
| JennisonDryden Asset Allocation Funds | | 29 |
JennisonDryden Conservative Allocation Fund
Statement of Operations
Six Months Ended March 31, 2008 (Unaudited)
| | | | |
Net Investment Income | | | | |
Income | | | | |
Affiliated dividend income | | $ | 815,915 | |
| | | | |
| |
Expenses | | | | |
Management fee | | | 44,375 | |
Distribution fee—Class A | | | 29,757 | |
Distribution fee—Class B | | | 67,917 | |
Distribution fee—Class C | | | 32,611 | |
Distribution fee—Class R | | | 10 | |
Registration fees | | | 65,000 | |
Custodian’s fees and expenses | | | 27,000 | |
Transfer agent’s fees and expenses (including affiliated expense of $10,200) (Note 3) | | | 18,000 | |
Audit fee | | | 10,000 | |
Reports to shareholders | | | 9,000 | |
Directors’ fees | | | 6,000 | |
Legal fees and expenses | | | 5,000 | |
Miscellaneous | | | 4,532 | |
| | | | |
Total expenses | | | 319,202 | |
Less: Expense subsidy (Note 2) | | | (76,734 | ) |
| | | | |
Net expenses | | | 242,468 | |
| | | | |
Net investment income | | | 573,447 | |
| | | | |
| |
Net Realized And Unrealized Gain (Loss) On Investments | | | | |
Net realized loss on investment transactions | | | (14,168 | ) |
Net capital gain distributions received | | | 1,036,598 | |
| | | | |
| | | 1,022,430 | |
Net change in unrealized depreciation on investments | | | (3,127,271 | ) |
| | | | |
Net loss on investments | | | (2,104,841 | ) |
| | | | |
Net Decrease In Net Assets Resulting From Operations | | $ | (1,531,394 | ) |
| | | | |
See Notes to Financial Statements.
| | |
| 30 | | Visit our website at www.jennisondryden.com |
JennisonDryden Moderate Allocation Fund
Statement of Operations
Six Months Ended March 31, 2008 (Unaudited)
| | | | |
Net Investment Income | | | | |
Income | | | | |
Affiliated dividend income | | $ | 1,591,407 | |
| | | | |
| |
Expenses | | | | |
Management fee | | | 106,602 | |
Distribution fee—Class A | | | 61,210 | |
Distribution fee—Class B | | | 200,815 | |
Distribution fee—Class C | | | 75,451 | |
Distribution fee—Class R | | | 6 | |
Registration fees | | | 67,000 | |
Transfer agent’s fees and expenses (including affiliated expense of $29,600) (Note 3) | | | 54,000 | |
Custodian’s fees and expenses | | | 27,000 | |
Audit fee | | | 10,000 | |
Reports to shareholders | | | 8,000 | |
Directors’ fees | | | 6,000 | |
Legal fees and expenses | | | 6,000 | |
Interest expense | | | 1,834 | |
Miscellaneous | | | 2,775 | |
| | | | |
Total expenses | | | 626,693 | |
Less: Expense subsidy (Note 2) | | | (18,333 | ) |
| | | | |
Net expenses | | | 608,360 | |
| | | | |
Net investment income | | | 983,047 | |
| | | | |
| |
Net Realized And Unrealized Gain (Loss) On Investments | | | | |
Net realized gain on investment transactions | | | 407,565 | |
Net capital gain distributions received | | | 3,664,653 | |
| | | | |
| | | 4,072,218 | |
Net change in unrealized appreciation on investments | | | (13,493,283 | ) |
| | | | |
Net loss on investments | | | (9,421,065 | ) |
| | | | |
Net Decrease In Net Assets Resulting From Operations | | $ | (8,438,018 | ) |
| | | | |
See Notes to Financial Statements.
| | |
| JennisonDryden Asset Allocation Funds | | 31 |
JennisonDryden Growth Allocation Fund
Statement of Operations
Six Months Ended March 31, 2008 (Unaudited)
| | | | |
Net Investment Income | | | | |
Income | | | | |
Affiliated dividend income | | $ | 785,550 | |
| | | | |
| |
Expenses | | | | |
Management fee | | | 66,714 | |
Distribution fee—Class A | | | 34,313 | |
Distribution fee—Class B | | | 149,629 | |
Distribution fee—Class C | | | 44,665 | |
Distribution fee—Class R | | | 6 | |
Registration fees | | | 67,000 | |
Transfer agent’s fees and expenses (including affiliated expense of $26,600) (Note 3) | | | 55,000 | |
Custodian’s fees and expenses | | | 27,000 | |
Reports to shareholders | | | 13,000 | |
Audit fee | | | 10,000 | |
Legal fees and expenses | | | 9,000 | |
Directors’ fees | | | 5,000 | |
Interest expense | | | 278 | |
Miscellaneous | | | 7,082 | |
| | | | |
Total expenses | | | 488,687 | |
Less: Expense subsidy (Note 2) | | | (89,544 | ) |
| | | | |
Net expenses | | | 399,143 | |
| | | | |
Net investment income | | | 386,407 | |
| | | | |
| |
Net Realized And Unrealized Gain (Loss) On Investments | | | | |
Net realized gain on investment transactions | | | 2,066 | |
Net capital gain distributions received | | | 2,907,167 | |
| | | | |
| | | 2,909,233 | |
Net change in unrealized appreciation (depreciation) on investments | | | (11,747,321 | ) |
| | | | |
Net loss on investments | | | (8,838,088 | ) |
| | | | |
Net Decrease In Net Assets Resulting From Operations | | $ | (8,451,681 | ) |
| | | | |
See Notes to Financial Statements.
| | |
| 32 | | Visit our website at www.jennisondryden.com |
JennisonDryden Conservative Allocation Fund
Statement of Changes in Net Assets
(Unaudited)
| | | | | | | | |
| | | Six Months
Ended
March 31, 2008 | | | Year Ended
September 30, 2007 | |
Increase (Decrease) In Net Assets | | | | | | | | |
Operations | | | | | | | | |
Net investment income | | $ | 573,447 | | | $ | 646,431 | |
Net realized gain (loss) on investment transactions | | | (14,168 | ) | | | 173,092 | |
Net capital gain distributions received | | | 1,036,598 | | | | 470,931 | |
Net change in unrealized appreciation/depreciation on investments | | | (3,127,271 | ) | | | 1,520,408 | |
| | | | | | | | |
Net increase (decrease) in net assets resulting from operations | | | (1,531,394 | ) | | | 2,810,862 | |
| | | | | | | | |
Dividends and distributions (Note 1) | | | | | | | | |
Dividends from net investment income | | | | | | | | |
Class A | | | (500,280 | ) | | | (345,352 | ) |
Class B | | | (240,227 | ) | | | (173,472 | ) |
Class C | | | (118,343 | ) | | | (58,005 | ) |
Class R | | | (51 | ) | | | (18 | ) |
Class Z | | | (8,872 | ) | | | (4,174 | ) |
| | | | | | | | |
| | | (867,773 | ) | | | (581,021 | ) |
| | | | | | | | |
Distributions from net realized gains | | | | | | | | |
Class A | | | (322,637 | ) | | | (139,400 | ) |
Class B | | | (181,593 | ) | | | (109,514 | ) |
Class C | | | (91,272 | ) | | | (35,116 | ) |
Class R | | | (35 | ) | | | — | |
Class Z | | | (5,535 | ) | | | (1,296 | ) |
| | | | | | | | |
| | | (601,072 | ) | | | (285,326 | ) |
| | | | | | | | |
| | |
Fund share transactions (Net of share conversions) (Note 6) | | | | | | | | |
Net proceeds from shares sold | | | 16,744,023 | | | | 20,678,690 | |
Net asset value of shares issued in reinvestment of dividends and distributions | | | 1,402,614 | | | | 829,721 | |
Cost of shares reacquired | | | (5,355,387 | ) | | | (7,937,579 | ) |
| | | | | | | | |
Net increase in net assets from Fund share transactions | | | 12,791,250 | | | | 13,570,832 | |
| | | | | | | | |
Total increase | | | 9,791,011 | | | | 15,515,347 | |
| | |
Net Assets | | | | | | | | |
Beginning of period | | | 39,828,392 | | | | 24,313,045 | |
| | | | | | | | |
End of period(a) | | $ | 49,619,403 | | | $ | 39,828,392 | |
| | | | | | | | |
(a) Includes undistributed net investment income of: | | $ | — | | | $ | 257,914 | |
| | | | | | | | |
See Notes to Financial Statements.
| | |
| JennisonDryden Asset Allocation Funds | | 33 |
JennisonDryden Moderate Allocation Fund
Statement of Changes in Net Assets
(Unaudited)
| | | | | | | | |
| | | Six Months
Ended
March 31, 2008 | | | Year Ended
September 30, 2007 | |
Increase (Decrease) In Net Assets | | | | | | | | |
Operations | | | | | | | | |
Net investment income | | $ | 983,047 | | | $ | 844,203 | |
Net realized gain on investment transactions | | | 407,565 | | | | 766,502 | |
Net capital gain distributions received | | | 3,664,653 | | | | 2,114,580 | |
Net change in unrealized appreciation/depreciation on investments | | | (13,493,283 | ) | | | 6,746,587 | |
| | | | | | | | |
Net increase (decrease) in net assets resulting from operations | | | (8,438,018 | ) | | | 10,471,872 | |
| | | | | | | | |
Dividends and distributions (Note 1) | | | | | | | | |
Dividends from net investment income: | | | | | | | | |
Class A | | | (1,176,934 | ) | | | (551,496 | ) |
Class B | | | (717,674 | ) | | | (347,417 | ) |
Class C | | | (270,750 | ) | | | (103,347 | ) |
Class R | | | (56 | ) | | | — | |
Class Z | | | (55,881 | ) | | | (31,907 | ) |
| | | | | | | | |
| | | (2,221,295 | ) | | | (1,034,167 | ) |
| | | | | | | | |
| | |
Distributions from net realized gains: | | | | | | | | |
Class A | | | (1,267,671 | ) | | | (408,369 | ) |
Class B | | | (1,037,365 | ) | | | (412,392 | ) |
Class C | | | (391,357 | ) | | | (122,676 | ) |
Class R | | | (67 | ) | | | — | |
Class Z | | | (54,669 | ) | | | (21,572 | ) |
| | | | | | | | |
| | | (2,751,129 | ) | | | (965,009 | ) |
| | | | | | | | |
| |
Fund share transactions (Net of share conversions) (Note 6) | | | | | |
Net proceeds from shares sold | | | 23,778,320 | | | | 35,032,861 | |
Net asset value of shares issued in reinvestment of dividends and distributions | | | 4,747,638 | | | | 1,906,406 | |
Cost of shares reacquired | | | (10,188,693 | ) | | | (13,754,910 | ) |
| | | | | | | | |
Net increase in net assets from Fund share transactions | | | 18,337,265 | | | | 23,184,357 | |
| | | | | | | | |
Total increase | | | 4,926,823 | | | | 31,657,053 | |
| | |
Net Assets | | | | | | | | |
Beginning of period | | | 103,086,330 | | | | 71,429,277 | |
| | | | | | | | |
End of period(a) | | $ | 108,013,153 | | | $ | 103,086,330 | |
| | | | | | | | |
(a) Includes undistributed net investment income of: | | $ | — | | | $ | 422,785 | |
| | | | | | | | |
See Notes to Financial Statements.
| | |
| 34 | | Visit our website at www.jennisondryden.com |
JennisonDryden Growth Allocation Fund
Statement of Changes in Net Assets
(Unaudited)
| | | | | | | | |
| | | Six Months
Ended
March 31, 2008 | | | Year
Ended
September 30, 2007 | |
Increase (Decrease) In Net Assets | | | | | | | | |
Operations | | | | | | | | |
Net investment gain (loss) | | $ | 386,407 | | | $ | (103,187 | ) |
Net realized gain on investment transactions | | | 2,066 | | | | 254,327 | |
Net capital gain distributions received | | | 2,907,167 | | | | 1,445,461 | |
Net change in unrealized appreciation (depreciation) on investments | | | (11,747,321 | ) | | | 5,861,599 | |
| | | | | | | | |
Net increase (decrease) in net assets resulting from operations | | | (8,451,681 | ) | | | 7,458,200 | |
| | | | | | | | |
Dividends and distributions (Note 1) | | | | | | | | |
Dividends from net investment income: | | | | | | | | |
Class A | | | (582,981 | ) | | | (178,008 | ) |
Class B | | | (446,835 | ) | | | (113,620 | ) |
Class C | | | (134,941 | ) | | | (33,765 | ) |
Class R | | | (44 | ) | | | — | |
Class Z | | | (9,676 | ) | | | (7,002 | ) |
| | | | | | | | |
| | | (1,174,477 | ) | | | (332,395 | ) |
| | | | | | | | |
Distributions from net realized gains: | | | | | | | | |
Class A | | | (564,519 | ) | | | (149,715 | ) |
Class B | | | (622,569 | ) | | | (197,667 | ) |
Class C | | | (188,012 | ) | | | (58,742 | ) |
Class R | | | (53 | ) | | | — | |
Class Z | | | (8,492 | ) | | | (4,913 | ) |
| | | | | | | | |
| | | (1,383,645 | ) | | | (411,037 | ) |
| | | | | | | | |
Fund share transactions (Net of share conversions) (Note 6) | | | | | | | | |
Net proceeds from shares sold | | | 17,160,190 | | | | 25,333,608 | |
Net asset value of shares issued in reinvestment of dividends and distributions | | | 2,478,944 | | | | 727,446 | |
Cost of shares reacquired | | | (5,791,178 | ) | | | (7,023,279 | ) |
| | | | | | | | |
Net increase in net assets from Fund share transactions | | | 13,847,956 | | | | 19,037,775 | |
| | | | | | | | |
Total increase | | | 2,838,153 | | | | 25,752,543 | |
| | |
Net Assets | | | | | | | | |
Beginning of period | | | 64,451,890 | | | | 38,699,347 | |
| | | | | | | | |
End of period | | $ | 67,290,043 | | | $ | 64,451,890 | |
| | | | | | | | |
See Notes to Financial Statements.
| | |
| JennisonDryden Asset Allocation Funds | | 35 |
Notes to Financial Statements
(Unaudited)
The Prudential Investment Portfolios, Inc. (the “Company”) is registered under the Investment Company Act of 1940 as an open-end management investment company. The Company was incorporated in Maryland on August 10, 1995 and consists of six series (“Fund” or “Funds”): Jennison Equity Opportunity Fund, Jennison Growth Fund, and Dryden Active Allocation Fund which are diversified funds and JennisonDryden Conservative Allocation Fund (“Conservative Allocation Fund”), JennisonDryden Moderate Allocation Fund (“Moderate Allocation Fund”) and JennisonDryden Growth Allocation Fund (“Growth Allocation Fund”) which are non-diversified. These financial statements relate to the Conservative Allocation Fund, Moderate Allocation Fund and Growth Allocation Fund (collectively referred to as “Asset Allocation Funds”). The inception date of the Asset Allocation Funds was March 30, 2004.
The Conservative Allocation Fund’s investment objective is current income and a reasonable level of capital appreciation. The Moderate Allocation Fund’s investment objective is capital appreciation and a reasonable level of current income. The Growth Allocation Fund’s investment objective is long-term capital appreciation. Each Asset Allocation Fund seeks to achieve its objective by investing in a combination of mutual funds in the JennisonDryden mutual fund family (each, an underlying fund). Each Fund in the Asset Allocation Funds is typically referred to as a “Fund of Funds” because it invests in other mutual funds. The Asset Allocation Funds may also invest directly in U.S. Government securities and money market instruments for cash management purposes or when assuming a defensive position.
Note 1. Accounting Policies
The following is a summary of significant accounting policies followed by the Company and the Asset Allocation Funds in the preparation of their financial statements.
Securities Valuation: Investments in the underlying funds are valued at the closing net asset value per share of each underlying fund as reported on each business day. Short-term debt investments maturing within sixty days or less are valued at amortized cost which approximates market value. The amortized cost method involves valuing a security at its cost on the date of purchase and thereafter assuming a constant amortization to maturity of the difference between the principal amount due at maturity and cost. Short-term debt securities which mature in more than sixty days are valued at current market value.
| | |
| 36 | | Visit our website at www.jennisondryden.com |
Securities Transactions and Net Investment Income: Securities transactions are recorded on the trade date. Realized gains or losses on sales of investments are calculated on the identified cost basis. Dividend income is recorded on the ex-dividend date. Expenses are recorded on an accrual basis and such expenses exclude those of the underlying funds. Expenses on the underlying funds are reflected in the net asset values of those funds.
Net Investment income or loss (other than distribution fees which are charged directly to the respective class) and unrealized and realized gains or losses are allocated daily to each class of shares based upon the relative proportion of net assets of each class at the beginning of the day.
Dividends and Distributions: Dividends will typically be distributed quarterly by the Conservative Allocation Fund, semi-annually by the Moderate Allocation Fund and annually by the Growth Allocation Fund. Each Asset Allocation Fund declares and pays its net realized capital gains, if any, at least annually. Dividends and distributions to shareholders, which are determined in accordance with federal income tax regulations and which may differ from generally accepted accounting principles, are recorded on the ex-dividend date. Permanent book/tax differences relating to income and gains are reclassified amongst undistributed net investment income, accumulated net realized gain or loss and paid-in capital in excess of par, as appropriate.
Taxes: For federal income tax purposes, each Fund in the Company is treated as a separate taxpaying entity. It is each of the Asset Allocation Funds’ policy to continue to meet the requirements of the Internal Revenue Code applicable to regulated investment companies and to distribute all of its net investment income and capital gains, if any, to its shareholders. Therefore, no federal income tax provision is required.
Estimates: The preparation of the financial statements requires management to make estimates and assumptions that affect the reported amounts and disclosures in the financial statements. Actual results could differ from those estimates.
Note 2. Agreements
The Company has a management agreement for the Asset Allocation Funds with Prudential Investments LLC (“PI”). Pursuant to this agreement, PI has responsibility for all investment advisory services and supervises the subadvisor’s performance of such services. PI has entered into a subadvisory agreement with Quantitative Management Associates LLC (“QMA”). The subadvisory agreement provides that QMA furnishes
| | |
| JennisonDryden Asset Allocation Funds | | 37 |
Notes to Financial Statements
(Unaudited) continued
investment advisory services in connection with the management of the Asset Allocation Funds. In connection therewith, QMA is obligated to keep certain books and records of the Asset Allocation Funds. PI pays for the services of QMA, the compensation of officers of the Asset Allocation Funds, occupancy and certain clerical and bookkeeping costs of the Asset Allocation Funds. The Asset Allocation Funds bear all other costs and expenses.
The management fee paid to PI is computed daily and payable monthly at an annual rate of .20 of 1% of each of the Asset Allocation Funds’ daily average net assets.
The Asset Allocation Funds have a distribution agreement with Prudential Investment Management Services LLC (“PIMS”), which acts as the distributor of the Class A, Class B, Class C, Class R and Class Z shares of the Asset Allocation Funds. The Asset Allocation Funds compensate PIMS for distributing and servicing the Asset Allocation Funds’ Class A, B, C and R shares, pursuant to plans of distribution (the “Class A, B, C and R Plans”), regardless of expenses actually incurred by PIMS. The distribution fees are accrued daily and payable monthly. No distribution or service fees are paid to PIMS as distributor of the Class Z shares of the Asset Allocation Funds.
Pursuant to the Class A, B, C and R Plans, the Asset Allocation Funds compensate PIMS for distribution-related activities at an annual rate of up to .30 of 1%, 1%, 1% and .75% of the average daily net assets of the Class A, B, C and R shares, respectively. PIMS contractually agreed to limit such fees to .25 of 1% of the average daily net assets of the Class A shares and .50 of 1% of the average daily net assets of the Class R shares.
PI has contractually agreed to limit the net annual operating expenses (exclusive of taxes, interest, brokerage commissions, non-routine expenses, distribution and service (12b-1) fees and underlying fund fees and expenses) of each class of shares of the Asset Allocation Funds to .50 of 1% of each Asset Allocation Funds’ average daily net assets.
| | |
| 38 | | Visit our website at www.jennisondryden.com |
PIMS has advised the Asset Allocation Funds of its receipt of front-end sales charges resulting from sales of Class A shares during the six months ended March 31, 2008. These amounts were approximately as follows:
| | | |
| Fund | | Class A |
Conservative Allocation Fund | | $ | 129,300 |
Moderate Allocation Fund | | | 217,300 |
Growth Allocation Fund | | | 226,900 |
From these fees, PIMS paid such sales charges to dealers, which in turn paid commissions to salespersons and incurred other distribution costs.
PIMS has advised the Asset Allocation Funds of its receipt of contingent deferred sales charges imposed upon certain redemptions by certain Class B and Class C shareholders for the six months ended March 31, 2008. These amounts were approximately as follows:
| | | | | | | | |
| Fund | | | | Class B | | Class C |
Conservative Allocation Fund | | | | $ | 18,300 | | $ | 900 |
Moderate Allocation Fund | | | | | 62,600 | | | 2,200 |
Growth Allocation Fund | | | | | 56,300 | | | 1,700 |
PI, QMA and PIMS are indirect, wholly-owned subsidiaries of Prudential Financial, Inc. (“Prudential”).
The Asset Allocation Funds, along with other affiliated registered investment companies (the “Funds”), are a party to a Syndicated Credit Agreement (“SCA”) with two banks. The SCA provides for a commitment of $500 million. Interest on any borrowings under the SCA is incurred at contracted market rates and a commitment fee for the unused amount is accrued daily and paid quarterly. Effective October 26, 2007, the Funds renewed the SCA with the banks. The Funds pay a commitment fee of ..06 of 1% of the unused portion of the renewed SCA. The expiration date of the renewed SCA will be October 24, 2008. For the period from October 27, 2006 through October 26, 2007, the Funds paid a commitment fee of .07 of 1% of the unused portion of the agreement. The purpose of the SCA is to provide an alternative source of temporary funding for capital share redemptions. The Asset Allocation Funds did not borrow any amounts pursuant to the SCA during the six months ended March 31, 2008.
Note 3. Other Transactions With Affiliates
Prudential Mutual Fund Services LLC (“PMFS”), an affiliate of PI and an indirect, wholly-owned subsidiary of Prudential, serves as the Company’s transfer agent.
| | |
| JennisonDryden Asset Allocation Funds | | 39 |
Notes to Financial Statements
(Unaudited) continued
Transfer agent fees and expenses in the Statement of Operations include certain out of pocket expenses paid to non-affiliates, where applicable.
The Asset Allocation Funds pay networking fees to affiliated and unaffiliated broker/dealers including fees relating to the services of Wachovia Securities, LLC (“Wachovia”) and First Clearing, LLC (“First Clearing”), affiliates of PI. These networking fees are payments made to broker/dealers that clear mutual fund transactions through a national clearing system. For the six months ended March 31, 2008, the Conservative Allocation Fund, Moderate Allocation Fund and Growth Allocation Fund incurred approximately $4,800, $14,000 and $13,000, respectively, in total networking fees, of which approximately $3,800, $11,500 and $11,000, respectively, was paid to First Clearing. These amounts are included in transfer agent’s fees and expenses in the Statement of Operations.
The Asset Allocation Funds invest in the Taxable Money Market Series (the “Series”), a portfolio of the Dryden Core Investment Fund, pursuant to an exemptive order received from the Securities and Exchange Commission. The Series is a money market mutual fund registered under the Investment Company Act of 1940, as amended, and managed by PI.
Note 4. Portfolio Securities
Purchases and sales of investment securities other than short-term investments, for the six months ended March 31, 2008 were as follows:
| | | | | | |
| Fund | | Purchases | | Sales |
Conservative Allocation Fund | | $ | 17,766,942 | | $ | 4,981,961 |
Moderate Allocation Fund | | | 32,816,574 | | | 14,836,759 |
Growth Allocation Fund | | | 24,080,670 | | | 9,334,193 |
| | |
| 40 | | Visit our website at www.jennisondryden.com |
Note 5. Tax Information
The United States federal income tax basis and net unrealized appreciation (depreciation) of the Asset Allocation Funds’ investments as of March 31, 2008 were as follows:
| | | | | | | | | | | | | | |
| Fund | | Tax Basis | | Appreciation | | Depreciation | | | Net Unrealized
Appreciation
(Depreciation) | |
Conservative Allocation Fund | | $ | 49,917,515 | | $ | 1,292,293 | | $ | (1,610,083 | ) | | $ | (317,790 | ) |
Moderate Allocation Fund | | $ | 107,281,505 | | $ | 6,057,653 | | $ | (5,349,548 | ) | | $ | 708,105 | |
Growth Allocation Fund | | $ | 68,121,778 | | $ | 3,062,412 | | $ | (3,727,177 | ) | | $ | (664,765 | ) |
The difference between book basis and tax basis was primarily attributable to deferred losses on wash sales.
Management has analyzed the Company’s tax positions taken on federal income tax returns for all open tax years and has concluded that as of March 31, 2008, no provision for income tax would be required in the Company’s financial statements. The Company’s federal and state income and federal excise tax returns for tax years for which the applicable statutes of limitations have not expired are subject to examination by the Internal Revenue Service and state departments of revenue.
Note 6. Capital
The Company offers Class A, Class B, Class C, Class R and Class Z shares. There are 6.25 billion shares of $.001 par value of common stock of the Company authorized which are divided into six series and five classes, designated Class A, Class B, Class C, Class R and Class Z. Each class of par value shares represents an interest in the same assets of the Company and is identical in all respects except that (1) each class is subject to different sales charges and distribution and/or service fees (except for Class Z shares, which are not subject to any sales charges and distribution and/or services fees), which may affect performance, (2) each class has exclusive voting rights on any matter submitted to shareholders that relates solely to its arrangement and has separate voting rights on any matter submitted to shareholders in which the interests of one class differ from the interests of any other class, (3) each class has a different exchange privilege, (4) only Class B shares have a conversion feature and (5) Class R and Class Z shares are offered exclusively for sale to a limited group of investors. As of March 31, 2008, Prudential owned approximately 221, 201, and 182 shares of Class R shares of the Conservative Allocation Fund, Moderate Allocation Fund and Growth Allocation Fund, respectively.
| | |
| JennisonDryden Asset Allocation Funds | | 41 |
Notes to Financial Statements
(Unaudited) continued
Transactions in shares of common stock were as follows:
Conservative Allocation Portfolio:
| | | | | | | |
Class A | | Shares | | | Amount | |
Six months ended March 31, 2008: | | | | | | | |
Shares sold | | 877,946 | | | $ | 10,053,768 | |
Shares issued in reinvestment of dividends and distributions | | 68,538 | | | | 792,809 | |
Shares reacquired | | (280,238 | ) | | | (3,165,475 | ) |
| | | | | | | |
Net increase (decrease) in shares outstanding before conversion | | 666,246 | | | | 7,681,102 | |
Shares issued upon conversion from Class B | | 34,998 | | | | 400,014 | |
| | | | | | | |
Net increase (decrease) in shares outstanding | | 701,244 | | | $ | 8,081,116 | |
| | | | | | | |
Year ended September 30, 2007: | | | | | | | |
Shares sold | | 1,039,325 | | | $ | 11,999,955 | |
Shares issued in reinvestment of dividends | | 40,937 | | | | 466,802 | |
Shares reacquired | | (390,248 | ) | | | (4,507,921 | ) |
| | | | | | | |
Net increase (decrease) in shares outstanding before conversion | | 690,014 | | | | 7,958,836 | |
Shares issued upon conversion from Class B | | 40,407 | | | | 469,049 | |
| | | | | | | |
Net increase (decrease) in shares outstanding | | 730,421 | | | $ | 8,427,885 | |
| | | | | | | |
Class B | | | | | | |
Six months ended March 31, 2008: | | | | | | | |
Shares sold | | 338,762 | | | $ | 3,859,734 | |
Shares issued in reinvestment of dividends and distributions | | 34,999 | | | | 403,997 | |
Shares reacquired | | (112,809 | ) | | | (1,295,894 | ) |
| | | | | | | |
Net increase (decrease) in shares outstanding before conversion | | 260,952 | | | | 2,967,837 | |
Shares reacquired upon conversion into Class A | | (35,090 | ) | | | (400,014 | ) |
| | | | | | | |
Net increase (decrease) in shares outstanding | | 225,862 | | | $ | 2,567,823 | |
| | | | | | | |
Year ended September 30, 2007: | | | | | | | |
Shares sold | | 409,547 | | | $ | 4,719,261 | |
Shares issued in reinvestment of dividends and distributions | | 24,146 | | | | 274,017 | |
Shares reacquired | | (186,419 | ) | | | (2,145,354 | ) |
| | | | | | | |
Net increase (decrease) in shares outstanding before conversion | | 247,274 | | | | 2,847,924 | |
Shares reacquired upon conversion into Class A | | (40,512 | ) | | | (469,049 | ) |
| | | | | | | |
Net increase (decrease) in shares outstanding | | 206,762 | | | $ | 2,378,875 | |
| | | | | | | |
| | |
| 42 | | Visit our website at www.jennisondryden.com |
| | | | | | | |
Class C | | Shares | | | Amount | |
Six months ended March 31, 2008: | | | | | | | |
Shares sold | | 216,086 | | | $ | 2,499,844 | |
Shares issued in reinvestment of dividends and distributions | | 16,589 | | | | 191,402 | |
Shares reacquired | | (74,444 | ) | | | (858,266 | ) |
| | | | | | | |
Net increase (decrease) in shares outstanding | | 158,231 | | | $ | 1,832,980 | |
| | | | | | | |
Year ended September 30, 2007: | | | | | | | |
Shares sold | | 322,932 | | | $ | 3,732,532 | |
Shares issued in reinvestment of dividends and distributions | | 7,344 | | | | 83,436 | |
Shares reacquired | | (108,161 | ) | | | (1,248,118 | ) |
| | | | | | | |
Net increase (decrease) in shares outstanding | | 222,115 | | | $ | 2,567,850 | |
| | | | | | | |
Class R | | | | | | |
Six months ended March 31, 2008: | | | | | | | |
Shares sold | | — | | | $ | — | |
Shares issued in reinvestment of dividends and distributions | | — | | | | — | |
Shares reacquired | | — | | | | — | |
| | | | | | | |
Net increase (decrease) in shares outstanding | | — | | | $ | — | |
| | | | | | | |
January 12, 2007* through September 30, 2007 | | | | | | | |
Shares sold | | 221 | | | $ | 2,500 | |
Shares issued in reinvestment of dividends and distributions | | — | | | | — | |
Shares reacquired | | — | | | | — | |
| | | | | | | |
Net increase (decrease) in shares outstanding | | 221 | | | $ | 2,500 | |
| | | | | | | |
Class Z | | | | | | |
Six months ended March 31, 2008: | | | | | | | |
Shares sold | | 29,151 | | | $ | 330,677 | |
Shares issued in reinvestment of dividends and distributions | | 1,242 | | | | 14,406 | |
Shares reacquired | | (3,148 | ) | | | (35,752 | ) |
| | | | | | | |
Net increase (decrease) in shares outstanding | | 27,245 | | | $ | 309,331 | |
| | | | | | | |
Year ended September 30, 2007: | | | | | | | |
Shares sold | | 19,337 | | | $ | 224,442 | |
Shares issued in reinvestment of dividends and distributions | | 477 | | | | 5,466 | |
Shares reacquired | | (3,116 | ) | | | (36,186 | ) |
| | | | | | | |
Net increase (decrease) in shares outstanding | | 16,698 | | | $ | 193,722 | |
| | | | | | | |
| | |
| JennisonDryden Asset Allocation Funds | | 43 |
Notes to Financial Statements
(Unaudited) continued
Moderate Allocation Portfolio:
| | | | | | | |
Class A | | Shares | | | Amount | |
Six Months Ended March 31, 2008: | | | | | | | |
Shares sold | | 826,907 | | | $ | 10,452,807 | |
Shares issued in reinvestment of dividends and distributions | | 186,816 | | | | 2,361,352 | |
Shares reacquired | | (387,069 | ) | | | (4,781,631 | ) |
| | | | | | | |
Net increase (decrease) in shares outstanding before conversion | | 626,654 | | | | 8,032,528 | |
Shares issued upon conversion from Class B | | 71,185 | | | | 889,279 | |
| | | | | | | |
Net increase (decrease) in shares outstanding | | 697,839 | | | $ | 8,921,807 | |
| | | | | | | |
Year ended September 30, 2007: | | | | | | | |
Shares sold | | 1,446,990 | | | $ | 18,567,132 | |
Shares issued in reinvestment of dividends and distributions | | 74,867 | | | | 926,851 | |
Shares reacquired | | (597,733 | ) | | | (7,676,332 | ) |
| | | | | | | |
Net increase (decrease) in shares outstanding before conversion | | 924,124 | | | | 11,817,651 | |
Shares issued upon conversion from Class B | | 87,703 | | | | 1,121,442 | |
| | | | | | | |
Net increase (decrease) in shares outstanding | | 1,011,827 | | | $ | 12,939,093 | |
| | | | | | | |
Class B | | | | | | |
Six Months Ended March 31, 2008: | | | | | | | |
Shares sold | | 540,861 | | | $ | 6,742,916 | |
Shares issued in reinvestment of dividends and distributions | | 136,163 | | | | 1,717,014 | |
Shares reacquired | | (276,583 | ) | | | (3,421,900 | ) |
| | | | | | | |
Net increase (decrease) in shares outstanding before conversion | | 400,441 | | | | 5,038,030 | |
Shares reacquired upon conversion into Class A | | (71,596 | ) | | | (889,279 | ) |
| | | | | | | |
Net increase (decrease) in shares outstanding | | 328,845 | | | $ | 4,148,751 | |
| | | | | | | |
Year ended September 30, 2007: | | | | | | | |
Shares sold | | 816,217 | | | $ | 10,435,503 | |
Shares issued in reinvestment of dividends and distributions | | 59,825 | | | | 740,630 | |
Shares reacquired | | (333,100 | ) | | | (4,266,635 | ) |
| | | | | | | |
Net increase (decrease) in shares outstanding before conversion | | 542,942 | | | | 6,909,498 | |
Shares reacquired upon conversion into Class A | | (88,014 | ) | | | (1,121,442 | ) |
| | | | | | | |
Net increase (decrease) in shares outstanding | | 454,928 | | | $ | 5,788,056 | |
| | | | | | | |
| | |
| 44 | | Visit our website at www.jennisondryden.com |
| | | | | | | |
Class C | | Shares | | | Amount | |
Six Months Ended March 31, 2008: | | | | | | | |
Shares sold | | 412,875 | | | $ | 5,179,730 | |
Shares issued in reinvestment of dividends and distributions | | 44,343 | | | | 558,721 | |
Shares reacquired | | (129,578 | ) | | | (1,578,213 | ) |
| | | | | | | |
Net increase (decrease) in shares outstanding | | 327,640 | | | $ | 4,160,238 | |
| | | | | | | |
Year ended September 30, 2007: | | | | | | | |
Shares sold | | 429,711 | | | $ | 5,471,378 | |
Shares issued in reinvestment of dividends and distributions | | 14,992 | | | | 185,451 | |
Shares reacquired | | (121,367 | ) | | | (1,549,955 | ) |
| | | | | | | |
Net increase (decrease) in shares outstanding | | 323,336 | | | $ | 4,106,874 | |
| | | | | | | |
Class R | | | | | | |
Six Months Ended March 31, 2008: | | | | | | | |
Shares sold | | — | | | $ | — | |
Shares issued in reinvestment of dividends and distributions | | — | | | | — | |
Shares reacquired | | — | | | | — | |
| | | | | | | |
Net increase (decrease) in shares outstanding | | — | | | | — | |
| | | | | | | |
January 12, 2007* through September 30, 2007: | | | | | | | |
Shares sold | | 200.8 | | | $ | 2,500 | |
Shares issued in reinvestment of dividends and distributions | | — | | | | — | |
Shares reacquired | | — | | | | — | |
| | | | | | | |
Net increase (decrease) in shares outstanding | | 200.8 | | | $ | 2,500 | |
| | | | | | | |
Class Z | | | | | | |
Six Months Ended March 31, 2008: | | | | | | | |
Shares sold | | 114,074 | | | $ | 1,402,867 | |
Shares issued in reinvestment of dividends and distributions | | 8,746 | | | | 110,551 | |
Shares reacquired | | (31,930 | ) | | | (406,949 | ) |
| | | | | | | |
Net increase (decrease) in shares outstanding | | 90,890 | | | $ | 1,106,469 | |
| | | | | | | |
Year ended September 30, 2007: | | | | | | | |
Shares sold | | 43,162 | | | $ | 556,348 | |
Shares issued in reinvestment of dividends and distributions | | 4,319 | | | | 53,474 | |
Shares reacquired | | (20,471 | ) | | | (261,988 | ) |
| | | | | | | |
Net increase (decrease) in shares outstanding | | 27,010 | | | $ | 347,834 | |
| | | | | | | |
| | |
| JennisonDryden Asset Allocation Funds | | 45 |
Notes to Financial Statements
(Unaudited) continued
Growth Allocation Portfolio:
| | | | | | | |
Class A | | Shares | | | Amount | |
Six Months Ended March 31, 2008: | | | | | | | |
Shares sold | | 564,320 | | | $ | 7,910,480 | |
Shares issued in reinvestment of dividends and distributions | | 79,783 | | | | 1,124,947 | |
Shares reacquired | | (200,821 | ) | | | (2,731,361 | ) |
| | | | | | | |
Net increase (decrease) in shares outstanding before conversion | | 443,282 | | | | 6,304,066 | |
Shares issued upon conversion from Class B | | 27,585 | | | | 360,958 | |
| | | | | | | |
Net increase (decrease) in shares outstanding | | 470,867 | | | $ | 6,665,024 | |
| | | | | | | |
Year ended September 30, 2007: | | | | | | | |
Shares sold | | 822,728 | | | $ | 11,733,949 | |
Shares issued in reinvestment of dividends and distributions | | 23,862 | | | | 325,715 | |
Shares reacquired | | (199,787 | ) | | | (2,866,933 | ) |
| | | | | | | |
Net increase (decrease) in shares outstanding before conversion | | 646,803 | | | | 9,192,731 | |
Shares issued upon conversion from Class B | | 39,683 | | | | 565,480 | |
| | | | | | | |
Net increase (decrease) in shares outstanding | | 686,486 | | | $ | 9,758,211 | |
| | | | | | | |
Class B | | | | | | |
Six Months Ended March 31, 2008: | | | | | | | |
Shares sold | | 534,906 | | | $ | 7,367,195 | |
Shares issued in reinvestment of dividends and distributions | | 74,818 | | | | 1,048,941 | |
Shares reacquired | | (166,477 | ) | | | (2,260,632 | ) |
| | | | | | | |
Net increase (decrease) in shares outstanding before conversion | | 443,247 | | | | 6,155,504 | |
Shares issued upon conversion from Class B | | (27,815 | ) | | | (360,958 | ) |
| | | | | | | |
Net increase (decrease) in shares outstanding | | 415,432 | | | $ | 5,794,546 | |
| | | | | | | |
Year ended September 30, 2007: | | | | | | | |
Shares sold | | 721,374 | | | $ | 10,226,340 | |
Shares issued in reinvestment of dividends and distributions | | 22,502 | | | | 305,808 | |
Shares reacquired | | (210,511 | ) | | | (2,989,402 | ) |
| | | | | | | |
Net increase (decrease) in shares outstanding before conversion | | 533,365 | | | | 7,542,746 | |
Shares issued upon conversion from Class A | | (40,013 | ) | | | (565,480 | ) |
| | | | | | | |
Net increase (decrease) in shares outstanding | | 493,352 | | | $ | 6,977,266 | |
| | | | | | | |
| | |
| 46 | | Visit our website at www.jennisondryden.com |
| | | | | | | |
Class C | | | | | | |
Six Months Ended March 31, 2008: | | | | | | | |
Shares sold | | 131,539 | | | $ | 1,831,801 | |
Shares issued in reinvestment of dividends and distributions | | 20,511 | | | | 287,347 | |
Shares reacquired | | (52,740 | ) | | | (713,808 | ) |
| | | | | | | |
Net increase (decrease) in shares outstanding | | 99,310 | | | $ | 1,405,340 | |
| | | | | | | |
Year ended September 30, 2007: | | | | | | | |
Shares sold | | 236,631 | | | $ | 3,349,340 | |
Shares issued in reinvestment of dividends and distributions | | 6,183 | | | | 84,020 | |
Shares reacquired | | (65,092 | ) | | | (926,984 | ) |
| | | | | | | |
Net increase (decrease) in shares outstanding | | 177,722 | | | $ | 2,506,376 | |
| | | | | | | |
Class R | | | | | | |
Six Months Ended March 31, 2008: | | | | | | | |
Shares sold | | — | | | $ | — | |
Shares issued in reinvestment of dividends and distributions | | — | | | | — | |
Shares reacquired | | — | | | | — | |
| | | | | | | |
Net increase (decrease) in shares outstanding | | — | | | $ | — | |
| | | | | | | |
January 12, 2007* through September 30, 2007: | | | | | | | |
Shares sold | | 181.7 | | | $ | 2,500 | |
Shares issued in reinvestment of dividends and distributions | | — | | | | — | |
Shares reacquired | | — | | | | — | |
| | | | | | | |
Net increase (decrease) in shares outstanding | | 181.7 | | | $ | 2,500 | |
| | | | | | | |
Class Z | | | | | | |
Six Months Ended March 31, 2008: | | | | | | | |
Shares sold | | 3,697 | | | $ | 50,714 | |
Shares issued in reinvestment of dividends and distributions | | 1,255 | | | | 17,709 | |
Shares reacquired | | (6,664 | ) | | | (85,377 | ) |
| | | | | | | |
Net increase (decrease) in shares outstanding | | (1,712 | ) | | $ | (16,954 | ) |
| | | | | | | |
Year ended September 30, 2007: | | | | | | | |
Shares sold | | 1,544 | | | $ | 21,479 | |
Shares issued in reinvestment of dividends and distributions | | 871 | | | | 11,903 | |
Shares reacquired | | (17,121 | ) | | | (239,960 | ) |
| | | | | | | |
Net increase (decrease) in shares outstanding | | (14,706 | ) | | $ | (206,578 | ) |
| | | | | | | |
| | |
| JennisonDryden Asset Allocation Funds | | 47 |
Notes to Financial Statements
(Unaudited) continued
Note 7. New Accounting Pronouncements
On September 20, 2006, the FASB released Statement of Financial Accounting Standards No. 157 “Fair Value Measurements” (FAS 157). FAS 157 establishes an authoritative definition of fair value, sets out a framework for measuring fair value, and requires additional disclosures about fair-value measurements. The application of FAS 157 is required for fiscal years beginning after November 15, 2007 and interim periods within those fiscal years. At this time, management is evaluating the implications of FAS 157 and its impact, if any, in the financial statements has not yet been determined.
In addition, in March 2008, the FASB released Statement of Financial Accounting Standards No. 161, Disclosures about Derivative Instruments and Hedging Activities (FAS 161). FAS 161 requires qualitative disclosures about objectives and strategies for using derivatives, quantitative disclosures about fair value amounts of and gains and losses on derivative instruments, and disclosures about credit-risk-related contingent features in derivative agreements. The application of FAS 161 is required for fiscal years beginning after November 15, 2008 and interim periods within those fiscal years. At this time, management is evaluating the implications of FAS 161 and its impact on the financial statements has not yet been determined.
| | |
| 48 | | Visit our website at www.jennisondryden.com |
Financial Highlights
(Unaudited)
| | |
| MARCH 31, 2008 | | SEMIANNUAL REPORT |
JennisonDryden Asset Allocation Funds
JennisonDryden Conservative Allocation Fund
Financial Highlights
(Unaudited)
| | | | |
| | | | |
| | | Class A | |
| | | Six Months Ended
March 31, 2008(a) | |
Per Share Operating Performance: | | | | |
Net Asset Value, Beginning Of Period | | $ | 11.91 | |
| | | | |
Income (loss) from investment operations: | | | | |
Net investment income | | | .17 | |
Net realized and unrealized gain (loss) on investment transactions | | | (.52 | ) |
| | | | |
Total from investment operations | | | (.35 | ) |
| | | | |
Less Dividends and Distributions: | | | | |
Dividends from net investment income | | | (.26 | ) |
Distributions from net realized gains | | | (.16 | ) |
| | | | |
Total dividends and distributions | | | (.42 | ) |
| | | | |
Net asset value, end of period | | $ | 11.14 | |
| | | | |
Total Return(c): | | | (3.09 | )% |
Ratios/Supplemental Data: | | | | |
Net assets, end of period (000) | | $ | 27,151 | |
Average net assets (000) | | $ | 23,811 | |
Ratios to average net assets(d): | | | | |
Expenses, including distribution and service (12b-1) fees(e) | | | .75 | %(f) |
Expenses, excluding distribution and service (12b-1) fees | | | .50 | %(f) |
Net investment income | | | 2.93 | %(f) |
Portfolio turnover rate | | | 11 | %(g) |
| (a) | Calculated based upon average shares outstanding during the period. |
| (b) | Inception date of Class A shares. |
| (c) | Total return does not consider the effects of sales loads. Total return is calculated assuming a purchase of a share on the first day and a sale on the last day of each period reported, and includes reinvestment of dividends and distributions. Total return includes the effect of expense subsidies. Total returns may reflect adjustments to conform to generally accepted accounting principles. Total returns for periods less than a full year are not annualized. |
| (d) | Net of expense subsidy. If the investment manager had not subsidized expenses, the expense ratios including distribution and service (12b-1) fees would have been 1.10%, 1.33%, 1.08%, 1.20% and 6.16% for the six months ended March 31, 2008, the year ended September 30, 2007, September 30, 2006, September 30, 2005 and the period ended September 30, 2004, respectively. The net investment income/(loss) ratios would have been 2.58%, 1.82%, 1.95%, 1.49% and (5.25)% for the six months ended March 31, 2008, the year ended September 30, 2007, September 30, 2006, September 30, 2005 and the period ended September 30, 2004, respectively. Does not include expenses of the investment companies in which the Fund invests. |
| (e) | The distributor of the Fund has contractually agreed to limit its distribution and service (12b-1) fees to .25 of 1% of the average daily net assets of the Class A shares. |
See Notes to Financial Statements.
| | |
| 50 | | Visit our website at www.jennisondryden.com |
| | | | | | | | | | | | | | |
| Class A | |
| Year Ended September 30, | | | March 30, 2004(b)
Through
September 30, 2004 | |
| 2007(a) | | | 2006 | | | 2005(a) | | |
| | | | | | | | | | | | | | |
| $ | 11.21 | | | $ | 10.78 | | | $ | 10.01 | | | $ | 10.00 | |
| | | | | | | | | | | | | | | |
| | | | | | | | | | | | | | |
| | .28 | | | | .25 | | | | .20 | | | | .05 | |
| | .81 | | | | .46 | | | | .78 | | | | (.04 | ) |
| | | | | | | | | | | | | | | |
| | 1.09 | | | | .71 | | | | .98 | | | | .01 | |
| | | | | | | | | | | | | | | |
| | | | | | | | | | | | | | |
| | (.27 | ) | | | (.24 | ) | | | (.21 | ) | | | — | |
| | (.12 | ) | | | (.04 | ) | | | — | | | | — | |
| | | | | | | | | | | | | | | |
| | (.39 | ) | | | (.28 | ) | | | (.21 | ) | | | — | |
| | | | | | | | | | | | | | | |
| $ | 11.91 | | | $ | 11.21 | | | $ | 10.78 | | | $ | 10.01 | |
| | | | | | | | | | | | | | | |
| | 9.89 | % | | | 6.71 | % | | | 9.92 | % | | | .10 | % |
| | | | | | | | | | | | | | |
| $ | 20,683 | | | $ | 11,278 | | | $ | 5,929 | | | $ | 2,548 | |
| $ | 16,051 | | | $ | 8,611 | | | $ | 4,136 | | | $ | 1,535 | |
| | | | | | | | | | | | | | |
| | .76 | % | | | .77 | % | | | .75 | % | | | .75 | %(f) |
| | .51 | % | | | .52 | % | | | .50 | % | | | .50 | %(f) |
| | 2.39 | % | | | 2.26 | % | | | 1.89 | % | | | 1.69 | %(f) |
| | 22 | % | | | 18 | % | | | 11 | % | | | 3 | %(g) |
See Notes to Financial Statements.
| | |
| JennisonDryden Asset Allocation Funds | | 51 |
JennisonDryden Conservative Allocation Fund
Financial Highlights
(Unaudited) continued
| | | | |
| | | | |
| | | Class B | |
| | | Six Months Ended
March 31, 2008(a) | |
Per Share Operating Performance: | | | | |
Net Asset Value, Beginning Of Period | | $ | 11.88 | |
| | | | |
Income (loss) from investment operations: | | | | |
Net investment income | | | .12 | |
Net realized and unrealized gain (loss) on investment transactions | | | (.52 | ) |
| | | | |
Total from investment operations | | | (.40 | ) |
| | | | |
Less Dividends and Distributions: | | | | |
Dividends from net investment income | | | (.21 | ) |
Distributions from net realized gains | | | (.16 | ) |
| | | | |
Total dividends and distributions | | | (.37 | ) |
| | | | |
Net asset value, end of period | | $ | 11.11 | |
| | | | |
Total Return(c): | | | (3.45 | )% |
Ratios/Supplemental Data: | | | | |
Net assets, end of period (000) | | $ | 14,686 | |
Average net assets (000) | | $ | 13,585 | |
Ratios to average net assets(d): | | | | |
Expenses, including distribution and service (12b-1) fees | | | 1.50 | %(e) |
Expenses, excluding distribution and service (12b-1) fees | | | .50 | %(e) |
Net investment income | | | 2.17 | %(e) |
| (a) | Calculated based upon average shares outstanding during the period. |
| (b) | Inception date of Class B shares. |
| (c) | Total return does not consider the effects of sales loads. Total return is calculated assuming a purchase of a share on the first day and a sale on the last day of each period reported, and includes reinvestment of dividends and distributions. Total return includes the effect of expense subsidies. Total returns may reflect adjustments to conform to generally accepted accounting principles. Total returns for periods less than a full year are not annualized. |
| (d) | Net of expense subsidy. If the investment manager had not subsidized expenses, the expense ratios including distribution and service (12b-1) fees would have been 1.85%, 2.08%, 1.83%, 1.95% and 6.91% for the six months ended March 31, 2008, the year ended September 30, 2007, September 30, 2006, September 30, 2005 and the period ended September 30, 2004, respectively. The net investment income/(loss) ratios would have been 1.82%, 1.10%, 1.21%, .71% and (6.02)% for the six months ended March 31, 2008, the year ended September 30, 2007, September 30, 2006, September 30, 2005 and the period ended September 30, 2004, respectively. Does not include expenses of the investment companies in which the Fund invests. |
See Notes to Financial Statements.
| | |
| 52 | | Visit our website at www.jennisondryden.com |
| | | | | | | | | | | | | | |
| Class B | |
| Year Ended September 30, | | | March 30, 2004(b)
Through
September 30, 2004 | |
| 2007(a) | | | 2006 | | | 2005(a) | | |
| | | | | | | | | | | | | | |
| $ | 11.18 | | | $ | 10.75 | | | $ | 9.97 | | | $ | 10.00 | |
| | | | | | | | | | | | | | | |
| | | | | | | | | | | | | | |
| | .19 | | | | .16 | | | | .12 | | | | .03 | |
| | .81 | | | | .47 | | | | .78 | | | | (.06 | ) |
| | | | | | | | | | | | | | | |
| | 1.00 | | | | .63 | | | | .90 | | | | (.03 | ) |
| | | | | | | | | | | | | | | |
| | | | | | | | | | | | | | |
| | (.18 | ) | | | (.16 | ) | | | (.12 | ) | | | — | |
| | (.12 | ) | | | (.04 | ) | | | — | | | | — | |
| | | | | | | | | | | | | | | |
| | (.30 | ) | | | (.20 | ) | | | (.12 | ) | | | — | |
| | | | | | | | | | | | | | | |
| $ | 11.88 | | | $ | 11.18 | | | $ | 10.75 | | | $ | 9.97 | |
| | | | | | | | | | | | | | | |
| | 9.09 | % | | | 5.91 | % | | | 9.11 | % | | | (.30 | )% |
| | | | | | | | | | | | | | |
| $ | 13,027 | | | $ | 9,950 | | | $ | 8,241 | | | $ | 5,234 | |
| $ | 11,421 | | | $ | 9,007 | | | $ | 7,032 | | | $ | 3,253 | |
| | | | | | | | | | | | | | |
| | 1.51 | % | | | 1.52 | % | | | 1.50 | % | | | 1.50 | %(e) |
| | .51 | % | | | .52 | % | | | .50 | % | | | .50 | %(e) |
| | 1.67 | % | | | 1.52 | % | | | 1.18 | % | | | .93 | %(e) |
See Notes to Financial Statements.
| | |
| JennisonDryden Asset Allocation Funds | | 53 |
JennisonDryden Conservative Allocation Fund
Financial Highlights
(Unaudited) continued
| | | | |
| |
| | | Class C | |
| | | Six Months Ended
March 31, 2008(a) | |
Per Share Operating Performance: | | | | |
Net Asset Value, Beginning Of Period | | $ | 11.88 | |
| | | | |
Income (loss) from investment operations: | | | | |
Net investment income | | | .12 | |
Net realized and unrealized gain (loss) on investment transactions | | | (.52 | ) |
| | | | |
Total from investment operations | | | (.40 | ) |
| | | | |
Less Dividends and Distributions: | | | | |
Dividends from net investment income | | | (.21 | ) |
Distributions from net realized gains | | | (.16 | ) |
| | | | |
Total dividends and distributions | | | (.37 | ) |
| | | | |
Net asset value, end of period | | $ | 11.11 | |
| | | | |
Total Return(c): | | | (3.45 | )% |
Ratios/Supplemental Data: | | | | |
Net assets, end of period (000) | | $ | 7,160 | |
Average net assets (000) | | $ | 6,523 | |
Ratios to average net assets(d): | | | | |
Expenses, including distribution and service (12b-1) fees | | | 1.50 | %(e) |
Expenses, excluding distribution and service (12b-1) fees | | | .50 | %(e) |
Net investment income | | | 2.16 | %(e) |
| (a) | Calculated based upon average shares outstanding during the period. |
| (b) | Inception date of Class C shares. |
| (c) | Total return does not consider the effects of sales loads. Total return is calculated assuming a purchase of a share on the first day and a sale on the last day of each period reported, and includes reinvestment of dividends and distributions. Total return includes the effect of expense subsidies. Total returns may reflect adjustments to conform to generally accepted accounting principles. Total returns for periods less than a full year are not annualized. |
| (d) | Net of expense subsidy. If the investment manager had not subsidized expenses, the expense ratios including distribution and service (12b-1) fees would have been 1.85%, 2.08%, 1.83%, 1.95% and 6.91% for the six months ended March 31, 2008, the year ended September 30, 2007, September 30, 2006, September 30, 2005 and the period ended September 30, 2004, respectively. The net investment income/(loss) ratios would have been 1.81%, 1.08%, 1.21%, .69% and (6.02)% for the six months ended March 31, 2008, the year ended September 30, 2007, September 30, 2006, September 30, 2005 and the period ended September 30, 2004, respectively. Does not include expenses of the investment companies in which the Fund invests. |
See Notes to Financial Statements.
| | |
| 54 | | Visit our website at www.jennisondryden.com |
| | | | | | | | | | | | | | |
| Class C | |
| Year Ended September 30, | | | March 30, 2004(b)
Through
September 30, 2004 | |
| 2007(a) | | | 2006 | | | 2005(a) | | |
| | | | | | | | | | | | | | |
| $ | 11.18 | | | $ | 10.75 | | | $ | 9.97 | | | $ | 10.00 | |
| | | | | | | | | | | | | | | |
| | | | | | | | | | | | | | |
| | .19 | | | | .16 | | | | .12 | | | | .03 | |
| | .81 | | | | .47 | | | | .78 | | | | (.06 | ) |
| | | | | | | | | | | | | | | |
| | 1.00 | | | | .63 | | | | .90 | | | | (.03 | ) |
| | | | | | | | | | | | | | | |
| | | | | | | | | | | | | | |
| | (.18 | ) | | | (.16 | ) | | | (.12 | ) | | | — | |
| | (.12 | ) | | | (.04 | ) | | | — | | | | — | |
| | | | | | | | | | | | | | | |
| | (.30 | ) | | | (.20 | ) | | | (.12 | ) | | | — | |
| | | | | | | | | | | | | | | |
| $ | 11.88 | | | $ | 11.18 | | | $ | 10.75 | | | $ | 9.97 | |
| | | | | | | | | | | | | | | |
| | 9.09 | % | | | 5.91 | % | | | 9.11 | % | | | (.30 | )% |
| | | | | | | | | | | | | | |
| $ | 5,779 | | | $ | 2,955 | | | $ | 1,879 | | | $ | 1,281 | |
| $ | 4,039 | | | $ | 2,093 | | | $ | 1,737 | | | $ | 983 | |
| | | | | | | | | | | | | | |
| | 1.51 | % | | | 1.52 | % | | | 1.50 | % | | | 1.50 | %(e) |
| | .51 | % | | | .52 | % | | | .50 | % | | | .50 | %(e) |
| | 1.65 | % | | | 1.53 | % | | | 1.17 | % | | | .91 | %(e) |
See Notes to Financial Statements.
| | |
| JennisonDryden Asset Allocation Funds | | 55 |
JennisonDryden Conservative Allocation Fund
Financial Highlights
(Unaudited) continued
| | | | | | | | |
| | | Class R | |
| | | Six Months Ended
March 31, 2008(a) | | | January 12, 2007(b)
Through
September 30, 2007(a) | |
Per Share Operating Performance: | | | | | | | | |
Net Asset Value, Beginning Of Period | | $ | 11.91 | | | $ | 11.33 | |
| | | | | | | | |
Income (loss) from investment operations: | | | | | | | | |
Net investment income | | | .22 | | | | .16 | |
Net realized and unrealized gain (loss) on investment transactions | | | (.56 | ) | | | .50 | |
| | | | | | | | |
Total from investment operations | | | (.34 | ) | | | .66 | |
| | | | | | | | |
Less Dividends and Distributions: | | | | | | | | |
Dividends from net investment income | | | (.23 | ) | | | (.08 | ) |
Distributions from net realized gains | | | (.16 | ) | | | — | |
| | | | | | | | |
Total dividends and distributions | | | (.39 | ) | | | (.08 | ) |
| | | | | | | | |
Net asset value, end of period | | $ | 11.18 | | | $ | 11.91 | |
| | | | | | | | |
Total Return(c): | | | (2.95 | )% | | | 5.86 | % |
Ratios/Supplemental Data: | | | | | | | | |
Net assets, end of period (000) | | $ | 2 | | | $ | 3 | |
Average net assets (000) | | $ | 4 | | | $ | 3 | |
Ratios to average net assets(d): | | | | | | | | |
Expenses, including distribution and service (12b-1) fees(e) | | | 1.00 | %(f) | | | 1.01 | %(f) |
Expenses, excluding distribution and service (12b-1) fees | | | .50 | %(f) | | | .51 | %(f) |
Net investment income | | | 2.36 | %(f) | | | 1.90 | %(f) |
| (a) | Calculated based upon average shares outstanding during the period. |
| (b) | Inception date of Class R shares. |
| (c) | Total return is calculated assuming a purchase of a share on the first day and a sale on the last day of each period reported, and includes reinvestment of dividends and distributions. Total return includes the effect of expense subsidies. Total returns may reflect adjustments to conform to generally accepted accounting principles. Total returns for periods less than a full year are not annualized. |
| (d) | Net of expense subsidy. If the investment manager had not subsidized expenses, the expense ratios including distribution and service (12b-1) fees would have been 1.35% and 1.58% for the six months ended March 31, 2008 and the period ended September 30, 2007, respectively. The net investment income/(loss) ratios would have been 2.01% and 1.33% for the six months ended March 31, 2008 and the period ended September 30, 2007, respectively. Does not include expenses of the investment companies in which the Fund invests. |
| (e) | The distributor of the Fund has contractually agreed to limit its distribution and service (12b-1) fees to .50 of 1% of the average daily net assets of the Class R shares. |
See Notes to Financial Statements.
| | |
| 56 | | Visit our website at www.jennisondryden.com |
This Page Intentionally Left Blank
JennisonDryden Conservative Allocation Fund
Financial Highlights
(Unaudited) continued
| | | | |
| |
| | | Class Z | |
| | | Six Months Ended
March 31, 2008(a) | |
Per Share Operating Performance: | | | | |
Net Asset Value, Beginning Of Period | | $ | 11.95 | |
| | | | |
Income (loss) from investment operations: | | | | |
Net investment income | | | .17 | |
Net realized and unrealized gain (loss) on investment transactions | | | (.51 | ) |
| | | | |
Total from investment operations | | | (.34 | ) |
| | | | |
Less Dividends and Distributions: | | | | |
Dividends from net investment income | | | (.27 | ) |
Distributions from net realized gains | | | (.16 | ) |
| | | | |
Total dividends and distributions | | | (.43 | ) |
| | | | |
Net asset value, end of period | | $ | 11.18 | |
| | | | |
Total Return(c): | | | (2.97 | )% |
Ratios/Supplemental Data: | | | | |
Net assets, end of period (000) | | $ | 620 | |
Average net assets (000) | | $ | 460 | |
Ratios to average net assets(d): | | | | |
Expenses, including distribution and service (12b-1) fees | | | .50 | %(e) |
Expenses, excluding distribution and service (12b-1) fees | | | .50 | %(e) |
Net investment income | | | 3.05 | %(e) |
| (a) | Calculated based upon average shares outstanding during the period. |
| (b) | Inception date of Class Z shares. |
| (c) | Total return is calculated assuming a purchase of a share on the first day and a sale on the last day of each period reported, and includes reinvestment of dividends and distributions. Total return includes the effect of expense subsidies. Total returns may reflect adjustments to conform to generally accepted accounting principles. Total returns for periods less than a full year are not annualized. |
| (d) | Net of expense subsidy. If the investment manager had not subsidized expenses, the expense ratios including distribution and service (12b-1) fees would have been .85%, 1.08%, .83%, .95% and 5.91% for the six months ended March 31, 2008, the year ended September 30, 2007, September 30, 2006, September 30, 2005 and the period ended September 30, 2004, respectively. The net investment income/(loss) ratios would have been 2.70%, 2.02%, 2.29%, 1.63% and (5.00)% for the six months ended March 31, 2008, the year ended September 30, 2007, September 30, 2006, September 30, 2005 and the period ended September 30, 2004, respectively. Does not include expenses of the investment companies in which the Fund invests. |
See Notes to Financial Statements.
| | |
| 58 | | Visit our website at www.jennisondryden.com |
| | | | | | | | | | | | | | |
| Class Z | |
| Year Ended September 30, | | | March 30, 2004(b)
Through
September 30, 2004 | |
| 2007(a) | | | 2006 | | | 2005(a) | | |
| | | | | | | | | | | | | | |
| $ | 11.25 | | | $ | 10.80 | | | $ | 10.03 | | | $ | 10.00 | |
| | | | | | | | | | | | | | | |
| | | | | | | | | | | | | | |
| | .30 | | | | .27 | | | | .24 | | | | .09 | |
| | .82 | | | | .49 | | | | .77 | | | | (.06 | ) |
| | | | | | | | | | | | | | | |
| | 1.12 | | | | .76 | | | | 1.01 | | | | .03 | |
| | | | | | | | | | | | | | | |
| | | | | | | | | | | | | | |
| | (.30 | ) | | | (.27 | ) | | | (.24 | ) | | | — | |
| | (.12 | ) | | | (.04 | ) | | | — | | | | — | |
| | | | | | | | | | | | | | | |
| | (.42 | ) | | | (.31 | ) | | | (.24 | ) | | | — | |
| | | | | | | | | | | | | | | |
| $ | 11.95 | | | $ | 11.25 | | | $ | 10.80 | | | $ | 10.03 | |
| | | | | | | | | | | | | | | |
| | 10.14 | % | | | 7.05 | % | | | 10.18 | % | | | .30 | % |
| | | | | | | | | | | | | | |
| $ | 337 | | | $ | 129 | | | $ | 42 | | | $ | 342 | |
| $ | 196 | | | $ | 50 | | | $ | 311 | | | $ | 312 | |
| | | | | | | | | | | | | | |
| | .51 | % | | | .52 | % | | | .50 | % | | | .50 | %(e) |
| | .51 | % | | | .52 | % | | | .50 | % | | | .50 | %(e) |
| | 2.59 | % | | | 2.60 | % | | | 2.27 | % | | | 1.90 | %(e) |
See Notes to Financial Statements.
| | |
| JennisonDryden Asset Allocation Funds | | 59 |
JennisonDryden Moderate Allocation Fund
Financial Highlights
(Unaudited) continued
| | | | |
| |
| | | Class A | |
| | | Six Months Ended
March 31, 2008 | |
Per Share Operating Performance: | | | | |
Net Asset Value, Beginning Of Period | | $ | 13.44 | |
| | | | |
Income (loss) from investment operations: | | | | |
Net investment income | | | .15 | |
Net realized and unrealized gain (loss) on investment transactions | | | (1.11 | ) |
| | | | |
Total from investment operations | | | (.96 | ) |
| | | | |
Less Dividends and Distributions: | | | | |
Dividends from net investment income | | | (.31 | ) |
Distributions from net realized gains | | | (.33 | ) |
| | | | |
Total dividends and distributions | | | (.64 | ) |
| | | | |
Net asset value, end of period | | $ | 11.84 | |
| | | | |
Total Return(c): | | | (7.42 | )% |
Ratios/Supplemental Data: | | | | |
Net assets, end of period (000) | | $ | 49,655 | |
Average net assets (000) | | $ | 48,980 | |
Ratios to average net assets(d): | | | | |
Expenses, including distribution and service (12b-1) fees(e) | | | .76 | %(f) |
Expenses, excluding distribution and service (12b-1) fees | | | .51 | %(f) |
Net investment income | | | 2.23 | %(f) |
Portfolio turnover rate | | | 14 | %(g) |
| (a) | Inception date of Class A shares. |
| (b) | Calculated based upon average shares outstanding during the period. |
| (c) | Total return does not consider the effects of sales loads. Total return is calculated assuming a purchase of a share on the first day and a sale on the last day of each period reported, and includes reinvestment of dividends and distributions. Total return includes the effect of expense subsidies. Total investment returns may reflect adjustments to conform to generally accepted accounting principles. Total returns for periods less than a full year are not annualized. |
| (d) | Net of expense subsidy. If the investment manager had not subsidized expenses, the expense ratios including distribution and service (12b-1) fees would have been .79%, .87%, .79%, .88% and 2.61%, for the six months ended March 31, 2008, the year ended September 30, 2007, September 30, 2006, September 30, 2005 and the period ended September 30, 2004, respectively. The investment income/(loss) ratios would have been 2.20%, 1.25%, 1.06%, .95% and (1.07)%, for the six months ended March 31, 2008, the year ended September 30, 2007, September 30, 2006, September 30, 2005 and the period ended September 30, 2004, respectively. Does not include expenses of the underlying portfolios in which the portfolio invests. |
| (e) | The distributor of the Fund has contractually agreed to limit its distribution and service (12b-1) fees to .25 of 1% of the average daily net assets of the Class A shares. |
See Notes to Financial Statements.
| | |
| 60 | | Visit our website at www.jennisondryden.com |
| | | | | | | | | | | | | | |
| Class A | |
| Year Ended September 30, | | | March 30, 2004(a)(b)
Through
September 30, 2004 | |
| 2007 | | | 2006 | | | 2005 | | |
| | | | | | | | | | | | | | |
| $ | 12.18 | | | $ | 11.34 | | | $ | 10.03 | | | $ | 10.00 | |
| | | | | | | | | | | | | | | |
| | | | | | | | | | | | | | |
| | .18 | | | | .14 | | | | .13 | | | | .04 | |
| | 1.45 | | | | .85 | | | | 1.34 | | | | (.01 | ) |
| | | | | | | | | | | | | | | |
| | 1.63 | | | | .99 | | | | 1.47 | | | | .03 | |
| | | | | | | | | | | | | | | |
| | | | | | | | | | | | | | |
| | (.21 | ) | | | (.11 | ) | | | (.16 | ) | | | — | |
| | (.16 | ) | | | (.04 | ) | | | — | | | | — | |
| | | | | | | | | | | | | | | |
| | (.37 | ) | | | (.15 | ) | | | (.16 | ) | | | — | |
| | | | | | | | | | | | | | | |
| $ | 13.44 | | | $ | 12.18 | | | $ | 11.34 | | | $ | 10.03 | |
| | | | | | | | | | | | | | | |
| | 13.60 | % | | | 8.91 | % | | | 14.77 | % | | | .30 | % |
| | | | | | | | | | | | | | |
| $ | 46,978 | | | $ | 30,263 | | | $ | 19,532 | | | $ | 9,863 | |
| $ | 37,930 | | | $ | 24,284 | | | $ | 14,172 | | | $ | 5,632 | |
| | | | | | | | | | | | | | |
| | .76 | % | | | .76 | % | | | .75 | % | | | .75 | %(f) |
| | .51 | % | | | .51 | % | | | .50 | % | | | .50 | %(f) |
| | 1.36 | % | | | 1.09 | % | | | 1.08 | % | | | .74 | %(f) |
| | 21 | % | | | 10 | % | | | 5 | % | | | 6 | %(g) |
See Notes to Financial Statements.
| | |
| JennisonDryden Asset Allocation Funds | | 61 |
JennisonDryden Moderate Allocation Fund
Financial Highlights
(Unaudited) continued
| | | | |
| |
| | | Class B | |
| | | Six Months Ended
March 31, 2008 | |
Per Share Operating Performance: | | | | |
Net Asset Value, Beginning Of Period | | $ | 13.36 | |
| | | | |
Income (loss) from investment operations: | | | | |
Net investment income | | | .10 | |
Net realized and unrealized gain (loss) on investment transactions | | | (1.11 | ) |
| | | | |
Total from investment operations | | | (1.01 | ) |
| | | | |
Less Dividends and Distributions: | | | | |
Dividends from net investment income | | | (.23 | ) |
Distributions from net realized gains | | | (.33 | ) |
| | | | |
Total dividends and distributions | | | (.56 | ) |
| | | | |
Net asset value, end of period | | $ | 11.79 | |
| | | | |
Total Return(d): | | | (7.80 | )% |
Ratios/Supplemental Data: | | | | |
Net assets, end of period (000) | | $ | 39,467 | |
Average net assets (000) | | $ | 40,172 | |
Ratios to average net assets(e): | | | | |
Expenses, including distribution and service (12b-1) fees | | | 1.51 | %(f) |
Expenses, excluding distribution and service (12b-1) fees | | | .51 | %(f) |
Net investment income | | | 1.49 | %(f) |
| (a) | Inception date of Class B shares. |
| (b) | Calculated based upon average shares outstanding during the period. |
| (c) | Less than $.005 per share. |
| (d) | Total return does not consider the effects of sales loads. Total return is calculated assuming a purchase of a share on the first day and a sale on the last day of each period reported, and includes reinvestment of dividends and distributions. Total return includes the effect of expense subsidies. Total investment returns may reflect adjustments to conform to generally accepted accounting principles. Total returns for periods less than a full year are not annualized. |
| (e) | Net of expense subsidy. If the investment manager had not subsidized expenses, the expense ratios including distribution and service (12b-1) fees would have been 1.54%, 1.62%, 1.54%, 1.63% and 3.36%, for the six months ended March 31, 2008, the year ended September 30, 2007, September 30, 2006, September 30, 2005 and the period ended September 30, 2004, respectively. The investment income/(loss) ratios would have been 1.46%, .53%, .32%, .20% and (1.84)%, for the six months ended March 31, 2008, the year ended September 30, 2007, September 30, 2006, September 30, 2005 and the period ended September 30, 2004, respectively. Does not include expenses of the underlying portfolios in which the portfolio invests. |
See Notes to Financial Statements.
| | |
| 62 | | Visit our website at www.jennisondryden.com |
| | | | | | | | | | | | | | |
| Class B | |
| Year Ended September 30, | | | March 30, 2004(a)(b)
Through
September 30, 2004 | |
| 2007 | | | 2006 | | | 2005 | | |
| | | | | | | | | | | | | | |
| $ | 12.13 | | | $ | 11.34 | | | $ | 9.99 | | | $ | 10.00 | |
| | | | | | | | | | | | | | | |
| | | | | | | | | | | | | | |
| | .09 | | | | .05 | | | | .04 | | | | — | (c) |
| | 1.43 | | | | .85 | | | | 1.35 | | | | (.01 | ) |
| | | | | | | | | | | | | | | |
| | 1.52 | | | | .90 | | | | 1.39 | | | | (.01 | ) |
| | | | | | | | | | | | | | | |
| | | | | | | | | | | | | | |
| | (.13 | ) | | | (.07 | ) | | | (.04 | ) | | | — | |
| | (.16 | ) | | | (.04 | ) | | | — | | | | — | |
| | | | | | | | | | | | | | | |
| | (.29 | ) | | | (.11 | ) | | | (.04 | ) | | | — | |
| | | | | | | | | | | | | | | |
| $ | 13.36 | | | $ | 12.13 | | | $ | 11.34 | | | $ | 9.99 | |
| | | | | | | | | | | | | | | |
| | 12.69 | % | | | 8.17 | % | | | 13.95 | % | | | (.10 | )% |
| | | | | | | | | | | | | | |
| $ | 40,308 | | | $ | 31,077 | | | $ | 24,146 | | | $ | 13,124 | |
| $ | 35,794 | | | $ | 27,760 | | | $ | 19,913 | | | $ | 7,614 | |
| | | | | | | | | | | | | | |
| | 1.51 | % | | | 1.51 | % | | | 1.50 | % | | | 1.50 | %(f) |
| | .51 | % | | | .51 | % | | | .50 | % | | | .50 | %(f) |
| | .64 | % | | | .35 | % | | | .33 | % | | | — | (f)(g) |
See Notes to Financial Statements.
| | |
| JennisonDryden Asset Allocation Funds | | 63 |
JennisonDryden Moderate Allocation Fund
Financial Highlights
(Unaudited) continued
| | | | |
| |
| | | Class C | |
| | | Six Months Ended
March 31, 2008 | |
Per Share Operating Performance: | | | | |
Net Asset Value, Beginning Of Period | | $ | 13.35 | |
| | | | |
Income (loss) from investment operations: | | | | |
Net investment income | | | .10 | |
Net realized and unrealized gain (loss) on investment transactions | | | (1.10 | ) |
| | | | |
Total from investment operations | | | (1.00 | ) |
| | | | |
Less Dividends and Distributions: | | | | |
Dividends from net investment income | | | (.23 | ) |
Distributions from net realized gains | | | (.33 | ) |
| | | | |
Total dividends and distributions | | | (.56 | ) |
| | | | |
Net asset value, end of period | | $ | 11.79 | |
| | | | |
Total Return(d): | | | (7.73 | )% |
Ratios/Supplemental Data: | | | | |
Net assets, end of period (000) | | $ | 15,957 | |
Average net assets (000) | | $ | 15,094 | |
Ratios to average net assets(e): | | | | |
Expenses, including distribution and service (12b-1) fees | | | 1.51 | %(f) |
Expenses, excluding distribution and service (12b-1) fees | | | .51 | %(f) |
Net investment income (loss) | | | 1.46 | %(f) |
| (a) | Inception date of Class C shares. |
| (b) | Calculated based upon average shares outstanding during the period. |
| (c) | Less than $.005 per share. |
| (d) | Total return does not consider the effects of sales loads. Total return is calculated assuming a purchase of a share on the first day and a sale on the last day of each period reported, and includes reinvestment of dividends and distributions. Total return includes the effect of expense subsidies. Total investment returns may reflect adjustments to conform to generally accepted accounting principles. Total returns for periods less than a full year are not annualized. |
| (e) | Net of expense subsidy. If the investment manager had not subsidized expenses, the expense ratios including distribution and service (12b-1) fees would have been 1.54%, 1.62%, 1.54%, 1.63% and 3.36%, for the six months ended March 31, 2008, the year ended September 30, 2007, September 30, 2006, September 30, 2005 and the period ended September 30, 2004, respectively. The investment income/(loss) ratios would have been 1.43%, .50%, .30%, .21% and (2.02)%, for the six months ended March 31, 2008, the year ended September 30, 2007, September 30, 2006, September 30, 2005 and the period ended September 30, 2004, respectively. Does not include expenses of the underlying portfolios in which the portfolio invests. |
See Notes to Financial Statements.
| | |
| 64 | | Visit our website at www.jennisondryden.com |
| | | | | | | | | | | | | | |
| Class C | |
| Year Ended September 30, | | | March 30, 2004(a)(b)
Through
September 30, 2004 | |
| 2007 | | | 2006 | | | 2005 | | |
| | | | | | | | | | | | | | |
| $ | 12.12 | | | $ | 11.34 | | | $ | 9.99 | | | $ | 10.00 | |
| | | | | | | | | | | | | | | |
| | | | | | | | | | | | | | |
| | .09 | | | | .05 | | | | .04 | | | | — | (c) |
| | 1.43 | | | | .84 | | | | 1.35 | | | | (.01 | ) |
| | | | | | | | | | | | | | | |
| | 1.52 | | | | .89 | | | | 1.39 | | | | (.01 | ) |
| | | | | | | | | | | | | | | |
| | | | | | | | | | | | | | |
| | (.13 | ) | | | (.07 | ) | | | (.04 | ) | | | — | |
| | (.16 | ) | | | (.04 | ) | | | — | | | | — | |
| | | | | | | | | | | | | | | |
| | (.29 | ) | | | (.11 | ) | | | (.04 | ) | | | — | |
| | | | | | | | | | | | | | | |
| $ | 13.35 | | | $ | 12.12 | | | $ | 11.34 | | | $ | 9.99 | |
| | | | | | | | | | | | | | | |
| | 12.70 | % | | | 7.80 | % | | | 14.05 | % | | | (.10 | )% |
| | | | | | | | | | | | | | |
| $ | 13,690 | | | $ | 8,509 | | | $ | 4,989 | | | $ | 3,250 | |
| $ | 11,212 | | | $ | 6,768 | | | $ | 4,321 | | | $ | 2,407 | |
| | | | | | | | | | | | | | |
| | 1.51 | % | | | 1.51 | % | | | 1.50 | % | | | 1.50 | %(f) |
| | .51 | % | | | .51 | % | | | .50 | % | | | .50 | %(f) |
| | .61 | % | | | .33 | % | | | .35 | % | | | (.02 | )%(f) |
See Notes to Financial Statements.
| | |
| JennisonDryden Asset Allocation Funds | | 65 |
JennisonDryden Moderate Allocation Fund
Financial Highlights
(Unaudited) continued
| | | | | | | | |
| | | Class R | |
| | | Six Months Ended
March 31, 2008 | | | January 12, 2007(a)
Through
September 30, 2007 | |
Per Share Operating Performance: | | | | | | | | |
Net Asset Value, Beginning Of Period | | $ | 13.42 | | | $ | 12.45 | |
| | | | | | | | |
Income (loss) from investment operations: | | | | | | | | |
Net investment income | | | .26 | | | | .07 | |
Net realized and unrealized gain (loss) on investment transactions | | | (1.23 | ) | | | .90 | |
| | | | | | | | |
Total from investment operations | | | (.97 | ) | | | .97 | |
| | | | | | | | |
Less Dividends and Distributions: | | | | | | | | |
Dividends from net investment income | | | (.28 | ) | | | — | |
Distributions from net realized gains | | | (.33 | ) | | | — | |
| | | | | | | | |
Total dividends and distributions | | | (.61 | ) | | | — | |
| | | | | | | | |
Net asset value, end of period | | $ | 11.84 | | | $ | 13.42 | |
| | | | | | | | |
Total Return(b): | | | (7.48 | )% | | | 7.79 | % |
Ratios/Supplemental Data: | | | | | | | | |
Net assets, end of period | | $ | 2 | | | $ | 3 | |
Average net assets (000) | | $ | 3 | | | $ | 3 | |
Ratios to average net assets(c): | | | | | | | | |
Expenses, including distribution and service (12b-1) fees(d) | | | 1.01 | %(e) | | | 1.01 | %(e) |
Expenses, excluding distribution and service (12b-1) fees | | | .51 | %(e) | | | .51 | %(e) |
Net investment income | | | 2.12 | %(e) | | | .73 | %(e) |
| (a) | Inception date of Class R shares. |
| (b) | Total return is calculated assuming a purchase of a share on the first day and a sale on the last day of each period reported, and includes reinvestment of dividends and distributions. Total returns includes the effect of expense subsidies. Total investment returns may reflect adjustments to conform to generally accepted accounting principles. Total returns for periods less than a full year are not annualized. |
| (c) | Net of expense subsidy. If the investment manager had not subsidized expenses, the expense ratio including distribution and service (12b-1) fees would have been 1.04% and 1.12% for the six months ended March 31, 2008 and the period ended September 30, 2007. The investment income/(loss) ratio would have been 2.09% and .67% for the six months ended March 31, 2008 and the period ended September 30, 2007. Does not include expenses of the underlying portfolios in which the portfolio invests. |
| (d) | The distributor of the Fund has contractually agreed to limit its distribution and service (12b-1) fees to .50 of 1% of the average daily net assets of the Class R shares. |
See Notes to Financial Statements.
| | |
| 66 | | Visit our website at www.jennisondryden.com |
This Page Intentionally Left Blank
JennisonDryden Moderate Allocation Fund
Financial Highlights
(Unaudited) continued
| | | | |
| |
| | | Class Z | |
| | | Six Months Ended
March 31, 2008 | |
Per Share Operating Performance: | | | | |
Net Asset Value, Beginning Of Period | | $ | 13.46 | |
| | | | |
Income (loss) from investment operations: | | | | |
Net investment income | | | .17 | |
Net realized and unrealized gain (loss) on investment transactions | | | (1.11 | ) |
| | | | |
Total from investment operations | | | (.94 | ) |
| | | | |
Less Dividends and Distributions: | | | | |
Dividends from net investment income | | | (.34 | ) |
Distributions from net realized gains | | | (.33 | ) |
| | | | |
Total dividends and distributions | | | (.67 | ) |
| | | | |
Net asset value, end of period | | $ | 11.85 | |
| | | | |
Total Return(c): | | | (7.26 | )% |
Ratios/Supplemental Data: | | | | |
Net assets, end of period (000) | | $ | 2,932 | |
Average net assets (000) | | $ | 2,379 | |
Ratios to average net assets(d): | | | | |
Expenses, including distribution and service (12b-1) fees | | | .51 | %(e) |
Expenses, excluding distribution and service (12b-1) fees | | | .51 | %(e) |
Net investment income | | | 2.30 | %(e) |
| (a) | Inception date of Class Z shares. |
| (b) | Calculated based upon average shares outstanding during the period. |
| (c) | Total return is calculated assuming a purchase of a share on the first day and a sale on the last day of each period reported, and includes reinvestment of dividends and distributions. Total returns includes the effect of expense subsidies. Total investment returns may reflect adjustments to conform to generally accepted accounting principles. Total returns for periods less than a full year are not annualized. |
| (d) | Net of expense subsidy. If the investment manager had not subsidized expenses, the expense ratios including distribution and service (12b-1) fees would have been .54%, .62%, .54%, .63% and 2.36%, for the six months ended March 31, 2008, the year ended September 30, 2007, September 30, 2006, September 30, 2005 and the period ended September 30, 2004, respectively. The investment income/(loss) ratios would have been 2.27%, 1.55%, 1.23%, 1.28% and (1.17)%, for the six months ended March 31, 2008, the year ended September 30, 2007, September 30, 2006, September 30, 2005 and the period ended September 30, 2004, respectively. Does not include expenses of the underlying portfolios in which the portfolio invests. |
See Notes to Financial Statements.
| | |
| 68 | | Visit our website at www.jennisondryden.com |
| | | | | | | | | | | | | | |
| Class Z | |
| Year Ended September 30, | | | March 30, 2004(a)(b)
Through
September 30, 2004 | |
| 2007 | | | 2006 | | | 2005 | | |
| | | | | | | | | | | | | | |
| $ | 12.19 | | | $ | 11.36 | | | $ | 10.04 | | | $ | 10.00 | |
| | | | | | | | | | | | | | | |
| | | | | | | | | | | | | | |
| | .20 | | | | .17 | | | | .18 | | | | .05 | |
| | 1.46 | | | | .82 | | | | 1.33 | | | | (.01 | ) |
| | | | | | | | | | | | | | | |
| | 1.66 | | | | .99 | | | | 1.51 | | | | .04 | |
| | | | | | | | | | | | | | | |
| | | | | | | | | | | | | | |
| | (.23 | ) | | | (.12 | ) | | | (.19 | ) | | | — | |
| | (.16 | ) | | | (.04 | ) | | | — | | | | — | |
| | | | | | | | | | | | | | | |
| | (.39 | ) | | | (.16 | ) | | | (.19 | ) | | | — | |
| | | | | | | | | | | | | | | |
| $ | 13.46 | | | $ | 12.19 | | | $ | 11.36 | | | $ | 10.04 | |
| | | | | | | | | | | | | | | |
| | 13.86 | % | | | 8.83 | % | | | 15.18 | % | | | .40 | % |
| | | | | | | | | | | | | | |
| $ | 2,108 | | | $ | 1,580 | | | $ | 513 | | | $ | 580 | |
| $ | 1,826 | | | $ | 1,268 | | | $ | 600 | | | $ | 497 | |
| | | | | | | | | | | | | | |
| | .51 | % | | | .51 | % | | | .50 | % | | | .50 | %(e) |
| | .51 | % | | | .51 | % | | | .50 | % | | | .50 | %(e) |
| | 1.66 | % | | | 1.26 | % | | | 1.43 | % | | | .97 | %(e) |
See Notes to Financial Statements.
| | |
| JennisonDryden Asset Allocation Funds | | 69 |
JennisonDryden Growth Allocation Fund
Financial Highlights
(Unaudited) continued
| | | | |
| |
| | | Class A | |
| | | Six Months Ended
March 31, 2008(b) | |
Per Share Operating Performance: | | | | |
Net Asset Value, Beginning Of Period | | $ | 15.08 | |
| | | | |
Income (loss) from investment operations: | | | | |
Net investment income (loss) | | | .11 | |
Net realized and unrealized gain (loss) on investment transactions | | | (1.81 | ) |
| | | | |
Total from investment operations | | | (1.70 | ) |
| | | | |
Less Dividends and Distributions: | | | | |
Dividends from net investment income | | | (.30 | ) |
Distributions from net realized gains | | | (.29 | ) |
| | | | |
Total dividends and distributions | | | (.59 | ) |
| | | | |
Net asset value, end of period | | $ | 12.79 | |
| | | | |
Total Return(c): | | | (11.63 | )% |
Ratios/Supplemental Data: | | | | |
Net assets, end of period (000) | | $ | 28,092 | |
Average net assets (000) | | $ | 27,455 | |
Ratios to average net assets(d): | | | | |
Expenses, including distribution and service (12b-1) fees(e) | | | .76 | %(f) |
Expenses, excluding distribution and service (12b-1) fees | | | .51 | %(f) |
Net investment income (loss) | | | 1.58 | %(f) |
For Class A, B, C, R and Z shares: | | | | |
Portfolio turnover rate | | | 14 | %(g) |
| (a) | Inception date of Class A shares. |
| (b) | Calculated based upon average shares outstanding during the period. |
| (c) | Total return does not consider the effects of sales loads. Total return is calculated assuming a purchase of a share on the first day and a sale on the last day of each period reported, and includes reinvestment of dividends and distributions. Total return includes the effect of expense subsidies. Total investment returns may reflect adjustments to conform to generally accepted accounting principles. Total returns for periods less than a full year are not annualized. |
| (d) | Net of expense subsidy. If the investment manager had not subsidized expenses, the expense ratios including distribution and service (12b-1) fees would have been .90%, 1.23%, .96%, 1.20% and 4.82% for the six months ended March 31, 2008, for the years ended September 30, 2007, September 30, 2006, September 30, 2005 and the period ended September 30, 2004, respectively. The investment income/(loss) ratios would have been 1.31%, (.25)%, (.27)%, (.47)% and (4.51)% for the six months ended March 31, 2008, for the years ended September 30, 2007, September 30, 2006, September 30, 2005 and the period ended September 30, 2004, respectively. Does not include expenses of the investment companies in which the Fund invests. |
| (e) | The distributor of the Fund has contractually agreed to limit its distribution and service (12b-1) fees to .25 of 1% of the average daily net assets of the Class A shares. |
See Notes to Financial Statements.
| | |
| 70 | | Visit our website at www.jennisondryden.com |
| | | | | | | | | | | | | | |
| Class A | |
| Year Ended September 30, | | | March 30, 2004(a)(b)
Through
September 30, 2004 | |
| 2007(b) | | | 2006 | | | 2005 | | |
| | | | | | | | | | | | | | |
| $ | 13.15 | | | $ | 11.99 | | | $ | 10.01 | | | $ | 10.00 | |
| | | | | | | | | | | | | | | |
| | | | | | | | | | | | | | |
| | .03 | | | | .01 | | | | .01 | | | | (.02 | ) |
| | 2.18 | | | | 1.24 | | | | 2.00 | | | | .03 | |
| | | | | | | | | | | | | | | |
| | 2.21 | | | | 1.25 | | | | 2.01 | | | | .01 | |
| | | | | | | | | | | | | | | |
| | | | | | | | | | | | | | |
| | (.15 | ) | | | (.08 | ) | | | (.03 | ) | | | — | |
| | (.13 | ) | | | (.01 | ) | | | — | | | | — | |
| | | | | | | | | | | | | | | |
| | (.28 | ) | | | (.09 | ) | | | (.03 | ) | | | — | |
| | | | | | | | | | | | | | | |
| $ | 15.08 | | | $ | 13.15 | | | $ | 11.99 | | | $ | 10.01 | |
| | | | | | | | | | | | | | | |
| | 17.01 | % | | | 10.61 | % | | | 20.02 | % | | | .10 | % |
| | | | | | | | | | | | | | |
| $ | 26,015 | | | $ | 13,666 | | | $ | 7,573 | | | $ | 3,421 | |
| $ | 19,510 | | | $ | 10,479 | | | $ | 5,125 | | | $ | 2,226 | |
| | | | | | | | | | | | | | |
| | .76 | % | | | .77 | % | | | .75 | % | | | .75 | %(f) |
| | .51 | % | | | .52 | % | | | .50 | % | | | .50 | %(f) |
| | .22 | % | | | (.08 | )% | | | (.02 | )% | | | (.40 | )%(f) |
| | | | | | | | | | | | | | |
| | 16 | % | | | 8 | % | | | 6 | % | | | 6 | %(g) |
See Notes to Financial Statements.
| | |
| JennisonDryden Asset Allocation Funds | | 71 |
JennisonDryden Growth Allocation Fund
Financial Highlights
(Unaudited) continued
| | | | |
| |
| | | Class B | |
| | | Six Months Ended
March 31, 2008(b) | |
Per Share Operating Performance: | | | | |
Net Asset Value, Beginning Of Period | | $ | 14.93 | |
| | | | |
Income (loss) from investment operations: | | | | |
Net investment income (loss) | | | .06 | |
Net realized and unrealized gain (loss) on investment transactions | | | (1.80 | ) |
| | | | |
Total from investment operations | | | (1.74 | ) |
| | | | |
Less Dividends and Distributions: | | | | |
Dividends from net investment income | | | (.21 | ) |
Distributions from net realized gains | | | (.29 | ) |
| | | | |
Total dividends and distributions | | | (.50 | ) |
| | | | |
Net asset value, end of period | | $ | 12.69 | |
| | | | |
Total Return(c): | | | (11.98 | )% |
Ratios/Supplemental Data: | | | | |
Net assets, end of period (000) | | $ | 30,075 | |
Average net assets (000) | | $ | 29,931 | |
Ratios to average net assets(d): | | | | |
Expenses, including distribution and service (12b-1) fees | | | 1.51 | %(e) |
Expenses, excluding distribution and service (12b-1) fees | | | .51 | %(e) |
Net investment income (loss) | | | .85 | %(e) |
| (a) | Inception date of Class B shares. |
| (b) | Calculated based upon average shares outstanding during the period. |
| (c) | Total return does not consider the effects of sales loads. Total return is calculated assuming a purchase of a share on the first and a sale on the last day of each period reported, and includes reinvestment of dividends and distributions. Total return includes the effect of expense subsidies. Total investment returns may reflect adjustments to conform to generally accepted accounting principles. Total returns for periods less than a full year are not annualized. |
| (d) | Net of expense subsidy. If the investment manager had not subsidized expenses, the expense ratios including distribution and service (12b-1) fees would have been 1.65%, 1.98%, 1.71%, 1.95% and 5.57% for the six months ended March 31, 2008, for the years ended September 30, 2007, September 30, 2006, September 30, 2005 and the period ended September 30, 2004, respectively. The investment income/(loss) ratios would have been .58%, (.95)%, (.99)%, (1.25)% and (5.09)% for the six months ended March 31, 2008, for the years ended September 30, 2007, September 30, 2006, September 30, 2005 and the period ended September 30, 2004, respectively. Does not include expenses of the investment companies in which the Fund invests. |
See Notes to Financial Statements.
| | |
| 72 | | Visit our website at www.jennisondryden.com |
| | | | | | | | | | | | | | |
| Class B | |
| Year Ended September 30, | | | March 30, 2004(a)(b) Through September 30, 2004 | |
| 2007(b) | | | 2006 | | | 2005 | | |
| | | | | | | | | | | | | | |
| $ | 13.05 | | | $ | 11.90 | | | $ | 9.98 | | | $ | 10.00 | |
| | | | | | | | | | | | | | | |
| | | | | | | | | | | | | | |
| | (.07 | ) | | | (.08 | ) | | | (.07 | ) | | | (.06 | ) |
| | 2.15 | | | | 1.24 | | | | 1.99 | | | | .04 | |
| | | | | | | | | | | | | | | |
| | 2.08 | | | | 1.16 | | | | 1.92 | | | | (.02 | ) |
| | | | | | | | | | | | | | | |
| | | | | | | | | | | | | | |
| | (.07 | ) | | | — | | | | — | | | | — | |
| | (.13 | ) | | | (.01 | ) | | | — | | | | — | |
| | | | | | | | | | | | | | | |
| | (.20 | ) | | | (.01 | ) | | | — | | | | — | |
| | | | | | | | | | | | | | | |
| $ | 14.93 | | | $ | 13.05 | | | $ | 11.90 | | | $ | 9.98 | |
| | | | | | | | | | | | | | | |
| | 16.09 | % | | | 9.95 | % | | | 19.04 | % | | | (.20 | )% |
| | | | | | | | | | | | | | |
| $ | 29,171 | | | $ | 19,062 | | | $ | 13,552 | | | $ | 6,585 | |
| $ | 23,884 | | | $ | 16,203 | | | $ | 10,343 | | | $ | 3,987 | |
| | | | | | | | | | | | | | |
| | 1.51 | % | | | 1.52 | % | | | 1.50 | % | | | 1.50 | %(e) |
| | .51 | % | | | .52 | % | | | .50 | % | | | .50 | %(e) |
| | (.48 | )% | | | (.80 | )% | | | (.80 | )% | | | (1.15 | )%(e) |
See Notes to Financial Statements.
| | |
| JennisonDryden Asset Allocation Funds | | 73 |
JennisonDryden Growth Allocation Fund
Financial Highlights
(Unaudited) continued
| | | | |
| |
| | | Class C | |
| | | Six Months Ended
March 31, 2008(b) | |
Per Share Operating Performance: | | | | |
Net Asset Value, Beginning Of Period | | $ | 14.92 | |
| | | | |
Income (loss) from investment operations: | | | | |
Net investment income (loss) | | | .06 | |
Net realized and unrealized gain (loss) on investment transactions | | | (1.78 | ) |
| | | | |
Total from investment operations | | | (1.72 | ) |
| | | | |
Less Dividends and Distributions: | | | | |
Dividends from net investment income | | | (.21 | ) |
Distributions from net realized gains | | | (.29 | ) |
| | | | |
Total dividends and distributions | | | (.50 | ) |
| | | | |
Net asset value, end of period | | $ | 12.70 | |
| | | | |
Total Return(c): | | | (11.85 | )% |
Ratios/Supplemental Data: | | | | |
Net assets, end of period (000) | | $ | 8,787 | |
Average net assets (000) | | $ | 8,934 | |
Ratios to average net assets(d): | | | | |
Expenses, including distribution and service (12b-1) fees | | | 1.51 | %(e) |
Expenses, excluding distribution and service (12b-1) fees | | | .51 | %(e) |
Net investment income (loss) | | | .85 | %(e) |
| (a) | Inception date of Class C shares. |
| (b) | Calculated based upon average shares outstanding during the period. |
| (c) | Total return does not consider the effects of sales loads. Total return is calculated assuming a purchase of a share on the first day and a sale on the last day of each period reported, and includes reinvestment of dividends and distributions. Total return includes the effect of expense subsidies. Total investment returns may reflect adjustments to conform to generally accepted accounting principles. Total returns for periods less than a full year are not annualized. |
| (d) | Net of expense subsidy. If the investment manager had not subsidized expenses, the expense ratios including distribution and service (12b-1) fees would have been 1.65%, 1.98%, 1.71%, 1.95% and 5.57% for the six months ended March 31, 2008, for the years ended September 30, 2007, September 30, 2006, September 30, 2005 and the period ended September 30, 2004, respectively. The investment income/(loss) ratios would have been .58%, (.96)%, (1.02)%, (1.22)% and (5.46)% for the six months ended March 31, 2008, for the years ended September 30, 2007, September 30, 2006, September 30, 2005 and the period ended September 30, 2004, respectively. Does not include expenses of the investment companies in which the Fund invests. |
See Notes to Financial Statements.
| | |
| 74 | | Visit our website at www.jennisondryden.com |
| | | | | | | | | | | | | | |
| Class C | |
| Year Ended September 30, | | | March 30, 2004(a)(b)
Through
September 30, 2004 | |
| 2007(b) | | | 2006 | | | 2005 | | |
| | | | | | | | | | | | | | |
| $ | 13.04 | | | $ | 11.91 | | | $ | 9.98 | | | $ | 10.00 | |
| | | | | | | | | | | | | | | |
| | | | | | | | | | | | | | |
| | (.07 | ) | | | (.07 | ) | | | (.07 | ) | | | (.06 | ) |
| | 2.15 | | | | 1.21 | | | | 2.00 | | | | .04 | |
| | | | | | | | | | | | | | | |
| | 2.08 | | | | 1.14 | | | | 1.93 | | | | (.02 | ) |
| | | | | | | | | | | | | | | |
| | | | | | | | | | | | | | |
| | (.07 | ) | | | — | | | | — | | | | — | |
| | (.13 | ) | | | (.01 | ) | | | — | | | | — | |
| | | | | | | | | | | | | | | |
| | (.20 | ) | | | (.01 | ) | | | — | | | | — | |
| | | | | | | | | | | | | | | |
| $ | 14.92 | | | $ | 13.04 | | | $ | 11.91 | | | $ | 9.98 | |
| | | | | | | | | | | | | | | |
| | 16.10 | % | | | 9.68 | % | | | 19.24 | % | | | (.20 | )% |
| | | | | | | | | | | | | | |
| $ | 8,843 | | | $ | 5,411 | | | $ | 2,746 | | | $ | 1,711 | |
| $ | 7,282 | | | $ | 3,860 | | | $ | 2,268 | | | $ | 1,282 | |
| | | | | | | | | | | | | | |
| | 1.51 | % | | | 1.52 | % | | | 1.50 | % | | | 1.50 | %(e) |
| | .51 | % | | | .52 | % | | | .50 | % | | | .50 | %(e) |
| | (.49 | )% | | | (.83 | )% | | | (.74 | )% | | | (1.14 | )%(e) |
See Notes to Financial Statements.
| | |
| JennisonDryden Asset Allocation Funds | | 75 |
JennisonDryden Growth Allocation Fund
Financial Highlights
(Unaudited) continued
| | | | | | | | |
| | | Class R | |
| | | Six Months Ended
March 31, 2008(b) | | | January 12, 2007(a)(b)
Through
September 30, 2007 | |
Per Share Operating Performance: | | | | | | | | |
Net Asset Value, Beginning Of Period | | $ | 15.04 | | | $ | 13.76 | |
| | | | | | | | |
Income (loss) from investment operations | | | | | | | | |
Net investment income (loss) | | | .10 | | | | (.06 | ) |
Net realized and unrealized gain (loss) on investment transactions | | | (1.81 | ) | | | 1.34 | |
| | | | | | | | |
Total from investment operations | | | (1.71 | ) | | | 1.28 | |
| | | | | | | | |
Less Dividends and Distributions | | | | | | | | |
Dividends from net investment income | | | (.24 | ) | | | — | |
Distributions from net realized gains | | | (.29 | ) | | | — | |
| | | | | | | | |
Total dividends and distributions | | | (.53 | ) | | | — | |
| | | | | | | | |
Net asset value, end of period | | $ | 12.80 | | | $ | 15.04 | |
| | | | | | | | |
Total Return(c): | | | (11.69 | )% | | | 9.30 | % |
Ratios/Supplemental Data: | | | | | | | | |
Net assets, end of period (000) | | $ | 2 | | | $ | 3 | |
Average net assets (000) | | $ | 3 | | | $ | 3 | |
Ratios to average net assets(d): | | | | | | | | |
Expenses, including distribution and service (12b-1) fees(e) | | | 1.01 | %(f) | | | 1.01 | %(f) |
Expenses, excluding distribution and service (12b-1) fees | | | .51 | %(f) | | | .51 | %(f) |
Net investment (loss) | | | 1.41 | %(f) | | | (.59 | )%(f) |
| (a) | Inception date of Class R shares. |
| (b) | Calculated based upon average shares outstanding during the period. |
| (c) | Total return is calculated assuming a purchase of a share on the first day and a sale on the last day of each period reported, and includes reinvestment of dividends and distributions. Total return includes the effect of expense subsidies. Total investment returns may reflect adjustments to conform to generally accepted accounting principles. Total returns for periods less than a full year are not annualized. |
| (d) | Net of expense subsidy. If the investment manager had not subsidized expenses, the expense ratios including distribution and service (12b-1) fees would have been 1.15% and 1.48% for the six months ended March 31, 2008 and the period ended September 30, 2007, respectively. The investment income (loss) ratios would have been 1.27% and (1.01)% for the six months ended March 31, 2008 and for the period ended September 30, 2007, respectively. Does not include expenses of the investment companies in which the Fund invests. |
| (e) | The distributor of the fund has contractually agreed to limit its distribution and service (12b-1) fee to .50% of 1% of the average net assets of the Class R shares. |
See Notes to Financial Statements.
| | |
| 76 | | Visit our website at www.jennisondryden.com |
This Page Intentionally Left Blank
JennisonDryden Growth Allocation Fund
Financial Highlights
(Unaudited) continued
| | | | |
| |
| | | Class Z | |
| | | Six Months Ended
March 31, 2008(b) | |
Per Share Operating Performance: | | | | |
Net Asset Value, Beginning Of Period | | $ | 15.11 | |
| | | | |
Income (loss) from investment operations: | | | | |
Net investment income (loss) | | | .13 | |
Net realized and unrealized gain (loss) on investment transactions | | | (1.81 | ) |
| | | | |
Total from investment operations | | | (1.68 | ) |
| | | | |
Less Dividends and Distributions: | | | | |
Dividends from net investment income | | | (.33 | ) |
Distributions from net realized gains | | | (.29 | ) |
| | | | |
Total dividends and distributions | | | (.62 | ) |
| | | | |
Net asset value, end of period | | $ | 12.81 | |
| | | | |
Total Return(c): | | | (11.49 | )% |
Ratios/Supplemental Data: | | | | |
Net assets, end of period (000) | | $ | 334 | |
Average net assets (000) | | $ | 402 | |
Ratios to average net assets(d): | | | | |
Expenses, including distribution and service (12b-1) fees | | | .51 | %(e) |
Expenses, excluding distribution and service (12b-1) fees | | | .51 | %(e) |
Net investment income (loss) | | | 1.91 | %(e) |
| (a) | Inception date of Class Z shares. |
| (b) | Calculated based upon average shares outstanding during the period. |
| (c) | Total return is calculated assuming a purchase of a share on the first day and a sale on the last day of each period reported, and includes reinvestment of dividends and distributions. Total return includes the effect of expense subsidies. Total investment returns may reflect adjustments to conform to generally accepted accounting principles. Total returns for periods less than a full year are not annualized. |
| (d) | Net of expense subsidy. If the investment manager had not subsidized expenses, the expense ratios including distribution and service (12b-1) fees would have been .65%, .98%, .71%, .95% and 4.57% for the six months ended March 31, 2008, for the years ended September 30, 2007 September 30, 2006, September 30, 2005 and the period ended September 30, 2004, respectively. The investment income/(loss) ratios would have been 1.64%, .19%, (.12)%, (.19)%, and (4.67)% for the six months ended March 31, 2008, for the years ended September 30, 2007, September 30, 2006, September 30, 2005, and the period ended September 30, 2004, respectively. Does not include expenses of the investment companies in which the Fund invests. |
See Notes to Financial Statements.
| | |
| 78 | | Visit our website at www.jennisondryden.com |
| | | | | | | | | | | | | | |
| Class Z | |
| Year Ended September 30, | | | March 30, 2004(a)(b)
Through
September 30, 2004 | |
| 2007(b) | | | 2006 | | | 2005 | | |
| | | | | | | | | | | | | | |
| $ | 13.18 | | | $ | 12.02 | | | $ | 10.03 | | | $ | 10.00 | |
| | | | | | | | | | | | | | | |
| | | | | | | | | | | | | | |
| | .10 | | | | .02 | | | | .04 | | | | (.01 | ) |
| | 2.14 | | | | 1.27 | | | | 2.00 | | | | .04 | |
| | | | | | | | | | | | | | | |
| | 2.24 | | | | 1.29 | | | | 2.04 | | | | .03 | |
| | | | | | | | | | | | | | | |
| | | | | | | | | | | | | | |
| | (.18 | ) | | | (.12 | ) | | | (.05 | ) | | | — | |
| | (.13 | ) | | | (.01 | ) | | | — | | | | — | |
| | | | | | | | | | | | | | | |
| | (.31 | ) | | | (.13 | ) | | | (.05 | ) | | | — | |
| | | | | | | | | | | | | | | |
| $ | 15.11 | | | $ | 13.18 | | | $ | 12.02 | | | $ | 10.03 | |
| | | | | | | | | | | | | | | |
| | 17.23 | % | | | 10.77 | % | | | 20.40 | % | | | .30 | % |
| | | | | | | | | | | | | | |
| $ | 420 | | | $ | 560 | | | $ | 443 | | | $ | 279 | |
| $ | 500 | | | $ | 662 | | | $ | 329 | | | $ | 237 | |
| | | | | | | | | | | | | | |
| | .51 | % | | | .52 | % | | | .50 | % | | | .50 | %(e) |
| | .51 | % | | | .52 | % | | | .50 | % | | | .50 | %(e) |
| | .67 | % | | | .07 | % | | | .28 | % | | | (.14 | )%(e) |
See Notes to Financial Statements.
| | |
| JennisonDryden Asset Allocation Funds | | 79 |
| | | | |
| n MAIL | | n TELEPHONE | | n WEBSITE |
Gateway Center Three 100 Mulberry Street Newark, NJ 07102 | | (800) 225-1852 | | www.jennisondryden.com |
|
| PROXY VOTING |
| The Board of Directors of the Funds has delegated to each Fund’s investment subadviser the responsibility for voting any proxies and maintaining proxy recordkeeping with respect to the Fund. A description of these proxy voting policies and procedures is available without charge, upon request, by calling (800) 225-1852 or by visiting the Securities and Exchange Commission’s website at www.sec.gov. Information regarding how the Funds voted proxies relating to portfolio securities during the most recent 12-month period ended June 30 is available on the Funds’ website and on the Commission’s website. |
|
| DIRECTORS |
| Linda W. Bynoe • David E.A. Carson • Robert F. Gunia • Robert E. La Blanc • Douglas H. McCorkindale • Richard A. Redeker • Judy A. Rice • Robin B. Smith • Stephen G. Stoneburn • Clay T. Whitehead |
|
| OFFICERS |
| Judy A. Rice, President • Robert F. Gunia, Vice President • Grace C. Torres, Treasurer and Principal Financial and Accounting Officer • Kathryn L. Quirk, Chief Legal Officer • Deborah A. Docs, Secretary • Timothy J. Knierim, Chief Compliance Officer • Valerie M. Simpson, Deputy Chief Compliance Officer • Noreen M. Fierro, Anti-Money Laundering Compliance Officer • Jonathan D. Shain, Assistant Secretary • Claudia DiGiacomo, Assistant Secretary • John P. Schwartz, Assistant Secretary • Andrew R. French, Assistant Secretary • M. Sadiq Peshimam, Assistant Treasurer • Peter Parrella, Assistant Treasurer |
| | | | |
| MANAGER | | Prudential Investments LLC | | Gateway Center Three 100 Mulberry Street Newark, NJ 07102 |
|
| INVESTMENT SUBADVISER | | Quantitative Management
Associates LLC | | Gateway Center Two 100 Mulberry Street Newark, NJ 07102 |
|
| DISTRIBUTOR | | Prudential Investment
Management Services LLC | | Gateway Center Three
100 Mulberry Street
Newark, NJ 07102 |
|
| CUSTODIAN | | The Bank of New York | | One Wall Street New York, NY 10286 |
|
| TRANSFER AGENT | | Prudential Mutual Fund
Services LLC | | PO Box 9658 Providence, RI 02940 |
|
INDEPENDENT REGISTERED
PUBLIC ACCOUNTING FIRM | | KPMG LLP | | 345 Park Avenue New York, NY 10154 |
|
| FUND COUNSEL | | Sullivan & Cromwell LLP | | 125 Broad Street New York, NY 10004 |
|
| An investor should consider the investment objectives, risks, charges, and expenses of each of the JennisonDryden Asset Allocation Funds carefully before investing. The prospectus for the JennisonDryden Asset Allocation Funds contains this and other information about the JennisonDryden Asset Allocation Funds. An investor may obtain a prospectus by visiting our website at www.jennisondryden.com or by calling (800) 225-1852. The prospectus should be read carefully before investing. |
|
| E-DELIVERY |
| To receive your mutual fund documents on-line, go to www.icsdelivery.com/prudential/funds and enroll. Instead of receiving printed documents by mail, you will receive notification via e-mail when new materials are available. You can cancel your enrollment or change your e-mail address at any time by clicking on the change/cancel enrollment option at the icsdelivery website address. |
|
| SHAREHOLDER COMMUNICATIONS WITH DIRECTORS |
| Shareholders can communicate directly with the Board of Directors by writing to the Chair of the Board, JennisonDryden Asset Allocation Funds, Prudential Investments, Attn: Board of Directors, 100 Mulberry Street, Gateway Center Three, Newark, NJ 07102. Shareholders can communicate directly with an individual Director by writing to the same address. Communications are not screened before being delivered to the addressee. |
|
| AVAILABILITY OF PORTFOLIO SCHEDULE |
| Each Fund files its complete schedule of portfolio holdings with the Securities and Exchange Commission for the first and third quarters of each fiscal year on Form N-Q under The Prudential Investment Portfolios, Inc. name. Each Fund’s Forms N-Q are available on the Commission’s website at www.sec.gov. Each Fund’s Forms N-Q may also be reviewed and copied at the Commission’s Public Reference Room in Washington, D.C. Information on the operation and location of the Public Reference Room may be obtained by calling (800) SEC-0330 (732-0330). Each Fund’s schedule of portfolio holdings is also available on the Fund’s website as of the end of each fiscal quarter. |
Mutual Funds:
| | | | |
ARE NOT INSURED BY THE FDIC OR ANY
FEDERAL GOVERNMENT AGENCY | | MAY LOSE VALUE | | ARE NOT A DEPOSIT OF OR GUARANTEED
BY ANY BANK OR ANY BANK AFFILIATE |

| | | | | | | | | | | | | | | | | | | | | | | | |
| JennisonDryden Asset Allocation Funds | | | | | | | | | | | | |
| | | | | Class A | | | | Class B | | | | Class C | | | | Class R | | | | Class Z | | | | |
| | | | NASDAQ | | CUSIP | | NASDAQ | | CUSIP | | NASDAQ | | CUSIP | | NASDAQ | | CUSIP | | NASDAQ | | CUSIP | | |
| | Conservative Allocation | | JDUAX | | 74437E750 | | JDABX | | 74437E743 | | JDACX | | 74437E735 | | JDCAR | | 74437E628 | | JDAZX | | 74437E784 | | |
| | Moderate Allocation | | JDTAX | | 74437E727 | | JDMBX | | 74437E719 | | JDMCX | | 74437E693 | | JDMAR | | 74437E610 | | JDMZX | | 74437E776 | | |
| | Growth Allocation | | JDAAX | | 74437E685 | | JDGBX | | 74437E677 | | JDGCX | | 74437E669 | | JDGAR | | 74437E594 | | JDGZX | | 74437E768 | | |
| | | | | | | | | | | | | | | | | | | | | | | | |
MF194E2 IFS-A148089 Ed. 05/2008

| Item 2 – | Code of Ethics – Not required, as this is not an annual filing. |
| Item 3 – | Audit Committee Financial Expert – Not required, as this is not an annual filing. |
| Item 4 – | Principal Accountant Fees and Services – Not required, as this is not an annual filing. |
| Item 5 – | Audit Committee of Listed Registrants – Not applicable. |
| Item 6 – | Schedule of Investments – The schedule is included as part of the report to shareholders filed under Item 1 of this Form. |
| Item 7 – | Disclosure of Proxy Voting Policies and Procedures for Closed-End Management Investment Companies – Not applicable. |
| Item 8 – | Portfolio Managers of Closed-End Management Investment Companies – Not applicable. |
| Item 9 – | Purchases of Equity Securities by Closed-End Management Investment Company and Affiliated Purchasers – Not applicable. |
| Item 10 – | Submission of Matters to a Vote of Security Holders – Not applicable. |
| Item 11 – | Controls and Procedures |
| | (a) | | It is the conclusion of the registrant’s principal executive officer and principal financial officer that the effectiveness of the registrant’s current disclosure controls and procedures (such disclosure controls and procedures having been evaluated within 90 days of the date of this filing) provide reasonable assurance that the information required to be disclosed by the registrant has been recorded, processed, summarized and reported within the time period specified in the Commission’s rules and forms and that the information required to be disclosed by the registrant has been accumulated and communicated to the registrant’s principal executive officer and principal financial officer in order to allow timely decisions regarding required disclosure. |
| | (b) | | There has been no significant change in the registrant’s internal control over financial reporting that occurred during the registrant’s most recent fiscal quarter of the period covered by this report that has materially affected, or is likely to materially affect, the registrant’s internal control over financial reporting. |
Item 12 – Exhibits
| | (a) | | (1) Code of Ethics – Not required, as this is not an annual filing. |
(2) Certifications pursuant to Section 302 of the Sarbanes-Oxley Act – Attached hereto as Exhibit
EX-99.CERT.
(3) Any written solicitation to purchase securities under Rule 23c-1. – Not applicable.
| | (b) | | Certifications pursuant to Section 906 of the Sarbanes-Oxley Act – Attached hereto as Exhibit |
SIGNATURES
Pursuant to the requirements of the Securities Exchange Act of 1934 and the Investment Company Act of 1940, the registrant has duly caused this report to be signed on its behalf by the undersigned, thereunto duly authorized.
(Registrant) The Prudential Investment Portfolios, Inc.
By (Signature and Title)* /s/Deborah A. Docs
Deborah A. Docs
Secretary
Date May 21, 2008
Pursuant to the requirements of the Securities Exchange Act of 1934 and the Investment Company Act of 1940, this report has been signed below by the following persons on behalf of the registrant and in the capacities and on the dates indicated.
By (Signature and Title)* /s/Judy A. Rice
Judy A. Rice
President and Principal Executive Officer
Date May 21, 2008
By (Signature and Title)* /s/Grace C. Torres
Grace C. Torres
Treasurer and Principal Financial Officer
Date May 21, 2008
* Print the name and title of each signing officer under his or her signature.