UNITED STATES
SECURITIES AND EXCHANGE COMMISSION
Washington, D.C. 20549
FORM N-CSR
CERTIFIED SHAREHOLDER REPORT OF REGISTERED
MANAGEMENT INVESTMENT COMPANIES
| | |
| Investment Company Act file number: | | 811-07343 |
| |
| Exact name of registrant as specified in charter: | | The Prudential Investment Portfolios, Inc. |
| |
| Address of principal executive offices: | | Gateway Center 3, |
| | 100 Mulberry Street, |
| | Newark, New Jersey 07102 |
| |
| Name and address of agent for service: | | Deborah A. Docs |
| | Gateway Center 3, |
| | 100 Mulberry Street, |
| | Newark, New Jersey 07102 |
| |
| Registrant’s telephone number, including area code: | | 800-225-1852 |
| |
| Date of fiscal year end: | | 9/30/2010 |
| |
| Date of reporting period: | | 3/31/2010 |
Item 1 – Reports to Stockholders

| | |
| SEMIANNUAL REPORT | | MARCH 31, 2010 |
Prudential Asset Allocation Fund
(Formerly known as Dryden Asset Allocation Fund)
| | | | |
Fund Type Balanced/allocation Objective Income and long-term growth of capital | | | | This report is not authorized for distribution to prospective investors unless preceded or accompanied by a current prospectus. The views expressed in this report and information about the Fund’s portfolio holdings are for the period covered by this report and are subject to change thereafter. The accompanying financial statements as of March 31, 2010. were not audited and, accordingly, no auditor’s opinion is expressed on them. Prudential Investments, Prudential Financial, and the Rock Prudential logo are registered service marks of The Prudential Insurance Company of America, Newark, NJ, and its affiliates. |
| | |

| | To enroll in e-delivery, go to www.prudentialfunds.com/edelivery |
May 14, 2010
Dear Shareholder:
Recently we announced the renaming of JennisonDryden, Prudential Financial’s mutual fund family, to Prudential Investments. As a result of this change, each of our funds has been renamed to feature “Prudential” as part of its new name. The name of your fund has changed from the Dryden Asset Allocation Fund to the Prudential Asset Allocation Fund.
While the name of your fund has changed, its investment objectives and portfolio management team remain the same. No action is required on your part. If you participate in an automatic investment plan, your account continues to be invested in the Fund under its new name.
Featuring the Prudential name in our funds creates an immediate connection to the experience and heritage of Prudential, a name recognized by millions for helping people grow and protect their wealth.
On the following pages, you will find your fund’s semiannual report, including a table showing fund performance over the first half of the fiscal year and for longer periods. The report also contains a listing of the fund’s holdings at period-end. If you have questions about your fund or the renaming of our mutual fund family, please contact your financial professional or visit our website at www.prudentialfunds.com.
Sincerely,

Judy A. Rice, President
Prudential Investment Portfolios, Inc./Prudential Asset Allocation Fund
| | |
| Prudential Investment Portfolios, Inc./Prudential Asset Allocation Fund | | 1 |
Your Fund’s Performance
Performance data quoted represent past performance. Past performance does not guarantee future results. The investment return and principal value of an investment will fluctuate, so that an investor’s shares, when redeemed, may be worth more or less than their original cost. Current performance may be lower or higher than the past performance data quoted. An investor may obtain performance data as of the most recent month-end by visiting our website at www.prudentialfunds.com or by calling (800) 225-1852. Class A and Class L shares have a maximum initial sales charge of 5.50% and 5.75%, respectively. Gross operating expenses: Class A, 1.24%; Class B, 1.94%; Class C, 1.94%; Class L, 1.44%; Class M, 1.94%; Class R, 1.69%; Class X, 1.94%; Class Z, 0.94%. Net operating expenses apply to: Class A, 1.22%; Class B, 1.92%; Class C, 1.92%; Class L, 1.42%; Class M, 1.92%; Class R, 1.42%; Class X, 1.92%; Class Z, 0.92%, after contractual reduction of management fees and/or distribution fees (Class R only).
| | | | | | | | | | | | | | |
| Cumulative Total Returns (Without Sales Charge) as of 3/31/10 |
| | | Six Months | | | One Year | | | Five Years | | | Ten Years | | | Since Inception |
Class A | | 8.26 | % | | 34.14 | % | | 11.12 | % | | 23.29 | % | | — |
Class B | | 7.96 | | | 33.27 | | | 7.22 | | | 14.74 | | | — |
Class C | | 7.96 | | | 33.11 | | | 7.22 | | | 14.74 | | | — |
Class L | | 8.24 | | | 33.90 | | | N/A | | | N/A | | | –8.30% (3/26/07) |
Class M | | 7.96 | | | 33.11 | | | N/A | | | N/A | | | –9.69 (3/26/07) |
Class R | | 8.16 | | | 33.55 | | | 9.63 | | | N/A | | | 9.39 (12/17/04) |
Class X | | 7.96 | | | 33.27 | | | N/A | | | N/A | | | –9.69 (3/26/07) |
Class Z | | 8.40 | | | 34.46 | | | 12.67 | | | 26.89 | | | — |
Customized Blend Index | | 7.53 | | | 32.48 | | | 20.85 | | | 31.58 | | | — |
Prior Customized Blend Index | | 7.60 | | | 30.40 | | | 19.76 | | | 28.11 | | | — |
Barclays Capital U.S. Aggregate Bond Index | | 1.99 | | | 7.69 | | | 30.33 | | | 83.98 | | | — |
S&P 500 Index | | 11.75 | | | 49.73 | | | 9.97 | | | –6.35 | | | — |
Lipper Average | | 8.06 | | | 40.02 | | | 15.93 | | | 22.87 | | | — |
| | |
| 2 | | Visit our website at www.prudentialfunds.com |
| | | | | | | | | | | |
| Average Annual Total Returns (With Sales Charge) as of 3/31/10 |
| | | One Year | | | Five Years | | | Ten Years | | | Since Inception |
Class A | | 26.76 | % | | 0.98 | % | | 1.54 | % | | — |
Class B | | 28.27 | | | 1.25 | | | 1.38 | | | — |
Class C | | 32.11 | | | 1.40 | | | 1.38 | | | — |
Class L | | 26.20 | | | N/A | | | N/A | | | –4.72% (3/26/07) |
Class M | | 27.11 | | | N/A | | | N/A | | | –4.18 (3/26/07) |
Class R | | 33.55 | | | 1.86 | | | N/A | | | 1.71 (12/17/04) |
Class X | | 27.27 | | | N/A | | | N/A | | | –4.46 (3/26/07) |
Class Z | | 34.46 | | | 2.41 | | | 2.41 | | | — |
Customized Blend Index | | 32.48 | | | 3.86 | | | 2.78 | | | — |
Prior Customized Blend Index | | 30.40 | | | 3.67 | | | 2.51 | | | — |
Barclays Capital U.S. Aggregate Bond Index | | 7.69 | | | 5.44 | | | 6.29 | | | — |
S&P 500 Index | | 49.73 | | | 1.92 | | | –0.65 | | | — |
Lipper Average | | 40.02 | | | 2.96 | | | 1.92 | | | — |
Source: Prudential Investments LLC and Lipper Inc. Performance figures may reflect fee waivers and/or expense reimbursements. In the absence of such fee waivers and/or expense reimbursements, total returns would be lower.
Inception returns are provided for any share class with less than 10 calendar years of returns. The Since Inception returns for the Customized Blend Index, Prior Customized Blend Index, Barclays Capital U.S. Aggregate Bond Index, S&P 500 Index, and the Lipper Average are measured from the closest month-end to inception date, and not from the Fund’s actual inception date.
The average annual total returns take into account applicable sales charges. Class A, Class B, Class C, Class L, Class M, Class R, and Class X shares are subject to an annual distribution and service (12b-1) fee of up to 0.30%, 1.00%, 1.00%, 0.50%, 1.00%, 0.75%, and 1.00%, respectively. Approximately seven years after purchase, Class B shares will automatically convert to Class A shares on a quarterly basis. Class Z shares are not subject to a 12b-1 fee. Under certain circumstances, Class A shares may be subject to a contingent deferred sales charge (CDSC) of 1%. Class B, Class C, Class L, Class M, and Class X shares are subject to a maximum CDSC of 5%, 1%, 1%, 6%, and 6%, respectively. Class R and Class Z shares are not subject to a sales charge. Class L shares are closed to most new purchasers (with the exception of exchanges from the same class of shares offered by certain other Prudential Investments funds). The returns in the tables do not reflect the deduction of taxes that a shareholder would pay on Fund distributions or following the redemption of Fund shares.
| | |
| Prudential Investment Portfolios, Inc./Prudential Asset Allocation Fund | | 3 |
Your Fund’s Performance (continued)
Benchmark Definitions
Customized Blend Index
The Customized Blend Index is made up of the S&P 500 Index (50%), the Barclays Capital U.S. Aggregate Bond Index (40%), the Russell 2000 Index (5%), and the MSCI EAFE ND Index (5%). Customized Blend Index Closest Month-End to Inception cumulative total returns are 19.01% for Class R; and 0.72% for Class L, Class M, and Class X. Customized Blend Index Closest Month-End to Inception average annual total returns are 3.37% for Class R; and 0.24% for Class L, Class M, and Class X.
Prior Customized Blend Index
The Prior Customized Blend Index is made up of the S&P 500 Index (57.5%), the Barclays Capital U.S. Aggregate Bond Index (40.0%), and the T-Bill 3-Month Blend (2.5%). Prior Customized Blend Index Closest Month-End to Inception cumulative total returns are 18.08% for Class R; and 1.45% for Class L, Class M, and Class X. Prior Customized Blend Index Closest Month-End to Inception average annual total returns are 3.22% for Class R; and 0.48% for Class L, Class M, and Class X.
Barclays Capital U.S. Aggregate Bond Index
The Barclays Capital U.S. Aggregate Bond Index is an unmanaged index of investment-grade securities issued by the U.S. government and its agencies, and by corporations with between one and 10 years remaining to maturity on the securities. It gives a broad look at how short- and intermediate-term bonds have performed. Barclays Capital U.S. Aggregate Bond Index Closest Month-End to Inception cumulative total returns are 29.71% for Class R; and 19.57% for Class L, Class M, and Class X. Barclays Capital U.S. Aggregate Bond Index Closest Month-End to Inception average annual total returns are 5.08% for Class R; and 6.14% for Class L, Class M, and Class X.
S&P 500 Index
The S&P 500 Index is an unmanaged index of 500 stocks of large U.S. public companies. It gives a broad look at how U.S. stock prices have performed. S&P 500 Index Closest Month-End to Inception cumulative total returns are 7.61% for Class R; and –11.97% for Class L, Class M, and Class X. S&P 500 Index Closest Month-End to Inception average annual total returns are 1.41% for Class R; and –4.16% for Class L, Class M, and Class X.
Lipper Mixed-Asset Target Allocation Growth Funds Average
The Lipper Mixed-Asset Target Allocation Growth Funds Average (Lipper Average) represents returns based on the average return of all funds in the Lipper Mixed-Asset Target Allocation Growth Funds category for the periods noted. Funds in the Lipper Average are funds whose primary objective is to conserve principal by maintaining at all times a balanced portfolio of both stocks and bonds. Typically, the stock:bond ratio ranges around 60%:40%. Lipper Average Closest Month-End to Inception cumulative total returns are 14.16% for Class R; and –4.98% for Class L, Class M, and Class X. Lipper Average Closest Month-End to Inception average annual total returns are 2.51% for Class R; and –1.74% for Class L, Class M, and Class X.
Investors cannot invest directly in an index. The returns for the Customized Blend Index, Prior Customized Blend Index, the Barclays Capital U.S. Aggregate Bond Index, and the S&P 500 Index would be lower if they included the effects of sales charges, operating expenses of a mutual fund, or taxes. Returns for the Lipper Average reflect the deduction of operating expenses, but not sales charges or taxes.
| | |
| 4 | | Visit our website at www.prudentialfunds.com |
| | | |
| Five Largest Equity Holdings expressed as a percentage of net assets as of 3/31/10 | | | |
Exxon Mobil Corp., Oil, Gas & Consumable Fuels | | 1.7 | % |
Microsoft Corp., Software | | 1.4 | |
Bank of America Corp., Diversified Financial Services | | 1.2 | |
Procter & Gamble Co. (The), Household Products | | 1.1 | |
Chevron Corp., Oil, Gas & Consumable Fuels | | 1.0 | |
Holdings reflect only long-term equity investments and are subject to change.
| | |
| Five Largest Equity Industries expressed as a percentage of net assets as of 3/31/10 | | |
Oil, Gas & Consumable Fuels | | 5.3 |
Pharmaceuticals | | 3.5 |
Computers & Peripherals | | 3.1 |
Diversified Financial Services | | 2.8 |
Insurance | | 2.7 |
Industry weightings reflect only long-term equity investments and are subject to change.
| | |
| Prudential Investment Portfolios, Inc./Prudential Asset Allocation Fund | | 5 |
Fees and Expenses (Unaudited)
As a shareholder of the Fund, you incur two types of costs: (1) transaction costs, including sales charges (loads) on purchase payments and redemptions, as applicable, and (2) ongoing costs, including management fees, distribution and/or service (12b-1) fees, and other Fund expenses, as applicable. This example is intended to help you understand your ongoing costs (in dollars) of investing in the Fund and to compare these costs with the ongoing costs of investing in other mutual funds.
The example is based on an investment of $1,000 invested on October 1, 2009, at the beginning of the period, and held through the six-month period ended March 31, 2010. The example is for illustrative purposes only; you should consult the Prospectus for information on initial and subsequent minimum investment requirements.
The Fund’s transfer agent may charge additional fees to holders of certain accounts that are not included in the expenses shown in the table on the following page. These fees apply to individual retirement accounts (IRAs) and Section 403(b) accounts. As of the close of the six-month period covered by the table, IRA fees included an annual maintenance fee of $15 per account (subject to a maximum annual maintenance fee of $25 for all accounts held by the same shareholder). Section 403(b) accounts are charged an annual $25 fiduciary maintenance fee. Some of the fees may vary in amount, or may be waived, based on your total account balance or the number of Prudential Investments funds, including the Fund, that you own. You should consider the additional fees that were charged to your Fund account over the six-month period when you estimate the total ongoing expenses paid over the period and the impact of these fees on your ending account value, as these additional expenses are not reflected in the information provided in the expense table. Additional fees have the effect of reducing investment returns.
Actual Expenses
The first line for each share class in the table on the following page provides information about actual account values and actual expenses. You may use the information on this line, together with the amount you invested, to estimate the expenses that you paid over the period. Simply divide your account value by $1,000 (for example, an $8,600 account value ÷ $1,000 = 8.6), then multiply the result by the number on the first line under the heading “Expenses Paid During the Six-Month Period” to estimate the expenses you paid on your account during this period.
Hypothetical Example for Comparison Purposes
The second line for each share class in the table on the following page provides information about hypothetical account values and hypothetical expenses based on the Fund’s actual expense ratio and an assumed rate of return of 5% per year before expenses, which is not the Fund’s actual return. The hypothetical account values and expenses may not be used to estimate the actual ending account balance or expenses you paid for the period. You may use this information to compare the ongoing costs of investing in the
| | |
| 6 | | Visit our website at www.prudentialfunds.com |
Fund and other funds. To do so, compare this 5% hypothetical example with the 5% hypothetical examples that appear in the shareholder reports of the other funds.
Please note that the expenses shown in the table are meant to highlight your ongoing costs only and do not reflect any transactional costs such as sales charges (loads). Therefore, the second line for each share class in the table is useful in comparing ongoing costs only and will not help you determine the relative total costs of owning different funds. In addition, if these transactional costs were included, your costs would have been higher.
| | | | | | | | | | | | | | |
Prudential Asset
Allocation Fund | | Beginning Account
Value
October 1, 2009 | | Ending Account
Value March 31, 2010 | | Annualized
Expense Ratio
Based on the
Six-Month Period | | | Expenses Paid
During the
Six-Month Period* |
| | | | | | | | | | | | | | |
| Class A | | Actual | | $ | 1,000.00 | | $ | 1,082.60 | | 1.22 | % | | $ | 6.33 |
| | | Hypothetical | | $ | 1,000.00 | | $ | 1,018.85 | | 1.22 | % | | $ | 6.14 |
| | | | | | | | | | | | | | |
| Class B | | Actual | | $ | 1,000.00 | | $ | 1,079.60 | | 1.92 | % | | $ | 9.95 |
| | | Hypothetical | | $ | 1,000.00 | | $ | 1,015.36 | | 1.92 | % | | $ | 9.65 |
| | | | | | | | | | | | | | |
| Class C | | Actual | | $ | 1,000.00 | | $ | 1,079.60 | | 1.92 | % | | $ | 9.95 |
| | | Hypothetical | | $ | 1,000.00 | | $ | 1,015.36 | | 1.92 | % | | $ | 9.65 |
| | | | | | | | | | | | | | |
| Class L | | Actual | | $ | 1,000.00 | | $ | 1,082.40 | | 1.42 | % | | $ | 7.37 |
| | | Hypothetical | | $ | 1,000.00 | | $ | 1,017.85 | | 1.42 | % | | $ | 7.14 |
| | | | | | | | | | | | | | |
| Class M | | Actual | | $ | 1,000.00 | | $ | 1,079.60 | | 1.92 | % | | $ | 9.95 |
| | | Hypothetical | | $ | 1,000.00 | | $ | 1,015.36 | | 1.92 | % | | $ | 9.65 |
| | | | | | | | | | | | | | |
| Class R | | Actual | | $ | 1,000.00 | | $ | 1,081.60 | | 1.42 | % | | $ | 7.37 |
| | | Hypothetical | | $ | 1,000.00 | | $ | 1,017.85 | | 1.42 | % | | $ | 7.14 |
| | | | | | | | | | | | | | |
| Class X | | Actual | | $ | 1,000.00 | | $ | 1,079.60 | | 1.92 | % | | $ | 9.95 |
| | | Hypothetical | | $ | 1,000.00 | | $ | 1,015.36 | | 1.92 | % | | $ | 9.65 |
| | | | | | | | | | | | | | |
| Class Z | | Actual | | $ | 1,000.00 | | $ | 1,084.00 | | 0.92 | % | | $ | 4.78 |
| | | Hypothetical | | $ | 1,000.00 | | $ | 1,020.34 | | 0.92 | % | | $ | 4.63 |
| | | | | | | | | | | | | | |
* Fund expenses (net of fee waivers or subsidies, if any) for each share class are equal to the annualized expense ratio for each share class (provided in the table), multiplied by the average account value over the period, multiplied by the 182 days in the six-month period ended March 31, 2010, and divided by the 365 days in the Fund’s fiscal year ending September 30, 2010 (to reflect the six-month period). Expenses presented in the table include the expenses of any underlying portfolios in which the Fund may invest.
| | |
| Prudential Investment Portfolios, Inc./Prudential Asset Allocation Fund | | 7 |
Portfolio of Investments
as of March 31, 2010 (Unaudited)
| | | | | |
| Shares | | Description | | Value (Note 1) |
| | | | | |
LONG-TERM INVESTMENTS 93.0% | | | |
COMMON STOCKS 60.6% | | | |
| |
Aerospace & Defense 2.0% | | | |
| 600 | | AAR Corp.(a) | | $ | 14,892 |
| 4,300 | | Alliant Techsystems, Inc.(a)(b) | | | 349,590 |
| 7,377 | | BAE Systems PLC (United Kingdom) | | | 41,565 |
| 2,334 | | Cobham PLC (United Kingdom) | | | 9,102 |
| 1,200 | | Cubic Corp. | | | 43,200 |
| 1,500 | | Ducommun, Inc. | | | 31,515 |
| 3,600 | | DynCorp International, Inc. (Class A Stock)(a) | | | 41,364 |
| 1,200 | | Esterline Technologies Corp.(a) | | | 59,316 |
| 830 | | European Aeronautic Defense and Space Co. NV (France) | | | 16,698 |
| 826 | | Finmeccanica SpA (Italy) | | | 11,023 |
| 1,000 | | GenCorp, Inc.(a) | | | 5,760 |
| 23,400 | | General Dynamics Corp. | | | 1,806,480 |
| 6,400 | | ITT Corp. | | | 343,104 |
| 900 | | L-3 Communications Holdings, Inc. (Class 3 Stock) | | | 82,467 |
| 12,300 | | Lockheed Martin Corp. | | | 1,023,606 |
| 23,700 | | Northrop Grumman Corp. | | | 1,554,009 |
| 11,800 | | Raytheon Co. | | | 674,016 |
| 3,778 | | Rolls-Royce Group PLC (United Kingdom) | | | 34,141 |
| 383 | | Safran SA (France) | | | 9,984 |
| 3,000 | | Singapore Technologies Engineering Ltd. (Singapore) | | | 6,841 |
| 10,600 | | TASER International, Inc.(a) | | | 62,116 |
| 1,000 | | Teledyne Technologies, Inc.(a) | | | 41,270 |
| 183 | | Thales SA (France) | | | 7,346 |
| 200 | | Triumph Group, Inc. | | | 14,018 |
| 30,500 | | United Technologies Corp. | | | 2,245,105 |
| | | | | |
| | | | | 8,528,528 |
| |
Air Freight & Logistics 0.7% | | | |
| 700 | | Air Transport Services Group, Inc.(a) | | | 2,359 |
| 1,725 | | Deutsche Post AG (Germany) | | | 29,846 |
| 2,700 | | Dynamex, Inc.(a) | | | 46,440 |
| 10,000 | | FedEx Corp. | | | 934,000 |
| 800 | | Forward Air Corp. | | | 21,040 |
| 756 | | TNT NV (Netherlands) | | | 21,678 |
| 1,349 | | Toll Holdings Ltd. (Australia) | | | 9,185 |
| 30,000 | | United Parcel Service, Inc. (Class B Stock) | | | 1,932,300 |
| 1,000 | | Yamato Holdings Co. Ltd. (Japan) | | | 14,055 |
| | | | | |
| | | | | 3,010,903 |
See Notes to Financial Statements.
| | |
| Prudential Investment Portfolios, Inc./Prudential Asset Allocation Fund | | 9 |
Portfolio of Investments
as of March 31, 2010 (Unaudited) continued
| | | | | |
| Shares | | Description | | Value (Note 1) |
| | | | | |
COMMON STOCKS (Continued) | | | |
| |
Airlines 0.1% | | | |
| 276 | | Air France-KLM (France)(a) | | $ | 4,363 |
| 13,900 | | AirTran Holdings, Inc.(a) | | | 70,612 |
| 4,000 | | Alaska Air Group, Inc.(a) | | | 164,920 |
| 2,000 | | All Nippon Airways Co. Ltd. (Japan)(a) | | | 5,712 |
| 1,300 | | Allegiant Travel Co. (Class A Stock)(a) | | | 75,218 |
| 1,178 | | British Airways PLC (United Kingdom)(a) | | | 4,344 |
| 2,000 | | Cathay Pacific Airways Ltd. (Hong Kong)(a) | | | 4,214 |
| 468 | | Deutsche Lufthansa AG (Germany) | | | 7,747 |
| 4,300 | | Hawaiian Holdings, Inc.(a) | | | 31,691 |
| 973 | | Iberia Lineas Aereas de Espana (Spain)(a) | | | 3,401 |
| 2,266 | | Qantas Airways Ltd. (Australia)(a) | | | 5,906 |
| 1,000 | | Singapore Airlines Ltd. (Singapore) | | | 10,865 |
| 2,600 | | Skywest, Inc. | | | 37,128 |
| | | | | |
| | | | | 426,121 |
| |
Auto Components 0.6% | | | |
| 400 | | Aisin Seiki Co. Ltd. (Japan) | | | 11,980 |
| 6,100 | | ArvinMeritor, Inc.(a) | | | 81,435 |
| 1,300 | | Bridgestone Corp. (Japan) | | | 22,193 |
| 297 | | Compagnie Generale des Etablissements Michelin (France) (Class B Stock) | | | 21,886 |
| 6,900 | | Cooper Tire & Rubber Co. | | | 131,238 |
| 1,000 | | Denso Corp. (Japan) | | | 29,789 |
| 700 | | Dorman Products, Inc.(a) | | | 13,293 |
| 1,100 | | Drew Industries, Inc.(a) | | | 24,222 |
| 49,300 | | Johnson Controls, Inc. | | | 1,626,407 |
| 200 | | NOK Corp. (Japan) | | | 3,010 |
| 217 | | Nokian Renkaat OYJ (Finland) | | | 5,636 |
| 5,343 | | Pirelli & C SpA (Italy)(a) | | | 3,284 |
| 1,400 | | Standard Motor Products, Inc. | | | 13,888 |
| 300 | | Stanley Electric Co. Ltd. (Japan) | | | 5,818 |
| 500 | | Sumitomo Rubber Industries Ltd. (Japan) | | | 4,407 |
| 1,700 | | Superior Industries International, Inc. | | | 27,336 |
| 2,700 | | Tenneco, Inc.(a) | | | 63,855 |
| 100 | | Toyoda Gosei Co. Ltd. (Japan) | | | 2,803 |
| 400 | | Toyota Industries Corp. (Japan) | | | 11,424 |
| 17,200 | | TRW Automotive Holdings Corp.(a) | | | 491,576 |
| | | | | |
| | | | | 2,595,480 |
See Notes to Financial Statements.
| | |
| 10 | | Visit our website at www.prudentialfunds.com |
| | | | | |
| Shares | | Description | | Value (Note 1) |
| | | | | |
COMMON STOCKS (Continued) | | | |
| |
Automobiles 0.5% | | | |
| 674 | | Bayerische Motoren Werke AG (Germany) | | $ | 31,156 |
| 1,838 | | Daimler AG (Germany) | | | 86,702 |
| 1,558 | | Fiat SpA (Italy)(a) | | | 20,286 |
| 119,800 | | Ford Motor Co.(a)(b) | | | 1,505,886 |
| 1,000 | | Fuji Heavy Industries Ltd. (Japan)(a) | | | 5,177 |
| 3,400 | | Honda Motor Co. Ltd. (Japan) | | | 120,013 |
| 2,000 | | Isuzu Motors Ltd. (Japan) | | | 5,412 |
| 3,000 | | Mazda Motor Corp. (Japan) | | | 8,439 |
| 8,000 | | Mitsubishi Motors Corp. (Japan)(a) | | | 10,867 |
| 5,100 | | Nissan Motor Co. Ltd. (Japan)(a) | | | 43,696 |
| 311 | | Peugeot SA (France)(a) | | | 9,157 |
| 179 | | Porsche Automobil Holding SE (Germany) | | | 10,886 |
| 378 | | Renault SA (France)(a) | | | 17,716 |
| 800 | | Suzuki Motor Corp. (Japan) | | | 17,653 |
| 2,200 | | Thor Industries, Inc. | | | 66,462 |
| 6,000 | | Toyota Motor Corp. (Japan) | | | 240,347 |
| 90 | | Volkswagen AG (Germany) | | | 8,691 |
| 2,200 | | Winnebago Industries(a) | | | 32,142 |
| 500 | | Yamaha Motor Co. Ltd. (Japan)(a) | | | 7,493 |
| | | | | |
| | | | | 2,248,181 |
| |
Beverages 1.4% | | | |
| 800 | | Asahi Breweries Ltd. (Japan) | | | 15,001 |
| 218 | | Carlsberg A/S (Denmark) (Class B Stock) | | | 18,297 |
| 1,136 | | Coca-Cola Amatil Ltd. (Australia) | | | 11,728 |
| 34,620 | | Coca-Cola Co. (The) | | | 1,904,100 |
| 373 | | Coca-Cola Hellenic Bottling Co. SA (Greece) | | | 10,056 |
| 100 | | Coca-Cola West Holdings Co. Ltd. (Japan) | | | 1,635 |
| 17,400 | | Constellation Brands, Inc. (Class A Stock)(a) | | | 286,056 |
| 5,095 | | Diageo PLC (United Kingdom) | | | 85,512 |
| 35,100 | | Dr Pepper Snapple Group, Inc. | | | 1,234,467 |
| 3,936 | | Foster’s Group Ltd. (Australia) | | | 19,107 |
| 225 | | Heineken Holding NV (Netherlands) | | | 10,009 |
| 499 | | Heineken NV (Netherlands) | | | 25,645 |
| 1,470 | | InBev NV (Belgium) | | | 74,048 |
| 200 | | ITO EN Ltd. (Japan) | | | 3,095 |
| 2,000 | | Kirin Holdings Co. Ltd. (Japan) | | | 29,500 |
| 35,000 | | PepsiCo, Inc. | | | 2,315,600 |
| 398 | | Pernod-Ricard SA (France) | | | 33,796 |
See Notes to Financial Statements.
| | |
| Prudential Investment Portfolios, Inc./Prudential Asset Allocation Fund | | 11 |
Portfolio of Investments
as of March 31, 2010 (Unaudited) continued
| | | | | |
| Shares | | Description | | Value (Note 1) |
| | | | | |
COMMON STOCKS (Continued) | | | |
| |
Beverages (cont’d.) | | | |
| 1,922 | | SABMiller PLC (United Kingdom) | | $ | 56,349 |
| 1,000 | | Sapporo Holdings Ltd. (Japan) | | | 5,220 |
| | | | | |
| | | | | 6,139,221 |
| |
Biotechnology 1.0% | | | |
| 204 | | Actelion Ltd. (Switzerland)(a) | | | 9,281 |
| 9,700 | | Alkermes, Inc.(a) | | | 125,809 |
| 21,600 | | Amgen, Inc.(a) | | | 1,290,816 |
| 1,900 | | Biogen Idec, Inc.(a) | | | 108,984 |
| 10,700 | | Celera Corp.(a) | | | 75,970 |
| 9,500 | | Celldex Therapeutics, Inc.(a) | | | 58,330 |
| 1,232 | | CSL Ltd. (Australia) | | | 41,186 |
| 4,300 | | Cubist Pharmaceuticals, Inc.(a) | | | 96,922 |
| 1,000 | | Dyax Corp.(a) | | | 3,410 |
| 3,800 | | Genomic Health, Inc.(a) | | | 66,842 |
| 42,600 | | Gilead Sciences, Inc.(a) | | | 1,937,448 |
| 142 | | Grifols SA (Spain) | | | 2,121 |
| 400 | | Human Genome Sciences, Inc.(a) | | | 12,080 |
| 3,400 | | Idenix Pharmaceuticals, Inc.(a) | | | 9,588 |
| 500 | | Idera Pharmaceuticals, Inc.(a) | | | 3,105 |
| 20,100 | | Immunomedics, Inc.(a) | | | 66,732 |
| 400 | | Infinity Pharmaceuticals, Inc.(a) | | | 2,440 |
| 2,100 | | Isis Pharmaceuticals, Inc.(a) | | | 22,932 |
| 200 | | Martek Biosciences Corp.(a) | | | 4,502 |
| 1,400 | | NABI Biopharmaceuticals(a) | | | 7,658 |
| 5,200 | | PDL Biopharma, Inc. | | | 32,292 |
| 12,100 | | Progenics Pharmaceuticals, Inc.(a) | | | 64,493 |
| 2,200 | | SciClone Pharmaceuticals, Inc.(a) | | | 7,766 |
| 3,400 | | Synta Pharmaceuticals Corp.(a) | | | 14,654 |
| 3,900 | | Theravance, Inc.(a) | | | 51,948 |
| | | | | |
| | | | | 4,117,309 |
| |
Building Products 0.1% | | | |
| 1,000 | | AAON, Inc. | | | 22,620 |
| 3,000 | | Asahi Glass Co. Ltd. (Japan) | | | 33,790 |
| 637 | | ASSA Abloy AB (Sweden) (Class B Stock) | | | 12,465 |
| 774 | | CIE de Saint-Gobain (France) | | | 37,216 |
| 500 | | Daikin Industries Ltd. (Japan) | | | 20,457 |
| 79 | | Geberit AG (Switzerland) | | | 14,138 |
| 6,700 | | Gibraltar Industries, Inc.(a) | | | 84,487 |
See Notes to Financial Statements.
| | |
| 12 | | Visit our website at www.prudentialfunds.com |
| | | | | |
| Shares | | Description | | Value (Note 1) |
| | | | | |
COMMON STOCKS (Continued) | | | |
| |
Building Products (cont’d.) | | | |
| 500 | | JS Group Corp. (Japan) | | $ | 10,178 |
| 1,000 | | Nippon Sheet Glass Co. Ltd. (Japan) | | | 2,952 |
| 1,400 | | Quanex Building Products Corp. | | | 23,142 |
| 1,000 | | Toto Ltd. (Japan) | | | 6,814 |
| 100 | | Universal Forest Products, Inc. | | | 3,852 |
| | | | | |
| | | | | 272,111 |
| |
Capital Markets 1.2% | | | |
| 1,967 | | 3i Group PLC (United Kingdom) | | | 8,692 |
| 1,000 | | Affiliated Managers Group, Inc.(a) | | | 79,000 |
| 7,100 | | Ameriprise Financial, Inc. | | | 322,056 |
| 6,300 | | Ares Capital Corp. | | | 93,492 |
| 2,700 | | Bank of New York Mellon Corp. (The)(b) | | | 83,376 |
| 8,300 | | BGC Partners, Inc. (Class A Stock) | | | 50,713 |
| 700 | | BlackRock, Inc. (Class A Stock) | | | 152,432 |
| 3,400 | | Calamos Asset Management, Inc. (Class A Stock) | | | 48,756 |
| 2,324 | | Credit Suisse Group AG (Switzerland) | | | 119,793 |
| 3,000 | | Daiwa Securities Group, Inc. (Japan) | | | 15,788 |
| 1,266 | | Deutsche Bank AG (Germany) | | | 97,637 |
| 100 | | Diamond Hill Investment Group, Inc. | | | 6,860 |
| 400 | | Fifth Street Finance Corp. | | | 4,644 |
| 1,500 | | Franklin Resources, Inc. | | | 166,350 |
| 431 | | GAM Holding Ltd. (Switzerland) | | | 5,294 |
| 1,500 | | GFI Group, Inc. | | | 8,670 |
| 16,915 | | Goldman Sachs Group, Inc. (The) | | | 2,886,206 |
| 1,058 | | ICAP PLC (United Kingdom) | | | 6,001 |
| 881 | | Investec PLC (United Kingdom) | | | 7,206 |
| 100 | | JAFCO Co. Ltd. (Japan) | | | 2,626 |
| 431 | | Julius Baer Group Ltd. (Switzerland) | | | 15,635 |
| 2,700 | | Knight Capital Group, Inc. (Class A Stock)(a) | | | 41,175 |
| 2,800 | | Labranche & Co., Inc.(a) | | | 14,728 |
| 653 | | Macquarie Group Ltd. (Australia) | | | 28,313 |
| 3,488 | | Man Group PLC (United Kingdom) | | | 12,783 |
| 1,297 | | Marfin Investment Group SA (Greece) | | | 2,978 |
| 200 | | Matsui Securities Co. Ltd. (Japan) | | | 1,429 |
| 967 | | Mediobanca SpA (Italy)(a) | | | 10,390 |
| 1,000 | | Mizuho Securities Co. Ltd. (Japan) | | | 3,166 |
| 21,900 | | Morgan Stanley | | | 641,451 |
| 7,300 | | Nomura Holdings, Inc. (Japan) | | | 53,799 |
| 9,900 | | PennantPark Investment Corp. | | | 102,564 |
See Notes to Financial Statements.
| | |
| Prudential Investment Portfolios, Inc./Prudential Asset Allocation Fund | | 13 |
Portfolio of Investments
as of March 31, 2010 (Unaudited) continued
| | | | | |
| Shares | | Description | | Value (Note 1) |
| | | | | |
COMMON STOCKS (Continued) | | | |
| |
Capital Markets (cont’d.) | | | |
| 1,300 | | Piper Jaffray Cos.(a) | | $ | 52,390 |
| 198 | | Ratos AB (Sweden) (Class B Stock) | | | 6,568 |
| 34 | | SBI Holdings, Inc. (Japan) | | | 6,710 |
| 251 | | Schroders PLC (United Kingdom) | | | 5,359 |
| 1,700 | | Sws Group, Inc. | | | 19,601 |
| 7,252 | | UBS AG (Switzerland)(a) | | | 117,886 |
| | | | | |
| | | | | 5,302,517 |
| |
Chemicals 0.9% | | | |
| 511 | | Air Liquide SA (France) | | | 61,344 |
| 2,600 | | Air Products & Chemicals, Inc. | | | 192,270 |
| 497 | | AKZO Nobel NV (Netherlands) | | | 28,324 |
| 3,000 | | Asahi Kasei Corp. (Japan) | | | 16,141 |
| 3,700 | | Ashland, Inc. | | | 195,249 |
| 1,902 | | BASF AG (Germany) | | | 118,146 |
| 5,100 | | Calgon Carbon Corp.(a) | | | 87,312 |
| 22,800 | | Celanese Corp. (Class A Stock) | | | 726,180 |
| 1,000 | | Daicel Chemical Industries Ltd. (Japan) | | | 6,878 |
| 1,000 | | Denki Kagaku Kogyo K. K. (Japan) | | | 4,300 |
| 3,400 | | E.I. du Pont de Nemours & Co. | | | 126,616 |
| 8,200 | | Eastman Chemical Co. | | | 522,176 |
| 16 | | Givaudan SA (Switzerland) | | | 14,036 |
| 2,200 | | HB Fuller Co. | | | 51,062 |
| 200 | | Hitachi Chemical Co. Ltd. (Japan) | | | 4,321 |
| 3,266 | | Incitec Pivot Ltd. (Australia) | | | 10,400 |
| 200 | | Innophos Holdings, Inc. | | | 5,580 |
| 438 | | Johnson Matthey PLC (United Kingdom) | | | 11,605 |
| 400 | | JSR Corp. (Japan) | | | 8,356 |
| 352 | | K+S AG (Germany) | | | 21,342 |
| 1,000 | | Kaneka Corp. (Japan) | | | 6,482 |
| 315 | | Koninklijke DSM NV (Netherlands) | | | 14,046 |
| 1,100 | | Koppers Holdings, Inc. | | | 31,152 |
| 1,000 | | Kuraray Co. Ltd. (Japan) | | | 13,456 |
| 309 | | Linde AG (Germany) | | | 36,727 |
| 2,500 | | Mitsubishi Chemical Holdings Corp. (Japan) | | | 12,782 |
| 1,000 | | Mitsubishi Gas Chemical Co., Inc. (Japan) | | | 6,022 |
| 2,000 | | Mitsui Chemicals, Inc. (Japan) | | | 6,054 |
| 27,300 | | Nalco Holding Co. | | | 664,209 |
| 700 | | NewMarket Corp. | | | 72,093 |
| 300 | | Nitto Denko Corp. (Japan) | | | 11,648 |
See Notes to Financial Statements.
| | |
| 14 | | Visit our website at www.prudentialfunds.com |
| | | | | |
| Shares | | Description | | Value (Note 1) |
| | | | | |
COMMON STOCKS (Continued) | | | |
| |
Chemicals (cont’d.) | | | |
| 109 | | Novozymes A/S (Denmark) (Class B Stock) | | $ | 12,063 |
| 350 | | Nufarm Ltd. (Australia) | | | 2,643 |
| 7,800 | | Omnova Solutions, Inc.(a) | | | 61,230 |
| 733 | | Orica Ltd. (Australia) | | | 18,020 |
| 1,200 | | Praxair, Inc. | | | 99,600 |
| 2,400 | | Schulman, Inc. | | | 58,728 |
| 800 | | Shin-Etsu Chemical Co. Ltd. (Japan) | | | 46,465 |
| 3,000 | | Showa Denko K.K. (Japan) | | | 6,771 |
| 4,500 | | Solutia, Inc.(a) | | | 72,495 |
| 121 | | Solvay SA (Belgium) | | | 12,439 |
| 5,300 | | Spartech Corp.(a) | | | 62,010 |
| 1,000 | | Stepan Co. | | | 55,890 |
| 3,000 | | Sumitomo Chemical Co. Ltd. (Japan) | | | 14,665 |
| 193 | | Syngenta AG (Switzerland) | | | 53,595 |
| 1,000 | | Taiyo Nippon Sanso Corp. (Japan) | | | 9,776 |
| 2,000 | | Teijin Ltd. (Japan) | | | 6,717 |
| 1,000 | | Tokuyama Corp. (Japan) | | | 5,541 |
| 3,000 | | Toray Industries, Inc. (Japan) | | | 17,521 |
| 1,000 | | Tosoh Corp. (Japan) | | | 2,546 |
| 2,000 | | UBE Industries Ltd. (Japan) | | | 5,134 |
| 233 | | Umicore (Belgium) | | | 8,137 |
| 32 | | Wacker Chemie AG (Germany) | | | 4,763 |
| 3,400 | | WR Grace & Co.(a) | | | 94,384 |
| 387 | | Yara International ASA (Norway) | | | 16,800 |
| | | | | |
| | | | | 3,834,242 |
| |
Commercial Banks 2.3% | | | |
| 1,000 | | 77 Bank Ltd. (The) (Japan) | | | 5,712 |
| 810 | | Alpha Bank A.E. (Greece)(a) | | | 7,669 |
| 2,000 | | Aozora Bank Ltd. (Japan) | | | 2,824 |
| 5,104 | | Australia & New Zealand Banking Group Ltd. (Australia) | | | 118,778 |
| 1,320 | | Banca Carige SpA (Italy) | | | 3,606 |
| 4,486 | | Banca Monte DEI Paschi DI Siena SpA (Italy) | | | 6,641 |
| 805 | | Banca Popolare Di Milano Scarl (Italy) | | | 4,999 |
| 7,297 | | Banco Bilbao Vizcaya Argentaria SA (Spain) | | | 99,839 |
| 4,793 | | Banco Comercial Portugues SA (Portugal) (Class R Stock) | | | 5,334 |
| 2,050 | | Banco de Sabadell SA (Spain) | | | 11,319 |
| 435 | | Banco de Valencia SA (Spain) | | | 2,773 |
| 1,072 | | Banco Espirito Santo SA (Portugal)(a) | | | 5,792 |
| 1,308 | | Banco Popolare SC (Italy)(a) | | | 9,098 |
See Notes to Financial Statements.
| | |
| Prudential Investment Portfolios, Inc./Prudential Asset Allocation Fund | | 15 |
Portfolio of Investments
as of March 31, 2010 (Unaudited) continued
| | | | | |
| Shares | | Description | | Value (Note 1) |
| | | | | |
COMMON STOCKS (Continued) | | | |
| |
Commercial Banks (cont’d.) | | | |
| 1,788 | | Banco Popular Espanol SA (Spain) | | $ | 13,162 |
| 16,823 | | Banco Santander Central Hispano SA (Spain) | | | 223,586 |
| 1,159 | | Bank of Cyprus Public Co. Ltd. (Cyprus) | | | 7,326 |
| 3,000 | | Bank of East Asia Ltd. (Hong Kong) | | | 11,051 |
| 1,000 | | Bank of Kyoto Ltd. (The) (Japan) | | | 9,210 |
| 3,000 | | Bank of Yokohama Ltd. (The) (Japan) | | | 14,697 |
| 580 | | Bankinter SA (Spain) | | | 4,826 |
| 23,233 | | Barclays (United Kingdom) | | | 127,027 |
| 710 | | Bendigo And Adelaide Bank Ltd. (Australia) | | | 6,515 |
| 1,930 | | BNP Paribas (France) | | | 148,221 |
| 9,500 | | BOC Hong Kong Holdings Ltd. (Hong Kong) | | | 22,660 |
| 300 | | Bryn Mawr Bank Corp. | | | 5,445 |
| 900 | | Camden National Corp. | | | 28,899 |
| 600 | | Cardinal Financial Corp. | | | 6,408 |
| 2,000 | | Chiba Bank Ltd. (The) (Japan) | | | 11,958 |
| 2,000 | | Chuo Mitsui Trust Holdings, Inc. (Japan) | | | 7,509 |
| 2,000 | | City Holding Co. | | | 68,580 |
| 1,447 | | Commerzbank AG (Germany)(a) | | | 12,408 |
| 3,194 | | Commonwealth Bank of Australia (Australia) | | | 164,985 |
| 1,300 | | Community Bank System, Inc. | | | 29,614 |
| 1,400 | | Community Trust Bancorp, Inc. | | | 37,926 |
| 2,059 | | Credit Agricole SA (France) | | | 36,042 |
| 924 | | Danske Bank A/S (Denmark)(a) | | | 22,732 |
| 4,000 | | DBS Group Holdings Ltd. (Singapore) | | | 40,888 |
| 129 | | Deutsche Postbank AG (Germany)(a) | | | 4,111 |
| 1,080 | | Dexia SA (Belgium)(a) | | | 6,442 |
| 1,826 | | DnB NOR ASA (Norway)(a) | | | 20,862 |
| 660 | | EFG Eurobank Ergasias SA (Greece)(a) | | | 6,062 |
| 384 | | Erste Group Bank AG (Austria) | | | 16,130 |
| 200 | | Financial Institutions, Inc. | | | 2,924 |
| 3,700 | | First Bancorp, Inc. | | | 8,917 |
| 500 | | First Bancorp, Inc./Maine | | | 7,970 |
| 2,500 | | First Bancorp, Inc./Troy, North Carolina | | | 33,800 |
| 8,200 | | First Commonwealth Financial Corp. | | | 55,022 |
| 2,900 | | First Community Bancshares, Inc. | | | 35,873 |
| 200 | | First Financial Bancorp | | | 3,558 |
| 10,500 | | FNB Corp. | | | 85,155 |
| 2,000 | | Fukuoka Financial Group, Inc. (Japan) | | | 8,493 |
| 1,000 | | Gunma Bank Ltd. (The) (Japan) | | | 5,530 |
| 1,000 | | Hachijuni Bank Ltd. (The) (Japan) | | | 5,690 |
See Notes to Financial Statements.
| | |
| 16 | | Visit our website at www.prudentialfunds.com |
| | | | | |
| Shares | | Description | | Value (Note 1) |
| | | | | |
COMMON STOCKS (Continued) | | | |
| |
Commercial Banks (cont’d.) | | | |
| 1,600 | | Hang Seng Bank Ltd. (Hong Kong) | | $ | 22,297 |
| 1,000 | | Hiroshima Bank Ltd. (The) (Japan) | | | 4,225 |
| 3,000 | | Hokuhoku Financial Group, Inc. (Japan) | | | 6,578 |
| 200 | | Home Bancorp, Inc.(a) | | | 2,800 |
| 35,338 | | HSBC Holdings PLC (United Kingdom) | | | 358,217 |
| 165,300 | | Huntington Bancshares, Inc. | | | 887,661 |
| 3,800 | | International Bancshares Corp. | | | 87,362 |
| 15,898 | | Intesa SanPaolo SpA (Italy)(a) | | | 59,211 |
| 1,904 | | Intesa SanPaolo SpA-RSP (Italy) | | | 5,703 |
| 1,000 | | Iyo Bank Ltd. (The) (Japan) | | | 9,509 |
| 1,000 | | Joyo Bank Ltd. (The) (Japan) | | | 4,460 |
| 329 | | KBC Groep NV (Belgium)(a) | | | 15,933 |
| 28,300 | | KeyCorp | | | 219,325 |
| 1,600 | | Lakeland Bancorp, Inc. | | | 14,160 |
| 77,727 | | Lloyds TSB Group PLC (United Kingdom)(a) | | | 74,037 |
| 2,800 | | MainSource Financial Group, Inc. | | | 18,844 |
| 25,800 | | Mitsubishi UFJ Financial Group, Inc. (Japan) | | | 135,223 |
| 27,000 | | Mizuho Financial Group, Inc. (Japan) | | | 53,428 |
| 3,000 | | Mizuho Trust & Banking Co. Ltd. (Japan) | | | 3,016 |
| 1,000 | | Nara Bancorp, Inc.(a) | | | 8,760 |
| 4,271 | | National Australia Bank Ltd. (Australia) | | | 107,859 |
| 1,280 | | National Bank of Greece SA (Greece)(a) | | | 25,760 |
| 1,781 | | Natixis (France)(a) | | | 9,610 |
| 300 | | NBT Bancorp, Inc. | | | 6,855 |
| 1,000 | | Nishi-Nippon City Bank Ltd. (The) (Japan) | | | 2,952 |
| 6,583 | | Nordea Bank AB (Sweden) | | | 64,958 |
| 900 | | Oriental Financial Group, Inc. | | | 12,150 |
| 5,000 | | Oversea-Chinese Banking Corp. Ltd. (Singapore) | | | 31,130 |
| 700 | | Peoples Bancorp, Inc. | | | 11,536 |
| 618 | | Piraeus Bank SA (Greece)(a) | | | 5,401 |
| 17,200 | | PNC Financial Services Group, Inc. | | | 1,026,840 |
| 2,100 | | Prosperity Bancshares, Inc. | | | 86,100 |
| 113 | | Raiffeisen International Bank Holding AG (Austria) | | | 5,372 |
| 21,200 | | Regions Financial Corp. | | | 166,420 |
| 300 | | Renasant Corp. | | | 4,854 |
| 1,100 | | Republic Bancorp, Inc. (Class A Stock) | | | 20,724 |
| 1,000 | | Resona Holdings, Inc. (Japan) | | | 12,643 |
| 34,526 | | Royal Bank of Scotland Group PLC (United Kingdom)(a) | | | 23,053 |
| 300 | | S&T Bancorp, Inc. | | | 6,270 |
| 900 | | Sapporo Hokuyo Holdings, Inc. (Japan) | | | 4,111 |
See Notes to Financial Statements.
| | |
| Prudential Investment Portfolios, Inc./Prudential Asset Allocation Fund | | 17 |
Portfolio of Investments
as of March 31, 2010 (Unaudited) continued
| | | | | |
| Shares | | Description | | Value (Note 1) |
| | | | | |
COMMON STOCKS (Continued) | | | |
| |
Commercial Banks (cont’d.) | | | |
| 1,000 | | Senshu Ikeda Holdings, Inc. (Japan) | | $ | 1,818 |
| 2,000 | | Shinsei Bank Ltd. (Japan) | | | 2,417 |
| 1,000 | | Shizuoka Bank Ltd. (The) (Japan) | | | 8,717 |
| 3,000 | | Signature Bank(a) | | | 111,150 |
| 3,096 | | Skandinaviska Enskilda Banken (Sweden) (Class A Stock)(a) | | | 19,779 |
| 1,282 | | Societe Generale (France) | | | 80,629 |
| 1,400 | | Southside Bancshares, Inc. | | | 30,198 |
| 4,097 | | Standard Chartered PLC (United Kingdom) | | | 111,754 |
| 300 | | State Bancorp, Inc./NY | | | 2,361 |
| 400 | | Suffolk Bancorp | | | 12,284 |
| 2,567 | | Sumitomo Mitsui Financial Group, Inc. (Japan) | | | 84,844 |
| 3,000 | | Sumitomo Trust & Banking Co. Ltd. (The) (Japan) | | | 17,585 |
| 700 | | Sun Bancorp, Inc.(a) | | | 2,758 |
| 2,300 | | SunTrust Banks, Inc. | | | 61,617 |
| 17,100 | | Susquehanna Bancshares, Inc. | | | 167,751 |
| 997 | | Svenska Handelsbanken AB (Sweden) (Class A Stock) | | | 29,217 |
| 1,037 | | Swedbank AB (Sweden) (Class A Stock) | | | 10,642 |
| 400 | | Texas Capital Bancshares, Inc.(a) | | | 7,596 |
| 45,008 | | U.S. Bancorp | | | 1,164,807 |
| 34,186 | | UniCredit SpA (Italy)(a) | | | 101,005 |
| 1,172 | | Unione di Banche Italiane ScpA (Italy) | | | 15,814 |
| 3,000 | | United Overseas Bank Ltd. (Singapore) | | | 41,217 |
| 700 | | Washington Trust Bancorp, Inc. | | | 13,048 |
| 5,700 | | Webster Financial Corp. | | | 99,693 |
| 72,641 | | Wells Fargo & Co. | | | 2,260,588 |
| 3,900 | | WesBanco, Inc. | | | 63,414 |
| 5,994 | | Westpac Banking Corp. (Australia) | | | 153,131 |
| 1,700 | | Wilshire Bancorp, Inc. | | | 18,751 |
| 500 | | Wing Hang Bank Ltd. (Hong Kong) | | | 4,572 |
| 200 | | Wintrust Financial Corp. | | | 7,442 |
| 7,600 | | Zions Bancorporation | | | 165,832 |
| | | | | |
| | | | | 10,150,376 |
| |
Commercial Services & Supplies 0.3% | | | |
| 1,400 | | ABM Industries, Inc. | | | 29,680 |
| 2,200 | | ATC Technology Corp.(a) | | | 37,752 |
| 5,800 | | Avery Dennison Corp. | | | 211,178 |
| 2,862 | | Brambles Ltd. (Australia) | | | 19,330 |
| 100 | | Consolidated Graphics, Inc.(a) | | | 4,141 |
| 1,400 | | Courier Corp. | | | 23,114 |
See Notes to Financial Statements.
| | |
| 18 | | Visit our website at www.prudentialfunds.com |
| | | | | |
| Shares | | Description | | Value (Note 1) |
| | | | | |
COMMON STOCKS (Continued) | | | |
| |
Commercial Services & Supplies (cont’d.) | | | |
| 1,000 | | DAI Nippon Printing Co. Ltd. (Japan) | | $ | 13,509 |
| 5,100 | | Deluxe Corp. | | | 99,042 |
| 3,900 | | Ennis, Inc. | | | 63,453 |
| 2,588 | | G4S PLC (United Kingdom) | | | 10,270 |
| 5,000 | | Herman Miller, Inc. | | | 90,300 |
| 600 | | M & F Worldwide Corp.(a) | | | 18,360 |
| 8,100 | | R.R. Donnelley & Sons Co. | | | 172,935 |
| 8,000 | | Republic Services, Inc. (Class A Stock) | | | 232,160 |
| 4,700 | | Rollins, Inc. | | | 101,896 |
| 4,000 | | Schawk, Inc. (Class A Stock) | | | 72,520 |
| 400 | | Secom Co. Ltd. (Japan) | | | 17,499 |
| 639 | | Securitas AB (Sweden) (Class B Stock) | | | 6,814 |
| 995 | | Serco Group PLC (United Kingdom) | | | 9,074 |
| 54 | | Societe BIC SA (France) | | | 4,135 |
| 1,200 | | Standard Parking Corp.(a) | | | 19,704 |
| 1,000 | | Toppan Printing Co. Ltd. (Japan) | | | 9,028 |
| 1,400 | | United Stationers, Inc.(a) | | | 82,390 |
| 2,700 | | Waste Management, Inc.(b) | | | 92,961 |
| | | | | |
| | | | | 1,441,245 |
| |
Communications Equipment 1.3% | | | |
| 4,733 | | Alcatel-Lucent (France)(a) | | | 14,965 |
| 15,200 | | ARRIS Group, Inc.(a) | | | 182,552 |
| 8,400 | | Aruba Networks, Inc.(a) | | | 114,744 |
| 2,000 | | Black Box Corp. | | | 61,520 |
| 132,166 | | Cisco Systems, Inc.(a) | | | 3,440,281 |
| 2,800 | | Globecomm Systems, Inc.(a) | | | 21,532 |
| 2,300 | | Harris Corp. | | | 109,227 |
| 24,800 | | Juniper Networks, Inc.(a) | | | 760,864 |
| 3,300 | | Loral Space & Communications, Inc.(a) | | | 115,896 |
| 2,500 | | NETGEAR, Inc.(a) | | | 65,250 |
| 2,700 | | Network Equipment Technologies, Inc.(a) | | | 14,877 |
| 7,675 | | Nokia Corp. (Finland) | | | 119,523 |
| 2,800 | | OPLINK Communications, Inc.(a) | | | 51,912 |
| 2,100 | | Plantronics, Inc. | | | 65,688 |
| 8,700 | | QUALCOMM, Inc. | | | 365,313 |
| 4,500 | | Riverbed Technology, Inc.(a) | | | 127,800 |
| 3,300 | | Tekelec(a) | | | 59,928 |
| 6,094 | | Telefonaktiebolaget LM Ericsson (Sweden) (Class B Stock) | | | 64,227 |
| | | | | |
| | | | | 5,756,099 |
See Notes to Financial Statements.
| | |
| Prudential Investment Portfolios, Inc./Prudential Asset Allocation Fund | | 19 |
Portfolio of Investments
as of March 31, 2010 (Unaudited) continued
| | | | | |
| Shares | | Description | | Value (Note 1) |
| | | | | |
COMMON STOCKS (Continued) | | | |
| |
Computers & Peripherals 3.1% | | | |
| 14,400 | | Apple, Inc.(a) | | $ | 3,382,992 |
| 70,000 | | EMC Corp.(a) | | | 1,262,800 |
| 4,000 | | Fujitsu Ltd. (Japan) | | | 26,185 |
| 54,911 | | Hewlett-Packard Co. | | | 2,918,520 |
| 33,241 | | International Business Machines Corp. | | | 4,263,158 |
| 372 | | Logitech International SA (Switzerland)(a) | | | 6,121 |
| 4,000 | | NEC Corp. (Japan) | | | 12,023 |
| 5,300 | | Novatel Wireless, Inc.(a) | | | 35,669 |
| 500 | | Rimage Corp.(a) | | | 7,230 |
| 10,600 | | Seagate Technology(a)(b) | | | 193,556 |
| 300 | | Seiko Epson Corp. (Japan) | | | 4,659 |
| 1,400 | | Teradata Corp.(a) | | | 40,446 |
| 8,000 | | Toshiba Corp. (Japan)(a) | | | 41,330 |
| 33,300 | | Western Digital Corp.(a) | | | 1,298,367 |
| | | | | |
| | | | | 13,493,056 |
| |
Construction & Engineering 0.1% | | | |
| 289 | | ACS Actividades de Construccion y Servicios SA (Spain) | | | 13,334 |
| 1,394 | | Balfour Beatty PLC (United Kingdom) | | | 6,181 |
| 456 | | Bouygues SA INH (France) | | | 22,924 |
| 866 | | Cintra Concesiones de Infraestructuras de Transporte SA (Spain) | | | 8,422 |
| 2,100 | | Dycom Industries, Inc.(a) | | | 18,417 |
| 83 | | Eiffage SA (France) | | | 4,293 |
| 3,700 | | EMCOR Group, Inc.(a) | | | 91,131 |
| 78 | | Fomento de Construcciones y Contratas SA (Spain) | | | 2,855 |
| 86 | | Hochtief AG (Germany) | | | 7,266 |
| 1,000 | | JGC Corp. (Japan) | | | 17,841 |
| 2,000 | | Kajima Corp. (Japan) | | | 4,899 |
| 114 | | Koninklijke Boskalis Westminster NV (Netherlands) | | | 4,369 |
| 304 | | Leighton Holdings Ltd. (Australia) | | | 10,880 |
| 1,000 | | Obayashi Corp. (Japan) | | | 4,439 |
| 187 | | Sacyr Vallehermoso SA (Spain)(a) | | | 1,650 |
| 1,000 | | Shimizu Corp. (Japan) | | | 4,171 |
| 815 | | Skanska AB (Sweden) (Class B Stock) | | | 14,809 |
| 2,000 | | Taisei Corp. (Japan) | | | 4,407 |
| 888 | | Vinci SA (France) | | | 52,335 |
| | | | | |
| | | | | 294,623 |
| |
Construction Materials | | | |
| 1,211 | | Boral Ltd. (Australia) | | | 6,234 |
| 480 | | Cimpor Cimentos de Portugal SGPS SA (Portugal) | | | 3,627 |
See Notes to Financial Statements.
| | |
| 20 | | Visit our website at www.prudentialfunds.com |
| | | | | |
| Shares | | Description | | Value (Note 1) |
| | | | | |
COMMON STOCKS (Continued) | | | |
| |
Construction Materials (cont’d.) | | | |
| 1,413 | | CRH PLC (Ireland) | | $ | 35,288 |
| 1,234 | | Fletcher Building Ltd. (New Zealand) | | | 7,319 |
| 294 | | Heidelbergcement AG (Germany) | | | 16,468 |
| 500 | | Holcim Ltd. (Switzerland)(a) | | | 37,272 |
| 69 | | Imerys SA (France) | | | 4,253 |
| 145 | | Italcementi SpA (Italy) | | | 1,677 |
| 883 | | James Hardie Industries NV (Austria)(a) | | | 5,883 |
| 407 | | Lafarge SA (France) | | | 28,640 |
| 2,000 | | Taiheiyo Cement Corp. (Japan)(a) | | | 2,867 |
| 118 | | Titan Cement Co. SA (Greece) | | | 3,124 |
| | | | | |
| | | | | 152,652 |
| |
Consumer Finance 0.7% | | | |
| 100 | | Acom Co. Ltd. (Japan) | | | 1,636 |
| 5,200 | | Advance America Cash Advance Centers, Inc. | | | 30,264 |
| 200 | | AEON Credit Service Co. Ltd. (Japan) | | | 2,375 |
| 31,400 | | American Express Co. | | | 1,295,564 |
| 3,100 | | Capital One Financial Corp. | | | 128,371 |
| 400 | | Credit Saison Co. Ltd. (Japan) | | | 6,204 |
| 7,800 | | Nelnet, Inc. (Class A Stock) | | | 144,768 |
| 230 | | ORIX Corp. (Japan) | | | 20,395 |
| 96,100 | | SLM Corp.(a) | | | 1,203,172 |
| 1,500 | | World Acceptance Corp.(a) | | | 54,120 |
| | | | | |
| | | | | 2,886,869 |
| |
Containers & Packaging 0.1% | | | |
| 1,500 | | AEP Industries, Inc.(a) | | | 39,030 |
| 2,485 | | Amcor Ltd. (Australia) | | | 14,572 |
| 4,600 | | Boise, Inc.(a) | | | 28,198 |
| 100 | | Bway Holding Co.(a) | | | 2,010 |
| 1,790 | | Rexam PLC (United Kingdom) | | | 7,956 |
| 3,000 | | Rock-Tenn Co. (Class A Stock) | | | 136,710 |
| 900 | | Silgan Holdings, Inc. | | | 54,207 |
| 400 | | Toyo Seikan Kaisha Ltd. (Japan) | | | 7,085 |
| | | | | |
| | | | | 289,768 |
| |
Distributors 0.1% | | | |
| 200 | | Canon Marketing Japan, Inc. (Japan) | | | 2,723 |
| 1,800 | | Core-Mark Holding Co., Inc.(a) | | | 55,098 |
See Notes to Financial Statements.
| | |
| Prudential Investment Portfolios, Inc./Prudential Asset Allocation Fund | | 21 |
Portfolio of Investments
as of March 31, 2010 (Unaudited) continued
| | | | | |
| Shares | | Description | | Value (Note 1) |
| | | | | |
COMMON STOCKS (Continued) | | | |
| |
Distributors (cont’d.) | | | |
| 4,000 | | Li & Fung Ltd. (Hong Kong) | | $ | 19,680 |
| 16,900 | | LKQ Corp.(a) | | | 343,070 |
| | | | | |
| | | | | 420,571 |
| |
Diversified Consumer Services 0.2% | | | |
| 200 | | Benesse Holdings, Inc. (Japan) | | | 8,664 |
| 1,200 | | Capella Education Co.(a) | | | 111,408 |
| 900 | | Career Education Corp.(a)(b) | | | 28,476 |
| 2,000 | | Coinstar, Inc.(a) | | | 65,000 |
| 1,600 | | Corinthian Colleges, Inc.(a) | | | 28,144 |
| 3,600 | | DeVry, Inc. | | | 234,720 |
| 10,200 | | Education Management Corp.(a) | | | 223,380 |
| 2,400 | | Universal Technical Institute, Inc.(a) | | | 54,768 |
| | | | | |
| | | | | 754,560 |
| |
Diversified Financial Services 2.8% | | | |
| 350 | | ASX Ltd. (Australia) | | | 10,901 |
| 289,445 | | Bank of America Corp. | | | 5,166,593 |
| 396,800 | | Citigroup, Inc.(a) | | | 1,607,040 |
| 400 | | CME Group, Inc. (Class A Stock) | | | 126,444 |
| 7,600 | | Compass Diversified Holdings | | | 115,976 |
| 1,717 | | Criteria CaixaCorp SA (Spain) | | | 8,509 |
| 398 | | Deutsche Boerse AG (Germany) | | | 29,485 |
| 56 | | Eurazeo (France) | | | 3,890 |
| 147 | | EXOR SpA (Italy) | | | 2,553 |
| 165 | | Groupe Bruxelles Lambert SA (Belgium) | | | 14,579 |
| 2,000 | | Hong Kong Exchanges and Clearing Ltd. (Hong Kong) | | | 33,384 |
| 7,592 | | ING Groep NV (Netherlands)(a) | | | 75,799 |
| 800 | | IntercontinentalExchange, Inc.(a) | | | 89,744 |
| 930 | | Investor AB (Sweden) (Class B Stock) | | | 17,839 |
| 85,330 | | JPMorgan Chase & Co. | | | 3,818,517 |
| 400 | | Kinnevik Investment AB (Sweden) (Class B Stock) | | | 7,368 |
| 304 | | London Stock Exchange Group PLC (United Kingdom) | | | 3,278 |
| 1,700 | | MarketAxess Holdings, Inc. | | | 26,741 |
| 67 | | Nationale a Portefeuille SA (Belgium) | | | 3,511 |
| 29,200 | | NYSE Euronext | | | 864,612 |
| 282 | | OKO Bank PLC (Finland) | | | 3,169 |
| 55 | | Pargesa Holding SA (Switzerland) | | | 4,668 |
| 3,600 | | PHH Corp.(a) | | | 84,852 |
| 2,000 | | Singapore Exchange Ltd. (Singapore) | | | 10,937 |
| | | | | |
| | | | | 12,130,389 |
See Notes to Financial Statements.
| | |
| 22 | | Visit our website at www.prudentialfunds.com |
| | | | | |
| Shares | | Description | | Value (Note 1) |
| | | | | |
COMMON STOCKS (Continued) | | | |
| |
Diversified Telecommunication Services 1.8% | | | |
| 153,810 | | AT&T, Inc. | | $ | 3,974,450 |
| 1,300 | | Atlantic Tele-Network, Inc. | | | 58,409 |
| 311 | | Belgacom SA (Belgium) | | | 12,148 |
| 17,167 | | BT Group PLC (United Kingdom) (Class A Stock) | | | 32,277 |
| 4,183 | | Cable & Wireless Communications PLC (United Kingdom) | | | 3,514 |
| 4,183 | | Cable & Wireless Worldwide (United Kingdom)(a) | | | 5,840 |
| 5,778 | | Deutsche Telekom AG (Germany) | | | 78,587 |
| 272 | | Elisa OYJ (Finland) | | | 5,610 |
| 3,779 | | France Telecom SA (France) | | | 90,420 |
| 500 | | Hellenic Telecommunications Organization SA (Greece) | | | 6,206 |
| 300 | | HickoryTech Corp. | | | 2,649 |
| 33 | | Iliad SA (France) | | | 3,403 |
| 1,000 | | Inmarsat PLC (United Kingdom) | | | 11,472 |
| 3,406 | | Koninklijke KPN NV (Netherlands) | | | 53,962 |
| 1,100 | | Nippon Telegraph & Telephone Corp. (Japan) | | | 46,358 |
| 8,000 | | PCCW Ltd. (Hong Kong) | | | 2,380 |
| 1,190 | | Portugal Telecom, SGPS SA (Portugal) | | | 13,305 |
| 600 | | Premiere Global Services, Inc.(a) | | | 4,956 |
| 16,000 | | Singapore Telecommunications Ltd. (Singapore) | | | 36,256 |
| 700 | | SureWest Communications(a) | | | 6,013 |
| 53 | | Swisscom AG (Switzerland) | | | 19,342 |
| 840 | | Talktalk Telecom Group PLC (United Kingdom)(a) | | | 1,644 |
| 623 | | Tele2 AB (Sweden) (Class B Stock) | | | 10,397 |
| 3,775 | | Telecom Corp. of New Zealand Ltd. (New Zealand) | | | 5,819 |
| 21,307 | | Telecom Italia SpA (Italy) | | | 30,678 |
| 12,304 | | Telecom Italia SpA-RSP (Italy) | | | 13,877 |
| 8,731 | | Telefonica SA (Spain) | | | 206,842 |
| 657 | | Telekom Austria AG (Austria) | | | 9,184 |
| 1,690 | | Telenor ASA (Norway)(a) | | | 22,919 |
| 4,576 | | Teliasonera AB (Sweden) | | | 32,479 |
| 8,877 | | Telstra Corp. Ltd. (Australia) | | | 24,357 |
| 93,750 | | Verizon Communications, Inc.(b) | | | 2,908,125 |
| �� | | | | |
| | | | | 7,733,878 |
| |
Electric Utilities 1.1% | | | |
| 52 | | Acciona SA (Spain) | | | 5,767 |
| 18,500 | | Allegheny Energy, Inc. | | | 425,500 |
| 2,800 | | American Electric Power Co., Inc. | | | 95,704 |
| 27 | | BKW FMB Energie AG (Switzerland) | | | 2,006 |
| 1,100 | | Central Vermont Public Service Corp. | | | 22,187 |
See Notes to Financial Statements.
| | |
| Prudential Investment Portfolios, Inc./Prudential Asset Allocation Fund | | 23 |
Portfolio of Investments
as of March 31, 2010 (Unaudited) continued
| | | | | |
| Shares | | Description | | Value (Note 1) |
| | | | | |
COMMON STOCKS (Continued) | | | |
| |
Electric Utilities (cont’d.) | | | |
| 1,000 | | Cheung Kong Infrastructure Holdings Ltd. (Hong Kong) | | $ | 3,870 |
| 1,400 | | Chubu Electric Power Co., Inc. (Japan) | | | 34,996 |
| 700 | | Chugoku Electric Power Co., Inc. (The) (Japan) | | | 13,912 |
| 4,000 | | CLP Holdings Ltd. (Hong Kong) | | | 28,593 |
| 613 | | Contact Energy Ltd. (New Zealand)(a) | | | 2,787 |
| 1,200 | | DPL, Inc. | | | 32,628 |
| 3,875 | | E.ON AG (Germany) | | | 143,092 |
| 491 | | EDF SA (France) | | | 26,792 |
| 26,400 | | Edison International | | | 902,088 |
| 3,563 | | EDP - Energias de Portugal SA (Portugal) | | | 14,163 |
| 1,500 | | El Paso Electric Co.(a) | | | 30,900 |
| 13,716 | | ENEL SpA (Italy) | | | 76,696 |
| 2,200 | | Entergy Corp. | | | 178,970 |
| 13,800 | | Exelon Corp. | | | 604,578 |
| 8,900 | | FirstEnergy Corp. | | | 347,901 |
| 905 | | Fortum OYJ (Finland) | | | 22,137 |
| 25,100 | | FPL Group, Inc. | | | 1,213,083 |
| 400 | | Hokkaido Electric Power Co., Inc. (Japan) | | | 7,676 |
| 200 | | Hokuriku Electric Power Co. (Japan) | | | 4,398 |
| 3,000 | | Hong Kong Electric Holdings Ltd. (Hong Kong) | | | 17,793 |
| 7,494 | | Iberdrola SA (Spain) | | | 63,515 |
| 1,400 | | IDACORP, Inc. | | | 48,468 |
| 1,600 | | Kansai Electric Power Co., Inc. (The) (Japan) | | | 36,659 |
| 800 | | Kyushu Electric Power Co., Inc. (Japan) | | | 17,414 |
| 2,600 | | PNM Resources, Inc. | | | 32,578 |
| 1,500 | | PPL Corp. | | | 41,565 |
| 237 | | Public Power Corp. SA (Greece)(a) | | | 4,161 |
| 221 | | Red Electrica Corp. SA (Spain) | | | 11,861 |
| 1,856 | | Scottish & Southern Energy PLC (United Kingdom) | | | 31,009 |
| 300 | | Shikoku Electric Power Co. (Japan) | | | 8,500 |
| 2,706 | | SP AusNet (Australia) (Class Miscellaneous Stock) | | | 2,247 |
| 2,656 | | Terna Rete Elettrica Nazionale SpA (Italy) | | | 11,489 |
| 900 | | Tohoku Electric Power Co., Inc. (Japan) | | | 19,022 |
| 2,500 | | Tokyo Electric Power Co., Inc. (The) (Japan) | | | 66,638 |
| 157 | | Verbund - Oesterreichische Elektrizitaetswirtschafts AG (Austria) (Class A Stock) | | | 6,232 |
| | | | | |
| | | | | 4,659,575 |
See Notes to Financial Statements.
| | |
| 24 | | Visit our website at www.prudentialfunds.com |
| | | | | |
| Shares | | Description | | Value (Note 1) |
| | | | | |
COMMON STOCKS (Continued) | | | |
| |
Electrical Equipment 0.7% | | | |
| 4,506 | | ABB Ltd. (Switzerland) | | $ | 98,419 |
| 700 | | Acuity Brands, Inc. | | | 29,547 |
| 433 | | Alstom SA (France) | | | 27,002 |
| 3,100 | | AO Smith Corp. | | | 162,967 |
| 1,000 | | AZZ, Inc. | | | 33,850 |
| 1,000 | | Brady Corp. (Class A Stock) | | | 31,120 |
| 18,200 | | Emerson Electric Co. | | | 916,188 |
| 2,900 | | EnerSys(a) | | | 71,514 |
| 1,000 | | Fuji Electric Holdings Co. Ltd. (Japan) | | | 2,728 |
| 1,000 | | Furukawa Electric Co. Ltd. (Japan) | | | 5,198 |
| 373 | | Gamesa Corp. Tecnologica SA (Spain) | | | 5,113 |
| 3,600 | | GrafTech International Ltd.(a) | | | 49,212 |
| 1,000 | | GS Yuasa Corp. (Japan) | | | 6,749 |
| 7,500 | | Hubbell, Inc. (Class B Stock) | | | 378,225 |
| 215 | | Legrand SA (France) | | | 6,792 |
| 4,000 | | Mitsubishi Electric Corp. (Japan) | | | 36,753 |
| 1,000 | | Panasonic Electric Works Co. Ltd. (Japan) | | | 12,622 |
| 1,100 | | Powell Industries, Inc.(a) | | | 35,783 |
| 203 | | Prysmian SpA (Italy) | | | 3,989 |
| 700 | | Regal-Beloit Corp. | | | 41,587 |
| 479 | | Renewable Energy Corp. ASA (Norway)(a) | | | 2,241 |
| 16,800 | | Rockwell Automation, Inc. | | | 946,848 |
| 478 | | Schneider Electric SA (France) | | | 56,065 |
| 171 | | Solarworld AG (Germany) | | | 2,597 |
| 1,600 | | Sumitomo Electric Industries Ltd. (Japan) | | | 19,613 |
| 300 | | Ushio, Inc. (Japan) | | | 5,089 |
| 416 | | Vestas Wind Systems A/S (Denmark)(a) | | | 22,605 |
| 1,500 | | Vicor Corp.(a) | | | 20,715 |
| | | | | |
| | | | | 3,031,131 |
| |
Electronic Equipment & Instruments 0.6% | | | |
| 13,800 | | Avnet, Inc.(a) | | | 414,000 |
| 4,100 | | Benchmark Electronics, Inc.(a) | | | 85,034 |
| 16,000 | | Brightpoint, Inc.(a) | | | 120,480 |
| 600 | | Checkpoint Systems, Inc.(a) | | | 13,272 |
| 600 | | Citizen Holdings Co. Ltd. (Japan) | | | 4,101 |
| 37,400 | | Corning, Inc. | | | 755,854 |
| 4,400 | | CTS Corp. | | | 41,448 |
| 4,200 | | Electro Rent Corp. | | | 55,146 |
| 500 | | Electro Scientific Industries, Inc.(a) | | | 6,405 |
See Notes to Financial Statements.
| | |
| Prudential Investment Portfolios, Inc./Prudential Asset Allocation Fund | | 25 |
Portfolio of Investments
as of March 31, 2010 (Unaudited) continued
| | | | | |
| Shares | | Description | | Value (Note 1) |
| | | | | |
COMMON STOCKS (Continued) | | | |
| |
Electronic Equipment & Instruments (cont’d.) | | | |
| 4,000 | | Foxconn International Holdings Ltd. (Hong Kong)(a) | | $ | 4,219 |
| 1,000 | | Fujifilm Holdings Corp. (Japan) | | | 34,442 |
| 100 | | Hirose Electric Co. Ltd. (Japan) | | | 11,531 |
| 100 | | Hitachi High-Technologies Corp. (Japan) | | | 2,294 |
| 10,000 | | Hitachi Ltd. (Japan)(a) | | | 37,330 |
| 800 | | Hoya Corp. (Japan) | | | 21,983 |
| 300 | | Ibiden Co. Ltd. (Japan) | | | 10,333 |
| 1,500 | | Insight Enterprises, Inc.(a) | | | 21,540 |
| 33,900 | | Jabil Circuit, Inc. | | | 548,841 |
| 100 | | Keyence Corp. (Japan) | | | 23,896 |
| 300 | | Kyocera Corp. (Japan) | | | 29,233 |
| 100 | | Mabuchi Motor Co. Ltd. (Japan) | | | 5,755 |
| 4,200 | | Mercury Computer Systems, Inc.(a) | | | 57,624 |
| 200 | | Mitsumi Electric Co. Ltd. (Japan) | | | 4,377 |
| 400 | | Murata Manufacturing Co. Ltd. (Japan) | | | 22,719 |
| 300 | | Nidec Corp. (Japan) | | | 32,153 |
| 1,000 | | Nippon Electric Glass Co. Ltd. (Japan) | | | 14,087 |
| 400 | | Omron Corp. (Japan) | | | 9,285 |
| 2,000 | | Park Electrochemical Corp. | | | 57,480 |
| 300 | | Rogers Corp.(a) | | | 8,703 |
| 400 | | ScanSource, Inc.(a) | | | 11,512 |
| 1,000 | | Shimadzu Corp. (Japan) | | | 8,012 |
| 1,400 | | SYNNEX Corp.(a) | | | 41,384 |
| 200 | | TDK Corp. (Japan) | | | 13,306 |
| 1,000 | | Yaskawa Electric Corp. (Japan) | | | 9,145 |
| 500 | | Yokogawa Electric Corp. (Japan) | | | 4,353 |
| | | | | |
| | | | | 2,541,277 |
| |
Energy Equipment & Services 0.6% | | | |
| 679 | | AMEC PLC (United Kingdom) | | | 8,233 |
| 1,600 | | Bristow Group, Inc.(a) | | | 60,368 |
| 7,900 | | Cal Dive International, Inc.(a) | | | 57,907 |
| 600 | | Carbo Ceramics, Inc. | | | 37,404 |
| 293 | | CIE Generale de Geophysique-Veritas (France)(a) | | | 8,312 |
| 2,400 | | Complete Production Services, Inc.(a) | | | 27,720 |
| 6,600 | | FMC Technologies, Inc.(a)(b) | | | 426,558 |
| 133 | | Fugro NV (Netherlands) | | | 8,693 |
| 1,400 | | Gulf Island Fabrication, Inc. | | | 30,450 |
| 12,800 | | Helmerich & Payne, Inc. | | | 487,424 |
| 10,500 | | National Oilwell Varco, Inc. | | | 426,090 |
See Notes to Financial Statements.
| | |
| 26 | | Visit our website at www.prudentialfunds.com |
| | | | | |
| Shares | | Description | | Value (Note 1) |
| | | | | |
COMMON STOCKS (Continued) | | | |
| |
Energy Equipment & Services (cont’d.) | | | |
| 100 | | OYO Geospace Corp.(a) | | $ | 4,781 |
| 423 | | Petrofac Ltd. (United Kingdom) | | | 7,716 |
| 541 | | Saipem SpA (Italy) | | | 20,935 |
| 306 | | SBM Offshore NV (Netherlands) | | | 6,123 |
| 7,100 | | Schlumberger Ltd. | | | 450,566 |
| 570 | | Seadrill Ltd. (Norway) | | | 13,283 |
| 212 | | Technip SA (France) | | | 17,237 |
| 1,039 | | Tenaris SA (Italy) | | | 22,425 |
| 11,500 | | Unit Corp.(a) | | | 486,220 |
| 335 | | WorleyParsons Ltd. (Australia) | | | 7,824 |
| | | | | |
| | | | | 2,616,269 |
| |
Food & Staples Retailing 1.1% | | | |
| 1,300 | | AEON Co. Ltd. (Japan) | | | 14,753 |
| 1,600 | | Andersons, Inc. (The) | | | 53,568 |
| 1,295 | | Carrefour SA (France) | | | 62,417 |
| 3,000 | | Casey’s General Stores, Inc. | | | 94,200 |
| 113 | | Casino Guichard Perrachon SA (France) | | | 9,562 |
| 31 | | Colruyt SA (Belgium) | | | 7,631 |
| 3,000 | | Costco Wholesale Corp. | | | 179,130 |
| 2,100 | | CVS Caremark Corp. | | | 76,776 |
| 226 | | Delhaize Group SA (Belgium) | | | 18,162 |
| 100 | | FamilyMart Co. Ltd. (Japan) | | | 3,182 |
| 2,424 | | J Sainsbury PLC (United Kingdom) | | | 12,050 |
| 450 | | Jeronimo Martins SGPS SA (Portugal) | | | 4,559 |
| 135 | | Kesko OYJ (Finland) (Class B Stock) | | | 5,313 |
| 2,434 | | Koninklijke Ahold NV (Netherlands) | | | 32,448 |
| 5,600 | | Kroger Co. (The) | | | 121,296 |
| 100 | | Lawson, Inc. (Japan) | | | 4,268 |
| 1,562 | | Metcash Ltd. (Australia) | | | 5,934 |
| 232 | | Metro AG (Germany) | | | 13,762 |
| 2,000 | | Olam International Ltd. (Singapore) | | | 3,703 |
| 1,600 | | Seven & I Holdings Co. Ltd. (Japan) | | | 38,661 |
| 16,400 | | SUPERVALU, Inc. | | | 273,552 |
| 16,171 | | Tesco PLC (United Kingdom) | | | 106,857 |
| 65,600 | | Wal-Mart Stores, Inc. | | | 3,647,360 |
| 200 | | Weis Markets, Inc. | | | 7,272 |
| 2,049 | | Wesfarmers Ltd. (Australia) | | | 59,774 |
| 310 | | Wesfarmers Ltd. (Australia) | | | 9,066 |
See Notes to Financial Statements.
| | |
| Prudential Investment Portfolios, Inc./Prudential Asset Allocation Fund | | 27 |
Portfolio of Investments
as of March 31, 2010 (Unaudited) continued
| | | | | |
| Shares | | Description | | Value (Note 1) |
| | | | | |
COMMON STOCKS (Continued) | | | |
| |
Food & Staples Retailing (cont’d.) | | | |
| 4,278 | | WM Morrison Supermarkets PLC (United Kingdom) | | $ | 19,054 |
| 2,557 | | Woolworths Ltd. (Australia) | | | 65,700 |
| | | | | |
| | | | | 4,950,010 |
| |
Food Products 1.4% | | | |
| 1,000 | | Ajinomoto Co., Inc. (Japan) | | | 9,905 |
| 2,200 | | American Italian Pasta Co. (Class A Stock)(a) | | | 85,514 |
| 52,000 | | Archer-Daniels-Midland Co. | | | 1,502,800 |
| 166 | | Aryzta AG (Switzerland) | | | 7,273 |
| 727 | | Associated British Foods PLC (United Kingdom) | | | 10,795 |
| 2,700 | | B & G Foods, Inc. (Class A Stock) | | | 28,296 |
| 4,300 | | Bunge Ltd. | | | 265,009 |
| 3,600 | | Chiquita Brands International, Inc.(a) | | | 56,628 |
| 2,900 | | Darling International, Inc.(a) | | | 25,984 |
| 54,000 | | Dean Foods Co.(a)(b) | | | 847,260 |
| 1,800 | | Dole Food Co., Inc.(a) | | | 21,330 |
| 1,000 | | Fresh Del Monte Produce, Inc.(a) | | | 20,250 |
| 6,500 | | General Mills, Inc. | | | 460,135 |
| 14,000 | | Golden Agri-Resources Ltd. (Singapore)(a) | | | 5,804 |
| 2,628 | | Goodman Fielder Ltd. (Australia) | | | 3,449 |
| 1,121 | | Groupe Danone SA (France) | | | 67,528 |
| 1,100 | | JM Smucker Co. (The) | | | 66,286 |
| 6,100 | | Kellogg Co. | | | 325,923 |
| 286 | | Kerry Group PLC (Ireland) (Class A Stock) | | | 8,885 |
| 13,500 | | Kraft Foods, Inc. (Class A Stock) | | | 408,240 |
| 2,100 | | Lancaster Colony Corp. | | | 123,816 |
| 2 | | Lindt & Spruengli AG (Switzerland) | | | 4,733 |
| 100 | | Meiji Holdings Co. Ltd. (Japan) | | | 3,883 |
| 7,067 | | Nestle SA (Switzerland) | | | 361,929 |
| 500 | | Nisshin Seifun Group, Inc. (Japan) | | | 6,455 |
| 100 | | Nissin Foods Holdings Co. Ltd. (Japan) | | | 3,364 |
| 3,477 | | Parmalat SpA (Italy) | | | 9,522 |
| 9,700 | | Sanderson Farms, Inc. | | | 520,017 |
| 135 | | Suedzucker AG (Germany) | | | 2,986 |
| 22,400 | | Tyson Foods, Inc. (Class A Stock) | | | 428,960 |
| 3,320 | | Unilever NV (Netherlands) | | | 100,423 |
| 2,616 | | Unilever PLC (United Kingdom) | | | 76,815 |
| 3,000 | | Wilmar International Ltd. (Singapore) | | | 14,368 |
| 200 | | Yakult Honsha Co. Ltd. (Japan) | | | 5,395 |
| | | | | |
| | | | | 5,889,960 |
See Notes to Financial Statements.
| | |
| 28 | | Visit our website at www.prudentialfunds.com |
| | | | | |
| Shares | | Description | | Value (Note 1) |
| | | | | |
COMMON STOCKS (Continued) | | | |
| |
Gas Utilities 0.1% | | | |
| 800 | | Chesapeake Utilities Corp. | | $ | 23,840 |
| 366 | | Enagas (Spain) | | | 8,021 |
| 2,400 | | Energen Corp. | | | 111,672 |
| 457 | | Gas Natural SDG SA (Spain) | | | 8,438 |
| 9,000 | | Hong Kong & China Gas Co. Ltd. (Hong Kong) | | | 22,441 |
| 200 | | Laclede Group, Inc. (The) | | | 6,744 |
| 800 | | New Jersey Resources Corp. | | | 30,048 |
| 600 | | Nicor, Inc. | | | 25,152 |
| 4,000 | | Osaka Gas Co. Ltd. (Japan) | | | 14,333 |
| 3,063 | | Snam Rete Gas SpA (Italy) | | | 15,524 |
| 2,000 | | Southwest Gas Corp. | | | 59,840 |
| 1,000 | | Toho Gas Co. Ltd. (Japan) | | | 5,455 |
| 5,000 | | Tokyo Gas Co. Ltd. (Japan) | | | 22,035 |
| 2,900 | | WGL Holdings, Inc. | | | 100,485 |
| | | | | |
| | | | | 454,028 |
| |
Healthcare Equipment & Supplies 1.5% | | | |
| 1,100 | | Abaxis, Inc.(a) | | | 29,909 |
| 500 | | Align Technology, Inc.(a) | | | 9,670 |
| 2,100 | | American Medical Systems Holdings, Inc.(a) | | | 39,018 |
| 200 | | Angiodynamics, Inc.(a) | | | 3,124 |
| 200 | | Atrion Corp. | | | 28,608 |
| 18,900 | | Becton Dickinson & Co. | | | 1,487,997 |
| 28 | | BioMerieux (France) | | | 3,216 |
| 2,800 | | C.R. Bard, Inc. | | | 242,536 |
| 1,100 | | Cantel Medical Corp. | | | 21,835 |
| 409 | | CIE Generale D’optique Essilor International SA (France) | | | 26,113 |
| 114 | | Cochlear Ltd. (Australia) | | | 7,620 |
| 46 | | Coloplast A/S (Denmark) (Class B Stock) | | | 5,066 |
| 1,300 | | Cryolife, Inc.(a) | | | 8,411 |
| 1,800 | | Cutera, Inc.(a) | | | 18,666 |
| 2,500 | | DexCom, Inc.(a) | | | 24,325 |
| 2,300 | | ev3, Inc.(a) | | | 36,478 |
| 58 | | Fresenius Se (Germany) | | | 4,265 |
| 409 | | Getinge AB (Sweden) (Class B Stock) | | | 9,805 |
| 1,700 | | Haemonetics Corp.(a) | | | 97,155 |
| 4,000 | | Idexx Laboratories, Inc.(a) | | | 230,200 |
| 400 | | Integra LifeSciences Holdings Corp.(a) | | | 17,532 |
| 4,600 | | Intuitive Surgical, Inc.(a)(b) | | | 1,601,398 |
| 2,800 | | Invacare Corp. | | | 74,312 |
See Notes to Financial Statements.
| | |
| Prudential Investment Portfolios, Inc./Prudential Asset Allocation Fund | | 29 |
Portfolio of Investments
as of March 31, 2010 (Unaudited) continued
| | | | | |
| Shares | | Description | | Value (Note 1) |
| | | | | |
COMMON STOCKS (Continued) | | | |
| |
Healthcare Equipment & Supplies (cont’d.) | | | |
| 3,600 | | Medical Action Industries, Inc.(a) | | $ | 44,172 |
| 31,600 | | Medtronic, Inc. | | | 1,422,948 |
| 3,200 | | Meridian Bioscience, Inc. | | | 65,184 |
| 600 | | Neogen Corp.(a) | | | 15,060 |
| 254 | | Nobel Biocare Holding AG (Switzerland) | | | 6,793 |
| 300 | | Olympus Corp. (Japan) | | | 9,627 |
| 4,500 | | Quidel Corp.(a) | | | 65,430 |
| 3,300 | | Sirona Dental Systems, Inc.(a) | | | 125,499 |
| 1,805 | | Smith & Nephew PLC (United Kingdom) | | | 17,982 |
| 95 | | Sonova Holding AG (Switzerland) | | | 11,803 |
| 4,300 | | STERIS Corp. | | | 144,738 |
| 16 | | Straumann Holding AG (Switzerland) | | | 3,983 |
| 121 | | Synthes, Inc. (Switzerland) | | | 15,102 |
| 300 | | Terumo Corp. (Japan) | | | 15,980 |
| 48 | | William Demant Holding (Denmark)(a) | | | 3,396 |
| 200 | | Young Innovations, Inc. | | | 5,632 |
| 6,200 | | Zimmer Holdings, Inc.(a) | | | 367,040 |
| | | | | |
| | | | | 6,367,628 |
| |
Healthcare Providers & Services 1.2% | | | |
| 100 | | Alfresa Holdings Corp. (Japan) | | | 4,311 |
| 1,000 | | Allied Healthcare International, Inc.(a) | | | 2,720 |
| 3,000 | | America Service Group, Inc. | | | 48,270 |
| 4,800 | | American Dental Partners, Inc.(a) | | | 62,640 |
| 2,400 | | AmSurg Corp. (Class A Stock)(a) | | | 51,816 |
| 2,400 | | Bio-Reference Labs, Inc.(a) | | | 105,528 |
| 174 | | Celesio AG (Germany) | | | 5,557 |
| 200 | | Chemed Corp. | | | 10,876 |
| 390 | | Fresenius Medical Care AG & Co. KGaA (Germany) | | | 22,005 |
| 2,600 | | Healthsouth Corp.(a) | | | 48,620 |
| 3,000 | | HealthSpring, Inc.(a) | | | 52,800 |
| 1,000 | | Inventiv Health, Inc.(a) | | | 22,460 |
| 2,700 | | IPC The Hospitalist Co., Inc.(a) | | | 94,797 |
| 1,000 | | Laboratory Corp. of America Holdings(a) | | | 75,710 |
| 800 | | LHC Group, Inc.(a) | | | 26,824 |
| 2,000 | | Magellan Health Services, Inc.(a) | | | 86,960 |
| 20,200 | | Medco Health Solutions, Inc.(a) | | | 1,304,112 |
| 300 | | Medipal Holdings Corp. (Japan) | | | 3,552 |
| 200 | | MWI Veterinary Supply, Inc.(a) | | | 8,080 |
| 2,000 | | Owens & Minor, Inc. | | | 92,780 |
See Notes to Financial Statements.
| | |
| 30 | | Visit our website at www.prudentialfunds.com |
| | | | | |
| Shares | | Description | | Value (Note 1) |
| | | | | |
COMMON STOCKS (Continued) | | | |
| |
Healthcare Providers & Services (cont’d.) | | | |
| 1,100 | | Psychiatric Solutions, Inc.(a) | | $ | 32,780 |
| 2,900 | | Quest Diagnostics, Inc. | | | 169,041 |
| 745 | | Sonic Healthcare Ltd. (Australia) | | | 9,824 |
| 100 | | Suzuken Co. Ltd. (Japan) | | | 3,525 |
| 3,700 | | Triple-S Management Corp. (Class B Stock)(a) | | | 65,675 |
| 30,900 | | UnitedHealth Group, Inc. | | | 1,009,503 |
| 1,200 | | US Physical Therapy, Inc.(a) | | | 20,880 |
| 24,000 | | WellPoint, Inc.(a) | | | 1,545,120 |
| | | | | |
| | | | | 4,986,766 |
| |
Healthcare Technology 0.1% | | | |
| 18,600 | | Allscripts-Misys Healthcare Solutions, Inc.(a) | | | 363,816 |
|
Hotels, Restaurants & Leisure 0.5% |
| 272 | | Accor SA (France) | | | 15,048 |
| 795 | | Aristocrat Leisure Ltd. (Australia) | | | 3,305 |
| 208 | | Autogrill SpA (Italy)(a) | | | 2,531 |
| 2,100 | | Bob Evans Farms, Inc. | | | 64,911 |
| 331 | | Carnival PLC (United Kingdom) | | | 13,587 |
| 3,800 | | Cheesecake Factory, Inc. (The)(a) | | | 102,828 |
| 3,772 | | Compass Group PLC (United Kingdom) | | | 30,108 |
| 1,000 | | Crown Ltd. (Australia) | | | 7,507 |
| 1,000 | | Denny’s Corp.(a) | | | 3,840 |
| 9,600 | | Genting Singapore PLC (Singapore)(a) | | | 6,073 |
| 525 | | Intercontinental Hotels Group PLC (United Kingdom) | | | 8,222 |
| 1,900 | | McCormick & Schmick’s Seafood Restaurants, Inc.(a) | | | 19,133 |
| 21,368 | | McDonald’s Corp. | | | 1,425,673 |
| 511 | | OPAP SA (Greece) | | | 11,595 |
| 100 | | Oriental Land Co. Ltd. (Japan) | | | 6,974 |
| 1,800 | | Papa John’s International, Inc.(a) | | | 46,278 |
| 1,000 | | PF Chang’s China Bistro, Inc.(a) | | | 44,130 |
| 4,800 | | Sands China Ltd. (Hong Kong)(a) | | | 7,629 |
| 2,000 | | Shangri-La Asia Ltd. (Hong Kong) | | | 3,926 |
| 1,174 | | Sky City Entertainment Group Ltd. (New Zealand) | | | 2,685 |
| 192 | | Sodexo (France) | | | 11,475 |
| 13,700 | | Starbucks Corp.(a) | | | 332,499 |
| 100 | | Steak ‘n Shake Co. (The)(a) | | | 38,127 |
| 1,287 | | Tabcorp Holdings Ltd. (Australia) | | | 8,149 |
| 2,464 | | Tatts Group Ltd. (Australia) | | | 5,562 |
| 8,400 | | Texas Roadhouse, Inc. (Class A Stock)(a) | | | 116,676 |
See Notes to Financial Statements.
| | |
| Prudential Investment Portfolios, Inc./Prudential Asset Allocation Fund | | 31 |
Portfolio of Investments
as of March 31, 2010 (Unaudited) continued
| | | | | |
| Shares | | Description | | Value (Note 1) |
| | | | | |
COMMON STOCKS (Continued) | | | |
| |
Hotels, Restaurants & Leisure (cont’d.) | | | |
| 1,176 | | Thomas Cook Group PLC (United Kingdom) | | $ | 4,815 |
| 283 | | TUI AG (Germany)(a) | | | 3,192 |
| 1,141 | | TUI Travel PLC (United Kingdom) | | | 5,220 |
| 358 | | Whitbread PLC (United Kingdom) | | | 8,008 |
| | | | | |
| | | | | 2,359,706 |
| |
Household Durables 0.5% | | | |
| 3,400 | | American Greetings Corp. (Class A Stock) | | | 70,856 |
| 500 | | Casio Computer Co. Ltd. (Japan) | | | 3,845 |
| 489 | | Electrolux AB (Sweden) | | | 11,174 |
| 900 | | Helen of Troy Ltd.(a) | | | 23,454 |
| 832 | | Husqvarna AB (Sweden) (Class B Stock)(a) | | | 6,049 |
| 29,900 | | Leggett & Platt, Inc. | | | 647,036 |
| 200 | | Makita Corp. (Japan) | | | 6,589 |
| 4,000 | | Matsushita Electric Industrial Co. Ltd. (Japan) | | | 61,183 |
| 49,600 | | Newell Rubbermaid, Inc. | | | 753,920 |
| 100 | | Rinnai Corp. (Japan) | | | 5,252 |
| 4,000 | | Sanyo Electric Co. Ltd. (Japan)(a) | | | 6,418 |
| 1,000 | | Sekisui Chemical Co. Ltd. (Japan) | | | 6,782 |
| 1,000 | | Sekisui House Ltd. (Japan) | | | 9,991 |
| 2,000 | | Sharp Corp. (Japan) | | | 25,008 |
| 2,100 | | Sony Corp. (Japan) | | | 80,415 |
| 6,800 | | Tempur-Pedic International, Inc.(a) | | | 205,088 |
| 3,000 | | Tupperware Brands Corp. | | | 144,660 |
| 800 | | Universal Electronics, Inc.(a) | | | 17,872 |
| 900 | | Whirlpool Corp. | | | 78,525 |
| | | | | |
| | | | | 2,164,117 |
| |
Household Products 1.4% | | | |
| 14,967 | | Colgate-Palmolive Co. | | | 1,276,087 |
| 265 | | Henkel AG & Co. KGaA (Germany) | | | 12,238 |
| 1,000 | | KAO Corp. (Japan) | | | 25,350 |
| 72,275 | | Procter & Gamble Co. (The) | | | 4,572,839 |
| 1,237 | | Reckitt Benckiser Group PLC (United Kingdom) | | | 67,896 |
| 100 | | Unicharm Corp. (Japan) | | | 9,659 |
| | | | | |
| | | | | 5,964,069 |
| |
Independent Power Producers & Energy Traders 0.1% | | | |
| 5,400 | | Constellation Energy Group, Inc. | | | 189,594 |
| 745 | | Drax Group PLC (United Kingdom) | | | 4,224 |
See Notes to Financial Statements.
| | |
| 32 | | Visit our website at www.prudentialfunds.com |
| | | | | |
| Shares | | Description | | Value (Note 1) |
| | | | | |
COMMON STOCKS (Continued) | | | |
| |
Independent Power Producers & Energy Traders (cont’d.) | | | |
| 359 | | EDP Renovaveis SA (Portugal)(a) | | $ | 2,805 |
| 300 | | Electric Power Development Co. Ltd. (Japan) | | | 9,883 |
| 1,725 | | Iberdrola Renovables SA (Spain) | | | 7,164 |
| 3,106 | | International Power PLC (United Kingdom) | | | 15,031 |
| 10,400 | | Mirant Corp.(a) | | | 112,944 |
| | | | | |
| | | | | 341,645 |
| |
Industrial Conglomerates 1.2% | | | |
| 22,800 | | 3M Co. | | | 1,905,396 |
| 2,495 | | CSR Ltd. (Australia) | | | 3,789 |
| 2,000 | | Fraser And Neave Ltd. (Singapore) | | | 6,862 |
| 165,550 | | General Electric Co. | | | 3,013,010 |
| 2,000 | | Hankyu Hanshin Holdings, Inc. (Japan) | | | 9,263 |
| 4,000 | | Hutchison Whampoa Ltd. (Hong Kong) | | | 29,262 |
| 3,000 | | Keppel Corp. Ltd. (Singapore) | | | 19,558 |
| 2,044 | | Koninklijke Philips Electronics NV (Netherlands) | | | 65,540 |
| 2,000 | | NWS Holdings Ltd. (Hong Kong) | | | 3,993 |
| 1,576 | | Orkla ASA (Norway) | | | 13,935 |
| 1,100 | | Raven Industries, Inc. | | | 32,439 |
| 2,000 | | SembCorp Industries Ltd. (Singapore) | | | 5,904 |
| 1,677 | | Siemens AG (Germany) | | | 168,180 |
| 794 | | Smiths Group PLC (United Kingdom) | | | 13,688 |
| 2,800 | | Standex International Corp. | | | 72,156 |
| 1,799 | | Tomkins PLC (United Kingdom) | | | 6,443 |
| 1,100 | | Tredegar Corp. | | | 18,788 |
| | | | | |
| | | | | 5,388,206 |
| |
Insurance 2.0% | | | |
| 380 | | Admiral Group PLC (United Kingdom) | | | 7,612 |
| 3,190 | | AEGON NV (Netherlands)(a) | | | 21,845 |
| 10,600 | | Aflac, Inc. | | | 575,474 |
| 933 | | Allianz SE (Germany) | | | 117,132 |
| 3,000 | | Allied World Assurance Co. Holdings Ltd. | | | 134,550 |
| 8,100 | | American Equity Investment Life Holding Co. | | | 86,265 |
| 200 | | American Physicians Service Group, Inc. | | | 5,000 |
| 300 | | Amerisafe, Inc.(a) | | | 4,911 |
| 4,380 | | AMP Ltd. (Australia) | | | 25,161 |
| 2,200 | | Amtrust Financial Services, Inc. | | | 30,690 |
| 1,900 | | Argo Group International Holdings Ltd. | | | 61,921 |
| 22,900 | | Aspen Insurance Holdings Ltd. | | | 660,436 |
See Notes to Financial Statements.
| | |
| Prudential Investment Portfolios, Inc./Prudential Asset Allocation Fund | | 33 |
Portfolio of Investments
as of March 31, 2010 (Unaudited) continued
| | | | | |
| Shares | | Description | | Value (Note 1) |
| | | | | |
COMMON STOCKS (Continued) | | | |
| |
Insurance (cont’d.) | | | |
| 2,380 | | Assicurazioni Generali SpA (Italy) | | $ | 57,123 |
| 8,800 | | Assurant, Inc. | | | 302,544 |
| 5,553 | | Aviva PLC (United Kingdom) | | | 32,468 |
| 2,078 | | AXA Asia Pacific Holdings Ltd. (Australia) | | | 12,051 |
| 3,460 | | AXA SA (France) | | | 76,969 |
| 102 | | Baloise Holding AG (Switzerland) | | | 9,045 |
| 22,500 | | Berkshire Hathaway, Inc. (Class B Stock)(a)(b) | | | 1,828,575 |
| 13,800 | | Chubb Corp. | | | 715,530 |
| 300 | | CNA Surety Corp.(a) | | | 5,337 |
| 76 | | CNP Assurances (France) | | | 7,177 |
| 10,500 | | Conseco, Inc.(a) | | | 65,310 |
| 1,462 | | Corporacion Mapfree (Spain) | | | 5,363 |
| 400 | | Delphi Financial Group, Inc. (Class A Stock) | | | 10,064 |
| 500 | | Ehealth, Inc.(a) | | | 7,875 |
| 400 | | First Mercury Financial Corp. | | | 5,212 |
| 5,600 | | Flagstone Reinsurance Holdings Ltd. | | | 64,176 |
| 127 | | Fondiaria-SAI SpA (Italy) | | | 1,911 |
| 4,543 | | Fortis Group (Belgium)(a) | | | 16,175 |
| 600 | | Greenlight Capital RE Ltd.(Class A Stock)(a) | | | 16,008 |
| 300 | | Hallmark Financial Services(a) | | | 2,700 |
| 123 | | Hannover Rueckversicherung AG (Germany)(a) | | | 6,074 |
| 700 | | Hilltop Holdings, Inc.(a) | | | 8,225 |
| 4,324 | | Insurance Australia Group Ltd. (Australia) | | | 15,395 |
| 11,968 | | Legal & General Group PLC (United Kingdom) | | | 15,991 |
| 17,800 | | Lincoln National Corp. | | | 546,460 |
| 3,000 | | Max Capital Group Ltd. | | | 68,970 |
| 447 | | Mediolanum SpA (Italy) | | | 2,616 |
| 14,400 | | MetLife, Inc. | | | 624,096 |
| 1,190 | | Mitsui Sumitomo Insurance Group Holdings, Inc. (Japan) | | | 33,031 |
| 3,400 | | Montpelier RE Holdings Ltd. | | | 57,154 |
| 400 | | Muenchener Rueckversicherungs AG (Germany) | | | 64,994 |
| 1,000 | | Nipponkoa Insurance Co. Ltd. (Japan) | | | 6,279 |
| 600 | | NYMAGIC, Inc. | | | 12,738 |
| 10,755 | | Old Mutual PLC (United Kingdom)(a) | | | 19,993 |
| 10,300 | | Phoenix Cos., Inc. (The)(a) | | | 24,926 |
| 1,400 | | Platinum Underwriters Holdings Ltd. | | | 51,912 |
| 700 | | PMA Capital Corp. (Class A Stock)(a) | | | 4,298 |
| 4,700 | | Presidential Life Corp. | | | 46,859 |
| 5,145 | | Prudential PLC (United Kingdom) | | | 42,746 |
| 2,049 | | QBE Insurance Group Ltd. (Australia) | | | 39,166 |
See Notes to Financial Statements.
| | |
| 34 | | Visit our website at www.prudentialfunds.com |
| | | | | |
| Shares | | Description | | Value (Note 1) |
| | | | | |
COMMON STOCKS (Continued) | | | |
| |
Insurance (cont’d.) | | | |
| 4,273 | | Resolution Ltd. (United Kingdom)(a) | | $ | 5,314 |
| 6,806 | | RSA Insurance Group PLC (United Kingdom) | | | 13,168 |
| 700 | | Safety Insurance Group, Inc. | | | 26,369 |
| 856 | | Sampo OYJ (Finland) (Class A Stock) | | | 22,707 |
| 338 | | SCOR SE (France) | | | 8,537 |
| 2,000 | | Sompo Japan Insurance, Inc. (Japan) | | | 14,034 |
| 2 | | Sony Financial Holdings, Inc. (Japan) | | | 6,567 |
| 4,518 | | Standard Life PLC (United Kingdom) | | | 13,733 |
| 3,200 | | Stewart Information Services Corp. | | | 44,160 |
| 2,755 | | Suncorp-Metway Ltd. (Australia) | | | 21,590 |
| 61 | | Swiss Life Holding AG (Switzerland) | | | 8,013 |
| 704 | | Swiss Reinsurance (Switzerland)(a) | | | 34,652 |
| 500 | | T & D Holdings, Inc. (Japan) | | | 11,835 |
| 1,500 | | Tokio Marine Holdings, Inc. (Japan) | | | 42,245 |
| 29 | | Topdanmark A/S (Denmark)(a) | | | 3,778 |
| 19,300 | | Travelers Cos., Inc. (The) | | | 1,041,042 |
| 49 | | TrygVesta AS (Denmark) | | | 3,234 |
| 1,511 | | Unipol SpA (Italy)(a) | | | 1,706 |
| 900 | | United America Indemnity Ltd. (Class A Stock)(a) | | | 8,613 |
| 2,900 | | Unitrin, Inc. | | | 81,345 |
| 78 | | Vienna Insurance Group (Austria) | | | 4,119 |
| 29,000 | | XL Capital Ltd. (Class A Stock) | | | 548,100 |
| 300 | | Zurich Financial Services AG (Switzerland) | | | 76,906 |
| | | | | |
| | | | | 8,706,300 |
| |
Internet & Catalog Retail | | | |
| 600 | | Amazon.com, Inc.(a) | | | 81,438 |
| 1,792 | | Home Retail Group PLC (United Kingdom) | | | 7,370 |
| 200 | | HSN, Inc.(a) | | | 5,888 |
| 15 | | Rakuten, Inc. (Japan) | | | 10,846 |
| | | | | |
| | | | | 105,542 |
|
Internet Software & Services 0.8% |
| 12,300 | | EarthLink, Inc. | | | 105,042 |
| 5,700 | | Google, Inc. (Class A Stock)(a) | | | 3,231,957 |
| 2,700 | | IAC/InterActiveCorp(a) | | | 61,398 |
| 3,500 | | j2 Global Communications, Inc.(a) | | | 81,900 |
| 3,100 | | Keynote Systems, Inc. | | | 35,309 |
| 1,300 | | Logmein, Inc.(a) | | | 26,897 |
| 3,000 | | Travelzoo, Inc.(a) | | | 45,030 |
See Notes to Financial Statements.
| | |
| Prudential Investment Portfolios, Inc./Prudential Asset Allocation Fund | | 35 |
Portfolio of Investments
as of March 31, 2010 (Unaudited) continued
| | | | | |
| Shares | | Description | | Value (Note 1) |
| | | | | |
COMMON STOCKS (Continued) | | | |
| |
Internet Software & Services (cont’d.) | | | |
| 257 | | United Internet AG (Germany)(a) | | $ | 3,886 |
| 5,500 | | United Online, Inc. | | | 41,140 |
| 30 | | Yahoo! Japan Corp. (Japan) | | | 10,926 |
| | | | | |
| | | | | 3,643,485 |
|
IT Services 0.5% |
| 93 | | ATOS Origin SA (France)(a) | | | 4,670 |
| 500 | | CACI International, Inc. (Class A Stock)(a) | | | 24,425 |
| 298 | | Capital Gemini SA (France) | | | 14,679 |
| 908 | | Computershare Ltd. (Australia) | | | 10,432 |
| 2,500 | | CSG Systems International, Inc.(a) | | | 52,400 |
| 200 | | CyberSource Corp.(a) | | | 3,528 |
| 3,300 | | DST Systems, Inc. | | | 136,785 |
| 3,600 | | iGATE Corp. | | | 35,028 |
| 201 | | Indra Sistemas SA (Spain) | | | 4,121 |
| 9,900 | | InfoGroup, Inc.(a) | | | 77,220 |
| 100 | | ITOCHU Techno-Solutions Corp. (Japan) | | | 3,284 |
| 3,500 | | Lionbridge Technologies, Inc.(a) | | | 12,705 |
| 400 | | ManTech International Corp. (Class A Stock)(a) | | | 19,532 |
| 1,200 | | NCI, Inc. (Class A Stock)(a) | | | 36,276 |
| 200 | | Nomura Research Institute Ltd. (Japan) | | | 4,557 |
| 3 | | NTT Data Corp. (Japan) | | | 9,996 |
| 20 | | OBIC Co. Ltd. (Japan) | | | 3,632 |
| 3,500 | | Online Resources Corp.(a) | | | 14,105 |
| 900 | | Syntel, Inc. | | | 34,623 |
| 1,900 | | VeriFone Holdings, Inc.(a) | | | 38,399 |
| 600 | | Virtusa Corp.(a) | | | 6,186 |
| 17,200 | | Visa, Inc. (Class A Stock) | | | 1,565,716 |
| 11,900 | | Western Union Co. (The) | | | 201,824 |
| 1,100 | | Wright Express Corp.(a) | | | 33,132 |
| | | | | |
| | | | | 2,347,255 |
|
Leisure Equipment & Products |
| 400 | | Namco Bandai Holdings, Inc. (Japan) | | | 3,898 |
| 1,000 | | Nikon Corp. (Japan) | | | 21,831 |
| 800 | | Polaris Industries, Inc. | | | 40,928 |
| 100 | | Sankyo Co. Ltd. (Japan) | | | 4,947 |
| 400 | | Sega Sammy Holdings, Inc. (Japan) | | | 4,843 |
| 100 | | Shimano, Inc. (Japan) | | | 4,423 |
| 200 | | Sport Supply Group, Inc. | | | 2,688 |
See Notes to Financial Statements.
| | |
| 36 | | Visit our website at www.prudentialfunds.com |
| | | | | |
| Shares | | Description | | Value (Note 1) |
| | | | | |
COMMON STOCKS (Continued) | | | |
| |
Leisure Equipment & Products (cont’d.) | | | |
| 1,800 | | Sturm, Ruger & Co., Inc. | | $ | 21,582 |
| 400 | | Yamaha Corp. (Japan) | | | 5,164 |
| | | | | |
| | | | | 110,304 |
|
Life Sciences Tools & Services 0.5% |
| 10,700 | | Affymetrix, Inc.(a) | | | 78,538 |
| 8,700 | | Bruker Corp.(a) | | | 127,455 |
| 700 | | Cambrex Corp.(a) | | | 2,835 |
| 3,500 | | Life Technologies Corp.(a) | | | 182,945 |
| 93 | | Lonza Group AG (Switzerland) | | | 7,585 |
| 467 | | Qiagen NV(a) | | | 10,723 |
| 32,400 | | Thermo Fisher Scientific, Inc.(a) | | | 1,666,656 |
| | | | | |
| | | | | 2,076,737 |
|
Machinery 1.3% |
| 4,100 | | Albany International Corp. (Class A Stock) | | | 88,273 |
| 701 | | ALFA Laval AB (Sweden) | | | 10,320 |
| 1,000 | | Amada Co. Ltd. (Japan) | | | 8,386 |
| 1,369 | | Atlas Copco AB (Sweden) (Class A Stock) | | | 21,235 |
| 797 | | Atlas Copco AB (Sweden) (Class B Stock) | | | 11,170 |
| 3,600 | | Blount International, Inc.(a) | | | 37,296 |
| 15,000 | | Crane Co. | | | 532,500 |
| 3,000 | | Deere & Co. | | | 178,380 |
| 8,700 | | Dover Corp. | | | 406,725 |
| 7,200 | | Eaton Corp. | | | 545,544 |
| 400 | | Fanuc Ltd. (Japan) | | | 42,443 |
| 8,000 | | Force Protection, Inc.(a) | | | 48,160 |
| 319 | | GEA Group AG (Germany) | | | 7,406 |
| 1,000 | | Hino Motors Ltd. (Japan) | | | 4,225 |
| 200 | | Hitachi Construction Machinery Co. Ltd. (Japan) | | | 4,726 |
| 6,300 | | IDEX Corp. | | | 208,530 |
| 3,000 | | IHI Corp. (Japan) | | | 5,487 |
| 2,100 | | Illinois Tool Works, Inc. | | | 99,456 |
| 1,636 | | Invensys PLC (United Kingdom) | | | 8,458 |
| 1,000 | | Japan Steel Works Ltd. (The) (Japan) | | | 11,456 |
| 3,300 | | John Bean Technologies Corp. | | | 57,882 |
| 4,600 | | Joy Global, Inc. | | | 260,360 |
| 400 | | JTEKT Corp. (Japan) | | | 4,724 |
| 1,200 | | Kadant, Inc.(a) | | | 17,292 |
| 3,000 | | Kawasaki Heavy Industries Ltd. (Japan) | | | 8,279 |
See Notes to Financial Statements.
| | |
| Prudential Investment Portfolios, Inc./Prudential Asset Allocation Fund | | 37 |
Portfolio of Investments
as of March 31, 2010 (Unaudited) continued
| | | | | |
| Shares | | Description | | Value (Note 1) |
| | | | | |
COMMON STOCKS (Continued) | | | |
| |
Machinery (cont’d.) | | | |
| 2,000 | | Komatsu Ltd. (Japan) | | $ | 41,930 |
| 314 | | Kone OYJ (Finland) (Class B Stock) | | | 12,978 |
| 2,000 | | Kubota Corp. (Japan) | | | 18,227 |
| 200 | | Kurita Water Industries Ltd. (Japan) | | | 5,658 |
| 216 | | MAN AG (Germany) | | | 18,076 |
| 260 | | Metso OYJ (Finland) | | | 8,397 |
| 900 | | Miller Industries, Inc. | | | 11,187 |
| 1,000 | | Minebea Co. Ltd. (Japan) | | | 6,086 |
| 6,000 | | Mitsubishi Heavy Industries Ltd. (Japan) | | | 24,837 |
| 2,000 | | Mitsui Engineering & Shipbuilding Co. Ltd. (Japan) | | | 4,984 |
| 3,300 | | Mueller Industries, Inc. | | | 88,407 |
| 1,500 | | NACCO Industries, Inc. (Class A Stock) | | | 111,225 |
| 1,000 | | NGK Insulators Ltd. (Japan) | | | 20,398 |
| 900 | | Nordson Corp. | | | 61,128 |
| 1,000 | | NSK Ltd. (Japan) | | | 7,894 |
| 1,000 | | NTN Corp. (Japan) | | | 4,514 |
| 19,100 | | Oshkosh Corp.(a) | | | 770,494 |
| 15,800 | | Parker Hannifin Corp. | | | 1,022,892 |
| 2,055 | | Sandvik AB (Sweden) | | | 25,685 |
| 668 | | Scania AB (Sweden) (Class B Stock) | | | 10,565 |
| 44 | | Schindler Holding AG (Switzerland) | | | 3,822 |
| 99 | | Schindler Holding AG - Part Certification (Switzerland) | | | 8,713 |
| 2,000 | | SembCorp Marine Ltd. (Singapore) | | | 5,990 |
| 792 | | SKF AB (Sweden) (Class B Stock) | | | 14,073 |
| 100 | | SMC Corp. (Japan) | | | 13,574 |
| 1,000 | | Sumitomo Heavy Industries Ltd. (Japan) | | | 6,022 |
| 300 | | Tecumseh Products Co. (Class A Stock)(a) | | | 3,681 |
| 2,600 | | Tennant Co. | | | 71,214 |
| 300 | | THK Co. Ltd. (Japan) | | | 6,546 |
| 2,600 | | Timken Co. | | | 78,026 |
| 600 | | Trimas Corp.(a) | | | 3,894 |
| 119 | | Vallourec (France) | | | 23,997 |
| 899 | | Volvo AB (Sweden) (Class A Stock) | | | 8,902 |
| 2,222 | | Volvo AB (Sweden) (Class B Stock) | | | 22,357 |
| 6,300 | | Wabco Holdings, Inc.(a) | | | 188,496 |
| 171 | | Wartsila OYJ (Finland) | | | 8,661 |
| 2,000 | | Watts Water Technologies, Inc. (Class A Stock) | | | 62,120 |
| 2,000 | | Yangzijiang Shipbuilding Holdings Ltd. (Singapore) | | | 1,658 |
| 272 | | Zardoya Otis SA (Spain) | | | 4,713 |
| | | | | |
| | | | | 5,440,734 |
See Notes to Financial Statements.
| | |
| 38 | | Visit our website at www.prudentialfunds.com |
| | | | | |
| Shares | | Description | | Value (Note 1) |
| | | | | |
COMMON STOCKS (Continued) | | | |
| |
Marine | | | |
| 1 | | A.P. Moller - Maersk A/S (Denmark) (Class A Stock) | | $ | 7,283 |
| 3 | | A.P. Moller - Maersk A/S (Denmark) (Class B Stock) | | | 22,860 |
| 1,000 | | Kawasaki Kisen Kaisha Ltd. (Japan)(a) | | | 3,990 |
| 110 | | Kuehne & Nagel International AG (Switzerland) | | | 11,131 |
| 2,000 | | Mitsui O.S.K. Lines Ltd. (Japan) | | | 14,354 |
| 2,000 | | Neptune Orient Lines Ltd. (Singapore) | | | 2,874 |
| 3,000 | | Nippon Yusen KK (Japan) | | | 11,841 |
| | | | | |
| | | | | 74,333 |
| |
Media 1.3% | | | |
| 2,322 | | British Sky Broadcasting Group PLC (United Kingdom) | | | 21,212 |
| 400 | | Carmike Cinemas, Inc.(a) | | | 5,548 |
| 117,800 | | Comcast Corp. (Class A Stock) | | | 2,216,996 |
| 300 | | Dentsu, Inc. (Japan) | | | 7,884 |
| 202 | | Eutelsat Communications (France) | | | 7,181 |
| 4,322 | | Fairfax Media Ltd. (Australia) | | | 7,139 |
| 1 | | Fuji Media Holdings, Inc. (Japan) | | | 1,481 |
| 33,500 | | Gannett Co., Inc. | | | 553,420 |
| 201 | | Gestevision Telecinco SA (Spain) | | | 3,155 |
| 50 | | Hakuhodo DY Holdings, Inc. (Japan) | | | 2,631 |
| 2,700 | | Harte-Hanks, Inc. | | | 34,722 |
| 136 | | JC Decaux SA (France)(a) | | | 3,801 |
| 241 | | Lagardere SCA (France) | | | 9,752 |
| 132 | | M6-Metropole Television (France) | | | 3,414 |
| 4,100 | | McGraw-Hill Cos., Inc. (The) | | | 146,165 |
| 1,447 | | Mediaset SpA (Italy) | | | 12,430 |
| 258 | | PagesJaunes Groupe (France) | | | 2,963 |
| 1,650 | | Pearson PLC (United Kingdom) | | | 25,940 |
| 240 | | Publicis Groupe (France) | | | 10,269 |
| 1,478 | | Reed Elsevier NV (Netherlands) | | | 17,962 |
| 2,471 | | Reed Elsevier PLC (United Kingdom) | | | 19,705 |
| 164 | | Sanoma OYJ (Finland) | | | 3,633 |
| 3,300 | | Scholastic Corp. | | | 92,400 |
| 578 | | SES SA (France) | | | 14,595 |
| 4,000 | | Singapore Press Holdings Ltd. (Singapore) | | | 10,923 |
| 240 | | Societe Television Francaise 1 (France) | | | 4,452 |
| 1,000 | | Television Broadcasts Ltd. (Hong Kong) | | | 4,843 |
| 25,566 | | Time Warner, Inc. | | | 799,449 |
| 300 | | Toho Co. Ltd. (Japan) | | | 4,833 |
| 20,100 | | Viacom, Inc. (Class B Stock)(a) | | | 691,038 |
See Notes to Financial Statements.
| | |
| Prudential Investment Portfolios, Inc./Prudential Asset Allocation Fund | | 39 |
Portfolio of Investments
as of March 31, 2010 (Unaudited) continued
| | | | | |
| Shares | | Description | | Value (Note 1) |
| | | | | |
COMMON STOCKS (Continued) | | | |
| |
Media (cont’d.) | | | |
| 2,513 | | Vivendi (France) | | $ | 67,256 |
| 20,275 | | Walt Disney Co. (The) | | | 707,800 |
| 100 | | Washington Post Co. (The) (Class B Stock) | | | 44,418 |
| 568 | | Wolters Kluwer NV (Netherlands) | | | 12,317 |
| 2,554 | | WPP PLC (United Kingdom) | | | 26,471 |
| | | | | |
| | | | | 5,598,198 |
| |
Metals & Mining 1.3% | | | |
| 286 | | Acerinox SA (Spain) | | | 5,630 |
| 42,600 | | Alcoa, Inc. | | | 606,624 |
| 4,982 | | Alumina Ltd. (Australia) | | | 7,886 |
| 2,683 | | Anglo American PLC (United Kingdom)(a) | | | 117,013 |
| 805 | | Antofagasta PLC (United Kingdom) | | | 12,704 |
| 1,750 | | Arcelormittal (Netherlands) | | | 76,795 |
| 6,890 | | BHP Billiton Ltd. (Australia) | | | 275,603 |
| 4,554 | | Billiton PLC (United Kingdom) | | | 156,181 |
| 3,723 | | BlueScope Steel Ltd. (Australia)(a) | | | 9,942 |
| 1,000 | | Daido Steel Co. Ltd. (Japan) | | | 4,204 |
| 1,000 | | DOWA Holdings Co. Ltd. (Japan) | | | 6,022 |
| 11 | | Eramet Group (France) | | | 3,786 |
| 526 | | Eurasian Natural Resources Corp. (Kazakhstan) | | | 9,515 |
| 2,523 | | Fortescue Metals Group Ltd. (Australia)(a) | | | 11,345 |
| 23,200 | | Freeport-McMoRan Copper & Gold, Inc. | | | 1,938,128 |
| 366 | | Fresnillo PLC (United Kingdom) | | | 4,710 |
| 1,000 | | JFE Holdings, Inc. (Japan) | | | 40,272 |
| 400 | | Kaiser Aluminum Corp. | | | 15,428 |
| 437 | | Kazakhmys PLC (United Kingdom)(a) | | | 10,126 |
| 5,000 | | Kobe Steel Ltd. (Japan) | | | 10,750 |
| 315 | | Lonmin PLC (United Kingdom)(a) | | | 9,742 |
| 100 | | Maruichi Steel Tube Ltd. (Japan) | | | 2,028 |
| 2,000 | | Mitsubishi Materials Corp. (Japan)(a) | | | 5,755 |
| 1,000 | | Mitsui Mining & Smelting Co. Ltd. (Japan) | | | 2,995 |
| 988 | | Newcrest Mining Ltd. (Australia) | | | 29,756 |
| 17,900 | | Newmont Mining Corp. | | | 911,647 |
| 10,000 | | Nippon Steel Corp. (Japan) | | | 39,256 |
| 1,000 | | Nisshin Steel Co. Ltd. (Japan) | | | 2,086 |
| 1,401 | | Norsk Hydro ASA (Norway)(a) | | | 10,679 |
| 2,707 | | OneSteel Ltd. (Australia) | | | 9,688 |
| 242 | | Outokumpu OYJ (Finland) | | | 5,311 |
| 6,373 | | OZ Minerals Ltd. (Australia)(a) | | | 6,696 |
See Notes to Financial Statements.
| | |
| 40 | | Visit our website at www.prudentialfunds.com |
| | | | | |
| Shares | | Description | | Value (Note 1) |
| | | | | |
COMMON STOCKS (Continued) | | | |
| |
Metals & Mining (cont’d.) | | | |
| 167 | | Randgold Resources Ltd. (United Kingdom) | | $ | 12,709 |
| 122 | | Rautaruukki OYJ Corp. (Finland) | | | 2,636 |
| 888 | | Rio Tinto Ltd. (Australia) | | | 63,886 |
| 2,831 | | Rio Tinto PLC (United Kingdom) | | | 167,760 |
| 80 | | Salzgitter AG (Germany) | | | 7,418 |
| 336 | | Sims Metal Management Ltd. (Australia) | | | 6,678 |
| 19,600 | | Southern Copper Corp. | | | 620,732 |
| 369 | | SSAB AB (Sweden) (Class A Stock) | | | 6,633 |
| 170 | | SSAB Svenskt Stal AB (Sweden) (Class B Stock) | | | 2,759 |
| 7,000 | | Sumitomo Metal Industries Ltd. (Japan) | | | 21,189 |
| 1,000 | | Sumitomo Metal Mining Co. Ltd. (Japan) | | | 14,879 |
| 682 | | ThyssenKrupp AG (Germany) | | | 23,439 |
| 200 | | Tokyo Steel Manufacturing Co. Ltd. (Japan) | | | 2,505 |
| 282 | | Vedanta Resources Ltd. (United Kingdom) | | | 11,879 |
| 240 | | Voestalpine AG (Austria) | | | 9,709 |
| 3,500 | | Worthington Industries, Inc. | | | 60,515 |
| 3,886 | | Xstrata PLC (United Kingdom)(a) | | | 73,624 |
| | | | | |
| | | | | 5,467,253 |
| |
Multiline Retail 0.6% | | | |
| 7,500 | | 99 Cents Only Stores(a) | | | 122,250 |
| 2,300 | | Dillard’s, Inc. (Class A Stock) | | | 54,280 |
| 1,400 | | Dollar Tree, Inc.(a) | | | 82,908 |
| 1,085 | | Harvey Norman Holdings Ltd. (Australia) | | | 3,604 |
| 1,000 | | Isetan Mitsukoshi Holdings Ltd. (Japan) | | | 10,750 |
| 1,000 | | J Front Retailing Co. Ltd. (Japan) | | | 5,883 |
| 1,000 | | Lifestyle International Holdings Ltd. (Hong Kong) | | | 1,806 |
| 35,400 | | Macy’s, Inc. | | | 770,658 |
| 3,213 | | Marks & Spencer Group (United Kingdom) | | | 18,045 |
| 500 | | Marui Group Co. Ltd. (Japan) | | | 3,626 |
| 402 | | Next PLC (United Kingdom) | | | 13,201 |
| 155 | | PPR (France) | | | 20,636 |
| 1,000 | | Takashimaya Co. Ltd. (Japan) | | | 8,215 |
| 32,300 | | Target Corp. | | | 1,698,980 |
| | | | | |
| | | | | 2,814,842 |
| |
Multi-Utilities 0.5% | | | |
| 2,239 | | A2A SpA (Italy) | | | 4,200 |
| 914 | | AGL Energy Ltd. (Australia) | | | 12,606 |
| 3,400 | | Ameren Corp. | | | 88,672 |
See Notes to Financial Statements.
| | |
| Prudential Investment Portfolios, Inc./Prudential Asset Allocation Fund | | 41 |
Portfolio of Investments
as of March 31, 2010 (Unaudited) continued
| | | | | |
| Shares | | Description | | Value (Note 1) |
| | | | | |
COMMON STOCKS (Continued) | | | |
| |
Multi-Utilities (cont’d.) | | | |
| 1,800 | | Avista Corp. | | $ | 37,278 |
| 200 | | Black Hills Corp. | | | 6,070 |
| 10,350 | | Centrica PLC (United Kingdom) | | | 46,160 |
| 2,528 | | GDF SUEZ (France) | | | 97,654 |
| 5,112 | | National Grid PLC (United Kingdom) | | | 49,764 |
| 2,300 | | Northwestern Corp. | | | 61,663 |
| 3,500 | | PG&E Corp. | | | 148,470 |
| 37,400 | | Public Service Enterprise Group, Inc. | | | 1,104,048 |
| 873 | | RWE AG (Germany) | | | 77,551 |
| 550 | | SUEZ Environnement Co. (France) | | | 12,658 |
| 21,200 | | TECO Energy, Inc.(b) | | | 336,868 |
| 1,391 | | United Utilities Group PLC (United Kingdom) | | | 11,800 |
| 772 | | Veolia Environnement (France) | | | 26,777 |
| | | | | |
| | | | | 2,122,239 |
| |
Office Electronics 0.2% | | | |
| 2,200 | | Canon, Inc. (Japan) | | | 101,893 |
| 1,000 | | Konica Minolta Holdings, Inc. (Japan) | | | 11,670 |
| 64 | | Neopost SA (France) | | | 5,115 |
| 1,000 | | Ricoh Co. Ltd. (Japan) | | | 15,616 |
| 60,200 | | Xerox Corp. | | | 586,950 |
| | | | | |
| | | | | 721,244 |
| |
Oil, Gas & Consumable Fuels 5.3% | | | |
| 14,200 | | Apache Corp. | | | 1,441,300 |
| 1,700 | | Approach Resources, Inc.(a) | | | 15,436 |
| 2,200 | | Arena Resources, Inc.(a) | | | 73,480 |
| 1,186 | | Arrow Energy Ltd. (Australia)(a) | | | 5,474 |
| 600 | | Atlas Energy, Inc.(a) | | | 18,672 |
| 1,300 | | Berry Petroleum Co. (Class A Stock) | | | 36,608 |
| 6,865 | | BG Group PLC (United Kingdom) | | | 118,813 |
| 2,300 | | Bill Barrett Corp.(a) | | | 70,633 |
| 38,805 | | BP PLC (United Kingdom) | | | 367,098 |
| 2,810 | | Cairn Energy PLC (United Kingdom)(a) | | | 17,782 |
| 276 | | Caltex Australia Ltd. (Australia) | | | 2,865 |
| 47,500 | | Chesapeake Energy Corp. | | | 1,122,900 |
| 57,392 | | Chevron Corp. | | | 4,352,035 |
| 1,100 | | Cimarex Energy Co. | | | 65,318 |
| 32,600 | | ConocoPhillips | | | 1,668,142 |
| 1,600 | | Contango Oil & Gas Co.(a) | | | 81,840 |
See Notes to Financial Statements.
| | |
| 42 | | Visit our website at www.prudentialfunds.com |
| | | | | |
| Shares | | Description | | Value (Note 1) |
| | | | | |
COMMON STOCKS (Continued) | | | |
| |
Oil, Gas & Consumable Fuels (cont’d.) | | | |
| 1,000 | | Cosmo Oil Co. Ltd. (Japan) | | $ | 2,417 |
| 2,300 | | CVR Energy, Inc.(a) | | | 20,125 |
| 19,600 | | Devon Energy Corp. | | | 1,262,828 |
| 136 | | Energy Resources of Australia Ltd. (Australia) | | | 2,359 |
| 5,306 | | ENI SpA (Italy) | | | 124,484 |
| 107,654 | | Exxon Mobil Corp. | | | 7,210,665 |
| 315 | | Galp Energia SGPS SA (Portugal) (Class B Stock) | | | 5,471 |
| 3,300 | | Gulfport Energy Corp.(a) | | | 37,092 |
| 4,600 | | Harvest Natural Resources, Inc.(a) | | | 34,638 |
| 187 | | Hellenic Petroleum SA (Greece) | | | 2,142 |
| 2 | | INPEX Holdings, Inc. (Japan) | | | 14,675 |
| 1,400 | | James River Coal Co.(a) | | | 22,260 |
| 454 | | Lundin Petroleum AB (Sweden)(a) | | | 3,845 |
| 34,256 | | Marathon Oil Corp. | | | 1,083,860 |
| 6,000 | | Mongolia Energy Co. Ltd. (Hong Kong)(a) | | | 2,774 |
| 10,000 | | Murphy Oil Corp. | | | 561,900 |
| 262 | | Neste Oil OYJ (Finland) | | | 4,569 |
| 2,000 | | Nippon Mining Holdings, Inc. (Japan) | | | 9,188 |
| 3,000 | | Nippon Oil Corp. (Japan) | | | 15,114 |
| 13,400 | | Occidental Petroleum Corp. | | | 1,132,836 |
| 340 | | OMV AG (Austria) | | | 12,757 |
| 1,783 | | Origin Energy Ltd. (Australia) | | | 27,079 |
| 1,146 | | Paladin Energy Ltd. (Australia)(a) | | | 4,154 |
| 5,600 | | Petroquest Energy, Inc.(a) | | | 28,168 |
| 1,548 | | Repsol YPF SA (Spain) | | | 36,652 |
| 7,295 | | Royal Dutch Shell PLC (United Kingdom) (Class A Stock) | | | 211,440 |
| 5,525 | | Royal Dutch Shell PLC (United Kingdom) (Class B Stock) | | | 152,215 |
| 1,732 | | Santos Ltd. (Australia) | | | 23,300 |
| 400 | | Showa Shell Sekiyu KK (Japan) | | | 2,704 |
| 10,300 | | Southwestern Energy Co.(a) | | | 419,416 |
| 2,356 | | StatoilHydro ASA (Norway) | | | 54,547 |
| 3,900 | | Stone Energy Corp.(a) | | | 69,225 |
| 1,000 | | TonenGeneral Sekiyu K.K. (Japan) | | | 8,439 |
| 4,375 | | Total SA (France) | | | 253,974 |
| 1,757 | | Tullow Oil PLC (United Kingdom) | | | 33,328 |
| 11,900 | | USEC, Inc.(a) | | | 68,663 |
| 13,700 | | VAALCO Energy, Inc. | | | 67,678 |
| 10,500 | | W&T Offshore, Inc. | | | 88,200 |
| 1,114 | | Woodside Petroleum Ltd. (Australia) | | | 47,944 |
| 3,300 | | World Fuel Services Corp. | | | 87,912 |
| | | | | |
| | | | | 22,709,433 |
See Notes to Financial Statements.
| | |
| Prudential Investment Portfolios, Inc./Prudential Asset Allocation Fund | | 43 |
Portfolio of Investments
as of March 31, 2010 (Unaudited) continued
| | | | | |
| Shares | | Description | | Value (Note 1) |
| | | | | |
COMMON STOCKS (Continued) | | | |
| |
Paper & Forest Products | | | |
| 500 | | Domtar Corp. (Canada)(a) | | $ | 32,205 |
| 108 | | Holmen AB (Sweden) (Class B Stock) | | | 2,909 |
| 200 | | Nippon Paper Group, Inc. (Japan) | | | 5,145 |
| 2,000 | | OJI Paper Co. Ltd. (Japan) | | | 8,771 |
| 1,188 | | Stora ENSO OYJ (Finland) (Class R Stock) | | | 9,050 |
| 1,160 | | Svenska Cellulosa AB (Sweden) (Class B Stock) | | | 16,354 |
| 1,060 | | UPM-Kymmene OYJ (Finland) | | | 14,067 |
| 4,100 | | Wausau Paper Corp.(a) | | | 35,014 |
| | | | | |
| | | | | 123,515 |
| |
Personal Products 0.1% | | | |
| 180 | | Beiersdorf AG (Germany) | | | 10,760 |
| 488 | | L’Oreal SA (France) | | | 51,319 |
| 2,100 | | Medifast, Inc.(a) | | | 52,773 |
| 3,000 | | Nu Skin Enterprises, Inc. (Class A Stock) | | | 87,300 |
| 800 | | Prestige Brands Holdings, Inc.(a) | | | 7,200 |
| 1,100 | | Revlon, Inc. (Class A Stock)(a) | | | 16,335 |
| 1,000 | | Shiseido Co. Ltd. (Japan) | | | 21,714 |
| 1,900 | | USANA Health Sciences, Inc.(a) | | | 59,679 |
| | | | | |
| | | | | 307,080 |
| |
Pharmaceuticals 3.5% | | | |
| 18,500 | | Abbott Laboratories | | | 974,580 |
| 22,200 | | Allergan, Inc. | | | 1,450,104 |
| 900 | | Astellas Pharma, Inc. (Japan) | | | 32,586 |
| 3,052 | | AstraZeneca PLC (United Kingdom) | | | 136,117 |
| 1,685 | | Bayer AG (Germany) | | | 113,816 |
| 56,300 | | Bristol-Myers Squibb Co. | | | 1,503,210 |
| 500 | | Chugai Pharmaceutical Co. Ltd. (Japan) | | | 9,402 |
| 1,400 | | Daiichi Sankyo Co. Ltd. (Japan) | | | 26,221 |
| 500 | | Eisai Co. Ltd. (Japan) | | | 17,836 |
| 972 | | Elan Corp. PLC (Ireland)(a) | | | 7,326 |
| 39,200 | | Eli Lilly & Co.(b) | | | 1,419,824 |
| 10,625 | | GlaxoSmithKline PLC (United Kingdom) | | | 204,042 |
| 121 | | H. Lundbeck A/S (Denmark) | | | 2,281 |
| 1,000 | | Impax Laboratories, Inc.(a) | | | 17,880 |
| 51 | | Ipsen SA (France) | | | 2,491 |
| 1,900 | | ISTA Pharmaceuticals, Inc.(a) | | | 7,733 |
| 52,000 | | Johnson & Johnson | | | 3,390,400 |
| 1,000 | | Kyowa Hakko Kogyo Co. Ltd. (Japan) | | | 10,322 |
See Notes to Financial Statements.
| | |
| 44 | | Visit our website at www.prudentialfunds.com |
| | | | | |
| Shares | | Description | | Value (Note 1) |
| | | | | |
COMMON STOCKS (Continued) | | | |
| |
Pharmaceuticals (cont’d.) | | | |
| 11,700 | | Medicines Co. (The)(a) | | $ | 91,728 |
| 5,800 | | Medicis Pharmaceutical Corp. (Class A Stock) | | | 145,928 |
| 43,489 | | Merck & Co., Inc. | | | 1,624,314 |
| 132 | | Merck KGaA (Germany) | | | 10,697 |
| 1,000 | | Mitsubishi Tanabe Pharma Corp. (Japan) | | | 14,119 |
| 4,339 | | Novartis AG (Switzerland) | | | 234,357 |
| 888 | | Novo Nordisk A/S (Denmark) (Class B Stock) | | | 68,906 |
| 1,200 | | Obagi Medical Products, Inc.(a) | | | 14,616 |
| 200 | | ONO Pharmaceutical Co. Ltd. (Japan) | | | 8,899 |
| 182 | | Orion OYJ (Finland) (Class B Stock) | | | 4,027 |
| 3,000 | | Par Pharmaceutical Cos., Inc.(a) | | | 74,400 |
| 171,019 | | Pfizer, Inc. | | | 2,932,976 |
| 1,100 | | POZEN, Inc.(a) | | | 10,538 |
| 1,444 | | Roche Holding AG (Switzerland) | | | 234,184 |
| 2,175 | | Sanofi-aventis (France) | | | 162,131 |
| 4,200 | | Santarus, Inc.(a) | | | 22,596 |
| 200 | | Santen Pharmaceutical Co. Ltd. (Japan) | | | 6,003 |
| 900 | | Shionogi & Co. Ltd. (Japan) | | | 17,116 |
| 1,144 | | Shire Ltd. (United Kingdom) | | | 25,242 |
| 1,500 | | Takeda Pharmaceutical Co. Ltd. (Japan) | | | 66,023 |
| 206 | | UCB SA (Belgium) | | | 8,796 |
| | | | | |
| | | | | 15,103,767 |
| |
Professional Services 0.1% | | | |
| 251 | | Adecco SA (Switzerland) | | | 14,247 |
| 100 | | Bureau Veritas SA (France) | | | 5,308 |
| 1,270 | | Capita Group PLC (The) (United Kingdom) | | | 14,579 |
| 2,090 | | Experian PLC (United Kingdom) | | | 20,568 |
| 1,900 | | Franklin Covey Co.(a) | | | 15,086 |
| 1,800 | | Kelly Services, Inc. (Class A Stock)(a) | | | 29,988 |
| 208 | | Randstad Holding NV (Netherlands)(a) | | | 9,885 |
| 11 | | SGS SA (Switzerland) | | | 15,169 |
| 4,200 | | Towers Watson & Co. (Class A Stock) | | | 199,500 |
| | | | | |
| | | | | 324,330 |
| |
Real Estate Investment Trusts 0.9% | | | |
| 1,300 | | American Capital Agency Corp. | | | 33,280 |
| 62,200 | | Annaly Capital Management, Inc.(b) | | | 1,068,596 |
| 14,000 | | Anworth Mortgage Asset Corp. | | | 94,360 |
| 3,000 | | Ascendas Real Estate Investment Trust (Singapore) | | | 4,117 |
See Notes to Financial Statements.
| | |
| Prudential Investment Portfolios, Inc./Prudential Asset Allocation Fund | | 45 |
Portfolio of Investments
as of March 31, 2010 (Unaudited) continued
| | | | | |
| Shares | | Description | | Value (Note 1) |
| | | | | |
COMMON STOCKS (Continued) | | | |
| |
Real Estate Investment Trusts (cont’d.) | | | |
| 1,800 | | BioMed Realty Trust, Inc. | | $ | 29,772 |
| 1,740 | | British Land Co. PLC (United Kingdom) | | | 12,703 |
| 5,000 | | CapitaMall Trust (Singapore) | | | 6,326 |
| 5,600 | | CapLease, Inc. | | | 31,080 |
| 9,000 | | CBL & Associates Properties, Inc. | | | 123,300 |
| 3,523 | | CFS Retail Property Trust (Australia) | | | 6,062 |
| 152,600 | | Chimera Investment Corp. | | | 593,614 |
| 7,600 | | Colonial Properties Trust | | | 97,888 |
| 2,600 | | Colony Financial, Inc. | | | 52,000 |
| 109 | | Corio NV (Netherlands) | | | 7,278 |
| 10,600 | | DCT Industrial Trust, Inc. | | | 55,438 |
| 8,100 | | Developers Diversified Realty Corp. | | | 98,577 |
| 9,598 | | Dexus Property Group (Australia) | | | 7,134 |
| 400 | | Equity Lifestyle Properties, Inc. | | | 21,552 |
| 48 | | Fonciere des Regions (France) | | | 5,287 |
| 300 | | Franklin Street Properties Corp. | | | 4,329 |
| 38 | | Gecina SA (France) | | | 4,206 |
| 200 | | Getty Realty Corp. | | | 4,680 |
| 600 | | Gladstone Commercial Corp. | | | 8,670 |
| 12,202 | | Goodman Group (Australia) | | | 7,334 |
| 17,476 | | GPT Group (Australia) | | | 9,221 |
| 1,420 | | Hammerson PLC (United Kingdom) | | | 8,477 |
| 31 | | Icade (France) | | | 3,450 |
| 2,000 | | Invesco Mortgage Capital, Inc. | | | 46,000 |
| 1,400 | | Investors Real Estate Trust | | | 12,628 |
| 1 | | Japan Prime Realty Investment Corp. (Japan) (Class A Stock) | | | 2,226 |
| 1 | | Japan Real Estate Investment Corp. (Japan) (Class A Stock) | | | 8,525 |
| 4 | | Japan Retail Fund Investment Corp. (Japan) (Class A Stock) | | | 4,706 |
| 186 | | Klepierre (France) | | | 7,306 |
| 1,544 | | Land Securities Group PLC (United Kingdom) | | | 15,886 |
| 1,038 | | Liberty International PLC (United Kingdom) | | | 7,931 |
| 4,500 | | Link REIT (The) (Hong Kong) | | | 11,093 |
| 1,600 | | LTC Properties, Inc. | | | 43,296 |
| 900 | | Medical Properties Trust, Inc. | | | 9,432 |
| 26,700 | | MFA Financial, Inc. | | | 196,512 |
| 5,155 | | Mirvac Group (Australia) (Class REIT Stock) | | | 6,977 |
| 800 | | Monmouth Real Estate Investment Corp. (Class A Stock) | | | 6,728 |
| 800 | | National Health Investors, Inc. | | | 31,008 |
| 2,700 | | National Retail Properties, Inc. | | | 61,641 |
| 1 | | Nippon Building Fund, Inc. (Japan) (Class A Stock) | | | 8,611 |
See Notes to Financial Statements.
| | |
| 46 | | Visit our website at www.prudentialfunds.com |
| | | | | |
| Shares | | Description | | Value (Note 1) |
| | | | | |
COMMON STOCKS (Continued) | | | |
| |
Real Estate Investment Trusts (cont’d.) | | | |
| 1 | | Nomura Real Estate Office Fund, Inc. (Japan) (Class A Stock) | | $ | 5,616 |
| 9,000 | | NorthStar Realty Finance Corp. | | | 37,890 |
| 800 | | OMEGA Healthcare Investors, Inc. | | | 15,592 |
| 3,300 | | Parkway Properties, Inc. | | | 61,974 |
| 500 | | Potlatch Corp. | | | 17,520 |
| 500 | | PS Business Parks, Inc. | | | 26,700 |
| 7,900 | | Ramco-Gershenson Properties Trust | | | 88,954 |
| 3,600 | | Redwood Trust, Inc. | | | 55,512 |
| 8,100 | | Resource Capital Corp. | | | 54,756 |
| 1,499 | | Segro PLC (United Kingdom) | | | 7,270 |
| 3,300 | | Simon Property Group, Inc. | | | 276,870 |
| 800 | | Starwood Property Trust, Inc. | | | 15,440 |
| 5,091 | | Stockland (Australia) | | | 18,640 |
| 184 | | Unibail-Rodamco (France) | | | 37,278 |
| 300 | | Urstadt Biddle Properties, Inc. (Class A Stock) | | | 4,743 |
| 600 | | Vornado Realty Trust(b) | | | 45,420 |
| 1,600 | | Walter Investment Management Corp. | | | 25,600 |
| 4,304 | | Westfield Group (Australia) | | | 47,632 |
| | | | | |
| | | | | 3,722,644 |
| |
Real Estate Management & Development 0.1% | | | |
| 5,000 | | CapitaLand Ltd. (Singapore) | | | 14,189 |
| 1,000 | | Capitamalls Asia Ltd. (Singapore)(a) | | | 1,615 |
| 3,000 | | Cheung Kong Holdings Ltd. (Hong Kong) | | | 38,639 |
| 1,000 | | Chinese Estates Holdings Ltd. (Hong Kong) | | | 1,672 |
| 1,000 | | City Developments Ltd. (Singapore) | | | 7,577 |
| 200 | | Daito Trust Construction Co. Ltd. (Japan) | | | 9,648 |
| 1,000 | | Daiwa House Industry Co. Ltd. (Japan) | | | 11,285 |
| 2,000 | | Forestar Group, Inc.(a) | | | 37,760 |
| 2,000 | | Hang Lung Group Ltd. (Hong Kong) | | | 10,613 |
| 4,000 | | Hang Lung Properties Ltd. (Hong Kong) | | | 16,125 |
| 2,000 | | Henderson Land Development Co. Ltd. (Hong Kong) | | | 14,090 |
| 2,000 | | Hopewell Holdings (Hong Kong) | | | 5,925 |
| 1,000 | | Hysan Development Co. Ltd. (Hong Kong) | | | 2,891 |
| 1,400 | | IMMOEAST AG (Austria)(a) | | | 7,677 |
| 1,500 | | Kerry Properties Ltd. (Hong Kong) | | | 8,047 |
| 888 | | Lend Lease Group (Australia) | | | 7,057 |
| 2,000 | | Mitsubishi Estate Co. Ltd. (Japan) | | | 32,731 |
| 2,000 | | Mitsui Fudosan Co. Ltd. (Japan) | | | 33,950 |
| 5,000 | | New World Development Ltd. (Hong Kong) | | | 9,788 |
See Notes to Financial Statements.
| | |
| Prudential Investment Portfolios, Inc./Prudential Asset Allocation Fund | | 47 |
Portfolio of Investments
as of March 31, 2010 (Unaudited) continued
| | | | | |
| Shares | | Description | | Value (Note 1) |
| | | | | |
COMMON STOCKS (Continued) | | | |
| |
Real Estate Management & Development (cont’d.) | | | |
| 2 | | NTT Urban Development Corp. (Japan) | | $ | 1,690 |
| 4,000 | | Sino Land Co. Ltd. (Hong Kong) | | | 7,841 |
| 1,000 | | Sumitomo Realty & Development Co. Ltd. (Japan) | | | 19,029 |
| 3,000 | | Sun Hung KAI Properties Ltd. (Hong Kong) | | | 45,130 |
| 1,500 | | Swire Pacific Ltd. (Hong Kong) | | | 18,044 |
| 1,000 | | Tokyo Tatemono Co. Ltd. (Japan) | | | 3,594 |
| 1,000 | | Tokyu Land Corp. (Japan) | | | 3,819 |
| 1,000 | | UOL Group Ltd. (Singapore) | | | 2,788 |
| 3,000 | | Wharf Holdings Ltd. (Hong Kong) | | | 16,904 |
| 2,000 | | Wheelock & Co. Ltd. (Hong Kong) | | | 5,899 |
| | | | | |
| | | | | 396,017 |
| |
Road & Rail 0.2% | | | |
| 1,100 | | Amerco, Inc.(a) | | | 59,719 |
| 5,498 | | Asciano Group (Australia)(a) | | | 9,561 |
| 3 | | Central Japan Railway Co. (Japan) | | | 22,847 |
| 4,000 | | ComfortDelGro Corp. Ltd. (Singapore) | | | 4,460 |
| 5,100 | | CSX Corp. | | | 259,590 |
| 4,000 | | Dollar Thrifty Automotive Group, Inc.(a) | | | 128,520 |
| 427 | | DSV A/S (Denmark) | | | 7,631 |
| 700 | | East Japan Railway Co. (Japan) | | | 48,668 |
| 984 | | FirstGroup PLC (United Kingdom) | | | 5,361 |
| 1,000 | | Keihin Electric Express Railway Co. Ltd. (Japan) | | | 8,215 |
| 1,000 | | KEIO Corp. (Japan) | | | 6,749 |
| 1,000 | | Keisei Electric Railway Co. Ltd. (Japan) | | | 6,086 |
| 3,000 | | Kintetsu Corp. (Japan) | | | 9,338 |
| 3,000 | | MTR Corp. (Hong Kong) | | | 11,360 |
| 2,000 | | Nippon Express Co. Ltd. (Japan) | | | 8,600 |
| 1,000 | | Odakyu Electric Railway Co. Ltd. (Japan) | | | 8,322 |
| 2,400 | | Ryder System, Inc. | | | 93,024 |
| 2,000 | | Tobu Railway Co. Ltd. (Japan) | | | 11,103 |
| 2,000 | | Tokyu Corp. (Japan) | | | 8,364 |
| 100 | | Universal Truckload Services, Inc.(a) | | | 1,758 |
| 600 | | Werner Enterprises, Inc. | | | 13,902 |
| 3 | | West Japan Railway Co. (Japan) | | | 10,333 |
| | | | | |
| | | | | 743,511 |
| |
Semiconductors & Semiconductor Equipment 1.9% | | | |
| 6,900 | | Advanced Analogic Technologies, Inc.(a) | | | 24,081 |
| 300 | | Advantest Corp. (Japan) | | | 7,502 |
See Notes to Financial Statements.
| | |
| 48 | | Visit our website at www.prudentialfunds.com |
| | | | | |
| Shares | | Description | | Value (Note 1) |
| | | | | |
COMMON STOCKS (Continued) | | | |
| |
Semiconductors & Semiconductor Equipment (cont’d.) | | | |
| 5,900 | | Amkor Technology, Inc.(a) | | $ | 41,713 |
| 600 | | Applied Micro Circuits Corp.(a) | | | 5,178 |
| 500 | | ASM Pacific Technology Ltd. (Hong Kong) | | | 4,737 |
| 879 | | ASML Holding NV (Netherlands) | | | 31,414 |
| 2,700 | | Atheros Communications, Inc.(a) | | | 104,517 |
| 17,500 | | Broadcom Corp. (Class A Stock)(b) | | | 580,650 |
| 1,100 | | Brooks Automation, Inc.(a) | | | 9,702 |
| 16,500 | | Cirrus Logic, Inc.(a) | | | 138,435 |
| 4,400 | | Diodes, Inc.(a) | | | 98,560 |
| 400 | | Elpida Memory, Inc. (Japan)(a) | | | 7,877 |
| 9,800 | | Fairchild Semiconductor International, Inc. (Class A Stock)(a) | | | 104,370 |
| 2,211 | | Infineon Technologies AG (Germany)(a) | | | 15,323 |
| 150,500 | | Intel Corp. | | | 3,350,130 |
| 12,300 | | Intersil Corp. (Class A Stock) | | | 181,548 |
| 4,000 | | Marvell Technology Group Ltd. ( )(a) | | | 81,520 |
| 2,900 | | Micron Technology, Inc.(a)(b) | | | 30,131 |
| 33,100 | | National Semiconductor Corp. | | | 478,295 |
| 6,100 | | Novellus Systems, Inc.(a) | | | 152,500 |
| 1,200 | | NVE Corp.(a) | | | 54,360 |
| 1,000 | | Power Integrations, Inc. | | | 41,200 |
| 15,300 | | RF Micro Devices, Inc.(a) | | | 76,194 |
| 200 | | ROHM Co. Ltd. (Japan) | | | 14,932 |
| 7,000 | | Semtech Corp.(a) | | | 122,010 |
| 200 | | Shinko Electric Industries Co. Ltd. (Japan) | | | 3,093 |
| 1,600 | | Skyworks Solutions, Inc.(a) | | | 24,960 |
| 1,394 | | STMicroelectronics NV (France) | | | 13,876 |
| 200 | | SUMCO Corp. (Japan)(a) | | | 4,253 |
| 800 | | Techwell, Inc.(a) | | | 14,960 |
| 85,700 | | Texas Instruments, Inc. | | | 2,097,079 |
| 400 | | Tokyo Electron Ltd. (Japan) | | | 26,527 |
| 4,900 | | Volterra Semiconductor Corp.(a) | | | 122,990 |
| 10,500 | | Zoran Corp.(a) | | | 112,980 |
| | | | | |
| | | | | 8,177,597 |
| |
Software 2.6% | | | |
| 3,200 | | Aci Worldwide, Inc.(a) | | | 65,952 |
| 9,300 | | Ariba, Inc.(a) | | | 119,505 |
| 448 | | Autonomy Corp. PLC (United Kingdom)(a) | | | 12,393 |
| 900 | | Blackbaud, Inc. | | | 22,671 |
| 1,600 | | Blackboard, Inc.(a) | | | 66,656 |
See Notes to Financial Statements.
| | |
| Prudential Investment Portfolios, Inc./Prudential Asset Allocation Fund | | 49 |
Portfolio of Investments
as of March 31, 2010 (Unaudited) continued
| | | | | |
| Shares | | Description | | Value (Note 1) |
| | | | | |
COMMON STOCKS (Continued) | | | |
| |
Software (cont’d.) | | | |
| 16,900 | | BMC Software, Inc.(a) | | $ | 642,200 |
| 800 | | CommVault Systems, Inc.(a) | | | 17,080 |
| 132 | | Dassault Systemes SA (France) | | | 7,808 |
| 3,700 | | Interactive Intelligence, Inc.(a) | | | 69,153 |
| 13,300 | | Intuit, Inc.(a) | | | 456,722 |
| 4,800 | | Jack Henry & Associates, Inc. | | | 115,488 |
| 1,200 | | JDA Software Group, Inc.(a) | | | 33,384 |
| 200 | | Konami Corp. (Japan) | | | 3,857 |
| 10,000 | | Lawson Software, Inc.(a) | | | 66,100 |
| 600 | | Manhattan Associates, Inc.(a) | | | 15,288 |
| 25,800 | | McAfee, Inc.(a) | | | 1,035,354 |
| 201,413 | | Microsoft Corp. | | | 5,895,359 |
| 100 | | MicroStrategy, Inc. (Class A Stock)(a) | | | 8,507 |
| 200 | | Nintendo Co. Ltd. (Japan) | | | 66,959 |
| 1,200 | | OPNET Technologies, Inc. | | | 19,344 |
| 36,300 | | Oracle Corp. | | | 932,547 |
| 100 | | Oracle Corp. (Japan) | | | 4,637 |
| 4,000 | | Pegasystems, Inc. | | | 148,000 |
| 2,200 | | S1 Corp.(a) | | | 12,980 |
| 2,677 | | Sage Group PLC (The) (United Kingdom) | | | 9,713 |
| 1,752 | | SAP AG (Germany) | | | 84,775 |
| 1,800 | | Solera Holdings, Inc. | | | 69,570 |
| 74,900 | | Symantec Corp.(a) | | | 1,267,308 |
| 7,600 | | Symyx Technologies, Inc.(a) | | | 34,124 |
| 4,900 | | TIBCO Software, Inc.(a) | | | 52,871 |
| 100 | | Trend Micro, Inc. (Japan) | | | 3,487 |
| | | | | |
| | | | | 11,359,792 |
| |
Specialty Retail 1.5% | | | |
| 2,200 | | America’s Car-Mart, Inc.(a) | | | 53,064 |
| 3,700 | | AnnTaylor Stores Corp.(a) | | | 76,590 |
| 24,200 | | Best Buy Co., Inc.(b) | | | 1,029,468 |
| 2,200 | | Big 5 Sporting Goods Corp. | | | 33,484 |
| 420 | | Carphone Warehouse Group PLC (United Kingdom)(a) | | | 1,017 |
| 1,500 | | Cato Corp. (The) (Class A Stock) | | | 32,160 |
| 39,100 | | Chico’s FAS, Inc. | | | 563,822 |
| 1,500 | | Coldwater Creek, Inc.(a) | | | 10,410 |
| 1,600 | | Collective Brands, Inc.(a) | | | 36,384 |
| 1,700 | | DSW, Inc. (Class A Stock)(a) | | | 43,401 |
| 2,561 | | Esprit Holdings Ltd. (Hong Kong) | | | 20,203 |
See Notes to Financial Statements.
| | |
| 50 | | Visit our website at www.prudentialfunds.com |
| | | | | |
| Shares | | Description | | Value (Note 1) |
| | | | | |
COMMON STOCKS (Continued) | | | |
| |
Specialty Retail (cont’d.) | | | |
| 100 | | Fast Retailing Co. Ltd. (Japan) | | $ | 17,382 |
| 30,900 | | Gap, Inc. (The) | | | 714,099 |
| 1,042 | | Hennes & Mauritz AB (H&M) (Sweden) (Class B Stock) | | | 67,695 |
| 27,600 | | Home Depot, Inc. (The) | | | 892,860 |
| 445 | | Inditex SA (Spain) | | | 29,334 |
| 1,400 | | J. Crew Group, Inc.(a) | | | 64,260 |
| 600 | | JOS A Bank Clothiers, Inc.(a) | | | 32,790 |
| 5,195 | | Kingfisher PLC (United Kingdom) | | | 16,902 |
| 2,500 | | Kirkland’s, Inc.(a) | | | 52,500 |
| 3,700 | | Lithia Motors, Inc. (Class A Stock)(a) | | | 23,680 |
| 6,800 | | Lowe’s Cos., Inc. | | | 164,832 |
| 1,300 | | Monro Muffler Brake, Inc. | | | 46,488 |
| 100 | | Nitori Co. Ltd. (Japan) | | | 7,594 |
| 2,300 | | Rent-A-Center, Inc. (Class A Stock)(a) | | | 54,395 |
| 7,000 | | Ross Stores, Inc.(b) | | | 374,290 |
| 8,800 | | Sally Beauty Holdings, Inc.(a) | | | 78,496 |
| 6,000 | | Sonic Automotive, Inc. (Class A Stock)(a) | | | 66,000 |
| 3,200 | | Stein Mart, Inc.(a) | | | 28,896 |
| 31,500 | | TJX Cos., Inc. | | | 1,339,380 |
| 700 | | Tractor Supply Co. | | | 40,635 |
| 1,800 | | ULTA Salon, Cosmetics & Fragrance, Inc.(a) | | | 40,716 |
| 8,300 | | Urban Outfitters, Inc.(a) | | | 315,649 |
| 50 | | USS Co. Ltd. (Japan) | | | 3,396 |
| 180 | | Yamada Denki Co. Ltd. (Japan) | | | 13,285 |
| | | | | |
| | | | | 6,385,557 |
| |
Textiles, Apparel & Luxury Goods 0.8% | | | |
| 395 | | Adidas AG (Germany) | | | 21,111 |
| 398 | | Billabong International Ltd. (Australia) | | | 4,127 |
| 884 | | Burberry Group PLC (United Kingdom) | | | 9,585 |
| 2,700 | | Carter’s, Inc.(a) | | | 81,405 |
| 130 | | Christian Dior SA (France) | | | 13,868 |
| 47,500 | | Coach, Inc. | | | 1,877,200 |
| 1,066 | | Compagnie Financiere Richemont SA (Switzerland) | | | 41,279 |
| 100 | | Deckers Outdoor Corp.(a) | | | 13,800 |
| 3,300 | | Fossil, Inc.(a) | | | 124,542 |
| 108 | | Hermes International (France) | | | 15,003 |
| 5,800 | | Jones Apparel Group, Inc. | | | 110,316 |
| 237 | | Luxottica Group SpA (Italy) | | | 6,338 |
| 499 | | LVMH, Moet Hennessy Louis Vuitton SA (France) | | | 58,326 |
See Notes to Financial Statements.
| | |
| Prudential Investment Portfolios, Inc./Prudential Asset Allocation Fund | | 51 |
Portfolio of Investments
as of March 31, 2010 (Unaudited) continued
| | | | | |
| Shares | | Description | | Value (Note 1) |
| | | | | |
COMMON STOCKS (Continued) | | | |
| |
Textiles, Apparel & Luxury Goods (cont’d.) | | | |
| 3,600 | | Maidenform Brands, Inc.(a) | | $ | 78,660 |
| 2,700 | | Oxford Industries, Inc. | | | 54,891 |
| 11 | | Puma AG Rudolf Dassler Sport (Germany) | | | 3,477 |
| 400 | | Skechers U.S.A., Inc. (Class A Stock)(a) | | | 14,528 |
| 1,600 | | Steven Madden Ltd.(a) | | | 78,080 |
| 89 | | Swatch Group AG (Switzerland) | | | 5,292 |
| 63 | | Swatch Group AG (The) (Switzerland) | | | 20,088 |
| 1,600 | | Under Armour, Inc. (Class A Stock)(a) | | | 47,056 |
| 100 | | UniFirst Corp. | | | 5,150 |
| 10,000 | | VF Corp. | | | 801,500 |
| 1,700 | | Warnaco Group, Inc. (The)(a) | | | 81,107 |
| 1,500 | | YUE Yuen Industrial Holdings Ltd. (Hong Kong) | | | 5,216 |
| | | | | |
| | | | | 3,571,945 |
| |
Thrifts & Mortgage Finance 0.2% | | | |
| 1,200 | | Dime Community Bancshares | | | 15,156 |
| 1,500 | | First Defiance Financial Corp. | | | 15,180 |
| 1,600 | | First Financial Holdings, Inc. | | | 24,096 |
| 500 | | Flushing Financial Corp. | | | 6,330 |
| 50,100 | | Hudson City Bancorp, Inc. | | | 709,416 |
| 200 | | Meridian Interstate Bancorp, Inc.(a) | | | 2,080 |
| 3,300 | | NewAlliance Bancshares, Inc. | | | 41,646 |
| 3,100 | | Oceanfirst Financial Corp. | | | 35,216 |
| 1,400 | | Ocwen Financial Corp.(a) | | | 15,526 |
| 7,400 | | Provident Financial Services, Inc. | | | 88,060 |
| 3,300 | | Radian Group, Inc. | | | 51,612 |
| 5,200 | | Trustco Bank Corp. NY | | | 32,084 |
| | | | | |
| | | | | 1,036,402 |
| |
Tobacco 0.6% | | | |
| 4,069 | | British American Tobacco (United Kingdom) | | | 140,258 |
| 2,123 | | Imperial Tobacco Group (United Kingdom) | | | 64,755 |
| 9 | | Japan Tobacco, Inc. (Japan) | | | 33,501 |
| 3,900 | | Lorillard, Inc. | | | 293,436 |
| 19,200 | | Philip Morris International, Inc. | | | 1,001,472 |
| 19,700 | | Reynolds American, Inc. | | | 1,063,406 |
| 512 | | Swedish Match AB (Sweden) | | | 12,239 |
| 1,000 | | Universal Corp. | | | 52,690 |
| | | | | |
| | | | | 2,661,757 |
See Notes to Financial Statements.
| | |
| 52 | | Visit our website at www.prudentialfunds.com |
| | | | | |
| Shares | | Description | | Value (Note 1) |
| | | | | |
COMMON STOCKS (Continued) | | | |
| |
Trading Companies & Distributors 0.3% | | | |
| 668 | | Bunzl PLC (United Kingdom) | | $ | 7,309 |
| 6,300 | | Interline Brands, Inc.(a) | | | 120,582 |
| 3,000 | | Itochu Corp. (Japan) | | | 26,281 |
| 3,000 | | Marubeni Corp. (Japan) | | | 18,644 |
| 2,600 | | Mitsubishi Corp. (Japan) | | | 68,136 |
| 4,000 | | Mitsui & Co. Ltd. (Japan) | | | 67,216 |
| 4,000 | | Noble Group Ltd. (Singapore) | | | 8,749 |
| 2,500 | | Sojitz Corp. (Japan) | | | 4,840 |
| 2,400 | | Sumitomo Corp. (Japan) | | | 27,596 |
| 500 | | Toyota Tsusho Corp. (Japan) | | | 7,840 |
| 580 | | Wolseley PLC (United Kingdom)(a) | | | 14,012 |
| 10,200 | | WW Grainger, Inc. | | | 1,102,824 |
| | | | | |
| | | | | 1,474,029 |
| |
Transportation Infrastructure | | | |
| 575 | | Abertis Infraestructuras SA (Spain) | | | 11,067 |
| 61 | | Aeroports de Paris (France) | | | 5,022 |
| 526 | | Atlantia SpA (Italy) | | | 12,277 |
| 1,751 | | Auckland International Airport Ltd. (New Zealand) | | | 2,413 |
| 368 | | Brisa Auto-Estradas de Portugal SA (Portugal) | | | 3,121 |
| 75 | | Fraport AG Frankfurt Airport Services Worldwide (Germany) | | | 3,952 |
| 900 | | Groupe Eurotunnel SA (France) | | | 9,172 |
| 1,000 | | Kamigumi Co. Ltd. (Japan) | | | 8,044 |
| 45 | | Koninklijke Vopak NV (Netherlands)(a) | | | 3,544 |
| 4,618 | | Macquarie Infrastructure Group (Australia) | | | 4,746 |
| 1,404 | | Map Group (Australia) | | | 3,981 |
| 46 | | Societe des Autoroutes Paris-Rhin-Rhone (France)(a) | | | 3,308 |
| 2,357 | | Transurban Group (Australia) | | | 10,923 |
| | | | | |
| | | | | 81,570 |
| |
Water Utilities | | | |
| 500 | | American States Water Co. | | | 17,350 |
| 1,100 | | Artesian Resources Corp. (Class A Stock) | | | 19,426 |
| 600 | | California Water Service Group | | | 22,566 |
| 483 | | Severn Trent PLC (United Kingdom) | | | 8,759 |
| | | | | |
| | | | | 68,101 |
| |
Wireless Telecommunication Services 0.1% | | | |
| 6 | | KDDI Corp. (Japan) | | | 31,062 |
| 154 | | Millicom SA | | | 13,778 |
See Notes to Financial Statements.
| | |
| Prudential Investment Portfolios, Inc./Prudential Asset Allocation Fund | | 53 |
Portfolio of Investments
as of March 31, 2010 (Unaudited) continued
| | | | | |
| Shares | | Description | | Value (Note 1) |
| | | | | |
COMMON STOCKS (Continued) | | | |
| |
Wireless Telecommunication Services (cont’d.) | | | |
| 61 | | Mobistar SA (Belgium) | | $ | 3,754 |
| 4,100 | | NTELOS Holdings Corp. | | | 72,939 |
| 31 | | NTT DoCoMo, Inc. (Japan) | | | 47,218 |
| 1,600 | | SoftBank Corp. (Japan) | | | 39,414 |
| 1,000 | | StarHub Ltd. (Singapore) | | | 1,637 |
| 1,100 | | Syniverse Holdings, Inc.(a) | | | 21,417 |
| 6,300 | | USA Mobility, Inc. | | | 79,821 |
| 108,464 | | Vodafone Group PLC (United Kingdom) | | | 250,182 |
| | | | | |
| | | | | 561,222 |
| | | | | |
| | Total common stocks
(cost $219,335,208) | | | 262,093,637 |
| | | | | |
PREFERRED STOCKS | | | |
| |
Automobiles | | | |
| 107 | | Bayerische Motoren Werke AG (Germany) | | | 3,751 |
| 213 | | Volkswagen AG PFD (Germany) | | | 19,534 |
| | | | | |
| | | | | 23,285 |
| |
Healthcare Equipment & Supplies | | | |
| 165 | | Fresenius Se (Germany) | | | 12,398 |
| |
Household Products | | | |
| 364 | | Henkel AG & Co. KGaA (Germany) | | | 19,567 |
| |
Multi-Utilities | | | |
| 80 | | RWE AG (Germany) | | | 6,564 |
| | | | | |
| | Total preferred stocks
(cost $58,576) | | | 61,814 |
| | | | | |
| | |
| Units | | | | |
RIGHT | | | | | |
| | |
Automobiles | | | | | |
| 303 | | Volkswagen AG (Germany)
(cost $0)(a) | | | 194 |
| | | | | |
See Notes to Financial Statements.
| | |
| 54 | | Visit our website at www.prudentialfunds.com |
| | | | | | | | |
Moody’s
Ratings†
(Unaudited) | | Principal
Amount (000) | | Description | | Value (Note 1) |
| | | | | | | | |
CORPORATE BONDS 11.4% | | | |
| |
Aerospace & Defense 0.1% | | | |
| Baa2 | | $ | 370 | | BAE Systems Holdings, Inc., Gtd. Notes, 144A,
4.750%, 8/15/10 | | $ | 375,012 |
| Baa2 | | | 100 | | 6.375%, 6/01/19 | | | 108,615 |
| | | | | | | | |
| | | | | | | | 483,627 |
| | | | | | | | |
| | |
Airlines 0.1% | | | | | |
| Baa2 | | | 35 | | Continental Airlines, Inc., Pass-thru Certs., Ser. 01-1,
6.703%, 6/15/21(c) | | | 32,025 |
| Baa2 | | | 130 | | Continental Airlines, Inc., Pass-thru Certs., Ser. A, 7.250%, 11/10/19 | | | 139,100 |
| Baa1 | | | 93 | | Delta Air Lines, Inc., Pass-thru Certs., Ser. 071A, 6.821%, 8/10/22 | | | 92,696 |
| Baa3 | | | 200 | | Southwest Airlines Co., Sr. Unsec’d. Notes,
6.500%, 3/01/12 | | | 212,357 |
| | | | | | | | |
| | | | | | | | 476,178 |
| | | | | | | | |
| | |
Automotive | | | | | |
| Baa1 | | | 85 | | Harley-Davidson Funding Corp., Gtd. Notes, 144A, MTN, 5.750%, 12/15/14 | | | 86,633 |
| Baa2 | | | 55 | | Johnson Controls, Inc., Sr. Unsec’d. Notes,
5.500%, 1/15/16 | | | 58,887 |
| | | | | | | | |
| | | | | | | | 145,520 |
| | | | | | | | |
| | |
Banking 2.2% | | | | | |
| A3 | | | 300 | | American Express Co., Sr. Unsec’d. Notes,
8.125%, 5/20/19 | | | 363,360 |
| A2 | | | 430 | | Banco Bradesco (Brazil), Sub. Notes,
8.750%, 10/24/13 | | | 506,325 |
| A3 | | | 355 | | Bank of America Corp., Sub. Notes,
5.750%, 8/15/16 | | | 363,685 |
| Ba3 | | | 500 | | Bank of America Corp., Jr. Sub. Notes,
8.000%, 12/29/49(d) | | | 510,165 |
| A1 | | | 400 | | Bank One Corp., Sub. Notes,
7.875%, 8/01/10 | | | 409,530 |
| Aa3 | | | 100 | | Bear Stearns Cos. LLC (The), Sr. Unsec’d. Notes,
5.300%, 10/30/15 | | | 106,459 |
| Aa3 | | | 90 | | 6.400%, 10/02/17 | | | 99,424 |
| Aa3 | | | 220 | | 7.250%, 2/01/18 | | | 254,252 |
See Notes to Financial Statements.
| | |
| Prudential Investment Portfolios, Inc./Prudential Asset Allocation Fund | | 55 |
Portfolio of Investments
as of March 31, 2010 (Unaudited) continued
| | | | | | | | |
Moody’s
Ratings†
(Unaudited) | | Principal
Amount (000) | | Description | | Value (Note 1) |
| | | | | | | | |
CORPORATE BONDS (Continued) | | | |
| |
Banking (cont’d.) | | | |
| A3 | | $ | 5 | | Capital One Bank, Sub. Notes,
6.500%, 6/13/13 | | $ | 5,466 |
| Baa3 | | | 90 | | Capital One Capital V,
10.250%, 8/15/39 | | | 106,622 |
| Baa3 | | | 185 | | Capital One Capital VI,
8.875%, 5/15/40 | | | 201,610 |
| Baa1 | | | 125 | | Capital One Financial Corp., Sr. Unsec’d. Notes, MTN,
5.700%, 9/15/11 | | | 130,643 |
| Baa1 | | | 82 | | Citigroup, Inc., Sub. Notes,
5.000%, 9/15/14 | | | 81,885 |
| Baa1 | | | 400 | | 5.625%, 8/27/12(a) | | | 419,305 |
| Baa1 | | | 165 | | 6.125%, 8/25/36 | | | 143,985 |
| A3 | | | 125 | | Citigroup, Inc., Sr. Unsec’d. Notes,
6.875%, 3/05/38 | | | 126,312 |
| A3 | | | 85 | | 8.125%, 7/15/39 | | | 98,124 |
| A2 | | | 280 | | Countrywide Financial Corp., Gtd. Notes, MTN,
5.800%, 6/07/12 | | | 297,641 |
| Aa2 | | | 290 | | Depfa ACS Bank (Ireland), Covered Notes, 144A, 5.125%, 3/16/37 | | | 214,296 |
| A1 | | | 140 | | Goldman Sachs Group, Inc., Sr. Unsec’d. Notes,
5.450%, 11/01/12 | | | 151,340 |
| A2 | | | 10 | | Goldman Sachs Group, Inc., Sub. Notes,
5.625%, 1/15/17 | | | 10,247 |
| A1 | | | 5 | | Goldman Sachs Group, Inc., Sr. Unsec’d. Notes,
5.125%, 1/15/15 | | | 5,274 |
| A2 | | | 385 | | Goldman Sachs Group, Inc., Sub. Notes,
6.450%, 5/01/36 | | | 372,268 |
| A2 | | | 52 | | 6.750%, 10/01/37 | | | 51,935 |
| Baa2 | | | 380 | | ICICI Bank Ltd. (Singapore), Sr. Unsec’d. Notes, 144A,
5.750%, 11/16/10 | | | 387,680 |
| Baa1 | | | 300 | | JPMorgan Chase & Co., Ser. 1,
7.900%, 4/29/49(d) | | | 319,830 |
| A2 | | | 8 | | JPMorgan Chase Capital XXVI (Capital Security, fixed to floating preferred),
8.000%, 5/15/48(d) | | | 217,040 |
| A2 | | | 200 | | JPMorgan Chase Capital XXVIII, Ser. AA,
7.000%, 11/01/39 | | | 204,101 |
See Notes to Financial Statements.
| | |
| 56 | | Visit our website at www.prudentialfunds.com |
| | | | | | | | |
Moody’s
Ratings†
(Unaudited) | | Principal
Amount (000) | | Description | | Value (Note 1) |
| | | | | | | | |
CORPORATE BONDS (Continued) | | | |
| |
Banking (cont’d.) | | | |
| Aa3 | | $ | 390 | | Lloyds TSB Bank PLC (United Kingdom),
Gtd. Notes., 144A,
5.800%, 1/13/20 | | $ | 380,518 |
| A2 | | | 125 | | Merrill Lynch & Co., Inc., MTN,
6.875%, 4/25/18 | | | 134,709 |
| A2 | | | 60 | | Merrill Lynch & Co., Inc., Sr. Unsec’d. Notes,
4.790%, 8/04/10 | | | 60,770 |
| A2 | | | 125 | | Merrill Lynch & Co., Inc.,
Sr. Unsec’d. Notes, Ser. C, MTN,
5.000%, 1/15/15 | | | 127,858 |
| A2 | | | 170 | | Merrill Lynch & Co., Inc., Sr. Unsec’d. Notes, MTN,
5.770%, 7/25/11 | | | 179,595 |
| A2 | | | 285 | | Morgan Stanley, Sr. Unsec’d. Notes, MTN,
5.625%, 9/23/19 | | | 283,995 |
| A2 | | | 460 | | Morgan Stanley, Sr. Unsec’d. Notes, Ser. E,
5.450%, 1/09/17 | | | 466,397 |
| A2 | | | 150 | | Morgan Stanley, Sr. Unsec’d. Notes,
4.250%, 5/15/10 | | | 150,575 |
| Ba1 | | | 150 | | MUFG Capital Finance 1 Ltd. (Cayman Islands),
Gtd. Notes.,
6.346%, 7/29/49(d) | | | 148,732 |
| A3 | | | 155 | | PNC Funding Corp., Gtd. Notes.,
6.700%, 6/10/19 | | | 173,200 |
| A1 | | | 250 | | Royal Bank of Scotland Group PLC (United Kingdom), Sr. Unsec’d. Notes, MTN,
6.400%, 10/21/19 | | | 249,937 |
| Aa3 | | | 140 | | Santander Central Hispano Issuances Ltd.
(Cayman Islands), Gtd. Notes.,
7.625%, 9/14/10 | | | 143,934 |
| A2 | | | 125 | | USB Capital XIII Trust,
6.625%, 12/15/39 | | | 126,532 |
| Aa3 | | | 450 | | Wachovia Bank NA, Sub. Notes,
7.800%, 8/18/10(b) | | | 461,598 |
| A1 | | | 140 | | Wells Fargo & Co., Sr. Unsec’d. Notes,
4.625%, 8/09/10 | | | 142,050 |
| Ba1 | | | 200 | | Wells Fargo Capital XIII, Ser. G, MTN,
7.700%, 12/29/49(d) | | | 206,500 |
| | | | | | | | |
| | | | | | | | 9,595,704 |
| | | | | | | | |
See Notes to Financial Statements.
| | |
| Prudential Investment Portfolios, Inc./Prudential Asset Allocation Fund | | 57 |
Portfolio of Investments
as of March 31, 2010 (Unaudited) continued
| | | | | | | | |
Moody’s
Ratings†
(Unaudited) | | Principal
Amount (000) | | Description | | Value (Note 1) |
| | | | | | | | |
CORPORATE BONDS (Continued) | | | |
| |
Brokerage 0.1% | | | |
| NR | | $ | 345 | | Lehman Brothers Holdings, Inc.,
Sr. Unsec’d. Notes, MTN,
5.250%, 2/06/12(f) | | $ | 80,213 |
| NR | | | 100 | | 6.875%, 5/02/18(f) | | | 23,625 |
| Baa2 | | | 170 | | Nomura Holdings, Inc. (Japan), Sr. Unsec’d. Notes,
6.700%, 3/04/20 | | | 176,428 |
| | | | | | | | |
| | | | | | | | 280,266 |
| | | | | | | | |
| |
Building Materials & Construction 0.1% | | | |
| B1 | | | 170 | | Hanson Ltd. (United Kingdom), Gtd. Notes,
7.875%, 9/27/10 | | | 174,653 |
| Baa3 | | | 200 | | Lafarge SA (France), Sr. Unsec’d. Notes,
6.150%, 7/15/11 | | | 208,905 |
| | | | | | | | |
| | | | | | | | 383,558 |
| | | | | | | | |
| |
Cable 0.4% | | | |
| Baa1 | | | 55 | | Comcast Cable Communications Holdings, Inc.,
Gtd. Notes,
9.455%, 11/15/22 | | | 73,489 |
| Baa1 | | | 30 | | Comcast Corp., Gtd. Notes,
6.400%, 5/15/38 | | | 30,442 |
| Baa1 | | | 15 | | 6.400%, 3/01/40 | | | 15,247 |
| Baa1 | | | 40 | | 6.450%, 3/15/37 | | | 40,735 |
| Baa1 | | | 110 | | 6.500%, 11/15/35 | | | 112,670 |
| Baa1 | | | 65 | | 6.950%, 8/15/37 | | | 70,318 |
| Baa2 | | | 185 | | COX Communications, Inc., Sr. Unsec’d. Notes,
6.750%, 3/15/11 | | | 193,693 |
| Baa3 | | | 340 | | DIRECTV Holdings LLC/DIRECTV Financing Co., Inc., Gtd. Notes, 144A,
4.750%, 10/01/14 | | | 355,203 |
| Baa2 | | | 590 | | Time Warner Cable, Inc., Gtd. Notes,
5.400%, 7/02/12 | | | 633,366 |
| Baa2 | | | 190 | | 6.750%, 6/15/39 | | | 199,311 |
| | | | | | | | |
| | | | | | | | 1,724,474 |
| | | | | | | | |
| |
Capital Goods 0.2% | | | |
| A2 | | | 50 | | Caterpillar Financial Services Corp.,
Sr. Unsec’d. Notes, MTN,
5.500%, 3/15/16 | | | 54,298 |
See Notes to Financial Statements.
| | |
| 58 | | Visit our website at www.prudentialfunds.com |
| | | | | | | | |
Moody’s
Ratings†
(Unaudited) | | Principal
Amount (000) | | Description | | Value (Note 1) |
| | | | | | | | |
CORPORATE BONDS (Continued) | | | |
| |
Capital Goods (cont’d.) | | | |
| Baa2 | | $ | 110 | | Erac USA Finance Co., Gtd. Notes, 144A,
5.800%, 10/15/12
(original cost $109,915; purchased date 10/10/07)(c)(g) | | $ | 118,777 |
| Baa2 | | | 296 | | 6.375%, 10/15/17
(original cost $295,482; purchased date 10/10/07)(c)(g) | | | 320,258 |
| Baa2 | | | 20 | | 7.000%, 10/15/37
(original cost $19,827; purchased date 10/10/07 - 06/04/08)(c)(g) | | | 20,619 |
| Baa2 | | | 75 | | FedEx Corp., Gtd. Notes,
7.250%, 2/15/11 | | | 78,554 |
| A2 | | | 105 | | United Technologies Corp., Sr. Unsec’d. Notes,
5.400%, 5/01/35 | | | 101,624 |
| | | | | | | | |
| | | | | | | | 694,130 |
| | | | | | | | |
| |
Chemicals 0.2% | | | |
| Baa3 | | | 135 | | Dow Chemical Co. (The), Sr. Unsec’d. Notes,
6.125%, 2/01/11 | | | 140,372 |
| Baa3 | | | 250 | | 7.600%, 5/15/14 | | | 285,398 |
| Baa3 | | | 95 | | 9.400%, 5/15/39(b) | | | 127,342 |
| Baa1 | | | 75 | | ICI Wilmington, Inc., Gtd. Notes,
5.625%, 12/01/13 | | | 80,185 |
| Ba2 | | | 100 | | Union Carbide Corp., Sr. Unsec’d. Notes,
7.500%, 6/01/25 | | | 94,000 |
| | | | | | | | |
| | | | | | | | 727,297 |
| | | | | | | | |
Consumer 0.3% | | | |
| A2 | | | 300 | | Avon Products, Inc., Sr. Unsec’d. Notes,
5.750%, 3/01/18 | | | 321,435 |
| Baa3 | | | 550 | | Fortune Brands, Inc., Sr. Unsec’d. Notes,
6.375%, 6/15/14 | | | 601,910 |
| Baa3 | | | 300 | | Newell Rubbermaid, Inc.,
Sr. Unsec’d. Notes,
6.250%, 4/15/18 | | | 302,422 |
| Baa3 | | | 195 | | Whirlpool Corp., Sr. Unsec’d. Notes,
6.125%, 6/15/11 | | | 202,803 |
| | | | | | | | |
| | | | | | | | 1,428,570 |
| | | | | | | | |
See Notes to Financial Statements.
| | |
| Prudential Investment Portfolios, Inc./Prudential Asset Allocation Fund | | 59 |
Portfolio of Investments
as of March 31, 2010 (Unaudited) continued
| | | | | | | | |
Moody’s
Ratings†
(Unaudited) | | Principal
Amount (000) | | Description | | Value (Note 1) |
| | | | | | | | |
CORPORATE BONDS (Continued) | | | |
| |
Electric 1.2% | | | |
| Baa2 | | $ | 125 | | Appalachian Power Co., Sr. Unsec’d. Notes, Ser. J,
4.400%, 6/01/10 | | $ | 125,678 |
| Baa2 | | | 35 | | Arizona Public Service Co., Sr. Unsec’d. Notes,
6.250%, 8/01/16 | | | 37,716 |
| Baa2 | | | 320 | | 6.375%, 10/15/11 | | | 339,806 |
| Baa2 | | | 115 | | Baltimore Gas & Electric Co., Sr. Unsec’d. Notes,
6.350%, 10/01/36 | | | 119,261 |
| A1 | | | 105 | | Carolina Power & Light Co., First Mtge. Bonds,
5.250%, 12/15/15 | | | 115,483 |
| Baa1 | | | 160 | | CenterPoint Energy Houston Electric LLC, Gen. Ref.
Mtge., Ser. J2,
5.700%, 3/15/13 | | | 173,583 |
| Baa1 | | | 120 | | CenterPoint Energy Houston Electric LLC, Gen. Ref.
Mtge., Ser. K2,
6.950%, 3/15/33 | | | 130,669 |
| A3 | | | 110 | | Consolidated Edison Co. of New York, Inc.,
Sr. Unsec’d. Notes, Ser. 09-C,
5.500%, 12/01/39 | | | 105,091 |
| A3 | | | 65 | | Consumers Energy Co., First Mtge. Bonds, Ser. D,
5.375%, 4/15/13 | | | 70,651 |
| Baa2 | | | 70 | | Dominion Resources, Inc., Sr. Unsec’d. Notes,
4.750%, 12/15/10 | | | 71,914 |
| Baa2 | | | 425 | | 5.200%, 8/15/19 | | | 434,997 |
| A1 | | | 55 | | Duke Energy Carolinas LLC,
6.050%, 4/15/38 | | | 57,385 |
| A2 | | | 170 | | E.ON International Finance BV (Netherlands), 144A,
6.650%, 4/30/38 | | | 190,742 |
| Baa2 | | | 135 | | El Paso Electric Co., Sr. Unsec’d. Notes,
6.000%, 5/15/35 | | | 121,815 |
| A2 | | | 210 | | ENEL Finance International SA (Luxembourg),
Gtd. Notes, 144A,
6.000%, 10/07/39 | | | 199,800 |
| A3 | | | 30 | | Energy East Corp., Sr. Unsec’d. Notes,
6.750%, 9/15/33 | | | 31,958 |
| Baa1 | | | 30 | | Exelon Corp., Sr. Unsec’d. Notes,
4.900%, 6/15/15 | | | 31,267 |
| A3 | | | 250 | | Exelon Generation Co. LLC, Sr. Unsec’d. Notes,
6.250%, 10/01/39 | | | 252,800 |
See Notes to Financial Statements.
| | |
| 60 | | Visit our website at www.prudentialfunds.com |
| | | | | | | | |
Moody’s
Ratings†
(Unaudited) | | Principal
Amount (000) | | Description | | Value (Note 1) |
| | | | | | | | |
CORPORATE BONDS (Continued) | | | |
| |
Electric (cont’d.) | | | |
| Aa2 | | $ | 60 | | Florida Power & Light Co., First Mtge. Bonds,
5.950%, 10/01/33 | | $ | 61,325 |
| A2 | | | 170 | | Georgia Power Co., Sr. Unsec’d. Notes, Ser. B,
5.700%, 6/01/17 | | | 186,341 |
| Baa2 | | | 90 | | Indiana Michigan Power Co., Sr. Unsec’d. Notes,
Ser. INDF,
5.050%, 11/15/14 | | | 94,672 |
| A2 | | | 265 | | Korea Hydro & Nuclear Power Co. Ltd. (South Korea),
Sr. Unsec’d. Notes, 144A,
6.250%, 6/17/14 | | | 290,383 |
| Baa1 | | | 75 | | Midamerican Energy Holdings Co., Sr. Unsec’d. Notes,
5.750%, 4/01/18 | | | 79,257 |
| Baa1 | | | 115 | | 5.950%, 5/15/37 | | | 113,212 |
| A2 | | | 15 | | National Rural Utilities Cooperative Finance Corp.,
Sr. Unsec’d. Notes, Ser. C, MTN,
7.250%, 3/01/12 | | | 16,500 |
| Baa3 | | | 280 | | Nevada Power Co., Genl. Ref. Mtge., Ser. O,
6.500%, 5/15/18 | | | 306,079 |
| A3 | | | 100 | | Niagara Mohawk Power Corp.,
Sr. Unsec’d. Notes, 144A,
4.881%, 8/15/19 | | | 99,312 |
| Baa3 | | | 55 | | NiSource Finance Corp., Gtd. Notes,
5.250%, 9/15/17 | | | 55,277 |
| Baa3 | | | 70 | | 5.450%, 9/15/20 | | | 69,385 |
| A1 | | | 110 | | NSTAR Electric Co., Sr. Unsec’d. Notes,
4.875%, 4/15/14 | | | 117,291 |
| A2 | | | 90 | | NSTAR Electric Co., Unsec’d. Notes, Sr. Unsec’d. Notes,
4.500%, 11/15/19 | | | 89,559 |
| Baa1 | | | 120 | | Oncor Electric Delivery Co., Sr. Sec’d. Notes,
7.000%, 9/01/22 | | | 136,800 |
| A3 | | | 295 | | Pacific Gas & Electric Co., First Mtge.,
Sr. Unsec’d. Notes,
6.050%, 3/01/34 | | | 303,795 |
| Baa3 | | | 55 | | Public Service Co. of New Mexico, Sr. Unsec’d. Notes,
7.950%, 5/15/18 | | | 57,381 |
| A2 | | | 125 | | Public Service Electric & Gas Co., Sec’d. Notes, MTN,
5.800%, 5/01/37 | | | 127,631 |
| A1 | | | 100 | | Southern California Edison Co., Ser. 04-F,
4.650%, 4/01/15 | | | 106,349 |
See Notes to Financial Statements.
| | |
| Prudential Investment Portfolios, Inc./Prudential Asset Allocation Fund | | 61 |
Portfolio of Investments
as of March 31, 2010 (Unaudited) continued
| | | | | | | | |
Moody’s
Ratings†
(Unaudited) | | Principal
Amount (000) | | Description | | Value (Note 1) |
| | | | | | | | |
CORPORATE BONDS (Continued) | | | |
| |
Electric (cont’d.) | | | |
| Baa1 | | $ | 36 | | Xcel Energy, Inc., Sr. Unsec’d. Notes,
5.613%, 4/01/17 | | $ | 37,866 |
| Baa1 | | | 95 | | 6.500%, 7/01/36 | | | 100,355 |
| | | | | | | | |
| | | | | | | | 5,059,386 |
| | | | | | | | |
| |
Energy - Integrated 0.2% | | | |
| Baa2 | | | 150 | | Cenovus Energy, Inc. (Canada),
Sr. Unsec’d. Notes, 144A,
6.750%, 11/15/39 | | | 162,685 |
| Baa2 | | | 65 | | Hess Corp., Sr. Unsec’d. Notes,
6.000%, 1/15/40 | | | 64,188 |
| Baa2 | | | 65 | | Husky Energy, Inc. (Canada), Sr. Unsec’d. Notes,
7.250%, 12/15/19 | | | 75,289 |
| Baa2 | | | 295 | | TNK-BP Finance SA (Luxembourg), Gtd. Notes, 144A,
7.500%, 7/18/16 | | | 320,813 |
| Baa1 | | | 55 | | Western Oil Sands, Inc. (Canada), Gtd. Notes,
8.375%, 5/01/12 | | | 61,790 |
| | | | | | | | |
| | | | | | | | 684,765 |
| | | | | | | | |
| |
Energy - Other 0.2% | | | |
| Baa3 | | | 85 | | Anadarko Petroleum Corp.,
6.200%, 3/15/40 | | | 83,633 |
| Baa1 | | | 71 | | Devon Financing Corp. ULC (Canada), Gtd. Notes,
7.875%, 9/30/31 | | | 88,152 |
| A2 | | | 30 | | Halliburton Co., Sr. Unsec’d. Notes,
5.500%, 10/15/10 | | | 30,826 |
| Baa3 | | | 25 | | Nexen, Inc. (Canada), Sr. Unsec’d. Notes,
6.400%, 5/15/37 | | | 25,200 |
| Baa3 | | | 125 | | Questar Market Resources, Inc., Sr. Unsec’d. Notes,
6.800%, 3/01/20 | | | 135,977 |
| Baa1 | | | 265 | | Woodside Finance Ltd. (Australia), Gtd. Notes, 144A,
5.000%, 11/15/13 | | | 279,008 |
| Baa2 | | | 135 | | XTO Energy, Inc., Sr. Unsec’d. Notes,
6.250%, 8/01/17 | | | 153,439 |
| | | | | | | | |
| | | | | | | | 796,235 |
| | | | | | | | |
See Notes to Financial Statements.
| | |
| 62 | | Visit our website at www.prudentialfunds.com |
| | | | | | | | |
Moody’s
Ratings†
(Unaudited) | | Principal
Amount (000) | | Description | | Value (Note 1) |
| | | | | | | | |
CORPORATE BONDS (Continued) | | | |
| |
Foods 0.5% | | | |
| Baa2 | | $ | 235 | | Anheuser-Busch InBev Worldwide, Inc.,
Gtd. Notes, 144A,
8.000%, 11/15/39 | | $ | 297,362 |
| Baa2 | | | 350 | | Anheuser-Busch InBev Worldwide, Inc., Gtd. Notes,
5.375%, 1/15/20 | | | 361,053 |
| Baa2 | | | 215 | | Bunge Ltd. , Gtd. Notes,
5.350%, 4/15/14 | | | 224,417 |
| Baa2 | | | 145 | | Bunge Ltd. Finance Corp., Gtd. Notes,
8.500%, 6/15/19 | | | 168,564 |
| A2 | | | 150 | | Cargill, Inc., Sr. Unsec’d. Notes, 144A,
6.000%, 11/27/17
(original cost $149,288; purchased date 11/19/07)(c)(g) | | | 162,820 |
| Baa2 | | | 9 | | ConAgra Foods, Inc., Sr. Unsec’d. Notes,
7.875%, 9/15/10 | | | 9,280 |
| Baa3 | | | 100 | | Delhaize America, Inc., Gtd. Notes,
9.000%, 4/15/31 | | | 127,211 |
| Baa3 | | | 110 | | Delhaize Group SA (Belgium), Gtd. Notes,
6.500%, 6/15/17 | | | 121,486 |
| Baa2 | | | 70 | | H.J. Heinz Finance Co., Gtd. Notes, 144A,
7.125%, 8/01/39 | | | 79,419 |
| Baa2 | | | 270 | | Kraft Foods, Inc., Sr. Unsec’d. Notes,
6.500%, 2/09/40 | | | 279,796 |
| Baa2 | | | 35 | | Kroger Co. (The), Gtd. Notes,
6.800%, 4/01/11 | | | 36,838 |
| Baa3 | | | 150 | | Ralcorp Holdings, Inc., Gtd. Notes, 144A,
6.625%, 8/15/39 | | | 149,119 |
| Ba3 | | | 150 | | Tyson Foods, Inc.,
7.850%, 4/01/16 | | | 161,250 |
| Baa3 | | | 35 | | Yum! Brands, Inc., Sr. Unsec’d. Notes,
8.875%, 4/15/11 | | | 37,537 |
| | | | | | | | |
| | | | | | | | 2,216,152 |
| | | | | | | | |
| |
Healthcare & Pharmaceutical l 0.5% | | | |
| Baa3 | | | 200 | | AmerisourceBergen Corp., Gtd. Notes,
5.625%, 9/15/12 | | | 215,433 |
| A1 | | | 110 | | AstraZeneca PLC (United Kingdom), Sr. Unsec’d. Notes,
6.450%, 9/15/37 | | | 122,409 |
See Notes to Financial Statements.
| | |
| Prudential Investment Portfolios, Inc./Prudential Asset Allocation Fund | | 63 |
Portfolio of Investments
as of March 31, 2010 (Unaudited) continued
| | | | | | | | |
Moody’s
Ratings†
(Unaudited) | | Principal
Amount (000) | | Description | | Value (Note 1) |
| | | | | | | | |
CORPORATE BONDS (Continued) | | | |
| |
Healthcare & Pharmaceutical (cont’d.) | | | |
| Baa3 | | $ | 110 | | Cardinal Health, Inc., Sr. Unsec’d. Notes,
5.500%, 6/15/13 | | $ | 118,727 |
| Baa3 | | | 55 | | Carefusion Corp., Sr. Unsec’d. Notes,
6.375%, 8/01/19 | | | 60,145 |
| AA-(e) | | | 60 | | Genentech, Inc., Sr. Unsec’d. Notes,
4.750%, 7/15/15 | | | 64,058 |
| A1 | | | 220 | | GlaxoSmithKline Capital, Inc.,
6.375%, 5/15/38 | | | 242,649 |
| Baa3 | | | 250 | | Laboratory Corp. of America Holdings,
Sr. Unsec’d. Notes,
5.625%, 12/15/15 | | | 270,623 |
| A1 | | | 190 | | Medtronic, Inc., Sr. Unsec’d. Notes,
4.450%, 3/15/20 | | | 189,090 |
| Aa3 | | | 194 | | Merck & Co., Inc., Gtd. Notes,
6.000%, 9/15/17 | | | 218,317 |
| Aa3 | | | 70 | | 6.550%, 9/15/37 | | | 79,942 |
| Aa3 | | | 30 | | Merck & Co., Inc., Sr. Unsec’d. Notes,
5.750%, 11/15/36 | | | 30,743 |
| Aa3 | | | 30 | | 5.850%, 6/30/39 | | | 31,426 |
| Aa3 | | | 30 | | 5.950%, 12/01/28 | | | 30,980 |
| Ba1 | | | 75 | | Watson Pharmaceuticals, Inc., Sr. Unsec’d. Notes,
6.125%, 8/15/19 | | | 78,835 |
| A1 | | | 35 | | Wyeth, Gtd. Notes,
5.500%, 2/01/14 | | | 38,610 |
| A1 | | | 200 | | 5.950%, 4/01/37 | | | 209,396 |
| A1 | | | 10 | | 6.450%, 2/01/24 | | | 11,401 |
| | | | | | | | |
| | | | | | | | 2,012,784 |
| | | | | | | | |
| |
Healthcare Insurance 0.4% | | | |
| A3 | | | 80 | | Aetna, Inc., Sr. Unsec’d. Notes,
5.750%, 6/15/11 | | | 83,873 |
| A3 | | | 110 | | 6.625%, 6/15/36 | | | 115,911 |
| Baa2 | | | 140 | | Cigna Corp., Sr. Unsec’d. Notes,
6.150%, 11/15/36 | | | 136,480 |
| Ba1 | | | 540 | | Coventry Health Care, Inc., Sr. Unsec’d. Notes,
6.125%, 1/15/15 | | | 537,406 |
See Notes to Financial Statements.
| | |
| 64 | | Visit our website at www.prudentialfunds.com |
| | | | | | | | |
Moody’s
Ratings†
(Unaudited) | | Principal
Amount (000) | | Description | | Value (Note 1) |
| | | | | | | | |
CORPORATE BONDS (Continued) | | | |
| |
Healthcare Insurance (cont’d.) | | | |
| Baa1 | | $ | 290 | | UnitedHealth Group, Inc., Sr. Unsec’d. Notes,
5.250%, 3/15/11 | | $ | 301,137 |
| Baa1 | | | 60 | | 6.000%, 6/15/17 | | | 64,306 |
| Baa1 | | | 100 | | 6.500%, 6/15/37 | | | 101,658 |
| Baa1 | | | 80 | | 6.625%, 11/15/37 | | | 83,161 |
| Baa1 | | | 170 | | WellPoint, Inc., Sr. Unsec’d. Notes,
5.000%, 12/15/14 | | | 181,468 |
| | | | | | | | |
| | | | | | | | 1,605,400 |
| | | | | | | | |
| |
Insurance 0.7% | | | |
| A3 | | | 130 | | American International Group, Inc., Sr. Unsec’d. Notes,
4.250%, 5/15/13 | | | 127,606 |
| A3 | | | 35 | | AXA SA (France), Sub. Notes,
8.600%, 12/15/30 | | | 42,440 |
| Baa1 | | | 160 | | Axis Specialty Finance LLC, Gtd. Notes,
5.875%, 6/01/20 | | | 157,887 |
| Aa2 | | | 95 | | Berkshire Hathaway Finance Corp., Gtd. Notes,
4.750%, 5/15/12 | | | 101,583 |
| Aa2 | | | 135 | | 5.750%, 1/15/40 | | | 133,546 |
| A2 | | | 310 | | Chubb Corp., Sr. Unsec’d. Notes,
6.000%, 11/15/11 | | | 332,229 |
| A3 | | | 210 | | Chubb Corp., Jr. Sub. Notes,
6.375%, 3/29/67(d) | | | 211,312 |
| Baa3 | | | 90 | | Hartford Financial Services Group, Inc.,
Sr. Unsec’d. Notes, MTN,
6.000%, 1/15/19 | | | 92,165 |
| Baa2 | | | 180 | | Liberty Mutual Group, Inc., Bonds, 144A,
7.000%, 3/15/34 | | | 164,121 |
| Ba1 | | | 40 | | Lincoln National Corp., Jr. Sub. Notes,
6.050%, 4/20/67(d) | | | 33,300 |
| Baa2 | | | 110 | | Lincoln National Corp., Sr. Unsec’d. Notes,
6.300%, 10/09/37 | | | 108,305 |
| Baa2 | | | 70 | | 8.750%, 7/01/19 | | | 85,594 |
| Baa2 | | | 50 | | Marsh & McLennan Cos., Inc., Sr. Unsec’d. Notes,
5.150%, 9/15/10 | | | 50,861 |
| A3 | | | 205 | | MetLife, Inc., Sr. Unsec’d. Notes,
5.700%, 6/15/35 | | | 196,625 |
| A3 | | | 70 | | 6.125%, 12/01/11 | | | 74,890 |
See Notes to Financial Statements.
| | |
| Prudential Investment Portfolios, Inc./Prudential Asset Allocation Fund | | 65 |
Portfolio of Investments
as of March 31, 2010 (Unaudited) continued
| | | | | | | | |
Moody’s
Ratings†
(Unaudited) | | Principal
Amount (000) | | Description | | Value (Note 1) |
| | | | | | | | |
CORPORATE BONDS (Continued) | | | |
| |
Insurance (cont’d.) | | | |
| A3 | | $ | 15 | | 6.375%, 6/15/34 | | $ | 15,524 |
| A3 | | | 50 | | 6.750%, 6/01/16 | | | 56,033 |
| Aa2 | | | 110 | | New York Life Insurance Co., Sub. Notes, 144A,
6.750%, 11/15/39 | | | 120,512 |
| Aa2 | | | 60 | | Northwestern Mutual Life Insurance, Notes, 144A,
6.063%, 3/30/40 | | | 60,214 |
| A3 | | | 150 | | Pacific Life Insurance Co., Sub. Notes, 144A,
9.250%, 6/15/39
(original cost $149,928; purchased date 06/16/09)(g) | | | 185,869 |
| A2 | | | 110 | | Progressive Corp. (The), Jr. Sub. Notes,
6.700%, 6/15/37(b)(d) | | | 108,005 |
| A2 | | | 140 | | St. Paul Travelers Cos., Inc., Sr. Unsec’d. Notes,
6.750%, 6/20/36 | | | 153,328 |
| Aa2 | | | 240 | | Teachers Insurance & Annuity Association of America,
Notes, 144A,
6.850%, 12/16/39 | | | 260,336 |
| A3 | | | 135 | | Travelers Cos., Inc. (The), Jr. Sub. Notes,
6.250%, 3/15/37(d) | | | 132,888 |
| Baa2 | | | 110 | | W.R. Berkley Corp., Sr. Unsec’d. Notes,
5.600%, 5/15/15 | | | 113,031 |
| Baa2 | | | 90 | | W.R. Berkley Corp., Sr. Unsub. Notes,
6.150%, 8/15/19 | | | 90,118 |
| Baa2 | | | 15 | | XL Capital Ltd. (Cayman Islands), Sr. Unsec’d. Notes,
5.250%, 9/15/14 | | | 15,506 |
| | | | | | | | |
| | | | | | | | 3,223,828 |
| | | | | | | | |
| |
Lodging 0.2% | | | |
| Ba1 | | | 300 | | Starwood Hotels & Resorts Worldwide, Inc.,
Sr. Unsec’d. Notes,
6.250%, 2/15/13 | | | 315,000 |
| Ba1 | | | 500 | | 6.750%, 5/15/18(b) | | | 501,250 |
| | | | | | | | |
| | | | | | | | 816,250 |
| | | | | | | | |
| |
Media & Entertainment 0.2% | | | |
| Baa1 | | | 110 | | News America, Inc., Gtd. Notes,
6.150%, 3/01/37 | | | 108,427 |
| Baa1 | | | 125 | | 7.625%, 11/30/28 | | | 138,950 |
See Notes to Financial Statements.
| | |
| 66 | | Visit our website at www.prudentialfunds.com |
| | | | | | | | |
Moody’s
Ratings†
(Unaudited) | | Principal
Amount (000) | | Description | | Value (Note 1) |
| | | | | | | | |
CORPORATE BONDS (Continued) | | | |
| |
Media & Entertainment (cont’d.) | | | |
| Baa2 | | $ | 125 | | Time Warner, Inc., Gtd. Notes,
4.875%, 3/15/20 | | $ | 122,129 |
| Baa2 | | | 160 | | 7.250%, 10/15/17 | | | 183,825 |
| Baa2 | | | 100 | | 9.150%, 2/01/23 | | | 129,853 |
| Baa2 | | | 105 | | Viacom, Inc., Sr. Unsec’d. Notes,
6.750%, 10/05/37 | | | 109,908 |
| Baa2 | | | 100 | | 6.875%, 4/30/36 | | | 106,019 |
| | | | | | | | |
| | | | | | | | 899,111 |
| | | | | | | | |
| |
Metals 0.4% | | | |
| Baa3 | | | 385 | | ArcelorMittal (Netherlands), Sr. Unsec’d. Notes,
5.375%, 6/01/13 | | | 409,799 |
| Baa2 | | | 145 | | Newmont Mining Corp., Gtd. Notes,
6.250%, 10/01/39 | | | 144,996 |
| Baa1 | | | 400 | | Rio Tinto Finance USA Ltd. (Australia),
5.875%, 7/15/13 | | | 439,678 |
| BBB+(e) | | | 70 | | Rio Trinto Alcan, Inc. (Canada), Sr. Unsec’d. Notes,
4.500%, 5/15/13 | | | 73,625 |
| BBB+(e) | | | 115 | | 5.000%, 6/01/15 | | | 120,496 |
| Baa3 | | | 95 | | Southern Copper Corp., Sr. Unsec’d. Notes,
7.500%, 7/27/35 | | | 98,998 |
| Ba2 | | | 250 | | United States Steel Corp., Sr. Unsec’d. Notes,
5.650%, 6/01/13 | | | 253,750 |
| Baa2 | | | 70 | | Xstrata Finance Canada Ltd. (Canada),
Gtd. Notes, 144A,
5.500%, 11/16/11 | | | 73,437 |
| | | | | | | | |
| | | | | | | | 1,614,779 |
| | | | | | | | |
| |
Non Captive Finance 0.5% | | | |
| Aa2 | | | 320 | | General Electric Capital Corp., Sr. Unsec’d. Notes, MTN,
5.500%, 1/08/20 | | | 326,485 |
| Aa2 | | | 90 | | 5.875%, 1/14/38 | | | 85,567 |
| Aa2 | | | 90 | | General Electric Capital Corp.,
Sr. Unsec’d. Notes, Ser. A, MTN,
6.125%, 2/22/11 | | | 94,124 |
| Aa2 | | | 600 | | General Electric Capital Corp., Sr. Unsec’d. Notes,
Ser. G, MTN,
6.000%, 8/07/19(l) | | | 634,001 |
See Notes to Financial Statements.
| | |
| Prudential Investment Portfolios, Inc./Prudential Asset Allocation Fund | | 67 |
Portfolio of Investments
as of March 31, 2010 (Unaudited) continued
| | | | | | | | |
Moody’s
Ratings†
(Unaudited) | | Principal
Amount (000) | | Description | | Value (Note 1) |
| | | | | | | | |
CORPORATE BONDS (Continued) | | | |
| |
Non Captive Finance (cont’d.) | | | |
| A3 | | $ | 100 | | HSBC Finance Corp., Sr. Unsec’d. Notes,
5.700%, 6/01/11 | | $ | 104,185 |
| B1 | | | 400 | | International Lease Finance Corp., Sr. Unsec’d. Notes,
6.375%, 3/25/13 | | | 390,903 |
| Ba1 | | | 130 | | SLM Corp., Sr. Notes, MTN,
8.000%, 3/25/20 | | | 126,589 |
| Ba1 | | | 480 | | SLM Corp., Sr. Unsec’d. Notes, MTN,
8.450%, 6/15/18 | | | 485,453 |
| | | | | | | | |
| | | | | | | | 2,247,307 |
| | | | | | | | |
| |
Non-Corporate Sovereign | | | |
| Aa2 | | | 125 | | Qatar Government International Bond (Qatar), 144A,
6.400%, 1/20/40 | | | 130,625 |
| | | | | | | | |
| |
Packaging | | | |
| Baa3 | | | 75 | | Sealed Air Corp., Sr. Unsec’d. Notes, 144A,
6.875%, 7/15/33 | | | 68,942 |
| | | | | | | | |
| |
Paper 0.1% | | | |
| Baa3 | | | 175 | | International Paper Co., Sr. Unsec’d. Notes,
7.300%, 11/15/39 | | | 187,014 |
| Baa3 | | | 85 | | 7.500%, 8/15/21(b) | | | 96,587 |
| | | | | | | | |
| | | | | | | | 283,601 |
| | | | | | | | |
| |
Pipelines & Other 0.3% | | | |
| Baa3 | | | 90 | | CenterPoint Energy Resources Corp.,
Sr. Unsec’d. Notes,
6.250%, 2/01/37 | | | 87,518 |
| Baa2 | | | 365 | | Duke Energy Field Services LLC, Sr. Unsec’d. Notes,
7.875%, 8/16/10 | | | 374,388 |
| Baa3 | | | 190 | | Enterprise Products Operating LLC, Gtd. Notes, Ser. K,
4.950%, 6/01/10 | | | 190,985 |
| Baa2 | | | 125 | | Kinder Morgan Energy Partners LP, Sr. Unsec’d. Notes,
6.500%, 9/01/39(b) | | | 128,488 |
| Baa2 | | | 85 | | ONEOK Partners LP, Gtd. Notes,
6.650%, 10/01/36 | | | 88,617 |
| Baa1 | | | 15 | | Sempra Energy, Sr. Unsec’d. Notes,
6.000%, 2/01/13 | | | 16,174 |
See Notes to Financial Statements.
| | |
| 68 | | Visit our website at www.prudentialfunds.com |
| | | | | | | | |
Moody’s
Ratings†
(Unaudited) | | Principal
Amount (000) | | Description | | Value (Note 1) |
| | | | | | | | |
CORPORATE BONDS (Continued) | | | |
| |
Pipelines & Other (cont’d.) | | | |
| Baa2 | | $ | 500 | | Spectra Energy Capital LLC,
6.200%, 4/15/18 | | $ | 539,185 |
| Baa2 | | | 45 | | Spectra Energy Capital LLC, Sr. Unsec’d. Notes,
6.250%, 2/15/13 | | | 49,182 |
| | | | | | | | |
| | | | | | | | 1,474,537 |
| | | | | | | | |
| |
Railroads 0.2% | | | |
| A3 | | | 135 | | Burlington Northern Santa Fe Corp., Sr. Unsec’d. Notes,
6.700%, 8/01/28 | | | 143,847 |
| Baa3 | | | 170 | | CSX Corp., Sr. Unsec’d. Notes,
6.150%, 5/01/37 | | | 171,335 |
| Baa1 | | | 105 | | Norfolk Southern Corp., Sr. Unsec’d. Notes,
5.590%, 5/17/25 | | | 102,953 |
| Baa1 | | | 4 | | 7.800%, 5/15/27 | | | 4,821 |
| Baa2 | | | 275 | | Union Pacific Corp., Sr. Unsec’d. Notes,
3.625%, 6/01/10 | | | 276,279 |
| | | | | | | | |
| | | | | | | | 699,235 |
| | | | | | | | |
| |
Real Estate Investment Trusts 0.2% | | | |
| Baa3 | | | 74 | | Brandywine Operating Partnership, Gtd. Notes,
5.750%, 4/01/12 | | | 76,019 |
| Baa2 | | | 115 | | Mack-Cali Realty Corp., Sr. Unsec’d. Notes,
7.750%, 8/15/19 | | | 126,813 |
| Baa3 | | | 90 | | Post Apartment Homes LP, Sr. Unsec’d. Notes,
5.450%, 6/01/12 | | | 93,463 |
| Baa3 | | | 135 | | 6.300%, 6/01/13 | | | 141,942 |
| Baa2 | | | 135 | | ProLogis, Sr. Sec’d. Notes,
6.875%, 3/15/20(b) | | | 133,344 |
| A3 | | | 500 | | Simon Property Group LP, Sr. Unsec’d. Notes,
6.125%, 5/30/18(b) | | | 517,276 |
| | | | | | | | |
| | | | | | | | 1,088,857 |
| | | | | | | | |
| |
Retailers 0.4% | | | |
| Baa2 | | | 260 | | CVS Caremark Corp., Sr. Unsec’d. Notes,
5.750%, 8/15/11 | | | 274,859 |
| Baa2 | | | 200 | | 6.125%, 9/15/39 | | | 198,776 |
| Ba2 | | | 45 | | Federated Retail Holdings, Inc., Gtd. Notes,
5.350%, 3/15/12(b) | | | 47,250 |
See Notes to Financial Statements.
| | |
| Prudential Investment Portfolios, Inc./Prudential Asset Allocation Fund | | 69 |
Portfolio of Investments
as of March 31, 2010 (Unaudited) continued
| | | | | | | | |
Moody’s
Ratings†
(Unaudited) | | Principal
Amount (000) | | Description | | Value (Note 1) |
| | | | | | | | |
CORPORATE BONDS (Continued) | | | |
| |
Retailers (cont’d.) | | | |
| Baa1 | | $ | 80 | | Home Depot, Inc. (The), Sr. Unsec’d. Notes,
5.875%, 12/16/36 | | $ | 77,634 |
| Baa1 | | | 170 | | Kohl’s Corp., Sr. Unsec’d. Notes,
6.875%, 12/15/37 | | | 189,452 |
| A1 | | | 60 | | Lowe’s Cos., Inc., Sr. Unsec’d. Notes,
6.500%, 3/15/29 | | | 64,938 |
| Baa2 | | | 1,000 | | Nordstrom, Inc., Sr. Unsec’d. Notes,
6.250%, 1/15/18(b) | | | 1,100,211 |
| | | | | | | | |
| | | | | | | | 1,953,120 |
| | | | | | | | |
| |
Technology 0.3% | | | |
| Baa1 | | | 300 | | Computer Sciences Corp., Sr. Unsec’d. Notes, Ser. WI,
6.500%, 3/15/18 | | | 332,134 |
| A2 | | | 25 | | Electronic Data Systems LLC, Sr. Unsec’d. Notes,
7.450%, 10/15/29 | | | 29,980 |
| Baa2 | | | 220 | | Fiserv, Inc., Gtd. Notes,
6.125%, 11/20/12 | | | 239,438 |
| Baa2 | | | 125 | | Intuit, Inc., Sr. Unsec’d. Notes,
5.400%, 3/15/12 | | | 132,585 |
| Baa2 | | | 445 | | Xerox Corp., Sr. Unsec’d. Notes,
4.250%, 2/15/15 | | | 448,675 |
| | | | | | | | |
| | | | | | | | 1,182,812 |
| | | | | | | | |
| |
Telecommunications 1.0% | | | |
| A2 | | | 100 | | America Movil SAB de CV (Mexico),
Gtd. Notes, 144A,
6.125%, 3/30/40 | | | 97,719 |
| A2 | | | 115 | | AT&T Corp., Gtd. Notes,
7.300%, 11/15/11 | | | 125,704 |
| A2 | | | 120 | | Cingular Wireless Services, Inc., Gtd. Notes,
8.125%, 5/01/12 | | | 135,416 |
| Baa1 | | | 60 | | Deutsche Telekom International Finance BV (Netherlands), Gtd. Notes,
8.750%, 6/15/30 | | | 76,843 |
| Baa3 | | | 80 | | Embarq Corp., Sr. Unsec’d. Notes,
7.082%, 6/01/16
(original cost $79,995; purchased date 05/12/06)(c)(g) | | | 87,132 |
See Notes to Financial Statements.
| | |
| 70 | | Visit our website at www.prudentialfunds.com |
| | | | | | | | |
Moody’s
Ratings†
(Unaudited) | | Principal
Amount (000) | | Description | | Value (Note 1) |
| | | | | | | | |
CORPORATE BONDS (Continued) | | | |
| |
Telecommunications (cont’d.) | | | |
| Baa3 | | $ | 400 | | 7.995%, 6/01/36
(original cost $407,390; purchased date 05/12/06 - 04/10/07)(c)(g) | | $ | 405,577 |
| A3 | | | 75 | | France Telecom SA (France), Sr. Unsec’d. Notes,
8.500%, 3/01/31 | | | 99,483 |
| Baa2 | | | 105 | | Koninklijke (Royal) KPN NV (Netherlands),
Sr. Unsec’d. Notes,
8.000%, 10/01/10 | | | 108,680 |
| A2 | | | 315 | | New Cingular Wireless Services, Inc.,
Sr. Unsec’d. Notes,
8.750%, 3/01/31 | | | 406,731 |
| Baa2 | | | 555 | | PCCW HKT Capital Ltd. (British Virgin),
Gtd. Notes, 144A,
8.000%, 11/15/11 | | | 600,788 |
| Ba1 | | | 400 | | Qwest Corp., Sr. Unsec’d. Notes,
8.875%, 3/15/12 | | | 438,000 |
| Baa2 | | | 90 | | Telecom Italia Capital SA (Luxembourg), Gtd. Notes,
5.250%, 11/15/13 | | | 94,268 |
| Baa2 | | | 290 | | 7.175%, 6/18/19 | | | 313,086 |
| Baa1 | | | 180 | | Telefonica Emisiones Sau (Spain), Gtd. Notes,
5.877%, 7/15/19 | | | 192,787 |
| A3 | | | 40 | | Telefonos de Mexico SAB de CV (Mexico),
Sr. Unsec’d. Notes, 144A,
5.500%, 11/15/19(b) | | | 40,495 |
| Baa1 | | | 187 | | TELUS Corp. (Canada), Sr. Unsec’d. Notes,
8.000%, 6/01/11 | | | 201,253 |
| Baa2 | | | 50 | | U.S. Cellular Corp., Sr. Unsec’d. Notes,
6.700%, 12/15/33 | | | 48,455 |
| A3 | | | 600 | | Verizon Communications, Inc., Sr. Unsec’d. Notes,
6.100%, 4/15/18 | | | 656,323 |
| | | | | | | | |
| | | | | | | | 4,128,740 |
| | | | | | | | |
| |
Tobacco 0.2% | | | |
| Baa1 | | | 40 | | Altria Group, Inc., Gtd. Notes,
9.250%, 8/06/19 | | | 48,605 |
| Baa1 | | | 190 | | 9.700%, 11/10/18 | | | 233,630 |
| Baa1 | | | 25 | | 9.950%, 11/10/38 | | | 32,829 |
| Baa1 | | | 160 | | 10.200%, 2/06/39 | | | 214,510 |
See Notes to Financial Statements.
| | |
| Prudential Investment Portfolios, Inc./Prudential Asset Allocation Fund | | 71 |
Portfolio of Investments
as of March 31, 2010 (Unaudited) continued
| | | | | | | | |
Moody’s
Ratings†
(Unaudited) | | Principal
Amount (000) | | Description | | Value (Note 1) |
| | | | | | | | |
CORPORATE BONDS (Continued) | | | |
| |
Tobacco (cont’d.) | | | |
| Baa2 | | $ | 115 | | Lorillard Tobacco Co., Sr. Unsec’d. Notes,
8.125%, 6/23/19 | | $ | 126,695 |
| A2 | | | 65 | | Philip Morris International, Inc., Sr. Unsec’d. Notes,
6.375%, 5/16/38 | | | 70,720 |
| Baa3 | | | 220 | | Reynolds American, Inc., Gtd. Notes,
6.750%, 6/15/17 | | | 235,639 |
| Baa3 | | | 35 | | 7.250%, 6/15/37 | | | 35,623 |
| | | | | | | | |
| | | | | | | | 998,251 |
| | | | | | | | |
| | | | | Total corporate bonds
(cost $47,147,858) | | | 49,124,041 |
| | | | | | | | |
| |
ASSET BACKED SECURITIES 0.5% | | | |
| |
Non-Residential Mortgage Asset-Backed Security 0.1% | | | |
| Baa2 | | | 300 | | Citibank Credit Card Issuance Trust,
Ser. 2006-C1, Class C1,
0.640%, 2/20/15(d) | | | 283,020 |
| | | | | | | | |
| |
Residential Mortgage Backed Securities 0.4% | | | |
| CC(e) | | | 21 | | Amortizing Residential Collateral Trust,
Ser. 2002-BC7, Class M2,
1.596%, 10/25/32(d) | | | 1,637 |
| Baa2 | | | 105 | | CDC Mortgage Capital Trust, Ser. 2002-HE3, Class M1,
1.896%, 3/25/33(d) | | | 67,503 |
| Aa3 | | | 360 | | Centex Home Equity, Ser. 2005-A, Class M2,
0.746%, 1/25/35(d) | | | 286,975 |
| A3 | | | 93 | | Credit-Based Asset Servicing and Securitization LLC,
Ser. 2005-CB6, Class A3,
5.120%, 7/25/35 | | | 78,743 |
| Aa2 | | | 161 | | Equity One ABS, Inc., Ser. 2004-3, Class M1,
5.700%, 7/25/34 | | | 125,530 |
| Ba3 | | | 300 | | First Franklin Mortgage Loan Asset Backed Certs.,
Ser. 2005-FFH1, Class M2,
0.766%, 6/25/36(d) | | | 50,913 |
| Aa1 | | | 83 | | HFC Home Equity Loan Asset Backed Certs.,
Ser. 2005-2, Class M2,
0.730%, 1/20/35(d) | | | 67,699 |
See Notes to Financial Statements.
| | |
| 72 | | Visit our website at www.prudentialfunds.com |
| | | | | | | | |
Moody’s
Ratings†
(Unaudited) | | Principal
Amount (000) | | Description | | Value (Note 1) |
| | | | | | | | |
ASSET BACKED SECURITIES (Continued) | | | |
| |
Residential Mortgage Backed Securities (cont’d.) | | | |
| Aa2 | | $ | 505 | | Morgan Stanley ABS Capital I,
Ser. 2004-NC1, Class M1,
1.296%, 12/25/33(d) | | $ | 408,625 |
| B3 | | | 205 | | Morgan Stanley Dean Witter Capital I,
Ser. 2002-HE1, Class M1,
1.146%, 7/25/32(d) | | | 139,825 |
| A2 | | | 159 | | Morgan Stanley Dean Witter Capital I,
Ser. 2002-NC4, Class M1,
1.521%, 9/25/32(d) | | | 115,802 |
| A1 | | | 38 | | Residential Asset Securities Corp.,
Ser. 2004-KS2, Class MI1,
4.710%, 3/25/34(d) | | | 20,111 |
| A2 | | | 240 | | Saxon Asset Securities Trust, Ser. 2005-2, Class M2,
0.686%, 10/25/35(d) | | | 94,992 |
| Caa1 | | | 300 | | Securitized Asset Backed Receivables LLC Trust,
Ser. 2006-FR3, Class A3,
0.496%, 5/25/36(d) | | | 114,129 |
| Aa2 | | | 265 | | Securitized Asset Backed Receivables LLC Trust,
Ser. 2004-OP1, Class M1,
1.011%, 2/25/34(d) | | | 204,094 |
| | | | | | | | |
| | | | | | | | 1,776,578 |
| | | | | | | | |
| | | | | Total asset-backed securities
(cost $2,978,315) | | | 2,059,598 |
| | | | | | | | |
| |
COLLATERALIZED MORTGAGE OBLIGATIONS 0.5% | | | |
| B3 | | | 620 | | Banc of America Alternative Loan Trust,
Ser. 2005-12, Class 3CB1,
6.000%, 1/25/36 | | | 472,856 |
| Ba1 | | | 125 | | Banc of America Mortgage Securities, Inc.,
Ser. 2005-A, Class 2A1,
3.180%, 2/25/35(d) | | | 106,765 |
| Ba2 | | | 129 | | Ser. 2005-B, Class 2A1,
3.051%, 3/25/35(d) | | | 105,439 |
| Ba2 | | | 463 | | Chase Mortgage Finance Corp.,
Ser. 2007-A1, Class 1A5,
3.642%, 2/25/37(d) | | | 438,026 |
See Notes to Financial Statements.
| | |
| Prudential Investment Portfolios, Inc./Prudential Asset Allocation Fund | | 73 |
Portfolio of Investments
as of March 31, 2010 (Unaudited) continued
| | | | | | | | |
Moody’s
Ratings†
(Unaudited) | | Principal
Amount (000) | | Description | | Value (Note 1) |
| | | | | | | | |
COLLATERALIZED MORTGAGE OBLIGATIONS (Continued) | | | |
| A1 | | $ | 195 | | Countrywide Alternative Loan Trust,
Ser. 2004-18CB, Class 3A1,
5.250%, 9/25/19 | | $ | 191,325 |
| B1 | | | 311 | | JPMorgan Mortgage Trust, Ser. 2007-A1, Class 4A1,
4.071%, 7/25/35(d) | | | 277,370 |
| AAA(e) | | | 15 | | Master Alternative Loans Trust,
Ser. 2003-8, Class 4A1,
7.000%, 12/25/33 | | | 14,505 |
| Aaa | | | 242 | | Ser. 2004-4, Class 4A1,
5.000%, 4/25/19 | | | 231,214 |
| A1 | | | 160 | | Structured Adjustable Rate Mortgage Loan Trust,
Ser. 2004-1, Class 4A3,
2.781%, 2/25/34(d) | | | 137,702 |
| A+(e) | | | 103 | | Washington Mutual Alternative Mortgage Pass-Through Certs., Ser. 2005-1, Class 3A,
5.000%, 3/25/20 | | | 83,175 |
| | | | | | | | |
| | | | | Total collateralized mortgage obligations
(cost $2,366,090) | | | 2,058,377 |
| | | | | | | | |
| |
COMMERCIAL MORTGAGE BACKED SECURITIES 3.9% | | | |
| AAA(e) | | | 1,364 | | Banc of America Commercial Mortgage, Inc.,
Ser. 2004-1, Class XP, I/O,
0.670%, 11/10/39(d) | | | 9,363 |
| Aaa | | | 185 | | Ser. 2004-2, Class A3,
4.050%, 11/10/38 | | | 187,094 |
| Aaa | | | 560 | | Ser. 2004-2, Class A4,
4.153%, 11/10/38 | | | 549,951 |
| Aaa | | | 500 | | Ser. 2006-4, Class A3A,
5.600%, 7/10/46 | | | 525,263 |
| Aaa | | | 200 | | Ser. 2007-1, Class A2,
5.381%, 1/15/49 | | | 206,474 |
| A3 | | | 430 | | Bear Stearns Commercial Mortgage Securities,
Ser. 2001-TOP4, Class E, 144A,
6.470%, 11/15/33(d) | | | 373,302 |
| AAA(e) | | | 3,087 | | Ser. 2004-T16, Class X2, I/O,
0.883%, 2/13/46(d) | | | 50,568 |
| Aaa | | | 350 | | Ser. 2005-T18, Class AAB,
4.823%, 2/13/42(d) | | | 364,359 |
| Aaa | | | 500 | | Ser. 2005-T20, Class AAB,
5.134%, 10/12/42(d) | | | 524,456 |
See Notes to Financial Statements.
| | |
| 74 | | Visit our website at www.prudentialfunds.com |
| | | | | | | | |
Moody’s
Ratings†
(Unaudited) | | Principal
Amount (000) | | Description | | Value (Note 1) |
| | | | | | | | |
COMMERCIAL MORTGAGE BACKED SECURITIES (Continued) | | | |
| Aaa | | $ | 132 | | Ser. 2006-BBA7, Class A1, 144A,
0.340%, 3/15/19(d) | | $ | 118,022 |
| AAA(e) | | | 500 | | C.W. Capital Cobalt Ltd., Ser. 2007-C3, Class A3,
5.820%, 5/15/46(d) | | | 512,917 |
| Aaa | | | 740 | | Citigroup Commercial Mortgage Trust,
Ser. 2006-C5, Class ASB,
5.413%, 10/15/49 | | | 771,933 |
| AAA(e) | | | 863 | | Commercial Mortgage Acceptance Corp.,
Ser. 1998-C2, Class X,
1.254%, 9/15/30(d) | | | 51,308 |
| AAA(e) | | | 1,515 | | Commercial Mortgage Pass-Through Certs.,
Ser. 2004-LB2A, Class X2, 144A,
1.004%, 3/10/39(d) | | | 11,504 |
| Aaa | | | 300 | | Credit Suisse First Boston Mortgage Securities Corp.,
Ser. 2004-C4, Class A4,
4.283%, 10/15/39 | | | 304,357 |
| AAA(e) | | | 1,200 | | Ser. 2005-C5, Class A4,
5.100%, 8/15/38(d) | | | 1,222,755 |
| AAA(e) | | | 800 | | Credit Suisse Mortgage Capital Certificates,
Ser. 2006-C1, Class A4,
5.549%, 2/15/39(d) | | | 824,471 |
| Aaa | | | 700 | | Ser. 2006-C5, Class A2,
5.246%, 12/15/39 | | | 727,219 |
| AAA(e) | | | 62 | | DLJ Commercial Mortgage Corp.,
Ser. 2000-CF1, Class A1B,
7.620%, 6/10/33 | | | 62,354 |
| Aaa | | | 3,174 | | GE Capital Commercial Mortgage Corp.,
Ser. 2004-C2, Class X2, 144A,
0.766%, 3/10/40(d) | | | 17,911 |
| AAA(e) | | | 645 | | GMAC Commercial Mortgage Securities, Inc.,
Ser. 2005-C1, Class A5,
4.697%, 5/10/43 | | | 661,594 |
| Aaa | | | 500 | | Greenwich Capital Commercial Funding Corp.,
Ser. 2007-GG9, Class A2,
5.381%, 3/10/39 | | | 514,606 |
| Aaa | | | 500 | | JPMorgan Chase Commercial Mortgage Securities Corp., Ser. 2005-CB12, Class A4,
4.895%, 9/12/37 | | | 509,001 |
See Notes to Financial Statements.
| | |
| Prudential Investment Portfolios, Inc./Prudential Asset Allocation Fund | | 75 |
Portfolio of Investments
as of March 31, 2010 (Unaudited) continued
| | | | | | | | |
Moody’s
Ratings†
(Unaudited) | | Principal
Amount (000) | | Description | | Value (Note 1) |
| | | | | | | | |
COMMERCIAL MORTGAGE BACKED SECURITIES (Continued) | | | |
| Aaa | | $ | 700 | | Ser. 2006-CB16, Class ASB,
5.523%, 5/12/45 | | $ | 734,542 |
| Aaa | | | 23,081 | | Ser. 2006-LDP6, Class X2, I/O,
0.234%, 4/15/43(d) | | | 66,990 |
| AAA(e) | | | 800 | | LB-UBS Commercial Mortgage Trust,
Ser. 2004-C6, Class A5,
4.826%, 8/15/29(d) | | | 820,058 |
| Aaa | | | 500 | | Ser. 2005-C3, Class A3,
4.647%, 7/15/30 | | | 510,447 |
| Aaa | | | 400 | | Merrill Lynch Mortgage Trust,
Ser. 2004-KEY2, Class A3,
4.615%, 8/12/39 | | | 406,191 |
| Aaa | | | 480 | | Merrill Lynch/Countrywide Commercial Mortgage Trust,
Ser. 2006-2, Class A4,
5.908%, 6/12/46(d) | | | 504,584 |
| Aaa | | | 1,500 | | Ser. 2007-7, Class ASB,
5.745%, 6/12/50(d) | | | 1,521,440 |
| Aaa | | | 133 | | Morgan Stanley Capital I,
Ser. 2004-HQ3, Class A2,
4.050%, 1/13/41 | | | 133,635 |
| Aaa | | | 1,000 | | Ser. 2007-HQ11, Class AAB,
5.444%, 2/12/44 | | | 1,026,726 |
| AAA(e) | | | 260 | | Ser. 2007-T27, Class AAB,
5.649%, 6/11/42(d) | | | 273,813 |
| AAA(e) | | | 517 | | Ser. 2008-T29, Class A3,
6.280%, 1/11/43(d) | | | 554,828 |
| Aaa | | | 500 | | Wachovia Bank Commercial Mortgage Trust,
Ser. 2005-C22, Class A3,
5.290%, 12/15/44(d) | | | 515,625 |
| Aaa | | | 150 | | Ser. 2006-C25, Class A4,
5.740%, 5/15/43(d) | | | 155,091 |
| Aaa | | | 500 | | Ser. 2006-C25, Class A3,
5.705%, 5/15/43(d) | | | 518,729 |
| | | | | | | | |
| | | | | Total commercial mortgage backed securities
(cost $16,179,313) | | | 16,843,481 |
| | | | | | | | |
| |
FOREIGN AGENCIES 0.4% | | | |
| Aaa | | | 1,220 | | Commonwealth Bank of Australia (Australia), 144A,
2.700%, 11/25/14 | | | 1,201,125 |
See Notes to Financial Statements.
| | |
| 76 | | Visit our website at www.prudentialfunds.com |
| | | | | | | | |
Moody’s
Ratings†
(Unaudited) | | Principal
Amount (000) | | Description | | Value (Note 1) |
| | | | | | | | |
FOREIGN AGENCIES (Continued) | | | |
| Baa1 | | $ | 460 | | RSHB Capital SA For OJSC Russian Agricultural Bank (Luxembourg), Sr. Sec’d. Notes, 144A,
6.299%, 5/15/17 | | $ | 477,204 |
| | | | | | | | |
| | | | | Total foreign agencies
(cost $1,679,146) | | | 1,678,329 |
| | | | | | | | |
| |
MORTGAGE BACKED SECURITIES 11.9% | | | |
| | | 1,677 | | Federal Home Loan Mortgage Corp.,
4.500%, 1/01/19 - 7/01/20 | | | 1,760,982 |
| | | 590 | | 4.500%, TBA 15 YR(h) | | | 611,848 |
| | | 1,823 | | 5.000%, 7/01/18 - 5/01/34 | | | 1,931,225 |
| | | 2,000 | | 5.000%, TBA 30 YR(h) | | | 2,065,000 |
| | | 369 | | 5.211%, 12/01/35(d) | | | 388,591 |
| | | 2,244 | | 5.500%, 12/01/33 - 10/01/37 | | | 2,376,596 |
| | | 1,500 | | 5.500%, TBA 30 YR(h) | | | 1,578,750 |
| | | 523 | | 6.000%, 1/01/34 | | | 566,250 |
| | | 351 | | 7.000%, 6/01/14 - 11/01/33 | | | 392,126 |
| | | 203 | | Federal National Mortgage Association,
4.000%, 5/01/19 | | | 210,138 |
| | | 2,418 | | 4.500%, 11/01/18 - 3/01/34 | | | 2,514,483 |
| | | 1,500 | | 4.500%, TBA 30 YR | | | 1,498,125 |
| | | 4,000 | | 4.500%, TBA 30 YR(h) | | | 4,008,752 |
| | | 2,203 | | 5.000%, 10/01/18 - 2/01/36 | | | 2,291,099 |
| | | 1,000 | | 5.000%, TBA 30 YR(h) | | | 1,031,562 |
| | | 7,121 | | 5.500%, 12/01/16 - 7/01/34 | | | 7,559,081 |
| | | 1,000 | | 5.500%, TBA 30 YR(h) | | | 1,053,906 |
| | | 1,556 | | 5.888%, 7/01/37(d) | | | 1,634,370 |
| | | 4,263 | | 6.000%, 9/01/13 - 8/01/38 | | | 4,600,747 |
| | | 4,000 | | 6.000%, TBA 30 YR(h) | | | 4,248,752 |
| | | 3,790 | | 6.500%, 5/01/13 - 10/01/37 | | | 4,122,014 |
| | | 82 | | 7.000%, 6/01/32 | | | 91,677 |
| | | 6 | | 7.500%, 9/01/30 | | | 7,009 |
| | | 14 | | 8.000%, 12/01/23 | | | 15,632 |
| | | 12 | | 8.500%, 2/01/28 | | | 13,756 |
| | | 2,820 | | Government National Mortgage Association,
5.500%, 7/15/33 - 2/15/36 | | | 2,999,089 |
| | | 1,000 | | 6.000%, TBA 30 YR(h) | | | 1,068,125 |
| | | 523 | | 6.500%, 9/15/23 - 8/15/32 | | | 567,053 |
| | | 118 | | 7.000%, 6/15/24 - 5/15/31 | | | 131,840 |
See Notes to Financial Statements.
| | |
| Prudential Investment Portfolios, Inc./Prudential Asset Allocation Fund | | 77 |
Portfolio of Investments
as of March 31, 2010 (Unaudited) continued
| | | | | | | | |
Moody’s
Ratings†
(Unaudited) | | Principal
Amount (000) | | Description | | Value (Note 1) |
| | | | | | | | |
MORTGAGE BACKED SECURITIES (Continued) | | | |
| | $ | 12 | | 7.500%, 4/15/29 - 5/15/31 | | $ | 13,208 |
| | | 105 | | 8.000%, 8/15/22 - 6/15/25 | | | 120,731 |
| | | | | | | | |
| | | | | Total mortgage backed securities
(cost $49,568,855) | | | 51,472,517 |
| | | | | | | | |
| |
MUNICIPAL BONDS 0.2% | | | |
| Aa3 | | | 220 | | Bay Area Toll Auth. Toll Brdg. Rev., Build America Bonds,
6.263%, 4/01/49 | | | 222,044 |
| A3 | | | 65 | | New Jersey State Tpk. Auth. Rev.,Tax. Issuer Subs.,
Ser. F, Build America Bonds,
7.414%, 1/01/40 | | | 75,550 |
| Aa2 | | | 190 | | New York City Trans. Fin. Auth.,Tax. Future, Tax. Secd. Sub., Ser. C-2, Build America Bonds,
5.767%, 8/01/36 | | | 188,567 |
| Baa1 | | | 40 | | State of California, G.O.,Tax. Var. Purp., Build America Bonds,
7.550%, 4/01/39 | | | 41,594 |
| Baa1 | | | 210 | | State of California,G.O., Build America Bonds,
7.300%, 10/01/39 | | | 210,708 |
| | | | | | | | |
| | | | | Total municipal bonds
(cost $727,266) | | | 738,463 |
| | | | | | | | |
| |
U.S. GOVERNMENT AGENCY OBLIGATIONS 0.9% | | | |
| | | 435 | | Federal Home Loan Bank,
5.625%, 6/11/21 | | | 479,256 |
| | | 1,060 | | Federal Home Loan Mortgage Corp.,
2.875%, 2/09/15 | | | 1,066,509 |
| | | 590 | | 3.750%, 3/27/19 | | | 575,565 |
| | | 60 | | 4.750%, 1/18/11 | | | 61,987 |
| | | 130 | | 5.125%, 11/17/17 | | | 142,357 |
| | | 620 | | Federal National Mortgage Association,
5.000%, 2/13/17 | | | 675,222 |
| | | 95 | | 5.375%, 6/12/17 | | | 105,195 |
| | | 280 | | 6.625%, 11/15/30 | | | 334,619 |
| | | 330 | | Resolution Funding Corp. Interest Strip,
4.780%, 4/15/18(i) | | | 237,367 |
See Notes to Financial Statements.
| | |
| 78 | | Visit our website at www.prudentialfunds.com |
| | | | | | | | |
Moody’s
Ratings†
(Unaudited) | | Principal
Amount (000) | | Description | | Value (Note 1) |
| | | | | | | | |
U.S. GOVERNMENT AGENCY OBLIGATIONS (Continued) | | | |
| | $ | 280 | | Tennessee Valley Authority,
4.500%, 4/01/18 | | $ | 288,851 |
| | | | | | | | |
| | | | | Total U.S. government agency obligations
(cost $3,973,021) | | | 3,966,928 |
| | | | | | | | |
| |
U.S. GOVERNMENT TREASURY SECURITIES 2.7% | | | |
| | | 410 | | United States Treasury Bond,
4.375%, 11/15/39 | | | 387,706 |
| | | 445 | | United States Treasury Bonds,
7.500%, 11/15/24 | | | 597,621 |
| | | 1,318 | | United States Treasury Notes,
2.500%, 3/31/15 | | | 1,314,296 |
| | | 760 | | 2.750%, 11/30/16 | | | 739,041 |
| | | | | United States Treasury Strip Coupon, | | | |
| | | 3,665 | | 4.750%, 5/15/24(j) | | | 1,887,874 |
| | | 2,075 | | 4.750%, 11/15/24(j) | | | 1,037,054 |
| | | 500 | | 4.760%, 2/15/25(j) | | | 246,481 |
| | | 1,880 | | 4.770%, 8/15/24(j) | | | 954,014 |
| | | 1,980 | | 5.190%, 5/15/20(j) | | | 1,291,269 |
| | | 475 | | 5.950%, 8/15/22(j) | | | 271,879 |
| | | 1,600 | | 6.910%, 5/15/25(j) | | | 776,546 |
| | | 1,035 | | 8.060%, 8/15/29(j) | | | 400,318 |
| | | | | United States Treasury Strip Principal, | | | |
| | | 190 | | 4.660%, 8/15/23(i) | | | 103,306 |
| | | 1,200 | | 4.730%, 11/15/24(i) | | | 606,028 |
| | | 600 | | 5.639%, 8/15/21(j) | | | 363,447 |
| | | 1,650 | | 6.070%, 2/15/23(i) | | | 920,347 |
| | | | | | | | |
| | | | | Total United States government treasury securities
(cost $12,012,794) | | | 11,897,227 |
| | | | | | | | |
| | | | | Total long-term investments
(cost $356,026,442) | | | 401,994,606 |
| | | | | | | | |
|
SHORT-TERM INVESTMENTS 14.1% |
|
U.S. GOVERNMENT TREASURY SECURITY 0.1% |
| | | 570 | | U.S. Treasury Bill
0.157%, 6/17/10(k)
(cost $569,812) | | | 569,823 |
| | | | | | | | |
See Notes to Financial Statements.
| | |
| Prudential Investment Portfolios, Inc./Prudential Asset Allocation Fund | | 79 |
Portfolio of Investments
as of March 31, 2010 (Unaudited) continued
| | | | | | | |
| Shares | | Description | | Value (Note 1) | |
| | | | | | | |
| AFFILIATED MUTUAL FUNDS 14.0% | | | | |
| | 2,760,123 | | Prudential Investment Portfolios 2-Prudential Core Short-Term Bond Fund
(cost $27,013,675)(m) | | $ | 24,095,871 | |
| | 36,314,132 | | Prudential Investment Portfolios 2-Prudential Core Taxable Money Market Fund (cost $36,314,132; includes $14,589,755 of cash collateral received for securities on loan)(m)(n) | | | 36,314,132 | |
| | | | | | | |
| | | Total affiliated mutual funds
(cost $63,327,807) | | | 60,410,003 | |
| | | | | | | |
| | |
Notional
Amount (000)# | | | | | |
| OUTSTANDING OPTION PURCHASED(a) | | | | |
| |
| Call Option | | | | |
| $ | 54 | | U.S. 2 Yr. Future Options, expiring 5/21/10 @ $108.50
(cost $14,624) | | | 12,234 | |
| | | | | | | |
| | | Total short-term investments
(cost $63,912,243) | | | 60,992,060 | |
| | | | | | | |
| | | Total Investments 107.1%
(cost $419,938,685; Note 5) | | | 462,986,666 | |
| | | Liabilities in excess of other assets(o) (7.1%) | | | (30,748,649 | ) |
| | | | | | | |
| | | Net Assets 100.0% | | $ | 432,238,017 | |
| | | | | | | |
The following abbreviations are used in the portfolio descriptions:
144A—Security was purchased pursuant to Rule 144A under the Securities Act of 1933 and may not be resold subject to that rule except to qualified institutional buyers. Unless otherwise noted, 144A securities are deemed to be liquid.
ABS—Asset-Based Security
HFC—Housing Finance Corporation
LLC—Limited Liability Corporation
LP—Limited Partnership
MTN—Medium Term Note
NR—Not Rated
REIT—Real Estate Investment Trust
SA—Special Assessment
STRIP—Separate trading of registered interest and principal of securities.
TBA—To Be Announced
ULC—Unlimited Liability Corporation
| † | The ratings reflected are as of March 31, 2010. Ratings of certain bonds may have changed subsequent to that date. |
| (a) | Non-income producing security. |
See Notes to Financial Statements.
| | |
| 80 | | Visit our website at www.prudentialfunds.com |
| (b) | All or a portion of security is on loan. The aggregate market value of such securities is $14,172,193; cash collateral of $14,589,755 (included in liabilities) was received with which the Fund purchased highly liquid short-term investments. |
| (c) | Indicates a security that has been deemed illiquid. |
| (d) | Variable rate instrument. The interest rate shown reflects the rate in effect at March 31, 2010. |
| (e) | Standard and Poor’s Rating. |
| (f) | Represents issuer in default on interest payments and/or principal repayment; non-income producing security. |
| (g) | Indicates a restricted security, the aggregate original cost of such securities is $1,211,825. The aggregate value of $1,301,052 is approximately 0.3% of net assets. |
| (h) | Principal amount of $15,090,000 represents a to-be announced (“TBA”) mortgage dollar roll. |
| (i) | Represents a zero coupon bond. Rate shown reflects the effective yield at reporting date. |
| (j) | The rate shown reflects the effective yield at reporting date. |
| (k) | Rate quoted represents yield-to-maturity as of purchase date. |
| (l) | Security segregated as collateral for futures contracts. |
| (m) | Prudential Investments LLC, the manager of the Fund, also serves as manager of the Prudential Investment Portfolios 2-Prudential Core Taxable Money Market Fund and the Prudential Investment Portfolios 2-Prudential Core Short-Term Bond Fund. |
| (n) | Represents security, or a portion thereof, purchased with cash collateral received for securities on loan. |
| (o) | Liabilities in excess of other assets include net unrealized appreciation (depreciation) on financial futures contracts and credit default swaps as follows: |
Open futures contracts outstanding at March 31, 2010:
| | | | | | | | | | | | | | |
Number of
Contracts | | Type | | Expiration
Date | | Value at
Trade
Date | | Value at
March 31,
2010 | | Unrealized
Appreciation/
(Depreciation) | |
| | Long Positions: | | | | | | | | | | | | |
| 6 | | EMINI MSCI EAFE | | Jun. 2010 | | $ | 470,520 | | $ | 472,140 | | $ | 1,620 | |
| 98 | | U.S. Treasury 2 Yr. Notes | | Jun. 2010 | | | 21,277,193 | | | 21,261,406 | | | (15,787 | ) |
| 210 | | U.S. Treasury 5 Yr. Notes | | Jun. 2010 | | | 24,226,636 | | | 24,117,188 | | | (109,448 | ) |
| 18 | | U.S. Treasury 5 Yr. Notes | | Jun. 2010 | | | 2,068,031 | | | 2,067,187 | | | (844 | ) |
| 84 | | S & P EMINI | | Jun. 2010 | | | 4,884,150 | | | 4,893,840 | | | 9,690 | |
| | | | | | | | | | | | | | |
| | | | | | | | | | | | | (114,769 | ) |
| | | | | | | | | | | | | | |
| | Short Positions: | | | | | | | | | | | | |
| 20 | | U.S. Treasury 10 Yr. Notes | | Jun. 2010 | | $ | 2,348,743 | | $ | 2,325,000 | | $ | 23,743 | |
| 74 | | U.S. Treasury Long Term Bonds | | Jun. 2010 | | | 8,615,370 | | | 8,593,250 | | | 22,120 | |
| 5 | | U.S. Ultra Bonds | | Jun. 2010 | | | 595,638 | | | 599,844 | | | (4,206 | ) |
| | | | | | | | | | | | | | |
| | | | | | | | | | | | | 41,657 | |
| | | | | | | | | | | | | | |
| | | | | | | | | | | | $ | (73,112 | ) |
| | | | | | | | | | | | | | |
See Notes to Financial Statements.
| | |
| Prudential Investment Portfolios, Inc./Prudential Asset Allocation Fund | | 81 |
Portfolio of Investments
as of March 31, 2010 (Unaudited) continued
Credit default swap agreements outstanding at March 31, 2010:
| | | | | | | | | | | | | | | | | | | | |
Counterparty | | Termination
Date | | Notional
Amount
(000)#(2) | | Fixed
Rate | | | Reference Entity/
Obligation | | Fair
Value | | | Upfront
Premiums
Paid/
(Received) | | Unrealized
Appreciation/
(Depreciation) | |
Buy Protection(1): | | | | | | | | | | | | | | | | | | | | |
Barclays Bank PLC | | 9/20/2012 | | 700 | | 0.595 | % | | Fortune Brands, Inc. 5.375%, due 01/15/16 | | $ | 2,323 | | | $ | — | | $ | 2,323 | |
Deutsche Bank AG | | 3/20/2014 | | 300 | | 7.050 | % | | Starwood Hotels & Resorts Holdings, Inc. 7.875%, due 05/01/12 | | | (65,743 | ) | | | — | | | (65,743 | ) |
JPMorgan Chase Bank | | 6/20/2014 | | 240 | | 0.650 | % | | Bunge Ltd. Finance Corp. 5.350%,9 due 04/15/14 | | | 4,868 | | | | — | | | 4,868 | |
Merrill Lynch Capital Services, Inc. | | 9/20/2016 | | 150 | | 1.730 | % | | Tyson Foods, Inc. 7.850%, due 04/01/16 | | | (656 | ) | | | — | | | (656 | ) |
Morgan Stanley Capital Services, Inc. | | 3/20/2018 | | 300 | | 0.700 | % | | Avon Products, Inc. 6.500%, due 03/01/19 | | | 437 | | | | — | | | 437 | |
Deutsche Bank AG | | 3/20/2018 | | 1,000 | | 0.990 | % | | Nordstrom, Inc. 6.950%, due 03/15/28 | | | 6,587 | | | | — | | | 6,587 | |
Barclays Bank, PLC | | 3/20/2018 | | 300 | | 1.220 | % | | Computer Sciences Corp. 5.000%, due 02/15/13 | | | (5,514 | ) | | | — | | | (5,514 | ) |
Credit Suisse International | | 6/20/2018 | | 600 | | 0.970 | % | | Verizon Communications, Inc.
4.900%, due 09/15/15 | | | 1,711 | | | | — | | | 1,711 | |
Morgan Stanley Capital Services, Inc. | | 6/20/2018 | | 500 | | 0.970 | % | | Simon Property Group L.P.
5.250%, due 12/01/16 | | | 19,999 | | | | — | | | 19,999 | |
Morgan Stanley Capital Services, Inc. | | 6/20/2018 | | 300 | | 1.000 | % | | Newell Rubbermaid, Inc. zero, due 07/15/28 | | | 8,603 | | | | — | | | 8,603 | |
Merrill Lynch Capital Services, Inc. | | 6/20/2018 | | 500 | | 1.130 | % | | Spectra Energy Capital LLC
6.250%, due 02/15/13 | | | (7,980 | ) | | | — | | | (7,980 | ) |
Merrill Lynch Capital Services, Inc. | | 6/20/2018 | | 500 | | 1.450 | % | | Starwood Hotel & Resorts Worldwide, Inc. 6.750%, due 05/15/18 | | | 10,868 | | | | — | | | 10,868 | |
Merrill Lynch Capital Services, Inc. | | 6/20/2018 | | 300 | | 3.050 | % | | SLM Corp.
5.125%, due 08/27/12 | | | 12,738 | | | | — | | | 12,738 | |
| | | | | | | | | | | | | | | | | | | | |
| | | | | | | | | | | $ | (11,759 | ) | | $ | — | | $ | (11,759 | ) |
| | | | | | | | | | | | | | | | | | | | |
| (1) | If the Portfolio is a buyer of protection, it pays the fixed rate. When a credit event occurs, as defined under the terms of that particular swap agreement, the Fund will either (i) receive from the seller of protection an amount equal to the notional amount of the swap and make delivery of the referenced obligation or underlying securities comprising the referenced index or (ii) receive a net settlement amount in the form of cash or securities equal to the notional amount of the swap less the recovery value of the referenced obligation or underlying securities comprising the referenced index. |
See Notes to Financial Statements.
| | |
| 82 | | Visit our website at www.prudentialfunds.com |
| (2) | Notional amount represents the maximum potential amount the Fund could be required to pay as a seller of credit protection or receive as a a buyer of credit protection if a credit event occurs as defined under the terms of that particular swap agreement. |
| # | Notional amount is shown in U.S. dollars unless otherwise stated. |
Various inputs are used in determining the value of the Portfolio’s investments. These inputs are summarized in the three broad levels listed below.
Level 1—quoted prices in active markets for identical securities
Level 2—other significant observable inputs (including quoted prices for similar securities, interest rates, prepayment speeds, credit risk, etc.)
Level 3—significant unobservable inputs (including the Portfolio’s own assumptions in determining the fair value of investments)
The following is a summary of the inputs used as of March 31, 2010 in valuing the Portfolio’s assets carried at fair value:
| | | | | | | | | | |
Investments in Securities | | Level 1 | | | Level 2 | | | Level 3 |
Common Stocks | | $ | 262,093,637 | | | $ | — | | | — |
Preferred Stocks | | | 61,814 | | | | — | | | — |
Right | | | 194 | | | | — | | | — |
Corporate Bonds | | | — | | | | 49,124,041 | | | — |
Asset Backed Securities | | | — | | | | 2,059,598 | | | — |
Collateralized Mortgage Obligations | | | — | | | | 2,058,377 | | | — |
Commercial Mortgage Backed Securities | | | — | | | | 16,843,481 | | | — |
Foreign Agencies | | | — | | | | 1,678,329 | | | — |
Mortgage Backed Securities | | | — | | | | 51,472,517 | | | — |
Municipal Bonds | | | — | | | | 738,463 | | | — |
U.S. Government Agency Obligations | | | — | | | | 3,966,928 | | | — |
U.S. Government Treasury Securities | | | — | | | | 12,467,050 | | | — |
Affiliated Mutual Funds | | | 60,410,003 | | | | — | | | — |
Outstanding Option Purchased | | | 12,234 | | | | — | | | |
Other Financial Instruments* | | | | | | | | | | — |
Futures | | | (73,112 | ) | | | — | | | |
Credit Default Swaps | | | — | | | | (11,759 | ) | | |
| | | | | | | | | | |
Total | | $ | 322,504,770 | | | $ | 140,397,025 | | | — |
| | | | | | | | | | |
| * | Other financial instruments are derivative instruments not reflected in the Portfolio of Investments, such as futures, forwards and swap contracts, which are valued at the unrealized appreciation/depreciation on the instrument. |
See Notes to Financial Statements.
| | |
| Prudential Investment Portfolios, Inc./Prudential Asset Allocation Fund | | 83 |
Portfolio of Investments
as of March 31, 2010 (Unaudited) continued
As of December 31, 2009 and March 31, 2010, the Portfolio did not use any significant unobservable inputs (Level 3) in determining the value of investments.
The industry classification of portfolio holdings and liabilities in excess of other assets shown as a percentage of net assets as of March 31, 2010 was as follows:
| | | |
Affiliated Mutual Fund (including 3.4% of collateral received for securities on loan) | | 14.0 | % |
Mortgage Backed Securities | | 11.9 | |
Oil, Gas & Consumable Fuels | | 5 .3 | |
Commercial Mortgage Backed Securities | | 3 .9 | |
Pharmaceuticals | | 3 .5 | |
Computers & Peripherals | | 3 .1 | |
Diversified Financial Services | | 2 .8 | |
U.S. Government Treasury Securities | | 2 .8 | |
Insurance | | 2 .7 | |
Software | | 2 .6 | |
Commercial Banks | | 2 .3 | |
Banking | | 2 .2 | |
Aerospace & Defense | | 2 .1 | |
Semiconductors & Semiconductor Equipment | | 1.9 | |
Diversified Telecommunication Services | | 1.8 | |
Healthcare Equipment & Supplies | | 1.5 | |
Specialty Retail | | 1.5 | |
Beverages | | 1.4 | |
Food Products | | 1.4 | |
Household Products | | 1.4 | |
Communications Equipment | | 1.3 | |
Machinery | | 1.3 | |
Media | | 1.3 | |
Metals & Mining | | 1.3 | |
Capital Markets | | 1.2 | |
Electric | | 1.2 | |
Healthcare Providers & Services | | 1.2 | |
Industrial Conglomerates | | 1.2 | |
Chemicals | | 1.1 | |
Electric Utilities | | 1.1 | |
Food & Staples Retailing | | 1.1 | |
Real Estate Investment Trusts | | 1.1 | |
Biotechnology | | 1.0 | |
Telecommunications | | 1.0 | |
U.S. Government Agency Obligations | | 0.9 | |
Internet Software & Services | | 0.8 | |
Textiles, Apparel & Luxury Goods | | 0.8 | |
Tobacco | | 0.8 | |
Air Freight & Logistics | | 0.7 | |
Consumer Finance | | 0.7 | |
Electrical Equipment | | 0.7 | |
Auto Components | | 0.6 | |
See Notes to Financial Statements.
| | |
| 84 | | Visit our website at www.prudentialfunds.com |
| | | |
Industry (cont’d.) | | | |
Electronic Equipment & Instruments | | 0.6 | % |
Energy Equipment & Services | | 0.6 | |
Multiline Retail | | 0.6 | |
Automobiles | | 0.5 | |
Collateralized Mortgage Obligations | | 0.5 | |
Foods | | 0.5 | |
Healthcare & Pharmaceutical | | 0.5 | |
Hotels, Restaurants & Leisure | | 0.5 | |
Household Durables | | 0.5 | |
IT Services | | 0.5 | |
Life Sciences Tools & Services | | 0.5 | |
Multi-Utilities | | 0.5 | |
Non Captive Finance | | 0.5 | |
Cable | | 0.4 | |
Foreign Agencies | | 0.4 | |
Healthcare Insurance | | 0.4 | |
Metals | | 0.4 | |
Residential Mortgage Backed Security | | 0.4 | |
Retailers | | 0.4 | |
Commercial Services & Supplies | | 0.3 | |
Consumer | | 0.3 | |
Pipelines & Other | | 0.3 | |
Technology | | 0.3 | |
Trading Companies & Distributors | | 0.3 | |
Airlines | | 0.2 | |
Capital Goods | | 0.2 | |
Diversified Consumer Services | | 0.2 | |
Energy - Integrated | | 0.2 | |
Energy - Other | | 0.2 | |
Lodging | | 0.2 | |
Media & Entertainment | | 0.2 | |
Municipal Bonds | | 0.2 | |
Office Electronics | | 0.2 | |
Railroads | | 0.2 | |
Road & Rail | | 0.2 | |
Thrifts & Mortgage Finance | | 0.2 | |
Brokerage | | 0.1 | |
Building Materials & Construction | | 0.1 | |
Building Products | | 0.1 | |
Construction & Engineering | | 0.1 | |
Containers & Packaging | | 0.1 | |
Distributors | | 0.1 | |
Gas Utilities | | 0.1 | |
Healthcare Technology | | 0.1 | |
Independent Power Producers & Energy Traders | | 0.1 | |
Non-Residential Mortgage Asset-Backed Security | | 0.1 | |
Paper | | 0.1 | |
See Notes to Financial Statements.
| | |
| Prudential Investment Portfolios, Inc./Prudential Asset Allocation Fund | | 85 |
Portfolio of Investments
as of March 31, 2010 (Unaudited) continued
| | | |
Industry (cont’d.) | | | |
Personal Products | | 0.1 | % |
Professional Services | | 0.1 | |
Real Estate Management & Development | | 0.1 | |
Wireless Telecommunication Services | | 0.1 | |
| | | |
| | 107.1 | |
Liabilities in excess of other assets | | (7 .1 | ) |
| | | |
| | 100.0 | % |
| | | |
The Series invested in derivative instruments during the reporting period. The primary types of risk associated with these derivative instruments are commodity risk, credit risk, equity risk, foreign exchange risk and interest rate risk. The effect of such derivative instruments on the Series’s financial position and financial performance as reflected in the Statement of Assets and Liabilities and Statement of Operations is presented in the summary below.
Fair values of derivative instruments as of March 31, 2010 as presented in the Statement of Assets and Liabilities: (Unaudited)
| | | | | | | | | | | | |
Derivatives not designated
as hedging instruments,
carried at fair value | | Asset Derivatives | | | Liability Derivatives | |
| | Balance
Sheet Location | | Fair
Value | | | Balance
Sheet Location | | Fair
Value | |
Credit contracts | | Unrealized appreciation
on swaps | | $ | 68,134 | | | Unrealized appreciation
on swaps | | $ | 79,893 | |
Equity contracts | | Due from broker—
variation margin | | | 11,310 | * | | — | | | — | |
Equity contracts | | Unaffiliated
Investments | | | 194 | | | — | | | — | |
Interest rate contracts | | Due from broker—
variation margin | | | 45,863 | * | | Due from broker—
variation margin | | | 130,285 | * |
Interest rate contracts | | Unaffiliated
Investments | | | 12,234 | | | — | | | — | |
| | | | | | | | | | | | |
Total | | | | $ | 137,735 | | | | | $ | 210,178 | |
| | | | | | | | | | | | |
| * | Includes cumulative appreciation/depreciation on futures contracts as reported in Portfolio of Investments. Only unsettled variation margin receivable (payable) is reported within the Statement of Assets and Liabilities. |
See Notes to Financial Statements.
| | |
| 86 | | Visit our website at www.prudentialfunds.com |
The effects of derivative instruments on the Statement of Operations for the six months ended March 31, 2010 are as follows: (Unaudited)
| | | | | | | | | | | | | | | | | | |
Amount of Realized Gain or (Loss) on Derivatives Recognized in Income | |
Derivatives not designated as hedging
instruments, carried at fair value | | Rights | | | Futures | | Swaps | | | Warrants | | Total | |
Credit contracts | | $ | — | | | $ | — | | $ | (34,377 | ) | | $ | — | | $ | (34,377 | ) |
Equity contracts | | | (31,860 | ) | | | 433,613 | | | — | | | | 133 | | | 401,886 | |
Interest rate contracts | | | — | | | | 781,284 | | | (135,639 | ) | | | — | | | 645,645 | |
| | | | | | | | | | | | | | | | | | |
Total | | $ | (31,860 | ) | | $ | 1,214,897 | | $ | (170,016 | ) | | $ | 133 | | $ | 1,013,154 | |
| | | | | | | | | | | | | | | | | | |
For the six months ended March 31, 2010 the Series did not have any realized gain or (loss) on derivatives recognized in income.
| | | | | | | | | | | | | | | | | | | | | | | | |
Change in Unrealized Appreciation or (Depreciation) on Derivatives Recognized in Income | |
Derivatives not designated
as hedging instruments,
carried at fair value | | Rights | | | Futures | | | Purchased
Swaps | | | Options | | | Warrants | | | Total | |
Credit contracts | | $ | — | | | $ | — | | | $ | (185,178 | ) | | $ | — | | | $ | — | | | $ | (185,178 | ) |
Equity contracts | | | (3,863 | ) | | | 46,660 | | | | — | | | | — | | | | (23 | ) | | | 42,774 | |
Interest rate contracts | | | — | | | | (203,428 | ) | | | 41,043 | | | | (2,390 | ) | | | — | | | | (164,775 | ) |
| | | | | | | | | | | | | | | | | | | | | | | | |
Total | | $ | (3,863 | ) | | $ | (156,768 | ) | | $ | (144,135 | ) | | $ | (2,390 | ) | | $ | (23 | ) | | $ | (307,179 | ) |
| | | | | | | | | | | | | | | | | | | | | | | | |
For the six months ended March 31, 2010, the Series’ average volume of derivative activities are as follows: (Unaudited)
| | | | |
Purchased Options (Cost) | | Futures
Long Position
(Value at Trade Date) | | Futures
Short Position
(Value at Trade Date) |
$4,875 | | $36,787,598 | | $6,046,681 |
| | |
Interest
Rate
Swaps
(Notional Amount in USD (000)) | | Credit
Default
Swaps as buyer
(Notional Amount in USD (000)) |
$1,615 | | $6,590 |
See Notes to Financial Statements.
| | |
| Prudential Investment Portfolios, Inc./Prudential Asset Allocation Fund | | 87 |
Statement of Assets and Liabilities
as of March 31, 2010 (Unaudited)
| | | | |
Assets | | | | |
Investments at value, including securities on loan of $14,172,193 | | | | |
Unaffiliated Investments (cost $356,610,878) | | $ | 402,576,663 | |
Affiliated Investments (cost $63,327,807) | | | 60,410,003 | |
Foreign currency, at value (cost $329,533) | | | 321,639 | |
Receivable for investments sold | | | 4,820,890 | |
Dividends and interest receivable | | | 1,549,815 | |
Receivable for Series shares sold | | | 139,140 | |
Unrealized appreciation on swaps | | | 68,134 | |
Foreign tax reclaim receivable | | | 36,127 | |
Prepaid expenses | | | 3,685 | |
Due from broker—variation margin | | | 3,198 | |
| | | | |
Total assets | | | 469,929,294 | |
| | | | |
| |
Liabilities | | | | |
Payable for investments purchased | | | 21,997,855 | |
Payable to broker for collateral for securities on loan | | | 14,589,755 | |
Payable for Series shares reacquired | | | 521,793 | |
Management fee payable | | | 229,966 | |
Distribution fee payable | | | 102,535 | |
Affiliated transfer agent fee payable | | | 82,739 | |
Accrued expenses and other liabilities | | | 81,983 | |
Unrealized depreciation on swaps | | | 79,893 | |
Deferred directors’ fees | | | 4,608 | |
Payable to custodian | | | 150 | |
| | | | |
Total liabilities | | | 37,691,277 | |
| | | | |
| |
Net Assets | | $ | 432,238,017 | |
| | | | |
| | | | | |
Net assets were comprised of: | | | | |
Common stock, at par | | $ | 38,628 | |
Paid-in capital in excess of par | | | 477,917,007 | |
| | | | |
| | | 477,955,635 | |
Undistributed net investment income | | | 1,566,009 | |
Accumulated net realized loss on investments and foreign currency transactions | | | (90,239,556 | ) |
Net unrealized appreciation on investments and foreign currencies | | | 42,955,929 | |
| | | | |
Net assets, March 31, 2010 | | $ | 432,238,017 | |
| | | | |
See Notes to Financial Statements.
| | |
| 88 | | Visit our website at www.prudentialfunds.com |
| | | |
Class A | | | |
Net asset value and redemption price per share
($281,217,810 ÷ 25,171,275 shares of common stock issued and outstanding) | | $ | 11.17 |
Maximum sales charge (5.50% of offering price) | | | 0.65 |
| | | |
Maximum offering price to public | | $ | 11.82 |
| | | |
| |
Class B | | | |
Net asset value, offering price and redemption price per share
($15,883,029 ÷ 1,415,812 shares of common stock issued and outstanding) | | $ | 11.22 |
| | | |
| |
Class C | | | |
Net asset value, offering price and redemption price per share
($12,183,730 ÷ 1,085,956 shares of common stock issued and outstanding) | | $ | 11.22 |
| | | |
| |
Class L | | | |
Net asset value, offering price and redemption price per share
($7,065,632 ÷ 630,353 shares of common stock issued and outstanding) | | $ | 11.21 |
| | | |
| |
Class M | | | |
Net asset value, offering price and redemption price per share
($2,877,354 ÷ 256,462 shares of common stock issued and outstanding) | | $ | 11.22 |
| | | |
| |
Class R | | | |
Net asset value, offering price and redemption price per share
($10,703 ÷ 957 shares of common stock issued and outstanding) | | $ | 11.18 |
| | | |
| |
Class X | | | |
Net asset value, offering price and redemption price per share
($1,916,487 ÷ 170,822 shares of common stock issued and outstanding) | | $ | 11.22 |
| | | |
| |
Class Z | | | |
Net asset value, offering price and redemption price per share
($111,083,272 ÷ 9,896,683 shares of common stock issued and outstanding) | | $ | 11.22 |
| | | |
See Notes to Financial Statements.
| | |
| Prudential Investment Portfolios, Inc./Prudential Asset Allocation Fund | | 89 |
Statement of Operations
Six Months Ended March 31, 2010 (Unaudited)
| | | | |
Net Investment Income | | | | |
Income | | | | |
Unaffiliated interest income | | $ | 3,235,597 | |
Unaffiliated dividend income (net of foreign withholding taxes of $13,488) | | | 2,684,754 | |
Affiliated dividend income | | | 187,680 | |
Affiliated income from securities loaned, net | | | 13,884 | |
| | | | |
Total income | | | 6,121,915 | |
| | | | |
| |
Expenses | | | | |
Management fee | | | 1,377,483 | |
Distribution fee—Class A | | | 415,449 | |
Distribution fee—Class B | | | 82,599 | |
Distribution fee—Class C | | | 62,343 | |
Distribution fee—Class L | | | 17,155 | |
Distribution fee—Class M | | | 16,575 | |
Distribution fee—Class R | | | 223 | |
Distribution fee—Class X | | | 10,878 | |
Transfer agent’s fees and expenses (including affiliated expense of $170,500) (Note 3) | | | 378,000 | |
Custodian’s fees and expenses | | | 85,000 | |
Reports to shareholders | | | 40,000 | |
Registration fees | | | 37,000 | |
Audit fee | | | 17,000 | |
Directors’ fees | | | 13,000 | |
Legal fees and expenses | | | 11,000 | |
Insurance | | | 5,000 | |
Loan interest expense (Note 7) | | | 10 | |
Miscellaneous | | | 30,316 | |
| | | | |
Total expenses | | | 2,599,031 | |
Less: Expense waiver (Note 2) | | | (42,384 | ) |
| | | | |
Net expenses | | | 2,556,647 | |
| | | | |
Net investment income | | | 3,565,268 | |
| | | | |
| |
Realized And Unrealized Gain (Loss) On Investments And Foreign Currencies | | | | |
Net realized gain (loss) on: | | | | |
Investment transactions (including affiliated: $(116,380)) | | | 15,447,354 | |
Foreign currency transactions | | | (14,257 | ) |
Financial futures transactions | | | 1,214,897 | |
Swap transactions | | | (170,016 | ) |
| | | | |
| | | 16,477,978 | |
| | | | |
Net change in unrealized appreciation (depreciation) on: | | | | |
Investments (including affiliated: $1,428,008) | | | 14,271,108 | |
Foreign currencies | | | (10,237 | ) |
Financial futures contracts | | | (156,768 | ) |
Swaps | | | (144,135 | ) |
| | | | |
| | | 13,959,968 | |
| | | | |
Net gain on investments and foreign currencies | | | 30,437,946 | |
| | | | |
Net Increase In Net Assets Resulting From Operations | | $ | 34,003,214 | |
| | | | |
See Notes to Financial Statements.
| | |
| 90 | | Visit our website at www.prudentialfunds.com |
Statement of Changes in Net Assets
(Unaudited)
| | | | | | | | |
| | | Six Months
Ended
March 31, 2010 | | | Year
Ended
September 30, 2009 | |
Increase (Decrease) In Net Assets | | | | | | | | |
Operations | | | | | | | | |
Net investment income | | $ | 3,565,268 | | | $ | 9,616,420 | |
Net realized gain (loss) on investments and foreign currency transactions | | | 16,477,978 | | | | (81,457,494 | ) |
Net change in unrealized appreciation (depreciation) on investments and foreign currencies | | | 13,959,968 | | | | 51,863,291 | |
| | | | | | | | |
Net increase (decrease) in net assets resulting from operations | | | 34,003,214 | | | | (19,977,783 | ) |
| | | | | | | | |
| | |
Dividends and Distributions (Note 1) | | | | | | | | |
Dividends from net investment income | | | | | | | | |
Class A | | | (5,346,561 | ) | | | (8,641,260 | ) |
Class B | | | (223,360 | ) | | | (455,417 | ) |
Class C | | | (165,450 | ) | | | (279,287 | ) |
Class L | | | (119,695 | ) | | | (191,576 | ) |
Class M | | | (45,904 | ) | | | (137,933 | ) |
Class R | | | (1,829 | ) | | | (17,959 | ) |
Class X | | | (29,240 | ) | | | (67,281 | ) |
Class Z | | | (2,280,105 | ) | | | (3,473,052 | ) |
| | | | | | | | |
| | | (8,212,144 | ) | | | (13,263,765 | ) |
| | | | | | | | |
| | |
Series share transactions (Net of share conversions) (Note 6) | | | | | | | | |
Net proceeds from shares sold | | | 13,502,269 | | | | 28,697,519 | |
Net asset value of shares issued in reinvestment of dividends | | | 8,027,809 | | | | 12,723,650 | |
Cost of shares reacquired | | | (36,873,008 | ) | | | (98,072,306 | ) |
| | | | | | | | |
Net decrease in net assets from Series share transactions | | | (15,342,930 | ) | | | (56,651,137 | ) |
| | | | | | | | |
Total increase (decrease) | | | 10,448,140 | | | | (89,892,685 | ) |
| | |
Net Assets: | | | | | | | | |
Beginning of period | | | 421,789,877 | | | | 511,682,562 | |
| | | | | | | | |
End of period(a) | | $ | 432,238,017 | | | $ | 421,789,877 | |
| | | | | | | | |
(a) Includes undistributed net investment income of: | | $ | 1,566,009 | | | $ | 6,212,885 | |
| | | | | | | | |
See Notes to Financial Statements.
| | |
| Prudential Investment Portfolios, Inc./Prudential Asset Allocation Fund | | 91 |
Notes to Financial Statements
(Unaudited)
The Prudential Investment Portfolios, Inc. (the “Company”) is registered under the Investment Company Act of 1940 as an open-end management investment company. The Company was incorporated in Maryland on August 10, 1995 and consists of six series: Prudential Asset Allocation Fund (formerly Dryden Asset Allocation Fund) (the “Series”), Prudential Jennison Growth Fund (formerly Jennison Growth Fund), and Prudential Jennison Equity Opportunity Fund (formerly Jennison Equity Opportunity Fund) which are diversified funds and Prudential Growth Allocation Fund (formerly JennisonDryden Growth Allocation Fund), Prudential Moderate Allocation Fund (formerly JennisonDryden Moderate Allocation Fund) and Prudential Conservative Allocation Fund (formerly JennisonDryden Conservative Allocation Fund) which are non-diversified funds. These financial statements relate to Prudential Asset Allocation Fund. The financial statements of the other series are not presented herein. The Series commenced investment operations on November 7, 1996.
The Series’ investment objective is to seek income and long-term growth of capital by investing in a portfolio of equity, fixed-income and money market securities which is actively managed to capitalize on opportunities created by perceived misvaluation.
Note 1. Accounting Policies
The following is a summary of significant accounting policies followed by the Series, in the preparation of its financial statements.
Securities Valuation: Securities listed on a securities exchange (other than options on securities and indices) are valued at the last sale price on such exchange on the day of valuation or, if there was no sale on such day, at the mean between the last reported bid and asked prices, or at the last bid price on such day in the absence of an asked price. Securities traded via NASDAQ are valued at the NASDAQ official closing price (“NOCP”) on the day of valuation, or if there was no NOCP, at the last sale price. Securities that are actively traded in the over-the-counter market, including listed securities for which the primary market is believed by Prudential Investments LLC (“PI” or “Manager”), in consultation with the subadviser, to be over-the-counter, are valued at market value using prices provided by an independent pricing agent or principal market maker. Options on securities and indices traded on an exchange are valued at their last sale price as of the close of trading on the applicable exchange or, if there was no sale, at the mean between the most recently quoted bid and asked prices on such exchange. Futures contracts and options thereon traded on a
| | |
| 92 | | Visit our website at www.prudentialfunds.com |
commodities exchange or board of trade are valued at the last sale price at the close of trading on such exchange or board of trade or, if there was no sale on the applicable commodities exchange or board of trade on such day, at the mean between the most recently quoted bid and asked prices on such exchange or board of trade or at the last bid price in the absence of an asked price. Prices may be obtained from independent pricing services which use information provided by market makers or estimates of market values obtained from yield data relating to investments or securities with similar characteristics. Securities for which reliable market quotations are not readily available, or whose values have been affected by events occurring after the close of the security’s foreign market and before the Series’ normal pricing time, are valued at fair value in accordance with the Board of Director’s approved fair valuation procedures. When determining the fair valuation of securities some of the factors influencing the valuation include, the nature of any restrictions on disposition of the securities; assessment of the general liquidity of the securities; the issuer’s financial condition and the markets in which it does business; the cost of the investment; the size of the holding and the capitalization of issuer; the prices of any recent transactions or bids/offers for such securities or any comparable securities; any available analyst media or other reports or information deemed reliable by the investment adviser regarding the issuer or the markets or industry in which it operates. Using fair value to price securities may result in a value that is different from a security’s most recent closing price and from the price used by other mutual funds to calculate their net asset values.
Investments in mutual funds are valued at their net asset value as of the close of the New York Stock Exchange on the date of valuation.
Short-term debt securities which mature in sixty days or less are valued at amortized cost, which approximates fair value. The amortized cost method involves valuing a security at its cost on the date of purchase and thereafter assuming a constant amortization to maturity of the difference between the principal amount due at maturity and cost. Short-term debt securities which mature in more than sixty days are valued at current market quotations.
Foreign Currency Translation: The books and records of the Series are maintained in U.S. dollars. Foreign currency amounts are translated into U.S. dollars on the following basis:
(i) market value of investment securities, other assets and liabilities—at the current rate of exchange;
(ii) purchases and sales of investment securities, income and expenses—at the rate of exchange prevailing on the respective dates of such transactions.
| | |
| Prudential Investment Portfolios, Inc./Prudential Asset Allocation Fund | | 93 |
Notes to Financial Statements
(Unaudited) continued
Although the net assets of the Series are presented at the foreign exchange rates and market values at the close of the fiscal year, the Series does not isolate that portion of the results of operations arising as a result of changes in the foreign exchange rates from the fluctuations arising from changes in the market prices of long-term portfolio securities held at fiscal year end. Similarly, the Series does not isolate the effect of changes in foreign exchange rates from the fluctuations arising from changes in the market prices of long-term portfolio securities sold during the fiscal year. Accordingly, these realized foreign currency gains or losses are included in the reported net realized gains or losses on investment transactions.
Net realized gains or losses on foreign currency transactions represent net foreign exchange gains or losses from holdings of foreign currencies, currency gains or losses realized between the trade and settlement dates of security transactions, and the difference between the amounts of dividends, interest and foreign withholding taxes recorded on the Series’ books and the U.S. dollar equivalent amounts actually received or paid. Net unrealized currency gains or losses from valuing foreign currency denominated assets and liabilities (other than investments) at year-end exchange rates are reflected as a component of unrealized appreciation (depreciation) on investments and foreign currencies.
Foreign security and currency transactions may involve certain considerations and risks not typically associated with those of domestic origin as a result of, among other factors, the possibility of political and economic instability or the level of governmental supervision and regulation of foreign securities markets.
Financial Futures Contracts: A financial futures contract is an agreement to purchase (long) or sell (short) an agreed amount of securities at a set price for delivery on a future date. Upon entering into a financial futures contract, the Series is required to pledge to the broker an amount of cash and/or other assets equal to a certain percentage of the contract amount. This amount is known as the “initial margin.” Subsequent payments, known as “variation margin,” are made or received by the Series each day, depending on the daily fluctuations in the value of the underlying security. Such variation margin is recorded for financial statement purposes on a daily basis as unrealized gain (loss). When the contract expires or is closed, the gain (loss) is realized and is presented in the Statement of Operations as net realized gain (loss) on financial futures contracts. Financial futures contracts involve elements of risk in excess of the amounts reflected on the Statement of Assets and Liabilities.
| | |
| 94 | | Visit our website at www.prudentialfunds.com |
The Series invests in financial futures contracts in order to hedge its existing portfolio securities, or securities the Series intends to purchase, against fluctuations in value caused by changes in prevailing interest rates, value of equities or foreign currency exchange rates. Should interest rates move unexpectedly, the Series may not achieve the anticipated benefits of the financial futures contracts and may realize a loss. The use of futures transactions involves the risk of imperfect correlation in movements in the price of futures contracts, interest rates and the underlying hedged assets.
Foreign Currency Contracts: A forward currency contract is a commitment to purchase or sell a foreign currency at a future date at a negotiated forward rate between two parties. The Series enters into forward currency contracts in order to hedge its exposure to changes in foreign currency exchange rates on its foreign portfolio holdings or specific receivables and payables denominated in a foreign currency. The contracts are valued daily at current exchange rates and any unrealized gain or loss is included in net unrealized appreciation or depreciation on foreign currencies. Gain or loss is realized on the settlement date of the contract equal to the difference between the settlement value of the original and renegotiated forward contracts. This gain or loss, if any, is included in net realized gain (loss) on foreign currency transactions. Risks may arise upon entering into these contracts from the potential inability of the counterparties to meet the terms of their contracts. Forward currency contracts involve risks from currency exchange rate and credit risk in excess of the amounts reflected on the Statement of Assets and Liabilities. The Series’ maximum risk of loss from counterparty credit risk is the net value of the cash flows to be received from the counterparty at the end of the contract’s life. This risk may be mitigated by having a master netting arrangement between the Series and the counterparty which may permit the Series to offset amounts payable by the Series to the same counterparty against amounts to be received; and by the receipt of collateral from the counterparty by the Series to cover the Series’ exposure to the counterparty. However, there is no assurance that such mitigating factors are easily enforceable.
Options: The Series may either purchase or write options in order to hedge against adverse market movements or fluctuations in value caused by changes in prevailing interest rates, value of equities or foreign currency exchange rates, with respect to securities which the Series currently owns or intends to purchase. The Series’ principal reason for writing options is to realize, through receipt of premiums, a greater current return than would be realized on the underlying security alone. When the Series purchases an option, it pays a premium and an amount equal to that premium is recorded as an asset. When the Series writes an option, it receives a premium and an amount equal to that premium is recorded as a liability. The asset or liability is adjusted daily to reflect the current market value of the option. If an option expires unexercised, the Series realizes a gain or loss to the extent of the premium
| | |
| Prudential Investment Portfolios, Inc./Prudential Asset Allocation Fund | | 95 |
Notes to Financial Statements
(Unaudited) continued
received or paid. If an option is exercised, the premium received or paid is recorded as an adjustment to the proceeds from the sale or the cost of the purchase in determining whether the Series has realized a gain or loss. The difference between the premium and the amount received or paid on effecting a closing purchase or sale transaction is also treated as a realized gain or loss. Gain or loss on purchased options is included in net realized gain or loss on investment transactions. Gain or loss on written options is presented separately as net realized gain or loss on options written. The Series, as writer of an option, may have no control over whether the underlying securities may be sold (called) or purchased (put). As a result, the Series bears the market risk of an unfavorable change in the price of the security underlying the written option. The Series, as purchaser of an over-the-counter option, bears the risk of the potential inability of the counterparties to meet the terms of their contracts.
With exchange-traded futures and options contracts, there is minimal counterparty credit risk to the Series since the exchanges’ clearinghouse acts as counterparty to all exchange traded futures and options and guarantees the futures and options contracts against default.
Swap Agreements: The Series may enter into credit default, interest rate, total return and other forms of swap agreements. A swap agreement is an agreement to exchange the return generated by one instrument for the return generated by another instrument. The swap agreements are valued daily at current market value and any change in value is included in the net unrealized appreciation or depreciation on investments. Payments received or paid by the Series are recorded as realized gains or losses upon termination or maturity of the swap. Risk of loss may exceed amounts recognized on the statements of assets and liabilities. Swap agreements outstanding at period end, if any, are listed on the Schedule of Investments.
Interest Rate Swaps: Interest rate swaps represent an agreement between counterparties to exchange cash flows based on the difference between two interest rates, applied to a notional principal amount for a specified period. The Series is subject to interest rate risk exposure in the normal course of pursuing its investment objectives. The Series may use interest rate swaps to either maintain its ability to generate steady cash flow by receiving a stream of fixed rate payments or to increase exposure to prevailing market rates by receiving floating rate payments using interest rate swap contracts. The Series’ maximum risk of loss from counterparty credit risk is the discounted net value of the cash flows to be received from the counterparty over
| | |
| 96 | | Visit our website at www.prudentialfunds.com |
the contract’s remaining life. This risk may be mitigated by having a master netting arrangement between the Series and the counterparty which may permit the Series to offset amounts payable by the Series to the same counterparty against amounts to be received; and by the receipt of collateral from the counterparty by the Series to cover the Series’ exposure to the counterparty. However, there is no assurance that such mitigating factors are easily enforceable.
Credit Default Swaps: Credit default swaps involve one party (the protection buyer) making a stream of payments to another party (the protection seller) in exchange for the right to receive a specified payment in the event of a default or as a result of a default (“credit event”) for the referenced party, typically corporate issues or sovereign issues of an emerging country, on its obligation; or in the event of a write-down, principal shortfall, interest shortfall or default of all or part of the referenced entities comprising a credit index.
The Series is subject to credit risk in the normal course of pursuing its investment objectives. The Series may use credit default swaps to provide a measure of protection against defaults of the issuers or to take an active long or short position with respect to the likelihood of a particular issuer’s default. The Series may use credit default swaps on credit indices to hedge a portfolio of credit default swaps or bonds, which is less expensive than it would be to buy many credit default swaps to achieve a similar effect. The Series’ maximum risk of loss from counterparty credit risk for purchased credit default swaps is the notional value of a credit default swap agreement. This risk may be mitigated by having a master netting arrangement between the Series and the counterparty which may permit the Series to offset amounts payable by the Series to the same counterparty against amounts to be received; and by the receipt of collateral from the counterparty by the Series to cover the Series’ exposure to the counterparty. However, there is no assurance that such mitigating factors are easily enforceable.
As a seller of protection on credit default swap agreements, the Series will generally receive from the buyer of protection an agreed upon payment throughout the term of the swap provided that there is no credit event. As the seller, the Series would effectively increase investment risk to its portfolio because, in addition to its total net assets, the Series may be subject to investment exposure on the notional amount of the swap.
The maximum amount of the payment that the Series as a seller of protection could be required to make under a credit default swap agreement would be equal the notional amount of the underlying security or index contract as a result of a credit event. These potential amounts will be partially offset by any recovery values of the
| | |
| Prudential Investment Portfolios, Inc./Prudential Asset Allocation Fund | | 97 |
Notes to Financial Statements
(Unaudited) continued
respective referenced obligations, or net amounts received from the settlement of buy protection credit default swap agreements entered into by the Series for the same referenced entity or index. As a buyer of protection, the Series generally receives an amount up to the notional value of the swap if a credit event occurs.
Implied credit spreads, represented in absolute terms, utilized in determining the market value of credit default swap agreements on corporate issues or sovereign issues of an emerging country as of year end are disclosed in the footnotes to the Schedules of Investments and serve as an indicator of the current status of the payment/performance risk and represent the likelihood or risk of default for the credit derivative. The implied credit spread of a particular referenced entity reflects the cost of buying/selling protection and may include upfront payments required to enter into the agreement. For credit default swap agreements on asset-backed securities and credit indices, the quoted market prices and resulting values serve as the indicator of the current status of the payment and/or performance risk. Wider credit spreads and increasing market value in absolute terms, when compared to the notional amount of the swap, represent a deterioration of the referenced entity’s credit soundness and a greater likelihood or risk of default or other credit event occurring as defined under the terms of the agreement.
In addition to each instrument’s primary underlying risk exposure (e.g. interest rate, credit, equity or foreign exchange, etc.), swap agreements involve, to varying degrees, elements of credit, market and documentation risk. Such risks involve the possibility that there will be no liquid market for these agreements, that the counterparty to the agreement may default on its obligation to perform or disagree as to the meaning of the contractual terms in the agreement, and that there will be unfavorable changes in net interest rates. In connection with these agreements, securities in the portfolio may be identified as collateral or received as collateral from the counterparty in accordance with the terms of the respective swap agreements to provide or receive assets of value and serve as recourse in the event of default or bankruptcy/insolvency of either party. Such over-the-counter derivative agreements include conditions which when materialized, give the counterparty the right to cause an early termination of the transactions under those agreements. Any election by the counterparty for early termination of the contract(s) may impact the amounts reported on financial statements.
As of March 31, 2010, the Series has not met conditions under such agreements, which give the counterparty the right to call for an early termination.
| | |
| 98 | | Visit our website at www.prudentialfunds.com |
Swaps and financial futures contracts involve elements of both market and credit risk in excess of the amounts reflected on the Statement of Assets and Liabilities.
Warrants and Rights: The Series may hold warrants and rights acquired either through a direct purchase, including as part of private placement, or pursuant to corporate actions. Warrants and rights entitle the holder to buy a proportionate amount of common stock at a specific price and time through the expiration dates. Such warrants and rights are held as long positions by the Series until exercised, sold or expired. Warrants and rights are valued at fair value in accordance with the Board of Trustees’ approved fair valuation procedures.
Dollar Rolls: The Series may enter into mortgage dollar rolls in which the Series sells mortgage-backed securities for delivery in the current month and simultaneously contracts to repurchase substantially similar (same type, coupon and maturity) securities on a specified future date.
During the roll period, the Series forgoes principal and interest paid on the securities. The Series’ policy is to record the components of dollar rolls as purchase and sale transactions. The Series had dollar rolls outstanding as of March 31, 2010, which are included in Receivable for Investments Sold and Payable for Investments Purchased in the Statement of Assets and Liabilities. The Series maintains a segregated account of U.S. government securities or other liquid assets, the dollar value of which is at least equal to its obligation with respect to dollar rolls.
The Series is subject to the risk that the market value of the securities the Series is obligated to repurchase under the agreement may decline below the repurchase price.
Securities Lending: The Series may lend its portfolio securities to broker-dealers. The loans are secured by collateral at least equal, at all times, to the market value of the securities loaned. Loans are subject to termination at the option of the borrower or the Series. Upon termination of the loan, the borrower will return to the lender securities identical to the loaned securities. Should the borrower of the securities fail financially, the Series has the right to repurchase the securities using the collateral in the open market. The Series recognizes income, net of any rebate and securities lending agent fees, for lending its securities in the form of fees or interest on the investment of any cash received as collateral. The Series also continues to receive interest and dividends or amounts equivalent thereto, on the securities loaned and recognizes any unrealized gain or loss in the market price of the securities loaned that may occur during the term of the loan.
| | |
| Prudential Investment Portfolios, Inc./Prudential Asset Allocation Fund | | 99 |
Notes to Financial Statements
(Unaudited) continued
Securities Transactions and Net Investment Income: Securities transactions are recorded on the trade date. Realized gains or losses on sales of investments are calculated on the identified cost basis. Interest income, including amortization of premium and accretion of discount on debt securities, as required, is recorded on an accrual basis. Dividend income is recorded on the ex-dividend date. Expenses are recorded on the accrual basis. Net Investment income or loss (other than distribution fees which are charged directly to the respective class) and unrealized and realized gains or losses are allocated daily to each class of shares based upon the relative proportion of net assets of each class at the beginning of the day.
Dividends and Distributions: The Series expects to pay dividends of net investment income and distributions of net realized capital gains, if any, annually. Dividends and distributions to shareholders, which are determined in accordance with federal income tax regulations and which may differ from generally accepted accounting principles, are recorded on the ex-dividend date. Permanent book/tax differences relating to income and gains are reclassified amongst undistributed net investment income, accumulated net realized gain or loss and paid-in capital in excess of par, as appropriate.
Taxes: For federal income tax purposes, each Series in the Fund is treated as a separate taxpaying entity. It is the Series’ policy to continue to meet the requirements of the Internal Revenue Code applicable to regulated investment companies and to distribute all of its net investment income and capital gains, if any, to its shareholders. Therefore, no federal income tax provision is required.
Withholding taxes on foreign dividends are recorded net of reclaimable amounts, at the time the related income is earned.
Estimates: The preparation of the financial statements requires management to make estimates and assumptions that affect the reported amounts and disclosures in the financial statements. Actual results could differ from those estimates.
Note 2. Agreements
The Fund has a management agreement for the Series with PI. Pursuant to this agreement, PI has responsibility for all investment advisory services and supervises the subadvisors’ performance of such services. PI has entered into a subadvisory
| | |
| 100 | | Visit our website at www.prudentialfunds.com |
agreement with Prudential Investment Management, Inc. (“PIM”) and Quantitative Management Associates LLC (QMA). The subadvisory agreements provides that PIM and QMA furnishes investment advisory services in connection with the management of the Series. In connection therewith, PIM and QMA are obligated to keep certain books and records of the Series. PI pays for the services of PIM and QMA, the compensation of officers of the Series, occupancy and certain clerical and bookkeeping costs of the Series. The Series bears all other costs and expenses.
The management fee paid to PI is computed daily and payable monthly at an annual rate of .65% of the Series’ daily average net assets up to $1 billion and .60% of the average net assets of the Series in excess of $1 billion. The effective management fee rate was .65% for the six months ended March 31, 2010.
PI has contractually agreed to waive up to 0.02% of its management fee to the extent that the Series’ annual operating expenses exceed 0.86% (exclusive of taxes, interest, brokerage commissions, distribution fees and non-routine expenses) of the Fund’s average net assets.
The Series has a distribution agreement with Prudential Investment Management Services LLC (“PIMS”), which acts as the distributor of the Class A, Class B, Class C, Class L, Class M, Class R, Class X and Class Z shares of the Series. The Series compensates PIMS for distributing and servicing the Series’ Class A, Class B, Class C, Class L, Class M, Class R and Class X shares, pursuant to plans of distribution (the “Class A, B, C, L, M, R and X Plans”), regardless of expenses actually incurred by PIMS. The distribution fees are accrued daily and payable monthly. No distribution or service fees are paid to PIMS as distributor of the Class Z shares of the Series.
Pursuant to the Class A, B, C, L, M, R and X Plans, the Series compensates PIMS for distribution-related activities at an annual rate of up to .30%, 1%, 1%, .50%, 1%, .75% and 1% of the average daily net assets of the Class A, B, C, L, M, R and X shares, respectively. For the six months ended March 31, 2010, PIMS contractually agreed to limit such fees to .50% of the average daily net assets of the Class R shares.
PIMS has advised the Series that it received $40,822 in front-end sales charges resulting from sales of Class A shares during the six months ended March 31, 2010. From these fees, PIMS paid such sales charges to dealers, which in turn paid commissions to salespersons and incurred other distribution costs.
PIMS has advised the Series that for the six months ended March 31, 2010, it received $707, $14,361, $560, $1,737 and $547 in contingent deferred sales charges imposed upon certain redemptions by Class A, Class B, Class C, Class M and Class X shareholders, respectively.
| | |
| Prudential Investment Portfolios, Inc./Prudential Asset Allocation Fund | | 101 |
Notes to Financial Statements
(Unaudited) continued
PI, PIM, PIMS and QMA are indirect, wholly-owned subsidiaries of Prudential Financial, Inc. (“Prudential”).
Note 3. Other Transactions with Affiliates
Prudential Mutual Fund Services LLC (“PMFS”), an affiliate of PI and an indirect, wholly-owned subsidiary of Prudential, serves as the Fund’s transfer agent. Transfer agent fees and expenses in the Statement of Operations include certain out-of-pocket expenses paid to non-affiliates, where applicable.
The Series pays networking fees to affiliated and unaffiliated broker/dealers, including fees relating to the services of Wells Fargo Advisors, LLC (“Wells Fargo”), an affiliate of PI through December 31, 2009. These networking fees are payments made to broker/dealers that clear mutual fund transactions through a national clearing system. For the six months ended March 31, 2010, the Series incurred approximately $34,900 in total networking fees, of which approximately $16,500 was paid to Wells Fargo. These amounts are included in transfer agent’s fees and expenses in the Statement of Operations.
PIM is the securities lending agent for the Series. For the six months ended March 31, 2010, PIM has been compensated by the Series approximately $5,100 for these services.
The Series invests in the Prudential Core Short-Term Bond Fund (formerly known as Short-Term Bond Series) and in the Prudential Core Taxable Money Market Fund (formerly known as Taxable Money Market Series) (each a “Portfolio” and collectively “Portfolios”), of the Prudential Investment Portfolios 2 (formerly known as Dryden Core Investment Fund). The Portfolios are mutual funds registered under the Investment Company Act of 1940, as amended, and managed by PI.
Note 4. Portfolio Securities
Purchases and sales of investment securities other than short-term investments and U.S. Government Securities, for the six months ended March 31, 2010 were $283,494,512 and $300,546,725, respectively.
There were no dollar rolls outstanding at March 31, 2010.
| | |
| 102 | | Visit our website at www.prudentialfunds.com |
Note 5. Distributions and Tax Information
The United States federal income tax basis of the Series’ investments and the net unrealized appreciation as of March 31, 2010 were as follows:
| | | | | | |
Tax Basis Investments | | Appreciation | | Depreciation | | Net Unrealized
Appreciation |
| $423,082,356 | | $50,359,776 | | $(10,455,466) | | $39,904,310 |
The difference between book basis and tax basis was attributable to deferred losses on wash sales and marking to market of unrealized appreciation on passive foreign investment companies.
For federal income tax purposes, the Fund has a capital loss carryforward as of September 30, 2009 of approximately $38,388,000 which expires in 2017. Accordingly, no capital gains distribution is expected to be paid to shareholders until net gains have been realized in excess of such carryforwards. It is uncertain if the Fund will be able to realize the full benefit of the remaining carryforwards prior to the expiration date.
The Series elected to treat post-October currency and capital losses of approximately $44,000 and $64,780,000 as having been incurred in this fiscal year.
Management has analyzed the Series’ tax positions taken on federal income tax returns for all open tax years and has concluded that as of March 31, 2010, no provision for income tax would be required in the Series’ financial statements. The Series’ federal and state income and federal excise tax returns for tax years for which the applicable statutes of limitations have not expired are subject to examination by the Internal Revenue Service and state departments of revenue.
Note 6. Capital
The Series offers Class A, Class B, Class C, Class L, Class M, Class R, Class X and Class Z shares. Class A and Class L shares are sold with a front-end sales charge of up to 5.50% and 5.75%, respectively. All investors who purchase Class A or Class L shares in an amount of $1 million or more are not subject to a front-end sales charge but are subject to a contingent deferred sales charge (CDSC) of 1% if they sell these shares within 12 months of purchase, including investors who purchase their shares through broker-dealers affiliated with Prudential. Class B shares are sold with a CDSC which declines from 5% to zero depending on the period of time the shares are held. Class M and Class X shares are sold with a CDSC which declines from 6% to zero
| | |
| Prudential Investment Portfolios, Inc./Prudential Asset Allocation Fund | | 103 |
Notes to Financial Statements
(Unaudited) continued
depending on the period of time the shares are held. Class C shares have a CDSC of 1% during the first 12 months. Class B shares will automatically convert to Class A shares on a quarterly basis approximately seven years after purchase. A special exchange privilege is also available for shareholders who qualified to purchase Class A shares at net asset value. Class M shares will automatically convert to Class A shares approximately eight years after purchase. Class L shares are closed to most new purchases (with the exception of reinvested dividends). Class L and Class M shares are only exchangeable with Class L and Class M shares, respectively, offered by certain other Strategic Partners Funds. Class X shares are closed to new purchases. Class R and Class Z shares are not subject to any sales or redemption charge and are offered exclusively for sale to a limited group of investors.
There are 1 billion shares of $.001 par value common stock of the Series, designated Class A, Class B, Class C, Class L, Class M, Class R, Class X and Class Z, each of which consists of 200 million, 125 million, 125 million, 125 million, 125 million, 75 million, 150 million, and 75 million authorized shares, respectively. As of March 31, 2010, Prudential did not own any Class R shares of the Series.
Transactions in shares of common stock were as follows:
| | | | | | | |
Class A | | Shares | | | Amount | |
Six months ended March 31, 2010: | | | | | | | |
Shares sold | | 345,510 | | | $ | 3,726,062 | |
Shares issued in reinvestment of dividends | | 487,207 | | | | 5,183,879 | |
Shares reacquired | | (2,189,516 | ) | | | (23,578,643 | ) |
| | | | | | | |
Net increase (decrease) in shares outstanding before conversion | | (1,356,799 | ) | | | (14,668,702 | ) |
Shares issued upon conversion from Class B, M and X | | 240,771 | | | | 2,605,617 | |
| | | | | | | |
Net increase (decrease) in shares outstanding | | (1,116,028 | ) | | $ | (12,063,085 | ) |
| | | | | | | |
Year ended September 30, 2009: | | | | | | | |
Shares sold | | 825,834 | | | $ | 7,587,544 | |
Shares issued in reinvestment of dividends | | 927,190 | | | | 8,168,545 | |
Shares reacquired | | (5,996,861 | ) | | | (54,833,015 | ) |
| | | | | | | |
Net increase (decrease) in shares outstanding before conversion | | (4,234,837 | ) | | | (39,076,926 | ) |
Shares issued upon conversion from Class B, M and X | | 855,181 | | | | 7,818,814 | |
| | | | | | | |
Net increase (decrease) in shares outstanding | | (3,388,656 | ) | | $ | (31,258,112 | ) |
| | | | | | | |
| | |
| 104 | | Visit our website at www.prudentialfunds.com |
| | | | | | | |
Class B | | Shares | | | Amount | |
Six months ended March 31, 2010: | | | | | | | |
Shares sold | | 75,827 | | | $ | 823,113 | |
Shares issued in reinvestment of dividends | | 20,575 | | | | 220,359 | |
Shares reacquired | | (192,302 | ) | | | (2,083,429 | ) |
| | | | | | | |
Net increase (decrease) in shares outstanding before conversion | | (95,900 | ) | | | (1,039,957 | ) |
Shares reacquired upon conversion into Class A | | (111,157 | ) | | | (1,214,309 | ) |
| | | | | | | |
Net increase (decrease) in shares outstanding | | (207,057 | ) | | $ | (2,254,266 | ) |
| | | | | | | |
Year ended September 30, 2009: | | | | | | | |
Shares sold | | 152,017 | | | $ | 1,388,001 | |
Shares issued in reinvestment of dividends | | 49,794 | | | | 441,676 | |
Shares reacquired | | (508,475 | ) | | | (4,622,376 | ) |
| | | | | | | |
Net increase (decrease) in shares outstanding before conversion | | (306,664 | ) | | | (2,792,699 | ) |
Shares reacquired upon conversion into Class A | | (514,342 | ) | | | (4,710,513 | ) |
| | | | | | | |
Net increase (decrease) in shares outstanding | | (821,006 | ) | | $ | (7,503,212 | ) |
| | | | | | | |
Class C | | | | | | |
Six months ended March 31, 2010: | | | | | | | |
Shares sold | | 29,027 | | | $ | 312,668 | |
Shares issued in reinvestment of dividends | | 14,660 | | | | 157,011 | |
Shares reacquired | | (153,935 | ) | | | (1,673,934 | ) |
| | | | | | | |
Net increase (decrease) in shares outstanding | | (110,248 | ) | | $ | (1,204,255 | ) |
| | | | | | | |
Year ended September 30, 2009: | | | | | | | |
Shares sold | | 112,265 | | | $ | 1,038,136 | |
Shares issued in reinvestment of dividends | | 27,728 | | | | 245,943 | |
Shares reacquired | | (428,680 | ) | | | (3,965,304 | ) |
| | | | | | | |
Net increase (decrease) in shares outstanding | | (288,687 | ) | | $ | (2,681,225 | ) |
| | | | | | | |
Class L | | | | | | |
Six months ended March 31, 2010: | | | | | | | |
Shares sold | | 3,177 | | | $ | 34,583 | |
Shares issued in reinvestment of dividends | | 10,635 | | | | 113,577 | |
Shares reacquired | | (24,854 | ) | | | (268,928 | ) |
| | | | | | | |
Net increase (decrease) in shares outstanding | | (11,042 | ) | | $ | (120,768 | ) |
| | | | | | | |
Year ended September 30, 2009: | | | | | | | |
Shares sold | | 8,209 | | | $ | 76,909 | |
Shares issued in reinvestment of dividends | | 20,611 | | | | 182,205 | |
Shares reacquired | | (123,432 | ) | | | (1,151,333 | ) |
| | | | | | | |
Net increase (decrease) in shares outstanding | | (94,612 | ) | | $ | (892,219 | ) |
| | | | | | | |
| | |
| Prudential Investment Portfolios, Inc./Prudential Asset Allocation Fund | | 105 |
Notes to Financial Statements
(Unaudited) continued
| | | | | | | |
Class M | | Shares | | | Amount | |
Six months ended March 31, 2010: | | | | | | | |
Shares sold | | 7,006 | | | $ | 75,440 | |
Shares issued in reinvestment of dividends | | 4,162 | | | | 44,576 | |
Shares reacquired | | (39,133 | ) | | | (421,513 | ) |
| | | | | | | |
Net increase (decrease) in shares outstanding before conversion | | (27,965 | ) | | | (301,497 | ) |
Shares reacquired upon conversion into Class A | | (81,380 | ) | | | (880,568 | ) |
| | | | | | | |
Net increase (decrease) in shares outstanding | | (109,345 | ) | | $ | (1,182,065 | ) |
| | | | | | | |
Year ended September 30, 2009: | | | | | | | |
Shares sold | | 20,013 | | | $ | 181,769 | |
Shares issued in reinvestment of dividends | | 14,862 | | | | 131,828 | |
Shares reacquired | | (216,162 | ) | | | (1,947,703 | ) |
| | | | | | | |
Net increase (decrease) in shares outstanding before conversion | | (181,287 | ) | | | (1,634,106 | ) |
Shares reacquired upon conversion into Class A | | (251,149 | ) | | | (2,300,716 | ) |
| | | | | | | |
Net increase (decrease) in shares outstanding | | (432,436 | ) | | $ | (3,934,822 | ) |
| | | | | | | |
Class R | | | | | | |
Six months ended March 31, 2010: | | | | | | | |
Shares sold | | 689 | | | $ | 7,410 | |
Shares issued in reinvestment of dividends | | 14 | | | | 144 | |
Shares reacquired | | (9,095 | ) | | | (99,041 | ) |
| | | | | | | |
Net increase (decrease) in shares outstanding | | (8,392 | ) | | $ | (91,487 | ) |
| | | | | | | |
Year ended September 30, 2009: | | | | | | | |
Shares sold | | 5,614 | | | $ | 51,669 | |
Shares issued in reinvestment of dividends | | 1,808 | | | | 15,987 | |
Shares reacquired | | (78,639 | ) | | | (767,325 | ) |
| | | | | | | |
Net increase (decrease) in shares outstanding | | (71,217 | ) | | $ | (699,669 | ) |
| | | | | | | |
Class X | | | | | | |
Six months ended March 31, 2010: | | | | | | | |
Shares sold | | 464 | | | $ | 5,044 | |
Shares issued in reinvestment of dividends | | 2,642 | | | | 28,295 | |
Shares reacquired | | (24,027 | ) | | | (260,235 | ) |
| | | | | | | |
Net increase (decrease) in shares outstanding before conversion | | (20,921 | ) | | | (226,896 | ) |
Shares reacquired upon conversion into Class A | | (47,169 | ) | | | (510,740 | ) |
| | | | | | | |
Net increase (decrease) in shares outstanding | | (68,090 | ) | | $ | (737,636 | ) |
| | | | | | | |
Year ended September 30, 2009: | | | | | | | |
Shares sold | | 15,275 | | | $ | 134,639 | |
Shares issued in reinvestment of dividends | | 7,417 | | | | 65,790 | |
Shares reacquired | | (77,244 | ) | | | (702,691 | ) |
| | | | | | | |
Net increase (decrease) in shares outstanding before conversion | | (54,552 | ) | | | (502,262 | ) |
Shares reacquired upon conversion into Class A | | (86,253 | ) | | | (807,585 | ) |
| | | | | | | |
Net increase (decrease) in shares outstanding | | (140,805 | ) | | $ | (1,309,847 | ) |
| | | | | | | |
| | |
| 106 | | Visit our website at www.prudentialfunds.com |
| | | | | | | |
Class Z | | Shares | | | Amount | |
Six months ended March 31, 2010: | | | | | | | |
Shares sold | | 786,675 | | | $ | 8,517,949 | |
Shares issued in reinvestment of dividends | | 213,480 | | | | 2,279,968 | |
Shares reacquired | | (784,452 | ) | | | (8,487,285 | ) |
| | | | | | | |
Net increase (decrease) in shares outstanding | | 215,703 | | | $ | 2,310,632 | |
| | | | | | | |
Year ended September 30, 2009: | | | | | | | |
Shares sold | | 1,958,310 | | | $ | 18,238,852 | |
Shares issued in reinvestment of dividends | | 392,724 | | | | 3,471,676 | |
Shares reacquired | | (3,211,902 | ) | | | (30,082,559 | ) |
| | | | | | | |
Net increase (decrease) in shares outstanding | | (860,868 | ) | | $ | (8,372,031 | ) |
| | | | | | | |
Note 7. Borrowing
The Series, along with other affiliated registered investment companies (the “Funds”), is a party to a Syndicated Credit Agreement (“SCA”) with two banks. The SCA provides for a commitment of $500 million. Interest on any borrowings under the SCA is incurred at contracted market rates and a commitment fee for the unused amount is accrued daily and paid quarterly. Effective October 22, 2009, the Funds renewed the SCA with the banks. The commitment under the renewed SCA continues to be $500 million. The Funds pay a commitment fee of .15% of the unused portion of the renewed SCA. For the period from October 24, 2008 through October 21, 2009, the Funds paid a commitment fee of .13% of the unused portion of the agreement. The expiration date of the renewed SCA will be October 20, 2010. The purpose of the SCA is to provide an alternative source of temporary funding for capital share redemptions.
The Series utilized the line of credit during the six months ended March 31, 2010. The balance for the 1 day the Fund had a loan outstanding during the period was $256,000 at an interest rate of 1.38%.
Note 8. New Accounting Pronouncement
In January 2010, the Financial Accounting Standards Board (“FASB”) issued Accounting Standards Update (“ASU”) No. 2010-06 “Improving Disclosures about Fair Value Measurements”. ASU 2010-06 will require reporting entities to make new disclosures about amounts and reasons for significant transfers in and out of Level 1 and Level 2 fair value measurements and input and valuation techniques used to measure fair value for both recurring and nonrecurring fair value measurements that fall in either Level 2 or Level 3, and information on purchases, sales, issuances, and
| | |
| Prudential Investment Portfolios, Inc./Prudential Asset Allocation Fund | | 107 |
Notes to Financial Statements
(Unaudited) continued
settlements in the roll forward of activity in Level 3 fair value measurements. The new and revised disclosures are effective for interim and annual reporting periods beginning after December 15, 2009 except for the disclosures about purchases, sales, issuances, and settlements in the roll forward of activity in Level 3 fair value measurements, which are effective for interim and annual reporting periods beginning after December 15, 2010. At this time, management is evaluating the implications of ASU No. 2010-06 and its impact on the financial statements has not been determined.
Note 9. Subsequent Events
Management has evaluated the impact of all subsequent events on the Series through the date the financial statements are issued and has determined that there were no subsequent events requiring recognition or disclosure in the financial statements.
| | |
| 108 | | Visit our website at www.prudentialfunds.com |
Financial Highlights
(Unaudited)
| | |
| MARCH 31, 2010 | | SEMIANNUAL REPORT |
Prudential Investment Portfolios, Inc./Prudential Asset Allocation Fund
Financial Highlights
(Unaudited)
| | | | |
| | | Class A | |
| | | Six Months Ended
March 31, 2010(a) | |
Per Share Operating Performance: | | | | |
Net Asset Value, Beginning Of Period | | $ | 10.52 | |
| | | | |
Income (loss) from investment operations: | | | | |
Net investment income | | | .09 | |
Net realized and unrealized gain (loss) on investment transactions | | | .77 | |
| | | | |
Total from investment operations | | | .86 | |
| | | | |
Less Dividends and Distributions: | | | | |
Dividends from net investment income | | | (.21 | ) |
Distributions from net realized gains | | | — | |
| | | | |
Total dividends and distributions | | | (.21 | ) |
| | | | |
Net asset value, end of period | | $ | 11.17 | |
| | | | |
Total Return(b): | | | 8.26 | % |
Ratios/Supplemental Data: | | | | |
Net assets, end of period (000) | | $ | 281,218 | |
Average net assets (000) | | $ | 277,697 | |
Ratios to average net assets(c): | | | | |
Expenses, including distribution and service (12b-1) fees | | | 1.22 | %(e)(f) |
Expenses, excluding distribution and service (12b-1) fees | | | .92 | %(e)(f) |
Net investment income | | | 1.67 | %(e)(f) |
For Class A, B, C, L, M, R, X and Z shares: | | | | |
Portfolio turnover rate | | | 87 | %(g) |
| (a) | Calculations are based on average shares outstanding during the period. |
| (b) | Total return does not consider the effects of sales loads. Total return is calculated assuming a purchase of a share on the first day and a sale on the last day of each period reported and includes reinvestment of dividends and distributions. Total investment returns may reflect adjustments to conform to generally accepted accounting principles. Total returns for periods less than one full year are not annualized. |
| (c) | Does not include expenses of the underlying portfolios in which the Series invests. |
| (d) | Prior to January 31, 2008, the distributor of the Series contractually agreed to limit its distribution and service (12b-1) fees to .25 of 1% on the average daily net assets of the Class A shares. |
| (e) | As of March 23, 2007, the manager of the Series has agreed to reimburse up to 0.02% of the Series’ management fee in order to limit operating expenses (excluding interest, taxes, brokerage commissions, 12b-1 fees and certain extraordinary expenses) when such expense ratio before waiver exceeds 0.86% of the average daily net assets of Class A. If the manager had not reimbursed the Series, the annual expenses (both including and excluding distribution and service (12b-1) fees) and net investment income ratios would be 1.24%, 0.94% and 1.65%, respectively, for the six months ended March 31, 2010, 1.27%, 0.97% and 2.39%, respectively, for the year ended September 30, 2009 and 1.18%, 0.90% and 2.14%, respectively, for the year ended September 30, 2008. |
See Notes to Financial Statements.
| | |
| 110 | | Visit our website at www.prudentialfunds.com |
| | | | | | | | | | | | | | | | | | |
| Class A | |
| Year Ended September 30, | |
| 2009(a) | | | 2008(a) | | | 2007(a) | | | 2006(a) | | | 2005(a) | |
| | | | | | | | | | | | | | | | | | |
| $ | 11.08 | | | $ | 14.62 | | | $ | 14.17 | | | $ | 14.00 | | | $ | 12.83 | |
| | | | | | | | | | | | | | | | | | | |
| | | | | | | | | | | | | | | | | | |
| | .22 | | | | .28 | | | | .29 | | | | .28 | | | | .21 | |
| | (.48 | ) | | | (2.46 | ) | | | 1.25 | | | | .79 | | | | 1.12 | |
| | | | | | | | | | | | | | | | | | | |
| | (.26 | ) | | | (2.18 | ) | | | 1.54 | | | | 1.07 | | | | 1.33 | |
| | | | | | | | | | | | | | | | | | | |
| | | | | | | | | | | | | | | | | | |
| | (.30 | ) | | | (.30 | ) | | | (.30 | ) | | | (.22 | ) | | | (.16 | ) |
| | — | | | | (1.06 | ) | | | (.79 | ) | | | (.68 | ) | | | — | |
| | | | | | | | | | | | | | | | | | | |
| | (.30 | ) | | | (1.36 | ) | | | (1.09 | ) | | | (.90 | ) | | | (.16 | ) |
| | | | | | | | | | | | | | | | | | | |
| $ | 10.52 | | | $ | 11.08 | | | $ | 14.62 | | | $ | 14.17 | | | $ | 14.00 | |
| | | | | | | | | | | | | | | | | | | |
| | (1.79 | )% | | | (16.22 | )% | | | 11.34 | % | | | 7.98 | % | | | 10.41 | % |
| | | | | | | | | | | | | | | | | | |
| $ | 276,469 | | | $ | 328,706 | | | $ | 436,337 | | | $ | 415,486 | | | $ | 424,341 | |
| $ | 259,847 | | | $ | 390,410 | | | $ | 430,168 | | | $ | 415,508 | | | $ | 428,897 | |
| | | | | | | | | | | | | | | | | | |
| | 1.25 | %(e) | | | 1.16 | %(d)(e) | | | 1.10 | %(d) | | | 1.08 | %(d) | | | 1.09 | %(d) |
| | .95 | %(e) | | | .88 | %(e) | | | .85 | % | | | .83 | % | | | .84 | % |
| | 2.41 | %(e) | | | 2.16 | %(e) | | | 2.00 | % | | | 2.05 | % | | | 1.52 | % |
| | | | | | | | | | | | | | | | | | |
| | 259 | % | | | 298 | % | | | 226 | % | | | 152 | % | | | 119 | % |
See Notes to Financial Statements.
| | |
| Prudential Investment Portfolios, Inc./Prudential Asset Allocation Fund | | 111 |
Financial Highlights
(Unaudited) continued
| | | | |
| | | Class B | |
| | | Six Months Ended
March 31, 2010(a) | |
Per Share Operating Performance: | | | | |
Net Asset Value, Beginning Of Period | | $ | 10.53 | |
| | | | |
Income (loss) from investment operations: | | | | |
Net investment income | | | .05 | |
Net realized and unrealized gain (loss) on investment transactions | | | .78 | |
| | | | |
Total from investment operations | | | .83 | |
| | | | |
Less Dividends and Distributions: | | | | |
Dividends from net investment income | | | (.14 | ) |
Distributions from net realized gains | | | — | |
| | | | |
Total dividends and distributions | | | (.14 | ) |
| | | | |
Net asset value, end of period | | $ | 11.22 | |
| | | | |
Total Return(b): | | | 7.96 | % |
Ratios/Supplemental Data: | | | | |
Net assets, end of period (000) | | $ | 15,883 | |
Average net assets (000) | | $ | 16,563 | |
Ratios to average net assets(c): | | | | |
Expenses, including distribution and service (12b-1) fees | | | 1.92 | %(d)(e) |
Expenses, excluding distribution and service (12b-1) fees | | | .92 | %(d)(e) |
Net investment income | | | .97 | %(d)(e) |
| (a) | Calculations are based on average shares outstanding during the period. |
| (b) | Total return does not consider the effects of sales loads. Total return is calculated assuming a purchase of a share on the first day and a sale on the last day of each period reported and includes reinvestment of dividends and distributions. Total investment returns may reflect adjustments to conform to generally accepted accounting principles. Total returns for periods less than one full year are not annualized. |
| (c) | Does not include expenses of the underlying portfolios in which the Series invests. |
| (d) | As of March 23, 2007, the manager of the Series has agreed to reimburse up to 0.02% of the Series’ management fee in order to limit operating expenses (excluding interest, taxes, brokerage commissions, 12b-1 fees and certain extraordinary expenses) when such expense ratio before waiver exceeds 0.86% of the average daily net assets of Class B. If the manager had not reimbursed the Series, the annual expenses (both including and excluding distribution and service (12b-1) fees) and net investment income ratios would be 1.94%, 0.94% and 0.95%, respectively, for the six months ended March 31, 2010, 1.97%, 0.97% and 1.73%, respectively, for the year ended September 30, 2009 and 1.90%, 0.90% and 1.42%, respectively, for the year ended September 30, 2008. |
See Notes to Financial Statements.
| | |
| 112 | | Visit our website at www.prudentialfunds.com |
| | | | | | | | | | | | | | | | | | |
| Class B | |
| Year Ended September 30, | |
| 2009(a) | | | 2008(a) | | | 2007(a) | | | 2006(a) | | | 2005(a) | |
| | | | | | | | | | | | | | | | | | |
| $ | 11.04 | | | $ | 14.57 | | | $ | 14.11 | | | $ | 13.94 | | | $ | 12.78 | |
| | | | | | | | | | | | | | | | | | | |
| | | | | | | | | | | | | | | | | | |
| | .16 | | | | .18 | | | | .18 | | | | .18 | | | | .11 | |
| | (.47 | ) | | | (2.45 | ) | | | 1.26 | | | | .78 | | | | 1.10 | |
| | | | | | | | | | | | | | | | | | | |
| | (.31 | ) | | | (2.27 | ) | | | 1.44 | | | | .96 | | | | 1.21 | |
| | | | | | | | | | | | | | | | | | | |
| | | | | | | | | | | | | | | | | | |
| | (.20 | ) | | | (.20 | ) | | | (.19 | ) | | | (.11 | ) | | | (.05 | ) |
| | — | | | | (1.06 | ) | | | (.79 | ) | | | (.68 | ) | | | — | |
| | | | | | | | | | | | | | | | | | | |
| | (.20 | ) | | | (1.26 | ) | | | (.98 | ) | | | (.79 | ) | | | (.05 | ) |
| | | | | | | | | | | | | | | | | | | |
| $ | 10.53 | | | $ | 11.04 | | | $ | 14.57 | | | $ | 14.11 | | | $ | 13.94 | |
| | | | | | | | | | | | | | | | | | | |
| | (2.49 | )% | | | (16.86 | )% | | | 10.58 | % | | | 7.14 | % | | | 9.50 | % |
| | | | | | | | | | | | | | | | | | |
| $ | 17,090 | | | $ | 26,977 | | | $ | 46,486 | | | $ | 52,601 | | | $ | 73,983 | |
| $ | 18,440 | | | $ | 37,753 | | | $ | 50,122 | | | $ | 64,048 | | | $ | 88,854 | |
| | | | | | | | | | | | | | | | | | |
| | 1.95 | %(d) | | | 1.88 | %(d) | | | 1.85 | % | | | 1.83 | % | | | 1.84 | % |
| | .95 | %(d) | | | .88 | %(d) | | | .85 | % | | | .83 | % | | | .84 | % |
| | 1.75 | %(d) | | | 1.44 | %(d) | | | 1.25 | % | | | 1.29 | % | | | .77 | % |
See Notes to Financial Statements.
| | |
| Prudential Investment Portfolios, Inc./Prudential Asset Allocation Fund | | 113 |
Financial Highlights
(Unaudited) continued
| | | | |
| | | Class C | |
| | | Six Months Ended
March 31, 2010(a) | |
Per Share Operating Performance: | | | | |
Net Asset Value, Beginning Of Period | | $ | 10.53 | |
| | | | |
Income (loss) from investment operations: | | | | |
Net investment income | | | .05 | |
Net realized and unrealized gain (loss) on investment transactions | | | .78 | |
| | | | |
Total from investment operations | | | .83 | |
| | | | |
Less Dividends and Distributions: | | | | |
Dividends from net investment income | | | (.14 | ) |
Distributions from net realized gains | | | — | |
| | | | |
Total dividends and distributions | | | (.14 | ) |
| | | | |
Net asset value, end of period | | $ | 11.22 | |
| | | | |
Total Return(b): | | | 7.96 | % |
Ratios/Supplemental Data: | | | | |
Net assets, end of period (000) | | $ | 12,184 | |
Average net assets (000) | | $ | 12,502 | |
Ratios to average net assets(c): | | | | |
Expenses, including distribution and service (12b-1) fees | | | 1.92 | %(d)(e) |
Expenses, excluding distribution and service (12b-1) fees | | | .92 | %(d)(e) |
Net investment income | | | .97 | %(d)(e) |
| (a) | Calculations are based on average shares outstanding during the period. |
| (b) | Total return does not consider the effects of sales loads. Total return is calculated assuming a purchase of a share on the first day and a sale on the last day of each period reported and includes reinvestment of dividends and distributions. Total investment returns may reflect adjustments to conform to generally accepted accounting principles. Total returns for periods less than one full year are not annualized. |
| (c) | Does not include expenses of the underlying portfolios in which the Series invests. |
| (d) | As of March 23, 2007, the manager of the Series has agreed to reimburse up to 0.02% of the Series’ management fee in order to limit operating expenses (excluding interest, taxes, brokerage commissions, 12b-1 fees and certain extraordinary expenses) when such expense ratio before waiver exceeds 0.86% of the average daily net assets of Class C. If the manager had not reimbursed the Series, the annual expenses (both including and excluding distribution and service (12b-1) fees) and net investment income ratios would be 1.94%, 0.94% and 0.95%, respectively, for the six months ended March 31, 2010, 1.97%, 0.97% and 1.70%, respectively, for the year ended September 30, 2009 and 1.90%, 0.90% and 1.42%, respectively, for the year ended September 30, 2008. |
See Notes to Financial Statements.
| | |
| 114 | | Visit our website at www.prudentialfunds.com |
| | | | | | | | | | | | | | | | | | |
| Class C | |
| Year Ended September 30, | |
| 2009(a) | | | 2008(a) | | | 2007(a) | | | 2006(a) | | | 2005(a) | |
| | | | | | | | | | | | | | | | | | |
| $ | 11.04 | | | $ | 14.57 | | | $ | 14.11 | | | $ | 13.95 | | | $ | 12.78 | |
| | | | | | | | | | | | | | | | | | | |
| | | | | | | | | | | | | | | | | | |
| | .16 | | | | .18 | | | | .17 | | | | .18 | | | | .11 | |
| | (.47 | ) | | | (2.45 | ) | | | 1.27 | | | | .77 | | | | 1.11 | |
| | | | | | | | | | | | | | | | | | | |
| | (.31 | ) | | | (2.27 | ) | | | 1.44 | | | | .95 | | | | 1.22 | |
| | | | | | | | | | | | | | | | | | | |
| | | | | | | | | | | | | | | | | | |
| | (.20 | ) | | | (.20 | ) | | | (.19 | ) | | | (.11 | ) | | | (.05 | ) |
| | — | | | | (1.06 | ) | | | (.79 | ) | | | (.68 | ) | | | — | |
| | | | | | | | | | | | | | | | | | | |
| | (.20 | ) | | | (1.26 | ) | | | (.98 | ) | | | (.79 | ) | | | (.05 | ) |
| | | | | | | | | | | | | | | | | | | |
| $ | 10.53 | | | $ | 11.04 | | | $ | 14.57 | | | $ | 14.11 | | | $ | 13.95 | |
| | | | | | | | | | | | | | | | | | | |
| | (2.49 | )% | | | (16.86 | )% | | | 10.58 | % | | | 7.14 | % | | | 9.50 | % |
| | | | | | | | | | | | | | | | | | |
| $ | 12,599 | | | $ | 16,393 | | | $ | 25,379 | | | $ | 13,287 | | | $ | 13,500 | |
| $ | 12,415 | | | $ | 21,104 | | | $ | 19,954 | | | $ | 13,413 | | | $ | 14,221 | |
| | | | | | | | | | | | | | | | | | |
| | 1.95 | %(d) | | | 1.88 | %(d) | | | 1.85 | % | | | 1.83 | % | | | 1.84 | % |
| | .95 | %(d) | | | .88 | %(d) | | | .85 | % | | | .83 | % | | | .84 | % |
| | 1.72 | %(d) | | | 1.44 | %(d) | | | 1.21 | % | | | 1.30 | % | | | .78 | % |
See Notes to Financial Statements.
| | |
| Prudential Investment Portfolios, Inc./Prudential Asset Allocation Fund | | 115 |
Financial Highlights
(Unaudited) continued
| | | | |
| | | Class L | |
| |
| | | Six Months Ended
March 31, 2010(a) | |
Per Share Operating Performance: | | | | |
Net Asset Value, Beginning Of Period | | $ | 10.54 | |
| | | | |
Income (loss) from investment operations: | | | | |
Net investment income | | | .08 | |
Net realized and unrealized gain (loss) on investment transactions | | | .78 | |
| | | | |
Total from investment operations | | | .86 | |
| | | | |
Less Dividends and Distributions: | | | | |
Dividends from net investment income | | | (.19 | ) |
Distributions from net realized gains | | | — | |
| | | | |
Total dividends and distributions | | | (.19 | ) |
| | | | |
Net asset value, end of period | | $ | 11.21 | |
| | | | |
Total Return(c): | | | 8.24 | % |
Ratios/Supplemental Data: | | | | |
Net assets, end of period (000) | | $ | 7,066 | |
Average net assets (000) | | $ | 6,880 | |
Ratios to average net assets(d): | | | | |
Expenses, including distribution and service (12b-1) fees | | | 1.42 | %(e)(f) |
Expenses, excluding distribution and service (12b-1) fees | | | .92 | %(e)(f) |
Net investment income | | | 1.47 | %(e)(f) |
| (a) | Calculations are based on average shares outstanding during the period. |
| (b) | Commencement of operations. |
| (c) | Total return does not consider the effects of sales loads. Total return is calculated assuming a purchase of a share on the first day and a sale on the last day of each period reported and includes reinvestment of dividends and distributions. Total investment returns may reflect adjustments to conform to generally accepted accounting principles. Total returns for periods less than one full year are not annualized. |
| (d) | Does not include expenses of the underlying portfolios in which the Series invests. |
| (e) | As of March 23, 2007, the manager of the Series has agreed to reimburse up to 0.02% of the Series’ management fee in order to limit operating expenses (excluding interest, taxes, brokerage commissions, 12b-1 fees and certain extraordinary expenses) when such expense ratio before waiver exceeds 0.86% of the average daily net assets of Class L. If the manager had not reimbursed the Series, the annual expenses (both including and excluding distribution and service (12b-1) fees) and net investment income ratios would be 1.44%, 0.94% and 1.45%, respectively, for the six months ended March 31, 2010, 1.47%, 0.97% and 2.19%, respectively, for the year ended September 30, 2009 and 1.40%, 0.90% and 1.92%, respectively, for the year ended September 30, 2008. |
See Notes to Financial Statements.
| | |
| 116 | | Visit our website at www.prudentialfunds.com |
| | | | | | | | | | |
| Class L | |
| Year Ended September 30, | | | March 26, 2007(b)
through
September 30, 2007(a) | |
| 2009(a) | | | 2008(a) | | |
| | | | | | | | | | |
| $ | 11.09 | | | $ | 14.62 | | | $ | 14.13 | |
| | | | | | | | | | | |
| | | | | | | | | | |
| | .21 | | | | .25 | | | | .12 | |
| | (.49 | ) | | | (2.46 | ) | | | .37 | |
| | | | | | | | | | | |
| | (.28 | ) | | | (2.21 | ) | | | .49 | |
| | | | | | | | | | | |
| | | | | | | | | | |
| | (.27 | ) | | | (.26 | ) | | | — | |
| | — | | | | (1.06 | ) | | | — | |
| | | | | | | | | | | |
| | (.27 | ) | | | (1.32 | ) | | | — | |
| | | | | | | | | | | |
| $ | 10.54 | | | $ | 11.09 | | | $ | 14.62 | |
| | | | | | | | | | | |
| | (2.05 | )% | | | (16.41 | )% | | | 3.47 | % |
| | | | | | | | | | |
| $ | 6,762 | | | $ | 8,160 | | | $ | 11,874 | |
| $ | 6,392 | | | $ | 10,201 | | | $ | 11,940 | |
| | | | | | | | | | |
| | 1.45 | %(e) | | | 1.38 | %(e) | | | 1.35 | %(f) |
| | .95 | %(e) | | | .88 | %(e) | | | .85 | %(f) |
| | 2.21 | %(e) | | | 1.94 | %(e) | | | 1.62 | %(f) |
See Notes to Financial Statements.
| | |
| Prudential Investment Portfolios, Inc./Prudential Asset Allocation Fund | | 117 |
Financial Highlights
(Unaudited) continued
| | | | |
| | | Class M | |
| |
| | | Six Months Ended
March 31, 2010(a) | |
Per Share Operating Performance: | | | | |
Net Asset Value, Beginning Of Period | | $ | 10.53 | |
| | | | |
Income (loss) from investment operations: | | | | |
Net investment income | | | .05 | |
Net realized and unrealized gain (loss) on investment transactions | | | .78 | |
| | | | |
Total from investment operations | | | .83 | |
| | | | |
Less Dividends and Distributions: | | | | |
Dividends from net investment income | | | (.14 | ) |
Distributions from net realized gains | | | — | |
| | | | |
Total dividends and distributions | | | (.14 | ) |
| | | | |
Net asset value, end of period | | $ | 11.22 | |
| | | | |
Total Return(c): | | | 7.96 | % |
Ratios/Supplemental Data: | | | | |
Net assets, end of period (000) | | $ | 2,877 | |
Average net assets (000) | | $ | 3,324 | |
Ratios to average net assets(d): | | | | |
Expenses, including distribution and service (12b-1) fees | | | 1.92 | %(e)(f) |
Expenses, excluding distribution and service (12b-1) fees | | | .92 | %(e)(f) |
Net investment income | | | .96 | %(e)(f) |
| (a) | Calculations are based on average shares outstanding during the period. |
| (b) | Commencement of operations. |
| (c) | Total return does not consider the effects of sales loads. Total return is calculated assuming a purchase of a share on the first day and a sale on the last day of each period reported and includes reinvestment of dividends and distributions. Total investment returns may reflect adjustments to conform to generally accepted accounting principles. Total returns for periods less than one full year are not annualized. |
| (d) | Does not include expenses of the underlying portfolios in which the Series invests. |
| (e) | As of March 23, 2007, the manager of the Series has agreed to reimburse up to 0.02% of the Series’ management fee in order to limit operating expenses (excluding interest, taxes, brokerage commissions, 12b-1 fees and certain extraordinary expenses) when such expense ratio before waiver exceeds 0.86% of the average daily net assets of Class M. If the manager had not reimbursed the Series, the annual expenses (both including and excluding distribution and service (12b-1) fees) and net investment income ratios would be 1.94%, 0.94% and 0.94%, respectively, for the six months ended March 31, 2010, 1.97%, 0.97% and 1.78%, respectively, for the year ended September 30, 2009 and 1.90%, 0.90% and 1.40%, respectively, for the year ended September 30, 2008. |
See Notes to Financial Statements.
| | |
| 118 | | Visit our website at www.prudentialfunds.com |
| | | | | | | | | | |
| Class M | |
| Year Ended September 30, | | | March 26, 2007(b)
through
September 30, 2007(a) | |
| 2009(a) | | | 2008(a) | | |
| | | | | | | | | | |
| $ | 11.04 | | | $ | 14.57 | | | $ | 14.12 | |
| | | | | | | | | | | |
| | | | | | | | | | |
| | .17 | | | | .18 | | | | .08 | |
| | (.48 | ) | | | (2.45 | ) | | | .37 | |
| | | | | | | | | | | |
| | (.31 | ) | | | (2.27 | ) | | | .45 | |
| | | | | | | | | | | |
| | | | | | | | | | |
| | (.20 | ) | | | (.20 | ) | | | — | |
| | — | | | | (1.06 | ) | | | — | |
| | | | | | | | | | | |
| | (.20 | ) | | | (1.26 | ) | | | — | |
| | | | | | | | | | | |
| $ | 10.53 | | | $ | 11.04 | | | $ | 14.57 | |
| | | | | | | | | | | |
| | (2.49 | )% | | | (16.86 | )% | | | 3.19 | % |
| | | | | | | | | | |
| $ | 3,853 | | | $ | 8,812 | | | $ | 25,279 | |
| $ | 5,042 | | | $ | 15,838 | | | $ | 29,898 | |
| | | | | | | | | | |
| | 1.95 | %(e) | | | 1.88 | %(e) | | | 1.85 | %(f) |
| | .95 | %(e) | | | .88 | %(e) | | | .85 | %(f) |
| | 1.80 | %(e) | | | 1.42 | %(e) | | | 1.08 | %(f) |
See Notes to Financial Statements.
| | |
| Prudential Investment Portfolios, Inc./Prudential Asset Allocation Fund | | 119 |
Financial Highlights
(Unaudited) continued
| | | | |
| | | Class R | |
| |
| | | Six Months Ended
March 31, 2010(a) | |
Per Share Operating Performance: | | | | |
Net Asset Value, Beginning Of Period | | $ | 10.52 | |
| | | | |
Income (loss) from investment operations: | | | | |
Net investment income | | | .08 | |
Net realized and unrealized gain (loss) on investment transactions | | | .77 | |
| | | | |
Total from investment operations | | | .85 | |
| | | | |
Less Dividends and Distributions: | | | | |
Dividends from net investment income | | | (.19 | ) |
Distributions from net realized gains | | | — | |
| | | | |
Total dividends and distributions | | | (.19 | ) |
| | | | |
Net asset value, end of period | | $ | 11.18 | |
| | | | |
Total Return(c): | | | 8.16 | % |
Ratios/Supplemental Data: | | | | |
Net assets, end of period (000) | | $ | 11 | |
Average net assets (000) | | $ | 90 | |
Ratios to average net assets(d): | | | | |
Expenses, including distribution and service (12b-1) fees(e) | | | 1.42 | %(f)(g) |
Expenses, excluding distribution and service (12b-1) fees | | | .92 | %(f)(g) |
Net investment income | | | 1.44 | %(f)(g) |
| (a) | Calculations are based on average shares outstanding during the period. |
| (b) | Commencement of operations. |
| (c) | Total return is calculated assuming a purchase of a share on the first day and a sale on the last day of each period reported and includes reinvestment of dividends and distributions. Total investment returns may reflect adjustments to conform to generally accepted accounting principles. Total returns for periods less than one full year are not annualized. |
| (d) | Does not include expenses of the underlying portfolios in which the Series invests. |
| (e) | The distributor of the Series contractually agreed to limit its distribution and service (12b-1) fees to .50 of 1% on the average daily net assets of the Class R shares. |
| (f) | As of March 23, 2007, the manager of the Series has agreed to reimburse up to 0.02% of the Series’ management fee in order to limit operating expenses (excluding interest, taxes, brokerage commissions, 12b-1 fees and certain extraordinary expenses) when such expense ratio before waiver exceeds 0.86% of the average daily net assets of Class R. If the manager had not reimbursed the Series, the annual expenses (both including and excluding distribution and service (12b-1) fees) and net investment income ratios would be 1.44%, 0.94% and 1.42%, respectively, for the six months ended March 31, 2010, 1.47%, 0.97% and 2.23%, respectively, for the year ended September 30, 2009 and 1.40%, 0.90% and 1.92%, respectively, for the year ended September 30, 2008. |
See Notes to Financial Statements.
| | |
| 120 | | Visit our website at www.prudentialfunds.com |
| | | | | | | | | | | | | | | | | | |
| Class R | |
| Year Ended September 30, | | | December 17, 2004(b)
through September 30, 2005(a) | |
| 2009(a) | | | 2008(a) | | | 2007(a) | | | 2006(a) | | |
| | | | | | | | | | | | | | | | | | |
| $ | 11.09 | | | $ | 14.62 | | | $ | 14.16 | | | $ | 14.00 | | | $ | 13.53 | |
| | | | | | | | | | | | | | | | | | | |
| | | | | | | | | | | | | | | | | | |
| | .20 | | | | .25 | | | | .25 | | | | .24 | | | | .12 | |
| | (.50 | ) | | | (2.46 | ) | | | 1.27 | | | | .78 | | | | .35 | |
| | | | | | | | | | | | | | | | | | | |
| | (.30 | ) | | | (2.21 | ) | | | 1.52 | | | | 1.02 | | | | .47 | |
| | | | | | | | | | | | | | | | | | | |
| | | | | | | | | | | | | | | | | | |
| | (.27 | ) | | | (.26 | ) | | | (.27 | ) | | | (.18 | ) | | | — | |
| | — | | | | (1.06 | ) | | | (.79 | ) | | | (.68 | ) | | | — | |
| | | | | | | | | | | | | | | | | | | |
| | (.27 | ) | | | (1.32 | ) | | | (1.06 | ) | | | (.86 | ) | | | — | |
| | | | | | | | | | | | | | | | | | | |
| $ | 10.52 | | | $ | 11.09 | | | $ | 14.62 | | | $ | 14.16 | | | $ | 14.00 | |
| | | | | | | | | | | | | | | | | | | |
| | (2.24 | )% | | | (16.41 | )% | | | 11.13 | % | | | 7.70 | % | | | 3.40 | % |
| | | | | | | | | | | | | | | | | | |
| $ | 98 | | | $ | 893 | | | $ | 1,181 | | | $ | 1,015 | | | $ | 3 | |
| $ | 506 | | | $ | 1,008 | | | $ | 1,105 | | | $ | 293 | | | $ | 2 | |
| | | | | | | | | | | | | | | | | | |
| | 1.45 | %(f) | | | 1.38 | %(f) | | | 1.35 | % | | | 1.33 | % | | | 1.34 | %(g) |
| | .95 | %(f) | | | .88 | %(f) | | | .85 | % | | | .83 | % | | | .84 | %(g) |
| | 2.25 | %(f) | | | 1.94 | %(f) | | | 1.76 | % | | | 1.94 | % | | | 1.48 | %(g) |
See Notes to Financial Statements.
| | |
| Prudential Investment Portfolios, Inc./Prudential Asset Allocation Fund | | 121 |
Financial Highlights
(Unaudited) continued
| | | | |
| | | Class X | |
| |
| | | Six Months Ended
March 31, 2010(a) | |
Per Share Operating Performance: | | | | |
Net Asset Value, Beginning Of Period | | $ | 10.53 | |
| | | | |
Income (loss) from investment operations: | | | | |
Net investment income | | | .05 | |
Net realized and unrealized gain (loss) on investment transactions | | | .78 | |
| | | | |
Total from investment operations | | | .83 | |
| | | | |
Less Dividends and Distributions: | | | | |
Dividends from net investment income | | | (.14 | ) |
Distributions from net realized gains | | | — | |
| | | | |
Total dividends and distributions | | | (.14 | ) |
| | | | |
Net asset value, end of period | | $ | 11.22 | |
| | | | |
Total Return(c): | | | 7.96 | % |
Ratios/Supplemental Data: | | | | |
Net assets, end of period (000) | | $ | 1,916 | |
Average net assets (000) | | $ | 2,181 | |
Ratios to average net assets(d): | | | | |
Expenses, including distribution and service (12b-1) fees | | | 1.92 | %(e)(f) |
Expenses, excluding distribution and service (12b-1) fees | | | .92 | %(e)(f) |
Net investment income | | | .96 | %(e)(f) |
| (a) | Calculations are based on average shares outstanding during the period. |
| (b) | Commencement of operations. |
| (c) | Total return does not consider the effects of sales loads. Total return is calculated assuming a purchase of a share on the first day and a sale on the last day of each period reported and includes reinvestment of dividends and distributions. Total investment returns may reflect adjustments to conform to generally accepted accounting principles. Total returns for periods less than one full year are not annualized. |
| (d) | Does not include expenses of the underlying portfolios in which the Series invests. |
| (e) | As of March 23, 2007, the manager of the Series has agreed to reimburse up to 0.02% of the Series’ management fee in order to limit operating expenses (excluding interest, taxes, brokerage commissions, 12b-1 fees and certain extraordinary expenses) when such expense ratio before waiver exceeds 0.86% of the average daily net assets of Class X. If the manager had not reimbursed the Series, the annual expenses (both including and excluding distribution and service (12b-1) fees) and net investment income ratios would be 1.94%, 0.94% and 0.94%, respectively, for the six months ended March 31, 2010, 1.97%, 0.97% and 1.73%, respectively, for the year ended September 30, 2009 and 1.90%, 0.90% and 1.41%, respectively, for the year ended September 30, 2008. |
See Notes to Financial Statements.
| | |
| 122 | | Visit our website at www.prudentialfunds.com |
| | | | | | | | | | |
| Class X | |
| Year Ended September 30, | | | March 26, 2007(b)
through September 30, 2007(a) | |
| 2009(a) | | | 2008(a) | | |
| | | | | | | | | | |
| $ | 11.04 | | | $ | 14.57 | | | $ | 14.12 | |
| | | | | | | | | | | |
| | | | | | | | | | |
| | .16 | | | | .18 | | | | .08 | |
| | (.47 | ) | | | (2.45 | ) | | | .37 | |
| | | | | | | | | | | |
| | (.31 | ) | | | (2.27 | ) | | | .45 | |
| | | | | | | | | | | |
| | | | | | | | | | |
| | (.20 | ) | | | (.20 | ) | | | — | |
| | — | | | | (1.06 | ) | | | — | |
| | | | | | | | | | | |
| | (.20 | ) | | | (1.26 | ) | | | — | |
| | | | | | | | | | | |
| $ | 10.53 | | | $ | 11.04 | | | $ | 14.57 | |
| | | | | | | | | | | |
| | (2.49 | )% | | | (16.86 | )% | | | 3.19 | % |
| | | | | | | | | | |
| $ | 2,516 | | | $ | 4,192 | | | $ | 7,157 | |
| $ | 2,815 | | | $ | 5,838 | | | $ | 7,694 | |
| | | | | | | | | | |
| | 1.95 | %(e) | | | 1.88 | %(e) | | | 1.85 | %(f) |
| | .95 | %(e) | | | .88 | %(e) | | | .85 | %(f) |
| | 1.75 | %(e) | | | 1.43 | %(e) | | | 1.09 | %(f) |
See Notes to Financial Statements.
| | |
| Prudential Investment Portfolios, Inc./Prudential Asset Allocation Fund | | 123 |
Financial Highlights
(Unaudited) continued
| | | | |
| | | Class Z | |
| | | Six Months Ended
March 31, 2010(a) | |
Per Share Operating Performance: | | | | |
Net Asset Value, Beginning Of Period | | $ | 10.58 | |
| | | | |
Income (loss) from investment operations: | | | | |
Net investment income | | | .11 | |
Net realized and unrealized gain (loss) on investment transactions | | | .77 | |
| | | | |
Total from investment operations | | | .88 | |
| | | | |
Less Dividends and Distributions: | | | | |
Dividends from net investment income | | | (.24 | ) |
Distributions from net realized gains | | | — | |
| | | | |
Total dividends and distributions | | | (.24 | ) |
| | | | |
Net asset value, end of period | | $ | 11.22 | |
| | | | |
Total Return(b): | | | 8.40 | % |
Ratios/Supplemental Data: | | | | |
Net assets, end of period (000) | | $ | 111,083 | |
Average net assets (000) | | $ | 105,726 | |
Ratios to average net assets(c): | | | | |
Expenses, including distribution and service (12b-1) fees | | | .92 | %(d)(e) |
Expenses, excluding distribution and service (12b-1) fees | | | .92 | %(d)(e) |
Net investment income | | | 1.97 | %(d)(e) |
| (a) | Calculations are based on average shares outstanding during the period. |
| (b) | Total return is calculated assuming a purchase of a share on the first day and a sale on the last day of each period reported and includes reinvestment of dividends and distributions. Total investment returns may reflect adjustments to conform to generally accepted accounting principles. Total returns for periods less than one full year are not annualized. |
| (c) | Does not include expenses of the underlying portfolios in which the Series invests. |
| (d) | As of March 23, 2007, the manager of the Series has agreed to reimburse up to 0.02% of the Series’ management fee in order to limit operating expenses (excluding interest, taxes, brokerage commissions, 12b-1 fees and certain extraordinary expenses) when such expense ratio before waiver exceeds 0.86% of the average daily net assets of Class Z. If the manager had not reimbursed the Series, the annual expenses (both including and excluding distribution and service (12b-1) fees) and net investment income ratios would be 0.94%, 0.94% and 1.95%, respectively, for the six months ended March 31, 2010, 0.97%, 0.97% and 2.69%, respectively, for the year ended September 30, 2009 and 0.90%, 0.90% and 2.42%, respectively, for the year ended September 30, 2008. |
See Notes to Financial Statements.
| | |
| 124 | | Visit our website at www.prudentialfunds.com |
| | | | | | | | | | | | | | | | | | |
| Class Z | |
| Year Ended September 30, | |
| 2009(a) | | | 2008(a) | | | 2007(a) | | | 2006(a) | | | 2005(a) | |
| | | | | | | | | | | | | | | | | | |
| $ | 11.15 | | | $ | 14.71 | | | $ | 14.25 | | | $ | 14.08 | | | $ | 12.90 | |
| | | | | | | | | | | | | | | | | | | |
| | | | | | | | | | | | | | | | | | |
| | .25 | | | | .31 | | | | .32 | | | | .32 | | | | .24 | |
| | (.48 | ) | | | (2.47 | ) | | | 1.27 | | | | .78 | | | | 1.13 | |
| | | | | | | | | | | | | | | | | | | |
| | (.23 | ) | | | (2.16 | ) | | | 1.59 | | | | 1.10 | | | | 1.37 | |
| | | | | | | | | | | | | | | | | | | |
| | | | | | | | | | | | | | | | | | |
| | (.34 | ) | | | (.34 | ) | | | (.34 | ) | | | (.25 | ) | | | (.19 | ) |
| | — | | | | (1.06 | ) | | | (.79 | ) | | | (.68 | ) | | | — | |
| | | | | | | | | | | | | | | | | | | |
| | (.34 | ) | | | (1.40 | ) | | | (1.13 | ) | | | (.93 | ) | | | (.19 | ) |
| | | | | | | | | | | | | | | | | | | |
| $ | 10.58 | | | $ | 11.15 | | | $ | 14.71 | | | $ | 14.25 | | | $ | 14.08 | |
| | | | | | | | | | | | | | | | | | | |
| | (1.47 | )% | | | (16.03 | )% | | | 11.64 | % | | | 8.29 | % | | | 10.63 | % |
| | | | | | | | | | | | | | | | | | |
| $ | 102,402 | | | $ | 117,549 | | | $ | 156,599 | | | $ | 164,649 | | | $ | 173,188 | |
| $ | 93,145 | | | $ | 140,799 | | | $ | 163,110 | | | $ | 168,165 | | | $ | 176,256 | |
| | | | | | | | | | | | | | | | | | |
| | .95 | %(d) | | | .88 | %(d) | | | .85 | % | | | .83 | % | | | .84 | % |
| | .95 | %(d) | | | .88 | %(d) | | | .85 | % | | | .83 | % | | | .84 | % |
| | 2.71 | %(d) | | | 2.44 | %(d) | | | 2.25 | % | | | 2.30 | % | | | 1.76 | % |
See Notes to Financial Statements.
| | |
| Prudential Investment Portfolios, Inc./Prudential Asset Allocation Fund | | 125 |
Results of Proxy Voting
(Unaudited)
At a special meeting of shareholders held on March 9, 2010, Fund shareholders approved a proposal to elect Directors.
The individuals listed in the table below were elected as directors of each Fund.* All directors, with the exception of Mr. Benjamin, served as directors to each Fund prior to the shareholder meeting.
| | | | |
Trustee | | For | | Withheld |
Kevin J. Bannon | | 123,240,410.836 | | 1,700,825.331 |
| | |
Linda W. Bynoe | | 123,157,644.037 | | 1,783,592.130 |
| | |
Michael S. Hyland | | 123,201,323.318 | | 1,739,912.849 |
| | |
Douglas H. McCorkindale | | 123,074,984.328 | | 1,866,251.839 |
| | |
Stephen P. Munn | | 123,216,742.859 | | 1,724,493.308 |
| | |
Richard A. Redeker | | 123,225,795.108 | | 1,715,441.059 |
| | |
Robin B. Smith | | 123,040,042.169 | | 1,901,193.998 |
| | |
Stephen G. Stoneburn | | 123,252,589.748 | | 1,688,646.419 |
| | |
Judy A. Rice | | 123,218,596.264 | | 1,722,639.903 |
| | |
Scott E. Benjamin | | 123,212,247.295 | | 1,728,988.872 |
| * | Results are for all funds within the same investment company. |
| | |
| 126 | | Visit our website at www.prudentialfunds.com |
| | | | |
| n MAIL | | n TELEPHONE | | n WEBSITE |
Gateway Center Three 100 Mulberry Street Newark, NJ 07102 | | (800) 225-1852 | | www.prudentialfunds.com |
|
| PROXY VOTING |
| The Board of Directors of the Fund has delegated to the Fund’s investment subadvisers the responsibility for voting any proxies and maintaining proxy recordkeeping with respect to the Fund. A description of these proxy voting policies and procedures is available without charge, upon request, by calling (800) 225-1852 or by visiting the Securities and Exchange Commission’s website at www.sec.gov. Information regarding how the Fund voted proxies relating to portfolio securities during the most recent 12-month period ended June 30 is available on the Fund’s website and on the Commission’s website. |
|
| DIRECTORS |
Kevin J. Bannon • Scott E. Benjamin • Linda W. Bynoe • Michael S. Hyland • Douglas H. McCorkindale • Stephen P. Munn • Richard A. Redeker • Judy A. Rice •
Robin B. Smith • Stephen G. Stoneburn |
|
| OFFICERS |
| Judy A. Rice, President • Scott E. Benjamin, Vice President • Grace C. Torres, Treasurer and Principal Financial and Accounting Officer • Kathryn L. Quirk, Chief Legal Officer • Deborah A. Docs, Secretary • Timothy J. Knierim, Chief Compliance Officer • Valerie M. Simpson, Deputy Chief Compliance Officer • Theresa C. Thompson, Deputy Chief Compliance Officer • Noreen M. Fierro, Anti-Money Laundering Compliance Officer • Jonathan D. Shain, Assistant Secretary • Claudia DiGiacomo, Assistant Secretary • John P. Schwartz, Assistant Secretary • Andrew R. French, Assistant Secretary • M. Sadiq Peshimam, Assistant Treasurer • Peter Parrella, Assistant Treasurer |
| | | | |
| MANAGER | | Prudential Investments LLC | | Gateway Center Three
100 Mulberry Street
Newark, NJ 07102 |
|
| INVESTMENT SUBADVISERS | | Prudential Investment
Management, Inc. Quantitative Management
Associates LLC | | Gateway Center Two
100 Mulberry Street
Newark, NJ 07102 Gateway Center Two
100 Mulberry Street
Newark, NJ 07102 |
|
| DISTRIBUTOR | | Prudential Investment
Management Services LLC | | Gateway Center Three
100 Mulberry Street
Newark, NJ 07102 |
|
| CUSTODIAN | | The Bank of New York Mellon | | One Wall Street
New York, NY 10286 |
|
| TRANSFER AGENT | | Prudential Mutual Fund
Services LLC | | PO Box 9658
Providence, RI 02940 |
|
INDEPENDENT REGISTERED
PUBLIC ACCOUNTING FIRM | | KPMG LLP | | 345 Park Avenue
New York, NY 10154 |
|
| FUND COUNSEL | | Sullivan & Cromwell LLP | | 125 Broad Street
New York, NY 10004 |
|
| An investor should consider the investment objectives, risks, charges, and expenses of the Fund carefully before investing. The prospectus for the Fund contains this and other information about the Fund. An investor may obtain a prospectus by visiting our website at www.prudentialfunds.com or by calling (800) 225-1852. The prospectus should be read carefully before investing. |
|
| E-DELIVERY |
To receive your mutual fund documents online, go to www.prudentialfunds.com/edelivery and enroll. Instead of receiving printed documents by mail, you will receive notification via e-mail when new materials are available. You can cancel your enrollment or change your e-mail address
at any time by visiting the website address above. |
|
| SHAREHOLDER COMMUNICATIONS WITH DIRECTORS |
| Shareholders can communicate directly with the Board of Directors by writing to the Chair of the Board, Prudential Asset Allocation Fund, Prudential Investments, Attn: Board of Directors, 100 Mulberry Street, Gateway Center Three, Newark, NJ 07102. Shareholders can communicate directly with an individual Director by writing to the same address. Communications are not screened before being delivered to the addressee. |
|
| AVAILABILITY OF PORTFOLIO SCHEDULE |
| The Fund files its complete schedule of portfolio holdings with the Securities and Exchange Commission for the first and third quarters of each fiscal year on Form N-Q under the Prudential Investment Portfolios, Inc. name. The Fund’s Forms N-Q are available on the Commission’s website at www.sec.gov. The Fund’s Forms N-Q may also be reviewed and copied at the Commission’s Public Reference Room in Washington, D.C. Information on the operation and location of the Public Reference Room may be obtained by calling (202) 551-8090. The Fund’s schedule of portfolio holdings is also available on the Fund’s website as of the end of each fiscal quarter. |
Mutual Funds:
| | | | |
| ARE NOT INSURED BY THE FDIC OR ANY FEDERAL GOVERNMENT AGENCY | | MAY LOSE VALUE | | ARE NOT A DEPOSIT OF OR GUARANTEED BY ANY BANK OR ANY BANK AFFILIATE |

| | | | | | | | | | | | | | | | | | | | |
| Prudential Asset Allocation Fund | | | | | | | | | | | | |
| | | Share Class | | A | | B | | C | | L | | M | | R | | X | | Z | | |
| | NASDAQ | | PIBAX | | PBFBX | | PABCX | | N/A | | DAAMX | | PALRX | | N/A | | PABFX | | |
| | CUSIP | | 74437E883 | | 74437E875 | | 74437E867 | | 74437E586 | | 74437E578 | | 74437E636 | | 74437E560 | | 74437E859 | | |
| | | | | | | | | | | | | | | | | | | | |
MF185E2 0179208-00001-00

| | |
| SEMIANNUAL REPORT | | MARCH 31, 2010 |
Prudential Jennison
Growth Fund
(Formerly known as Jennison Growth Fund)
| | | | |
Fund Type Large-cap stock Objective Long-term growth
of capital | | | | This report is not authorized for distribution to prospective investors unless preceded or accompanied by a current prospectus. The views expressed in this report and information about the Fund’s portfolio holdings are for the period covered by this report and are subject to change thereafter. The accompanying financial statements as of March 31, 2010, were not audited and, accordingly, no auditor’s opinion is expressed on them. Prudential Investments, Prudential Financial, the Rock Prudential logo, Jennison Associates, and Jennison are registered service marks of The Prudential Insurance Company of America, Newark, NJ, and its affiliates. |
| | |

| | To enroll in e-delivery, go to www.prudentialfunds.com/edelivery |
May 14, 2010
Dear Shareholder:
Recently we announced the renaming of JennisonDryden, Prudential Financial’s mutual fund family, to Prudential Investments. As a result of this change, each of our funds has been renamed to feature “Prudential” as part of its new name. The name of your fund has changed from the Jennison Growth Fund to the Prudential Jennison Growth Fund.
While the name of your fund has changed, its investment objectives and portfolio management team remain the same. No action is required on your part. If you participate in an automatic investment plan, your account continues to be invested in the Fund under its new name.
Featuring the Prudential name in our funds creates an immediate connection to the experience and heritage of Prudential, a name recognized by millions for helping people grow and protect their wealth.
On the following pages, you will find your fund’s semiannual report, including a table showing fund performance over the first half of the fiscal year and for longer periods. The report also contains a listing of the fund’s holdings at period-end. If you have questions about your fund or the renaming of our mutual fund family, please contact your financial professional or visit our website at www.prudentialfunds.com.
Sincerely,

Judy A. Rice, President
Prudential Investment Portfolios, Inc./Prudential Jennison Growth Fund
| | |
| Prudential Investment Portfolios, Inc./Prudential Jennison Growth Fund | | 1 |
Your Fund’s Performance
Performance data quoted represent past performance. Past performance does not guarantee future results. The investment return and principal value of an investment will fluctuate, so that an investor’s shares, when redeemed, may be worth more or less than their original cost. Current performance may be lower or higher than the past performance data quoted. An investor may obtain performance data as of the most recent month-end by visiting our website at www.prudentialfunds.com or by calling (800) 225-1852. The maximum initial sales charge is 5.50% (Class A shares). Gross operating expenses: Class A, 1.11%; Class B, 1.81%; Class C, 1.81%; Class R, 1.56%; Class Z, 0.81%. Net operating expenses apply to: Class A, 1.11%; Class B, 1.81%; Class C, 1.81%; Class R, 1.31%; Class Z, 0.81%, after contractual reduction through 1/31/2011 for Class R shares.
| | | | | | | | | | | | | | |
| Cumulative Total Returns (without sales charges) as of 3/31/10 | | | |
| | | Six Months | | | One Year | | | Five Years | | | Ten Years | | | Since Inception |
Class A | | 12.47 | % | | 47.47 | % | | 24.25 | % | | –32.11 | % | | — |
Class B | | 12.04 | | | 46.41 | | | 19.79 | | | –36.92 | | | — |
Class C | | 12.26 | | | 46.71 | | | 20.03 | | | –36.79 | | | — |
Class R | | 12.31 | | | 47.15 | | | 23.26 | | | N/A | | | 18.22% (12/17/04) |
Class Z | | 12.65 | | | 47.90 | | | 25.99 | | | –30.31 | | | — |
Russell 1000 Growth Index | | 12.96 | | | 49.75 | | | 18.31 | | | -34.96 | | | — |
S&P 500 Index | | 11.75 | | | 49.73 | | | 9.97 | | | -6.35 | | | — |
Lipper Average | | 11.48 | | | 46.16 | | | 14.35 | | | -24.24 | | | — |
| | | | | | | | | | | | | | |
| Average Annual Total Returns (with sales charges) as of 3/31/10 |
| | | | | | One Year | | | Five Years | | | Ten Years | | | Since Inception |
Class A | | | | | 39.36 | % | | 3.26 | % | | –4.34 | % | | — |
Class B | | | | | 41.41 | | | 3.50 | | | –4.50 | | | — |
Class C | | | | | 45.71 | | | 3.72 | | | –4.48 | | | — |
Class R | | | | | 47.15 | | | 4.27 | | | N/A | | | 3.22% (12/17/04) |
Class Z | | | | | 47.90 | | | 4.73 | | | –3.55 | | | — |
Russell 1000 Growth Index | | | | | 49.75 | | | 3.42 | | | -4.21 | | | — |
S&P 500 Index | | | | | 49.73 | | | 1.92 | | | -0.65 | | | — |
Lipper Average | | | | | 46.16 | | | 2.64 | | | -3.11 | | | — |
| | |
| 2 | | Visit our website at www.prudentialfunds.com |
Source: Prudential Investments LLC and Lipper Inc. Performance figures may reflect fee waivers and/or expense reimbursements. In the absence of such fee waivers and/or expense reimbursements, total returns would be lower.
Inception returns are provided for any share class with less than 10 calendar years of returns.
The average annual total returns take into account applicable sales charges. Class A, Class B, Class C, and Class R shares are subject to an annual distribution and service (12b-1) fee of up to 0.30%, 1.00%, 1.00%, and 0.75%, respectively. Approximately seven years after purchase, Class B shares will automatically convert to Class A shares on a quarterly basis. Class Z shares are not subject to a 12b-1 fee. Under certain circumstances, Class A shares may be subject to a contingent deferred sales charge (CDSC) of 1%. Class B and Class C shares are subject to a maximum CDSC of 5% and 1%, respectively. Class R and Class Z shares are not subject to a sales charge. The returns in the tables do not reflect the deduction of taxes that a shareholder would pay on Fund distributions or following the redemption of Fund shares.
Benchmark Definitions
Russell 1000 Growth Index
The Russell 1000 Growth Index is an unmanaged index comprising those securities in the Russell 1000 Index with a greater-than-average growth orientation. Companies in this index tend to exhibit relatively high price-to-book ratios, price-to-earnings ratios, forecasted growth rates, and relatively low dividend yields. Russell 1000 Growth Index Closest Month-End to Inception cumulative total return is 13.48% for Class R. Russell 1000 Growth Index Closest Month-End to Inception average annual total return is 2.44% for Class R.
S&P 500 Index
The S&P 500 Index is an unmanaged index of 500 stocks of large U.S. public companies. It gives a broad look at how U.S. stock prices have performed. S&P 500 Index Closest Month-End to Inception cumulative total return is 7.61% for Class R. S&P 500 Index Closest Month-End to Inception average annual total return is 1.41% for Class R.
Lipper Large-Cap Growth Funds Average
The Lipper Large-Cap Growth Funds Average (Lipper Average) represents returns based on the average return of all funds in the Lipper Large-Cap Growth Funds category for the periods noted. Funds in the Lipper Average invest at least 75% of their equity assets in companies with market capitalizations (on a three-year weighted basis) greater than 300% of the dollar-weighted median market capitalization of the middle 1,000 securities of the S&P SuperComposite 1500 Index. Large-cap growth funds typically have an above-average price-to-earnings ratio, price-to-book ratio, and three-year sales-per-share growth value compared with the S&P 500 Index. Lipper Average Closest Month-End to Inception cumulative total return is 9.78% for Class R. Lipper Average Closest Month-End to Inception average annual total return is 1.71% for Class R.
Investors cannot invest directly in an index. The returns for the Russell 1000 Growth Index and the S&P 500 Index would be lower if they included the effects of sales charges, operating expenses of a mutual fund, or taxes. Returns for the Lipper Average reflect the deduction of operating expenses, but not sales charges or taxes.
| | |
| Prudential Investment Portfolios, Inc./Prudential Jennison Growth Fund | | 3 |
Your Fund’s Performance (continued)
| | | |
Five Largest Holdings expressed as a percentage of net assets as of 3/31/10
(excluding short-term investments) | | | |
Apple, Inc., Computers & Peripherals | | 5.1 | % |
Google, Inc. (Class A Stock), Internet Software & Services | | 4.0 | |
Amazon.com, Inc., Internet & Catalog Retail | | 3.9 | |
Microsoft Corp., Software | | 3.4 | |
Visa, Inc. (Class A Stock), IT Services | | 3.0 | |
Holdings are subject to change.
| | | |
Five Largest Industries expressed as a percentage of net assets as of 3/31/10
(excluding short-term investments) | | | |
Computers & Peripherals | | 10.0 | % |
Software | | 8.2 | |
IT Services | | 5.9 | |
Internet Software & Services | | 5.7 | |
Communications Equipment | | 5.6 | |
Industry weightings are subject to change.
| | |
| 4 | | Visit our website at www.prudentialfunds.com |
Fees and Expenses (Unaudited)
As a shareholder of the Fund, you incur two types of costs: (1) transaction costs, including sales charges (loads) on purchase payments and redemptions, as applicable, and (2) ongoing costs, including management fees, distribution and/or service (12b-1) fees, and other Fund expenses, as applicable. This example is intended to help you understand your ongoing costs (in dollars) of investing in the Fund and to compare these costs with the ongoing costs of investing in other mutual funds.
The example is based on an investment of $1,000 invested on October 1, 2009, at the beginning of the period, and held through the six-month period ended March 31, 2010. The example is for illustrative purposes only; you should consult the Prospectus for information on initial and subsequent minimum investment requirements.
The Fund’s transfer agent may charge additional fees to holders of certain accounts that are not included in the expenses shown in the table on the following page. These fees apply to individual retirement accounts (IRAs) and Section 403(b) accounts. As of the close of the six-month period covered by the table, IRA fees included an annual maintenance fee of $15 per account (subject to a maximum annual maintenance fee of $25 for all accounts held by the same shareholder). Section 403(b) accounts are charged an annual $25 fiduciary maintenance fee. Some of the fees may vary in amount, or may be waived, based on your total account balance or the number of Prudential Investments funds, including the Fund, that you own. You should consider the additional fees that were charged to your Fund account over the six-month period when you estimate the total ongoing expenses paid over the period and the impact of these fees on your ending account value, as these additional expenses are not reflected in the information provided in the expense table. Additional fees have the effect of reducing investment returns.
Actual Expenses
The first line for each share class in the table on the following page provides information about actual account values and actual expenses. You may use the information on this line, together with the amount you invested, to estimate the expenses that you paid over the period. Simply divide your account value by $1,000 (for example, an $8,600 account value ÷ $1,000 = 8.6), then multiply the result by the number on the first line under the heading “Expenses Paid During the Six-Month Period” to estimate the expenses you paid on your account during this period.
Hypothetical Example for Comparison Purposes
The second line for each share class in the table on the following page provides information about hypothetical account values and hypothetical expenses based on the Fund’s actual expense ratio and an assumed rate of return of 5% per year before
| | |
| Prudential Investment Portfolios, Inc./Prudential Jennison Growth Fund | | 5 |
Fees and Expenses (continued)
expenses, which is not the Fund’s actual return. The hypothetical account values and expenses may not be used to estimate the actual ending account balance or expenses you paid for the period. You may use this information to compare the ongoing costs of investing in the Fund and other funds. To do so, compare this 5% hypothetical example with the 5% hypothetical examples that appear in the shareholder reports of the other funds.
Please note that the expenses shown in the table are meant to highlight your ongoing costs only and do not reflect any transactional costs such as sales charges (loads). Therefore, the second line for each share class in the table is useful in comparing ongoing costs only and will not help you determine the relative total costs of owning different funds. In addition, if these transactional costs were included, your costs would have been higher.
| | | | | | | | | | | | | | |
Prudential Jennison
Growth Fund | | Beginning Account Value October 1, 2009 | | Ending Account
Value March 31, 2010 | | Annualized Expense Ratio
Based on the
Six-Month Period | | | Expenses Paid
During the
Six-Month Period* |
| | | | | | | | | | | | | | |
| Class A | | Actual | | $ | 1,000.00 | | $ | 1,124.70 | | 1.11 | % | | $ | 5.88 |
| | | Hypothetical | | $ | 1,000.00 | | $ | 1,019.40 | | 1.11 | % | | $ | 5.59 |
| | | | | | | | | | | | | | |
| Class B | | Actual | | $ | 1,000.00 | | $ | 1,120.40 | | 1.81 | % | | $ | 9.57 |
| | | Hypothetical | | $ | 1,000.00 | | $ | 1,015.91 | | 1.81 | % | | $ | 9.10 |
| | | | | | | | | | | | | | |
| Class C | | Actual | | $ | 1,000.00 | | $ | 1,122.60 | | 1.81 | % | | $ | 9.58 |
| | | Hypothetical | | $ | 1,000.00 | | $ | 1,015.91 | | 1.81 | % | | $ | 9.10 |
| | | | | | | | | | | | | | |
| Class R | | Actual | | $ | 1,000.00 | | $ | 1,123.10 | | 1.31 | % | | $ | 6.93 |
| | | Hypothetical | | $ | 1,000.00 | | $ | 1,018.40 | | 1.31 | % | | $ | 6.59 |
| | | | | | | | | | | | | | |
| Class Z | | Actual | | $ | 1,000.00 | | $ | 1,126.50 | | 0.81 | % | | $ | 4.29 |
| | | Hypothetical | | $ | 1,000.00 | | $ | 1,020.89 | | 0.81 | % | | $ | 4.08 |
* Fund expenses (net of fee waivers or subsidies, if any) for each share class are equal to the annualized expense ratio for each share class (provided in the table), multiplied by the average account value over the period, multiplied by the 182 days in the six-month period ended March 31, 2010, and divided by the 365 days in the Fund's fiscal year ending September 30, 2010 (to reflect the six-month period). Expenses presented in the table include the expenses of any underlying portfolios in which the Fund may invest.
| | |
| 6 | | Visit our website at www.prudentialfunds.com |
Portfolio of Investments
as of March 31, 2010 (Unaudited)
| | | | | |
| Shares | | Description | | Value (Note 1) |
| | | | | |
LONG-TERM INVESTMENTS 98.9% | | | |
COMMON STOCKS | | | |
| |
Aerospace & Defense 4.1% | | | |
| 346,110 | | Boeing Co. (The) | | $ | 25,131,047 |
| 232,280 | | Precision Castparts Corp. | | | 29,432,199 |
| 354,000 | | United Technologies Corp. | | | 26,057,940 |
| | | | | |
| | | | | 80,621,186 |
| |
Auto Components 1.2% | | | |
| 724,300 | | Johnson Controls, Inc. | | | 23,894,657 |
| |
Biotechnology 4.2% | | | |
| 513,300 | | Celgene Corp.(a) | | | 31,804,068 |
| 861,700 | | Gilead Sciences, Inc.(a) | | | 39,190,116 |
| 315,600 | | Vertex Pharmaceuticals, Inc.(a)(b) | | | 12,898,572 |
| | | | | |
| | | | | 83,892,756 |
| |
Capital Markets 4.7% | | | |
| 1,529,500 | | Charles Schwab Corp. (The)(b) | | | 28,586,355 |
| 260,800 | | Goldman Sachs Group, Inc. (The) | | | 44,500,304 |
| 671,600 | | Morgan Stanley | | | 19,671,164 |
| | | | | |
| | | | | 92,757,823 |
| |
Chemicals 1.4% | | | |
| 121,900 | | Monsanto Co. | | | 8,706,098 |
| 218,800 | | Praxair, Inc.(b) | | | 18,160,400 |
| | | | | |
| | | | | 26,866,498 |
| |
Communications Equipment 5.6% | | | |
| 1,705,100 | | Cisco Systems, Inc.(a) | | | 44,383,753 |
| 1,086,200 | | Juniper Networks, Inc.(a)(b) | | | 33,324,616 |
| 779,200 | | QUALCOMM, Inc. | | | 32,718,608 |
| | | | | |
| | | | | 110,426,977 |
| |
Computers & Peripherals 10.0% | | | |
| 430,847 | | Apple, Inc.(a) | | | 101,218,886 |
| 1,125,100 | | Hewlett-Packard Co. | | | 59,799,065 |
| 1,102,300 | | NetApp, Inc.(a)(b) | | | 35,890,888 |
| | | | | |
| | | | | 196,908,839 |
| |
Diversified Financial Services 1.7% | | | |
| 728,000 | | JPMorgan Chase & Co. | | | 32,578,000 |
See Notes to Financial Statements.
| | |
| Prudential Investment Portfolios, Inc./Prudential Jennison Growth Fund | | 7 |
Portfolio of Investments
as of March 31, 2010 (Unaudited) continued
| | | | | |
| Shares | | Description | | Value (Note 1) |
| | | | | |
COMMON STOCKS (Continued) | | | |
| |
Electronic Equipment & Instruments 1.0% | | | |
| 572,142 | | Agilent Technologies, Inc.(a)(b) | | $ | 19,675,963 |
| |
Energy Equipment & Services 2.9% | | | |
| 912,280 | | Schlumberger Ltd. | | | 57,893,289 |
| |
Food & Staples Retailing 1.7% | | | |
| 463,400 | | Costco Wholesale Corp.(b) | | | 27,669,614 |
| 164,800 | | Whole Foods Market, Inc.(a)(b) | | | 5,957,520 |
| | | | | |
| | | | | 33,627,134 |
| |
Food Products 2.5% | | | |
| 647,200 | | Kraft Foods, Inc. | | | 19,571,328 |
| 166,200 | | Mead Johnson Nutrition Co. | | | 8,647,386 |
| 688,000 | | Unilever PLC (United Kingdom) | | | 20,202,130 |
| | | | | |
| | | | | 48,420,844 |
| |
Healthcare Equipment & Supplies 3.6% | | | |
| 191,650 | | Alcon, Inc. | | | 30,962,974 |
| 701,800 | | Baxter International, Inc. | | | 40,844,760 |
| | | | | |
| | | | | 71,807,734 |
| |
Healthcare Providers & Services 3.7% | | | |
| 198,400 | | Express Scripts, Inc.(a) | | | 20,189,184 |
| 824,500 | | Medco Health Solutions, Inc.(a) | | | 53,229,720 |
| | | | | |
| | | | | 73,418,904 |
| |
Hotels, Restaurants & Leisure 1.6% | | | |
| 757,788 | | Marriott International, Inc. (Class A Stock)(b) | | | 23,885,478 |
| 324,300 | | Starbucks Corp.(a) | | | 7,870,761 |
| | | | | |
| | | | | 31,756,239 |
| |
Household Products 1.4% | | | |
| 313,500 | | Colgate-Palmolive Co. | | | 26,729,010 |
| |
Internet & Catalog Retail 3.9% | | | |
| 572,900 | | Amazon.com, Inc.(a) | | | 77,759,717 |
| |
Internet Software & Services 5.7% | | | |
| 31,339 | | Baidu, Inc. (China), ADR(a)(b) | | | 18,709,383 |
| 138,377 | | Google, Inc. (Class A Stock)(a) | | | 78,461,143 |
| 723,300 | | Tencent Holdings Ltd. (China) | | | 14,513,976 |
| | | | | |
| | | | | 111,684,502 |
See Notes to Financial Statements.
| | |
| 8 | | Visit our website at www.prudentialfunds.com |
| | | | | |
| Shares | | Description | | Value (Note 1) |
| | | | | |
COMMON STOCKS (Continued) | | | |
| |
IT Services 5.9% | | | |
| 223,300 | | Mastercard, Inc. (Class A Stock)(b) | | $ | 56,718,200 |
| 659,100 | | Visa, Inc. (Class A Stock) | | | 59,997,873 |
| | | | | |
| | | | | 116,716,073 |
| |
Life Sciences, Tools & Services 0.6% | | | |
| 298,900 | | Illumina, Inc.(a)(b) | | | 11,627,210 |
| |
Machinery 0.9% | | | |
| 297,460 | | Cummins, Inc. | | | 18,427,647 |
| |
Media 2.3% | | | |
| 1,306,199 | | Walt Disney Co. (The) | | | 45,599,407 |
| |
Multiline Retail 2.1% | | | |
| 390,970 | | Dollar General Corp.(a) | | | 9,871,992 |
| 584,800 | | Target Corp. | | | 30,760,480 |
| | | | | |
| | | | | 40,632,472 |
| |
Oil, Gas & Consumable Fuels 3.5% | | | |
| 598,500 | | Occidental Petroleum Corp. | | | 50,597,190 |
| 442,600 | | Southwestern Energy Co.(a) | | | 18,022,672 |
| | | | | |
| | | | | 68,619,862 |
| |
Pharmaceuticals 5.5% | | | |
| 829,900 | | Mylan, Inc.(a)(b) | | | 18,847,029 |
| 170,800 | | Novartis AG (Switzerland), ADR(b) | | | 9,240,280 |
| 447,000 | | Roche Holding AG (Switzerland), ADR | | | 18,112,440 |
| 353,900 | | Shire PLC (Ireland), ADR(b) | | | 23,343,244 |
| 633,700 | | Teva Pharmaceutical Industries Ltd. (Israel), ADR(b) | | | 39,973,796 |
| | | | | |
| | | | | 109,516,789 |
| |
Road & Rail 1.4% | | | |
| 382,500 | | Union Pacific Corp. | | | 28,037,250 |
| |
Semiconductors & Semiconductor Equipment 1.8% | | | |
| 9,281 | | Cree, Inc.(a)(b) | | | 651,712 |
| 1,577,500 | | Intel Corp. | | | 35,115,150 |
| | | | | |
| | | | | 35,766,862 |
| |
Software 8.2% | | | |
| 1,298,500 | | Adobe Systems, Inc.(a) | | | 45,927,945 |
| 2,325,700 | | Microsoft Corp. | | | 68,073,239 |
See Notes to Financial Statements.
| | |
| Prudential Investment Portfolios, Inc./Prudential Jennison Growth Fund | | 9 |
Portfolio of Investments
as of March 31, 2010 (Unaudited) continued
| | | | | | |
| Shares | | Description | | Value (Note 1) | |
| | | | | | |
COMMON STOCKS (Continued) | | | | |
| |
Software (cont’d.) | | | | |
| 359,755 | | Salesforce.com, Inc.(a)(b) | | $ | 26,783,760 | |
| 426,290 | | SolarWinds, Inc.(a)(b) | | | 9,233,441 | |
| 219,800 | | VMware, Inc. (Class A Stock)(a) | | | 11,715,340 | |
| | | | | | |
| | | | | 161,733,725 | |
| |
Specialty Retail 2.7% | | | | |
| 574,900 | | Home Depot, Inc. (The)(b) | | | 18,598,015 | |
| 852,800 | | Staples, Inc. | | | 19,946,992 | |
| 317,318 | | Tiffany & Co. | | | 15,069,432 | |
| | | | | | |
| | | | | 53,614,439 | |
| |
Textiles, Apparel & Luxury Goods 3.1% | | | | |
| 414,480 | | Coach, Inc. | | | 16,380,250 | |
| 619,740 | | NIKE, Inc. (Class B Stock)(b) | | | 45,550,890 | |
| | | | | | |
| | | | | 61,931,140 | |
| | | | | | |
| | Total long-term investments
(cost $1,360,458,330) | | | 1,952,942,948 | |
| | | | | | |
SHORT-TERM INVESTMENT 15.3% | | | | |
| |
Affiliated Money Market Mutual Fund | | | | |
| 302,190,668 | | Prudential Investment Portfolios 2 - Prudential Core Taxable Money Market Fund (cost $302,190,668; includes $298,170,015 of cash collateral received for securities on loan) (Note 3)(c)(d) | | | 302,190,668 | |
| | | | | | |
| | Total Investments 114.2%
(cost $1,662,648,998; Note 5) | | | 2,255,133,616 | |
| | Liabilities in excess of other assets (14.2%) | | | (281,266,750 | ) |
| | | | | | |
| | Net Assets 100.0% | | $ | 1,973,866,866 | |
| | | | | | |
The following abbreviation is used in the portfolio descriptions:
ADR—American Depositary Receipt
| (a) | Non-income producing security. |
| (b) | All or a portion of security is on loan. The aggregate market value of such securities is $289,861,992; cash collateral of $298,170,015 (included in liabilities) was received with which the Fund purchased highly liquid short-term investments. |
| (c) | Prudential Investments LLC, the manager of the Fund, also serves as manager of the Prudential Investment Portfolios 2-Prudential Core Taxable Money Market Fund. |
| (d) | Represents security, or a portion thereof, purchased with cash collateral received for securities on loan. |
See Notes to Financial Statements.
| | |
| 10 | | Visit our website at www.prudentialfunds.com |
Various inputs are used in determining the value of the Series’ investments. These inputs are summarized in the three broad levels listed below.
Level 1—quoted prices in active markets for identical securities
Level 2—other significant observable inputs (including quoted prices for similar securities, interest rates, prepayment speeds, credit risk, etc.)
Level 3—significant unobservable inputs (including the Series’ own assumptions in determining the fair value of investments)
The following is a summary of the inputs used as of March 31, 2010 in valuing the Series’ assets carried at fair value:
| | | | | | | | | |
| | | Level 1 | | Level 2 | | Level 3 |
Investments in Securities | | | | | | | | | |
Common Stocks | | $ | 1,952,942,948 | | $ | — | | $ | — |
Affiliated Money Market Mutual Fund | | | 302,190,668 | | | — | | | — |
| | | | | | | | | |
| | | 2,255,133,616 | | | — | | | — |
Other Financial Instruments* | | | — | | | — | | | — |
| | | | | | | | | |
Total | | $ | 2,255,133,616 | | $ | — | | | $ — |
| | | | | | | | | |
| * | Other financial instruments are derivative instruments not reflected in the Portfolio of Investments, such as futures, forwards and swap contracts, which are valued at the unrealized appreciation/depreciation on the instrument. |
As of September 30, 2009 and March 31, 2010, the Series did not use any significant unobservable inputs (Level 3) in determining the value of investments.
The industry classification of portfolio holdings and liabilities in excess of other assets shown as a percentage of net assets as of March 31, 2010 was as follows:
| | | |
Affiliated Money Market Mutual Fund (including 15.1% of collateral received for securities on loan) | | 15.3 | % |
Computers & Peripherals | | 10.0 | |
Software | | 8.2 | |
IT Services | | 5.9 | |
Internet Software & Services | | 5.7 | |
Communications Equipment | | 5.6 | |
Pharmaceuticals | | 5.5 | |
Capital Markets | | 4.7 | |
Biotechnology | | 4.2 | |
Aerospace & Defense | | 4.1 | |
Internet & Catalog Retail | | 3.9 | |
See Notes to Financial Statements.
| | |
| Prudential Investment Portfolios, Inc./Prudential Jennison Growth Fund | | 11 |
Portfolio of Investments
as of March 31, 2010 (Unaudited) continued
| | | |
Industry (cont’d.) | | | |
Healthcare Providers & Services | | 3.7 | % |
Healthcare Equipment & Supplies | | 3.6 | |
Oil, Gas & Consumable Fuels | | 3.5 | |
Textiles, Apparel & Luxury Goods | | 3.1 | |
Energy Equipment & Services | | 2.9 | |
Specialty Retail | | 2.7 | |
Food Products | | 2.5 | |
Media | | 2.3 | |
Multiline Retail | | 2.1 | |
Semiconductors & Semiconductor Equipment | | 1.8 | |
Diversified Financial Services | | 1.7 | |
Food & Staples Retailing | | 1.7 | |
Hotels, Restaurants & Leisure | | 1.6 | |
Chemicals | | 1.4 | |
Household Products | | 1.4 | |
Road & Rail | | 1.4 | |
Auto Components | | 1.2 | |
Electronic Equipment & Instruments | | 1.0 | |
Machinery | | 0.9 | |
Life Sciences, Tools & Services | | 0.6 | |
| | | |
| | 114.2 | |
Liabilities in excess of other assets | | (14.2 | ) |
| | | |
| | 100.0 | % |
| | | |
See Notes to Financial Statements.
| | |
| 12 | | Visit our website at www.prudentialfunds.com |
Financial Statements
(Unaudited)
| | |
| March 31, 2010 | | SEMIANNUAL REPORT |
Prudential Jennison Growth Fund
Statement of Assets and Liabilities
as of March 31, 2010 (Unaudited)
| | | | |
Assets | | | | |
Investments at value, including securities on loan of $289,861,992: | | | | |
Unaffiliated investments (cost $1,360,458,330) | | $ | 1,952,942,948 | |
Affiliated investments (cost $302,190,668) | | | 302,190,668 | |
Cash | | | 2,439,045 | |
Receivable for investments sold | | | 27,461,621 | |
Receivable for Series shares sold | | | 3,324,120 | |
Dividends receivable | | | 2,090,109 | |
Foreign tax reclaim receivable | | | 513,361 | |
Prepaid expenses | | | 16,257 | |
| | | | |
Total assets | | | 2,290,978,129 | |
| | | | |
| |
Liabilities | | | | |
Payable to broker for collateral for securities on loan | | | 298,170,015 | |
Payable for investments purchased | | | 13,088,708 | |
Payable for Series shares reacquired | | | 3,254,152 | |
Management fee payable | | | 957,089 | |
Accrued expenses | | | 875,951 | |
Affiliated transfer agent fee payable | | | 378,951 | |
Distribution fee payable | | | 378,846 | |
Deferred directors’ fees | | | 7,551 | |
| | | | |
Total liabilities | | | 317,111,263 | |
| | | | |
| |
Net Assets | | $ | 1,973,866,866 | |
| | | | |
| | | | | |
Net assets were comprised of: | | | | |
Common stock, at par | | $ | 117,653 | |
Paid-in capital in excess of par | | | 2,837,691,258 | |
| | | | |
| | | 2,837,808,911 | |
Accumulated net investment loss | | | (657,174 | ) |
Accumulated net realized loss on investments and foreign currency transactions | | | (1,455,769,489 | ) |
Net unrealized appreciation on investments and foreign currencies | | | 592,484,618 | |
| | | | |
Net assets, March 31, 2010 | | $ | 1,973,866,866 | |
| | | | |
See Notes to Financial Statements.
| | |
| 14 | | Visit our website at www.prudentialfunds.com |
| | | |
Class A | | | |
Net asset value and redemption price per share
($1,068,090,644 ÷ 64,007,968 shares of common stock issued and outstanding) | | $ | 16.69 |
Maximum sales charge (5.50% of offering price) | | | 0.97 |
| | | |
Maximum offering price to public | | $ | 17.66 |
| | | |
| |
Class B | | | |
Net asset value, offering price and redemption price per share | | | |
($53,569,343 ÷ 3,597,598 shares of common stock issued and outstanding) | | $ | 14.89 |
| | | |
| |
Class C | | | |
Net asset value, offering price and redemption price per share | | | |
($71,682,265 ÷ 4,806,003 shares of common stock issued and outstanding) | | $ | 14.92 |
| | | |
| |
Class R | | | |
Net asset value, offering price and redemption price per share | | | |
($8,509,294 ÷ 554,949 shares of common stock issued and outstanding) | | $ | 15.33 |
| | | |
| |
Class Z | | | |
Net asset value, offering price and redemption price per share | | | |
($772,015,320 ÷ 44,686,237 shares of common stock issued and outstanding) | | $ | 17.28 |
| | | |
See Notes to Financial Statements.
| | |
| Prudential Investment Portfolios, Inc./Prudential Jennison Growth Fund | | 15 |
Statement of Operations
Six Months Ended March 31, 2010 (Unaudited)
| | | | |
Net Investment Loss | | | | |
Income | | | | |
Unaffiliated dividend income (net of foreign withholding taxes of $251,108) | | $ | 9,149,253 | |
Affiliated income from securities loaned, net | | | 111,979 | |
Affiliated dividend income | | | 21,345 | |
| | | | |
Total income | | | 9,282,577 | |
| | | | |
| |
Expenses | | | | |
Management fee | | | 5,434,221 | |
Distribution fee—Class A | | | 1,541,611 | |
Distribution fee—Class B | | | 280,114 | |
Distribution fee—Class C | | | 314,617 | |
Distribution fee—Class R | | | 17,648 | |
Transfer agent’s fees and expenses (including affiliated expense of $778,300) | | | 1,829,000 | |
Reports to shareholders | | | 95,000 | |
Custodian’s fees and expenses | | | 86,000 | |
Directors’ fees | | | 37,000 | |
Registration fees | | | 35,000 | |
Insurance | | | 24,000 | |
Legal fees and expenses | | | 18,000 | |
Audit fee | | | 11,000 | |
Commitment fee | | | 8,000 | |
Miscellaneous expenses | | | 9,561 | |
| | | | |
Total expenses | | | 9,740,772 | |
| | | | |
Net investment loss | | | (458,195 | ) |
| | | | |
| |
Realized And Unrealized Gain (Loss) On Investments And Foreign Currencies | | | | |
Net realized gain (loss) on: | | | | |
Investment transactions | | | 129,829,910 | |
Foreign currency transactions | | | (92,614 | ) |
| | | | |
| | | 129,737,296 | |
| | | | |
Net change in unrealized appreciation (depreciation) on: | | | | |
Investments | | | 89,018,706 | |
Foreign currencies | | | 11,482 | |
| | | | |
| | | 89,030,188 | |
| | | | |
Net gain on investments and foreign currencies | | | 218,767,484 | |
| | | | |
Net Increase In Net Assets Resulting From Operations | | $ | 218,309,289 | |
| | | | |
See Notes to Financial Statements.
| | |
| 16 | | Visit our website at www.prudentialfunds.com |
Statement of Changes in Net Assets
(Unaudited)
| | | | | | | | |
| | | Six Months
Ended
March 31, 2010 | | | Year
Ended
September 30, 2009 | |
Increase (Decrease) In Net Assets | | | | | | | | |
Operations | | | | | | | | |
Net investment income (loss) | | $ | (458,195 | ) | | $ | 3,044,726 | |
Net realized gain (loss) on investments and foreign currency transactions | | | 129,737,296 | | | | (172,131,798 | ) |
Net change in unrealized appreciation (depreciation) on investments and foreign currencies | | | 89,030,188 | | | | 163,585,404 | |
| | | | | | | | |
Net increase (decrease) in net assets resulting from operations | | | 218,309,289 | | | | (5,501,668 | ) |
| | | | | | | | |
Dividends (Note 1) | | | | | | | | |
Dividends from net investment income: | | | | | | | | |
Class A | | | — | | | | (917,293 | ) |
Class R | | | — | | | | (867 | ) |
Class Z | | | — | | | | (2,220,096 | ) |
| | | | | | | | |
| | | — | | | | (3,138,256 | ) |
| | | | | | | | |
Tax return of capital distributions: | | | | | | | | |
Class A | | | — | | | | (58,899 | ) |
Class R | | | — | | | | (55 | ) |
Class Z | | | — | | | | (142,551 | ) |
| | | | | | | | |
| | | — | | | | (201,505 | ) |
| | | | | | | | |
| | |
Series share transactions (Net of share conversions) (Note 6) | | | | | | | | |
Net proceeds from shares sold | | | 151,611,350 | | | | 277,831,506 | |
Net asset value of shares issued in reinvestment of dividends | | | — | | | | 3,261,143 | |
Cost of shares reacquired | | | (177,104,395 | ) | | | (588,896,885 | ) |
| | | | | | | | |
Net decrease in net assets from Series share transactions | | | (25,493,045 | ) | | | (307,804,236 | ) |
| | | | | | | | |
| | |
Capital Contributions (Note 6) | | | | | | | | |
Proceeds from third party regulatory settlement | | | 2,445,247 | | | | — | |
| | | | | | | | |
Total increase (decrease) | | | 195,261,491 | | | | (316,645,665 | ) |
| | |
Net Assets | | | | | | | | |
Beginning of period | | | 1,778,605,375 | | | | 2,095,251,040 | |
| | | | | | | | |
End of period | | $ | 1,973,866,866 | | | $ | 1,778,605,375 | |
| | | | | | | | |
See Notes to Financial Statements.
| | |
| Prudential Investment Portfolios, Inc./Prudential Jennison Growth Fund | | 17 |
Notes to Financial Statements
(Unaudited)
The Prudential Investment Portfolios, Inc. (the “Company”) is registered under the Investment Company Act of 1940 as an open-end management investment company. The Fund was incorporated in Maryland on August 10, 1995 and consists of six series: Prudential Jennison Growth Fund (formerly Jennison Growth Fund) (the “Series”), Prudential Jennison Equity Opportunity Fund (formerly Jennison Equity Opportunity Fund) and Prudential Asset Allocation Fund (formerly Dryden Asset Allocation Fund) which are diversified funds and Prudential Growth Allocation Fund (formerly JennisonDryden Growth Allocation Fund), Prudential Moderate Allocation Fund (formerly JennisonDryden Moderate Allocation Fund) and Prudential Conservative Allocation Fund (formerly JennisonDryden Conservative Allocation Fund) which are non-diversified funds. These financial statements relate to the Prudential Jennison Growth Fund. The financial statements of the other series are not presented herein. The Series commenced investment operations on November 2, 1995.
The Series’ investment objective is to achieve long-term growth of capital. The Series seeks to achieve its objective by investing primarily in equity securities (common stock, preferred stock and securities convertible into common stock) of established companies with above-average growth prospects.
Note 1. Accounting Policies
The following is a summary of significant accounting policies followed by the Series in the preparation of its financial statements.
Securities Valuation: Securities listed on a securities exchange are valued at the last sale price on such exchange on the day of valuation or, if there was no sale on such day, at the mean between the last reported bid and asked prices, or at the last bid price on such day in the absence of an asked price. Securities traded via NASDAQ are valued at the NASDAQ official closing price (“NOCP”) on the day of valuation, or if there was no NOCP, at the last sale price. Securities that are actively traded in the over-the-counter market, including listed securities for which the primary market is believed by Prudential Investments LLC (“PI” or “Manager”), in consultation with the Subadviser(s), to be over-the-counter, are valued at market value using prices provided by an independent pricing agent or principal market maker. Securities for which reliable market quotations are not readily available, or whose values have been affected by events occurring after the close of the security’s foreign market and
| | |
| 18 | | Visit our website at www.prudentialfunds.com |
before the Series’ normal pricing time, are valued at fair value in accordance with the Board of Directors’ approved fair valuation procedures. When determining the fair valuation of securities some of the factors influencing the valuation include, the nature of any restrictions on disposition of the securities; assessment of the general liquidity of the securities; the issuer’s financial condition and the markets in which it does business; the cost of the investment; the size of the holding and the capitalization of issuer; the prices of any recent transactions or bids/offers for such securities or any comparable securities; any available analyst media or other reports or information deemed reliable by the investment adviser regarding the issuer or the markets or industry in which it operates. Using fair value to price securities may result in a value that is different from a security’s most recent closing price and from the price used by other mutual funds to calculate their net asset values.
Investments in mutual funds are valued at the net asset value as of the close of the New York Stock Exchange on the date of valuation.
Securities Lending: The Series may lend its portfolio securities to broker-dealers. The loans are secured by collateral, at least equal, at all times to the market value of the securities loaned. Loans are subject to termination at the option of the borrower or the Series. Upon termination of the loan, the borrower will return to the lender securities identical to the loaned securities. Should the borrower of the securities fail financially, the Series has the right to repurchase the securities using the collateral in the open market. The Series recognizes income, net of any rebate and securities lending agent fees, for lending its securities in the form of fees or interest on the investment of any cash received as collateral. The Series also continues to receive interest and dividends or amounts equivalent thereto, on the securities loaned and recognizes any unrealized gain or loss in the market price of the securities loaned that may occur during the term of the loan.
Foreign Currency Translation: The books and records of the Series are maintained in U.S. dollars. Foreign currency amounts are translated into U.S. dollars on the following basis:
(i) market value of investment securities, other assets and liabilities-at the current rates of exchange;
(ii) purchases and sales of investment securities, income and expenses-at the rates of exchange prevailing on the respective dates of such transactions.
Although the net assets of the Series are presented at the foreign exchange rates and market values at the close of the fiscal period, the Series does not isolate that portion of the results of operations arising as a result of changes in the foreign exchange rates
| | |
| Prudential Investment Portfolios, Inc./Prudential Jennison Growth Fund | | 19 |
Notes to Financial Statements
(Unaudited) continued
from the fluctuations arising from changes in the market prices of long-term portfolio securities held at the end of the fiscal period. Similarly, the Series does not isolate the effect of changes in foreign exchange rates from the fluctuations arising from changes in the market prices of long-term portfolio securities sold during the fiscal period. Accordingly, these realized foreign currency gains or losses are included in the reported net realized gains or losses on investment transactions.
Net realized gains or losses on foreign currency transactions represent net foreign exchange gains or losses from the holding of foreign currencies, currency gains or losses realized between the trade date and settlement dates on security transactions, and the difference between the amounts of dividends, interest and foreign withholding taxes recorded on the Series’ books and the U.S. dollar equivalent amounts actually received or paid. Net unrealized currency gains or losses from valuing foreign currency denominated assets and liabilities (other than investments) at period end exchange rates are reflected as a component of net unrealized appreciation (depreciation) on foreign currencies.
Foreign security and currency transactions may involve certain considerations and risks not typically associated with those of domestic origin as a result of, among other factors, the possibility of political and economic instability and the level of governmental supervision and regulation of foreign securities markets.
Securities Transactions and Net Investment Income: Securities transactions are recorded on the trade date. Realized gains or losses on sales of securities are calculated on the identified cost basis. Dividend income is recorded on the ex-dividend date and interest income, including amortization of premium and accretion of discount on debt securities, as required, is recorded on the accrual basis.
Net investment income or loss (other than distribution fees which are charged directly to the respective class), realized and unrealized gains or losses, are allocated daily to each class of shares based upon the relative proportion of net assets of each class at the beginning of the day. The Company’s expenses are allocated to the respective Series on the basis of relative net assets except for expenses that are charged directly to the Series level.
Dividends and Distributions: The Series expects to pay dividends of net investment income and distributions of net realized capital and currency gains, if any, annually.
| | |
| 20 | | Visit our website at www.prudentialfunds.com |
Dividends and distributions, which are determined in accordance with federal income tax regulations and which may differ from generally accepted accounting principles, are recorded on the ex-dividend date. Permanent book/tax differences relating to income and gains are reclassified amongst undistributed net investment income, accumulated net realized gain or loss and paid-in capital in excess of par, as appropriate.
Taxes: For federal income tax purposes, each Series in the Company is treated as a separate tax-paying entity. It is the Series’ policy to continue to meet the requirements of the Internal Revenue Code applicable to regulated investment companies and to distribute all of its taxable net income and capital gains, if any, to shareholders. Therefore, no federal income tax provision is required.
Withholding taxes on foreign dividends are recorded net of reclaimable amounts, at the time the related income is earned.
Estimates: The preparation of the financial statements requires management to make estimates and assumptions that affect the reported amounts and disclosures in the financial statements. Actual results could differ from those estimates.
Note 2. Agreements
The Company has a management agreement for the Series with PI. Pursuant to this agreement, PI has responsibility for all investment advisory services and supervises the subadvisor’s performance of such services. PI has entered into a subadvisory agreement with Jennison Associates LLC (“Jennison”). The subadvisory agreement provides that Jennison furnishes investment advisory services in connection with the management of the Series. In connection therewith, Jennison is obligated to keep certain books and records of the Series. PI pays for the services of Jennison, the cost of compensation of officers and employees of the Series, occupancy and certain clerical and bookkeeping costs of the Series. The Series bears all other costs and expenses.
The management fee paid to PI is computed daily and payable monthly at an annual rate of 0.600% of the Series’ average daily net assets up to $300 million, 0.575% of the next $2.7 billion and 0.550% of the Series’ average daily net assets in excess of $3 billion. The effective management fee rate was 0.58% of the Series’ average daily net assets for the six months ended March 31, 2010.
The Series has a distribution agreement with Prudential Investment Management Services LLC (“PIMS”), which acts as the distributor of the Class A, Class B, Class C,
| | |
| Prudential Investment Portfolios, Inc./Prudential Jennison Growth Fund | | 21 |
Notes to Financial Statements
(Unaudited) continued
Class R and Class Z shares of the Series. The Series compensates PIMS for distributing and servicing the Series’ Class A, Class B, Class C and Class R shares, pursuant to plans of distribution (the “Class A, B, C and R Plans”), regardless of expenses actually incurred by PIMS. The distribution fees are accrued daily and payable monthly. No distribution or service fees are paid to PIMS as distributor of the Class Z shares of the Series.
Pursuant to the Class A, B, C and R Plans, the Series compensates PIMS for distribution related activities at an annual rate of up to 0.30%, 1%, 1% and 0.75% of the average daily net assets of the Class A, B, C and R shares, respectively. PIMS contractually agreed to limit such fees 0.50% of the average daily net assets of the Class R shares.
PIMS has advised the Series that it received $104,902 in front-end sales charges resulting from sales of Class A shares during the six months ended March 31, 2010. From these fees, PIMS paid such sales charges to affiliated broker/dealers, which in turn paid commissions to salespersons and incurred other distribution costs.
PIMS has advised the Series that for the six months ended March 31, 2010, it received $228, $48,706 and $1,806 in contingent deferred sales charges imposed upon redemptions by certain Class A, Class B and C shareholders, respectively.
PI, PIMS and Jennison are indirect, wholly-owned subsidiaries of Prudential Financial, Inc. (“Prudential”).
The Series, along with other affiliated registered investment companies (the “Funds”), is a party to a Syndicated Credit Agreement (“SCA”) with two banks. The SCA provides for a commitment of $500 million. Interest on any borrowings under the SCA is incurred at contracted market rates and a commitment fee for the unused amount is accrued daily and paid quarterly. Effective October 22, 2009, the Funds renewed the SCA with the banks. The commitment under the renewed SCA continues to be $500 million. The Funds pay a commitment fee of 0.15% of the unused portion of the renewed SCA. The expiration date of the renewed SCA will be October 20, 2010. For the period from October 24, 2008 through October 21, 2009, the Funds paid a commitment fee of 0.13% of the unused portion of the agreement. The purpose of the SCA is to provide an alternative source of temporary funding for capital share
| | |
| 22 | | Visit our website at www.prudentialfunds.com |
redemptions. The Series did not borrow any amounts pursuant to the SCA during the six months ended March 31, 2010.
Note 3. Other Transactions with Affiliates
Prudential Mutual Fund Services LLC (“PMFS”), an affiliate of PI and an indirect, wholly-owned subsidiary of Prudential, serves as the Series’ transfer agent. Transfer agent’s fees and expenses on the Statement of Operations include certain out-of-pocket expenses paid to non-affiliates, where applicable.
The Series pays networking fees to affiliated and unaffiliated broker/dealers, including fees relating to the services of Wells Fargo Advisors, LLC (“Wells Fargo”), an affiliate of PI through December 31, 2009. These networking fees are payments made to broker/dealers that clear mutual fund transactions through a national clearing system. For the six months ended March 31, 2010, the Series incurred approximately $470,300 in total networking fees, of which approximately $66,700 was paid to Wells Fargo through December 31, 2009. These amounts are included in transfer agent’s fees and expenses in the Statement of Operations.
Prudential Investment Management, Inc. (“PIM”), an indirect, wholly-owned subsidiary of Prudential, is the Series’ security lending agent. For the six months ended March 31, 2010, PIM has been compensated approximately $41,400 for these services.
The Series invests in the Prudential Core Taxable Money Market Fund (formerly Taxable Money Market Series) (the “Portfolio”), a portfolio of the Prudential Investment Portfolios 2 (formerly Dryden Core Investment Fund). The Portfolio is a money market mutual fund registered under the Investment Company Act of 1940, as amended, and managed by PI. Earnings from the Portfolio are disclosed on the Statement of Operations as affiliated dividend income.
Note 4. Portfolio Securities
Purchases and sales of investment securities, other than short-term investments, for the six months ended March 31, 2010 were $739,923,847 and $770,433,014, respectively.
| | |
| Prudential Investment Portfolios, Inc./Prudential Jennison Growth Fund | | 23 |
Notes to Financial Statements
(Unaudited) continued
Note 5. Tax Information
The United States federal income tax basis of the Series’ investments and the net unrealized appreciation as of March 31, 2010 were as follows:
| | | | | | |
Tax Basis of
Investments | | Appreciation | | Depreciation | | Net Unrealized
Appreciation |
| $1,687,677,217 | | $570,940,679 | | $(3,484,280) | | $567,456,399 |
The differences between book and tax basis are primarily attributable to deferred losses on wash sales.
For federal income tax purposes, the Series had a capital loss carryforward as of September 30, 2009 of approximately $1,504,491,000 of which $442,788,000 expires in 2010, $827,428,000 expires in 2011, $68,190,000 expires in 2012 and $166,085,000 expires in 2017. Accordingly, no capital gains distribution is expected to be paid to shareholders until net gains have been realized in excess of such amounts. It is uncertain whether, the Series will be able to realize the full benefit prior to the expiration date.
The Series has elected to treat post-October capital losses of approximately $55,987,000 and post-October currency losses of approximately $191,000 incurred in the eleven months ended September 30, 2009 as having been incurred in the next fiscal year (September 30, 2010).
Management has analyzed the Series’ tax positions taken on federal income tax returns for all open tax years and has concluded that as of March 31, 2010, no provision for income tax would be required in the Series’ financial statements. The Series’ federal and state income and federal excise tax returns for tax years for which the applicable statutes of limitations have not expired are subject to examination by the Internal Revenue Service and state departments of revenue.
Note 6. Capital
The Series offers Class A, Class B, Class C, Class R and Class Z shares. Class A shares are subject to a maximum front-end sales charge of 5.50%. Investors who purchase Class A shares in an amount of $1 million or more and sell these shares within 12
| | |
| 24 | | Visit our website at www.prudentialfunds.com |
months of purchase are not subject to an initial sales charge but are subject to a contingent deferred sales charge (CDSC) of 1%, including investors who purchase their shares through broker-dealers affiliated with Prudential. Class B shares are subject to a CDSC of 5%, which decreases by 1% annually to 1% in the fifth and sixth years and 0% in the seventh year. The CDSC for Class C shares is 1% for shares redeemed within 12 months of purchase. Class B shares automatically convert to Class A shares on a quarterly basis approximately seven years after purchase. A special exchange privilege is also available for shareholders who qualified to purchase Class A shares at net asset value. Class R and Class Z shares are not subject to any sales or redemption charge and are offered exclusively for sale to a limited group of investors.
There are 6.25 billion shares of $.001 par value common stock of the Company authorized which are divided into six series. There are 1.25 billion shares authorized for the Series divided into five classes, designated Class A, Class B, Class C, Class R and Class Z shares, each of which consists of 208,333,333 authorized shares. The Series also may offer Class I shares, of which 208,333,333 shares are authorized, but none are currently issued and outstanding. As of March 31, 2010, Prudential Investments Fund Management LLC owned 193 shares of Class R shares of the Series.
For the six months ended March 31, 2010, the Series received $2,445,247 related to a third-party’s settlement of regulatory proceedings involving allegations of improper trading. This amount is presented in the Series’ Statement of Changes in Net Assets.
Transactions in shares of common stock were as follows:
| | | | | | | |
Class A | | Shares | | | Amount | |
Six months ended March 31, 2010: | | | | | | | |
Shares sold | | 4,316,032 | | | $ | 67,678,782 | |
Shares reacquired | | (6,602,762 | ) | | | (104,218,275 | ) |
| | | | | | | |
Net increase (decrease) in shares outstanding before conversion | | (2,286,730 | ) | | | (36,539,493 | ) |
Shares issued upon conversion from Class B | | 271,431 | | | | 4,396,392 | |
| | | | | | | |
Net increase (decrease) in shares outstanding | | (2,015,299 | ) | | $ | (32,143,101 | ) |
| | | | | | | |
Year ended September 30, 2009: | | | | | | | |
Shares sold | | 9,574,420 | | | $ | 115,819,615 | |
Shares issued in reinvestment of dividends | | 68,086 | | | | 906,213 | |
Shares reacquired | | (20,112,906 | ) | | | (240,976,222 | ) |
| | | | | | | |
Net increase (decrease) in shares outstanding before conversion | | (10,470,400 | ) | | | (124,250,394 | ) |
Shares issued upon conversion from Class B | | 1,592,079 | | | | 19,022,996 | |
| | | | | | | |
Net increase (decrease) in shares outstanding | | (8,878,321 | ) | | $ | (105,227,398 | ) |
| | | | | | | |
| | |
| Prudential Investment Portfolios, Inc./Prudential Jennison Growth Fund | | 25 |
Notes to Financial Statements
(Unaudited) continued
| | | | | | | |
Class B | | Shares | | | Amount | |
Six months ended March 31, 2010: | | | | | | | |
Shares sold | | 131,908 | | | $ | 1,860,870 | |
Shares reacquired | | (470,372 | ) | | | (6,673,264 | ) |
| | | | | | | |
Net increase (decrease) in shares outstanding before conversion | | (338,464 | ) | | | (4,812,394 | ) |
Shares reacquired upon conversion into Class A | | (303,867 | ) | | | (4,396,392 | ) |
| | | | | | | |
Net increase (decrease) in shares outstanding | | (642,331 | ) | | $ | (9,208,786 | ) |
| | | | | | | |
Year ended September 30, 2009: | | | | | | | |
Shares sold | | 398,689 | | | $ | 4,339,270 | |
Shares reacquired | | (973,240 | ) | | | (10,427,872 | ) |
| | | | | | | |
Net increase (decrease) in shares outstanding before conversion | | (574,551 | ) | | | (6,088,602 | ) |
Shares reacquired upon conversion into Class A | | (1,772,685 | ) | | | (19,022,996 | ) |
| | | | | | | |
Net increase (decrease) in shares outstanding | | (2,347,236 | ) | | $ | (25,111,598 | ) |
| | | | | | | |
Class C | | | | | | |
Six months ended March 31, 2010: | | | | | | | |
Shares sold | | 1,131,875 | | | $ | 16,454,724 | |
Shares reacquired | | (443,447 | ) | | | (6,248,524 | ) |
| | | | | | | |
Net increase (decrease) in shares outstanding | | 688,428 | | | $ | 10,206,200 | |
| | | | | | | |
Year ended September 30, 2009: | | | | | | | |
Shares sold | | 702,848 | | | $ | 7,759,502 | |
Shares reacquired | | (932,912 | ) | | | (10,129,582 | ) |
| | | | | | | |
Net increase (decrease) in shares outstanding | | (230,064 | ) | | $ | (2,370,080 | ) |
| | | | | | | |
Class R | | | | | | |
Six months ended March 31, 2010: | | | | | | | |
Shares sold | | 224,102 | | | $ | 3,284,989 | |
Shares reacquired | | (92,904 | ) | | | (1,358,695 | ) |
| | | | | | | |
Net increase (decrease) in shares outstanding | | 131,198 | | | $ | 1,926,294 | |
| | | | | | | |
Year ended September 30, 2009: | | | | | | | |
Shares sold | | 291,958 | | | $ | 3,360,599 | |
Shares issued in reinvestment of dividends | | 75 | | | | 922 | |
Shares reacquired | | (99,033 | ) | | | (1,138,666 | ) |
| | | | | | | |
Net increase (decrease) in shares outstanding | | 193,000 | | | $ | 2,222,855 | |
| | | | | | | |
| | |
| 26 | | Visit our website at www.prudentialfunds.com |
| | | | | | | |
Class Z | | Shares | | | Amount | |
Six months ended March 31, 2010: | | | | | | | |
Shares sold | | 3,808,024 | | | $ | 62,331,985 | |
Shares reacquired | | (3,581,690 | ) | | | (58,605,637 | ) |
| | | | | | | |
Net increase (decrease) in shares outstanding | | 226,334 | | | $ | 3,726,348 | |
| | | | | | | |
Year ended September 30, 2009: | | | | | | | |
Shares sold | | 11,686,332 | | | $ | 146,552,520 | |
Shares issued in reinvestment of dividends | | 171,201 | | | | 2,354,008 | |
Shares reacquired | | (25,673,367 | ) | | | (326,224,543 | ) |
| | | | | | | |
Net increase (decrease) in shares outstanding | | (13,815,834 | ) | | $ | (177,318,015 | ) |
| | | | | | | |
Note 7. New Accounting Pronouncements
In January 2010, the Financial Accounting Standards Board (“FASB”) issued Accounting Standards Update (“ASU”) No. 2010-06 “Improving Disclosures about Fair Value Measurements”. ASU 2010-06 will require reporting entities to make new disclosures about amounts and reasons for significant transfers in and out of Level 1 and Level 2 fair value measurements and input and valuation techniques used to measure fair value for both recurring and nonrecurring fair value measurements that fall in either Level 2 or Level 3, and information on purchases, sales, issuances, and settlements in the roll forward of activity in Level 3 fair value measurements. The new and revised disclosures are effective for interim and annual reporting periods beginning after December 15, 2009 except for the disclosures about purchases, sales, issuances, and settlements in the roll forward of activity in Level 3 fair value measurements, which are effective for interim and annual reporting periods beginning after December 15, 2010. At this time, management is evaluating the implications of ASU No. 2010-06 and its impact on the financial statements has not been determined.
Note 8. Subsequent Events
Management has evaluated the impact of all subsequent events on the Series and has determined that there were no subsequent events requiring recognition or disclosure in the financial statements.
| | |
| Prudential Investment Portfolios, Inc./Prudential Jennison Growth Fund | | 27 |
Financial Highlights
(Unaudited)
| | | | |
| | | Class A | |
| | | Six Months Ended
March 31, 2010 | |
Per Share Operating Performance(a): | | | | |
Net Asset Value, Beginning Of Period | | $ | 14.84 | |
| | | | |
Income (loss) from investment operations: | | | | |
Net investment income (loss) | | | (0.01 | ) |
Net realized and unrealized gain (loss) on investment and foreign currency transactions | | | 1.84 | |
| | | | |
Total from investment operations | | | 1.83 | |
| | | | |
Less Dividends: | | | | |
Dividends from net investment income | | | — | |
Tax return of capital distributions | | | — | |
| | | | |
Total distributions | | | — | |
| | | | |
Capital Contributions | | | 0.02 | |
| | | | |
Net asset value, end of period | | $ | 16.69 | |
| | | | |
Total Return(c): | | | 12.47 | % |
Ratios/Supplemental Data: | | | | |
Net assets, end of period (000) | | $ | 1,068,091 | |
Average net assets (000) | | $ | 1,030,380 | |
Ratios to average net assets(e): | | | | |
Expenses, including distribution and service (12b-1) fees | | | 1.11 | %(g) |
Expenses, excluding distribution and service (12b-1) fees | | | 0.81 | %(g) |
Net investment income (loss) | | | (0.12 | )%(g) |
For Class A, B, C, R and Z shares: | | | | |
Portfolio turnover rate | | | 40 | %(h) |
| (a) | Calculations are based on average shares outstanding during the period. |
| (b) | Less than $.005 per share. |
| (c) | Total return does not consider the effects of sales loads. Total return is calculated assuming a purchase of a share on the first day and a sale on the last day of each period reported and includes reinvestment of dividends and distributions. Total investment returns may reflect adjustments to conform to generally accepted accounting principles. Total returns for periods less than one full year are not annualized. |
| (d) | The distributor of the Series contractually agreed to limit its distribution and service (12b-1) fees to .25 of 1% on the average daily net assets of the Class A shares through January 31, 2008. |
| (e) | Does not include expenses of the underlying portfolios in which the Series invests. |
See Notes to Financial Statements.
| | |
| 28 | | Visit our website at www.prudentialfunds.com |
| | | | | | | | | | | | | | | | | | |
| Class A | |
| Year Ended September 30, | |
| 2009 | | | 2008 | | | 2007 | | | 2006 | | | 2005 | |
| | | | | | | | | | | | | | | | | | |
| $ | 14.43 | | | $ | 18.22 | | | $ | 15.78 | | | $ | 15.31 | | | $ | 12.84 | |
| | | | | | | | | | | | | | | | | | | |
| | | | | | | | | | | | | | | | | | |
| | 0.01 | | | | (0.01 | ) | | | — | (b) | | | (0.03 | ) | | | 0.01 | |
| | 0.41 | | | | (3.78 | ) | | | 2.44 | | | | 0.50 | | | | 2.46 | |
| | | | | | | | | | | | | | | | | | | |
| | 0.42 | | | | (3.79 | ) | | | 2.44 | | | | 0.47 | | | | 2.47 | |
| | | | | | | | | | | | | | | | | | | |
| | | | | | | | | | | | | | | | | | |
| | (0.01 | ) | | | — | (b) | | | — | | | | — | | | | — | |
| | — | (b) | | | — | | | | — | | | | — | | | | — | |
| | | | | | | | | | | | | | | | | | | |
| | (0.01 | ) | | | — | (b) | | | — | | | | — | | | | — | |
| | | | | | | | | | | | | | | | | | | |
| | — | | | | — | | | | — | | | | — | | | | — | |
| | | | | | | | | | | | | | | | | | | |
| $ | 14.84 | | | $ | 14.43 | | | $ | 18.22 | | | $ | 15.78 | | | $ | 15.31 | |
| | | | | | | | | | | | | | | | | | | |
| | 2.95 | % | | | (20.78 | )% | | | 15.46 | % | | | 3.07 | % | | | 19.24 | % |
| | | | | | | | | | | | | | | | | | |
| $ | 979,671 | | | $ | 1,081,148 | | | $ | 1,566,814 | | | $ | 1,481,913 | | | $ | 1,348,039 | |
| $ | 837,882 | | | $ | 1,374,025 | | | $ | 1,525,634 | | | $ | 1,393,481 | | | $ | 1,258,500 | |
| | | | | | | | | | | | | | | | | | |
| | 1.13 | % | | | 1.08 | %(d) | | | 1.02 | %(d) | | | 1.04 | %(d) | | | 1.06 | %(d) |
| | 0.83 | % | | | 0.80 | % | | | 0.77 | % | | | 0.79 | % | | | 0.81 | % |
| | 0.10 | % | | | (0.04 | )% | | | — | (f) | | | (0.18 | )% | | | 0.04 | % |
| | | | | | | | | | | | | | | | | | |
| | 74 | % | | | 83 | % | | | 63 | % | | | 72 | % | | | 57 | % |
See Notes to Financial Statements.
| | |
| Prudential Investment Portfolios, Inc./Prudential Jennison Growth Fund | | 29 |
Financial Highlights
(Unaudited) continued
| | | | |
| | | Class B | |
| | | Six Months Ended
March 31, 2010 | |
Per Share Operating Performance(a): | | | | |
Net Asset Value, Beginning Of Period | | $ | 13.29 | |
| | | | |
Income (loss) from investment operations: | | | | |
Net investment loss | | | (0.06 | ) |
Net realized and unrealized gain (loss) on investment and foreign currency transactions | | | 1.64 | |
| | | | |
Total from investment operations | | | 1.58 | |
| | | | |
Capital Contributions | | | 0.02 | |
| | | | |
Net asset value, end of period | | $ | 14.89 | |
| | | | |
Total Return(b): | | | 12.04 | % |
Ratios/Supplemental Data: | | | | |
Net assets, end of period (000) | | $ | 53,569 | |
Average net assets (000) | | $ | 56,169 | |
Ratios to average net assets(c): | | | | |
Expenses, including distribution and service (12b-1) fees | | | 1.81 | %(d) |
Expenses, excluding distribution and service (12b-1) fees | | | 0.81 | %(d) |
Net investment loss | | | (0.81 | )%(d) |
| (a) | Calculations are based on average shares outstanding during the period. |
| (b) | Total return does not consider the effects of sales loads. Total return is calculated assuming a purchase of a share on the first day and a sale on the last day of each period reported and includes reinvestment of dividends and distributions. Total investment returns may reflect adjustments to conform to generally accepted accounting principles. Total returns for periods less than one full year are not annualized. |
| (c) | Does not include expenses of the underlying portfolios in which the Series invests. |
See Notes to Financial Statements.
| | |
| 30 | | Visit our website at www.prudentialfunds.com |
| | | | | | | | | | | | | | | | | | |
| Class B | |
| Year Ended September 30, | |
| 2009 | | | 2008 | | | 2007 | | | 2006 | | | 2005 | |
| | | | | | | | | | | | | | | | | | |
| $ | 13.00 | | | $ | 16.53 | | | $ | 14.42 | | | $ | 14.09 | | | $ | 11.90 | |
| | | | | | | | | | | | | | | | | | | |
| | | | | | | | | | | | | | | | | | |
| | (0.06 | ) | | | (0.12 | ) | | | (0.12 | ) | | | (0.13 | ) | | | (0.09 | ) |
| | 0.35 | | | | (3.41 | ) | | | 2.23 | | | | 0.46 | | | | 2.28 | |
| | | | | | | | | | | | | | | | | | | |
| | 0.29 | | | | (3.53 | ) | | | 2.11 | | | | 0.33 | | | | 2.19 | |
| | | | | | | | | | | | | | | | | | | |
| | — | | | | — | | | | — | | | | — | | | | — | |
| | | | | | | | | | | | | | | | | | | |
| $ | 13.29 | | | $ | 13.00 | | | $ | 16.53 | | | $ | 14.42 | | | $ | 14.09 | |
| | | | | | | | | | | | | | | | | | | |
| | 2.23 | % | | | (21.36 | )% | | | 14.63 | % | | | 2.34 | % | | | 18.40 | % |
| | | | | | | | | | | | | | | | | | |
| $ | 56,336 | | | $ | 85,641 | | | $ | 163,232 | | | $ | 243,951 | | | $ | 371,561 | |
| $ | 57,781 | | | $ | 127,973 | | | $ | 205,950 | | | $ | 322,042 | | | $ | 439,078 | |
| | | | | | | | | | | | | | | | | | |
| | 1.83 | % | | | 1.80 | % | | | 1.77 | % | | | 1.79 | % | | | 1.81 | % |
| | 0.83 | % | | | 0.80 | % | | | 0.77 | % | | | 0.79 | % | | | 0.81 | % |
| | (0.57 | )% | | | (0.75 | )% | | | (0.75 | )% | | | (0.91 | )% | | | (0.66 | )% |
See Notes to Financial Statements.
| | |
| Prudential Investment Portfolios, Inc./Prudential Jennison Growth Fund | | 31 |
Financial Highlights
(Unaudited) continued
| | | | |
| | | Class C | |
| | | Six Months Ended
March 31, 2010 | |
Per Share Operating Performance(a): | | | | |
Net Asset Value, Beginning Of Period | | $ | 13.29 | |
| | | | |
Income (loss) from investment operations: | | | | |
Net investment loss | | | (0.06 | ) |
Net realized and unrealized gain (loss) on investment and foreign currency transactions | | | 1.67 | |
| | | | |
Total from investment operations | | | 1.61 | |
| | | | |
Capital Contributions | | | 0.02 | |
| | | | |
Net asset value, end of period | | $ | 14.92 | |
| | | | |
Total Return(b): | | | 12.26 | % |
Ratios/Supplemental Data: | | | | |
Net assets, end of period (000) | | $ | 71,682 | |
Average net assets (000) | | $ | 63,088 | |
Ratios to average net assets(c): | | | | |
Expenses, including distribution and service (12b-1) fees | | | 1.81 | %(d) |
Expenses, excluding distribution and service (12b-1) fees | | | 0.81 | %(d) |
Net investment loss | | | (0.81 | )%(d) |
| (a) | Calculations are based on average shares outstanding during the period. |
| (b) | Total return does not consider the effects of sales loads. Total return is calculated assuming a purchase of a share on the first day and a sale on the last day of each period reported and includes reinvestment of dividends and distributions. Total investment returns may reflect adjustments to conform to generally accepted accounting principles. Total returns for periods less than one full year are not annualized. |
| (c) | Does not include expenses of the underlying portfolios in which the Series invests. |
See Notes to Financial Statements.
| | |
| 32 | | Visit our website at www.prudentialfunds.com |
| | | | | | | | | | | | | | | | | | |
| Class C | |
| Year Ended September 30, | |
| 2009 | | | 2008 | | | 2007 | | | 2006 | | | 2005 | |
| | | | | | | | | | | | | | | | | | |
| $ | 13.00 | | | $ | 16.53 | | | $ | 14.42 | | | $ | 14.09 | | | $ | 11.90 | |
| | | | | | | | | | | | | | | | | | | |
| | | | | | | | | | | | | | | | | | |
| | (0.07 | ) | | | (0.12 | ) | | | (0.12 | ) | | | (0.14 | ) | | | (0.08 | ) |
| | 0.36 | | | | (3.41 | ) | | | 2.23 | | | | 0.47 | | | | 2.27 | |
| | | | | | | | | | | | | | | | | | | |
| | 0.29 | | | | (3.53 | ) | | | 2.11 | | | | 0.33 | | | | 2.19 | |
| | | | | | | | | | | | | | | | | | | |
| | — | | | | — | | | | — | | | | — | | | | — | |
| | | | | | | | | | | | | | | | | | | |
| $ | 13.29 | | | $ | 13.00 | | | $ | 16.53 | | | $ | 14.42 | | | $ | 14.09 | |
| | | | | | | | | | | | | | | | | | | |
| | 2.23 | % | | | (21.36 | )% | | | 14.63 | % | | | 2.34 | % | | | 18.40 | % |
| | | | | | | | | | | | | | | | | | |
| $ | 54,710 | | | $ | 56,527 | | | $ | 78,280 | | | $ | 83,123 | | | $ | 86,198 | |
| $ | 46,097 | | | $ | 70,987 | | | $ | 79,797 | | | $ | 87,385 | | | $ | 91,313 | |
| | | | | | | | | | | | | | | | | | |
| | 1.83 | % | | | 1.80 | % | | | 1.77 | % | | | 1.79 | % | | | 1.81 | % |
| | 0.83 | % | | | 0.80 | % | | | 0.77 | % | | | 0.79 | % | | | 0.81 | % |
| | (0.60 | )% | | | (0.76 | )% | | | (0.75 | )% | | | (0.99 | )% | | | (0.61 | )% |
See Notes to Financial Statements.
| | |
| Prudential Investment Portfolios, Inc./Prudential Jennison Growth Fund | | 33 |
Financial Highlights
(Unaudited) continued
| | | | |
| | | Class R | |
| |
| | | Six Months Ended
March 31, 2010 | |
Per Share Operating Performance(b): | | | | |
Net Asset Value, Beginning Of Period | | $ | 13.65 | |
| | | | |
Income (loss) from investment operations: | | | | |
Net investment loss | | | (0.02 | ) |
Net realized and unrealized gain (loss) on investment and foreign currency transactions | | | 1.68 | |
| | | | |
Total from investment operations | | | 1.66 | |
| | | | |
Less Dividends: | | | | |
Dividends from net investment income | | | — | |
Tax return of capital distributions | | | — | |
| | | | |
Total distributions | | | — | |
| | | | |
Capital Contributions | | | 0.02 | |
| | | | |
Net asset value, end of period | | $ | 15.33 | |
| | | | |
Total Return(c): | | | 12.31 | % |
Ratios/Supplemental Data: | | | | |
Net assets, end of period (000) | | $ | 8,509 | |
Average net assets (000) | | $ | 7,077 | |
Ratios to average net assets(e): | | | | |
Expenses, including distribution and service (12b-1) fees(f) | | | 1.31 | %(g) |
Expenses, excluding distribution and service (12b-1) fees | | | 0.81 | %(g) |
Net investment loss | | | (0.32 | )%(g) |
| (a) | Inception date of Class R shares. |
| (b) | Calculations are based on average shares outstanding during the period. |
| (c) | Total return is calculated assuming a purchase of a share on the first day and a sale on the last day of each period reported and includes reinvestment of dividends and distributions. Total investment returns may reflect adjustments to conform to generally accepted accounting principles. Total returns for periods less than one full year are not annualized. |
| (d) | Amount is actual and not rounded. |
| (e) | Does not include expenses of the underlying portfolios in which the Series invests. |
| (f) | The distributor of the Series contractually agreed to limit its distribution and service (12b-1) fees to .50 of 1% on the average daily net assets of the Class R shares. |
| (h) | Less than $.005 per share. |
See Notes to Financial Statements.
| | |
| 34 | | Visit our website at www.prudentialfunds.com |
| | | | | | | | | | | | | | | | | | |
| Class R | |
| Year Ended September 30, | | | December 17, 2004(a)
through
September 30, 2005 | |
| 2009 | | | 2008 | | | 2007 | | | 2006 | | |
| | | | | | | | | | | | | | | | | | |
| $ | 13.29 | | | $ | 16.80 | | | $ | 14.59 | | | $ | 14.15 | | | $ | 12.97 | |
| | | | | | | | | | | | | | | | | | | |
| | | | | | | | | | | | | | | | | | |
| | (0.01 | ) | | | (0.04 | ) | | | (0.03 | ) | | | (0.06 | ) | | | (0.05 | ) |
| | 0.37 | | | | (3.47 | ) | | | 2.24 | | | | 0.50 | | | | 1.23 | |
| | | | | | | | | | | | | | | | | | | |
| | 0.36 | | | | (3.51 | ) | | | 2.21 | | | | 0.44 | | | | 1.18 | |
| | | | | | | | | | | | | | | | | | | |
| | | | | | | | | | | | | | | | | | |
| | — | (h) | | | — | | | | — | | | | — | | | | — | |
| | — | (h) | | | — | | | | — | | | | — | | | | — | |
| | | | | | | | | | | | | | | | | | | |
| | — | (h) | | | — | | | | — | | | | — | | | | — | |
| | | | | | | | | | | | | | | | | | | |
| | — | | | | — | | | | — | | | | — | | | | — | |
| | | | | | | | | | | | | | | | | | | |
| $ | 13.65 | | | $ | 13.29 | | | $ | 16.80 | | | $ | 14.59 | | | $ | 14.15 | |
| | | | | | | | | | | | | | | | | | | |
| | 2.73 | % | | | (20.89 | )% | | | 15.15 | % | | | 3.11 | % | | | 9.10 | % |
| | | | | | | | | | | | | | | | | | |
| $ | 5,784 | | | $ | 3,067 | | | $ | 2,977 | | | $ | 179,270 | (d) | | $ | 2,727 | (d) |
| $ | 3,608 | | | $ | 3,165 | | | $ | 1,849 | | | $ | 54,657 | (d) | | $ | 2,528 | (d) |
| | | | | | | | | | | | | | | | | | |
| | 1.33 | % | | | 1.30 | % | | | 1.27 | % | | | 1.29 | % | | | 1.31 | %(g) |
| | 0.83 | % | | | 0.80 | % | | | 0.77 | % | | | 0.79 | % | | | 0.81 | %(g) |
| | (0.12 | )% | | | (0.26 | )% | | | (0.20 | )% | | | (0.47 | )% | | | (0.52 | )%(g) |
See Notes to Financial Statements.
| | |
| Prudential Investment Portfolios, Inc./Prudential Jennison Growth Fund | | 35 |
Financial Highlights
(Unaudited) continued
| | | | |
| | | Class Z | |
| | | Six Months Ended
March 31, 2010 | |
Per Share Operating Performance(a): | | | | |
Net Asset Value, Beginning Of Period | | $ | 15.34 | |
| | | | |
Income (loss) from investment operations: | | | | |
Net investment income | | | 0.01 | |
Net realized and unrealized gain (loss) on investment and foreign currency transactions | | | 1.91 | |
| | | | |
Total from investment operations | | | 1.92 | |
| | | | |
Less Dividends: | | | | |
Dividends from net investment income | | | — | |
Tax return of capital distributions | | | — | |
| | | | |
Total distributions | | | — | |
| | | | |
Capital Contributions | | | 0.02 | |
| | | | |
Net asset value, end of period | | $ | 17.28 | |
| | | | |
Total Return(b): | | | 12.65 | % |
Ratios/Supplemental Data: | | | | |
Net assets, end of period (000) | | $ | 772,015 | |
Average net assets (000) | | $ | 725,457 | |
Ratios to average net assets(c): | | | | |
Expenses, including distribution and service (12b-1) fees | | | 0.81 | %(e) |
Expenses, excluding distribution and service (12b-1) fees | | | 0.81 | %(e) |
Net investment income | | | 0.18 | %(e) |
| (a) | Calculations are based on average shares outstanding during the period. |
| (b) | Total return is calculated assuming a purchase of a share on the first day and a sale on the last day of each period reported and includes reinvestment of dividends and distributions. Total investment returns may reflect adjustments to conform to generally accepted accounting principles. Total returns for periods less than one full year are not annualized. |
| (c) | Does not include expenses of the underlying portfolios in which the Series invests. |
| (d) | Less than $.005 per share |
See Notes to Financial Statements.
| | |
| 36 | | Visit our website at www.prudentialfunds.com |
| | | | | | | | | | | | | | | | | | |
| Class Z | |
| Year Ended September 30, | |
| 2009 | | | 2008 | | | 2007 | | | 2006 | | | 2005 | |
| | | | | | | | | | | | | | | | | | |
| $ | 14.91 | | | $ | 18.80 | | | $ | 16.25 | | | $ | 15.72 | | | $ | 13.15 | |
| | | | | | | | | | | | | | | | | | | |
| | | | | | | | | | | | | | | | | | |
| | 0.05 | | | | 0.04 | | | | 0.04 | | | | 0.01 | | | | 0.04 | |
| | 0.42 | | | | (3.89 | ) | | | 2.51 | | | | 0.52 | | | | 2.53 | |
| | | | | | | | | | | | | | | | | | | |
| | 0.47 | | | | (3.85 | ) | | | 2.55 | | | | 0.53 | | | | 2.57 | |
| | | | | | | | | | | | | | | | | | | |
| | | | | | | | | | | | | | | | | | |
| | (0.04 | ) | | | (0.04 | ) | | | — | | | | — | | | | — | |
| | — | (d) | | | — | | | | — | | | | — | | | | — | |
| | | | | | | | | | | | | | | | | | | |
| | (0.04 | ) | | | (0.04 | ) | | | — | | | | — | | | | — | |
| | | | | | | | | | | | | | | | | | | |
| | — | | | | — | | | | — | | | | — | | | | — | |
| | | | | | | | | | | | | | | | | | | |
| $ | 15.34 | | | $ | 14.91 | | | $ | 18.80 | | | $ | 16.25 | | | $ | 15.72 | |
| | | | | | | | | | | | | | | | | | | |
| | 3.20 | % | | | (20.51 | )% | | | 15.69 | % | | | 3.37 | % | | | 19.54 | % |
| | | | | | | | | | | | | | | | | | |
| $ | 682,104 | | | $ | 868,869 | | | $ | 1,100,959 | | | $ | 1,182,040 | | | $ | 1,393,365 | |
| $ | 679,423 | | | $ | 1,026,959 | | | $ | 1,134,856 | | | $ | 1,305,889 | | | $ | 1,324,754 | |
| | | | | | | | | | | | | | | | | | |
| | 0.83 | % | | | 0.80 | % | | | 0.77 | % | | | 0.79 | % | | | 0.81 | % |
| | 0.83 | % | | | 0.80 | % | | | 0.77 | % | | | 0.79 | % | | | 0.81 | % |
| | 0.41 | % | | | 0.24 | % | | | 0.25 | % | | | 0.08 | % | | | 0.28 | % |
See Notes to Financial Statements.
| | |
| Prudential Investment Portfolios, Inc./Prudential Jennison Growth Fund | | 37 |
Results of Proxy Voting
(Unaudited)
At a special meeting of shareholders held on March 9, 2010, Fund shareholders approved a proposal to elect Directors.
The individuals listed in the table below were elected as directors of each Fund.* All directors, with the exception of Mr. Benjamin, served as directors to each Fund prior to the shareholder meeting.
| | | | |
Trustee | | For | | Withheld |
Kevin J. Bannon | | 123,240,410.836 | | 1,700,825.331 |
| | |
Linda W. Bynoe | | 123,157,644.037 | | 1,783,592.130 |
| | |
Michael S. Hyland | | 123,201,323.318 | | 1,739,912.849 |
| | |
Douglas H. McCorkindale | | 123,074,984.328 | | 1,866,251.839 |
| | |
Stephen P. Munn | | 123,216,742.859 | | 1,724,493.308 |
| | |
Richard A. Redeker | | 123,225,795.108 | | 1,715,441.059 |
| | |
Robin B. Smith | | 123,040,042.169 | | 1,901,193.998 |
| | |
Stephen G. Stoneburn | | 123,252,589.748 | | 1,688,646.419 |
| | |
Judy A. Rice | | 123,218,596.264 | | 1,722,639.903 |
| | |
Scott E. Benjamin | | 123,212,247.295 | | 1,728,988.872 |
| * | Results are for all funds within the same investment company. |
| | |
| 38 | | Visit our website at www.prudentialfunds.com |
| | | | |
| n MAIL | | n TELEPHONE | | n WEBSITE |
Gateway Center Three 100 Mulberry Street Newark, NJ 07102 | | (800) 225-1852 | | www.prudentialfunds.com |
|
| PROXY VOTING |
| The Board of Directors of the Fund has delegated to the Fund’s investment subadviser the responsibility for voting any proxies and maintaining proxy recordkeeping with respect to the Fund. A description of these proxy voting policies and procedures is available without charge, upon request, by calling (800) 225-1852 or by visiting the Securities and Exchange Commission’s website at www.sec.gov. Information regarding how the Fund voted proxies relating to portfolio securities during the most recent 12-month period ended June 30 is available on the Fund’s website and on the Commission’s website. |
|
| DIRECTORS |
| Kevin J. Bannon • Scott E. Benjamin • Linda W. Bynoe • Michael S. Hyland • Douglas H. McCorkindale • Stephen P. Munn • Richard A. Redeker • Judy A. Rice • Robin B. Smith • Stephen G. Stoneburn |
|
| OFFICERS |
| Judy A. Rice, President • Scott E. Benjamin, Vice President • Grace C. Torres, Treasurer and Principal Financial and Accounting Officer • Kathryn L. Quirk, Chief Legal Officer • Deborah A. Docs, Secretary • Timothy J. Knierim, Chief Compliance Officer • Valerie M. Simpson, Deputy Chief Compliance Officer • Theresa C. Thompson, Deputy Chief Compliance Officer • Noreen M. Fierro, Anti-Money Laundering Compliance Officer • Jonathan D. Shain, Assistant Secretary • Claudia DiGiacomo, Assistant Secretary • John P. Schwartz, Assistant Secretary • Andrew R. French, Assistant Secretary • M. Sadiq Peshimam, Assistant Treasurer • Peter Parrella, Assistant Treasurer |
| | | | |
| MANAGER | | Prudential Investments LLC | | Gateway Center Three
100 Mulberry Street
Newark, NJ 07102 |
|
| INVESTMENT SUBADVISER | | Jennison Associates LLC | | 466 Lexington Avenue
New York, NY 10017 |
|
| DISTRIBUTOR | | Prudential Investment
Management Services LLC | | Gateway Center Three
100 Mulberry Street
Newark, NJ 07102 |
|
| CUSTODIAN | | The Bank of New York Mellon | | One Wall Street
New York, NY 10286 |
|
| TRANSFER AGENT | | Prudential Mutual Fund
Services LLC | | PO Box 9658
Providence, RI 02940 |
|
INDEPENDENT REGISTERED
PUBLIC ACCOUNTING FIRM | | KPMG LLP | | 345 Park Avenue
New York, NY 10154 |
|
| FUND COUNSEL | | Sullivan & Cromwell LLP | | 125 Broad Street
New York, NY 10004 |
|
| An investor should consider the investment objectives, risks, charges, and expenses of the Fund carefully before investing. The prospectus for the Fund contains this and other information about the Fund. An investor may obtain a prospectus by visiting our website at www.prudentialfunds.com or by calling (800) 225-1852. The prospectus should be read carefully before investing. |
|
| E-DELIVERY |
| To receive your mutual fund documents online, go to www.prudentialfunds.com/edelivery and enroll. Instead of receiving printed documents by mail, you will receive notification via e-mail when new materials are available. You can cancel your enrollment or change your e-mail address at any time by visiting the website address above. |
|
| SHAREHOLDER COMMUNICATIONS WITH DIRECTORS |
| Shareholders can communicate directly with the Board of Directors by writing to the Chair of the Board, Prudential Jennison Growth Fund, Prudential Investments, Attn: Board of Directors, 100 Mulberry Street, Gateway Center Three, Newark, NJ 07102. Shareholders can communicate directly with an individual Director by writing to the same address. Communications are not screened before being delivered to the addressee. |
|
| AVAILABILITY OF PORTFOLIO SCHEDULE |
| The Fund files its complete schedule of portfolio holdings with the Securities and Exchange Commission for the first and third quarters of each fiscal year on Form N-Q under the Prudential Investment Portfolios, Inc. name. The Fund’s Forms N-Q are available on the Commission’s website at www.sec.gov. The Fund’s Forms N-Q may also be reviewed and copied at the Commission’s Public Reference Room in Washington, D.C. Information on the operation and location of the Public Reference Room may be obtained by calling (202) 551-8090. The Fund’s schedule of portfolio holdings is also available on the Fund’s website as of the end of each fiscal quarter. |
Mutual Funds:
| | | | |
ARE NOT INSURED BY THE FDIC OR ANY
FEDERAL GOVERNMENT AGENCY | | MAY LOSE VALUE | | ARE NOT A DEPOSIT OF OR GUARANTEED
BY ANY BANK OR ANY BANK AFFILIATE |

| | | | | | | | | | | | | | |
| Prudential Jennison Growth Fund | | |
| | | Share Class | | A | | B | | C | | R | | Z | | |
| | NASDAQ | | PJFAX | | PJFBX | | PJFCX | | PJGRX | | PJFZX | | |
| | CUSIP | | 74437E107 | | 74437E206 | | 74437E305 | | 74437E651 | | 74437E404 | | |
| | | | | | | | | | | | | | |
MF168E2 0179286-00001-00

| | |
| SEMIANNUAL REPORT | | MARCH 31, 2010 |
Prudential Jennison Equity Opportunity Fund
(Formerly known as Jennison Equity Opportunity Fund)
| | | | |
Fund Type Multi-cap stock Objective Long-term growth of capital | | | | This report is not authorized for distribution to prospective investors unless preceded or accompanied by a current prospectus. The views expressed in this report and information about the Fund’s portfolio holdings are for the period covered by this report and are subject to change thereafter. The accompanying financial statements as of March 31, 2010, were not audited and, accordingly, no auditor’s opinion is expressed on them. Prudential Investments, Prudential Financial, the Rock Prudential logo, Jennison Associates, and Jennison are registered service marks of The Prudential Insurance Company of America, Newark, NJ, and its affiliates. |
| | |

| | To enroll in e-delivery, go to www.prudentialfunds.com/edelivery |
May 14, 2010
Dear Shareholder:
Recently we announced the renaming of JennisonDryden, Prudential Financial’s mutual fund family, to Prudential Investments. As a result of this change, each of our funds has been renamed to feature “Prudential” as part of its new name. The name of your fund has changed from the Jennison Equity Opportunity Fund to the Prudential Jennison Equity Opportunity Fund.
While the name of your fund has changed, its investment objectives and portfolio management team remain the same. No action is required on your part. If you participate in an automatic investment plan, your account continues to be invested in the Fund under its new name.
Featuring the Prudential name in our funds creates an immediate connection to the experience and heritage of Prudential, a name recognized by millions for helping people grow and protect their wealth.
On the following pages, you will find your fund’s semiannual report, including a table showing fund performance over the first half of the fiscal year and for longer periods. The report also contains a listing of the fund’s holdings at period-end. If you have questions about your fund or the renaming of our mutual fund family, please contact your financial professional or visit our website at www.prudentialfunds.com.
Sincerely,

Judy A. Rice, President
Prudential Investment Portfolios, Inc./Prudential Jennison Equity Opportunity Fund
| | |
| Prudential Investment Portfolios, Inc./Prudential Jennison Equity Opportunity Fund | | 1 |
Your Fund’s Performance
Performance data quoted represent past performance. Past performance does not guarantee future results. The investment return and principal value of an investment will fluctuate, so that an investor’s shares, when redeemed, may be worth more or less than their original cost. Current performance may be lower or higher than the past performance data quoted. An investor may obtain performance data as of the most recent month-end by visiting our website at www.prudentialfunds.com or by calling (800) 225-1852. The maximum initial sales charge is 5.50% (Class A shares). Gross operating expenses: Class A, 1.20%; Class B, 1.90%; Class C, 1.90%; Class R, 1.65%; Class Z, 0.90%. Net operating expenses apply to: Class A, 1.20%; Class B, 1.90%; Class C, 1.90%; Class R, 1.40%; Class Z, 0.90%, after contractual reduction through 1/31/2011.
| | | | | | | | | | | | | | |
| Cumulative Total Returns (Without Sales Charges) as of 3/31/10 | | | |
| | | Six Months | | | One Year | | | Five Years | | | Ten Years | | | Since Inception |
Class A | | 10.28 | % | | 57.97 | % | | 19.27 | % | | 92.51 | % | | — |
Class B | | 9.87 | | | 56.89 | | | 14.99 | | | 78.86 | | | — |
Class C | | 9.87 | | | 56.89 | | | 14.99 | | | 78.86 | | | — |
Class R | | 10.15 | | | 57.72 | | | 17.95 | | | N/A | | | 16.75% (12/17/04) |
Class Z | | 10.40 | | | 58.60 | | | 20.98 | | | 97.50 | | | — |
S&P 500 Index | | 11.75 | | | 49.73 | | | 9.97 | | | –6.35 | | | — |
Lipper Average | | 11.01 | | | 52.56 | | | 12.74 | | | 24.40 | | | — |
| | | | | | | | | | | | | | |
| Average Annual Total Returns (With Sales Charges) as of 3/31/10 | | | |
| | | | | | One Year | | | Five Years | | | Ten Years | | | Since Inception |
Class A | | | | | 49.28 | % | | 2.42 | % | | 6.17 | % | | — |
Class B | | | | | 51.89 | | | 2.71 | | | 5.99 | | | — |
Class C | | | | | 55.89 | | | 2.83 | | | 5.99 | | | — |
Class R | | | | | 57.72 | | | 3.36 | | | N/A | | | 2.97% (12/17/04) |
Class Z | | | | | 58.60 | | | 3.88 | | | 7.04 | | | — |
S&P 500 Index | | | | | 49.73 | | | 1.92 | | | –0.65 | | | — |
Lipper Average | | | | | 52.56 | | | 2.33 | | | 1.70 | | | — |
Source: Prudential Investments LLC and Lipper Inc. Performance figures may reflect fee waivers and/or expense reimbursements. In the absence of such fee waivers and/or expense reimbursements, total returns would be lower.
Inception returns are provided for any share class with less than 10 calendar years of returns.
The average annual total returns take into account applicable sales charges. Class A, Class B, Class C, and Class R shares are subject to an annual distribution and service (12b-1) fee of up to 0.30%, 1.00%, 1.00%, and 0.75%, respectively. Approximately seven years after purchase, Class B shares will automatically convert to Class A shares on a quarterly basis. Class Z shares are not subject to a 12b-1 fee. Under certain circumstances, Class A shares may be subject to a contingent deferred sales charge (CDSC) of 1%. Class B and Class C shares are subject to a maximum CDSC of 5% and 1%, respectively. Class R and Class Z shares are not subject to a sales charge. The returns in the tables do not reflect the deduction of taxes that a shareholder would pay on Fund distributions or following the redemption of Fund shares.
| | |
| 2 | | Visit our website at www.prudentialfunds.com |
Benchmark Definitions
S&P 500 Index
The S&P 500 Index is an unmanaged index of 500 stocks of large U.S. public companies. It gives a broad look at how U.S. stock prices have performed. S&P 500 Index Closest Month-End to Inception cumulative total return is 7.61% for Class R. S&P 500 Index Closest Month-End to Inception average annual total return is 1.41% for Class R.
Lipper Multi-Cap Core Funds Average
The Lipper Multi-Cap Core Funds Average (Lipper Average) represents returns based on the average return of all funds in the Lipper Multi-Cap Core Funds category for the periods noted. Funds in the Lipper Average invest in a variety of market capitalization ranges without concentrating 75% of their equity assets in any one market capitalization range over an extended period of time. Multi-cap funds in the Lipper Average typically have between 25% and 75% of their assets invested in companies with market capitalizations (on a three-year weighted basis) above 300% of the dollar-weighted median market capitalization of the middle 1,000 securities of the S&P SuperComposite 1500 Index. Multi-cap core funds have more latitude in the companies in which they invest. These funds typically have an average price-to-earnings ratio, price-to-book ratio, and three-year sales-per-share growth value compared with the S&P SuperComposite 1500 Index. Lipper Average Closest Month-End to Inception cumulative total return is 10.52% for Class R. Lipper Average Closest Month-End to Inception average annual total return is 1.82% for Class R.
Investors cannot invest directly in an index. The returns for the S&P 500 Index would be lower if they included the effects of sales charges, operating expenses of a mutual fund, or taxes. Returns for the Lipper Average reflect the deduction of operating expenses, but not sales charges or taxes.
| | | |
| Five Largest Holdings expressed as a percentage of net assets as of 3/31/10 | | | |
Pfizer, Inc., Pharmaceuticals | | 2.2 | % |
Wal-Mart Stores, Inc., Food & Staples Retailing | | 2.1 | |
Travelers Cos., Inc. (The), Insurance | | 2.1 | |
Viacom, Inc. (Class B Stock), Media | | 2.0 | |
Time Warner Cable, Inc., Media | | 2.0 | |
Holdings reflect only long-term investments and are subject to change.
| | | |
| Five Largest Long-Term Industries expressed as a percentage of net assets as of 3/31/10 | | | |
Media | | 9.1 | % |
Oil, Gas & Consumable Fuels | | 8.4 | |
Pharmaceuticals | | 7.2 | |
Insurance | | 6.4 | |
Food Products | | 5.0 | |
Industry weightings reflect only long-term investments and are subject to change.
| | |
| Prudential Investment Portfolios, Inc./Prudential Jennison Equity Opportunity Fund | | 3 |
Fees and Expenses (Unaudited)
As a shareholder of the Fund, you incur two types of costs: (1) transaction costs, including sales charges (loads) on purchase payments and redemptions, as applicable, and (2) ongoing costs, including management fees, distribution and/or service (12b-1) fees, and other Fund expenses, as applicable. This example is intended to help you understand your ongoing costs (in dollars) of investing in the Fund and to compare these costs with the ongoing costs of investing in other mutual funds.
The example is based on an investment of $1,000 invested on October 1, 2009, at the beginning of the period, and held through the six-month period ended March 31, 2010. The example is for illustrative purposes only; you should consult the Prospectus for information on initial and subsequent minimum investment requirements.
The Fund’s transfer agent may charge additional fees to holders of certain accounts that are not included in the expenses shown in the table on the following page. These fees apply to individual retirement accounts (IRAs) and Section 403(b) accounts. As of the close of the six-month period covered by the table, IRA fees included an annual maintenance fee of $15 per account (subject to a maximum annual maintenance fee of $25 for all accounts held by the same shareholder). Section 403(b) accounts are charged an annual $25 fiduciary maintenance fee. Some of the fees may vary in amount, or may be waived, based on your total account balance or the number of Prudential Investments funds, including the Fund, that you own. You should consider the additional fees that were charged to your Fund account over the six-month period when you estimate the total ongoing expenses paid over the period and the impact of these fees on your ending account value, as these additional expenses are not reflected in the information provided in the expense table. Additional fees have the effect of reducing investment returns.
Actual Expenses
The first line for each share class in the table on the following page provides information about actual account values and actual expenses. You may use the information on this line, together with the amount you invested, to estimate the expenses that you paid over the period. Simply divide your account value by $1,000 (for example, an $8,600 account value ÷ $1,000 = 8.6), then multiply the result by the number on the first line under the heading “Expenses Paid During the Six-Month Period” to estimate the expenses you paid on your account during this period.
Hypothetical Example for Comparison Purposes
The second line for each share class in the table on the following page provides information about hypothetical account values and hypothetical expenses based on the Fund’s actual expense ratio and an assumed rate of return of 5% per year before
| | |
| 4 | | Visit our website at www.prudentialfunds.com |
expenses, which is not the Fund’s actual return. The hypothetical account values and expenses may not be used to estimate the actual ending account balance or expenses you paid for the period. You may use this information to compare the ongoing costs of investing in the Fund and other funds. To do so, compare this 5% hypothetical example with the 5% hypothetical examples that appear in the shareholder reports of the other funds.
Please note that the expenses shown in the table are meant to highlight your ongoing costs only and do not reflect any transactional costs such as sales charges (loads). Therefore, the second line for each share class in the table is useful in comparing ongoing costs only and will not help you determine the relative total costs of owning different funds. In addition, if these transactional costs were included, your costs would have been higher.
| | | | | | | | | | | | | | |
Prudential
Jennison Equity
Opportunity Fund | | Beginning Account Value October 1, 2009 | | Ending Account
Value March 31, 2010 | | Annualized Expense Ratio
Based on the
Six-Month Period | | | Expenses Paid
During the
Six-Month Period* |
| | | | | | | | | | | | | | |
| Class A | | Actual | | $ | 1,000.00 | | $ | 1,102.80 | | 1.20 | % | | $ | 6.29 |
| | | Hypothetical | | $ | 1,000.00 | | $ | 1,018.95 | | 1.20 | % | | $ | 6.04 |
| | | | | | | | | | | | | | |
| Class B | | Actual | | $ | 1,000.00 | | $ | 1,098.70 | | 1.90 | % | | $ | 9.94 |
| | | Hypothetical | | $ | 1,000.00 | | $ | 1,015.46 | | 1.90 | % | | $ | 9.55 |
| | | | | | | | | | | | | | |
| Class C | | Actual | | $ | 1,000.00 | | $ | 1,098.70 | | 1.90 | % | | $ | 9.94 |
| | | Hypothetical | | $ | 1,000.00 | | $ | 1,015.46 | | 1.90 | % | | $ | 9.55 |
| | | | | | | | | | | | | | |
| Class R | | Actual | | $ | 1,000.00 | | $ | 1,101.50 | | 1.40 | % | | $ | 7.34 |
| | | Hypothetical | | $ | 1,000.00 | | $ | 1,017.95 | | 1.40 | % | | $ | 7.04 |
| | | | | | | | | | | | | | |
| Class Z | | Actual | | $ | 1,000.00 | | $ | 1,104.00 | | 0.90 | % | | $ | 4.72 |
| | | Hypothetical | | $ | 1,000.00 | | $ | 1,020.44 | | 0.90 | % | | $ | 4.53 |
* Fund expenses (net of fee waivers or subsidies, if any) for each share class are equal to the annualized expense ratio for each share class (provided in the table), multiplied by the average account value over the period, multiplied by the 182 days in the six-month period ended March 31, 2010, and divided by the 365 days in the Fund’s fiscal year ending September 30, 2010 (to reflect the six-month period). Expenses presented in the table include the expenses of any underlying portfolios in which the Fund may invest.
| | |
| Prudential Investment Portfolios, Inc./Prudential Jennison Equity Opportunity Fund | | 5 |
Portfolio of Investments
as of March 31, 2010 (Unaudited)
| | | | | |
| Shares | | Description | | Value (Note 1) |
| | | | | |
LONG-TERM INVESTMENTS 96.4% | | | |
COMMON STOCKS | | | |
| |
Aerospace & Defense 1.2% | | | |
| 101,020 | | Teledyne Technologies, Inc.(a) | | $ | 4,169,095 |
| |
Air Freight & Logistics 1.2% | | | |
| 148,302 | | Hub Group, Inc. (Class A Stock)(a) | | | 4,149,490 |
| |
Airlines 2.6% | | | |
| 259,000 | | Delta Air Lines, Inc.(a)(b) | | | 3,778,810 |
| 873,700 | | JetBlue Airways Corp.(a)(b) | | | 4,875,246 |
| | | | | |
| | | | | 8,654,056 |
| |
Auto Components 2.7% | | | |
| 135,792 | | Gentex Corp.(b) | | | 2,637,081 |
| 81,000 | | Lear Corp.(a) | | | 6,427,350 |
| | | | | |
| | | | | 9,064,431 |
| |
Biotechnology 2.8% | | | |
| 95,300 | | Amgen, Inc.(a) | | | 5,695,128 |
| 80,300 | | Gilead Sciences, Inc.(a) | | | 3,652,044 |
| | | | | |
| | | | | 9,347,172 |
| |
Capital Markets 4.6% | | | |
| 293,500 | | Charles Schwab Corp. (The) | | | 5,485,515 |
| 31,100 | | Goldman Sachs Group, Inc. (The) | | | 5,306,593 |
| 128,700 | | Lazard Ltd. (Class A Stock) | | | 4,594,590 |
| | | | | |
| | | | | 15,386,698 |
| |
Chemicals 2.4% | | | |
| 89,300 | | Celanese Corp. (Class A Stock) | | | 2,844,205 |
| 405,800 | | Ferro Corp. | | | 3,566,982 |
| 20,900 | | Monsanto Co. | | | 1,492,678 |
| | | | | |
| | | | | 7,903,865 |
| |
Commercial Services & Supplies 1.5% | | | |
| 172,164 | | Republic Services, Inc. | | | 4,996,199 |
| |
Communications Equipment 2.6% | | | |
| 237,700 | | Cisco Systems, Inc.(a) | | | 6,187,331 |
| 86,700 | | CommScope, Inc.(a) | | | 2,429,334 |
| | | | | |
| | | | | 8,616,665 |
See Notes to Financial Statements.
| | |
| The Prudential Investment Portfolios, Inc./Prudential Jennison Equity Opportunity Fund | | 7 |
Portfolio of Investments
as of March 31, 2010 (Unaudited) continued
| | | | | |
| Shares | | Description | | Value (Note 1) |
| | | | | |
COMMON STOCKS (Continued) | | | |
| |
Computers & Peripherals 1.8% | | | |
| 398,000 | | Dell, Inc.(a) | | $ | 5,973,980 |
| |
Diversified Consumer Services 1.8% | | | |
| 78,000 | | Career Education Corp.(a)(b) | | | 2,467,920 |
| 116,000 | | H&R Block, Inc. | | | 2,064,800 |
| 61,900 | | Weight Watchers International, Inc. | | | 1,580,307 |
| | | | | |
| | | | | 6,113,027 |
| |
Diversified Financial Services 3.1% | | | |
| 272,127 | | Bank of America Corp. | | | 4,857,467 |
| 124,000 | | JPMorgan Chase & Co. | | | 5,549,000 |
| | | | | |
| | | | | 10,406,467 |
| |
Energy Equipment & Services 3.3% | | | |
| 85,800 | | Schlumberger Ltd. | | | 5,444,868 |
| 129,000 | | Smith International, Inc. | | | 5,523,780 |
| | | | | |
| | | | | 10,968,648 |
| |
Food & Staples Retailing 2.1% | | | |
| 126,950 | | Wal-Mart Stores, Inc. | | | 7,058,420 |
| |
Food Products 5.0% | | | |
| 80,600 | | Bunge Ltd. | | | 4,967,378 |
| 228,000 | | ConAgra Foods, Inc. | | | 5,715,960 |
| 108,740 | | Kraft Foods, Inc. | | | 3,288,298 |
| 152,900 | | Tyson Foods, Inc. (Class A Stock) | | | 2,928,035 |
| | | | | |
| | | | | 16,899,671 |
| |
Healthcare Equipment & Supplies 0.8% | | | |
| 16,750 | | Alcon, Inc. | | | 2,706,130 |
| |
Healthcare Providers & Services 0.8% | | | |
| 40,700 | | Medco Health Solutions, Inc.(a) | | | 2,627,592 |
| |
Hotels Restaurants & Leisure 2.5% | | | |
| 567,286 | | Pinnacle Entertainment, Inc.(a) | | | 5,525,366 |
| 71,500 | | Yum! Brands, Inc. | | | 2,740,595 |
| | | | | |
| | | | | 8,265,961 |
| |
Household Durables 1.4% | | | |
| 202,200 | | Ryland Group, Inc. | | | 4,537,368 |
See Notes to Financial Statements.
| | |
| 8 | | Visit our website at www.prudentialfunds.com |
| | | | | |
| Shares | | Description | | Value (Note 1) |
| | | | | |
COMMON STOCKS (Continued) | | | |
| |
Independent Power Producers & Energy Traders 1.2% | | | |
| 194,700 | | NRG Energy, Inc.(a) | | $ | 4,069,230 |
| |
Insurance 6.4% | | | |
| 196,200 | | Axis Capital Holdings Ltd. | | | 6,133,212 |
| 154,100 | | Marsh & McLennan Cos., Inc. | | | 3,763,122 |
| 12,700 | | Primerica, Inc.(a) | | | 190,500 |
| 81,500 | | Symetra Financial Corp.(a) | | | 1,074,170 |
| 128,800 | | Travelers Cos., Inc. (The) | | | 6,947,472 |
| 122,100 | | Validus Holdings Ltd. | | | 3,361,413 |
| | | | | |
| | | | | 21,469,889 |
| |
Internet Software & Services 4.5% | | | |
| 160,900 | | Akamai Technologies, Inc.(a)(b) | | | 5,053,869 |
| 185,850 | | IAC/InterActiveCorp.(a) | | | 4,226,229 |
| 221,400 | | VeriSign, Inc.(a)(b) | | | 5,758,614 |
| | | | | |
| | | | | 15,038,712 |
| |
IT Services 1.1% | | | |
| 202,300 | | SAIC, Inc.(a) | | | 3,580,710 |
| |
Life Sciences Tools & Services 1.5% | | | |
| 98,500 | | Thermo Fisher Scientific, Inc.(a) | | | 5,066,840 |
| |
Machinery 1.6% | | | |
| 114,500 | | Dover Corp. | | | 5,352,875 |
| |
Media 9.1% | | | |
| 215,437 | | Liberty Global, Inc. (Series C Stock)(a) | | | 6,223,975 |
| 210,209 | | Live Nation Entertainment, Inc.(a)(b) | | | 3,048,031 |
| 122,700 | | Time Warner Cable, Inc. | | | 6,541,137 |
| 195,043 | | Viacom, Inc. (Class B Stock)(a) | | | 6,705,578 |
| 165,100 | | Vivendi SA (France) | | | 4,418,618 |
| 534,806 | | Warner Music Group Corp.(a) | | | 3,695,509 |
| | | | | |
| | | | | 30,632,848 |
| |
Metals & Mining 2.7% | | | |
| 153,300 | | Goldcorp, Inc.(b) | | | 5,705,826 |
| 42,800 | | Randgold Resources Ltd. (Jersey), ADR | | | 3,288,324 |
| | | | | |
| | | | | 8,994,150 |
See Notes to Financial Statements.
| | |
| The Prudential Investment Portfolios, Inc./Prudential Jennison Equity Opportunity Fund | | 9 |
Portfolio of Investments
as of March 31, 2010 (Unaudited) continued
| | | | | |
| Shares | | Description | | Value (Note 1) |
| | | | | |
COMMON STOCKS (Continued) | | | |
| |
Oil, Gas & Consumable Fuels 8.4% | | | |
| 51,700 | | Apache Corp. | | $ | 5,247,550 |
| 91,800 | | Cabot Oil & Gas Corp. | | | 3,378,240 |
| 91,900 | | Hess Corp. | | | 5,748,345 |
| 99,200 | | Newfield Exploration Co.(a)(b) | | | 5,163,360 |
| 58,300 | | Occidental Petroleum Corp. | | | 4,928,682 |
| 119,600 | | Sunoco, Inc. | | | 3,553,316 |
| | | | | |
| | | | | 28,019,493 |
| |
Pharmaceuticals 7.2% | | | |
| 66,600 | | Abbott Laboratories | | | 3,508,488 |
| 60,100 | | Novartis AG (Switzerland), ADR(b) | | | 3,251,410 |
| 430,254 | | Pfizer, Inc. | | | 7,378,856 |
| 70,200 | | Shire PLC (Ireland), ADR | | | 4,630,392 |
| 132,400 | | Watson Pharmaceuticals, Inc.(a)(b) | | | 5,530,348 |
| | | | | |
| | | | | 24,299,494 |
| |
Road & Rail 0.8% | | | |
| 53,700 | | CSX Corp. | | | 2,733,330 |
| |
Semiconductors & Semiconductor Equipment 2.7% | | | |
| 357,400 | | Advanced Micro Devices, Inc.(a) | | | 3,313,098 |
| 255,200 | | Intel Corp. | | | 5,680,752 |
| | | | | |
| | | | | 8,993,850 |
| |
Software 2.3% | | | |
| 95,000 | | Adobe Systems, Inc.(a) | | | 3,360,150 |
| 260,600 | | Symantec Corp.(a) | | | 4,409,352 |
| | | | | |
| | | | | 7,769,502 |
| |
Specialty Retail 1.5% | | | |
| 230,300 | | GameStop Corp. (Class A Stock)(a)(b) | | | 5,045,873 |
| |
Trading Companies & Distributors 1.2% | | | |
| 522,175 | | RSC Holdings, Inc.(a)(b) | | | 4,156,513 |
| | | | | |
| | Total long-term investments
(cost $275,270,690) | | | 323,068,244 |
| | | | | |
See Notes to Financial Statements.
| | |
| 10 | | Visit our website at www.prudentialfunds.com |
| | | | | | |
| Shares | | Description | | Value (Note 1) | |
| | | | | | |
SHORT-TERM INVESTMENTS 15.2% | | | | |
| |
Affiliated Money Market Mutual Fund | | | | |
| 50,801,043 | | Prudential Investment Portfolios 2 - Prudential Core Taxable Money Market Fund
(cost $50,801,043; includes $40,946,271 of cash collateral received for securities on loan) (Note 3)(c)(d) | | $ | 50,801,043 | |
| | | | | | |
| | Total Investments, Before Security Sold Short 111.6%
(cost $326,071,733) | | | 373,869,287 | |
| | | | | | |
SECURITY SOLD SHORT (1.2)% | | | | |
COMMON STOCK | | | | |
| |
Specialty Retail (1.2)% | | | | |
| 95,000 | | Best Buy Co., Inc.
(proceeds $3,649,082) | | | (4,041,300 | ) |
| | | | | | |
| | Total Investments, Net of Security Sold Short 110.4%
(cost $322,422,651; Note 5) | | | 369,827,987 | |
| | Other liabilities in excess of other assets (10.4%) | | | (34,868,640 | ) |
| | | | | | |
| | Net Assets 100.0% | | $ | 334,959,347 | |
| | | | | | |
The following abbreviation is used in the portfolio descriptions:
ADR—American Depositary Receipt
| (a) | Non-income producing security. |
| (b) | All or a portion of security is on loan. The aggregate market value of such securities is $39,640,730; cash collateral of $40,946,271 (included in liabilities) was received with which the Series purchased highly liquid short-term investments. |
| (c) | Prudential Investments LLC, the manager of the Series, also serves as manager of the Prudential Investment Portfolios 2-Prudential Core Taxable Money Market Fund. |
| (d) | Represents security, or a portion thereof, purchased with cash collateral received for securities on loan. |
Various inputs are used in determining the value of the Series’ investments. These inputs are summarized in the three broad levels listed below.
Level 1—quoted prices in active markets for identical securities
Level 2—other significant observable inputs (including quoted prices for similar securities, interest rates, prepayment speeds, credit risk, etc.)
Level 3—significant unobservable inputs (including the Series’ own assumptions in determining the fair value of investments)
See Notes to Financial Statements.
| | |
| The Prudential Investment Portfolios, Inc./Prudential Jennison Equity Opportunity Fund | | 11 |
Portfolio of Investments
as of March 31, 2010 (Unaudited) continued
The following is a summary of the inputs used as of March 31, 2010 in valuing the Series’ assets carried at fair value:
| | | | | | | | | | |
| | | Level 1 | | | Level 2 | | Level 3 |
Investments in Securities | | | | | | | | | | |
Common Stocks | | $ | 323,068,244 | | | $ | — | | $ | — |
Security Sold Short | | | (4,041,300 | ) | | | — | | | — |
Affiliated Money Market Mutual Fund | | | 50,801,043 | | | | — | | | — |
| | | | | | | | | | |
| | | 369,827,987 | | | | — | | | — |
Other Financial Instruments* | | | — | | | | — | | | — |
| | | | | | | | | | |
Total | | $ | 369,827,987 | | | $ | — | | $ | — |
| | | | | | | | | | |
| * | Other financial instruments are derivative instruments not reflected in the Portfolio of Investments, such as futures, forwards and swap contracts, which are valued at the unrealized appreciation/depreciation on the instrument. |
As of September 30, 2009 and March 31, 2010, the Series did not use any significant unobservable inputs (Level 3) in determining the value of investments.
The industry classification of portfolio holdings and other liabilities in excess of other assets shown as a percentage of net assets as of March 31, 2010 was as follows:
| | | |
Affiliated Money Market Mutual Fund (including 12.2% of collateral received for securities on loan) | | 15.2 | % |
Media | | 9.1 | |
Oil, Gas & Consumable Fuels | | 8.4 | |
Pharmaceuticals | | 7.2 | |
Insurance | | 6.4 | |
Food Products | | 5.0 | |
Capital Markets | | 4.6 | |
Internet Software & Services | | 4.5 | |
Energy Equipment & Services | | 3.3 | |
Diversified Financial Services | | 3.1 | |
Biotechnology | | 2.8 | |
Auto Components | | 2.7 | |
Metals & Mining | | 2.7 | |
Semiconductors & Semiconductor Equipment | | 2.7 | |
Airlines | | 2.6 | |
Communications Equipment | | 2.6 | |
Hotels Restaurants & Leisure | | 2.5 | |
Chemicals | | 2.4 | |
Software | | 2.3 | |
Food & Staples Retailing | | 2.1 | |
Computers & Peripherals | | 1.8 | |
Diversified Consumer Services | | 1.8 | |
See Notes to Financial Statements.
| | |
| 12 | | Visit our website at www.prudentialfunds.com |
| | | |
Industry (cont’d.) | | | |
Machinery | | 1.6 | % |
Commercial Services & Supplies | | 1.5 | |
Life Sciences Tools & Services | | 1.5 | |
Household Durables | | 1.4 | |
Aerospace & Defense | | 1.2 | |
Air Freight & Logistics | | 1.2 | |
Independent Power Producers & Energy Traders | | 1.2 | |
Trading Companies & Distributors | | 1.2 | |
IT Services | | 1.1 | |
Healthcare Equipment & Supplies | | 0.8 | |
Healthcare Providers & Services | | 0.8 | |
Road & Rail | | 0.8 | |
Specialty Retail | | 0.3 | |
| | | |
| | 110.4 | |
Other liabilities in excess of other assets | | (10.4 | ) |
| | | |
| | 100.0 | % |
| | | |
See Notes to Financial Statements.
| | |
| The Prudential Investment Portfolios, Inc./Prudential Jennison Equity Opportunity Fund | | 13 |
Statement of Assets and Liabilities
as of March 31, 2010 (Unaudited)
| | | | |
Assets | | | | |
Investments at value, including securities on loan of $39,640,730: | | | | |
Unaffiliated investments (cost $275,270,690) | | $ | 323,068,244 | |
Affiliated investments (cost $50,801,043) | | | 50,801,043 | |
Cash | | | 431,130 | |
Foreign currency, at value (cost $12) | | | 12 | |
Receivable for investments sold | | | 6,097,015 | |
Receivable for Series shares sold | | | 410,991 | |
Dividends receivable | | | 318,767 | |
Foreign tax reclaim receivable | | | 23,878 | |
Prepaid expenses | | | 12,381 | |
| | | | |
Total assets | | | 381,163,461 | |
| | | | |
| |
Liabilities | | | | |
Payable to broker for collateral for securities on loan (Note 3) | | | 40,946,271 | |
Securities sold short, at value (proceeds $3,649,082) | | | 4,041,300 | |
Payable for Series shares reacquired | | | 517,082 | |
Payable for investments purchased | | | 205,748 | |
Accrued expenses and other liabilities | | | 174,141 | |
Management fee payable | | | 168,241 | |
Distribution fee payable | | | 97,903 | |
Affiliated transfer agent fee payable | | | 50,725 | |
Deferred directors’ fees | | | 2,703 | |
| | | | |
Total liabilities | | | 46,204,114 | |
| | | | |
| |
Net Assets | | $ | 334,959,347 | |
| | | | |
| | | | | |
Net assets were comprised of: | | | | |
Common stock, at par | | $ | 26,987 | |
Paid-in capital in excess of par | | | 374,416,579 | |
| | | | |
| | | 374,443,566 | |
Undistributed net investment income | | | 1,411,718 | |
Accumulated net realized loss on investment and foreign currency transactions | | | (88,301,273 | ) |
Net unrealized appreciation on investments and foreign currencies | | | 47,405,336 | |
| | | | |
Net assets, March 31, 2010 | | $ | 334,959,347 | |
| | | | |
See Notes to Financial Statements.
| | |
| 14 | | Visit our website at www.prudentialfunds.com |
| | | |
Class A | | | |
Net asset value and redemption price per share
($224,991,251 ÷ 17,928,990 shares of common stock issued and outstanding) | | $ | 12.55 |
Maximum sales charge (5.50% of offering price) | | | 0.73 |
| | | |
Maximum offering price to public | | $ | 13.28 |
| | | |
| |
Class B | | | |
Net asset value, offering price and redemption price per share
($20,088,660 ÷ 1,770,016 shares of common stock issued and outstanding) | | $ | 11.35 |
| | | |
| |
Class C | | | |
Net asset value, offering price and redemption price per share
($28,011,939 ÷ 2,467,909 shares of common stock issued and outstanding) | | $ | 11.35 |
| | | |
| |
Class R | | | |
Net asset value, offering price and redemption price per share
($45,880 ÷ 3,953 shares of common stock issued and outstanding) | | $ | 11.61 |
| | | |
| |
Class Z | | | |
Net asset value, offering price and redemption price per share
($61,821,617 ÷ 4,816,303 shares of common stock issued and outstanding) | | $ | 12.84 |
| | | |
See Notes to Financial Statements.
| | |
| The Prudential Investment Portfolios, Inc./Prudential Jennison Equity Opportunity Fund | | 15 |
Statement of Operations
Six Months Ended March 31, 2010 (Unaudited)
| | | | |
Net Investment Income | | | | |
Income | | | | |
Unaffiliated dividend income (net of foreign withholding taxes of $20,033) | | $ | 1,718,789 | |
Affiliated income from securities loaned, net | | | 26,888 | |
Affiliated dividend income | | | 13,696 | |
| | | | |
Total income | | | 1,759,373 | |
| | | | |
| |
Expenses | | | | |
Management fee | | | 944,376 | |
Distribution fee—Class A | | | 322,525 | |
Distribution fee—Class B | | | 105,818 | |
Distribution fee—Class C | | | 131,372 | |
Distribution fee—Class R | | | 39 | |
Transfer agent’s fees and expenses (including affiliated expense of $113,700) | | | 310,000 | |
Reports to shareholders | | | 37,000 | |
Custodian’s fees and expenses | | | 31,000 | |
Dividend expense on short positions | | | 26,600 | |
Registration fees | | | 23,000 | |
Directors’ fees | | | 11,000 | |
Legal fees and expenses | | | 11,000 | |
Audit fee | | | 10,000 | |
Insurance | | | 4,000 | |
Miscellaneous expenses | | | 5,834 | |
| | | | |
Total expenses | | | 1,973,564 | |
| | | | |
Net investment loss | | | (214,191 | ) |
| | | | |
| |
Realized And Unrealized Gain (Loss) On Investments And Foreign Currencies | | | | |
Net realized gain (loss) on: | | | | |
Investment transactions | | | 18,959,640 | |
Foreign currency transactions | | | (56,926 | ) |
Short sale transactions | | | 509,028 | |
| | | | |
| | | 19,411,742 | |
| | | | |
Net change in unrealized appreciation on: | | | | |
Investments | | | 11,840,600 | |
Foreign currencies | | | 1,401 | |
Short sales | | | 63,592 | |
| | | | |
| | | 11,905,593 | |
| | | | |
Net gain on investments and foreign currencies | | | 31,317,335 | |
| | | | |
Net Increase in Net Assets Resulting From Operations | | $ | 31,103,144 | |
| | | | |
See Notes to Financial Statements.
| | |
| 16 | | Visit our website at www.prudentialfunds.com |
Statement of Changes in Net Assets
(Unaudited)
| | | | | | | | |
| | | Six Months Ended March 31, 2010 | | | Year
Ended
September 30, 2009 | |
Increase (Decrease) In Net Assets | | | | | | | | |
Operations | | | | | | | | |
Net investment income (loss) | | $ | (214,191 | ) | | $ | 3,416,058 | |
Net realized gain (loss) on investment and foreign currency transactions | | | 19,411,742 | | | | (90,191,178 | ) |
Net change in unrealized appreciation (depreciation) on investments and foreign currencies | | | 11,905,593 | | | | 81,346,288 | |
| | | | | | | | |
Net increase (decrease) in net assets resulting from operations | | | 31,103,144 | | | | (5,428,832 | ) |
| | | | | | | | |
Dividends and distributions (Note 1) | | | | | | | | |
Dividends from net investment income | | | | | | | | |
Class A | | | — | | | | (1,591,693 | ) |
Class B | | | — | | | | (162,561 | ) |
Class C | | | — | | | | (126,835 | ) |
Class R | | | — | | | | (49 | ) |
Class Z | | | — | | | | (388,216 | ) |
| | | | | | | | |
| | | — | | | | (2,269,354 | ) |
| | | | | | | | |
Tax return of capital | | | | | | | | |
Class A | | | — | | | | (1,345,772 | ) |
Class B | | | — | | | | (137,444 | ) |
Class C | | | — | | | | (107,239 | ) |
Class R | | | — | | | | (41 | ) |
Class Z | | | — | | | | (328,236 | ) |
| | | | | | | | |
| | | — | | | | (1,918,732 | ) |
| | | | | | | | |
| | |
Series share transactions (Net of share conversions) (Note 6) | | | | | | | | |
Net proceeds from shares sold | | | 29,359,756 | | | | 36,379,590 | |
Net asset value of shares issued in reinvestment of dividends and distributions | | | — | | | | 3,945,873 | |
Cost of shares reacquired | | | (31,861,415 | ) | | | (77,580,747 | ) |
| | | | | | | | |
Net decrease in net assets from Series share transactions | | | (2,501,659 | ) | | | (37,255,284 | ) |
| | | | | | | | |
Capital Contributions (Note 6) | | | | | | | | |
Proceeds from third party regulatory settlement | | | 29,781 | | | | — | |
| | | | | | | | |
Total increase (decrease) | | | 28,631,266 | | | | (46,872,202 | ) |
| | |
Net Assets: | | | | | | | | |
Beginning of period | | | 306,328,081 | | | | 353,200,283 | |
| | | | | | | | |
End of period(a) | | $ | 334,959,347 | | | $ | 306,328,081 | |
| | | | | | | | |
(a) Includes undistributed net investment income of: | | $ | 1,411,718 | | | $ | 1,625,909 | |
| | | | | | | | |
See Notes to Financial Statements.
| | |
| The Prudential Investment Portfolios, Inc./Prudential Jennison Equity Opportunity Fund | | 17 |
Notes to Financial Statements
(Unaudited)
The Prudential Investment Portfolios, Inc. (the “Company”) is registered under the Investment Company Act of 1940, as amended, as an open-end management investment company. The Company was incorporated in Maryland on August 10, 1995 and consists of six series: Prudential Jennison Equity Opportunity Fund (formerly Jennison Equity Opportunity Fund) (the “Series”), Prudential Jennison Growth Fund (formerly Jennison Growth Fund ) and Prudential Asset Allocation Fund (formerly Dryden Asset Allocation Fund) which are diversified funds and Prudential Growth Allocation Fund (formerly JennisonDryden Growth Allocation Fund), Prudential Moderate Allocation Fund (formerly JennisonDryden Moderate Allocation Fund) and Prudential Conservative Allocation Fund (formerly JennisonDryden Conservative Allocation Fund) which are non-diversified funds. These financial statements relate to Prudential Jennison Equity Opportunity Fund. The financial statements of the other series are not presented herein. The Series commenced investment operations on November 7, 1996.
The Series’ investment objective is to achieve long-term growth of capital. The Series seeks to achieve its objectives by investing primarily in common stocks of established companies with growth prospects believed to be underappreciated by the market.
Note 1. Accounting Policies
The following is a summary of significant accounting policies followed by the Series in the preparation of its financial statements.
Securities Valuation: Securities listed on a securities exchange are valued at the last sale price on such exchange on the day of valuation or, if there was no sale on such day, at the mean between the last reported bid and asked prices, or at the last bid price on such day in the absence of an asked price. Securities traded via NASDAQ are valued at the official closing price provided by NASDAQ. Securities that are actively traded in the over-the-counter market, including listed securities for which the primary market is believed by Prudential Investments LLC (“PI” or “Manager”), in consultation with the subadvisor; to be over-the-counter, are valued at market value using prices provided by an independent pricing agent or principal market maker. Securities for which reliable market quotations are not readily available, or whose values have been affected by events occurring after the close of the security’s foreign market and before the Series’ normal pricing time, are valued at fair value in accordance with The Board of Directors’ approved fair valuation procedures. When
| | |
| 18 | | Visit our website at www.prudentialfunds.com |
determining the fair valuation of securities some of the factors influencing the valuation include, the nature of any restrictions on disposition of the securities; assessment of the general liquidity of the securities; the issuer’s financial condition and the markets in which it does business; the cost of the investment; the size of the holding and the capitalization of issuer; the prices of any recent transactions or bids/offers for such securities or any comparable securities; any available analyst media or other reports or information deemed reliable by the investment adviser regarding the issuer or the markets or industry in which it operates. Using fair value to price securities may result in a value that is different from a security’s most recent closing price and from the price used by other mutual funds to calculate their net asset values.
Investments in mutual funds are valued at their net asset value as of the close of the New York Stock Exchange on the date of valuation.
Short-term debt securities which mature in 60 days or less are valued at amortized cost, which approximates market-value. The amortized cost method includes valuing a security at its cost on the date of purchase and thereafter assuming a constant amortization to maturity of the difference between the principal amount due at maturity and cost. Short-term debt securities which mature in more than 60 days are valued at current market quotations.
Restricted Securities: The Series may hold up to 15% of its net assets in illiquid securities, including those which are restricted as to disposition under securities law (“restricted securities”). Restricted securities held by the Series at the end of the fiscal period may include registration rights under which the Series may demand registration by the issuers, of which the Series may bear the cost of such registration. Restricted securities, are valued pursuant to the valuation procedures noted above.
Foreign Currency Translation: The books and records of the Series are maintained in U.S. dollars. Foreign currency amounts are translated into U.S. dollars on the following basis:
(i) market value of investment securities, other assets and liabilities-at the current rates of exchange.
(ii) purchases and sales of investment securities, income and expenses-at the rates of exchange prevailing on the respective dates of such transactions.
The Series does not isolate that portion of the results of operations arising as a result of changes in the foreign exchange rates from the fluctuations arising from changes in the market prices of long term securities held at the end of the fiscal year. Similarly,
| | |
| The Prudential Investment Portfolios, Inc./Prudential Jennison Equity Opportunity Fund | | 19 |
Notes to Financial Statements
(Unaudited) continued
the Series does not isolate the effect of changes in foreign exchange rates from the fluctuations arising from changes in the market prices of portfolio securities sold during the fiscal year. Accordingly, realized foreign currency gains or losses are included in the reported net realized gains or losses on investment transactions.
Net realized gains or losses on foreign currency transactions represent net foreign exchange gains or losses from the holding of foreign currencies, currency gains or losses realized between the trade and settlement dates on securities transactions, and the difference between the amounts of dividends, interest and foreign withholding taxes recorded on the Series’ books and the U.S. dollar equivalent amounts actually received or paid. Net unrealized currency gains or losses from valuing foreign currency denominated assets and liabilities (other than investments) at fiscal year end exchange rates are reflected as a component of net unrealized appreciation (depreciation) on investments and foreign currencies.
Foreign security and currency transactions may involve certain considerations and risks not typically associated with those of domestic origin as a result of, among other factors, the possibility of political and economic instability or the level of governmental supervision and regulation of foreign securities markets.
Securities Lending: The Series may lend its portfolio securities to broker-dealers. The loans are secured by collateral, at least equal, at all times to the market value of the securities loaned. Loans are subject to termination at the option of the borrower or the Series. Upon termination of the loan, the borrower will return to the lender securities identical to the loaned securities. Should the borrower of the securities fail financially, the Series has the right to repurchase the securities using the collateral in the open market. The Series recognizes income, net of any rebate and securities lending agent fees, for lending its securities in the form of fees or interest on the investment of any cash received as collateral. The Series also continues to receive interest and dividends or amounts equivalent thereto, on the securities loaned and recognizes any unrealized gain or loss in the market price of the securities loaned that may occur during the term of the loan.
Short Sales: The Series may make short sales of securities as a method of hedging potential price declines in similar securities owned. The Series may sell a security it does not own in anticipation of a decline in the market value of that security (short sale). When the Series makes a short sale, it will borrow the security sold short and deliver it to the broker-dealer through which it made the short sale as collateral for its
| | |
| 20 | | Visit our website at www.prudentialfunds.com |
obligation to deliver the security upon conclusion of the sale. The Series may have to pay a fee to borrow the particular securities and may be obligated to return any interest or dividends received on such borrowed securities. A gain, limited to the price at which the Series sold the security short, or a loss, unlimited as to dollar amount, will be recognized upon the termination of a short sale if the market price is less or greater than the proceeds originally received, respectively, and is presented in the Statement of Operations as net realized gain or loss on short sales.
Securities Transactions and Net Investment Income: Securities transactions are recorded on the trade date. Realized gains or losses from investment and currency transactions are calculated on the identified cost basis. Dividend income is recorded on the ex-dividend date and interest income, including amortization of premiums and accretion of discounts on debt securities, as required, is recorded on the accrual basis. Expenses are recorded on an accrual basis.
Net investment income or loss (other than distribution fees which are charged directly to the respective class) and realized and unrealized gains and losses are allocated daily to each class of shares based upon the relative proportion of net assets of each class at the beginning of the day.
Dividends and Distributions: The Series expects to pay dividends of net investment income, if any, semi-annually and distributions of net realized capital gains, if any, at least annually. Dividends and distributions, which are determined in accordance with federal income tax regulations and which may differ from generally accepted accounting principles, are recorded on the ex-dividend date.
Taxes: For federal income tax purposes, each Series in the Company is treated as a separate tax paying entity. It is the Series’ policy to continue to meet the requirements of the Internal Revenue Code applicable to regulated investment companies and to distribute all of its taxable net income and capital gains, if any, to shareholders. Therefore, no federal tax provision is required.
Withholding taxes on foreign dividends are recorded net of reclaimable amounts, at the time the related income is earned.
Estimates: The preparation of the financial statements requires management to make estimates and assumptions that affect the reported amounts and disclosures in the financial statements. Actual results could differ from those estimates.
| | |
| The Prudential Investment Portfolios, Inc./Prudential Jennison Equity Opportunity Fund | | 21 |
Notes to Financial Statements
(Unaudited) continued
Note 2. Agreements
The Company has a management agreement for the Series with PI. Pursuant to this agreement PI has responsibility for all investment advisory services and supervises the subadvisor’s performance of such services. PI has entered into a subadvisory agreement with Jennison Associates LLC (“Jennison”). The subadvisory agreement provides that Jennison furnishes investment advisory services in connection with the management of the Series. In connection therewith, Jennison is obligated to keep certain books and records of the Series. PI pays for the services of Jennison, the cost of compensation of officers and employees of the Series, occupancy and certain clerical and bookkeeping costs of the Series. The Series bears all other costs and expenses.
The management fee paid to PI is computed daily and payable monthly, at an annual rate of 0.60% of the average daily net assets of the Series up to $300 million and 0.575% of the average daily net assets of the Series over $300 million. The effective management fee rate was 0.60% of the Series average daily net assets for the six months ended March 31, 2010.
The Series has a distribution agreement with Prudential Investment Management Services LLC (“PIMS”), which acts as the distributor of the Class A, Class B, Class C, Class R and Class Z shares of the Series. The Series compensates PIMS for distributing and servicing the Series’ Class A, Class B, Class C and Class R shares, pursuant to plans of distribution (the “Class A, B, C and R Plans”), regardless of expenses actually incurred by PIMS. The distribution fees are accrued daily and payable monthly. No distribution or service fees are paid to PIMS as distributor of the Class Z shares of the Series.
Pursuant to the Class A, B, C and R Plans, the Series compensates PIMS for distribution related activities at an annual rate of up to 0.30%, 1%, 1% and 0.75% of the average daily net assets of the Class A, B, C and R shares, respectively. PIMS contractually agreed to limit such fees to 0.50% for Class R shares.
PIMS has advised the Series that it received $41,838 in front-end sales charges resulting from sales of Class A shares during the six months ended March 31, 2010. From these fees PIMS paid such sales charges to affiliated brokers/dealers, which in turn paid commissions to salespersons and incurred other distribution costs.
| | |
| 22 | | Visit our website at www.prudentialfunds.com |
PIMS has advised the Series that for the six months ended March 31, 2010, it received $12,823 and $186 in contingent deferred sales charges imposed upon redemptions by certain Class B and Class C shareholders, respectively.
PI, PIMS, and Jennison are indirect, wholly-owned subsidiaries of Prudential Financial, Inc. (“Prudential”).
The Company, along with other affiliated registered investment companies (the “Funds”), is a party to a Syndicated Credit Agreement (“SCA”) with two banks. The SCA provides for a commitment of $500 million. Interest on any borrowings under the SCA is incurred at contracted market rates and a commitment fee for the unused amount is accrued daily and paid quarterly. Effective October 22, 2009, the Funds renewed the SCA with the banks. The commitment under the renewed SCA continues to be $500 million. The Funds pay a commitment fee of 0.15% of the unused portion of the renewed SCA. The expiration date of the renewed SCA will be October 20, 2010. For the period from October 24, 2008 through October 21, 2009, the Funds paid a commitment fee of 0.13% of the unused portion of the agreement. The purpose of the SCA is to provide an alternative source of temporary funding for capital share redemptions. The Series did not utilize the SCA during the six months ended March 31, 2010.
Note 3. Other Transactions with Affiliates
Prudential Mutual Fund Services LLC (“PMFS”), an affiliate of PI and an indirect, wholly-owned subsidiary of Prudential, serves as the Company’s transfer agent. Transfer agent’s fees and expenses in the Statement of Operations include certain out-of-pocket expenses paid to non-affiliates, where applicable.
The Series pays networking fees to affiliated and unaffiliated broker/dealers including fees relating to the services of Wells Fargo Advisors, LLC (“Wells Fargo”), an affiliate of PI through December 31, 2009. These networking fees are payments made to broker/dealers that clear mutual fund transactions through a national clearing system. For the six months ended March 31, 2010, the Series incurred approximately $115,400 in total networking fees, of which approximately $26,300 was paid to Wells Fargo through December 31, 2009. These amounts are included in transfer agent’s fees and expenses in the Statement of Operations.
Prudential Investment Management, Inc., (“PIM”), an indirect wholly-owned subsidiary of Prudential, is the Series’ security lending agent. For the six months ended March 31, 2010, PIM has been compensated approximately $9,900 for these services.
| | |
| The Prudential Investment Portfolios, Inc./Prudential Jennison Equity Opportunity Fund | | 23 |
Notes to Financial Statements
(Unaudited) continued
As a result of the bankruptcy filing by Lehman Brothers Holdings Inc., which was the parent company to the Company’s Securities Lending Counter Party, Lehman Brothers Inc. (Lehman), the Company’s Securities Lending Agent utilized collateral held on behalf of the Company for securities out on loan to compensate the Company for the failure of Lehman to return the securities.
The Series invests in the Prudential Core Taxable Money Market Fund (formerly Taxable Money Market Series) (the “portfolio”), a portfolio of the Prudential Investment Portfolios 2 (formerly Dryden Core Investment Fund), pursuant to an exemptive order received from the Securities and Exchange Commission. The portfolio is a money market mutual fund registered under the Investment Company Act of 1940, as amended, and managed by PI.
Note 4. Portfolio Securities
Purchases and sales of investment securities, other than short-term investments, for the six months ended March 31, 2010 were $122,536,533 and $132,822,078, respectively.
Note 5. Tax Information
The United States federal income tax basis of the Series’ investments and the net unrealized appreciation as of March 31, 2010 were as follows:
| | | | | | |
Tax Basis of
Investments | | Appreciation | | Depreciation | | Net
Unrealized
Appreciation |
| $329,487,161 | | $54,731,603 | | $(10,349,477) | | $44,382,126 |
The differences between book and tax basis are primarily attributable to deferred losses on wash sales.
Management has analyzed the Fund’s tax positions taken on federal income tax returns for all open tax years and has concluded that as of March 31, 2010, no provision for income tax would be required in the Funds’ financial statements. The Fund’s federal and state income and federal excise tax returns for tax years for which the applicable statutes of limitations have not expired are subject to examination by the Internal Revenue Service and state departments of revenue.
| | |
| 24 | | Visit our website at www.prudentialfunds.com |
Note 6. Capital
The Series offers Class A, Class B, Class C, Class R and Class Z shares. Class A shares are subject to a maximum front-end sales charge of 5.5%. Investors who purchase Class A shares in an amount of $1 million or more and sell these shares within 12 months of purchase are subject to a contingent deferred sales charge (CDSC) of 1%, including investors who purchase their shares through broker-dealers affiliated with Prudential Financial, Inc. Class B shares are sold with a contingent deferred sales charge which declines from 5% to zero depending on the period of time the shares are held. Class C shares are sold with a contingent deferred sales charge of 1% during the first 12 months. Class B shares automatically convert to Class A shares on a quarterly basis approximately seven years after purchase. A special exchange privilege is also available for shareholders who qualified to purchase Class A shares at net asset value. Class R and Class Z shares are not subject to any sales or redemption charge and are offered exclusively for sale to a limited group of investors.
There are 1 billion shares of $.001 par value common stock of the Series, designated Class A, Class B, Class C, Class R and Class Z, each of which consists of 200 million authorized shares. As of March 31, 2010 Prudential owned 138 Class R shares of the Series.
For the six months ended March 31, 2010, the Series received $29,781 related to an affiliate’s settlement of regulatory proceedings involving allegations of improper trading. This amount is presented in the Series’ statement of changes in net assets. The Series was not involved in the proceedings or the calculation of the payment.
Transactions in shares of common stock were as follows:
| | | | | | | |
Class A | | Shares | | | Amount | |
Six months ended March 31, 2010: | | | | | | | |
Shares sold | | 1,345,036 | | | $ | 15,887,619 | |
Shares reacquired | | (1,885,910 | ) | | | (22,412,078 | ) |
| | | | | | | |
Net increase (decrease) in shares outstanding before conversion | | (540,874 | ) | | | (6,524,459 | ) |
Shares issued upon conversion from Class B | | 114,220 | | | | 1,369,315 | |
| | | | | | | |
Net increase (decrease) in shares outstanding | | (426,654 | ) | | $ | (5,155,144 | ) |
| | | | | | | |
Year ended September 30, 2009: | | | | | | | |
Shares sold | | 2,435,053 | | | $ | 22,468,945 | |
Shares issued in reinvestment of dividends | | 291,896 | | | | 2,783,572 | |
Shares reacquired | | (6,040,016 | ) | | | (55,863,137 | ) |
| | | | | | | |
Net increase (decrease) in shares outstanding before conversion | | (3,313,067 | ) | | | (30,610,620 | ) |
Shares issued upon conversion from Class B | | 1,983,286 | | | | 17,679,143 | |
| | | | | | | |
Net increase (decrease) in shares outstanding | | (1,329,781 | ) | | $ | (12,931,477 | ) |
| | | | | | | |
| | |
| The Prudential Investment Portfolios, Inc./Prudential Jennison Equity Opportunity Fund | | 25 |
Notes to Financial Statements
(Unaudited) continued
| | | | | | | |
Class B | | Shares | | | Amount | |
Six months ended March 31, 2010: | | | | | | | |
Shares sold | | 107,548 | | | $ | 1,159,364 | |
Shares reacquired | | (348,010 | ) | | | (3,760,401 | ) |
| | | | | | | |
Net increase (decrease) in shares outstanding before conversion | | (240,462 | ) | | | (2,601,037 | ) |
Shares reacquired upon conversion into Class A | | (126,121 | ) | | | (1,369,315 | ) |
| | | | | | | |
Net increase (decrease) in shares outstanding | | (366,583 | ) | | $ | (3,970,352 | ) |
| | | | | | | |
Year ended September 30, 2009: | | | | | | | |
Shares sold | | 195,120 | | | $ | 1,608,715 | |
Shares issued in reinvestment of dividends | | 26,578 | | | | 243,456 | |
Shares reacquired | | (1,042,564 | ) | | | (8,188,665 | ) |
| | | | | | | |
Net increase (decrease) in shares outstanding before conversion | | (820,866 | ) | | | (6,336,494 | ) |
Shares reacquired upon conversion into Class A | | (2,179,108 | ) | | | (17,679,143 | ) |
| | | | | | | |
Net increase (decrease) in shares outstanding | | (2,999,974 | ) | | $ | (24,015,637 | ) |
| | | | | | | |
Class C | | | | | | |
Six months ended March 31, 2010: | | | | | | | |
Shares sold | | 192,289 | | | $ | 2,063,726 | |
Shares reacquired | | (201,624 | ) | | | (2,153,700 | ) |
| | | | | | | |
Net increase (decrease) in shares outstanding | | (9,335 | ) | | $ | (89,974 | ) |
| | | | | | | |
Year ended September 30, 2009: | | | | | | | |
Shares sold | | 227,623 | | | $ | 1,983,606 | |
Shares issued in reinvestment of dividends | | 23,900 | | | | 218,920 | |
Shares reacquired | | (588,934 | ) | | | (4,617,392 | ) |
| | | �� | | | | |
Net increase (decrease) in shares outstanding | | (337,411 | ) | | $ | (2,414,866 | ) |
| | | | | | | |
Class R | | | | | | |
Six months ended March 31, 2010: | | | | | | | |
Shares sold | | 3,465 | | | $ | 39,167 | |
Shares reacquired | | (20 | ) | | | (232 | ) |
| | | | | | | |
Net increase (decrease) in shares outstanding | | 3,445 | | | $ | 38,935 | |
| | | | | | | |
Year ended September 30, 2009: | | | | | | | |
Shares sold | | 584 | | | $ | 4,827 | |
Shares issued in reinvestment of dividends | | 11 | | | | 86 | |
Shares reacquired | | (1,481 | ) | | | (11,240 | ) |
| | | | | | | |
Net increase (decrease) in shares outstanding | | (886 | ) | | $ | (6,327 | ) |
| | | | | | | |
| | |
| 26 | | Visit our website at www.prudentialfunds.com |
| | | | | | | |
Class Z | | Shares | | | Amount | |
Six months ended March 31, 2010: | | | | | | | |
Shares sold | | 836,603 | | | $ | 10,209,880 | |
Shares reacquired | | (292,054 | ) | | | (3,535,004 | ) |
| | | | | | | |
Net increase (decrease) in shares outstanding | | 544,549 | | | $ | 6,674,876 | |
| | | | | | | |
Year ended September 30, 2009: | | | | | | | |
Shares sold | | 1,063,742 | | | $ | 10,313,497 | |
Shares issued in reinvestment of dividends | | 73,116 | | | | 699,839 | |
Shares reacquired | | (998,844 | ) | | | (8,900,313 | ) |
| | | | | | | |
Net increase (decrease) in shares outstanding | | 138,014 | | | $ | 2,113,023 | |
| | | | | | | |
Note 7. New Accounting Pronouncement
In January 2010, the Financial Accounting Standards Board (“FASB”) issued Accounting Standards Update (“ASU”) No. 2010-06 “Improving Disclosures about Fair Value Measurements”. ASU 2010-06 will require reporting entities to make new disclosures about amounts and reasons for significant transfers in and out of Level 1 and Level 2 fair value measurements and input and valuation techniques used to measure fair value for both recurring and nonrecurring fair value measurements that fall in either Level 2 or Level 3, and information on purchases, sales, issuances, and settlements in the roll forward of activity in Level 3 fair value measurements. The new and revised disclosures are effective for interim and annual reporting periods beginning after December 15, 2009 except for the disclosures about purchases, sales, issuances, and settlements in the roll forward of activity in Level 3 fair value measurements, which are effective for interim and annual reporting periods beginning after December 15, 2010. At this time, management is evaluating the implications of ASU No. 2010-06 and its impact on the financial statements has not been determined.
Note 8. Subsequent Events
Management has evaluated the impact of all subsequent events on the Series through the date the financial statements were issued and has determined that there were no subsequent events requiring recognition or disclosure in the financial statements.
| | |
| The Prudential Investment Portfolios, Inc./Prudential Jennison Equity Opportunity Fund | | 27 |
Financial Highlights
(Unaudited)
| | | | |
| | | Class A | |
| | Six Months Ended
March 31, 2010(a) | |
Per Share Operating Performance: | | | | |
Net Asset Value, Beginning Of Period | | $ | 11.38 | |
| | | | |
Income (loss) from investment operations: | | | | |
Net investment income (loss) | | | — | (g) |
Net realized and unrealized gain (loss) on investment and foreign currency transactions | | | 1.17 | |
| | | | |
Total from investment operations | | | 1.17 | |
| | | | |
Less Dividends and Distributions: | | | | |
Dividends from net investment income | | | — | |
Tax return of capital | | | — | |
Distributions from net realized gains | | | — | |
| | | | |
Total dividends and distributions | | | — | |
| | | | |
Capital contributions | | | — | (g) |
| | | | |
Net asset value, end of period | | $ | 12.55 | |
| | | | |
Total Return(b): | | | 10.28 | % |
Ratios/Supplemental Data: | | | | |
Net assets, end of period (000) | | $ | 224,991 | |
Average net assets (000) | | $ | 215,577 | |
Ratios to average net assets(d): | | | | |
Expenses, including distribution and service (12b-1) fees | | | 1.20 | %(e) |
Expenses, excluding distribution and service (12b-1) fees | | | .90 | %(e) |
Net investment income (loss) | | | (.08 | )%(e) |
For Class A, B, C, R and Z shares: | | | | |
Portfolio turnover rate | | | 41 | %(f) |
| (a) | Calculations are based on average shares outstanding during the period. |
| (b) | Total return does not consider the effects of sales loads. Total return is calculated assuming a purchase of a share on the first day and a sale on the last day of each period reported and includes reinvestment of dividends and distributions. Total investment returns may reflect adjustments to conform to generally accepted accounting principles. Total returns for periods less than one full year are not annualized. |
| (c) | The distributor of the Series contractually agreed to limit its distribution and service (12b-1) fees to 0.25% on the average daily net assets of the Class A shares through January 31, 2008. |
| (d) | Does not include expenses of the underlying portfolios in which the Series invests. |
See Notes to Financial Statements.
| | |
| 28 | | Visit our website at www.prudentialfunds.com |
| | | | | | | | | | | | | | | | | | |
| Class A | |
| Year Ended September 30, | |
| 2009(a) | | | 2008(a) | | | 2007(a) | | | 2006(a) | | | 2005 | |
| | | | | | | | | | | | | | | | | | |
| $ | 11.35 | | | $ | 17.74 | | | $ | 17.38 | | | $ | 18.47 | | | $ | 16.60 | |
| | | | | | | | | | | | | | | | | | | |
| | | | | | | | | | | | | | | | | | |
| | .13 | | | | .08 | | | | .06 | | | | .02 | | | | .13 | |
| | .06 | | | | (3.74 | ) | | | 2.65 | | | | 1.70 | | | | 2.14 | |
| | | | | | | | | | | | | | | | | | | |
| | .19 | | | | (3.66 | ) | | | 2.71 | | | | 1.72 | | | | 2.27 | |
| | | | | | | | | | | | | | | | | | | |
| | | | | | | | | | | | | | | | | | |
| | (.09 | ) | | | (.07 | ) | | | (.02 | ) | | | (.09 | ) | | | (.03 | ) |
| | (.07 | ) | | | — | | | | — | | | | — | | | | — | |
| | — | | | | (2.66 | ) | | | (2.33 | ) | | | (2.72 | ) | | | (.37 | ) |
| | | | | | | | | | | | | | | | | | | |
| | (.16 | ) | | | (2.73 | ) | | | (2.35 | ) | | | (2.81 | ) | | | (.40 | ) |
| | | | | | | | | | | | | | | | | | | |
| | — | | | | — | | | | — | | | | — | | | | — | |
| | | | | | | | | | | | | | | | | | | |
| $ | 11.38 | | | $ | 11.35 | | | $ | 17.74 | | | $ | 17.38 | | | $ | 18.47 | |
| | | | | | | | | | | | | | | | | | | |
| | 1.93 | % | | | (23.30 | )% | | | 17.21 | % | | | 10.68 | % | | | 13.91 | % |
| | | | | | | | | | | | | | | | | | |
| $ | 208,977 | | | $ | 223,338 | | | $ | 324,835 | | | $ | 306,424 | | | $ | 326,512 | |
| $ | 173,786 | | | $ | 271,189 | | | $ | 324,483 | | | $ | 314,651 | | | $ | 336,880 | |
| | | | | | | | | | | | | | | | | | |
| | 1.26 | % | | | 1.06 | %(c) | | | 1.06 | %(c) | | | 1.11 | %(c) | | | 1.12 | %(c) |
| | .96 | % | | | .78 | % | | | .81 | % | | | .86 | % | | | .87 | % |
| | 1.37 | % | | | .56 | % | | | .33 | % | | | .10 | % | | | .68 | % |
| | | | | | | | | | | | | | | | | | |
| | 74 | % | | | 76 | % | | | 77 | % | | | 75 | % | | | 93 | % |
See Notes to Financial Statements.
| | |
| The Prudential Investment Portfolios, Inc./Prudential Jennison Equity Opportunity Fund | | 29 |
Financial Highlights
(Unaudited) continued
| | | | |
| | | Class B | |
| | | Six Months Ended
March 31, 2010(a) | |
Per Share Operating Performance: | | | | |
Net Asset Value, Beginning Of Period | | $ | 10.33 | |
| | | | |
Income (loss) from investment operations: | | | | |
Net investment income (loss) | | | (.04 | ) |
Net realized and unrealized gain (loss) on investment and foreign currency transactions | | | 1.06 | |
| | | | |
Total from investment operations | | | 1.02 | |
| | | | |
Less Dividends and Distributions: | | | | |
Dividends from net investment income | | | — | |
Tax return of capital | | | — | |
Distributions from net realized gains | | | — | |
| | | | |
Total dividends and distributions | | | — | |
| | | | |
Capital contributions | | | — | (e) |
| | | | |
Net asset value, end of period | | $ | 11.35 | |
| | | | |
Total Return(b): | | | 9.87 | % |
Ratios/Supplemental Data: | | | | |
Net assets, end of period (000) | | $ | 20,089 | |
Average net assets (000) | | $ | 21,219 | |
Ratios to average net assets(c): | | | | |
Expenses, including distribution and service (12b-1) fees | | | 1.90 | %(d) |
Expenses, excluding distribution and service (12b-1) fees | | | .90 | %(d) |
Net investment income (loss) | | | (.78 | )%(d) |
| (a) | Calculations are based on average shares outstanding during the period. |
| (b) | Total return does not consider the effects of sales loads. Total return is calculated assuming a purchase of a share on the first day and a sale on the last day of each period reported and includes reinvestment of dividends and distributions. Total investment returns may reflect adjustments to conform to generally accepted accounting principles. Total returns for periods less than one full year are not annualized. |
| (c) | Does not include expenses of the underlying portfolios in which the Series invests. |
See Notes to Financial Statements.
| | |
| 30 | | Visit our website at www.prudentialfunds.com |
| | | | | | | | | | | | | | | | | | |
| Class B | |
| Year Ended September 30, | |
| 2009(a) | | | 2008(a) | | | 2007(a) | | | 2006(a) | | | 2005 | |
| | | | | | | | | | | | | | | | | | |
| $ | 10.31 | | | $ | 16.43 | | | $ | 16.34 | | | $ | 17.56 | | | $ | 15.88 | |
| | | | | | | | | | | | | | | | | | | |
| | | | | | | | | | | | | | | | | | |
| | .07 | | | | (.02 | ) | | | (.07 | ) | | | (.04 | ) | | | (.01 | ) |
| | .05 | | | | (3.43 | ) | | | 2.49 | | | | 1.54 | | | | 2.06 | |
| | | | | | | | | | | | | | | | | | | |
| | .12 | | | | (3.45 | ) | | | 2.42 | | | | 1.50 | | | | 2.05 | |
| | | | | | | | | | | | | | | | | | | |
| | | | | | | | | | | | | | | | | | |
| | (.03 | ) | | | (.01 | ) | | | — | | | | — | | | | — | |
| | (.07 | ) | | | — | | | | — | | | | — | | | | — | |
| | — | | | | (2.66 | ) | | | (2.33 | ) | | | (2.72 | ) | | | (.37 | ) |
| | | | | | | | | | | | | | | | | | | |
| | (.10 | ) | | | (2.67 | ) | | | (2.33 | ) | | | (2.72 | ) | | | (.37 | ) |
| | | | | | | | | | | | | | | | | | | |
| | — | | | | — | | | | — | | | | — | | | | — | |
| | | | | | | | | | | | | | | | | | | |
| $ | 10.33 | | | $ | 10.31 | | | $ | 16.43 | | | $ | 16.34 | | | $ | 17.56 | |
| | | | | | | | | | | | | | | | | | | |
| | 1.24 | % | | | (23.88 | )% | | | 16.40 | % | | | 9.83 | % | | | 13.12 | % |
| | | | | | | | | | | | | | | | | | |
| $ | 22,077 | | | $ | 52,943 | | | $ | 124,475 | | | $ | 143,053 | | | $ | 180,496 | |
| $ | 28,455 | | | $ | 92,183 | | | $ | 137,977 | | | $ | 161,565 | | | $ | 202,371 | |
| | | | | | | | | | | | | | | | | | |
| | 1.96 | % | | | 1.78 | % | | | 1.81 | % | | | 1.86 | % | | | 1.87 | % |
| | .96 | % | | | .78 | % | | | .81 | % | | | .86 | % | | | .87 | % |
| | .93 | % | | | (.18 | )% | | | (.42 | )% | | | (.26 | )% | | | (.05 | )% |
See Notes to Financial Statements.
| | |
| The Prudential Investment Portfolios, Inc./Prudential Jennison Equity Opportunity Fund | | 31 |
Financial Highlights
(Unaudited) continued
| | | | |
| | | Class C | |
| | | Six Months Ended
March 31, 2010(a) | |
Per Share Operating Performance: | | | | |
Net Asset Value, Beginning Of Period | | $ | 10.33 | |
| | | | |
Income (loss) from investment operations: | | | | |
Net investment income (loss) | | | (.04 | ) |
Net realized and unrealized gain (loss) on investment and foreign currency transactions | | | 1.06 | |
| | | | |
Total from investment operations | | | 1.02 | |
| | | | |
Less Dividends and Distributions: | | | | |
Dividends from net investment income | | | — | |
Tax return of capital | | | — | |
Distributions from net realized gains | | | — | |
| | | | |
Total dividends and distributions | | | — | |
| | | | |
Capital contributions | | | — | (e) |
| | | | |
Net asset value, end of period | | $ | 11.35 | |
| | | | |
Total Return(b): | | | 9.87 | % |
Ratios/Supplemental Data: | | | | |
Net assets, end of period (000) | | $ | 28,012 | |
Average net assets (000) | | $ | 26,343 | |
Ratios to average net assets(c): | | | | |
Expenses, including distribution and service (12b-1) fees | | | 1.90 | %(d) |
Expenses, excluding distribution and service (12b-1) fees | | | .90 | %(d) |
Net investment income (loss) | | | (.78 | )%(d) |
| (a) | Calculations are based on average shares outstanding during the period. |
| (b) | Total return does not consider the effects of sales loads. Total return is calculated assuming a purchase of a share on the first day and a sale on the last day of each period reported and includes reinvestment of dividends and distributions. Total investment returns may reflect adjustments to conform to generally accepted accounting principles. Total returns for periods less than one full year are not annualized. |
| (c) | Does not include expenses of the underlying portfolios in which the Series invests. |
See Notes to Financial Statements.
| | |
| 32 | | Visit our website at www.prudentialfunds.com |
| | | | | | | | | | | | | | | | | | |
| Class C | |
| Year Ended September 30, | |
| 2009(a) | | | 2008(a) | | | 2007(a) | | | 2006(a) | | | 2005 | |
| | | | | | | | | | | | | | | | | | |
| $ | 10.31 | | | $ | 16.43 | | | $ | 16.34 | | | $ | 17.56 | | | $ | 15.88 | |
| | | | | | | | | | | | | | | | | | | |
| | | | | | | | | | | | | | | | | | |
| | .06 | | | | (.02 | ) | | | (.07 | ) | | | (.05 | ) | | | (.01 | ) |
| | .06 | | | | (3.43 | ) | | | 2.49 | | | | 1.55 | | | | 2.06 | |
| | | | | | | | | | | | | | | | | | | |
| | .12 | | | | (3.45 | ) | | | 2.42 | | | | 1.50 | | | | 2.05 | |
| | | | | | | | | | | | | | | | | | | |
| | | | | | | | | | | | | | | | | | |
| | (.03 | ) | | | (.01 | ) | | | — | | | | — | | | | — | |
| | (.07 | ) | | | — | | | | — | | | | — | | | | — | |
| | — | | | | (2.66 | ) | | | (2.33 | ) | | | (2.72 | ) | | | (.37 | ) |
| | | | | | | | | | | | | | | | | | | |
| | (.10 | ) | | | (2.67 | ) | | | (2.33 | ) | | | (2.72 | ) | | | (.37 | ) |
| | | | | | | | | | | | | | | | | | | |
| | — | | | | — | | | | — | | | | — | | | | — | |
| | | | | | | | | | | | | | | | | | | |
| $ | 10.33 | | | $ | 10.31 | | | $ | 16.43 | | | $ | 16.34 | | | $ | 17.56 | |
| | | | | | | | | | | | | | | | | | | |
| | 1.24 | % | | | (23.88 | )% | | | 16.40 | % | | | 9.83 | % | | | 13.12 | % |
| | | | | | | | | | | | | | | | | | |
| $ | 25,599 | | | $ | 29,011 | | | $ | 48,445 | | | $ | 50,717 | | | $ | 59,409 | |
| $ | 21,081 | | | $ | 38,511 | | | $ | 50,851 | | | $ | 54,051 | | | $ | 63,559 | |
| | | | | | | | | | | | | | | | | | |
| | 1.96 | % | | | 1.78 | % | | | 1.81 | % | | | 1.86 | % | | | 1.87 | % |
| | .96 | % | | | .78 | % | | | .81 | % | | | .86 | % | | | .87 | % |
| | .69 | % | | | (.17 | )% | | | (.42 | )% | | | (.35 | )% | | | (.06 | )% |
See Notes to Financial Statements.
| | |
| The Prudential Investment Portfolios, Inc./Prudential Jennison Equity Opportunity Fund | | 33 |
Financial Highlights
(Unaudited) continued
| | | | |
| | | Class R | |
| |
| | | Six Months Ended
March 31, 2010(b) | |
Per Share Operating Performance: | | | | |
Net Asset Value, Beginning Of Period | | $ | 10.52 | |
| | | | |
Income (loss) from investment operations: | | | | |
Net investment income (loss) | | | (.01 | ) |
Net realized and unrealized gain (loss) on investment and foreign currency transactions | | | 1.10 | |
| | | | |
Total from investment operations | | | 1.09 | |
| | | | |
Less Dividends and Distributions: | | | | |
Dividends from net investment income | | | — | |
Tax return of capital | | | — | |
Distributions from net realized gains | | | — | |
| | | | |
Total dividends and distributions | | | — | |
| | | | |
Capital contributions | | | — | (g) |
| | | | |
Net asset value, end of period | | $ | 11.61 | |
| | | | |
Total Return(c): | | | 10.36 | % |
Ratios/Supplemental Data: | | | | |
Net assets, end of period (000) | | $ | 46 | |
Average net assets (000) | | $ | 15 | |
Ratios to average net assets(f): | | | | |
Expenses, including distribution and service (12b-1) fees(d) | | | 1.40 | %(e) |
Expenses, excluding distribution and service (12b-1) fees | | | .90 | %(e) |
Net investment income (loss) | | | (.11 | )%(e) |
| (a) | Commencement of operations. |
| (b) | Calculations are based on average shares outstanding during the period. |
| (c) | Total return is calculated assuming a purchase of a share on the first day and a sale on the last day of each period reported and includes reinvestment of dividends and distributions. Total investment returns may reflect adjustments to conform to generally accepted accounting principles. Total returns for periods less than one full year are not annualized. |
| (d) | During the period, the distributor of the Series contractually agreed to limit its distribution and service (12b-1) fees to 0.50% on the average daily net assets of the Class R shares. |
| (f) | Does not include the expenses of the underlying funds in which the Series invests. |
See Notes to Financial Statements.
| | |
| 34 | | Visit our website at www.prudentialfunds.com |
| | | | | | | | | | | | | | | | | | |
| Class R | |
| Year Ended September 30, | | | December 17, 2004(a)
through
September 30, 2005 | |
| 2009(b) | | | 2008(a) | | | 2007(a) | | | 2006(a) | | |
| | | | | | | | | | | | | | | | | | |
| $ | 10.52 | | | $ | 16.67 | | | $ | 16.48 | | | $ | 17.70 | | | $ | 16.73 | |
| | | | | | | | | | | | | | | | | | | |
| | | | | | | | | | | | | | | | | | |
| | .04 | | | | .06 | | | | .02 | | | | .04 | | | | .04 | |
| | .10 | | | | (3.51 | ) | | | 2.50 | | | | 1.51 | | | | .93 | |
| | | | | | | | | | | | | | | | | | | |
| | .14 | | | | (3.45 | ) | | | 2.52 | | | | 1.55 | | | | .97 | |
| | | | | | | | | | | | | | | | | | | |
| | | | | | | | | | | | | | | | | | |
| | (.07 | ) | | | (.04 | ) | | | — | | | | (.05 | ) | | | — | |
| | (.07 | ) | | | — | | | | — | | | | — | | | | — | |
| | — | | | | (2.66 | ) | | | (2.33 | ) | | | (2.72 | ) | | | — | |
| | | | | | | | | | | | | | | | | | | |
| | (.14 | ) | | | (2.70 | ) | | | (2.33 | ) | | | (2.77 | ) | | | — | |
| | | | | | | | | | | | | | | | | | | |
| | — | | | | — | | | | — | | | | — | | | | — | |
| | | | | | | | | | | | | | | | | | | |
| $ | 10.52 | | | $ | 10.52 | | | $ | 16.67 | | | $ | 16.48 | | | $ | 17.70 | |
| | | | | | | | | | | | | | | | | | | |
| | 1.55 | % | | | (23.53 | )% | | | 16.94 | % | | | 10.12 | % | | | 5.80 | % |
| | | | | | | | | | | | | | | | | | |
| $ | 5 | | | $ | 15 | | | $ | 3 | | | $ | 3 | | | $ | 3 | |
| $ | 7 | | | $ | 6 | | | $ | 3 | | | $ | 3 | | | $ | 3 | |
| | | | | | | | | | | | | | | | | | |
| | 1.46 | % | | | 1.28 | % | | | 1.31 | % | | | 1.36 | % | | | 1.37 | %(e) |
| | .96 | % | | | .78 | % | | | .81 | % | | | .86 | % | | | .87 | %(e) |
| | .47 | % | | | .52 | % | | | .10 | % | | | .23 | % | | | .27 | %(e) |
See Notes to Financial Statements.
| | |
| The Prudential Investment Portfolios, Inc./Prudential Jennison Equity Opportunity Fund | | 35 |
Financial Highlights
(Unaudited) continued
| | | | |
| | | Class Z | |
| | | Six Months Ended
March 31, 2010(a) | |
Per Share Operating Performance: | | | | |
Net Asset Value, Beginning Of Period | | $ | 11.63 | |
| | | | |
Income (loss) from investment operations: | | | | |
Net investment income | | | .01 | |
Net realized and unrealized gain (loss) on investment and foreign currency transactions | | | 1.20 | |
| | | | |
Total from investment operations | | | 1.21 | |
| | | | |
Less Dividends and Distributions: | | | | |
Dividends from net investment income | | | — | |
Tax return of capital | | | — | |
Distributions from net realized gains | | | — | |
| | | | |
Total dividends and distributions | | | — | |
| | | | |
Capital contributions | | | — | (e) |
| | | | |
Net asset value, end of period | | $ | 12.84 | |
| | | | |
Total Return(b): | | | 10.40 | % |
Ratios/Supplemental Data: | | | | |
Net assets, end of period (000) | | $ | 61,822 | |
Average net assets (000) | | $ | 53,140 | |
Ratios to average net assets(c): | | | | |
Expenses, including distribution and service (12b-1) fees | | | .90 | %(d) |
Expenses, excluding distribution and service (12b-1) fees | | | .90 | %(d) |
Net investment income (loss) | | | .23 | %(d) |
| (a) | Calculations are based on average shares outstanding during the period. |
| (b) | Total return is calculated assuming a purchase of a share on the first day and a sale on the last day of each period reported and includes reinvestment of dividends and distributions. Total investment returns may reflect adjustments to conform to generally accepted accounting principles. Total returns for periods less than one full year are not annualized. |
| (c) | Does not include expenses of the underlying portfolios in which the Series invests. |
See Notes to Financial Statements.
| | |
| 36 | | Visit our website at www.prudentialfunds.com |
| | | | | | | | | | | | | | | | | | |
| Class Z | |
| Year Ended September 30, | |
| 2009(a) | | | 2008(a) | | | 2007(a) | | | 2006(a) | | | 2005 | |
| | | | | | | | | | | | | | | | | | |
| $ | 11.59 | | | $ | 18.05 | | | $ | 17.65 | | | $ | 18.74 | | | $ | 16.83 | |
| | | | | | | | | | | | | | | | | | | |
| | | | | | | | | | | | | | | | | | |
| | .16 | | | | .12 | | | | .10 | | | | .12 | | | | .18 | |
| | .07 | | | | (3.81 | ) | | | 2.71 | | | | 1.66 | | | | 2.17 | |
| | | | | | | | | | | | | | | | | | | |
| | .23 | | | | (3.69 | ) | | | 2.81 | | | | 1.78 | | | | 2.35 | |
| | | | | | | | | | | | | | | | | | | |
| | | | | | | | | | | | | | | | | | |
| | (.12 | ) | | | (.11 | ) | | | (.08 | ) | | | (.15 | ) | | | (.07 | ) |
| | (.07 | ) | | | — | | | | — | | | | — | | | | — | |
| | — | | | | (2. 66 | ) | | | (2. 33 | ) | | | (2. 72 | ) | | | (. 37 | ) |
| | | | | | | | | | | | | | | | | | | |
| | (.19 | ) | | | (2.77 | ) | | | (2.41 | ) | | | (2.87 | ) | | | (.44 | ) |
| | | | | | | | | | | | | | | | | | | |
| | — | | | | — | | | | — | | | | — | | | | — | |
| | | | | | | | | | | | | | | | | | | |
| $ | 11.63 | | | $ | 11.59 | | | $ | 18.05 | | | $ | 17.65 | | | $ | 18.74 | |
| | | | | | | | | | | | | | | | | | | |
| | 2.31 | % | | | (23.06 | )% | | | 17.52 | % | | | 10.92 | % | | | 14.23 | % |
| | | | | | | | | | | | | | | | | | |
| $ | 49,670 | | | $ | 47,893 | | | $ | 74,149 | | | $ | 96,626 | | | $ | 277,372 | |
| $ | 37,242 | | | $ | 60,764 | | | $ | 79,338 | | | $ | 184,440 | | | $ | 313,971 | |
| | | | | | | | | | | | | | | | | | |
| | .96 | % | | | .78 | % | | | .81 | % | | | .86 | % | | | .87 | % |
| | .96 | % | | | .78 | % | | | .81 | % | | | .86 | % | | | .87 | % |
| | 1.67 | % | | | .84 | % | | | .58 | % | | | .69 | % | | | .96 | % |
See Notes to Financial Statements.
| | |
| The Prudential Investment Portfolios, Inc./Prudential Jennison Equity Opportunity Fund | | 37 |
Results of Proxy Voting
(Unaudited)
At a special meeting of shareholders held on March 9, 2010, Fund shareholders approved a proposal to elect Directors.
The individuals listed in the table below were elected as directors of each Fund.* All directors, with the exception of Mr. Benjamin, served as directors to each Fund prior to the shareholder meeting.
| | | | |
Trustee | | For | | Withheld |
Kevin J. Bannon | | 123,240,410.836 | | 1,700,825.331 |
| | |
Linda W. Bynoe | | 123,157,644.037 | | 1,783,592.130 |
| | |
Michael S. Hyland | | 123,201,323.318 | | 1,739,912.849 |
| | |
Douglas H. McCorkindale | | 123,074,984.328 | | 1,866,251.839 |
| | |
Stephen P. Munn | | 123,216,742.859 | | 1,724,493.308 |
| | |
Richard A. Redeker | | 123,225,795.108 | | 1,715,441.059 |
| | |
Robin B. Smith | | 123,040,042.169 | | 1,901,193.998 |
| | |
Stephen G. Stoneburn | | 123,252,589.748 | | 1,688,646.419 |
| | |
Judy A. Rice | | 123,218,596.264 | | 1,722,639.903 |
| | |
Scott E. Benjamin | | 123,212,247.295 | | 1,728,988.872 |
| * | Results are for all funds within the same investment company. |
| | |
| 38 | | Visit our website at www.prudentialfunds.com |
| | | | |
| n MAIL | | n TELEPHONE | | n WEBSITE |
Gateway Center Three 100 Mulberry Street Newark, NJ 07102 | | (800) 225-1852 | | www.prudentialfunds.com |
|
| PROXY VOTING |
The Board of Directors of the Fund has delegated to the Fund’s investment subadviser the responsibility for voting any proxies and maintaining proxy recordkeeping with respect to the
Fund. A description of these proxy voting policies and procedures is available without charge, upon request, by calling (800) 225-1852 or by visiting the Securities and Exchange Commission’s website at www.sec.gov. Information regarding how the Fund voted proxies relating to portfolio securities during the most recent 12-month period ended June 30 is available on the Fund’s website and on the Commission’s website. |
|
| DIRECTORS |
| Kevin J. Bannon • Scott E. Benjamin • Linda W. Bynoe • Michael S. Hyland • Douglas H. McCorkindale • Stephen P. Munn • Richard A. Redeker • Judy A. Rice • Robin B. Smith • Stephen G. Stoneburn |
|
| OFFICERS |
| Judy A. Rice, President • Scott E. Benjamin, Vice President • Grace C. Torres, Treasurer and Principal Financial and Accounting Officer • Kathryn L. Quirk, Chief Legal Officer • Deborah A. Docs, Secretary • Timothy J. Knierim, Chief Compliance Officer • Valerie M. Simpson, Deputy Chief Compliance Officer • Theresa C. Thompson, Deputy Chief Compliance Officer • Noreen M. Fierro, Anti-Money Laundering Compliance Officer • Jonathan D. Shain, Assistant Secretary • Claudia DiGiacomo, Assistant Secretary • John P. Schwartz, Assistant Secretary • Andrew R. French, Assistant Secretary • M. Sadiq Peshimam, Assistant Treasurer • Peter Parrella, Assistant Treasurer |
| | | | |
| MANAGER | | Prudential Investments LLC | | Gateway Center Three
100 Mulberry Street Newark, NJ 07102 |
|
| INVESTMENT SUBADVISER | | Jennison Associates LLC | | 466 Lexington Avenue
New York, NY 10017 |
|
| DISTRIBUTOR | | Prudential Investment
Management Services LLC | | Gateway Center Three
100 Mulberry Street Newark, NJ 07102 |
|
| CUSTODIAN | | The Bank of New York Mellon | | One Wall Street
New York, NY 10286 |
|
| TRANSFER AGENT | | Prudential Mutual Fund
Services LLC | | PO Box 9658
Providence, RI 02940 |
|
INDEPENDENT REGISTERED
PUBLIC ACCOUNTING FIRM | | KPMG LLP | | 345 Park Avenue
New York, NY 10154 |
|
| FUND COUNSEL | | Sullivan & Cromwell LLP | | 125 Broad Street
New York, NY 10004 |
|
| An investor should consider the investment objectives, risks, charges, and expenses of the Fund carefully before investing. The prospectus for the Fund contains this and other information about the Fund. An investor may obtain a prospectus by visiting our website at www.prudentialfunds.com or by calling (800) 225-1852. The prospectus should be read carefully before investing. |
|
| E-DELIVERY |
| To receive your mutual fund documents online, go to www.prudentialfunds.com/edelivery and enroll. Instead of receiving printed documents by mail, you will receive notification via e-mail when new materials are available. You can cancel your enrollment or change your e-mail address at any time by visiting the website address above. |
|
| SHAREHOLDER COMMUNICATIONS WITH DIRECTORS |
| Shareholders can communicate directly with the Board of Directors by writing to the Chair of the Board, Prudential Jennison Equity Opportunity Fund, Prudential Investments, Attn: Board of Directors, 100 Mulberry Street, Gateway Center Three, Newark, NJ 07102. Shareholders can communicate directly with an individual Director by writing to the same address. Communications are not screened before being delivered to the addressee. |
|
| AVAILABILITY OF PORTFOLIO SCHEDULE |
| The Fund files its complete schedule of portfolio holdings with the Securities and Exchange Commission for the first and third quarters of each fiscal year on Form N-Q under the Prudential Investment Portfolios, Inc. name. The Fund’s Forms N-Q are available on the Commission’s website at www.sec.gov. The Fund’s Forms N-Q may also be reviewed and copied at the Commission’s Public Reference Room in Washington, D.C. Information on the operation and location of the Public Reference Room may be obtained by calling (202) 551-8090. The Fund’s schedule of portfolio holdings is also available on the Fund’s website as of the end of each fiscal quarter. |
Mutual Funds:
| | | | |
| ARE NOT INSURED BY THE FDIC OR ANY FEDERAL GOVERNMENT AGENCY | | MAY LOSE VALUE | | ARE NOT A DEPOSIT OF OR GUARANTEED BY ANY BANK OR ANY BANK AFFILIATE |

| | | | | | | | | | | | | | |
Prudential Jennison Equity Opportunity Fund | | | | |
| | | Share Class | | A | | B | | C | | R | | Z | | |
| | NASDAQ | | PJIAX | | PJIBX | | PJGCX | | PJORX | | PJGZX | | |
| | CUSIP | | 74437E503 | | 74437E602 | | 74437E701 | | 74437E644 | | 74437E800 | | |
| | | | | | | | | | | | | | |
MF172E2 0179285-00001-00

| | |
| SEMIANNUAL REPORT | | MARCH 31, 2010 |
Prudential Asset Allocation Funds
Prudential Conservative Allocation Fund
Prudential Moderate Allocation Fund
Prudential Growth Allocation Fund
(Formerly known as JennisonDryden Asset Allocation Funds)
| | | | |
Fund Type Balanced/allocation | | | | This report is not authorized for distribution to prospective investors unless preceded or accompanied by a current prospectus. The views expressed in this report and information about the Funds’ portfolio holdings are for the period covered by this report and are subject to change thereafter. The accompanying financial statements as of March 31, 2010, were not audited and, accordingly, no auditor’s opinion is expressed on them. Prudential Investments, Prudential Financial, and the Rock Prudential logo are registered service marks of The Prudential Insurance Company of America, Newark, NJ, and its affiliates. |
| | |

| | To enroll in e-delivery, go to www.prudentialfunds.com/edelivery |
PRUDENTIAL ASSET ALLOCATION FUNDS
TABLE OF CONTENTS
May 14, 2010
Dear Shareholder:
Recently we announced the renaming of JennisonDryden, Prudential Financial’s mutual fund family, to Prudential Investments. As a result of this change, each of our funds has been renamed to feature “Prudential” as part of its new name. The name of the JennisonDryden Asset Allocation Funds has changed to the Prudential Asset Allocation Funds.
While the name of your fund has changed, its investment objectives and portfolio management team remain the same. No action is required on your part. If you participate in an automatic investment plan, your account continues to be invested in the Fund under its new name.
Featuring the Prudential name in our funds creates an immediate connection to the experience and heritage of Prudential, a name recognized by millions for helping people grow and protect their wealth.
On the following pages, you will find your fund’s semiannual report, including a table showing fund performance over the first half of the fiscal year and for longer periods. The report also contains a listing of the fund’s holdings at period-end. If you have questions about your fund or the renaming of our mutual fund family, please contact your financial professional or visit our website at www.prudentialfunds.com.
Sincerely,

Judy A. Rice, President
Prudential Asset Allocation Funds
| | |
| Prudential Investment Portfolios, Inc./Prudential Asset Allocation Funds | | 1 |
Your Fund’s Performance—Conservative Allocation Fund
Performance data quoted represent past performance. Past performance does not guarantee future results. The investment return and principal value of an investment will fluctuate, so that an investor’s shares, when redeemed, may be worth more or less than their original cost. Current performance may be lower or higher than the past performance data quoted. An investor may obtain performance data as of the most recent month-end by visiting our website at www.prudentialfunds.com or by calling (800) 225-1852. The maximum initial sales charge is 5.50% (Class A shares). Gross operating expenses: Class A, 1.56%; Class B, 2.26%; Class C, 2.26%; Class R, 2.01%; Class Z, 1.26%. Net operating expenses apply to: Class A, 1.51%; Class B, 2.26%; Class C, 2.26%; Class R, 1.76%; Class Z, 1.26%, after contractual reduction through 1/31/2011. These figures include a weighted average of the net operating expenses of the underlying funds in which the Fund invests. Such expenses, annualized, amounted to 0.77% for each share class.
| | | | | | | | | | | | |
| Cumulative Total Returns (Without Sales Charges) as of 3/31/10 | | | | |
| | | Six Months | | | One Year | | | Five Years | | | Since Inception | |
Class A | | 6.68 | % | | 29.98 | % | | 28.80 | % | | 34.26 | % |
Class B | | 6.22 | | | 28.94 | | | 23.97 | | | 28.21 | |
Class C | | 6.22 | | | 29.06 | | | 24.08 | | | 28.33 | |
Class R | | 6.48 | | | 29.67 | | | N/A | | | 9.73 | |
Class Z | | 6.77 | | | 30.29 | | | 30.60 | | | 36.47 | |
Conservative Customized Blend | | 5.46 | | | 28.28 | | | 25.95 | | | — | |
Russell 1000 Index | | 12.11 | | | 51.60 | | | 12.08 | | | — | |
S&P 500 Index | | 11.75 | | | 49.73 | | | 9.97 | | | — | |
Lipper Average | | 5.60 | | | 27.20 | | | 18.80 | | | — | |
| | | | | | | | | | | | |
| Average Annual Total Returns (With Sales Charges) as of 3/31/10 | | | | |
| | | | | | One Year | | | Five Years | | | Since Inception | |
Class A | | | | | 22.83 | % | | 4.01 | % | | 4.04 | % |
Class B | | | | | 23.94 | | | 4.22 | | | 4.23 | |
Class C | | | | | 28.06 | | | 4.41 | | | 4.24 | |
Class R | | | | | 29.67 | | | N/A | | | 2.93 | |
Class Z | | | | | 30.29 | | | 5.49 | | | 5.32 | |
Conservative Customized Blend | | | | | 28.28 | | | 4.72 | | | — | |
Russell 1000 Index | | | | | 51.60 | | | 2.31 | | | — | |
S&P 500 Index | | | | | 49.73 | | | 1.92 | | | — | |
Lipper Average | | | | | 27.20 | | | 3.46 | | | — | |
| | |
| 2 | | Visit our website at www.prudentialfunds.com |
Sources: Prudential Investments LLC and Lipper Inc. Performance figures may reflect fee waivers and/or expense reimbursements. In the absence of such fee waivers and/or expense reimbursements, total returns would be lower.
Inception dates: Class A, B, C, and Z, 3/30/04; Class R, 1/12/07. The Since Inception returns for the Conservative Customized Blend, Russell 1000 Index, S&P 500 Index, and Lipper Mixed-Asset Target Allocation Moderate Funds Average (Lipper Average) are measured from the closest month-end to inception date, and not from the Fund’s actual inception date.
Benchmark Definitions
Conservative Customized Blend
The Conservative Customized Blend is an unmanaged model portfolio consisting of the Russell 3000 Index (25%), the Morgan Stanley Capital International Europe, Australasia, and Far East (MSCI EAFE ND) Index (10%), the Barclays Capital U.S. Aggregate Bond Index (30%), the BofA Merrill Lynch 1-3 Year Corporate Index (30%), and the Standard & Poor’s (S&P) Developed BMI Property Net Index (5%). Each component of the Conservative Customized Blend is an unmanaged index generally considered as representing the performance of its asset class. See page 5 for the definitions of each component index. The Conservative Customized Blend is intended to provide a theoretical comparison to the Fund’s performance based on the amounts allocated to each asset class. The Conservative Customized Blend does not reflect deductions for any sales charges, operating expenses of a mutual fund, or taxes. The Conservative Customized Blend Closest Month-End to Inception cumulative total returns are 31.45% for Class A, Class B, Class C, and Class Z; and 7.02% for Class R. The Conservative Customized Blend Closest Month-End to Inception average annual total returns are 4.66% for Class A, Class B, Class C, and Class Z; and 2.11% for Class R.
Russell 1000 Index
The Russell 1000 Index is an unmanaged index that consists of the 1,000 largest securities in the Russell 3000 Index. Russell 1000 Index Closest Month-End to Inception cumulative total returns are 20.19% for Class A, Class B, Class C, and Class Z; and –10.40% for Class R. Russell 1000 Index Closest Month-End to Inception average annual total returns are 3.11% for Class A, Class B, Class C, and Class Z; and –3.32% for Class R.
S&P 500 Index
The S&P 500 Index is an unmanaged index of 500 stocks of large U.S. public companies. It gives a broad look at how U.S. stock prices have performed. S&P 500 Index Closest Month-End to Inception cumulative total returns are 17.32% for Class A, Class B, Class C, and Class Z; and –11.41% for Class R. S&P 500 Index Closest Month-End to Inception average annual total returns are 2.70% for Class A, Class B, Class C, and Class Z; and –3.66% for Class R.
Lipper Average
Lipper Mixed-Asset Target Allocation Conservative Funds Average maintains a mix of between 20% and 40% equity securities with the remainder in bonds, cash, and cash equivalents. Lipper Mixed-Asset Closest Month-End to Inception cumulative total returns are 22.71% for Class A, Class B, Class C, and Class Z; and 5.78% for Class R. Lipper Mixed-Asset Closest Month-End to Inception average annual total returns are 3.42% for Class A, Class B, Class C, and Class Z; and 1.68% for Class R.
| | |
| Prudential Investment Portfolios, Inc./Prudential Asset Allocation Funds | | 3 |
Your Fund’s Performance (continued)
The average annual total returns take into account applicable sales charges. Class A, Class B, Class C, and Class R shares are subject to an annual distribution and service (12b-1) fee of up to 0.30%, 1.00%, 1.00%, and 0.75%, respectively. Approximately seven years after purchase, Class B shares will automatically convert to Class A shares on a quarterly basis. Class Z shares are not subject to a 12b-1 fee. Under certain circumstances, Class A shares may be subject to a contingent deferred sales charge (CDSC) of 1%. Class B and Class C shares are subject to a maximum CDSC of 5% and 1%, respectively. Class R and Class Z shares are not subject to a sales charge. The returns in the tables do not reflect the deduction of taxes that a shareholder would pay on Fund distributions or following the redemption of Fund shares.
Investors cannot invest directly in an index. The returns for the Conservative Customized Blend, Russell 1000 Index, and S&P 500 Index would be lower if they included the effects of sales charges, operating expenses of a mutual fund, or taxes. Returns for the Lipper Average reflect the deduction of operating expenses, but not sales charges or taxes.
| | |
| 4 | | Visit our website at www.prudentialfunds.com |
Performance Target—Conservative Customized Blend
The Prudential Conservative Allocation Fund seeks to beat a performance target—the Conservative Customized Blend—consisting of a weighted average return of five securities indexes that are generally considered representative of the asset classes in which the Fund may invest. The chart below shows both the total returns of these indexes for the six-month period ended March 31, 2010 and their weightings in the Conservative Customized Blend. Index returns do not reflect sales charges, a mutual fund’s operating expenses, or taxes, and investors cannot invest directly in an index. The Fund seeks to beat this target by holding positions in specific Prudential mutual funds. In response to market developments, the Fund’s investment adviser may vary its holdings in those funds (within specified ranges). Past performance is not indicative of future results.
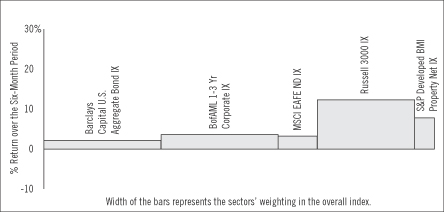
Source: Lipper Inc.
The Barclays Capital U.S. Aggregate Bond Index is an unmanaged index of investment-grade securities issued by the U.S. government and its agencies and by corporations with between one and 10 years remaining to maturity. It gives a broad look at how bond prices of short- and intermediate-term bonds have performed.
The BofA Merrill Lynch 1-3 Year Corporate Index is an unmanaged index consisting of fixed-rate, coupon-bearing corporate bonds with a maturity of one to three years and a rating of BBB/Baa3 and above.
The Morgan Stanley Capital International Europe, Australasia, and Far East Index (MSCI EAFE ND Index) is an unmanaged, weighted index that reflects stock price movements in Europe, Australasia, and the Far East. It gives a broad look at how foreign stock prices have performed.
The Russell 3000 Index is an unmanaged index which represents the U.S. equity market—it covers about 98% of all investable stocks in the U.S.
The Standard & Poor’s (S&P) Developed BMI Property Net Index is an unmanaged, broad market index of more than 400 companies from 21 countries, and is available for a wide range of regions (including ex-U.S.) as well as by country.
Investors cannot invest directly in an index.
| | |
| Prudential Investment Portfolios, Inc./Prudential Asset Allocation Funds | | 5 |
Your Fund’s Performance—Moderate Allocation Fund
Performance data quoted represent past performance. Past performance does not guarantee future results. The investment return and principal value of an investment will fluctuate, so that an investor’s shares, when redeemed, may be worth more or less than their original cost. Current performance may be lower or higher than the past performance data quoted. An investor may obtain performance data as of the most recent month-end by visiting our website at www.prudentialfunds.com or by calling (800) 225-1852. The maximum initial sales charge is 5.50% (Class A shares). Gross operating expenses: Class A, 1.67%; Class B, 2.37%; Class C, 2.37%; Class R, 2.12%; Class Z, 1.37%. Net operating expenses apply to: Class A, 1.62%; Class B, 2.37%; Class C, 2.37%; Class R, 1.87%; Class Z, 1.37%, after contractual reduction through 1/31/2011. These figures include a weighted average of the net operating expenses of the underlying funds in which the Fund invests. Such expenses, annualized, amounted to 0.89% for each share class.
| | | | | | | | | | | | |
| Cumulative Total Returns (Without Sales Charges) as of 3/31/10 | | | | |
| | | Six Months | | | One Year | | | Five Years | | | Since Inception | |
Class A | | 8.06 | % | | 40.65 | % | | 25.34 | % | | 33.94 | % |
Class B | | 7.60 | | | 39.47 | | | 20.66 | | | 27.87 | |
Class C | | 7.60 | | | 39.47 | | | 20.67 | | | 27.88 | |
Class R | | 7.86 | | | 40.16 | | | N/A | | | 0.84 | |
Class Z | | 8.19 | | | 40.95 | | | 26.80 | | | 35.72 | |
Moderate Customized Blend | | 7.31 | | | 38.49 | | | 21.97 | | | — | |
Russell 1000 Index | | 12.11 | | | 51.60 | | | 12.08 | | | — | |
S&P 500 Index | | 11.75 | | | 49.73 | | | 9.97 | | | — | |
Lipper Average | | 8.06 | | | 40.02 | | | 15.93 | | | — | |
| | | | | | | | | | | | |
| Average Annual Total Returns (With Sales Charges) as of 3/31/10 | | | | |
| | | | | | One Year | | | Five Years | | | Since Inception | |
Class A | | | | | 32.92 | % | | 3.44 | % | | 4.00 | % |
Class B | | | | | 34.47 | | | 3.65 | | | 4.18 | |
Class C | | | | | 38.47 | | | 3.83 | | | 4.18 | |
Class R | | | | | 40.16 | | | N/A | | | 0.26 | |
Class Z | | | | | 40.95 | | | 4.86 | | | 5.22 | |
Moderate Customized Blend | | | | | 38.49 | | | 4.05 | | | — | |
Russell 1000 Index | | | | | 51.60 | | | 2.31 | | | — | |
S&P 500 Index | | | | | 49.73 | | | 1.92 | | | — | |
Lipper Average | | | | | 40.02 | | | 2.96 | | | — | |
| | |
| 6 | | Visit our website at www.prudentialfunds.com |
Sources: Prudential Investments LLC and Lipper Inc. Performance figures may reflect fee waivers and/or expense reimbursements. In the absence of such fee waivers and/or expense reimbursements, total returns would be lower.
Inception dates: Class A, B, C, and Z, 3/30/04; Class R, 1/12/07. The Since Inception returns for the S&P 500 Index, Russell 1000 Index, Moderate Customized Blend and Lipper Mixed-Asset Target Allocation Growth Funds Average (Lipper Average) are measured from the closest month-end to inception date, and not from the Fund’s actual inception date.
The average annual total returns take into account applicable sales charges. Class A, Class B, Class C, and Class R shares are subject to an annual distribution and service (12b-1) fee of up to 0.30%, 1.00%, 1.00%, and 0.75%, respectively. Approximately seven years after purchase, Class B shares will automatically convert to Class A shares on a quarterly basis. Class Z shares are not subject to a 12b-1 fee. Under certain circumstances, Class A shares may be subject to a contingent deferred sales charge (CDSC) of 1%. Class B and Class C shares are subject to a maximum CDSC of 5% and 1%, respectively. Class R and Class Z shares are not subject to a sales charge. The returns in the tables do not reflect the deduction of taxes that a shareholder would pay on Fund distributions or following the redemption of Fund shares.
Benchmark Definitions
Moderate Customized Blend
The Moderate Customized Blend is an unmanaged model portfolio consisting of the Russell 3000 Index (45%), the Morgan Stanley Capital International Europe, Australasia, and Far East (MSCI EAFE ND) Index (15%), the Barclays Capital U.S. Aggregate Bond Index (20%), the BofA Merrill Lynch 1-3 Year Corporate Index (15%), and the Standard & Poor’s (S&P) Developed BMI Property Net Index (5%). Each component of the Moderate Customized Blend is an unmanaged index generally considered as representing the performance of its asset class. See page 9 for the definitions of each component index. The Moderate Customized Blend is intended to provide a theoretical comparison to the Fund’s performance based on the amounts allocated to each asset class. The Moderate Customized Blend does not reflect deductions for any sales charges, operating expenses of a mutual fund, or taxes. The Moderate Customized Blend Closest Month-End to Inception cumulative total returns are 29.78% for Class A, Class B, Class C, and Class Z; and –1.06% for Class R. The Moderate Customized Blend Closest Month-End to Inception average annual total returns are 4.44% for Class A, Class B, Class C, and Class Z; and –0.33% for Class R.
Russell 1000 Index
The Russell 1000 Index is an unmanaged index that consists of the 1,000 largest securities in the Russell 3000 Index. Russell 1000 Index Closest Month-End to Inception cumulative total returns are 20.19% for Class A, Class B, Class C, and Class Z; and –10.40% for Class R. Russell 1000 Index Closest Month-End to Inception average annual total returns are 3.11% for Class A, Class B, Class C, and Class Z; and –3.32% for Class R.
S&P 500 Index
The S&P 500 Index is an unmanaged index of 500 stocks of large U.S. public companies. It gives a broad look at how U.S. stock prices have performed. S&P 500 Index Closest Month-End to Inception cumulative total returns are 17.32% for Class A, Class B, Class C, and Class Z; and –11.41% for Class R. S&P 500 Index Closest Month-End to Inception average annual total returns are 2.70% for Class A, Class B, Class C, and Class Z; and –3.66% for Class R.
| | |
| Prudential Investment Portfolios, Inc./Prudential Asset Allocation Funds | | 7 |
Your Fund’s Performance (continued)
Lipper Average
The Lipper Average represents returns based on the average return of all funds in the Lipper Mixed-Asset Target Allocation Growth Funds category. Funds in the Lipper Average have a primary objective to conserve principal by maintaining at all times a balanced portfolio of both stocks and bonds. Typically, the stock:bond ratio ranges around 60%:40%. Lipper Mixed-Asset Closest Month-End to Inception cumulative total returns are 22.40% for Class A, Class B, Class C, and Class Z; and –3.63% for Class R. Lipper Mixed-Asset Closest Month-End to Inception average annual total returns are 3.38% for Class A, Class B, Class C, and Class Z; and –1.18% for Class R.
Investors cannot invest directly in an index. The returns for the Moderate Customized Blend, Russell 1000 Index, and S&P 500 Index would be lower if they included the effects of sales charges, operating expenses of a mutual fund, or taxes. Returns for the Lipper Average reflect the deduction of operating expenses, but not sales charges or taxes.
| | |
| 8 | | Visit our website at www.prudentialfunds.com |
Performance Target—Moderate Customized Blend
The Prudential Moderate Allocation Fund seeks to beat a performance target—the Moderate Customized Blend—consisting of a weighted average return of five securities indexes that are generally considered representative of the asset classes in which the Fund may invest. The chart below shows both the total returns of these indexes for the six-month period ended March 31, 2010, and their weightings in the Moderate Customized Blend. Index returns do not reflect sales charges, a mutual fund’s operating expenses, or taxes, and investors cannot invest directly in an index. The Fund seeks to beat this target by holding positions in specific Prudential mutual funds. In response to market developments, the Fund’s investment adviser may vary its holdings in those funds (within specified ranges). Past performance is not indicative of future results.
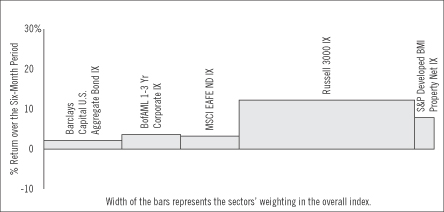
Source: Lipper Inc.
The Barclays Capital U.S. Aggregate Bond Index is an unmanaged index of investment-grade securities issued by the U.S. government and its agencies and by corporations with between one and 10 years remaining to maturity. It gives a broad look at how bond prices of short- and intermediate-term bonds have performed.
The BofA Merrill Lynch 1-3 Year Corporate Index is an unmanaged index consisting of fixed-rate, coupon-bearing corporate bonds with a maturity of one to three years and a rating of BBB/Baa3 and above.
The Morgan Stanley Capital International Europe, Australasia, and Far East Index (MSCI EAFE ND Index) is an unmanaged, weighted index that reflects stock price movements in Europe, Australasia, and the Far East. It gives a broad look at how foreign stock prices have performed.
The Russell 3000 Index is an unmanaged index which represents the U.S. equity market—it covers about 98% of all investable stocks in the U.S.
The Standard & Poor’s (S&P) Developed BMI Property Net Index is an unmanaged, broad market index of more than 400 companies from 21 countries, and is available for a wide range of regions (including ex-U.S.) as well as by country.
Investors cannot invest directly in an index.
| | |
| Prudential Investment Portfolios, Inc./Prudential Asset Allocation Funds | | 9 |
Your Fund’s Performance—Growth Allocation Fund
Performance data quoted represent past performance. Past performance does not guarantee future results. The investment return and principal value of an investment will fluctuate, so that an investor’s shares, when redeemed, may be worth more or less than their original cost. Current performance may be lower or higher than the past performance data quoted. An investor may obtain performance data as of the most recent month-end by visiting our website at www.prudentialfunds.com or by calling (800) 225-1852. The maximum initial sales charge is 5.50% (Class A shares). Gross operating expenses: Class A, 2.03%; Class B, 2.73%; Class C, 2.73%; Class R, 2.48%; Class Z, 1.73%. Net operating expenses apply to: Class A, 1.76%; Class B, 2.51%; Class C, 2.51%; Class R, 2.01%; Class Z, 1.51%, after contractual reduction through 1/31/2011. These figures include a weighted average of the net operating expenses of the underlying funds in which the Fund invests. Such expenses, annualized, amounted to 1.01% for each share class.
| | | | | | | | | | | | |
| Cumulative Total Returns as of 3/31/10 | | | | |
| | | Six Months | | | One Year | | | Five Years | | | Since Inception | |
Class A | | 9.35 | % | | 52.07 | % | | 18.93 | % | | 30.12 | % |
Class B | | 8.95 | | | 50.89 | | | 14.53 | | | 24.50 | |
Class C | | 8.94 | | | 50.83 | | | 14.63 | | | 24.61 | |
Class R | | 9.11 | | | 51.51 | | | N/A | | | –9.12 | |
Class Z | | 9.42 | | | 52.43 | | | 20.24 | | | 32.04 | |
Growth Customized Blend | | 8.66 | | | 49.40 | | | 17.54 | | | — | |
Russell 1000 Index | | 12.11 | | | 51.60 | | | 12.08 | | | — | |
S&P 500 Index | | 11.75 | | | 49.73 | | | 9.97 | | | — | |
Lipper Average | | 11.01 | | | 52.56 | | | 12.74 | | | — | |
| | | | | | | | | | | | |
| Average Annual Total Returns as of 3/31/10 | | | | |
| | | | | | One Year | | | Five Years | | | Since Inception | |
Class A | | | | | 43.70 | % | | 2.36 | % | | 3.50 | % |
Class B | | | | | 45.89 | | | 2.57 | | | 3.72 | |
Class C | | | | | 49.83 | | | 2.77 | | | 3.73 | |
Class R | | | | | 51.51 | | | N/A | | | –2.93 | |
Class Z | | | | | 52.43 | | | 3.76 | | | 4.74 | |
Growth Customized Blend | | | | | 49.40 | | | 3.29 | | | — | |
Russell 1000 Index | | | | | 51.60 | | | 2.31 | | | — | |
S&P 500 Index | | | | | 49.73 | | | 1.92 | | | — | |
Lipper Average | | | | | 52.56 | | | 2.33 | | | — | |
| | |
| 10 | | Visit our website at www.prudentialfunds.com |
Sources: Prudential Investments LLC and Lipper Inc. Performance figures may reflect fee waivers and/or expense reimbursements. In the absence of such fee waivers and/or expense reimbursements, total returns would be lower.
Inception dates: Class A, B, C, and Z, 3/30/04; Class R, 1/12/07. The Since Inception returns for the S&P 500 Index, Russell 1000 Index, Growth Customized Blend, and Lipper Multi-Cap Core Funds Average (Lipper Average) are measured from the closest month-end to inception date, and not from the Fund’s actual inception date.
Benchmark Definitions
Growth Customized Blend
The Growth Customized Blend is an unmanaged model portfolio consisting of the Russell 3000 Index (60%), the Morgan Stanley Capital International Europe, Australasia, and Far East (MSCI EAFE ND) Index (25%), the Barclays Capital U.S. Aggregate Bond Index (10%), and the Standard & Poor’s (S&P) Developed BMI Property Net Index (5%). Each component of the Growth Customized Blend is an unmanaged index generally considered as representing the performance of its asset class. See page 13 for the definitions of each component index. The Growth Customized Blend is intended to provide a theoretical comparison to the Fund’s performance based on the amounts allocated to each asset class. The Growth Customized Blend does not reflect deductions for any sales charges, operating expenses of a mutual fund, or taxes. The Growth Customized Blend Closest Month-End to Inception cumulative total returns are 27.91% for Class A, Class B, Class C, and Class Z; and –9.53% for Class R. The Growth Customized Blend Closest Month-End to Inception average annual total returns are 4.19% for Class A, Class B, Class C, and Class Z; and –3.03% for Class R.
Russell 1000 Index
The Russell 1000 Index is an unmanaged index that consists of the 1,000 largest securities in the Russell 3000 Index. Russell 1000 Index Closest Month-End to Inception cumulative total returns are 20.19% for Class A, Class B, Class C, and Class Z; and –10.40% for Class R. Russell 1000 Index Closest Month-End to Inception average annual total returns are 3.11% for Class A, Class B, Class C, and Class Z; and –3.32% for Class R.
S&P 500 Index
The S&P 500 Index is an unmanaged index of 500 stocks of large U.S. public companies. It gives a broad look at how U.S. stock prices have performed. S&P 500 Index Closest Month-End to Inception cumulative total returns are 17.32% for Class A, Class B, Class C, and Class Z; and –11.41% for Class R. S&P 500 Index Closest Month-End to Inception average annual total returns are 2.70% for Class A, Class B, Class C, and Class Z; and –3.66% for Class R.
Lipper Average
The Lipper Average represents returns based on the average return of all funds in the Lipper Multi-Cap Core Funds category. Funds in the Lipper Average invest in a variety of market capitalization ranges without concentrating 75% of their equity assets in any one market capitalization range over an extended period of time. Multi-cap funds typically have between 25% and 75% of their assets invested in companies with market capitalizations (on a three-year weighted basis) above 300% of the dollar-weighted median market capitalization of the middle 1,000 securities of the S&P SuperComposite 1500 Index. Multi-cap core funds have more latitude in the companies in which they invest. These funds typically have an average price-to-earnings ratio, price-to-book ratio, and three-year sales-per-share growth value compared to the S&P SuperComposite 1500 Index. Lipper Multi-Cap Closest Month-End to Inception cumulative total returns are 19.80% for Class A,
| | |
| Prudential Investment Portfolios, Inc./Prudential Asset Allocation Funds | | 11 |
Your Fund’s Performance (continued)
Class B, Class C, and Class Z; and –8.85% for Class R. Lipper Multi-Cap Closest Month-End to Inception average annual total returns are 2.95% for Class A, Class B, Class C, and Class Z; and –3.00% for Class R.
The average annual total returns take into account applicable sales charges. Class A, Class B, Class C, and Class R shares are subject to an annual distribution and service (12b-1) fee of up to 0.30%, 1.00%, 1.00%, and 0.75%, respectively. Approximately seven years after purchase, Class B shares will automatically convert to Class A shares on a quarterly basis. Class Z shares are not subject to a 12b-1 fee. Under certain circumstances, Class A shares may be subject to a contingent deferred sales charge (CDSC) of 1%. Class B and Class C shares are subject to a maximum CDSC of 5% and 1%, respectively. Class R and Class Z shares are not subject to a sales charge. The returns in the tables do not reflect the deduction of taxes that a shareholder would pay on Fund distributions or following the redemption of Fund shares.
Investors cannot invest directly in an index. The returns for the Growth Customized Blend, Russell 1000 Index, and S&P 500 Index would be lower if they included the effects of sales charges, operating expenses of a mutual fund, or taxes. Returns for the Lipper Average reflect the deduction of operating expenses, but not sales charges or taxes.
| | |
| 12 | | Visit our website at www.prudentialfunds.com |
Performance Target—Growth Customized Blend
The Prudential Growth Allocation Fund seeks to exceed a performance target—the Growth Customized Blend—consisting of a weighted average return of four securities indexes that are generally considered representative of the asset classes in which the Fund may invest. The chart below shows both the total returns of these indexes for the six-month period ended March 31, 2010 and their weightings in the Growth Customized Blend. Index returns do not reflect sales charges, a mutual fund’s operating expenses, or taxes, and investors cannot invest directly in an index. The Fund seeks to exceed this target by holding positions in specific Prudential mutual funds. In response to market developments, the Fund’s investment adviser may vary its holdings in those funds (within specified ranges). Past performance is not indicative of future results.
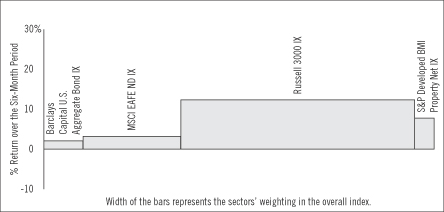
Source: Lipper Inc.
The Barclays Capital U.S. Aggregate Bond Index is an unmanaged index of investment-grade securities issued by the U.S. government and its agencies and by corporations with between one and 10 years remaining to maturity. It gives a broad look at how bond prices of short- and intermediate-term bonds have performed.
The Morgan Stanley Capital International Europe, Australasia, and Far East Index (MSCI EAFE ND Index) is an unmanaged, weighted index that reflects stock price movements in Europe, Australasia, and the Far East. It gives a broad look at how foreign stock prices have performed.
The Russell 3000 Index is an unmanaged index which represents the U.S. equity market—it covers about 98% of all investable stocks in the U.S.
The Standard & Poor’s (S&P) Developed BMI Property Net Index is an unmanaged, broad market index of more than 400 companies from 21 countries, and is available for a wide range of regions (including ex-U.S.) as well as by country.
Investors cannot invest directly in an index.
| | |
| Prudential Investment Portfolios, Inc./Prudential Asset Allocation Funds | | 13 |
Fees and Expenses (Unaudited)
As a shareholder of a Fund, you incur two types of costs: (1) transaction costs, including sales charges (loads) on purchase payments and redemptions, as applicable, and (2) ongoing costs, including management fees, distribution and/or service (12b-1) fees, and other Fund expenses, as applicable. These examples are intended to help you understand your ongoing costs (in dollars) of investing in the Funds and to compare these costs with the ongoing costs of investing in other mutual funds.
These examples are based on an investment of $1,000 invested on October 1, 2009, at the beginning of the period, and held through the six-month period ended March 31, 2010. These examples are for illustrative purposes only; you should consult the Prospectus for information on initial and subsequent minimum investment requirements.
The Fund’s transfer agent may charge additional fees to holders of certain accounts that are not included in the expenses shown in the tables on the following pages. These fees apply to individual retirement accounts (IRAs) and Section 403(b) accounts. As of the close of the six-month period covered by the tables, IRA fees included an annual maintenance fee of $15 per account (subject to a maximum annual maintenance fee of $25 for all accounts held by the same shareholder). Section 403(b) accounts are charged an annual $25 fiduciary maintenance fee. Some of the fees may vary in amount, or may be waived, based on your total account balance or the number of Prudential Investments funds, including the Fund, that you own. You should consider the additional fees that were charged to your Fund account over the six-month period when you estimate the total ongoing expenses paid over the period and the impact of these fees on your ending account value, as these additional expenses are not reflected in the information provided in the expense tables. Additional fees have the effect of reducing investment returns.
Actual Expenses
The first line for each share class in the tables on the following pages provides information about actual account values and actual expenses. You may use the information on this line, together with the amount you invested, to estimate the expenses that you paid over the period. Simply divide your account value by $1,000 (for example, an $8,600 account value ÷ $1,000 = 8.6), then multiply the result by the number on the first line under the heading “Expenses Paid During the Six-Month Period” to estimate the expenses you paid on your account during this period.
| | |
| 14 | | Visit our website at www.prudentialfunds.com |
Hypothetical Example for Comparison Purposes
The second line for each share class in the tables below provides information about hypothetical account values and hypothetical expenses based on the Fund’s actual expense ratio and an assumed rate of return of 5% per year before expenses, which is not the Fund’s actual return. The hypothetical account values and expenses may not be used to estimate the actual ending account balance or expenses you paid for the period. You may use this information to compare the ongoing costs of investing in the Fund and other funds. To do so, compare this 5% hypothetical example with the 5% hypothetical examples that appear in the shareholder reports of the other funds.
Please note that the expenses shown in the tables are meant to highlight your ongoing costs only and do not reflect any transactional costs such as sales charges (loads). Therefore, the second line for each share class in the tables is useful in comparing ongoing costs only and will not help you determine the relative total costs of owning different funds. In addition, if these transactional costs were included, your costs would have been higher.
| | | | | | | | | | | | | | |
Prudential
Conservative
Allocation Fund | | Beginning Account
Value
October 1, 2009 | | Ending Account
Value
March 31, 2010 | | Annualized
Expense Ratio
Based on the
Six-Month Period | | | Expenses Paid
During the
Six-Month Period* |
| | | | | | | | | | | | | | |
| Class A | | Actual | | $ | 1,000.00 | | $ | 1,066.80 | | 1.51 | % | | $ | 7.78 |
| | | Hypothetical | | $ | 1,000.00 | | $ | 1,017.40 | | 1.51 | % | | $ | 7.59 |
| | | | | | | | | | | | | | |
| Class B | | Actual | | $ | 1,000.00 | | $ | 1,062.20 | | 2.26 | % | | $ | 11.62 |
| | | Hypothetical | | $ | 1,000.00 | | $ | 1,013.66 | | 2.26 | % | | $ | 11.35 |
| | | | | | | | | | | | | | |
| Class C | | Actual | | $ | 1,000.00 | | $ | 1,062.20 | | 2.26 | % | | $ | 11.62 |
| | | Hypothetical | | $ | 1,000.00 | | $ | 1,013.66 | | 2.26 | % | | $ | 11.35 |
| | | | | | | | | | | | | | |
| Class R | | Actual | | $ | 1,000.00 | | $ | 1,064.80 | | 1.76 | % | | $ | 9.06 |
| | | Hypothetical | | $ | 1,000.00 | | $ | 1,016.16 | | 1.76 | % | | $ | 8.85 |
| | | | | | | | | | | | | | |
| Class Z | | Actual | | $ | 1,000.00 | | $ | 1,067.70 | | 1.26 | % | | $ | 6.50 |
| | | Hypothetical | | $ | 1,000.00 | | $ | 1,018.65 | | 1.26 | % | | $ | 6.34 |
| | |
| Prudential Investment Portfolios, Inc./Prudential Asset Allocation Funds | | 15 |
Fees and Expenses (continued)
| | | | | | | | | | | | | | |
Prudential
Moderate
Allocation Fund | | Beginning Account
Value
October 1, 2009 | | Ending Account
Value
March 31, 2010 | | Annualized
Expense Ratio
Based on the
Six-Month Period | | | Expenses Paid
During the
Six-Month Period* |
| | | | | | | | | | | | | | |
| Class A | | Actual | | $ | 1,000.00 | | $ | 1,080.60 | | 1.62 | % | | $ | 8.40 |
| | | Hypothetical | | $ | 1,000.00 | | $ | 1,016.85 | | 1.62 | % | | $ | 8.15 |
| | | | | | | | | | | | | | |
| Class B | | Actual | | $ | 1,000.00 | | $ | 1,076.00 | | 2.37 | % | | $ | 12.27 |
| | | Hypothetical | | $ | 1,000.00 | | $ | 1,013.11 | | 2.37 | % | | $ | 11.89 |
| | | | | | | | | | | | | | |
| Class C | | Actual | | $ | 1,000.00 | | $ | 1,076.00 | | 2.37 | % | | $ | 12.27 |
| | | Hypothetical | | $ | 1,000.00 | | $ | 1,013.11 | | 2.37 | % | | $ | 11.89 |
| | | | | | | | | | | | | | |
| Class R | | Actual | | $ | 1,000.00 | | $ | 1,078.60 | | 1.87 | % | | $ | 9.69 |
| | | Hypothetical | | $ | 1,000.00 | | $ | 1,015.61 | | 1.87 | % | | $ | 9.40 |
| | | | | | | | | | | | | | |
| Class Z | | Actual | | $ | 1,000.00 | | $ | 1,081.90 | | 1.37 | % | | $ | 7.11 |
| | | Hypothetical | | $ | 1,000.00 | | $ | 1,018.10 | | 1.37 | % | | $ | 6.89 |
| | | | | | | | | | | | | | |
| | | | | | | | | | | | | | |
Prudential
Growth
Allocation Fund | | Beginning Account Value October 1, 2009 | | Ending Account
Value
March 31, 2010 | | Annualized
Expense Ratio
Based on the
Six-Month Period | | | Expenses Paid
During the
Six-Month Period* |
| | | | | | | | | | | | | | |
| Class A | | Actual | | $ | 1,000.00 | | $ | 1,093.50 | | 1.76 | % | | $ | 9.19 |
| | | Hypothetical | | $ | 1,000.00 | | $ | 1,016.16 | | 1.76 | % | | $ | 8.85 |
| | | | | | | | | | | | | | |
| Class B | | Actual | | $ | 1,000.00 | | $ | 1,089.50 | | 2.51 | % | | $ | 13.08 |
| | | Hypothetical | | $ | 1,000.00 | | $ | 1,012.42 | | 2.51 | % | | $ | 12.59 |
| | | | | | | | | | | | | | |
| Class C | | Actual | | $ | 1,000.00 | | $ | 1,089.40 | | 2.51 | % | | $ | 13.08 |
| | | Hypothetical | | $ | 1,000.00 | | $ | 1,012.42 | | 2.51 | % | | $ | 12.59 |
| | | | | | | | | | | | | | |
| Class R | | Actual | | $ | 1,000.00 | | $ | 1,091.10 | | 2.01 | % | | $ | 10.48 |
| | | Hypothetical | | $ | 1,000.00 | | $ | 1,014.91 | | 2.01 | % | | $ | 10.10 |
| | | | | | | | | | | | | | |
| Class Z | | Actual | | $ | 1,000.00 | | $ | 1,094.20 | | 1.51 | % | | $ | 7.88 |
| | | Hypothetical | | $ | 1,000.00 | | $ | 1,017.40 | | 1.51 | % | | $ | 7.59 |
* Fund expenses (net of fee waivers or subsidies, if any) for each share class are equal to the annualized expense ratio for each share class (provided in the table), multiplied by the average account value over the period, multiplied by the 182 days in the six-month period ended March 31, 2010, and divided by the 365 days in the Fund’s fiscal year ending September 30, 2010 (to reflect the six-month period). Expenses presented in the table include the expenses of any underlying portfolios in which the Fund may invest.
| | |
| 16 | | Visit our website at www.prudentialfunds.com |
Prudential Conservative Allocation Fund
Portfolio of Investments
as of March 31, 2010 (Unaudited)
| | | | | |
| Description | | Shares | | Value (Note 1) |
LONG-TERM INVESTMENTS 98.8% | | | | | |
| | |
AFFILIATED REGISTERED INVESTMENT COMPANIES | | | | | |
Prudential Global Real Estate Fund (Class Z) | | 312,383 | | $ | 5,276,151 |
Prudential Government Income Fund, Inc. (Class Z) | | 1,467,627 | | | 13,707,640 |
Prudential High Yield Fund, Inc. (Class Z) | | 805,029 | | | 4,306,907 |
Prudential International Equity Fund (Class Z) | | 1,101,358 | | | 6,597,134 |
Prudential Jennison 20/20 Focus Fund (Class Z)(a) | | 371,321 | | | 5,718,340 |
Prudential Jennison Equity Opportunity Fund (Class Z) | | 184,823 | | | 2,373,133 |
Prudential Jennison Growth Fund (Class Z) | | 124,474 | | | 2,150,917 |
Prudential Jennison Mid-Cap Growth Fund, Inc. (Class Z) | | 128,584 | | | 3,226,184 |
Prudential Jennison Natural Resources Fund, Inc. (Class Z) | | 40,411 | | | 1,886,383 |
Prudential Jennison Value Fund (Class Z) | | 308,299 | | | 4,306,938 |
Prudential Large-Cap Core Equity Fund (Class Z) | | 385,407 | | | 4,293,437 |
Prudential Mid-Cap Value Fund (Class Z) | | 254,194 | | | 3,228,259 |
Prudential Short-Term Corporate Bond Fund, Inc. (Class Z) | | 2,603,176 | | | 29,936,527 |
Prudential Small-Cap Core Equity Fund, Inc. (Class Z) | | 269,829 | | | 4,252,500 |
Prudential Total Return Bond Fund, Inc. (Class Z) | | 1,106,742 | | | 14,996,357 |
| | | | | |
TOTAL LONG-TERM INVESTMENTS | | | | | |
(cost $91,267,830) | | | | | 106,256,807 |
| | | | | |
| | |
SHORT-TERM INVESTMENT 1.0% | | | | | |
| | |
AFFILIATED MONEY MARKET MUTUAL FUND | | | | | |
Prudential Investment Portfolios 2 - Prudential Core Taxable Money Market Fund | | | | | |
(cost $1,073,095; Note 3) | | 1,073,095 | | | 1,073,095 |
| | | | | |
TOTAL INVESTMENTS(b) 99.8% | | | | | |
(cost $92,340,925; Note 5) | | | | | 107,329,902 |
Other assets in excess of liabilities 0.2% | | | | | 203,885 |
| | | | | |
NET ASSETS 100.0% | | | | $ | 107,533,787 |
| | | | | |
| (a) | Non-income producing security. |
| (b) | Prudential Investments LLC, the manager of the Fund, also serves as manager of the underlying funds in which the Fund invests. |
See Notes to Financial Statements.
| | |
| Prudential Investment Portfolios, Inc./Prudential Asset Allocation Funds | | 17 |
Prudential Conservative Allocation Fund
Portfolio of Investments
as of March 31, 2010 (Unaudited) continued
Various inputs are used in determining the value of the Fund’s investments. These inputs are summarized in the three broad levels listed below.
Level 1—quoted prices in active markets for identical securities
Level 2—other significant observable inputs (including quoted prices for similar securities, interest rates, prepayment speeds, credit risk, etc.)
Level 3—significant unobservable inputs (including the Fund’s own assumptions in determining the fair value of investments)
The following is a summary of the inputs used as of March 31, 2010 in valuing the Fund’s assets carried at fair value:
| | | | | | | | | |
| | | Level 1 | | Level 2 | | Level 3 |
Investments in Securities | | | | | | | | | |
Affiliated Registered Investment Companies | | $ | 106,256,807 | | $ | — | | $ | — |
Affiliated Money Market Mutual Fund | | | 1,073,095 | | | — | | | — |
| | | | | | | | | |
| | $ | 107,329,902 | | $ | — | | $ | — |
Other Financial Instruments* | | | — | | | — | | | — |
| | | | | | | | | |
Total | | $ | 107,329,902 | | $ | — | | $ | — |
| | | | | | | | | |
| * | Other financial instruments are derivative instruments not reflected in the Portfolio of Investments, such as futures, forwards and swap contracts, which are valued at the unrealized appreciation/depreciation on the instrument. |
As of March 31, 2010 and September 30, 2009, the Fund did not use any significant unobservable inputs (Level 3) in determining the value of investments.
See Notes to Financial Statements.
| | |
| 18 | | Visit our website at www.prudentialfunds.com |
The investment allocation of portfolio holdings and other assets in excess of liabilities shown as a percentage of net assets as of March 31, 2010 were as follows:
| | | |
Short-Term Debt | | 27.8 | % |
Multi-Sector Debt | | 13.9 | |
U.S. Government Debt | | 12.8 | |
Large-Cap Core | | 9.3 | |
International | | 6.1 | |
Large/Mid-Cap Growth | | 5.0 | |
Global Real Estate | | 4.9 | |
High Yield | | 4.0 | |
Large-Cap Value | | 4.0 | |
Small-Cap Core | | 4.0 | |
Small/Mid-Cap Value | | 3.0 | |
Multi-Cap Value | | 2.2 | |
Natural Resources | | 1.8 | |
| | | |
| | 98.8 | |
Short-Term Investment | | 1.0 | |
Other assets in excess of liabilities | | 0.2 | |
| | | |
| | 100.0 | % |
| | | |
See Notes to Financial Statements.
| | |
| Prudential Investment Portfolios, Inc./Prudential Asset Allocation Funds | | 19 |
Prudential Moderate Allocation Fund
Portfolio of Investments
as of March 31, 2010 (Unaudited)
| | | | | |
| Description | | Shares | | Value (Note 1) |
LONG-TERM INVESTMENTS 98.8% | | | | | |
| | |
AFFILIATED REGISTERED INVESTMENT COMPANIES | | | | | |
Prudential Global Real Estate Fund (Class Z) | | 414,927 | | $ | 7,008,118 |
Prudential Government Income Fund, Inc. (Class Z) | | 1,015,415 | | | 9,483,973 |
Prudential High Yield Fund, Inc. (Class Z) | | 799,998 | | | 4,279,987 |
Prudential International Equity Fund (Class Z) | | 3,117,498 | | | 18,673,813 |
Prudential Jennison 20/20 Focus Fund (Class Z)(a) | | 774,183 | | | 11,922,414 |
Prudential Jennison Equity Opportunity Fund (Class Z) | | 572,574 | | | 7,351,847 |
Prudential Jennison Growth Fund (Class Z) | | 247,306 | | | 4,273,445 |
Prudential Jennison Mid-Cap Growth Fund, Inc. (Class Z) | | 283,318 | | | 7,108,437 |
Prudential Jennison Natural Resources Fund, Inc. (Class Z) | | 85,181 | | | 3,976,248 |
Prudential Jennison Value Fund (Class Z) | | 709,892 | | | 9,917,195 |
Prudential Large-Cap Core Equity Fund (Class Z) | | 639,090 | | | 7,119,467 |
Prudential Mid-Cap Value Fund (Class Z) | | 564,106 | | | 7,164,143 |
Prudential Short-Term Corporate Bond Fund, Inc. (Class Z) | | 1,841,977 | | | 21,182,732 |
Prudential Small-Cap Core Equity Fund, Inc. (Class Z) | | 538,031 | | | 8,479,361 |
Prudential Total Return Bond Fund, Inc. (Class Z) | | 939,521 | | | 12,730,513 |
| | | | | |
TOTAL LONG-TERM INVESTMENTS | | | | | |
(cost $118,360,040) | | | | | 140,671,693 |
| | | | | |
| | |
SHORT-TERM INVESTMENT 1.0% | | | | | |
| | |
AFFILIATED MONEY MARKET MUTUAL FUND | | | | | |
Prudential Investment Portfolios 2 - Prudential Core Taxable Money Market Fund | | | | | |
(cost $1,478,635; Note 3) | | 1,478,635 | | | 1,478,635 |
| | | | | |
TOTAL INVESTMENTS(b) 99.8% | | | | | |
(cost $119,838,675; Note 5) | | | | | 142,150,328 |
Other assets in excess of liabilities 0.2% | | | | | 230,228 |
| | | | | |
NET ASSETS 100.0% | | | | $ | 142,380,556 |
| | | | | |
| (a) | Non-income producing security. |
| (b) | Prudential Investments LLC, the manager of the Fund, also serves as manager of the underlying funds in which the Fund invests. |
See Notes to Financial Statements.
| | |
| 20 | | Visit our website at www.prudentialfunds.com |
Various inputs are used in determining the value of the Fund’s investments. These inputs are summarized in the three broad levels listed below.
Level 1—quoted prices in active markets for identical securities
Level 2—other significant observable inputs (including quoted prices for similar securities, interest rates, prepayment speeds, credit risk, etc.)
Level 3—significant unobservable inputs (including the Fund’s own assumptions in determining the fair value of investments)
The following is a summary of the inputs used as of March 31, 2010 in valuing the Fund’s assets carried at fair value:
| | | | | | | | | |
| | | Level 1 | | Level 2 | | Level 3 |
Investments in Securities | | | | | | | | | |
Affiliated Registered Investment Companies | | $ | 140,671,693 | | $ | — | | $ | — |
Affiliated Money Market Mutual Fund | | | 1,478,635 | | | — | | | — |
| | | | | | | | | |
| | $ | 142,150,328 | | $ | — | | $ | — |
Other Financial Instruments* | | | — | | | — | | | — |
| | | | | | | | | |
Total | | $ | 142,150,328 | | $ | — | | $ | — |
| | | | | | | | | |
| * | Other financial instruments are derivative instruments not reflected in the Portfolio of Investments, such as futures, forwards and swap contracts, which are valued at the unrealized appreciation/depreciation on the instrument. |
As of March 31, 2010 and September 30, 2009, the Fund did not use any significant unobservable inputs (Level 3) in determining the value of investments.
See Notes to Financial Statements.
| | |
| Prudential Investment Portfolios, Inc./Prudential Asset Allocation Funds | | 21 |
Prudential Moderate Allocation Fund
Portfolio of Investments
as of March 31, 2010 (Unaudited) continued
The investment allocation of portfolio holdings and other assets in excess of liabilities shown as a percentage of net assets as of March 31, 2010 were as follows:
| | | |
Short-Term Debt | | 14.9 | % |
Large-Cap Core | | 13.4 | |
International | | 13.1 | |
Multi-Sector Debt | | 8.9 | |
Large/Mid-Cap Growth | | 8.0 | |
Large-Cap Value | | 7.0 | |
U.S. Government Debt | | 6.7 | |
Small-Cap Core | | 5.9 | |
Multi-Cap Value | | 5.2 | |
Small/Mid-Cap Value | | 5.0 | |
Global Real Estate | | 4.9 | |
High Yield | | 3.0 | |
Natural Resources | | 2.8 | |
| | | |
| | 98.8 | |
Short-Term Investment | | 1.0 | |
Other assets in excess of liabilities | | 0.2 | |
| | | |
| | 100.0 | % |
| | | |
See Notes to Financial Statements.
| | |
| 22 | | Visit our website at www.prudentialfunds.com |
Prudential Growth Allocation Fund
Portfolio of Investments
as of March 31, 2010 (Unaudited)
| | | | | | |
| Description | | Shares | | Value (Note 1) | |
LONG-TERM INVESTMENTS 99.0% | | | | | | |
| | |
AFFILIATED REGISTERED INVESTMENT COMPANIES | | | | | | |
Prudential Global Real Estate Fund (Class Z) | | 215,652 | | $ | 3,642,366 | |
Prudential International Equity Fund (Class Z) | | 2,492,909 | | | 14,932,523 | |
Prudential Jennison 20/20 Focus Fund (Class Z)(a) | | 504,050 | | | 7,762,378 | |
Prudential Jennison Equity Opportunity Fund (Class Z) | | 305,548 | | | 3,923,241 | |
Prudential Jennison Growth Fund (Class Z) | | 171,037 | | | 2,955,516 | |
Prudential Jennison Mid-Cap Growth Fund, Inc. (Class Z) | | 207,385 | | | 5,203,280 | |
Prudential Jennison Natural Resources Fund, Inc. (Class Z) | | 60,345 | | | 2,816,885 | |
Prudential Jennison Value Fund (Class Z) | | 532,611 | | | 7,440,582 | |
Prudential Large-Cap Core Equity Fund (Class Z) | | 532,966 | | | 5,937,242 | |
Prudential Mid-Cap Value Fund (Class Z) | | 410,909 | | | 5,218,548 | |
Prudential Small-Cap Core Equity Fund, Inc. (Class Z) | | 463,614 | | | 7,306,559 | |
Prudential Total Return Bond Fund, Inc. (Class Z) | | 461,934 | | | 6,259,200 | |
| | | | | | |
TOTAL LONG-TERM INVESTMENTS
(cost $65,128,880) | | | | | 73,398,320 | |
| | | | | | |
| | |
SHORT-TERM INVESTMENT 1.2% | | | | | | |
| | |
AFFILIATED MONEY MARKET MUTUAL FUND | | | | | | |
Prudential Investment Portfolios 2 - Prudential Core Taxable Money Market Fund (cost $863,792; Note 3) | | 863,792 | | | 863,792 | |
| | | | | | |
TOTAL INVESTMENTS(b) 100.2%
(cost $65,992,672; Note 5) | | | | | 74,262,112 | |
Liabilities in excess of other assets (0.2)% | | | | | (131,294 | ) |
| | | | | | |
NET ASSETS 100.0% | | | | $ | 74,130,818 | |
| | | | | | |
| (a) | Non-income producing security. |
| (b) | Prudential Investments LLC, the manager of the Fund, also serves as the manager of the underlying funds in which the Fund invests. |
See Notes to Financial Statements.
| | |
| Prudential Investment Portfolios, Inc./Prudential Asset Allocation Funds | | 23 |
Prudential Growth Allocation Fund
Portfolio of Investments
as of March 31, 2010 (Unaudited) continued
Various inputs are used in determining the value of the Fund’s investments. These inputs are summarized in the three broad levels listed below.
Level 1—quoted prices in active markets for identical securities
Level 2—other significant observable inputs (including quoted prices for similar securities, interest rates, prepayment speeds, credit risk, etc.)
Level 3—significant unobservable inputs (including the Fund’s own assumptions in determining the fair value of investments)
The following is a summary of the inputs used as of March 31, 2010 in valuing the Fund’s assets carried at fair value:
| | | | | | | | | |
| | | Level 1 | | Level 2 | | Level 3 |
Investments in Securities | | | | | | | | | |
Affiliated Registered Investment Companies | | $ | 73,398,320 | | $ | — | | $ | — |
Affiliated Money Market Mutual Fund | | | 863,792 | | | — | | | — |
| | | | | | | | | |
| | $ | 74,262,112 | | $ | — | | $ | — |
Other Financial Instruments* | | | — | | | — | | | — |
| | | | | | | | | |
Total | | $ | 74,262,112 | | $ | — | | $ | — |
| | | | | | | | | |
| * | Other financial instruments are derivative instruments not reflected in the Portfolio of Investments, such as futures, forwards and swap contracts, which are valued at the unrealized appreciation/depreciation on the instrument. |
As of March 31, 2010 and September 30, 2009, the Fund did not use any significant unobservable inputs (Level 3) in determining the value of investments.
| | |
| 24 | | Visit our website at www.prudentialfunds.com |
See Notes to Financial Statements.
The investment allocation of portfolio holdings and liabilities in excess of other assets shown as a percentage of net assets as of March 31, 2010 were as follows:
| | | |
International | | 20.2 | % |
Large-Cap Core | | 18.5 | |
Large-Cap Value | | 10.0 | |
Small-Cap Core | | 9.9 | |
Multi-Sector Debt | | 8.4 | |
Small/Mid-Cap Value | | 7.0 | |
Small/Mid-Cap Growth | | 7.0 | |
Multi-Cap Value | | 5.3 | |
Global Real Estate | | 4.9 | |
Large/Mid-Cap Growth | | 4.0 | |
Natural Resources | | 3.8 | |
| | | |
| | 99.0 | |
Short-Term Investment | | 1.2 | |
Liabilities in excess of other assets | | (0.2 | ) |
| | | |
| | 100.0 | % |
| | | |
See Notes to Financial Statements.
| | |
| Prudential Investment Portfolios, Inc./Prudential Asset Allocation Funds | | 25 |
Prudential Conservative Allocation Fund
Statement of Assets and Liabilities
as of March 31, 2010 (Unaudited)
| | | | |
Assets | | | | |
Affiliated investments (cost $92,340,925) | | $ | 107,329,902 | |
Receivable for Fund shares sold | | | 416,588 | |
Dividends receivable | | | 70,683 | |
Prepaid expenses | | | 667 | |
| | | | |
Total assets | | | 107,817,840 | |
| | | | |
| |
Liabilities | | | | |
Payable for Fund shares reacquired | | | 175,518 | |
Distribution fee payable | | | 62,792 | |
Accrued expenses | | | 18,146 | |
Management fee payable | | | 17,966 | |
Affiliated transfer agent fee payable | | | 8,943 | |
Deferred directors’ fees | | | 688 | |
| | | | |
Total liabilities | | | 284,053 | |
| | | | |
| |
Net assets | | $ | 107,533,787 | |
| | | | |
| | | | | |
Net assets were comprised of: | | | | |
Common stock, at par | | $ | 9,617 | |
Paid-in capital in excess of par | | | 101,287,570 | |
| | | | |
| | | 101,297,187 | |
Undistributed net investment income | | | 440,363 | |
Accumulated net realized loss on investment transactions | | | (9,192,740 | ) |
Net unrealized appreciation on investments | | | 14,988,977 | |
| | | | |
Net assets, March 31, 2010 | | $ | 107,533,787 | |
| | | | |
See Notes to Financial Statements.
| | |
| 26 | | Visit our website at www.prudentialfunds.com |
| | | |
Class A | | | |
Net asset value and redemption price per share | | | |
($42,098,965 ÷ 3,756,675 shares of common stock issued and outstanding) | | $ | 11.21 |
Maximum sales charge (5.50% of offering price) | | | .65 |
| | | |
Maximum offering price to public | | $ | 11.86 |
| | | |
| |
Class B | | | |
Net asset value, offering price and redemption price per share | | | |
($46,477,246 ÷ 4,163,051 shares of common stock issued and outstanding) | | $ | 11.16 |
| | | |
| |
Class C | | | |
Net asset value, offering price and redemption price per share | | | |
($17,950,853 ÷ 1,607,484 shares of common stock issued and outstanding) | | $ | 11.17 |
| | | |
| |
Class R | | | |
Net asset value, offering price and redemption price per share | | | |
($19,777 ÷ 1,760 shares of common stock issued and outstanding) | | $ | 11.24 |
| | | |
| |
Class Z | | | |
Net asset value, offering price and redemption price per share | | | |
($986,946 ÷ 87,732 shares of common stock issued and outstanding) | | $ | 11.25 |
| | | |
See Notes to Financial Statements.
| | |
| Prudential Investment Portfolios, Inc./Prudential Asset Allocation Funds | | 27 |
Prudential Moderate Allocation Fund
Statement of Assets and Liabilities
as of March 31, 2010 (Unaudited)
| | | | |
Assets | | | | |
Affiliated investments (cost $119,838,675) | | $ | 142,150,328 | |
Receivable for Fund shares sold | | | 533,139 | |
Dividends receivable | | | 55,186 | |
Prepaid expenses | | | 943 | |
| | | | |
Total assets | | | 142,739,596 | |
| | | | |
| |
Liabilities | | | | |
Payable for Fund shares reacquired | | | 188,747 | |
Distribution fee payable | | | 79,559 | |
Accrued expenses | | | 49,920 | |
Management fee payable | | | 23,754 | |
Affiliated transfer agent fee payable | | | 16,307 | |
Deferred directors’ fees | | | 753 | |
| | | | |
Total liabilities | | | 359,040 | |
| | | | |
| |
Net assets | | $ | 142,380,556 | |
| | | | |
| | | | | |
Net assets were comprised of: | | | | |
Common stock, at par | | $ | 12,665 | |
Paid-in capital in excess of par | | | 141,796,480 | |
| | | | |
| | | 141,809,145 | |
Undistributed net investment income | | | 707,494 | |
Accumulated net realized loss on investment transactions | | | (22,447,736 | ) |
Net unrealized appreciation on investments | | | 22,311,653 | |
| | | | |
Net assets, March 31, 2010 | | $ | 142,380,556 | |
| | | | |
See Notes to Financial Statements.
| | |
| 28 | | Visit our website at www.prudentialfunds.com |
| | | |
Class A | | | |
Net asset value and redemption price per share | | | |
($59,880,428 ÷ 5,314,859 shares of common stock issued and outstanding) | | $ | 11.27 |
Maximum sales charge (5.50% of offering price) | | | .66 |
| | | |
Maximum offering price to public | | $ | 11.93 |
| | | |
| |
Class B | | | |
Net asset value, offering price and redemption price per share | | | |
($63,342,869 ÷ 5,643,321 shares of common stock issued and outstanding) | | $ | 11.22 |
| | | |
| |
Class C | | | |
Net asset value, offering price and redemption price per share | | | |
($17,178,573 ÷ 1,531,101 shares of common stock issued and outstanding) | | $ | 11.22 |
| | | |
| |
Class R | | | |
Net asset value, offering price and redemption price per share | | | |
($2,404 ÷ 213.9 shares of common stock issued and outstanding) | | $ | 11.24 |
| | | |
| |
Class Z | | | |
Net asset value, offering price and redemption price per share | | | |
($1,976,282 ÷ 175,388 shares of common stock issued and outstanding) | | $ | 11.27 |
| | | |
See Notes to Financial Statements.
| | |
| Prudential Investment Portfolios, Inc./Prudential Asset Allocation Funds | | 29 |
Prudential Growth Allocation Fund
Statement of Assets and Liabilities
as of March 31, 2010 (Unaudited)
| | | | |
Assets | | | | |
Affiliated investments (cost $65,992,672) | | $ | 74,262,112 | |
Receivable for Fund shares sold | | | 176,771 | |
Dividends receivable | | | 6,806 | |
Due from Manager | | | 934 | |
Prepaid expenses | | | 508 | |
| | | | |
Total assets | | | 74,447,131 | |
| | | | |
| |
Liabilities | | | | |
Payable for Fund shares reacquired | | | 166,307 | |
Accrued expenses | | | 70,134 | |
Distribution fee payable | | | 42,355 | |
Payable to custodian | | | 22,684 | |
Affiliated transfer agent fee payable | | | 14,083 | |
Deferred directors’ fees | | | 750 | |
| | | | |
Total liabilities | | | 316,313 | |
| | | | |
| |
Net assets | | $ | 74,130,818 | |
| | | | |
| | | | | |
Net assets were comprised of: | | | | |
Common stock, at par | | $ | 6,427 | |
Paid-in capital in excess of par | | | 78,739,573 | |
| | | | |
| | | 78,746,000 | |
Undistributed net investment income | | | 289,857 | |
Accumulated net realized loss on investments transactions | | | (13,174,479 | ) |
Net unrealized appreciation on investments | | | 8,269,440 | |
| | | | |
Net assets, March 31, 2010 | | $ | 74,130,818 | |
| | | | |
See Notes to Financial Statements.
| | |
| 30 | | Visit our website at www.prudentialfunds.com |
| | | |
Class A | | | |
Net asset value and redemption price per share | | | |
($30,665,886 ÷ 2,632,678 shares of common stock issued and outstanding) | | $ | 11.65 |
Maximum sales charge (5.50% of offering price) | | | .68 |
| | | |
Maximum offering price to public | | $ | 12.33 |
| | | |
| |
Class B | | | |
Net asset value, offering price and redemption price per share | | | |
($34,289,044 ÷ 2,994,762 shares of common stock issued and outstanding) | | $ | 11.45 |
| | | |
| |
Class C | | | |
Net asset value, offering price and redemption price per share | | | |
($8,817,417 ÷ 769,376 shares of common stock issued and outstanding) | | $ | 11.46 |
| | | |
| |
Class R | | | |
Net asset value, offering price and redemption price per share | | | |
($2,190 ÷ 188.4 shares of common stock issued and outstanding) | | $ | 11.62 |
| | | |
| |
Class Z | | | |
Net asset value, offering price and redemption price per share | | | |
($356,281 ÷ 30,442 shares of common stock issued and outstanding) | | $ | 11.70 |
| | | |
See Notes to Financial Statements.
| | |
| Prudential Investment Portfolios, Inc./Prudential Asset Allocation Funds | | 31 |
Prudential Conservative Allocation Fund
Statement of Operations
Six Months Ended March 31, 2010 (Unaudited)
| | | |
Net Investment Income | | | |
Income | | | |
Affiliated dividend income | | $ | 1,723,093 |
| | | |
| |
Expenses | | | |
Management fee | | | 98,151 |
Distribution fee—Class A | | | 48,010 |
Distribution fee—Class B | | | 214,910 |
Distribution fee—Class C | | | 79,044 |
Distribution fee—Class R | | | 40 |
Transfer agent’s fees and expenses (including affiliated expense of $19,600) (Note 3) | | | 37,000 |
Custodian’s fees and expenses | | | 30,000 |
Registration fees | | | 27,000 |
Reports to shareholders | | | 12,000 |
Audit fee | | | 11,000 |
Legal fees and expenses | | | 11,000 |
Directors’ fees | | | 8,000 |
Insurance | | | 1,000 |
Miscellaneous | | | 3,066 |
| | | |
Total expenses | | | 580,221 |
| | | |
Net investment income | | | 1,142,872 |
| | | |
| |
Net Realized And Unrealized Gain On Affiliated Investments | | | |
Net realized gain on investment transactions | | | 76,925 |
Net change in unrealized appreciation (depreciation) on investments | | | 4,895,614 |
| | | |
Net gain on investments | | | 4,972,539 |
| | | |
Net Increase In Net Assets Resulting From Operations | | $ | 6,115,411 |
| | | |
See Notes to Financial Statements.
| | |
| 32 | | Visit our website at www.prudentialfunds.com |
Prudential Moderate Allocation Fund
Statement of Operations
Six Months Ended March 31, 2010 (Unaudited)
| | | | |
Net Investment Income | | | | |
Income | | | | |
Affiliated dividend income | | $ | 1,857,521 | |
| | | | |
| |
Expenses | | | | |
Management fee | | | 130,293 | |
Distribution fee—Class A | | | 69,868 | |
Distribution fee—Class B | | | 283,822 | |
Distribution fee—Class C | | | 79,196 | |
Distribution fee—Class R | | | 6 | |
Transfer agent’s fees and expenses (including affiliated expense of $30,900) (Note 3) | | | 69,000 | |
Registration fees | | | 35,000 | |
Custodian’s fees and expenses | | | 29,000 | |
Legal fees and expenses | | | 12,000 | |
Reports to shareholders | | | 12,000 | |
Audit fee | | | 11,000 | |
Directors’ fees | | | 7,000 | |
Insurance | | | 1,000 | |
Miscellaneous | | | 5,522 | |
| | | | |
Total expenses | | | 744,707 | |
| | | | |
Net investment income | | | 1,112,814 | |
| | | | |
| |
Net Realized And Unrealized Gain (Loss) On Affiliated Investments | | | | |
Net realized loss on investment transactions | | | (821,122 | ) |
Net change in unrealized appreciation (depreciation) on investments | | | 9,592,599 | |
| | | | |
Net gain on investments | | | 8,771,477 | |
| | | | |
Net Increase In Net Assets Resulting From Operations | | $ | 9,884,291 | |
| | | | |
See Notes to Financial Statements.
| | |
| Prudential Investment Portfolios, Inc./Prudential Asset Allocation Funds | | 33 |
Prudential Growth Allocation Fund
Statement of Operations
Six Months Ended March 31, 2010 (Unaudited)
| | | | |
Net Investment Income | | | | |
Income | | | | |
Affiliated dividend income | | $ | 707,908 | |
| | | | |
| |
Expenses | | | | |
Management fee | | | 69,007 | |
Distribution fee—Class A | | | 35,864 | |
Distribution fee—Class B | | | 158,395 | |
Distribution fee—Class C | | | 41,247 | |
Distribution fee—Class R | | | 5 | |
Transfer agent’s fees and expenses (including affiliated expense of $33,300) (Note 3) | | | 67,000 | |
Custodian’s fees and expenses | | | 30,000 | |
Registration fees | | | 29,000 | |
Reports to shareholders | | | 17,000 | |
Legal fees and expenses | | | 11,000 | |
Audit fee | | | 10,000 | |
Directors’ fees | | | 7,000 | |
Insurance | | | 800 | |
Miscellaneous expenses | | | 7,935 | |
| | | | |
Total expenses | | | 484,253 | |
Less: Expense subsidy (Note 2) | | | (76,271 | ) |
| | | | |
Net expenses | | | 407,982 | |
| | | | |
Net investment income | | | 299,926 | |
| | | | |
| |
Net Realized And Unrealized Gain (Loss) On Affiliated Investments | | | | |
Net realized loss on investment transactions | | | (798,853 | ) |
Net change in unrealized appreciation on investments | | | 6,570,179 | |
| | | | |
Net gain on investments | | | 5,771,326 | |
| | | | |
Net Increase in Net Assets Resulting From Operations | | $ | 6,071,252 | |
| | | | |
See Notes to Financial Statements.
| | |
| 34 | | Visit our website at www.prudentialfunds.com |
Prudential Conservative Allocation Fund
Statement of Changes in Net Assets
(Unaudited)
| | | | | | | | |
| | | Six Months Ended March 31, 2010 | | | Year
Ended September 30, 2009 | |
Increase (Decrease) In Net Assets | | | | | | | | |
Operations | | | | | | | | |
Net investment income | | $ | 1,142,872 | | | $ | 1,387,645 | |
Net realized gain (loss) on investment transactions | | | 76,925 | | | | (9,068,288 | ) |
Net capital gain distributions received | | | — | | | | 518,895 | |
Net change in unrealized appreciation on investments | | | 4,895,614 | | | | 14,382,352 | |
| | | | | | | | |
Net increase in net assets resulting from operations | | | 6,115,411 | | | | 7,220,604 | |
| | | | | | | | |
Dividends and Distributions (Note 1) | | | | | | | | |
Dividends from net investment income | | | | | | | | |
Class A | | | (470,180 | ) | | | (676,015 | ) |
Class B | | | (375,183 | ) | | | (439,651 | ) |
Class C | | | (135,886 | ) | | | (187,183 | ) |
Class R | | | (166 | ) | | | (49 | ) |
Class Z | | | (12,220 | ) | | | (25,029 | ) |
| | | | | | | | |
| | | (993,635 | ) | | | (1,327,927 | ) |
| | | | | | | | |
Distributions from net realized gains | | | | | | | | |
Class A | | | — | | | | (400,626 | ) |
Class B | | | — | | | | (334,561 | ) |
Class C | | | — | | | | (158,164 | ) |
Class R | | | — | | | | (32 | ) |
Class Z | | | — | | | | (13,712 | ) |
| | | | | | | | |
| | | — | | | | (907,095 | ) |
| | | | | | | | |
| | |
Fund share transactions (Net of share conversions) (Note 6) | | | | | | | | |
Net proceeds from shares sold | | | 24,065,628 | | | | 44,352,526 | |
Net asset value of shares issued in reinvestment of dividends and distributions | | | 879,866 | | | | 2,065,721 | |
Cost of shares reacquired | | | (11,925,629 | ) | | | (20,025,546 | ) |
| | | | | | | | |
Net increase in net assets from Fund share transactions | | | 13,019,865 | | | | 26,392,701 | |
| | | | | | | | |
Total increase | | | 18,141,641 | | | | 31,378,283 | |
| | |
Net Assets | | | | | | | | |
Beginning of period | | | 89,392,146 | | | | 58,013,863 | |
| | | | | | | | |
End of period(a) | | $ | 107,533,787 | | | $ | 89,392,146 | |
| | | | | | | | |
(a) Includes undistributed net investment income of: | | $ | 440,363 | | | $ | 291,126 | |
| | | | | | | | |
See Notes to Financial Statements.
| | |
| Prudential Investment Portfolios, Inc./Prudential Asset Allocation Funds | | 35 |
Prudential Moderate Allocation Fund
Statement of Changes in Net Assets
(Unaudited)
| | | | | | | | |
| | | Six Months Ended March 31, 2010 | | | Year
Ended September 30, 2009 | |
Increase (Decrease) In Net Assets | | | | | | | | |
Operations | | | | | | | | |
Net investment income | | $ | 1,112,814 | | | $ | 1,409,787 | |
Net realized loss on investment transactions | | | (821,122 | ) | | | (21,288,863 | ) |
Net capital gain distributions received | | | — | | | | 1,124,007 | |
Net change in unrealized appreciation on investments | | | 9,592,599 | | | | 23,423,844 | |
| | | | | | | | |
Net increase in net assets resulting from operations | | | 9,884,291 | | | | 4,668,775 | |
| | | | | | | | |
Dividends and Distributions (Note 1) | | | | | | | | |
Dividends from net investment income | | | | | | | | |
Class A | | | (539,655 | ) | | | (795,756 | ) |
Class B | | | (180,782 | ) | | | (361,875 | ) |
Class C | | | (50,313 | ) | | | (131,390 | ) |
Class R | | | (17 | ) | | | (33 | ) |
Class Z | | | (20,517 | ) | | | (38,114 | ) |
| | | | | | | | |
| | | (791,284 | ) | | | (1,327,168 | ) |
| | | | | | | | |
Distributions from net realized gains | | | | | | | | |
Class A | | | — | | | | (1,434,244 | ) |
Class B | | | — | | | | (1,185,237 | ) |
Class C | | | — | | | | (430,337 | ) |
Class R | | | — | | | | (61 | ) |
Class Z | | | — | | | | (59,233 | ) |
| | | | | | | | |
| | | — | | | | (3,109,112 | ) |
| | | | | | | | |
| | |
Fund share transactions (Net of share conversions) (Note 6) | | | | | | | | |
Net proceeds from shares sold | | | 25,140,859 | | | | 34,011,099 | |
Net asset value of shares issued in reinvestment of dividends and distributions | | | 771,494 | | | | 4,266,857 | |
Cost of shares reacquired | | | (13,629,155 | ) | | | (26,978,201 | ) |
| | | | | | | | |
Net increase in net assets from Fund share transactions | | | 12,283,198 | | | | 11,299,755 | |
| | | | | | | | |
Total increase | | | 21,376,205 | | | | 11,532,250 | |
| | |
Net Assets | | | | | | | | |
Beginning of period | | | 121,004,351 | | | | 109,472,101 | |
| | | | | | | | |
End of period(a) | | $ | 142,380,556 | | | $ | 121,004,351 | |
| | | | | | | | |
(a) Includes undistributed net investment income of: | | $ | 707,494 | | | $ | 385,964 | |
| | | | | | | | |
See Notes to Financial Statements.
| | |
| 36 | | Visit our website at www.prudentialfunds.com |
Prudential Growth Allocation Fund
Statement of Changes in Net Assets
(Unaudited)
| | | | | | | | |
| | | Six Months
Ended March 31, 2010 | | | Year
Ended September 30, 2009 | |
Increase (Decrease) In Net Assets | | | | | | | | |
Operations | | | | | | | | |
Net investment income | | $ | 299,926 | | | $ | 367,679 | |
Net realized loss on investments | | | (798,853 | ) | | | (12,110,172 | ) |
Net capital gain distributions received | | | — | | | | 741,552 | |
Net change in unrealized appreciation on investments | | | 6,570,179 | | | | 10,806,351 | |
| | | | | | | | |
Net increase (decrease) in net assets resulting from operations | | | 6,071,252 | | | | (194,590 | ) |
| | | | | | | | |
Dividends and Distributions (Note 1) | | | | | | | | |
Dividends from net investment income | | | | | | | | |
Class A | | | (264,136 | ) | | | — | |
Class B | | | (93,290 | ) | | | — | |
Class C | | | (24,230 | ) | | | — | |
Class R | | | (14 | ) | | | — | |
Class Z | | | (3,909 | ) | | | — | |
| | | | | | | | |
| | | (385,579 | ) | | | — | |
| | | | | | | | |
Distributions from net realized gains | | | | | | | | |
Class A | | | — | | | | (580,165 | ) |
Class B | | | — | | | | (630,895 | ) |
Class C | | | — | | | | (179,866 | ) |
Class R | | | — | | | | (44 | ) |
Class Z | | | — | | | | (9,080 | ) |
| | | | | | | | |
| | | — | | | | (1,400,050 | ) |
| | | | | | | | |
| |
Fund share transactions (Net of share conversions) (Note 6) | | | | | |
Net proceeds from shares sold | | | 9,630,194 | | | | 13,222,314 | |
Net asset value of shares issued in reinvestment of dividends and distributions | | | 376,289 | | | | 1,358,664 | |
Cost of shares reacquired | | | (6,014,962 | ) | | | (11,943,906 | ) |
| | | | | | | | |
Net increase in net assets from Fund share transactions | | | 3,991,521 | | | | 2,637,072 | |
| | | | | | | | |
Total increase | | | 9,677,194 | | | | 1,042,432 | |
| | |
Net Assets | | | | | | | | |
Beginning of period | | | 64,453,624 | | | | 63,411,192 | |
| | | | | | | | |
End of period(a) | | $ | 74,130,818 | | | $ | 64,453,624 | |
| | | | | | | | |
(a) Includes undistributed net investment income of: | | $ | 289,857 | | | $ | 375,510 | |
| | | | | | | | |
See Notes to Financial Statements.
| | |
| Prudential Investment Portfolios, Inc./Prudential Asset Allocation Funds | | 37 |
Notes to Financial Statements
(Unaudited)
The Prudential Investment Portfolios, Inc. (the “Company”) is registered under the Investment Company Act of 1940 as an open-end management investment company. The Company was incorporated in Maryland on August 10, 1995 and consists of six series (“Fund” or “Funds”): Prudential Jennison Equity Opportunity Fund (formerly Jennison Equity Opportunity Fund), Prudential Jennison Growth Fund (formerly Jennison Growth Fund), and Prudential Asset Allocation Fund (formerly Dryden Asset Allocation Fund) which are diversified funds and Prudential Conservative Allocation Fund (formerly JennisonDryden Conservative Allocation Fund) (“Conservative Allocation Fund”), Prudential Moderate Allocation Fund (formerly JennisonDryden Moderate Allocation Fund) (“Moderate Allocation Fund”) and Prudential Growth Allocation Fund (formerly JennisonDryden Growth Allocation Fund) (“Growth Allocation Fund”) which are non-diversified. These financial statements relate to the Conservative Allocation Fund, Moderate Allocation Fund and Growth Allocation Fund (collectively referred to as the “Allocation Funds”).
The Conservative Allocation Fund’s investment objective is current income and a reasonable level of capital appreciation. The Moderate Allocation Fund’s investment objective is capital appreciation and a reasonable level of current income. The Growth Allocation Fund’s investment objective is long-term capital appreciation. Each Allocation Fund seeks to achieve its objective by investing in a combination of mutual funds in the Prudential (formerly JennisonDryden) mutual fund family (each, an underlying fund). Each Fund in the Allocation Funds is typically referred to as a “Fund of Funds” because it invests in other mutual funds. The Allocation Funds may also invest directly in U.S. Government securities and money market instruments for cash management purposes or when assuming a defensive position.
Note 1. Accounting Policies
The following is a summary of significant accounting policies followed by the Company and the Allocation Funds in the preparation of their financial statements.
Securities Valuation: Investments in the underlying funds are valued at the closing net asset value per share of each underlying fund as reported on each business day. Short-term debt investments maturing within sixty days or less are valued at amortized cost which approximates fair value. The amortized cost method involves valuing a security at its cost on the date of purchase and thereafter assuming a constant
| | |
| 38 | | Visit our website at www.prudentialfunds.com |
amortization to maturity of the difference between the principal amount due at maturity and cost. Short-term debt securities which mature in more than sixty days are valued at current market value.
Securities Transactions and Net Investment Income: Securities transactions are recorded on the trade date. Realized gains or losses on sales of investments are calculated on the identified cost basis. Dividend income is recorded on the ex-dividend date. Expenses are recorded on an accrual basis and such expenses exclude those of the underlying funds. Expenses on the underlying funds are reflected in the net asset values of those funds.
Net investment income or loss (other than distribution fees which are charged directly to the respective class) and unrealized and realized gains or losses are allocated daily to each class of shares based upon the relative proportion of net assets of each class at the beginning of the day.
Dividends and Distributions: Dividends will typically be distributed quarterly by the Conservative Allocation Fund and annually by the Moderate Allocation Fund and the Growth Allocation Fund. Each Allocation Fund declares and pays its net realized capital gains, if any, at least annually. Dividends and distributions to shareholders, which are determined in accordance with federal income tax regulations and which may differ from generally accepted accounting principles, are recorded on the ex-dividend date. Permanent book/tax differences relating to income and gains are reclassified amongst undistributed net investment income, accumulated net realized gain or loss and paid-in capital in excess of par, as appropriate.
Taxes: For federal income tax purposes, each Fund in the Company is treated as a separate taxpaying entity. It is each of the Allocation Funds’ policy to continue to meet the requirements of the Internal Revenue Code applicable to regulated investment companies and to distribute all of its net investment income and capital gains, if any, to its shareholders. Therefore, no federal income tax provision is required.
Estimates: The preparation of the financial statements requires management to make estimates and assumptions that affect the reported amounts and disclosures in the financial statements. Actual results could differ from those estimates.
Note 2. Agreements
The Company has a management agreement for the Allocation Funds with Prudential Investments LLC (“PI”). Pursuant to this agreement, PI has responsibility for all
| | |
| Prudential Investment Portfolios, Inc./Prudential Asset Allocation Funds | | 39 |
Notes to Financial Statements
(Unaudited) continued
investment advisory services and supervises the subadvisor’s performance of such services. PI has entered into a subadvisory agreement with Quantitative Management Associates LLC (“QMA”). The subadvisory agreement provides that QMA furnishes investment advisory services in connection with the management of the Allocation Funds. In connection therewith, QMA is obligated to keep certain books and records of the Allocation Funds. PI pays for the services of QMA, the compensation of officers of the Allocation Funds, occupancy and certain clerical and bookkeeping costs of the Allocation Funds. The Allocation Funds bear all other costs and expenses.
The management fee paid to PI is computed daily and payable monthly at an annual rate of .20% of each of the Allocation Funds’ daily average net assets.
The Allocation Funds have a distribution agreement with Prudential Investment Management Services LLC (“PIMS”), which acts as the distributor of the Class A, Class B, Class C, Class R and Class Z shares of the Allocation Funds. The Allocation Funds compensate PIMS for distributing and servicing the Allocation Funds’ Class A, B, C and R shares, pursuant to plans of distribution (the “Class A, B, C and R Plans”), regardless of expenses actually incurred by PIMS. The distribution fees are accrued daily and payable monthly. No distribution or service fees are paid to PIMS as distributor of the Class Z shares of the Allocation Funds.
Pursuant to the Class A, B, C and R Plans, the Allocation Funds compensate PIMS for distribution-related activities at an annual rate of up to .30%, 1%, 1% and .75% of the average daily net assets of the Class A, B, C and R shares, respectively. PIMS contractually agreed to limit such fees to .25% of the average daily net assets of the Class A shares and .50% of the average daily net assets of the Class R shares.
PI has contractually agreed to limit the net annual operating expenses (exclusive of taxes, interest, brokerage commissions, non-routine expenses, distribution and service (12b-1) fees and underlying fund fees and expenses) of each class of shares of the Allocation Funds to .50% of each Allocation Funds’ average daily net assets.
PIMS has advised the Allocation Funds of its receipt of front-end sales charges resulting from sales of Class A shares during the six months ended March 31, 2010. These amounts were as follows:
| | | |
Fund | | Class A |
Conservative Allocation Fund | | $ | 188,736 |
Moderate Allocation Fund | | | 265,753 |
Growth Allocation Fund | | | 94,769 |
| | |
| 40 | | Visit our website at www.prudentialfunds.com |
From these fees, PIMS paid such sales charges to dealers, which in turn paid commissions to salespersons and incurred other distribution costs.
PIMS has advised the Allocation Funds of its receipt of contingent deferred sales charges imposed upon certain redemptions by certain Class B and Class C shareholders for the six months ended March 31, 2010. These amounts were as follows:
| | | | | | |
Fund | | Class B | | Class C |
Conservative Allocation Fund | | $ | 150,769 | | $ | 2,326 |
Moderate Allocation Fund | | | 148,770 | | | 1,041 |
Growth Allocation Fund | | | 59,596 | | | 1,022 |
PI, QMA and PIMS are indirect, wholly-owned subsidiaries of Prudential Financial, Inc. (“Prudential”).
The Allocation Funds, along with other affiliated registered investment companies (the “Funds”), is a party to a Syndicated Credit Agreement (“SCA”) with two banks. The SCA provides for a commitment of $500 million. Interest on any borrowings under the SCA is incurred at contracted market rates and a commitment fee for the unused amount is accrued daily and paid quarterly. Effective October 22, 2009, the Funds renewed the SCA with the banks. The commitment under the renewed SCA continues to be $500 million. The Funds pay a commitment fee of .15% of the unused portion of the renewed SCA. The expiration date of the renewed SCA will be October 20, 2010. For the period from October 24, 2008 through October 21, 2009, the Funds paid a commitment fee of .13% of the unused portion of the agreement. The purpose of the SCA is to provide an alternative source of temporary funding for capital share redemptions. The Allocation Funds did not utilize the line of credit during the six months ended March 31, 2010.
Note 3. Other Transactions With Affiliates
Prudential Mutual Fund Services LLC (“PMFS”), an affiliate of PI and an indirect, wholly-owned subsidiary of Prudential, serves as the Company’s transfer agent. Transfer agent fees and expenses in the Statement of Operations include certain out-of-pocket expenses paid to non-affiliates, where applicable.
The Allocation Funds pay networking fees to affiliated and unaffiliated broker/dealers including fees related to the services of Wells Fargo Advisors, LLC (“Wells Fargo”), an affiliate of PI through December 31, 2009. These networking fees are payments made to broker/dealers that clear mutual fund transactions through a national mutual fund clearing system. For the six months ended March 31, 2010, the Conservative
| | |
| Prudential Investment Portfolios, Inc./Prudential Asset Allocation Funds | | 41 |
Notes to Financial Statements
(Unaudited) continued
Allocation Fund, Moderate Allocation Fund, Growth Allocation Fund incurred approximately $33,000, $39,000 and $22,600, respectively, in total networking fees, of which approximately $12,400, $34,100 and $9,500, respectively, was paid to Wells Fargo, through December 31, 2009. These amounts are included in transfer agent fees and expenses in the Statement of Operations.
The Allocation Funds invest in the Prudential Core Taxable Money Market Fund (formerly Taxable Money Market Series) (the “Portfolio”), a Portfolio of the Prudential Investment Portfolios 2 (formerly Dryden Core Investment Fund). The Portfolio is a money market mutual fund registered under the Investment Company Act of 1940, as amended, and managed by PI. Earnings from the Portfolio is disclosed on the Statement of Operations as affiliated dividend income.
| | |
| 42 | | Visit our website at www.prudentialfunds.com |
Note 4. Investments in Affiliated Issuers
A summary of cost of purchases and proceeds of sales of shares of affiliated registered investment companies, other than short-term investments, for the six months ended March 31, 2010 is presented as follows:
Conservative Allocation Fund:
| | | | | | | | | | | | | | | | | | |
Affiliated Registered
Investment Company | | Value,
beginning
of period | | Cost of
Purchases | | Proceeds
of Sales | | Dividend
Income | | Capital Gain
Distributions
Received | | Value,
end of
period |
Prudential Global Real Estate Fund (Class Z) | | $ | 4,072,538 | | $ | 1,846,040 | | $ | 900,000 | | $ | 186,040 | | $ | — | | $ | 5,276,151 |
Prudential Government Income Fund, Inc. (Class Z) | | | 11,481,637 | | | 2,804,218 | | | 725,000 | | | 208,652 | | | — | | | 13,707,640 |
Prudential High Yield Fund, Inc. (Class Z) | | | 3,563,839 | | | 580,768 | | | 75,000 | | | 182,958 | | | — | | | 4,306,907 |
Prudential International Equity Fund (Class Z) | | | 5,361,532 | | | 1,965,897 | | | 800,000 | | | 115,897 | | | — | | | 6,597,134 |
Prudential Jennison 20/20 Focus Fund (Class Z) | | | 4,711,439 | | | 1,225,000 | | | 855,000 | | | — | | | — | | | 5,718,340 |
Prudential Jennison Equity Opportunity Fund (Class Z) | | | 1,780,920 | | | 500,000 | | | 125,000 | | | — | | | — | | | 2,373,133 |
Prudential Jennison Growth Fund (Class Z) | | | 1,767,672 | | | 325,000 | | | 180,000 | | | — | | | — | | | 2,150,917 |
Prudential Jennison Mid-Cap Growth Fund, Inc. (Class Z) | | | 2,697,228 | | | 413,376 | | | 250,000 | | | 13,376 | | | — | | | 3,226,184 |
Prudential Jennison Natural Resources Fund, Inc. (Class Z) | | | 1,638,208 | | | 528,548 | | | 450,000 | | | 28,548 | | | — | | | 1,886,383 |
Prudential Jennison Value Fund (Class Z) | | | 3,561,970 | | | 770,720 | | | 515,000 | | | 20,720 | | | — | | | 4,306,938 |
Prudential Large-Cap Core Equity Fund (Class Z) | | | 3,969,022 | | | 803,400 | | | 900,000 | | | 28,400 | | | — | | | 4,293,437 |
Prudential Mid-Cap Value Fund (Class Z) | | | 2,681,277 | | | 677,470 | | | 545,000 | | | 27,470 | | | — | | | 3,228,259 |
Prudential Short-Term Corporate Bond Fund, Inc. (Class Z) | | | 24,909,868 | | | 6,172,013 | | | 1,400,000 | | | 603,973 | | | — | | | 29,936,527 |
Prudential Small-Cap Core Equity Fund, Inc. (Class Z) | | | 3,544,157 | | | 1,002,563 | | | 790,000 | | | 2,563 | | | — | | | 4,252,500 |
Prudential Total Return Bond Fund, Inc. (Class Z) | | | 12,486,691 | | | 2,826,256 | | | 875,000 | | | 303,188 | | | — | | | 14,996,357 |
| | | | | | | | | | | | | | | | | | |
Total | | $ | 88,227,998 | | $ | 22,441,269 | | $ | 9,385,000 | | $ | 1,721,785 | | $ | — | | $ | 106,256,807 |
| | | | | | | | | | | | | | | | | | |
| | |
| Prudential Investment Portfolios, Inc./Prudential Asset Allocation Funds | | 43 |
Notes to Financial Statements
(Unaudited) continued
Moderate Allocation Fund:
| | | | | | | | | | | | | | | | | | |
Affiliated Registered
Investment Company | | Value,
beginning
of period | | Cost of
Purchases | | Proceeds
of Sales | | Dividend
Income | | Capital Gain
Distributions
Received | | Value,
end of
period |
Prudential Global Real Estate Fund (Class Z) | | $ | 5,576,600 | | $ | 1,917,207 | | $ | 825,000 | | $ | 242,207 | | $ | — | | $ | 7,008,118 |
Prudential Government Income Fund, Inc. (Class Z) | | | 8,112,728 | | | 2,591,844 | | | 1,325,000 | | | 144,866 | | | — | | | 9,483,973 |
Prudential High Yield Fund, Inc. (Class Z) | | | 3,613,544 | | | 680,635 | | | 250,000 | | | 182,639 | | | — | | | 4,279,987 |
Prudential International Equity Fund (Class Z) | | | 15,670,884 | | | 3,850,625 | | | 1,025,000 | | | 325,625 | | | — | | | 18,673,813 |
Prudential Jennison 20/20 Focus Fund (Class Z) | | | 10,116,459 | | | 1,325,000 | | | 835,000 | | | — | | | — | | | 11,922,414 |
Prudential Jennison Equity Opportunity Fund (Class Z) | | | 6,074,442 | | | 675,000 | | | 75,000 | | | — | | | — | | | 7,351,847 |
Prudential Jennison Growth Fund (Class Z) | | | 3,576,997 | | | 325,000 | | | 100,000 | | | — | | | — | | | 4,273,445 |
Prudential Jennison Mid-Cap Growth Fund, Inc. (Class Z) | | | 6,054,523 | | | 604,816 | | | 350,000 | | | 29,816 | | | — | | | 7,108,437 |
Prudential Jennison Natural Resources Fund, Inc. (Class Z) | | | 3,299,373 | | | 1,132,144 | | | 800,000 | | | 57,144 | | | — | | | 3,976,248 |
Prudential Jennison Value Fund (Class Z) | | | 8,479,331 | | | 923,053 | | | 600,000 | | | 48,053 | | | — | | | 9,917,195 |
Prudential Large-Cap Core Equity Fund (Class Z) | | | 6,690,962 | | | 697,284 | | | 950,000 | | | 47,284 | | | — | | | 7,119,467 |
Prudential Mid-Cap Value Fund (Class Z) | | | 6,111,002 | | | 836,742 | | | 675,000 | | | 61,742 | | | — | | | 7,164,143 |
Prudential Short-Term Corporate Bond Fund, Inc. (Class Z) | | | 18,022,748 | | | 5,775,025 | | | 2,800,000 | | | 452,711 | | | — | | | 21,182,732 |
Prudential Small-Cap Core Equity Fund, Inc. (Class Z) | | | 7,260,111 | | | 1,255,152 | | | 990,000 | | | 5,152 | | | — | | | 8,479,361 |
Prudential Total Return Bond Fund, Inc. (Class Z) | | | 10,818,661 | | | 3,182,324 | | | 1,750,000 | | | 258,679 | | | — | | | 12,730,513 |
| | | | | | | | | | | | | | | | | | |
Total | | $ | 119,478,365 | | $ | 25,771,851 | | $ | 13,350,000 | | $ | 1,855,918 | | $ | — | | $ | 140,671,693 |
| | | | | | | | | | | | | | | | | | |
| | |
| 44 | | Visit our website at www.prudentialfunds.com |
Growth Allocation Fund:
| | | | | | | | | | | | | | | | | | |
Affiliated Registered
Investment Company | | Value,
beginning
of period | | Cost of
Purchases | | Proceeds
of Sales | | Dividend
Income | | Capital Gain
Distributions
Received | | Value,
end of
period |
Prudential Global Real Estate Fund (Class Z) | | $ | 2,942,844 | | $ | 751,508 | | $ | 225,000 | | $ | 126,508 | | $ | — | | $ | 3,642,366 |
Prudential International Equity Fund (Class Z) | | | 12,875,545 | | | 2,471,910 | | | 525,000 | | | 266,910 | | | — | | | 14,932,523 |
Prudential Jennison 20/20 Focus Fund (Class Z) | | | 6,730,052 | | | 350,000 | | | 175,000 | | | — | | | — | | | 7,762,378 |
Prudential Jennison Equity Opportunity Fund (Class Z) | | | 3,213,015 | | | 400,000 | | | 50,000 | | | — | | | — | | | 3,923,241 |
Prudential Jennison Growth Fund (Class Z) | | | 2,578,005 | | | 75,000 | | | 25,000 | | | — | | | — | | | 2,955,516 |
Prudential Jennison Mid-Cap Growth Fund, Inc. (Class Z) | | | 4,545,106 | | | 197,403 | | | 125,000 | | | 22,403 | | | — | | | 5,203,280 |
Prudential Jennison Natural Resources Fund, Inc. (Class Z) | | | 2,531,391 | | | 418,087 | | | 375,000 | | | 43,087 | | | — | | | 2,816,885 |
Prudential Jennison Value Fund (Class Z) | | | 6,474,068 | | | 286,712 | | | 150,000 | | | 36,712 | | | — | | | 7,440,582 |
Prudential Large-Cap Core Equity Fund (Class Z) | | | 5,533,480 | | | 314,931 | | | 475,000 | | | 39,931 | | | — | | | 5,937,242 |
Prudential Mid-Cap Value Fund (Class Z) | | | 4,596,147 | | | 170,791 | | | 200,000 | | | 45,791 | | | — | | | 5,218,548 |
Prudential Small-Cap Core Equity Fund, Inc. (Class Z) | | | 6,447,997 | | | 729,605 | | | 700,000 | | | 4,605 | | | — | | | 7,306,559 |
Prudential Total Return Bond Fund, Inc. (Class Z) | | | 5,389,527 | | | 1,553,870 | | | 925,000 | | | 120,463 | | | — | | | 6,259,200 |
| | | | | | | | | | | | | | | | | | |
Total | | $ | 63,857,177 | | $ | 7,719,817 | | $ | 3,950,000 | | $ | 706,410 | | $ | — | | $ | 73,398,320 |
| | | | | | | | | | | | | | | | | | |
Note 5. Tax Information
Distributions to shareholders, which are determined in accordance with federal income tax regulations and which may differ from generally accepted accounting principles, are recorded on the ex-dividends date.
The United States federal income tax basis and net unrealized appreciation of the Funds’ investments as of March 31, 2010 were as follows:
| | | | | | | | | | | | | |
Fund | | Tax Basis | | Appreciation | | Depreciation | | | Net Unrealized
Appreciation |
Conservative Allocation Fund | | $ | 99,133,293 | | $ | 8,634,877 | | $ | (438,268 | ) | | $ | 8,196,609 |
Moderate Allocation Fund | | | 131,977,351 | | | 11,041,825 | | | (868,848 | ) | | | 10,172,977 |
Growth Allocation Fund | | | 71,196,765 | | | 5,085,546 | | | (2,020,199 | ) | | | 3,065,347 |
| | |
| Prudential Investment Portfolios, Inc./Prudential Asset Allocation Funds | | 45 |
Notes to Financial Statements
(Unaudited) continued
The difference between book basis and tax basis was primarily attributable to deferred losses on wash sales.
For federal income tax purposes the following Funds elected to treat post-October losses incurred as having been incurred in the following fiscal year (September 30, 2010). Certain Funds had capital loss carryforwards as of September 30, 2009. Accordingly, no capital gain distributions are expected to be paid to shareholders until future net gains have been realized in excess of such carryforwards. The approximate amounts were as follows:
| | | | | | | |
Fund | | Post-October
Capital Losses | | Capital Loss
Carryforward | |
Conservative Allocation Fund | | $ | 2,399,000 | | $ | 100,000 | (a) |
Moderate Allocation Fund | | | 9,021,000 | | | 645,000 | (a) |
Growth Allocation Fund | | | 6,675,000 | | | 682,000 | (a) |
Management has analyzed the Company’s tax positions taken on federal income tax returns for all open tax years and has concluded that as of March 31, 2010, no provision for income tax would be required in the Allocation Funds’ financial statements. The Company’s federal and state income and federal excise tax returns for tax years for which the applicable statutes of limitations have not expired are subject to examination by the Internal Revenue Service and state departments of revenue.
Note 6. Capital
The Company offers Class A, Class B, Class C, Class R and Class Z shares. There are 6.25 billion shares of $.001 par value of common stock of the Company authorized which are divided into six series and five classes, designated Class A, Class B, Class C, Class R and Class Z. Each class of par value shares represents an interest in the same assets of the Company and is identical in all respects except that (1) each class is subject to different sales charges and distribution and/or service fees (except for Class Z shares, which are not subject to any sales charges and distribution and/or services fees), which may affect performance, (2) each class has exclusive voting rights on any matter submitted to shareholders that relates solely to its arrangement and has separate voting rights on any matter submitted to shareholders in which the interests of one class differ from the interests of any other class, (3) each class has a
| | |
| 46 | | Visit our website at www.prudentialfunds.com |
different exchange privilege, (4) only Class B shares have a conversion feature and (5) Class R and Class Z shares are offered exclusively for sale to a limited group of investors. As of March 31, 2010, Prudential owned 231, 214, and 188 shares of Class R shares of the Conservative Allocation Fund, Moderate Allocation Fund and Growth Allocation Fund, respectively.
Transactions in shares of common stock were as follows:
Conservative Allocation Fund:
| | | | | | | |
Class A | | Shares | | | Amount | |
Six months ended March 31, 2010: | | | | | | | |
Shares sold | | 811,008 | | | $ | 8,840,006 | |
Shares issued in reinvestment of dividends | | 37,504 | | | | 406,213 | |
Shares reacquired | | (427,333 | ) | | | (4,651,922 | ) |
| | | | | | | |
Net increase (decrease) in shares outstanding before conversion | | 421,179 | | | | 4,594,297 | |
Shares issued upon conversion from Class B | | 13,477 | | | | 148,751 | |
| | | | | | | |
Net increase (decrease) in shares outstanding | | 434,656 | | | $ | 4,743,048 | |
| | | | | | | |
Year ended September 30, 2009: | | | | | | | |
Shares sold | | 1,285,322 | | | $ | 12,405,641 | |
Shares issued in reinvestment of dividends and distributions | | 115,074 | | | | 1,029,410 | |
Shares reacquired | | (832,219 | ) | | | (7,677,803 | ) |
| | | | | | | |
Net increase (decrease) in shares outstanding before conversion | | 568,177 | | | | 5,757,248 | |
Shares issued upon conversion from Class B | | 56,431 | | | | 528,481 | |
| | | | | | | |
Net increase (decrease) in shares outstanding | | 624,608 | | | $ | 6,285,729 | |
| | | | | | | |
Class B | | | | | | |
Six months ended March 31, 2010: | | | | | | | |
Shares sold | | 908,430 | | | $ | 9,853,997 | |
Shares issued in reinvestment of dividends | | 33,375 | | | | 361,099 | |
Shares reacquired | | (480,631 | ) | | | (5,219,808 | ) |
| | | | | | | |
Net increase (decrease) in shares outstanding before conversion | | 461,174 | | | | 4,995,288 | |
Shares reacquired upon conversion into Class A | | (13,526 | ) | | | (148,751 | ) |
| | | | | | | |
Net increase (decrease) in shares outstanding | | 447,648 | | | $ | 4,846,537 | |
| | | | | | | |
Year ended September 30, 2009: | | | | | | | |
Shares sold | | 2,640,272 | | | $ | 24,574,109 | |
Shares issued in reinvestment of dividends and distributions | | 84,017 | | | | 748,734 | |
Shares reacquired | | (940,844 | ) | | | (8,650,479 | ) |
| | | | | | | |
Net increase (decrease) in shares outstanding before conversion | | 1,783,445 | | | | 16,672,364 | |
Shares reacquired upon conversion into Class A | | (56,610 | ) | | | (528,481 | ) |
| | | | | | | |
Net increase (decrease) in shares outstanding | | 1,726,835 | | | $ | 16,143,883 | |
| | | | | | | |
| | |
| Prudential Investment Portfolios, Inc./Prudential Asset Allocation Funds | | 47 |
Notes to Financial Statements
(Unaudited) continued
| | | | | | | |
Class C | | Shares | | | Amount | |
Six months ended March 31, 2010: | | | | | | | |
Shares sold | | 473,387 | | | $ | 5,141,696 | |
Shares issued in reinvestment of dividends | | 9,304 | | | | 100,701 | |
Shares reacquired | | (172,703 | ) | | | (1,889,007 | ) |
| | | | | | | |
Net increase (decrease) in shares outstanding | | 309,988 | | | $ | 3,353,390 | |
| | | | | | | |
Year ended September 30, 2009: | | | | | | | |
Shares sold | | 761,101 | | | $ | 7,154,328 | |
Shares issued in reinvestment of dividends and distributions | | 28,348 | | | | 252,035 | |
Shares reacquired | | (358,702 | ) | | | (3,278,341 | ) |
| | | | | | | |
Net increase (decrease) in shares outstanding | | 430,747 | | | $ | 4,128,022 | |
| | | | | | | |
Class R | | | | | | |
Six months ended March 31, 2010: | | | | | | | |
Shares sold | | 518 | | | $ | 5,707 | |
Shares issued in reinvestment of dividends | | 15 | | | | 166 | |
Shares reacquired | | (9 | ) | | | (99 | ) |
| | | | | | | |
Net increase (decrease) in shares outstanding | | 524 | | | $ | 5,774 | |
| | | | | | | |
Year ended September 30, 2009: | | | | | | | |
Shares sold | | 1,007 | | | $ | 10,444 | |
Shares issued in reinvestment of dividends and distributions | | 8 | | | | 72 | |
Shares reacquired | | — | | | | — | |
| | | | | | | |
Net increase (decrease) in shares outstanding | | 1,015 | | | $ | 10,516 | |
| | | | | | | |
Class Z | | | | | | |
Six months ended March 31, 2010: | | | | | | | |
Shares sold | | 20,756 | | | $ | 224,222 | |
Shares issued in reinvestment of dividends | | 1,076 | | | | 11,687 | |
Shares reacquired | | (15,117 | ) | | | (164,793 | ) |
| | | | | | | |
Net increase (decrease) in shares outstanding | | 6,715 | | | $ | 71,116 | |
| | | | | | | |
Year ended September 30, 2009: | | | | | | | |
Shares sold | | 23,607 | | | $ | 208,004 | |
Shares issued in reinvestment of dividends and distributions | | 3,951 | | | | 35,470 | |
Shares reacquired | | (45,493 | ) | | | (418,923 | ) |
| | | | | | | |
Net increase (decrease) in shares outstanding | | (17,935 | ) | | $ | (175,449 | ) |
| | | | | | | |
| | |
| 48 | | Visit our website at www.prudentialfunds.com |
Moderate Allocation Fund:
| | | | | | | |
Class A | | Shares | | | Amount | |
Six months ended March 31, 2010: | | | | | | | |
Shares sold | | 773,404 | | | $ | 8,408,454 | |
Shares issued in reinvestment of dividends | | 48,582 | | | | 530,022 | |
Shares reacquired | | (604,099 | ) | | | (6,574,319 | ) |
| | | | | | | |
Net increase (decrease) in shares outstanding before conversion | | 217,887 | | | | 2,364,157 | |
Shares issued upon conversion from Class B | | 20,463 | | | | 226,635 | |
| | | | | | | |
Net increase (decrease) in shares outstanding | | 238,350 | | | $ | 2,590,792 | |
| | | | | | | |
Year ended September 30, 2009: | | | | | | | |
Shares sold | | 1,210,432 | | | $ | 11,048,323 | |
Shares issued in reinvestment of dividends and distributions | | 265,902 | | | | 2,172,418 | |
Shares reacquired | | (1,369,087 | ) | | | (12,040,416 | ) |
| | | | | | | |
Net increase (decrease) in shares outstanding before conversion | | 107,247 | | | | 1,180,325 | |
Shares issued upon conversion from Class B | | 102,444 | | | | 888,159 | |
| | | | | | | |
Net increase (decrease) in shares outstanding | | 209,691 | | | $ | 2,068,484 | |
| | | | | | | |
Class B | | | | | | |
Six months ended March 31, 2010: | | | | | | | |
Shares sold | | 1,280,271 | | | $ | 13,825,739 | |
Shares issued in reinvestment of dividends | | 16,424 | | | | 179,023 | |
Shares reacquired | | (495,727 | ) | | | (5,357,126 | ) |
| | | | | | | |
Net increase (decrease) in shares outstanding before conversion | | 800,968 | | | | 8,647,636 | |
Shares reacquired upon conversion into Class A | | (20,551 | ) | | | (226,635 | ) |
| | | | | | | |
Net increase (decrease) in shares outstanding | | 780,417 | | | $ | 8,421,001 | |
| | | | | | | |
Year ended September 30, 2009: | | | | | | | |
Shares sold | | 2,139,167 | | | $ | 19,146,508 | |
Shares issued in reinvestment of dividends and distributions | | 186,745 | | | | 1,523,837 | |
Shares reacquired | | (1,180,710 | ) | | | (10,345,032 | ) |
| | | | | | | |
Net increase (decrease) in shares outstanding before conversion | | 1,145,202 | | | | 10,325,313 | |
Shares reacquired upon conversion into Class A | | (102,959 | ) | | | (888,159 | ) |
| | | | | | | |
Net increase (decrease) in shares outstanding | | 1,042,243 | | | $ | 9,437,154 | |
| | | | | | | |
Class C | | | | | | |
Six months ended March 31, 2010: | | | | | | | |
Shares sold | | 237,119 | | | $ | 2,568,570 | |
Shares issued in reinvestment of dividends | | 3,926 | | | | 42,749 | |
Shares reacquired | | (121,542 | ) | | | (1,318,743 | ) |
| | | | | | | |
Net increase (decrease) in shares outstanding | | 119,503 | | | $ | 1,292,576 | |
| | | | | | | |
Year ended September 30, 2009: | | | | | | | |
Shares sold | | 382,491 | | | $ | 3,455,668 | |
Shares issued in reinvestment of dividends and distributions | | 59,057 | | | | 481,904 | |
Shares reacquired | | (453,184 | ) | | | (3,829,543 | ) |
| | | | | | | |
Net increase (decrease) in shares outstanding | | (11,636 | ) | | $ | 108,029 | |
| | | | | | | |
| | |
| Prudential Investment Portfolios, Inc./Prudential Asset Allocation Funds | | 49 |
Notes to Financial Statements
(Unaudited) continued
| | | | | | | |
Class R | | Shares | | | Amount | |
Six months ended March 31, 2010: | | | | | | | |
Shares sold | | — | | | $ | — | |
Shares issued in reinvestment of dividends | | 1.6 | | | | 17 | |
Shares reacquired | | — | | | | — | |
| | | | | | | |
Net increase (decrease) in shares outstanding | | 1.6 | | | $ | 17 | |
| | | | | | | |
Year ended September 30, 2009: | | | | | | | |
Shares sold | | — | | | $ | — | |
Shares issued in reinvestment of dividends and distributions | | 11.5 | | | | 94 | |
Shares reacquired | | — | | | | — | |
| | | | | | | |
Net increase (decrease) in shares outstanding | | 11.5 | | | $ | 94 | |
| | | | | | | |
Class Z | | | | | | |
Six months ended March 31, 2010: | | | | | | | |
Shares sold | | 31,102 | | | $ | 338,096 | |
Shares issued in reinvestment of dividends | | 1,804 | | | | 19,683 | |
Shares reacquired | | (35,256 | ) | | | (378,967 | ) |
| | | | | | | |
Net increase (decrease) in shares outstanding | | (2,350 | ) | | $ | (21,188 | ) |
| | | | | | | |
Year ended September 30, 2009: | | | | | | | |
Shares sold | | 39,641 | | | $ | 360,600 | |
Shares issued in reinvestment of dividends and distributions | | 10,858 | | | | 88,604 | |
Shares reacquired | | (87,477 | ) | | | (763,210 | ) |
| | | | | | | |
Net increase (decrease) in shares outstanding | | (36,978 | ) | | $ | (314,006 | ) |
| | | | | | | |
Growth Allocation Fund:
| | | | | | | |
Class A | | Shares | | | Amount | |
Six months ended March 31, 2010: | | | | | | | |
Shares sold | | 345,927 | | | $ | 3,854,731 | |
Shares issued in reinvestment of dividends | | 23,100 | | | | 259,648 | |
Shares reacquired | | (245,411 | ) | | | (2,743,005 | ) |
| | | | | | | |
Net increase (decrease) in shares outstanding before conversion | | 123,616 | | | | 1,371,374 | |
Shares issued upon conversion from Class B | | 11,500 | | | | 131,514 | |
| | | | | | | |
Net increase (decrease) in shares outstanding | | 135,116 | | | $ | 1,502,888 | |
| | | | | | | |
Year ended September 30, 2009: | | | | | | | |
Shares sold | | 598,788 | | | $ | 5,260,325 | |
Shares issued in reinvestment of dividends | | 71,570 | | | | 571,125 | |
Shares reacquired | | (618,291 | ) | | | (5,368,149 | ) |
| | | | | | | |
Net increase (decrease) in shares outstanding before conversion | | 52,067 | | | | 463,301 | |
Shares issued upon conversion from Class B | | 46,002 | | | | 407,540 | |
| | | | | | | |
Net increase (decrease) in shares outstanding | | 98,069 | | | $ | 870,841 | |
| | | | | | | |
| | |
| 50 | | Visit our website at www.prudentialfunds.com |
| | | | | | | |
Class B | | Shares | | | Amount | |
Six months ended March 31, 2010: | | | | | | | |
Shares sold | | 438,766 | | | $ | 4,785,126 | |
Shares issued in reinvestment of dividends | | 8,346 | | | | 92,387 | |
Shares reacquired | | (226,842 | ) | | | (2,485,356 | ) |
| | | | | | | |
Net increase (decrease) in shares outstanding before conversion | | 220,270 | | | | 2,392,157 | |
Shares reacquired upon conversion into Class A | | (11,706 | ) | | | (131,514 | ) |
| | | | | | | |
Net increase (decrease) in shares outstanding | | 208,564 | | | $ | 2,260,643 | |
| | | | | | | |
Year ended September 30, 2009: | | | | | | | |
Shares sold | | 731,098 | | | $ | 6,361,233 | |
Shares issued in reinvestment of dividends | | 79,020 | | | | 622,679 | |
Shares reacquired | | (572,357 | ) | | | (4,868,467 | ) |
| | | | | | | |
Net increase (decrease) in shares outstanding before conversion | | 237,761 | | | | 2,115,445 | |
Shares reacquired upon conversion into Class A | | (46,748 | ) | | | (407,540 | ) |
| | | | | | | |
Net increase (decrease) in shares outstanding | | 191,013 | | | $ | 1,707,905 | |
| | | | | | | |
Class C | | | | | | |
Six months ended March 31, 2010: | | | | | | | |
Shares sold | | 87,402 | | | $ | 961,170 | |
Shares issued in reinvestment of dividends | | 1,930 | | | | 21,379 | |
Shares reacquired | | (59,747 | ) | | | (651,789 | ) |
| | | | | | | |
Net increase (decrease) in shares outstanding | | 29,585 | | | $ | 330,760 | |
| | | | | | | |
Year ended September 30, 2009: | | | | | | | |
Shares sold | | 178,063 | | | $ | 1,567,305 | |
Shares issued in reinvestment of dividends | | 19,987 | | | | 157,496 | |
Shares reacquired | | (202,630 | ) | | | (1,672,030 | ) |
| | | | | | | |
Net increase (decrease) in shares outstanding | | (4,580 | ) | | $ | 52,771 | |
| | | | | | | |
Class R | | | | | | |
Six months ended March 31, 2010: | | | | | | | |
Shares sold | | — | | | $ | — | |
Shares issued in reinvestment of dividends | | 1.20 | | | | 14 | |
Shares reacquired | | — | | | | — | |
| | | | | | | |
Net increase (decrease) in shares outstanding | | 1.20 | | | $ | 14 | |
| | | | | | | |
Year ended September 30, 2009: | | | | | | | |
Shares sold | | — | | | $ | — | |
Shares issued in reinvestment of dividends | | 5.50 | | | | 44 | |
Shares reacquired | | — | | | | — | |
| | | | | | | |
Net increase (decrease) in shares outstanding | | 5.50 | | | $ | 44 | |
| | | | | | | |
| | |
| Prudential Investment Portfolios, Inc./Prudential Asset Allocation Funds | | 51 |
Notes to Financial Statements
(Unaudited) continued
| | | | | | | |
Class Z | | Shares | | | Amount | |
Six months ended March 31, 2010: | | | | | | | |
Shares sold | | 2,626 | | | $ | 29,167 | |
Shares issued in reinvestment of dividends | | 253 | | | | 2,861 | |
Shares reacquired | | (12,081 | ) | | | (134,812 | ) |
| | | | | | | |
Net increase (decrease) in shares outstanding | | (9,202 | ) | | $ | (102,784 | ) |
| | | | | | | |
Year ended September 30, 2009: | | | | | | | |
Shares sold | | 3,396 | | | $ | 33,451 | |
Shares issued in reinvestment of dividends | | 914 | | | | 7,320 | |
Shares reacquired | | (4,194 | ) | | | (35,260 | ) |
| | | | | | | |
Net increase (decrease) in shares outstanding | | 116 | | | $ | 5,511 | |
| | | | | | | |
Note 7. New Accounting Pronouncement
In January 2010, the Financial Accounting Standards Board (“FASB”) issued Accounting Standards Update (“ASU”) No. 2010-06 “Improving Disclosures about Fair Value Measurements”. ASU 2010-06 will require reporting entities to make new disclosures about amounts and reasons for significant transfers in and out of Level 1 and Level 2 fair value measurements and input and valuation techniques used to measure fair value for both recurring and nonrecurring fair value measurements that fall in either Level 2 or Level 3, and information on purchases, sales, issuances, and settlements in the roll forward of activity in Level 3 fair value measurements. The new and revised disclosures are effective for interim and annual reporting periods beginning after December 15, 2009 except for the disclosures about purchases, sales, issuances, and settlements in the roll forward of activity in Level 3 fair value measurements, which are effective for interim and annual reporting periods beginning after December 15, 2010. At this time, management is evaluating the implications of ASU No. 2010-06 and its impact on the financial statements has not been determined.
Note 8. Subsequent Events
Management has evaluated the impact of all subsequent events on the Allocation Funds through the date the financial statements are issued and has determined that there were no subsequent events requiring recognition or disclosure in the financial statements.
| | |
| 52 | | Visit our website at www.prudentialfunds.com |
Financial Highlights
(Unaudited)
| | |
| MARCH 31, 2010 | | SEMIANNUAL REPORT |
Prudential Asset Allocation Funds
Prudential Conservative Allocation Fund
Financial Highlights
(Unaudited)
| | | | |
| | | Class A | |
| | | Six Months Ended
March 31, 2010(a) | |
Per Share Operating Performance: | | | | |
Net Asset Value, Beginning Of Period | | $ | 10.64 | |
| | | | |
Income (loss) from investment operations: | | | | |
Net investment income | | | .15 | |
Net realized and unrealized gain (loss) on investment transactions | | | .56 | |
| | | | |
Total from investment operations | | | .71 | |
| | | | |
Less Dividends and Distributions: | | | | |
Dividends from net investment income | | | (.14 | ) |
Distributions from net realized gains | | | — | |
| | | | |
Total dividends and distributions | | | (.14 | ) |
| | | | |
Net asset value, end of period | | $ | 11.21 | |
| | | | |
Total Return(b): | | | 6.68 | % |
Ratios/Supplemental Data: | | | | |
Net assets, end of period (000) | | $ | 42,099 | |
Average net assets (000) | | $ | 38,509 | |
Ratios to average net assets(c): | | | | |
Expenses, including distribution and service (12b-1) fees(d) | | | .74 | %(e) |
Expenses, excluding distribution and service (12b-1) fees | | | .49 | %(e) |
Net investment income | | | 2.78 | %(e) |
For Class A, B, C, R and Z shares: | | | | |
Portfolio turnover rate | | | 10 | %(f) |
| (a) | Calculated based upon average shares outstanding during the period. |
| (b) | Total return does not consider the effects of sales loads. Total return is calculated assuming a purchase of a share on the first day and a sale on the last day of each period reported and includes reinvestment of dividends and distributions. Total return includes the effect of expense subsidies. Total returns may reflect adjustments to conform to generally accepted accounting principles. Total returns for periods less than a full year are not annualized. |
| (c) | Net of expense subsidy. If the investment manager had not subsidized expenses, the expense ratios including distribution and service (12b-1) fees would have been .87%, 1.00%, 1.33%, 1.08% and 1.20% for the years ended September 30, 2009, 2008, 2007, 2006 and 2005, respectively. The expense ratios excluding distribution and services (12b-1) fees would have been .62%, .75%, 1.08%, .83% and .95% for the years ended September 30, 2009, 2008, 2007, 2006 and 2005, respectively. The net investment income ratios would have been 2.50%, 2.13%, 1.82%, 1.95% and 1.49% for the years ended September 30, 2009, 2008, 2007, 2006 and 2005, respectively. Does not include expenses of the investment companies in which the Fund invests. |
| (d) | The distributor of the Fund has contractually agreed to limit its distribution and service (12b-1) fees to .25% of the average daily net assets of the Class A shares. |
See Notes to Financial Statements.
| | |
| 54 | | Visit our website at www.prudentialfunds.com |
| | | | | | | | | | | | | | | | | | |
| Class A | |
| Year Ended September 30, | |
| 2009(a) | | | 2008(a) | | | 2007(a) | | | 2006 | | | 2005(a) | |
| | | | | | | | | | | | | | | | | | |
| $ | 10.28 | | | $ | 11.91 | | | $ | 11.21 | | | $ | 10.78 | | | $ | 10.01 | |
| | | | | | | | | | | | | | | | | | | |
| | | | | | | | | | | | | | | | | | |
| | .24 | | | | .27 | | | | .28 | | | | .25 | | | | .20 | |
| | .51 | | | | (1.38 | ) | | | .81 | | | | .46 | | | | .78 | |
| | | | | | | | | | | | | | | | | | | |
| | .75 | | | | (1.11 | ) | | | 1.09 | | | | .71 | | | | 0.98 | |
| | | | | | | | | | | | | | | | | | | |
| | | | | | | | | | | | | | | | | | |
| | (.24 | ) | | | (.36 | ) | | | (.27 | ) | | | (.24 | ) | | | (.21 | ) |
| | (.15 | ) | | | (.16 | ) | | | (.12 | ) | | | (.04 | ) | | | — | |
| | | | | | | | | | | | | | | | | | | |
| | (.39 | ) | | | (.52 | ) | | | (.39 | ) | | | (.28 | ) | | | (.21 | ) |
| | | | | | | | | | | | | | | | | | | |
| $ | 10.64 | | | $ | 10.28 | | | $ | 11.91 | | | $ | 11.21 | | | $ | 10.78 | |
| | | | | | | | | | | | | | | | | | | |
| | 8.06 | % | | | (9.75 | )% | | | 9.89 | % | | | 6.71 | % | | | 9.92 | % |
| | | | | | | | | | | | | | | | | | |
| $ | 35,354 | | | $ | 27,730 | | | $ | 20,683 | | | $ | 11,278 | | | $ | 5,929 | |
| $ | 26,869 | | | $ | 26,310 | | | $ | 16,051 | | | $ | 8,611 | | | $ | 4,136 | |
| | | | | | | | | | | | | | | | | | |
| | .75 | % | | | .75 | % | | | .76 | % | | | .77 | % | | | .75 | % |
| | .50 | % | | | .50 | % | | | .51 | % | | | .52 | % | | | .50 | % |
| | 2.62 | % | | | 2.38 | % | | | 2.39 | % | | | 2.26 | % | | | 1.89 | % |
| | | | | | | | | | | | | | | | | | |
| | 69 | % | | | 24 | % | | | 22 | % | | | 18 | % | | | 11 | % |
See Notes to Financial Statements.
| | |
| Prudential Investment Portfolios, Inc./Prudential Asset Allocation Funds | | 55 |
Prudential Conservative Allocation Fund
Financial Highlights
(Unaudited) continued
| | | | |
| | | Class B | |
| | | Six Months Ended
March 31, 2010(a) | |
Per Share Operating Performance: | | | | |
Net Asset Value, Beginning Of Period | | $ | 10.60 | |
| | | | |
Income (loss) from investment operations: | | | | |
Net investment income | | | .11 | |
Net realized and unrealized gain (loss) on investment transactions | | | .55 | |
| | | | |
Total from investment operations | | | .66 | |
| | | | |
Less Dividends and Distributions: | | | | |
Dividends from net investment income | | | (.10 | ) |
Distributions from net realized gains | | | — | |
| | | | |
Total dividends and distributions | | | (.10 | ) |
| | | | |
Net asset value, end of period | | $ | 11.16 | |
| | | | |
Total Return(b): | | | 6.22 | % |
Ratios/Supplemental Data: | | | | |
Net assets, end of period (000) | | $ | 46,477 | |
Average net assets (000) | | $ | 43,098 | |
Ratios to average net assets(c): | | | | |
Expenses, including distribution and service (12b-1) fees | | | 1.49 | %(d) |
Expenses, excluding distribution and service (12b-1) fees | | | .49 | %(d) |
Net investment income | | | 2.03 | %(d) |
| (a) | Calculated based upon average shares outstanding during the period. |
| (b) | Total return does not consider the effects of sales loads. Total return is calculated assuming a purchase of a share on the first day and a sale on the last day of each period reported and includes reinvestment of dividends and distributions. Total return includes the effect of expense subsidies. Total returns may reflect adjustments to conform to generally accepted accounting principles. Total returns for periods less than a full year are not annualized. |
| (c) | Net of expense subsidy. If the investment manager had not subsidized expenses, the expense ratios including distribution and service (12b-1) fees would have been 1.62%, 1.75%, 2.08%, 1.83% and 1.95% for the years ended September 30, 2009, 2008, 2007, 2006 and 2005, respectively. The expense ratios excluding distribution and services (12b-1) fees would have been .62%, .75%, 1.08%, .83% and .95% for the years ended September 30, 2009, 2008, 2007, 2006 and 2005, respectively. The net investment income ratios would have been 1.63%, 1.36%, 1.10%, 1.21% and .71% for the years ended September 30, 2009, 2008, 2007, 2006 and 2005, respectively. Does not include expenses of the investment companies in which the Fund invests. |
See Notes to Financial Statements.
| | |
| 56 | | Visit our website at www.prudentialfunds.com |
| | | | | | | | | | | | | | | | | | |
| Class B | |
| Year Ended September 30, | |
| 2009(a) | | | 2008(a) | | | 2007(a) | | | 2006 | | | 2005(a) | |
| | | | | | | | | | | | | | | | | | |
| $ | 10.25 | | | $ | 11.88 | | | $ | 11.18 | | | $ | 10.75 | | | $ | 9.97 | |
| | | | | | | | | | | | | | | | | | | |
| | | | | | | | | | | | | | | | | | |
| | .16 | | | | .18 | | | | .19 | | | | .16 | | | | .12 | |
| | .52 | | | | (1.37 | ) | | | .81 | | | | .47 | | | | .78 | |
| | | | | | | | | | | | | | | | | | | |
| | .68 | | | | (1.19 | ) | | | 1.00 | | | | 0.63 | | | | .90 | |
| | | | | | | | | | | | | | | | | | | |
| | | | | | | | | | | | | | | | | | |
| | (.18 | ) | | | (.28 | ) | | | (.18 | ) | | | (.16 | ) | | | (.12 | ) |
| | (.15 | ) | | | (.16 | ) | | | (.12 | ) | | | (.04 | ) | | | — | |
| | | | | | | | | | | | | | | | | | | |
| | (.33 | ) | | | (.44 | ) | | | (.30 | ) | | | (.20 | ) | | | (.12 | ) |
| | | | | | | | | | | | | | | | | | | |
| $ | 10.60 | | | $ | 10.25 | | | $ | 11.88 | | | $ | 11.18 | | | $ | 10.75 | |
| | | | | | | | | | | | | | | | | | | |
| | 7.21 | % | | | (10.42 | )% | | | 9.09 | % | | | 5.91 | % | | | 9.11 | % |
| | | | | | | | | | | | | | | | | | |
| $ | 39,398 | | | $ | 20,376 | | | $ | 13,027 | | | $ | 9,950 | | | $ | 8,241 | |
| $ | 26,506 | | | $ | 15,543 | | | $ | 11,421 | | | $ | 9,007 | | | $ | 7,032 | |
| | | | | | | | | | | | | | | | | | |
| | 1.50 | % | | | 1 .50 | % | | | 1 .51 | % | | | 1.52 | % | | | 1.50 | % |
| | .50 | % | | | .50 | % | | | .51 | % | | | .52 | % | | | .50 | % |
| | 1.75 | % | | | 1 .61 | % | | | 1 .67 | % | | | 1.52 | % | | | 1.18 | % |
See Notes to Financial Statements.
| | |
| Prudential Investment Portfolios, Inc./Prudential Asset Allocation Funds | | 57 |
Prudential Conservative Allocation Fund
Financial Highlights
(Unaudited) continued
| | | | |
| | | Class C | |
| | | Six Months Ended March 31, 2010(a) | |
Per Share Operating Performance: | | | | |
Net Asset Value, Beginning Of Period | | $ | 10.61 | |
| | | | |
Income (loss) from investment operations: | | | | |
Net investment income | | | .11 | |
Net realized and unrealized gain (loss) on investment transactions | | | .55 | |
| | | | |
Total from investment operations | | | .66 | |
| | | | |
Less Dividends and Distributions: | | | | |
Dividends from net investment income | | | (.10 | ) |
Distributions from net realized gains | | | — | |
| | | | |
Total dividends and distributions | | | (.10 | ) |
| | | | |
Net asset value, end of period | | $ | 11.17 | |
| | | | |
Total Return(b): | | | 6.22 | % |
Ratios/Supplemental Data: | | | | |
Net assets, end of period (000) | | $ | 17,951 | |
Average net assets (000) | | $ | 15,851 | |
Ratios to average net assets(c): | | | | |
Expenses, including distribution and service (12b-1) fees | | | 1.49 | %(d) |
Expenses, excluding distribution and service (12b-1) fees | | | .49 | %(d) |
Net investment income | | | 2.02 | %(d) |
| (a) | Calculated based upon average shares outstanding during the period. |
| (b) | Total return does not consider the effects of sales loads. Total return is calculated assuming a purchase of a share on the first day and a sale on the last day of each period reported and includes reinvestment of dividends and distributions. Total return includes the effect of expense subsidies. Total returns may reflect adjustments to conform to generally accepted accounting principles. Total returns for periods less than a full year are not annualized. |
| (c) | Net of expense subsidy. If the investment manager had not subsidized expenses, the expense ratios including distribution and service (12b-1) fees would have been 1.62%, 1.75%, 2.08%, 1.83% and 1.95% for the years ended September 30, 2009, 2008, 2007, 2006 and 2005, respectively. The expense ratios excluding distribution and services (12b-1) fees would have been .62%, .75%, 1.08%, .83% and .95% for the years ended September 30, 2009, 2008, 2007, 2006 and 2005, respectively. The net investment income ratios would have been 1.76%, 1.37%, 1.08%, 1.21% and .69% for the years ended September 30, 2009, 2008, 2007, 2006 and 2005, respectively. Does not include expenses of the investment companies in which the Fund invests. |
See Notes to Financial Statements.
| | |
| 58 | | Visit our website at www.prudentialfunds.com |
| | | | | | | | | | | | | | | | | | |
| Class C | |
| Year Ended September 30, | |
| 2009(a) | | | 2008(a) | | | 2007(a) | | | 2006 | | | 2005(a) | |
| | | | | | | | | | | | | | | | | | |
| $ | 10.25 | | | $ | 11.88 | | | $ | 11.18 | | | $ | 10.75 | | | $ | 9.97 | |
| | | | | | | | | | | | | | | | | | | |
| | | | | | | | | | | | | | | | | | |
| | .18 | | | | .18 | | | | .19 | | | | .16 | | | | .12 | |
| | .51 | | | | (1.37 | ) | | | .81 | | | | .47 | | | | .78 | |
| | | | | | | | | | | | | | | | | | | |
| | .69 | | | | (1.19 | ) | | | 1.00 | | | | .63 | | | | .90 | |
| | | | | | | | | | | | | | | | | | | |
| | | | | | | | | | | | | | | | | | |
| | (.18 | ) | | | (.28 | ) | | | (.18 | ) | | | (.16 | ) | | | (.12 | ) |
| | (.15 | ) | | | (.16 | ) | | | (.12 | ) | | | (.04 | ) | | | — | |
| | | | | | | | | | | | | | | | | | | |
| | (.33 | ) | | | (.44 | ) | | | (.30 | ) | | | (.20 | ) | | | (.12 | ) |
| | | | | | | | | | | | | | | | | | | |
| $ | 10.61 | | | $ | 10.25 | | | $ | 11.88 | | | $ | 11.18 | | | $ | 10.75 | |
| | | | | | | | | | | | | | | | | | | |
| | 7.31 | % | | | (10.42 | )% | | | 9.09 | % | | | 5.91 | % | | | 9.11 | % |
| | | | | | | | | | | | | | | | | | |
| $ | 13,762 | | | $ | 8,884 | | | $ | 5,779 | | | $ | 2,955 | | | $ | 1,879 | |
| $ | 10,334 | | | $ | 7,240 | | | $ | 4,039 | | | $ | 2,093 | | | $ | 1,737 | |
| | | | | | | | | | | | | | | | | | |
| | 1.50 | % | | | 1.50 | % | | | 1.51 | % | | | 1.52 | % | | | 1.50 | % |
| | .50 | % | | | .50 | % | | | .51 | % | | | .52 | % | | | .50 | % |
| | 1.88 | % | | | 1.62 | % | | | 1.65 | % | | | 1.53 | % | | | 1.17 | % |
See Notes to Financial Statements.
| | |
| Prudential Investment Portfolios, Inc./Prudential Asset Allocation Funds | | 59 |
Prudential Conservative Allocation Fund
Financial Highlights
(Unaudited) continued
| | | | |
| | | Class R | |
| | | Six Months Ended March 31, 2010(a) | |
Per Share Operating Performance: | | | | |
Net Asset Value, Beginning Of Period | | $ | 10.68 | |
| | | | |
Income (loss) from investment operations: | | | | |
Net investment income | | | .13 | |
Net realized and unrealized gain (loss) on investment transactions | | | .56 | |
| | | | |
Total from investment operations | | | .69 | |
| | | | |
Less Dividends and Distributions: | | | | |
Dividends from net investment income | | | (.13 | ) |
Distributions from net realized gains | | | — | |
| | | | |
Total dividends and distributions | | | (.13 | ) |
| | | | |
Net asset value, end of period | | $ | 11.24 | |
| | | | |
Total Return(c): | | | 6.48 | % |
Ratios/Supplemental Data: | | | | |
Net assets, end of period (000) | | $ | 20 | |
Average net assets (000) | | $ | 16 | |
Ratios to average net assets(d): | | | | |
Expenses, including distribution and service (12b-1) fees(e) | | | .99 | %(f) |
Expenses, excluding distribution and service (12b-1) fees | | | .49 | %(f) |
Net investment income | | | 2.46 | %(f) |
| (a) | Calculated based upon average shares outstanding during the period. |
| (b) | Inception date of Class R shares. |
| (c) | Total return is calculated assuming a purchase of a share on the first day and a sale on the last day of each period reported and includes reinvestment of dividends and distributions. Total return includes the effect of expense subsidies. Total returns may reflect adjustments to conform to generally accepted accounting principles. Total returns for periods less than a full year are not annualized. |
| (d) | Net of expense subsidy. If the investment manager had not subsidized expenses, the expense ratios including distribution and service (12b-1) fees would have been 1.12%, 1.25% and 1.58% for the years ended September 30, 2009 and 2008 and the period ended September 30, 2007, respectively. The expense ratios excluding distribution and services (12b-1) fees would have been .62%, .75% and 1.08% for the years ended September 30, 2009 and 2008 and the period ended September 30, 2007, respectively. The net investment income ratios would have been 2.05%, 1.87% and 1.33% for the years ended September 30, 2009 and 2008 and the period ended September 30, 2007, respectively. Does not include expenses of the investment companies in which the Fund invests. |
| (e) | The distributor of the Fund has contractually agreed to limit its distribution and service (12b-1) fees to .50% of the average daily net assets of the Class R shares. |
See Notes to Financial Statements.
| | |
| 60 | | Visit our website at www.prudentialfunds.com |
| | | | | | | | | | |
| Class R | |
| Year Ended September 30, | | | January 12, 2007(b) through September 30, 2007(a) | |
| 2009(a) | | | 2008(a) | | |
| | | | | | | | | | |
| $ | 10.31 | | | $ | 11.91 | | | $ | 11.33 | |
| | | | | | | | | | | |
| | | | | | | | | | |
| | .18 | | | | .32 | | | | .16 | |
| | .56 | | | | (1.43 | ) | | | .50 | |
| | | | | | | | | | | |
| | .74 | | | | (1.11 | ) | | | .66 | |
| | | | | | | | | | | |
| | | | | | | | | | |
| | (.22 | ) | | | (.33 | ) | | | (.08 | ) |
| | (.15 | ) | | | (.16 | ) | | | — | |
| | | | | | | | | | | |
| | (.37 | ) | | | (.49 | ) | | | (.08 | ) |
| | | | | | | | | | | |
| $ | 10.68 | | | $ | 10.31 | | | $ | 11.91 | |
| | | | | | | | | | | |
| | 7.86 | % | | | (9.75 | )% | | | 5.86 | % |
| | | | | | | | | | |
| $ | 13 | | | $ | 2 | | | $ | 3 | |
| $ | 3 | | | $ | 3 | | | $ | 3 | |
| | | | | | | | | | |
| | 1.00 | % | | | 1.00 | % | | | 1.01 | %(f) |
| | .50 | % | | | .50 | % | | | .51 | %(f) |
| | 2.17 | % | | | 2.12 | % | | | 1.90 | %(f) |
See Notes to Financial Statements.
| | |
| Prudential Investment Portfolios, Inc./Prudential Asset Allocation Funds | | 61 |
Prudential Conservative Allocation Fund
Financial Highlights
(Unaudited) continued
| | | | |
| | | Class Z | |
| | | Six Months Ended March 31, 2010(a) | |
Per Share Operating Performance: | | | | |
Net Asset Value, Beginning Of Period | | $ | 10.68 | |
| | | | |
Income (loss) from investment operations: | | | | |
Net investment income | | | .17 | |
Net realized and unrealized gain (loss) on investment transactions | | | .55 | |
| | | | |
Total from investment operations | | | .72 | |
| | | | |
Less Dividends and Distributions: | | | | |
Dividends from net investment income | | | (.15 | ) |
Distributions from net realized gains | | | — | |
| | | | |
Total dividends and distributions | | | (.15 | ) |
| | | | |
Net asset value, end of period | | $ | 11.25 | |
| | | | |
Total Return(b): | | | 6.77 | % |
Ratios/Supplemental Data: | | | | |
Net assets, end of period (000) | | $ | 987 | |
Average net assets (000) | | $ | 939 | |
Ratios to average net assets(c): | | | | |
Expenses, including distribution and service (12b-1) fees | | | .49 | %(d) |
Expenses, excluding distribution and service (12b-1) fees | | | .49 | %(d) |
Net investment income | | | 3.04 | %(d) |
| (a) | Calculated based upon average shares outstanding during the period. |
| (b) | Total return is calculated assuming a purchase of a share on the first day and a sale on the last day of each period reported and includes reinvestment of dividends and distributions. Total return includes the effect of expense subsidies. Total returns may reflect adjustments to conform to generally accepted accounting principles. |
| (c) | Net of expense subsidy. If the investment manager had not subsidized expenses, the expense ratios including distribution and service (12b-1) fees would have been .62%, .75%, 1.08%, .83% and .95% for the years ended September 30, 2009, 2008, 2007, 2006 and 2005, respectively. The expense ratios excluding distribution and services (12b-1) fees would have been .62%, .75%, 1.08%, .83% and .95% for the years ended September 30, 2009, 2008, 2007, 2006 and 2005, respectively. The net investment income ratios would have been 2.79%, 2.28%, 2.02%, 2.29% and 1.63% for the years ended September 30, 2009, 2008, 2007, 2006 and 2005, respectively. Does not include expenses of the investment companies in which the Fund invests. |
See Notes to Financial Statements.
| | |
| 62 | | Visit our website at www.prudentialfunds.com |
| | | | | | | | | | | | | | | | | | |
| Class Z | |
| Year Ended September 30, | |
| 2009(a) | | | 2008(a) | | | 2007(a) | | | 2006 | | | 2005(a) | |
| | | | | | | | | | | | | | | | | | |
| $ | 10.32 | | | $ | 11.95 | | | $ | 11.25 | | | $ | 10.80 | | | $ | 10.03 | |
| | | | | | | | | | | | | | | | | | | |
| | | | | | | | | | | | | | | | | | |
| | .27 | | | | .27 | | | | .30 | | | | .27 | | | | .24 | |
| | .51 | | | | (1.36 | ) | | | .82 | | | | .49 | | | | .77 | |
| | | | | | | | | | | | | | | | | | | |
| | .78 | | | | (1.09 | ) | | | 1.12 | | | | .76 | | | | 1.01 | |
| | | | | | | | | | | | | | | | | | | |
| | | | | | | | | | | | | | | | | | |
| | (.27 | ) | | | (.38 | ) | | | (.30 | ) | | | (.27 | ) | | | (.24 | ) |
| | (.15 | ) | | | (.16 | ) | | | (.12 | ) | | | (.04 | ) | | | — | |
| | | | | | | | | | | | | | | | | | | |
| | (.42 | ) | | | (.54 | ) | | | (.42 | ) | | | (.31 | ) | | | (.24 | ) |
| | | | | | | | | | | | | | | | | | | |
| $ | 10.68 | | | $ | 10.32 | | | $ | 11.95 | | | $ | 11.25 | | | $ | 10.80 | |
| | | | | | | | | | | | | | | | | | | |
| | 8.31 | % | | | (9.51 | )% | | | 10.14 | % | | | 7.05 | % | | | 10.18 | % |
| | | | | | | | | | | | | | | | | | |
| $ | 865 | | | $ | 1,021 | | | $ | 337 | | | $ | 129 | | | $ | 42 | |
| $ | 863 | | | $ | 579 | | | $ | 196 | | | $ | 50 | | | $ | 311 | |
| | | | | | | | | | | | | | | | | | |
| | .50 | % | | | .50 | % | | | .51 | % | | | .52 | % | | | .50 | % |
| | .50 | % | | | .50 | % | | | .51 | % | | | .52 | % | | | .50 | % |
| | 2.91 | % | | | 2.53 | % | | | 2.59 | % | | | 2.60 | % | | | 2.27 | % |
See Notes to Financial Statements.
| | |
| Prudential Investment Portfolios, Inc./Prudential Asset Allocation Funds | | 63 |
Prudential Moderate Allocation Fund
Financial Highlights
(Unaudited)
| | | | |
| | | Class A | |
| | | Six Months Ended March 31, 2010 | |
Per Share Operating Performance: | | | | |
Net Asset Value, Beginning Of Period | | $ | 10.53 | |
| | | | |
Income (loss) from investment operations: | | | | |
Net investment income | | | .11 | |
Net realized and unrealized gain (loss) on investment transactions | | | .74 | |
| | | | |
Total from investment operations | | | .85 | |
| | | | |
Less Dividends and Distributions: | | | | |
Dividends from net investment income | | | (.11 | ) |
Distributions from net realized gains | | | — | |
| | | | |
Total dividends and distributions | | | (.11 | ) |
| | | | |
Net asset value, end of period | | $ | 11.27 | |
| | | | |
Total Return(b): | | | 8.06 | % |
Ratios/Supplemental Data: | | | | |
Net assets, end of period (000) | | $ | 59,880 | |
Average net assets (000) | | $ | 56,044 | |
Ratios to average net assets(c): | | | | |
Expenses, including distribution and service (12b-1) fees(d) | | | .73 | %(f) |
Expenses, excluding distribution and service (12b-1) fees | | | .48 | %(f) |
Net investment income | | | 2.13 | %(f) |
For Class A, B, C, R and Z shares: | | | | |
Portfolio turnover rate | | | 10 | %(g) |
| (a) | Calculated based upon average shares outstanding during the period. |
| (b) | Total return does not consider the effects of sales loads. Total return is calculated assuming a purchase of a share on the first day and a sale on the last day of each period reported, and includes reinvestment of dividends and distributions. Total return includes the effect of expense subsidies. Total returns may reflect adjustments to conform to generally accepted accounting principles. Total returns for periods less than a full year are not annualized. |
| (c) | Does not include expenses of the investment companies in which the Fund invests. |
| (d) | The distributor of the Fund has contractually agreed to limit its distribution and service (12b-1) fees to .25% of the average daily net assets of the Class A shares. |
| (e) | Net of expense subsidy. If the investment manager had not subsidized expenses, the expense ratios including distribution and service (12b-1) fees would have been .80%, .87%, .79% and .88% for the years ended September 30, 2009, 2007, 2006 and 2005, respectively. The expense ratios excluding distribution and service (12b-1) fees would have been .55%, .62%, .54% and .63% for the years ended September 30, 2009, 2007, 2006, and 2005, respectively. The net investment income ratios would have been 1.83%, 1.25%, 1.06% and .95% for the years ended September 30, 2009, 2007, 2006 and 2005, respectively. |
See Notes to Financial Statements.
| | |
| 64 | | Visit our website at www.prudentialfunds.com |
| | | | | | | | | | | | | | | | | | |
| Class A | |
| Year Ended September 30, | |
| 2009 | | | 2008(a) | | | 2007 | | | 2006 | | | 2005 | |
| | | | | | | | | | | | | | | | | | |
| $ | 10.64 | | | $ | 13.44 | | | $ | 12.18 | | | $ | 11.34 | | | $ | 10.03 | |
| | | | | | | | | | | | | | | | | | | |
| | | | | | | | | | | | | | | | | | |
| | .17 | | | | .18 | | | | .18 | | | | .14 | | | | .13 | |
| | .19 | | | | (2.34 | ) | | | 1.45 | | | | .85 | | | | 1.34 | |
| | | | | | | | | | | | | | | | | | | |
| | .36 | | | | (2.16 | ) | | | 1.63 | | | | .99 | | | | 1.47 | |
| | | | | | | | | | | | | | | | | | | |
| | | | | | | | | | | | | | | | | | |
| | (.17 | ) | | | (.31 | ) | | | (.21 | ) | | | (.11 | ) | | | (.16 | ) |
| | (.30 | ) | | | (.33 | ) | | | (.16 | ) | | | (.04 | ) | | | — | |
| | | | | | | | | | | | | | | | | | | |
| | (.47 | ) | | | (.64 | ) | | | (.37 | ) | | | (.15 | ) | | | (.16 | ) |
| | | | | | | | | | | | | | | | | | | |
| $ | 10.53 | | | $ | 10.64 | | | $ | 13.44 | | | $ | 12.18 | | | $ | 11.34 | |
| | | | | | | | | | | | | | | | | | | |
| | 4.70 | % | | | (16.80 | )% | | | 13.60 | % | | | 8 .91 | % | | | 14.77 | % |
| | | | | | | | | | | | | | | | | | |
| $ | 53,471 | | | $ | 51,802 | | | $ | 46,978 | | | $ | 30,263 | | | $ | 19,532 | |
| $ | 43,547 | | | $ | 52,040 | | | $ | 37,930 | | | $ | 24,284 | | | $ | 14,172 | |
| | | | | | | | | | | | | | | | | | |
| | .75 | %(e) | | | .75 | % | | | .76 | %(e) | | | .76 | %(e) | | | .75 | %(e) |
| | .50 | %(e) | | | .50 | % | | | .51 | %(e) | | | .51 | %(e) | | | .50 | %(e) |
| | 1.88 | %(e) | | | 1.49 | % | | | 1.36 | %(e) | | | 1.09 | %(e) | | | 1.08 | %(e) |
| | | | | | | | | | | | | | | | | | |
| | 71 | % | | | 23 | % | | | 21 | % | | | 10 | % | | | 5 | % |
See Notes to Financial Statements.
| | |
| Prudential Investment Portfolios, Inc./Prudential Asset Allocation Funds | | 65 |
Prudential Moderate Allocation Fund
Financial Highlights
(Unaudited) continued
| | | | |
| | | Class B | |
| | | Six Months Ended March 31, 2010 | |
Per Share Operating Performance: | | | | |
Net Asset Value, Beginning Of Period | | $ | 10.46 | |
| | | | |
Income (loss) from investment operations: | | | | |
Net investment income | | | .07 | |
Net realized and unrealized gain (loss) on investment transactions | | | .72 | |
| | | | |
Total from investment operations | | | .79 | |
| | | | |
Less Dividends and Distributions: | | | | |
Dividends from net investment income | | | (.03 | ) |
Distributions from net realized gains | | | — | |
| | | | |
Total dividends and distributions | | | (.03 | ) |
| | | | |
Net asset value, end of period | | $ | 11.22 | |
| | | | |
Total Return(b): | | | 7.60 | % |
Ratios/Supplemental Data: | | | | |
Net assets, end of period (000) | | $ | 63,343 | |
Average net assets (000) | | $ | 56,917 | |
Ratios to average net assets(c): | | | | |
Expenses, including distribution and service (12b-1) fees | | | 1.48 | %(e) |
Expenses, excluding distribution and service (12b-1) fees | | | .48 | %(e) |
Net investment income | | | 1.37 | %(e) |
| (a) | Calculated based upon average shares outstanding during the period. |
| (b) | Total return does not consider the effects of sales loads. Total return is calculated assuming a purchase of a share on the first day and a sale on the last day of each period reported, and includes reinvestment of dividends and distributions. Total return includes the effect of expense subsidies. Total returns may reflect adjustments to conform to generally accepted accounting principles. Total returns for periods less than a full year are not annualized. |
| (c) | Does not include expenses of the investment companies in which the Fund invests. |
| (d) | Net of expense subsidy. If the investment manager had not subsidized expenses, the expense ratios including distribution and service (12b-1) fees would have been 1.55%, 1.62%, 1.54% and 1.63% for the years ended September 30, 2009, 2007, 2006 and 2005, respectively. The expense ratios excluding distribution and service (12b-1) fees would have been .55%, .62%, .54% and .63% for the years ended September 30, 2009, 2007, 2006 and 2005, respectively. The net investment income ratios would have been 1.02%, .53%, .32% and .20% for the years ended September 30, 2009, 2007, 2006 and 2005, respectively. |
See Notes to Financial Statements.
| | |
| 66 | | Visit our website at www.prudentialfunds.com |
| | | | | | | | | | | | | | | | | | |
| Class B | |
| Year Ended September 30, | |
| 2009 | | | 2008(a) | | | 2007 | | | 2006 | | | 2005 | |
| | | | | | | | | | | | | | | | | | |
| $ | 10.56 | | | $ | 13.36 | | | $ | 12.13 | | | $ | 11.34 | | | $ | 9.99 | |
| | | | | | | | | | | | | | | | | | | |
| | | | | | | | | | | | | | | | | | |
| | .10 | | | | .09 | | | | .09 | | | | .05 | | | | .04 | |
| | .19 | | | | (2.33 | ) | | | 1.43 | | | | .85 | | | | 1.35 | |
| | | | | | | | | | | | | | | | | | | |
| | .29 | | | | (2.24 | ) | | | 1.52 | | | | .90 | | | | 1.39 | |
| | | | | | | | | | | | | | | | | | | |
| | | | | | | | | | | | | | | | | | |
| | (.09 | ) | | | (.23 | ) | | | (.13 | ) | | | (.07 | ) | | | (.04 | ) |
| | (.30 | ) | | | (.33 | ) | | | (.16 | ) | | | (.04 | ) | | | — | |
| | | | | | | | | | | | | | | | | | | |
| | (.39 | ) | | | (.56 | ) | | | (.29 | ) | | | (.11 | ) | | | (.04 | ) |
| | | | | | | | | | | | | | | | | | | |
| $ | 10.46 | | | $ | 10.56 | | | $ | 13.36 | | | $ | 12.13 | | | $ | 11.34 | |
| | | | | | | | | | | | | | | | | | | |
| | 3.88 | % | | | (17.42 | )% | | | 12.69 | % | | | 8.17 | % | | | 13.95 | % |
| | | | | | | | | | | | | | | | | | |
| $ | 50,890 | | | $ | 40,355 | | | $ | 40,308 | | | $ | 31,077 | | | $ | 24,146 | |
| $ | 37,913 | | | $ | 41,167 | | | $ | 35,794 | | | $ | 27,760 | | | $ | 19,913 | |
| | | | | | | | | | | | | | | | | | |
| | 1.50 | %(d) | | | 1.50 | % | | | 1.51 | %(d) | | | 1.51 | %(d) | | | 1.50 | %(d) |
| | .50 | %(d) | | | .50 | % | | | .51 | %(d) | | | .51 | %(d) | | | .50 | %(d) |
| | 1.07 | %(d) | | | .77 | % | | | .64 | %(d) | | | .35 | %(d) | | | .33 | %(d) |
See Notes to Financial Statements.
| | |
| Prudential Investment Portfolios, Inc./Prudential Asset Allocation Funds | | 67 |
Prudential Moderate Allocation Fund
Financial Highlights
(Unaudited) continued
| | | | |
| | | Class C | |
| | | Six Months Ended March 31, 2010 | |
Per Share Operating Performance: | | | | |
Net Asset Value, Beginning Of Period | | $ | 10.46 | |
| | | | |
Income (loss) from investment operations: | | | | |
Net investment income | | | .07 | |
Net realized and unrealized gain (loss) on investment transactions | | | .72 | |
| | | | |
Total from investment operations | | | .79 | |
| | | | |
Less Dividends and Distributions: | | | | |
Dividends from net investment income | | | (.03 | ) |
Distributions from net realized gains | | | — | |
| | | | |
Total dividends and distributions | | | (.03 | ) |
| | | | |
Net asset value, end of period | | $ | 11.22 | |
| | | | |
Total Return(b): | | | 7.60 | % |
Ratios/Supplemental Data: | | | | |
Net assets, end of period (000) | | $ | 17,179 | |
Average net assets (000) | | $ | 15,881 | |
Ratios to average net assets(c): | | | | |
Expenses, including distribution and service (12b-1) fees | | | 1.48 | %(e) |
Expenses, excluding distribution and service (12b-1) fees | | | .48 | %(e) |
Net investment income | | | 1.38 | %(e) |
| (a) | Calculated based upon average shares outstanding during the period. |
| (b) | Total return does not consider the effects of sales loads. Total return is calculated assuming a purchase of a share on the first day and a sale on the last day of each period reported, and includes reinvestment of dividends and distributions. Total return includes the effect of expense subsidies. Total returns may reflect adjustments to conform to generally accepted accounting principles. Total returns for periods less than a full year are not annualized. |
| (c) | Does not include expenses of the investment companies in which the Fund invests. |
| (d) | Net of expense subsidy. If the investment manager had not subsidized expenses, the expense ratios including distribution and service (12b-1) fees would have been 1.55%, 1.62%, 1.54% and 1.63% for the years ended September 30, 2009, 2007, 2006 and 2005, respectively. The expense ratios excluding distribution and service (12b-1) fees would have been .55%, .62%, .54% and .63% for the years ended September 30, 2009, 2007, 2006 and 2005, respectively. The net investment income ratios would have been 1.13%, .50%, .30% and .21% for the years ended September 30, 2009, 2007, 2006 and 2005, respectively. |
See Notes to Financial Statements.
| | |
| 68 | | Visit our website at www.prudentialfunds.com |
| | | | | | | | | | | | | | | | | | |
| Class C | |
| Year Ended September 30, | |
| 2009 | | | 2008(a) | | | 2007 | | | 2006 | | | 2005 | |
| | | | | | | | | | | | | | | | | | |
| $ | 10.56 | | | $ | 13.35 | | | $ | 12.12 | | | $ | 11.34 | | | $ | 9.99 | |
| | | | | | | | | | | | | | | | | | | |
| | | | | | | | | | | | | | | | | | |
| | .10 | | | | .09 | | | | .09 | | | | .05 | | | | .04 | |
| | .19 | | | | (2.32 | ) | | | 1.43 | | | | .84 | | | | 1.35 | |
| | | | | | | | | | | | | | | | | | | |
| | .29 | | | | (2.23 | ) | | | 1.52 | | | | .89 | | | | 1.39 | |
| | | | | | | | | | | | | | | | | | | |
| | | | | | | | | | | | | | | | | | |
| | (.09 | ) | | | (.23 | ) | | | (.13 | ) | | | (.07 | ) | | | (.04 | ) |
| | (.30 | ) | | | (.33 | ) | | | (.16 | ) | | | (.04 | ) | | | — | |
| | | | | | | | | | | | | | | | | | | |
| | (.39 | ) | | | (.56 | ) | | | (.29 | ) | | | (.11 | ) | | | (.04 | ) |
| | | | | | | | | | | | | | | | | | | |
| $ | 10.46 | | | $ | 10.56 | | | $ | 13.35 | | | $ | 12.12 | | | $ | 11.34 | |
| | | | | | | | | | | | | | | | | | | |
| | 3.88 | % | | | (17.35 | )% | | | 12.70 | % | | | 7.80 | % | | | 14.05 | % |
| | | | | | | | | | | | | | | | | | |
| $ | 14,767 | | | $ | 15,024 | | | $ | 13,690 | | | $ | 8,509 | | | $ | 4,989 | |
| $ | 12,398 | | | $ | 15,886 | | | $ | 11,212 | | | $ | 6,768 | | | $ | 4,321 | |
| | | | | | | | | | | | | | | | | | |
| | 1.50 | %(d) | | | 1.50 | % | | | 1.51 | %(d) | | | 1.51 | %(d) | | | 1.50 | %(d) |
| | .50 | %(d) | | | .50 | % | | | .51 | %(d) | | | .51 | %(d) | | | .50 | %(d) |
| | 1.18 | %(d) | | | .74 | % | | | .61 | %(d) | | | .33 | %(d) | | | .35 | %(d) |
See Notes to Financial Statements.
| | |
| Prudential Investment Portfolios, Inc./Prudential Asset Allocation Funds | | 69 |
Prudential Moderate Allocation Fund
Financial Highlights
(Unaudited) continued
| | | | |
| | | Class R | |
| | | Six Months
Ended March 31, 2010 | |
Per Share Operating Performance: | | | | |
Net Asset Value, Beginning Of Period | | $ | 10.50 | |
| | | | |
Income (loss) from investment operations: | | | | |
Net investment income | | | .10 | |
Net realized and unrealized gain (loss) on investment transactions | | | .72 | |
| | | | |
Total from investment operations | | | .82 | |
| | | | |
Less Dividends and Distributions: | | | | |
Dividends from net investment income | | | (.08 | ) |
Distributions from net realized gains | | | — | |
| | | | |
Total dividends and distributions | | | (.08 | ) |
| | | | |
Net asset value, end of period | | $ | 11.24 | |
| | | | |
Total Return(c): | | | 7.86 | % |
Ratios/Supplemental Data: | | | | |
Net assets, end of period (000) | | $ | 2 | |
Average net assets (000) | | $ | 2 | |
Ratios to average net assets(d): | | | | |
Expenses, including distribution and service (12b-1) fees(e) | | | .98 | %(g) |
Expenses, excluding distribution and service (12b-1) fees | | | .48 | %(g) |
Net investment income | | | 1.92 | %(g) |
| (a) | Inception date of Class R shares. |
| (b) | Calculated based upon average shares outstanding during the period. |
| (c) | Total return is calculated assuming a purchase of a share on the first day and a sale on the last day of each period reported, and includes reinvestment of dividends and distributions. Total return includes the effect of expense subsidies. Total returns may reflect adjustments to conform to generally accepted accounting principles. Total returns for periods less than a full year are not annualized. |
| (d) | Does not include expenses of the investment companies in which the Fund invests. |
| (e) | The distributor of the Fund has contractually agreed to limit its distribution and service (12b-1) fees to .50% of the average daily net assets of the Class R shares. |
| (f) | Net of expense subsidy. If the investment manager had not subsidized expenses, the expense ratios including distribution and service (12b-1) fees would have been 1.05% for the year ended September 30, 2009 and 1.12% for the period ended September 30, 2007. The expense ratios excluding distribution and service (12b-1) fees would been .55% for the year ended September 30, 2009 and .62% for the period ended September 30, 2007. The net investment income ratios would have been 1.54% for the year ended September 30, 2009 and .67% for the period ended September 30, 2007. |
See Notes to Financial Statements.
| | |
| 70 | | Visit our website at www.prudentialfunds.com |
| | | | | | | | | | |
| Class R | |
| Year Ended September 30, | | | January 12, 2007(a) through September 30, 2007 | |
| 2009 | | | 2008(b) | | |
| | | | | | | | | | |
| $ | 10.63 | | | $ | 13.42 | | | $ | 12.45 | |
| | | | | | | | | | | |
| | | | | | | | | | |
| | .14 | | | | .17 | | | | .07 | |
| | .19 | | | | (2.35 | ) | | | .90 | |
| | | | | | | | | | | |
| | .33 | | | | (2.18 | ) | | | .97 | |
| | | | | | | | | | | |
| | | | | | | | | | |
| | (.16 | ) | | | (.28 | ) | | | — | |
| | (.30 | ) | | | (.33 | ) | | | — | |
| | | | | | | | | | | |
| | (.46 | ) | | | (.61 | ) | | | — | |
| | | | | | | | | | | |
| $ | 10.50 | | | $ | 10.63 | | | $ | 13.42 | |
| | | | | | | | | | | |
| | 4.43 | % | | | (16.93 | )% | | | 7.79 | % |
| | | | | | | | | | |
| $ | 2 | | | $ | 2 | | | $ | 3 | |
| $ | 2 | | | $ | 2 | | | $ | 3 | |
| | | | | | | | | | |
| | 1.00 | %(f) | | | 1.00 | % | | | 1.01 | %(f)(g) |
| | .50 | %(f) | | | .50 | % | | | .51 | %(f)(g) |
| | 1.59 | %(f) | | | 1.41 | % | | | .73 | %(f)(g) |
See Notes to Financial Statements.
| | |
| Prudential Investment Portfolios, Inc./Prudential Asset Allocation Funds | | 71 |
Prudential Moderate Allocation Fund
Financial Highlights
(Unaudited) continued
| | | | |
| | | Class Z | |
| | | Six Months Ended March 31, 2010 | |
Per Share Operating Performance: | | | | |
Net Asset Value, Beginning Of Period | | $ | 10.54 | |
| | | | |
Income (loss) from investment operations: | | | | |
Net investment income | | | .13 | |
Net realized and unrealized gain (loss) on investment transactions | | | .73 | |
| | | | |
Total from investment operations | | | .86 | |
| | | | |
Less Dividends and Distributions: | | | | |
Dividends from net investment income | | | (.13 | ) |
Distributions from net realized gains | | | — | |
| | | | |
Total dividends and distributions | | | (.13 | ) |
| | | | |
Net asset value, end of period | | $ | 11.27 | |
| | | | |
Total Return(b): | | | 8.19 | % |
Ratios/Supplemental Data: | | | | |
Net assets, end of period (000) | | $ | 1,976 | |
Average net assets (000) | | $ | 1,798 | |
Ratios to average net assets(c): | | | | |
Expenses, including distribution and service (12b-1) fees | | | .48 | %(e) |
Expenses, excluding distribution and service (12b-1) fees | | | .48 | %(e) |
Net investment income | | | 2.35 | %(e) |
| (a) | Calculated based upon average shares outstanding during the period. |
| (b) | Total return is calculated assuming a purchase of a share on the first day and a sale on the last day of each period reported, and includes reinvestment of dividends and distributions. Total return includes the effect of expense subsidies. Total returns may reflect adjustments to conform to generally accepted accounting principles. Total returns for periods less than a full year are not annualized. |
| (c) | Does not include expenses of the investment companies in which the Fund invests. |
| (d) | Net of expense subsidy. If the investment manager had not subsidized expenses, the expense ratios including distribution and service (12b-1) fees would have been .55%, .62%, .54% and .63% for the years ended September 30, 2009, 2007, 2006 and 2005, respectively. The expense ratios excluding distribution and service (12b-1) fees would have been .55%, .62%, .54% and .63% for the years ended September 30, 2009, 2007, 2006 and 2005, respectively. The net investment income ratios would have been 2.15%, 1.55%, 1.23% and 1.28% for the years ended September 30, 2009, 2007, 2006 and 2005, respectively. |
See Notes to Financial Statements.
| | |
| 72 | | Visit our website at www.prudentialfunds.com |
| | | | | | | | | | | | | | | | | | |
| Class Z | |
| Year Ended September 30, | |
| 2009 | | | 2008(a) | | | 2007 | | | 2006 | | | 2005 | |
| | | | | | | | | | | | | | | | | | |
| $ | 10.66 | | | $ | 13.46 | | | $ | 12.19 | | | $ | 11.36 | | | $ | 10.04 | |
| | | | | | | | | | | | | | | | | | | |
| | | | | | | | | | | | | | | | | | |
| | .22 | | | | .20 | | | | .20 | | | | .17 | | | | .18 | |
| | .16 | | | | (2.33 | ) | | | 1.46 | | | | .82 | | | | 1.33 | |
| | | | | | | | | | | | | | | | | | | |
| | .38 | | | | (2.13 | ) | | | 1.66 | | | | .99 | | | | 1.51 | |
| | | | | | | | | | | | | | | | | | | |
| | | | | | | | | | | | | | | | | | |
| | (.20 | ) | | | (.34 | ) | | | (.23 | ) | | | (.12 | ) | | | (.19 | ) |
| | (.30 | ) | | | (.33 | ) | | | (.16 | ) | | | (.04 | ) | | | — | |
| | | | | | | | | | | | | | | | | | | |
| | (.50 | ) | | | (.67 | ) | | | (.39 | ) | | | (.16 | ) | | | (.19 | ) |
| | | | | | | | | | | | | | | | | | | |
| $ | 10.54 | | | $ | 10.66 | | | $ | 13.46 | | | $ | 12.19 | | | $ | 11.36 | |
| | | | | | | | | | | | | | | | | | | |
| | 4.94 | % | | | (16.57 | )% | | | 13.86 | % | | | 8.83 | % | | | 15.18 | % |
| | | | | | | | | | | | | | | | | | |
| $ | 1,874 | | | $ | 2,290 | | | $ | 2,108 | | | $ | 1,580 | | | $ | 513 | |
| $ | 1,680 | | | $ | 2,675 | | | $ | 1,826 | | | $ | 1,268 | | | $ | 600 | |
| | | | | | | | | | | | | | | | | | |
| | .50 | %(d) | | | .50 | % | | | .51 | %(d) | | | .51 | %(d) | | | .50 | %(d) |
| | .50 | %(d) | | | .50 | % | | | .51 | %(d) | | | .51 | %(d) | | | .50 | %(d) |
| | 2.20 | %(d) | | | 1.62 | % | | | 1.66 | %(d) | | | 1.26 | %(d) | | | 1.43 | %(d) |
See Notes to Financial Statements.
| | |
| Prudential Investment Portfolios, Inc./Prudential Asset Allocation Funds | | 73 |
Prudential Growth Allocation Fund
Financial Highlights
(Unaudited)
| | | | |
| | | Class A | |
| | | Six Months Ended March 31, 2010 | |
Per Share Operating Performance: | | | | |
Net Asset Value, Beginning Of Period | | $ | 10.75 | |
| | | | |
Income (loss) from investment operations: | | | | |
Net investment income | | | .06 | |
Net realized and unrealized gain (loss) on investment transactions | | | .94 | |
| | | | |
Total from investment operations | | | 1.00 | |
| | | | |
Less Dividends and Distributions: | | | | |
Dividends from net investment income | | | (.10 | ) |
Distributions from net realized gains | | | — | |
| | | | |
Total dividends and distributions | | | (.10 | ) |
| | | | |
Net asset value, end of period | | $ | 11.65 | |
| | | | |
Total Return(b): | | | 9.35 | % |
Ratios/Supplemental Data: | | | | |
Net assets, end of period (000) | | $ | 30,666 | |
Average net assets (000) | | $ | 28,766 | |
Ratios to average net assets(c): | | | | |
Expenses, including distribution and service (12b-1) fees(d) | | | .75 | %(e) |
Expenses, excluding distribution and service (12b-1) fees | | | .50 | %(e) |
Net investment income (loss) | | | 1.31 | %(e) |
For Class A, B, C, R and Z shares: | | | | |
Portfolio turnover rate | | | 6 | %(f) |
| (a) | Calculated based upon average shares outstanding during the period. |
| (b) | Total return does not consider the effects of sales loads. Total return is calculated assuming a purchase of a share on the first day and a sale on the last day of each period reported, and includes reinvestment of dividends and distributions. Total returns may reflect adjustments to conform to generally accepted accounting principles. Total returns for periods less than one full year are not annualized. |
| (c) | Net of expense subsidy. If the investment manager had not subsidized expenses, the expense ratios including distribution and service (12b-1) fees would have been .97%, 1.13%, ..94%,1.23%, .96%, and 1.20% for the six months ended March 31, 2010 and the years ended September 30, 2009, 2008, 2007, 2006 and 2005, respectively. The expense ratios excluding distribution and service (12b-1) fees would have been .72%, ..88%, .69%, .98%, .71%, and .95%, for the six months ended March 31, 2010 and the years ended September 30, 2009, 2008, 2007, 2006 and 2005. The net investment income/(loss) ratios would have been 1.09%, .77%, .42%, (.25)%, (.27)%, and (.47)% for the six months ended March 31, 2010 and the years ended September 30, 2009, 2008, 2007, 2006 and 2005, respectively. Does not include expenses of the investment companies in which the Fund invests. |
| (d) | The distributor of the Fund contractually agreed to limit its distribution and service (12b-1) fees to .25 of the average daily net assets of the Class A shares. |
See Notes to Financial Statements.
| | |
| 74 | | Visit our website at www.prudentialfunds.com |
| | | | | | | | | | | | | | | | | | |
| Class A | |
| Year Ended September 30, | |
| 2009 | | | 2008(a) | | | 2007(a) | | | 2006 | | | 2005 | |
| | | | | | | | | | | | | | | | | | |
| $ | 11.04 | | | $ | 15.08 | | | $ | 13.15 | | | $ | 11.99 | | | $ | 10.01 | |
| | | | | | | | | | | | | | | | | | | |
| | | | | | | | | | | | | | | | | | |
| | .10 | | | | .08 | | | | .03 | | | | .01 | | | | .01 | |
| | (.15 | ) | | | (3.53 | ) | | | 2.18 | | | | 1.24 | | | | 2.00 | |
| | | | | | | | | | | | | | | | | | | |
| | (.05 | ) | | | (3.45 | ) | | | 2.21 | | | | 1.25 | | | | 2.01 | |
| | | | | | | | | | | | | | | | | | | |
| | | | | | | | | | | | | | | | | | |
| | — | | | | (.30 | ) | | | (.15 | ) | | | (.08 | ) | | | (.03 | ) |
| | (.24 | ) | | | (.29 | ) | | | (.13 | ) | | | (.01 | ) | | | — | |
| | | | | | | | | | | | | | | | | | | |
| | (.24 | ) | | | (.59 | ) | | | (.28 | ) | | | (.09 | ) | | | (.03 | ) |
| | | | | | | | | | | | | | | | | | | |
| $ | 10.75 | | | $ | 11.04 | | | $ | 15.08 | | | $ | 13.15 | | | $ | 11.99 | |
| | | | | | | | | | | | | | | | | | | |
| | .33 | % | | | (23.72 | )% | | | 17.01 | % | | | 10.61 | % | | | 20.02 | % |
| | | | | | | | | | | | | | | | | | |
| $ | 26,846 | | | $ | 26,501 | | | $ | 26,015 | | | $ | 13,666 | | | $ | 7,573 | |
| $ | 21,419 | | | $ | 28,816 | | | $ | 19,510 | | | $ | 10,479 | | | $ | 5,125 | |
| | | | | | | | | | | | | | | | | | |
| | .75 | % | | | .76 | % | | | .76 | % | | | .77 | % | | | .75 | % |
| | .50 | % | | | .51 | % | | | .51 | % | | | .52 | % | | | .50 | % |
| | 1.15 | % | | | .60 | % | | | .22 | % | | | (.08 | )% | | | (.20 | )% |
| | | | | | | | | | | | | | | | | | |
| | 46 | % | | | 22 | % | | | 16 | % | | | 8 | % | | | 6 | % |
See Notes to Financial Statements.
| | |
| Prudential Investment Portfolios, Inc./Prudential Asset Allocation Funds | | 75 |
Prudential Growth Allocation Fund
Financial Highlights
(Unaudited) continued
| | | | |
| | | Class B | |
| | | Six Months Ended March 31, 2010 | |
Per Share Operating Performance: | | | | |
Net Asset Value, Beginning Of Period | | $ | 10.54 | |
| | | | |
Income (loss) from investment operations: | | | | |
Net investment income (loss) | | | .03 | |
Net realized and unrealized gain (loss) on investment transactions | | | .91 | |
| | | | |
Total from investment operations | | | .94 | |
| | | | |
Less Dividends and Distributions: | | | | |
Dividends from net investment income | | | (.03 | ) |
Distributions from net realized gains | | | — | |
| | | | |
Total dividends and distributions | | | (.03 | ) |
| | | | |
Net asset value, end of period | | $ | 11.45 | |
| | | | |
Total Return(b): | | | 8.95 | % |
Ratios/Supplemental Data: | | | | |
Net assets, end of period (000) | | $ | 34,289 | |
Average net assets (000) | | $ | 31,762 | |
Ratios to average net assets(c): | | | | |
Expenses, including distribution and service (12b-1) fees | | | 1.50 | %(d) |
Expenses, excluding distribution and service (12b-1) fees | | | .50 | %(d) |
Net investment income (loss) | | | .54 | %(d) |
| (a) | Calculated based upon average shares outstanding during the period. |
| (b) | Total return does not consider the effects of sales loads. Total return is calculated assuming a purchase of a share on the first day and a sale on the last day of each period reported, and includes reinvestment of dividends and distributions. Total returns may reflect adjustments to conform to generally accepted accounting principles. Total returns for periods less than one full year are not annualized. |
| (c) | Net of expense subsidy. If the investment manager had not subsidized expenses, the expense ratios including distribution and service (12b-1) fees would have been 1.72%, 1.88%, 1.69%,1.98%, 1.71%, and 1.95% for the six months ended March 31, 2010 and the years ended September 30, 2009, 2008, 2007, 2006 and 2005, respectively. The expense ratios excluding distribution and service (12b-1) fees would have been .72%, ..88%, .69%, .98%, .71%, and .95%, for the six months ended March 31, 2010 and the years ended September 30, 2009, 2008, 2007, 2006 and 2005. The net investment income/(loss) ratios would have been .32%, .00%, (.31)%, (.95)%, (.99)%, and (1.25)% for the six months ended March 31, 2010 and the years ended September 30, 2009, 2008, 2007, 2006 and 2005, respectively. Does not include expenses of the investment companies in which the Fund invests. |
See Notes to Financial Statements.
| | |
| 76 | | Visit our website at www.prudentialfunds.com |
| | | | | | | | | | | | | | | | | | |
| Class B | |
| Year Ended September 30, | |
| 2009 | | | 2008(a) | | | 2007(a) | | | 2006 | | | 2005 | |
| | | | | | | | | | | | | | | | | | |
| $ | 10.92 | | | $ | 14.93 | | | $ | 13.05 | | | $ | 11.90 | | | $ | 9.98 | |
| | | | | | | | | | | | | | | | | | | |
| | | | | | | | | | | | | | | | | | |
| | .03 | | | | (.02 | ) | | | (.07 | ) | | | (.08 | ) | | | (.07 | ) |
| | (.17 | ) | | | (3.49 | ) | | | 2.15 | | | | 1.24 | | | | 1.99 | |
| | | | | | | | | | | | | | | | | | | |
| | (.14 | ) | | | (3.51 | ) | | | 2.08 | | | | 1.16 | | | | 1.92 | |
| | | | | | | | | | | | | | | | | | | |
| | | | | | | | | | | | | | | | | | |
| | — | | | | (.21 | ) | | | (.07 | ) | | | — | | | | — | |
| | (.24 | ) | | | (.29 | ) | | | (.13 | ) | | | (.01 | ) | | | — | |
| | | | | | | | | | | | | | | | | | | |
| | (.24 | ) | | | (.50 | ) | | | (.20 | ) | | | (.01 | ) | | | — | |
| | | | | | | | | | | | | | | | | | | |
| $ | 10.54 | | | $ | 10.92 | | | $ | 14.93 | | | $ | 13.05 | | | $ | 11.90 | |
| | | | | | | | | | | | | | | | | | | |
| | (.51 | )% | | | (24.26 | )% | | | 16.09 | % | | | 9.95 | % | | | 19.04 | % |
| | | | | | | | | | | | | | | | | | |
| $ | 29,371 | | | $ | 28,335 | | | $ | 29,171 | | | $ | 19,062 | | | $ | 13,552 | |
| $ | 23,273 | | | $ | 31,100 | | | $ | 23,884 | | | $ | 16,203 | | | $ | 10,343 | |
| | | | | | | | | | | | | | | | | | |
| | 1.50 | % | | | 1.51 | % | | | 1.51 | % | | | 1.52 | % | | | 1.50 | % |
| | .50 | % | | | .51 | % | | | .51 | % | | | .52 | % | | | .50 | % |
| | .38 | % | | | (.13 | )% | | | (.48 | )% | | | (.80 | )% | | | (.80 | )% |
See Notes to Financial Statements.
| | |
| Prudential Investment Portfolios, Inc./Prudential Asset Allocation Funds | | 77 |
Prudential Growth Allocation Fund
Financial Highlights
(Unaudited) continued
| | | | |
| | | Class C | |
| | | Six Months Ended March 31, 2010 | |
Per Share Operating Performance: | | | | |
Net Asset Value, Beginning Of Period | | $ | 10.55 | |
| | | | |
Income (loss) from investment operations: | | | | |
Net investment income (loss) | | | .03 | |
Net realized and unrealized gain (loss) on investment transactions | | | .91 | |
| | | | |
Total from investment operations | | | .94 | |
| | | | |
Less Dividends and Distributions: | | | | |
Dividends from net investment income | | | (.03 | ) |
Distributions from net realized gains | | | — | |
| | | | |
Total dividends and distributions | | | (.03 | ) |
| | | | |
Net asset value, end of period | | $ | 11.46 | |
| | | | |
Total Return(b): | | | 8.94 | % |
Ratios/Supplemental Data: | | | | |
Net assets, end of period (000) | | $ | 8,818 | |
Average net assets (000) | | $ | 8,271 | |
Ratios to average net assets(c): | | | | |
Expenses, including distribution and service (12b-1) fees | | | 1.50 | %(d) |
Expenses, excluding distribution and service (12b-1) fees | | | .50 | %(d) |
Net investment income (loss) | | | .55 | %(d) |
| (a) | Calculated based upon average shares outstanding during the period. |
| (b) | Total return does not consider the effects of sales loads. Total return is calculated assuming a purchase of a share on the first day and a sale on the last day of each period reported, and includes reinvestment of dividends and distributions. Total returns may reflect adjustments to conform to generally accepted accounting principles. Total returns for periods less than one full year are not annualized. |
| (c) | Net of expense subsidy. If the investment manager had not subsidized expenses, the expense ratios including distribution and service (12b-1) fees would have been 1.72%, 1.88%, 1.69%,1.98%, 1.71%, and 1.95% for the six months ended March 31, 2010 and the years ended September 30, 2009, 2008, 2007, 2006 and 2005, respectively. The expense ratios excluding distribution and service (12b-1) fees would have been .72%, ..88%, .69%, .98%, .71%, and .95%, for the six months ended March 31, 2010 and the years ended September 30, 2009, 2008, 2007, 2006 and 2005. The net investment income/(loss) ratios would have been .33%, .06%, (.29)%, (.96)%, (1.02)%, and (1.22)% for the six months ended March 31, 2010 and the years ended September 30, 2009, 2008, 2007, 2006 and 2005, respectively. Does not include expenses of the investment companies in which the Fund invests. |
See Notes to Financial Statements.
| | |
| 78 | | Visit our website at www.prudentialfunds.com |
| | | | | | | | | | | | | | | | | | |
| Class C | |
| Year Ended September 30, | |
| 2009 | | | 2008(a) | | | 2007(a) | | | 2006 | | | 2005 | |
| | | | | | | | | | | | | | | | | | |
| $ | 10.93 | | | $ | 14.92 | | | $ | 13.04 | | | $ | 11.91 | | | $ | 9.98 | |
| | | | | | | | | | | | | | | | | | | |
| | | | | | | | | | | | | | | | | | |
| | .04 | | | | (.02 | ) | | | (.07 | ) | | | (.07 | ) | | | (.07 | ) |
| | (.18 | ) | | | (3.47 | ) | | | 2.15 | | | | 1.21 | | | | 2.00 | |
| | | | | | | | | | | | | | | | | | | |
| | (.14 | ) | | | (3.49 | ) | | | 2.08 | | | | 1.14 | | | | 1.93 | |
| | | | | | | | | | | | | | | | | | | |
| | | | | | | | | | | | | | | | | | |
| | — | | | | (.21 | ) | | | (.07 | ) | | | — | | | | — | |
| | (.24 | ) | | | (.29 | ) | | | (.13 | ) | | | (.01 | ) | | | — | |
| | | | | | | | | | | | | | | | | | | |
| | (.24 | ) | | | (.50 | ) | | | (.20 | ) | | | (.01 | ) | | | — | |
| | | | | | | | | | | | | | | | | | | |
| $ | 10.55 | | | $ | 10.93 | | | $ | 14.92 | | | $ | 13.04 | | | $ | 11.91 | |
| | | | | | | | | | | | | | | | | | | |
| | (.51 | )% | | | (24.13 | )% | | | 16.10 | % | | | 9.68 | % | | | 19.24 | % |
| | | | | | | | | | | | | | | | | | |
| $ | 7,806 | | | $ | 8,135 | | | $ | 8,843 | | | $ | 5,411 | | | $ | 2,746 | |
| $ | 6,366 | | | $ | 9,082 | | | $ | 7,282 | | | $ | 3,860 | | | $ | 2,268 | |
| | | | | | | | | | | | | | | | | | |
| | 1.50 | % | | | 1.51 | % | | | 1.51 | % | | | 1.52 | % | | | 1.50 | % |
| | .50 | % | | | .51 | % | | | .51 | % | | | .52 | % | | | .50 | % |
| | .44 | % | | | (.11 | )% | | | (.49 | )% | | | (.83 | )% | | | (.74 | )% |
See Notes to Financial Statements.
| | |
| Prudential Investment Portfolios, Inc./Prudential Asset Allocation Funds | | 79 |
Prudential Growth Allocation Fund
Financial Highlights
(Unaudited) continued
| | | | |
| | | Class R | |
| | | Six Months
Ended March 31, 2010 | |
Per Share Operating Performance: | | | | |
Net Asset Value, Beginning Of Period | | $ | 10.72 | |
| | | | |
Income (loss) from investment operations: | | | | |
Net investment income (loss) | | | .05 | |
Net realized and unrealized gain (loss) on investment transactions | | | .92 | |
| | | | |
Total from investment operations | | | .97 | |
| | | | |
Less Dividends and Distributions: | | | | |
Dividends from net investment income | | | (.07 | ) |
Distributions from net realized gains | | | — | |
| | | | |
Total dividends and distributions | | | (.07 | ) |
| | | | |
Net asset value, end of period | | $ | 11.62 | |
| | | | |
Total Return(b): | | | 9.11 | % |
Ratios/Supplemental Data: | | | | |
Net assets, end of period (000) | | $ | 2 | |
Average net assets (000) | | $ | 2 | |
Ratios to average net assets(d): | | | | |
Expenses, including distribution and service (12b-1) fees(e) | | | 1.00 | %(f) |
Expenses, excluding distribution and service (12b-1) fees | | | .50 | %(f) |
Net investment income (loss) | | | .98 | %(f) |
| (a) | Inception date of Class R shares. |
| (b) | Calculations based upon average shares outstanding during the period. |
| (c) | Total return is calculated assuming a purchase of a share on the first day and a sale on the last day of each period reported, and includes reinvestment of dividends and distributions. Total returns may reflect adjustments to conform to generally accepted accounting principles. Total returns for periods less than one full year are not annualized. |
| (d) | Net of expense subsidy. If the investment manager had not subsidized expenses, the expense ratios including distribution and service (12b-1) fees would have been 1.22%, 1.38%, 1.19%, and 1.48%, for the six months ended March 31, 2010 and the years ended September 30, 2009, 2008 and the period ended September 30, 2007 respectively. The expense ratios excluding distribution and service (12b-1) fees would have been .72%, .88%, .69%, and .98%, for the six months ended March 31, 2010 and the years ended September 30, 2009, 2008, and the period ended September 30, 2007 respectively. The net investment income/(loss) ratios would have been .76%, ..52%, .31%, and (1.01)% for the six months ended March 31, 2010 and the years ended September 30, 2009, 2008, and the period ended September 2007, respectively. Does not include expenses of the investment companies in which the Fund invests. |
| (e) | The distributor of the Fund has contractually agreed to limit its distribution and service (12b-1) fee to .50 of the average daily net assets of the Class R shares. |
See Notes to Financial Statements.
| | |
| 80 | | Visit our website at www.prudentialfunds.com |
| | | | | | | | | | |
| Class R | |
| Year Ended September 30, | | | January 12, 2007(a)(b)
through
September 30, 2007 | |
| 2009 | | | 2008(b) | | |
| | | | | | | | | | |
| $ | 11.04 | | | $ | 15.04 | | | $ | 13.76 | |
| | | | | | | | | | | |
| | | | | | | | | | |
| | .08 | | | | .07 | | | | (.06 | ) |
| | (.16 | ) | | | (3.54 | ) | | | 1.34 | |
| | | | | | | | | | | |
| | (.08 | ) | | | (3.47 | ) | | | 1.28 | |
| | | | | | | | | | | |
| | | | | | | | | | |
| | — | | | | (.24 | ) | | | — | |
| | (.24 | ) | | | (.29 | ) | | | — | |
| | | | | | | | | | | |
| | (.24 | ) | | | (.53 | ) | | | — | |
| | | | | | | | | | | |
| $ | 10.72 | | | $ | 11.04 | | | $ | 15.04 | |
| | | | | | | | | | | |
| | .05 | % | | | (23.84 | )% | | | 9.30 | % |
| | | | | | | | | | |
| $ | 2 | | | $ | 2 | | | $ | 3 | |
| $ | 2 | | | $ | 2 | | | $ | 3 | |
| | | | | | | | | | |
| | 1.00 | % | | | 1.01 | % | | | 1.01 | %(f) |
| | .50 | % | | | .51 | % | | | .51 | %(f) |
| | .90 | % | | | .49 | % | | | (.59 | )%(f) |
See Notes to Financial Statements.
| | |
| Prudential Investment Portfolios, Inc./Prudential Asset Allocation Funds | | 81 |
Prudential Growth Allocation Fund
Financial Highlights
(Unaudited) continued
| | | | |
| | | Class Z | |
| | | Six Months Ended March 31, 2010 | |
Per Share Operating Performance: | | | | |
Net Asset Value, Beginning Of Period | | $ | 10.81 | |
| | | | |
Income (loss) from investment operations: | | | | |
Net investment income | | | .15 | |
Net realized and unrealized gain (loss) on investment transactions | | | .86 | |
| | | | |
Total from investment operations | | | 1.01 | |
| | | | |
Less Dividends and Distributions: | | | | |
Dividends from net investment income | | | (.12 | ) |
Distributions from net realized gains | | | — | |
| | | | |
Total dividends and distributions | | | (.12 | ) |
| | | | |
Net asset value, end of period | | $ | 11.70 | |
| | | | |
Total Return(b): | | | 9.42 | % |
Ratios/Supplemental Data: | | | | |
Net assets, end of period (000) | | $ | 356 | |
Average net assets (000) | | $ | 387 | |
Ratios to average net assets(c): | | | | |
Expenses, including distribution and service (12b-1) fees | | | .50 | %(d) |
Expenses, excluding distribution and service (12b-1) fees | | | .50 | %(d) |
Net investment income | | | 1.82 | %(d) |
| (a) | Calculated based upon average shares outstanding during the period. |
| (b) | Total return is calculated assuming a purchase of a share on the first day and a sale on the last day of each period reported, and includes reinvestment of dividends and distributions. Total returns may reflect adjustments to conform to generally accepted accounting principles. Total returns for periods less than one full year are not annualized. |
| (c) | Net of expense subsidy. If the investment manager had not subsidized expenses, the expense ratios including distribution and service (12b-1) fees would have been .72%, .88%, ..69%,.98%, .71%, and .95% for the six months ended March 31, 2010 and the years ended September 30, 2009, 2008, 2007, 2006 and 2005, respectively. The expense ratios excluding distribution and service (12b-1) fees would have been .72%, ..88%, .69%, .98%, .71%, and .95%, for the six months ended March 31, 2010 and the years ended September 30, 2009, 2008, 2007, 2006 and 2005. The net investment income/(loss) ratios would have been 1.60%, 1.03%, .70%, .19%, (.12)%, and (.19)% for the six months ended March 31, 2010 and the years ended September 30, 2009, 2008, 2007, 2006 and 2005, respectively. Does not include expenses of the investment companies in which the Fund invests. |
See Notes to Financial Statements.
| | |
| 82 | | Visit our website at www.prudentialfunds.com |
| | | | | | | | | | | | | | | | | | |
| Class Z | |
| Year Ended September 30, | |
| 2009 | | | 2008(a) | | | 2007(a) | | | 2006 | | | 2005 | |
| | | | | | | | | | | | | | | | | | |
| $ | 11.08 | | | $ | 15.11 | | | $ | 13.18 | | | $ | 12.02 | | | $ | 10.03 | |
| | | | | | | | | | | | | | | | | | | |
| | | | | | | | | | | | | | | | | | |
| | .12 | | | | .12 | | | | .10 | | | | .02 | | | | .04 | |
| | (.15 | ) | | | (3.53 | ) | | | 2.14 | | | | 1.27 | | | | 2.00 | |
| | | | | | | | | | | | | | | | | | | |
| | (.03 | ) | | | (3.41 | ) | | | 2.24 | | | | 1.29 | | | | 2.04 | |
| | | | | | | | | | | | | | | | | | | |
| | | | | | | | | | | | | | | | | | |
| | — | | | | (.33 | ) | | | (.18 | ) | | | (.12 | ) | | | (.05 | ) |
| | (.24 | ) | | | (.29 | ) | | | (.13 | ) | | | (.01 | ) | | | — | |
| | | | | | | | | | | | | | | | | | | |
| | (.24 | ) | | | (.62 | ) | | | (.31 | ) | | | (.13 | ) | | | (.05 | ) |
| | | | | | | | | | | | | | | | | | | |
| $ | 10.81 | | | $ | 11.08 | | | $ | 15.11 | | | $ | 13.18 | | | $ | 12.02 | |
| | | | | | | | | | | | | | | | | | | |
| | .51 | % | | | (23.44 | )% | | | 17.23 | % | | | 10.77 | % | | | 20.40 | % |
| | | | | | | | | | | | | | | | | | |
| $ | 428 | | | $ | 438 | | | $ | 420 | | | $ | 560 | | | $ | 443 | |
| $ | 333 | | | $ | 426 | | | $ | 500 | | | $ | 662 | | | $ | 329 | |
| | | | | | | | | | | | | | | | | | |
| | .50 | % | | | .51 | % | | | .51 | % | | | .52 | % | | | .50 | % |
| | .50 | % | | | .51 | % | | | .51 | % | | | .52 | % | | | .50 | % |
| | 1.41 | % | | | .88 | % | | | .67 | % | | | .07 | % | | | .28 | % |
See Notes to Financial Statements.
| | |
| Prudential Investment Portfolios, Inc./Prudential Asset Allocation Funds | | 83 |
Results of Proxy Voting
(Unaudited)
At a special meeting of shareholders held on March 9, 2010, Fund shareholders approved a proposal to elect Directors.
The individuals listed in the table below were elected as directors of each Fund.* All directors, with the exception of Mr. Benjamin, served as directors to each Fund prior to the shareholder meeting.
| | | | |
Trustee | | For | | Withheld |
Kevin J. Bannon | | 123,240,410.836 | | 1,700,825.331 |
| | |
Linda W. Bynoe | | 123,157,644.037 | | 1,783,592.130 |
| | |
Michael S. Hyland | | 123,201,323.318 | | 1,739,912.849 |
| | |
Douglas H. McCorkindale | | 123,074,984.328 | | 1,866,251.839 |
| | |
Stephen P. Munn | | 123,216,742.859 | | 1,724,493.308 |
| | |
Richard A. Redeker | | 123,225,795.108 | | 1,715,441.059 |
| | |
Robin B. Smith | | 123,040,042.169 | | 1,901,193.998 |
| | |
Stephen G. Stoneburn | | 123,252,589.748 | | 1,688,646.419 |
| | |
Judy A. Rice | | 123,218,596.264 | | 1,722,639.903 |
| | |
Scott E. Benjamin | | 123,212,247.295 | | 1,728,988.872 |
| * | Results are for all funds within the same investment company. |
| | |
| 84 | | Visit our website at www.prudentialfunds.com |
| | | | |
| n MAIL | | n TELEPHONE | | n WEBSITE |
Gateway Center Three 100 Mulberry Street Newark, NJ 07102 | | (800) 225-1852 | | www.prudentialfunds.com |
|
| PROXY VOTING |
| The Board of Directors of the Funds has delegated to each Fund’s investment subadviser the responsibility for voting any proxies and maintaining proxy recordkeeping with respect to the Fund. A description of these proxy voting policies and procedures is available without charge, upon request, by calling (800) 225-1852 or by visiting the Securities and Exchange Commission’s website at www.sec.gov. Information regarding how the Funds voted proxies relating to portfolio securities during the most recent 12-month period ended June 30 is available on the Funds’ website and on the Commission’s website. |
|
| DIRECTORS |
| Kevin J. Bannon • Scott E. Benjamin • Linda W. Bynoe • Michael S. Hyland • Douglas H. McCorkindale • Stephen P. Munn • Richard A. Redeker • Judy A. Rice • Robin B. Smith • Stephen G. Stoneburn |
|
| OFFICERS |
| Judy A. Rice, President • Scott E. Benjamin, Vice President • Grace C. Torres, Treasurer and Principal Financial and Accounting Officer • Kathryn L. Quirk, Chief Legal Officer • Deborah A. Docs, Secretary • Timothy J. Knierim, Chief Compliance Officer • Valerie M. Simpson, Deputy Chief Compliance Officer • Theresa C. Thompson, Deputy Chief Compliance Officer • Noreen M. Fierro, Anti-Money Laundering Compliance Officer • Jonathan D. Shain, Assistant Secretary • Claudia DiGiacomo, Assistant Secretary • John P. Schwartz, Assistant Secretary • Andrew R. French, Assistant Secretary • M. Sadiq Peshimam, Assistant Treasurer • Peter Parrella, Assistant Treasurer |
| | | | |
| MANAGER | | Prudential Investments LLC | | Gateway Center Three
100 Mulberry Street Newark, NJ 07102 |
|
| INVESTMENT SUBADVISER | | Quantitative Management
Associates LLC | | Gateway Center Two
100 Mulberry Street Newark, NJ 07102 |
|
| DISTRIBUTOR | | Prudential Investment
Management Services LLC | | Gateway Center Three
100 Mulberry Street
Newark, NJ 07102 |
|
| CUSTODIAN | | The Bank of New York Mellon | | One Wall Street
New York, NY 10286 |
|
| TRANSFER AGENT | | Prudential Mutual Fund
Services LLC | | PO Box 9658
Providence, RI 02940 |
|
INDEPENDENT REGISTERED
PUBLIC ACCOUNTING FIRM | | KPMG LLP | | 345 Park Avenue
New York, NY 10154 |
|
| FUND COUNSEL | | Sullivan & Cromwell LLP | | 125 Broad Street
New York, NY 10004 |
|
| An investor should consider the investment objectives, risks, charges, and expenses of each of the Prudential Asset Allocation Funds carefully before investing. The prospectus for the Prudential Asset Allocation Funds contains this and other information about the Prudential Asset Allocation Funds. An investor may obtain a prospectus by visiting our website at www.prudentialfunds.com or by calling (800) 225-1852. The prospectus should be read carefully before investing. |
|
| E-DELIVERY |
| To receive your mutual fund documents online, go to www.prudentialfunds.com/edelivery and enroll. Instead of receiving printed documents by mail, you will receive notification via e-mail when new materials are available. You can cancel your enrollment or change your e-mail address at any time by visiting the website address above. |
|
| SHAREHOLDER COMMUNICATIONS WITH DIRECTORS |
| Shareholders can communicate directly with the Board of Directors by writing to the Chair of the Board, Prudential Asset Allocation Funds, Prudential Investments, Attn: Board of Directors, 100 Mulberry Street, Gateway Center Three, Newark, NJ 07102. Shareholders can communicate directly with an individual Director by writing to the same address. Communications are not screened before being delivered to the addressee. |
|
| AVAILABILITY OF PORTFOLIO SCHEDULE |
| Each Fund files its complete schedule of portfolio holdings with the Securities and Exchange Commission for the first and third quarters of each fiscal year on Form N-Q under the Prudential Investment Portfolios, Inc. name. Each Fund’s Forms N-Q are available on the Commission’s website at www.sec.gov. Each Fund’s Forms N-Q may also be reviewed and copied at the Commission’s Public Reference Room in Washington, D.C. Information on the operation and location of the Public Reference Room may be obtained by calling (202) 551-8090. Each Fund’s schedule of portfolio holdings is also available on the Fund’s website as of the end of each fiscal quarter. |
Mutual Funds:
| | | | |
ARE NOT INSURED BY THE FDIC OR ANY
FEDERAL GOVERNMENT AGENCY | | MAY LOSE VALUE | | ARE NOT A DEPOSIT OF OR GUARANTEED
BY ANY BANK OR ANY BANK AFFILIATE |

| | | | | | | | | | | | | | | | | | | | | | | | |
| | | Prudential Asset Allocation Funds | | |
| | | | | Class A | | | | Class B | | | | Class C | | | | Class R | | | | Class Z | | | | |
| | | | NASDAQ | | CUSIP | | NASDAQ | | CUSIP | | NASDAQ | | CUSIP | | NASDAQ | | CUSIP | | NASDAQ | | CUSIP | | |
| | Conservative Allocation | | JDUAX | | 74437E750 | | JDABX | | 74437E743 | | JDACX | | 74437E735 | | JDARX | | 74437E628 | | JDAZX | | 74437E784 | | |
| | Moderate Allocation | | JDTAX | | 74437E727 | | JDMBX | | 74437E719 | | JDMCX | | 74437E693 | | JMARX | | 74437E610 | | JDMZX | | 74437E776 | | |
| | Growth Allocation | | JDAAX | | 74437E685 | | JDGBX | | 74437E677 | | JDGCX | | 74437E669 | | JGARX | | 74437E594 | | JDGZX | | 74437E768 | | |
| | | | | | | | | | | | | | | | | | | | | | | | |
MF194E2 0179438-00001-00
Item 2 – Code of Ethics – Not required, as this is not an annual filing.
Item 3 – Audit Committee Financial Expert – Not required, as this is not an annual filing.
Item 4 – Principal Accountant Fees and Services – Not required, as this is not an annual filing.
Item 5 – Audit Committee of Listed Registrants – Not applicable.
Item 6 – Schedule of Investments – The schedule is included as part of the report to shareholders filed under Item 1 of this Form.
Item 7 – Disclosure of Proxy Voting Policies and Procedures for Closed-End Management Investment Companies – Not applicable.
Item 8 – Portfolio Managers of Closed-End Management Investment Companies – Not applicable.
Item 9 – Purchases of Equity Securities by Closed-End Management Investment Company and Affiliated Purchasers – Not applicable.
Item 10 – Submission of Matters to a Vote of Security Holders – Not applicable.
Item 11 – Controls and Procedures
| | (a) | It is the conclusion of the registrant’s principal executive officer and principal financial officer that the effectiveness of the registrant’s current disclosure controls and procedures (such disclosure controls and procedures having been evaluated within 90 days of the date of this filing) provide reasonable assurance that the information required to be disclosed by the registrant has been recorded, processed, summarized and reported within the time period specified in the Commission’s rules and forms and that the information required to be disclosed by the registrant has been accumulated and communicated to the registrant’s principal executive officer and principal financial officer in order to allow timely decisions regarding required disclosure. |
| | (b) | There has been no significant change in the registrant’s internal control over financial reporting that occurred during the registrant’s most recent fiscal quarter of the period covered by this report that has materially affected, or is likely to materially affect, the registrant’s internal control over financial reporting. |
Item 12 – Exhibits
| | (a) | (1) Code of Ethics – Not required, as this is not an annual filing. |
| | (2) | Certifications pursuant to Section 302 of the Sarbanes-Oxley Act – Attached hereto as Exhibit EX-99.CERT. |
| | (3) | Any written solicitation to purchase securities under Rule 23c-1. – Not applicable. |
| | (b) | Certifications pursuant to Section 906 of the Sarbanes-Oxley Act – Attached hereto as Exhibit EX-99.906CERT. |
SIGNATURES
Pursuant to the requirements of the Securities Exchange Act of 1934 and the Investment Company Act of 1940, the registrant has duly caused this report to be signed on its behalf by the undersigned, thereunto duly authorized.
(Registrant): The Prudential Investment Portfolios, Inc.
| | |
| By: | | /S/ DEBORAH A. DOCS |
| | Deborah A. Docs |
| | Secretary |
Date: May 25, 2010
Pursuant to the requirements of the Securities Exchange Act of 1934 and the Investment Company Act of 1940, this report has been signed below by the following persons on behalf of the registrant and in the capacities and on the dates indicated.
| | |
By: | | /S/ JUDY A. RICE |
| | Judy A. Rice |
| | President and Principal Executive Officer |
Date: May 25, 2010
| | |
By: | | /S/ GRACE C. TORRES |
| | Grace C. Torres |
| | Treasurer and Principal Financial Officer |
Date: May 25, 2010