UNITED STATES
SECURITIES AND EXCHANGE COMMISSION
Washington, D.C. 20549
FORM N-CSR
CERTIFIED SHAREHOLDER REPORT OF REGISTERED
MANAGEMENT INVESTMENT COMPANIES
| | |
| Investment Company Act file number: | | 811-07343 |
| |
| Exact name of registrant as specified in charter: | | The Prudential Investment Portfolios, Inc. |
| |
| Address of principal executive offices: | | Gateway Center 3, |
| | 100 Mulberry Street, |
| | Newark, New Jersey 07102 |
| |
| Name and address of agent for service: | | Deborah A. Docs |
| | Gateway Center 3, |
| | 100 Mulberry Street, |
| | Newark, New Jersey 07102 |
| |
| Registrant’s telephone number, including area code: | | 800-225-1852 |
| |
| Date of fiscal year end: | | 9/30/2012 |
| |
| Date of reporting period: | | 3/31/2012 |
Item 1 – Reports to Stockholders

PRUDENTIAL INVESTMENTS»MUTUAL FUNDS
PRUDENTIAL ASSET ALLOCATION FUND
SEMIANNUAL REPORT · MARCH 31, 2012
Fund Type
Balanced/allocation
Objective
Income and long-term growth of capital
This report is not authorized for distribution to prospective investors unless preceded or accompanied by a current prospectus.
The views expressed in this report and information about the Fund’s portfolio holdings are for the period covered by this report and are subject to change thereafter.
The accompanying financial statements as of March 31, 2012, were not audited and, accordingly, no auditor’s opinion is expressed on them.
Prudential Investments, Prudential, the Prudential logo, the Rock symbol, and Bring Your Challenges are service marks of Prudential Financial, Inc. and its related entities, registered in many jurisdictions worldwide.

May 15, 2012
Dear Shareholder:
After an extraordinary career at Prudential, Judy Rice retired at the end of 2011 as President of Prudential Investments and President and Director of the Prudential Asset Allocation Fund (the Fund). While she will remain as Chairman of Prudential Investments until the end of 2012, I was named to succeed her as President of Prudential Investments and President and Director of the Fund effective January 1, 2012. I previously served as Executive Vice President of Retail Mutual Fund Distribution for Prudential Investments for the past six years.
Since this is my first letter to shareholders, I would like to recognize Judy for the significant contributions she made in building the Prudential Investments fund family and her unflagging commitment to helping investors like you meet the challenges of a rapidly changing investment environment. My goal is to build on Judy’s accomplishments, with a particular focus on delivering the solutions you need to address your financial goals.
I hope you find the semiannual report for the Fund informative. We recognize that ongoing market volatility may make it a difficult time to be an investor. We continue to believe a prudent response to uncertainty is to maintain a diversified portfolio, including stock and bond mutual funds consistent with your tolerance for risk, time horizon, and financial goals.
Your financial professional can help you create a diversified investment plan that reflects your personal investor profile and risk tolerance. Keep in mind that diversification and asset allocation strategies do not assure a profit or protect against loss in declining markets. We encourage you to call your financial professional before making any investment decision.
Prudential Investments provides a wide range of mutual funds to choose from that can help you make progress toward your financial goals. Our funds offer the experience, resources, and professional discipline of Prudential Financial’s affiliated asset managers. Thank you for choosing the Prudential Investments family of mutual funds.
Sincerely,

Stuart S. Parker, President
Prudential Asset Allocation Fund
| | | | |
| Prudential Asset Allocation Fund | | | 1 | |
Your Fund’s Performance (Unaudited)
Performance data quoted represent past performance. Past performance does not guarantee future results. The investment return and principal value of an investment will fluctuate, so that an investor’s shares, when redeemed, may be worth more or less than their original cost. Current performance may be lower or higher than the past performance data quoted. An investor may obtain performance data as of the most recent month-end by visiting our website at www.prudentialfunds.com or by calling (800) 225-1852. Class A and Class L shares have a maximum initial sales charge of 5.50% and 5.75%, respectively. Gross operating expenses: Class A, 1.37%; Class B, 2.07%; Class C, 2.07%; Class L, 1.57%; Class M, 2.07%; Class R, 1.82%; Class X, 2.07%; Class Z, 1.07%. Net operating expenses: Class A, 1.35%; Class B, 2.05%; Class C, 2.05%; Class L, 1.55%; Class M, 2.05%; Class R, 1.55%; Class X, 2.05%; Class Z, 1.05%, after contractual reduction of management fees and/or distribution fees for Class R shares.
| | | | | | | | | | | | | | | | | | |
Cumulative Total Returns (Without Sales Charge) as of 3/31/12 |
| | | Six Months | | | One Year | | | Five Years | | | Ten Years | | | Since Inception |
Class A | | | 16.45 | % | | | 6.74 | % | | | 11.69 | % | | | 60.25 | % | | — |
Class B | | | 16.08 | | | | 6.05 | | | | 7.81 | | | | 49.13 | | | — |
Class C | | | 16.08 | | | | 6.05 | | | | 7.73 | | | | 49.14 | | | — |
Class L | | | 16.26 | | | | 6.50 | | | | 10.48 | | | | N/A | | | 9.69% (3/26/07) |
Class M | | | 16.15 | | | | 6.21 | | | | 7.90 | | | | N/A | | | 7.13 (3/26/07) |
Class R | | | 16.32 | | | | 6.52 | | | | 10.15 | | | | N/A | | | 30.81 (12/17/04) |
Class X | | | 15.99 | | | | 5.97 | | | | 7.73 | | | | N/A | | | 6.89 (3/26/07) |
Class Z | | | 16.61 | | | | 7.02 | | | | 13.25 | | | | 64.40 | | | — |
Customized Blend Index | | | 15.32 | | | | 7.42 | | | | 21.25 | | | | 68.93 | | | — |
Barclays Capital U.S. Aggregate Bond Index | | | 1.43 | | | | 7.71 | | | | 35.39 | | | | 75.72 | | | — |
S&P 500 Index | | | 25.86 | | | | 8.51 | | | | 10.48 | | | | 49.69 | | | — |
Lipper Mixed-Asset Target Allocation Growth Funds Average | | | 17.06 | | | | 3.19 | | | | 11.15 | | | | 58.25 | | | — |
| | |
| 2 | | Visit our website at www.prudentialfunds.com |
| | | | | | | | | | | | | | |
Average Annual Total Returns (With Sales Charge) as of 3/31/12 |
| | | One Year | | | Five Years | | | Ten Years | | | Since Inception |
Class A | | | 0.87 | % | | | 1.09 | % | | | 4.24 | % | | — |
Class B | | | 1.05 | | | | 1.34 | | | | 4.08 | | | — |
Class C | | | 5.05 | | | | 1.50 | | | | 4.08 | | | — |
Class L | | | 0.38 | | | | 0.81 | | | | N/A | | | 0.67% (3/26/07) |
Class M | | | 0.21 | | | | 1.18 | | | | N/A | | | 1.03 (3/26/07) |
Class R | | | 6.52 | | | | 1.95 | | | | N/A | | | 3.75 (12/17/04) |
Class X | | | –0.03 | | | | 0.97 | | | | N/A | | | 0.99 (3/26/07) |
Class Z | | | 7.02 | | | | 2.52 | | | | 5.10 | | | — |
Customized Blend Index | | | 7.42 | | | | 3.93 | | | | 5.38 | | | — |
Barclays Capital U.S. Aggregate Bond Index | | | 7.71 | | | | 6.25 | | | | 5.80 | | | — |
S&P 500 Index | | | 8.51 | | | | 2.01 | | | | 4.12 | | | — |
Lipper Mixed-Asset Target Allocation Growth Funds Average | | | 3.19 | | | | 2.08 | | | | 4.64 | | | — |
Source: Prudential Investments LLC and Lipper Inc. Performance figures may reflect fee waivers and/or expense reimbursements. In the absence of such fee waivers and/or expense reimbursements, total returns would be lower.
Inception returns are provided for any share class with less than 10 calendar years of returns.
The average annual total returns take into account applicable sales charges. Class A and Class L shares are subject to a maximum front-end sales charge of 5.50% and 5.75%, respectively, and an annual 12b-1 fee of 0.30% and 0.50%, respectively. Investors who purchase Class A and Class L shares in an amount of $1 million or more do not pay a front-end sales charge, but are subject to a contingent deferred sales charge (CDSC) of 1% for shares sold within 12 months of purchase. The Class A CDSC is waived for purchases by certain retirement or benefit plans. Under certain circumstances, an exchange may be made from specified share classes of the Fund to one or more other share classes of the Fund. Class B shares do not pay a front-end sales charge, but are subject to a declining CDSC of 5%, 4%, 3%, 2%, 1%, and 1%, respectively, for the first six years after purchase and a 12b-1 fee of 1% annually. Approximately seven years after purchase, Class B shares will automatically convert to Class A shares on a quarterly basis. Class C shares are subject to a CDSC of 1% on sales made within 12 months of the date of purchase and an annual 12b-1 fee of 1%. Class L shares and Class X shares are closed to new investors. Class R shares are not subject to sales charges, but charge a 12b-1 fee of up to 0.75%. Class X shares are subject to a CDSC of 6% and an annual 12b-1 fee of 1%. Class X shares automatically convert to Class A shares on a monthly basis approximately 10 years (eight years in the case of shares purchased prior to August 19, 1998) after purchase. Class Z shares are not subject to sales charges or 12b-1 fees. The returns in the tables reflect the share class expense structure in effect at the close of the fiscal period. The returns in the tables do not reflect the deduction of taxes that a shareholder would pay on Fund distributions or following the redemption of Fund shares.
Note: Class M shares are no longer issued and no Class M shares are outstanding. Class M shares performance is shown for historical periods during which time Class M shares were outstanding.
| | | | |
| Prudential Asset Allocation Fund | | | 3 | |
Your Fund’s Performance (continued)
Benchmark Definitions
Customized Blend Index
The Customized Blend Index is made up of the S&P 500 Index (50%), the Barclays Capital U.S. Aggregate Bond Index (40%), the Russell 2000 Index (5%), and the Morgan Stanley Capital International Europe, Australasia and Far East Net Dividend (MSCI EAFE ND) Index (5%). Customized Blend Index Closest Month-End to Inception cumulative total returns are 43.27% for Class R; and 21.25% for Class L, Class M, and Class X. Customized Blend Index Closest Month-End to Inception average annual total returns are 5.08% for Class R; and 3.93% for Class L, Class M, and Class X.
Barclays Capital U.S. Aggregate Bond Index
The Barclays Capital U.S. Aggregate Bond Index is an unmanaged index of investment-grade securities issued by the U.S. government and its agencies and by corporations with between one and 10 years remaining to maturity on the securities. It gives a broad look at how short- and intermediate-term bonds have performed. Barclays Capital U.S. Aggregate Bond Index Closest Month-End to Inception cumulative total returns are 46.86% for Class R; and 35.39% for Class L, Class M, and Class X. Barclays Capital U.S. Aggregate Bond Index Closest Month-End to Inception average annual total returns are 5.44% for Class R; and 6.25% for Class L, Class M, and Class X.
S&P 500 Index
The S&P 500 Index is an unmanaged index of 500 stocks of large U.S. public companies. It gives a broad look at how U.S. stock prices have performed. S&P 500 Index Closest Month-End to Inception cumulative total returns are 35.05% for Class R; and 10.48% for Class L, Class M, and Class X. S&P 500 Index Closest Month-End to Inception average annual total returns are 4.23% for Class R; and 2.01% for Class L, Class M, and Class X.
Lipper Mixed-Asset Target Allocation Growth Funds Average
The Lipper Mixed-Asset Target Allocation Growth Funds Average (Lipper Average) represents returns based on the average return of all funds in the Lipper Mixed-Asset Target Allocation Growth Funds category for the periods noted. Funds in the Lipper Average are funds whose primary objective is to conserve principal by maintaining at all times a balanced portfolio of both stocks and bonds. Typically, the stock:bond ratio ranges around 60%:40%. Lipper Average Closest Month-End to Inception cumulative total returns are 34.51% for Class R; and 11.15% for Class L, Class M, and Class X. Lipper Average Closest Month-End to Inception average annual total returns are 4.13% for Class R; and 2.08% for Class L, Class M, and Class X.
Investors cannot invest directly in an index or average. The returns for the Indexes would be lower if they included the effects of sales charges, operating expenses of a mutual fund, or taxes. Returns for the Lipper Average reflect the deduction of operating expenses, but not sales charges or taxes.
| | | | |
Five Largest Equity Holdings expressed as a percentage of net assets as of 3/31/12 | | | | |
Apple, Inc., Computers & Peripherals | | | 2.6 | % |
Exxon Mobil Corp., Oil, Gas & Consumable Fuels | | | 1.8 | |
Chevron Corp., Oil, Gas & Consumable Fuels | | | 1.2 | |
International Business Machines Corp., IT Services | | | 1.0 | |
Wells Fargo & Co., Commercial Banks | | | 1.0 | |
Holdings reflect only long-term equity investments and are subject to change.
| | |
| 4 | | Visit our website at www.prudentialfunds.com |
| | | | |
Five Largest Equity Industries expressed as a percentage of net assets as of 3/31/12 | | | | |
Oil, Gas & Consumable Fuels | | | 5.9 | % |
Pharmaceuticals | | | 3.4 | |
Computers & Peripherals | | | 3.4 | |
Commercial Banks | | | 2.7 | |
Software | | | 2.4 | |
Industry weightings reflect only long-term equity investments and are subject to change.
| | | | |
| Prudential Asset Allocation Fund | | | 5 | |
Fees and Expenses (Unaudited)
As a shareholder of the Fund, you incur two types of costs: (1) transaction costs, including sales charges (loads) on purchase payments and redemptions, as applicable, and (2) ongoing costs, including management fees, distribution and/or service (12b-1) fees, and other Fund expenses, as applicable. This example is intended to help you understand your ongoing costs (in dollars) of investing in the Fund and to compare these costs with the ongoing costs of investing in other mutual funds.
The example is based on an investment of $1,000 invested on October 1, 2011, at the beginning of the period, and held through the six-month period ended March 31, 2012. The example is for illustrative purposes only; you should consult the Prospectus for information on initial and subsequent minimum investment requirements.
The Fund’s transfer agent may charge additional fees to holders of certain accounts that are not included in the expenses shown in the table on the following page. These fees apply to individual retirement accounts (IRAs) and Section 403(b) accounts. As of the close of the six-month period covered by the table, IRA fees included an annual maintenance fee of $15 per account (subject to a maximum annual maintenance fee of $25 for all accounts held by the same shareholder). Section 403(b) accounts are charged an annual $25 fiduciary maintenance fee. Some of the fees may vary in amount, or may be waived, based on your total account balance or the number of Prudential Investments funds, including the Fund, that you own. You should consider the additional fees that were charged to your Fund account over the six-month period when you estimate the total ongoing expenses paid over the period and the impact of these fees on your ending account value, as these additional expenses are not reflected in the information provided in the expense table. Additional fees have the effect of reducing investment returns.
Actual Expenses
The first line for each share class in the table on the following page provides information about actual account values and actual expenses. You may use the information on this line, together with the amount you invested, to estimate the expenses that you paid over the period. Simply divide your account value by $1,000 (for example, an $8,600 account value ÷ $1,000 = 8.6), then multiply the result by the number on the first line under the heading “Expenses Paid During the Six-Month Period” to estimate the expenses you paid on your account during this period.
Hypothetical Example for Comparison Purposes
The second line for each share class in the table on the following page provides information about hypothetical account values and hypothetical expenses based on the Fund’s actual expense ratio and an assumed rate of return of 5% per year before
| | |
| 6 | | Visit our website at www.prudentialfunds.com |
expenses, which is not the Fund’s actual return. The hypothetical account values and expenses may not be used to estimate the actual ending account balance or expenses you paid for the period. You may use this information to compare the ongoing costs of investing in the Fund and other funds. To do so, compare this 5% hypothetical example with the 5% hypothetical examples that appear in the shareholder reports of the other funds.
Please note that the expenses shown in the table are meant to highlight your ongoing costs only and do not reflect any transactional costs such as sales charges (loads). Therefore, the second line for each share class in the table is useful in comparing ongoing costs only and will not help you determine the relative total costs of owning different funds. In addition, if these transactional costs were included, your costs would have been higher.
| | | | | | | | | | | | | | | | | | |
Prudential Asset
Allocation Fund | | Beginning Account
Value
October 1, 2011 | | | Ending Account
Value March 31, 2012 | | | Annualized
Expense Ratio
Based on the
Six-Month Period | | | Expenses Paid
During the
Six-Month Period* | |
| | | | | | | | | | | | | | | | | | |
| Class A | | Actual | | $ | 1,000.00 | | | $ | 1,164.50 | | | | 1.35 | % | | $ | 7.31 | |
| | | Hypothetical | | $ | 1,000.00 | | | $ | 1,018.25 | | | | 1.35 | % | | $ | 6.81 | |
| | | | | | | | | | | | | | | | | | |
| Class B | | Actual | | $ | 1,000.00 | | | $ | 1,160.80 | | | | 2.05 | % | | $ | 11.07 | |
| | | Hypothetical | | $ | 1,000.00 | | | $ | 1,014.75 | | | | 2.05 | % | | $ | 10.33 | |
| | | | | | | | | | | | | | | | | | |
| Class C | | Actual | | $ | 1,000.00 | | | $ | 1,160.80 | | | | 2.05 | % | | $ | 11.07 | |
| | | Hypothetical | | $ | 1,000.00 | | | $ | 1,014.75 | | | | 2.05 | % | | $ | 10.33 | |
| | | | | | | | | | | | | | | | | | |
| Class L | | Actual | | $ | 1,000.00 | | | $ | 1,162.60 | | | | 1.55 | % | | $ | 8.38 | |
| | | Hypothetical | | $ | 1,000.00 | | | $ | 1,017.25 | | | | 1.55 | % | | $ | 7.82 | |
| | | | | | | | | | | | | | | | | | |
| Class M | | Actual | | $ | 1,000.00 | | | $ | 1,161.50 | | | | 2.05 | % | | $ | 11.08 | |
| | | Hypothetical | | $ | 1,000.00 | | | $ | 1,014.75 | | | | 2.05 | % | | $ | 10.33 | |
| | | | | | | | | | | | | | | | | | |
| Class R | | Actual | | $ | 1,000.00 | | | $ | 1,163.20 | | | | 1.55 | % | | $ | 8.38 | |
| | | Hypothetical | | $ | 1,000.00 | | | $ | 1,017.25 | | | | 1.55 | % | | $ | 7.82 | |
| | | | | | | | | | | | | | | | | | |
| Class X | | Actual | | $ | 1,000.00 | | | $ | 1,159.90 | | | | 2.05 | % | | $ | 11.07 | |
| | | Hypothetical | | $ | 1,000.00 | | | $ | 1,014.75 | | | | 2.05 | % | | $ | 10.33 | |
| | | | | | | | | | | | | | | | | | |
| Class Z | | Actual | | $ | 1,000.00 | | | $ | 1,166.10 | | | | 1.05 | % | | $ | 5.69 | |
| | | Hypothetical | | $ | 1,000.00 | | | $ | 1,019.75 | | | | 1.05 | % | | $ | 5.30 | |
| | | | | | | | | | | | | | | | | | |
* Fund expenses (net of fee waivers or subsidies, if any) for each share class are equal to the annualized expense ratio for each share class (provided in the table), multiplied by the average account value over the period, multiplied by the 183 days in the
| | | | |
| Prudential Asset Allocation Fund | | | 7 | |
Fees and Expenses (continued)
six-month period ended March 31, 2012, and divided by the 366 days in the Fund’s fiscal year ending September 30, 2012 (to reflect the six-month period). Expenses presented in the table include the expenses of any underlying portfolios in which the Fund may invest.
| | |
| 8 | | Visit our website at www.prudentialfunds.com |
Portfolio of Investments
as of March 31, 2012 (Unaudited)
| | | | | | |
| Shares | | Description | | Value (Note 1) | |
| | | | | | |
LONG-TERM INVESTMENTS 95.8% | |
COMMON STOCKS 61.7% | |
|
Aerospace & Defense 1.2% | |
| 2,300 | | Alliant Techsystems, Inc. | | $ | 115,276 | |
| 4,856 | | BAE Systems PLC (United Kingdom) | | | 23,294 | |
| 1,537 | | Cobham PLC (United Kingdom) | | | 5,632 | |
| 1,300 | | Cubic Corp. | | | 61,464 | |
| 2,200 | | Curtiss-Wright Corp. | | | 81,422 | |
| 30 | | Elbit Systems Ltd. (Israel) | | | 1,164 | |
| 577 | | European Aeronautic Defence and Space Co. NV (France) | | | 23,629 | |
| 561 | | Finmeccanica SpA (Italy) | | | 3,038 | |
| 14,100 | | General Dynamics Corp. | | | 1,034,658 | |
| 1,543 | | Heico Corp. | | | 79,603 | |
| 8,800 | | L-3 Communications Holdings, Inc. | | | 622,776 | |
| 1,600 | | LMI Aerospace, Inc.* | | | 29,120 | |
| 1,104 | | Meggitt PLC (United Kingdom) | | | 7,132 | |
| 10,000 | | Northrop Grumman Corp. | | | 610,800 | |
| 2,700 | | Rolls-Royce Holdings PLC (United Kingdom) | | | 35,067 | |
| 237 | | Safran SA (France) | | | 8,710 | |
| 2,000 | | Singapore Technologies Engineering Ltd. (Singapore) | | | 5,171 | |
| 1,800 | | Teledyne Technologies, Inc.* | | | 113,490 | |
| 146 | | Thales SA (France) | | | 5,464 | |
| 900 | | TransDigm Group, Inc.* | | | 104,184 | |
| 11,700 | | United Technologies Corp. | | | 970,398 | |
| | | | | | |
| | | | | 3,941,492 | |
|
Air Freight & Logistics 0.4% | |
| 1,231 | | Deutsche Post AG (Germany) | | | 23,699 | |
| 2,700 | | FedEx Corp. | | | 248,292 | |
| 1,100 | | Forward Air Corp. | | | 40,337 | |
| 539 | | TNT Express NV (Netherlands) | | | 6,657 | |
| 947 | | Toll Holdings Ltd. (Australia) | | | 5,758 | |
| 14,200 | | United Parcel Service, Inc. (Class B Stock) | | | 1,146,224 | |
| 600 | | Yamato Holdings Co. Ltd. (Japan) | | | 9,272 | |
| | | | | | |
| | | | | 1,480,239 | |
|
Airlines 0.1% | |
| 3,600 | | Alaska Air Group, Inc.* | | | 128,952 | |
| 1,300 | | All Nippon Airways Co. Ltd. (Japan) | | | 3,927 | |
| 2,000 | | Cathay Pacific Airways Ltd. (Hong Kong) | | | 3,703 | |
| 314 | | Deutsche Lufthansa AG (Germany) | | | 4,395 | |
| 4,200 | | Hawaiian Holdings, Inc.* | | | 21,966 | |
See Notes to Financial Statements.
| | | | |
| Prudential Asset Allocation Fund | | | 9 | |
Portfolio of Investments
as of March 31, 2012 (Unaudited) continued
| | | | | | |
| Shares | | Description | | Value (Note 1) | |
| | | | | | |
COMMON STOCKS (Continued) | |
|
Airlines (cont’d.) | |
| 1,400 | | International Consolidated Airlines Group SA (United Kingdom)* | | $ | 4,031 | |
| 1,762 | | Qantas Airways Ltd. (Australia)* | | | 3,258 | |
| 1,000 | | Singapore Airlines Ltd. (Singapore) | | | 8,568 | |
| | | | | | |
| | | | | 178,800 | |
|
Auto Components 0.1% | |
| 250 | | Aisin Seiki Co. Ltd. (Japan) | | | 8,777 | |
| 900 | | Bridgestone Corp. (Japan) | | | 21,812 | |
| 259 | | Cie Generale des Etablissements Michelin (France) | | | 19,285 | |
| 116 | | Continental AG (Germany)* | | | 10,949 | |
| 700 | | Denso Corp. (Japan) | | | 23,384 | |
| 100 | | Dorman Products, Inc.* | | | 5,060 | |
| 200 | | Drew Industries, Inc.* | | | 5,462 | |
| 9,000 | | Federal-Mogul Corp.* | | | 154,890 | |
| 2,173 | | GKN PLC (United Kingdom) | | | 7,164 | |
| 100 | | Koito Manufacturing Co. Ltd. (Japan) | | | 1,618 | |
| 1,400 | | Lear Corp. | | | 65,086 | |
| 700 | | Modine Manufacturing Co.* | | | 6,181 | |
| 300 | | NHK Spring Co. Ltd. (Japan) | | | 3,226 | |
| 100 | | NOK Corp. (Japan) | | | 2,175 | |
| 149 | | Nokian Renkaat OYJ (Finland) | | | 7,261 | |
| 333 | | Pirelli & C. SpA (Italy) | | | 3,962 | |
| 200 | | Stanley Electric Co. Ltd. (Japan) | | | 3,178 | |
| 300 | | Sumitomo Rubber Industries Ltd. (Japan) | | | 3,983 | |
| 400 | | Superior Industries International, Inc. | | | 7,816 | |
| 700 | | Tower International, Inc.* | | | 8,526 | |
| 100 | | Toyoda Gosei Co. Ltd. (Japan) | | | 1,946 | |
| 250 | | Toyota Industries Corp. (Japan) | | | 7,539 | |
| | | | | | |
| | | | | 379,280 | |
|
Automobiles 0.5% | |
| 479 | | Bayerische Motoren Werke AG (Germany) | | | 43,077 | |
| 300 | | Daihatsu Motor Co. Ltd. (Japan) | | | 5,495 | |
| 1,290 | | Daimler AG (Germany) | | | 77,783 | |
| 1,073 | | Fiat SpA (Italy) | | | 6,308 | |
| 65,000 | | Ford Motor Co.(a) | | | 811,850 | |
| 1,000 | | Fuji Heavy Industries Ltd. (Japan) | | | 8,034 | |
| 2,300 | | Honda Motor Co. Ltd. (Japan) | | | 87,393 | |
| 2,000 | | Isuzu Motors Ltd. (Japan) | | | 11,719 | |
| 2,000 | | Mazda Motor Corp. (Japan)* | | | 3,504 | |
See Notes to Financial Statements.
| | |
| 10 | | Visit our website at www.prudentialfunds.com |
| | | | | | |
| Shares | | Description | | Value (Note 1) | |
| | | | | | |
COMMON STOCKS (Continued) | |
|
Automobiles (cont’d.) | |
| 6,000 | | Mitsubishi Motors Corp. (Japan)* | | $ | 6,814 | |
| 3,600 | | Nissan Motor Co. Ltd. (Japan) | | | 38,318 | |
| 330 | | Peugeot SA (France) | | | 5,315 | |
| 295 | | Renault SA (France) | | | 15,551 | |
| 500 | | Suzuki Motor Corp. (Japan) | | | 11,943 | |
| 10,900 | | Thor Industries, Inc. | | | 344,004 | |
| 3,900 | | Toyota Motor Corp. (Japan) | | | 168,213 | |
| 47 | | Volkswagen AG (Germany) | | | 7,579 | |
| 400 | | Yamaha Motor Co. Ltd. (Japan) | | | 5,359 | |
| | | | | | |
| | | | | 1,658,259 | |
|
Beverages 1.2% | |
| 1,159 | | Anheuser-Busch InBev NV (Belgium) | | | 84,677 | |
| 600 | | Asahi Group Holdings Ltd. (Japan) | | | 13,287 | |
| 160 | | Carlsberg A/S (Denmark) (Class B Stock) | | | 13,220 | |
| 816 | | Coca-Cola Amatil Ltd. (Australia) | | | 10,540 | |
| 1,000 | | Coca-Cola Bottling Co. Consolidated | | | 62,740 | |
| 21,320 | | Coca-Cola Co. (The) | | | 1,577,893 | |
| 8,900 | | Coca-Cola Enterprises, Inc. | | | 254,540 | |
| 254 | | Coca-Cola Hellenic Bottling Co. SA (Greece) | | | 4,861 | |
| 100 | | Coca-Cola West Co. Ltd. (Japan) | | | 1,753 | |
| 3,620 | | Diageo PLC (United Kingdom) | | | 86,997 | |
| 5,000 | | Dr Pepper Snapple Group, Inc. | | | 201,050 | |
| 162 | | Heineken Holding NV (Netherlands) | | | 7,584 | |
| 373 | | Heineken NV (Netherlands) | | | 20,732 | |
| 1,000 | | Kirin Holdings Co. Ltd. (Japan) | | | 12,940 | |
| 1,000 | | MGP Ingredients, Inc. | | | 5,380 | |
| 17,600 | | Molson Coors Brewing Co. (Class B Stock) | | | 796,400 | |
| 2,400 | | National Beverage Corp.* | | | 38,496 | |
| 9,600 | | PepsiCo, Inc. | | | 636,960 | |
| 286 | | Pernod-Ricard SA (France) | | | 29,905 | |
| 1,326 | | SABMiller PLC (United Kingdom) | | | 53,225 | |
| | | | | | |
| | | | | 3,913,180 | |
|
Biotechnology 1.2% | |
| 1,700 | | Acorda Therapeutics, Inc.* | | | 45,135 | |
| 164 | | Actelion Ltd. (Switzerland) | | | 5,995 | |
| 900 | | Alexion Pharmaceuticals, Inc.* | | | 83,574 | |
| 2,400 | | Alnylam Pharmaceuticals, Inc.* | | | 26,568 | |
| 13,900 | | Amgen, Inc. | | | 945,061 | |
See Notes to Financial Statements.
| | | | |
| Prudential Asset Allocation Fund | | | 11 | |
Portfolio of Investments
as of March 31, 2012 (Unaudited) continued
| | | | | | |
| Shares | | Description | | Value (Note 1) | |
| | | | | | |
COMMON STOCKS (Continued) | |
|
Biotechnology (cont’d.) | |
| 8,400 | | Biogen Idec, Inc.* | | $ | 1,058,148 | |
| 15,000 | | Celgene Corp.* | | | 1,162,800 | |
| 756 | | CSL Ltd. (Australia) | | | 28,106 | |
| 1,100 | | Cubist Pharmaceuticals, Inc.* | | | 47,575 | |
| 202 | | Grifols SA (Spain)* | | | 4,310 | |
| 1,800 | | Halozyme Therapeutics, Inc.* | | | 22,968 | |
| 2,700 | | InterMune, Inc.* | | | 39,609 | |
| 400 | | Ligand Pharmaceuticals, Inc. (Class B Stock)* | | | 6,380 | |
| 400 | | Medivation, Inc.* | | | 29,888 | |
| 2,200 | | Myriad Genetics, Inc.* | | | 52,052 | |
| 1,600 | | Onyx Pharmaceuticals, Inc.* | | | 60,288 | |
| 21,700 | | Opko Health, Inc.* | | | 102,641 | |
| 4,700 | | PDL BioPharma, Inc. | | | 29,845 | |
| 1,200 | | Pharmacyclics, Inc.* | | | 33,312 | |
| 2,000 | | Progenics Pharmaceuticals, Inc.* | | | 19,800 | |
| 3,900 | | SciClone Pharmaceuticals, Inc.* | | | 24,609 | |
| 2,100 | | Targacept, Inc.* | | | 10,752 | |
| 2,200 | | Theravance, Inc.* | | | 42,900 | |
| 300 | | Trius Therapeutics, Inc.* | | | 1,605 | |
| 2,100 | | United Therapeutics Corp.* | | | 98,973 | |
| 500 | | Vanda Pharmaceuticals, Inc.* | | | 2,395 | |
| | | | | | |
| | | | | 3,985,289 | |
|
Building Products 0.1% | |
| 700 | | A.O. Smith Corp. | | | 31,465 | |
| 1,000 | | Asahi Glass Co. Ltd. (Japan) | | | 8,481 | |
| 456 | | Assa Abloy AB (Sweden) (Class B Stock) | | | 14,323 | |
| 564 | | Cie de Saint-Gobain (France) | | | 25,188 | |
| 300 | | Daikin Industries Ltd. (Japan) | | | 8,166 | |
| 58 | | Geberit AG (Switzerland) | | | 12,137 | |
| 4,100 | | Gibraltar Industries, Inc.* | | | 62,115 | |
| 400 | | JS Group Corp. (Japan) | | | 8,375 | |
| 1,800 | | NCI Building Systems, Inc.* | | | 20,718 | |
| 1,000 | | Nippon Sheet Glass Co. Ltd. (Japan) | | | 1,534 | |
| 500 | | Toto Ltd. (Japan) | | | 3,764 | |
| | | | | | |
| | | | | 196,266 | |
|
Capital Markets 1.5% | |
| 1,300 | | 3i Group PLC (United Kingdom) | | | 4,450 | |
| 58,100 | | Bank of New York Mellon Corp. (The) | | | 1,401,953 | |
See Notes to Financial Statements.
| | |
| 12 | | Visit our website at www.prudentialfunds.com |
| | | | | | |
| Shares | | Description | | Value (Note 1) | |
| | | | | | |
COMMON STOCKS (Continued) | |
|
Capital Markets (cont’d.) | |
| 500 | | Calamos Asset Management, Inc. (Class A Stock) | | $ | 6,555 | |
| 1,661 | | Credit Suisse Group AG (Switzerland) | | | 47,344 | |
| 2,000 | | Daiwa Securities Group, Inc. (Japan) | | | 7,901 | |
| 1,324 | | Deutsche Bank AG (Germany) | | | 65,874 | |
| 333 | | GAM Holding AG (Switzerland) | | | 4,851 | |
| 800 | | GAMCO Investors, Inc. (Class A Stock) | | | 39,688 | |
| 8,015 | | Goldman Sachs Group, Inc. (The) | | | 996,826 | |
| 300 | | Golub Capital BDC, Inc. | | | 4,581 | |
| 890 | | ICAP PLC (United Kingdom) | | | 5,592 | |
| 800 | | INTL FCStone, Inc.* | | | 16,880 | |
| 630 | | Investec PLC (United Kingdom) | | | 3,852 | |
| 306 | | Julius Baer Group Ltd. (Switzerland) | | | 12,353 | |
| 5,900 | | Knight Capital Group, Inc. (Class A Stock)* | | | 75,933 | |
| 494 | | Macquarie Group Ltd. (Australia) | | | 14,881 | |
| 2,620 | | Man Group PLC (United Kingdom) | | | 5,649 | |
| 2,000 | | MCG Capital Corp. | | | 8,500 | |
| 725 | | Mediobanca SpA (Italy) | | | 4,258 | |
| 73,400 | | Morgan Stanley | | | 1,441,576 | |
| 4,900 | | Nomura Holdings, Inc. (Japan) | | | 21,667 | |
| 6 | | Partners Group Holding AG (Switzerland) | | | 1,171 | |
| 4,500 | | PennantPark Investment Corp. | | | 46,800 | |
| 268 | | Ratos AB (Sweden) (Class B Stock) | | | 3,721 | |
| 34 | | SBI Holdings, Inc. (Japan) | | | 3,208 | |
| 151 | | Schroders PLC (United Kingdom) | | | 3,816 | |
| 1,100 | | Solar Capital Ltd. | | | 24,277 | |
| 600 | | SWS Group, Inc. | | | 3,432 | |
| 12,300 | | T. Rowe Price Group, Inc. | | | 803,190 | |
| 5,272 | | UBS AG (Switzerland)* | | | 73,879 | |
| | | | | | |
| | | | | 5,154,658 | |
|
Chemicals 1.1% | |
| 1,600 | | A. Schulman, Inc. | | | 43,232 | |
| 395 | | Air Liquide SA (France) | | | 52,660 | |
| 340 | | Akzo Nobel NV (Netherlands) | | | 20,075 | |
| 80 | | Arkema SA (France) | | | 7,455 | |
| 2,000 | | Asahi Kasei Corp. (Japan) | | | 12,347 | |
| 1,314 | | BASF SE (Germany) | | | 114,946 | |
| 4,400 | | CF Industries Holdings, Inc. | | | 803,660 | |
| 4,900 | | Chemtura Corp.* | | | 83,202 | |
| 500 | | Daicel Corp. (Japan) | | | 3,220 | |
See Notes to Financial Statements.
| | | | |
| Prudential Asset Allocation Fund | | | 13 | |
Portfolio of Investments
as of March 31, 2012 (Unaudited) continued
| | | | | | |
| Shares | | Description | | Value (Note 1) | |
| | | | | | |
COMMON STOCKS (Continued) | |
|
Chemicals (cont’d.) | |
| 500 | | Denki Kagaku Kogyo K.K. (Japan) | | $ | 2,000 | |
| 2,200 | | E.I. du Pont de Nemours & Co. | | | 116,380 | |
| 16,000 | | Eastman Chemical Co. | | | 827,040 | |
| 12 | | Givaudan SA (Switzerland) | | | 11,565 | |
| 100 | | Hitachi Chemical Co. Ltd. (Japan) | | | 1,800 | |
| 2,354 | | Incitec Pivot Ltd. (Australia) | | | 7,681 | |
| 400 | | Innophos Holdings, Inc. | | | 20,048 | |
| 649 | | Israel Chemicals Ltd. (Israel) | | | 7,384 | |
| 3 | | Israel Corp. Ltd. (The) (Israel) | | | 2,020 | |
| 307 | | Johnson Matthey PLC (United Kingdom) | | | 11,584 | |
| 300 | | JSR Corp. (Japan) | | | 6,038 | |
| 250 | | K+S AG (Germany) | | | 13,079 | |
| 500 | | Kaneka Corp. (Japan) | | | 3,014 | |
| 211 | | Koninklijke DSM NV (Netherlands) | | | 12,209 | |
| 2,300 | | Koppers Holdings, Inc. | | | 88,688 | |
| 500 | | Kuraray Co. Ltd. (Japan) | | | 7,074 | |
| 121 | | Lanxess AG (Germany) | | | 10,002 | |
| 244 | | Linde AG (Germany) | | | 43,786 | |
| 2,500 | | LSB Industries, Inc.* | | | 97,300 | |
| 2,000 | | LyondellBasell Industries NV (Netherlands) (Class A Stock) | | | 87,300 | |
| 2,000 | | Mitsubishi Chemical Holdings Corp. (Japan) | | | 10,680 | |
| 500 | | Mitsubishi Gas Chemical Co., Inc. (Japan) | | | 3,341 | |
| 1,000 | | Mitsui Chemicals, Inc. (Japan) | | | 3,033 | |
| 200 | | Nitto Denko Corp. (Japan) | | | 8,058 | |
| 330 | | Novozymes A/S (Denmark) (Class B Stock) | | | 9,611 | |
| 475 | | Orica Ltd. (Australia) | | | 13,762 | |
| 5,700 | | PolyOne Corp. | | | 82,080 | |
| 8,500 | | PPG Industries, Inc. | | | 814,300 | |
| 600 | | Shin-Etsu Chemical Co. Ltd. (Japan) | | | 34,650 | |
| 2,000 | | Showa Denko K.K. (Japan) | | | 4,543 | |
| 3 | | Sika AG (Switzerland) | | | 6,494 | |
| 84 | | Solvay SA (Belgium) | | | 9,945 | |
| 170 | | Stepan Co. | | | 14,926 | |
| 2,000 | | Sumitomo Chemical Co. Ltd. (Japan) | | | 8,505 | |
| 135 | | Syngenta AG (Switzerland) | | | 46,675 | |
| 1,000 | | Teijin Ltd. (Japan) | | | 3,359 | |
| 2,000 | | Toray Industries, Inc. (Japan) | | | 14,836 | |
| 1,000 | | Tosoh Corp. (Japan) | | | 2,779 | |
| 200 | | Tredegar Corp. | | | 3,918 | |
| 1,500 | | UBE Industries Ltd. (Japan) | | | 4,078 | |
See Notes to Financial Statements.
| | |
| 14 | | Visit our website at www.prudentialfunds.com |
| | | | | | |
| Shares | | Description | | Value (Note 1) | |
| | | | | | |
COMMON STOCKS (Continued) | |
|
Chemicals (cont’d.) | |
| 2,900 | | Valspar Corp. | | $ | 140,041 | |
| 25 | | Wacker Chemie AG (Germany)(a) | | | 2,204 | |
| 263 | | Yara International ASA (Norway) | | | 12,543 | |
| | | | | | |
| | | | | 3,771,150 | |
|
Commercial Banks 2.7% | |
| 1,000 | | Aozora Bank Ltd. (Japan) | | | 2,888 | |
| 3,765 | | Australia & New Zealand Banking Group Ltd. (Australia) | | | 90,713 | |
| 907 | | Banca Carige SpA (Italy) | | | 1,190 | |
| 6,084 | | Banca Monte dei Paschi di Siena SpA (Italy) | | | 2,565 | |
| 600 | | BancFirst Corp. | | | 26,136 | |
| 6,667 | | Banco Bilbao Vizcaya Argentaria SA (Spain) | | | 53,058 | |
| 2,355 | | Banco de Sabadell SA (Spain) | | | 6,414 | |
| 798 | | Banco Espirito Santo SA (Portugal) | | | 1,458 | |
| 5,000 | | Banco Latinoamericano de Comercio Exterior SA (Class E Stock) | | | 105,550 | |
| 2,563 | | Banco Popolare SC (Italy) | | | 4,861 | |
| 1,415 | | Banco Popular Espanol SA (Spain) | | | 5,077 | |
| 12,225 | | Banco Santander SA (Spain) | | | 94,077 | |
| 1,000 | | Bancorp, Inc.* | | | 10,040 | |
| 1,541 | | Bank Hapoalim BM (Israel) | | | 5,658 | |
| 1,673 | | Bank Leumi Le-Israel BM (Israel) | | | 5,268 | |
| 1,800 | | Bank of East Asia Ltd. (Hong Kong) | | | 6,768 | |
| 500 | | Bank of Kyoto Ltd. (The) (Japan) | | | 4,537 | |
| 2,000 | | Bank of Yokohama Ltd. (The) (Japan) | | | 10,004 | |
| 1,016 | | Bankia SA (Spain)* | | | 3,680 | |
| 380 | | Bankinter SA (Spain) | | | 1,993 | |
| 900 | | Banner Corp. | | | 19,827 | |
| 16,462 | | Barclays PLC (United Kingdom) | | | 61,943 | |
| 4,100 | | BB&T Corp.(a) | | | 128,699 | |
| 514 | | Bendigo and Adelaide Bank Ltd. (Australia) | | | 4,126 | |
| 1,395 | | BNP Paribas SA (France) | | | 66,188 | |
| 5,500 | | BOC Hong Kong Holdings Ltd. (Hong Kong) | | | 15,192 | |
| 1,000 | | Boston Private Financial Holdings, Inc. | | | 9,910 | |
| 1,219 | | CaixaBank (Spain) | | | 4,746 | |
| 500 | | Camden National Corp. | | | 17,575 | |
| 1,200 | | Cardinal Financial Corp. | | | 13,560 | |
| 3,900 | | Cathay General Bancorp | | | 69,030 | |
| 200 | | Centerstate Banks, Inc. | | | 1,632 | |
| 1,800 | | Chemical Financial Corp. | | | 42,192 | |
| 1,500 | | Chiba Bank Ltd. (The) (Japan) | | | 9,569 | |
See Notes to Financial Statements.
| | | | |
| Prudential Asset Allocation Fund | | | 15 | |
Portfolio of Investments
as of March 31, 2012 (Unaudited) continued
| | | | | | |
| Shares | | Description | | Value (Note 1) | |
| | | | | | |
COMMON STOCKS (Continued) | |
|
Commercial Banks (cont’d.) | |
| 200 | | Chugoku Bank Ltd. (The) (Japan) | | $ | 2,704 | |
| 1,100 | | Citizens & Northern Corp. | | | 22,000 | |
| 5,006 | | Commerzbank AG (Germany)* | | | 12,665 | |
| 2,254 | | Commonwealth Bank of Australia (Australia) | | | 116,974 | |
| 2,100 | | Community Trust Bancorp, Inc. | | | 67,347 | |
| 1,242 | | Credit Agricole SA (France) | | | 7,719 | |
| 803 | | Danske Bank A/S (Denmark)* | | | 13,600 | |
| 2,500 | | DBS Group Holdings Ltd. (Singapore) | | | 28,201 | |
| 1,410 | | DNB ASA (Norway) | | | 18,124 | |
| 1,100 | | Eagle Bancorp, Inc.* | | | 18,414 | |
| 600 | | Enterprise Financial Services Corp. | | | 7,044 | |
| 280 | | Erste Group Bank AG (Austria) | | | 6,457 | |
| 44,000 | | Fifth Third Bancorp | | | 618,200 | |
| 2,200 | | Financial Institutions, Inc. | | | 35,574 | |
| 1,400 | | First Bancorp | | | 15,302 | |
| 4,200 | | First Commonwealth Financial Corp. | | | 25,704 | |
| 2,800 | | First Community Bancshares, Inc. | | | 37,408 | |
| 3,000 | | First Interstate Bancsystem, Inc. | | | 43,860 | |
| 1,000 | | Fukuoka Financial Group, Inc. (Japan) | | | 4,434 | |
| 1,000 | | Gunma Bank Ltd. (The) (Japan) | | | 5,352 | |
| 1,000 | | Hachijuni Bank Ltd. (The) (Japan) | | | 5,896 | |
| 1,100 | | Hancock Holding Co. | | | 39,061 | |
| 1,100 | | Hang Seng Bank Ltd. (Hong Kong) | | | 14,618 | |
| 1,400 | | Hanmi Financial Corp.* | | | 14,168 | |
| 500 | | Hiroshima Bank Ltd. (The) (Japan) | | | 2,283 | |
| 2,000 | | Hokuhoku Financial Group, Inc. (Japan) | | | 3,818 | |
| 500 | | Home Bancshares, Inc. | | | 13,305 | |
| 25,461 | | HSBC Holdings PLC (United Kingdom) | | | 225,940 | |
| 69,500 | | Huntington Bancshares, Inc. | | | 448,275 | |
| 2,100 | | International Bancshares Corp. | | | 44,415 | |
| 14,399 | | Intesa SanPaolo SpA (Italy) | | | 25,810 | |
| 1,447 | | Intesa SanPaolo SpA-RSP (Italy) | | | 2,233 | |
| 1,045 | | Israel Discount Bank Ltd. (Israel) (Class A Stock)* | | | 1,383 | |
| 1,000 | | Joyo Bank Ltd. (The) (Japan) | | | 4,579 | |
| 230 | | KBC Groep NV (Belgium) | | | 5,770 | |
| 47,500 | | KeyCorp | | | 403,750 | |
| 400 | | Lakeland Financial Corp. | | | 10,412 | |
| 59,563 | | Lloyds Banking Group PLC (United Kingdom)* | | | 32,016 | |
| 4,200 | | MainSource Financial Group, Inc. | | | 50,610 | |
| 18,100 | | Mitsubishi UFJ Financial Group, Inc. (Japan) | | | 90,095 | |
See Notes to Financial Statements.
| | |
| 16 | | Visit our website at www.prudentialfunds.com |
| | | | | | |
| Shares | | Description | | Value (Note 1) | |
| | | | | | |
COMMON STOCKS (Continued) | |
|
Commercial Banks (cont’d.) | |
| 180 | | Mizrahi Tefahot Bank Ltd. (Israel) | | $ | 1,622 | |
| 31,960 | | Mizuho Financial Group, Inc. (Japan) | | | 52,128 | |
| 3,283 | | National Australia Bank Ltd. (Australia) | | | 83,657 | |
| 1,280 | | National Bank of Greece SA (Greece)* | | | 3,278 | |
| 1,281 | | Natixis (France) | | | 4,929 | |
| 1,000 | | Nishi-Nippon City Bank Ltd. (The) (Japan) | | | 2,827 | |
| 3,702 | | Nordea Bank AB (Sweden) | | | 33,658 | |
| 5,300 | | Old National Bancorp | | | 69,642 | |
| 4,074 | | Oversea-Chinese Banking Corp. Ltd. (Singapore) | | | 28,909 | |
| 1,300 | | Peoples Bancorp, Inc. | | | 22,802 | |
| 14,900 | | PNC Financial Services Group, Inc. | | | 960,901 | |
| 64 | | Raiffeisen Bank International AG (Austria)(a) | | | 2,262 | |
| 1,800 | | Republic Bancorp, Inc. (Class A Stock) | | | 43,056 | |
| 2,800 | | Resona Holdings, Inc. (Japan) | | | 12,889 | |
| 23,514 | | Royal Bank of Scotland Group PLC (United Kingdom)* | | | 10,396 | |
| 2,000 | | Shinsei Bank Ltd. (Japan) | | | 2,610 | |
| 500 | | Shizuoka Bank Ltd. (The) (Japan) | | | 5,147 | |
| 2,004 | | Skandinaviska Enskilda Banken AB (Sweden) (Class A Stock) | | | 14,237 | |
| 944 | | Societe Generale SA (France) | | | 27,654 | |
| 3,400 | | Standard Chartered PLC (United Kingdom) | | | 84,837 | |
| 1,900 | | State Bank Financial Corp.* | | | 33,269 | |
| 1,100 | | Sterling Financial Corp.* | | | 22,968 | |
| 1,967 | | Sumitomo Mitsui Financial Group, Inc. (Japan) | | | 64,711 | |
| 4,480 | | Sumitomo Mitsui Trust Holdings, Inc. (Japan) | | | 14,289 | |
| 300 | | Suruga Bank Ltd. (Japan) | | | 3,063 | |
| 707 | | Svenska Handelsbanken AB (Sweden) (Class A Stock) | | | 22,538 | |
| 1,176 | | Swedbank AB (Sweden) (Class A Stock) | | | 18,273 | |
| 9,308 | | U.S. Bancorp | | | 294,877 | |
| 5,619 | | UniCredit SpA (Italy) | | | 28,148 | |
| 800 | | Union First Market Bankshares Corp. | | | 11,200 | |
| 1,160 | | Unione di Banche Italiane ScpA (Italy) | | | 4,917 | |
| 1,600 | | United Overseas Bank Ltd. (Singapore) | | | 23,356 | |
| 200 | | Washington Trust Bancorp, Inc. | | | 4,828 | |
| 1,700 | | Webster Financial Corp. | | | 38,539 | |
| 97,041 | | Wells Fargo & Co. | | | 3,312,980 | |
| 2,200 | | WesBanco, Inc. | | | 44,308 | |
| 900 | | West Bancorporation, Inc. | | | 8,991 | |
| 4,286 | | Westpac Banking Corp. (Australia) | | | 97,184 | |
| 1,500 | | Wilshire Bancorp, Inc.* | | | 7,245 | |
| 500 | | Wing Hang Bank Ltd. (Hong Kong) | | | 4,967 | |
See Notes to Financial Statements.
| | | | |
| Prudential Asset Allocation Fund | | | 17 | |
Portfolio of Investments
as of March 31, 2012 (Unaudited) continued
| | | | | | |
| Shares | | Description | | Value (Note 1) | |
| | | | | | |
COMMON STOCKS (Continued) | |
|
Commercial Banks (cont’d.) | |
| 500 | | Yamaguchi Financial Group, Inc. (Japan) | | $ | 4,543 | |
| | | | | | |
| | | | | 8,984,279 | |
|
Commercial Services & Supplies 0.2% | |
| 396 | | Aggreko PLC (United Kingdom) | | | 14,251 | |
| 523 | | Babcock International Group PLC (United Kingdom) | | | 6,663 | |
| 2,125 | | Brambles Ltd. (Australia) | | | 15,628 | |
| 2,300 | | Brink’s Co. (The) | | | 54,901 | |
| 1,000 | | Consolidated Graphics, Inc.* | | | 45,250 | |
| 10,400 | | Copart, Inc.* | | | 271,128 | |
| 1,600 | | Courier Corp. | | | 18,560 | |
| 800 | | Dai Nippon Printing Co. Ltd. (Japan) | | | 8,177 | |
| 900 | | Deluxe Corp. | | | 21,078 | |
| 222 | | Edenred (France) | | | 6,680 | |
| 500 | | Encore Capital Group, Inc.* | | | 11,275 | |
| 2,009 | | G4S PLC (United Kingdom) | | | 8,757 | |
| 3,500 | | Rollins, Inc. | | | 74,480 | |
| 300 | | Secom Co. Ltd. (Japan) | | | 14,679 | |
| 396 | | Securitas AB (Sweden) (Class B Stock) | | | 3,819 | |
| 659 | | Serco Group PLC (United Kingdom) | | | 5,718 | |
| 40 | | Societe BIC SA (France) | | | 4,014 | |
| 900 | | Standard Parking Corp.* | | | 18,450 | |
| 8,000 | | Steelcase, Inc. (Class A Stock) | | | 76,800 | |
| 4,200 | | Sykes Enterprises, Inc.* | | | 66,360 | |
| 2,500 | | Tetra Tech, Inc.* | | | 65,900 | |
| 500 | | Toppan Printing Co. Ltd. (Japan) | | | 3,902 | |
| 200 | | United Stationers, Inc. | | | 6,206 | |
| 200 | | US Ecology, Inc. | | | 4,348 | |
| | | | | | |
| | | | | 827,024 | |
|
Communications Equipment 1.7% | |
| 500 | | ADTRAN, Inc. | | | 15,595 | |
| 3,377 | | Alcatel-Lucent (France)* | | | 7,679 | |
| 2,300 | | ARRIS Group, Inc.* | | | 25,990 | |
| 1,700 | | Black Box Corp. | | | 43,367 | |
| 107,366 | | Cisco Systems, Inc. | | | 2,270,791 | |
| 400 | | Digi International, Inc.* | | | 4,396 | |
| 700 | | F5 Networks, Inc.* | | | 94,472 | �� |
| 200 | | InterDigital, Inc. | | | 6,972 | |
| 900 | | Ixia* | | | 11,241 | |
See Notes to Financial Statements.
| | |
| 18 | | Visit our website at www.prudentialfunds.com |
| | | | | | |
| Shares | | Description | | Value (Note 1) | |
| | | | | | |
COMMON STOCKS (Continued) | |
|
Communications Equipment (cont’d.) | |
| 1,200 | | Loral Space & Communications, Inc.* | | $ | 95,520 | |
| 12,800 | | Motorola Solutions, Inc. | | | 650,624 | |
| 2,700 | | NETGEAR, Inc.* | | | 103,140 | |
| 5,083 | | Nokia OYJ (Finland) | | | 27,673 | |
| 2,600 | | Plantronics, Inc. | | | 104,676 | |
| 32,500 | | QUALCOMM, Inc. | | | 2,210,650 | |
| 4,290 | | Telefonaktiebolaget LM Ericsson (Sweden) (Class B Stock) | | | 44,451 | |
| | | | | | |
| | | | | 5,717,237 | |
|
Computers & Peripherals 3.4% | |
| 14,800 | | Apple, Inc.* | | | 8,872,156 | |
| 32,500 | | Dell, Inc.* | | | 539,500 | |
| 4,500 | | Electronics for Imaging, Inc.* | | | 74,790 | |
| 2,500 | | Fujitsu Ltd. (Japan) | | | 13,169 | |
| 55,000 | | Hewlett-Packard Co. | | | 1,310,650 | |
| 3,300 | | Lexmark International, Inc. (Class A Stock)(a) | | | 109,692 | |
| 4,000 | | NEC Corp. (Japan)* | | | 8,361 | |
| 900 | | Rimage Corp. | | | 9,009 | |
| 200 | | Seiko Epson Corp. (Japan) | | | 2,803 | |
| 6,000 | | Toshiba Corp. (Japan) | | | 26,386 | |
| 13,000 | | Western Digital Corp.* | | | 538,070 | |
| 2,500 | | Xyratex Ltd. | | | 39,775 | |
| | | | | | |
| | | | | 11,544,361 | |
|
Construction & Engineering 0.1% | |
| 207 | | ACS Actividades de Construccion y Servicios SA (Spain) | | | 5,298 | |
| 1,105 | | Balfour Beatty PLC (United Kingdom) | | | 5,046 | |
| 346 | | Bouygues SA (France) | | | 10,581 | |
| 58 | | Eiffage SA (France) | | | 2,244 | |
| 518 | | Ferrovial SA (Spain) | | | 5,954 | |
| 78 | | Fomento de Construcciones y Contratas SA (Spain) | | | 1,743 | |
| 58 | | Hochtief AG (Germany) | | | 3,519 | |
| 400 | | JGC Corp. (Japan) | | | 12,396 | |
| 1,000 | | Kajima Corp. (Japan) | | | 3,045 | |
| 90 | | Koninklijke Boskalis Westminster NV (Netherlands) | | | 3,381 | |
| 1,500 | | Layne Christensen Co.* | | | 33,375 | |
| 218 | | Leighton Holdings Ltd. (Australia) | | | 4,814 | |
| 500 | | Michael Baker Corp.* | | | 11,925 | |
| 1,000 | | Obayashi Corp. (Japan) | | | 4,362 | |
| 4,400 | | Primoris Services Corp. | | | 70,664 | |
See Notes to Financial Statements.
| | | | |
| Prudential Asset Allocation Fund | | | 19 | |
Portfolio of Investments
as of March 31, 2012 (Unaudited) continued
| | | | | | |
| Shares | | Description | | Value (Note 1) | |
| | | | | | |
COMMON STOCKS (Continued) | |
|
Construction & Engineering (cont’d.) | |
| 1,000 | | Shimizu Corp. (Japan) | | $ | 4,011 | |
| 582 | | Skanska AB (Sweden) (Class B Stock) | | | 10,090 | |
| 1,500 | | Taisei Corp. (Japan) | | | 3,914 | |
| 645 | | Vinci SA (France) | | | 33,635 | |
| | | | | | |
| | | | | 229,997 | |
|
Construction Materials | |
| 973 | | Boral Ltd. (Australia) | | | 4,062 | |
| 293 | | Cimpor Cimentos de Portugal SGPS SA (Portugal) | | | 1,954 | |
| 1,010 | | CRH PLC (Ireland) | | | 20,610 | |
| 300 | | Eagle Materials, Inc. | | | 10,425 | |
| 979 | | Fletcher Building Ltd. (New Zealand) | | | 5,403 | |
| 201 | | HeidelBergCement AG (Germany) | | | 12,166 | |
| 350 | | Holcim Ltd. (Switzerland) | | | 22,837 | |
| 53 | | Imerys SA (France) | | | 3,223 | |
| 570 | | James Hardie Industries SE (Australia) | | | 4,534 | |
| 283 | | Lafarge SA (France) | | | 13,507 | |
| | | | | | |
| | | | | 98,721 | |
|
Consumer Finance 0.5% | |
| 100 | | Aeon Credit Service Co. Ltd. (Japan) | | | 1,573 | |
| 1,180 | | Credit Acceptance Corp.* | | | 119,192 | |
| 200 | | Credit Saison Co. Ltd. (Japan) | | | 4,047 | |
| 21,500 | | Discover Financial Services | | | 716,810 | |
| 4,600 | | Nelnet, Inc. (Class A Stock) | | | 119,186 | |
| 45,300 | | SLM Corp. | | | 713,928 | |
| | | | | | |
| | | | | 1,674,736 | |
|
Containers & Packaging 0.1% | |
| 1,873 | | Amcor Ltd. (Australia) | | | 14,435 | |
| 18,500 | | Owens-Illinois, Inc.* | | | 431,790 | |
| 1,219 | | Rexam PLC (United Kingdom) | | | 8,347 | |
| 200 | | Toyo Seikan Kaisha Ltd. (Japan) | | | 2,868 | |
| | | | | | |
| | | | | 457,440 | |
|
Distributors 0.3% | |
| 800 | | Core-Mark Holding Co., Inc. | | | 32,752 | |
| 16,400 | | Genuine Parts Co. | | | 1,029,100 | |
| 200 | | Jardine Cycle & Carriage Ltd. (Singapore) | | | 7,683 | |
| 8,000 | | Li & Fung Ltd. (Hong Kong) | | | 18,358 | |
| | | | | | |
| | | | | 1,087,893 | |
See Notes to Financial Statements.
| | |
| 20 | | Visit our website at www.prudentialfunds.com |
| | | | | | |
| Shares | | Description | | Value (Note 1) | |
| | | | | | |
COMMON STOCKS (Continued) | |
|
Diversified Consumer Services 0.1% | |
| 100 | | Benesse Holdings, Inc. (Japan) | | $ | 4,984 | |
| 1,800 | | Capella Education Co.* | | | 64,710 | |
| 8,000 | | DeVry, Inc. | | | 270,960 | |
| 1,900 | | Hillenbrand, Inc. | | | 43,605 | |
| 1,100 | | Lincoln Educational Services Corp. | | | 8,701 | |
| 200 | | Mac-Gray Corp. | | | 3,026 | |
| 500 | | Steiner Leisure Ltd.* | | | 24,415 | |
| | | | | | |
| | | | | 420,401 | |
|
Diversified Financial Services 1.5% | |
| 246 | | ASX Ltd. (Australia) | | | 8,460 | |
| 39,245 | | Bank of America Corp. | | | 375,575 | |
| 30,170 | | Citigroup, Inc. | | | 1,102,713 | |
| 1,800 | | Compass Diversified Holdings | | | 26,622 | |
| 283 | | Deutsche Boerse AG (Germany) | | | 19,053 | |
| 44 | | Eurazeo (France) | | | 2,239 | |
| 130 | | Exor SpA (Italy) | | | 3,282 | |
| 5,000 | | First Pacific Co. Ltd. (Hong Kong) | | | 5,544 | |
| 500 | | Gain Capital Holdings, Inc. | | | 2,510 | |
| 116 | | Groupe Bruxelles Lambert SA (Belgium) | | | 8,979 | |
| 1,500 | | Hong Kong Exchanges and Clearing Ltd. (Hong Kong) | | | 25,207 | |
| 120 | | Industrivarden AB (Sweden) (Class C Stock) | | | 1,783 | |
| 5,397 | | ING Groep NV (Netherlands)* | | | 44,966 | |
| 7,200 | | Interactive Brokers Group, Inc. (Class A Stock) | | | 122,400 | |
| 291 | | Investment AB Kinnevik (Sweden) (Class B Stock) | | | 6,769 | |
| 629 | | Investor AB (Sweden) (Class B Stock) | | | 13,948 | |
| 60,230 | | JPMorgan Chase & Co. | | | 2,769,375 | |
| 313 | | London Stock Exchange Group PLC (United Kingdom) | | | 5,177 | |
| 90 | | Mitsubishi UFJ Lease & Finance Co. Ltd. (Japan) | | | 3,958 | |
| 9,700 | | Moody’s Corp.(a) | | | 408,370 | |
| 700 | | NASDAQ OMX Group, Inc. (The)*(a) | | | 18,130 | |
| 150 | | ORIX Corp. (Japan) | | | 14,317 | |
| 40 | | Pargesa Holding SA (Switzerland) | | | 2,876 | |
| 184 | | Pohjola Bank PLC (Finland) (Class A Stock) | | | 2,038 | |
| 1,000 | | Singapore Exchange Ltd. (Singapore) | | | 5,521 | |
| | | | | | |
| | | | | 4,999,812 | |
|
Diversified Telecommunication Services 1.3% | |
| 900 | | AboveNet, Inc.* | | | 74,520 | |
| 64,710 | | AT&T, Inc. | | | 2,020,893 | |
See Notes to Financial Statements.
| | | | |
| Prudential Asset Allocation Fund | | | 21 | |
Portfolio of Investments
as of March 31, 2012 (Unaudited) continued
| | | | | | |
| Shares | | Description | | Value (Note 1) | |
| | | | | | |
COMMON STOCKS (Continued) | |
|
Diversified Telecommunication Services (cont’d.) | |
| 400 | | Atlantic Tele-Network, Inc. | | $ | 14,544 | |
| 214 | | Belgacom SA (Belgium) | | | 6,880 | |
| 2,535 | | Bezeq the Israeli Telecommunication Corp. Ltd. (Israel) | | | 4,162 | |
| 11,285 | | BT Group PLC (United Kingdom) | | | 40,866 | |
| 900 | | Cbeyond, Inc.* | | | 7,200 | |
| 400 | | Consolidated Communications Holdings, Inc. | | | 7,852 | |
| 4,001 | | Deutsche Telekom AG (Germany) | | | 48,170 | |
| 215 | | Elisa OYJ (Finland) | | | 5,153 | |
| 2,641 | | France Telecom SA (France) | | | 39,115 | |
| 349 | | Hellenic Telecommunications Organization SA (Greece) | | | 1,485 | |
| 43 | | HKT Trust and HKT Ltd. (Hong Kong)* | | | 33 | |
| 27 | | Iliad SA (France) | | | 3,720 | |
| 640 | | Inmarsat PLC (United Kingdom) | | | 4,712 | |
| 2,221 | | Koninklijke KPN NV (Netherlands) | | | 24,432 | |
| 700 | | Nippon Telegraph & Telephone Corp. (Japan) | | | 31,757 | |
| 4,000 | | PCCW Ltd. (Hong Kong) | | | 1,432 | |
| 835 | | Portugal Telecom SGPS SA (Portugal) | | | 4,543 | |
| 3,300 | | Premiere Global Services, Inc.* | | | 29,832 | |
| 11,000 | | Singapore Telecommunications Ltd. (Singapore) | | | 27,565 | |
| 35 | | Swisscom AG (Switzerland) | | | 14,148 | |
| 491 | | TDC A/S (Denmark) | | | 3,571 | |
| 452 | | Tele2 AB (Sweden) (Class B Stock) | | | 9,223 | |
| 2,987 | | Telecom Corp. of New Zealand Ltd. (New Zealand) | | | 5,931 | |
| 13,722 | | Telecom Italia SpA (Italy) | | | 16,315 | |
| 9,850 | | Telecom Italia SpA-RSP (Italy) | | | 9,682 | |
| 5,939 | | Telefonica SA (Spain) | | | 97,308 | |
| 457 | | Telekom Austria AG (Austria) | | | 5,322 | |
| 1,069 | | Telenor ASA (Norway) | | | 19,823 | |
| 3,103 | | TeliaSonera AB (Sweden) | | | 21,641 | |
| 6,211 | | Telstra Corp. Ltd. (Australia) | | | 21,167 | |
| 41,150 | | Verizon Communications, Inc.(a) | | | 1,573,164 | |
| 1,763 | | Vivendi SA (France) | | | 32,354 | |
| | | | | | |
| | | | | 4,228,515 | |
|
Electric Utilities 0.8% | |
| 37 | | Acciona SA (Spain) | | | 2,584 | |
| 9,500 | | American Electric Power Co., Inc. | | | 366,510 | |
| 1,000 | | Cheung Kong Infrastructure Holdings Ltd. (Hong Kong) | | | 6,084 | |
| 1,000 | | Chubu Electric Power Co., Inc. (Japan) | | | 18,050 | |
| 400 | | Chugoku Electric Power Co., Inc. (The) (Japan) | | | 7,428 | |
See Notes to Financial Statements.
| | |
| 22 | | Visit our website at www.prudentialfunds.com |
| | | | | | |
| Shares | | Description | | Value (Note 1) | |
| | | | | | |
COMMON STOCKS (Continued) | |
|
Electric Utilities (cont’d.) | |
| 3,000 | | CLP Holdings Ltd. (Hong Kong) | | $ | 25,883 | |
| 277 | | Contact Energy Ltd. (New Zealand)* | | | 1,073 | |
| 11,200 | | Duke Energy Corp.(a) | | | 235,312 | |
| 2,578 | | E.ON AG (Germany) | | | 61,752 | |
| 344 | | EDF SA (France) | | | 7,850 | |
| 2,811 | | EDP - Energias de Portugal SA (Portugal) | | | 8,177 | |
| 3,300 | | El Paso Electric Co. | | | 107,217 | |
| 9,376 | | Enel SpA (Italy) | | | 33,913 | |
| 5,600 | | Entergy Corp. | | | 376,320 | |
| 800 | | Exelon Corp. | | | 31,368 | |
| 9,000 | | FirstEnergy Corp. | | | 410,310 | |
| 639 | | Fortum OYJ (Finland) | | | 15,511 | |
| 300 | | Hokkaido Electric Power Co., Inc. (Japan) | | | 4,404 | |
| 200 | | Hokuriku Electric Power Co. (Japan) | | | 3,615 | |
| 5,971 | | Iberdrola SA (Spain) | | | 33,901 | |
| 1,000 | | IDACORP, Inc. | | | 41,120 | |
| 1,100 | | Kansai Electric Power Co., Inc. (The) (Japan) | | | 17,037 | |
| 600 | | Kyushu Electric Power Co., Inc. (Japan) | | | 8,547 | |
| 6,900 | | Pinnacle West Capital Corp. | | | 330,510 | |
| 800 | | PNM Resources, Inc. | | | 14,640 | |
| 5,100 | | Portland General Electric Co. | | | 127,398 | |
| 2,000 | | Power Assets Holdings Ltd. (Hong Kong) | | | 14,680 | |
| 8,500 | | PPL Corp. | | | 240,210 | |
| 155 | | Red Electrica Corp. SA (Spain) | | | 7,585 | |
| 200 | | Shikoku Electric Power Co., Inc. (Japan) | | | 5,637 | |
| 1,542 | | SP AusNet (Australia) | | | 1,717 | |
| 1,353 | | SSE PLC (United Kingdom) | | | 28,761 | |
| 1,821 | | Terna Rete Elettrica Nazionale SpA (Italy) | | | 7,320 | |
| 600 | | Tohoku Electric Power Co., Inc. (Japan)* | | | 6,843 | |
| 2,200 | | Tokyo Electric Power Co., Inc. (The) (Japan)* | | | 5,528 | |
| 82 | | Verbund AG (Austria) | | | 2,495 | |
| | | | | | |
| | | | | 2,617,290 | |
|
Electrical Equipment 0.8% | |
| 3,089 | | ABB Ltd. (Switzerland) | | | 63,375 | |
| 1,000 | | Acuity Brands, Inc. | | | 62,830 | |
| 290 | | Alstom SA (France) | | | 11,317 | |
| 9,300 | | AMETEK, Inc. | | | 451,143 | |
| 3,300 | | Brady Corp. (Class A Stock) | | | 106,755 | |
| 26,700 | | Emerson Electric Co. | | | 1,393,206 | |
See Notes to Financial Statements.
| | | | |
| Prudential Asset Allocation Fund | | | 23 | |
Portfolio of Investments
as of March 31, 2012 (Unaudited) continued
| | | | | | |
| Shares | | Description | | Value (Note 1) | |
| | | | | | |
COMMON STOCKS (Continued) | |
|
Electrical Equipment (cont’d.) | |
| 3,300 | | EnerSys* | | $ | 114,345 | |
| 600 | | Franklin Electric Co., Inc. | | | 29,442 | |
| 1,000 | | Fuji Electric Co. Ltd. (Japan) | | | 2,634 | |
| 1,000 | | Furukawa Electric Co. Ltd. (Japan) | | | 2,658 | |
| 500 | | Generac Holdings, Inc.* | | | 12,275 | |
| 1,000 | | GS Yuasa Corp. (Japan) | | | 5,485 | |
| 290 | | Legrand SA (France) | | | 10,671 | |
| 3,000 | | Mitsubishi Electric Corp. (Japan) | | | 26,531 | |
| 200 | | Nidec Corp. (Japan) | | | 18,219 | |
| 55 | | NV Bekaert SA (Belgium)(a) | | | 1,772 | |
| 294 | | Prysmian SpA (Italy) | | | 5,168 | |
| 2,900 | | Rockwell Automation, Inc. | | | 231,130 | |
| 400 | | Roper Industries, Inc. | | | 39,664 | |
| 696 | | Schneider Electric SA (France) | | | 45,475 | |
| 1,100 | | Sumitomo Electric Industries Ltd. (Japan) | | | 15,057 | |
| 100 | | Ushio, Inc. (Japan) | | | 1,405 | |
| 232 | | Vestas Wind Systems A/S (Denmark)* | | | 2,354 | |
| | | | | | |
| | | | | 2,652,911 | |
|
Electronic Equipment, Instruments & Components 0.4% | |
| 300 | | Anixter International, Inc.* | | | 21,759 | |
| 1,700 | | Avnet, Inc.* | | | 61,863 | |
| 3,600 | | Brightpoint, Inc.* | | | 28,980 | |
| 400 | | Citizen Holdings Co. Ltd. (Japan) | | | 2,532 | |
| 8,700 | | Corning, Inc. | | | 122,496 | |
| 4,900 | | DDi Corp. | | | 59,780 | |
| 8,000 | | Dolby Laboratories, Inc. (Class A Stock)* | | | 304,480 | |
| 400 | | DTS, Inc.* | | | 12,088 | |
| 4,000 | | Foxconn International Holdings Ltd. (Hong Kong)* | | | 2,848 | |
| 600 | | Fujifilm Holdings Corp. (Japan) | | | 14,070 | |
| 800 | | GSI Group, Inc.* | | | 9,648 | |
| 370 | | Hexagon AB (Sweden) (Class B Stock) | | | 7,181 | |
| 50 | | Hirose Electric Co. Ltd. (Japan) | | | 5,250 | |
| 100 | | Hitachi High-Technologies Corp. (Japan) | | | 2,386 | |
| 6,400 | | Hitachi Ltd. (Japan) | | | 41,058 | |
| 600 | | Hoya Corp. (Japan) | | | 13,476 | |
| 200 | | Ibiden Co. Ltd. (Japan) | | | 5,115 | |
| 12,100 | | Ingram Micro, Inc. (Class A Stock)* | | | 224,576 | |
| 3,800 | | Insight Enterprises, Inc.* | | | 83,334 | |
| 66 | | Keyence Corp. (Japan) | | | 15,517 | |
See Notes to Financial Statements.
| | |
| 24 | | Visit our website at www.prudentialfunds.com |
| | | | | | |
| Shares | | Description | | Value (Note 1) | |
| | | | | | |
COMMON STOCKS (Continued) | |
|
Electronic Equipment, Instruments & Components (cont’d.) | |
| 250 | | Kyocera Corp. (Japan) | | $ | 22,895 | |
| 250 | | Murata Manufacturing Co. Ltd. (Japan) | | | 14,815 | |
| 1,000 | | Nippon Electric Glass Co. Ltd. (Japan) | | | 8,687 | |
| 300 | | Omron Corp. (Japan) | | | 6,452 | |
| 1,100 | | PC Connection, Inc. | | | 9,042 | |
| 200 | | ScanSource, Inc.* | | | 7,464 | |
| 500 | | Shimadzu Corp. (Japan) | | | 4,513 | |
| 3,000 | | SYNNEX Corp.* | | | 114,420 | |
| 200 | | TDK Corp. (Japan) | | | 11,333 | |
| 1,700 | | Tech Data Corp.*(a) | | | 92,242 | |
| 300 | | Yaskawa Electric Corp. (Japan) | | | 2,820 | |
| 200 | | Yokogawa Electric Corp. (Japan) | | | 2,022 | |
| | | | | | |
| | | | | 1,335,142 | |
|
Energy Equipment & Services 1.1% | |
| 245 | | Aker Solutions ASA (Norway) | | | 4,145 | |
| 471 | | AMEC PLC (United Kingdom) | | | 8,347 | |
| 7,500 | | Baker Hughes, Inc. | | | 314,550 | |
| 500 | | Bristow Group, Inc. | | | 23,865 | |
| 192 | | Cie Generale de Geophysique-Veritas (France)* | | | 5,682 | |
| 2,200 | | Exterran Holdings, Inc.* | | | 29,018 | |
| 95 | | Fugro NV (Netherlands) | | | 6,768 | |
| 36,600 | | Halliburton Co. | | | 1,214,754 | |
| 2,800 | | Helix Energy Solutions Group, Inc.* | | | 49,840 | |
| 3,600 | | Helmerich & Payne, Inc.(a) | | | 194,220 | |
| 2,800 | | Matrix Service Co.* | | | 39,228 | |
| 12,200 | | National Oilwell Varco, Inc. | | | 969,534 | |
| 11,200 | | Parker Drilling Co.* | | | 66,864 | |
| 372 | | Petrofac Ltd. (United Kingdom) | | | 10,353 | |
| 380 | | Saipem SpA (Italy) | | | 19,629 | |
| 270 | | SBM Offshore NV (Netherlands) | | | 5,519 | |
| 7,100 | | Schlumberger Ltd. | | | 496,503 | |
| 409 | | Seadrill Ltd. (Norway) | | | 15,327 | |
| 391 | | Subsea 7 SA (Norway)* | | | 10,354 | |
| 151 | | Technip SA (France) | | | 17,789 | |
| 675 | | Tenaris SA (Italy) | | | 12,874 | |
| 2,700 | | TETRA Technologies, Inc.* | | | 25,434 | |
| 464 | | Transocean Ltd. | | | 25,315 | |
| 500 | | Union Drilling, Inc.* | | | 2,780 | |
| 2,400 | | Willbros Group, Inc.* | | | 7,776 | |
See Notes to Financial Statements.
| | | | |
| Prudential Asset Allocation Fund | | | 25 | |
Portfolio of Investments
as of March 31, 2012 (Unaudited) continued
| | | | | | |
| Shares | | Description | | Value (Note 1) | |
| | | | | | |
COMMON STOCKS (Continued) | |
|
Energy Equipment & Services (cont’d.) | |
| 281 | | WorleyParsons Ltd. (Australia) | | $ | 8,333 | |
| | | | | | |
| | | | | 3,584,801 | |
|
Food & Staples Retailing 1.4% | |
| 900 | | Aeon Co. Ltd. (Japan) | | | 11,830 | |
| 100 | | Arden Group, Inc. (Class A Stock) | | | 9,089 | |
| 827 | | Carrefour SA (France) | | | 19,826 | |
| 78 | | Casino Guichard Perrachon SA (France) | | | 7,688 | |
| 108 | | Colruyt SA (Belgium) | | | 4,341 | |
| 38,600 | | CVS Caremark Corp. | | | 1,729,280 | |
| 149 | | Delhaize Group SA (Belgium) | | | 7,840 | |
| 827 | | Distribuidora Internacional de Alimentacion SA (Spain)* | | | 4,100 | |
| 100 | | FamilyMart Co. Ltd. (Japan) | | | 4,229 | |
| 1,757 | | J Sainsbury PLC (United Kingdom) | | | 8,748 | |
| 322 | | Jeronimo Martins SGPS SA (Portugal)* | | | 6,560 | |
| 85 | | Kesko OYJ (Finland) (Class B Stock) | | | 2,758 | |
| 1,661 | | Koninklijke Ahold NV (Netherlands) | | | 23,017 | |
| 44,100 | | Kroger Co. (The) | | | 1,068,543 | |
| 100 | | Lawson, Inc. (Japan) | | | 6,295 | |
| 768 | | Metcash Ltd. (Australia) | | | 3,421 | |
| 172 | | Metro AG (Germany) | | | 6,650 | |
| 2,000 | | Olam International Ltd. (Singapore) | | | 3,755 | |
| 800 | | Ruddick Corp. | | | 32,080 | |
| 1,050 | | Seven & I Holdings Co. Ltd. (Japan) | | | 31,182 | |
| 1,500 | | Susser Holdings Corp.* | | | 38,505 | |
| 11,176 | | Tesco PLC (United Kingdom) | | | 58,990 | |
| 300 | | Village Super Market, Inc. (Class A Stock) | | | 9,477 | |
| 26,300 | | Wal-Mart Stores, Inc. | | | 1,609,560 | |
| 1,416 | | Wesfarmers Ltd. (Australia) | | | 44,032 | |
| 3,134 | | WM Morrison Supermarkets PLC (United Kingdom) | | | 14,938 | |
| 1,724 | | Woolworths Ltd. (Australia) | | | 46,395 | |
| | | | | | |
| | | | | 4,813,129 | |
|
Food Products 1.0% | |
| 1,000 | | Ajinomoto Co., Inc. (Japan) | | | 12,541 | |
| 7,100 | | Archer-Daniels-Midland Co. | | | 224,786 | |
| 136 | | Aryzta AG (Switzerland) | | | 6,719 | |
| 503 | | Associated British Foods PLC (United Kingdom) | | | 9,815 | |
| 2 | | Barry Callebaut AG (Switzerland) | | | 2,004 | |
| 12,500 | | Bunge Ltd. | | | 855,500 | |
See Notes to Financial Statements.
| | |
| 26 | | Visit our website at www.prudentialfunds.com |
| | | | | | |
| Shares | | Description | | Value (Note 1) | |
| | | | | | |
COMMON STOCKS (Continued) | |
|
Food Products (cont’d.) | |
| 3,600 | | Corn Products International, Inc. | | $ | 207,540 | |
| 835 | | Danone (France) | | | 58,244 | |
| 200 | | Darling International, Inc.* | | | 3,484 | |
| 2,100 | | Fresh Del Monte Produce, Inc. | | | 47,964 | |
| 9,000 | | Golden Agri-Resources Ltd. (Singapore) | | | 5,620 | |
| 800 | | Hormel Foods Corp. | | | 23,616 | |
| 200 | | Kerry Group PLC (Ireland) (Class A Stock) | | | 9,256 | |
| 4,600 | | Kraft Foods, Inc. (Class A Stock) | | | 174,846 | |
| 2 | | Lindt & Spruengli AG (Switzerland) | | | 6,425 | |
| 100 | | Meiji Holdings Co. Ltd. (Japan) | | | 4,368 | |
| 4,709 | | Nestle SA (Switzerland) | | | 296,301 | |
| 500 | | Nisshin Seifun Group, Inc. (Japan) | | | 6,047 | |
| 100 | | Nissin Foods Holdings Co. Ltd. (Japan) | | | 3,739 | |
| 500 | | Omega Protein Corp.* | | | 3,805 | |
| 5,400 | | Pilgrim’s Pride Corp.* | | | 40,284 | |
| 1,800 | | Smart Balance, Inc.* | | | 11,898 | |
| 20,700 | | Smithfield Foods, Inc.*(a) | | | 456,021 | |
| 90 | | Suedzucker AG (Germany) | | | 2,866 | |
| 656 | | Tate & Lyle PLC (United Kingdom) | | | 7,397 | |
| 46,500 | | Tyson Foods, Inc. (Class A Stock) | | | 890,475 | |
| 2,296 | | Unilever NV (Netherlands) | | | 78,132 | |
| 1,834 | �� | Unilever PLC (United Kingdom) | | | 60,547 | |
| 3,000 | | Wilmar International Ltd. (Singapore) | | | 11,694 | |
| 100 | | Yakult Honsha Co. Ltd. (Japan) | | | 3,437 | |
| | | | | | |
| | | | | 3,525,371 | |
|
Gas Utilities 0.1% | |
| 500 | | APA Group (Australia) | | | 2,641 | |
| 3,300 | | Atmos Energy Corp. | | | 103,818 | |
| 700 | | Chesapeake Utilities Corp. | | | 28,784 | |
| 240 | | Enagas SA (Spain) | | | 4,619 | |
| 468 | | Gas Natural SDG SA (Spain) | | | 7,478 | |
| 6,490 | | Hong Kong & China Gas Co. Ltd. (Hong Kong) | | | 16,631 | |
| 3,000 | | Osaka Gas Co. Ltd. (Japan) | | | 12,033 | |
| 2,067 | | Snam SpA (Italy) | | | 9,941 | |
| 1,100 | | Southwest Gas Corp. | | | 47,014 | |
| 1,000 | | Toho Gas Co. Ltd. (Japan) | | | 5,896 | |
| 3,500 | | Tokyo Gas Co. Ltd. (Japan) | | | 16,492 | |
| | | | | | |
| | | | | 255,347 | |
See Notes to Financial Statements.
| | | | |
| Prudential Asset Allocation Fund | | | 27 | |
Portfolio of Investments
as of March 31, 2012 (Unaudited) continued
| | | | | | |
| Shares | | Description | | Value (Note 1) | |
| | | | | | |
COMMON STOCKS (Continued) | |
|
Healthcare Equipment & Supplies 0.8% | |
| 200 | | Analogic Corp. | | $ | 13,508 | |
| 1,400 | | AngioDynamics, Inc.* | | | 17,150 | |
| 2,400 | | Arthrocare Corp.* | | | 64,440 | |
| 200 | | Atrion Corp. | | | 42,042 | |
| 1,800 | | Becton Dickinson and Co. | | | 139,770 | |
| 2,000 | | Cantel Medical Corp. | | | 50,180 | |
| 17,200 | | CareFusion Corp.* | | | 445,996 | |
| 290 | | Cie Generale d’Optique Essilor International SA (France) | | | 25,848 | |
| 81 | | Cochlear Ltd. (Australia) | | | 5,194 | |
| 29 | | Coloplast A/S (Denmark) (Class B Stock) | | | 5,021 | |
| 200 | | CONMED Corp. | | | 5,974 | |
| 2,700 | | Cyberonics, Inc.* | | | 102,951 | |
| 277 | | Getinge AB (Sweden) (Class B Stock) | | | 7,888 | |
| 9,000 | | Hill-Rom Holdings, Inc. | | | 300,690 | |
| 1,500 | | Intuitive Surgical, Inc.* | | | 812,625 | |
| 2,900 | | Invacare Corp. | | | 48,053 | |
| 5,000 | | Masimo Corp.* | | | 116,900 | |
| 300 | | Olympus Corp. (Japan)* | | | 4,908 | |
| 2,400 | | RTI Biologics, Inc.* | | | 8,880 | |
| 1,800 | | Sirona Dental Systems, Inc.* | | | 92,772 | |
| 1,244 | | Smith & Nephew PLC (United Kingdom) | | | 12,605 | |
| 74 | | Sonova Holding AG (Switzerland) | | | 8,222 | |
| 400 | | Spectranetics Corp.* | | | 4,160 | |
| 11 | | Straumann Holding AG (Switzerland)* | | | 1,872 | |
| 3,300 | | Stryker Corp. | | | 183,084 | |
| 3,300 | | Synergetics USA, Inc.* | | | 21,450 | |
| 88 | | Synthes, Inc. (Switzerland) | | | 15,266 | |
| 100 | | Sysmex Corp. (Japan) | | | 4,035 | |
| 200 | | Terumo Corp. (Japan) | | | 9,557 | |
| 33 | | William Demant Holding A/S (Denmark)* | | | 3,075 | |
| 1,900 | | Young Innovations, Inc. | | | 58,748 | |
| | | | | | |
| | | | | 2,632,864 | |
|
Healthcare Providers & Services 1.7% | |
| 24,500 | | Aetna, Inc. | | | 1,228,920 | |
| 100 | | Alfresa Holdings Corp. (Japan) | | | 4,754 | |
| 123 | | Celesio AG (Germany) | | | 2,226 | |
| 800 | | Centene Corp.* | | | 39,176 | |
| 600 | | Chemed Corp. | | | 37,608 | |
| 262 | | Fresenius Medical Care AG & Co. KGaA (Germany) | | | 18,569 | |
See Notes to Financial Statements.
| | |
| 28 | | Visit our website at www.prudentialfunds.com |
| | | | | | |
| Shares | | Description | | Value (Note 1) | |
| | | | | | |
COMMON STOCKS (Continued) | |
|
Healthcare Providers & Services (cont’d.) | |
| 159 | | Fresenius SE & Co. KGaA (Germany) | | $ | 16,305 | |
| 5,600 | | Humana, Inc. | | | 517,888 | |
| 1,500 | | Magellan Health Services, Inc.* | | | 73,215 | |
| 200 | | Medipal Holdings Corp. (Japan) | | | 2,590 | |
| 100 | | Miraca Holdings, Inc. (Japan) | | | 3,903 | |
| 1,100 | | National Healthcare Corp. | | | 50,116 | |
| 2,300 | | Providence Service Corp. (The)* | | | 35,673 | |
| 187 | | Ramsay Health Care Ltd. (Australia) | | | 3,787 | |
| 5,400 | | Select Medical Holdings Corp.* | | | 41,526 | |
| 2,100 | | Skilled Healthcare Group, Inc. (Class A Stock)* | | | 16,086 | |
| 502 | | Sonic Healthcare Ltd. (Australia) | | | 6,510 | |
| 2,100 | | Sun Healthcare Group, Inc.* | | | 14,364 | |
| 100 | | Suzuken Co. Ltd. (Japan) | | | 3,083 | |
| 1,300 | | Team Health Holdings, Inc.* | | | 26,728 | |
| 1,600 | | Triple-S Management Corp. (Class B Stock)* | | | 36,960 | |
| 37,300 | | UnitedHealth Group, Inc. | | | 2,198,462 | |
| 2,000 | | Universal American Corp. | | | 21,560 | |
| 2,400 | | WellCare Health Plans, Inc.* | | | 172,512 | |
| 16,900 | | WellPoint, Inc. | | | 1,247,220 | |
| | | | | | |
| | | | | 5,819,741 | |
|
Healthcare Technology 0.1% | |
| 3,000 | | Allscripts Healthcare Solutions, Inc.* | | | 49,800 | |
| 1,700 | | Computer Programs & Systems, Inc. | | | 96,084 | |
| 6,000 | | MedAssets, Inc.* | | | 78,960 | |
| 400 | | Medidata Solutions, Inc.* | | | 10,656 | |
| 2,400 | | SXC Health Solutions Corp. (Canada)* | | | 179,904 | |
| | | | | | |
| | | | | 415,404 | |
|
Hotels, Restaurants & Leisure 1.1% | |
| 210 | | Accor SA (France) | | | 7,498 | |
| 400 | | AFC Enterprises, Inc.* | | | 6,784 | |
| 1,000 | | Ameristar Casinos, Inc. | | | 18,630 | |
| 164 | | Autogrill SpA (Italy) | | | 1,731 | |
| 120 | | Biglari Holdings, Inc.* | | | 48,342 | |
| 2,700 | | Bob Evans Farms, Inc. | | | 101,844 | |
| 209 | | Carnival PLC (United Kingdom) | | | 6,679 | |
| 700 | | Carrols Restaurant Group, Inc.* | | | 10,675 | |
| 900 | | CEC Entertainment, Inc. | | | 34,119 | |
| 2,719 | | Compass Group PLC (United Kingdom) | | | 28,508 | |
See Notes to Financial Statements.
| | | | |
| Prudential Asset Allocation Fund | | | 29 | |
Portfolio of Investments
as of March 31, 2012 (Unaudited) continued
| | | | | | |
| Shares | | Description | | Value (Note 1) | |
| | | | | | |
COMMON STOCKS (Continued) | |
|
Hotels, Restaurants & Leisure (cont’d.) | |
| 800 | | Cracker Barrel Old Country Store, Inc. | | $ | 44,640 | |
| 676 | | Crown Ltd. (Australia) | | | 6,085 | |
| 600 | | Domino’s Pizza, Inc. | | | 21,780 | |
| 951 | | Echo Entertainment Group Ltd. (Australia) | | | 4,325 | |
| 200 | | Einstein Noah Restaurant Group, Inc. | | | 2,984 | |
| 2,000 | | Galaxy Entertainment Group Ltd. (Hong Kong)* | | | 5,524 | |
| 8,600 | | Genting Singapore PLC (Singapore)* | | | 11,665 | |
| 426 | | Intercontinental Hotels Group PLC (United Kingdom) | | | 9,901 | |
| 2,800 | | Interval Leisure Group, Inc. | | | 48,720 | |
| 18,468 | | McDonald’s Corp. | | | 1,811,711 | |
| 100 | | McDonald’s Holdings Co. Japan Ltd. (Japan) | | | 2,653 | |
| 302 | | OPAP SA (Greece) | | | 2,928 | |
| 100 | | Oriental Land Co. Ltd. (Japan) | | | 10,716 | |
| 3,100 | | Panera Bread Co. (Class A Stock)* | | | 498,852 | |
| 2,300 | | Papa John’s International, Inc.* | | | 86,618 | |
| 2,500 | | Pinnacle Entertainment, Inc.* | | | 28,775 | |
| 3,300 | | Sands China Ltd. (Hong Kong) | | | 12,897 | |
| 2,000 | | Shangri-La Asia Ltd. (Hong Kong) | | | 4,373 | |
| 300 | | Six Flags Entertainment Corp. | | | 14,031 | |
| 2,400 | | SJM Holdings Ltd. (Hong Kong) | | | 4,883 | |
| 684 | | SKYCITY Entertainment Group Ltd. (New Zealand) | | | 2,207 | |
| 136 | | Sodexo (France) | | | 11,166 | |
| 997 | | Tabcorp Holdings Ltd. (Australia) | | | 2,810 | |
| 1,961 | | Tatts Group Ltd. (Australia) | | | 5,038 | |
| 668 | | TUI Travel PLC (United Kingdom) | | | 2,097 | |
| 240 | | Whitbread PLC (United Kingdom) | | | 7,079 | |
| 2,000 | | Wynn Macau Ltd. (Hong Kong) | | | 5,846 | |
| 10,600 | | Yum! Brands, Inc. | | | 754,508 | |
| | | | | | |
| | | | | 3,689,622 | |
|
Household Durables 0.5% | |
| 1,300 | | Blyth, Inc. | | | 97,279 | |
| 300 | | Casio Computer Co. Ltd. (Japan) | | | 2,142 | |
| 600 | | CSS Industries, Inc. | | | 11,676 | |
| 341 | | Electrolux AB, Ser. B (Sweden) | | | 7,211 | |
| 1,800 | | Harman International Industries, Inc. | | | 84,258 | |
| 2,000 | | Helen of Troy Ltd.* | | | 68,020 | |
| 455 | | Husqvarna AB (Sweden) (Class B Stock) | | | 2,745 | |
| 2,600 | | iRobot Corp.* | | | 70,876 | |
| 700 | | La-Z-Boy, Inc.* | | | 10,472 | |
See Notes to Financial Statements.
| | |
| 30 | | Visit our website at www.prudentialfunds.com |
| | | | | | |
| Shares | | Description | | Value (Note 1) | |
| | | | | | |
COMMON STOCKS (Continued) | |
|
Household Durables (cont’d.) | |
| 400 | | Libbey, Inc.* | | $ | 5,176 | |
| 3,000 | | Panasonic Corp. (Japan) | | | 27,582 | |
| 50 | | Rinnai Corp. (Japan) | | | 3,600 | |
| 1,000 | | Sekisui Chemical Co. Ltd. (Japan) | | | 8,675 | |
| 800 | | Sekisui House Ltd. (Japan) | | | 7,839 | |
| 1,400 | | Sharp Corp. (Japan) | | | 10,216 | |
| 1,400 | | Sony Corp. (Japan) | | | 28,822 | |
| 6,100 | | Tupperware Brands Corp. | | | 387,350 | |
| 9,700 | | Whirlpool Corp. | | | 745,542 | |
| | | | | | |
| | | | | 1,579,481 | |
|
Household Products 0.7% | |
| 1,800 | | Colgate-Palmolive Co. | | | 176,004 | |
| 187 | | Henkel AG & Co. KGaA (Germany) | | | 11,672 | |
| 7,400 | | Kimberly-Clark Corp. | | | 546,786 | |
| 25,575 | | Procter & Gamble Co. (The) | | | 1,718,896 | |
| 876 | | Reckitt Benckiser Group PLC (United Kingdom) | | | 49,503 | |
| 200 | | Unicharm Corp. (Japan) | | | 10,559 | |
| | | | | | |
| | | | | 2,513,420 | |
|
Independent Power Producers & Energy Traders 0.4% | |
| 62,300 | | AES Corp. (The)* | | | 814,261 | |
| 306 | | EDP Renovaveis SA (Portugal)* | | | 1,521 | |
| 200 | | Electric Power Development Co. Ltd. (Japan) | | | 5,422 | |
| 2,300 | | Enel Green Power SpA (Italy) | | | 4,371 | |
| 700 | | Genie Energy Ltd. (Class B Stock) | | | 6,769 | |
| 2,272 | | International Power PLC (United Kingdom) | | | 14,718 | |
| 22,700 | | NRG Energy, Inc.* | | | 355,709 | |
| | | | | | |
| | | | | 1,202,771 | |
|
Industrial Conglomerates 1.0% | |
| 4,300 | | 3M Co. | | | 383,603 | |
| 6 | | Delek Group Ltd. (Israel) | | | 1,174 | |
| 1,400 | | Fraser and Neave Ltd. (Singapore) | | | 7,462 | |
| 120,250 | | General Electric Co. | | | 2,413,417 | |
| 1,000 | | Hopewell Holdings Ltd. (Hong Kong) | | | 2,743 | |
| 3,000 | | Hutchison Whampoa Ltd. (Hong Kong) | | | 29,979 | |
| 2,000 | | Keppel Corp. Ltd. (Singapore) | | | 17,485 | |
| 1,389 | | Koninklijke Philips Electronics NV (Netherlands) | | | 28,158 | |
| 1,500 | | NWS Holdings Ltd. (Hong Kong) | | | 2,295 | |
See Notes to Financial Statements.
| | | | |
| Prudential Asset Allocation Fund | | | 31 | |
Portfolio of Investments
as of March 31, 2012 (Unaudited) continued
| | | | | | |
| Shares | | Description | | Value (Note 1) | |
| | | | | | |
COMMON STOCKS (Continued) | |
|
Industrial Conglomerates (cont’d.) | |
| 1,121 | | Orkla ASA (Norway) | | $ | 8,870 | |
| 4 | | Seaboard Corp.* | | | 7,804 | |
| 1,500 | | SembCorp Industries Ltd. (Singapore) | | | 6,300 | |
| 1,189 | | Siemens AG (Germany) | | | 119,869 | |
| 573 | | Smiths Group PLC (United Kingdom) | | | 9,642 | |
| 8,900 | | Tyco International Ltd. | | | 500,002 | |
| 57 | | Wendel SA (France) | | | 4,869 | |
| | | | | | |
| | | | | 3,543,672 | |
|
Insurance 1.8% | |
| 9,200 | | ACE Ltd. | | | 673,440 | |
| 279 | | Admiral Group PLC (United Kingdom) | | | 5,297 | |
| 2,498 | | AEGON NV (Netherlands)* | | | 13,873 | |
| 16,100 | | Aflac, Inc. | | | 740,439 | |
| 3,129 | | Ageas (Belgium) | | | 6,877 | |
| 11,000 | | AIA Group Ltd. (Hong Kong) | | | 40,300 | |
| 644 | | Allianz SE (Germany) | | | 76,846 | |
| 9,800 | | American Financial Group, Inc. | | | 378,084 | |
| 3,911 | | AMP Ltd. (Australia) | | | 17,501 | |
| 1,683 | | Assicurazioni Generali SpA (Italy) | | | 26,127 | |
| 11,600 | | Assurant, Inc. | | | 469,800 | |
| 4,258 | | Aviva PLC (United Kingdom) | | | 22,577 | |
| 2,458 | | AXA SA (France) | | | 40,749 | |
| 68 | | Baloise Holding AG (Switzerland) | | | 5,476 | |
| 12,800 | | Berkshire Hathaway, Inc. (Class B Stock)* | | | 1,038,720 | |
| 1,700 | | CNA Financial Corp. | | | 49,861 | |
| 239 | | CNP Assurances (France) | | | 3,729 | |
| 12 | | Dai-ichi Life Insurance Co. Ltd. (The) (Japan) | | | 16,571 | |
| 166 | | Delta Lloyd NV (Netherlands) | | | 2,918 | |
| 1,100 | | FBL Financial Group, Inc. (Class A Stock) | | | 37,070 | |
| 284 | | Gjensidige Forsikring ASA (Norway) | | | 3,354 | |
| 97 | | Hannover Rueckversicherung AG (Germany) | | | 5,762 | |
| 5,800 | | HCC Insurance Holdings, Inc. | | | 180,786 | |
| 2,953 | | Insurance Australia Group Ltd. (Australia) | | | 10,400 | |
| 800 | | Kansas City Life Insurance Co. | | | 25,760 | |
| 8,504 | | Legal & General Group PLC (United Kingdom) | | | 17,778 | |
| 14,500 | | Loews Corp. | | | 578,115 | |
| 1,200 | | Maiden Holdings Ltd. | | | 10,800 | |
| 1,129 | | Mapfre SA (Spain) | | | 3,635 | |
| 790 | | MS&AD Insurance Group Holdings (Japan) | | | 16,216 | |
See Notes to Financial Statements.
| | |
| 32 | | Visit our website at www.prudentialfunds.com |
| | | | | | |
| Shares | | Description | | Value (Note 1) | |
| | | | | | |
COMMON STOCKS (Continued) | |
|
Insurance (cont’d.) | |
| 268 | | Muenchener Rueckversicherungs AG (Germany) | | $ | 40,408 | |
| 475 | | NKSJ Holdings, Inc. (Japan) | | | 10,617 | |
| 7,880 | | Old Mutual PLC (United Kingdom) | | | 19,990 | |
| 3,900 | | Presidential Life Corp. | | | 44,577 | |
| 4,400 | | Primerica, Inc. | | | 110,924 | |
| 1,290 | | ProAssurance Corp. | | | 113,662 | |
| 3,584 | | Prudential PLC (United Kingdom) | | | 42,851 | |
| 1,578 | | QBE Insurance Group Ltd. (Australia) | | | 23,162 | |
| 2,205 | | Resolution Ltd. (United Kingdom) | | | 9,216 | |
| 5,102 | | RSA Insurance Group PLC (United Kingdom) | | | 8,536 | |
| 598 | | Sampo OYJ (Finland) (Class A Stock) | | | 17,283 | |
| 230 | | SCOR SE (France) | | | 6,215 | |
| 200 | | Sony Financial Holdings, Inc. (Japan) | | | 3,552 | |
| 3,325 | | Standard Life PLC (United Kingdom) | | | 12,216 | |
| 200 | | State Auto Financial Corp. | | | 2,922 | |
| 1,737 | | Suncorp Group Ltd. (Australia) | | | 15,114 | |
| 42 | | Swiss Life Holding AG (Switzerland) | | | 4,997 | |
| 490 | | Swiss Re AG (Switzerland) | | | 31,293 | |
| 29,300 | | Symetra Financial Corp. | | | 337,829 | |
| 800 | | T&D Holdings, Inc. (Japan) | | | 9,269 | |
| 1,000 | | Tokio Marine Holdings, Inc. (Japan) | | | 27,438 | |
| 26 | | Tryg A/S (Denmark) | | | 1,466 | |
| 5,300 | | Unum Group | | | 129,744 | |
| 4,600 | | Validus Holdings Ltd. | | | 142,370 | |
| 54 | | Vienna Insurance Group AG Wiener Versicherung Gruppe (Austria) | | | 2,382 | |
| 14,600 | | XL Group PLC (Ireland) | | | 316,674 | |
| 209 | | Zurich Financial Services AG (Switzerland) | | | 56,169 | |
| | | | | | |
| | | | | 6,059,737 | |
|
Internet & Catalog Retail 0.1% | |
| 700 | | 1-800-Flowers.com, Inc. (Class A Stock)* | | | 2,121 | |
| 8,100 | | Expedia, Inc.(a) | | | 270,864 | |
| 2,800 | | HSN, Inc. | | | 106,484 | |
| 2,300 | | Liberty Interactive Corp., Ser. A* | | | 43,907 | |
| 100 | | priceline.com, Inc.* | | | 71,750 | |
| 11 | | Rakuten, Inc. (Japan) | | | 11,522 | |
| | | | | | |
| | | | | 506,648 | |
|
Internet Software & Services 0.7% | |
| 100 | | Dena Co. Ltd. (Japan) | | | 2,770 | |
See Notes to Financial Statements.
| | | | |
| Prudential Asset Allocation Fund | | | 33 | |
Portfolio of Investments
as of March 31, 2012 (Unaudited) continued
| | | | | | |
| Shares | | Description | | Value (Note 1) | |
| | | | | | |
COMMON STOCKS (Continued) | |
|
Internet Software & Services (cont’d.) | |
| 5,100 | | Dice Holdings, Inc.* | | $ | 47,583 | |
| 2,400 | | Google, Inc. (Class A Stock)* | | | 1,538,976 | |
| 100 | | Gree, Inc. (Japan)(a) | | | 2,524 | |
| 4,100 | | IAC/InterActiveCorp | | | 201,269 | |
| 6,900 | | Infospace, Inc.* | | | 88,389 | |
| 2,200 | | IntraLinks Holdings, Inc.* | | | 11,638 | |
| 1,000 | | j2 Global, Inc. | | | 28,680 | |
| 5,700 | | NIC, Inc. | | | 69,141 | |
| 900 | | Perficient, Inc.* | | | 10,809 | |
| 900 | | QuinStreet, Inc.* | | | 9,441 | |
| 181 | | United Internet AG (Germany) | | | 3,411 | |
| 6,700 | | United Online, Inc. | | | 32,763 | |
| 23 | | Yahoo! Japan Corp. (Japan) | | | 7,442 | |
| 16,200 | | Yahoo!, Inc.*(a) | | | 246,564 | |
| 1,200 | | Zix Corp.* | | | 3,492 | |
| | | | | | |
| | | | | 2,304,892 | |
|
IT Services 2.1% | |
| 12,800 | | Accenture PLC (Ireland) (Class A Stock) | | | 825,600 | |
| 388 | | Amadeus IT Holding SA (Spain) (Class A Stock) | | | 7,322 | |
| 65 | | AtoS (France) | | | 3,749 | |
| 1,400 | | CACI International, Inc. (Class A Stock)* | | | 87,206 | |
| 214 | | Cap Gemini SA (France) | | | 9,578 | |
| 600 | | Computershare Ltd. (Australia) | | | 5,594 | |
| 900 | | Dynamics Research Corp.* | | | 8,676 | |
| 400 | | ExlService Holdings, Inc.* | | | 10,976 | |
| 4,600 | | Fiserv, Inc.*(a) | | | 319,194 | |
| 1,400 | | Heartland Payment Systems, Inc. | | | 40,376 | |
| 126 | | Indra Sistemas SA (Spain) | | | 1,544 | |
| 16,841 | | International Business Machines Corp. | | | 3,513,875 | |
| 50 | | ITOCHU Techno-Solutions Corp. (Japan) | | | 2,238 | |
| 500 | | ManTech International Corp. (Class A Stock) | | | 17,230 | |
| 400 | | MasterCard, Inc. (Class A Stock) | | | 168,216 | |
| 1,200 | | MAXIMUS, Inc. | | | 48,804 | |
| 1,000 | | NCI, Inc. (Class A Stock)* | | | 6,390 | |
| 100 | | Nomura Research Institute Ltd. (Japan) | | | 2,480 | |
| 2 | | NTT Data Corp. (Japan) | | | 7,029 | |
| 50 | | Otsuka Corp. (Japan) | | | 4,066 | |
| 10,400 | | SAIC, Inc.*(a) | | | 137,280 | |
| 1,900 | | Syntel, Inc. | | | 106,400 | |
See Notes to Financial Statements.
| | |
| 34 | | Visit our website at www.prudentialfunds.com |
| | | | | | |
| Shares | | Description | | Value (Note 1) | |
| | | | | | |
COMMON STOCKS (Continued) | |
|
IT Services (cont’d.) | |
| 700 | | TeleTech Holdings, Inc.* | | $ | 11,270 | |
| 400 | | TNS, Inc.* | | | 8,692 | |
| 4,800 | | Unisys Corp.* | | | 94,656 | |
| 14,100 | | Visa, Inc. (Class A Stock) | | | 1,663,800 | |
| | | | | | |
| | | | | 7,112,241 | |
|
Leisure Equipment & Products 0.2% | |
| 2,400 | | Arctic Cat, Inc.* | | | 102,792 | |
| 300 | | Namco Bandai Holdings, Inc. (Japan) | | | 4,328 | |
| 500 | | Nikon Corp. (Japan) | | | 15,175 | |
| 6,800 | | Polaris Industries, Inc.(a) | | | 490,620 | |
| 50 | | Sankyo Co. Ltd. (Japan) | | | 2,452 | |
| 300 | | Sega Sammy Holdings, Inc. (Japan) | | | 6,285 | |
| 100 | | Shimano, Inc. (Japan) | | | 6,023 | |
| 400 | | Steinway Musical Instruments, Inc.* | | | 10,000 | |
| 2,000 | | Sturm, Ruger & Co., Inc. | | | 98,200 | |
| 200 | | Yamaha Corp. (Japan) | | | 2,073 | |
| | | | | | |
| | | | | 737,948 | |
|
Life Sciences Tools & Services 0.2% | |
| 700 | | Cambrex Corp.* | | | 4,893 | |
| 500 | | Charles River Laboratories International, Inc.* | | | 18,045 | |
| 900 | | eResearchTechnology, Inc.* | | | 7,038 | |
| 81 | | Lonza Group AG (Switzerland) | | | 4,187 | |
| 900 | | Mettler-Toledo International, Inc.*(a) | | | 166,275 | |
| 319 | | QIAGEN NV* | | | 4,967 | |
| 11,400 | | Thermo Fisher Scientific, Inc. | | | 642,732 | |
| | | | | | |
| | | | | 848,137 | |
|
Machinery 1.5% | |
| 8,900 | | AGCO Corp.*(a) | | | 420,169 | |
| 489 | | Alfa Laval AB (Sweden) | | | 10,060 | |
| 500 | | Amada Co. Ltd. (Japan) | | | 3,371 | |
| 500 | | American Railcar Industries, Inc.* | | | 11,755 | |
| 970 | | Atlas Copco AB (Sweden) (Class A Stock) | | | 23,474 | |
| 573 | | Atlas Copco AB (Sweden) (Class B Stock) | | | 12,351 | |
| 400 | | Cascade Corp. | | | 20,048 | |
| 800 | | CLARCOR, Inc. | | | 39,272 | |
| 1,000 | | Cosco Corp. Singapore Ltd. (Singapore) | | | 927 | |
| 1,300 | | Crane Co. | | | 63,050 | |
See Notes to Financial Statements.
| | | | |
| Prudential Asset Allocation Fund | | | 35 | |
Portfolio of Investments
as of March 31, 2012 (Unaudited) continued
| | | | | | |
| Shares | | Description | | Value (Note 1) | |
| | | | | | |
COMMON STOCKS (Continued) | |
|
Machinery (cont’d.) | |
| 10,900 | | Cummins, Inc. | | $ | 1,308,436 | |
| 15,300 | | Deere & Co. | | | 1,237,770 | |
| 1,200 | | Dover Corp. | | | 75,528 | |
| 300 | | FANUC Corp. (Japan) | | | 53,208 | |
| 1,200 | | Federal Signal Corp.* | | | 6,672 | |
| 1,093 | | Fiat Industrial SpA (Italy)* | | | 11,662 | |
| 269 | | GEA Group AG (Germany) | | | 9,278 | |
| 500 | | Hino Motors Ltd. (Japan) | | | 3,612 | |
| 100 | | Hitachi Construction Machinery Co. Ltd. (Japan) | | | 2,212 | |
| 2,000 | | IHI Corp. (Japan) | | | 5,050 | |
| 3,300 | | Illinois Tool Works, Inc. | | | 188,496 | |
| 1,080 | | Invensys PLC (United Kingdom) | | | 3,438 | |
| 500 | | Japan Steel Works Ltd. (The) (Japan) | | | 3,425 | |
| 800 | | John Bean Technologies Corp. | | | 12,960 | |
| 300 | | JTEKT Corp. (Japan) | | | 3,592 | |
| 2,000 | | Kawasaki Heavy Industries Ltd. (Japan) | | | 6,113 | |
| 1,400 | | Komatsu Ltd. (Japan) | | | 39,901 | |
| 228 | | Kone OYJ (Finland) (Class B Stock) | | | 12,702 | |
| 2,000 | | Kubota Corp. (Japan) | | | 19,210 | |
| 100 | | Kurita Water Industries Ltd. (Japan) | | | 2,450 | |
| 600 | | L.B. Foster Co. (Class A Stock) | | | 17,106 | |
| 2,300 | | Lincoln Electric Holdings, Inc. | | | 104,236 | |
| 600 | | Lindsay Corp. | | | 39,762 | |
| 150 | | Makita Corp. (Japan) | | | 6,017 | |
| 128 | | MAN SE (Germany) | | | 17,042 | |
| 1,300 | | Meritor, Inc.* | | | 10,491 | |
| 185 | | Metso OYJ (Finland) | | | 7,908 | |
| 300 | | Miller Industries, Inc. | | | 5,076 | |
| 4,500 | | Mitsubishi Heavy Industries Ltd. (Japan) | | | 21,801 | |
| 100 | | Mueller Industries, Inc. | | | 4,545 | |
| 690 | | NACCO Industries, Inc. (Class A Stock) | | | 80,295 | |
| 500 | | NGK Insulators Ltd. (Japan) | | | 7,134 | |
| 1,000 | | NSK Ltd. (Japan) | | | 7,696 | |
| 1,000 | | NTN Corp. (Japan) | | | 4,229 | |
| 6,600 | | Oshkosh Corp.*(a) | | | 152,922 | |
| 1,600 | | Robbins & Myers, Inc. | | | 83,280 | |
| 1,435 | | Sandvik AB (Sweden) | | | 20,714 | |
| 1,800 | | Sauer-Danfoss, Inc. | | | 84,600 | |
| 459 | | Scania AB (Sweden) (Class B Stock) | | | 9,547 | |
| 33 | | Schindler Holding AG (Switzerland) | | | 3,944 | |
See Notes to Financial Statements.
| | |
| 36 | | Visit our website at www.prudentialfunds.com |
| | | | | | |
| Shares | | Description | | Value (Note 1) | |
| | | | | | |
COMMON STOCKS (Continued) | |
|
Machinery (cont’d.) | |
| 68 | | Schindler Holding AG - Part Certification (Switzerland) | | $ | 8,181 | |
| 1,000 | | SembCorp Marine Ltd. (Singapore) | | | 4,200 | |
| 552 | | SKF AB (Sweden) (Class B Stock) | | | 13,475 | |
| 100 | | SMC Corp. (Japan) | | | 15,899 | |
| 34 | | Sulzer AG (Switzerland) | | | 4,832 | |
| 500 | | Sumitomo Heavy Industries Ltd. (Japan) | | | 2,779 | |
| 2,450 | | Sun Hydraulics Corp. | | | 64,092 | |
| 150 | | THK Co. Ltd. (Japan) | | | 3,050 | |
| 5,100 | | Toro Co. (The) | | | 362,661 | |
| 200 | | Trimas Corp.* | | | 4,478 | |
| 164 | | Vallourec SA (France) | | | 10,390 | |
| 900 | | Valmont Industries, Inc. | | | 105,669 | |
| 1,984 | | Volvo AB (Sweden) (Class B Stock) | | | 28,909 | |
| 222 | | Wartsila OYJ (Finland) | | | 8,373 | |
| 326 | | Weir Group PLC (The) (United Kingdom) | | | 9,198 | |
| 4,000 | | Yangzijiang Shipbuilding Holdings Ltd. (Singapore) | | | 4,232 | |
| 219 | | Zardoya Otis SA (Spain) | | | 2,836 | |
| | | | | | |
| | | | | 4,951,791 | |
|
Marine | |
| 1 | | A.P. Moller - Maersk A/S (Denmark) (Class A Stock) | | | 7,356 | |
| 2 | | A.P. Moller - Maersk A/S (Denmark) (Class B Stock) | | | 15,442 | |
| 1,000 | | Kawasaki Kisen Kaisha Ltd. (Japan)* | | | 2,199 | |
| 79 | | Kuehne + Nagel International AG (Switzerland) | | | 10,686 | |
| 1,500 | | Mitsui O.S.K. Lines Ltd. (Japan) | | | 6,524 | |
| 1,000 | | Neptune Orient Lines Ltd. (Singapore) | | | 1,126 | |
| 2,000 | | Nippon Yusen K.K. (Japan) | | | 6,282 | |
| 500 | | Orient Overseas International Ltd. (Hong Kong) | | | 3,557 | |
| | | | | | |
| | | | | 53,172 | |
|
Media 1.4% | |
| 30 | | Axel Springer AG (Germany) | | | 1,515 | |
| 1,613 | | British Sky Broadcasting Group PLC (United Kingdom) | | | 17,441 | |
| 5,700 | | Cinemark Holdings, Inc. | | | 125,115 | |
| 3,600 | | Comcast Corp. (Class A Stock) | | | 108,036 | |
| 250 | | Dentsu, Inc. (Japan) | | | 7,962 | |
| 24,300 | | DIRECTV (Class A Stock)* | | | 1,198,962 | |
| 132 | | Eutelsat Communications SA (France) | | | 4,880 | |
| 3,413 | | Fairfax Media Ltd. (Australia) | | | 2,563 | |
| 4,000 | | Global Sources Ltd.* | | | 24,640 | |
See Notes to Financial Statements.
| | | | |
| Prudential Asset Allocation Fund | | | 37 | |
Portfolio of Investments
as of March 31, 2012 (Unaudited) continued
| | | | | | |
| Shares | | Description | | Value (Note 1) | |
| | | | | | |
COMMON STOCKS (Continued) | |
|
Media (cont’d.) | |
| 50 | | Hakuhodo DY Holdings, Inc. (Japan) | | $ | 3,141 | |
| 5,818 | | ITV PLC (United Kingdom) | | | 8,222 | |
| 95 | | JCDecaux SA (France)* | | | 2,903 | |
| 2,400 | | Journal Communications, Inc. (Class A Stock)* | | | 13,512 | |
| 2 | | Jupiter Telecommunications Co. Ltd. (Japan) | | | 2,003 | |
| 128 | | Kabel Deutschland Holding AG (Germany)* | | | 7,906 | |
| 162 | | Lagardere SCA (France) | | | 4,997 | |
| 400 | | Liberty Media Corp. - Liberty Capital, Ser. A* | | | 35,260 | |
| 3,000 | | McGraw-Hill Cos., Inc. (The) | | | 145,410 | |
| 959 | | Mediaset SpA (Italy) | | | 2,645 | |
| 64 | | Modern Times Group AB (Sweden) (Class B Stock) | | | 3,525 | |
| 34,800 | | News Corp. (Class A Stock) | | | 685,212 | |
| 1,131 | | Pearson PLC (United Kingdom) | | | 21,075 | |
| 214 | | Publicis Groupe SA (France) | | | 11,798 | |
| 1,015 | | Reed Elsevier NV (Netherlands) | | | 12,963 | |
| 1,691 | | Reed Elsevier PLC (United Kingdom) | | | 15,011 | |
| 109 | | Sanoma OYJ (Finland) | | | 1,396 | |
| 434 | | SES SA (France) | | | 10,769 | |
| 1,300 | | Sinclair Broadcast Group, Inc. (Class A Stock) | | | 14,378 | |
| 2,000 | | Singapore Press Holdings Ltd. (Singapore) | | | 6,237 | |
| 170 | | Societe Television Francaise 1 (France) | | | 2,082 | |
| 30,000 | | Time Warner, Inc.(a) | | | 1,132,500 | |
| 200 | | Toho Co. Ltd. (Japan) | | | 3,670 | |
| 16,400 | | Viacom, Inc. (Class B Stock) | | | 778,344 | |
| 4,875 | | Walt Disney Co. (The) | | | 213,427 | |
| 429 | | Wolters Kluwer NV (Netherlands) | | | 8,125 | |
| 1,798 | | WPP PLC (United Kingdom) | | | 24,574 | |
| | | | | | |
| | | | | 4,662,199 | |
|
Metals & Mining 1.1% | |
| 153 | | Acerinox SA (Spain) | | | 1,967 | |
| 3,468 | | Alumina Ltd. (Australia) | | | 4,437 | |
| 1,891 | | Anglo American PLC (United Kingdom) | | | 70,686 | |
| 522 | | Antofagasta PLC (United Kingdom) | | | 9,619 | |
| 1,227 | | ArcelorMittal (Netherlands) | | | 23,451 | |
| 4,644 | | BHP Billiton Ltd. (Australia) | | | 166,491 | |
| 3,030 | | BHP Billiton PLC (United Kingdom) | | | 92,446 | |
| 420 | | Boliden AB (Sweden) | | | 6,596 | |
| 4,900 | | Coeur d’Alene Mines Corp.* | | | 116,326 | |
| 10,100 | | Commercial Metals Co. | | | 149,682 | |
See Notes to Financial Statements.
| | |
| 38 | | Visit our website at www.prudentialfunds.com |
| | | | | | |
| Shares | | Description | | Value (Note 1) | |
| | | | | | |
COMMON STOCKS (Continued) | |
|
Metals & Mining (cont’d.) | |
| 500 | | Daido Steel Co. Ltd. (Japan) | | $ | 3,461 | |
| 319 | | Eurasian Natural Resources Corp. PLC (United Kingdom) | | | 3,023 | |
| 1,815 | | Fortescue Metals Group Ltd. (Australia) | | | 10,923 | |
| 20,300 | | Freeport-McMoRan Copper & Gold, Inc. | | | 772,212 | |
| 240 | | Fresnillo PLC (United Kingdom) | | | 6,134 | |
| 1,781 | | Glencore International PLC (United Kingdom) | | | 11,093 | |
| 400 | | Haynes International, Inc. | | | 25,340 | |
| 7,000 | | Hecla Mining Co. | | | 32,340 | |
| 200 | | Hitachi Metals Ltd. (Japan) | | | 2,484 | |
| 737 | | Iluka Resources Ltd. (Australia) | | | 13,581 | |
| 600 | | JFE Holdings, Inc. (Japan) | | | 12,889 | |
| 289 | | Kazakhmys PLC (United Kingdom) | | | 4,197 | |
| 4,000 | | Kobe Steel Ltd. (Japan) | | | 6,476 | |
| 196 | | Lonmin PLC (United Kingdom) | | | 3,204 | |
| 1,422 | | Lynas Corp. Ltd. (Australia)* | | | 1,613 | |
| 100 | | Maruichi Steel Tube Ltd. (Japan) | | | 2,334 | |
| 1,700 | | Metals USA Holdings Corp.* | | | 24,497 | |
| 2,000 | | Mitsubishi Materials Corp. (Japan) | | | 6,331 | |
| 1,084 | | Newcrest Mining Ltd. (Australia) | | | 33,327 | |
| 3,000 | | Newmont Mining Corp. | | | 153,810 | |
| 7,000 | | Nippon Steel Corp. (Japan) | | | 19,198 | |
| 1,000 | | Nisshin Steel Co. Ltd. (Japan) | | | 1,679 | |
| 6,400 | | Noranda Aluminum Holding Corp. | | | 63,808 | |
| 1,285 | | Norsk Hydro ASA (Norway) | | | 6,997 | |
| 503 | | OZ Minerals Ltd. (Australia) | | | 5,085 | |
| 131 | | Randgold Resources Ltd. (United Kingdom) | | | 11,252 | |
| 6,800 | | Reliance Steel & Aluminum Co. | | | 384,064 | |
| 621 | | Rio Tinto Ltd. (Australia) | | | 42,069 | |
| 2,002 | | Rio Tinto PLC (United Kingdom) | | | 110,347 | |
| 49 | | Salzgitter AG (Germany) | | | 2,686 | |
| 258 | | Sims Metal Management Ltd. (Australia) | | | 3,926 | |
| 22,300 | | Southern Copper Corp. | | | 707,133 | |
| 209 | | SSAB AB (Sweden) (Class A Stock) | | | 1,976 | |
| 41,900 | | Steel Dynamics, Inc. | | | 609,226 | |
| 5,000 | | Sumitomo Metal Industries Ltd. (Japan) | | | 10,088 | |
| 1,000 | | Sumitomo Metal Mining Co. Ltd. (Japan) | | | 14,051 | |
| 551 | | ThyssenKrupp AG (Germany) | | | 13,716 | |
| 161 | | Umicore SA (Belgium) | | | 8,869 | |
| 189 | | Vedanta Resources PLC (United Kingdom) | | | 3,712 | |
| 149 | | Voestalpine AG (Austria) | | | 5,011 | |
See Notes to Financial Statements.
| | | | |
| Prudential Asset Allocation Fund | | | 39 | |
Portfolio of Investments
as of March 31, 2012 (Unaudited) continued
| | | | | | |
| Shares | | Description | | Value (Note 1) | |
| | | | | | |
COMMON STOCKS (Continued) | |
|
Metals & Mining (cont’d.) | |
| 2,948 | | Xstrata PLC (United Kingdom) | | $ | 50,359 | |
| 100 | | Yamato Kogyo Co. Ltd. (Japan) | | | 2,918 | |
| | | | | | |
| | | | | 3,849,140 | |
|
Multiline Retail 0.6% | |
| 7,000 | | Dollar Tree, Inc.* | | | 661,430 | |
| 800 | | Gordmans Stores, Inc.* | | | 17,576 | |
| 689 | | Harvey Norman Holdings Ltd. (Australia) | | | 1,435 | |
| 600 | | Isetan Mitsukoshi Holdings Ltd. (Japan) | | | 7,046 | |
| 700 | | J. Front Retailing Co. Ltd. (Japan) | | | 3,907 | |
| 6,700 | | Kohl’s Corp. | | | 335,201 | |
| 1,000 | | Lifestyle International Holdings Ltd. (Hong Kong) | | | 2,537 | |
| 2,244 | | Marks & Spencer Group PLC (United Kingdom) | | | 13,603 | |
| 400 | | Marui Group Co. Ltd. (Japan) | | | 3,335 | |
| 257 | | Next PLC (United Kingdom) | | | 12,262 | |
| 107 | | PPR (France) | | | 18,409 | |
| 400 | | Takashimaya Co. Ltd. (Japan) | | | 3,320 | |
| 13,600 | | Target Corp. | | | 792,472 | |
| | | | | | |
| | | | | 1,872,533 | |
|
Multi-Utilities 0.8% | |
| 855 | | A2A SpA (Italy) | �� | | 686 | |
| 645 | | AGL Energy Ltd. (Australia) | | | 9,855 | |
| 6,100 | | Ameren Corp. | | | 198,738 | |
| 2,800 | | Avista Corp. | | | 71,624 | |
| 7,504 | | Centrica PLC (United Kingdom) | | | 37,976 | |
| 24,500 | | Dominion Resources, Inc. | | | 1,254,645 | |
| 1,758 | | GDF SUEZ (France) | | | 45,416 | |
| 5,170 | | National Grid PLC (United Kingdom) | | | 52,138 | |
| 28,300 | | Public Service Enterprise Group, Inc. | | | 866,263 | |
| 792 | | RWE AG (Germany) | | | 37,821 | |
| 395 | | Suez Environnement Co. (France) | | | 6,058 | |
| 512 | | Veolia Environnement SA (France) | | | 8,491 | |
| | | | | | |
| | | | | 2,589,711 | |
|
Office Electronics 0.1% | |
| 400 | | Brother Industries Ltd. (Japan) | | | 5,422 | |
| 1,600 | | Canon, Inc. (Japan) | | | 75,583 | |
| 500 | | Konica Minolta Holdings, Inc. (Japan) | | | 4,368 | |
| 53 | | Neopost SA (France) | | | 3,408 | |
See Notes to Financial Statements.
| | |
| 40 | | Visit our website at www.prudentialfunds.com |
| | | | | | |
| Shares | | Description | | Value (Note 1) | |
| | | | | | |
COMMON STOCKS (Continued) | |
|
Office Electronics (cont’d.) | |
| 1,000 | | Ricoh Co. Ltd. (Japan) | | $ | 9,726 | |
| 21,800 | | Xerox Corp. | | | 176,144 | |
| | | | | | |
| | | | | 274,651 | |
|
Oil, Gas & Consumable Fuels 5.9% | |
| 5,200 | | ALON USA Energy, Inc. | | | 47,060 | |
| 1,500 | | Anadarko Petroleum Corp. | | | 117,510 | |
| 10,600 | | Apache Corp. | | | 1,064,664 | |
| 470 | | Apco Oil and Gas International, Inc. | | | 32,040 | |
| 4,825 | | BG Group PLC (United Kingdom) | | | 111,750 | |
| 27,675 | | BP PLC (United Kingdom) | | | 204,752 | |
| 181 | | Caltex Australia Ltd. (Australia) | | | 2,604 | |
| 38,392 | | Chevron Corp. | | | 4,117,158 | |
| 2,500 | | Cloud Peak Energy, Inc.* | | | 39,825 | |
| 30,300 | | ConocoPhillips | | | 2,303,103 | |
| 800 | | Contango Oil & Gas Co.* | | | 47,128 | |
| 1,000 | | Cosmo Oil Co. Ltd. (Japan) | | | 2,779 | |
| 800 | | Energy Partners Ltd.* | | | 13,288 | |
| 4,100 | | Energy XXI (Bermuda) Ltd.* | | | 148,051 | |
| 3,423 | | ENI SpA (Italy) | | | 80,303 | |
| 3,800 | | EOG Resources, Inc. | | | 422,180 | |
| 200 | | Essar Energy PLC (United Kingdom)* | | | 497 | |
| 71,154 | | Exxon Mobil Corp. | | | 6,171,186 | |
| 315 | | Galp Energia SGPS SA (Portugal) (Class B Stock) | | | 5,184 | |
| 2,600 | | Golar LNG Ltd. (Norway) | | | 98,930 | |
| 19,200 | | Hess Corp. | | | 1,131,840 | |
| 60 | | Idemitsu Kosan Co. Ltd. (Japan) | | | 5,980 | |
| 3 | | Inpex Corp. (Japan) | | | 20,261 | |
| 3,310 | | JX Holdings, Inc. (Japan) | | | 20,515 | |
| 262 | | Lundin Petroleum AB (Sweden)* | | | 5,616 | |
| 13,956 | | Marathon Oil Corp. | | | 442,405 | |
| 4,278 | | Marathon Petroleum Corp. | | | 185,494 | |
| 3,900 | | Murphy Oil Corp. | | | 219,453 | |
| 185 | | Neste Oil OYJ (Finland) | | | 2,279 | |
| 5,300 | | Newfield Exploration Co.* | | | 183,804 | |
| 12,900 | | Occidental Petroleum Corp. | | | 1,228,467 | |
| 252 | | OMV AG (Austria)(a) | | | 8,957 | |
| 1,520 | | Origin Energy Ltd. (Australia) | | | 21,020 | |
| 1,101 | | Repsol YPF SA (Spain) | | | 27,621 | |
| 1,600 | | Rex American Resources Corp.* | | | 49,120 | |
See Notes to Financial Statements.
| | | | |
| Prudential Asset Allocation Fund | | | 41 | |
Portfolio of Investments
as of March 31, 2012 (Unaudited) continued
| | | | | | |
| Shares | | Description | | Value (Note 1) | |
| | | | | | |
COMMON STOCKS (Continued) | |
|
Oil, Gas & Consumable Fuels (cont’d.) | |
| 5,288 | | Royal Dutch Shell PLC (United Kingdom) (Class A Stock) | | $ | 184,682 | |
| 3,881 | | Royal Dutch Shell PLC (United Kingdom) (Class B Stock) | | | 136,536 | |
| 1,439 | | Santos Ltd. (Australia) | | | 21,226 | |
| 300 | | Showa Shell Sekiyu K.K. (Japan) | | | 1,914 | |
| 1,590 | | Statoil ASA (Norway) | | | 43,165 | |
| 3,900 | | Stone Energy Corp.* | | | 111,501 | |
| 500 | | TonenGeneral Sekiyu K.K. (Japan) | | | 4,603 | |
| 3,069 | | Total SA (France) | | | 156,522 | |
| 1,264 | | Tullow Oil PLC (United Kingdom) | | | 30,872 | |
| 6,500 | | Vaalco Energy, Inc.* | | | 61,425 | |
| 7,700 | | Valero Energy Corp. | | | 198,429 | |
| 2,200 | | Western Refining, Inc. | | | 41,404 | |
| 2,900 | | Williams Cos., Inc. (The) | | | 89,349 | |
| 884 | | Woodside Petroleum Ltd. (Australia) | | | 31,875 | |
| 1,900 | | World Fuel Services Corp. | | | 77,900 | |
| | | | | | |
| | | | | 19,774,227 | |
|
Paper & Forest Products 0.1% | |
| 2,800 | | Buckeye Technologies, Inc. | | | 95,116 | |
| 74 | | Holmen AB (Sweden) (Class B Stock) | | | 2,032 | |
| 400 | | KapStone Paper and Packaging Corp.* | | | 7,880 | |
| 100 | | Nippon Paper Group, Inc. (Japan) | | | 2,082 | |
| 1,000 | | OJI Paper Co. Ltd. (Japan) | | | 4,833 | |
| 1,500 | | Schweitzer-Mauduit International, Inc. | | | 103,590 | |
| 851 | | Stora ENSO OYJ (Finland) (Class R Stock) | | | 6,322 | |
| 851 | | Svenska Cellulosa AB (Sweden) (Class B Stock) | | | 14,741 | |
| 760 | | UPM-Kymmene OYJ (Finland) | | | 10,349 | |
| | | | | | |
| | | | | 246,945 | |
|
Personal Products 0.2% | |
| 17,000 | | Avon Products, Inc. | | | 329,120 | |
| 140 | | Beiersdorf AG (Germany) | | | 9,135 | |
| 800 | | Kao Corp. (Japan) | | | 20,993 | |
| 333 | | L’Oreal SA (France) | | | 41,077 | |
| 2,400 | | Nu Skin Enterprises, Inc. (Class A Stock) | | | 138,984 | |
| 500 | | Shiseido Co. Ltd. (Japan) | | | 8,627 | |
| 500 | | USANA Health Sciences, Inc.* | | | 18,665 | |
| | | | | | |
| | | | | 566,601 | |
See Notes to Financial Statements.
| | |
| 42 | | Visit our website at www.prudentialfunds.com |
| | | | | | |
| Shares | | Description | | Value (Note 1) | |
| | | | | | |
COMMON STOCKS (Continued) | |
|
Pharmaceuticals 3.4% | |
| 28,900 | | Abbott Laboratories(a) | | $ | 1,771,281 | |
| 600 | | Astellas Pharma, Inc. (Japan) | | | 24,647 | |
| 1,932 | | AstraZeneca PLC (United Kingdom) | | | 85,877 | |
| 1,172 | | Bayer AG (Germany) | | | 82,438 | |
| 33,300 | | Bristol-Myers Squibb Co. | | | 1,123,875 | |
| 300 | | Chugai Pharmaceutical Co. Ltd. (Japan) | | | 5,531 | |
| 900 | | Daiichi Sankyo Co. Ltd. (Japan) | | | 16,397 | |
| 300 | | Dainippon Sumitomo Pharma Co. Ltd. (Japan) | | | 3,179 | |
| 400 | | Eisai Co. Ltd. (Japan) | | | 15,900 | |
| 900 | | Elan Corp. PLC (Ireland)* | | | 13,174 | |
| 22,700 | | Eli Lilly & Co. | | | 914,129 | |
| 7,282 | | GlaxoSmithKline PLC (United Kingdom) | | | 162,657 | |
| 100 | | Hisamitsu Pharmaceutical Co., Inc. (Japan) | | | 4,742 | |
| 500 | | Hi-Tech Pharmacal Co., Inc.* | | | 17,965 | |
| 2,400 | | Impax Laboratories, Inc.* | | | 58,992 | |
| 2,100 | | Jazz Pharmaceuticals PLC* | | | 101,787 | |
| 25,100 | | Johnson & Johnson | | | 1,655,596 | |
| 200 | | Kyowa Hakko Kirin Co. Ltd. (Japan) | | | 2,223 | |
| 900 | | Medicis Pharmaceutical Corp. (Class A Stock) | | | 33,831 | |
| 48,489 | | Merck & Co., Inc. | | | 1,861,978 | |
| 91 | | Merck KGaA (Germany) | | | 10,071 | |
| 500 | | Mitsubishi Tanabe Pharma Corp. (Japan) | | | 7,013 | |
| 3,374 | | Novartis AG (Switzerland) | | | 186,734 | |
| 614 | | Novo Nordisk A/S (Denmark) (Class B Stock) | | | 85,010 | |
| 4,700 | | Obagi Medical Products, Inc.* | | | 62,980 | |
| 100 | | Ono Pharmaceutical Co. Ltd. (Japan) | | | 5,570 | |
| 131 | | Orion OYJ (Finland) (Class B Stock) | | | 2,589 | |
| 400 | | Otsuka Holdings Co. Ltd. (Japan) | | | 11,840 | |
| 3,300 | | Par Pharmaceutical Cos., Inc.* | | | 127,809 | |
| 91,819 | | Pfizer, Inc. | | | 2,080,619 | |
| 500 | | Questcor Pharmaceuticals, Inc.* | | | 18,810 | |
| 1,016 | | Roche Holding AG (Switzerland) | | | 176,818 | |
| 1,657 | | Sanofi (France) | | | 128,686 | |
| 100 | | Santen Pharmaceutical Co. Ltd. (Japan) | | | 4,271 | |
| 300 | | Shionogi & Co. Ltd. (Japan) | | | 4,146 | |
| 789 | | Shire PLC (United Kingdom) | | | 25,492 | |
| 30 | | Taisho Pharmaceutical Holdings Co. Ltd. (Japan) | | | 2,432 | |
| 1,100 | | Takeda Pharmaceutical Co. Ltd. (Japan) | | | 48,441 | |
| 1,339 | | Teva Pharmaceutical Industries Ltd. (Israel) | | | 59,203 | |
| 100 | | Tsumura & Co. (Japan) | | | 2,889 | |
See Notes to Financial Statements.
| | | | |
| Prudential Asset Allocation Fund | | | 43 | |
Portfolio of Investments
as of March 31, 2012 (Unaudited) continued
| | | | | | |
| Shares | | Description | | Value (Note 1) | |
| | | | | | |
COMMON STOCKS (Continued) | |
|
Pharmaceuticals (cont’d.) | |
| 119 | | UCB SA (Belgium) | | $ | 5,134 | |
| 1,200 | | ViroPharma, Inc.* | | | 36,084 | |
| 7,500 | | Watson Pharmaceuticals, Inc.* | | | 502,950 | |
| | | | | | |
| | | | | 11,551,790 | |
|
Professional Services 0.1% | |
| 180 | | Adecco SA (Switzerland) | | | 9,432 | |
| 100 | | Barrett Business Services, Inc. | | | 1,983 | |
| 65 | | Bureau Veritas SA (France) | | | 5,721 | |
| 95 | | Campbell Brothers Ltd. (Australia) | | | 6,616 | |
| 889 | | Capita PLC (United Kingdom) | | | 10,416 | |
| 1,456 | | Experian PLC (United Kingdom) | | | 22,695 | |
| 700 | | Exponent, Inc.* | | | 33,964 | |
| 1,800 | | ICF International, Inc.* | | | 45,666 | |
| 1,000 | | Insperity, Inc. | | | 30,640 | |
| 222 | | Intertek Group PLC (United Kingdom) | | | 8,916 | |
| 700 | | Kforce, Inc.* | | | 10,430 | |
| 1,300 | | Korn/Ferry International* | | | 21,775 | |
| 3,400 | | Navigant Consulting, Inc.* | | | 47,294 | |
| 156 | | Randstad Holding NV (Netherlands) | | | 5,886 | |
| 8 | | SGS SA (Switzerland) | | | 15,562 | |
| | | | | | |
| | | | | 276,996 | |
|
Real Estate Investment Trusts 1.2% | |
| 1,000 | | AG Mortgage Investment Trust, Inc. | | | 19,740 | |
| 200 | | Agree Realty Corp. | | | 4,516 | |
| 1,600 | | American Campus Communities, Inc. | | | 71,552 | |
| 1,100 | | American Capital Agency Corp. | | | 32,494 | |
| 3,400 | | Anworth Mortgage Asset Corp. | | | 22,372 | |
| 800 | | Apollo Commercial Real Estate Finance, Inc. | | | 12,520 | |
| 2,000 | | Ascendas Real Estate Investment Trust (Singapore) | | | 3,214 | |
| 5,100 | | Ashford Hospitality Trust, Inc. | | | 45,951 | |
| 1,179 | | British Land Co. PLC (United Kingdom) | | | 9,050 | |
| 2,500 | | Camden Property Trust | | | 164,375 | |
| 796 | | Capital Shopping Centres Group PLC (United Kingdom) | | | 4,219 | |
| 3,000 | | CapitaMall Trust (Singapore) | | | 4,308 | |
| 1,000 | | CapLease, Inc. | | | 4,030 | |
| 5,500 | | Capstead Mortgage Corp. | | | 72,105 | |
| 4,100 | | Cedar Realty Trust, Inc. | | | 20,992 | |
| 2,896 | | CFS Retail Property Trust (Australia) | | | 5,370 | |
See Notes to Financial Statements.
| | |
| 44 | | Visit our website at www.prudentialfunds.com |
| | | | | | |
| Shares | | Description | | Value (Note 1) | |
| | | | | | |
COMMON STOCKS (Continued) | |
|
Real Estate Investment Trusts (cont’d.) | |
| 2,300 | | Chatham Lodging Trust | | $ | 29,187 | |
| 57,200 | | Chimera Investment Corp. | | | 161,876 | |
| 2,200 | | Cogdell Spencer, Inc. | | | 9,328 | |
| 1,700 | | Colony Financial, Inc. | | | 27,846 | |
| 17,200 | | CommonWealth REIT | | | 320,264 | |
| 91 | | Corio NV (Netherlands) | | | 4,800 | |
| 4,000 | | Corporate Office Properties Trust | | | 92,840 | |
| 1,600 | | CreXus Investment Corp. | | | 16,544 | |
| 2,600 | | DCT Industrial Trust, Inc. | | | 15,340 | |
| 6,614 | | Dexus Property Group (Australia) | | | 5,960 | |
| 6,600 | | Dynex Capital, Inc. | | | 63,030 | |
| 3,300 | | First Industrial Realty Trust, Inc.* | | | 40,755 | |
| 39 | | Fonciere des Regions (France)(a) | | | 3,133 | |
| 6,200 | | Franklin Street Properties Corp. | | | 65,720 | |
| 27 | | Gecina SA (France) | | | 2,821 | |
| 1,900 | | Gladstone Commercial Corp. | | | 32,699 | |
| 10,477 | | Goodman Group (Australia) | | | 7,488 | |
| 2,100 | | Government Properties Income Trust | | | 50,631 | |
| 2,480 | | GPT Group (Australia) | | | 8,015 | |
| 979 | | Hammerson PLC (United Kingdom) | | | 6,508 | |
| 2,700 | | Hatteras Financial Corp. | | | 75,330 | |
| 14,500 | | Hospitality Properties Trust | | | 383,815 | |
| 34 | | ICADE (France)(a) | | | 3,033 | |
| 7,800 | | Inland Real Estate Corp. | | | 69,186 | |
| 6,400 | | Invesco Mortgage Capital, Inc. | | | 112,960 | |
| 2,400 | | Investors Real Estate Trust | | | 18,456 | |
| 1 | | Japan Prime Realty Investment Corp. (Japan) | | | 2,874 | |
| 1 | | Japan Real Estate Investment Corp. (Japan) | | | 8,808 | |
| 2 | | Japan Retail Fund Investment Corp. (Japan) | | | 2,970 | |
| 153 | | Klepierre (France) | | | 5,305 | |
| 1,141 | | Land Securities Group PLC (United Kingdom) | | | 13,186 | |
| 700 | | LaSalle Hotel Properties | | | 19,698 | |
| 3,000 | | Link REIT (The) (Hong Kong) | | | 11,165 | |
| 16,500 | | MFA Financial, Inc. | | | 123,255 | |
| 5,155 | | Mirvac Group (Australia) | | | 6,248 | |
| 1,300 | | Monmouth Real Estate Investment Corp. (Class A Stock) | | | 12,662 | |
| 500 | | National Health Investors, Inc. | | | 24,390 | |
| 1 | | Nippon Building Fund, Inc. (Japan) | | | 9,496 | |
| 1,600 | | Omega Healthcare Investors, Inc. | | | 34,016 | |
| 1,600 | | Pebblebrook Hotel Trust | | | 36,128 | |
See Notes to Financial Statements.
| | | | |
| Prudential Asset Allocation Fund | | | 45 | |
Portfolio of Investments
as of March 31, 2012 (Unaudited) continued
| | | | | | |
| Shares | | Description | | Value (Note 1) | |
| | | | | | |
COMMON STOCKS (Continued) | |
|
Real Estate Investment Trusts (cont’d.) | |
| 4,700 | | PennyMac Mortgage Investment Trust | | $ | 87,749 | |
| 600 | | PS Business Parks, Inc. | | | 39,324 | |
| 4,900 | | Public Storage | | | 677,033 | |
| 11,700 | | Resource Capital Corp. | | | 63,063 | |
| 1,200 | | RLJ Lodging Trust | | | 22,356 | |
| 5,900 | | Sabra Health Care REIT, Inc. | | | 96,996 | |
| 400 | | Saul Centers, Inc. | | | 16,144 | |
| 981 | | Segro PLC (United Kingdom) | | | 3,684 | |
| 2,600 | | Simon Property Group, Inc. | | | 378,768 | |
| 800 | | Sovran Self Storage, Inc. | | | 39,864 | |
| 1,200 | | Starwood Property Trust, Inc. | | | 25,224 | |
| 3,514 | | Stockland (Australia) | | | 10,701 | |
| 2,400 | | Summit Hotel Properties, Inc. | | | 18,192 | |
| 2,900 | | Sunstone Hotel Investors, Inc.* | | | 28,246 | |
| 200 | | Terreno Realty Corp. | | | 2,862 | |
| 130 | | Unibail-Rodamco SE (France) | | | 25,999 | |
| 600 | | Urstadt Biddle Properties, Inc. (Class A Stock) | | | 11,844 | |
| 3,166 | | Westfield Group (Australia) | | | 28,958 | |
| 4,335 | | Westfield Retail Trust (Australia) | | | 11,585 | |
| 4,100 | | Winthrop Realty Trust | | | 47,519 | |
| | | | | | |
| | | | | 4,070,685 | |
|
Real Estate Management & Development 0.3% | |
| 100 | | Aeon Mall Co. Ltd. (Japan) | | | 2,323 | |
| 3,700 | | CapitaLand Ltd. (Singapore) | | | 9,183 | |
| 1,000 | | CapitaMalls Asia Ltd. (Singapore) | | | 1,301 | |
| 2,000 | | Cheung Kong Holdings Ltd. (Hong Kong) | | | 25,832 | |
| 1,000 | | City Developments Ltd. (Singapore) | | | 9,029 | |
| 100 | | Daito Trust Construction Co. Ltd. (Japan) | | | 8,977 | |
| 1,000 | | Daiwa House Industry Co. Ltd. (Japan) | | | 13,217 | |
| 800 | | Forestar Group, Inc.* | | | 12,312 | |
| 2,000 | | Global Logistic Properties Ltd. (Singapore)* | | | 3,500 | |
| 1,000 | | Hang Lung Group Ltd. (Hong Kong) | | | 6,471 | |
| 3,500 | | Hang Lung Properties Ltd. (Hong Kong) | | | 12,823 | |
| 2,000 | | Henderson Land Development Co. Ltd. (Hong Kong) | | | 11,036 | |
| 1,000 | | Hysan Development Co. Ltd. (Hong Kong) | | | 4,005 | |
| 2,100 | | IMMOFINANZ AG (Austria) | | | 7,629 | |
| 8,600 | | Jones Lang LaSalle, Inc. | | | 716,466 | |
| 1,000 | | Keppel Land Ltd. (Singapore) | | | 2,760 | |
| 1,000 | | Kerry Properties Ltd. (Hong Kong) | | | 4,501 | |
See Notes to Financial Statements.
| | |
| 46 | | Visit our website at www.prudentialfunds.com |
| | | | | | |
| Shares | | Description | | Value (Note 1) | |
| | | | | | |
COMMON STOCKS (Continued) | |
|
Real Estate Management & Development (cont’d.) | |
| 738 | | Lend Lease Group (Australia) | | $ | 5,710 | |
| 2,000 | | Mitsubishi Estate Co. Ltd. (Japan) | | | 35,665 | |
| 1,100 | | Mitsui Fudosan Co. Ltd. (Japan) | | | 21,038 | |
| 5,000 | | New World Development Co. Ltd. (Hong Kong) | | | 6,007 | |
| 100 | | Nomura Real Estate Holdings, Inc. (Japan) | | | 1,763 | |
| 2 | | NTT Urban Development Corp. (Japan) | | | 1,629 | |
| 3,300 | | Sino Land Co. Ltd. (Hong Kong) | | | 5,269 | |
| 600 | | Sumitomo Realty & Development Co. Ltd. (Japan) | | | 14,462 | |
| 2,000 | | Sun Hung Kai Properties Ltd. (Hong Kong) | | | 24,853 | |
| 1,000 | | Swire Pacific Ltd. (Hong Kong) (Class A Stock) | | | 11,210 | |
| 700 | | Swire Properties Ltd. (Hong Kong)* | | | 1,740 | |
| 1,000 | | Tokyu Land Corp. (Japan) | | | 4,893 | |
| 1,000 | | UOL Group Ltd. (Singapore) | | | 3,771 | |
| 2,000 | | Wharf Holdings Ltd. (Hong Kong) | | | 10,869 | |
| 1,000 | | Wheelock & Co. Ltd. (Hong Kong) | | | 3,013 | |
| | | | | | |
| | | | | 1,003,257 | |
|
Road & Rail 0.9% | |
| 800 | | Amerco, Inc. | | | 84,408 | |
| 1,406 | | Asciano Ltd. (Australia) | | | 7,136 | |
| 1,000 | | Celadon Group, Inc. | | | 15,550 | |
| 2 | | Central Japan Railway Co. (Japan) | | | 16,479 | |
| 3,000 | | ComfortDelGro Corp. Ltd. (Singapore) | | | 3,723 | |
| 33,600 | | CSX Corp. | | | 723,072 | |
| 300 | | DSV A/S (Denmark) | | | 6,802 | |
| 500 | | East Japan Railway Co. (Japan) | | | 31,473 | |
| 1,000 | | Keikyu Corp. (Japan) | | | 8,747 | |
| 500 | | KEIO Corp. (Japan) | | | 3,582 | |
| 500 | | Keisei Electric Railway Co. Ltd. (Japan) | | | 3,866 | |
| 2,500 | | Kintetsu Corp. (Japan) | | | 9,514 | |
| 2,000 | | MTR Corp. Ltd. (Hong Kong) | | | 7,160 | |
| 1,500 | | Nippon Express Co. Ltd. (Japan) | | | 5,854 | |
| 10,600 | | Norfolk Southern Corp. | | | 697,798 | |
| 700 | | Odakyu Electric Railway Co. Ltd. (Japan) | | | 6,614 | |
| 2,600 | | Old Dominion Freight Line, Inc.* | | | 123,942 | |
| 2,400 | | QR National Ltd. (Australia) | | | 9,273 | |
| 1,000 | | Tobu Railway Co. Ltd. (Japan) | | | 5,304 | |
| 1,500 | | Tokyu Corp. (Japan) | | | 7,122 | |
| 11,300 | | Union Pacific Corp. | | | 1,214,524 | |
| 300 | | West Japan Railway Co. (Japan) | | | 12,051 | |
| | | | | | |
| | | | | 3,003,994 | |
See Notes to Financial Statements.
| | | | |
| Prudential Asset Allocation Fund | | | 47 | |
Portfolio of Investments
as of March 31, 2012 (Unaudited) continued
| | | | | | |
| Shares | | Description | | Value (Note 1) | |
| | | | | | |
COMMON STOCKS (Continued) | |
|
Semiconductors & Semiconductor Equipment 1.3% | |
| 200 | | Advantest Corp. (Japan) | | $ | 3,151 | |
| 500 | | Alpha & Omega Semiconductor Ltd.* | | | 4,810 | |
| 2,200 | | Amtech Systems, Inc.* | | | 18,326 | |
| 33,200 | | Applied Materials, Inc. | | | 413,008 | |
| 1,929 | | ARM Holdings PLC (United Kingdom) | | | 18,266 | |
| 300 | | ASM Pacific Technology Ltd. (Hong Kong) | | | 4,377 | |
| 623 | | ASML Holding NV (Netherlands) | | | 31,142 | |
| 1,700 | | ATMI, Inc.* | | | 39,610 | |
| 300 | | Brooks Automation, Inc. | | | 3,699 | |
| 1,100 | | Cabot Microelectronics Corp. | | | 42,768 | |
| 5,000 | | Cirrus Logic, Inc.* | | | 119,000 | |
| 700 | | Cohu, Inc. | | | 7,959 | |
| 300 | | Cymer, Inc.* | | | 15,000 | |
| 400 | | DSP Group, Inc.* | | | 2,664 | |
| 11,500 | | Entegris, Inc.* | | | 107,410 | |
| 200 | | Hittite Microwave Corp.* | | | 10,862 | |
| 1,630 | | Infineon Technologies AG (Germany) | | | 16,665 | |
| 100,200 | | Intel Corp. | | | 2,816,622 | |
| 400 | | IXYS Corp.* | | | 5,280 | |
| 5,300 | | KLA-Tencor Corp. | | | 288,426 | |
| 2,000 | | Kulicke & Soffa Industries, Inc.* | | | 24,860 | |
| 13,200 | | LSI Corp.* | | | 114,576 | |
| 1,100 | | Monolithic Power Systems, Inc.* | | | 21,637 | |
| 900 | | PDF Solutions, Inc.* | | | 7,587 | |
| 11,200 | | PMC - Sierra, Inc.* | | | 80,976 | |
| 150 | | Rohm Co. Ltd. (Japan) | | | 7,403 | |
| 925 | | STMicroelectronics NV (France) | | | 7,559 | |
| 200 | | Sumco Corp. (Japan)* | | | 2,433 | |
| 3,600 | | Tessera Technologies, Inc.* | | | 62,100 | |
| 250 | | Tokyo Electron Ltd. (Japan) | | | 14,302 | |
| 1,100 | | Ultra Clean Holdings* | | | 8,294 | |
| | | | | | |
| | | | | 4,320,772 | |
|
Software 2.4% | |
| 34,900 | | CA, Inc.(a) | | | 961,844 | |
| 85 | | Dassault Systemes SA (France) | | | 7,821 | |
| 100 | | Digimarc Corp.* | | | 2,794 | |
| 2,800 | | Fair Isaac Corp. | | | 122,920 | |
| 1,400 | | Fortinet, Inc.* | | | 38,710 | |
| 18,900 | | Intuit, Inc. | | | 1,136,457 | |
See Notes to Financial Statements.
| | |
| 48 | | Visit our website at www.prudentialfunds.com |
| | | | | | |
| Shares | | Description | | Value (Note 1) | |
| | | | | | |
COMMON STOCKS (Continued) | |
|
Software (cont’d.) | |
| 100 | | Konami Corp. (Japan) | | $ | 2,834 | |
| 600 | | Manhattan Associates, Inc.* | | | 28,518 | |
| 82,413 | | Microsoft Corp. | | | 2,657,819 | |
| 2,800 | | Monotype Imaging Holdings, Inc.* | | | 41,720 | |
| 3,500 | | Netscout Systems, Inc.* | | | 71,190 | |
| 74 | | NICE Systems Ltd. (Israel)* | | | 2,901 | |
| 150 | | Nintendo Co. Ltd. (Japan) | | | 22,562 | |
| 83,900 | | Oracle Corp. | | | 2,446,524 | |
| 100 | | Oracle Corp. Japan (Japan) | | | 3,800 | |
| 5,900 | | Parametric Technology Corp.* | | | 164,846 | |
| 1,863 | | Sage Group PLC (The) (United Kingdom) | | | 8,916 | |
| 1,317 | | SAP AG (Germany) | | | 91,970 | |
| 2,800 | | SeaChange International, Inc.* | | | 21,784 | |
| 3,700 | | SolarWinds, Inc.* | | | 143,005 | |
| 100 | | Square Enix Holdings Co. Ltd. (Japan) | | | 2,100 | |
| 3,700 | | SS&C Technologies Holdings, Inc.* | | | 86,321 | |
| 6,500 | | Symantec Corp.* | | | 121,550 | |
| 2,300 | | TeleNav, Inc.* | | | 16,146 | |
| 100 | | Trend Micro, Inc. (Japan) | | | 3,072 | |
| | | | | | |
| | | | | 8,208,124 | |
|
Specialty Retail 1.7% | |
| 200 | | America’s Car-Mart, Inc.* | | | 8,796 | |
| 3,700 | | Ascena Retail Group, Inc.* | | | 163,984 | |
| 3,700 | | Bed Bath & Beyond, Inc.* | | | 243,349 | |
| 400 | | Big 5 Sporting Goods Corp. | | | 3,136 | |
| 500 | | Body Central Corp.* | | | 14,510 | |
| 900 | | Destination Maternity Corp. | | | 16,713 | |
| 4,800 | | Express, Inc.* | | | 119,904 | |
| 100 | | Fast Retailing Co. Ltd. (Japan) | | | 22,786 | |
| 3,700 | | Finish Line, Inc. (The) (Class A Stock) | | | 78,514 | |
| 900 | | Genesco, Inc.* | | | 64,485 | |
| 1,473 | | Hennes & Mauritz AB (H&M) (Sweden) (Class B Stock) | | | 53,302 | |
| 25,100 | | Home Depot, Inc. (The) | | | 1,262,781 | |
| 306 | | Inditex SA (Spain) | | | 29,311 | |
| 3,268 | | Kingfisher PLC (United Kingdom) | | | 16,032 | |
| 600 | | Kirkland’s, Inc.* | | | 9,708 | |
| 22,200 | | Lowe’s Cos., Inc. | | | 696,636 | |
| 50 | | Nitori Holdings Co. Ltd. (Japan) | | | 4,519 | |
| 2,700 | | Penske Automotive Group, Inc. | | | 66,501 | |
See Notes to Financial Statements.
| | | | |
| Prudential Asset Allocation Fund | | | 49 | |
Portfolio of Investments
as of March 31, 2012 (Unaudited) continued
| | | | | | |
| Shares | | Description | | Value (Note 1) | |
| | | | | | |
COMMON STOCKS (Continued) | |
|
Specialty Retail (cont’d.) | |
| 1,200 | | PetSmart, Inc.(a) | | $ | 68,664 | |
| 3,500 | | Pier 1 Imports, Inc.* | | | 63,630 | |
| 11,100 | | Ross Stores, Inc. | | | 644,910 | |
| 100 | | Sanrio Co. Ltd. (Japan) | | | 3,902 | |
| 500 | | Select Comfort Corp.* | | | 16,195 | |
| 1,500 | | Shoe Carnival, Inc.* | | | 48,330 | |
| 3,600 | | Stein Mart, Inc.* | | | 23,760 | |
| 500 | | Systemax, Inc.* | | | 8,430 | |
| 33,000 | | TJX Cos., Inc. | | | 1,310,430 | |
| 4,600 | | Ulta Salon, Cosmetics & Fragrance, Inc. | | | 427,294 | |
| 30 | | USS Co. Ltd. (Japan) | | | 3,041 | |
| 400 | | Vitamin Shoppe, Inc.* | | | 17,684 | |
| 4,100 | | Williams-Sonoma, Inc. | | | 153,668 | |
| 130 | | Yamada Denki Co. Ltd. (Japan) | | | 8,120 | |
| | | | | | |
| | | | | 5,673,025 | |
|
Textiles, Apparel & Luxury Goods 0.5% | |
| 301 | | Adidas AG (Germany) | | | 23,501 | |
| 637 | | Burberry Group PLC (United Kingdom) | | | 15,252 | |
| 700 | | Carter’s, Inc.* | | | 34,839 | |
| 78 | | Christian Dior SA (France) | | | 11,969 | |
| 740 | | Cie Financiere Richemont SA (Switzerland) | | | 46,399 | |
| 16,800 | | Coach, Inc. | | | 1,298,304 | |
| 900 | | Crocs, Inc.* | | | 18,828 | |
| 164 | | Luxottica Group SpA (Italy) | | | 5,938 | |
| 370 | | LVMH Moet Hennessy Louis Vuitton SA (France) | | | 63,584 | |
| 2,400 | | Movado Group, Inc. | | | 58,920 | |
| 500 | | Oxford Industries, Inc. | | | 25,410 | |
| 43 | | Swatch Group AG (The) (Bearer Shares) (Switzerland) | | | 19,792 | |
| 70 | | Swatch Group AG (The) (Registered Shares) (Switzerland) | | | 5,626 | |
| 3,700 | | True Religion Apparel, Inc.* | | | 101,380 | |
| 500 | | Unifi, Inc.* | | | 4,830 | |
| 1,000 | | Yue Yuen Industrial Holdings Ltd. (Hong Kong) | | | 3,509 | |
| | | | | | |
| | | | | 1,738,081 | |
|
Thrifts & Mortgage Finance | |
| 1,000 | | First Defiance Financial Corp. | | | 16,860 | |
| 200 | | First Financial Holdings, Inc. | | | 2,200 | |
| 200 | | Fox Chase Bancorp, Inc. | | | 2,600 | |
| 3,700 | | OceanFirst Financial Corp. | | | 52,688 | |
See Notes to Financial Statements.
| | |
| 50 | | Visit our website at www.prudentialfunds.com |
| | | | | | |
| Shares | | Description | | Value (Note 1) | |
| | | | | | |
COMMON STOCKS (Continued) | |
|
Thrifts & Mortgage Finance (cont’d.) | |
| 2,100 | | Provident Financial Services, Inc. | | $ | 30,513 | |
| 1,000 | | Provident New York Bancorp | | | 8,460 | |
| | | | | | |
| | | | | 113,321 | |
|
Tobacco 1.3% | |
| 59,000 | | Altria Group, Inc. | | | 1,821,330 | |
| 2,825 | | British American Tobacco PLC (United Kingdom) | | | 142,357 | |
| 1,450 | | Imperial Tobacco Group PLC (United Kingdom) | | | 58,793 | |
| 7 | | Japan Tobacco, Inc. (Japan) | | | 39,411 | |
| 3,700 | | Lorillard, Inc. | | | 479,076 | |
| 12,900 | | Philip Morris International, Inc. | | | 1,143,069 | |
| 16,800 | | Reynolds American, Inc. | | | 696,192 | |
| 304 | | Swedish Match AB (Sweden) | | | 12,103 | |
| 200 | | Universal Corp. | | | 9,320 | |
| | | | | | |
| | | | | 4,401,651 | |
|
Trading Companies & Distributors 0.5% | |
| 1,400 | | Aircastle Ltd. | | | 17,136 | |
| 2,800 | | Applied Industrial Technologies, Inc. | | | 115,164 | |
| 400 | | Beacon Roofing Supply, Inc.* | | | 10,304 | |
| 58 | | Brenntag AG (Germany) | | | 7,103 | |
| 440 | | Bunzl PLC (United Kingdom) | | | 7,066 | |
| 1,200 | | DXP Enterprises, Inc.* | | | 52,188 | |
| 2,500 | | Fastenal Co.(a) | | | 135,250 | |
| 3,600 | | Interline Brands, Inc.* | | | 77,796 | |
| 2,200 | | ITOCHU Corp. (Japan) | | | 24,001 | |
| 400 | | Kaman Corp. | | | 13,580 | |
| 800 | | Lawson Products, Inc. | | | 12,088 | |
| 2,500 | | Marubeni Corp. (Japan) | | | 18,032 | |
| 2,000 | | Mitsubishi Corp. (Japan) | | | 46,394 | |
| 2,500 | | Mitsui & Co. Ltd. (Japan) | | | 40,987 | |
| 5,500 | | MSC Industrial Direct Co., Inc. (Class A Stock) | | | 458,040 | |
| 5,181 | | Noble Group Ltd. (Singapore) | | | 5,688 | |
| 1,900 | | Sojitz Corp. (Japan) | | | 3,397 | |
| 1,600 | | Sumitomo Corp. (Japan) | | | 23,119 | |
| 1,300 | | Textainer Group Holdings Ltd. | | | 44,070 | |
| 300 | | Toyota Tsusho Corp. (Japan) | | | 6,107 | |
| 2,000 | | W.W. Grainger, Inc. | | | 429,620 | |
| 422 | | Wolseley PLC (United Kingdom) | | | 16,092 | |
| | | | | | |
| | | | | 1,563,222 | |
See Notes to Financial Statements.
| | | | |
| Prudential Asset Allocation Fund | | | 51 | |
Portfolio of Investments
as of March 31, 2012 (Unaudited) continued
| | | | | | |
| Shares | | Description | | Value (Note 1) | |
| | | | | | |
COMMON STOCKS (Continued) | |
|
Transportation Infrastructure | |
| 484 | | Abertis Infraestructuras SA (Spain) | | $ | 8,240 | |
| 46 | | Aeroports de Paris (France) | | | 3,776 | |
| 457 | | Atlantia SpA (Italy) | | | 7,588 | |
| 1,056 | | Auckland International Airport Ltd. (New Zealand) | | | 2,127 | |
| 55 | | Fraport AG Frankfurt Airport Services Worldwide (Germany) | | | 3,444 | |
| 769 | | Groupe Eurotunnel SA (France) | | | 6,679 | |
| 7,000 | | Hutchison Port Holdings Trust (Singapore) | | | 5,355 | |
| 300 | | Kamigumi Co. Ltd. (Japan) | | | 2,483 | |
| 120 | | Koninklijke Vopak NV (Netherlands) | | | 6,913 | |
| 354 | | Sydney Airport (Australia) | | | 1,052 | |
| 1,843 | | Transurban Group (Australia) | | | 10,691 | |
| 600 | | Wesco Aircraft Holdings, Inc.* | | | 9,720 | |
| | | | | | |
| | | | | 68,068 | |
|
Water Utilities | |
| 1,500 | | American States Water Co. | | | 54,210 | |
| 1,200 | | American Water Works Co., Inc. | | | 40,836 | |
| 331 | | Severn Trent PLC (United Kingdom) | | | 8,175 | |
| 999 | | United Utilities Group PLC (United Kingdom) | | | 9,611 | |
| | | | | | |
| | | | | 112,832 | |
|
Wireless Telecommunication Services 0.1% | |
| 90 | | Cellcom Israel Ltd. (Israel) | | | 1,140 | |
| 4 | | KDDI Corp. (Japan) | | | 25,903 | |
| 110 | | Millicom International Cellular SA | | | 12,470 | |
| 41 | | Mobistar SA (Belgium) | | | 2,042 | |
| 21 | | NTT DoCoMo, Inc. (Japan) | | | 34,861 | |
| 114 | | Partner Communications Co. Ltd. (Israel) | | | 879 | |
| 500 | | Shenandoah Telecommunications Co. | | | 5,575 | |
| 1,300 | | Softbank Corp. (Japan) | | | 38,433 | |
| 1,000 | | StarHub Ltd. (Singapore) | | | 2,466 | |
| 72,449 | | Vodafone Group PLC (United Kingdom) | | | 199,548 | |
| | | | | | |
| | | | | 323,317 | |
| | | | | | |
| | Total common stocks
(cost $163,777,994) | | | 207,949,703 | |
| | | | | | |
EXCHANGE TRADED FUND 0.2% | |
| 12,800 | | iShares MSCI EAFE Index Fund(a)
(cost $681,295) | | | 702,720 | |
| | | | | | |
See Notes to Financial Statements.
| | |
| 52 | | Visit our website at www.prudentialfunds.com |
| | | | | | | | | | |
| | | Shares | | | Description | | Value (Note 1) | |
| | | | | | | | | | |
PREFERRED STOCKS 0.1% | |
|
Automobiles | |
| | | 81 | | | Bayerische Motoren Werke AG (Germany) | | $ | 4,811 | |
| | | 224 | | | Porsche Automobil Holding SE (Germany) | | | 13,220 | |
| | | 206 | | | Volkswagen AG (Germany) | | | 36,225 | |
| | | | | | | | | | |
| | | | | | | | | 54,256 | |
|
Banking 0.1% | |
| | | 3,000 | | | Citigroup Capital XIII (Capital security, fixed to floating preferred)(b) | | | 81,600 | |
| | | 8,000 | | | JPMorgan Chase Capital XXVI (Capital security, fixed to floating preferred)(b) | | | 207,120 | |
| | | | | | | | | | |
| | | | | | | | | 288,720 | |
|
Household Products | |
| | | 251 | | | Henkel AG & Co. KGaA (Germany) | | | 18,392 | |
|
Media | |
| | | 110 | | | ProSiebenSat.1 Media AG (Germany) | | | 2,827 | |
|
Multi-Utilities | |
| | | 61 | | | RWE AG (Germany) | | | 2,682 | |
| | | | | | | | | | |
| | | | | | Total preferred stocks
(cost $332,394) | | | 366,877 | |
| | | | | | | | | | |
| | | |
Moody’s
Ratings† | | Principal
Amount (000)# | | | | | | |
CORPORATE BONDS 10.7% | |
|
Aerospace & Defense | |
| Baa3 | | $ | 95 | | | L-3 Communications Corp.,
Gtd. Notes,
4.750%, 07/15/20 | | | 98,093 | |
|
Airlines 0.2% | |
| Baa2 | | | 31 | | | Continental Airlines, Inc., Pass-thru Certs.,
Ser. 01-1,
6.703%, 06/15/21(c) | | | 33,520 | |
| Baa2 | | | 120 | | | Ser. A,
7.250%, 11/10/19 | | | 134,951 | |
See Notes to Financial Statements.
| | | | |
| Prudential Asset Allocation Fund | | | 53 | |
Portfolio of Investments
as of March 31, 2012 (Unaudited) continued
| | | | | | | | | | |
Moody’s
Ratings† | | Principal
Amount (000)# | | | Description | | Value (Note 1) | |
| | | | | | | | | | |
CORPORATE BONDS (Continued) | |
|
Airlines (cont’d.) | |
| Baa1 | | $ | 81 | | | Delta Air Lines, Inc., Pass-thru Certs.,
Ser. 071A,
6.821%, 08/10/22 | | $ | 88,281 | |
| Baa2 | | | 235 | | | Ser. A,
5.300%, 04/15/19(a) | | | 250,569 | |
| | | | | | | | | | |
| | | | | | | | | 507,321 | |
| | | | | | | | | | |
|
Automotive 0.1% | |
| Baa1 | | | 85 | | | Harley-Davidson Funding Corp.,
Gtd. Notes, 144A, MTN,
5.750%, 12/15/14 | | | 92,675 | |
| Baa1 | | | 55 | | | Johnson Controls, Inc.,
Sr. Unsec’d. Notes,
5.500%, 01/15/16 | | | 62,034 | |
| | | | | | | | | | |
| | | | | | | | | 154,709 | |
| | | | | | | | | | |
|
Banking 2.6% | |
| A3 | | | 300 | | | American Express Co.,
Sr. Unsec’d. Notes,
8.125%, 05/20/19(a) | | | 392,188 | |
| A2 | | | 190 | | | American Express Credit Corp.,
Sr. Unsec’d. Notes, MTN,
2.800%, 09/19/16 | | | 195,206 | |
| A2 | | | 430 | | | Banco Bradesco (Brazil),
Sub. Notes,
8.750%, 10/24/13 | | | 468,700 | |
| Ba3 | | | 380 | | | Bank of America Corp.,
Jr. Sub. Notes, Ser. K,
8.000%, 12/29/49(a)(b) | | | 389,667 | |
| Baa1 | | | 165 | | | Sr. Unsec’d. Notes,
5.700%, 01/24/22 | | | 174,666 | |
| Baa1 | | | 135 | | | 6.000%, 09/01/17 | | | 147,037 | |
| Baa1 | | | 95 | | | Sr. Unsec’d. Notes, Ser. 1,
3.750%, 07/12/16 | | | 95,473 | |
| Baa1 | | | 80 | | | Sr. Unsec’d. Notes, MTN,
5.000%, 05/13/21 | | | 80,123 | |
| Baa2 | | | 355 | | | Sub. Notes,
5.750%, 08/15/16(a) | | | 369,643 | |
See Notes to Financial Statements.
| | |
| 54 | | Visit our website at www.prudentialfunds.com |
| | | | | | | | | | |
Moody’s
Ratings† | | Principal
Amount (000)# | | | Description | | Value (Note 1) | |
| | | | | | | | | | |
CORPORATE BONDS (Continued) | |
|
Banking (cont’d.) | |
| Aa3 | | $ | 100 | | | Bear Stearns Cos. LLC (The),
Sr. Unsec’d. Notes,
5.300%, 10/30/15 | | $ | 110,389 | |
| Aa3 | | | 90 | | | 6.400%, 10/02/17 | | | 104,790 | |
| Aa3 | | | 220 | | | 7.250%, 02/01/18(a) | | | 265,281 | |
| Baa1 | | | 5 | | | Capital One Bank,
Sub. Notes,
6.500%, 06/13/13 | | | 5,278 | |
| Baa3 | | | 90 | | | Capital One Capital V, Ltd.
Gtd. Notes,
10.250%, 08/15/39 | | | 92,475 | |
| Baa3 | | | 185 | | | Capital One Capital VI, Ltd.
Gtd. Notes,
8.875%, 05/15/40 | | | 186,243 | |
| A3 | | | 150 | | | Citigroup, Inc.,
Sr. Unsec’d. Notes,
4.500%, 01/14/22(a) | | | 150,587 | |
| A3 | | | 280 | | | 6.125%, 05/15/18 | | | 313,876 | |
| A3 | | | 200 | | | 8.125%, 07/15/39 | | | 259,198 | |
| A3 | | | 65 | | | 8.500%, 05/22/19(a) | | | 80,137 | |
| Baa1 | | | 82 | | | Sub. Notes,
5.000%, 09/15/14 | | | 84,922 | |
| Baa1 | | | 400 | | | 5.625%, 08/27/12 | | | 406,738 | |
| Baa1 | | | 165 | | | 6.125%, 08/25/36 | | | 158,577 | |
| Baa1 | | | 280 | | | Countrywide Financial Corp.,
Gtd. Notes, MTN,
5.800%, 06/07/12(c) | | | 282,211 | |
| Aa3 | | | 290 | | | Depfa ACS Bank (Ireland),
Covered Notes, 144A,
5.125%, 03/16/37 | | | 208,268 | |
| A1 | | | 15 | | | Goldman Sachs Group, Inc. (The),
Sr. Notes,
6.250%, 02/01/41 | | | 14,815 | |
| A1 | | | 270 | | | Sr. Unsec’d. Notes,
5.250%, 07/27/21(a) | | | 267,277 | |
| A1 | | | 140 | | | 5.450%, 11/01/12 | | | 143,190 | |
| A1 | | | 180 | | | 5.750%, 01/24/22(a) | | | 185,173 | |
| A1 | | | 5 | | | 6.250%, 09/01/17 | | | 5,481 | |
See Notes to Financial Statements.
| | | | |
| Prudential Asset Allocation Fund | | | 55 | |
Portfolio of Investments
as of March 31, 2012 (Unaudited) continued
| | | | | | | | | | |
Moody’s
Ratings† | | Principal
Amount (000)# | | | Description | | Value (Note 1) | |
| | | | | | | | | | |
CORPORATE BONDS (Continued) | |
|
Banking (cont’d.) | |
| A2 | | $ | 10 | | | Sub. Notes,
5.625%, 01/15/17 | | $ | 10,504 | |
| A2 | | | 385 | | | 6.450%, 05/01/36 | | | 372,522 | |
| A2 | | | 52 | | | 6.750%, 10/01/37 | | | 50,808 | |
| Baa2 | | | 20 | | | Huntington Bancshares, Inc.,
Sub. Notes,
7.000%, 12/15/20 | | | 22,569 | |
| Baa1 | | | 300 | | | JPMorgan Chase & Co.,
Jr. Sub. Notes, Ser. 1,
7.900%, 04/29/49(a)(b) | | | 328,656 | |
| Aa3 | | | 225 | | | Sr. Unsec’d. Notes,
3.150%, 07/05/16(a) | | | 231,944 | |
| Aa3 | | | 220 | | | 4.250%, 10/15/20 | | | 225,251 | |
| A2 | | | 200 | | | JPMorgan Chase Capital XXVII, Ltd.
Gtd. Notes, Ser. AA,
7.000%, 11/01/39 | | | 202,700 | |
| A1 | | | 195 | | | Lloyds TSB Bank PLC (United Kingdom),
Gtd. Notes, 144A, MTN,
5.800%, 01/13/20 | | | 200,279 | |
| A2 | | | 110 | | | Morgan Stanley,
Sr. Unsec’d. Notes,
5.500%, 07/28/21(a) | | | 107,501 | |
| A2 | | | 285 | | | Sr. Unsec’d. Notes, MTN,
5.625%, 09/23/19 | | | 281,699 | |
| A2 | | | 460 | | | Sr. Unsec’d. Notes, Ser. G, MTN,
5.450%, 01/09/17 | | | 469,774 | |
| Ba1 | | | 150 | | | MUFG Capital Finance 1 Ltd. (Cayman Islands),
Gtd. Notes,
6.346%, 07/29/49(b) | | | 158,129 | |
| A3 | | | 130 | | | PNC Funding Corp.,
Gtd. Notes,
2.700%, 09/19/16(a) | | | 133,949 | |
| A3 | | | 65 | | | 6.700%, 06/10/19 | | | 79,083 | |
| A3 | | | 250 | | | Royal Bank of Scotland Group PLC (United Kingdom),
Sr. Unsec’d. Notes, MTN,
6.400%, 10/21/19 | | | 262,196 | |
| A2 | | | 20 | | | Royal Bank of Scotland PLC (The) (United Kingdom),
Gtd. Notes, Ser. 2,
3.400%, 08/23/13 | | | 20,269 | |
See Notes to Financial Statements.
| | |
| 56 | | Visit our website at www.prudentialfunds.com |
| | | | | | | | | | |
Moody’s
Ratings† | | Principal
Amount (000)# | | | Description | | Value (Note 1) | |
| | | | | | | | | | |
CORPORATE BONDS (Continued) | |
|
Banking (cont’d.) | |
| A2 | | $ | 125 | | | USB Capital XIII Trust, Ltd.
Gtd. Notes,
6.625%, 12/15/39 | | $ | 126,175 | |
| | | | | | | | | | |
| | | | | | | | | 8,921,617 | |
| | | | | | | | | | |
|
Brokerage | |
| NR | | | 345 | | | Lehman Brothers Holdings, Inc.,
Sr. Unsec’d. Notes, MTN,
5.250%, 02/06/12(e) | | | 100,912 | |
| NR | | | 100 | | | 6.875%, 05/02/18(e) | | | 30,000 | |
| | | | | | | | | | |
| | | | | | | | | 130,912 | |
| | | | | | | | | | |
|
Cable 0.2% | |
| B1 | | | 125 | | | Cablevision Systems Corp.,
Sr. Unsec’d. Notes,
8.625%, 09/15/17(a) | | | 136,093 | |
| Baa1 | | | 40 | | | Comcast Corp.,
Gtd. Notes,
6.450%, 03/15/37 | | | 47,873 | |
| Baa1 | | | 110 | | | 6.500%, 11/15/35 | | | 132,141 | |
| Baa1 | | | 65 | | | 6.950%, 08/15/37(a) | | | 82,295 | |
| Baa2 | | | 45 | | | DIRECTV Holdings LLC / DIRECTV Financing Co., Inc.,
Gtd. Notes,
3.500%, 03/01/16 | | | 47,261 | |
| Baa2 | | | 25 | | | 3.550%, 03/15/15 | | | 26,401 | |
| Baa2 | | | 200 | | | 5.150%, 03/15/42 | | | 194,837 | |
| | | | | | | | | | |
| | | | | | | | | 666,901 | |
| | | | | | | | | | |
|
Capital Goods 0.2% | |
| A2 | | | 50 | | | Caterpillar Financial Services Corp.,
Sr. Unsec’d. Notes, MTN,
5.500%, 03/15/16 | | | 57,674 | |
| | | | | | Erac USA Finance Co.,
Gtd. Notes, 144A,
5.800%, 10/15/12 | | | | |
| Baa1 | | | 110 | | | (original cost $109,915; purchased date
10/10/07)(c)(f)
| | | 112,661 | |
See Notes to Financial Statements.
| | | | |
| Prudential Asset Allocation Fund | | | 57 | |
Portfolio of Investments
as of March 31, 2012 (Unaudited) continued
| | | | | | | | | | |
Moody’s
Ratings† | | Principal
Amount (000)# | | | Description | | Value (Note 1) | |
| | | | | | | | | | |
CORPORATE BONDS (Continued) | |
|
Capital Goods (cont’d.) | |
| | | | | | 6.375%, 10/15/17 | | | | |
| Baa1 | | $ | 296 | | | (original cost $295,482; purchased date
10/10/07)(c)(f)
| | $ | 339,700 | |
| | | | | | 7.000%, 10/15/37 | | | | |
| Baa1 | | | 20 | | | (original cost $19,827; purchased date
10/10/07)(c)(f) | | | 22,817 | |
| A1 | | | 30 | | | Illinois Tool Works, Inc.,
Sr. Unsec’d. Notes, 144A,
4.875%, 09/15/41 | | | 32,355 | |
| A2 | | | 60 | | | United Technologies Corp.,
Sr. Unsec’d. Notes,
6.125%, 07/15/38 | | | 75,009 | |
| Baa2 | | | 160 | | | Xylem, Inc.,
Sr. Unsec’d. Notes, 144A,
4.875%, 10/01/21 | | | 170,732 | |
| | | | | | | | | | |
| | | | | | | | | 810,948 | |
| | | | | | | | | | |
|
Chemicals 0.2% | |
| Baa3 | | | 250 | | | Dow Chemical Co. (The),
Sr. Unsec’d. Notes,
7.600%, 05/15/14 | | | 283,079 | |
| Baa3 | | | 82 | | | 9.400%, 05/15/39 | | | 126,092 | |
| Baa1 | | | 40 | | | Ecolab, Inc.,
Sr. Unsec’d. Notes,
5.500%, 12/08/41 | | | 43,380 | |
| Baa1 | | | 75 | | | ICI Wilmington, Inc.,
Gtd. Notes,
5.625%, 12/01/13 | | | 79,565 | |
| Baa1 | | | 35 | | | PPG Industries, Inc.,
Sr. Unsec’d. Notes,
5.500%, 11/15/40 | | | 38,655 | |
| Baa3 | | | 100 | | | Union Carbide Corp.,
Sr. Unsec’d. Notes,
7.500%, 06/01/25 | | | 116,312 | |
| | | | | | | | | | |
| | | | | | | | | 687,083 | |
| | | | | | | | | | |
|
Consumer 0.1% | |
| Baa3 | | | 300 | | | Newell Rubbermaid, Inc.,
Sr. Unsec’d. Notes,
6.250%, 04/15/18 | | | 342,364 | |
See Notes to Financial Statements.
| | |
| 58 | | Visit our website at www.prudentialfunds.com |
| | | | | | | | | | |
Moody’s
Ratings† | | Principal
Amount (000)# | | | Description | | Value (Note 1) | |
| | | | | | | | | | |
CORPORATE BONDS (Continued) | |
|
Consumer (cont’d.) | |
| A3 | | $ | 80 | | | VF Corp.,
Sr. Unsec’d. Notes,
3.500%, 09/01/21 | | $ | 82,097 | |
| | | | | | | | | | |
| | | | | | | | | 424,461 | |
| | | | | | | | | | |
|
Electric 0.8% | |
| Baa2 | | | 35 | | | Arizona Public Service Co.,
Sr. Unsec’d. Notes,
6.250%, 08/01/16 | | | 41,018 | |
| Baa1 | | | 115 | | | Baltimore Gas & Electric Co.,
Sr. Unsec’d. Notes,
6.350%, 10/01/36 | | | 141,602 | |
| A3 | | | 120 | | | CenterPoint Energy Houston Electric LLC, Gen. Ref. Mtge.,
Ser. K2,
6.950%, 03/15/33 | | | 157,790 | |
| A3 | | | 65 | | | Consumers Energy Co.,
First Mtge. Bonds, Ser. D,
5.375%, 04/15/13 | | | 68,159 | |
| A1 | | | 55 | | | Duke Energy Carolinas LLC,
First Mtge. Bonds,
6.050%, 04/15/38(a) | | | 69,552 | |
| Baa2 | | | 135 | | | El Paso Electric Co.,
Sr. Unsec’d. Notes,
6.000%, 05/15/35 | | | 149,556 | |
| A3 | | | 210 | | | ENEL Finance International SA (Luxembourg),
Gtd. Notes, 144A,
6.000%, 10/07/39 | | | 190,592 | |
| Baa2 | | | 30 | | | Exelon Corp.,
Sr. Unsec’d. Notes,
4.900%, 06/15/15 | | | 32,724 | |
| Baa1 | | | 250 | | | Exelon Generation Co. LLC,
Sr. Unsec’d. Notes,
6.250%, 10/01/39 | | | 292,541 | |
| Aa3 | | | 60 | | | Florida Power & Light Co.,
First Mtge. Bonds,
5.950%, 10/01/33 | | | 73,863 | |
| A3 | | | 170 | | | Georgia Power Co.,
Sr. Unsec’d. Notes, Ser. B,
5.700%, 06/01/17 | | | 203,238 | |
See Notes to Financial Statements.
| | | | |
| Prudential Asset Allocation Fund | | | 59 | |
Portfolio of Investments
as of March 31, 2012 (Unaudited) continued
| | | | | | | | | | |
Moody’s
Ratings† | | Principal
Amount (000)# | | | Description | | Value (Note 1) | |
| | | | | | | | | | |
CORPORATE BONDS (Continued) | |
|
Electric (cont’d.) | |
| A3 | | $ | 30 | | | Iberdrola International BV (Netherlands),
Gtd. Notes,
6.750%, 09/15/33 | | $ | 32,529 | |
| Baa2 | | | 90 | | | Indiana Michigan Power Co.,
Sr. Unsec’d. Notes, Ser. INDF,
5.050%, 11/15/14 | | | 97,227 | |
| Baa1 | | | 115 | | | Midamerican Energy Holdings Co.,
Sr. Unsec’d. Notes,
5.950%, 05/15/37 | | | 134,304 | |
| Baa2 | | | 280 | | | Nevada Power Co., Genl. Ref. Mtge.,
Ser. O,
6.500%, 05/15/18 | | | 342,733 | |
| A3 | | | 100 | | | Niagara Mohawk Power Corp.,
Sr. Unsec’d. Notes, 144A,
4.881%, 08/15/19 | | | 109,791 | |
| A2 | | | 90 | | | NSTAR Electric Co.,
Sr. Unsec’d. Notes,
4.500%, 11/15/19 | | | 98,370 | |
| A1 | | | 110 | | | 4.875%, 04/15/14 | | | 118,713 | |
| Baa3 | | | 55 | | | Public Service Co. of New Mexico,
Sr. Unsec’d. Notes,
7.950%, 05/15/18 | | | 66,769 | |
| A2 | | | 125 | | | Public Service Electric & Gas Co.,
Sr. Sec’d. Notes, MTN,
5.800%, 05/01/37 | | | 154,858 | |
| Baa3 | | | 60 | | | Southwestern Electric Power Co.,
Sr. Unsec’d. Notes,
3.550%, 02/15/22 | | | 58,928 | |
| Baa1 | | | 105 | | | Xcel Energy, Inc.,
Sr. Unsec’d. Notes,
4.800%, 09/15/41(a) | | | 110,233 | |
| Baa1 | | | 36 | | | 5.613%, 04/01/17 | | | 41,371 | |
| | | | | | | | | | |
| | | | | | | | | 2,786,461 | |
| | | | | | | | | | |
|
Energy - Integrated 0.1% | |
| A2 | | | 70 | | | BP Capital Markets PLC (United Kingdom),
Gtd. Notes,
4.500%, 10/01/20 | | | 76,895 | |
| A2 | | | 145 | | | 5.250%, 11/07/13 | | | 154,949 | |
| | | | | | | | | | |
| | | | | | | | | 231,844 | |
| | | | | | | | | | |
See Notes to Financial Statements.
| | |
| 60 | | Visit our website at www.prudentialfunds.com |
| | | | | | | | | | |
Moody’s
Ratings† | | Principal
Amount (000)# | | | Description | | Value (Note 1) | |
| | | | | | | | | | |
CORPORATE BONDS (Continued) | |
|
Energy - Other 0.3% | |
| Baa3 | | $ | 150 | | | Anadarko Petroleum Corp.,
Sr. Unsec’d. Notes,
6.375%, 09/15/17(a) | | $ | 178,232 | |
| Baa3 | | | 50 | | | 6.450%, 09/15/36 | | | 57,880 | |
| Baa3 | | | 25 | | | 6.950%, 06/15/19 | | | 30,519 | |
| B1 | | | 150 | | | Forest Oil Corp.,
Gtd. Notes,
8.500%, 02/15/14(a) | | | 160,500 | |
| Baa2 | | | 140 | | | Nabors Industries, Inc.,
Gtd. Notes,
4.625%, 09/15/21 | | | 146,063 | |
| Baa1 | | | 60 | | | Phillips 66,
Gtd. Notes, 144A,
2.950%, 05/01/17 | | | 60,984 | |
| Baa3 | | | 20 | | | Transocean, Inc. (Cayman Islands),
Gtd. Notes,
7.350%, 12/15/41 | | | 23,647 | |
| Baa2 | | | 115 | | | Weatherford International Ltd. Bermuda (Bermuda),
Gtd. Notes,
5.125%, 09/15/20(a) | | | 122,345 | |
| Baa1 | | | 265 | | | Woodside Finance Ltd. (Australia),
Gtd. Notes, 144A,
5.000%, 11/15/13 | | | 278,303 | |
| | | | | | | | | | |
| | | | | | | | | 1,058,473 | |
| | | | | | | | | | |
|
Foods 0.5% | |
| A3 | | | 235 | | | Anheuser-Busch InBev Worldwide, Inc.,
Gtd. Notes,
8.000%, 11/15/39 | | | 351,157 | |
| Baa2 | | | 177 | | | Beam, Inc.,
Sr. Unsec’d. Notes,
6.375%, 06/15/14 | | | 194,653 | |
| Baa2 | | | 215 | | | Bunge Ltd.,
Gtd. Notes,
5.350%, 04/15/14 | | | 228,032 | |
| Baa2 | | | 145 | | | Bunge Ltd. Finance Corp.,
Gtd. Notes,
8.500%, 06/15/19 | | | 177,131 | |
See Notes to Financial Statements.
| | | | |
| Prudential Asset Allocation Fund | | | 61 | |
Portfolio of Investments
as of March 31, 2012 (Unaudited) continued
| | | | | | | | | | |
Moody’s
Ratings† | | Principal
Amount (000)# | | | Description | | Value (Note 1) | |
| | | | | | | | | | |
CORPORATE BONDS (Continued) | |
|
Foods (cont’d.) | |
| | | | | | Cargill, Inc.,
Sr. Unsec’d. Notes, 144A,
6.000%, 11/27/17 | | | | |
| A2 | | $ | 150 | | | (original cost $149,288; purchased date
11/19/07)(c)(f) | | $ | 178,599 | |
| A3 | | | 60 | | | JM Smucker Co. (The),
Gtd. Notes,
3.500%, 10/15/21 | | | 60,787 | |
| Baa1 | | | 200 | | | SABMiller Holdings, Inc.,
Gtd. Notes, 144A,
3.750%, 01/15/22(a) | | | 203,472 | |
| Ba2 | | | 110 | | | Smithfield Foods, Inc.,
Sr. Sec’d. Notes,
10.000%, 07/15/14 | | | 128,700 | |
| Ba1 | | | 150 | | | Tyson Foods, Inc.,
Gtd. Notes,
6.850%, 04/01/16 | | | 170,250 | |
| | | | | | | | | | |
| | | | | | | | | 1,692,781 | |
| | | | | | | | | | |
|
Healthcare & Pharmaceutical 0.5% | |
| Baa2 | | | 200 | | | AmerisourceBergen Corp.,
Gtd. Notes,
5.625%, 09/15/12 | | | 204,325 | |
| Baa1 | | | 240 | | | Amgen, Inc.,
Sr. Unsec’d. Notes,
5.150%, 11/15/41 | | | 240,967 | |
| Baa3 | | | 310 | | | Aristotle Holding, Inc.,
Gtd. Notes, 144A,
2.750%, 11/21/14 | | | 318,514 | |
| A1 | | | 110 | | | AstraZeneca PLC (United Kingdom),
Sr. Unsec’d. Notes,
6.450%, 09/15/37 | | | 143,445 | |
| Baa3 | | | 110 | | | Cardinal Health, Inc.,
Sr. Unsec’d. Notes,
5.500%, 06/15/13 | | | 115,850 | |
| Baa1 | | | 70 | | | Gilead Sciences, Inc.,
Sr. Unsec’d. Notes,
5.650%, 12/01/41 | | | 74,774 | |
See Notes to Financial Statements.
| | |
| 62 | | Visit our website at www.prudentialfunds.com |
| | | | | | | | | | |
Moody’s
Ratings† | | Principal
Amount (000)# | | | Description | | Value (Note 1) | |
| | | | | | | | | | |
CORPORATE BONDS (Continued) | |
|
Healthcare & Pharmaceutical (cont’d.) | |
| Baa2 | | $ | 250 | | | Laboratory Corp. of America Holdings,
Sr. Unsec’d. Notes,
5.625%, 12/15/15 | | $ | 281,601 | |
| Aa3 | | | 30 | | | Merck & Co., Inc.,
Sr. Unsec’d. Notes,
5.950%, 12/01/28 | | | 37,637 | |
| Baa3 | | | 75 | | | Watson Pharmaceuticals, Inc.,
Sr. Unsec’d. Notes,
6.125%, 08/15/19(a) | | | 84,221 | |
| A1 | | | 35 | | | Wyeth LLC,
Gtd. Notes,
5.500%, 02/01/14 | | | 38,070 | |
| | | | | | | | | | |
| | | | | | | | | 1,539,404 | |
| | | | | | | | | | |
|
Healthcare Insurance 0.4% | |
| Baa1 | | | 110 | | | Aetna, Inc.,
Sr. Unsec’d. Notes,
6.625%, 06/15/36(a) | | | 137,020 | |
| Baa2 | | | 50 | | | Cigna Corp.,
Sr. Unsec’d. Notes,
5.875%, 03/15/41 | | | 55,398 | |
| Baa2 | | | 140 | | | 6.150%, 11/15/36 | | | 155,772 | |
| Baa3 | | | 540 | | | Coventry Health Care, Inc.,
Sr. Unsec’d. Notes,
6.125%, 01/15/15 | | | 584,682 | |
| A3 | | | 60 | | | UnitedHealth Group, Inc.,
Sr. Unsec’d. Notes,
6.000%, 06/15/17 | | | 72,111 | |
| A3 | | | 100 | | | 6.500%, 06/15/37 | | | 123,118 | |
| A3 | | | 80 | | | 6.625%, 11/15/37 | | | 101,205 | |
| | | | | | | | | | |
| | | | | | | | | 1,229,306 | |
| | | | | | | | | | |
|
Insurance 0.9% | |
| Baa1 | | | 80 | | | Allied World Assurance Co. Holdings Ltd. (Bermuda),
Gtd. Notes,
5.500%, 11/15/20 | | | 81,711 | |
| A3 | | | 15 | | | Allstate Corp. (The),
Sr. Unsec’d. Notes,
5.200%, 01/15/42 | | | 15,693 | |
See Notes to Financial Statements.
| | | | |
| Prudential Asset Allocation Fund | | | 63 | |
Portfolio of Investments
as of March 31, 2012 (Unaudited) continued
| | | | | | | | | | |
Moody’s
Ratings† | | Principal
Amount (000)# | | | Description | | Value (Note 1) | |
| | | | | | | | | | |
CORPORATE BONDS (Continued) | |
|
Insurance (cont’d.) | |
| Baa1 | | $ | 130 | | | American International Group, Inc.,
Sr. Unsec’d. Notes,
4.250%, 05/15/13 | | $ | 132,873 | |
| Baa1 | | | 100 | | | 6.400%, 12/15/20 | | | 113,173 | |
| Baa1 | | | 155 | | | 8.250%, 08/15/18 | | | 186,064 | |
| Baa1 | | | 160 | | | Axis Specialty Finance LLC,
Gtd. Notes,
5.875%, 06/01/20 | | | 167,440 | |
| A3 | | | 210 | | | Chubb Corp. (The),
Jr. Sub. Notes,
6.375%, 03/29/67(a)(b) | | | 216,825 | |
| Baa3 | | | 90 | | | Hartford Financial Services Group, Inc.,
Sr. Unsec’d. Notes, MTN,
6.000%, 01/15/19 | | | 98,312 | |
| Baa2 | | | 180 | | | Liberty Mutual Group, Inc.,
Bonds, 144A,
7.000%, 03/15/34 | | | 196,154 | |
| Ba1 | | | 40 | | | Lincoln National Corp.,
Jr. Sub. Notes,
6.050%, 04/20/67(b) | | | 37,300 | |
| Baa2 | | | 110 | | | Sr. Unsec’d. Notes,
6.300%, 10/09/37 | | | 118,151 | |
| Baa2 | | | 90 | | | 7.000%, 06/15/40 | | | 105,697 | |
| Baa2 | | | 70 | | | 8.750%, 07/01/19 | | | 88,611 | |
| A3 | | | 135 | | | MetLife, Inc.,
Sr. Unsec’d. Notes,
5.700%, 06/15/35 | | | 157,030 | |
| A3 | | | 15 | | | 6.375%, 06/15/34 | | | 18,455 | |
| A3 | | | 50 | | | 6.750%, 06/01/16(a) | | | 59,403 | |
| Aa2 | | | 110 | | | New York Life Insurance Co.,
Sub. Notes, 144A,
6.750%, 11/15/39 | | | 137,814 | |
| Aa2 | | | 60 | | | Northwestern Mutual Life Insurance Co. (The),
Sub. Notes, 144A,
6.063%, 03/30/40(a) | | | 70,639 | |
| Baa1 | | | 150 | | | Ohio National Financial Services, Inc.,
Sr. Notes, 144A,
6.350%, 04/01/13 | | | 155,343 | |
| Baa1 | | | 105 | | | 6.375%, 04/30/20 | | | 114,722 | |
See Notes to Financial Statements.
| | |
| 64 | | Visit our website at www.prudentialfunds.com |
| | | | | | | | | | |
Moody’s
Ratings† | | Principal
Amount (000)# | | | Description | | Value (Note 1) | |
| | | | | | | | | | |
CORPORATE BONDS (Continued) | |
|
Insurance (cont’d.) | |
| A3 | | $ | 150 | | | Pacific Life Insurance Co.,
Sub. Notes, 144A,
9.250%, 06/15/39 | | $ | 194,270 | |
| A2 | | | 110 | | | Progressive Corp. (The),
Jr. Sub. Notes,
6.700%, 06/15/37(b) | | | 114,125 | |
| Aa2 | | | 240 | | | Teachers Insurance & Annuity Association of America,
Sub. Notes, 144A,
6.850%, 12/16/39 | | | 297,223 | |
| Baa3 | | | 50 | | | Unum Group,
Sr. Unsec’d. Notes,
5.625%, 09/15/20 | | | 52,917 | |
| Baa2 | | | 110 | | | W.R. Berkley Corp.,
Sr. Unsec’d. Notes,
5.600%, 05/15/15 | | | 117,169 | |
| Baa2 | | | 90 | | | Sr. Unsub. Notes,
6.150%, 08/15/19 | | | 96,717 | |
| Baa2 | | | 15 | | | XL Group PLC (Ireland),
Sr. Unsec’d. Notes,
5.250%, 09/15/14 | | | 15,890 | |
| | | | | | | | | | |
| | | | | | | | | 3,159,721 | |
| | | | | | | | | | |
|
Lodging 0.3% | |
| Baa3 | | | 300 | | | Starwood Hotels & Resorts Worldwide, Inc.,
Sr. Unsec’d. Notes,
6.250%, 02/15/13 | | | 312,000 | |
| Baa3 | | | 500 | | | 6.750%, 05/15/18(a) | | | 580,000 | |
| | | | | | | | | | |
| | | | | | | | | 892,000 | |
| | | | | | | | | | |
|
Media & Entertainment 0.3% | |
| Baa2 | | | 135 | | | NBC Universal Media LLC,
Sr. Unsec’d. Notes,
4.375%, 04/01/21(a) | | | 144,605 | |
| Baa1 | | | 100 | | | News America, Inc.,
Gtd. Notes,
6.150%, 03/01/37 | | | 111,778 | |
| Baa1 | | | 70 | | | 6.150%, 02/15/41 | | | 80,188 | |
| Baa1 | | | 125 | | | 7.625%, 11/30/28 | | | 144,133 | |
See Notes to Financial Statements.
| | | | |
| Prudential Asset Allocation Fund | | | 65 | |
Portfolio of Investments
as of March 31, 2012 (Unaudited) continued
| | | | | | | | | | |
Moody’s
Ratings† | | Principal
Amount (000)# | | | Description | | Value (Note 1) | |
| | | | | | | | | | |
CORPORATE BONDS (Continued) | |
|
Media & Entertainment (cont’d.) | |
| Baa2 | | $ | 25 | | | Time Warner, Inc.,
Gtd. Notes,
6.200%, 03/15/40 | | $ | 28,328 | |
| Baa2 | | | 30 | | | 6.250%, 03/29/41 | | | 34,280 | |
| Baa2 | | | 160 | | | 7.250%, 10/15/17 | | | 197,425 | |
| Baa2 | | | 20 | | | 7.625%, 04/15/31 | | | 25,607 | |
| Baa2 | | | 100 | | | 9.150%, 02/01/23 | | | 136,197 | |
| Baa1 | | | 105 | | | Viacom, Inc.,
Sr. Unsec’d. Notes,
6.750%, 10/05/37 | | | 130,913 | |
| | | | | | | | | | |
| | | | | | | | | 1,033,454 | |
| | | | | | | | | | |
|
Metals 0.4% | |
| Baa3 | | | 385 | | | ArcelorMittal (Luxembourg),
Sr. Unsec’d. Notes,
5.375%, 06/01/13 | | | 399,577 | |
| Baa3 | | | 15 | | | 6.125%, 06/01/18(a) | | | 15,761 | |
| Baa3 | | | 70 | | | 6.250%, 02/25/22 | | | 70,777 | |
| Baa3 | | | 140 | | | Freeport-McMoRan Copper & Gold, Inc.,
Sr. Unsec’d. Notes,
3.550%, 03/01/22 | | | 134,459 | |
| Ba1 | | | 190 | | | Peabody Energy Corp.,
Gtd. Notes, 144A,
6.000%, 11/15/18(a) | | | 186,200 | |
| A-(d) | | | 70 | | | Rio Trinto Alcan, Inc. (Canada),
Sr. Unsec’d. Notes,
4.500%, 05/15/13 | | | 72,963 | |
| A-(d) | | | 115 | | | 5.000%, 06/01/15 | | | 127,346 | |
| Baa2 | | | 95 | | | Southern Copper Corp.,
Sr. Unsec’d. Notes,
7.500%, 07/27/35 | | | 111,379 | |
| Baa2 | | | 85 | | | Teck Resources Ltd. (Canada),
Gtd. Notes,
5.200%, 03/01/42(a) | | | 80,641 | |
| Baa2 | | | 150 | | | Xstrata Finance (Canada) Ltd. (Canada),
Gtd. Notes, 144A,
2.850%, 11/10/14 | | | 152,724 | |
| | | | | | | | | | |
| | | | | | | | | 1,351,827 | |
| | | | | | | | | | |
See Notes to Financial Statements.
| | |
| 66 | | Visit our website at www.prudentialfunds.com |
| | | | | | | | | | |
Moody’s
Ratings† | | Principal
Amount (000)# | | | Description | | Value (Note 1) | |
| | | | | | | | | | |
CORPORATE BONDS (Continued) | |
|
Non Captive Finance 0.5% | |
| Aa2 | | $ | 600 | | | General Electric Capital Corp.,
Sr. Unsec’d. Notes, Ser. G, MTN,
6.000%, 08/07/19(g) | | $ | 700,656 | |
| Aa2 | | | 170 | | | 6.875%, 01/10/39(a) | | | 209,940 | |
| Aa3 | | | 100 | | | Sub. Notes,
5.300%, 02/11/21(a) | | | 108,303 | |
| B1 | | | 400 | | | International Lease Finance Corp.,
Sr. Unsec’d. Notes, MTN,
6.375%, 03/25/13(a) | | | 411,000 | |
| Ba1 | | | 130 | | | SLM Corp.,
Sr. Unsec’d. Notes, MTN,
8.000%, 03/25/20 | | | 140,400 | |
| Ba1 | | | 180 | | | 8.450%, 06/15/18(a) | | | 200,700 | |
| | | | | | | | | | |
| | | | | | | | | 1,770,999 | |
| | | | | | | | | | |
|
Packaging | |
| B1 | | | 75 | | | Sealed Air Corp.,
Gtd. Notes, 144A,
6.875%, 07/15/33 | | | 71,625 | |
|
Paper 0.2% | |
| | | | | | Georgia-Pacific LLC,
Gtd. Notes, 144A,
5.400%, 11/01/20 | | | | |
| Baa3 | | | 40 | | | (original cost $39,765; purchased date
10/27/10)(c)(f) | | | 44,651 | |
| Baa3 | | | 30 | | | International Paper Co.,
Sr. Unsec’d. Notes,
6.000%, 11/15/41 | | | 32,564 | |
| Baa3 | | | 175 | | | 7.300%, 11/15/39 | | | 213,054 | |
| Baa3 | | | 85 | | | 7.500%, 08/15/21(a) | | | 107,143 | |
| Ba1 | | | 95 | | | Rock-Tenn Co.,
Unsec’d. Notes, 144A,
4.900%, 03/01/22 | | | 94,861 | |
| | | | | | | | | | |
| | | | | | | | | 492,273 | |
| | | | | | | | | | |
|
Pipelines & Other 0.3% | |
| Baa2 | | | 90 | | | CenterPoint Energy Resources Corp.,
Sr. Unsec’d. Notes,
6.250%, 02/01/37 | | | 103,180 | |
See Notes to Financial Statements.
| | | | |
| Prudential Asset Allocation Fund | | | 67 | |
Portfolio of Investments
as of March 31, 2012 (Unaudited) continued
| | | | | | | | | | |
Moody’s
Ratings† | | Principal
Amount (000)# | | | Description | | Value (Note 1) | |
| | | | | | | | | | |
CORPORATE BONDS (Continued) | |
|
Pipelines & Other (cont’d.) | |
| Baa3 | | $ | 90 | | | Energy Transfer Partners LP,
Sr. Unsec’d. Notes,
4.650%, 06/01/21 | | $ | 91,690 | |
| Baa3 | | | 50 | | | 5.200%, 02/01/22 | | | 52,308 | |
| Baa3 | | | 55 | | | NiSource Finance Corp.,
Gtd. Notes,
5.250%, 09/15/17 | | | 61,111 | |
| Baa3 | | | 70 | | | 5.450%, 09/15/20 | | | 77,382 | |
| Baa1 | | | 15 | | | Sempra Energy,
Sr. Unsec’d. Notes,
6.000%, 02/01/13 | | | 15,654 | |
| Baa2 | | | 500 | | | Spectra Energy Capital LLC,
Gtd. Notes,
6.200%, 04/15/18 | | | 583,996 | |
| Baa2 | | | 45 | | | 6.250%, 02/15/13 | | | 46,996 | |
| | | | | | | | | | |
| | | | | | | | | 1,032,317 | |
| | | | | | | | | | |
|
Railroads 0.1% | |
| A3 | | | 135 | | | Burlington Northern Santa Fe Corp.,
Sr. Unsec’d. Notes,
6.700%, 08/01/28 | | | 162,079 | |
| Baa3 | | | 170 | | | CSX Corp.,
Sr. Unsec’d. Notes,
6.150%, 05/01/37 | | | 197,408 | |
| Baa1 | | | 105 | | | Norfolk Southern Corp.,
Sr. Unsec’d. Notes,
5.590%, 05/17/25 | | | 123,462 | |
| Baa1 | | | 4 | | | 7.800%, 05/15/27 | | | 5,534 | |
| | | | | | | | | | |
| | | | | | | | | 488,483 | |
| | | | | | | | | | |
|
Real Estate Investment Trusts 0.4% | |
| Baa3 | | | 74 | | | Brandywine Operating Partnership,
Gtd. Notes,
5.750%, 04/01/12 | | | 74,005 | |
| Baa2 | | | 100 | | | HCP, Inc.,
Sr. Unsec’d. Notes,
2.700%, 02/01/14 | | | 101,395 | |
See Notes to Financial Statements.
| | |
| 68 | | Visit our website at www.prudentialfunds.com |
| | | | | | | | | | |
Moody’s
Ratings† | | Principal
Amount (000)# | | | Description | | Value (Note 1) | |
| | | | | | | | | | |
CORPORATE BONDS (Continued) | |
|
Real Estate Investment Trusts (cont’d.) | |
| Baa2 | | $ | 115 | | | Mack-Cali Realty Corp.,
Sr. Unsec’d. Notes,
7.750%, 08/15/19 | | $ | 138,855 | |
| Baa3 | | | 90 | | | Post Apartment Homes LP,
Sr. Unsec’d. Notes,
5.450%, 06/01/12 | | | 90,561 | |
| Baa3 | | | 135 | | | 6.300%, 06/01/13 | | | 141,088 | |
| Baa2 | | | 11 | | | ProLogis LP,
Gtd. Notes,
6.875%, 03/15/20 | | | 12,636 | |
| A3 | | | 30 | | | Simon Property Group LP,
Sr. Unsec’d. Notes,
2.800%, 01/30/17 | | | 30,718 | |
| A3 | | | 30 | | | 3.375%, 03/15/22(a) | | | 28,932 | |
| A3 | | | 530 | | | 6.125%, 05/30/18 | | | 624,000 | |
| | | | | | | | | | |
| | | | | | | | | 1,242,190 | |
| | | | | | | | | | |
|
Retailers 0.1% | |
| Baa2 | | | 110 | | | CVS Caremark Corp.,
Sr. Unsec’d. Notes,
5.750%, 05/15/41 | | | 123,987 | |
| A3 | | | 60 | | | Lowe’s Cos., Inc.,
Sr. Unsec’d. Notes,
6.500%, 03/15/29 | | | 73,371 | |
| Baa3 | | | 45 | | | Macy’s Retail Holdings, Inc.,
Gtd. Notes,
3.875%, 01/15/22(a) | | | 45,131 | |
| | | | | | | | | | |
| | | | | | | | | 242,489 | |
| | | | | | | | | | |
|
Technology 0.3% | |
| Baa3 | | | 60 | | | Arrow Electronics, Inc.,
Sr. Unsec’d. Notes,
3.375%, 11/01/15(a) | | | 61,772 | |
| Baa2 | | | 70 | | | Fiserv, Inc.,
Gtd. Notes,
3.125%, 06/15/16 | | | 71,529 | |
| Baa3 | | | 110 | | | Seagate Technology International (Cayman Islands),
Sec’d. Notes, 144A,
10.000%, 05/01/14 | | | 124,300 | |
See Notes to Financial Statements.
| | | | |
| Prudential Asset Allocation Fund | | | 69 | |
Portfolio of Investments
as of March 31, 2012 (Unaudited) continued
| | | | | | | | | | |
Moody’s
Ratings† | | Principal
Amount (000)# | | | Description | | Value (Note 1) | |
| | | | | | | | | | |
CORPORATE BONDS (Continued) | |
|
Technology (cont’d.) | |
| Ba1 | | $ | 125 | | | STATS ChipPAC Ltd. (Singapore),
Gtd. Notes, 144A,
7.500%, 08/12/15 | | $ | 134,063 | |
| Baa2 | | | 445 | | | Xerox Corp.,
Sr. Unsec’d. Notes,
4.250%, 02/15/15 | | | 472,648 | |
| | | | | | | | | | |
| | | | | | | | | 864,312 | |
| | | | | | | | | | |
|
Telecommunications 0.4% | |
| A2 | | | 100 | | | America Movil SAB de CV (Mexico),
Gtd. Notes,
6.125%, 03/30/40 | | | 116,132 | |
| A2 | | | 33 | | | AT&T, Inc.,
Sr. Unsec’d. Notes,
5.350%, 09/01/40 | | | 35,089 | |
| A2 | | | 180 | | | 5.550%, 08/15/41(a) | | | 199,516 | |
| A2 | | | 215 | | | 6.550%, 02/15/39(a) | | | 261,646 | |
| Baa2 | | | 50 | | | British Telecommunications PLC (United Kingdom),
Sr. Unsec’d. Notes,
9.625%, 12/15/30 | | | 73,566 | |
| | | | | | Embarq Corp.,
Sr. Unsec’d. Notes,
7.082%, 06/01/16 | | | | |
| Baa3 | | | 75 | | | (original cost $84,771; purchased date
05/04/11 - 05/11/11)(c)(f)
| | | 84,466 | |
| | | | | | 7.995%, 06/01/36 | | | | |
| Baa3 | | | 200 | | | (original cost $199,986; purchased date
05/12/06)(c)(f) | | | 202,153 | |
| Baa2 | | | 90 | | | Telecom Italia Capital SA (Luxembourg),
Gtd. Notes,
5.250%, 11/15/13 | | | 92,475 | |
| Baa2 | | | 40 | | | 7.175%, 06/18/19 | | | 42,600 | |
| Baa2 | | | 140 | | | 7.200%, 07/18/36 | | | 135,800 | |
| A3 | | | 40 | | | Telefonos de Mexico SAB de CV (Mexico),
Sr. Unsec’d. Notes,
5.500%, 11/15/19 | | | 45,311 | |
| Baa2 | | | 40 | | | U.S. Cellular Corp.,
Sr. Unsec’d. Notes,
6.700%, 12/15/33 | | | 38,913 | |
See Notes to Financial Statements.
| | |
| 70 | | Visit our website at www.prudentialfunds.com |
| | | | | | | | | | |
Moody’s
Ratings† | | Principal
Amount (000)# | | | Description | | Value (Note 1) | |
| | | | | | | | | | |
CORPORATE BONDS (Continued) | |
|
Telecommunications (cont’d.) | |
| Ba3 | | $ | 100 | | | Windstream Corp.,
Gtd. Notes,
8.125%, 08/01/13 | | $ | 106,500 | |
| | | | | | | | | | |
| | | | | | | | | 1,434,167 | |
| | | | | | | | | | |
|
Tobacco 0.3% | |
| Baa1 | | | 235 | | | Altria Group, Inc.,
Gtd. Notes,
9.700%, 11/10/18 | | | 319,324 | |
| Baa1 | | | 160 | | | 10.200%, 02/06/39 | | | 248,067 | |
| Baa2 | | | 50 | | | Lorillard Tobacco Co.,
Gtd. Notes,
8.125%, 06/23/19 | | | 62,080 | |
| Baa3 | | | 220 | | | Reynolds American, Inc.,
Gtd. Notes,
6.750%, 06/15/17 | | | 262,077 | |
| Baa3 | | | 35 | | | 7.250%, 06/15/37 | | | 40,831 | |
| | | | | | | | | | |
| | | | | | | | | 932,379 | |
| | | | | | | | | | |
| | | | | | Total corporate bonds
(cost $33,175,767) | | | 35,948,550 | |
| | | | | | | | | | |
|
ASSET BACKED SECURITIES 1.2% | |
|
Non-Residential Mortgage Backed Securities 0.8% | |
| Aaa | | | 492 | | | Aimco CDO (Cayman Islands),
Ser. 2005-AA, Class A1B, 144A,
0.811%, 10/20/19(b) | | | 469,036 | |
| Aaa | | | 300 | | | Apidos CDO (Cayman Islands),
Ser. 2011-8A, Class A1, 144A,
2.094%, 10/17/21(b) | | | 299,272 | |
| Aaa | | | 238 | | | ARES Enhanced Loan Investment Strategy Ltd. (Cayman Islands),
Ser. 2005-2A, Class A2, 144A,
0.819%, 01/26/20(b) | | | 229,801 | |
| Baa2 | | | 300 | | | Citibank Credit Card Issuance Trust,
Ser. 2006-C1, Class C1,
0.642%, 02/20/15(b) | | | 299,228 | |
See Notes to Financial Statements.
| | | | |
| Prudential Asset Allocation Fund | | | 71 | |
Portfolio of Investments
as of March 31, 2012 (Unaudited) continued
| | | | | | | | | | |
Moody’s
Ratings† | | Principal
Amount (000)# | | | Description | | Value (Note 1) | |
| | | | | | | | | | |
ASSET BACKED SECURITIES (Continued) | |
|
Non-Residential Mortgage Backed Securities (cont’d.) | |
| Baa2 | | $ | 265 | | | Fuel Trust,
Sec’d. Notes, 144A,
4.207%, 04/15/16 | | $ | 271,963 | |
| Aaa | | | 243 | | | Gulf Stream - Sextant CLO Ltd. (Cayman Islands),
Ser. 2006-1A, Class A1A, 144A,
0.723%, 08/21/20(b) | | | 235,818 | |
| Aaa | | | 81 | | | Hewett’s Island CDO Ltd. (Cayman Islands),
Ser. 2004-1A, Class A1, 144A,
0.814%, 12/15/16(b) | | | 79,807 | |
| Aaa | | | 250 | | | Landmark CDO Ltd. (Cayman Islands),
Ser. 2007-9A, Class A1,
0.782%, 04/15/21(b) | | | 241,236 | |
| Aaa | | | 500 | | | Trimaran CLO Ltd. (Cayman Islands),
Ser. 2006-2A, Class A1L, 144A,
0.797%, 11/01/18(b) | | | 483,631 | |
| | | | | | | | | | |
| | | | | | | | | 2,609,792 | |
| | | | | | | | | | |
|
Residential Mortgage Backed Securities 0.4% | |
| B2 | | | 80 | | | CDC Mortgage Capital Trust,
Ser. 2002-HE3, Class M1,
1.892%, 03/25/33(b) | | | 47,473 | |
| Baa1 | | | 520 | | | Countrywide Asset-Backed Certificates,
Ser. 2004-1, Class M1,
0.992%, 03/25/34(b) | | | 401,005 | |
| B3 | | | 60 | | | Credit-Based Asset Servicing and Securitization LLC,
Ser. 2005-CB6, Class A3,
5.120%, 07/25/35 | | | 50,148 | |
| Baa1 | | | 136 | | | Equity One ABS, Inc.,
Ser. 2004-3, Class M1,
5.700%, 07/25/34 | | | 106,833 | |
| Aa1 | | | 61 | | | HFC Home Equity Loan Asset Backed Certificates,
Ser. 2005-2, Class M2,
0.732%, 01/20/35(b) | | | 54,677 | |
| Baa2 | | | 482 | | | Morgan Stanley ABS Capital I,
Ser. 2004-NC1, Class M1,
1.292%, 12/25/33(b) | | | 417,386 | |
| Caa3 | | | 139 | | | Morgan Stanley Dean Witter Capital I,
Ser. 2002-HE1, Class M1,
1.142%, 07/25/32(b) | | | 98,490 | |
See Notes to Financial Statements.
| | |
| 72 | | Visit our website at www.prudentialfunds.com |
| | | | | | | | | | |
Moody’s
Ratings† | | Principal
Amount (000)# | | | Description | | Value (Note 1) | |
| | | | | | | | | | |
ASSET BACKED SECURITIES (Continued) | |
|
Residential Mortgage Backed Securities (cont’d.) | |
| B2 | | $ | 128 | | | Ser. 2002-NC4, Class M1,
1.517%, 09/25/32(b) | | $ | 98,644 | |
| B2 | | | 31 | | | Residential Asset Securities Corp.,
Ser. 2004-KS2, Class MI1,
4.710%, 03/25/34(b) | | | 15,258 | |
| Ba3 | | | 218 | | | Securitized Asset Backed Receivables LLC Trust,
Ser. 2004-OP1, Class M1,
1.007%, 02/25/34(b) | | | 164,420 | |
| Ca | | | 300 | | | Ser. 2006-FR3, Class A3,
0.492%, 05/25/36(b) | | | 99,392 | |
| | | | | | | | | | |
| | | | | | | | | 1,553,726 | |
| | | | | | | | | | |
| | | | | | Total asset backed securities
(cost $4,511,637) | | | 4,163,518 | |
| | | | | | | | | | |
|
COLLATERALIZED MORTGAGE OBLIGATIONS 0.4% | |
| Caa2 | | | 510 | | | Banc of America Alternative Loan Trust,
Ser. 2005-12, Class 3CB1,
6.000%, 01/25/36 | | | 372,385 | |
| B2 | | | 96 | | | Banc of America Mortgage Securities, Inc.,
Ser. 2005-A, Class 2A1,
2.989%, 02/25/35(b) | | | 84,090 | |
| Caa1 | | | 100 | | | Ser. 2005-B, Class 2A1,
2.972%, 03/25/35(b) | | | 85,082 | |
| Ba2 | | | 319 | | | Chase Mortgage Finance Corp.,
Ser. 2007-A1, Class 1A5,
2.794%, 02/25/37(b) | | | 304,269 | |
| Ba3 | | | 128 | | | Countrywide Alternative Loan Trust,
Ser. 2004-18CB, Class 3A1,
5.250%, 09/25/19 | | | 130,642 | |
| B1 | | | 206 | | | JPMorgan Mortgage Trust,
Ser. 2007-A1, Class 4A1,
2.778%, 07/25/35(b) | | | 194,726 | |
| AAA(d) | | | 11 | | | Mastr Alternative Loans Trust,
Ser. 2003-8, Class 4A1,
7.000%, 12/25/33 | | | 11,687 | |
| Baa1 | | | 153 | | | Ser. 2004-4, Class 4A1,
5.000%, 04/25/19 | | | 156,965 | |
See Notes to Financial Statements.
| | | | |
| Prudential Asset Allocation Fund | | | 73 | |
Portfolio of Investments
as of March 31, 2012 (Unaudited) continued
| | | | | | | | | | |
Moody’s
Ratings† | | Principal
Amount (000)# | | | Description | | Value (Note 1) | |
| | | | | | | | | | |
COLLATERALIZED MORTGAGE OBLIGATIONS (Continued) | |
| Baa1 | | $ | 136 | | | Structured Adjustable Rate Mortgage Loan Trust,
Ser. 2004-1, Class 4A3,
2.722%, 02/25/34(b) | | $ | 129,477 | |
| CCC(d) | | | 65 | | | Washington Mutual Alternative Mortgage
Pass-Through Certificates,
Ser. 2005-1, Class 3A,
5.000%, 03/25/20 | | | 59,105 | |
| | | | | | | | | | |
| | | | | | Total collateralized mortgage obligations
(cost $1,724,290) | | | 1,528,428 | |
| | | | | | | | | | |
|
COMMERCIAL MORTGAGE BACKED SECURITIES 4.8% | |
| Aaa | | | 19 | | | Banc of America Commercial Mortgage, Inc.,
Ser. 2004-2, Class A3,
4.050%, 11/10/38 | | | 19,749 | |
| Aaa | | | 560 | | | Ser. 2004-2, Class A4,
4.153%, 11/10/38 | | | 579,925 | |
| Aaa | | | 500 | | | Ser. 2006-4, Class A3A,
5.600%, 07/10/46 | | | 508,713 | |
| Aaa | | | 38 | | | Ser. 2007-1, Class A2,
5.381%, 01/15/49 | | | 38,081 | |
| Aaa | | | 600 | | | Banc of America Merrill Lynch Commercial Mortgage, Inc.,
Ser. 2006-6, Class A3,
5.369%, 10/10/45 | | | 641,358 | |
| AAA(d) | | | 2,375 | | | Bear Stearns Commercial Mortgage Securities,
Ser. 2004-T16, Class X2, I/O,
0.951%, 02/13/46(b) | | | 11,580 | |
| Aaa | | | 687 | | | Citigroup Commercial Mortgage Trust,
Ser. 2006-C5, Class ASB,
5.413%, 10/15/49 | | | 736,783 | |
| AAA(d) | | | 598 | | | Commercial Mortgage Acceptance Corp.,
Ser. 1998-C2, Class X, I/O,
1.668%, 09/15/30(b) | | | 23,327 | |
| Aaa | | | 14 | | | Credit Suisse First Boston Mortgage Securities Corp.,
Ser. 2004-C4, Class A4,
4.283%, 10/15/39 | | | 13,932 | |
| AAA(d) | | | 1,200 | | | Ser. 2005-C5, Class A4,
5.100%, 08/15/38(b) | | | 1,324,964 | |
| Aaa | | | 750 | | | Ser. 2005-C6, Class A4,
5.230%, 12/15/40(b) | | | 827,292 | |
See Notes to Financial Statements.
| | |
| 74 | | Visit our website at www.prudentialfunds.com |
| | | | | | | | | | |
Moody’s
Ratings† | | Principal
Amount (000)# | | | Description | | Value (Note 1) | |
| | | | | | | | | | |
COMMERCIAL MORTGAGE BACKED SECURITIES (Continued) | |
| AAA(d) | | $ | 800 | | | Credit Suisse Mortgage Capital Certificates,
Ser. 2006-C1, Class A4,
5.419%, 02/15/39(b) | | $ | 895,642 | |
| AAA(d) | | | 500 | | | CWCapital Cobalt Ltd.,
Ser. 2007-C3, Class A3,
5.816%, 05/15/46(b) | | | 535,489 | |
| Aaa | | | 335 | | | DBUBS Mortgage Trust,
Ser. 2011-LC3A, Class A2,
3.642%, 08/10/44 | | | 358,108 | |
| NR | | | 1,200 | | | FHLMC Multifamily Structured Pass Through Certificates,
Ser. K501, Class X1A, I/O,
1.758%, 08/25/16(b) | | | 70,062 | |
| AAA(d) | | | 645 | | | GMAC Commercial Mortgage Securities, Inc.,
Ser. 2005-C1, Class A5,
4.697%, 05/10/43 | | | 694,899 | |
| Aaa | | | 375 | | | Greenwich Capital Commercial Funding Corp.,
Ser. 2007-GG9, Class A2,
5.381%, 03/10/39 | | | 379,454 | |
| Aaa | | | 500 | | | JPMorgan Chase Commercial Mortgage Securities Corp.,
Ser. 2005-CB12, Class A4,
4.895%, 09/12/37 | | | 547,779 | |
| Aaa | | | 382 | | | Ser. 2005-CB13, Class ASB,
5.285%, 01/12/43(b) | | | 401,938 | |
| Aa2 | | | 100 | | | Ser. 2005-LDP2, Class AM,
4.780%, 07/15/42 | | | 105,518 | |
| Aaa | | | 66 | | | Ser. 2005-LDP2, Class A3,
4.697%, 07/15/42 | | | 66,614 | |
| Aaa | | | 611 | | | Ser. 2006-CB16, Class ASB,
5.523%, 05/12/45 | | | 657,917 | |
| Aaa | | | 17,697 | | | Ser. 2006-LDP6, Class X2, I/O,
0.224%, 04/15/43(b) | | | 17,661 | |
| Aaa | | | 173 | | | LB-UBS Commercial Mortgage Trust,
Ser. 2005-C3, Class A3,
4.647%, 07/15/30 | | | 173,447 | |
| AAA(d) | | | 141 | | | Ser. 2006-C1, Class A2,
5.084%, 02/15/31 | | | 142,484 | |
| Aaa | | | 4 | | | Ser. 2006-C3, Class A2,
5.532%, 03/15/32 | | | 3,778 | |
| Aaa | | | 400 | | | Merrill Lynch Mortgage Trust,
Ser. 2004-KEY2, Class A3,
4.615%, 08/12/39 | | | 415,554 | |
See Notes to Financial Statements.
| | | | |
| Prudential Asset Allocation Fund | | | 75 | |
Portfolio of Investments
as of March 31, 2012 (Unaudited) continued
| | | | | | | | | | |
Moody’s
Ratings† | | Principal
Amount (000)# | | | Description | | Value (Note 1) | |
| | | | | | | | | | |
COMMERCIAL MORTGAGE BACKED SECURITIES (Continued) | |
| Aaa | | $ | 480 | | | Merrill Lynch/Countrywide Commercial
Mortgage Trust,
Ser. 2006-2, Class A4,
6.095%, 06/12/46(b) | | $ | 546,755 | |
| Aaa | | | 311 | | | Ser. 2007-6, Class A2,
5.331%, 03/12/51 | | | 311,120 | |
| Aaa | | | 1,500 | | | Ser. 2007-7, Class ASB,
5.742%, 06/12/50(b) | | | 1,572,030 | |
| Aaa | | | 500 | | | Morgan Stanley Capital I,
Ser. 2006-HQ8, Class A4,
5.418%, 03/12/44(b) | | | 555,827 | |
| AAA(d) | | | 700 | | | Ser. 2006-IQ11, Class A4,
5.731%, 10/15/42(b) | | | 786,794 | |
| Aaa | | | 200 | | | Ser. 2007-HQ11, Class A31,
5.439%, 02/12/44 | | | 209,235 | |
| Aaa | | | 999 | | | Ser. 2007-HQ11, Class AAB,
5.444%, 02/12/44 | | | 1,052,900 | |
| AAA(d) | | | 260 | | | Ser. 2007-T27, Class AAB,
5.640%, 06/11/42(b) | | | 274,963 | |
| Aa1 | | | 135 | | | Wachovia Bank Commercial Mortgage Trust,
Ser. 2005-C20, Class AMFX,
5.179%, 07/15/42(b) | | | 145,118 | |
| Aaa | | | 150 | | | Ser. 2006-C25, Class A4,
5.737%, 05/15/43(b) | | | 169,267 | |
| Aaa | | | 280 | | | Ser. 2007-C33, Class A2,
5.854%, 02/15/51(b) | | | 281,192 | |
| | | | | | | | | | |
| | | | | | Total commercial mortgage backed securities
(cost $15,094,155) | | | 16,097,249 | |
| | | | | | | | | | |
|
FOREIGN AGENCIES 0.7% | |
| Aaa | | | 1,220 | | | Commonwealth Bank of Australia (Australia),
Gov’t . Gtd. Notes, 144A,
2.700%, 11/25/14 | | | 1,276,884 | |
| A1 | | | 100 | | | Export-Import Bank of Korea (South Korea),
Sr. Unsec’d. Notes,
5.125%, 06/29/20 | | | 107,183 | |
| A1 | | | 120 | | | Korea Hydro & Nuclear Power Co. Ltd. (South Korea),
Sr. Unsec’d. Notes, 144A,
6.250%, 06/17/14 | | | 129,909 | |
| Aaa | | | 115 | | | Kreditanstalt Fuer Wiederaufbau (Germany),
Gtd. Notes,
2.375%, 08/25/21 | | | 112,403 | |
See Notes to Financial Statements.
| | |
| 76 | | Visit our website at www.prudentialfunds.com |
| | | | | | | | | | |
Moody’s
Ratings† | | Principal
Amount (000)# | | | Description | | Value (Note 1) | |
| | | | | | | | | | |
FOREIGN AGENCIES (Continued) | |
| A3 | | $ | 250 | | | Petrobras International Finance Co. (Cayman Islands),
Gtd. Notes,
5.375%, 01/27/21 | | $ | 269,185 | |
| Baa1 | | | 460 | | | RSHB Capital SA For OJSC Russian Agricultural Bank (Luxembourg),
Sr. Unsec’d. Notes, 144A,
6.299%, 05/15/17 | | | 487,600 | |
| | | | | | | | | | |
| | | | | | Total foreign agencies
(cost $2,280,026) | | | 2,383,164 | |
| | | | | | | | | | |
| |
MORTGAGE BACKED SECURITIES 11.0% | | | | |
| | | 500 | | | Federal Home Loan Mortgage Corp.,
3.000%, TBA 15 YR(h) | | | 515,547 | |
| | | 1,743 | | | 4.000%, 06/01/26 - 11/01/39 | | | 1,837,795 | |
| | | 1,218 | | | 4.500%, 10/01/39 | | | 1,292,162 | |
| | | 2,500 | | | 4.500%, TBA 30 YR(h) | | | 2,650,781 | |
| | | 820 | | | 5.000%, 07/01/18 - 05/01/34 | | | 888,371 | |
| | | 1,500 | | | 5.000%, TBA 30 YR(h) | | | 1,614,785 | |
| | | 202 | | | 5.236%, 12/01/35(b) | | | 215,377 | |
| | | 1,223 | | | 5.500%, 12/01/33 - 10/01/37 | | | 1,337,649 | |
| | | 256 | | | 6.000%, 01/01/34 | | | 286,536 | |
| | | 97 | | | 7.000%, 10/01/31 - 05/01/32 | | | 111,914 | |
| | | 1,000 | | | Federal National Mortgage Association,
3.000%, TBA 15 YR(h) | | | 1,032,500 | |
| | | 461 | | | 3.500%, 06/01/39 | | | 473,504 | |
| | | 1,250 | | | 3.500%, TBA 15 YR(h) | | | 1,310,938 | |
| | | 1,000 | | | 4.000%, TBA 30 YR(h) | | | 1,046,250 | |
| | | 2,035 | | | 4.500%, 07/01/19 - 09/01/39 | | | 2,169,733 | |
| | | 1,077 | | | 5.000%, 10/01/18 - 02/01/36 | | | 1,165,795 | |
| | | 1,723 | | | 5.500%, 12/01/16 - 07/01/34 | | | 1,893,519 | |
| | | 354 | | | 5.545%, 07/01/37(b) | | | 377,032 | |
| | | 2,308 | | | 6.000%, 09/01/17 - 08/01/38 | | | 2,572,361 | |
| | | 2,292 | | | 6.500%, 05/01/13 - 10/01/37 | | | 2,586,671 | |
| | | 54 | | | 7.000%, 06/01/32 | | | 62,265 | |
| | | 4 | | | 7.500%, 09/01/30 | | | 5,047 | |
| | | 8 | | | 8.000%, 12/01/23 | | | 9,593 | |
| | | 8 | | | 8.500%, 02/01/28 | | | 10,275 | |
| | | 1,000 | | | Government National Mortgage Association,
3.500%, TBA 30 YR(h) | | | 1,042,031 | |
| | | 1,000 | | | 4.000%, TBA 30 YR(h) | | | 1,070,156 | |
| | | 500 | | | 4.000%, TBA 30 YR | | | 536,406 | |
See Notes to Financial Statements.
| | | | |
| Prudential Asset Allocation Fund | | | 77 | |
Portfolio of Investments
as of March 31, 2012 (Unaudited) continued
| | | | | | | | | | |
Moody’s
Ratings† | | Principal
Amount (000)# | | | Description | | Value (Note 1) | |
| | | | | | | | | | |
MORTGAGE BACKED SECURITIES (Continued) | |
| | $ | 3,250 | | | 4.500%, TBA 30 YR(h) | | $ | 3,534,883 | |
| | | 1,500 | | | 5.000%, TBA 30 YR(h) | | | 1,653,281 | |
| | | 1,759 | | | 5.500%, 07/15/33 - 02/15/36 | | | 1,983,194 | |
| | | 1,000 | | | 6.000%, TBA 30 YR(h) | | | 1,127,031 | |
| | | 388 | | | 6.500%, 09/15/23 - 08/15/32 | | | 447,091 | |
| | | 84 | | | 7.000%, 06/15/24 - 05/15/31 | | | 98,133 | |
| | | 9 | | | 7.500%, 04/15/29 - 05/15/31 | | | 9,294 | |
| | | 82 | | | 8.000%, 08/15/22 - 06/15/25 | | | 94,803 | |
| | | | | | | | | | |
| | | | | | Total mortgage backed securities
(cost $35,569,585) | | | 37,062,703 | |
| | | | | | | | | | |
| |
MUNICIPAL BONDS 0.6% | | | | |
| Aa3 | | | 220 | | | Bay Area Toll Auth. Toll Brdg. Rev., Build America Bonds,
6.263%, 04/01/49 | | | 283,219 | |
| A1 | | | 160 | | | Chicago O’Hare Int’l. Arpt., Build America Bonds,
6.395%, 01/01/40 | | | 195,504 | |
| Aa2 | | | 160 | | | Metropolitan Government of Nashville & Davidson County Convention Center Auth., Taxable Sub. B, Direct Pay, Build America Bonds,
6.731%, 07/01/43 | | | 188,144 | |
| A3 | | | 165 | | | New Jersey State Tpk. Auth. Rev., Tax. Issuer Subs.,
Ser. F, Build America Bonds,
7.414%, 01/01/40 | | | 235,341 | |
| Aa1 | | | 190 | | | New York City Trans. Fin. Auth., Tax. Future, Tax. Secd. Sub., Ser. C-2, Build America Bonds,
5.767%, 08/01/36 | | | 224,818 | |
| Aa1 | | | 65 | | | Ohio State University Gen. Rcpts., Build America Bonds,
4.910%, 06/01/40 | | | 72,278 | |
| Aaa | | | 45 | | | Ohio State Water Development Auth. Wtr. Poll. Ctl. Rev.,
Taxable Ld Fd. B-2 Wtr. Quality, Build America Bonds,
4.879%, 12/01/34 | | | 48,373 | |
| Aa2 | | | 70 | | | Oregon State Dept. of Trans. Hwy. User Tax Rev., Taxable Sub. Lien, Ser. A, Build America Bonds,
5.834%, 11/15/34 | | | 84,742 | |
| Aa3 | | | 80 | | | Pennsylvania State Turnpike Commission Rev.,
Ser. B, Build America Bonds,
5.511%, 12/01/45 | | | 88,440 | |
| A1 | | | 210 | | | State of California, GO, Build America Bonds,
7.300%, 10/01/39 | | | 262,920 | |
See Notes to Financial Statements.
| | |
| 78 | | Visit our website at www.prudentialfunds.com |
| | | | | | | | | | |
Moody’s
Ratings† | | Principal
Amount (000)# | | | Description | | Value (Note 1) | |
| | | | | | | | | | |
MUNICIPAL BONDS (Continued) | |
| A1 | | $ | 90 | | | State of California, GO, Tax. Var. Purp., Build America Bonds,
7.500%, 04/01/34 | | $ | 114,026 | |
| A1 | | | 40 | | | 7.550%, 04/01/39 | | | 51,396 | |
| Aaa | | | 50 | | | Texas State Trans. Commission Rev., Taxable First Tier,
Ser. B, Build America Bonds,
5.028%, 04/01/26 | | | 59,750 | |
| | | | | | | | | | |
| | | | | | Total municipal bonds
(cost $1,570,538) | | | 1,908,951 | |
| | | | | | | | | | |
| | |
SOVEREIGN BONDS 0.1% | | | | | | | |
| Baa1 | | | 118 | | | Mexico Government International Bond (Mexico),
Sr. Unsec’d. Notes, MTN,
4.750%, 03/08/44(a) | | | 115,640 | |
| Baa1 | | | 400 | | | Russian Foreign Bond - Eurobond (Russia),
Unsec’d. Notes, 144A,
3.250%, 04/04/17 | | | 403,032 | |
| | | | | | | | | | |
| | | | | | Total sovereign bonds
(cost $514,928) | | | 518,672 | |
| | | | | | | | | | |
| |
U.S. GOVERNMENT AGENCY OBLIGATIONS 0.2% | | | | |
| | | 135 | | | Federal Home Loan Banks,
5.500%, 07/15/36 | | | 169,365 | |
| | | 225 | | | Federal Home Loan Mortgage Corp.,
1.250%, 05/12/17 | | | 224,696 | |
| | | 330 | | | Resolution Funding Corp. Interest Strip,
1.790%, 04/15/18(i) | | | 297,318 | |
| | | | | | | | | | |
| | | | | | Total U.S. government agency obligations
(cost $637,622) | | | 691,379 | |
| | | | | | | | | | |
|
U.S. GOVERNMENT TREASURY SECURITIES 4.1% | |
| | | 590 | | | U.S. Treasury Bonds,
3.125%, 11/15/41 | | | 565,939 | |
| | | 125 | | | 4.375%, 05/15/41 | | | 150,274 | |
| | | 1,045 | | | 4.750%, 02/15/41 | | | 1,331,885 | |
| | | 120 | | | 6.250%, 08/15/23 | | | 166,200 | |
| | | 2,055 | | | U.S. Treasury Notes,
1.500%, 03/31/19 | | | 2,039,427 | |
| | | 860 | | | 1.875%, 09/30/17 | | | 890,570 | |
| | | 150 | | | 2.000%, 02/15/22(a) | | | 147,117 | |
| | | 805 | | | 4.250%, 11/15/17 | | | 937,007 | |
| | | 305 | | | 4.750%, 08/15/17 | | | 362,188 | |
See Notes to Financial Statements.
| | | | |
| Prudential Asset Allocation Fund | | | 79 | |
Portfolio of Investments
as of March 31, 2012 (Unaudited) continued
| | | | | | | | |
Principal
Amount (000)# | | | Description | | Value (Note 1) | |
| | | | | | | | |
| U.S. GOVERNMENT TREASURY SECURITIES (Continued) | |
| $ | 3,665 | | | U.S. Treasury Strip Coupon,
2.830%, 05/15/24(i) | | $ | 2,606,511 | |
| | 1,880 | | | 2.870%, 08/15/24(i) | | | 1,321,210 | |
| | 500 | | | 2.940%, 02/15/25(i) | | | 342,718 | |
| | 885 | | | 3.160%, 11/15/23(i) | | | 644,564 | |
| | 1,600 | | | 3.580%, 05/15/25(i) | | | 1,083,766 | |
| | 790 | | | 3.880%, 08/15/26(i) | | | 504,318 | |
| | 1,080 | | | U.S. Treasury Strip Principal,
3.940%, 08/15/27(j) | | | 669,206 | |
| | | | | | | | |
| | | | Total U.S. government treasury securities
(cost $12,729,936) | | | 13,762,900 | |
| | | | | | | | |
| | | | Total long-term investments
(cost $272,600,167) | | | 323,084,814 | |
| | | | | | | | |
| SHORT-TERM INVESTMENTS 15.1% | |
|
| U.S. Government Treasury Security 0.1% | |
| | 420 | | | U.S. Treasury Bills
0.044%, 06/28/12(g)(k)
(cost $419,955) | | | 419,929 | |
| | | | | | | | |
| | |
Shares | | | | | | |
| AFFILIATED MUTUAL FUNDS 15.0% | |
| | 2,254,197 | | | Prudential Investment Portfolios 2 - Prudential Core Short-Term Bond Fund(l)
(cost $21,927,790) | | | 20,175,064 | |
| | 30,315,833 | | | Prudential Investment Portfolios 2 - Prudential Core Taxable Money Market Fund(l)(m)
(cost $30,315,833; includes $17,571,976 of cash collateral received for securities on loan) | | | 30,315,833 | |
| | | | | | | | |
| | | | Total affiliated mutual funds
(cost $52,243,623) | | | 50,490,897 | |
| | | | | | | | |
| | | | Total short-term investments
(cost $52,663,578) | | | 50,910,826 | |
| | | | | | | | |
| | | | Total Investments 110.9%
(cost $325,263,745; Note 5) | | | 373,995,640 | |
| | | | Liabilities in excess of other assets(n) (10.9%) | | | (36,716,661 | ) |
| | | | | | | | |
| | | | Net Assets 100.0% | | $ | 337,278,979 | |
| | | | | | | | |
See Notes to Financial Statements.
| | |
| 80 | | Visit our website at www.prudentialfunds.com |
The following abbreviations are used in the portfolio descriptions:
144A—Security was purchased pursuant to Rule 144A under the Securities Act of 1933 and may not be resold subject to that rule except to qualified institutional buyers. Unless otherwise noted, 144A securities are deemed to be liquid.
ABS—Asset-Backed Security
CDO—Collateralized Debt Obligation
CLO—Collateralized Loan Obligation
FHLMC—Federal Home Loan Mortgage Association
GO—General Obligation
HFC—Housing Finance Corp.
I/O—Interest Only
LLC—Limited Liability Corp.
LP—Limited Partnership
MTN—Medium Term Note
NR—Not Rated
REIT—Real Estate Investment Trust
SA—Special Assessment
Strip—Separate trading of registered interest and principal of securities
TBA—To Be Announced
| * | Non-income producing security. |
| † | The ratings reflected are as of March 31, 2012. Ratings of certain bonds may have changed subsequent to that date. |
| # | Principal amount is shown in U.S. dollars unless otherwise stated. |
| (a) | All or a portion of security is on loan. The aggregate market value of such securities, including those sold and pending settlement, is $17,175,783; cash collateral of $17,571,976 (included in liabilities) was received with which the Series purchased highly liquid short-term investments. |
| (b) | Variable rate instrument. The interest rate shown reflects the rate in effect at March 31, 2012. |
| (c) | Indicates a security that has been deemed illiquid. |
| (d) | Standard and Poor’s Rating. |
| (e) | Represents issuer in default on interest payments and/or principal repayment; non-income producing security. |
| (f) | Indicates a restricted security, the aggregate original cost of such securities is $899,034. The aggregate value of $985,047 is approximately 0.3% of net assets. |
| (g) | Represents security, or a portion thereof, segregated as collateral for futures contracts. |
| (h) | Principal amount of $15,500,000 represents a to-be announced (“TBA”) mortgage dollar roll. |
| (i) | The rate shown is the effective yield at March 31, 2012. |
| (j) | Represents a zero coupon bond. Rate shown reflects the effective yield at March 31, 2012. |
| (k) | Rate quoted represents yield-to-maturity as of purchase date. |
| (l) | Prudential Investments LLC, the manager of the Series, also serves as manager of the Prudential Investment Portfolios 2 - Prudential Core Taxable Money Market Fund and the Prudential Investment Portfolios 2 - Prudential Core Short-Term Bond Fund. |
| (m) | Represents security, or a portion thereof, purchased with cash collateral received for securities on loan. |
See Notes to Financial Statements.
| | | | |
| Prudential Asset Allocation Fund | | | 81 | |
Portfolio of Investments
as of March 31, 2012 (Unaudited) continued
| (n) | Includes net unrealized appreciation (depreciation) on the following derivative contracts held at reporting period end: |
Open futures contracts outstanding at March 31, 2012:
| | | | | | | | | | | | | | | | | | | | |
Number of
Contracts | | | Type | | Expiration
Date | | | Value at
Trade
Date | | | Value at
March 31,
2012 | | | Unrealized
Appreciation | |
| | | | Long Positions: | | | | | | | | | | | | | | | | |
| | 35 | | | 2 Year U.S. Treasury Notes | | | Jun. 2012 | | | $ | 7,703,324 | | | $ | 7,704,922 | | | $ | 1,598 | |
| | 69 | | | 5 Year U.S. Treasury Notes | | | Jun. 2012 | | | | 8,424,905 | | | | 8,455,195 | | | | 30,290 | |
| | 30 | | | 10 Year U.S. Treasury Notes | | | Jun. 2012 | | | | 3,855,490 | | | | 3,884,531 | | | | 29,041 | |
| | 10 | | | EMINI MSCI EAFE | | | Jun. 2012 | | | | 767,860 | | | | 770,800 | | | | 2,940 | |
| | 74 | | | S & P EMINI | | | Jun. 2012 | | | | 5,057,878 | | | | 5,191,840 | | | | 133,962 | |
| | | | | | | | | | | | | | | | | | | | |
| | | | | | | | | | | | | | | | | | | 197,831 | |
| | | | | | | | | | | | | | | | | | | | |
| | | | Short Positions: | | | | | | | | | | | | | | | | |
| | 26 | | | U.S. Long Bond | | | Jun. 2012 | | | | 3,687,937 | | | | 3,581,500 | | | | 106,437 | |
| | 9 | | | U.S. Ultra Bond | | | Jun. 2012 | | | | 1,395,034 | | | | 1,358,719 | | | | 36,315 | |
| | | | | | | | | | | | | | | | | | | | |
| | | | | | | | | | | | | | | | | | | 142,752 | |
| | | | | | | | | | | | | | | | | | | | |
| | | | | | | | | | | | | | | | | | $ | 340,583 | |
| | | | | | | | | | | | | | | | | | | | |
Interest rate swap agreements outstanding at March 31, 2012:
| | | | | | | | | | | | | | | | | | | | | | | | | | |
Notional
Amount
(000)# | | | Termination
Date | | | Fixed
Rate | | | Floating Rate | | Fair
Value | | | Upfront
Premiums
Paid/
(Received) | | | Unrealized
Appreciation
(Depreciation) | | | Counterparty |
| $ | 245 | | | | 09/14/16 | | | | 1.206% | | | 3 month LIBOR(a) | | $ | (925 | ) | | $ | — | | | $ | (925 | ) | | Deutsche Bank AG |
| | 320 | | | | 01/09/17 | | | | 1.237% | | | 3 month LIBOR(a) | | | (824 | ) | | | — | | | | (824 | ) | | Barclays Bank PLC |
| | 1,020 | | | | 11/15/18 | | | | 1.531% | | | 3 month LIBOR(a) | | | 10,181 | | | | — | | | | 10,181 | | | Citibank NA |
| | 1,005 | | | | 11/15/18 | | | | 1.700% | | | 3 month LIBOR(a) | | | (769 | ) | | | — | | | | (769 | ) | | Morgan Stanley Capital Services, Inc. |
| | 1,005 | | | | 11/15/18 | | | | 1.712% | | | 3 month LIBOR(a) | | | (1,520 | ) | | | — | | | | (1,520 | ) | | Citibank NA |
| | 750 | | | | 07/20/21 | | | | 3.035% | | | 3 month LIBOR(b) | | | 58,890 | | | | — | | | | 58,890 | | | Citibank NA |
| | 690 | | | | 11/23/21 | | | | 2.148% | | | 3 month LIBOR(a) | | | 334 | | | | — | | | | 334 | | | Citibank NA |
| | 170 | | | | 01/30/22 | | | | 2.082% | | | 3 month LIBOR(a) | | | 2,301 | | | | — | | | | 2,301 | | | Citibank NA |
| | 360 | | | | 02/07/22 | | | | 2.056% | | | 3 month LIBOR(a) | | | 5,922 | | | | — | | | | 5,922 | | | Citibank NA |
| | 405 | | | | 02/10/22 | | | | 2.097% | | | 3 month LIBOR(a) | | | 5,230 | | | | — | | | | 5,230 | | | Morgan Stanley Capital Services, Inc. |
| | | | | | | | | | | | | | | | | | | | | | | | | | |
| | | | | | | | | | | | | | $ | 78,820 | | | $ | — | | | $ | 78,820 | | | |
| | | | | | | | | | | | | | | | | | | | | | | | | | |
See Notes to Financial Statements.
| | |
| 82 | | Visit our website at www.prudentialfunds.com |
| LIBOR—London | Interbank Offered Rate |
| (a) | The Series pays the fixed rate and receives the floating rate. |
| (b) | The Series pays the floating rate and receives the fixed rate. |
| # | Notional amount is shown in U.S. dollars unless otherwise stated. |
Credit default swap agreements outstanding at March 31, 2012:
| | | | | | | | | | | | | | | | | | | | | | | | | | |
Reference
Entity/
Obligation | | Termination
Date | | | Fixed
Rate | | | Notional
Amount
(000)#(2) | | | Fair
Value | | | Upfront
Premiums
Paid/
(Received) | | | Unrealized
Appreciation
(Depreciation) | | | Counterparty |
Over-the-counter credit default swaps—Buy Protection(1): |
Bunge Ltd. Finance Corp. | | | 06/20/14 | | | | 0.650% | | | $ | 240 | | | $ | 1,818 | | | $ | — | | | $ | 1,818 | | | JPMorgan Chase Bank |
Newell Rubbermaid, Inc. | | | 06/20/18 | | | | 1.000% | | | | 300 | | | | 608 | | | | — | | | | 608 | | | Morgan Stanley Capital Services, Inc. |
Simon Property Group L.P. | | | 06/20/18 | | | | 0.970% | | | | 500 | | | | 1,745 | | | | — | | | | 1,745 | | | Morgan Stanley Capital Services, Inc. |
Spectra Energy Capital LLC | | | 06/20/18 | | | | 1.130% | | | | 500 | | | | (462 | ) | | | — | | | | (462 | ) | | Merrill Lynch Capital Services, Inc. |
Starwood Hotel & Resorts Worldwide, Inc. | | | 06/20/18 | | | | 1.450% | | | | 500 | | | | (5,612 | ) | | | — | | | | (5,612 | ) | | Merrill Lynch Capital Services, Inc. |
Starwood Hotels & Resorts Holdings, Inc. | | | 03/20/14 | | | | 7.050% | | | | 300 | | | | (38,797 | ) | | | — | | | | (38,797 | ) | | Deutsche Bank AG |
| | | | | | | | | | | | | | | | | | | | | | | | | | |
| | | | | | | | | | | | | | $ | (40,700 | ) | | $ | — | | | $ | (40,700 | ) | | |
| | | | | | | | | | | | | | | | | | | | | | | | | | |
| (1) | If the Series is a buyer of protection, it pays the fixed rate. When a credit event occurs, as defined under the terms of that particular swap agreement, the Series will either (i) receive from the seller of protection an amount equal to the notional amount of the swap and make delivery of the referenced obligation or underlying securities comprising the referenced index or (ii) receive a net settlement amount in the form of cash or securities equal to the notional amount of the swap less the recovery value of the referenced obligation or underlying securities comprising the referenced index. |
| (2) | Notional amount represents the maximum potential amount the Series could be required to pay as a seller of credit protection or receive as a buyer of credit protection if a credit event occurs as defined under the terms of that particular swap agreement. |
| # | Notional amount is shown in U.S. dollars unless otherwise stated. |
See Notes to Financial Statements.
| | | | |
| Prudential Asset Allocation Fund | | | 83 | |
Portfolio of Investments
as of March 31, 2012 (Unaudited) continued
Various inputs are used in determining the value of the Series’ investments. These inputs are summarized in the three broad levels listed below.
Level 1—quoted prices generally for securities actively traded on a regulated securities exchange and for open-end mutual funds which trade at daily net asset value.
Level 2—other significant observable inputs (including, but not limited to, quoted prices for similar securities, interest rates, prepayment speeds, foreign currency exchange rates, and amortized cost) generally for debt securities, swaps, forward foreign currency contracts and for foreign stocks priced using vendor modeling tools.
Level 3—significant unobservable inputs for securities valued in accordance with Board approved fair valuation procedures.
The following is a summary of the inputs used as of March 31, 2012 in valuing such portfolio securities:
| | | | | | | | | | | | |
| | | Level 1 | | | Level 2 | | | Level 3 | |
Investments in Securities | | | | | | | | | | | | |
Common Stocks | | $ | 207,949,703 | | | $ | — | | | $ | — | |
Exchange Traded Fund | | | 702,720 | | | | — | | | | — | |
Preferred Stocks | | | 366,877 | | | | — | | | | — | |
Corporate Bonds | | | — | | | | 35,948,550 | | | | — | |
Asset Backed Securities | | | — | | | | 4,163,518 | | | | — | |
Collateralized Mortgage Obligations | | | — | | | | 1,528,428 | | | | — | |
Commercial Mortgage Backed Securities | | | — | | | | 16,027,187 | | | | 70,062 | |
Foreign Agencies | | | — | | | | 2,383,164 | | | | — | |
Mortgage Backed Securities | | | — | | | | 37,062,703 | | | | — | |
Municipal Bonds | | | — | | | | 1,908,951 | | | | — | |
Sovereign Bonds | | | — | | | | 518,672 | | | | — | |
U.S. Government Agency Obligations | | | — | | | | 691,379 | | | | — | |
U.S. Government Treasury Securities | | | — | | | | 14,182,829 | | | | — | |
Affiliated Mutual Funds | | | 50,490,897 | | | | — | | | | — | |
Other Financial Instruments* | | | | | | | | | | | | |
Futures | | | 340,583 | | | | — | | | | — | |
Interest Rate Swaps | | | — | | | | 78,820 | | | | — | |
Credit Default Swaps | | | — | | | | (40,700 | ) | | | — | |
| | | | | | | | | | | | |
Total | | $ | 259,850,780 | | | $ | 114,453,501 | | | $ | 70,062 | |
| | | | | | | | | | | | |
| * | Other financial instruments are derivative instruments not reflected in the Portfolio of Investments, such as futures, forwards and swap contracts, which are recorded at the unrealized appreciation/depreciation on the instrument. |
See Notes to Financial Statements.
| | |
| 84 | | Visit our website at www.prudentialfunds.com |
The industry classification of portfolio holdings and liabilities in excess of other assets shown as a percentage of net assets as of March 31, 2012 was as follows:
| | | | |
Affiliated Mutual Funds (including 5.2% of collateral received for securities on loan) | | | 15.0 | % |
Mortgage Backed Securities | | | 11.0 | |
Oil, Gas & Consumable Fuels | | | 5.9 | |
Commercial Mortgage Backed Securities | | | 4.8 | |
U.S. Government Treasury Securities | | | 4.2 | |
Computers & Peripherals | | | 3.4 | |
Pharmaceuticals | | | 3.4 | |
Banking | | | 2.7 | |
Commercial Banks | | | 2.7 | |
Insurance | | | 2.7 | |
Software | | | 2.4 | |
IT Services | | | 2.1 | |
Communications Equipment | | | 1.7 | |
Healthcare Providers & Services | | | 1.7 | |
Specialty Retail | | | 1.7 | |
Real Estate Investment Trusts | | | 1.6 | |
Tobacco | | | 1.6 | |
Capital Markets | | | 1.5 | |
Diversified Financial Services | | | 1.5 | |
Machinery | | | 1.5 | |
Food & Staples Retailing | | | 1.4 | |
Media | | | 1.4 | |
Chemicals | | | 1.3 | |
Diversified Telecommunication Services | | | 1.3 | |
Semiconductors & Semiconductor Equipment | | | 1.3 | |
Aerospace & Defense | | | 1.2 | |
Beverages | | | 1.2 | |
Biotechnology | | | 1.2 | |
Energy Equipment & Services | | | 1.1 | |
Hotels, Restaurants & Leisure | | | 1.1 | |
Metals & Mining | | | 1.1 | |
Food Products | | | 1.0 | |
Industrial Conglomerates | | | 1.0 | |
Road & Rail | | | 0.9 | |
Electric | | | 0.8 | |
Electric Utilities | | | 0.8 | |
Electrical Equipment | | | 0.8 | |
Healthcare Equipment & Supplies | | | 0.8 | |
Multi-Utilities | | | 0.8 | |
Non-Residential Mortgage Backed Securities | | | 0.8 | |
Foreign Agencies | | | 0.7 | |
Household Products | | | 0.7 | |
Internet Software & Services | | | 0.7 | % |
Multiline Retail | | | 0.6 | |
Municipal Bonds | | | 0.6 | |
Automobiles | | | 0.5 | |
Consumer Finance | | | 0.5 | |
Foods | | | 0.5 | |
Healthcare & Pharmaceutical | | | 0.5 | |
Household Durables | | | 0.5 | |
Non Captive Finance | | | 0.5 | |
Textiles, Apparel & Luxury Goods | | | 0.5 | |
Trading Companies & Distributors | | | 0.5 | |
Air Freight & Logistics | | | 0.4 | |
Collateralized Mortgage Obligations | | | 0.4 | |
Electronic Equipment, Instruments & Components | | | 0.4 | |
Healthcare Insurance | | | 0.4 | |
Independent Power Producers & Energy Traders | | | 0.4 | |
Metals | | | 0.4 | |
Residential Mortgage Backed Securities | | | 0.4 | |
Telecommunications | | | 0.4 | |
Airlines | | | 0.3 | |
Distributors | | | 0.3 | |
Energy—Other | | | 0.3 | |
Lodging | | | 0.3 | |
Media & Entertainment | | | 0.3 | |
Pipelines & Other | | | 0.3 | |
Real Estate Management & Development | | | 0.3 | |
Technology | | | 0.3 | |
Cable | | | 0.2 | |
Capital Goods | | | 0.2 | |
Commercial Services & Supplies | | | 0.2 | |
Exchange Traded Fund | | | 0.2 | |
Leisure Equipment & Products | | | 0.2 | |
Life Sciences Tools & Services | | | 0.2 | |
Paper | | | 0.2 | |
Personal Products | | | 0.2 | |
U.S. Government Agency Obligations | | | 0.2 | |
Auto Components | | | 0.1 | |
Automotive | | | 0.1 | |
Building Products | | | 0.1 | |
Construction & Engineering | | | 0.1 | |
Consumer | | | 0.1 | |
Containers & Packaging | | | 0.1 | |
Diversified Consumer Services | | | 0.1 | |
See Notes to Financial Statements.
| | | | |
| Prudential Asset Allocation Fund | | | 85 | |
Portfolio of Investments
as of March 31, 2012 (Unaudited) continued
| | | | |
Industry (cont’d.) | | | |
Energy—Integrated | | | 0.1 | % |
Gas Utilities | | | 0.1 | |
Healthcare Technology | | | 0.1 | |
Internet & Catalog Retail | | | 0.1 | |
Office Electronics | | | 0.1 | |
Paper & Forest Products | | | 0.1 | |
Professional Services | | | 0.1 | |
Railroads | | | 0.1 | % |
Retailers | | | 0.1 | |
Sovereign Bonds | | | 0.1 | |
Wireless Telecommunication Services | | | 0.1 | |
| | | | |
| | | 110.9 | |
Liabilities in excess of other assets | | | (10.9 | ) |
| | | | |
| | | 100.0 | % |
| | | | |
The Series invested in derivative instruments during the reporting period. The primary types of risk associated with these derivative instruments are credit risk, equity risk and interest rate risk. The effect of such derivative instruments on the Series’ financial position and financial performance as reflected in the Statement of Assets and Liabilities and Statement of Operations is presented in the summary below.
Fair values of derivative instruments as of March 31, 2012 as presented in the Statement of Assets and Liabilities:
| | | | | | | | | | | | |
Derivatives not designated
as hedging instruments,
carried at fair value | | Asset Derivatives | | | Liability Derivatives | |
| | Balance
Sheet Location | | Fair
Value | | | Balance
Sheet Location | | Fair
Value | |
| Credit contracts | | Unrealized appreciation on swap agreements | | $ | 4,171 | | | Unrealized depreciation on swap agreements | | $ | 44,871 | |
| Equity contracts | | Due from broker—variation margin | | | 136,902 | * | | — | | | — | |
| Interest rate contracts | | Unrealized appreciation on swap agreements | | | 82,858 | | | Unrealized depreciation on swap agreements | | | 4,038 | |
| Interest rate contracts | | Due from broker—variation margin | | | 203,681 | * | | — | | | — | |
| | | | | | | | | | | | |
Total | | | | $ | 427,612 | | | | | $ | 48,909 | |
| | | | | | | | | | | | |
| * | Includes cumulative appreciation/depreciation on futures contracts as reported in Portfolio of Investments. Only unsettled variation margin receivable (payable) is reported within the Statement of Assets and Liabilities. |
See Notes to Financial Statements.
| | |
| 86 | | Visit our website at www.prudentialfunds.com |
The effects of derivative instruments on the Statement of Operations for the six months ended March 31, 2012 are as follows:
| | | | | | | | | | | | | | | | | | | | | | | | |
Amount of Realized Gain or (Loss) on Derivatives Recognized in Income | |
Derivatives not designated as hedging
instruments, carried at fair value | | Purchased
Options | | | Written
Options | | | Rights | | | Futures | | | Swaps | | | Total | |
Credit contracts | | $ | — | | | $ | — | | | $ | — | | | $ | — | | | $ | 19,791 | | | $ | 19,791 | |
Equity contracts | | | — | | | | — | | | | (728 | ) | | | 733,290 | | | | — | | | | 732,562 | |
Interest rate contracts | | | 42,907 | | | | (29,530 | ) | | | — | | | | (269,745 | ) | | | 33,986 | | | | (222,382 | ) |
| | | | | | | | | | | | | | | | | | | | | | | | |
Total | | $ | 42,907 | | | $ | (29,530 | ) | | $ | (728 | ) | | $ | 463,545 | | | $ | 53,777 | | | $ | 529,971 | |
| | | | | | | | | | | | | | | | | | | | | | | | |
| | | | | | | | | | | | | | | | |
Change in Unrealized Appreciation or (Depreciation) on Derivatives Recognized in Income | |
Derivatives not designated as hedging
instruments, carried at fair value | | Rights | | | Futures | | | Swaps | | | Total | |
Credit contracts | | $ | — | | | $ | — | | | $ | (163,837 | ) | | $ | (163,837 | ) |
Equity contracts | | | (993 | ) | | | 395,888 | | | | — | | | | 394,895 | |
Interest rate contracts | | | — | | | | 371,677 | | | | 23,768 | | | | 395,445 | |
| | | | | | | | | | | | | | | | |
Total | | $ | (993 | ) | | $ | 767,565 | | | $ | (140,069 | ) | | $ | 626,503 | |
| | | | | | | | | | | | | | | | |
For the six months ended March 31, 2012, the Series’ average volume of derivative activities is as follows:
| | | | | | | | | | | | | | |
Futures
Long Position | | | Futures
Short Position | | | Interest
Rate Swaps | | | Credit Default
Swaps as Buyer | |
(Value at
Trade Date) | | | (Value at
Trade Date) | | | (Notional Amount
in USD (000)) | | | (Notional Amount
in USD (000)) | |
| $ | 22,195,223 | | | $ | 6,214,240 | | | $ | 3,998 | | | $ | 2,673 | |
See Notes to Financial Statements.
| | | | |
| Prudential Asset Allocation Fund | | | 87 | |
Statement of Assets and Liabilities
as of March 31, 2012 (Unaudited)
| | | | |
Assets | | | | |
Investments at value, including securities on loan of $17,175,783: | | | | |
Unaffiliated Investments (cost $273,020,122) | | $ | 323,504,743 | |
Affiliated Investments (cost $52,243,623) | | | 50,490,897 | |
Foreign currency, at value (cost $135,131) | | | 138,142 | |
Receivable for investments sold | | | 18,291,467 | |
Dividends and interest receivable | | | 1,195,487 | |
Receivable for Series shares sold | | | 133,760 | |
Unrealized appreciation on swap agreements | | | 87,029 | |
Due from broker—variation margin | | | 48,084 | |
Foreign tax reclaim receivable | | | 24,197 | |
Prepaid expenses | | | 2,398 | |
| | | | |
Total assets | | | 393,916,204 | |
| | | | |
| |
Liabilities | | | | |
Payable for investments purchased | | | 37,550,869 | |
Payable to broker for collateral for securities on loan (Note 3) | | | 17,571,976 | |
Payable for Series shares reacquired | | | 754,673 | |
Accrued expenses and other liabilities | | | 370,041 | |
Management fee payable | | | 178,880 | |
Distribution fee payable | | | 89,491 | |
Affiliated transfer agent fee payable | | | 60,642 | |
Unrealized depreciation on swap agreements | | | 48,909 | |
Payable to custodian | | | 11,744 | |
| | | | |
Total liabilities | | | 56,637,225 | |
| | | | |
| |
Net Assets | | $ | 337,278,979 | |
| | | | |
| | | | | |
Net assets were comprised of: | | | | |
Common stock, at par | | $ | 25,988 | |
Paid-in capital in excess of par | | | 329,464,804 | |
| | | | |
| | | 329,490,792 | |
Undistributed net investment income | | | 1,040,351 | |
Accumulated net realized loss on investment and foreign currency transactions | | | (42,366,911 | ) |
Net unrealized appreciation on investments and foreign currencies | | | 49,114,747 | |
| | | | |
Net assets, March 31, 2012 | | $ | 337,278,979 | |
| | | | |
See Notes to Financial Statements.
| | |
| 88 | | Visit our website at www.prudentialfunds.com |
| | | | |
Class A | | | | |
Net asset value and redemption price per share
($266,659,521 ÷ 20,566,361 shares of common stock issued and outstanding) | | $ | 12.97 | |
Maximum sales charge (5.50% of offering price) | | | 0.75 | |
| | | | |
Maximum offering price to public | | $ | 13.72 | |
| | | | |
| |
Class B | | | | |
Net asset value, offering price and redemption price per share
($10,819,750 ÷ 830,909 shares of common stock issued and outstanding) | | $ | 13.02 | |
| | | | |
| |
Class C | | | | |
Net asset value, offering price and redemption price per share
($10,940,613 ÷ 840,496 shares of common stock issued and outstanding) | | $ | 13.02 | |
| | | | |
| |
Class L | | | | |
Net asset value, offering price and redemption price per share
($6,669,267 ÷ 512,676 shares of common stock issued and outstanding) | | $ | 13.01 | |
| | | | |
| |
Class M | | | | |
Net asset value, offering price and redemption price per share
($14,522 ÷ 1,114 shares of common stock issued and outstanding) | | $ | 13.04 | |
| | | | |
| |
Class R | | | | |
Net asset value, offering price and redemption price per share
($38,010 ÷ 2,930 shares of common stock issued and outstanding) | | $ | 12.97 | |
| | | | |
| |
Class X | | | | |
Net asset value, offering price and redemption price per share
($778,041 ÷ 59,780 shares of common stock issued and outstanding) | | $ | 13.02 | |
| | | | |
| |
Class Z | | | | |
Net asset value, offering price and redemption price per share
($41,359,255 ÷ 3,173,712 shares of common stock issued and outstanding) | | $ | 13.03 | |
| | | | |
See Notes to Financial Statements.
| | | | |
| Prudential Asset Allocation Fund | | | 89 | |
Statement of Operations
Six Months Ended March 31, 2012 (Unaudited)
| | | | |
Net Investment Income | | | | |
Income | | | | |
Unaffiliated interest income | | $ | 2,268,660 | |
Unaffiliated dividend income (net of foreign withholding taxes of $17,449) | | | 2,226,576 | |
Affiliated dividend income | | | 146,562 | |
Affiliated income from securities loaned, net | | | 11,205 | |
| | | | |
Total income | | | 4,653,003 | |
| | | | |
| |
Expenses | | | | |
Management fee | | | 1,046,818 | |
Distribution fee—Class A | | | 384,276 | |
Distribution fee—Class B | | | 55,834 | |
Distribution fee—Class C | | | 52,539 | |
Distribution fee—Class L | | | 15,966 | |
Distribution fee—Class M | | | 1,098 | |
Distribution fee—Class R | | | 37 | |
Distribution fee—Class X | | | 4,025 | |
Transfer agent’s fees and expenses (including affiliated expense of $130,900) (Note 3) | | | 307,000 | |
Custodian’s fees and expenses | | | 144,000 | |
Registration fees | | | 55,000 | |
Reports to shareholders | | | 55,000 | |
Audit fee | | | 19,000 | |
Legal fees and expenses | | | 14,000 | |
Directors’ fees | | | 9,000 | |
Insurance | | | 4,000 | |
Miscellaneous | | | 70,353 | |
| | | | |
Total expenses | | | 2,237,946 | |
Less: Expense waiver (Note 2) | | | (32,298 | ) |
| | | | |
Net expenses | | | 2,205,648 | |
| | | | |
Net investment income | | | 2,447,355 | |
| | | | |
|
Realized And Unrealized Gain (Loss) On Investment And Foreign Currencies | |
Net realized gain (loss) on: | | | | |
Investment transactions | | $ | 4,075,073 | |
Foreign currency transactions | | | (10,013 | ) |
Financial futures transactions | | | 463,545 | |
Swap agreement transactions | | | 53,777 | |
Options written transactions | | | (29,530 | ) |
| | | | |
| | | 4,552,852 | |
| | | | |
Net change in unrealized appreciation (depreciation) on: | | | | |
Investments (including affiliated: $180,178) | | | 41,024,903 | |
Foreign currencies | | | 4,312 | |
Financial futures contracts | | | 767,565 | |
Short sales | | | (2,656 | ) |
Swap agreements | | | (140,069 | ) |
| | | | |
| | | 41,654,055 | |
| | | | |
Net gain on investment and foreign currency transactions | | | 46,206,907 | |
| | | | |
Net Increase In Net Assets Resulting From Operations | | $ | 48,654,262 | |
| | | | |
See Notes to Financial Statements.
| | |
| 90 | | Visit our website at www.prudentialfunds.com |
Statement of Changes in Net Assets
(Unaudited)
| | | | | | | | |
| | | Six Months
Ended
March 31, 2012 | | | Year
Ended
September 30, 2011 | |
Increase (Decrease) In Net Assets | | | | | | | | |
Operations | | | | | | | | |
Net investment income | | $ | 2,447,355 | | | $ | 5,034,082 | |
Net realized gain on investment and foreign currency transactions | | | 4,552,852 | | | | 36,167,574 | |
Net change in unrealized appreciation (depreciation) on investments and foreign currencies | | | 41,654,055 | | | | (29,823,453 | ) |
| | | | | | | | |
Net increase in net assets resulting from operations | | | 48,654,262 | | | | 11,378,203 | |
| | | | | | | | |
| | |
Dividends from net investment income (Note 1) | | | | | | | | |
Class A | | | (4,078,954 | ) | | | (4,852,583 | ) |
Class B | | | (105,078 | ) | | | (164,182 | ) |
Class C | | | (94,351 | ) | | | (127,858 | ) |
Class L | | | (89,178 | ) | | | (106,454 | ) |
Class M | | | (2,801 | ) | | | (19,560 | ) |
Class R | | | (184 | ) | | | (169 | ) |
Class X | | | (7,530 | ) | | | (17,268 | ) |
Class Z | | | (670,668 | ) | | | (880,277 | ) |
| | | | | | | | |
| | | (5,048,744 | ) | | | (6,168,351 | ) |
| | | | | | | | |
| | |
Series share transactions (Net of share conversions) (Note 6) | | | | | | | | |
Net proceeds from shares sold | | | 9,568,846 | | | | 13,603,154 | |
Net asset value of shares issued in reinvestment of dividends | | | 4,910,362 | | | | 6,016,575 | |
Cost of shares reacquired | | | (25,000,085 | ) | | | (132,410,666 | ) |
| | | | | | | | |
Net decrease in net assets from Series share transactions | | | (10,520,877 | ) | | | (112,790,937 | ) |
| | | | | | | | |
Total increase (decrease) | | | 33,084,641 | | | | (107,581,085 | ) |
| | |
Net Assets: | | | | | | | | |
Beginning of period | | | 304,194,338 | | | | 411,775,423 | |
| | | | | | | | |
End of period(a) | | $ | 337,278,979 | | | $ | 304,194,338 | |
| | | | | | | | |
(a) Includes undistributed net investment income of: | | $ | 1,040,351 | | | $ | 3,641,740 | |
| | | | | | | | |
See Notes to Financial Statements.
| | | | |
| Prudential Asset Allocation Fund | | | 91 | |
Notes to Financial Statements
(Unaudited)
The Prudential Investment Portfolios, Inc. (the “Company”) is an open-end management investment company, registered under the Investment Company Act of 1940, as amended, (“1940 Act”). The Company was incorporated in Maryland on August 10, 1995 and consists of six series: Prudential Asset Allocation Fund (the “Series”), Prudential Jennison Growth Fund and Prudential Jennison Equity Opportunity Fund which are diversified funds and Prudential Growth Allocation Fund, Prudential Moderate Allocation Fund and Prudential Conservative Allocation Fund which are non-diversified funds. These financial statements relate to Prudential Asset Allocation Fund. The financial statements of the other series are not presented herein. The Fund commenced investment operations on November 7, 1996.
The Series’ investment objective is to seek income and long-term growth of capital.
Note 1. Accounting Policies
The following is a summary of significant accounting policies followed by the Series, in the preparation of its financial statements.
Securities Valuation: Securities listed on a securities exchange (other than options on securities and indices) are valued at the last sale price on such exchange on the day of valuation or, if there was no sale on such day, at the mean between the last reported bid and asked prices, or at the last bid price on such day in the absence of an asked price. Securities traded via NASDAQ are valued at the NASDAQ official closing price (“NOCP”) on the day of valuation, or if there was no NOCP, at the last sale price. Securities that are actively traded in the over-the-counter market, including listed securities for which the primary market is believed by Prudential Investments LLC (“PI” or “Manager”), in consultation with the subadvisor, to be over-the-counter, are valued at market value using prices provided by an independent pricing agent or principal market maker. Options on securities and indices traded on an exchange are valued at their last sale price as of the close of trading on the applicable exchange or, if there was no sale, at the mean between the most recently quoted bid and asked prices on such exchange. Futures contracts and options thereon traded on a commodities exchange or board of trade are valued at the last sale price at the close of trading on such exchange or board of trade or, if there was no sale on the applicable commodities exchange or board of trade on such day, at the mean between the most recently quoted bid and asked prices on such exchange or board of trade or at the last bid price in the absence of an asked price. Prices may be obtained
| | |
| 92 | | Visit our website at www.prudentialfunds.com |
from independent pricing services which use information provided by market makers or estimates of market values obtained from yield data relating to investments or securities with similar characteristics. Securities for which reliable market quotations are not readily available, or whose values have been affected by events occurring after the close of the security’s foreign market and before the Series’ normal pricing time, are valued at fair value in accordance with the Board of Directors’ approved fair valuation procedures. When determining the fair valuation of securities some of the factors influencing the valuation include, the nature of any restrictions on disposition of the securities; assessment of the general liquidity of the securities; the issuer’s financial condition and the markets in which it does business; the cost of the investment; the size of the holding and the capitalization of issuer; the prices of any recent transactions or bids/offers for such securities or any comparable securities; any available analyst media or other reports or information deemed reliable by the investment advisor regarding the issuer or the markets or industry in which it operates. Using fair value to price securities may result in a value that is different from a security’s most recent closing price and from the price used by other mutual funds to calculate their net asset values.
Investments in open-end, non-exchange-traded mutual funds are valued at their net asset value as of the close of the New York Stock Exchange on the date of valuation.
Short-term debt securities of sufficient credit quality, which mature in sixty days or less, are valued at amortized cost, which approximates fair value. The amortized cost method involves valuing a security at its cost on the date of purchase and thereafter assuming a constant amortization to maturity of the difference between the principal amount due at maturity and cost. Short-term debt securities which mature in more than sixty days are valued at fair value.
Foreign Currency Translation: The books and records of the Series are maintained in U.S. dollars. Foreign currency amounts are translated into U.S. dollars on the following basis:
(i) market value of investment securities, other assets and liabilities—at the current rate of exchange;
(ii) purchases and sales of investment securities, income and expenses—at the rate of exchange prevailing on the respective dates of such transactions.
Although the net assets of the Series are presented at the foreign exchange rates and market values at the close of the fiscal year, the Series does not isolate that portion of the results of operations arising as a result of changes in the foreign exchange rates from the fluctuations arising from changes in the market prices of long-term portfolio
| | | | |
| Prudential Asset Allocation Fund | | | 93 | |
Notes to Financial Statements
(Unaudited) continued
securities held at fiscal year end. Similarly, the Series does not isolate the effect of changes in foreign exchange rates from the fluctuations arising from changes in the market prices of long-term portfolio securities sold during the fiscal year. Accordingly, these realized foreign currency gains or losses are included in the reported net realized gains or losses on investment transactions.
Net realized gains or losses on foreign currency transactions represent net foreign exchange gains or losses from holdings of foreign currencies, currency gains or losses realized between the trade and settlement dates of security transactions, and the difference between the amounts of dividends, interest and foreign withholding taxes recorded on the Series’ books and the U.S. dollar equivalent amounts actually received or paid. Net unrealized currency gains or losses from valuing foreign currency denominated assets and liabilities (other than investments) at year-end exchange rates are reflected as a component of unrealized appreciation (depreciation) on investments and foreign currencies.
Foreign security and currency transactions may involve certain considerations and risks not typically associated with those of domestic origin as a result of, among other factors, the possibility of political and economic instability or the level of governmental supervision and regulation of foreign securities markets.
Options: Certain Portfolios purchased or wrote options in order to hedge against adverse market movements or fluctuations in value caused by changes in prevailing interest rates and foreign currency exchange rates with respect to securities or currencies which the Portfolio currently owns or intends to purchase. Certain Portfolios also used purchased options to gain exposure to certain securities or foreign currencies. The Portfolios’ principal reason for writing options is to realize, through receipt of premiums, a greater current return than would be realized on the underlying security alone. When the Portfolio purchases an option, it pays a premium and an amount equal to that premium is recorded as an asset. When the Portfolio writes an option, it receives a premium and an amount equal to that premium is recorded as a liability. The asset or liability is adjusted daily to reflect the current market value of the option.
If an option expires unexercised, the Portfolio realizes a gain or loss to the extent of the premium received or paid. If an option is exercised, the premium received or paid is recorded as an adjustment to the proceeds from the sale or the cost basis of the
| | |
| 94 | | Visit our website at www.prudentialfunds.com |
purchase in determining whether the Portfolio has realized a gain or loss. The difference between the premium and the amount received or paid on affecting a closing purchase or sale transaction is also treated as a realized gain or loss. Gains or losses on purchased options are included in net realized gains or losses on investment transactions. Gains or losses on written options are presented separately as net realized gains or losses on options written.
The Portfolio, as writer of an option, may have no control over whether the underlying securities or financial instruments may be sold (called) or purchased (put). As a result, the Portfolio bears the market risk of an unfavorable change in the price of the security or financial instrument underlying the written option. Over-the-counter options involve the risk of the potential inability of the counterparties to meet the terms of their contracts.
With exchange-traded futures and options contracts, there is minimal counterparty credit risk to the Portfolio since the exchanges’ clearinghouse acts as counterparty to all exchange traded futures and options, and guarantees the futures and options contracts against default.
When a Portfolio writes an option on a swap, an amount equal to any premium received by the Portfolio is recorded as a liability and is subsequently adjusted to the current market value of the written option on the swap. If a call option on a swap is exercised, the Portfolio becomes obligated to pay a fixed interest rate (noted as the strike price) and receive a variable interest rate on a notional amount. If a put option on a swap is exercised, the Portfolio becomes obligated to pay a variable interest rate and receive a fixed interest rate (noted as the strike price) on a notional amount. Premiums received from writing options on swaps that expire or are exercised are treated as realized gains upon the expiration or exercise of such options on swaps. The risk associated with writing put and call options on swaps is that the Portfolio will be obligated to be party to a swap agreement if an option on a swap is exercised.
Financial Futures Contracts: A financial futures contract is an agreement to purchase (long) or sell (short) an agreed amount of securities at a set price for delivery on a future date. Upon entering into a financial futures contract, the Series is required to pledge to the broker an amount of cash and/or other assets equal to a certain percentage of the contract amount. This amount is known as the “initial margin.” Subsequent payments, known as “variation margin,” are made or received by the Series each day, depending on the daily fluctuations in the value of the underlying security. Such variation margin is recorded for financial statement purposes on a daily basis as unrealized gain (loss). When the contract expires or is closed, the gain (loss) is realized and is presented in the Statement of Operations as net realized gain (loss)
| | | | |
| Prudential Asset Allocation Fund | | | 95 | |
Notes to Financial Statements
(Unaudited) continued
on financial futures contracts. Financial futures contracts involve elements of risk in excess of the amounts reflected on the Statement of Assets and Liabilities.
The Series entered into financial futures contracts in order to hedge its existing portfolio securities, or securities the Series intends to purchase, against fluctuations in value caused by changes in prevailing interest rates, value of equities or foreign currency exchange rates. Should interest rates move unexpectedly, the Series may not achieve the anticipated benefits of the financial futures contracts and may realize a loss. The use of futures transactions involves the risk of imperfect correlation in movements in the price of futures contracts, interest rates and the underlying hedged assets.
Short Sales: The Fund engages in short sales (selling securities it does not own) as part of its normal investment activities. These short sales are collateralized at all times by cash deposits with the prime broker and/or securities held in a segregated account at the custodian. The short stock rebate, when in excess of expenses is included in the Statement of Operations and represents the net income earned on short sale proceeds held on deposit with the prime broker and margin interest earned or incurred on short sale transactions. Margin interest is the income earned (or expense incurred) as a result of the market value of securities sold short being less than (or greater than) the proceeds received from the short sales.
Dividends declared on short positions are recorded on the ex-dividend date as an expense on the Statement of Operations and included in the expense ratio in the Financial Highlights. Liability for securities sold short is reported at market value on the Statement of Assets and Liabilities. The Fund records a loss if the price of the security increases between the date of the short sale and the date on which the Fund replaces the borrowed security. The Fund records a gain if the price of the security declines between those dates. Short selling involves the off-balance sheet risk of potentially unlimited increase in the market value of the security sold short, which could result in potentially unlimited loss for the Fund. The Fund is subject to risk of loss if the broker were to fail to perform its obligation under contractual terms. A gain, limited to the price at which the Fund sold the security short, or a loss, unlimited in size, will be recognized upon the termination of the short sale.
Swap Agreements: The Series entered into credit default and interest rate swap agreements. A swap agreement is an agreement to exchange the return generated by one instrument for the return generated by another instrument. Swap agreements are
| | |
| 96 | | Visit our website at www.prudentialfunds.com |
negotiated in the over-the-counter market and may be executed either directly with counterparty (“OTC Traded”) or through a central clearing facility, such as a registered commodities exchange (“Exchange Traded”). Swap agreements are valued daily at current market value and any change in value is included in the net unrealized appreciation or depreciation on investments. Upon entering into an exchange traded swap, the Fund pledges with the clearing broker an initial margin and thereafter, pays or receives an amount, known as “variation margin”, based on daily changes in valuation of swap contract. Payments received or paid by the Series are recorded as realized gains or losses upon termination or maturity of the swap. Risk of loss may exceed amounts recognized on the Statements of Assets and Liabilities. Swap agreements outstanding at fiscal year end, if any, are listed on the Portfolio of Investments.
Interest Rate Swaps: Interest rate swaps represent an agreement between counterparties to exchange cash flows based on the difference between two interest rates, applied to a notional principal amount for a specified period. The Series is subject to interest rate risk exposure in the normal course of pursuing its investment objectives. The Series used interest rate swaps to maintain its ability to generate steady cash flow by receiving a stream of fixed rate payments and to increase exposure to prevailing market rates by receiving floating rate payments using interest rate swap contracts. The Series’ maximum risk of loss from counterparty credit risk is the discounted net value of the cash flows to be received from the counterparty over the contract’s remaining life. A master netting arrangement between the Series and the counterparty permits the Series to offset amounts payable by the Series to the same counterparty against amounts to be received; and by the receipt of collateral from the counterparty by the Series to cover the Series’ exposure to the counterparty. However, there is no assurance that such mitigating factors are easily enforceable.
Credit Default Swaps: Credit default swaps involve one party (the protection buyer) making a stream of payments to another party (the protection seller) in exchange for the right to receive a specified payment in the event of a default or as a result of a default (“credit event”) for the referenced party, typically corporate issues or sovereign issues of an emerging country, on its obligation; or in the event of a write-down, principal shortfall, interest shortfall or default of all or part of the referenced entities comprising a credit index.
The Series is subject to credit risk in the normal course of pursuing its investment objectives. The Series purchased credit default swaps to provide a measure of protection against defaults of the issuers. The Series’ maximum risk of loss from counterparty credit risk for purchased credit default swaps is the notional value of a credit default swap agreement. A master netting arrangement between the Series and
| | | | |
| Prudential Asset Allocation Fund | | | 97 | |
Notes to Financial Statements
(Unaudited) continued
the counterparty permits the Series to offset amounts payable by the Series to the same counterparty against amounts to be received; and by the receipt of collateral from the counterparty by the Series to cover the Series’ exposure to the counterparty. However, there is no assurance that such mitigating factors are easily enforceable.
As a seller of protection on credit default swap agreements, the Series will generally receive from the buyer of protection an agreed upon payment throughout the term of the swap provided that there is no credit event. As the seller, the Series would effectively increase investment risk to its portfolio because, in addition to its total net assets, the Series may be subject to investment exposure on the notional amount of the swap.
The maximum amount of the payment that the Series as a seller of protection could be required to make under a credit default swap agreement would be equal to the notional amount of the underlying security or index contract as a result of a credit event. These potential amounts will be partially offset by any recovery values of the respective referenced obligations, or net amounts received from the settlement of buy protection credit default swap agreements entered into by the Series for the same referenced entity or index. As a buyer of protection, the Series generally receives an amount up to the notional value of the swap if a credit event occurs.
Implied credit spreads, represented in absolute terms, utilized in determining the market value of credit default swap agreements on corporate issues or sovereign issues of an emerging country as of fiscal year end are disclosed in the footnotes to the Portfolio of Investments, if applicable, and serve as an indicator of the current status of the payment/performance risk and represent the likelihood of risk of default for the credit derivative. The implied credit spread of a particular referenced entity reflects the cost of buying/selling protection and may include upfront payments required to enter into the agreement. For credit default swap agreements on asset-backed securities and credit indices, the quoted market prices and resulting values serve as the indicator of the current status of the payment and/or performance risk. Wider credit spreads and increasing market value in absolute terms, when compared to the notional amount of the swap, represent a deterioration of the referenced entity’s credit soundness and a greater likelihood or risk of default or other credit event occurring as defined under the terms of the agreement.
| | |
| 98 | | Visit our website at www.prudentialfunds.com |
In addition to each instrument’s primary underlying risk exposure (e.g. interest rate, credit, equity or foreign exchange, etc.), swap agreements involve, to varying degrees, elements of credit, market and documentation risk. Such risks involve the possibility that there will be no liquid market for these agreements, that the counterparty to the agreement may default on its obligation to perform or disagree as to the meaning of the contractual terms in the agreement, and that there will be unfavorable changes in net interest rates. In connection with these agreements, securities in the portfolio may be identified as collateral or received as collateral from the counterparty in accordance with the terms of the respective swap agreements to provide or receive assets of value and serve as recourse in the event of default or bankruptcy/insolvency of either party. Such over-the-counter derivative agreements include conditions which when materialized, give the counterparty the right to cause an early termination of the transactions under those agreements. Any election by the counterparty for early termination of the contract(s) may impact the amounts reported on financial statements.
As of March 31, 2012, the Series has not met conditions under such agreements, which give the counterparty the right to call for an early termination.
Swaps and financial futures contracts involve elements of both market and credit risk in excess of the amounts reflected on the Statement of Assets and Liabilities.
Warrants and Rights: The Series held warrants and rights acquired either through a direct purchase, including as part of private placement, or pursuant to corporate actions. Warrants and rights entitle the holder to buy a proportionate amount of common stock at a specific price and time through the expiration dates. Such warrants and rights are held as long positions by the Series until exercised, sold or expired. Warrants and rights are valued at fair value in accordance with the Board of Directors’ approved fair valuation procedures.
Dollar Rolls: The Series may enter into mortgage dollar rolls in which the Series sells mortgage-backed securities for delivery in the current month and simultaneously contracts to repurchase substantially similar (same type, coupon and maturity) securities on a specified future date.
During the roll period, the Series forgoes principal and interest paid on the securities. The Series’ policy is to record the components of dollar rolls as purchase and sale transactions. The Series had dollar rolls outstanding as of March 31, 2012, which are included in Receivable for Investments Sold and Payable for Investments Purchased in the Statement of Assets and Liabilities. The Series maintains a segregated account of U.S. government securities or other liquid assets, the dollar value of which is at least equal to its obligation with respect to dollar rolls.
| | | | |
| Prudential Asset Allocation Fund | | | 99 | |
Notes to Financial Statements
(Unaudited) continued
The Series is subject to the risk that the market value of the securities the Series is obligated to repurchase under the agreement may decline below the repurchase price.
Securities Lending: The Series may lend its portfolio securities to banks and broker-dealers. The loans are secured by collateral at least equal to the market value of the securities loaned. Collateral pledged by each borrower is marked to market daily, based on the previous day’s market value, such that the value of the collateral exceeds the value of the loaned securities. Loans are subject to termination at the option of the borrower or the Series. Upon termination of the loan, the borrower will return to the lender securities identical to the loaned securities. Should the borrower of the securities fail financially, the Series has the right to repurchase the securities using the collateral in the open market. The Series recognizes income, net of any rebate and securities lending agent fees, for lending its securities in the form of fees or interest on the investment of any cash received as collateral. The Series also continues to receive interest and dividends or amounts equivalent thereto, on the securities loaned and recognizes any unrealized gain or loss in the market price of the securities loaned that may occur during the term of the loan.
Securities Transactions and Net Investment Income: Securities transactions are recorded on the trade date. Realized gains or losses on sales of investments are calculated on the identified cost basis. Interest income, including amortization of premium and accretion of discount on debt securities, as required, is recorded on an accrual basis. Dividend income is recorded on the ex-dividend date. Expenses are recorded on the accrual basis. The Fund invests in real estate investment trusts (“REITs”), which report information on the source of their distributions annually. Based on current and historical information, a portion of distributions received from REITs during the period is estimated to be dividend income, capital gain or return of capital and recorded accordingly. These estimates are adjusted periodically when the actual source of distributions is disclosed by the REITs. Net Investment income or loss (other than distribution fees which are charged directly to the respective class) and unrealized and realized gains or losses are allocated daily to each class of shares based upon the relative proportion of adjusted net assets of each class at the beginning of the day.
Dividends and Distributions: The Series expects to pay dividends of net investment income and distributions of net realized capital gains, if any, annually. Dividends and distributions to shareholders, which are determined in accordance with federal income tax regulations and which may differ from generally accepted accounting
| | |
| 100 | | Visit our website at www.prudentialfunds.com |
principles, are recorded on the ex-dividend date. Permanent book/tax differences relating to income and gains are reclassified amongst undistributed net investment income, accumulated net realized gain or loss and paid-in capital in excess of par, as appropriate.
Taxes: For federal income tax purposes, each series in the Company is treated as a separate taxpaying entity. It is the Series’ policy to continue to meet the requirements of the Internal Revenue Code applicable to regulated investment companies and to distribute all of its net investment income and capital gains, if any, to its shareholders. Therefore, no federal income tax provision is required.
Withholding taxes on foreign dividends are recorded net of reclaimable amounts, at the time the related income is earned.
Estimates: The preparation of the financial statements requires management to make estimates and assumptions that affect the reported amounts and disclosures in the financial statements. Actual results could differ from those estimates.
Note 2. Agreements
The Series has a management agreement for the Series with PI. Pursuant to this agreement, PI has responsibility for all investment advisory services and supervises the subadvisors’ performance of such services. PI has entered into a subadvisory agreement with Prudential Investment Management, Inc. (“PIM”) and Quantitative Management Associates LLC (QMA). The subadvisory agreement provides that PIM and QMA furnishes investment advisory services in connection with the management of the Series. In connection therewith, PIM and QMA are obligated to keep certain books and records of the Series. PI pays for the services of PIM and QMA, the compensation of officers of the Series, occupancy and certain clerical and bookkeeping costs of the Series. The Series bears all other costs and expenses.
The management fee paid to PI is computed daily and payable monthly at an annual rate of .65% of the Series’ daily average net assets up to $1 billion and .60% of the average net assets of the Series in excess of $1 billion. The effective management fee rate was .65% for the six months ended March 31, 2012.
PI has contractually agreed to waive up to .02% of its management fee to the extent that the Series’ annual operating expenses exceed .86% (exclusive of taxes, interest, brokerage commissions, distribution fees and non-routine expenses) of the Series’ average net assets through January 31, 2013.
| | | | |
| Prudential Asset Allocation Fund | | | 101 | |
Notes to Financial Statements
(Unaudited) continued
The Series has a distribution agreement with Prudential Investment Management Services LLC (“PIMS”), which acts as the distributor of the Class A, Class B, Class C, Class L, Class M, Class R, Class X and Class Z shares of the Series. The Series compensates PIMS for distributing and servicing the Series’ Class A, Class B, Class C, Class L, Class M, Class R and Class X shares, pursuant to plans of distribution (the “Class A, B, C, L, M, R and X Plans”), regardless of expenses actually incurred by PIMS. The distribution fees are accrued daily and payable monthly. No distribution or service fees are paid to PIMS as distributor of the Class Z shares of the Series.
Pursuant to the Class A, B, C, L, M, R and X Plans, the Series compensates PIMS for distribution-related activities at an annual rate of up to .30%, 1%, 1%, .50%, 1%, .75% and 1% of the average daily net assets of the Class A, B, C, L, M, R and X shares, respectively. For the six months ended March 31, 2012, PIMS contractually agreed to limit such fees to .50% of the average daily net assets of the Class R shares.
PIMS has advised the Series that it received $31,597 in front-end sales charges resulting from sales of Class A shares during the six months ended March 31, 2012. From these fees, PIMS paid such sales charges to dealers, which in turn paid commissions to salespersons and incurred other distribution costs.
PIMS has advised the Series that for the six months ended March 31, 2012, it received $25, $9,278, $71, and $53 in contingent deferred sales charges imposed upon certain redemptions by Class A, Class B, Class C, and Class X shareholders, respectively.
PI, PIM, PIMS and QMA are indirect, wholly-owned subsidiaries of Prudential Financial, Inc. (“Prudential”).
Note 3. Other Transactions with Affiliates
Prudential Mutual Fund Services LLC (“PMFS”), an affiliate of PI and an indirect, wholly-owned subsidiary of Prudential, serves as the Series’ transfer agent. Transfer agent fees and expenses in the Statement of Operations include certain out-of-pocket expenses paid to non-affiliates, where applicable.
PIM is the Series’ security lending agent. For the six months ended March 31, 2012, PIM has been compensated $3,347 for these services.
| | |
| 102 | | Visit our website at www.prudentialfunds.com |
The Series invests in the Prudential Core Short-Term Bond Fund, pursuant to an exemptive order received from the Securities and Exchange Commission and in the Prudential Core Taxable Money Market Fund (the “Core Funds”), each a portfolio of the Prudential Investment Portfolios 2, registered under the 1940 Act, as amended, and managed by PI. Earnings from the Core Funds are disclosed on the Statement of Operations as affiliated dividend income.
Note 4. Portfolio Securities
Purchases and sales of investment securities other than short-term investments and U.S. Government Securities, for the six months ended March 31, 2012 were $247,415,962 and $259,839,883, respectively.
The amount of dollar rolls outstanding at March 31, 2012 was $16,598,183 (principal $15,500,000), which was 4.9% of total net assets.
Note 5. Distributions and Tax Information
The United States federal income tax basis of the Series’ investments and the net unrealized appreciation as of March 31, 2012 were as follows:
| | | | | | |
Tax Basis | | Appreciation | | Depreciation | | Net
Unrealized
Appreciation |
| $328,544,949 | | $53,066,687 | | $(7,615,996) | | $45,450,691 |
The difference between book basis and tax basis was attributable to deferred losses on wash sales, investments in passive foreign investment companies and trust preferred securities. The other cost basis adjustments are primarily attributable to appreciation (depreciation) of foreign currencies, swaps, short sales transactions and mark-to-market of receivables and payables.
For federal income tax purposes, the Series had a capital loss carryforward as of September 30, 2011 of approximately $44,110,000 of which $3,152,000 expires in 2017 and $40,958,000 expires in 2018. The Series utilized approximately $35,236,000 of its capital loss carryforward to offset net taxable gains realized in the year ended September 30, 2011. Accordingly, no capital gains distributions are expected to be paid to shareholders until net gains have been realized in excess of such carryforward. Under the recently enacted Regulated Investment Company Modernization Act of 2010 (the “Act”), the Series is permitted to carryforward capital losses incurred in taxable years beginning after December 22, 2010 (“post-enactment
| | | | |
| Prudential Asset Allocation Fund | | | 103 | |
Notes to Financial Statements
(Unaudited) continued
losses”) for an unlimited period. However, any post-enactment losses are required to be utilized before the utilization of losses incurred prior to the effective date of the Act. As a result of this ordering rule, capital loss carryforwards related to the taxable years beginning prior to the effective date of the Act may have an increased likelihood to expire unused. Additionally, post-enactment capital losses that are carried forward will retain their character as either short-term or long-term capital losses rather than being considered all short-term as under previous law.
Management has analyzed the Series’ tax positions taken on federal income tax returns for all open tax years and has concluded that no provision for income tax is required in the Series’ financial statements for the current reporting period. The Series’ federal and state income and federal excise tax returns for tax years for which the applicable statutes of limitations have not expired are subject to examination by the Internal Revenue Service and state departments of revenue.
Note 6. Capital
The Series offers Class A, Class B, Class C, Class L, Class M, Class R, Class X and Class Z shares. Class A shares are sold with a front-end sales charge of up to 5.50%. Purchases of $1 million or more are subject to a contingent deferred sales charge (“CDSC”) if shares are redeemed within 12 months of their purchase. The Class A shares CDSC is waived for purchases by certain retirement and/or benefit plans. Class B shares are sold with a CDSC which declines from 5% to zero depending upon the period of time the shares are held. Class B shares will automatically convert to Class A shares approximately seven years after purchase. Class C shares are sold with a CDSC of 1% on shares redeemed within the first 12 months of purchase. Class L shares are closed to most new purchases (with the exception of reinvested dividends and purchases by certain college savings plans). Class L shares are only exchangeable with Class L shares offered by the other Prudential Investments Funds. As of April 13, 2012, the last conversion of Class M shares to Class A shares was completed. There are no Class M shares outstanding and Class M shares are no longer being offered for sale. Class X shares are closed to new purchases. Class M and Class X shares will automatically convert to Class A shares approximately eight and ten years, respectively, after purchase. Class R and Class Z shares are not subject to any sales or redemption charge and are offered exclusively for a sale to a limited group of investors.
| | |
| 104 | | Visit our website at www.prudentialfunds.com |
Under certain circumstances, an exchange may be made from specified share classes of the Series to one or more other share classes of the Series as presented in the table of transactions in shares of capital stock.
There are 1 billion shares of $.001 par value common stock of the Series, designated Class A, Class B, Class C, Class L, Class M, Class R, Class X and Class Z, each of which consists of 200 million, 125 million, 125 million, 125 million, 125 million, 75 million, 150 million, and 75 million authorized shares, respectively. As of March 31, 2012, PI owned 252 Class R shares of the Series.
Transactions in shares of common stock were as follows:
| | | | | | | | |
Class A | | Shares | | | Amount | |
Six months ended March 31, 2012: | | | | | | | | |
Shares sold | | | 267,217 | | | $ | 3,261,324 | |
Shares issued in reinvestment of dividends | | | 331,120 | | | | 3,956,891 | |
Shares reacquired | | | (1,692,252 | ) | | | (20,598,979 | ) |
| | | | | | | | |
Net increase (decrease) in shares outstanding before conversion | | | (1,093,915 | ) | | | (13,380,764 | ) |
Shares issued upon conversion from Class B, M and X | | | 166,944 | | | | 2,069,122 | |
| | | | | | | | |
Net increase (decrease) in shares outstanding | | | (926,971 | ) | | $ | (11,311,642 | ) |
| | | | | | | | |
Year ended September 30, 2011: | | | | | | | | |
Shares sold | | | 477,965 | | | $ | 5,735,859 | |
Shares issued in reinvestment of dividends | | | 405,787 | | | | 4,719,302 | |
Shares reacquired | | | (3,247,643 | ) | | | (39,019,327 | ) |
| | | | | | | | |
Net increase (decrease) in shares outstanding before conversion | | | (2,363,891 | ) | | | (28,564,166 | ) |
Shares issued upon conversion from Class B, M and X | | | 456,243 | | | | 5,450,111 | |
Shares reacquired upon conversion into Class Z | | | (68,514 | ) | | | (844,791 | ) |
| | | | | | | | |
Net increase (decrease) in shares outstanding | | | (1,976,162 | ) | | $ | (23,958,846 | ) |
| | | | | | | | |
| | | | |
| Prudential Asset Allocation Fund | | | 105 | |
Notes to Financial Statements
(Unaudited) continued
| | | | | | | | |
Class B | | Shares | | | Amount | |
Six months ended March 31, 2012: | | | | | | | | |
Shares sold | | | 71,641 | | | $ | 883,868 | |
Shares issued in reinvestment of dividends | | | 8,549 | | | | 102,840 | |
Shares reacquired | | | (67,119 | ) | | | (824,636 | ) |
| | | | | | | | |
Net increase (decrease) in shares outstanding before conversion | | | 13,071 | | | | 162,072 | |
Shares reacquired upon conversion into Class A | | | (124,498 | ) | | | (1,557,362 | ) |
| | | | | | | | |
Net increase (decrease) in shares outstanding | | | (111,427 | ) | | $ | (1,395,290 | ) |
| | | | | | | | |
Year ended September 30, 2011: | | | | | | | | |
Shares sold | | | 137,946 | | | $ | 1,660,892 | |
Shares issued in reinvestment of dividends | | | 13,820 | | | | 161,696 | |
Shares reacquired | | | (143,739 | ) | | | (1,732,372 | ) |
| | | | | | | | |
Net increase (decrease) in shares outstanding before conversion | | | 8,027 | | | | 90,216 | |
Shares reacquired upon conversion into Class A | | | (298,250 | ) | | | (3,570,325 | ) |
| | | | | | | | |
Net increase (decrease) in shares outstanding | | | (290,223 | ) | | $ | (3,480,109 | ) |
| | | | | | | | |
Class C | | | | | | |
Six months ended March 31, 2012: | | | | | | | | |
Shares sold | | | 43,049 | | | $ | 525,051 | |
Shares issued in reinvestment of dividends | | | 7,320 | | | | 87,984 | |
Shares reacquired | | | (91,813 | ) | | | (1,126,791 | ) |
| | | | | | | | |
Net increase (decrease) in shares outstanding | | | (41,444 | ) | | $ | (513,756 | ) |
| | | | | | | | |
Year ended September 30, 2011: | | | | | | | | |
Shares sold | | | 86,637 | | | $ | 1,039,609 | |
Shares issued in reinvestment of dividends | | | 10,392 | | | | 121,581 | |
Shares reacquired | | | (196,631 | ) | | | (2,375,782 | ) |
| | | | | | | | |
Net increase (decrease) in shares outstanding | | | (99,602 | ) | | $ | (1,214,592 | ) |
| | | | | | | | |
Class L | | | | | | |
Six months ended March 31, 2012: | | | | | | | | |
Shares sold | | | 2,846 | | | $ | 35,723 | |
Shares issued in reinvestment of dividends | | | 7,034 | | | | 84,399 | |
Shares reacquired | | | (24,141 | ) | | | (298,970 | ) |
| | | | | | | | |
Net increase (decrease) in shares outstanding | | | (14,261 | ) | | $ | (178,848 | ) |
| | | | | | | | |
Year ended September 30, 2011: | | | | | | | | |
Shares sold | | | 3,938 | | | $ | 47,620 | |
Shares issued in reinvestment of dividends | | | 8,402 | | | | 98,135 | |
Shares reacquired | | | (77,376 | ) | | | (922,758 | ) |
| | | | | | | | |
Net increase (decrease) in shares outstanding | | | (65,036 | ) | | $ | (777,003 | ) |
| | | | | | | | |
| | |
| 106 | | Visit our website at www.prudentialfunds.com |
| | | | | | | | |
Class M | | Shares | | | Amount | |
Six months ended March 31, 2012: | | | | | | | | |
Shares issued in reinvestment of dividends | | | 233 | | | $ | 2,801 | |
Shares reacquired | | | (1,816 | ) | | | (22,335 | ) |
| | | | | | | | |
Net increase (decrease) in shares outstanding before conversion | | | (1,583 | ) | | | (19,534 | ) |
Shares reacquired upon conversion into Class A | | | (31,453 | ) | | | (386,947 | ) |
| | | | | | | | |
Net increase (decrease) in shares outstanding | | | (33,036 | ) | | $ | (406,481 | ) |
| | | | | | | | |
Year ended September 30, 2011: | | | | | | | | |
Shares sold | | | 1,015 | | | $ | 12,334 | |
Shares issued in reinvestment of dividends | | | 1,652 | | | | 19,333 | |
Shares reacquired | | | (19,411 | ) | | | (232,220 | ) |
| | | | | | | | |
Net increase (decrease) in shares outstanding before conversion | | | (16,744 | ) | | | (200,553 | ) |
Shares reacquired upon conversion into Class A | | | (115,501 | ) | | | (1,387,351 | ) |
| | | | | | | | |
Net increase (decrease) in shares outstanding | | | (132,245 | ) | | $ | (1,587,904 | ) |
| | | | | | | | |
Class R | | | | | | |
Six months ended March 31, 2012: | | | | | | | | |
Shares sold | | | 1,972 | | | $ | 25,318 | |
Shares issued in reinvestment of dividends | | | 14 | | | | 173 | |
Shares reacquired | | | (64 | ) | | | (762 | ) |
| | | | | | | | |
Net increase (decrease) in shares outstanding | | | 1,922 | | | $ | 24,729 | |
| | | | | | | | |
Year ended September 30, 2011: | | | | | | | | |
Shares sold | | | 111 | | | $ | 1,309 | |
Shares issued in reinvestment of dividends | | | 15 | | | | 169 | |
Shares reacquired | | | (1 | ) | | | (8 | ) |
| | | | | | | | |
Net increase (decrease) in shares outstanding | | | 125 | | | $ | 1,470 | |
| | | | | | | | |
Class X | | | | | | |
Six months ended March 31, 2012: | | | | | | | | |
Shares issued in reinvestment of dividends | | | 623 | | | $ | 7,489 | |
Shares reacquired | | | (2,959 | ) | | | (35,689 | ) |
| | | | | | | | |
Net increase (decrease) in shares outstanding before conversion | | | (2,336 | ) | | | (28,200 | ) |
Shares reacquired upon conversion into Class A | | | (10,163 | ) | | | (124,813 | ) |
| | | | | | | | |
Net increase (decrease) in shares outstanding | | | (12,499 | ) | | $ | (153,013 | ) |
| | | | | | | | |
Year ended September 30, 2011: | | | | | | | | |
Shares issued in reinvestment of dividends | | | 1,452 | | | $ | 16,984 | |
Shares reacquired | | | (27,235 | ) | | | (330,335 | ) |
| | | | | | | | |
Net increase (decrease) in shares outstanding before conversion | | | (25,783 | ) | | | (313,351 | ) |
Shares reacquired upon conversion into Class A | | | (41,045 | ) | | | (492,435 | ) |
| | | | | | | | |
Net increase (decrease) in shares outstanding | | | (66,828 | ) | | $ | (805,786 | ) |
| | | | | | | | |
| | | | |
| Prudential Asset Allocation Fund | | | 107 | |
Notes to Financial Statements
Unaudited) continued
| | | | | | | | |
Class Z | | Shares | | | Amount | |
Six months ended March 31, 2012: | | | | | | | | |
Shares sold | | | 390,688 | | | $ | 4,837,562 | |
Shares issued in reinvestment of dividends | | | 55,649 | | | | 667,785 | |
Shares reacquired | | | (171,125 | ) | | | (2,091,923 | ) |
| | | | | | | | |
Net increase (decrease) in shares outstanding | | | 275,212 | | | $ | 3,413,424 | |
| | | | | | | | |
Year ended September 30, 2011: | | | | | | | | |
Shares sold | | | 428,398 | | | $ | 5,105,531 | |
Shares issued in reinvestment of dividends | | | 75,289 | | | | 879,375 | |
Shares reacquired | | | (7,428,559 | ) | | | (87,797,864 | ) |
| | | | | | | | |
Net increase (decrease) in shares outstanding before conversion | | | (6,924,872 | ) | | | (81,812,958 | ) |
Shares issued upon conversion from Class A | | | 68,127 | | | | 844,791 | |
| | | | | | | | |
Net increase (decrease) in shares outstanding | | | (6,856,745 | ) | | $ | (80,968,167 | ) |
| | | | | | | | |
Note 7. Borrowings
The Series, along with other affiliated registered investment companies (the “Funds”), is a party to a Syndicated Credit Agreement (“SCA”) with a group of banks. The purpose of the SCA is to provide an alternative source of temporary funding for capital share redemptions. The SCA provides for a commitment of $900 million for the period December 16, 2011 through December 14, 2012. The Funds pay an annualized commitment fee of 0.08% of the unused portion of the SCA. Prior to December 16, 2011, the Funds had another Syndicated Credit Agreement of a $750 million commitment with an annualized commitment fee of 0.10% of the unused portion. Interest on any borrowings under the SCA is paid at contracted market rates. The commitment fee for the unused amount is accrued daily and paid quarterly.
The Series did not utilize the SCA during the six months ended March 31, 2012.
Note 8. New Accounting Pronouncements
In April 2011, the Financial Accounting Standards Board (“FASB”) issued Accounting Standards Update (“ASU”) No. 2011-03 “Reconsideration of Effective Control for Repurchase Agreements”. The objective of ASU No. 2011-03 is to improve the accounting for repurchase agreements and other agreements that both entitle and obligate a transferor to repurchase or redeem financial assets before their maturity. Under previous guidance, whether or not to account for a transaction as a sale was
| | |
| 108 | | Visit our website at www.prudentialfunds.com |
based on, in part, if the entity maintained effective control over the transferred financial assets. ASU No. 2011-03 removes the transferor’s ability criterion from the effective control assessment. This guidance is effective prospectively for interim and annual reporting periods beginning on or after December 15, 2011. At this time, management is evaluating the implications of ASU No. 2011-03 and its impact on the financial statements has not been determined.
In May 2011, the FASB issued ASU No. 2011-04 “Amendments to Achieve Common Fair Value Measurement and Disclosure Requirements in U.S. GAAP and IFRSs”. ASU No. 2011-04 includes common requirements for measurement of and disclosure about fair value between U.S. GAAP and IFRS. ASU No. 2011-04 will require reporting entities to disclose quantitative information about the unobservable inputs used in the fair value measurements categorized within Level 3 of the fair value hierarchy. In addition, ASU No. 2011-04 will require reporting entities to make disclosures about amounts and reasons for all transfers in and out of Level 1 and Level 2 fair value measurements. The new and revised disclosures are effective for interim and annual reporting periods beginning after December 15, 2011. At this time, management is evaluating the implications of ASU No. 2011-04 and its impact on the financial statements has not been determined.
| | | | |
| Prudential Asset Allocation Fund | | | 109 | |
Financial Highlights
(Unaudited)
| | | | | | | | | | | | | | | | | | | | | | | | | | |
| Class A Shares | |
| | | Six Months
Ended
March 31, | | | | | Year Ended September 30, | |
| | | 2012(a) | | | | | 2011(a) | | | 2010(a) | | | 2009(a) | | | 2008(a) | | | 2007(a) | |
| Per Share Operating Performance: | | | | | | | | | | | | | | | | | | | | | | | | | | |
| Net Asset Value, Beginning Of Period | | | $11.32 | | | | | | $11.31 | | | | $10.52 | | | | $11.08 | | | | $14.62 | | | | $14.17 | |
| Income (loss) from investment operations: | | | | | | | | | | | | | | | | | | | | | | | | | | |
| Net investment income | | | .09 | | | | | | .17 | | | | .17 | | | | .22 | | | | .28 | | | | .29 | |
| Net realized and unrealized gain (loss) on investment transactions | | | 1.76 | | | | | | .05 | | | | .83 | | | | (.48 | ) | | | (2.46 | ) | | | 1.25 | |
| Total from investment operations | | | 1.85 | | | | | | .22 | | | | 1.00 | | | | (.26 | ) | | | (2.18 | ) | | | 1.54 | |
| Less Dividends and Distributions: | | | | | | | | | | | | | | | | | | | | | | | | | | |
| Dividends from net investment income | | | (.20 | ) | | | | | (.21 | ) | | | (.21 | ) | | | (.30 | ) | | | (.30 | ) | | | (.30 | ) |
| Distributions from net realized gains | | | - | | | | | | - | | | | - | | | | - | | | | (1.06 | ) | | | (.79 | ) |
| Total dividends and distributions | | | (.20 | ) | | | | | (.21 | ) | | | (.21 | ) | | | (.30 | ) | | | (1.36 | ) | | | (1.09 | ) |
| Capital Contributions (Note 6) | | | - | | | | | | - | | | | - | (f) | | | - | | | | - | | | | - | |
| Net asset value, end of period | | | $12.97 | | | | | | $11.32 | | | | $11.31 | | | | $10.52 | | | | $11.08 | | | | $14.62 | |
| Total Return(b): | | | 16.45% | | | | | | 1.91% | | | | 9.61% | | | | (1.79)% | | | | (16.22)% | | | | 11.34% | |
| | | | | |
| Ratios/Supplemental Data(c): | |
| Net assets, end of period (000) | | | $266,659 | | | | | | $243,314 | | | | $265,496 | | | | $276,469 | | | | $328,706 | | | | $436,337 | |
| Average net assets (000) | | | $256,184 | �� | | | | | $271,396 | | | | $272,202 | | | | $259,847 | | | | $390,410 | | | | $430,168 | |
| Ratios to average net assets: | | | | | | | | | | | | | | | | | | | | | | | | | | |
| Expenses, including distribution and service (12b-1) fees | | | 1.35% | (e)(g) | | | | | 1.32% | (e) | | | 1.28% | (e) | | | 1.25% | (e) | | | 1.16% | (d)(e) | | | 1.10% | (d) |
| Expenses, excluding distribution and service (12b-1) fees | | | 1.05% | (e)(g) | | | | | 1.02% | (e) | | | .98% | (e) | | | .95% | (e) | | | .88% | (e) | | | .85% | |
| Net investment income | | | 1.54% | (e)(g) | | | | | 1.45% | (e) | | | 1.60% | (e) | | | 2.41% | (e) | | | 2.16% | (e) | | | 2.00% | |
| Portfolio turnover rate | | | 95% | (h) | | | | | 230% | | | | 185% | | | | 259% | | | | 298% | | | | 226% | |
(a) Calculated based on average shares outstanding during the period.
(b) Total return does not consider the effect of sales loads. Total return is calculated assuming a purchase of a share on the first day and a sale on the last day of each period reported and includes reinvestment of dividends and distributions. Total returns may reflect adjustments to conform to generally accepted accounting principles.
(c) Does not include expenses of the underlying portfolios in which the Series invests.
(d) Prior to January 31, 2008, the distributor of the Series contractually agreed to limit its distribution and service (12b-1) fees to .25% of the average daily net assets of the Class A shares.
(e) As of March 23, 2007, the manager of the Series has agreed to reimburse up to .02% of the Series’ management fee in order to limit operating expenses (excluding interest, taxes, brokerage commissions, 12b-1 fees and certain extraordinary expenses) when such expense ratio before waiver exceeds .86% of the average daily net assets of Class A. If the manager had not reimbursed the Series, the annual expenses (both including and excluding distribution and service (12b-1) fees) and net investment income ratios would be 1.37%, 1.07%, and 1.52% respectively, for the six months ended March 31, 2012, 1.34%, 1.04% and 1.43%, respectively, for the year ended September 30, 2011, 1.30%, 1.00% and 1.58%, respectively, for the year ended September 30, 2010, 1.27%, .97% and 2.39%, respectively, for the year ended September 30, 2009 and 1.18%, ..90% and 2.14%, respectively, for the year ended September 30, 2008.
(f) Less than $.005 per share.
(g) Annualized.
(h) Not annualized.
See Notes to Financial Statements.
| | |
| 110 | | Visit our website at www.prudentialfunds.com |
| | | | | | | | | | | | | | | | | | | | | | | | | | |
| Class B Shares | |
| | | Six Months
Ended
March 31, | | | | | Year Ended September 30, | |
| | | 2012(a) | | | | | 2011(a) | | | 2010(a) | | | 2009(a) | | | 2008(a) | | | 2007(a) | |
| Per Share Operating Performance: | | | | | | | | | | | | | | | | | | | | | | | | | | |
| Net Asset Value, Beginning Of Period | | | $11.33 | | | | | | $11.32 | | | | $10.53 | | | | $11.04 | | | | $14.57 | | | | $14.11 | |
| Income (loss) from investment operations: | | | | | | | | | | | | | | | | | | | | | | | | | | |
| Net investment income | | | .05 | | | | | | .09 | | | | .10 | | | | .16 | | | | .18 | | | | .18 | |
| Net realized and unrealized gain (loss) on investment transactions | | | 1.75 | | | | | | .05 | | | | .83 | | | | (.47 | ) | | | (2.45 | ) | | | 1.26 | |
| Total from investment operations | | | 1.80 | | | | | | .14 | | | | .93 | | | | (.31 | ) | | | (2.27 | ) | | | 1.44 | |
| Less Dividends and Distributions: | | | | | | | | | | | | | | | | | | | | | | | | | | |
| Dividends from net investment income | | | (.11 | ) | | | | | (.13 | ) | | | (.14 | ) | | | (.20 | ) | | | (.20 | ) | | | (.19 | ) |
| Distributions from net realized gains | | | - | | | | | | - | | | | - | | | | - | | | | (1.06 | ) | | | (.79 | ) |
| Total dividends and distributions | | | (.11 | ) | | | | | (.13 | ) | | | (.14 | ) | | | (.20 | ) | | | (1.26 | ) | | | (.98 | ) |
| Capital Contributions (Note 6) | | | - | | | | | | - | | | | - | (e) | | | - | | | | - | | | | - | |
| Net asset value, end of period | | | $13.02 | | | | | | $11.33 | | | | $11.32 | | | | $10.53 | | | | $11.04 | | | | $14.57 | |
| Total Return(b): | | | 15.97% | | | | | | 1.23% | | | | 8.92% | | | | (2.49)% | | | | (16.86)% | | | | 10.58% | |
| |
| Ratios/Supplemental Data(c): | |
| Net assets, end of period (000) | | | $10,820 | | | | | | $10,672 | | | | $13,952 | | | | $17,090 | | | | $26,977 | | | | $46,486 | |
| Average net assets (000) | | | $11,167 | | | | | | $13,268 | | | | $15,682 | | | | $18,440 | | | | $37,753 | | | | $50,122 | |
| Ratios to average net assets: | | | | | | | | | | | | | | | | | | | | | | | | | | |
| Expenses, including distribution and service (12b-1) fees | | | 2.05% | (d)(f) | | | | | 2.02% | (d) | | | 1.98% | (d) | | | 1.95% | (d) | | | 1.88% | (d) | | | 1.85% | |
| Expenses, excluding distribution and service (12b-1) fees | | | 1.05% | (d)(f) | | | | | 1.02% | (d) | | | .98% | (d) | | | .95% | (d) | | | .88% | (d) | | | .85% | |
| Net investment income | | | .84% | (d)(f) | | | | | .75% | (d) | | | .91% | (d) | | | 1.75% | (d) | | | 1.44% | (d) | | | 1.25% | |
| Portfolio turnover rate | | | 95% | (g) | | | | | 230% | | | | 185% | | | | 259% | | | | 298% | | | | 226% | |
(a) Calculated based on average shares outstanding during the period.
(b) Total return does not consider the effect of sales loads. Total return is calculated assuming a purchase of a share on the first day and a sale on the last day of each period reported and includes reinvestment of dividends and distributions. Total returns may reflect adjustments to conform to generally accepted accounting principles.
(c) Does not include expenses of the underlying portfolios in which the Series invests.
(d) As of March 23, 2007, the manager of the Series has agreed to reimburse up to .02% of the Series’ management fee in order to limit operating expenses (excluding interest, taxes, brokerage commissions, 12b-1 fees and certain extraordinary expenses) when such expense ratio before waiver exceeds .86% of the average daily net assets of Class B. If the manager had not reimbursed the Series, the annual expenses (both including and excluding distribution and service (12b-1) fees) and net investment income ratios would be 2.07%, 1.07%, and .82% respectively, for the six months ended March 31, 2012, 2.04%, 1.04% and .73%, respectively, for the year ended September 30, 2011, 2.00%, 1.00% and .89% respectively, for the year ended September 30, 2010, 1.97%, .97% and 1.73%, respectively, for the year ended September 30, 2009 and 1.90%, .90% and 1.42%, respectively, for the year ended September 30, 2008.
(e) Less than $.005 per share.
See Notes to Financial Statements.
| | | | |
| Prudential Asset Allocation Fund | | | 111 | |
Financial Highlights
(Unaudited) continued
| | | | | | | | | | | | | | | | | | | | | | | | | | |
| Class C Shares | |
| | | Six Months
Ended
March 31, | | | | | Year Ended September 30, | |
| | | 2012(a) | | | | 2011(a) | | | 2010(a) | | | 2009(a) | | | 2008(a) | | | 2007(a) | |
| Per Share Operating Performance: | | | | | | | | | | | | | | | | | | | | | | | | | | |
| Net Asset Value, Beginning Of Period | | | $11.32 | | | | | | $11.32 | | | | $10.53 | | | | $11.04 | | | | $14.57 | | | | $14.11 | |
| Income (loss) from investment operations: | | | | | | | | | | | | | | | | | | | | | | | | | | |
| Net investment income | | | .05 | | | | | | .09 | | | | .10 | | | | .16 | | | | .18 | | | | .17 | |
| Net realized and unrealized gain (loss) on investment transactions | | | 1.76 | | | | | | .04 | | | | .83 | | | | (.47 | ) | | | (2.45 | ) | | | 1.27 | |
| Total from investment operations | | | 1.81 | | | | | | .13 | | | | .93 | | | | (.31 | ) | | | (2.27 | ) | | | 1.44 | |
| Less Dividends and Distributions: | | | | | | | | | | | | | | | | | | | | | | | | | | |
| Dividends from net investment income | | | (.11 | ) | | | | | (.13 | ) | | | (.14 | ) | | | (.20 | ) | | | (.20 | ) | | | (.19 | ) |
| Distributions from net realized gains | | | - | | | | | | - | | | | - | | | | - | | | | (1.06 | ) | | | (.79 | ) |
| Total dividends and distributions | | | (.11 | ) | | | | | (.13 | ) | | | (.14 | ) | | | (.20 | ) | | | (1.26 | ) | | | (.98 | ) |
| Capital Contributions (Note 6) | | | - | | | | | | - | | | | - | (e) | | | - | | | | - | | | | - | |
| Net asset value, end of period | | | $13.02 | | | | | | $11.32 | | | | $11.32 | | | | $10.53 | | | | $11.04 | | | | $14.57 | |
| Total Return(b): | | | 16.08% | | | | | | 1.15% | | | | 8.92% | | | | (2.49)% | | | | (16.86)% | | | | 10.58% | |
| |
| Ratios/Supplemental Data: | |
| Net assets, end of period (000) | | | $10,941 | | | | | | $9,987 | | | | $11,111 | | | | $12,599 | | | | $16,393 | | | | $25,379 | |
| Average net assets (000) | | | $10,508 | | | | | | $11,105 | | | | $11,986 | | | | $12,415 | | | | $21,104 | | | | $19,954 | |
| Ratios to average net assets(c): | | | | | | | | | | | | | | | | | | | | | | | | | | |
| Expenses, including distribution and service (12b-1) fees | | | 2.05% | (d)(f) | | | | | 2.02% | (d) | | | 1.98% | (d) | | | 1.95% | (d) | | | 1.88% | (d) | | | 1.85% | |
| Expenses, excluding distribution and service (12b-1) fees | | | 1.05% | (d)(f) | | | | | 1.02% | (d) | | | .98% | (d) | | | .95% | (d) | | | .88% | (d) | | | .85% | |
| Net investment income | | | .84% | (d)(f) | | | | | .75% | (d) | | | .90% | (d) | | | 1.72% | (d) | | | 1.44% | (d) | | | 1.21% | |
| Portfolio turnover rate | | | 95% | (g) | | | | | 230% | | | | 185% | | | | 259% | | | | 298% | | | | 226% | |
(a) Calculated based on average shares outstanding during the period.
(b) Total return does not consider the effect of sales loads. Total return is calculated assuming a purchase of a share on the first day and a sale on the last day of each period reported and includes reinvestment of dividends and distributions. Total returns may reflect adjustments to conform to generally accepted accounting principles.
(c) Does not include expenses of the underlying portfolios in which the Series invests.
(d) As of March 23, 2007, the manager of the Series has agreed to reimburse up to .02% of the Series’ management fee in order to limit operating expenses (excluding interest, taxes, brokerage commissions, 12b-1 fees and certain extraordinary expenses) when such expense ratio before waiver exceeds .86% of the average daily net assets of Class C. If the manager had not reimbursed the Series, the annual expenses (both including and excluding distribution and service (12b-1) fees) and net investment income ratios would be 2.07%, 1.07%, and .82% respectively, for the six months ended March 31, 2012, 2.04%, 1.04% and .73%, respectively, for the year ended September 30, 2011, 2.00%, 1.00% and .88%, respectively, for the year ended September 30, 2010, 1.97%, .97% and 1.70%, respectively, for the year ended September 30, 2009 and 1.90%, .90% and 1.42%, respectively, for the year ended September 30, 2008.
(e) Less than $.005 per share.
(f) Annualized.
(g) Not annualized.
See Notes to Financial Statements.
| | |
| 112 | | Visit our website at www.prudentialfunds.com |
| | | | | | | | | | | | | | | | | | | | | | | | | | | | |
| Class L Shares | |
| | | Six Months
Ended
March 31, | | | | | Year Ended September 30, | | | | | March 26,
2007(b)
through
September 30, | |
| | | 2012(a) | | | | | 2011(a) | | | 2010(a) | | | 2009(a) | | | 2008(a) | | | | | 2007(a) | |
| Per Share Operating Performance: | | | | | | | | | | | | | | | | | | | | | | | | | |
| Net Asset Value, Beginning Of Period | | | $11.35 | | | | | | $11.34 | | | | $10.54 | | | | $11.09 | | | | $14.62 | | | | | | $14.13 | |
| Income (loss) from investment operations: | | | | | | | | | | | | | | | | | | | | | | | | | |
| Net investment income | | | .08 | | | | | | .15 | | | | .15 | | | | .21 | | | | .25 | | | | | | .12 | |
| Net realized and unrealized gain (loss) on investment transactions | | | 1.75 | | | | | | .05 | | | | .84 | | | | (.49 | ) | | | (2.46 | ) | | | | | .37 | |
| Total from investment operations | | | 1.83 | | | | | | .20 | | | | .99 | | | | (.28 | ) | | | (2.21 | ) | | | | | .49 | |
| Less Dividends and Distributions: | | | | | | | | | | | | | | | | | | | | | | | | | | | | |
| Dividends from net investment income | | | (.17 | ) | | | | | (.19 | ) | | | (.19 | ) | | | (.27 | ) | | | (.26 | ) | | | | | - | |
| Distributions from net realized gains | | | - | | | | | | - | | | | - | | | | - | | | | (1.06 | ) | | | | | - | |
| Total dividends and distributions | | | (.17 | ) | | | | | (.19 | ) | | | (.19 | ) | | | (.27 | ) | | | (1.32 | ) | | | | | - | |
| Capital Contributions (Note 6) | | | - | | | | | | - | | | | - | (g) | | | - | | | | - | | | | | | - | |
| Net asset value, end of period | | | $13.01 | | | | | | $11.35 | | | | $11.34 | | | | $10.54 | | | | $11.09 | | | | | | $14.62 | |
| Total Return(c): | | | 16.26% | | | | | | 1.71% | | | | 9.50% | | | | (2.05)% | | | | (16.41)% | | | | | | 3.47% | |
| |
| Ratios/Supplemental Data(d): | |
| Net assets, end of period (000) | | | $6,669 | | | | | | $5,979 | | | | $6,712 | | | | $6,762 | | | | $8,160 | | | | | | $11,874 | |
| Average net assets (000) | | | $6,386 | | | | | | $6,658 | | | | $6,810 | | | | $6,392 | | | | $10,201 | | | | | | $11,940 | |
| Ratios to average net assets : | | | | | | | | | | | | | | | | | | | | | | | | | | | | |
| Expenses, including distribution and service (12b-1) fees | | | 1.55% | (e)(f) | | | | | 1.52% | (e) | | | 1.48% | (e) | | | 1.45% | (e) | | | 1.38% | (e) | | | | | 1.35% | (f) |
| Expenses, excluding distribution and service (12b-1) fees | | | 1.05% | (e)(f) | | | | | 1.02% | (e) | | | .98% | (e) | | | .95% | (e) | | | .88% | (e) | | | | | .85% | (f) |
| Net investment income | | | 1.34% | (e)(f) | | | | | 1.25% | (e) | | | 1.40% | (e) | | | 2.21% | (e) | | | 1.94% | (e) | | | | | 1.62% | (f) |
| Portfolio turnover rate | | | 95% | (h) | | | | | 230% | | | | 185% | | | | 259% | | | | 298% | | | | | | 226% | (h) |
(a) Calculated based on average shares outstanding during the period.
(b) Commencement of offering.
(c) Total return does not consider the effect of sales loads. Total return is calculated assuming a purchase of a share on the first day and a sale on the last day of each period reported and includes reinvestment of dividends and distributions. Total returns may reflect adjustments to conform to generally accepted accounting principles. Total returns for periods less than one full year are not annualized.
(d) Does not include expenses of the underlying portfolios in which the Series invests.
(e) As of March 23, 2007, the manager of the Series has agreed to reimburse up to .02% of the Series’ management fee in order to limit operating expenses (excluding interest, taxes, brokerage commissions, 12b-1 fees and certain extraordinary expenses) when such expense ratio before waiver exceeds .86% of the average daily net assets of Class L. If the manager had not reimbursed the Series, the annual expenses (both including and excluding distribution and service (12b-1) fees) and net investment income ratios would be 1.57%, 1.07%, and 1.32% respectively, for the six months ended March 31, 2012, 1.54%, 1.04% and 1.23%, respectively, for the year ended September 30, 2011, 1.50%, 1.00% and 1.38%, respectively, for the year ended September 30, 2010, 1.47%, .97% and 2.19%, respectively, for the year ended September 30, 2009 and 1.40%, .90% and 1.92%, respectively, for the year ended September 30, 2008.
(f) Annualized.
(g) Less than $.005 per share.
(h) Not annualized.
See Notes to Financial Statements.
| | | | |
| Prudential Asset Allocation Fund | | | 113 | |
Financial Highlights
(Unaudited) continued
| | | | | | | | | | | | | | | | | | | | | | | | | | | | |
| Class M Shares | |
| | | Six Months
Ended
March 31, | | | | | Year Ended September 30 | | | | | March 26,
2007(b)
through
September 30, | |
| | | 2012(a) | | | | | 2011(a) | | | 2010(a) | | | 2009(a) | | | 2008(a) | | | | | 2007(a) | |
| Per Share Operating Performance: | | | | | | | | | | | | | | | | | | | | | | | | | |
| Net Asset Value, Beginning Of Period | | | $11.34 | | | | | | $11.32 | | | | $10.53 | | | | $11.04 | | | | $14.57 | | | | | | $14.12 | |
| Income (loss) from investment operations: | | | | | | | | | | | | | | | | | | | | | | | | | |
| Net investment income | | | .05 | | | | | | .09 | | | | .10 | | | | .17 | | | | .18 | | | | | | .08 | |
| Net realized and unrealized gain (loss) on investment transactions | | | 1.76 | | | | | | .06 | | | | .83 | | | | (.48 | ) | | | (2.45 | ) | | | | | .37 | |
| Total from investment operations | | | 1.81 | | | | | | .15 | | | | .93 | | | | (.31 | ) | | | (2.27 | ) | | | | | .45 | |
| Less Dividends and Distributions: | | | | | | | | | | | | | | | | | | | | | | | | | | | | |
| Dividends from net investment income | | | (.11 | ) | | | | | (.13 | ) | | | (.14 | ) | | | (.20 | ) | | | (.20 | ) | | | | | - | |
| Distributions from net realized gains | | | - | | | | | | - | | | | - | | | | - | | | | (1.06 | ) | | | | | - | |
| Total dividends and distributions | | | (.11 | ) | | | | | (.13 | ) | | | (.14 | ) | | | (.20 | ) | | | (1.26 | ) | | | | | - | |
| Capital Contributions (Note 6) | | | - | | | | | | - | | | | - | (g) | | | - | | | | - | | | | | | - | |
| Net asset value, end of period | | | $13.04 | | | | | | $11.34 | | | | $11.32 | | | | $10.53 | | | | $11.04 | | | | | | $14.57 | |
| Total Return(c): | | | 16.05% | | | | | | 1.32% | | | | 8.92% | | | | (2.49)% | | | | (16.86)% | | | | | | 3.19% | |
| |
| Ratios/Supplemental Data(d): | | | | | | |
| Net assets, end of period (000) | | | $15 | | | | | | $387 | | | | $1,883 | | | | $3,853 | | | | $8,812 | | | | | | $25,279 | |
| Average net assets (000) | | | $220 | | | | | | $1,263 | | | | $2,794 | | | | $5,042 | | | | $15,838 | | | | | | $29,898 | |
| Ratios to average net assets: | | | | | | | | | | | | | | | | | | | | | | | | | | | | |
| Expenses, including distribution and service (12b-1) fees | | | 2.05% | (e)(f) | | | | | 2.02% | (e) | | | 1.98% | (e) | | | 1.95% | (e) | | | 1.88% | (e) | | | | | 1.85% | (f) |
| Expenses, excluding distribution and service (12b-1) fees | | | 1.05% | (e)(f) | | | | | 1.02% | (e) | | | .98% | (e) | | | .95% | (e) | | | .88% | (e) | | | | | .85% | (f) |
| Net investment income | | | .80% | (e)(f) | | | | | .73% | (e) | | | .91% | (e) | | | 1.80% | (e) | | | 1.42% | (e) | | | | | 1.08% | (f) |
| Portfolio turnover rate | | | 95% | (h) | | | | | 230% | | | | 185% | | | | 259% | | | | 298% | | | | | | 226% | (h) |
(a) Calculated based on average shares outstanding during the period.
(b) Commencement of offering.
(c) Total return does not consider the effect of sales loads. Total return is calculated assuming a purchase of a share on the first day and a sale on the last day of each period reported and includes reinvestment of dividends and distributions. Total returns may reflect adjustments to conform to generally accepted accounting principles. Total returns for periods less than one full year are not annualized.
(d) Does not include expenses of the underlying portfolios in which the Series invests.
(e) As of March 23, 2007, the manager of the Series has agreed to reimburse up to .02% of the Series’ management fee in order to limit operating expenses (excluding interest, taxes, brokerage commissions, 12b-1 fees and certain extraordinary expenses) when such expense ratio before waiver exceeds .86% of the average daily net assets of Class M. If the manager had not reimbursed the Series, the annual expenses (both including and excluding distribution and service (12b-1) fees) and net investment income ratios would be 2.07%, 1.07%, and .78% respectively, for the six months ended March 31, 2012, 2.04%, 1.04% and .71%, respectively, for the year ended September 30, 2011, 2.00%, 1.00% and .89%, respectively, for the year ended September 30, 2010, 1.97%, .97% and 1.78%, respectively, for the year ended September 30, 2009 and 1.90%, .90% and 1.40%, respectively, for the year ended September 30, 2008.
(f) Annualized.
(g) Less than $.005 per share.
(h) Not annualized.
See Notes to Financial Statements.
| | |
| 114 | | Visit our website at www.prudentialfunds.com |
| | | | | | | | | | | | | | | | | | | | | | | | | | |
| Class R Shares | |
| | | Six Months
Ended
March 31, | | | | | Year Ended September 30 | |
| | | 2012(a) | | | | | 2011(a) | | | 2010(a) | | | 2009(a) | | | 2008(a) | | | 2007(a) | |
| Per Share Operating Performance: | | | | | | | | | | | | | | | | | | | | | | | | | | |
| Net Asset Value, Beginning Of Period | | | $11.31 | | | | | | $11.31 | | | | $10.52 | | | | $11.09 | | | | $14.62 | | | | $14.16 | |
| Income (loss) from investment operations: | | | | | | | | | | | | | | | | | | | | | | | | | | |
| Net investment income | | | .07 | | | | | | .15 | | | | .14 | | | | .20 | | | | .25 | | | | .25 | |
| Net realized and unrealized gain (loss) on investment transactions | | | 1.76 | | | | | | .04 | | | | .84 | | | | (.50 | ) | | | (2.46 | ) | | | 1.27 | |
| Total from investment operations | | | 1.83 | | | | | | .19 | | | | .98 | | | | (.30 | ) | | | (2.21 | ) | | | 1.52 | |
| Less Dividends and Distributions: | | | | | | | | | | | | | | | | | | | | | | | | | | |
| Dividends from net investment income | | | (.17 | ) | | | | | (.19 | ) | | | (.19 | ) | | | (.27 | ) | | | (.26 | ) | | | (.27 | ) |
| Distributions from net realized gains | | | - | | | | | | - | | | | - | | | | - | | | | (1.06 | ) | | | (.79 | ) |
| Total dividends and distributions | | | (.17 | ) | | | | | (.19 | ) | | | (.19 | ) | | | (.27 | ) | | | (1.32 | ) | | | (1.06 | ) |
| Capital Contributions (Note 6) | | | - | | | | | | - | | | | - | (f) | | | - | | | | - | | | | - | |
| Net asset value, end of period | | | $12.97 | | | | | | $11.31 | | | | $11.31 | | | | $10.52 | | | | $11.09 | | | | $14.62 | |
| Total Return(b): | | | 16.32% | | | | | | 1.63% | | | | 9.42% | | | | (2.24)% | | | | (16.41)% | | | | 11.13% | |
| |
| Ratios/Supplemental Data(c): | |
| Net assets, end of period (000) | | | $38 | | | | | | $11 | | | | $10 | | | | $98 | | | | $893 | | | | $1,181 | |
| Average net assets (000) | | | $15 | | | | | | $11 | | | | $49 | | | | $506 | | | | $1,008 | | | | $1,105 | |
| Ratios to average net assets: | | | | | | | | | | | | | | | | | | | | | | | | | | |
| Expenses, including distribution and service (12b-1) fees(d) | | | 1.55% | (e)(g) | | | | | 1.52% | (e) | | | 1.48% | (e) | | | 1.45% | (e) | | | 1.38% | (e) | | | 1.35% | |
| Expenses, excluding distribution and service (12b-1) fees | | | 1.05% | (e)(g) | | | | | 1.02% | (e) | | | .98% | (e) | | | .95% | (e) | | | .88% | (e) | | | .85% | |
| Net investment income | | | 1.28% | (e)(g) | | | | | 1.25% | (e) | | | 1.43% | (e) | | | 2.25% | (e) | | | 1.94% | (e) | | | 1.76% | |
| Portfolio turnover rate | | | 95% | (h) | | | | | 230% | | | | 185% | | | | 259% | | | | 298% | | | | 226% | |
(a) Calculated based on average shares outstanding during the period.
(b) Total return is calculated assuming a purchase of a share on the first day and a sale on the last day of each period reported and includes reinvestment of dividends and distributions. Total returns may reflect adjustments to conform to generally accepted accounting principles.
(c) Does not include expenses of the underlying portfolios in which the Series invests.
(d) The distributor of the Series contractually agreed to limit its distribution and service (12b-1) fees to .50% of the average daily net assets of the Class R shares.
(e) As of March 23, 2007, the manager of the Series has agreed to reimburse up to .02% of the Series’ management fee in order to limit operating expenses (excluding interest, taxes, brokerage commissions, 12b-1 fees and certain extraordinary expenses) when such expense ratio before waiver exceeds .86% of the average daily net assets of Class R. If the manager had not reimbursed the Series, the annual expenses (both including and excluding distribution and service (12b-1) fees) and net investment income ratios would be 1.57%, 1.07%, and 1.26% respectively, for the six months ended March 31, 2012, 1.54%, 1.04% and 1.23%, respectively, for the year ended September 30, 2011, 1.50%, 1.00% and 1.41%, respectively, for the year ended September 30, 2010, 1.47%, .97% and 2.23%, respectively, for the year ended September 30, 2009 and 1.40%, .90% and 1.92%, respectively, for the year ended September 30, 2008.
(f) Less than $.005 per share.
(g) Annualized.
(h) Not annualized.
See Notes to Financial Statements.
| | | | |
| Prudential Asset Allocation Fund | | | 115 | |
Financial Highlights
(Unaudited) continued
| | | | | | | | | | | | | | | | | | | | | | | | | | | | |
| Class X Shares | |
| | | Six Months
Ended
March 31, | | | | | Year Ended September 30 | | | | | March 26,
2007(b)
through
September 30, | |
| | | 2012(a) | | | | | 2011(a) | | | 2010(a) | | | 2009(a) | | | 2008(a) | | | | | 2007(a) | |
| Per Share Operating Performance: | | | | | | | | | | | | | | | | | | | | | | | | | | | | |
| Net Asset Value, Beginning Of Period | | | $11.32 | | | | | | $11.32 | | | | $10.53 | | | | $11.04 | | | | $14.57 | | | | | | $14.12 | |
| Income (loss) from investment operations: | | | | | | | | | | | | | | | | | | | | | | | | | | | | |
| Net investment income | | | .05 | | | | | | .09 | | | | .10 | | | | .16 | | | | .18 | | | | | | .08 | |
| Net realized and unrealized gain (loss) on investment transactions | | | 1.76 | | | | | | .04 | | | | .83 | | | | (.47 | ) | | | (2.45 | ) | | | | | .37 | |
| Total from investment operations | | | 1.81 | | | | | | .13 | | | | .93 | | | | (.31 | ) | | | (2.27 | ) | | | | | .45 | |
| Less Dividends and Distributions: | | | | | | | | | | | | | | | | | | | | | | | | | | | | |
| Dividends from net investment income | | | (.11 | ) | | | | | (.13 | ) | | | (.14 | ) | | | (.20 | ) | | | (.20 | ) | | | | | - | |
| Distributions from net realized gains | | | - | | | | | | - | | | | - | | | | - | | | | (1.06 | ) | | | | | - | |
| Total dividends and distributions | | | (.11 | ) | | | | | (.13 | ) | | | (.14 | ) | | | (.20 | ) | | | (1.26 | ) | | | | | - | |
| Capital Contributions (Note 6) | | | - | | | | | | - | | | | - | (g) | | | - | | | | - | | | | | | - | |
| Net asset value, end of period | | | $13.02 | | | | | | $11.32 | | | | $11.32 | | | | $10.53 | | | | $11.04 | | | | | | $14.57 | |
| Total Return(c): | | | 16.08% | | | | | | 1.15% | | | | 8.92% | | | | (2.49)% | | | | (16.86)% | | | | | | 3.19% | |
| | | | | | | |
| Ratios/Supplemental Data: | |
| Net assets, end of period (000) | | | $778 | | | | | | $818 | | | | $1,575 | | | | $2,516 | | | | $4,192 | | | | | | $7,157 | |
| Average net assets (000) | | | $805 | | | | | | $1,287 | | | | $1,929 | | | | $2,815 | | | | $5,838 | | | | | | $7,694 | |
| Ratios to average net assets(d): | | | | | | | | | | | | | | | | | | | | | | | | | | | | |
| Expenses, including distribution and service (12b-1) fees | | | 2.05% | (e)(f) | | | | | 2.02% | (e) | | | 1.98% | (e) | | | 1.95% | (e) | | | 1.88% | (e) | | | | | 1.85% | (f) |
| Expenses, excluding distribution and service (12b-1) fees | | | 1.05% | (e)(f) | | | | | 1.02% | (e) | | | .98% | (e) | | | .95% | (e) | | | .88% | (e) | | | | | .85% | (f) |
| Net investment income | | | .84% | (e)(f) | | | | | .74% | (e) | | | .91% | (e) | | | 1.75% | (e) | | | 1.43% | (e) | | | | | 1.09% | (f) |
| Portfolio turnover rate | | | 95% | (h) | | | | | 230% | | | | 185% | | | | 259% | | | | 298% | | | | | | 226% | (h) |
(a) Calculated based on average shares outstanding during the period.
(b) Commencement of offering.
(c) Total return does not consider the effect of sales loads. Total return is calculated assuming a purchase of a share on the first day and a sale on the last day of each period reported and includes reinvestment of dividends and distributions. Total returns may reflect adjustments to conform to generally accepted accounting principles. Total returns for periods less than one full year are not annualized.
(d) Does not include expenses of the underlying portfolios in which the Series invests.
(e) As of March 23, 2007, the manager of the Series has agreed to reimburse up to .02% of the Series’ management fee in order to limit operating expenses (excluding interest, taxes, brokerage commissions, 12b-1 fees and certain extraordinary expenses) when such expense ratio before waiver exceeds .86% of the average daily net assets of Class X. If the manager had not reimbursed the Series, the annual expenses (both including and excluding distribution and service (12b-1) fees) and net investment income ratios would be 2.07%, 1.07%, and .82% respectively, for the six months ended March 31, 2012, 2.04%, 1.04% and .72%, respectively, for the year ended September 30, 2011, 2.00%, 1.00% and .89%, respectively, for the year ended September 30, 2010, 1.97%, .97% and 1.73%, respectively, for the year ended September 30, 2009 and 1.90%, .90% and 1.41%, respectively, for the year ended September 30, 2008.
(f) Annualized.
(g) Less than $.005 per share.
(h) Not annualized.
See Notes to Financial Statements.
| | |
| 116 | | Visit our website at www.prudentialfunds.com |
| | | | | | | | | | | | | | | | | | | | | | | | | | |
| Class Z Shares | |
| | | Six Months
Ended
March 31, | | | | | Year Ended September 30, | |
| | | 2012(a) | | | | | 2011(a) | | | 2010(a) | | | 2009(a) | | | 2008(a) | | | 2007(a) | |
| Per Share Operating Performance: | | | | | | | | | | | | | | | | | | | | | | | | | | |
| Net Asset Value, Beginning Of Period | | | $11.39 | | | | | | $11.38 | | | | $10.58 | | | | $11.15 | | | | $14.71 | | | | $14.25 | |
| Income (loss) from investment operations: | | | | | | | | | | | | | | | | | | | | | | | | | | |
| Net investment income | | | .11 | | | | | | .20 | | | | .21 | | | | .25 | | | | .31 | | | | .32 | |
| Net realized and unrealized gain (loss) on investment transactions | | | 1.76 | | | | | | .06 | | | | .83 | | | | (.48 | ) | | | (2.47 | ) | | | 1.27 | |
| Total from investment operations | | | 1.87 | | | | | | .26 | | | | 1.04 | | | | (.23 | ) | | | (2.16 | ) | | | 1.59 | |
| Less Dividends and Distributions: | | | | | | | | | | | | | | | | | | | | | | | | | | |
| Dividends from net investment income | | | (.23 | ) | | | | | (.25 | ) | | | (.24 | ) | | | (.34 | ) | | | (.34 | ) | | | (.34 | ) |
| Distributions from net realized gains | | | - | | | | | | - | | | | - | | | | - | | | | (1.06 | ) | | | (.79 | ) |
| Total dividends and distributions | | | (.23 | ) | | | | | (.25 | ) | | | (.24 | ) | | | (.34 | ) | | | (1.40 | ) | | | (1.13 | ) |
| Capital Contributions (Note 6) | | | - | | | | | | - | | | | - | (e) | | | - | | | | - | | | | - | |
| Net asset value, end of period | | | $13.03 | | | | | | $11.39 | | | | $11.38 | | | | $10.58 | | | | $11.15 | | | | $14.71 | |
| Total Return(b): | | | 16.61% | | | | | | 2.19% | | | | 9.95% | | | | (1.47)% | | | | (16.03)% | | | | 11.64% | |
| |
| Ratios/Supplemental Data: | |
| Net assets, end of period (000) | | | $41,359 | | | | | | $33,026 | | | | $111,036 | | | | $102,402 | | | | $117,549 | | | | $156,599 | |
| Average net assets (000) | | | $36,813 | | | | | | $47,885 | | | | $107,157 | | | | $93,145 | | | | $140,799 | | | | $163,110 | |
| Ratios to average net assets(c): | | | | | | | | | | | | | | | | | | | | | | | | | | |
| Expenses, including distribution and service (12b-1) fees | | | 1.05% | (d)(f) | | | | | 1.02% | (d) | | | .98% | (d) | | | .95% | (d) | | | .88% | (d) | | | .85% | |
| Expenses, excluding distribution and service (12b-1) fees | | | 1.05% | (d)(f) | | | | | 1.02% | (d) | | | .98% | (d) | | | .95% | (d) | | | .88% | (d) | | | .85% | |
| Net investment income | | | 1.84% | (d)(f) | | | | | 1.72% | (d) | | | 1.90% | (d) | | | 2.71% | (d) | | | 2.44% | (d) | | | 2.25% | |
| Portfolio turnover rate | | | 95% | (g) | | | | | 230% | | | | 185% | | | | 259% | | | | 298% | | | | 226% | |
(a) Calculated based on average shares outstanding during the period.
(b) Total return is calculated assuming a purchase of a share on the first day and a sale on the last day of each period reported and includes reinvestment of dividends and distributions. Total returns may reflect adjustments to conform to generally accepted accounting principles.
(c) Does not include expenses of the underlying portfolios in which the Series invests.
(d) As of March 23, 2007, the manager of the Series has agreed to reimburse up to .02% of the Series’ management fee in order to limit operating expenses (excluding interest, taxes, brokerage commissions, 12b-1 fees and certain extraordinary expenses) when such expense ratio before waiver exceeds .86% of the average daily net assets of Class Z. If the manager had not reimbursed the Series, the annual expenses (both including and excluding distribution and service (12b-1) fees) and net investment income ratios would be 1.07%, 1.07%, and 1.82% respectively, for the six months ended March 31, 2012, 1.04%, 1.04% and 1.70%, respectively, for the year ended September 30, 2011, 1.00%, 1.00% and 1.88%, respectively, for the year ended September 30, 2010, .97%, .97% and 2.69%, respectively, for the year ended September 30, 2009 and .90%, .90% and 2.42%, respectively, for the year ended September 30, 2008.
(e) Less than $.005 per share.
(f) Annualized.
(g) Not annualized.
See Notes to Financial Statements.
| | | | |
| Prudential Asset Allocation Fund | | | 117 | |
| | | | |
| n MAIL | | n TELEPHONE | | n WEBSITE |
Gateway Center Three 100 Mulberry Street Newark, NJ 07102 | | (800) 225-1852 | | www.prudentialfunds.com |
|
| PROXY VOTING |
| The Board of Directors of the Fund has delegated to the Fund’s investment subadvisers the responsibility for voting any proxies and maintaining proxy recordkeeping with respect to the Fund. A description of these proxy voting policies and procedures is available without charge, upon request, by calling (800) 225-1852 or by visiting the Securities and Exchange Commission’s website at www.sec.gov. Information regarding how the Fund voted proxies relating to portfolio securities during the most recent 12-month period ended June 30 is available on the Fund’s website and on the Commission’s website. |
|
| DIRECTORS |
Kevin J. Bannon • Scott E. Benjamin • Linda W. Bynoe • Michael S. Hyland • Douglas H. McCorkindale • Stephen P. Munn • Stuart S. Parker • Richard A. Redeker •
Robin B. Smith • Stephen G. Stoneburn |
|
| OFFICERS |
| Stuart S. Parker, President • Judy A. Rice, Vice President • Scott E. Benjamin, Vice President • Grace C. Torres, Treasurer and Principal Financial and Accounting Officer • Kathryn L. Quirk, Chief Legal Officer • Deborah A. Docs, Secretary • Timothy J. Knierim, Chief Compliance Officer • Valerie M. Simpson, Deputy Chief Compliance Officer • Theresa C. Thompson, Deputy Chief Compliance Officer • Richard W. Kinville, Anti-Money Laundering Compliance Officer • Jonathan D. Shain, Assistant Secretary • Claudia DiGiacomo, Assistant Secretary • John P. Schwartz, Assistant Secretary • Andrew R. French, Assistant Secretary • M. Sadiq Peshimam, Assistant Treasurer • Peter Parrella, Assistant Treasurer |
| | | | |
| MANAGER | | Prudential Investments LLC | | Gateway Center Three
100 Mulberry Street
Newark, NJ 07102 |
|
| INVESTMENT SUBADVISERS | | Prudential Investment
Management, Inc. | | Gateway Center Two
100 Mulberry Street
Newark, NJ 07102 |
|
| | Quantitative Management
Associates LLC | | Gateway Center Two
100 Mulberry Street
Newark, NJ 07102 |
|
| DISTRIBUTOR | | Prudential Investment
Management Services LLC | | Gateway Center Three
100 Mulberry Street
Newark, NJ 07102 |
|
| CUSTODIAN | | The Bank of New York Mellon | | One Wall Street
New York, NY 10286 |
|
| TRANSFER AGENT | | Prudential Mutual Fund
Services LLC | | PO Box 9658
Providence, RI 02940 |
|
INDEPENDENT REGISTERED
PUBLIC ACCOUNTING FIRM | | KPMG LLP | | 345 Park Avenue
New York, NY 10154 |
|
| FUND COUNSEL | | Willkie Farr & Gallagher LLP | | 787 Seventh Avenue
New York, NY 10019 |
|
| An investor should consider the investment objectives, risks, charges, and expenses of the Fund carefully before investing. The prospectus and summary prospectus contain this and other information about the Fund. An investor may obtain a prospectus and summary prospectus by visiting our website at www.prudentialfunds.com or by calling (800) 225-1852. The prospectus and summary prospectus should be read carefully before investing. |
|
| E-DELIVERY |
To receive your mutual fund documents online, go to www.prudentialfunds.com/edelivery and enroll. Instead of receiving printed documents by mail, you will receive notification via email when new materials are available. You can cancel your enrollment or change your email address
at any time by visiting the website address above. |
|
| SHAREHOLDER COMMUNICATIONS WITH DIRECTORS |
| Shareholders can communicate directly with the Board of Directors by writing to the Chair of the Board, Prudential Asset Allocation Fund, Prudential Investments, Attn: Board of Directors, 100 Mulberry Street, Gateway Center Three, Newark, NJ 07102. Shareholders can communicate directly with an individual Director by writing to the same address. Communications are not screened before being delivered to the addressee. |
|
| AVAILABILITY OF PORTFOLIO SCHEDULE |
| The Fund files its complete schedule of portfolio holdings with the Securities and Exchange Commission for the first and third quarters of each fiscal year on Form N-Q under the Prudential Investment Portfolios, Inc. name. The Fund’s Forms N-Q are available on the Commission’s website at www.sec.gov. The Fund’s Forms N-Q may also be reviewed and copied at the Commission’s Public Reference Room in Washington, D.C. Information on the operation and location of the Public Reference Room may be obtained by calling (202) 551-8090. The Fund’s schedule of portfolio holdings is also available on the Fund’s website as of the end of each month. |
Mutual Funds:
| | | | |
| ARE NOT INSURED BY THE FDIC OR ANY FEDERAL GOVERNMENT AGENCY | | MAY LOSE VALUE | | ARE NOT A DEPOSIT OF OR GUARANTEED BY ANY BANK OR ANY BANK AFFILIATE |

PRUDENTIAL ASSET ALLOCATION FUND
| | | | | | | | | | | | | | | | | | |
| | | SHARE CLASS | | A | | B | | C | | L | | M | | R | | X | | Z |
| | NASDAQ | | PIBAX | | PBFBX | | PABCX | | N/A | | DAAMX | | PALRX | | N/A | | PABFX |
| | CUSIP | | 74437E883 | | 74437E875 | | 74437E867 | | 74437E586 | | 74437E578 | | 74437E636 | | 74437E560 | | 74437E859 |
MF185E2 0224671-00001-00

PRUDENTIAL INVESTMENTS»MUTUAL FUNDS
PRUDENTIAL JENNISON EQUITY OPPORTUNITY FUND
SEMIANNUAL REPORT · MARCH 31, 2012
Fund Type
Multi-Cap Stock
Objective
Long-term growth of capital
This report is not authorized for distribution to prospective investors unless preceded or accompanied by a current prospectus.
The views expressed in this report and information about the Fund’s portfolio holdings are for the period covered by this report and are subject to change thereafter.
The accompanying financial statements as of March 31, 2012, were not audited and, accordingly, no auditor’s opinion is expressed on them.
Prudential Investments, Prudential, Jennison, the Prudential logo, the Rock symbol, and Bring Your Challenges are service marks of Prudential Financial, Inc. and its related entities, registered in many jurisdictions worldwide.

May 15, 2012
Dear Shareholder:
After an extraordinary career at Prudential, Judy Rice retired at the end of 2011 as President of Prudential Investments and President and Director of the Prudential Jennison Equity Opportunity Fund (the Fund). While she will remain as Chairman of Prudential Investments until the end of 2012, I was named to succeed her as President of Prudential Investments and President and Director of the Fund effective January 1, 2012. I previously served as Executive Vice President of Retail Mutual Fund Distribution for Prudential Investments for the past six years.
Since this is my first letter to shareholders, I would like to recognize Judy for the significant contributions she made in building the Prudential Investments fund family and her unflagging commitment to helping investors like you meet the challenges of a rapidly changing investment environment. My goal is to build on Judy’s accomplishments, with a particular focus on delivering the solutions you need to address your financial goals.
I hope you find the semiannual report for the Fund informative. We recognize that ongoing market volatility may make it a difficult time to be an investor. We continue to believe a prudent response to uncertainty is to maintain a diversified portfolio, including stock and bond mutual funds consistent with your tolerance for risk, time horizon, and financial goals.
Your financial professional can help you create a diversified investment plan that reflects your personal investor profile and risk tolerance. Keep in mind that diversification and asset allocation strategies do not assure a profit or protect against loss in declining markets. We encourage you to call your financial professional before making any investment decision.
Prudential Investments provides a wide range of mutual funds to choose from that can help you make progress toward your financial goals. Our funds offer the experience, resources, and professional discipline of Prudential Financial’s affiliated asset managers. Thank you for choosing the Prudential Investments family of mutual funds.
Sincerely,

Stuart S. Parker, President
Prudential Jennison Equity Opportunity Fund
| | | | |
| Prudential Jennison Equity Opportunity Fund | | | 1 | |
Your Fund’s Performance (Unaudited)
Performance data quoted represent past performance. Past performance does not guarantee future results. The investment return and principal value of an investment will fluctuate, so that an investor’s shares, when redeemed, may be worth more or less than their original cost. Current performance may be lower or higher than the past performance data quoted. An investor may obtain performance data as of the most recent month-end by visiting our website at www.prudentialfunds.com or by calling (800) 225-1852. The maximum initial sales charge is 5.50% (Class A shares). Gross operating expenses: Class A, 1.15%; Class B, 1.85%; Class C, 1.85%; Class R, 1.60%; Class Z, 0.85%. Net operating expenses: Class A, 1.15%; Class B, 1.85%; Class C, 1.85%; Class R, 1.35%; Class Z, 0.85%, after contractual reduction through 1/31/2013.
| | | | | | | | | | | | | | | | | | |
Cumulative Total Returns (Without Sales Charges) as of 3/31/12 |
| | | Six Months | | | One Year | | | Five Years | | | Ten Years | | | Since Inception |
Class A | | | 26.81 | % | | | 4.90 | % | | | 11.48 | % | | | 63.84 | % | | — |
Class B | | | 26.47 | | | | 4.24 | | | | 7.63 | | | | 52.48 | | | — |
Class C | | | 26.47 | | | | 4.24 | | | | 7.63 | | | | 52.48 | | | — |
Class R | | | 26.76 | | | | 4.72 | | | | 10.32 | | | | N/A | | | 42.90% (12/17/04) |
Class Z | | | 27.06 | | | | 5.23 | | | | 13.14 | | | | 68.46 | | | — |
S&P 500 Index | | | 25.86 | | | | 8.51 | | | | 10.48 | | | | 49.69 | | | — |
Lipper Customized Blend Funds Average | | | 25.06 | | | | 2.58 | | | | 4.93 | | | | 62.65 | | | — |
Lipper Multi-Cap Core Funds Average | | | 24.67 | | | | 2.95 | | | | 6.73 | | | | 58.59 | | | — |
| | | | | | | | | | | | | | | | | | |
Average Annual Total Returns (With Sales Charges) as of 3/31/12 |
| | | | | | One Year | | | Five Years | | | Ten Years | | | Since Inception |
Class A | | | | | | | –0.87 | % | | | 1.05 | % | | | 4.47 | % | | — |
Class B | | | | | | | –0.76 | | | | 1.32 | | | | 4.31 | | | — |
Class C | | | | | | | 3.24 | | | | 1.48 | | | | 4.31 | | | — |
Class R | | | | | | | 4.72 | | | | 1.98 | | | | N/A | | | 5.02% (12/17/04) |
Class Z | | | | | | | 5.23 | | | | 2.50 | | | | 5.35 | | | — |
S&P 500 Index | | | | | | | 8.51 | | | | 2.01 | | | | 4.12 | | | — |
Lipper Customized Blend Funds Average | | | | | | | 2.58 | | | | 0.79 | | | | 4.76 | | | — |
Lipper Multi-Cap Core Funds Average | | | | | | | 2.95 | | | | 1.21 | | | | 4.56 | | | — |
| | |
| 2 | | Visit our website at www.prudentialfunds.com |
Source: Prudential Investments LLC and Lipper Inc. Performance figures may reflect fee waivers and/or expense reimbursements. In the absence of such fee waivers and/or expense reimbursements, total returns would be lower.
Inception returns are provided for any share class with less than 10 calendar years of returns.
The average annual total returns take into account applicable sales charges. Class A shares are subject to a maximum front-end sales charge of 5.50% and a 12b-1 fee of 0.30% annually. Investors who purchase Class A shares in an amount of $1 million or more do not pay a front-end sales charge, but are subject to a contingent deferred sales charge (CDSC) of 1% for shares sold within 12 months of purchase. The Class A shares CDSC is waived for purchases by certain retirement or benefit plans. Under certain circumstances, an exchange may be made from specified share classes of the Fund to one or more other share classes of the Fund. Class B shares do not pay a front-end sales charge but are subject to a declining CDSC of 5%, 4%, 3%, 2%, 1%, and 1%, respectively, for the first six years after purchase and a 12b-1 fee of 1% annually. Approximately seven years after purchase, Class B shares will automatically convert to Class A shares on a quarterly basis. Class C shares are subject to a CDSC of 1% on sales made within 12 months of purchase and an annual 12b-1 fee of 1%. Class R shares are not subject to sales charges, but charge a 12b-1 fee of 0.75%. Class Z shares are not subject to sales charges or 12b-1 fees. The returns in the tables reflect the share class expense structure in effect at the close of the fiscal period. The returns in the tables do not reflect the deduction of taxes that a shareholder would pay on Fund distributions or following the redemption of Fund shares.
Benchmark Definitions
S&P 500 Index
The S&P 500 Index is an unmanaged index of 500 stocks of large U.S. public companies. It gives a broad look at how U.S. stock prices have performed. S&P 500 Index Closest Month-End to Inception cumulative total return is 35.05% for Class R. S&P 500 Index Closest Month-End to Inception average annual total return is 4.23% for Class R.
Lipper Multi-Cap Core Funds Average
The Lipper Multi-Cap Core Funds Average (Lipper Average) represents returns based on the average return of all funds in the Lipper Multi-Cap Core Funds category for the periods noted. Funds in the Lipper Average invest in a variety of market capitalization ranges without concentrating 75% of their equity assets in any one market capitalization range over an extended period of time. Multi-cap funds in the Lipper Average typically have between 25% and 75% of their assets invested in companies with market capitalizations (on a three-year weighted basis) above 300% of the dollar-weighted median market capitalization of the middle 1,000 securities of the S&P SuperComposite 1500 Index. Multi-cap core funds have more latitude in the companies in which they invest. These funds typically have an average price-to-earnings ratio, price-to-book ratio, and three-year sales-per-share growth value compared with the S&P SuperComposite 1500 Index. Lipper Average Closest Month-End to Inception cumulative total return is 33.58% for Class R. Lipper Average Closest Month-End to Inception average annual total return is 3.98% for Class R.
Lipper Customized Blend Funds Average
The Lipper Customized Blend Funds Average (Lipper Average) is a 50/50 blend of the Lipper Multi-Cap Value Funds and Lipper Multi-Cap Blend Funds Averages. The Lipper Customized Blend Funds Average was utilized because PI believes that a blend of the two averages provides a more appropriate basis for Fund performance
| | | | |
| Prudential Jennison Equity Opportunity Fund | | | 3 | |
Your Fund’s Performance (continued)
comparisons, although Lipper only classifies the Fund in the Lipper Multi-Cap Core Funds Universe. Lipper Average Closest Month-End to Inception cumulative total returns is 28.42% for Class R. Lipper Average Closest Month-End to Inception average annual total return is 3.40% for Class R.
Investors cannot invest directly in an index or average. The returns for the Index would be lower if they included the effects of sales charges, operating expenses of a mutual fund, or taxes. Returns for the Lipper Averages reflect the deduction of operating expenses, but not sales charges or taxes.
| | | | |
Five Largest Holdings expressed as a percentage of net assets as of 3/31/12 | | | | |
Comcast Corp., Media | | | 2.2 | % |
News Corp., Media | | | 2.1 | |
Xilinx Inc., Semiconductors & Semiconductors Equipment | | | 2.0 | |
Monsanto Co., Chemicals | | | 1.9 | |
Schlumberger Ltd., Energy Equipment & Services | | | 1.9 | |
Holdings reflect only long-term investments and are subject to change.
| | | | |
Five Largest Long-Term Industries expressed as a percentage of net assets as of 3/31/12 | |
Energy Equipment & Services | | | 7.4 | % |
Media | | | 7.3 | |
Hotels, Restaurants & Leisure | | | 6.0 | |
Software | | | 5.2 | |
Oil, Gas & Consumable Fuels | | | 4.9 | |
Industry weightings reflect only long-term investments and are subject to change.
| | |
| 4 | | Visit our website at www.prudentialfunds.com |
Fees and Expenses (Unaudited)
As a shareholder of the Fund, you incur two types of costs: (1) transaction costs, including sales charges (loads) on purchase payments and redemptions, as applicable, and (2) ongoing costs, including management fees, distribution and/or service (12b-1) fees, and other Fund expenses, as applicable. This example is intended to help you understand your ongoing costs (in dollars) of investing in the Fund and to compare these costs with the ongoing costs of investing in other mutual funds.
The example is based on an investment of $1,000 invested on October 1, 2011, at the beginning of the period, and held through the six-month period ended March 31, 2012. The example is for illustrative purposes only; you should consult the Prospectus for information on initial and subsequent minimum investment requirements.
The Fund’s transfer agent may charge additional fees to holders of certain accounts that are not included in the expenses shown in the table on the following page. These fees apply to individual retirement accounts (IRAs) and Section 403(b) accounts. As of the close of the six-month period covered by the table, IRA fees included an annual maintenance fee of $15 per account (subject to a maximum annual maintenance fee of $25 for all accounts held by the same shareholder). Section 403(b) accounts are charged an annual $25 fiduciary maintenance fee. Some of the fees may vary in amount, or may be waived, based on your total account balance or the number of Prudential Investments funds, including the Fund, that you own. You should consider the additional fees that were charged to your Fund account over the six-month period when you estimate the total ongoing expenses paid over the period and the impact of these fees on your ending account value, as these additional expenses are not reflected in the information provided in the expense table. Additional fees have the effect of reducing investment returns.
Actual Expenses
The first line for each share class in the table on the following page provides information about actual account values and actual expenses. You may use the information on this line, together with the amount you invested, to estimate the expenses that you paid over the period. Simply divide your account value by $1,000 (for example, an $8,600 account value ÷ $1,000 = 8.6), then multiply the result by the number on the first line under the heading “Expenses Paid During the Six-Month Period” to estimate the expenses you paid on your account during this period.
Hypothetical Example for Comparison Purposes
The second line for each share class in the table on the following page provides information about hypothetical account values and hypothetical expenses based on the Fund’s actual expense ratio and an assumed rate of return of 5% per year before
| | | | |
| Prudential Jennison Equity Opportunity Fund | | | 5 | |
Fees and Expenses (continued)
expenses, which is not the Fund’s actual return. The hypothetical account values and expenses may not be used to estimate the actual ending account balance or expenses you paid for the period. You may use this information to compare the ongoing costs of investing in the Fund and other funds. To do so, compare this 5% hypothetical example with the 5% hypothetical examples that appear in the shareholder reports of the other funds.
Please note that the expenses shown in the table are meant to highlight your ongoing costs only and do not reflect any transactional costs such as sales charges (loads). Therefore, the second line for each share class in the table is useful in comparing ongoing costs only and will not help you determine the relative total costs of owning different funds. In addition, if these transactional costs were included, your costs would have been higher.
| | | | | | | | | | | | | | | | | | |
Prudential
Jennison Equity
Opportunity Fund | | Beginning Account Value October 1, 2011 | | | Ending Account
Value
March 31, 2012 | | | Annualized Expense Ratio
Based on the
Six-Month Period | | | Expenses Paid
During the
Six-Month Period* | |
| | | | | | | | | | | | | | | | | | |
| Class A | | Actual | | $ | 1,000.00 | | | $ | 1,268.10 | | | | 1.15 | % | | $ | 6.52 | |
| | | Hypothetical | | $ | 1,000.00 | | | $ | 1,019.25 | | | | 1.15 | % | | $ | 5.81 | |
| | | | | | | | | | | | | | | | | | |
| Class B | | Actual | | $ | 1,000.00 | | | $ | 1,264.70 | | | | 1.85 | % | | $ | 10.47 | |
| | | Hypothetical | | $ | 1,000.00 | | | $ | 1,015.75 | | | | 1.85 | % | | $ | 9.32 | |
| | | | | | | | | | | | | | | | | | |
| Class C | | Actual | | $ | 1,000.00 | | | $ | 1,264.70 | | | | 1.85 | % | | $ | 10.47 | |
| | | Hypothetical | | $ | 1,000.00 | | | $ | 1,015.75 | | | | 1.85 | % | | $ | 9.32 | |
| | | | | | | | | | | | | | | | | | |
| Class R | | Actual | | $ | 1,000.00 | | | $ | 1,267.60 | | | | 1.35 | % | | $ | 7.65 | |
| | | Hypothetical | | $ | 1,000.00 | | | $ | 1,018.25 | | | | 1.35 | % | | $ | 6.81 | |
| | | | | | | | | | | | | | | | | | |
| Class Z | | Actual | | $ | 1,000.00 | | | $ | 1,270.60 | | | | 0.85 | % | | $ | 4.83 | |
| | | Hypothetical | | $ | 1,000.00 | | | $ | 1,020.75 | | | | 0.85 | % | | $ | 4.29 | |
* Fund expenses (net of fee waivers or subsidies, if any) for each share class are equal to the annualized expense ratio for each share class (provided in the table), multiplied by the average account value over the period, multiplied by the 183 days in the six-month period ended March 31, 2012, and divided by the 366 days in the Fund’s fiscal year ending September 30, 2012 (to reflect the six-month period). Expenses presented in the table include the expenses of any underlying portfolios in which the Fund may invest.
| | |
| 6 | | Visit our website at www.prudentialfunds.com |
Portfolio of Investments
as of March 31, 2012 (Unaudited)
| | | | | | |
| Shares | | Description | | Value (Note 1) | |
| | | | | | |
LONG-TERM INVESTMENTS 96.3% | |
COMMON STOCKS | |
|
Aerospace & Defense 4.7% | |
| 78,401 | | Boeing Co. (The) | | $ | 5,830,682 | |
| 371,150 | | Exelis, Inc. | | | 4,646,798 | |
| 45,641 | | Teledyne Technologies, Inc.* | | | 2,877,665 | |
| 41,759 | | United Technologies Corp. | | | 3,463,492 | |
| | | | | | |
| | | | | 16,818,637 | |
|
Airlines 1.0% | |
| 362,880 | | Delta Air Lines, Inc.* | | | 3,596,141 | |
|
Auto Components 1.4% | |
| 108,563 | | Lear Corp. | | | 5,047,094 | |
|
Automobiles 1.5% | |
| 59,459 | | Toyota Motor Corp. (Japan), ADR | | | 5,162,230 | |
|
Biotechnology 3.4% | |
| 266,145 | | Amarin Corp. PLC (Ireland), ADR*(a) | | | 3,012,761 | |
| 52,665 | | Celgene Corp.* | | | 4,082,591 | |
| 120,247 | | Vertex Pharmaceuticals, Inc.* | | | 4,931,330 | |
| | | | | | |
| | | | | 12,026,682 | |
|
Capital Markets 3.8% | |
| 294,398 | | Charles Schwab Corp. (The)(a) | | | 4,230,499 | |
| 121,975 | | Evercore Partners, Inc. (Class A Stock) | | | 3,545,813 | |
| 44,878 | | Goldman Sachs Group, Inc. (The) | | | 5,581,477 | |
| | | | | | |
| | | | | 13,357,789 | |
|
Chemicals 2.9% | |
| 84,279 | | Monsanto Co. | | | 6,722,093 | |
| 39,084 | | PPG Industries, Inc. | | | 3,744,247 | |
| | | | | | |
| | | | | 10,466,340 | |
|
Commercial Banks 1.5% | |
| 154,742 | | Wells Fargo & Co. | | | 5,282,892 | |
|
Communications Equipment 1.1% | |
| 176,716 | | Juniper Networks, Inc.* | | | 4,043,262 | |
See Notes to Financial Statements.
| | | | |
| Prudential Jennison Equity Opportunity Fund | | | 7 | |
Portfolio of Investments
as of March 31, 2012 (Unaudited) continued
| | | | | | |
| Shares | | Description | | Value (Note 1) | |
| | | | | | |
COMMON STOCKS (Continued) | |
|
Computers & Peripherals 2.1% | |
| 210,016 | | Dell, Inc.* | | $ | 3,486,266 | |
| 135,641 | | EMC Corp.* | | | 4,052,953 | |
| | | | | | |
| | | | | 7,539,219 | |
| |
Diversified Financial Services 3.6% | | | | |
| 97,754 | | Citigroup, Inc. | | | 3,572,909 | |
| 125,855 | | JPMorgan Chase & Co. | | | 5,786,813 | |
| 85,179 | | Moody’s Corp.(a) | | | 3,586,036 | |
| | | | | | |
| | | | | 12,945,758 | |
| |
Diversified Telecommunication Services 1.0% | | | | |
| 184,694 | | Vivendi SA (France) | | | 3,389,468 | |
| |
Electric Utilities 1.3% | | | | |
| 117,872 | | Exelon Corp. | | | 4,621,761 | |
| |
Electronic Equipment & Instruments 0.9% | | | | |
| 446,247 | | Flextronics International Ltd.* | | | 3,226,366 | |
| |
Energy Equipment & Services 7.4% | | | | |
| 124,582 | | Cameron International Corp.* | | | 6,581,667 | |
| 59,397 | | Ensco PLC (United Kingdom), ADR | | | 3,143,883 | |
| 68,583 | | National Oilwell Varco, Inc. | | | 5,450,291 | |
| 95,570 | | Schlumberger Ltd. | | | 6,683,210 | |
| 82,627 | | Transocean Ltd. | | | 4,519,697 | |
| | | | | | |
| | | | | 26,378,748 | |
| |
Food & Staples Retailing 3.2% | | | | |
| 134,302 | | CVS Caremark Corp. | | | 6,016,730 | |
| 89,548 | | Wal-Mart Stores, Inc. | | | 5,480,337 | |
| | | | | | |
| | | | | 11,497,067 | |
| |
Food Products 4.2% | | | | |
| 76,296 | | Bunge Ltd. | | | 5,221,698 | |
| 150,095 | | Kraft Foods, Inc. (Class A Stock) | | | 5,705,111 | |
| 199,834 | | Tyson Foods, Inc. (Class A Stock) | | | 3,826,821 | |
| | | | | | |
| | | | | 14,753,630 | |
| |
Healthcare Equipment & Supplies 1.8% | | | | |
| 297,491 | | Hologic, Inc.* | | | 6,410,931 | |
See Notes to Financial Statements.
| | |
| 8 | | Visit our website at www.prudentialfunds.com |
| | | | | | |
| Shares | | Description | | Value (Note 1) | |
| | | | | | |
COMMON STOCKS (Continued) | |
| |
Healthcare Providers & Services 2.2% | | | | |
| 67,137 | | Quest Diagnostics, Inc. | | $ | 4,105,428 | |
| 81,319 | | Universal Health Services, Inc. (Class B Stock) | | | 3,408,079 | |
| | | | | | |
| | | | | 7,513,507 | |
| |
Hotels, Restaurants & Leisure 6.0% | | | | |
| 118,668 | | Accor SA (France) | | | 4,236,843 | |
| 378,832 | | International Game Technology | | | 6,360,589 | |
| 534,954 | | Pinnacle Entertainment, Inc.* | | | 6,157,320 | |
| 934,265 | | Wendy’s Co. (The) | | | 4,680,668 | |
| | | | | | |
| | | | | 21,435,420 | |
| |
Household Durables 1.4% | | | | |
| 263,334 | | Ryland Group, Inc. (The)(a) | | | 5,077,080 | |
| |
Independent Power Producers & Energy Traders 1.5% | | | | |
| 308,978 | | Calpine Corp.* | | | 5,317,512 | |
| |
Insurance 2.8% | | | | |
| 115,147 | | Axis Capital Holdings Ltd. | | | 3,819,426 | |
| 72,183 | | MetLife, Inc. | | | 2,696,035 | |
| 310,593 | | Symetra Financial Corp. | | | 3,581,137 | |
| | | | | | |
| | | | | 10,096,598 | |
| |
Internet & Catalog Retail 0.7% | | | | |
| 69,970 | | Expedia, Inc.(a) | | | 2,339,797 | |
| |
Internet Software & Services 1.7% | | | | |
| 9,368 | | Google, Inc. (Class A Stock)* | | | 6,007,136 | |
| |
IT Services 0.8% | | | | |
| 6,946 | | MasterCard, Inc. (Class A Stock) | | | 2,921,071 | |
| |
Life Sciences Tools & Services 1.0% | | | | |
| 62,822 | | Thermo Fisher Scientific, Inc. | | | 3,541,904 | |
| |
Machinery 2.6% | | | | |
| 60,332 | | Dover Corp.(a) | | | 3,797,296 | |
| 196,816 | | Xylem, Inc. | | | 5,461,644 | |
| | | | | | |
| | | | | 9,258,940 | |
See Notes to Financial Statements.
| | | | |
| Prudential Jennison Equity Opportunity Fund | | | 9 | |
Portfolio of Investments
as of March 31, 2012 (Unaudited) continued
| | | | | | |
| Shares | | Description | | Value (Note 1) | |
| | | | | | |
COMMON STOCKS (Continued) | |
| |
Media 7.3% | | | | |
| 264,472 | | Comcast Corp. (Class A Stock) | | $ | 7,804,569 | |
| 72,700 | | Liberty Global, Inc. (Series C Stock)* | | | 3,481,603 | |
| 380,841 | | News Corp. (Class A Stock) | | | 7,498,759 | |
| 119,244 | | Thomson Reuters Corp. | | | 3,446,152 | |
| 74,238 | | Viacom, Inc. (Class B Stock) | | | 3,523,335 | |
| | | | | | |
| | | | | 25,754,418 | |
| |
Metals & Mining 0.8% | | | | |
| 66,971 | | Goldcorp, Inc. | | | 3,017,713 | |
| |
Oil, Gas & Consumable Fuels 4.9% | | | | |
| 182,705 | | Cobalt International Energy, Inc.* | | | 5,486,631 | |
| 141,464 | | Consol Energy, Inc.(a) | | | 4,823,923 | |
| 112,814 | | Kosmos Energy Ltd.*(a) | | | 1,493,657 | |
| 65,285 | | Peabody Energy Corp. | | | 1,890,654 | |
| 115,536 | | Suncor Energy, Inc. | | | 3,778,027 | |
| | | | | | |
| | | | | 17,472,892 | |
|
Pharmaceuticals 3.5% | |
| 60,094 | | Eli Lilly & Co. | | | 2,419,985 | |
| 167,403 | | Impax Laboratories, Inc.* | | | 4,114,766 | |
| 265,462 | | Pfizer, Inc. | | | 6,015,369 | |
| | | | | | |
| | | | | 12,550,120 | |
|
Professional Services 1.3% | |
| 95,586 | | Manpower, Inc. | | | 4,527,909 | |
|
Road & Rail 1.0% | |
| 162,542 | | CSX Corp. | | | 3,497,904 | |
|
Semiconductors & Semiconductor Equipment 3.3% | |
| 151,539 | | Maxim Integrated Products, Inc. | | | 4,332,500 | |
| 198,892 | | Xilinx, Inc. | | | 7,245,636 | |
| | | | | | |
| | | | | 11,578,136 | |
|
Software 5.2% | |
| 379,441 | | Activision Blizzard, Inc.(a) | | | 4,864,434 | |
| 197,897 | | Microsoft Corp. | | | 6,382,178 | |
| 85,381 | | Oracle Corp. | | | 2,489,710 | |
| 244,912 | | Symantec Corp.* | | | 4,579,854 | |
| | | | | | |
| | | | | 18,316,176 | |
See Notes to Financial Statements.
| | |
| 10 | | Visit our website at www.prudentialfunds.com |
| | | | | | |
| Shares | | Description | | Value (Note 1) | |
| | | | | | |
COMMON STOCKS (Continued) | |
|
Specialty Retail 1.5% | |
| 244,088 | | GameStop Corp. (Class A Stock)(a) | | $ | 5,330,882 | |
| | | | | | |
| | Total long-term investments
(cost $291,513,178) | | | 342,119,130 | |
| | | | | | |
SHORT-TERM INVESTMENT 12.1% | |
|
Affiliated Money Market Mutual Fund | |
| 43,129,118 | | Prudential Investment Portfolios 2 - Prudential Core Taxable
Money Market Fund
(cost $43,129,118; includes $32,401,652 of cash collateral received for securities on loan)(b)(c) | | | 43,129,118 | |
| | | | | | |
| | Total Investments 108.4%
(cost $334,642,296; Note 5) | | | 385,248,248 | |
| | Liabilities in excess of other assets (8.4%) | | | (29,994,160 | ) |
| | | | | | |
| | Net Assets 100.0% | | $ | 355,254,088 | |
| | | | | | |
The following abbreviations are used in the portfolio descriptions:
ADR—American Depositary Receipt
SA—Special Assessment
| * | Non-income producing security. |
| (a) | All or a portion of security is on loan. The aggregate market value of such securities, including those sold and pending settlement, is $31,177,787; cash collateral of $32,401,652 (included in liabilities) was received with which the Series purchased highly liquid short-term investments. |
| (b) | Prudential Investments LLC, the manager of the Series, also serves as manager of the Prudential Investment Portfolios 2 - Prudential Core Taxable Money Market Fund. |
| (c) | Represents security, or a portion thereof, purchased with cash collateral received for securities on loan. |
Various inputs are used in determining the value of the Series’ investments. These inputs are summarized in the three broad levels listed below.
Level 1—quoted prices generally for securities actively traded on a regulated securities exchange and for open-end mutual funds which trade at daily net asset value.
Level 2—other significant observable inputs (including, but not limited to, quoted prices for similar securities, interest rates, prepayment speeds, foreign currency exchange rates, and amortized cost) generally for debt securities, swaps, forward foreign currency contracts and for foreign stocks priced using vendor modeling tools.
See Notes to Financial Statements.
| | | | |
| Prudential Jennison Equity Opportunity Fund | | | 11 | |
Portfolio of Investments
as of March 31, 2012 (Unaudited) continued
Level 3—significant unobservable inputs for securities valued in accordance with Board approved fair valuation procedures.
The following is a summary of the inputs used as of March 31, 2012 in valuing such portfolio securities:
| | | | | | | | | | | | |
| | | Level 1 | | | Level 2 | | | Level 3 | |
Investments in Securities | | | | | | | | | | | | |
Common Stocks | | $ | 342,119,130 | | | $ | — | | | $ | — | |
Affiliated Money Market Mutual Fund | | | 43,129,118 | | | | — | | | | — | |
| | | | | | | | | | | | |
Total | | $ | 385,248,248 | | | $ | — | | | $ | — | |
| | | | | | | | | | | | |
The industry classification of portfolio holdings and liabilities in excess of other assets shown as a percentage of net assets as of March 31, 2012 was as follows:
| | | | |
Affiliated Money Market Mutual Fund (including 9.1% of collateral received for securities on loan) | | | 12.1 | % |
Energy Equipment & Services | | | 7.4 | |
Media | | | 7.3 | |
Hotels, Restaurants & Leisure | | | 6.0 | |
Software | | | 5.2 | |
Oil, Gas & Consumable Fuels | | | 4.9 | |
Aerospace & Defense | | | 4.7 | |
Food Products | | | 4.2 | |
Capital Markets | | | 3.8 | |
Diversified Financial Services | | | 3.6 | |
Pharmaceuticals | | | 3.5 | |
Biotechnology | | | 3.4 | |
Semiconductors & Semiconductor Equipment | | | 3.3 | |
Food & Staples Retailing | | | 3.2 | |
Chemicals | | | 2.9 | |
Insurance | | | 2.8 | |
Machinery | | | 2.6 | |
Healthcare Providers & Services | | | 2.2 | |
Computers & Peripherals | | | 2.1 | |
Healthcare Equipment & Supplies | | | 1.8 | |
Internet Software & Services | | | 1.7 | |
Automobiles | | | 1.5 | % |
Commercial Banks | | | 1.5 | |
Independent Power Producers &
Energy Traders | | | 1.5 | |
Specialty Retail | | | 1.5 | |
Auto Components | | | 1.4 | |
Household Durables | | | 1.4 | |
Electric Utilities | | | 1.3 | |
Professional Services | | | 1.3 | |
Communications Equipment | | | 1.1 | |
Airlines | | | 1.0 | |
Diversified Telecommunication Services | | | 1.0 | |
Life Sciences Tools & Services | | | 1.0 | |
Road & Rail | | | 1.0 | |
Electronic Equipment & Instruments | | | 0.9 | |
IT Services | | | 0.8 | |
Metals & Mining | | | 0.8 | |
Internet & Catalog Retail | | | 0.7 | |
| | | | |
| | | 108.4 | |
Liabilities in excess of other assets | | | (8.4 | ) |
| | | | |
| | | 100.0 | % |
| | | | |
See Notes to Financial Statements.
| | |
| 12 | | Visit our website at www.prudentialfunds.com |
Financial Statements
(Unaudited)
| | |
| MARCH 31, 2012 | | SEMIANNUAL REPORT |
Prudential Jennison Equity Opportunity Fund
Statement of Assets and Liabilities
as of March 31, 2012 (Unaudited)
| | | | |
Assets | | | | |
Investments at value, including securities on loan of $31,177,787: | | | | |
Unaffiliated Investments (cost $291,513,178) | | $ | 342,119,130 | |
Affiliated Investments (cost $43,129,118) | | | 43,129,118 | |
Foreign currency, at value (cost $12) | | | 12 | |
Receivable for Investments sold | | | 4,000,748 | |
Receivable for Series shares sold | | | 492,829 | |
Dividends and interest receivable | | | 361,997 | |
Prepaid expenses | | | 2,589 | |
| | | | |
Total assets | | | 390,106,423 | |
| | | | |
| |
Liabilities | | | | |
Payable to broker for collateral for securities on loan | | | 32,401,652 | |
Payable for investments purchased | | | 1,479,414 | |
Payable for Series shares reacquired | | | 408,303 | |
Management fee payable | | | 178,240 | |
Accrued expenses and other liabilities | | | 152,805 | |
Payable to custodian | | | 104,415 | |
Distribution fee payable | | | 91,351 | |
Affiliated transfer agent fee payable | | | 36,155 | |
| | | | |
Total liabilities | | | 34,852,335 | |
| | | | |
| |
Net Assets | | $ | 355,254,088 | |
| | | | |
| | | | | |
Net assets were comprised of: | | | | |
Common stock, at par | | $ | 23,218 | |
Paid-in capital in excess of par | | | 325,908,961 | |
| | | | |
| | | 325,932,179 | |
Undistributed net investment income | | | 544,200 | |
Accumulated net realized loss on investment and foreign currency transactions | | | (21,828,243 | ) |
Net unrealized appreciation on investments and foreign currencies | | | 50,605,952 | |
| | | | |
Net assets, March 31, 2012 | | $ | 355,254,088 | |
| | | | |
See Notes to Financial Statements.
| | |
| 14 | | Visit our website at www.prudentialfunds.com |
| | | | |
Class A | | | | |
Net asset value and redemption price per share
($223,981,598 ÷ 14,525,932 shares of common stock issued and outstanding) | | $ | 15.42 | |
Maximum sales charge (5.50% of offering price) | | | 0.90 | |
| | | | |
Maximum offering price to public | | $ | 16.32 | |
| | | | |
| |
Class B | | | | |
Net asset value, offering price and redemption price per share
($10,267,114 ÷ 746,242 shares of common stock issued and outstanding) | | $ | 13.76 | |
| | | | |
| |
Class C | | | | |
Net asset value, offering price and redemption price per share
($29,192,066 ÷ 2,121,721 shares of common stock issued and outstanding) | | $ | 13.76 | |
| | | | |
| |
Class R | | | | |
Net asset value, offering price and redemption price per share
($2,993,753 ÷ 210,713 shares of common stock issued and outstanding) | | $ | 14.21 | |
| | | | |
| |
Class Z | | | | |
Net asset value, offering price and redemption price per share
($88,819,557 ÷ 5,613,183 shares of common stock issued and outstanding) | | $ | 15.82 | |
| | | | |
See Notes to Financial Statements.
| | | | |
| Prudential Jennison Equity Opportunity Fund | | | 15 | |
Statement of Operations
Six Months Ended March 31, 2012 (Unaudited)
| | | | |
Net Investment Income | | | | |
Income | | | | |
Unaffiliated dividend income (net of foreign withholding taxes of $17,865) | | $ | 2,406,143 | |
Affiliated income from securities loaned, net | | | 31,234 | |
Affiliated dividend income | | | 5,689 | |
| | | | |
Total income | | | 2,443,066 | |
| | | | |
| |
Expenses | | | | |
Management fee | | | 985,414 | |
Distribution fee—Class A | | | 314,328 | |
Distribution fee—Class B | | | 53,378 | |
Distribution fee—Class C | | | 137,353 | |
Distribution fee—Class R | | | 4,479 | |
Transfer agent’s fees and expenses (including affiliated expense of $84,000) | | | 255,000 | |
Registration fees | | | 39,000 | |
Custodian’s fees and expenses | | | 39,000 | |
Reports to shareholders | | | 29,000 | |
Legal fees and expenses | | | 16,000 | |
Audit fee | | | 11,000 | |
Directors’ fees | | | 9,000 | |
Insurance | | | 4,000 | |
Interest expense (Note 7) | | | 176 | |
Miscellaneous | | | 8,363 | |
| | | | |
Total expenses | | | 1,905,491 | |
| | | | |
Net investment income | | | 537,575 | |
| | | | |
| |
Realized And Unrealized Gain (Loss) On Investment And Foreign Currency Transactions | | | | |
Net realized gain (loss) on: | | | | |
Investment transactions | | | 14,848,948 | |
Foreign currency transactions | | | (3,857 | ) |
| | | | |
| | | 14,845,091 | |
| | | | |
Net change in unrealized appreciation (depreciation) on investments | | | 61,915,506 | |
| | | | |
Net gain on investment and foreign currency transactions | | | 76,760,597 | |
| | | | |
Net Increase In Net Assets Resulting From Operations | | $ | 77,298,172 | |
| | | | |
See Notes to Financial Statements.
| | |
| 16 | | Visit our website at www.prudentialfunds.com |
Statement of Changes in Net Assets
(Unaudited)
| | | | | | | | |
| | | Six Months
Ended
March 31, 2012 | | | Year
Ended
September 30, 2011 | |
Increase (Decrease) In Net Assets | | | | | | | | |
Operations | | | | | | | | |
Net investment income | | $ | 537,575 | | | $ | 282,085 | |
Net realized gain on investment and foreign currency transactions | | | 14,845,091 | | | | 33,077,950 | |
Net change in unrealized appreciation (depreciation) on investments and foreign currencies | | | 61,915,506 | | | | (36,986,329 | ) |
| | | | | | | | |
Net increase (decrease) in net assets resulting from operations | | | 77,298,172 | | | | (3,626,294 | ) |
| | | | | | | | |
Dividends from net investment income (Note 1) | | | | | | | | |
Class Z | | | (225,277 | ) | | | — | |
| | | | | | | | |
| | |
Series share transactions (Net of share conversions) (Note 6) | | | | | | | | |
Net proceeds from shares sold | | | 23,983,274 | | | | 49,234,838 | |
Net asset value of shares issued in reinvestment of dividends | | | 174,824 | | | | — | |
Cost of shares reacquired | | | (39,873,091 | ) | | | (71,903,761 | ) |
| | | | | | | | |
Net decrease in net assets from Series share transactions | | | (15,714,993 | ) | | | (22,668,923 | ) |
| | | | | | | | |
Total increase (decrease) | | | 61,357,902 | | | | (26,295,217 | ) |
| | |
Net Assets: | | | | | | | | |
Beginning of period | | | 293,896,186 | | | | 320,191,403 | |
| | | | | | | | |
End of period(a) | | $ | 355,254,088 | | | $ | 293,896,186 | |
| | | | | | | | |
(a) Includes undistributed net investment income of: | | $ | 544,200 | | | $ | 231,902 | |
| | | | | | | | |
See Notes to Financial Statements.
| | | | |
| Prudential Jennison Equity Opportunity Fund | | | 17 | |
Notes to Financial Statements
(Unaudited)
The Prudential Investment Portfolios, Inc. (the “Company”), is an open-end management investment company, registered under the Investment Company Act of 1940 (the “1940 Act”), as amended. The Company was incorporated in Maryland on August 10, 1995 and consists of six series: Prudential Jennison Equity Opportunity Fund (the “Series”), Prudential Jennison Growth Fund and Prudential Asset Allocation Fund which are diversified funds and Prudential Growth Allocation Fund, Prudential Moderate Allocation Fund and Prudential Conservative Allocation Fund which are non-diversified funds. These financial statements relate to Prudential Jennison Equity Opportunity Fund. The financial statements of the other series are not presented herein. The Series commenced investment operations on November 7, 1996.
The Series’ investment objective is to achieve long-term growth of capital.
Note 1. Accounting Policies
The following is a summary of significant accounting policies followed by the Series in the preparation of its financial statements.
Securities Valuation: Securities listed on a securities exchange are valued at the last sale price on such exchange on the day of valuation or, if there was no sale on such day, at the mean between the last reported bid and asked prices, or at the last bid price on such day in the absence of an asked price. Securities traded via NASDAQ are valued at the official closing price provided by NASDAQ. Securities that are actively traded in the over-the-counter market, including listed securities for which the primary market is believed by Prudential Investments LLC (“PI” or “Manager”), in consultation with the subadvisor, to be over-the-counter, are valued at market value using prices provided by an independent pricing agent or principal market maker. Securities for which reliable market quotations are not readily available, or whose values have been affected by events occurring after the close of the security’s foreign market and before the Series’ normal pricing time, are valued at fair value in accordance with The Board of Directors’ approved fair valuation procedures. When determining the fair valuation of securities some of the factors influencing the valuation include, the nature of any restrictions on disposition of the securities; assessment of the general liquidity of the securities; the issuer’s financial condition and the markets in which it does business; the cost of the investment; the size of the holding and the capitalization of issuer; the prices of any recent transactions or bids/offers for such securities or any comparable securities; any available analyst media or
| | |
| 18 | | Visit our website at www.prudentialfunds.com |
other reports or information deemed reliable by the investment adviser regarding the issuer or the markets or industry in which it operates. Using fair value to price securities may result in a value that is different from a security’s most recent closing price and from the price used by other mutual funds to calculate their net asset values.
Investments in open end, non exchange-traded mutual funds are valued at their net asset value as of the close of the New York Stock Exchange on the date of valuation.
Short-term debt securities of sufficient credit quality, which mature in sixty days or less, are valued at amortized cost, which approximates fair value. The amortized cost method includes valuing a security at its cost on the date of purchase and thereafter assuming a constant amortization to maturity of the difference between the principal amount due at maturity and cost. Short-term debt securities, which mature in more than sixty days, are valued at fair value.
Restricted Securities: The Series may hold up to 15% of its net assets in illiquid securities, including those which are restricted as to disposition under securities law (“restricted securities”). Restricted securities held by the Series at the end of the fiscal period may include registration rights under which the Series may demand registration by the issuers, of which the Series may bear the cost of such registration. Restricted securities are valued pursuant to the valuation procedures noted above.
Foreign Currency Translation: The books and records of the Series are maintained in U.S. dollars. Foreign currency amounts are translated into U.S. dollars on the following basis:
(i) market value of investment securities, other assets and liabilities-at the current rates of exchange.
(ii) purchases and sales of investment securities, income and expenses-at the rates of exchange prevailing on the respective dates of such transactions.
The Series does not isolate that portion of the results of operations arising as a result of changes in the foreign exchange rates from the fluctuations arising from changes in the market prices of long term securities held at the end of the fiscal year. Similarly, the Series does not isolate the effect of changes in foreign exchange rates from the fluctuations arising from changes in the market prices of portfolio securities sold during the fiscal year. Accordingly, realized foreign currency gains or losses are included in the reported net realized gains or losses on investment transactions. Net realized gains or losses on foreign currency transactions represent net foreign exchange gains or losses from the holding of foreign currencies, currency gains or
| | | | |
| Prudential Jennison Equity Opportunity Fund | | | 19 | |
Notes to Financial Statements
(Unaudited) continued
losses realized between the trade and settlement dates on securities transactions, and the difference between the amounts of dividends, interest and foreign withholding taxes recorded on the Series’ books and the U.S. dollar equivalent amounts actually received or paid. Net unrealized currency gains or losses from valuing foreign currency denominated assets and liabilities (other than investments) at fiscal year end exchange rates are reflected as a component of net unrealized appreciation (depreciation) on investments and foreign currencies.
Foreign security and currency transactions may involve certain considerations and risks not typically associated with those of domestic origin as a result of, among other factors, the possibility of political and economic instability or the level of governmental supervision and regulation of foreign securities markets.
Securities Lending: The Series may lend its portfolio securities to banks and broker-dealers. The loans are secured by collateral, at least equal to the market value of the securities loaned. Collateral pledged by each borrower is marked to market daily, based on the previous day’s market value, such that the value of the collateral exceeds the value of the loaned securities. Loans are subject to termination at the option of the borrower or the Series. Upon termination of the loan, the borrower will return to the lender securities identical to the loaned securities. Should the borrower of the securities fail financially, the Series has the right to repurchase the securities using the collateral in the open market. The Series recognizes income, net of any rebate and securities lending agent fees, for lending its securities in the form of fees or interest on the investment of any cash received as collateral. The Series also continues to receive interest and dividends or amounts equivalent thereto, on the securities loaned and recognizes any unrealized gain or loss in the market price of the securities loaned that may occur during the term of the loan.
Short Sales: The Series may make short sales of securities as a method of hedging potential price declines in similar securities owned. The Series may sell a security it does not own in anticipation of a decline in the market value of that security (short sale). When the Series makes a short sale, it will borrow the security sold short and deliver it to the broker-dealer through which it made the short sale as collateral for its obligation to deliver the security upon conclusion of the sale. The Series may have to pay a fee to borrow the particular securities and may be obligated to return any interest or dividends received on such borrowed securities. A gain, limited to the price at which the Series sold the security short, or a loss, unlimited as to dollar
| | |
| 20 | | Visit our website at www.prudentialfunds.com |
amount, will be recognized upon the termination of a short sale if the market price is less or greater than the proceeds originally received, respectively, and is presented in the Statement of Operations as net realized gain or loss on short sales.
Securities Transactions and Net Investment Income: Securities transactions are recorded on the trade date. Realized gains or losses from investment and currency transactions on sales of portfolio securities are calculated on the identified cost basis. Dividend income is recorded on the ex-dividend date and interest income, including amortization of premium and accretion of discount on debt securities, as required, is recorded on the accrual basis. Expenses are recorded on the accrual basis which may require the use of certain estimates by management. The Company’s expenses are allocated to the respective portfolios on the basis of relative net assets except for expenses that are charged directly at the portfolio or class level. Net investment income or loss (other than distribution fees which are charged directly to the respective class), and unrealized and realized gains or losses are allocated daily to each class of shares based upon the relative proportion of adjusted net assets of each class at the beginning of the day.
Dividends and Distributions: The Series expects to pay dividends of net investment income, if any, semi-annually and distributions of net realized capital gains, if any, at least annually. Dividends and distributions, which are determined in accordance with federal income tax regulations and which may differ from generally accepted accounting principles, are recorded on the ex-dividend date.
Taxes: For federal income tax purposes, each Series in the Company is treated as a separate tax paying entity. It is the Series’ policy to continue to meet the requirements of the Internal Revenue Code applicable to regulated investment companies and to distribute all of its taxable net income and capital gains, if any, to shareholders. Therefore, no federal tax provision is required.
Withholding taxes on foreign dividends are recorded net of reclaimable amounts, at the time the related income is earned.
Estimates: The preparation of the financial statements requires management to make estimates and assumptions that affect the reported amounts and disclosures in the financial statements. Actual results could differ from those estimates.
Note 2. Agreements
The Company has a management agreement for the Series with PI. Pursuant to this agreement PI has responsibility for all investment advisory services and supervises the subadvisor’s performance of such services. PI has entered into a subadvisory
| | | | |
| Prudential Jennison Equity Opportunity Fund | | | 21 | |
Notes to Financial Statements
(Unaudited) continued
agreement with Jennison Associates LLC (“Jennison”). The subadvisory agreement provides that Jennison furnishes investment advisory services in connection with the management of the Series. In connection therewith, Jennison is obligated to keep certain books and records of the Series. PI pays for the services of Jennison, the cost of compensation of officers and employees of the Series, occupancy and certain clerical and bookkeeping costs of the Series. The Series bears all other costs and expenses.
The management fee paid to PI is computed daily and payable monthly, at an annual rate of .60% of the average daily net assets of the Series up to $300 million and 0.575% of the average daily net assets of the Series over $300 million. The effective management fee rate was 0.60% of the Series average daily net assets for the six months ended March 31, 2012.
The Series has a distribution agreement with Prudential Investment Management Services LLC (“PIMS”), which acts as the distributor of the Class A, Class B, Class C, Class R and Class Z shares of the Series. The Series compensates PIMS for distributing and servicing the Series’ Class A, Class B, Class C and Class R shares, pursuant to plans of distribution (the “Class A, B, C and R Plans”), regardless of expenses actually incurred by PIMS. The distribution fees are accrued daily and payable monthly. No distribution or service fees are paid to PIMS as distributor of the Class Z shares of the Series.
Pursuant to the Class A, B, C and R Plans, the Series compensates PIMS for distribution related activities at an annual rate of up to .30%, 1%, 1% and .75% of the average daily net assets of the Class A, B, C and R shares, respectively. PIMS has contractually agreed to limit such fees to .50% for Class R shares.
PIMS has advised the Series that it received $33,907 in front-end sales charges resulting from sales of Class A shares during the six months ended March 31, 2012. From these fees PIMS paid such sales charges to affiliated brokers/dealers, which in turn paid commissions to salespersons and incurred other distribution costs.
PIMS has advised the Series that for the six months ended March 31, 2012, it received $47, $12,496 and $540 in contingent deferred sales charges imposed upon redemptions by certain Class A, Class B and Class C shareholders, respectively.
PI, PIMS, and Jennison are indirect, wholly-owned subsidiaries of Prudential Financial, Inc. (“Prudential”).
| | |
| 22 | | Visit our website at www.prudentialfunds.com |
Note 3. Other Transactions with Affiliates
Prudential Mutual Fund Services LLC (“PMFS”), an affiliate of PI and an indirect, wholly-owned subsidiary of Prudential, serves as the Company’s transfer agent. Transfer agent’s fees and expenses in the Statement of Operations include certain out-of-pocket expenses paid to non-affiliates, where applicable.
Prudential Investment Management, Inc., (“PIM”), an indirect, wholly-owned subsidiary of Prudential, is the Series’ security lending agent. For the six months ended March 31, 2012, PIM has been compensated approximately $9,300 for these services.
The Series invests in the Prudential Core Taxable Money Market Fund (the “Core Fund”), a portfolio of the Prudential Investment Portfolios 2 registered under the 1940 Act, as amended, and managed by PI. Earnings from the Core Fund are disclosed on the Statement of Operations as affiliated dividend income.
Note 4. Portfolio Securities
Purchases and sales of investment securities, other than short-term investments, for the six months ended March 31, 2012 were $68,067,851 and $89,331,571, respectively.
Note 5. Distributions and Tax Information
The United States federal income tax basis of the Series’ investments and the net unrealized appreciation as of March 31, 2012 were as follows:
| | | | | | |
Tax Basis | | Appreciation | | Depreciation | | Net
Unrealized
Appreciation |
| $336,482,443 | | $55,807,427 | | $(7,041,622) | | $48,765,805 |
The differences between book and tax basis are primarily attributable to deferred losses on wash sales and other book-to-tax differences as of the most recent fiscal year end.
For federal income tax purposes, the Series had a capital loss carryforward as of September 30, 2011 of approximately $34,809,000 expires in 2018. The Series utilized approximately $31,597,000 of its capital loss carryforward to offset net taxable gains realized in the year ended September 30, 2011. Accordingly, no capital
| | | | |
| Prudential Jennison Equity Opportunity Fund | | | 23 | |
Notes to Financial Statements
(Unaudited) continued
gains distributions are expected to be paid to shareholders until net gains have been realized in excess of such carryforward. Under the recently enacted Regulated Investment Company Modernization Act of 2010 (the “Act”), the Series is permitted to carryforward capital losses incurred in taxable years beginning after December 22, 2010 (“post-enactment losses”) for an unlimited period. However, any post-enactment losses are required to be utilized before the utilization of losses incurred prior to the effective date of the Act. As a result of this ordering rule, capital loss carryforwards related to the taxable years beginning prior to the effective date of the Act may have an increased likelihood to expire unused. Additionally, post-enactment capital losses that are carried forward will retain their character as either short-term or long-term capital losses rather than being considered all short-term as under previous law.
In addition, the Series elected to treat net foreign currency losses of approximately $8,000, incurred between November 1, 2010 and September 30, 2011 as being incurred during the fiscal year ending September 30, 2012.
Management has analyzed the Series’ tax positions taken on federal income tax returns for all open tax years and has concluded that no provision for income tax is required in the Series’ financial statements for the current reporting period. The Series’ federal and state income and federal excise tax returns for tax years for which the applicable statutes of limitations have not expired are subject to examination by the Internal Revenue Service and state departments of revenue.
Note 6. Capital
The Series offers Class A, Class B, Class C, Class R and Class Z shares. Class A shares are subject to a maximum front-end sales charge of 5.5%. Investors who purchase Class A shares in an amount of $1 million or more and sell these shares within 12 months of purchase are subject to a contingent deferred sales charge (CDSC) of 1%, including investors who purchase their shares through broker-dealers affiliated with Prudential. Class B shares are sold with a contingent deferred sales charge which declines from 5% to zero depending on the period of time the shares are held. Class C shares are sold with a contingent deferred sales charge of 1% during the first 12 months. Class B shares automatically convert to Class A shares on a quarterly basis approximately seven years after purchase. Under certain limited circumstances, an exchange may be made from specified share classes of the Series to one or more other share classes of the Series as presented in the table of transactions in shares of
| | |
| 24 | | Visit our website at www.prudentialfunds.com |
common stock. A special exchange privilege is also available for shareholders who qualified to purchase Class A shares at net asset value. Class R and Class Z shares are not subject to any sales or redemption charge and are offered exclusively for sale to a limited group of investors.
There are 1 billion shares of $.001 par value common stock of the Series, designated Class A, Class B, Class C, Class R and Class Z, each of which consists of 200 million authorized shares.
For the year ended September 30, 2010, the Series received $29,781 related to an affiliate’s settlement of regulatory proceedings involving allegations of improper trading. The per share effect of this amount is disclosed in the financial highlights. The Series was not involved in the proceedings or the calculation of the payment.
| | | | | | | | |
Class A | | Shares | | | Amount | |
Six months ended March 31, 2012: | | | | | | | | |
Shares sold | | | 549,019 | | | $ | 7,758,022 | |
Shares reacquired | | | (1,700,305 | ) | | | (23,697,607 | ) |
| | | | | | | | |
Net increase (decrease) in shares outstanding before conversion | | | (1,151,286 | ) | | | (15,939,585 | ) |
Shares issued upon conversion from Class B and Z | | | 122,429 | | | | 1,757,025 | |
Shares reacquired upon conversion into Class Z | | | (5,566 | ) | | | (75,767 | ) |
| | | | | | | | |
Net increase (decrease) in shares outstanding | | | (1,034,423 | ) | | $ | (14,258,327 | ) |
| | | | | | | | |
Year ended September 30, 2011: | | | | | | | | |
Shares sold | | | 2,184,286 | | | $ | 30,186,298 | |
Shares reacquired | | | (3,795,452 | ) | | | (52,353,288 | ) |
| | | | | | | | |
Net increase (decrease) in shares outstanding before conversion | | | (1,611,166 | ) | | | (22,166,990 | ) |
Shares issued upon conversion from Class B and Z | | | 428,364 | | | | 5,946,962 | |
Shares reacquired upon conversion into Class Z | | | (249,216 | ) | | | (3,566,018 | ) |
| | | | | | | | |
Net increase (decrease) in shares outstanding | | | (1,432,018 | ) | | $ | (19,786,046 | ) |
| | | | | | | | |
Class B | | | | | | |
Six months ended March 31, 2012: | | | | | | | | |
Shares sold | | | 31,964 | | | $ | 410,352 | |
Shares reacquired | | | (80,047 | ) | | | (1,004,177 | ) |
| | | | | | | | |
Net increase (decrease) in shares outstanding before conversion | | | (48,083 | ) | | | (593,825 | ) |
Shares reacquired upon conversion into Class A | | | (131,883 | ) | | | (1,696,567 | ) |
| | | | | | | | |
Net increase (decrease) in shares outstanding | | | (179,966 | ) | | $ | (2,290,392 | ) |
| | | | | | | | |
Year ended September 30, 2011: | | | | | | | | |
Shares sold | | | 116,768 | | | $ | 1,462,834 | |
Shares reacquired | | | (222,395 | ) | | | (2,755,419 | ) |
| | | | | | | | |
Net increase (decrease) in shares outstanding before conversion | | | (105,627 | ) | | | (1,292,585 | ) |
Shares reacquired upon conversion into Class A | | | (476,448 | ) | | | (5,938,356 | ) |
| | | | | | | | |
Net increase (decrease) in shares outstanding | | | (582,075 | ) | | $ | (7,230,941 | ) |
| | | | | | | | |
| | | | |
| Prudential Jennison Equity Opportunity Fund | | | 25 | |
Notes to Financial Statements
(Unaudited) continued
| | | | | | | | |
Class C | | Shares | | | Amount | |
Six months ended March 31, 2012: | | | | | | | | |
Shares sold | | | 98,596 | | | $ | 1,223,370 | |
Shares reacquired | | | (205,392 | ) | | | (2,610,505 | ) |
| | | | | | | | |
Net increase (decrease) in shares outstanding | | | (106,796 | ) | | $ | (1,387,135 | ) |
| | | | | | | | |
Year ended September 30, 2011: | | | | | | | | |
Shares sold | | | 280,171 | | | $ | 3,552,050 | |
Shares reacquired | | | (474,124 | ) | | | (5,961,933 | ) |
| | | | | | | | |
Net increase (decrease) in shares outstanding before conversion | | | (193,953 | ) | | | (2,409,883 | ) |
Shares reacquired upon conversion into Class Z | | | (4,187 | ) | | | (49,518 | ) |
| | | | | | | | |
Net increase (decrease) in shares outstanding | | | (198,140 | ) | | $ | (2,459,401 | ) |
| | | | | | | | |
Class R | | | | | | |
Six months ended March 31, 2012: | | | | | | | | |
Shares sold | | | 148,749 | | | $ | 1,958,821 | |
Shares reacquired | | | (30,908 | ) | | | (397,603 | ) |
| | | | | | | | |
Net increase (decrease) in shares outstanding | | | 117,841 | | | $ | 1,561,218 | |
| | | | | | | | |
Year ended September 30, 2011: | | | | | | | | |
Shares sold | | | 59,937 | | | $ | 779,795 | |
Shares reacquired | | | (31,269 | ) | | | (389,381 | ) |
| | | | | | | | |
Net increase (decrease) in shares outstanding | | | 28,668 | | | $ | 390,414 | |
| | | | | | | | |
Class Z | | | | | | |
Six months ended March 31, 2012: | | | | | | | | |
Shares sold | | | 871,949 | | | $ | 12,632,709 | |
Shares issued in reinvestment of dividends | | | 13,204 | | | | 174,824 | |
Shares reacquired | | | (830,261 | ) | | | (12,163,199 | ) |
| | | | | | | | |
Net increase (decrease) in shares outstanding before conversion | | | 54,892 | | | | 644,334 | |
Shares issued upon conversion from Class A | | | 5,428 | | | | 75,767 | |
Shares reacquired upon conversion into Class A | | | (4,437 | ) | | | (60,458 | ) |
| | | | | | | | |
Net increase (decrease) in shares outstanding | | | 55,883 | | | $ | 659,643 | |
| | | | | | | | |
Year ended September 30, 2011: | | | | | | | | |
Shares sold | | | 913,266 | | | $ | 13,253,861 | |
Shares reacquired | | | (723,544 | ) | | | (10,443,740 | ) |
| | | | | | | | |
Net increase (decrease) in shares outstanding before conversion | | | 189,722 | | | | 2,810,121 | |
Shares issued upon conversion from Class A and C | | | 246,426 | | | | 3,615,536 | |
Shares reacquired upon conversion into Class A | | | (660 | ) | | | (8,606 | ) |
| | | | | | | | |
Net increase (decrease) in shares outstanding | | | 435,488 | | | $ | 6,417,051 | |
| | | | | | | | |
| | |
| 26 | | Visit our website at www.prudentialfunds.com |
Note 7. Borrowings
The Series, along with other affiliated registered investment companies (the “Funds”), is a party to a syndicated credit agreement (“SCA”) with a group of banks. The purpose of the SCA is to provide an alternative source of temporary funding for capital share redemptions. The SCA provides for a commitment of $750 million for the period December 17, 2010 through December 16, 2011. The Funds pay an annualized commitment fee of 0.10% of the unused portion of the SCA. Prior to December 17, 2010, the Funds had another Syndicated Credit Agreement (“Expired SCA”) of a $500 million commitment with an annualized commitment fee of 0.15% of the unused portion. Interest on any borrowings under these SCA’s is paid at contracted market rates. The commitment fee for the unused amount is accrued daily and paid quarterly.
The Series utilized the line of credit during the year ended September 30, 2011. The daily balance for the 7 days that the Series had loans outstanding during the year was $505,000, borrowed at a weighted average interest rate of 1.48%. At March 31, 2012 the Series did not have an outstanding loan amount.
Note 8. New Accounting Pronouncements
In April 2011, the Financial Accounting Standards Board (“FASB”) issued Accounting Standards Update (“ASU”) No. 2011-03 “Reconsideration of Effective Control for Repurchase Agreements”. The objective of ASU No. 2011-03 is to improve the accounting for repurchase agreements and other agreements that both entitle and obligate a transferor to repurchase or redeem financial assets before their maturity. Under previous guidance, whether or not to account for a transaction as a sale was based on, in part, if the entity maintained effective control over the transferred financial assets. ASU No. 2011-03 removes the transferor’s ability criterion from the effective control assessment. This guidance is effective prospectively for interim and annual reporting periods beginning on or after December 15, 2011. At this time, management is evaluating the implications of ASU No. 2011-03 and its impact on the financial statements has not been determined.
In May 2011, the FASB issued ASU No. 2011-04 “Amendments to Achieve Common Fair Value Measurement and Disclosure Requirements in U.S. GAAP and IFRSs”. ASU No. 2011-04 includes common requirements for measurement of and disclosure about fair value between U.S. GAAP and IFRS. ASU No. 2011-04 will require reporting entities to disclose quantitative information about the unobservable inputs used in the fair value measurements categorized within Level 3 of the fair value hierarchy. In addition, ASU No. 2011-04 will require reporting entities to make
| | | | |
| Prudential Jennison Equity Opportunity Fund | | | 27 | |
Notes to Financial Statements
(Unaudited) continued
disclosures about amounts and reasons for all transfers in and out of Level 1 and Level 2 fair value measurements. The new and revised disclosures are effective for interim and annual reporting periods beginning after December 15, 2011. At this time, management is evaluating the implications of ASU No. 2011-04 and its impact on the financial statements has not been determined.
| | |
| 28 | | Visit our website at www.prudentialfunds.com |
Financial Highlights
(Unaudited)
| | | | | | | | | | | | | | | | | | | | | | | | | | |
| Class A Shares | |
| | | Six Months
Ended
March 31, | | | | | Year Ended September 30, | |
| | | 2012(a) | | | | | 2011(a) | | | 2010(a) | | | 2009(a) | | | 2008(a) | | | 2007(a) | |
| Per Share Operating Performance: | | | | | | | | | | | | | | | | | | | | | | | | | | |
| Net Asset Value, Beginning Of Period | | | $12.15 | | | | | | $12.39 | | | | $11.38 | | | | $11.35 | | | | $17.74 | | | | $17.38 | |
| Income (loss) from investment operations: | | | | | | | | | | | | | | | | | | | | | | | | | | |
| Net investment income | | | .02 | | | | | | .01 | | | | - | (b) | | | .13 | | | | .08 | | | | .06 | |
| Net realized and unrealized gain (loss) on investment and foreign currency transactions | | | 3.25 | | | | | | (.25 | ) | | | 1.01 | | | | .06 | | | | (3.74 | ) | | | 2.65 | |
| Total from investment operations | | | 3.27 | | | | | | (.24 | ) | | | 1.01 | | | | .19 | | | | (3.66 | ) | | | 2.71 | |
| Less Dividends and Distributions: | | | | | | | | | | | | | | | | | | | | | | | | | | |
| Dividends from net investment income | | | - | | | | | | - | | | | - | | | | (.09 | ) | | | (.07 | ) | | | (.02 | ) |
| Distributions from net realized gains | | | - | | | | | | - | | | | - | | | | - | | | | (2.66 | ) | | | (2.33 | ) |
| Tax return of capital contributions | | | - | | | | | | - | | | | - | | | | (.07 | ) | | | - | | | | - | |
| Total dividends and distributions | | | - | | | | | | - | | | | - | | | | (.16 | ) | | | (2.73 | ) | | | (2.35 | ) |
| Capital Contributions | | | - | | | | | | - | | | | - | (b) | | | - | | | | - | | | | - | |
| Net asset value, end of period | | | $15.42 | | | | | | $12.15 | | | | $12.39 | | | | $11.38 | | | | $11.35 | | | | $17.74 | |
| Total Return(c): | | | 26.81% | | | | | | (1.94)% | | | | 8.88% | | | | 1.93% | | | | (23.30)% | | | | 17.21% | |
| |
| Ratios/Supplemental Data: | | | | |
| Net assets, end of period (000) | | | $223,982 | | | | | | $189,105 | | | | $210,516 | | | | $208,977 | | | | $223,338 | | | | $324,835 | |
| Average net assets (000) | | | $209,552 | | | | | | $227,408 | | | | $212,873 | | | | $173,786 | | | | $271,189 | | | | $324,483 | |
| Ratios to average net assets(d): | | | | | | | | | | | | | | | | | | | | | | | | | | |
| Expenses, including distribution and service (12b-1) fees(e) | | | 1.15% | (f) | | | | | 1.15% | | | | 1.20% | | | | 1.26% | | | | 1.06% | (e) | | | 1.06% | (e) |
| Expenses, excluding distribution and service (12b-1) fees | | | .85% | (f) | | | | | .85% | | | | .90% | | | | .96% | | | | .78% | | | | .81% | |
| Net investment income (loss) | | | .34% | (f) | | | | | .11% | | | | (.03)% | | | | 1.37% | | | | .56% | | | | .33% | |
| Portfolio turnover rate | | | 21% | (g) | | | | | 66% | | | | 71% | | | | 74% | | | | 76% | | | | 77% | |
(a) Calculated based on average shares outstanding during the period.
(b) Less than $.005.
(c) Total return does not consider the effects of sales loads. Total return is calculated assuming a purchase of a share on the first day and a sale on the last day of each period reported, and includes reinvestment of dividends and distributions. Total returns may reflect adjustments to conform to generally accepted accounting principles. Total returns for periods less than one full year are not annualized.
(d) Does not include expenses of the underlying portfolio in which the Series invests.
(e) The distributor of the Series has contractually agreed to limit its distribution and service (12b-1) fees to .25% of the average daily net assets of the Class A shares through January 31, 2008.
(f) Annualized.
(g) Not annualized.
See Notes to Financial Statements.
| | | | |
| Prudential Jennison Equity Opportunity Fund | | | 29 | |
Financial Highlights
(Unaudited) continued
| | | | | | | | | | | | | | | | | | | | | | | | | | |
| Class B Shares | |
| | | Six Months
Ended
March 31, | | | | | Year Ended September 30, | |
| | | 2012(a) | | | | | 2011(a) | | | 2010(a) | | | 2009(a) | | | 2008(a) | | | 2007(a) | |
| Per Share Operating Performance: | | | | | | | | | | | | | | | | | | | | | | | | | | |
| Net Asset Value, Beginning Of Period | | | $10.88 | | | | | | $11.17 | | | | $10.33 | | | | $10.31 | | | | $16.43 | | | | $16.34 | |
| Income (loss) from investment operations: | | | | | | | | | | | | | | | | | | | | | | | | | | |
| Net investment income (loss) | | | (.01 | ) | | | | | (.07 | ) | | | (.08 | ) | | | .07 | | | | (.02 | ) | | | (.07 | ) |
| Net realized and unrealized gain (loss) on investment and foreign currency transactions | | | 2.89 | | | | | | (.22 | ) | | | .92 | | | | .05 | | | | (3.43 | ) | | | 2.49 | |
| Total from investment operations | | | 2.88 | | | | | | (.29 | ) | | | .84 | | | | .12 | | | | (3.45 | ) | | | 2.42 | |
| Less Dividends and Distributions: | | | | | | | | | | | | | | | | | | | | | | | | | | |
| Dividends from net investment income | | | - | | | | | | - | | | | - | | | | (.03 | ) | | | (.01 | ) | | | - | |
| Distributions from net realized gains | | | - | | | | | | - | | | | - | | | | - | | | | (2.66 | ) | | | (2.33 | ) |
| Tax return of capital contributions | | | - | | | | | | - | | | | - | | | | (.07 | ) | | | - | | | | - | |
| Total dividends and distributions | | | - | | | | | | - | | | | - | | | | (.10 | ) | | | (2.67 | ) | | | (2.33 | ) |
| Capital Contributions | | | - | | | | | | - | | | | - | (b) | | | - | | | | - | | | | - | |
| Net asset value, end of period | | | $13.76 | | | | | | $10.88 | | | | $11.17 | | | | $10.33 | | | | $10.31 | | | | $16.43 | |
| Total Return(c): | | | 26.47% | | | | | | (2.60)% | | | | 8.13% | | | | 1.24% | | | | (23.88)% | | | | 16.40% | |
| |
| Ratios/Supplemental Data: | | | | | | | | | | | | | | | | | | | | |
| Net assets, end of period (000) | | | $10,267 | | | | | | $10,079 | | | | $16,841 | | | | $22,077 | | | | $52,943 | | | | $124,475 | |
| Average net assets (000) | | | $10,676 | | | | | | $15,538 | | | | $19,765 | | | | $28,455 | | | | $92,183 | | | | $137,977 | |
| Ratios to average net assets(d): | | | | | | | | | | | | | | | | | | | | | | | | | | |
| Expenses, including distribution and service (12b-1) fees | | | 1.85% | (e) | | | | | 1.85% | | | | 1.90% | | | | 1.96% | | | | 1.78% | | | | 1.81% | |
| Expenses, excluding distribution and service (12b-1) fees | | | .85% | (e) | | | | | .85% | | | | .90% | | | | .96% | | | | .78% | | | | .81% | |
| Net investment income (loss) | | | (.36)% | (e) | | | | | (.60)% | | | | (.73)% | | | | .93% | | | | (.18)% | | | | (.42)% | |
| Portfolio turnover rate | | | 21% | (f) | | | | | 66% | | | | 71% | | | | 74% | | | | 76% | | | | 77% | |
(a) Calculated based on average shares outstanding during the period.
(b) Less than $.005.
(c) Total return does not consider the effects of sales loads. Total return is calculated assuming a purchase of a share on the first day and a sale on the last day of each period reported, and includes reinvestment of dividends and distributions. Total returns may reflect adjustments to conform to generally accepted accounting principles. Total returns for periods less than one full year are not annualized.
(d) Does not include expenses of the underlying portfolio in which the Series invests.
(e) Annualized.
(f) Not annualized.
See Notes to Financial Statements.
| | |
| 30 | | Visit our website at www.prudentialfunds.com |
| | | | | | | | | | | | | | | | | | | | | | | | | | |
| Class C Shares | |
| | | Six Months
Ended
March 31, | | | | | Year Ended September 30, | |
| | | 2012(a) | | | | | 2011(a) | | | 2010(a) | | | 2009(a) | | | 2008(a) | | | 2007(a) | |
| Per Share Operating Performance: | | | | | | | | | | | | | | | | | | | | | | | | | | |
| Net Asset Value, Beginning Of Period | | | $10.88 | | | | | | $11.17 | | | | $10.33 | | | | $10.31 | | | | $16.43 | | | | $16.34 | |
| Income (loss) from investment operations: | | | | | | | | | | | | | | | | | | | | | | | | | | |
| Net investment income (loss) | | | (.02 | ) | | | | | (.07 | ) | | | (.08 | ) | | | .06 | | | | (.02 | ) | | | (.07 | ) |
| Net realized and unrealized gain (loss) on investment and foreign currency transactions | | | 2.90 | | | | | | (.22 | ) | | | .92 | | | | .06 | | | | (3.43 | ) | | | 2.49 | |
| Total from investment operations | | | 2.88 | | | | | | (.29 | ) | | | .84 | | | | .12 | | | | (3.45 | ) | | | 2.42 | |
| Less Dividends and Distributions: | | | | | | | | | | | | | | | | | | | | | | | | | | |
| Dividends from net investment income | | | - | | | | | | - | | | | - | | | | (.03 | ) | | | (.01 | ) | | | - | |
| Distributions from net realized gains | | | - | | | | | | - | | | | - | | | | - | | | | (2.66 | ) | | | (2.33 | ) |
| Tax return of capital contributions | | | - | | | | | | - | | | | - | | | | (.07 | ) | | | - | | | | - | |
| Total dividends and distributions | | | - | | | | | | - | | | | - | | | | (.10 | ) | | | (2.67 | ) | | | (2.33 | ) |
| Capital Contributions | | | - | | | | | | - | | | | - | (b) | | | - | | | | - | | | | - | |
| Net asset value, end of period | | | $13.76 | | | | | | $10.88 | | | | $11.17 | | | | $10.33 | | | | $10.31 | | | | $16.43 | |
| Total Return(c): | | | 26.47% | | | | | | (2.60)% | | | | 8.13% | | | | 1.24% | | | | (23.88)% | | | | 16.40% | |
| |
| Ratios/Supplemental Data: | | | | |
| Net assets, end of period (000) | | | $29,192 | | | | | | $24,251 | | | | $27,097 | | | | $25,599 | | | | $29,011 | | | | $48,445 | |
| Average net assets (000) | | | $27,471 | | | | | | $29,339 | | | | $26,616 | | | | $21,081 | | | | $38,511 | | | | $50,851 | |
| Ratios to average net assets(d): | | | | | | | | | | | | | | | | | | | | | | | | | | |
| Expenses, including distribution and service (12b-1) fees | | | 1.85% | (e) | | | | | 1.85% | | | | 1.90% | | | | 1.96% | | | | 1.78% | | | | 1.81% | |
| Expenses, excluding distribution and service (12b-1) fees | | | .85% | (e) | | | | | .85% | | | | .90% | | | | .96% | | | | .78% | | | | .81% | |
| Net investment income (loss) | | | (.36)% | (e) | | | | | (.59)% | | | | (.73)% | | | | .69% | | | | (.17)% | | | | (.42)% | |
| Portfolio turnover rate | | | 21% | (f) | | | | | 66% | | | | 71% | | | | 74% | | | | 76% | | | | 77% | |
(a) Calculated based on average shares outstanding during the period.
(b) Less than $.005.
(c) Total return does not consider the effects of sales loads. Total return is calculated assuming a purchase of a share on the first day and a sale on the last day of each period reported, and includes reinvestment of dividends and distributions. Total returns may reflect adjustments to conform to generally accepted accounting principles. Total returns for periods less than one full year are not annualized.
(d) Does not include expenses of the underlying portfolios in which the Series invests.
(e) Annualized.
(f) Not annualized.
See Notes to Financial Statements.
| | | | |
| Prudential Jennison Equity Opportunity Fund | | | 31 | |
Financial Highlights
(Unaudited) continued
| | | | | | | | | | | | | | | | | | | | | | | | | | |
| Class R Shares | | | | |
| | | Six Months
Ended
March 31, | | | | | Year Ended September 30, | |
| | | 2012(a) | | | | | 2011(a) | | | 2010(a) | | | 2009(a) | | | 2008(a) | | | 2007(a) | |
| Per Share Operating Performance: | | | | | | | | | | | | | | | | | | | | | | | | | | |
| Net Asset Value, Beginning Of Period | | | $11.21 | | | | | | $11.45 | | | | $10.52 | | | | $10.52 | | | | $16.67 | | | | $16.48 | |
| Income (loss) from investment operations: | | | | | | | | | | | | | | | | | | | | | | | | | | |
| Net investment income (loss) | | | .02 | | | | | | (.01 | ) | | | (.02 | ) | | | .04 | | | | .06 | | | | .02 | |
| Net realized and unrealized gain (loss) on investment and foreign currency transactions | | | 2.98 | | | | | | (.23 | ) | | | .95 | | | | .10 | | | | (3.51 | ) | | | 2.50 | |
| Total from investment operations | | | 3.00 | | | | | | (.24 | ) | | | .93 | | | | .14 | | | | (3.45 | ) | | | 2.52 | |
| Less Dividends and Distributions: | | | | | | | | | | | | | | | | | | | | | | | | | | |
| Dividends from net investment income | | | - | | | | | | - | | | | - | | | | (.07 | ) | | | (.04 | ) | | | - | |
| Distributions from net realized gains | | | - | | | | | | - | | | | - | | | | - | | | | (2.66 | ) | | | (2.33 | ) |
| Tax return of capital contributions | | | - | | | | | | - | | | | - | | | | (.07 | ) | | | - | | | | - | |
| Total dividends and distributions | | | - | | | | | | - | | | | - | | | | (.14 | ) | | | (2.70 | ) | | | (2.33 | ) |
| Capital Contributions | | | - | | | | | | - | | | | - | (b) | | | - | | | | - | | | | - | |
| Net asset value, end of period | | | $14.21 | | | | | | $11.21 | | | | $11.45 | | | | $10.52 | | | | $10.52 | | | | $16.67 | |
| Total Return(c): | | | 26.76% | | | | | | (2.10)% | | | | 8.84% | | | | 1.55% | | | | (23.53)% | | | | 16.94% | |
| |
| Ratios/Supplemental Data: | | | | |
| Net assets, end of period (000) | | | $2,994 | | | | | | $1,041 | | | | $735 | | | | $5 | | | | $15 | | | | $3 | |
| Average net assets (000) | | | $1,792 | | | | | | $1,104 | | | | $202 | | | | $7 | | | | $6 | | | | $3 | |
| Ratios to average net assets(d): | | | | | | | | | | | | | | | | | | | | | | | | | | |
| Expenses, including distribution and service (12b-1) fees(e) | | | 1.35% | (f) | | | | | 1.35% | | | | 1.40% | | | | 1.46% | | | | 1.28% | | | | 1.31% | |
| Expenses, excluding distribution and service (12b-1) fees | | | .85% | (f) | | | | | .85% | | | | .90% | | | | .96% | | | | .78% | | | | .81% | |
| Net investment income (loss) | | | .13% | (f) | | | | | (.09)% | | | | (.20)% | | | | .47% | | | | .52% | | | | .10% | |
| Portfolio turnover rate | | | 21% | (g) | | | | | 66% | | | | 71% | | | | 74% | | | | 76% | | | | 77% | |
(a) Calculated based on average shares outstanding during the period.
(b) Less than $.005.
(c) Total return is calculated assuming a purchase of a share on the first day and a sale on the last day of each period reported, and includes reinvestment of dividends and distributions. Total returns may reflect adjustments to conform to generally accepted accounting principles. Total returns for periods less than one full year are not annualized.
(d) Does not include expenses of the underlying portfolios in which the Series invests.
(e) The distributor of the Series has contractually agreed to limit its distribution and service (12b-1) fees to .50% of the average daily net assets of the Class R shares.
(f) Annualized.
(g) Not annualized.
See Notes to Financial Statements.
| | |
| 32 | | Visit our website at www.prudentialfunds.com |
| | | | | | | | | | | | | | | | | | | | | | | | | | |
| Class Z Shares | | | | |
| | | Six Months
Ended
March 31, | | | | | Year Ended September 30, | |
| | | 2012(a) | | | | | 2011(a) | | | 2010(a) | | | 2009(a) | | | 2008(a) | | | 2007(a) | |
| Per Share Operating Performance: | | | | | | | | | | | | | | | | | | | | | | | | | | |
| Net Asset Value, Beginning Of Period | | | $12.49 | | | | | | $12.69 | | | | $11.63 | | | | $11.59 | | | | $18.05 | | | | $17.65 | |
| Income (loss) from investment operations: | | | | | | | | | | | | | | | | | | | | | | | | | | |
| Net investment income | | | .05 | | | | | | .06 | | | | .03 | | | | .16 | | | | .12 | | | | .10 | |
| Net realized and unrealized gain (loss) on investment and foreign currency transactions | | | 3.32 | | | | | | (.26 | ) | | | 1.03 | | | | .07 | | | | (3.81 | ) | | | 2.71 | |
| Total from investment operations | | | 3.37 | | | | | | (.20 | ) | | | 1.06 | | | | .23 | | | | (3.69 | ) | | | 2.81 | |
| Less Dividends and Distributions: | | | | | | | | | | | | | | | | | | | | | | | | | | |
| Dividends from net investment income | | | (.04 | ) | | | | | - | | | | - | | | | (.12 | ) | | | (.11 | ) | | | (.08 | ) |
| Distributions from net realized gains | | | - | | | | | | - | | | | - | | | | - | | | | (2.66 | ) | | | (2.33 | ) |
| Tax return of capital contributions | | | - | | | | | | - | | | | - | | | | (.07 | ) | | | - | | | | - | |
| Total dividends and distributions | | | (.04 | ) | | | | | - | | | | - | | | | (.19 | ) | | | (2.77 | ) | | | (2.41 | ) |
| Capital Contributions | | | - | | | | | | - | | | | - | (b) | | | - | | | | - | | | | - | |
| Net asset value, end of period | | | $15.82 | | | | | | $12.49 | | | | $12.69 | | | | $11.63 | | | | $11.59 | | | | $18.05 | |
| Total Return(c): | | | 27.06% | | | | | | (1.58)% | | | | 9.11% | | | | 2.31% | | | | (23.06)% | | | | 17.52% | |
| |
| Ratios/Supplemental Data: | | | | |
| Net assets, end of period (000) | | | $88,820 | | | | | | $69,420 | | | | $65,002 | | | | $49,670 | | | | $47,893 | | | | $74,149 | |
| Average net assets (000) | | | $80,220 | | | | | | $76,050 | | | | $57,774 | | | | $37,242 | | | | $60,764 | | | | $79,338 | |
| Ratios to average net assets(d): | | | | | | | | | | | | | | | | | | | | | | | | | | |
| Expenses, including distribution and service (12b-1) fees | | | .85% | (e) | | | | | .85% | | | | .90% | | | | .96% | | | | .78% | | | | .81% | |
| Expenses, excluding distribution and service (12b-1) fees | | | .85% | (e) | | | | | .85% | | | | .90% | | | | .96% | | | | .78% | | | | .81% | |
| Net investment income | | | .63% | (e) | | | | | .41% | | | | .28% | | | | 1.67% | | | | .84% | | | | .58% | |
| Portfolio turnover rate | | | 21% | (f) | | | | | 66% | | | | 71% | | | | 74% | | | | 76% | | | | 77% | |
(a) Calculated based on average shares outstanding during the period.
(b) Less than $.005.
(c) Total return is calculated assuming a purchase of a share on the first day and a sale on the last day of each period reported, and includes reinvestment of dividends and distributions. Total returns may reflect adjustments to conform to generally accepted accounting principles. Total returns for periods less than one full year are not annualized.
(d) Does not include expenses of the underlying portfolios in which the Series invests.
(e) Annualized.
(f) Not annualized.
See Notes to Financial Statements.
| | | | |
| Prudential Jennison Equity Opportunity Fund | | | 33 | |
| | | | |
| n MAIL | | n TELEPHONE | | n WEBSITE |
Gateway Center Three 100 Mulberry Street Newark, NJ 07102 | | (800) 225-1852 | | www.prudentialfunds.com |
|
| PROXY VOTING |
The Board of Directors of the Fund has delegated to the Fund’s investment subadviser the responsibility for voting any proxies and maintaining proxy recordkeeping with respect to the
Fund. A description of these proxy voting policies and procedures is available without charge, upon request, by calling (800) 225-1852 or by visiting the Securities and Exchange Commission’s website at www.sec.gov. Information regarding how the Fund voted proxies relating to portfolio securities during the most recent 12-month period ended June 30 is available on the Fund’s website and on the Commission’s website. |
|
| DIRECTORS |
| Kevin J. Bannon • Scott E. Benjamin • Linda W. Bynoe • Michael S. Hyland • Douglas H. McCorkindale • Stephen P. Munn • Stuart S. Parker • Richard A. Redeker • Robin B. Smith • Stephen G. Stoneburn |
|
| OFFICERS |
| Stuart S. Parker, President • Judy A. Rice, Vice President • Scott E. Benjamin, Vice President • Grace C. Torres, Treasurer and Principal Financial and Accounting Officer • Kathryn L. Quirk, Chief Legal Officer • Deborah A. Docs, Secretary • Timothy J. Knierim, Chief Compliance Officer • Valerie M. Simpson, Deputy Chief Compliance Officer • Theresa C. Thompson, Deputy Chief Compliance Officer • Richard W. Kinville, Anti-Money Laundering Compliance Officer • Jonathan D. Shain, Assistant Secretary • Claudia DiGiacomo, Assistant Secretary • John P. Schwartz, Assistant Secretary • Andrew R. French, Assistant Secretary • M. Sadiq Peshimam, Assistant Treasurer • Peter Parrella, Assistant Treasurer |
| | | | |
| MANAGER | | Prudential Investments LLC | | Gateway Center Three
100 Mulberry Street Newark, NJ 07102 |
|
| INVESTMENT SUBADVISER | | Jennison Associates LLC | | 466 Lexington Avenue
New York, NY 10017 |
|
| DISTRIBUTOR | | Prudential Investment
Management Services LLC | | Gateway Center Three
100 Mulberry Street Newark, NJ 07102 |
|
| CUSTODIAN | | The Bank of New York Mellon | | One Wall Street
New York, NY 10286 |
|
| TRANSFER AGENT | | Prudential Mutual Fund
Services LLC | | PO Box 9658
Providence, RI 02940 |
|
INDEPENDENT REGISTERED
PUBLIC ACCOUNTING FIRM | | KPMG LLP | | 345 Park Avenue
New York, NY 10154 |
|
| FUND COUNSEL | | Willkie Farr & Gallagher LLP | | 787 Seventh Avenue
New York, NY 10019 |
|
| An investor should consider the investment objectives, risks, charges, and expenses of the Fund carefully before investing. The prospectus and summary prospectus contain this and other information about the Fund. An investor may obtain a prospectus and summary prospectus by visiting our website at www.prudentialfunds.com or by calling (800) 225-1852. The prospectus and summary prospectus should be read carefully before investing. |
|
| E-DELIVERY |
| To receive your mutual fund documents online, go to www.prudentialfunds.com/edelivery and enroll. Instead of receiving printed documents by mail, you will receive notification via email when new materials are available. You can cancel your enrollment or change your email address at any time by visiting the website address above. |
|
| SHAREHOLDER COMMUNICATIONS WITH DIRECTORS |
| Shareholders can communicate directly with the Board of Directors by writing to the Chair of the Board, Prudential Jennison Equity Opportunity Fund, Prudential Investments, Attn: Board of Directors, 100 Mulberry Street, Gateway Center Three, Newark, NJ 07102. Shareholders can communicate directly with an individual Director by writing to the same address. Communications are not screened before being delivered to the addressee. |
|
| AVAILABILITY OF PORTFOLIO SCHEDULE |
| The Fund files its complete schedule of portfolio holdings with the Securities and Exchange Commission for the first and third quarters of each fiscal year on Form N-Q under the Prudential Investment Portfolios, Inc. name. The Fund’s Forms N-Q are available on the Commission’s website at www.sec.gov. The Fund’s Forms N-Q may also be reviewed and copied at the Commission’s Public Reference Room in Washington, D.C. Information on the operation and location of the Public Reference Room may be obtained by calling (202) 551-8090. The Fund’s schedule of portfolio holdings is also available on the Fund’s website as of the end of each month. |
Mutual Funds:
| | | | |
| ARE NOT INSURED BY THE FDIC OR ANY FEDERAL GOVERNMENT AGENCY | | MAY LOSE VALUE | | ARE NOT A DEPOSIT OF OR GUARANTEED BY ANY BANK OR ANY BANK AFFILIATE |

PRUDENTIAL JENNISON EQUITY OPPORTUNITY FUND
| | | | | | | | | | |
| SHARE CLASS | | A | | B | | C | | R | | Z |
| NASDAQ | | PJIAX | | PJIBX | | PJGCX | | PJORX | | PJGZX |
| CUSIP | | 74437E503 | | 74437E602 | | 74437E701 | | 74437E644 | | 74437E800 |
MF172E2 0224674-00001-00

PRUDENTIAL INVESTMENTS»MUTUAL FUNDS
PRUDENTIAL JENNISON GROWTH FUND
SEMIANNUAL REPORT · MARCH 31, 2012
Fund Type
Large Cap Stock
Objective
Long-term growth of capital
This report is not authorized for distribution to prospective investors unless preceded or accompanied by a current prospectus.
The views expressed in this report and information about the Fund’s portfolio holdings are for the period covered by this report and are subject to change thereafter.
The accompanying financial statements as of March 31, 2012, were not audited and, accordingly, no auditor’s opinion is expressed on them.
Prudential Investments, Prudential, Jennison, the Prudential logo, the Rock symbol, and Bring Your Challenges are service marks of Prudential Financial, Inc. and its related entities, registered in many jurisdictions worldwide.

May 15, 2012
Dear Shareholder:
After an extraordinary career at Prudential, Judy Rice retired at the end of 2011 as President of Prudential Investments and President and Director of the Prudential Jennison Growth Fund (the Fund). While she will remain as Chairman of Prudential Investments until the end of 2012, I was named to succeed her as President of Prudential Investments and President and Director of the Fund effective January 1, 2012. I previously served as Executive Vice President of Retail Mutual Fund Distribution for Prudential Investments for the past six years.
Since this is my first letter to shareholders, I would like to recognize Judy for the significant contributions she made in building the Prudential Investments fund family and her unflagging commitment to helping investors like you meet the challenges of a rapidly changing investment environment. My goal is to build on Judy’s accomplishments, with a particular focus on delivering the solutions you need to address your financial goals.
I hope you find the semiannual report for the Fund informative. We recognize that ongoing market volatility may make it a difficult time to be an investor. We continue to believe a prudent response to uncertainty is to maintain a diversified portfolio, including stock and bond mutual funds consistent with your tolerance for risk, time horizon, and financial goals.
Your financial professional can help you create a diversified investment plan that reflects your personal investor profile and risk tolerance. Keep in mind that diversification and asset allocation strategies do not assure a profit or protect against loss in declining markets. We encourage you to call your financial professional before making any investment decision.
Prudential Investments provides a wide range of mutual funds to choose from that can help you make progress toward your financial goals. Our funds offer the experience, resources, and professional discipline of Prudential Financial’s affiliated asset managers. Thank you for choosing the Prudential Investments family of mutual funds.
Sincerely,

Stuart S. Parker, President
Prudential Jennison Growth Fund
| | | | |
| Prudential Jennison Growth Fund | | | 1 | |
Your Fund’s Performance (Unaudited)
Performance data quoted represent past performance. Past performance does not guarantee future results. The investment return and principal value of an investment will fluctuate, so that an investor’s shares, when redeemed, may be worth more or less than their original cost. Current performance may be lower or higher than the past performance data quoted. An investor may obtain performance data as of the most recent month-end by visiting our website at www.prudentialfunds.com or by calling (800) 225-1852. The maximum initial sales charge is 5.50% (Class A shares). Gross operating expenses: Class A, 1.07%; Class B, 1.77%; Class C, 1.77%; Class R, 1.52%; Class Z, 0.77%. Net operating expenses: Class A, 1.07%; Class B, 1.77%; Class C, 1.77%; Class R, 1.27%; Class Z, 0.77%, after contractual reduction through 1/31/2013 for Class R shares.
| | | | | | | | | | | | | | | | | | |
Cumulative Total Returns (Without Sales Charges) as of 3/31/12 |
| | | Six Months | | | One Year | | | Five Years | | | Ten Years | | | Since Inception |
Class A | | | 27.61 | % | | | 14.21 | % | | | 29.69 | % | | | 51.78 | % | | — |
Class B | | | 27.18 | | | | 13.41 | | | | 25.17 | | | | 41.10 | | | — |
Class C | | | 27.13 | | | | 13.38 | | | | 25.36 | | | | 41.33 | | | — |
Class R | | | 27.55 | | | | 14.05 | | | | 28.41 | | | | N/A | | | 52.07% (12/17/04) |
Class Z | | | 27.86 | | | | 14.61 | | | | 31.55 | | | | 56.03 | | | — |
Russell 1000 Growth Index | | | 26.85 | | | | 11.02 | | | | 28.24 | | | | 52.12 | | | — |
S&P 500 Index | | | 25.86 | | | | 8.51 | | | | 10.48 | | | | 49.69 | | | — |
Lipper Large-Cap Growth Funds Average | | | 26.88 | | | | 8.38 | | | | 21.41 | | | | 45.11 | | | — |
| | | | | | | | | | | | | | | | | | |
Average Annual Total Returns (With Sales Charges) as of 3/31/12 |
| | | | | | One Year | | | Five Years | | | Ten Years | | | Since Inception |
Class A | | | | | | | 7.93 | % | | | 4.15 | % | | | 3.67 | % | | — |
Class B | | | | | | | 8.41 | | | | 4.42 | | | | 3.50 | | | — |
Class C | | | | | | | 12.38 | | | | 4.62 | | | | 3.52 | | | — |
Class R | | | | | | | 14.05 | | | | 5.13 | | | | N/A | | | 5.92% (12/17/04) |
Class Z | | | | | | | 14.61 | | | | 5.64 | | | | 4.55 | | | — |
Russell 1000 Growth Index | | | | | | | 11.02 | | | | 5.10 | | | | 4.28 | | | — |
S&P 500 Index | | | | | | | 8.51 | | | | 2.01 | | | | 4.12 | | | — |
Lipper Large-Cap Growth Funds Average | | | | | | | 8.38 | | | | 3.87 | | | | 3.71 | | | — |
Source: Prudential Investments LLC and Lipper Inc. Performance figures may reflect fee waivers and/or expense reimbursements. In the absence of such fee waivers and/or expense reimbursements, total returns would be lower.
Inception returns are provided for any share class with less than 10 calendar years of returns.
| | |
| 2 | | Visit our website at www.prudentialfunds.com |
The average annual total returns take into account applicable sales charges. Class A shares are subject to a maximum front-end sales charge of 5.50% and a 12b-1 fee of 0.30% annually. All investors who purchase Class A shares in an amount of $1 million or more and sell these shares within 12 months of purchase are subject to a contingent deferred sales charge (CDSC) of 1%. The Class A shares CDSC is waived for purchases by certain retirement or benefit plans. Under certain circumstances, an exchange may be made from specified share classes of the Fund to one or more other share classes of the Fund. Class B shares do not pay a front-end sales charge but are subject to a declining CDSC of 5%, 4%, 3%, 2%, 1%, and 1%, respectively, for the first six years after purchase and a 12b-1 fee of 1% annually. Approximately seven years after purchase, Class B shares will automatically convert to Class A shares on a quarterly basis. Class C shares are subject to a CDSC of 1% on sales made within 12 months of purchase and an annual 12b-1 fee of 1%. Class R shares are not subject to sales charges, but charge a 12b-1 fee of 0.75%. Class Z shares are not subject to sales charges or 12b-1 fees. The returns in the tables reflect the share class expense structure in effect at the close of the fiscal period. The returns in the tables do not reflect the deduction of taxes that a shareholder would pay on Fund distributions or following the redemption of Fund shares.
Benchmark Definitions
Russell 1000 Growth Index
The Russell 1000 Growth Index is an unmanaged index comprising those securities in the Russell 1000 Index with a greater-than-average growth orientation. Companies in this index tend to exhibit relatively high price-to-book ratios, price-to-earnings ratios, forecasted growth rates, and relatively low dividend yields. Russell 1000 Growth Index Closest Month-End to Inception cumulative total return is 48.99% for Class R. Russell 1000 Growth Index Closest Month-End to Inception average annual total return is 5.65% for Class R.
S&P 500 Index
The S&P 500 Index is an unmanaged index of 500 stocks of large U.S. public companies. It gives a broad look at how U.S. stock prices have performed. S&P 500 Index Closest Month-End to Inception cumulative total return is 35.05% for Class R. S&P 500 Index Closest Month-End to Inception average annual total return is 4.23% for Class R.
Lipper Large-Cap Growth Funds Average
The Lipper Large-Cap Growth Funds Average (Lipper Average) represents returns based on the average return of all funds in the Lipper Large-Cap Growth Funds category for the periods noted. Funds in the Lipper Average invest at least 75% of their equity assets in companies with market capitalizations (on a three-year weighted basis) greater than 300% of the dollar-weighted median market capitalization of the middle 1,000 securities of the S&P SuperComposite 1500 Index. Large-cap growth funds typically have an above-average price-to-earnings ratio, price-to-book ratio, and three-year sales-per-share growth value compared with the S&P 500 Index. Lipper Average Closest Month-End to Inception cumulative total return is 39.04% for Class R. Lipper Average Closest Month-End to Inception average annual total return is 4.58% for Class R.
Investors cannot invest directly in an index or average. The returns for the Indexes would be lower if they included the effects of sales charges, operating expenses of a mutual fund, or taxes. Returns for the Lipper Average reflect the deduction of operating expenses, but not sales charges or taxes.
| | | | |
| Prudential Jennison Growth Fund | | | 3 | |
Your Fund’s Performance (continued)
| | | | |
Five Largest Holdings expressed as a percentage of net assets as of 3/31/12
(excluding short-term investments) | | | | |
Apple, Inc., Computers & Peripherals | | | 6.6 | % |
MasterCard, Inc. (Class A Stock), IT Services | | | 2.7 | |
EMC Corp., Computers & Peripherals | | | 2.5 | |
Goldman Sachs Group, Inc. (The), Capital Markets | | | 2.4 | |
Amazon.com, Inc., Internet & Catalog Retail | | | 2.3 | |
Holdings are subject to change.
| | | | |
Five Largest Industries expressed as a percentage of net assets as of 3/31/12
(excluding short-term investments) | | | | |
Computers & Peripherals | | | 10.4 | % |
Textiles, Apparel & Luxury Goods | | | 7.6 | |
IT Services | | | 6.8 | |
Hotels, Restaurants & Leisure | | | 6.5 | |
Internet Software & Services | | | 6.2 | |
Industry weightings are subject to change.
| | |
| 4 | | Visit our website at www.prudentialfunds.com |
Fees and Expenses (Unaudited)
As a shareholder of the Fund, you incur two types of costs: (1) transaction costs, including sales charges (loads) on purchase payments and redemptions, as applicable, and (2) ongoing costs, including management fees, distribution and/or service (12b-1) fees, and other Fund expenses, as applicable. This example is intended to help you understand your ongoing costs (in dollars) of investing in the Fund and to compare these costs with the ongoing costs of investing in other mutual funds.
The example is based on an investment of $1,000 invested on October 1, 2011, at the beginning of the period, and held through the six-month period ended March 31, 2012. The example is for illustrative purposes only; you should consult the Prospectus for information on initial and subsequent minimum investment requirements.
The Fund’s transfer agent may charge additional fees to holders of certain accounts that are not included in the expenses shown in the table on the following page. These fees apply to individual retirement accounts (IRAs) and Section 403(b) accounts. As of the close of the six-month period covered by the table, IRA fees included an annual maintenance fee of $15 per account (subject to a maximum annual maintenance fee of $25 for all accounts held by the same shareholder). Section 403(b) accounts are charged an annual $25 fiduciary maintenance fee. Some of the fees may vary in amount, or may be waived, based on your total account balance or the number of Prudential Investments funds, including the Fund, that you own. You should consider the additional fees that were charged to your Fund account over the six-month period when you estimate the total ongoing expenses paid over the period and the impact of these fees on your ending account value, as these additional expenses are not reflected in the information provided in the expense table. Additional fees have the effect of reducing investment returns.
Actual Expenses
The first line for each share class in the table on the following page provides information about actual account values and actual expenses. You may use the information on this line, together with the amount you invested, to estimate the expenses that you paid over the period. Simply divide your account value by $1,000 (for example, an $8,600 account value ÷ $1,000 = 8.6), then multiply the result by the number on the first line under the heading “Expenses Paid During the Six-Month Period” to estimate the expenses you paid on your account during this period.
Hypothetical Example for Comparison Purposes
The second line for each share class in the table on the following page provides information about hypothetical account values and hypothetical expenses based on the Fund’s actual expense ratio and an assumed rate of return of 5% per year before
| | | | |
| Prudential Jennison Growth Fund | | | 5 | |
Fees and Expenses (continued)
expenses, which is not the Fund’s actual return. The hypothetical account values and expenses may not be used to estimate the actual ending account balance or expenses you paid for the period. You may use this information to compare the ongoing costs of investing in the Fund and other funds. To do so, compare this 5% hypothetical example with the 5% hypothetical examples that appear in the shareholder reports of the other funds.
Please note that the expenses shown in the table are meant to highlight your ongoing costs only and do not reflect any transactional costs such as sales charges (loads). Therefore, the second line for each share class in the table is useful in comparing ongoing costs only and will not help you determine the relative total costs of owning different funds. In addition, if these transactional costs were included, your costs would have been higher.
| | | | | | | | | | | | | | | | | | |
Prudential Jennison
Growth Fund | | Beginning Account
Value
October 1, 2011 | | | Ending Account
Value
March 31, 2012 | | | Annualized
Expense Ratio
Based on the
Six-Month Period | | | Expenses Paid
During the
Six-Month Period* | |
| | | | | | | | | | | | | | | | | | |
| Class A | | Actual | | $ | 1,000.00 | | | $ | 1,276.10 | | | | 1.07 | % | | $ | 6.09 | |
| | | Hypothetical | | $ | 1,000.00 | | | $ | 1,019.65 | | | | 1.07 | % | | $ | 5.40 | |
| | | | | | | | | | | | | | | | | | |
| Class B | | Actual | | $ | 1,000.00 | | | $ | 1,271.80 | | | | 1.77 | % | | $ | 10.05 | |
| | | Hypothetical | | $ | 1,000.00 | | | $ | 1,016.15 | | | | 1.77 | % | | $ | 8.92 | |
| | | | | | | | | | | | | | | | | | |
| Class C | | Actual | | $ | 1,000.00 | | | $ | 1,271.30 | | | | 1.77 | % | | $ | 10.05 | |
| | | Hypothetical | | $ | 1,000.00 | | | $ | 1,016.15 | | | | 1.77 | % | | $ | 8.92 | |
| | | | | | | | | | | | | | | | | | |
| Class R | | Actual | | $ | 1,000.00 | | | $ | 1,275.50 | | | | 1.27 | % | | $ | 7.22 | |
| | | Hypothetical | | $ | 1,000.00 | | | $ | 1,018.65 | | | | 1.27 | % | | $ | 6.41 | |
| | | | | | | | | | | | | | | | | | |
| Class Z | | Actual | | $ | 1,000.00 | | | $ | 1,278.60 | | | | 0.77 | % | | $ | 4.39 | |
| | | Hypothetical | | $ | 1,000.00 | | | $ | 1,021.15 | | | | 0.77 | % | | $ | 3.89 | |
* Fund expenses (net of fee waivers or subsidies, if any) for each share class are equal to the annualized expense ratio for each share class (provided in the table), multiplied by the average account value over the period, multiplied by the 183 days in the six-month period ended March 31, 2012, and divided by the 366 days in the Fund’s fiscal year ending September 30, 2012 (to reflect the six-month period). Expenses presented in the table include the expenses of any underlying portfolios in which the Fund may invest.
| | |
| 6 | | Visit our website at www.prudentialfunds.com |
Portfolio of Investments
as of March 31, 2012 (Unaudited)
| | | | | | |
| Shares | | Description | | Value (Note 1) | |
| | | | | | |
LONG-TERM INVESTMENTS 98.2% | |
COMMON STOCKS | |
| |
Aerospace & Defense 4.9% | | | | |
| 441,425 | | Boeing Co. (The) | | $ | 32,828,777 | |
| 299,606 | | Precision Castparts Corp. | | | 51,801,878 | |
| 409,680 | | United Technologies Corp. | | | 33,978,859 | |
| | | | | | |
| | | | | 118,609,514 | |
| |
Auto Components 0.9% | | | | |
| 255,470 | | BorgWarner, Inc.*(a) | | | 21,546,340 | |
| |
Automobiles 1.8% | | | | |
| 173,911 | | Bayerische Motoren Werke AG (Germany) | | | 15,640,137 | |
| 581,333 | | Harley-Davidson, Inc. | | | 28,531,824 | |
| | | | | | |
| | | | | 44,171,961 | |
| |
Biotechnology 3.2% | | | | |
| 300,731 | | Alexion Pharmaceuticals, Inc.* | | | 27,925,880 | |
| 425,415 | | Celgene Corp.* | | | 32,978,171 | |
| 414,793 | | Vertex Pharmaceuticals, Inc.*(a) | | | 17,010,661 | |
| | | | | | |
| | | | | 77,914,712 | |
| |
Capital Markets 2.4% | | | | |
| 459,287 | | Goldman Sachs Group, Inc. (The) | | | 57,121,524 | |
| |
Chemicals 1.5% | | | | |
| 441,484 | | Monsanto Co. | | | 35,212,764 | |
| |
Communications Equipment 2.2% | | | | |
| 705,947 | | Juniper Networks, Inc.* | | | 16,152,067 | |
| 528,451 | | QUALCOMM, Inc. | | | 35,945,237 | |
| | | | | | |
| | | | | 52,097,304 | |
| |
Computers & Peripherals 10.4% | | | | |
| 263,696 | | Apple, Inc.* | | | 158,077,841 | |
| 2,007,021 | | EMC Corp.* | | | 59,969,788 | |
| 734,972 | | NetApp, Inc.* | | | 32,904,696 | |
| | | | | | |
| | | | | 250,952,325 | |
| |
Consumer Finance 1.4% | | | | |
| 585,873 | | American Express Co. | | | 33,898,612 | |
See Notes to Financial Statements.
| | | | |
| Prudential Jennison Growth Fund | | | 7 | |
Portfolio of Investments
as of March 31, 2012 (Unaudited) continued
| | | | | | |
| Shares | | Description | | Value (Note 1) | |
| | | | | | |
COMMON STOCKS (Continued) | |
| |
Electrical Equipment 0.5% | | | | |
| 119,477 | | Roper Industries, Inc. | | $ | 11,847,339 | |
|
Energy Equipment & Services 2.0% | |
| 337,873 | | National Oilwell Varco, Inc. | | | 26,850,767 | |
| 308,391 | | Schlumberger Ltd. | | | 21,565,783 | |
| | | | | | |
| | | | | 48,416,550 | |
|
Food & Staples Retailing 3.1% | |
| 423,546 | | Costco Wholesale Corp. | | | 38,457,977 | |
| 428,141 | | Whole Foods Market, Inc. | | | 35,621,331 | |
| | | | | | |
| | | | | 74,079,308 | |
|
Food Products 1.1% | |
| 323,327 | | Mead Johnson Nutrition Co. | | | 26,668,011 | |
|
Healthcare Providers & Services 2.5% | |
| 439,034 | | Express Scripts, Inc.*(a) | | | 23,786,862 | |
| 627,385 | | UnitedHealth Group, Inc. | | | 36,978,072 | |
| | | | | | |
| | | | | 60,764,934 | |
|
Hotels, Restaurants & Leisure 6.5% | |
| 79,656 | | Chipotle Mexican Grill, Inc.*(a) | | | 33,296,208 | |
| 543,608 | | Dunkin’ Brands Group, Inc.(a) | | | 16,368,037 | |
| 408,633 | | McDonald’s Corp. | | | 40,086,897 | |
| 73,206 | | Panera Bread Co. (Class A Stock)* | | | 11,780,310 | |
| 982,579 | | Starbucks Corp. | | | 54,916,341 | |
| | | | | | |
| | | | | 156,447,793 | |
|
Internet & Catalog Retail 3.8% | |
| 276,795 | | Amazon.com, Inc.* | | | 56,053,755 | |
| 49,811 | | Priceline.com, Inc.*(a) | | | 35,739,393 | |
| | | | | | |
| | | | | 91,793,148 | |
|
Internet Software & Services 6.2% | |
| 302,827 | | Baidu, Inc. (China), ADR* | | | 44,143,092 | |
| 79,481 | | Google, Inc. (Class A Stock)* | | | 50,966,397 | |
| 285,084 | | LinkedIn Corp. (Class A Stock)*(a) | | | 29,075,717 | |
| 839,566 | | Tencent Holdings Ltd. (China) | | | 23,417,529 | |
| 94,163 | | Youku, Inc. (China), ADR*(a) | | | 2,070,644 | |
| | | | | | |
| | | | | 149,673,379 | |
See Notes to Financial Statements.
| | |
| 8 | | Visit our website at www.prudentialfunds.com |
| | | | | | |
| Shares | | Description | | Value (Note 1) | |
| | | | | | |
COMMON STOCKS (Continued) | |
|
IT Services 6.8% | |
| 187,714 | | Cognizant Technology Solutions Corp. (Class A Stock)* | | $ | 14,444,592 | |
| 224,454 | | International Business Machines Corp. | | | 46,832,327 | |
| 156,437 | | MasterCard, Inc. (Class A Stock) | | | 65,788,016 | |
| 298,258 | | Visa, Inc. (Class A Stock) | | | 35,194,444 | |
| | | | | | |
| | | | | 162,259,379 | |
|
Life Sciences Tools & Services 2.4% | |
| 877,193 | | Agilent Technologies, Inc. | | | 39,043,860 | |
| 340,813 | | Illumina, Inc.* | | | 17,930,172 | |
| | | | | | |
| | | | | 56,974,032 | |
|
Media 1.1% | |
| 606,148 | | Walt Disney Co. (The)(a) | | | 26,537,159 | |
|
Oil, Gas & Consumable Fuels 3.8% | |
| 329,481 | | Anadarko Petroleum Corp. | | | 25,811,541 | |
| 191,321 | | Concho Resources, Inc.* | | | 19,530,048 | |
| 206,337 | | EOG Resources, Inc. | | | 22,924,041 | |
| 236,548 | | Occidental Petroleum Corp. | | | 22,526,466 | |
| | | | | | |
| | | | | 90,792,096 | |
|
Personal Products 1.6% | |
| 604,345 | | Estee Lauder Cos., Inc. (The)(Class A Stock) | | | 37,433,129 | |
|
Pharmaceuticals 5.8% | |
| 407,755 | | Allergan, Inc. | | | 38,912,060 | |
| 696,643 | | Bristol-Myers Squibb Co. | | | 23,511,701 | |
| 300,063 | | Novo Nordisk A/S (Denmark), ADR | | | 41,621,739 | |
| 383,475 | | Shire PLC (Ireland), ADR | | | 36,334,256 | |
| | | | | | |
| | | | | 140,379,756 | |
|
Real Estate Investment Trusts 1.4% | |
| 523,630 | | American Tower Corp. (Class A Stock) | | | 32,999,163 | |
|
Road & Rail 1.3% | |
| 300,158 | | Union Pacific Corp. | | | 32,260,982 | |
|
Semiconductors & Semiconductor Equipment 2.1% | |
| 502,621 | | Altera Corp. | | | 20,014,368 | |
| 417,658 | | ARM Holdings PLC (United Kingdom), ADR(a) | | | 11,815,545 | |
See Notes to Financial Statements.
| | | | |
| Prudential Jennison Growth Fund | | | 9 | |
Portfolio of Investments
as of March 31, 2012 (Unaudited) continued
| | | | | | |
| Shares | | Description | | Value (Note 1) | |
| | | | | | |
COMMON STOCKS (Continued) | |
|
Semiconductors & Semiconductor Equipment (cont’d.) | |
| 493,743 | | Avago Technologies Ltd. | | $ | 19,241,165 | |
| | | | | | |
| | | | | 51,071,078 | |
|
Software 6.0% | |
| 832,136 | | Oracle Corp. | | | 24,265,086 | |
| 593,369 | | Red Hat, Inc.* | | | 35,536,870 | |
| 278,830 | | Salesforce.com, Inc.*(a) | | | 43,082,023 | |
| 375,255 | | VMware, Inc. (Class A Stock)* | | | 42,167,404 | |
| | | | | | |
| | | | | 145,051,383 | |
|
Specialty Retail 3.3% | |
| 377,266 | | Inditex SA (Spain) | | | 36,137,110 | |
| 992,691 | | Lowe’s Cos., Inc. | | | 31,150,644 | |
| 170,744 | | Tiffany & Co. | | | 11,803,533 | |
| | | | | | |
| | | | | 79,091,287 | |
|
Textiles, Apparel & Luxury Goods 7.6% | |
| 1,017,254 | | Burberry Group PLC (United Kingdom) | | | 24,357,474 | |
| 334,129 | | Coach, Inc. | | | 25,821,489 | |
| 149,831 | | Fossil, Inc.* | | | 19,774,695 | |
| 377,391 | | Lululemon Athletica, Inc.*(a) | | | 28,183,560 | |
| 422,661 | | NIKE, Inc. (Class B Stock) | | | 45,833,359 | |
| 217,809 | | Ralph Lauren Corp. | | | 37,970,643 | |
| | | | | | |
| | | | | 181,941,220 | |
|
Wireless Telecommunication Services 0.6% | |
| 261,116 | | Crown Castle International Corp.*(a) | | | 13,927,927 | |
| | | | | | |
| | Total long-term investments
(cost $1,519,705,446) | | | 2,361,934,109 | |
| | | | | | |
SHORT-TERM INVESTMENT 11.2% | |
|
Affiliated Money Market Mutual Fund | |
| 268,419,076 | | Prudential Investment Portfolios 2 - Prudential Core Taxable Money Market Fund
(cost $268,419,076; includes $219,032,339 of cash collateral received for securities on loan) (Note 3)(b)(c) | | | 268,419,076 | |
| | | | | | |
| | Total Investments 109.4%
(cost $1,788,124,522; Note 5) | | | 2,630,353,185 | |
| | Liabilities in excess of other assets (9.4%) | | | (225,343,888 | ) |
| | | | | | |
| | Net Assets 100.0% | | $ | 2,405,009,297 | |
| | | | | | |
See Notes to Financial Statements.
| | |
| 10 | | Visit our website at www.prudentialfunds.com |
The following abbreviation is used in the portfolio descriptions:
ADR—American Depositary Receipt
| * | Non-income producing security. |
| (a) | All or a portion of security is on loan. The aggregate market value of such securities, including those sold and pending settlement, is $214,725,006; cash collateral of $219,032,339 (included in liabilities) was received with which the Series purchased highly liquid short-term investments. |
| (b) | Prudential Investments LLC, the manager of the Series, also serves as manager of the Prudential Investment Portfolios 2 - Prudential Core Taxable Money Market Fund. |
| (c) | Represents security, or a portion thereof, purchased with cash collateral received for securities on loan. |
Various inputs are used in determining the value of the Series’ investments. These inputs are summarized in the three broad levels listed below.
Level 1—quoted prices generally for securities actively traded on regulated securities exhange and for open-end mutual funds which trade at daily net asset value.
Level 2—other significant observable inputs (including, but not limited to, quoted prices for similar securities, interest rates, prepayment speeds, foreign currency exchange rates and amortized cost) generally for debt securities, swaps, forward foreign currency contracts and for foreign stocks priced using vendor modeling tools.
Level 3—significant unobservable inputs for securities valued in accordance with Board approved fair valuation procedures.
The following is a summary of the inputs used as of March 31, 2012 in valuing such portfolio securities:
| | | | | | | | | | | | |
| | | Level 1 | | | Level 2 | | | Level 3 | |
Investments in Securities | | | | | | | | | | | | |
Common Stocks | | $ | 2,361,934,109 | | | $ | — | | | $ | — | |
Affiliated Money Market Mutual Fund | | | 268,419,076 | | | | — | | | | — | |
| | | | | | | | | | | | |
Total | | $ | 2,630,353,185 | | | $ | — | | | $ | — | |
| | | | | | | | | | | | |
See Notes to Financial Statements.
| | | | |
| Prudential Jennison Growth Fund | | | 11 | |
Portfolio of Investments
as of March 31, 2012 (Unaudited) continued
The industry classification of portfolio holdings and liabilities in excess of other assets shown as a percentage of net assets as of March 31, 2012 were as follows:
| | | | |
Affiliated Money Market Mutual Fund (including 9.1% of collateral received for securities on loan) | | | 11.2 | % |
Computers & Peripherals | | | 10.4 | |
Textiles, Apparel & Luxury Goods | | | 7.6 | |
IT Services | | | 6.8 | |
Hotels, Restaurants & Leisure | | | 6.5 | |
Internet Software & Services | | | 6.2 | |
Software | | | 6.0 | |
Pharmaceuticals | | | 5.8 | |
Aerospace & Defense | | | 4.9 | |
Internet & Catalog Retail | | | 3.8 | |
Oil, Gas & Consumable Fuels | | | 3.8 | |
Specialty Retail | | | 3.3 | |
Biotechnology | | | 3.2 | |
Food & Staples Retailing | | | 3.1 | |
Healthcare Providers & Services | | | 2.5 | |
Capital Markets | | | 2.4 | |
Life Sciences Tools & Services | | | 2.4 | |
Communications Equipment | | | 2.2 | |
Semiconductors & Semiconductor Equipment | | | 2.1 | |
Energy Equipment & Services | | | 2.0 | |
Automobiles | | | 1.8 | |
Personal Products | | | 1.6 | |
Chemicals | | | 1.5 | |
Consumer Finance | | | 1.4 | |
Real Estate Investment Trusts | | | 1.4 | |
Road & Rail | | | 1.3 | |
Food Products | | | 1.1 | |
Media | | | 1.1 | |
Auto Components | | | 0.9 | |
Wireless Telecommunication Services | | | 0.6 | |
Electrical Equipment | | | 0.5 | |
| | | | |
| | | 109.4 | |
Liabilities in excess of other assets | | | (9.4 | ) |
| | | | |
| | | 100.0 | % |
| | | | |
See Notes to Financial Statements.
| | |
| 12 | | Visit our website at www.prudentialfunds.com |
Financial Statements
(Unaudited)
| | |
| MARCH 31, 2012 | | SEMIANNUAL REPORT |
Prudential Jennison Growth Fund
Statement of Assets and Liabilities
as of March 31, 2012 (Unaudited)
| | | | |
Assets | | | | |
Investments at value, including securities on loan of $214,725,006: | | | | |
Unaffiliated Investments (cost $1,519,705,446) | | $ | 2,361,934,109 | |
Affiliated Investments (cost $268,419,076) | | | 268,419,076 | |
Cash | | | 4,551 | |
Receivable for Series shares sold | | | 3,144,750 | |
Receivable for investments sold | | | 2,401,458 | |
Dividends receivable | | | 1,657,565 | |
Foreign tax reclaim receivable | | | 144,687 | |
Prepaid expenses | | | 13,843 | |
| | | | |
Total assets | | | 2,637,720,039 | |
| | | | |
| |
Liabilities | | | | |
Payable to broker for collateral for securities on loan | | | 219,032,339 | |
Payable for investments purchased | | | 8,111,939 | |
Payable for Series shares reacquired | | | 2,860,437 | |
Management fee payable | | | 1,139,869 | |
Accrued expenses | | | 893,302 | |
Distribution fee payable | | | 339,201 | |
Affiliated transfer agent fee payable | | | 333,655 | |
| | | | |
Total liabilities | | | 232,710,742 | |
| | | | |
| |
Net Assets | | $ | 2,405,009,297 | |
| | | | |
| | | | | |
Net assets were comprised of: | | | | |
Common stock, at par | | $ | 109,972 | |
Paid-in capital in excess of par | | | 1,770,713,560 | |
| | | | |
| | | 1,770,823,532 | |
Accumulated net investment loss | | | (720,032 | ) |
Accumulated net realized loss on investment and foreign currency transactions | | | (207,316,858 | ) |
Net unrealized appreciation on investments and foreign currencies | | | 842,222,655 | |
| | | | |
Net assets, March 31, 2012 | | $ | 2,405,009,297 | |
| | | | |
See Notes to Financial Statements.
| | |
| 14 | | Visit our website at www.prudentialfunds.com |
| | | | |
Class A | | | | |
Net asset value and redemption price per share
($998,358,587 ÷ 46,355,105 shares of common stock issued and outstanding) | | $ | 21.54 | |
Maximum sales charge (5.50% of offering price) | | | 1.25 | |
| | | | |
Maximum offering price to public | | $ | 22.79 | |
| | | | |
| |
Class B | | | | |
Net asset value, offering price and redemption price per share
($34,632,522 ÷ 1,827,279 shares of common stock issued and outstanding) | | $ | 18.95 | |
| | | | |
| |
Class C | | | | |
Net asset value, offering price and redemption price per share
($60,843,218 ÷ 3,204,963 shares of common stock issued and outstanding) | | $ | 18.98 | |
| | | | |
| |
Class R | | | | |
Net asset value, offering price and redemption price per share
($24,285,320 ÷ 1,231,117 shares of common stock issued and outstanding) | | $ | 19.73 | |
| | | | |
| |
Class Z | | | | |
Net asset value, offering price and redemption price per share
($1,286,889,650 ÷ 57,353,980 shares of common stock issued and outstanding) | | $ | 22.44 | |
| | | | |
See Notes to Financial Statements.
| | | | |
| Prudential Jennison Growth Fund | | | 15 | |
Statement of Operations
Six Months Ended March 31, 2012 (Unaudited)
| | | | |
Net Investment Loss | | | | |
Income | | | | |
Unaffiliated dividend income (net of foreign withholding taxes of $34,862) | | $ | 8,872,652 | |
Affiliated income from securities loaned, net | | | 180,436 | |
Affiliated dividend income | | | 29,469 | |
| | | | |
Total income | | | 9,082,557 | |
| | | | |
| |
Expenses | | | | |
Management fee | | | 5,821,739 | |
Distribution fee—Class A | | | 1,351,991 | |
Distribution fee—Class B | | | 168,487 | |
Distribution fee—Class C | | | 265,898 | |
Distribution fee—Class R | | | 59,266 | |
Transfer agent’s fees and expenses (including affiliated expense of $774,400) | | | 1,610,000 | |
Custodian’s fees and expenses | | | 118,000 | |
Reports to shareholders | | | 70,000 | |
Registration fees | | | 45,000 | |
Directors’ fees | | | 28,000 | |
Insurance | | | 21,000 | |
Legal fees and expenses | | | 16,000 | |
Audit fee | | | 11,000 | |
Miscellaneous | | | 14,940 | |
| | | | |
Total expenses | | | 9,601,321 | |
| | | | |
Net investment loss | | | (518,764 | ) |
| | | | |
| |
Realized And Unrealized Gain (Loss) On Investments And Foreign Currencies | | | | |
Net realized gain (loss) on: | | | | |
Investment transactions | | | 34,124,915 | |
Foreign currency transactions | | | (80,495 | ) |
| | | | |
| | | 34,044,420 | |
| | | | |
Net change in unrealized appreciation (depreciation) on: | | | | |
Investments | | | 463,850,543 | |
Foreign currencies | | | (4,804 | ) |
| | | | |
| | | 463,845,739 | |
| | | | |
Net gain on investments and foreign currencies | | | 497,890,159 | |
| | | | |
Net Increase In Net Assets Resulting From Operations | | $ | 497,371,395 | |
| | | | |
See Notes to Financial Statements.
| | |
| 16 | | Visit our website at www.prudentialfunds.com |
Statement of Changes in Net Assets
(Unaudited)
| | | | | | | | |
| | | Six Months
Ended
March 31, 2012 | | | Year
Ended
September 30, 2011 | |
Increase (Decrease) In Net Assets | | | | | | | | |
Operations | | | | | | | | |
Net investment loss | | $ | (518,764 | ) | | $ | (3,322,738 | ) |
Net realized gain on investment and foreign currency transactions | | | 34,044,420 | | | | 157,301,410 | |
Net change in unrealized appreciation (depreciation) on investments and foreign currencies | | | 463,845,739 | | | | (71,503,651 | ) |
| | | | | | | | |
Net increase in net assets resulting from operations | | | 497,371,395 | | | | 82,475,021 | |
| | | | | | | | |
| | |
Series share transactions (Net of share conversions) (Note 6) | | | | | | | | |
Net proceeds from shares sold | | | 448,671,513 | | | | 378,799,028 | |
Cost of shares reacquired | | | (251,993,901 | ) | | | (494,920,580 | ) |
| | | | | | | | |
Net increase (decrease) in net assets from Series share transactions | | | 196,677,612 | | | | (116,121,552 | ) |
| | | | | | | | |
Total increase (decrease) | | | 694,049,007 | | | | (33,646,531 | ) |
| | |
Net Assets: | | | | | | | | |
Beginning of period | | | 1,710,960,290 | | | | 1,744,606,821 | |
| | | | | | | | |
End of period | | $ | 2,405,009,297 | | | $ | 1,710,960,290 | |
| | | | | | | | |
See Notes to Financial Statements.
| | | | |
| Prudential Jennison Growth Fund | | | 17 | |
Notes to Financial Statements
(Unaudited)
The Prudential Investment Portfolios, Inc. (the “Company”), is an open-end management investment company, registered under the Investment Company Act of 1940, as amended, (“1940 Act”). The Company was incorporated in Maryland on August 10, 1995 and consists of six series: Prudential Jennison Growth Fund (the “Series”), Prudential Jennison Equity Opportunity Fund and Prudential Asset Allocation Fund which are diversified funds and Prudential Growth Allocation Fund, Prudential Moderate Allocation Fund and Prudential Conservative Allocation Fund which are non-diversified funds. These financial statements relate to the Prudential Jennison Growth Fund. The financial statements of the other series are not presented herein. The Series commenced investment operations on November 2, 1995.
The Series’ investment objective is to achieve long-term growth of capital.
Note 1. Accounting Policies
The following is a summary of significant accounting policies followed by the Series in the preparation of its financial statements.
Securities Valuation: Securities listed on a securities exchange are valued at the last sale price on such exchange on the day of valuation or, if there was no sale on such day, at the mean between the last reported bid and asked prices, or at the last bid price on such day in the absence of an asked price. Securities traded via NASDAQ are valued at the NASDAQ official closing price (“NOCP”) on the day of valuation, or if there was no NOCP, at the last sale price. Securities that are actively traded in the over-the-counter market, including listed securities for which the primary market is believed by Prudential Investments LLC (“PI” or “Manager”), in consultation with the Subadviser(s), to be over-the-counter, are valued at market value using prices provided by an independent pricing agent or principal market maker. Securities for which reliable market quotations are not readily available, or whose values have been affected by events occurring after the close of the security’s foreign market and before the Series’ normal pricing time, are valued at fair value in accordance with the Board of Directors’ approved fair valuation procedures. When determining the fair valuation of securities some of the factors influencing the valuation include, the nature of any restrictions on disposition of the securities; assessment of the general liquidity of the securities; the issuer’s financial condition and the markets in which it does business; the cost of the investment; the size of the holding and the capitalization of issuer; the prices of any recent transactions or bids/offers for such securities or any comparable securities; any available analyst media or other reports
| | |
| 18 | | Visit our website at www.prudentialfunds.com |
or information deemed reliable by the investment adviser regarding the issuer or the markets or industry in which it operates. Using fair value to price securities may result in a value that is different from a security’s most recent closing price and from the price used by other mutual funds to calculate their net asset values.
Investments in open-end, non-exchange-traded mutual funds are valued at the net asset value as of the close of the New York Stock Exchange on the date of valuation.
Securities Lending: The Series may lend its portfolio securities to banks and broker-dealers. The loans are secured by collateral at least equal to the market value of the securities loaned. Collateral pledged by each borrower is marked to market daily, based on the previous day’s market value, such that the value of the collateral exceeds the value of the loaned securities. Loans are subject to termination at the option of the borrower or the Series. Upon termination of the loan, the borrower will return to the Series securities identical to the loaned securities. Should the borrower of the securities fail financially, the Series has the right to repurchase the securities using the collateral in the open market. The Series recognizes income, net of any rebate and securities lending agent fees, for lending its securities in the form of fees or interest on the investment of any cash received as collateral. The Series also continues to receive interest and dividends or amounts equivalent thereto, on the securities loaned and recognizes any unrealized gain or loss in the market price of the securities loaned that may occur during the term of the loan.
Foreign Currency Translation: The books and records of the Series are maintained in U.S. dollars. Foreign currency amounts are translated into U.S. dollars on the following basis:
(i) market value of investment securities, other assets and liabilities-at the current rates of exchange;
(ii) purchases and sales of investment securities, income and expenses-at the rates of exchange prevailing on the respective dates of such transactions.
Although the net assets of the Series are presented at the foreign exchange rates and market values at the close of the fiscal period, the Series does not isolate that portion of the results of operations arising as a result of changes in the foreign exchange rates from the fluctuations arising from changes in the market prices of long-term portfolio securities held at the end of the fiscal period. Similarly, the Series does not isolate the effect of changes in foreign exchange rates from the fluctuations arising from changes in the market prices of long-term portfolio securities sold during the fiscal period. Accordingly, these realized foreign currency gains or losses are included in the reported net realized gains or losses on investment transactions.
| | | | |
| Prudential Jennison Growth Fund | | | 19 | |
Notes to Financial Statements
(Unaudited) continued
Net realized gains or losses on foreign currency transactions represent net foreign exchange gains or losses from the holding of foreign currencies, currency gains or losses realized between the trade date and settlement dates on security transactions, and the difference between the amounts of dividends, interest and foreign withholding taxes recorded on the Series’ books and the U.S. dollar equivalent amounts actually received or paid. Net unrealized currency gains or losses from valuing foreign currency denominated assets and liabilities (other than investments) at period end exchange rates are reflected as a component of net unrealized appreciation (depreciation) on foreign currencies.
Foreign security and currency transactions may involve certain considerations and risks not typically associated with those of domestic origin as a result of, among other factors, the possibility of political and economic instability and the level of governmental supervision and regulation of foreign securities markets.
Securities Transactions and Net Investment Income: Securities transactions are recorded on the trade date. Realized gains or losses on sales of securities are calculated on the identified cost basis. Dividend income is recorded on the ex-dividend date and interest income, including amortization of premium and accretion of discount on debt securities, as required, is recorded on the accrual basis. Expenses are recorded on the accrual basis. The Company’s expenses are allocated to the respective Series on the basis of relative net assets except for expenses that are charged directly to the Series level.
Net investment income or loss (other than distribution fees which are charged directly to the respective class), realized and unrealized gains or losses, are allocated daily to each class of shares based upon the relative proportion of adjusted net assets of each class at the beginning of the day.
Dividends and Distributions: The Series expects to pay dividends of net investment income and distributions of net realized capital and currency gains, if any, annually. Dividends and distributions, which are determined in accordance with federal income tax regulations and which may differ from generally accepted accounting principles, are recorded on the ex-dividend date. Permanent book/tax differences relating to income and gains are reclassified amongst undistributed net investment income, accumulated net realized gain or loss and paid-in capital in excess of par, as appropriate.
| | |
| 20 | | Visit our website at www.prudentialfunds.com |
Taxes: For federal income tax purposes, each Series in the Company is treated as a separate tax-paying entity. It is the Series’ policy to continue to meet the requirements of the Internal Revenue Code applicable to regulated investment companies and to distribute all of its taxable net income and capital gains, if any, to shareholders. Therefore, no federal income tax provision is required.
Withholding taxes on foreign dividends are recorded net of reclaimable amounts, at the time the related income is earned.
Estimates: The preparation of the financial statements requires management to make estimates and assumptions that affect the reported amounts and disclosures in the financial statements. Actual results could differ from those estimates.
Note 2. Agreements
The Company has a management agreement for the Series with PI. Pursuant to this agreement, PI has responsibility for all investment advisory services and supervises the subadvisor’s performance of such services. PI has entered into a subadvisory agreement with Jennison Associates LLC (“Jennison”). The subadvisory agreement provides that Jennison furnishes investment advisory services in connection with the management of the Series. In connection therewith, Jennison is obligated to keep certain books and records of the Series. PI pays for the services of Jennison, the cost of compensation of officers and employees of the Series, occupancy and certain clerical and bookkeeping costs of the Series. The Series bears all other costs and expenses.
The management fee paid to PI is computed daily and payable monthly at an annual rate of .60% of the Series’ average daily net assets up to $300 million, .575% of the next $2.7 billion and .55% of the Series’ average daily net assets in excess of $3 billion. The effective management fee rate was .58% of the Series’ average daily net assets for the six months ended March 31, 2012.
The Series has a distribution agreement with Prudential Investment Management Services LLC (“PIMS”), which acts as the distributor of the Class A, Class B, Class C, Class R and Class Z shares of the Series. The Series compensates PIMS for distributing and servicing the Series’ Class A, Class B, Class C and Class R shares, pursuant to plans of distribution (the “Class A, B, C and R Plans”), regardless of expenses actually incurred by PIMS. The distribution fees are accrued daily and payable monthly. No distribution or service fees are paid to PIMS as distributor of the Class Z shares of the Series.
Pursuant to the Class A, B, C and R Plans, the Series compensates PIMS for distribution related activities at an annual rate of up to .30%, 1%, 1% and .75% of the
| | | | |
| Prudential Jennison Growth Fund | | | 21 | |
Notes to Financial Statements
(Unaudited) continued
average daily net assets of the Class A, B, C and R shares, respectively. PIMS contractually agreed to limit such fees to .50% of the average daily net assets of the Class R shares through January 31, 2013.
PIMS has advised the Series that it received $100,388 in front-end sales charges resulting from sales of Class A shares during the six months ended March 31, 2012. From these fees, PIMS paid such sales charges to affiliated broker/dealers, which in turn paid commissions to salespersons and incurred other distribution costs.
PIMS has advised the Series that for the six months ended March 31, 2012, it received $74, $24,711 and $2,370 in contingent deferred sales charges imposed upon redemptions by certain Class A, Class B and C shareholders, respectively.
PI, PIMS and Jennison are indirect, wholly-owned subsidiaries of Prudential Financial, Inc. (“Prudential”).
Note 3. Other Transactions with Affiliates
Prudential Mutual Fund Services LLC (“PMFS”), an affiliate of PI and an indirect, wholly-owned subsidiary of Prudential, serves as the Series’ transfer agent. Transfer agent’s fees and expenses on the Statement of Operations include certain out-of-pocket expenses paid to non-affiliates, where applicable.
Prudential Investment Management, Inc. (“PIM”), an indirect, wholly-owned subsidiary of Prudential, is the Series’ security lending agent. For the six months ended March 31, 2012, PIM has been compensated approximately $54,000 for these services.
The Series invests in the Prudential Core Taxable Money Market Fund (the “Core Fund”), a portfolio of the Prudential Investment Portfolios 2, registered under the 1940 Act, as amended, and managed by PI. Earnings from the Core Fund are disclosed on the Statement of Operations as affiliated dividend income.
Note 4. Portfolio Securities
Purchases and sales of portfolio securities, other than short-term investments, for the six months ended March 31, 2012 were $675,012,295 and $496,396,989, respectively.
| | |
| 22 | | Visit our website at www.prudentialfunds.com |
Note 5. Tax Information
The United States federal income tax basis of the Series’ investments and the net unrealized appreciation as of March 31, 2012 were as follows:
| | | | | | |
Tax Basis | | Appreciation | | Depreciation | | Net
Unrealized
Appreciation |
| $1,795,210,792 | | $837,770,882 | | $(2,628,489) | | $835,142,393 |
The difference between book basis and tax basis was primarily attributed to deferred losses on wash sales as of the most recent fiscal year end.
For federal income tax purposes, the Series had a capital loss carryforward as of September 30, 2011 of approximately $234,275,000, of which $68,190,000 expires in 2012 and $166,085,000 expires in 2017. Approximately $683,774,000 of its capital loss carryforward expired unused in the current fiscal year. In addition, the Series utilized approximately $143,654,000 of its capital loss carryforward to offset net taxable gains realized in the year ended September 30, 2011. Accordingly, no capital gains distributions are expected to be paid to shareholders until net gains have been realized in excess of such carryforward. Under the recently enacted Regulated Investment Company Modernization Act of 2010 (“the Act”), the Series is permitted to carryforward capital losses incurred in taxable years beginning after December 22, 2010 (“post-enactment losses”) for an unlimited period. However, any post-enactment losses are required to be utilized before the utilization of losses incurred prior to the effective date of the Act. As a result of this ordering rule, capital loss carryforwards related to the taxable years beginning prior to the effective date of the Act may have an increased likelihood to expire unused. Additionally, post-enactment capital losses that are carried forward will retain their character as either short-term or long-term capital losses rather than being considered all short-term as under previous law.
The Series elected to treat post-October currency losses of approximately $200,000 as having been incurred in the following fiscal year (September 30, 2012).
Management has analyzed the Series’ tax positions taken on federal income tax returns for all open tax years and has concluded that no provision for income tax is required in the Series’ financial statements for the current reporting period. The Series’ federal and state income and federal excise tax returns for tax years for which the applicable statutes of limitations have not expired are subject to examination by the Internal Revenue Service and state departments of revenue.
| | | | |
| Prudential Jennison Growth Fund | | | 23 | |
Notes to Financial Statements
(Unaudited) continued
Note 6. Capital
The Series offers Class A, Class B, Class C, Class R and Class Z shares. Class A shares are subject to a maximum front-end sales charge of 5.50%. Investors who purchase Class A shares in an amount of $1 million or more and sell these shares within 12 months of purchase are not subject to an initial sales charge but are subject to a contingent deferred sales charge (CDSC) of 1%. The Class A CDSC is waived for purchases by certain retirement or benefits plans. Class B shares are subject to a CDSC of 5%, which decreases by 1% annually to 1% in the fifth and sixth years and 0% in the seventh year. The CDSC for Class C shares is 1% for shares redeemed within 12 months of purchase. Class B shares automatically convert to Class A shares on a quarterly basis approximately seven years after purchase. A special exchange privilege is also available for shareholders who qualified to purchase Class A shares at net asset value. Class R and Class Z shares are not subject to any sales or redemption charge and are offered exclusively for sale to a limited group of investors.
Under certain circumstances, an exchange may be made from specified share classes of the Series to one or more other share classes of the Series as presented in the table of transactions in shares of common stock.
There are 6.25 billion shares of $.001 par value common stock of the Company authorized which are divided into six series. There are 1.25 billion shares authorized for the Series equally divided into six classes, designated Class A, Class B, Class C, Class I, Class R and Class Z shares. The Series currently does not have any authorized shares issued and outstanding of Class I shares. As of March 31, 2012, PI did not own any shares of the Series.
During the fiscal year ended September 30, 2010, the Series received $2,635,189 related to settlements of regulatory proceedings involving allegations of improper trading in Series shares. The amounts relating to a former affiliate and to an unaffiliated-third party were $2,445,247 and $189,942, respectively. The per share effect of these amounts are disclosed in the financial highlights. The Series was not involved in the proceedings or in the calculation of the amount of settlement.
| | |
| 24 | | Visit our website at www.prudentialfunds.com |
Transactions in shares of common stock were as follows:
| | | | | | | | |
Class A | | Shares | | | Amount | |
Six months ended March 31, 2012: | | | | | | | | |
Shares sold | | | 4,261,666 | | | $ | 81,444,824 | |
Shares reacquired | | | (5,826,348 | ) | | | (112,262,169 | ) |
| | | | | | | | |
Net increase (decrease) in shares outstanding before conversion | | | (1,564,682 | ) | | | (30,817,345 | ) |
Shares issued upon conversion from Class B and Z | | | 233,488 | | | | 4,613,609 | |
Shares reacquired upon conversion into Class Z | | | (25,179 | ) | | | (482,657 | ) |
| | | | | | | | |
Net increase (decrease) in shares outstanding | | | (1,356,373 | ) | | $ | (26,686,393 | ) |
| | | | | | | | |
Year ended September 30, 2011: | | | | | | | | |
Shares sold | | | 7,528,446 | | | $ | 140,194,003 | |
Shares reacquired | | | (11,463,799 | ) | | | (210,047,154 | ) |
| | | | | | | | |
Net increase (decrease) in shares outstanding before conversion | | | (3,935,353 | ) | | | (69,853,151 | ) |
Shares issued upon conversion from Class B and Z | | | 605,248 | | | | 11,024,705 | |
Shares reacquired upon conversion into Class Z | | | (415,563 | ) | | | (7,765,466 | ) |
| | | | | | | | |
Net increase (decrease) in shares outstanding | | | (3,745,668 | ) | | $ | (66,593,912 | ) |
| | | | | | | | |
Class B | | | | | | |
Six months ended March 31, 2012: | | | | | | | | |
Shares sold | | | 97,865 | | | $ | 1,648,828 | |
Shares reacquired | | | (114,143 | ) | | | (1,928,799 | ) |
| | | | | | | | |
Net increase (decrease) in shares outstanding before conversion | | | (16,278 | ) | | | (279,971 | ) |
Shares reacquired upon conversion into Class A | | | (246,248 | ) | | | (4,305,704 | ) |
| | | | | | | | |
Net increase (decrease) in shares outstanding | | | (262,526 | ) | | $ | (4,585,675 | ) |
| | | | | | | | |
Year ended September 30, 2011: | | | | | | | | |
Shares sold | | | 205,520 | | | $ | 3,338,837 | |
Shares reacquired | | | (391,100 | ) | | | (6,344,571 | ) |
| | | | | | | | |
Net increase (decrease) in shares outstanding before conversion | | | (185,580 | ) | | | (3,005,734 | ) |
Shares reacquired upon conversion into Class A | | | (680,521 | ) | | | (10,982,916 | ) |
| | | | | | | | |
Net increase (decrease) in shares outstanding | | | (866,101 | ) | | $ | (13,988,650 | ) |
| | | | | | | | |
Class C | | | | | | |
Six months ended March 31, 2012: | | | | | | | | |
Shares sold | | | 309,863 | | | $ | 5,253,915 | |
Shares reacquired | | | (226,098 | ) | | | (3,806,117 | ) |
| | | | | | | | |
Net increase (decrease) in shares outstanding before conversion | | | 83,765 | | | | 1,447,798 | |
Shares reacquired upon conversion into Class Z | | | (1,678 | ) | | | (30,463 | ) |
| | | | | | | | |
Net increase (decrease) in shares outstanding | | | 82,087 | | | $ | 1,417,335 | |
| | | | | | | | |
Year ended September 30, 2011: | | | | | | | | |
Shares sold | | | 256,393 | | | $ | 4,225,310 | |
Shares reacquired | | | (774,642 | ) | | | (12,565,978 | ) |
| | | | | | | | |
Net increase (decrease) in shares outstanding before conversion | | | (518,249 | ) | | | (8,340,668 | ) |
Shares reacquired upon conversion into Class R and Z | | | (949,799 | ) | | | (16,519,756 | ) |
| | | | | | | | |
Net increase (decrease) in shares outstanding | | | (1,468,048 | ) | | $ | (24,860,424 | ) |
| | | | | | | | |
| | | | |
| Prudential Jennison Growth Fund | | | 25 | |
Notes to Financial Statements
(Unaudited) continued
| | | | | | | | |
Class R | | Shares | | | Amount | |
Six months ended March 31, 2012: | | | | | | | | |
Shares sold | | | 479,368 | | | $ | 8,579,154 | |
Shares reacquired | | | (787,080 | ) | | | (13,557,911 | ) |
| | | | | | | | |
Net increase (decrease) in shares outstanding | | | (307,712 | ) | | $ | (4,978,757 | ) |
| | | | | | | | |
Year ended September 30, 2011: | | | | | | | | |
Shares sold | | | 528,907 | | | $ | 8,909,263 | |
Shares reacquired | | | (501,886 | ) | | | (8,428,425 | ) |
| | | | | | | | |
Net increase (decrease) in shares outstanding before conversion | | | 27,021 | | | | 480,838 | |
Shares issued upon conversion from Class C | | | 908,100 | | | | 16,344,149 | |
| | | | | | | | |
Net increase (decrease) in shares outstanding | | | 935,121 | | | $ | 16,824,987 | |
| | | | | | | | |
Class Z | | | | | | |
Six months ended March 31, 2012: | | | | | | | | |
Shares sold | | | 17,436,659 | | | $ | 351,744,792 | |
Shares reacquired | | | (5,889,561 | ) | | | (120,438,905 | ) |
| | | | | | | | |
Net increase (decrease) in shares outstanding before conversion | | | 11,547,098 | | | | 231,305,887 | |
Shares issued upon conversion from Class A and C | | | 25,607 | | | | 513,120 | |
Shares reacquired upon conversion into Class A | | | (15,878 | ) | | | (307,905 | ) |
| | | | | | | | |
Net increase (decrease) in shares outstanding | | | 11,556,827 | | | $ | 231,511,102 | |
| | | | | | | | |
Year ended September 30, 2011: | | | | | | | | |
Shares sold | | | 11,672,434 | | | $ | 222,131,615 | |
Shares reacquired | | | (13,507,521 | ) | | | (257,534,452 | ) |
| | | | | | | | |
Net increase (decrease) in shares outstanding before conversion | | | (1,835,087 | ) | | | (35,402,837 | ) |
Shares issued upon conversion from Class A and C | | | 409,336 | | | | 7,941,073 | |
Shares reacquired upon conversion into Class A | | | (2,255 | ) | | | (41,789 | ) |
| | | | | | | | |
Net increase (decrease) in shares outstanding | | | (1,428,006 | ) | | $ | (27,503,553 | ) |
| | | | | | | | |
Note 7. Borrowings
The Series, along with other affiliated registered investment companies (the “Funds”), is a party to a Syndicated Credit Agreement (“SCA”) with a group of banks. The purpose of the SCA is to provide an alternative source of temporary funding for capital share redemptions. The SCA provides for a commitment of $900 million for the period December 16, 2011 through December 14, 2012. The Funds pay an annualized commitment fee of 0.08% of the unused portion of the SCA. Prior to December 16, 2011, the Funds had another Syndicated Credit Agreement of a $750 million commitment with an annualized commitment fee of 0.10% of the unused portion.
| | |
| 26 | | Visit our website at www.prudentialfunds.com |
Interest on any borrowings under the SCA is paid at contracted market rates. The commitment fee for the unused amount is accrued daily and paid quarterly.
The Series did not utilize the SCA during the period ended March 31, 2012.
Note 8. New Accounting Pronouncements
In April 2011, the Financial Accounting Standards Board (“FASB”) issued Accounting Standards Update (“ASU”) No. 2011-03 “Reconsideration of Effective Control for Repurchase Agreements”. The objective of ASU No. 2011-03 is to improve the accounting for repurchase agreements and other agreements that both entitle and obligate a transferor to repurchase or redeem financial assets before their maturity. Under previous guidance, whether or not to account for a transaction as a sale was based on, in part, if the entity maintained effective control over the transferred financial assets. ASU No. 2011-03 removes the transferor’s ability criterion from the effective control assessment. This guidance is effective prospectively for interim and annual reporting periods beginning on or after December 15, 2011. At this time, management is evaluating the implications of ASU No. 2011-03 and its impact on the financial statements has not been determined.
In May 2011, the FASB issued ASU No. 2011-04 “Amendments to Achieve Common Fair Value Measurement and Disclosure Requirements in U.S. GAAP and IFRSs”. ASU No. 2011-04 includes common requirements for measurement of and disclosure about fair value between U.S. GAAP and IFRS. ASU No. 2011-04 will require reporting entities to disclose quantitative information about the unobservable inputs used in the fair value measurements categorized within Level 3 of the fair value hierarchy. In addition, ASU No. 2011-04 will require reporting entities to make disclosures about amounts and reasons for all transfers in and out of Level 1 and Level 2 fair value measurements. The new and revised disclosures are effective for interim and annual reporting periods beginning after December 15, 2011. At this time, management is evaluating the implications of ASU No. 2011-04 and its impact on the financial statements has not been determined.
| | | | |
| Prudential Jennison Growth Fund | | | 27 | |
Financial Highlights
(Unaudited)
| | | | | | | | | | | | | | | | | | | | | | | | | | |
| Class A Shares | |
| | | Six Months
Ended
March 31, | | | | | Year Ended September 30, | |
| | | 2012 | | | | | 2011 | | | 2010 | | | 2009 | | | 2008 | | | 2007 | |
| Per Share Operating Performance(a): | | | | | | | | | | | | | | | | | | | | | | | | | | |
| Net Asset Value, Beginning Of Period | | | $16.88 | | | | | | $16.20 | | | | $14.84 | | | | $14.43 | | | | $18.22 | | | | $15.78 | |
| Income (loss) from investment operations: | | | | | | | | | | | | | | | | | | | | | | | | | | |
| Net investment income (loss) | | | (.02 | ) | | | | | (.05 | ) | | | (.03 | ) | | | .01 | | | | (.01 | ) | | | - | (b) |
| Net realized and unrealized gain (loss) on investment and foreign currency transactions | | | 4.68 | | | | | | .73 | | | | 1.37 | | | | .41 | | | | (3.78 | ) | | | 2.44 | |
| Total from investment operations | | | 4.66 | | | | | | .68 | | | | 1.34 | | | | .42 | | | | (3.79 | ) | | | 2.44 | |
| Less Dividends and Distributions: | | | | | | | | | | | | | | | | | | | | | | | | | | |
| Dividends from net investment income | | | - | | | | | | - | | | | - | | | | (.01 | ) | | | - | (b) | | | - | |
| Tax return of capital distributions | | | - | | | | | | - | | | | - | | | | - | (b) | | | - | | | | - | |
| Total dividends and distributions | | | - | | | | | | - | | | | - | | | | (.01 | ) | | | - | (b) | | | - | |
| Capital Contributions (Note 6): | | | - | | | | | | - | | | | .02 | | | | - | | | | - | | | | - | |
| Net asset value, end of period | | | $21.54 | | | | | | $16.88 | | | | $16.20 | | | | $14.84 | | | | $14.43 | | | | $18.22 | |
| Total Return(c): | | | 27.61% | | | | | | 4.20% | | | | 9.16% | | | | 2.95% | | | | (20.78)% | | | | 15.46% | |
| | | | | |
| Ratios/Supplemental Data: | |
| Net assets, end of period (000) | | | $998,359 | | | | | | $805,293 | | | | $833,584 | | | | $979,671 | | | | $1,081,148 | | | | $1,566,814 | |
| Average net assets (000) | | | $901,328 | | | | | | $904,612 | | | | $946,738 | | | | $837,882 | | | | $1,374,025 | | | | $1,525,634 | |
| Ratios to average net assets(d): | | | | | | | | | | | | | | | | | | | | | | | | | | |
| Expenses, including distribution and service (12b-1) fees | | | 1.07% | (g) | | | | | 1.08% | | | | 1.11% | | | | 1.13% | | | | 1.08% | (e) | | | 1.02% | (e) |
| Expenses, excluding distribution and service (12b-1) fees | | | .77% | (g) | | | | | .78% | | | | .81% | | | | .83% | | | | .80% | | | | .77% | |
| Net investment income (loss) | | | (.17)% | (g) | | | | | (.27)% | | | | (.18)% | | | | .10% | | | | (.04)% | | | | -% | (f) |
| Portfolio turnover rate | | | 25% | (h) | | | | | 63% | | | | 73% | | | | 74% | | | | 83% | | | | 63% | |
(a) Calculated based on average shares outstanding during the period.
(b) Less than $.005 per share.
(c) Total return does not consider the effects of sales loads. Total return is calculated assuming a purchase of a share on the first day and a sale on the last day of each period reported, and includes reinvestment of dividends and distributions. Total returns may reflect adjustments to conform to generally accepted accounting principles. Total returns for periods less than one full year are not annualized.
(d) Does not include expenses of the underlying portfolio in which the Series invests.
(e) The distributor of the Series had contractually agreed to limit its distribution and service (12b-1) fees to .25% of the average daily net assets of the Class A shares through January 31, 2008.
(f) Less than .005%.
(g) Annualized.
(h) Not annualized.
See Notes to Financial Statements.
| | |
| 28 | | Visit our website at www.prudentialfunds.com |
| | | | | | | | | | | | | | | | | | | | | | | | | | |
| Class B Shares | |
| | | Six Months
Ended
March 31, | | | | | Year Ended September 30, | |
| | | 2012 | | | | | 2011 | | | 2010 | | | 2009 | | | 2008 | | | 2007 | |
| Per Share Operating Performance(a): | | | | | | | | | | | | | | | | | | | | | | | | | | |
| Net Asset Value, Beginning Of Period | | | $14.90 | | | | | | $14.41 | | | | $13.29 | | | | $13.00 | | | | $16.53 | | | | $14.42 | |
| Income (loss) from investment operations: | | | | | | | | | | | | | | | | | | | | | | | | | | |
| Net investment loss | | | (.07 | ) | | | | | (.16 | ) | | | (.12 | ) | | | (.06 | ) | | | (.12 | ) | | | (.12 | ) |
| Net realized and unrealized gain (loss) on investment and foreign currency transactions | | | 4.12 | | | | | | .65 | | | | 1.22 | | | | .35 | | | | (3.41 | ) | | | 2.23 | |
| Total from investment operations | | | 4.05 | | | | | | .49 | | | | 1.10 | | | | .29 | | | | (3.53 | ) | | | 2.11 | |
| Capital Contributions (Note 6): | | | - | | | | | | - | | | | .02 | | | | - | | | | - | | | | - | |
| Net asset value, end of period | | | $18.95 | | | | | | $14.90 | | | | $14.41 | | | | $13.29 | | | | $13.00 | | | | $16.53 | |
| Total Return(b): | | | 27.18% | | | | | | 3.40% | | | | 8.43% | | | | 2.23% | | | | (21.36)% | | | | 14.63% | |
| | | | | | | | | | | | | | | | | | | | | | | | | | |
| Ratios/Supplemental Data: | |
| Net assets, end of period (000) | | | $34,633 | | | | | | $31,148 | | | | $42,581 | | | | $56,336 | | | | $85,641 | | | | $163,232 | |
| Average net assets (000) | | | $33,697 | | | | | | $41,009 | | | | $51,415 | | | | $57,781 | | | | $127,973 | | | | $205,950 | |
| Ratios to average net assets(c): | | | | | | | | | | | | | | | | | | | | | | | | | | |
| Expenses, including distribution and service (12b-1) fees | | | 1.77% | (d) | | | | | 1.78% | | | | 1.81% | | | | 1.83% | | | | 1.80% | | | | 1.77% | |
| Expenses, excluding distribution and service (12b-1) fees | | | .77% | (d) | | | | | .78% | | | | .81% | | | | .83% | | | | .80% | | | | .77% | |
| Net investment loss | | | (.86)% | (d) | | | | | (.97)% | | | | (.87)% | | | | (.57)% | | | | (.75)% | | | | (.75)% | |
| Portfolio turnover rate | | | 25% | (e) | | | | | 63% | | | | 73% | | | | 74% | | | | 83% | | | | 63% | |
(a) Calculated based on average shares outstanding during the period.
(b) Total return does not consider the effects of sales loads. Total return is calculated assuming a purchase of a share on the first day and a sale on the last day of each period reported, and includes reinvestment of dividends and distributions. Total returns may reflect adjustments to conform to generally accepted accounting principles. Total returns for periods less than one full year are not annualized.
(c) Does not include expenses of the underlying portfolio in which the Series invests.
(d) Annualized.
(e) Not annualized.
See Notes to Financial Statements.
| | | | |
| Prudential Jennison Growth Fund | | | 29 | |
Financial Highlights
(Unaudited) continued
| | | | | | | | | | | | | | | | | | | | | | | | | | |
| Class C Shares | |
| | | Six Months
Ended
March 31, | | | | | Year Ended September 30, | |
| | | 2012 | | | | | 2011 | | | 2010 | | | 2009 | | | 2008 | | | 2007 | |
| Per Share Operating Performance(a): | | | | | | | | | | | | | | | | | | | | | | | | | | |
| Net Asset Value, Beginning Of Period | | | $14.93 | | | | | | $14.43 | | | | $13.29 | | | | $13.00 | | | | $16.53 | | | | $14.42 | |
Income (loss) from investment
operations: | | | | | | | | | | | | | | | | | | | | | | | | | | |
| Net investment loss | | | (.07 | ) | | | | | (.16 | ) | | | (.13 | ) | | | (.07 | ) | | | (.12 | ) | | | (.12 | ) |
| Net realized and unrealized gain (loss) on investment and foreign currency transactions | | | 4.12 | | | | | | .66 | | | | 1.25 | | | | .36 | | | | (3.41 | ) | | | 2.23 | |
| Total from investment operations | | | 4.05 | | | | | | .50 | | | | 1.12 | | | | .29 | | | | (3.53 | ) | | | 2.11 | |
| Capital Contributions (Note 6): | | | - | | | | | | - | | | | .02 | | | | - | | | | - | | | | - | |
| Net asset value, end of period | | | $18.98 | | | | | | $14.93 | | | | $14.43 | | | | $13.29 | | | | $13.00 | | | | $16.53 | |
| Total Return(b): | | | 27.13% | | | | | | 3.47% | | | | 8.58% | | | | 2.23% | | | | (21.36)% | | | | 14.63% | |
| | | | | |
| Ratios/Supplemental Data: | |
| Net assets, end of period (000) | | | $60,843 | | | | | | $46,623 | | | | $66,240 | | | | $54,710 | | | | $56,527 | | | | $78,280 | |
| Average net assets (000) | | | $53,180 | | | | | | $63,040 | | | | $64,722 | | | | $46,097 | | | | $70,987 | | | | $79,797 | |
| Ratios to average net assets(c): | | | | | | | | | | | | | | | | | | | | | | | | | | |
| Expenses, including distribution and service (12b-1) fees | | | 1.77% | (d) | | | | | 1.78% | | | | 1.81% | | | | 1.83% | | | | 1.80% | | | | 1.77% | |
| Expenses, excluding distribution and service (12b-1) fees | | | .77% | (d) | | | | | .78% | | | | .81% | | | | .83% | | | | .80% | | | | .77% | |
| Net investment loss | | | (.87)% | (d) | | | | | (.98)% | | | | (.88)% | | | | (.60)% | | | | (.76)% | | | | (.75)% | |
| Portfolio turnover rate | | | 25% | (e) | | | | | 63% | | | | 73% | | | | 74% | | | | 83% | | | | 63% | |
(a) Calculated based on average shares outstanding during the period.
(b) Total return does not consider the effects of sales loads. Total return is calculated assuming a purchase of a share on the first day and a sale on the last day of each period reported, and includes reinvestment of dividends and distributions. Total returns may reflect adjustments to conform to generally accepted accounting principles. Total returns for periods less than one full year are not annualized.
(c) Does not include expenses of the underlying portfolio in which the Series invests.
(d) Annualized.
(e) Not annualized.
See Notes to Financial Statements.
| | |
| 30 | | Visit our website at www.prudentialfunds.com |
| | | | | | | | | | | | | | | | | | | | | | | | | | |
| Class R Shares | |
| | | Six Months
Ended
March 31, | | | | | Year Ended September 30, | |
| | | 2012 | | | | | 2011 | | | 2010 | | | 2009 | | | 2008 | | | 2007 | |
| Per Share Operating Performance(a): | | | | | | | | | | | | | | | | | | | | | | | | | | |
| Net Asset Value, Beginning Of Period | | | $15.47 | | | | | | $14.87 | | | | $13.65 | | | | $13.29 | | | | $16.80 | | | | $14.59 | |
Income (loss) from investment
operations: | | | | | | | | | | | | | | | | | | | | | | | | | | |
| Net investment loss | | | (.03 | ) | | | | | (.08 | ) | | | (.06 | ) | | | (.01 | ) | | | (.04 | ) | | | (.03 | ) |
| Net realized and unrealized gain (loss) on investment and foreign currency transactions | | | 4.29 | | | | | | .68 | | | | 1.26 | | | | .37 | | | | (3.47 | ) | | | 2.24 | |
| Total from investment operations | | | 4.26 | | | | | | .60 | | | | 1.20 | | | | .36 | | | | (3.51 | ) | | | 2.21 | |
| Less Dividends and Distributions: | | | | | | | | | | | | | | | | | | | | | | | | | | |
| Dividends from net investment income | | | - | | | | | | - | | | | - | | | | - | (b) | | | - | | | | - | |
| Tax return of capital distributions | | | - | | | | | | - | | | | - | | | | - | (b) | | | - | | | | - | |
| Total dividends and distributions | | | - | | | | | | - | | | | - | | | | - | (b) | | | - | | | | - | |
| Capital Contributions (Note 6): | | | - | | | | | | - | | | | .02 | | | | - | | | | - | | | | - | |
| Net asset value, end of period | | | $19.73 | | | | | | $15.47 | | | | $14.87 | | | | $13.65 | | | | $13.29 | | | | $16.80 | |
| Total Return(c): | | | 27.54% | | | | | | 4.03% | | | | 8.94% | | | | 2.73% | | | | (20.89)% | | | | 15.15% | |
| | | | | |
| Ratios/Supplemental Data: | |
| Net assets, end of period (000) | | | $24,285 | | | | | | $23,811 | | | | $8,977 | | | | $5,784 | | | | $3,067 | | | | $2,977 | |
| Average net assets (000) | | | $23,707 | | | | | | $17,091 | | | | $7,777 | | | | $3,608 | | | | $3,165 | | | | $1,849 | |
| Ratios to average net assets(d): | | | | | | | | | | | | | | | | | | | | | | | | | | |
| Expenses, including distribution and service (12b-1) fees(e) | | | 1.27% | (f) | | | | | 1.28% | | | | 1.31% | | | | 1.33% | | | | 1.30% | | | | 1.27% | |
| Expenses, excluding distribution and service (12b-1) fees | | | .77% | (f) | | | | | .78% | | | | .81% | | | | .83% | | | | .80% | | | | .77% | |
| Net investment loss | | | (.36)% | (f) | | | | | (.45)% | | | | (.38)% | | | | (.12)% | | | | (.26)% | | | | (.20)% | |
| Portfolio turnover rate | | | 25% | (g) | | | | | 63% | | | | 73% | | | | 74% | | | | 83% | | | | 63% | |
(a) Calculated based on average shares outstanding during the period.
(b) Less than $.005 per share.
(c) Total return is calculated assuming a purchase of a share on the first day and a sale on the last day of each period reported, and includes reinvestment of dividends and distributions. Total returns may reflect adjustments to conform to generally accepted accounting principles. Total returns for periods less than one full year are not annualized.
(d) Does not include expenses of the underlying portfolio in which the Series invests.
(e) The distributor of the Series has contractually agreed to limit its distribution and service (12b-1) fees to .50% of the average daily net assets of the Class R shares through January 31, 2013.
(f) Annualized.
(g) Not annualized.
See Notes to Financial Statements.
| | | | |
| Prudential Jennison Growth Fund | | | 31 | |
Financial Highlights
(Unaudited) continued
| | | | | | | | | | | | | | | | | | | | | | | | | | |
| Class Z Shares | |
| | | Six Months
Ended
March 31, | | | | | Year Ended September 30, | |
| | | 2012 | | | | | 2011 | | | 2010 | | | 2009 | | | 2008 | | | 2007 | |
| Per Share Operating Performance(a): | | | | | | | | | | | | | | | | | | | | | | | | | | |
| Net Asset Value, Beginning Of Period | | | $17.56 | | | | | | $16.80 | | | | $15.34 | | | | $14.91 | | | | $18.80 | | | | $16.25 | |
| Income (loss) from investment operations: | | | | | | | | | | | | | | | | | | | | | | | | | | |
| Net investment income | | | .01 | | | | | | - | (b) | | | .02 | | | | .05 | | | | .04 | | | | .04 | |
| Net realized and unrealized gain (loss) on investment and foreign currency transactions | | | 4.87 | | | | | | .76 | | | | 1.42 | | | | .42 | | | | (3.89 | ) | | | 2.51 | |
| Total from investment operations | | | 4.88 | | | | | | .76 | | | | 1.44 | | | | .47 | | | | (3.85 | ) | | | 2.55 | |
| Less Dividends and Distributions: | | | | | | | | | | | | | | | | | | | | | | | | | | |
| Dividends from net investment income | | | - | | | | | | - | | | | - | | | | (.04 | ) | | | (.04 | ) | | | - | |
| Tax return of capital distributions | | | - | | | | | | - | | | | - | | | | - | (b) | | | - | | | | - | |
| Total dividends and distributions | | | - | | | | | | - | | | | - | | | | (.04 | ) | | | (.04 | ) | | | - | |
| Capital Contributions (Note 6): | | | - | | | | | | - | | | | .02 | | | | - | | | | - | | | | - | |
| Net asset value, end of period | | | $22.44 | | | | | | $17.56 | | | | $16.80 | | | | $15.34 | | | | $14.91 | | | | $18.80 | |
| Total Return(c): | | | 27.79% | | | | | | 4.52% | | | | 9.52% | | | | 3.20% | | | | (20.51)% | | | | 15.69% | |
| | | | | |
| Ratios/Supplemental Data: | |
| Net assets, end of period (000) | | | $1,286,890 | | | | | | $804,085 | | | | $793,225 | | | | $682,104 | | | | $868,869 | | | | $1,100,959 | |
| Average net assets (000) | | | $999,998 | | | | | | $870,663 | | | | $736,912 | | | | $679,423 | | | | $1,026,959 | | | | $1,134,856 | |
| Ratios to average net assets(d): | | | | | | | | | | | | | | | | | | | | | | | | | | |
| Expenses, including distribution and service (12b-1) fees | | | .77% | (e) | | | | | .78% | | | | .81% | | | | .83% | | | | .80% | | | | .77% | |
| Expenses, excluding distribution and service (12b-1) fees | | | .77% | (e) | | | | | .78% | | | | .81% | | | | .83% | | | | .80% | | | | .77% | |
| Net investment income | | | .13% | (e) | | | | | .03% | | | | .12% | | | | .41% | | | | .24% | | | | .25% | |
| Portfolio turnover rate | | | 25% | (f) | | | | | 63% | | | | 73% | | | | 74% | | | | 83% | | | | 63% | |
(a) Calculated based on average shares outstanding during the period.
(b) Less than $.005 per shares.
(c) Total return is calculated assuming a purchase of a share on the first day and a sale on the last day of each period reported, and includes reinvestment of dividends and distributions. Total returns may reflect adjustments to conform to generally accepted accounting principles. Total returns for periods less than one full year are not annualized.
(d) Does not include expenses of the underlying portfolio in which the Series invests.
(e) Annualized.
(f) Not annualized.
See Notes to Financial Statements.
| | |
| 32 | | Visit our website at www.prudentialfunds.com |
| | | | |
| n MAIL | | n TELEPHONE | | n WEBSITE |
Gateway Center Three 100 Mulberry Street Newark, NJ 07102 | | (800) 225-1852 | | www.prudentialfunds.com |
|
| PROXY VOTING |
| The Board of Directors of the Fund has delegated to the Fund’s investment subadviser the responsibility for voting any proxies and maintaining proxy recordkeeping with respect to the Fund. A description of these proxy voting policies and procedures is available without charge, upon request, by calling (800) 225-1852 or by visiting the Securities and Exchange Commission’s website at www.sec.gov. Information regarding how the Fund voted proxies relating to portfolio securities during the most recent 12-month period ended June 30 is available on the Fund’s website and on the Commission’s website. |
|
| DIRECTORS |
| Kevin J. Bannon • Scott E. Benjamin • Linda W. Bynoe • Michael S. Hyland • Douglas H. McCorkindale • Stephen P. Munn • Stuart S. Parker • Richard A. Redeker • Robin B. Smith • Stephen G. Stoneburn |
|
| OFFICERS |
| Stuart S. Parker, President • Judy A. Rice, Vice President • Scott E. Benjamin, Vice President • Grace C. Torres, Treasurer and Principal Financial and Accounting Officer • Kathryn L. Quirk, Chief Legal Officer • Deborah A. Docs, Secretary • Timothy J. Knierim, Chief Compliance Officer • Valerie M. Simpson, Deputy Chief Compliance Officer • Theresa C. Thompson, Deputy Chief Compliance Officer • Richard W. Kinville, Anti-Money Laundering Compliance Officer • Jonathan D. Shain, Assistant Secretary • Claudia DiGiacomo, Assistant Secretary • John P. Schwartz, Assistant Secretary • Andrew R. French, Assistant Secretary • M. Sadiq Peshimam, Assistant Treasurer • Peter Parrella, Assistant Treasurer |
| | | | |
| MANAGER | | Prudential Investments LLC | | Gateway Center Three
100 Mulberry Street
Newark, NJ 07102 |
|
| INVESTMENT SUBADVISER | | Jennison Associates LLC | | 466 Lexington Avenue
New York, NY 10017 |
|
| DISTRIBUTOR | | Prudential Investment
Management Services LLC | | Gateway Center Three
100 Mulberry Street
Newark, NJ 07102 |
|
| CUSTODIAN | | The Bank of New York Mellon | | One Wall Street
New York, NY 10286 |
|
| TRANSFER AGENT | | Prudential Mutual Fund
Services LLC | | PO Box 9658
Providence, RI 02940 |
|
INDEPENDENT REGISTERED
PUBLIC ACCOUNTING FIRM | | KPMG LLP | | 345 Park Avenue
New York, NY 10154 |
|
| FUND COUNSEL | | Willkie Farr & Gallagher LLP | | 787 Seventh Avenue
New York, NY 10019 |
|
| An investor should consider the investment objectives, risks, charges, and expenses of the Fund carefully before investing. The prospectus and summary prospectus contain this and other information about the Fund. An investor may obtain a prospectus and summary prospectus by visiting our website at www.prudentialfunds.com or by calling (800) 225-1852. The prospectus and summary prospectus should be read carefully before investing. |
|
| E-DELIVERY |
| To receive your mutual fund documents online, go to www.prudentialfunds.com/edelivery and enroll. Instead of receiving printed documents by mail, you will receive notification via email when new materials are available. You can cancel your enrollment or change your email address at any time by visiting the website address above. |
|
| SHAREHOLDER COMMUNICATIONS WITH DIRECTORS |
| Shareholders can communicate directly with the Board of Directors by writing to the Chair of the Board, Prudential Jennison Growth Fund, Prudential Investments, Attn: Board of Directors, 100 Mulberry Street, Gateway Center Three, Newark, NJ 07102. Shareholders can communicate directly with an individual Director by writing to the same address. Communications are not screened before being delivered to the addressee. |
|
| AVAILABILITY OF PORTFOLIO SCHEDULE |
| The Fund files its complete schedule of portfolio holdings with the Securities and Exchange Commission for the first and third quarters of each fiscal year on Form N-Q under the Prudential Investment Portfolios, Inc. name. The Fund’s Forms N-Q are available on the Commission’s website at www.sec.gov. The Fund’s Forms N-Q may also be reviewed and copied at the Commission’s Public Reference Room in Washington, D.C. Information on the operation and location of the Public Reference Room may be obtained by calling (202) 551-8090. The Fund’s schedule of portfolio holdings is also available on the Fund’s website as of the end of each month. |
Mutual Funds:
| | | | |
ARE NOT INSURED BY THE FDIC OR ANY
FEDERAL GOVERNMENT AGENCY | | MAY LOSE VALUE | | ARE NOT A DEPOSIT OF OR GUARANTEED
BY ANY BANK OR ANY BANK AFFILIATE |

PRUDENTIAL JENNISON GROWTH FUND
| | | | | | | | | | |
| SHARE CLASS | | A | | B | | C | | R | | Z |
| NASDAQ | | PJFAX | | PJFBX | | PJFCX | | PJGRX | | PJFZX |
| CUSIP | | 74437E107 | | 74437E206 | | 74437E305 | | 74437E651 | | 74437E404 |
MF168E2 0224672-00001-00

PRUDENTIAL INVESTMENTS»MUTUAL FUNDS
PRUDENTIAL ASSET ALLOCATION FUNDS
SEMIANNUAL REPORT · MARCH 31, 2012
Fund Type
Balanced/Allocation
PRUDENTIAL CONSERVATIVE ALLOCATION FUND
PRUDENTIAL MODERATE ALLOCATION FUND
PRUDENTIAL GROWTH ALLOCATION FUND
This report is not authorized for distribution to prospective investors unless preceded or accompanied by a current prospectus.
The views expressed in this report and information about the Funds’ portfolio holdings are for the period covered by this report and are subject to change thereafter.
The accompanying financial statements as of March 31, 2012, were not audited and, accordingly, no auditor’s opinion is expressed on them.
Prudential Investments, Prudential, the Prudential logo, the Rock symbol, and Bring Your Challenges are service marks of Prudential Financial, Inc. and its related entities, registered in many jurisdictions worldwide.

PRUDENTIAL ASSET ALLOCATION FUNDS
TABLE OF CONTENTS
May 15, 2012
Dear Shareholder:
After an extraordinary career at Prudential, Judy Rice retired at the end of 2011 as President of Prudential Investments and President and Director of the Prudential Asset Allocation Funds (the Funds). While she will remain as Chairman of Prudential Investments until the end of 2012, I was named to succeed her as President of Prudential Investments and President and Director of the Funds effective January 1, 2012. I previously served as Executive Vice President of Retail Mutual Fund Distribution for Prudential Investments for the past six years.
Since this is my first letter to shareholders, I would like to recognize Judy for the significant contributions she made in building the Prudential Investments fund family and her unflagging commitment to helping investors like you meet the challenges of a rapidly changing investment environment. My goal is to build on Judy’s accomplishments, with a particular focus on delivering the solutions you need to address your financial goals.
I hope you find the semiannual report for the Funds informative. We recognize that ongoing market volatility may make it a difficult time to be an investor. We continue to believe a prudent response to uncertainty is to maintain a diversified portfolio, including stock and bond mutual funds consistent with your tolerance for risk, time horizon, and financial goals.
Your financial professional can help you create a diversified investment plan that reflects your personal investor profile and risk tolerance. Keep in mind that diversification and asset allocation strategies do not assure a profit or protect against loss in declining markets. We encourage you to call your financial professional before making any investment decision.
Prudential Investments provides a wide range of mutual funds to choose from that can help you make progress toward your financial goals. Our funds offer the experience, resources, and professional discipline of Prudential Financial’s affiliated asset managers. Thank you for choosing the Prudential Investments family of mutual funds.
Sincerely,

Stuart S. Parker, President
Prudential Asset Allocation Funds
| | | | |
| Prudential Asset Allocation Funds | | | 1 | |
Your Fund’s Performance—Conservative Allocation Fund
(Unaudited)
Performance data quoted represent past performance. Past performance does not guarantee future results. The investment return and principal value of an investment will fluctuate, so that an investor’s shares, when redeemed, may be worth more or less than their original cost. Current performance may be lower or higher than the past performance data quoted. An investor may obtain performance data as of the most recent month-end by visiting our website at www.prudentialfunds.com or by calling (800) 225-1852. The maximum initial sales charge is 5.50% (Class A shares). Gross operating expenses: Class A, 1.64%; Class B, 2.34%; Class C, 2.34%; Class R, 2.09%; Class Z, 1.34%. Net operating expenses: Class A, 1.57%; Class B, 2.32%; Class C, 2.32%; Class R, 1.82%; Class Z, 1.32%, after contractual reduction through 1/31/2013. These figures include a weighted average of the net operating expenses of the underlying funds in which the Fund invests. Such expenses, annualized, amounted to 0.82% for each share class.
| | | | | | | | | | | | | | |
Cumulative Total Returns (Without Sales Charges) as of 3/31/12 |
| | | Six Months | | | One Year | | | Five Years | | | Since Inception |
Class A | | | 10.58 | % | | | 3.73 | % | | | 23.58 | % | | 52.71% (3/30/04) |
Class B | | | 10.12 | | | | 2.89 | | | | 18.91 | | | 43.64 (3/30/04) |
Class C | | | 10.21 | | | | 2.98 | | | | 19.00 | | | 43.76 (3/30/04) |
Class R | | | 10.41 | | | | 3.38 | | | | 22.31 | | | 24.15 (1/27/07) |
Class Z | | | 10.77 | | | | 3.98 | | | | 25.10 | | | 56.05 (3/30/04) |
Conservative Customized Blend Index | | | 9.66 | | | | 4.71 | | | | 19.79 | | | — |
Russell 1000 Index | | | 26.27 | | | | 7.86 | | | | 11.43 | | | — |
S&P 500 Index | | | 25.86 | | | | 8.51 | | | | 10.48 | | | — |
Lipper Mixed-Asset Target Allocation Conservative Funds Average | | | 8.89 | | | | 4.36 | | | | 19.70 | | | — |
| | | | | | | | | | | | | | |
Average Annual Total Returns (With Sales Charges) as of 3/31/12 |
| | | | | | One Year | | | Five Years | | | Since Inception |
Class A | | | | | | | –1.97 | % | | | 3.15 | % | | 4.69% (3/30/04) |
Class B | | | | | | | –2.11 | | | | 3.35 | | | 4.63 (3/30/04) |
Class C | | | | | | | 1.98 | | | | 3.54 | | | 4.64 (3/30/04) |
Class R | | | | | | | 3.38 | | | | 4.11 | | | 4.23 (1/12/07) |
Class Z | | | | | | | 3.98 | | | | 4.58 | | | 5.72 (3/30/04) |
Conservative Customized Blend Index | | | | | | | 4.71 | | | | 3.68 | | | — |
Russell 1000 Index | | | | | | | 7.86 | | | | 2.19 | | | — |
S&P 500 Index | | | | | | | 8.51 | | | | 2.01 | | | — |
Lipper Mixed-Asset Target Allocation Conservative Funds Average | | | | | | | 4.36 | | | | 3.61 | | | — |
| | |
| 2 | | Visit our website at www.prudentialfunds.com |
Sources: Prudential Investments LLC and Lipper Inc. Performance figures may reflect fee waivers and/or expense reimbursements. In the absence of such fee waivers and/or expense reimbursements, total returns would be lower.
Inception returns are provided for any share class with less than 10 calendar years of returns.
The average annual total returns take into account applicable sales charges. Class A shares are subject to a maximum front-end sales charge of 5.50% and a 12b-1 fee of 0.30% annually. All investors who purchase Class A shares in an amount of $1 million or more and sell these shares within 12 months of purchase are subject to a contingent deferred sales charge (CDSC) of 1%. The Class A shares CDSC is waived for purchases by certain retirement or benefit plans. Under certain circumstances, an exchange may be made from specified share classes of the Fund to one or more other share classes of the Fund. Class B shares are not subject to a front-end sales charge but are subject to a declining CDSC of 5%, 4%, 3%, 2%, 1%, and 1%, respectively, for the first six years after purchase and a 12b-1 fee of 1% annually. Approximately seven years after purchase, Class B shares will automatically convert to Class A shares on a quarterly basis. Class C shares are not subject to a front-end sales charge, but charge a CDSC of 1% for shares sold within 12 months from the date of purchase and an annual 12b-1 fee of 1%. Class R shares are not subject to sales charges, but charge a 12b-1 fee of 0.75%. Class Z shares are not subject to sales charges or a 12b-1 fee. The returns in the tables reflect the share class expense structure in effect at the close of the fiscal period. The returns in the tables do not reflect the deduction of taxes that a shareholder would pay on Fund distributions or following the redemption of Fund shares.
Benchmark Definitions
Conservative Customized Blend Index
The Conservative Customized Blend Index is a model portfolio consisting of the Russell 3000 Index (24%), the Morgan Stanley Capital International Europe, Australasia, and Far East Net Dividend (MSCI EAFE ND) Index (10%), the Barclays Capital U.S. Aggregate Bond Index (29%), the BofA Merrill Lynch 1-3 Year Corporate Index (29%), the Standard & Poor’s (S&P) Developed BMI Property Net Index (5%), and the Citigroup 3-Month T-Bill Index (3%). See page 5 for the definitions of each component index. The Conservative Customized Blend Index does not reflect deductions for any sales charges or operating expenses of a mutual fund or taxes. The Conservative Customized Blend Index Closest Month-End to Inception cumulative total returns are 49.74% for Class A, Class B, Class C, and Class Z; and 22.14% for Class R. The Conservative Customized Blend Index Closest Month-End to Inception average annual total returns are 5.18% for Class A, Class B, Class C, and Class Z; and 3.88% for Class R.
Russell 1000 Index
The Russell 1000 Index is an unmanaged index that consists of the 1,000 largest securities in the Russell 3000 Index. Russell 1000 Index Closest Month-End to Inception cumulative total returns are 51.29% for Class A, Class B, Class C, and Class Z; and 12.78% for Class R. Russell 1000 Index Closest Month-End to Inception average annual total returns are 5.31% for Class A, Class B, Class C, and Class Z; and 2.32% for Class R.
S&P 500 Index
The S&P 500 Index is an unmanaged index of 500 stocks of large U.S. public companies. It gives a broad look at how U.S. stock prices have performed. S&P 500 Index Closest Month-End to Inception cumulative total returns are 47.25% for Class A, Class B, Class C, and Class Z; and 11.19% for Class R. S&P 500 Index Closest Month-End to Inception average annual total returns are 4.96% for Class A, Class B, Class C, and Class Z; and 2.04% for Class R.
| | | | |
| Prudential Asset Allocation Funds | | | 3 | |
Your Fund’s Performance (continued)
Lipper Mixed-Asset Target Allocation Conservative Funds Average
Funds in the Lipper Mixed-Asset Target Allocation Conservative Funds Average maintain a mix of between 20% and 40% equity securities with the remainder in bonds, cash, and cash equivalents. Lipper Average Closest Month-End to Inception cumulative total returns are 40.89% for Class A, Class B, Class C, and Class Z; and 21.50% for Class R. Lipper Average Closest Month-End to Inception average annual total returns are 4.34% for Class A, Class B, Class C, and Class Z; and 3.73% for Class R.
Investors cannot invest directly in an index or average. The returns for the Indexes would be lower if they included the effects of sales charges, operating expenses of a mutual fund, or taxes. Returns for the Lipper Average reflect the deduction of operating expenses, but not sales charges or taxes.
| | |
| 4 | | Visit our website at www.prudentialfunds.com |
Performance Target—Conservative Customized Blend
The Prudential Conservative Allocation Fund seeks to exceed a performance target—the Conservative Customized Blend Index—consisting of a weighted average return of six securities indexes that are generally considered representative of the asset classes in which the Fund may invest. The chart below shows both the total returns of these indexes for the six-month period ended March 31, 2012, and their weightings in the Conservative Customized Blend Index. Index returns do not reflect sales charges, a mutual fund’s operating expenses, or taxes, and investors cannot invest directly in an index. The Fund seeks to exceed this target by holding positions in specific Prudential mutual funds. In response to market developments, the Fund’s investment subadviser may vary its holdings in those funds (within specified ranges). Past performance is not indicative of future results.
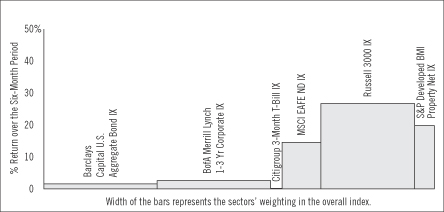
Source: Lipper Inc.
The Barclays Capital U.S. Aggregate Bond Index is an unmanaged index of investment-grade securities issued by the U.S. government and its agencies and by corporations with between one and 10 years remaining to maturity. It gives a broad look at how bond prices of short- and intermediate-term bonds have performed.
The BofA Merrill Lynch 1-3 Year Corporate Index is an unmanaged index consisting of fixed-rate, coupon-bearing corporate bonds with a maturity of one to three years and a rating of BBB/Baa3 and above.
The Citigroup 3-Month T-Bill Index is an unmanaged index representing monthly return equivalents of yield averages of the last 3-month Treasury Bill issues.
The Morgan Stanley Capital International Europe, Australasia, and Far East Net Dividend Index (MSCI EAFE ND Index) is an unmanaged, weighted index that reflects stock price movements in Europe, Australasia, and the Far East. It gives a broad look at how foreign stock prices have performed.
The Russell 3000 Index is an unmanaged index which represents the U.S. equity market—it covers about 98% of all investable stocks in the U.S.
The Standard & Poor’s (S&P) Developed BMI Property Net Index is an unmanaged, broad market index of more than 400 companies from 21 countries, and is available for a wide range of regions (including ex-U.S.) as well as by country.
Investors cannot invest directly in an index or average.
| | | | |
| Prudential Asset Allocation Funds | | | 5 | |
Your Fund’s Performance—Moderate Allocation Fund
(Unaudited)
Performance data quoted represent past performance. Past performance does not guarantee future results. The investment return and principal value of an investment will fluctuate, so that an investor’s shares, when redeemed, may be worth more or less than their original cost. Current performance may be lower or higher than the past performance data quoted. An investor may obtain performance data as of the most recent month-end by visiting our website at www.prudentialfunds.com or by calling (800) 225-1852. The maximum initial sales charge is 5.50% (Class A shares). Gross operating expenses: Class A, 1.77%; Class B, 2.47%; Class C, 2.47%; Class R, 2.22%; Class Z, 1.47%. Net operating expenses: Class A, 1.71%; Class B, 2.46%; Class C, 2.46%; Class R, 1.96%; Class Z, 1.46%, after contractual reduction through 1/31/2013. These figures include a weighted average of the net operating expenses of the underlying funds in which the Fund invests. Such expenses, annualized, amounted to 0.96% for each share class.
| | | | | | | | | | | | | | |
Cumulative Total Returns (Without Sales Charges) as of 3/31/12 |
| | | Six Months | | | One Year | | | Five Years | | | Since Inception |
Class A | | | 15.44 | % | | | 2.50 | % | | | 14.81 | % | | 54.00% (3/30/04) |
Class B | | | 14.96 | | | | 1.65 | | | | 10.53 | | | 44.87 (3/30/04) |
Class C | | | 15.06 | | | | 1.73 | | | | 10.63 | | | 44.87 (3/30/04) |
Class R | | | 15.39 | | | | 2.25 | | | | 13.60 | | | 15.52 (1/27/07) |
Class Z | | | 15.63 | | | | 2.68 | | | | 16.16 | | | 56.80 (3/30/04) |
Moderate Customized Blend Index | | | 14.88 | | | | 4.56 | | | | 13.59 | | | — |
Russell 1000 Index | | | 26.27 | | | | 7.86 | | | | 11.43 | | | — |
S&P 500 Index | | | 25.86 | | | | 8.51 | | | | 10.48 | | | — |
Lipper Mixed-Asset Target Allocation Growth Funds Average | | | 17.06 | | | | 3.19 | | | | 11.15 | | | — |
| | | | | | | | | | | | | | |
Average Annual Total Returns (With Sales Charges) as of 3/31/12 |
| | | | | | One Year | | | Five Years | | | Since Inception |
Class A | | | | | | | –3.13 | % | | | 1.64 | % | | 4.80% (3/30/04) |
Class B | | | | | | | –3.35 | | | | 1.84 | | | 4.74 (3/30/04) |
Class C | | | | | | | 0.73 | | | | 2.04 | | | 4.74 (3/30/04) |
Class R | | | | | | | 2.25 | | | | 2.58 | | | 2.80 (1/27/07) |
Class Z | | | | | | | 2.68 | | | | 3.04 | | | 5.78 (3/30/04) |
Moderate Customized Blend Index | | | | | | | 4.56 | | | | 2.58 | | | — |
Russell 1000 Index | | | | | | | 7.86 | | | | 2.19 | | | — |
S&P 500 Index | | | | | | | 8.51 | | | | 2.01 | | | — |
Lipper Mixed-Asset Target Allocation Growth Funds Average | | | | | | | 3.19 | | | | 2.08 | | | — |
| | |
| 6 | | Visit our website at www.prudentialfunds.com |
Sources: Prudential Investments LLC and Lipper Inc. Performance figures may reflect fee waivers and/or expense reimbursements. In the absence of such fee waivers and/or expense reimbursements, total returns would be lower.
Inception returns are provided for any share class with less than 10 calendar years of returns.
The average annual total returns take into account applicable sales charges. Class A shares are subject to a maximum front-end sales charge of 5.50% and a 12b-1 fee of 0.30% annually. All investors who purchase Class A shares in an amount of $1 million or more and sell these shares within 12 months of purchase are subject to a contingent deferred sales charge (CDSC) of 1%. The Class A shares CDSC is waived for purchases by certain retirement or benefit plans. Under certain circumstances, an exchange may be made from specified share classes of the Fund to one or more other share classes of the Fund. Class B shares are not subject to a front-end sales charge but are subject to a declining CDSC of 5%, 4%, 3%, 2%, 1%, and 1%, respectively, for the first six years after purchase and a 12b-1 fee of 1% annually. Approximately seven years after purchase, Class B shares will automatically convert to Class A shares on a quarterly basis. Class C shares are not subject to a front-end sales charge, but charge a CDSC of 1% for shares sold within 12 months from the date of purchase and an annual 12b-1 fee of 1%. Class R shares are not subject to sales charges, but charge a 12b-1 fee of 0.75%. Class Z shares are not subject to sales charges or a 12b-1 fee. The returns in the tables reflect the share class expense structure in effect at the close of the fiscal period. The returns in the tables do not reflect the deduction of taxes that a shareholder would pay on Fund distributions or following the redemption of Fund shares.
Benchmark Definitions
Moderate Customized Blend Index
The Moderate Customized Blend Index is a model portfolio consisting of the Russell 3000 Index (43%), the Morgan Stanley Capital International Europe, Australasia, and Far East Net Dividend (MSCI EAFE ND) Index (15%), the Barclays Capital U.S. Aggregate Bond Index (19%), the BofA Merrill Lynch 1-3 Year Corporate Index (14%), the Standard & Poor’s (S&P) Developed BMI Property Net Index (5%), and the Citigroup 3-Month T-Bill Index (4%). See page 9 for the definitions of each component index. The Moderate Customized Blend Index does not reflect deductions for any sales charges or operating expenses of a mutual fund. The Moderate Customized Blend Index Closest Month-End to Inception cumulative total returns are 51.44% for Class A, Class B, Class C, and Class Z; and 15.91% for Class R. The Moderate Customized Blend Index Closest Month-End to Inception average annual total returns are 5.32% for Class A, Class B, Class C, and Class Z; and 2.85% for Class R.
Russell 1000 Index
The Russell 1000 Index is an unmanaged index that consists of the 1,000 largest securities in the Russell 3000 Index. Russell 1000 Index Closest Month-End to Inception cumulative total returns are 51.29% for Class A, Class B, Class C, and Class Z; and 12.78% for Class R. Russell 1000 Index Closest Month-End to Inception average annual total returns are 5.31% for Class A, Class B, Class C, and Class Z; and 2.32% for Class R.
S&P 500 Index
The S&P 500 Index is an unmanaged index of 500 stocks of large U.S. public companies. It gives a broad look at how U.S. stock prices have performed. S&P 500 Index Closest Month-End to Inception cumulative total returns are 47.25% for Class A, Class B, Class C, and Class Z; and 11.19% for Class R. S&P 500 Index Closest Month-End to Inception average annual total returns are 4.96% for Class A, Class B, Class C, and Class Z; and 2.04% for Class R.
| | | | |
| Prudential Asset Allocation Funds | | | 7 | |
Your Fund’s Performance (continued)
Lipper Mixed-Asset Target Allocation Growth Funds Average
The Lipper Average represents returns based on the average return of all funds in the Lipper Mixed-Asset Target Allocation Growth Funds category. Funds in the Lipper Average have a primary objective to conserve principal by maintaining at all times a balanced portfolio of both stocks and bonds. Typically, the stock:bond ratio is around 60%:40%. Lipper Average Closest Month-End to Inception cumulative total returns are 44.92% for Class A, Class B, Class C, and Class Z; and 12.80% for Class R. Lipper Average Closest Month-End to Inception average annual total returns are 4.70% for Class A, Class B, Class C, and Class Z; and 2.27% for Class R.
Investors cannot invest directly in an index or average. The returns for the Indexes would be lower if they included the effects of sales charges, operating expenses of a mutual fund, or taxes. Returns for the Lipper Average reflect the deduction of operating expenses, but not sales charges or taxes.
| | |
| 8 | | Visit our website at www.prudentialfunds.com |
Performance Target—Moderate Customized Blend
The Prudential Moderate Allocation Fund seeks to exceed a performance target—the Moderate Customized Blend Index—consisting of a weighted average return of six securities indexes that are generally considered representative of the asset classes in which the Fund may invest. The chart below shows both the total returns of these indexes for the six-month period ended March 31, 2012, and their weightings in the Moderate Customized Blend Index. Index returns do not reflect sales charges, a mutual fund’s operating expenses, or taxes, and investors cannot invest directly in an index. The Fund seeks to exceed this target by holding positions in specific Prudential mutual funds. In response to market developments, the Fund’s investment subadviser may vary its holdings in those funds (within specified ranges). Past performance is not indicative of future results.
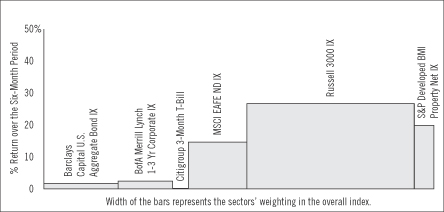
Source: Lipper Inc.
The Barclays Capital U.S. Aggregate Bond Index is an unmanaged index of investment-grade securities issued by the U.S. government and its agencies and by corporations with between one and 10 years remaining to maturity. It gives a broad look at how bond prices of short- and intermediate-term bonds have performed.
The BofA Merrill Lynch 1-3 Year Corporate Index is an unmanaged index consisting of fixed-rate, coupon-bearing corporate bonds with a maturity of one to three years and a rating of BBB/Baa3 and above.
The Citigroup 3-Month T-Bill Index is an unmanaged index representing monthly return equivalents of yield averages of the last 3-month Treasury Bill issues.
The Morgan Stanley Capital International Europe, Australasia, and Far East Net Dividend Index (MSCI EAFE ND Index) is an unmanaged, weighted index that reflects stock price movements in Europe, Australasia, and the Far East. It gives a broad look at how foreign stock prices have performed.
The Russell 3000 Index is an unmanaged index which represents the U.S. equity market—it covers about 98% of all investable stocks in the U.S.
The Standard & Poor’s (S&P) Developed BMI Property Net Index is an unmanaged, broad market index of more than 400 companies from 21 countries, and is available for a wide range of regions (including ex-U.S.) as well as by country.
Investors cannot invest directly in an index or average.
| | | | |
| Prudential Asset Allocation Funds | | | 9 | |
Your Fund’s Performance—Growth Allocation Fund
(Unaudited)
Performance data quoted represent past performance. Past performance does not guarantee future results. The investment return and principal value of an investment will fluctuate, so that an investor’s shares, when redeemed, may be worth more or less than their original cost. Current performance may be lower or higher than the past performance data quoted. An investor may obtain performance data as of the most recent month-end by visiting our website at www.prudentialfunds.com or by calling (800) 225-1852. The maximum initial sales charge is 5.50% (Class A shares). Gross operating expenses: Class A, 2.10%; Class B, 2.80%; Class C, 2.80%; Class R, 2.55%; Class Z, 1.80%. Net operating expenses: Class A, 1.85%; Class B, 2.60%; Class C, 2.60%; Class R, 2.10%; Class Z, 1.60%, after contractual reduction through 1/31/2013. These figures include a weighted average of the net operating expenses of the underlying funds in which the Fund invests. Such expenses, annualized, amounted to 1.10% for each share class.
| | | | | | | | | | | | | | |
Cumulative Total Returns (Without Sales Charges) as of 3/31/12 |
| | | Six Months | | | One Year | | | Five Years | | | Since Inception |
Class A | | | 20.48 | % | | | 1.20 | % | | | 4.38 | % | | 51.12% (3/30/04) |
Class B | | | 20.07 | | | | 0.38 | | | | 0.46 | | | 42.44 (3/30/04) |
Class C | | | 20.05 | | | | 0.38 | | | | 0.54 | | | 42.55 (3/30/04) |
Class R | | | 20.41 | | | | 0.98 | | | | 3.17 | | | 5.19 (1/27/07) |
Class Z | | | 20.56 | | | | 1.41 | | | | 5.65 | | | 54.15 (3/30/04) |
Growth Customized Blend Index | | | 19.80 | | | | 3.65 | | | | 5.31 | | | — |
Russell 1000 Index | | | 26.27 | | | | 7.86 | | | | 11.43 | | | — |
S&P 500 Index | | | 25.86 | | | | 8.51 | | | | 10.48 | | | — |
Lipper Multi-Cap Core Funds Average | | | 24.67 | | | | 2.95 | | | | 6.73 | | | — |
| | | | | | | | | | | | | | |
Average Annual Total Returns (With Sales Charges) as of 3/31/12 |
| | | | | | One Year | | | Five Years | | | Since Inception |
Class A | | | | | | | –4.37 | % | | | –0.27 | % | | 4.55% (3/30/04) |
Class B | | | | | | | –4.62 | | | | –0.10 | | | 4.52 (3/30/04) |
Class C | | | | | | | –0.62 | | | | 0.11 | | | 4.53 (3/30/04) |
Class R | | | | | | | 0.98 | | | | 0.63 | | | 0.97 (1/27/07) |
Class Z | | | | | | | 1.41 | | | | 1.11 | | | 5.55 (3/30/04) |
Growth Customized Blend Index | | | | | | | 3.65 | | | | 1.04 | | | — |
Russell 1000 Index | | | | | | | 7.86 | | | | 2.19 | | | — |
S&P 500 Index | | | | | | | 8.51 | | | | 2.01 | | | — |
Lipper Multi-Cap Core Funds Average | | | | | | | 2.95 | | | | 1.21 | | | — |
Sources: Prudential Investments LLC and Lipper Inc. Performance figures may reflect fee waivers and/or expense reimbursements. In the absence of such fee waivers and/or expense reimbursements, total returns would be lower.
| | |
| 10 | | Visit our website at www.prudentialfunds.com |
Inception returns are provided for any share class with less than 10 calendar years of returns.
The average annual total returns take into account applicable sales charges. Class A shares are subject to a maximum front-end sales charge of 5.50% and a 12b-1 fee of 0.30% annually. All investors who purchase Class A shares in an amount of $1 million or more and sell these shares within 12 months of purchase are subject to a contingent deferred sales charge (CDSC) of 1%. The Class A shares CDSC is waived for purchases by certain retirement or benefit plans. Under certain circumstances, an exchange may be made from specified share classes of the Fund to one or more other share classes of the Fund. Class B shares are not subject to a front-end sales charge but are subject to a declining CDSC of 5%, 4%, 3%, 2%, 1%, and 1%, respectively, for the first six years after purchase and a 12b-1 fee of 1% annually. Approximately seven years after purchase, Class B shares will automatically convert to Class A shares on a quarterly basis. Class C shares are not subject to a front-end sales charge, but charge a CDSC of 1% for shares sold within 12 months from the date of purchase and an annual 12b-1 fee of 1%. Class R shares are not subject to sales charges, but charge a 12b-1 fee of 0.75%. Class Z shares are not subject to sales charges or a 12b-1 fee. The returns in the tables reflect the share class expense structure in effect at the close of the fiscal period. The returns in the tables do not reflect the deduction of taxes that a shareholder would pay on Fund distributions or following the redemption of Fund shares.
Benchmark Definitions
Growth Customized Blend Index
The Growth Customized Blend Index is a model portfolio consisting of the Russell 3000 Index (58%), the Morgan Stanley Capital International Europe, Australasia, and Far East Net Dividend (MSCI EAFE ND) Index (24%), the Barclays Capital U.S. Aggregate Bond Index (8%), the Standard & Poor’s (S&P) Developed BMI Property Net Index (5%) and the Citigroup 3-Month T-Bill Index (5%). See page 13 for the definitions of each component index. The Growth Customized Blend Index does not reflect deductions for any sales charges or operating expenses of a mutual fund. The Growth Customized Blend Index Closest Month-End to Inception cumulative total returns are 50.97% for Class A, Class B, Class C, and Class Z; and 7.65% for Class R. The Growth Customized Blend Index Closest Month-End to Inception average annual total returns are 5.28% for Class A, Class B, Class C, and Class Z; and 1.41% for Class R.
Russell 1000 Index
The Russell 1000 Index is an unmanaged index that consists of the 1,000 largest securities in the Russell 3000 Index. Russell 1000 Index Closest Month-End to Inception cumulative total returns are 51.29% for Class A, Class B, Class C, and Class Z; and 12.78% for Class R. Russell 1000 Index Closest Month-End to Inception average annual total returns are 5.31% for Class A, Class B, Class C, and Class Z; and 2.32% for Class R.
S&P 500 Index
The S&P 500 Index is an unmanaged index of 500 stocks of large U.S. public companies. It gives a broad look at how U.S. stock prices have performed. S&P 500 Index Closest Month-End to Inception cumulative total returns are 47.25% for Class A, Class B, Class C, and Class Z; and 11.19% for Class R. S&P 500 Index Closest Month-End to Inception average annual total returns are 4.96% for Class A, Class B, Class C, and Class Z; and 2.04% for Class R.
| | | | |
| Prudential Asset Allocation Funds | | | 11 | |
Your Fund’s Performance (continued)
Lipper Multi-Cap Core Funds Average
The Lipper Average represents returns based on the average return of all funds in the Lipper Multi-Cap Core Funds category. Funds in the Lipper Average invest in a variety of market capitalization ranges without concentrating 75% of their equity assets in any one market capitalization range over an extended period of time. Multi-cap funds typically have between 25% and 75% of their assets invested in companies with market capitalizations (on a three-year weighted basis) above 300% of the dollar-weighted median market capitalization of the middle 1,000 securities of the S&P SuperComposite 1500 Index. Multi-cap core funds have more latitude in the companies in which they invest. These funds typically have an average price-to-earnings ratio, price-to-book ratio, and three-year sales-per-share growth value compared to the S&P SuperComposite 1500 Index. Lipper Average Closest Month-End to Inception cumulative total returns are 46.26% for Class A, Class B, Class C, and Class Z; and 9.23% for Class R. Lipper Average Closest Month-End to Inception average annual total returns are 4.77% for Class A, Class B, Class C, and Class Z; and 1.59% for Class R.
Investors cannot invest directly in an index or average. The returns for the Indexes would be lower if they included the effects of sales charges, operating expenses of a mutual fund, or taxes. Returns for the Lipper Average reflect the deduction of operating expenses, but not sales charges or taxes.
| | |
| 12 | | Visit our website at www.prudentialfunds.com |
Performance Target—Growth Customized Blend
The Prudential Growth Allocation Fund seeks to exceed a performance target—the Growth Customized Blend Index—consisting of a weighted average return of five securities indexes that are generally considered representative of the asset classes in which the Fund may invest. The chart below shows both the total returns of these indexes for the six-month period ended March 31, 2012, and their weightings in the Growth Customized Blend Index. Index returns do not reflect sales charges, a mutual fund’s operating expenses, or taxes, and investors cannot invest directly in an index. The Fund seeks to exceed this target by holding positions in specific Prudential mutual funds. In response to market developments, the Fund’s investment subadviser may vary its holdings in those funds (within specified ranges). Past performance is not indicative of future results.
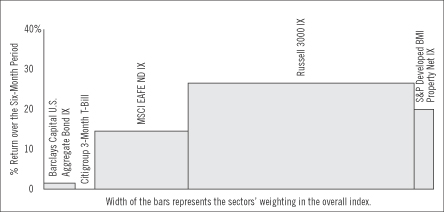
Source: Lipper Inc.
The Barclays Capital U.S. Aggregate Bond Index is an unmanaged index of investment-grade securities issued by the U.S. government and its agencies and by corporations with between one and 10 years remaining to maturity. It gives a broad look at how bond prices of short- and intermediate-term bonds have performed.
The Citigroup 3-Month T-Bill Index is an unmanaged index representing monthly return equivalents of yield averages of the last 3-month Treasury Bill issues.
The Morgan Stanley Capital International Europe, Australasia, and Far East Net Dividend Index (MSCI EAFE ND Index) is an unmanaged, weighted index that reflects stock price movements in Europe, Australasia, and the Far East. It gives a broad look at how foreign stock prices have performed.
The Russell 3000 Index is an unmanaged index which represents the U.S. equity market—it covers about 98% of all investable stocks in the U.S.
The Standard & Poor’s (S&P) Developed BMI Property Net Index is an unmanaged, broad market index of more than 400 companies from 21 countries, and is available for a wide range of regions (including ex-U.S.) as well as by country.
Investors cannot invest directly in an index or average.
| | | | |
| Prudential Asset Allocation Funds | | | 13 | |
Fees and Expenses (Unaudited)
As a shareholder of a Fund, you incur two types of costs: (1) transaction costs, including sales charges (loads) on purchase payments and redemptions, as applicable, and (2) ongoing costs, including management fees, distribution and/or service (12b-1) fees, and other Fund expenses, as applicable. These examples are intended to help you understand your ongoing costs (in dollars) of investing in the Funds and to compare these costs with the ongoing costs of investing in other mutual funds.
These examples are based on an investment of $1,000 invested on October 1, 2011, at the beginning of the period, and held through the six-month period ended March 31, 2012. These examples are for illustrative purposes only; you should consult the Prospectus for information on initial and subsequent minimum investment requirements.
The Fund’s transfer agent may charge additional fees to holders of certain accounts that are not included in the expenses shown in the tables on the following pages. These fees apply to individual retirement accounts (IRAs) and Section 403(b) accounts. As of the close of the six-month period covered by the tables, IRA fees included an annual maintenance fee of $15 per account (subject to a maximum annual maintenance fee of $25 for all accounts held by the same shareholder). Section 403(b) accounts are charged an annual $25 fiduciary maintenance fee. Some of the fees may vary in amount, or may be waived, based on your total account balance or the number of Prudential Investments funds, including the Fund, that you own. You should consider the additional fees that were charged to your Fund account over the six-month period when you estimate the total ongoing expenses paid over the period and the impact of these fees on your ending account value, as these additional expenses are not reflected in the information provided in the expense tables. Additional fees have the effect of reducing investment returns.
Actual Expenses
The first line for each share class in the tables on the following pages provides information about actual account values and actual expenses. You may use the information on this line, together with the amount you invested, to estimate the expenses that you paid over the period. Simply divide your account value by $1,000 (for example, an $8,600 account value ÷ $1,000 = 8.6), then multiply the result by the number on the first line under the heading “Expenses Paid During the Six-Month Period” to estimate the expenses you paid on your account during this period.
| | |
| 14 | | Visit our website at www.prudentialfunds.com |
Hypothetical Example for Comparison Purposes
The second line for each share class in the tables below provides information about hypothetical account values and hypothetical expenses based on the Fund’s actual expense ratio and an assumed rate of return of 5% per year before expenses, which is not the Fund’s actual return. The hypothetical account values and expenses may not be used to estimate the actual ending account balance or expenses you paid for the period. You may use this information to compare the ongoing costs of investing in the Fund and other funds. To do so, compare this 5% hypothetical example with the 5% hypothetical examples that appear in the shareholder reports of the other funds.
Please note that the expenses shown in the tables are meant to highlight your ongoing costs only and do not reflect any transactional costs such as sales charges (loads). Therefore, the second line for each share class in the tables is useful in comparing ongoing costs only and will not help you determine the relative total costs of owning different funds. In addition, if these transactional costs were included, your costs would have been higher.
| | | | | | | | | | | | | | | | | | |
Prudential
Conservative
Allocation Fund | | Beginning Account
Value
October 1, 2011 | | | Ending Account
Value
March 31, 2012 | | | Annualized
Expense Ratio
Based on the
Six-Month Period | | | Expenses Paid
During the
Six-Month Period* | |
| | | | | | | | | | | | | | | | | | |
| Class A | | Actual | | $ | 1,000.00 | | | $ | 1,105.80 | | | | 1.57 | % | | $ | 8.27 | |
| | | Hypothetical | | $ | 1,000.00 | | | $ | 1,017.15 | | | | 1.57 | % | | $ | 7.92 | |
| | | | | | | | | | | | | | | | | | |
| Class B | | Actual | | $ | 1,000.00 | | | $ | 1,101.20 | | | | 2.32 | % | | $ | 12.19 | |
| | | Hypothetical | | $ | 1,000.00 | | | $ | 1,013.40 | | | | 2.32 | % | | $ | 11.68 | |
| | | | | | | | | | | | | | | | | | |
| Class C | | Actual | | $ | 1,000.00 | | | $ | 1,102.10 | | | | 2.32 | % | | $ | 12.19 | |
| | | Hypothetical | | $ | 1,000.00 | | | $ | 1,013.40 | | | | 2.32 | % | | $ | 11.68 | |
| | | | | | | | | | | | | | | | | | |
| Class R | | Actual | | $ | 1,000.00 | | | $ | 1,104.10 | | | | 1.82 | % | | $ | 9.57 | |
| | | Hypothetical | | $ | 1,000.00 | | | $ | 1,015.90 | | | | 1.82 | % | | $ | 9.17 | |
| | | | | | | | | | | | | | | | | | |
| Class Z | | Actual | | $ | 1,000.00 | | | $ | 1,107.70 | | | | 1.32 | % | | $ | 6.96 | |
| | | Hypothetical | | $ | 1,000.00 | | | $ | 1,018.40 | | | | 1.32 | % | | $ | 6.66 | |
| | | | |
| Prudential Asset Allocation Funds | | | 15 | |
Fees and Expenses (continued)
| | | | | | | | | | | | | | | | | | |
Prudential
Moderate
Allocation Fund | | Beginning Account
Value
October 1, 2011 | | | Ending Account
Value
March 31, 2012 | | | Annualized
Expense Ratio
Based on the
Six-Month Period | | | Expenses Paid
During the
Six-Month Period* | |
| | | | | | | | | | | | | | | | | | |
| Class A | | Actual | | $ | 1,000.00 | | | $ | 1,154.40 | | | | 1.71 | % | | $ | 9.21 | |
| | | Hypothetical | | $ | 1,000.00 | | | $ | 1,016.45 | | | | 1.71 | % | | $ | 8.62 | |
| | | | | | | | | | | | | | | | | | |
| Class B | | Actual | | $ | 1,000.00 | | | $ | 1,149.60 | | | | 2.46 | % | | $ | 13.22 | |
| | | Hypothetical | | $ | 1,000.00 | | | $ | 1,012.70 | | | | 2.46 | % | | $ | 12.38 | |
| | | | | | | | | | | | | | | | | | |
| Class C | | Actual | | $ | 1,000.00 | | | $ | 1,150.60 | | | | 2.46 | % | | $ | 13.23 | |
| | | Hypothetical | | $ | 1,000.00 | | | $ | 1,012.70 | | | | 2.46 | % | | $ | 12.38 | |
| | | | | | | | | | | | | | | | | | |
| Class R | | Actual | | $ | 1,000.00 | | | $ | 1,153.90 | | | | 1.96 | % | | $ | 10.55 | |
| | | Hypothetical | | $ | 1,000.00 | | | $ | 1,015.20 | | | | 1.96 | % | | $ | 9.87 | |
| | | | | | | | | | | | | | | | | | |
| Class Z | | Actual | | $ | 1,000.00 | | | $ | 1,156.30 | | | | 1.46 | % | | $ | 7.87 | |
| | | Hypothetical | | $ | 1,000.00 | | | $ | 1,017.70 | | | | 1.46 | % | | $ | 7.36 | |
| | | | | | | | | | | | | | | | | | |
| | | | | | | | | | | | | | | | | | |
Prudential
Growth
Allocation Fund | | Beginning Account Value October 1, 2011 | | | Ending Account
Value
March 31, 2012 | | | Annualized
Expense Ratio
Based on the
Six-Month Period | | | Expenses Paid
During the
Six-Month Period* | |
| | | | | | | | | | | | | | | | | | |
| Class A | | Actual | | $ | 1,000.00 | | | $ | 1,204.80 | | | | 1.85 | % | | $ | 10.20 | |
| | | Hypothetical | | $ | 1,000.00 | | | $ | 1,015.75 | | | | 1.85 | % | | $ | 9.32 | |
| | | | | | | | | | | | | | | | | | |
| Class B | | Actual | | $ | 1,000.00 | | | $ | 1,200.70 | | | | 2.60 | % | | $ | 14.30 | |
| | | Hypothetical | | $ | 1,000.00 | | | $ | 1,012.00 | | | | 2.60 | % | | $ | 13.08 | |
| | | | | | | | | | | | | | | | | | |
| Class C | | Actual | | $ | 1,000.00 | | | $ | 1,200.50 | | | | 2.60 | % | | $ | 14.30 | |
| | | Hypothetical | | $ | 1,000.00 | | | $ | 1,012.00 | | | | 2.60 | % | | $ | 13.08 | |
| | | | | | | | | | | | | | | | | | |
| Class R | | Actual | | $ | 1,000.00 | | | $ | 1,204.10 | | | | 2.10 | % | | $ | 11.57 | |
| | | Hypothetical | | $ | 1,000.00 | | | $ | 1,014.50 | | | | 2.10 | % | | $ | 10.58 | |
| | | | | | | | | | | | | | | | | | |
| Class Z | | Actual | | $ | 1,000.00 | | | $ | 1,205.60 | | | | 1.60 | % | | $ | 8.82 | |
| | | Hypothetical | | $ | 1,000.00 | | | $ | 1,017.00 | | | | 1.60 | % | | $ | 8.07 | |
* Fund expenses (net of fee waivers or subsidies, if any) for each share class are equal to the annualized expense ratio for each share class (provided in the table), multiplied by the average account value over the period, multiplied by the 183 days in the six-month period ended March 31, 2012, and divided by the 366 days in the Fund’s fiscal year ending September 30, 2012 (to reflect the six-month period). Expenses presented in the table include the expenses of any underlying portfolios in which the Fund may invest.
| | |
| 16 | | Visit our website at www.prudentialfunds.com |
Prudential Conservative Allocation Fund
Portfolio of Investments
as of March 31, 2012 (Unaudited)
| | | | | | | | |
| Description | | Shares | | | Value (Note 1) | |
LONG-TERM INVESTMENTS 99.1% | | | | | | | | |
| | |
AFFILIATED REGISTERED INVESTMENT COMPANIES | | | | | | | | |
Prudential Global Real Estate Fund (Class Z) | | | 310,734 | | | $ | 6,168,064 | |
Prudential Government Income Fund, Inc. (Class Z) | | | 1,520,990 | | | | 15,103,433 | |
Prudential High Yield Fund, Inc. (Class Q) | | | 669,102 | | | | 3,713,516 | |
Prudential International Equity Fund (Class Z) | | | 1,642,736 | | | | 9,839,986 | |
Prudential Jennison 20/20 Focus Fund (Class Q)* | | | 145,955 | | | | 2,579,023 | |
Prudential Jennison Equity Opportunity Fund (Class Z) | | | 164,252 | | | | 2,598,468 | |
Prudential Jennison Growth Fund (Class Z)* | | | 65,765 | | | | 1,475,770 | |
Prudential Jennison Market Neutral Fund (Class Z)* | | | 373,709 | | | | 3,662,352 | |
Prudential Jennison Mid-Cap Growth Fund, Inc. (Class Q) | | | 119,539 | | | | 3,938,800 | |
Prudential Jennison Natural Resources Fund, Inc. (Class Q)* | | | 48,728 | | | | 2,452,501 | |
Prudential Jennison Small Company Fund, Inc. (Class Q) | | | 80,998 | | | | 1,846,755 | |
Prudential Jennison Value Fund (Class Q) | | | 317,680 | | | | 4,917,693 | |
Prudential Large-Cap Core Equity Fund (Class Z) | | | 503,378 | | | | 6,402,974 | |
Prudential Mid-Cap Value Fund (Class Q) | | | 81,198 | | | | 1,233,396 | |
Prudential Short-Term Corporate Bond Fund, Inc. (Class Q) | | | 3,359,127 | | | | 38,663,547 | |
Prudential Small-Cap Value Fund (Class Z) | | | 125,176 | | | | 1,836,336 | |
Prudential Strategic Value Fund (Class Z) | | | 337,169 | | | | 3,698,742 | |
Prudential Total Return Bond Fund, Inc. (Class Q) | | | 815,333 | | | | 11,545,120 | |
| | | | | | | | |
TOTAL LONG-TERM INVESTMENTS
(cost $102,383,528) | | | | | | | 121,676,476 | |
| | | | | | | | |
| | |
SHORT-TERM INVESTMENT 1.0% | | | | | | | | |
| | |
AFFILIATED MONEY MARKET MUTUAL FUND | | | | | | | | |
Prudential Investment Portfolios 2 - Prudential Core Taxable Money Market Fund
(cost $1,253,429; Note 3) | | | 1,253,429 | | | | 1,253,429 | |
| | | | | | | | |
TOTAL INVESTMENTS(a) 100.1%
(cost $103,636,957; Note 5) | | | | | | | 122,929,905 | |
Liabilities in excess of other assets (0.1)% | | | | | | | (164,923 | ) |
| | | | | | | | |
NET ASSETS 100.0% | | | | | | $ | 122,764,982 | |
| | | | | | | | |
| * | Non-income producing security. |
| (a) | Prudential Investments LLC, the manager of the Fund, also serves as the manager of the underlying funds in which the Fund invests. |
See Notes to Financial Statements.
| | | | |
| Prudential Asset Allocation Funds | | | 17 | |
Prudential Conservative Allocation Fund
Portfolio of Investments
as of March 31, 2012 (Unaudited) continued
Various inputs are used in determining the value of the Fund’s investments. These inputs are summarized in the three broad levels listed below.
Level 1—quoted prices generally for securities actively traded on a regulated securities exchange and for open-end mutual funds which trade at daily net asset value.
Level 2—other significant observable inputs (including, but not limited to, quoted prices for similar securities, interest rates, prepayment speeds, foreign currency exchange rates and amortized cost) generally for debt securities, swaps, forward foreign currency contracts and for foreign stocks priced using vendor modeling tools.
Level 3—significant unobservable inputs valued in accordance with Board approved fair valuation procedures
The following is a summary of the inputs used as of March 31, 2012 in valuing such portfolio securities:
| | | | | | | | | | | | |
| | | Level 1 | | | Level 2 | | | Level 3 | |
Investments in Securities | | | | | | | | | | | | |
Affiliated Registered Investment Companies | | $ | 121,676,476 | | | $ | — | | | $ | — | |
Affiliated Money Market Mutual Fund | | | 1,253,429 | | | | — | | | | — | |
| | | | | | | | | | | | |
Total | | $ | 122,929,905 | | | $ | — | | | $ | — | |
| | | | | | | | | | | | |
The investment allocation of portfolio holdings and liabilities in excess of other assets shown as a percentage of net assets as of March 31, 2012 were as follows:
| | | | |
Short-Term Debt | | | 31.5 | % |
U.S. Government Debt | | | 12.3 | |
Large-Cap Core | | | 10.3 | |
Multi-Sector Debt | | | 9.4 | |
International | | | 8.0 | |
Global Real Estate | | | 5.1 | |
Large/Mid-Cap Growth | | | 4.4 | |
Large-Cap Value | | | 4.0 | |
High Yield | | | 3.0 | |
Strategic Value | | | 3.0 | % |
Small/Mid-Cap Value | | | 2.5 | |
Multi-Cap Value | | | 2.1 | |
Natural Resources | | | 2.0 | |
Small-Cap Core | | | 1.5 | |
| | | | |
| | | 99.1 | |
Short-Term Investment | | | 1.0 | |
Liabilities in excess of other assets | | | (0.1 | ) |
| | | | |
| | | 100.0 | % |
| | | | |
See Notes to Financial Statements.
| | |
| 18 | | Visit our website at www.prudentialfunds.com |
Prudential Moderate Allocation Fund
Portfolio of Investments
as of March 31, 2012 (Unaudited)
| | | | | | | | |
| Description | | Shares | | | Value (Note 1) | |
LONG-TERM INVESTMENTS 99.2% | | | | | | | | |
| | |
AFFILIATED REGISTERED INVESTMENT COMPANIES | | | | | | | | |
Prudential Global Real Estate Fund (Class Z) | | | 375,987 | | | $ | 7,463,348 | |
Prudential Government Income Fund, Inc. (Class Z) | | | 1,670,277 | | | | 16,585,850 | |
Prudential High Yield Fund, Inc. (Class Q) | | | 813,633 | | | | 4,515,661 | |
Prudential International Equity Fund (Class Z) | | | 3,231,681 | | | | 19,357,770 | |
Prudential Jennison 20/20 Focus Fund (Class Q)* | | | 361,400 | | | | 6,385,934 | |
Prudential Jennison Equity Opportunity Fund (Class Z) | | | 386,986 | | | | 6,122,119 | |
Prudential Jennison Growth Fund (Class Z)* | | | 158,940 | | | | 3,566,609 | |
Prudential Jennison Market Neutral Fund (Class Z)* | | | 604,404 | | | | 5,923,159 | |
Prudential Jennison Mid-Cap Growth Fund, Inc. (Class Q) | | | 239,691 | | | | 7,897,807 | |
Prudential Jennison Natural Resources Fund, Inc. (Class Q)* | | | 88,628 | | | | 4,460,636 | |
Prudential Jennison Small Company Fund, Inc. (Class Q) | | | 195,538 | | | | 4,458,258 | |
Prudential Jennison Value Fund (Class Q) | | | 480,928 | | | | 7,444,759 | |
Prudential Large-Cap Core Equity Fund (Class Z) | | | 960,821 | | | | 12,221,644 | |
Prudential Mid-Cap Value Fund (Class Q) | | | 196,655 | | | | 2,987,190 | |
Prudential Short-Term Corporate Bond Fund, Inc. (Class Q) | | | 1,201,111 | | | | 13,824,792 | |
Prudential Small-Cap Value Fund (Class Z) | | | 302,940 | | | | 4,444,133 | |
Prudential Strategic Value Fund (Class Z) | | | 815,998 | | | | 8,951,494 | |
Prudential Total Return Bond Fund, Inc. (Class Q) | | | 756,938 | | | | 10,718,248 | |
| | | | | | | | |
TOTAL LONG-TERM INVESTMENTS
(cost $117,686,879) | | | | | | | 147,329,411 | |
| | | | | | | | |
| | |
SHORT-TERM INVESTMENT 1.1% | | | | | | | | |
| | |
AFFILIATED MONEY MARKET MUTUAL FUND | | | | | | | | |
Prudential Investment Portfolios 2 - Prudential Core Taxable Money Market Fund
(cost $1,606,288; Note 3) | | | 1,606,288 | | | | 1,606,288 | |
| | | | | | | | |
TOTAL INVESTMENTS(a) 100.3%
(cost $119,293,167; Note 5) | | | | | | | 148,935,699 | |
Liabilities in excess of other assets (0.3)% | | | | | | | (412,098 | ) |
| | | | | | | | |
NET ASSETS 100.0% | | | | | | $ | 148,523,601 | |
| | | | | | | | |
| * | Non-income producing security. |
| (a) | Prudential Investments LLC, the manager of the Fund, also serves as the manager of the underlying funds in which the Fund invests. |
See Notes to Financial Statements.
| | | | |
| Prudential Asset Allocation Funds | | | 19 | |
Prudential Moderate Allocation Fund
Portfolio of Investments
as of March 31, 2012 (Unaudited) continued
Various inputs are used in determining the value of the Fund’s investments. These inputs are summarized in the three broad levels listed below.
Level 1—quoted prices generally for securities actively traded on a regulated securities exchange and for open-end mutual funds which trade at daily net asset value.
Level 2—other significant observable inputs (including, but not limited to, quoted prices for similar securities, interest rates, prepayment speeds, foreign currency exchange rates and amortized cost) generally for debt securities, swaps, forward foreign currency contracts and for foreign stocks priced using vendor modeling tools.
Level 3—significant unobservable inputs for securities valued in accordance with Board approved fair valuation procedures.
The following is a summary of the inputs used as of March 31, 2012 in valuing such portfolio securities:
| | | | | | | | | | | | |
| | | Level 1 | | | Level 2 | | | Level 3 | |
Investments in Securities | | | | | | | | | | | | |
Affiliated Registered Investment Companies | | $ | 147,329,411 | | | $ | — | | | $ | — | |
Affiliated Money Market Mutual Fund | | | 1,606,288 | | | | — | | | | — | |
| | | | | | | | | | | | |
Total | | $ | 148,935,699 | | | $ | — | | | $ | — | |
| | | | | | | | | | | | |
The investment allocation of portfolio holdings and liabilities in excess of other assets shown as a percentage of net assets as of March 31, 2012 were as follows:
| | | | |
Large-Cap Core | | | 16.5 | % |
International | | | 13.1 | |
U.S. Government Debt | | | 11.2 | |
Short-Term Debt | | | 9.3 | |
Large/Mid-Cap Growth | | | 7.7 | |
Multi-Sector Debt | | | 7.2 | |
Strategic Value | | | 6.0 | |
Global Real Estate | | | 5.0 | |
Large-Cap Value | | | 5.0 | |
Small/Mid-Cap Value | | | 5.0 | % |
Multi-Cap Value | | | 4.1 | |
High Yield | | | 3.1 | |
Natural Resources | | | 3.0 | |
Small-Cap Core | | | 3.0 | |
| | | | |
| | | 99.2 | |
Short-Term Investment | | | 1.1 | |
Liabilities in excess of other assets | | | (0.3 | ) |
| | | | |
| | | 100.0 | % |
| | | | |
See Notes to Financial Statements.
| | |
| 20 | | Visit our website at www.prudentialfunds.com |
Prudential Growth Allocation Fund
Portfolio of Investments
as of March 31, 2012 (Unaudited)
| | | | | | | | |
| Description | | Shares | | | Value (Note 1) | |
LONG-TERM INVESTMENTS 99.1% | | | | | | | | |
| | |
AFFILIATED REGISTERED INVESTMENT COMPANIES | | | | | | | | |
Prudential Global Real Estate Fund (Class Z) | | | 198,029 | | | $ | 3,930,880 | |
Prudential Government Income Fund, Inc. (Class Z) | | | 79,236 | | | | 786,812 | |
Prudential International Equity Fund (Class Z) | | | 2,490,279 | | | | 14,916,774 | |
Prudential Jennison 20/20 Focus Fund (Class Q)* | | | 238,769 | | | | 4,219,040 | |
Prudential Jennison Equity Opportunity Fund (Class Z) | | | 362,515 | | | | 5,734,991 | |
Prudential Jennison Growth Fund (Class Z)* | | | 121,936 | | | | 2,736,243 | |
Prudential Jennison Market Neutral Fund (Class Z)* | | | 398,074 | | | | 3,901,125 | |
Prudential Jennison Mid-Cap Growth Fund, Inc. (Class Q) | | | 152,504 | | | | 5,025,017 | |
Prudential Jennison Natural Resources Fund, Inc. (Class Q)* | | | 62,329 | | | | 3,136,994 | |
Prudential Jennison Small Company Fund, Inc. (Class Q) | | | 154,238 | | | | 3,516,633 | |
Prudential Jennison Value Fund (Class Q) | | | 354,965 | | | | 5,494,853 | |
Prudential Large-Cap Core Equity Fund (Class Z) | | | 691,362 | | | | 8,794,126 | |
Prudential Mid-Cap Value Fund (Class Q) | | | 154,844 | | | | 2,352,086 | |
Prudential Small-Cap Value Fund (Class Z) | | | 238,724 | | | | 3,502,088 | |
Prudential Strategic Value Fund (Class Z) | | | 572,438 | | | | 6,279,647 | |
Prudential Total Return Bond Fund, Inc. (Class Q) | | | 233,132 | | | | 3,301,146 | |
| | | | | | | | |
TOTAL LONG-TERM INVESTMENTS
(cost $61,789,293) | | | | | | | 77,628,455 | |
| | | | | | | | |
| | |
SHORT-TERM INVESTMENT 1.0% | | | | | | | | |
| | |
AFFILIATED MONEY MARKET MUTUAL FUND | | | | | | | | |
Prudential Investment Portfolios 2 - Prudential Core Taxable Money Market Fund
(cost $752,675; Note 3) | | | 752,675 | | | | 752,675 | |
| | | | | | | | |
TOTAL INVESTMENTS(a) 100.1%
(cost $62,541,968; Note 5) | | | | | | | 78,381,130 | |
Liabilities in excess of other assets (0.1)% | | | | | | | (90,069 | ) |
| | | | | | | | |
NET ASSETS 100.0% | | | | | | $ | 78,291,061 | |
| | | | | | | | |
| * | Non-income producing security. |
| (a) | Prudential Investments LLC, the manager of the Fund, also serves as the manager of the underlying funds in which the Fund invests. |
See Notes to Financial Statements.
| | | | |
| Prudential Asset Allocation Funds | | | 21 | |
Prudential Growth Allocation Fund
Portfolio of Investments
as of March 31, 2012 (Unaudited) continued
Various inputs are used in determining the value of the Fund’s investments. These inputs are summarized in the three broad levels listed below.
Level 1—quoted prices generally for securities actively traded on a regulated securities exchange and for open-end mutual funds which trade at daily net asset value.
Level 2—other significant observable inputs (including, but not limited to, quoted prices for similar securities, interest rates, prepayment speeds, foreign currency exchange rates, and amortized cost) generally for debt securities, swaps, forward foreign currency contracts and for foreign stocks priced using vendor modeling tools.
Level 3—significant unobservable inputs for securities valued in accordance with Board approved fair valuation procedures.
The following is a summary of the inputs used as of March 31, 2012 in valuing such portfolio securities:
| | | | | | | | | | | | |
| | | Level 1 | | | Level 2 | | | Level 3 | |
Investments in Securities | | | | | | | | | | | | |
Affiliated Registered Investment Companies | | $ | 77,628,455 | | | $ | — | | | $ | — | |
Affiliated Money Market Mutual Fund | | | 752,675 | | | | — | | | | — | |
| | | | | | | | | | | | |
Total | | $ | 78,381,130 | | | $ | — | | | $ | — | |
| | | | | | | | | | | | |
The investment allocation of portfolio holdings and liabilities in excess of other assets shown as a percentage of net assets as of March 31, 2012 were as follows:
| | | | |
Large-Cap Core | | | 21.6 | % |
International | | | 19.1 | |
Small/Mid-Cap Value | | | 13.9 | |
Large/Mid-Cap Growth | | | 10.8 | |
Strategic Value | | | 8.0 | |
Large-Cap Value | | | 7.0 | |
Global Real Estate | | | 5.0 | |
Small-Cap Core | | | 4.5 | |
Multi-Sector Debt | | | 4.2 | % |
Natural Resources | | | 4.0 | |
U.S. Government Debt | | | 1.0 | |
| | | | |
| | | 99.1 | |
Short-Term Investment | | | 1.0 | |
Liabilities in excess of other assets | | | (0.1 | ) |
| | | | |
| | | 100.0 | % |
| | | | |
See Notes to Financial Statements.
| | |
| 22 | | Visit our website at www.prudentialfunds.com |
Financial Statements
(Unaudited)
| | |
| MARCH 31, 2012 | | SEMIANNUAL REPORT |
Prudential Asset Allocation Funds
Prudential Conservative Allocation Fund
Statement of Assets and Liabilities
as of March 31, 2012 (Unaudited)
| | | | |
Assets | | | | |
Affiliated investments (cost $103,636,957) | | $ | 122,929,905 | |
Receivable for investments sold | | | 425,000 | |
Dividends receivable | | | 205,252 | |
Receivable for Fund shares sold | | | 150,038 | |
Prepaid expenses | | | 177 | |
| | | | |
Total assets | | | 123,710,372 | |
| | | | |
| |
Liabilities | | | | |
Payable for investments purchased | | | 633,001 | |
Accrued expenses | | | 110,881 | |
Payable for Fund shares reacquired | | | 94,195 | |
Distribution fee payable | | | 65,472 | |
Management fee payable | | | 18,330 | |
Payable to custodian | | | 16,871 | |
Affiliated transfer agent fee payable | | | 6,640 | |
| | | | |
Total liabilities | | | 945,390 | |
| | | | |
| |
Net Assets | | $ | 122,764,982 | |
| | | | |
| | | | | |
Net assets were comprised of: | | | | |
Common stock, at par | | $ | 10,062 | |
Paid-in capital in excess of par | | | 106,535,102 | |
| | | | |
| | | 106,545,164 | |
Undistributed net investment income | | | 238,566 | |
Accumulated net realized loss on investment transactions | | | (3,311,696 | ) |
Net unrealized appreciation on investments | | | 19,292,948 | |
| | | | |
Net assets, March 31, 2012 | | $ | 122,764,982 | |
| | | | |
See Notes to Financial Statements.
| | |
| 24 | | Visit our website at www.prudentialfunds.com |
| | | | |
Class A | | | | |
Net asset value and redemption price per share
($56,724,188 ÷ 4,639,752 shares of common stock issued and outstanding) | | $ | 12.23 | |
Maximum sales charge (5.50% of offering price) | | | 0.71 | |
| | | | |
Maximum offering price to public | | $ | 12.94 | |
| | | | |
| |
Class B | | | | |
Net asset value, offering price and redemption price per share
($45,319,137 ÷ 3,722,586 shares of common stock issued and outstanding) | | $ | 12.17 | |
| | | | |
| |
Class C | | | | |
Net asset value, offering price and redemption price per share
($17,551,259 ÷ 1,441,329 shares of common stock issued and outstanding) | | $ | 12.18 | |
| | | | |
| |
Class R | | | | |
Net asset value, offering price and redemption price per share
($38,522 ÷ 3,142 shares of common stock issued and outstanding) | | $ | 12.26 | |
| | | | |
| |
Class Z | | | | |
Net asset value, offering price and redemption price per share
($3,131,876 ÷ 255,145 shares of common stock issued and outstanding) | | $ | 12.27 | |
| | | | |
See Notes to Financial Statements.
| | | | |
| Prudential Asset Allocation Funds | | | 25 | |
Prudential Moderate Allocation Fund
Statement of Assets and Liabilities
as of March 31, 2012 (Unaudited)
| | | | |
Assets | | | | |
Affiliated investments (cost $119,293,167) | | $ | 148,935,699 | |
Cash | | | 46,148 | |
Receivable for investments sold | | | 765,000 | |
Receivable for Fund shares sold | | | 286,766 | |
Dividends receivable | | | 138,546 | |
Prepaid expenses | | | 177 | |
| | | | |
Total assets | | | 150,172,336 | |
| | | | |
| |
Liabilities | | | | |
Payable for investments purchased | | | 1,206,434 | |
Payable for Fund shares reacquired | | | 213,772 | |
Accrued expenses | | | 110,985 | |
Distribution fee payable | | | 79,579 | |
Management fee payable | | | 25,055 | |
Affiliated transfer agent fee payable | | | 12,910 | |
| | | | |
Total liabilities | | | 1,648,735 | |
| | | | |
| |
Net Assets | | $ | 148,523,601 | |
| | | | |
| | | | | |
Net assets were comprised of: | | | | |
Common stock, at par | | $ | 11,787 | |
Paid-in capital in excess of par | | | 131,142,405 | |
| | | | |
| | | 131,154,192 | |
Undistributed net investment income | | | 438,066 | |
Accumulated net realized loss on investment transactions | | | (12,711,189 | ) |
Net unrealized appreciation on investments | | | 29,642,532 | |
| | | | |
Net assets, March 31, 2012 | | $ | 148,523,601 | |
| | | | |
See Notes to Financial Statements.
| | |
| 26 | | Visit our website at www.prudentialfunds.com |
| | | | |
Class A | | | | |
Net asset value and redemption price per share
($69,535,402 ÷ 5,505,398 shares of common stock issued and outstanding) | | $ | 12.63 | |
Maximum sales charge (5.50% of offering price) | | | 0.74 | |
| | | | |
Maximum offering price to public | | $ | 13.37 | |
| | | | |
| |
Class B | | | | |
Net asset value, offering price and redemption price per share
($56,959,041 ÷ 4,529,951 shares of common stock issued and outstanding) | | $ | 12.57 | |
| | | | |
| |
Class C | | | | |
Net asset value, offering price and redemption price per share
($19,575,115 ÷ 1,557,335 shares of common stock issued and outstanding) | | $ | 12.57 | |
| | | | |
| |
Class R | | | | |
Net asset value, offering price and redemption price per share
($7,087 ÷ 562 shares of common stock issued and outstanding) | | $ | 12.61 | |
| | | | |
| |
Class Z | | | | |
Net asset value, offering price and redemption price per share
($2,446,956 ÷ 193,727 shares of common stock issued and outstanding) | | $ | 12.63 | |
| | | | |
See Notes to Financial Statements.
| | | | |
| Prudential Asset Allocation Funds | | | 27 | |
Prudential Growth Allocation Fund
Statement of Assets and Liabilities
as of March 31, 2012 (Unaudited)
| | | | |
Assets | | | | |
Affiliated investments (cost $62,541,968) | | $ | 78,381,130 | |
Receivable for investments sold | | | 605,000 | |
Receivable for Fund shares sold | | | 50,237 | |
Dividends receivable | | | 12,328 | |
Prepaid expenses | | | 179 | |
| | | | |
Total assets | | | 79,048,874 | |
| | | | |
| |
Liabilities | | | | |
Payable for investments purchased | | | 552,579 | |
Accrued expenses | | | 97,179 | |
Distribution fee payable | | | 41,910 | |
Payable to custodian | | | 39,094 | |
Management fee payable | | | 1,864 | |
Payable for Fund shares reacquired | | | 13,138 | |
Affiliated transfer agent fee payable | | | 12,049 | |
| | | | |
Total liabilities | | | 757,813 | |
| | | | |
| |
Net Assets | | $ | 78,291,061 | |
| | | | |
| | | | | |
Net assets were comprised of: | | | | |
Common stock, at par | | $ | 5,882 | |
Paid-in capital in excess of par | | | 72,151,695 | |
| | | | |
| | | 72,157,577 | |
Undistributed net investment income | | | 311,520 | |
Accumulated net realized loss on investment transactions | | | (10,017,198 | ) |
Net unrealized appreciation on investments | | | 15,839,162 | |
| | | | |
Net assets, March 31, 2012 | | $ | 78,291,061 | |
| | | | |
See Notes to Financial Statements.
| | |
| 28 | | Visit our website at www.prudentialfunds.com |
| | | | |
Class A | | | | |
Net asset value and redemption price per share
($37,744,397 ÷ 2,789,751 shares of common stock issued and outstanding) | | $ | 13.53 | |
Maximum sales charge (5.50% of offering price) | | | 0.79 | |
| | | | |
Maximum offering price to public | | $ | 14.32 | |
| | | | |
| |
Class B | | | | |
Net asset value, offering price and redemption price per share
($30,306,286 ÷ 2,313,385 shares of common stock issued and outstanding) | | $ | 13.10 | |
| | | | |
| |
Class C | | | | |
Net asset value, offering price and redemption price per share
($9,518,177 ÷ 725,923 shares of common stock issued and outstanding) | | $ | 13.11 | |
| | | | |
| |
Class R | | | | |
Net asset value, offering price and redemption price per share
($2,534 ÷ 188.4 shares of common stock issued and outstanding) | | $ | 13.45 | |
| | | | |
| |
Class Z | | | | |
Net asset value, offering price and redemption price per share
($719,667 ÷ 52,675 shares of common stock issued and outstanding) | | $ | 13.66 | |
| | | | |
See Notes to Financial Statements.
| | | | |
| Prudential Asset Allocation Funds | | | 29 | |
Prudential Conservative Allocation Fund
Statement of Operations
Six Months Ended March 31, 2012 (Unaudited)
| | | | |
Net Investment Income | | | | |
Affiliated dividend income | | $ | 1,813,180 | |
| | | | |
| |
Expenses | | | | |
Management fee | | | 123,458 | |
Distribution fee—Class A | | | 70,685 | |
Distribution fee—Class B | | | 226,685 | |
Distribution fee—Class C | | | 93,859 | |
Distribution fee—Class R | | | 99 | |
Transfer agent’s fees and expenses (including affiliated expense of $16,500) (Note 3) | | | 74,000 | |
Registration fees | | | 39,000 | |
Custodian’s fees and expenses | | | 37,000 | |
Reports to shareholders | | | 14,000 | |
Audit fee | | | 11,000 | |
Legal fees and expenses | | | 9,000 | |
Directors’ fees | | | 7,000 | |
Miscellaneous | | | 6,498 | |
| | | | |
Total expenses | | | 712,284 | |
Less: Expense subsidy (Note 2) | | | (12,140 | ) |
| | | | |
Net expenses | | | 700,144 | |
| | | | |
Net investment income | | | 1,113,036 | |
| | | | |
| |
Net Realized And Unrealized Gain (Loss) On Affiliated Investments | | | | |
Net realized gain on investment transactions | | | 2,288,092 | |
Net capital gain distributions received | | | 888,583 | |
| | | | |
| | | 3,176,675 | |
Net change in unrealized appreciation (depreciation) on investments | | | 7,781,751 | |
| | | | |
Net gain on investments | | | 10,958,426 | |
| | | | |
Net Increase In Net Assets Resulting From Operations | | $ | 12,071,462 | |
| | | | |
See Notes to Financial Statements.
| | |
| 30 | | Visit our website at www.prudentialfunds.com |
Prudential Moderate Allocation Fund
Statement of Operations
Six Months Ended March 31, 2012 (Unaudited)
| | | | |
Net Investment Income | | | | |
Affiliated dividend income | | $ | 1,739,519 | |
| | | | |
| |
Expenses | | | | |
Management fee | | | 142,674 | |
Distribution fee—Class A | | | 81,407 | |
Distribution fee—Class B | | | 284,082 | |
Distribution fee—Class C | | | 91,033 | |
Distribution fee—Class R | | | 26 | |
Transfer agent’s fees and expenses (including affiliated expense of $29,200) (Note 3) | | | 97,000 | |
Registration fees | | | 40,000 | |
Custodian’s fees and expenses | | | 36,000 | |
Reports to shareholders | | | 14,000 | |
Audit fee | | | 11,000 | |
Legal fees and expenses | | | 9,000 | |
Directors’ fees | | | 7,000 | |
Miscellaneous | | | 5,470 | |
| | | | |
Total expenses | | | 818,692 | |
Less: Expense subsidy (Note 2) | | | (5,437 | ) |
| | | | |
Net expenses | | | 813,255 | |
| | | | |
Net investment income | | | 926,264 | |
| | | | |
| |
Net Realized And Unrealized Gain (Loss) On Affiliated Investments | | | | |
Net realized gain on investment transactions | | | 3,824,783 | |
Net capital gain distributions received | | | 1,232,237 | |
| | | | |
| | | 5,057,020 | |
Net change in unrealized appreciation (depreciation) on investments | | | 14,032,286 | |
| | | | |
Net gain on investments | | | 19,089,306 | |
| | | | |
Net Increase In Net Assets Resulting From Operations | | $ | 20,015,570 | |
| | | | |
See Notes to Financial Statements.
| | | | |
| Prudential Asset Allocation Funds | | | 31 | |
Prudential Growth Allocation Fund
Statement of Operations
Six Months Ended March 31, 2012 (Unaudited)
| | | | |
Net Investment Income | | | | |
Affiliated dividend income | | $ | 734,517 | |
| | | | |
| |
Expenses | | | | |
Management fee | | | 74,083 | |
Distribution fee—Class A | | | 43,152 | |
Distribution fee—Class B | | | 149,760 | |
Distribution fee—Class C | | | 44,929 | |
Distribution fee—Class R | | | 6 | |
Transfer agent’s fees and expenses (including affiliated expense of $24,600) (Note 3) | | | 70,000 | |
Registration fees | | | 37,000 | |
Custodian’s fees and expenses | | | 35,000 | |
Audit fee | | | 11,000 | |
Reports to shareholders | | | 11,000 | |
Legal fees and expenses | | | 11,000 | |
Directors’ fees | | | 6,000 | |
Miscellaneous | | | 5,750 | |
| | | | |
Total expenses | | | 498,680 | |
Less: Expense subsidy (Note 2) | | | (75,683 | ) |
| | | | |
Net expenses | | | 422,997 | |
| | | | |
Net investment income | | | 311,520 | |
| | | | |
| |
Net Realized And Unrealized Gain (Loss) On Affiliated Investments | | | | |
Net realized gain (loss) on Investment transactions | | | 1,321,462 | |
Net capital gain distributions received | | | 796,483 | |
| | | | |
| | | 2,117,945 | |
Net change in unrealized appreciation (depreciation) on investments | | | 11,028,418 | |
| | | | |
Net gain on investments | | | 13,146,363 | |
| | | | |
Net Increase In Net Assets Resulting From Operations | | $ | 13,457,883 | |
| | | | |
See Notes to Financial Statements.
| | |
| 32 | | Visit our website at www.prudentialfunds.com |
Prudential Conservative Allocation Fund
Statement of Changes in Net Assets
(Unaudited)
| | | | | | | | |
| |
| Six Months
Ended
March 31, 2012 |
| |
| Year
Ended
September 30, 2011 |
|
Increase (Decrease) In Net Assets | | | | | | | | |
Operations | | | | | | | | |
Net investment income | | $ | 1,113,036 | | | $ | 1,978,195 | |
Net realized gain on investment transactions | | | 2,288,092 | | | | 2,035,819 | |
Net capital gain distributions received | | | 888,583 | | | | 173,196 | |
Net change in unrealized appreciation (depreciation) on investments | | | 7,781,751 | | | | (5,043,375 | ) |
| | | | | | | | |
Net increase (decrease) in net assets resulting from operations | | | 12,071,462 | | | | (856,165 | ) |
| | | | | | | | |
| | |
Dividends from net investment income (Note 1) | | | | | | | | |
Class A | | | (706,134 | ) | | | (995,474 | ) |
Class B | | | (395,593 | ) | | | (637,559 | ) |
Class C | | | (159,256 | ) | | | (254,069 | ) |
Class R | | | (529 | ) | | | (785 | ) |
Class Z | | | (36,466 | ) | | | (31,800 | ) |
| | | | | | | | |
| | | (1,297,978 | ) | | | (1,919,687 | ) |
| | | | | | | | |
| | |
Fund share transactions (Net of share conversions) (Note 6) | | | | | | | | |
Net proceeds from shares sold | | | 8,832,694 | | | | 34,718,533 | |
Net asset value of shares issued in reinvestment of dividends and distributions | | | 1,089,083 | | | | 1,637,878 | |
Cost of shares reacquired | | | (18,978,574 | ) | | | (26,777,206 | ) |
| | | | | | | | |
Net increase (decrease) in net assets from Fund share transactions | | | (9,056,797 | ) | | | 9,579,205 | |
| | | | | | | | |
Total increase | | | 1,716,687 | | | | 6,803,353 | |
| | |
Net Assets: | | | | | | | | |
Beginning of period | | | 121,048,295 | | | | 114,244,942 | |
| | | | | | | | |
End of period(a) | | $ | 122,764,982 | | | $ | 121,048,295 | |
| | | | | | | | |
(a) Includes undistributed net investment income of: | | $ | 238,566 | | | $ | 423,508 | |
| | | | | | | | |
See Notes to Financial Statements.
| | | | |
| Prudential Asset Allocation Funds | | | 33 | |
Prudential Moderate Allocation Fund
Statement of Changes in Net Assets
(Unaudited)
| | | | | | | | |
| |
| Six Months
Ended
March 31, 2012 |
| |
| Year
Ended
September 30, 2011 |
|
Increase (Decrease) In Net Assets | | | | | | | | |
Operations | | | | | | | | |
Net investment income | | $ | 926,264 | | | $ | 1,225,307 | |
Net realized gain on investment transactions | | | 3,824,783 | | | | 4,469,191 | |
Net capital gain distributions received | | | 1,232,237 | | | | 136,850 | |
Net change in unrealized appreciation (depreciation) on investments | | | 14,032,286 | | | | (7,865,682 | ) |
| | | | | | | | |
Net increase (decrease) in net assets resulting from operations | | | 20,015,570 | | | | (2,034,334 | ) |
| | | | | | | | |
| | |
Dividends from net investment income (Note 1) | | | | | | | | |
Class A | | | (869,317 | ) | | | (779,380 | ) |
Class B | | | (329,834 | ) | | | (366,506 | ) |
Class C | | | (105,427 | ) | | | (93,090 | ) |
Class R | | | (129 | ) | | | (25 | ) |
Class Z | | | (41,396 | ) | | | (28,435 | ) |
| | | | | | | | |
| | | (1,346,103 | ) | | | (1,267,436 | ) |
| | | | | | | | |
| | |
Fund share transactions (Net of share conversions) (Note 6) | | | | | | | | |
Net proceeds from shares sold | | | 7,640,486 | | | | 24,038,317 | |
Net asset value of shares issued in reinvestment of dividends | | | 1,281,064 | | | | 1,222,912 | |
Cost of shares reacquired | | | (13,027,206 | ) | | | (34,168,978 | ) |
| | | | | | | | |
Net decrease in net assets from Fund share transactions | | | (4,105,656 | ) | | | (8,907,749 | ) |
| | | | | | | | |
Total increase (decrease) | | | 14,563,811 | | | | (12,209,519 | ) |
| | |
Net Assets: | | | | | | | | |
Beginning of period | | | 133,959,790 | | | | 146,169,309 | |
| | | | | | | | |
End of period(a) | | $ | 148,523,601 | | | $ | 133,959,790 | |
| | | | | | | | |
(a) Includes undistributed net investment income of: | | $ | 438,066 | | | $ | 857,905 | |
| | | | | | | | |
See Notes to Financial Statements.
| | |
| 34 | | Visit our website at www.prudentialfunds.com |
Prudential Growth Allocation Fund
Statement of Changes in Net Assets
(Unaudited)
| | | | | | | | |
| | | Six Months
Ended
March 31, 2012 | | | Year
Ended
September 30, 2011 | |
Increase (Decrease) In Net Assets | | | | | | | | |
Operations | | | | | | | | |
Net investment income (loss) | | $ | 311,520 | | | $ | (94,176 | ) |
Net realized gain on investment and foreign currency transactions | | | 1,321,462 | | | | 1,840,640 | |
Net capital gain distributions received | | | 796,483 | | | | 58,425 | |
Net change in unrealized appreciation (depreciation) on investments and foreign currencies | | | 11,028,418 | | | | (4,115,834 | ) |
| | | | | | | | |
Net increase (decrease) in net assets resulting from operations | | | 13,457,883 | | | | (2,310,945 | ) |
| | | | | | | | |
| | |
Fund share transactions (Net of share conversions) (Note 6) | | | | | | | | |
Net proceeds from shares sold | | | 3,712,533 | | | | 12,201,484 | |
Cost of shares reacquired | | | (6,179,024 | ) | | | (14,973,942 | ) |
| | | | | | | | |
Net decrease in net assets from Fund share transactions | | | (2,466,491 | ) | | | (2,772,458 | ) |
| | | | | | | | |
Total increase (decrease) | | | 10,991,392 | | | | (5,083,403 | ) |
| | |
Net Assets: | | | | | | | | |
Beginning of period | | | 67,299,669 | | | | 72,383,072 | |
| | | | | | | | |
End of period(a) | | $ | 78,291,061 | | | $ | 67,299,669 | |
| | | | | | | | |
(a) Includes undistributed net investment income of: | | $ | 311,520 | | | $ | — | |
| | | | | | | | |
See Notes to Financial Statements.
| | | | |
| Prudential Asset Allocation Funds | | | 35 | |
Notes to Financial Statements
(Unaudited)
The Prudential Investment Portfolios, Inc. (the “Company”) is an open-end management investment company, registered under the Investment Company Act of 1940, as amended (the “1940 Act”). The Company was incorporated in Maryland on August 10, 1995 and consists of six series (“Fund” or “Funds”): Prudential Jennison Equity Opportunity Fund, Prudential Jennison Growth Fund and Prudential Asset Allocation Fund which are diversified funds and Prudential Conservative Allocation Fund (“Conservative Allocation Fund”), Prudential Moderate Allocation Fund (“Moderate Allocation Fund”) and Prudential Growth Allocation Fund (“Growth Allocation Fund”) which are non-diversified. These financial statements relate to the Conservative Allocation Fund, Moderate Allocation Fund and Growth Allocation Fund (collectively referred to as the “Allocation Funds”).
The Conservative Allocation Fund’s investment objective is current income and a reasonable level of capital appreciation. The Moderate Allocation Fund’s investment objective is capital appreciation and a reasonable level of current income. The Growth Allocation Fund’s investment objective is long-term capital appreciation. Each Allocation Fund seeks to achieve its objective by investing in a combination of mutual funds in the Prudential mutual fund family (each, an underlying fund). Each Fund in the Allocation Funds is typically referred to as a “Fund of Funds” because it invests in other mutual funds. The Allocation Funds may also invest directly in U.S. Government securities and money market instruments for cash management purposes or when assuming a defensive position.
Note 1. Accounting Policies
The following is a summary of significant accounting policies followed by the Company and the Allocation Funds in the preparation of their financial statements.
Securities Valuation: Investments in the underlying funds are valued at the closing net asset value per share of each underlying fund as reported on each business day.
Securities Transactions and Net Investment Income: Securities transactions are recorded on the trade date. Realized gains or losses on sales of investments are calculated on the identified cost basis. Dividend income is recorded on the ex-dividend date. Expenses are recorded on an accrual basis and such expenses exclude those of the underlying funds. Expenses on the underlying funds are reflected in the net asset values of those funds.
| | |
| 36 | | Visit our website at www.prudentialfunds.com |
Net investment income or loss (other than distribution fees, which are charged directly to the respective class) and unrealized and realized gains or losses are allocated daily to each class of shares based upon the relative proportion of adjusted net assets of each class at the beginning of the day.
Dividends and Distributions: Dividends will typically be distributed quarterly by the Conservative Allocation Fund and annually by the Moderate Allocation Fund and the Growth Allocation Fund. Each Allocation Fund declares and pays its net realized capital gains, if any, at least annually. Dividends and distributions to shareholders, which are determined in accordance with federal income tax regulations and which may differ from generally accepted accounting principles, are recorded on the ex-dividend date. Permanent book/tax differences relating to income and gains are reclassified amongst undistributed net investment income, accumulated net realized gain or loss and paid-in capital in excess of par, as appropriate.
Taxes: For federal income tax purposes, each Fund in the Company is treated as a separate taxpaying entity. It is each of the Allocation Funds’ policy to continue to meet the requirements of the Internal Revenue Code applicable to regulated investment companies and to distribute all of its net investment income and capital gains, if any, to its shareholders. Therefore, no federal income tax provision is required.
Estimates: The preparation of the financial statements requires management to make estimates and assumptions that affect the reported amounts and disclosures in the financial statements. Actual results could differ from those estimates.
Note 2. Agreements
The Company has a management agreement for the Allocation Funds with Prudential Investments LLC (“PI”). Pursuant to this agreement, PI has responsibility for all investment advisory services and supervises the subadvisor’s performance of such services. PI has entered into a subadvisory agreement with Quantitative Management Associates LLC (“QMA”). The subadvisory agreement provides that QMA furnishes investment advisory services in connection with the management of the Allocation Funds. In connection therewith, QMA is obligated to keep certain books and records of the Allocation Funds. PI pays for the services of QMA, the compensation of officers of the Allocation Funds, occupancy and certain clerical and bookkeeping costs of the Allocation Funds. The Allocation Funds bear all other costs and expenses.
The management fee paid to PI is computed daily and payable monthly at an annual rate of .20% of each of the Allocation Funds’ average daily net assets.
| | | | |
| Prudential Asset Allocation Funds | | | 37 | |
Notes to Financial Statements
(Unaudited) continued
The Allocation Funds have a distribution agreement with Prudential Investment Management Services LLC (“PIMS”), which acts as the distributor of the Class A, Class B, Class C, Class R and Class Z shares of the Allocation Funds. The Allocation Funds compensate PIMS for distributing and servicing the Allocation Funds’ Class A, B, C and R shares, pursuant to plans of distribution (the “Class A, B, C and R Plans”), regardless of expenses actually incurred by PIMS. The distribution fees are accrued daily and payable monthly. No distribution or service fees are paid to PIMS as distributor of the Class Z shares of the Allocation Funds.
Pursuant to the Class A, B, C and R Plans, the Allocation Funds compensate PIMS for distribution-related activities at an annual rate of up to .30%, 1%, 1% and .75% of the average daily net assets of the Class A, B, C and R shares, respectively. PIMS contractually agreed to limit such fees to .25% of the average daily net assets of the Class A shares and .50% of the average daily net assets of the Class R shares.
PI has contractually agreed to limit the net annual operating expenses (exclusive of taxes, interest, brokerage commissions, non-routine expenses, distribution and service (12b-1) fees and underlying fund fees and expenses) of each class of shares of the Allocation Funds to .50% of each Allocation Funds’ average daily net assets.
PIMS has advised the Allocation Funds of its receipt of front-end sales charges resulting from sales of Class A shares during the six months ended March 31, 2012. These amounts were as follows:
| | | | |
Fund | | Class A | |
Conservative Allocation Fund | | $ | 66,703 | |
Moderate Allocation Fund | | | 82,991 | |
Growth Allocation Fund | | | 56,154 | |
From these fees, PIMS paid such sales charges to dealers, which in turn paid commissions to salespersons and incurred other distribution costs.
PIMS has advised the Allocation Funds of its receipt of contingent deferred sales charges imposed upon certain redemptions by certain Class B and Class C shareholders for the six months ended March 31, 2012. These amounts were as follows:
| | | | | | | | |
Fund | | Class B | | | Class C | |
Conservative Allocation Fund | | $ | 74,620 | | | $ | 2,624 | |
Moderate Allocation Fund | | | 91,516 | | | | 1,149 | |
Growth Allocation Fund | | | 38,998 | | | | 595 | |
| | |
| 38 | | Visit our website at www.prudentialfunds.com |
PI, QMA and PIMS are indirect, wholly-owned subsidiaries of Prudential Financial, Inc. (“Prudential”).
Note 3. Other Transactions with Affiliates
Prudential Mutual Fund Services LLC (“PMFS”), an affiliate of PI and an indirect, wholly-owned subsidiary of Prudential, serves as the Company’s transfer agent. Transfer agent fees and expenses in the Statement of Operations include certain out-of-pocket expenses paid to non-affiliates, where applicable.
The Allocation Funds invest in the Prudential Core Taxable Money Market Fund (the “Core Fund”), a portfolio of the Prudential Investment Portfolios 2, registered under the 1940 Act and managed by PI. Earnings from the Core Fund are disclosed on the Statement of Operations as affiliated dividend income.
Note 4. Investments in Affiliated Issuers
A summary of cost of purchases and proceeds of sales of shares of affiliated registered investment companies, other than short-term investments, for the six months ended March 31, 2012 is presented as follows:
Conservative Allocation Fund:
| | | | | | | | | | | | | | | | | | | | | | | | | | | | |
Affiliated
Registered
Investment
Company | | Value,
beginning
of period | | | Cost of
Purchases | | | Exchange | | | Proceeds
of Sales | | | Dividend
Income | | | Capital Gain
Distributions
Received | | | Value,
ending of
period | |
Prudential Global Real Estate Fund (Class Z) | | $ | 5,742,397 | | | $ | 271,873 | | | $ | — | | | $ | 1,047,000 | | | $ | 46,873 | | | $ | — | | | $ | 6,168,064 | |
Prudential Government Income Fund, Inc. (Class Z) | | | 15,363,922 | | | | 1,442,876 | | | | — | | | | 1,668,000 | | | | 200,842 | | | | — | | | | 15,103,433 | |
Prudential High Yield Fund, Inc. (Class Q) | | | — | | | | 157,690 | | | | 4,685,755 | | | | 1,778,000 | | | | 149,234 | | | | — | | | | 3,713,516 | |
Prudential High Yield Fund, Inc. (Class Z) | | | 4,999,938 | | | | 2,259 | | | | (4,685,755 | ) | | | 40,000 | | | | 34,330 | | | | — | | | | — | |
Prudential International Equity Fund (Class Z) | | | 8,850,372 | | | | 791,457 | | | | — | | | | 1,133,000 | | | | 216,457 | | | | — | | | | 9,839,986 | |
Prudential Jennison 20/20 Focus Fund (Class Q) | | | 3,580,176 | | | | 144,552 | | | | — | | | | 1,832,000 | | | | — | | | | 94,552 | | | | 2,579,023 | |
| | | | |
| Prudential Asset Allocation Funds | | | 39 | |
Notes to Financial Statements
(Unaudited) continued
Conservative Allocation Fund (cont’d.):
| | | | | | | | | | | | | | | | | | | | | | | | | | | | |
Affiliated
Registered
Investment
Company | | Value,
beginning
of period | | | Cost of
Purchases | | | Exchange | | | Proceeds
of Sales | | | Dividend
Income | | | Capital Gain
Distributions
Received | | | Value,
ending of
period | |
Prudential Jennison Equity Opportunity Fund (Class Z) | | $ | 2,473,843 | | | $ | 57,609 | | | $ | — | | | $ | 565,000 | | | $ | 7,609 | | | $ | — | | | $ | 2,598,468 | |
Prudential Jennison Growth Fund
(Class Z) | | | 2,531,746 | | | | — | | | | — | | | | 1,644,000 | | | | — | | | | — | | | | 1,475,770 | |
Prudential Jennison Market Neutral Fund (Class Z) | | | 3,809,043 | | | | 115,000 | | | | — | | | | 278,000 | | | | — | | | | — | | | | 3,662,352 | |
Prudential Jennison Mid-Cap Growth Fund, Inc. (Class Q) | | | 2,394,717 | | | | 1,325,743 | | | | — | | | | 413,000 | | | | 12,918 | | | | 12,826 | | | | 3,938,800 | |
Prudential Jennison Natural Resources Fund, Inc. (Class Q) | | | 2,014,419 | | | | 415,000 | | | | — | | | | 377,000 | | | | — | | | | — | | | | 2,452,501 | |
Prudential Jennison Small Company Fund, Inc. (Class Q) | | | 1,717,047 | | | | 7,763 | | | | — | | | | 324,000 | | | | 7,763 | | | | — | | | | 1,846,755 | |
Prudential Jennison Value Fund (Class Q) | | | — | | | | 174,160 | | | | 4,578,625 | | | | 1,979,000 | | | | 49,160 | | | | — | | | | 4,917,693 | |
Prudential Jennison Value Fund (Class Z) | | | 5,790,998 | | | | — | | | | (4,578,625 | ) | | | 350,000 | | | | — | | | | — | | | | — | |
Prudential Large-Cap Core Equity Fund (Class Z) | | | 6,236,385 | | | | 506,240 | | | | — | | | | 1,460,000 | | | | 79,680 | | | | 426,560 | | | | 6,402,974 | |
Prudential Mid-Cap Value Fund (Class Q) | | | 2,320,668 | | | | 31,855 | | | | — | | | | 1,601,000 | | | | 31,855 | | | | — | | | | 1,233,396 | |
Prudential Short-Term Corporate Bond Fund, Inc. (Class Q) | | | — | | | | 15,675 | | | | 37,253,903 | | | | 310,000 | | | | 107,448 | | | | — | | | | 38,663,547 | |
Prudential Short-Term Corporate Bond Fund, Inc. (Class Z) | | | 34,374,460 | | | | 7,345,102 | | | | (37,253,903 | ) | | | 3,297,000 | | | | 564,710 | | | | — | | | | — | |
Prudential Small-Cap Value Fund (Class Z) | | | 1,725,385 | | | | 18,700 | | | | — | | | | 354,000 | | | | 18,700 | | | | — | | | | 1,836,336 | |
| | |
| 40 | | Visit our website at www.prudentialfunds.com |
Conservative Allocation Fund (cont’d.):
| | | | | | | | | | | | | | | | | | | | | | | | | | | | |
Affiliated
Registered
Investment
Company | | Value,
beginning
of period | | | Cost of
Purchases | | | Exchange | | | Proceeds
of Sales | | | Dividend
Income | | | Capital Gain
Distributions
Received | | | Value,
ending of
period | |
Prudential Strategic Value Fund (Class Z) | | $ | — | | | $ | 3,900,000 | | | $ | — | | | $ | 325,000 | | | $ | — | | | $ | — | | | $ | 3,698,742 | |
Prudential Total Return Bond Fund, Inc. (Class Q) | | | 16,131,597 | | | | 1,136,965 | | | | — | | | | 5,744,000 | | | | 284,358 | | | | 354,645 | | | | 11,545,120 | |
| | | | | | | | | | | | | | | | | | | | | | | | | | | | |
Total | | $ | 120,057,113 | | | $ | 17,860,519 | | | $ | — | | | $ | 26,519,000 | | | $ | 1,811,937 | | | $ | 888,583 | | | $ | 121,676,476 | |
| | | | | | | | | | | | | | | | | | | | | | | | | | | | |
Moderate Allocation Fund:
| | | | | | | | | | | | | | | | | | | | | | | | | | | | |
Affiliated
Registered
Investment
Company | | Value,
beginning
of period | | | Cost of
Purchases | | | Exchange | | | Proceeds
of Sales | | | Dividend
Income | | | Capital Gain
Distributions
Received | | | Value,
ending of
period | |
Prudential Global Real Estate Fund (Class Z) | | $ | 6,298,094 | | | $ | 328,619 | | | $ | — | | | $ | 506,330 | | | $ | 53,619 | | | $ | — | | | $ | 7,463,348 | |
Prudential Government Income Fund, Inc. (Class Z) | | | 13,332,632 | | | | 4,390,916 | | | | — | | | | 1,087,040 | | | | 187,226 | | | | — | | | | 16,585,850 | |
Prudential High Yield Fund, Inc. (Class Q) | | | — | | | | 189,045 | | | | 3,947,073 | | | | 213,240 | | | | 140,506 | | | | — | | | | 4,515,661 | |
Prudential High Yield Fund, Inc. (Class Z) | | | 4,201,471 | | | | 51,900 | | | | (3,947,073 | ) | | | 45,000 | | | | 28,840 | | | | — | | | | — | |
Prudential International Equity Fund (Class Z) | | | 16,648,763 | | | | 1,479,073 | | | | — | | | | 1,290,370 | | | | 404,073 | | | | — | | | | 19,357,770 | |
Prudential Jennison 20/20 Focus Fund (Class Q) | | | 6,512,081 | | | | 579,510 | | | | — | | | | 2,022,060 | | | | — | | | | 179,509 | | | | 6,385,934 | |
Prudential Jennison Equity Opportunity Fund (Class Z) | | | 5,378,377 | | | | 41,924 | | | | — | | | | 698,090 | | | | 16,924 | | | | — | | | | 6,122,119 | |
Prudential Jennison Growth Fund (Class Z) | | | 4,156,504 | | | | 350,000 | | | | — | | | | 1,978,550 | | | | — | | | | — | | | | 3,566,609 | |
Prudential Jennison Market Neutral Fund (Class Z) | | | 5,588,306 | | | | 530,000 | | | | — | | | | 217,350 | | | | — | | | | — | | | | 5,923,159 | |
Prudential Jennison Mid-Cap Growth Fund, Inc. (Class Q) | | | 5,343,667 | | | | 1,668,965 | | | | — | | | | 497,440 | | | | 29,588 | | | | 29,377 | | | | 7,897,807 | |
| | | | |
| Prudential Asset Allocation Funds | | | 41 | |
Notes to Financial Statements
(Unaudited) continued
Moderate Allocation Fund (cont’d.):
| | | | | | | | | | | | | | | | | | | | | | | | | | | | |
Affiliated
Registered
Investment
Company | | Value,
beginning
of period | | | Cost of
Purchases | | | Exchange | | | Proceeds
of Sales | | | Dividend
Income | | | Capital Gain
Distributions
Received | | | Value,
ending of
period | |
Prudential Jennison Natural Resources Fund, Inc. (Class Q) | | $ | 3,342,640 | | | $ | 605,000 | | | $ | — | | | $ | 147,670 | | | $ | — | | | $ | — | | | $ | 4,460,636 | |
Prudential Jennison Small Company Fund, Inc. (Class Q) | | | 3,923,334 | | | | 47,622 | | | | — | | | | 538,020 | | | | 17,622 | | | | — | | | | 4,458,258 | |
Prudential Jennison Value Fund (Class Q) | | | — | | | | 239,846 | | | | 8,572,096 | | | | 5,065,440 | | | | 89,846 | | | | — | | | | 7,444,759 | |
Prudential Jennison Value Fund (Class Z) | | | 10,467,651 | | | | — | | | | (8,572,096 | ) | | | 505,000 | | | | — | | | | — | | | | — | |
Prudential Large-Cap Core Equity Fund (Class Z) | | | 10,946,058 | | | | 914,369 | | | | — | | | | 1,661,100 | | | | 143,918 | | | | 770,451 | | | | 12,221,644 | |
Prudential Mid-Cap Value Fund (Class Q) | | | 5,276,130 | | | | 72,143 | | | | — | | | | 3,467,440 | | | | 72,143 | | | | — | | | | 2,987,190 | |
Prudential Short-Term Corporate Bond Fund, Inc. (Class Q) | | | — | | | | 105,591 | | | | 12,794,622 | | | | 175,000 | | | | 38,005 | | | | — | | | | 13,824,792 | |
Prudential Short-Term Corporate Bond Fund, Inc. (Class Z) | | | 16,204,513 | | | | 1,602,995 | | | | (12,794,622 | ) | | | 4,160,740 | | | | 259,988 | | | | — | | | | — | |
Prudential Small-Cap Value Fund (Class Z) | | | 3,908,911 | | | | 42,691 | | | | — | | | | 533,110 | | | | 42,691 | | | | — | | | | 4,444,133 | |
Prudential Strategic Value Fund (Class Z) | | | — | | | | 9,000,000 | | | | — | | | | 340,000 | | | | — | | | | — | | | | 8,951,494 | |
Prudential Total Return Bond Fund, Inc. (Class Q) | | | 11,308,247 | | | | 1,046,880 | | | | — | | | | 1,644,570 | | | | 213,119 | | | | 252,900 | | | | 10,718,248 | |
| | | | | | | | | | | | | | | | | | | | | | | | | | | | |
Total | | $ | 132,837,379 | | | $ | 23,287,089 | | | $ | — | | | $ | 26,793,560 | | | $ | 1,738,108 | | | $ | 1,232,237 | | | $ | 147,329,411 | |
| | | | | | | | | | | | | | | | | | | | | | | | | | | | |
| | |
| 42 | | Visit our website at www.prudentialfunds.com |
Growth Allocation Fund:
| | | | | | | | | | | | | | | | | | | | | | | | | | | | |
Affiliated
Registered
Investment
Company | | Value,
beginning
of period | | | Cost of
Purchases | | | Exchange | | | Proceeds
of Sales | | | Dividend
Income | | | Capital Gain
Distributions
Received | | | Value,
end of
period | |
Prudential Global Real Estate Fund (Class Z) | | $ | 3,223,197 | | | $ | 217,728 | | | $ | — | | | $ | 200,000 | | | $ | 27,728 | | | $ | — | | | $ | 3,930,880 | |
Prudential Government Income Fund, Inc. (Class Z) | | | — | | | | 865,600 | | | | — | | | | 75,000 | | | | 2,182 | | | | — | | | | 786,812 | |
Prudential International Equity Fund (Class Z) | | | 12,349,107 | | | | 1,056,886 | | | | — | | | | 350,000 | | | | 306,886 | | | | — | | | | 14,916,774 | |
Prudential Jennison 20/20 Focus Fund (Class Q) | | | 4,011,214 | | | | 397,041 | | | | — | | | | 1,010,000 | | | | — | | | | 112,042 | | | | 4,219,040 | |
Prudential Jennison Equity Opportunity Fund (Class Z) | | | 4,758,354 | | | | 65,370 | | | | — | | | | 335,000 | | | | 15,370 | | | | — | | | | 5,734,991 | |
Prudential Jennison Growth Fund (Class Z) | | | 2,760,572 | | | | 225,000 | | | | — | | | | 970,000 | | | | — | | | | — | | | | 2,736,243 | |
Prudential Jennison Market Neutral Fund (Class Z) | | | 3,521,159 | | | | 590,000 | | | | — | | | | 225,000 | | | | — | | | | — | | | | 3,901,125 | |
Prudential Jennison Mid-Cap Growth Fund, Inc. (Class Q) | | | 3,377,346 | | | | 1,037,575 | | | | — | | | | 270,000 | | | | 18,855 | | | | 18,720 | | | | 5,025,017 | |
Prudential Jennison Natural Resources Fund, Inc. (Class Q) | | | 2,304,298 | | | | 540,000 | | | | — | | | | 160,000 | | | | — | | | | — | | | | 3,136,994 | |
Prudential Jennison Small Company Fund, Inc. (Class Q) | | | 3,004,694 | | | | 43,727 | | | | — | | | | 320,000 | | | | 13,727 | | | | — | | | | 3,516,633 | |
Prudential Jennison Value Fund (Class Q) | | | — | | | | 64,665 | | | | 7,257,299 | | | | 3,395,000 | | | | 64,665 | | | | — | | | | 5,494,853 | |
Prudential Jennison Value Fund (Class Z) | | | 7,357,707 | | | | — | | | | (7,257,299 | ) | | | 160,000 | | | | — | | | | — | | | | — | |
Prudential Large-Cap Core Equity Fund (Class Z) | | | 7,539,349 | | | | 691,629 | | | | — | | | | 855,000 | | | | 100,990 | | | | 540,639 | | | | 8,794,126 | |
Prudential Mid-Cap Value Fund (Class Q) | | | 4,012,404 | | | | 56,596 | | | | — | | | | 2,560,000 | | | | 56,596 | | | | — | | | | 2,352,086 | |
Prudential Small-Cap Value Fund (Class Z) | | | 3,005,387 | | | | 33,482 | | | | — | | | | 325,000 | | | | 33,482 | | | | — | | | | 3,502,088 | |
| | | | |
| Prudential Asset Allocation Funds | | | 43 | |
Notes to Financial Statements
(Unaudited) continued
Growth Allocation Fund (cont’d.):
| | | | | | | | | | | | | | | | | | | | | | | | | | | | |
Affiliated
Registered
Investment
Company | | Value,
beginning
of period | | | Cost of
Purchases | | | Exchange | | | Proceeds
of Sales | | | Dividend
Income | | | Capital Gain
Distributions
Received | | | Value,
end of
period | |
Prudential Strategic Value Fund (Class Z) | | $ | — | | | $ | 6,275,000 | | | $ | — | | | $ | 200,000 | | | $ | — | | | $ | — | | | $ | 6,279,647 | |
Prudential Total Return Bond Fund, Inc. (Class Q) | | | 5,428,071 | | | | 747,838 | | | | — | | | | 2,885,000 | | | | 93,352 | | | | 125,082 | | | | 3,301,146 | |
| | | | | | | | | | | | | | | | | | | | | | | | | | | | |
Total | | $ | 66,652,859 | | | $ | 12,908,137 | | | $ | — | | | $ | 14,295,000 | | | $ | 733,833 | | | $ | 796,483 | | | $ | 77,628,455 | |
| | | | | | | | | | | | | | | | | | | | | | | | | | | | |
Note 5. Distributions and Tax Information
Distributions to shareholders, which are determined in accordance with federal income tax regulations, which may differ from generally accepted accounting principles, are recorded on the ex-dividend date.
The United States federal income tax basis and net unrealized appreciation of the Funds’ investments as of March 31, 2012 were as follows:
| | | | | | | | | | | | | | | | |
Fund | | Tax Basis | | | Appreciation | | | Depreciation | | | Net
Unrealized
Appreciation | |
| Conservative Allocation Fund | | $ | 108,326,060 | | | $ | 14,650,201 | | | $ | (46,356 | ) | | $ | 14,603,845 | |
| Moderate Allocation Fund | | | 127,579,075 | | | | 21,440,188 | | | | (83,564 | ) | | | 21,356,624 | |
| Growth Allocation Fund | | | 66,690,314 | | | | 11,745,091 | | | | (54,275 | ) | | | 11,690,816 | |
The difference between book basis and tax basis was primarily attributable to deferred losses on wash sales as of the most recent fiscal year end.
For federal income tax purposes the following Allocation Funds elected to treat post-October losses incurred in the period November 1, 2010 to September 30, 2011 as having been incurred in the following year (September 30, 2012). In addition, certain Allocation Funds had capital loss carryforwards as of September 30, 2011.
| | |
| 44 | | Visit our website at www.prudentialfunds.com |
Accordingly, no capital gains distributions are expected to be paid to shareholders until net gains have been realized in excess of such carryforwards. The approximate amounts were as follows:
| | | | | | | | |
Fund | | Post-October
Capital Losses | | | Capital Loss
Carryforward | |
Conservative Allocation Fund | | $ | 72,000 | | | | $1,728,000(a) | |
Moderate Allocation Fund | | | 69,000 | | | | 9,414,000(b) | |
Growth Allocation Fund | | | — | | | | 7,987,000(c) | |
| (a) | $62,000 expiring in 2017 and $1,666,000 expiring in 2018. |
| (b) | $386,000 expiring in 2017 and $9,028,000 expiring in 2018. |
| (c) | $682,000 expiring in 2017, $6,702,000 expiring in 2018 and $603,000 expiring in 2019. |
Under the recently enacted Regulated Investment Company Modernization Act of 2010, the Allocation Funds are permitted to carryforward capital losses incurred in taxable years beginning after December 22, 2010 (“post-enactment losses”) for an unlimited period. However, any post-enactment losses are required to be utilized before the utilization of losses incurred prior to the effective date of the Act. As a result of this ordering rule, capital loss carryforwards related to the taxable years beginning prior to the effective date of the Act may have an increased likelihood to expire unused. Additionally, post-enactment capital losses that are carried forward will retain their character as either short-term or long-term capital losses rather than being considered all short-term as under previous law.
Management has analyzed the Company’s tax positions taken on federal income tax returns for all open tax years and has concluded that no provision for income tax is required in the Allocation Funds’ financial statements for the current reporting period. The Company’s federal and state income and federal excise tax returns for tax years for which the applicable statutes of limitations have not expired are subject to examination by the Internal Revenue Service and state departments of revenue.
Note 6. Capital
There are 6.25 billion shares of $.001 par value of common stock of the Company authorized which are divided into six series. Each of the Allocation Funds has five classes, designated Class A, Class B, Class C, Class R and Class Z shares, each of which consists of 250 million, 250 million, 250 million, 100 million, and 150 million authorized shares, respectively. Each class of par value shares represents an interest in the same assets of the Company and is identical in all respects except that (1) each class is subject to different sales charges and distribution and/or service fees (except for Class Z shares, which are not subject to any sales charges and distribution and/or
| | | | |
| Prudential Asset Allocation Funds | | | 45 | |
Notes to Financial Statements
(Unaudited) continued
services fees), which may affect performance, (2) each class has exclusive voting rights on any matter submitted to shareholders that relates solely to its arrangement and has separate voting rights on any matter submitted to shareholders in which the interests of one class differ from the interests of any other class, (3) each class has a different exchange privilege, (4) Class B shares have a conversion feature and (5) Class R and Class Z shares are offered exclusively for sale to a limited group of investors. Under certain circumstances, an exchange may be made from specified share classes of the Allocation Funds to one or more other share classes of the Allocation Funds as presented in the table of transactions in shares of common stock. As of March 31, 2012, PI owned 240, 218 and 188 shares of Class R shares of the Conservative Allocation Fund, Moderate Allocation Fund and Growth Allocation Fund, respectively.
Transactions in shares of common stock were as follows:
Conservative Allocation Fund:
| | | | | | | | |
Class A | | Shares | | | Amount | |
Six months ended March 31, 2012: | | | | | | | | |
Shares sold | | | 359,287 | | | $ | 4,252,232 | |
Shares issued in reinvestment of dividends | | | 49,610 | | | | 574,168 | |
Shares reacquired | | | (686,336 | ) | | | (8,189,091 | ) |
| | | | | | | | |
Net increase (decrease) in shares outstanding before conversion | | | (277,439 | ) | | | (3,362,691 | ) |
Shares issued upon conversion from Class B | | | 108,167 | | | | 1,287,424 | |
Shares reacquired upon conversion into Class Z | | | (2,648 | ) | | | (31,488 | ) |
| | | | | | | | |
Net increase (decrease) in shares outstanding | | | (171,920 | ) | | $ | (2,106,755 | ) |
| | | | | | | | |
Year ended September 30, 2011: | | | | | | | | |
Shares sold | | | 1,715,934 | | | $ | 20,358,543 | |
Shares issued in reinvestment of dividends | | | 70,562 | | | | 835,057 | |
Shares reacquired | | | (1,000,502 | ) | | | (11,740,323 | ) |
| | | | | | | | |
Net increase (decrease) in shares outstanding before conversion | | | 785,994 | | | | 9,453,277 | |
Shares issued upon conversion from Class B | | | 181,007 | | | | 2,136,826 | |
Shares reacquired upon conversion into Class Z | | | (2,300 | ) | | | (27,702 | ) |
| | | | | | | | |
Net increase (decrease) in shares outstanding | | | 964,701 | | | $ | 11,562,401 | |
| | | | | | | | |
| | |
| 46 | | Visit our website at www.prudentialfunds.com |
| | | | | | | | |
Class B | | Shares | | | Amount | |
Six months ended March 31, 2012: | | | | | | | | |
Shares sold | | | 141,372 | | | $ | 1,667,199 | |
Shares issued in reinvestment of dividends | | | 31,187 | | | | 360,056 | |
Shares reacquired | | | (313,528 | ) | | | (3,684,069 | ) |
| | | | | | | | |
Net increase (decrease) in shares outstanding before conversion | | | (140,969 | ) | | | (1,656,814 | ) |
Shares reacquired upon conversion into Class A | | | (108,583 | ) | | | (1,287,424 | ) |
| | | | | | | | |
Net increase (decrease) in shares outstanding | | | (249,552 | ) | | $ | (2,944,238 | ) |
| | | | | | | | |
Year ended September 30, 2011: | | | | | | | | |
Shares sold | | | 568,169 | | | $ | 6,679,162 | |
Shares issued in reinvestment of dividends | | | 50,048 | | | | 589,421 | |
Shares reacquired | | | (870,493 | ) | | | (10,288,901 | ) |
| | | | | | | | |
Net increase (decrease) in shares outstanding before conversion | | | (252,276 | ) | | | (3,020,318 | ) |
Shares reacquired upon conversion into Class A | | | (181,673 | ) | | | (2,136,826 | ) |
| | | | | | | | |
Net increase (decrease) in shares outstanding | | | (433,949 | ) | | $ | (5,157,144 | ) |
| | | | | | | | |
Class C | | | | | | |
Six months ended March 31, 2012: | | | | | | | | |
Shares sold | | | 156,235 | | | $ | 1,834,300 | |
Shares issued in reinvestment of dividends | | | 10,559 | | | | 121,933 | |
Shares reacquired | | | (552,244 | ) | | | (6,412,432 | ) |
| | | | | | | | |
Net increase (decrease) in shares outstanding | | | (385,450 | ) | | $ | (4,456,199 | ) |
| | | | | | | | |
Year ended September 30, 2011: | | | | | | | | |
Shares sold | | | 499,495 | | | $ | 5,889,172 | |
Shares issued in reinvestment of dividends | | | 15,584 | | | | 183,750 | |
Shares reacquired | | | (373,560 | ) | | | (4,388,660 | ) |
| | | | | | | | |
Net increase (decrease) in shares outstanding | | | 141,519 | | | $ | 1,684,262 | |
| | | | | | | | |
Class R | | | | | | |
Six months ended March 31, 2012: | | | | | | | | |
Shares sold | | | 404 | | | $ | 4,753 | |
Shares issued in reinvestment of dividends | | | 45 | | | | 529 | |
Shares reacquired | | | (3,885 | ) | | | (45,065 | ) |
| | | | | | | | |
Net increase (decrease) in shares outstanding | | | (3,436 | ) | | $ | (39,783 | ) |
| | | | | | | | |
Year ended September 30, 2011: | | | | | | | | |
Shares sold | | | 4,800 | | | $ | 57,190 | |
Shares issued in reinvestment of dividends | | | 66 | | | | 785 | |
Shares reacquired | | | (394 | ) | | | (4,806 | ) |
| | | | | | | | |
Net increase (decrease) in shares outstanding | | | 4,472 | | | $ | 53,169 | |
| | | | | | | | |
| | | | |
| Prudential Asset Allocation Funds | | | 47 | |
Notes to Financial Statements
(Unaudited) continued
| | | | | | | | |
Class Z | | Shares | | | Amount | |
Six months ended March 31, 2012: | | | | | | | | |
Shares sold | | | 90,551 | | | $ | 1,074,210 | |
Shares issued in reinvestment of dividends | | | 2,790 | | | | 32,397 | |
Shares reacquired | | | (54,542 | ) | | | (647,917 | ) |
| | | | | | | | |
Net increase (decrease) in shares outstanding before conversion | | | 38,799 | | | | 458,690 | |
Shares issued upon conversion from Class A | | | 2,639 | | | | 31,488 | |
| | | | | | | | |
Net increase (decrease) in shares outstanding | | | 41,438 | | | $ | 490,178 | |
| | | | | | | | |
Year ended September 30, 2011: | | | | | | | | |
Shares sold | | | 144,607 | | | $ | 1,734,466 | |
Shares issued in reinvestment of dividends | | | 2,419 | | | | 28,865 | |
Shares reacquired | | | (29,693 | ) | | | (354,516 | ) |
| | | | | | | | |
Net increase (decrease) in shares outstanding before conversion | | | 117,333 | | | | 1,408,815 | |
Shares issued upon conversion from Class A | | | 2,293 | | | | 27,702 | |
| | | | | | | | |
Net increase (decrease) in shares outstanding | | | 119,626 | | | $ | 1,436,517 | |
| | | | | | | | |
Moderate Allocation Fund:
| | | | | | | | |
Class A | | Shares | | | Amount | |
Six months ended March 31, 2012: | | | | | | | | |
Shares sold | | | 321,361 | | | $ | 3,876,776 | |
Shares issued in reinvestment of dividends | | | 71,230 | | | | 833,386 | |
Shares reacquired | | | (547,654 | ) | | | (6,569,080 | ) |
| | | | | | | | |
Net increase (decrease) in shares outstanding before conversion | | | (155,063 | ) | | | (1,858,918 | ) |
Shares issued upon conversion from Class B | | | 237,581 | | | | 2,898,477 | |
| | | | | | | | |
Net increase (decrease) in shares outstanding | | | 82,518 | | | $ | 1,039,559 | |
| | | | | | | | |
Year ended September 30, 2011: | | | | | | | | |
Shares sold | | | 887,207 | | | $ | 10,761,444 | |
Shares issued in reinvestment of dividends | | | 63,260 | | | | 758,494 | |
Shares reacquired | | | (1,259,662 | ) | | | (15,306,898 | ) |
| | | | | | | | |
Net increase (decrease) in shares outstanding before conversion | | | (309,195 | ) | | | (3,786,960 | ) |
Shares issued upon conversion from Class B | | | 438,140 | | | | 5,249,281 | |
Shares reacquired upon conversion into Class Z | | | (11,000 | ) | | | (134,975 | ) |
| | | | | | | | |
Net increase (decrease) in shares outstanding | | | 117,945 | | | $ | 1,327,346 | |
| | | | | | | | |
| | |
| 48 | | Visit our website at www.prudentialfunds.com |
| | | | | | | | |
Class B | | Shares | | | Amount | |
Six months ended March 31, 2012: | | | | | | | | |
Shares sold | | | 149,450 | | | $ | 1,797,486 | |
Shares issued in reinvestment of dividends | | | 27,907 | | | | 325,674 | |
Shares reacquired | | | (372,163 | ) | | | (4,419,924 | ) |
| | | | | | | | |
Net increase (decrease) in shares outstanding before conversion | | | (194,806 | ) | | | (2,296,764 | ) |
Shares reacquired upon conversion into Class A | | | (239,302 | ) | | | (2,898,477 | ) |
| | | | | | | | |
Net increase (decrease) in shares outstanding | | | (434,108 | ) | | $ | (5,195,241 | ) |
| | | | | | | | |
Year ended September 30, 2011: | | | | | | | | |
Shares sold | | | 622,740 | | | $ | 7,449,653 | |
Shares issued in reinvestment of dividends | | | 30,278 | | | | 362,130 | |
Shares reacquired | | | (1,110,210 | ) | | | (13,413,102 | ) |
| | | | | | | | |
Net increase (decrease) in shares outstanding before conversion | | | (457,192 | ) | | | (5,601,319 | ) |
Shares reacquired upon conversion into Class A | | | (440,959 | ) | | | (5,249,281 | ) |
| | | | | | | | |
Net increase (decrease) in shares outstanding | | | (898,151 | ) | | $ | (10,850,600 | ) |
| | | | | | | | |
Class C | | | | | | |
Six months ended March 31, 2012: | | | | | | | | |
Shares sold | | | 146,275 | | | $ | 1,782,486 | |
Shares issued in reinvestment of dividends | | | 7,070 | | | | 82,506 | |
Shares reacquired | | | (133,038 | ) | | | (1,581,618 | ) |
| | | | | | | | |
Net increase (decrease) in shares outstanding | | | 20,307 | | | $ | 283,374 | |
| | | | | | | | |
Year ended September 30, 2011: | | | | | | | | |
Shares sold | | | 408,612 | | | $ | 4,968,972 | |
Shares issued in reinvestment of dividends | | | 6,302 | | | | 75,369 | |
Shares reacquired | | | (397,934 | ) | | | (4,803,120 | ) |
| | | | | | | | |
Net increase (decrease) in shares outstanding | | | 16,980 | | | $ | 241,221 | |
| | | | | | | | |
Class R | | | | | | |
Six months ended March 31, 2012: | | | | | | | | |
Shares sold | | | 346 | | | $ | 4,374 | |
Shares issued in reinvestment of dividends | | | 11 | | | | 129 | |
Shares reacquired | | | (790 | ) | | | (9,927 | ) |
| | | | | | | | |
Net increase (decrease) in shares outstanding | | | (433 | ) | | $ | (5,424 | ) |
| | | | | | | | |
Year ended September 30, 2011: | | | | | | | | |
Shares sold | | | 779.00 | | | $ | 9,800 | |
Shares issued in reinvestment of dividends | | | 2.10 | | | | 25 | |
Shares reacquired | | | — | | | | — | |
| | | | | | | | |
Net increase (decrease) in shares outstanding | | | 781.10 | | | $ | 9,825 | |
| | | | | | | | |
| | | | |
| Prudential Asset Allocation Funds | | | 49 | |
Notes to Financial Statements
(Unaudited) continued
| | | | | | | | |
Class Z | | Shares | | | Amount | |
Six months ended March 31, 2012: | | | | | | | | |
Shares sold | | | 14,898 | | | $ | 179,364 | |
Shares issued in reinvestment of dividends | | | 3,368 | | | | 39,369 | |
Shares reacquired | | | (36,319 | ) | | | (446,657 | ) |
| | | | | | | | |
Net increase (decrease) in shares outstanding | | | (18,053 | ) | | $ | (227,924) | |
| | | | | | | | |
Year ended September 30, 2011: | | | | | | | | |
Shares sold | | | 68,899 | | | $ | 848,448 | |
Shares issued in reinvestment of dividends | | | 2,243 | | | | 26,894 | |
Shares reacquired | | | (53,047 | ) | | | (645,858 | ) |
| | | | | | | | |
Net increase (decrease) in shares outstanding before conversion | | | 18,095 | | | | 229,484 | |
Shares issued upon conversion from Class A | | | 10,991 | | | | 134,975 | |
| | | | | | | | |
Net increase (decrease) in shares outstanding | | | 29,086 | | | $ | 364,459 | |
| | | | | | | | |
Growth Allocation Fund:
| | | | | | | | |
Class A | | Shares | | | Amount | |
Six months ended March 31, 2012: | | | | | | | | |
Shares sold | | | 148,454 | | | $ | 1,898,414 | |
Shares reacquired | | | (234,555 | ) | | | (2,968,224 | ) |
| | | | | | | | |
Net increase (decrease) in shares outstanding before conversion | | | (86,101 | ) | | | (1,069,810 | ) |
Shares issued upon conversion from Class B | | | 124,944 | | | | 1,614,207 | |
| | | | | | | | |
Net increase (decrease) in shares outstanding | | | 38,843 | | | $ | 544,397 | |
| | | | | | | | |
Year ended September 30, 2011: | | | | | | | | |
Shares sold | | | 442,138 | | | $ | 5,659,598 | |
Shares reacquired | | | (526,569 | ) | | | (6,749,074 | ) |
| | | | | | | | |
Net increase (decrease) in shares outstanding before conversion | | | (84,431 | ) | | | (1,089,476 | ) |
Shares issued upon conversion from Class B | | | 245,816 | | | | 3,089,969 | |
Shares reacquired upon conversion into Class Z | | | (10,730 | ) | | | (138,203 | ) |
| | | | | | | | |
Net increase (decrease) in shares outstanding | | | 150,655 | | | $ | 1,862,290 | |
| | | | | | | | |
| | |
| 50 | | Visit our website at www.prudentialfunds.com |
| | | | | | | | |
Class B | | Shares | | | Amount | |
Six months ended March 31, 2012: | | | | | | | | |
Shares sold | | | 82,391 | | | $ | 1,008,054 | |
Shares reacquired | | | (179,540 | ) | | | (2,218,782 | ) |
| | | | | | | | |
Net increase (decrease) in shares outstanding before conversion | | | (97,149 | ) | | | (1,210,728 | ) |
Shares reacquired upon conversion into Class A | | | (128,867 | ) | | | (1,614,207 | ) |
| | | | | | | | |
Net increase (decrease) in shares outstanding | | | (226,016 | ) | | $ | (2,824,935 | ) |
| | | | | | | | |
Year ended September 30, 2011: | | | | | | | | |
Shares sold | | | 331,762 | | | $ | 4,116,047 | |
Shares reacquired | | | (470,549 | ) | | | (5,902,915 | ) |
| | | | | | | | |
Net increase (decrease) in shares outstanding before conversion | | | (138,787 | ) | | | (1,786,868 | ) |
Shares reacquired upon conversion into Class | | | (252,389 | ) | | | (3,089,969 | ) |
| | | | | | | | |
Net increase (decrease) in shares outstanding | | | (391,176 | ) | | $ | (4,876,837 | ) |
| | | | | | | | |
Class C | | | | | | |
Six months ended March 31, 2012: | | | | | | | | |
Shares sold | | | 57,566 | | | $ | 690,692 | |
Shares reacquired | | | (80,746 | ) | | | (969,152 | ) |
| | | | | | | | |
Net increase (decrease) in shares outstanding | | | (23,180 | ) | | $ | (278,460 | ) |
| | | | | | | | |
Year ended September 30, 2011: | | | | | | | | |
Shares sold | | | 183,369 | | | $ | 2,291,457 | |
Shares reacquired | | | (179,404 | ) | | | (2,257,523 | ) |
| | | | | | | | |
Net increase (decrease) in shares outstanding | | | 3,965 | | | $ | 33,934 | |
| | | | | | | | |
Class Z | | | | | | |
Six months ended March 31, 2012: | | | | | | | | |
Shares sold | | | 8,955 | | | $ | 115,373 | |
Shares reacquired | | | (1,735 | ) | | | (22,866 | ) |
| | | | | | | | |
Net increase (decrease) in shares outstanding | | | 7,220 | | | $ | 92,507 | |
| | | | | | | | |
Year ended September 30, 2011: | | | | | | | | |
Shares sold | | | 10,193 | | | $ | 134,382 | |
Shares reacquired | | | (4,882 | ) | | | (64,430 | ) |
| | | | | | | | |
Net increase (decrease) in shares outstanding before conversion | | | 5,311 | | | | 69,952 | |
Shares issued upon conversion from Class A | | | 10,639 | | | | 138,203 | |
| | | | | | | | |
Net increase (decrease) in shares outstanding | | | 15,950 | | | $ | 208,155 | |
| | | | | | | | |
Note 7. Borrowings
The Fund, along with other affiliated registered investment companies (the “Funds”), is a party to a Syndicated Credit Agreement (“SCA”) with a group of banks. The purpose of the SCA is to provide an alternative source of temporary funding for capital share redemptions. The SCA provides for a commitment of $900 million for the period December 16, 2011 through December 14, 2012. The Funds pay an
| | | | |
| Prudential Asset Allocation Funds | | | 51 | |
Notes to Financial Statements
(Unaudited) continued
annualized commitment fee of 0.08% of the unused portion of the SCA. Prior to December 16, 2011, the Funds had another SCA of a $750 million commitment with an annualized commitment fee of 0.10% of the unused portion. Interest on any borrowings under the SCA is paid at contracted market rates. The commitment fee for the unused amount is accrued daily and paid quarterly.
The Allocation Funds did not utilize the SCA during the six months ended March 31, 2012.
Note 8. New Accounting Pronouncements
In April 2011, the Financial Accounting Standards Board (“FASB”) issued Accounting Standards Update (“ASU”) No. 2011-03 “Reconsideration of Effective Control for Repurchase Agreements”. The objective of ASU No. 2011-03 is to improve the accounting for repurchase agreements and other agreements that both entitle and obligate a transferor to repurchase or redeem financial assets before their maturity. Under previous guidance, whether or not to account for a transaction as a sale was based on, in part, if the entity maintained effective control over the transferred financial assets. ASU No. 2011-03 removes the transferor’s ability criterion from the effective control assessment. This guidance is effective prospectively for interim and annual reporting periods beginning on or after December 15, 2011. At this time, management is evaluating the implications of ASU No. 2011-03 and its impact on the financial statements has not been determined.
In May 2011, the FASB issued ASU No. 2011-04 “Amendments to Achieve Common Fair Value Measurement and Disclosure Requirements in U.S. GAAP and IFRSs”. ASU No. 2011-04 includes common requirements for measurement of and disclosure about fair value between U.S. GAAP and IFRS. ASU No. 2011-04 will require reporting entities to disclose quantitative information about the unobservable inputs used in the fair value measurements categorized within Level 3 of the fair value hierarchy. In addition, ASU No. 2011-04 will require reporting entities to make disclosures about amounts and reasons for all transfers in and out of Level 1 and Level 2 fair value measurements. The new and revised disclosures are effective for interim and annual reporting periods beginning after December 15, 2011. At this time, management is evaluating the implications of ASU No. 2011-04 and its impact on the financial statements has not been determined.
| | |
| 52 | | Visit our website at www.prudentialfunds.com |
Prudential Conservative Allocation Fund
Financial Highlights
(Unaudited)
| | | | | | | | | | | | | | | | | | | | | | | | | | |
| Class A Shares | | | | |
| | | Six Months
Ended
March 31, | | | | | Year Ended September 30, | |
| | | 2012(a) | | | | | 2011(a) | | | 2010(a) | | | 2009(a) | | | 2008(a) | | | 2007(a) | |
| Per Share Operating Performance: | | | | | | | | | | | | | | | | | | | | | | | | | | |
| Net Asset Value, Beginning Of Period | | | $11.20 | | | | | | $11.41 | | | | $10.64 | | | | $10.28 | | | | $11.91 | | | | $11.21 | |
| Income (loss) from investment operations: | | | | | | | | | | | | | | | | | | | | | | | | | | |
| Net investment income | | | .13 | | | | | | .23 | | | | .24 | | | | .24 | | | | .27 | | | | .28 | |
| Net realized and unrealized gain (loss) on investment transactions | | | 1.05 | | | | | | (.21 | ) | | | .77 | | | | .51 | | | | (1.38 | ) | | | .81 | |
| Total from investment operations | | | 1.18 | | | | | | .02 | | | | 1.01 | | | | .75 | | | | (1.11 | ) | | | 1.09 | |
| Less Dividends and Distributions: | | | | | | | | | | | | | | | | | | | | | | | | | | |
| Dividends from net investment income | | | (.15 | ) | | | | | (.23 | ) | | | (.24 | ) | | | (.24 | ) | | | (.36 | ) | | | (.27 | ) |
| Distributions from net realized gains | | | - | | | | | | - | | | | - | | | | (.15 | ) | | | (.16 | ) | | | (.12 | ) |
| Total dividends and distributions | | | (.15 | ) | | | | | (.23 | ) | | | (.24 | ) | | | (.39 | ) | | | (.52 | ) | | | (.39 | ) |
| Net asset value, end of period | | | $12.23 | | | | | | $11.20 | | | | $11.41 | | | | $10.64 | | | | $10.28 | | | | $11.91 | |
| Total Return(b): | | | 10.58% | | | | | | .10% | | | | 9.61% | | | | 8.06% | | | | (9.75)% | | | | 9.89% | |
| |
| Ratios/Supplemental Data: | |
| Net assets, end of period (000) | | | $56,724 | | | | | | $53,890 | | | | $43,900 | | | | $35,354 | | | | $27,730 | | | | $20,683 | |
| Average net assets (000) | | | $56,576 | | | | | | $52,244 | | | | $39,798 | | | | $26,869 | | | | $26,310 | | | | $16,051 | |
| Ratios to average net assets(c): | | | | | | | | | | | | | | | | | | | | | | | | | | |
| Expenses, including distribution and service (12b-1) fees(d) | | | .75% | (e) | | | | | .75% | | | | .75% | | | | .75% | | | | .75% | | | | .76% | |
| Expenses, excluding distribution and service (12b-1) fees | | | .50% | (e) | | | | | .50% | | | | .50% | | | | .50% | | | | .50% | | | | .51% | |
| Net investment income | | | 2.18% | (e) | | | | | 1.97% | | | | 2.21% | | | | 2.62% | | | | 2.38% | | | | 2.39% | |
| Portfolio turnover rate | | | 15% | (f) | | | | | 16% | | | | 29% | | | | 69% | | | | 24% | | | | 22% | |
(a) Calculated based on average shares outstanding during the period.
(b) Total return does not consider the effects of sales loads. Total return is calculated assuming a purchase of a share on the first day and a sale on the last day of each period reported and includes reinvestment of dividends and distributions. Total returns may reflect adjustments to conform to generally accepted accounting principles. Total returns for periods less than one full year are not annualized.
(c) Net of expense subsidy. If the investment manager had not subsidized expenses, the expense ratios including distribution and service (12b-1) fees would have been .77%, .77%, .80%, .87%, 1.00% and 1.33% for the six months ended March 31, 2012 and the years ended September 30, 2011, 2010, 2009, 2008, and 2007, respectively. The expense ratios excluding distribution and service (12b-1) fees would have been .52%, .52%, .55%, .62%, .75% and 1.08% for the six months ended March 31, 2012 and the years ended September 30, 2011, 2010, 2009, 2008, and 2007, respectively. The net investment income ratios would have been 2.16%, 1.95%, 2.16%, 2.50%, 2.13% and 1.82% for the six months ended March 31, 2012 and the years ended September 30, 2011, 2010, 2009, 2008, and 2007, respectively. Does not include expenses of the investment companies in which the Fund invests.
(d) The distributor of the Fund has contractually agreed to limit its distribution and service (12b-1) fees to .25% of the average daily net assets of the Class A shares.
(e) Annualized.
(f) Not annualized.
See Notes to Financial Statements.
| | | | |
| Prudential Asset Allocation Funds | | | 53 | |
Prudential Conservative Allocation Fund
Financial Highlights
(Unaudited) continued
| | | | | | | | | | | | | | | | | | | | | | | | | | |
| Class B Shares | |
| | | Six Months
Ended
March 31, | | | | | Year Ended September 30, | |
| | | 2012(a) | | | | | 2011(a) | | | 2010(a) | | | 2009(a) | | | 2008(a) | | | 2007(a) | |
| Per Share Operating Performance: | | | | | | | | | | | | | | | | | | | | | | | | | | |
| Net Asset Value, Beginning Of Period | | | $11.15 | | | | | | $11.37 | | | | $10.60 | | | | $10.25 | | | | $11.88 | | | | $11.18 | |
| Income (loss) from investment operations: | | | | | | | | | | | | | | | | | | | | | | | | | | |
| Net investment income | | | .08 | | | | | | .15 | | | | .16 | | | | .16 | | | | .18 | | | | .19 | |
| Net realized and unrealized gain (loss) on investment transactions | | | 1.04 | | | | | | (.22 | ) | | | .77 | | | | .52 | | | | (1.37 | ) | | | .81 | |
| Total from investment operations | | | 1.12 | | | | | | (.07 | ) | | | .93 | | | | .68 | | | | (1.19 | ) | | | 1.00 | |
| Less Dividends and Distributions: | | | | | | | | | | | | | | | | | | | | | | | | | | |
| Dividends from net investment income | | | (.10 | ) | | | | | (.15 | ) | | | (.16 | ) | | | (.18 | ) | | | (.28 | ) | | | (.18 | ) |
| Distributions from net realized gains | | | - | | | | | | - | | | | - | | | | (.15 | ) | | | (.16 | ) | | | (.12 | ) |
| Total dividends and distributions | | | (.10 | ) | | | | | (.15 | ) | | | (.16 | ) | | | (.33 | ) | | | (.44 | ) | | | (.30 | ) |
| Net asset value, end of period | | | $12.17 | | | | | | $11.15 | | | | $11.37 | | | | $10.60 | | | | $10.25 | | | | $11.88 | |
| Total Return(b): | | | 10.12% | | | | | | (0.72)% | | | | 8.85% | | | | 7.21% | | | | (10.42)% | | | | 9.09% | |
| |
| Ratios/Supplemental Data: | |
| Net assets, end of period (000) | | | $45,319 | | | | | | $44,301 | | | | $50,082 | | | | $39,398 | | | | $20,376 | | | | $13,027 | |
| Average net assets (000) | | | $45,337 | | | | | | $51,101 | | | | $45,227 | | | | $26,506 | | | | $15,543 | | | | $11,421 | |
| Ratios to average net assets(c): | | | | | | | | | | | | | | | | | | | | | | | | | | |
| Expenses, including distribution and service (12b-1) fees | | | 1.50% | (d) | | | | | 1.50% | | | | 1.50% | | | | 1.50% | | | | 1.50% | | | | 1.51% | |
| Expenses, excluding distribution and service (12b-1) fees | | | .50% | (d) | | | | | .50% | | | | .50% | | | | .50% | | | | .50% | | | | .51% | |
| Net investment income | | | 1.43% | (d) | | | | | 1.27% | | | | 1.45% | | | | 1.75% | | | | 1.61% | | | | 1.67% | |
| Portfolio turnover rate | | | 15% | (e) | | | | | 16% | | | | 29% | | | | 69% | | | | 24% | | | | 22% | |
(a) Calculated based on average shares outstanding during the period.
(b) Total return does not consider the effects of sales loads. Total return is calculated assuming a purchase of a share on the first day and a sale on the last day of each period reported and includes reinvestment of dividends and distributions. Total returns may reflect adjustments to conform to generally accepted accounting principles. Total returns for periods less than one full year are not annualized.
(c) Net of expense subsidy. If the investment manager had not subsidized expenses, the expense ratios including distribution and service (12b-1) fees would have been 1.52%, 1.52%, 1.55%, 1.62%, 1.75% and 2.08% for the six months ended March 31, 2012 and the years ended September 30, 2011, 2010, 2009, 2008, and 2007, respectively. The expense ratios excluding distribution and service (12b-1) fees would have been .52%, .52%, .55%, .62%, .75% and 1.08% for the six months ended March 31, 2012 and the years ended September 30, 2011, 2010, 2009, 2008, and 2007, respectively. The net investment income ratios would have been 1.41%, 1.25%, 1.40%, 1.63%, 1.36% and 1.10% for the six months ended March 31, 2012 and the years ended September 30, 2011, 2010, 2009, 2008, and 2007, respectively. Does not include expenses of the investment companies in which the Fund invests.
(d) Annualized.
(e) Not annualized.
See Notes to Financial Statements.
| | |
| 54 | | Visit our website at www.prudentialfunds.com |
| | | | | | | | | | | | | | | | | | | | | | | | | | |
| Class C Shares | | | | |
| | | Six Months
Ended
March 31, | | | | | Year Ended September 30, | |
| | | 2012(a) | | | | | 2011(a) | | | 2010(a) | | | 2009(a) | | | 2008(a) | | | 2007(a) | |
| Per Share Operating Performance: | | | | | | | | | | | | | | | | | | | | | | | | | | |
| Net Asset Value, Beginning Of Period | | | $11.16 | | | | | | $11.37 | | | | $10.61 | | | | $10.25 | | | | $11.88 | | | | $11.18 | |
| Income (loss) from investment operations: | | | | | | | | | | | | | | | | | | | | | | | | | | |
| Net investment income | | | .09 | | | | | | .15 | | | | .16 | | | | .18 | | | | .18 | | | | .19 | |
| Net realized and unrealized gain (loss) on investment transactions | | | 1.03 | | | | | | (.21 | ) | | | .76 | | | | .51 | | | | (1.37 | ) | | | .81 | |
| Total from investment operations | | | 1.12 | | | | | | (.06 | ) | | | .92 | | | | .69 | | | | (1.19 | ) | | | 1.00 | |
| Less Dividends and Distributions: | | | | | | | | | | | | | | | | | | | | | | | | | | |
| Dividends from net investment income | | | (.10 | ) | | | | | (.15 | ) | | | (.16 | ) | | | (.18 | ) | | | (.28 | ) | | | (.18 | ) |
| Distributions from net realized gains | | | - | | | | | | - | | | | - | | | | (.15 | ) | | | (.16 | ) | | | (.12 | ) |
| Total dividends and distributions | | | (.10 | ) | | | | | (.15 | ) | | | (.16 | ) | | | (.33 | ) | | | (.44 | ) | | | (.30 | ) |
| Net asset value, end of period | | | $12.18 | | | | | | $11.16 | | | | $11.37 | | | | $10.61 | | | | $10.25 | | | | $11.88 | |
| Total Return(b): | | | 10.21% | | | | | | (.63)% | | | | 8.75% | | | | 7.31% | | | | (10.42)% | | | | 9.09% | |
| |
| Ratios/Supplemental Data: | |
| Net assets, end of period (000) | | | $17,551 | | | | | | $20,380 | | | | $19,161 | | | | $13,762 | | | | $8,884 | | | | $5,779 | |
| Average net assets (000) | | | $18,772 | | | | | | $20,876 | | | | $17,097 | | | | $10,334 | | | | $7,240 | | | | $4,039 | |
| Ratios to average net assets(c) : | | | | | | | | | | | | | | | | | | | | | | | | | | |
| Expenses, including distribution and service (12b-1) fees | | | 1.50% | (d) | | | | | 1.50% | | | | 1.50% | | | | 1.50% | | | | 1.50% | | | | 1.51% | |
| Expenses, excluding distribution and service (12b-1) fees | | | .50% | (d) | | | | | .50% | | | | .50% | | | | .50% | | | | .50% | | | | .51% | |
| Net investment income | | | 1.49% | (d) | | | | | 1.25% | | | | 1.43% | | | | 1.88% | | | | 1.62% | | | | 1.65% | |
| Portfolio turnover rate | | | 15% | (e) | | | | | 16% | | | | 29% | | | | 69% | | | | 24% | | | | 22% | |
(a) Calculated based on average shares outstanding during the period.
(b) Total return does not consider the effects of sales loads. Total return is calculated assuming a purchase of a share on the first day and a sale on the last day of each period reported and includes reinvestment of dividends and distributions. Total returns may reflect adjustments to conform to generally accepted accounting principles. Total returns for periods less than one full year are not annualized.
(c) Net of expense subsidy. If the investment manager had not subsidized expenses, the expense ratios including distribution and service (12b-1) fees would have been 1.52%, 1.52%, 1.55%, 1.62%, 1.75% and 2.08% for the six months ended March 31, 2012 and the years ended September 30, 2011, 2010, 2009, 2008, and 2007, respectively. The expense ratios excluding distribution and service (12b-1) fees would have been .52%, .52%, .55%, .62%, .75% and 1.08% for the six months ended March 31, 2012 and the years ended September 30, 2011, 2010, 2009, 2008, and 2007, respectively. The net investment income ratios would have been 1.47%, 1.23%, 1.38%, 1.76%, 1.37% and 1.08% for the six months ended March 31, 2012 and the years ended September 30, 2011, 2010, 2009, 2008, and 2007, respectively. Does not include expenses of the investment companies in which the Fund invests.
(d) Annualized.
(e) Not annualized.
See Notes to Financial Statements.
| | | | |
| Prudential Asset Allocation Funds | | | 55 | |
Prudential Conservative Allocation Fund
Financial Highlights
(Unaudited) continued
| | | | | | | | | | | | | | | | | | | | | | | | | | | | |
| Class R Shares | |
| | | Six Months
Ended
March 31, | | | | | Year Ended September 30, | | | | | January 12,
2007(b)
through
September 30, | |
| | | 2012(a) | | | | | 2011(a) | | | 2010(a) | | | 2009(a) | | | 2008(a) | | | | | 2007(a) | |
| Per Share Operating Performance: | | | | | | | | | | | | | | | | | | | | | | | | | | | | |
| Net Asset Value, Beginning Of Period | | | $11.23 | | | | | | $11.45 | | | | $10.68 | | | | $10.31 | | | | $11.91 | | | | | | $11.33 | |
| Income (loss) from investment operations: | | | | | | | | | | | | | | | | | | | | | | | | | | | | |
| Net investment income | | | .10 | | | | | | .19 | | | | .21 | | | | .18 | | | | .32 | | | | | | .16 | |
| Net realized and unrealized gain (loss) on investment transactions | | | 1.06 | | | | | | (.21 | ) | | | .78 | | | | .56 | | | | (1.43 | ) | | | | | .50 | |
| Total from investment operations | | | 1.16 | | | | | | (.02 | ) | | | .99 | | | | .74 | | | | (1.11 | ) | | | | | .66 | |
| Less Dividends and Distributions: | | | | | | | | | | | | | | | | | | | | | | | | | | | | |
| Dividends from net investment income | | | (.13 | ) | | | | | (.20 | ) | | | (.22 | ) | | | (.22 | ) | | | (.33 | ) | | | | | (.08 | ) |
| Distributions from net realized gains | | | - | | | | | | - | | | | - | | | | (.15 | ) | | | (.16 | ) | | | | | - | |
| Total dividends and distributions | | | (.13 | ) | | | | | (.20 | ) | | | (.22 | ) | | | (.37 | ) | | | (.49 | ) | | | | | (.08 | ) |
| Net asset value, end of period | | | $12.26 | | | | | | $11.23 | | | | $11.45 | | | | $10.68 | | | | $10.31 | | | | | | $11.91 | |
| Total Return(c): | | | 10.41% | | | | | | (.23)% | | | | 9.37% | | | | 7.86% | | | | (9.75)% | | | | | | 5.86% | |
| |
| Ratios/Supplemental Data: | |
| Net assets, end of period (000) | | | $39 | | | | | | $74 | | | | $24 | | | | $13 | | | | $2 | | | | | | $3 | |
| Average net assets (000) | | | $39 | | | | | | $58 | | | | $19 | | | | $3 | | | | $3 | | | | | | $3 | |
| Ratios to average net assets(d): | | | | | | | | | | | | | | | | | | | | | | | | | | | | |
| Expenses, including distribution and service (12b-1) fees(e) | | | 1.00% | (f) | | | | | 1.00% | | | | 1.00% | | | | 1.00% | | | | 1.00% | | | | | | 1.01% | (f) |
| Expenses, excluding distribution and service (12b-1) fees | | | .50% | (f) | | | | | .50% | | | | .50% | | | | .50% | | | | .50% | | | | | | .51% | (f) |
| Net investment income | | | 1.82% | (f) | | | | | 1.58% | | | | 1.87% | | | | 2.17% | | | | 2.12% | | | | | | 1.90% | (f) |
| Portfolio turnover rate | | | 15% | (g) | | | | | 16% | | | | 29% | | | | 69% | | | | 24% | | | | | | 22% | (g) |
(a) Calculated based on average shares outstanding during the period.
(b) Inception date of Class R shares.
(c) Total return is calculated assuming a purchase of a share on the first day and a sale on the last day of each period reported and includes reinvestment of dividends and distributions. Total returns may reflect adjustments to conform to generally accepted accounting principles. Total returns for periods less than one full year are not annualized.
(d) Net of expense subsidy. If the investment manager had not subsidized expenses, the expense ratios including distribution and service (12b-1) fees would have been 1.02%, 1.02%, 1.05%, 1.12%, 1.25% and 1.58% for the six months ended March 31, 2012 and the years ended September 30, 2011, 2010, 2009, 2008, and the period ended September 30, 2007, respectively. The expense ratios excluding distribution and service (12b-1) fees would have been .52%, .52%, .55%, .62%, .75% and 1.08% for the six months ended March 31, 2012 and the years ended September 30, 2011, 2010, 2009, 2008, and the period ended September 30, 2007, respectively. The net investment income ratios would have been 1.80%, 1.56%, 1.82%, 2.05%, 1.87% and 1.33% for the six months ended March 31, 2012 and the years ended September 30, 2011, 2010, 2009, 2008, and the period ended September 30, 2007, respectively. Does not include expenses of the investment companies in which the Fund invests.
(e) The distributor of the Fund has contractually agreed to limit its distribution and service (12b-1) fees to .50% of the average daily net assets of the Class R shares.
(f) Annualized.
(g) Not annualized.
See Notes to Financial Statements.
| | |
| 56 | | Visit our website at www.prudentialfunds.com |
| | | | | | | | | | | | | | | | | | | | | | | | | | |
| Class Z Shares | |
| | | Six Months
Ended
March 31, | | | | | Year Ended September 30, | |
| | | 2012(a) | | | | | 2011(a) | | | 2010(a) | | | 2009(a) | | | 2008(a) | | | 2007(a) | |
| Per Share Operating Performance: | | | | | | | | | | | | | | | | | | | | | | | | | | |
| Net Asset Value, Beginning Of Period | | | $11.24 | | | | | | $11.46 | | | | $10.68 | | | | $10.32 | | | | $11.95 | | | | $11.25 | |
| Income (loss) from investment operations: | | | | | | | | | | | | | | | | | | | | | | | | | | |
| Net investment income | | | .14 | | | | | | .25 | | | | .27 | | | | .27 | | | | .27 | | | | .30 | |
| Net realized and unrealized gain (loss) on investment transactions | | | 1.05 | | | | | | (.21 | ) | | | .78 | | | | .51 | | | | (1.36 | ) | | | .82 | |
| Total from investment operations | | | 1.19 | | | | | | .04 | | | | 1.05 | | | | .78 | | | | (1.09 | ) | | | 1.12 | |
| Less Dividends and Distributions: | | | | | | | | | | | | | | | | | | | | | | | | | | |
| Dividends from net investment income | | | (.16 | ) | | | | | (.26 | ) | | | (.27 | ) | | | (.27 | ) | | | (.38 | ) | | | (.30 | ) |
| Distributions from net realized gains | | | - | | | | | | - | | | | - | | | | (.15 | ) | | | (.16 | ) | | | (.12 | ) |
| Total dividends and distributions | | | (.16 | ) | | | | | (.26 | ) | | | (.27 | ) | | | (.42 | ) | | | (.54 | ) | | | (.42 | ) |
| Net asset value, end of period | | | $12.27 | | | | | | $11.24 | | | | $11.46 | | | | $10.68 | | | | $10.32 | | | | $11.95 | |
| Total Return(b): | | | 10.77% | | | | | | 0.26% | | | | 9.93% | | | | 8.31% | | | | (9.51)% | | | | 10.14% | |
| |
| Ratios/Supplemental Data: | |
| Net assets, end of period (000) | | | $3,132 | | | | | | $2,403 | | | | $1,078 | | | | $865 | | | | $1,021 | | | | $337 | |
| Average net assets (000) | | | $2,761 | | | | | | $1,632 | | | | $1,020 | | | | $863 | | | | $579 | | | | $196 | |
| Ratios to average net assets(c): | | | | | | | | | | | | | | | | | | | | | | | | | | |
| Expenses, including distribution and service (12b-1) fees | | | .50% | (d) | | | | | .50% | | | | .50% | | | | .50% | | | | .50% | | | | .51% | |
| Expenses, excluding distribution and service (12b-1) fees | | | .50% | (d) | | | | | .50% | | | | .50% | | | | .50% | | | | .50% | | | | .51% | |
| Net investment income | | | 2.40% | (d) | | | | | 2.15% | | | | 2.44% | | | | 2.91% | | | | 2.53% | | | | 2.59% | |
| Portfolio turnover rate | | | 15% | (e) | | | | | 16% | | | | 29% | | | | 69% | | | | 24% | | | | 22% | |
(a) Calculated based on average shares outstanding during the period.
(b) Total return is calculated assuming a purchase of a share on the first day and a sale on the last day of each period reported and includes reinvestment of dividends and distributions. Total returns may reflect adjustments to conform to generally accepted accounting principles. Total returns for periods less than one full year are not annualized.
(c) Net of expense subsidy. If the investment manager had not subsidized expenses, the expense ratios including distribution and service (12b-1) fees would have been .52%, .52%, .55%, .62%, .75% and 1.08% for the six months ended March 31, 2012 and the years ended September 30, 2011, 2010, 2009, 2008, and 2007, respectively. The expense ratios excluding distribution and service (12b-1) fees would have been .52%, .52%, .55%, .62%, .75% and 1.08% for the six months ended March 31, 2012 and the years ended September 30, 2011, 2010, 2009, 2008, and 2007, respectively. The net investment income ratios would have been 2.38%, 2.13%, 2.39%, 2.79%, 2.28% and 2.02% for the six months ended March 31, 2012 and the years ended September 30, 2011, 2010, 2009, 2008, and 2007, respectively. Does not include expenses of the investment companies in which the Fund invests.
(d) Annualized.
(e) Not annualized.
See Notes to Financial Statements.
| | | | |
| Prudential Asset Allocation Funds | | | 57 | |
Prudential Moderate Allocation Fund
Financial Highlights
(Unaudited)
| | | | | | | | | | | | | | | | | | | | | | | | | | |
| Class A Shares | | | | |
| | | Six Months
Ended
March 31, | | | | | Year Ended September 30, | |
| | | 2012 | | | | | 2011(a) | | | 2010 | | | 2009 | | | 2008(a) | | | 2007 | |
| Per Share Operating Performance: | | | | | | | | | | | | | | | | | | | | | | | | | | |
| Net Asset Value, Beginning Of Period | | | $11.09 | | | | | | $11.41 | | | | $10.53 | | | | $10.64 | | | | $13.44 | | | | $12.18 | |
| Income (loss) from investment operations: | | | | | | | | | | | | | | | | | | | | | | | | | | |
| Net investment income | | | .10 | | | | | | .15 | | | | .15 | | | | .17 | | | | .18 | | | | .18 | |
| Net realized and unrealized gain (loss) on investment transactions | | | 1.60 | | | | | | (.32 | ) | | | .84 | | | | .19 | | | | (2.34 | ) | | | 1.45 | |
| Total from investment operations | | | 1.70 | | | | | | (.17 | ) | | | .99 | | | | .36 | | | | (2.16 | ) | | | 1.63 | |
| Less Dividends and Distributions: | | | | | | | | | | | | | | | | | | | | | | | | | | |
| Dividends from net investment income | | | (.16 | ) | | | | | (.15 | ) | | | (.11 | ) | | | (.17 | ) | | | (.31 | ) | | | (.21 | ) |
| Distributions from net realized gains | | | - | | | | | | - | | | | - | | | | (.30 | ) | | | (.33 | ) | | | (.16 | ) |
| Total dividends and distributions | | | (.16 | ) | | | | | (.15 | ) | | | (.11 | ) | | | (.47 | ) | | | (.64 | ) | | | (.37 | ) |
| Net asset value, end of period | | | $12.63 | | | | | | $11.09 | | | | $11.41 | | | | $10.53 | | | | $10.64 | | | | $13.44 | |
| Total Return(b): | | | 15.44% | | | | | | (1.63)% | | | | 9.40% | | | | 4.70% | | | | (16.80)% | | | | 13.60% | |
| |
| Ratios/Supplemental Data: | |
| Net assets, end of period (000) | | | $69,535 | | | | | | $60,123 | | | | $60,514 | | | | $53,471 | | | | $51,802 | | | | $46,978 | |
| Average net assets (000) | | | $65,125 | | | | | | $65,266 | | | | $57,241 | | | | $43,547 | | | | $52,040 | | | | $37,930 | |
| Ratios to average net assets(c): | | | | | | | | | | | | | | | | | | | | | | | | | | |
| Expenses, including distribution and service (12b-1) fees(d) | | | .75% | (e)(f) | | | | | .74% | | | | .75% | (e) | | | .75% | (e) | | | .75% | | | | .76% | (e) |
| Expenses, excluding distribution and service (12b-1) fees | | | .50% | (e)(f) | | | | | .49% | | | | .50% | (e) | | | .50% | (e) | | | .50% | | | | .51% | (e) |
| Net investment income | | | 1.67% | (e)(f) | | | | | 1.20% | | | | 1.37% | (e) | | | 1.88% | (e) | | | 1.49% | | | | 1.36% | (e) |
| Portfolio turnover rate | | | 16% | (g) | | | | | 19% | | | | 28% | | | | 71% | | | | 23% | | | | 21% | |
(a) Calculated based on average shares outstanding during the period.
(b) Total return does not consider the effects of sales loads. Total return is calculated assuming a purchase of a share on the first day and a sale on the last day of each period reported and includes reinvestment of dividends and distributions. Total return includes the effect of expense subsidies. Total returns may reflect adjustments to conform to generally accepted accounting principles. Total returns for periods less than a full year are not annualized.
(c) Does not include expenses of the investment companies in which the Fund invests.
(d) The distributor of the Fund has contractually agreed to limit its distribution and service (12b-1) fees to .25% of the average daily net assets of the Class A shares.
(e) Net of expense subsidy. If the investment manager had not subsidized expenses, the expense ratios including distribution and service (12b-1) fees would have been .76%, .76%, .80% and .87% for the six months ended March 31, 2012 and the years ended September 30, 2010, 2009 and 2007, respectively. The expense ratios excluding distribution and service (12b-1) fees would have been .51%, .51%, .55% and .62% for the six months ended March 31, 2012 and the years ended September 30, 2010, 2009 and 2007, respectively. The net investment income ratios would have been 1.66%, 1.36%, 1.83% and 1.25% for the six months ended March 31, 2012 and the years ended September 30, 2010, 2009 and 2007, respectively.
(f) Annualized.
(g) Not annualized.
See Notes to Financial Statements.
| | |
| 58 | | Visit our website at www.prudentialfunds.com |
| | | | | | | | | | | | | | | | | | | | | | | | | | |
| Class B Shares | | | | |
| | | Six Months
Ended
March 31, | | | | | Year Ended September 30, | |
| | | 2012 | | | | | 2011(a) | | | 2010 | | | 2009 | | | 2008(a) | | | 2007 | |
| Per Share Operating Performance: | | | | | | | | | | | | | | | | | | | | | | | | | | |
| Net Asset Value, Beginning Of Period | | | $11.00 | | | | | | $11.32 | | | | $10.46 | | | | $10.56 | | | | $13.36 | | | | $12.13 | |
| Income (loss) from investment operations: | | | | | | | | | | | | | | | | | | | | | | | | | | |
| Net investment income | | | .06 | | | | | | .06 | | | | .06 | | | | .10 | | | | .09 | | | | .09 | |
| Net realized and unrealized gain (loss) on investment transactions | | | 1.58 | | | | | | (.32 | ) | | | .83 | | | | .19 | | | | (2.33 | ) | | | 1.43 | |
| Total from investment operations | | | 1.64 | | | | | | (.26 | ) | | | .89 | | | | .29 | | | | (2.24 | ) | | | 1.52 | |
| Less Dividends and Distributions: | | | | | | | | | | | | | | | | | | | | | | | | | | |
| Dividends from net investment income | | | (.07 | ) | | | | | (.06 | ) | | | (.03 | ) | | | (.09 | ) | | | (.23 | ) | | | (.13 | ) |
| Distributions from net realized gains | | | - | | | | | | - | | | | - | | | | (.30 | ) | | | (.33 | ) | | | (.16 | ) |
| Total dividends and distributions | | | (.07 | ) | | | | | (.06 | ) | | | (.03 | ) | | | (.39 | ) | | | (.56 | ) | | | (.29 | ) |
| Net asset value, end of period | | | $12.57 | | | | | | $11.00 | | | | $11.32 | | | | $10.46 | | | | $10.56 | | | | $13.36 | |
| Total Return(b): | | | 14.96% | | | | | | (2.32)% | | | | 8.56% | | | | 3.88% | | | | (17.42)% | | | | 12.69% | |
| |
| Ratios/Supplemental Data: | |
| Net assets, end of period (000) | | | $56,959 | | | | | | $54,580 | | | | $66,364 | | | | $50,890 | | | | $40,355 | | | | $40,308 | |
| Average net assets (000) | | | $56,816 | | | | | | $68,070 | | | | $60,124 | | | | $37,913 | | | | $41,167 | | | | $35,794 | |
| Ratios to average net assets(c): | | | | | | | | | | | | | | | | | | | | | | | | | | |
| Expenses, including distribution and service (12b-1) fees | | | 1.50% | (d)(e) | | | | | 1.49% | | | | 1.50% | (d) | | | 1.50% | (d) | | | 1.50% | | | | 1.51% | (d) |
| Expenses, excluding distribution and service (12b-1) fees | | | .50% | (d)(e) | | | | | .49% | | | | .50% | (d) | | | .50% | (d) | | | .50% | | | | .51% | (d) |
| Net investment income | | | .96% | (d)(e) | | | | | .48% | | | | .59% | (d) | | | 1.07% | (d) | | | .77% | | | | .64% | (d) |
| Portfolio turnover rate | | | 16% | (f) | | | | | 19% | | | | 28% | | | | 71% | | | | 23% | | | | 21% | |
(a) Calculated based on average shares outstanding during the period.
(b) Total return does not consider the effects of sales loads. Total return is calculated assuming a purchase of a share on the first day and a sale on the last day of each period reported and includes reinvestment of dividends and distributions. Total return includes the effect of expense subsidies. Total returns may reflect adjustments to conform to generally accepted accounting principles. Total returns for periods less than a full year are not annualized.
(c) Does not include expenses of the investment companies in which the Fund invests.
(d) Net of expense subsidy. If the investment manager had not subsidized expenses, the expense ratios including distribution and service (12b-1) fees would have been 1.51%, 1.51%, 1.55% and 1.62% for the six months ended March 31, 2012 and the years ended September 30, 2010, 2009 and 2007, respectively. The expense ratios excluding distribution and service (12b-1) fees would have been .51%, .51%, .55% and .62% for the six months ended March 31, 2012 and the years ended September 2010, 2009 and 2007, respectively. The net investment income ratios would have been .95%, ..58%, 1.02% and .53% for the six months ended March 31, 2012 and the years ended September 30, 2010, 2009 and 2007, respectively.
(e) Annualized.
(f) Not annualized.
See Notes to Financial Statements.
| | | | |
| Prudential Asset Allocation Funds | | | 59 | |
Prudential Moderate Allocation Fund
Financial Highlights
(Unaudited) continued
| | | | | | | | | | | | | | | | | | | | | | | | | | |
| Class C Shares | |
| | | Six Months
Ended
March 31, | | | | | Year Ended September 30, | |
| | | 2012 | | | | | 2011(a) | | | 2010 | | | 2009 | | | 2008(a) | | | 2007 | |
| Per Share Operating Performance: | | | | | | | | | | | | | | | | | | | | | | | | | | |
| Net Asset Value, Beginning Of Period | | | $10.99 | | | | | | $11.32 | | | | $10.46 | | | | $10.56 | | | | $13.35 | | | | $12.12 | |
| Income (loss) from investment operations: | | | | | | | | | | | | | | | | | | | | | | | | | | |
| Net investment income | | | .06 | | | | | | .05 | | | | .07 | | | | .10 | | | | .09 | | | | .09 | |
| Net realized and unrealized gain (loss) on investment transactions | | | 1.59 | | | | | | (.32 | ) | | | .82 | | | | .19 | | | | (2.32 | ) | | | 1.43 | |
| Total from investment operations | | | 1.65 | | | | | | (.27 | ) | | | .89 | | | | .29 | | | | (2.23 | ) | | | 1.52 | |
| Less Dividends and Distributions: | | | | | | | | | | | | | | | | | | | | | | | | | | |
| Dividends from net investment income | | | (.07 | ) | | | | | (.06 | ) | | | (.03 | ) | | | (.09 | ) | | | (.23 | ) | | | (.13 | ) |
| Distributions from net realized gains | | | - | | | | | | - | | | | - | | | | (.30 | ) | | | (.33 | ) | | | (.16 | ) |
| Total dividends and distributions | | | (.07 | ) | | | | | (.06 | ) | | | (.03 | ) | | | (.39 | ) | | | (.56 | ) | | | (.29 | ) |
| Net asset value, end of period | | | $12.57 | | | | | | $10.99 | | | | $11.32 | | | | $10.46 | | | | $10.56 | | | | $13.35 | |
| Total Return(b): | | | 15.06% | | | | | | (2.41)% | | | | 8.56% | | | | 3.88% | | | | (17.35)% | | | | 12.70% | |
| |
| Ratios/Supplemental Data: | |
| Net assets, end of period (000) | | | $19,575 | | | | | | $16,894 | | | | $17,202 | | | | $14,767 | | | | $15,024 | | | | $13,690 | |
| Average net assets (000) | | | $18,207 | | | | | | $18,569 | | | | $16,324 | | | | $12,398 | | | | $15,886 | | | | $11,212 | |
| Ratios to average net assets(c): | | | | | | | | | | | | | | | | | | | | | | | | | | |
| Expenses, including distribution and service (12b-1) fees | | | 1.50% | (d)(e) | | | | | 1.49% | | | | 1.50% | (d) | | | 1.50% | (d) | | | 1.50% | | | | 1.51% | (d) |
| Expenses, excluding distribution and service (12b-1) fees | | | .50% | (d)(e) | | | | | .49% | | | | .50% | (d) | | | .50% | (d) | | | .50% | | | | .51% | (d) |
| Net investment income | | | .93% | (d)(e) | | | | | .44% | | | | .61% | (d) | | | 1.18% | (d) | | | .74% | | | | .61% | (d) |
| Portfolio turnover rate | | | 16% | (f) | | | | | 19% | | | | 28% | | | | 71% | | | | 23% | | | | 21% | |
(a) Calculated based on average shares outstanding during the period.
(b) Total return does not consider the effects of sales loads. Total return is calculated assuming a purchase of a share on the first day and a sale on the last day of each period reported and includes reinvestment of dividends and distributions. Total return includes the effect of expense subsidies. Total returns may reflect adjustments to conform to generally accepted accounting principles. Total returns for periods less than a full year are not annualized.
(c) Does not include expenses of the investment companies in which the Fund invests.
(d) Net of expense subsidy. If the investment manager had not subsidized expenses, the expense ratios including distribution and service (12b-1) fees would have been 1.51%, 1.51%, 1.55% and 1.62% for the six months ended March 31, 2012 and the years ended September 30, 2010, 2009 and 2007, respectively. The expense ratios excluding distribution and service (12b-1) fees would have been .51%, .51%, .55% and .62% for the six months ended March 31, 2012 and the years ended September 2010, 2009 and 2007, respectively. The net investment income ratios would have been .92%, .60%, 1.13% and ..50% for the six months ended March 31, 2012 and the years ended September 30, 2010, 2009 and 2007, respectively.
(e) Annualized.
(f) Not annualized.
See Notes to Financial Statements.
| | |
| 60 | | Visit our website at www.prudentialfunds.com |
| | | | | | | | | | | | | | | | | | | | | | | | | | | | |
| Class R Shares | |
| | | Six Months
Ended
March 31, | | | | | Year Ended September 30, | | | | | January 12,
2007(a)
through
September 30, | |
| | | 2012 | | | | | 2011(b) | | | 2010 | | | 2009 | | | 2008(b) | | | | | 2007 | |
| Per Share Operating Performance: | | | | | | | | | | | | | | | | | | | | | | | | | | | | |
| Net Asset Value, Beginning Of Period | | | $11.05 | | | | | | $11.37 | | | | $10.50 | | | | $10.63 | | | | $13.42 | | | | | | $12.45 | |
| Income (loss) from investment operations: | | | | | | | | | | | | | | | | | | | | | | | | | | | | |
| Net investment income | | | .08 | | | | | | .09 | | | | .13 | | | | .14 | | | | .17 | | | | | | .07 | |
| Net realized and unrealized gain (loss) on investment transactions | | | 1.61 | | | | | | (.29 | ) | | | .82 | | | | .19 | | | | (2.35 | ) | | | | | .90 | |
| Total from investment operations | | | 1.69 | | | | | | (.20 | ) | | | .95 | | | | .33 | | | | (2.18 | ) | | | | | .97 | |
| Less Dividends and Distributions: | | | | | | | | | | | | | | | | | | | | | | | | | | | | |
| Dividends from net investment income | | | (.13 | ) | | | | | (.12 | ) | | | (.08 | ) | | | (.16 | ) | | | (.28 | ) | | | | | - | |
| Distributions from net realized gains | | | - | | | | | | - | | | | - | | | | (.30 | ) | | | (.33 | ) | | | | | - | |
| Total dividends and distributions | | | (.13 | ) | | | | | (.12 | ) | | | (.08 | ) | | | (.46 | ) | | | (.61 | ) | | | | | - | |
| Net asset value, end of period | | | $12.61 | | | | | | $11.05 | | | | $11.37 | | | | $10.50 | | | | $10.63 | | | | | | $13.42 | |
| Total Return(c): | | | 15.39% | | | | | | (1.86)% | | | | 9.10% | | | | 4.43% | | | | (16.93)% | | | | | | 7.79% | |
| |
| Ratios/Supplemental Data: | |
| Net assets, end of period (000) | | | $7 | | | | | | $11 | | | | $2 | | | | $2 | | | | $2 | | | | | | $3 | |
| Average net assets (000) | | | $11 | | | | | | $5 | | | | $2 | | | | $2 | | | | $2 | | | | | | $3 | |
| Ratios to average net assets(d): | | | | | | | | | | | | | | | | | | | | | | | | | | | | |
| Expenses, including distribution and service (12b-1) fees(e) | | | 1.00% | (f)(g) | | | | | .99% | | | | 1.00% | (f) | | | 1.00% | (f) | | | 1.00% | | | | | | 1.01% | (f)(g) |
| Expenses, excluding distribution and service (12b-1) fees | | | .50% | (f)(g) | | | | | .49% | | | | .50% | (f) | | | .50% | (f) | | | .50% | | | | | | .51% | (f)(g) |
| Net investment income | | | 1.59% | (f)(g) | | | | | .71% | | | | 1.17% | (f) | | | 1.59% | (f) | | | 1.41% | | | | | | .73% | (f)(g) |
| Portfolio turnover rate | | | 16% | (h) | | | | | 19% | | | | 28% | | | | 71% | | | | 23% | | | | | | 21% | (h) |
(a) Commencement of offering.
(b) Calculated based on average shares outstanding during the period.
(c) Total return is calculated assuming a purchase of a share on the first day and a sale on the last day of each period reported and includes reinvestment of dividends and distributions. Total return includes the effect of expense subsidies. Total returns may reflect adjustments to conform to generally accepted accounting principles. Total returns for periods less than a full year are not annualized.
(d) Does not include expenses of the investment companies in which the Fund invests.
(e) The distributor of the Fund has contractually agreed to limit its distribution and service (12b-1) fees to .50% of the average daily net assets of the Class R shares.
(f) Net of expense subsidy. If the investment manager had not subsidized expenses, the expense ratios including distribution and service (12b-1) fees would have been 1.01%, 1.01% and 1.05% for the six months ended March 31, 2012, the years ended September 30, 2010 and 2009 and 1.12% for the period ended September 30, 2007. The expense ratios excluding distribution and service (12b-1) fees would have been .51%, .51% and .55% for the six months ended March 31, 2012, the years ended September 30, 2010 and 2009 and .62% for the period ended September 30, 2007. The net investment income ratios would have been 1.58%, 1.16% and 1.54% for the six months ended March 31, 2012, the years ended September 30, 2010 and 2009 and .67% for the period ended September 30, 2007.
(g) Annualized.
(h) Not annualized.
See Notes to Financial Statements.
| | | | |
| Prudential Asset Allocation Funds | | | 61 | |
Prudential Moderate Allocation Fund
Financial Highlights
(Unaudited) continued
| | | | | | | | | | | | | | | | | | | | | | | | | | |
| Class Z Shares | | | | |
| | | Six Months
Ended
March 31, | | | | | Year Ended September 30, | |
| | | 2012 | | | | | 2011(a) | | | 2010 | | | 2009 | | | 2008(a) | | | 2007 | |
| Per Share Operating Performance: | | | | | | | | | | | | | | | | | | | | | | | | | | |
| Net Asset Value, Beginning Of Period | | | $11.10 | | | | | | $11.42 | | | | $10.54 | | | | $10.66 | | | | $13.46 | | | | $12.19 | |
| Income (loss) from investment operations: | | | | | | | | | | | | | | | | | | | | | | | | | | |
| Net investment income | | | .12 | | | | | | .17 | | | | .18 | | | | .22 | | | | .20 | | | | .20 | |
| Net realized and unrealized gain (loss) on investment transactions | | | 1.60 | | | | | | (.32 | ) | | | .83 | | | | .16 | | | | (2.33 | ) | | | 1.46 | |
| Total from investment operations | | | 1.72 | | | | | | (.15 | ) | | | 1.01 | | | | .38 | | | | (2.13 | ) | | | 1.66 | |
| Less Dividends and Distributions: | | | | | | | | | | | | | | | | | | | | | | | | | | |
| Dividends from net investment income | | | (.19 | ) | | | | | (.17 | ) | | | (.13 | ) | | | (.20 | ) | | | (.34 | ) | | | (.23 | ) |
| Distributions from net realized gains | | | - | | | | | | - | | | | - | | | | (.30 | ) | | | (.33 | ) | | | (.16 | ) |
| Total dividends and distributions | | | (.19 | ) | | | | | (.17 | ) | | | (.13 | ) | | | (.50 | ) | | | (.67 | ) | | | (.39 | ) |
| Net asset value, end of period | | | $12.63 | | | | | | $11.10 | | | | $11.42 | | | | $10.54 | | | | $10.66 | | | | $13.46 | |
| Total Return(b): | | | 15.63% | | | | | | (1.40)% | | | | 9.63% | | | | 4.94% | | | | (16.57)% | | | | 13.86% | |
| |
| Ratios/Supplemental Data: | |
| Net assets, end of period (000) | | | $2,447 | | | | | | $2,351 | | | | $2,087 | | | | $1,874 | | | | $2,290 | | | | $2,108 | |
| Average net assets (000) | | | $2,515 | | | | | | $2,198 | | | | $1,879 | | | | $1,680 | | | | $2,675 | | | | $1,826 | |
| Ratios to average net assets(c): | | | | | | | | | | | | | | | | | | | | | | | | | | |
| Expenses, including distribution and service (12b-1) fees | | | .50% | (d)(e) | | | | | .49% | | | | .50% | (d) | | | .50% | (d) | | | .50% | | | | .51% | (d) |
| Expenses, excluding distribution and service (12b-1) fees | | | .50% | (d)(e) | | | | | .49% | | | | .50% | (d) | | | .50% | (d) | | | .50% | | | | .51% | (d) |
| Net investment income | | | 1.98% | (d)(e) | | | | | 1.43% | | | | 1.59% | (d) | | | 2.20% | (d) | | | 1.62% | | | | 1.66% | (d) |
| Portfolio turnover | | | 16% | (f) | | | | | 19% | | | | 28% | | | | 71% | | | | 23% | | | | 21% | |
(a) Calculated based on average shares outstanding during the period.
(b) Total return is calculated assuming a purchase of a share on the first day and a sale on the last day of each period reported and includes reinvestment of dividends and distributions. Total return includes the effect of expense subsidies. Total returns may reflect adjustments to conform to generally accepted accounting principles. Total returns for periods less than a full year are not annualized.
(c) Does not include expenses of the investment companies in which the Fund invests.
(d) Net of expense subsidy. If the investment manager had not subsidized expenses, the expense ratios including distribution and service (12b-1) fees would have been .51%, .51%, .55% and .62% for the six months ended March 31, 2012 and the years ended September 30, 2010, 2009 and 2007, respectively. The expense ratios excluding distribution and service (12b-1) fees would have been ..51%, .51%, .55% and .62% for the six months ended March 31, 2012 and the years ended September 30, 2010, 2009 and 2007, respectively. The net investment income ratios would have been 1.97%, 1.58%, 2.15% and 1.55% for the six months ended March 31, 2012 and the years ended September 30, 2010, 2009 and 2007, respectively.
(e) Annualized.
(f) Not annualized.
See Notes to Financial Statements.
| | |
| 62 | | Visit our website at www.prudentialfunds.com |
Prudential Growth Allocation Fund
Financial Highlights
(Unaudited)
| | | | | | | | | | | | | | | | | | | | | | | | | | |
| Class A Shares | | | | |
| | | Six Months
Ended
March 31, | | | | | Year Ended September 30, | |
| | | 2012(a) | | | | | 2011(a) | | | 2010 | | | 2009 | | | 2008(a) | | | 2007(a) | |
| Per Share Operating Performance: | | | | | | | | | | | | | | | | | | | | | | | | | | |
| Net Asset Value, Beginning Of Period | | | $11.23 | | | | | | $11.62 | | | | $10.75 | | | | $11.04 | | | | $15.08 | | | | $13.15 | |
| Income (loss) from investment operations: | | | | | | | | | | | | | | | | | | | | | | | | | | |
| Net investment income | | | .08 | | | | | | .04 | | | | .04 | | | | .10 | | | | .08 | | | | .03 | |
| Net realized and unrealized gain (loss) on investment transactions | | | 2.22 | | | | | | (.43 | ) | | | .93 | | | | (.15 | ) | | | (3.53 | ) | | | 2.18 | |
| Total from investment operations | | | 2.30 | | | | | | (.39 | ) | | | .97 | | | | (.05 | ) | | | (3.45 | ) | | | 2.21 | |
| Less Dividends and Distributions: | | | | | | | | | | | | | | | | | | | | | | | | | | |
| Dividends from net investment income | | | - | | | | | | - | | | | (.10 | ) | | | - | | | | (.30 | ) | | | (.15 | ) |
| Distributions from net realized gains | | | - | | | | | | - | | | | - | | | | (.24 | ) | | | (.29 | ) | | | (.13 | ) |
| Total dividends and distributions | | | - | | | | | | - | | | | (.10 | ) | | | (.24 | ) | | | (.59 | ) | | | (.28 | ) |
| Net asset value, end of period | | | $13.53 | | | | | | $11.23 | | | | $11.62 | | | | $10.75 | | | | $11.04 | | | | $15.08 | |
| Total Return(b): | | | 20.48% | | | | | | (3.36)% | | | | 9.06% | | | | .33% | | | | (23.72)% | | | | 17.01% | |
| |
| Ratios/Supplemental Data: | |
| Net assets, end of period (000) | | | $37,744 | | | | | | $30,888 | | | | $30,211 | | | | $26,846 | | | | $26,501 | | | | $26,015 | |
| Average net assets (000) | | | $34,522 | | | | | | $33,830 | | | | $29,037 | | | | $21,419 | | | | $28,816 | | | | $19,510 | |
| Ratios to average net assets(c): | | | | | | | | | | | | | | | | | | | | | | | | | | |
| Expenses, including distribution and service (12b-1) fees(d) | | | .75% | (e) | | | | | .75% | | | | .75% | | | | .75% | | | | .76% | | | | .76% | |
| Expenses, excluding distribution and service (12b-1) fees | | | .50% | (e) | | | | | .50% | | | | .50% | | | | .50% | | | | .51% | | | | .51% | |
| Net investment income | | | 1.21% | (e) | | | | | .29% | | | | .41% | | | | 1.15% | | | | .60% | | | | .22% | |
| Portfolio turnover rate | | | 18% | (f) | | | | | 20% | | | | 24% | | | | 46% | | | | 22% | | | | 16% | |
(a) Calculated based on average shares outstanding during the period.
(b) Total return does not consider the effects of sales loads. Total return is calculated assuming a purchase of a share on the first day and a sale on the last day of each period reported, and includes reinvestment of dividends and distributions. Total returns may reflect adjustments to conform to generally accepted accounting principles. Total returns for periods less than one full year are not annualized.
(c) Net of expense subsidy. If the investment manager had not subsidized expenses, the expense ratios including distribution and service (12b-1) fees would have been .95%, .94%, .97%, 1.13%, .94% and 1.23% for the six months ended March 31, 2012 and the years ended September 30, 2011, 2010, 2009, 2008 and 2007, respectively. The expense ratios excluding distribution and service (12b-1) fees would have been .70%, .69%, .72%, .88%, .69% and .98% for the six months ended March 31, 2012 and the years ended September 30, 2011, 2010, 2009, 2008 and 2007, respectively. The net investment income/(loss) ratios would have been 1.01%, .10%, .19%, .77%, .42% and (.25)% for the six months ended March 31, 2012 and the years ended September 30, 2011, 2010, 2009, 2008 and 2007, respectively. Does not include expenses of the investment companies in which the Fund invests
(d) The distributor of the Fund has contractually agreed to limit its distribution and service (12b-1) fees to .25% of the average daily net assets of the Class A shares.
(e) Annualized.
(f) Not annualized.
See Notes to Financial Statements.
| | | | |
| Prudential Asset Allocation Funds | | | 63 | |
Prudential Growth Allocation Fund
Financial Highlights
(Unaudited) continued
| | | | | | | | | | | | | | | | | | | | | | | | | | |
| Class B Shares | | | | |
| | | Six Months
Ended
March 31, | | | | | Year Ended September 30, | |
| | | 2012(a) | | | | | 2011(a) | | | 2010 | | | 2009 | | | 2008(a) | | | 2007(a) | |
| Per Share Operating Performance: | | | | | | | | | | | | | | | | | | | | | | | | | | |
| Net Asset Value, Beginning Of Period | | | $10.91 | | | | | | $11.38 | | | | $10.54 | | | | $10.92 | | | | $14.93 | | | | $13.05 | |
| Income (loss) from investment operations: | | | | | | | | | | | | | | | | | | | | | | | | | | |
| Net investment income (loss) | | | .03 | | | | | | (.05 | ) | | | (.04 | ) | | | .03 | | | | (.02 | ) | | | (.07 | ) |
| Net realized and unrealized gain (loss) on investment transactions | | | 2.16 | | | | | | (.42 | ) | | | .91 | | | | (.17 | ) | | | (3.49 | ) | | | 2.15 | |
| Total from investment operations | | | 2.19 | | | | | | (.47 | ) | | | .87 | | | | (.14 | ) | | | (3.51 | ) | | | 2.08 | |
| Less Dividends and Distributions: | | | | | | | | | | | | | | | | | | | | | | | | | | |
| Dividends from net investment income | | | - | | | | | | - | | | | (.03 | ) | | | - | | | | (.21 | ) | | | (.07 | ) |
| Distributions from net realized gains | | | - | | | | | | - | | | | - | | | | (.24 | ) | | | (.29 | ) | | | (.13 | ) |
| Total dividends and distributions | | | - | | | | | | - | | | | (.03 | ) | | | (.24 | ) | | | (.50 | ) | | | (.20 | ) |
| Net asset value, end of period | | | $13.10 | | | | | | $10.91 | | | | $11.38 | | | | $10.54 | | | | $10.92 | | | | $14.93 | |
| Total Return(b): | | | 20.07% | | | | | | (4.13)% | | | | 8.28% | | | | (.51)% | | | | (24.26)% | | | | 16.09% | |
| |
| Ratios/Supplemental Data: | |
| Net assets, end of period (000) | | | $30,306 | | | | | | $27,713 | | | | $33,340 | | | | $29,371 | | | | $28,335 | | | | $29,171 | |
| Average net assets (000) | | | $29,952 | | | | | | $35,195 | | | | $32,262 | | | | $23,273 | | | | $31,100 | | | | $23,884 | |
| Ratios to average net assets(c): | | | | | | | | | | | | | | | | | | | | | | | | | | |
| Expenses, including distribution and service (12b-1) fees | | | 1.50% | (d) | | | | | 1.50% | | | | 1.50% | | | | 1.50% | | | | 1.51% | | | | 1.51% | |
| Expenses, excluding distribution and service (12b-1) fees | | | .50% | (d) | | | | | .50% | | | | .50% | | | | .50% | | | | .51% | | | | .51% | |
| Net investment income (loss) | | | .51% | (d) | | | | | (.42)% | | | | (.36)% | | | | .38% | | | | (.13)% | | | | (.48)% | |
| Portfolio turnover rate | | | 18% | (e) | | | | | 20% | | | | 24% | | | | 46% | | | | 22% | | | | 16% | |
(a) Calculated based on average shares outstanding during the period.
(b) Total return does not consider the effects of sales loads. Total return is calculated assuming a purchase of a share on the first day and a sale on the last day of each period reported, and includes reinvestment of dividends and distributions. Total returns may reflect adjustments to conform to generally accepted accounting principles. Total returns for periods less than one full year are not annualized.
(c) Net of expense subsidy. If the investment manager had not subsidized expenses, the expense ratios including distribution and service (12b-1) fees would have been 1.70%, 1.69%, 1.72%, 1.88%, 1.69% and 1.98% for the six months ended March 31, 2012 and the years ended September 30, 2011, 2010, 2009, 2008 and 2007, respectively. The expense ratios excluding distribution and service (12b-1) fees would have been .70%, .69%, .72%, .88%, .69% and .98% for the six months ended March 31, 2012 and the years ended September 30, 2011, 2010, 2009, 2008 and 2007, respectively. The net investment income/(loss) ratios would have been .31%, (.61)%, (.58)%, .00%, (.31)% and (.95)% for the six months ended March 31, 2012 and the years ended September 30, 2011, 2010, 2009, 2008 and 2007, respectively. Does not include expenses of the investment companies in which the Fund invests.
(d) Annualized.
(e) Not annualized.
See Notes to Financial Statements.
| | |
| 64 | | Visit our website at www.prudentialfunds.com |
| | | | | | | | | | | | | | | | | | | | | | | | | | |
| Class C Shares | | | | |
| | | Six Months
Ended
March 31, | | | | | Year Ended September 30, | |
| | | 2012(a) | | | | | 2011(a) | | | 2010 | | | 2009 | | | 2008(a) | | | 2007(a) | |
| Per Share Operating Performance: | | | | | | | | | | | | | | | | | | | | | | | | | | |
| Net Asset Value, Beginning Of Period | | | $10.92 | | | | | | $11.39 | | | | $10.55 | | | | $10.93 | | | | $14.92 | | | | $13.04 | |
| Income (loss) from investment operations: | | | | | | | | | | | | | | | | | | | | | | | | | | |
| Net investment income (loss) | | | .03 | | | | | | (.06 | ) | | | (.04 | ) | | | .04 | | | | (.02 | ) | | | (.07 | ) |
| Net realized and unrealized gain (loss) on investment transactions | | | 2.16 | | | | | | (.41 | ) | | | .91 | | | | (.18 | ) | | | (3.47 | ) | | | 2.15 | |
| Total from investment operations | | | 2.19 | | | | | | (.47 | ) | | | .87 | | | | (.14 | ) | | | (3.49 | ) | | | 2.08 | |
| Less Dividends and Distributions: | | | | | | | | | | | | | | | | | | | | | | | | | | |
| Dividends from net investment income | | | - | | | | | | - | | | | (.03 | ) | | | - | | | | (.21 | ) | | | (.07 | ) |
| Distributions from net realized gains | | | - | | | | | | - | | | | - | | | | (.24 | ) | | | (.29 | ) | | | (.13 | ) |
| Total dividends and distributions | | | - | | | | | | - | | | | (.03 | ) | | | (.24 | ) | | | (.50 | ) | | | (.20 | ) |
| Net asset value, end of period | | | $13.11 | | | | | | $10.92 | | | | $11.39 | | | | $10.55 | | | | $10.93 | | | | $14.92 | |
| Total Return(b): | | | 20.05% | | | | | | (4.13)% | | | | 8.27% | | | | (.51)% | | | | (24.13)% | | | | 16.10% | |
| |
| Ratios/Supplemental Data: | |
| Net assets, end of period (000) | | | $9,518 | | | | | | $8,182 | | | | $8,485 | | | | $7,806 | | | | $8,135 | | | | $8,843 | |
| Average net assets (000) | | | $8,986 | | | | | | $9,614 | | | | $8,334 | | | | $6,366 | | | | $9,082 | | | | $7,282 | |
| Ratios to average net assets(c): | | | | | | | | | | | | | | | | | | | | | | | | | | |
| Expenses, including distribution and service (12b-1) fees | | | 1.50% | (d) | | | | | 1.50% | | | | 1.50% | | | | 1.50% | | | | 1.51% | | | | 1.51% | |
| Expenses, excluding distribution and service (12b-1) fees | | | .50% | (d) | | | | | .50% | | | | .50% | | | | .50% | | | | .51% | | | | .51% | |
| Net investment income (loss) | | | .49% | (d) | | | | | (.47)% | | | | (.34)% | | | | .44% | | | | (.11)% | | | | (.49)% | |
| Portfolio turnover rate | | | 18% | (e) | | | | | 20% | | | | 24% | | | | 46% | | | | 22% | | | | 16% | |
(a) Calculated based on average shares outstanding during the period.
(b) Total return does not consider the effects of sales loads. Total return is calculated assuming a purchase of a share on the first day and a sale on the last day of each period reported, and includes reinvestment of dividends and distributions. Total returns may reflect adjustments to conform to generally accepted accounting principles. Total returns for periods less than one full year are not annualized.
(c) Net of expense subsidy. If the investment manager had not subsidized expenses, the expense ratios including distribution and service (12b-1) fees would have been 1.70%, 1.69%, 1.72%, 1.88%, 1.69% and 1.98% for the six months ended March 31, 2012 and the years ended September 30, 2011, 2010, 2009, 2008 and 2007, respectively. The expense ratios excluding distribution and service (12b-1) fees would have been .70%, .69%, .72%, .88%, .69% and .98% for the six months ended March 31, 2012 and the years ended September 30, 2011, 2010, 2009, 2008 and 2007, respectively. The net investment income/(loss) ratios would have been .29%, (.66)%, (.56)%, .06%, (.29)% and (.96)% for the six months ended March 31, 2012 and the years ended September 30, 2011, 2010, 2009, 2008 and 2007, respectively. Does not include expenses of the investment companies in which the Fund invests.
(d) Annualized.
(e) Not annualized.
See Notes to Financial Statements.
| | | | |
| Prudential Asset Allocation Funds | | | 65 | |
Prudential Growth Allocation Fund
Financial Highlights
(Unaudited) continued
| | | | | | | | | | | | | | | | | | | | | | | | | | | | |
| Class R Shares | |
| | | Six Months
Ended
March 31, | | | | | Year Ended September 30, | | | | | January 12,
2007(a)(b)
through
September 30, | |
| | | 2012(b) | | | | | 2011(b) | | | 2010 | | | 2009 | | | 2008(b) | | | | | 2007 | |
| Per Share Operating Performance: | | | | | | | | | | | | | | | | | | | | | | | | | | | | |
| Net Asset Value, Beginning Of Period | | | $11.17 | | | | | | $11.58 | | | | $10.72 | | | | $11.04 | | | | $15.04 | | | | | | $13.76 | |
| Income (loss) from investment operations: | | | | | | | | | | | | | | | | | | | | | | | | | | | | |
| Net investment income (loss) | | | .07 | | | | | | .01 | | | | .02 | | | | .08 | | | | .07 | | | | | | (.06 | ) |
| Net realized and unrealized gain (loss) on investment transactions | | | 2.21 | | | | | | (.42 | ) | | | .91 | | | | (.16 | ) | | | (3.54 | ) | | | | | 1.34 | |
| Total from investment operations | | | 2.28 | | | | | | (.41 | ) | | | .93 | | | | (.08 | ) | | | (3.47 | ) | | | | | 1.28 | |
| Less Dividends and Distributions: | | | | | | | | | | | | | | | | | | | | | | | | | | | | |
| Dividends from net investment income | | | - | | | | | | - | | | | (.07 | ) | | | - | | | | (.24 | ) | | | | | - | |
| Distributions from net realized gains | | | - | | | | | | - | | | | - | | | | (.24 | ) | | | (.29 | ) | | | | | - | |
| Total dividends and distributions | | | - | | | | | | - | | | | (.07 | ) | | | (.24 | ) | | | (.53 | ) | | | | | - | |
| Net asset value, end of period | | | $13.45 | | | | | | $11.17 | | | | $11.58 | | | | $10.72 | | | | $11.04 | | | | | | $15.04 | |
| Total Return(c): | | | 20.41% | | | | | | (3.54)% | | | | 8.73% | | | | .05% | | | | (23.84)% | | | | | | 9.30% | |
| |
| Ratios/Supplemental Data: | |
| Net assets, end of period (000) | | | $3 | | | | | | $2 | | | | $2 | | | | $2 | | | | $2 | | | | | | $3 | |
| Average net assets (000) | | | $2 | | | | | | $2 | | | | $2 | | | | $2 | | | | $2 | | | | | | $3 | |
| Ratios to average net assets(d): | | | | | | | | | | | | | | | | | | | | | | | | | | | | |
| Expenses, including distribution and service (12b-1) fees(e) | | | 1.00% | (f) | | | | | 1.00% | | | | 1.00% | | | | 1.00% | | | | 1.01% | | | | | | 1.01% | (f) |
| Expenses, excluding distribution and service (12b-1) fees | | | .50% | (f) | | | | | .50% | | | | .50% | | | | .50% | | | | .51% | | | | | | .51% | (f) |
| Net investment income (loss) | | | 1.05% | (f) | | | | | .11% | | | | .15% | | | | .90% | | | | .49% | | | | | | (.59)% | (f) |
| Portfolio turnover rate | | | 18% | (g) | | | | | 20% | | | | 24% | | | | 46% | | | | 22% | | | | | | 16% | (g) |
(a) Commencement of offering.
(b) Calculated based on average shares outstanding during the period.
(c) Total return is calculated assuming a purchase of a share on the first day and a sale on the last day of each period reported, and includes reinvestment of dividends and distributions. Total returns may reflect adjustments to conform to generally accepted accounting principles. Total returns for periods less than one full year are not annualized.
(d) Net of expense subsidy. If the investment manager had not subsidized expenses, the expense ratios including distribution and service (12b-1) fees would have been 1.20%, 1.19%, 1.22%, 1.38%, 1.19%, and 1.48% for the six months ended March 31, 2012 and the years ended September 30, 2011, 2010, 2009, 2008 and the period ended September 30, 2007, respectively. The expense ratios excluding distribution and service (12b-1) fees would have been .70%, .69%, .72%, .88%, .69%, and .98% for the six months ended March 31, 2012 and the years ended September 30, 2011, 2010, 2009, 2008 and the period ended September 30, 2007, respectively. The net investment income/(loss) ratios would have been .85%, (.08)%, (.07)%, .52%, .31%, and (1.01)% for the six months ended March 31, 2012 and the years ended September 30, 2011, 2010, 2009, 2008 and the period ended September 2007, respectively. Does not include expenses of the investment companies in which the Fund invests.
(e) The distributor of the Fund has contractually agreed to limit its distribution and service (12b-1) fee to .50% of the average daily net assets of the Class R shares.
(f) Annualized.
(g) Not annualized.
See Notes to Financial Statements.
| | |
| 66 | | Visit our website at www.prudentialfunds.com |
| | | | | | | | | | | | | | | | | | | | | | | | | | |
| Class Z Shares | | | | |
| | | Six Months
Ended
March 31, | | | | | Year Ended September 30, | |
| | | 2012(a) | | | | | 2011(a) | | | 2010 | | | 2009 | | | 2008(a) | | | 2007(a) | |
| Per Share Operating Performance: | | | | | | | | | | | | | | | | | | | | | | | | | | |
| Net Asset Value, Beginning Of Period | | | $11.32 | | | | | | $11.69 | | | | $10.81 | | | | $11.08 | | | | $15.11 | | | | $13.18 | |
| Income (loss) from investment operations: | | | | | | | | | | | | | | | | | | | | | | | | | | |
| Net investment income | | | .09 | | | | | | .06 | | | | .15 | | | | .12 | | | | .12 | | | | .10 | |
| Net realized and unrealized gain (loss) on investment transactions | | | 2.25 | | | | | | (.43 | ) | | | .85 | | | | (.15 | ) | | | (3.53 | ) | | | 2.14 | |
| Total from investment operations | | | 2.34 | | | | | | (.37 | ) | | | 1.00 | | | | (.03 | ) | | | (3.41 | ) | | | 2.24 | |
| Less Dividends and Distributions: | | | | | | | | | | | | | | | | | | | | | | | | | | |
| Dividends from net investment income | | | - | | | | | | - | | | | (.12 | ) | | | - | | | | (.33 | ) | | | (.18 | ) |
| Distributions from net realized gains | | | - | | | | | | - | | | | - | | | | (.24 | ) | | | (.29 | ) | | | (.13 | ) |
| Total dividends and distributions | | | - | | | | | | - | | | | (.12 | ) | | | (.24 | ) | | | (.62 | ) | | | (.31 | ) |
| Net asset value, end of period | | | $13.66 | | | | | | $11.32 | | | | $11.69 | | | | $10.81 | | | | $11.08 | | | | $15.11 | |
| Total Return(b): | | | 20.67% | | | | | | (3.17)% | | | | 9.33% | | | | .51% | | | | (23.44)% | | | | 17.23% | |
| |
| Ratios/Supplemental Data: | |
| Net assets, end of period (000) | | | $720 | | | | | | $515 | | | | $345 | | | | $429 | | | | $438 | | | | $420 | |
| Average net assets (000) | | | $621 | | | | | | $448 | | | | $361 | | | | $333 | | | | $426 | | | | $500 | |
| Ratios to average net assets(c): | | | | | | | | | | | | | | | | | | | | | | | | | | |
| Expenses, including distribution and service (12b-1) fees | | | .50% | (d) | | | | | .50% | | | | .50% | | | | .50% | | | | .51% | | | | .51% | |
| Expenses, excluding distribution and service (12b-1) fees | | | .50% | (d) | | | | | .50% | | | | .50% | | | | .50% | | | | .51% | | | | .51% | |
| Net investment income | | | 1.40% | (d) | | | | | .43% | | | | .87% | | | | 1.41% | | | | .88% | | | | .67% | |
| Portfolio turnover rate | | | 18% | (e) | | | | | 20% | | | | 24% | | | | 46% | | | | 22% | | | | 16% | |
(a) Calculated based on average shares outstanding during the period.
(b) Total return does not consider the effects of sales loads. Total return is calculated assuming a purchase of a share on the first day and a sale on the last day of each period reported, and includes reinvestment of dividends and distributions. Total returns may reflect adjustments to conform to generally accepted accounting principles. Total returns for periods less than one full year are not annualized.
(c) Net of expense subsidy. If the investment manager had not subsidized expenses, the expense ratios including distribution and service (12b-1) fees would have been .70%, .69%, .72%, .88%, .69% and .98% for the six months ended March 31, 2012 and the years ended September 30, 2011, 2010, 2009, 2008 and 2007, respectively. The expense ratios excluding distribution and service (12b-1) fees would have been .70%, .69%, .72%, .88%, .69% and .98% for the six months ended March 31, 2012 and the years ended September 30, 2011,2010, 2009, 2008 and 2007, respectively. The net investment income/(loss) ratios would have been 1.20%, .24%, .65%, 1.03%, .70% and .19% for the six months ended March 31, 2012 and the years ended September 30, 2011, 2010, 2009, 2008 and 2007, respectively. Does not include expenses of the investment companies in which the Fund invests.
(d) Annualized.
(e) Not annualized.
See Notes to Financial Statements.
| | | | |
| Prudential Asset Allocation Funds | | | 67 | |
| | | | |
| n MAIL | | n TELEPHONE | | n WEBSITE |
Gateway Center Three 100 Mulberry Street Newark, NJ 07102 | | (800) 225-1852 | | www.prudentialfunds.com |
|
| PROXY VOTING |
| The Board of Directors of the Funds has delegated to each Fund’s investment subadviser the responsibility for voting any proxies and maintaining proxy recordkeeping with respect to the Fund. A description of these proxy voting policies and procedures is available without charge, upon request, by calling (800) 225-1852 or by visiting the Securities and Exchange Commission’s website at www.sec.gov. Information regarding how the Funds voted proxies relating to portfolio securities during the most recent 12-month period ended June 30 is available on the Funds’ website and on the Commission’s website. |
|
| DIRECTORS |
| Kevin J. Bannon • Scott E. Benjamin • Linda W. Bynoe • Michael S. Hyland • Douglas H. McCorkindale • Stephen P. Munn • Stuart S. Parker • Richard A. Redeker • Robin B. Smith • Stephen G. Stoneburn |
|
| OFFICERS |
| Stuart S. Parker, President • Judy A. Rice, Vice President • Scott E. Benjamin, Vice President • Grace C. Torres, Treasurer and Principal Financial and Accounting Officer • Kathryn L. Quirk, Chief Legal Officer • Deborah A. Docs, Secretary • Timothy J. Knierim, Chief Compliance Officer • Valerie M. Simpson, Deputy Chief Compliance Officer • Theresa C. Thompson, Deputy Chief Compliance Officer • Richard W. Kinville, Anti-Money Laundering Compliance Officer • Jonathan D. Shain, Assistant Secretary • Claudia DiGiacomo, Assistant Secretary • John P. Schwartz, Assistant Secretary • Andrew R. French, Assistant Secretary • M. Sadiq Peshimam, Assistant Treasurer • Peter Parrella, Assistant Treasurer |
| | | | |
| MANAGER | | Prudential Investments LLC | | Gateway Center Three
100 Mulberry Street Newark, NJ 07102 |
|
| INVESTMENT SUBADVISER | | Quantitative Management
Associates LLC | | Gateway Center Two
100 Mulberry Street Newark, NJ 07102 |
|
| DISTRIBUTOR | | Prudential Investment
Management Services LLC | | Gateway Center Three
100 Mulberry Street
Newark, NJ 07102 |
|
| CUSTODIAN | | The Bank of New York Mellon | | One Wall Street
New York, NY 10286 |
|
| TRANSFER AGENT | | Prudential Mutual Fund
Services LLC | | PO Box 9658
Providence, RI 02940 |
|
INDEPENDENT REGISTERED
PUBLIC ACCOUNTING FIRM | | KPMG LLP | | 345 Park Avenue
New York, NY 10154 |
|
| FUND COUNSEL | | Willkie Farr & Gallagher LLP | | 787 Seventh Avenue
New York, NY 10019 |
|
| An investor should consider the investment objectives, risks, charges, and expenses of the Fund carefully before investing. The prospectus and summary prospectus contain this and other information about the Funds. An investor may obtain a prospectus and summary prospectus by visiting our website at www.prudentialfunds.com or by calling (800) 225-1852. The prospectus and summary prospectus should be read carefully before investing. |
|
| E-DELIVERY |
| To receive your mutual fund documents online, go to www.prudentialfunds.com/edelivery and enroll. Instead of receiving printed documents by mail, you will receive notification via email when new materials are available. You can cancel your enrollment or change your email address at any time by visiting the website address above. |
|
| SHAREHOLDER COMMUNICATIONS WITH DIRECTORS |
| Shareholders can communicate directly with the Board of Directors by writing to the Chair of the Board, Prudential Asset Allocation Funds, Prudential Investments, Attn: Board of Directors, 100 Mulberry Street, Gateway Center Three, Newark, NJ 07102. Shareholders can communicate directly with an individual Director by writing to the same address. Communications are not screened before being delivered to the addressee. |
|
| AVAILABILITY OF PORTFOLIO SCHEDULE |
| Each Fund files its complete schedule of portfolio holdings with the Securities and Exchange Commission for the first and third quarters of each fiscal year on Form N-Q under the Prudential Investment Portfolios, Inc. name. Each Fund’s Forms N-Q are available on the Commission’s website at www.sec.gov. Each Fund’s Forms N-Q may also be reviewed and copied at the Commission’s Public Reference Room in Washington, D.C. Information on the operation and location of the Public Reference Room may be obtained by calling (202) 551-8090. Each Fund’s schedule of portfolio holdings is also available on the Fund’s website as of the end of each month. |
Mutual Funds:
| | | | |
ARE NOT INSURED BY THE FDIC OR ANY
FEDERAL GOVERNMENT AGENCY | | MAY LOSE VALUE | | ARE NOT A DEPOSIT OF OR GUARANTEED
BY ANY BANK OR ANY BANK AFFILIATE |

| | | | | | | | | | |
| PRUDENTIAL ASSET ALLOCATION FUNDS | | NASDAQ | | CUSIP | | | | NASDAQ | | CUSIP |
| Conservative Allocation (Class A) | | JDUAX | | 74437E750 | | Moderate Allocation (Class R) | | JMARX | | 74437E610 |
| Conservative Allocation (Class B) | | JDABX | | 74437E743 | | Moderate Allocation (Class Z) | | JDMZX | | 74437E776 |
| Conservative Allocation (Class C) | | JDACX | | 74437E735 | | Growth Allocation (Class A) | | JDAAX | | 74437E685 |
| Conservative Allocation (Class R) | | JDARX | | 74437E628 | | Growth Allocation (Class B) | | JDGBX | | 74437E677 |
| Conservative Allocation (Class Z) | | JDAZX | | 74437E784 | | Growth Allocation (Class C) | | JDGCX | | 74437E669 |
| Moderate Allocation (Class A) | | JDTAX | | 74437E727 | | Growth Allocation (Class R) | | JGARX | | 74437E594 |
| Moderate Allocation (Class B) | | JDMBX | | 74437E719 | | Growth Allocation (Class Z) | | JDGZX | | 74437E768 |
| Moderate Allocation (Class C) | | JDMCX | | 74437E693 | | | | | | |
MF194E2 0224691-00001-00
Item 2 – Code of Ethics – Not required, as this is not an annual filing.
Item 3 – Audit Committee Financial Expert – Not required, as this is not an annual filing.
Item 4 – Principal Accountant Fees and Services – Not required, as this is not an annual filing.
Item 5 – Audit Committee of Listed Registrants – Not applicable.
Item 6 – Schedule of Investments – The schedule is included as part of the report to shareholders filed under Item 1 of this Form.
Item 7 – Disclosure of Proxy Voting Policies and Procedures for Closed-End Management Investment Companies – Not applicable.
Item 8 – Portfolio Managers of Closed-End Management Investment Companies – Not applicable.
Item 9 – Purchases of Equity Securities by Closed-End Management Investment Company and Affiliated Purchasers – Not
applicable.
Item 10 – Submission of Matters to a Vote of Security Holders – Not applicable.
Item 11 – Controls and Procedures
| | (a) | It is the conclusion of the registrant’s principal executive officer and principal financial officer that the effectiveness of the registrant’s current disclosure controls and procedures (such disclosure controls and procedures having been evaluated within 90 days of the date of this filing) provide reasonable assurance that the information required to be disclosed by the registrant has been recorded, processed, summarized and reported within the time period specified in the Commission’s rules and forms and that the information required to be disclosed by the registrant has been accumulated and communicated to the registrant’s principal executive officer and principal financial officer in order to allow timely decisions regarding required disclosure. |
| | (b) | There has been no significant change in the registrant’s internal control over financial reporting that occurred during the registrant’s most recent fiscal quarter of the period covered by this report that has materially affected, or is likely to materially affect, the registrant’s internal control over financial reporting. |
Item 12 – Exhibits
| | |
| (a) (1) | | Code of Ethics – Not required, as this is not an annual filing. |
| |
| (2) | | Certifications pursuant to Section 302 of the Sarbanes-Oxley Act – Attached hereto as Exhibit EX-99.CERT. |
| |
| (3) | | Any written solicitation to purchase securities under Rule 23c-1. – Not applicable. |
|
| (b) Certifications pursuant to Section 906 of the Sarbanes-Oxley Act – Attached hereto as Exhibit EX-99.906CERT. |
SIGNATURES
Pursuant to the requirements of the Securities Exchange Act of 1934 and the Investment Company Act of 1940, the registrant has duly caused this report to be signed on its behalf by the undersigned, thereunto duly authorized.
| | |
| Registrant: | | The Prudential Investment Portfolios, Inc. |
| |
| By: | | /s/ Deborah A. Docs |
| | Deborah A. Docs |
| | Secretary |
| |
| Date: | | May 23, 2012 |
Pursuant to the requirements of the Securities Exchange Act of 1934 and the Investment Company Act of 1940, this report has been signed below by the following persons on behalf of the registrant and in the capacities and on the dates indicated.
| | |
| By: | | /s/ Stuart S. Parker |
| | Stuart S. Parker |
| | President and Principal Executive Officer |
| |
| Date: | | May 23, 2012 |
| |
| By: | | /s/ Grace C. Torres |
| | Grace C. Torres |
| | Treasurer and Principal Financial Officer |
| |
| Date: | | May 23, 2012 |