UNITED STATES
SECURITIES AND EXCHANGE COMMISSION
Washington, D.C. 20549
FORM N-CSR
CERTIFIED SHAREHOLDER REPORT OF REGISTERED
MANAGEMENT INVESTMENT COMPANIES
| Investment Company Act file number: | 811-07343 | |
| Exact name of registrant as specified in charter: | The Prudential Investment Portfolios, Inc. | |
| Address of principal executive offices: | Gateway Center 3, | |
| 100 Mulberry Street, | ||
| Newark, New Jersey 07102 | ||
| Name and address of agent for service: | Deborah A. Docs | |
| Gateway Center 3, | ||
| 100 Mulberry Street, | ||
| Newark, New Jersey 07102 | ||
| Registrant’s telephone number, including area code: | 800-225-1852 | |
| Date of fiscal year end: | 9/30/2015 | |
| Date of reporting period: | 3/31/2015 | |
Item 1 | – | Reports to Stockholders |

PRUDENTIAL INVESTMENTS»MUTUAL FUNDS
PRUDENTIAL BALANCED FUND
(formerly known as Prudential Asset Allocation Fund)
SEMIANNUAL REPORT · MARCH 31, 2015
Objective
Income and long-term growth of capital
This report is not authorized for distribution to prospective investors unless preceded or accompanied by a current prospectus.
The views expressed in this report and information about the Fund’s portfolio holdings are for the period covered by this report and are subject to change thereafter.
The accompanying financial statements as of March 31, 2015, were not audited and, accordingly, no auditor’s opinion is expressed on them.
Mutual funds are distributed by Prudential Investment Management Services LLC, a Prudential Financial company. Quantitative Management Associates, LLC (QMA) is a wholly owned subsidiary of Prudential Investment Management, Inc. (PIM). QMA and PIM are registered investment advisers and Prudential Financial companies. © 2015 Prudential Financial, Inc. and its related entities. Prudential Investments LLC, Prudential, the Prudential logo, Bring Your Challenges, and the Rock symbol are service marks of Prudential Financial, Inc. and its related entities, registered in many jurisdictions worldwide.

|  |

THE PRUDENTIAL INVESTMENT PORTFOLIOS, INC.
Prudential Asset Allocation Fund
Supplement dated April 22, 2015,
to the Currently Effective Summary Prospectus, Prospectus and Statement of Additional Information
At a recent meeting, the Board of Directors of the Prudential Asset Allocation Fund approved the following changes:
| 1. | Changing the name of the Fund from Prudential Asset Allocation Fund to Prudential Balanced Fund. |
| 2. | Changing the Fund’s dividend distribution schedule from annual to quarterly. |
The name change for the Fund will not result in any changes to the Fund’s current investment policies, investment strategies, investment objective or benchmark.
The new name for the Fund will be effective on or about May 22, 2015. The change in the Fund’s dividend distribution schedule will also be effective on or about May 22, 2015.
LR761
May 15, 2015
Dear Shareholder:
We hope you find the semiannual report for the Prudential Balanced Fund, which recently changed its name from the Prudential Asset Allocation Fund, informative and useful. Although the Fund’s name has changed, the Fund’s investment strategies, policies, and objectives have not changed. The report covers performance for the six-month period that ended March 31, 2015.
Since market conditions change over time, we believe it is important to maintain a diversified portfolio of funds consistent with your tolerance for risk, time horizon, and financial goals.
Your financial advisor can help you create a diversified investment plan that may include funds covering all the basic asset classes and that reflects your personal investor profile and risk tolerance. Keep in mind, however, that diversification and asset allocation strategies do not assure a profit or protect against loss in declining markets.
Prudential Investments® is dedicated to helping you solve your toughest investment challenges—whether it’s capital growth, reliable income, or protection from market volatility and other risks. We offer the expertise of Prudential Financial’s affiliated asset managers that strive to be leaders in a broad range of funds to help you stay on course to the future you envision. They also manage money for major corporations and pension funds around the world, which means you benefit from the same expertise, innovation, and attention to risk demanded by today’s most sophisticated investors.
Thank you for choosing the Prudential Investments family of funds.
Sincerely,

Stuart S. Parker, President
Prudential Balanced Fund
| Prudential Balanced Fund | 1 |
Your Fund’s Performance (Unaudited)
Performance data quoted represent past performance. Past performance does not guarantee future results. The investment return and principal value of an investment will fluctuate, so that an investor’s shares, when redeemed, may be worth more or less than their original cost. Current performance may be lower or higher than the past performance data quoted. An investor may obtain performance data as of the most recent month-end by visiting our website at www.prudentialfunds.com or by calling (800) 225-1852.
Cumulative Total Returns (Without Sales Charge) as of 3/31/15 |
| |||||||||||||||
| Six Months | One Year | Five Years | Ten Years | |||||||||||||
Class A | 4.83 | % | 9.07 | % | 64.65 | % | 82.96 | % | ||||||||
Class B | 4.48 | 8.30 | 58.97 | 70.45 | ||||||||||||
Class C | 4.48 | 8.30 | 58.97 | 70.45 | ||||||||||||
Class R | 4.69 | 8.86 | 62.92 | 78.61 | ||||||||||||
Class Z | 4.98 | 9.41 | 67.21 | 88.40 | ||||||||||||
Customized Blend Index | 5.20 | 9.10 | 62.72 | 96.65 | ||||||||||||
Barclays US Aggregate Bond Index | 3.43 | 5.72 | 24.10 | 61.74 | ||||||||||||
S&P 500 Index | 5.92 | 12.71 | 96.40 | 115.97 | ||||||||||||
Lipper Mixed-Asset Target Allocation Growth Funds Average | 4.21 | 6.75 | 56.48 | 84.43 | ||||||||||||
Average Annual Total Returns (With Sales Charge) as of 3/31/15 |
| |||||||||||||||
| One Year | Five Years | Ten Years | ||||||||||||||
Class A | 3.08 | % | 9.24 | % | 5.63 | % | ||||||||||
Class B | 3.40 | 9.58 | 5.48 | |||||||||||||
Class C | 7.32 | 9.71 | 5.48 | |||||||||||||
Class R | 8.86 | 10.25 | 5.97 | |||||||||||||
Class Z | 9.41 | 10.83 | 6.54 | |||||||||||||
Customized Blend Index | 9.10 | 10.23 | 7.00 | |||||||||||||
Barclays US Aggregate Bond Index | 5.72 | 4.41 | 4.93 | |||||||||||||
S&P 500 Index | 12.71 | 14.45 | 8.00 | |||||||||||||
Lipper Mixed-Asset Target Allocation Growth Funds Average | 6.75 | 9.33 | 6.26 | |||||||||||||
Source: Prudential Investments LLC and Lipper Inc.
| 2 | Visit our website at www.prudentialfunds.com |
The returns in the tables do not reflect the deduction of taxes that a shareholder would pay on Fund distributions or following the redemption of Fund shares. The average annual total returns take into account applicable sales charges, which are described for each share class in the table below.
| Class A | Class B* | Class C | Class R | Class Z | ||||||
Maximum initial sales charge | 5.50% of the public offering price | None | None | None | None | |||||
Contingent Deferred Sales Charge (CDSC) (as a percentage of the lower of original purchase price or sale proceeds) | 1% on sales of $1 million or more made within 12 months of purchase | 5% (Yr.1) 4% (Yr.2) 3% (Yr.3) 2% (Yr.4) 1% (Yr.5) 1% (Yr.6) 0% (Yr.7) | 1% on sales made within 12 months of purchase | None | None | |||||
Annual distribution and service (12b-1) fees (shown as a percentage of average daily net assets) | .30% | 1% | 1% | .75% (.50% currently) | None |
*Class B shares are closed to all purchase activity and no additional Class B shares may be purchased or acquired except by exchange from Class B shares of another Fund or through dividend or capital gains reinvestment.
Benchmark Definitions
Customized Blend Index
The Customized Blend Index is made up of the S&P 500 Index (50%), the Barclays US Aggregate Bond Index (40%), the Russell 2000 Index (5%), and the Morgan Stanley Capital International Europe, Australasia and Far East Net Dividend (MSCI EAFE ND) Index (5%). The Net Dividend (ND) version of the MSCI EAFE Index reflects the impact of the maximum withholding taxes on reinvested dividends. Each component of the customized blend is an unmanaged index generally considered to represent the performance of its asset class. The Customized Blend Index is intended to provide a theoretical comparison to the Fund’s performance based on the amounts allocated to each class under the Fund’s investment strategies.
Barclays US Aggregate Bond Index
The Barclays US Aggregate Bond Index is an unmanaged index of investment-grade securities issued by the US Government and its agencies and by corporations with between one and 10 years remaining to maturity on the securities. It gives a broad look at how US investment grade bonds have performed.
S&P 500 Index
The S&P 500 Index is an unmanaged index of 500 stocks of large US public companies. It gives a broad look at how US stock prices have performed.
| Prudential Balanced Fund | 3 |
Your Fund’s Performance (continued)
Lipper Mixed-Asset Target Allocation Growth Funds Average
The Lipper Mixed-Asset Target Allocation Growth Funds Average (Lipper Average) represents returns based on the average return of all funds in the Lipper Mixed-Asset Target Allocation Growth Funds category for the periods noted. Funds in the Lipper Average are funds whose primary objective is to conserve principal by maintaining at all times a balanced portfolio of both stocks and bonds. Typically, the stock:bond ratio ranges around 60%:40%.
Investors cannot invest directly in an index or average. The returns for the Indexes would be lower if they included the effects of sales charges, operating expenses of a mutual fund, or taxes. Returns for the Lipper Average reflect the deduction of operating expenses, but not sales charges or taxes.
Five Largest Equity Holdings expressed as a percentage of net assets as of 3/31/15 |
| |||
Apple, Inc., Technology Hardware, Storage & Peripherals | 2.2 | % | ||
Microsoft Corp., Software | 1.2 | |||
JPMorgan Chase & Co., Banks | 1.0 | |||
Berkshire Hathaway, Inc., Diversified Financial Services | 0.9 | |||
Exxon Mobil Corp., Oil, Gas & Consumable Fuels | 0.9 | |||
Holdings reflect only long-term equity investments and are subject to change.
Five Largest Equity Industries expressed as a percentage of net assets as of 3/31/15 |
| |||
Oil, Gas & Consumable Fuels | 4.3 | % | ||
Banks | 4.0 | |||
Pharmaceuticals | 3.8 | |||
Technology Hardware, Storage & Peripherals | 2.8 | |||
Software | 2.4 | |||
Industry weightings reflect only long-term equity investments and are subject to change.
| 4 | Visit our website at www.prudentialfunds.com |
Fees and Expenses (Unaudited)
As a shareholder of the Fund, you incur two types of costs: (1) transaction costs, including sales charges (loads) on purchase payments and redemptions, as applicable, and (2) ongoing costs, including management fees, distribution and/or service (12b-1) fees, and other Fund expenses, as applicable. This example is intended to help you understand your ongoing costs (in dollars) of investing in the Fund and to compare these costs with the ongoing costs of investing in other mutual funds.
The example is based on an investment of $1,000 invested on October 1, 2014, at the beginning of the period, and held through the six-month period ended March 31, 2015. The example is for illustrative purposes only; you should consult the Prospectus for information on initial and subsequent minimum investment requirements.
Actual Expenses
The first line for each share class in the table on the following page provides information about actual account values and actual expenses. You may use the information on this line, together with the amount you invested, to estimate the expenses that you paid over the period. Simply divide your account value by $1,000 (for example, an $8,600 account value ÷ $1,000 = 8.6), then multiply the result by the number on the first line under the heading “Expenses Paid During the Six-Month Period” to estimate the expenses you paid on your account during this period.
Hypothetical Example for Comparison Purposes
The second line for each share class in the table on the following page provides information about hypothetical account values and hypothetical expenses based on the Fund’s actual expense ratio and an assumed rate of return of 5% per year before expenses, which is not the Fund’s actual return. The hypothetical account values and expenses may not be used to estimate the actual ending account balance or expenses you paid for the period. You may use this information to compare the ongoing costs of investing in the Fund and other funds. To do so, compare this 5% hypothetical example with the 5% hypothetical examples that appear in the shareholder reports of the other funds.
The Fund’s transfer agent may charge additional fees to holders of certain accounts that are not included in the expenses shown in the table on the following page. These fees apply to individual retirement accounts (IRAs) and Section 403(b) accounts. As of the close of the six-month period covered by the table, IRA fees included an annual maintenance fee of $15 per account (subject to a maximum annual maintenance fee of $25 for all accounts held by the same shareholder). Section 403(b) accounts are charged an annual $25 fiduciary maintenance fee. Some of the fees may vary in amount, or may be waived, based on your total account balance or the number of
| Prudential Balanced Fund | 5 |
Fees and Expenses (continued)
Prudential Investments funds, including the Fund, that you own. You should consider the additional fees that were charged to your Fund account over the six-month period when you estimate the total ongoing expenses paid over the period and the impact of these fees on your ending account value, as these additional expenses are not reflected in the information provided in the expense table. Additional fees have the effect of reducing investment returns.
Please note that the expenses shown in the table are meant to highlight your ongoing costs only and do not reflect any transactional costs such as sales charges (loads). Therefore, the second line for each share class in the table is useful in comparing ongoing costs only and will not help you determine the relative total costs of owning different funds. In addition, if these transactional costs were included, your costs would have been higher.
Prudential | Beginning Account Value October 1, 2014 | Ending Account Value March 31, 2015 | Annualized Expense Ratio Based on the Six-Month Period | Expenses Paid During the Six-Month Period* | ||||||||||||||
Class A | Actual | $ | 1,000.00 | $ | 1,048.30 | 1.26 | % | $ | 6.43 | |||||||||
Hypothetical | $ | 1,000.00 | $ | 1,018.65 | 1.26 | % | $ | 6.34 | ||||||||||
| Class B | Actual | $ | 1,000.00 | $ | 1,044.80 | 1.96 | % | $ | 9.99 | |||||||||
| Hypothetical | $ | 1,000.00 | $ | 1,015.16 | 1.96 | % | $ | 9.85 | ||||||||||
| Class C | Actual | $ | 1,000.00 | $ | 1,044.80 | 1.96 | % | $ | 9.99 | |||||||||
| Hypothetical | $ | 1,000.00 | $ | 1,015.16 | 1.96 | % | $ | 9.85 | ||||||||||
| Class R | Actual | $ | 1,000.00 | $ | 1,046.90 | 1.46 | % | $ | 7.45 | |||||||||
| Hypothetical | $ | 1,000.00 | $ | 1,017.65 | 1.46 | % | $ | 7.34 | ||||||||||
| Class Z | Actual | $ | 1,000.00 | $ | 1,049.80 | 0.96 | % | $ | 4.91 | |||||||||
| Hypothetical | $ | 1,000.00 | $ | 1,020.14 | 0.96 | % | $ | 4.84 | ||||||||||
*Fund expenses (net of fee waivers or subsidies, if any) for each share class are equal to the annualized expense ratio for each share class (provided in the table), multiplied by the average account value over the period, multiplied by the 182 days in the six-month period ended March 31, 2015, and divided by the 365 days in the Fund’s fiscal year ending September 30, 2015 (to reflect the six-month period). Expenses presented in the table include the expenses of any underlying portfolios in which the Fund may invest.
| 6 | Visit our website at www.prudentialfunds.com |
The Fund’s annualized expense ratios for the six-month period ended March 31, 2015, are as follows:
| Class | Gross Operating Expenses | Net Operating Expenses | ||||||
A | 1.28 | % | 1.26 | % | ||||
B | 1.98 | 1.96 | ||||||
C | 1.98 | 1.96 | ||||||
R | 1.73 | 1.46 | ||||||
Z | 0.98 | 0.96 | ||||||
Net operating expenses shown above reflect any fee waivers and/or expense reimbursements. Additional information on Fund expenses and any fee waivers and/or expense reimbursements can be found in the “Financial Highlights” tables in this report and in the Notes to the Financial Statements in this report.
| Prudential Balanced Fund | 7 |
Portfolio of Investments
as of March 31, 2015 (Unaudited)
Description | Shares | Value (Note 1) | ||||||
LONG-TERM INVESTMENTS 96.1% | ||||||||
COMMON STOCKS 61.8% | ||||||||
Aerospace & Defense 1.5% | ||||||||
Airbus Group NV (France) | 943 | $ | 61,305 | |||||
BAE Systems PLC (United Kingdom) | 5,063 | 39,236 | ||||||
Cobham PLC (United Kingdom) | 1,771 | 7,978 | ||||||
Curtiss-Wright Corp. | 1,500 | 110,910 | ||||||
Ducommun, Inc.* | 800 | 20,720 | ||||||
Finmeccanica SpA (Italy)* | 718 | 8,529 | ||||||
General Dynamics Corp. | 11,900 | 1,615,187 | ||||||
HEICO Corp.(a) | 2,775 | 169,469 | ||||||
Huntington Ingalls Industries, Inc. | 5,100 | 714,765 | ||||||
Lockheed Martin Corp. | 4,900 | 994,504 | ||||||
Meggitt PLC (United Kingdom) | 1,292 | 10,502 | ||||||
Northrop Grumman Corp. | 6,700 | 1,078,432 | ||||||
Rolls-Royce Holdings PLC (United Kingdom) | 3,026 | 42,678 | ||||||
Safran SA (France) | 469 | 32,770 | ||||||
Singapore Technologies Engineering Ltd. (Singapore) | 2,400 | 6,086 | ||||||
Teledyne Technologies, Inc.* | 1,430 | 152,624 | ||||||
Thales SA (France) | 146 | 8,100 | ||||||
United Technologies Corp. | 10,300 | 1,207,160 | ||||||
Zodiac Aerospace (France) | 289 | 9,562 | ||||||
|
| |||||||
| 6,290,517 | ||||||||
Air Freight & Logistics 0.8% | ||||||||
Bollore SA (France) | 1,391 | 7,412 | ||||||
Deutsche Post AG (Germany) | 1,552 | 48,352 | ||||||
FedEx Corp. | 11,100 | 1,836,495 | ||||||
Park-Ohio Holdings Corp. | 400 | 21,068 | ||||||
Royal Mail PLC (United Kingdom) | 1,039 | 6,739 | ||||||
TNT Express NV (Netherlands) | 661 | 4,199 | ||||||
Toll Holdings Ltd. (Australia) | 1,069 | 7,192 | ||||||
United Parcel Service, Inc. (Class B Stock) | 12,900 | 1,250,526 | ||||||
Yamato Holdings Co. Ltd. (Japan) | 600 | 13,829 | ||||||
|
| |||||||
| 3,195,812 | ||||||||
Airlines 0.6% | ||||||||
Allegiant Travel Co. | 810 | 155,755 | ||||||
ANA Holdings, Inc. (Japan) | 1,800 | 4,819 | ||||||
Cathay Pacific Airways Ltd. (Hong Kong) | 2,000 | 4,628 | ||||||
Deutsche Lufthansa AG (Germany) | 366 | 5,125 | ||||||
easyJet PLC (United Kingdom) | 246 | 6,846 | ||||||
See Notes to Financial Statements.
| Prudential Balanced Fund | 9 |
Portfolio of Investments
as of March 31, 2015 (Unaudited) continued
Description | Shares | Value (Note 1) | ||||||
COMMON STOCKS (Continued) | ||||||||
Airlines (cont’d.) | ||||||||
International Consolidated Airlines Group SA (United Kingdom)* | 1,587 | $ | 14,219 | |||||
Japan Airlines Co. Ltd. (Japan) | 100 | 3,111 | ||||||
Qantas Airways Ltd. (Australia)* | 1,762 | 4,179 | ||||||
Republic Airways Holdings, Inc.* | 5,000 | 68,750 | ||||||
Singapore Airlines Ltd. (Singapore) | 1,000 | 8,707 | ||||||
Southwest Airlines Co. | 38,600 | 1,709,980 | ||||||
United Continental Holdings, Inc.* | 8,900 | 598,525 | ||||||
|
| |||||||
| 2,584,644 | ||||||||
Auto Components 0.5% | ||||||||
Aisin Seiki Co. Ltd. (Japan) | 350 | 12,689 | ||||||
Bridgestone Corp. (Japan) | 1,000 | 40,040 | ||||||
Cie Generale des Etablissements Michelin (France) | 299 | 29,734 | ||||||
Continental AG (Germany) | 176 | 41,447 | ||||||
Cooper-Standard Holding, Inc.* | 200 | 11,840 | ||||||
Dana Holding Corp.(a) | 6,700 | 141,772 | ||||||
Denso Corp. (Japan) | 750 | 34,189 | ||||||
GKN PLC (United Kingdom) | 2,552 | 13,537 | ||||||
Johnson Controls, Inc. | 29,000 | 1,462,760 | ||||||
Koito Manufacturing Co. Ltd. (Japan) | 200 | 6,014 | ||||||
NGK Spark Plug Co. Ltd. (Japan) | 300 | 8,053 | ||||||
NHK Spring Co. Ltd. (Japan) | 300 | 3,121 | ||||||
NOK Corp. (Japan) | 200 | 6,014 | ||||||
Nokian Renkaat OYJ (Finland) | 171 | 5,096 | ||||||
Pirelli & C. SpA (Italy) | 382 | 6,323 | ||||||
Stanley Electric Co. Ltd. (Japan) | 300 | 6,772 | ||||||
Sumitomo Electric Industries Ltd. (Japan) | 1,200 | 15,730 | ||||||
Sumitomo Rubber Industries Ltd. (Japan) | 300 | 5,530 | ||||||
Tenneco, Inc.* | 2,700 | 155,034 | ||||||
Toyoda Gosei Co. Ltd. (Japan) | 100 | 2,232 | ||||||
Toyota Industries Corp. (Japan) | 300 | 17,159 | ||||||
Valeo SA (France) | 127 | 18,943 | ||||||
|
| |||||||
| 2,044,029 | ||||||||
Automobiles 0.4% | ||||||||
Bayerische Motoren Werke AG (Germany) | 531 | 66,128 | ||||||
Daihatsu Motor Co. Ltd. (Japan) | 300 | 4,589 | ||||||
Daimler AG (Germany) | 1,544 | 148,277 | ||||||
Fiat Chrysler Automobiles NV (United Kingdom)* | 1,443 | 23,426 | ||||||
Fuji Heavy Industries Ltd. (Japan) | 900 | 29,877 | ||||||
See Notes to Financial Statements.
| 10 |
Description | Shares | Value (Note 1) | ||||||
COMMON STOCKS (Continued) | ||||||||
Automobiles (cont’d.) | ||||||||
Honda Motor Co. Ltd. (Japan) | 2,600 | $ | 84,872 | |||||
Isuzu Motors Ltd. (Japan) | 950 | 12,604 | ||||||
Mazda Motor Corp. (Japan) | 860 | 17,425 | ||||||
Mitsubishi Motors Corp. (Japan) | 1,170 | 10,550 | ||||||
Nissan Motor Co. Ltd. (Japan) | 4,000 | 40,682 | ||||||
Peugeot SA (France)* | 609 | 10,180 | ||||||
Renault SA (France) | 308 | 27,975 | ||||||
Suzuki Motor Corp. (Japan) | 600 | 18,020 | ||||||
Thor Industries, Inc. | 14,000 | 884,940 | ||||||
Toyota Motor Corp. (Japan) | 4,400 | 307,136 | ||||||
Volkswagen AG (Germany) | 46 | 11,828 | ||||||
Yamaha Motor Co. Ltd. (Japan) | 500 | 12,045 | ||||||
|
| |||||||
| 1,710,554 | ||||||||
Banks 4.0% | ||||||||
Aozora Bank Ltd. (Japan) | 2,100 | 7,444 | ||||||
Australia & New Zealand Banking Group Ltd. (Australia) | 4,422 | 123,021 | ||||||
Banca Monte dei Paschi di Siena SpA (Italy)* | 6,766 | 4,490 | ||||||
BancFirst Corp. | 600 | 36,588 | ||||||
Banco Bilbao Vizcaya Argentaria SA (Spain) | 10,009 | 101,086 | ||||||
Banco Comercial Portugues SA (Portugal)* | 56,314 | 5,790 | ||||||
Banco de Sabadell SA (Spain) | 5,305 | 12,962 | ||||||
Banco Espirito Santo SA (Portugal)* | 4,022 | — | ||||||
Banco Latinoamericano de Comercio Exterior SA (Class E Stock) | 600 | 19,674 | ||||||
Banco Popolare SC (Italy)* | 563 | 8,764 | ||||||
Banco Popular Espanol SA (Spain) | 2,775 | 13,573 | ||||||
Banco Santander SA (Spain) | 22,500 | 168,668 | ||||||
Bank Hapoalim BM (Israel) | 1,878 | 9,030 | ||||||
Bank Leumi Le-Israel BM (Israel)* | 2,063 | 7,650 | ||||||
Bank of America Corp. | 184,300 | 2,836,377 | ||||||
Bank of East Asia Ltd. (The) (Hong Kong) | 2,000 | 7,967 | ||||||
Bank of Ireland (Ireland)* | 42,795 | 16,328 | ||||||
Bank of Kyoto Ltd. (The) (Japan) | 700 | 7,337 | ||||||
Bank of Queensland Ltd. (Australia) | 590 | 6,182 | ||||||
Bank of Yokohama Ltd. (The) (Japan) | 1,900 | 11,128 | ||||||
Bankia SA (Spain)* | 7,167 | 9,988 | ||||||
Bankinter SA (Spain) | 1,043 | 7,952 | ||||||
Barclays PLC (United Kingdom) | 26,342 | 95,082 | ||||||
BBCN Bancorp, Inc. | 5,600 | 81,032 | ||||||
Bendigo & Adelaide Bank Ltd. (Australia) | 737 | 7,023 | ||||||
See Notes to Financial Statements.
| Prudential Balanced Fund | 11 |
Portfolio of Investments
as of March 31, 2015 (Unaudited) continued
Description | Shares | Value (Note 1) | ||||||
COMMON STOCKS (Continued) | ||||||||
Banks (cont’d.) | ||||||||
Berkshire Hills Bancorp, Inc. | 900 | $ | 24,930 | |||||
BNP Paribas SA (France) | 1,699 | 103,377 | ||||||
BOC Hong Kong Holdings Ltd. (Hong Kong) | 6,000 | 21,399 | ||||||
CaixaBank SA (Spain) | 3,858 | 18,296 | ||||||
Camden National Corp. | 500 | 19,920 | ||||||
Chemical Financial Corp. | 1,400 | 43,904 | ||||||
Chiba Bank Ltd. (The) (Japan) | 1,200 | 8,795 | ||||||
Chugoku Bank Ltd. (The) (Japan) | 300 | 4,480 | ||||||
Citigroup, Inc. | 29,870 | 1,538,902 | ||||||
Commerzbank AG (Germany)* | 1,616 | 22,206 | ||||||
Commonwealth Bank of Australia (Australia) | 2,601 | 184,490 | ||||||
Community Trust Bancorp, Inc. | 720 | 23,875 | ||||||
Credit Agricole SA (France) | 1,653 | 24,291 | ||||||
Customers Bancorp, Inc.* | 860 | 20,950 | ||||||
Danske Bank A/S (Denmark) | 1,052 | 27,734 | ||||||
DBS Group Holdings Ltd. (Singapore) | 2,842 | 42,141 | ||||||
DNB ASA (Norway) | 1,568 | 25,166 | ||||||
Enterprise Financial Services Corp. | 1,100 | 22,726 | ||||||
Erste Group Bank AG (Austria) | 435 | 10,694 | ||||||
Financial Institutions, Inc. | 1,600 | 36,688 | ||||||
First Bancorp | 1,000 | 17,560 | ||||||
First BanCorp (Puerto Rico)* | 11,800 | 73,160 | ||||||
First Community Bancshares, Inc. | 1,700 | 29,801 | ||||||
First Financial Corp. | 700 | 25,123 | ||||||
First Interstate BancSystem, Inc. (Class A Stock) | 2,500 | 69,550 | ||||||
First Merchants Corp. | 2,600 | 61,204 | ||||||
First NBC Bank Holding Co.* | 1,600 | 52,768 | ||||||
Fukuoka Financial Group, Inc. (Japan) | 1,300 | 6,685 | ||||||
Great Southern Bancorp, Inc. | 700 | 27,573 | ||||||
Great Western Bancorp, Inc. | 3,000 | 66,030 | ||||||
Gunma Bank Ltd. (The) (Japan) | 600 | 4,053 | ||||||
Hachijuni Bank Ltd. (The) (Japan) | 800 | 5,641 | ||||||
Hang Seng Bank Ltd. (Hong Kong) | 1,300 | 23,528 | ||||||
Hanmi Financial Corp. | 2,500 | 52,875 | ||||||
Hilltop Holdings, Inc.* | 6,500 | 126,360 | ||||||
Hiroshima Bank Ltd. (The) (Japan) | 800 | 4,311 | ||||||
Hokuhoku Financial Group, Inc. (Japan) | 1,900 | 4,235 | ||||||
Horizon Bancorp | 750 | 17,542 | ||||||
HSBC Holdings PLC (United Kingdom) | 30,934 | 263,601 | ||||||
ING Groep NV-CVA (Netherlands)* | 6,188 | 90,641 | ||||||
See Notes to Financial Statements.
| 12 |
Description | Shares | Value (Note 1) | ||||||
COMMON STOCKS (Continued) | ||||||||
Banks (cont’d.) | ||||||||
International Bancshares Corp. | 1,700 | $ | 44,251 | |||||
Intesa Sanpaolo SpA (Italy) | 20,268 | 68,789 | ||||||
Intesa Sanpaolo SpA - RSP (Italy) | 1,491 | 4,631 | ||||||
Investors Bancorp, Inc. | 3,100 | 36,332 | ||||||
Iyo Bank Ltd. (The) (Japan) | 400 | 4,744 | ||||||
Joyo Bank Ltd. (The) (Japan) | 1,200 | 6,167 | ||||||
JPMorgan Chase & Co. | 68,530 | 4,151,547 | ||||||
KBC Groep NV (Belgium)* | 415 | 25,648 | ||||||
KeyCorp | 91,500 | 1,295,640 | ||||||
Lloyds Banking Group PLC (United Kingdom)* | 91,589 | 106,164 | ||||||
MainSource Financial Group, Inc. | 2,800 | 54,992 | ||||||
MidWestOne Financial Group, Inc. | 400 | 11,532 | ||||||
Mitsubishi UFJ Financial Group, Inc. (Japan) | 20,500 | 126,965 | ||||||
Mizrahi Tefahot Bank Ltd. (Israel)* | 203 | 2,060 | ||||||
Mizuho Financial Group, Inc. (Japan) | 37,060 | 65,132 | ||||||
National Australia Bank Ltd. (Australia) | 3,795 | 111,096 | ||||||
Natixis SA (France) | 1,500 | 11,236 | ||||||
Nordea Bank AB (Sweden) | 4,872 | 59,343 | ||||||
Old National Bancorp | 4,600 | 65,274 | ||||||
Oversea-Chinese Banking Corp. Ltd. (Singapore) | 4,836 | 37,239 | ||||||
Pacific Premier Bancorp, Inc.* | 700 | 11,333 | ||||||
Popular, Inc. (Puerto Rico)* | 7,300 | 251,047 | ||||||
Preferred Bank | 800 | 21,976 | ||||||
Prosperity Bancshares, Inc. | 1,000 | 52,480 | ||||||
Raiffeisen Bank International AG (Austria) | 186 | 2,585 | ||||||
Regions Financial Corp. | 132,100 | 1,248,345 | ||||||
Resona Holdings, Inc. (Japan) | 3,500 | 17,370 | ||||||
Royal Bank of Scotland Group PLC (United Kingdom)* | 4,056 | 20,490 | ||||||
S&T Bancorp, Inc. | 1,700 | 48,246 | ||||||
ServisFirst Bancshares, Inc. | 700 | 23,093 | ||||||
Seven Bank Ltd. (Japan) | 900 | 4,438 | ||||||
Shinsei Bank Ltd. (Japan) | 2,600 | 5,170 | ||||||
Shizuoka Bank Ltd. (The) (Japan) | 900 | 8,976 | ||||||
Simmons First National Corp. (Class A Stock) | 200 | 9,094 | ||||||
Skandinaviska Enskilda Banken AB (Sweden) (Class A Stock) | 2,437 | 28,444 | ||||||
Societe Generale SA (France) | 1,162 | 56,103 | ||||||
Standard Chartered PLC (United Kingdom) | 3,962 | 64,171 | ||||||
Stock Yards Bancorp, Inc. | 500 | 17,215 | ||||||
Sumitomo Mitsui Financial Group, Inc. (Japan) | 2,067 | 79,176 | ||||||
Sumitomo Mitsui Trust Holdings, Inc. (Japan) | 5,580 | 23,180 | ||||||
See Notes to Financial Statements.
| Prudential Balanced Fund | 13 |
Portfolio of Investments
as of March 31, 2015 (Unaudited) continued
Description | Shares | Value (Note 1) | ||||||
COMMON STOCKS (Continued) | ||||||||
Banks (cont’d.) | ||||||||
Suruga Bank Ltd. (Japan) | 300 | $ | 6,230 | |||||
Svenska Handelsbanken AB (Sweden) (Class A Stock) | 801 | 36,074 | ||||||
Swedbank AB (Sweden) (Class A Stock) | 1,453 | 34,689 | ||||||
UniCredit SpA (Italy) | 7,054 | 47,835 | ||||||
Unione di Banche Italiane SCpA (Italy) | 1,374 | 10,716 | ||||||
United Overseas Bank Ltd. (Singapore) | 2,052 | 34,396 | ||||||
Univest Corp. of Pennsylvania | 1,000 | 19,790 | ||||||
Wells Fargo & Co. | 15,641 | 850,870 | ||||||
WesBanco, Inc. | 400 | 13,032 | ||||||
West Bancorporation, Inc. | 800 | 15,912 | ||||||
Western Alliance Bancorp* | 800 | 23,712 | ||||||
Westpac Banking Corp. (Australia) | 4,973 | 148,648 | ||||||
Wilshire Bancorp, Inc. | 8,200 | 81,754 | ||||||
Yadkin Financial Corp.* | 1,100 | 22,330 | ||||||
Yamaguchi Financial Group, Inc. (Japan) | 400 | 4,597 | ||||||
|
| |||||||
| 16,484,640 | ||||||||
Beverages 1.3% | ||||||||
Anheuser-Busch InBev NV (Belgium) | 1,290 | 157,593 | ||||||
Asahi Group Holdings Ltd. (Japan) | 650 | 20,611 | ||||||
Carlsberg A/S (Denmark) (Class B Stock) | 184 | 15,172 | ||||||
Coca-Cola Amatil Ltd. (Australia) | 891 | 7,295 | ||||||
Coca-Cola HBC AG (Switzerland) | 308 | 5,540 | ||||||
Diageo PLC (United Kingdom) | 4,030 | 111,366 | ||||||
Heineken Holding NV (Netherlands) | 162 | 11,148 | ||||||
Heineken NV (Netherlands) | 370 | 28,241 | ||||||
Kirin Holdings Co. Ltd. (Japan) | 1,300 | 17,051 | ||||||
Monster Beverage Corp.* | 13,300 | 1,840,653 | ||||||
National Beverage Corp.* | 1,400 | 34,174 | ||||||
PepsiCo, Inc. | 29,200 | 2,792,104 | ||||||
Pernod-Ricard SA (France) | 341 | 40,320 | ||||||
Remy Cointreau SA (France) | 40 | 2,946 | ||||||
SABMiller PLC (United Kingdom) | 1,551 | 81,244 | ||||||
Treasury Wine Estates Ltd. (Australia) | 1,004 | 3,901 | ||||||
|
| |||||||
| 5,169,359 | ||||||||
Biotechnology 2.3% | ||||||||
Acorda Therapeutics, Inc.* | 2,900 | 96,512 | ||||||
Actelion Ltd. (Switzerland) | 172 | 19,837 | ||||||
Alexion Pharmaceuticals, Inc.* | 7,300 | 1,265,090 | ||||||
See Notes to Financial Statements.
| 14 |
Description | Shares | Value (Note 1) | ||||||
COMMON STOCKS (Continued) | ||||||||
Biotechnology (cont’d.) | ||||||||
Amgen, Inc. | 9,000 | $ | 1,438,650 | |||||
Anacor Pharmaceuticals, Inc.* | 400 | 23,140 | ||||||
Ardelyx, Inc.* | 600 | 7,854 | ||||||
Biogen, Inc.* | 6,300 | 2,660,112 | ||||||
BioSpecifics Technologies Corp.* | 200 | 7,830 | ||||||
Celgene Corp.* | 8,800 | 1,014,464 | ||||||
CSL Ltd. (Australia) | 761 | 53,241 | ||||||
Dyax Corp.* | 11,000 | 184,305 | ||||||
Epizyme, Inc.* | 2,300 | 43,194 | ||||||
Five Prime Therapeutics, Inc.* | 2,200 | 50,270 | ||||||
Genomic Health, Inc.* | 1,400 | 42,770 | ||||||
Gilead Sciences, Inc.* | 16,400 | 1,609,332 | ||||||
Grifols SA (Spain) | 239 | 10,241 | ||||||
Halozyme Therapeutics, Inc.* | 5,700 | 81,396 | ||||||
Hyperion Therapeutics, Inc.* | 3,300 | 151,470 | ||||||
Infinity Pharmaceuticals, Inc.* | 3,400 | 47,532 | ||||||
Ligand Pharmaceuticals, Inc.*(a) | 1,700 | 131,087 | ||||||
MiMedx Group, Inc.*(a) | 6,300 | 65,520 | ||||||
Portola Pharmaceuticals, Inc.* | 1,200 | 45,552 | ||||||
Prothena Corp. PLC (Ireland)* | 4,900 | 186,886 | ||||||
Regulus Therapeutics, Inc.*(a) | 2,900 | 49,126 | ||||||
Repligen Corp.* | 1,400 | 42,504 | ||||||
Threshold Pharmaceuticals, Inc.* | 2,900 | 11,774 | ||||||
|
| |||||||
| 9,339,689 | ||||||||
Building Products 0.3% | ||||||||
A.O. Smith Corp. | 10,300 | 676,298 | ||||||
AAON, Inc. | 1,075 | 26,370 | ||||||
American Woodmark Corp.* | 1,500 | 82,095 | ||||||
Asahi Glass Co. Ltd. (Japan) | 1,600 | 10,480 | ||||||
Assa Abloy AB (Sweden) (Class B Stock) | 536 | 31,927 | ||||||
Cie de Saint-Gobain (France) | 729 | 32,008 | ||||||
Continental Building Products, Inc.* | 2,200 | 49,698 | ||||||
Daikin Industries Ltd. (Japan) | 350 | 23,399 | ||||||
Geberit AG (Switzerland) | 63 | 23,576 | ||||||
LIXIL Group Corp. (Japan) | 500 | 11,833 | ||||||
Patrick Industries, Inc.* | 1,200 | 74,724 | ||||||
TOTO Ltd. (Japan) | 500 | 7,424 | ||||||
Trex Co., Inc.* | 700 | 38,171 | ||||||
See Notes to Financial Statements.
| Prudential Balanced Fund | 15 |
Portfolio of Investments
as of March 31, 2015 (Unaudited) continued
Description | Shares | Value (Note 1) | ||||||
COMMON STOCKS (Continued) | ||||||||
Building Products (cont’d.) | ||||||||
Universal Forest Products, Inc. | 1,800 | $ | 99,864 | |||||
|
| |||||||
| 1,187,867 | ||||||||
Capital Markets 1.3% | ||||||||
3i Group PLC (United Kingdom) | 1,559 | 11,139 | ||||||
Aberdeen Asset Management PLC (United Kingdom) | 1,537 | 10,457 | ||||||
Bank of New York Mellon Corp. (The) | 37,800 | 1,521,072 | ||||||
BGC Partners, Inc. (Class A Stock) | 13,700 | 129,465 | ||||||
Credit Suisse Group AG (Switzerland) | 2,449 | 65,888 | ||||||
Daiwa Securities Group, Inc. (Japan) | 2,800 | 22,041 | ||||||
Deutsche Bank AG (Germany) | 2,212 | 76,663 | ||||||
Franklin Resources, Inc. | 18,800 | 964,816 | ||||||
GAMCO Investors, Inc. (Class A Stock) | 800 | 62,808 | ||||||
Goldman Sachs Group, Inc. (The) | 10,815 | 2,032,896 | ||||||
Hargreaves Lansdown PLC (United Kingdom) | 369 | 6,294 | ||||||
ICAP PLC (United Kingdom) | 890 | 6,941 | ||||||
Investec PLC (South Africa) | 878 | 7,282 | ||||||
Julius Baer Group Ltd. (Switzerland) | 348 | 17,394 | ||||||
Macquarie Group Ltd. (Australia) | 460 | 26,738 | ||||||
Mediobanca SpA (Italy) | 964 | 9,223 | ||||||
Nomura Holdings, Inc. (Japan) | 5,800 | 34,067 | ||||||
Partners Group Holding AG (Switzerland) | 31 | 9,242 | ||||||
Piper Jaffray Cos.* | 2,300 | 120,658 | ||||||
Platinum Asset Management Ltd. (Australia) | 372 | 2,210 | ||||||
SBI Holdings, Inc. (Japan) | 340 | 4,116 | ||||||
Schroders PLC (United Kingdom) | 199 | 9,427 | ||||||
UBS Group AG (Switzerland) | 5,858 | 109,844 | ||||||
Westwood Holdings Group, Inc. | 700 | 42,210 | ||||||
|
| |||||||
| 5,302,891 | ||||||||
Chemicals 1.3% | ||||||||
A. Schulman, Inc. | 200 | 9,640 | ||||||
Air Liquide SA (France) | 553 | 71,193 | ||||||
Air Water, Inc. (Japan) | 300 | 5,357 | ||||||
Akzo Nobel NV (Netherlands) | 389 | 29,412 | ||||||
Arkema SA (France) | 113 | 8,949 | ||||||
Asahi Kasei Corp. (Japan) | 2,100 | 20,054 | ||||||
Axiall Corp. | 800 | 37,552 | ||||||
BASF SE (Germany) | 1,473 | 145,820 | ||||||
Cabot Corp. | 9,000 | 405,000 | ||||||
See Notes to Financial Statements.
| 16 |
Description | Shares | Value (Note 1) | ||||||
COMMON STOCKS (Continued) | ||||||||
Chemicals (cont’d.) | ||||||||
Celanese Corp. Series A | 17,200 | $ | 960,792 | |||||
Croda International PLC (United Kingdom) | 210 | 8,517 | ||||||
Daicel Corp. (Japan) | 500 | 5,960 | ||||||
EMS-Chemie Holding AG (Switzerland) | 13 | 5,286 | ||||||
Ferro Corp.* | 1,400 | 17,570 | ||||||
FutureFuel Corp. | 3,400 | 34,918 | ||||||
Givaudan SA (Switzerland) | 15 | 27,100 | ||||||
Hitachi Chemical Co. Ltd. (Japan) | 200 | 4,271 | ||||||
Incitec Pivot Ltd. (Australia) | 2,715 | 8,386 | ||||||
Israel Chemicals Ltd. (Israel) | 712 | 5,057 | ||||||
Israel Corp. Ltd. (The) (Israel) | 4 | 1,393 | ||||||
Johnson Matthey PLC (United Kingdom) | 319 | 15,983 | ||||||
JSR Corp. (Japan) | 300 | 5,195 | ||||||
K+S AG (Germany) | 267 | 8,699 | ||||||
Kaneka Corp. (Japan) | 500 | 3,515 | ||||||
Kansai Paint Co. Ltd. (Japan) | 400 | 7,280 | ||||||
Koninklijke DSM NV (Netherlands) | 268 | 14,937 | ||||||
Kraton Performance Polymers, Inc.* | 1,000 | 20,210 | ||||||
Kronos Worldwide, Inc. | 1,600 | 20,240 | ||||||
Kuraray Co. Ltd. (Japan) | 600 | 8,124 | ||||||
LANXESS AG (Germany) | 142 | 7,552 | ||||||
Linde AG (Germany) | 298 | 60,598 | ||||||
LyondellBasell Industries NV (Netherlands) (Class A Stock) | 19,100 | 1,676,980 | ||||||
Mitsubishi Chemical Holdings Corp. (Japan) | 2,400 | 13,932 | ||||||
Mitsubishi Gas Chemical Co., Inc. (Japan) | 600 | 2,953 | ||||||
Mitsui Chemicals, Inc. (Japan) | 1,300 | 4,169 | ||||||
Nitto Denko Corp. (Japan) | 300 | 20,032 | ||||||
Novozymes A/S (Denmark) | 403 | 18,397 | ||||||
OCI NV (Netherlands)* | 131 | 4,054 | ||||||
Orica Ltd. (Australia) | 563 | 8,549 | ||||||
Sherwin-Williams Co. (The) | 5,200 | 1,479,400 | ||||||
Shin-Etsu Chemical Co. Ltd. (Japan) | 700 | 45,702 | ||||||
Sika AG (Switzerland) | 3 | 10,741 | ||||||
Solvay SA (Belgium) | 92 | 13,299 | ||||||
Stepan Co. | 2,140 | 89,152 | ||||||
Sumitomo Chemical Co. Ltd. (Japan) | 2,600 | 13,344 | ||||||
Symrise AG (Germany) | 191 | 12,043 | ||||||
Syngenta AG (Switzerland) | 149 | 50,620 | ||||||
Taiyo Nippon Sanso Corp. (Japan) | 300 | 4,082 | ||||||
Teijin Ltd. (Japan) | 1,500 | 5,089 | ||||||
See Notes to Financial Statements.
| Prudential Balanced Fund | 17 |
Portfolio of Investments
as of March 31, 2015 (Unaudited) continued
Description | Shares | Value (Note 1) | ||||||
COMMON STOCKS (Continued) | ||||||||
Chemicals (cont’d.) | ||||||||
Toray Industries, Inc. (Japan) | 2,400 | $ | 20,088 | |||||
Trecora Resources* | 1,900 | 23,180 | ||||||
Tredegar Corp. | 1,600 | 32,176 | ||||||
Umicore SA (Belgium) | 168 | 7,017 | ||||||
Yara International ASA (Norway) | 282 | 14,318 | ||||||
|
| |||||||
| 5,553,877 | ||||||||
Commercial Services & Supplies 0.2% | ||||||||
Aggreko PLC (United Kingdom) | 398 | 9,003 | ||||||
Babcock International Group PLC (United Kingdom) | 389 | 5,675 | ||||||
Brambles Ltd. (Australia) | 2,609 | 22,816 | ||||||
Dai Nippon Printing Co. Ltd. (Japan) | 900 | 8,742 | ||||||
Deluxe Corp. | 2,700 | 187,056 | ||||||
Edenred (France) | 320 | 7,984 | ||||||
G4S PLC (United Kingdom) | 2,414 | 10,582 | ||||||
ISS A/S (Denmark)* | 194 | 6,115 | ||||||
MSA Safety, Inc. | 1,400 | 69,832 | ||||||
Performant Financial Corp.* | 2,200 | 7,480 | ||||||
Quad/Graphics, Inc. | 1,500 | 34,470 | ||||||
Secom Co. Ltd. (Japan) | 300 | 20,010 | ||||||
Securitas AB (Sweden) (Class B Stock) | 486 | 6,977 | ||||||
Societe BIC SA (France) | 45 | 6,411 | ||||||
Steelcase, Inc. (Class A Stock) | 6,900 | 130,686 | ||||||
Toppan Printing Co. Ltd. (Japan) | 900 | 6,923 | ||||||
UniFirst Corp. | 1,000 | 117,690 | ||||||
West Corp. | 3,100 | 104,563 | ||||||
|
| |||||||
| 763,015 | ||||||||
Communications Equipment 1.2% | ||||||||
Alcatel-Lucent (France)* | 4,676 | 17,579 | ||||||
Cisco Systems, Inc. | 98,966 | 2,724,039 | ||||||
F5 Networks, Inc.* | 1,500 | 172,410 | ||||||
Harris Corp.(a) | 4,500 | 354,420 | ||||||
Nokia OYJ (Finland) | 6,007 | 45,802 | ||||||
Plantronics, Inc. | 2,800 | 148,260 | ||||||
Polycom, Inc.* | 10,100 | 135,340 | ||||||
QUALCOMM, Inc. | 18,600 | 1,289,724 | ||||||
Telefonaktiebolaget LM Ericsson (Sweden) (Class B Stock) | 4,882 | 61,293 | ||||||
|
| |||||||
| 4,948,867 | ||||||||
See Notes to Financial Statements.
| 18 |
Description | Shares | Value (Note 1) | ||||||
COMMON STOCKS (Continued) | ||||||||
Construction & Engineering 0.1% | ||||||||
ACS Actividades de Construccion y Servicios SA (Spain) | 275 | $ | 9,733 | |||||
Aegion Corp.* | 4,700 | 84,835 | ||||||
Argan, Inc. | 2,200 | 79,574 | ||||||
Boskalis Westminster NV (Netherlands) | 158 | 7,788 | ||||||
Bouygues SA (France) | 260 | 10,206 | ||||||
Chiyoda Corp. (Japan) | 300 | 2,563 | ||||||
Ferrovial SA (Spain) | 709 | 15,075 | ||||||
JGC Corp. (Japan) | 400 | 7,943 | ||||||
Kajima Corp. (Japan) | 1,300 | 6,027 | ||||||
Leighton Holdings Ltd. (Australia) | 169 | 2,708 | ||||||
MYR Group, Inc.* | 1,000 | 31,340 | ||||||
Obayashi Corp. (Japan) | 1,000 | 6,482 | ||||||
Shimizu Corp. (Japan) | 1,000 | 6,761 | ||||||
Skanska AB (Sweden) (Class B Stock) | 628 | 14,079 | ||||||
Taisei Corp. (Japan) | 1,700 | 9,595 | ||||||
Vinci SA (France) | 785 | 44,850 | ||||||
|
| |||||||
| 339,559 | ||||||||
Construction Materials 0.1% | ||||||||
Boral Ltd. (Australia) | 1,235 | 5,987 | ||||||
CRH PLC (Ireland) | 1,305 | 34,129 | ||||||
Fletcher Building Ltd. (New Zealand) | 1,071 | 6,727 | ||||||
Headwaters, Inc.* | 7,600 | 139,384 | ||||||
HeidelbergCement AG (Germany) | 219 | 17,319 | ||||||
Holcim Ltd. (Switzerland) | 367 | 27,342 | ||||||
Imerys SA (France) | 53 | 3,889 | ||||||
James Hardie Industries PLC (Ireland) | 791 | 9,150 | ||||||
Lafarge SA (France) | 311 | 20,218 | ||||||
Taiheiyo Cement Corp. (Japan) | 2,000 | 6,107 | ||||||
United States Lime & Minerals, Inc. | 500 | 32,250 | ||||||
|
| |||||||
| 302,502 | ||||||||
Consumer Finance 0.2% | ||||||||
Acom Co. Ltd. (Japan)* | 1,000 | 3,468 | ||||||
AEON Financial Service Co. Ltd. (Japan) | 200 | 5,045 | ||||||
Credit Acceptance Corp.* | 210 | 40,950 | ||||||
Credit Saison Co. Ltd. (Japan) | 300 | 5,382 | ||||||
Nelnet, Inc. (Class A Stock) | 2,500 | 118,300 | ||||||
Regional Management Corp.* | 1,300 | 19,188 | ||||||
Synchrony Financial*(a) | 15,300 | 464,355 | ||||||
|
| |||||||
| 656,688 | ||||||||
See Notes to Financial Statements.
| Prudential Balanced Fund | 19 |
Portfolio of Investments
as of March 31, 2015 (Unaudited) continued
Description | Shares | Value (Note 1) | ||||||
COMMON STOCKS (Continued) | ||||||||
Containers & Packaging 0.2% | ||||||||
Amcor Ltd. (Australia) | 2,053 | $ | 21,874 | |||||
Greif, Inc. (Class A Stock) | 2,000 | 78,540 | ||||||
Rexam PLC (United Kingdom) | 1,129 | 9,676 | ||||||
Rock-Tenn Co. (Class A Stock)(a) | 9,700 | 625,650 | ||||||
Toyo Seikan Group Holdings Ltd. (Japan) | 300 | 4,388 | ||||||
|
| |||||||
| 740,128 | ||||||||
Distributors | ||||||||
Jardine Cycle & Carriage Ltd. (Singapore) | 200 | 5,974 | ||||||
Diversified Consumer Services | ||||||||
American Public Education, Inc.* | 300 | 8,994 | ||||||
Benesse Holdings, Inc. (Japan) | 150 | 4,719 | ||||||
Capella Education Co. | 200 | 12,976 | ||||||
Grand Canyon Education, Inc.* | 600 | 25,980 | ||||||
K12, Inc.* | 2,600 | 40,872 | ||||||
Strayer Education, Inc.* | 1,000 | 53,410 | ||||||
|
| |||||||
| 146,951 | ||||||||
Diversified Financial Services 1.0% | ||||||||
ASX Ltd. (Australia) | 301 | 9,470 | ||||||
Berkshire Hathaway, Inc. (Class B Stock)* | 26,500 | 3,824,480 | ||||||
Deutsche Boerse AG (Germany) | 310 | 25,299 | ||||||
Eurazeo SA (France) | 60 | 4,112 | ||||||
EXOR SpA (Italy) | 155 | 7,031 | ||||||
First Pacific Co. Ltd. (Hong Kong) | 4,000 | 3,993 | ||||||
Gain Capital Holdings, Inc. | 5,800 | 56,666 | ||||||
Groupe Bruxelles Lambert SA (Belgium) | 133 | 11,027 | ||||||
Hong Kong Exchanges & Clearing Ltd. (Hong Kong) | 1,800 | 44,122 | ||||||
Industrivarden AB (Sweden) (Class C Stock) | 309 | 5,798 | ||||||
Investment AB Kinnevik (Sweden) | 366 | 12,218 | ||||||
Investor AB (Sweden) (Class B Stock) | 731 | 29,099 | ||||||
London Stock Exchange Group PLC (United Kingdom) | 351 | 12,766 | ||||||
Marlin Business Services Corp. | 800 | 16,024 | ||||||
Mitsubishi UFJ Lease & Finance Co. Ltd. (Japan) | 900 | 4,447 | ||||||
ORIX Corp. (Japan) | 2,120 | 29,788 | ||||||
Pargesa Holding SA (Switzerland) | 58 | 4,070 | ||||||
Singapore Exchange Ltd. (Singapore) | 1,300 | 7,708 | ||||||
Wendel SA (France) | 51 | 6,079 | ||||||
|
| |||||||
| 4,114,197 | ||||||||
See Notes to Financial Statements.
| 20 |
Description | Shares | Value (Note 1) | ||||||
COMMON STOCKS (Continued) | ||||||||
Diversified Telecommunication Services 1.0% | ||||||||
AT&T, Inc. | 51,910 | $ | 1,694,861 | |||||
Atlantic Tele-Network, Inc. | 900 | 62,298 | ||||||
Belgacom SA (Belgium) | 236 | 8,257 | ||||||
Bezeq the Israeli Telecommunication Corp. Ltd. (Israel) | 2,949 | 5,491 | ||||||
BT Group PLC (United Kingdom) (Class A Stock) | 13,057 | 84,842 | ||||||
Deutsche Telekom AG (Germany) | 5,093 | 93,153 | ||||||
Elisa OYJ (Finland) | 215 | 5,399 | ||||||
HKT Trust and HKT Ltd. (Hong Kong) | 4,720 | 6,082 | ||||||
IDT Corp. (Class B Stock) | 2,000 | 35,500 | ||||||
Iliad SA (France) | 41 | 9,580 | ||||||
Inmarsat PLC (United Kingdom) | 724 | 9,915 | ||||||
Inteliquent, Inc. | 5,000 | 78,700 | ||||||
Intelsat SA*(a) | 4,900 | 58,800 | ||||||
Koninklijke KPN NV (Netherlands) | 5,397 | 18,294 | ||||||
Nippon Telegraph & Telephone Corp. (Japan) | 650 | 40,125 | ||||||
Orange SA (France) | 2,974 | 47,761 | ||||||
PCCW Ltd. (Hong Kong) | 6,200 | 3,789 | ||||||
Premiere Global Services, Inc.* | 4,700 | 44,932 | ||||||
Singapore Telecommunications Ltd. (Singapore) | 12,800 | 40,845 | ||||||
Spark New Zealand Ltd. (New Zealand) | 2,845 | 6,327 | ||||||
Swisscom AG (Switzerland) | 37 | 21,456 | ||||||
TDC A/S (Denmark) | 1,280 | 9,171 | ||||||
Telecom Italia SpA (Italy)* | 16,940 | 19,835 | ||||||
Telecom Italia SpA-RSP (Italy) | 9,349 | 8,791 | ||||||
Telefonica Deutschland Holding AG (Germany) | 869 | 4,997 | ||||||
Telefonica SA (Spain) | 6,758 | 96,163 | ||||||
Telenor ASA (Norway) | 1,180 | 23,813 | ||||||
TeliaSonera AB (Sweden) | 4,172 | 26,512 | ||||||
Telstra Corp. Ltd. (Australia) | 6,986 | 33,536 | ||||||
TPG Telecom Ltd. (Australia) | 444 | 3,082 | ||||||
Verizon Communications, Inc. | 32,350 | 1,573,181 | ||||||
Vonage Holdings Corp.* | 2,700 | 13,257 | ||||||
|
| |||||||
| 4,188,745 | ||||||||
Electric Utilities 0.9% | ||||||||
AusNet Services (Australia) | 2,513 | 2,789 | ||||||
Cheung Kong Infrastructure Holdings Ltd. (Hong Kong) | 1,000 | 8,589 | ||||||
Chubu Electric Power Co., Inc. (Japan) | 1,100 | 13,116 | ||||||
Chugoku Electric Power Co., Inc. (The) (Japan) | 500 | 6,518 | ||||||
CLP Holdings Ltd. (Hong Kong) | 2,800 | 24,472 | ||||||
See Notes to Financial Statements.
| Prudential Balanced Fund | 21 |
Portfolio of Investments
as of March 31, 2015 (Unaudited) continued
Description | Shares | Value (Note 1) | ||||||
COMMON STOCKS (Continued) | ||||||||
Electric Utilities (cont’d.) | ||||||||
Contact Energy Ltd. (New Zealand) | 574 | $ | 2,563 | |||||
EDP - Energias de Portugal SA (Portugal) | 3,995 | 14,962 | ||||||
Electricite de France SA (France) | 388 | 9,303 | ||||||
Endesa SA (Spain) | 508 | 9,807 | ||||||
Enel SpA (Italy) | 10,558 | 47,695 | ||||||
Entergy Corp. | 13,100 | 1,015,119 | ||||||
Fortum OYJ (Finland) | 760 | 15,922 | ||||||
Hokuriku Electric Power Co. (Japan) | 300 | 3,970 | ||||||
Iberdrola SA (Spain) | 8,274 | 53,355 | ||||||
IDACORP., Inc. | 2,400 | 150,888 | ||||||
Kansai Electric Power Co., Inc. (The) (Japan)* | 1,100 | 10,484 | ||||||
Kyushu Electric Power Co., Inc. (Japan) | 700 | 6,782 | ||||||
MGE Energy, Inc. | 1,600 | 70,912 | ||||||
Mighty River Power Ltd. (New Zealand) | 1,083 | 2,508 | ||||||
Portland General Electric Co. | 1,500 | 55,635 | ||||||
Power Assets Holdings Ltd. (Hong Kong) | 2,000 | 20,416 | ||||||
PPL Corp. | 43,700 | 1,470,942 | ||||||
Red Electrica Corp. SA (Spain) | 185 | 15,043 | ||||||
Shikoku Electric Power Co., Inc. (Japan)* | 300 | 3,692 | ||||||
Southern Co. (The) | 17,400 | 770,472 | ||||||
SSE PLC (United Kingdom) | 1,590 | 35,287 | ||||||
Terna Rete Elettrica Nazionale SpA (Italy) | 2,493 | 10,978 | ||||||
Tohoku Electric Power Co., Inc. (Japan) | 700 | 7,951 | ||||||
Tokyo Electric Power Co., Inc. (Japan)* | 2,300 | 8,705 | ||||||
|
| |||||||
| 3,868,875 | ||||||||
Electrical Equipment 0.6% | ||||||||
ABB Ltd. (Switzerland) | 3,527 | 74,822 | ||||||
Acuity Brands, Inc. | 2,500 | 420,400 | ||||||
Alstom SA (France)* | 358 | 11,016 | ||||||
AZZ, Inc. | 1,900 | 88,521 | ||||||
Eaton Corp. PLC | 4,500 | 305,730 | ||||||
Emerson Electric Co.(a) | 26,600 | 1,506,092 | ||||||
Encore Wire Corp. | 600 | 22,728 | ||||||
Fuji Electric Co. Ltd. (Japan) | 1,000 | 4,718 | ||||||
Legrand SA (France) | 440 | 23,834 | ||||||
Mabuchi Motor Co. Ltd. (Japan) | 100 | 5,290 | ||||||
Mitsubishi Electric Corp. (Japan) | 3,100 | 36,801 | ||||||
Nidec Corp. (Japan) | 350 | 23,234 | ||||||
OSRAM Licht AG (Germany) | 147 | 7,277 | ||||||
See Notes to Financial Statements.
| 22 |
Description | Shares | Value (Note 1) | ||||||
COMMON STOCKS (Continued) | ||||||||
Electrical Equipment (cont’d.) | ||||||||
Prysmian SpA (Italy) | 317 | $ | 6,533 | |||||
Schneider Electric SE (France) | 842 | 65,523 | ||||||
Vestas Wind Systems A/S (Denmark) | 349 | 14,390 | ||||||
|
| |||||||
| 2,616,909 | ||||||||
Electronic Equipment, Instruments & Components 0.4% | ||||||||
Benchmark Electronics, Inc.* | 4,400 | 105,732 | ||||||
CDW Corp. | 13,800 | 513,912 | ||||||
Citizen Holdings Co. Ltd. (Japan) | 400 | 3,066 | ||||||
CTS Corp. | 1,200 | 21,588 | ||||||
Hamamatsu Photonics KK (Japan) | 300 | 9,043 | ||||||
Hexagon AB (Sweden) (Class B Stock) | 397 | 14,095 | ||||||
Hirose Electric Co. Ltd. (Japan) | 52 | 6,695 | ||||||
Hitachi High-Technologies Corp. (Japan) | 100 | 3,043 | ||||||
Hitachi Ltd. (Japan) | 7,800 | 53,273 | ||||||
Hoya Corp. (Japan) | 700 | 28,024 | ||||||
Ibiden Co. Ltd. (Japan) | 200 | 3,371 | ||||||
Insight Enterprises, Inc.* | 4,100 | 116,932 | ||||||
Jabil Circuit, Inc. | 8,500 | 198,730 | ||||||
Japan Display, Inc. (Japan) | 600 | 2,141 | ||||||
Keyence Corp. (Japan) | 66 | 36,016 | ||||||
Kyocera Corp. (Japan) | 600 | 32,792 | ||||||
Littelfuse, Inc. | 600 | 59,634 | ||||||
Methode Electronics, Inc. | 3,400 | 159,936 | ||||||
Murata Manufacturing Co. Ltd. (Japan) | 350 | 48,069 | ||||||
Nippon Electric Glass Co. Ltd. (Japan) | 600 | 2,932 | ||||||
Omron Corp. (Japan) | 300 | 13,515 | ||||||
PC Connection, Inc. | 1,400 | 36,526 | ||||||
Sanmina Corp.* | 5,800 | 140,302 | ||||||
ScanSource, Inc.* | 1,500 | 60,975 | ||||||
Shimadzu Corp. (Japan) | 400 | 4,455 | ||||||
TDK Corp. (Japan) | 200 | 14,161 | ||||||
Yaskawa Electric Corp. (Japan) | 400 | 5,846 | ||||||
Yokogawa Electric Corp. (Japan) | 400 | 4,309 | ||||||
|
| |||||||
| 1,699,113 | ||||||||
Energy Equipment & Services 0.3% | ||||||||
Amec Foster Wheeler PLC (United Kingdom) | 604 | 8,080 | ||||||
Atwood Oceanics, Inc. | 16,000 | 449,760 | ||||||
Era Group, Inc.* | 800 | 16,672 | ||||||
See Notes to Financial Statements.
| Prudential Balanced Fund | 23 |
Portfolio of Investments
as of March 31, 2015 (Unaudited) continued
Description | Shares | Value (Note 1) | ||||||
COMMON STOCKS (Continued) | ||||||||
Energy Equipment & Services (cont’d.) | ||||||||
Helix Energy Solutions Group, Inc.* | 6,900 | $ | 103,224 | |||||
Matrix Service Co.* | 3,200 | 56,192 | ||||||
Noble Corp. PLC(a) | 50,400 | 719,712 | ||||||
Parker Drilling Co.* | 5,300 | 18,497 | ||||||
Petrofac Ltd. (United Kingdom) | 402 | 5,659 | ||||||
Saipem SpA (Italy)*(a) | 411 | 4,181 | ||||||
Seadrill Ltd. (Norway) | 697 | 6,527 | ||||||
Subsea 7 SA (Luxembourg) | 438 | 3,761 | ||||||
Technip SA (France) | 164 | 9,920 | ||||||
Tenaris SA (Luxembourg) | 735 | 10,303 | ||||||
Transocean Ltd.(a) | 563 | 8,111 | ||||||
WorleyParsons Ltd. (Australia) | 321 | 2,323 | ||||||
|
| |||||||
| 1,422,922 | ||||||||
Food & Staples Retailing 1.8% | ||||||||
Aeon Co. Ltd. (Japan) (Class A Stock) | 1,100 | 12,066 | ||||||
Andersons, Inc. (The) | 600 | 24,822 | ||||||
Carrefour SA (France) | 1,002 | 33,474 | ||||||
Casey’s General Stores, Inc. | 500 | 45,050 | ||||||
Casino Guichard Perrachon SA (France) | 99 | 8,766 | ||||||
Colruyt SA (Belgium) | 109 | 4,744 | ||||||
Costco Wholesale Corp. | 6,300 | 954,418 | ||||||
CVS Health Corp. | 13,300 | 1,372,693 | ||||||
Delhaize Group SA (Belgium) | 165 | 14,824 | ||||||
Distribuidora Internacional de Alimentacion SA (Spain) | 949 | 7,406 | ||||||
FamilyMart Co. Ltd. (Japan) | 100 | 4,190 | ||||||
ICA Gruppen AB (Sweden) | 120 | 4,022 | ||||||
J Sainsbury PLC (United Kingdom) | 2,176 | 8,350 | ||||||
Jeronimo Martins SGPS SA (Portugal) | 402 | 5,059 | ||||||
Koninklijke Ahold NV (Netherlands) | 1,447 | 28,514 | ||||||
Kroger Co. (The) | 26,400 | 2,023,824 | ||||||
Lawson, Inc. (Japan) | 100 | 6,932 | ||||||
METRO AG (Germany) | 252 | 8,540 | ||||||
Seven & i Holdings Co. Ltd. (Japan) | 1,250 | 52,529 | ||||||
SUPERVALU, Inc.* | 5,500 | 63,965 | ||||||
Tesco PLC (United Kingdom) | 13,030 | 46,511 | ||||||
Village Super Market, Inc. (Class A Stock) | 500 | 15,720 | ||||||
Wal-Mart Stores, Inc. | 32,000 | 2,632,000 | ||||||
Weis Markets, Inc. | 400 | 19,904 | ||||||
Wesfarmers Ltd. (Australia) | 1,802 | 60,176 | ||||||
See Notes to Financial Statements.
| 24 |
Description | Shares | Value (Note 1) | ||||||
COMMON STOCKS (Continued) | ||||||||
Food & Staples Retailing (cont’d.) | ||||||||
WM Morrison Supermarkets PLC (United Kingdom) | 3,557 | $ | 10,166 | |||||
Woolworths Ltd. (Australia) | 2,021 | 45,258 | ||||||
|
| |||||||
| 7,513,923 | ||||||||
Food Products 0.7% | ||||||||
Ajinomoto Co., Inc. (Japan) | 900 | 19,745 | ||||||
Archer-Daniels-Midland Co. | 31,800 | 1,507,320 | ||||||
Aryzta AG (Switzerland) | 144 | 8,828 | ||||||
Associated British Foods PLC (United Kingdom) | 571 | 23,829 | ||||||
Barry Callebaut AG (Switzerland) | 4 | 3,905 | ||||||
Cal-Maine Foods, Inc.(a) | 3,160 | 123,430 | ||||||
Chocoladefabriken Lindt & Spruengli AG (Switzerland) | 2 | 10,705 | ||||||
ConAgra Foods, Inc. | 6,600 | 241,098 | ||||||
Danone SA (France) | 929 | 62,622 | ||||||
Golden Agri-Resources Ltd. (Singapore) | 11,000 | 3,404 | ||||||
John B. Sanfilippo & Son, Inc. | 800 | 34,480 | ||||||
Kerry Group PLC (Ireland) (Class A Stock) | 266 | 17,876 | ||||||
Kikkoman Corp. (Japan) | 200 | 6,342 | ||||||
Lancaster Colony Corp. | 800 | 76,136 | ||||||
MEIJI Holdings Co. Ltd. (Japan) | 100 | 12,181 | ||||||
Nestle SA (Switzerland) | 5,198 | 391,422 | ||||||
NH Foods Ltd. (Japan) | 300 | 6,913 | ||||||
Nisshin Seifun Group, Inc. (Japan) | 105 | 1,236 | ||||||
Nissin Foods Holdings Co. Ltd. (Japan) | 100 | 4,915 | ||||||
Orkla ASA (Norway) | 1,268 | 9,570 | ||||||
Sanderson Farms, Inc.(a) | 1,400 | 111,510 | ||||||
Seaboard Corp.* | 5 | 20,660 | ||||||
Tate & Lyle PLC (United Kingdom) | 724 | 6,417 | ||||||
Toyo Suisan Kaisha Ltd. (Japan) | 100 | 3,518 | ||||||
Tyson Foods, Inc. (Class A Stock) | 3,800 | 145,540 | ||||||
Unilever NV - CVA (Netherlands) | 2,613 | 109,190 | ||||||
Unilever PLC (United Kingdom) | 2,059 | 85,908 | ||||||
WH Group Ltd. (Hong Kong), 144A* | 6,000 | 3,408 | ||||||
Wilmar International Ltd. (Singapore) | 3,000 | 7,122 | ||||||
Yakult Honsha Co. Ltd. (Japan) | 150 | 10,449 | ||||||
Yamazaki Baking Co. Ltd. (Japan) | 200 | 3,604 | ||||||
|
| |||||||
| 3,073,283 | ||||||||
See Notes to Financial Statements.
| Prudential Balanced Fund | 25 |
Portfolio of Investments
as of March 31, 2015 (Unaudited) continued
Description | Shares | Value (Note 1) | ||||||
COMMON STOCKS (Continued) | ||||||||
Gas Utilities 0.5% | ||||||||
AGL Resources, Inc. | 23,700 | $ | 1,176,705 | |||||
APA Group (Australia) | 1,787 | 12,291 | ||||||
Chesapeake Utilities Corp. | 600 | 30,366 | ||||||
Enagas SA (Spain) | 340 | 9,722 | ||||||
Gas Natural SDG SA (Spain) | 545 | 12,236 | ||||||
Hong Kong & China Gas Co. Ltd. (Hong Kong) | 10,445 | 24,186 | ||||||
New Jersey Resources Corp. | 1,600 | 49,696 | ||||||
Osaka Gas Co. Ltd. (Japan) | 3,100 | 12,964 | ||||||
Snam SpA (Italy) | 3,373 | 16,373 | ||||||
Southwest Gas Corp. | 500 | 29,085 | ||||||
Toho Gas Co. Ltd. (Japan) | 600 | 3,498 | ||||||
Tokyo Gas Co. Ltd. (Japan) | 3,700 | 23,261 | ||||||
UGI Corp. | 15,000 | 488,850 | ||||||
|
| |||||||
| 1,889,233 | ||||||||
Health Care Equipment & Supplies 1.2% | ||||||||
Abaxis, Inc. | 1,600 | 102,576 | ||||||
Abbott Laboratories | 34,600 | 1,603,018 | ||||||
ABIOMED, Inc.* | 1,800 | 128,844 | ||||||
Atrion Corp. | 190 | 65,647 | ||||||
C.R. Bard, Inc. | 7,500 | 1,255,125 | ||||||
Cochlear Ltd. (Australia) | 88 | 6,050 | ||||||
Coloplast A/S (Denmark) (Class B Stock) | 173 | 13,069 | ||||||
Cyberonics, Inc.*(a) | 800 | 51,936 | ||||||
Elekta AB (Sweden) (Class B Stock) | 568 | 5,108 | ||||||
Essilor International SA (France) | 328 | 37,659 | ||||||
Getinge AB (Sweden) (Class B Stock) | 311 | 7,685 | ||||||
Globus Medical, Inc. (Class A Stock)*(a) | 4,700 | 118,628 | ||||||
Greatbatch, Inc.* | 2,200 | 127,270 | ||||||
Invacare Corp. | 2,800 | 54,348 | ||||||
Masimo Corp.* | 3,300 | 108,834 | ||||||
Medtronic PLC | 14,500 | 1,130,855 | ||||||
Natus Medical, Inc.* | 3,300 | 130,251 | ||||||
Olympus Corp. (Japan)* | 400 | 14,830 | ||||||
Smith & Nephew PLC (United Kingdom) | 1,432 | 24,418 | ||||||
Sonova Holding AG (Switzerland) | 84 | 11,655 | ||||||
SurModics, Inc.* | 1,500 | 39,045 | ||||||
Sysmex Corp. (Japan) | 200 | 11,089 | ||||||
Terumo Corp. (Japan) | 500 | 13,172 | ||||||
Vascular Solutions, Inc.* | 1,700 | 51,544 | ||||||
See Notes to Financial Statements.
| 26 |
Description | Shares | Value (Note 1) | ||||||
COMMON STOCKS (Continued) | ||||||||
Health Care Equipment & Supplies (cont’d.) | ||||||||
William Demant Holding A/S (Denmark)* | 41 | $ | 3,481 | |||||
|
| |||||||
| 5,116,137 | ||||||||
Health Care Providers & Services 1.8% | ||||||||
Addus HomeCare Corp.* | 700 | 16,114 | ||||||
Aetna, Inc. | 18,900 | 2,013,417 | ||||||
Alfresa Holdings Corp. (Japan) | 300 | 4,227 | ||||||
Anthem, Inc. | 5,000 | 772,050 | ||||||
Celesio AG (Germany) | 81 | 2,392 | ||||||
Chemed Corp. | 180 | 21,492 | ||||||
Cigna Corp. | 4,900 | 634,256 | ||||||
CorVel Corp.* | 700 | 24,087 | ||||||
Ensign Group, Inc. (The) | 800 | 37,488 | ||||||
Express Scripts Holding Co.* | 9,100 | 789,607 | ||||||
Fresenius Medical Care AG & Co. KGaA (Germany) | 348 | 28,926 | ||||||
Fresenius SE & Co. KGaA (Germany) | 607 | 36,187 | ||||||
Healthscope Ltd. (Australia) | 1,742 | 4,050 | ||||||
HealthSouth Corp. | 800 | 35,488 | ||||||
LHC Group, Inc.* | 600 | 19,818 | ||||||
Medipal Holdings Corp. (Japan) | 200 | 2,607 | ||||||
Miraca Holdings, Inc. (Japan) | 100 | 4,597 | ||||||
National HealthCare Corp. | 1,000 | 63,710 | ||||||
Providence Service Corp. (The)* | 300 | 15,936 | ||||||
Ramsay Health Care Ltd. (Australia) | 211 | 10,773 | ||||||
Ryman Healthcare Ltd. (New Zealand) | 734 | 4,296 | ||||||
Select Medical Holdings Corp. | 9,300 | 137,919 | ||||||
Sonic Healthcare Ltd. (Australia) | 611 | 9,493 | ||||||
Suzuken Co. Ltd. (Japan) | 165 | 5,029 | ||||||
Team Health Holdings, Inc.* | 300 | 17,553 | ||||||
Triple-S Management Corp. (Puerto Rico) (Class B Stock)* | 2,000 | 39,760 | ||||||
UnitedHealth Group, Inc. | 21,500 | 2,543,235 | ||||||
|
| |||||||
| 7,294,507 | ||||||||
Health Care Technology 0.4% | ||||||||
Cerner Corp.* | 18,400 | 1,347,984 | ||||||
Computer Programs & Systems, Inc.(a) | 500 | 27,130 | ||||||
MedAssets, Inc.* | 700 | 13,174 | ||||||
Quality Systems, Inc. | 5,300 | 84,694 | ||||||
|
| |||||||
| 1,472,982 | ||||||||
See Notes to Financial Statements.
| Prudential Balanced Fund | 27 |
Portfolio of Investments
as of March 31, 2015 (Unaudited) continued
Description | Shares | Value (Note 1) | ||||||
COMMON STOCKS (Continued) | ||||||||
Hotels, Restaurants & Leisure 1.3% | ||||||||
Accor SA (France) | 338 | $ | 17,625 | |||||
Bloomin’ Brands, Inc. | 500 | 12,165 | ||||||
Buffalo Wild Wings, Inc.* | 510 | 92,432 | ||||||
Carnival Corp. | 3,500 | 167,440 | ||||||
Carnival PLC | 305 | 14,915 | ||||||
Chipotle Mexican Grill, Inc.* | 300 | 195,162 | ||||||
Compass Group PLC (United Kingdom) | 2,691 | 46,714 | ||||||
Cracker Barrel Old Country Store, Inc.(a) | 600 | 91,284 | ||||||
Crown Resorts Ltd. (Australia) | 624 | 6,334 | ||||||
Darden Restaurants, Inc. | 11,200 | 776,608 | ||||||
DineEquity, Inc. | 1,600 | 171,216 | ||||||
Flight Centre Travel Group Ltd. (Australia) | 85 | 2,558 | ||||||
Galaxy Entertainment Group Ltd. (Hong Kong) | 3,700 | 16,799 | ||||||
Genting Singapore PLC (Singapore) | 9,500 | 6,352 | ||||||
Hyatt Hotels Corp. (Class A Stock)* | 4,100 | 242,802 | ||||||
InterContinental Hotels Group PLC (United Kingdom) | 367 | 14,314 | ||||||
Jack in the Box, Inc. | 2,100 | 201,432 | ||||||
Las Vegas Sands Corp. | 7,800 | 429,312 | ||||||
Marcus Corp. | 1,800 | 38,322 | ||||||
Marriott Vacations Worldwide Corp. | 2,300 | 186,415 | ||||||
McDonald’s Corp. | 22,868 | 2,228,258 | ||||||
McDonald’s Holdings Co. Japan Ltd. (Japan)(a) | 100 | 2,216 | ||||||
Merlin Entertainments PLC (United Kingdom), 144A | 1,144 | 7,490 | ||||||
MGM China Holdings Ltd. (Macau) | 1,600 | 3,006 | ||||||
Monarch Casino & Resort, Inc.* | 1,100 | 21,054 | ||||||
Oriental Land Co. Ltd. (Japan) | 400 | 30,287 | ||||||
Ruth’s Hospitality Group, Inc. | 2,000 | 31,760 | ||||||
Sands China Ltd. (Hong Kong) | 3,800 | 15,714 | ||||||
Shangri-La Asia Ltd. (Hong Kong) | 2,000 | 2,747 | ||||||
SJM Holdings Ltd. (Hong Kong) | 3,000 | 3,918 | ||||||
Sodexo (France) | 147 | 14,337 | ||||||
Tabcorp Holdings Ltd. (Australia) | 1,326 | 4,778 | ||||||
Tatts Group Ltd. (Australia) | 2,268 | 6,862 | ||||||
TUI AG (Germany) | 720 | 12,632 | ||||||
Whitbread PLC (United Kingdom) | 301 | 23,372 | ||||||
William Hill PLC (United Kingdom) | 1,338 | 7,347 | ||||||
Wynn Macau Ltd. (Macau) | 2,500 | 5,403 | ||||||
Yum! Brands, Inc. | 3,500 | 275,520 | ||||||
|
| |||||||
| 5,426,902 | ||||||||
See Notes to Financial Statements.
| 28 |
Description | Shares | Value (Note 1) | ||||||
COMMON STOCKS (Continued) | ||||||||
Household Durables 0.1% | ||||||||
Casio Computer Co. Ltd. (Japan) | 400 | $ | 7,577 | |||||
Cavco Industries, Inc.* | 200 | 15,012 | ||||||
CSS Industries, Inc. | 500 | 15,075 | ||||||
Electrolux AB (Sweden) Series B | 386 | 11,027 | ||||||
Ethan Allen Interiors, Inc. | 700 | 19,348 | ||||||
Helen of Troy Ltd.* | 1,900 | 154,831 | ||||||
Husqvarna AB (Sweden) (Class B Stock) | 644 | 4,665 | ||||||
La-Z-Boy, Inc. (Class Z Stock) | 3,400 | 95,574 | ||||||
Nikon Corp. (Japan) | 600 | 8,045 | ||||||
Panasonic Corp. (Japan) | 3,600 | 47,275 | ||||||
Persimmon PLC, B/C Shares (United Kingdom) | 491 | 12,100 | ||||||
Rinnai Corp. (Japan) | 70 | 5,188 | ||||||
Sekisui Chemical Co. Ltd. (Japan) | 700 | 9,083 | ||||||
Sekisui House Ltd. (Japan) | 900 | 13,068 | ||||||
Sharp Corp. (Japan) | 2,300 | 4,505 | ||||||
Skullcandy, Inc.* | 1,600 | 18,080 | ||||||
Sony Corp. (Japan)* | 1,900 | 50,813 | ||||||
Techtronic Industries Co. (Hong Kong) | 3,000 | 10,114 | ||||||
Universal Electronics, Inc.* | 1,700 | 95,948 | ||||||
|
| |||||||
| 597,328 | ||||||||
Household Products 1.2% | ||||||||
Colgate-Palmolive Co. | 7,700 | 533,918 | ||||||
Henkel AG & Co. KGaA (Germany) | 182 | 18,781 | ||||||
Kimberly-Clark Corp. | 11,400 | 1,221,054 | ||||||
Procter & Gamble Co. (The) | 35,175 | 2,882,240 | ||||||
Reckitt Benckiser Group PLC (United Kingdom) | 1,042 | 89,513 | ||||||
Svenska Cellulosa AB SCA (Sweden) (Class B Stock) | 973 | 22,358 | ||||||
Unicharm Corp. (Japan) | 600 | 15,708 | ||||||
|
| |||||||
| 4,783,572 | ||||||||
Independent Power & Renewable Electricity Producers 0.4% | ||||||||
AES Corp. (The) | 83,600 | 1,074,260 | ||||||
Atlantic Power Corp. | 2,900 | 8,149 | ||||||
Calpine Corp.* | 20,200 | 461,974 | ||||||
Electric Power Development Co. Ltd. (Japan) | 200 | 6,738 | ||||||
Enel Green Power SpA (Italy) | 2,716 | 5,064 | ||||||
Meridian Energy Ltd. (New Zealand) | 1,943 | 2,937 | ||||||
Ormat Technologies, Inc. | 1,100 | 41,822 | ||||||
|
| |||||||
| 1,600,944 | ||||||||
See Notes to Financial Statements.
| Prudential Balanced Fund | 29 |
Portfolio of Investments
as of March 31, 2015 (Unaudited) continued
Description | Shares | Value (Note 1) | ||||||
COMMON STOCKS (Continued) | ||||||||
Industrial Conglomerates 0.9% | ||||||||
3M Co. | 1,000 | $ | 164,950 | |||||
General Electric Co. | 123,050 | 3,052,870 | ||||||
Hutchison Whampoa Ltd. (Hong Kong) | 3,400 | 47,127 | ||||||
Keihan Electric Railway Co. Ltd. (Japan) | 1,000 | 6,086 | ||||||
Keppel Corp. Ltd. (Singapore) | 2,300 | 15,070 | ||||||
Koninklijke Philips NV (Netherlands) | 1,560 | 44,257 | ||||||
NWS Holdings Ltd. (Hong Kong) | 2,900 | 4,830 | ||||||
Roper Industries, Inc. | 500 | 86,000 | ||||||
Sembcorp Industries Ltd. (Singapore) | 1,500 | 4,605 | ||||||
Siemens AG (Germany) | 1,272 | 137,572 | ||||||
Smiths Group PLC (United Kingdom) | 633 | 10,469 | ||||||
Toshiba Corp. (Japan) | 6,700 | 28,073 | ||||||
|
| |||||||
| 3,601,909 | ||||||||
Insurance 1.4% | ||||||||
Admiral Group PLC (United Kingdom) | 315 | 7,132 | ||||||
Aegon NV (Netherlands) | 2,926 | 23,103 | ||||||
Aflac, Inc. | 24,000 | 1,536,240 | ||||||
Ageas (Belgium) | 352 | 12,641 | ||||||
AIA Group Ltd. (Hong Kong) | 19,100 | 119,919 | ||||||
Allianz SE (Germany) | 732 | 127,087 | ||||||
Allstate Corp. (The) | 6,000 | 427,020 | ||||||
American Financial Group, Inc. | 6,200 | 397,730 | ||||||
American International Group, Inc. | 12,400 | 679,396 | ||||||
AMP Ltd. (Australia) | 4,900 | 23,916 | ||||||
Argo Group International Holdings Ltd. | 1,210 | 60,681 | ||||||
Assicurazioni Generali SpA (Italy) | 1,873 | 36,827 | ||||||
Aviva PLC (United Kingdom) | 4,728 | 37,837 | ||||||
AXA SA (France) | 2,913 | 73,318 | ||||||
Baloise Holding AG (Switzerland) | 81 | 10,705 | ||||||
CNP Assurances (France) | 257 | 4,504 | ||||||
Dai-ichi Life Insurance Co. Ltd. (The) (Japan) | 1,729 | 25,079 | ||||||
Delta Lloyd NV (Netherlands) | 353 | 6,658 | ||||||
Direct Line Insurance Group PLC (United Kingdom) | 2,334 | 11,014 | ||||||
FBL Financial Group, Inc. (Class A Stock) | 900 | 55,809 | ||||||
Fidelity & Guaranty Life | 1,600 | 33,920 | ||||||
Friends Life Group Ltd. (Guernsey) | 2,275 | 13,928 | ||||||
Genworth Financial, Inc. (Class A Stock)* | 14,700 | 107,457 | ||||||
Gjensidige Forsikring ASA (Norway) | 327 | 5,642 | ||||||
Global Indemnity PLC (Class A Stock)* | 400 | 11,100 | ||||||
See Notes to Financial Statements.
| 30 |
Description | Shares | Value (Note 1) | ||||||
COMMON STOCKS (Continued) | ||||||||
Insurance (cont’d.) | ||||||||
Hannover Rueck SE (Germany) | 97 | $ | 10,023 | |||||
Insurance Australia Group Ltd. (Australia) | 3,643 | 16,863 | ||||||
Kansas City Life Insurance Co. | 300 | 13,779 | ||||||
Legal & General Group PLC (United Kingdom) | 9,525 | 39,227 | ||||||
Mapfre SA (Spain) | 1,748 | 6,382 | ||||||
Medibank Pvt Ltd. (Australia)* | 4,418 | 7,792 | ||||||
MetLife, Inc. | 3,800 | 192,090 | ||||||
MS&AD Insurance Group Holdings (Japan) | 890 | 24,916 | ||||||
Muenchener Rueckversicherungs AG (Germany) | 277 | 59,522 | ||||||
National Western Life Insurance Co. (Class A Stock) | 70 | 17,801 | ||||||
Navigators Group, Inc. (The)* | 800 | 62,272 | ||||||
NN Group NV (Netherlands)* | 254 | 7,201 | ||||||
Old Mutual PLC (United Kingdom) | 7,869 | 25,831 | ||||||
Prudential PLC (United Kingdom) | 4,117 | 102,165 | ||||||
QBE Insurance Group Ltd. (Australia) | 2,251 | 22,251 | ||||||
RSA Insurance Group PLC (United Kingdom) | 1,670 | 10,409 | ||||||
Sampo OYJ (Finland) (Class A Stock) | 717 | 36,164 | ||||||
SCOR SE (France) | 244 | 8,230 | ||||||
Sompo Japan Nipponkoa Holdings, Inc. (Japan) | 575 | 17,876 | ||||||
Sony Financial Holdings, Inc. (Japan) | 300 | 4,826 | ||||||
Standard Life PLC (United Kingdom) | 3,234 | 22,724 | ||||||
Suncorp Group Ltd. (Australia) | 2,133 | 21,873 | ||||||
Swiss Life Holding AG (Switzerland) | 51 | 12,599 | ||||||
Swiss Re AG (Switzerland) | 565 | 54,499 | ||||||
Symetra Financial Corp. | 5,100 | 119,646 | ||||||
T&D Holdings, Inc. (Japan) | 900 | 12,363 | ||||||
Third Point Reinsurance Ltd.* | 1,800 | 25,470 | ||||||
Tokio Marine Holdings, Inc. (Japan) | 1,200 | 45,296 | ||||||
Tryg A/S (Denmark) | 38 | 4,469 | ||||||
UnipolSai SpA (Italy) | 1,422 | 4,138 | ||||||
Universal Insurance Holdings, Inc. | 4,400 | 112,596 | ||||||
Unum Group | 22,700 | 765,671 | ||||||
Vienna Insurance Group AG Wiener Versicherung Gruppe (Austria) | 54 | 2,391 | ||||||
Zurich Insurance Group AG (Switzerland) | 240 | 81,121 | ||||||
|
| |||||||
| 5,819,139 | ||||||||
Internet & Catalog Retail 0.3% | ||||||||
1-800-Flowers.com, Inc. (Class A Stock)* | 2,500 | 29,575 | ||||||
FTD Cos., Inc.* | 900 | 26,946 | ||||||
HSN, Inc. | 300 | 20,469 | ||||||
See Notes to Financial Statements.
| Prudential Balanced Fund | 31 |
Portfolio of Investments
as of March 31, 2015 (Unaudited) continued
Description | Shares | Value (Note 1) | ||||||
COMMON STOCKS (Continued) | ||||||||
Internet & Catalog Retail (cont’d.) | ||||||||
Liberty Ventures (Class A Stock)* | 5,200 | $ | 218,452 | |||||
Nutrisystem, Inc. | 3,500 | 69,930 | ||||||
Rakuten, Inc. (Japan) | 1,310 | 23,067 | ||||||
TripAdvisor, Inc.* | 12,200 | 1,014,674 | ||||||
|
| |||||||
| 1,403,113 | ||||||||
Internet Software & Services 1.5% | ||||||||
Constant Contact, Inc.* | 1,400 | 53,494 | ||||||
Demand Media, Inc.* | 3,400 | 19,448 | ||||||
Envestnet, Inc.* | 900 | 50,472 | ||||||
Global Sources Ltd.* | 2,261 | 13,249 | ||||||
Google, Inc. (Class A Stock)* | 4,100 | 2,274,270 | ||||||
Google, Inc. (Class C Stock)* | 5,700 | 3,123,600 | ||||||
Liquidity Services, Inc.* | 1,800 | 17,784 | ||||||
LogMeIn, Inc.* | 1,400 | 78,386 | ||||||
NIC, Inc. | 7,300 | 128,991 | ||||||
United Internet AG (Germany) | 188 | 8,533 | ||||||
XO Group, Inc.* | 2,900 | 51,243 | ||||||
Yahoo Japan Corp. (Japan) | 2,300 | 9,487 | ||||||
Yahoo!, Inc.* | 5,200 | 231,062 | ||||||
|
| |||||||
| 6,060,019 | ||||||||
IT Services 1.5% | ||||||||
Amadeus IT Holding SA (Spain) (Class A Stock) | 682 | 29,228 | ||||||
AtoS (France) | 123 | 8,467 | ||||||
Booz Allen Hamilton Holding Corp. | 11,400 | 329,916 | ||||||
Broadridge Financial Solutions, Inc. | 11,800 | 649,118 | ||||||
Cap Gemini SA (France) | 224 | 18,377 | ||||||
Computershare Ltd. (Australia) | 743 | 7,182 | ||||||
DST Systems, Inc. | 9,800 | 1,084,958 | ||||||
EPAM Systems, Inc.* | 200 | 12,258 | ||||||
Fiserv, Inc.* | 11,600 | 921,040 | ||||||
Fujitsu Ltd. (Japan) | 3,100 | 21,141 | ||||||
International Business Machines Corp. | 5,041 | 809,081 | ||||||
Itochu Techno-Solutions Corp. (Japan) | 100 | 2,074 | ||||||
MasterCard, Inc. (Class A Stock) | 6,500 | 561,535 | ||||||
MAXIMUS, Inc. | 2,800 | 186,928 | ||||||
Nomura Research Institute Ltd. (Japan) | 200 | 7,514 | ||||||
NTT Data Corp. (Japan) | 200 | 8,687 | ||||||
Otsuka Corp. (Japan) | 90 | 3,835 | ||||||
See Notes to Financial Statements.
| 32 |
Description | Shares | Value (Note 1) | ||||||
COMMON STOCKS (Continued) | ||||||||
IT Services (cont’d.) | ||||||||
Syntel, Inc.* | 3,300 | $ | 170,709 | |||||
Visa, Inc. (Class A Stock)(a) | 19,200 | 1,255,872 | ||||||
|
| |||||||
| 6,087,920 | ||||||||
Leisure Products 0.2% | ||||||||
Bandai Namco Holdings, Inc. (Japan) | 300 | 5,839 | ||||||
Brunswick Corp. | 3,300 | 169,785 | ||||||
Nautilus, Inc.* | 4,000 | 61,080 | ||||||
Polaris Industries, Inc. | 3,300 | 465,630 | ||||||
Sankyo Co. Ltd. (Japan) | 50 | 1,776 | ||||||
Sega Sammy Holdings, Inc. (Japan) | 300 | 4,371 | ||||||
Shimano, Inc. (Japan) | 100 | 14,860 | ||||||
Yamaha Corp. (Japan) | 300 | 5,239 | ||||||
|
| |||||||
| 728,580 | ||||||||
Life Sciences Tools & Services 0.1% | ||||||||
Cambrex Corp.* | 2,900 | 114,927 | ||||||
Lonza Group AG (Switzerland) | 90 | 11,205 | ||||||
PAREXEL International Corp.* | 2,300 | 158,677 | ||||||
QIAGEN NV* | 405 | 10,163 | ||||||
|
| |||||||
| 294,972 | ||||||||
Machinery 0.7% | ||||||||
Alamo Group, Inc. | 700 | 44,191 | ||||||
Alfa Laval AB (Sweden) | 499 | 9,801 | ||||||
Amada Co. Ltd. (Japan) | 700 | 6,742 | ||||||
ANDRITZ AG (Austria) | 113 | 6,747 | ||||||
Atlas Copco AB (Sweden) (Class A Stock) | 1,077 | 34,866 | ||||||
Atlas Copco AB (Sweden) (Class B Stock) | 607 | 17,924 | ||||||
Blount International, Inc.* | 6,900 | 88,872 | ||||||
CNH Industrial NV (United Kingdom) | 1,473 | 12,072 | ||||||
Columbus McKinnon Corp. | 300 | 8,082 | ||||||
Cummins, Inc. | 1,500 | 207,960 | ||||||
FANUC Corp. (Japan) | 320 | 69,860 | ||||||
Federal Signal Corp. | 1,600 | 25,264 | ||||||
GEA Group AG (Germany) | 284 | 13,652 | ||||||
Global Brass & Copper Holdings, Inc. | 2,200 | 33,990 | ||||||
Hillenbrand, Inc. | 3,700 | 114,219 | ||||||
Hino Motors Ltd. (Japan) | 400 | 5,691 | ||||||
Hitachi Construction Machinery Co. Ltd. (Japan) | 200 | 3,491 | ||||||
See Notes to Financial Statements.
| Prudential Balanced Fund | 33 |
Portfolio of Investments
as of March 31, 2015 (Unaudited) continued
Description | Shares | Value (Note 1) | ||||||
COMMON STOCKS (Continued) | ||||||||
Machinery (cont’d.) | ||||||||
IHI Corp. (Japan) | 2,200 | $ | 10,287 | |||||
IMI PLC (United Kingdom) | 422 | 7,963 | ||||||
JTEKT Corp. (Japan) | 400 | 6,237 | ||||||
Kadant, Inc. | 400 | 21,044 | ||||||
Kawasaki Heavy Industries Ltd. (Japan) | 2,500 | 12,613 | ||||||
Komatsu Ltd. (Japan) | 1,500 | 29,404 | ||||||
Kone OYJ (Finland) (Class B Stock) | 519 | 23,013 | ||||||
Kubota Corp. (Japan) | 1,800 | 28,438 | ||||||
Kurita Water Industries Ltd. (Japan) | 200 | 4,832 | ||||||
LB Foster Co. (Class A Stock) | 600 | 28,488 | ||||||
Lincoln Electric Holdings, Inc. | 6,400 | 418,496 | ||||||
Makita Corp. (Japan) | 150 | 7,773 | ||||||
MAN SE (Germany) | 53 | 5,579 | ||||||
Melrose Industries PLC (United Kingdom) | 1,582 | 6,497 | ||||||
Meritor, Inc.* | 3,500 | 44,135 | ||||||
Metso OYJ (Finland) | 166 | 4,850 | ||||||
Minebea Co. Ltd. (Japan) | 1,000 | 15,728 | ||||||
Mitsubishi Heavy Industries Ltd. (Japan) | 4,900 | 26,961 | ||||||
Mueller Industries, Inc. | 1,200 | 43,356 | ||||||
Nabtesco Corp. (Japan) | 200 | 5,778 | ||||||
NGK Insulators Ltd. (Japan) | 500 | 10,653 | ||||||
NSK Ltd. (Japan) | 800 | 11,676 | ||||||
Parker Hannifin Corp. | 8,500 | 1,009,630 | ||||||
Sandvik AB (Sweden) | 1,659 | 18,578 | ||||||
Schindler Holding AG (Switzerland) | 32 | 5,229 | ||||||
Schindler Holding AG - Participation Certificates (Switzerland) | 76 | 12,613 | ||||||
SembCorp. Marine Ltd. (Singapore) | 1,300 | 2,759 | ||||||
SKF AB (Sweden) (Class B Stock) | 651 | 16,810 | ||||||
SMC Corp. (Japan) | 100 | 29,776 | ||||||
Standex International Corp. | 1,200 | 98,556 | ||||||
Sulzer AG (Switzerland)* | 43 | 4,720 | ||||||
Sumitomo Heavy Industries Ltd. (Japan) | 900 | 5,890 | ||||||
THK Co. Ltd. (Japan) | 150 | 3,812 | ||||||
Vallourec SA (France) | 157 | 3,832 | ||||||
Volvo AB (Sweden) | 2,461 | 29,784 | ||||||
Wartsila OYJ Abp (Finland) | 237 | 10,483 | ||||||
Weir Group PLC (The) (United Kingdom) | 342 | 8,630 | ||||||
Woodward, Inc. | 800 | 40,808 | ||||||
Yangzijiang Shipbuilding Holdings Ltd. (China) | 2,700 | 2,482 | ||||||
See Notes to Financial Statements.
| 34 |
Description | Shares | Value (Note 1) | ||||||
COMMON STOCKS (Continued) | ||||||||
Machinery (cont’d.) | ||||||||
Zardoya Otis SA (Spain) | 241 | $ | 3,110 | |||||
|
| |||||||
| 2,784,727 | ||||||||
Marine | ||||||||
A.P. Moeller - Maersk A/S (Denmark) (Class A Stock) | 6 | 12,184 | ||||||
A.P. Moeller - Maersk A/S (Denmark) (Class B Stock) | 12 | 25,083 | ||||||
Kuehne + Nagel International AG (Switzerland) | 90 | 13,362 | ||||||
Matson, Inc. | 1,200 | 50,592 | ||||||
Mitsui OSK Lines Ltd. (Japan) | 1,700 | 5,766 | ||||||
Nippon Yusen K.K. (Japan) | 2,900 | 8,342 | ||||||
|
| |||||||
| 115,329 | ||||||||
Media 1.6% | ||||||||
Altice SA (Luxembourg)* | 135 | 14,639 | ||||||
Axel Springer AG (Germany) | 57 | 3,364 | ||||||
Comcast Corp. (Class A Stock) | 28,900 | 1,631,983 | ||||||
Dentsu, Inc. (Japan) | 350 | 14,973 | ||||||
DIRECTV*(a) | 17,500 | 1,489,250 | ||||||
Discovery Communications, Inc. (Class C Stock)* | 22,100 | 651,398 | ||||||
Eutelsat Communications SA (France) | 249 | 8,260 | ||||||
Gannett Co., Inc.(a) | 5,100 | 189,108 | ||||||
Hakuhodo DY Holdings, Inc. (Japan) | 460 | 4,890 | ||||||
Harte-Hanks, Inc. | 4,600 | 35,880 | ||||||
ITV PLC (United Kingdom) | 6,363 | 23,823 | ||||||
JCDecaux SA (France) | 95 | 3,199 | ||||||
Kabel Deutschland Holding AG (Germany)* | 35 | 4,543 | ||||||
Lagardere SCA (France) | 183 | 5,500 | ||||||
Meredith Corp. | 1,500 | 83,655 | ||||||
New Media Investment Group, Inc. | 2,100 | 50,253 | ||||||
Numericable-SFR SAS (France)* | 152 | 8,293 | ||||||
Pearson PLC (United Kingdom) | 1,315 | 28,304 | ||||||
ProSiebenSat 1 Media AG (Germany) | 340 | 16,630 | ||||||
Publicis Groupe SA (France) | 299 | 23,070 | ||||||
REA Group Ltd. (Australia) | 83 | 3,040 | ||||||
Reed Elsevier NV (Netherlands) | 1,122 | 27,957 | ||||||
Reed Elsevier PLC (United Kingdom) | 1,832 | 31,506 | ||||||
RTL Group SA (Germany) | 61 | 5,866 | ||||||
SES SA (Luxembourg) | 511 | 18,115 | ||||||
Singapore Press Holdings Ltd. (Singapore) | 2,500 | 7,631 | ||||||
Sky PLC (United Kingdom) | 1,656 | 24,363 | ||||||
See Notes to Financial Statements.
| Prudential Balanced Fund | 35 |
Portfolio of Investments
as of March 31, 2015 (Unaudited) continued
Description | Shares | Value (Note 1) | ||||||
COMMON STOCKS (Continued) | ||||||||
Media (cont’d.) | ||||||||
Telenet Group Holding NV (Belgium)* | 81 | $ | 4,457 | |||||
Time Warner, Inc. | 1,700 | 143,548 | ||||||
Time, Inc. | 900 | 20,196 | ||||||
Toho Co. Ltd. (Japan) | 200 | 4,890 | ||||||
Vivendi SA (France) | 1,947 | 48,340 | ||||||
Walt Disney Co. (The) | 20,075 | 2,105,667 | ||||||
Wolters Kluwer NV (Netherlands) | 496 | 16,197 | ||||||
WPP PLC (United Kingdom) | 2,113 | 47,987 | ||||||
|
| |||||||
| 6,800,775 | ||||||||
Metals & Mining 0.2% | ||||||||
Alumina Ltd. (Australia) | 4,039 | 4,915 | ||||||
Anglo American PLC (United Kingdom) | 2,240 | 33,454 | ||||||
Antofagasta PLC (United Kingdom) | 612 | 6,621 | ||||||
ArcelorMittal (Luxembourg) | 1,555 | 14,590 | ||||||
BHP Billiton Ltd. (Australia) | 5,152 | 119,753 | ||||||
BHP Billiton PLC (United Kingdom) | 3,388 | 74,350 | ||||||
Boliden AB (Sweden) | 420 | 8,320 | ||||||
Century Aluminum Co.*(a) | 8,500 | 117,300 | ||||||
Fortescue Metals Group Ltd. (Australia)(a) | 2,422 | 3,585 | ||||||
Fresnillo PLC (Mexico) | 353 | 3,565 | ||||||
Glencore PLC (Switzerland) | 17,928 | 75,687 | ||||||
Globe Specialty Metals, Inc. | 5,500 | 104,060 | ||||||
Hitachi Metals Ltd. (Japan) | 400 | 6,131 | ||||||
Iluka Resources Ltd. (Australia) | 642 | 4,138 | ||||||
JFE Holdings, Inc. (Japan) | 800 | 17,659 | ||||||
Kobe Steel Ltd. (Japan) | 4,900 | 9,038 | ||||||
Maruichi Steel Tube Ltd. (Japan) | 100 | 2,367 | ||||||
Mitsubishi Materials Corp. (Japan) | 2,100 | 7,057 | ||||||
Newcrest Mining Ltd. (Australia)* | 1,277 | 12,879 | ||||||
Nippon Steel & Sumitomo Metal Corp. (Japan) | 12,175 | 30,613 | ||||||
Norsk Hydro ASA (Norway) | 2,157 | 11,338 | ||||||
Randgold Resources Ltd. (Channel Islands) | 137 | 9,497 | ||||||
Rio Tinto Ltd. (Australia) | 699 | 30,288 | ||||||
Rio Tinto PLC (United Kingdom) | 2,041 | 84,164 | ||||||
Sumitomo Metal Mining Co. Ltd. (Japan) | 900 | 13,154 | ||||||
ThyssenKrupp AG (Germany) | 759 | 19,871 | ||||||
Voestalpine AG (Austria) | 209 | 7,645 | ||||||
Worthington Industries, Inc. | 4,400 | 117,084 | ||||||
See Notes to Financial Statements.
| 36 |
Description | Shares | Value (Note 1) | ||||||
COMMON STOCKS (Continued) | ||||||||
Metals & Mining (cont’d.) | ||||||||
Yamato Kogyo Co. Ltd. (Japan) | 100 | $ | 2,410 | |||||
|
| |||||||
| 951,533 | ||||||||
Multi-Utilities 0.5% | ||||||||
AGL Energy Ltd. (Australia) | 1,066 | 12,341 | ||||||
Avista Corp. | 2,900 | 99,122 | ||||||
Black Hills Corp. | 600 | 30,264 | ||||||
Centrica PLC (United Kingdom) | 8,050 | 30,109 | ||||||
E.ON SE (Germany) | 3,210 | 47,729 | ||||||
GDF Suez (France) | 2,322 | 45,843 | ||||||
National Grid PLC (United Kingdom) | 6,049 | 77,766 | ||||||
Public Service Enterprise Group, Inc. | 33,800 | 1,416,896 | ||||||
RWE AG (Germany) | 815 | 20,750 | ||||||
Suez Environnement Co. (France) | 460 | 7,920 | ||||||
Vectren Corp. | 4,600 | 203,044 | ||||||
Veolia Environnement SA (France) | 656 | 12,407 | ||||||
|
| |||||||
| 2,004,191 | ||||||||
Multiline Retail 0.7% | ||||||||
Dillard’s, Inc. (Class A Stock) | 6,300 | 860,013 | ||||||
Harvey Norman Holdings Ltd. (Australia) | 720 | 2,434 | ||||||
Isetan Mitsukoshi Holdings Ltd. (Japan) | 600 | 9,914 | ||||||
J. Front Retailing Co. Ltd. (Japan) | 450 | 7,064 | ||||||
Marks & Spencer Group PLC (United Kingdom) | 2,728 | 21,575 | ||||||
Marui Group Co. Ltd. (Japan) | 400 | 4,533 | ||||||
Next PLC (United Kingdom) | 254 | 26,416 | ||||||
Takashimaya Co. Ltd. (Japan) | 400 | 3,929 | ||||||
Target Corp. | 21,700 | 1,780,919 | ||||||
|
| |||||||
| 2,716,797 | ||||||||
Oil, Gas & Consumable Fuels 4.3% | ||||||||
Adams Resources & Energy, Inc. | 300 | 20,163 | ||||||
Alon USA Energy, Inc. | 6,000 | 99,420 | ||||||
BG Group PLC (United Kingdom) | 5,471 | 67,149 | ||||||
BP PLC (United Kingdom) | 29,551 | 191,554 | ||||||
Caltex Australia Ltd. (Australia) | 209 | 5,547 | ||||||
Chevron Corp. | 19,192 | 2,014,776 | ||||||
Delek Group Ltd. (Israel) | 7 | 1,801 | ||||||
Delek US Holdings, Inc. | 4,100 | 162,975 | ||||||
Eni SpA (Italy) | 4,081 | 70,634 | ||||||
See Notes to Financial Statements.
| Prudential Balanced Fund | 37 |
Portfolio of Investments
as of March 31, 2015 (Unaudited) continued
Description | Shares | Value (Note 1) | ||||||
COMMON STOCKS (Continued) | ||||||||
Oil, Gas & Consumable Fuels (cont’d.) | ||||||||
EQT Corp. | 15,500 | $ | 1,284,485 | |||||
Exxon Mobil Corp. | 42,754 | 3,634,090 | ||||||
Galp Energia SGPS SA (Portugal) (Class B Stock) | 600 | 6,489 | ||||||
HollyFrontier Corp. | 25,600 | 1,030,912 | ||||||
Idemitsu Kosan Co. Ltd. (Japan) | 140 | 2,438 | ||||||
Inpex Corp. (Japan) | 1,487 | 16,385 | ||||||
JX Holdings, Inc. (Japan) | 3,910 | 15,044 | ||||||
Koninklijke Vopak NV (Netherlands) | 109 | 6,015 | ||||||
Lundin Petroleum AB (Sweden)* | 320 | 4,378 | ||||||
Marathon Oil Corp. | 2,456 | 64,126 | ||||||
Marathon Petroleum Corp. | 14,500 | 1,484,655 | ||||||
Neste Oil OYJ (Finland) | 189 | 4,959 | ||||||
OMV AG (Austria) | 228 | 6,254 | ||||||
ONEOK, Inc. | 27,500 | 1,326,600 | ||||||
Origin Energy Ltd. (Australia) | 1,753 | 15,026 | ||||||
PDC Energy, Inc.* | 2,500 | 135,100 | ||||||
Phillips 66 | 22,200 | 1,744,920 | ||||||
Repsol SA (Spain) | 1,672 | 31,125 | ||||||
REX American Resources Corp.* | 1,600 | 97,296 | ||||||
Royal Dutch Shell PLC (Netherlands) (Class A Stock) | 6,324 | 188,057 | ||||||
Royal Dutch Shell PLC (Netherlands) (Class B Stock) | 3,915 | 121,953 | ||||||
Santos Ltd. (Australia) | 1,550 | 8,385 | ||||||
Showa Shell Sekiyu KK (Japan) | 300 | 2,740 | ||||||
Statoil ASA (Norway) | 1,790 | 31,650 | ||||||
Targa Resources Corp. | 5,500 | 526,845 | ||||||
Tesoro Corp. | 8,300 | 757,707 | ||||||
TonenGeneral Sekiyu KK (Japan) | 500 | 4,312 | ||||||
Total SA (France) | 3,433 | 170,644 | ||||||
Tullow Oil PLC (United Kingdom) | 1,460 | 6,121 | ||||||
Valero Energy Corp. | 25,000 | 1,590,500 | ||||||
Western Refining, Inc. | 3,600 | 177,804 | ||||||
Woodside Petroleum Ltd. (Australia) | 1,189 | 31,151 | ||||||
World Fuel Services Corp. | 9,700 | 557,556 | ||||||
|
| |||||||
| 17,719,741 | ||||||||
Paper & Forest Products 0.1% | ||||||||
Clearwater Paper Corp.* | 1,500 | 97,950 | ||||||
Neenah Paper, Inc. | 600 | 37,524 | ||||||
Oji Holdings Corp. (Japan) | 1,200 | 4,910 | ||||||
P.H. Glatfelter Co. | 900 | 24,777 | ||||||
See Notes to Financial Statements.
| 38 |
Description | Shares | Value (Note 1) | ||||||
COMMON STOCKS (Continued) | ||||||||
Paper & Forest Products (cont’d.) | ||||||||
Resolute Forest Products, Inc.* | 1,300 | $ | 22,425 | |||||
Schweitzer-Mauduit International, Inc. | 700 | 32,284 | ||||||
Stora Enso OYJ (Finland) (Class R Stock) | 851 | 8,750 | ||||||
UPM-Kymmene OYJ (Finland) | 881 | 17,115 | ||||||
|
| |||||||
| 245,735 | ||||||||
Personal Products | ||||||||
Beiersdorf AG (Germany) | 157 | 13,613 | ||||||
Kao Corp. (Japan) | 850 | 42,444 | ||||||
L’Oreal SA (France) | 403 | 74,229 | ||||||
Shiseido Co. Ltd. (Japan) | 600 | 10,644 | ||||||
|
| |||||||
| 140,930 | ||||||||
Pharmaceuticals 3.8% | ||||||||
AbbVie, Inc. | 36,700 | 2,148,418 | ||||||
Astellas Pharma, Inc. (Japan) | 3,500 | 57,347 | ||||||
AstraZeneca PLC (United Kingdom) | 2,025 | 138,952 | ||||||
Bayer AG (Germany) | 1,333 | 199,437 | ||||||
Bristol-Myers Squibb Co. | 33,400 | 2,154,300 | ||||||
Catalent, Inc.* | 1,100 | 34,265 | ||||||
Chugai Pharmaceutical Co. Ltd. (Japan) | 400 | 12,624 | ||||||
Daiichi Sankyo Co. Ltd. (Japan) | 1,000 | 15,891 | ||||||
Eisai Co. Ltd. (Japan) | 400 | 28,451 | ||||||
GlaxoSmithKline PLC (United Kingdom) | 7,835 | 180,361 | ||||||
Hisamitsu Pharmaceutical Co., Inc. (Japan) | 100 | 4,107 | ||||||
Impax Laboratories, Inc.* | 600 | 28,122 | ||||||
Johnson & Johnson | 33,400 | 3,360,040 | ||||||
Kyowa Hakko Kirin Co. Ltd. (Japan) | 400 | 5,214 | ||||||
Lannett Co., Inc.*(a) | 2,700 | 182,817 | ||||||
Merck & Co., Inc. | 38,089 | 2,189,356 | ||||||
Merck KGaA (Germany) | 215 | 24,062 | ||||||
Mitsubishi Tanabe Pharma Corp. (Japan) | 400 | 6,862 | ||||||
Novartis AG (Switzerland) | 3,708 | 365,982 | ||||||
Novo Nordisk A/S (Class B Stock) (Denmark) | 3,219 | 171,843 | ||||||
Ono Pharmaceutical Co. Ltd. (Japan) | 100 | 11,284 | ||||||
Orion OYJ (Finland) (Class B Stock) | 177 | 4,989 | ||||||
Otsuka Holdings Co. Ltd. (Japan) | 600 | 18,770 | ||||||
Pfizer, Inc. | 95,619 | 3,326,585 | ||||||
Phibro Animal Health Corp. (Class A Stock) | 2,900 | 102,689 | ||||||
Roche Holding AG (Switzerland) | 1,132 | 311,065 | ||||||
See Notes to Financial Statements.
| Prudential Balanced Fund | 39 |
Portfolio of Investments
as of March 31, 2015 (Unaudited) continued
Description | Shares | Value (Note 1) | ||||||
COMMON STOCKS (Continued) | ||||||||
Pharmaceuticals (cont’d.) | ||||||||
Sanofi (France) | 1,925 | $ | 190,111 | |||||
Santen Pharmaceutical Co. Ltd. (Japan) | 750 | 10,939 | ||||||
Shionogi & Co. Ltd. (Japan) | 500 | 16,645 | ||||||
Shire PLC (Ireland) | 946 | 75,418 | ||||||
Sucampo Pharmaceuticals, Inc. (Class A Stock)*(a) | 4,700 | 73,132 | ||||||
Sumitomo Dainippon Pharma Co. Ltd. (Japan) | 300 | 3,553 | ||||||
Taisho Pharmaceutical Holdings Co. Ltd. (Japan) | 30 | 2,229 | ||||||
Takeda Pharmaceutical Co. Ltd. (Japan) | 1,300 | 64,893 | ||||||
Teva Pharmaceutical Industries Ltd. (Israel) | 1,374 | 85,871 | ||||||
UCB SA (Belgium) | 216 | 15,604 | ||||||
|
| |||||||
| 15,622,228 | ||||||||
Professional Services 0.1% | ||||||||
Adecco SA (Switzerland) | 284 | 23,607 | ||||||
ALS Ltd. (Australia) | 688 | 2,584 | ||||||
Bureau Veritas SA (France) | 428 | 9,183 | ||||||
Capita PLC (United Kingdom) | 1,109 | 18,333 | ||||||
CBIZ, Inc.* | 1,100 | 10,263 | ||||||
Corporate Executive Board Co. (The) | 900 | 71,874 | ||||||
Experian PLC (United Kingdom) | 1,589 | 26,303 | ||||||
ICF International, Inc.* | 1,000 | 40,850 | ||||||
Intertek Group PLC (United Kingdom) | 259 | 9,593 | ||||||
Korn/Ferry International | 2,700 | 88,749 | ||||||
Navigant Consulting, Inc.* | 4,400 | 57,024 | ||||||
Randstad Holding NV (Netherlands) | 194 | 11,760 | ||||||
Resources Connection, Inc. | 4,000 | 70,000 | ||||||
Seek Ltd. (Australia) | 503 | 6,522 | ||||||
SGS SA (Switzerland) | 9 | 17,159 | ||||||
|
| |||||||
| 463,804 | ||||||||
Real Estate Investment Trusts (REITs) 2.0% | ||||||||
AG Mortgage Investment Trust, Inc. | 4,200 | 79,128 | ||||||
Agree Realty Corp. | 300 | 9,891 | ||||||
American Assets Trust, Inc. | 3,600 | 155,808 | ||||||
Annaly Capital Management, Inc. | 39,000 | 405,600 | ||||||
Apollo Residential Mortgage, Inc. | 5,000 | 79,750 | ||||||
Ares Commercial Real Estate Corp. | 2,800 | 30,940 | ||||||
Armada Hoffler Properties, Inc. | 700 | 7,462 | ||||||
Ascendas Real Estate Investment Trust (Singapore) | 3,200 | 6,036 | ||||||
Ashford Hospitality Prime, Inc. | 2,500 | 41,925 | ||||||
See Notes to Financial Statements.
| 40 |
Description | Shares | Value (Note 1) | ||||||
COMMON STOCKS (Continued) | ||||||||
Real Estate Investment Trusts (REITs) (cont’d.) | ||||||||
Ashford Hospitality Trust, Inc. | 10,800 | $ | 103,896 | |||||
British Land Co. PLC (The) (United Kingdom) | 1,608 | 19,818 | ||||||
CapitaCommercial Trust (Singapore) | 3,000 | 3,862 | ||||||
CapitaMall Trust (Singapore) | 3,600 | 5,763 | ||||||
Cedar Realty Trust, Inc. | 4,600 | 34,454 | ||||||
Chambers Street Properties | 17,300 | 136,324 | ||||||
CorEnergy Infrastructure Trust, Inc. | 1,300 | 9,009 | ||||||
Crown Castle International Corp. | 16,700 | 1,378,418 | ||||||
Dexus Property Group (Australia) | 1,408 | 8,106 | ||||||
DiamondRock Hospitality Co. | 8,400 | 118,692 | ||||||
Federation Centres Ltd. (Australia) | 2,269 | 5,238 | ||||||
First Industrial Realty Trust, Inc. | 1,000 | 21,430 | ||||||
Fonciere Des Regions (France), Equiduct Exchange | 53 | 5,248 | ||||||
Fonciere Des Regions (France), Euronext Paris Exchange* | 3 | 289 | ||||||
Franklin Street Properties Corp. | 8,900 | 114,098 | ||||||
Gecina SA (France) | 44 | 5,951 | ||||||
GEO Group, Inc. (The) | 3,500 | 153,090 | ||||||
Gladstone Commercial Corp. | 1,500 | 27,915 | ||||||
Goodman Group (Australia) | 3,022 | 14,551 | ||||||
GPT Group (Australia) | 2,704 | 9,392 | ||||||
Hammerson PLC (United Kingdom) | 1,220 | 12,015 | ||||||
Hospitality Properties Trust | 32,700 | 1,078,773 | ||||||
Host Hotels & Resorts, Inc. | 39,200 | 791,056 | ||||||
ICADE (France) | 57 | 5,150 | ||||||
Intu Properties PLC (United Kingdom) | 1,395 | 7,192 | ||||||
Invesco Mortgage Capital, Inc. | 8,100 | 125,793 | ||||||
Investors Real Estate Trust | 7,500 | 56,250 | ||||||
Japan Prime Realty Investment Corp. (Japan) | 1 | 3,444 | ||||||
Japan Real Estate Investment Corp. (Japan) | 2 | 9,407 | ||||||
Japan Retail Fund Investment Corp. (Japan) | 4 | 7,948 | ||||||
Klepierre (France) | 281 | 13,799 | ||||||
Land Securities Group PLC (United Kingdom) | 1,268 | 23,541 | ||||||
Lexington Realty Trust | 11,500 | 113,045 | ||||||
Link REIT (The) (Hong Kong) | 3,500 | 21,592 | ||||||
Mirvac Group (Australia) | 5,744 | 8,771 | ||||||
New Residential Investment Corp. | 8,900 | 133,767 | ||||||
Nippon Building Fund, Inc. (Japan) | 2 | 9,825 | ||||||
Novion Property Group (Australia) | 3,393 | 6,463 | ||||||
Parkway Properties, Inc. | 1,400 | 24,290 | ||||||
Potlatch Corp. | 600 | 24,024 | ||||||
See Notes to Financial Statements.
| Prudential Balanced Fund | 41 |
Portfolio of Investments
as of March 31, 2015 (Unaudited) continued
Description | Shares | Value (Note 1) | ||||||
COMMON STOCKS (Continued) | ||||||||
Real Estate Investment Trusts (REITs) (cont’d.) | ||||||||
Prologis, Inc. | 24,900 | $ | 1,084,644 | |||||
Redwood Trust, Inc. | 3,900 | 69,693 | ||||||
Resource Capital Corp. | 15,200 | 69,008 | ||||||
RLJ Lodging Trust | 5,700 | 178,467 | ||||||
Scentre Group (Australia) | 8,540 | 24,261 | ||||||
Segro PLC (United Kingdom) | 1,151 | 7,108 | ||||||
Simon Property Group, Inc. | 6,400 | 1,252,096 | ||||||
Stockland (Australia) | 3,720 | 12,710 | ||||||
Summit Hotel Properties, Inc. | 1,800 | 25,326 | ||||||
Sunstone Hotel Investors, Inc. | 8,681 | 144,712 | ||||||
Suntec Real Estate Investment Trust (Singapore) | 4,000 | 5,402 | ||||||
Unibail-Rodamco SE (France) | 157 | 42,395 | ||||||
Urstadt Biddle Properties, Inc. (Class A Stock) | 900 | 20,754 | ||||||
Westfield Corp. (Australia) | 3,167 | 22,952 | ||||||
|
| |||||||
| 8,427,757 | ||||||||
Real Estate Management & Development 0.6% | ||||||||
Aeon Mall Co. Ltd. (Japan) | 220 | 4,357 | ||||||
CapitaLand Ltd. (Singapore) | 4,300 | 11,208 | ||||||
CBRE Group, Inc. (Class A Stock)* | 22,200 | 859,362 | ||||||
City Developments Ltd. (Singapore) | 600 | 4,398 | ||||||
CK Hutchison Holdings Ltd. (Hong Kong) | 2,300 | 46,990 | ||||||
Daito Trust Construction Co. Ltd. (Japan) | 100 | 11,167 | ||||||
Daiwa House Industry Co. Ltd. (Japan) | 1,000 | 19,710 | ||||||
Deutsche Annington Immobilien SE (Germany) | 553 | 18,635 | ||||||
Deutsche Wohnen AG (Germany) | 445 | 11,382 | ||||||
Global Logistic Properties Ltd. (Singapore) | 5,500 | 10,615 | ||||||
Hang Lung Properties Ltd. (Hong Kong) | 3,500 | 9,833 | ||||||
Henderson Land Development Co. Ltd. (Hong Kong) | 1,815 | 12,750 | ||||||
Hysan Development Co. Ltd. (Hong Kong) | 1,000 | 4,383 | ||||||
IMMOFINANZ AG (Austria)* | 1,775 | 5,228 | ||||||
Jones Lang LaSalle, Inc. | 5,600 | 954,240 | ||||||
Kerry Properties Ltd. (Hong Kong) | 1,000 | 3,471 | ||||||
Lend Lease Group (Australia) | 920 | 11,620 | ||||||
Marcus & Millichap, Inc.* | 1,800 | 67,464 | ||||||
Mitsubishi Estate Co. Ltd. (Japan) | 2,000 | 46,384 | ||||||
Mitsui Fudosan Co. Ltd. (Japan) | 1,500 | 44,052 | ||||||
New World Development Co. Ltd. (Hong Kong) | 8,200 | 9,507 | ||||||
Nomura Real Estate Holdings, Inc. (Japan) | 200 | 3,602 | ||||||
NTT Urban Development Corp. (Japan) | 200 | 1,998 | ||||||
See Notes to Financial Statements.
| 42 |
Description | Shares | Value (Note 1) | ||||||
COMMON STOCKS (Continued) | ||||||||
Real Estate Management & Development (cont’d.) | ||||||||
Sino Land Co. Ltd. (Hong Kong) | 5,300 | $ | 8,642 | |||||
Sumitomo Realty & Development Co. Ltd. (Japan) | 590 | 21,241 | ||||||
Sun Hung Kai Properties Ltd. (Hong Kong) | 2,700 | 41,633 | ||||||
Swire Pacific Ltd. (Hong Kong) (Class A Stock) | 1,000 | 13,612 | ||||||
Swire Properties Ltd. (Hong Kong) | 1,600 | 5,196 | ||||||
Swiss Prime Site AG (Switzerland) | 106 | 9,204 | ||||||
Tokyo Tatemono Co. Ltd. (Japan) | 300 | 2,198 | ||||||
Tokyu Fudosan Holdings Corp. (Japan) | 1,000 | 6,821 | ||||||
UOL Group Ltd. (Singapore) | 721 | 4,013 | ||||||
Wharf Holdings Ltd. (The) (Hong Kong) | 2,400 | 16,754 | ||||||
Wheelock & Co. Ltd. (Hong Kong) | 1,400 | 7,154 | ||||||
|
| |||||||
| 2,308,824 | ||||||||
Road & Rail 0.8% | ||||||||
Asciano Ltd. (Australia) | 1,729 | 8,315 | ||||||
Aurizon Holdings Ltd. (Australia) | 3,325 | 12,238 | ||||||
Central Japan Railway Co. (Japan) | 231 | 41,746 | ||||||
ComfortDelGro Corp. Ltd. (Singapore) | 3,600 | 7,584 | ||||||
CSX Corp. | 9,700 | 321,264 | ||||||
DSV A/S (Denmark) | 275 | 8,547 | ||||||
East Japan Railway Co. (Japan) | 500 | 40,067 | ||||||
Hankyu Hanshin Holdings, Inc. (Japan) | 2,000 | 12,355 | ||||||
Keikyu Corp. (Japan) | 800 | 6,395 | ||||||
Keio Corp. (Japan) | 900 | 7,049 | ||||||
Keisei Electric Railway Co. Ltd. (Japan) | 500 | 6,206 | ||||||
Kintetsu Corp. (Japan) | 3,100 | 11,373 | ||||||
MTR Corp. Ltd. (Hong Kong) | 2,500 | 11,891 | ||||||
Nagoya Railroad Co. Ltd. (Japan) | 1,000 | 3,993 | ||||||
Nippon Express Co. Ltd. (Japan) | 1,300 | 7,263 | ||||||
Odakyu Electric Railway Co. Ltd. (Japan) | 1,000 | 10,185 | ||||||
Tobu Railway Co. Ltd. (Japan) | 1,600 | 7,580 | ||||||
Tokyu Corp. (Japan) | 1,900 | 11,755 | ||||||
Union Pacific Corp. | 23,000 | 2,491,130 | ||||||
Werner Enterprises, Inc. | 2,800 | 87,948 | ||||||
West Japan Railway Co. (Japan) | 300 | 15,729 | ||||||
|
| |||||||
| 3,130,613 | ||||||||
Semiconductors & Semiconductor Equipment 1.9% | ||||||||
Advantest Corp. (Japan) | 300 | 3,782 | ||||||
Amkor Technology, Inc.* | 13,800 | 121,923 | ||||||
See Notes to Financial Statements.
| Prudential Balanced Fund | 43 |
Portfolio of Investments
as of March 31, 2015 (Unaudited) continued
Description | Shares | Value (Note 1) | ||||||
COMMON STOCKS (Continued) | ||||||||
Semiconductors & Semiconductor Equipment (cont’d.) | ||||||||
ARM Holdings PLC (United Kingdom) | 2,253 | $ | 36,592 | |||||
ASM Pacific Technology Ltd. (Hong Kong) | 400 | 4,163 | ||||||
ASML Holding NV (Netherlands) | 573 | 58,090 | ||||||
Avago Technologies Ltd. (Singapore) | 2,600 | 330,148 | ||||||
Cabot Microelectronics Corp.* | 200 | 9,994 | ||||||
Diodes, Inc.* | 3,600 | 102,816 | ||||||
Infineon Technologies AG (Germany) | 1,878 | 22,342 | ||||||
Integrated Device Technology, Inc.* | 9,100 | 182,182 | ||||||
Intel Corp. | 96,000 | 3,001,920 | ||||||
Microsemi Corp.* | 1,200 | 42,480 | ||||||
MKS Instruments, Inc. | 3,000 | 101,430 | ||||||
Pericom Semiconductor Corp. | 1,800 | 27,846 | ||||||
PMC-Sierra, Inc.* | 1,100 | 10,208 | ||||||
Qorvo, Inc.* | 3,300 | 263,010 | ||||||
Rohm Co. Ltd. (Japan) | 200 | 13,667 | ||||||
Semtech Corp.* | 600 | 15,987 | ||||||
Skyworks Solutions, Inc. | 12,400 | 1,218,796 | ||||||
STMicroelectronics NV (Switzerland) | 1,013 | 9,440 | ||||||
Tessera Technologies, Inc. | 3,800 | 153,064 | ||||||
Texas Instruments, Inc. | 38,600 | 2,207,341 | ||||||
Tokyo Electron Ltd. (Japan) | 250 | 17,341 | ||||||
|
| |||||||
| 7,954,562 | ||||||||
Software 2.4% | ||||||||
Aspen Technology, Inc.* | 4,300 | 165,507 | ||||||
AVG Technologies NV* | 1,800 | 38,970 | ||||||
Dassault Systemes SA (France) | 208 | 14,076 | ||||||
ePlus, Inc.* | 800 | 69,544 | ||||||
Fair Isaac Corp.(a) | 100 | 8,872 | ||||||
Gemalto NV (Netherlands)(a) | 123 | 9,800 | ||||||
GungHo Online Entertainment, Inc. (Japan) | 200 | 781 | ||||||
Konami Corp. (Japan) | 200 | 3,742 | ||||||
Manhattan Associates, Inc.* | 4,000 | 202,440 | ||||||
Microsoft Corp. | 123,313 | 5,013,290 | ||||||
MicroStrategy, Inc. (Class A Stock)* | 640 | 108,282 | ||||||
NetScout Systems, Inc.*(a) | 3,200 | 140,320 | ||||||
Nexon Co. Ltd. (Japan) | 200 | 2,130 | ||||||
NICE Systems Ltd. (Israel) | 92 | 5,616 | ||||||
Nintendo Co. Ltd. (Japan) | 150 | 22,009 | ||||||
Oracle Corp. | 63,500 | 2,740,025 | ||||||
See Notes to Financial Statements.
| 44 |
Description | Shares | Value (Note 1) | ||||||
COMMON STOCKS (Continued) | ||||||||
Software (cont’d.) | ||||||||
Oracle Corp. Japan (Japan) | 100 | $ | 4,303 | |||||
Pegasystems, Inc. | 4,400 | 95,700 | ||||||
Progress Software Corp.* | 2,900 | 78,793 | ||||||
Sage Group PLC (The) (United Kingdom) | 1,706 | 11,785 | ||||||
SAP SE (Germany) | 1,478 | 106,825 | ||||||
SolarWinds, Inc.* | 2,600 | 133,224 | ||||||
SS&C Technologies Holdings, Inc. | 3,200 | 199,360 | ||||||
Symantec Corp. | 33,600 | 785,064 | ||||||
Trend Micro, Inc. (Japan) | 200 | 6,590 | ||||||
Tyler Technologies, Inc.* | 210 | 25,311 | ||||||
|
| |||||||
| 9,992,359 | ||||||||
Specialty Retail 1.6% | ||||||||
ANN, Inc.* | 2,000 | 82,060 | ||||||
AutoNation, Inc.* | 17,300 | 1,112,909 | ||||||
Build-A-Bear Workshop, Inc.* | 600 | 11,790 | ||||||
Cato Corp. (The) (Class A Stock) | 1,900 | 75,240 | ||||||
Citi Trends, Inc.* | 1,000 | 27,000 | ||||||
Destination Maternity Corp. | 1,500 | 22,590 | ||||||
Dixons Carphone PLC (United Kingdom) | 1,524 | 9,320 | ||||||
Express, Inc.* | 7,700 | 127,281 | ||||||
Fast Retailing Co. Ltd. (Japan) | 100 | 38,666 | ||||||
Finish Line, Inc. (The) (Class A Stock) | 2,800 | 68,656 | ||||||
Foot Locker, Inc. | 1,900 | 119,700 | ||||||
Group 1 Automotive, Inc. | 900 | 77,697 | ||||||
Haverty Furniture Cos., Inc. | 1,900 | 47,272 | ||||||
Hennes & Mauritz AB (Sweden) (Class B Stock) | 1,523 | 61,708 | ||||||
Inditex SA (Spain) | 1,750 | 56,185 | ||||||
Kingfisher PLC (United Kingdom) | 3,960 | 22,342 | ||||||
Kirkland’s, Inc.* | 600 | 14,250 | ||||||
Lowe’s Cos., Inc. | 24,000 | 1,785,360 | ||||||
Murphy USA, Inc.* | 3,600 | 260,532 | ||||||
Nitori Holdings Co. Ltd. (Japan) | 150 | 10,154 | ||||||
Ross Stores, Inc. | 15,800 | 1,664,688 | ||||||
Sanrio Co. Ltd. (Japan) | 50 | 1,336 | ||||||
Shoe Carnival, Inc. | 1,200 | 35,328 | ||||||
Sports Direct International PLC (United Kingdom)* | 431 | 3,874 | ||||||
Tilly’s, Inc. (Class A Stock)* | 3,300 | 51,645 | ||||||
Ulta Salon Cosmetics & Fragrance, Inc.* | 4,300 | 648,655 | ||||||
USS Co. Ltd. (Japan) | 400 | 6,912 | ||||||
See Notes to Financial Statements.
| Prudential Balanced Fund | 45 |
Portfolio of Investments
as of March 31, 2015 (Unaudited) continued
Description | Shares | Value (Note 1) | ||||||
COMMON STOCKS (Continued) | ||||||||
Specialty Retail (cont’d.) | ||||||||
Yamada Denki Co. Ltd. (Japan) | 1,500 | $ | 6,177 | |||||
Zumiez, Inc.* | 1,200 | 48,300 | ||||||
|
| |||||||
| 6,497,627 | ||||||||
Technology Hardware, Storage & Peripherals 2.8% | ||||||||
Apple, Inc. | 72,200 | 8,983,846 | ||||||
Brother Industries Ltd. (Japan) | 400 | 6,355 | ||||||
Canon, Inc. (Japan) | 1,850 | 65,455 | ||||||
EMC Corp. | 3,000 | 76,680 | ||||||
FUJIFILM Holdings Corp. (Japan) | 700 | 24,904 | ||||||
Hewlett-Packard Co. | 62,000 | 1,931,920 | ||||||
Konica Minolta, Inc. (Japan) | 800 | 8,107 | ||||||
NEC Corp. (Japan) | 4,100 | 12,043 | ||||||
Ricoh Co. Ltd. (Japan) | 1,100 | 11,961 | ||||||
Seiko Epson Corp. (Japan) | 400 | 7,085 | ||||||
Super Micro Computer, Inc.* | 2,300 | 76,383 | ||||||
Western Digital Corp. | 4,500 | 409,545 | ||||||
|
| |||||||
| 11,614,284 | ||||||||
Textiles, Apparel & Luxury Goods 0.7% | ||||||||
Adidas AG (Germany) | 336 | 26,532 | ||||||
Asics Corp. (Japan) | 300 | 8,164 | ||||||
Burberry Group PLC (United Kingdom) | 741 | 19,029 | ||||||
Christian Dior SA (France) | 85 | 15,999 | ||||||
Cie Financiere Richemont SA (Switzerland) | 837 | 67,254 | ||||||
Culp, Inc. | 1,000 | 26,750 | ||||||
Hermes International (France) | �� | 41 | 14,476 | |||||
HUGO BOSS AG (Germany) | 108 | 13,121 | ||||||
Kering (France) | 121 | 23,621 | ||||||
Li & Fung Ltd. (Hong Kong) | 9,000 | 8,788 | ||||||
Luxottica Group SpA (Italy) | 284 | 17,987 | ||||||
LVMH Moet Hennessy Louis Vuitton SE (France) | 448 | 78,840 | ||||||
Michael Kors Holdings Ltd.* | 19,300 | 1,268,975 | ||||||
Pandora A/S (Denmark) | 179 | 16,297 | ||||||
PVH Corp. | 9,600 | 1,022,976 | ||||||
Steven Madden Ltd.* | 1,100 | 41,800 | ||||||
Swatch Group AG (The) (Switzerland) (Bearer Shares) | 51 | 21,568 | ||||||
Swatch Group AG (The) (Switzerland) (Registered Shares) | 79 | 6,621 | ||||||
Yue Yuen Industrial Holdings Ltd. (Hong Kong) | 1,000 | 3,539 | ||||||
|
| |||||||
| 2,702,337 | ||||||||
See Notes to Financial Statements.
| 46 |
Description | Shares | Value (Note 1) | ||||||
COMMON STOCKS (Continued) | ||||||||
Thrifts & Mortgage Finance | ||||||||
Brookline Bancorp, Inc. | 1,200 | $ | 12,060 | |||||
Essent Group Ltd.* | 700 | 16,737 | ||||||
First Defiance Financial Corp. | 700 | 22,974 | ||||||
Home Loan Servicing Solutions Ltd. | 2,900 | 47,966 | ||||||
Meridian Bancorp, Inc.* | 2,400 | 31,608 | ||||||
OceanFirst Financial Corp. | 1,800 | 31,086 | ||||||
United Financial Bancorp, Inc. | 700 | 8,701 | ||||||
Walker & Dunlop, Inc.* | 1,700 | 30,141 | ||||||
|
| |||||||
| 201,273 | ||||||||
Tobacco 1.0% | ||||||||
Altria Group, Inc. | 44,500 | 2,225,890 | ||||||
British American Tobacco (United Kingdom) | 2,990 | 154,834 | ||||||
Imperial Tobacco Group PLC (United Kingdom) | 1,535 | 67,334 | ||||||
Japan Tobacco, Inc. (Japan) | 1,764 | 55,769 | ||||||
Philip Morris International, Inc. | 18,600 | 1,401,138 | ||||||
Reynolds American, Inc. | 2,700 | 186,057 | ||||||
Swedish Match AB (Sweden) | 314 | 9,232 | ||||||
|
| |||||||
| 4,100,254 | ||||||||
Trading Companies & Distributors 0.1% | ||||||||
Aircastle Ltd. | 1,400 | 31,444 | ||||||
Applied Industrial Technologies, Inc. | 1,200 | 54,408 | ||||||
Ashtead Group PLC (United Kingdom) | 779 | 12,493 | ||||||
Brenntag AG (Germany) | 248 | 14,817 | ||||||
Bunzl PLC (United Kingdom) | 519 | 14,071 | ||||||
ITOCHU Corp. (Japan) | 2,500 | 27,055 | ||||||
Marubeni Corp. (Japan) | 2,600 | 15,032 | ||||||
Mitsubishi Corp. (Japan) | 2,200 | 44,206 | ||||||
Mitsui & Co. Ltd. (Japan) | 2,800 | 37,498 | ||||||
Noble Group Ltd. (Hong Kong) | 6,681 | 4,475 | ||||||
Rexel SA (France) | 420 | 7,919 | ||||||
Sumitomo Corp. (Japan) | 1,800 | 19,208 | ||||||
Toyota Tsusho Corp. (Japan) | 300 | 7,937 | ||||||
Travis Perkins PLC (United Kingdom) | 384 | 11,087 | ||||||
United Rentals, Inc.*(a) | 2,300 | 209,668 | ||||||
Wolseley PLC (United Kingdom) | 428 | 25,297 | ||||||
|
| |||||||
| 536,615 | ||||||||
See Notes to Financial Statements.
| Prudential Balanced Fund | 47 |
Portfolio of Investments
as of March 31, 2015 (Unaudited) continued
Description | Shares | Value (Note 1) | ||||||
COMMON STOCKS (Continued) | ||||||||
Transportation Infrastructure | ||||||||
Abertis Infraestructuras SA (Spain) | 642 | $ | 11,604 | |||||
Aena SA (Spain), 144A* | 96 | 9,653 | ||||||
Aeroports de Paris (France) | 46 | 5,498 | ||||||
Atlantia SpA (Italy) | 642 | 16,859 | ||||||
Auckland International Airport Ltd. (New Zealand) | 1,365 | 4,585 | ||||||
Fraport AG Frankfurt Airport Services Worldwide (Germany) | 55 | 3,285 | ||||||
Groupe Eurotunnel SE (France) | 750 | 10,752 | ||||||
Hutchison Port Holdings Trust (Singapore) | 8,800 | 6,116 | ||||||
Kamigumi Co. Ltd. (Japan) | 400 | 3,776 | ||||||
Mitsubishi Logistics Corp. (Japan) | 200 | 3,113 | ||||||
Sydney Airport (Australia) | 1,706 | 6,713 | ||||||
Transurban Group (Australia) | 2,966 | 21,476 | ||||||
|
| |||||||
| 103,430 | ||||||||
Water Utilities | ||||||||
Connecticut Water Service, Inc. | 700 | 25,431 | ||||||
Middlesex Water Co. | 800 | 18,208 | ||||||
Severn Trent PLC (United Kingdom) | 394 | 12,010 | ||||||
United Utilities Group PLC (United Kingdom) | 1,061 | 14,671 | ||||||
|
| |||||||
| 70,320 | ||||||||
Wireless Telecommunication Services 0.1% | ||||||||
KDDI Corp. (Japan) | 2,805 | 63,372 | ||||||
Millicom International Cellular SA, (Luxembourg), SDR | 117 | 8,460 | ||||||
NTT DOCOMO, Inc. (Japan) | 2,451 | 42,834 | ||||||
Shenandoah Telecommunications Co. | 700 | 21,812 | ||||||
SoftBank Corp. (Japan) | 1,500 | 87,359 | ||||||
StarHub Ltd. (Singapore) | 1,000 | 3,170 | ||||||
Tele2 AB (Sweden) (Class B Stock) | 493 | 5,902 | ||||||
Vodafone Group PLC (United Kingdom) | 42,507 | 139,096 | ||||||
|
| |||||||
| 372,005 | ||||||||
|
| |||||||
TOTAL COMMON STOCKS | 255,020,837 | |||||||
|
| |||||||
EXCHANGE TRADED FUND 0.1% | ||||||||
iShares MSCI EAFE Index Fund(a) | 8,000 | 513,360 | ||||||
|
| |||||||
See Notes to Financial Statements.
| 48 |
Description | Shares | Value (Note 1) | ||||||
PREFERRED STOCKS 0.1% | ||||||||
Automobiles 0.1% | ||||||||
Bayerische Motoren Werke AG (Germany) | 96 | $ | 8,867 | |||||
Porsche Automobil Holding SE (Germany) | 254 | 24,874 | ||||||
Volkswagen AG (Germany) | 261 | 69,217 | ||||||
|
| |||||||
| 102,958 | ||||||||
Banks | ||||||||
Citigroup Capital XIII, 7.875% (Capital security, fixed to floating preferred)(c) | 3,000 | 79,560 | ||||||
Chemicals | ||||||||
FUCHS PETROLUB SE (Germany) | 116 | 4,627 | ||||||
Household Products | ||||||||
Henkel AG & Co. KGaA (Germany) | 286 | 33,594 | ||||||
|
| |||||||
TOTAL PREFERRED STOCKS | 220,739 | |||||||
|
| |||||||
Units | ||||||||
RIGHTS* | ||||||||
Banks | ||||||||
Banco Bilbao Vizcaya Argentaria SA (Spain), expiring 04/14/15 | 10,009 | 1,442 | ||||||
Banco de Sabadell SA (Spain), expiring 04/17/15 | 5,305 | 1,346 | ||||||
|
| |||||||
| 2,788 | ||||||||
Diversified Telecommunication Services | ||||||||
Telefonica SA (Spain), expiring 04/12/15 | 6,758 | 1,090 | ||||||
|
| |||||||
TOTAL RIGHTS | 3,878 | |||||||
|
| |||||||
Interest | Maturity | Principal | ||||||||||||
CORPORATE BONDS 9.7% | ||||||||||||||
Airlines 0.1% | ||||||||||||||
Continental Airlines, Inc., Pass-thru Certs., | 4.000% | 10/29/24 | 109 | 114,048 | ||||||||||
Ser. 2001-1, Class A1 | 6.703 | 06/15/21 | 31 | 32,642 | ||||||||||
Ser. 2009-2, Class A | 7.250 | 11/10/19 | 101 | 116,566 | ||||||||||
Delta Air Lines, Inc., Pass-thru Certs., | 5.300 | 04/15/19 | 160 | 173,983 | ||||||||||
Ser. 2007-1, Class A | 6.821 | 08/10/22 | 67 | 78,132 | ||||||||||
See Notes to Financial Statements.
| Prudential Balanced Fund | 49 |
Portfolio of Investments
as of March 31, 2015 (Unaudited) continued
| Description | Interest Rate | Maturity Date | Principal Amount (000)# | Value (Note 1) | ||||||||||
CORPORATE BONDS (Continued) | ||||||||||||||
Airlines (cont’d.) | ||||||||||||||
United Airlines, Inc., Pass-through Trust, | 4.000% | 10/11/27 | 90 | $ | 94,950 | |||||||||
|
| |||||||||||||
| 610,321 | ||||||||||||||
Automotive 0.2% | ||||||||||||||
Ford Motor Credit Co. LLC, Sr. Unsec’d. Notes | 4.207 | 04/15/16 | 265 | 272,575 | ||||||||||
General Motors Co., | 4.875 | 10/02/23 | 155 | 167,821 | ||||||||||
Sr. Unsec’d. Notes | 6.250 | 10/02/43 | 135 | 165,383 | ||||||||||
Johnson Controls, Inc., Sr. Unsec’d. Notes | 5.500 | 01/15/16 | 55 | 57,007 | ||||||||||
|
| |||||||||||||
| 662,786 | ||||||||||||||
Banking 2.9% | ||||||||||||||
American Express Co., Sr. Unsec’d. Notes | 2.650 | 12/02/22 | 345 | 343,235 | ||||||||||
Bank of America Corp., | 8.000(c) | 12/29/49 | 380 | 406,125 | ||||||||||
Sr. Unsec’d. Notes, Ser. 1 | 3.750 | 07/12/16 | 95 | 97,921 | ||||||||||
Sr. Unsec’d. Notes | 4.100 | 07/24/23 | 130 | 138,716 | ||||||||||
Sr. Unsec’d. Notes, MTN | 4.125 | 01/22/24 | 620 | 663,918 | ||||||||||
Sr. Unsec’d. Notes, MTN | 5.000 | 05/13/21 | 25 | 28,220 | ||||||||||
Sr. Unsec’d. Notes | 5.700 | 01/24/22 | 255 | 298,156 | ||||||||||
Sr. Unsec’d. Notes | 7.625 | 06/01/19 | 265 | 319,851 | ||||||||||
Sub. Notes(a) | 5.750 | 08/15/16 | 355 | 375,624 | ||||||||||
Bank of Nova Scotia (Canada), Covered Bonds, 144A | 1.650 | 10/29/15 | 180 | 181,174 | ||||||||||
Bear Stearns Cos. LLC, | 5.300 | 10/30/15 | 100 | 102,572 | ||||||||||
Sr. Unsec’d. Notes | 6.400 | 10/02/17 | 90 | 100,408 | ||||||||||
Sr. Unsec’d. Notes | 7.250 | 02/01/18 | 220 | 253,278 | ||||||||||
Citigroup, Inc., | 8.125 | 07/15/39 | 200 | 314,616 | ||||||||||
Sr. Unsec’d. Notes | 8.500 | 05/22/19 | 65 | 80,950 | ||||||||||
Sub. Notes | 6.675 | 09/13/43 | 240 | 320,029 | ||||||||||
Sub. Notes | 6.125 | 08/25/36 | 165 | 199,815 | ||||||||||
Discover Bank, Sr. Unsec’d. Notes(a) | 4.250 | 03/13/26 | 315 | 333,977 | ||||||||||
See Notes to Financial Statements.
| 50 |
| Description | Interest Rate | Maturity Date | Principal Amount (000)# | Value (Note 1) | ||||||||||
CORPORATE BONDS (Continued) | ||||||||||||||
Banking (cont’d.) | ||||||||||||||
Goldman Sachs Group, Inc. (The), | 4.800 % | 07/08/44 | 400 | $ | 444,236 | |||||||||
Sr. Unsec’d. Notes | 5.250 | 07/27/21 | 270 | 307,048 | ||||||||||
Sr. Unsec’d. Notes | 6.250 | 09/01/17 | 5 | 5,545 | ||||||||||
Sub. Notes | 5.625 | 01/15/17 | 10 | 10,723 | ||||||||||
Sub. Notes(a) | 6.750 | 10/01/37 | 275 | 361,090 | ||||||||||
Huntington Bancshares, Inc., | 2.600 | 08/02/18 | 195 | 198,873 | ||||||||||
Sub. Notes | 7.000 | 12/15/20 | 20 | 24,261 | ||||||||||
International Bank for Reconstruction & Development, Sr. Unsec’d. Notes | 2.250 | 06/24/21 | 670 | 687,179 | ||||||||||
Intesa Sanpaolo SpA (Italy), Gtd. Notes | 3.125 | 01/15/16 | 200 | 202,724 | ||||||||||
JPMorgan Chase & Co., | 7.900(c) | 04/29/49 | 300 | 322,875 | ||||||||||
Sr. Unsec’d. Notes | 5.400 | 01/06/42 | 150 | 179,611 | ||||||||||
Sub. Notes | 3.375 | 05/01/23 | 105 | 105,706 | ||||||||||
Sub. Notes(a) | 5.625 | 08/16/43 | 195 | 233,896 | ||||||||||
Lloyds TSB Bank PLC (United Kingdom), Gtd. Notes | 6.375 | 01/21/21 | 200 | 241,964 | ||||||||||
Gtd. Notes, MTN, 144A(a) | 5.800 | 01/13/20 | 195 | 226,957 | ||||||||||
Morgan Stanley, | 5.450(c) | 12/31/49 | 125 | 125,938 | ||||||||||
Sr. Unsec’d. Notes, GMTN | 5.450 | 01/09/17 | 460 | 492,077 | ||||||||||
Sr. Unsec’d. Notes, MTN | 5.625 | 09/23/19 | 285 | 324,408 | ||||||||||
Sr. Unsec’d. Notes(a) | 6.375 | 07/24/42 | 145 | 193,389 | ||||||||||
Sr. Unsec’d. Notes, Series G, GMTN(a) | 5.500 | 07/28/21 | 110 | 127,607 | ||||||||||
MUFG Capital Finance 1 Ltd. (Japan), Gtd. Notes | 6.346(c) | 07/29/49 | 150 | 157,875 | ||||||||||
Northern Trust Corp., Sub. Notes(a) | 3.950 | 10/30/25 | 150 | 161,142 | ||||||||||
PNC Funding Corp., Gtd. Notes | 6.700 | 06/10/19 | 65 | 77,318 | ||||||||||
Royal Bank of Canada (Canada), Covered Bonds | 2.200 | 09/23/19 | 465 | 473,509 | ||||||||||
Royal Bank of Scotland Group PLC (United Kingdom), Sr. Unsec’d. Notes | 6.400 | 10/21/19 | 250 | 289,379 | ||||||||||
Santander Holdings USA, Inc., Sr. Unsec’d. Notes | 3.000 | 09/24/15 | 110 | 110,857 | ||||||||||
Sumitomo Mitsui Banking Corp. (Japan), Gtd. Notes(a) | 2.450 | 01/10/19 | 250 | 253,976 | ||||||||||
See Notes to Financial Statements.
| Prudential Balanced Fund | 51 |
Portfolio of Investments
as of March 31, 2015 (Unaudited) continued
| Description | Interest Rate | Maturity Date | Principal Amount (000)# | Value (Note 1) | ||||||||||
CORPORATE BONDS (Continued) | ||||||||||||||
Banking (cont’d.) | ||||||||||||||
Toronto-Dominion Bank (The) (Canada), Covered Bonds, 144A | 1.950 % | 04/02/20 | 490 | $ | 491,971 | |||||||||
US Bancorp, Sub. Notes, MTN | 2.950 | 07/15/22 | 130 | 132,244 | ||||||||||
Wells Fargo & Co., Sub. Notes | 4.125 | 08/15/23 | 345 | 368,252 | ||||||||||
|
| |||||||||||||
| 11,891,215 | ||||||||||||||
Brokerage 0.1% | ||||||||||||||
Jefferies Group, Inc., Sr. Unsec’d. Notes | 6.500 | 01/20/43 | 65 | 64,674 | ||||||||||
Lehman Brothers Holdings, Inc., | 5.250 | 02/06/12 | 345 | 49,594 | ||||||||||
Sr. Unsec’d. Notes(d) | 6.875 | 05/02/18 | 100 | 14,500 | ||||||||||
Nomura Holdings, Inc. (Japan), Sr. Unsec’d. Notes, MTN | 2.000 | 09/13/16 | 100 | 100,939 | ||||||||||
|
| |||||||||||||
| 229,707 | ||||||||||||||
Building Materials & Construction 0.2% | ||||||||||||||
Building Materials Corp. of America, | 5.375 | 11/15/24 | 120 | 121,800 | ||||||||||
D.R. Horton, Inc., Gtd. Notes | 3.625 | 02/15/18 | 150 | 153,000 | ||||||||||
Mohawk Industries, Inc., Sr. Unsec’d. Notes | 6.125 | 01/15/16 | 119 | 123,528 | ||||||||||
Odebrecht Finance Ltd. (Brazil), | 5.250 | 06/27/29 | 210 | 169,575 | ||||||||||
Owens Corning, Inc., Gtd. Notes | 4.200 | 12/15/22 | 90 | 93,920 | ||||||||||
|
| |||||||||||||
| 661,823 | ||||||||||||||
Cable 0.3% | ||||||||||||||
Cablevision Systems Corp., Sr. Unsec’d. Notes | 8.625 | 09/15/17 | 125 | 140,625 | ||||||||||
CCO Holdings LLC/CCO Holdings Capital Corp., Gtd. Notes | 8.125 | 04/30/20 | 175 | 182,875 | ||||||||||
Comcast Corp., | 6.450 | 03/15/37 | 35 | 47,394 | ||||||||||
Gtd. Notes | 6.950 | 08/15/37 | 65 | 92,326 | ||||||||||
DIRECTV Holdings LLC/DIRECTV Financing Co., Inc., | 3.500 | 03/01/16 | 45 | 45,990 | ||||||||||
Gtd. Notes(a) | 5.150 | 03/15/42 | 200 | 209,014 | ||||||||||
See Notes to Financial Statements.
| 52 |
| Description | Interest Rate | Maturity Date | Principal Amount (000)# | Value (Note 1) | ||||||||||
CORPORATE BONDS (Continued) | ||||||||||||||
Cable (cont’d.) | ||||||||||||||
DISH DBS Corp., Gtd. Notes | 7.125 % | 02/01/16 | 150 | $ | 155,813 | |||||||||
Time Warner Cable, Inc., Gtd. Notes | 5.850 | 05/01/17 | 310 | 337,180 | ||||||||||
Videotron Ltd. (Canada), Gtd. Notes | 5.000 | 07/15/22 | 150 | 154,500 | ||||||||||
|
| |||||||||||||
| 1,365,717 | ||||||||||||||
Capital Goods 0.4% | ||||||||||||||
Actuant Corp., Gtd. Notes | 5.625 | 06/15/22 | 160 | 165,800 | ||||||||||
Case New Holland, Inc., Gtd. Notes | 7.875 | 12/01/17 | 125 | 138,475 | ||||||||||
Caterpillar Financial Services Corp., Sr. Unsec’d. Notes, MTN | 5.500 | 03/15/16 | 50 | 52,355 | ||||||||||
Clean Harbors, Inc., Gtd. Notes | 5.250 | 08/01/20 | 125 | 127,813 | ||||||||||
ERAC USA Finance LLC, | 6.375 | 10/15/17 | 296 | 331,672 | ||||||||||
Gtd. Notes, 144A (original cost $19,827; purchased 10/10/07)(e)(f) | 7.000 | 10/15/37 | 20 | 26,969 | ||||||||||
General Electric Co., | 4.125 | 10/09/42 | 15 | 15,832 | ||||||||||
Sr. Unsec’d. Notes | 4.500 | 03/11/44 | 25 | 28,063 | ||||||||||
Griffon Corp., Gtd. Notes | 5.250 | 03/01/22 | 65 | 64,129 | ||||||||||
Penske Truck Leasing Co. LP/PTL Finance Corp., Unsec’d. Notes, 144A (original cost $59,942; purchased 05/08/12)(e)(f) | 3.125 | 05/11/15 | 60 | 60,127 | ||||||||||
SPX Corp., Gtd. Notes(a) | 6.875 | 09/01/17 | 225 | 244,687 | ||||||||||
United Technologies Corp., Sr. Unsec’d. Notes | 5.700 | 04/15/40 | 60 | 76,837 | ||||||||||
Xylem, Inc., Sr. Unsec’d. Notes | 4.875 | 10/01/21 | 160 | 176,316 | ||||||||||
|
| |||||||||||||
| 1,509,075 | ||||||||||||||
Chemicals 0.2% | ||||||||||||||
Ashland, Inc., Sr. Unsec’d. Notes(a) | 3.875 | 04/15/18 | 135 | 138,375 | ||||||||||
CF Industries, Inc., Gtd. Notes(a) | 5.375 | 03/15/44 | 90 | 101,120 | ||||||||||
Dow Chemical Co. (The), | 4.625 | 10/01/44 | 10 | 10,453 | ||||||||||
Sr. Unsec’d. Notes(a) | 9.400 | 05/15/39 | 67 | 110,901 | ||||||||||
Koppers, Inc., Gtd. Notes | 7.875 | 12/01/19 | 200 | 200,500 | ||||||||||
Monsanto Co., Sr. Unsec’d. Notes(a) | 4.400 | 07/15/44 | 35 | 37,639 | ||||||||||
See Notes to Financial Statements.
| Prudential Balanced Fund | 53 |
Portfolio of Investments
as of March 31, 2015 (Unaudited) continued
| Description | Interest Rate | Maturity Date | Principal Amount (000)# | Value (Note 1) | ||||||||||
CORPORATE BONDS (Continued) | ||||||||||||||
Chemicals (cont’d.) | ||||||||||||||
Mosaic Co. (The), | 5.450 % | 11/15/33 | 55 | $ | 63,594 | |||||||||
Sr. Unsec’d. Notes | 5.625 | 11/15/43 | 170 | 201,876 | ||||||||||
Union Carbide Corp., Sr. Unsec’d. Notes | 7.500 | 06/01/25 | 100 | 129,808 | ||||||||||
|
| |||||||||||||
| 994,266 | ||||||||||||||
Consumer 0.1% | ||||||||||||||
Newell Rubbermaid, Inc., Sr. Unsec’d. Notes | 6.250 | 04/15/18 | 300 | 336,878 | ||||||||||
Electric 0.5% | ||||||||||||||
Arizona Public Service Co., Sr. Unsec’d. Notes | 6.250 | 08/01/16 | 35 | 37,528 | ||||||||||
Baltimore Gas & Electric Co., Sr. Unsec’d. Notes | 6.350 | 10/01/36 | 115 | 159,201 | ||||||||||
Berkshire Hathaway Energy Co., Sr. Unsec’d. Notes | 6.125 | 04/01/36 | 120 | 156,422 | ||||||||||
CenterPoint Energy Houston Electric LLC, Gen. Ref. Mtge. | 6.950 | 03/15/33 | 120 | 171,214 | ||||||||||
Duke Energy Carolinas LLC, First Mortgage | 6.050 | 04/15/38 | 55 | 74,722 | ||||||||||
El Paso Electric Co., Sr. Unsec’d. Notes | 6.000 | 05/15/35 | 135 | 168,477 | ||||||||||
Exelon Corp., Sr. Unsec’d. Notes | 4.900 | 06/15/15 | 30 | 30,237 | ||||||||||
FirstEnergy Corp., Sr. Unsec’d. Notes | 2.750 | 03/15/18 | 180 | 184,336 | ||||||||||
FirstEnergy Transmission LLC, Sr. Unsec’d. Notes, 144A | 5.450 | 07/15/44 | 50 | 56,286 | ||||||||||
Florida Power & Light Co., First Mortgage | 5.950 | 10/01/33 | 60 | 79,999 | ||||||||||
Iberdrola International BV (Spain), Gtd. Notes | 6.750 | 09/15/33 | 30 | 36,427 | ||||||||||
IPALCO Enterprises, Inc., Sr. Sec’d. Notes, 144A | 7.250 | 04/01/16 | 150 | 156,750 | ||||||||||
Niagara Mohawk Power Corp., Sr. Unsec’d. Notes, 144A | 4.881 | 08/15/19 | 100 | 111,968 | ||||||||||
NSTAR LLC, Sr. Unsec’d. Notes | 4.500 | 11/15/19 | 90 | 99,210 | ||||||||||
Public Service Co. of Colorado, First Mortgage | 4.300 | 03/15/44 | 35 | 39,872 | ||||||||||
Public Service Co. of New Mexico, Sr. Unsec’d. Notes | 7.950 | 05/15/18 | 55 | 64,569 | ||||||||||
Public Service Electric & Gas Co., Sr. Sec’d. Notes, MTN | 5.800 | 05/01/37 | 125 | 166,557 | ||||||||||
Xcel Energy, Inc., | 4.800 | 09/15/41 | 105 | 121,678 | ||||||||||
Sr. Unsec’d. Notes | 5.613 | 04/01/17 | 36 | 39,233 | ||||||||||
|
| |||||||||||||
| 1,954,686 | ||||||||||||||
See Notes to Financial Statements.
| 54 |
| Description | Interest Rate | Maturity Date | Principal Amount (000)# | Value (Note 1) | ||||||||||
CORPORATE BONDS (Continued) | ||||||||||||||
Energy - Integrated | ||||||||||||||
BP Capital Markets PLC (United Kingdom), Gtd. Notes | 4.500 % | 10/01/20 | 70 | $ | 77,647 | |||||||||
Pacific Rubiales Energy Corp. (Colombia), Gtd. Notes, 144A(a) | 5.375 | 01/26/19 | 100 | 66,000 | ||||||||||
|
| |||||||||||||
| 143,647 | ||||||||||||||
Energy - Other 0.3% | ||||||||||||||
Anadarko Petroleum Corp., | 6.375 | 09/15/17 | 300 | 333,789 | ||||||||||
Sr. Unsec’d. Notes | 6.450 | 09/15/36 | 50 | 62,025 | ||||||||||
Sr. Unsec’d. Notes | 6.950 | 06/15/19 | 25 | 29,495 | ||||||||||
Devon Financing Corp. LLC, Gtd. Notes | 7.875 | 09/30/31 | 200 | 272,608 | ||||||||||
Dominion Gas Holdings LLC, Sr. Unsec’d. Notes(a) | 4.800 | 11/01/43 | 10 | 11,302 | ||||||||||
EOG Resources, Inc., Sr. Unsec’d. Notes | 3.900 | 04/01/35 | 120 | 123,052 | ||||||||||
Helmerich & Payne International Drilling Co., Gtd. Notes, 144A | 4.650 | 03/15/25 | 240 | 248,547 | ||||||||||
Nabors Industries, Inc., Gtd. Notes | 4.625 | 09/15/21 | 140 | 134,734 | ||||||||||
Valero Energy Corp., Sr. Unsec’d. Notes(a) | 4.900 | 03/15/45 | 65 | 67,200 | ||||||||||
|
| |||||||||||||
| 1,282,752 | ||||||||||||||
Foods 0.2% | ||||||||||||||
Anheuser-Busch InBev Worldwide, Inc. (Belgium), Gtd. Notes | 8.000 | 11/15/39 | 235 | 363,863 | ||||||||||
Bunge Ltd. Finance Corp., Gtd. Notes | 8.500 | 06/15/19 | 145 | 178,675 | ||||||||||
Cargill, Inc., Sr. Unsec’d. Notes, 144A (original cost $149,288; purchased 11/19/2007)(e)(f) | 6.000 | 11/27/17 | 150 | 167,274 | ||||||||||
Tyson Foods, Inc., Gtd. Notes | 6.600 | 04/01/16 | 150 | 158,236 | ||||||||||
|
| |||||||||||||
| 868,048 | ||||||||||||||
Gaming | ||||||||||||||
GLP Capital LP/GLP Financing II, Inc., Gtd. Notes(a) | 4.375 | 11/01/18 | 150 | 154,125 | ||||||||||
Healthcare & Pharmaceutical 0.8% | ||||||||||||||
Actavis Funding SCS, | 3.800 | 03/15/25 | 115 | 118,683 | ||||||||||
Gtd. Notes | 4.550 | 03/15/35 | 265 | 276,214 | ||||||||||
See Notes to Financial Statements.
| Prudential Balanced Fund | 55 |
Portfolio of Investments
as of March 31, 2015 (Unaudited) continued
| Description | Interest Rate | Maturity Date | Principal Amount (000)# | Value (Note 1) | ||||||||||
CORPORATE BONDS (Continued) | ||||||||||||||
Healthcare & Pharmaceutical (cont’d.) | ||||||||||||||
Actavis, Inc., Gtd. Notes | 6.125% | 08/15/19 | 75 | $ | 85,685 | |||||||||
Amgen, Inc., Sr. Unsec’d. Notes | 5.150 | 11/15/41 | 335 | 385,840 | ||||||||||
AstraZeneca PLC (United Kingdom), Sr. Unsec’d. Notes | 6.450 | 09/15/37 | 110 | 151,318 | ||||||||||
Becton Dickinson and Co., Sr. Unsec’d. Notes(a) | 3.734 | 12/15/24 | 140 | 146,524 | ||||||||||
Fresenius Medical Care U.S. Finance II, Inc. (Germany), Gtd. Notes, 144A | 4.125 | 10/15/20 | 175 | 177,953 | ||||||||||
Gilead Sciences, Inc., Sr. Unsec’d. Notes(a) | 5.650 | 12/01/41 | 30 | 38,220 | ||||||||||
HCA, Inc., | 4.250 | 10/15/19 | 55 | 56,513 | ||||||||||
Sr. Sec’d. Notes | 4.750 | 05/01/23 | 200 | 207,500 | ||||||||||
Sr. Sec’d. Notes | 5.250 | 04/15/25 | 100 | 108,000 | ||||||||||
Laboratory Corp. of America Holdings, | 3.200 | 02/01/22 | 20 | 20,247 | ||||||||||
Sr. Unsec’d. Notes | 5.625 | 12/15/15 | 250 | 258,039 | ||||||||||
LifePoint Hospitals, Inc., Gtd. Notes | 6.625 | 10/01/20 | 125 | 130,938 | ||||||||||
Mallinckrodt International Finance SA, Gtd. Notes | 3.500 | 04/15/18 | 175 | 172,375 | ||||||||||
Medtronic, Inc., | 3.500 | 03/15/25 | 440 | 459,972 | ||||||||||
Gtd. Notes, 144A | 4.375 | 03/15/35 | 185 | 201,177 | ||||||||||
Mylan, Inc., Gtd. Notes | 1.800 | 06/24/16 | 50 | 50,402 | ||||||||||
Novartis Capital Corp. (Switzerland), Gtd. Notes(a) | 4.400 | 05/06/44 | 210 | 241,858 | ||||||||||
Zoetis, Inc., Sr. Unsec’d. Notes | 4.700 | 02/01/43 | 20 | 20,855 | ||||||||||
|
| |||||||||||||
| 3,308,313 | ||||||||||||||
Healthcare Insurance 0.2% | ||||||||||||||
Cigna Corp., | 5.875 | 03/15/41 | 50 | 65,451 | ||||||||||
Sr. Unsec’d. Notes | 6.150 | 11/15/36 | 140 | 185,992 | ||||||||||
UnitedHealth Group, Inc., | 6.000 | 06/15/17 | 60 | 66,455 | ||||||||||
Sr. Unsec’d. Notes | 6.500 | 06/15/37 | 100 | 140,637 | ||||||||||
Sr. Unsec’d. Notes | 6.625 | 11/15/37 | 80 | 114,102 | ||||||||||
WellPoint, Inc., | 4.625 | 05/15/42 | 45 | 48,778 | ||||||||||
Sr. Unsec’d. Notes | 4.650 | 01/15/43 | 30 | 32,519 | ||||||||||
|
| |||||||||||||
| 653,934 | ||||||||||||||
See Notes to Financial Statements.
| 56 |
| Description | Interest Rate | Maturity Date | Principal Amount (000)# | Value (Note 1) | ||||||||||
CORPORATE BONDS (Continued) | ||||||||||||||
Insurance 0.9% | ||||||||||||||
Allied World Assurance Co. Holdings Ltd., Gtd. Notes | 5.500% | 11/15/20 | 80 | $ | 90,627 | |||||||||
Allstate Corp. (The), Sr. Unsec’d. Notes | 4.500 | 06/15/43 | 20 | 22,753 | ||||||||||
American International Group, Inc., | 4.500 | 07/16/44 | 125 | 134,177 | ||||||||||
Sr. Unsec’d. Notes | 6.400 | 12/15/20 | 260 | 314,942 | ||||||||||
Axis Specialty Finance LLC, Gtd. Notes(a) | 5.875 | 06/01/20 | 160 | 183,911 | ||||||||||
Chubb Corp. (The), Jr. Sub. Notes(a) | 6.375(c) | 03/29/67 | 210 | 222,600 | ||||||||||
Dai-ichi Life Insurance Co. Ltd. (The) (Japan), Jr. Sub. Notes, 144A | 5.100(c) | 12/29/49 | 200 | 217,750 | ||||||||||
Hartford Financial Services Group, Inc. (The), Sr. Unsec’d. Notes, MTN | 6.000 | 01/15/19 | 90 | 102,308 | ||||||||||
Liberty Mutual Group, Inc., Sr. Unsec’d. Notes, 144A | 7.000 | 03/15/34 | 180 | 233,386 | ||||||||||
Lincoln National Corp., | 6.050(c) | 04/20/67 | 40 | 38,540 | ||||||||||
Sr. Unsec’d. Notes | 6.300 | 10/09/37 | 110 | 141,933 | ||||||||||
Sr. Unsec’d. Notes | 7.000 | 06/15/40 | 130 | 179,943 | ||||||||||
Sr. Unsec’d. Notes | 8.750 | 07/01/19 | 70 | 88,080 | ||||||||||
Markel Corp., Sr. Unsec’d. Notes | 5.000 | 03/30/43 | 25 | 27,536 | ||||||||||
MetLife, Inc., | 5.700 | 06/15/35 | 135 | 171,185 | ||||||||||
Sr. Unsec’d. Notes | 6.375 | 06/15/34 | 15 | 20,257 | ||||||||||
Sr. Unsec’d. Notes | 6.750 | 06/01/16 | 50 | 53,364 | ||||||||||
New York Life Insurance Co., Sub. Notes, 144A | 6.750 | 11/15/39 | 110 | 157,561 | ||||||||||
Nippon Life Insurance Co. (Japan), Sub. Notes, 144A(a) | 5.100(c) | 10/16/44 | 295 | 319,706 | ||||||||||
Northwestern Mutual Life Insurance Co. (The), Sub. Notes, 144A | 6.063 | 03/30/40 | 60 | 79,459 | ||||||||||
Ohio National Financial Services, Inc., | 6.375 | 04/30/20 | 105 | 122,149 | ||||||||||
Pacific Life Insurance Co., Sub. Notes, 144A | 9.250 | 06/15/39 | 140 | 223,271 | ||||||||||
Principal Financial Group, Inc., Gtd. Notes | 4.625 | 09/15/42 | 15 | 16,359 | ||||||||||
Progressive Corp. (The), Jr. Sub. Notes | 6.700(c) | 06/15/37 | 110 | 115,981 | ||||||||||
Teachers Insurance & Annuity Association of America, Sub. Notes, 144A(e) | 6.850 | 12/16/39 | 240 | 334,446 | ||||||||||
Unum Group, Sr. Unsec’d. Notes | 5.625 | 09/15/20 | 50 | 57,233 | ||||||||||
See Notes to Financial Statements.
| Prudential Balanced Fund | 57 |
Portfolio of Investments
as of March 31, 2015 (Unaudited) continued
| Description | Interest Rate | Maturity Date | Principal Amount (000)# | Value (Note 1) | ||||||||||
CORPORATE BONDS (Continued) | ||||||||||||||
Insurance (cont’d.) | ||||||||||||||
W.R. Berkley Corp., | 5.600 % | 05/15/15 | 110 | $ | 110,575 | |||||||||
Sr. Unsec’d. Notes | 6.150 | 08/15/19 | 90 | 103,065 | ||||||||||
|
| |||||||||||||
| 3,883,097 | ||||||||||||||
Lodging 0.2% | ||||||||||||||
Choice Hotels International, Inc., Gtd. Notes | 5.750 | 07/01/22 | 200 | 217,000 | ||||||||||
Marriott International, Inc., Sr. Unsec’d. Notes | 3.250 | 09/15/22 | 130 | 132,434 | ||||||||||
Starwood Hotels & Resorts Worldwide, Inc., | 6.750 | 05/15/18 | 500 | 572,458 | ||||||||||
Wyndham Worldwide Corp., Sr. Unsec’d. Notes | 2.500 | 03/01/18 | 60 | 60,252 | ||||||||||
|
| |||||||||||||
| 982,144 | ||||||||||||||
Media & Entertainment 0.2% | ||||||||||||||
Historic TW, Inc., Gtd. Notes | 9.150 | 02/01/23 | 100 | 138,108 | ||||||||||
News America, Inc., | 6.150 | 02/15/41 | 70 | 90,501 | ||||||||||
Gtd. Notes | 7.625 | 11/30/28 | 125 | 169,451 | ||||||||||
Time Warner Cos., Inc., Gtd. Notes | 7.250 | 10/15/17 | 160 | 183,215 | ||||||||||
Time Warner, Inc., | 6.200 | 03/15/40 | 25 | 31,959 | ||||||||||
Gtd. Notes | 6.250 | 03/29/41 | 30 | 38,717 | ||||||||||
Gtd. Notes | 7.625 | 04/15/31 | 10 | 13,982 | ||||||||||
Viacom, Inc., | 4.875 | 06/15/43 | 55 | 55,052 | ||||||||||
Sr. Unsec’d. Notes | 5.850 | 09/01/43 | 60 | 67,544 | ||||||||||
|
| |||||||||||||
| 788,529 | ||||||||||||||
Metals 0.1% | ||||||||||||||
BHP Billiton Finance USA Ltd. (Australia), Gtd. Notes(a) | 5.000 | 09/30/43 | 140 | 160,328 | ||||||||||
Glencore Finance Canada Ltd. (Switzerland), Gtd. Notes, 144A | 2.050 | 10/23/15 | 105 | 105,441 | ||||||||||
Goldcorp, Inc. (Canada), Sr. Unsec’d. Notes | 3.625 | 06/09/21 | 110 | 111,853 | ||||||||||
Rio Tinto Alcan, Inc. (Canada), Sr. Unsec’d. Notes | 5.000 | 06/01/15 | 115 | 115,746 | ||||||||||
Southern Copper Corp. (Mexico), Sr. Unsec’d. Notes | 7.500 | 07/27/35 | 95 | 108,351 | ||||||||||
|
| |||||||||||||
| 601,719 | ||||||||||||||
See Notes to Financial Statements.
| 58 |
| Description | Interest Rate | Maturity Date | Principal Amount (000)# | Value (Note 1) | ||||||||||
CORPORATE BONDS (Continued) | ||||||||||||||
Non-Captive Finance 0.3% | ||||||||||||||
AerCap Ireland Capital Ltd./AerCap Global Aviation Trust (Netherlands), Gtd. Notes, 144A | 3.750 % | 05/15/19 | 150 | $ | 150,703 | |||||||||
General Electric Capital Corp., | 6.000 | 08/07/19 | 600 | 700,908 | ||||||||||
Sr. Unsec’d. Notes, GMTN | 6.875 | 01/10/39 | 170 | 244,550 | ||||||||||
Sub. Notes | 5.300 | 02/11/21 | 100 | 115,513 | ||||||||||
Navient LLC, Sr. Unsec’d. Notes, MTN | 8.450 | 06/15/18 | 90 | 99,900 | ||||||||||
|
| |||||||||||||
| 1,311,574 | ||||||||||||||
Packaging 0.1% | ||||||||||||||
Ball Corp., Gtd. Notes(a) | 4.000 | 11/15/23 | 250 | 243,750 | ||||||||||
Crown Americas LLC/Crown Americas Capital Corp. IV, Gtd. Notes(a) | 4.500 | 01/15/23 | 150 | 151,313 | ||||||||||
|
| |||||||||||||
| 395,063 | ||||||||||||||
Paper 0.1% | ||||||||||||||
Georgia-Pacific LLC, Gtd. Notes, 144A (original cost $39,765; purchased 10/27/10)(e)(f) | 5.400 | 11/01/20 | 40 | 45,634 | ||||||||||
International Paper Co., | 6.000 | 11/15/41 | 30 | 35,609 | ||||||||||
Sr. Unsec’d. Notes | 7.300 | 11/15/39 | 175 | 233,482 | ||||||||||
Sr. Unsec’d. Notes | 7.500 | 08/15/21 | 85 | 106,795 | ||||||||||
Rock-Tenn Co., Gtd. Notes | 4.900 | 03/01/22 | 95 | 104,686 | ||||||||||
|
| |||||||||||||
| 526,206 | ||||||||||||||
Pipelines & Other 0.2% | ||||||||||||||
Energy Transfer Partners LP, | 4.900 | 03/15/35 | 35 | 34,764 | ||||||||||
Sr. Unsec’d. Notes | 5.150 | 03/15/45 | 90 | 90,564 | ||||||||||
Enterprise Products Operating LLC, | 4.850 | 03/15/44 | 160 | 172,476 | ||||||||||
Gtd. Notes | 6.875 | 03/01/33 | 35 | 45,946 | ||||||||||
NiSource Finance Corp., | 4.800 | 02/15/44 | 40 | 44,969 | ||||||||||
Gtd. Notes | 5.250 | 09/15/17 | 55 | 60,136 | ||||||||||
Gtd. Notes | 5.450 | 09/15/20 | 70 | 80,580 | ||||||||||
See Notes to Financial Statements.
| Prudential Balanced Fund | 59 |
Portfolio of Investments
as of March 31, 2015 (Unaudited) continued
| Description | Interest Rate | Maturity Date | Principal Amount (000)# | Value (Note 1) | ||||||||||
CORPORATE BONDS (Continued) | ||||||||||||||
Pipelines & Other (cont’d.) | ||||||||||||||
ONEOK Partners LP, Gtd. Notes(a) | 6.200 % | 09/15/43 | 205 | $ | 213,468 | |||||||||
|
| |||||||||||||
| 742,903 | ||||||||||||||
Railroads 0.1% | ||||||||||||||
Burlington Northern Santa Fe LLC, | 4.450 | 03/15/43 | 100 | 107,135 | ||||||||||
Sr. Unsec’d. Notes | 6.700 | 08/01/28 | 135 | 176,291 | ||||||||||
CSX Corp., Sr. Unsec’d. Notes | 6.150 | 05/01/37 | 170 | 222,697 | ||||||||||
Norfolk Southern Corp., | 2.903 | 02/15/23 | 97 | 97,652 | ||||||||||
Sr. Unsec’d. Notes | 5.590 | 05/17/25 | 20 | 24,007 | ||||||||||
|
| |||||||||||||
| 627,782 | ||||||||||||||
Real Estate Investment Trusts (REITs) 0.1% | ||||||||||||||
Mack-Cali Realty Corp., Sr. Unsec’d. Notes | 7.750 | 08/15/19 | 115 | 132,960 | ||||||||||
ProLogis LP, Gtd. Notes | 6.875 | 03/15/20 | 11 | 12,973 | ||||||||||
Simon Property Group LP, | 2.800 | 01/30/17 | 30 | 30,863 | ||||||||||
Sr. Unsec’d. Notes | 3.375 | 03/15/22 | 30 | 31,208 | ||||||||||
|
| |||||||||||||
| 208,004 | ||||||||||||||
Retailers 0.1% | ||||||||||||||
CVS Health Corp., Sr. Unsec’d. Notes(a) | 5.300 | 12/05/43 | 35 | 42,757 | ||||||||||
Home Depot, Inc. (The), Sr. Unsec’d. Notes | 4.200 | 04/01/43 | 110 | 120,173 | ||||||||||
Limited Brands, Inc., Gtd. Notes | 6.625 | 04/01/21 | 125 | 143,189 | ||||||||||
Lowe’s Cos, Inc., Sr. Unsec’d. Notes | 6.500 | 03/15/29 | 60 | 78,637 | ||||||||||
Macy’s Retail Holdings, Inc., Gtd. Notes(a) | 3.875 | 01/15/22 | 45 | 48,034 | ||||||||||
Target Corp., Sr. Unsec’d. Notes | 3.500 | 07/01/24 | 60 | 63,701 | ||||||||||
|
| |||||||||||||
| 496,491 | ||||||||||||||
Technology 0.1% | ||||||||||||||
Fiserv, Inc., Gtd. Notes | 3.125 | 06/15/16 | 70 | 71,796 | ||||||||||
Oracle Corp., Sr. Unsec’d. Notes | 4.300 | 07/08/34 | 145 | 157,334 | ||||||||||
Seagate HDD Cayman, Gtd. Notes | 3.750 | 11/15/18 | 90 | 93,796 | ||||||||||
|
| |||||||||||||
| 322,926 | ||||||||||||||
See Notes to Financial Statements.
| 60 |
| Description | Interest Rate | Maturity Date | Principal Amount (000)# | Value (Note 1) | ||||||||||
CORPORATE BONDS (Continued) | ||||||||||||||
Telecommunications 0.5% | ||||||||||||||
AT&T Corp., Sr. Unsec’d. Notes(a) | 4.800 % | 06/15/44 | 305 | $ | 312,329 | |||||||||
AT&T, Inc., Sr. Unsec’d. Notes | 5.350 | 09/01/40 | 33 | 36,013 | ||||||||||
British Telecommunications PLC | 9.625 | 12/15/30 | 50 | 82,464 | ||||||||||
Embarq Corp., | 7.082 | 06/01/16 | 75 | 79,556 | ||||||||||
Sr. Unsec’d. Notes (original cost $59,996; purchased 05/12/06)(e)(f) | 7.995 | 06/01/36 | 60 | 71,346 | ||||||||||
Sprint Communications, Inc., Sr. Unsec’d. Notes | 6.000 | 12/01/16 | 125 | 130,500 | ||||||||||
Telefonos de Mexico Sab de CV (Mexico), Gtd. Notes | 5.500 | 11/15/19 | 40 | 45,280 | ||||||||||
Verizon Communications, Inc., | 4.862 | 08/21/46 | 65 | 68,051 | ||||||||||
Sr. Unsec’d. Notes | 5.012 | 08/21/54 | 523 | 542,660 | ||||||||||
Sr. Unsec’d. Notes, 144A | 4.522 | 09/15/48 | 220 | 219,002 | ||||||||||
Sr. Unsec’d. Notes, 144A | 4.672 | 03/15/55 | 472 | 462,249 | ||||||||||
|
| |||||||||||||
| 2,049,450 | ||||||||||||||
Tobacco 0.2% | ||||||||||||||
Altria Group, Inc., Gtd. Notes | 10.200 | 02/06/39 | 52 | 91,960 | ||||||||||
Imperial Tobacco Finance PLC | 2.050 | 02/11/18 | 245 | 246,398 | ||||||||||
Lorillard Tobacco Co., Gtd. Notes(a) | 8.125 | 06/23/19 | 50 | 61,151 | ||||||||||
Reynolds American, Inc., Gtd. Notes | 6.750 | 06/15/17 | 220 | 244,135 | ||||||||||
|
| |||||||||||||
| 643,644 | ||||||||||||||
|
| |||||||||||||
TOTAL CORPORATE BONDS | 40,206,825 | |||||||||||||
|
| |||||||||||||
ASSET-BACKED SECURITIES 3.4% | ||||||||||||||
Collateralized Loan Obligations 2.0% | ||||||||||||||
ACAS CLO Ltd. (Cayman Islands), Series 2013-1A, Class A, 144A | 1.437(c) | 04/20/25 | 250 | 246,397 | ||||||||||
Anchorage Capital CLO Ltd. (Cayman Islands), | 1.444(c) | 07/13/25 | 300 | 295,573 | ||||||||||
Series 2014-3A, Class A1, 144A | 1.756(c) | 04/28/26 | 300 | 299,143 | ||||||||||
See Notes to Financial Statements.
| Prudential Balanced Fund | 61 |
Portfolio of Investments
as of March 31, 2015 (Unaudited) continued
| Description | Interest Rate | Maturity Date | Principal Amount (000)# | Value (Note 1) | ||||||||||
ASSET-BACKED SECURITIES (Continued) | ||||||||||||||
Collateralized Loan Obligations (cont’d.) | ||||||||||||||
Atlas Senior Loan Fund Ltd. (Cayman Islands), | 1.796 % (c) | 10/15/26 | 250 | $ | 249,673 | |||||||||
Battalion CLO VIII Ltd. (Cayman Islands), | 1.791(c) | 04/18/27 | 250 | 249,625 | ||||||||||
Benefit Street Partners CLO V Ltd. (Cayman Islands), | 1.857(c) | 10/20/26 | 250 | 250,255 | ||||||||||
Blue Hill CLO Ltd. (Cayman Islands), Series 2013-1A, Class A, 144A | 1.733(c) | 01/15/26 | 250 | 248,652 | ||||||||||
Brookside Mill CLO Ltd. (Cayman Islands), Series 2013-1A, Class A1, 144A | 1.403(c) | 04/17/25 | 250 | 246,176 | ||||||||||
Catamaran CLO Ltd. (Cayman Islands), Series 2014-1A, Class A1, 144A | 1.807(c) | 04/20/26 | 350 | 349,606 | ||||||||||
ECP CLO Ltd. (Cayman Islands), | 1.685(c) | 07/15/26 | 250 | 248,668 | ||||||||||
Flagship VII CLO Ltd. (Cayman Islands), | 1.727(c) | 01/20/26 | 300 | 298,826 | ||||||||||
Galaxy XVIII CLO Ltd. (Cayman Islands), | 1.704(c) | 10/15/26 | 250 | 248,865 | ||||||||||
ING Investment Management CLO Ltd. (Cayman Islands), | 1.393(c) | 04/15/24 | 300 | 295,410 | ||||||||||
ING Investment Management Co. (Cayman Islands), | 2.057(c) | 01/18/26 | 300 | 287,543 | ||||||||||
Magnetite VIII Ltd. (Cayman Islands), | 1.733(c) | 04/15/26 | 850 | 850,354 | ||||||||||
Series 2014-9A, Class A1, 144A | 1.676(c) | 07/25/26 | 600 | 596,016 | ||||||||||
Ocean Trails CLO IV (Cayman Islands), Series 2013-4A, Class A, 144A | 1.558(c) | 08/13/25 | 300 | 296,609 | ||||||||||
Seneca Park CLO Ltd. (Cayman Islands), Series 2014-1A, Class A, 144A | 1.737(c) | 07/17/26 | 300 | 299,855 | ||||||||||
Shackleton CLO VI (Cayman Islands), Series 2014-6A, Class A1, 144A | 1.737(c) | 07/17/26 | 250 | 249,878 | ||||||||||
Sheridan Square CLO Ltd. (Cayman Islands), Series 2013-1A, Class A1, 144A | 1.303(c) | 04/15/25 | 300 | 294,551 | ||||||||||
Sound Point CLO Ltd. (Cayman Islands), Series 2012-1A, Class B, 144A | 2.957(c) | 10/20/23 | 250 | 251,888 | ||||||||||
See Notes to Financial Statements.
| 62 |
| Description | Interest Rate | Maturity Date | Principal Amount (000)# | Value (Note 1) | ||||||||||
ASSET-BACKED SECURITIES (Continued) | ||||||||||||||
Collateralized Loan Obligations (cont’d.) | ||||||||||||||
Tyron Park CLO Ltd. (Cayman Islands), Series 2013-1A, Class A1, 144A | 1.373 % (c) | 07/15/25 | 300 | $ | 294,758 | |||||||||
Vibrant CLO Ltd. (Cayman Islands), Series 2015-3A, Class A1, 144A | 1.885(c) | 04/20/26 | 250 | 249,044 | ||||||||||
Voya CLO Ltd. (Cayman Islands), | 1.570(c) | 10/15/22 | 750 | 749,625 | ||||||||||
Washington Mill CLO Ltd. (Cayman Islands), Series 2014-1A, Class A1, 144A | 1.757(c) | 04/20/26 | 350 | 348,985 | ||||||||||
|
| |||||||||||||
| 8,295,975 | ||||||||||||||
Non-Residential Mortgage-Backed Securities 1.0% |
| |||||||||||||
Avis Budget Rental Car Funding AESOP LLC, Series 2015-1A, Class A, 144A | 2.500 | 07/20/21 | 800 | 805,922 | ||||||||||
Chase Issuance Trust, Series 2007-C1, Class C1 | 0.635(c) | 04/15/19 | 800 | 796,942 | ||||||||||
Ford Credit Auto Owner Trust, Series 2014-2, Class A, 144A | 2.310 | 04/15/26 | 500 | 509,344 | ||||||||||
Ford Credit Auto Owner Trust/Ford Credit, Series 2014-1, Class A, 144A | 2.260 | 11/15/25 | 300 | 305,561 | ||||||||||
GE Capital Credit Card Master Note Trust, Series 2012-4, Class B | 1.025(c) | 06/15/18 | 600 | 600,116 | ||||||||||
OZLM Funding IV Ltd. (Cayman Islands), Series 2013-4A, Class A1, 144A | 1.407(c) | 07/22/25 | 250 | 245,887 | ||||||||||
Slater Mill Loan Fund LP (Cayman Islands), Series 2012-1A, Class B, 144A | 2.907(c) | 08/17/22 | 250 | 251,855 | ||||||||||
Springleaf Funding Trust, Series AA, Class A, 144A | 3.160 | 11/15/24 | 400 | 403,792 | ||||||||||
|
| |||||||||||||
| 3,919,419 | ||||||||||||||
Residential Mortgage-Backed Securities 0.4% |
| |||||||||||||
CDC Mortgage Capital Trust, Series 2002-HE3, Class M1 | 1.824(c) | 03/25/33 | 46 | 43,537 | ||||||||||
Countrywide Asset-Backed Certificates, Series 2004-1, Class M1 | 0.924(c) | 03/25/34 | 407 | 388,261 | ||||||||||
Credit-Based Asset Servicing and Securitization LLC, Series 2005-CB6, Class A3 | 3.996 | 07/25/35 | 58 | 56,021 | ||||||||||
Equity One Mortgage Pass-Through Trust, Series 2004-3, Class M1 | 4.985 | 07/25/34 | 69 | 65,978 | ||||||||||
See Notes to Financial Statements.
| Prudential Balanced Fund | 63 |
Portfolio of Investments
as of March 31, 2015 (Unaudited) continued
| Description | Interest Rate | Maturity Date | Principal Amount (000)# | Value (Note 1) | ||||||||||
ASSET-BACKED SECURITIES (Continued) | ||||||||||||||
Residential Mortgage-Backed Securities (cont’d.) | ||||||||||||||
Morgan Stanley ABS Capital I, Inc. Trust, Series 2004-NC1, Class M1 | 1.224 % (c) | 12/27/33 | 307 | $ | 296,082 | |||||||||
Morgan Stanley Dean Witter Capital I, Inc. Trust, Series 2002-HE1, Class M1 | 1.074(c) | 07/25/32 | 71 | 68,104 | ||||||||||
Series 2002-NC4, Class M1 | 1.449(c) | 09/25/32 | 85 | 83,473 | ||||||||||
RASC Trust, Series 2004-KS2, Class MI1 | 4.710(c) | 03/25/34 | 22 | 19,453 | ||||||||||
Securitized Asset Backed Receivables LLC Trust, Series 2004-OP1, Class M1 | 0.939(c) | 02/25/34 | 156 | 146,159 | ||||||||||
Sierra Timeshare Receivables Funding LLC, Series 2013-3A, Class A, 144A | 2.200 | 10/20/30 | 429 | 432,279 | ||||||||||
|
| |||||||||||||
| 1,599,347 | ||||||||||||||
|
| |||||||||||||
TOTAL ASSET-BACKED SECURITIES | 13,814,741 | |||||||||||||
|
| |||||||||||||
COLLATERALIZED MORTGAGE OBLIGATIONS 0.4% |
| |||||||||||||
Banc of America Alternative Loan Trust, Series 2005-12, Class 3CB1 | 6.000 | 01/25/36 | 295 | 249,473 | ||||||||||
Banc of America Mortgage Trust, | 2.663(c) | 02/25/35 | 55 | 53,294 | ||||||||||
Series 2005-B, Class 2A1 | 2.657(c) | 03/25/35 | 62 | 56,160 | ||||||||||
Chase Mortgage Finance Trust, Series 2007-A1, Class 1A5 | 2.526(c) | 02/25/37 | 161 | 156,792 | ||||||||||
Countrywide Alternative Loan Trust, Series 2004-18CB, Class 3A1 | 5.250 | 09/25/19 | 51 | 52,123 | ||||||||||
Fannie Mae Connecticut Avenue Securities, | 2.124(c) | 11/25/24 | 659 | 665,372 | ||||||||||
Series 2015-C01, Class 1M1 | 1.672(c) | 02/25/25 | 190 | 190,898 | ||||||||||
JPMorgan Mortgage Trust, Series 2007-A1, Class 4A1 | 2.489(c) | 07/25/35 | 93 | 93,084 | ||||||||||
MASTR Alternative Loan Trust, | 7.000 | 12/25/33 | 6 | 6,270 | ||||||||||
Series 2004-4, Class 4A1 | 5.000 | 04/25/19 | 59 | 59,778 | ||||||||||
Structured Adjustable Rate Mortgage Loan Trust, Series 2004-1, Class 4A3 | 2.545(c) | 02/25/34 | 90 | 89,105 | ||||||||||
Washington Mutual Mortgage Pass-Through Certificates, Series 2005-1, Class 3A | 5.000 | 03/25/20 | 28 | 27,787 | ||||||||||
|
| |||||||||||||
TOTAL COLLATERALIZED MORTGAGE OBLIGATIONS |
| 1,700,136 | ||||||||||||
|
| |||||||||||||
See Notes to Financial Statements.
| 64 |
| Description | Interest Rate | Maturity Date | Principal Amount (000)# | Value (Note 1) | ||||||||||
COMMERCIAL MORTGAGE-BACKED SECURITIES 4.4% |
| |||||||||||||
Banc of America Commercial Mortgage Trust, | 5.369 % | 10/10/45 | 600 | $ | 607,799 | |||||||||
Series 2007-2, Class A1A | 5.536(c) | 04/10/49 | 882 | 938,983 | ||||||||||
Citigroup Commercial Mortgage Trust, | 5.413 | 10/15/49 | 255 | 256,179 | ||||||||||
Series 2007-C6, Class A4 | 5.703(c) | 12/10/49 | 100 | 108,179 | ||||||||||
Series 2013-GC11, Class A3 | 2.815 | 04/10/46 | 100 | 101,929 | ||||||||||
Series 2014-GC21, Class A4 | 3.575 | 05/10/47 | 420 | 446,822 | ||||||||||
COMM Mortgage Trust, | 2.929 | 03/10/46 | 200 | 205,433 | ||||||||||
Series 2013-CR8, Class A4 | 3.334 | 06/10/46 | 600 | 631,578 | ||||||||||
Series 2014-CR15, Class A2 | 2.928 | 02/10/47 | 400 | 415,458 | ||||||||||
COMM Mortgage Trust, | 3.550 | 07/15/47 | 400 | 425,201 | ||||||||||
Series 2014-UBS3, Class A2 | 2.844 | 06/10/47 | 300 | 310,252 | ||||||||||
Series 2014-UBS4, Class A4 | 3.420 | 08/10/47 | 700 | 734,378 | ||||||||||
Series 2005-GG5, Class AM | 5.277(c) | 04/10/37 | 740 | 751,156 | ||||||||||
Credit Suisse Commercial Mortgage Trust, Series 2006-C1, Class A4 | 5.469(c) | 02/15/39 | 782 | 797,557 | ||||||||||
Fannie Mae-ACES, Series M2, Class A2 | 3.513(c) | 12/25/23 | 375 | 405,870 | ||||||||||
FHLMC Multifamily Structured | 2.873 | 12/25/21 | 500 | 522,911 | ||||||||||
Series K020, Class A2 | 2.373 | 05/25/22 | 1,000 | 1,013,207 | ||||||||||
Series K020, Class X1, I/O | 1.463(c) | 05/25/22 | 2,918 | 245,566 | ||||||||||
Series K021, Class X1, I/O | 1.501(c) | 06/25/22 | 881 | 76,615 | ||||||||||
Series K025, Class X1, I/O | 0.899(c) | 10/25/22 | 1,484 | 81,415 | ||||||||||
Series K029, Class A2 | 3.320(c) | 02/25/23 | 800 | 860,126 | ||||||||||
Series K030, Class A2 | 3.250(c) | 04/25/23 | 300 | 321,089 | ||||||||||
Series K034, Class A2 | 3.531(c) | 07/25/23 | 400 | 435,174 | ||||||||||
Series K501, Class X1A, I/O | 1.643(c) | 08/25/16 | 888 | 14,176 | ||||||||||
Series K710, Class X1, I/O | 1.777(c) | 05/25/19 | 2,446 | 152,770 | ||||||||||
Series K711, Class X1, I/O | 1.705(c) | 07/25/19 | 2,459 | 149,416 | ||||||||||
GS Mortgage Securities Trust, | 3.136 | 02/10/48 | 400 | 409,572 | ||||||||||
JPMorgan Chase Commercial Mortgage Securities Corp., | 4.895 | 09/12/37 | 434 | 435,430 | ||||||||||
Series 2005-LDP2, Class AM | 4.780 | 07/15/42 | 100 | 100,149 | ||||||||||
Series 2013-C16, Class A2 | 3.070 | 12/15/46 | 700 | 733,302 | ||||||||||
See Notes to Financial Statements.
| Prudential Balanced Fund | 65 |
Portfolio of Investments
as of March 31, 2015 (Unaudited) continued
| Description | Interest Rate | Maturity Date | Principal Amount (000)# | Value (Note 1) | ||||||||||
COMMERCIAL MORTGAGE-BACKED SECURITIES (Continued) |
| |||||||||||||
JPMorgan Chase Commercial Mortgage Securities Trust, | 5.523 % | 05/12/45 | 161 | $ | 163,675 | |||||||||
Series 2012-CBX, Class A3 | 3.139 | 06/15/45 | 277 | 286,148 | ||||||||||
Series 2012-LC9, Class A4 | 2.611 | 12/15/47 | 200 | 200,779 | ||||||||||
Series 2013-C10, Class A4 | 2.875 | 12/15/47 | 500 | 510,184 | ||||||||||
Series 2013-LC11, Class A4 | 2.694 | 04/15/46 | 200 | 201,350 | ||||||||||
Merrill Lynch/Countrywide Commercial Mortgage Trust, | 5.868(c) | 06/12/46 | 461 | 477,843 | ||||||||||
Series 2007-6, Class A2 | 5.331 | 03/12/51 | 226 | 228,342 | ||||||||||
Series 2007-7, Class ASB | 5.735(c) | 06/12/50 | 250 | 251,126 | ||||||||||
Morgan Stanley Bank of America Merrill Lynch Trust, Series 2013-C8, Class A3 | 2.863 | 12/15/48 | 200 | 203,454 | ||||||||||
Morgan Stanley Capital I Trust, | 5.646(c) | 10/15/42 | 569 | 579,251 | ||||||||||
Series 2007-HQ11, Class A31 | 5.439 | 02/12/44 | 34 | 34,181 | ||||||||||
Series 2007-HQ11, Class AAB | 5.444 | 02/12/44 | 323 | 322,767 | ||||||||||
Series 2007-T27, Class AAB | 5.654(c) | 06/11/42 | 47 | 47,716 | ||||||||||
PNC Commercial Mortgage Acceptance Corp., Series 1998-C2, Class X, I/O | 1.582(c) | 09/15/30 | 124 | 4,690 | ||||||||||
UBS-Barclays Commercial Mortgage Trust, | 2.792 | 12/10/45 | 200 | 204,064 | ||||||||||
Series 2013-C5, Class A3 | 2.920 | 03/10/46 | 500 | 510,958 | ||||||||||
Series 2013-C6, Class A3 | 2.971 | 04/10/46 | 200 | 205,585 | ||||||||||
Wachovia Bank Commercial Mortgage Trust, | 5.179(c) | 07/15/42 | 135 | 136,029 | ||||||||||
Series 2007-C34, Class A1A | 5.608(c) | 05/15/46 | 989 | 1,050,231 | ||||||||||
|
| |||||||||||||
TOTAL COMMERCIAL MORTGAGE-BACKED SECURITIES (cost $18,288,698) | 18,306,065 | |||||||||||||
|
| |||||||||||||
FOREIGN AGENCIES 0.6% |
| |||||||||||||
Comision Federal de Electricidad (Mexico), Sr. Unsec’d. Notes, 144A | 4.875 | 01/15/24 | 200 | 213,000 | ||||||||||
Export-Import Bank of Korea (South Korea), Sr. Unsec’d. Notes | 5.125 | 06/29/20 | 100 | 114,341 | ||||||||||
Kommunalbanken AS (Norway), Sr. Unsec’d Notes, 144A | 1.125 | 05/23/18 | 382 | 381,357 | ||||||||||
Pemex Project Funding Master Trust (Mexico), Gtd. Notes | 6.625 | 06/15/35 | 255 | 291,975 | ||||||||||
See Notes to Financial Statements.
| 66 |
| Description | Interest Rate | Maturity Date | Principal Amount (000)# | Value (Note 1) | ||||||||||
FOREIGN AGENCIES (Continued) |
| |||||||||||||
Petrobras Global Finance BV (Brazil), Gtd. Notes | 2.000 % | 05/20/16 | 195 | $ | 186,517 | |||||||||
Petroleos Mexicanos (Mexico), | 3.500 | 01/30/23 | 115 | 112,298 | ||||||||||
Gtd. Notes | 4.875 | 01/18/24 | 65 | 68,803 | ||||||||||
Gtd. Notes | 5.500 | 01/21/21 | 300 | 329,250 | ||||||||||
Gtd. Notes | 6.500 | 06/02/41 | 85 | 96,263 | ||||||||||
RSHB Capital SA For OJSC Russian Agricultural Bank (Russia), Sr. Unsec’d. Notes, 144A | 6.299 | 05/15/17 | 200 | 194,988 | ||||||||||
Sinopec Group Overseas Development 2014 Ltd. (China), Gtd. Notes, 144A | 1.750 | 04/10/17 | 250 | 250,199 | ||||||||||
State Grid Overseas Investment 2014 Ltd. (China), Gtd. Notes, 144A | 2.750 | 05/07/19 | 200 | 203,786 | ||||||||||
|
| |||||||||||||
TOTAL FOREIGN AGENCIES | 2,442,777 | |||||||||||||
|
| |||||||||||||
MUNICIPAL BONDS 0.5% | ||||||||||||||
California 0.1% | ||||||||||||||
Bay Area Toll Authority, Taxable, Revenue Bonds, BABs | 6.263 | 04/01/49 | 220 | 316,782 | ||||||||||
State of California, | 7.500 | 04/01/34 | 15 | 22,436 | ||||||||||
GO, BABs(a) | 7.300 | 10/01/39 | 210 | 313,013 | ||||||||||
|
| |||||||||||||
| 652,231 | ||||||||||||||
Illinois 0.1% | ||||||||||||||
City of Chicago IL, O’Hare Int’l. Arpt., BABs | 6.395 | 01/01/40 | 160 | 217,597 | ||||||||||
New Jersey 0.1% | ||||||||||||||
New Jersey State Turnpike Auth. Rev., Tax. Issuer Subs., Ser. F, BABs(a) | 7.414 | 01/01/40 | 165 | 248,276 | ||||||||||
New York 0.1% | ||||||||||||||
New York City Trans. Fin. Auth., Tax. Future, Tax. Secd. Sub., Ser. C-2, BABs | 5.767 | 08/01/36 | 190 | 240,225 | ||||||||||
Ohio | ||||||||||||||
Ohio State University Gen. Repts., BABs | 4.910 | 06/01/40 | 65 | 79,302 | ||||||||||
See Notes to Financial Statements.
| Prudential Balanced Fund | 67 |
Portfolio of Investments
as of March 31, 2015 (Unaudited) continued
| Description | Interest Rate | Maturity Date | Principal Amount (000)# | Value (Note 1) | ||||||||||
MUNICIPAL BONDS (Continued) | ||||||||||||||
Ohio (cont’d.) | ||||||||||||||
Ohio State Water Development Auth. Wtr. Poll. Ctl. Rev., Taxable Ld. Fd. B-2 Wtr. Quality, BABs | 4.879 % | 12/01/34 | 45 | $ | 52,528 | |||||||||
|
| |||||||||||||
| 131,830 | ||||||||||||||
Oregon | ||||||||||||||
Oregon State Department of Trans. Hwy. User Tax Rev., Taxable Sub. Lien, Ser. A, BABs | 5.834 | 11/15/34 | 70 | 92,350 | ||||||||||
Pennsylvania | ||||||||||||||
Pennsylvania Turnpike Commission Rev., Ser. B, BABs | 5.511 | 12/01/45 | 80 | 100,352 | ||||||||||
Tennessee 0.1% | ||||||||||||||
Metropolitan Government of Nashville & Davidson County Convention Center Auth., Taxable Sub. B, Direct Pay, BABs | 6.731 | 07/01/43 | 160 | 215,104 | ||||||||||
Texas | ||||||||||||||
Texas State Trans. Commission Rev., Taxable First Tier, Ser. B, BABs | 5.028 | 04/01/26 | 50 | 59,329 | ||||||||||
|
| |||||||||||||
TOTAL MUNICIPAL BONDS | 1,957,294 | |||||||||||||
|
| |||||||||||||
SOVEREIGN BONDS 0.4% | ||||||||||||||
Brazilian Government International Bond (Brazil), Sr. Unsec’d. Notes(a) | 4.250 | 01/07/25 | 200 | 196,000 | ||||||||||
Colombia Government International Bond (Colombia), Sr. Unsec’d. Notes | 4.000 | 02/26/24 | 225 | 231,975 | ||||||||||
Hungary Government International Bond (Hungary), Sr. Unsec’d. Notes | 4.000 | 03/25/19 | 90 | 93,871 | ||||||||||
Indonesia Government International Bond (Indonesia), | 6.875 | 01/17/18 | 165 | 186,037 | ||||||||||
Sr. Unsec’d. Notes, 144A | 5.875 | 03/13/20 | 200 | 226,250 | ||||||||||
Mexico Government International Bond (Mexico), Sr. Unsec’d. Notes, MTN | 3.625 | 03/15/22 | 100 | 103,850 | ||||||||||
Panama Government International Bond (Panama), Sr. Unsec’d. Notes(a) | 5.200 | 01/30/20 | 100 | 111,250 | ||||||||||
See Notes to Financial Statements.
| 68 |
| Description | Interest Rate | Maturity Date | Principal Amount (000)# | Value (Note 1) | ||||||||||
SOVEREIGN BONDS (Continued) | ||||||||||||||
Poland Government International Bond (Poland), Sr. Unsec’d. Notes | 3.000 % | 03/17/23 | 160 | $ | 164,240 | |||||||||
Romanian Government International Bond (Romania), | 6.125 | 01/22/44 | 50 | 63,938 | ||||||||||
Sr. Unsec’d. Notes, 144A(a) | 4.875 | 01/22/24 | 30 | 33,225 | ||||||||||
Turkey Government International Bond (Turkey), Sr. Unsec’d. Notes | 7.000 | 06/05/20 | 190 | 219,450 | ||||||||||
United Mexican States (Mexico), | 4.750 | 03/08/44 | 118 | 123,900 | ||||||||||
|
| |||||||||||||
TOTAL SOVEREIGN BONDS | 1,753,986 | |||||||||||||
|
| |||||||||||||
U.S. GOVERNMENT AGENCY OBLIGATIONS 11.1% |
| |||||||||||||
Federal Home Loan Bank | 0.375 | 08/28/15 | 55 | 55,038 | ||||||||||
Federal Home Loan Bank | 4.000 | 02/01/41 | 700 | 750,499 | ||||||||||
Federal Home Loan Bank | 5.500 | 07/15/36 | 135 | 189,283 | ||||||||||
Federal Home Loan Mortgage Corp. | 2.236(c) | 12/01/35 | 53 | 56,310 | ||||||||||
Federal Home Loan Mortgage Corp. | 2.375 | 01/13/22 | 790 | 816,937 | ||||||||||
Federal Home Loan Mortgage Corp. | 3.000 | TBA | 2,000 | 2,035,586 | ||||||||||
Federal Home Loan Mortgage Corp. | 3.000 | 06/01/29 | 458 | 481,746 | ||||||||||
Federal Home Loan Mortgage Corp. | 3.500 | TBA | (g) | 1,500 | 1,572,041 | |||||||||
Federal Home Loan Mortgage Corp. | 3.500 | 08/01/26 | 480 | 513,437 | ||||||||||
Federal Home Loan Mortgage Corp. | 4.000 | 06/01/26 - 11/01/39 | 807 | 864,901 | ||||||||||
Federal Home Loan Mortgage Corp. | 4.500 | TBA | (g) | 500 | 544,492 | |||||||||
Federal Home Loan Mortgage Corp. | 4.500 | 10/01/39 | 493 | 537,666 | ||||||||||
Federal Home Loan Mortgage Corp. | 5.000 | 07/01/18 - 10/01/35 | 437 | 476,854 | ||||||||||
Federal Home Loan Mortgage Corp. | 5.500 | 12/01/33 - 10/01/37 | 368 | 414,567 | ||||||||||
Federal Home Loan Mortgage Corp. | 6.000 | 01/01/34 | 85 | 96,977 | ||||||||||
Federal Home Loan Mortgage Corp. | 7.000 | 10/01/31 - 05/01/32 | 49 | 57,119 | ||||||||||
Federal National Mortgage Assoc.(a) | 1.625 | 01/21/20 | 1,130 | 1,137,805 | ||||||||||
Federal National Mortgage Assoc. | 1.875 | 02/19/19 | 30 | 30,692 | ||||||||||
Federal National Mortgage Assoc. | 1.917(c) | 07/01/37 | 266 | 282,260 | ||||||||||
Federal National Mortgage Assoc. | 2.500 | TBA | (g) | 2,000 | 2,054,062 | |||||||||
Federal National Mortgage Assoc. | 2.625 | 09/06/24 | 620 | 642,376 | ||||||||||
Federal National Mortgage Assoc. | 3.000 | TBA | 1,250 | 1,274,878 | ||||||||||
Federal National Mortgage Assoc. | 3.000 | 12/01/42 - 07/01/43 | 1,406 | 1,440,771 | ||||||||||
Federal National Mortgage Assoc. | 3.500 | TBA | (g) | 2,000 | 2,100,625 | |||||||||
Federal National Mortgage Assoc. | 3.500 | TBA | 5,500 | 5,762,754 | ||||||||||
Federal National Mortgage Assoc. | 3.500 | 06/01/39 | 272 | 285,993 | ||||||||||
See Notes to Financial Statements.
| Prudential Balanced Fund | 69 |
Portfolio of Investments
as of March 31, 2015 (Unaudited) continued
| Description | Interest Rate | Maturity Date | Principal Amount (000)# | Value (Note 1) | ||||||||||
U.S. GOVERNMENT AGENCY OBLIGATIONS (Continued) |
| |||||||||||||
Federal National Mortgage Assoc.(h) | 3.500 % | 05/01/42 | 2,639 | $ | 2,775,694 | |||||||||
Federal National Mortgage Assoc. | 4.000 | TBA | 2,000 | 2,135,000 | ||||||||||
Federal National Mortgage Assoc. | 4.500 | TBA | (g) | 750 | 816,153 | |||||||||
Federal National Mortgage Assoc. | 4.500 | 07/01/19 - 08/01/40 | 1,053 | 1,149,703 | ||||||||||
Federal National Mortgage Assoc. | 5.000 | TBA | (g) | 2,000 | 2,223,906 | |||||||||
Federal National Mortgage Assoc. | 5.000 | 10/01/18 - 02/01/36 | 284 | 312,902 | ||||||||||
Federal National Mortgage Assoc. | 5.500 | 12/01/16 - 07/01/34 | 614 | 696,042 | ||||||||||
Federal National Mortgage Assoc. | 6.000 | 09/01/17 - 08/01/38 | 1,095 | 1,257,470 | ||||||||||
Federal National Mortgage Assoc. | 6.500 | 07/01/17 - 10/01/37 | 753 | 872,257 | ||||||||||
Federal National Mortgage Assoc. | 7.000 | 06/01/32 | 28 | 34,958 | ||||||||||
Federal National Mortgage Assoc. | 7.500 | 09/01/30 | 2 | 2,592 | ||||||||||
Federal National Mortgage Assoc. | 8.000 | 12/01/23 | 4 | 4,398 | ||||||||||
Federal National Mortgage Assoc. | 8.500 | 02/01/28 | 5 | 6,448 | ||||||||||
Financing Corp., FICO Strip Principal, Series A-P | 1.280(i) | 10/06/17 | 240 | 233,683 | ||||||||||
Financing Corp., FICO Strip Principal, Series B-P | 1.280(i) | 10/06/17 | 330 | 322,706 | ||||||||||
Government National Mortgage Assoc. | 3.000 | TBA | 500 | 514,609 | ||||||||||
Government National Mortgage Assoc. | 3.000 | TBA | (g) | 500 | 514,834 | |||||||||
Government National Mortgage Assoc. | 3.500 | TBA | (g) | 2,500 | 2,630,566 | |||||||||
Government National Mortgage Assoc. | 4.000 | TBA | (g) | 2,500 | 2,663,574 | |||||||||
Government National Mortgage Assoc. | 4.500 | 06/20/41 | 815 | 888,507 | ||||||||||
Government National Mortgage Assoc. | 5.500 | 07/15/33 - 02/15/36 | 782 | 887,656 | ||||||||||
Government National Mortgage Assoc. | 6.500 | 09/15/23 - 08/15/32 | 225 | 260,806 | ||||||||||
Government National Mortgage Assoc. | 7.000 | 06/15/24 - 05/15/31 | 44 | 52,228 | ||||||||||
Government National Mortgage Assoc. | 7.500 | 04/15/29 - 05/15/31 | 6 | 5,915 | ||||||||||
Government National Mortgage Assoc. | 8.000 | 08/15/22 - 06/15/25 | 56 | 63,482 | ||||||||||
|
| |||||||||||||
TOTAL U.S. GOVERNMENT AGENCY OBLIGATIONS |
| 45,801,758 | ||||||||||||
|
| |||||||||||||
U.S. TREASURY OBLIGATIONS 3.6% |
| |||||||||||||
U.S. Treasury Bonds | 2.500 | 02/15/45 | 580 | 574,653 | ||||||||||
U.S. Treasury Bonds | 3.000 | 11/15/44 | 245 | 268,447 | ||||||||||
U.S. Treasury Notes | 0.625 | 05/31/17 | 1,160 | 1,160,090 | ||||||||||
U.S. Treasury Notes | 0.875 | 01/15/18 | 535 | 535,544 | ||||||||||
U.S. Treasury Notes | 1.000 | 09/15/17 | 140 | 140,962 | ||||||||||
U.S. Treasury Notes | 1.375 | 06/30/18 - 03/31/20 | 1,200 | 1,202,696 | ||||||||||
U.S. Treasury Notes | 1.500 | 12/31/18 | 70 | 70,930 | ||||||||||
U.S. Treasury Notes | 1.625 | 04/30/19 | 4,425 | 4,498,287 | ||||||||||
U.S. Treasury Notes(j) | 2.000 | 02/28/21 | 740 | 758,037 | ||||||||||
U.S. Treasury Notes | 2.000 | 05/31/21 | 85 | 87,039 | ||||||||||
See Notes to Financial Statements.
| 70 |
| Description | Interest Rate | Maturity Date | Principal Amount (000)# | Value (Note 1) | ||||||||||
U.S. TREASURY OBLIGATIONS (Continued) |
| |||||||||||||
U.S. Treasury Notes(a) | 2.000% | 02/15/25 | 1,200 | $ | 1,207,594 | |||||||||
U.S. Treasury Notes | 2.250 | 03/31/21 | 515 | 534,634 | ||||||||||
U.S. Treasury Notes | 2.375 | 05/31/18 | 1,725 | 1,801,278 | ||||||||||
U.S. Treasury Notes | 3.125 | 05/15/19 | 420 | 451,828 | ||||||||||
U.S. Treasury Strip Coupon | 2.400(i) | 08/15/21 | 735 | 658,095 | ||||||||||
U.S. Treasury Strip Coupon | 2.500(i) | 11/15/30 | 640 | 437,360 | ||||||||||
U.S. Treasury Strip Principal | 2.350(i) | 05/15/43 | 360 | 172,421 | ||||||||||
U.S. Treasury Strip Principal | 3.504(i) | 05/15/44 | 975 | 455,956 | ||||||||||
|
| |||||||||||||
TOTAL U.S. TREASURY OBLIGATIONS | 15,015,851 | |||||||||||||
|
| |||||||||||||
TOTAL LONG-TERM INVESTMENTS | 396,758,247 | |||||||||||||
|
| |||||||||||||
Shares | ||||||||||||||
SHORT-TERM INVESTMENTS 15.0% |
| |||||||||||||
AFFILIATED MUTUAL FUNDS 14.9% |
| |||||||||||||
Prudential Investment Portfolios 2 - Prudential Core |
| 2,212,384 | 20,641,546 | |||||||||||
Prudential Investment Portfolios 2 - Prudential Core |
| 41,040,428 | 41,040,428 | |||||||||||
|
| |||||||||||||
TOTAL AFFILIATED MUTUAL FUNDS | 61,681,974 | |||||||||||||
|
| |||||||||||||
Notional | ||||||||||||||
OPTIONS PURCHASED* | ||||||||||||||
Call Options | ||||||||||||||
2 Year U.S. Treasury Notes, | 7,400 | 8,094 | ||||||||||||
2 Year U.S. Treasury Notes, | 7,400 | 578 | ||||||||||||
10 Year U.S. Treasury Notes, expiring 04/24/15, Strike Price $127.00 | 2,200 | 44,687 | ||||||||||||
10 Year U.S. Treasury Notes, expiring 04/24/15, Strike Price $133.00 | 2,200 | 688 | ||||||||||||
|
| |||||||||||||
TOTAL OPTIONS PURCHASED | 54,047 | |||||||||||||
|
| |||||||||||||
See Notes to Financial Statements.
| Prudential Balanced Fund | 71 |
Portfolio of Investments
as of March 31, 2015 (Unaudited) continued
| Description | Interest Rate | Maturity Date | Principal Amount (000)# | Value (Note 1) | ||||||||
U.S. TREASURY OBLIGATION 0.1% |
| |||||||||||
U.S. Treasury Bill | 0.152 % (m) | 09/17/15 | 390 | $ | 389,817 | |||||||
|
| |||||||||||
TOTAL SHORT-TERM INVESTMENTS | 62,125,838 | |||||||||||
|
| |||||||||||
TOTAL INVESTMENTS, BEFORE OPTIONS WRITTEN 111.1% | 458,884,085 | |||||||||||
|
| |||||||||||
Notional | ||||||||||||
OPTIONS WRITTEN* | ||||||||||||
Call Options | ||||||||||||
2 Year U.S. Treasury Notes, | 14,800 | (4,625 | ) | |||||||||
10 Year U.S. Treasury Notes, | 4,400 | (14,437 | ) | |||||||||
|
| |||||||||||
TOTAL OPTIONS WRITTEN | (19,062 | ) | ||||||||||
|
| |||||||||||
TOTAL INVESTMENTS, NET OF OPTIONS WRITTEN 111.1% |
| 458,865,023 | ||||||||||
Liabilities in excess of other assets(n) (11.1)% |
| (45,948,993 | ) | |||||||||
|
| |||||||||||
NET ASSETS 100.0% | $ | 412,916,030 | ||||||||||
|
| |||||||||||
The following abbreviations are used in the portfolio descriptions:
144A—Security was purchased pursuant to Rule 144A under the Securities Act of 1933 and may not be resold subject to that rule except to qualified institutional buyers. Unless otherwise noted, 144A securities are deemed to be liquid.
ABS—Asset-Backed Security
ACES—Alternative Credit Enhancements Securities
BABs—Build America Bonds
CDX—Credit Derivative Index
CLO—Collateralized Loan Obligation
CMBS—Collateralized Mortgage-Backed Security
CVA—Certificate Van Aandelen (Bearer)
FHLMC—Federal Home Loan Mortgage Corp.
FICO—Financing Corp.
FTSE—Financial Times and Stock Exchange
GMTN—Global Medium Term Note
GO—General Obligation
See Notes to Financial Statements.
| 72 |
I/O—Interest Only
LIBOR—London Interbank Offered Rate
MTN—Medium Term Note
REIT—Real Estate Investment Trust
RSP—Non-Voting Shares
SDR—Swedish Depositary Receipt
TBA—To Be Announced
TIPS—Treasury Inflation-Protected Securities
TOPIX—Tokyo Stock Price Index
BRL—Brazilian Real
MXN—Mexican Peso
| # | Principal or notional amount is shown in U.S. dollars unless otherwise stated. |
| * | Non-income producing security. |
| (a) | All or a portion of security is on loan. The aggregate market value of such securities, including those sold and pending settlement, is $18,616,077; cash collateral of $19,058,334 (included in liabilities) was received with which the Series purchased highly liquid short-term investments. Securities on loan are subject to contractual netting arrangements. |
| (c) | Variable rate instrument. The interest rate shown reflects the rate in effect at March 31, 2015. |
| (d) | Represents issuer in default on interest payments and/or principal repayment. Non-income producing security. Such securities may be post maturity. |
| (e) | Indicates a security or securities that have been deemed illiquid. |
| (f) | Indicates a restricted security; the aggregate original cost of the restricted securities is $1,039,071. The aggregate value of $1,073,953 is approximately 0.3% of net assets. |
| (g) | Principal amount of $14,250,000 represents “TBA” mortgage dollar rolls. |
| (h) | Represents security, or a portion thereof, segregated as collateral for futures contracts. |
| (i) | Represents zero coupon bond or principal only securities. Rate represents yield to maturity at purchase date. |
| (j) | Represents security, or a portion thereof, segregated as collateral for swap agreements. |
| (k) | Prudential Investments LLC, the manager of the Series, also serves as manager of the Prudential Investment Portfolios 2 - Prudential Core Taxable Money Market Fund and the Prudential Investment Portfolios 2 - Prudential Core Short-Term Bond Fund. |
| (l) | Represents security, or a portion thereof, purchased with cash collateral received for securities on loan. |
| (m) | Rate reflects yield to maturity at purchase date. |
See Notes to Financial Statements.
| Prudential Balanced Fund | 73 |
Portfolio of Investments
as of March 31, 2015 (Unaudited) continued
| (n) | Includes net unrealized appreciation (depreciation) on the following derivative contracts held at reporting period end: |
Futures contracts outstanding at March 31, 2015:
| Number of Contracts | Type | Expiration Date | Value at Trade Date | Value at March 31, 2015 | Unrealized Appreciation (Depreciation)(1) | |||||||||||||||
| Long Positions: | ||||||||||||||||||||
| 17 | 2 Year U.S. Treasury Notes | Jun. 2015 | $ | 3,712,834 | $ | 3,725,656 | $ | 12,822 | ||||||||||||
| 57 | 5 Year U.S. Treasury Notes | Jun. 2015 | 6,819,772 | 6,852,023 | 32,251 | |||||||||||||||
| 41 | 10 Year U.S. Treasury Notes | Jun. 2015 | 5,222,679 | 5,285,156 | 62,477 | |||||||||||||||
| 39 | DJ Euro Stoxx 50 Index | Jun. 2015 | 1,521,074 | 1,522,645 | 1,571 | |||||||||||||||
| 2 | FTSE 100 Index | Jun. 2015 | 200,407 | 199,576 | (831 | ) | ||||||||||||||
| 2 | MSCI EAFE Index Mini | Jun. 2015 | 181,595 | 182,990 | 1,395 | |||||||||||||||
| 22 | S&P 500 E-Mini | Jun. 2015 | 2,275,310 | 2,266,880 | (8,430 | ) | ||||||||||||||
| 1 | TOPIX Index | Jun. 2015 | 126,710 | 128,695 | 1,985 | |||||||||||||||
| 8 | U.S. Ultra Bonds | Jun. 2015 | 1,331,954 | 1,359,000 | 27,046 | |||||||||||||||
|
| |||||||||||||||||||
| 130,286 | ||||||||||||||||||||
|
| |||||||||||||||||||
| Short Position: | ||||||||||||||||||||
| 3 | U.S. Long Bonds | Jun. 2015 | 490,215 | 491,625 | (1,410 | ) | ||||||||||||||
|
| |||||||||||||||||||
| $ | 128,876 | |||||||||||||||||||
|
| |||||||||||||||||||
| (1) | A U.S. Treasury Obligation with a market value of $389,817 has been segregated with Goldman Sachs & Co. and a U.S. Government Agency Obligation with a market value of $368,165 has been segregated with JPMorgan Chase to cover requirements for open future contracts at March 31, 2015. |
Interest rate swap agreements outstanding at March 31, 2015:
Notional | Termination Date | Fixed Rate | Floating | Fair Value | Upfront Premiums Paid (Received) | Unrealized Appreciation (Depreciation) | Counterparty | |||||||||||||||||||
| Over-the-counter swap agreements: |
| ||||||||||||||||||||||||
| BRL 5,008 | 01/01/18 | 11.770% | 1 Day Brazil Interbank Rate(2) | $ | (54,694 | ) | $ | — | $ | (54,694 | ) | Deutsche Bank AG | ||||||||||||||
| 382 | 05/17/18 | 0.989% | 3 Month LIBOR(1) | 567 | — | 567 | Credit Suisse First Boston Corp. | |||||||||||||||||||
| 1,570 | 03/30/25 | 2.015% | 3 Month LIBOR(1) | (6,049 | ) | — | (6,049 | ) | Barclays Capital Group | |||||||||||||||||
|
|
|
|
|
| |||||||||||||||||||||
| $ | (60,176 | ) | $ | — | $ | (60,176 | ) | |||||||||||||||||||
|
|
|
|
|
| |||||||||||||||||||||
See Notes to Financial Statements.
| 74 |
Notional | Termination Date | Fixed Rate | Floating Rate | Value at Trade Date | Value at March 31, 2015 | Unrealized Appreciation (Depreciation) | ||||||||||||||||
Exchange-traded swap agreements: |
| |||||||||||||||||||||
| 1,885 | 12/24/17 | 1.384% | 3 Month LIBOR(1) | $ | 493 | $ | (17,798 | ) | $ | (18,291 | ) | |||||||||||
| 4,150 | 10/31/21 | 1.957% | 3 Month LIBOR(1) | (4,817 | ) | (55,286 | ) | (50,469 | ) | |||||||||||||
| MXN 11,100 | 08/19/24 | 6.010% | 28 Day Mexican Interbank Rate(2) | (2,356 | ) | 826 | 3,182 | |||||||||||||||
| 700 | 09/08/24 | 2.569% | 3 Month LIBOR(1) | 155 | (35,178 | ) | (35,333 | ) | ||||||||||||||
|
|
|
|
|
| |||||||||||||||||
| $ | (6,525 | ) | $ | (107,436 | ) | $ | (100,911 | ) | ||||||||||||||
|
|
|
|
|
| |||||||||||||||||
| (1) | The Series pays the fixed rate and receives the floating rate. |
| (2) | The Series pays the floating rate and receives the fixed rate. |
Credit default swap agreements outstanding at March 31, 2015:
Reference Entity/ | Termination Date | Fixed Rate | Notional Amount (000)#(2) | Value at Trade Date | Value at March 31, 2015(3) | Unrealized Appreciation | ||||||||||||||||||
Exchange-traded credit default swaps on credit indices—Buy Protection(1): |
| |||||||||||||||||||||||
CDX.NA.IG.24.V1 | 06/20/20 | 1.000% | 13,000 | $ | (238,014 | ) | $ | (235,174 | ) | $ | 2,840 | |||||||||||||
|
|
|
|
|
| |||||||||||||||||||
A U.S. Treasury Obligation with a market value of $297,069 has been segregated with Citigroup Global Markets to cover requirements for open exchange-traded interest rate and credit default swap contracts at March 31, 2015.
The Series entered into credit default swaps (“CDS”) to provide a measure of protection against defaults or to take an active long or short position with respect to the likelihood of a particular issuer’s default or the reference entity’s credit soundness. CDS contracts generally trade based on a spread which represents the cost a protection buyer has to pay the protection seller. The protection buyer is said to be short the credit as the value of the contract rises the more the credit deteriorates. The value of the CDS contract increases for the protection buyer if the spread increases.
| (1) | If the Series is a buyer of protection, it pays the fixed rate. When a credit event occurs, as defined under the terms of that particular swap agreement, the Series will either (i) receive from the seller of protection an amount equal to the notional amount of the swap and make delivery of the referenced obligation or underlying securities comprising the referenced index or (ii) receive a net settlement amount in the form of cash or securities equal to the notional amount of the swap less the recovery value of the referenced obligation or underlying securities comprising the referenced index. |
| (2) | Notional amount represents the maximum potential amount the Series could be required to pay as a seller of credit protection or receive as a buyer of credit protection if a credit event occurs as defined under the terms of that particular swap agreement. |
| (3) | The fair value of credit default swap agreements on credit indices serves as an indicator of the current status of the payment/performance risk and represents the likelihood of an expected liability (or profit) for the credit derivative should the notional amount of the swap agreement be closed/sold as the reporting date. Increasing fair |
See Notes to Financial Statements.
| Prudential Balanced Fund | 75 |
Portfolio of Investments
as of March 31, 2015 (Unaudited) continued
value in absolute terms when compared to the notional amount of the swap, represents a deterioration of the referenced entity’s credit soundness and a greater likelihood of risk of default or other credit event occurring as defined under the terms of the agreement. |
Various inputs are used in determining the value of the Series’ investments. These inputs are summarized in the three broad levels listed below.
Level 1—quoted prices generally in active markets for identical securities.
Level 2—quoted prices for similar securities, interest rates and yield curves, prepayment speeds, foreign currency exchange rates and other observable inputs.
Level 3—unobservable inputs for securities valued in accordance with Board approved fair valuation procedures.
The following is a summary of the inputs used as of March 31, 2015 in valuing such portfolio securities:
| Level 1 | Level 2 | Level 3 | ||||||||||
Investments in Securities | ||||||||||||
Common Stocks | $ | 234,435,932 | $ | 20,584,905 | $ | — | ||||||
Exchange Traded Fund | 513,360 | — | — | |||||||||
Preferred Stocks | 79,560 | 141,179 | — | |||||||||
Rights | 3,878 | — | — | |||||||||
Corporate Bonds | — | 39,596,504 | 610,321 | |||||||||
Asset-Backed Securities | ||||||||||||
Collateralized Loan Obligations | — | 7,296,725 | 999,250 | |||||||||
Non-Residential Mortgage-Backed Securities | — | 3,919,419 | — | |||||||||
Residential Mortgage-Backed Securities | — | 1,599,347 | — | |||||||||
Collateralized Mortgage Obligations | — | 1,700,136 | — | |||||||||
Commercial Mortgage-Backed Securities | — | 18,306,065 | — | |||||||||
Foreign Agencies | — | 2,442,777 | — | |||||||||
Municipal Bonds | — | 1,957,294 | — | |||||||||
Sovereign Bonds | — | 1,753,986 | — | |||||||||
U.S. Government Agency Obligations | — | 45,801,758 | — | |||||||||
U.S. Treasury Obligations | — | 15,405,668 | — | |||||||||
Affiliated Mutual Funds | 61,681,974 | — | — | |||||||||
Options Purchased | 54,047 | — | — | |||||||||
Options Written | (19,062 | ) | — | — | ||||||||
See Notes to Financial Statements.
| 76 |
| Level 1 | Level 2 | Level 3 | ||||||||||
Other Financial Instruments* | ||||||||||||
Futures Contracts | $ | 128,876 | $ | — | $ | — | ||||||
Exchange-traded interest rate swaps | — | (100,911 | ) | — | ||||||||
Over-the-counter interest rate swaps | — | (60,176 | ) | — | ||||||||
Exchange-traded credit default swap | — | 2,840 | — | |||||||||
|
|
|
|
|
| |||||||
Total | $ | 296,878,565 | $ | 160,347,516 | $ | 1,609,571 | ||||||
|
|
|
|
|
| |||||||
| * | Other financial instruments are derivative instruments not reflected in the Portfolio of Investments, such as futures, forwards and exchange-traded swap contracts, which are recorded at the unrealized appreciation/depreciation on the instrument, and over-the-counter swap contracts which are recorded at fair value. |
The industry classification of investments and liabilities in excess of other assets shown as a percentage of net assets as of March 31, 2015 was as follows:
Affiliated Mutual Funds (including 4.6% of collateral for securities on loan) | 14.9 | % | ||
U.S. Government Agency Obligations | 11.1 | |||
Commercial Mortgage-Backed Securities | 4.4 | |||
Oil, Gas & Consumable Fuels | 4.3 | |||
Banks | 4.0 | |||
Pharmaceuticals | 3.8 | |||
U.S. Treasury Obligations | 3.7 | |||
Banking | 2.9 | |||
Technology Hardware, Storage & Peripherals | 2.8 | |||
Software | 2.4 | |||
Insurance | 2.3 | |||
Biotechnology | 2.3 | |||
Real Estate Investment Trusts (REITs) | 2.1 | |||
Collateralized Loan Obligations | 2.0 | |||
Semiconductors & Semiconductor Equipment | 1.9 | |||
Food & Staples Retailing | 1.8 | |||
Health Care Providers & Services | 1.8 | |||
Media | 1.6 | |||
Specialty Retail | 1.6 | |||
Chemicals | 1.5 | |||
Aerospace & Defense | 1.5 | |||
IT Services | 1.5 | |||
Internet Software & Services | 1.5 | |||
Hotels, Restaurants & Leisure | 1.3 | |||
Capital Markets | 1.3 | |||
Beverages | 1.3 | |||
Health Care Equipment & Supplies | 1.2 | |||
Communications Equipment | 1.2 | |||
Household Products | 1.2 | % | ||
Tobacco | 1.2 | |||
Diversified Telecommunication Services | 1.0 | |||
Diversified Financial Services | 1.0 | |||
Non-Residential Mortgage-Backed Securities | 1.0 | |||
Electric Utilities | 0.9 | |||
Industrial Conglomerates | 0.9 | |||
Healthcare & Pharmaceutical | 0.8 | |||
Air Freight & Logistics | 0.8 | |||
Road & Rail | 0.8 | |||
Airlines | 0.7 | |||
Food Products | 0.7 | |||
Machinery | 0.7 | |||
Multiline Retail | 0.7 | |||
Textiles, Apparel & Luxury Goods | 0.7 | |||
Electrical Equipment | 0.6 | |||
Foreign Agencies | 0.6 | |||
Real Estate Management & Development | 0.6 | |||
Telecommunications | 0.5 | |||
Auto Components | 0.5 | |||
Multi-Utilities | 0.5 | |||
Municipal Bonds | 0.5 | |||
Electric | 0.5 | |||
Gas Utilities | 0.5 | |||
Automobiles | 0.5 | |||
Sovereign Bonds | 0.4 | |||
Collateralized Mortgage Obligations | 0.4 | |||
Electronic Equipment, Instruments & Components | 0.4 |
See Notes to Financial Statements.
| Prudential Balanced Fund | 77 |
Portfolio of Investments
as of March 31, 2015 (Unaudited) continued
Independent Power & Renewable Electricity Producers | 0.4 | % | ||
Residential Mortgage-Backed Securities | 0.4 | |||
Capital Goods | 0.4 | |||
Health Care Technology | 0.4 | |||
Energy Equipment & Services | 0.3 | |||
Internet & Catalog Retail | 0.3 | |||
Cable | 0.3 | |||
Non-Captive Finance | 0.3 | |||
Energy-Other | 0.3 | |||
Building Products | 0.3 | |||
Lodging | 0.2 | |||
Metals & Mining | 0.2 | |||
Foods | 0.2 | |||
Media & Entertainment | 0.2 | |||
Commercial Services & Supplies | 0.2 | |||
Pipelines & Other | 0.2 | |||
Containers & Packaging | 0.2 | |||
Leisure Products | 0.2 | |||
Automotive | 0.2 | |||
Building Materials & Construction | 0.2 | |||
Consumer Finance | 0.2 | |||
Healthcare Insurance | 0.2 | |||
Railroads | 0.1 | % | ||
Metals | 0.1 | |||
Household Durables | 0.1 | |||
Trading Companies & Distributors | 0.1 | |||
Paper | 0.1 | |||
Exchange Traded Fund | 0.1 | |||
Retailers | 0.1 | |||
Professional Services | 0.1 | |||
Packaging | 0.1 | |||
Wireless Telecommunication Services | 0.1 | |||
Construction & Engineering | 0.1 | |||
Consumer | 0.1 | |||
Technology | 0.1 | |||
Construction Materials | 0.1 | |||
Life Sciences Tools & Services | 0.1 | |||
Paper & Forest Products | 0.1 | |||
Brokerage | 0.1 | |||
Options Purchased | — | * | ||
Options Written | — | * | ||
|
| |||
| 111.1 | ||||
Liabilities in excess of other assets | (11.1 | ) | ||
|
| |||
| 100.0 | % | |||
|
|
| * | Less than 0.05% |
The Series invested in derivative instruments during the reporting period. The primary types of risk associated with these derivative instruments are credit risk, equity risk and interest rate risk. The effect of such derivative instruments on the Series’ financial position and financial performance as reflected in the Statement of Assets and Liabilities and Statement of Operations is presented in the summary below.
See Notes to Financial Statements.
| 78 |
Fair values of derivative instruments as of March 31, 2015 as presented in the Statement of Assets and Liabilities:
Derivatives not designated | Asset Derivatives | Liability Derivatives | ||||||||||
Balance Sheet | Fair Value | Balance Sheet | Fair Value | |||||||||
| Credit contracts | Due to/from broker—variation margin swaps | $ | 2,840 | * | — | $ | — | |||||
| Equity contracts | Due to/from broker—variation margin futures | 4,951 | * | Due to/from broker—variation margin futures | 9,261 | * | ||||||
| Equity contracts | Unaffiliated Investments | 3,878 | — | — | ||||||||
| Interest rate contracts | Due to/from broker—variation margin futures | 134,596 | * | Due to/from broker—variation margin futures | 1,410 | * | ||||||
| Interest rate contracts | Due to/from broker—variation margin swaps | 3,182 | * | Due to/from broker—variation margin swaps | 104,093 | * | ||||||
| Interest rate contracts | Unaffiliated Investments | 54,047 | Options written outstanding, at value | 19,062 | ||||||||
| Interest rate contracts | Unrealized appreciation on over-the-counter swap agreements | 567 | Unrealized depreciation on over-the-counter swap agreements | 60,743 | ||||||||
|
|
|
| |||||||||
Total | $ | 204,061 | $ | 194,569 | ||||||||
|
|
|
| |||||||||
| * | Includes cumulative appreciation/depreciation as reported in the schedule of open futures and exchange traded swap contracts cleared through an exchange. Only unsettled variation margin receivable (payable) is reported within the Statement of Assets and Liabilities. |
See Notes to Financial Statements.
| Prudential Balanced Fund | 79 |
Portfolio of Investments
as of March 31, 2015 (Unaudited) continued
The effects of derivative instruments on the Statement of Operations for the six months ended March 31, 2015 are as follows:
Amount of Realized Gain or (Loss) on Derivatives Recognized in Income | ||||||||||||||||||||
Derivatives not designated as hedging | Options Purchased(1) | Futures | Options Written | Swaps | Total | |||||||||||||||
Credit contracts | $ | — | $ | — | $ | — | $ | (66,271 | ) | $ | (66,271 | ) | ||||||||
Equity contracts | — | 235,393 | — | — | 235,393 | |||||||||||||||
Interest rate contracts | (30,344 | ) | 331,136 | (15,318 | ) | (21,433 | ) | 264,041 | ||||||||||||
|
|
|
|
|
|
|
|
|
| |||||||||||
Total | $ | (30,344 | ) | $ | 566,529 | $ | (15,318 | ) | $ | (87,704 | ) | $ | 433,163 | |||||||
|
|
|
|
|
|
|
|
|
| |||||||||||
Change in Unrealized Appreciation or (Depreciation) on Derivatives Recognized in Income | ||||||||||||||||||||||||
Derivatives not designated as hedging | Rights(2) | Options Purchased(2) | Futures | Options Written | Swaps | Total | ||||||||||||||||||
Credit contracts | $ | — | $ | — | $ | — | $ | — | $ | (6,861 | ) | $ | (6,861 | ) | ||||||||||
Equity contracts | 2,492 | — | 21,346 | — | — | 23,838 | ||||||||||||||||||
Interest rate contracts | — | 63,950 | 98,780 | (24,563 | ) | (115,214 | ) | 22,953 | ||||||||||||||||
|
|
|
|
|
|
|
|
|
|
|
| |||||||||||||
Total | $ | 2,492 | $ | 63,950 | $ | 120,126 | $ | (24,563 | ) | $ | (122,075 | ) | $ | 39,930 | ||||||||||
|
|
|
|
|
|
|
|
|
|
|
| |||||||||||||
| (1) | Included in net realized gain (loss) on investment transactions in the Statement of Operations. |
| (2) | Included in net change in unrealized appreciation (depreciation) on investments in the Statement of Operations. |
For the six months ended March 31, 2015, the Series’ average volume of derivative activities is as follows:
| Options Purchased(1) | Futures—Long Positions(2) | Futures—Short Positions(2) | Options Written(3) | Interest Rate Swaps(3) | Credit Default Swaps—as Buyer(3) | |||||||||||||||||
| $ | 59,475 | $ | 27,038,001 | $ | 3,702,009 | $ | 24,933,333 | $ | 17,809,093 | $ | 9,326,667 | |||||||||||
| (1) | Cost. |
| (2) | Value at Trade Date. |
| (3) | Notional Amount. |
See Notes to Financial Statements.
| 80 |
Offsetting of over-the-counter (OTC) derivative assets and liabilities:
The Series invested in OTC derivatives during the reporting period that are either offset in accordance with current requirements or are subject to enforceable master netting arrangements or similar agreements that permit offsetting.
The information about offsetting and related netting arrangements for OTC derivatives, where the legal right to set-off exists, is presented in the summary below.
Counterparty | Gross Amounts of Recognized Assets(1) | Gross Amounts Available for Offset | Collateral Received(3) | Net Amount | ||||||||||||
Barclays Capital Group | $ | — | $ | — | $ | — | $ | — | ||||||||
Credit Suisse First Boston Corp. | 567 | — | — | 567 | ||||||||||||
Deutsche Bank AG | — | — | — | — | ||||||||||||
|
| |||||||||||||||
| $ | 567 | |||||||||||||||
|
| |||||||||||||||
Counterparty | Gross Amounts of Recognized Liabilities(2) | Gross Amounts Available for Offset | Collateral Pledged(3) | Net Amount | ||||||||||||
Barclays Capital Group | $ | (6,049 | ) | $ | — | $ | — | $ | (6,049 | ) | ||||||
Credit Suisse First Boston Corp. | — | — | — | — | ||||||||||||
Deutsche Bank AG | (54,694 | ) | — | — | (54,694 | ) | ||||||||||
|
| |||||||||||||||
| $ | (60,743 | ) | ||||||||||||||
|
| |||||||||||||||
| (1) | Includes unrealized appreciation on swaps and forwards, premiums paid on swap agreements and market value of purchased options. |
| (2) | Includes unrealized depreciation on swaps and forwards, premiums received on swap agreements and market value of written options. |
| (3) | Amounts shown reflect actual collateral received or pledged by the Portfolio. Such amounts are applied up to 100% of the Portfolio’s OTC derivative exposure by counterparty. |
See Notes to Financial Statements.
| Prudential Balanced Fund | 81 |
Statement of Assets & Liabilities
as of March 31, 2015 (Unaudited)
Assets |
| |||
Investments at value, including securities on loan of $18,616,077: | ||||
Unaffiliated investments (cost $328,433,992) | $ | 397,202,111 | ||
Affiliated investments (cost $62,483,599) | 61,681,974 | |||
Foreign currency, at value (cost $703,827) | 691,914 | |||
Receivable for investments sold | 14,382,641 | |||
Dividends and interest receivable | 1,216,693 | |||
Receivable for Series shares sold | 449,119 | |||
Tax reclaim receivable | 31,810 | |||
Due from broker—variation margin futures | 25,276 | |||
Unrealized appreciation on over-the-counter swap agreements | 567 | |||
Prepaid expenses | 1,902 | |||
|
| |||
Total Assets | 475,684,007 | |||
|
| |||
Liabilities | ||||
Payable for investments purchased | 42,578,155 | |||
Payable to broker for collateral for securities on loan | 19,058,334 | |||
Payable for Series shares reacquired | 257,393 | |||
Accrued expenses and other liabilities | 249,717 | |||
Management fee payable | 221,113 | |||
Distribution fee payable | 114,942 | |||
Due to broker—variation margin swaps | 60,973 | |||
Affiliated transfer agent fee payable | 60,819 | |||
Unrealized depreciation on over-the-counter swap agreements | 60,743 | |||
Payable to custodian | 47,762 | |||
Due to broker—variation margin futures | 38,964 | |||
Options written outstanding, at value (premiums received $17,164) | 19,062 | |||
|
| |||
Total Liabilities | 62,767,977 | |||
|
| |||
Net Assets | $ | 412,916,030 | ||
|
| |||
Net assets were comprised of: | ||||
Common stock, at par | $ | 26,637 | ||
Paid-in capital in excess of par | 335,676,805 | |||
|
| |||
| 335,703,442 | ||||
Undistributed net investment income | 1,320,625 | |||
Accumulated net realized gain on investment and foreign currency transactions | 7,974,400 | |||
Net unrealized appreciation on investments and foreign currencies | 67,917,563 | |||
|
| |||
Net assets, March 31, 2015 | $ | 412,916,030 | ||
|
| |||
See Notes to Financial Statements.
| 82 |
Class A | ||||
Net asset value and redemption price per share | $ | 15.48 | ||
Maximum sales charge (5.50% of offering price) | 0.90 | |||
|
| |||
Maximum offering price to public | $ | 16.38 | ||
|
| |||
Class B | ||||
Net asset value, offering price and redemption price per share | ||||
($13,762,545 ÷ 885,344 shares of common stock issued and outstanding) | $ | 15.54 | ||
|
| |||
Class C | ||||
Net asset value, offering price and redemption price per share | ||||
($27,221,968 ÷ 1,751,540 shares of common stock issued and outstanding) | $ | 15.54 | ||
|
| |||
Class R | ||||
Net asset value, offering price and redemption price per share | ||||
($532,561 ÷ 34,396 shares of common stock issued and outstanding) | $ | 15.48 | ||
|
| |||
Class Z | ||||
Net asset value, offering price and redemption price per share | ||||
($57,910,511 ÷ 3,717,130 shares of common stock issued and outstanding) | $ | 15.58 | ||
|
| |||
See Notes to Financial Statements.
| Prudential Balanced Fund | 83 |
Statement of Operations
Six Months Ended March 31, 2015 (Unaudited)
Net Investment Income | ||||
Income | ||||
Unaffiliated dividend income (net of foreign withholding taxes of $12,825) | $ | 2,745,882 | ||
Interest income (net of foreign withholding taxes of $1,126) | 1,954,402 | |||
Affiliated dividend income | 141,987 | |||
Affiliated income from securities lending, net | 14,845 | |||
|
| |||
Total income | 4,857,116 | |||
|
| |||
Expenses | ||||
Management fee | 1,316,286 | |||
Distribution fee—Class A | 463,273 | |||
Distribution fee—Class B | 73,227 | |||
Distribution fee—Class C | 116,744 | |||
Distribution fee—Class R | 1,895 | |||
Transfer agent’s fees and expenses (including affiliated expense of $110,400) | 323,000 | |||
Custodian and accounting fees | 121,000 | |||
Shareholders’ reports | 67,000 | |||
Registration fees | 42,000 | |||
Audit fee | 19,000 | |||
Directors’ fees | 11,000 | |||
Legal fees and expenses | 10,000 | |||
Interest expense | 6,150 | |||
Commitment fee on syndicated credit agreement | 3,000 | |||
Insurance expenses | 3,000 | |||
Miscellaneous | 63,043 | |||
|
| |||
Total expenses | 2,639,618 | |||
Less: Management fee waiver and/or expense reimbursement | (40,501 | ) | ||
Less: Distribution fee waiver—Class R | (632 | ) | ||
|
| |||
Net expenses | 2,598,485 | |||
|
| |||
Net investment income | 2,258,631 | |||
|
| |||
Realized And Unrealized Gain (Loss) On Investments And Foreign Currency Transactions | ||||
Net realized gain (loss) on: | ||||
Investment transactions | 16,337,583 | |||
Futures transactions | 566,529 | |||
Options written transactions | (15,318 | ) | ||
Swap agreement transactions | (87,704 | ) | ||
Foreign currency transactions | (73,369 | ) | ||
|
| |||
| 16,727,721 | ||||
|
| |||
Net change in unrealized appreciation (depreciation) on: | ||||
Investments (including affiliated: $(66,137)) | (461,711 | ) | ||
Futures | 120,126 | |||
Options written | (24,563 | ) | ||
Swap agreements | (122,075 | ) | ||
Foreign currencies | 1,969 | |||
|
| |||
| (486,254 | ) | |||
|
| |||
Net gain on investment and foreign currency transactions | 16,241,467 | |||
|
| |||
Net Increase In Net Assets Resulting From Operations | $ | 18,500,098 | ||
|
| |||
See Notes to Financial Statements.
| 84 |
Statement of Changes in Net Assets
(Unaudited)
Six Months March 31, 2015 | Year September 30, 2014 | |||||||
Increase (Decrease) in Net Assets | ||||||||
Operations | ||||||||
Net investment income | $ | 2,258,631 | $ | 5,352,100 | ||||
Net realized gain on investment and foreign currency transactions | 16,727,721 | 39,581,876 | ||||||
Net change in unrealized appreciation (depreciation) on investments and foreign currencies | (486,254 | ) | 6,959,045 | |||||
|
|
|
| |||||
Net increase in net assets resulting from operations | 18,500,098 | 51,893,021 | ||||||
|
|
|
| |||||
Dividends and Distributions (Note 1) | ||||||||
Dividends from net investment income | ||||||||
Class A | (3,697,052 | ) | (3,859,086 | ) | ||||
Class B | (76,099 | ) | (98,460 | ) | ||||
Class C | (119,476 | ) | (114,650 | ) | ||||
Class R | (5,047 | ) | (3,719 | ) | ||||
Class X | — | (714 | ) | |||||
Class Z | (797,351 | ) | (1,347,895 | ) | ||||
|
|
|
| |||||
| (4,695,025 | ) | (5,424,524 | ) | |||||
|
|
|
| |||||
Distributions from net realized gains | ||||||||
Class A | (28,365,237 | ) | — | |||||
Class B | (1,340,974 | ) | — | |||||
Class C | (2,105,339 | ) | — | |||||
Class R | (46,177 | ) | — | |||||
Class Z | (4,929,070 | ) | — | |||||
|
|
|
| |||||
| (36,786,797 | ) | — | ||||||
|
|
|
| |||||
Series share transactions (Net of share conversions) (Note 6) | ||||||||
Net proceeds from shares sold | 33,775,269 | 49,415,501 | ||||||
Net asset value of shares issued in reinvestment of dividends and distributions | 40,521,060 | 5,296,719 | ||||||
Cost of shares reacquired | (76,092,714 | ) | (59,708,245 | ) | ||||
|
|
|
| |||||
Net decrease in net assets from Series share transactions | (1,796,385 | ) | (4,996,025 | ) | ||||
|
|
|
| |||||
Total increase (decrease) | (24,778,109 | ) | 41,472,472 | |||||
Net Assets: | ||||||||
Beginning of period | 437,694,139 | 396,221,667 | ||||||
|
|
|
| |||||
End of period(a) | $ | 412,916,030 | $ | 437,694,139 | ||||
|
|
|
| |||||
(a) Includes undistributed net investment income of: | $ | 1,320,625 | $ | 3,757,019 | ||||
|
|
|
| |||||
See Notes to Financial Statements.
| Prudential Balanced Fund | 85 |
Notes to Financial Statements
(Unaudited)
The Prudential Investment Portfolios, Inc. (the “Company”) is an open-end management investment company, registered under the Investment Company Act of 1940, as amended, (“1940 Act”). The Company was incorporated in Maryland on August 10, 1995 and consists of six series: Prudential Balanced Fund (the “Series”), Prudential Jennison Growth Fund and Prudential Jennison Equity Opportunity Fund which are diversified funds and Prudential Growth Allocation Fund, Prudential Moderate Allocation Fund and Prudential Conservative Allocation Fund which are non-diversified funds. These financial statements relate to Prudential Balanced Fund. The financial statements of the other series are not presented herein.
The Series’ investment objective is to seek income and long-term growth of capital.
Note 1. Accounting Policies
The Series follows investment company accounting and reporting guidance of the Financial Accounting Standards Board (FASB) Accounting Standard Codification Topic 946 Financial Services-Investment Companies. The following accounting policies conform to U.S. generally accepted accounting principles. The Series consistently follows such policies in the preparation of its financial statements.
Securities Valuation: The Series holds securities and other assets that are fair valued at the close of each day the New York Stock Exchange (“NYSE”) is open for trading. Fair value is the price that would be received to sell an asset or paid to transfer a liability in an orderly transaction between market participants on the measurement date. The Board of Directors (the “Board”) has adopted Valuation Procedures for security valuation under which fair valuation responsibilities have been delegated to Prudential Investments LLC (“PI” or “Manager”). Under the current Valuation Procedures, the established Valuation Committee is responsible for supervising the valuation of portfolio securities and other assets. The Valuation Procedures permit the Series to utilize independent pricing vendor services, quotations from market makers, and alternative valuation methods when market quotations are either not readily available or not deemed representative of fair value. A record of the Valuation Committee’s actions is subject to the Board’s review, approval, and ratification at its next regularly-scheduled quarterly meeting.
| 86 |
Various inputs determine how the Series’ investments are valued, all of which are categorized according to the three broad levels (Level 1, 2, or 3) detailed in the table following the Portfolio of Investments.
Common and preferred stocks, exchange-traded funds, and derivative instruments such as futures or options that are traded on a national securities exchange are valued at the last sale price as of the close of trading on the applicable exchange where the security principally trades. Securities traded via NASDAQ are valued at the NASDAQ official closing price. To the extent these securities are valued at the last sale price or NASDAQ official closing price, they are classified as Level 1 in the fair value hierarchy.
In the event that no sale or official closing price on valuation date exists, these securities are generally valued at the mean between the last reported bid and ask prices, or at the last bid price in the absence of an ask price. These securities are classified as Level 2 in the fair value hierarchy, as the inputs are observable.
Common and preferred stocks traded on foreign securities exchanges are valued using pricing vendor services that provide model prices derived using adjustment factors based on information such as local closing price, relevant general and sector indices, currency fluctuations, depositary receipts, and futures, as applicable. Securities valued using such model prices are classified as Level 2 in the fair value hierarchy, as the adjustment factors are observable. Such securities are valued using model prices to the extent that the valuation meets the established confidence level for each security. If the confidence level is not met or the vendor does not provide a model price, securities are valued in accordance with exchange-traded common and preferred stocks discussed above.
Investments in open-end, non-exchange-traded mutual funds are valued at their net asset values as of the close of the NYSE on the date of valuation. These securities are classified as Level 1 in the fair value hierarchy since they may be purchased or sold at their net asset values on the date of valuation.
Fixed income securities traded in the over-the-counter market are generally valued at prices provided by approved independent pricing vendors. The pricing vendors provide these prices after evaluating observable inputs including, but not limited to yield curves, yield spreads, credit ratings, deal terms, tranche level attributes, default rates, cash flows, prepayment speeds, broker/dealer quotations, and reported trades. Securities valued using such vendor prices are classified as Level 2 in the fair value hierarchy.
| Prudential Balanced Fund | 87 |
Notes to Financial Statements
(Unaudited) continued
Over-the-counter derivative instruments are generally valued using pricing vendor services, which derive the valuation based on inputs such as underlying asset prices, indices, spreads, interest rates, and exchange rates. These instruments are categorized as Level 2 in the fair value hierarchy.
Centrally cleared swaps listed or traded on a multilateral or trade platform, such as a registered exchange, are valued at the daily settlement price determined by the respective exchange. These securities are classified as Level 2 in the fair value hierarchy, as the daily settlement price is not public.
Securities and other assets that cannot be priced according to the methods described above are valued based on pricing methodologies approved by the Board. In the event that unobservable inputs are used when determining such valuations, the securities will be classified as Level 3 in the fair value hierarchy.
When determining the fair value of securities, some of the factors influencing the valuation include: the nature of any restrictions on disposition of the securities; assessment of the general liquidity of the securities; the issuer’s financial condition and the markets in which it does business; the cost of the investment; the size of the holding and the capitalization of the issuer; the prices of any recent transactions or bids/offers for such securities or any comparable securities; any available analyst media or other reports or information deemed reliable by the investment adviser regarding the issuer or the markets or industry in which it operates. Using fair value to price securities may result in a value that is different from a security’s most recent closing price and from the price used by other mutual funds to calculate their net asset values.
Restricted and Illiquid Securities: Subject to guidelines adopted by the Board, the Series may invest up to 15% of its net assets in illiquid securities, including those which are restricted as to disposition under securities law (“restricted securities”). Restricted securities are valued pursuant to the valuation procedures noted above. Illiquid securities are those that, because of the absence of a readily available market or due to legal or contractual restrictions on resale, cannot be sold within seven days in the ordinary course of business at approximately the amount at which the Series has valued the investment. Therefore, the Series may find it difficult to sell illiquid securities at the time considered most advantageous by its Subadviser and may incur expenses that would not be incurred in the sale of securities that were freely
| 88 |
marketable. Certain securities that would otherwise be considered illiquid because of legal restrictions on resale to the general public may be traded among qualified institutional buyers under Rule 144A of the Securities Act of 1933. These Rule 144A securities, as well as commercial paper that is sold in private placements under Section 4(2) of the Securities Act, may be deemed liquid by the Series’ Subadviser under the guidelines adopted by the Directors of the Series. However, the liquidity of the Series’ investments in Rule 144A securities could be impaired if trading does not develop or declines.
Foreign Currency Translation: The books and records of the Series are maintained in U.S. dollars. Foreign currency amounts are translated into U.S. dollars on the following basis:
(i) market value of investment securities, other assets and liabilities—at the current rates of exchange.
(ii) purchases and sales of investment securities, income and expenses—at the rates of exchange prevailing on the respective dates of such transactions.
Although the net assets of the Series are presented at the foreign exchange rates and market values at the close of the period, the Series does not isolate that portion of the results of operations arising as a result of changes in the foreign exchange rates from the fluctuations arising from changes in the market prices of long-term portfolio securities held at the end of the period. Similarly, the Series does not isolate the effect of changes in foreign exchange rates from the fluctuations arising from changes in the market prices of long-term portfolio securities sold during the period. Accordingly, these realized foreign currency gains or losses are included in the reported net realized gains or losses on investment transactions.
Net realized gains or losses on foreign currency transactions represent net foreign exchange gains or losses from holdings of foreign currencies, forward currency contracts, disposition of foreign currencies, currency gains or losses realized between the trade and settlement dates on securities transactions, and the difference between the amounts of interest, dividends and foreign withholding taxes recorded on the Series’ books and the U.S. dollar equivalent amounts actually received or paid. Net unrealized currency gains or losses from valuing foreign currency denominated assets and liabilities (other than investments) at period-end exchange rates are reflected as a component of unrealized appreciation (depreciation) on investments and foreign currencies. Foreign security and currency transactions may involve certain considerations and risks not typically associated with those of domestic origin as a result of, among other factors, the possibility of political and economic instability or the level of governmental supervision and regulation of foreign securities markets.
| Prudential Balanced Fund | 89 |
Notes to Financial Statements
(Unaudited) continued
REITs: The Series invests in real estate investment trusts (“REITs”), which report information on the source of their distributions annually. Based on current and historical information, a portion of distributions received from REITs during the period is estimated to be dividend income, capital gain or return of capital and recorded accordingly. These estimates are adjusted periodically when the actual sources of distributions is disclosed by the REITs.
Options: The Series purchased and wrote options in order to hedge against adverse market movements or fluctuations in value caused by changes in prevailing interest rates and foreign currency exchange rates with respect to securities or currencies which the Series currently owns or intends to purchase. The Series also used purchased options to gain exposure to certain securities or foreign currencies. The Series’ principal reason for writing options is to realize, through receipt of premiums, a greater current return than would be realized on the underlying security alone. When the Series purchases an option, it pays a premium and an amount equal to that premium is recorded as an asset. When the Series writes an option, it receives a premium and an amount equal to that premium is recorded as a liability. The asset or liability is adjusted daily to reflect the current market value of the option. If an option expires unexercised, the Series realizes a gain or loss to the extent of the premium received or paid. If an option is exercised, the premium received or paid is recorded as an adjustment to the proceeds from the sale or the cost basis of the purchase in determining whether the Series has realized a gain or loss. The difference between the premium and the amount received or paid on affecting a closing purchase or sale transaction is also treated as a realized gain or loss. Gains or losses on purchased options are included in net realized gains or losses on investment transactions. Gains or losses on written options are presented separately as net realized gains or losses on options written. The Series, as writer of an option, may have no control over whether the underlying securities or financial instruments may be sold (called) or purchased (put). As a result, the Series bears the market risk of an unfavorable change in the price of the security or financial instrument underlying the written option. The Series, as purchaser of an over-the-counter option, bears the risk of the potential inability of the counterparties to meet the terms of their contracts. With exchange-traded options contracts, there is minimal counterparty credit risk to the Series since the exchanges’ clearinghouse acts as counterparty to all exchange-traded options and guarantees the options contracts against default.
| 90 |
When the Series writes an option on a swap contract, an amount equal to any premium received by the Series is recorded as a liability and is subsequently adjusted to the current market value of the written option on the swap. If a call option on a swap is exercised, the Series becomes obligated to pay a fixed interest rate (noted as the strike price) and receive a variable interest rate on a notional amount. If a put option on a swap is exercised, the Series becomes obligated to pay a variable interest rate and receive a fixed interest rate (noted as the strike price) on a notional amount. Premiums received from writing options on swaps that expire or are exercised are treated as realized gains upon the expiration or exercise of such options on swaps. The risk associated with writing put and call options on swaps is that the Series will be obligated to be party to a swap agreement if an option on a swap is exercised.
Financial Futures Contracts: A financial futures contract is an agreement to purchase (long) or sell (short) an agreed amount of securities at a set price for delivery on a future date. Upon entering into a financial futures contract, the Series is required to pledge to the broker an amount of cash and/or other assets equal to a certain percentage of the contract amount. This amount is known as the “initial margin.” Subsequent payments, known as “variation margin,” are made or received by the Series each day, depending on the daily fluctuations in the value of the underlying security. Such variation margin is recorded for financial statement purposes on a daily basis as unrealized gain or loss. When the contract expires or is closed, the gain or loss is realized and is presented in the Statement of Operations as net realized gain or loss on financial futures contracts.
The Series invested in financial futures contracts in order to hedge its existing portfolio securities, or securities the Series intends to purchase, against fluctuations in value caused by changes in prevailing interest rates, value of equities or foreign currency exchange rates. Should interest rates move unexpectedly, the Series may not achieve the anticipated benefits of the financial futures contracts and may realize a loss. The use of futures transactions involves the risk of imperfect correlation in movements in the price of futures contracts, interest rates and the underlying hedged assets. Financial futures contracts involve elements of risk in excess of the amounts reflected on the Statement of Assets and Liabilities. With exchange-traded futures and options contracts, there is minimal counterparty credit risk to the Series since the exchanges’ clearinghouse acts as counterparty to all exchange-traded futures and options, and guarantees the futures and options contracts against default.
Swap Agreements: The Series entered into credit default and interest rate swap agreements. A swap agreement is an agreement to exchange the return generated by one instrument for the return generated by another instrument. Swap agreements are negotiated in the over-the-counter market and may be executed either directly with
| Prudential Balanced Fund | 91 |
Notes to Financial Statements
(Unaudited) continued
counterparty (“OTC-Traded”) or through a central clearing facility, such as a registered commodities exchange (“Exchange-Traded”). Swap agreements are valued daily at current market value and any change in value is included in the net unrealized appreciation or depreciation on investments. Exchange-traded swaps pay or receive an amount, known as “variation margin”, based on daily changes in the valuation of the swap contract. Payments received or paid by the Series are recorded as realized gains or losses upon termination or maturity of the swap. Risk of loss may exceed amounts recognized on the Statements of Assets and Liabilities. Swap agreements outstanding at period end, if any, are listed on the Portfolio of Investments.
Interest Rate Swaps: Interest rate swaps represent an agreement between counterparties to exchange cash flows based on the difference between two interest rates, applied to a notional principal amount for a specified period. The Series is subject to interest rate risk exposure in the normal course of pursuing its investment objectives. The Series used interest rate swaps to generate steady cash flow by receiving a stream of fixed rate payments and to increase exposure to prevailing market rates by receiving floating rate payments. The Series’ maximum risk of loss from counterparty credit risk is the discounted net value of the cash flows to be received from the counterparty over the contract’s remaining life.
Credit Default Swaps: Credit default swaps(“CDS”) involve one party (the protection buyer) making a stream of payments to another party (the protection seller) in exchange for the right to receive a specified payment in the event of a default or as a result of a default (collectively a “credit event”) for the referenced entity (typically corporate issues or sovereign issues of an emerging country) on its obligation; or in the event of a write-down, principal shortfall, interest shortfall or default of all or part of the referenced entities comprising a credit index.
The Series is subject to credit risk in the normal course of pursuing its investment objectives. The Series may enter into credit default swaps to provide a measure of protection against defaults or to take an active long or short position with respect to the likelihood of a particular issuer’s default or the reference entity’s credit soundness. CDS contracts generally trade based on a spread which represents the cost a protection buyer has to pay the protection seller. The protection buyer is said to be short the credit as the value of the contract rises the more the credit deteriorates. The value of the CDS contract increases for the protection buyer if the spread increases.
| 92 |
The Series’ maximum risk of loss from counterparty credit risk for purchased credit default swaps is the inability of the counterparty to honor the contract up to the notional value based on credit event.
As a seller of protection on credit default swap agreements, the Series will generally receive from the buyer of protection an agreed upon payment throughout the term of the swap provided that there is no credit event. As the seller, the Series would effectively increase investment risk to its portfolio because, in addition to its total assets, the Series may be subject to investment exposure on the notional amount of the swap.
The maximum amount of the payment that the Series as a seller of protection could be required to make under a credit default swap agreement would be equal to the notional amount of the underlying security or index contract as a result of a credit event. This potential amount will be partially offset by any recovery values of the respective referenced obligations, or net amounts received from the settlement of buy protection credit default swap agreements which the Series entered into for the same referenced entity or index. As a buyer of protection, the Series generally receives an amount up to the notional value of the swap if a credit event occurs.
Implied credit spreads, represented in absolute terms, utilized in determining the market value of credit default swap agreements on corporate issues or sovereign issues of an emerging country as of period end are disclosed in the footnotes to the Portfolio of Investments, if applicable, and serve as an indicator of the current status of the payment/performance risk and represent the likelihood of risk of default for the credit derivative. The implied credit spread of a particular referenced entity reflects the cost of buying/selling protection and may include upfront payments required to enter into the agreement. For credit default swap agreements on asset-backed securities and credit indices, the quoted market prices and resulting values serve as the indicator of the current status of the payment and/or performance risk. Wider credit spreads and increasing market value in absolute terms, when compared to the notional amount of the swap, represents a deterioration of the referenced entity’s credit soundness and a greater likelihood or risk of default or other credit event occurring as defined under the terms of the agreement.
Master Netting Arrangements: The Series is subject to various Master Agreements, or netting arrangements, with select counterparties. These are agreements which a sub-adviser may have negotiated and entered into on behalf of the Series. For multi-sleeve Series, different sub-advisers who manage their respective sleeve, may enter into such agreements with the same counterparty and are disclosed separately for each sleeve when presenting information about offsetting and related netting arrangements for
| Prudential Balanced Fund | 93 |
Notes to Financial Statements
(Unaudited) continued
(OTC) derivatives under FASB Accounting Standards Update (ASU) 2013-01 disclosure. A master netting arrangement between the Series and the counterparty permits the Series to offset amounts payable by the Series to the same counterparty against amounts to be received; and by the receipt of collateral from the counterparty by the Series to cover the Series’ exposure to the counterparty. However, there is no assurance that such mitigating factors are easily enforceable. The right to set-off exists when all the conditions are met such that each of the parties owes the other determinable amounts, the reporting party has the right to set-off the amount owed with the amount owed by the other party, the reporting party intends to set-off, and the right of set-off is enforceable by law. During the reporting period, there were no instances where the right of set-off existed and management has not elected to offset.
The Series is a party to ISDA (International Swaps and Derivatives Association, Inc.) Master Agreements (Master Agreements) with certain counterparties that govern over-the-counter derivative and foreign exchange contracts entered into from time to time. The Master Agreements may contain provisions regarding, among other things, the parties’ general obligations, representations, agreements, collateral requirements, events of default and early termination. With respect to certain counterparties, in accordance with the terms of the Master Agreements, collateral posted to the Series is held in a segregated account by the Series’ custodian and with respect to those amounts which can be sold or re-pledged, is presented in the Portfolio of Investments. Collateral pledged by the Series is segregated by the Series’ custodian and identified in the Portfolio of Investments. Collateral can be in the form of cash or debt securities issued by the U.S. Government or related agencies or other securities as agreed to by the Series and the applicable counterparty. Collateral requirements are determined based on the Series’ net position with each counterparty. Termination events applicable to the Series may occur upon a decline in the Series’ net assets below a specified threshold over a certain period of time. Termination events applicable to counterparties may occur upon a decline in the counterparty’s long-term and short term credit ratings below a specified level. In each case, upon occurrence, the other party may elect to terminate early and cause settlement of all derivative and foreign exchange contracts outstanding, including the payment of any losses and costs resulting from such early termination, as reasonably determined by the terminating party. Any decision by one or more of the Series’ counterparties to elect early termination could impact the Series’ future derivative activity.
| 94 |
In addition to each instrument’s primary underlying risk exposure (e.g. interest rate, credit, equity or foreign exchange, etc.), swap agreements involve, to varying degrees, elements of credit, market and documentation risk. Such risks involve the possibility that there will be no liquid market for these agreements, that the counterparty to the agreement may default on its obligation to perform or disagree as to the meaning of the contractual terms in the agreement, and that there will be unfavorable changes in net interest rates. In connection with these agreements, securities in the portfolio may be identified as collateral or received as collateral from the counterparty in accordance with the terms of the respective swap agreements to provide or receive assets of value and serve as recourse in the event of default or bankruptcy/insolvency of either party. Such over-the-counter derivative agreements include conditions which when materialized; give the counterparty the right to cause an early termination of the transactions under those agreements. Any election by the counterparty for early termination of the contract(s) may impact the amounts reported on financial statements.
As of March 31, 2015, the Series has not met conditions under such agreements, which give the counterparty the right to call for an early termination.
Written options, swaps and financial futures contracts involve elements of both market and credit risk in excess of the amounts reflected on the Statement of Assets and Liabilities. Such risks may be mitigated by engaging in master netting arrangements.
Rights: The Series held rights acquired either through a direct purchase, including as part of private placement, or pursuant to corporate actions. Rights entitle the holder to buy a proportionate amount of common stock at a specific price and time through the expiration dates. Such rights are held as long positions by the Series until exercised, sold or expired. Rights are valued at fair value in accordance with the Board of Directors’ approved fair valuation procedures.
Dollar Rolls: The Series may enter into mortgage dollar rolls in which the Series sells mortgage-backed securities for delivery in the current month and simultaneously contracts to repurchase substantially similar (same type, coupon and maturity) securities on a specified future date.
During the roll period, the Series forgoes principal and interest paid on the securities. The Series’ policy is to record the components of dollar rolls as purchase and sale transactions. The Series had dollar rolls outstanding as of March 31, 2015, which are included in Receivable for investments sold and Payable for investments purchased in the Statement of Assets and Liabilities. The Series maintains a segregated account of
| Prudential Balanced Fund | 95 |
Notes to Financial Statements
(Unaudited) continued
U.S. government securities or other liquid assets, the dollar value of which is at least equal to its obligation with respect to dollar rolls.
The Series is subject to the risk that the market value of the securities the Series is obligated to repurchase under the agreement may decline below the repurchase price.
Securities Lending: The Series may lend its portfolio securities to banks and broker-dealers. The loans are secured by collateral at least equal to the market value of the securities loaned. Collateral pledged by each borrower is invested in a highly liquid short term money market fund and is marked to market daily, based on the previous day’s market value, such that the value of the collateral exceeds the value of the loaned securities. Loans are subject to termination at the option of the borrower or the Series. Upon termination of the loan, the borrower will return to the Series securities identical to the loaned securities. Should the borrower of the securities fail financially, the Series has the right to repurchase the securities using the collateral in the open market. The Series recognizes income, net of any rebate and securities lending agent fees, for lending its securities, and any interest on the investment of cash received as collateral. The Series also continues to receive interest and dividends or amounts equivalent thereto, on the securities loaned and recognizes any unrealized gain or loss in the market price of the securities loaned that may occur during the term of the loan.
Securities Transactions and Net Investment Income: Securities transactions are recorded on the trade date. Realized gains or losses from investment and currency transactions are calculated on the identified cost basis. Dividend income is recorded on the ex-dividend date. Interest income, including amortization of premium and accretion of discount on debt securities, as required, is recorded on an accrual basis. Expenses are recorded on an accrual basis, which may require the use of certain estimates by management, which may differ from actual.
Net Investment income or loss (other than distribution fees which are charged directly to the respective class) and unrealized and realized gains or losses are allocated daily to each class of shares based upon the relative proportion of adjusted net assets of each class at the beginning of the day.
Dividends and Distributions: The Series expects to pay dividends of net investment income and distributions of net realized capital gains, if any, annually. Effective on May 22, 2015, the Series expects to pay dividends of net investment income quarterly
| 96 |
and distributions of net realized capital gains, if any, annually. Dividends and distributions to shareholders, which are determined in accordance with federal income tax regulations and which may differ from generally accepted accounting principles, are recorded on the ex-dividend date. Permanent book/tax differences relating to income and gains are reclassified amongst undistributed net investment income, accumulated net realized gain or loss and paid-in capital in excess of par, as appropriate.
Taxes: For federal income tax purposes, each Series in the Company is treated as a separate taxpaying entity. It is the Series’ policy to continue to meet the requirements of the Internal Revenue Code applicable to regulated investment companies and to distribute all of its net investment income and capital gains, if any, to its shareholders. Therefore, no federal income tax provision is required.
Withholding taxes on foreign dividends are recorded net of reclaimable amounts, at the time the related income is earned.
Estimates: The preparation of the financial statements requires management to make estimates and assumptions that affect the reported amounts and disclosures in the financial statements. Actual results could differ from those estimates.
Note 2. Agreements
The Series has a management agreement for the Series with PI. Pursuant to this agreement, PI has responsibility for all investment advisory services and supervises the subadvisors’ performance of such services. PI has entered into a subadvisory agreement with Prudential Investment Management, Inc. (“PIM”) and Quantitative Management Associates LLC (“QMA”). The subadvisory agreement provides that PIM and QMA furnishes investment advisory services in connection with the management of the Series. In connection therewith, PIM and QMA are obligated to keep certain books and records of the Series. PI pays for the services of PIM and QMA, cost of compensation of officers of the Series, occupancy and certain clerical and bookkeeping costs of the Series. The Series bears all other costs and expenses.
The management fee paid to PI is accrued daily and payable monthly at an annual rate of .65% of the Series’ daily average net assets up to $1 billion and .60% of the average net assets of the Series in excess of $1 billion. The effective management fee rate before any waivers and/or expense reimbursement was .65% for the six months ended March 31, 2015. The effective management fee rate, net of waivers and/or expense reimbursement, was .63%.
| Prudential Balanced Fund | 97 |
Notes to Financial Statements
(Unaudited) continued
PI has contractually agreed to waive up to .02% of its management fee to the extent that the Series’ annual operating expenses exceed .86% (exclusive of taxes, interest, brokerage commissions, distribution fees and non-routine expenses) of the Series’ average net assets.
The Series has a distribution agreement with Prudential Investment Management Services LLC (“PIMS”), which acts as the distributor of the Class A, Class B, Class C, Class R and Class Z shares. Formerly through April 11, 2014, the Series had a distribution agreement with Prudential Annuities Distributors, Inc. (“PAD”), which, together with PIMS, served as co-distributor of the Class X shares of the Series. The Series compensates PIMS for distributing and servicing the Fund’s Class A, Class B, Class C and Class R shares, pursuant to plans of distribution (the “Class A,B, C and R Plans”), regardless of expenses actually incurred by PIMS. The distribution fees are accrued daily and payable monthly. No distribution or service fees are paid to PIMS as distributor of the Class Z shares of the Series.
Pursuant to the Class A, B, C and R Plans, the Series compensates PIMS for distribution-related activities at an annual rate of up to .30%, 1%, 1% and .75% of the average daily net assets of the Class A, B, C and R shares, respectively. PIMS has contractually agreed through December 31, 2015 to limit such expenses to .50% of the averaged daily net assets of the Class R shares. As of April 11, 2014, the last conversion of Class X shares to Class A shares was completed. There are no Class X shares outstanding and Class X shares are no longer being offered for sale.
Prior to the final conversion of Class X shares, Management received the maximum allowable of sales charges for Class X shares in accordance with regulatory limits. As such, any contingent deferred sales charges received by the Manager were contributed back into the Series and included in the Financial Highlights as a contribution to capital.
PIMS has advised the Series that it has received $222,568 in front-end sales charges resulting from sales of Class A shares during the six months ended March 31, 2015. From these fees, PIMS paid such sales charges to affiliated broker-dealers, which in turn paid commissions to salespersons and incurred other distribution costs.
PIMS has advised the Series that for the six months ended March 31, 2015, it received $12 and $14,542 in contingent deferred sales charges imposed upon certain redemptions by Class A and Class B shareholders, respectively.
| 98 |
PI, PIM, PIMS, QMA and PAD are indirect, wholly-owned subsidiaries of Prudential Financial, Inc. (“Prudential”).
Note 3. Other Transactions with Affiliates
Prudential Mutual Fund Services LLC (“PMFS”), an affiliate of PI and an indirect, wholly-owned subsidiary of Prudential, serves as the Series’ transfer agent. Transfer agent’s fees and expenses in the Statement of Operations include certain out-of-pocket expenses paid to non-affiliates, where applicable.
Prudential Investment Management, Inc. (“PIM”), an indirect, wholly-owned subsidiary of Prudential, is the Series’ securities lending agent. Earning from securities lending are disclosed on the Statement of Operations as “Affiliated income from securities lending, net”. For the six months ended March 31, 2015, PIM was compensated $4,434 for the securities lending.
The Series invests in the Prudential Core Short-Term Bond Fund, pursuant to an exemptive order received from the Securities and Exchange Commission and in the Prudential Core Taxable Money Market Fund (the “Core Funds”), each a portfolio of the Prudential Investment Portfolios 2, registered under the 1940 Act and managed by PI. Earnings from the Core Funds are disclosed on the Statement of Operations as “Affiliated dividend income”.
Note 4. Portfolio Securities
Purchases and sales of investment securities other than short-term investments and U.S. Government Securities, for the six months ended March 31, 2015 were $385,361,475 and $417,870,176, respectively. The amount of dollar rolls outstanding at March 31, 2015 was $15,120,253 (principal $14,250,000), which was 3.7% of total net assets.
Transactions in options written during the six months ended March 31, 2015, were as follows:
| Notional Amount (000) | Premiums Received | |||||||
Options outstanding at September 30, 2014 | 40,800 | $ | 46,825 | |||||
Options written | 60,900 | 93,251 | ||||||
Options terminated in closing purchase transactions | (56,100 | ) | (82,574 | ) | ||||
Options expired | (26,400 | ) | (40,338 | ) | ||||
|
|
|
| |||||
Options outstanding at March 31, 2015 | 19,200 | $ | 17,164 | |||||
|
|
|
| |||||
| Prudential Balanced Fund | 99 |
Notes to Financial Statements
(Unaudited) continued
Note 5. Tax Information
The United States federal income tax basis of the Series’ investments and the net unrealized appreciation as of March 31, 2015 were as follows:
Tax Basis | $ | 393,949,992 | ||
|
| |||
Appreciation | 70,580,387 | |||
Depreciation | (5,646,294 | ) | ||
|
| |||
Net Unrealized Appreciation | $ | 64,934,093 | ||
|
|
The book basis may differ from tax basis due to certain tax related adjustments.
Management has analyzed the Series’ tax positions taken on federal, state and local income tax returns for all open tax years and has concluded that no provisions for income tax are required in the Series’ financial statements for the current reporting period. The Series’ federal, state and local income tax returns for tax years for which the applicable statutes of limitations have not expired are subject to examination by the Internal Revenue Service and state departments of revenue.
Note 6. Capital
The Series offers Class A, Class B, Class C, Class R and Class Z shares. Class A shares are sold with a front-end sales charge of up to 5.50%. All investors who purchase Class A shares in an amount of $1 million or more and sell these shares within 12 months of purchase are subject to a contingent deferred sales charge (“CDSC”) of 1%. The Class A shares CDSC is waived for purchases by certain retirement and/or benefit plans. Class B shares are sold with a CDSC which declines from 5% to zero depending upon the period of time the shares are held. Class B shares will automatically convert to Class A shares on a quarterly basis approximately seven years after purchase. Class B shares are closed to new purchases. Class C shares are sold with a CDSC of 1% on shares redeemed within the first 12 months of purchase. As of April 11, 2014, the last conversion of Class X shares to Class A shares was completed. There are no Class X shares outstanding and Class X shares are no longer being offered for sale. Class R and Class Z shares are not subject to any sales or redemption charge and are offered exclusively for a sale to a limited group of investors.
| 100 |
Under certain circumstances, an exchange may be made from specified share classes of the Series to one or more other share classes of the Series as presented in the table of transactions in shares of capital stock.
The Company is authorized to issue 6.25 billion shares of common stock at $.001 par value per share. There are 1 billion shares authorized for the Series, designated Class A, Class B, Class C, Class M, Class R, Class X and Class Z, each of which consists of 325 million, 125 million, 125 million, 125 million, 75 million, 150 million, and 75 million authorized shares, respectively. As of March 31, 2015, PI owned 288 Class R shares of the Series.
Transactions in shares of common stock were as follows:
Class A | Shares | Amount | ||||||
Six months ended March 31, 2015: | ||||||||
Shares sold | 1,041,593 | $ | 16,466,205 | |||||
Shares issued in reinvestment of dividends and distributions | 2,050,647 | 31,337,844 | ||||||
Shares reacquired | (1,337,725 | ) | (21,153,911 | ) | ||||
|
|
|
| |||||
Net increase (decrease) in shares outstanding before conversion | 1,754,515 | 26,650,138 | ||||||
Shares issued upon conversion from Class B | 74,204 | 1,162,140 | ||||||
Shares reacquired upon conversion into Class Z | (9,111 | ) | (149,143 | ) | ||||
|
|
|
| |||||
Net increase (decrease) in shares outstanding | 1,819,608 | $ | 27,663,135 | |||||
|
|
|
| |||||
Year ended September 30, 2014: | ||||||||
Shares sold | 1,111,378 | $ | 17,725,315 | |||||
Shares issued in reinvestment of dividends and distributions | 248,844 | 3,750,081 | ||||||
Shares reacquired | (2,168,870 | ) | (34,151,479 | ) | ||||
|
|
|
| |||||
Net increase (decrease) in shares outstanding before conversion | (808,648 | ) | (12,676,083 | ) | ||||
Shares issued upon conversion from Class B and Class X | 135,266 | 2,142,494 | ||||||
Shares reacquired upon conversion into Class Z | (43,275 | ) | (693,473 | ) | ||||
|
|
|
| |||||
Net increase (decrease) in shares outstanding | (716,657 | ) | $ | (11,227,062 | ) | |||
|
|
|
| |||||
| Prudential Balanced Fund | 101 |
Notes to Financial Statements
(Unaudited) continued
Class B | Shares | Amount | ||||||
Six months ended March 31, 2015: | ||||||||
Shares sold | 30,520 | $ | 486,834 | |||||
Shares issued in reinvestment of dividends and distributions | 89,530 | 1,376,071 | ||||||
Shares reacquired | (66,174 | ) | (1,057,115 | ) | ||||
|
|
|
| |||||
Net increase (decrease) in shares outstanding before conversion | 53,876 | 805,790 | ||||||
Shares reacquired upon conversion into Class A | (73,981 | ) | (1,162,140 | ) | ||||
|
|
|
| |||||
Net increase (decrease) in shares outstanding | (20,105 | ) | $ | (356,350 | ) | |||
|
|
|
| |||||
Year ended September 30, 2014: | ||||||||
Shares sold | 223,981 | $ | 3,520,156 | |||||
Shares issued in reinvestment of dividends and distributions | 6,368 | 96,540 | ||||||
Shares reacquired | (101,743 | ) | (1,618,479 | ) | ||||
|
|
|
| |||||
Net increase (decrease) in shares outstanding before conversion | 128,606 | 1,998,217 | ||||||
Shares reacquired upon conversion into Class A | (121,959 | ) | (1,944,685 | ) | ||||
|
|
|
| |||||
Net increase (decrease) in shares outstanding | 6,647 | $ | 53,532 | |||||
|
|
|
| |||||
Class C | ||||||||
Six months ended March 31, 2015: | ||||||||
Shares sold | 488,431 | $ | 7,743,115 | |||||
Shares issued in reinvestment of dividends and distributions | 137,280 | 2,111,039 | ||||||
Shares reacquired | (137,770 | ) | (2,205,268 | ) | ||||
|
|
|
| |||||
Net increase (decrease) in shares outstanding before conversion | 487,941 | 7,648,886 | ||||||
Shares reacquired upon conversion into Class Z | (3,057 | ) | (48,274 | ) | ||||
|
|
|
| |||||
Net increase (decrease) in shares outstanding | 484,884 | $ | 7,600,612 | |||||
|
|
|
| |||||
Year ended September 30, 2014: | ||||||||
Shares sold | 441,757 | $ | 7,103,877 | |||||
Shares issued in reinvestment of dividends and distributions | 7,167 | 108,577 | ||||||
Shares reacquired | (255,675 | ) | (4,065,176 | ) | ||||
|
|
|
| |||||
Net increase (decrease) in shares outstanding before conversion | 193,249 | 3,147,278 | ||||||
Shares reacquired upon conversion into Class Z | (9,417 | ) | (144,796 | ) | ||||
|
|
|
| |||||
Net increase (decrease) in shares outstanding | 183,832 | $ | 3,002,482 | |||||
|
|
|
| |||||
| 102 |
Class R | Shares | Amount | ||||||
Six months ended March 31, 2015: | ||||||||
Shares sold | 3,288 | $ | 51,208 | |||||
Shares issued in reinvestment of dividends and distributions | 1,809 | 27,667 | ||||||
Shares reacquired | (52 | ) | (864 | ) | ||||
|
|
|
| |||||
Net increase (decrease) in shares outstanding | 5,045 | $ | 78,011 | |||||
|
|
|
| |||||
Year ended September 30, 2014: | ||||||||
Shares sold | 9,183 | $ | 145,668 | |||||
Shares issued in reinvestment of dividends and distributions | 89 | 1,334 | ||||||
Shares reacquired | (703 | ) | (11,207 | ) | ||||
|
|
|
| |||||
Net increase (decrease) in shares outstanding | 8,569 | $ | 135,795 | |||||
|
|
|
| |||||
Class X | ||||||||
Period ended April 11, 2014*: | ||||||||
Shares issued in reinvestment of dividends and distributions | 45 | $ | 676 | |||||
Shares reacquired | (861 | ) | (12,932 | ) | ||||
|
|
|
| |||||
Net increase (decrease) in shares outstanding before conversion | (816 | ) | (12,256 | ) | ||||
Shares reacquired upon conversion into Class A | (12,886 | ) | (197,809 | ) | ||||
|
|
|
| |||||
Net increase (decrease) in shares outstanding | (13,702 | ) | $ | (210,065 | ) | |||
|
|
|
| |||||
Class Z | ||||||||
Six months ended March 31, 2015: | ||||||||
Shares sold | 564,020 | $ | 9,027,907 | |||||
Shares issued in reinvestment of dividends and distributions | 369,039 | 5,668,439 | ||||||
Shares reacquired | (3,163,070 | ) | (51,675,556 | ) | ||||
|
|
|
| |||||
Net increase (decrease) in shares outstanding before conversion | (2,230,011 | ) | (36,979,210 | ) | ||||
Shares issued upon conversion from Class A and Class C | 12,095 | 197,417 | ||||||
|
|
|
| |||||
Net increase (decrease) in shares outstanding | (2,217,916 | ) | $ | (36,781,793 | ) | |||
|
|
|
| |||||
Year ended September 30, 2014: | ||||||||
Shares sold | 1,310,501 | $ | 20,920,485 | |||||
Shares issued in reinvestment of dividends and distributions | 88,475 | 1,339,511 | ||||||
Shares reacquired | (1,262,838 | ) | (19,848,972 | ) | ||||
|
|
|
| |||||
Net increase (decrease) in shares outstanding before conversion | 136,138 | 2,411,024 | ||||||
Shares issued upon conversion from Class A and Class C | 52,358 | 838,269 | ||||||
|
|
|
| |||||
Net increase (decrease) in shares outstanding | 188,496 | $ | 3,249,293 | |||||
|
|
|
| |||||
| * | As of April 11, 2014, the last conversion of Class X shares to Class A shares was completed. There are no Class X shares outstanding and Class X shares are no longer being offered for sale. |
Note 7. Borrowings
The Series, along with other affiliated registered investment companies (the “Funds”), is a party to a Syndicated Credit Agreement (“SCA”) with a group of banks. The purpose of the SCA is to provide an alternative source of temporary funding for
| Prudential Balanced Fund | 103 |
Notes to Financial Statements
(Unaudited) continued
capital share redemptions. The SCA provides for a commitment of $900 million for the period October 9, 2014 through October 8, 2015. The Funds pay an annualized commitment fee of .075% of the unused portion of the SCA. Prior to October 9, 2014, the Funds had another SCA that provided a commitment of $900 million and the Funds paid an annualized commitment fee of .08% of the unused portion of the SCA. Interest on any borrowings under the SCA is paid at contracted market rates. The commitment fee for the unused amount is accrued daily and paid quarterly.
The Series utilized the SCA during the six months ended March 31, 2015. The average daily balance for the 9 days that the Series had loans outstanding during the period was $17,549,000, borrowed at a weighted average interest rate of 1.40%. The maximum loan outstanding amount during the period was $36,802,000. At March 31, 2015, the Series did not have an outstanding loan amount.
Note 8. New Accounting Pronouncement
In May 2015, the FASB issued Accounting Standards Update (“ASU”) No. 2015-07 regarding “Disclosures for Investments in Certain Entities That Calculate Net Asset Value per Share”. The amendments in this update are effective for the Fund for fiscal years beginning after December 15, 2015, and interim periods within those fiscal years. ASU No. 2015-07 will eliminate the requirement to categorize investments in the fair value hierarchy if their fair value is measured at net asset value (“NAV”) per share (or its equivalent) using the practical expedient in the FASB’s fair value measurement guidance. At this time, management is evaluating the implications of ASU No. 2015-07 and its impact on the financial statement disclosures has not yet been determined.
| 104 |
Financial Highlights
(Unaudited)
| Class A Shares | ||||||||||||||||||||||||||
| Six Months Ended March 31, | Year Ended September 30, | |||||||||||||||||||||||||
| 2015 | 2014 | 2013 | 2012 | 2011 | 2010 | |||||||||||||||||||||
| Per Share Operating Performance(a): | ||||||||||||||||||||||||||
| Net Asset Value, Beginning Of Period | $16.45 | $14.70 | $13.37 | $11.32 | $11.31 | $10.52 | ||||||||||||||||||||
| Income (loss) from investment operations: | ||||||||||||||||||||||||||
| Net investment income | .09 | .20 | .21 | .19 | .17 | .17 | ||||||||||||||||||||
| Net realized and unrealized gain on investment transactions | .68 | 1.76 | 1.34 | 2.06 | .05 | .83 | ||||||||||||||||||||
| Total from investment operations | .77 | 1.96 | 1.55 | 2.25 | .22 | 1.00 | ||||||||||||||||||||
| Less Dividends and Distributions: | ||||||||||||||||||||||||||
| Dividends from net investment income | (.20 | ) | (.21 | ) | (.22 | ) | (.20 | ) | (.21 | ) | (.21 | ) | ||||||||||||||
| Distributions from net realized gains | (1.54 | ) | - | - | - | - | - | |||||||||||||||||||
| Total dividends and distributions | (1.74 | ) | (.21 | ) | (.22 | ) | (.20 | ) | (.21 | ) | (.21 | ) | ||||||||||||||
| Capital Contributions(f): | - | - | - | - | - | - | (e) | |||||||||||||||||||
| Net asset value, end of period | $15.48 | $16.45 | $14.70 | $13.37 | $11.32 | $11.31 | ||||||||||||||||||||
| Total Return(b): | 4.83% | 13.43% | 11.78% | 20.04% | 1.91% | 9.61% | ||||||||||||||||||||
| Ratios/Supplemental Data: | ||||||||||||||||||||||||||
| Net assets, end of period (000) | $313,488 | $303,153 | $281,499 | $269,131 | $243,314 | $265,496 | ||||||||||||||||||||
| Average net assets (000) | $309,699 | $295,552 | $273,250 | $257,847 | $271,396 | $272,202 | ||||||||||||||||||||
| Ratios to average net assets(c): | ||||||||||||||||||||||||||
| Expenses after waivers and/or expense reimbursement | 1.26% | (g) | 1.22% | 1.22% | 1.29% | 1.32% | 1.28% | |||||||||||||||||||
| Expenses before waivers and/or expense reimbursement | 1.28% | (g) | 1.24% | 1.24% | 1.31% | 1.34% | 1.30% | |||||||||||||||||||
| Net investment income | 1.14% | (g) | 1.27% | 1.50% | 1.55% | 1.45% | 1.60% | |||||||||||||||||||
| Portfolio turnover rate(d) | 102% | (h) | 215% | 234% | 204% | 230% | 185% | |||||||||||||||||||
(a) Calculated based on average shares outstanding during the period.
(b) Total return does not consider the effect of sales loads. Total return is calculated assuming a purchase of a share on the first day and a sale on the last day of each period reported and includes reinvestment of dividends and distributions. Total returns may reflect adjustments to conform to generally accepted accounting principles. Total returns for periods less than one full year are not annualized.
(c) Does not include expenses of the underlying portfolios in which the Series invests.
(d) The Series accounts for mortgage dollar roll transactions as purchases and sales which, as a result, can increase its portfolio turnover rate.
(e) Less than $.005 per share.
(f) The Series received payments related to an unaffiliated-third party settlement of regulatory proceedings involving allegations of improper trading in Series shares during the fiscal year ended September 30, 2010. The Series was not involved in the proceedings or in the calculation of the amount of settlement.
(g) Annualized.
(h) Not annualized.
See Notes to Financial Statements.
| Prudential Balanced Fund | 105 |
Financial Highlights
(Unaudited) continued
| Class B Shares | ||||||||||||||||||||||||||
| Six Months Ended March 31, | Year Ended September 30, | |||||||||||||||||||||||||
| 2015 | 2014 | 2013 | 2012 | 2011 | 2010 | |||||||||||||||||||||
| Per Share Operating Performance(a): | ||||||||||||||||||||||||||
| Net Asset Value, Beginning Of Period | $16.45 | $14.71 | $13.38 | $11.33 | $11.32 | $10.53 | ||||||||||||||||||||
| Income (loss) from investment operations: | ||||||||||||||||||||||||||
| Net investment income | .03 | .09 | .11 | .11 | .09 | .10 | ||||||||||||||||||||
| Net realized and unrealized gain on investment transactions | .69 | 1.75 | 1.35 | 2.05 | .05 | .83 | ||||||||||||||||||||
| Total from investment operations | .72 | 1.84 | 1.46 | 2.16 | .14 | .93 | ||||||||||||||||||||
| Less Dividends and Distributions: | ||||||||||||||||||||||||||
| Dividends from net investment income | (.09 | ) | (.10 | ) | (.13 | ) | (.11 | ) | (.13 | ) | (.14 | ) | ||||||||||||||
| Distributions from net realized gains | (1.54 | ) | - | - | - | - | - | |||||||||||||||||||
| Total dividends and distributions | (1.63 | ) | (.10 | ) | (.13 | ) | (.11 | ) | (.13 | ) | (.14 | ) | ||||||||||||||
| Capital Contributions(f): | - | - | - | - | - | - | (e) | |||||||||||||||||||
| Net asset value, end of period | $15.54 | $16.45 | $14.71 | $13.38 | $11.33 | $11.32 | ||||||||||||||||||||
| Total Return(b): | 4.48% | 12.60% | 11.01% | 19.18% | 1.23% | 8.92% | ||||||||||||||||||||
| Ratios/Supplemental Data: | ||||||||||||||||||||||||||
| Net assets, end of period (000) | $13,763 | $14,899 | $13,222 | $10,142 | $10,672 | $13,952 | ||||||||||||||||||||
| Average net assets (000) | $14,686 | $14,806 | $11,466 | $10,739 | $13,268 | $15,682 | ||||||||||||||||||||
| Ratios to average net assets(c): | ||||||||||||||||||||||||||
| Expenses after waivers and/or expense reimbursement | 1.96% | (g) | 1.92% | 1.92% | 2.00% | 2.02% | 1.98% | |||||||||||||||||||
| Expenses before waivers and/or expense reimbursement | 1.98% | (g) | 1.94% | 1.94% | 2.02% | 2.04% | 2.00% | |||||||||||||||||||
| Net investment income | .44% | (g) | .57% | .80% | .85% | .75% | .91% | |||||||||||||||||||
| Portfolio turnover rate(d) | 102% | (h) | 215% | 234% | 204% | 230% | 185% | |||||||||||||||||||
(a) Calculated based on average shares outstanding during the period.
(b) Total return does not consider the effect of sales loads. Total return is calculated assuming a purchase of a share on the first day and a sale on the last day of each period reported and includes reinvestment of dividends and distributions. Total returns may reflect adjustments to conform to generally accepted accounting principles. Total returns for periods less than one full year are not annualized.
(c) Does not include expenses of the underlying portfolios in which the Series invests.
(d) The Series accounts for mortgage dollar roll transactions as purchases and sales which, as a result, can increase its portfolio turnover rate.
(e) Less than $.005 per share.
(f) The Series received payments related to an unaffiliated-third party settlement of regulatory proceedings involving allegations of improper trading in Series shares during the fiscal year ended September 30, 2010. The Series was not involved in the proceedings or in the calculation of the amount of settlement.
(g) Annualized.
(h) Not annualized.
See Notes to Financial Statements.
| 106 |
| Class C Shares | ||||||||||||||||||||||||||
| Six Months Ended March 31, | Year Ended September 30, | |||||||||||||||||||||||||
| 2015 | 2014 | 2013 | 2012 | 2011 | 2010 | |||||||||||||||||||||
| Per Share Operating Performance(a): | ||||||||||||||||||||||||||
| Net Asset Value, Beginning Of Period | $16.45 | $14.71 | $13.37 | $11.32 | $11.32 | $10.53 | ||||||||||||||||||||
| Income (loss) from investment operations: | ||||||||||||||||||||||||||
| Net investment income | .04 | .09 | .11 | .11 | .09 | .10 | ||||||||||||||||||||
| Net realized and unrealized gain on investment transactions | .68 | 1.75 | 1.36 | 2.05 | .04 | .83 | ||||||||||||||||||||
| Total from investment operations | .72 | 1.84 | 1.47 | 2.16 | .13 | .93 | ||||||||||||||||||||
| Less Dividends and Distributions: | ||||||||||||||||||||||||||
| Dividends from net investment income | (.09 | ) | (.10 | ) | (.13 | ) | (.11 | ) | (.13 | ) | (.14 | ) | ||||||||||||||
| Distributions from net realized gains | (1.54 | ) | - | - | - | - | - | |||||||||||||||||||
| Total dividends and distributions | (1.63 | ) | (.10 | ) | (.13 | ) | (.11 | ) | (.13 | ) | (.14 | ) | ||||||||||||||
| Capital Contributions(f): | - | - | - | - | - | - | (e) | |||||||||||||||||||
| Net asset value, end of period | $15.54 | $16.45 | $14.71 | $13.37 | $11.32 | $11.32 | ||||||||||||||||||||
| Total Return(b): | 4.48% | 12.60% | 11.10% | 19.20% | 1.15% | 8.92% | ||||||||||||||||||||
| Ratios/Supplemental Data: | ||||||||||||||||||||||||||
| Net assets, end of period (000) | $27,222 | $20,838 | $15,926 | $10,653 | $9,987 | $11,111 | ||||||||||||||||||||
| Average net assets (000) | $23,413 | $17,899 | $12,912 | $10,547 | $11,105 | $11,986 | ||||||||||||||||||||
| Ratios to average net assets(c): | ||||||||||||||||||||||||||
| Expenses after waivers and/or expense reimbursement | 1.96% | (g) | 1.92% | 1.92% | 1.99% | 2.02% | 1.98% | |||||||||||||||||||
| Expenses before waivers and/or expense reimbursement | 1.98% | (g) | 1.94% | 1.94% | 2.01% | 2.04% | 2.00% | |||||||||||||||||||
| Net investment income | .46% | (g) | .58% | .79% | .85% | .75% | .90% | |||||||||||||||||||
| Portfolio turnover rate(d) | 102% | (h) | 215% | 234% | 204% | 230% | 185% | |||||||||||||||||||
(a) Calculated based on average shares outstanding during the period.
(b) Total return does not consider the effect of sales loads. Total return is calculated assuming a purchase of a share on the first day and a sale on the last day of each period reported and includes reinvestment of dividends and distributions. Total returns may reflect adjustments to conform to generally accepted accounting principles. Total returns for periods less than one full year are not annualized.
(c) Does not include expenses of the underlying portfolios in which the Series invests.
(d) The Series accounts for mortgage dollar roll transactions as purchases and sales which, as a result, can increase its portfolio turnover rate.
(e) Less than $.005 per share.
(f) The Series received payments related to an unaffiliated-third party settlement of regulatory proceedings involving allegations of improper trading in Series shares during the fiscal year ended September 30, 2010. The Series was not involved in the proceedings or in the calculation of the amount of settlement.
(g) Annualized.
(h) Not annualized.
See Notes to Financial Statements.
| Prudential Balanced Fund | 107 |
Financial Highlights
(Unaudited) continued
| Class R Shares | ||||||||||||||||||||||||||
| Six Months Ended March 31, | Year Ended September 30, | |||||||||||||||||||||||||
| 2015 | 2014 | 2013 | 2012 | 2011 | 2010 | |||||||||||||||||||||
| Per Share Operating Performance(a): | ||||||||||||||||||||||||||
| Net Asset Value, Beginning Of Period | $16.43 | $14.69 | $13.36 | $11.31 | $11.31 | $10.52 | ||||||||||||||||||||
| Income (loss) from investment operations: | ||||||||||||||||||||||||||
| Net investment income | .07 | .17 | .18 | .12 | .15 | .14 | ||||||||||||||||||||
| Net realized and unrealized gain on investment transactions | .69 | 1.75 | 1.35 | 2.10 | .04 | .84 | ||||||||||||||||||||
| Total from investment operations | .76 | 1.92 | 1.53 | 2.22 | .19 | .98 | ||||||||||||||||||||
| Less Dividends and Distributions: | ||||||||||||||||||||||||||
| Dividends from net investment income | (.17 | ) | (.18 | ) | (.20 | ) | (.17 | ) | (.19 | ) | (.19 | ) | ||||||||||||||
| Distributions from net realized gains | (1.54 | ) | - | - | - | - | - | |||||||||||||||||||
| Total dividends and distributions | (1.71 | ) | (.18 | ) | (.20 | ) | (.17 | ) | (.19 | ) | (.19 | ) | ||||||||||||||
| Capital Contributions(f): | - | - | - | - | - | - | (e) | |||||||||||||||||||
| Net asset value, end of period | $15.48 | $16.43 | $14.69 | $13.36 | $11.31 | $11.31 | ||||||||||||||||||||
| Total Return(b): | 4.75% | 13.16% | 11.58% | 19.82% | 1.63% | 9.42% | ||||||||||||||||||||
| Ratios/Supplemental Data: | ||||||||||||||||||||||||||
| Net assets, end of period (000) | $533 | $482 | $305 | $222 | $11 | $10 | ||||||||||||||||||||
| Average net assets (000) | $507 | $395 | $273 | $27 | $11 | $49 | ||||||||||||||||||||
| Ratios to average net assets(c): | ||||||||||||||||||||||||||
| Expenses after waivers and/or expense reimbursement | 1.46% | (g) | 1.42% | 1.42% | 1.51% | 1.52% | 1.48% | |||||||||||||||||||
| Expenses before waivers and/or expense reimbursement | 1.73% | (g) | 1.69% | 1.69% | 1.78% | 1.79% | 1.75% | |||||||||||||||||||
| Net investment income | .94% | (g) | 1.08% | 1.30% | 1.37% | 1.25% | 1.43% | |||||||||||||||||||
| Portfolio turnover rate(d) | 102% | (h) | 215% | 234% | 204% | 230% | 185% | |||||||||||||||||||
(a) Calculated based on average shares outstanding during the period.
(b) Total return is calculated assuming a purchase of a share on the first day and a sale on the last day of each period reported and includes reinvestment of dividends and distributions. Total returns may reflect adjustments to conform to generally accepted accounting principles. Total returns for periods less than one full year are not annualized.
(c) Does not include expenses of the underlying portfolios in which the Series invests.
(d) The Series accounts for mortgage dollar roll transactions as purchases and sales which, as a result, can increase its portfolio turnover rate.
(e) Less than $.005 per share.
(f) The Series received payments related to an unaffiliated-third party settlement of regulatory proceedings involving allegations of improper trading in Series shares during the fiscal year ended September 30, 2010. The Series was not involved in the proceedings or in the calculation of the amount of settlement.
(g) Annualized.
(h) Not annualized.
See Notes to Financial Statements.
| 108 |
| Class X Shares | ||||||||||||||||||||||
| Period Ended April 11, | Year Ended September 30, | |||||||||||||||||||||
| 2014(i) | 2013 | 2012 | 2011 | 2010 | ||||||||||||||||||
| Per Share Operating Performance(a): | ||||||||||||||||||||||
| Net Asset Value, Beginning Of Period | $14.70 | $13.37 | $11.32 | $11.32 | $10.53 | |||||||||||||||||
| Income (loss) from investment operations: | ||||||||||||||||||||||
| Net investment income | .04 | .11 | .11 | .09 | .10 | |||||||||||||||||
| Net realized and unrealized gain on investment transactions | .97 | 1.35 | 2.05 | .04 | .83 | |||||||||||||||||
| Total from investment operations | 1.01 | 1.46 | 2.16 | .13 | .93 | |||||||||||||||||
| Less Dividends: | ||||||||||||||||||||||
| Dividends from net investment income | (.10 | ) | (.13 | ) | (.11 | ) | (.13 | ) | (.14 | ) | ||||||||||||
| Capital Contributions(f): | - | - | - | - | - | (e) | ||||||||||||||||
| Net asset value, end of period | $15.61 | $14.70 | $13.37 | $11.32 | $11.32 | |||||||||||||||||
| Total Return(b): | 6.92% | 11.02% | 19.20% | 1.15% | 8.92% | |||||||||||||||||
| Ratios/Supplemental Data: | ||||||||||||||||||||||
| Net assets, end of period (000) | $11 | $201 | $472 | $818 | $1,575 | |||||||||||||||||
| Average net assets (000) | $91 | $338 | $688 | $1,287 | $1,929 | |||||||||||||||||
| Ratios to average net assets(c): | ||||||||||||||||||||||
| Expenses after waivers and/or expense reimbursement | 1.92% | (g) | 1.92% | 2.00% | 2.02% | 1.98% | ||||||||||||||||
| Expenses before waivers and/or expense reimbursement | 1.94% | (g) | 1.94% | 2.02% | 2.04% | 2.00% | ||||||||||||||||
| Net investment income | .49% | (g) | .83% | .84% | .74% | .91% | ||||||||||||||||
| Portfolio turnover rate(d) | 215% | (h) | 234% | 204% | 230% | 185% | ||||||||||||||||
(a) Calculated based on average shares outstanding during the period.
(b) Total return does not consider the effect of sales loads. Total return is calculated assuming a purchase of a share on the first day and a sale on the last day of each period reported and includes reinvestment of dividends and distributions. Total returns may reflect adjustments to conform to generally accepted accounting principles. Total returns for periods less than one full year are not annualized.
(c) Does not include expenses of the underlying portfolios in which the Series invests.
(d) The Series accounts for mortgage dollar roll transactions as purchases and sales which, as a result, can increase its portfolio turnover rate.
(e) Less than $.005 per share.
(f) The Series received payments related to an unaffiliated-third party settlement of regulatory proceedings involving allegations of improper trading in Series shares during the fiscal year ended September 30, 2010. The Series was not involved in the proceedings or in the calculation of the amount of settlement.
(g) Annualized.
(h) Calculated as of September 30, 2014.
(i) As of April 11, 2014, the last conversion of Class X shares to Class A shares was completed. There are no Class X shares outstanding and Class X shares are no longer being offered for sale.
See Notes to Financial Statements.
| Prudential Balanced Fund | 109 |
Financial Highlights
(Unaudited) continued
| Class Z Shares | ||||||||||||||||||||||||||
| Six Months Ended March 31, | Year Ended September 30, | |||||||||||||||||||||||||
| 2015 | 2014 | 2013 | 2012 | 2011 | 2010 | |||||||||||||||||||||
| Per Share Operating Performance(a): | ||||||||||||||||||||||||||
| Net Asset Value, Beginning Of Period | $16.57 | $14.80 | $13.46 | $11.39 | $11.38 | $10.58 | ||||||||||||||||||||
| Income (loss) from investment operations: | ||||||||||||||||||||||||||
| Net investment income | .11 | .25 | .25 | .24 | .20 | .21 | ||||||||||||||||||||
| Net realized and unrealized gain on investment transactions | .69 | 1.77 | 1.35 | 2.06 | .06 | .83 | ||||||||||||||||||||
| Total from investment operations | .80 | 2.02 | 1.60 | 2.30 | .26 | 1.04 | ||||||||||||||||||||
| Less Dividends and Distributions: | ||||||||||||||||||||||||||
| Dividends from net investment income | (.25 | ) | (.25 | ) | (.26 | ) | (.23 | ) | (.25 | ) | (.24 | ) | ||||||||||||||
| Distributions from net realized gains | (1.54 | ) | - | - | - | - | - | |||||||||||||||||||
| Total dividends and distributions | (1.79 | ) | (.25 | ) | (.26 | ) | (.23 | ) | (.25 | ) | (.24 | ) | ||||||||||||||
| Capital Contributions(f): | - | - | - | - | - | - | (e) | |||||||||||||||||||
| Net asset value, end of period | $15.58 | $16.57 | $14.80 | $13.46 | $11.39 | $11.38 | ||||||||||||||||||||
| Total Return(b): | 4.98% | 13.80% | 12.10% | 20.46% | 2.19% | 9.95% | ||||||||||||||||||||
| Ratios/Supplemental Data: | ||||||||||||||||||||||||||
| Net assets, end of period (000) | $57,911 | $98,321 | $85,068 | $41,826 | $33,026 | $111,036 | ||||||||||||||||||||
| Average net assets (000) | $57,822 | $89,928 | $70,535 | $38,043 | $47,885 | $107,157 | ||||||||||||||||||||
| Ratios to average net assets(c): | ||||||||||||||||||||||||||
| Expenses after waivers and/or expense reimbursement | .96% | (g) | .92% | .92% | .99% | 1.02% | .98% | |||||||||||||||||||
| Expenses before waivers and/or expense reimbursement | .98% | (g) | .94% | .94% | 1.01% | 1.04% | 1.00% | |||||||||||||||||||
| Net investment income | 1.42% | (g) | 1.57% | 1.76% | 1.85% | 1.72% | 1.90% | |||||||||||||||||||
| Portfolio turnover rate(d) | 102% | (h) | 215% | 234% | 204% | 230% | 185% | |||||||||||||||||||
(a) Calculated based on average shares outstanding during the period.
(b) Total return is calculated assuming a purchase of a share on the first day and a sale on the last day of each period reported and includes reinvestment of dividends and distributions. Total returns may reflect adjustments to conform to generally accepted accounting principles. Total returns for periods less than one full year are not annualized.
(c) Does not include expenses of the underlying portfolios in which the Series invests.
(d) The Series accounts for mortgage dollar roll transactions as purchases and sales which, as a result, can increase its portfolio turnover rate.
(e) Less than $.005 per share.
(f) The Series received payments related to an unaffiliated-third party settlement of regulatory proceedings involving allegations of improper trading in Series shares during the fiscal year ended September 30, 2010. The Series was not involved in the proceedings or in the calculation of the amount of settlement.
(g) Annualized.
(h) Not annualized.
See Notes to Financial Statements.
| 110 |
Results of Proxy Voting
(Unaudited)
At a special meeting of shareholders held on November 26, 2014, shareholders of the Prudential Investment Portfolios, Inc., which is comprised of Prudential Balanced Fund, Prudential Growth Allocation Fund, Prudential Moderate Allocation Fund, Prudential Conservative Allocation Fund, Prudential Jennison Equity Opportunity Fund and Prudential Jennison Growth Fund (collectively, the “Funds”), approved the following proposal. Shareholders of all Funds voted together on the proposal:
To elect twelve Directors:
| SHARES VOTED | % OF VOTED | % OF TOTAL | ||||||||||
(a) Ellen S. Alberding; | ||||||||||||
FOR | 95,100,802.626 | 98.280 | 55.055 | |||||||||
WITHHELD | 1,664,556.591 | 1.720 | 0.963 | |||||||||
(b) Kevin J. Bannon; | ||||||||||||
FOR | 95,146,900.682 | 98.328 | 55.082 | |||||||||
WITHHELD | 1,618,458.535 | 1.672 | 0.936 | |||||||||
(c) Linda W. Bynoe; | ||||||||||||
FOR | 95,140,861.216 | 98.322 | 55.078 | |||||||||
WITHHELD | 1,624,498.001 | 1.678 | 0.940 | |||||||||
(d) Keith F. Hartstein; | ||||||||||||
FOR | 95,133,836.925 | 98.314 | 55.074 | |||||||||
WITHHELD | 1,631,522.292 | 1.686 | 0.944 | |||||||||
(e) Michael S. Hyland; | ||||||||||||
FOR | 95,117,285.270 | 98.297 | 55.064 | |||||||||
WITHHELD | 1,648,073.947 | 1.703 | 0.954 | |||||||||
(f) Stephen P. Munn; | ||||||||||||
FOR | 95,030,269.772 | 98.207 | 55.014 | |||||||||
WITHHELD | 1,735,089.445 | 1.793 | 1.004 | |||||||||
(g) James E. Quinn; | ||||||||||||
FOR | 95,133,075.390 | 98.314 | 55.074 | |||||||||
WITHHELD | 1,632,283.827 | 1.686 | 0.944 | |||||||||
(h) Richard A. Redeker; | ||||||||||||
FOR | 95,042,171.501 | 98.220 | 55.021 | |||||||||
WITHHELD | 1,723,187.716 | 1.780 | 0.997 | |||||||||
(i) Stephen G. Stoneburn; | ||||||||||||
FOR | 95,055,450.417 | 98.233 | 55.029 | |||||||||
WITHHELD | 1,709,908.800 | 1.767 | 0.989 | |||||||||
(j) Stuart S. Parker; | ||||||||||||
FOR | 95,151,749.610 | 98.333 | 55.084 | |||||||||
WITHHELD | 1,613,609.607 | 1.667 | 0.934 | |||||||||
| Prudential Balanced Fund | 111 |
Results of Proxy Voting
(Unaudited) continued
| SHARES VOTED | % OF VOTED | % OF TOTAL | ||||||||||
(k) Scott E. Benjamin; and | ||||||||||||
FOR | 95,115,629.702 | 98.296 | 55.063 | |||||||||
WITHHELD | 1,649,729.515 | 1.704 | 0.955 | |||||||||
(l) Grace C. Torres. | ||||||||||||
FOR | 95,092,614.445 | 98.272 | 55.050 | |||||||||
WITHHELD | 1,672,744.772 | 1.728 | 0.968 | |||||||||
The special meeting of shareholders of the Prudential Balanced Fund (the “Fund”) held on November 26, 2014, was adjourned to December 3, 2014, and further adjourned to December 10, 2014 and January 9, 2015 to permit further solicitation of proxies on the proposals noted below.
An abstention or a broker non-vote is considered present for purposes of determining a quorum but has the effect of a vote against such matters. At the special meeting of shareholders held on January 9, 2015, insufficient votes were obtained to approve the following proposals:
Proposal: To permit PI to enter into or make material changes to the Fund’s subadvisory agreements with subadvisers that are wholly-owned subsidiaries of PI or a sister company of PI (wholly-owned subadvisers) without shareholder approval.
| SHARES VOTED | % OF VOTED | % OF TOTAL | ||||||||||
FOR | 3,139,857.951 | 28.854 | 11.909 | |||||||||
AGAINST | 519,571.680 | 4.775 | 1.971 | |||||||||
ABSTAIN | 305,349.289 | 2.806 | 1.158 | |||||||||
BROKER NON-VOTE | 6,917,156.911 | 63.565 | 26.237 | |||||||||
TOTAL | 10,881,935.831 | 100.000 | % | 41.275 | % | |||||||
Proposal: To approve a proposal to designate the Fund’s investment objective as a non-fundamental policy of the Fund.
| SHARES VOTED | % OF VOTED | % OF TOTAL | ||||||||||
FOR | 3,071,576.660 | 28.227 | 11.650 | |||||||||
AGAINST | 509,795.233 | 4.685 | 1.934 | |||||||||
ABSTAIN | 383,407.027 | 3.523 | 1.454 | |||||||||
BROKER NON-VOTE | 6,917,156.911 | 63.565 | 26.237 | |||||||||
TOTAL | 10,881,935.831 | 100.000 | % | 41.275 | % | |||||||
| 112 |
| n MAIL | n TELEPHONE | n WEBSITE | ||
Gateway Center Three 100 Mulberry Street Newark, NJ 07102 | (800) 225-1852 | www.prudentialfunds.com |
| PROXY VOTING |
| The Board of Directors of the Fund has delegated to the Fund’s investment subadvisers the responsibility for voting any proxies and maintaining proxy recordkeeping with respect to the Fund. A description of these proxy voting policies and procedures is available without charge, upon request, by calling (800) 225-1852 or by visiting the Securities and Exchange Commission’s website at www.sec.gov. Information regarding how the Fund voted proxies relating to portfolio securities during the most recent 12-month period ended June 30 is available on the Fund’s website and on the Securities and Exchange Commission’s website. |
| DIRECTORS |
| Ellen S. Alberding • Kevin J. Bannon • Scott E. Benjamin • Linda W. Bynoe • Keith F. Hartstein • Michael S. Hyland • Stephen P. Munn • Stuart S. Parker • James E. Quinn • Richard A. Redeker • Stephen G. Stoneburn • Grace C. Torres |
| OFFICERS |
| Stuart S. Parker, President • Scott E. Benjamin, Vice President • M. Sadiq Peshimam, Treasurer and Principal Financial and Accounting Officer • Raymond A. O’Hara, Chief Legal Officer • Deborah A. Docs, Secretary • Chad A. Earnst, Chief Compliance Officer • Theresa C. Thompson, Deputy Chief Compliance Officer • Richard W. Kinville, Anti-Money Laundering Compliance Officer • Jonathan D. Shain, Assistant Secretary • Claudia DiGiacomo, Assistant Secretary • Amanda S. Ryan, Assistant Secretary • Andrew R. French, Assistant Secretary • Peter Parrella, Assistant Treasurer • Lana Lomuti, Assistant Treasurer • Linda McMullin, Assistant Treasurer • Kelly A. Coyne, Assistant Treasurer |
| MANAGER | Prudential Investments LLC | Gateway Center Three 100 Mulberry Street Newark, NJ 07102 | ||
| ||||
| INVESTMENT SUBADVISERS | Prudential Investment Management, Inc. | Gateway Center Two 100 Mulberry Street Newark, NJ 07102 | ||
| ||||
| Quantitative Management Associates LLC | Gateway Center Two 100 Mulberry Street Newark, NJ 07102 | |||
| ||||
| DISTRIBUTOR | Prudential Investment Management Services LLC | Gateway Center Three 100 Mulberry Street | ||
| ||||
| CUSTODIAN | The Bank of New York Mellon | One Wall Street New York, NY 10286 | ||
| ||||
| TRANSFER AGENT | Prudential Mutual Fund Services LLC | PO Box 9658 Providence, RI 02940 | ||
| ||||
| INDEPENDENT REGISTERED PUBLIC ACCOUNTING FIRM | KPMG LLP | 345 Park Avenue New York, NY 10154 | ||
| ||||
| FUND COUNSEL | Willkie Farr & Gallagher LLP | 787 Seventh Avenue New York, NY 10019 | ||
| An investor should consider the investment objectives, risks, charges, and expenses of the Fund carefully before investing. The prospectus and summary prospectus contain this and other information about the Fund. An investor may obtain a prospectus and summary prospectus by visiting our website at www.prudentialfunds.com or by calling (800) 225-1852. The prospectus and summary prospectus should be read carefully before investing. |
| E-DELIVERY |
| To receive your mutual fund documents online, go to www.prudentialfunds.com/edelivery and enroll. Instead of receiving printed documents by mail, you will receive notification via email when new materials are available. You can cancel your enrollment or change your email address at any time by visiting the website address above. |
| SHAREHOLDER COMMUNICATIONS WITH DIRECTORS |
| Shareholders can communicate directly with the Board of Directors by writing to the Chair of the Board, Prudential Balanced Fund, Prudential Investments, Attn: Board of Directors, 100 Mulberry Street, Gateway Center Three, Newark, NJ 07102. Shareholders can communicate directly with an individual Director by writing to the same address. Communications are not screened before being delivered to the addressee. |
| AVAILABILITY OF PORTFOLIO SCHEDULE |
| The Fund files its complete schedule of portfolio holdings with the Securities and Exchange Commission for the first and third quarters of each fiscal year on Form N-Q. The Fund’s Forms N-Q are available on the Commission’s website at www.sec.gov. The Fund’s Forms N-Q may also be reviewed and copied at the Commission’s Public Reference Room in Washington, D.C. Information on the operation and location of the Public Reference Room may be obtained by calling 1-800-SEC-0330. The Fund’s schedule of portfolio holdings is also available on the Fund’s website as of the end of each month. |
Mutual Funds:
| ARE NOT INSURED BY THE FDIC OR ANY FEDERAL GOVERNMENT AGENCY | MAY LOSE VALUE | ARE NOT A DEPOSIT OF OR GUARANTEED BY ANY BANK OR ANY BANK AFFILIATE |
PRUDENTIAL BALANCED FUND
| SHARE CLASS | A | B | C | R | Z | |||||||
| NASDAQ | PIBAX | PBFBX | PABCX | PALRX | PABFX | |||||||
| CUSIP | 74437E883 | 74437E875 | 74437E867 | 74437E636 | 74437E859 |
MF185E2 0277394-00001-00

PRUDENTIAL INVESTMENTS»MUTUAL FUNDS
PRUDENTIAL JENNISON EQUITY OPPORTUNITY FUND
SEMIANNUAL REPORT · MARCH 31, 2015
Objective
Long-term growth of capital
This report is not authorized for distribution to prospective investors unless preceded or accompanied by a current prospectus.
The views expressed in this report and information about the Fund’s portfolio holdings are for the period covered by this report and are subject to change thereafter.
The accompanying financial statements as of March 31, 2015, were not audited and, accordingly, no auditor’s opinion is expressed on them.
Mutual funds are distributed by Prudential Investment Management Services LLC (PIMS). Jennison Associates is a registered investment adviser. Both are Prudential Financial companies. © 2015 Prudential Financial, Inc. and its related entities. Prudential Investments LLC, Prudential, Jennison Associates, Jennison, the Prudential logo, Bring Your Challenges, and the Rock symbol are service marks of Prudential Financial, Inc. and its related entities, registered in many jurisdictions worldwide.

|  |

May 15, 2015
Dear Shareholder:
We hope you find the semiannual report for the Prudential Jennison Equity Opportunity Fund informative and useful. The report covers performance for the 6-month period that ended March 31, 2015.
Since market conditions change over time, we believe it is important to maintain a diversified portfolio of funds consistent with your tolerance for risk, time horizon, and financial goals.
Your financial advisor can help you create a diversified investment plan that may include funds covering all the basic asset classes and that reflects your personal investor profile and risk tolerance. Keep in mind, however, that diversification and asset allocation strategies do not assure a profit or protect against loss in declining markets.
Prudential Investments® is dedicated to helping you solve your toughest investment challenges—whether it’s capital growth, reliable income, or protection from market volatility and other risks. We offer the expertise of Prudential Financial’s affiliated asset managers that strive to be leaders in a broad range of funds to help you stay on course to the future you envision. They also manage money for major corporations and pension funds around the world, which means you benefit from the same expertise, innovation, and attention to risk demanded by today’s most sophisticated investors.
Thank you for choosing the Prudential Investments family of funds.
Sincerely,

Stuart S. Parker, President
Prudential Jennison Equity Opportunity Fund
| Prudential Jennison Equity Opportunity Fund | 1 |
Your Fund’s Performance (Unaudited)
Performance data quoted represent past performance. Past performance does not guarantee future results. The investment return and principal value of an investment will fluctuate, so that an investor’s shares, when redeemed, may be worth more or less than their original cost. Current performance may be lower or higher than the past performance data quoted. An investor may obtain performance data as of the most recent month-end by visiting our website at www.prudentialfunds.com or by calling (800) 225-1852.
Cumulative Total Returns (Without Sales Charges) as of 3/31/15 |
| |||||||||||||||||||
| Six Months | One Year | Five Years | Ten Years | Since Inception | ||||||||||||||||
Class A | 6.46 | % | 7.36 | % | 90.10 | % | 126.72 | % | — | |||||||||||
Class B | 6.07 | 6.64 | 83.73 | 111.27 | — | |||||||||||||||
Class C | 6.07 | 6.58 | 83.73 | 111.27 | — | |||||||||||||||
Class Q | N/A | N/A | N/A | N/A | 3.80% (11/25/14) | |||||||||||||||
Class R | 6.35 | 7.17 | 88.24 | 122.03 | — | |||||||||||||||
Class Z | 6.60 | 7.67 | 93.02 | 133.51 | — | |||||||||||||||
S&P 500 Index | 5.92 | 12.71 | 96.40 | 115.97 | — | |||||||||||||||
Lipper Customized Blend Funds Average* | 6.07 | 9.30 | 84.63 | 106.14 | — | |||||||||||||||
Lipper Multi-Cap Core Funds Average | 6.55 | 10.01 | 85.49 | 109.32 | — | |||||||||||||||
Average Annual Total Returns (With Sales Charges) as of 3/31/15 |
| |||||||||||||||||||
| One Year | Five Years | Ten Years | Since Inception | |||||||||||||||||
Class A | 1.46 | % | 12.43 | % | 7.92 | % | — | |||||||||||||
Class B | 1.85 | 12.81 | 7.77 | — | ||||||||||||||||
Class C | 5.63 | 12.94 | 7.77 | — | ||||||||||||||||
Class Q | N/A | N/A | N/A | N/A (11/25/14) | ||||||||||||||||
Class R | 7.17 | 13.49 | 8.30 | — | ||||||||||||||||
Class Z | 7.67 | 14.06 | 8.85 | — | ||||||||||||||||
S&P 500 Index | 12.71 | 14.45 | 8.00 | — | ||||||||||||||||
Lipper Customized Blend Funds Average* | 9.30 | 12.96 | 7.40 | — | ||||||||||||||||
Lipper Multi-Cap Core Funds Average | 10.01 | 13.06 | 7.57 | — | ||||||||||||||||
*The Lipper Customized Blend Funds Average is a blend of the Lipper Multi-Cap Core Funds and Lipper Multi-Cap Value Funds Averages. The Lipper Customized Blend Funds Average was utilized because the Fund’s Manager believes that a blend of the Lipper Multi-Cap Core and Lipper Multi-Cap Value Averages provides a more appropriate basis for Fund performance comparisons, although Lipper classifies the Fund only in the Lipper Multi-Cap Core Funds category.
Source: Prudential Investments LLC and Lipper Inc.
Inception returns are provided for any share class with less than 10 years of calendar returns.
| 2 | Visit our website at www.prudentialfunds.com |
The returns in the tables do not reflect the deduction of taxes that a shareholder would pay on Fund distributions or following the redemption of Fund shares. The average annual total returns take into account applicable sales charges, which are described for each share class in the table below.
| Class A | Class B* | Class C | Class Q | Class R | Class Z | |||||||
Maximum Initial Sales Charge | 5.50% of the public offering price | None | None | None | None | None | ||||||
Contingent Deferred Sales Charge (CDSC) (as a percentage of the lower of original purchase price or sale proceeds) | 1% on sales of $1 million or more made within | 5% (Yr.1) 4% (Yr.2) 3% (Yr.3) 2% (Yr.4) 1% (Yr.5) 1% (Yr.6) 0% (Yr.7) | 1% on sales made within 12 months of purchase | None | None | None | ||||||
Annual Distribution and Service (12b-1) fees (shown as a percentage of average daily net assets) | .30% | 1% | 1% | None | .75% (.50% currently) | None |
*Class B shares are closed to all purchase activity and no additional Class B shares may be purchased or acquired except by exchange from Class B shares of another Fund or through dividend or capital gains reinvestment.
Benchmark Definitions
S&P 500 Index
The S&P 500 Index is an unmanaged index of 500 stocks of large US public companies. It gives a broad look at how US stock prices have performed. The cumulative total return for the S&P 500 Index measured from the month-end closest to the inception date for Class Q shares through 3/31/15 is 0.69%. Class Q shares have been in existence for less than one year and have no average annual total return performance information available.
Lipper Customized Blend Funds Average
The Lipper Customized Blend Funds Average (Lipper Average) is a 50/50 blend of the Lipper Multi-Cap Value Funds and Lipper Multi-Cap Core Funds Averages. The cumulative total return for the Lipper Average measured from the month-end closest to the inception date for Class Q shares through 3/31/15 is 1.81%. Class Q shares have been in existence for less than one year and have no average annual total return performance information available.
Lipper Multi-Cap Core Funds Average
The Lipper Multi-Cap Core Funds Average (Lipper Average) represents returns based on the average return of all funds in the Lipper Multi-Cap Core Funds category for the periods noted. Funds in the Lipper Average invest in a variety of market capitalization ranges without concentrating 75% of their equity assets in any one market capitalization range over an extended period of time. Multi-Cap Core Funds in the Lipper Average typically have between 25% and 75% of their assets invested in companies with market capitalizations (on a three-year weighted basis) above 300% of the dollar-weighted median market capitalization of the middle 1,000 securities of the S&P SuperComposite 1500 Index. Multi-Cap Core Funds have more latitude in the companies in which they
| Prudential Jennison Equity Opportunity Fund | 3 |
Your Fund’s Performance (continued)
invest. These funds typically have an average price-to-earnings ratio, price-to-book ratio, and three-year sales-per-share growth value compared with the S&P SuperComposite 1500 Index. The cumulative total return for the Lipper Average measured from the month-end closest to the inception date for Class Q shares through 3/31/15 is 2.05%. Class Q shares have been in existence for less than one year and have no average annual total return performance information available.
Lipper Multi-Cap Value Funds Average
The Lipper Multi-Cap Value Funds Average (Lipper Average) is based on the average return of all funds in the Lipper Multi-Cap Value Funds category for the periods noted. Funds in the Lipper Average invest in a variety of market capitalization ranges without concentrating 75% of their equity assets in any one market capitalization range over an extended period of time. Multi-cap value funds typically have a below-average price-to-earnings ratio, price-to-book ratio, and three-year sales-per-share growth value, compared to the S&P SuperComposite 1500 Index. The cumulative total return for the Lipper Average measured from the month-end closest to the inception date for Class Q shares through 3/31/15 is 1.18%. Class Q shares have been in existence for less than one year and have no average annual total return performance information available.
Investors cannot invest directly in an index or average. The returns for the Index would be lower if they included the effects of sales charges, operating expenses of a mutual fund, or taxes. Returns for the Lipper Averages reflect the deduction of operating expenses, but not sales charges or taxes. The Since Inception returns for the Index and the Lipper Averages are measured from the closest month-end to the inception date, and not from the Class’s actual inception date.
Five Largest Holdings expressed as a percentage of net assets as of 3/31/15 |
Bristol-Myers Squibb Co., Pharmaceuticals | 2.3 | % | ||
Carnival Corp., Hotels, Restaurants & Leisure | 2.1 | |||
Fortinet, Inc., Software | 2.1 | |||
Wendy’s Co. (The), Hotels, Restaurants & Leisure | 2.1 | |||
ADT Corp. (The), Commercial Services & Supplies | 2.0 |
Holdings reflect only long-term investments and are subject to change.
Five Largest Industries expressed as a percentage of net assets as of 3/31/15 | ||
Pharmaceuticals | 9.9 | % | ||
Hotels, Restaurants & Leisure | 7.7 | |||
Software | 7.3 | |||
Banks | 6.9 | |||
Communications Equipment | 6.5 |
Industry weightings reflect only long-term investments and are subject to change.
| 4 | Visit our website at www.prudentialfunds.com |
Fees and Expenses (Unaudited)
As a shareholder of the Fund, you incur two types of costs: (1) transaction costs, including sales charges (loads) on purchase payments and redemptions, as applicable, and (2) ongoing costs, including management fees, distribution and/or service (12b-1) fees, and other Fund expenses, as applicable. This example is intended to help you understand your ongoing costs (in dollars) of investing in the Fund and to compare these costs with the ongoing costs of investing in other mutual funds.
The example is based on an investment of $1,000 invested on October 1, 2014, at the beginning of the period, and held through the six-month period ended March 31, 2015. The example is for illustrative purposes only; you should consult the Prospectus for information on initial and subsequent minimum investment requirements.
Actual Expenses
The first line for each share class in the table on the following page provides information about actual account values and actual expenses. You may use the information on this line, together with the amount you invested, to estimate the expenses that you paid over the period. Simply divide your account value by $1,000 (for example, an $8,600 account value ÷ $1,000 = 8.6), then multiply the result by the number on the first line under the heading “Expenses Paid During the Six-Month Period” to estimate the expenses you paid on your account during this period.
Hypothetical Example for Comparison Purposes
The second line for each share class in the table on the following page provides information about hypothetical account values and hypothetical expenses based on the Fund’s actual expense ratio and an assumed rate of return of 5% per year before expenses, which is not the Fund’s actual return. The hypothetical account values and expenses may not be used to estimate the actual ending account balance or expenses you paid for the period. You may use this information to compare the ongoing costs of investing in the Fund and other funds. To do so, compare this 5% hypothetical example with the 5% hypothetical examples that appear in the shareholder reports of the other funds.
The Fund’s transfer agent may charge additional fees to holders of certain accounts that are not included in the expenses shown in the table on the following page. These fees apply to individual retirement accounts (IRAs) and Section 403(b) accounts. As of the close of the six-month period covered by the table, IRA fees included an annual maintenance fee of $15 per account (subject to a maximum annual maintenance fee of $25 for all accounts held by the same shareholder). Section 403(b) accounts are charged an annual $25 fiduciary maintenance fee. Some of the fees may vary in amount, or may be waived, based on your total account balance or the number of
| Prudential Jennison Equity Opportunity Fund | 5 |
Fees and Expenses (continued)
Prudential Investments funds, including the Fund, that you own. You should consider the additional fees that were charged to your Fund account over the six-month period when you estimate the total ongoing expenses paid over the period and the impact of these fees on your ending account value, as these additional expenses are not reflected in the information provided in the expense table. Additional fees have the effect of reducing investment returns.
Please note that the expenses shown in the table are meant to highlight your ongoing costs only and do not reflect any transactional costs such as sales charges (loads). Therefore, the second line for each share class in the table is useful in comparing ongoing costs only and will not help you determine the relative total costs of owning different funds. In addition, if these transactional costs were included, your costs would have been higher.
| Prudential Jennison Equity Opportunity Fund | Beginning Account Value | Ending Account Value March 31, 2015 | Annualized Expense Ratio | Expenses Paid During the Six-Month Period* | ||||||||||||||
| Class A | Actual | $ | 1,000.00 | $ | 1,064.60 | 1.08 | % | $ | 5.56 | |||||||||
| Hypothetical | $ | 1,000.00 | $ | 1,019.55 | 1.08 | % | $ | 5.44 | ||||||||||
| Class B | Actual | $ | 1,000.00 | $ | 1,060.70 | 1.78 | % | $ | 9.14 | |||||||||
| Hypothetical | $ | 1,000.00 | $ | 1,016.06 | 1.78 | % | $ | 8.95 | ||||||||||
| Class C | Actual | $ | 1,000.00 | $ | 1,060.70 | 1.78 | % | $ | 9.14 | |||||||||
| Hypothetical | $ | 1,000.00 | $ | 1,016.06 | 1.78 | % | $ | 8.95 | ||||||||||
| Class Q | Actual** | $ | 1,000.00 | $ | 1,038.00 | 0.66 | % | $ | 2.32 | |||||||||
| Hypothetical | $ | 1,000.00 | $ | 1,021.67 | 0.66 | % | $ | 3.30 | ||||||||||
| Class R | Actual | $ | 1,000.00 | $ | 1,063.50 | 1.28 | % | $ | 6.59 | |||||||||
| Hypothetical | $ | 1,000.00 | $ | 1,018.55 | 1.28 | % | $ | 6.44 | ||||||||||
| Class Z | Actual | $ | 1,000.00 | $ | 1,066.00 | 0.78 | % | $ | 4.02 | |||||||||
| Hypothetical | $ | 1,000.00 | $ | 1,021.04 | 0.78 | % | $ | 3.93 | ||||||||||
*Fund expenses (net of fee waivers or subsidies, if any) for each share class are equal to the annualized expense ratio for each share class (provided in the table), multiplied by the average account value over the period, multiplied by the 182 days in the six-month period ended March 31, 2015, and divided by the 365 days in the Fund’s fiscal year ending September 30, 2015 (to reflect the six-month period). Expenses presented in the table include the expenses of any underlying portfolios in which the Fund may invest.
**“Actual” expenses are calculated using the 127 day period ended March 31, 2015 due to the Class’s inception date of November 25, 2014.
| 6 | Visit our website at www.prudentialfunds.com |
The Fund’s annualized expense ratios for the six-month period ended March 31, 2015, are as follows:
| Class | Gross Operating Expenses | Net Operating Expenses | ||||||
A | 1.08 | % | 1.08 | % | ||||
B | 1.78 | 1.78 | ||||||
C | 1.78 | 1.78 | ||||||
Q | 0.66 | 0.66 | ||||||
R | 1.53 | 1.28 | ||||||
Z | 0.78 | 0.78 | ||||||
Net operating expenses shown above reflect any fee waivers and/or expense reimbursements. Additional information on Fund expenses and any fee waivers and/or expense reimbursements can be found in the “Financial Highlights” tables in this report and in the Notes to the Financial Statements in this report.
| Prudential Jennison Equity Opportunity Fund | 7 |
Portfolio of Investments
as of March 31, 2015 (Unaudited)
| Shares | Value (Note 1) | |||||||
LONG-TERM INVESTMENTS 96.9% | ||||||||
COMMON STOCKS | ||||||||
Aerospace & Defense 2.8% | ||||||||
Boeing Co. (The) | 54,535 | $ | 8,184,613 | |||||
United Technologies Corp. | 62,316 | 7,303,435 | ||||||
|
| |||||||
| 15,488,048 | ||||||||
Air Freight & Logistics 1.0% | ||||||||
FedEx Corp. | 32,813 | 5,428,911 | ||||||
Airlines 1.3% | ||||||||
Delta Air Lines, Inc. | 160,110 | 7,198,546 | ||||||
Auto Components 1.6% | ||||||||
Lear Corp. | 82,209 | 9,110,401 | ||||||
Banks 6.9% | ||||||||
Bank of America Corp. | 549,015 | 8,449,341 | ||||||
JPMorgan Chase & Co. | 163,291 | 9,892,169 | ||||||
PNC Financial Services Group, Inc. (The) | 109,588 | 10,217,985 | ||||||
Wells Fargo & Co. | 186,545 | 10,148,048 | ||||||
|
| |||||||
| 38,707,543 | ||||||||
Capital Markets 1.8% | ||||||||
Goldman Sachs Group, Inc. (The) | 53,634 | 10,081,583 | ||||||
Chemicals 3.0% | ||||||||
Monsanto Co. | 68,297 | 7,686,144 | ||||||
Potash Corp. of Saskatchewan, Inc. (Canada) | 279,918 | 9,027,356 | ||||||
|
| |||||||
| 16,713,500 | ||||||||
Commercial Services & Supplies 4.3% | ||||||||
ADT Corp. (The)(a) | 274,366 | 11,391,676 | ||||||
Brink’s Co. (The) | 236,606 | 6,537,424 | ||||||
ManpowerGroup, Inc. | 69,480 | 5,985,702 | ||||||
|
| |||||||
| 23,914,802 | ||||||||
Communications Equipment 6.5% | ||||||||
Aruba Networks, Inc.* | 158,634 | 3,884,947 | ||||||
Brocade Communications Systems, Inc. | 742,001 | 8,803,842 | ||||||
JDS Uniphase Corp.* | 604,396 | 7,929,675 | ||||||
Juniper Networks, Inc.(a) | 352,189 | 7,952,428 | ||||||
See Notes to Financial Statements.
| Prudential Jennison Equity Opportunity Fund | 9 |
Portfolio of Investments
as of March 31, 2015 (Unaudited) continued
| Shares | Value (Note 1) | |||||||
COMMON STOCKS (Continued) | ||||||||
Communications Equipment (cont’d) | ||||||||
Polycom, Inc.* | 592,895 | $ | 7,944,793 | |||||
|
| |||||||
| 36,515,685 | ||||||||
Diversified Financial Services 1.5% | ||||||||
Voya Financial, Inc. | 196,203 | 8,458,311 | ||||||
Diversified Telecommunication Services 1.8% | ||||||||
Vivendi SA (France) | 407,737 | 10,123,169 | ||||||
Electric Utilities 3.5% | ||||||||
FirstEnergy Corp. | 307,358 | 10,775,971 | ||||||
PPL Corp. | 270,642 | 9,109,810 | ||||||
|
| |||||||
| 19,885,781 | ||||||||
Electronic Equipment, Instruments & Components 0.9% | ||||||||
Benchmark Electronics, Inc.* | 213,118 | 5,121,225 | ||||||
Food & Staples Retailing 1.1% | ||||||||
CVS Health Corp. | 60,136 | 6,206,637 | ||||||
Food Products 3.2% | ||||||||
Diamond Foods, Inc.* | 327,798 | 10,676,381 | ||||||
Mondelez International, Inc. (Class A Stock) | 196,410 | 7,088,437 | ||||||
|
| |||||||
| 17,764,818 | ||||||||
Health Care Equipment & Supplies 1.7% | ||||||||
Hologic, Inc.* | 296,129 | 9,779,660 | ||||||
Hotels, Restaurants & Leisure 7.7% | ||||||||
Carnival Corp. | 249,380 | 11,930,339 | ||||||
Hyatt Hotels Corp. (Class A Stock)* | 161,726 | 9,577,414 | ||||||
Pinnacle Entertainment, Inc.* | 287,885 | 10,389,770 | ||||||
Wendy’s Co. (The) | 1,060,214 | 11,556,332 | ||||||
|
| |||||||
| 43,453,855 | ||||||||
Independent Power & Renewable Electricity Producers 1.8% | ||||||||
Calpine Corp.* | 282,881 | 6,469,489 | ||||||
NRG Energy, Inc. | 140,570 | 3,540,958 | ||||||
|
| |||||||
| 10,010,447 | ||||||||
Industrial Conglomerates 0.7% | ||||||||
Siemens AG (Germany) | 35,731 | 3,864,441 | ||||||
See Notes to Financial Statements.
| 10 |
| Shares | Value (Note 1) | |||||||
COMMON STOCKS (Continued) | ||||||||
Insurance 2.4% | ||||||||
MetLife, Inc. | 178,353 | $ | 9,015,744 | |||||
Symetra Financial Corp. | 201,500 | 4,727,190 | ||||||
|
| |||||||
| 13,742,934 | ||||||||
Internet Software & Services 0.9% | ||||||||
Twitter, Inc.* | 104,286 | 5,222,643 | ||||||
Machinery 1.6% | ||||||||
SPX Corp. | 66,930 | 5,682,357 | ||||||
Terex Corp. | 123,369 | 3,280,382 | ||||||
|
| |||||||
| 8,962,739 | ||||||||
Media 6.2% | ||||||||
Comcast Corp. (Special Class A Stock) | 182,523 | 10,233,152 | ||||||
Live Nation Entertainment, Inc.* | 313,802 | 7,917,225 | ||||||
Nine Entertainment Co. Holdings Ltd. (Australia) | 1,298,256 | 2,078,640 | ||||||
Nine Entertainment Co. Holdings Ltd., 144A (Australia)(b) | 1,239,630 | 1,984,774 | ||||||
Thomson Reuters Corp. | 144,743 | 5,870,776 | ||||||
Twenty-First Century Fox, Inc. (Class A Stock) | 199,535 | 6,752,264 | ||||||
|
| |||||||
| 34,836,831 | ||||||||
Metals & Mining 1.2% | ||||||||
Constellium NV (Netherlands) (Class A Stock)* | 341,509 | 6,939,463 | ||||||
Multiline Retail 2.0% | ||||||||
Target Corp. | 138,548 | 11,370,634 | ||||||
Oil, Gas & Consumable Fuels 5.4% | ||||||||
Anadarko Petroleum Corp. | 115,904 | 9,598,010 | ||||||
Cobalt International Energy, Inc.* | 286,138 | 2,692,559 | ||||||
Laredo Petroleum, Inc.* | 351,834 | 4,587,915 | ||||||
Noble Energy, Inc. | 198,461 | 9,704,743 | ||||||
Rice Energy, Inc.*(a) | 181,955 | 3,959,341 | ||||||
|
| |||||||
| 30,542,568 | ||||||||
Pharmaceuticals 9.9% | ||||||||
Bristol-Myers Squibb Co. | 199,012 | 12,836,274 | ||||||
Impax Laboratories, Inc.* | 101,521 | 4,758,289 | ||||||
Merck & Co., Inc. | 162,809 | 9,358,261 | ||||||
Mylan NV* | 163,662 | 9,713,340 | ||||||
See Notes to Financial Statements.
| Prudential Jennison Equity Opportunity Fund | 11 |
Portfolio of Investments
as of March 31, 2015 (Unaudited) continued
| Shares | Value (Note 1) | |||||||
COMMON STOCKS (Continued) | ||||||||
Pharmaceuticals (cont’d) | ||||||||
Pfizer, Inc. | 294,496 | $ | 10,245,516 | |||||
Shire PLC (Ireland), ADR | 36,434 | 8,718,292 | ||||||
|
| |||||||
| 55,629,972 | ||||||||
Semiconductors & Semiconductor Equipment 2.7% | ||||||||
Altera Corp. | 227,376 | 9,756,704 | ||||||
Maxim Integrated Products, Inc. | 163,725 | 5,699,267 | ||||||
|
| |||||||
| 15,455,971 | ||||||||
Software 7.3% | ||||||||
Cadence Design Systems, Inc.*(a) | 368,919 | 6,802,866 | ||||||
Fortinet, Inc.* | 334,695 | 11,697,590 | ||||||
Guidewire Software, Inc.*(a) | 148,546 | 7,815,005 | ||||||
Microsoft Corp. | 131,316 | 5,338,652 | ||||||
Rovi Corp.*(a) | 512,436 | 9,331,460 | ||||||
|
| |||||||
| 40,985,573 | ||||||||
Technology Hardware, Storage & Peripherals 3.7% | ||||||||
Apple, Inc. | 81,175 | 10,100,605 | ||||||
Diebold, Inc. | 302,502 | 10,726,721 | ||||||
|
| |||||||
| 20,827,326 | ||||||||
Textiles, Apparel & Luxury Goods 0.5% | ||||||||
Lululemon Athletica, Inc.* | 43,491 | 2,784,294 | ||||||
|
| |||||||
TOTAL LONG-TERM INVESTMENTS | 545,128,311 | |||||||
|
| |||||||
SHORT-TERM INVESTMENT 10.8% | ||||||||
AFFILIATED MONEY MARKET MUTUAL FUND | ||||||||
Prudential Investment Portfolios 2 - Prudential Core Taxable Money Market Fund (cost $60,899,796; includes $28,191,163 of cash collateral for securities on loan) (Note 3)(c)(d) | 60,899,796 | 60,899,796 | ||||||
|
| |||||||
TOTAL INVESTMENTS 107.7% | 606,028,107 | |||||||
Liabilities in excess of other assets (7.7)% | (43,194,245 | ) | ||||||
|
| |||||||
NET ASSETS 100.0% | $ | 562,833,862 | ||||||
|
| |||||||
See Notes to Financial Statements.
| 12 |
The following abbreviations are used in the portfolio descriptions:
144A—Security was purchased pursuant to Rule 144A under the Securities Act of 1933 and may not be resold subject to that rule except to qualified institutional buyers. Unless otherwise noted, 144A securities are deemed to be liquid.
ADR—American Depositary Receipt
| * | Non-income producing security. |
| (a) | All or a portion of security is on loan. The aggregate market value of such securities, including those sold and pending settlement, is $27,433,044; cash collateral of $28,191,163 (included with liabilities) was received with which the Portfolio purchased highly liquid short-term investments. Securities on loan are subject to contractual netting arrangements. |
| (b) | Indicates a security or securities that have been deemed illiquid. |
| (c) | Represents security, or a portion thereof, purchased with cash collateral received for securities on loan. |
| (d) | Prudential Investments LLC, the manager of the Series, also serves as manager of the Prudential Investment Portfolios 2 - Prudential Core Taxable Money Market Fund. |
Various inputs are used in determining the value of the Series’ investments. These inputs are summarized in the three broad levels listed below.
Level 1—quoted prices generally in active markets for identical securities.
Level 2—quoted prices for similar securities, interest rates and yield curves, prepayment speeds, foreign currency exchange rates and other observable inputs.
Level 3—unobservable inputs for securities valued in accordance with Board approved fair valuation procedures.
The following is a summary of the inputs used as of March 31, 2015 in valuing such portfolio securities:
| Level 1 | Level 2 | Level 3 | ||||||||||
Investments in Securities | ||||||||||||
Common Stocks | ||||||||||||
Aerospace & Defense | $ | 15,488,048 | $ | — | $ | — | ||||||
Air Freight & Logistics | 5,428,911 | — | — | |||||||||
Airlines | 7,198,546 | — | — | |||||||||
Auto Components | 9,110,401 | — | — | |||||||||
Banks | 38,707,543 | — | — | |||||||||
Capital Markets | 10,081,583 | — | — | |||||||||
Chemicals | 16,713,500 | — | — | |||||||||
Commercial Services & Supplies | 23,914,802 | — | — | |||||||||
See Notes to Financial Statements.
| Prudential Jennison Equity Opportunity Fund | 13 |
Portfolio of Investments
as of March 31, 2015 (Unaudited) continued
| Level 1 | Level 2 | Level 3 | ||||||||||
Communications Equipment | $ | 36,515,685 | $ | — | $ | — | ||||||
Diversified Financial Services | 8,458,311 | — | — | |||||||||
Diversified Telecommunication Services | — | 10,123,169 | — | |||||||||
Electric Utilities | 19,885,781 | — | — | |||||||||
Electronic Equipment, Instruments & Components | 5,121,225 | — | — | |||||||||
Food & Staples Retailing | 6,206,637 | — | — | |||||||||
Food Products | 17,764,818 | — | — | |||||||||
Health Care Equipment & Supplies | 9,779,660 | — | — | |||||||||
Hotels, Restaurants & Leisure | 43,453,855 | — | — | |||||||||
Independent Power & Renewable Electricity Producers | 10,010,447 | — | — | |||||||||
Industrial Conglomerates | — | 3,864,441 | — | |||||||||
Insurance | 13,742,934 | — | — | |||||||||
Internet Software & Services | 5,222,643 | — | — | |||||||||
Machinery | 8,962,739 | — | — | |||||||||
Media | 30,773,417 | 4,063,414 | — | |||||||||
Metals & Mining | 6,939,463 | — | — | |||||||||
Multiline Retail | 11,370,634 | — | — | |||||||||
Oil, Gas & Consumable Fuels | 30,542,568 | — | — | |||||||||
Pharmaceuticals | 55,629,972 | — | — | |||||||||
Semiconductors & Semiconductor Equipment | 15,455,971 | — | — | |||||||||
Software | 40,985,573 | — | — | |||||||||
Technology Hardware, Storage & Peripherals | 20,827,326 | — | — | |||||||||
Textiles, Apparel & Luxury Goods | 2,784,294 | — | — | |||||||||
Affiliated Money Market Mutual Fund | 60,899,796 | — | — | |||||||||
|
|
|
|
|
| |||||||
Total | $ | 587,977,083 | $ | 18,051,024 | $ | — | ||||||
|
|
|
|
|
| |||||||
See Notes to Financial Statements.
| 14 |
The industry classification of investments and liabilities in excess of other assets shown as a percentage of net assets as of March 31, 2015 was as follows:
Affiliated Money Market Mutual Fund (including 5.0% of collateral for securities on loan) | 10.8 | % | ||
Pharmaceuticals | 9.9 | |||
Hotels, Restaurants & Leisure | 7.7 | |||
Software | 7.3 | |||
Banks | 6.9 | |||
Communications Equipment | 6.5 | |||
Media | 6.2 | |||
Oil, Gas & Consumable Fuels | 5.4 | |||
Commercial Services & Supplies | 4.3 | |||
Technology Hardware, Storage & Peripherals | 3.7 | |||
Electric Utilities | 3.5 | |||
Food Products | 3.2 | |||
Chemicals | 3.0 | |||
Aerospace & Defense | 2.8 | |||
Semiconductors & Semiconductor Equipment | 2.7 | |||
Insurance | 2.4 | |||
Multiline Retail | 2.0 | |||
Diversified Telecommunication Services | 1.8 | |||
Capital Markets | 1.8 | |||
Independent Power & Renewable Electricity Producers | 1.8 | % | ||
Health Care Equipment & Supplies | 1.7 | |||
Auto Components | 1.6 | |||
Machinery | 1.6 | |||
Diversified Financial Services | 1.5 | |||
Airlines | 1.3 | |||
Metals & Mining | 1.2 | |||
Food & Staples Retailing | 1.1 | |||
Air Freight & Logistics | 1.0 | |||
Internet Software & Services | 0.9 | |||
Electronic Equipment, Instruments & Components | 0.9 | |||
Industrial Conglomerates | 0.7 | |||
Textiles, Apparel & Luxury Goods | 0.5 | |||
|
| |||
| 107.7 | ||||
Liabilities in excess of other assets | (7.7 | ) | ||
|
| |||
| 100.0 | % | |||
|
|
See Notes to Financial Statements.
| Prudential Jennison Equity Opportunity Fund | 15 |
Statement of Assets & Liabilities
as of March 31, 2015 (Unaudited)
Assets | ||||
Investments at value, including securities on loan of $27,433,044: | ||||
Unaffiliated investments (cost $420,109,544) | $ | 545,128,311 | ||
Affiliated investments (cost $60,899,796) | 60,899,796 | |||
Cash | 1,859 | |||
Receivable for investments sold | 1,295,860 | |||
Dividends receivable | 483,036 | |||
Receivable for Series shares sold | 353,893 | |||
Tax reclaim receivable | 37,336 | |||
Prepaid expenses | 2,529 | |||
|
| |||
Total Assets | 608,202,620 | |||
|
| |||
Liabilities | ||||
Payable to broker for collateral for securities on loan | 28,191,163 | |||
Payable for investments purchased | 16,149,240 | |||
Payable for Series shares reacquired | 498,117 | |||
Management fee payable | 280,292 | |||
Distribution fee payable | 131,496 | |||
Accrued expenses and other liabilities | 84,465 | |||
Affiliated transfer agent fee payable | 33,985 | |||
|
| |||
Total Liabilities | 45,368,758 | |||
|
| |||
Net Assets | $ | 562,833,862 | ||
|
| |||
Net assets were comprised of: | ||||
Common stock, at par | $ | 27,322 | ||
Paid-in capital in excess of par | 414,959,196 | |||
|
| |||
| 414,986,518 | ||||
Undistributed net investment income | 1,460,600 | |||
Accumulated net realized gain on investment and foreign currency transactions | 21,374,954 | |||
Net unrealized appreciation (depreciation) on investments and foreign currencies | 125,011,790 | |||
|
| |||
Net assets, March 31, 2015 | $ | 562,833,862 | ||
|
| |||
See Notes to Financial Statements.
| 16 |
Class A | ||||
Net asset value and redemption price per share ($296,919,337 ÷ 14,293,766 shares of common stock issued and outstanding) | $ | 20.77 | ||
Maximum sales charge (5.50% of offering price) | 1.21 | |||
|
| |||
Maximum offering price to public | $ | 21.98 | ||
|
| |||
Class B | ||||
Net asset value, offering price and redemption price per share ($11,723,956 ÷ 653,189 shares of common stock issued and outstanding) | $ | 17.95 | ||
|
| |||
Class C | ||||
Net asset value, offering price and redemption price per share ($50,504,433 ÷ 2,814,169 shares of common stock issued and outstanding) | $ | 17.95 | ||
|
| |||
Class Q | ||||
Net asset value, offering price and redemption price per share ($17,528,380 ÷ 818,424 shares of common stock issued and outstanding) | $ | 21.42 | ||
|
| |||
Class R | ||||
Net asset value, offering price and redemption price per share ($7,817,955 ÷ 414,096 shares of common stock issued and outstanding) | $ | 18.88 | ||
|
| |||
Class Z | ||||
Net asset value, offering price and redemption price per share ($178,339,801 ÷ 8,328,583 shares of common stock issued and outstanding) | $ | 21.41 | ||
|
| |||
See Notes to Financial Statements.
| Prudential Jennison Equity Opportunity Fund | 17 |
Statement of Operations
Six Months Ended March 31, 2015 (Unaudited)
Net Investment Income | ||||
Income | ||||
Unaffiliated dividend income (net of foreign withholding taxes of $16,957) | $ | 4,261,447 | ||
Affiliated income from securities lending, net | 108,023 | |||
Affiliated dividend income | 15,733 | |||
|
| |||
Total income | 4,385,203 | |||
|
| |||
Expenses | ||||
Management fee | 1,642,055 | |||
Distribution fee—Class A | 442,770 | |||
Distribution fee—Class B | 60,451 | |||
Distribution fee—Class C | 245,780 | |||
Distribution fee—Class R | 29,689 | |||
Transfer agent’s fees and expenses (including affiliated expense of $73,200) | 332,000 | |||
Shareholders’ reports | 53,000 | |||
Custodian and accounting fees | 45,000 | |||
Registration fees | 38,000 | |||
Legal fees and expenses | 13,000 | |||
Directors’ fees | 12,000 | |||
Audit fee | 11,000 | |||
Insurance expenses | 4,000 | |||
Commitment fee on syndicated credit agreement | 1,000 | |||
Miscellaneous | 8,344 | |||
|
| |||
Total expenses | 2,938,089 | |||
Less: Distribution fee waiver—Class R | (9,896 | ) | ||
|
| |||
Net expenses | 2,928,193 | |||
|
| |||
Net investment income | 1,457,010 | |||
|
| |||
Realized And Unrealized Gain (Loss) On Investments And Foreign Currency Transactions | ||||
Net realized gain (loss) on: | ||||
Investment transactions | 22,972,742 | |||
Foreign currency transactions | (6,784 | ) | ||
|
| |||
| 22,965,958 | ||||
|
| |||
Net change in unrealized appreciation (depreciation) on: | ||||
Investments | 10,459,343 | |||
Foreign currencies | 1,168 | |||
|
| |||
| 10,460,511 | ||||
|
| |||
Net gain on investment and foreign currency transactions | 33,426,469 | |||
|
| |||
Net Increase In Net Assets Resulting From Operations | $ | 34,883,479 | ||
|
| |||
See Notes to Financial Statements.
| 18 |
Statement of Changes in Net Assets
(Unaudited)
| Six Months Ended March 31, 2015 | Year Ended September 30, 2014 | |||||||
Increase (Decrease) in Net Assets | ||||||||
Operations | ||||||||
Net investment income | $ | 1,457,010 | $ | 1,429,332 | ||||
Net realized gain on investment and foreign currency transactions | 22,965,958 | 49,608,446 | ||||||
Net change in unrealized appreciation (depreciation) on investments and foreign currencies | 10,460,511 | 11,221,903 | ||||||
|
|
|
| |||||
Net increase in net assets resulting from operations | 34,883,479 | 62,259,681 | ||||||
|
|
|
| |||||
Dividends and Distributions (Note 1) | ||||||||
Dividends from net investment income | ||||||||
Class A | (495,610 | ) | (496,567 | ) | ||||
Class Q | (77,909 | ) | — | |||||
Class R | (533 | ) | (2,001 | ) | ||||
Class Z | (788,675 | ) | (580,891 | ) | ||||
|
|
|
| |||||
| (1,362,727 | ) | (1,079,459 | ) | |||||
|
|
|
| |||||
Distributions from net realized gains | ||||||||
Class A | (26,217,119 | ) | (9,522,750 | ) | ||||
Class B | (1,196,089 | ) | (479,822 | ) | ||||
Class C | (4,948,461 | ) | (1,446,736 | ) | ||||
Class Q | (1,450,511 | ) | — | |||||
Class R | (772,530 | ) | (199,099 | ) | ||||
Class Z | (15,091,768 | ) | (4,478,742 | ) | ||||
|
|
|
| |||||
| (49,676,478 | ) | (16,127,149 | ) | |||||
|
|
|
| |||||
Series share transactions (Net of share conversions) | ||||||||
Net proceeds from shares sold | 40,954,309 | 156,174,272 | ||||||
Net asset value of shares issued in reinvestment of dividends and distributions | 45,627,512 | 15,187,996 | ||||||
Cost of shares reacquired | (76,113,966 | ) | (76,699,717 | ) | ||||
|
|
|
| |||||
Net increase in net assets from Series share transactions | 10,467,855 | 94,662,551 | ||||||
|
|
|
| |||||
Total increase (decrease) | (5,687,871 | ) | 139,715,624 | |||||
Net Assets: | ||||||||
Beginning of period | 568,521,733 | 428,806,109 | ||||||
|
|
|
| |||||
End of period(a) | $ | 562,833,862 | $ | 568,521,733 | ||||
|
|
|
| |||||
(a) Includes undistributed net investment income of: | $ | 1,460,600 | $ | 1,366,317 | ||||
|
|
|
| |||||
See Notes to Financial Statements.
| Prudential Jennison Equity Opportunity Fund | 19 |
Notes to Financial Statements
(Unaudited)
The Prudential Investment Portfolios, Inc. (the “Company”) is an open-end management investment company, registered under the Investment Company Act of 1940, as amended, (“1940 Act”). The Company consists of six series: Prudential Jennison Equity Opportunity Fund (the “Series”), Prudential Jennison Growth Fund, and Prudential Asset Allocation Fund which are diversified funds and Prudential Growth Allocation Fund, Prudential Moderate Allocation Fund and Prudential Conservative Allocation Fund which are non-diversified funds. These financial statements relate to Prudential Jennison Equity Opportunity Fund. The financial statements of the other series are not presented herein.
The Series’ investment objective is to achieve long-term growth of capital.
Note 1. Accounting Policies
The Series follows investment company accounting and reporting guidance of the Financial Accounting Standards Board (FASB) Accounting Standard Codification Topic 946 Financial Services-Investment Companies. The following accounting policies conform to U.S. generally accepted accounting principles. The Series consistently follows such policies in the preparation of its financial statements.
Securities Valuation: The Series holds securities and other assets that are fair valued at the close of each day the New York Stock Exchange (“NYSE”) is open for trading. Fair value is the price that would be received to sell an asset or paid to transfer a liability in an orderly transaction between market participants on the measurement date. The Board of Directors (the “Board”) has adopted Valuation Procedures for security valuation under which fair valuation responsibilities have been delegated to Prudential Investments LLC (“PI” or “Manager”). Under the current Valuation Procedures, the established Valuation Committee is responsible for supervising the valuation of portfolio securities and other assets. The Valuation Procedures permit the Series to utilize independent pricing vendor services, quotations from market makers, and alternative valuation methods when market quotations are either not readily available or not deemed representative of fair value. A record of the Valuation Committee’s actions is subject to the Board’s review, approval, and ratification at its next regularly-scheduled quarterly meeting.
Various inputs determine how the Series’ investments are valued, all of which are categorized according to the three broad levels (Level 1, 2, or 3) detailed in the table following the Portfolio of Investments.
| 20 |
Common and preferred stocks, exchange-traded funds, and derivative instruments that are traded on a national securities exchange are valued at the last sale price as of the close of trading on the applicable exchange where the security principally trades. Securities traded via NASDAQ are valued at the NASDAQ official closing price. To the extent these securities are valued at the last sale price or NASDAQ official closing price, they are classified as Level 1 in the fair value hierarchy.
In the event that no sale or official closing price on valuation date exists, these securities are generally valued at the mean between the last reported bid and ask prices, or at the last bid price in the absence of an ask price. These securities are classified as Level 2 in the fair value hierarchy, as the inputs are observable.
Common and preferred stocks traded on foreign securities exchanges are valued using pricing vendor services that provide model prices derived using adjustment factors based on information such as local closing price, relevant general and sector indices, currency fluctuations, depositary receipts, and futures, as applicable. Securities valued using such model prices are classified as Level 2 in the fair value hierarchy, as the adjustment factors are observable. Such securities are valued using model prices to the extent that the valuation meets the established confidence level for each security. If the confidence level is not met or the vendor does not provide a model price, securities not valued using such model prices are valued in accordance with exchange-traded common and preferred stocks discussed above.
Investments in open-end, non-exchange-traded mutual funds are valued at their net asset values as of the close of the NYSE on the date of valuation. These securities are classified as Level 1 in the fair value hierarchy since they may be purchased or sold at their net asset values on the date of valuation.
Fixed income securities traded in the over-the-counter market are generally valued at prices provided by approved independent pricing vendors. The pricing vendors provide these prices after evaluating observable inputs including, but not limited to yield curves, yield spreads, credit ratings, deal terms, tranche level attributes, default rates, cash flows, prepayment speeds, broker/dealer quotations, and reported trades. Securities valued using such vendor prices are classified as Level 2 in the fair value hierarchy.
| Prudential Jennison Equity Opportunity Fund | 21 |
Notes to Financial Statements
(Unaudited) continued
Over-the-counter derivative instruments are generally valued using pricing vendor services, which derive the valuation based on inputs such as underlying asset prices, indices, spreads, interest rates, and exchange rates. These instruments are categorized as Level 2 in the fair value hierarchy.
Centrally cleared swaps listed or traded on a multilateral or trade facility platform, such as a registered exchange, are valued at the daily settlement price determined by the respective exchange. These securities are classified as Level 2 in the fair value hierarchy, as the daily settlement price is not public.
Securities and other assets that cannot be priced according to the methods described above are valued based on pricing methodologies approved by the Board. In the event that unobservable inputs are used when determining such valuations, the securities will be classified as Level 3 in the fair value hierarchy.
When determining the fair value of securities, some of the factors influencing the valuation include: the nature of any restrictions on disposition of the securities; assessment of the general liquidity of the securities; the issuer’s financial condition and the markets in which it does business; the cost of the investment; the size of the holding and the capitalization of the issuer; the prices of any recent transactions or bids/offers for such securities or any comparable securities; any available analyst media or other reports or information deemed reliable by the investment adviser regarding the issuer or the markets or industry in which it operates. Using fair value to price securities may result in a value that is different from a security’s most recent closing price and from the price used by other mutual funds to calculate their net asset values.
Restricted and Illiquid Securities: Subject to guidelines adopted by the Board, the Series may invest up to 15% of its net assets in illiquid securities, including those which are restricted as to disposition under securities law (“restricted securities”). Restricted securities are valued pursuant to the valuation procedures noted above. Illiquid securities are those that, because of the absence of a readily available market or due to legal or contractual restrictions on resale, cannot be sold within seven days in the ordinary course of business at approximately the amount at which the Series has valued the investment. Therefore, the Series may find it difficult to sell illiquid securities at the time considered most advantageous by its Subadviser and may incur expenses that would not be incurred in the sale of securities that were freely
| 22 |
marketable. Certain securities that would otherwise be considered illiquid because of legal restrictions on resale to the general public may be traded among qualified institutional buyers under Rule 144A of the Securities Act of 1933. These Rule 144A securities, as well as commercial paper that is sold in private placements under Section 4(2) of the Securities Act, may be deemed liquid by the Series’ Subadviser under the guidelines adopted by the Directors of the Series. However, the liquidity of the Series’ investments in Rule 144A securities could be impaired if trading does not develop or declines.
Foreign Currency Translation: The books and records of the Series are maintained in U.S. dollars. Foreign currency amounts are translated into U.S. dollars on the following basis:
(i) market value of investment securities, other assets and liabilities—at the current daily rates of exchange;
(ii) purchases and sales of investment securities, income and expenses—at the rates of exchange prevailing on the respective dates of such transactions.
Although the net assets of the Series are presented at the foreign exchange rates and market values at the close of the period, the Series does not isolate that portion of the results of operations arising as a result of changes in the foreign exchange rates from the fluctuations arising from changes in the market prices of long-term portfolio securities held at the end of the period. Similarly, the Series does not isolate the effect of changes in foreign exchange rates from the fluctuations arising from changes in the market prices of long-term portfolio securities sold during the period. Accordingly, these realized foreign currency gains or losses are included in the reported net realized gains or losses on investment transactions.
Net realized gains or losses on foreign currency transactions represent net foreign exchange gains or losses from holdings of foreign currencies, forward currency contracts, disposition of foreign currencies, currency gains or losses realized between the trade and settlement dates on securities transactions, and the difference between the amounts of interest, dividends and foreign withholding taxes recorded on the Series’ books and the U.S. dollar equivalent amounts actually received or paid. Net unrealized currency gains or losses from valuing foreign currency denominated assets and liabilities (other than investments) at period end exchange rates are reflected as a component of net unrealized appreciation (depreciation) on foreign currencies.
Master Netting Arrangements: The Series is subject to various Master Agreements, or netting arrangements, with select counterparties. These are agreements which a sub-adviser may have negotiated and entered into on behalf of the Series. A master netting
| Prudential Jennison Equity Opportunity Fund | 23 |
Notes to Financial Statements
(Unaudited) continued
arrangement between the Series and the counterparty permits the Series to offset amounts payable by the Series to the same counterparty against amounts to be received; and by the receipt of collateral from the counterparty by the Series to cover the Series’ exposure to the counterparty. However, there is no assurance that such mitigating factors are easily enforceable. The right to set-off exists when all the conditions are met such that each of the parties owes the other determinable amounts, the reporting party has the right to set-off the amount owed with the amount owed by the other party, the reporting party intends to set-off and the right of set-off is enforceable by law. During the reporting period, no instances occurred where the right to set-off existed and management has not elected to offset.
Securities Lending: The Series may lend its portfolio securities to banks and broker-dealers. The loans are secured by collateral at least equal to the market value of the securities loaned. Collateral pledged by each borrower is invested in a highly liquid short-term money market fund and is marked to market daily, based on the previous day’s market value, such that the value of the collateral exceeds the value of the loaned securities. Loans are subject to termination at the option of the borrower or the Series. Upon termination of the loan, the borrower will return to the Series securities identical to the loaned securities. Should the borrower of the securities fail financially, the Series has the right to repurchase the securities in the open market using the collateral. The Series recognizes income, net of any rebate and securities lending agent fees, for lending its securities, and any interest on the investment of cash received as collateral. The Series also continues to receive interest and dividends or amounts equivalent thereto, on the securities loaned and recognizes any unrealized gain or loss in the market price of the securities loaned that may occur during the term of the loan.
Securities Transactions and Net Investment Income: Securities transactions are recorded on the trade date. Realized gains or losses from investment and currency transactions are calculated on the identified cost basis. Dividend income is recorded on the ex-dividend date. Interest income, including amortization of premium and accretion of discount on debt securities, as required, is recorded on an accrual basis. Expenses are recorded on the accrual basis, which may require the use of certain estimates by management that may differ from actual.
Net investment income or loss (other than distribution fees, which are charged directly to the respective class and transfer agency fees specific to Class Q shares
| 24 |
which are charged to that share class) and unrealized and realized gains or losses are allocated daily to each class of shares based upon the relative proportion of adjusted net assets of each class at the beginning of the day.
Dividends and Distributions: The Series expects to pay dividends from net investment income and distributions from net realized capital gains, if any, at least annually. Dividends and distributions to shareholders, which are determined in accordance with federal income tax regulations and which may differ from generally accepted accounting principles, are recorded on the ex-dividend date. Permanent book/tax differences relating to income and gains are reclassified amongst undistributed net investment income, accumulated net realized gain or loss and paid-in capital in excess of par, as appropriate.
Taxes: For federal income tax purposes, the Series is treated as a separate taxpaying entity. It is the Series’ policy to continue to meet the requirements of the Internal Revenue Code applicable to regulated investment companies and to distribute all of its taxable net investment income and capital gains, if any, to its shareholders. Therefore, no federal income tax provision is required. Withholding taxes on foreign dividends are recorded net of reclaimable amounts, at the time the related income is earned.
Estimates: The preparation of the financial statements requires management to make estimates and assumptions that affect the reported amounts and disclosures in the financial statements. Actual results could differ from those estimates.
Note 2. Agreements
The Series has a management agreement with PI. Pursuant to this agreement, PI has responsibility for all investment advisory services and supervises the subadvisor’s performance of such services. PI has entered into a subadvisory agreement with Jennison Associates LLC (“Jennison”). The subadvisory agreement provides that Jennison furnishes investment advisory services in connection with the management of the Series. In connection therewith, Jennison is obligated to keep certain books and records of the Series. PI pays for the services of Jennison, the cost of compensation of officers of the Series, occupancy and certain clerical and bookkeeping costs of the Series. The Series bears all other costs and expenses.
| Prudential Jennison Equity Opportunity Fund | 25 |
Notes to Financial Statements
(Unaudited) continued
The management fee paid to PI is accrued daily and payable monthly at an annual rate of 0.600% of the average daily net assets of the Series up to $300 million and 0.575% of the average daily net assets of the Series over $300 million. The effective management fee rate was 0.590% of the Series’ average daily net assets for the six months ended March 31, 2015.
The Series has a distribution agreement with Prudential Investment Management Services LLC (“PIMS”), which acts as the distributor of the Class A, Class B, Class C, Class Q, Class R and Class Z shares of the Series. The Series compensates PIMS for distributing and servicing the Series’ Class A, Class B, Class C and Class R shares, pursuant to plans of distribution (the “Class A, B, C and R Plans”), regardless of expenses actually incurred by PIMS. The distribution fees are accrued daily and payable monthly. No distribution or service fees are paid to PIMS as distributor of the Class Q and Class Z shares of the Series.
Pursuant to the Class A, B, C and R Plans, the Series compensates PIMS for distribution related activities at an annual rate of up to .30%, 1%, 1% and .75% of the average daily net assets of the Class A, B, C and R shares, respectively. PIMS has contractually agreed to limit such fees to .50% for Class R shares.
PIMS has advised the Series that it has received $121,083 in front-end sales charges resulting from sales of Class A shares during the six months ended March 31, 2015. From these fees, PIMS paid such sales charges to affiliated broker-dealers, which in turn paid commissions to salespersons and incurred other distribution costs.
PIMS has advised the Series that for the six months ended March 31, 2015, it received $2,520, $5,153 and $4,620 in contingent deferred sales charges imposed upon redemptions by certain Class A, Class B and Class C shareholders, respectively.
PI, PIMS and Jennison are indirect, wholly-owned subsidiaries of Prudential Financial, Inc. (“Prudential”).
Note 3. Other Transactions with Affiliates
Prudential Mutual Fund Services LLC (“PMFS”), an affiliate of PI and an indirect, wholly-owned subsidiary of Prudential, serves as the Company’s transfer agent. Transfer agent’s fees and expenses in the Statement of Operations include certain out-of-pocket expenses paid to non-affiliates, where applicable.
Prudential Investment Management, Inc. (“PIM”), an indirect, wholly-owned subsidiary of Prudential, is the Series’ securities lending agent. Earnings from
| 26 |
securities lending are disclosed on the Statement of Operations as “Affiliated income from securities lending, net.” For the six months ended March 31, 2015, PIM was compensated approximately $32,000 for these services.
The Series invests in the Prudential Core Taxable Money Market Fund (the “Core Fund”), a portfolio of Prudential Investment Portfolios 2, registered under the 1940 Act and managed by PI. Earnings from the Core Fund are disclosed on the Statement of Operations as “Affiliated dividend income.”
Note 4. Portfolio Securities
Purchases and sales of portfolio securities, other than short-term investments, for the six months ended March 31, 2015, were $165,375,186 and $197,413,042, respectively.
Note 5. Tax Information
The United States federal income tax basis of the Series’ investments and the net unrealized appreciation as of March 31, 2015 were as follows:
Tax Basis | $ | 482,120,736 | ||
|
| |||
Appreciation | 133,686,072 | |||
Depreciation | (9,778,701 | ) | ||
|
| |||
Net Unrealized Appreciation | $ | 123,907,371 | ||
|
|
The book basis may differ from tax basis due to certain tax-related adjustments.
Management has analyzed the Series’ tax positions taken on federal, state and local income tax returns for all open tax years and has concluded that no provision for income tax is required in the Series’ financial statements for the current reporting period. The Series’ federal, state and local income and federal excise tax returns for tax years for which the applicable statutes of limitations have not expired are subject to examination by the Internal Revenue Service and state departments of revenue.
Note 6. Capital
The Series offers Class A, Class B, Class C, Class Q, Class R and Class Z shares. Class A shares are subject front-end sales charge of 5.50%. Investors who purchase Class A shares in an amount of $1 million or more and sell these shares within 12 months of purchase are subject to a contingent deferred sales charge (“CDSC”) of 1%,
| Prudential Jennison Equity Opportunity Fund | 27 |
Notes to Financial Statements
(Unaudited) continued
including investors who purchase their shares through broker-dealers affiliated with Prudential. Class B shares are sold with a contingent deferred sales charge which declines from 5% to zero depending on the period of time the shares are held. Class B shares automatically convert to Class A shares on a quarterly basis approximately seven years after purchase. Class B shares are closed to new purchases. Class C shares are sold with a contingent deferred sales charge of 1% during the first 12 months. A special exchange privilege is also available for shareholders who qualified to purchase Class A shares at net asset value. Class Q, Class R and Class Z shares are not subject to any sales or redemption charge and are offered exclusively for sale to a limited group of investors.
Under certain circumstances, an exchange may be made from specified share classes of the Series to one or more other share classes of the Series as presented in the table of transactions in shares of common stock.
There are 1 billion shares of $.001 par value common stock of the Series, designated Class A, Class B, Class C, Class Q, Class R and Class Z, each of which consists of 200 million, 5 million, 170 million, 230 million, 170 million, and 225 million authorized shares, respectively. As of March 31, 2015, Prudential through its affiliates owned 485 Class Q shares of the Series.
Transactions in shares of common stock were as follows:
Class A | Shares | Amount | ||||||
Six months ended March 31, 2015: | ||||||||
Shares sold | 777,026 | $ | 15,886,269 | |||||
Shares issued in reinvestment of dividends and distributions | 1,316,982 | 25,233,376 | ||||||
Shares reacquired | (1,975,590 | ) | (40,220,702 | ) | ||||
|
|
|
| |||||
Net increase (decrease) in shares outstanding before conversion | 118,418 | 898,943 | ||||||
Shares issued upon conversion from Class B | 48,740 | 1,010,585 | ||||||
Shares reacquired upon conversion into Class Z | (18,373 | ) | (379,637 | ) | ||||
|
|
|
| |||||
Net increase (decrease) in shares outstanding | 148,785 | $ | 1,529,891 | |||||
|
|
|
| |||||
Year ended September 30, 2014: | ||||||||
Shares sold | 2,627,042 | $ | 55,569,138 | |||||
Shares issued in reinvestment of dividends and distributions | 474,709 | 9,370,749 | ||||||
Shares reacquired | (2,132,341 | ) | (44,812,865 | ) | ||||
|
|
|
| |||||
Net increase (decrease) in shares outstanding before conversion | 969,410 | 20,127,022 | ||||||
Shares issued upon conversion from Class B and Class Z | 100,876 | 2,131,502 | ||||||
Shares reacquired upon conversion into Class Z | (255,978 | ) | (5,601,180 | ) | ||||
|
|
|
| |||||
Net increase (decrease) in shares outstanding | 814,308 | $ | 16,657,344 | |||||
|
|
|
| |||||
| 28 |
Class B | Shares | Amount | ||||||
Six months ended March 31, 2015: | ||||||||
Shares sold | 15,177 | $ | 269,842 | |||||
Shares issued in reinvestment of dividends and distributions | 69,124 | 1,146,772 | ||||||
Shares reacquired | (67,112 | ) | (1,193,928 | ) | ||||
|
|
|
| |||||
Net increase (decrease) in shares outstanding before conversion | 17,189 | 222,686 | ||||||
Shares reacquired upon conversion into Class A | (56,096 | ) | (1,010,585 | ) | ||||
|
|
|
| |||||
Net increase (decrease) in shares outstanding | (38,907 | ) | $ | (787,899 | ) | |||
|
|
|
| |||||
Year ended September 30, 2014: | ||||||||
Shares sold | 252,790 | $ | 4,593,586 | |||||
Shares issued in reinvestment of dividends and distributions | 26,672 | 464,900 | ||||||
Shares reacquired | (74,784 | ) | (1,375,543 | ) | ||||
|
|
|
| |||||
Net increase (decrease) in shares outstanding before conversion | 204,678 | 3,682,943 | ||||||
Shares reacquired upon conversion into Class A | (112,950 | ) | (2,101,115 | ) | ||||
|
|
|
| |||||
Net increase (decrease) in shares outstanding | 91,728 | $ | 1,581,828 | |||||
|
|
|
| |||||
Class C | ||||||||
Six months ended March 31, 2015: | ||||||||
Shares sold | 237,164 | $ | 4,250,728 | |||||
Shares issued in reinvestment of dividends and distributions | 274,043 | 4,546,372 | ||||||
Shares reacquired | (284,619 | ) | (5,085,359 | ) | ||||
|
|
|
| |||||
Net increase (decrease) in shares outstanding before conversion | 226,588 | 3,711,741 | ||||||
Shares reacquired upon conversion into Class Z | (6,714 | ) | (122,904 | ) | ||||
|
|
|
| |||||
Net increase (decrease) in shares outstanding | 219,874 | $ | 3,588,837 | |||||
|
|
|
| |||||
Year ended September 30, 2014: | ||||||||
Shares sold | 892,301 | 16,501,317 | ||||||
Shares issued in reinvestment of dividends and distributions | 76,038 | 1,325,350 | ||||||
Shares reacquired | (275,040 | ) | (5,095,360 | ) | ||||
|
|
|
| |||||
Net increase (decrease) in shares outstanding before conversion | 693,299 | 12,731,307 | ||||||
Shares reacquired upon conversion into Class Z | (13,096 | ) | (247,856 | ) | ||||
|
|
|
| |||||
Net increase (decrease) in shares outstanding | 680,203 | $ | 12,483,451 | |||||
|
|
|
| |||||
Class Q | ||||||||
Period ended March 31, 2015*: | ||||||||
Shares sold | 16,583 | $ | 334,999 | |||||
Shares issued in reinvestment of dividends and distributions | 77,467 | 1,528,420 | ||||||
Shares reacquired | (38,778 | ) | (815,000 | ) | ||||
|
|
|
| |||||
Net increase (decrease) in shares outstanding before conversion | 55,272 | 1,048,419 | ||||||
Shares issued upon conversion from Class Z | 763,152 | 17,346,436 | ||||||
|
|
|
| |||||
Net increase (decrease) in shares outstanding | 818,424 | $ | 18,394,855 | |||||
|
|
|
| |||||
| Prudential Jennison Equity Opportunity Fund | 29 |
Notes to Financial Statements
(Unaudited) continued
Class R | Shares | Amount | ||||||
Six months ended March 31, 2015: | ||||||||
Shares sold | 46,483 | $ | 852,110 | |||||
Shares issued in reinvestment of dividends and distributions | 27,086 | 471,839 | ||||||
Shares reacquired | (75,372 | ) | (1,388,494 | ) | ||||
|
|
|
| |||||
Net increase (decrease) in shares outstanding | (1,803 | ) | $ | (64,545 | ) | |||
|
|
|
| |||||
Year ended September 30, 2014: | ||||||||
Shares sold | 286,216 | $ | 5,536,023 | |||||
Shares issued in reinvestment of dividends and distributions | 6,283 | 113,919 | ||||||
Shares reacquired | (122,181 | ) | (2,374,387 | ) | ||||
|
|
|
| |||||
Net increase (decrease) in shares outstanding | 170,318 | $ | 3,275,555 | |||||
|
|
|
| |||||
Class Z | Shares | Amount | ||||||
Six months ended March 31, 2015: | ||||||||
Shares sold | 924,475 | $ | 19,360,361 | |||||
Shares issued in reinvestment of dividends and distributions | 643,727 | 12,700,733 | ||||||
Shares reacquired | (1,294,420 | ) | (27,410,483 | ) | ||||
|
|
|
| |||||
Net increase (decrease) in shares outstanding before conversion | 273,782 | 4,650,611 | ||||||
Shares issued upon conversion from Class A and Class C | 23,529 | 502,541 | ||||||
Shares reacquired upon conversion into Class Q | (763,152 | ) | (17,346,436 | ) | ||||
|
|
|
| |||||
Net increase (decrease) in shares outstanding | (465,841 | ) | $ | (12,193,284 | ) | |||
|
|
|
| |||||
Year ended September 30, 2014: | ||||||||
Shares sold | 3,425,739 | $ | 73,974,208 | |||||
Shares issued in reinvestment of dividends and distributions | 192,952 | 3,913,078 | ||||||
Shares reacquired | (1,054,785 | ) | (23,041,562 | ) | ||||
|
|
|
| |||||
Net increase (decrease) in shares outstanding before conversion | 2,563,906 | 54,845,724 | ||||||
Shares issued upon conversion from Class A and Class C | 259,939 | 5,849,036 | ||||||
Shares reacquired upon conversion into Class A | (1,429 | ) | (30,387 | ) | ||||
|
|
|
| |||||
Net increase (decrease) in shares outstanding | 2,822,416 | $ | 60,664,373 | |||||
|
|
|
| |||||
| * | Commencement of offering was November 25, 2014. |
Note 7. Borrowings
The Series, along with other affiliated registered investment companies (the “Funds”), is a party to a Syndicated Credit Agreement (“SCA”) with a group of banks. The purpose of the SCA is to provide an alternative source of temporary funding for capital share redemptions. The SCA provides for a commitment of $900 million for the period October 9, 2014 through October 8, 2015. The Funds pay an annualized commitment fee of .075% of the unused portion of the SCA. Prior to October 9, 2014
| 30 |
the Funds had another SCA that provided a commitment fee of $900 million and the Funds paid an annualized commitment fee of .08% of the unused portion of the SCA. Interest on any borrowings under the SCA is paid at contracted market rates. The commitment fee for the unused amount is accrued daily and paid quarterly.
The Series did not utilize the SCA during the six months ended March 31, 2015.
Note 8. New Accounting Pronouncement
In May 2015, the FASB issued Accounting Standards Update (“ASU”) No. 2015-07 regarding “Disclosures for Investments in Certain Entities That Calculate Net Asset Value per Share”. The amendments in this update are effective for the Fund for fiscal years beginning after December 15, 2015, and interim periods within those fiscal years. ASU No. 2015-07 will eliminate the requirement to categorize investments in the fair value hierarchy if their fair value is measured at net asset value (“NAV”) per share (or its equivalent) using the practical expedient in the FASB’s fair value measurement guidance. At this time, management is evaluating the implications of ASU No. 2015-07 and its impact on the financial statement disclosures has not yet been determined.
| Prudential Jennison Equity Opportunity Fund | 31 |
Financial Highlights
(Unaudited)
| Class A Shares | ||||||||||||||||||||||||||
| Six Months Ended March 31, 2015 | Year Ended September 30, | |||||||||||||||||||||||||
| 2014 | 2013 | 2012 | 2011 | 2010 | ||||||||||||||||||||||
| Per Share Operating Performance(a): | ||||||||||||||||||||||||||
| Net Asset Value, Beginning Of Period | $21.48 | $19.56 | $15.40 | $12.15 | $12.39 | $11.38 | ||||||||||||||||||||
| Income (loss) from investment operations: | ||||||||||||||||||||||||||
| Net investment income (loss) | .05 | .05 | .06 | .06 | .01 | - | (d) | |||||||||||||||||||
| Net realized and unrealized gain (loss) on investment transactions | 1.18 | 2.63 | 4.18 | 3.19 | (.25 | ) | 1.01 | |||||||||||||||||||
| Total from investment operations | 1.23 | 2.68 | 4.24 | 3.25 | (.24 | ) | 1.01 | |||||||||||||||||||
| Less Dividends and Distributions: | ||||||||||||||||||||||||||
| Dividends from net investment income | (.04 | ) | (.04 | ) | (.08 | ) | - | - | - | |||||||||||||||||
| Distributions from net realized gains | (1.90 | ) | (.72 | ) | - | - | - | - | ||||||||||||||||||
| Total dividends and distributions | (1.94 | ) | (.76 | ) | (.08 | ) | - | - | - | |||||||||||||||||
| Capital Contributions(e): | - | - | - | - | - | - | (d) | |||||||||||||||||||
| Net asset value, end of period | $20.77 | $21.48 | $19.56 | $15.40 | $12.15 | $12.39 | ||||||||||||||||||||
| Total Return(b): | 6.46% | 14.00% | 27.64% | 26.75% | (1.94)% | 8.88% | ||||||||||||||||||||
| Ratios/Supplemental Data: | ||||||||||||||||||||||||||
| Net assets, end of period (000) | $296,919 | $303,859 | $260,720 | $213,926 | $189,105 | $210,516 | ||||||||||||||||||||
| Average net assets (000) | $295,991 | $291,978 | $231,545 | $210,097 | $227,408 | $212,873 | ||||||||||||||||||||
| Ratios to average net assets(c): | ||||||||||||||||||||||||||
| Expenses after waivers and/or expense reimbursement | 1.08% | (f) | 1.07% | 1.10% | 1.13% | 1.15% | 1.20% | |||||||||||||||||||
| Expenses before waivers and/or expense reimbursement | 1.08% | (f) | 1.07% | 1.10% | 1.13% | 1.15% | 1.20% | |||||||||||||||||||
| Net investment income (loss) | .49% | (f) | .26% | .36% | .44% | .11% | (.03)% | |||||||||||||||||||
| Portfolio turnover rate | 30% | (g) | 47% | 55% | 40% | 66% | 71% | |||||||||||||||||||
(a) Calculated based on average shares outstanding during the period.
(b) Total return does not consider the effects of sales loads. Total return is calculated assuming a purchase of a share on the first day and a sale on the last day of each period reported and includes reinvestment of dividends and distributions. Total returns may reflect adjustments to conform to generally accepted accounting principles. Total returns for periods less than one full year are not annualized.
(c) Does not include expenses of the underlying portfolio in which the Series invests.
(d) Less than $.005 per share.
(e) The Series received payments related to a former affiliate’s settlement of regulatory proceedings involving allegations of improper trading in Series shares during the fiscal year ended September 30, 2010. The Series was not involved in the proceedings or in the calculation of the amount of settlement.
(f) Annualized.
(g) Not annualized.
See Notes to Financial Statements.
| 32 |
| Class B Shares | ||||||||||||||||||||||||||
| Six Months Ended March 31, 2015 | Year Ended September 30, | |||||||||||||||||||||||||
| 2014 | 2013 | 2012 | 2011 | 2010 | ||||||||||||||||||||||
| Per Share Operating Performance(a): | ||||||||||||||||||||||||||
| Net Asset Value, Beginning Of Period | $18.86 | $17.33 | $13.70 | $10.88 | $11.17 | $10.33 | ||||||||||||||||||||
| Income (loss) from investment operations: | ||||||||||||||||||||||||||
| Net investment loss | (.02 | ) | (.08 | ) | (.05 | ) | (.03 | ) | (.07 | ) | (.08 | ) | ||||||||||||||
| Net realized and unrealized gain (loss) on investment transactions | 1.01 | 2.33 | 3.70 | 2.85 | (.22 | ) | .92 | |||||||||||||||||||
| Total from investment operations | .99 | 2.25 | 3.65 | 2.82 | (.29 | ) | .84 | |||||||||||||||||||
| Less Dividends and Distributions: | ||||||||||||||||||||||||||
| Dividends from net investment income | - | - | (.02 | ) | - | - | - | |||||||||||||||||||
| Distributions from net realized gains | (1.90 | ) | (.72 | ) | - | - | - | - | ||||||||||||||||||
| Total dividends and distributions | (1.90 | ) | (.72 | ) | (.02 | ) | - | - | - | |||||||||||||||||
| Capital Contributions(e): | - | - | - | - | - | - | (d) | |||||||||||||||||||
| Net asset value, end of period | $17.95 | $18.86 | $17.33 | $13.70 | $10.88 | $11.17 | ||||||||||||||||||||
| Total Return(b): | 6.07% | 13.30% | 26.66% | 25.92% | (2.60)% | 8.13% | ||||||||||||||||||||
| Ratios/Supplemental Data: | ||||||||||||||||||||||||||
| Net assets, end of period (000) | $11,724 | $13,049 | $10,406 | $8,856 | $10,079 | $16,841 | ||||||||||||||||||||
| Average net assets (000) | $12,123 | $13,038 | $9,405 | $9,961 | $15,538 | $19,765 | ||||||||||||||||||||
| Ratios to average net assets(c): | ||||||||||||||||||||||||||
| Expenses after waivers and/or expense reimbursement | 1.78% | (f) | 1.77% | 1.80% | 1.83% | 1.85% | 1.90% | |||||||||||||||||||
| Expenses before waivers and/or expense reimbursement | 1.78% | (f) | 1.77% | 1.80% | 1.83% | 1.85% | 1.90% | |||||||||||||||||||
| Net investment loss | (.19)% | (f) | (.43)% | (.33)% | (.26)% | (.60)% | (.73)% | |||||||||||||||||||
| Portfolio turnover rate | 30% | (g) | 47% | 55% | 40% | 66% | 71% | |||||||||||||||||||
(a) Calculated based on average shares outstanding during the period.
(b) Total return does not consider the effects of sales loads. Total return is calculated assuming a purchase of a share on the first day and a sale on the last day of each period reported and includes reinvestment of dividends and distributions. Total returns may reflect adjustments to conform to generally accepted accounting principles. Total returns for periods less than one full year are not annualized.
(c) Does not include expenses of the underlying portfolio in which the Series invests.
(d) Less than $.005 per share.
(e) The Series received payments related to a former affiliate’s settlement of regulatory proceedings involving allegations of improper trading in Series shares during the fiscal year ended September 30, 2010. The Series was not involved in the proceedings or in the calculation of the amount of settlement.
(f) Annualized.
(g) Not annualized.
See Notes to Financial Statements.
| Prudential Jennison Equity Opportunity Fund | 33 |
Financial Highlights
(Unaudited) continued
| Class C Shares | ||||||||||||||||||||||||||
| Six Months Ended March 31, 2015 | Year Ended September 30, | |||||||||||||||||||||||||
| 2014 | 2013 | 2012 | 2011 | 2010 | ||||||||||||||||||||||
| Per Share Operating Performance(a): | ||||||||||||||||||||||||||
| Net Asset Value, Beginning Of Period | $18.86 | $17.33 | $13.70 | $10.88 | $11.17 | $10.33 | ||||||||||||||||||||
| Income (loss) from investment operations: | ||||||||||||||||||||||||||
| Net investment loss | (.02 | ) | (.08 | ) | (.05 | ) | (.03 | ) | (.07 | ) | (.08 | ) | ||||||||||||||
| Net realized and unrealized gain (loss) on investments and foreign currency transactions | 1.01 | 2.33 | 3.70 | 2.85 | (.22 | ) | .92 | |||||||||||||||||||
| Total from investment operations | .99 | 2.25 | 3.65 | 2.82 | (.29 | ) | .84 | |||||||||||||||||||
| Less Dividends and Distributions: | ||||||||||||||||||||||||||
| Dividends from net investment income | - | - | (.02 | ) | - | - | - | |||||||||||||||||||
| Distributions from net realized gains | (1.90 | ) | (.72 | ) | - | - | - | - | ||||||||||||||||||
| Total dividends and distributions | (1.90 | ) | (.72 | ) | (.02 | ) | - | - | - | |||||||||||||||||
| Capital Contributions(e): | - | - | - | - | - | - | (d) | |||||||||||||||||||
| Net asset value, end of period | $17.95 | $18.86 | $17.33 | $13.70 | $10.88 | $11.17 | ||||||||||||||||||||
| Total Return(b): | 6.07% | 13.30% | 26.66% | 25.92% | (2.60)% | 8.13% | ||||||||||||||||||||
| Ratios/Supplemental Data: | ||||||||||||||||||||||||||
| Net assets, end of period (000) | $50,504 | $48,927 | $33,179 | $26,667 | $24,251 | $27,097 | ||||||||||||||||||||
| Average net assets (000) | $49,291 | $42,781 | $28,668 | $27,151 | $29,339 | $26,616 | ||||||||||||||||||||
| Ratios to average net assets(c): | ||||||||||||||||||||||||||
| Expenses after waivers and/or expense reimbursement | 1.78% | (f) | 1.77% | 1.80% | 1.83% | 1.85% | 1.90% | |||||||||||||||||||
| Expenses before waivers and/or expense reimbursement | 1.78% | (f) | 1.77% | 1.80% | 1.83% | 1.85% | 1.90% | |||||||||||||||||||
| Net investment loss | (.20)% | (f) | (.44)% | (.34)% | (.26)% | (.59)% | (.73)% | |||||||||||||||||||
| Portfolio turnover rate | 30% | (g) | 47% | 55% | 40% | 66% | 71% | |||||||||||||||||||
(a) Calculated based on average shares outstanding during the period.
(b) Total return does not consider the effects of sales loads. Total return is calculated assuming a purchase of a share on the first day and a sale on the last day of each period reported and includes reinvestment of dividends and distributions. Total returns may reflect adjustments to conform to generally accepted accounting principles. Total returns for periods less than one full year are not annualized.
(c) Does not include expenses of the underlying portfolio in which the Series invests.
(d) Less than $.005 per share.
(e) The Series received payments related to a former affiliate’s settlement of regulatory proceedings involving allegations of improper trading in Series shares during the fiscal year ended September 30, 2010. The Series was not involved in the proceedings or in the calculation of the amount of settlement.
(f) Annualized.
(g) Not annualized.
See Notes to Financial Statements.
| 34 |
| Class Q Shares | ||||
| November 25, 2014(a) through March 31, 2015 | ||||
| Per Share Operating Performance(b): | ||||
| Net Asset Value, Beginning Of Period | $22.73 | |||
| Income from investment operations: | ||||
| Net investment income | .05 | |||
| Net realized and unrealized gain on investment transactions | .64 | |||
| Total from investment operations | .69 | |||
| Less Dividends and Distributions: | ||||
| Dividends from net investment income | (.10 | ) | ||
| Distributions from net realized gains | (1.90 | ) | ||
| Total dividends and distributions | (2.00 | ) | ||
| Net asset value, end of period | $21.42 | |||
| Total Return(c): | 3.80% | |||
| Ratios/Supplemental Data: | ||||
| Net assets, end of period (000) | $17,528 | |||
| Average net assets (000) | $16,845 | |||
| Ratios to average net assets(d): | ||||
| Expenses after waivers and/or expense reimbursement | .66% | (e) | ||
| Expenses before waivers and/or expense reimbursement | .66% | (e) | ||
| Net investment income | .73% | (e) | ||
| Portfolio turnover rate | 30% | (f) | ||
(a) Commencement of offering.
(b) Calculated based on average shares outstanding during the period.
(c) Total return is calculated assuming a purchase of a share on the first day and a sale on the last day of each period reported and includes reinvestment of dividends and distributions. Total returns may reflect adjustments to conform to generally accepted accounting principles. Total returns for periods of less than one full year are not annualized.
(d) Does not include expenses of the underlying portfolio in which the Series invests.
(e) Annualized.
(f) Not annualized.
See Notes to Financial Statements.
Prudential Jennison Equity Opportunity Fund | 35 |
Financial Highlights
(Unaudited) continued
| Class R Shares | ||||||||||||||||||||||||||
| Six Months Ended March 31, 2015 | Year Ended September 30, | |||||||||||||||||||||||||
| 2014 | 2013 | 2012 | 2011 | 2010 | ||||||||||||||||||||||
| Per Share Operating Performance(a): | ||||||||||||||||||||||||||
| Net Asset Value, Beginning Of Period | $19.69 | $17.99 | $14.18 | $11.21 | $11.45 | $10.52 | ||||||||||||||||||||
| Income (loss) from investment operations: | ||||||||||||||||||||||||||
| Net investment income (loss) | .03 | .01 | .03 | .04 | (.01 | ) | (.02 | ) | ||||||||||||||||||
| Net realized and unrealized gain (loss) on investment transactions | 1.06 | 2.42 | 3.83 | 2.93 | (.23 | ) | .95 | |||||||||||||||||||
| Total from investment operations | 1.09 | 2.43 | 3.86 | 2.97 | (.24 | ) | .93 | |||||||||||||||||||
| Less Dividends and Distributions: | ||||||||||||||||||||||||||
| Dividends from net investment income | - | (d) | (.01 | ) | (.05 | ) | - | - | - | |||||||||||||||||
| Distributions from net realized gains | (1.90 | ) | (.72 | ) | - | - | - | - | ||||||||||||||||||
| Total dividends and distributions | (1.90 | ) | (.73 | ) | (.05 | ) | - | - | - | |||||||||||||||||
| Capital Contributions(e): | - | - | - | - | - | - | (d) | |||||||||||||||||||
| Net asset value, end of period | $18.88 | $19.69 | $17.99 | $14.18 | $11.21 | $11.45 | ||||||||||||||||||||
| Total Return(b): | 6.35% | 13.81% | 27.34% | 26.49% | (2.10)% | 8.84% | ||||||||||||||||||||
| Ratios/Supplemental Data: | ||||||||||||||||||||||||||
| Net assets, end of period (000) | $7,818 | $8,188 | $4,418 | $3,056 | $1,041 | $735 | ||||||||||||||||||||
| Average net assets (000) | $7,939 | $6,569 | $3,599 | $2,401 | $1,104 | $202 | ||||||||||||||||||||
| Ratios to average net assets(c): | ||||||||||||||||||||||||||
| Expenses after waivers and/or expense reimbursement | 1.28% | (f) | 1.27% | 1.30% | 1.33% | 1.35% | 1.40% | |||||||||||||||||||
| Expenses before waivers and/or expense reimbursement | 1.53% | (f) | 1.52% | 1.55% | 1.58% | 1.60% | 1.65% | |||||||||||||||||||
| Net investment income (loss) | .30% | (f) | .07% | .17% | .27% | (.09)% | (.20)% | |||||||||||||||||||
| Portfolio turnover rate | 30% | (g) | 47% | 55% | 40% | 66% | 71% | |||||||||||||||||||
(a) Calculated based on average shares outstanding during the period.
(b) Total return is calculated assuming a purchase of a share on the first day and a sale on the last day of each period reported and includes reinvestment of dividends and distributions. Total returns may reflect adjustments to conform to generally accepted accounting principles. Total returns for periods less than one full year are not annualized.
(c) Does not include expenses of the underlying portfolio in which the Series invests.
(d) Less than $.005 per share.
(e) The Series received payments related to a former affiliate’s settlement of regulatory proceedings involving allegations of improper trading in Series shares during the fiscal year ended September 30, 2010. The Series was not involved in the proceedings or in the calculation of the amount of settlement.
(f) Annualized.
(g) Not annualized.
See Notes to Financial Statements.
| 36 |
| Class Z Shares | ||||||||||||||||||||||||||
| Six Months Ended March 31, 2015 | Year Ended September 30, | |||||||||||||||||||||||||
| 2014 | 2013 | 2012 | 2011 | 2010 | ||||||||||||||||||||||
| Per Share Operating Performance(a): | ||||||||||||||||||||||||||
| Net Asset Value, Beginning Of Period | $22.12 | $20.11 | $15.83 | $12.49 | $12.69 | $11.63 | ||||||||||||||||||||
| Income (loss) from investment operations: | ||||||||||||||||||||||||||
| Net investment income | .09 | .12 | .12 | .11 | .06 | .03 | ||||||||||||||||||||
| Net realized and unrealized gain (loss) on investment transactions | 1.20 | 2.70 | 4.28 | 3.27 | (.26 | ) | 1.03 | |||||||||||||||||||
| Total from investment operations | 1.29 | 2.82 | 4.40 | 3.38 | (.20 | ) | 1.06 | |||||||||||||||||||
| Less Dividends and Distributions: | ||||||||||||||||||||||||||
| Dividends from net investment income | (.10 | ) | (.09 | ) | (.12 | ) | (.04 | ) | - | - | ||||||||||||||||
| Distributions from net realized gains | (1.90 | ) | (.72 | ) | - | - | - | - | ||||||||||||||||||
| Total dividends and distributions | (2.00 | ) | (.81 | ) | (.12 | ) | (.04 | ) | - | - | ||||||||||||||||
| Capital Contributions(e): | - | - | - | - | - | - | (d) | |||||||||||||||||||
| Net asset value, end of period | $21.41 | $22.12 | $20.11 | $15.83 | $12.49 | $12.69 | ||||||||||||||||||||
| Total Return(b): | 6.60% | 14.38% | 28.01% | 27.14% | (1.58)% | 9.11% | ||||||||||||||||||||
| Ratios/Supplemental Data: | ||||||||||||||||||||||||||
| Net assets, end of period (000) | $178,340 | $194,498 | $120,082 | $94,646 | $69,420 | $65,002 | ||||||||||||||||||||
| Average net assets (000) | $182,854 | $161,815 | $104,364 | $84,211 | $76,050 | $57,774 | ||||||||||||||||||||
| Ratios to average net assets(c): | ||||||||||||||||||||||||||
| Expenses after waivers and/or expense reimbursement | .78% | (f) | .77% | .80% | .83% | .85% | .90% | |||||||||||||||||||
| Expenses before waivers and/or expense reimbursement | .78% | (f) | .77% | .80% | .83% | .85% | .90% | |||||||||||||||||||
| Net investment income | .81% | (f) | .57% | .66% | .74% | .41% | .28% | |||||||||||||||||||
| Portfolio turnover rate | 30% | (g) | 47% | 55% | 40% | 66% | 71% | |||||||||||||||||||
(a) Calculated based on average shares outstanding during the period.
(b) Total return is calculated assuming a purchase of a share on the first day and a sale on the last day of each period reported and includes reinvestment of dividends and distributions. Total returns may reflect adjustments to conform to generally accepted accounting principles. Total returns for periods less than one full year are not annualized.
(c) Does not include expenses of the underlying portfolio in which the Series invests.
(d) Less than $.005 per share.
(e) The Series received payments related to a former affiliate’s settlement of regulatory proceedings involving allegations of improper trading in Series shares during the fiscal year ended September 30, 2010. The Series was not involved in the proceedings or in the calculation of the amount of settlement.
(f) Annualized.
(g) Not annualized.
See Notes to Financial Statements.
| Prudential Jennison Equity Opportunity Fund | 37 |
Results of Proxy Voting
(Unaudited)
At a special meeting of shareholders held on November 26, 2014, shareholders of the Prudential Investment Portfolios, Inc., which is comprised of Prudential Balanced Fund, Prudential Growth Allocation Fund, Prudential Moderate Allocation Fund, Prudential Conservative Allocation Fund, Prudential Jennison Equity Opportunity Fund and Prudential Jennison Growth Fund (collectively, the “Funds”), approved the following proposal. Shareholders of all Funds voted together on the proposal:
To elect twelve Directors:
| SHARES VOTED | % OF VOTED | % OF TOTAL | ||||||||||
(a) Ellen S. Alberding; | ||||||||||||
FOR | 95,100,802.626 | 98.280 | 55.055 | |||||||||
WITHHELD | 1,664,556.591 | 1.720 | 0.963 | |||||||||
(b) Kevin J. Bannon; | ||||||||||||
FOR | 95,146,900.682 | 98.328 | 55.082 | |||||||||
WITHHELD | 1,618,458.535 | 1.672 | 0.936 | |||||||||
(c) Linda W. Bynoe; | ||||||||||||
FOR | 95,140,861.216 | 98.322 | 55.078 | |||||||||
WITHHELD | 1,624,498.001 | 1.678 | 0.940 | |||||||||
(d) Keith F. Hartstein; | ||||||||||||
FOR | 95,133,836.925 | 98.314 | 55.074 | |||||||||
WITHHELD | 1,631,522.292 | 1.686 | 0.944 | |||||||||
(e) Michael S. Hyland; | ||||||||||||
FOR | 95,117,285.270 | 98.297 | 55.064 | |||||||||
WITHHELD | 1,648,073.947 | 1.703 | 0.954 | |||||||||
(f) Stephen P. Munn; | ||||||||||||
FOR | 95,030,269.772 | 98.207 | 55.014 | |||||||||
WITHHELD | 1,735,089.445 | 1.793 | 1.004 | |||||||||
(g) James E. Quinn; | ||||||||||||
FOR | 95,133,075.390 | 98.314 | 55.074 | |||||||||
WITHHELD | 1,632,283.827 | 1.686 | 0.944 | |||||||||
(h) Richard A. Redeker; | ||||||||||||
FOR | 95,042,171.501 | 98.220 | 55.021 | |||||||||
WITHHELD | 1,723,187.716 | 1.780 | 0.997 | |||||||||
(i) Stephen G. Stoneburn; | ||||||||||||
FOR | 95,055,450.417 | 98.233 | 55.029 | |||||||||
WITHHELD | 1,709,908.800 | 1.767 | 0.989 | |||||||||
(j) Stuart S. Parker; | ||||||||||||
FOR | 95,151,749.610 | 98.333 | 55.084 | |||||||||
WITHHELD | 1,613,609.607 | 1.667 | 0.934 | |||||||||
| 38 |
| SHARES VOTED | % OF VOTED | % OF TOTAL | ||||||||||
(k) Scott E. Benjamin; and | ||||||||||||
FOR | 95,115,629.702 | 98.296 | 55.063 | |||||||||
WITHHELD | 1,649,729.515 | 1.704 | 0.955 | |||||||||
(l) Grace C. Torres. | ||||||||||||
FOR | 95,092,614.445 | 98.272 | 55.050 | |||||||||
WITHHELD | 1,672,744.772 | 1.728 | 0.968 | |||||||||
The special meeting of shareholders of the Prudential Jennison Equity Opportunity Fund (the “Fund”) held on November 26, 2014, was adjourned to December 3, 2014, and further adjourned to December 10, 2014 and January 9, 2015 to permit further solicitation of proxies on the proposals noted below.
An abstention or a broker non-vote is considered present for purposes of determining a quorum but has the effect of a vote against such matters. At the special meeting of shareholders held on January 9, 2015, insufficient votes were obtained to approve the following proposals:
Proposal: To permit PI to enter into or make material changes to the Fund’s subadvisory agreements with subadvisers that are wholly-owned subsidiaries of PI or a sister company of PI (wholly-owned subadvisers) without shareholder approval.
| SHARES VOTED | % OF VOTED | % OF TOTAL | ||||||||||
FOR | 5,314,856.797 | 28.167 | 19.932 | |||||||||
AGAINST | 322,431.065 | 1.709 | 1.209 | |||||||||
ABSTAIN | 120,948.685 | 0.641 | 0.454 | |||||||||
BROKER NON-VOTE | 13,110,967.112 | 69.483 | 49.169 | |||||||||
TOTAL | 18,869,203.659 | 100.000 | 70.764 | |||||||||
Proposal: To approve a proposal to designate the Fund’s investment objective as a non-fundamental policy of the Fund.
| SHARES VOTED | % OF VOTED | % OF TOTAL | ||||||||||
FOR | 3,606,357.905 | 19.113 | 13.525 | |||||||||
AGAINST | 1,925,141.457 | 10.203 | 7.220 | |||||||||
ABSTAIN | 226,737.185 | 1.201 | 0.850 | |||||||||
BROKER NON-VOTE | 13,110,967.112 | 69.483 | 49.169 | |||||||||
TOTAL | 18,869,203.659 | 100.000 | 70.764 | |||||||||
| Prudential Jennison Equity Opportunity Fund | 39 |
| n MAIL | n TELEPHONE | n WEBSITE | ||
Gateway Center Three 100 Mulberry Street Newark, NJ 07102 | (800) 225-1852 | www.prudentialfunds.com |
| PROXY VOTING |
| The Board of Directors of the Fund has delegated to the Fund’s investment subadviser the responsibility for voting any proxies and maintaining proxy recordkeeping with respect to the Fund. A description of these proxy voting policies and procedures is available without charge, upon request, by calling (800) 225-1852 or by visiting the Securities and Exchange Commission’s website at www.sec.gov. Information regarding how the Fund voted proxies relating to portfolio securities during the most recent 12-month period ended June 30 is available on the Fund’s website and on the Securities and Exchange Commission’s website. |
| DIRECTORS |
| Ellen S. Alberding • Kevin J. Bannon • Scott E. Benjamin • Linda W. Bynoe • Keith F. Hartstein • Michael S. Hyland • Stephen P. Munn • Stuart S. Parker • James E. Quinn • Richard A. Redeker • Stephen G. Stoneburn • Grace C. Torres |
| OFFICERS |
| Stuart S. Parker, President • Scott E. Benjamin, Vice President • M. Sadiq Peshimam, Treasurer and Principal Financial and Accounting Officer • Raymond A. O’Hara, Chief Legal Officer • Deborah A. Docs, Secretary • Chad A. Earnst, Chief Compliance Officer • Theresa C. Thompson, Deputy Chief Compliance Officer • Richard W. Kinville, Anti-Money Laundering Compliance Officer • Jonathan D. Shain, Assistant Secretary • Claudia DiGiacomo, Assistant Secretary • Amanda S. Ryan, Assistant Secretary • Andrew R. French, Assistant Secretary • Peter Parrella, Assistant Treasurer • Lana Lomuti, Assistant Treasurer • Linda McMullin, Assistant Treasurer • Kelly A. Coyne, Assistant Treasurer |
| MANAGER | Prudential Investments LLC | Gateway Center Three 100 Mulberry Street Newark, NJ 07102 | ||
| ||||
| INVESTMENT SUBADVISER | Jennison Associates LLC | 466 Lexington Avenue New York, NY 10017 | ||
| ||||
| DISTRIBUTOR | Prudential Investment Management Services LLC | Gateway Center Three 100 Mulberry Street Newark, NJ 07102 | ||
| ||||
| CUSTODIAN | The Bank of New York Mellon | One Wall Street New York, NY 10286 | ||
| ||||
| TRANSFER AGENT | Prudential Mutual Fund Services LLC | PO Box 9658 Providence, RI 02940 | ||
| ||||
| INDEPENDENT REGISTERED PUBLIC ACCOUNTING FIRM | KPMG LLP | 345 Park Avenue New York, NY 10154 | ||
| ||||
| FUND COUNSEL | Willkie Farr & Gallagher LLP | 787 Seventh Avenue New York, NY 10019 | ||
| An investor should consider the investment objectives, risks, charges, and expenses of the Fund carefully before investing. The prospectus and summary prospectus contain this and other information about the Fund. An investor may obtain a prospectus and summary prospectus by visiting our website at www.prudentialfunds.com or by calling (800) 225-1852. The prospectus and summary prospectus should be read carefully before investing. |
| E-DELIVERY |
| To receive your mutual fund documents online, go to www.prudentialfunds.com/edelivery and enroll. Instead of receiving printed documents by mail, you will receive notification via email when new materials are available. You can cancel your enrollment or change your email address at any time by visiting the website address above. |
| SHAREHOLDER COMMUNICATIONS WITH DIRECTORS |
| Shareholders can communicate directly with the Board of Directors by writing to the Chair of the Board, Prudential Jennison Equity Opportunity Fund, Prudential Investments, Attn: Board of Directors, 100 Mulberry Street, Gateway Center Three, Newark, NJ 07102. Shareholders can communicate directly with an individual Director by writing to the same address. Communications are not screened before being delivered to the addressee. |
| AVAILABILITY OF PORTFOLIO SCHEDULE |
| The Fund files its complete schedule of portfolio holdings with the Securities and Exchange Commission for the first and third quarters of each fiscal year on Form N-Q. The Fund’s Forms N-Q are available on the Commission’s website at www.sec.gov. The Fund’s Forms N-Q may also be reviewed and copied at the Commission’s Public Reference Room in Washington, D.C. Information on the operation and location of the Public Reference Room may be obtained by calling 1-800-SEC-0330. The Fund’s schedule of portfolio holdings is also available on the Fund’s website as of the end of each month. |
Mutual Funds:
| ARE NOT INSURED BY THE FDIC OR ANY FEDERAL GOVERNMENT AGENCY | MAY LOSE VALUE | ARE NOT A DEPOSIT OF OR GUARANTEED BY ANY BANK OR ANY BANK AFFILIATE |
PRUDENTIAL JENNISON EQUITY OPPORTUNITY FUND
| SHARE CLASS | A | B | C | Q | R | Z | ||||||
| NASDAQ | PJIAX | PJIBX | PJGCX | PJOQX | PJORX | PJGZX | ||||||
| CUSIP | 74437E503 | 74437E602 | 74437E701 | 74437E552 | 74437E644 | 74437E800 |
MF172E2 0277395-00001-00

PRUDENTIAL INVESTMENTS»MUTUAL FUNDS
PRUDENTIAL JENNISON GROWTH FUND
SEMIANNUAL REPORT · MARCH 31, 2015
Objective
Long-term growth of capital
This report is not authorized for distribution to prospective investors unless preceded or accompanied by a current prospectus.
The views expressed in this report and information about the Fund’s portfolio holdings are for the period covered by this report and are subject to change thereafter.
The accompanying financial statements as of March 31, 2015, were not audited and, accordingly, no auditor’s opinion is expressed on them.
Mutual funds are distributed by Prudential Investment Management Services LLC (PIMS). Jennison Associates is a registered investment adviser. Both are Prudential Financial companies. © 2015 Prudential Financial, Inc. and its related entities. Prudential Investments LLC, Prudential, Jennison Associates, Jennison, the Prudential logo, Bring Your Challenges, and the Rock symbol are service marks of Prudential Financial, Inc. and its related entities, registered in many jurisdictions worldwide.

|  |

May 15, 2015
Dear Shareholder:
We hope you find the semiannual report for the Prudential Jennison Growth Fund informative and useful. The report covers performance for the six-month period that ended March 31, 2015.
Since market conditions change over time, we believe it is important to maintain a diversified portfolio of funds consistent with your tolerance for risk, time horizon, and financial goals.
Your financial advisor can help you create a diversified investment plan that may include funds covering all the basic asset classes and that reflects your personal investor profile and risk tolerance. Keep in mind, however, that diversification and asset allocation strategies do not assure a profit or protect against loss in declining markets.
Prudential Investments® is dedicated to helping you solve your toughest investment challenges—whether it’s capital growth, reliable income, or protection from market volatility and other risks. We offer the expertise of Prudential Financial’s affiliated asset managers that strive to be leaders in a broad range of funds to help you stay on course to the future you envision. They also manage money for major corporations and pension funds around the world, which means you benefit from the same expertise, innovation, and attention to risk demanded by today’s most sophisticated investors.
Thank you for choosing the Prudential Investments family of funds.
Sincerely,

Stuart S. Parker, President
Prudential Jennison Growth Fund
| Prudential Jennison Growth Fund | 1 |
Your Fund’s Performance (Unaudited)
Performance data quoted represent past performance. Past performance does not guarantee future results. The investment return and principal value of an investment will fluctuate, so that an investor’s shares, when redeemed, may be worth more or less than their original cost. Current performance may be lower or higher than the past performance data quoted. An investor may obtain performance data as of the most recent month-end by visiting our website at www.prudentialfunds.com or by calling (800) 225-1852.
Cumulative Total Returns (Without Sales Charges) as of 3/31/15 |
| |||||||||||||||
| Six Months | One Year | Five Years | Ten Years | |||||||||||||
Class A | 8.99 | % | 15.82 | % | 98.38 | % | 146.49 | % | ||||||||
Class B | 8.61 | 15.04 | 91.64 | 129.57 | ||||||||||||
Class C | 8.59 | 15.02 | 91.52 | 129.89 | ||||||||||||
Class R | 8.88 | 15.61 | 96.64 | 142.37 | ||||||||||||
Class Z | 9.14 | 16.15 | 101.39 | 153.73 | ||||||||||||
Russell 1000® Growth Index | 8.81 | 16.09 | 106.75 | 144.61 | ||||||||||||
S&P 500 Index | 5.92 | 12.71 | 96.40 | 115.97 | ||||||||||||
Lipper Large-Cap Growth Funds Average | 8.33 | 14.54 | 93.05 | 127.95 | ||||||||||||
Average Annual Total Returns (With Sales Charges) as of 3/31/15 |
| |||||||||||||||
| One Year | Five Years | Ten Years | ||||||||||||||
Class A | 9.45 | % | 13.39 | % | 8.82 | % | ||||||||||
Class B | 10.04 | 13.77 | 8.67 | |||||||||||||
Class C | 14.02 | 13.88 | 8.68 | |||||||||||||
Class R | 15.61 | 14.48 | 9.26 | |||||||||||||
Class Z | 16.15 | 15.03 | 9.76 | |||||||||||||
Russell 1000 Growth Index | 16.09 | 15.63 | 9.36 | |||||||||||||
S&P 500 Index | 12.71 | 14.45 | 8.00 | |||||||||||||
Lipper Large-Cap Growth Funds Average | 14.54 | 14.01 | 8.51 | |||||||||||||
Source: Prudential Investments LLC and Lipper Inc.
Inception returns are provided for any share class with less than 10 calendar years of returns.
| 2 | Visit our website at www.prudentialfunds.com |
The returns in the tables do not reflect the deduction of taxes that a shareholder would pay on Fund distributions or following the redemption of Fund shares. The average annual total returns take into account applicable sales charges, which are described for each share class in the table below.
| Class A | Class B* | Class C | Class R | Class Z | ||||||
Maximum Initial Sales Charge | 5.50% of the public offering price | None | None | None | None | |||||
Contingent Deferred Sales Charge (CDSC) (as a percentage of the lower of original purchase price or sale proceeds) | 1% on sales of $1 million or more made | 5% (Yr.1) 4% (Yr.2) 3% (Yr.3) 2% (Yr.4) 1% (Yr.5) 1% (Yr.6) 0% (Yr.7) | 1% on sales made within 12 months of purchase | None | None | |||||
Annual Distribution and Service (12b-1) fees (shown as a percentage of average daily net assets) | .30% | 1% | 1% | .75% (.50% currently) | None |
*Class B shares are closed to all purchase activity and no additional Class B shares may be purchased or acquired except by exchange from Class B shares of another Fund or through dividend or capital gains reinvestment.
Benchmark Definitions
Russell 1000 Growth Index
The Russell 1000 Growth Index is an unmanaged index comprising those securities in the Russell 1000 Index with a greater-than-average growth orientation. Companies in this index tend to exhibit relatively high price-to-book ratios, price-to-earnings ratios, forecasted growth rates, and relatively low dividend yields.
S&P 500 Index
The S&P 500 Index is an unmanaged index of 500 stocks of large US public companies. It gives a broad look at how US stock prices have performed.
Lipper Large-Cap Growth Funds Average
The Lipper Large-Cap Growth Funds Average (Lipper Average) is based on the average return of all funds in the Lipper Large-Cap Growth Funds category for the periods noted. Funds in the Lipper Average invest at least 75% of their equity assets in companies with market capitalizations (on a three-year weighted basis) greater than 300% of the dollar-weighted median market capitalization of the middle 1,000 securities of the S&P SuperComposite 1500 Index. Large-Cap Growth Funds typically have an above-average price-to-earnings ratio, price-to-book ratio, and three-year sales-per-share growth value compared with the S&P 500 Index.
Investors cannot invest directly in an index or average. The returns for the Indexes would be lower if they included the effects of sales charges, operating expenses of a mutual fund, or taxes. Returns for the Lipper Average reflect the deduction of operating expenses, but not sales charges or taxes.
| Prudential Jennison Growth Fund | 3 |
Your Fund’s Performance (continued)
Five Largest Holdings expressed as a percentage of net assets as of 3/31/15 (excluding short-term investments) | ||||
Apple, Inc., Technology Hardware, Storage & Peripherals | 5.9 | % | ||
Facebook, Inc., (Class A Stock), Internet Software & Services | 3.6 | |||
MasterCard, Inc. (Class A Stock), IT Services | 3.4 | |||
Amazon.com, Inc., Internet & Catalog Retail | 2.8 | |||
Biogen Idec, Inc., Biotechnology | 2.7 |
Holdings are subject to change.
Five Largest Industries expressed as a percentage of net assets as of 3/31/15 (excluding short-term investments) | ||||
Internet Software & Services | 13.7 | % | ||
Biotechnology | 8.5 | |||
Software | 8.4 | |||
Pharmaceuticals | 8.2 | |||
IT Services | 7.2 |
Industry weightings are subject to change.
| 4 | Visit our website at www.prudentialfunds.com |
Fees and Expenses (Unaudited)
As a shareholder of the Fund, you incur two types of costs: (1) transaction costs, including sales charges (loads) on purchase payments and redemptions, as applicable, and (2) ongoing costs, including management fees, distribution and/or service (12b-1) fees, and other Fund expenses, as applicable. This example is intended to help you understand your ongoing costs (in dollars) of investing in the Fund and to compare these costs with the ongoing costs of investing in other mutual funds.
The example is based on an investment of $1,000 invested on October 1, 2014, at the beginning of the period, and held through the six-month period ended March 31, 2015. The example is for illustrative purposes only; you should consult the Prospectus for information on initial and subsequent minimum investment requirements.
Actual Expenses
The first line for each share class in the table on the following page provides information about actual account values and actual expenses. You may use the information on this line, together with the amount you invested, to estimate the expenses that you paid over the period. Simply divide your account value by $1,000 (for example, an $8,600 account value ÷ $1,000 = 8.6), then multiply the result by the number on the first line under the heading “Expenses Paid During the Six-Month Period” to estimate the expenses you paid on your account during this period.
Hypothetical Example for Comparison Purposes
The second line for each share class in the table on the following page provides information about hypothetical account values and hypothetical expenses based on the Fund’s actual expense ratio and an assumed rate of return of 5% per year before expenses, which is not the Fund’s actual return. The hypothetical account values and expenses may not be used to estimate the actual ending account balance or expenses you paid for the period. You may use this information to compare the ongoing costs of investing in the Fund and other funds. To do so, compare this 5% hypothetical example with the 5% hypothetical examples that appear in the shareholder reports of the other funds.
The Fund’s transfer agent may charge additional fees to holders of certain accounts that are not included in the expenses shown in the table on the following page. These fees apply to individual retirement accounts (IRAs) and Section 403(b) accounts. As of the close of the six-month period covered by the table, IRA fees included an annual maintenance fee of $15 per account (subject to a maximum annual maintenance fee of $25 for all accounts held by the same shareholder). Section 403(b) accounts are charged an annual $25 fiduciary maintenance fee. Some of the fees may vary in amount, or may be waived, based on your total account balance or the number of
| Prudential Jennison Growth Fund | 5 |
Fees and Expenses (continued)
Prudential Investments funds, including the Fund, that you own. You should consider the additional fees that were charged to your Fund account over the six-month period when you estimate the total ongoing expenses paid over the period and the impact of these fees on your ending account value, as these additional expenses are not reflected in the information provided in the expense table. Additional fees have the effect of reducing investment returns.
Please note that the expenses shown in the table are meant to highlight your ongoing costs only and do not reflect any transactional costs such as sales charges (loads). Therefore, the second line for each share class in the table is useful in comparing ongoing costs only and will not help you determine the relative total costs of owning different funds. In addition, if these transactional costs were included, your costs would have been higher.
| Prudential Jennison Growth Fund | Beginning Account Value October 1, 2014 | Ending Account Value March 31, 2015 | Annualized Expense Ratio | Expenses Paid During the Six-Month Period* | ||||||||||||||
| Class A | Actual | $ | 1,000.00 | $ | 1,089.90 | 1.05 | % | $ | 5.47 | |||||||||
| Hypothetical | $ | 1,000.00 | $ | 1,019.70 | 1.05 | % | $ | 5.29 | ||||||||||
| Class B | Actual | $ | 1,000.00 | $ | 1,086.10 | 1.75 | % | $ | 9.10 | |||||||||
| Hypothetical | $ | 1,000.00 | $ | 1,016.21 | 1.75 | % | $ | 8.80 | ||||||||||
| Class C | Actual | $ | 1,000.00 | $ | 1,085.90 | 1.75 | % | $ | 9.10 | |||||||||
| Hypothetical | $ | 1,000.00 | $ | 1,016.21 | 1.75 | % | $ | 8.80 | ||||||||||
| Class R | Actual | $ | 1,000.00 | $ | 1,088.80 | 1.25 | % | $ | 6.51 | |||||||||
| Hypothetical | $ | 1,000.00 | $ | 1,018.70 | 1.25 | % | $ | 6.29 | ||||||||||
| Class Z | Actual | $ | 1,000.00 | $ | 1,091.40 | 0.75 | % | $ | 3.91 | |||||||||
| Hypothetical | $ | 1,000.00 | $ | 1,021.19 | 0.75 | % | $ | 3.78 | ||||||||||
*Fund expenses (net of fee waivers or subsidies, if any) for each share class are equal to the annualized expense ratio for each share class (provided in the table), multiplied by the average account value over the period, multiplied by the 182 days in the six-month period ended March 31, 2015, and divided by the 365 days in the Fund’s fiscal year ending September 30, 2015 (to reflect the six-month period). Expenses presented in the table include the expenses of any underlying portfolios in which the Fund may invest.
| 6 | Visit our website at www.prudentialfunds.com |
The Fund’s annual expense ratios for the six-month period ended March 31, 2015, are as follows:
| Class | Gross Operating Expenses | Net Operating Expenses | ||||||
A | 1.05 | % | 1.05 | % | ||||
B | 1.75 | 1.75 | ||||||
C | 1.75 | 1.75 | ||||||
R | 1.50 | 1.25 | ||||||
Z | 0.75 | 0.75 | ||||||
Net operating expenses shown above reflect any fee waivers and/or expense reimbursements. Additional information on Fund expenses and any fee waivers and/or expense reimbursements can be found in the “Financial Highlights” tables in this report and in the Notes to the Financial Statements in this report.
| Prudential Jennison Growth Fund | 7 |
Portfolio of Investments
as of March 31, 2015 (Unaudited)
| Description | Shares | Value (Note 1) | ||||||
LONG-TERM INVESTMENTS 99.6% | ||||||||
COMMON STOCKS | ||||||||
Aerospace & Defense 1.9% | ||||||||
Boeing Co. (The) | 372,192 | $ | 55,858,575 | |||||
Automobiles 1.2% | ||||||||
Tesla Motors, Inc.*(a) | 182,502 | 34,450,902 | ||||||
Beverages 0.1% | ||||||||
Monster Beverage Corp.* | 16,208 | 2,243,106 | ||||||
Biotechnology 8.5% | ||||||||
Alexion Pharmaceuticals, Inc.* | 210,976 | 36,562,141 | ||||||
Biogen Idec, Inc.* | 189,041 | 79,820,672 | ||||||
Celgene Corp.* | 491,647 | 56,677,066 | ||||||
Gilead Sciences, Inc.* | 377,703 | 37,063,995 | ||||||
Incyte Corp. Ltd.*(a) | 98,210 | 9,001,929 | ||||||
Vertex Pharmaceuticals, Inc.* | 241,873 | 28,533,758 | ||||||
|
| |||||||
| 247,659,561 | ||||||||
Capital Markets 1.0% | ||||||||
Morgan Stanley | 849,130 | 30,305,450 | ||||||
Chemicals 1.9% | ||||||||
Monsanto Co. | 386,452 | 43,491,308 | ||||||
Sherwin-Williams Co. (The) | 48,296 | 13,740,212 | ||||||
|
| |||||||
| 57,231,520 | ||||||||
Diversified Financial Services 1.1% | ||||||||
McGraw-Hill Financial, Inc. | 307,629 | 31,808,839 | ||||||
Energy Equipment & Services 1.0% | ||||||||
Schlumberger Ltd. | 348,912 | 29,113,217 | ||||||
Food & Staples Retailing 2.9% | ||||||||
Costco Wholesale Corp. | 365,563 | 55,380,967 | ||||||
Kroger Co. (The) | 395,238 | 30,298,945 | ||||||
|
| |||||||
| 85,679,912 | ||||||||
Food Products 1.6% | ||||||||
Mead Johnson Nutrition Co. | 219,076 | 22,023,710 | ||||||
Mondelez International, Inc. (Class A Stock) | 685,749 | 24,748,682 | ||||||
|
| |||||||
| 46,772,392 | ||||||||
See Notes to Financial Statements.
| Prudential Jennison Growth Fund | 9 |
Portfolio of Investments
as of March 31, 2015 (Unaudited) continued
| Description | Shares | Value (Note 1) | ||||||
COMMON STOCKS (Continued) | ||||||||
Health Care Equipment & Supplies 1.7% | ||||||||
Abbott Laboratories | 1,057,203 | $ | 48,980,215 | |||||
Hotels, Restaurants & Leisure 4.0% | ||||||||
Chipotle Mexican Grill, Inc.* | 42,508 | 27,653,154 | ||||||
Marriott International, Inc. (Class A Stock) | 538,851 | 43,280,513 | ||||||
Starbucks Corp. | 497,709 | 47,133,042 | ||||||
|
| |||||||
| 118,066,709 | ||||||||
Internet & Catalog Retail 7.1% | ||||||||
Amazon.com, Inc.* | 221,287 | 82,340,893 | ||||||
Netflix, Inc.* | 105,220 | 43,844,122 | ||||||
Priceline Group, Inc. (The)* | 44,237 | 51,498,504 | ||||||
TripAdvisor, Inc.* | 220,979 | 18,378,823 | ||||||
Vipshop Holdings Ltd. (China)*(a) | 362,389 | 10,668,732 | ||||||
|
| |||||||
| 206,731,074 | ||||||||
Internet Software & Services 13.7% |
| |||||||
Alibaba Group Holding Ltd. (China), ADR*(a) | 612,875 | 51,015,715 | ||||||
Facebook, Inc. (Class A Stock)* | 1,292,687 | 106,278,262 | ||||||
Google, Inc. (Class A Stock)* | 78,835 | 43,729,774 | ||||||
Google, Inc. (Class C Stock)* | 90,040 | 49,341,920 | ||||||
LendingClub Corp.*(a) | 125,563 | 2,467,313 | ||||||
LinkedIn Corp. (Class A Stock)* | 239,267 | 59,783,253 | ||||||
Tencent Holdings Ltd. (China) | 2,447,915 | 46,485,703 | ||||||
Twitter, Inc.* | 834,659 | 41,799,723 | ||||||
|
| |||||||
| 400,901,663 | ||||||||
IT Services 7.2% | ||||||||
FleetCor Technologies, Inc.* | 243,045 | 36,680,351 | ||||||
MasterCard, Inc. (Class A Stock) | 1,154,922 | 99,773,712 | ||||||
Visa, Inc. (Class A Stock)(a) | 1,116,783 | 73,048,776 | ||||||
|
| |||||||
| 209,502,839 | ||||||||
Life Sciences Tools & Services 1.5% | ||||||||
Illumina, Inc.* | 237,751 | 44,136,096 | ||||||
|
| |||||||
Media 3.1% | ||||||||
Time Warner, Inc. | 310,363 | 26,207,052 | ||||||
Walt Disney Co. (The) | 606,804 | 63,647,671 | ||||||
|
| |||||||
| 89,854,723 | ||||||||
See Notes to Financial Statements.
| 10 |
| Description | Shares | Value (Note 1) | ||||||
COMMON STOCKS (Continued) | ||||||||
Oil, Gas & Consumable Fuels 2.2% | ||||||||
Concho Resources, Inc.* | 304,627 | $ | 35,312,362 | |||||
EOG Resources, Inc. | 309,385 | 28,367,510 | ||||||
|
| |||||||
| 63,679,872 | ||||||||
Pharmaceuticals 8.2% | ||||||||
Actavis PLC*(a) | 224,563 | 66,834,440 | ||||||
Bristol-Myers Squibb Co. | 1,012,967 | 65,336,372 | ||||||
Novo Nordisk A/S (Denmark), ADR | 1,108,673 | 59,192,051 | ||||||
Shire PLC (Ireland), ADR | 201,062 | 48,112,126 | ||||||
|
| |||||||
| 239,474,989 | ||||||||
Real Estate Investment Trusts (REITs) 1.2% | ||||||||
American Tower Corp. | 362,518 | 34,131,070 | ||||||
|
| |||||||
Road & Rail 2.4% | ||||||||
Canadian Pacific Railway Ltd. (Canada) | 181,480 | 33,156,396 | ||||||
Union Pacific Corp. | 341,097 | 36,944,216 | ||||||
|
| |||||||
| 70,100,612 | ||||||||
Semiconductors & Semiconductor Equipment 1.9% | ||||||||
ARM Holdings PLC (United Kingdom), ADR |
| 778,108 179,809 |
| 38,360,725 | ||||
NXP Semiconductors NV (Netherlands)*(a) | 18,045,631 | |||||||
|
| |||||||
| 56,406,356 | ||||||||
Software 8.4% | ||||||||
Adobe Systems, Inc.* | 654,594 | 48,400,680 | ||||||
FireEye, Inc.*(a) | 393,689 | 15,452,293 | ||||||
Red Hat, Inc.* | 586,186 | 44,403,590 | ||||||
salesforce.com, inc.* | 878,665 | 58,703,609 | ||||||
Splunk, Inc.* | 469,576 | 27,798,899 | ||||||
VMware, Inc. (Class A Stock)*(a) | 224,913 | 18,445,115 | ||||||
Workday, Inc. (Class A Stock)*(a) | 372,787 | 31,466,951 | ||||||
|
| |||||||
| 244,671,137 | ||||||||
Specialty Retail 5.1% | ||||||||
Inditex SA (Spain) | 1,567,655 | 50,330,440 | ||||||
O’Reilly Automotive, Inc.* | 176,166 | 38,094,136 | ||||||
Tiffany & Co. | 316,555 | 27,860,006 | ||||||
TJX Cos., Inc. (The) | 469,709 | 32,903,115 | ||||||
|
| |||||||
| 149,187,697 | ||||||||
See Notes to Financial Statements.
| Prudential Jennison Growth Fund | 11 |
Portfolio of Investments
as of March 31, 2015 (Unaudited) continued
| Description | Shares | Value (Note 1) | ||||||
COMMON STOCKS (Continued) | ||||||||
Technology Hardware, Storage & Peripherals 5.9% | ||||||||
Apple, Inc. | 1,376,673 | $ | 171,299,421 | |||||
|
| |||||||
Textiles, Apparel & Luxury Goods 4.8% | ||||||||
Luxottica Group SpA (Italy) | 475,872 | 30,139,569 | ||||||
NIKE, Inc. (Class B Stock) | 731,553 | 73,396,712 | ||||||
Under Armour, Inc. (Class A Stock)*(a) | 471,907 | 38,106,490 | ||||||
|
| |||||||
| 141,642,771 | ||||||||
TOTAL LONG-TERM INVESTMENTS |
| 2,909,890,718 | ||||||
|
| |||||||
SHORT-TERM INVESTMENT 8.7% | ||||||||
AFFILIATED MONEY MARKET MUTUAL FUND | ||||||||
Prudential Investment Portfolios 2 - Prudential Core Taxable Money Market Fund | 252,851,637 | 252,851,637 | ||||||
|
| |||||||
TOTAL INVESTMENTS 108.3% | 3,162,742,355 | |||||||
Liabilities in excess of other assets (8.3)% | (242,668,467 | ) | ||||||
|
| |||||||
NET ASSETS 100.0% | $ | 2,920,073,888 | ||||||
|
| |||||||
The following abbreviations are used in the portfolio descriptions:
ADR—American Depositary Receipt
| * | Non-income producing security. |
| (a) | All or a portion of security is on loan. The aggregate market value of such securities, including those sold and pending settlement, is $240,672,816; cash collateral of $248,290,582 (included with liabilities) was received with which the Series purchased highly liquid short-term investments. Securities on loan are subject to contractual netting arrangements. |
| (b) | Represents security, or a portion thereof, purchased with cash collateral received for securities on loan. |
| (c) | Prudential Investments LLC, the manager of the Series, also serves as manager of the Prudential Investment Portfolios 2 - Prudential Core Taxable Money Market Fund. |
See Notes to Financial Statements.
| 12 |
Various inputs are used in determining the value of the Series’ investments. These inputs are summarized in the three broad levels listed below.
Level 1—quoted prices generally in active markets for identical securities.
Level 2—quoted prices for similar securities, interest rates and yield curves, prepayment speeds, foreign currency exchange rates and other observable inputs.
Level 3—unobservable inputs for securities valued in accordance with Board approved fair valuation procedures.
The following is a summary of the inputs used as of March 31, 2015 in valuing such portfolio securities:
| Level 1 | Level 2 | Level 3 | ||||||||||
Investments in Securities | ||||||||||||
Common Stocks | ||||||||||||
Aerospace & Defense | $ | 55,858,575 | $ | — | $ | — | ||||||
Automobiles | 34,450,902 | — | — | |||||||||
Beverages | 2,243,106 | — | — | |||||||||
Biotechnology | 247,659,561 | — | — | |||||||||
Capital Markets | 30,305,450 | — | — | |||||||||
Chemicals | 57,231,520 | — | — | |||||||||
Diversified Financial Services | 31,808,839 | — | — | |||||||||
Energy Equipment & Services | 29,113,217 | — | — | |||||||||
Food & Staples Retailing | 85,679,912 | — | — | |||||||||
Food Products | 46,772,392 | — | — | |||||||||
Health Care Equipment & Supplies | 48,980,215 | — | — | |||||||||
Hotels, Restaurants & Leisure | 118,066,709 | — | — | |||||||||
Internet & Catalog Retail | 206,731,074 | — | — | |||||||||
Internet Software & Services | 354,415,960 | 46,485,703 | — | |||||||||
IT Services | 209,502,839 | — | — | |||||||||
Life Sciences Tools & Services | 44,136,096 | — | — | |||||||||
Media | 89,854,723 | — | — | |||||||||
Oil, Gas & Consumable Fuels | 63,679,872 | — | — | |||||||||
Pharmaceuticals | 239,474,989 | — | — | |||||||||
Real Estate Investment Trusts (REITs) | 34,131,070 | — | — | |||||||||
Road & Rail | 70,100,612 | — | — | |||||||||
Semiconductors & Semiconductor Equipment | 56,406,356 | — | — | |||||||||
Software | 244,671,137 | — | — | |||||||||
Specialty Retail | 98,857,257 | 50,330,440 | — | |||||||||
Technology Hardware, Storage & Peripherals | 171,299,421 | — | — | |||||||||
Textiles, Apparel & Luxury Goods | 111,503,202 | 30,139,569 | — | |||||||||
Affiliated Money Market Mutual Fund | 252,851,637 | — | — | |||||||||
|
|
|
|
|
| |||||||
Total | $ | 3,035,786,643 | $ | 126,955,712 | $ | — | ||||||
|
|
|
|
|
| |||||||
See Notes to Financial Statements.
| Prudential Jennison Growth Fund | 13 |
Portfolio of Investments
as of March 31, 2015 (Unaudited) continued
The industry classification of investments and liabilities in excess of other assets shown as a percentage of net assets as of March 31, 2015 was as follows:
Internet Software & Services | 13.7 | % | ||
Affiliated Money Market Mutual Fund (including 8.5% of collateral for securities on loan) | 8.7 | |||
Biotechnology | 8.5 | |||
Software | 8.4 | |||
Pharmaceuticals | 8.2 | |||
IT Services | 7.2 | |||
Internet & Catalog Retail | 7.1 | |||
Technology Hardware, Storage & Peripherals | 5.9 | |||
Specialty Retail | 5.1 | |||
Textiles, Apparel & Luxury Goods | 4.8 | |||
Hotels, Restaurants & Leisure | 4.0 | |||
Media | 3.1 | |||
Food & Staples Retailing | 2.9 | |||
Road & Rail | 2.4 | |||
Oil, Gas & Consumable Fuels | 2.2 | |||
Chemicals | 1.9 | |||
Semiconductors & Semiconductor Equipment | 1.9 | |||
Aerospace & Defense | 1.9 | |||
Health Care Equipment & Supplies | 1.7 | |||
Food Products | 1.6 | |||
Life Sciences Tools & Services | 1.5 | |||
Automobiles | 1.2 | |||
Real Estate Investment Trusts (REITs) | 1.2 | |||
Diversified Financial Services | 1.1 | |||
Capital Markets | 1.0 | |||
Energy Equipment & Services | 1.0 | |||
Beverages | 0.1 | |||
|
| |||
| 108.3 | ||||
Liabilities in excess of other assets | (8.3 | ) | ||
|
| |||
| 100.0 | % | |||
|
|
See Notes to Financial Statements.
| 14 |
PRUDENTIAL INVESTMENTS»MUTUAL FUNDS
FINANCIAL STATEMENTS
(UNAUDITED)
SEMIANNUAL REPORT · MARCH 31, 2015
Prudential Jennison Growth Fund
Statements of Assets and Liabilities
as of March 31,2015 (Unaudited)
Assets |
| |||
Investments at value, including securities on loan of $240,672,816: | ||||
Unaffiliated investments (cost $1,570,512,295) | $ | 2,909,890,718 | ||
Affiliated investments (cost $252,851,637) | 252,851,637 | |||
Cash | 164,206 | |||
Receivable for investments sold | 13,694,415 | |||
Receivable for Series shares sold | 8,174,835 | |||
Dividends receivable | 1,107,155 | |||
Tax reclaim receivable | 255,050 | |||
Prepaid expenses | 11,745 | |||
|
| |||
Total Assets | 3,186,149,761 | |||
|
| |||
Liabilities | ||||
Payable to broker for collateral for securities on loan | 248,290,582 | |||
Payable for investments purchased | 11,909,468 | |||
Payable for Series shares reacquired | 2,958,149 | |||
Management fee payable | 1,445,786 | |||
Accrued expenses | 816,146 | |||
Distribution fee payable | 395,113 | |||
Loan interest payable | 231 | |||
Affiliated transfer agent fee payable | 260,398 | |||
|
| |||
Total Liabilities | 266,075,873 | |||
|
| |||
Net Assets | $ | 2,920,073,888 | ||
|
| |||
Net assets were comprised of: | ||||
Common stock, at par | $ | 94,497 | ||
Paid-in capital in excess of par | 1,490,150,505 | |||
|
| |||
| 1,490,245,002 | ||||
Accumulated net investment loss | (729,085 | ) | ||
Accumulated net realized gain on investment and foreign currency transactions | 91,207,494 | |||
Net unrealized appreciation on investments and foreign currencies | 1,339,350,477 | |||
|
| |||
Net assets, March 31, 2015 | $ | 2,920,073,888 | ||
|
| |||
See Notes to Financial Statements.
| 16 |
Class A |
| |||
Net asset value and redemption price per share | ||||
($1,083,404,858 ÷ 35,840,203 shares of common stock issued and outstanding) | $ | 30.23 | ||
Maximum sales charge (5.50% of offering price) | 1.76 | |||
|
| |||
Maximum offering price to public | $ | 31.99 | ||
|
| |||
Class B | ||||
Net asset value, offering price and redemption price per share | ||||
($24,357,202 ÷ 948,914 shares of common stock issued and outstanding) | $ | 25.67 | ||
|
| |||
Class C | ||||
Net asset value, offering price and redemption price per share | ||||
($83,639,071 ÷ 3,252,947 shares of common stock issued and outstanding) | $ | 25.71 | ||
|
| |||
Class R | ||||
Net asset value, offering price and redemption price per share | ||||
($53,244,408 ÷ 1,952,553 shares of common stock issued and outstanding) | $ | 27.27 | ||
|
| |||
Class Z | ||||
Net asset value, offering price and redemption price per share | ||||
($1,675,428,349 ÷ 52,502,631 shares of common stock issued and outstanding) | $ | 31.91 | ||
|
| |||
See Notes to Financial Statements.
| Prudential Jennison Growth Fund | 17 |
Statement of Operations
Six Months Ended March 31, 2015 (Unaudited)
Net Investment Loss |
| |||
Income | ||||
Unaffiliated dividend income (net of foreign withholding taxes of $211,320) | $ | 11,790,419 | ||
Affiliated income from securities lending, net | 160,237 | |||
Affiliated dividend income | 20,807 | |||
|
| |||
Total income | 11,971,463 | |||
|
| |||
Expenses | ||||
Management fee | 8,058,390 | |||
Distribution fee—Class A | 1,593,506 | |||
Distribution fee—Class B | 129,390 | |||
Distribution fee—Class C | 392,767 | |||
Distribution fee—Class R | 188,863 | |||
Transfer agent’s fees and expenses (including affiliated expense of $520,900) | 1,853,000 | |||
Shareholders’ reports | 237,000 | |||
Custodian and accounting fees | 170,000 | |||
Registration fees | 46,000 | |||
Directors’ fees | 36,000 | |||
Insurance expenses | 18,000 | |||
Legal fees and expenses | 17,000 | |||
Audit fee | 11,000 | |||
Commitment fee on syndicated credit agreement | 3,000 | |||
Loan interest expense | 231 | |||
Miscellaneous | 9,355 | |||
|
| |||
Total expenses | 12,763,502 | |||
Less: Distribution fee waiver—Class R | (62,954 | ) | ||
|
| |||
Net expenses | 12,700,548 | |||
|
| |||
Net investment loss | (729,085 | ) | ||
|
| |||
Realized And Unrealized Gain (Loss) On Investments And Foreign Currency Transactions |
| |||
Net realized gain (loss) on: | ||||
Investment transactions | 103,190,706 | |||
Foreign currency transactions | (11,874 | ) | ||
|
| |||
| 103,178,832 | ||||
|
| |||
Net change in unrealized appreciation (depreciation) on: | ||||
Investments | 140,209,924 | |||
Foreign currencies | (17,189 | ) | ||
|
| |||
| 140,192,735 | ||||
|
| |||
Net gain on investment and foreign currency transactions | 243,371,567 | |||
|
| |||
Net Increase In Net Assets Resulting From Operations | $ | 242,642,482 | ||
|
| |||
See Notes to Financial Statements.
| 18 |
Statement of Changes in Net Assets
(Unaudited)
| Six Months Ended March 31, 2015 | Year Ended September 30, 2014 | |||||||
Increase (Decrease) in Net Assets | ||||||||
Operations | ||||||||
Net investment loss | $ | (729,085 | ) | $ | (3,764,462 | ) | ||
Net realized gain on investment and foreign currency transactions | 103,178,832 | 208,966,383 | ||||||
Net change in unrealized appreciation (depreciation) on investments and foreign currencies | 140,192,735 | 235,078,479 | ||||||
|
|
|
| |||||
Net increase in net assets resulting from operations | 242,642,482 | 440,280,400 | ||||||
|
|
|
| |||||
Dividends and Distributions (Note 1) | ||||||||
Dividends from net investment income | ||||||||
Class Z | — | (211,567 | ) | |||||
|
|
|
| |||||
Distributions from net realized gains | ||||||||
Class A | (53,790,565 | ) | (38,305,986 | ) | ||||
Class B | (1,529,817 | ) | (1,203,693 | ) | ||||
Class C | (4,685,609 | ) | (2,854,963 | ) | ||||
Class R | (2,843,467 | ) | (1,650,198 | ) | ||||
Class Z | (77,542,876 | ) | (45,749,026 | ) | ||||
|
|
|
| |||||
| (140,392,334 | ) | (89,763,866 | ) | |||||
|
|
|
| |||||
Series share transactions (Net of share conversions) | ||||||||
Net proceeds from shares sold | 296,649,247 | 488,980,794 | ||||||
Net asset value of shares issued in reinvestment of dividends and distributions | 125,481,567 | 80,895,115 | ||||||
Cost of shares reacquired | (305,885,760 | ) | (596,020,974 | ) | ||||
|
|
|
| |||||
Net increase (decrease) in net assets from Series share transactions | 116,245,054 | (26,145,065 | ) | |||||
|
|
|
| |||||
Total increase | 218,495,202 | 324,159,902 | ||||||
Net Assets: | ||||||||
Beginning of period | 2,701,578,686 | 2,377,418,784 | ||||||
|
|
|
| |||||
End of period | $ | 2,920,073,888 | $ | 2,701,578,686 | ||||
|
|
|
| |||||
See Notes to Financial Statements.
| Prudential Jennison Growth Fund | 19 |
Notes to Financial Statements
(Unaudited)
The Prudential Investment Portfolios, Inc. (the “Company”) is an open-end management investment company, registered under the Investment Company Act of 1940, as amended, (“1940 Act”). The Company consists of six series: Prudential Jennison Growth Fund (the “Series”), Prudential Jennison Equity Opportunity Fund and Prudential Asset Allocation Fund which are diversified funds and Prudential Growth Allocation Fund, Prudential Moderate Allocation Fund and Prudential Conservative Allocation Fund which are non-diversified funds. These financial statements relate to Prudential Jennison Growth Fund. The financial statements of the other series are not presented herein.
The Series’ investment objective is to achieve long-term growth of capital.
Note 1. Accounting Policies
The Series follows investment company accounting and reporting guidance of the Financial Accounting Standards Board (FASB) Accounting Standard Codification Topic 946 Financial Services-Investment Companies. The following accounting policies conform to U.S. generally accepted accounting principles. The Series consistently follows such policies in the preparation of its financial statements.
Securities Valuation: The Series holds securities and other assets that are fair valued at the close of each day the New York Stock Exchange (“NYSE”) is open for trading. Fair value is the price that would be received to sell an asset or paid to transfer a liability in an orderly transaction between market participants on the measurement date. The Board of Directors (the “Board”) has adopted Valuation Procedures for security valuation under which fair valuation responsibilities have been delegated to Prudential Investments LLC (“PI” or “Manager”). Under the current Valuation Procedures, the established Valuation Committee is responsible for supervising the valuation of portfolio securities and other assets. The Valuation Procedures permit the Series to utilize independent pricing vendor services, quotations from market makers, and alternative valuation methods when market quotations are either not readily available or not deemed representative of fair value. A record of the Valuation Committee’s actions is subject to the Board’s review, approval, and ratification at its next regularly-scheduled quarterly meeting.
Various inputs determine how the Series’ investments are valued, all of which are categorized according to the three broad levels (Level 1, 2, or 3) detailed in the table following the Portfolio of Investments.
| 20 |
Common and preferred stocks, exchange-traded funds, and derivative instruments such as futures or options that are traded on a national securities exchange are valued at the last sale price as of the close of trading on the applicable exchange where the security principally trades. Securities traded via NASDAQ are valued at the NASDAQ official closing price. To the extent these securities are valued at the last sale price or NASDAQ official closing price, they are classified as Level 1 in the fair value hierarchy.
In the event that no sale or official closing price on valuation date exists, these securities are generally valued at the mean between the last reported bid and ask prices, or at the last bid price in the absence of an ask price. These securities are classified as Level 2 in the fair value hierarchy, as the inputs are observable.
Common and preferred stocks traded on foreign securities exchanges are valued using pricing vendor services that provide model prices derived using adjustment factors based on information such as local closing price, relevant general and sector indices, currency fluctuations, depositary receipts, and futures, as applicable. Securities valued using such model prices are classified as Level 2 in the fair value hierarchy, as the adjustment factors are observable. Such securities are valued using model prices to the extent that the valuation meets the established confidence level for each security. If the confidence level is not met or the vendor does not provide a model price, securities are valued in accordance with exchange-traded common and preferred stocks discussed above.
Investments in open-end, non-exchange-traded mutual funds are valued at their net asset values as of the close of the NYSE on the date of valuation. These securities are classified as Level 1 in the fair value hierarchy since they may be purchased or sold at their net asset values on the date of valuation.
Fixed income securities traded in the over-the-counter market are generally valued at prices provided by approved independent pricing vendors. The pricing vendors provide these prices after evaluating observable inputs including, but not limited to yield curves, yield spreads, credit ratings, deal terms, tranche level attributes, default rates, cash flows, prepayment speeds, broker/dealer quotations, and reported trades. Securities valued using such vendor prices are classified as Level 2 in the fair value hierarchy.
Over-the-counter derivative instruments are generally valued using pricing vendor services, which derive the valuation based on inputs such as underlying asset prices, indices, spreads, interest rates, and exchange rates. These instruments are categorized as Level 2 in the fair value hierarchy.
| Prudential Jennison Growth Fund | 21 |
Notes to Financial Statements
(Unaudited) continued
Centrally cleared swaps listed or traded on a multilateral or trade facility platform, such as a registered exchange, are valued at the daily settlement price determined by the respective exchange. These securities are classified as Level 2 in the fair value hierarchy, as the daily settlement price is not public.
Securities and other assets that cannot be priced according to the methods described above are valued based on pricing methodologies approved by the Board. In the event that unobservable inputs are used when determining such valuations, the securities will be classified as Level 3 in the fair value hierarchy.
When determining the fair value of securities, some of the factors influencing the valuation include: the nature of any restrictions on disposition of the securities; assessment of the general liquidity of the securities; the issuer’s financial condition and the markets in which it does business; the cost of the investment; the size of the holding and the capitalization of the issuer; the prices of any recent transactions or bids/offers for such securities or any comparable securities; any available analyst media or other reports or information deemed reliable by the investment adviser regarding the issuer or the markets or industry in which it operates. Using fair value to price securities may result in a value that is different from a security’s most recent closing price and from the price used by other mutual funds to calculate their net asset values.
Foreign Currency Translation: The books and records of the Series are maintained in U.S. dollars. Foreign currency amounts are translated into U.S. dollars on the following basis:
(i) market value of investment securities, other assets and liabilities—at the current rates of exchange;
(ii) purchases and sales of investment securities, income and expenses—at the rates of exchange prevailing on the respective dates of such transactions.
Although the net assets of the Series are presented at the foreign exchange rates and market values at the close of the period, the Series does not isolate that portion of the results of operations arising as a result of changes in the foreign exchange rates from the fluctuations arising from changes in the market prices of long-term portfolio securities held at the end of the period. Similarly, the Series does not isolate the effect of changes in foreign exchange rates from the fluctuations arising from changes in the market prices of long-term portfolio securities sold during the period. Accordingly,
| 22 |
these realized foreign currency gains or losses are included in the reported net realized gains or losses on investment transactions.
Net realized gains or losses on foreign currency transactions represent net foreign exchange gains or losses from holdings of foreign currencies, forward currency contracts, disposition of foreign currencies, currency gains or losses realized between the trade and settlement dates on securities transactions, and the difference between the amounts of dividends, interest and foreign withholding taxes recorded on the Series’ books and the U.S. dollar equivalent amounts actually received or paid. Net unrealized currency gains or losses from valuing foreign currency denominated assets and liabilities (other than investments) at period end exchange rates are reflected as a component of net unrealized appreciation (depreciation) on foreign currencies.
Foreign security and currency transactions may involve certain considerations and risks not typically associated with those of domestic origin as a result of, among other factors, the possibility of political and economic instability, or the level of governmental supervision and regulation of foreign securities markets.
Master Netting Arrangements: The Series is subject to various Master Agreements, or netting arrangements, with select counterparties. These are agreements which a sub-adviser may have negotiated and entered into on behalf of the Series. A master netting arrangement between the Series and the counterparty permits the Series to offset amounts payable by the Series to the same counterparty against amounts to be received; and by the receipt of collateral from the counterparty by the Series to cover the Series’ exposure to the counterparty. However, there is no assurance that such mitigating factors are easily enforceable. The right to set-off exists when all the conditions are met such that each of the parties owes the other determinable amounts, the reporting party has the right to set-off the amount owed with the amount owed by the other party, the reporting party intends to set-off and the right of set-off is enforceable by law. During the reporting period, there were no instances where the right to set-off existed and management has not elected to offset.
Securities Lending: The Series may lend its portfolio securities to banks and broker-dealers. The loans are secured by collateral at least equal to the market value of the securities loaned. Collateral pledged by each borrower is invested in a highly liquid short-term money market fund and is marked to market daily, based on the previous day’s market value, such that the value of the collateral exceeds the value of the loaned securities. Loans are subject to termination at the option of the borrower or the Series. Upon termination of the loan, the borrower will return to the Series securities identical to the loaned securities. Should the borrower of the securities fail financially, the Series has the right to repurchase the securities in the open market using the
| Prudential Jennison Growth Fund | 23 |
Notes to Financial Statements
(Unaudited) continued
collateral. The Series recognizes income, net of any rebate and securities lending agent fees, for lending its securities, and any interest on the investment of cash received as collateral. The Series also continues to receive interest and dividends or amounts equivalent thereto, on the securities loaned and recognizes any unrealized gain or loss in the market price of the securities loaned that may occur during the term of the loan.
REITs: The Series invests in real estate investment trusts (“REITs”), which report information on the source of their distributions annually. Based on current and historical information, a portion of distributions received from REITs during the period is estimated to be dividend income, capital gain or return of capital and recorded accordingly. These estimates are adjusted periodically when the actual sources of distributions is disclosed by the REITs.
Securities Transactions and Net Investment Income: Securities transactions are recorded on the trade date. Realized gains or losses from investment and currency transactions are calculated on the identified cost basis. Dividend income is recorded on the ex-dividend date. Interest income, including amortization of premium and accretion of discount on debt securities, as required, is recorded on an accrual basis. Expenses are recorded on the accrual basis, which may require the use of certain estimates by management that may differ from actual.
Net investment income or loss (other than distribution fees, which are charged directly to the respective class) and unrealized and realized gains or losses are allocated daily to each class of shares based upon the relative proportion of adjusted net assets of each class at the beginning of the day.
Dividends and Distributions: The Series expects to pay dividends from net investment income and distributions from net realized capital gains, if any, at least annually. Dividends and distributions to shareholders, which are determined in accordance with federal income tax regulations and which may differ from generally accepted accounting principles, are recorded on the ex-dividend date. Permanent book/tax differences relating to income and gains are reclassified amongst undistributed net investment income, accumulated net realized gain or loss and paid-in capital in excess of par, as appropriate.
| 24 |
Taxes: For federal income tax purposes, the Series is treated as a separate taxpaying entity. It is the Series’ policy to continue to meet the requirements of the Internal Revenue Code applicable to regulated investment companies and to distribute all of its taxable net investment income and capital gains, if any, to its shareholders. Therefore, no federal income tax provision is required. Withholding taxes on foreign dividends, are recorded, net of reclaimable amounts, at the time the related income is earned.
Estimates: The preparation of the financial statements requires management to make estimates and assumptions that affect the reported amounts and disclosures in the financial statements. Actual results could differ from those estimates.
Note 2. Agreements
The Company has a management agreement for the Series with PI. Pursuant to this agreement, PI has responsibility for all investment advisory services and supervises the subadvisor’s performance of such services. PI has entered into a subadvisory agreement with Jennison Associates LLC (“Jennison”). The subadvisory agreement provides that Jennison furnishes investment advisory services in connection with the management of the Series. In connection therewith, Jennison is obligated to keep certain books and records of the Series. PI pays for the services of Jennison, the cost of compensation of officers of the Series, occupancy and certain clerical and bookkeeping costs of the Series. The Series bears all other costs and expenses.
The management fee paid to PI is accrued daily and payable monthly at an annual rate of .60% of the Series’ average daily net assets up to $300 million, .575% of the average daily net assets on the next $2.7 billion and .55% of the average daily net assets in excess of $3 billion. The effective management fee rate was .58% of the Series’ average daily net assets for the six months ended March 31, 2015.
The Series has a distribution agreement with Prudential Investment Management Services LLC (“PIMS”), which acts as the distributor of the Class A, Class B, Class C, Class R and Class Z shares of the Series. The Series compensates PIMS for distributing and servicing the Series’ Class A, Class B, Class C and Class R shares, pursuant to plans of distribution (the “Class A, B, C and R Plans”), regardless of expenses actually incurred by PIMS. The distribution fees are accrued daily and payable monthly. No distribution or service fees are paid to PIMS as distributor of the Class Z shares of the Series.
Pursuant to the Class A, B, C and R Plans, the Series compensates PIMS for distribution related activities at an annual rate of up to .30%, 1%, 1% and .75%, of the average daily net assets of the Class A, B, C and R shares, respectively. PIMS
| Prudential Jennison Growth Fund | 25 |
Notes to Financial Statements
(Unaudited) continued
contractually agreed to limit such fees to .50% of the average daily net assets of the Class R shares through January 31, 2016.
PIMS has advised the Series that it has received $294,934 in front-end sales charges resulting from sales of Class A shares, during the six months ended March 31, 2015. From these fees, PIMS paid such sales charges to affiliated broker-dealers, which in turn paid commissions to salespersons and incurred other distribution costs.
PIMS has advised the Series that for the six months ended March 31, 2015, it received $528, $11,353 and $2,171 in contingent deferred sales charges imposed upon redemptions by certain Class A, Class B and Class C shareholders, respectively.
PI, PIMS and Jennison are indirect, wholly-owned subsidiaries of Prudential Financial, Inc. (“Prudential”).
Note 3. Other Transactions with Affiliates
Prudential Mutual Fund Services LLC (“PMFS”), an affiliate of PI and an indirect, wholly-owned subsidiary of Prudential, serves as the Series’ transfer agent. Transfer agent’s fees and expenses in the Statement of Operations include certain out-of-pocket expenses paid to non-affiliates, where applicable.
Prudential Investment Management, Inc. (“PIM”), an indirect, wholly-owned subsidiary of Prudential, is the Series’ security lending agent. Earnings from securities lending are disclosed on the Statement of Operations as “Affiliated income from securities lending, net”. For the six months ended March 31, 2015, PIM has been compensated approximately $47,900 for these services.
The Series invests in the Prudential Core Taxable Money Market Fund (the “Core Fund”), a portfolio of Prudential Investment Portfolios 2, registered under the 1940 Act, and managed by PI. Earnings from the Core Fund are disclosed on the Statement of Operations as “Affiliated dividend income”.
Note 4. Portfolio Securities
Purchases and sales of portfolio securities, other than short-term investments, for the six months ended March 31, 2015, were $506,562,129 and $528,172,037, respectively.
| 26 |
Note 5. Tax Information
The United States federal income tax basis of the Series’ investments and the net unrealized appreciation as of March 31, 2015 were as follows:
Tax Basis | $ | 1,828,909,003 | ||
|
| |||
Appreciation | 1,340,860,212 | |||
Depreciation | (7,026,860 | ) | ||
|
| |||
Net Unrealized Appreciation | $ | 1,333,833,352 | ||
|
|
The book basis may differ from tax basis due to certain tax-related adjustments.
Management has analyzed the Series’ tax positions taken on federal, state and local income tax returns for all open tax years and has concluded that no provision for income tax is required in the Series’ financial statements for the current reporting period. The Series’ federal, state and local income and federal excise tax returns for tax years for which the applicable statutes of limitations have not expired are subject to examination by the Internal Revenue Service and state departments of revenue.
Note 6. Capital
The Series offers Class A, Class B, Class C, Class R and Class Z shares. Class A shares are subject to a maximum front-end sales charge of 5.50%. All investors who purchase Class A shares in an amount of $1 million or more and sell these shares within 12 months of purchase are subject to a contingent deferred sales charge (“CDSC”) of 1%. The Class A CDSC is waived for purchases by certain retirement or benefits plans. Class B shares are sold with a CDSC which declines from 5% to zero depending on the period of time the shares are held. Class B shares automatically convert to Class A shares on a quarterly basis approximately seven years after purchase. Class B shares are closed to new purchases. Class C shares are sold with a CDSC of 1% on shares redeemed within the first 12 months after purchase. A special exchange privilege is also available for shareholders who qualified to purchase Class A shares at net asset value. Class R and Class Z shares are not subject to any sales or redemption charge and are offered exclusively for sale to a limited group of investors.
Under certain circumstances, an exchange may be made from specified share classes of the Series to one or more other share classes of the Series as presented in the table of transactions in shares of common stock.
The Company is authorized to issue 6.25 billion shares of common stock at $.001 par value per shares. There are 1.25 billion shares authorized for the Series equally
| Prudential Jennison Growth Fund | 27 |
Notes to Financial Statements
(Unaudited) continued
divided into six classes, designated Class A, Class B, Class C, Class I, Class R and Class Z shares. The Series currently does not have any Class I shares outstanding. As of March 31, 2015, PI did not own any shares of the Series.
Transactions in shares of common stock were as follows:
Class A | Shares | Amount | ||||||
Six months ended March 31, 2015: | ||||||||
Shares sold | 2,491,870 | $ | 73,352,893 | |||||
Shares issued in reinvestment of dividends and distributions | 1,817,984 | 49,921,845 | ||||||
Shares reacquired | (4,320,749 | ) | (127,305,125 | ) | ||||
|
|
|
| |||||
Net increase (decrease) in shares outstanding before conversion | (10,895 | ) | (4,030,387 | ) | ||||
Shares issued upon conversion from Class B, Class C and Class Z | 151,095 | 4,499,173 | ||||||
Shares reacquired upon conversion into Class Z | (1,374,042 | ) | (42,133,965 | ) | ||||
|
|
|
| |||||
Net increase (decrease) in shares outstanding | (1,233,842 | ) | $ | (41,665,179 | ) | |||
|
|
|
| |||||
Year ended September 30, 2014: | ||||||||
Shares sold | 5,065,325 | $ | 141,511,555 | |||||
Shares issued in reinvestment of dividends and distributions | 1,303,493 | 35,533,187 | ||||||
Shares reacquired | (8,459,277 | ) | (234,667,659 | ) | ||||
|
|
|
| |||||
Net increase (decrease) in shares outstanding before conversion | (2,090,459 | ) | (57,622,917 | ) | ||||
Shares issued upon conversion from Class B, C and Z | 278,117 | 7,867,396 | ||||||
Shares reacquired upon conversion into Class Z | (438,486 | ) | (12,640,679 | ) | ||||
|
|
|
| |||||
Net increase (decrease) in shares outstanding | (2,250,828 | ) | $ | (62,396,200 | ) | |||
|
|
|
| |||||
Class B | ||||||||
Six months ended March 31, 2015: | ||||||||
Shares sold | 24,269 | $ | 610,696 | |||||
Shares issued in reinvestment of dividends and distributions | 62,720 | 1,465,783 | ||||||
Shares reacquired | (47,537 | ) | (1,200,279 | ) | ||||
|
|
|
| |||||
Net increase (decrease) in shares outstanding before conversion | 39,452 | 876,200 | ||||||
Shares reacquired upon conversion into Class A | (130,765 | ) | (3,334,633 | ) | ||||
|
|
|
| |||||
Net increase (decrease) in shares outstanding | (91,313 | ) | $ | (2,458,433 | ) | |||
|
|
|
| |||||
Year ended September 30, 2014: Shares sold | 134,724 | $ | 3,209,197 | |||||
Shares issued in reinvestment of dividends and distributions | 49,731 | 1,172,652 | ||||||
Shares reacquired | (148,586 | ) | (3,560,923 | ) | ||||
|
|
|
| |||||
Net increase (decrease) in shares outstanding before conversion | 35,869 | 820,926 | ||||||
Shares reacquired upon conversion into Class A | (259,348 | ) | (6,353,720 | ) | ||||
|
|
|
| |||||
Net increase (decrease) in shares outstanding | (223,479 | ) | $ | (5,532,794 | ) | |||
|
|
|
| |||||
| 28 |
Class C | Shares | Amount | ||||||
Six months ended March 31, 2015: | ||||||||
Shares sold | 311,153 | $ | 7,815,455 | |||||
Shares issued in reinvestment of dividends and distributions | 175,269 | 4,103,055 | ||||||
Shares reacquired | (192,320 | ) | (4,831,046 | ) | ||||
|
|
|
| |||||
Net increase (decrease) in shares outstanding before conversion | 294,102 | 7,087,464 | ||||||
Shares reacquired upon conversion into Class A and Class Z | (36,282 | ) | (906,643 | ) | ||||
|
|
|
| |||||
Net increase (decrease) in shares outstanding | 257,820 | $ | 6,180,821 | |||||
|
|
|
| |||||
Year ended September 30, 2014: | ||||||||
Shares sold | 416,917 | $ | 10,051,909 | |||||
Shares issued in reinvestment of dividends and distributions | 105,252 | 2,485,004 | ||||||
Shares reacquired | (371,559 | ) | (8,938,575 | ) | ||||
|
|
|
| |||||
Net increase (decrease) in shares outstanding before conversion | 150,610 | 3,598,338 | ||||||
Shares reacquired upon conversion into Class A and Z | (32,142 | ) | (784,240 | ) | ||||
|
|
|
| |||||
Net increase (decrease) in shares outstanding | 118,468 | $ | 2,814,098 | |||||
|
|
|
| |||||
Class R | ||||||||
Six months ended March 31, 2015 | ||||||||
Shares sold | 362,956 | $ | 9,648,609 | |||||
Shares issued in reinvestment of dividends and distributions | 105,654 | 2,619,164 | ||||||
Shares reacquired | (317,757 | ) | (8,445,729 | ) | ||||
|
|
|
| |||||
Net increase (decrease) in shares outstanding | 150,853 | $ | 3,822,044 | ) | ||||
|
|
|
| |||||
Year ended September 30, 2014: | ||||||||
Shares sold | 618,020 | $ | 15,743,669 | |||||
Shares issued in reinvestment of dividends and distributions | 61,367 | 1,521,890 | ||||||
Shares reacquired | (469,378 | ) | (11,902,750 | ) | ||||
|
|
|
| |||||
Net increase (decrease) in shares outstanding | 210,009 | $ | 5,362,809 | |||||
|
|
|
| |||||
Class Z | ||||||||
Six months ended March 31, 2015: | ||||||||
Shares sold | 6,625,884 | $ | 205,221,594 | |||||
Shares issued in reinvestment of dividends and distributions | 2,325,568 | 67,371,720 | ||||||
Shares reacquired | (5,307,122 | ) | (164,103,581 | ) | ||||
|
|
|
| |||||
Net increase (decrease) in shares outstanding before conversion | 3,644,330 | 108,489,733 | ||||||
Shares issued upon conversion from Class A and C | 1,334,967 | 43,017,336 | ||||||
Shares reacquired upon conversion into Class A | (36,851 | ) | (1,141,268 | ) | ||||
|
|
|
| |||||
Net increase (decrease) in shares outstanding | 4,942,446 | $ | 150,365,801 | |||||
|
|
|
| |||||
Year ended September 30, 2014: | ||||||||
Shares sold | 10,905,296 | $ | 318,464,464 | |||||
Shares issued in reinvestment of dividends and distributions | 1,405,470 | 40,182,382 | ||||||
Shares reacquired | (11,497,094 | ) | (336,951,067 | ) | ||||
|
|
|
| |||||
Net increase (decrease) in shares outstanding before conversion | 813,672 | 21,695,779 | ||||||
Shares issued upon conversion from Class A and C | 441,852 | 13,367,251 | ||||||
Shares reacquired upon conversion into Class A | (49,487 | ) | (1,456,008 | ) | ||||
|
|
|
| |||||
Net increase (decrease) in shares outstanding | 1,206,037 | $ | 33,607,022 | |||||
|
|
|
| |||||
| Prudential Jennison Growth Fund | 29 |
Notes to Financial Statements
(Unaudited) continued
Note 7. Borrowings
The Series, along with other affiliated registered investment companies (the “Funds”), is a party to a Syndicated Credit Agreement (“SCA”) with a group of banks. The purpose of the SCA is to provide an alternative source of temporary funding for capital share redemptions. The SCA provides for a commitment of $900 million for the period October 9, 2014 through October 8, 2015. The Funds pay an annualized commitment fee of .075% on the unused portion of the SCA. Prior to October 9, 2014 the Funds had another SCA that provided a commitment fee of $900 million and the Funds paid an annualized commitment fee of .08% of the unused portion of the SCA. Interest on any borrowings under the SCA is paid at contracted market rates. The commitment fee for the unused amount is accrued daily and paid quarterly.
The Series utilized the SCA during the six months ended March 31, 2015. The average daily balance for the 1 day the Series had loans outstanding during the period was $5,905,000, borrowed at a weighted average interest rate of 1.43%. The maximum loan outstanding amount during the period was $5,905,000. At March 31, 2015, the Series did not have an outstanding loan amount.
Note 8. New Accounting Pronouncement
In May 2015, the FASB issued Accounting Standards Update (“ASU”) No. 2015-07 regarding “Disclosures for Investments in Certain Entities That Calculate Net Asset Value per Share”. The amendments in this update are effective for the Fund for fiscal years beginning after December 15, 2015, and interim periods within those fiscal years. ASU No. 2015-07 will eliminate the requirement to categorize investments in the fair value hierarchy if their fair value is measured at net asset value (“NAV”) per share (or its equivalent) using the practical expedient in the FASB’s fair value measurement guidance. At this time, management is evaluating the implications of ASU No. 2015-07 and its impact on the financial statement disclosures has not yet been determined.
| 30 |
Financial Highlights
(Unaudited)
| Class A Shares | ||||||||||||||||||||||||||
| Six Months Ended March 31, | Year Ended September 30, | |||||||||||||||||||||||||
| 2015 | 2014 | 2013 | 2012 | 2011 | 2010 | |||||||||||||||||||||
| Per Share Operating Performance(a): | ||||||||||||||||||||||||||
| Net Asset Value, Beginning Of Period | $29.31 | $25.59 | $21.16 | $16.88 | $16.20 | $14.84 | ||||||||||||||||||||
| Income (loss) from investment operations: | ||||||||||||||||||||||||||
| Net investment loss | (.03 | ) | (.08 | ) | (.01 | ) | (.04 | ) | (.05 | ) | (.03 | ) | ||||||||||||||
| Net realized and unrealized gain on investment and foreign currency transactions | 2.51 | 4.79 | 4.44 | 4.32 | .73 | 1.37 | ||||||||||||||||||||
| Total from investment operations | 2.48 | 4.71 | 4.43 | 4.28 | .68 | 1.34 | ||||||||||||||||||||
| Less Distributions: | ||||||||||||||||||||||||||
| Distributions from net realized gains | (1.56 | ) | (.99 | ) | - | - | - | - | ||||||||||||||||||
| Capital Contributions(d): | - | - | - | - | - | .02 | ||||||||||||||||||||
| Net asset value, end of period | $30.23 | $29.31 | $25.59 | $21.16 | $16.88 | $16.20 | ||||||||||||||||||||
| Total Return(b): | 8.99% | 18.72% | 20.94% | 25.36% | 4.20% | 9.16% | ||||||||||||||||||||
| Ratios/Supplemental Data: | ||||||||||||||||||||||||||
| Net assets, end of period (000) | $1,083,405 | $1,086,552 | $1,006,407 | $904,802 | $805,293 | $833,584 | ||||||||||||||||||||
| Average net assets (000) | $1,065,256 | $1,079,657 | $933,021 | $916,595 | $904,612 | $946,738 | ||||||||||||||||||||
| Ratios to average net assets(c): | ||||||||||||||||||||||||||
| Expenses after waivers and/or expense reimbursement | 1.05% | (e) | 1.05% | 1.06% | 1.06% | 1.08% | 1.11% | |||||||||||||||||||
| Expenses before waivers and/or expense reimbursement | 1.05% | (e) | 1.05% | 1.06% | 1.06% | 1.08% | 1.11% | |||||||||||||||||||
| Net investment loss | (.19)% | (e) | (.27)% | (.04)% | (.18)% | (.27)% | (.18)% | |||||||||||||||||||
| Portfolio turnover rate | 18% | (f) | 38% | 43% | 44% | 63% | 73% | |||||||||||||||||||
(a) Calculated based on average shares outstanding during the period.
(b) Total return does not consider the effects of sales loads. Total return is calculated assuming a purchase of a share on the first day and a sale on the last day of each period reported, and includes reinvestment of dividends and distributions. Total returns may reflect adjustments to conform to generally accepted accounting principles. Total returns for periods less than one full year are not annualized.
(c) Does not include expenses of the underlying portfolios in which the Series invests.
(d) The Series received payments related to a former affiliate’s and to an unaffiliated-third party’s settlement of regulatory proceedings involving allegations of improper trading in Series shares during the fiscal year ended September 30, 2010. The Series was not involved in the proceedings or in the calculation of the amount of settlement.
(e) Annualized.
(f) Not annualized.
See Notes to Financial Statements.
| Prudential Jennison Growth Fund | 31 |
Financial Highlights
(Unaudited) continued
| Class B Shares | ||||||||||||||||||||||||||
| Six Months Ended March 31, | Year Ended September 30, | |||||||||||||||||||||||||
| 2015 | 2014 | 2013 | 2012 | 2011 | 2010 | |||||||||||||||||||||
| Per Share Operating Performance(a): | ||||||||||||||||||||||||||
| Net Asset Value, Beginning Of Period | $25.21 | $22.29 | $18.55 | $14.90 | $14.41 | $13.29 | ||||||||||||||||||||
| Income (loss) from investment operations: | ||||||||||||||||||||||||||
| Net investment loss | (.11 | ) | (.23 | ) | (.14 | ) | (.15 | ) | (.16 | ) | (.12 | ) | ||||||||||||||
| Net realized and unrealized gain on investment and foreign currency transactions | 2.13 | 4.14 | 3.88 | 3.80 | .65 | 1.22 | ||||||||||||||||||||
| Total from investment operations | 2.02 | 3.91 | 3.74 | 3.65 | .49 | 1.10 | ||||||||||||||||||||
| Less Distributions: | ||||||||||||||||||||||||||
| Distributions from net realized gains | (1.56 | ) | (.99 | ) | - | - | - | - | ||||||||||||||||||
| Capital Contributions(d): | - | - | - | - | - | .02 | ||||||||||||||||||||
| Net asset value, end of period | $25.67 | $25.21 | $22.29 | $18.55 | $14.90 | $14.41 | ||||||||||||||||||||
| Total Return(b): | 8.61% | 17.87% | 20.16% | 24.50% | 3.40% | 8.43% | ||||||||||||||||||||
| Ratios/Supplemental Data: | ||||||||||||||||||||||||||
| Net assets, end of period (000) | $24,357 | $26,222 | $28,166 | $30,110 | $31,148 | $42,581 | ||||||||||||||||||||
| Average net assets (000) | $25,949 | $28,811 | $28,518 | $32,576 | $41,009 | $51,415 | ||||||||||||||||||||
| Ratios to average net assets(c): | ||||||||||||||||||||||||||
| Expenses after waivers and/or expense reimbursement | 1.75% | (e) | 1.75% | 1.76% | 1.76% | 1.78% | 1.81% | |||||||||||||||||||
| Expenses before waivers and/or expense reimbursement | 1.75% | (e) | 1.75% | 1.76% | 1.76% | 1.78% | 1.81% | |||||||||||||||||||
| Net investment loss | (.89)% | (e) | (.97)% | (.72)% | (.88)% | (.97)% | (.87)% | |||||||||||||||||||
| Portfolio turnover rate | 18% | (f) | 38% | 43% | 44% | 63% | 73% | |||||||||||||||||||
(a) Calculated based on average shares outstanding during the period.
(b) Total return does not consider the effects of sales loads. Total return is calculated assuming a purchase of a share on the first day and a sale on the last day of each period reported, and includes reinvestment of dividends and distributions. Total returns may reflect adjustments to conform to generally accepted accounting principles. Total returns for periods less than one full year are not annualized.
(c) Does not include expenses of the underlying portfolios in which the Series invests.
(d) The Series received payments related to a former affiliate’s and to an unaffiliated-third party’s settlement of regulatory proceedings involving allegations of improper trading in Series shares during the fiscal year ended September 30, 2010. The Series was not involved in the proceedings or in the calculation of the amount of settlement.
(e) Annualized.
(f) Not annualized.
See Notes to Financial Statements.
| 32 |
| Class C Shares | ||||||||||||||||||||||||||
| Six Months Ended March 31, | Year Ended September 30, | |||||||||||||||||||||||||
| 2015 | 2014 | 2013 | 2012 | 2011 | 2010 | |||||||||||||||||||||
| Per Share Operating Performance(a): | ||||||||||||||||||||||||||
| Net Asset Value, Beginning Of Period | $25.25 | $22.32 | $18.58 | $14.93 | $14.43 | $13.29 | ||||||||||||||||||||
| Income (loss) from investment operations: | ||||||||||||||||||||||||||
| Net investment loss | (.11 | ) | (.24 | ) | (.15 | ) | (.15 | ) | (.16 | ) | (.13 | ) | ||||||||||||||
| Net realized and unrealized gain on investment and foreign currency transactions | 2.13 | 4.16 | 3.89 | 3.80 | .66 | 1.25 | ||||||||||||||||||||
| Total from investment operations | 2.02 | 3.92 | 3.74 | 3.65 | .50 | 1.12 | ||||||||||||||||||||
| Less Distributions: | ||||||||||||||||||||||||||
| Distributions from net realized gains | (1.56 | ) | (.99 | ) | - | - | - | - | ||||||||||||||||||
| Capital Contributions(d): | - | - | - | - | - | .02 | ||||||||||||||||||||
| Net asset value, end of period | $25.71 | $25.25 | $22.32 | $18.58 | $14.93 | $14.43 | ||||||||||||||||||||
| Total Return(b): | 8.59% | 17.89% | 20.13% | 24.45% | 3.47% | 8.58% | ||||||||||||||||||||
| Ratios/Supplemental Data: | ||||||||||||||||||||||||||
| Net assets, end of period (000) | $83,639 | $75,620 | $64,213 | $58,437 | $46,623 | $66,240 | ||||||||||||||||||||
| Average net assets (000) | $78,769 | $71,867 | $59,245 | $55,226 | $63,040 | $64,722 | ||||||||||||||||||||
| Ratios to average net assets(c): | ||||||||||||||||||||||||||
| Expenses after waivers and/or expense reimbursement | 1.75% | (e) | 1.75% | 1.76% | 1.76% | 1.78% | 1.81% | |||||||||||||||||||
| Expenses before waivers and/or expense reimbursement | 1.75% | (e) | 1.75% | 1.76% | 1.76% | 1.78% | 1.81% | |||||||||||||||||||
| Net investment loss | (.89)% | (e) | (.97)% | (.74)% | (.88)% | (.98)% | (.88)% | |||||||||||||||||||
| Portfolio turnover rate | 18% | (f) | 38% | 43% | 44% | 63% | 73% | |||||||||||||||||||
(a) Calculated based on average shares outstanding during the period.
(b) Total return does not consider the effects of sales loads. Total return is calculated assuming a purchase of a share on the first day and a sale on the last day of each period reported, and includes reinvestment of dividends and distributions. Total returns may reflect adjustments to conform to generally accepted accounting principles. Total returns for periods less than one full year are not annualized.
(c) Does not include expenses of the underlying portfolios in which the Series invests.
(d) The Series received payments related to a former affiliate’s and to an unaffiliated-third party’s settlement of regulatory proceedings involving allegations of improper trading in Series shares during the fiscal year ended September 30, 2010. The Series was not involved in the proceedings or in the calculation of the amount of settlement.
(e) Annualized.
(f) Not annualized.
See Notes to Financial Statements.
| Prudential Jennison Growth Fund | 33 |
Financial Highlights
(Unaudited) continued
| Class R Shares | ||||||||||||||||||||||||||
| Six Months Ended March 31, | Year Ended September 30, | |||||||||||||||||||||||||
| 2015 | 2014 | 2013 | 2012 | 2011 | 2010 | |||||||||||||||||||||
| Per Share Operating Performance(a): | ||||||||||||||||||||||||||
| Net Asset Value, Beginning Of Period | $26.62 | $23.37 | $19.36 | $15.47 | $14.87 | $13.65 | ||||||||||||||||||||
| Income (loss) from investment operations: | ||||||||||||||||||||||||||
| Net investment loss | (.05 | ) | (.12 | ) | (.05 | ) | (.07 | ) | (.08 | ) | (.06 | ) | ||||||||||||||
| Net realized and unrealized gain on investment and foreign currency transactions | 2.26 | 4.36 | 4.06 | 3.96 | .68 | 1.26 | ||||||||||||||||||||
| Total from investment operations | 2.21 | 4.24 | 4.01 | 3.89 | .60 | 1.20 | ||||||||||||||||||||
| Less Distributions: | ||||||||||||||||||||||||||
| Distributions from net realized gains | (1.56 | ) | (.99 | ) | - | - | - | - | ||||||||||||||||||
| Capital Contributions(d): | - | - | - | - | - | .02 | ||||||||||||||||||||
| Net asset value, end of period | $27.27 | $26.62 | $23.37 | $19.36 | $15.47 | $14.87 | ||||||||||||||||||||
| Total Return(b): | 8.88% | 18.48% | 20.71% | 25.15% | 4.03% | 8.94% | ||||||||||||||||||||
| Ratios/Supplemental Data: | ||||||||||||||||||||||||||
| Net assets, end of period (000) | $53,244 | $47,957 | $37,198 | $34,287 | $23,811 | $8,977 | ||||||||||||||||||||
| Average net assets (000) | $50,502 | $43,736 | $38,280 | $27,346 | $17,091 | $7,777 | ||||||||||||||||||||
| Ratios to average net assets(c): | ||||||||||||||||||||||||||
| Expenses after waivers and/or expense reimbursement | 1.25% | (e) | 1.25% | 1.26% | 1.26% | 1.28% | 1.31% | |||||||||||||||||||
| Expenses before waivers and/or expense reimbursement | 1.50% | (e) | 1.50% | 1.51% | 1.51% | 1.53% | 1.56% | |||||||||||||||||||
| Net investment loss | (.39)% | (e) | (.48)% | (.25)% | (.38)% | (.45)% | (.38)% | |||||||||||||||||||
| Portfolio turnover rate | 18% | (f) | 38% | 43% | 44% | 63% | 73% | |||||||||||||||||||
(a) Calculated based on average shares outstanding during the period.
(b) Total return is calculated assuming a purchase of a share on the first day and a sale on the last day of each period reported, and includes reinvestment of dividends and distributions. Total returns may reflect adjustments to conform to generally accepted accounting principles. Total returns for periods less than one full year are not annualized.
(c) Does not include expenses of the underlying portfolios in which the Series invests.
(d) The Series received payments related to a former affiliate’s and to an unaffiliated-third party’s settlement of regulatory proceedings involving allegations of improper trading in Series shares during the fiscal year ended September 30, 2010. The Series was not involved in the proceedings or in the calculation of the amount of settlement.
(e) Annualized.
(f) Not annualized.
See Notes to Financial Statements.
| 34 |
| Class Z Shares | ||||||||||||||||||||||||||
| Six Months Ended March 31, | Year Ended September 30, | |||||||||||||||||||||||||
| 2015 | 2014 | 2013 | 2012 | 2011 | 2010 | |||||||||||||||||||||
| Per Share Operating Performance(a): | ||||||||||||||||||||||||||
| Net Asset Value, Beginning Of Period | $30.81 | $26.78 | $22.07 | $17.56 | $16.80 | $15.34 | ||||||||||||||||||||
| Income (loss) from investment operations: | ||||||||||||||||||||||||||
| Net investment income | .02 | .01 | .06 | .02 | - | (d) | .02 | |||||||||||||||||||
| Net realized and unrealized gain on investment and foreign currency transactions | 2.64 | 5.01 | 4.65 | 4.49 | .76 | 1.42 | ||||||||||||||||||||
| Total from investment operations | 2.66 | 5.02 | 4.71 | 4.51 | .76 | 1.44 | ||||||||||||||||||||
| Less Dividends and Distributions: | ||||||||||||||||||||||||||
| Dividends from net investment income | - | - | (d) | - | - | - | - | |||||||||||||||||||
| Distributions from net realized gains | (1.56 | ) | (.99 | ) | - | - | - | - | ||||||||||||||||||
| Total dividends and distributions | (1.56 | ) | (.99 | ) | - | - | - | - | ||||||||||||||||||
| Capital Contributions(e): | - | - | - | - | - | .02 | ||||||||||||||||||||
| Net asset value, end of period | $31.91 | $30.81 | $26.78 | $22.07 | $17.56 | $16.80 | ||||||||||||||||||||
| Total Return(b): | 9.14% | 19.07% | 21.34% | 25.68% | 4.52% | 9.52% | ||||||||||||||||||||
| Ratios/Supplemental Data: | ||||||||||||||||||||||||||
| Net assets, end of period (000) | $1,675,428 | $1,465,227 | $1,241,434 | $984,242 | $804,085 | $793,225 | ||||||||||||||||||||
| Average net assets (000) | $1,577,099 | $1,398,654 | $1,077,941 | $1,103,837 | $870,663 | $736,912 | ||||||||||||||||||||
| Ratios to average net assets(c): | ||||||||||||||||||||||||||
| Expenses after waivers and/or expense reimbursement | .75% | (f) | .75% | .76% | .76% | .78% | .81% | |||||||||||||||||||
| Expenses before waivers and/or expense reimbursement | .75% | (f) | .75% | .76% | .76% | .78% | .81% | |||||||||||||||||||
| Net investment income | .11% | (f) | .03% | .25% | .12% | .03% | .12% | |||||||||||||||||||
| Portfolio turnover rate | 18% | (g) | 38% | 43% | 44% | 63% | 73% | |||||||||||||||||||
(a) Calculated based on average shares outstanding during the period.
(b) Total return is calculated assuming a purchase of a share on the first day and a sale on the last day of each period reported and includes reinvestment of dividends and distributions. Total returns may reflect adjustments to conform to generally accepted accounting principles. Total return for periods less than one full year are not annualized.
(c) Does not include expenses of the underlying portfolios in which the Series invests.
(d) Less than $.005 per share.
(e) The Series received payments related to a former affiliate’s and to an unaffiliated-third party’s settlement of regulatory proceedings involving allegations of improper trading in Series shares during the fiscal year ended September 30, 2010. The Series was not involved in the proceedings or in the calculation of the amount of settlement.
(f) Annualized.
(g) Not annualized.
See Notes to Financial Statements.
| Prudential Jennison Growth Fund | 35 |
Results of Proxy Voting
(Unaudited)
At a special meeting of shareholders held on November 26, 2014, shareholders of the Prudential Investment Portfolios, Inc., which is comprised of Prudential Balanced Fund, Prudential Growth Allocation Fund, Prudential Moderate Allocation Fund, Prudential Conservative Allocation Fund, Prudential Jennison Equity Opportunity Fund and Prudential Jennison Growth Fund (collectively, the “Funds”), approved the following proposal. Shareholders of all Funds voted together on the proposal:
To elect twelve Directors:
| SHARES VOTED | % OF VOTED | % OF TOTAL | ||||||||||
(a) Ellen S. Alberding; | ||||||||||||
FOR | 95,100,802.626 | 98.280 | 55.055 | |||||||||
WITHHELD | 1,664,556.591 | 1.720 | 0.963 | |||||||||
(b) Kevin J. Bannon; | ||||||||||||
FOR | 95,146,900.682 | 98.328 | 55.082 | |||||||||
WITHHELD | 1,618,458.535 | 1.672 | 0.936 | |||||||||
(c) Linda W. Bynoe; | ||||||||||||
FOR | 95,140,861.216 | 98.322 | 55.078 | |||||||||
WITHHELD | 1,624,498.001 | 1.678 | 0.940 | |||||||||
(d) Keith F. Hartstein; | ||||||||||||
FOR | 95,133,836.925 | 98.314 | 55.074 | |||||||||
WITHHELD | 1,631,522.292 | 1.686 | 0.944 | |||||||||
(e) Michael S. Hyland; | ||||||||||||
FOR | 95,117,285.270 | 98.297 | 55.064 | |||||||||
WITHHELD | 1,648,073.947 | 1.703 | 0.954 | |||||||||
(f) Stephen P. Munn; | ||||||||||||
FOR | 95,030,269.772 | 98.207 | 55.014 | |||||||||
WITHHELD | 1,735,089.445 | 1.793 | 1.004 | |||||||||
(g) James E. Quinn; | ||||||||||||
FOR | 95,133,075.390 | 98.314 | 55.074 | |||||||||
WITHHELD | 1,632,283.827 | 1.686 | 0.944 | |||||||||
(h) Richard A. Redeker; | ||||||||||||
FOR | 95,042,171.501 | 98.220 | 55.021 | |||||||||
WITHHELD | 1,723,187.716 | 1.780 | 0.997 | |||||||||
(i) Stephen G. Stoneburn; | ||||||||||||
FOR | 95,055,450.417 | 98.233 | 55.029 | |||||||||
WITHHELD | 1,709,908.800 | 1.767 | 0.989 | |||||||||
(j) Stuart S. Parker; | ||||||||||||
FOR | 95,151,749.610 | 98.333 | 55.084 | |||||||||
WITHHELD | 1,613,609.607 | 1.667 | 0.934 | |||||||||
| 36 |
| SHARES VOTED | % OF VOTED | % OF TOTAL | ||||||||||
(k) Scott E. Benjamin; and | ||||||||||||
FOR | 95,115,629.702 | 98.296 | 55.063 | |||||||||
WITHHELD | 1,649,729.515 | 1.704 | 0.955 | |||||||||
(l) Grace C. Torres. | ||||||||||||
FOR | 95,092,614.445 | 98.271 | 55.050 | |||||||||
WITHHELD | 1,672,744.772 | 1.72 | 0.968 | |||||||||
The special meeting of shareholders of the Prudential Jennison Growth Fund (the “Fund”) held on November 26, 2014, was adjourned to December 3, 2014, and further adjourned to December 10, 2014 and January 9, 2015 to permit further solicitation of proxies on the proposals noted below.
An abstention or a broker non-vote is considered present for purposes of determining a quorum but has the effect of a vote against such matters. At the special meeting of shareholders held on January 9, 2015, insufficient votes were obtained to approve the following proposals:
Proposal: To permit PI to enter into or make material changes to the Fund’s subadvisory agreements with subadvisers that are wholly-owned subsidiaries of PI or a sister company of PI (wholly-owned subadvisers) without shareholder approval.
| SHARES VOTED | % OF VOTED | % OF TOTAL | ||||||||||
FOR | 13,120,281.358 | 27.395 | 14.421 | |||||||||
AGAINST | 4,312,906.518 | 9.006 | 4.740 | |||||||||
ABSTAIN | 883,569.608 | 1.844 | 0.971 | |||||||||
BROKER NON-VOTE | 29,576,968.709 | 61.755 | 32.510 | |||||||||
TOTAL | 47,893,726.193 | 100.000 | 52.642 | |||||||||
Proposal: To approve a proposal to designate the Fund’s investment objective as a non-fundamental policy of the Fund.
| SHARES VOTED | % OF VOTED | % OF TOTAL | ||||||||||
FOR | 9,575,236.498 | 19.993 | 10.525 | |||||||||
AGAINST | 7,546,343.578 | 15.757 | 8.294 | |||||||||
ABSTAIN | 1,195,177.408 | 2.495 | 1.313 | |||||||||
BROKER NON-VOTE | 29,576,968.709 | 61.755 | 32.510 | |||||||||
TOTAL | 47,893,726.193 | 100.000 | 52.642 | |||||||||
| Prudential Jennison Growth Fund | 37 |
| n MAIL | n TELEPHONE | n WEBSITE | ||
Gateway Center Three 100 Mulberry Street Newark, NJ 07102 | (800) 225-1852 | www.prudentialfunds.com |
| PROXY VOTING |
| The Board of Directors of the Fund has delegated to the Fund’s investment subadviser the responsibility for voting any proxies and maintaining proxy recordkeeping with respect to the Fund. A description of these proxy voting policies and procedures is available without charge, upon request, by calling (800) 225-1852 or by visiting the Securities and Exchange Commission’s website at www.sec.gov. Information regarding how the Fund voted proxies relating to portfolio securities during the most recent 12-month period ended June 30 is available on the Fund’s website and on the Securities and Exchange Commission’s website. |
| DIRECTORS |
| Ellen S. Alberding • Kevin J. Bannon • Scott E. Benjamin • Linda W. Bynoe • Keith F. Hartstein • Michael S. Hyland • Stephen P. Munn • Stuart S. Parker • James E Quinn • Richard A. Redeker • Stephen G. Stoneburn • Grace C. Torres |
| OFFICERS |
| Stuart S. Parker, President • Scott E. Benjamin, Vice President • M. Sadiq Peshimam, Treasurer and Principal Financial and Accounting Officer • Raymond A. O’Hara, Chief Legal Officer • Deborah A. Docs, Secretary • Chad A. Earnst, Chief Compliance Officer • Theresa C. Thompson, Deputy Chief Compliance Officer • Richard W. Kinville, Anti-Money Laundering Compliance Officer • Jonathan D. Shain, Assistant Secretary • Claudia DiGiacomo, Assistant Secretary • Amanda S. Ryan, Assistant Secretary • Andrew R. French, Assistant Secretary • Peter Parrella, Assistant Treasurer • Lana Lomuti, Assistant Treasurer • Linda McMullin, Assistant Treasurer • Kelly A. Coyne, Assistant Treasurer |
| MANAGER | Prudential Investments LLC | Gateway Center Three 100 Mulberry Street | ||
| ||||
| INVESTMENT SUBADVISER | Jennison Associates LLC | 466 Lexington Avenue New York, NY 10017 | ||
| ||||
| DISTRIBUTOR | Prudential Investment Management Services LLC | Gateway Center Three 100 Mulberry Street | ||
| ||||
| CUSTODIAN | The Bank of New York Mellon | One Wall Street New York, NY 10286 | ||
| ||||
| TRANSFER AGENT | Prudential Mutual Fund Services LLC | PO Box 9658 Providence, RI 02940 | ||
| ||||
| INDEPENDENT REGISTERED PUBLIC ACCOUNTING FIRM | KPMG LLP | 345 Park Avenue New York, NY 10154 | ||
| ||||
| FUND COUNSEL | Willkie Farr & Gallagher LLP | 787 Seventh Avenue New York, NY 10019 | ||
| An investor should consider the investment objectives, risks, charges, and expenses of the Fund carefully before investing. The prospectus and summary prospectus contain this and other information about the Fund. An investor may obtain a prospectus and summary prospectus by visiting our website at www.prudentialfunds.com or by calling (800) 225-1852. The prospectus and summary prospectus should be read carefully before investing. |
| E-DELIVERY |
| To receive your mutual fund documents online, go to www.prudentialfunds.com/edelivery and enroll. Instead of receiving printed documents by mail, you will receive notification via email when new materials are available. You can cancel your enrollment or change your email address at any time by visiting the website address above. |
| SHAREHOLDER COMMUNICATIONS WITH DIRECTORS |
| Shareholders can communicate directly with the Board of Directors by writing to the Chair of the Board, Prudential Jennison Growth Fund, Prudential Investments, Attn: Board of Directors, 100 Mulberry Street, Gateway Center Three, Newark, NJ 07102. Shareholders can communicate directly with an individual Director by writing to the same address. Communications are not screened before being delivered to the addressee. |
| AVAILABILITY OF PORTFOLIO SCHEDULE |
| The Fund files its complete schedule of portfolio holdings with the Securities and Exchange Commission for the first and third quarters of each fiscal year on Form N-Q. The Fund’s Forms N-Q are available on the Commission’s website at www.sec.gov. The Fund’s Forms N-Q may also be reviewed and copied at the Commission’s Public Reference Room in Washington, D.C. Information on the operation and location of the Public Reference Room may be obtained by calling 1-800-SEC-0330. The Fund’s schedule of portfolio holdings is also available on the Fund’s website as of the end of each month. |
Mutual Funds:
| ARE NOT INSURED BY THE FDIC OR ANY FEDERAL GOVERNMENT AGENCY | MAY LOSE VALUE | ARE NOT A DEPOSIT OF OR GUARANTEED BY ANY BANK OR ANY BANK AFFILIATE |
PRUDENTIAL JENNISON GROWTH FUND
| SHARE CLASS | A | B | C | R | Z | |||||
| NASDAQ | PJFAX | PJFBX | PJFCX | PJGRX | PJFZX | |||||
| CUSIP | 74437E107 | 74437E206 | 74437E305 | 74437E651 | 74437E404 |
MF168E2 0277396-00001-00

PRUDENTIAL INVESTMENTS»MUTUAL FUNDS
PRUDENTIAL ASSET ALLOCATION FUNDS
SEMIANNUAL REPORT · MARCH 31, 2015
Fund Type
Balanced/Allocation
PRUDENTIAL CONSERVATIVE ALLOCATION FUND
PRUDENTIAL MODERATE ALLOCATION FUND
PRUDENTIAL GROWTH ALLOCATION FUND
This report is not authorized for distribution to prospective investors unless preceded or accompanied by a current prospectus.
The views expressed in this report and information about the Funds’ portfolio holdings are for the period covered by this report and are subject to change thereafter.
The accompanying financial statements as of March 31, 2015, were not audited and, accordingly, no auditor’s opinion is expressed on them.
Mutual funds are distributed by Prudential Investment Management Services LLC (PIMS). Quantitative Management Associates, LLC and Prudential Investment Management, Inc. (PIM) are registered investment advisers and Prudential Financial companies. Prudential Fixed Income is a unit of PIM. © 2015 Prudential Financial, Inc. and its related entities. Prudential Investments LLC, Prudential, the Prudential logo, Bring Your Challenges, and the Rock symbol are service marks of Prudential Financial, Inc. and its related entities, registered in many jurisdictions worldwide.

|  |

PRUDENTIAL ASSET ALLOCATION FUNDS
| 1 | ||||
| 2 | ||||
| 6 | ||||
| 10 | ||||
| 14 | ||||
May 15, 2015
We hope you find the semiannual report for the Prudential Asset Allocation Funds informative and useful. The report covers performance for the six-month period that ended March 31, 2015.
Since market conditions change over time, we believe it is important to maintain a diversified portfolio of funds consistent with your tolerance for risk, time horizon, and financial goals.
Your financial advisor can help you create a diversified investment plan that may include funds covering all the basic asset classes and that reflects your personal investor profile and risk tolerance. Keep in mind, however, that diversification and asset allocation strategies do not assure a profit or protect against loss in declining markets.
Prudential Investments® is dedicated to helping you solve your toughest investment challenges—whether it’s capital growth, reliable income, or protection from market volatility and other risks. We offer the expertise of Prudential Financial’s affiliated asset managers that strive to be leaders in a broad range of funds to help you stay on course to the future you envision. They also manage money for major corporations and pension funds around the world, which means you benefit from the same expertise, innovation, and attention to risk demanded by today’s most sophisticated investors.
Thank you for choosing the Prudential Investments family of funds.
Sincerely,

Stuart S. Parker, President
Prudential Asset Allocation Funds
| Prudential Asset Allocation Funds | 1 |
Your Fund’s Performance—Conservative Allocation Fund
(Unaudited)
Performance data quoted represent past performance. Past performance does not guarantee future results. The investment return and principal value of an investment will fluctuate, so that an investor’s shares, when redeemed, may be worth more or less than their original cost. Current performance may be lower or higher than the past performance data quoted. An investor may obtain performance data as of the most recent month-end by visiting our website at www.prudentialfunds.com or by calling (800) 225-1852.
Cumulative Total Returns (Without Sales Charges) as of 3/31/15 |
| |||||||||||||||||||
| Six Months | One Year | Five Years | Ten Years | Since Inception | ||||||||||||||||
Class A | 3.45 | % | 4.62 | % | 36.42 | % | 75.70 | % | — | |||||||||||
Class B | 3.06 | 3.85 | 31.49 | 63.01 | — | |||||||||||||||
Class C | 3.06 | 3.85 | 31.37 | 63.00 | — | |||||||||||||||
Class R | 3.30 | 4.34 | 34.71 | N/A | 47.82% (1/12/07) | |||||||||||||||
Class Z | 3.56 | 4.94 | 38.17 | 80.45 | — | |||||||||||||||
Conservative Customized Blend Index | 3.63 | 5.82 | 38.10 | 74.50 | — | |||||||||||||||
Russell 1000® Index | 6.55 | 12.73 | 98.76 | 122.76 | — | |||||||||||||||
S&P 500 Index | 5.92 | 12.71 | 96.40 | 115.97 | — | |||||||||||||||
Lipper Mixed-Asset Target Allocation Conservative Funds Average | 2.44 | 4.10 | 34.73 | 61.20 | — | |||||||||||||||
Average Annual Total Returns (With Sales Charges) as of 3/31/15 |
| |||||||||||||||||||
| One Year | Five Years | Ten Years | Since Inception | |||||||||||||||||
Class A | –1.13 | % | 5.21 | % | 5.20 | % | — | |||||||||||||
Class B | –1.15 | 5.47 | 5.01 | — | ||||||||||||||||
Class C | 2.85 | 5.61 | 5.01 | — | ||||||||||||||||
Class R | 4.34 | 6.14 | N/A | 4.87% (1/12/07) | ||||||||||||||||
Class Z | 4.94 | 6.68 | 6.08 | — | ||||||||||||||||
Conservative Customized Blend Index | 5.82 | 6.67 | 5.73 | — | ||||||||||||||||
Russell 1000 Index | 12.73 | 14.73 | 8.34 | — | ||||||||||||||||
S&P 500 Index | 12.71 | 14.45 | 8.00 | — | ||||||||||||||||
Lipper Mixed-Asset Target Allocation Conservative Funds Average | 4.10 | 6.10 | 4.84 | — | ||||||||||||||||
Source: Prudential Investments LLC and Lipper Inc. inception returns are provided for any share class with less than 10 calendar years of returns.
| 2 | Visit our website at www.prudentialfunds.com |
The returns in the tables do not reflect the deduction of taxes that a shareholder would pay on Fund distributions or following the redemption of Fund shares. The average annual total returns take into account applicable sales charges, which are described for each share class in the table below.
| Class A | Class B* | Class C | Class R | Class Z | ||||||
Maximum Initial Sales Charge | 5.50% of the public offering price | None | None | None | None | |||||
Contingent Deferred Sales Charge (CDSC) (as a percentage of the lower of original purchase price or sale proceeds) | 1% on sales of $1 million or more made within 12 months of purchase | 5% (Yr.1) 4% (Yr.2) 3% (Yr.3) 2% (Yr.4) 1% (Yr.5) 1% (Yr.6) 0% (Yr.7) | 1% on sales made within 12 months of purchase | None | None | |||||
Annual Distribution and Service (12b-1) fees (shown as a percentage of average daily net assets) | .30% (.25% currently) | 1% | 1% | .75% (.50% currently) | None |
*Class B shares are closed to all purchase activity and no additional Class B shares may be purchased or acquired except by exchange from Class B shares of another Fund or through dividend or capital gains reinvestment.
Benchmark Definitions
Conservative Customized Blend Index
The Conservative Customized Blend is a model portfolio consisting of the Russell 3000 Index (25.5%), the MSCI ACWI ex-US Index (10%), the Barclays US Aggregate Bond Index (29%), the Barclays 1-3 Year Government/Credit Index (29%), the Standard & Poor’s (S&P) Developed Property Net Index (5%) and the Citigroup 3-Month T-Bill (1.5%). The Conservative Customized Blend does not reflect deductions for any sales charges or operating expenses of a mutual fund or taxes. These returns would be lower if they included the effect of these expenses. The cumulative total return for the Conservative Customized Blend Index measured from the month-end closest to inception date for Class R shares through 3/31/15 is 48.04%. The average annual total return for the Conservative Customized Blend Index measured from the month-end closest to the inception date for Class R shares through 3/31/15 is 4.87%.
Russell 1000 Index
The Russell 1000 Index is an unmanaged index that consists of the 1,000 largest securities in the Russell 3000 Index. The cumulative total return for the Russell 1000 Index measured from the month-end closest to inception date for Class R shares through 3/31/15 is 78.10%. The average annual total return for the Russell 1000 Index measured from the month-end closest to the inception date for Class R shares through 3/31/15 is 7.25%.
S&P 500 Index
The S&P 500 Index is an unmanaged index of 500 stocks of large US public companies. It gives a broad look at how US stock prices have performed. The cumulative total return for the S&P 500 Index measured from the month-end closest to inception date for Class R shares through 3/31/15 is 73.99%. The average annual total return for the S&P 500 Index measured from the month-end closest to the inception date for Class R shares through 3/31/15 is 6.94%.
| Prudential Asset Allocation Funds | 3 |
Your Fund’s Performance (continued)
Lipper Mixed-Asset Target Allocation Conservative Funds Average
The Lipper Mixed-Asset Target Allocation Conservative Funds Average (Lipper Average) is based on an average return of all funds in the Lipper Mixed-Asset Target Allocation Conservative Funds category for the periods noted. Funds in the Lipper Average maintain a mix of between 20% and 40% equity securities with the remainder in bonds, cash, and cash equivalents. The cumulative total return for the Lipper Average measured from the month-end closest to inception date for Class R shares through 3/31/15 is 42.59%. The average annual total return for the Lipper Average measured from the month-end closest to the inception date for Class R shares through 3/31/15 is 4.33%.
Investors cannot invest directly in an index or average. The returns for the Indexes would be lower if they included the effects of sales charges, operating expenses of a mutual fund, or taxes. Returns for the Lipper Average reflect the deduction of operating expenses, but not sales charges or taxes. The Since Inception returns for the Indexes and the Lipper Average are measured from the closest month-end to inception date, and not from the Class’s actual inception date.
| 4 | Visit our website at www.prudentialfunds.com |
Performance Target—Conservative Customized Blend
The Prudential Conservative Allocation Fund seeks to exceed a performance target—the Conservative Customized Blend Index—consisting of a weighted average return of six securities indexes that are generally considered representative of the asset classes in which the Fund may invest. The chart below shows both the total returns of these indexes for the six-month period ended March 31, 2015, and their weightings in the Conservative Customized Blend Index. Index returns do not reflect sales charges, a mutual fund’s operating expenses, or taxes, and investors cannot invest directly in an index. The Fund seeks to exceed this target by holding positions in specific Prudential mutual funds. In response to market developments, the Fund’s investment subadviser may vary its holdings in those funds (within specified ranges). Past performance is not indicative of future results.
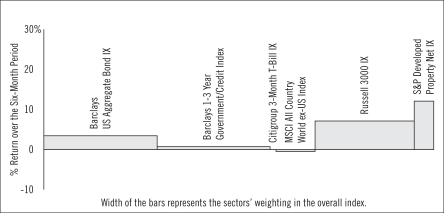
Source: Lipper Inc.
The Barclays US Aggregate Bond Index is an unmanaged index of investment-grade securities issued by the US Government and its agencies and by corporations with between one and 10 years remaining to maturity. It gives a broad look at how bond prices of short- and intermediate-term bonds have performed.
The Barclays 1-3 Year Government/Credit Index is considered representative of the performance of short-term US corporate bonds and US government bonds with maturities from one to three years.
The Citigroup 3-Month T-Bill Index is an unmanaged index representing monthly return equivalents of yield averages of the last 3-month Treasury Bill issues.
The MSCI All Country World ex-US Index is a free float-adjusted market capitalization weighted index that is designed to measure the equity market performance of developed and emerging markets, excluding the US. It comprises approximately 23 developed and 21 emerging market country indexes.
The Russell 3000 Index is an unmanaged index which represents the US equity market—it covers about 98% of all investable stocks in the US.
The Standard & Poor’s (S&P) Developed Property Net Index defines and measures the investable universe of publicly traded property companies domiciled in developed markets.
Investors cannot invest directly in an index or average.
| Prudential Asset Allocation Funds | 5 |
Your Fund’s Performance—Moderate Allocation Fund
(Unaudited)
Performance data quoted represent past performance. Past performance does not guarantee future results. The investment return and principal value of an investment will fluctuate, so that an investor’s shares, when redeemed, may be worth more or less than their original cost. Current performance may be lower or higher than the past performance data quoted. An investor may obtain performance data as of the most recent month-end by visiting our website at www.prudentialfunds.com or by calling (800) 225-1852.
Cumulative Total Returns (Without Sales Charges) as of 3/31/15 | ||||||||||||||||||
| Six Months | One Year | Five Years | Ten Years | Since Inception | ||||||||||||||
Class A | 4.38 | % | 5.77 | % | 48.48 | % | 86.11 | % | — | |||||||||
Class B | 3.91 | 4.96 | 43.07 | 72.63 | — | |||||||||||||
Class C | 3.99 | 4.96 | 43.07 | 72.64 | — | |||||||||||||
Class R | 4.21 | 5.53 | 46.63 | N/A | 47.87% (1/12/07) | |||||||||||||
Class Z | 4.50 | 6.03 | 50.38 | 90.68 | — | |||||||||||||
Moderate Customized Blend Index | 4.54 | 7.43 | 54.79 | 91.27 | — | |||||||||||||
Russell 1000 Index | 6.55 | 12.73 | 98.76 | 122.76 | — | |||||||||||||
S&P 500 Index | 5.92 | 12.71 | 96.40 | 115.97 | — | |||||||||||||
Lipper Mixed-Asset Target Allocation Moderate Funds Average* | 3.14 | 5.07 | 46.83 | 74.07 | — | |||||||||||||
Lipper Mixed-Asset Target Allocation Growth Funds Average | 4.21 | 6.75 | 56.48 | 84.43 | — | |||||||||||||
Average Annual Total Returns (With Sales Charges) as of 3/31/15 | ||||||||||||||||||
| One Year | Five Years | Ten Years | Since Inception | |||||||||||||||
Class A | –0.05 | % | 7.01 | % | 5.81 | % | — | |||||||||||
Class B | –0.04 | 7.28 | 5.61 | — | ||||||||||||||
Class C | 3.96 | 7.43 | 5.61 | — | ||||||||||||||
Class R | 5.53 | 7.96 | N/A | 4.88% (1/12/07) | ||||||||||||||
Class Z | 6.03 | 8.50 | 6.67 | — | ||||||||||||||
Moderate Customized Blend Index | 7.43 | 9.13 | 6.70 | — | ||||||||||||||
Russell 1000 Index | 12.73 | 14.73 | 8.34 | — | ||||||||||||||
S&P 500 Index | 12.71 | 14.45 | 8.00 | — | ||||||||||||||
Lipper Mixed-Asset Target Allocation Moderate Funds Average* | 5.07 | 7.93 | 5.65 | — | ||||||||||||||
Lipper Mixed-Asset Target Allocation Growth Funds Average | 6.75 | 9.33 | 6.26 | — | ||||||||||||||
*The Fund is compared to the Lipper Mixed-Asset Target Allocation Moderate Funds Performance Universe, although Lipper classifies the Fund in the Lipper Mixed-Asset Target Allocation Growth Funds Performance Universe. The Lipper Mixed-Asset Target Allocation Moderate Funds Performance Universe is utilized because the Fund’s manager believes that the funds included in this Universe provide a more appropriate basis for Fund performance comparisons.
| 6 | Visit our website at www.prudentialfunds.com |
Source: Prudential Investments LLC and Lipper Inc.
Inception returns are provided for any share class with less than 10 calendar years of returns.
The returns in the tables do not reflect the deduction of taxes that a shareholder would pay on Fund distributions or following the redemption of Fund shares. The average annual total returns take into account applicable sales charges, which are described for each share class in the table below.
| Class A | Class B* | Class C | Class R | Class Z | ||||||
Maximum Initial Sales Charge | 5.50% of the public offering price | None | None | None | None | |||||
Contingent Deferred Sales Charge (CDSC) (as a percentage of the lower of original purchase price or sale proceeds) | 1% on sales of $1 million or more made within 12 months of purchase | 5% (Yr.1) 4% (Yr.2) 3% (Yr.3) 2% (Yr.4) 1% (Yr.5) 1% (Yr.6) 0% (Yr.7) | 1% on sales made within 12 months of purchase | None | None | |||||
Annual Distribution and Service (12b-1) fees (shown as a percentage of average daily net assets) | .30% (.25% currently) | 1% | 1% | .75% (.50% currently) | None |
*Class B shares are closed to all purchase activity and no additional Class B shares may be purchased or acquired except by exchange from Class B shares of another Fund or through dividend or capital gains reinvestment.
Benchmark Definitions
Moderate Customized Blend Index
The Moderate Customized Blend is a model portfolio consisting of the Russell 3000 Index (45%), the MSCI ACWI ex-US Index (15%), the Barclays US Aggregate Bond Index (19%), the Barclays 1-3 Year Government/Credit Index (14%), the S&P Developed Property Net Index (5%) and the Citigroup 3-Month T-Bill (2%). The Moderate Customized Blend does not reflect deductions for any sales charges or operating expenses of a mutual fund or taxes. These returns would be lower if they included the effect of these expenses. The cumulative total return for the Moderate Customized Blend Index measured from the month-end closest to inception date for Class R shares through 3/31/15 is 54.69%. The average annual total return for the Moderate Customized Blend Index measured from the month-end closest to the inception date for Class R shares through 3/31/15 is 5.43%.
Russell 1000 Index
The Russell 1000 Index is an unmanaged index that consists of the 1,000 largest securities in the Russell 3000 Index. The cumulative total return for the Russell 1000 Index measured from the month-end closest to inception date for Class R shares through 3/31/15 is 78.10%. The average annual total return for the Russell 1000 Index measured from the month-end closest to the inception date for Class R shares through 3/31/15 is 7.25%.
| Prudential Asset Allocation Funds | 7 |
Your Fund’s Performance (continued)
S&P 500 Index
The S&P 500 Index is an unmanaged index of 500 stocks of large US public companies. It gives a broad look at how US stock prices have performed. The cumulative total return for the S&P 500 Index measured from the month-end closest to inception date for Class R shares through 3/31/15 is 73.99%. The average annual total return for the S&P 500 Index measured from the month-end closest to the inception date for Class R shares through 3/31/15 is 6.94%.
Lipper Mixed-Asset Target Allocation Moderate Funds Average
The Lipper Mixed-Asset Target Allocation Moderate Funds Average (Lipper Average) is based on an average return of all funds in the Lipper Mixed-Asset Target Allocation Moderate Funds category for the periods noted. These are funds that, by portfolio practice, maintain a mix of between 40%-60% equity securities, with the remainder invested in bonds, cash, and cash equivalents. The cumulative total return for the Lipper Average measured from the month-end closest to inception date for Class R shares through 3/31/15 is 47.69%. The average annual total return for the Lipper Average measured from the month-end closest to the inception date for Class R shares through 3/31/15 is 4.79%.
Lipper Mixed-Asset Target Allocation Growth Funds Average
The Lipper Mixed-Asset Target Allocation Growth Funds Average (Lipper Average) is based on an average return of all funds in the Lipper Mixed-Asset Target Allocation Growth Funds category for the periods noted. These are funds that, by portfolio practice, maintain a mix of between 60%-80% equity securities, with the remainder invested in bonds, cash, and cash equivalents. The cumulative total return for the Lipper Average measured from the month-end closest to inception date for Class R shares through 3/31/15 is 52.38%. The average annual total return for the Lipper Average measured from the month-end closest to the inception date for Class R shares through 3/31/15 is 5.18%.
Investors cannot invest directly in an index or average. The returns for the Indexes would be lower if they included the effects of sales charges, operating expenses of a mutual fund, or taxes. Returns for the Lipper Averages reflect the deduction of operating expenses, but not sales charges or taxes. The Since Inception returns for the Indexes and the Lipper Averages are measured from the closest month-end to inception date, and not from the Class’s actual inception date.
| 8 | Visit our website at www.prudentialfunds.com |
Performance Target—Moderate Customized Blend
The Prudential Moderate Allocation Fund seeks to exceed a performance target—the Moderate Customized Blend Index—consisting of a weighted average return of six securities indexes that are generally considered representative of the asset classes in which the Fund may invest. The chart below shows both the total returns of these indexes for the six-month period ended March 31, 2015, and their weightings in the Moderate Customized Blend Index. Index returns do not reflect sales charges, a mutual fund’s operating expenses, or taxes, and investors cannot invest directly in an index. The Fund seeks to exceed this target by holding positions in specific Prudential mutual funds. In response to market developments, the Fund’s investment subadviser may vary its holdings in those funds (within specified ranges). Past performance is not indicative of future results.
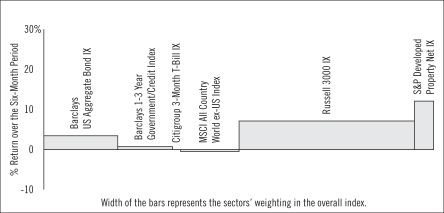
Source: Lipper Inc.
The Barclays US Aggregate Bond Index is an unmanaged index of investment-grade securities issued by the US Government and its agencies and by corporations with between one and 10 years remaining to maturity. It gives a broad look at how bond prices of short- and intermediate-term bonds have performed.
The Barclays 1-3 Year Government/Credit Index is considered representative of the performance of short-term US corporate bonds and US government bonds with maturities from one to three years.
The Citigroup 3-Month T-Bill Index is an unmanaged index representing monthly return equivalents of yield averages of the last 3-month Treasury Bill issues.
The MSCI All Country World ex-US Index is a free float-adjusted market capitalization weighted index that is designed to measure the equity market performance of developed and emerging markets, excluding the US. It comprises approximately 23 developed and 21 emerging market country indexes.
The Russell 3000 Index is an unmanaged index which represents the US equity market—it covers about 98% of all investable stocks in the US.
The Standard & Poor’s (S&P) Developed Property Net Index defines and measures the investable universe of publicly traded property companies domiciled in developed markets.
Investors cannot invest directly in an index or average.
| Prudential Asset Allocation Funds | 9 |
Your Fund’s Performance—Growth Allocation Fund
(Unaudited)
Performance data quoted represent past performance. Past performance does not guarantee future results. The investment return and principal value of an investment will fluctuate, so that an investor’s shares, when redeemed, may be worth more or less than their original cost. Current performance may be lower or higher than the past performance data quoted. An investor may obtain performance data as of the most recent month-end by visiting our website at www.prudentialfunds.com or by calling (800) 225-1852.
Cumulative Total Returns (Without Sales Charges) as of 3/31/15 | ||||||||||||||||||
| Six Months | One Year | Five Years | Ten Years | Since Inception | ||||||||||||||
Class A | 4.81 | % | 6.03 | % | 59.04 | % | 89.14 | % | — | |||||||||
Class B | 4.42 | 5.24 | 53.19 | 75.45 | — | |||||||||||||
Class C | 4.42 | 5.23 | 53.23 | 75.65 | — | |||||||||||||
Class R | 4.66 | 5.70 | 57.23 | N/A | 42.89% (1/12/07) | |||||||||||||
Class Z | 4.95 | 6.28 | 61.11 | 93.72 | — | |||||||||||||
Growth Customized Blend Index | 5.09 | 8.42 | 69.17 | 103.95 | — | |||||||||||||
Russell 1000 Index | 6.55 | 12.73 | 98.76 | 122.76 | — | |||||||||||||
S&P 500 Index | 5.92 | 12.71 | 96.40 | 115.97 | — | |||||||||||||
Lipper Mixed-Asset Target Allocation Aggressive Growth Funds Average | 4.89 | 6.59 | 62.49 | 82.35 | — | |||||||||||||
Average Annual Total Returns (With Sales Charges) as of 3/31/15 | ||||||||||||||||||
| One Year | Five Years | Ten Years | Since Inception | |||||||||||||||
Class A | 0.20 | % | 8.49 | % | 5.98 | % | — | |||||||||||
Class B | 0.24 | 8.76 | 5.78 | — | ||||||||||||||
Class C | 4.23 | 8.91 | 5.80 | — | ||||||||||||||
Class R | 5.70 | 9.47 | N/A | 4.44% (1/12/07) | ||||||||||||||
Class Z | 6.28 | 10.01 | 6.84 | — | ||||||||||||||
Growth Customized Blend Index | 8.42 | 11.09 | 7.39 | — | ||||||||||||||
Russell 1000 Index | 12.73 | 14.73 | 8.34 | — | ||||||||||||||
S&P 500 Index | 12.71 | 14.45 | 8.00 | — | ||||||||||||||
Lipper Mixed-Asset Target Allocation Aggressive Growth Funds Average | 6.59 | 10.17 | 6.16 | — | ||||||||||||||
| 10 | Visit our website at www.prudentialfunds.com |
Source: Prudential Investments LLC and Lipper Inc.
Inception returns are provided for any share class with less than 10 calendar years of returns.
The returns in the tables do not reflect the deduction of taxes that a shareholder would pay on Fund distributions or following the redemption of Fund shares. The average annual total returns take into account applicable sales charges, which are described for each share class in the table below.
| Class A | Class B* | Class C | Class R | Class Z | ||||||
Maximum Initial Sales Charge | 5.50% of the public offering price | None | None | None | None | |||||
Contingent Deferred Sales Charge (CDSC) (as a percentage of the lower of original purchase price or sale proceeds) | 1% on sales of $1 million or more made within 12 months of purchase | 5% (Yr.1) 4% (Yr.2) 3% (Yr.3) 2% (Yr.4) 1% (Yr.5) 1% (Yr.6) 0% (Yr.7) | 1% on sales made within 12 months of purchase | None | None | |||||
Annual Distribution and Service (12b-1) fees (shown as a percentage of average daily net assets) | .30% (.25% currently) | 1% | 1% | .75% (.50% currently) | None |
*Class B shares are closed to all purchase activity and no additional Class B shares may be purchased or acquired except by exchange from Class B shares of another Fund or through dividend or capital gains reinvestment.
Benchmark Definitions
Growth Customized Blend Index
The Growth Customized Blend is a model portfolio consisting of the Russell 3000 Index (60.5%), the MSCI ACWI ex-US Index (24%), the Barclays US Aggregate Bond Index (8%), the S&P Developed Property Net Index (5%) and the Citigroup 3-Month T-Bill (2.5%). The Growth Customized Blend does not reflect deductions for any sales charges or operating expenses of a mutual fund or taxes. These returns would be lower if they included the effect of these expenses. The cumulative total return for the Growth Customized Blend Index measured from the month-end closest to inception date for Class R shares through 3/31/15 is 56.35%. The average annual total return for the Growth Customized Blend Index measured from the month-end closest to the inception date for Class R shares through 3/31/15 is 5.57%.
Russell 1000 Index
The Russell 1000 Index is an unmanaged index that consists of the 1,000 largest securities in the Russell 3000 Index. The cumulative total return for the Russell 1000 Index measured from the month-end closest to inception date for Class R shares through 3/31/15 is 78.10%. The average annual total return for the Russell 1000 Index measured from the month-end closest to the inception date for Class R shares through 3/31/15 is 7.25%.
| Prudential Asset Allocation Funds | 11 |
Your Fund’s Performance (continued)
S&P 500 Index
The S&P 500 Index is an unmanaged index of 500 stocks of large US public companies. It gives a broad look at how US stock prices have performed. The cumulative total return for the S&P 500 Index measured from the month-end closest to inception date for Class R shares through 3/31/15 is 73.99%. The average annual total return for the S&P 500 Index measured from the month-end closest to the inception date for Class R shares through 3/31/15 is 6.94%.
Lipper Mixed-Asset Target Allocation Aggressive Growth Funds Average
The Lipper Mixed-Asset Target Allocation Aggressive Growth Funds Average represents returns based on the average return of all funds in the Lipper Mixed-Asset Target Allocation Aggressive Growth Funds category for the periods noted. Funds in the Lipper Average are funds of funds that, by portfolio practice, maintain at least 80% of assets in equity securities, with the remainder invested in bonds, cash, and cash equivalents. An investment cannot be made directly in an index or average. All indexes and averages are unmanaged. The cumulative total return for the Lipper Average measured from the month-end closest to inception date for Class R shares through 3/31/15 is 43.20%. The average annual total return for the Lipper Average measured from the month-end closest to the inception date for Class R shares through 3/31/15 is 4.40%.
Investors cannot invest directly in an index or average. The returns for the Indexes would be lower if they included the effects of sales charges, operating expenses of a mutual fund, or taxes. Returns for the Lipper Average reflect the deduction of operating expenses, but not sales charges or taxes. The Since Inception returns for the Indexes and Lipper Average are measured from the closest month-end to inception date, and not from the Class’s actual inception date.
| 12 | Visit our website at www.prudentialfunds.com |
Performance Target—Growth Customized Blend
The Prudential Growth Allocation Fund seeks to exceed a performance target—the Growth Customized Blend Index—consisting of a weighted average return of five securities indexes that are generally considered representative of the asset classes in which the Fund may invest. The chart below shows both the total returns of these indexes for the six-month period ended March 31, 2015, and their weightings in the Growth Customized Blend Index. Index returns do not reflect sales charges, a mutual fund’s operating expenses, or taxes, and investors cannot invest directly in an index. The Fund seeks to exceed this target by holding positions in specific Prudential mutual funds. In response to market developments, the Fund’s investment subadviser may vary its holdings in those funds (within specified ranges). Past performance is not indicative of future results.
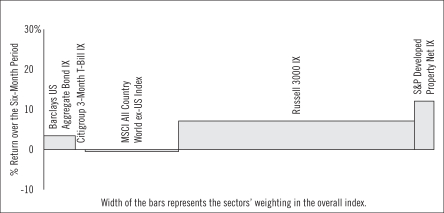
Source: Lipper Inc.
The Barclays US Aggregate Bond Index is an unmanaged index of investment-grade securities issued by the US Government and its agencies and by corporations with between one and 10 years remaining to maturity. It gives a broad look at how bond prices of short- and intermediate-term bonds have performed.
The Citigroup 3-Month T-Bill Index is an unmanaged index representing monthly return equivalents of yield averages of the last 3-month Treasury Bill issues.
The MSCI All Country World ex-US Index is a free float-adjusted market capitalization weighted index that is designed to measure the equity market performance of developed and emerging markets, excluding the US. It comprises approximately 23 developed and 21 emerging market country indexes.
The Russell 3000 Index is an unmanaged index which represents the US equity market—it covers about 98% of all investable stocks in the US.
The Standard & Poor’s (S&P) Developed Property Net Index defines and measures the investable universe of publicly traded property companies domiciled in developed markets.
Investors cannot invest directly in an index or average.
| Prudential Asset Allocation Funds | 13 |
As a shareholder of a Fund, you incur two types of costs: (1) transaction costs, including sales charges (loads) on purchase payments and redemptions, as applicable, and (2) ongoing costs, including management fees, distribution and/or service (12b-1) fees, and other Fund expenses, as applicable. These examples are intended to help you understand your ongoing costs (in dollars) of investing in the Funds and to compare these costs with the ongoing costs of investing in other mutual funds.
These examples are based on an investment of $1,000 invested on October 1, 2014, at the beginning of the period, and held through the six-month period ended March 31, 2015. These examples are for illustrative purposes only; you should consult the Prospectus for information on initial and subsequent minimum investment requirements.
Actual Expenses
The first line for each share class in the tables on the following pages provides information about actual account values and actual expenses. You may use the information on this line, together with the amount you invested, to estimate the expenses that you paid over the period. Simply divide your account value by $1,000 (for example, an $8,600 account value ÷ $1,000 = 8.6), then multiply the result by the number on the first line under the heading “Expenses Paid During the Six-Month Period” to estimate the expenses you paid on your account during this period.
Hypothetical Example for Comparison Purposes
The second line for each share class in the tables below provides information about hypothetical account values and hypothetical expenses based on the Fund’s actual expense ratio and an assumed rate of return of 5% per year before expenses, which is not the Fund’s actual return. The hypothetical account values and expenses may not be used to estimate the actual ending account balance or expenses you paid for the period. You may use this information to compare the ongoing costs of investing in the Fund and other funds. To do so, compare this 5% hypothetical example with the 5% hypothetical examples that appear in the shareholder reports of the other funds.
The Fund’s transfer agent may charge additional fees to holders of certain accounts that are not included in the expenses shown in the tables on the following pages. These fees apply to individual retirement accounts (IRAs) and Section 403(b) accounts. As of the close of the six-month period covered by the tables, IRA fees included an annual maintenance fee of $15 per account (subject to a maximum annual maintenance fee of $25 for all accounts held by the same shareholder). Section 403(b) accounts are charged an annual $25 fiduciary maintenance fee. Some of the fees may vary in amount, or may be waived, based on your total account balance or the number of Prudential Investments funds, including the Fund, that you
| 14 | Visit our website at www.prudentialfunds.com |
own. You should consider the additional fees that were charged to your Fund account over the six-month period when you estimate the total ongoing expenses paid over the period and the impact of these fees on your ending account value, as these additional expenses are not reflected in the information provided in the expense tables. Additional fees have the effect of reducing investment returns.
Please note that the expenses shown in the tables are meant to highlight your ongoing costs only and do not reflect any transactional costs such as sales charges (loads). Therefore, the second line for each share class in the tables is useful in comparing ongoing costs only and will not help you determine the relative total costs of owning different funds. In addition, if these transactional costs were included, your costs would have been higher.
| Prudential Conservative Allocation Fund | Beginning Account Value October 1, 2014 | Ending Account March 31, 2015 | Annualized Expense Ratio Based on the Six-Month Period | Expenses Paid During the Six-Month Period* | ||||||||||||||
| Class A | Actual | $ | 1,000.00 | $ | 1,034.50 | 1.52 | % | $ | 7.71 | |||||||||
| Hypothetical | $ | 1,000.00 | $ | 1,017.35 | 1.52 | % | $ | 7.64 | ||||||||||
| Class B | Actual | $ | 1,000.00 | $ | 1,030.60 | 2.27 | % | $ | 11.49 | |||||||||
| Hypothetical | $ | 1,000.00 | $ | 1,013.61 | 2.27 | % | $ | 11.40 | ||||||||||
| Class C | Actual | $ | 1,000.00 | $ | 1,030.60 | 2.27 | % | $ | 11.49 | |||||||||
| Hypothetical | $ | 1,000.00 | $ | 1,013.61 | 2.27 | % | $ | 11.40 | ||||||||||
| Class R | Actual | $ | 1,000.00 | $ | 1,033.00 | 1.77 | % | $ | 8.97 | |||||||||
| Hypothetical | $ | 1,000.00 | $ | 1,016.11 | 1.77 | % | $ | 8.90 | ||||||||||
| Class Z | Actual | $ | 1,000.00 | $ | 1,035.60 | 1.27 | % | $ | 6.45 | |||||||||
| Hypothetical | $ | 1,000.00 | $ | 1,018.60 | 1.27 | % | $ | 6.39 | ||||||||||
| Prudential Asset Allocation Funds | 15 |
Fees and Expenses (continued)
| Prudential Moderate Allocation Fund | Beginning Account Value October 1, 2014 | Ending Account March 31, 2015 | Annualized Expense Ratio Based on the Six-Month Period | Expenses Paid During the Six-Month Period* | ||||||||||||||
| Class A | Actual | $ | 1,000.00 | $ | 1,043.80 | 1.61 | % | $ | 8.20 | |||||||||
| Hypothetical | $ | 1,000.00 | $ | 1,016.90 | 1.61 | % | $ | 8.10 | ||||||||||
| Class B | Actual | $ | 1,000.00 | $ | 1,039.10 | 2.36 | % | $ | 12.00 | |||||||||
| Hypothetical | $ | 1,000.00 | $ | 1,013.16 | 2.36 | % | $ | 11.85 | ||||||||||
| Class C | Actual | $ | 1,000.00 | $ | 1,039.90 | 2.36 | % | $ | 12.00 | |||||||||
| Hypothetical | $ | 1,000.00 | $ | 1,013.16 | 2.36 | % | $ | 11.85 | ||||||||||
| Class R | Actual | $ | 1,000.00 | $ | 1,042.10 | 1.86 | % | $ | 9.47 | |||||||||
| Hypothetical | $ | 1,000.00 | $ | 1,015.66 | 1.86 | % | $ | 9.35 | ||||||||||
| Class Z | Actual | $ | 1,000.00 | $ | 1,045.00 | 1.36 | % | $ | 6.93 | |||||||||
| Hypothetical | $ | 1,000.00 | $ | 1,018.15 | 1.36 | % | $ | 6.84 | ||||||||||
| Prudential Growth Allocation Fund | Beginning Account October 1, 2014 | Ending Account Value March 31, 2015 | Annualized Based on the | Expenses Paid During the Six-Month Period* | ||||||||||||||
| Class A | Actual | $ | 1,000.00 | $ | 1,048.10 | 1.77 | % | $ | 9.04 | |||||||||
| Hypothetical | $ | 1,000.00 | $ | 1,016.11 | 1.77 | % | $ | 8.90 | ||||||||||
| Class B | Actual | $ | 1,000.00 | $ | 1,044.20 | 2.52 | % | $ | 12.84 | |||||||||
| Hypothetical | $ | 1,000.00 | $ | 1,012.37 | 2.52 | % | $ | 12.64 | ||||||||||
| Class C | Actual | $ | 1,000.00 | $ | 1,044.20 | 2.52 | % | $ | 12.84 | |||||||||
| Hypothetical | $ | 1,000.00 | $ | 1,012.37 | 2.52 | % | $ | 12.64 | ||||||||||
| Class R | Actual | $ | 1,000.00 | $ | 1,046.60 | 2.06 | % | $ | 10.51 | |||||||||
| Hypothetical | $ | 1,000.00 | $ | 1,014.86 | 2.06 | % | $ | 10.35 | ||||||||||
| Class Z | Actual | $ | 1,000.00 | $ | 1,049.50 | 1.52 | % | $ | 7.77 | |||||||||
| Hypothetical | $ | 1,000.00 | $ | 1,017.35 | 1.52 | % | $ | 7.64 | ||||||||||
*Fund expenses (net of fee waivers or subsidies, if any) for each share class are equal to the annualized expense ratio for each share class (provided in the table), multiplied by the average account value over the period, multiplied by the 182 days in the six-month period ended March 31, 2015, and divided by the 365 days in the Fund’s fiscal year ending September 30, 2015 (to reflect the six-month period). Expenses presented in the table include the expenses of any underlying portfolios in which the Fund may invest.
| 16 | Visit our website at www.prudentialfunds.com |
Each Fund’s annual expense ratios for the six-month period ended March 31, 2015, are as follows:
Conservative Allocation Fund
| Class | Gross Operating Expenses | Net Operating Expenses | ||||||
A | 1.57 | % | 1.52 | % | ||||
B | 2.27 | 2.27 | ||||||
C | 2.27 | 2.27 | ||||||
R | 2.02 | 1.77 | ||||||
Z | 1.27 | 1.27 | ||||||
Moderate Allocation Fund
| Class | Gross Operating Expenses | Net Operating Expenses | ||||||
A | 1.66 | % | 1.61 | % | ||||
B | 2.36 | 2.36 | ||||||
C | 2.36 | 2.36 | ||||||
R | 2.11 | 1.86 | ||||||
Z | 1.36 | 1.36 | ||||||
Growth Allocation Fund
| Class | Gross Operating Expenses | Net Operating Expenses | ||||||
A | 1.94 | % | 1.77 | % | ||||
B | 2.64 | 2.52 | ||||||
C | 2.64 | 2.52 | ||||||
R | 2.36 | 2.06 | ||||||
Z | 1.64 | 1.52 | ||||||
Net operating expenses shown above reflect any fee waivers and/or expense reimbursements. These expenses include a weighted average of the net operating expenses of the underlying funds in which the Fund invests. Additional information on Fund expenses and any fee waivers and/or expense reimbursements can be found in the “Financial Highlights” tables in this report and in the Notes to the Financial Statements in this report.
| Prudential Asset Allocation Funds | 17 |
Prudential Conservative Allocation Fund
Portfolio of Investments
as of March 31, 2015 (Unaudited)
| Shares | Value (Note1) | |||||||
LONG-TERM INVESTMENTS 99.0% | ||||||||
AFFILIATED REGISTERED INVESTMENT COMPANIES | ||||||||
Prudential Absolute Return Bond Fund (Class Q) | 790,557 | $ | 7,668,399 | |||||
Prudential Global Real Estate Fund (Class Q) | 297,419 | 7,569,316 | ||||||
Prudential Government Income Fund (Class Z) | 941,876 | 9,230,389 | ||||||
Prudential High Yield Fund (Class Q) | 552,787 | 3,090,080 | ||||||
Prudential International Equity Fund (Class Z) | 1,384,497 | 9,829,932 | ||||||
Prudential Jennison 20/20 Focus Fund (Class Q)* | 84,554 | 1,531,275 | ||||||
Prudential Jennison Equity Opportunity Fund (Class Q) | 142,870 | 3,060,266 | ||||||
Prudential Jennison Growth Fund (Class Z)* | 28,628 | 913,511 | ||||||
Prudential Jennison International Opportunities Fund (Class Z)* | 476,199 | 6,547,739 | ||||||
Prudential Jennison Mid-Cap Growth Fund, Inc. (Class Q)* | 142,765 | 6,094,624 | ||||||
Prudential Jennison Natural Resources Fund, Inc. (Class Q)* | 5,554 | 224,440 | ||||||
Prudential Jennison Small Company Fund, Inc. (Class Q) | 109,957 | 3,064,514 | ||||||
Prudential Jennison Value Fund (Class Q) | 74,473 | 1,534,136 | ||||||
Prudential Large-Cap Core Equity Fund (Class Z) | 448,705 | 7,295,941 | ||||||
Prudential Long/Short Equity Fund (Class Z)* | 346,007 | 3,816,457 | ||||||
Prudential Mid-Cap Value Fund (Class Q) | 214,177 | 4,602,668 | ||||||
Prudential Short Duration Multi-Sector Bond Fund (Class Q) | 4,073,472 | 40,082,965 | ||||||
Prudential Short-Term Corporate Bond Fund, Inc. (Class Q) | 68,246 | 769,819 | ||||||
Prudential Small-Cap Value Fund (Class Q) | 125,131 | 2,327,430 | ||||||
Prudential Strategic Value Fund (Class Z) | 451,482 | 6,722,573 | ||||||
Prudential Total Return Bond Fund (Class Q) | 1,723,062 | 25,242,853 | ||||||
|
| |||||||
TOTAL LONG-TERM INVESTMENTS | 151,219,327 | |||||||
|
| |||||||
SHORT-TERM INVESTMENT 1.1% | ||||||||
AFFILIATED MONEY MARKET MUTUAL FUND | ||||||||
Prudential Investment Portfolios 2 - Prudential Core Taxable Money | 1,644,824 | 1,644,824 | ||||||
|
| |||||||
TOTAL INVESTMENTS(a) 100.1% | 152,864,151 | |||||||
Liabilities in excess of other assets (0.1)% | (185,191 | ) | ||||||
|
| |||||||
NET ASSETS 100.0% | $ | 152,678,960 | ||||||
|
| |||||||
| * | Non-income producing security. |
| (a) | Prudential Investments LLC, the manager of the Fund, also serves as the manager of the underlying funds in which the Fund invests. |
See Notes to Financial Statements.
| Prudential Asset Allocation Funds | 19 |
Prudential Conservative Allocation Fund
Portfolio of Investments
as of March 31, 2015 (Unaudited) continued
Various inputs are used in determining the value of the Fund’s investments. These inputs are summarized in the three broad levels listed below.
Level 1—quoted prices generally in active markets for identical securities.
Level 2—quoted prices for similar securities, interest rates and yield curves, prepayment speeds, foreign currency exchange rates and other observable inputs.
Level 3—unobservable inputs for securities valued in accordance with Board approved fair valuation procedures.
The following is a summary of the inputs used as of March 31, 2015 in valuing such portfolio securities:
| Level 1 | Level 2 | Level 3 | ||||||||||
Investments in Securities | ||||||||||||
Affiliated Registered Investment Companies | $ | 151,219,327 | $ | — | $ | — | ||||||
Affiliated Money Market Mutual Fund | 1,644,824 | — | — | |||||||||
|
|
|
|
|
| |||||||
Total | $ | 152,864,151 | $ | — | $ | — | ||||||
|
|
|
|
|
| |||||||
The investment allocation of investments and liabilities in excess of other assets shown as a percentage of net assets as of March 31, 2015 was as follows:
Multi-Sector Debt | 47.8 | % | ||
International | 10.7 | |||
Large/Mid-Cap Growth | 6.6 | |||
U.S. Government Debt | 6.0 | |||
Large-Cap Core | 5.8 | |||
Large-Cap Value | 5.4 | |||
Global Real Estate | 5.0 | |||
Small/Mid-Cap Value | 4.5 | |||
Long/Short Cap | 2.5 | |||
High Yield | 2.0 | % | ||
Small-Cap Core | 2.0 | |||
Short-Term Debt | 0.5 | |||
Natural Resources | 0.2 | |||
|
| |||
| 99.0 | ||||
Short-Term Investment | 1.1 | |||
Liabilities in excess of other assets | (0.1 | ) | ||
|
| |||
| 100.0 | % | |||
|
|
See Notes to Financial Statements.
| 20 |
Prudential Moderate Allocation Fund
Portfolio of Investments
as of March 31, 2015 (Unaudited)
| Shares | Value (Note 1) | |||||||
LONG-TERM INVESTMENTS 99.0% | ||||||||
AFFILIATED REGISTERED INVESTMENT COMPANIES | ||||||||
Prudential Absolute Return Bond Fund (Class Q) | 578,314 | $ | 5,609,649 | |||||
Prudential Global Real Estate Fund (Class Q) | 363,265 | 9,245,104 | ||||||
Prudential Government Income Fund (Class Z) | 374,384 | 3,668,963 | ||||||
Prudential High Yield Fund (Class Q) | 340,915 | 1,905,715 | ||||||
Prudential International Equity Fund (Class Z) | 2,519,471 | 17,888,245 | ||||||
Prudential Jennison 20/20 Focus Fund (Class Q)* | 204,080 | 3,695,882 | ||||||
Prudential Jennison Equity Opportunity Fund (Class Q) | 347,385 | 7,440,986 | ||||||
Prudential Jennison Growth Fund (Class Z)* | 63,856 | 2,037,647 | ||||||
Prudential Jennison International Opportunities Fund (Class Z)* | 878,814 | 12,083,692 | ||||||
Prudential Jennison Mid-Cap Growth Fund, Inc. (Class Q)* | 282,580 | 12,063,349 | ||||||
Prudential Jennison Natural Resources Fund, Inc. (Class Q)* | 9,041 | 365,333 | ||||||
Prudential Jennison Small Company Fund, Inc. (Class Q) | 233,805 | 6,516,155 | ||||||
Prudential Jennison Value Fund (Class Q) | 225,457 | 4,644,417 | ||||||
Prudential Large-Cap Core Equity Fund (Class Z) | 864,811 | 14,061,826 | ||||||
Prudential Long/Short Equity Fund (Class Z)* | 587,118 | 6,475,910 | ||||||
Prudential Mid-Cap Value Fund (Class Q) | 605,781 | 13,018,234 | ||||||
Prudential Short Duration Multi-Sector Bond Fund (Class Q) | 2,476,007 | 24,363,909 | ||||||
Prudential Small-Cap Value Fund (Class Q) | 151,775 | 2,823,009 | ||||||
Prudential Strategic Value Fund (Class Z) | 1,011,538 | 15,061,807 | ||||||
Prudential Total Return Bond Fund (Class Q) | 1,436,343 | 21,042,430 | ||||||
|
| |||||||
TOTAL LONG-TERM INVESTMENTS | 184,012,262 | |||||||
|
| |||||||
SHORT-TERM INVESTMENT 0.9% | ||||||||
AFFILIATED MONEY MARKET MUTUAL FUND | ||||||||
Prudential Investment Portfolios 2 - Prudential Core Taxable Money Market Fund | 1,770,806 | 1,770,806 | ||||||
|
| |||||||
TOTAL INVESTMENTS(a) 99.9% | 185,783,068 | |||||||
Other assets in excess of liabilities 0.1% | 95,143 | |||||||
|
| |||||||
NET ASSETS 100.0% | $ | 185,878,211 | ||||||
|
| |||||||
| * | Non-income producing security. |
| (a) | Prudential Investments LLC, the manager of the Fund, also serves as the manager of the underlying funds in which the Fund invests. |
See Notes to Financial Statements.
| Prudential Asset Allocation Funds | 21 |
Prudential Moderate Allocation Fund
Portfolio of Investments
as of March 31, 2015 (Unaudited) continued
Various inputs are used in determining the value of the Fund’s investments. These inputs are summarized in the three broad levels listed below.
Level 1—quoted prices generally in active markets for identical securities.
Level 2—quoted prices for similar securities, interest rates and yield curves, prepayment speeds, foreign currency exchange rates and other observable inputs.
Level 3—unobservable inputs for securities valued in accordance with Board approved fair valuation procedures.
The following is a summary of the inputs used as of March 31, 2015 in valuing such portfolio securities:
| Level 1 | Level 2 | Level 3 | ||||||||||
Investments in Securities | ||||||||||||
Affiliated Registered Investment Companies | $ | 184,012,262 | $ | — | $ | — | ||||||
Affiliated Money Market Mutual Fund | 1,770,806 | — | — | |||||||||
|
|
|
|
|
| |||||||
Total | $ | 185,783,068 | $ | — | $ | — | ||||||
|
|
|
|
|
| |||||||
The investment allocation of investments and other assets in excess of liabilities shown as a percentage of net assets as of March 31, 2015 was as follows:
Multi-Sector Debt | 27.4 | % | ||
International | 16.1 | |||
Large/Mid-Cap Growth | 11.6 | |||
Large-Cap Value | 10.6 | |||
Large-Cap Core | 9.6 | |||
Small/Mid-Cap Value | 8.5 | |||
Global Real Estate | 5.0 | |||
Small-Cap Core | 3.5 | |||
Long/Short Cap | 3.5 | |||
U.S. Government Debt | 2.0 | % | ||
High Yield | 1.0 | |||
Natural Resources | 0.2 | |||
|
| |||
| 99.0 | ||||
Short-Term Investment | 0.9 | |||
Other assets in excess of liabilities | 0.1 | |||
|
| |||
| 100.0 | % | |||
|
|
See Notes to Financial Statements.
| 22 |
Prudential Growth Allocation Fund
Portfolio of Investments
as of March 31, 2015 (Unaudited)
| Description | Shares | Value (Note 1) | ||||||
LONG-TERM INVESTMENTS 99.2% | ||||||||
AFFILIATED REGISTERED INVESTMENT COMPANIES | ||||||||
Prudential Absolute Return Bond Fund (Class Q) | 105,041 | $ | 1,018,895 | |||||
Prudential Global Real Estate Fund (Class Q) | 195,275 | 4,969,750 | ||||||
Prudential International Equity Fund (Class Z) | 2,148,345 | 15,253,253 | ||||||
Prudential Jennison 20/20 Focus Fund (Class Q)* | 165,823 | 3,003,062 | ||||||
Prudential Jennison Equity Opportunity Fund (Class Q) | 327,685 | 7,019,016 | ||||||
Prudential Jennison Growth Fund (Class Z)* | 62,550 | 1,995,961 | ||||||
Prudential Jennison International Opportunities Fund (Class Z)* | 738,658 | 10,156,553 | ||||||
Prudential Jennison Mid-Cap Growth Fund, Inc. (Class Q)* | 152,348 | 6,503,750 | ||||||
Prudential Jennison Natural Resources Fund, Inc. (Class Q)* | 3,497 | 141,323 | ||||||
Prudential Jennison Small Company Fund, Inc. (Class Q) | 162,186 | 4,520,111 | ||||||
Prudential Jennison Value Fund (Class Q) | 218,644 | 4,504,075 | ||||||
Prudential Large-Cap Core Equity Fund (Class Z) | 645,013 | 10,487,908 | ||||||
Prudential Long/Short Equity Fund (Class Z)* | 409,800 | 4,520,097 | ||||||
Prudential Mid-Cap Value Fund (Class Q) | 303,283 | 6,517,561 | ||||||
Prudential Short Duration Multi-Sector Bond Fund (Class Q) | 62,112 | 611,178 | ||||||
Prudential Small-Cap Value Fund (Class Q) | 189,675 | 3,527,962 | ||||||
Prudential Strategic Value Fund (Class Z) | 741,833 | 11,045,889 | ||||||
Prudential Total Return Bond Fund (Class Q) | 216,027 | 3,164,795 | ||||||
|
| |||||||
TOTAL LONG-TERM INVESTMENTS | 98,961,139 | |||||||
|
| |||||||
SHORT-TERM INVESTMENT 1.1% | ||||||||
AFFILIATED MONEY MARKET MUTUAL FUND | ||||||||
Prudential Investment Portfolios 2 - Prudential Core Taxable Money Market Fund | 1,157,113 | 1,157,113 | ||||||
|
| |||||||
TOTAL INVESTMENTS(a) 100.3% | 100,118,252 | |||||||
Liabilities in excess of other assets (0.3)% | (336,280 | ) | ||||||
|
| |||||||
NET ASSETS 100.0% | $ | 99,781,972 | ||||||
|
| |||||||
| * | Non-income producing security. |
| (a) | Prudential Investments LLC, the manager of the Fund, also serves as the manager of the underlying funds in which the Fund invests. |
See Notes to Financial Statements.
| Prudential Asset Allocation Funds | 23 |
Prudential Growth Allocation Fund
Portfolio of Investments
as of March 31, 2015 (Unaudited) continued
Various inputs are used in determining the value of the Fund’s investments. These inputs are summarized in the three broad levels listed below.
Level 1—quoted prices generally in active markets for identical securities.
Level 2—quoted prices for similar securities, interest rates and yield curves, prepayment speeds, foreign currency exchange rates and other observable inputs.
Level 3—unobservable inputs for securities valued in accordance with Board approved fair valuation procedures.
The following is a summary of the inputs used as of March 31, 2015 in valuing such portfolio securities:
| Level 1 | Level 2 | Level 3 | ||||||||||
Investments in Securities | ||||||||||||
Affiliated Registered Investment Companies | $ | 98,961,139 | $ | — | $ | — | ||||||
Affiliated Money Market Mutual Fund | 1,157,113 | — | — | |||||||||
|
|
|
|
|
| |||||||
Total | $ | 100,118,252 | $ | — | $ | — | ||||||
|
|
|
|
|
| |||||||
The investment allocation of investments and liabilities in excess of other assets shown as a percentage of net assets as of March 31, 2015 was as follows:
International | 25.5 | % | ||
Large-Cap Value | 15.6 | |||
Large/Mid-Cap Growth | 15.5 | |||
Large-Cap Core | 13.5 | |||
Small/Mid-Cap Value | 10.1 | |||
Global Real Estate | 5.0 | |||
Multi-Sector Debt | 4.8 | |||
Small-Cap Core | 4.5 | |||
Long/Short Cap | 4.5 | % | ||
Natural Resources | 0.2 | |||
|
| |||
| 99.2 | ||||
Short-Term Investment | 1.1 | |||
Liabilities in excess of other assets | (0.3 | ) | ||
|
| |||
| 100.0 | % | |||
|
|
See Notes to Financial Statements.
| 24 |
PRUDENTIAL INVESTMENTS»MUTUAL FUNDS
FINANCIAL STATEMENTS
(UNAUDITED)
SEMIANNUAL REPORT · MARCH 31, 2015
Prudential Asset Allocation Funds
Prudential Conservative Allocation Fund
Statement of Assets & Liabilities
as of March 31, 2015 (Unaudited)
Assets | ||||
Affiliated investments (cost $131,083,992) | $ | 152,864,151 | ||
Receivable for investments sold | 335,000 | |||
Dividends receivable | 212,923 | |||
Receivable for Fund shares sold | 165,727 | |||
Prepaid expenses | 327 | |||
|
| |||
Total assets | 153,578,128 | |||
|
| |||
Liabilities | ||||
Payable for investments purchased | 549,490 | |||
Payable for Fund shares reacquired | 175,606 | |||
Distribution fee payable | 75,052 | |||
Accrued expenses | 62,930 | |||
Management fee payable | 25,714 | |||
Affiliated transfer agent fee payable | 10,376 | |||
|
| |||
Total liabilities | 899,168 | |||
|
| |||
Net Assets | $ | 152,678,960 | ||
|
| |||
Net assets were comprised of: | ||||
Common stock, at par | $ | 11,579 | ||
Paid-in capital in excess of par | 126,437,821 | |||
|
| |||
| 126,449,400 | ||||
Undistributed net investment income | 74,415 | |||
Accumulated net realized gain on investment transactions | 4,374,986 | |||
Net unrealized appreciation on investments | 21,780,159 | |||
|
| |||
Net assets, March 31, 2015 | $ | 152,678,960 | ||
|
| |||
See Notes to Financial Statements.
| 26 |
Class A | ||||
Net asset value and redemption price per share ($77,462,374 ÷ 5,863,839 shares of common stock issued and outstanding) | $ | 13.21 | ||
Maximum sales charge (5.50% of offering price) | 0.77 | |||
|
| |||
Maximum offering price to public | $ | 13.98 | ||
|
| |||
Class B | ||||
Net asset value, offering price and redemption price per share ($37,772,076 ÷ 2,872,652 shares of common stock issued and outstanding) | $ | 13.15 | ||
|
| |||
Class C | ||||
Net asset value, offering price and redemption price per share ($31,271,025 ÷ 2,377,295 shares of common stock issued and outstanding) | $ | 13.15 | ||
|
| |||
Class R | ||||
Net asset value, offering price and redemption price per share ($102,053 ÷ 7,701 shares of common stock issued and outstanding) | $ | 13.25 | ||
|
| |||
Class Z | ||||
Net asset value, offering price and redemption price per share ($6,071,432 ÷ 457,548 shares of common stock issued and outstanding) | $ | 13.27 | ||
|
| |||
See Notes to Financial Statements.
| Prudential Asset Allocation Funds | 27 |
Prudential Moderate Allocation Fund
Statement of Assets & Liabilities
as of March 31, 2015 (Unaudited)
Assets | ||||
Affiliated investments (cost $149,256,580) | $ | 185,783,068 | ||
Cash | 88 | |||
Receivable for investments sold | 565,000 | |||
Receivable for Fund shares sold | 279,463 | |||
Dividends receivable | 142,845 | |||
Prepaid expenses | 264 | |||
|
| |||
Total Assets | 186,770,728 | |||
|
| |||
Liabilities | ||||
Payable for investments purchased | 613,711 | |||
Distribution fee payable | 91,023 | |||
Accrued expenses | 76,881 | |||
Payable for Fund shares reacquired | 60,409 | |||
Management fee payable | 31,507 | |||
Affiliated transfer agent fee payable | 18,986 | |||
|
| |||
Total Liabilities | 892,517 | |||
|
| |||
Net Assets | $ | 185,878,211 | ||
|
| |||
Net assets were comprised of: | ||||
Common stock, at par | $ | 12,431 | ||
Paid-in capital in excess of par | 141,284,066 | |||
|
| |||
| 141,296,497 | ||||
Distributions in excess of net investment income | (1,087,202 | ) | ||
Accumulated net realized gain on investment transactions | 9,142,428 | |||
Net unrealized appreciation on investments | 36,526,488 | |||
|
| |||
Net assets, March 31, 2015 | $ | 185,878,211 | ||
|
| |||
See Notes to Financial Statements.
| 28 |
Class A | ||||
Net asset value and redemption price per share ($100,799,524 ÷ 6,723,237 shares of common stock issued and outstanding) | $ | 14.99 | ||
Maximum sales charge (5.50% of offering price) | 0.87 | |||
|
| |||
Maximum offering price to public | $ | 15.86 | ||
|
| |||
Class B | ||||
Net asset value, offering price and redemption price per share ($48,560,607 ÷ 3,258,074 shares of common stock issued and outstanding) | $ | 14.90 | ||
|
| |||
Class C | ||||
Net asset value, offering price and redemption price per share ($32,715,282 ÷ 2,195,742 shares of common stock issued and outstanding) | $ | 14.90 | ||
|
| |||
Class R | ||||
Net asset value, offering price and redemption price per share ($191,065 ÷ 12,787 shares of common stock issued and outstanding) | $ | 14.94 | ||
|
| |||
Class Z | ||||
Net asset value, offering price and redemption price per share ($3,611,733 ÷ 240,813 shares of common stock issued and outstanding) | $ | 15.00 | ||
|
| |||
See Notes to Financial Statements.
| Prudential Asset Allocation Funds | 29 |
Prudential Growth Allocation Fund
Statement of Assets & Liabilities
as of March 31, 2015 (Unaudited)
Assets | ||||
Affiliated investments (cost $76,130,369) | $ | 100,118,252 | ||
Receivable for investments sold | 225,000 | |||
Receivable for Fund shares sold | 72,694 | |||
Dividends receivable | 11,444 | |||
Prepaid expenses | 264 | |||
|
| |||
Total Assets | 100,427,654 | |||
|
| |||
Liabilities | ||||
Payable for investments purchased | 361,339 | |||
Payable for Fund shares reacquired | 133,230 | |||
Accrued expenses | 80,376 | |||
Distribution fee payable | 45,070 | |||
Affiliated transfer agent fee payable | 16,806 | |||
Management fee payable | 8,861 | |||
|
| |||
Total Liabilities | 645,682 | |||
|
| |||
Net Assets | $ | 99,781,972 | ||
|
| |||
Net assets were comprised of: | ||||
Common stock, at par | $ | 5,698 | ||
Paid-in capital in excess of par | 70,441,155 | |||
|
| |||
| 70,446,853 | ||||
Distributions in excess of net investment income | (1,075,163 | ) | ||
Accumulated net realized gain on investment transactions | 6,422,399 | |||
Net unrealized appreciation on investments | 23,987,883 | |||
|
| |||
Net assets, March 31, 2015 | $ | 99,781,972 | ||
|
| |||
See Notes to Financial Statements.
| 30 |
Class A | ||||
Net asset value and redemption price per share | $ | 17.74 | ||
Maximum sales charge (5.50% of offering price) | 1.03 | |||
|
| |||
Maximum offering price to public | $ | 18.77 | ||
|
| |||
Class B | ||||
Net asset value, offering price and redemption price per share | $ | 17.12 | ||
|
| |||
Class C | ||||
Net asset value, offering price and redemption price per share | $ | 17.14 | ||
|
| |||
Class R | ||||
Net asset value, offering price and redemption price per share | $ | 17.61 | ||
|
| |||
Class Z | ||||
Net asset value, offering price and redemption price per share | $ | 17.93 | ||
|
| |||
See Notes to Financial Statements.
| Prudential Asset Allocation Funds | 31 |
Prudential Conservative Allocation Fund
Statement of Operations
Six Months Ended March 31, 2015 (Unaudited)
Net Investment Income | ||||
Affiliated dividend income | $ | 2,441,126 | ||
|
| |||
Expenses | ||||
Management fee | 148,457 | |||
Distribution fee—Class A | 110,196 | |||
Distribution fee—Class B | 197,731 | |||
Distribution fee—Class C | 148,149 | |||
Distribution fee—Class R | 368 | |||
Transfer agent’s fees and expenses (including affiliated expense of $19,500) | 69,000 | |||
Registration fees | 36,000 | |||
Custodian and accounting fees | 35,000 | |||
Shareholders’ reports | 18,000 | |||
Audit fee | 11,000 | |||
Legal fees and expenses | 9,000 | |||
Directors’ fees | 8,000 | |||
Commitment fee on syndicated credit agreement | 1,000 | |||
Miscellaneous | 6,443 | |||
|
| |||
Total expenses | 798,344 | |||
Less: Distribution fee waiver—Class A | (18,366 | ) | ||
Distribution fee waiver—Class R | (123 | ) | ||
|
| |||
Net expenses | 779,855 | |||
|
| |||
Net investment income | 1,661,271 | |||
|
| |||
Realized And Unrealized Gain (Loss) On Affiliated Investments | ||||
Net realized gain on investment transactions | 2,458,608 | |||
Net capital gain distributions received | 2,988,003 | |||
|
| |||
| 5,446,611 | ||||
|
| |||
Net change in unrealized appreciation (depreciation) on investments | (2,295,101 | ) | ||
|
| |||
Net gain on investment transactions | 3,151,510 | |||
|
| |||
Net Increase In Net Assets Resulting From Operations | $ | 4,812,781 | ||
|
| |||
See Notes to Financial Statements.
| 32 |
Prudential Moderate Allocation Fund
Statement of Operations
Six Months Ended March 31, 2015 (Unaudited)
Net Investment Income | ||||
Affiliated dividend income | $ | 2,393,183 | ||
|
| |||
Expenses | ||||
Management fee | 181,432 | |||
Distribution fee—Class A | 143,861 | |||
Distribution fee—Class B | 256,402 | |||
Distribution fee—Class C | 152,850 | |||
Distribution fee—Class R | 690 | |||
Transfer agent’s fees and expenses (including affiliated expense of $33,700) | 110,000 | |||
Custodian and accounting fees | 35,000 | |||
Registration fees | 34,000 | |||
Shareholders’ reports | 22,000 | |||
Audit fee | 11,000 | |||
Legal fees and expenses | 9,000 | |||
Directors’ fees | 8,000 | |||
Commitment fee on syndicated credit agreement | 1,000 | |||
Miscellaneous | 6,819 | |||
|
| |||
Total expenses | 972,054 | |||
Less: Distribution fee waiver—Class A | (23,977 | ) | ||
Distribution fee waiver—Class R | (230 | ) | ||
|
| |||
Net expenses | 947,847 | |||
|
| |||
Net investment income | 1,445,336 | |||
|
| |||
Realized And Unrealized Gain (Loss) On Affiliated Investments | ||||
Net realized gain on investment transactions | 5,363,999 | |||
Net capital gain distributions received | 6,464,333 | |||
|
| |||
| 11,828,332 | ||||
|
| |||
Net change in unrealized appreciation (depreciation) on investments | (5,809,264 | ) | ||
|
| |||
Net gain on investment transactions | 6,019,068 | |||
|
| |||
Net Increase In Net Assets Resulting From Operations | $ | 7,464,404 | ||
|
| |||
See Notes to Financial Statements.
| Prudential Asset Allocation Funds | 33 |
Prudential Growth Allocation Fund
Statement of Operations
Six Months Ended March 31, 2015 (Unaudited)
Net Investment Income | ||||
Affiliated dividend income | $ | 1,011,505 | ||
|
| |||
Expenses | ||||
Management fee | 97,867 | |||
Distribution fee—Class A | 86,702 | |||
Distribution fee—Class B | 132,995 | |||
Distribution fee—Class C | 60,834 | |||
Distribution fee—Class R | 13 | |||
Transfer agent’s fees and expenses (including affiliated expense of $28,800) | 82,000 | |||
Custodian and accounting fees | 35,000 | |||
Registration fees | 33,000 | |||
Shareholders’ reports | 20,000 | |||
Audit fee | 11,000 | |||
Legal fees and expenses | 9,000 | |||
Directors’ fees | 8,000 | |||
Commitment fee on syndicated credit agreement | 1,000 | |||
Miscellaneous | 6,555 | |||
|
| |||
Total expenses | 583,966 | |||
Less: Expense subsidy | (58,773 | ) | ||
Distribution fee waiver—Class A | (14,450 | ) | ||
Distribution fee waiver—Class R | (4 | ) | ||
|
| |||
Net expenses | 510,739 | |||
|
| |||
Net investment income | 500,766 | |||
|
| |||
Realized And Unrealized Gain (Loss) On Investments | ||||
Net realized gain on investment transactions | 3,848,770 | |||
Net capital gain distributions received | 4,710,906 | |||
|
| |||
| 8,559,676 | ||||
|
| |||
Net change in unrealized appreciation (depreciation) on investments | (4,582,106 | ) | ||
|
| |||
Net gain on investment transactions | 3,977,570 | |||
|
| |||
Net Increase In Net Assets Resulting From Operations | $ | 4,478,336 | ||
|
| |||
See Notes to Financial Statements.
| 34 |
Prudential Conservative Allocation Fund
Statement of Changes in Net Assets
(Unaudited)
| Six Months Ended March 31, 2015 | Year Ended September 30, 2014 | |||||||
Increase (Decrease) in Net Assets | ||||||||
Operations | ||||||||
Net investment income | $ | 1,661,271 | $ | 1,592,198 | ||||
Net realized gain on investment transactions | 2,458,608 | 2,976,130 | ||||||
Net capital gain distributions received | 2,988,003 | 1,677,360 | ||||||
Net change in unrealized appreciation (depreciation) on investments | (2,295,101 | ) | 901,882 | |||||
|
|
|
| |||||
Net increase in net assets resulting from operations | 4,812,781 | 7,147,570 | ||||||
|
|
|
| |||||
Dividends and Distributions (Note 1) | ||||||||
Dividends from net investment income | ||||||||
Class A | (1,036,756 | ) | (1,099,908 | ) | ||||
Class B | (407,770 | ) | (407,131 | ) | ||||
Class C | (304,671 | ) | (228,514 | ) | ||||
Class R | (1,239 | ) | (982 | ) | ||||
Class Z | (87,121 | ) | (120,406 | ) | ||||
|
|
|
| |||||
| (1,837,557 | ) | (1,856,941 | ) | |||||
|
|
|
| |||||
Distributions from net realized gains | ||||||||
Class A | (1,945,817 | ) | (1,181,328 | ) | ||||
Class B | (1,038,222 | ) | (784,333 | ) | ||||
Class C | (778,453 | ) | (439,030 | ) | ||||
Class R | (2,553 | ) | (1,211 | ) | ||||
Class Z | (149,793 | ) | (116,617 | ) | ||||
|
|
|
| |||||
| (3,914,838 | ) | (2,522,519 | ) | |||||
|
|
|
| |||||
Fund share transactions (Net of share conversions) (Note 6) | ||||||||
Net proceeds from shares sold | 16,082,954 | 35,624,815 | ||||||
Net asset value of shares issued in reinvestment of dividends and distributions | 5,225,160 | 3,963,058 | ||||||
Cost of shares reacquired | (15,235,821 | ) | (31,323,168 | ) | ||||
|
|
|
| |||||
Net increase in net assets from Fund share transactions | 6,072,293 | 8,264,705 | ||||||
|
|
|
| |||||
Total increase | 5,132,679 | 11,032,815 | ||||||
Net Assets: | ||||||||
Beginning of period | 147,546,281 | 136,513,466 | ||||||
|
|
|
| |||||
End of period(a) | $ | 152,678,960 | $ | 147,546,281 | ||||
|
|
|
| |||||
(a) Includes undistributed net investment income of: | $ | 74,415 | $ | 250,701 | ||||
|
|
|
| |||||
See Notes to Financial Statements.
| Prudential Asset Allocation Funds | 35 |
Prudential Moderate Allocation Fund
Statement of Changes in Net Assets
(Unaudited)
| Six Months Ended March 31, 2015 | Year Ended September 30, 2014 | |||||||
Increase (Decrease) in Net Assets | ||||||||
Operations | ||||||||
Net investment income | $ | 1,445,336 | $ | 1,162,188 | ||||
Net realized gain on investment transactions | 5,363,999 | 5,778,560 | ||||||
Net capital gain distributions received | 6,464,333 | 3,547,616 | ||||||
Net change in unrealized appreciation (depreciation) on investments | (5,809,264 | ) | 2,094,064 | |||||
|
|
|
| |||||
Net increase in net assets resulting from operations | 7,464,404 | 12,582,428 | ||||||
|
|
|
| |||||
Dividends and Distributions (Note 1) | ||||||||
Dividends from net investment income | ||||||||
Class A | (1,922,706 | ) | (941,007 | ) | ||||
Class B | (650,555 | ) | (212,126 | ) | ||||
Class C | (387,403 | ) | (102,518 | ) | ||||
Class R | (3,243 | ) | (1,344 | ) | ||||
Class Z | (77,547 | ) | (36,515 | ) | ||||
|
|
|
| |||||
| (3,041,454 | ) | (1,293,510 | ) | |||||
|
|
|
| |||||
Distributions from net realized gains | ||||||||
Class A | (3,284,805 | ) | — | |||||
Class B | (1,752,393 | ) | — | |||||
Class C | (1,043,543 | ) | — | |||||
Class R | (6,312 | ) | — | |||||
Class Z | (117,938 | ) | — | |||||
|
|
|
| |||||
| (6,204,991 | ) | — | ||||||
|
|
|
| |||||
Fund share transactions (Net of share conversions) (Note 6) | ||||||||
Net proceeds from shares sold | 12,239,837 | 29,216,856 | ||||||
Net asset value of shares issued in reinvestment of dividends and distributions | 8,867,760 | 1,242,072 | ||||||
Cost of shares reacquired | (13,834,366 | ) | (25,163,850 | ) | ||||
|
|
|
| |||||
Net increase in net assets from Fund share transactions | 7,273,231 | 5,295,078 | ||||||
|
|
|
| |||||
Total increase | 5,491,190 | 16,583,996 | ||||||
Net Assets: | ||||||||
Beginning of period | 180,387,021 | 163,803,025 | ||||||
|
|
|
| |||||
End of period(a) | $ | 185,878,211 | $ | 180,387,021 | ||||
|
|
|
| |||||
(a) Includes undistributed net investment income of: | $ | — | $ | 508,916 | ||||
|
|
|
| |||||
See Notes to Financial Statements.
| 36 |
Prudential Growth Allocation Fund
Statement of Changes in Net Assets
(Unaudited)
| Six Months Ended March 31, 2015 | Year Ended September 30, 2014 | |||||||
Increase (Decrease) in Net Assets | ||||||||
Operations | ||||||||
Net investment income | $ | 500,766 | $ | 145,051 | ||||
Net realized gain on investment transactions | 3,848,770 | 2,428,835 | ||||||
Net capital gain distributions received | 4,710,906 | 2,578,231 | ||||||
Net change in unrealized appreciation (depreciation) on investments | (4,582,106 | ) | 2,927,627 | |||||
|
|
|
| |||||
Net increase in net assets resulting from operations | 4,478,336 | 8,079,744 | ||||||
|
|
|
| |||||
Dividends and Distributions (Note 1) | ||||||||
Dividends from net investment income | ||||||||
Class A | (1,168,713 | ) | (323,022 | ) | ||||
Class B | (354,448 | ) | — | |||||
Class C | (162,576 | ) | — | |||||
Class R | (59 | ) | (13 | ) | ||||
Class Z | (31,954 | ) | (9,432 | ) | ||||
|
|
|
| |||||
| (1,717,750 | ) | (332,467 | ) | |||||
|
|
|
| |||||
Distributions from net realized gains | ||||||||
Class A | (481,196 | ) | — | |||||
Class B | (224,704 | ) | — | |||||
Class C | (103,065 | ) | — | |||||
Class R | (28 | ) | — | |||||
Class Z | (11,722 | ) | — | |||||
|
|
|
| |||||
| (820,715 | ) | — | ||||||
|
|
|
| |||||
Fund share transactions (Net of share conversions) (Note 6) | ||||||||
Net proceeds from shares sold | 5,398,654 | 14,023,338 | ||||||
Net asset value of shares issued in reinvestment of dividends and distributions | 2,468,084 | 322,730 | ||||||
Cost of shares reacquired | (7,584,756 | ) | (12,638,320 | ) | ||||
|
|
|
| |||||
Net increase in net assets from Fund share transactions | 281,982 | 1,707,748 | ||||||
|
|
|
| |||||
Total increase | 2,221,853 | 9,455,025 | ||||||
Net Assets: | ||||||||
Beginning of period | 97,560,119 | 88,105,094 | ||||||
|
|
|
| |||||
End of period(a) | $ | 99,781,972 | $ | 97,560,119 | ||||
|
|
|
| |||||
(a) Includes undistributed net investment income of: | $ | — | $ | 141,821 | ||||
|
|
|
| |||||
See Notes to Financial Statements.
| Prudential Asset Allocation Funds | 37 |
Notes to Financial Statements
(Unaudited)
The Prudential Investment Portfolios, Inc. (the “Company”) is an open-end management investment company, registered under the Investment Company Act of 1940, as amended (“1940 Act”). The Company was incorporated in Maryland on August 10, 1995 and consists of six series (“Fund” or “Funds”): Prudential Jennison Equity Opportunity Fund, Prudential Jennison Growth Fund and Prudential Asset Allocation Fund which are diversified funds and Prudential Conservative Allocation Fund (“Conservative Allocation Fund”), Prudential Moderate Allocation Fund (“Moderate Allocation Fund”) and Prudential Growth Allocation Fund (“Growth Allocation Fund”) which are non-diversified. These financial statements relate to the Conservative Allocation Fund, Moderate Allocation Fund and Growth Allocation Fund (collectively referred to as the “Allocation Funds”).
The Conservative Allocation Fund’s investment objective is current income and a reasonable level of capital appreciation. The Moderate Allocation Fund’s investment objective is capital appreciation and a reasonable level of current income. The Growth Allocation Fund’s investment objective is long-term capital appreciation. Each Allocation Fund seeks to achieve its objective by investing in a combination of mutual funds in the Prudential mutual fund family (each, an underlying fund). Each Fund in the Allocation Funds is typically referred to as a “Fund of Funds” because it invests in other mutual funds. The Allocation Funds may also invest directly in U.S. Government securities and money market instruments for cash management purposes or when assuming a defensive position.
Note 1. Accounting Policies
The Allocation Funds follow investment company accounting and reporting guidance of the Financial Accounting Standards Board (FASB) Accounting Standard Codification Topic 946 Financial Services-Investment Companies. The following accounting policies conform to U.S. generally accepted accounting principles. The Company and the Allocation Funds consistently follow such policies in the preparation of their financial statements.
Securities Valuation: The Allocation Funds hold securities and other assets that are fair valued at the close of each day the New York Stock Exchange (“NYSE”) is open for trading. Fair value is the price that would be received to sell an asset or paid to transfer a liability in an orderly transaction between market participants on the measurement date. The Board of Directors (the “Board”) has adopted Valuation
| 38 |
Procedures for security valuation under which fair valuation responsibilities have been delegated to Prudential Investments LLC (“PI” or “Manager”). Under the current Valuation Procedures, the established Valuation Committee is responsible for supervising the valuation of portfolio securities and other assets. The Valuation Procedures permit the Allocation Funds to utilize independent pricing vendor services, quotations from market makers, and alternative valuation methods when market quotations are either not readily available or not deemed representative of fair value. A record of the Valuation Committee’s actions is subject to the Board’s review, approval, and ratification at its next regularly-scheduled quarterly meeting.
Various inputs determine how each of the Allocation Funds’ investments are valued, all of which are categorized according to the three broad levels (Level 1, 2, or 3) detailed in the table following the Portfolios of Investments.
Common and preferred stocks, exchange-traded funds, and derivative instruments such as futures or options that are traded on a national securities exchange are valued at the last sale price as of the close of trading on the applicable exchange where the security principally trades. Securities traded via NASDAQ are valued at the NASDAQ official closing price. To the extent these securities are valued at the last sale price or NASDAQ official closing price, they are classified as Level 1 in the fair value hierarchy.
In the event that no sale or official closing price on valuation date exists, these securities are generally valued at the mean between the last reported bid and ask prices, or at the last bid price in the absence of an ask price. These securities are classified as Level 2 in the fair value hierarchy, as the inputs are observable.
Common and preferred stocks traded on foreign securities exchanges are valued using pricing vendor services that provide model prices derived using adjustment factors based on information such as local closing price, relevant general and sector indices, currency fluctuations, depositary receipts, and futures, as applicable. Securities valued using such model prices are classified as Level 2 in the fair value hierarchy, as the adjustment factors are observable. Such securities are valued using model prices to the extent that the valuation meets the established confidence level for each security. If the confidence level is not met or the vendor does not provide a model price, securities are valued in accordance with exchange-traded common and preferred stocks discussed above.
Investments in open-end, non-exchange-traded mutual funds are valued at their net asset values as of the close of the NYSE on the date of valuation. These securities are classified as Level 1 in the fair value hierarchy since they may be purchased or sold at their net asset values on the date of valuation.
| Prudential Asset Allocation Funds | 39 |
Notes to Financial Statements
(Unaudited) continued
Fixed income securities traded in the over-the-counter market are generally valued at prices provided by approved independent pricing vendors. The pricing vendors provide these prices after evaluating observable inputs including, but not limited to yield curves, yield spreads, credit ratings, deal terms, tranche level attributes, default rates, cash flows, prepayment speeds, broker/dealer quotations, and reported trades. Securities valued using such vendor prices are classified as Level 2 in the fair value hierarchy.
Over-the-counter derivative instruments are generally valued using pricing vendor services, which derive the valuation based on inputs such as underlying asset prices, indices, spreads, interest rates, and exchange rates. These instruments are categorized as Level 2 in the fair value hierarchy.
Centrally cleared swaps listed or traded on a multilateral or trade facility platform, such as a registered exchange, are valued at the daily settlement price determined by the respective exchange. These securities are classified as Level 2 in the fair value hierarchy, as the daily settlement price is not public.
Securities and other assets that cannot be priced according to the methods described above are valued based on pricing methodologies approved by the Board. In the event that unobservable inputs are used when determining such valuations, the securities will be classified as Level 3 in the fair value hierarchy.
When determining the fair value of securities, some of the factors influencing the valuation include: the nature of any restrictions on disposition of the securities; assessment of the general liquidity of the securities; the issuer’s financial condition and the markets in which it does business; the cost of the investment; the size of the holding and the capitalization of the issuer; the prices of any recent transactions or bids/offers for such securities or any comparable securities; any available analyst media or other reports or information deemed reliable by the investment adviser regarding the issuer or the markets or industry in which it operates. Using fair value to price securities may result in a value that is different from a security’s most recent closing price and from the price used by other mutual funds to calculate their net asset values.
Securities Transactions and Net Investment Income: Securities transactions are recorded on the trade date. Realized gains or losses from investment transactions are calculated on the identified cost basis. Dividend income is recorded on the ex-dividend date. Interest income, including amortization of premium and accretion of
| 40 |
discount on debt securities, as required, is recorded on an accrual basis. Expenses are recorded on an accrual basis, which may require the use of certain estimates by management that may differ from actual and such expenses exclude those of the underlying funds. Expenses on the underlying funds are reflected in the net asset values of those funds. The Company’s expenses are allocated to the respective portfolio on the basis of relative net assets except the expenses that are charged directly at the portfolio or class level.
Net investment income or loss (other than distribution fees which are charged directly to the respective class) and unrealized and realized gains or losses are allocated daily to each class of shares based upon the relative proportion of adjusted net assets of each class at the beginning of the day.
Dividends and Distributions: Dividends will typically be distributed quarterly by the Conservative Allocation Fund and annually by the Moderate Allocation Fund and the Growth Allocation Fund. Each Allocation Fund declares and pays its net realized capital gains, if any, at least annually. Dividends and distributions to shareholders, which are determined in accordance with federal income tax regulations and which may differ from generally accepted accounting principles, are recorded on the ex-dividend date. Permanent book/tax differences relating to income and gains are reclassified amongst undistributed net investment income, accumulated net realized gain or loss and paid-in capital in excess of par, as appropriate.
Taxes: For federal income tax purposes, each Fund in the Company is treated as a separate taxpaying entity. It is each of the Allocation Funds’ policy to continue to meet the requirements of the Internal Revenue Code applicable to regulated investment companies and to distribute all of its taxable net investment income and capital gains, if any, to its shareholders. Therefore, no federal income tax provision is required.
Estimates: The preparation of the financial statements requires management to make estimates and assumptions that affect the reported amounts and disclosures in the financial statements. Actual results could differ from those estimates.
Note 2. Agreements
The Company has a management agreement for the Allocation Funds with PI. Pursuant to this agreement, PI has responsibility for all investment advisory services and supervises the subadvisor’s performance of such services. PI has entered into a subadvisory agreement with Quantitative Management Associates LLC (“QMA”). The subadvisory agreement provides that QMA furnishes investment advisory services in connection with the management of the Allocation Funds. In connection therewith,
| Prudential Asset Allocation Funds | 41 |
Notes to Financial Statements
(Unaudited) continued
QMA is obligated to keep certain books and records of the Allocation Funds. PI pays for the services of QMA, the cost of compensation of officers, occupancy and certain clerical and bookkeeping costs of the Allocation Funds. The Allocation Funds bear all other costs and expenses.
The management fee paid to PI is accrued daily and payable monthly at an annual rate of .20% of each of the Allocation Funds’ average daily net assets.
The Allocation Funds have a distribution agreement with Prudential Investment Management Services LLC (“PIMS”), which acts as the distributor of the Class A, Class B, Class C, Class R and Class Z shares of the Allocation Funds. The Allocation Funds compensate PIMS for distributing and servicing the Allocation Funds’ Class A, B, C and R shares, pursuant to plans of distribution (the “Class A, B, C and R Plans”), regardless of expenses actually incurred by PIMS. The distribution fees are accrued daily and payable monthly. No distribution or service fees are paid to PIMS as distributor of the Class Z shares of the Allocation Funds.
Pursuant to the Class A, B, C and R Plans, the Allocation Funds compensate PIMS for distribution related activities at an annual rate of up to .30%, 1%, 1% and .75% of the average daily net assets of the Class A, B, C and R shares, respectively. PIMS has contractually agreed through January 31, 2016 to limit such expenses to .25% and .50% of the average daily net assets of the Class A and Class R shares, respectively.
PI has contractually agreed to limit the net annual operating expenses (exclusive of taxes, interest, brokerage commissions, non-routine expenses, distribution and service (12b-1) fees and underlying fund fees and expenses) of each class of shares of the Allocation Funds to .50% of each Allocation Funds’ average daily net assets.
PIMS has advised the Allocation Funds of its receipt of front-end sales charges resulting from sales of Class A shares during the six months ended March 31, 2015. These amounts were as follows:
Fund | Class A | |||
Conservative Allocation Fund | $ | 154,533 | ||
Moderate Allocation Fund | 169,982 | |||
Growth Allocation Fund | 139,873 | |||
From these fees, PIMS paid such sales charges to affiliated broker-dealers, which in turn paid commissions to salespersons and incurred other distribution costs.
| 42 |
PIMS has advised the Allocation Funds of its receipt of contingent deferred sales charges imposed upon redemptions by certain Class A, Class B and Class C shareholders for the six months ended March 31, 2015. These amounts were as follows:
Fund | Class A | Class B | Class C | |||||||||
Conservative Allocation Fund | $ | 46 | $ | 20,242 | $ | 1,878 | ||||||
Moderate Allocation Fund | 59 | 23,449 | 2,956 | |||||||||
Growth Allocation Fund | — | 13,057 | 1,370 | |||||||||
PI, QMA and PIMS are indirect, wholly-owned subsidiaries of Prudential Financial, Inc. (“Prudential”).
Note 3. Other Transactions with Affiliates
Prudential Mutual Fund Services LLC (“PMFS”), an affiliate of PI and an indirect, wholly-owned subsidiary of Prudential, serves as the Company’s transfer agent. Transfer agent’s fees and expenses in the Statement of Operations include certain out-of-pocket expenses paid to non-affiliates, where applicable.
The Allocation Funds invest in the Prudential Core Taxable Money Market Fund (the “Core Fund”), a portfolio of Prudential Investment Portfolios 2, registered under the 1940 Act and managed by PI. Earnings from the Core Fund are disclosed on the Statement of Operations as “Affiliated dividend income”.
Note 4. Investments in Affiliated Issuers
A summary of cost of purchases and proceeds of sales of shares of affiliated registered investment companies, other than short-term investments, for the six months ended March 31, 2015 is presented as follows:
Conservative Allocation Fund:
Affiliated Registered | Value, beginning of period | Cost of Purchases | Exchange | Proceeds of Sales | Dividend Income | Capital Gain Distributions Received | Value, ending of period | |||||||||||||||||||||
Prudential Absolute Return Bond Fund (Class Q) | $ | 8,923,730 | $ | 480,034 | $ | — | $ | (1,650,000 | ) | $ | 134,321 | $ | — | $ | 7,668,399 | |||||||||||||
Prudential Global Real Estate Fund | 8,841,040 | 309,681 | — | (2,375,000 | ) | 204,682 | — | 7,569,316 | ||||||||||||||||||||
| Prudential Asset Allocation Funds | 43 |
Notes to Financial Statements
(Unaudited) continued
Conservative Allocation Fund (cont’d):
Affiliated Registered | Value, beginning of period | Cost of Purchases | Exchange | Proceeds of Sales | Dividend Income | Capital Gain Distributions Received | Value, ending of period | |||||||||||||||||||||
Prudential Government Income Fund | $ | 9,026,258 | $ | 420,782 | $ | — | $ | (435,000 | ) | $ | 60,780 | $ | — | $ | 9,230,389 | |||||||||||||
Prudential High Yield Fund (Class Q) | 2,977,827 | 193,310 | — | (45,000 | ) | 98,297 | — | 3,090,080 | ||||||||||||||||||||
Prudential International Equity Fund (Class Z) | 9,347,896 | 1,350,352 | — | (385,000 | ) | 245,352 | — | 9,829,932 | ||||||||||||||||||||
Prudential Jennison 20/20 Focus Fund (Class Q) | 1,479,329 | 209,636 | — | (80,000 | ) | — | 134,636 | 1,531,275 | ||||||||||||||||||||
Prudential Jennison Equity Opportunity Fund (Class Q) | — | 409,015 | 2,998,103 | (200,000 | ) | 13,458 | 250,557 | 3,060,266 | ||||||||||||||||||||
Prudential Jennison Equity Opportunity Fund (Class Z) | 2,951,141 | 15,000 | (2,998,103 | ) | (50,000 | ) | — | — | — | |||||||||||||||||||
Prudential Jennison Growth Fund | 750,064 | 211,448 | — | (80,000 | ) | — | 36,448 | 913,511 | ||||||||||||||||||||
Prudential Jennison International Opportunities Fund (Class Z) | 6,303,817 | 360,000 | — | (510,000 | ) | — | — | 6,547,739 | ||||||||||||||||||||
Prudential Jennison Market Neutral Fund (Class Z) | 2,952,181 | — | — | (2,884,053 | ) | — | — | — | ||||||||||||||||||||
Prudential Jennison Mid-Cap Growth Fund, Inc. (Class Q) | 4,412,666 | 2,098,994 | — | (665,000 | ) | — | 428,994 | 6,094,624 | ||||||||||||||||||||
Prudential Jennison Natural Resources Fund, Inc. (Class Q) | 296,199 | — | — | — | — | — | 224,440 | |||||||||||||||||||||
Prudential Jennison Small Company Fund, Inc. (Class Q) | 2,894,157 | 749,310 | — | (455,000 | ) | 18,484 | 405,827 | 3,064,514 | ||||||||||||||||||||
Prudential Jennison Value Fund | 3,100,816 | 313,114 | — | (1,635,000 | ) | 27,633 | 210,481 | 1,534,136 | ||||||||||||||||||||
Prudential Large-Cap Core Equity Fund (Class Z) | 7,380,869 | 2,100,913 | — | (2,135,000 | ) | 64,854 | 541,059 | 7,295,941 | ||||||||||||||||||||
| 44 |
Conservative Allocation Fund (cont’d):
Affiliated Registered | Value, beginning of period | Cost of Purchases | Exchange | Proceeds of Sales | Dividend Income | Capital Gain Distributions Received | Value, ending of period | |||||||||||||||||||||
Prudential Long-Short Equity Fund | $ | — | $ | 3,799,054 | $ | — | $ | — | $ | — | $ | — | $ | 3,816,457 | ||||||||||||||
Prudential Mid-Cap Value Fund | 4,567,082 | 369,194 | — | (445,000 | ) | 42,722 | 241,472 | 4,602,668 | ||||||||||||||||||||
Prudential Short Duration Multi-Sector Bond Fund (Class Q) | 37,063,357 | 4,620,221 | — | (1,150,000 | ) | 1,038,015 | — | 40,082,965 | ||||||||||||||||||||
Prudential Short-Term Corporate Bond Fund, Inc. (Class Q) | 7,416,998 | 240,423 | — | (6,880,000 | ) | 65,454 | — | 769,819 | ||||||||||||||||||||
Prudential Small-Cap Value Fund | 2,330,811 | 560,629 | — | (579,000 | ) | 31,460 | 239,169 | 2,327,430 | ||||||||||||||||||||
Prudential Strategic Value Fund | 6,915,543 | 711,387 | — | (575,000 | ) | 53,054 | 475,333 | 6,722,573 | ||||||||||||||||||||
Prudential Total Return Bond Fund (Class Q) | 16,306,959 | 10,027,637 | — | (1,520,000 | ) | 341,311 | 24,027 | 25,242,853 | ||||||||||||||||||||
|
|
|
|
|
|
|
|
|
|
|
|
|
| |||||||||||||||
Total | $ | 146,238,740 | $ | 29,550,134 | — | $ | (24,733,053 | ) | $ | 2,439,877 | $ | 2,988,003 | $ | 151,219,327 | ||||||||||||||
|
|
|
|
|
|
|
|
|
|
|
|
|
| |||||||||||||||
Moderate Allocation Fund:
Affiliated Registered | Value, beginning of period | Cost of Purchases | Exchange | Proceeds of Sales | Dividend Income | Capital Gain Distributions Received | Value, ending of period | |||||||||||||||||||||
Prudential Absolute Return Bond Fund (Class Q) | $ | 9,086,908 | $ | 500,820 | $ | — | $ | (3,885,000 | ) | $ | 125,084 | $ | — | $ | 5,609,649 | |||||||||||||
Prudential Global Real Estate Fund | 10,825,535 | 274,795 | — | (2,825,000 | ) | 249,795 | — | 9,245,104 | ||||||||||||||||||||
Prudential Government Income Fund | 3,640,825 | 149,503 | — | (210,000 | ) | 24,502 | — | 3,668,963 | ||||||||||||||||||||
Prudential High Yield Fund (Class Q) | 1,817,698 | 110,585 | — | — | 60,584 | — | 1,905,715 | |||||||||||||||||||||
Prudential International Equity Fund (Class Z) | 17,209,564 | 2,266,994 | — | (675,000 | ) | 456,994 | — | 17,888,245 | ||||||||||||||||||||
| Prudential Asset Allocation Funds | 45 |
Notes to Financial Statements
(Unaudited) continued
Moderate Allocation Fund (cont’d):
Affiliated Registered | Value, beginning of period | Cost of Purchases | Exchange | Proceeds of Sales | Dividend Income | Capital Gain Distributions Received | Value, ending of period | |||||||||||||||||||||
Prudential Jennison 20/20 Focus Fund (Class Q) | $ | 3,622,334 | $ | 404,404 | $ | — | $ | (140,000 | ) | $ | — | $ | 329,404 | $ | 3,695,882 | |||||||||||||
Prudential Jennison Equity Opportunity Fund (Class Q) | — | 826,892 | 7,345,976 | (370,000 | ) | 32,974 | 613,917 | 7,440,986 | ||||||||||||||||||||
Prudential Jennison Equity Opportunity Fund (Class Z) | 7,210,930 | 65,000 | (7,345,976 | ) | (130,000 | ) | — | — | — | |||||||||||||||||||
Prudential Jennison Growth Fund | 1,815,125 | 199,270 | — | (50,000 | ) | — | 89,270 | 2,037,647 | ||||||||||||||||||||
Prudential Jennison International Opportunities Fund (Class Z) | 11,521,545 | 910,000 | — | (1,065,000 | ) | — | — | 12,083,692 | ||||||||||||||||||||
Prudential Jennison Market Neutral Fund (Class Z) | 5,421,410 | — | — | (5,296,301 | ) | — | — | — | ||||||||||||||||||||
Prudential Jennison Mid-Cap Growth Fund, Inc. (Class Q) | 8,993,276 | 3,743,400 | — | (1,145,000 | ) | — | 878,400 | 12,063,349 | ||||||||||||||||||||
Prudential Jennison Natural Resources Fund, Inc. (Class Q) | 360,585 | 95,000 | — | — | — | — | 365,333 | |||||||||||||||||||||
Prudential Jennison Small Company Fund, Inc. (Class Q) | 7,143,800 | 1,359,107 | — | (1,630,000 | ) | 45,484 | 998,623 | 6,516,155 | ||||||||||||||||||||
Prudential Jennison Value Fund | 7,378,010 | 696,499 | — | (2,875,000 | ) | 66,322 | 505,177 | 4,644,417 | ||||||||||||||||||||
Prudential Large-Cap Core Equity Fund (Class Z) | 13,537,832 | 4,293,335 | — | (3,745,000 | ) | 118,095 | 985,240 | 14,061,826 | ||||||||||||||||||||
Prudential Long-Short Equity Fund | — | 6,446,301 | — | — | — | — | 6,475,910 | |||||||||||||||||||||
Prudential Mid-Cap Value Fund | 11,893,036 | 1,723,825 | — | (930,000 | ) | 111,816 | 632,009 | 13,018,234 | ||||||||||||||||||||
| 46 |
Moderate Allocation Fund (cont’d):
Affiliated Registered | Value, beginning of period | Cost of Purchases | Exchange | Proceeds of Sales | Dividend Income | Capital Gain Distributions Received | Value, ending of period | |||||||||||||||||||||
Prudential Short Duration Multi-Sector Bond Fund (Class Q) | $ | 22,328,722 | $ | 3,252,197 | $ | — | $ | (945,000 | ) | $ | 625,842 | $ | — | $ | 24,363,909 | |||||||||||||
Prudential Small-Cap Value Fund | 3,747,584 | 842,595 | — | (1,745,000 | ) | 50,869 | 386,726 | 2,823,009 | ||||||||||||||||||||
Prudential Strategic Value Fund | 14,787,137 | 1,750,200 | — | (770,000 | ) | 113,983 | 1,021,217 | 15,061,807 | ||||||||||||||||||||
Prudential Total Return Bond Fund (Class Q) | 16,334,271 | 5,596,979 | — | (1,295,000 | ) | 310,299 | 24,350 | 21,042,430 | ||||||||||||||||||||
|
|
|
|
|
|
|
|
|
|
|
|
|
| |||||||||||||||
Total | $ | 178,676,127 | $ | 35,507,701 | $ | — | $ | (29,726,301 | ) | $ | 2,392,643 | $ | 6,464,333 | $ | 184,012,262 | |||||||||||||
|
|
|
|
|
|
|
|
|
|
|
|
|
| |||||||||||||||
Growth Allocation Fund:
Affiliated Registered | Value, beginning of period | Cost of Purchases | Exchange | Proceeds of Sales | Dividend Income | Capital Gain Distributions Received | Value, ending of period | |||||||||||||||||||||
Prudential Absolute Return Bond Fund (Class Q) | $ | 997,178 | $ | 30,945 | $ | — | — | $ | 15,865 | $ | — | $ | 1,018,895 | |||||||||||||||
Prudential Global Real Estate Fund | 5,869,218 | 163,676 | — | (1,590,000 | ) | 133,676 | — | 4,969,750 | ||||||||||||||||||||
Prudential Government Income Fund | 9,399 | 32 | — | (9,648 | ) | 36 | — | — | ||||||||||||||||||||
Prudential International Equity Fund (Class Z) | 14,500,215 | 2,197,171 | — | (675,000 | ) | 387,171 | — | 15,253,253 | ||||||||||||||||||||
Prudential Jennison 20/20 Focus Fund (Class Q) | 2,935,879 | 323,984 | — | (100,000 | ) | — | 268,984 | 3,003,062 | ||||||||||||||||||||
Prudential Jennison Equity Opportunity Fund (Class Q) | — | 616,633 | 7,002,357 | (245,000 | ) | 31,432 | 585,201 | 7,019,016 | ||||||||||||||||||||
Prudential Jennison Equity Opportunity Fund (Class Z) | 6,837,095 | 45,000 | (7,002,357 | ) | (70,000 | ) | — | — | — | |||||||||||||||||||
Prudential Jennison Growth Fund | 980,822 | 1,008,832 | — | (90,000 | ) | — | 48,832 | 1,995,961 | ||||||||||||||||||||
| Prudential Asset Allocation Funds | 47 |
Notes to Financial Statements
(Unaudited) continued
Growth Allocation Fund (cont’d):
Affiliated Registered | Value, beginning of period | Cost of Purchases | Exchange | Proceeds of Sales | Dividend Income | Capital Gain Distributions Received | Value, ending of period | |||||||||||||||||||||
Prudential Jennison International Opportunities Fund (Class Z) | $ | 9,665,122 | $ | 715,000 | $ | — | $ | (830,000 | ) | $ | — | $ | — | $ | 10,156,553 | |||||||||||||
Prudential Jennison Market Neutral Fund (Class Z) | 3,914,927 | — | — | (3,824,582 | ) | — | — | — | ||||||||||||||||||||
Prudential Jennison Mid-Cap Growth Fund, Inc. (Class Q) | 4,876,585 | 1,923,760 | — | (550,000 | ) | — | 478,760 | 6,503,750 | ||||||||||||||||||||
Prudential Jennison Natural Resources Fund, Inc. (Class Q) | 186,507 | — | — | — | — | — | 141,323 | |||||||||||||||||||||
Prudential Jennison Small Company Fund, Inc. (Class Q) | 4,380,974 | 1.074,296 | — | (750,000 | ) | 27,850 | 611,446 | 4,520,111 | ||||||||||||||||||||
Prudential Jennison Value Fund | 5,963,183 | 547,698 | — | (1,585,000 | ) | 53,696 | 409,002 | 4,504,075 | ||||||||||||||||||||
Prudential Large-Cap Core Equity Fund (Class Z) | 10,581,823 | 1,793,187 | — | (1,830,000 | ) | 90,785 | 757,401 | 10,487,908 | ||||||||||||||||||||
Prudential Long-Short Equity Fund | — | 4,499,582 | — | — | — | — | 4,520,097 | |||||||||||||||||||||
Prudential Mid-Cap Value Fund | 6,364,626 | 434,757 | — | (435,000 | ) | 60,094 | 339,663 | 6,517,561 | ||||||||||||||||||||
Prudential Short Duration Multi-Sector Bond Fund (Class Q) | 581,789 | 36,744 | — | — | 16,708 | — | 611,178 | |||||||||||||||||||||
Prudential Small-Cap Value Fund | 4,359,287 | 828,258 | — | (1,640,000 | ) | 59,083 | 449,175 | 3,527,962 | ||||||||||||||||||||
Prudential Strategic Value Fund | 10,953,257 | 1,127,826 | — | (505,000 | ) | 84,626 | 758,200 | 11,045,889 | ||||||||||||||||||||
Prudential Total Return Bond Fund (Class Q) | 2,778,849 | 1,039,589 | — | (720,000 | ) | 50,303 | 4,242 | 3,164,795 | ||||||||||||||||||||
|
|
|
|
|
|
|
|
|
|
|
|
|
| |||||||||||||||
Total | $ | 96,736,735 | $ | 18,406,970 | $ | — | $ | (15,449,230 | ) | $ | 1,011,325 | $ | 4,710,906 | 98,961,139 | ||||||||||||||
|
|
|
|
|
|
|
|
|
|
|
|
|
| |||||||||||||||
| 48 |
Note 5. Tax Information
The United States federal income tax basis and net unrealized appreciation of the Funds’ investments as of March 31, 2015 were as follows:
Fund | Tax Basis | Appreciation | Depreciation | Net Unrealized Appreciation | ||||||||||||
Conservative Allocation Fund | $ | 132,115,434 | $ | 21,437,430 | $ | (688,713 | ) | $ | 20,748,717 | |||||||
Moderate Allocation Fund | 151,878,839 | 34,567,263 | (663,034 | ) | 33,904,229 | |||||||||||
Growth Allocation Fund | 78,247,795 | 22,220,978 | (350,521 | ) | 21,870,457 | |||||||||||
The book basis may differ from tax basis due to certain tax related adjustments.
The Allocation Funds utilized capital loss carryforward to offset net taxable capital gains realized in the fiscal year ended September 30, 2014 of approximately:
Conservative Allocation Fund | $ | — | ||
Moderate Allocation Fund | 2,584,000 | |||
Growth Allocation Fund | 3,557,000 |
The Growth Allocation Fund elected to treat late year ordinary losses of approximately $25,000 as having been incurred in the following fiscal year (September 30, 2015).
Management has analyzed the Allocation Fund’s tax positions taken on federal, state and local income tax returns for all open tax years and has concluded that no provision for income tax is required in the Allocation Funds’ financial statements for the current reporting period. The Allocation Fund’s federal, state and local income tax returns for tax years for which the applicable statutes of limitations have not expired are subject to examination by the Internal Revenue Service and state departments of revenue.
Note 6. Capital
The Allocation Funds offer Class A, Class B, Class C, Class R and Class Z shares. Class A shares are sold with a front-end sales charge of up to 5.50%. All investors who purchase Class A shares in an amount of $1 million or more and sell these shares within 12 months of purchase are subject to a contingent deferred sales charge (“CDSC”) of 1%. Class B shares are sold with a CDSC which declines from 5% to zero depending on the period of time the shares are held. Class B shares will automatically convert to Class A shares on a quarterly basis approximately seven years after purchase. Class B shares are closed to new purchases. Class C shares are
| Prudential Asset Allocation Funds | 49 |
Notes to Financial Statements
(Unaudited) continued
sold with a CDSC of 1% on shares redeemed within the first 12 months of purchase. Class R and Class Z shares are not subject to any sales or redemption charge and are offered exclusively for sale to a limited group of investors.
Under certain circumstances, an exchange may be made from specified share classes of the Allocation Funds to one or more other share classes of the Allocation Funds as presented in the table of transactions in shares of common stock.
There are 6.25 billion shares of $.001 par value of common stock of the Company authorized which are divided into six series. Each of the Allocation Funds, comprising three of the six series, has five classes, designated Class A, Class B, Class C, Class R and Class Z, which consists of 250 million, 250 million, 250 million, 100 million and 150 million authorized shares, respectively.
As of March 31, 2015, PI owned 264, 236 and 195 shares of Class R shares of the Conservative Allocation Fund, Moderate Allocation Fund and Growth Allocation Fund, respectively.
Transactions in shares of common stock were as follows:
Conservative Allocation Fund:
Class A | Shares | Amount | ||||||
Six months ended March 31, 2015: | ||||||||
Shares sold | 726,523 | $ | 9,614,979 | |||||
Shares issued in reinvestment of dividends and distributions | 211,402 | 2,752,981 | ||||||
Shares reacquired | (564,404 | ) | (7,451,311 | ) | ||||
|
|
|
| |||||
Net increase (decrease) in shares outstanding before conversion | 373,521 | 4,916,649 | ||||||
Shares issued upon conversion from Class B | 88,242 | 1,160,816 | ||||||
Shares reacquired upon conversion into Class Z | (33,915 | ) | (447,916 | ) | ||||
|
|
|
| |||||
Net increase (decrease) in shares outstanding | 427,848 | $ | 5,629,549 | |||||
|
|
|
| |||||
Year ended September 30, 2014: | ||||||||
Shares sold | 1,411,129 | $ | 18,755,470 | |||||
Shares issued in reinvestment of dividends and distributions | 161,187 | 2,102,302 | ||||||
Shares reacquired | (1,195,485 | ) | (15,791,891 | ) | ||||
|
|
|
| |||||
Net increase (decrease) in shares outstanding before conversion | 376,831 | 5,065,881 | ||||||
Shares issued upon conversion from Class B | 132,535 | 1,762,194 | ||||||
Shares reacquired upon conversion into Class Z | (24,345 | ) | (326,822 | ) | ||||
|
|
|
| |||||
Net increase (decrease) in shares outstanding | 485,021 | $ | 6,501,253 | |||||
|
|
|
| |||||
| 50 |
Class B | Shares | Amount | ||||||
Six months ended March 31, 2015: | ||||||||
Shares sold | 31,765 | $ | 416,818 | |||||
Shares issued in reinvestment of dividends and distributions | 99,217 | 1,287,909 | ||||||
Shares reacquired | (256,578 | ) | (3,376,533 | ) | ||||
|
|
|
| |||||
Net increase (decrease) in shares outstanding before conversion | (125,596 | ) | (1,671,806 | ) | ||||
Shares reacquired upon conversion into Class A | (88,622 | ) | (1,160,816 | ) | ||||
|
|
|
| |||||
Net increase (decrease) in shares outstanding | (214,218 | ) | $ | (2,832,622 | ) | |||
|
|
|
| |||||
Year ended September 30, 2014: | ||||||||
Shares sold | 293,074 | $ | 3,845,246 | |||||
Shares issued in reinvestment of dividends and distributions | 81,225 | 1,054,415 | ||||||
Shares reacquired | (529,252 | ) | (6,998,939 | ) | ||||
|
|
|
| |||||
Net increase (decrease) in shares outstanding before conversion | (154,953 | ) | (2,099,278 | ) | ||||
Shares reacquired upon conversion into Class A | (130,800 | ) | (1,730,777 | ) | ||||
|
|
|
| |||||
Net increase (decrease) in shares outstanding | (285,753 | ) | $ | (3,830,055 | ) | |||
|
|
|
| |||||
Class C | ||||||||
Six months ended March 31, 2015: | ||||||||
Shares sold | 384,711 | $ | 5,062,889 | |||||
Shares issued in reinvestment of dividends and distributions | 73,409 | 953,641 | ||||||
Shares reacquired | (244,464 | ) | (3,213,040 | ) | ||||
|
|
|
| |||||
Net increase (decrease) in shares outstanding before conversion | 213,656 | 2,803,490 | ||||||
Shares reacquired upon conversion into Class Z | (5,422 | ) | (71,466 | ) | ||||
|
|
|
| |||||
Net increase (decrease) in shares outstanding | 208,234 | $ | 2,732,024 | |||||
|
|
|
| |||||
Year ended September 30, 2014: | ||||||||
Shares sold | 811,759 | $ | 10,704,324 | |||||
Shares issued in reinvestment of dividends and distributions | 44,318 | 575,374 | ||||||
Shares reacquired | (369,465 | ) | (4,882,860 | ) | ||||
|
|
|
| |||||
Net increase (decrease) in shares outstanding before conversion | 486,612 | 6,396,838 | ||||||
Shares reacquired upon conversion into Class Z | (16,665 | ) | (218,420 | ) | ||||
|
|
|
| |||||
Net increase (decrease) in shares outstanding | 469,947 | $ | 6,178,418 | |||||
|
|
|
| |||||
Class R | ||||||||
Six months ended March 31, 2015: | ||||||||
Shares sold | 328 | $ | 4,333 | |||||
Shares issued in reinvestment of dividends and distributions | 290 | 3,792 | ||||||
Shares reacquired | (41 | ) | (544 | ) | ||||
|
|
|
| |||||
Net increase (decrease) in shares outstanding | 577 | $ | 7,581 | |||||
|
|
|
| |||||
Year ended September 30, 2014: | ||||||||
Shares sold | 2,494 | $ | 33,279 | |||||
Shares issued in reinvestment of dividends and distributions | 168 | 2,193 | ||||||
Shares reacquired | (67 | ) | (899 | ) | ||||
|
|
|
| |||||
Net increase (decrease) in shares outstanding | 2,595 | $ | 34,573 | |||||
|
|
|
| |||||
| Prudential Asset Allocation Funds | 51 |
Notes to Financial Statements
(Unaudited) continued
Class Z | Shares | Amount | ||||||
Six months ended March 31, 2015: | ||||||||
Shares sold | 74,036 | $ | 983,935 | |||||
Shares issued in reinvestment of dividends and distributions | 17,352 | 226,837 | ||||||
Shares reacquired | (90,180 | ) | (1,194,393 | ) | ||||
|
|
|
| |||||
Net increase (decrease) in shares outstanding before conversion | 1,208 | 16,379 | ||||||
Shares issued upon conversion from Class A and Class C | 39,143 | 519,382 | ||||||
|
|
|
| |||||
Net increase (decrease) in shares outstanding | 40,351 | $ | 535,761 | |||||
|
|
|
| |||||
Year ended September 30, 2014: | ||||||||
Shares sold | 171,947 | $ | 2,286,496 | |||||
Shares issued in reinvestment of dividends and distributions | 17,479 | 228,774 | ||||||
Shares reacquired | (276,522 | ) | (3,648,579 | ) | ||||
|
|
|
| |||||
Net increase (decrease) in shares outstanding before conversion | (87,096 | ) | (1,133,309 | ) | ||||
Shares issued upon conversion from Class A and Class C | 40,802 | 545,242 | ||||||
Shares reacquired upon conversion into Class A | (2,313 | ) | (31,417 | ) | ||||
|
|
|
| |||||
Net increase (decrease) in shares outstanding | (48,607 | ) | $ | (619,484 | ) | |||
|
|
|
| |||||
Moderate Allocation Fund:
Class A | ||||||||
Six months ended March 31, 2015: | ||||||||
Shares sold | 401,581 | $ | 6,043,039 | |||||
Shares issued in reinvestment of dividends and distributions | 344,014 | 5,084,521 | ||||||
Shares reacquired | (395,697 | ) | (5,924,801 | ) | ||||
|
|
|
| |||||
Net increase (decrease) in shares outstanding before conversion | 349,898 | 5,202,759 | ||||||
Shares issued upon conversion from Class B | 196,180 | 2,932,199 | ||||||
Shares reacquired upon conversion into Class Z | (1,237 | ) | (18,432 | ) | ||||
|
|
|
| |||||
Net increase (decrease) in shares outstanding | 544,841 | $ | 8,116,526 | |||||
|
|
|
| |||||
Year ended September 30, 2014: | ||||||||
Shares sold | 971,732 | $ | 14,507,141 | |||||
Shares issued in reinvestment of dividends and distributions | 62,105 | 912,948 | ||||||
Shares reacquired | (867,028 | ) | (12,961,246 | ) | ||||
|
|
|
| |||||
Net increase (decrease) in shares outstanding before conversion | 166,809 | 2,458,843 | ||||||
Shares issued upon conversion from Class B | 258,704 | 3,896,636 | ||||||
Shares reacquired upon conversion into Class Z | (2,623 | ) | (39,887 | ) | ||||
|
|
|
| |||||
Net increase (decrease) in shares outstanding | 422,890 | $ | 6,315,592 | |||||
|
|
|
| |||||
| 52 |
Class B | Shares | Amount | ||||||
Six months ended March 31, 2015: | ||||||||
Shares sold | 30,222 | $ | 449,885 | |||||
Shares issued in reinvestment of dividends and distributions | 160,025 | 2,355,560 | ||||||
Shares reacquired | (267,818 | ) | (4,003,045 | ) | ||||
|
|
|
| |||||
Net increase (decrease) in shares outstanding before conversion | (77,571 | ) | (1,197,600 | ) | ||||
Shares reacquired upon conversion into Class A | (197,712 | ) | (2,932,199 | ) | ||||
|
|
|
| |||||
Net increase (decrease) in shares outstanding | (275,283 | ) | $ | (4,129,799 | ) | |||
|
|
|
| |||||
Year ended September 30, 2014: | ||||||||
Shares sold | 371,424 | $ | 5,446,683 | |||||
Shares issued in reinvestment of dividends and distributions | 14,172 | 207,621 | ||||||
Shares reacquired | (465,147 | ) | (6,916,095 | ) | ||||
|
|
|
| |||||
Net increase (decrease) in shares outstanding before conversion | (79,551 | ) | (1,261,791 | ) | ||||
Shares reacquired upon conversion into Class A | (260,799 | ) | (3,896,636 | ) | ||||
|
|
|
| |||||
Net increase (decrease) in shares outstanding | (340,350 | ) | $ | (5,158,427 | ) | |||
|
|
|
| |||||
Class C | ||||||||
Six months ended March 31, 2015: | ||||||||
Shares sold | 331,791 | $ | 4,935,305 | |||||
Shares issued in reinvestment of dividends and distributions | 83,637 | 1,230,302 | ||||||
Shares reacquired | (176,593 | ) | (2,638,867 | ) | ||||
|
|
|
| |||||
Net increase (decrease) in shares outstanding before conversion | 238,835 | 3,526,740 | ||||||
Shares reacquired upon conversion into Class Z | (9,950 | ) | (150,161 | ) | ||||
|
|
|
| |||||
Net increase (decrease) in shares outstanding | 228,885 | $ | 3,376,579 | |||||
|
|
|
| |||||
Year ended September 30, 2014: | ||||||||
Shares sold | 547,590 | $ | 8,092,664 | |||||
Shares issued in reinvestment of dividends and distributions | 5,816 | 85,143 | ||||||
Shares reacquired | (310,604 | ) | (4,608,321 | ) | ||||
|
|
|
| |||||
Net increase (decrease) in shares outstanding before conversion | 242,802 | 3,569,486 | ||||||
Shares reacquired upon conversion into Class Z | (22,867 | ) | (340,404 | ) | ||||
|
|
|
| |||||
Net increase (decrease) in shares outstanding | 219,935 | $ | 3,229,082 | |||||
|
|
|
| |||||
Class R | ||||||||
Six months ended March 31, 2015: | ||||||||
Shares sold | 435 | $ | 6,559 | |||||
Shares issued in reinvestment of dividends and distributions | 648 | 9,554 | ||||||
Shares reacquired | (15 | ) | (221 | ) | ||||
|
|
|
| |||||
Net increase (decrease) in shares outstanding | 1,068 | $ | 15,892 | |||||
|
|
|
| |||||
Year ended September 30, 2014: | ||||||||
Shares sold | 953 | $ | 14,297 | |||||
Shares issued in reinvestment of dividends and distributions | 92 | 1,344 | ||||||
Shares reacquired | (128 | ) | (1,886 | ) | ||||
|
|
|
| |||||
Net increase (decrease) in shares outstanding | 917 | $ | 13,755 | |||||
|
|
|
| |||||
| Prudential Asset Allocation Funds | 53 |
Notes to Financial Statements
(Unaudited) continued
Class Z | Shares | Amount | ||||||
Six months ended March 31, 2015: | ||||||||
Shares sold | 54,147 | $ | 805,049 | |||||
Shares issued in reinvestment of dividends and distributions | 12,717 | 187,823 | ||||||
Shares reacquired | (85,007 | ) | (1,267,432 | ) | ||||
|
|
|
| |||||
Net increase (decrease) in shares outstanding before conversion | (18,143 | ) | (274,560 | ) | ||||
Shares issued upon conversion from Class A and Class C | 11,077 | 168,593 | ||||||
|
|
|
| |||||
Net increase (decrease) in shares outstanding | (7,066 | ) | $ | (105,967 | ) | |||
|
|
|
| |||||
Year ended September 30, 2014: | ||||||||
Shares sold | 76,418 | $ | 1,156,071 | |||||
Shares issued in reinvestment of dividends and distributions | 2,384 | 35,016 | ||||||
Shares reacquired | (44,902 | ) | (676,302 | ) | ||||
|
|
|
| |||||
Net increase (decrease) in shares outstanding before conversion | 33,900 | 514,785 | ||||||
Shares issued upon conversion from Class A and Class C | 25,353 | 380,291 | ||||||
|
|
|
| |||||
Net increase (decrease) in shares outstanding | 59,253 | $ | 895,076 | |||||
|
|
|
| |||||
Growth Allocation Fund:
Class A | ||||||||
Six months ended March 31, 2015: | ||||||||
Shares sold | 230,636 | $ | 4,039,228 | |||||
Shares issued in reinvestment of dividends and distributions | 91,848 | 1,607,344 | ||||||
Shares reacquired | (266,669 | ) | (4,660,126 | ) | ||||
|
|
|
| |||||
Net increase (decrease) in shares outstanding before conversion | 55,815 | 986,446 | ||||||
Shares issued upon conversion from Class B | 180,280 | 3,140,648 | ||||||
Shares reacquired upon conversion into Class Z | (766 | ) | (13,632 | ) | ||||
|
|
|
| |||||
Net increase (decrease) in shares outstanding | 235,329 | $ | 4,113,462 | |||||
|
|
|
| |||||
Year ended September 30, 2014: | ||||||||
Shares sold | 496,573 | $ | 8,482,376 | |||||
Shares issued in reinvestment of dividends and distributions | 18,566 | 313,577 | ||||||
Shares reacquired | (414,769 | ) | (7,110,179 | ) | ||||
|
|
|
| |||||
Net increase (decrease) in shares outstanding before conversion | 100,370 | 1,685,774 | ||||||
Shares issued upon conversion from Class B | 208,578 | 3,634,921 | ||||||
Shares reacquired upon conversion into Class Z | (3,969 | ) | (68,655 | ) | ||||
|
|
|
| |||||
Net increase (decrease) in shares outstanding | 304,979 | $ | 5,252,040 | |||||
|
|
|
| |||||
| 54 |
Class B | Shares | Amount | ||||||
Six months ended March 31, 2015: | ||||||||
Shares sold | 6,086 | $ | 103,175 | |||||
Shares issued in reinvestment of dividends and distributions | 33,804 | 571,972 | ||||||
Shares reacquired | (93,499 | ) | (1,572,472 | ) | ||||
|
|
|
| |||||
Net increase (decrease) in shares outstanding before conversion | (53,609 | ) | (897,325 | ) | ||||
Shares reacquired upon conversion into Class A | (187,063 | ) | (3,140,648 | ) | ||||
|
|
|
| |||||
Net increase (decrease) in shares outstanding | (240,672 | ) | $ | (4,037,973 | ) | |||
|
|
|
| |||||
Year ended September 30, 2014: | ||||||||
Shares sold | 168,330 | $ | 2,742,870 | |||||
Shares reacquired | (215,010 | ) | (3,562,672 | ) | ||||
|
|
|
| |||||
Net increase (decrease) in shares outstanding before conversion | (46,680 | ) | (819,802 | ) | ||||
Shares reacquired upon conversion into Class A | (216,267 | ) | (3,634,921 | ) | ||||
|
|
|
| |||||
Net increase (decrease) in shares outstanding | (262,947 | ) | $ | (4,454,723 | ) | |||
|
|
|
| |||||
Class C | ||||||||
Six months ended March 31, 2015: | ||||||||
Shares sold | 69,595 | $ | 1,172,868 | |||||
Shares issued in reinvestment of dividends and distributions | 14,785 | 250,309 | ||||||
Shares reacquired | (49,169 | ) | (831,309 | ) | ||||
|
|
|
| |||||
Net increase (decrease) in shares outstanding before conversion | 35,211 | 591,868 | ||||||
Shares reacquired upon conversion into Class Z | (802 | ) | (13,843 | ) | ||||
|
|
|
| |||||
Net increase (decrease) in shares outstanding | 34,409 | $ | 578,025 | |||||
|
|
|
| |||||
Year ended September 30, 2014: | ||||||||
Shares sold | 148,477 | $ | 2,446,365 | |||||
Shares reacquired | (103,377 | ) | (1,727,442 | ) | ||||
|
|
|
| |||||
Net increase (decrease) in shares outstanding before conversion | 45,100 | 718,923 | ||||||
Shares reacquired upon conversion into Class Z | (12,325 | ) | (204,258 | ) | ||||
|
|
|
| |||||
Net increase (decrease) in shares outstanding | 32,775 | $ | 514,665 | |||||
|
|
|
| |||||
Class R | ||||||||
Six months ended March 31, 2015: | ||||||||
Shares issued in reinvestment of dividends and distributions | 5.0 | $ | 87 | |||||
|
|
|
| |||||
Net increase (decrease) in shares outstanding | 5.0 | $ | 87 | |||||
|
|
|
| |||||
Year ended September 30, 2014 | ||||||||
Shares issued in reinvestment of dividends and distributions | 0.9 | $ | 13 | |||||
|
|
|
| |||||
Net increase (decrease) in shares outstanding | 0.9 | $ | 13 | |||||
|
|
|
| |||||
| Prudential Asset Allocation Funds | 55 |
Notes to Financial Statements
(Unaudited) continued
Class Z | Shares | Amount | ||||||
Six months ended March 31, 2015: | ||||||||
Shares sold | 4,720 | $ | 83,383 | |||||
Shares issued in reinvestment of dividends and distributions | 2,172 | 38,372 | ||||||
Shares reacquired | (29,688 | ) | (520,849 | ) | ||||
|
|
|
| |||||
Net increase (decrease) in shares outstanding before conversion | (22,796 | ) | (399,094 | ) | ||||
Shares issued upon conversion from Class A and Class C | 1,526 | 27,475 | ||||||
|
|
|
| |||||
Net increase (decrease) in shares outstanding | (21,270 | ) | $ | (371,619 | ) | |||
|
|
|
| |||||
Year ended September 30, 2014: | ||||||||
Shares sold | 20,113 | $ | 351,727 | |||||
Shares issued in reinvestment of dividends and distributions | 536 | 9,140 | ||||||
Shares reacquired | (13,607 | ) | (238,027 | ) | ||||
|
|
|
| |||||
Net increase (decrease) in shares outstanding before conversion | 7,042 | 122,840 | ||||||
Shares issued upon conversion from Class A and Class C | 15,716 | 272,913 | ||||||
|
|
|
| |||||
Net increase (decrease) in shares outstanding | 22,758 | $ | 395,753 | |||||
|
|
|
| |||||
Note 7. Borrowings
The Allocation Funds, along with other affiliated registered investment companies (the “Funds”), are a party to a Syndicated Credit Agreement (“SCA”) with a group of banks. The purpose of the SCA is to provide an alternative source of temporary funding for capital share redemptions. The SCA provides for a commitment of $900 million for the period October 9, 2014 through October 8, 2015. The Funds pay an annualized commitment fee of .075% of the unused portion of the SCA. Prior to October 9, 2014, the Funds had another SCA that provided a commitment of $900 million and the Funds paid an annualized commitment fee of .08% of the unused portion of the SCA. Interest on any borrowings under the SCA is paid at contracted market rates. The commitment fee for the unused amount is accrued daily and paid quarterly.
The Allocation Funds did not utilize the SCA during the six months ended March 31, 2015.
Note 8. Dividends to Shareholders
Subsequent to the six months ended March 31, 2015, the Conservative Allocation Fund declared ordinary income dividends on April 8, 2015 to shareholders of record
| 56 |
on April 9, 2015. The ex-dividend date was April 10, 2015. The per share amounts declared were as follows:
| Ordinary Income | ||||
Class A | $ | 0.0657 | ||
Class B | 0.0416 | |||
Class C | 0.0416 | |||
Class R | 0.0575 | |||
Class Z | 0.0737 | |||
Note 9. New Accounting Pronouncement
In May 2015, the FASB issued Accounting Standards Update (“ASU”) No. 2015-07 regarding “Disclosures for Investments in Certain Entities That Calculate Net Asset Value per Share”. The amendments in this update are effective for the Fund for fiscal years beginning after December 15, 2015, and interim periods within those fiscal years. ASU No. 2015-07 will eliminate the requirement to categorize investments in the fair value hierarchy if their fair value is measured at net asset value (“NAV”) per share (or its equivalent) using the practical expedient in the FASB’s fair value measurement guidance. At this time, management is evaluating the implications of ASU No. 2015-07 and its impact on the financial statement disclosures has not yet been determined.
| Prudential Asset Allocation Funds | 57 |
Prudential Conservative Allocation Fund
Financial Highlights
(Unaudited)
| Class A Shares | ||||||||||||||||||||||||||
| Six Months Ended March 31, 2015 | Year Ended September 30, | |||||||||||||||||||||||||
| 2014 | 2013(a) | 2012(a) | 2011(a) | 2010(a) | ||||||||||||||||||||||
| Per Share Operating Performance: | ||||||||||||||||||||||||||
| Net Asset Value, Beginning Of Period | $13.30 | $13.03 | $12.39 | $11.20 | $11.41 | $10.64 | ||||||||||||||||||||
| Income (loss) from investment operations: | ||||||||||||||||||||||||||
| Net investment income | .17 | .20 | .22 | .21 | .23 | .24 | ||||||||||||||||||||
| Net realized and unrealized gain (loss) on investment transactions | .28 | .53 | .70 | 1.21 | (.21 | ) | .77 | |||||||||||||||||||
| Total from investment operations | .45 | .73 | .92 | 1.42 | .02 | 1.01 | ||||||||||||||||||||
| Less Dividends and Distributions: | ||||||||||||||||||||||||||
| Dividends from net investment income | (.19 | ) | (.22 | ) | (.28 | ) | (.23 | ) | (.23 | ) | (.24 | ) | ||||||||||||||
| Distributions from net realized gains | (.35 | ) | (.24 | ) | - | - | - | - | ||||||||||||||||||
| Total dividends and distributions | (.54 | ) | (.46 | ) | (.28 | ) | (.23 | ) | (.23 | ) | (.24 | ) | ||||||||||||||
| Net asset value, end of period | $13.21 | $13.30 | $13.03 | $12.39 | $11.20 | $11.41 | ||||||||||||||||||||
| Total Return(b): | 3.45% | 5.67% | 7.52% | 12.84% | .10% | 9.61% | ||||||||||||||||||||
| Ratios/Supplemental Data: | ||||||||||||||||||||||||||
| Net assets, end of period (000) | $77,462 | $72,292 | $64,535 | $57,791 | $53,890 | $43,900 | ||||||||||||||||||||
| Average net assets (000) | $73,666 | $66,510 | $60,521 | $56,264 | $52,244 | $39,798 | ||||||||||||||||||||
| Ratios to average net assets(c): | ||||||||||||||||||||||||||
| Expenses, after waivers and/or expense reimbursement | .71% | (d) | .71% | .72% | .75% | .75% | .75% | |||||||||||||||||||
| Expenses, before waivers and/or expense reimbursement | .76% | (d) | .76% | .77% | .81% | .82% | .85% | |||||||||||||||||||
| Net investment income | 2.58% | (d) | 1.48% | 1.74% | 1.80% | 1.97% | 2.21% | |||||||||||||||||||
| Portfolio turnover rate | 19% | (e) | 46% | 25% | 23% | 16% | 29% | |||||||||||||||||||
(a) Calculated based on average shares outstanding during the period.
(b) Total return does not consider the effects of sales loads. Total return is calculated assuming a purchase of a share on the first day and a sale on the last day of each period reported and includes reinvestment of dividends and distributions. Total returns may reflect adjustments to conform to generally accepted accounting principles. Total returns for periods less than one full year are not annualized.
(c) Does not include expenses of the investment companies in which the Fund invests.
(d) Annualized.
(e) Not annualized.
See Notes to Financial Statements.
| 58 |
| Class B Shares | ||||||||||||||||||||||||||
| Six Months Ended March 31, 2015 | Year Ended September 30, | |||||||||||||||||||||||||
| 2014 | 2013(a) | 2012(a) | 2011(a) | 2010(a) | ||||||||||||||||||||||
| Per Share Operating Performance: | ||||||||||||||||||||||||||
| Net Asset Value, Beginning Of Period | $13.24 | $12.98 | $12.33 | $11.15 | $11.37 | $10.60 | ||||||||||||||||||||
| Income (loss) from investment operations: | ||||||||||||||||||||||||||
| Net investment income | .12 | .10 | .13 | .13 | .15 | .16 | ||||||||||||||||||||
| Net realized and unrealized gain (loss) on investment transactions | .28 | .52 | .70 | 1.20 | (.22 | ) | .77 | |||||||||||||||||||
| Total from investment operations | .40 | .62 | .83 | 1.33 | (.07 | ) | .93 | |||||||||||||||||||
| Less Dividends and Distributions: | ||||||||||||||||||||||||||
| Dividends from net investment income | (.14 | ) | (.12 | ) | (.18 | ) | (.15 | ) | (.15 | ) | (.16 | ) | ||||||||||||||
| Distributions from net realized gains | (.35 | ) | (.24 | ) | - | - | - | - | ||||||||||||||||||
| Total dividends and distributions | (.49 | ) | (.36 | ) | (.18 | ) | (.15 | ) | (.15 | ) | (.16 | ) | ||||||||||||||
| Net asset value, end of period | $13.15 | $13.24 | $12.98 | $12.33 | $11.15 | $11.37 | ||||||||||||||||||||
| Total Return(b): | 3.06% | 4.82% | 6.84% | 11.96% | (.72)% | 8.85% | ||||||||||||||||||||
| Ratios/Supplemental Data: | ||||||||||||||||||||||||||
| Net assets, end of period (000) | $37,772 | $40,863 | $43,767 | $43,162 | $44,301 | $50,082 | ||||||||||||||||||||
| Average net assets (000) | $39,655 | $43,801 | $43,407 | $44,359 | $51,101 | $45,227 | ||||||||||||||||||||
| Ratios to average net assets(c): | ||||||||||||||||||||||||||
| Expenses, after waivers and/or expense reimbursement | 1.46% | (d) | 1.46% | 1.47% | 1.50% | 1.50% | 1.50% | |||||||||||||||||||
| Expenses, before waivers and/or expense reimbursement | 1.46% | (d) | 1.46% | 1.47% | 1.51% | 1.52% | 1.55% | |||||||||||||||||||
| Net investment income | 1.84% | (d) | .73% | 1.01% | 1.06% | 1.27% | 1.45% | |||||||||||||||||||
| Portfolio turnover rate | 19% | (e) | 46% | 25% | 23% | 16% | 29% | |||||||||||||||||||
(a) Calculated based on average shares outstanding during the period.
(b) Total return does not consider the effects of sales loads. Total return is calculated assuming a purchase of a share on the first day and a sale on the last day of each period reported and includes reinvestment of dividends and distributions. Total returns may reflect adjustments to conform to generally accepted accounting principles. Total returns for periods less than one full year are not annualized.
(c) Does not include expenses of the investment companies in which the Fund invests.
(d) Annualized.
(e) Not annualized.
See Notes to Financial Statements.
| Prudential Asset Allocation Funds | 59 |
Prudential Conservative Allocation Fund
Financial Highlights
(Unaudited) continued
| Class C Shares | ||||||||||||||||||||||||||
| Six Months Ended March 31, 2015 | Year Ended September 30, | |||||||||||||||||||||||||
| 2014 | 2013(a) | 2012(a) | 2011(a) | 2010(a) | ||||||||||||||||||||||
| Per Share Operating Performance: | ||||||||||||||||||||||||||
| Net Asset Value, Beginning Of Period | $13.24 | $12.98 | $12.34 | $11.16 | $11.37 | $10.61 | ||||||||||||||||||||
| Income (loss) from investment operations: | ||||||||||||||||||||||||||
| Net investment income | .12 | .10 | .12 | .13 | .15 | .16 | ||||||||||||||||||||
| Net realized and unrealized gain (loss) on investment transactions | .28 | .52 | .70 | 1.20 | (.21 | ) | .76 | |||||||||||||||||||
| Total from investment operations | .40 | .62 | .82 | 1.33 | (.06 | ) | .92 | |||||||||||||||||||
| Less Dividends and Distributions: | ||||||||||||||||||||||||||
| Dividends from net investment income | (.14 | ) | (.12 | ) | (.18 | ) | (.15 | ) | (.15 | ) | (.16 | ) | ||||||||||||||
| Distributions from net realized gains | (.35 | ) | (.24 | ) | - | - | - | - | ||||||||||||||||||
| Total dividends and distributions | (.49 | ) | (.36 | ) | (.18 | ) | (.15 | ) | (.15 | ) | (.16 | ) | ||||||||||||||
| Net asset value, end of period | $13.15 | $13.24 | $12.98 | $12.34 | $11.16 | $11.37 | ||||||||||||||||||||
| Total Return(b): | 3.06% | 4.82% | 6.75% | 11.95% | (.63)% | 8.75% | ||||||||||||||||||||
| Ratios/Supplemental Data: | ||||||||||||||||||||||||||
| Net assets, end of period (000) | $31,271 | $28,724 | $22,055 | $18,224 | $20,380 | $19,161 | ||||||||||||||||||||
| Average net assets (000) | $29,711 | $26,250 | $19,308 | $18,095 | $20,876 | $17,097 | ||||||||||||||||||||
| Ratios to average net assets(c): | ||||||||||||||||||||||||||
| Expenses, after waivers and/or expense reimbursement | 1.46% | (d) | 1.46% | 1.47% | 1.50% | 1.50% | 1.50% | |||||||||||||||||||
| Expenses, before waivers and/or expense reimbursement | 1.46% | (d) | 1.46% | 1.47% | 1.51% | 1.52% | 1.55% | |||||||||||||||||||
| Net investment income | 1.81% | (d) | .69% | .98% | 1.10% | 1.25% | 1.43% | |||||||||||||||||||
| Portfolio turnover rate | 19% | (e) | 46% | 25% | 23% | 16% | 29% | |||||||||||||||||||
(a) Calculated based on average shares outstanding during the period.
(b) Total return does not consider the effects of sales loads. Total return is calculated assuming a purchase of a share on the first day and a sale on the last day of each period reported and includes reinvestment of dividends and distributions. Total returns may reflect adjustments to conform to generally accepted accounting principles. Total returns for periods less than one full year are not annualized.
(c) Does not include expenses of the investment companies in which the Fund invests.
(d) Annualized.
(e) Not annualized.
See Notes to Financial Statements.
| 60 |
| Class R Shares | ||||||||||||||||||||||||||
| Six Months Ended March 31, 2015 | Year Ended September 30, | |||||||||||||||||||||||||
| 2014 | 2013(a) | 2012(a) | 2011(a) | 2010(a) | ||||||||||||||||||||||
| Per Share Operating Performance: | ||||||||||||||||||||||||||
| Net Asset Value, Beginning Of Period | $13.34 | $13.07 | $12.42 | $11.23 | $11.45 | $10.68 | ||||||||||||||||||||
| Income (loss) from investment operations: | ||||||||||||||||||||||||||
| Net investment income | .16 | .17 | .19 | .17 | .19 | .21 | ||||||||||||||||||||
| Net realized and unrealized gain (loss) on investment transactions | .27 | .53 | .71 | 1.22 | (.21 | ) | .78 | |||||||||||||||||||
| Total from investment operations | .43 | .70 | .90 | 1.39 | (.02 | ) | .99 | |||||||||||||||||||
| Less Dividends and Distributions: | ||||||||||||||||||||||||||
| Dividends from net investment income | (.17 | ) | (.19 | ) | (.25 | ) | (.20 | ) | (.20 | ) | (.22 | ) | ||||||||||||||
| Distributions from net realized gains | (.35 | ) | (.24 | ) | - | - | - | - | ||||||||||||||||||
| Total dividends and distributions | (.52 | ) | (.43 | ) | (.25 | ) | (.20 | ) | (.20 | ) | (.22 | ) | ||||||||||||||
| Net asset value, end of period | $13.25 | $13.34 | $13.07 | $12.42 | $11.23 | $11.45 | ||||||||||||||||||||
| Total Return(b): | 3.30% | 5.38% | 7.32% | 12.52% | (.23)% | 9.37% | ||||||||||||||||||||
| Ratios/Supplemental Data: | ||||||||||||||||||||||||||
| Net assets, end of period (000) | $102 | $95 | $59 | $49 | $74 | $24 | ||||||||||||||||||||
| Average net assets (000) | $98 | $76 | $54 | $42 | $58 | $19 | ||||||||||||||||||||
| Ratios to average net assets(c): | ||||||||||||||||||||||||||
| Expenses, after waivers and/or expense reimbursement | .96% | (d) | .96% | .97% | 1.00% | 1.00% | 1.00% | |||||||||||||||||||
| Expenses, before waivers and/or expense reimbursement | 1.21% | (d) | 1.21% | 1.22% | 1.26% | 1.27% | 1.30% | |||||||||||||||||||
| Net investment income | 2.33% | (d) | 1.18% | 1.48% | 1.48% | 1.58% | 1.87% | |||||||||||||||||||
| Portfolio turnover rate | 19% | (e) | 46% | 25% | 23% | 16% | 29% | |||||||||||||||||||
(a) Calculated based on average shares outstanding during the period.
(b) Total return is calculated assuming a purchase of a share on the first day and a sale on the last day of each period reported and includes reinvestment of dividends and distributions. Total returns may reflect adjustments to conform to generally accepted accounting principles. Total returns for periods less than one full year are not annualized.
(c) Does not include expenses of the investment companies in which the Fund invests.
(d) Annualized.
(e) Not annualized.
See Notes to Financial Statements.
| Prudential Asset Allocation Funds | 61 |
Prudential Conservative Allocation Fund
Financial Highlights
(Unaudited) continued
| Class Z Shares | ||||||||||||||||||||||||||
| Six Months Ended March 31, 2015 | Year Ended September 30, | |||||||||||||||||||||||||
| 2014 | 2013(a) | 2012(a) | 2011(a) | 2010(a) | ||||||||||||||||||||||
| Per Share Operating Performance: | ||||||||||||||||||||||||||
| Net Asset Value, Beginning Of Period | $13.36 | $13.09 | $12.44 | $11.24 | $11.46 | $10.68 | ||||||||||||||||||||
| Income (loss) from investment operations: | ||||||||||||||||||||||||||
| Net investment income | .19 | .22 | .24 | .24 | .25 | .27 | ||||||||||||||||||||
| Net realized and unrealized gain (loss) on investment transactions | .27 | .54 | .72 | 1.22 | (.21 | ) | .78 | |||||||||||||||||||
| Total from investment operations | .46 | .76 | .96 | 1.46 | .04 | 1.05 | ||||||||||||||||||||
| Less Dividends and Distributions: | �� | |||||||||||||||||||||||||
| Dividends from net investment income | (.20 | ) | (.25 | ) | (.31 | ) | (.26 | ) | (.26 | ) | (.27 | ) | ||||||||||||||
| Distributions from net realized gains | (.35 | ) | (.24 | ) | - | - | - | - | ||||||||||||||||||
| Total dividends and distributions | (.55 | ) | (.49 | ) | (.31 | ) | (.26 | ) | (.26 | ) | (.27 | ) | ||||||||||||||
| Net asset value, end of period | $13.27 | $13.36 | $13.09 | $12.44 | $11.24 | $11.46 | ||||||||||||||||||||
| Total Return(b): | 3.56% | 5.90% | 7.84% | 13.17% | .26% | 9.93% | ||||||||||||||||||||
| Ratios/Supplemental Data: | ||||||||||||||||||||||||||
| Net assets, end of period (000) | $6,071 | $5,572 | $6,097 | $3,960 | $2,403 | $1,078 | ||||||||||||||||||||
| Average net assets (000) | $5,735 | $5,941 | $5,492 | $3,176 | $1,632 | $1,020 | ||||||||||||||||||||
| Ratios to average net assets(c): | ||||||||||||||||||||||||||
| Expenses, after waivers and/or expense reimbursement | .46% | (d) | .46% | .47% | .50% | .50% | .50% | |||||||||||||||||||
| Expenses, before waivers and/or expense reimbursement | .46% | (d) | .46% | .47% | .51% | .52% | .55% | |||||||||||||||||||
| Net investment income | 2.85% | (d) | 1.75% | 1.90% | 1.99% | 2.15% | 2.44% | |||||||||||||||||||
| Portfolio turnover rate | 19% | (e) | 46% | 25% | 23% | 16% | 29% | |||||||||||||||||||
(a) Calculated based on average shares outstanding during the period.
(b) Total return is calculated assuming a purchase of a share on the first day and a sale on the last day of each period reported and includes reinvestment of dividends and distributions. Total returns may reflect adjustments to conform to generally accepted accounting principles. Total returns for periods less than one full year are not annualized.
(c) Does not include expenses of the investment companies in which the Fund invests.
(d) Annualized.
(e) Not annualized.
See Notes to Financial Statements.
| 62 |
Prudential Moderate Allocation Fund
Financial Highlights
(Unaudited)
| Class A Shares | ||||||||||||||||||||||||||
| Six Months Ended March 31, 2015(a) | Year Ended September 30, | |||||||||||||||||||||||||
| 2014 | 2013(a) | 2012(a) | 2011(a) | 2010 | ||||||||||||||||||||||
| Per Share Operating Performance: | ||||||||||||||||||||||||||
| Net Asset Value, Beginning Of Period | $15.17 | $14.21 | $12.80 | $11.09 | $11.41 | $10.53 | ||||||||||||||||||||
| Income (loss) from investment operations: | ||||||||||||||||||||||||||
| Net investment income | .14 | .15 | .16 | .14 | .15 | .15 | ||||||||||||||||||||
| Net realized and unrealized gain (loss) on investment transactions | .52 | .97 | 1.49 | 1.73 | (.32 | ) | .84 | |||||||||||||||||||
| Total from investment operations | .66 | 1.12 | 1.65 | 1.87 | (.17 | ) | .99 | |||||||||||||||||||
| Less Dividends and Distributions: | ||||||||||||||||||||||||||
| Dividends from net investment income | (.31 | ) | (.16 | ) | (.24 | ) | (.16 | ) | (.15 | ) | (.11 | ) | ||||||||||||||
| Distributions from net realized gains | (.53 | ) | - | - | - | - | - | |||||||||||||||||||
| Total dividends and distributions | (.84 | ) | (.16 | ) | (.24 | ) | (.16 | ) | (.15 | ) | (.11 | ) | ||||||||||||||
| Net asset value, end of period | $14.99 | $15.17 | $14.21 | $12.80 | $11.09 | $11.41 | ||||||||||||||||||||
| Total Return(b): | 4.38% | 7.91% | 13.13% | 17.00% | (1.63)% | 9.40% | ||||||||||||||||||||
| Ratios/Supplemental Data: | ||||||||||||||||||||||||||
| Net assets, end of period (000) | $100,800 | $93,752 | $81,788 | $70,155 | $60,123 | $60,514 | ||||||||||||||||||||
| Average net assets (000) | $96,171 | $89,611 | $74,440 | $66,664 | $65,266 | $57,241 | ||||||||||||||||||||
| Ratios to average net assets(c): | ||||||||||||||||||||||||||
| Expenses, after waivers and/or expense reimbursement | .71% | (d) | .70% | .71% | .74% | .74% | .75% | |||||||||||||||||||
| Expenses, before waivers and/or expense reimbursement | .76% | (d) | .75% | .76% | .79% | .79% | .81% | |||||||||||||||||||
| Net investment income | 1.93% | (d) | 1.00% | 1.22% | 1.11% | 1.20% | 1.37% | |||||||||||||||||||
| Portfolio turnover rate | 20% | (e) | 35% | 30% | 27% | 19% | 28% | |||||||||||||||||||
(a) Calculated based on average shares outstanding during the period.
(b) Total return does not consider the effects of sales loads. Total return is calculated assuming a purchase of a share on the first day and a sale on the last day of each period reported and includes reinvestment of dividends and distributions. Total returns may reflect adjustments to conform to generally accepted accounting principles. Total returns for periods less than one full year are not annualized.
(c) Does not include expenses of the investment companies in which the Fund invests.
(d) Annualized.
(e) Not annualized.
See Notes to Financial Statements.
| Prudential Asset Allocation Funds | 63 |
Prudential Moderate Allocation Fund
Financial Highlights
(Unaudited) continued
| Class B Shares | ||||||||||||||||||||||||||
| Six Months Ended March 31, 2015(a) | Year Ended September 30, | |||||||||||||||||||||||||
| 2014 | 2013(a) | 2012(a) | 2011(a) | 2010 | ||||||||||||||||||||||
| Per Share Operating Performance: | ||||||||||||||||||||||||||
| Net Asset Value, Beginning Of Period | $15.04 | $14.09 | $12.69 | $11.00 | $11.32 | $10.46 | ||||||||||||||||||||
| Income (loss) from investment operations: | ||||||||||||||||||||||||||
| Net investment income | .09 | .04 | .07 | .05 | .06 | .06 | ||||||||||||||||||||
| Net realized and unrealized gain (loss) on investment transactions | .49 | .97 | 1.48 | 1.71 | (.32 | ) | .83 | |||||||||||||||||||
| Total from investment operations | .58 | 1.01 | 1.55 | 1.76 | (.26 | ) | .89 | |||||||||||||||||||
| Less Dividends and Distributions: | ||||||||||||||||||||||||||
| Dividends from net investment income | (.19 | ) | (.06 | ) | (.15 | ) | (.07 | ) | (.06 | ) | (.03 | ) | ||||||||||||||
| Distributions from net realized gains | (.53 | ) | - | - | - | - | - | |||||||||||||||||||
| Total dividends and distributions | (.72 | ) | (.06 | ) | (.15 | ) | (.07 | ) | (.06 | ) | (.03 | ) | ||||||||||||||
| Net asset value, end of period | $14.90 | $15.04 | $14.09 | $12.69 | $11.00 | $11.32 | ||||||||||||||||||||
| Total Return(b): | 3.91% | 7.15% | 12.35% | 16.06% | (2.32)% | 8.56% | ||||||||||||||||||||
| Ratios/Supplemental Data: | ||||||||||||||||||||||||||
| Net assets, end of period (000) | $48,561 | $53,127 | $54,574 | $53,400 | $54,580 | $66,364 | ||||||||||||||||||||
| Average net assets (000) | $51,421 | $56,302 | $54,466 | $55,362 | $68,070 | $60,124 | ||||||||||||||||||||
| Ratios to average net assets(c): | ||||||||||||||||||||||||||
| Expenses, after waivers and/or expense reimbursement | 1.46% | (d) | 1.45% | 1.46% | 1.49% | 1.49% | 1.50% | |||||||||||||||||||
| Expenses, before waivers and/or expense reimbursement | 1.46% | (d) | 1.45% | 1.46% | 1.49% | 1.49% | 1.51% | |||||||||||||||||||
| Net investment income | 1.18% | (d) | .28% | .51% | .40% | .48% | .59% | |||||||||||||||||||
| Portfolio turnover rate | 20% | (e) | 35% | 30% | 27% | 19% | 28% | |||||||||||||||||||
(a) Calculated based on average shares outstanding during the period.
(b) Total return does not consider the effects of sales loads. Total return is calculated assuming a purchase of a share on the first day and a sale on the last day of each period reported and includes reinvestment of dividends and distributions. Total returns may reflect adjustments to conform to generally accepted accounting principles. Total returns for periods less than one full year are not annualized.
(c) Does not include expenses of the investment companies in which the Fund invests.
(d) Annualized.
(e) Not annualized.
See Notes to Financial Statements.
| 64 |
| Class C Shares | ||||||||||||||||||||||||||
| Six Months Ended March 31, 2015(a) | Year Ended September 30, | |||||||||||||||||||||||||
| 2014 | 2013(a) | 2012(a) | 2011(a) | 2010 | ||||||||||||||||||||||
| Per Share Operating Performance: | ||||||||||||||||||||||||||
| Net Asset Value, Beginning Of Period | $15.03 | $14.08 | $12.69 | $10.99 | $11.32 | $10.46 | ||||||||||||||||||||
| Income (loss) from investment operations: | ||||||||||||||||||||||||||
| Net investment income | .09 | .04 | .06 | .04 | .05 | .07 | ||||||||||||||||||||
| Net realized and unrealized gain (loss) on investment transactions | .50 | .97 | 1.48 | 1.73 | (.32 | ) | .82 | |||||||||||||||||||
| Total from investment operations | .59 | 1.01 | 1.54 | 1.77 | (.27 | ) | .89 | |||||||||||||||||||
| Less Dividends and Distributions: | ||||||||||||||||||||||||||
| Dividends from net investment income | (.19 | ) | (.06 | ) | (.15 | ) | (.07 | ) | (.06 | ) | (.03 | ) | ||||||||||||||
| Distributions from net realized gains | (.53 | ) | - | - | - | - | - | |||||||||||||||||||
| Total dividends and distributions | (.72 | ) | (.06 | ) | (.15 | ) | (.07 | ) | (.06 | ) | (.03 | ) | ||||||||||||||
| Net asset value, end of period | $14.90 | $15.03 | $14.08 | $12.69 | $10.99 | $11.32 | ||||||||||||||||||||
| Total Return(b): | 3.99% | 7.15% | 12.27% | 16.16% | (2.41)% | 8.56% | ||||||||||||||||||||
| Ratios/Supplemental Data: | ||||||||||||||||||||||||||
| Net assets, end of period (000) | $32,715 | $29,564 | $24,604 | $19,485 | $16,894 | $17,202 | ||||||||||||||||||||
| Average net assets (000) | $30,654 | $28,118 | $21,933 | $18,652 | $18,569 | $16,324 | ||||||||||||||||||||
| Ratios to average net assets(c): | ||||||||||||||||||||||||||
| Expenses, after waivers and/or expense reimbursement | 1.46% | (d) | 1.45% | 1.46% | 1.49% | 1.49% | 1.50% | |||||||||||||||||||
| Expenses, before waivers and/or expense reimbursement | 1.46% | (d) | 1.45% | 1.46% | 1.49% | 1.49% | 1.51% | |||||||||||||||||||
| Net investment income | 1.15% | (d) | .24% | .43% | .36% | .44% | .61% | |||||||||||||||||||
| Portfolio turnover rate | 20% | (e) | 35% | 30% | 27% | 19% | 28% | |||||||||||||||||||
(a) Calculated based on average shares outstanding during the period.
(b) Total return does not consider the effects of sales loads. Total return is calculated assuming a purchase of a share on the first day and a sale on the last day of each period reported and includes reinvestment of dividends and distributions. Total returns may reflect adjustments to conform to generally accepted accounting principles. Total returns for periods less than one full year are not annualized.
(c) Does not include expenses of the investment companies in which the Fund invests.
(d) Annualized.
(e) Not annualized.
See Notes to Financial Statements.
| Prudential Asset Allocation Funds | 65 |
Prudential Moderate Allocation Fund
Financial Highlights
(Unaudited) continued
| Class R Shares | ||||||||||||||||||||||||||
| Six Months Ended March 31, 2015(a) | Year Ended September 30, | |||||||||||||||||||||||||
| 2014 | 2013(a) | 2012(a) | 2011(a) | 2010 | ||||||||||||||||||||||
| Per Share Operating Performance: | ||||||||||||||||||||||||||
| Net Asset Value, Beginning Of Period | $15.11 | $14.15 | $12.76 | $11.05 | $11.37 | $10.50 | ||||||||||||||||||||
| Income (loss) from investment operations: | ||||||||||||||||||||||||||
| Net investment income | .13 | .11 | .05 | .13 | .09 | .13 | ||||||||||||||||||||
| Net realized and unrealized gain (loss) on investment transactions | .50 | .97 | 1.55 | 1.71 | (.29 | ) | .82 | |||||||||||||||||||
| Total from investment operations | .63 | 1.08 | 1.60 | 1.84 | (.20 | ) | .95 | |||||||||||||||||||
| Less Dividends and Distributions: | ||||||||||||||||||||||||||
| Dividends from net investment income | (.27 | ) | (.12 | ) | (.21 | ) | (.13 | ) | (.12 | ) | (.08 | ) | ||||||||||||||
| Distributions from net realized gains | (.53 | ) | - | - | - | - | - | |||||||||||||||||||
| Total dividends and distributions | (.80 | ) | (.12 | ) | (.21 | ) | (.13 | ) | (.12 | ) | (.08 | ) | ||||||||||||||
| Net asset value, end of period | $14.94 | $15.11 | $14.15 | $12.76 | $11.05 | $11.37 | ||||||||||||||||||||
| Total Return(b): | 4.21% | 7.67% | 12.74% | 16.76% | (1.86)% | 9.10% | ||||||||||||||||||||
| Ratios/Supplemental Data: | ||||||||||||||||||||||||||
| Net assets, end of period (000) | $191 | $177 | $153 | $7 | $11 | $2 | ||||||||||||||||||||
| Average net assets (000) | $185 | $167 | $15 | $9 | $5 | $2 | ||||||||||||||||||||
| Ratios to average net assets(c): | ||||||||||||||||||||||||||
| Expenses, after waivers and/or expense reimbursement | .96% | (d) | .95% | .90% | .99% | .99% | 1.00% | |||||||||||||||||||
| Expenses, before waivers and/or expense reimbursement | 1.21% | (d) | 1.20% | 1.15% | 1.24% | 1.24% | 1.26% | |||||||||||||||||||
| Net investment income | 1.69% | (d) | .76% | .40% | 1.08% | .71% | 1.17% | |||||||||||||||||||
| Portfolio turnover rate | 20% | (e) | 35% | 30% | 27% | 19% | 28% | |||||||||||||||||||
(a) Calculated based on average shares outstanding during the period.
(b) Total return is calculated assuming a purchase of a share on the first day and a sale on the last day of each period reported and includes reinvestment of dividends and distributions. Total returns may reflect adjustments to conform to generally accepted accounting principles. Total returns for periods less than one full year are not annualized.
(c) Does not include expenses of the investment companies in which the Fund invests.
(d) Annualized.
(e) Not annualized.
See Notes to Financial Statements.
| 66 |
| Class Z Shares | ||||||||||||||||||||||||||
| Six Months Ended March 31, 2015(a) | Year Ended September 30, | |||||||||||||||||||||||||
| 2014 | 2013(a) | 2012(a) | 2011(a) | 2010 | ||||||||||||||||||||||
| Per Share Operating Performance: | ||||||||||||||||||||||||||
| Net Asset Value, Beginning Of Period | $15.20 | $14.23 | $12.81 | $11.10 | $11.42 | $10.54 | ||||||||||||||||||||
| Income (loss) from investment operations: | ||||||||||||||||||||||||||
| Net investment income | .16 | .17 | .21 | .17 | .17 | .18 | ||||||||||||||||||||
| Net realized and unrealized gain (loss) on investment transactions | .52 | .99 | 1.49 | 1.73 | (.32 | ) | .83 | |||||||||||||||||||
| Total from investment operations | .68 | 1.16 | 1.70 | 1.90 | (.15 | ) | 1.01 | |||||||||||||||||||
| Less Dividends and Distributions: | ||||||||||||||||||||||||||
| Dividends from net investment income | (.35 | ) | (.19 | ) | (.28 | ) | (.19 | ) | (.17 | ) | (.13 | ) | ||||||||||||||
| Distributions from net realized gains | (.53 | ) | - | - | - | - | - | |||||||||||||||||||
| Total dividends and distributions | (.88 | ) | (.19 | ) | (.28 | ) | (.19 | ) | (.17 | ) | (.13 | ) | ||||||||||||||
| Net asset value, end of period | $15.00 | $15.20 | $14.23 | $12.81 | $11.10 | $11.42 | ||||||||||||||||||||
| Total Return(b): | 4.50% | 8.22% | 13.48% | 17.28% | (1.40)% | 9.63% | ||||||||||||||||||||
| Ratios/Supplemental Data: | ||||||||||||||||||||||||||
| Net assets, end of period (000) | $3,612 | $3,767 | $2,684 | $3,052 | $2,351 | $2,087 | ||||||||||||||||||||
| Average net assets (000) | $3,501 | $3,190 | $2,874 | $2,590 | $2,198 | $1,879 | ||||||||||||||||||||
| Ratios to average net assets(c): | ||||||||||||||||||||||||||
| Expenses, after waivers and/or expense reimbursement | .46% | (d) | .45% | .46% | .49% | .49% | .50% | |||||||||||||||||||
| Expenses, before waivers and/or expense reimbursement | .46% | (d) | .45% | .46% | .49% | .49% | .51% | |||||||||||||||||||
| Net investment income | 2.18% | (d) | 1.20% | 1.57% | 1.38% | 1.43% | 1.59% | |||||||||||||||||||
| Portfolio turnover rate | 20% | (e) | 35% | 30% | 27% | 19% | 28% | |||||||||||||||||||
(a) Calculated based on average shares outstanding during the period.
(b) Total return is calculated assuming a purchase of a share on the first day and a sale on the last day of each period reported and includes reinvestment of dividends and distributions. Total returns may reflect adjustments to conform to generally accepted accounting principles. Total returns for periods less than one full year are not annualized.
(c) Does not include expenses of the investment companies in which the Fund invests.
(d) Annualized.
(e) Not annualized.
See Notes to Financial Statements.
| Prudential Asset Allocation Funds | 67 |
Prudential Growth Allocation Fund
Financial Highlights
(Unaudited)
| Class A Shares | ||||||||||||||||||||||||||
| Six Months Ended March 31, 2015(a) | Year Ended September 30, | |||||||||||||||||||||||||
| 2014(a) | 2013(a) | 2012(a) | 2011(a) | 2010 | ||||||||||||||||||||||
| Per Share Operating Performance: | ||||||||||||||||||||||||||
| Net Asset Value, Beginning Of Period | $17.41 | $16.02 | $13.58 | $11.23 | $11.62 | $10.75 | ||||||||||||||||||||
| Income (loss) from investment operations: | ||||||||||||||||||||||||||
| Net investment income | .11 | .08 | .10 | .05 | .04 | .04 | ||||||||||||||||||||
| Net realized and unrealized gain (loss) on investment transactions | .72 | 1.42 | 2.46 | 2.30 | (.43 | ) | .93 | |||||||||||||||||||
| Total from investment operations | .83 | 1.50 | 2.56 | 2.35 | (.39 | ) | .97 | |||||||||||||||||||
| Less Dividends and Distributions: | ||||||||||||||||||||||||||
| Dividends from net investment income | (.35 | ) | (.11 | ) | (.12 | ) | - | - | (.10 | ) | ||||||||||||||||
| Distributions from net realized gains | (.15 | ) | - | - | - | - | - | |||||||||||||||||||
| Total dividends and distributions | (.50 | ) | (.11 | ) | (.12 | ) | - | - | (.10 | ) | ||||||||||||||||
| Net asset value, end of period | $17.74 | $17.41 | $16.02 | $13.58 | $11.23 | $11.62 | ||||||||||||||||||||
| Total Return(b): | 4.81% | 9.37% | 19.02% | 20.93% | (3.36)% | 9.06% | ||||||||||||||||||||
| Ratios/Supplemental Data: | ||||||||||||||||||||||||||
| Net assets, end of period (000) | $61,543 | $56,293 | $46,911 | $37,934 | $30,888 | $30,211 | ||||||||||||||||||||
| Average net assets (000) | $57,960 | $52,609 | $41,896 | $35,571 | $33,830 | $29,037 | ||||||||||||||||||||
| Ratios to average net assets(c): | ||||||||||||||||||||||||||
| Expenses, after waivers and/or expense reimbursement | .75% | (d) | .75% | .75% | .75% | .75% | .75% | |||||||||||||||||||
| Expenses, before waivers and/or expense reimbursement | .92% | (d) | .90% | .92% | .99% | .99% | 1.02% | |||||||||||||||||||
| Net investment income | 1.31% | (d) | .46% | .65% | .41% | .29% | .41% | |||||||||||||||||||
| Portfolio turnover rate | 23% | (e) | 24% | 23% | 30% | 20% | 24% | |||||||||||||||||||
(a) Calculated based on average shares outstanding during the period.
(b) Total return does not consider the effects of sales loads. Total return is calculated assuming a purchase of a share on the first day and a sale on the last day of each period reported and includes reinvestment of dividends and distributions. Total returns may reflect adjustments to conform to generally accepted accounting principles. Total returns for periods less than one full year are not annualized.
(c) Does not include expenses of the investment companies in which the Fund invests.
(d) Annualized.
(e) Not annualized.
See Notes to Financial Statements.
| 68 |
| Class B Shares | ||||||||||||||||||||||||||
Six Months | Year Ended September 30, | |||||||||||||||||||||||||
| 2014(a) | 2013(a) | 2012(a) | 2011(a) | 2010 | ||||||||||||||||||||||
| Per Share Operating Performance: | ||||||||||||||||||||||||||
| Net Asset Value, Beginning Of Period | $16.76 | $15.44 | $13.10 | $10.91 | $11.38 | $10.54 | ||||||||||||||||||||
| Income (loss) from investment operations: | ||||||||||||||||||||||||||
| Net investment income (loss) | .05 | (.04 | ) | (.01 | ) | (.03 | ) | (.05 | ) | (.04 | ) | |||||||||||||||
| Net realized and unrealized gain (loss) on investment transactions | .69 | 1.36 | 2.38 | 2.22 | (.42 | ) | .91 | |||||||||||||||||||
| Total from investment operations | .74 | 1.32 | 2.37 | 2.19 | (.47 | ) | .87 | |||||||||||||||||||
| Less Dividends and Distributions: | ||||||||||||||||||||||||||
| Dividends from net investment income | (.23 | ) | - | (.03 | ) | - | - | (.03 | ) | |||||||||||||||||
| Distributions from net realized gains | (.15 | ) | - | - | - | - | - | |||||||||||||||||||
| Total dividends and distributions | (.38 | ) | - | (.03 | ) | - | - | (.03 | ) | |||||||||||||||||
| Net asset value, end of period | $17.12 | $16.76 | $15.44 | $13.10 | $10.91 | $11.38 | ||||||||||||||||||||
| Total Return(b): | 4.42% | 8.55% | 18.13% | 20.07% | (4.13)% | 8.28% | ||||||||||||||||||||
| Ratios/Supplemental Data: | ||||||||||||||||||||||||||
| Net assets, end of period (000) | $24,410 | $27,929 | $29,785 | $28,111 | $27,713 | $33,340 | ||||||||||||||||||||
| Average net assets (000) | $26,672 | $30,822 | $29,020 | $29,094 | $35,195 | $32,262 | ||||||||||||||||||||
| Ratios to average net assets(c): | ||||||||||||||||||||||||||
| Expenses, after waivers and/or expense reimbursement | 1.50% | (d) | 1.50% | 1.50% | 1.50% | 1.50% | 1.50% | |||||||||||||||||||
| Expenses, before waivers and/or expense reimbursement | 1.62% | (d) | 1.60% | 1.62% | 1.69% | 1.69% | 1.72% | |||||||||||||||||||
| Net investment income (loss) | .59% | (d) | (.22)% | (.06)% | (.26)% | (.42)% | (.36)% | |||||||||||||||||||
| Portfolio turnover rate | 23% | (e) | 24% | 23% | 30% | 20% | 24% | |||||||||||||||||||
(a) Calculated based on average shares outstanding during the period.
(b) Total return does not consider the effects of sales loads. Total return is calculated assuming a purchase of a share on the first day and a sale on the last day of each period reported and includes reinvestment of dividends and distributions. Total returns may reflect adjustments to conform to generally accepted accounting principles. Total returns for periods less than one full year are not annualized.
(c) Does not include expenses of the investment companies in which the Fund invests.
(d) Annualized.
(e) Not annualized.
See Notes to Financial Statements.
| Prudential Asset Allocation Funds | 69 |
Prudential Growth Allocation Fund
Financial Highlights
(Unaudited) continued
| Class C Shares | ||||||||||||||||||||||||||
| Six Months Ended March 31, 2015(a) | Year Ended September 30, | |||||||||||||||||||||||||
| 2014(a) | 2013(a) | 2012(a) | 2011(a) | 2010 | ||||||||||||||||||||||
| Per Share Operating Performance: | ||||||||||||||||||||||||||
| Net Asset Value, Beginning Of Period | $16.78 | $15.45 | $13.11 | $10.92 | $11.39 | $10.55 | ||||||||||||||||||||
| Income (loss) from investment operations: | ||||||||||||||||||||||||||
| Net investment income (loss) | .05 | (.05 | ) | (.01 | ) | (.03 | ) | (.06 | ) | (.04 | ) | |||||||||||||||
| Net realized and unrealized gain (loss) on investment transactions | .69 | 1.38 | 2.38 | 2.22 | (.41 | ) | .91 | |||||||||||||||||||
| Total from investment operations | .74 | 1.33 | 2.37 | 2.19 | (.47 | ) | .87 | |||||||||||||||||||
| Less Dividends and Distributions: | ||||||||||||||||||||||||||
| Dividends from net investment income | (.23 | ) | - | (.03 | ) | - | - | (.03 | ) | |||||||||||||||||
| Distributions from net realized gains | (.15 | ) | - | - | - | - | - | |||||||||||||||||||
| Total dividends and distributions | (.38 | ) | - | (.03 | ) | - | - | (.03 | ) | |||||||||||||||||
| Net asset value, end of period | $17.14 | $16.78 | $15.45 | $13.11 | $10.92 | $11.39 | ||||||||||||||||||||
| Total Return(b): | 4.42% | 8.61% | 18.11% | 20.05% | (4.13)% | 8.27% | ||||||||||||||||||||
| Ratios/Supplemental Data: | ||||||||||||||||||||||||||
| Net assets, end of period (000) | $12,704 | $11,858 | $10,416 | $8,566 | $8,182 | $8,485 | ||||||||||||||||||||
| Average net assets (000) | $12,200 | $11,625 | $9,377 | $8,756 | $9,614 | $8,334 | ||||||||||||||||||||
| Ratios to average net assets(c): | ||||||||||||||||||||||||||
| Expenses, after waivers and/or expense reimbursement | 1.50% | (d) | 1.50% | 1.50% | 1.50% | 1.50% | 1.50% | |||||||||||||||||||
| Expenses, before waivers and/or expense reimbursement | 1.62% | (d) | 1.60% | 1.62% | 1.69% | 1.69% | 1.72% | |||||||||||||||||||
| Net investment income (loss) | .55% | (d) | (.29)% | (.10)% | (.28)% | (.47)% | (.34)% | |||||||||||||||||||
| Portfolio turnover rate | 23% | (e) | 24% | 23% | 30% | 20% | 24% | |||||||||||||||||||
(a) Calculated based on average shares outstanding during the period.
(b) Total return does not consider the effects of sales loads. Total return is calculated assuming a purchase of a share on the first day and a sale on the last day of each period reported and includes reinvestment of dividends and distributions. Total returns may reflect adjustments to conform to generally accepted accounting principles. Total returns for periods less than one full year are not annualized.
(c) Does not include the expenses of the investment companies in which the Fund invests.
(d) Annualized.
(e) Not annualized.
See Notes to Financial Statements.
| 70 |
| Class R Shares | ||||||||||||||||||||||||||
| Six Months Ended March 31, 2015(a) | Year Ended September 30, | |||||||||||||||||||||||||
| 2014(a) | 2013(a) | 2012(a) | 2011(a) | 2010 | ||||||||||||||||||||||
| Per Share Operating Performance: | ||||||||||||||||||||||||||
| Net Asset Value, Beginning Of Period | $17.27 | $15.90 | $13.48 | $11.17 | $11.58 | $10.72 | ||||||||||||||||||||
| Income (loss) from investment operations: | ||||||||||||||||||||||||||
| Net investment income | .09 | .04 | .06 | .03 | .01 | .02 | ||||||||||||||||||||
| Net realized and unrealized gain (loss) on investment transactions | .71 | 1.40 | 2.45 | 2.28 | (.42 | ) | .91 | |||||||||||||||||||
| Total from investment operations | .80 | 1.44 | 2.51 | 2.31 | (.41 | ) | .93 | |||||||||||||||||||
| Less Dividends and Distributions: | ||||||||||||||||||||||||||
| Dividends from net investment income | (.31 | ) | (.07 | ) | (.09 | ) | - | - | (.07 | ) | ||||||||||||||||
| Distributions from net realized gains | (.15 | ) | - | - | - | - | - | |||||||||||||||||||
| Total dividends and distributions | (.46 | ) | (.07 | ) | (.09 | ) | - | - | (.07 | ) | ||||||||||||||||
| Net asset value, end of period | $17.61 | $17.27 | $15.90 | $13.48 | $11.17 | $11.58 | ||||||||||||||||||||
| Total Return(b): | 4.66% | 9.07% | 18.74% | 20.68% | (3.54)% | 8.73% | ||||||||||||||||||||
| Ratios/Supplemental Data: | ||||||||||||||||||||||||||
| Net assets, end of period (000) | $3 | $3 | $3 | $3 | $2 | $2 | ||||||||||||||||||||
| Average net assets (000) | $3 | $3 | $3 | $2 | $2 | $2 | ||||||||||||||||||||
| Ratios to average net assets(c)(d): | ||||||||||||||||||||||||||
| Expenses, after waivers and/or expense reimbursement | 1.04% | (d) | .97% | 1.00% | 1.00% | 1.00% | 1.00% | |||||||||||||||||||
| Expenses, before waivers and/or expense reimbursement | 1.34% | (d) | 1.31% | 1.37% | 1.30% | 1.44% | 1.47% | |||||||||||||||||||
| Net investment income | 1.00% | (d) | .25% | .40% | .22% | .11% | .15% | |||||||||||||||||||
| Portfolio turnover rate | 23% | (e) | 24% | 23% | 30% | 20% | 24% | |||||||||||||||||||
(a) Calculated based on average shares outstanding during the period.
(b) Total return is calculated assuming a purchase of a share on the first day and a sale on the last day of each period reported and includes reinvestment of dividends and distributions. Total returns may reflect adjustments to conform to generally accepted accounting principles. Total returns for periods less than one full year are not annualized.
(c) Does not include expenses of the investment companies in which the Fund invests.
(d) Annualized.
(e) Not annualized.
See Notes to Financial Statements.
| Prudential Asset Allocation Funds | 71 |
Prudential Growth Allocation Fund
Financial Highlights
(Unaudited) continued
| Class Z Shares | ||||||||||||||||||||||||||
| Six Months Ended March 31, 2015(a) | Year Ended September 30, | |||||||||||||||||||||||||
| 2014(a) | 2013(a) | 2012(a) | 2011(a) | 2010 | ||||||||||||||||||||||
| Per Share Operating Performance: | ||||||||||||||||||||||||||
| Net Asset Value, Beginning Of Period | $17.61 | $16.20 | $13.73 | $11.32 | $11.69 | $10.81 | ||||||||||||||||||||
| Income (loss) from investment operations: | ||||||||||||||||||||||||||
| Net investment income | .16 | .11 | .13 | .06 | .06 | .15 | ||||||||||||||||||||
| Net realized and unrealized gain (loss) on investment transactions | .71 | 1.45 | 2.50 | 2.35 | (.43 | ) | .85 | |||||||||||||||||||
| Total from investment operations | .87 | 1.56 | 2.63 | 2.41 | (.37 | ) | 1.00 | |||||||||||||||||||
| Less Dividends and Distributions: | ||||||||||||||||||||||||||
| Dividends from net investment income | (.40 | ) | (.15 | ) | (.16 | ) | - | - | (.12 | ) | ||||||||||||||||
| Distributions from net realized gains | (.15 | ) | - | - | - | - | - | |||||||||||||||||||
| Total dividends and distributions | (.55 | ) | (.15 | ) | (.16 | ) | - | - | (.12 | ) | ||||||||||||||||
| Net asset value, end of period | $17.93 | $17.61 | $16.20 | $13.73 | $11.32 | $11.69 | ||||||||||||||||||||
| Total Return(b): | 4.95% | 9.64% | 19.31% | 21.29% | (3.17)% | 9.33% | ||||||||||||||||||||
| Ratios/Supplemental Data: | ||||||||||||||||||||||||||
| Net assets, end of period (000) | $1,122 | $1,477 | $989 | $1,112 | $515 | $345 | ||||||||||||||||||||
| Average net assets (000) | $1,300 | $1,278 | $1,071 | $786 | $448 | $361 | ||||||||||||||||||||
| Ratios to average net assets(c): | ||||||||||||||||||||||||||
| Expenses, after waivers and/or expense reimbursement | .50% | (d) | .50% | .50% | .50% | .50% | .50% | |||||||||||||||||||
| Expenses, before waivers and/or expense reimbursement | .62% | (d) | .60% | .62% | .69% | .69% | .72% | |||||||||||||||||||
| Net investment income | 1.77% | (d) | .62% | .84% | .49% | .43% | .87% | |||||||||||||||||||
| Portfolio turnover rate | 23% | (e) | 24% | 23% | 30% | 20% | 24% | |||||||||||||||||||
(a) Calculated based on average shares outstanding during the period.
(b) Total return is calculated assuming a purchase of a share on the first day and a sale on the last day of each period reported and includes reinvestment of dividends and distributions. Total returns may reflect adjustments to conform to generally accepted accounting principles. Total returns for periods less than one full year are not annualized.
(c) Does not include expenses of the investment companies in which the Fund invests.
(d) Annualized.
(e) Not annualized.
See Notes to Financial Statements.
| 72 |
Results of Proxy Voting
(Unaudited)
At a special meeting of shareholders held on November 26, 2014, shareholders of the Prudential Investment Portfolios, Inc., which is comprised of Prudential Balanced Fund, Prudential Growth Allocation Fund, Prudential Moderate Allocation Fund, Prudential Conservative Allocation Fund, Prudential Jennison Equity Opportunity Fund and Prudential Jennison Growth Fund (collectively, the “Funds”), approved the following proposal. Shareholders of all Funds voted together on the proposal:
To elect twelve Directors:
| SHARES VOTED | % OF VOTED | % OF TOTAL | ||||||||||
(a) Ellen S. Alberding; | ||||||||||||
FOR | 95,100,802.626 | 98.280 | 55.055 | |||||||||
WITHHELD | 1,664,556.591 | 1.720 | 0.963 | |||||||||
(b) Kevin J. Bannon; | ||||||||||||
FOR | 95,146,900.682 | 98.328 | 55.082 | |||||||||
WITHHELD | 1,618,458.535 | 1.672 | 0.936 | |||||||||
(c) Linda W. Bynoe; | ||||||||||||
FOR | 95,140,861.216 | 98.322 | 55.078 | |||||||||
WITHHELD | 1,624,498.001 | 1.678 | 0.940 | |||||||||
(d) Keith F. Hartstein; | ||||||||||||
FOR | 95,133,836.925 | 98.314 | 55.074 | |||||||||
WITHHELD | 1,631,522.292 | 1.686 | 0.944 | |||||||||
(e) Michael S. Hyland; | ||||||||||||
FOR | 95,117,285.270 | 98.297 | 55.064 | |||||||||
WITHHELD | 1,648,073.947 | 1.703 | 0.954 | |||||||||
(f) Stephen P. Munn; | ||||||||||||
FOR | 95,030,269.772 | 98.207 | 55.014 | |||||||||
WITHHELD | 1,735,089.445 | 1.793 | 1.004 | |||||||||
(g) James E. Quinn; | ||||||||||||
FOR | 95,133,075.390 | 98.314 | 55.074 | |||||||||
WITHHELD | 1,632,283.827 | 1.686 | 0.944 | |||||||||
(h) Richard A. Redeker; | ||||||||||||
FOR | 95,042,171.501 | 98.220 | 55.021 | |||||||||
WITHHELD | 1,723,187.716 | 1.780 | 0.997 | |||||||||
(i) Stephen G. Stoneburn; | ||||||||||||
FOR | 95,055,450.417 | 98.233 | 55.029 | |||||||||
WITHHELD | 1,709,908.800 | 1.767 | 0.989 | |||||||||
(j) Stuart S. Parker; | ||||||||||||
FOR | 95,151,749.610 | 98.333 | 55.084 | |||||||||
WITHHELD | 1,613,609.607 | 1.667 | 0.934 | |||||||||
| Prudential Asset Allocation Funds | 73 |
Results of Proxy Voting
(Unaudited) continued
| SHARES VOTED | % OF VOTED | % OF TOTAL | ||||||||||
(k) Scott E. Benjamin; and | ||||||||||||
FOR | 95,115,629.702 | 98.296 | 55.063 | |||||||||
WITHHELD | 1,649,729.515 | 1.704 | 0.955 | |||||||||
(l) Grace C. Torres. | ||||||||||||
FOR | 95,092,614.445 | 98.272 | 55.050 | |||||||||
WITHHELD | 1,672,744.772 | 1.728 | 0.968 | |||||||||
The special meeting of shareholders of each of the Prudential Growth Allocation Fund, Prudential Moderate Allocation Fund and Prudential Conservative Allocation Fund held on November 26, 2014, was adjourned to December 3, 2014, and further adjourned to December 10, 2014 and January 9, 2015 to permit further solicitation of proxies on the proposals noted below.
An abstention or a broker non-vote is considered present for purposes of determining a quorum but has the effect of a vote against such matters. At the special meeting of shareholders held on January 9, 2015, insufficient votes were obtained to approve the following proposals:
Prudential Growth Allocation Fund:
Proposal: To permit PI to enter into or make material changes to the Fund’s subadvisory agreements with subadvisers that are wholly-owned subsidiaries of PI or a sister company of PI (wholly-owned subadvisers) without shareholder approval.
| SHARES VOTED | % OF VOTED | % OF TOTAL | ||||||||||
FOR | 313,842.924 | 9.870 | 5.513 | |||||||||
AGAINST | 26,299.953 | 0.828 | 0.462 | |||||||||
ABSTAIN | 25,213.538 | 0.792 | 0.443 | |||||||||
BROKER NON-VOTE | 2,814,612.002 | 88.510 | 49.446 | |||||||||
TOTAL | 3,179,968.417 | 100.000 | 55.864 | |||||||||
Proposal: To approve a proposal to designate the Fund’s investment objective as a non-fundamental policy of the Fund.
| SHARES VOTED | % OF VOTED | % OF TOTAL | ||||||||||
FOR | 300,698.080 | 9.457 | 5.283 | |||||||||
AGAINST | 35,950.338 | 1.131 | 0.631 | |||||||||
ABSTAIN | 28,707.997 | 0.902 | 0.504 | |||||||||
BROKER NON-VOTE | 2,814,612.002 | 88.510 | 49.446 | |||||||||
TOTAL | 3,179,968.417 | 100.000 | 55.864 | |||||||||
| 74 |
Prudential Moderate Allocation Fund:
Proposal: To permit PI to enter into or make material changes to the Fund’s subadvisory agreements with subadvisers that are wholly-owned subsidiaries of PI or a sister company of PI (wholly-owned subadvisers) without shareholder approval.
| SHARES VOTED | % OF VOTED | % OF TOTAL | ||||||||||
FOR | 1,025,553.481 | 12.771 | 8.582 | |||||||||
AGAINST | 129,301.590 | 1.611 | 1.082 | |||||||||
ABSTAIN | 101,569.016 | 1.264 | 0.850 | |||||||||
BROKER NON-VOTE | 6,774,160.803 | 84.354 | 56.687 | |||||||||
TOTAL | 8,030,584.890 | 100.000 | 67.201 | |||||||||
Proposal: To approve a proposal to designate the Fund’s investment objective as a non-fundamental policy of the Fund.
| SHARES VOTED | % OF VOTED | % OF TOTAL | ||||||||||
FOR | 1,002,483.167 | 12.484 | 8.389 | |||||||||
AGAINST | 145,706.912 | 1.815 | 1.219 | |||||||||
ABSTAIN | 108,234.008 | 1.347 | 0.905 | |||||||||
BROKER NON-VOTE | 6,774,160.803 | 84.354 | 56.688 | |||||||||
TOTAL | 8,030,584.890 | 100.000 | 67.201 | |||||||||
Prudential Conservative Allocation Fund:
Proposal: To permit PI to enter into or make material changes to the Fund’s subadvisory agreements with subadvisers that are wholly-owned subsidiaries of PI or a sister company of PI (wholly-owned subadvisers) without shareholder approval.
| SHARES VOTED | % OF VOTED | % OF TOTAL | ||||||||||
FOR | 1,058,500.980 | 12.961 | 9.545 | |||||||||
AGAINST | 72,292.519 | 0.886 | 0.652 | |||||||||
ABSTAIN | 138,728.752 | 1.698 | 1.251 | |||||||||
BROKER NON-VOTE | 6,897,680.466 | 84.455 | 62.204 | |||||||||
TOTAL | 8,167,202.717 | 100.000 | 73.652 | |||||||||
Proposal: To approve a proposal to designate the Fund’s investment objective as a non-fundamental policy of the Fund.
| SHARES VOTED | % OF VOTED | % OF TOTAL | ||||||||||
FOR | 1,035,823.806 | 12.683 | 9.341 | |||||||||
AGAINST | 83,394.200 | 1.022 | 0.752 | |||||||||
ABSTAIN | 150,304.245 | 1.840 | 1.355 | |||||||||
BROKER NON-VOTE | 6,897,680.466 | 84.455 | 62.204 | |||||||||
TOTAL | 8,167,202.717 | 100.000 | 73.652 | |||||||||
| Prudential Asset Allocation Funds | 75 |
| n MAIL | n TELEPHONE | n WEBSITE | ||
Gateway Center Three 100 Mulberry Street Newark, NJ 07102 | (800) 225-1852 | www.prudentialfunds.com |
| PROXY VOTING |
| The Board of Directors of the Funds has delegated to each Fund’s investment subadviser the responsibility for voting any proxies and maintaining proxy recordkeeping with respect to the Funds. A description of these proxy voting policies and procedures is available without charge, upon request, by calling (800) 225-1852 or by visiting the Securities and Exchange Commission’s website at www.sec.gov. Information regarding how the Funds voted proxies relating to portfolio securities during the most recent 12-month period ended June 30 is available on the Funds’ website and on the Securities and Exchange Commission’s website. |
| DIRECTORS |
| Ellen S. Alberding • Kevin J. Bannon • Scott E. Benjamin • Linda W. Bynoe • Keith F. Hartstein • Michael S. Hyland • Stephen P. Munn • Stuart S. Parker • James E. Quinn • Richard A. Redeker • Stephen G. Stoneburn • Grace C. Torres |
| OFFICERS |
| Stuart S. Parker, President • Scott E. Benjamin, Vice President • M. Sadiq Peshimam, Treasurer and Principal Financial and Accounting Officer • Raymond A. O’Hara, Chief Legal Officer • Deborah A. Docs, Secretary • Chad A. Earnst, Chief Compliance Officer • Theresa C. Thompson, Deputy Chief Compliance Officer • Richard W. Kinville, Anti-Money Laundering Compliance Officer • Jonathan D. Shain, Assistant Secretary • Claudia DiGiacomo, Assistant Secretary • Amanda S. Ryan, Assistant Secretary • Andrew R. French, Assistant Secretary • Peter Parrella, Assistant Treasurer • Lana Lomuti, Assistant Treasurer • Linda McMullin, Assistant Treasurer • Kelly A. Coyne, Assistant Treasurer |
| MANAGER | Prudential Investments LLC | Gateway Center Three 100 Mulberry Street Newark, NJ 07102 | ||
| ||||
| INVESTMENT SUBADVISER | Quantitative Management Associates LLC | Gateway Center Two 100 Mulberry Street Newark, NJ 07102 | ||
| ||||
| DISTRIBUTOR | Prudential Investment Management Services LLC | Gateway Center Three 100 Mulberry Street | ||
| ||||
| CUSTODIAN | The Bank of New York Mellon | One Wall Street New York, NY 10286 | ||
| ||||
| TRANSFER AGENT | Prudential Mutual Fund Services LLC | PO Box 9658 Providence, RI 02940 | ||
| ||||
| INDEPENDENT REGISTERED PUBLIC ACCOUNTING FIRM | KPMG LLP | 345 Park Avenue New York, NY 10154 | ||
| ||||
| FUND COUNSEL | Willkie Farr & Gallagher LLP | 787 Seventh Avenue New York, NY 10019 | ||
| An investor should consider the investment objectives, risks, charges, and expenses of the Funds carefully before investing. The prospectus and summary prospectus for each Fund contain this and other information about the Funds. An investor may obtain a prospectus and summary prospectus by visiting our website at www.prudentialfunds.com or by calling (800) 225-1852. The prospectus and summary prospectus should be read carefully before investing. |
| E-DELIVERY |
| To receive your mutual fund documents online, go to www.prudentialfunds.com/edelivery and enroll. Instead of receiving printed documents by mail, you will receive notification via email when new materials are available. You can cancel your enrollment or change your email address at any time by visiting the website address above. |
| SHAREHOLDER COMMUNICATIONS WITH DIRECTORS |
| Shareholders can communicate directly with the Board of Directors by writing to the Chair of the Board, Prudential Asset Allocation Funds, Prudential Investments, Attn: Board of Directors, 100 Mulberry Street, Gateway Center Three, Newark, NJ 07102. Shareholders can communicate directly with an individual Director by writing to the same address. Communications are not screened before being delivered to the addressee. |
| AVAILABILITY OF PORTFOLIO SCHEDULE |
| Each Fund files its complete schedule of portfolio holdings with the Securities and Exchange Commission for the first and third quarters of each fiscal year on Form N-Q. Each Fund’s Forms N-Q are available on the Commission’s website at www.sec.gov. Each Fund’s Forms N-Q may also be reviewed and copied at the Commission’s Public Reference Room in Washington, D.C. Information on the operation and location of the Public Reference Room may be obtained by calling 1-800-SEC-0330. Each Fund’s schedule of portfolio holdings is also available on the Fund’s website as of the end of each month. |
Mutual Funds:
| ARE NOT INSURED BY THE FDIC OR ANY FEDERAL GOVERNMENT AGENCY | MAY LOSE VALUE | ARE NOT A DEPOSIT OF OR GUARANTEED BY ANY BANK OR ANY BANK AFFILIATE |
| PRUDENTIAL ASSET ALLOCATION FUNDS | NASDAQ | CUSIP | NASDAQ | CUSIP | ||||||
| Conservative Allocation (Class A) | JDUAX | 74437E750 | Moderate Allocation (Class R) | JMARX | 74437E610 | |||||
| Conservative Allocation (Class B) | JDABX | 74437E743 | Moderate Allocation (Class Z) | JDMZX | 74437E776 | |||||
| Conservative Allocation (Class C) | JDACX | 74437E735 | Growth Allocation (Class A) | JDAAX | 74437E685 | |||||
| Conservative Allocation (Class R) | JDARX | 74437E628 | Growth Allocation (Class B) | JDGBX | 74437E677 | |||||
| Conservative Allocation (Class Z) | JDAZX | 74437E784 | Growth Allocation (Class C) | JDGCX | 74437E669 | |||||
| Moderate Allocation (Class A) | JDTAX | 74437E727 | Growth Allocation (Class R) | JGARX | 74437E594 | |||||
| Moderate Allocation (Class B) | JDMBX | 74437E719 | Growth Allocation (Class Z) | JDGZX | 74437E768 | |||||
| Moderate Allocation (Class C) | JDMCX | 74437E693 |
MF194E2 0277418-00001-00
| Item 2 | – Code of Ethics – Not required, as this is not an annual filing. | |
| Item3 | – Audit Committee Financial Expert – Not required, as this is not an annual filing. | |
| Item 4 | – Principal Accountant Fees and Services – Not required, as this is not an annual filing. | |
| Item5 | – Audit Committee of Listed Registrants – Not applicable. | |
| Item6 | – Schedule of Investments – The schedule is included as part of the report to shareholders filed under Item 1 of this Form. | |
| Item7 | – Disclosure of Proxy Voting Policies and Procedures for Closed-End Management Investment Companies – Not applicable. | |
| Item8 | – Portfolio Managers of Closed-End Management Investment Companies – Not applicable. | |
| Item9 | – Purchases of Equity Securities by Closed-End Management Investment Company and Affiliated Purchasers – Not applicable. | |
| Item10 | – Submission of Matters to a Vote of Security Holders – Not applicable. | |
| Item11 | – Controls and Procedures | |
(a) It is the conclusion of the registrant’s principal executive officer and principal financial officer that the effectiveness of the registrant’s current disclosure controls and procedures (such disclosure controls and procedures having been evaluated within 90 days of the date of this filing) provide reasonable assurance that the information required to be disclosed by the registrant has been recorded, processed, summarized and reported within the time period specified in the Commission’s rules and forms and that the information required to be disclosed by the registrant has been accumulated and communicated to the registrant’s principal executive officer and principal financial officer in order to allow timely decisions regarding required disclosure. | ||
(b) There has been no significant change in the registrant’s internal control over financial reporting that occurred during the registrant’s most recent fiscal quarter of the period covered by this report that has materially affected, or is likely to materially affect, the registrant’s internal control over financial reporting. | ||
| Item12 | – Exhibits | |
(a) (1) Code of Ethics – Not required, as this is not an annual filing. | ||
(2) Certifications pursuant to Section 302 of the Sarbanes-Oxley Act – Attached hereto as Exhibit EX-99.CERT. | ||
(3) Any written solicitation to purchase securities under Rule 23c-1. – Not applicable. | ||
(b) Certifications pursuant to Section 906 of the Sarbanes-Oxley Act – Attached hereto as Exhibit EX-99.906CERT. | ||
SIGNATURES
Pursuant to the requirements of the Securities Exchange Act of 1934 and the Investment Company Act of 1940, the registrant has duly caused this report to be signed on its behalf by the undersigned, thereunto duly authorized.
| Registrant: | The Prudential Investment Portfolios, Inc. | |||
| By: | /s/ Deborah A. Docs | |||
| Deborah A. Docs | ||||
| Secretary | ||||
| Date: | May 19, 2015 | |||
Pursuant to the requirements of the Securities Exchange Act of 1934 and the Investment Company Act of 1940, this report has been signed below by the following persons on behalf of the registrant and in the capacities and on the dates indicated.
| By: | /s/ Stuart S. Parker | |||
| Stuart S. Parker | ||||
| President and Principal Executive Officer | ||||
| Date: | May 19, 2015 | |||
| By: | /s/ M. Sadiq Peshimam | |||
| M. Sadiq Peshimam | ||||
| Treasurer and Principal Financial and Accounting Officer | ||||
| Date: | May 19, 2015 | |||