Free signup for more
- Track your favorite companies
- Receive email alerts for new filings
- Personalized dashboard of news and more
- Access all data and search results
Filing tables
Filing exhibits
Deutsche Market Trust similar filings
- 3 Jul 24 Certified semi-annual shareholder report (management investment company)
- 1 Dec 23 Certified semi-annual shareholder report (management investment company)
- 30 Jun 23 Certified semi-annual shareholder report (management investment company)
- 2 Dec 22 Certified semi-annual shareholder report (management investment company)
- 8 Jul 22 Certified semi-annual shareholder report (management investment company)
- 2 Dec 21 Certified semi-annual shareholder report (management investment company)
- 2 Jul 21 Certified semi-annual shareholder report (management investment company)
Filing view
External links


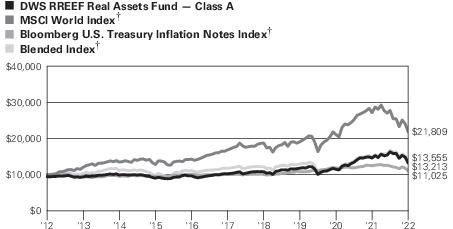 Yearly periods ended September 30