Portfolio Management Team
Dokyoung Lee, CFA, Regional Head of Multi Asset & Solutions
Portfolio Manager of the Fund through April 25, 2023. Began managing the Fund in 2018.
—Joined DWS in 2018 with 24 years of industry experience; previously, worked as Head of Research and Portfolio Manager in the Global Multi-Asset Group at Oppenheimer Funds, and in research and portfolio management roles at AllianceBernstein.
—Americas Multi-Asset Head: New York.
—BSE, Princeton University.
Di Kumble, CFA, Senior Portfolio Manager Equity
Portfolio Manager of the Fund. Began managing the Fund in 2017.
—Joined DWS in 2003 with seven years of industry experience. Prior to joining, she served as a Portfolio Manager at Graham Capital Management. Previously, she worked as a Quantitative Strategist at ITG Inc. and Morgan Stanley.
—Senior Portfolio Manager, Head of Tax Managed Equities: New York.
—BS, Beijing University; PhD in Chemistry, Princeton University.
Thomas M. Farina, CFA, Head of Investment Strategy Fixed Income
Portfolio Manager of the Fund through April 25, 2023. Began managing the Fund in 2019.
—Joined DWS in 2006 with 12 years of industry experience. Head of Investment Grade Corporate Credit since 2013. Prior to joining, he held roles at Merrill Lynch Investment Management, Greenwich NatWest and at DnB Asset Management. He began his career as a Ratings Analyst at Standard & Poor’s.
—Senior Portfolio Manager and Co-Head of US Credit: New York.
—BA and MA in Economics, State University of New York at Albany.
Darwei Kung, Head of Investment Strategy Liquid Real Assets
Portfolio Manager of the Fund. Began managing the Fund in 2015.
—Joined DWS in 2006; previously has worked as a Director, Engineering and Business Development at Calpoint LLC from 2001–2004.
—Portfolio Manager: New York.
—BS and MS, University of Washington, Seattle; MS and MBA, Carnegie Mellon University.
Effective April 25, 2023, the portfolio management team is as follows:
Darwei Kung, Head of Investment Strategy Liquid Real Assets
Portfolio Manager of the Fund. Began managing the Fund in 2015.
—Joined DWS in 2006; previously has worked as a Director, Engineering and Business Development at Calpoint LLC from 2001–2004.
—Portfolio Manager: New York.
—BS and MS, University of Washington, Seattle; MS and MBA, Carnegie Mellon University.
Di Kumble, CFA, Senior Portfolio Manager Equity
Portfolio Manager of the Fund. Began managing the Fund in 2017.
—Joined DWS in 2003 with seven years of industry experience. Prior to joining, she served as a Portfolio Manager at Graham Capital Management. Previously, she worked as a Quantitative Strategist at ITG Inc. and Morgan Stanley.
—Senior Portfolio Manager, Head of Tax Managed Equities: New York.
—BS, Beijing University; PhD in Chemistry, Princeton University.


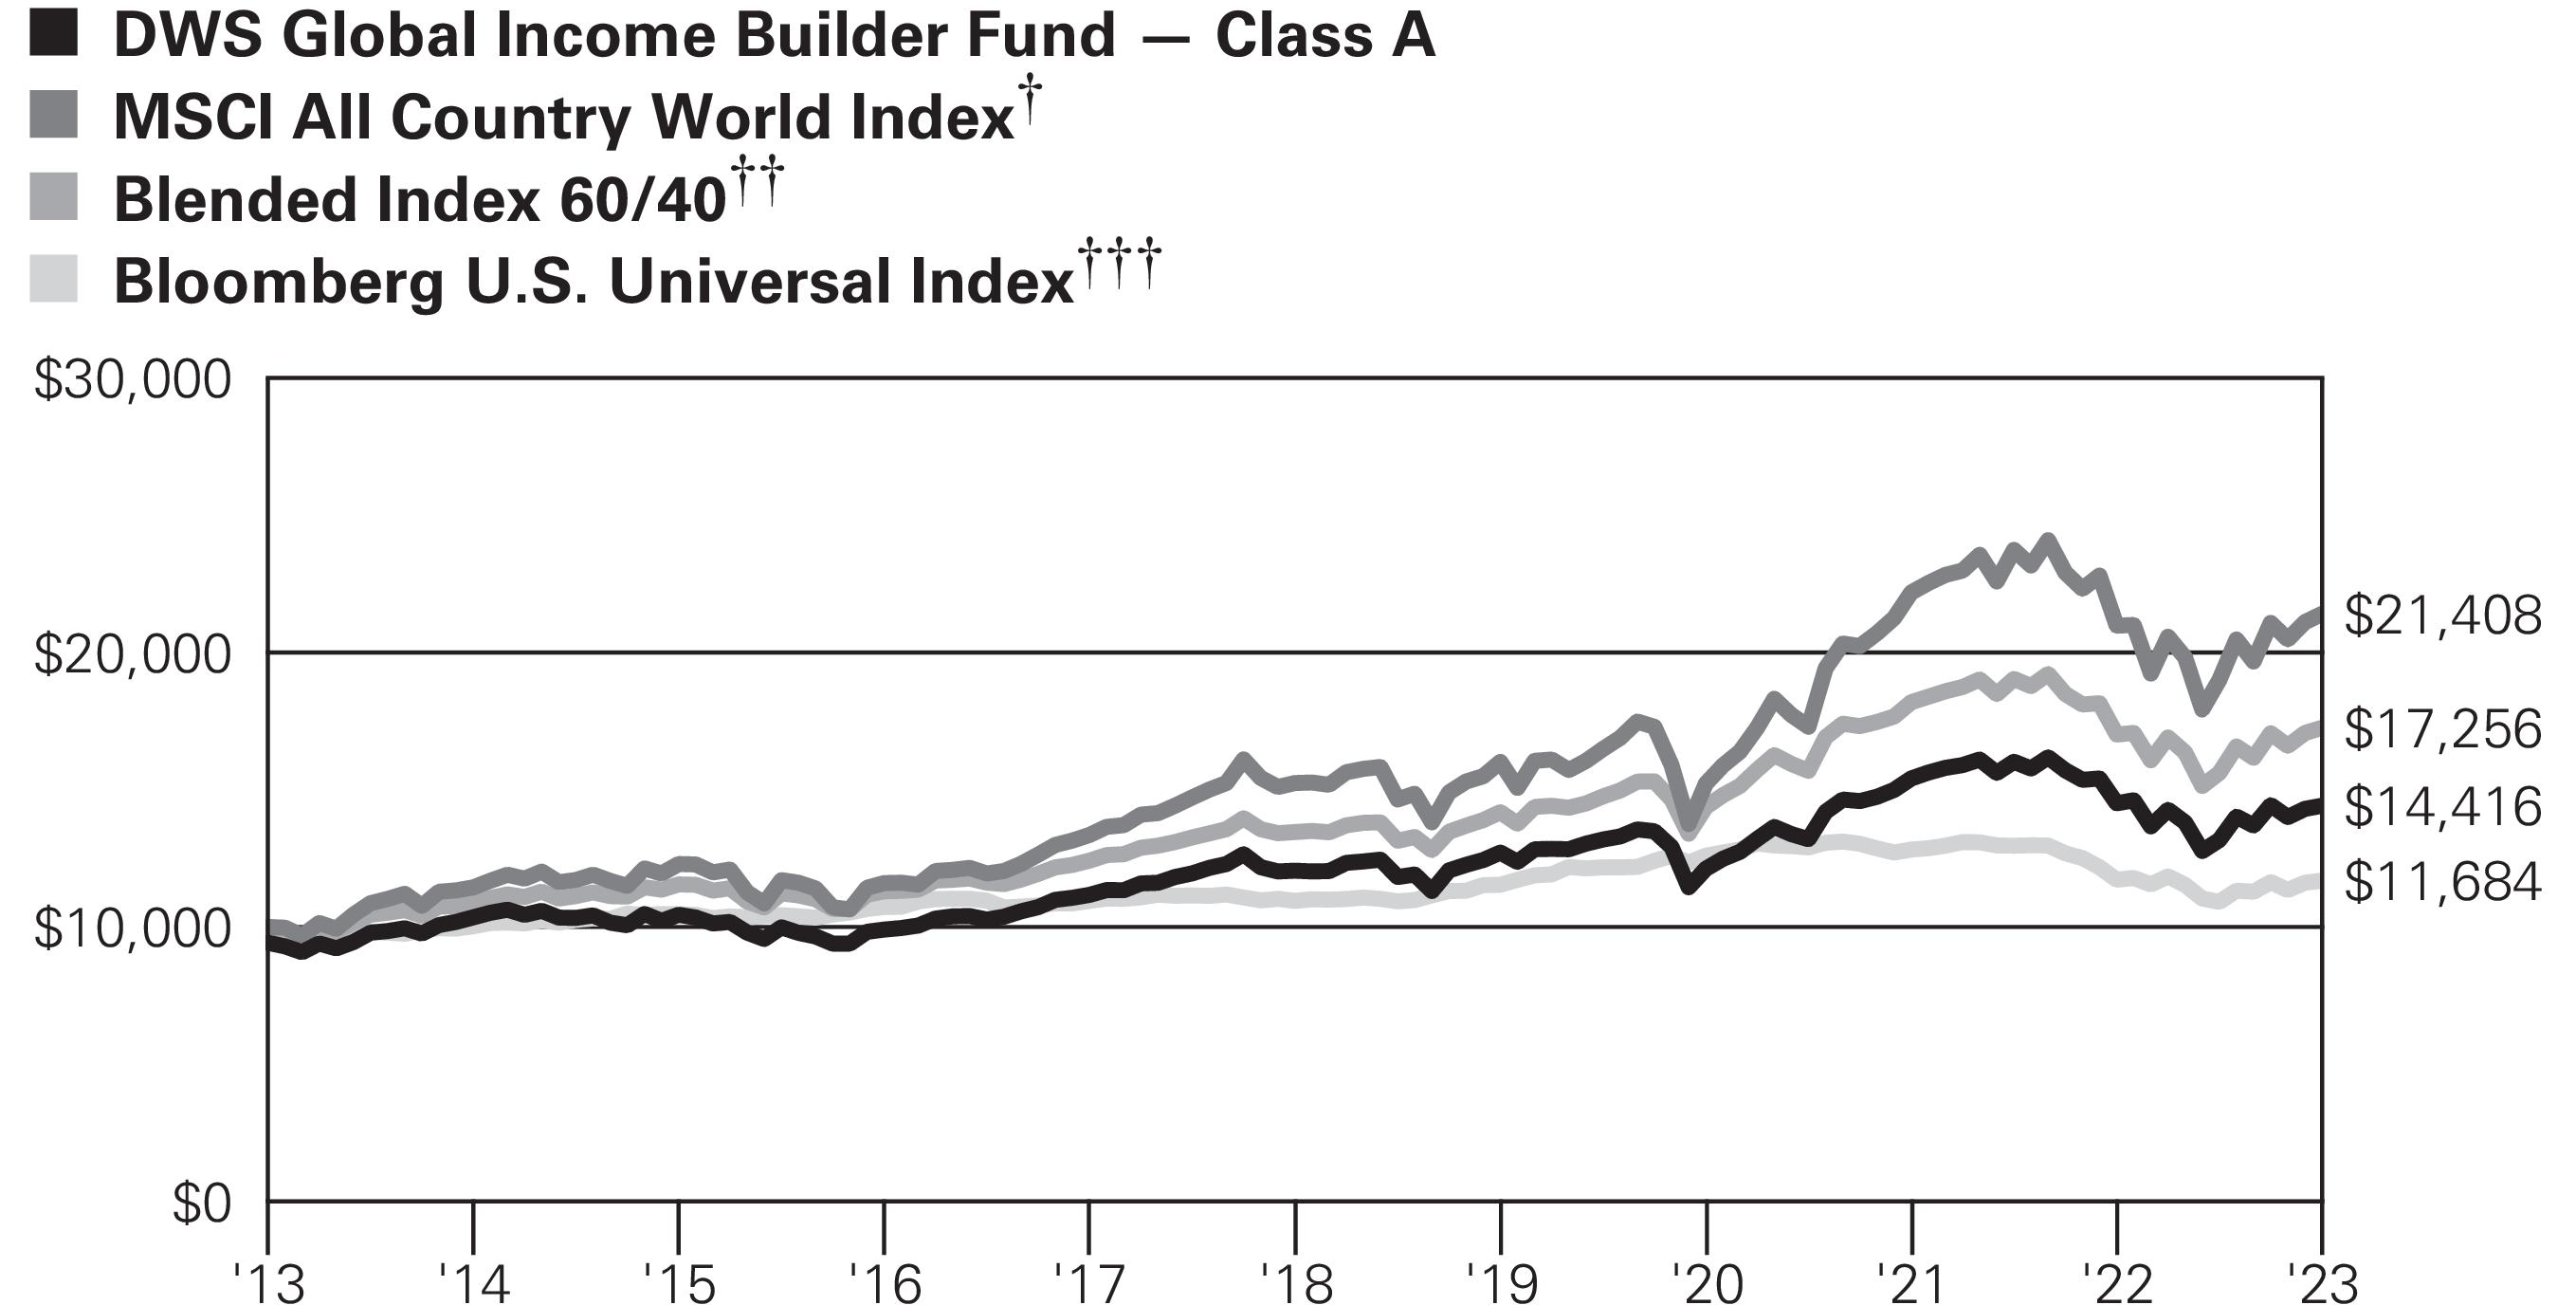 Yearly periods ended April 30