UNITED STATES
SECURITIES AND EXCHANGE COMMISSION
WASHINGTON, D. C. 20549
FORM N-CSRS
Investment Company Act file number: 811-01236
Deutsche DWS Market Trust
(Exact Name of Registrant as Specified in Charter)
875 Third Avenue
New York, NY 10022-6225
(Address of Principal Executive Offices) (Zip Code)
Registrant’s Telephone Number, including Area Code: (212) 454-4500
Diane Kenneally
100 Summer Street
Boston, MA 02110
(Name and Address of Agent for Service)
Date of fiscal year end: | 3/31 |
Date of reporting period: | 9/30/2023 |
ITEM 1. | REPORT TO STOCKHOLDERS |
(a) | |
Contents
4 | |
5 | |
9 | |
10 | |
12 | |
23 | |
25 | |
26 | |
27 | |
33 | |
48 | |
49 | |
51 | |
56 |
NOT FDIC/NCUA INSURED NO BANK GUARANTEE MAY LOSE VALUE
NOT A DEPOSIT NOT INSURED BY ANY FEDERAL GOVERNMENT AGENCY
2 | | | DWS RREEF Real Assets Fund |
DWS RREEF Real Assets Fund | | | 3 |
4 | | | DWS RREEF Real Assets Fund |
Class A | 6-Month‡ | 1-Year | 5-Year | 10-Year |
Average Annual Total Returns as of 9/30/23 | ||||
Unadjusted for Sales Charge | –5.14% | 0.81% | 4.30% | 3.56% |
Adjusted for the Maximum Sales Charge (max 5.75% load) | –10.59% | –4.99% | 3.07% | 2.95% |
MSCI World Index† | 3.13% | 21.95% | 7.26% | 8.26% |
Bloomberg U.S. Treasury Inflation Notes Index† | –3.98% | 1.25% | 2.12% | 1.74% |
Blended Index† | –4.53% | 3.74% | 2.99% | 3.11% |
Class C | 6-Month‡ | 1-Year | 5-Year | 10-Year |
Average Annual Total Returns as of 9/30/23 | ||||
Unadjusted for Sales Charge | –5.53% | 0.13% | 3.52% | 2.78% |
Adjusted for the Maximum Sales Charge (max 1.00% CDSC) | –6.48% | 0.13% | 3.52% | 2.78% |
MSCI World Index† | 3.13% | 21.95% | 7.26% | 8.26% |
Bloomberg U.S. Treasury Inflation Notes Index† | –3.98% | 1.25% | 2.12% | 1.74% |
Blended Index† | –4.53% | 3.74% | 2.99% | 3.11% |
Class R | 6-Month‡ | 1-Year | 5-Year | 10-Year |
Average Annual Total Returns as of 9/30/23 | ||||
No Sales Charges | –5.34% | 0.56% | 4.01% | 3.30% |
MSCI World Index† | 3.13% | 21.95% | 7.26% | 8.26% |
Bloomberg U.S. Treasury Inflation Notes Index† | –3.98% | 1.25% | 2.12% | 1.74% |
Blended Index† | –4.53% | 3.74% | 2.99% | 3.11% |
Class R6 | 6-Month‡ | 1-Year | 5-Year | Life of Class* |
Average Annual Total Returns as of 9/30/23 | ||||
No Sales Charges | –5.01% | 1.13% | 4.60% | 3.65% |
MSCI World Index† | 3.13% | 21.95% | 7.26% | 7.63% |
Bloomberg U.S. Treasury Inflation Notes Index† | –3.98% | 1.25% | 2.12% | 1.66% |
Blended Index† | –4.53% | 3.74% | 2.99% | 2.54% |
DWS RREEF Real Assets Fund | | | 5 |
Class S | 6-Month‡ | 1-Year | 5-Year | 10-Year |
Average Annual Total Returns as of 9/30/23 | ||||
No Sales Charges | –5.15% | 0.95% | 4.43% | 3.71% |
MSCI World Index† | 3.13% | 21.95% | 7.26% | 8.26% |
Bloomberg U.S. Treasury Inflation Notes Index† | –3.98% | 1.25% | 2.12% | 1.74% |
Blended Index† | –4.53% | 3.74% | 2.99% | 3.11% |
Institutional Class | 6-Month‡ | 1-Year | 5-Year | 10-Year |
Average Annual Total Returns as of 9/30/23 | ||||
No Sales Charges | –5.01% | 1.13% | 4.60% | 3.88% |
MSCI World Index† | 3.13% | 21.95% | 7.26% | 8.26% |
Bloomberg U.S. Treasury Inflation Notes Index† | –3.98% | 1.25% | 2.12% | 1.74% |
Blended Index† | –4.53% | 3.74% | 2.99% | 3.11% |
6 | | | DWS RREEF Real Assets Fund |
* | Class R6 shares commenced operations on November 28, 2014. |
DWS RREEF Real Assets Fund | | | 7 |
† | The Morgan Stanley Capital International (MSCI) World Index is an unmanaged index representing large and mid-cap equity performance across 23 developed markets countries. It covers approximately 85% of the free float-adjusted market capitalization in each country. The Bloomberg U.S. Treasury Inflation Notes Index includes all publicly issued U.S. Treasury inflation-protected securities that have at least one year remaining to maturity, are rated investment grade, and have $250 million or more of outstanding face value. 
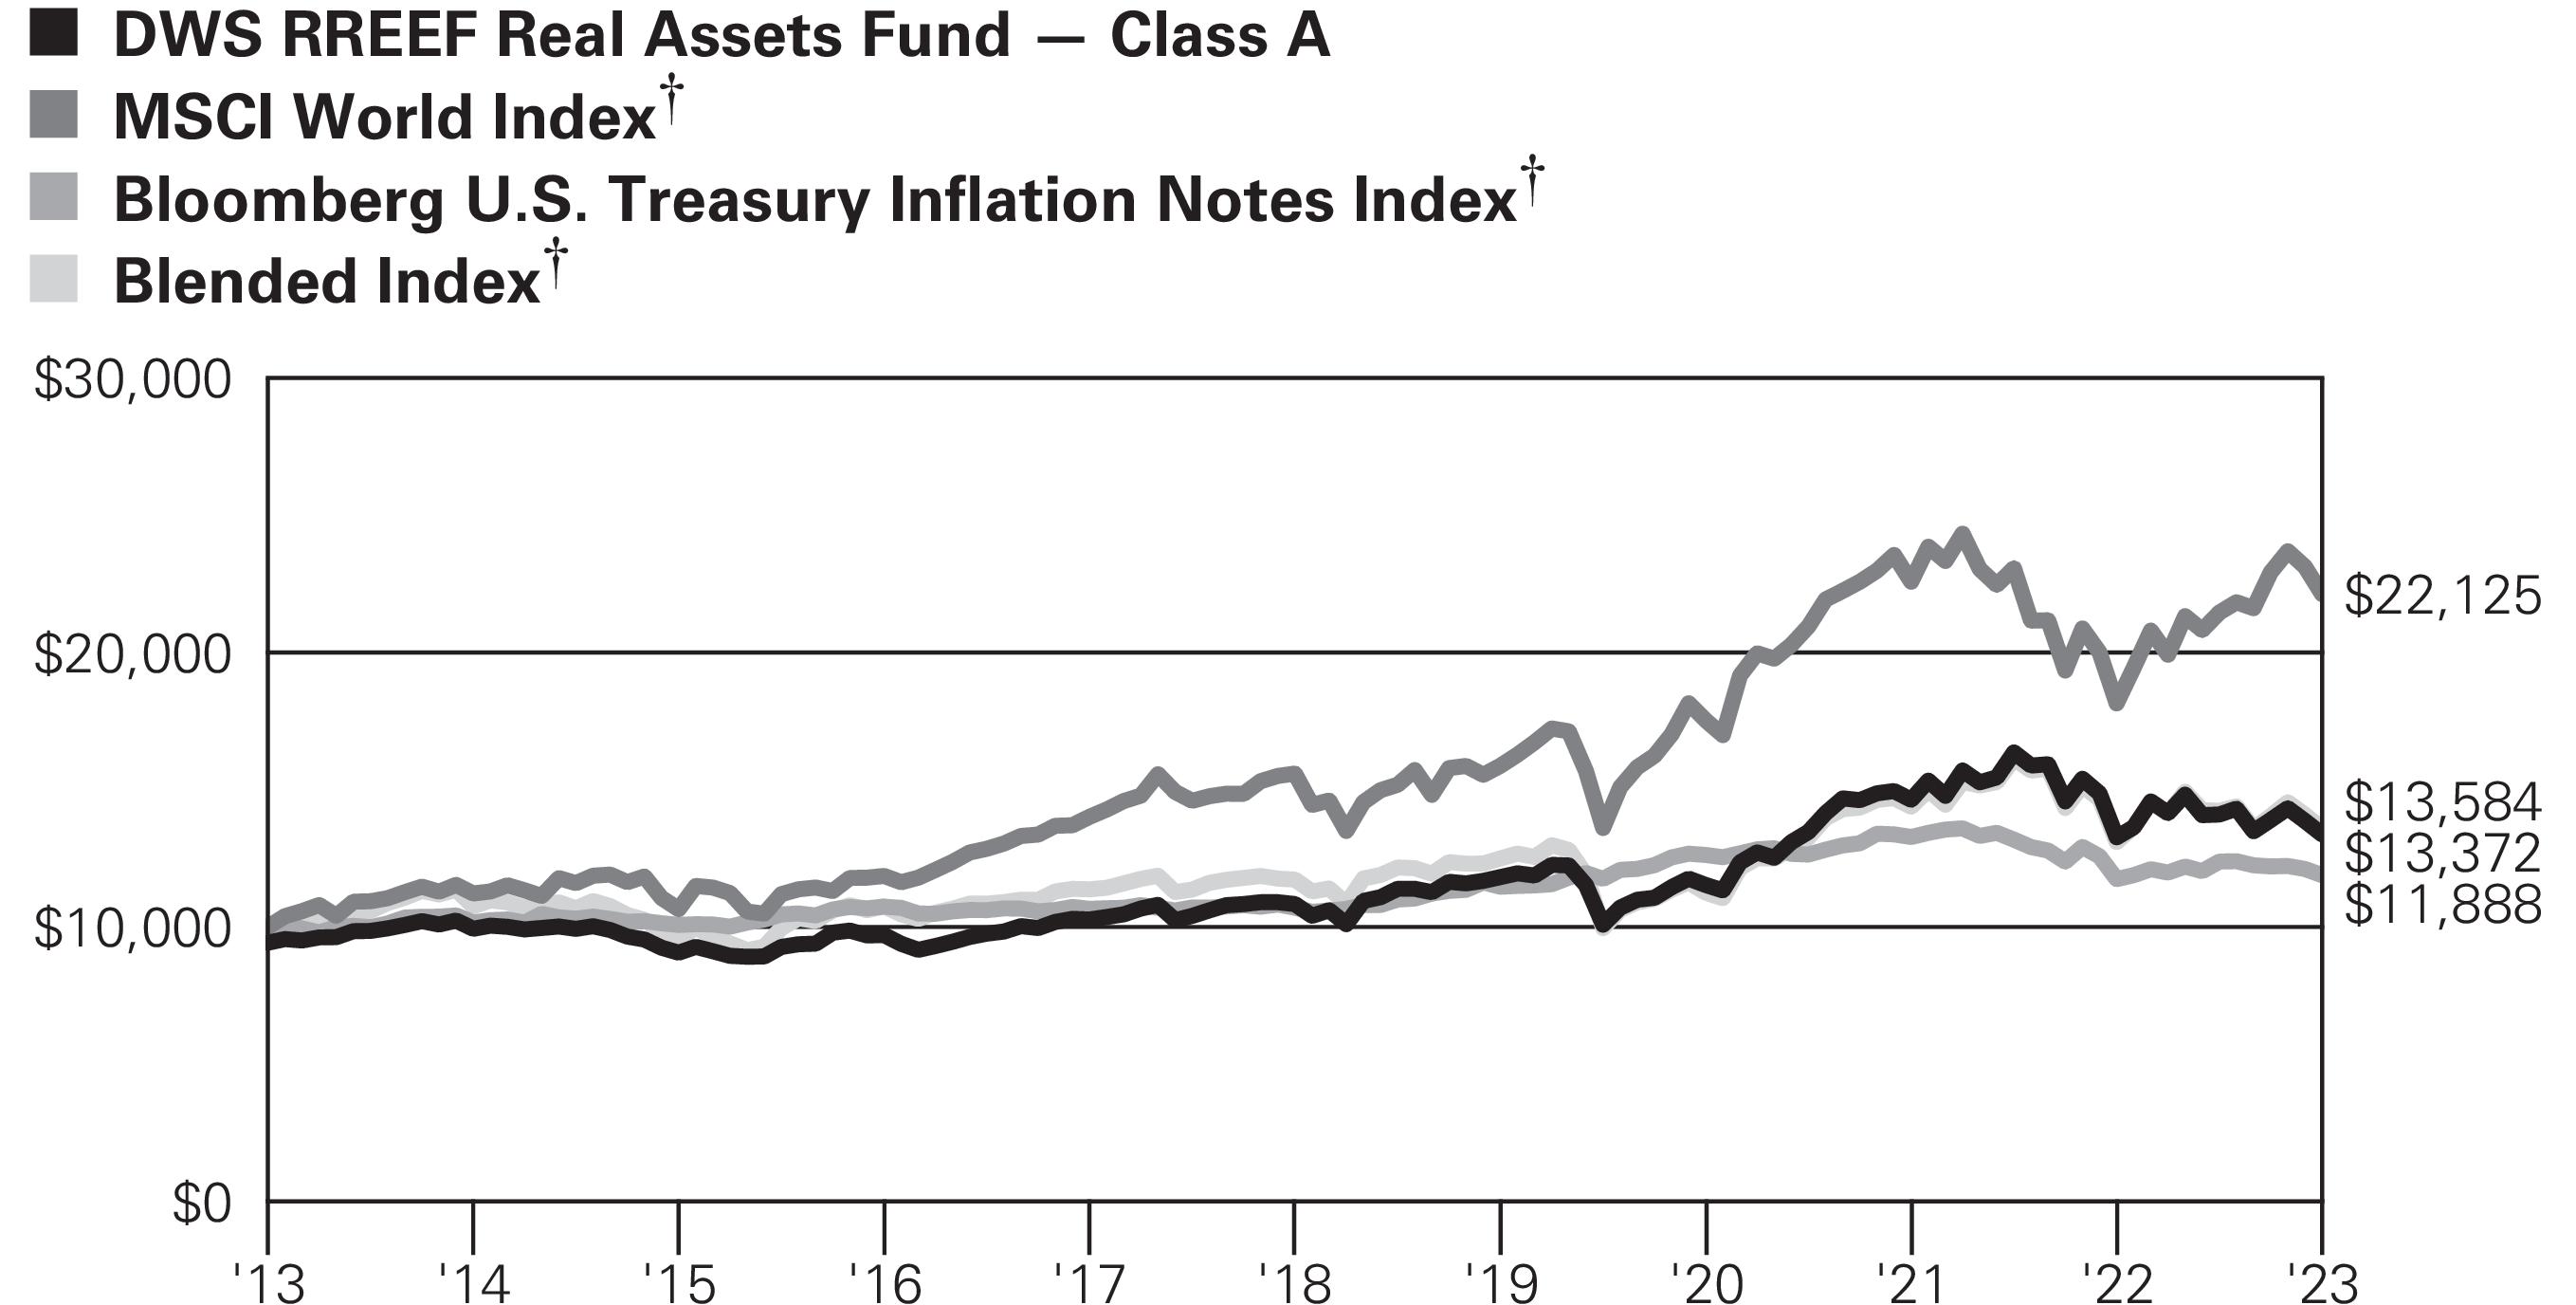
The Blended Index is composed of 30% in the Dow Jones Brookfield Infrastructure Index, 30% in the FTSE EPRA/NAREIT Developed Index, 15% in the Bloomberg Commodity Index, 15% in the S&P Global Natural Resources Index and 10% in the Bloomberg U.S. Treasury Inflation Notes Index. Dow Jones Brookfield Infrastructure Index measures the stock performance of companies worldwide whose primary business is the ownership and operation of (rather than service of) infrastructure assets. To be included in the indices, a company must have more than 70% of estimated cash flows (based on publicly available information) derived from the following infrastructure sectors: airports, toll roads, ports, communications, electricity transmission and distribution, oil and gas storage and transportation, water, and other sectors. FTSE EPRA/NAREIT Developed Index is an unmanaged, market-weighted index designed to track the performance of listed real estate companies and REITS worldwide. Bloomberg Commodity Index is an unmanaged index that tracks a diversified group of commodities and commodities futures contracts traded on both U.S. and London exchanges. S&P Global Natural Resources Index includes 90 of the largest publicly-traded companies in natural resources and commodities businesses that meet specific investability requirements, offering investors diversified and investable equity exposure across 3 primary commodity-related sectors: agribusiness, energy, and metals & mining. |
‡ | Total returns shown for periods less than one year are not annualized. |
Class A | Class C | Class R | Class R6 | Class S | Institutional Class | |
Net Asset Value | ||||||
9/30/23 | $10.66 | $10.56 | $10.71 | $10.59 | $10.57 | $10.59 |
3/31/23 | $11.29 | $11.21 | $11.36 | $11.21 | $11.20 | $11.21 |
Distribution Information as of 9/30/23 | ||||||
Income Dividends, Six Months | $.05 | $.03 | $.04 | $.06 | $.05 | $.06 |
8 | | | DWS RREEF Real Assets Fund |
DWS RREEF Real Assets Fund | | | 9 |
Asset Allocation (As a % of Net Assets) | 9/30/23 | 3/31/23 |
Common Stocks | ||
Infrastructure | 35% | 37% |
Real Estate | 26% | 27% |
Natural Resource Equities | 15% | 13% |
Commodity Futures | 12% | 12% |
Treasury Inflation Protected Securities | 11% | 9% |
Cash Equivalents, U.S. Treasury Notes, Short-Term U.S. Treasury Obligations and Other Assets and Liabilities, net* | 1% | 2% |
100% | 100% |
* | Net of notional exposure to futures contracts |
Sector Diversification (As a % of Common Stocks) | 9/30/23 | 3/31/23 |
Real Estate | 40% | 43% |
Utilities | 19% | 21% |
Energy | 18% | 13% |
Materials | 10% | 10% |
Industrials | 9% | 8% |
Communication Services | 2% | 3% |
Consumer Staples | 2% | 2% |
Information Technology | — | 0% |
100% | 100% |
Geographical Diversification (As a % of Common Stocks and Government & Agency Obligations) | 9/30/23 | 3/31/23 |
United States | 66% | 60% |
Canada | 8% | 8% |
United Kingdom | 6% | 7% |
Japan | 4% | 4% |
France | 3% | 2% |
Spain | 2% | 3% |
Australia | 2% | 2% |
Hong Kong | 2% | 4% |
Italy | 2% | 1% |
Switzerland | 1% | 2% |
Singapore | 1% | 2% |
Other | 3% | 5% |
100% | 100% |
10 | | | DWS RREEF Real Assets Fund |
Ten Largest Equity Holdings at September 30, 2023 (17.7% of Net Assets) | Country | Percent | |
1ONEOK, Inc. | United States | 2.3% | |
Operator of natural gas and natural gas liquids business | |||
2Prologis, Inc. | United States | 2.1% | |
Owner, operator and developer of industrial real estate | |||
3National Grid PLC | United Kingdom | 1.9% | |
Provider of electricity and natural gas transmission services | |||
4American Tower Corp. | United States | 1.9% | |
Operator and developer of wireless communications and broadcast towers | |||
5Equinix, Inc. | United States | 1.7% | |
Provider of technology-related real estate | |||
6SBA Communications Corp. | United States | 1.7% | |
Operator of wireless communication infrastructure | |||
7Enbridge, Inc. | Canada | 1.7% | |
Provider of energy transportation, distribution and related services | |||
8Targa Resources Corp. | United States | 1.5% | |
Provider of midstream gas and natural gas liquid services | |||
9Vinci SA | France | 1.5% | |
Provider of electrical, mechanical, civil engineering and construction services | |||
10Exelon Corp. | United States | 1.4% | |
Distributor of natural gas and electricity |
DWS RREEF Real Assets Fund | | | 11 |
Shares | Value ($) | ||
Common Stocks 76.2% | |||
Communication Services 1.5% | |||
Diversified Telecommunication Services | |||
Cellnex Telecom SA 144A* | 1,485,376 | 51,621,062 | |
China Tower Corp. Ltd. “H” 144A | 168,208,000 | 16,084,834 | |
67,705,896 | |||
Consumer Staples 1.4% | |||
Food Products | |||
Archer-Daniels-Midland Co. | 458,750 | 34,598,925 | |
Bunge Ltd. | 198,726 | 21,512,089 | |
Darling Ingredients, Inc.* | 195,000 | 10,179,000 | |
66,290,014 | |||
Energy 13.7% | |||
Energy Equipment & Services 0.2% | |||
Halliburton Co. | 259,100 | 10,493,550 | |
Oil, Gas & Consumable Fuels 13.5% | |||
BP PLC | 9,958,100 | 64,559,538 | |
Canadian Natural Resources Ltd. | 262,075 | 16,948,771 | |
Cheniere Energy, Inc. | 144,392 | 23,963,296 | |
Chevron Corp. | 353,560 | 59,617,287 | |
Devon Energy Corp. | 148,990 | 7,106,823 | |
Diamondback Energy, Inc. | 157,840 | 24,446,259 | |
Enbridge, Inc. | 2,351,390 | 77,990,149 | |
Gazprom PJSC (ADR)* (a) | 1,013,306 | 0 | |
Gibson Energy, Inc. | 17,701 | 253,216 | |
Keyera Corp. (b) | 1,294,411 | 30,391,141 | |
LUKOIL PJSC ** (a) | 91,202 | 0 | |
Marathon Petroleum Corp. | 139,338 | 21,087,413 | |
ONEOK, Inc. | 1,658,100 | 105,173,284 | |
Pembina Pipeline Corp. (b) | 1,407,400 | 42,317,847 | |
Targa Resources Corp. | 818,394 | 70,152,734 | |
TotalEnergies SE | 693,066 | 45,739,194 | |
Williams Companies, Inc. | 987,783 | 33,278,409 | |
623,025,361 |
12 | | | DWS RREEF Real Assets Fund |
Shares | Value ($) | ||
Industrials 6.5% | |||
Commercial Services & Supplies 1.4% | |||
GFL Environmental, Inc. | 1,081,000 | 34,332,560 | |
Waste Connections, Inc. | 240,812 | 32,341,052 | |
66,673,612 | |||
Construction & Engineering 2.2% | |||
Ferrovial SE | 1,127,825 | 34,439,132 | |
Vinci SA | 606,392 | 67,007,059 | |
101,446,191 | |||
Ground Transportation 1.6% | |||
Canadian Pacific Kansas City Ltd. | 279,010 | 20,739,076 | |
East Japan Railway Co. | 240,450 | 13,768,592 | |
Union Pacific Corp. | 182,130 | 37,087,132 | |
71,594,800 | |||
Transportation Infrastructure 1.3% | |||
Aena SME SA 144A | 160,360 | 24,104,423 | |
Grupo Aeroportuario del Pacifico SAB de CV (ADR) | 114,740 | 18,859,813 | |
Japan Airport Terminal Co., Ltd. | 122,742 | 5,189,679 | |
Transurban Group (Units) | 1,260,279 | 10,268,059 | |
58,421,974 | |||
Materials 7.7% | |||
Chemicals 2.0% | |||
CF Industries Holdings, Inc. | 293,160 | 25,135,538 | |
Corteva, Inc. | 700,388 | 35,831,850 | |
Nutrien Ltd. (b) | 492,657 | 30,424,494 | |
91,391,882 | |||
Containers & Packaging 0.4% | |||
SIG Group AG | 424,900 | 10,470,174 | |
Westrock Co. | 296,089 | 10,599,986 | |
21,070,160 | |||
Metals & Mining 4.7% | |||
Agnico Eagle Mines Ltd. | 450,098 | 20,452,824 | |
Freeport-McMoRan, Inc. | 505,420 | 18,847,112 | |
Glencore PLC | 5,586,692 | 31,963,720 | |
Gold Fields Ltd. (ADR) | 566,000 | 6,146,760 | |
Newmont Corp. | 476,840 | 17,619,238 | |
Nippon Steel Corp. (b) | 832,000 | 19,469,427 | |
Norsk Hydro ASA | 1,854,686 | 11,606,398 | |
Reliance Steel & Aluminum Co. | 96,170 | 25,218,659 |
DWS RREEF Real Assets Fund | | | 13 |
Shares | Value ($) | ||
Rio Tinto Ltd. | 571,300 | 41,599,144 | |
Teck Resources Ltd. “B” | 515,626 | 22,192,892 | |
215,116,174 | |||
Paper & Forest Products 0.6% | |||
Mondi PLC | 691,900 | 11,557,050 | |
Svenska Cellulosa AB SCA “B” | 1,279,600 | 17,512,262 | |
29,069,312 | |||
Real Estate 30.6% | |||
Diversified REITs 1.2% | |||
Activia Properties, Inc. | 4,268 | 11,778,956 | |
British Land Co. PLC | 3,607,353 | 13,884,523 | |
Essential Properties Realty Trust, Inc. | 624,400 | 13,505,772 | |
Hulic Reit, Inc. | 4,384 | 4,675,978 | |
Mori Trust REIT, Inc. | 28,380 | 13,817,148 | |
57,662,377 | |||
Health Care REITs 2.1% | |||
Omega Healthcare Investors, Inc. | 893,900 | 29,641,724 | |
Ventas, Inc. | 394,800 | 16,632,924 | |
Welltower, Inc. | 627,400 | 51,396,608 | |
97,671,256 | |||
Hotel & Resort REITs 0.5% | |||
Ryman Hospitality Properties, Inc. | 258,854 | 21,557,361 | |
Industrial REITs 5.0% | |||
Americold Realty Trust, Inc. | 948,600 | 28,846,926 | |
CapitaLand Ascendas REIT | 9,130,500 | 18,328,373 | |
EastGroup Properties, Inc. | 184,103 | 30,658,673 | |
Frasers Logistics & Commercial Trust | 15,512,400 | 12,119,916 | |
Industrial & Infrastructure Fund Investment Corp. | 12,343 | 11,413,684 | |
Mapletree Industrial Trust | 411,700 | 680,595 | |
Mapletree Logistics Trust | 12,582,000 | 15,420,019 | |
Prologis, Inc. | 876,408 | 98,341,742 | |
Segro PLC | 1,839,698 | 16,073,918 | |
231,883,846 | |||
Office REITs 0.7% | |||
SL Green Realty Corp. (b) | 414,900 | 15,475,770 | |
Vornado Realty Trust | 669,400 | 15,181,992 | |
30,657,762 | |||
Real Estate Management & Development 4.0% | |||
CapitaLand Investment Ltd. | 4,136,500 | 9,342,147 |
14 | | | DWS RREEF Real Assets Fund |
Shares | Value ($) | ||
Castellum AB (b) | 1,718,489 | 17,404,503 | |
CK Asset Holdings Ltd. | 2,259,363 | 11,853,594 | |
CTP NV 144A | 933,120 | 13,368,774 | |
Fastighets AB Balder “B” * | 3,595,540 | 16,115,549 | |
Mitsubishi Estate Co., Ltd. | 2,071,600 | 27,028,264 | |
Mitsui Fudosan Co., Ltd. | 1,464,900 | 32,256,236 | |
PSP Swiss Property AG (Registered) | 149,890 | 17,690,599 | |
Sun Hung Kai Properties Ltd. | 1,095,700 | 11,683,930 | |
Vonovia SE | 1,082,484 | 25,918,841 | |
182,662,437 | |||
Residential REITs 3.4% | |||
American Homes 4 Rent “A” | 639,679 | 21,550,786 | |
AvalonBay Communities, Inc. | 336,010 | 57,706,357 | |
Canadian Apartment Properties REIT (b) | 268,373 | 8,907,237 | |
Equity LifeStyle Properties, Inc. | 329,020 | 20,961,864 | |
UDR, Inc. | 929,263 | 33,146,811 | |
UNITE Group PLC | 1,439,891 | 15,676,762 | |
157,949,817 | |||
Retail REITs 3.9% | |||
Agree Realty Corp. | 457,012 | 25,245,343 | |
Kenedix Retail REIT Corp. | 6,146 | 11,887,591 | |
Kite Realty Group Trust | 1,511,329 | 32,372,667 | |
Klepierre SA | 609,910 | 14,927,063 | |
Link REIT | 4,353,641 | 21,273,089 | |
Region RE Ltd. | 6,155,500 | 7,980,014 | |
RioCan Real Estate Investment Trust (b) | 1,344,000 | 17,880,420 | |
Simon Property Group, Inc. | 239,270 | 25,848,338 | |
Spirit Realty Capital, Inc. | 622,657 | 20,877,689 | |
178,292,214 | |||
Specialized REITs 9.8% | |||
American Tower Corp. | 523,702 | 86,122,794 | |
Big Yellow Group PLC | 559,266 | 6,360,642 | |
CubeSmart | 589,000 | 22,458,570 | |
Digital Realty Trust, Inc. | 387,200 | 46,858,944 | |
Equinix, Inc. | 110,334 | 80,131,171 | |
Iron Mountain, Inc. | 640,811 | 38,096,214 | |
Public Storage | 164,800 | 43,428,096 | |
SBA Communications Corp. | 394,624 | 78,991,886 | |
VICI Properties, Inc. | 920,684 | 26,791,904 | |
Weyerhaeuser Co. | 665,442 | 20,402,452 | |
449,642,673 |
DWS RREEF Real Assets Fund | | | 15 |
Shares | Value ($) | ||
Utilities 14.8% | |||
Electric Utilities 4.3% | |||
Exelon Corp. | 1,748,374 | 66,071,053 | |
Orsted AS 144A | 115,802 | 6,289,023 | |
PG&E Corp.* | 3,199,107 | 51,601,596 | |
SSE PLC | 1,158,740 | 22,777,086 | |
Terna - Rete Elettrica Nazionale | 6,622,349 | 49,826,789 | |
196,565,547 | |||
Gas Utilities 3.0% | |||
APA Group (Units) | 4,333,610 | 23,092,894 | |
Atmos Energy Corp. | 317,340 | 33,615,826 | |
China Resources Gas Group Ltd. | 2,164,500 | 6,328,934 | |
ENN Energy Holdings Ltd. | 1,276,900 | 10,527,268 | |
Hong Kong & China Gas Co., Ltd. | 6,678,850 | 4,646,011 | |
Kunlun Energy Co., Ltd. | 20,205,000 | 17,363,534 | |
Snam SpA | 4,211,000 | 19,765,170 | |
Tokyo Gas Co., Ltd. | 1,030,800 | 23,384,054 | |
138,723,691 | |||
Multi-Utilities 6.3% | |||
Ameren Corp. | 427,923 | 32,021,478 | |
CenterPoint Energy, Inc. | 2,115,514 | 56,801,551 | |
National Grid PLC | 7,331,138 | 87,602,244 | |
NiSource, Inc. | 2,036,770 | 50,267,484 | |
Sempra | 911,740 | 62,025,672 | |
288,718,429 | |||
Water Utilities 1.2% | |||
American Water Works Co., Inc. | 295,549 | 36,597,833 | |
Severn Trent PLC | 367,100 | 10,580,262 | |
United Utilities Group PLC | 896,800 | 10,337,976 | |
57,516,071 | |||
Total Common Stocks (Cost $3,612,753,687) | 3,511,802,407 |
Principal Amount ($) | Value ($) | ||
Government & Agency Obligations 20.0% | |||
U.S. Treasury Obligations | |||
U.S. Treasury Inflation-Indexed Bonds: | |||
0.875%, 2/15/2047 | 37,329,175 | 27,201,449 | |
1.375%, 2/15/2044 | 44,461,884 | 37,157,370 |
16 | | | DWS RREEF Real Assets Fund |
Principal Amount ($) | Value ($) | ||
U.S. Treasury Inflation-Indexed Notes: | |||
0.125%, 7/15/2031 | 44,369,576 | 37,668,643 | |
0.25%, 1/15/2025 | 84,856,244 | 81,616,956 | |
0.25%, 7/15/2029 | 46,508,533 | 41,431,200 | |
0.375%, 1/15/2027 | 85,945,888 | 79,940,587 | |
0.375%, 7/15/2027 | 63,220,007 | 58,621,122 | |
0.625%, 1/15/2026 | 86,098,084 | 81,846,992 | |
0.625%, 7/15/2032 | 24,613,130 | 21,443,950 | |
0.875%, 1/15/2029 | 25,674,979 | 23,819,811 | |
U.S. Treasury Notes: | |||
2.0%, 5/31/2024 | 45,000,000 | 43,989,258 | |
2.25%, 12/31/2023 | 60,000,000 | 59,521,875 | |
2.25%, 3/31/2024 | 46,000,000 | 45,279,453 | |
2.375%, 2/29/2024 | 50,000,000 | 49,376,953 | |
2.5%, 1/31/2024 | 60,000,000 | 59,416,406 | |
2.5%, 4/30/2024 | 50,000,000 | 49,150,390 | |
2.875%, 10/31/2023 | 65,000,000 | 64,872,073 | |
2.875%, 11/30/2023 | 47,000,000 | 46,802,492 | |
3.0%, 6/30/2024 | 12,500,000 | 12,272,461 | |
Total Government & Agency Obligations (Cost $966,611,323) | 921,429,441 |
Shares | Value ($) | ||
Securities Lending Collateral 2.0% | |||
DWS Government & Agency Securities Portfolio “DWS Government Cash Institutional Shares” , 5.25% (c) (d) (Cost $90,969,482) | 90,969,482 | 90,969,482 | |
Cash Equivalents 1.8% | |||
DWS Central Cash Management Government Fund, 5.36% (c) (Cost $84,960,121) | 84,960,121 | 84,960,121 |
% of Net Assets | Value ($) | ||
Total Consolidated Investment Portfolio (Cost $4,755,294,613) | 100.0 | 4,609,161,451 | |
Other Assets and Liabilities, Net | 0.0 | 535,770 | |
Net Assets | 100.0 | 4,609,697,221 |
DWS RREEF Real Assets Fund | | | 17 |
Value ($) at 3/31/2023 | Pur- chases Cost ($) | Sales Proceeds ($) | Net Real- ized Gain/ (Loss) ($) | Net Change in Unreal- ized Appreci- ation (Depreci- ation) ($) | Income ($) | Capital Gain Distri- butions ($) | Number of Shares at 9/30/2023 | Value ($) at 9/30/2023 |
Securities Lending Collateral 2.0% | ||||||||
DWS Government & Agency Securities Portfolio “DWS Government Cash Institutional Shares” , 5.25% (c) (d) | ||||||||
23,744,750 | 67,224,732 (e) | — | — | — | 502,153 | — | 90,969,482 | 90,969,482 |
Cash Equivalents 1.8% | ||||||||
DWS Central Cash Management Government Fund, 5.36% (c) | ||||||||
100,676,680 | 1,276,600,551 | 1,292,317,110 | — | — | 1,749,711 | — | 84,960,121 | 84,960,121 |
124,421,430 | 1,343,825,283 | 1,292,317,110 | — | — | 2,251,864 | — | 175,929,603 | 175,929,603 |
* | Non-income producing security. |
** | Non-income producing security; due to applicable sanctions, dividend income was not recorded. |
(a) | Investment was valued using significant unobservable inputs. |
(b) | All or a portion of these securities were on loan. In addition, “Other Assets and Liabilities, Net” may include pending sales that are also on loan. The value of securities loaned at September 30, 2023 amounted to $86,443,817, which is 1.9% of net assets. |
(c) | Affiliated fund managed by DWS Investment Management Americas, Inc. The rate shown is the annualized seven-day yield at period end. |
(d) | Represents cash collateral held in connection with securities lending. Income earned by the Fund is net of borrower rebates. |
(e) | Represents the net increase (purchase cost) or decrease (sales proceeds) in the amount invested in cash collateral for the period ended September 30, 2023. |
144A: Security exempt from registration under Rule 144A of the Securities Act of 1933. These securities may be resold in transactions exempt from registration, normally to qualified institutional buyers. |
ADR: American Depositary Receipt |
HRW: Hard Red Winter |
LME: London Metal Exchange |
PJSC: Public Joint Stock Company |
RBOB: Reformulated Blendstock for Oxygenate Blending |
REIT: Real Estate Investment Trust |
ULSD: Ultra-Low Sulfur Diesel |
WTI: West Texas Intermediate |
18 | | | DWS RREEF Real Assets Fund |
Futures | Currency | Expiration Date | Contracts | Notional Amount ($) | Notional Value ($) | Unrealized Appreciation/ (Depreciation) ($) |
Brent Crude Oil Futures | USD | 11/30/2023 | 511 | 45,411,705 | 46,173,960 | 762,255 |
Copper Futures | USD | 12/27/2023 | 319 | 30,328,446 | 29,806,562 | (521,884) |
Corn Futures | USD | 12/14/2023 | 1,023 | 26,798,301 | 24,385,763 | (2,412,538) |
Cotton No. 2 Futures | USD | 12/6/2023 | 392 | 16,434,463 | 17,081,400 | 646,937 |
Gasoline RBOB Futures | USD | 12/29/2023 | 187 | 19,563,795 | 18,250,340 | (1,313,455) |
Gold 100 oz. Futures | USD | 12/27/2023 | 579 | 113,670,730 | 108,047,190 | (5,623,540) |
Kansas City HRW Wheat Futures | USD | 12/14/2023 | 269 | 10,993,503 | 8,927,438 | (2,066,065) |
Lean Hogs Futures | USD | 12/14/2023 | 484 | 14,515,572 | 13,895,640 | (619,932) |
Live Cattle Futures | USD | 12/29/2023 | 138 | 10,384,530 | 10,373,460 | (11,070) |
Live Cattle Futures | USD | 2/29/2024 | 135 | 10,196,898 | 10,395,000 | 198,102 |
LME Nickel Futures | USD | 11/13/2023 | 82 | 10,084,459 | 9,141,852 | (942,607) |
LME Nickel Futures | USD | 1/15/2024 | 39 | 4,821,742 | 4,387,734 | (434,008) |
LME Primary Aluminium Futures | USD | 11/13/2023 | 351 | 19,177,007 | 20,590,538 | 1,413,531 |
LME Primary Aluminium Futures | USD | 1/15/2024 | 376 | 20,841,758 | 22,153,450 | 1,311,692 |
LME Zinc Futures | USD | 11/13/2023 | 408 | 24,615,104 | 27,022,350 | 2,407,246 |
LME Zinc Futures | USD | 1/15/2024 | 134 | 8,439,241 | 8,890,900 | 451,659 |
Low Sulfur Gas Oil Futures | USD | 11/10/2023 | 52 | 4,536,826 | 5,024,500 | 487,674 |
Low Sulfur Gas Oil Futures | USD | 1/11/2024 | 137 | 12,068,182 | 12,353,975 | 285,793 |
DWS RREEF Real Assets Fund | | | 19 |
Futures | Currency | Expiration Date | Contracts | Notional Amount ($) | Notional Value ($) | Unrealized Appreciation/ (Depreciation) ($) |
Natural Gas Futures | USD | 10/27/2023 | 522 | 15,998,748 | 15,289,380 | (709,368) |
Natural Gas Futures | USD | 12/27/2023 | 457 | 16,859,839 | 16,292,050 | (567,789) |
NY Harbor ULSD Futures | USD | 10/31/2023 | 35 | 4,711,100 | 4,851,882 | 140,782 |
NY Harbor ULSD Futures | USD | 12/29/2023 | 144 | 18,931,431 | 18,540,749 | (390,682) |
Silver Futures | USD | 12/27/2023 | 239 | 29,353,541 | 26,827,750 | (2,525,791) |
Soybean Futures | USD | 11/14/2023 | 106 | 7,299,376 | 6,757,500 | (541,876) |
Soybean Meal Futures | USD | 1/12/2024 | 119 | 4,704,203 | 4,514,860 | (189,343) |
Soybean Oil Futures | USD | 1/12/2024 | 228 | 15,780,758 | 14,757,300 | (1,023,458) |
Soybean Oil Futures | USD | 1/12/2024 | 133 | 4,803,134 | 4,406,556 | (396,578) |
Sugar No. 11 Futures | USD | 2/29/2024 | 825 | 23,452,231 | 24,467,520 | 1,015,289 |
Wheat Futures | USD | 12/14/2023 | 722 | 23,741,755 | 19,548,150 | (4,193,605) |
WTI Crude Futures | USD | 12/19/2023 | 529 | 46,099,014 | 46,012,420 | (86,594) |
Total | 599,168,169 | (15,449,223) |
Futures | Currency | Expiration Date | Contracts | Notional Amount ($) | Notional Value ($) | Unrealized Appreciation/ (Depreciation) ($) |
LME Nickel Futures | USD | 11/13/2023 | 43 | 5,268,050 | 4,793,898 | 474,152 |
LME Primary Aluminium Futures | USD | 11/13/2023 | 351 | 19,232,165 | 20,590,538 | (1,358,373) |
20 | | | DWS RREEF Real Assets Fund |
Futures | Currency | Expiration Date | Contracts | Notional Amount ($) | Notional Value ($) | Unrealized Appreciation/ (Depreciation) ($) |
LME Zinc Futures | USD | 11/13/2023 | 297 | 18,033,231 | 19,670,681 | (1,637,450) |
LME Zinc Futures | USD | 1/15/2024 | 24 | 1,520,804 | 1,592,400 | (71,596) |
Total | 46,647,517 | (2,593,267) |
USD | United States Dollar |
DWS RREEF Real Assets Fund | | | 21 |
Assets | Level 1 | Level 2 | Level 3 | Total |
Common Stocks | ||||
Communication Services | $— | $67,705,896 | $— | $67,705,896 |
Consumer Staples | 66,290,014 | — | — | 66,290,014 |
Energy | 523,220,179 | 110,298,732 | 0 | 633,518,911 |
Industrials | 143,359,633 | 154,776,944 | — | 298,136,577 |
Materials | 212,469,353 | 144,178,175 | — | 356,647,528 |
Real Estate | 1,029,019,035 | 378,960,708 | — | 1,407,979,743 |
Utilities | 389,002,493 | 292,521,245 | — | 681,523,738 |
Government & Agency Obligations | — | 921,429,441 | — | 921,429,441 |
Short-Term Investments (a) | 175,929,603 | — | — | 175,929,603 |
Derivatives (b) | ||||
Futures Contracts | 9,595,112 | — | — | 9,595,112 |
Total | $2,548,885,422 | $2,069,871,141 | $0 | $4,618,756,563 |
Liabilities | Level 1 | Level 2 | Level 3 | Total |
Derivatives (b) | ||||
Futures Contracts | $(27,637,602 ) | $— | $— | $(27,637,602 ) |
Total | $(27,637,602 ) | $— | $— | $(27,637,602 ) |
(a) | See Consolidated Investment Portfolio for additional detailed categorizations. |
(b) | Derivatives include unrealized appreciation (depreciation) on open futures contracts. |
22 | | | DWS RREEF Real Assets Fund |
Assets | |
Investments in non-affiliated securities, at value (cost $4,579,365,010) — including $86,443,817 of securities loaned | $4,433,231,848 |
Investment in DWS Government & Agency Securities Portfolio (cost $90,969,482)* | 90,969,482 |
Investment in DWS Central Cash Management Government Fund (cost $84,960,121) | 84,960,121 |
Cash | 20,000 |
Foreign currency, at value (cost $5,192,980) | 5,155,738 |
Deposit with broker for futures contracts | 41,926,022 |
Receivable for investments sold | 73,207,473 |
Receivable for Fund shares sold | 9,746,939 |
Dividends receivable | 7,254,767 |
Interest receivable | 4,563,425 |
Foreign taxes recoverable | 691,535 |
Other assets | 200,807 |
Total assets | 4,751,928,157 |
Liabilities | |
Payable upon return of securities loaned | 90,969,482 |
Payable for investments purchased | 34,535,593 |
Payable for Fund shares redeemed | 5,738,237 |
Payable for variation margin on futures contracts | 6,508,051 |
Accrued management fee | 2,540,655 |
Accrued Trustees' fees | 56,138 |
Other accrued expenses and payables | 1,882,780 |
Total liabilities | 142,230,936 |
Net assets, at value | $4,609,697,221 |
Net Assets Consist of | |
Distributable earnings (loss) | (1,012,618,094 ) |
Paid-in capital | 5,622,315,315 |
Net assets, at value | $4,609,697,221 |
DWS RREEF Real Assets Fund | | | 23 |
as of September 30, 2023 (Unaudited) (continued)
Net Asset Value | |
Class A | |
Net Asset Value and redemption price per share ($94,144,769 ÷ 8,833,529 outstanding shares of beneficial interest, no par value, unlimited number of shares authorized) | $10.66 |
Maximum offering price per share (100 ÷ 94.25 of $10.66) | $11.31 |
Class C | |
Net Asset Value, offering and redemption price (subject to contingent deferred sales charge) per share ($18,137,379 ÷ 1,717,884 outstanding shares of beneficial interest, no par value, unlimited number of shares authorized) | $10.56 |
Class R | |
Net Asset Value, offering and redemption price per share ($2,012,864 ÷ 187,905 outstanding shares of beneficial interest, no par value, unlimited number of shares authorized) | $10.71 |
Class R6 | |
Net Asset Value, offering and redemption price per share ($151,930,916 ÷ 14,348,146 outstanding shares of beneficial interest, no par value, unlimited number of shares authorized) | $10.59 |
Class S | |
Net Asset Value, offering and redemption price per share ($298,594,706 ÷ 28,238,333 outstanding shares of beneficial interest, no par value, unlimited number of shares authorized) | $10.57 |
Institutional Class | |
Net Asset Value, offering and redemption price per share ($4,044,876,587 ÷ 382,096,314 outstanding shares of beneficial interest, no par value, unlimited number of shares authorized) | $10.59 |
24 | | | DWS RREEF Real Assets Fund |
Investment Income | |
Income: | |
Dividends (net of foreign taxes withheld of $4,304,527) | $78,860,639 |
Interest (net of foreign taxes withheld of $175,728) | 26,124,040 |
Income distributions — DWS Central Cash Management Government Fund | 1,749,711 |
Securities lending income, net of borrower rebates | 502,153 |
Total income | 107,236,543 |
Expenses: | |
Management fee | 20,215,103 |
Administration fee | 2,540,120 |
Services to shareholders | 2,978,022 |
Distribution and service fees | 239,393 |
Custodian fee | 118,478 |
Professional fees | 79,013 |
Reports to shareholders | 169,756 |
Registration fees | 283,372 |
Trustees' fees and expenses | 115,656 |
Other | 132,728 |
Total expenses before expense reductions | 26,871,641 |
Expense reductions | (2,740,656 ) |
Total expenses after expense reductions | 24,130,985 |
Net investment income | 83,105,558 |
Realized and Unrealized Gain (Loss) | |
Net realized gain (loss) from: | |
Investments | (246,110,449 ) |
Futures | (7,870,033 ) |
Foreign currency | (96,062 ) |
(254,076,544 ) | |
Change in net unrealized appreciation (depreciation) on: | |
Investments | (70,035,071 ) |
Futures | (14,029,982 ) |
Foreign currency | (109,237 ) |
(84,174,290 ) | |
Net gain (loss) | (338,250,834 ) |
Net increase (decrease) in net assets resulting from operations | $(255,145,276 ) |
DWS RREEF Real Assets Fund | | | 25 |
Six Months Ended September 30, 2023 | Year Ended March 31, | |
Increase (Decrease) in Net Assets | (Unaudited) | 2023 |
Operations: | ||
Net investment income | $83,105,558 | $127,406,450 |
Net realized gain (loss) | (254,076,544 ) | (389,268,715 ) |
Change in net unrealized appreciation (depreciation) | (84,174,290 ) | (641,323,569 ) |
Net increase (decrease) in net assets resulting from operations | (255,145,276 ) | (903,185,834 ) |
Distributions to shareholders: | ||
Class A | (479,901 ) | (5,276,345 ) |
Class T | — | (390 ) |
Class C | (57,139 ) | (803,109 ) |
Class R | (8,373 ) | (101,955 ) |
Class R6 | (851,129 ) | (5,689,006 ) |
Class S | (1,549,068 ) | (16,823,577 ) |
Institutional Class | (24,629,905 ) | (221,636,463 ) |
Total distributions | (27,575,515 ) | (250,330,845 ) |
Fund share transactions: | ||
Proceeds from shares sold | 626,887,926 | 3,528,736,002 |
Reinvestment of distributions | 23,497,937 | 218,163,907 |
Payments for shares redeemed | (1,451,316,814 ) | (2,397,150,805 ) |
Net increase (decrease) in net assets from Fund share transactions | (800,930,951 ) | 1,349,749,104 |
Increase (decrease) in net assets | (1,083,651,742 ) | 196,232,425 |
Net assets at beginning of period | 5,693,348,963 | 5,497,116,538 |
Net assets at end of period | $4,609,697,221 | $5,693,348,963 |
26 | | | DWS RREEF Real Assets Fund |
DWS RREEF Real Assets Fund — Class A | ||||||
Six Months Ended 9/30/23 | Years Ended March 31, | |||||
(Unaudited) | 2023 | 2022 | 2021 | 2020 | 2019 | |
Selected Per Share Data | ||||||
Net asset value, beginning of period | $11.29 | $13.64 | $11.50 | $8.73 | $10.05 | $9.32 |
Income (loss) from investment operations: | ||||||
Net investment incomea | .16 | .22 | .15 | .11 | .15 | .14 |
Net realized and unrealized gain (loss) | (.74 ) | (2.10 ) | 2.29 | 2.80 | (1.28 ) | .73 |
Total from investment operations | (.58 ) | (1.88 ) | 2.44 | 2.91 | (1.13 ) | .87 |
Less distributions from: | ||||||
Net investment income | (.05 ) | (.47 ) | (.30 ) | (.14 ) | (.19 ) | (.14 ) |
Net asset value, end of period | $10.66 | $11.29 | $13.64 | $11.50 | $8.73 | $10.05 |
Total Return (%)b,c | (5.14 )* | (13.83 ) | 21.49 | 33.59 | (11.51 ) | 9.49 |
Ratios to Average Net Assets and Supplemental Data | ||||||
Net assets, end of period ($ millions) | 94 | 116 | 147 | 92 | 70 | 72 |
Ratio of expenses before expense reductions (%) | 1.30 ** | 1.27 | 1.29 | 1.33 | 1.36 | 1.37 |
Ratio of expenses after expense reductions (%) | 1.22 ** | 1.22 | 1.22 | 1.22 | 1.22 | 1.22 |
Ratio of net investment income (%) | 2.88 ** | 1.88 | 1.15 | 1.07 | 1.48 | 1.42 |
Portfolio turnover rate (%) | 33 * | 86 | 65 | 74 | 88 | 72 |
a | Based on average shares outstanding during the period. |
b | Total return does not reflect the effect of any sales charges. |
c | Total return would have been lower had certain expenses not been reduced. |
* | Not annualized |
** | Annualized |
DWS RREEF Real Assets Fund | | | 27 |
DWS RREEF Real Assets Fund — Class C | ||||||
Six Months Ended 9/30/23 | Years Ended March 31, | |||||
(Unaudited) | 2023 | 2022 | 2021 | 2020 | 2019 | |
Selected Per Share Data | ||||||
Net asset value, beginning of period | $11.21 | $13.54 | $11.42 | $8.67 | $9.97 | $9.25 |
Income (loss) from investment operations: | ||||||
Net investment incomea | .12 | .13 | .05 | .03 | .08 | .07 |
Net realized and unrealized gain (loss) | (.74 ) | (2.08 ) | 2.27 | 2.78 | (1.27 ) | .72 |
Total from investment operations | (.62 ) | (1.95 ) | 2.32 | 2.81 | (1.19 ) | .79 |
Less distributions from: | ||||||
Net investment income | (.03 ) | (.38 ) | (.20 ) | (.06 ) | (.11 ) | (.07 ) |
Net asset value, end of period | $10.56 | $11.21 | $13.54 | $11.42 | $8.67 | $9.97 |
Total Return (%)b,c | (5.53 )* | (14.47 ) | 20.53 | 32.58 | (12.05 ) | 8.62 |
Ratios to Average Net Assets and Supplemental Data | ||||||
Net assets, end of period ($ millions) | 18 | 24 | 24 | 12 | 16 | 29 |
Ratio of expenses before expense reductions (%) | 2.03 ** | 2.01 | 2.02 | 2.08 | 2.10 | 2.13 |
Ratio of expenses after expense reductions (%) | 1.97 ** | 1.97 | 1.97 | 1.97 | 1.97 | 1.97 |
Ratio of net investment income (%) | 2.12 ** | 1.12 | .40 | .28 | .79 | .69 |
Portfolio turnover rate (%) | 33 * | 86 | 65 | 74 | 88 | 72 |
a | Based on average shares outstanding during the period. |
b | Total return does not reflect the effect of any sales charges. |
c | Total return would have been lower had certain expenses not been reduced. |
* | Not annualized |
** | Annualized |
28 | | | DWS RREEF Real Assets Fund |
DWS RREEF Real Assets Fund — Class R | ||||||
Six Months Ended 9/30/23 | Years Ended March 31, | |||||
(Unaudited) | 2023 | 2022 | 2021 | 2020 | 2019 | |
Selected Per Share Data | ||||||
Net asset value, beginning of period | $11.36 | $13.72 | $11.57 | $8.79 | $10.11 | $9.38 |
Income (loss) from investment operations: | ||||||
Net investment incomea | .15 | .20 | .12 | .08 | .13 | .11 |
Net realized and unrealized gain (loss) | (.76 ) | (2.11 ) | 2.30 | 2.82 | (1.28 ) | .74 |
Total from investment operations | (.61 ) | (1.91 ) | 2.42 | 2.90 | (1.15 ) | .85 |
Less distributions from: | ||||||
Net investment income | (.04 ) | (.45 ) | (.27 ) | (.12 ) | (.17 ) | (.12 ) |
Net asset value, end of period | $10.71 | $11.36 | $13.72 | $11.57 | $8.79 | $10.11 |
Total Return (%)b | (5.34 )* | (14.02 ) | 21.16 | 33.15 | (11.65 ) | 9.16 |
Ratios to Average Net Assets and Supplemental Data | ||||||
Net assets, end of period ($ millions) | 2 | 2 | 3 | 3 | 2 | 3 |
Ratio of expenses before expense reductions (%) | 1.67 ** | 1.64 | 1.67 | 1.71 | 1.75 | 1.75 |
Ratio of expenses after expense reductions (%) | 1.47 ** | 1.47 | 1.47 | 1.47 | 1.47 | 1.47 |
Ratio of net investment income (%) | 2.62 ** | 1.64 | .93 | .80 | 1.26 | 1.18 |
Portfolio turnover rate (%) | 33 * | 86 | 65 | 74 | 88 | 72 |
a | Based on average shares outstanding during the period. |
b | Total return would have been lower had certain expenses not been reduced. |
* | Not annualized |
** | Annualized |
DWS RREEF Real Assets Fund | | | 29 |
DWS RREEF Real Assets Fund — Class R6 | ||||||
Six Months Ended 9/30/23 | Years Ended March 31, | |||||
(Unaudited) | 2023 | 2022 | 2021 | 2020 | 2019 | |
Selected Per Share Data | ||||||
Net asset value, beginning of period | $11.21 | $13.55 | $11.42 | $8.67 | $9.97 | $9.25 |
Income (loss) from investment operations: | ||||||
Net investment incomea | .18 | .25 | .18 | .21 | .17 | .16 |
Net realized and unrealized gain (loss) | (.74 ) | (2.08 ) | 2.29 | 2.71 | (1.25 ) | .73 |
Total from investment operations | (.56 ) | (1.83 ) | 2.47 | 2.92 | (1.08 ) | .89 |
Less distributions from: | ||||||
Net investment income | (.06 ) | (.51 ) | (.34 ) | (.17 ) | (.22 ) | (.17 ) |
Net asset value, end of period | $10.59 | $11.21 | $13.55 | $11.42 | $8.67 | $9.97 |
Total Return (%)b | (5.01 )* | (13.59 ) | 21.92 | 33.94 | (11.17 ) | 9.74 |
Ratios to Average Net Assets and Supplemental Data | ||||||
Net assets, end of period ($ millions) | 152 | 160 | 117 | 37 | 4 | 1 |
Ratio of expenses before expense reductions (%) | .91 ** | .90 | .91 | .95 | 1.00 | 1.06 |
Ratio of expenses after expense reductions (%) | .90 ** | .90 | .90 | .93 | .95 | .95 |
Ratio of net investment income (%) | 3.20 ** | 2.16 | 1.44 | 2.04 | 1.66 | 1.70 |
Portfolio turnover rate (%) | 33 * | 86 | 65 | 74 | 88 | 72 |
a | Based on average shares outstanding during the period. |
b | Total return would have been lower had certain expenses not been reduced. |
* | Not annualized |
** | Annualized |
30 | | | DWS RREEF Real Assets Fund |
DWS RREEF Real Assets Fund — Class S | ||||||
Six Months Ended 9/30/23 | Years Ended March 31, | |||||
(Unaudited) | 2023 | 2022 | 2021 | 2020 | 2019 | |
Selected Per Share Data | ||||||
Net asset value, beginning of period | $11.20 | $13.53 | $11.41 | $8.66 | $9.97 | $9.24 |
Income (loss) from investment operations: | ||||||
Net investment incomea | .17 | .24 | .16 | .12 | .17 | .15 |
Net realized and unrealized gain (loss) | (.75 ) | (2.08 ) | 2.28 | 2.79 | (1.27 ) | .74 |
Total from investment operations | (.58 ) | (1.84 ) | 2.44 | 2.91 | (1.10 ) | .89 |
Less distributions from: | ||||||
Net investment income | (.05 ) | (.49 ) | (.32 ) | (.16 ) | (.21 ) | (.16 ) |
Net asset value, end of period | $10.57 | $11.20 | $13.53 | $11.41 | $8.66 | $9.97 |
Total Return (%)b | (5.15 )* | (13.69 ) | 21.65 | 33.81 | (11.38 ) | 9.72 |
Ratios to Average Net Assets and Supplemental Data | ||||||
Net assets, end of period ($ millions) | 299 | 372 | 392 | 243 | 149 | 255 |
Ratio of expenses before expense reductions (%) | 1.13 ** | 1.10 | 1.12 | 1.16 | 1.17 | 1.16 |
Ratio of expenses after expense reductions (%) | 1.07 ** | 1.07 | 1.07 | 1.07 | 1.07 | 1.07 |
Ratio of net investment income (%) | 3.01 ** | 2.03 | 1.29 | 1.23 | 1.68 | 1.57 |
Portfolio turnover rate (%) | 33 * | 86 | 65 | 74 | 88 | 72 |
a | Based on average shares outstanding during the period. |
b | Total return would have been lower had certain expenses not been reduced. |
* | Not annualized |
** | Annualized |
DWS RREEF Real Assets Fund | | | 31 |
DWS RREEF Real Assets Fund — Institutional Class | ||||||
Six Months Ended 9/30/23 | Years Ended March 31, | |||||
(Unaudited) | 2023 | 2022 | 2021 | 2020 | 2019 | |
Selected Per Share Data | ||||||
Net asset value, beginning of period | $11.21 | $13.54 | $11.42 | $8.67 | $9.97 | $9.25 |
Income (loss) from investment operations: | ||||||
Net investment incomea | .18 | .26 | .19 | .15 | .17 | .16 |
Net realized and unrealized gain (loss) | (.74 ) | (2.08 ) | 2.27 | 2.77 | (1.25 ) | .73 |
Total from investment operations | (.56 ) | (1.82 ) | 2.46 | 2.92 | (1.08 ) | .89 |
Less distributions from: | ||||||
Net investment income | (.06 ) | (.51 ) | (.34 ) | (.17 ) | (.22 ) | (.17 ) |
Net asset value, end of period | $10.59 | $11.21 | $13.54 | $11.42 | $8.67 | $9.97 |
Total Return (%)b | (5.01 )* | (13.53 ) | 21.83 | 33.94 | (11.17 ) | 9.74 |
Ratios to Average Net Assets and Supplemental Data | ||||||
Net assets, end of period ($ millions) | 4,045 | 5,020 | 4,815 | 1,146 | 340 | 170 |
Ratio of expenses before expense reductions (%) | 1.01 ** | 1.00 | 1.00 | 1.03 | 1.07 | 1.07 |
Ratio of expenses after expense reductions (%) | .90 ** | .90 | .90 | .94 | .95 | .95 |
Ratio of net investment income (%) | 3.20 ** | 2.20 | 1.50 | 1.49 | 1.72 | 1.68 |
Portfolio turnover rate (%) | 33 * | 86 | 65 | 74 | 88 | 72 |
a | Based on average shares outstanding during the period. |
b | Total return would have been lower had certain expenses not been reduced. |
* | Not annualized |
** | Annualized |
32 | | | DWS RREEF Real Assets Fund |
DWS RREEF Real Assets Fund | | | 33 |
34 | | | DWS RREEF Real Assets Fund |
DWS RREEF Real Assets Fund | | | 35 |
36 | | | DWS RREEF Real Assets Fund |
DWS RREEF Real Assets Fund | | | 37 |
38 | | | DWS RREEF Real Assets Fund |
DWS RREEF Real Assets Fund | | | 39 |
Assets Derivative | Futures Contracts |
Commodity Contracts (a) | $9,595,112 |
The above derivative is located in the following Consolidated Statement of Assets and Liabilities account: |
(a) | Includes cumulative appreciation of futures contracts as disclosed in the Consolidated Investment Portfolio. Unsettled variation margin is disclosed separately within the Consolidated Statement of Assets and Liabilities. |
Liability Derivative | Futures Contracts |
Commodity Contracts (a) | $(27,637,602 ) |
The above derivative is located in the following Consolidated Statement of Assets and Liabilities account: |
(a) | Includes cumulative depreciation of futures contracts as disclosed in the Consolidated Investment Portfolio. Unsettled variation margin is disclosed separately within the Consolidated Statement of Assets and Liabilities. |
40 | | | DWS RREEF Real Assets Fund |
Realized Gain (Loss) | Futures Contracts |
Commodity Contracts (a) | $(7,870,033 ) |
The above derivative is located in the following Consolidated Statement of Operations account: |
(a) | Net realized gain (loss) from futures contracts |
Change in Net Unrealized Appreciation (Depreciation) | Futures Contracts |
Commodity Contracts (a) | $(14,029,982 ) |
The above derivative is located in the following Consolidated Statement of Operations account: |
(a) | Change in net unrealized appreciation (depreciation) on futures contracts |
Purchases | Sales | |
Non-U.S. Treasury Obligations | $1,451,920,909 | $2,066,499,083 |
U.S. Treasury Obligations | $86,003,135 | $240,837,925 |
DWS RREEF Real Assets Fund | | | 41 |
First $500 million of the Fund’s average daily net assets | .800% |
Next $1.5 billion of such net assets | .785% |
Next $1.5 billion of such net assets | .775% |
Next $3.0 billion of such net assets | .750% |
Over $6.5 billion of such net assets | .725% |
Class A | 1.22% |
Class C | 1.97% |
Class R | 1.47% |
Class R6 | .90% |
Class S | 1.07% |
Institutional Class | .90% |
Class A | 1.21% | |
Class C | 1.96% | |
Class R | 1.46% | |
Class S | 1.06% |
42 | | | DWS RREEF Real Assets Fund |
Class A | $41,914 |
Class C | 6,277 |
Class R | 2,185 |
Class R6 | 4,982 |
Class S | 96,714 |
Institutional Class | 2,588,584 |
$2,740,656 |
Services to Shareholders | Total Aggregated | Unpaid at September 30, 2023 |
Class A | $10,387 | $3,635 |
Class C | 531 | 186 |
Class R | 162 | 66 |
Class R6 | 1,135 | 358 |
Class S | 36,446 | 14,324 |
Institutional Class | 3,244 | 1,069 |
$51,905 | $19,638 |
DWS RREEF Real Assets Fund | | | 43 |
Sub-Recordkeeping | Total Aggregated |
Class A | $66,146 |
Class C | 12,301 |
Class R | 2,718 |
Class S | 324,221 |
Institutional Class | 2,485,289 |
$2,890,675 |
Distribution Fee | Total Aggregated | Unpaid at September 30, 2023 |
Class C | $78,408 | $11,683 |
Class R | 2,718 | 425 |
$81,126 | $12,108 |
Service Fee | Total Aggregated | Unpaid at September 30, 2023 | Annualized Rate |
Class A | $129,446 | $41,323 | .25% |
Class C | 26,123 | 7,721 | .25% |
Class R | 2,698 | 888 | .25% |
$158,267 | $49,932 |
44 | | | DWS RREEF Real Assets Fund |
DWS RREEF Real Assets Fund | | | 45 |
Six Months Ended September 30, 2023 | Year Ended March 31, 2023 | |||
Shares | Dollars | Shares | Dollars | |
Shares sold | ||||
Class A | 726,659 | $8,116,610 | 3,531,483 | $43,992,755 |
Class C | 42,036 | 467,160 | 863,183 | 10,695,665 |
Class R | 9,072 | 101,746 | 48,342 | 617,866 |
Class R6 | 1,293,024 | 14,322,716 | 7,641,957 | 93,247,331 |
Class S | 2,835,120 | 31,258,446 | 17,901,218 | 220,098,392 |
Institutional Class | 51,700,948 | 572,621,248 | 260,187,106 | 3,160,083,993 |
$626,887,926 | $3,528,736,002 | |||
Shares issued to shareholders in reinvestment of distributions | ||||
Class A | 38,986 | $423,782 | 409,700 | $4,757,955 |
Class T | — | — | 33 * | 390 * |
Class C | 4,173 | 45,021 | 51,756 | 599,069 |
Class R | 766 | 8,373 | 8,712 | 101,955 |
Class R6 | 76,035 | 820,416 | 472,737 | 5,420,965 |
Class S | 140,852 | 1,518,389 | 1,435,984 | 16,523,452 |
Institutional Class | 1,916,771 | 20,681,956 | 16,584,868 | 190,760,121 |
$23,497,937 | $218,163,907 | |||
Shares redeemed | ||||
Class A | (2,168,837 ) | $(24,271,850 ) | (4,443,693 ) | $(52,803,276 ) |
Class T | — | — | (1,221 )* | (13,127 )* |
Class C | (435,146 ) | (4,821,261 ) | (553,068 ) | (6,435,532 ) |
Class R | (26,020 ) | (291,997 ) | (71,914 ) | (847,121 ) |
Class R6 | (1,301,270 ) | (14,294,732 ) | (2,485,400 ) | (29,655,061 ) |
Class S | (7,929,606 ) | (88,457,245 ) | (15,095,165 ) | (173,497,315 ) |
Institutional Class | (119,401,649 ) | (1,319,179,729 ) | (184,438,803 ) | (2,133,899,373 ) |
$(1,451,316,814 ) | $(2,397,150,805 ) |
46 | | | DWS RREEF Real Assets Fund |
Six Months Ended September 30, 2023 | Year Ended March 31, 2023 | |||
Shares | Dollars | Shares | Dollars | |
Net increase (decrease) | ||||
Class A | (1,403,192 ) | $(15,731,458 ) | (502,510 ) | $(4,052,566 ) |
Class T | — | — | (1,188 )* | (12,737 )* |
Class C | (388,937 ) | (4,309,080 ) | 361,871 | 4,859,202 |
Class R | (16,182 ) | (181,878 ) | (14,860 ) | (127,300 ) |
Class R6 | 67,789 | 848,400 | 5,629,294 | 69,013,235 |
Class S | (4,953,634 ) | (55,680,410 ) | 4,242,037 | 63,124,529 |
Institutional Class | (65,783,930 ) | (725,876,525 ) | 92,333,171 | 1,216,944,741 |
$(800,930,951 ) | $1,349,749,104 |
* | For the period from April 1, 2022 to September 30, 2022 (Class T liquidation date). |
DWS RREEF Real Assets Fund | | | 47 |
48 | | | DWS RREEF Real Assets Fund |
DWS RREEF Real Assets Fund | | | 49 |
Actual Fund Return | Class A | Class C | Class R | Class R6 | Class S | Institutional Class |
Beginning Account Value 4/1/23 | $1,000.00 | $1,000.00 | $1,000.00 | $1,000.00 | $1,000.00 | $1,000.00 |
Ending Account Value 9/30/23 | $948.60 | $944.70 | $946.60 | $949.90 | $948.50 | $949.90 |
Expenses Paid per $1,000* | $5.94 | $9.58 | $7.15 | $4.39 | $5.21 | $4.39 |
Hypothetical 5% Fund Return | Class A | Class C | Class R | Class R6 | Class S | Institutional Class |
Beginning Account Value 4/1/23 | $1,000.00 | $1,000.00 | $1,000.00 | $1,000.00 | $1,000.00 | $1,000.00 |
Ending Account Value 9/30/23 | $1,018.90 | $1,015.15 | $1,017.65 | $1,020.50 | $1,019.65 | $1,020.50 |
Expenses Paid per $1,000* | $6.16 | $9.92 | $7.41 | $4.55 | $5.40 | $4.55 |
* | Expenses are equal to the Fund’s annualized expense ratio for each share class, multiplied by the average account value over the period, multiplied by 183 (the number of days in the most recent six-month period), then divided by 366. |
Annualized Expense Ratios | Class A | Class C | Class R | Class R6 | Class S | Institutional Class |
DWS RREEF Real Assets Fund | 1.22% | 1.97% | 1.47% | .90% | 1.07% | .90% |
50 | | | DWS RREEF Real Assets Fund |
DWS RREEF Real Assets Fund | | | 51 |
52 | | | DWS RREEF Real Assets Fund |
DWS RREEF Real Assets Fund | | | 53 |
54 | | | DWS RREEF Real Assets Fund |
DWS RREEF Real Assets Fund | | | 55 |
For More Information | The automated telephone system allows you to access personalized account information and obtain information on other DWS funds using either your voice or your telephone keypad. Certain account types within Classes A, C and S also have the ability to purchase, exchange or redeem shares using this system. |
For more information, contact your financial representative. You may also access our automated telephone system or speak with a Shareholder Service representative by calling: (800) 728-3337 | |
Web Site | dws.com View your account transactions and balances, trade shares, monitor your asset allocation, subscribe to fund and account updates by e-mail, and change your address, 24 hours a day. |
Obtain prospectuses and applications, news about DWS funds, insight from DWS economists and investment specialists and access to DWS fund account information. | |
Written Correspondence | DWS PO Box 219151 Kansas City, MO 64121-9151 |
Proxy Voting | The Fund’s policies and procedures for voting proxies for portfolio securities and information about how the Fund voted proxies related to its portfolio securities during the most recent 12-month period ended June 30 are available on our Web site — dws.com/en-us/resources/proxy-voting — or on the SEC’s Web site — sec.gov. To obtain a written copy of the Fund’s policies and procedures without charge, upon request, call us toll free at (800) 728-3337. |
Portfolio Holdings | Following the Fund’s fiscal first and third quarter-end, a complete portfolio holdings listing is posted on dws.com and is available free of charge by contacting your financial intermediary or, if you are a direct investor, by calling (800) 728-3337. In addition, the portfolio holdings listing is filed with the SEC on the Fund’s Form N-PORT and will be available on the SEC’s Web site at sec.gov. Additional portfolio holdings for the Fund are also posted on dws.com from time to time. Please see the Fund’s current prospectus for more information. |
Principal Underwriter | If you have questions, comments or complaints, contact: DWS Distributors, Inc. 222 South Riverside Plaza Chicago, IL 60606-5808 (800) 621-1148 |
56 | | | DWS RREEF Real Assets Fund |
Investment Management | DWS Investment Management Americas, Inc. (“DIMA” or the “Advisor” ), which is part of the DWS Group GmbH & Co. KGaA (“DWS Group” ), is the investment advisor for the Fund. DIMA and its predecessors have more than 90 years of experience managing mutual funds and DIMA provides a full range of investment advisory services to both institutional and retail clients. DIMA is an indirect, wholly owned subsidiary of DWS Group. |
DWS Group is a global organization that offers a wide range of investing expertise and resources, including hundreds of portfolio managers and analysts and an office network that reaches the world’s major investment centers. This well-resourced global investment platform brings together a wide variety of experience and investment insight across industries, regions, asset classes and investing styles. |
Class A | Class C | Class S | Institutional Class | |
Nasdaq Symbol | AAAAX | AAAPX | AAASX | AAAZX |
CUSIP Number | 25159K 879 | 25159K 887 | 25159K 804 | 25159K 705 |
Fund Number | 487 | 787 | 2087 | 1487 |
For shareholders of Class R and Class R6 | |
Automated Information Line | DWS/Ascensus Plan Access (800) 728-3337 |
24-hour access to your retirement plan account. | |
Web Site | dws.com |
Obtain prospectuses and applications, news about DWS funds, insight from DWS economists and investment specialists and access to DWS fund account information. | |
Log in/register to manage retirement account assets at https://www.mykplan.com/participantsecure_net/login.aspx. | |
For More Information | (800) 728-3337 |
To speak with a service representative. | |
Written Correspondence | DWS Service Company 222 South Riverside Plaza Chicago, IL 60606-5806 |
Class R | Class R6 | |
Nasdaq Symbol | AAAQX | AAAVX |
CUSIP Number | 25159K 200 | 25159K 713 |
Fund Number | 1587 | 1687 |
DWS RREEF Real Assets Fund | | | 57 |
(b) Not applicable | ||
ITEM 2. | CODE OF ETHICS | |
Not applicable. | ||
ITEM 3. | AUDIT COMMITTEE FINANCIAL EXPERT | |
Not applicable | ||
ITEM 4. | PRINCIPAL ACCOUNTANT FEES AND SERVICES | |
Not applicable | ||
ITEM 5. | AUDIT COMMITTEE OF LISTED REGISTRANTS | |
Not applicable | ||
ITEM 6. | INVESTMENTS | |
Not applicable | ||
ITEM 7. | DISCLOSURE OF PROXY VOTING POLICIES AND PROCEDURES FOR CLOSED-END MANAGEMENT INVESTMENT COMPANIES | |
Not applicable | ||
ITEM 8. | PORTFOLIO MANAGERS OF CLOSED-END MANAGEMENT INVESTMENT COMPANIES | |
Not applicable | ||
ITEM 9. | PURCHASES OF EQUITY SECURITIES BY CLOSED-END MANAGEMENT INVESTMENT COMPANY AND AFFILIATED PURCHASERS | |
Not applicable | ||
ITEM 10. | SUBMISSION OF MATTERS TO A VOTE OF SECURITY HOLDERS | |
There were no material changes to the procedures by which shareholders may recommend nominees to the Fund’s Board. The primary function of the Nominating and Governance Committee is to identify and recommend individuals for membership on the Board and oversee the administration of the Board Governance Guidelines. Shareholders may recommend candidates for Board positions by forwarding their correspondence by U.S. mail or courier service to Keith R. Fox, DWS Funds Board Chair, c/o Thomas R. Hiller, Ropes & Gray LLP, Prudential Tower, 800 Boylston Street, Boston, MA 02199-3600. | ||
ITEM 11. | CONTROLS AND PROCEDURES | |
(a) | The Chief Executive and Financial Officers concluded that the Registrant’s Disclosure Controls and Procedures are effective based on the evaluation of the Disclosure Controls and Procedures as of a date within 90 days of the filing date of this report. | |
(b) | There have been no changes in the registrant’s internal control over financial reporting that occurred during the period covered by this report that has materially affected, or is reasonably likely to materially affect, the registrant’s internal controls over financial reporting. | |
ITEM 12. | Disclosure of Securities Lending Activities for Closed-End Management Investment Companies. | |
Not applicable | ||
ITEM 13. | EXHIBITS | |
(a)(1) | Not applicable | |
(a)(2) | Certification pursuant to Rule 30a-2(a) under the Investment Company Act of 1940 (17 CFR 270.30a-2(a)) is filed and attached hereto as Exhibit 99.CERT. | |
(b) | Certification pursuant to Rule 30a-2(b) under the Investment Company Act of 1940 (17 CFR 270.30a-2(b)) is furnished and attached hereto as Exhibit 99.906CERT. |
SIGNATURES
Pursuant to the requirements of the Securities Exchange Act of 1934 and the Investment Company Act of 1940, the registrant has duly caused this report to be signed on its behalf by the undersigned, thereunto duly authorized.
Registrant: | DWS RREEF Real Assets Fund, a series of Deutsche DWS Market Trust |
By: | /s/Hepsen Uzcan Hepsen Uzcan President |
Date: | 11/29/2023 |
Pursuant to the requirements of the Securities Exchange Act of 1934 and the Investment Company Act of 1940, this report has been signed below by the following persons on behalf of the registrant and in the capacities and on the dates indicated.
By: | /s/Hepsen Uzcan Hepsen Uzcan President |
Date: | 11/29/2023 |
By: | /s/Diane Kenneally Diane Kenneally Chief Financial Officer and Treasurer |
Date: | 11/29/2023 |