UNITED STATES
SECURITIES AND EXCHANGE COMMISSION
Washington, D.C. 20549
FORM N-CSR
CERTIFIED SHAREHOLDER REPORT OF REGISTERED
MANAGEMENT INVESTMENT COMPANIES
Investment Company Act file number | 811-1735 |
|
FPA NEW INCOME, INC. |
(Exact name of registrant as specified in charter) |
|
11400 WEST OLYMPIC BLVD., SUITE 1200, LOS ANGELES, CALIFORNIA | | 90064 |
(Address of principal executive offices) | | (Zip code) |
|
J. RICHARD ATWOOD, 11400 WEST OLYMPIC BLVD., SUITE 1200, LOS ANGELES, CALIFORNIA 90064 |
(Name and address of agent for service) |
|
Registrant’s telephone number, including area code: | 310-473-0225 | |
|
Date of fiscal year end: | SEPTEMBER 30 | |
|
Date of reporting period: | MARCH 31, 2012 | |
| | | | | | | |
Item 1. Report to Stockholders.
FPA New Income, Inc.
Semi-Annual Report
March 31, 2012

Distributor:
FPA FUND DISTRIBUTORS, INC.
11400 West Olympic Boulevard, Suite 1200
Los Angeles, California 90064
LETTER TO SHAREHOLDERS
Performance Discussion
This Semi-Annual Report covers the six-month period ended March 31, 2012. Your Fund's net asset value (NAV) closed at $10.70. Dividends of $0.11 and $0.10 were paid on October 7 and December 21, 2011, to holders of record on September 30 and December 19, 2011, respectively. There were no capital gains distributions.
The following table shows the average annual total return for several different periods ended on that date for the Fund calculated at net asset value (NAV) and net of the maximum sales charge of 3.5% of the offering price.
| | | Periods Ended March 31, 2012 | |
| | | 1 Year | | 5 Years | | 10 Years | | 15 Years | | 20 Years | | 25 Years | | 6/30/1984
Inception | |
| FPA New Income (NAV)* | | | 1.78 | % | | | 3.54 | % | | | 3.78 | % | | | 5.13 | % | | | 5.99 | % | | | 6.92 | % | | | 8.18 | % | |
FPA New Income
(Net of Sales Charge)** | | | -1.79 | % | | | 2.80 | % | | | 3.41 | % | | | 4.88 | % | | | 5.81 | % | | | 6.77 | % | | | 8.04 | % | |
Lipper A-Rated Fund
Average | | | 7.42 | % | | | 5.84 | % | | | 5.55 | % | | | 5.83 | % | | | 6.33 | % | | | NA | | | | NA | | |
| Barclays Govt/Credit Index | | | 8.53 | % | | | 6.26 | % | | | 5.91 | % | | | 6.42 | % | | | 6.65 | % | | | 7.10 | % | | | 8.33 | % | |
The data quoted represents past performance, and an investment in the Fund may fluctuate so that an investor's shares when redeemed may be worth more or less than their original cost and prior performance does not guarantee future results. The Barclays Government/Credit Index is a broad-based unmanaged index of all government and corporate bonds that are investment grade with at least one year to maturity. The Barclays Government/Credit Index does not reflect any commissions or fees which would be incurred by an investor purchasing the securities it represents. The Lipper A-Rated Fund Average provides an additional comparison of how your Fund performed in relation to other mutual funds with similar objectives. The Lipper data does not include sales charges. The Fund's most recent month-end performance can be obtained online at www.fpafunds.com.
FPA New Income, Inc., implementing FPA's absolute return fixed income strategy, returned 0.66% for the period from October 1, 2011 to March 31, 2012. This compares with the Barclays Government/Credit Index and CPI + 100 basis points, which returned 1.26% and 1.45%, respectively, during the same period. Given our positioning, such relative performance was to be expected. However, as interest rates rose during the past two months (as discussed in detail below) your Fund saw the benefits of our now longstanding approach to risk and reward in light of the current fixed income environment.
We would like to highlight three areas of the portfolio that positively contributed to performance during the reporting period:
• GNMA project loan interest-only securities, currently comprising around 9% of the portfolio, continue to generate attractive yields and additionally benefit the portfolio through the receipt of prepayment penalties;
• Single family mortgage interest-only securities, comprising approximately 4% of the portfolio, provide the portfolio an attractive current yield and tend to benefit from rising interest rates;
• 10-year amortization agency mortgage securities, comprising about 23% of the portfolio, are relatively liquid even in times of market dislocation and provide income while we wait for more attractive opportunities.
* Does not reflect deduction of the sales charge which, if reflected, would reduce the performance shown.
** Reflects deduction of the maximum sales charge of 3.5% of the offering price.
1
Portfolio Commentary
The portfolio had an effective duration of approximately 1.5 years at the end of March (which is up from 0.89 years six months earlier), compared to 5.9 years for the Barclays Government/Credit Index. This equates to the Fund taking just 25% of the benchmark's interest rate risk. The increase in interest rates during the last six months, as measured by the 10-year Treasury note, which rose from 1.91% to 2.23% during the period, afforded us the opportunity to strategically add to some of our longer duration holdings at more attractive absolute returns, increasing the portfolio's yield while only slightly increasing our interest rate risk.
The portfolio had a yield to worst of 2.54% (the lowest potential yield that can be received without the issuers defaulting), in contrast with 1.96% for the Barclays Government/Credit Index. The portfolio's average credit quality was similar to the Index.
In summary, your Fund's portfolio has a shorter duration than and similar credit quality to the index, yet has a higher yield. This, in our opinion, results in a better risk/reward proposition than the overall fixed income market is offering.
The value of our lower interest rate risk and higher yield is exhibited by the table below which shows the change in intermediate- and longer-term Treasury rates for the period from January 31 through March 20 and the impact on performance for both the Fund and major bond indexes.
| | | Yield on
1/31/12 | | Yield on
3/20/12 | | Percentage
Increase | |
| 5-Year Treasury Note | | | 0.71 | % | | | 1.22 | % | | | 71.8 | % | |
| 10-Year Treasury Note | | | 1.83 | % | | | 2.38 | % | | | 30.1 | % | |
| | | Total Return
(1/31/12-3/20/12) | | | | | |
| FPA New Income | | | 0.19 | % | | | | | | | | | |
| Barclays Govt/Credit Index | | | -1.49 | % | | | | | | | | | |
| Barclays Aggregate Bond Index | | | -1.02 | % | | | | | | | | | |
This serves as a good reminder that the timing of rising interest rates is unpredictable and can happen despite the best efforts of the Federal Reserve. Given that interest rates are still negative in real terms (yield to maturity minus the trailing twelve month rate of inflation) even after the most recent rise, we remain hesitant to put investor capital at risk in longer dated securities until we are adequately compensated for doing so.
Purchases in the Portfolio
We committed approximately one third of the portfolio, part of which had previously been in cash and equivalents, into fixed income markets over the past six months. Primary purchases were in two key areas.
The largest allocation of capital went to agency-backed securities (MBS), specifically 3% and 3.5% mortgage pools backed by 10-year amortization mortgages. We expect these pools to yield between 1.75 – 1.95%, based upon an average life of 3.5 – 4.5 years. The 'average life' is driven by the range of potential prepayments that could occur over the lifetime of the loan.
Second, we purchased collateralized mortgage obligations (CMOs) backed by the same loans.
For these CMOs, we concentrated on creating interest-only securities (IOs) backed by this same type of mortgage loan. Depending on the pace of prepayments, these CMOs could yield between 5% and 10% with the same average life span.
2
Other areas of investment were commercial mortgage-backed securities, which we purchased with a yield-to-worst range of 1.80% to 7.73% and a range of average lives of 0.2 to 3.2 years, and other asset-backed securities with an average 1.71% yield and an average life just short of 2 years.
Decisions Driving Our Purchases
In general, we seek high credit quality debtors with low loan-to-value ratios and minimal sensitivity to refinancing. We are drawn to borrowers where the data demonstrates a desire to reduce the loan balance and own the property free and clear because these borrowers are less likely to refinance. This contrasts with borrowers motivated primarily by the amount of the monthly payment.
By scrutinizing the data behind these securities, we are able to extrapolate much about the behavior of the underlying borrower. Signposts that signal a prudent borrower, who is unlikely to default, are apparent — you just have to be able to recognize them. A ten-year maturity indicates a relatively rapid accrual of equity in a property, and that in turn translates to a borrower putting their own capital at risk. Since we are also putting our capital at risk, we like this alignment of interest. The borrowers we pursue have more to lose, and so they tend to default less often.
Since we seek slower rates of loan prepayment, yellow flags pop up with third-party loan origination, as borrowers associated with mortgage-broker-generated loans tend to refinance faster. We avoid loan servicers that aggressively turn over their mortgage loan books to generate fee income. We even steer clear of certain property markets altogether; for example, we disfavor fine-weather California, where people move and/or refinance often. We prefer the East Coast's relative permanence and/or the blustery Midwest. We sift and sort by loan size and by fixed costs of refinancing. Mixing it all together, we hope to identify loan pools that prepay at a slower rate than the market anticipates or, simply put, just a slower rate than the average borrower.
Moving from the purely domestic world of U.S. mortgage loans to a scenario that has evolved on the world stage, last December we found ourselves well positioned to capture a new source of income. The opportunity arose from the Greek debt crisis. A European bank in need of liquidity to compensate for problem loans came to the market with a large pool of Government National Mortgage Association (GNMA) project loan short average life bonds for sale. Buyers were scarce due to the holidays. We committed a substantial amount to this transaction and shareholders benefited from the forced sale of a high-quality holding by a seller under pressure.
GNMA project loans are loans on apartments, nursing homes, and assisting living facilities where the government is making a portion of the rental payment — all kinds of government-assisted housing. GNMA guarantees the mortgages. It's a high-quality loan because of the guarantee, and a forced seller makes the yield even more attractive.
Over the past six months we increased our accumulation of these securities with yields in the range of 1.70% to 2.10% and average lives of less than 2.5 years, and we now have a total allocation of about 9%. These potential returns are more attractive to us than other high-quality short-maturity alternatives.
Macroeconomic Environment
There's been chatter in the investment world about climbing and/or descending a 'wall of worry'. That image illustrates the need to refinance large amounts of public and private debt. At FPA, as always, we scan the environment at both macro and granular levels. In the case of this metaphor, we note that every wall is comprised of individual bricks. No single brick is imposing at first glance; indeed, they appear innocuous. But taken together, the bricks form a wall of impressive magnitude.
If you liken each sector of the bond market to a brick, and view that brick as a component of a coming wall of debt to be refinanced over the next five years, it results in a scary refinancing scenario.
Let's parse through it.
3
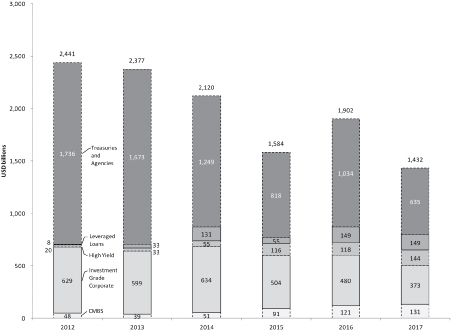
The chart below estimates the domestic maturity 'wall' over the next five years. Note that Treasury securities that need refinancing do not include the Federal government's deficit over the next five years. According to "Budget and Economic Outlook: Fiscal Years 2012-2022", published by the Congressional Budget Office (CBO) in January 2012, the total Federal government deficit through 2017 will be approximately $2.8 trillion. Given the length of the projections and the assumptions of growth, interest rates and revenue collections it is difficult to vouch for the accuracy of this number. But it is still instructive for the purposes of this letter.
We have discussed on prior conference calls and shareholder letters the Federal government's near-term fiscal woes and the impact on economic growth over the next several years. In addition to previously mentioned issues (election year, entitlements, Obamacare etc.), we'd like to add a few more for 2012 that continue to create economic uncertainty, and still seek a resolution. These include:
Bush era tax rates, which expire at the end of 2012, including ordinary income and investment income tax rates. If not resolved, all will increase significantly in 2013.
Payroll tax cut, which expires for all wage earners at the end of 2012.
Debt ceiling, which will need to be increased at the end of 2012.
Accelerated depreciation deduction for purchases of equipment, expiring in 2012.
My partner Bob Rodriguez refers to these facts as the Fiscal Cliff that occurs on January 1, 2013 when various fiscal policies, expiration of tax cuts, program expirations (payroll and unemployment), tax program increases (healthcare), expiration accelerated depreciation etc. are coming due. If this occurs, the result could cause a drag on the US economy to the tune of 3-31/2%.
Unfortunately, this is only a partial list. As of now, there is no credible plan in place to reverse the Federal government's catastrophic fiscal situation. In our opinion, none will be forthcoming until after the presidential election. In an optimal scenario, 2013 would be devoted to the discussion and passage of plans with implementation commencing in 2014-2015.
Last year the Treasury issued approximately $1.06 trillion in new debt. Overseas buyers purchased $286 billion and the U.S. Federal Reserve Bank purchased $653 million, leaving about $161 billion to be bought by everyone else. Over the coming two years, the CBO estimates that $1.2 trillion in additional Treasury financing will be required. If the last year's pattern of purchases by overseas buyers holds true going forward, then they will absorb 27% or $324 billion, leaving $876 billion to be purchased by the Fed and other domestic entities. Every maturity from 10 years inwards has a negative real yield. This poor return profile is unlikely to entice prospective private-sector investors.
Institutional investors express themselves by underweighting this segment of the market. That leaves the Fed as the sole remaining buyer, unless it cajoles foreign central banks to participate. Given this situation, it may not be a stretch to see the real return on Treasury bonds move from negative to positive in order to incentivize the private sector; either inflation declines or the Treasury rate will rise. The only way for this not to happen is for the Fed to be the marginal buyer of the additional Treasury issuance. That may also be called QE? — the vehicle used to purchase the new supply. Bear in mind that the Federal government must refinance $3.4 trillion in debt at the same time.
In our view, neither option is a short, intermediate, or long-term positive for bond investors. Either interest rates start increasing now to accommodate the need for the private sector to buy the additional issuance, or the Fed continues to print money to buy the new bonds. Either way, over the intermediate term we see a resulting increase in potential inflation due to too much money chasing too few goods.
4
Fortunately, the needs of commercial mortgage-backed securities, investment grade, high yield and leveraged loan corporates amount to only $1.4 trillion over the next two years. But, as the chart illustrates, starting in 2014 the needs across the private sector increase from $705 billion in 2013 to $873 billion in 2014, decline to $766 billion in 2015, then again increase to the $797 – $868 billion range annually through 2017. These estimates do not include any new capital needs from these areas of the market and do not include needs from the Euro zone or Japan, two other highly levered developed economic regions.
Our point is that the credit sectors of the domestic bond market will need to undertake very large refinancing after resolution of the Federal government's near-term and additional financing needs. From a monetary perspective, the Federal Reserve Bank currently expects to start raising the Fed Funds rate and exit its 'zero interest' rate policy in the latter half of 2014. How this change is interpreted by investors, and how it will be implemented, will have a significant impact on the level of Treasury interest rates coming into the peak refinancing needs of the private sector. Looking at it today, the totality of all of these unknown elements leads us to conclude that the investment landscape, going forward, is shrouded in uncertainty.
Domestic Maturity "Wall"
5
Navigating Through the Fog
So, what tactics should a prudent portfolio manager adopt to best operate in this climate, much less take advantage of possible future outcomes? One approach would be to invest today with a short-term time horizon, purchasing assets that may perform best over the next 9 to 18 months. Then, in 2014 and beyond, sell those assets and redeploy the proceeds into whatever market sectors look attractive at the time.
This may sound good but the problem with this approach is that the liquidity situation for selling bonds in 2014 is unknown. If it is not very constructive, the resulting price haircut will inevitably impair the re-investable proceeds. Another problem is that no one can credibly know what interest rates will be in 2014; if rates are higher, the sale proceeds could be lower than the principal value of what was purchased. Again, the re-investable proceeds are threatened.
We favor a different approach. We aim to minimize and/or eliminate both market risks. We intend to focus on i) maturity and ii) amortization of principal as the primary return drivers of our invested capital. In this way we can position the portfolio to recover 100% of the capital we deploy today in the period 2014-17.
We've constructed a portfolio which, after adding in maturities and amortization of principal, over 75% of the portfolio's total value is returned for reinvestment between 2013 and 2017. In this way we have maximum flexibility to reinvest during the period of high refinancing, that is, the wall of debt and its bricks. We expect that both fiscal policy and monetary policy should be much clearer by that time. This could mean significantly higher interest rates across the maturity spectrum, which implies a more normalized risk and reward environment.
Over the coming year, shareholders can expect the portfolio to maintain focus in those same areas invested over the past six months. That said, we are not averse to taking on more credit or interest rate risk should attractive opportunities present themselves. For example, if there is difficulty resolving the policy items, listed above, that are tagged for resolution in 2012, we anticipate related opportunities (along the line of our GNMA purchase from distressed European bank). Overall, however, we continue to focus on maturities and principal amortization that returns your capital back for reinvestment in the 2014-17 time frame.
We at FPA thank you for your continued trust placed in our investment team and strategy through your investment in FPA New Income, Inc.
Respectfully submitted,

Thomas H. Atteberry
Chief Executive Officer and Portfolio Manager
April 19, 2012
The discussion of Fund investments represents the views of the Fund's managers at the time of this report and are subject to change without notice. References to individual securities are for informational purposes only and should not be construed as recommendations to purchase or sell individual securities.
6
FORWARD LOOKING STATEMENT DISCLOSURE
As mutual fund managers, one of our responsibilities is to communicate with shareholders in an open and direct manner. Insofar as some of our opinions and comments in our letters to shareholders are based on current management expectations, they are considered "forward-looking statements" which may or may not be accurate over the long term. While we believe we have a reasonable basis for our comments and we have confidence in our opinions, actual results may differ materially from those we anticipate. You can identify forward-looking statements by words such as "believe," "expect," "may," "anticipate," and other similar expressions when discussing prospects for particular portfolio holdings and/or the markets, generally. We cannot, however, assure future results and disclaim any obligation to update or alter any forward-looking statements, whether as a result of new information, future events, or otherwise. Further, information provided in this report should not be construed as a recommendation to purchase or sell any particular security.
7
PORTFOLIO SUMMARY
March 31, 2012
(Unaudited)
| Bonds & Debentures | | | | | 93.1 | % | |
| Mortgage Pass-Through | | | 29.3 | % | | | | | |
| Mortgage-Backed | | | 19.4 | % | | | | | |
| Commercial Mortgage-Backed | | | 14.9 | % | | | | | |
| Stripped Mortgage-Backed | | | 13.1 | % | | | | | |
| Asset-Backed | | | 10.2 | % | | | | | |
| U.S. Treasuries* | | | 2.9 | % | | | | | |
| Corporate | | | 2.6 | % | | | | | |
| U.S. Agencies | | | 0.7 | % | | | | | |
| Short-Term Investments* | | | | | 7.5 | % | |
| Other Assets and Liabilities, net* | | | | | -0.6 | % | |
| Total Net Assets | | | | | 100.0 | % | |
| *Cash Plus Liquidity | | | | | 9.8 | % | |
MAJOR PORTFOLIO CHANGES
For the Six Months Ended March 31, 2012
(Unaudited)
| | | Principal
Amount | |
| NET PURCHASES | | | |
| Federal National Mortgage Association | |
| 2012-48 CL MB — 3.5% 2027 (1) | | $ | 56,983,369 | | |
| 2012-41 CL LB — 3.5% 2042 (1) | | $ | 56,947,125 | | |
| Government National Mortgage Association | |
| 2007-34 CL B — 4.579% 2031 (1) | | $ | 50,753,664 | | |
| 2006-67 CL B — 4.858% 2034 (1) | | $ | 60,662,306 | | |
| NET SALES | | | |
| Federal National Mortgage Association MA029— 4% 2020 (2) | | $ | 54,084,797 | | |
| U.S. Treasury Notes | |
| — 0.375% 2012 | | $ | 70,084,766 | | |
| — 4.25% 2012 | | $ | 51,791,016 | | |
(1) Indicates new commitment to portfolio
(2) Indicates elimination from portfolio
8
PORTFOLIO OF INVESTMENTS
March 31, 2012
(Unaudited)
| BONDS & DEBENTURES | | Principal
Amount | | Value | |
| MORTGAGE PASS-THROUGH SECURITIES — 29.3% | | | |
| Federal Home Loan Mortgage Corporation | |
| 847526 — 2.373% 2034 | | $ | 7,650,080 | | | $ | 8,082,462 | | |
| 782629 — 2.384% 2035 | | | 1,188,219 | | | | 1,261,853 | | |
| 848215 — 2.424% 2038 | | | 4,743,971 | | | | 5,023,676 | | |
| J12954 — 3.5% 2020 | | | 6,608,479 | | | | 6,929,519 | | |
| J13919 — 3.5% 2020 | | | 42,421,180 | | | | 44,727,832 | | |
| E97666 — 4% 2018 | | | 13,154,453 | | | | 14,063,426 | | |
| J11574 — 4% 2020 | | | 14,890,082 | | | | 15,773,957 | | |
| G18305 — 4% 2024 | | | 13,343,867 | | | | 14,181,862 | | |
| J11410 — 4% 2025 | | | 16,287,593 | | | | 17,262,894 | | |
| G14025 — 4% 2025 | | | 40,547,087 | | | | 43,093,444 | | |
| J12397 — 4% 2025 | | | 24,544,756 | | | | 26,014,741 | | |
| J11204 — 4.5% 2019 | | | 10,436,911 | | | | 11,122,825 | | |
| E01322 — 5% 2018 | | | 11,500,466 | | | | 12,452,360 | | |
| G13091 — 5% 2018 | | | 5,828,609 | | | | 6,328,762 | | |
| E01642 — 5% 2019 | | | 7,197,681 | | | | 7,815,314 | | |
| G13812 — 5% 2020 | | | 18,752,383 | | | | 20,361,525 | | |
| G14187 — 5.5% 2020 | | | 26,731,433 | | | | 28,998,526 | | |
| G12139 — 6.5% 2019 | | | 3,081,080 | | | | 3,428,749 | | |
| A26942 — 6.5% 2034 | | | 991,721 | | | | 1,153,937 | | |
| G08107 — 6.5% 2036 | | | 4,157,529 | | | | 4,866,180 | | |
| P50543 — 6.5% 2037 | | | 353,613 | | | | 418,904 | | |
| Federal National Mortgage Association | |
| AD0705 — 2.418% 2040 | | | 8,313,654 | | | | 8,804,575 | | |
| 890328 — 3% 2020 | | | 31,143,567 | | | | 32,326,400 | | |
| AB4390 — 3% 2022 | | | 49,165,826 | | | | 51,462,794 | | |
| MA0577 — 3.5% 2020 | | | 22,186,099 | | | | 23,329,571 | | |
| MA0598 — 3.5% 2020 | | | 8,165,201 | | | | 8,586,035 | | |
| MA0629 — 3.5% 2021 | | | 81,297,889 | | | | 85,918,528 | | |
| AB4015 — 3.5% 2021 | | | 7,110,399 | | | | 7,476,869 | | |
| MA0905 — 3.5% 2021 | | | 22,328,030 | | | | 23,597,064 | | |
| MA0989 — 3.5% 2022 | | | 58,009,755 | | | | 60,999,578 | | |
| MA1019 — 3.5% 2022 | | | 61,474,215 | | | | 64,968,157 | | |
| 932108 — 4% 2019 | | | 13,349,591 | | | | 14,187,945 | | |
| 931711 — 4% 2019 | | | 9,998,241 | | | | 10,626,130 | | |
| MA0150 — 4% 2019 | | | 44,271,710 | | | | 47,051,973 | | |
| MA0203 — 4% 2019 | | | 23,237,244 | | | | 24,696,543 | | |
| MA0235 — 4% 2019 | | | 21,025,424 | | | | 22,345,821 | | |
| MA0267 — 4% 2019 | | | 15,039,139 | | | | 15,983,597 | | |
| MA0099 — 4% 2019 | | | 12,754,338 | | | | 13,555,310 | | |
| MA0124 — 4% 2019 | | | 3,224,169 | | | | 3,426,647 | | |
9
PORTFOLIO OF INVESTMENTS
March 31, 2012
(Unaudited)
| BONDS & DEBENTURES — Continued | | Principal
Amount | | Value | |
| 932433 — 4% 2020 | | $ | 1,596,274 | | | $ | 1,696,520 | | |
| MA0380 — 4% 2020 | | | 12,597,576 | | | | 13,388,704 | | |
| MA0322 — 4% 2020 | | | 24,353,920 | | | | 25,883,346 | | |
| MA0357 — 4% 2020 | | | 43,184,524 | | | | 45,896,512 | | |
| MA0430 — 4% 2020 | | | 7,992,005 | | | | 8,493,903 | | |
| AA4552 — 4% 2024 | | | 1,474,536 | | | | 1,566,591 | | |
| AC8539 — 4% 2024 | | | 6,588,251 | | | | 6,994,944 | | |
| AB1243 — 4% 2025 | | | 37,640,407 | | | | 39,932,331 | | |
| AE0307 — 4% 2025 | | | 6,021,311 | | | | 6,393,007 | | |
| AD9338 — 4% 2025 | | | 5,475,630 | | | | 5,807,891 | | |
| AH4841 — 4% 2026 | | | 32,228,369 | | | | 34,121,141 | | |
| 735494 — 4.5% 2020 | | | 25,258,071 | | | | 27,202,942 | | |
| AA8521 — 4.5% 2020 | | | 13,322,977 | | | | 14,375,492 | | |
| AA0905 — 4.5% 2021 | | | 6,962,569 | | | | 7,520,340 | | |
| 995756 — 5% 2018 | | | 18,737,568 | | | | 20,335,695 | | |
| 735453 — 5% 2019 | | | 9,828,275 | | | | 10,718,029 | | |
| AE0126 — 5% 2020 | | | 24,428,992 | | | | 26,601,218 | | |
| 890122 — 5% 2021 | | | 8,341,309 | | | | 9,106,624 | | |
| 890083 — 5% 2021 | | | 10,192,594 | | | | 11,065,997 | | |
| 995861 — 5% 2021 | | | 20,178,647 | | | | 21,907,755 | | |
| AE0792 — 5% 2026 | | | 18,513,222 | | | | 20,196,814 | | |
| 257100 — 5.5% 2018 | | | 2,034,372 | | | | 2,215,879 | | |
| 745500 — 5.5% 2018 | | | 14,459,360 | | | | 15,763,160 | | |
| 995327 — 5.5% 2019 | | | 4,275,207 | | | | 4,662,028 | | |
| 735521 — 5.5% 2020 | | | 7,976,930 | | | | 8,698,284 | | |
| 889318 — 5.5% 2020 | | | 16,195,454 | | | | 17,669,402 | | |
| 995284 — 5.5% 2020 | | | 18,223,495 | | | | 19,866,161 | | |
| 889069 — 5.5% 2021 | | | 15,225,091 | | | | 16,599,917 | | |
| AE0237 — 5.5% 2023 | | | 19,551,823 | | | | 21,316,375 | | |
| 865963 — 5.828% 2036 | | | 4,808,379 | | | | 5,162,997 | | |
| 745832 — 6% 2021 | | | 33,504,096 | | | | 36,230,659 | | |
| AD0951 — 6% 2021 | | | 18,502,725 | | | | 20,009,957 | | |
| 890225 — 6% 2023 | | | 18,764,503 | | | | 20,291,183 | | |
| 923306 — 6.5% 2037 | | | 249,053 | | | | 277,149 | | |
| 323282 — 7.5% 2028 | | | 473,797 | | | | 550,453 | | |
| Government National Mortgage Association | |
| 782281 — 6% 2023 | | | 6,469,957 | | | | 6,994,024 | | |
| TOTAL MORTGAGE PASS-THROUGH SECURITIES | | $ | 1,368,219,709 | | |
10
PORTFOLIO OF INVESTMENTS
March 31, 2012
(Unaudited)
| BONDS & DEBENTURES — Continued | | Principal
Amount | | Value | |
| MORTGAGE-BACKED SECURITIES — 19.4% | | | |
| CMSI 2005-5 CL 2A3 — 5% 2020 | | $ | 647,048 | | | $ | 663,625 | | |
| Federal Home Loan Bank | |
| 00-0606 CL Y — 5.27% 2012 | | | 11,466,025 | | | | 11,797,278 | | |
| I7-2014 1 — 5.34% 2014 | | | 27,978,720 | | | | 29,680,106 | | |
| VN-2015 CL A — 5.46% 2015 | | | 22,707,177 | | | | 24,497,865 | | |
| 00-0986 — 5.739% 2014 | | | 21,393,460 | | | | 23,011,661 | | |
| Federal Home Loan Mortgage Corporation | |
| 3829 CL CD — 3% 2024 | | | 9,009,164 | | | | 9,314,214 | | |
| 2630 CL KS — 4% 2017 | | | 3,310,120 | | | | 3,321,904 | | |
| 2786 CL JC — 4% 2018 | | | 1,149,018 | | | | 1,162,209 | | |
| 3806 CL AB — 4% 2023 | | | 23,563,525 | | | | 24,868,473 | | |
| 2869 CL JA — 4% 2034 | | | 10,007,629 | | | | 10,202,478 | | |
| 2877 CL WA — 4.25% 2034 | | | 10,544,345 | | | | 10,961,268 | | |
| 3578 CL AM — 4.5% 2016 | | | 7,359,950 | | | | 7,791,537 | | |
| 2677 CL LD — 4.5% 2017 | | | 5,808,287 | | | | 5,880,600 | | |
| 2914 CL JQ — 4.5% 2019 | | | 6,449,449 | | | | 6,667,247 | | |
| 3439 CL AC — 4.5% 2022 | | | 12,911,972 | | | | 13,369,701 | | |
| 2509 CL CB — 5% 2017 | | | 6,645,724 | | | | 7,026,059 | | |
| 2602 CL ET — 5% 2017 | | | 4,392,567 | | | | 4,512,792 | | |
| 2747 CL DX — 5% 2019 | | | 10,566,587 | | | | 11,366,266 | | |
| 3852 CL HA — 5% 2021 | | | 19,873,246 | | | | 21,415,211 | | |
| 3285 CL LC — 5% 2025 | | | 11,756,194 | | | | 12,149,909 | | |
| 2494 CL CF — 5.5% 2017 | | | 7,068,222 | | | | 7,573,529 | | |
| 2503 CL B — 5.5% 2017 | | | 6,969,027 | | | | 7,451,772 | | |
| R005 CL AB — 5.5% 2018 | | | 7,409,430 | | | | 7,500,714 | | |
| 3808 CL BQ — 5.5% 2025 | | | 28,351,828 | | | | 30,633,300 | | |
| 3806 CL JB — 5.5% 2026 | | | 10,992,697 | | | | 12,052,173 | | |
| 3855 CL HQ — 5.5% 2026 | | | 15,581,444 | | | | 16,906,178 | | |
| 2903 CL UZ — 5.5% 2031 | | | 546,976 | | | | 547,096 | | |
| 2922 CL Z — 5.5% 2032 | | | 3,122,487 | | | | 3,211,946 | | |
| 2670 CL QG — 5.5% 2032 | | | 21,000,510 | | | | 21,804,410 | | |
| 3133 CL BD — 5.75% 2033 | | | 3,078,884 | | | | 3,153,947 | | |
| 3926 CL GP — 6% 2025 | | | 13,490,777 | | | | 14,542,788 | | |
| 3614 CL DY — 6% 2032 | | | 19,866,348 | | | | 22,213,160 | | |
| Federal National Mortgage Association | |
| 2011-125 GD — 3.5% 2025 | | | 24,796,503 | | | | 25,447,163 | | |
| 2012-48 CL MB — 3.5% 2027 | | | 54,440,000 | | | | 56,983,369 | | |
| 2012-8 CL LE — 3.5% 2042 | | | 43,390,000 | | | | 45,042,478 | | |
| 2012-26 CL ME — 3.5% 2042 | | | 56,555,000 | | | | 58,749,769 | | |
| 2012-41 CL LB — 3.5% 2042 | | | 54,300,000 | | | | 56,947,125 | | |
| 2009-68 KA — 3.75% 2022 | | | 4,249,709 | | | | 4,373,206 | | |
11
PORTFOLIO OF INVESTMENTS
March 31, 2012
(Unaudited)
| BONDS & DEBENTURES — Continued | | Principal
Amount | | Value | |
| 2011-67 CL EA — 4% 2021 | | $ | 46,024,711 | | | $ | 48,618,664 | | |
| 2009-70 CL NU — 4.25% 2019 | | | 15,770,675 | | | | 16,704,930 | | |
| 2004-90 CL GA — 4.35% 2034 | | | 8,685,376 | | | | 8,999,092 | | |
| 2003-24 CL PD — 5% 2018 | | | 7,449,464 | | | | 7,961,019 | | |
| 2008-77 CL DA — 5% 2023 | | | 8,189,649 | | | | 8,653,838 | | |
| 2005-4 CL E — 5% 2032 | | | 4,172,316 | | | | 4,231,021 | | |
| 2010-39 CL PL — 5% 2032 | | | 14,558,915 | | | | 15,462,441 | | |
| 2004-60 CL LB — 5% 2034 | | | 16,795,501 | | | | 18,218,920 | | |
| 2003-W17 CL 1A5 — 5.35% 2033 | | | 8,133,845 | | | | 8,483,438 | | |
| 2011-19 CL WB — 5.5% 2018 | | | 17,441,207 | | | | 18,809,993 | | |
| 2009-116 CL PA — 5.5% 2024 | | | 10,146,837 | | | | 10,754,328 | | |
| 2006-21 CL CA — 5.5% 2029 | | | 4,471,659 | | | | 4,610,236 | | |
| 2003-28 CL PG — 5.5% 2032 | | | 5,509,942 | | | | 5,697,060 | | |
| 2002-87 CL N — 5.5% 2032 | | | 2,906,230 | | | | 2,961,448 | | |
| 2002-9 CL PC — 6% 2017 | | | 6,862,467 | | | | 7,392,181 | | |
| Sequoia Mortgage Trust 2012-1 1A1 — 2.865% 2042 | | | 19,455,007 | | | | 19,598,186 | | |
| Stanwich Mortgage Loan Trust Series | |
| 2009-2A — 3.23997% 2049† | | | 357,505 | | | | 159,876 | | |
| 2010-1A — 13.67773% 2047† | | | 2,143,092 | | | | 1,083,976 | | |
| 2010-2A — 6.87472% 2057† | | | 7,579,300 | | | | 3,821,483 | | |
| 2010-3A — 11.61398% 2038† | | | 4,442,534 | | | | 2,222,600 | | |
| 2010-4A — 8.36327% 2049† | | | 6,091,165 | | | | 2,846,401 | | |
| 2011-1 A — 7.29707% 2039†,* | | | 10,424,011 | | | | 5,497,926 | | |
| 2011-2 A — 12.44747% 2050†,* | | | 8,222,298 | | | | 4,400,607 | | |
| Structured Asset Securities Corp 2002-RM1 CL A — 0.94368% 2037† | | | 21,760,040 | | | | 18,278,434 | | |
| VOLT 2011-NL3A A1 — 5.1938% 2051† | | | 10,165,922 | | | | 10,175,376 | | |
| Wells Fargo Mortgage-Backed Securities Trust 2006-5 2A1 — 5.25% 2021 | | | 13,587,838 | | | | 13,845,599 | | |
| TOTAL MORTGAGE-BACKED SECURITIES | | $ | 904,283,599 | | |
| COMMERCIAL MORTGAGE-BACKED SECURITIES — 14.9% | | | |
| Government National Mortgage Association | |
| 2012-22 CL AB — 1.6661% 2026 | | $ | 7,890,189 | | | $ | 7,948,728 | | |
| 2011-49 CL AB — 2.8% 2034 | | | 41,382,433 | | | | 41,956,407 | | |
| 2006-15 A — 3.727% 2027 | | | 183,884 | | | | 184,925 | | |
| 2011-120 CL A — 3.94317% 2033 | | | 48,217,470 | | | | 50,340,485 | | |
| 2006-67 CL A — 3.947% 2030 | | | 2,329,568 | | | | 2,354,774 | | |
| 2011-143 CL AB — 3.9731% 2033 | | | 48,289,860 | | | | 50,643,025 | | |
| 2004-108 A — 3.999% 2027 | | | 10,630,681 | | | | 10,771,750 | | |
| 2008-45 CL C — 4.055% 2035 | | | 27,560,000 | | | | 28,719,593 | | |
| 2006-30 A — 4.175% 2028 | | | 14,542,309 | | | | 14,754,918 | | |
| 2006-51 CL A — 4.253% 2030 | | | 1,848,705 | | | | 1,866,416 | | |
| 2007-15 CL B — 4.425% 2032 | | | 40,922,000 | | | | 42,778,631 | | |
12
PORTFOLIO OF INVESTMENTS
March 31, 2012
(Unaudited)
| BONDS & DEBENTURES — Continued | | Principal
Amount | | Value | |
| 2008-39 CL A — 4.5% 2023 | | $ | 7,722,667 | | | $ | 7,814,103 | | |
| 2007-34 CL B — 4.579% 2031 | | | 48,265,000 | | | | 50,916,674 | | |
| 2005-52 CL C — 4.587% 2045 | | | 4,978,282 | | | | 5,096,466 | | |
| 2007-55 CL B — 4.633% 2033 | | | 50,000,000 | | | | 52,589,910 | | |
| 2004-78 CL C — 4.658% 2029 | | | 2,098,499 | | | | 2,134,174 | | |
| 2006-67 CL GA — 4.68926% 2034 | | | 2,909,167 | | | | 2,916,556 | | |
| 2008-92 CL A — 4.771% 2027 | | | 4,655,810 | | | | 4,702,508 | | |
| 2006-67 CL B — 4.858% 2034 | | | 57,330,000 | | | | 60,801,515 | | |
| 2006-55 CL B — 4.875% 2032 | | | 42,840,000 | | | | 44,448,698 | | |
| 2006-30 CL B — 4.958% 2031 | | | 27,620,000 | | | | 29,239,582 | | |
| 2007-69 CL B — 4.959% 2030 | | | 15,085,000 | | | | 15,428,485 | | |
| 2006-8 CL C — 5.313% 2036 | | | 28,306,649 | | | | 29,307,855 | | |
| 2008-59 CL B — 5.553% 2026 | | | 10,697,305 | | | | 10,937,139 | | |
| GS Mortgage Securities Corporation II | |
| 2007-EOP A1 — 1.10313% 2020† | | | 8,930,738 | | | | 8,864,740 | | |
| 2007-EOP A2 — 1.26008% 2020† | | | 20,755,000 | | | | 20,476,675 | | |
| 2007-EOP A3 — 1.45627% 2020† | | | 17,696,000 | | | | 17,381,896 | | |
| JP Morgan Clearing Corporation 2011-FL1 MH — 5.29% 2028† | | | 20,000,000 | | | | 19,429,400 | | |
| LSTAR Commercial Mortgage Trust 2001-1 A — 3.9129% 2017† | | | 13,372,676 | | | | 13,585,970 | | |
| Lehman Brothers Floating Rate Commercial Mortgage Trust | |
| 2007-LLFA A2 — 0.59175% 2022† | | | 22,218,000 | | | | 20,829,375 | | |
| Washington Mutual Commercial Mortgage Series Trust | |
| 2007-SL2 CL A — 5.31147% 2049† | | | 28,871,806 | | | | 26,812,380 | | |
| TOTAL COMMERCIAL MORTGAGE-BACKED SECURITIES | | $ | 696,033,753 | | |
| STRIPPED MORTGAGE-BACKED SECURITIES — 13.1% | | | |
| PRINCIPAL ONLY SECURITIES | | | |
| Federal Home Loan Mortgage Corporation 217 — 6.5% 2032 | | $ | 931,029 | | | $ | 859,833 | | |
| INTEREST ONLY SECURITIES | | | |
| Federal Home Loan Mortgage Corporation | |
| 3714 TI — 2.25% 2015 | | | 92,625,673 | | | | 4,243,182 | | |
| 3948 AI — 3% 2021 | | | 16,861,615 | | | | 1,454,314 | | |
| 3935 LI — 3% 2021 | | | 12,213,784 | | | | 889,774 | | |
| 3956 KI — 3% 2021 | | | 31,860,691 | | | | 2,766,782 | | |
| 3968 AI — 3% 2021 | | | 12,291,476 | | | | 1,069,358 | | |
| 3992 OI — 3% 2022 | | | 9,301,239 | | | | 812,835 | | |
| 3994 EI — 3% 2022 | | | 19,797,889 | | | | 1,781,810 | | |
| 3998 KI — 3% 2026 | | | 34,054,435 | | | | 3,547,791 | | |
| 3994 AI — 3% 2027 | | | 21,586,250 | | | | 1,942,763 | | |
| 3706 AI — 3.5% 2020 | | | 26,962,527 | | | | 2,582,741 | | |
| 3722 AI — 3.5% 2020 | | | 24,264,735 | | | | 2,714,981 | | |
13
PORTFOLIO OF INVESTMENTS
March 31, 2012
(Unaudited)
| BONDS & DEBENTURES — Continued | | Principal
Amount | | Value | |
| 3735 AI — 3.5% 2020 | | $ | 12,221,278 | | | $ | 1,362,550 | | |
| 3755 AI — 3.5% 2020 | | | 22,745,715 | | | | 2,375,335 | | |
| 3760 KI — 3.5% 2020 | | | 19,948,467 | | | | 2,230,039 | | |
| 3753 CI KI — 3.5% 2020 | | | 5,159,104 | | | | 596,857 | | |
| 3874 DI — 3.5% 2020 | | | 21,691,466 | | | | 1,640,417 | | |
| 3893 DI — 3.5% 2020 | | | 15,746,026 | | | | 1,205,555 | | |
| 3784 BI — 3.5% 2021 | | | 14,041,439 | | | | 1,504,961 | | |
| 3874 BI — 3.5% 2021 | | | 11,681,922 | | | | 1,095,180 | | |
| 3893 BI — 3.5% 2021 | | | 9,675,099 | | | | 930,358 | | |
| 3909 KI — 3.5% 2021 | | | 10,254,765 | | | | 1,012,658 | | |
| 3938 IO — 3.5% 2021 | | | 55,479,122 | | | | 5,505,748 | | |
| 3778 GI — 3.5% 2024 | | | 12,015,955 | | | | 1,126,496 | | |
| 3763 NI — 3.5% 2025 | | | 8,748,391 | | | | 901,434 | | |
| 3854 GI — 3.5% 2024 | | | 12,871,288 | | | | 768,255 | | |
| 3852 YI — 3.5% 2025 | | | 34,403,611 | | | | 2,341,854 | | |
| 3904 QI — 3.5% 2025 | | | 10,718,135 | | | | 863,024 | | |
| 3909 UI — 3.5% 2025 | | | 20,922,289 | | | | 1,350,115 | | |
| 3904 NI — 3.5% 2026 | | | 19,683,199 | | | | 2,343,531 | | |
| 3930 AI — 3.5% 2026 | | | 20,463,427 | | | | 2,567,546 | | |
| 4018 AI — 3.5% 2027 | | | 37,415,502 | | | | 5,051,093 | | |
| 3917 AI — 4.5% 2026 | | | 70,539,401 | | | | 8,905,599 | | |
| 3684 CI — 4.5% 2024 | | | 57,403,767 | | | | 5,894,586 | | |
| 2558 CL JW — 5.5% 2022 | | | 1,961,564 | | | | 70,146 | | |
| 217 — 6.5% 2032 | | | 931,029 | | | | 195,637 | | |
| Federal National Mortgage Association | |
| 2010-91 MI — 2% 2013 | | | 47,024,098 | | | | 824,332 | | |
| 2010-95 MI — 2% 2013 | | | 40,421,582 | | | | 719,504 | | |
| 2011-88 BI — 3% 2020 | | | 9,702,239 | | | | 546,042 | | |
| 2011-113 GI — 3% 2021 | | | 15,987,280 | | | | 1,233,898 | | |
| 2011-129 AI — 3% 2021 | | | 20,805,816 | | | | 1,798,455 | | |
| 2011-149 KI — 3% 2021 | | | 30,942,999 | | | | 2,388,181 | | |
| 2012-8 UI — 3% 2021 | | | 52,937,154 | | | | 5,181,404 | | |
| 2011-137 AI — 3% 2022 | | | 28,670,045 | | | | 2,612,701 | | |
| 2011-138 IG — 3% 2022 | | | 32,216,751 | | | | 3,116,326 | | |
| 2011-145 — 3% 2022 | | | 41,957,299 | | | | 3,624,691 | | |
| 2012-32 AI — 3% 2022 | | | 29,015,000 | | | | 2,646,168 | | |
| 2012-23 IA — 3% 2022 | | | 17,365,516 | | | | 1,649,724 | | |
| 2010-124 AI — 3.5% 2020 | | | 16,548,779 | | | | 1,184,272 | | |
| 2010-128 LI — 3.5% 2020 | | | 31,515,448 | | | | 2,255,324 | | |
| 2010-145 BI — 3.5% 2020 | | | 14,250,835 | | | | 1,233,588 | | |
| 2011-75 BI — 3.5% 2020 | | | 16,356,558 | | | | 1,225,106 | | |
| 2011-78 LI — 3.5% 2020 | | | 41,626,829 | | | | 3,063,318 | | |
14
PORTFOLIO OF INVESTMENTS
March 31, 2012
(Unaudited)
| BONDS & DEBENTURES — Continued | | Principal
Amount | | Value | |
| 2010-104 CI — 3.5% 2021 | | $ | 31,879,807 | | | $ | 3,006,903 | | |
| 2011-61 BI — 3.5% 2021 | | | 10,994,284 | | | | 1,047,893 | | |
| 2011-66 QI — 3.5% 2021 | | | 19,597,251 | | | | 1,479,984 | | |
| 2011-104 DI — 3.5% 2021 | | | 56,887,482 | | | | 4,704,026 | | |
| 2011-110 AI — 3.5% 2021 | | | 23,885,728 | | | | 2,026,226 | | |
| 2011-118 IC — 3.5% 2021 | | | 59,250,942 | | | | 5,294,072 | | |
| 2011-125 DI — 3.5% 2021 | | | 40,081,602 | | | | 3,631,794 | | |
| 2011-143 MI — 3.5% 2022 | | | 19,557,571 | | | | 1,590,275 | | |
| 2012-2 MI — 3.5% 2022 | | | 24,401,846 | | | | 2,562,194 | | |
| 2010-135 DI — 3.5% 2024 | | | 26,195,555 | | | | 2,128,389 | | |
| 2010-137 BI — 3.5% 2024 | | | 13,191,370 | | | | 838,575 | | |
| 2011-22 IC — 3.5% 2025 | | | 14,391,126 | | | | 1,667,788 | | |
| 2011-66 BI — 3.5% 2025 | | | 7,259,870 | | | | 472,763 | | |
| 2011-67 CI — 3.5% 2025 | | | 10,685,222 | | | | 1,131,031 | | |
| 2011-75 A — 3.5% 2025 | | | 44,780,836 | | | | 3,326,320 | | |
| 2011-80 KI — 3.5% 2025 | | | 20,796,430 | | | | 1,624,721 | | |
| 2011-101 IC — 3.5% 2026 | | | 107,018,049 | | | | 13,477,586 | | |
| 2011-101 EI — 3.5% 2026 | | | 38,745,380 | | | | 4,528,366 | | |
| 2011-101 IE — 3.5% 2026 | | | 36,388,164 | | | | 3,662,469 | | |
| 2011-104 IM — 3.5% 2026 | | | 32,491,017 | | | | 3,233,181 | | |
| 2010-89 LI — 4% 2020 | | | 26,517,459 | | | | 2,788,046 | | |
| 2010-104 CI — 4% 2020 | | | 11,431,603 | | | | 1,069,655 | | |
| 2011-69 TI — 4% 2020 | | | 18,212,403 | | | | 1,334,969 | | |
| 2011-67 EI — 4% 2021 | | | 30,008,732 | | | | 2,330,778 | | |
| 2008-15 JI — 4.5% 2022 | | | 13,992,234 | | | | 785,804 | | |
| 2009-70 IN — 4.5% 2019 | | | 47,224,772 | | | | 3,470,549 | | |
| 2010-114 CI — 5% 2018 | | | 43,115,635 | | | | 3,851,520 | | |
| 2003-64 XI — 5% 2033 | | | 3,324,509 | | | | 640,267 | | |
| 2010-30 — 5% 2018 | | | 19,277,060 | | | | 1,520,189 | | |
| Government National Mortgage Association | |
| 2002-56 — 0.04249% 2042 | | | 416,988 | | | | 776 | | |
| 2004-43 — 0.18892% 2044 | | | 100,020,398 | | | | 1,714,350 | | |
| 2006-15 — 0.28239% 2046 | | | 25,196,519 | | | | 610,764 | | |
| 2004-10 — 0.43943% 2044 | | | 88,321,666 | | | | 857,603 | | |
| 2008-48 — 0.45517% 2048 | | | 101,848,269 | | | | 3,088,040 | | |
| 2005-9 — 0.49887% 2045 | | | 21,285,959 | | | | 511,927 | | |
| 2004-108 — 0.53264% 2044 | | | 69,901,803 | | | | 1,535,044 | | |
| 2008-78 — 0.56688% 2048 | | | 91,561,100 | | | | 3,640,469 | | |
| 2006-55 — 0.58404% 2046 | | | 79,106,035 | | | | 2,592,305 | | |
| 2006-30 — 0.61182% 2046 | | | 23,716,355 | | | | 843,354 | | |
| 2006-5 — 0.62023% 2046 | | | 85,579,166 | | | | 2,295,233 | | |
| 2007-4 — 0.64946% 2047 | | | 41,288,929 | | | | 1,495,898 | | |
15
PORTFOLIO OF INVESTMENTS
March 31, 2012
(Unaudited)
| BONDS & DEBENTURES — Continued | | Principal
Amount | | Value | |
| 2005-90 — 0.65597% 2045 | | $ | 96,373,119 | | | $ | 2,592,437 | | |
| 2011-10 — 0.70521% 2045 | | | 122,185,862 | | | | 5,510,582 | | |
| 2008-45 — 0.70994% 2048 | | | 127,891,731 | | | | 3,838,031 | | |
| 2005-50 — 0.76663% 2045 | | | 26,542,303 | | | | 827,058 | | |
| 2007-15 — 0.77589% 2047 | | | 147,777,710 | | | | 6,252,475 | | |
| 2006-67 — 0.80318% 2046 | | | 67,808,382 | | | | 2,362,444 | | |
| 2007-55 — 0.82873% 2047 | | | 132,455,517 | | | | 5,495,579 | | |
| 2010-161 IA — 0.83527% 2050 | | | 287,529,896 | | | | 13,884,819 | | |
| 2007-34 — 0.86488% 2047 | | | 54,090,603 | | | | 2,468,695 | | |
| 2010-18 — 0.87944% 2050 | | | 186,945,090 | | | | 9,330,429 | | |
| 2007-77 — 0.88698% 2047 | | | 154,344,507 | | | | 6,385,232 | | |
| 2010-123 — 0.89724% 2050 | | | 88,944,313 | | | | 5,242,378 | | |
| 2008-92 — 0.95935% 2048 | | | 127,355,234 | | | | 6,147,437 | | |
| 2010-63 — 0.96107% 2050 | | | 94,817,228 | | | | 4,606,221 | | |
| 2008-8 — 1.02612% 2047 | | | 151,401,569 | | | | 5,112,831 | | |
| 2012-9 — 1.02733% 2052 | | | 180,801,550 | | | | 19,186,661 | | |
| 2011-6 — 1.04336% 2052 | | | 253,212,815 | | | | 15,413,064 | | |
| 2009-119 — 1.04766% 2049 | | | 338,761,282 | | | | 18,398,125 | | |
| 2011-165 — 1.06849% 2051 | | | 259,193,782 | | | | 15,981,889 | | |
| 2012-35 — 1.0702% 2052 | | | 132,960,000 | | | | 10,735,481 | | |
| 2009-105 — 1.08697% 2049 | | | 158,591,359 | | | | 9,453,631 | | |
| 2008-24 — 1.09508% 2047 | | | 62,391,936 | | | | 2,575,539 | | |
| 2012-25 — 1.0959% | | | 124,870,053 | | | | 9,838,394 | | |
| 2011-143 — 1.10586% | | | 101,097,525 | | | | 14,173,873 | | |
| 2009-60 — 1.12527% 2049 | | | 150,417,269 | | | | 8,214,287 | | |
| 2009-86 — 1.12544% 2049 | | | 162,764,702 | | | | 8,738,837 | | |
| 2011-64 — 1.12979% 2044 | | | 161,497,475 | | | | 11,881,369 | | |
| 2010-28 — 1.16226% 2050 | | | 165,050,962 | | | | 9,543,247 | | |
| 2011-120 — 1.16865% 2043 | | | 125,301,294 | | | | 15,647,626 | | |
| 2011-49 — 1.17381% 2045 | | | 95,932,596 | | | | 6,499,433 | | |
| 2010-49 — 1.18955% 2050 | | | 170,396,540 | | | | 9,992,053 | | |
| 2011-149 — 1.20576% | | | 169,220,640 | | | | 13,977,625 | | |
| 2009-4 — 1.22502% 2049 | | | 126,790,731 | | | | 7,150,997 | | |
| 2011-78 — 1.2718% 2046 | | | 192,076,453 | | | | 14,317,379 | | |
| 2011-16 — 1.28333% 2046 | | | 155,966,688 | | | | 10,571,422 | | |
| 2009-49 — 1.37278% 2049 | | | 158,849,392 | | | | 9,985,273 | | |
| 2011-164 — 1.40753% 2046 | | | 225,205,418 | | | | 18,225,875 | | |
| 2011-92 — 1.44383% 2044 | | | 44,921,904 | | | | 3,800,842 | | |
| 2010-148 — 1.47129% 2052 | | | 91,247,946 | | | | 6,849,983 | | |
| 2012-4 — 1.65334% 2052 | | | 308,500,199 | | | | 28,187,201 | | |
| 2009-71 — 1.65808% 2049 | | | 173,922,802 | | | | 12,131,116 | | |
| 2009-30 — 1.92838% 2049 | | | 115,599,041 | | | | 9,762,339 | | |
| TOTAL STRIPPED MORTGAGE-BACKED SECURITIES | | $ | 611,510,477 | | |
16
PORTFOLIO OF INVESTMENTS
March 31, 2012
(Unaudited)
| BONDS & DEBENTURES — Continued | | Principal
Amount | | Value | |
| ASSET-BACKED SECURITIES — 10.2% | | | |
| AmeriCredit Automobile Receivables Trust | |
| 2011-2 C — 3.19% 2016 | | $ | 8,580,000 | | | $ | 8,871,291 | | |
| 2010-3 D — 4.98% 2018 | | | 13,735,000 | | | | 14,649,888 | | |
| 2010-1 C — 5.19% 2015 | | | 2,765,000 | | | | 2,921,748 | | |
| 2010-2 D — 6.24% 2016 | | | 6,990,000 | | | | 7,505,582 | | |
| Cabela's Inc. 2011-4A A2 — 0.79175% 2019† | | | 18,500,000 | | | | 18,646,520 | | |
| Case New Holland Wholesale Master Note Trust | |
| 2009-1A A — 1.94175% 2015† | | | 15,209,000 | | | | 15,265,578 | | |
| Credit Acceptance Auto Loan Trust | |
| 2012-1A — 2.2% 2019† | | | 3,500,000 | | | | 3,500,000 | | |
| 2011-1 A — 2.61% 2019† | | | 19,295,000 | | | | 19,274,933 | | |
| 2012-1A B— 3.12% 2020† | | | 4,500,000 | | | | 4,500,000 | | |
| FIFC Premium Funding LLC 2009-A A — 1.69175% 2014† | | | 49,755,000 | | | | 49,978,400 | | |
| First National Master Note Trust 2009-3 A — 1.59175% 2015 | | | 28,150,000 | | | | 28,250,496 | | |
| GE Capital Credit Card Master Note Trust 2009-2 A — 3.69% 2015 | | | 6,697,000 | | | | 6,757,943 | | |
| HFG HEALTHCO-4 LLC 2011-1A A —2.4994% 2017† | | | 16,552,000 | | | | 16,414,784 | | |
| MassMutual Asset Finance LLC | |
| 2011-AA A2 — 0.90% 2014† | | | 22,420,000 | | | | 22,346,462 | | |
| 2009-AA — 2.37% 2013† | | | 20,092,178 | | | | 20,180,985 | | |
| PFS Financing Corporation | |
| 2012-AA A — 1.44175% 2016† | | | 25,808,000 | | | | 25,811,200 | | |
| 2011-BA A — 1.74175% 2016† | | | 43,915,000 | | | | 43,827,170 | | |
| 2012-AA B — 1.94175% 2016† | | | 4,720,000 | | | | 4,720,585 | | |
| 2011-BA B — 2.49175% 2016† | | | 4,000,000 | | | | 3,982,640 | | |
| Prestige Auto Receivables Trust | |
| 2011-1A A2 — 1.25% 2014† | | | 12,821,104 | | | | 12,785,077 | | |
| 2012-1A A2 — 1.67% 2015† | | | 11,424,000 | | | | 11,423,902 | | |
| 2009-1A B — 10% 2013† | | | 5,736,795 | | | | 6,010,612 | | |
| National Collegiate Student Loan Trust 2006-3 A2 — 0.35175% 2026 | | | 38,195,774 | | | | 37,879,895 | | |
| Santander Drive Auto Receivables Trust | |
| 2010-B A2 — 1.01% 2013† | | | 8,695,887 | | | | 8,699,626 | | |
| 2011-3 A2 — 1.11% 2014 | | | 33,500,000 | | | | 33,440,370 | | |
| 2012-1 A2 — 1.25% 2015 | | | 9,172,000 | | | | 9,153,473 | | |
| 2011-4 A2 — 1.37% 2015 | | | 26,260,000 | | | | 26,276,019 | | |
| World Financial Network Credit Card Master Trust II | |
| 2010-1 — 4.16% 2017† | | | 15,255,000 | | | | 15,400,380 | | |
| TOTAL ASSET-BACKED SECURITIES | | $ | 478,475,559 | | |
| U.S. TREASURY SECURITIES — 2.9% | | | |
| U.S. Treasury Notes | |
| —0.375% 2012 | | $ | 9,553,000 | | | $ | 9,563,031 | | |
| —0.375% 2012 | | | 50,000,000 | | | | 50,060,500 | | |
| —4.25% 2012 | | | 75,000,000 | | | | 76,515,000 | | |
| TOTAL U.S. TREASURY SECURITIES | | $ | 136,138,531 | | |
17
PORTFOLIO OF INVESTMENTS
March 31, 2012
(Unaudited)
| BONDS & DEBENTURES — Continued | | Principal
Amount | | Value | |
| CORPORATE BONDS & DEBENTURES — 2.6% | | | |
| Barclays Bank plc — 1.9% 2014 | | $ | 38,654,000 | | | $ | 38,188,606 | | |
| Continental Airlines Company | |
| —1997-1 1A 7.461% 2015 | | | 1,421,873 | | | | 1,421,873 | | |
| —8.388% 2020 | | | 11,666,048 | | | | 11,841,039 | | |
| International Lease Finance Corporation — 0.9265% 2012 | | | 24,420,000 | | | | 24,153,822 | | |
| Qwest Corporation | |
| —3.72365% 2013 | | | 7,139,000 | | | | 7,213,960 | | |
| —7.625% 2015 | | | 16,142,000 | | | | 18,456,279 | | |
| United Airlines, Inc. — 9.875% 2013† | | | 21,034,000 | | | | 22,058,145 | | |
| TOTAL CORPORATE BONDS & DEBENTURES | | $ | 123,333,724 | | |
| U.S. AGENCIES SECURITIES — 0.7% | | | |
| Federal National Mortgage Association — 0.4% 2012 | | $ | 33,700,000 | | | $ | 33,727,297 | | |
| TOTAL U.S. AGENCIES SECURITIES | | | |
| TOTAL INVESTMENT SECURITIES — 93.1% (Cost $4,380,109,656) | | $ | 4,351,722,649 | | |
| SHORT-TERM INVESTMENTS — 7.5% (Cost $348,378,073) | | | |
| Federal Home Loan Mortgage Corporation | |
| —0.04% 04/09/12 | | $ | 50,000,000 | | | $ | 49,999,555 | | |
| —0.08% 04/18/12 | | | 100,000,000 | | | | 99,996,222 | | |
| —10.07% 04/20/12 | | | 69,000,000 | | | | 68,997,451 | | |
| Federal National Mortgage Association | |
| —0.04% 04/05/12 | | | 50,000,000 | | | | 49,999,778 | | |
| —0.08% 04/25/12 | | | 73,593,000 | | | | 73,589,075 | | |
| General Electric Capital Corporation — 0.04% 04/02/12 | | | 5,796,000 | | | | 5,795,992 | | |
| TOTAL SHORT-TERM INVESTMENTS | | $ | 348,378,073 | | |
| TOTAL INVESTMENTS — 100.6% (Cost $4,728,487,729) | | $ | 4,700,100,722 | | |
| Other assets and liabilities, net — (0.6)% | | | (28,077,058 | ) | |
| TOTAL NET ASSETS — 100.0% | | $ | 4,672,023,664 | | |
† Restricted securities. These restricted securities constituted 10.7% of total net assets at March 31, 2012.
* These securities have been valued in good faith under policies adopted by authority of the Board of Directors in accordance with the Fund's fair value procedures. These securities constitued 0.2% of total net assets at March 31, 2012.
See notes to financial statements.
18
STATEMENT OF ASSETS AND LIABILITIES
March 31, 2012
(Unaudited)
| ASSETS | |
| Investments at value: | |
Investments securities — at market value
(identified cost $4,380,109,656) | | $ | 4,351,722,649 | | | | | | |
Short-term investments — at amortized cost
(maturities 60 days or less) | | | 348,378,073 | | | $ | 4,700,100,722 | | |
| Cash | | | | | | | 40 | | |
| Receivable for: | |
| Interest | | $ | 25,399,773 | | | | | | |
| Capital Stock sold | | | 13,624,826 | | | | 39,024,599 | | |
| | | | | $ | 4,739,125,361 | | |
| LIABILITIES | |
| Payable for: | |
| Investment securities purchased | | $ | 59,786,896 | | | | | | |
| Capital Stock repurchased | | | 4,892,833 | | | | | | |
| Advisory fees | | | 1,974,968 | | | | | | |
| Accrued expenses and other liabilities | | | 447,000 | | | | 67,101,697 | | |
| NET ASSETS | | | | | | $ | 4,672,023,664 | | |
| SUMMARY OF SHAREHOLDERS' EQUITY | |
Capital Stock — par value $.01 per share; authorized
500,000,000 shares; outstanding 436,683,434 shares | | | | $ | 4,366,834 | | |
| Additional Paid in Capital | | | | | 4,811,727,166 | | |
| Accumulated net realized losses on investments | | | | | (210,855,850 | ) | |
| Undistributed net investment income | | | | | 95,172,521 | | |
| Unrealized depreciation of investments | | | | | (28,387,007 | ) | |
| NET ASSETS | | | | $ | 4,672,023,664 | | |
NET ASSET VALUE, REDEMPTION PRICE AND
MAXIMUM OFFERING PRICE PER SHARE | |
Net asset value and redemption price per share
(net assets divided by shares outstanding) | | | | $ | 10.70 | | |
Maximum offering price per share
(100/96.5 of per share net asset value) | | | | $ | 11.09 | | |
See notes to financial statements.
19
STATEMENT OF OPERATIONS
For the Six Months Ended March 31, 2012
(Unaudited)
| INVESTMENT INCOME | |
| Interest | | | | | | $ | 141,811,636 | | |
| EXPENSES | |
| Advisory fees | | $ | 11,238,932 | | | | | | |
| Transfer agent fees and expenses | | | 1,304,423 | | | | | | |
| Custodian fees and expenses | | | 139,151 | | | | | | |
| Reports to shareholders | | | 129,524 | | | | | | |
| Registration fees | | | 85,187 | | | | | | |
| Directors' fees and expenses | | | 45,048 | | | | | | |
| Audit and tax services | | | 29,780 | | | | | | |
| Legal fees | | | 12,264 | | | | | | |
| Other expenses | | | 52,699 | | | | 13,037,008 | | |
| Net investment income | | | | $ | 128,774,628 | | |
| NET REALIZED AND UNREALIZED LOSS ON INVESTMENTS | |
| Net realized loss on investments: | |
Proceeds from sale of investment securities (excluding
short-term investments with maturities 60 days or less) | | $ | 2,146,316,207 | | | | | | |
| Cost of investment securities sold | | | 2,217,499,411 | | | | | | |
| Net realized loss on investments | | | | | | $ | (71,183,204 | ) | |
| Unrealized depreciation of investments: | |
| Unrealized appreciation at beginning of period | | $ | 216,997 | | | | | | |
| Unrealized depreciation at end of period | | | (28,387,007 | ) | | | | | |
| Change in unrealized appreciation of investments | | | | | | | (28,604,004 | ) | |
| Net realized and unrealized loss on investments | | | | | | $ | (99,787,208 | ) | |
| NET CHANGE IN NET ASSETS RESULTING FROM OPERATIONS | | | | | | $ | 28,987,420 | | |
See notes to financial statements.
20
STATEMENT OF CHANGES IN NET ASSETS
| | | For the Six Months Ended
March 31, 2012
(Unaudited) | | For the Year Ended
September 30, 2011 | |
| CHANGES IN NET ASSETS | |
| Operations: | |
| Net investment income | | $ | 128,774,628 | | | | | | | $ | 150,703,689 | | | | | | |
Net realized loss
on investments | | | (71,183,204 | ) | | | | | | | (43,776,731 | ) | | | | | |
Change in unrealized
appreciation of investments | | | (28,604,004 | ) | | | | | | | (18,343,157 | ) | | | | | |
Change in net assets resulting
from operations | | | | | | $ | 28,987,420 | | | | | | | $ | 88,583,801 | | |
Distributions to shareholders from
net investment income | | | | | | | (85,178,364 | ) | | | | | | | (162,104,999 | ) | |
| Capital stock transactions: | |
| Proceeds from capital stock sold | | $ | 1,215,248,786 | | | | | | | $ | 1,924,276,959 | | | | | | |
Proceeds from shares issued to
shareholders upon reinvestment
of dividends and distributions | | | 62,867,645 | | | | | | | | 125,649,634 | | | | | | |
| Cost of capital stock repurchased* | | | (826,101,412 | ) | | | 452,015,019 | | | | (1,845,604,618 | ) | | | 204,321,975 | | |
| Total change in net assets | | | | | | $ | 395,824,075 | | | | | | | $ | 130,800,777 | | |
| NET ASSETS | |
| Beginning of period | | | | | | | 4,276,199,589 | | | | | | | | 4,145,398,812 | | |
| End of period | | | | | | $ | 4,672,023,664 | | | | | | | $ | 4,276,199,589 | | |
CHANGE IN CAPITAL STOCK
OUTSTANDING | |
| Shares of capital stock sold | | | | | | | 113,600,434 | | | | | | | | 176,921,878 | | |
Shares issued to shareholders upon
reinvestment of dividends
and distributions | | | | | | | 5,880,478 | | | | | | | | 11,584,688 | | |
| Shares of capital stock repurchased | | | | | | | (77,312,338 | ) | | | | | | | (169,311,361 | ) | |
| Increase in capital stock outstanding | | | | | | | 42,168,574 | | | | | | | | 19,195,205 | | |
* Net of redemption fees of $456,155 and $202,426 for the periods ended March 31, 2012, and September 30, 2011, respectively.
See notes to financial statements.
21
FINANCIAL HIGHLIGHTS
Selected Data for Each Share of Capital Stock Outstanding Throughout Each Period
| | | Six
Months
Ended
March 31,
2012 | | For the Year Ended September 30, | |
| | | (Unaudited) | | 2011 | | 2010 | | 2009 | | 2008 | | 2007 | |
| Per share operating performance: | |
Net asset value at beginning
of year | | $ | 10.84 | | | $ | 11.04 | | | $ | 11.09 | | | $ | 11.06 | | | $ | 11.03 | | | $ | 10.99 | | |
| Income from investment operations: | |
| Net investment income | | $ | 0.30 | | | $ | 0.43 | | | $ | 0.36 | | | $ | 0.36 | | | $ | 0.47 | | | $ | 0.50 | | |
Net realized and unrealized
gain (loss) on investment
securities | | | (0.23 | ) | | | (0.16 | ) | | | (0.04 | ) | | | 0.08 | | | | 0.05 | | | | 0.07 | | |
Total from investment
operations | | $ | 0.07 | | | $ | 0.27 | | | $ | 0.32 | | | $ | 0.44 | | | $ | 0.52 | | | $ | 0.57 | | |
Less dividends from net
investment income | | $ | (0.21 | ) | | $ | (0.47 | ) | | $ | (0.37 | ) | | $ | (0.41 | ) | | $ | (0.49 | ) | | $ | (0.53 | ) | |
| Redemption fees | | | — | * | | | — | * | | | — | * | | | — | * | | | — | * | | | — | * | |
| Net asset value at end of period | | $ | 10.70 | | | $ | 10.84 | | | $ | 11.04 | | | $ | 11.09 | | | $ | 11.06 | | | $ | 11.03 | | |
| Total investment return** | | | 0.66 | % | | | 2.47 | % | | | 2.90 | % | | | 4.03 | % | | | 4.84 | % | | | 5.36 | % | |
| Ratios/supplemental data: | |
Net assets at end of period
(in $000's) | | $ | 4,672,024 | | | $ | 4,276,200 | | | $ | 4,145,399 | | | $ | 3,813,468 | | | $ | 2,186,138 | | | $ | 1,832,030 | | |
Ratio of expenses to average
net assets | | | 0.58 | %† | | | 0.60 | % | | | 0.60 | % | | | 0.60 | % | | | 0.61 | % | | | 0.62 | % | |
Ratio of net investment income
to average net assets | | | 5.74 | %† | | | 3.94 | % | | | 2.98 | % | | | 3.20 | % | | | 4.21 | % | | | 4.31 | % | |
| Portfolio turnover rate | | | 89 | %† | | | 117 | % | | | 78 | % | | | 64 | % | | | 32 | % | | | 53 | % | |
* Rounds to less than $0.01 per share.
** Return is based on net asset value per share, adjusted for reinvestment of distributions, and does not reflect deduction of the sales charge. The total investment return for the six months ended March 31, 2012 is not annualized.
† Annualized
See notes to financial statements.
22
NOTES TO FINANCIAL STATEMENTS
March 31, 2012
NOTE 1 — Significant Accounting Policies
The Fund is registered under the Investment Company Act of 1940 as a diversified, open-end, management investment company. The Fund's primary investment objective is to seek current income and long-term total return. The following is a summary of significant accounting policies consistently followed by the Fund in the preparation of its financial statements.
A. Security Valuation
The Fund's investments are reported at fair value as defined by accounting principles generally accepted in the United States of America. The Fund generally determines its net asset value as of approximately 4:00 p.m. New York time each day the New York Stock Exchange is open. Further discussion of valuation methods, inputs and classifications can be found under Note 8.
B. Securities Transactions and Related Investment Income
Securities transactions are accounted for on the date the securities are purchased or sold. Dividend income and distributions to shareholders are recorded on the ex-dividend date. Interest income and expenses are recorded on an accrual basis. Market discounts and premiums on fixed income securities are amortized over the expected life of the securities. Realized gains or losses are based on the specific identification method.
C. Use of Estimates
The preparation of financial statements in conformity with accounting principles generally accepted in the United States requires management to make estimates and assumptions that affect the amounts reported. Actual results could differ from these estimates.
NOTE 2 — Risk Considerations
Investing in the Fund may involve certain risks including, but not limited to, those described below.
Market Risk: Because the values of the Fund's investments will fluctuate with market conditions, so will the value of your investment in the Fund. You could lose money on your investment in the Fund or the Fund could underperform other investments.
Interest Rate Risk: The values of, and the income generated by, most debt securities held by the Fund may be affected by changing interest rates and by changes in the effective maturities and credit ratings of these securities. For example, the values of debt securities in the Fund's portfolio generally will decline when interest rates rise and increase when interest rates fall. In addition, falling interest rates may cause an issuer to redeem, call or refinance a security before its stated maturity, which may result in the Fund having to reinvest the proceeds in lower-yielding securities.
Mortgage-Backed and Other Asset-Backed Securities Risk: The values of some mortgaged-backed and other asset-backed securities may expose the Fund to a lower rate of return upon reinvestment of principal. When interest rates rise, the value of mortgage-related securities generally will decline; however, when interest rates are declining, the value of mortgage related-securities with prepayment features may not increase as much as other fixed income securities. The rate of prepayments on underlying mortgages will affect the price and volatility of a mortgage-related security, and may shorten or extend the effective maturity of the security beyond what was anticipated at the time of purchase. If an unanticipated rate of prepayment on underlying mortgages increases the effective maturity of a mortgage-related security, the volatility of the security can be expected to increase. The value of these securities may also fluctuate in response to the market's perception of the creditworthiness of the issuers. Additionally, although mortgages and mortgage-related securities are generally supported by some form of government or private guarantee and/or insurance, there is no assurance that private guarantors or insurers will meet their obligations.
23
NOTES TO FINANCIAL STATEMENTS
Continued
Stripped Mortgage-Backed Interest Only ("I/O") and Principal Only ("P/O") Securities: Stripped mortgage-backed securities are usually structured with two classes that receive different proportions of the interest and principal distributions on a pool of mortgage assets. In certain cases, one class will receive all of the interest payments on the underlying mortgages (the I/O class), while the other class will receive all of the principal payments (the P/O class). The Fund currently has investments in I/O securities. The yield to maturity on IOs is sensitive to the rate of principal repayments (including prepayments) on the related underlying mortgage assets, and principal payments may have a material effect on yield-to-maturity. If the underlying mortgage assets experience greater than anticipated prepayments of principal, a Fund may not fully recoup its initial investment in I/Os.
Credit Risk: Debt securities are subject to credit risk, meaning that the issuer of the debt security may default or fail to make timely payments of principal or interest. The values of any of the Fund's investments may also decline in response to events affecting the issuer or its credit rating. The lower rated debt securities in which the Fund may invest are considered speculative and are generally subject to greater volatility and risk of loss than investment grade securities, particularly in deteriorating economic conditions. The Fund invests a significant portion of its assets in securities of issuers that hold mortgage- and asset-backed securities and direct investments in securities backed by commercial and residential mortgage loans and other financial assets. The value and related income of these securities is sensitive to changes in economic conditions, including delinquencies and/or defaults. Continuing shifts in the market's perception of credit quality on securities backed by commercial and residential mortgage loans and other financial assets may result in increased volatility of market price and periods of illiquidity that can negatively impact the valuation of certain securities held by the Fund.
NOTE 3 — Purchases of Investment Securities
Cost of purchases of investment securities (excluding short-term investments with maturities of 60 days or less) aggregated $2,232,502,627 for the period ended March 31, 2012.
NOTE 4 — Advisory Fees and Other Affiliated Transactions
Pursuant to an Investment Advisory Agreement (the "Agreement"), advisory fees were paid by the Fund to First Pacific Advisors, LLC (the "Adviser"). Under the terms of this Agreement, the Fund pays the Adviser a monthly fee calculated at the annual rate of 0.5% of the average daily net assets of the Fund. The Agreement obligates the Adviser to reduce its fee to the extent necessary to reimburse the Fund for any annual expenses (exclusive of interest, taxes, the cost of any supplemental statistical and research information, and extraordinary expenses such as litigation) in excess of 11/2% of the first $15 million and 1% of the remaining average net assets of the Fund for the year.
For the period ended March 31, 2012, the Fund paid aggregate fees of $45,000 to all Directors who are not interested persons of the Adviser. Certain officers of the Fund are also officers of the Adviser and FPA Fund Distributors, Inc.
NOTE 5 — Federal Income Tax
No provision for federal income tax is required because the Fund has elected to be taxed as a "regulated investment company" under the Internal Revenue Code and intends to maintain this qualification and to distribute each year to its shareholders, in accordance with the minimum distribution requirements of the Code, all of its taxable net investment income and taxable net realized gains on investments.
The cost of investment securities at March 31, 2012 for federal income tax purposes was $4,389,830,340. Gross unrealized appreciation and depreciation for all securities at March 31, 2012 for federal income tax purposes was $37,655,999 and $75,763,691, respectively, resulting in net unrealized depreciation of $38,107,692. As of
24
NOTES TO FINANCIAL STATEMENTS
Continued
and during the period ended March 31, 2012, the Fund did not have any liability for unrecognized tax benefits. The Fund recognizes interest and penalties, if any, related to unrecognized tax benefits as income tax expense in the Statement of Operations. During the period, the Fund did not incur any interest or penalties. The Fund is not subject to examination by U.S. federal tax authorities for years ended before September 30, 2008 or by state tax authorities for years ended before September 30, 2007.
NOTE 6 — Distributor
For the period ended March 31, 2012, FPA Fund Distributors, Inc. ("Distributor"), a wholly owned subsidiary of the Adviser, received $28,317 in net Fund share sales commissions after reallowance to other dealers. The Distributor pays its own overhead and general administrative expenses, the cost of supplemental sales literature, promotion and advertising.
NOTE 7 — Redemption Fees
A redemption fee of 2% applies to redemptions within 90 days of purchase for certain purchases made by persons eligible to purchase shares without an initial sales charge. For the period ended March 31, 2012, the Fund collected $456,155 in redemption fees, which amounted to less than $0.01 per share.
NOTE 8 — Disclosure of Fair Value Measurements
The Fund uses the following methods and inputs to establish the fair value of its assets and liabilities. Use of particular methods and inputs may vary over time based on availability and relevance as market and economic conditions evolve.
Equity securities are generally valued at the official closing price of, or the last reported sale price on, the exchange or market on which such securities are traded, as of the close of business on the day the securities are being valued or, lacking any sales, at the last available bid price. Prices for each security are taken from the principal exchange or market in which the security trades. Securities that are unlisted and fixed-income and convertible securities listed on a national securities exchange for which the over-the-counter market more accurately reflects the securities' value in the judgment of the Fund's officers, are valued at the most recent bid price. However, most fixed income securities are generally valued at prices obtained from pricing vendors. Vendors value such securities based on one or more of the following inputs: transactions, bids, offers quotations from dealers and trading systems, spreads and other relationships observed in the markets among comparable securities, benchmarks, underlying equity of the issuer, and proprietary pricing models such as cash flows, financial or collateral performance and other reference data (includes prepayments, defaults, collateral, credit enhancements, and interest rate volatility). Short-term corporate notes with maturities of 60 days or less are valued at amortized cost, which approximates market value.
Securities for which representative market quotations are not readily available or are considered unreliable by the Investment Adviser are valued as determined in good faith under guidelines adopted by authority of the Fund's Board of Directors. Various inputs may be reviewed in order to make a good faith determination of a security's value. These inputs include, but are not limited to, the type and cost of the security; contractual or legal restrictions on resale of the security; relevant financial or business developments of the issuer; actively traded similar or related securities; conversion or exchange rights on the security; related corporate actions; significant events occurring after the close of trading in the security; and changes in overall market conditions. Fair valuations and valuations of investments that are not actively trading involve judgment and may differ materially from valuations of investments that would have been used had greater market activity occurred.
The Fund classifies its assets based on three valuation methodologies. Level 1 investment securities are valued based on quoted market prices in active markets for identical assets. Level 2 investment securities are valued based
25
NOTES TO FINANCIAL STATEMENTS
Continued
on significant observable market inputs, such as quoted prices for similar assets and quoted prices in inactive markets or other market observable inputs as noted above including spreads, cash flows, financial performance, prepayments, defaults, collateral, credit enhancements, and interest rate volatility. Level 3 investment securities are valued using significant unobservable inputs that reflect the Fund's determination of assumptions that market participants might reasonably use in valuing the assets. These assumptions consider inputs such as proprietary pricing models, cash flows, prepayments, defaults, and collateral. The valuation levels are not necessarily an indication of the risk associated with investing in those securities. The following table presents the valuation levels of the Fund's investments as of March 31, 2012:
| Investments | | Level 1 | | Level 2 | | Level 3 | | Total | |
| Bonds & Debentures | |
| Mortgage Pass-Through | | | — | | | $ | 1,368,219,709 | | | | — | | | $ | 1,368,219,709 | | |
| Mortgage-Backed | | | — | | | | 865,972,296 | | | $ | 38,311,303 | | | | 904,283,599 | | |
| Commercial Mortgage-Backed | | | — | | | | 696,033,753 | | | | — | | | | 696,033,753 | | |
| Stripped Mortgage-Backed | | | — | | | | 611,510,477 | | | | — | | | | 611,510,477 | | |
| Asset-Backed | | | — | | | | 478,475,559 | | | | — | | | | 478,475,559 | | |
| U.S. Treasuries | | | — | | | | 136,138,531 | | | | — | | | | 136,138,531 | | |
| Corporate | | | — | | | | 123,333,724 | | | | — | | | | 123,333,724 | | |
| U.S. Agencies | | | — | | | | 33,727,297 | | | | — | | | | 33,727,297 | | |
| Short-Term Investments | | | — | | | | 348,378,073 | | | | — | | | | 348,378,073 | | |
| Total Investments | | | — | | | $ | 4,661,789,419 | | | $ | 38,311,303 | | | $ | 4,700,100,722 | | |
The following table summarizes the Fund's Level 3 investment securities and related transactions during the period ended March 31, 2012:
| Investments | | Beginning
Value at
September 30,
2011 | | Net Realized and
Unrealized Gains
(Losses) | | Net
Purchases
(Sales) | | Net
Transfers
In (Out)* | | Ending
Value at
March 31,
2012 | |
| Mortgage-Backed | | $ | 44,951,618 | | | $ | (6,640,315 | ) | | $ | — | | | $ | — | | | $ | 38,311,303 | | |
* Transfers of investments between different levels of the fair value hierarchy are recorded at market value as of the end of the reporting period. There were no significant transfers between Level 1 and Level 2 during the period ended March 31, 2012.
NOTE 9 — Distribution to Shareholders
On March 30, 2012, the Board of Directors declared a dividend from net investment income of $0.08 per share payable April 3, 2012 to shareholders of record on March 30, 2012. For financial statement purposes, this dividend was recorded on the ex-dividend date, April 2, 2012.
NOTE 10 — New Accounting Pronouncements
In April 2011, the Financial Accounting Standards Board (FASB) issued Accounting Standards Update (ASU) No. 2011-03 "Transfers and Servicing (Topic 860): Reconsideration of Effective Control for Repurchase Agreements." The ASU 2011-03 is intended to improve financial reporting of repurchase agreements and other
26
NOTES TO FINANCIAL STATEMENTS
Continued
agreements that both entitle and obligate a transferor to repurchase or redeem the financial assets before their maturity. In May 2011, the FASB issued ASU No. 2011-04 "Amendments to Achieve Common Fair Value Measurement and Disclosure Requirements in U.S. GAAP and IFRS". ASU 2011-04 includes common requirements for measurement of and disclosure about fair value between U.S. GAAP and IFRS. ASU 2011-04 will require reporting entities to disclose quantitative information about the unobservable inputs used in the fair value measurements categorized within Level 3 of the fair value hierarchy. In addition, ASU 2011-04 will require reporting entities to make disclosures about amounts and reasons for all transfers in and out of Level 1 and Level 2 fair value measurements. These new pronouncements are effective for interim and annual reporting periods beginning after December 15, 2011. Management is currently evaluating the impact these pronouncements may have on the Fund's financial statements.
27
SHAREHOLDER EXPENSE EXAMPLE
March 31, 2012
Fund Expenses
As a shareholder of the Fund, you incur two types of costs: (1) transaction costs, and (2) ongoing costs, including advisory and administrative fees; shareholder service fees; and other Fund expenses. The Example is intended to help you understand your ongoing costs (in dollars) of investing in the Fund and to compare these costs with the ongoing costs of investing in other mutual funds. The Example is based on an investment of $1,000 invested at the beginning of the year and held for the entire year.
Actual Expenses
The information in the table under the heading "Actual Performance" provides information about actual account values and actual expenses. You may use the information in this column, together with the amount you invested, to estimate the expenses that you paid over the period. Simply divide your account value by $1,000 (for example, an $8,600 account value divided by $1,000= 8.6), then multiply the result by the number in the first column in the row entitled "Expenses Paid During Period" to estimate the expenses you paid on your account during this period.
Hypothetical Example for Comparison Purposes
The information in the table under the heading "Hypothetical Performance (5% return before expenses)" provides information about hypothetical account values and hypothetical expenses based on the Fund's actual expense ratio and an assumed rate of return of 5% per year before expenses, which is not the Fund's actual return. The hypothetical account values and expenses may not be used to estimate the actual ending account balance or expenses you paid for the period. You may use this information to compare the ongoing costs of investing in the Fund and other funds. To do so, compare this 5% hypothetical example with the 5% hypothetical examples that appear in the shareholder reports of other funds.
Please note that the expenses shown in the table are meant to highlight your ongoing costs only and do not reflect any transactional costs. Therefore, the information under the heading "Hypothetical Performance (5% return before expenses)" is useful in comparing ongoing costs only, and will not help you determine the relative total costs of owning different funds. In addition, if these transactional costs were included, your costs would have been higher.
| | | Actual
Performance | | Hypothetical
Performance
(5% return
before
expenses) | |
Beginning Account Value
September 30, 2011 | | $ | 1,000.00 | | | $ | 1,000.00 | | |
Ending Account Value
March 31, 2012 | | $ | 1,006.60 | | | $ | 1,022.06 | | |
Expenses Paid During
Period* | | $ | 2.91 | | | $ | 2.94 | | |
* Expenses are equal to the Fund's annualized expense ratio of 0.58%, multiplied by the average account value over the period and prorated for the six-months ended March 31, 2012 (183/366 days).
28
DIRECTOR AND OFFICER INFORMATION
| Name, Age & Address | | Position(s)
With Fund/
Years Served | | Principal Occupation(s)
During the Past 5 Years | | Portfolios in
Fund Complex
Overseen | | Other Directorships | |
| Willard H. Altman, Jr. – (76)* | | Director and Chairman†
Years Served: 14 | | Retired. Formerly, until 1995, Partner of Ernst & Young LLP, a public accounting firm. | | | 7 | | | | |
|
| Thomas P. Merrick – (75)* | | Director†
Years Served: 3 | | Private Consultant. President of Strategic Planning Consultants for more than the past five years. Former Executive Committee Member and Vice President of Fluor Corporation, responsible for strategic planning, from 1984 to 1998. | | | 7 | | | | |
|
| Alfred E. Osborne, Jr. – (67)* | | Director†
Years Served: 12 | | Senior Associate Dean of the John E. Anderson School of Management at UCLA. | | | 4 | | | Wedbush, Inc., Heckmann Corporation, and Kaiser Aluminum Corporation. | |
|
| Patrick B. Purcell – (69)* | | Director†
Years Served: 6 | | Retired. Formerly Executive Vice President, Chief Financial Officer and Chief Administrative Officer of Paramount Pictures from 1983 to 1998. | | | 5 | | | Ocean Conservancy and The Motion Picture and Television Fund | |
|
| Allan M. Rudnick – (71)* | | Director†
Years Served: 2 | | Private Investor. Formerly, Co-Founder,
Chief Executive Officer, Chairman and
Chief Investment Officer of Kayne Anderson Rudnick Investment Management from 1989 to 2007 | | | 4 | | | | |
|
| Robert L. Rodriguez – (63) | | Director†
Portfolio Manager
Years Served: 28 | | Chief Executive Officer of the Adviser. | | | 2 | | | FPA Fund Distributors, Inc. | |
|
| Thomas H. Atteberry – (58) | | Chief Executive Officer & Portfolio Manager
Years Served: 7 | | Partner of the Adviser. Formerly Vice President of First Pacific Advisors, Inc. from 1997 to 2006. | | | | | |
|
| Eric S. Ende – (67) | | Vice President
Years Served: 27 | | Partner of the Adviser. Formerly Senior Vice President of First Pacific Advisors, Inc. from 1983 to 2006. | | | 3 | | | | |
|
| J. Richard Atwood – (51) | | Treasurer
Years Served: 15 | | Chief Operating Officer of the Adviser. President and Chief Executive Officer of FPA Fund Distributors, Inc. | | | | FPA Fund Distributors, Inc. | |
|
| Christopher H. Thomas – (55) | | Chief Compliance Officer
Years Served: 17 | | Vice President and Chief Compliance Officer of the Adviser and Vice President of FPA Fund Distributors, Inc. | | | | FPA Fund Distributors, Inc. | |
|
| Sherry Sasaki – (57) | | Secretary
Years Served: 28 | | Assistant Vice President and Secretary of the Adviser and Secretary of FPA Fund Distributors, Inc. | | | | | |
|
| E. Lake Setzler – (45) | | Assistant Treasurer
Years Served: 6 | | Vice President and Controller of the Adviser since 2005. | | | | | |
|
| Michael P. Gomez – (26) | | Assistant Vice President
Years Served: <1 | | Assistant Vice President of the Adviser since 2010. Formerly In-Charge Associate of PricewaterhouseCoopers from 2007 to 2010. | | | | | |
|
† Directors serve until their resignation, removal or retirement.
* Audit Committee member
Additional information on the Directors is available in the Statement of Additional Information. Each of the above listed individuals can be contacted at 11400 W. Olympic Blvd., Suite 1200, Los Angeles, CA 90064.
29
FPA NEW INCOME, INC.
INVESTMENT ADVISER
First Pacific Advisors, LLC
11400 West Olympic Boulevard, Suite 1200
Los Angeles, California 90064
DISTRIBUTOR
FPA Fund Distributors, Inc.
11400 West Olympic Boulevard, Suite 1200
Los Angeles, California 90064
LEGAL COUNSEL
K&L Gates LLP
San Francisco, California
TICKER: FPNIX
CUSIP: 302544101
INDEPENDENT REGISTERED PUBLIC ACCOUNTING FIRM
Deloitte & Touche LLP
Los Angeles, California
CUSTODIAN
State Street Bank and Trust Company
Boston, Massachusetts
TRANSFER & SHAREHOLDER SERVICE AGENT
UMB Fund Services, Inc.
P.O. Box 2175
Milwaukee, WI 53201-2175
803 W. Michigan St., Ste. A
Milwaukee, WI 53233-2301
(800) 638-3060
This report has been prepared for the information of shareholders of FPA New Income, Inc., and is not authorized for distribution to prospective investors unless preceded or accompanied by a prospectus.
The Fund's complete proxy voting record for the 12 months ended June 30, 2011 is available without charge, upon request, by calling (800) 982-4372 and on the SEC's website at www.sec.gov.
The Fund's schedule of portfolio holdings, filed the first and third quarter of the Fund's fiscal year on Form N-Q with the SEC, is available on the SEC's website at www.sec.gov. Form N-Q is available at the SEC's Public Reference Room in Washington, D.C., and information on the operations of the Public Reference Room may be obtained by calling (202) 942-8090. To obtain information on Form N-Q from the Fund, shareholders can call (800) 982-4372.
Additional information about the Fund is available online at www.fpafunds.com. This information includes, among other things, holdings, top sectors and performance, and is updated on or about the 15th business day after the end of each quarter.
Item 2. | | Code of Ethics. Not Applicable to this semi-annual report. |
| | |
Item 3. | | Audit Committee Financial Expert. Not Applicable to this semi-annual report. |
| | |
Item 4. | | Principal Accountant Fees and Services. Not Applicable to this semi- annual report. |
| | |
Item 5. | | Audit Committee of Listed Registrants. Not Applicable. |
| | |
Item 6. | | Schedule of Investments. The schedule of investments is included as part of the report to stockholders filed under Item 1 of this Form. |
| | |
Item 7. | | Disclosure of Proxy Voting Policies and Procedures for Closed-End Management Investment Companies. Not Applicable. |
| | |
Item 8. | | Portfolio Managers of Closed-End Management Investment Companies. Not Applicable. |
| | |
Item 9. | | Purchases of Equity Securities by Closed-End Management Investment Company and Affiliated Purchasers. Not Applicable. |
| | |
Item 10. | | Submission of Matters to a Vote of Security Holders. There has been no material change to the procedures by which shareholders may recommend nominees to the registrant’s board of directors. |
| | |
Item 11. | | Controls and Procedures. |
| | |
| | (a) | The principal executive officer and principal financial officer of the registrant have concluded that the registrant’s disclosure controls and procedures (as defined in Rule 30a-3(c) under the Investment Company Act of 1940) are effective based on their evaluation of the disclosure controls and procedures as of a date within 90 days of the filing date of this report. |
| | | |
| | (b) | There have been no significant changes in the registrant’s internal controls over financial reporting (as defined in Rule 30a-3(d) under the Investment Company Act of 1940) that occurred during the second fiscal quarter of the period covered by this report that have materially affected, or is reasonably likely to materially affect, the registrant’s internal controls over financial reporting. |
Item 12. | | Exhibits. |
| | | |
| | (a)(1) | Code of ethics as applies to the registrant’s principal executive and financial officers, as required to be disclosed under Item 2 of Form N-CSR. Not Applicable to this semi-annual report. |
| | | |
| | (a)(2) | Separate certification for the registrant’s principal executive officer and principal financial officer, as required by Rule 30a-2(a) under the Investment Company Act of 1940. Attached hereto. |
| | | |
| | (a)(3) | Not Applicable |
| | | |
| | (b) | Separate certification for the registrant’s principal executive officer and principal financial officer, as required by Rule 30a-2(b) under the Investment Company Act of 1940. Attached hereto. |
SIGNATURES
Pursuant to the requirements of the Securities Exchange Act of 1934 and the Investment Company Act of 1940, the registrant has duly caused this report to be signed on its behalf by the undersigned, thereunto duly authorized.
FPA NEW INCOME, INC.
By: | /s/ THOMAS H. ATTEBERRY | |
Thomas H. Atteberry, Chief Executive Officer | |
(Principal Executive Officer) | |
| |
Date: May 18, 2012 | |
Pursuant to the requirements of the Securities Exchange Act of 1934 and the Investment Company Act of 1940, this report has been signed below by the following persons on behalf of the registrant and in the capacities and on the dates indicated.
FPA NEW INCOME, INC.
By: | /s/ THOMAS H. ATTEBERRY | |
Thomas H. Atteberry, Chief Executive Officer | |
(Principal Executive Officer) | |
| |
Date: May 18, 2012 | |
By: | /s/ J. RICHARD ATWOOD | |
J. Richard Atwood, Treasurer | |
(Principal Financial Officer) | |
| |
Date: May 18, 2012 | |