UNITED STATES
SECURITIES AND EXCHANGE COMMISSION
Washington, D.C. 20549
FORM N-CSR
CERTIFIED SHAREHOLDER REPORT OF REGISTERED
MANAGEMENT INVESTMENT COMPANIES
Investment Company Act file number | 811-1735 |
|
FPA NEW INCOME, INC. |
(Exact name of registrant as specified in charter) |
|
11601 WILSHIRE BLVD., STE. 1200
LOS ANGELES, CALIFORNIA | |
90025
|
(Address of principal executive offices) | | (Zip code) |
|
J. RICHARD ATWOOD, PRESIDENT FPA NEW INCOME, INC. 11601 WILSHIRE BLVD., STE. 1200 LOS ANGELES, CALIFORNIA 90025 | Copy to: MARK D. PERLOW, ESQ. K&L GATES LLP FOUR EMBARCADERO CENTER SAN FRANCISCO, CA 94111 |
(Name and address of agent for service) |
|
Registrant’s telephone number, including area code: | (310) 473-0225 | |
|
Date of fiscal year end: | September 30 | |
|
Date of reporting period: | March 31, 2015 | |
| | | | | | | | | |
Item 1: Report to Shareholders.
FPA New Income, Inc.
Semi-Annual Report

Distributor:
UMB DISTRIBUTION SERVICES, LLC
235 West Galena Street
Milwaukee, Wisconsin 53212
FPA NEW INCOME, INC.
LETTER TO SHAREHOLDERS
Fund Performance
This Semi-Annual Report covers the six-month period ended March 31, 2015. Your Fund's net asset value (NAV) closed at $10.18. Dividends of $0.05 and $0.075 were paid on October 2, 2014 and December 23, 2014, to holders of record on September 30 and December 19, 2014, respectively. There were no capital gains distributions.
The following table shows the average annual total return for several different periods ended on that date for the Fund and its benchmarks.
| | | Periods Ended March 31, 2015 | |
| | | 1 Year | | 5 Years* | | 10 Years* | | 15 Years* | | 20 Years* | | 7/11/1984
Inception | |
FPA New Income, Inc. | | | 1.33 | % | | | 1.79 | % | | | 2.96 | % | | | 4.21 | % | | | 4.94 | % | | | 7.44 | % | |
Barclays U.S. Aggregate Bond Index | | | 5.72 | % | | | 4.41 | % | | | 4.93 | % | | | 5.66 | % | | | 6.03 | % | | | 7.87 | % | |
Consumer Price Index + 100 Basis Points | | | 0.98 | % | | | 2.66 | % | | | 3.04 | % | | | 3.19 | % | | | 3.27 | % | | | N/A | | |
* Annualized
Portfolio Commentary
FPA New Income appreciated 0.59% during the first quarter of 2015 and rose 1.33% over the past twelve months. While we are pleased to have grown shareholder wealth in real terms (or after inflation), as we have discussed in previous commentaries, for the time being we continue to expect it to be challenging to meet our rolling five-year goal of outpacing CPI + 1% given the current low yield environment. Inflation over the past twelve months ending March 31, 2015 was -0.02%.
Looking back longer-term, we think one appropriate way to think about the Fund's performance is to consider it alongside a passive, index-based alternative that performs the best under our stress test. As longtime shareholders know, we are continually stress testing the portfolio to position it to achieve a positive return should interest rates rise by 100 basis points (or one percentage point) over a twelve-month period (the Stress Test). The Barclays U.S. Aggregate Bond Index would have produced at least -1% returns at all points in time over the last five years under the Stress Test. Over the last three years, the broad-based index that would have performed the best (though still producing a slightly negative return) under that same stress test at the beginning of each calendar year would have been the Barclays U.S. Aggregate 1-3 year Index.
1
FPA NEW INCOME, INC.
LETTER TO SHAREHOLDERS
Continued
As the table below shows, the same holds true as of March 31, 2015.
As of 3/31/15 | | Duration1 | | Yield-to-worst2 | | YTW/Duration | | Stress Test Return | |
| FPA New Income | | | 1.40 | | | | 2.32 | | | | 1.66 | | | | 1.42 | | |
| BC U.S. Aggregate Bond Index | | | 5.45 | | | | 2.06 | | | | 0.38 | | | | -2.89 | | |
| BC U.S. Aggregate 1-3 Year Index | | | 1.89 | | | | 0.83 | | | | 0.44 | | | | -0.56 | | |
| BC U.S. Aggregate 3-5 Year Index | | | 3.44 | | | | 1.71 | | | | 0.50 | | | | -1.21 | | |
| BC U.S. Aggregate 5-7 Year Index | | | 4.27 | | | | 2.29 | | | | 0.54 | | | | -1.48 | | |
Source: Barclays, Morningstar
It is important to note that the Stress Test Returns do not reflect the actual performance of the Fund and are shown for illustrative, informational purposes only. They do not represent performance that the Fund or any investor actually attained but rather a depiction of what the returns of the Fund might have been assuming interest rates rose 100 basis points for the one year period ending March 31, 2015. The Stress Test Return also assumes that the Fund's portfolio managers would have made the same investment decisions for the Fund over the same one year period notwithstanding the assumed rise in interest rates. The assumptions have been made strictly for the purposes of presenting the Stress Test Return and are unlikely to be realized. No representation or warranty is made as to the reasonableness of the assumptions made or that all assumptions used in calculating the Stress Test Returns have been stated or fully considered. The Stress Test Returns have many inherent limitations and do not reflect the impact that material economic and market factors may have had on the decision-making process including, for example, if interest rates had in fact risen by 100 basis points over the period. Actual performance may have differed substantially from the Stress Test Returns presented and, faced with a similar rise in interest rates in the future, the Fund's performance may be materially different from that stated. Changes in the assumptions would have a material impact on the Stress Test Returns presented. Other periods selected may have different results, including losses. There can be no assurance that Fund will achieve profits or avoid incurring substantial losses.
Stress Test calculation: [Yield + (1+Yield)]/2 - Duration
The table below shows our results versus various indices:
Three years ended 3/31/15 | | Three-year return | | Duration (average) | |
| FPA New Income | | | 1.43 | | | | 1.54 | | |
| BC U.S. Aggregate 1-3 Year Index | | | 0.99 | | | | 1.88 | | |
| BC U.S. Aggregate Bond Index | | | 3.10 | | | | 5.39 | | |
| CPI | | | 0.99 | | | | N/A | | |
Source: Barclays, Morningstar
Past performance is no guarantee of future results and the index performance is not representative of the FPA New Income. As of March 31, 2015, the SEC yield was 3.27%. This calculation begins with the Fund's dividend payments for the last 30 days, subtracts fund expenses and uses this number to estimate your returns for a year. The SEC yield is based on the price of the fund at the beginning of the month. The income yield stated here reflects prospective data and thus assumes payments collected by the fund may fluctuate.
Over the past three years, FPA New Income returned 1.43% net of fees versus 0.99% gross of fees for the Barclays U.S. Aggregate 1-3 Year Index. Our risk-adjusted results were even more compelling: over the past three years the Fund took on about 20% less interest rate as measured by duration.
1 Duration is a measure of the sensitivity of the price (the value of principal) of a fixed-income investment to a change in interest rates.
2 Yield-to-worst is the lowest possible yield on a callable bond. As of March 31, 2015, the SEC yield was 3.27%. This calculation begins with the Fund's dividend payments for the last 30 days, subtracts Fund expenses and uses this number to estimate your returns for a year. The SEC yield is based on the price of the Fund at the beginning of the month. The income yield stated here reflects prospective data and thus assumes payments collected by the Fund may fluctuate.
2
FPA NEW INCOME, INC.
LETTER TO SHAREHOLDERS
Continued
To earn our fees, we believe we must outpace a cheap, passive index-based alternative on a risk-adjusted basis. Importantly, this won't always be the Barclays U.S. Aggregate 1-3 Year Index as interest rates rise and fall in the future. An advantage to investing alongside us is that as interest rates and credit spreads move up and down, we have the flexibility to reposition the portfolio accordingly to take advantage of what we believe are the best risk-adjusted opportunities.
Over the past year we have committed significant resources to enhancing our portfolio management tools. As previously discussed, this resulted in changing our portfolio analytics system. The new system is far more robust and as an example has enabled us to highlight each security by its investment idea and thus sort the portfolio by these ideas instead of the traditional sector sorting. The top ideas represent over 75% of the portfolio's assets broken down as follows by order of their size allocation to the portfolio.
1. Asset Backed Securities (ABS)3 — Sub-prime automobile loans
2. Treasury notes — Two-year maturity floating rate notes and less than one year to maturity fixed rate notes
3. Commercial Mortgage Backed Security (CMBS)4 — GNMA Project Loan Interest Only (IO) Securities
4. Corporate High Yield loans and bonds
5. Collateralized Mortgage Obligation (CMO)5 — Agency backed relocation loans
6. High coupon seasoned 15-year agency mortgages
7. Collateralized Mortgage Obligation (CMO) — Non-performing single family mortgages
8. Commercial Mortgage Backed Security (CMBS) — Non-agency mortgages
Leaders and Laggards
The sectors contributing the most to performance during the quarter were the corporate high yield bonds and bank loans. It was followed by CMOs backed by agency relocation loans and the GNMA Project Loan IO securities. This was driven by the decline in longer maturity treasury yields and a decline in high yield credit spreads. While producing a modest absolute positive return, the weakest performers were the seasoned 15-year agency mortgages and Treasury notes.
Looking back over the previous twelve months, the main contributors were corporate high yield loans and bonds, CMOs backed by agency relocation mortgage pools, and CMOs backed by non-performing single family mortgages. With the weakest performance coming from the Treasury notes and the 15-year seasoned agency mortgages.
Portfolio Activity
For the first quarter of 2015 we continued to find opportunities that met our goals of producing an absolute positive return over rolling twelve-month periods and positive real returns (outperform inflation plus 100 basis points) over five-year periods as well as competitive returns versus the bond market universe.
3 Asset backed securities are bonds or notes backed by assets
4 Commercial mortgage backed securities are securities backed by commercial mortgages rather than residential mortgages
5 Collateralized mortgage obligations are mortgage-backed bonds that separate mortgage pools into different maturity classes.
3
FPA NEW INCOME, INC.
LETTER TO SHAREHOLDERS
Continued
The largest amount of purchasing activity during the quarter was concentrated in the sub-prime automobile loan ABS segment followed by the CMOs backed by non-performing single family mortgages, GNMA Project Loan IOs, and ABS bonds backed by prime automobile loans. We also continued to add to existing high yield bonds and loans positions. A new area that was introduced in the portfolio during the quarter was fixed rate credit card receivables. We found an asset-backed issuer that met our credit quality requirements and has attractive yield-to-worst versus effective duration metrics.
We continue to cull through the portfolio looking for holdings that, after subjecting them to multiple stress tests, do not perform in an acceptable fashion. Once identified, these holdings are eliminated from the portfolio. During the quarter a few names did surface from this review and were sold. In addition, several holdings were called away.
The portfolio continues to be constructed with a defensive posture. Both the effective duration and yield-to-worst declined slightly during the quarter. While we did find some investment opportunities during the past three months, the buildup in the cash component to more normal levels impacted the duration and yield.
Market Commentary
The undertaking of Quantitative Easing (QE) by yet another developed economy central bank was a significant event this quarter. While the Fed has concluded its current expansionary QE program, they do continue to reinvest about $20 billion per month in the mortgage area alone from bond maturities and mortgage principal pay-downs. Japan continues to roll along targeting to purchase upwards of $1.4 trillion in sovereign debt. The newest player joining at the table is the European Central Bank (ECB) that announced the intent to purchase about $50 billion of securities per month between now and September 2016 for a total of around $1.3 trillion. Both Japan and Europe are attempting to boost inflation to their target levels and are comfortable with the added benefit of a lower currency value that, in their view, will stimulate exports and thus increase economic activity. That activity however is not internally demand-driven but predicated on an increase in consumer and business spending by the U.S.
Europe is now experiencing a growing class of negative sovereign and high quality bond interest rates. Today approximately 30% of the outstanding sovereign debt in Europe trades with a negative yield. A negative yield means that someone is willing to lend someone else their money for a period of time and pay them to take the money, hardly a good long-term strategy. This is not just short maturity bonds, as an example seven eurozone countries have negative rates for their five-year maturities including "A" rated Slovakia. Eighteen European countries have ten-year bond yields that are lower than the U.S. ten-year Treasury.
There are several reasons why the yields went negative. First, over the next two years, with the purchases by the ECB, there will be a negative net issuance of sovereign debt in the eurozone. Secondly, certain institutions such as banks, insurance companies, and pension plans by regulation have to hold a certain amount of high quality assets against their liabilities. These institutions may tend to hoard their holdings realizing they are not replaceable. Longer-term, these negative or negligibly positive yields on high quality bonds may have a negative impact on profitability for these institutions which in turn could impact their ability to deliver on the promised obligations. Suffice it to say, this is an unhealthy long-term situation. The illustration below shows the change in German government bond yields over the past year.
4
FPA NEW INCOME, INC.
LETTER TO SHAREHOLDERS
Continued
Date | | Two-Year Yield | | Ten-Year Yield | | Slope (difference) | |
March 31, 2014 | | | 0.158 | % | | | 1.565 | % | | 141 basis points | |
March 31, 2015 | | | -0.255 | % | | | 0.180 | % | | 44 basis points | |
Change | | | -0.413 | % | | | -1.385 | % | | -97 basis points | |
Source: Bloomberg
Past performance is no guarantee of future results
The German government yield curve not only went to a noticeable negative yield on the front end of the curve, the long end of the curve declined by an even greater amount. The result is a significant flattening of the yield curve during a period of slowing economic growth.
Below is a table showing the change in the yield curve of lower credit quality eurozone country, Italy.
Date | | Two-Year Yield | | Ten-Year Yield | | Slope (difference) | |
March 31, 2014 | | | 0.834 | % | | | 3.291 | % | | 246 basis points | |
March 31, 2015 | | | 0.188 | % | | | 1.239 | % | | 105 basis points | |
Change | | | -0.646 | % | | | -2.052 | % | | -141 basis points | |
Source: Bloomberg
Past performance is no guarantee of future results
The decline in the overall level of yields and the flattening of the yield curve is more pervasive in this case. In both cases economic growth may be difficult to achieve through increased lending if the yield curve remains flat. Also, in our view, a decline in the long end of the yield curve to a greater extent than the short end in both cases reflects a rather cavalier view towards inflation.
Throw in about a 50% decline in the price of oil, the resulting headline CPI6 at "0" in the U.S., the appreciation of the dollar versus major world currencies by about 18% and how all this may impact the domestic bond market, and the result is a market place with much uncertainty. If the price of oil stays at these levels through the rest of the year, the consumer will have more money to either spend or save. Should they choose to spend it, imported goods will look cheaper due to the rise in the dollar. This activity could result in an uneven benefit to our GDP growth. The service sector may benefit more than the goods producing sector. A "0" CPI or very low CPI will result in higher real interest rates. This has the effect of making even low nominal interest rates more difficult to repay. An increase in the value of the dollar in combination with a rise in real interest rates has a similar effect to the Fed raising short term interest rates. Finally, whether the yield curve flattens due to a decline in long-term rates or a rise in short-term rates, or a combination of both, the impact is the same — diminishing availability of credit because the ability to borrow short and lend long at a profit declines.
As a fixed income portfolio manager we face two potential outcomes: deflation and central bank bond buying that drive longer rates down and suppress short rates on high quality assets or inflation (perhaps due to wage pressures or increased consumer spending) that results in rising short rates from a change in the Fed interest rate policy (the exit of zero interest rate policy) and creates the potential for inflation-driven increases in longer-term rates. Which event prevails is uncertain and one event might be followed by the other such as deflation first and inflation second.
6 Headline CPI is the raw inflation figure as reported through the Consumer Price Index (CPI) that is released monthly by the Bureau of Labor Statistics.
5
FPA NEW INCOME, INC.
LETTER TO SHAREHOLDERS
Continued
Our solution has been and continues to be constructing a portfolio that we believe survives both worlds with our capital intact. We favor bonds that self-liquidate through amortization (reduce market illiquidity risk), bonds backed by critical assets for the borrower (minimize deflation default risk), assets where the borrower has equity in the collateral (minimize default risk), assets that can be valued accurately and can be obtained in the event of default (increase odds of getting money back in liquidation), and five-year or less to maturity (minimize inflation risk).
In June 2003, Bob Rodriguez and I penned a memo called "Buyers' Strike," where we stated that we see little value in high quality long-term bonds and as such will not commit our clients' capital to them. We revisited the thesis in June 2008 and continued that assessment. The decline in longer-term high quality interest rates today due to central bank purchases and fears of deflation, while a tempting trade to some, is not of interest to us as we continue to view the long end of the high quality bond market devoid of fundamental value for the investor.
We consider this investment discipline and strive to consistently apply the same research and analytical approach every day. If we are consistent in that application, our clients will be comfortable in how this portfolio will act as the bond market vacillates between the fear of inflation and the fear of deflation. It is this consistency that results in our fixed income investment management strategy being an anchor in clients' overall portfolio allocations as they seek to achieve their long-term investment goals.
Illiquidity in Liquidity's Clothing
"Risk like energy, tends to be conserved not dissipated, to change its composition but not its quantum" Andrew Haldane, Chief Economist Bank of England, August 5, 2014
Much has been written about the decrease in liquidity in today's fixed income markets. We share those concerns, which we have expressed in the past so we will not repeat them here. However, amidst all of this discussion, one particular topic has come to the fore which we find particularly troublesome, namely the use of exchange-traded funds (ETFs) by mutual fund managers as a source of liquidity. Specifically, some mutual fund managers have been using ETFs to manage inflows and outflows of cash into their funds.
This phenomenon came to our attention specifically in the high yield sector. Imagine a high yield mutual fund manager receives a large inflow. Suppose that this manager wants to be fully invested at all times (and ignore whether it is wise to be fully invested at all times). Rather than taking the time to buy individual bonds with the newly contributed cash, the manager will simply buy a high yield ETF which allows the fund to be fully invested in a matter of hours versus the days or weeks it would take if the manager were to buy specific bonds. On the flip side, if this fund experiences a large redemption, rather than sell bonds to create the necessary liquidity, the manager would sell the ETF, again turning what should be a multi-day process into a multi-minute process. This approach sounds like a great solution to the problem of managing inflows and outflows in a fully invested fund that has daily liquidity. The problem is that this approach is based on the false premise that ETFs are liquid. Despite what the glossy marketing materials will tell you, some ETFs are in fact illiquidity in liquidity's clothing.
The risk is that ETF investors (including mutual fund managers) get lulled into the liquidity of the ETF shares while failing to respect the illiquidity of the bonds underlying the ETF. Liquidity is not only the ability to sell but rather it is the ability to sell at a price that reflects the value one would get in a functioning market (i.e., not a market with one buyer who is willing to pay a steeply discounted price). As it is, even in today's environment with low volatility, it is not clear that a high yield ETF closely tracks the market value of the underlying bonds. Fixed income markets, and high yield in particular, are special in that they are often quoted but are not necessarily executable at the quoted price. ETFs are designed to track a net asset value (NAV) which is based on market quotes but the market quote may not reflect the price at which bonds could actually be bought or sold. While, on paper, the discount or premium to NAV for a high yield ETF is small, in reality the discount or premium to the true market value may be meaningfully larger. This is a phenomenon which some refer to as the "fuzzy NAV".
6
FPA NEW INCOME, INC.
LETTER TO SHAREHOLDERS
Continued
Also consider that the mechanism which causes the price of a high yield ETF to hew closely to the market value of the underlying bonds requires that an "authorized participant," typically a large broker-dealer, buy or sell the bonds. Recall that the large broker-dealers were also supposed to serve as the back-stop bid on auction rate securities and yet they failed to fulfill that obligation during the financial crisis. What happens in a crisis when the authorized participant does not have balance sheet capacity or willingness to engage in ETF bond transactions? What is the ETF worth in that situation?
In declining high yield markets, bond prices tend to experience multiple point movements as their illiquidity leaves them in search of an equilibrium price level. Oftentimes, a market-clearing price can be hard to ascertain. Lest anyone think we are being alarmists, consider the case of a notable energy-focused hedge fund which had trouble valuing its fund at the end of 2014 because the turmoil in the energy high yield market made it difficult to accurately price its bond holdings. This hedge fund was subsequently forced to restate and mark down the value of its holdings following an auditor's review.
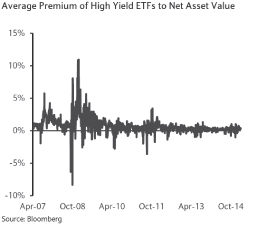
Selling in the high yield market plus the impact of the fuzzy NAV plus the potential absence of the authorized participants could lead to violent movements in the price of a high yield ETF as it experiences waves of liquidity selling while the underlying bonds are trying to discover their price. In situations like these, high yield ETF holders may face a precipitously falling price which dissociates from the value of the underlying bonds. The following chart shows the premium and discount of high yield ETFs versus the NAV and demonstrates how a high yield ETF puts its holders in a position of additional losses on top of the losses which the high yield market experiences. Note that the discount rose to nearly 10% during the financial crisis. Also note that this chart does not capture the difference between the quoted fuzzy NAV value and the true market value of the bonds.
There is no magic — despite the protestations of ETF issuers, it is not possible to decouple the liquidity of the ETF from the liquidity of the high yield market which is to say that you may be able to sell your ETF but at what price? Will that price reflect market value? As a holder of a high yield ETF, your ability to avoid extra
7
FPA NEW INCOME, INC.
LETTER TO SHAREHOLDERS
Continued
losses beyond the losses on the underlying bonds depends on whether you can sell before everyone else. Given the erroneous perception of liquidity, there will be a lot of sellers trying to sell very quickly. Do you feel lucky?
We bring this to your attention because, as a fixed income investor, you should be aware of practices in the fixed income industry. We would be remiss in not advising our investors of the risks they could face. Rest assured we do not use ETFs to manage our liquidity. Notwithstanding that we do not feel that fixed income ETFs are a good investment today, using ETFs to manage liquidity is simply not prudent.
Rather than rely on an illusory instrument of liquidity like an ETF, we express our liquidity concerns by owning a large amount of structured products whose monthly amortization organically creates liquidity and by maintaining significant holdings in short duration bonds whose prices should be less susceptible to market illiquidity. Also, we manage exposures in the strategy using cash so that we are not faced with the prospect of selling into a declining market to meet redemptions. We want to be buyers when others are sellers.
Conclusion
Given the uncertainty of continued quantitative easing and its impact on inflation, coupled with the declining oil price and pressuring deflation, further complicated by an illusion of liquidity in portions of the credit market, our team continues to focus on investment opportunities that minimize these risks to the portfolio and go towards achieving both our long-term and short-term investment objectives.
Finally, on April 1, 2015 Prakash Gopinath joined the team as Vice President and Research Analyst. He has over eight years of experience working in the areas of mid-market direct lending, private equity research, and fixed income credit research for a hedge fund. He will be working alongside Joe Choi covering the corporate credit portion of the portfolio. In conjunction with this addition to the team, Abhi Patwardhan has assumed the role of Director of Research.
We thank you for continued support and continue to work diligently to maintain your trust.
Respectfully submitted,

Thomas H. Atteberry
Portfolio Manager
April 24, 2015
The discussion of Fund investments represents the views of the Fund's managers at the time of this report and is subject to change without notice. References to individual securities are for informational purposes only and should not be construed as recommendations to purchase or sell individual securities.
8
FPA NEW INCOME, INC.
LETTER TO SHAREHOLDERS
Continued
FUND RISKS
Investments in mutual funds carry risks and investors may lose principal value. Capital markets are volatile and can decline significantly in response to adverse issuer, political, regulatory, market, or economic developments. The Fund can purchase foreign securities, which are subject to interest rate, currency exchange rate, economic and political risks. The securities of smaller, less well-known companies can be more volatile than those of larger companies. The return of principal in a bond fund is not guaranteed. Bond funds have the same issuer, interest rate, inflation and credit risks that are associated with underlying bonds owned by the fund. Lower rated bonds, convertible securities and other types of debt obligations involve greater risks than higher rated bonds. Mortgage securities and collateralized mortgage obligations (CMOs) are subject to prepayment risk and the risk of default on the underlying mortgages or other assets; derivatives may increase volatility. High yield securities can be volatile and subject to much higher instances of default.
FORWARD LOOKING STATEMENT DISCLOSURE
As mutual fund managers, one of our responsibilities is to communicate with shareholders in an open and direct manner. Insofar as some of our opinions and comments in our letters to shareholders are based on current management expectations, they are considered "forward-looking statements" which may or may not be accurate over the long term. While we believe we have a reasonable basis for our comments and we have confidence in our opinions, actual results may differ materially from those we anticipate. You can identify forward-looking statements by words such as "believe," "expect," "may," "anticipate," and other similar expressions when discussing prospects for particular portfolio holdings and/or the markets, generally. We cannot, however, assure future results and disclaim any obligation to update or alter any forward-looking statements, whether as a result of new information, future events, or otherwise. Further, information provided in this report should not be construed as a recommendation to purchase or sell any particular security.
FPA NEW INCOME, INC.
PORTFOLIO SUMMARY
March 31, 2015 (Unaudited)
Bonds & Debentures | | | 99.2 | % | |
Asset-Backed Securities | | | 33.3 | % | |
Residential Mortgage-Backed
Securities | | | 25.9 | % | |
Commercial Mortgage-Backed
Securities | | | 15.1 | % | |
U.S. Treasury & Government
Agencies | | | 11.8 | % | |
Corporate Bonds & Notes | | | 10.2 | % | |
Corporate Bank Debt | | | 2.8 | % | |
Repurchase Agreements | | | 1.3 | % | |
Municipals | | | 0.1 | % | |
Short-Term Investments | | | 1.3 | % | |
Other Assets & Liabilities, Net | | | (0.5 | )% | |
Net Assets | | | 100.0 | % | |
9
FPA NEW INCOME, INC.
PORTFOLIO OF INVESTMENTS
March 31, 2015 (Unaudited)
BONDS & DEBENTURES | | Principal
Amount | | Fair
Value | |
COMMERCIAL MORTGAGE-BACKED SECURITIES — 15.1% | |
AGENCY — 1.7% | |
Government National Mortgage Association | |
| 2013-55 A — 1.317% 5/16/2034 | | $ | 992,083 | | | $ | 987,049 | | |
| 2012-22 AB — 1.661% 3/16/2033 | | | 4,236,679 | | | | 4,260,704 | | |
| 2012-2 A — 1.862% 6/16/2031 | | | 6,446,252 | | | | 6,475,120 | | |
| 2011-49 A — 2.45% 7/16/2038 | | | 3,367,644 | | | | 3,391,138 | | |
| 2010-155 B — 2.525% 6/16/2039 | | | 2,825,000 | | | | 2,874,797 | | |
| 2011-49 AB — 2.80% 1/16/2034 | | | 16,275,636 | | | | 16,454,506 | | |
| 2011-120 A — 3.856% 8/16/2033 | | | 26,800,789 | | | | 27,333,052 | | |
| 2011-143 AB — 3.928% 3/16/2033 | | | 34,603,488 | | | | 35,473,420 | | |
| 2006-63 B — 5.005% 3/16/2038 | | | 354,029 | | | | 361,159 | | |
| 2010-148 AC — 7.00% 12/16/2050 | | | 265,558 | | | | 290,575 | | |
| | | $ | 97,901,520 | | |
AGENCY STRIPPED — 10.1% | |
Government National Mortgage Association | |
| 2004-10 — 0.00% 1/16/2044 | | | 15,800,628 | | | | 158 | | |
| 2002-56 — 0.043% 6/16/2042 | | | 210,969 | | | | 329 | | |
| 2010-49 — 0.091% 2/16/2050 | | | 47,681,805 | | | | 869,239 | | |
| 2009-119 — 0.106% 12/16/2049 | | | 76,575,256 | | | | 1,398,264 | | |
| 2010-63 — 0.106% 5/16/2050 | | | 38,115,803 | | | | 641,108 | | |
| 2011-10 — 0.109% 12/16/2045 | | | 59,637,163 | | | | 1,297,705 | | |
| 2010-18 — 0.12% 1/16/2050 | | | 51,570,480 | | | | 1,079,370 | | |
| 2011-6 — 0.188% 10/16/2052 | | | 148,779,940 | | | | 3,154,135 | | |
| 2011-64 IX — 0.193% 10/16/2044 | | | 47,571,187 | | | | 2,005,601 | | |
| 2009-60 — 0.205% 6/16/2049 | | | 37,518,318 | | | | 730,482 | | |
| 2008-8 — 0.272% 11/16/2047 | | | 25,487,017 | | | | 464,373 | | |
| 2007-77 — 0.284% 11/16/2047 | | | 38,125,885 | | | | 1,146,445 | | |
| 2009-86 — 0.289% 10/16/2049 | | | 54,724,266 | | | | 1,114,733 | | |
| 2008-24 — 0.292% 11/16/2047 | | | 9,936,594 | | | | 181,939 | | |
| 2009-71 — 0.366% 7/16/2049 | | | 22,934,368 | | | | 561,204 | | |
| 2010-148 IX — 0.377% 10/16/2052 | | | 44,085,024 | | | | 1,412,925 | | |
| 2010-28 — 0.468% 3/16/2050 | | | 49,840,337 | | | | 1,327,747 | | |
| 2009-49 — 0.478% 6/16/2049 | | | 23,950,074 | | | | 700,779 | | |
| 2004-108 — 0.482% 12/16/2044 | | | 12,919,328 | | | | 242,367 | | |
| 2011-16 — 0.488% 9/16/2046 | | | 87,829,155 | | | | 3,164,484 | | |
| 2005-9 — 0.521% 1/16/2045 | | | 4,480,017 | | | | 103,623 | | |
| 2013-72 — 0.527% 11/16/2047 | | | 530,351,714 | | | | 29,420,519 | | |
| 2009-105 — 0.53% 11/16/2049 | | | 26,286,247 | | | | 1,018,592 | | |
| 2004-43 — 0.563% 6/16/2044 | | | 36,942,648 | | | | 876,280 | | |
| 2010-161 IA — 0.57% 12/16/2050 | | | 205,181,216 | | | | 5,439,354 | | |
10
FPA NEW INCOME, INC.
PORTFOLIO OF INVESTMENTS (Continued)
March 31, 2015 (Unaudited)
BONDS & DEBENTURES | | Principal
Amount | | Fair
Value | |
| 2008-45 — 0.599% 2/16/2048 | | $ | 10,381,354 | | | $ | 338,744 | | |
| 2013-35 — 0.623% 1/16/2053 | | | 348,910,761 | | | | 19,530,699 | | |
| 2008-92 — 0.663% 10/16/2048 | | | 34,244,035 | | | | 1,538,242 | | |
| 2006-55 — 0.687% 8/16/2046 | | | 22,025,434 | | | | 809,875 | | |
| 2013-29 — 0.689% 5/16/2053 | | | 115,702,942 | | | | 6,893,315 | | |
| 2008-48 — 0.704% 4/16/2048 | | | 12,653,712 | | | | 505,895 | | |
| 2012-35 — 0.728% 11/16/2052 | | | 118,658,116 | | | | 5,960,411 | | |
| 2013-7 — 0.748% 5/16/2053 | | | 362,836,530 | | | | 23,881,247 | | |
| 2010-123 — 0.758% 9/16/2050 | | | 54,244,765 | | | | 2,143,753 | | |
| 2012-44 — 0.759% 3/16/2049 | | | 53,172,529 | | | | 2,332,434 | | |
| 2014-120 — 0.781% 4/16/2056 | | | 70,692,125 | | | | 4,508,348 | | |
| 2008-78 — 0.792% 7/16/2048 | | | 10,821,021 | | | | 529,148 | | |
| 2012-9 — 0.793% 11/16/2052 | | | 148,767,490 | | | | 11,602,377 | | |
2011-49 IX — 0.813% 4/16/2045 | | | 62,932,975 | | | | 2,511,026 | | |
| 2009-30 — 0.859% 3/16/2049 | | | 12,555,136 | | | | 517,899 | | |
| 2014-88 IE — 0.863% 3/16/2055 | | | 207,111,307 | | | | 13,969,098 | | |
| 2009-4 — 0.874% 1/16/2049 | | | 22,029,386 | | | | 1,032,958 | | |
| 2012-95 — 0.877% 2/16/2053 | | | 142,376,321 | | | | 9,986,574 | | |
| 2012-131 — 0.883% 2/16/2053 | | | 107,862,199 | | | | 8,161,199 | | |
| 2012-45 — 0.89% 4/16/2053 | | | 32,289,228 | | | | 2,130,530 | | |
| 2014-157 — 0.89% 5/16/2055 | | | 190,008,100 | | | | 13,696,715 | | |
| 2011-78 IX — 0.897% 8/16/2046 | | | 112,200,674 | | | | 5,326,166 | | |
| 2011-164 — 0.902% 4/16/2046 | | | 116,647,073 | | | | 6,107,641 | | |
| 2013-80 — 0.907% 3/16/2052 | | | 63,218,412 | | | | 4,945,956 | | |
| 2013-1 — 0.914% 2/16/2054 | | | 137,148,338 | | | | 10,522,295 | | |
| 2014-138 — 0.914% 4/16/2056 | | | 37,344,006 | | | | 2,825,201 | | |
| 2012-150 — 0.919% 11/16/2052 | | | 93,770,480 | | | | 6,801,576 | | |
| 2011-92 IX — 0.927% 11/16/2044 | | | 26,231,600 | | | | 1,475,790 | | |
| 2013-125 — 0.934% 10/16/2054 | | | 26,420,766 | | | | 1,519,390 | | |
| 2014-164 — 0.94% 1/16/2056 | | | 376,936,124 | | | | 27,289,422 | | |
| 2013-13 — 0.946% 7/16/2047 | | | 105,478,457 | | | | 6,892,986 | | |
| 2012-58 — 0.946% 2/16/2053 | | | 292,533,483 | | | | 19,743,085 | | |
| 2012-25 — 0.956% 8/16/2052 | | | 178,595,272 | | | | 10,098,991 | | |
| 2014-135 — 0.961% 1/16/2056 | | | 389,813,112 | | | | 29,199,536 | | |
| 2012-79 — 0.963% 3/16/2053 | | | 175,722,494 | | | | 11,404,390 | | |
| 2011-165 — 0.968% 10/16/2051 | | | 223,191,184 | | | | 10,402,941 | | |
| 2013-30 — 0.977% 9/16/2053 | | | 225,728,314 | | | | 15,740,396 | | |
| 2012-85 — 0.983% 9/16/2052 | | | 187,098,501 | | | | 13,258,623 | | |
| 2011-120 — 1.005% 12/16/2043 | | | 103,783,044 | | | | 9,428,689 | | |
| 2013-61 — 1.007% 5/16/2053 | | | 152,344,053 | | | | 10,711,112 | | |
| 2014-110 — 1.009% 1/16/2057 | | | 57,640,328 | | | | 5,204,339 | | |
11
FPA NEW INCOME, INC.
PORTFOLIO OF INVESTMENTS (Continued)
March 31, 2015 (Unaudited)
BONDS & DEBENTURES | | Principal
Amount | | Fair
Value | |
| 2014-153 — 1.015% 4/16/2056 | | $ | 302,564,252 | | | $ | 26,119,585 | | |
| 2011-143 — 1.034% 4/16/2053 | | | 90,202,893 | | | | 10,405,806 | | |
| 2015-19 — 1.034% 1/16/2057 | | | 116,646,253 | | | | 10,592,530 | | |
| 2014-187 — 1.036% 5/16/2056 | | | 260,175,987 | | | | 22,536,600 | | |
| 2014-175 — 1.04% 4/16/2056 | | | 309,246,190 | | | | 26,413,583 | | |
| 2013-45 — 1.045% 12/16/2053 | | | 119,862,975 | | | | 7,359,371 | | |
| 2006-30 — 1.046% 5/16/2046 | | | 4,060,009 | | | | 290,534 | | |
| 2011-149 — 1.061% 10/16/2046 | | | 54,075,965 | | | | 3,985,939 | | |
| 2015-41 — 1.083% 9/16/2056 | | | 105,598,000 | | | | 9,341,717 | | |
| 2012-4 — 1.097% 5/16/2052 | | | 216,931,261 | | | | 10,927,934 | | |
| 2012-33 — 1.138% 6/16/2052 | | | 273,415,940 | | | | 13,318,911 | | |
| 2014-28 — 1.197% 10/16/2054 | | | 112,362,868 | | | | 9,680,218 | | |
| 2014-49 — 1.358% 8/16/2054 | | | 172,179,188 | | | | 15,741,586 | | |
| | | $ | 566,545,081 | | |
NON-AGENCY — 3.3% | |
| A10 Term Asset Financing LLC 2013-2 A — 2.62% 11/15/2027** | | $ | 10,328,825 | | | $ | 10,363,842 | | |
Citigroup Commercial Mortgage Trust | |
| 2007-FL3A B — 0.345% 4/15/2022** | | | 114,156 | | | | 114,144 | | |
| 2007-FL3A C — 0.385% 4/15/2022** | | | 546,612 | | | | 546,480 | | |
Credit Suisse Commercial Mortgage Trust
Series 2006-C5 A3 — 5.311% 12/15/2039 | | | 32,486,193 | | | | 33,904,950 | | |
Del Coronado Trust 2013-DEL MZ
2013-HDMZ M — 5.175% 3/15/2018** | | | 9,488,000 | | | | 9,512,637 | | |
| Monty Parent Issuer 1 LLC 2013-LTR1 B — 4.25% 11/20/2028** | | | 10,704,380 | | | | 10,704,825 | | |
Morgan Stanley Capital I Trust 2006-TOP23
2006-T23 A4 — 5.877% 8/12/2041 | | | 19,508,262 | | | | 20,379,445 | | |
| Ores NPL LLC 2014-LV3 B — 6.00% 3/27/2024** | | | 49,969,000 | | | | 49,968,825 | | |
Rialto Capital Management LLC | |
| 2014-LT5 B — 5.00% 5/15/2024**†† | | | 7,412,000 | | | | 7,374,940 | | |
| 2014-LT6 B — 5.486% 9/15/2024** | | | 10,040,000 | | | | 10,043,796 | | |
| 2013-RIA4 A2 — 6.00% 11/27/2028**†† | | | 12,099,500 | | | | 11,753,501 | | |
| Starwood Property Mortgage Trust 2013-FV1 B — 2.177% 8/11/2028** | | | 18,051,000 | | | | 18,047,316 | | |
| VFC LLC 2014-2 B — 5.50% 7/20/2030** | | | 6,185,000 | | | | 6,183,868 | | |
| | | $ | 188,898,569 | | |
| TOTAL COMMERCIAL MORTGAGE-BACKED SECURITIES | | $ | 850,834,144 | | |
12
FPA NEW INCOME, INC.
PORTFOLIO OF INVESTMENTS (Continued)
March 31, 2015 (Unaudited)
BONDS & DEBENTURES | | Principal
Amount | | Fair
Value | |
RESIDENTIAL MORTGAGE-BACKED SECURITIES — 25.9% | |
AGENCY COLLATERALIZED MORTGAGE OBLIGATION — 17.0% | |
| Banc of America Large Loan Ball 2009 FDG C** | | $ | 22,008,000 | | | $ | 23,927,120 | | |
Federal Home Loan Mortgage Corporation | |
| 3818 HA — 1.50% 1/15/2018 | | | 4,566,951 | | | | 4,606,998 | | |
| 4350 CA — 2.00% 10/15/2019 | | | 32,418,935 | | | | 32,884,069 | | |
| 4351 GA — 2.00% 11/15/2019 | | | 23,466,865 | | | | 23,781,774 | | |
| 4383 JC — 2.00% 5/15/2023 | | | 34,036,514 | | | | 34,536,527 | | |
| 3711 AD — 2.50% 8/15/2023 | | | 180,373 | | | | 182,042 | | |
| 4399 A — 2.50% 7/15/2024 | | | 106,755,758 | | | | 108,979,737 | | |
| 3825 AB — 3.00% 8/15/2020 | | | 2,913,952 | | | | 3,001,472 | | |
| 2634 PA — 3.00% 2/15/2023 | | | 31,265 | | | | 31,588 | | |
| 3829 CD — 3.00% 8/15/2024 | | | 1,148,829 | | | | 1,160,502 | | |
| 2809 UC — 4.00% 6/15/2019 | | | 500,724 | | | | 524,540 | | |
| 3625 AJ — 4.00% 3/15/2023 | | | 18,297 | | | | 18,298 | | |
| 2990 TD — 4.00% 5/15/2035 | | | 69,341 | | | | 71,908 | | |
| 3992 H — 4.00% 6/15/2036 | | | 157,831 | | | | 160,892 | | |
| 3986 P — 4.00% 3/15/2039 | | | 347,139 | | | | 357,379 | | |
| 3578 AM — 4.50% 9/15/2016 | | | 957,949 | | | | 973,631 | | |
| 2614 BY — 4.50% 5/15/2018 | | | 1,328,593 | | | | 1,391,179 | | |
| 2625 JK — 4.50% 6/15/2018 | | | 3,226,784 | | | | 3,378,041 | | |
| 2645 BY — 4.50% 7/15/2018 | | | 269,784 | | | | 281,914 | | |
| 2649 AN — 4.50% 7/15/2018 | | | 2,437,768 | | | | 2,557,146 | | |
| 2656 PE — 4.50% 7/15/2018 | | | 533,880 | | | | 559,801 | | |
| 2885 DX — 4.50% 11/15/2019 | | | 8,012,643 | | | | 8,449,622 | | |
| 2900 PC — 4.50% 12/15/2019 | | | 4,634,678 | | | | 4,888,047 | | |
| 2930 KT — 4.50% 2/15/2020 | | | 1,302,324 | | | | 1,374,822 | | |
| 2933 AD — 4.50% 2/15/2020 | | | 3,289,594 | | | | 3,480,395 | | |
| 2995 JK — 4.50% 6/15/2020 | | | 1,672,127 | | | | 1,755,569 | | |
| 3271 TB — 4.50% 2/15/2022 | | | 4,716,096 | | | | 4,973,765 | | |
| 3969 MP — 4.50% 4/15/2039 | | | 124,225 | | | | 129,608 | | |
| 3939 D — 4.50% 9/15/2041 | | | 2,156,671 | | | | 2,288,409 | | |
| 2509 CB — 5.00% 10/15/2017 | | | 1,508,534 | | | | 1,565,874 | | |
| 2568 XD — 5.00% 2/15/2018 | | | 381,884 | | | | 400,407 | | |
| 2747 DX — 5.00% 2/15/2019 | | | 3,243,173 | | | | 3,414,705 | | |
| 3852 HA — 5.00% 12/15/2021 | | | 6,379,096 | | | | 6,760,247 | | |
| 2494 CF — 5.50% 9/15/2017 | | | 1,502,130 | | | | 1,564,303 | | |
| 2503 B — 5.50% 9/15/2017 | | | 1,474,639 | | | | 1,534,200 | | |
| 3808 BQ — 5.50% 8/15/2025 | | | 6,641,493 | | | | 7,000,864 | | |
| 3806 JB — 5.50% 2/15/2026 | | | 3,622,568 | | | | 3,973,087 | | |
| 3855 HQ — 5.50% 2/15/2026 | | | 3,583,296 | | | | 3,816,568 | | |
13
FPA NEW INCOME, INC.
PORTFOLIO OF INVESTMENTS (Continued)
March 31, 2015 (Unaudited)
BONDS & DEBENTURES | | Principal
Amount | | Fair
Value | |
| 2453 BD — 6.00% 5/15/2017 | | $ | 438,481 | | | $ | 457,856 | | |
| 3926 GP — 6.00% 8/15/2025 | | | 3,640,747 | | | | 3,878,378 | | |
| 3614 DY — 6.00% 1/15/2032 | | | 8,085,165 | | | | 9,006,146 | | |
Federal National Mortgage Association | |
| 2012-117 DA — 1.50% 12/25/2039 | | | 7,994,756 | | | | 8,048,131 | | |
| 2013-64 TZ — 1.50% 3/25/2042 | | | 1,546,095 | | | | 1,528,773 | | |
| 2013-30 CA — 1.50% 4/25/2043 | | | 23,679,936 | | | | 23,239,352 | | |
| 2013-30 JA — 1.50% 4/25/2043 | | | 16,580,264 | | | | 16,264,144 | | |
| 2014-80 GD — 2.00% 2/25/2042 | | | 45,455,905 | | | | 45,544,575 | | |
| 2013-66 JA — 2.25% 7/25/2043 | | | 70,076,678 | | | | 70,349,346 | | |
| 2010-83 AH — 2.50% 11/25/2018 | | | 1,460,468 | | | | 1,495,368 | | |
| 2011-125 GE — 2.50% 12/25/2041 | | | 48,051,175 | | | | 48,626,929 | | |
| 2011-23 AB — 2.75% 6/25/2020 | | | 1,584,369 | | | | 1,628,915 | | |
| 2011-25 AH — 2.75% 6/25/2021 | | | 3,717,802 | | | | 3,821,118 | | |
| 2012-73 JB — 3.50% 1/25/2042 | | | 33,156,657 | | | | 34,866,260 | | |
| 2012-8 LE — 3.50% 2/25/2042 | | | 31,806,955 | | | | 33,448,214 | | |
| 2012-26 ME — 3.50% 3/25/2042 | | | 42,397,893 | | | | 44,585,751 | | |
| 2012-41 LB — 3.50% 4/25/2042 | | | 39,963,443 | | | | 41,981,993 | | |
| 2012-48 MB — 3.50% 5/25/2042 | | | 39,446,349 | | | | 41,483,520 | | |
| 2012-117 AD — 3.50% 10/25/2042 | | | 62,269,889 | | | | 65,485,724 | | |
| 2013-112 WA — 3.50% 2/25/2043 | | | 24,417,579 | | | | 25,376,997 | | |
| 2010-32 CL — 3.75% 8/25/2018 | | | 601,501 | | | | 625,577 | | |
| 2003-128 NG — 4.00% 1/25/2019 | | | 319,931 | | | | 334,555 | | |
| 2004-7 JK — 4.00% 2/25/2019 | | | 2,717,285 | | | | 2,838,066 | | |
| 2008-15 JM — 4.00% 2/25/2019 | | | 20,834 | | | | 20,904 | | |
| 2008-18 MD — 4.00% 3/25/2019 | | | 656,993 | | | | 685,147 | | |
| 2004-76 CL — 4.00% 10/25/2019 | | | 716,689 | | | | 749,598 | | |
| 2011-67 EA — 4.00% 7/25/2021 | | | 13,216,470 | | | | 13,919,719 | | |
| 2009-31 A — 4.00% 2/25/2024 | | | 320,285 | | | | 333,362 | | |
| 2009-76 MA — 4.00% 9/25/2024 | | | 814,509 | | | | 842,428 | | |
| 2012-95 AB — 4.00% 11/25/2040 | | | 5,749,293 | | | | 5,864,539 | | |
| 2009-70 NU — 4.25% 8/25/2019 | | | 4,159,397 | | | | 4,315,666 | | |
| 2004-90 GA — 4.35% 3/25/2034 | | | 361,605 | | | | 363,319 | | |
| 2003-30 HW — 4.50% 4/25/2018 | | | 519,252 | | | | 542,941 | | |
| 2003-92 HP — 4.50% 9/25/2018 | | | 6,907,049 | | | | 7,267,156 | | |
| 2008-40 KA — 4.50% 10/25/2018 | | | 872,645 | | | | 901,737 | | |
| 2008-18 NB — 4.50% 5/25/2020 | | | 1,619,248 | | | | 1,690,618 | | |
| 2005-47 HK — 4.50% 6/25/2020 | | | 9,435,264 | | | | 9,900,086 | | |
| 2008-15 JN — 4.50% 2/25/2023 | | | 34,414,308 | | | | 36,622,241 | | |
| 2008-59 KB — 4.50% 7/25/2023 | | | 3,332,378 | | | | 3,502,696 | | |
| 2011-7 PA — 4.50% 10/25/2039 | | | 377,931 | | | | 389,800 | | |
14
FPA NEW INCOME, INC.
PORTFOLIO OF INVESTMENTS (Continued)
March 31, 2015 (Unaudited)
BONDS & DEBENTURES | | Principal
Amount | | Fair
Value | |
| 2012-67 PB — 4.50% 12/25/2040 | | $ | 8,191,287 | | | $ | 8,465,039 | | |
| 2011-148 PB — 4.50% 12/25/2041 | | | 6,372,001 | | | | 6,824,514 | | |
| 2002-74 PE — 5.00% 11/25/2017 | | | 502,322 | | | | 524,205 | | |
| 2003-24 PD — 5.00% 4/25/2018 | | | 1,883,316 | | | | 1,964,393 | | |
| 2003-46 BG — 5.00% 6/25/2018 | | | 1,603,240 | | | | 1,684,557 | | |
| 2003-97 CA — 5.00% 10/25/2018 | | | 12,389,875 | | | | 13,072,513 | | |
| 2008-77 DA — 5.00% 4/25/2023 | | | 1,400,210 | | | | 1,428,746 | | |
| 2010-39 PL — 5.00% 10/25/2032 | | | 677,151 | | | | 680,042 | | |
| 2004-60 LB — 5.00% 4/25/2034 | | | 6,613,747 | | | | 7,142,648 | | |
| 2003-W17 1A5 — 5.35% 8/25/2033 | | | 288,106 | | | | 288,048 | | |
| 2011-19 WB — 5.50% 10/25/2018 | | | 4,621,804 | | | | 4,871,890 | | |
| 2009-116 A — 5.50% 4/25/2024 | | | 2,291,993 | | | | 2,352,479 | | |
| 2002-9 PC — 6.00% 3/25/2017 | | | 1,286,746 | | | | 1,332,464 | | |
| | | $ | 964,196,233 | | |
AGENCY POOL ADJUSTABLE RATE — 0.0% | |
| Federal National Mortgage Association 865963 — 2.298% 3/1/2036 | | $ | 1,926,835 | | | $ | 2,051,886 | | |
AGENCY POOL FIXED RATE — 6.5% | |
Federal Home Loan Mortgage Corporation | |
| —4.50% 6/1/2019 | | $ | 756,656 | | | $ | 795,517 | | |
| —5.00% 11/1/2019 | | | 3,512,317 | | | | 3,745,088 | | |
| —5.00% 7/1/2020 | | | 259,367 | | | | 276,562 | | |
Federal National Mortgage Association | |
| —4.50% 12/25/2040 | | | 5,432,539 | | | | 5,581,005 | | |
| —6.00% 4/1/2021 | | | 11,645,401 | | | | 12,358,565 | | |
Federal Home Loan Mortgage Corporation | |
| P60959 — 4.50% 9/1/2020 | | | 1,951,033 | | | | 2,055,726 | | |
| G15169 — 4.50% 9/1/2026 | | | 13,400,667 | | | | 14,273,479 | | |
| G15272 — 4.50% 9/1/2026 | | | 16,628,076 | | | | 17,574,037 | | |
| B11858 — 5.00% 1/1/2019 | | | 1,786,515 | | | | 1,888,091 | | |
| B17433 — 5.00% 12/1/2019 | | | 2,511,243 | | | | 2,680,022 | | |
| G12131 — 5.00% 12/1/2019 | | | 949,979 | | | | 1,006,793 | | |
| G18026 — 5.00% 12/1/2019 | | | 980,820 | | | | 1,046,677 | | |
| B17562 — 5.00% 1/1/2020 | | | 1,981,584 | | | | 2,116,393 | | |
| G18033 — 5.00% 1/1/2020 | | | 2,716,023 | | | | 2,898,396 | | |
| G13812 — 5.00% 12/1/2020 | | | 4,931,523 | | | | 5,185,299 | | |
| J05860 — 5.00% 1/1/2021 | | | 1,202,579 | | | | 1,288,138 | | |
| G12358 — 5.00% 5/1/2021 | | | 1,393,321 | | | | 1,492,422 | | |
| G13670 — 5.00% 12/1/2021 | | | 3,010,158 | | | | 3,214,700 | | |
| J10227 — 5.00% 5/1/2022 | | | 1,525,196 | | | | 1,631,317 | | |
| G13674 — 5.00% 6/1/2022 | | | 2,777,460 | | | | 2,966,064 | | |
15
FPA NEW INCOME, INC.
PORTFOLIO OF INVESTMENTS (Continued)
March 31, 2015 (Unaudited)
BONDS & DEBENTURES | | Principal
Amount | | Fair
Value | |
| G15036 — 5.00% 6/1/2024 | | $ | 19,571,388 | | | $ | 20,704,050 | | |
| G13667 — 5.00% 8/1/2024 | | | 1,961,884 | | | | 2,120,839 | | |
| G15173 — 5.00% 6/1/2026 | | | 13,001,630 | | | | 13,828,750 | | |
| G12400 — 5.50% 11/1/2016 | | | 99,342 | | | | 102,052 | | |
| G12730 — 5.50% 7/1/2017 | | | 16,672 | | | | 17,344 | | |
| G12829 — 5.50% 10/1/2017 | | | 17,370 | | | | 18,150 | | |
| G14187 — 5.50% 12/1/2020 | | | 9,160,432 | | | | 9,713,355 | | |
| J01270 — 5.50% 2/1/2021 | | | 161,181 | | | | 174,917 | | |
| G15230 — 5.50% 12/1/2024 | | | 20,331,534 | | | | 21,919,916 | | |
| G12139 — 6.50% 9/1/2019 | | | 493,755 | | | | 511,071 | | |
| A26942 — 6.50% 9/1/2034 | | | 606,568 | | | | 696,843 | | |
| G08107 — 6.50% 1/1/2036 | | | 1,463,349 | | | | 1,681,139 | | |
| P50543 — 6.50% 4/1/2037 | | | 140,553 | | | | 154,928 | | |
Federal National Mortgage Association | |
| MA0323 — 4.50% 2/1/2020 | | | 629,692 | | | | 659,599 | | |
| MA0358 — 4.50% 3/1/2020 | | | 368,576 | | | | 386,081 | | |
| MA0419 — 4.50% 5/1/2020 | | | 598,653 | | | | 627,086 | | |
| 889531 — 4.50% 5/1/2022 | | | 95,789 | | | | 101,446 | | |
| AL6212 — 4.50% 1/1/2027 | | | 19,418,784 | | | | 20,398,860 | | |
| 720396 — 5.00% 7/1/2018 | | | 1,466,313 | | | | 1,538,956 | | |
| 254907 — 5.00% 10/1/2018 | | | 1,179,379 | | | | 1,240,350 | | |
| 995565 — 5.00% 12/1/2018 | | | 894,979 | | | | 941,251 | | |
| 995756 — 5.00% 12/1/2018 | | | 5,002,753 | | | | 5,286,009 | | |
| 745387 — 5.00% 4/1/2019 | | | 410,977 | | | | 433,488 | | |
| AL5252 — 5.00% 4/1/2019 | | | 1,561,449 | | | | 1,633,675 | | |
| 735660 — 5.00% 6/1/2020 | | | 229,159 | | | | 244,444 | | |
| AE0126 — 5.00% 6/1/2020 | | | 17,438,957 | | | | 18,445,708 | | |
| 310097 — 5.00% 10/1/2020 | | | 1,730,029 | | | | 1,810,034 | | |
| AE0792 — 5.00% 12/1/2020 | | | 5,720,538 | | | | 6,053,588 | | |
| 995861 — 5.00% 1/1/2021 | | | 5,618,308 | | | | 5,936,417 | | |
| 888104 — 5.00% 5/1/2021 | | | 133,448 | | | | 141,765 | | |
| AE0314 — 5.00% 8/1/2021 | | | 30,281,699 | | | | 31,940,158 | | |
| 890185 — 5.00% 10/1/2021 | | | 1,735,996 | | | | 1,863,107 | | |
| 890083 — 5.00% 12/1/2021 | | | 2,859,333 | | | | 3,021,572 | | |
| 889738 — 5.00% 9/1/2022 | | | 719,908 | | | | 773,187 | | |
| AL5656 — 5.00% 9/1/2025 | | | 2,098,641 | | | | 2,234,815 | | |
| AL5764 — 5.00% 9/1/2025 | | | 15,216,337 | | | | 16,164,985 | | |
| AL4056 — 5.00% 6/1/2026 | | | 17,298,200 | | | | 18,479,422 | | |
| 257100 — 5.50% 1/1/2018 | | | 500,254 | | | | 528,253 | | |
| 745500 — 5.50% 12/1/2018 | | | 3,388,407 | | | | 3,541,680 | | |
| 995284 — 5.50% 3/1/2020 | | | 3,736,608 | | | | 3,863,578 | | |
16
FPA NEW INCOME, INC.
PORTFOLIO OF INVESTMENTS (Continued)
March 31, 2015 (Unaudited)
BONDS & DEBENTURES | | Principal
Amount | | Fair
Value | |
| 745190 — 5.50% 6/1/2020 | | $ | 547,118 | | | $ | 572,574 | | |
| 889318 — 5.50% 7/1/2020 | | | 4,839,047 | | | | 5,156,682 | | |
| AL5867 — 5.50% 8/1/2023 | | | 3,762,194 | | | | 3,994,482 | | |
| AE0237 — 5.50% 11/1/2023 | | | 4,736,583 | | | | 5,041,288 | | |
| AL5812 — 5.50% 5/1/2025 | | | 14,803,056 | | | | 15,732,759 | | |
| AL0471 — 5.50% 7/1/2025 | | | 460,200 | | | | 502,159 | | |
| AL4433 — 5.50% 9/1/2025 | | | 4,202,368 | | | | 4,539,353 | | |
| AL4901 — 5.50% 9/1/2025 | | | 7,243,937 | | | | 7,735,832 | | |
| 735439 — 6.00% 9/1/2019 | | | 862,910 | | | | 905,891 | | |
| 745238 — 6.00% 12/1/2020 | | | 2,334,583 | | | | 2,460,832 | | |
| AD0951 — 6.00% 12/1/2021 | | | 4,707,284 | | | | 5,024,885 | | |
| AL0294 — 6.00% 10/1/2022 | | | 254,311 | | | | 277,385 | | |
| 890225 — 6.00% 5/1/2023 | | | 4,085,746 | | | | 4,375,915 | | |
| 890403 — 6.00% 5/1/2023 | | | 4,911,735 | | | | 5,184,133 | | |
| 725951 — 7.50% 8/1/2017 | | | 34,753 | | | | 36,214 | | |
| 323282 — 7.50% 7/1/2028 | | | 301,734 | | | | 341,493 | | |
| Government National Mortgage Association 782281 — 6.00% 3/15/2023 | | | 2,533,816 | | | | 2,763,606 | | |
| | | $ | 368,652,642 | | |
AGENCY STRIPPED — 1.3% | |
Federal Home Loan Mortgage Corporation | |
| 217 PO — 0.00% 1/1/2032 | | | 400,626 | | | | 367,658 | | |
| 3714 TI — 2.25% 8/15/2015 | | | 27,633,524 | | | | 196,300 | | |
| 4138 AI — 2.50% 11/15/2022 | | | 4,889,770 | | | | 291,710 | | |
| 3935 LI — 3.00% 10/15/2021 | | | 5,261,918 | | | | 349,660 | | |
| 3948 AI — 3.00% 10/15/2021 | | | 6,553,531 | | | | 446,558 | | |
| 3956 KI — 3.00% 11/15/2021 | | | 14,365,603 | | | | 1,009,639 | | |
| 3968 AI — 3.00% 12/15/2021 | | | 5,423,439 | | | | 377,119 | | |
| 3992 OI — 3.00% 1/15/2022 | | | 4,123,381 | | | | 290,143 | | |
| 3994 AI — 3.00% 2/15/2022 | | | 10,274,528 | | | | 740,263 | | |
| 3994 EI — 3.00% 2/15/2022 | | | 9,785,590 | | | | 713,595 | | |
| 3998 KI — 3.00% 11/15/2026 | | | 18,336,499 | | | | 1,854,575 | | |
| 4100 EI — 3.00% 8/15/2027 | | | 84,934,405 | | | | 9,329,051 | | |
| 3706 AI — 3.50% 7/15/2020 | | | 6,056,796 | | | | 231,098 | | |
| 3722 AI — 3.50% 9/15/2020 | | | 8,711,309 | | | | 578,429 | | |
| 3735 AI — 3.50% 10/15/2020 | | | 4,160,837 | | | | 276,156 | | |
| 3874 DI — 3.50% 10/15/2020 | | | 7,097,350 | | | | 361,460 | | |
| 3893 DI — 3.50% 10/15/2020 | | | 5,170,267 | | | | 261,315 | | |
| 3753 CI — 3.50% 11/15/2020 | | | 2,028,681 | | | | 142,063 | | |
| 3755 AI — 3.50% 11/15/2020 | | | 8,000,313 | | | | 560,529 | | |
| 3760 KI — 3.50% 11/15/2020 | | | 6,273,680 | | | | 432,034 | | |
| 3784 BI — 3.50% 1/15/2021 | | | 5,477,727 | | | | 393,966 | | |
17
FPA NEW INCOME, INC.
PORTFOLIO OF INVESTMENTS (Continued)
March 31, 2015 (Unaudited)
BONDS & DEBENTURES | | Principal
Amount | | Fair
Value | |
| 3874 BI — 3.50% 6/15/2021 | | $ | 4,644,719 | | | $ | 348,791 | | |
| 3893 BI — 3.50% 7/15/2021 | | | 3,963,675 | | | | 300,066 | | |
| 3909 KI — 3.50% 7/15/2021 | | | 3,483,921 | | | | 266,146 | | |
| 3938 IO — 3.50% 10/15/2021 | | | 23,515,069 | | | | 1,825,534 | | |
| 3778 GI — 3.50% 6/15/2024 | | | 4,456,748 | | | | 271,021 | | |
| 3854 GI — 3.50% 11/15/2024 | | | 2,902,447 | | | | 119,710 | | |
| 3852 YI — 3.50% 3/15/2025 | | | 10,122,683 | | | | 541,838 | | |
| 3763 NI — 3.50% 5/15/2025 | | | 3,907,822 | | | | 342,598 | | |
| 3904 QI — 3.50% 5/15/2025 | | | 4,068,765 | | | | 277,572 | | |
| 3909 UI — 3.50% 8/15/2025 | | | 6,321,080 | | | | 393,872 | | |
| 3904 NI — 3.50% 8/15/2026 | | | 9,060,799 | | | | 1,034,268 | | |
| 3930 AI — 3.50% 9/15/2026 | | | 11,574,483 | | | | 1,324,973 | | |
| 4018 AI — 3.50% 3/15/2027 | | | 19,859,604 | | | | 2,172,361 | | |
| 3684 CI — 4.50% 8/15/2024 | | | 20,380,693 | | | | 1,745,881 | | |
| 3917 AI — 4.50% 7/15/2026 | | | 31,656,007 | | | | 4,116,433 | | |
| 3636 IO — 5.00% 11/15/2018 | | | 17,562,318 | | | | 998,052 | | |
| 217 IO — 6.50% 1/1/2032 | | | 385,760 | | | | 89,488 | | |
Federal National Mortgage Association | |
| 2011-88 BI — 3.00% 11/25/2020 | | | 3,143,743 | | | | 143,341 | | |
| 2011-141 EI — 3.00% 7/25/2021 | | | 14,017,597 | | | | 817,386 | | |
| 2012-8 TI — 3.00% 10/25/2021 | | | 6,655,427 | | | | 453,654 | | |
| 2011-113 GI — 3.00% 11/25/2021 | | | 6,396,912 | | | | 436,033 | | |
| 2011-129 AI — 3.00% 12/25/2021 | | | 8,822,149 | | | | 611,972 | | |
| 2012-8 UI — 3.00% 12/25/2021 | | | 21,686,997 | | | | 1,504,577 | | |
| 2011-137 AI — 3.00% 1/25/2022 | | | 11,347,268 | | | | 792,383 | | |
| 2011-138 IG — 3.00% 1/25/2022 | | | 14,122,615 | | | | 1,014,523 | | |
| 2011-145 IO — 3.00% 1/25/2022 | | | 17,862,217 | | | | 1,239,113 | | |
| 2012-78 AI — 3.00% 2/25/2022 | | | 10,594,345 | | | | 625,611 | | |
| 2012-23 IA — 3.00% 3/25/2022 | | | 8,207,775 | | | | 579,654 | | |
| 2012-32 AI — 3.00% 4/25/2022 | | | 13,592,524 | | | | 976,808 | | |
| 2012-53 CI — 3.00% 5/25/2022 | | | 20,879,728 | | | | 1,513,419 | | |
| 2012-147 AI — 3.00% 10/25/2027 | | | 31,424,886 | | | | 3,575,153 | | |
| 2012-145 DI — 3.00% 1/25/2028 | | | 17,203,431 | | | | 1,984,913 | | |
| 2012-149 CI — 3.00% 1/25/2028 | | | 46,663,223 | | | | 5,321,992 | | |
| 2010-128 LI — 3.50% 11/25/2020 | | | 10,181,273 | | | | 694,500 | | |
| 2011-75 BI — 3.50% 11/25/2020 | | | 5,166,990 | | | | 258,230 | | |
| 2011-78 IA — 3.50% 11/25/2020 | | | 13,687,549 | | | | 653,771 | | |
| 2010-145 BI — 3.50% 12/25/2020 | | | 5,167,210 | | | | 362,169 | | |
| 2011-61 BI — 3.50% 7/25/2021 | | | 4,549,135 | | | | 352,701 | | |
| 2011-66 QI — 3.50% 7/25/2021 | | | 7,918,169 | | | | 618,969 | | |
| 2011-104 CI — 3.50% 10/25/2021 | | | 13,487,250 | | | | 1,031,652 | | |
18
FPA NEW INCOME, INC.
PORTFOLIO OF INVESTMENTS (Continued)
March 31, 2015 (Unaudited)
BONDS & DEBENTURES | | Principal
Amount | | Fair
Value | |
| 2011-104 DI — 3.50% 10/25/2021 | | $ | 22,613,335 | | | $ | 1,655,748 | | |
| 2011-110 AI — 3.50% 11/25/2021 | | | 9,460,915 | | | | 704,968 | | |
| 2011-118 IC — 3.50% 11/25/2021 | | | 25,480,576 | | | | 1,993,348 | | |
| 2011-125 DI — 3.50% 12/25/2021 | | | 17,985,844 | | | | 1,452,042 | | |
| 2011-143 MI — 3.50% 1/25/2022 | | | 7,180,166 | | | | 507,742 | | |
| 2012-2 MI — 3.50% 2/25/2022 | | | 10,846,791 | | | | 876,534 | | |
| 2010-137 BI — 3.50% 2/25/2024 | | | 3,718,593 | | | | 158,993 | | |
| 2010-135 DI — 3.50% 4/25/2024 | | | 8,063,741 | | | | 389,507 | | |
| 2011-75 AI — 3.50% 1/25/2025 | | | 15,432,500 | | | | 822,453 | | |
| 2011-66 BI — 3.50% 3/25/2025 | | | 1,839,465 | | | | 93,129 | | |
| 2011-80 KI — 3.50% 4/25/2025 | | | 7,857,093 | | | | 467,023 | | |
| 2011-67 CI — 3.50% 8/25/2025 | | | 4,056,311 | | | | 310,877 | | |
| 2011-22 IC — 3.50% 12/25/2025 | | | 7,995,228 | | | | 819,732 | | |
| 2011-101 EI — 3.50% 10/25/2026 | | | 18,322,697 | | | | 2,091,756 | | |
| 2011-69 TI — 4.00% 5/25/2020 | | | 4,777,864 | | | | 251,797 | | |
| 2010-89 LI — 4.00% 8/25/2020 | | | 7,773,062 | | | | 528,990 | | |
| 2010-104 CI — 4.00% 9/25/2020 | | | 3,435,272 | | | | 240,800 | | |
| 2011-67 EI — 4.00% 7/25/2021 | | | 8,596,629 | | | | 576,346 | | |
| 2010-110 IH — 4.50% 10/25/2018 | | | 9,000,364 | | | | 550,633 | | |
| 2009-70 IN — 4.50% 8/25/2019 | | | 12,455,179 | | | | 674,813 | | |
| 2008-15 JI — 4.50% 6/25/2022 | | | 1,568,398 | | | | 33,164 | | |
| 2010-114 CI — 5.00% 4/25/2018 | | | 10,900,163 | | | | 628,474 | | |
| 2010-30 IO — 5.00% 8/25/2018 | | | 4,620,915 | | | | 284,159 | | |
| 2003-64 XI — 5.00% 7/25/2033 | | | 1,088,188 | | | | 172,547 | | |
| | | $ | 77,220,024 | | |
NON-AGENCY COLLATERALIZED MORTGAGE
OBLIGATION — 1.1% | |
Citicorp Mortgage Securities REMIC Pass-Through Certificates
Trust Series 2005-5 2A3 — 5.00% 8/25/2020 | | $ | 112,701 | | | $ | 115,488 | | |
| Citigroup Mortgage Loan Trust 2014-A A — 4.00% 1/1/2035** | �� | | 22,415,251 | | | | 23,151,834 | | |
| RiverView HECM Trust 2007-1 A — 0.61% 5/25/2047** | | | 33,198,156 | | | | 28,994,937 | | |
| Sequoia Mortgage Trust 2012-1 1A1 — 2.865% 1/25/2042 | | | 5,259,507 | | | | 5,279,482 | | |
Wells Fargo Mortgage Backed Securities
Trust 2006-5 2A1 — 5.25% 4/25/2021 | | | 4,325,151 | | | | 4,413,730 | | |
| | | $ | 61,955,471 | | |
| TOTAL RESIDENTIAL MORTGAGE-BACKED SECURITIES | | $ | 1,476,587,282 | | |
19
FPA NEW INCOME, INC.
PORTFOLIO OF INVESTMENTS (Continued)
March 31, 2015 (Unaudited)
BONDS & DEBENTURES | | Principal
Amount | | Fair
Value | |
ASSET-BACKED SECURITIES — 33.3% | |
AUTO — 20.1% | |
Ally Auto Receivables Trust | |
| 2013-SN1 A3 — 0.72% 5/20/2016 | | $ | 2,150,254 | | | $ | 2,151,453 | | |
| 2012-1 B — 1.84% 11/15/2016** | | | 8,666,000 | | | | 8,674,910 | | |
American Credit Acceptance Receivables Trust | |
| 2014-2 A — 0.99% 10/10/2017** | | | 4,769,654 | | | | 4,767,869 | | |
| 2014-1 A — 1.14% 3/12/2018** | | | 1,639,134 | | | | 1,639,782 | | |
| 2013-2 A — 1.32% 2/15/2017** | | | 188,490 | | | | 188,571 | | |
AmeriCredit Automobile Receivables Trust | |
| 2014-1 A2 — 0.57% 7/10/2017 | | | 22,944,186 | | | | 22,957,255 | | |
| 2013-1 A3 — 0.61% 10/10/2017 | | | 885,854 | | | | 885,642 | | |
| 2012-5 A3 — 0.62% 6/8/2017 | | | 331,067 | | | | 331,103 | | |
| 2014-3 A2A — 0.64% 4/9/2018 | | | 42,091,390 | | | | 42,044,505 | | |
| 2013-2 A3 — 0.65% 12/8/2017 | | | 16,422,673 | | | | 16,412,240 | | |
| 2012-4 A3 — 0.67% 6/8/2017 | | | 24,407,356 | | | | 24,408,122 | | |
| 2013-4 A2 — 0.74% 11/8/2016 | | | 4,384,734 | | | | 4,384,993 | | |
| 2013-4 A3 — 0.96% 4/9/2018 | | | 8,314,000 | | | | 8,319,476 | | |
| 2013-3 B — 1.58% 9/10/2018 | | | 5,024,000 | | | | 5,045,373 | | |
| 2013-4 B — 1.66% 9/10/2018 | | | 90,000 | | | | 90,284 | | |
| 2012-5 C — 1.69% 11/8/2018 | | | 14,140,000 | | | | 14,287,284 | | |
| 2012-1 B — 1.73% 2/8/2017 | | | 418,981 | | | | 419,131 | | |
| 2012-4 C — 1.93% 8/8/2018 | | | 3,665,700 | | | | 3,690,173 | | |
| 2012-3 C — 2.42% 5/8/2018 | | | 1,650,000 | | | | 1,665,253 | | |
| 2012-2 C — 2.64% 10/10/2017 | | | 4,893,000 | | | | 4,948,966 | | |
| 2012-1 C — 2.67% 1/8/2018 | | | 2,371,000 | | | | 2,391,887 | | |
| 2011-3 C — 2.86% 1/9/2017 | | | 1,476,642 | | | | 1,482,536 | | |
| 2012-3 D — 3.03% 7/9/2018 | | | 24,856,000 | | | | 25,383,646 | | |
| 2011-4 C — 3.08% 7/10/2017 | | | 191,202 | | | | 192,626 | | |
| 2010-3 C — 3.34% 4/8/2016 | | | 141,063 | | | | 141,084 | | |
| 2012-1 D — 4.72% 3/8/2018 | | | 8,891,000 | | | | 9,220,502 | | |
| 2010-3 D — 4.98% 1/8/2018 | | | 13,735,000 | | | | 13,745,576 | | |
| BMW Vehicle Lease Trust 2014-1 A2 — 0.45% 3/21/2016 | | | 13,265,863 | | | | 13,267,675 | | |
California Republic Auto Receivables Trust
2013-2 A2 — 1.23% 3/15/2019 | | | 12,399,733 | | | | 12,438,763 | | |
Capital Auto Receivables Asset Trust | |
| 2013-1 A3 — 0.79% 6/20/2017 | | | 3,345,000 | | | | 3,346,523 | | |
| 2013-4 A2 — 0.85% 2/21/2017 | | | 6,750,000 | | | | 6,753,729 | | |
CarMax Auto Owner Trust | |
| 2014-2 A2 — 0.46% 4/17/2017 | | | 27,762,704 | | | | 27,761,347 | | |
| 2014-1 A2 — 0.47% 2/15/2017 | | | 18,593,579 | | | | 18,597,504 | | |
20
FPA NEW INCOME, INC.
PORTFOLIO OF INVESTMENTS (Continued)
March 31, 2015 (Unaudited)
BONDS & DEBENTURES | | Principal
Amount | | Fair
Value | |
| 2012-3 A3 — 0.52% 7/17/2017 | | $ | 13,437,784 | | | $ | 13,436,018 | | |
| Chesapeake Funding LLC 2014-1A A — 0.595% 3/7/2026** | | | 29,025,000 | | | | 29,026,219 | | |
Credit Acceptance Auto Loan Trust | |
| 2014-2A A — 1.88% 3/15/2022** | | | 16,243,000 | | | | 16,269,520 | | |
| 2014-2A B — 2.67% 9/15/2022** | | | 8,639,000 | | | | 8,681,652 | | |
DT Auto Owner Trust | |
| 2014-1A A — 0.66% 7/17/2017** | | | 618,554 | | | | 618,444 | | |
| 2014-2A A — 0.68% 8/15/2017** | | | 5,432,703 | | | | 5,431,055 | | |
| 2014-2A B — 1.34% 4/16/2018** | | | 8,474,000 | | | | 8,483,204 | | |
| 2014-1A B — 1.43% 3/15/2018** | | | 5,730,000 | | | | 5,735,344 | | |
| 2013-2A B — 1.78% 6/15/2017** | | | 7,313,750 | | | | 7,323,223 | | |
Enterprise Fleet Financing LLC | |
| 2012-2 A2 — 0.72% 4/20/2018** | | | 2,507,945 | | | | 2,508,316 | | |
| 2014-2 A2 — 1.05% 3/20/2020** | | | 5,941,000 | | | | 5,943,722 | | |
Exeter Automobile Receivables Trust | |
| 2014-2A A — 1.06% 8/15/2018** | | | 5,771,045 | | | | 5,756,122 | | |
| 2014-1A A — 1.29% 5/15/2018** | | | 18,967,428 | | | | 19,003,859 | | |
| 2013-2A A — 1.49% 11/15/2017** | | | 7,720,820 | | | | 7,736,016 | | |
| Fifth Third Auto Trust 2014-1 A2 — 0.46% 8/15/2016 | | | 17,095,682 | | | | 17,098,026 | | |
First Investors Auto Owner Trust | |
| 2014-1A A2 — 0.80% 2/15/2018** | | | 2,757,520 | | | | 2,757,341 | | |
| 2014-2A A2 — 0.86% 8/15/2018** | | | 20,524,606 | | | | 20,511,819 | | |
| 2013-3A A2 — 0.89% 9/15/2017** | | | 1,655,563 | | | | 1,655,909 | | |
| 2014-1A A3 — 1.49% 1/15/2020** | | | 9,500,000 | | | | 9,522,087 | | |
| Ford Credit Auto Lease Trust 2013-A A3 — 0.60% 3/15/2016 | | | 13,814,274 | | | | 13,818,460 | | |
| Ford Credit Auto Owner Trust 2013-A A3 — 0.55% 7/15/2017 | | | 31,869,873 | | | | 31,878,252 | | |
Honda Auto Receivables Owner Trust | |
| 2014-2 A2 — 0.39% 9/19/2016 | | | 20,569,824 | | | | 20,569,314 | | |
| 2014-1 A2 — 0.41% 9/21/2016 | | | 26,450,392 | | | | 26,451,312 | | |
Hyundai Auto Lease Securitization Trust
2015-A A2 — 1.00% 10/16/2017** | | | 29,432,000 | | | | 29,432,889 | | |
Hyundai Auto Receivables Trust | |
| 2014-B A2 — 0.44% 2/15/2017 | | | 30,428,709 | | | | 30,422,690 | | |
| 2012-C A4 — 0.73% 6/15/2018 | | | 500,000 | | | | 500,242 | | |
| Mercedes Benz Auto Lease Trust 2014-A A2A — 0.48% 6/15/2016 | | | 30,725,047 | | | | 30,731,293 | | |
| Mercedes-Benz Auto Lease Trust 2013-A A3 — 0.59% 2/15/2016 | | | 4,073,863 | | | | 4,074,156 | | |
| Nissan Auto Lease 2013-A A3 — 0.61% 4/15/2016 | | | 44,800,413 | | | | 44,819,009 | | |
Porsche Financial Auto Securitization Trust
2014-1 A2 — 0.38% 9/23/2016** | | | 19,593,516 | | | | 19,592,544 | | |
| Porsche Innovative Lease Owner Trust 2014-1 A4 — 1.26% 9/21/2020** | | | 15,253,000 | | | | 15,271,819 | | |
21
FPA NEW INCOME, INC.
PORTFOLIO OF INVESTMENTS (Continued)
March 31, 2015 (Unaudited)
BONDS & DEBENTURES | | Principal
Amount | | Fair
Value | |
Prestige Auto Receivables Trust | |
| 2014-1A A2 — 0.97% 3/15/2018** | | $ | 10,335,469 | | | $ | 10,334,550 | | |
| 2013-1A A2 — 1.09% 2/15/2018** | | | 4,663,030 | | | | 4,670,490 | | |
| 2013-1A A3 — 1.33% 5/15/2019** | | | 4,625,000 | | | | 4,633,399 | | |
| 2014-1A A3 — 1.52% 4/15/2020** | | | 17,250,000 | | | | 17,257,048 | | |
| 2015-1 A3 — 1.53% 2/15/2021** | | | 16,433,000 | | | | 16,433,656 | | |
| 2015-1 B — 2.04% 4/15/2021** | | | 10,395,000 | | | | 10,394,789 | | |
| 2012-1A B — 2.49% 4/16/2018** | | | 3,855,000 | | | | 3,892,382 | | |
Santander Drive Auto Receivables Trust | |
| 2014-2 A2A — 0.54% 7/17/2017 | | | 16,523,729 | | | | 16,520,811 | | |
| 2014-3 A2A — 0.54% 8/15/2017 | | | 11,682,624 | | | | 11,680,472 | | |
| 2013-1 A3 — 0.62% 6/15/2017 | | | 8,600,293 | | | | 8,600,846 | | |
| 2013-5 A2A — 0.64% 4/17/2017 | | | 769,231 | | | | 769,269 | | |
| 2014-1 A2A — 0.66% 6/15/2017 | | | 8,565,268 | | | | 8,566,600 | | |
| 2014-4 A2A — 0.67% 1/16/2018 | | | 39,021,268 | | | | 39,018,400 | | |
| 2013-2 A3 — 0.70% 9/15/2017 | | | 23,085,550 | | | | 23,084,451 | | |
| 2013-3 A3 — 0.70% 10/16/2017 | | | 3,683,278 | | | | 3,682,367 | | |
| 2014-1 A3 — 0.87% 1/16/2018 | | | 19,425,000 | | | | 19,436,391 | | |
| 2013-1 B — 1.16% 1/15/2019 | | | 3,570,000 | | | | 3,572,710 | | |
| 2012-AA B — 1.21% 10/16/2017** | | | 17,943,000 | | | | 17,957,064 | | |
| 2012-6 B — 1.33% 5/15/2017 | | | 6,646,909 | | | | 6,651,525 | | |
| 2013-5 B — 1.55% 10/15/2018 | | | 17,165,000 | | | | 17,243,341 | | |
| 2014-1 B — 1.59% 10/15/2018 | | | 11,705,000 | | | | 11,753,440 | | |
| 2012-3 B — 1.94% 12/15/2016 | | | 394,799 | | | | 394,938 | | |
| 2013-4 B — 2.16% 1/15/2020 | | | 4,218,000 | | | | 4,254,870 | | |
| 2012-3 D — 3.64% 5/15/2018 | | | 32,352,000 | | | | 33,523,411 | | |
| Toyota Auto Receivables Owner Trust 2014-A A3 — 0.67% 12/15/2017 | | | 35,000,000 | | | | 34,980,648 | | |
Westlake Automobile Receivables Trust | |
| 2014-1A A2 — 0.70% 5/15/2017** | | | 1,484,432 | | | | 1,482,960 | | |
| 2015-1A A2 — 1.17% 3/15/2018** | | | 15,449,000 | | | | 15,448,863 | | |
| 2014-1A B — 1.24% 11/15/2019** | | | 4,500,000 | | | | 4,498,997 | | |
| 2015-1A B — 1.68% 11/16/2020** | | | 11,721,000 | | | | 11,719,616 | | |
| 2014-1A C — 1.70% 11/15/2019** | | | 500,000 | | | | 499,570 | | |
| 2015-1A C — 2.29% 11/16/2020** | | | 550,000 | | | | 549,926 | | |
| Wheels SPV 2 LLC 2014-1A A2 — 0.84% 3/20/2023** | | | 17,039,418 | | | | 17,019,927 | | |
| | | $ | 1,137,623,386 | | |
OTHER — 13.2% | |
Bayview Opportunity Master Fund IIa Trust PL
2014-20NP A — 3.721% 8/28/2044** | | $ | 193,915 | | | $ | 194,040 | | |
| Beacon Container Finance LLC 2012-1A A — 3.72% 9/20/2027** | | | 469,525 | | | | 480,068 | | |
22
FPA NEW INCOME, INC.
PORTFOLIO OF INVESTMENTS (Continued)
March 31, 2015 (Unaudited)
BONDS & DEBENTURES | | Principal
Amount | | Fair
Value | |
Cabela's Credit Card Master Note Trust | |
| 2012-2A A1 — 1.45% 6/15/2020** | | $ | 30,268,000 | | | $ | 30,423,408 | | |
| 2012-1A A1 — 1.63% 2/18/2020** | | | 8,983,000 | | | | 9,070,251 | | |
| 2011-4A A1 — 1.90% 10/15/2019** | | | 31,487,000 | | | | 31,928,725 | | |
| 2010-2A A1 — 2.29% 9/17/2018** | | | 7,560,000 | | | | 7,616,409 | | |
| CCG Receivables Trust 2014-1 A2 — 1.06% 11/15/2021** | | | 9,603,473 | | | | 9,598,959 | | |
Cerberus Onshore II CLO-2 LLC | |
| 2014-1A A — 2.176% 10/15/2023** | | | 9,499,000 | | | | 9,499,902 | | |
| 2014-1A B — 2.976% 10/15/2023** | | | 6,612,000 | | | | 6,568,599 | | |
| HFG Healthco-4 LLC 2011-1A A — 2.422% 6/2/2017** | | | 17,140,000 | | | | 17,404,110 | | |
HLSS Servicer Advance Receivables Backed Notes Series | |
| 2013-T2 B2 — 1.495% 5/16/2044** | | | 8,050,000 | | | | 8,011,078 | | |
| 2013-T5 BT5 — 2.276% 8/15/2046** | | | 9,300,000 | | | | 9,190,790 | | |
HLSS Servicer Advance Receivables Trust | |
| 2013-T1 A2 — 1.495% 1/16/2046** | | | 24,512,000 | | | | 24,436,430 | | |
| 2013-T1 B2 — 1.744% 1/16/2046** | | | 5,750,000 | | | | 5,707,191 | | |
| 2012-T2 B2 — 2.48% 10/15/2045** | | | 14,078,000 | | | | 14,043,396 | | |
| Kubota Credit Owner Trust 2014-1A A2 — 0.58% 2/15/2017** | | | 5,215,488 | | | | 5,213,943 | | |
MMAF Equipment Finance LLC | |
| 2013-AA A2 — 0.69% 5/9/2016** | | | 7,980,619 | | | | 7,981,848 | | |
| 2012-AA A3 — 0.94% 8/10/2016** | | | 6,082,826 | | | | 6,086,427 | | |
| 2013-AA A3 — 1.03% 12/11/2017** | | | 2,419,000 | | | | 2,423,969 | | |
| Nationstar HECM Loan Trust A 2014-1A A — 4.50% 11/25/2017** | | | 27,981,148 | | | | 27,977,637 | | |
Normandy Mortgage Loan Co. LLC
2013-NPL3 A — 4.949% 9/16/2043** | | | 24,859,269 | | | | 24,824,713 | | |
PFS Financing Corp. | |
| 2013-BA A — 0.675% 4/17/2017** | | | 35,160,000 | | | | 35,163,583 | | |
| 2014-AA A — 0.775% 2/15/2019** | | | 26,000,000 | | | | 25,973,293 | | |
| 2014-BA A — 0.775% 10/15/2019** | | | 14,121,000 | | | | 14,114,469 | | |
| Progreso Receivables Funding I LLC 2013-A A — 4.00% 7/9/2018**†† | | | 15,371,000 | | | | 15,467,069 | | |
| Progreso Receivables Funding II LLC 2014-A A — 3.50% 7/8/2019**†† | | | 9,735,000 | | | | 9,741,084 | | |
| Stanwich Mortgage Loan Co. LLC 2013-NPL2 A — 3.228% 4/16/2059** | | | 28,049,068 | | | | 28,042,620 | | |
| Stanwich Mortgage Loan Trust 2013-NPL1 A — 2.981% 2/16/2043** | | | 6,977,612 | | | | 6,989,861 | | |
Stanwich Mortgage Loan Trust Series | |
| 2010-2 A — 1.00% 2/28/2057**†† | | | 2,704,325 | | | | 1,363,521 | | |
| 2010-4 A — 1.183% 8/31/2049**†† | | | 1,802,684 | | | | 910,355 | | |
| 2011-1 A — 1.187% 8/15/2050**†† | | | 3,032,164 | | | | 1,599,251 | | |
| 2011-2 A — 1.967% 9/15/2050**†† | | | 2,611,528 | | | | 1,397,700 | | |
| 2010-3 A — 3.434% 7/31/2038**†† | | | 1,737,623 | | | | 869,333 | | |
| 2010-1 A — 4.083% 9/30/2047**†† | | | 572,126 | | | | 289,381 | | |
| 2009-2 A — 4.218% 2/15/2049**†† | | | 305,711 | | | | 136,714 | | |
23
FPA NEW INCOME, INC.
PORTFOLIO OF INVESTMENTS (Continued)
March 31, 2015 (Unaudited)
BONDS & DEBENTURES | | Principal
Amount | | Fair
Value | |
| STORE Master Funding LLC 2012-1A A — 5.77% 8/20/2042** | | $ | 481,814 | | | $ | 522,479 | | |
Sunset Mortgage Loan Co. LLC | |
| 2014-NPL1 A — 3.228% 8/16/2044** | | | 43,405,646 | | | | 43,514,334 | | |
| 2014-NPL2 A — 3.721% 11/16/2044** | | | 50,676,959 | | | | 50,851,090 | | |
| Synchrony Credit Card Master Note Trust 2012-6 A — 1.36% 8/17/2020 | | | 57,527,000 | | | | 57,578,556 | | |
Truman Capital Mortgage Loan Trust | |
| 2014-NPL3 A1 — 3.125% 4/25/2053** | | | 5,763,191 | | | | 5,729,132 | | |
| 2014-NPL2 A1 — 3.125% 6/25/2054** | | | 6,476,193 | | | | 6,438,578 | | |
Vericrest Opportunity Loan Transferee LLC
2014-NPL4 A1 — 3.125% 4/27/2054** | | | 32,936,077 | | | | 32,907,633 | | |
| VOLT XXVII LLC 2014-NPL7 A1 — 3.375% 8/27/2057** | | | 55,898,948 | | | | 55,787,525 | | |
| VOLT XXXIII LLC 2015-NPL5 A1 — 3.50% 3/25/2055** | | | 56,903,000 | | | | 56,905,276 | | |
Volvo Financial Equipment LLC Series A
2015-1A A2 — 0.95% 11/15/2017** | | | 40,215,000 | | | | 40,236,326 | | |
| | | $ | 751,211,056 | | |
| TOTAL ASSET-BACKED SECURITIES | | $ | 1,888,834,442 | | |
CORPORATE BONDS & NOTES — 10.2% | |
BASIC MATERIALS — 0.9% | |
| Thompson Creek Metals Co., Inc. — 9.75% 12/1/2017 | | $ | 49,274,000 | | | $ | 50,752,220 | | |
COMMUNICATIONS — 1.9% | |
| GTP Acquisition Partners I LLC — 4.704% 5/15/2043** | | $ | 16,569,000 | | | $ | 16,782,574 | | |
Unison Ground Lease Funding LLC | |
| —9.522% 4/15/2040** | | | 20,699,000 | | | | 23,372,276 | | |
| —5.78% 3/15/2043**†† | | | 12,545,000 | | | | 12,519,408 | | |
| —6.268% 3/15/2043** | | | 3,843,000 | | | | 3,823,016 | | |
| WCP ISSUER LLC — 6.657% 8/15/2043**†† | | | 15,711,000 | | | | 16,644,705 | | |
| Zayo Group LLC / Zayo Capital, Inc. — 8.125% 1/1/2020 | | | 34,514,000 | | | | 36,529,618 | | |
| | | $ | 109,671,597 | | |
CONSUMER, CYCLICAL — 2.9% | |
| Algeco Scotsman Global Finance plc — 8.50% 10/15/2018** | | $ | 56,846,000 | | | $ | 56,351,440 | | |
Continental Airlines 1997-1 Class A
Pass Through Trust — 7.461% 10/1/2016 | | | 220,678 | | | | 220,678 | | |
Continental Airlines 2000-1 Class B
Pass Through Trust — 8.388% 5/1/2022 | | | 5,242,493 | | | | 5,337,487 | | |
| HD Supply, Inc. — 11.00% 4/15/2020 | | | 37,556,000 | | | | 42,626,060 | | |
24
FPA NEW INCOME, INC.
PORTFOLIO OF INVESTMENTS (Continued)
March 31, 2015 (Unaudited)
BONDS & DEBENTURES | | Principal
Amount | | Fair
Value | |
Northwest Airlines 1999-2 Class C
Pass Through Trust — 8.304% 9/1/2010†† | | $ | 23,450,793 | | | $ | 15,477,523 | | |
Northwest Airlines 2000-1 Class G
Pass Through Trust — 7.15% 4/1/2021 | | | 13,966,906 | | | | 14,665,251 | | |
| US Airways 1998-1B Pass Through Trust — 7.35% 7/30/2019 | | | 5,963,399 | | | | 6,201,935 | | |
| US Airways 1998-1C Pass Through Trust — 6.82% 1/30/2019 | | | 9,381,579 | | | | 9,287,763 | | |
| US Airways 1999-1C Pass Through Trust — 7.96% 7/20/2019 | | | 15,022,669 | | | | 13,370,176 | | |
| Wal-Mart Stores, Inc. — 2.875% 4/1/2015 | | | 1,875,000 | | | | 1,874,995 | | |
| | | $ | 165,413,308 | | |
CONSUMER, NON-CYCLICAL — 0.2% | |
| InSite Issuer LLC — 8.595% 8/15/2043**†† | | $ | 11,901,000 | | | $ | 12,613,275 | | |
DIVERSIFIED — 1.0% | |
| PT Boart Longyear Management Pty Ltd. — 10.00% 10/1/2018** | | $ | 51,802,000 | | | $ | 52,967,545 | | |
ENERGY — 1.3% | |
| EP Energy LLC / Everest Acquisition Finance, Inc. — 6.875% 5/1/2019 | | $ | 69,367,000 | | | $ | 71,101,175 | | |
| Atwood Oceanics, Inc. — 6.50% 2/1/2020 | | | 4,318,000 | | | | 4,156,075 | | |
| | | $ | 75,257,250 | | |
FINANCIAL — 0.3% | |
| N671US Trust — 7.50% 9/15/2020**†† | | $ | 15,228,136 | | | $ | 15,266,206 | | |
INDUSTRIAL — 1.7% | |
| Air 2 US — 10.127% 10/1/2020**†† | | $ | 39,258,228 | | | $ | 9,421,975 | | |
Reynolds Group Issuer, Inc. / Reynolds Group Issuer LLC / Reynolds
Group Issuer Lu — 7.875% 8/15/2019 | | | 71,693,000 | | | | 75,815,347 | | |
| Air 2 US — 8.027% 10/1/2020** | | | 8,580,276 | | | | 9,154,082 | | |
| | | $ | 94,391,404 | | |
| TOTAL CORPORATE BONDS & NOTES | | $ | 576,332,805 | | |
CORPORATE BANK DEBT — 2.8% | |
| La Frontera Generation Term Loan B — 4.50% 9/30/2020** | | $ | 27,477,690 | | | $ | 27,385,090 | | |
| Novelis, Inc. Term Loan — 3.32% 3/10/2017** | | | 33,151,091 | | | | 33,187,226 | | |
| OCI Beaumont LLC Term Loan B — 5.00% 8/20/2019** | | | 17,709,496 | | | | 17,895,446 | | |
| OSG International Term Loan B — 5.75% 3/7/2019** | | | 29,588,921 | | | | 29,563,771 | | |
25
FPA NEW INCOME, INC.
PORTFOLIO OF INVESTMENTS (Continued)
March 31, 2015 (Unaudited)
BONDS & DEBENTURES | | Principal
Amount | | Fair
Value | |
| Scientific Games International Term Loan B2 — 6.00% 10/1/2021** | | $ | 32,838,698 | | | $ | 32,837,712 | | |
| Toys R Us Property Term Loan B — 6.00% 8/21/2019** | | | 18,426,570 | | | | 17,472,995 | | |
| TOTAL CORPORATE BANK DEBT | | $ | 158,342,240 | | |
MUNICIPALS — 0.1% | |
Panhandle-Plains Student Finance Corp. Rev.,
(STUDENT LN REV NT SR 2001A-2 A), — 1.673% 12/1/2031†† | | $ | 7,800,000 | | | $ | 7,683,000 | | |
U.S. TREASURIES — 11.8% | |
U.S. Treasury Notes | |
| —0.104% 4/30/2016 | | $ | 85,000,000 | | | $ | 85,009,256 | | |
| —0.105% 7/31/2016 | | | 20,000,000 | | | | 19,999,322 | | |
| —0.25% 9/30/2015 | | | 15,000,000 | | | | 15,008,204 | | |
| —0.25% 10/15/2015 | | | 100,000,000 | | | | 100,054,200 | | |
| —0.375% 6/30/2015 | | | 15,000,000 | | | | 15,011,426 | | |
| —1.25% 8/31/2015 | | | 120,000,000 | | | | 120,563,088 | | |
| —1.25% 9/30/2015 | | | 110,000,000 | | | | 110,605,858 | | |
| —1.75% 7/31/2015 | | | 200,000,000 | | | | 201,118,160 | | |
| TOTAL U.S. TREASURIES | | $ | 667,369,514 | | |
TOTAL INVESTMENT SECURITIES — 99.2%
(Cost $5,751,780,674) | | $ | 5,625,983,427 | | |
26
FPA NEW INCOME, INC.
PORTFOLIO OF INVESTMENTS (Continued)
March 31, 2015 (Unaudited)
| | | Principal
Amount | | Fair
Value | |
SHORT-TERM INVESTMENTS — 1.3% | |
State Street Bank Repurchase Agreement — 0.00% 4/1/2015 | |
(Dated 03/31/2015, repurchase price of $75,585,000, collateralized by
$61,130,000 principal amount U.S. Treasury Bond — 3.75% 2043,
fair value $77,100,213) | | $ | 75,585,000 | | | $ | 75,585,000 | | |
TOTAL SHORT-TERM INVESTMENTS
(Cost $75,585,000) | | $ | 75,585,000 | | |
TOTAL INVESTMENTS — 100.5%
(Cost $5,827,365,674) | | $ | 5,701,568,427 | | |
| Other Assets and Liabilities, net — (0.5)% | | | (29,762,107 | ) | |
| NET ASSETS — 100.0% | | $ | 5,671,806,320 | | |
** Restricted securities. These restricted securities constituted 29.35% of total net assets at March 31, 2015, most of which are considered liquid by the Adviser. These securities are not registered and may not be sold to the public. There are legal and/or contractual restrictions on resale. The Fund does not have the right to demand that such securities be registered. The values of these securities are determined by valuations provided by pricing services, brokers, dealers, market makers, or in good faith under policies adopted by authority of the Fund's Board of Directors.
†† These securities have been valued in good faith under policies adopted by authority of the Board of Trustees in accordance with the Fund's fair value procedures. These securities constituted 2.50% of total net assets at March 31, 2015
27
FPA NEW INCOME, INC.
RESTRICTED SECURITIES
March 31, 2015 (Unaudited)
Issuer | | Acquisition
Date(s) | |
Cost
| | Fair
Value | |
Net Assets
| |
A10 Term Asset
Financing LLC 2013-2 A | | 10/30/2013, 7/31/2014 | | $ | 10,326,945 | | | $ | 10,363,842 | | | | 0.18 | % | |
Air 2 US | | 7/1/2014, 10/27/2014 | | | 9,393,666 | | | | 9,421,975 | | | | 0.17 | % | |
Air 2 US | | 7/24/2014, 8/22/2014,
2/12/2015 | | | 9,347,305 | | | | 9,154,082 | | | | 0.16 | % | |
Algeco Scotsman Global
Finance plc
| |
9/4/2014, 9/9/2014,
9/15/2014, 9/22/2014,
9/26/2014, 9/29/2014,
10/2/2014, 10/14/2014,
10/15/2014, 11/13/2014,
11/19/2014, 11/20/2014,
11/21/2014, 12/1/2014,
12/3/2014, 12/8/2014,
12/10/2014
| | | 58,484,399 | | | | 56,351,440 | | | | 0.98 | % | |
Ally Auto Receivables
Trust 2012-1 B | | 6/10/14 | | | 8,756,722 | | | | 8,674,910 | | | | 0.15 | % | |
American Credit Acceptance
Receivables Trust 2013-2 A | | 6/5/14 | | | 188,872 | | | | 188,571 | | | | 0.00 | % | |
American Credit Acceptance
Receivables Trust 2014-1 A | | 1/7/14 | | | 1,874,149 | | | | 1,639,782 | | | | 0.03 | % | |
American Credit Acceptance
ReceivablesTrust 2014-2 A | | 4/15/14 | | | 5,190,793 | | | | 4,767,869 | | | | 0.08 | % | |
Banc of America Large
Loan Ball 2009 FDG C | | 3/31/15 | | | 23,888,137 | | | | 23,927,120 | | | | 0.42 | % | |
Bayview Opportunity
Master Fund IIa
Trust PL 2014-20NP A | | 8/19/14 | | | 193,915 | | | | 194,040 | | | | 0.00 | % | |
Beacon Container
Finance LLC 2012-1A A | | 5/1/14 | | | 479,208 | | | | 480,068 | | | | 0.01 | % | |
Cabela's Credit Card
Master Note Trust 2010-2A A1 | | 5/22/14 | | | 7,734,825 | | | | 7,616,409 | | | | 0.13 | % | |
Cabela's Credit Card Master
Note Trust 2012-1A A1 | | 3/19/15 | | | 9,061,601 | | | | 9,070,251 | | | | 0.16 | % | |
Cabela's Credit Card Master
Note Trust 2012-2A A1 | | 3/11/15 | | | 30,335,394 | | | | 30,423,408 | | | | 0.54 | % | |
Cabela's Credit Card Master
Note Trust2011-4A A1 | | 3/11/2015, 3/30/2015 | | | 31,899,309 | | | | 31,928,725 | | | | 0.56 | % | |
CCG Receivables Trust 2014-1 A2 | | 5/6/2014, 3/31/15 | | | 9,601,881 | | | | 9,598,959 | | | | 0.17 | % | |
Cerberus Onshore II
CLO-2 LLC 2014-1A A | | 11/20/2014, 2/12/2015 | | | 9,499,229 | | | | 9,499,902 | | | | 0.17 | % | |
Cerberus Onshore II
CLO-2 LLC 2014-1A B | | 11/20/14 | | | 6,556,309 | | | | 6,568,599 | | | | 0.12 | % | |
28
FPA NEW INCOME, INC.
RESTRICTED SECURITIES (Continued)
March 31, 2015 (Unaudited)
Issuer | | Acquisition
Date(s) | |
Cost | | Fair
Value | |
Net Assets | |
Chesapeake Funding LLC
2014-1A A | | 3/4/14 | | $ | 29,025,000 | | | $ | 29,026,219 | | | | 0.51 | % | |
Citigroup Commercial
Mortgage Trust 2007-FL3A B | | 1/28/14 | | | 111,873 | | | | 114,144 | | | | 0.00 | % | |
Citigroup Commercial
Mortgage Trust 2007-FL3A C | | 1/28/14 | | | 531,580 | | | | 546,480 | | | | 0.01 | % | |
Citigroup Mortgage Loan
Trust 2014-A A 4% 1/1/2035 | | 2/24/14 | | | 23,205,763 | | | | 23,151,834 | | | | 0.41 | % | |
Credit Acceptance Auto
Loan Trust 2014- 2A A | | 3/2/15 | | | 16,263,304 | | | | 16,269,520 | | | | 0.29 | % | |
Credit Acceptance Auto
Loan Trust 2014-2A B | | 9/18/14 | | | 8,637,455 | | | | 8,681,652 | | | | 0.15 | % | |
Del Coronado
Trust 2013-DEL
MZ 2013- HDMZ M | |
4/1/2013, 11/13/2013,
2/12/2015 | | | 9,516,719 | | | | 9,512,637 | | | | 0.17 | % | |
DT Auto Owner
Trust 2013-2A B | | 9/17/13 | | | 7,313,221 | | | | 7,323,223 | | | | 0.13 | % | |
DT Auto Owner
Trust 2014-1A A | | 8/28/14 | | | 618,554 | | | | 618,444 | | | | 0.01 | % | |
DT Auto Owner
Trust 2014-1A B | | 1/14/14 | | | 5,729,040 | | | | 5,735,344 | | | | 0.10 | % | |
DT Auto Owner
Trust 2014-2A A | | 4/9/14 | | | 5,432,510 | | | | 5,431,055 | | | | 0.10 | % | |
DT Auto Owner
Trust 2014-2A B | | 4/9/14 | | | 8,473,053 | | | | 8,483,204 | | | | 0.15 | % | |
Enterprise Fleet
Financing LLC 2012-2 A2 | | 8/26/14 | | | 2,509,904 | | | | 2,508,316 | | | | 0.04 | % | |
Enterprise Fleet
Financing LLC 2014-2 A2 | | 8/26/2014, 3/25/2015 | | | 5,938,413 | | | | 5,943,722 | | | | 0.11 | % | |
Exeter Automobile
Receivables Trust 2013-2A A | | 9/11/13 | | | 7,720,716 | | | | 7,736,016 | | | | 0.14 | % | |
Exeter Automobile
Receivables Trust
2014-1A A | | 1/29/2014, 5/2/2014 | | | 18,968,642 | | | | 19,003,859 | | | | 0.34 | % | |
Exeter Automobile
Receivables Trust 2014-2A A | | 5/20/14 | | | 5,770,818 | | | | 5,756,122 | | | | 0.10 | % | |
First Investors Auto Owner
Trust 2013-3A A2 | | 11/6/13 | | | 1,655,443 | | | | 1,655,909 | | | | 0.03 | % | |
First Investors Auto
Owner Trust 2014-1A A2 | | 8/28/14 | | | 2,757,736 | | | | 2,757,341 | | | | 0.05 | % | |
First Investors Auto
Owner Trust 2014-1A A3 | | 4/3/14 | | | 9,497,992 | | | | 9,522,087 | | | | 0.17 | % | |
29
FPA NEW INCOME, INC.
RESTRICTED SECURITIES (Continued)
March 31, 2015 (Unaudited)
Issuer | | Acquisition
Date(s) | |
Cost | | Fair
Value | |
Net Assets | |
First Investors Auto Owner
Trust 2014-2A A2 | | 8/6/14 | | $ | 20,523,327 | | | $ | 20,511,819 | | | | 0.36 | % | |
GTP Acquisition Partners I LLC | | 4/17/2013, 2/12/2015 | | | 16,558,669 | | | | 16,782,574 | | | | 0.30 | % | |
HFG Healthco-4 LLC 2011-1A A | | 5/26/2011, 9/22/2011,
2/18/2015 | | | 17,174,176 | | | | 17,404,110 | | | | 0.31 | % | |
HLSS Servicer Advance
Receivables Backed
Notes Series 2013-T2 B2 | | 2/14/14 | | | 8,042,472 | | | | 8,011,078 | | | | 0.14 | % | |
HLSS Servicer Advance
Receivables Backed Notes
Series 2013-T5 BT5 | | 2/12/14 | | | 9,333,425 | | | | 9,190,790 | | | | 0.16 | % | |
HLSS Servicer Advance
Receivables Trust 2012-T2 B2 | | 2/13/2014, 2/14/2014 | | | 14,266,672 | | | | 14,043,396 | | | | 0.25 | % | |
HLSS Servicer Advance
Receivables Trust 2013-T1 A2 | | 2/12/2014, 2/13/2014 | | | 24,541,782 | | | | 24,436,430 | | | | 0.43 | % | |
HLSS Servicer Advance
Receivables Trust 2013-T1 B2 | | 2/14/14 | | | 5,746,406 | | | | 5,707,191 | | | | 0.10 | % | |
Hyundai Auto Lease
Securitization Trust 2015-A A2 | | 3/4/15 | | | 29,431,653 | | | | 29,432,889 | | | | 0.52 | % | |
InSite Issuer LLC | | 8/19/2013, 2/12/2015 | | | 11,921,560 | | | | 12,613,275 | | | | 0.22 | % | |
Kubota Credit Owner
Trust 2014-1A A2 | | 4/15/14 | | | 5,215,020 | | | | 5,213,943 | | | | 0.09 | % | |
La Frontera Generation Term
Loan B | | 5/9/2013, 5/15/2013,
5/22/2013, 5/23/2013 | | | 27,446,095 | | | | 27,385,090 | | | | 0.48 | % | |
MMAF Equipment
Finance LLC 2012-AA A3 | | 4/28/14 | | | 7,369,257 | | | | 6,086,427 | | | | 0.11 | % | |
MMAF Equipment
Finance LLC 2013-AA A2 | | 8/7/2013, 5/1/2014 | | | 9,489,470 | | | | 7,981,848 | | | | 0.14 | % | |
MMAF Equipment
Finance LLC 2013-AA A3 | | 3/26/15 | | | 2,420,890 | | | | 2,423,969 | | | | 0.04 | % | |
Monty Parent
Issuer 1 LLC 2013-LTR1 B | | 11/14/2013, 1/27/2015,
2/12/2015 | | | 10,676,701 | | | | 10,704,825 | | | | 0.19 | % | |
N671US Trust | | 8/16/12 | | | 15,228,136 | | | | 15,266,206 | | | | 0.27 | % | |
Nationstar HECM Loan
Trust A 2014-1A A | | 12/9/2014, 2/12/2015 | | | 27,980,983 | | | | 27,977,637 | | | | 0.49 | % | |
Normandy Mortgage
Loan Co. LLC 2013- NPL3 A | | 8/28/2013, 2/12/2015 | | | 24,857,951 | | | | 24,824,713 | | | | 0.44 | % | |
Novelis, Inc. Term Loan B
| | 11/20/2014, 11/25/2014,
12/11/2014, 12/16/2015,
2/12/2015, 3/13/2015,
3/17/2015, 3/27/2015 | | | 33,049,335 | | | | 33,187,226 | | | | 0.59 | % | |
30
FPA NEW INCOME, INC.
RESTRICTED SECURITIES (Continued)
March 31, 2015 (Unaudited)
Issuer | | Acquisition
Date(s) | |
Cost | | Fair
Value | |
Net Assets | |
OCI Beaumont LLC Term Loan B1 | | 3/26/2014, 4/2/2014,
4/9/2014, 11/1/2014 | | $ | 17,739,604 | | | $ | 17,895,446 | | | | 0.32 | % | |
Ores NPL LLC 2014-LV3 B | | 3/21/2014, 2/12/2015 | | | 49,839,848 | | | | 49,968,825 | | | | 0.88 | % | |
OSG International Term Loan B
| | 7/7/2014, 7/8/2014,
7/25/2014, 8/15/2014,
9/24/2014, 10/2/2014,
10/24/2014, 11/3/2014,
1/7/2015, 2/4/2015 | | | 29,647,541 | | | | 29,563,771 | | | | 0.52 | % | |
PFS Financing Corp. 2013-BA A | | 1/31/2014, 7/16/2014,
8/15/2014, 9/5/2014 | | | 35,181,787 | | | | 35,163,583 | | | | 0.62 | % | |
PFS Financing Corp. 2014-AA A | | 2/4/14 | | | 26,000,000 | | | | 25,973,293 | | | | 0.46 | % | |
PFS Financing Corp. 2014-BA A | | 10/7/2015, 2/18/2015 | | | 14,120,733 | | | | 14,114,469 | | | | 0.25 | % | |
Porsche Financial Auto
Securitization Trust 2014-1 A2 | | 5/14/14 | | | 19,593,185 | | | | 19,592,544 | | | | 0.35 | % | |
Porsche Innovative Lease
Owner Trust 2014-1 A4 | | 3/2/15 | | | 15,257,171 | | | | 15,271,819 | | | | 0.27 | % | |
Prestige Auto Receivables
Trust 2012-1A B | | 7/17/14 | | | 3,929,691 | | | | 3,892,382 | | | | 0.07 | % | |
Prestige Auto Receivables
Trust 2013-1A A2 | | 8/27/2013, 10/10/2013 | | | 4,666,363 | | | | 4,670,490 | | | | 0.08 | % | |
Prestige Auto Receivables
Trust 2013-1A A3 | | 9/12/14 | | | 4,643,608 | | | | 4,633,399 | | | | 0.08 | % | |
Prestige Auto Receivables
Trust 2014-1A A2 | | 3/18/14 | | | 10,334,240 | | | | 10,334,550 | | | | 0.18 | % | |
Prestige Auto Receivables
Trust 2014-1A A3 | | 3/18/14 | | | 17,249,017 | | | | 17,257,048 | | | | 0.30 | % | |
Prestige Auto Receivables
Trust 2015-1 A3 | | 3/18/15 | | | 16,432,965 | | | | 16,433,656 | | | | 0.29 | % | |
Prestige Auto Receivables
Trust 2015-1 B | | 3/18/15 | | | 10,394,352 | | | | 10,394,789 | | | | 0.18 | % | |
Progreso Receivables
Funding I LLC 2013-A A | | 6/14/2013, 2/12/2015 | | | 15,373,902 | | | | 15,467,069 | | | | 0.27 | % | |
Progreso Receivables
Funding II LLC 2014- A A | | 6/18/2014, 2/12/2015 | | | 9,735,092 | | | | 9,741,084 | | | | 0.17 | % | |
PT Boart Longyear
Management Pty Ltd.
| |
9/20/2013, 9/24/2014,
10/6/2014, 10/24/2014,
11/13/2014, 11/21/2014,
12/5/2014, 12/10/2014,
2/20/2015, 3/2/2015 | | | 53,424,793 | | | | 52,967,545 | | | | 0.93 | % | |
Rialto Capital
Management LLC
2013-RIA4 A2 | | 11/18/13 | | | 11,753,262 | | | | 11,753,501 | | | | 0.21 | % | |
31
FPA NEW INCOME, INC.
RESTRICTED SECURITIES (Continued)
March 31, 2015 (Unaudited)
Issuer | | Acquisition
Date(s) | |
Cost | | Fair
Value | |
Net Assets | |
Rialto Capital
Management LLC 2014-LT5 B | | 11/20/14 | | $ | 7,430,530 | | | $ | 7,374,940 | | | | 0.13 | % | |
Rialto Capital
Management LLC 2014-LT6 B | | 9/17/2014, 2/12/2015 | | | 10,041,313 | | | | 10,043,796 | | | | 0.18 | % | |
RiverView HECM
Trust 2007-1 A- .061% 5/25/2047 | | 1/9/2013, 2/12/2015 | | | 30,206,771 | | | | 28,994,937 | | | | 0.51 | % | |
Santander Drive Auto
Receivables Trust 2012-AA B | | 5/13/2014, 8/22/2014 | | | 18,024,820 | | | | 17,957,064 | | | | 0.32 | % | |
Scientific Games International
Term Loan B2
| | 9/17/2014, 9/24/2014,
10/3/2014, 12/16/2014,
3/27/2015 | | |
32,617,247 | | | |
32,837,712 | | | |
0.58 | % | |
Stanwich Mortgage
Loan Co. LLC 2013-NPL2 A
| |
2/15/2013, 8/21/2013,
2/12/2015 | | | 28,048,913 | | | | 28,042,620 | | | | 0.49 | % | |
Stanwich Mortgage Loan
Trust 2013-NPL1 A | | 5/31/2013, 2/12/2015 | | | 6,977,984 | | | | 6,989,861 | | | | 0.12 | % | |
Stanwich Mortgage Loan
Trust Series 2009-2 A | | 9/22/2011, 7/1/2013 | | | 135,699 | | | | 136,714 | | | | 0.00 | % | |
Stanwich Mortgage Loan
Trust Series 2010-1 A | | 4/22/2010, 9/22/2011 | | | 298,614 | | | | 289,381 | | | | 0.01 | % | |
Stanwich Mortgage Loan
Trust Series 2010-2 A | | 5/21/2010, 9/22/2011 | | | 1,423,845 | | | | 1,363,521 | | | | 0.02 | % | |
Stanwich Mortgage Loan
Trust Series 2010-3 A | | 6/2/2010, 9/22/2011 | | | 834,248 | | | | 869,333 | | | | 0.02 | % | |
Stanwich Mortgage Loan
Trust Series 2010-4 A | | 8/4/2010, 9/22/2011 | | | 839,416 | | | | 910,355 | | | | 0.02 | % | |
Stanwich Mortgage Loan
Trust Series 2011-1A | | 5/10/2011, 9/22/2011 | | | 1,599,252 | | | | 1,599,251 | | | | 0.03 | % | |
Stanwich Mortgage Loan
Trust Series 2011-2A | | 6/10/2011, 9/22/2011 | | | 1,397,700 | | | | 1,397,700 | | | | 0.02 | % | |
Starwood Property Mortgage
Trust 2013-FV1 B | | 7/30/13 | | | 18,051,000 | | | | 18,047,316 | | | | 0.32 | % | |
STORE Master
Funding LLC 2012-1A A | | 8/31/12 | | | 480,289 | | | | 522,479 | | | | 0.01 | % | |
Sunset Mortgage
Loan Co. LLC 2014-NPL1 A | | 8/21/2014, 2/12/2015 | | | 43,279,151 | | | | 43,514,334 | | | | 0.77 | % | |
Sunset Mortgage
Loan Co. LLC 2014-NPL2 A | | 11/25/14 | | | 50,676,959 | | | | 50,851,090 | | | | 0.90 | % | |
Toys R Us Property Term Loan
| | 7/31/2013, 10/17/2013,
12/4/2013, 12/18/2013,
11/3/2014, 12/16/2014 | | | 17,993,462 | | | | 17,472,995 | | | | 0.31 | % | |
32
FPA NEW INCOME, INC.
RESTRICTED SECURITIES (Continued)
March 31, 2015 (Unaudited)
Issuer | | Acquisition
Date(s) | |
Cost | | Fair
Value | |
Net Assets | |
Truman Capital Mortgage
Loan Trust 2014-NPL2 A1 | | 9/9/2014, 2/12/2015 | | $ | 6,468,547 | | | $ | 6,438,578 | | | | 0.11 | % | |
Truman Capital Mortgage
Loan Trust 2014-NPL3 A1 | | 9/9/2014, 2/12/2015 | | | 5,755,593 | | | | 5,729,132 | | | | 0.10 | % | |
Unison Ground Lease
Funding LLC | | 3/12/2013, 7/16/2013,
2/12/2015 | | �� | 12,409,760 | | | | 12,519,408 | | | | 0.22 | % | |
Unison Ground Lease
Funding LLC | | 3/12/2013, 2/12/2015 | | | 3,841,986 | | | | 3,823,016 | | | | 0.07 | % | |
Unison Ground Lease
Funding LLC | | 12/13/2012, 2/12/2015 | | | 25,296,452 | | | | 23,372,276 | | | | 0.41 | % | |
Vericrest Opportunity
Loan Transferee LLC
2014-NPL4 A1 | | 6/20/2014, 2/12/2015 | | | 32,888,133 | | | | 32,907,633 | | | | 0.58 | % | |
VFC LLC 2014-2 B | | 7/9/14 | | | 6,178,828 | | | | 6,183,868 | | | | 0.11 | % | |
VOLT XXVII LLC
2014-NPL7 A1 | | 10/24/14 | | | 55,828,192 | | | | 55,787,525 | | | | 0.98 | % | |
VOLT XXXIII LLC
2015-NPL5 A1 | | 3/13/15 | | | 56,845,636 | | | | 56,905,276 | | | | 1.00 | % | |
Volvo Financial
Equipment LLC
Series A 2015-1A A2 | | 3/11/15 | | | 40,211,606 | | | | 40,236,326 | | | | 0.71 | % | |
WCP ISSUER LLC | | 8/1/2013, 2/12/2015 | | | 15,736,076 | | | | 16,644,705 | | | | 0.29 | % | |
Westlake Automobile
Receivables Trust 2014-1A A2 | | 5/20/14 | | | 1,484,326 | | | | 1,482,960 | | | | 0.03 | % | |
Westlake Automobile
Receivables Trust
2014-1A B | | 5/20/14 | | | 4,499,869 | | | | 4,498,997 | | | | 0.08 | % | |
Westlake Automobile
Receivables Trust 2014-1A C | | 5/20/14 | | | 499,931 | | | | 499,570 | | | | 0.01 | % | |
Westlake Automobile
Receivables Trust 2015-1A A2 | | 3/4/15 | | | 15,448,214 | | | | 15,448,863 | | | | 0.27 | % | |
Westlake Automobile
Receivables Trust 2015-1A B | | 3/4/15 | | | 11,719,123 | | | | 11,719,616 | | | | 0.21 | % | |
Westlake Automobile
Receivables Trust 2015-1A C | | 3/4/15 | | | 549,903 | | | | 549,926 | | | | 0.01 | % | |
Wheels SPV 2 LLC
2014-1A A2 | | 5/13/2014, 2/18/2015,
3/27/2015 | | | 17,032,991 | | | | 17,019,927 | | | | 0.30 | % | |
TOTAL RESTRICTED SECURITIES | | | | $ | 1,672,133,908 | | | $ | 1,664,904,780 | | | | 29.35 | % | |
33
FPA NEW INCOME, INC.
STATEMENT OF ASSETS AND LIABILITIES
March 31, 2015
(Unaudited)
ASSETS | |
Investment securities — at fair value (identified cost $5,751,780,674) | | $ | 5,625,983,427 | | |
Short-term investments — at amortized cost (maturities 60 days or less) | | | 75,585,000 | | |
Cash | | | 626 | | |
Receivable for: | |
Dividends and interest | | | 30,071,077 | | |
Capital Stock sold | | | 5,704,467 | | |
Investment securities sold | | | 4,102,703 | | |
Total assets | | | 5,741,447,300 | | |
LIABILITIES | |
Payable for: | |
Investment securities purchased | | | 57,519,748 | | |
Capital Stock repurchased | | | 9,387,560 | | |
Due to advisor | | | 2,450,459 | | |
Accrued expenses and other liabilities | | | 283,213 | | |
Total liabilities | | | 69,640,980 | | |
NET ASSETS | | $ | 5,671,806,320 | | |
SUMMARY OF SHAREHOLDERS' EQUITY | |
Capital Stock — par value $0.01 per share; authorized
700,000,000 shares; outstanding 556,886,229 shares | | $ | 5,568,862 | | |
Additional Paid-in Capital | | | 6,020,878,726 | | |
Accumulated net realized loss on investments | | | (272,858,292 | ) | |
Accumulated net investment income | | | 44,014,271 | | |
Net unrealized depreciation | | | (125,797,247 | ) | |
NET ASSETS | | $ | 5,671,806,320 | | |
NET ASSET VALUE | |
Offering and redemption price per share | | $ | 10.18 | | |
See accompanying notes to financial statements.
34
FPA NEW INCOME INC.
STATEMENT OF OPERATIONS
For the Six Months Ended March 31, 2015
(Unaudited)
INVESTMENT INCOME | |
Interest | | $ | 112,932,806 | | |
EXPENSES | |
Advisory fees | | | 14,407,974 | | |
Transfer agent fees and expenses | | | 1,338,555 | | |
Filing fees | | | 223,588 | | |
Custodian fees | | | 186,860 | | |
Reports to shareholders | | | 172,740 | | |
Directors fees and expenses | | | 85,897 | | |
Audit and tax services fees | | | 41,069 | | |
Legal fees | | | 18,138 | | |
Other | | | 43,835 | | |
Total expenses | | | 16,518,656 | | |
Net investment income | | | 96,414,150 | | |
NET REALIZED AND UNREALIZED GAIN (LOSS) | |
Net realized gain (loss) on: | |
Investments | | | (13,522,684 | ) | |
Net change in unrealized appreciation (depreciation) of: | |
Investments | | | (41,568,144 | ) | |
Net realized and unrealized loss | | | (55,090,828 | ) | |
NET INCREASE IN NET ASSETS RESULTING FROM OPERATIONS | | $ | 41,323,322 | | |
See accompanying notes to financial statements.
35
FPA NEW INCOME INC.
STATEMENTS OF CHANGES IN NET ASSETS
| | | Six Months Ended
March 31, 2015
(Unaudited) | | Year Ended
September 30, 2014 | |
INCREASE (DECREASE) IN NET ASSETS | |
Operations: | |
Net investment income | | $ | 96,414,150 | | | $ | 140,410,499 | | |
Net realized loss | | | (13,522,684 | ) | | | (50,975,625 | ) | |
Net change in unrealized depreciation | | | (41,568,144 | ) | | | (16,217,063 | ) | |
Net increase in net assets resulting from operations | | | 41,323,322 | | | | 73,217,811 | | |
Distributions to shareholders from: | |
Net investment income | | | (70,297,969 | ) | | | (182,659,674 | ) | |
| Total Distributions | | | (70,297,969 | ) | | | (182,659,674 | ) | |
Capital Stock transactions: | |
Proceeds from Capital Stock sold | | | 1,187,922,809 | | | | 2,661,056,738 | | |
Proceeds from shares issued to shareholders upon
reinvestment of dividends and distributions | | | 58,911,639 | | | | 147,373,658 | | |
Cost of Capital Stock repurchased | | | (1,375,918,928 | ) | | | (1,901,690,465 | ) | |
Net increase (decrease) from Capital Stock transactions | | | (129,084,480 | ) | | | 906,739,931 | | |
Total change in net assets | | | (158,059,127 | ) | | | 797,298,068 | | |
NET ASSETS | |
Beginning of Period | | | 5,829,865,447 | | | | 5,032,567,379 | | |
End of Period | | $ | 5,671,806,320 | | | $ | 5,829,865,447 | | |
CHANGE IN CAPITAL STOCK OUTSTANDING | |
Shares of Capital Stock sold | | | 116,788,196 | | | | 258,440,070 | | |
Shares issued to shareholders upon reinvestment of
dividends and distributions | | | 5,808,616 | | | | 14,341,031 | | |
Shares of Capital Stock repurchased | | | (135,306,158 | ) | | | (184,676,382 | ) | |
Change in Capital Stock outstanding | | | (12,709,346 | ) | | | 88,104,719 | | |
* Net of redemption fees of $265,693 and $780,788 for the periods ended March 31, 2015 September 30, 2014, respectively.
See accompanying notes to financial statements.
36
FPA NEW INCOME INC.
FINANCIAL HIGHLIGHTS
Selected Data for Each Share of Capital Stock Outstanding Throughout Each Period
| | | Six
Months
Ended
March 31,
2015 | | Year Ended September 30, | |
| | | (unaudited) | | 2014 | | 2013 | | 2012 | | 2011 | | 2010 | |
Per share operating performance: | |
Net asset value at beginning
of period | | $ | 10.24 | | | $ | 10.45 | | | $ | 10.70 | | | $ | 10.84 | | | $ | 11.04 | | | $ | 11.09 | | |
Income from investment operations: | |
Net investment income | | $ | 0.17 | | | $ | 0.30 | | | $ | 0.28 | | | $ | 0.27 | | | $ | 0.43 | | | $ | 0.36 | | |
Net realized and unrealized
gain (loss) on investment
securities | | | (0.10 | ) | | | (0.15 | ) | | | (0.21 | ) | | | (0.04 | ) | | | (0.16 | ) | | | (0.04 | ) | |
Total from investment operations | | $ | 0.07 | | | $ | 0.15 | | | $ | 0.07 | | | $ | 0.23 | | | $ | 0.27 | | | $ | 0.32 | | |
Less distributions: | |
Dividends from net
investment income | | | (0.13 | ) | | | (0.36 | ) | | | (0.32 | ) | | | (0.37 | ) | | | (0.47 | ) | | | (0.37 | ) | |
Redemption fees | | | — | * | | | — | * | | | — | * | | | — | * | | | — | * | | | — | * | |
Net asset value at end of period | | $ | 10.18 | | | $ | 10.24 | | | $ | 10.45 | | | $ | 10.70 | | | $ | 10.84 | | | $ | 11.04 | | |
Total investment return** | | | 0.64 | % | | | 1.47 | % | | | 0.66 | % | | | 2.18 | % | | | 2.47 | % | | | 2.90 | % | |
Ratios/supplemental data: | |
Net Assets, End of Period
(in $000's) | | $ | 5,671,806 | | | $ | 5,829,865 | | | $ | 5,032,567 | | | $ | 5,091,681 | | | $ | 4,276,200 | | | $ | 4,145,399 | | |
Ratio of expenses to average
net assets | | | 0.57 | %† | | | 0.56 | % | | | 0.58 | % | | | 0.57 | % | | | 0.60 | % | | | 0.60 | % | |
Ratio of net investment income
(loss) to average net assets | | | 3.35 | %† | | | 2.59 | % | | | 2.74 | % | | | 2.21 | % | | | 3.94 | % | | | 2.98 | % | |
| Portfolio turnover rate | | | 73 | %† | | | 97 | % | | | 84 | % | | | 77 | % | | | 117 | % | | | 78 | % | |
* Rounds to less than $0.01 per share.
** Return is based on net asset value per share, adjusted for reinvestment of distributions, and does not reflect deduction of the sales charge.
† Annualized
See accompanying notes to financial statements.
37
FPA NEW INCOME, INC.
NOTES TO FINANCIAL STATEMENTS
March 31, 2015
NOTE 1 — Significant Accounting Policies
FPA New Income, Inc. (the "Fund") is registered under the Investment Company Act of 1940, as a diversified, open-end, management investment company. The Fund's primary investment objective is to seek current income and long-term total return. The Fund qualifies as an investment company pursuant to Financial Accounting Standard Board (FASB) Accounting Standards Codification (ASC) No. 946, Financial Services — Investment Companies. The following is a summary of significant accounting policies consistently followed by the Fund in the preparation of its financial statements.
A. Security Valuation
The Fund's investments are reported at fair value as defined by accounting principles generally accepted in the United States of America. The Fund generally determines its net asset value as of approximately 4:00 p.m. New York time each day the New York Stock Exchange is open. Further discussion of valuation methods, inputs and classifications can be found under Note 7.
B. Securities Transactions and Related Investment Income
Securities transactions are accounted for on the date the securities are purchased or sold. Dividend income and distributions to shareholders are recorded on the ex-dividend date. Interest income and expenses are recorded on an accrual basis. Market discounts and premiums on fixed income securities are amortized over the expected life of the securities. Realized gains or losses are based on the specific identification method.
C. Use of Estimates
The preparation of financial statements in conformity with accounting principles generally accepted in the United States of America requires management to make estimates and assumptions that affect the amounts reported. Actual results could differ from these estimates.
NOTE 2 — Risk Considerations
Investing in the Fund may involve certain risks including, but not limited to, those described below.
Market Risk: Because the values of the Fund's investments will fluctuate with market conditions, so will the value of your investment in the Fund. You could lose money on your investment in the Fund or the Fund could underperform other investments.
Interest Rate Risk: The values of, and the income generated by, most debt securities held by the Fund may be affected by changing interest rates and by changes in the effective maturities and credit ratings of these securities. For example, the values of debt securities in the Fund's portfolio generally will decline when interest rates rise and increase when interest rates fall. In addition, falling interest rates may cause an issuer to redeem, call or refinance a security before its stated maturity, which may result in the Fund having to reinvest the proceeds in lower-yielding securities.
Mortgage-Backed and Other Asset-Backed Securities Risk: The values of some mortgage-backed and other asset-backed securities may expose the Fund to a lower rate of return upon reinvestment of principal. When interest rates rise, the value of mortgage-related securities generally will decline; however, when interest rates are declining, the value of mortgage related-securities with prepayment features may not increase as much as other fixed income securities. The rate of prepayments on underlying mortgages will affect the price and volatility of a mortgage-related security, and may shorten or extend the effective maturity of the security beyond what was anticipated at the time of purchase. If an unanticipated rate of prepayment on underlying mortgages increases the effective maturity of a mortgage-related security, the volatility of the security can be expected to increase. The value of these securities may also fluctuate in response to the market's perception of the creditworthiness of the issuers. Additionally, although mortgages and mortgage-related securities are generally supported by some form
38
FPA NEW INCOME, INC.
NOTES TO FINANCIAL STATEMENTS
Continued
of government or private guarantee and/or insurance, there is no assurance that private guarantors or insurers will meet their obligations.
Stripped Mortgage-Backed Interest Only ("I/O") and Principal Only ("P/O") Securities: Stripped mortgage backed securities are usually structured with two classes that receive different proportions of the interest and principal distributions on a pool of mortgage assets. In certain cases, one class will receive all of the interest payments on the underlying mortgages (the I/O class), while the other class will receive all of the principal payments (the P/O class). The Fund currently has investments in I/O and P/O securities. The yield to maturity on IOs is sensitive to the rate of principal repayments (including prepayments) on the related underlying mortgage assets, and principal payments may have a material effect on yield-to-maturity. If the underlying mortgage assets experience greater than anticipated prepayments of principal, a Fund may not fully recoup its initial investment in I/Os.
Credit Risk: Debt securities are subject to credit risk, meaning that the issuer of the debt security may default or fail to make timely payments of principal or interest. The values of any of the Fund's investments may also decline in response to events affecting the issuer or its credit rating. The lower rated debt securities in which the Fund may invest are considered speculative and are generally subject to greater volatility and risk of loss than investment grade securities, particularly in deteriorating economic conditions. The Fund invests a significant portion of its assets in securities of issuers that hold mortgage- and asset-backed securities and direct investments in securities backed by commercial and residential mortgage loans and other financial assets. The value and related income of these securities is sensitive to changes in economic conditions, including delinquencies and/or defaults. Continuing shifts in the market's perception of credit quality on securities backed by commercial and residential mortgage loans and other financial assets may result in increased volatility of market price and periods of illiquidity that can negatively impact the valuation of certain securities held by the Fund.
Repurchase Agreements: Repurchase agreements permit the Fund to maintain liquidity and earn income over periods of time as short as overnight. Repurchase agreements held by the Fund are fully collateralized by U.S. Government securities, or securities issued by U.S. Government agencies, or securities that are within the three highest credit categories assigned by established rating agencies (Aaa, Aa, or A by Moody's or AAA, AA or A by Standard & Poor's) or, if not rated by Moody's or Standard & Poor's, are of equivalent investment quality as determined by the Adviser. Such collateral is in the possession of the Fund's custodian. The collateral is evaluated daily to ensure its market value equals or exceeds the current market value of the repurchase agreements including accrued interest. In the event of default on the obligation to repurchase, the Fund has the right to liquidate the collateral and apply the proceeds in satisfaction of the obligation.
The Fund may enter into repurchase agreements, under the terms of a Master Repurchase Agreement ("MRA"). The MRA permits the Fund, under certain circumstances including an event of default (such as bankruptcy or insolvency), to offset payables and/or receivables under the MRA with collateral held and/or posted to the counterparty and create one single net payment due to or from the Fund. However, bankruptcy or insolvency laws of a particular jurisdiction may impose restrictions on or prohibitions against such a right of offset in the event of a MRA counterparty's bankruptcy or insolvency. Pursuant to the terms of the MRA, the Fund receives securities as collateral with a market value in excess of the repurchase price to be received by the Fund upon the maturity of the repurchase transaction. Upon a bankruptcy or insolvency of the MRA counterparty, the Fund recognizes a liability with respect to such excess collateral to reflect the Fund's obligation under bankruptcy law to return the excess to the counterparty. Repurchase agreements outstanding at the end of the period are listed in the Fund's Portfolio of Investments.
NOTE 3 — Purchases and Sales of Investment Securities
Cost of purchases of investment securities (excluding short-term investments with maturities generally of 60 days or less at the time of purchase) aggregated $2,007,915,087 for the period ended March 31, 2015. The
39
FPA NEW INCOME, INC.
NOTES TO FINANCIAL STATEMENTS
Continued
proceeds and cost of securities sold resulting in net realized losses of $13,522,684 aggregated $2,027,051,005 and $2,040,576,689, respectively, for the period ended March 31, 2015.
NOTE 4 — Advisory Fees and Other Affiliated Transactions
Pursuant to an Investment Advisory Agreement (the "Agreement"), advisory fees were paid by the Fund to First Pacific Advisors, LLC (the "Adviser"). Under the terms of this Agreement, the Fund pays the Adviser a monthly fee calculated at the annual rate of 0.5% of the average daily net assets of the Fund. The Agreement obligates the Adviser to reduce its fee to the extent necessary to reimburse the Fund for any annual expenses (exclusive of interest, taxes, the cost of any supplemental statistical and research information, and extraordinary expenses such as litigation) in excess of 11/2% of the first $15 million and 1% of the remaining average net assets of the Fund for the year. Effective as of March 23, 2015, the Fund engaged State Street Bank and Trust Company to provide these financial and administrative services and terminated this portion of the Agreement with the Adviser.
For the period ended March 31, 2015, the Fund paid aggregate fees of $85,897 to all Directors who are not interested persons of the Adviser. Certain officers of the Fund are also officers of the Adviser.
NOTE 5 — Federal Income Tax
No provision for federal income tax is required because the Fund has elected to be taxed as a "regulated investment company" under the Internal Revenue Code and intends to maintain this qualification and to distribute each year to its shareholders, in accordance with the distribution requirements of the Code, all of its taxable net investment income and taxable net realized gains on investments.
The cost of investment securities at March 31, 2015 for federal income tax purposes was $5,764,187,773. Gross unrealized appreciation and depreciation for those investments securities at March 31, 2015 for federal income tax purposes was $13,583,890 and $151,788,236, respectively, resulting in net unrealized depreciation of $138,204,346. As of and during the period ended March 31, 2015, the Fund did not have any liability for unrecognized tax benefits. The Fund recognizes interest and penalties, if any, related to unrecognized tax benefits as income tax expense in the Statement of Operations. During the period, the Fund did not incur any interest or penalties. The Fund is not subject to examination by U.S. federal tax authorities for years ended before September 30, 2011 or by state tax authorities for years ended before September 30, 2010.
NOTE 6 — Redemption Fees
A redemption fee of 2% applies to redemptions within 90 days of purchase. For the period ended March 31, 2015, the Fund collected $265,693 in redemption fees, which amounted to less than $0.01 per share.
NOTE 7 — Disclosure of Fair Value Measurements
The Fund uses the following methods and inputs to establish the fair value of its assets and liabilities. Use of particular methods and inputs may vary over time based on availability and relevance as market and economic conditions evolve.
Equity securities are generally valued each day at the official closing price of, or the last reported sale price on, the exchange or market on which such securities are principally are traded, as of the close of business on that day. If there have been no sales that day, equity securities are generally valued at the last available bid price. Securities that are unlisted and fixed-income and convertible securities listed on a national securities exchange for which the over-the-counter market more accurately reflects the securities' value in the judgment of the Fund's officers, are valued at the most recent bid price. However, most fixed income securities are generally valued at prices obtained from pricing vendors. Vendors value such securities based on one or more of the following inputs: transactions, bids, offers quotations from dealers and trading systems, spreads and other relationships observed
40
FPA NEW INCOME, INC.
NOTES TO FINANCIAL STATEMENTS
Continued
in the markets among comparable securities, benchmarks, underlying equity of the issuer, and proprietary pricing models such as cash flows, financial or collateral performance and other reference data (includes prepayments, defaults, collateral, credit enhancements, and interest rate volatility). Short-term corporate notes with maturities of 60 days or less are valued at amortized cost, which approximates fair value.
Securities for which representative market quotations are not readily available or are considered unreliable by the Adviser are valued as determined in good faith under procedures adopted by authority of the Fund's Board of Directors. Various inputs may be reviewed in order to make a good faith determination of a security's value. These inputs include, but are not limited to, the type and cost of the security; contractual or legal restrictions on resale of the security; relevant financial or business developments of the issuer; actively traded similar or related securities; conversion or exchange rights on the security; related corporate actions; significant events occurring after the close of trading in the security; and changes in overall market conditions. Fair valuations and valuations of investments that are not actively trading involve judgment and may differ materially from valuations of investments that would have been used had greater market activity occurred.
The Fund classifies its assets based on three valuation methodologies. Level 1 investment securities are valued based on quoted market prices in active markets for identical assets. Level 2 investment securities are valued based on significant observable market inputs, such as quoted prices for similar assets and quoted prices in inactive markets or other market observable inputs as noted above including spreads, cash flows, financial performance, prepayments, defaults, collateral, credit enhancements, and interest rate volatility. Level 3 investment securities are valued using significant unobservable inputs that reflect the Fund's determination of assumptions that market participants might reasonably use in valuing the assets. These assumptions consider inputs such as proprietary pricing models, cash flows, prepayments, defaults, and collateral. The valuation levels are not necessarily an indication of the risk associated with investing in those securities. The following table presents the valuation levels of the Fund's investments as of March 31, 2015:
Investments | | Level 1 | | Level 2 | | Level 3 | | Total | |
Commercial Mortgage-Backed Securities | |
Agency | | | — | | | $ | 97,901,520 | | | | — | | | $ | 97,901,520 | | |
Agency Stripped | | | — | | | | 564,034,055 | | | | — | | | | 564,034,055 | | |
Non-Agency | | | — | | | | 169,770,128 | | | $ | 19,128,441 | | | | 188,898,569 | | |
Residential Mortgage-Backed Securities | |
Agency Collateralized Mortgage Obligation | | | — | | | | 964,196,233 | | | | — | | | | 964,196,233 | | |
Agency Pool Adjustable Rate | | | — | | | | 2,051,886 | | | | — | | | | 2,051,886 | | |
Agency Pool Fixed Rate | | | — | | | | 368,652,642 | | | | — | | | | 368,652,642 | | |
Agency Stripped | | | — | | | | 79,731,050 | | | | — | | | | 79,731,050 | | |
Non-Agency Collateralized Mortgage Obligation | | | — | | | | 61,955,471 | | | | — | | | | 61,955,471 | | |
Asset-Backed Securities | |
Auto | | | — | | | | 1,137,623,386 | | | | — | | | | 1,137,623,386 | | |
Other | | | — | | | | 719,436,648 | | | | 31,774,408 | | | | 751,211,056 | | |
Corporate Bonds & Notes | | | — | | | | 494,389,713 | | | | 81,943,092 | | | | 576,332,805 | | |
41
FPA NEW INCOME, INC.
NOTES TO FINANCIAL STATEMENTS
Continued
Investments | | Level 1 | | Level 2 | | Level 3 | | Total | |
Corporate Bank Debt | | | — | | | $ | 158,342,240 | | | | — | | | $ | 158,342,240 | | |
Municipals | | | — | | | | — | | | $ | 7,683,000 | | | | 7,683,000 | | |
U.S. Treasury & Government Agencies | | | — | | | | 667,369,514 | | | | — | | | | 667,369,514 | | |
Short-Term Investment | | | — | | | | 75,585,000 | | | | — | | | | 75,585,000 | | |
| | | | — | | | $ | 5,561,039,486 | | | $ | 140,528,941 | | | $ | 5,701,568,427 | | |
The following table summarizes the Fund's Level 3 investment securities and related transactions during the period ended March 31, 2015:
Investment | | Beginning
Balance at
September 30,
2014 | | Net
Realized
and
Unrealized
Gains
(Losses) | | Purchases | | (Sales) | | Gross
Transfers
In (Out) | | Ending
Value at
March 31,
2015 | | Net Change
in Unrealized
Appreciation
(Depreciation)
related to
Investments
Held at
March 31,
2015 | |
Commercial
Mortgage-
Backed
Non-Agency | | $ | 11,753,254 | | | $ | (55,343 | ) | | $ | 7,430,530 | | | | — | | | | — | | | $ | 19,128,441 | | | $ | (55,343 | ) | |
Residential
Mortgage-
Backed
Agency
Collateralized
Mortgage
Obligation | | | 133,850,731 | | | | (881,227 | ) | | | — | | | $ | (23,989,767 | ) | | $ | (108,979,737 | ) | | | — | | | | — | | |
Asset-Backed
Securities-Other | | | 84,422,299 | | | | 795,872 | | | | 2,052,481 | | | | (18,503,821 | ) | | | (36,992,423 | ) | | | 31,774,408 | | | | 556,365 | | |
Corporate
Bonds & Notes | | | 75,163,053 | | | | (2,072,157 | ) | | | 12,739,992 | | | | (3,887,796 | ) | | | — | | | | 81,943,092 | | | | 1,831,966 | | |
Municipals | | | — | | | | — | | | | 1,871,500 | | | | — | | | | 5,811,500 | | | | 7,683,000 | | | | — | | |
| | | $ | 305,189,337 | | | $ | (2,212,855 | ) | | $ | 24,094,503 | | | $ | (46,381,384 | ) | | $ | (140,160,660 | ) | | $ | 140,528,941 | | | $ | 2,332,988 | | |
Level 3 Valuation Process: Investments classified within Level 3 of the fair value hierarchy are valued by the Adviser in good faith under procedures adopted by authority of the Fund's Board of Directors. The Adviser employs various methods to determine fair valuations including regular review of key inputs and assumptions, and review of related market activity, if any. However, there are generally no observable trade activities in these securities. The Adviser reports to the Board of Directors at their regularly scheduled quarterly meetings, or more often if warranted. The report includes a summary of the results of the process, the key inputs and assumptions noted, and any changes to the inputs and assumptions used. When appropriate, the Adviser will recommend
42
FPA NEW INCOME, INC.
NOTES TO FINANCIAL STATEMENTS
Continued
changes to the procedures and process employed. The value determined for an investment using the fair value procedures may differ significantly from the value realized upon the sale of such investment.
Transfers of investments between different levels of the fair value hierarchy are recorded at market value as of the end of the reporting period. There were no transfers between Level 1 and 2. There were transfers of $140,160,660 out of Level 3 during the period ended March 31, 2015. The transfers in are largely a result of a change in the number of brokers providing daily quotes and a change in the availability of observable inputs.
The following table summarizes the quantitative inputs and assumptions used for items categorized as items categorized as Level 3 of the fair value hierarchy as of March 31, 2015:
Financial Assets | | Fair Value at
March 31,
2015 | | Valuation
Technique(s) | | Unobservable
Inputs | | Price/Range | |
Commercial Mortgage-Backed
Non-Agency
| | | $19,128,441
| | | Third-Party
Broker Quote* | | Quotes/Prices
| | $97.14
| |
Asset-Backed Securities-Other
| | | 6,566,255
| | | Pricing Model**
| | Prices
Discount | | $45.27-$64.97 ($53.00)
2.1%-12.3% (3.4%) | |
|
| | | | 25,208,153
| | | Third-Party
Broker Quote* | | Quotes/Prices
| | $100.06-$100.63
| |
Corporate Bonds and Notes
| | | 81,943,092
| | | Third-Party
Broker Quote* | | Quotes/Prices
| | $24.00-$105.99
| |
Municipals
| | | 7,683,000
| | | Third-Party
Broker Quote* | | Quotes/Prices
| | $98.50
| |
* The Third-Party Broker Quote technique involves obtaining an independent third-party broker quote for the security.
** The Pricing Model technique for Level 3 securities involves preparing a proprietary broker price opinion (BPO) model using valuation information provided by the loan servicer based on local market resources and sales trends published by the National Association of Realtors, and a broker, and then applying an appropriate discount to that valuation. The discount reflects market conditions such as lack of liquidity of the investment, the costs associated with foreclosure and liquidation, the historical performance of the loan pool and the characteristics of the remaining loans including whether or not the loans are performing.
NOTE 8 — Distribution to Shareholders
On March 31, 2015, the Board of Directors declared a dividend from net investment income of $0.07 per share payable April 2, 2015 to shareholders of record on March 31, 2015. For financial statement purposes, this dividend was recorded on the ex-dividend date, April 1, 2015.
NOTE 9 — Collateral Requirements
The Fund has implemented the disclosure requirements pursuant to FASB Accounting Standards Update No. 2011-11, Disclosures about Offsetting Assets and Liabilities, that requires disclosures to make financial statements that are prepared under U.S. GAAP more comparable to those prepared under International Financial Reporting Standards. Under this guidance the Fund discloses both gross and net information about instruments and transactions eligible for offset such as instruments and transactions subject to an agreement similar to a master netting arrangement. In addition, the Fund discloses collateral received and posted in connection with master netting agreements or similar arrangements.
43
FPA NEW INCOME, INC.
NOTES TO FINANCIAL STATEMENTS
Continued
The following table presents the Fund's repurchase agreements by counterparty net of amounts available for offset under an ISDA Master agreement or similar agreements and net of the related collateral received or pledged by the Fund as of March 31, 2015, are as follows:
Counterparty | | Gross Assets
in the Statement of
Assets and Liabilities | | Collateral
Received | | Assets (Liabilities)
Availiable for Offset | | Net Amount
of Assets* | |
State Street Bank
and Trust Company | | $ | 75,585,000 | | | $ | 75,585,000 | ** | | | — | | | | — | | |
* Represents the net amount receivable from the counterparty in the event of default.
** Collateral with a value of $77,100,213 has been received in connection with a master repurchase agreement. Excess of collateral received from the individual master repurchase agreement is not shown for financial reporting purposes.
44
FPA NEW INCOME, INC.
SHAREHOLDER EXPENSE EXAMPLE
March 31, 2015
Fund Expenses
As a shareholder of the Fund, you incur two types of costs: (1) transaction costs, and (2) ongoing costs, including advisory and administrative fees; shareholder service fees; and other Fund expenses. The Example is intended to help you understand your ongoing costs (in dollars) of investing in the Fund and to compare these costs with the ongoing costs of investing in other mutual funds. The Example is based on an investment of $1,000 invested at the beginning of the year and held for the entire year.
Actual Expenses
The information in the table under the heading "Actual Performance" provides information about actual account values and actual expenses. You may use the information in this column, together with the amount you invested, to estimate the expenses that you paid over the period. Simply divide your account value by $1,000 (for example, an $8,600 account value divided by $1,000 = 8.6), then multiply the result by the number in the first column in the row entitled "Expenses Paid During Period" to estimate the expenses you paid on your account during this period.
Hypothetical Example for Comparison Purposes
The information in the table under the heading "Hypothetical Performance (5% return before expenses)" provides information about hypothetical account values and hypothetical expenses based on the Fund's actual expense ratio and an assumed rate of return of 5% per year before expenses, which is not the Fund's actual return. The hypothetical account values and expenses may not be used to estimate the
actual ending account balance or expenses you paid for the period. You may use this information to compare the ongoing costs of investing in the Fund and other funds. To do so, compare this 5% hypothetical example with the 5% hypothetical examples that appear in the shareholder reports of other funds.
Please note that the expenses shown in the table are meant to highlight your ongoing costs only and do not reflect any transactional costs. Therefore, the information under the heading "Hypothetical Performance (5% return before expenses)" is useful in comparing ongoing costs only, and will not help you determine the relative total costs of owning different funds. In addition, if these transactional costs were included, your costs would have been higher.
| | | Actual
Performance | | Hypothetical
Performance
(5% return
before
expenses) | |
Beginning Account Value
September 30, 2014 | | $ | 1,000.00 | | | $ | 1,000.00 | | |
Ending Account Value
March 31, 2015 | | $ | 1,006.40 | | | $ | 1,022.12 | | |
Expenses Paid During
Period* | | $ | 2.85 | | | $ | 2.88 | | |
* Expenses are equal to the Fund's annualized expense ratio of 0.57%, multiplied by the average account value over the period and prorated for the six-months ended March 31, 2015 (182/365 days).
45
FPA NEW INCOME, INC.
DIRECTOR AND OFFICER INFORMATION
| Name, Age & Address | | Position(s)
With Fund/
Years Served | | Principal Occupation(s)
During the Past 5 Years | | Portfolios in
Fund Complex
Overseen | | Other Directorships | |
Allan M. Rudnick – (74)* | | Director and Chairman†
Years Served: 5 | | Private Investor. Formerly, Co-Founder, Chief Executive Officer, Chairman and Chief Investment Officer of Kayne Anderson Rudnick Investment Management from 1989 to 2007 | | | 7 | | | | |
Thomas P. Merrick – (78)* | | Director†
Years Served: 6 | | Private Consultant. President of Strategic Planning Consultants for more than the past five years. Former Executive Committee Member and Vice President of Fluor Corporation, responsible for strategic planning, from 1984 to 1998. | | | 7 | | | | |
Alfred E. Osborne, Jr. – (70)* | | Director†
Years Served: 15 | | Senior Associate Dean of the John E. Anderson School of Management at UCLA. | | | 7 | | | Wedbush, Inc., Nuverra Environmental Solutions, Inc., and Kaiser Aluminum Corporation. | |
A. Robert Pisano – (72)* | | Director†
Years Served: 2 | | Consultant. Formerly President and Chief Operating Officer of the Motion Picture Association of America, Inc. from 2005 to 2011. | | | 7 | | | Entertainment Partners, Resources Global Professionals and The Motion Picture and Television Fund | |
Patrick B. Purcell – (72)* | | Director†
Years Served: 9 | | Retired. Formerly Executive Vice President, Chief Financial Officer and Chief Administrative Officer of Paramount Pictures from 1983 to 1998. | | | 7 | | | The Motion Picture and Television Fund | |
Robert L. Rodriguez – (66) | | Director†
Years Served: 31 | | Managing Partner of the Adviser. | | | 2 | | | | |
Thomas H. Atteberry – (61) | | Portfolio Manager
Years Served: 10 | | Partner of the Adviser. | | | | | |
J. Richard Atwood – (54) | | President
Years Served: 18 | | Managing Partner of the Adviser. | | | | | |
Leora R. Weiner – (44) | | Chief Compliance Officer
Years Served: <1 | | Managing Director, General Counsel and Chief Compliance Officer of the Adviser since 2014. Formerly Managing Director, General Counsel and Chief Compliance Officer of Tradewinds Global Investors, LLC from 2008 to 2014. | | | | | |
46
FPA NEW INCOME, INC.
DIRECTOR AND OFFICER INFORMATION
Continued
| Name, Age & Address | | Position(s)
With Fund/
Years Served | | Principal Occupation(s)
During the Past 5 Years | | Portfolios in
Fund Complex
Overseen | | Other Directorships | |
E. Lake Setzler – (48) | | Treasurer
Years Served: 9 | | Senior Vice President and Controller of the Adviser. | | | | | |
Francine S. Hayes – (47) | | Secretary
Years Served: <1 | | Vice President and Senior Counsel of State Street Bank and Trust Company. | | | | | |
Brian F. Link – (42) | | Assistant Secretary
Years Served: <1 | | Vice President and Managing Counsel of State Street Bank. | | | | | |
Michael P. Gomez – (29) | | Assistant Vice President
Years Served: 3 | | Assistant Vice President of the Adviser since 2010. Formerly In-Charge Associate of PricewaterhouseCoopers from 2007 to 2010. | | | | | |
† Directors serve until their resignation, removal or retirement.
* Audit Committee member
Additional information on the Directors is available in the Statement of Additional Information. Each of the above listed individuals can be contacted at 11601 Wilshire Blvd., Suite 1200, Los Angeles, CA 90025.
47
INVESTMENT ADVISER
First Pacific Advisors, LLC
11601 Wilshire Boulevard, Suite 1200
Los Angeles, California 90025
DISTRIBUTOR
UMB Distribution Services, LLC
235 West Galena Street
Milwaukee, Wisconsin 53212
LEGAL COUNSEL
K&L Gates LLP
San Francisco, California
TICKER: FPNIX
CUSIP: 302544101
INDEPENDENT REGISTERED PUBLIC ACCOUNTING FIRM
Deloitte & Touche LLP
Los Angeles, California
CUSTODIAN AND ADMINISTRATOR
State Street Bank and Trust Company
Boston, Massachusetts
TRANSFER & SHAREHOLDER SERVICE AGENT
UMB Fund Services, Inc.
P.O. Box 2175
Milwaukee, WI 53201-2175
235 West Galena St.
Milwaukee, WI 53212
(800) 638-3060
This report has been prepared for the information of shareholders of FPA New Income, Inc., and is not authorized for distribution to prospective investors unless preceded or accompanied by a prospectus.
The Fund's complete proxy voting record for the 12 months ended June 30, 2014 is available without charge, upon request, by calling (800) 982-4372 and on the SEC's website at www.sec.gov.
The Fund's schedule of portfolio holdings, filed the first and third quarter of the Fund's fiscal year on Form N-Q with the SEC, is available on the SEC's website at www.sec.gov. Form N-Q is available at the SEC's Public Reference Room in Washington, D.C., and information on the operations of the Public Reference Room may be obtained by calling (202) 551-8090. To obtain information on Form N-Q from the Fund, shareholders can call (800) 982-4372.
Additional information about the Fund is available online at www.fpafunds.com. This information includes, among other things, holdings, top sectors and performance, and is updated on or about the 15th business day after the end of each quarter.
Item 2. Code of Ethics.
Not applicable to this semi-annual report.
Item 3. Audit Committee Financial Expert.
Not applicable to this semi-annual report.
Item 4. Principal Accountant Fees and Services.
Not applicable to this semi-annual report.
Item 5. Audit Committee of Listed Registrants.
Not applicable to this semi-annual report.
Item 6. Investments.
(a) Schedule of Investments is included as a part of the report to shareholders filed under Item 1 of this Form N-CSR.
(b) Not applicable.
Item 7. Disclosure of Proxy Voting Policies and Procedures for Closed-End Management Investment Companies.
Not applicable.
Item 8. Portfolio Managers of Closed-End Management Investment Companies.
Not applicable.
Item 9. Purchases of Equity Securities by Closed-End Management Investment Company and Affiliated Purchasers.
Not applicable.
Item 10. Submission of Matters to a Vote of Security Holders.
There have been no material changes to the procedures by which the shareholders may recommend nominees to the registrant’s board of directors.
Item 11. Controls and Procedures.
(a) The principal executive officer and principal financial officer of the registrant have concluded that the registrant’s disclosure controls and procedures (as defined in Rule 30a-3(c) under the Investment Company Act of 1940) are effective based on their evaluation of the disclosure controls and procedures as of a date within 90 days of the filing date of this report.
(b) There have been no significant changes in the registrant’s internal controls over financial reporting (as defined in Rule 30a-3(d) under the Investment Company Act of 1940) that occurred during the registrant’s second fiscal quarter of the period covered by this report that have materially affected, or is reasonably likely to materially affect, the registrant’s internal controls over financial reporting.
Item 12. Exhibits.
(a)(1) Not applicable.
(a)(2) The certifications required by Rule 30a-2(a) under the Investment Company Act of 1940 are attached hereto.
(a)(3) Not applicable.
(b) The certifications required by Rule 30a-2(b) under the Investment Company Act of 1940 and Section 906 of the Sarbanes-Oxley Act of 2002 are attached hereto.
SIGNATURES
Pursuant to the requirements of the Securities Exchange Act of 1934 and the Investment Company Act of 1940, the registrant has duly caused this report to be signed on its behalf by the undersigned, thereunto duly authorized.
FPA NEW INCOME, INC. | |
| |
| |
By: | /s/ J. Richard Atwood | | |
| J. Richard Atwood | |
| President (principal executive officer) | |
| | |
Date: | June 4, 2015 | |
| | | |
Pursuant to the requirements of the Securities Exchange Act of 1934 and the Investment Company Act of 1940, this report has been signed below by the following persons on behalf of the registrant and in the capacities and on the dates indicated.
By: | /s/ J. Richard Atwood | | |
| J. Richard Atwood | |
| President (principal executive officer) | |
| | |
Date: | June 4, 2015 | |
| | |
By: | /s/ E. Lake Setzler III | | |
| E. Lake Setzler III | |
| Treasurer (principal financial officer) | |
| | |
Date: | June 4, 2015 | |