UNITED STATES
SECURITIES AND EXCHANGE COMMISSION
Washington, D.C. 20549
FORM N-CSR
CERTIFIED SHAREHOLDER REPORT OF REGISTERED
MANAGEMENT INVESTMENT COMPANIES
Investment Company Act file number | 811-1735 |
|
FPA NEW INCOME, INC. |
(Exact name of registrant as specified in charter) |
|
11400 WEST OLYMPIC BLVD., SUITE 1200, LOS ANGELES, CALIFORNIA | | 90064 |
(Address of principal executive offices) | | (Zip code) |
|
J. RICHARD ATWOOD, 11400 WEST OLYMPIC BLVD., SUITE 1200, LOS ANGELES, CALIFORNIA 90064 |
(Name and address of agent for service) |
|
Registrant’s telephone number, including area code: | 310-473-0225 | |
|
Date of fiscal year end: | SEPTEMBER 30 | |
|
Date of reporting period: | MARCH 31, 2014 | |
| | | | | | | |
Item 1. Report to Stockholders.

Distributor:
UMB DISTRIBUTION SERVICES, LLC
803 West Michigan Street
Milwaukee, Wisconsin 53233
FPA NEW INCOME, INC.
LETTER TO SHAREHOLDERS
Fund Performance
This Semi-Annual Report covers the six-month period ended March 31, 2014. Your Fund's net asset value (NAV) closed at $10.33. Dividends of $0.12 and $0.08 were paid on October 2, 2013 and December 19, 2013, to holders of record on September 30 and December 17, 2013, respectively. There were no capital gains distributions.
The following table shows the average annual total return for several different periods ended on that date for the Fund and its benchmarks.
| | | Periods Ended March 31, 2013 | |
| | | 1 Year | | 5 Years* | | 10 Years* | | 15 Years* | | 20 Years* | | 25 Years* | | Since
6/30/1984*,† | |
FPA New Income, Inc. | | | 0.68 | % | | | 2.14 | % | | | 3.01 | % | | | 4.46 | % | | | 5.13 | % | | | 6.40 | % | | | 7.72 | % | |
Barclays U.S. Aggregate
Bond Index | | | -0.10 | % | | | 4.80 | % | | | 4.46 | % | | | 5.40 | % | | | 5.99 | % | | | 6.86 | % | | | 7.94 | % | |
Consumer Price Index + 100
Basis Points | | | 2.44 | % | | | 3.11 | % | | | 3.36 | % | | | 3.44 | % | | | 3.41 | % | | | 3.69 | % | | | 3.83 | % | |
* Annualized
† Inception for FPA management was July 11, 1984. Return information for period July 1-July 10, 1984 reflects performance by a manager other than FPA. A benchmark comparison is not available based on the Fund's inception date therefore a comparison using July 1, 1984 is used.
A redemption fee of 2.00% will be imposed on redemptions within 90 days. Expense ratio calculated as of the date of the most recent prospectus is 0.58%. As of March 31, 2014, the 30 day SEC yield was 3.54%.
Past performance is no guarantee of future results and current performance may be higher or lower than the performance shown. This data represents past performance and investors should understand that investment returns and principal values fluctuate, so that when you redeem, your investment may be worth more or less than its original cost. Current month-end performance data may be obtained by calling toll-free, 1-800-982-4372.
Portfolio Commentary
During the past quarter the Fund appreciated 0.58% while the Barclays U.S. Aggregate Bond Index rose 1.84%. The main driver of the Fund's underperformance was the decline in Treasury yields. The 10-year Treasury note declined from 3.04% to 2.73%. This benefited the Index, which continues to have a duration of around 5 years (versus the Fund's duration of less than 2 years).
For the trailing twelve months the Fund gained 0.68% versus a -0.10% loss for the Index. We encourage shareholders interested in a recap of the challenging bond market conditions of 2013 to refer to our last quarterly letter.
From a sector perspective, the Collateralized Mortgage Obligations were the best performer for the quarter followed by the Asset Backed Security holdings, then the corporate bond holdings. Specifically the CMO1 bonds backed by relocation mortgage loans associated with corporate and military relocation programs turned in excellent results. The prepayment speeds started to climb as homeowners were being transferred to another
1 CMO is Collateralized Mortgage Obligation. It is a mortgage-backed bond that separates mortgage pools into different maturity classes.
1
FPA NEW INCOME, INC.
LETTER TO SHAREHOLDERS
Continued
location thus causing the existing mortgage loans to be paid off. The worst performing sector for the quarter were our Commercial Mortgage Backed Securities which provided a slightly negative return for the quarter.
Portfolio Activity
The portfolio entered the first quarter 2014 with an elevated level of cash and equivalents, the result of selling assets during the fourth quarter that no longer passed our stress test. By the end of this quarter, we had significantly reduced the level of cash in the portfolio through expanding the portfolio's holdings in Asset Backed Securities (ABS) that are backed by consumer automobile loans and leases. This sector was the largest area of investment during the quarter. The portfolio continued to accumulate Collateralized Mortgages Obligations (CMOs) backed by pools of non-performing residential mortgage loans purchased from commercial banks. Within the high-yield corporate portion of the portfolio, we continued to purchase securities with solid financials and good asset protection, maturities of less than six years, callable in approximately one to two years, and have interest coupons that are so large as to make the prospect of the bond being called very likely. If the bond is not called, we are comfortable owning the security until it matures.
The agency-backed single family mortgage market continues to be very challenging. In general, these bonds do not provide sufficient yield to protect the portfolio in the event interest rates rise by 100 basis points2 over the next year. As we believe this portion of the market offers very limited value at the moment, we continue to sell some of our mortgage holdings. Over the last quarter, several of the portfolio's CMOs backed by very large balance jumbo loans guaranteed by FNMA3 or FHLMC4 were liquidated.
We continue to look across the bond market for investment opportunities to help the portfolio achieve a positive absolute return in any one-year period if interest rates rise 100 basis points and a return that is greater than the Consumer Price Index plus 100 basis points on rolling five-year basis.
Market Commentary
As our fixed income investment team has grown over the past few years, its organization is making adjustments too. Melinda Newman joined the team in January 2013 to head up our corporate credit analysis effort and was instrumental in increasing the portfolio's allocation to high yield corporate credit during the second quarter of 2013. Abhi Patwardhan joined the team in 2010 as a generalist with experience in both structured product and corporate credit and has been the lead analyst in several structured product areas such as our non-agency CMBS investments and non-performing residential loan investments. Starting this year he heads up the structured product investment research segment of the fixed income team.
Both Melinda and Abhi have been key contributors during our quarterly client conference calls. Starting this quarter they will be sharing commentary on their respective areas of market focus in the quarterly client letters.
2 Basis Point is a unit that is equal to 1/100th of 1%, and is used to denote the change in a financial instrument.
3 FNMA (Federal National Mortgage Association) is a government-sponsored enterprise (GSE) that was created in 1938 to expand the flow of mortgage money by creating a secondary mortgage market. Fannie Mae is a publicly traded company, currently under conservatorship, which operates under a congressional charter that directs Fannie Mae to channel its efforts into increasing the availability and affordability of homeownership for low-, moderate- and middle-income Americans.
4 FHLMC (Federal Home Loan Mortgage Corp) is a stockholder-owned, government-sponsored enterprise (GSE), currently under conservatorship, chartered by Congress in 1970 to keep money flowing to mortgage lenders in support of homeownership and rental housing for middle income Americans.
2
FPA NEW INCOME, INC.
LETTER TO SHAREHOLDERS
Continued
Does an increase in intermediate and longer-term Treasury rates present an investment opportunity?
We have long used the shape of the Treasury yield curve as an indicator of investors' views toward the future direction of interest rates. Through history we have observed that when the Treasury yield curve is flat (i.e. short-term interest rates are similar to long-term rates), the next directional move in interest rates is down. However, the timing of this move is uncertain. A flat yield curve, such as in June 2006, when two-year, ten-year and thirty-year Treasury yields were around 5%, tells us the investors are not fearful of inflation and do not require higher interest rates to tie up their money for a longer period of time. Over the subsequent several years interest rates declined and by July 24, 2012 the ten-year Treasury yield was 1.39%.
When the difference between short-term and long-term interest rates is quite large, such as today, investors are exhibiting a different concern. The current 230 basis point spread between yields on the two-year and ten-year Treasury is a little more than 2.5 times the median level of the last 37 years5. Today investors do fear inflation and they are requiring a higher return to tie up their money for a longer period of time. Looking at history, we observe that in similar situations the next significant move in interest rates is up. An example of such a time period is the end of 2002, when a two-year Treasury had a yield of 1.6% and a ten-year Treasury had a yield of 3.8%. By mid-2006 both instruments had a yield of approximately 5.15%. As with the flat yield curve scenario, the timing of the increase in the level of interest rates is unknown.
This leads us to the next question — are we being adequately compensated for the outcome of such an event? The chart below compares the level of interest rates at the lowest point of July 24, 2012 and end of first quarter 2014.
Treasury Maturity | | Yield 7/24/2012 | | Yield 3/31/2014 | | Change | |
Two-year | | | 0.22 | % | | | 0.42 | % | | | +0.20% | | |
Three-year | | | 0.28 | % | | | 0.87 | % | | | +0.59% | | |
Five-year | | | 0.54 | % | | | 1.72 | % | | | +1.18% | | |
Seven-year | | | 0.88 | % | | | 2.30 | % | | | +1.42% | | |
Ten-year | | | 1.39 | % | | | 2.72 | % | | | +1.33% | | |
Thirty-year | | | 2.45 | % | | | 3.56 | % | | | +1.11% | | |
Difference between two-year and ten-year | | | 1.17 | % | | | 2.30 | % | | | 1.13 | % | |
Our first observation is that the difference between the yield on the two-year Treasury and the yield on the ten-year Treasury has changed dramatically and the bulk of the changes in Treasury interest rates occurred in those with maturities of five years and longer. So has the increase in longer-term interest rates over the past two years made the Treasuries more attractive investments? One tool we use to answer this question is a stress test which calculates the total return over a one-year period if we purchased one of those maturities and its yield were to increase by 100 basis points. We use this metric because history tells us that a 100 basis point movement in yields is a normal market event. The stress test, performed on July 24, 2012 and March 31, 2014, shows us that despite the recent increase in overall Treasury yields, investments in Treasuries could easily result in negative returns and the recent rise in yields has not greatly diminished risk of loss.
5 Calculated quarterly since March of 1977
3
FPA NEW INCOME, INC.
LETTER TO SHAREHOLDERS
Continued
| Treasury Maturity | | Impact of an increase in yield
by 100 basis points in a 12 month
period 7/24/2012 | | Impact of an increase in yield
by 100 basis points in a 12 month
period 3/31/2014 | |
Two-year | | | -0.70 | % | | | -0.57 | % | |
Three-year | | | -1.67 | % | | | -1.05 | % | |
Five-year | | | -3.27 | % | | | -2.07 | % | |
Seven-year | | | -4.71 | % | | | -3.13 | % | |
Ten-year | | | -6.47 | % | | | -4.80 | % | |
Thirty-year | | | -15.55 | % | | | -12.68 | % | |
While the increase in the level of Treasury rates has been significant, they are still not at a level that makes them attractive enough for us to invest in them. However, this steepening of the yield curve presents us with some investment opportunities in securities outside of the Treasury sector with two to three year maturities. This opportunity is offset by the fact that the spread one can get above a Treasury for investing in various non-Treasury segments of the market has declined since June 2012 as well. While challenging, the team still feels confident that they can uncover opportunities that fit our investment criteria.
As stated in previous commentaries, given the current market environment, we have kept the effective duration in the one to two year range, with an average life of our holdings between two and three years, and a yield-to-worst of 2-2.5%. The following table looks at the portfolio as of the end of second quarter 2012 and first quarter 2014.
Portfolio | | Average Coupon | | Average Life | | Yield-to-Worst6 | | Effective Duration | |
June 30, 2012 | | | 3.20 | % | | | 2.44 years | | | | 2.46 | % | | | 1.33 years | | |
March 31, 2014 | | | 2.89 | % | | | 1.99 years | | | | 2.01 | % | | | 1.51 years | | |
Why is the portfolio's effective duration so similar after such a rise in rates? While Treasury interest rates have increased, little has changed as it relates to valuation that warrants any major changes in the portfolio's interest rate risk exposure. With spreads in some sectors tighter, the ability to find investment opportunities with longer durations is also constrained. The result is that we continue to focus on investment ideas that lean toward preservation of capital and as such are willing to accept slightly less yield. Therefore, we have a portfolio with a lower average coupon, shorter average life and lower yield to worst with only a slightly higher effective duration.
The Federal Reserve Bank finances revisited
At this point corporations have reported 2013 year-end earnings. We thought it would be interesting to look at the Federal Reserve from a profit perspective over last year. For 2013, the Federal Reserve reported a net profit of $79 billion which was remitted to the United States Treasury Department, thus assisting in the reduction of the federal budget deficit. The size of the Fed's bond portfolio increased from about $3 trillion to almost $4 trillion, approximately a 33% increase. However, the interest income of the portfolio increased from $78 billion
6 Yield to worst is the lowest possible yield on a callable bond. As of March 31, 2014, the SEC yield was 3.54%. This calculation begins with the Fund's dividend payments for the last 30 days, subtracts fund expenses and uses this number to estimate your returns for a year. The SEC yield is based on the price of the fund at the beginning of the month. The income yield stated here reflects prospective data and thus assumes payments collected by the fund may fluctuate.
4
FPA NEW INCOME, INC.
LETTER TO SHAREHOLDERS
Continued
to $85 billion, a far less significant increase. One can deduce that while the assets went up dramatically, the earnings on those assets were lower than on those previously on the bank's books.
Now we move to the not so good news. If the Federal Reserve Bank marked its assets to market, they would have experienced an unrealized loss of $53 billion with $38 billion coming from its mortgage holdings according to the Financial Times article by Robin Harding dated March 14, 2014, the Federal Reserve Bank's Combined Financial Statements for the years ending December 31, 2013 and 2012 and the Independent Auditors Report. As long as the bank chooses not to sell any assets, it can leave them in a held to maturity classification and not mark them to market. Why is there such a large unreported loss in the mortgage holdings? First, the Federal Reserve owns about $522 billion, at amortized cost, of 3% 30-year amortization mortgage pools which have a weighted average coupon for the borrower of about 3.5%. These pools represent approximately 34% of the total Mortgage Backed Security holdings. Looking at TBA pricing7 for this mortgage pool, the price at the beginning of 2013 was $104.78 compared to $94.97 at year-end resulting in a $9.81 loss before interest payments and prepayment activity. As of the end of 2013, the new market rate for borrowing money for a 30-year fixed rate mortgage guaranteed by FNMA or FHLMC was about 4.55% according to the Bank Rate Monitor. Higher mortgage rates usually equate to slower prepayment speeds as the ability to refinance is curtailed and the assumed average life increases. Coupled with rising interest rates, this could result in a large potential negative impact to the price of the bank's holdings. Overall this does not look good either from the standpoint of profitability or the value of bank's assets, two metrics that a private investor would take into account when looking at the soundness and attractiveness of a private bank.
These unrealized losses have the potential to curtail the options available to the Federal Reserve to control the excess reserves (money) in the monetary system it created by printing the money to purchase these securities. Only time will tell if the Quantitative Easing (QE) program created unintended consequences to the nation's monetary system. In our opinion, it introduced an additional level of complexity and risk to the capital markets of the United States and, to a lesser degree, the global capital markets as well. We address these concerns by taking on slightly less interest rate and credit risk in the portfolio.
Quantitative Easing and the risk-on trade: the music is playing and the punch bowl is flowing
The relationship between credit spreads and real GDP8 growth is a favorite topic among academics seeking to improve fickle macroeconomic models with an infusion of data from allegedly efficient financial markets. We are not economists. However, it seems clear to us that there is a significant relationship between high yield credit spreads and real GDP growth. The correlation coefficient9 of the average spread-to-worst for the Barclays U.S. Corporate High Yield Index and quarter-over-quarter real GDP growth in the U.S.10 is -0.60 for the period from November 1998 through March 201411.
7 TBA pricing is used to term used to describe a forward mortgage-backed securities trade. Pass-through securities issued by Freddie Mac, Fannie Mae and Ginnie Mae trade in the TBA market. The term TBA is derived from the fact that the actual mortgage-backed security that will be delivered to fulfill a TBA trade is not designated at the time the trade is made. The securities are "to be announced" 48 hours prior to the established trade settlement date.
8 GDP (Gross Domestic Product) is the total market value of all final goods and services produced in a country in a given year, equal to total consumer, investment and government spending, plus the value of exports, minus the value of imports.
9 Correlation Coefficient is a measure that determines the degree to which two variable's movements are associated.
10 Using Bloomberg median Q1 2014 quarter-over-quarter real GDP forecast of 1.5% as of 4/22/14
11 Calculated using month-end average spread-to-worst
5
FPA NEW INCOME, INC.
LETTER TO SHAREHOLDERS
Continued
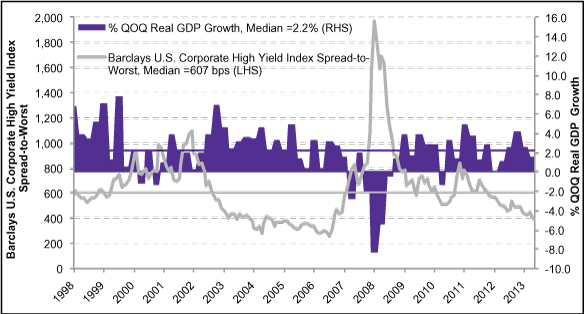
Source: Bloomberg, U.S. Bureau of Economic Analysis, Barclays
Note: uses median Q1 2014 quarter-over-quarter (QOQ) real GDP forecast of 1.5% as of 04/22/14; calculated using month-end average spread-to-worst12.
BBB-rated bond spreads, for which we have a longer data set going back to 1953, also have a negative correlation with economic growth. The correlation coefficient for BBB credit spreads13 and quarter-over-quarter real GDP growth was -0.32 for the period from April 1953 through March 2014.
The negative correlation between credit spreads and real GDP growth makes intuitive sense. In periods of strong economic growth, corporate earnings and free cash flow improve, companies de-lever, and the risk of default declines. Risk is lower, and investors demand less compensation for lower risk. Once an economic expansion becomes overheated, complacency sets in, equity and debt valuations become stretched, corporate profits and capital are misallocated, and leverage rises. Then, inflation picks up, and central banks intervene by tightening monetary policy. Earnings decline, leverage increases, and the risk of default rises in the tighter monetary environment. Investors then demand more compensation for greater risk.
QE has disrupted the normal relationship between credit spreads and economic growth. The correlation between high yield spreads and real GDP growth is +0.21 since the November 2010 announcement of QE2, a notable reversal in the relationship from -0.66 for the period from November 1998 through November 2010. The same is true for the correlation between BBB spreads and economic growth, which is +0.13 for the post-QE2
12 Spread-to-Worst: the difference in overall returns between two different classes of securities, or returns from the same class, but different representative securities.
13 BBB credit spreads calculated by subtracting 20-Year Treasury Constant Maturity Rate from the Board of Governors of the Federal Reserve System from Moody's Seasoned Baa Corporate Bond Yield, which includes bonds with maturities between 20 and 30 years. Changes in the 30-Year Constant Maturity Rate were used as a proxy for 20-Year CMT for the January 1987-September 1993 period
6
FPA NEW INCOME, INC.
LETTER TO SHAREHOLDERS
Continued
period vs. -0.32 from April 1953 through November 2010. This means that the worse the economy gets, the more the credit market rallies. There are two possible explanations for this change. The first is that the credit market is correctly forecasting more robust economic growth in the future. The second is that investors are currently too complacent about credit risk. Given deteriorating consensus forecasts for 1Q2014 real GDP growth, declining consensus estimates for 2014 corporate earnings growth, bearish company revenue and earnings guidance, and the generally lackluster track record QE has thus far in stimulating the economy, we believe the latter is the more likely scenario.
We have commented previously on the increasing amount of capital deployed in fixed income strategies with higher credit risk, such as high yield and leveraged loans, as well as nontraditional bond funds, which can take considerable credit risk given unconstrained guidelines. These three bond fund categories comprised 31% of domestic open-end bond fund assets under management at the end of 2013 according to Morningstar, the highest level since 2000. Bank loan fund assets increased 92% to $137 billion in 2013, and nontraditional bond fund assets grew 79% to $122 billion. While the mutual fund market represents only a portion of the overall domestic fixed income market, we believe this increased exposure to credit has likely been replicated among institutional investors, insurance companies, and other fixed income investors. On a broader scale, this can be seen by the high yield allocation in the Barclays Capital U.S. Universal Bond Index's which now tops 8% — the highest percentage since 2003-2006.
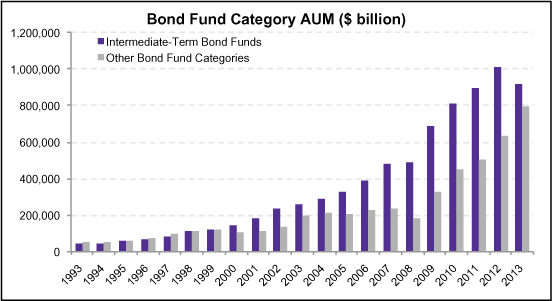
Source: Morningstar
7
FPA NEW INCOME, INC.
LETTER TO SHAREHOLDERS
Continued
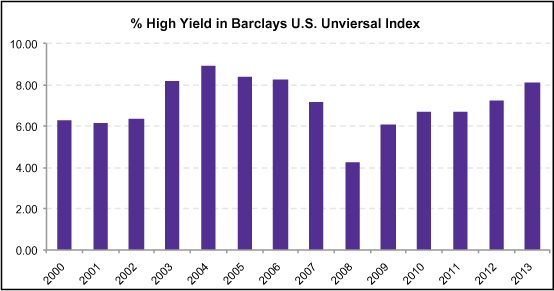
Source: Barclays
The quest for yield has driven investors further out on the risk spectrum and is likely responsible for the notable decrease in yields of below investment grade debt to an all-time low of 5.5%14. Perhaps investors believe increased demand for risk assets will help to support asset prices regardless of the state of the economy or that the shorter duration of high yield bonds and leveraged loans will afford some degree of insulation from interest rate risk
Given fairly weak real GDP growth, high yield spreads of 387 bps (as represented by Barclays U.S. High-Yield Bond Index), which are almost 200 bps inside long-term averages, seem incongruous with the current economic landscape. We are also concerned with anomalies in the term structure of credit spreads, the relationship between spread-to-worst for short, medium, and long duration high yield indices. The term structure of high yield spread-to-worst is normally inverted, and spread for short duration bonds is normally higher than for long duration bonds. Lately this term structure of spreads has been flat, similar to the August 2005-June 2007 period. In that period, the housing bubble was still building. The flat term structure of spreads raises our concerns over the potential for future financial instability, especially when we take into account that the Fed's monetary policy is even more accommodative now than it was in 2005.
14 BofA Merrill Lynch US High Yield Master II Effective Yield was 5.63 as of 3/31/14. https://research.stlouisfed.org/fred2/series/BAMLH0A0HYM2EY
8
FPA NEW INCOME, INC.
LETTER TO SHAREHOLDERS
Continued
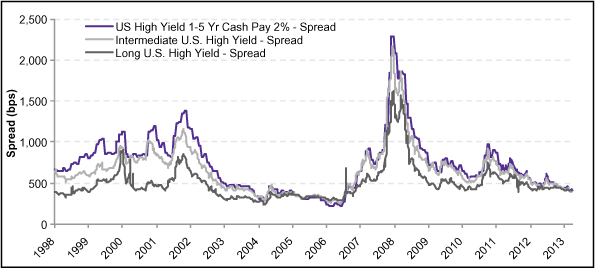
Source: Barclays
It is our nature as value investors to plan for the worst, but hope for a better outcome. As such, we have deployed capital into credit quite carefully by keeping our duration short, mitigating extension risk, and remaining relatively high in the capital structure of companies we invest in. While we hope that tight credit spreads do portend a return to more robust economic growth, we have planned for an eventual widening of spreads to something more commensurate with a lackluster economic environment and normalization of overly easy monetary policy.
9
FPA NEW INCOME, INC.
LETTER TO SHAREHOLDERS
Continued
Crowding in short duration bonds
Given the market environment of the past several years, we have maintained a short duration for the portfolio. Unfortunately for us, we are not the only bond investors pursuing this strategy. Having seen last year's sudden increase in interest rates and the losses that such interest rate increases can create for longer duration portfolios, a number of other investment managers have similarly begun buying short duration bonds. Increased demand for short-duration bonds has led to lower risk-adjusted yields for these bonds and has made it more difficult for us to find attractive investment opportunities. This phenomenon can be seen in 15-year amortization agency mortgage pools. We had previously found these mortgages attractive because the 15-year amortization limits the potential duration extension in a rising interest rate environment, a characteristic which has recently led other investors to find these mortgages attractive as well. The increased demand for these mortgages has pushed up pricing resulting in greater risk of negative total returns in an increasing interest rate environment. As an example, the chart below shows the yield and duration for the generic 3.5% coupon, 15-year agency mortgage pool. As shown in the chart, coincident with the May 2013 increase in Treasury yields, the yield on these 15-year mortgages increased. However, the increase in yield is a misleading indicator of the attractiveness of these bonds because the increase in Treasury rates caused an increase in the mortgages' duration too:
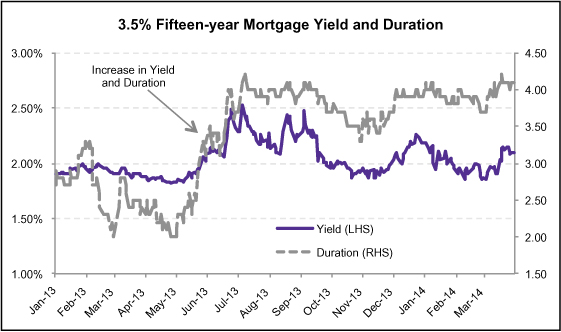
Source: Bloomberg
10
FPA NEW INCOME, INC.
LETTER TO SHAREHOLDERS
Continued
Due to the increase in duration, despite the higher yield, the riskiness of the mortgages actually increased. The chart below highlights this point by plotting the ratio of the yield to the duration, i.e. how much yield investors receive per unit of duration. Since May 2013, 15-year mortgages have become more expensive as reflected by the fact that investors are now receiving less yield per unit of duration.
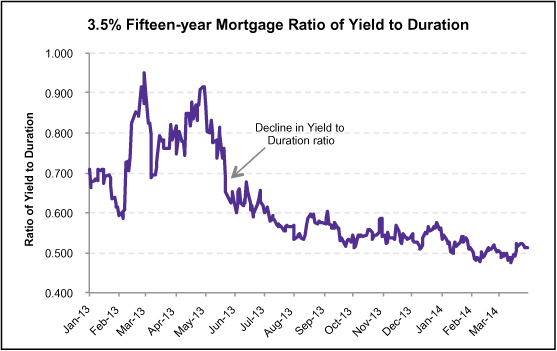
Source: Bloomberg
Agency mortgages are emblematic of the recent trend in short-duration bonds which have become more expensive thus making an already difficult investing environment even more challenging for us.
Conclusion
There are two consequences of expensive bonds. The first consequence is that we have to look to new sectors within the fixed income universe to find investment opportunities. Historically, we had deployed a significant amount of our capital in agency mortgages because they were the most attractive securities that met our absolute return criteria. As demonstrated above, these days it is difficult to find agency mortgages that meet our investment criteria. In the absence of attractive absolute value in agency mortgages, we have been able to find attractive absolute value in asset-backed securities, which resulted in a significant increase in the portfolio's exposure to asset-backed securities from June 30, 2013 through March 31, 2014.
The second consequence of expensive bonds is that the portfolio carries a higher cash balance. Typically, the portfolio's cash balance is the inverse of attractive investment ideas. Thus, low cash balances mean that there is significant investment opportunity and high cash balances reflect limited investment opportunity. We have not
11
FPA NEW INCOME, INC.
LETTER TO SHAREHOLDERS
Continued
been able to find enough attractive asset-backed or other fixed income investments to offset the decrease in our agency mortgage investments, which is reflected in the portfolio's higher cash balance.
Having said that, with yields at such a low absolute level, the opportunity cost of holding cash is very small. In other words, by holding cash instead of investing that cash, the income that we are sacrificing is de minimis. With such a low opportunity cost, we would rather hold cash and wait until the market presents us with opportunities to invest your capital at attractive absolute returns versus making sub-optimum relative investments.
With the prospect of higher rates coming into clearer view, now is not the time to bend our investment discipline. We have been employing a portfolio construction tactic of owning bonds that amortize their principal monthly, mature within two to three years or are callable over the next two years. This allows the portfolio to continuously reinvest the capital at progressively higher interest rates as shorter-term interest rates rise while protecting the principal from a negative absolute return. As we saw last year, the opportunity set can change quickly. For example, when the May 2013 increase in interest rates occurred, we pounced on the opportunity to buy corporate bonds at attractive prices. In anticipation of similar opportunities in the future, we will remain disciplined in investing your money so that we can preserve capital to take advantage of that opportunity the moment it arrives.
Thank you for your continued support.
Respectfully submitted,

Thomas H. Atteberry
Chief Executive Officer and Portfolio Manager
April 22, 2014
The discussion of Fund investments represents the views of the Fund's managers at the time of this report and are subject to change without notice. Portfolio composition will change due to ongoing management of the Fund. References to individual securities are for informational purposes only and should not be construed as recommendations by the Fund, Adviser or Distributor.
The Barclays U.S. Aggregate Bond Index is a broad base index and a market capitalization-weighted index and is often used to represent investment grade bonds being traded in the United States. CPI+100 is a measure of the consumer price index (CPI) plus an additional 100 basis points. The CPI, or a measure that examines the weighted average of prices of a basket of consumer goods and services, such as transportation, food and medical care. The CPI is calculated by taking price changes for each item in the predetermined basket of goods and averaging them; the goods are weighted according to their importance.
12
FPA NEW INCOME, INC.
LETTER TO SHAREHOLDERS
Continued
FUND RISKS
Investments in mutual funds carry risks and investors may lose principal value. Capital markets are volatile and can decline significantly in response to adverse issuer, political, regulatory, market, or economic developments. The Fund can purchase foreign securities, which are subject to interest rate, currency exchange rate, economic and political risks. The securities of smaller, less well-known companies can be more volatile than those of larger companies.
The return of principal in a bond fund is not guaranteed. Bond funds have the same issuer, interest rate, inflation and credit risks that are associated with underlying bonds owned by the fund. Lower rated bonds, convertible securities and other types of debt obligations involve greater risks than higher rated bonds. Mortgage securities and collateralized mortgage obligations (CMOs) are subject to prepayment risk and the risk of default on the underlying mortgages or other assets; derivatives may increase volatility. High yield securities can be volatile and subject to much higher instances of default.
FORWARD LOOKING STATEMENT DISCLOSURE
As mutual fund managers, one of our responsibilities is to communicate with shareholders in an open and direct manner. Insofar as some of our opinions and comments in our letters to shareholders are based on current management expectations, they are considered "forward-looking statements" which may or may not be accurate over the long term. While we believe we have a reasonable basis for our comments and we have confidence in our opinions, actual results may differ materially from those we anticipate. You can identify forward-looking statements by words such as "believe," "expect," "may," "anticipate," and other similar expressions when discussing prospects for particular portfolio holdings and/or the markets, generally. We cannot, however, assure future results and disclaim any obligation to update or alter any forward-looking statements, whether as a result of new information, future events, or otherwise. Further, information provided in this report should not be construed as a recommendation to purchase or sell any particular security.
13
FPA NEW INCOME, INC.
PORTFOLIO SUMMARY
March 31, 2014 (Unaudited)
Bonds & Debentures | | | | | 96.9 | % | |
Commercial Mortgage-Backed | |
Agency Stripped | | | 7.3 | % | | | | | |
Non-Agency | | | 5.9 | % | | | | | |
Agency | | | 2.1 | % | | | | | |
Residential Mortgage-Backed | |
Agency Pool Fixed Rate | | | 4.6 | % | | | | | |
Agency Collateralized Mortgage
Obligation | | | 17.4 | % | | | | | |
Non-Agency Collateralized
Mortgage Obligation | | | 8.8 | % | | | | | |
Agency Stripped | | | 2.2 | % | | | | | |
Agency Pool Adjustable Rate | | | 0.0 | % | | | | | |
Asset-Backed | |
Auto | | | 15.4 | % | | | | | |
Other | | | 10.0 | % | | | | | |
U.S. Treasuries | | | 14.4 | % | | | | | |
Corporate | | | 7.0 | % | | | | | |
Corporate Bank Debt | | | 1.8 | % | | | | | |
Short-Term Investments | | | | | 2.9 | % | |
Other Assets and Liabilities, net | | | | | 0.2 | % | |
Net Assets | | | | | 100.0 | % | |
MAJOR PORTFOLIO CHANGES
For the Six Months Ended March 31, 2014
(Unaudited)
| | | Principal
Amount | |
NET PURCHASES | |
U.S Treasury Note — 2.375% 08/31/14 (1) | | $ | 193,000,000 | | |
U.S Treasury Note — 2.625% 06/30/14 (1) | | $ | 193,000,000 | | |
U.S Treasury Note — 2.625% 07/31/14 (1) | | $ | 168,000,000 | | |
U.S Treasury Note — 1% 05/15/14 | | $ | 110,000,000 | | |
CARDS II TR 2012-4A CL A — 0.605% 9/15/2017 (1) | | $ | 75,000,000 | | |
GE Capital Credit Card Master Note Trust 2010-1 A — 3.69% 3/15/2018 (1) | | $ | 63,545,000 | | |
Federal National Mortgage Association 2013-112 CL WA — 3.5% 02/25/43 (1) | | $ | 52,946,954 | | |
NET SALES | |
U.S Treasury Note — 0.25% 01/31/14 (2) | | $ | 50,000,000 | | |
U.S Treasury Note — 1% 01/15/14 (2) | | $ | 50,000,000 | | |
U.S Treasury Note — 1.75% 03/31/14 (2) | | $ | 50,000,000 | | |
U.S Treasury Note — 1.25% 03/15/14 (2) | | $ | 70,000,000 | | |
U.S Treasury Note — 0.25% 04/30/14 (2) | | $ | 75,000,000 | | |
U.S Treasury Note — 0.75% 12/15/13 (2) | | $ | 75,000,000 | | |
U.S Treasury Note — 1.875% 02/28/14 (2) | | $ | 75,000,000 | | |
U.S Treasury Note — 0.25% 03/31/14 (2) | | $ | 150,000,000 | | |
(1) Indicates new commitment to portfolio
(2) Indicates elimination from portfolio
14
FPA NEW INCOME, INC.
PORTFOLIO OF INVESTMENTS
March 31, 2014 (Unaudited)
BONDS & DEBENTURES | | Coupon
Rate (%) | | Maturity
Date | | Principal
Amount | | Fair
Value | |
COMMERCIAL MORTGAGE-BACKED
SECURITIES AGENCY STRIPPED — 7.3% | | | |
Government National Mortgage Association | |
2004-10 | | | 0.0351 | | | 1/16/2044 | | $ | 26,531,811 | | | $ | 6,368 | | |
2002-56 | | | 0.0425 | | | 6/16/2042 | | | 218,179 | | | | 345 | | |
2009-119 | | | 0.1896 | | | 12/16/2049 | | | 100,596,653 | | | | 2,599,417 | | |
2010-63 | | | 0.1970 | | | 5/16/2050 | | | 44,355,253 | | | | 1,063,639 | | |
2010-18 | | | 0.2221 | | | 1/16/2050 | | | 56,830,840 | | | | 1,429,296 | | |
2011-10 | | | 0.2739 | | | 12/16/2045 | | | 79,253,420 | | | | 2,381,565 | | |
2008-8 | | | 0.3068 | | | 11/16/2047 | | | 38,591,516 | | | | 911,532 | | |
2008-24 | | | 0.3140 | | | 11/16/2047 | | | 14,427,216 | | | | 341,781 | | |
2008-45 | | | 0.3405 | | | 2/16/2048 | | | 24,093,091 | | | | 558,237 | | |
2007-77 | | | 0.3921 | | | 11/16/2047 | | | 52,224,122 | | | | 1,736,974 | | |
2005-9 | | | 0.4247 | | | 1/16/2045 | | | 6,536,968 | | | | 142,179 | | |
2006-55 | | | 0.4815 | | | 8/16/2046 | | | 28,801,649 | | | | 918,773 | | |
2009-105 | | | 0.4979 | | | 11/16/2049 | | | 35,946,106 | | | | 1,386,801 | | |
2008-48 | | | 0.5186 | | | 4/16/2048 | | | 15,560,652 | | | | 597,840 | | |
2013-72 | | | 0.5266 | | | 11/16/2047 | | | 541,056,061 | | | | 32,783,777 | | |
2004-43 | | | 0.5330 | | | 6/16/2044 | | | 41,741,264 | | | | 1,038,523 | | |
2010-49 | | | 0.5569 | | | 2/16/2050 | | | 79,993,788 | | | | 2,308,621 | | |
2009-71 | | | 0.5652 | | | 7/16/2049 | | | 66,842,826 | | | | 2,073,464 | | |
2004-108 | | | 0.5812 | | | 12/16/2044 | | | 17,991,020 | | | | 448,696 | | |
2009-86 | | | 0.5816 | | | 9/16/2049 | | | 70,569,053 | | | | 2,086,727 | | |
2006-30 | | | 0.5924 | | | 5/16/2046 | | | 6,159,148 | | | | 365,484 | | |
2011-6 | | | 0.6269 | | | 10/16/2052 | | | 198,303,957 | | | | 6,748,284 | | |
2009-49 | | | 0.6375 | | | 6/16/2049 | | | 52,797,954 | | | | 1,933,461 | | |
2013-35 | | | 0.6550 | | | 1/16/2053 | | | 362,176,904 | | | | 22,867,017 | | |
2009-60 | | | 0.6647 | | | 7/16/2049 | | | 64,026,129 | | | | 2,057,159 | | |
2008-92 | | | 0.6691 | | | 10/16/2048 | | | 42,219,476 | | | | 1,883,411 | | |
| 2010-161 IA | | | 0.6744 | | | 12/16/2050 | | | 239,356,343 | | | | 8,310,452 | | |
| 2011-64 IX | | | 0.7034 | | | 10/16/2044 | | | 67,754,667 | | | | 3,574,059 | | |
2010-28 | | | 0.7280 | | | 3/16/2050 | | | 83,309,133 | | | | 2,836,676 | | |
2013-7 | | | 0.7416 | | | 5/16/2053 | | | 131,194,676 | | | | 9,367,523 | | |
2008-78 | | | 0.7481 | | | 7/16/2048 | | | 11,842,315 | | | | 614,735 | | |
2011-16 | | | 0.7711 | | | 9/16/2046 | | | 103,458,101 | | | | 4,779,764 | | |
2009-4 | | | 0.7744 | | | 1/16/2049 | | | 34,679,286 | | | | 1,517,912 | | |
2010-123 | | | 0.8072 | | | 9/16/2050 | | | 61,261,015 | | | | 2,861,502 | | |
2013-29 | | | 0.8295 | | | 5/16/2053 | | | 127,436,257 | | | | 8,984,995 | | |
2013-1 | | | 0.9110 | | | 2/16/2054 | | | 139,757,244 | | | | 11,602,059 | | |
| 2010-148 IX | | | 0.9137 | | | 10/16/2052 | | | 64,932,344 | | | | 3,155,063 | | |
2013-80 | | | 0.9200 | | | 3/16/2052 | | | 64,818,605 | | | | 5,408,341 | | |
15
FPA NEW INCOME, INC.
PORTFOLIO OF INVESTMENTS (Continued)
March 31, 2014 (Unaudited)
BONDS & DEBENTURES — Continued | | Coupon
Rate (%) | | Maturity
Date | | Principal
Amount | | Fair
Value | |
2009-30 | | | 0.9210 | | | 3/16/2049 | | $ | 14,181,814 | | | $ | 678,316 | | |
2012-131 | | | 0.9293 | | | 2/16/2053 | | | 112,330,910 | | | | 9,136,940 | | |
2013-13 | | | 0.9459 | | | 7/16/2047 | | | 107,369,300 | | | | 7,488,364 | | |
2013-125 | | | 0.9493 | | | 10/16/2054 | | | 26,842,044 | | | | 1,584,424 | | |
2012-150 | | | 0.9557 | | | 11/16/2052 | | | 99,559,667 | | | | 7,791,510 | | |
2013-30 | | | 0.9804 | | | 9/16/2053 | | | 231,691,139 | | | | 17,582,902 | | |
2011-165 | | | 0.9921 | | | 10/16/2051 | | | 232,714,215 | | | | 12,378,069 | | |
2012-9 | | | 0.9945 | | | 11/16/2052 | | | 172,330,744 | | | | 16,955,622 | | |
2011-49 | | | 1.0110 | | | 4/16/2045 | | | 75,096,927 | | | | 3,859,982 | | |
2012-45 | | | 1.0166 | | | 4/16/2053 | | | 34,888,001 | | | | 2,675,132 | | |
2012-58 | | | 1.0292 | | | 1/16/2055 | | | 233,755,521 | | | | 18,415,260 | | |
2012-35 | | | 1.0394 | | | 11/16/2052 | | | 146,550,400 | | | | 10,089,922 | | |
2012-95 | | | 1.0406 | | | 2/16/2053 | | | 145,060,002 | | | | 11,675,502 | | |
2013-61 | | | 1.0466 | | | 5/16/2053 | | | 158,544,807 | | | | 12,268,435 | | |
2012-79 | | | 1.0500 | | | 3/16/2053 | | | 146,291,100 | | | | 11,085,939 | | |
2012-85 | | | 1.0669 | | | 9/16/2052 | | | 122,340,057 | | | | 9,736,874 | | |
2013-45 | | | 1.0754 | | | 12/16/2040 | | | 126,756,319 | | | | 8,417,862 | | |
2012-25 | | | 1.0841 | | | 8/16/2052 | | | 120,133,331 | | | | 8,267,456 | | |
2011-143 | | | 1.0996 | | | 4/16/2053 | | | 95,528,094 | | | | 13,057,735 | | |
2011-120 | | | 1.1237 | | | 12/16/2043 | | | 115,208,758 | | | | 12,816,974 | | |
| 2011-78 IX | | | 1.1927 | | | 8/16/2046 | | | 147,185,394 | | | | 8,791,383 | | |
2011-164 | | | 1.2064 | | | 4/16/2046 | | | 170,659,406 | | | | 11,133,820 | | |
| 2011-92 IX | | | 1.2071 | | | 11/16/2044 | | | 33,113,502 | | | | 2,275,560 | | |
2011-149 | | | 1.2295 | | | 10/16/2046 | | | 114,408,535 | | | | 8,731,659 | | |
2012-4 | | | 1.4742 | | | 5/16/2052 | | | 273,215,235 | | | | 19,100,559 | | |
TOTAL AGENCY STRIPPED | | $ | 399,678,653 | | |
NON-AGENCY — 5.9% | | | |
A10 Securitization 2013-2 A† | | | 2.6000 | | | 11/15/2027 | | $ | 11,610,000 | | | $ | 11,620,903 | | |
Citigroup Commercial Mortgage Trust | |
| 2007-FL3A B† | | | 0.3250 | | | 4/15/2022 | | | 440,933 | | | | 437,292 | | |
| 2007-FL3A C† | | | 0.3650 | | | 4/15/2022 | | | 546,612 | | | | 541,240 | | |
| 2007-FL3A D† | | | 0.4050 | | | 4/15/2022 | | | 361,447 | | | | 357,894 | | |
| 2007-FL3A E† | | | 0.4550 | | | 4/15/2022 | | | 413,082 | | | | 406,983 | | |
Citigroup Mortgage Loan Trust Inc. 2014-A A | | | 4.0000 | | | 1/1/2035 | | | 31,019,106 | | | | 32,024,912 | | |
COMM Mortgage Trust 2013-RIA4 A2† | | | 6.0000 | | | 6/25/2028 | | | 12,099,500 | | | | 11,753,254 | | |
Credit Suisse Mortgage Trust | |
| 2007-TF2A B† | | | 0.5050 | | | 4/15/2022 | | | 401,000 | | | | 388,970 | | |
| 2007-TF2A A3† | | | 0.4250 | | | 4/15/2022 | | | 43,257,311 | | | | 42,564,809 | | |
Del Coronado Trust 2013-HDMZ CL M† | | | 5.1545 | | | 3/15/2018 | | | 9,299,000 | | | | 9,325,541 | | |
16
FPA NEW INCOME, INC.
PORTFOLIO OF INVESTMENTS (Continued)
March 31, 2014 (Unaudited)
BONDS & DEBENTURES — Continued | | Coupon
Rate (%) | | Maturity
Date | | Principal
Amount | | Fair
Value | |
Lehman Brothers Floating Rate
Commercial 2007-LLFA F† | | | 1.1550 | | | 6/15/2022 | | $ | 12,924,000 | | | $ | 12,463,518 | | |
LSTAR Commercial Mortgage
Trust 2011-1 A† | | | 3.9129 | | | 7/25/2017 | | | 1,640,302 | | | | 1,671,583 | | |
Monty Parent Issuer LLC | |
| 2013-LTR1 A† | | | 3.4700 | | | 11/20/2028 | | | 9,382,925 | | | | 9,385,740 | | |
| 2013-LTR1 B† | | | 4.2500 | | | 11/20/2028 | | | 19,647,987 | | | | 19,672,547 | | |
Motel 6 Trust | |
| 2012-MTL6 D† | | | 3.7812 | | | 10/5/2017 | | | 37,033,000 | | | | 37,117,254 | | |
| 2012-MTL6 E† | | | 4.2743 | | | 10/5/2017 | | | 10,061,000 | | | | 9,767,321 | | |
Ores NPL LLC | |
| 2014-LV3 CL A† | | | 3.0000 | | | 3/27/2024 | | | 17,822,000 | | | | 17,822,000 | | |
| 2013-LV2 CL A† | | | 3.0810 | | | 9/25/2025 | | | 24,968,347 | | | | 24,984,077 | | |
| 2014-LV3 CL B† | | | 6.0000 | | | 3/27/2024 | | | 47,419,000 | | | | 47,300,452 | | |
RREF 2012 LT1 LLC 2013-LT2 CL A† | | | 2.8331 | | | 5/22/2028 | | | 11,402,556 | | | | 11,402,556 | | |
Starwood Commercial Mortgage Trust
2013-FV1 CL B† | | | 2.1570 | | | 8/11/2028 | | | 18,051,000 | | | | 18,063,275 | | |
TOTAL NON-AGENCY | | $ | 319,072,121 | | |
AGENCY — 2.1% | | | |
Government National Mortgage Association | |
| 2012-22 CL AB | | | 1.6610 | | | 2/1/2026 | | $ | 6,402,229 | | | $ | 6,405,280 | | |
| 2011-49 CL AB | | | 2.8000 | | | 4/16/2034 | | | 25,496,424 | | | | 25,856,434 | | |
| 2009-49 CL B | | | 3.4360 | | | 6/16/2034 | | | 1,133 | | | | 1,133 | | |
| 2011-120 CL A | | | 3.9291 | | | 8/16/2033 | | | 38,167,282 | | | | 39,122,609 | | |
| 2011-143 CL AB | | | 3.9739 | | | 3/16/2033 | | | 41,270,809 | | | | 42,317,849 | | |
TOTAL AGENCY | | $ | 113,703,305 | | |
RESIDENTIAL MORTGAGE-BACKED
SECURITIES AGENCY POOL FIXED
RATE MORTGAGES — 4.6% | | | |
Federal Home Loan Mortgage Corporation | |
J13919 | | | 3.5000 | | | 12/1/2020 | | $ | 20,575,636 | | | $ | 21,593,970 | | |
J11204 | | | 4.5000 | | | 11/1/2019 | | | 5,423,542 | | | | 5,761,266 | | |
P60959 | | | 4.5000 | | | 9/1/2020 | | | 3,116,299 | | | | 3,307,172 | | |
E01322 | | | 5.0000 | | | 3/1/2018 | | | 4,646,431 | | | | 4,948,774 | | |
G13091 | | | 5.0000 | | | 6/1/2018 | | | 2,206,430 | | | | 2,341,486 | | |
E01642 | | | 5.0000 | | | 5/1/2019 | | | 3,525,128 | | | | 3,756,835 | | |
G14987 | | | 5.0000 | | | 1/1/2020 | | | 4,316,960 | | | | 4,617,941 | | |
G13812 | | | 5.0000 | | | 12/1/2020 | | | 7,679,470 | | | | 8,150,759 | | |
G14979 | | | 5.5000 | | | 12/1/2018 | | | 1,780,228 | | | | 1,920,668 | | |
17
FPA NEW INCOME, INC.
PORTFOLIO OF INVESTMENTS (Continued)
March 31, 2014 (Unaudited)
BONDS & DEBENTURES — Continued | | Coupon
Rate (%) | | Maturity
Date | | Principal
Amount | | Fair
Value | |
G14187 | | | 5.5000 | | | 12/1/2020 | | $ | 13,293,372 | | | $ | 14,318,291 | | |
G12139 | | | 6.5000 | | | 9/1/2019 | | | 986,734 | | | | 1,025,473 | | |
A26942 | | | 6.5000 | | | 9/1/2034 | | | 624,103 | | | | 705,012 | | |
G08107 | | | 6.5000 | | | 1/1/2036 | | | 1,990,872 | | | | 2,247,874 | | |
P50543 | | | 6.5000 | | | 4/1/2037 | | | 142,986 | | | | 157,286 | | |
Federal National Mortgage Association | |
AA0905 | | | 4.5000 | | | 1/1/2021 | | | 3,024,437 | | | | 3,211,287 | | |
995756 | | | 5.0000 | | | 12/1/2018 | | | 8,016,437 | | | | 8,564,040 | | |
735453 | | | 5.0000 | | | 12/1/2019 | | | 4,405,993 | | | | 4,712,518 | | |
AE0126 | | | 5.0000 | | | 6/1/2020 | | | 11,118,893 | | | | 11,891,322 | | |
995861 | | | 5.0000 | | | 1/1/2021 | | | 8,815,978 | | | | 9,419,255 | | |
890122 | | | 5.0000 | | | 11/1/2021 | | | 4,152,943 | | | | 4,396,928 | | |
890083 | | | 5.0000 | | | 12/1/2021 | | | 4,476,138 | | | | 4,782,977 | | |
AE0792 | | | 5.0000 | | | 1/1/2026 | | | 8,433,397 | | | | 9,020,361 | | |
AL4056 | | | 5.0000 | | | 6/1/2026 | | | 25,257,433 | | | | 27,068,598 | | |
257100 | | | 5.5000 | | | 1/1/2018 | | | 772,410 | | | | 824,123 | | |
745500 | | | 5.5000 | | | 12/1/2018 | | | 5,784,023 | | | | 6,167,619 | | |
995327 | | | 5.5000 | | | 12/1/2019 | | | 2,078,046 | | | | 2,238,804 | | |
735521 | | | 5.5000 | | | 3/1/2020 | | | 3,734,546 | | | | 4,019,454 | | |
995284 | | | 5.5000 | | | 3/1/2020 | | | 7,033,248 | | | | 7,499,693 | | |
889318 | | | 5.5000 | | | 7/1/2020 | | | 7,522,027 | | | | 8,058,498 | | |
889069 | | | 5.5000 | | | 1/1/2021 | | | 6,970,804 | | | | 7,494,590 | | |
AE0237 | | | 5.5000 | | | 11/1/2023 | | | 8,143,034 | | | | 8,750,830 | | |
AL4901 | | | 5.5000 | | | 9/1/2025 | | | 11,491,785 | | | | 12,317,667 | | |
745832 | | | 6.0000 | | | 4/1/2021 | | | 14,380,038 | | | | 15,466,019 | | |
AD0951 | | | 6.0000 | | | 4/1/2021 | | | 7,794,575 | | | | 8,389,613 | | |
890225 | | | 6.0000 | | | 5/1/2023 | | | 7,364,415 | | | | 7,921,754 | | |
323282 | | | 7.5000 | | | 7/1/2028 | | | 348,466 | | | | 401,558 | | |
Government National Mortgage Association | |
782281 | | | 6.0000 | | | 3/15/2023 | | | 3,718,814 | | | | 4,089,084 | | |
TOTAL AGENCY POOL FIXED RATE
MORTGAGES | | $ | 251,559,399 | | |
AGENCY COLLATERALIZED MORTGAGE
OBLIGATION — 17.4% | | | |
Federal Home Loan Bank | |
00-0986 | | | 5.7390 | | | 7/20/2014 | | $ | 9,959,785 | | | $ | 10,101,015 | | |
Federal Home Loan Mortgage Corporation | |
| 4151 CL YU | | | 2.0000 | | | 1/15/2043 | | | 23,310,719 | | | | 18,754,590 | | |
| 4125 CL NA | | | 2.5000 | | | 4/15/2042 | | | 26,396,148 | | | | 23,055,800 | | |
| 4141 CL CK | | | 2.5000 | | | 12/15/2042 | | | 3,673,963 | | | | 3,113,172 | | |
18
FPA NEW INCOME, INC.
PORTFOLIO OF INVESTMENTS (Continued)
March 31, 2014 (Unaudited)
BONDS & DEBENTURES — Continued | | Coupon
Rate (%) | | Maturity
Date | | Principal
Amount | | Fair
Value | |
| 4144 CL BY | | | 2.5000 | | | 12/15/2042 | | $ | 23,217,334 | | | $ | 20,233,110 | | |
| 4153 CL KP | | | 2.5000 | | | 1/15/2043 | | | 21,577,497 | | | | 19,017,502 | | |
| 3829 CL CD | | | 3.0000 | | | 8/15/2024 | | | 2,522,904 | | | | 2,584,917 | | |
| 3806 CL AB | | | 4.0000 | | | 2/15/2023 | | | 2,573,260 | | | | 2,594,489 | | |
| 2869 CL JA | | | 4.0000 | | | 4/15/2034 | | | 11,738 | | | | 11,735 | | |
| 3992 CL H | | | 4.0000 | | | 6/15/2036 | | | 186,452 | | | | 191,044 | | |
| 3877 CL EL | | | 4.0000 | | | 8/15/2038 | | | 2,393,052 | | | | 2,409,940 | | |
| 4088 CL LE | | | 4.0000 | | | 10/15/2040 | | | 14,666,157 | | | | 15,115,230 | | |
| 2877 CL WA | | | 4.2500 | | | 10/15/2034 | | | 1,618,302 | | | | 1,633,206 | | |
| 3578 CL AM | | | 4.5000 | | | 9/15/2016 | | | 2,419,728 | | | | 2,500,087 | | |
| 2914 CL JQ | | | 4.5000 | | | 5/15/2019 | | | 298,251 | | | | 298,707 | | |
| 2900 CL PC | | | 4.5000 | | | 12/15/2019 | | | 6,956,626 | | | | 7,389,270 | | |
| 3439 CL AC | | | 4.5000 | | | 4/15/2022 | | | 1,466,758 | | | | 1,476,292 | | |
| 3939 CL D | | | 4.5000 | | | 9/15/2041 | | | 3,079,531 | | | | 3,263,804 | | |
| 2509 CL CB | | | 5.0000 | | | 10/15/2017 | | | 2,579,676 | | | | 2,704,094 | | |
| 2747 CL DX | | | 5.0000 | | | 2/15/2019 | | | 5,056,056 | | | | 5,430,406 | | |
| 3852 CL HA | | | 5.0000 | | | 12/15/2021 | | | 9,034,585 | | | | 9,694,561 | | |
| 2494 CL CF | | | 5.5000 | | | 9/15/2017 | | | 2,727,860 | | | | 2,900,779 | | |
| 2503 CL B | | | 5.5000 | | | 9/15/2017 | | | 2,670,995 | | | | 2,818,274 | | |
| 3808 CL BQ | | | 5.5000 | | | 8/15/2025 | | | 9,623,634 | | | | 10,248,208 | | |
| 3806 CL JB | | | 5.5000 | | | 2/15/2026 | | | 4,668,898 | | | | 5,112,490 | | |
| 3855 CL HQ | | | 5.5000 | | | 2/15/2026 | | | 4,982,308 | | | | 5,345,767 | | |
| 3926 CL GP | | | 6.0000 | | | 8/15/2025 | | | 5,424,990 | | | | 5,710,453 | | |
| 3614 CL DY | | | 6.0000 | | | 1/15/2032 | | | 10,070,913 | | | | 11,193,417 | | |
Federal National Mortgage Association | |
| 2013-64 CL TZ | | | 1.5000 | | | 3/25/2042 | | | 1,881,025 | | | | 1,868,874 | | |
| 2013-6 CL TA | | | 1.5000 | | | 1/25/2043 | | | 46,851,435 | | | | 45,207,334 | | |
| 2013-30 CL CA | | | 1.5000 | | | 4/25/2043 | | | 28,827,253 | | | | 27,612,118 | | |
| 2013-30 CL JA | | | 1.5000 | | | 4/25/2043 | | | 19,623,524 | | | | 18,707,777 | | |
| 2013-66 CL JA | | | 2.2500 | | | 7/25/2043 | | | 78,259,773 | | | | 78,079,932 | | |
| 2011-125 GE | | | 2.5000 | | | 12/25/2041 | | | 56,095,390 | | | | 55,131,234 | | |
| 2011-110 BH | | | 3.0000 | | | 10/25/2041 | | | 3,281,635 | | | | 3,269,164 | | |
| 2012-73 CL JB | | | 3.5000 | | | 1/25/2042 | | | 39,707,245 | | | | 41,496,430 | | |
| 2012-8 CL LE | | | 3.5000 | | | 2/25/2042 | | | 37,427,241 | | | | 39,111,253 | | |
| 2012-26 CL ME | | | 3.5000 | | | 3/25/2042 | | | 50,627,053 | | | | 52,902,010 | | |
| 2012-41 CL LB | | | 3.5000 | | | 4/25/2042 | | | 48,565,151 | | | | 50,788,454 | | |
| 2012-48 CL MB | | | 3.5000 | | | 5/25/2042 | | | 48,220,975 | | | | 50,382,905 | | |
| 2012-117 CL AD | | | 3.5000 | | | 10/25/2042 | | | 67,816,414 | | | | 69,979,276 | | |
| 2013-112 CL WA | | | 3.5000 | | | 2/25/2043 | | | 52,946,954 | | | | 54,597,131 | | |
| 2011-67 CL EA | | | 4.0000 | | | 7/25/2021 | | | 19,166,263 | | | | 20,306,656 | | |
| 2012-95 CL AB | | | 4.0000 | | | 11/25/2040 | | | 8,179,540 | | | | 8,359,523 | | |
19
FPA NEW INCOME, INC.
PORTFOLIO OF INVESTMENTS (Continued)
March 31, 2014 (Unaudited)
BONDS & DEBENTURES — Continued | | Coupon
Rate (%) | | Maturity
Date | | Principal
Amount | | Fair
Value | |
| 2012-78 CL PA | | | 4.0000 | | | 8/25/2041 | | $ | 12,895,513 | | | $ | 13,615,727 | | |
| 2012-97 CL MA | | | 4.0000 | | | 10/25/2041 | | | 11,420,499 | | | | 11,786,797 | | |
| 2012-81 CL Q | | | 4.0000 | | | 8/25/2042 | | | 9,095,406 | | | | 9,500,659 | | |
| 2014-1 CL DA | | | 4.0000 | | | 6/25/2043 | | | 15,078,945 | | | | 15,722,345 | | |
| 2009-70 CL NU | | | 4.2500 | | | 8/25/2019 | | | 6,598,931 | | | | 6,942,273 | | |
| 2004-90 -CL GA | | | 4.3500 | | | 3/25/2034 | | | 1,935,379 | | | | 1,970,429 | | |
| 2012-67 CL PB | | | 4.5000 | | | 6/1/2027 | | | 10,719,139 | | | | 11,175,881 | | |
| 2012-40 CL GC | | | 4.5000 | | | 12/25/2040 | | | 7,236,889 | | | | 7,450,939 | | |
| 2011-148 CL PB | | | 4.5000 | | | 12/25/2041 | | | 8,535,796 | | | | 9,114,063 | | |
| 2003-24 -CL PD | | | 5.0000 | | | 4/25/2018 | | | 3,098,413 | | | | 3,285,743 | | |
| 2008-77 CL DA | | | 5.0000 | | | 4/25/2023 | | | 2,913,205 | | | | 3,034,074 | | |
| 2010-39 CL PL | | | 5.0000 | | | 10/25/2032 | | | 2,767,403 | | | | 2,826,072 | | |
| 2004-60 CL LB | | | 5.0000 | | | 4/25/2034 | | | 8,830,604 | | | | 9,600,809 | | |
| 2014-2 CL MC | | | 5.0000 | | | 3/25/2042 | | | 9,070,416 | | | | 9,574,658 | | |
| 2003-W17 CL 1A5 | | | 5.3500 | | | 8/25/2033 | | | 2,470,613 | | | | 2,491,786 | | |
| 2011-19 CL WB | | | 5.5000 | | | 10/25/2018 | | | 7,237,638 | | | | 7,791,752 | | |
| 2009-116 CL PA | | | 5.5000 | | | 4/25/2024 | | | 4,293,188 | | | | 4,469,681 | | |
| 2002-9 CL PC | | | 6.0000 | | | 3/25/2017 | | | 2,647,114 | | | | 2,803,585 | | |
TOTAL AGENCY COLLATERALIZED
MORTGAGE OBLIGATION | | $ | 945,859,703 | | |
NON-AGENCY COLLATERALIZED
MORTGAGE OBLIGATION — 8.8% | | | |
Bayview Opportunity Master Fund Trust | |
| 2013-2RPL CL A† | | | 3.4721 | | | 3/28/2016 | | $ | 5,489,022 | | | $ | 5,447,672 | | |
| 2013-13NP CL A† | | | 3.7210 | | | 6/28/2033 | | | 11,108,208 | | | | 11,021,582 | | |
| 2012-4NR2 CL A† | | | 3.9496 | | | 1/28/2034 | | | 9,015,753 | | | | 9,023,884 | | |
| 2013-14NP CL A† | | | 4.2130 | | | 8/28/2033 | | | 27,432,853 | | | | 27,628,200 | | |
| 2013-4RPL CL A† | | | 4.4583 | | | 7/28/2018 | | | 14,753,935 | | | | 14,946,555 | | |
Citicorp Mortgage Securities Inc.
2005-5 CL 2A3 | | | 5.0000 | | | 8/25/2020 | | | 168,787 | | | | 170,237 | | |
Credit Suisse Mortgage Trust
2013-6 1A1† | | | 2.5000 | | | 8/25/2043 | | | 92,473,135 | | | | 88,432,318 | | |
JP Morgan Mortgage Trust
2013-1 CL 2A2† | | | 2.5000 | | | 3/1/2043 | | | 37,837,917 | | | | 36,999,762 | | |
Normandy Mortgage Loan Trust
2013-NPL3 A† | | | 4.9486 | | | 9/16/2043 | | | 35,732,578 | | | | 35,553,915 | | |
Riverview HECM Trust 2007-1 CL A† | | | 0.6200 | | | 5/25/2047 | | | 35,643,141 | | | | 31,949,799 | | |
Sequoia Mortgage Trust | |
| 2013-2 A1 | | | 1.8740 | | | 2/17/2043 | | | 43,618,780 | | | | 38,263,999 | | |
| 2012-1 1A1 | | | 2.8650 | | | 1/25/2042 | | | 7,674,869 | | | | 7,573,054 | | |
20
FPA NEW INCOME, INC.
PORTFOLIO OF INVESTMENTS (Continued)
March 31, 2014 (Unaudited)
BONDS & DEBENTURES — Continued | | Coupon
Rate (%) | | Maturity
Date | | Principal
Amount | | Fair
Value | |
Stanwich Mortgage Loan Trust Series | |
| 2009-2 A†,* | | | 2.1892 | | | 2/15/2049 | | $ | 552,652 | | | $ | 247,146 | | |
| 2010-1 A†,* | | | 1.2897 | | | 9/15/2047 | | | 839,928 | | | | 424,836 | | |
| 2010-2 A†,* | | | 7.5851 | | | 2/28/2057 | | | 3,981,252 | | | | 2,007,347 | | |
| 2010-3 A†,* | | | 1.3103 | | | 7/31/2038 | | | 2,667,316 | | | | 1,334,458 | | |
| 2010-4 A†,* | | | 1.0254 | | | 8/31/2049 | | | 3,059,310 | | | | 1,544,952 | | |
| 2011-1 A†,* | | | 3.8944 | | | 6/30/2039 | | | 5,309,279 | | | | 2,800,268 | | |
| 2011-2 A†,* | | | 2.8890 | | | 9/15/2050 | | | 3,470,445 | | | | 1,857,396 | | |
| 2012-NPL4 CL A† | | | 2.9814 | | | 10/15/2042 | | | 7,145,095 | | | | 7,162,160 | | |
| 2012-NPL5 CL A† | | | 2.9814 | | | 10/16/2042 | | | 10,153,366 | | | | 10,162,890 | | |
| 2013-NPL1 CL A† | | | 2.9814 | | | 2/16/2043 | | | 30,465,639 | | | | 30,744,259 | | |
| 2013-NPL2 CL A† | | | 3.2282 | | | 4/16/2059 | | | 38,559,120 | | | | 38,559,081 | | |
US Residential Opportunity Fund Trust
2014-4A† | | | 3.4656 | | | 3/25/2034 | | | 11,870,000 | | | | 11,910,714 | | |
Vericrest Opportunity Loan Transferee | |
| 2013-3A A† | | | 3.2216 | | | 5/27/2053 | | | 14,638,720 | | | | 14,520,641 | | |
| 2014-NPL1 A1† | | | 3.6250 | | | 10/27/2053 | | | 10,667,159 | | | | 10,691,517 | | |
| 2014-NPL2 A1† | | | 3.6250 | | | 11/25/2053 | | | 13,273,359 | | | | 13,303,699 | | |
| 2014-NPL3 A1† | | | 3.2500 | | | 11/25/2053 | | | 17,375,000 | | | | 17,396,696 | | |
Wells Fargo Mortgage-Backed Securities Trust
2006-5 2A1 | | | 5.2500 | | | 4/25/2021 | | | 6,392,118 | | | | 6,689,352 | | |
TOTAL NON-AGENCY COLLATERALIZED
MORTGAGE OBLIGATION | | $ | 478,368,389 | | |
AGENCY STRIPPED — 2.2% | | | |
PRINCIPAL ONLY SECURITIES | | | |
Federal Home Loan Mortgage
Corporation 217 | | | 6.5000 | | | 1/1/2032 | | $ | 493,458 | | | $ | 454,521 | | |
INTEREST ONLY SECURITIES — | | | |
Federal Home Loan Mortgage Corporation | |
| 3714 TI | | | 2.2500 | | | 8/15/2015 | | | 41,938,930 | | | | 1,054,663 | | |
| 3935 LI | | | 3.0000 | | | 10/15/2021 | | | 6,843,766 | | | | 573,403 | | |
| 3948 AI | | | 3.0000 | | | 10/15/2021 | | | 8,544,932 | | | | 725,465 | | |
| 3956 KI | | | 3.0000 | | | 11/15/2021 | | | 18,905,879 | | | | 1,671,062 | | |
| 3968 AI | | | 3.0000 | | | 12/15/2021 | | | 7,123,437 | | | | 626,784 | | |
| 3992 OI | | | 3.0000 | | | 1/15/2022 | | | 5,567,678 | | | | 470,909 | | |
| 3994 EI | | | 3.0000 | | | 2/15/2022 | | | 12,617,388 | | | | 1,134,856 | | |
| 3998 KI | | | 3.0000 | | | 11/15/2026 | | | 21,476,946 | | | | 2,577,092 | | |
| 3994 AI | | | 3.0000 | | | 2/1/2027 | | | 13,118,538 | | | | 1,176,536 | | |
| 4100 EI | | | 3.0000 | | | 8/15/2027 | | | 99,015,932 | | | | 11,926,429 | | |
| 3706 AI | | | 3.5000 | | | 7/15/2020 | | | 9,888,940 | | | | 601,006 | | |
21
FPA NEW INCOME, INC.
PORTFOLIO OF INVESTMENTS (Continued)
March 31, 2014 (Unaudited)
BONDS & DEBENTURES — Continued | | Coupon
Rate (%) | | Maturity
Date | | Principal
Amount | | Fair
Value | |
| 3722 AI | | | 3.5000 | | | 9/15/2020 | | $ | 12,244,262 | | | $ | 1,046,042 | | |
| 3735 AI | | | 3.5000 | | | 10/15/2020 | | | 5,919,214 | | | | 527,952 | | |
| 3874 DI | | | 3.5000 | | | 10/15/2020 | | | 10,364,410 | | | | 692,271 | | |
| 3893 DI | | | 3.5000 | | | 10/15/2020 | | | 7,526,618 | | | | 509,436 | | |
| 3753 CI | | | 3.5000 | | | 11/15/2020 | | | 2,715,075 | | | | 247,640 | | |
| 3755 AI | | | 3.5000 | | | 11/15/2020 | | | 11,175,888 | | | | 997,326 | | |
| 3760 KI | | | 3.5000 | | | 11/15/2020 | | | 8,883,687 | | | | 730,251 | | |
| 3784 BI | | | 3.5000 | | | 1/15/2021 | | | 7,501,778 | | | | 702,565 | | |
| 3874 BI | | | 3.5000 | | | 6/15/2021 | | | 6,220,078 | | | | 597,937 | | |
| 3893 BI | | | 3.5000 | | | 7/15/2021 | | | 5,236,220 | | | | 485,599 | | |
| 3909 KI | | | 3.5000 | | | 7/15/2021 | | | 4,522,812 | | | | 421,100 | | |
| 3938 IO | | | 3.5000 | | | 10/15/2021 | | | 31,377,815 | | | | 3,072,945 | | |
| 3714 TI | | | 3.5000 | | | 4/25/2024 | | | 11,211,140 | | | | 839,192 | | |
| 3778 GI | | | 3.5000 | | | 6/15/2024 | | | 5,882,968 | | | | 503,788 | | |
| 3854 GI | | | 3.5000 | | | 11/15/2024 | | | 4,363,031 | | | | 280,110 | | |
| 3852 YI | | | 3.5000 | | | 3/15/2025 | | | 14,497,517 | | | | 1,199,822 | | |
| 3763 NI | | | 3.5000 | | | 5/15/2025 | | | 4,843,069 | | | | 487,091 | | |
| 3904 QI | | | 3.5000 | | | 5/15/2025 | | | 5,268,629 | | | | 483,386 | | |
| 3909 UI | | | 3.5000 | | | 8/15/2025 | | | 8,299,407 | | | | 716,670 | | |
| 3904 NI | | | 3.5000 | | | 8/15/2026 | | | 10,977,588 | | | | 1,433,762 | | |
| 3930 AI | | | 3.5000 | | | 9/15/2026 | | | 14,146,788 | | | | 2,042,595 | | |
| 4018 AI | | | 3.5000 | | | 3/15/2027 | | | 24,506,541 | | | | 3,210,161 | | |
| 3684 CI | | | 4.5000 | | | 8/15/2024 | | | 28,523,202 | | | | 2,832,922 | | |
| 3917 AI | | | 4.5000 | | | 7/15/2026 | | | 40,177,007 | | | | 5,589,956 | | |
217 | | | 6.5000 | | | 1/1/2032 | | | 475,148 | | | | 96,737 | | |
Federal National Mortgage Association | |
| 2011-88 BI | | | 3.0000 | | | 11/25/2020 | | | 4,576,533 | | | | 270,050 | | |
| 2011-141 EI | | | 3.0000 | | | 7/25/2021 | | | 19,011,824 | | | | 1,446,026 | | |
| 2012-8 TI | | | 3.0000 | | | 10/25/2021 | | | 8,843,222 | | | | 685,809 | | |
| 2011-113 GI | | | 3.0000 | | | 11/25/2021 | | | 8,499,728 | | | | 659,738 | | |
| 2011-129 AI | | | 3.0000 | | | 12/25/2021 | | | 11,503,375 | | | | 944,785 | | |
| 2012-8 UI | | | 3.0000 | | | 12/25/2021 | | | 28,209,726 | | | | 2,326,278 | | |
| 2011-137 AI | | | 3.0000 | | | 1/25/2022 | | | 15,096,867 | | | | 1,213,790 | | |
| 2011-138 IG | | | 3.0000 | | | 1/25/2022 | | | 17,928,337 | | | | 1,538,149 | | |
| 2011-145 IO | | | 3.0000 | | | 1/25/2022 | | | 23,280,626 | | | | 1,892,848 | | |
| 2012-78 AI | | | 3.0000 | | | 2/25/2022 | | | 14,258,940 | | | | 1,100,264 | | |
| 2012-23 IA | | | 3.0000 | | | 3/25/2022 | | | 10,650,643 | | | | 920,855 | | |
| 2012-32 AI | | | 3.0000 | | | 4/25/2022 | | | 17,290,582 | | | | 1,520,522 | | |
| 2012-53 CI | | | 3.0000 | | | 5/25/2022 | | | 26,496,701 | | | | 2,353,238 | | |
| 2012-147 AI | | | 3.0000 | | | 10/25/2027 | | | 36,551,441 | | | | 4,770,800 | | |
| 2012-145 DI | | | 3.0000 | | | 1/25/2028 | | | 20,111,067 | | | | 2,640,983 | | |
| 2012-149 CI | | | 3.0000 | | | 1/25/2028 | | | 53,452,833 | | | | 6,906,523 | | |
22
FPA NEW INCOME, INC.
PORTFOLIO OF INVESTMENTS (Continued)
March 31, 2014 (Unaudited)
BONDS & DEBENTURES — Continued | | Coupon
Rate (%) | | Maturity
Date | | Principal
Amount | | Fair
Value | |
| 2010-128 LI | | | 3.5000 | | | 11/25/2020 | | $ | 14,209,831 | | | $ | 1,183,611 | | |
| 2011-75 BI | | | 3.5000 | | | 11/25/2020 | | | 7,770,073 | | | | 528,176 | | |
| 2011-78 LI | | | 3.5000 | | | 11/25/2020 | | | 20,115,023 | | | | 1,253,824 | | |
| 2010-145 BI | | | 3.5000 | | | 12/25/2020 | | | 7,074,840 | | | | 620,187 | | |
| 2011-61 BI | | | 3.5000 | | | 7/25/2021 | | | 6,058,861 | | | | 589,568 | | |
| 2011-66 QI | | | 3.5000 | | | 7/25/2021 | | | 10,702,780 | | | | 990,554 | | |
| 2010-104 CI | | | 3.5000 | | | 10/25/2021 | | | 18,112,254 | | | | 1,692,500 | | |
| 2011-104 DI | | | 3.5000 | | | 10/25/2021 | | | 30,287,677 | | | | 2,719,467 | | |
| 2011-110 AI | | | 3.5000 | | | 11/25/2021 | | | 12,816,629 | | | | 1,179,741 | | |
| 2011-118 IC | | | 3.5000 | | | 11/25/2021 | | | 33,544,476 | | | | 3,180,033 | | |
| 2011-125 DI | | | 3.5000 | | | 12/25/2021 | | | 23,461,511 | | | | 2,287,636 | | |
| 2011-143 MI | | | 3.5000 | | | 1/25/2022 | | | 9,789,698 | | | | 850,835 | | |
| 2012-2 MI | | | 3.5000 | | | 2/25/2022 | | | 14,469,451 | | | | 1,428,463 | | |
| 2010-137 BI | | | 3.5000 | | | 2/25/2024 | | | 5,359,479 | | | | 356,500 | | |
| 2011-75 AI | | | 3.5000 | | | 1/25/2025 | | | 20,867,588 | | | | 1,723,853 | | |
| 2011-66 BI | | | 3.5000 | | | 3/25/2025 | | | 2,615,448 | | | | 196,845 | | |
| 2011-80 KI | | | 3.5000 | | | 4/25/2025 | | | 10,756,604 | | | | 961,239 | | |
| 2011-67 CI | | | 3.5000 | | | 8/25/2025 | | | 5,206,986 | | | | 523,197 | | |
| 2011-22 IC | | | 3.5000 | | | 12/25/2025 | | | 10,148,229 | | | | 1,113,996 | | |
| 2011-101 EI | | | 3.5000 | | | 10/25/2026 | | | 22,610,236 | | | | 3,076,141 | | |
| 2011-69 TI | | | 4.0000 | | | 5/25/2020 | | | 7,245,873 | | | | 486,457 | | |
| 2010-89 LI | | | 4.0000 | | | 8/25/2020 | | | 11,196,626 | | | | 976,579 | | |
| 2010-104 CI | | | 4.0000 | | | 9/25/2020 | | | 4,997,035 | | | | 440,651 | | |
| 2011-67 EI | | | 4.0000 | | | 7/25/2021 | | | 12,496,661 | | | | 1,025,976 | | |
| 2010-110 IH | | | 4.5000 | | | 10/25/2018 | | | 13,729,897 | | | | 1,061,531 | | |
| 2009-70 IN | | | 4.5000 | | | 8/25/2019 | | | 19,760,289 | | | | 1,353,084 | | |
| 2008-15 JI | | | 4.5000 | | | 6/25/2022 | | | 4,075,270 | | | | 152,539 | | |
| 2010-114 CI | | | 5.0000 | | | 4/25/2018 | | | 17,932,838 | | | | 1,370,585 | | |
2010-30 | | | 5.0000 | | | 5/25/2018 | | | 7,358,099 | | | | 575,715 | | |
| 2003-64 XI | | | 5.0000 | | | 7/25/2033 | | | 1,323,833 | | | | 199,294 | | |
TOTAL RMBS AGENCY STRIPPED | | $ | 118,029,417 | | |
AGENCY POOL ADJUSTABLE RATE
MORTGAGES — 0.0% | | | |
Federal National Mortgage Association 865963 | | | 2.2980 | | | 3/1/2036 | | $ | 2,086,776 | | | $ | 2,199,274 | | |
ASSET-BACKED — AUTO — 15.4% | | | |
American Credit Acceptance Receivables
2014-1 A† | | | 1.1400 | | | 3/12/2018 | | $ | 5,443,637 | | | $ | 5,444,307 | | |
AmeriCredit Automobile Receivables Trust | |
| 2014-1 A1 | | | 0.2100 | | | 3/9/2015 | | | 25,145,000 | | | | 25,145,302 | | |
23
FPA NEW INCOME, INC.
PORTFOLIO OF INVESTMENTS (Continued)
March 31, 2014 (Unaudited)
BONDS & DEBENTURES — Continued | | Coupon
Rate (%) | | Maturity
Date | | Principal
Amount | | Fair
Value | |
| 2013-5 A1† | | | 0.2500 | | | 4/8/2014 | | $ | 16,461,245 | | | $ | 16,461,782 | | |
| 2013-2 A2 | | | 0.5300 | | | 11/8/2016 | | | 28,096,815 | | | | 28,106,669 | | |
| 2014-1 A2 | | | 0.5700 | | | 6/8/2017 | | | 36,935,000 | | | | 36,934,018 | | |
| 2013-1 A2† | | | 0.6300 | | | 6/8/2016 | | | 15,754,324 | | | | 15,752,588 | | |
| 2013-4 A2 | | | 0.7400 | | | 11/8/2016 | | | 47,905,095 | | | | 47,934,193 | | |
| 2011-1 B | | | 2.1900 | | | 2/8/2016 | | | 2,745,297 | | | | 2,748,197 | | |
| 2011-4 B | | | 2.2600 | | | 9/8/2016 | | | 7,952,000 | | | | 8,008,384 | | |
| 2011-2 C | | | 3.1900 | | | 10/8/2016 | | | 8,580,000 | | | | 8,710,673 | | |
| 2010-3 C | | | 3.3400 | | | 4/8/2016 | | | 4,989,604 | | | | 5,040,175 | | |
| 2010-3 D | | | 4.9800 | | | 1/8/2018 | | | 13,735,000 | | | | 14,440,567 | | |
| 2010-1 C | | | 5.1900 | | | 8/17/2015 | | | 954,224 | | | | 962,717 | | |
| 2010-2 D | | | 6.2400 | | | 6/8/2016 | | | 6,990,000 | | | | 7,265,895 | | |
Credit Acceptance Auto Loan Trust
2012-1A B† | | | 3.1200 | | | 3/16/2020 | | | 4,500,000 | | | | 4,527,668 | | |
Carmax Auto Owner Trust 2014-1 A2 | |
| 2014-1 A1 | | | 0.1900 | | | 2/17/2015 | | | 19,778,296 | | | | 19,775,050 | | |
| 2014-1 A2 | | | 0.4700 | | | 2/15/2017 | | | 40,000,000 | | | | 39,843,452 | | |
DT Auto Owner Trust | |
| 2014-1A B† | | | 1.4300 | | | 3/15/2018 | | | 5,730,000 | | | | 5,719,363 | | |
| 2012-2A B† | | | 1.7800 | | | 6/15/2017 | | | 9,548,000 | | | | 9,591,761 | | |
| 2012-2A B† | | | 1.8500 | | | 4/17/2017 | | | 5,545,587 | | | | 5,549,489 | | |
Exeter Automobile Receivables Trust 2013-2A A | |
| 2013-2A A† | | | 1.4960 | | | 11/15/2017 | | | 24,887,755 | | | | 24,971,667 | | |
| 2014-1A A† | | | 1.2900 | | | 5/15/2018 | | | 40,830,261 | | | | 40,938,792 | | |
Fifth Third Auto Trust | |
| 2014-1 A1 | | | 0.2000 | | | 3/16/2015 | | | 18,444,878 | | | | 18,445,523 | | |
| 2014-1 A2 | | | 0.4600 | | | 8/15/2016 | | | 42,380,000 | | | | 42,380,347 | | |
First Investors Auto Owner Trust | |
| 2013-3A A1† | | | 0.3300 | | | 11/17/2014 | | | 1,057,885 | | | | 1,057,977 | | |
| 2013-3A A2† | | | 0.8900 | | | 9/15/2017 | | | 6,856,000 | | | | 6,859,060 | | |
Ford Credit Auto Owner Trust 2014-A A1† | | | 0.2300 | | | 1/15/15 | | | 10,469,214 | | | | 10,469,475 | | |
Honda Auto Receivables Owner Trust | |
| 2014-1 A1 | | | 0.1900 | | | 3/23/2015 | | | 29,265,088 | | | | 29,265,088 | | |
| 2014-1 A2 | | | 0.4100 | | | 8/22/2016 | | | 42,000,000 | | | | 41,996,825 | | |
Hyundai Auto Receivables Trust | | | 0.2400 | | | 2/17/2015 | | | 12,761,932 | | | | 12,761,303 | | |
Mercedes-Benz Auto Lease | |
| 2012 A A4 | | | 1.0700 | | | 11/15/2017 | | | 3,960,000 | | | | 3,961,076 | | |
| 2013 A A3 | | | 0.5900 | | | 2/15/2016 | | | 37,803,000 | | | | 37,840,115 | | |
Nissan Auto Lease Trust 2012 A A3 | | | 0.9800 | | | 5/15/2015 | | | 20,949,090 | | | | 20,968,344 | | |
Nissan Auto Receivables Owner Trust 2013-C A1 | |
| 2013-C CL A1 | | | 0.2300 | | | 12/15/2014 | | | 3,329,846 | | | | 3,329,618 | | |
| 2014-A CL A1 | | | 0.1900 | | | 2/17/2015 | | | 16,705,545 | | | | 16,706,130 | | |
24
FPA NEW INCOME, INC.
PORTFOLIO OF INVESTMENTS (Continued)
March 31, 2014 (Unaudited)
BONDS & DEBENTURES — Continued | | Coupon
Rate (%) | | Maturity
Date | | Principal
Amount | | Fair
Value | |
Prestige Automobile Receivables Trust | |
| 2014-1A A2† | | | 0.9700 | | | 3/15/2018 | | $ | 16,390,000 | | | $ | 16,387,838 | | |
| 2013-1A A2† | | | 1.0900 | | | 2/15/2018 | | | 16,363,341 | | | | 16,393,886 | | |
| 2014-1A A3† | | | 1.5200 | | | 4/15/2020 | | | 17,250,000 | | | | 17,246,452 | | |
Santander Drive Auto Receivables Trust | |
| 2013-5 A1 | | | 0.2600 | | | 11/17/2014 | | | 5,913,001 | | | | 5,913,170 | | |
| 2014-1 1 A1 | | | 0.2700 | | | 1/15/2015 | | | 16,778,661 | | | | 16,779,742 | | |
| 2013-1 A2 | | | 0.4800 | | | 2/16/2016 | | | 3,659,302 | | | | 3,659,588 | | |
| 2013-3 A2 | | | 0.5500 | | | 9/15/2016 | | | 20,794,073 | | | | 20,802,565 | | |
| 2013-1 A3 | | | 0.6200 | | | 6/15/2017 | | | 28,000,000 | | | | 28,010,528 | | |
| 2014-1 A2A | | | 0.6600 | | | 7/17/2017 | | | 24,276,000 | | | | 24,279,459 | | |
| 2012-6 A2 | | | 0.8300 | | | 9/15/2015 | | | 1,928,564 | | | | 1,928,702 | | |
| 2014-1 A3 | | | 0.8700 | | | 1/16/2018 | | | 19,425,000 | | | | 19,434,652 | | |
| 2013-4 A2 | | | 0.8900 | | | 9/15/2016 | | | 2,634,049 | | | | 2,637,776 | | |
| 2012-4 A3 | | | 1.0400 | | | 8/15/2016 | | | 5,435,103 | | | | 5,444,898 | | |
| 2012-3 A3 | | | 1.0800 | | | 4/15/2016 | | | 7,204,161 | | | | 7,212,579 | | |
Volkswagen Auto Loan Enhanced Trust
2013-2 A1 | | | 0.3500 | | | 11/20/2014 | | | 7,512,412 | | | | 7,512,142 | | |
Volkswagen Auto Lease Trust 2014-A A1 | | | 0.2000 | | | 2/20/2015 | | | 17,236,727 | | | | 17,235,138 | | |
Westlake Automobile Receivables Trust
2013-1A A1† | | | 0.5500 | | | 10/15/2014 | | | 5,472,131 | | | | 5,474,152 | | |
TOTAL ASSET-BACKED — AUTO | | $ | 836,266,857 | | |
ASSET-BACKED — OTHER — 10.0% | | | |
CARDS II TR 2012-4A A† | | | 0.6050 | | | 9/15/2017 | | $ | 75,000,000 | | | $ | 75,074,303 | | |
CLI Funding LLC 2012-1A† | | | 4.2100 | | | 12/18/2022 | | | 40,841,585 | | | | 41,006,993 | | |
Chesapeake Funding LLC† | | | 0.5756 | | | 3/7/2026 | | | 29,025,000 | | | | 29,025,348 | | |
GE Capital Credit Card Master Note Trust
2010-1 A | | | 3.6900 | | | 3/15/2018 | | | 63,545,000 | | | | 65,411,456 | | |
Global Tower Partners Acquisition Partners† | | | 4.7040 | | | 5/15/2018 | | | 15,981,000 | | | | 16,212,405 | | |
HFG HEALTHCO-4 LLC 2011-1A A† | | | 2.4053 | | | 6/2/2017 | | | 16,552,000 | | | | 16,806,024 | | |
HLSS Servicer Advance Receivables Back | |
| 2013-T4 AT4† | | | 1.1830 | | | 8/15/2044 | | | 1,095,000 | | | | 1,092,810 | | |
| 2014-T1 AT1† | | | 1.3104 | | | 1/17/2045 | | | 19,425,000 | | | | 19,432,207 | | |
| 2013-T2 B2† | | | 1.4953 | | | 5/16/2044 | | | 8,050,000 | | | | 8,010,025 | | |
| 2013-T1 A2† | | | 1.4953 | | | 1/16/2046 | | | 24,512,000 | | | | 24,450,720 | | |
| 2013-T1 B2† | | | 1.7436 | | | 1/16/2046 | | | 5,750,000 | | | | 5,728,869 | | |
| 2013-T5 BT5† | | | 2.2761 | | | 8/15/2046 | | | 9,300,000 | | | | 9,310,230 | | |
| 2012-T2 B2† | | | 2.4800 | | | 10/15/2045 | | | 14,078,000 | | | | 14,289,339 | | |
Insite Issuer LLC† | | | 8.5950 | | | 8/15/2043 | | | 11,613,000 | | | | 12,059,116 | | |
MMAF Equipment Finance LLC 2013-AA A2† | | | 0.6900 | | | 5/9/2016 | | | 20,656,000 | | | | 20,667,053 | | |
25
FPA NEW INCOME, INC.
PORTFOLIO OF INVESTMENTS (Continued)
March 31, 2014 (Unaudited)
BONDS & DEBENTURES — Continued | | Coupon
Rate (%) | | Maturity
Date | | Principal
Amount | | Fair
Value | |
PFS Financing Corpation | |
| 2013-B A† | | | 0.6550 | | | 4/17/2017 | | $ | 4,000,000 | | | $ | 4,002,083 | | |
| 2014-AA A† | | | 0.7545 | | | 2/15/2019 | | | 26,000,000 | | | | 25,999,969 | | |
| 2012-BA B† | | | 0.8550 | | | 10/17/2016 | | | 18,795,000 | | | | 18,835,644 | | |
| 2011-BA A† | | | 1.6550 | | | 10/17/2016 | | | 4,710,000 | | | | 4,737,017 | | |
| 2011-BA B† | | | 2.4050 | | | 10/17/2016 | | | 4,000,000 | | | | 4,013,896 | | |
Panhandle-Plains Student Finance Corp
2001-1 CL A2 | | | 1.6560 | | | 12/1/2031 | | | 5,900,000 | | | | 5,811,500 | | |
Progresso Receivables Funding I LLC
2013-A CL A† | | | 4.0000 | | | 7/9/2018 | | | 14,984,000 | | | | 15,021,460 | | |
Global SC Finance SRL 2012-1A CL A† | | | 4.1100 | | | 7/17/2027 | | | 8,945,834 | | | | 9,048,174 | | |
Store Master Funding LLC 2012-1A CLA† | | | 5.7700 | | | 8/20/2042 | | | 16,865,287 | | | | 18,181,623 | | |
TAL Advantage LLC 2006-1A† | | | 0.3440 | | | 4/20/2021 | | | 9,583,335 | | | | 9,419,843 | | |
Textainer Marine Containers Ltd 2012-1A A† | | | 4.2100 | | | 4/15/2027 | | | 14,017,310 | | | | 14,031,840 | | |
Triton Container Finance LLC 2006-1A† | | | 4.2100 | | | 5/14/2027 | | | 6,344,681 | | | | 6,368,220 | | |
Unison Ground Lease Fund† | | | 5.7800 | | | 3/16/2020 | | | 10,932,000 | | | | 10,953,918 | | |
Unison Ground Lease Fund† | | | 6.2680 | | | 3/16/2020 | | | 3,768,000 | | | | 3,686,574 | | |
Unison Ground Lease Fund† | | | 9.5220 | | | 4/15/2020 | | | 19,600,000 | | | | 21,988,064 | | |
WCP Issuer LLC 2013-1 CL B† | | | 6.6570 | | | 8/15/2020 | | | 15,347,000 | | | | 16,115,546 | | |
TOTAL ASSET-BACKED — OTHER | | $ | 546,792,269 | | |
U.S. TREASURY NOTES — 14.4% | | | |
U.S Treasury Note | | | 0.1250 | | | 7/31/2014 | | $ | 38,000,000 | | | $ | 38,007,421 | | |
U.S Treasury Note | | | 0.2500 | | | 5/31/2014 | | | 36,000,000 | | | | 36,011,250 | | |
U.S Treasury Note | | | 0.2500 | | | 6/30/2014 | | | 3,000,000 | | | | 3,001,392 | | |
U.S Treasury Note | | | 0.5000 | | | 8/15/2014 | | | 18,000,000 | | | | 18,028,741 | | |
U.S Treasury Note | | | 1.0000 | | | 5/15/2014 | | | 110,000,000 | | | | 110,124,608 | | |
U.S Treasury Note | | | 2.3750 | | | 8/31/2014 | | | 193,000,000 | | | | 194,815,030 | | |
U.S Treasury Note | | | 2.6250 | | | 6/30/2014 | | | 193,000,000 | | | | 194,226,978 | | |
U.S Treasury Note | | | 2.6250 | | | 7/31/2014 | | | 168,000,000 | | | | 169,424,069 | | |
U.S Treasury Note | | | 4.7500 | | | 5/15/2014 | | | 18,000,000 | | | | 18,100,987 | | |
TOTAL U.S. TREASURY NOTES | | $ | 781,740,476 | | |
CORPORATE BONDS & DEBENTURES — 7.0% | | | |
Boart Longyear Management Pty Ltd† | | | 10.0000 | | | 10/1/2018 | | $ | 21,104,000 | | | $ | 21,895,400 | | |
British Airways plc† | | | 5.6250 | | | 6/20/2020 | | | 8,375,000 | | | | 8,909,325 | | |
Colgate Palmolive Co. | | | 1.2500 | | | 5/1/2014 | | | 1,084,000 | | | | 1,084,849 | | |
Colgate Palmolive Co. | | | 0.6000 | | | 11/15/2014 | | | 4,968,000 | | | | 4,976,243 | | |
26
FPA NEW INCOME, INC.
PORTFOLIO OF INVESTMENTS (Continued)
March 31, 2014 (Unaudited)
BONDS & DEBENTURES — Continued | | Coupon
Rate (%) | | Maturity
Date | | Principal
Amount | | Fair
Value | |
Continental Airlines Company | |
| 1997-1 1A | | | 7.4610 | | | 4/1/2015 | | $ | 796,692 | | | $ | 804,659 | | |
2000-1 | | | 8.3880 | | | 11/1/2020 | | | 8,231,954 | | | | 8,577,696 | | |
Delta Airlines | |
| 2012-1B† | | | 6.8750 | | | 5/7/2019 | | | 2,158,901 | | | | 2,358,599 | | |
N671US† | | | 7.5000 | | | 9/15/2020 | | | 17,745,840 | | | | 17,834,569 | | |
Everest ACQ LLC / Finance | | | 6.8750 | | | 5/1/2019 | | | 3,803,000 | | | | 4,108,381 | | |
Denbury Resources Inc. | | | 8.2500 | | | 2/15/2020 | | | 20,771,000 | | | | 22,588,462 | | |
Fidelity National Information Services | | | 7.8750 | | | 7/15/2020 | | | 14,162,000 | | | | 15,283,836 | | |
HD Supply Inc. | | | 8.1250 | | | 4/15/2019 | | | 45,225,000 | | | | 50,425,875 | | |
HD Supply Inc. | | | 11.0000 | | | 4/15/2020 | | | 6,287,000 | | | | 7,465,813 | | |
Nielsen Finance LLC Co. | | | 7.7500 | | | 10/15/2018 | | | 51,409,000 | | | | 55,007,630 | | |
Northwest Airlines | |
| 1999-2 B | | | 7.9500 | | | 9/1/2016 | | | 2,557,426 | | | | 2,634,148 | | |
| 1999-2 C | | | 8.3040 | | | 9/1/2019 | | | 8,254,799 | | | | 6,273,647 | | |
| 2000-1 G | | | 7.1500 | | | 10/1/2020 | | | 16,625,242 | | | | 18,266,985 | | |
Procter & Gamble Co. | |
Procter & Gamble Co. | | | 0.7000 | | | 8/15/2014 | | | 22,968,000 | | | | 23,003,534 | | |
Procter & Gamble Co. | | | 3.5000 | | | 2/15/2015 | | | 22,990,000 | | | | 23,609,242 | | |
Procter & Gamble Co. | | | 4.9500 | | | 8/15/2014 | | | 1,965,000 | | | | 1,998,736 | | |
Thompson Creek Metals Co Inc. | | | 9.7500 | | | 12/1/2017 | | | 25,377,000 | | | | 28,105,028 | | |
US Airways PT Trust | |
| 1998-1B | | | 7.3500 | | | 7/30/2019 | | | 6,946,240 | | | | 7,328,283 | | |
| 1998-1C | | | 6.8200 | | | 1/30/2016 | | | 17,414,053 | | | | 17,109,307 | | |
| 1999-1C | | | 7.9600 | | | 1/20/2018 | | | 5,038,051 | | | | 4,977,594 | | |
Woodbine Acquisition LLC† | | | 12.0000 | | | 5/15/2016 | | | 27,128,000 | | | | 28,755,680 | | |
TOTAL CORPORATE BONDS &
DEBENTURES | | $ | 383,383,521 | | |
CORPORATE BANK DEBT — 1.8% | | | |
Kar Auction Services Term Loan BL1252123† | | | 3.7500 | | | 9/28/2017 | | $ | 14,972,000 | | | $ | 15,035,332 | | |
La Frontera Generation Term Loan B† | | | 4.5000 | | | 9/30/2020 | | | 30,036,030 | | | | 30,103,311 | | |
Nielsen Finance LLC Term Loan LN 284932† | | | 2.9065 | | | 5/1/2016 | | | 11,655,198 | | | | 11,666,736 | | |
OCI Beaumont LLC Term Loan B1† | | | 6.2500 | | | 8/20/2019 | | | 16,511,660 | | | | 16,682,390 | | |
Toys R Us Property Term Loan† | | | 6.0000 | | | 8/21/2019 | | | 25,412,310 | | | | 24,395,055 | | |
TOTAL CORPORATE BANK DEBT | | $ | 97,882,824 | | |
TOTAL INVESTMENT SECURITIES — 96.9%
(Cost $5,363,633,935) | | $ | 5,274,536,208 | | |
27
FPA NEW INCOME, INC.
PORTFOLIO OF INVESTMENTS (Continued)
March 31, 2014 (Unaudited)
| | | Coupon
Rate (%) | | Maturity
Date | | Principal
Amount | | Fair
Value | |
SHORT-TERM INVESTMENTS — 2.9%
(Cost $158,111,467) | |
Exxon Mobil Corporation | | | 0.0500 | | | 4/7/2014 | | $ | 50,000,000 | | | $ | 49,999,583 | | |
Exxon Mobil Corporation | | | 0.0600 | | | 4/2/2014 | | | 70,000,000 | | | | 69,999,884 | | |
State Street Bank Repurchase Agreement —
0.00% 04/01/14 (Dated 03/31/2014, repurchase
price of $38,112,000, collateralized by
$38,350,000 principal amount U.S. Treasury
Note — 3.625% 2044, fair value $38,877,313) | | | 0.0000 | | | 4/1/2014 | | | 38,112,000 | | | | 38,112,000 | | |
TOTAL SHORT-TERM INVESTMENTS | | $ | 158,111,467 | | |
TOTAL INVESTMENTS — 99.8%
(Cost $5,521,745,402) | | $ | 5,432,647,675 | | |
Other assets and liabilities, net — 0.2% | | | 10,714,724 | | |
TOTAL NET ASSETS — 100.0% | | $ | 5,443,362,399 | | |
* These securities have been valued in good faith under policies adopted by authority of the Board of Directors in accordance with the Fund's fair value procedures. These securities constituted 0.19% of total net assets at March 31, 2014
† Restricted securities. These restricted securities constituted 28.82% of total net assets at March 31, 2014, most of which are considered liquid by the Adviser. These securities are not registered and may not be sold to the public. There are legal and/or contractual restrictions on resale. The Fund does not have the right to demand that such securities be registered. The values of these securities are determined by valuations provided by pricing services, brokers, dealers, market makers, or in good faith under policies adopted by authority of the Fund's Board of Directors. A full listing of all of the Fund's restricted securities can be found beginning on page 29.
28
FPA NEW INCOME, INC.
RESTRICTED SECURITIES
March 31, 2014 (Unaudited)
| Issuer | | Acquisition
Date(s) | | Cost | | Fair
Value | | Fair
Value as a %
of Net Assets | |
A10 Securitization 2013-2 A | | 10/30/2013 | | $ | 11,607,887 | | | $ | 11,620,903 | | | | 0.21 | % | |
Citigroup Commercial Mortgage
Trust 2007-FL3A B | | 1/28/2014 | | | 432,115 | | | | 437,292 | | | | 0.01 | % | |
Citigroup Commercial Mortgage
Trust 2007-FL3A C | | 1/28/2014 | | | 531,580 | | | | 541,240 | | | | 0.01 | % | |
Citigroup Commercial Mortgage
Trust 2007-FL3A D | | 1/28/2014 | | | 351,055 | | | | 357,894 | | | | 0.01 | % | |
Citigroup Commercial Mortgage
Trust 2007-FL3A E | | 1/28/2014 | | | 400,302 | | | | 406,983 | | | | 0.01 | % | |
COMM Mortgage Trust
2013-RIA4 A2 | | 11/18/2013 | | | 11,753,254 | | | | 11,753,254 | | | | 0.22 | % | |
Credit Suisse Mortgage Trust
2007-TF2A B | | 1/29/2014 | | | 386,213 | | | | 388,970 | | | | 0.01 | % | |
Credit Suisse Mortgage Trust
2007-TF2A A3 | | 1/29/2014, 1/30/214 | | | 41,986,627 | | | | 42,564,809 | | | | 0.78 | % | |
Del Coronado Trust
2013-HDMZ CL M | | 4/1/2013, 11/13/2013 | | | 9,327,664 | | | | 9,325,541 | | | | 0.17 | % | |
Lehman Brothers Floating Rate
Commercial 2007-LLFA F | | 2/8/2013 | | | 12,213,180 | | | | 12,463,518 | | | | 0.23 | % | |
LSTAR Commercial Mortgage
Trust 2001-1 A | | 6/23/2011 | | | 1,640,788 | | | | 1,671,583 | | | | 0.03 | % | |
Monty Parent Issuer LLC
2013-LTR1 A | | 11/14/2013 | | | 9,382,277 | | | | 9,385,740 | | | | 0.17 | % | |
Monty Parent Issuer LLC
2013-LTR1 B | | 11/14/2013 | | | 19,585,143 | | | | 19,672,547 | | | | 0.36 | % | |
Motel 6 Trust 2012-MTL6 D | | 11/2/2012, 3/12/2013,
3/14/2013 | | | 37,118,870 | | | | 37,117,254 | | | | 0.68 | % | |
Motel 6 Trust 2012-MTL6 E | | 11/2/2012 | | | 10,060,970 | | | | 9,767,321 | | | | 0.18 | % | |
Ores NPL LLC 2014-LV3 CL A | | 3/21/2014 | | | 17,822,000 | | | | 17,822,000 | | | | 0.33 | % | |
Ores NPL LLC 2013-LV2 CL A | | 8/9/2013 | | | 24,968,348 | | | | 24,984,077 | | | | 0.46 | % | |
Ores NPL LLC 2014-LV3 CL B | | 3/21/2014 | | | 47,289,925 | | | | 47,300,452 | | | | 0.87 | % | |
RREF 2012 LT1 LLC
2013-LT2 CL A | | 3/20/2013 | | | 11,402,547 | | | | 11,402,556 | | | | 0.21 | % | |
Starwood Commercial Mortgage
Trust 2013-FV1 CL B | | 7/30/2013 | | | 18,051,000 | | | | 18,063,275 | | | | 0.33 | % | |
Bayview Opportunity Master Fund
Trust 2013-2RPL CL A | | 4/11/2013 | | | 5,489,020 | | | | 5,447,672 | | | | 0.10 | % | |
Bayview Opportunity Master Fund
Trust 2013-13NP CL A | | 6/10/2013 | | | 11,108,208 | | | | 11,021,582 | | | | 0.20 | % | |
29
FPA NEW INCOME, INC.
RESTRICTED SECURITIES (Continued)
March 31, 2014 (Unaudited)
Issuer | | Acquisition
Date(s) | | Cost | | Fair
Value | | Fair
Value as a %
of Net Assets | |
Bayview Opportunity Master Fund
Trust 2012-4NR2 CL A | | 1/17/2014 | | $ | 9,015,753 | | | $ | 9,023,884 | | | | 0.17 | % | |
Bayview Opportunity Master Fund
Trust 2013-14NP CL A | | 7/24/2013 | | | 27,432,853 | | | | 27,628,200 | | | | 0.51 | % | |
Bayview Opportunity Master Fund
Trust 2013-4RPL CL A | | 8/9/2013 | | | 14,753,934 | | | | 14,946,555 | | | | 0.27 | % | |
Credit Suisse Mortgage Trust
2013-6 1A1 | | 7/26/2013 | | | 90,161,307 | | | | 88,432,318 | | | | 1.62 | % | |
JP Morgan Mortgage Trust
2013-1 CL 2A2 | | 3/25/2013 | | | 38,469,452 | | | | 36,999,762 | | | | 0.68 | % | |
Normandy Mortgage Loan Trust
2013-NPL3 A | | 8/28/2013 | | | 35,732,578 | | | | 35,553,915 | | | | 0.65 | % | |
Riverview HECM Trust
2007-1 CL A | | 1/9/2013 | | | 32,435,259 | | | | 31,949,799 | | | | 0.59 | % | |
Stanwich Mortgage Loan Trust
Series 2009-2 A | | 9/22/2011 | | | 245,706 | | | | 247,146 | | | | 0.00 | % | |
Stanwich Mortgage Loan Trust
Series 2010-1 A | | 4/22/2010, 9/22/2011 | | | 349,520 | | | | 424,836 | | | | 0.01 | % | |
Stanwich Mortgage Loan Trust
Series 2010-2 A | | 5/21/2010, 9/22/2011 | | | 2,042,535 | | | | 2,007,347 | | | | 0.04 | % | |
Stanwich Mortgage Loan Trust
Series 2010-3 A | | 6/2/2010, 9/22/2011 | | | 1,120,766 | | | | 1,334,458 | | | | 0.02 | % | |
Stanwich Mortgage Loan Trust
Series 2010-4 A | | 8/4/2010, 9/22/2011 | | | 1,424,491 | | | | 1,544,952 | | | | 0.03 | % | |
Stanwich Mortgage Loan Trust
Series 2011-1 A | | 5/10/2011, 9/22/2011 | | | 2,409,757 | | | | 2,800,268 | | | | 0.05 | % | |
Stanwich Mortgage Loan Trust
Series 2011-2 A† | | 6/10/2011, 9/22/2011 | | | 1,309,183 | | | | 1,857,396 | | | | 0.03 | % | |
Stanwich Mortgage Loan Trust
Series 2012-NPL4 CL A | | 9/24/2012 | | | 7,145,095 | | | | 7,162,160 | | | | 0.13 | % | |
Stanwich Mortgage Loan Trust
Series 2012-NPL5 CL A | | 11/5/2012, 11/20/2012,
3/12/2013 | | | 10,160,116 | | | | 10,162,890 | | | | 0.19 | % | |
Stanwich Mortgage Loan Trust
Series 2013-NPL1 CL A | | 2/15/2013 | | | 30,464,590 | | | | 30,744,259 | | | | 0.56 | % | |
Stanwich Mortgage Loan Trust
Series 2013-NPL2 CL A | | 5/31/2013 | | | 38,559,119 | | | | 38,559,081 | | | | 0.71 | % | |
US Residential Opportunity Fund
Trust 2014-4A | | 3/14/2014 | | | 11,870,000 | | | | 11,910,714 | | | | 0.22 | % | |
30
FPA NEW INCOME, INC.
RESTRICTED SECURITIES (Continued)
March 31, 2014 (Unaudited)
Issuer | | Acquisition
Date(s) | | Cost | | Fair
Value | | Fair
Value as a %
of Net Assets | |
Vericrest Opportunity Loan
Transferee 2013-3A A | | 5/9/2013, 8/29/2013 | | $ | 14,504,334 | | | $ | 14,520,641 | | | | 0.27 | % | |
Vericrest Opportunity Loan
Transferee 2014-NPL1 A1 | | 2/20/2014, 3/25/2014 | | | 10,667,159 | | | | 10,691,517 | | | | 0.20 | % | |
Vericrest Opportunity Loan
Transferee 2014-NPL2 A1 | | 2/20/2014, 3/25/2014 | | | 13,273,359 | | | | 13,303,699 | | | | 0.24 | % | |
Vericrest Opportunity Loan
Transferee 2014-NPL3 A1 | | 3/14/2014 | | | 17,375,000 | | | | 17,396,696 | | | | 0.32 | % | |
American Credit Acceptance
Receivables 2014-1 A | | 1/7/2014 | | | 5,443,374 | | | | 5,444,307 | | | | 0.10 | % | |
AmeriCredit Automobile
Receivables Trust 2013-5 A1 | | 11/5/2013 | | | 16,461,245 | | | | 16,461,782 | | | | 0.30 | % | |
AmeriCredit Automobile
Receivables Trust 2013-1 A2 | | 1/15/2013 | | | 15,753,805 | | | | 15,752,588 | | | | 0.29 | % | |
Credit Acceptance Auto Loan Trust
2012-1A B | | 3/22/2012 | | | 4,499,265 | | | | 4,527,668 | | | | 0.08 | % | |
DT Auto Owner Trust 2014-1A B | | 1/14/2014 | | | 5,729,040 | | | | 5,719,363 | | | | 0.11 | % | |
DT Auto Owner Trust 2012-2A B | | 9/17/2013 | | | 9,547,310 | | | | 9,591,761 | | | | 0.18 | % | |
DT Auto Owner Trust 2012-2A B | | 7/17/2012 | | | 5,545,302 | | | | 5,549,489 | | | | 0.10 | % | |
Exeter Automobile Receivables
Trust 2013-2A A | | 9/11/2013 | | | 24,887,419 | | | | 24,971,667 | | | | 0.46 | % | |
Exeter Automobile Receivables
Trust 2014-1A A | | 1/29/2014 | | | 40,826,648 | | | | 40,938,792 | | | | 0.75 | % | |
First Investors Auto Owner
Trust 2013-3A A1 | | 11/6/2013 | | | 1,057,885 | | | | 1,057,977 | | | | 0.02 | % | |
First Investors Auto Owner
Trust 2013-3A A2 | | 11/6/2013 | | | 6,855,506 | | | | 6,859,060 | | | | 0.13 | % | |
Ford Credit Auto Owner
Trust 2014-A A1 | | 1/14/2014 | | | 10,469,214 | | | | 10,469,475 | | | | 0.19 | % | |
Prestige Automobile Receivables
Trust 2014-1A A2 | | 3/18/2014 | | | 16,388,051 | | | | 16,387,838 | | | | 0.30 | % | |
Prestige Automobile Receivables
Trust 2013-1A A2 | | 8/27/2013, 10/10/2013 | | | 16,375,760 | | | | 16,393,886 | | | | 0.30 | % | |
Prestige Automobile Receivables
Trust 2014-1A A3 | | 3/18/2014 | | | 17,249,017 | | | | 17,246,452 | | | | 0.32 | % | |
Westlake Automobile Receivables
Trust 2013-1A A1 | | 9/18/2013 | | | 5,472,132 | | | | 5,474,152 | | | | 0.10 | % | |
CARDS II TR 2012-4A A | | 11/26/2013 | | | 75,105,469 | | | | 75,074,303 | | | | 1.38 | % | |
CLI Funding LLC 2012-1A | | 6/14/2012 | | | 40,836,525 | | | | 41,006,993 | | | | 0.75 | % | |
Chesapeake Funding LLC | | 3/4/2014 | | | 29,025,000 | | | | 29,025,348 | | | | 0.53 | % | |
31
FPA NEW INCOME, INC.
RESTRICTED SECURITIES (Continued)
March 31, 2014 (Unaudited)
Issuer | | Acquisition
Date(s) | | Cost | | Fair
Value | | Fair
Value as a %
of Net Assets | |
Global Tower Partners Acquisition
Partners | | 4/17/2013 | | $ | 15,981,000 | | | $ | 16,212,405 | | | | 0.30 | % | |
HFG HEALTHCO-4 LLC
2011-1A A | | 5/26/2011, 9/22/2011 | | | 16,577,140 | | | | 16,806,024 | | | | 0.31 | % | |
HLSS Servicer Advance Receivables
Back 2013-T4 AT4 | | 2/13/2014 | | | 1,096,625 | | | | 1,092,810 | | | | 0.02 | % | |
HLSS Servicer Advance Receivables
Back 2014-T1 AT1 | | 1/14/2014 | | | 19,424,986 | | | | 19,432,207 | | | | 0.36 | % | |
HLSS Servicer Advance Receivables
Back 2013-T2 B2 | | 2/14/2014 | | | 8,042,453 | | | | 8,010,025 | | | | 0.15 | % | |
HLSS Servicer Advance Receivables
Back 2013-T1 A2 | | 2/12/2014, 2/13/2014 | | | 24,541,782 | | | | 24,450,720 | | | | 0.45 | % | |
HLSS Servicer Advance Receivables
Back 2013-T1 B2 | | 2/14/2014 | | | 5,746,406 | | | | 5,728,869 | | | | 0.11 | % | |
HLSS Servicer Advance Receivables
Back 2013-T5 BT5 | | 2/12/2014 | | | 9,333,422 | | | | 9,310,230 | | | | 0.17 | % | |
HLSS Servicer Advance Receivables
Back 2012-T2 B2 | | 2/13/2014, 2/14/2014 | | | 14,266,672 | | | | 14,289,339 | | | | 0.26 | % | |
Insite Issuer LLC | | 8/19/2013 | | | 11,613,000 | | | | 12,059,116 | | | | 0.22 | % | |
MMAF Equipment Finance LLC
2013-AA A2 | | 8/7/2013 | | | 20,653,837 | | | | 20,667,053 | | | | 0.38 | % | |
PFS Financing Corpation
2013-B A | | 1/31/2014 | | | 4,002,344 | | | | 4,002,083 | | | | 0.07 | % | |
PFS Financing Corpation
2014-AA A | | 2/4/2014 | | | 26,000,000 | | | | 25,999,969 | | | | 0.48 | % | |
PFS Financing Corpation
2012-BA B | | 1/31/2014 | | | 18,833,746 | | | | 18,835,644 | | | | 0.35 | % | |
PFS Financing Corpation
2011-BA A | | 9/27/2013 | | | 4,749,005 | | | | 4,737,017 | | | | 0.09 | % | |
PFS Financing Corpation
2011-BA B | | 11/3/2011 | | | 4,000,000 | | | | 4,013,896 | | | | 0.07 | % | |
Progresso Receivables Funding I
LLC 2013-A CL A | | 6/14/2013 | | | 14,984,000 | | | | 15,021,460 | | | | 0.28 | % | |
Global SC Finance SRL
2012-1A CL A | | 7/25/2012 | | | 8,944,060 | | | | 9,048,174 | | | | 0.17 | % | |
Store Master Funding LLC
2012-1A CLA | | 8/31/2012 | | | 16,811,925 | | | | 18,181,623 | | | | 0.33 | % | |
32
FPA NEW INCOME, INC.
RESTRICTED SECURITIES (Continued)
March 31, 2014 (Unaudited)
Issuer | | Acquisition
Date(s) | | Cost | | Fair
Value | | Fair
Value as a %
of Net Assets | |
TAL Advantage LLC 2006-1A 6/28/12, 7/16/12,
7/31/12, 8/7/12, | |
9/11/12, 10/10/12 | | $ | 9,302,543 | | | $ | 9,419,843 | | | | 0.17 | % | |
Textainer Marine Containers Ltd
2012-1A A | | 1/18/2013 | | | 14,469,038 | | | | 14,031,840 | | | | 0.26 | % | |
Triton Container Finance LLC
2006-1A | | 4/17/2013 | | | 6,569,721 | | | | 6,368,220 | | | | 0.12 | % | |
Unison Ground Lease Fund | | 3/12/2013 | | | 10,782,695 | | | | 10,953,918 | | | | 0.20 | % | |
Unison Ground Lease Fund | | 3/12/2013 | | | 3,768,000 | | | | 3,686,574 | | | | 0.07 | % | |
Unison Ground Lease Fund | | 12/13/2012 | | | 24,059,000 | | | | 21,988,064 | | | | 0.40 | % | |
WCP Issuer LLC 2013-1 CL B | | 8/1/2013 | | | 15,347,000 | | | | 16,115,546 | | | | 0.30 | % | |
Boart Longyear Management Pty Ltd | | 9/20/2013 | | | 21,104,000 | | | | 21,895,400 | | | | 0.40 | % | |
British Airways plc | | 6/25/2013 | | | 8,375,000 | | | | 8,909,325 | | | | 0.16 | % | |
Delta Airlines 2012-1B | | 6/27/2012 | | | 2,158,901 | | | | 2,358,599 | | | | 0.04 | % | |
Delta Airlines N671US | | 8/16/2012 | | | 17,745,840 | | | | 17,834,569 | | | | 0.33 | % | |
Woodbine Acquisition LLC | | 1/9/2014, 1/13/2014 | | | 28,865,894 | | | | 28,755,680 | | | | 0.53 | % | |
Kar Auction Services Term Loan
BL1252123 | | 3/7/2014 | | | 14,972,000 | | | | 15,035,332 | | | | 0.28 | % | |
La Frontera Generation Term Loan B 5/9/2013, 5/15/2013,
5/22/2013, 5/23/2013,
10/2/2013, 10/3/2013, | |
1/3/2014 | | | 29,969,765 | | | | 30,103,311 | | | | 0.55 | % | |
Nielsen Finance LLC Term Loan
LN 284932 | | 2/25/2013 | | | 11,664,150 | | | | 11,666,736 | | | | 0.21 | % | |
OCI Beaumont LLC Term Loan B1 | | 8/13/2013, 9/24/2013,
9/25/2013 | | | 16,390,647 | | | | 16,682,390 | | | | 0.31 | % | |
Toys R Us Property Term Loan 7/31/2013, 10/17/2013,
12/4/2013, 12/18/2013, | |
2/3/2014, 2/11/2014 | | | 24,964,258 | | | | 24,395,055 | | | | 0.45 | % | |
| | | | | $ | 1,567,469,660 | | | $ | 1,568,770,923 | | | | 28.82 | % | |
33
FPA NEW INCOME, INC.
STATEMENT OF ASSETS AND LIABILITIES
March 31, 2014
(Unaudited)
ASSETS | |
Investments at value: | |
Investments securities — at fair value
(identified cost $5,363,633,935) | | $ | 5,274,536,208 | | | | | | |
Short-term investments — at cost plus interest earned
(maturities 60 days or less) | | | 158,111,467 | | | $ | 5,432,647,675 | | |
Cash | | | | | | | 728 | | |
Receivable for: | |
Interest | | $ | 26,272,975 | | | | | | |
Investment Securities sold | | | 7,245,927 | | | | | | |
Capital Stock sold | | | 11,074,494 | | | | 44,593,396 | | |
| | | | | $ | 5,477,241,799 | | |
LIABILITIES | |
Payable for: | |
Investment securities purchased | | $ | 27,089,311 | | | | | | |
Capital Stock repurchased | | | 4,195,816 | | | | | | |
Advisory fees | | | 2,296,403 | | | | | | |
Accrued expenses and other liabilities | | | 297,870 | | | | 33,879,400 | | |
NET ASSETS | | | | | | $ | 5,443,362,399 | | |
SUMMARY OF SHAREHOLDERS' EQUITY | |
Capital Stock — par value $0.01 per share; authorized
600,000,000 shares; outstanding 526,737,199 shares | | | | $ | 5,267,372 | | |
Additional paid in capital | | | | | 5,731,305,834 | | |
Accumulated net realized loss | | | | | (235,828,355 | ) | |
Undistributed net investment income | | | | | 31,715,275 | | |
Unrealized depreciation of investments | | | | | (89,097,727 | ) | |
NET ASSETS | | | | $ | 5,443,362,399 | | |
NET ASSET VALUE | |
Offering and redemption price per share | | | | $ | 10.33 | | |
See notes to financial statements.
34
FPA NEW INCOME, INC.
STATEMENT OF OPERATIONS
For the Six Months Ended March 31, 2014
(Unaudited)
INVESTMENT INCOME | |
Interest | | | | | | $ | 98,610,734 | | |
EXPENSES | |
Advisory fees | | $ | 12,924,931 | | | | | | |
Transfer agent fees and expenses | | | 1,282,598 | | | | | | |
Custodian fees and expenses | | | 166,559 | | | | | | |
Reports to shareholders | | | 152,480 | | | | | | |
Directors' fees and expenses | | | 105,000 | | | | | | |
Registration fees | | | 80,432 | | | | | | |
Audit fees | | | 37,980 | | | | | | |
Legal fees | | | 12,831 | | | | | | |
Other expenses | | | 49,785 | | | | 14,812,596 | | |
Net investment income | | | | $ | 83,798,138 | | |
NET REALIZED AND UNREALIZED LOSS ON INVESTMENTS | |
Net realized loss on investments: | |
Proceeds from sale of investment securities (excluding
short-term investments with maturities 60 days or less) | | $ | 2,444,489,529 | | | | | | |
Cost of investment securities sold | | | 2,466,266,222 | | | | | | |
Net realized loss on investments | | | | | | $ | (21,776,693 | ) | |
Unrealized depreciation of investments: | |
Unrealized depreciation at beginning of period | | $ | (68,012,040 | ) | | | | | |
Unrealized depreciation at end of period | | | (89,097,727 | ) | | | | | |
Change in unrealized depreciation of investments | | | | | | | (21,085,687 | ) | |
Net realized and unrealized loss on investments | | | | | | $ | (42,862,380 | ) | |
NET CHANGE IN NET ASSETS RESULTING FROM OPERATIONS | | | | | | $ | 40,935,758 | | |
See notes to financial statements.
35
FPA NEW INCOME, INC.
STATEMENT OF CHANGES IN NET ASSETS
| | | For the Six Months Ended
March 31, 2014
(Unaudited) | | For the Year Ended
September 30, 2013 | |
INCREASE IN NET ASSETS | |
Operations: | |
Net investment income | | $ | 83,798,138 | | | | | | | $ | 135,765,350 | | | | | | |
Net realized gain (loss) on investments | | | (21,776,693 | ) | | | | | | | (26,486,105 | ) | | | | | |
Decrease in unrealized
appreciation of investments | | | (21,085,687 | ) | | | | | | | (75,600,542 | ) | | | | | |
Increase in net assets resulting
from operations | | | | | | $ | 40,935,758 | | | | | | | $ | 33,678,703 | | |
Dividends to shareholders from
net investment income | | | | | | | (97,048,341 | ) | | | | | | | (149,351,776 | ) | |
Capital Stock transactions: | |
Proceeds from Capital Stock sold | | $ | 1,593,437,912 | | | | | | | $ | 2,091,317,496 | | | | | | |
Proceeds from shares issued to
shareholders upon reinvestment
of dividends and distributions | | | 77,289,157 | | | | | | | | 115,048,142 | | | | | | |
Cost of Capital Stock repurchased* | | | (1,203,819,466 | ) | | | 466,907,603 | | | | (2,149,805,799 | ) | | | 56,559,839 | | |
Total change in net assets | | | | | | $ | 410,795,020 | | | | | | | $ | (59,113,234 | ) | |
NET ASSETS | |
Beginning of period | | | | | | | 5,032,567,379 | | | | | | | | 5,091,680,613 | | |
End of period | | | | | | $ | 5,443,362,399 | | | | | | | $ | 5,032,567,379 | | |
CHANGE IN CAPITAL STOCK
OUTSTANDING | |
Shares of Capital Stock sold | | | | | | | 154,379,266 | | | | | | | | 198,339,785 | | |
Shares issued to shareholders upon
reinvestment of dividends
and distributions | | | | | | | 7,496,646 | | | | | | | | 10,913,447 | | |
Shares of Capital Stock repurchased | | | | | | | (116,629,569 | ) | | | | | | | (203,499,236 | ) | |
ChangeIncrease in Capital Stock
outstanding | | | | | | | 45,246,343 | | | | | | | | 5,753,996 | | |
* Net of redemption fees of $511,087 and $846,642 for the periods ended March 31, 2014, and September 30, 2013, respectively.
See notes to financial statements.
36
FPA NEW INCOME, INC.
FINANCIAL HIGHLIGHTS
Selected Data for Each Share of Capital Stock Outstanding Throughout Each Period
| | Six
Months
Ended
March 31,
2014 | | For the Year Ended September 30, | |
| | | (Unaudited) | | 2013 | | 2012 | | 2011 | | 2010 | | 2009 | |
Per share operating performance: | |
Net asset value at beginning
of period | | $ | 10.45 | | | $ | 10.70 | | | $ | 10.84 | | | $ | 11.04 | | | $ | 11.09 | | | $ | 11.06 | | |
Income from investment operations: | |
Net investment income | | $ | 0.17 | | | $ | 0.28 | | | $ | 0.27 | | | $ | 0.43 | | | $ | 0.36 | | | $ | 0.36 | | |
Net realized and unrealized
gain (loss) on investment
securities | | | (0.09 | ) | | | (0.21 | ) | | | (0.04 | ) | | | (0.16 | ) | | | (0.04 | ) | | | 0.08 | | |
Total from investment
operations | | $ | 0.08 | | | $ | 0.07 | | | $ | 0.23 | | | $ | 0.27 | | | $ | 0.32 | | | $ | 0.44 | | |
Less dividends from net
investment income | | $ | (0.20 | ) | | $ | (0.32 | ) | | $ | (0.37 | ) | | $ | (0.47 | ) | | $ | (0.37 | ) | | $ | (0.41 | ) | |
Redemption fees | | | — | * | | | — | * | | | — | * | | | — | * | | | — | * | | | — | * | |
Net asset value at end of period | | $ | 10.33 | | | $ | 10.45 | | | $ | 10.70 | | | $ | 10.84 | | | $ | 11.04 | | | $ | 11.09 | | |
| Total investment return** | | | 0.78 | % | | | 0.66 | % | | | 2.18 | % | | | 2.47 | % | | | 2.90 | % | | | 4.03 | % | |
Ratios/supplemental data: | |
Net assets at end of period
(in $000's) | | $ | 5,443,362 | | | $ | 5,032,567 | | | $ | 5,091,681 | | | $ | 4,276,200 | | | $ | 4,145,399 | | | $ | 3,813,468 | | |
Ratio of expenses to average
net assets | | | 0.57 | %† | | | 0.58 | % | | | 0.57 | % | | | 0.60 | % | | | 0.60 | % | | | 0.60 | % | |
Ratio of net investment income
to average net assets | | | 3.21 | %† | | | 2.74 | % | | | 2.21 | % | | | 3.94 | % | | | 2.98 | % | | | 3.20 | % | |
| Portfolio turnover rate | | | 101 | %† | | | 84 | % | | | 77 | % | | | 117 | % | | | 78 | % | | | 64 | % | |
* Rounds to less than $0.01 per share.
** Return is based on net asset value per share, adjusted for reinvestment of distributions, and does not reflect deduction of the sales charge. The total investment return for the six months ended March 31, 2014 is not annualized.
† Annualized
See notes to financial statements.
37
FPA NEW INCOME, INC.
NOTES TO FINANCIAL STATEMENTS
March 31, 2014
NOTE 1 — Significant Accounting Policies
The Fund is registered under the Investment Company Act of 1940 as a diversified, open-end, management investment company. The Fund's primary investment objective is to seek current income and long-term total return. The following is a summary of significant accounting policies consistently followed by the Fund in the preparation of its financial statements.
A. Security Valuation
The Fund's investments are reported at fair value as defined by accounting principles generally accepted in the United States of America. The Fund generally determines its net asset value as of approximately 4:00 p.m. New York time each day the New York Stock Exchange is open. Further discussion of valuation methods, inputs and classifications can be found under Note 7.
B. Securities Transactions and Related Investment Income
Securities transactions are accounted for on the date the securities are purchased or sold. Dividend income and distributions to shareholders are recorded on the ex-dividend date. Interest income and expenses are recorded on an accrual basis. Market discounts and premiums on fixed income securities are amortized over the expected life of the securities. Realized gains or losses are based on the specific identification method.
C. Use of Estimates
The preparation of financial statements in conformity with accounting principles generally accepted in the United States requires management to make estimates and assumptions that affect the amounts reported. Actual results could differ from these estimates.
NOTE 2 — Risk Considerations
Investing in the Fund may involve certain risks including, but not limited to, those described below.
Market Risk: Because the values of the Fund's investments will fluctuate with market conditions, so will the value of your investment in the Fund. You could lose money on your investment in the Fund or the Fund could underperform other investments.
Interest Rate Risk: The values of, and the income generated by, most debt securities held by the Fund may be affected by changing interest rates and by changes in the effective maturities and credit ratings of these securities. For example, the values of debt securities in the Fund's portfolio generally will decline when interest rates rise and increase when interest rates fall. In addition, falling interest rates may cause an issuer to redeem, call or refinance a security before its stated maturity, which may result in the Fund having to reinvest the proceeds in lower-yielding securities.
Mortgage-Backed and Other Asset-Backed Securities Risk: The values of some mortgaged-backed and other asset-backed securities may expose the Fund to a lower rate of return upon reinvestment of principal. When interest rates rise, the value of mortgage-related securities generally will decline; however, when interest rates are declining, the value of mortgage related-securities with prepayment features may not increase as much as other fixed income securities. The rate of prepayments on underlying mortgages will affect the price and volatility of a mortgage-related security, and may shorten or extend the effective maturity of the security beyond what was anticipated at the time of purchase. If an unanticipated rate of prepayment on underlying mortgages increases the effective maturity of a mortgage-related security, the volatility of the security can be expected to increase. The value of these securities may also fluctuate in response to the market's perception of the creditworthiness of the issuers. Additionally, although mortgages and mortgage-related securities are generally supported by some form
38
FPA NEW INCOME, INC.
NOTES TO FINANCIAL STATEMENTS
Continued
of government or private guarantee and/or insurance, there is no assurance that private guarantors or insurers will meet their obligations.
Stripped Mortgage-Backed Interest Only ("I/O") and Principal Only ("P/O") Securities: Stripped mortgage-backed securities are usually structured with two classes that receive different proportions of the interest and principal distributions on a pool of mortgage assets. In certain cases, one class will receive all of the interest payments on the underlying mortgages (the I/O class), while the other class will receive all of the principal payments (the P/O class). The Fund currently has investments in I/O securities. The yield to maturity on IOs is sensitive to the rate of principal repayments (including prepayments) on the related underlying mortgage assets, and principal payments may have a material effect on yield-to-maturity. If the underlying mortgage assets experience greater than anticipated prepayments of principal, a Fund may not fully recoup its initial investment in I/Os.
Credit Risk: Debt securities are subject to credit risk, meaning that the issuer of the debt security may default or fail to make timely payments of principal or interest. The values of any of the Fund's investments may also decline in response to events affecting the issuer or its credit rating. The lower rated debt securities in which the Fund may invest are considered speculative and are generally subject to greater volatility and risk of loss than investment grade securities, particularly in deteriorating economic conditions. The Fund invests a significant portion of its assets in securities of issuers that hold mortgage- and asset-backed securities and direct investments in securities backed by commercial and residential mortgage loans and other financial assets. The value and related income of these securities is sensitive to changes in economic conditions, including delinquencies and/or defaults. Continuing shifts in the market's perception of credit quality on securities backed by commercial and residential mortgage loans and other financial assets may result in increased volatility of market price and periods of illiquidity that can negatively impact the valuation of certain securities held by the Fund.
Repurchase Agreements: Repurchase agreements permit the Fund to maintain liquidity and earn income over periods of time as short as overnight. Repurchase agreements held by the Fund are fully collateralized by U.S. Government securities, or securities issued by U.S. Government agencies, or securities that are within the three highest credit categories assigned by established rating agencies (Aaa, Aa, or A by Moody's or AAA, AA or A by Standard & Poor's) or, if not rated by Moody's or Standard & Poor's, are of equivalent investment quality as determined by the Adviser. Such collateral is in the possession of the Fund's custodian. The collateral is evaluated daily to ensure its market value equals or exceeds the current market value of the repurchase agreements including accrued interest. In the event of default on the obligation to repurchase, the Fund has the right to liquidate the collateral and apply the proceeds in satisfaction of the obligation.
The Fund may enter into repurchase agreements, under the terms of a Master Repurchase Agreement ("MRA"). The MRA permits the Fund, under certain circumstances including an event of default (such as bankruptcy or insolvency), to offset payables and/or receivables under the MRA with collateral held and/or posted to the counterparty and create one single net payment due to or from the Fund. However, bankruptcy or insolvency laws of a particular jurisdiction may impose restrictions on or prohibitions against such a right of offset in the event of a MRA counterparty's bankruptcy or insolvency. Pursuant to the terms of the MRA, the Fund receives securities as collateral with a market value in excess of the repurchase price to be received by the Fund upon the maturity of the repurchase transaction. Upon a bankruptcy or insolvency of the MRA counterparty, the Fund recognizes a liability with respect to such excess collateral to reflect the Fund's obligation under bankruptcy law to return the excess to the counterparty. Repurchase agreements outstanding at the end of the period are listed in the Fund's Portfolio of Investments.
NOTE 3 — Purchases of Investment Securities
Cost of purchases of investment securities (excluding short-term investments with maturities of 60 days or less) aggregated $2,905,432,440 for the period ended March 31, 2014.
39
FPA NEW INCOME, INC.
NOTES TO FINANCIAL STATEMENTS
Continued
NOTE 4 — Advisory Fees and Other Affiliated Transactions
Pursuant to an Investment Advisory Agreement (the "Agreement"), advisory fees were paid by the Fund to First Pacific Advisors, LLC (the "Adviser"). Under the terms of this Agreement, the Fund pays the Adviser a monthly fee calculated at the annual rate of 0.5% of the average daily net assets of the Fund. The Agreement obligates the Adviser to reduce its fee to the extent necessary to reimburse the Fund for any annual expenses (exclusive of interest, taxes, the cost of any supplemental statistical and research information, and extraordinary expenses such as litigation) in excess of 11/2% of the first $15 million and 1% of the remaining average net assets of the Fund for the year.
For the period ended March 31, 2014, the Fund paid aggregate fees of $105,000 to all Directors who are not interested persons of the Adviser. Certain officers of the Fund are also officers of the Adviser.
NOTE 5 — Federal Income Tax
No provision for federal income tax is required because the Fund has elected to be taxed as a "regulated investment company" under the Internal Revenue Code and intends to maintain this qualification and to distribute each year to its shareholders, in accordance with the minimum distribution requirements of the Code, all of its taxable net investment income and taxable net realized gains on investments.
The cost of investment securities at March 31, 2014 for federal income tax purposes was $5,372,240,925. Gross unrealized appreciation and depreciation for all securities at March 31, 2014 for federal income tax purposes was $19,149,263 and $116,853,980, respectively, resulting in net unrealized depreciation of $97,704,717. As of and during the period ended March 31, 2014, the Fund did not have any liability for unrecognized tax benefits. The Fund recognizes interest and penalties, if any, related to unrecognized tax benefits as income tax expense in the Statement of Operations. During the period, the Fund did not incur any interest or penalties. The Fund is not subject to examination by U.S. federal tax authorities for years ended before September 30, 2010 or by state tax authorities for years ended before September 30, 2009.
NOTE 6 — Redemption Fees
A redemption fee of 2% applies to redemptions within 90 days of purchase for certain purchases made by persons eligible to purchase shares without an initial sales charge. For the period ended March 31, 2014, the Fund collected $511,087 in redemption fees, which amounted to less than $0.01 per share.
NOTE 7 — Disclosure of Fair Value Measurements
The Fund uses the following methods and inputs to establish the fair value of its assets and liabilities. Use of particular methods and inputs may vary over time based on availability and relevance as market and economic conditions evolve.
Equity securities are generally valued each day at the official closing price of, or the last reported sale price on, the exchange or market on which such securities principally are traded, as of the close of business on that day. If there have been no sales that day, equity securities are generally valued at the last available bid price. Securities that are unlisted and fixed-income and convertible securities listed on a national securities exchange for which the over-the-counter market more accurately reflects the securities' value in the judgment of the Fund's officers, are valued at the most recent bid price. However, most fixed income securities are generally valued at prices obtained from pricing vendors. Vendors value such securities based on one or more of the following inputs: transactions, bids, offers quotations from dealers and trading systems, spreads and other relationships observed in the markets among comparable securities, benchmarks, underlying equity of the issuer, and proprietary pricing models such as cash flows, financial or collateral performance and other reference data (includes prepayments, defaults, collateral, credit enhancements, and interest rate volatility). Short-term corporate notes with maturities of 60 days or less at time of purchase are valued at amortized cost, which approximates fair value.
40
FPA NEW INCOME, INC.
NOTES TO FINANCIAL STATEMENTS
Continued
Securities for which representative market quotations are not readily available or are considered unreliable by the Investment Adviser are valued as determined in good faith under guidelines adopted by authority of the Fund's Board of Directors. Various inputs may be reviewed in order to make a good faith determination of a security's value. These inputs include, but are not limited to, the type and cost of the security; contractual or legal restrictions on resale of the security; relevant financial or business developments of the issuer; actively traded similar or related securities; conversion or exchange rights on the security; related corporate actions; significant events occurring after the close of trading in the security; and changes in overall market conditions. Fair valuations and valuations of investments that are not actively trading involve judgment and may differ materially from valuations of investments that would have been used had greater market activity occurred.
The Fund classifies its assets based on three valuation methodologies. Level 1 investment securities are valued based on quoted market prices in active markets for identical assets. Level 2 investment securities are valued based on significant observable market inputs, such as quoted prices for similar assets and quoted prices in inactive markets or other market observable inputs as noted above including spreads, cash flows, financial performance, prepayments, defaults, collateral, credit enhancements, and interest rate volatility. Level 3 investment securities are valued using significant unobservable inputs that reflect the Fund's determination of assumptions that market participants might reasonably use in valuing the assets. These assumptions consider inputs such as proprietary pricing models, cash flows, prepayments, defaults, and collateral. The valuation levels are not necessarily an indication of the risk associated with investing in those securities. The following table presents the valuation levels of the Fund's investments as of March 31, 2014:
Investments | | Level 1 | | Level 2 | | Level 3 | | Total | |
Bonds & Debentures | |
Commercial Mortgage-Backed | |
Agency Stripped | | | — | | | $ | 399,678,653 | | | | — | | | $ | 399,678,653 | | |
Non-Agency | | | — | | | | 319,072,121 | | | | — | | | | 319,072,121 | | |
Agency | | | — | | | | 113,703,305 | | | | — | | | | 113,703,305 | | |
Residential Mortgage-Backed | |
Agency Pool Fixed Rate | | | — | | | | 251,559,399 | | | | — | | | | 251,559,399 | | |
Agency Collateralized Mortgage Obligation | | | — | | | | 945,859,703 | | | | — | | | | 945,859,703 | | |
Non-Agency Collateralized Mortgage Obligation | | | — | | | | 468,151,986 | | | $ | 10,216,403 | | | | 478,368,389 | | |
Agency Stripped | | | — | | | | 118,029,417 | | | | — | | | | 118,029,417 | | |
Agency Pool Adjustable Rate Mortgages | | | — | | | | 2,199,274 | | | | — | | | | 2,199,274 | | |
Asset-Backed Securities | |
Auto | | | — | | | | 836,266,857 | | | | — | | | | 836,266,857 | | |
Other | | | — | | | | 546,792,269 | | | | — | | | | 546,792,269 | | |
U.S. Treasuries | | | — | | | | 781,740,476 | | | | — | | | | 781,740,476 | | |
Corporate Bonds and Debentures | | | — | | | | 383,383,521 | | | | — | | | | 383,383,521 | | |
Corporate Bank Debt | | | — | | | | 97,882,824 | | | | — | | | | 97,882,824 | | |
Short-Term Investments | | | — | | | | 158,111,467 | | | | — | | | | 158,111,467 | | |
Total Investments | | | — | | | $ | 5,422,431,272 | | | $ | 10,216,403 | | | $ | 5,432,647,675 | | |
41
FPA NEW INCOME, INC.
NOTES TO FINANCIAL STATEMENTS
Continued
The following table summarizes the Fund's Level 3 investment securities and related transactions during the period ended March 31, 2014:
| Investment | | Beginning
Value at
September 30,
2013 | | Net Realized and
Unrealized Gains
(Losses)* | | Purchases | | (Sales) | | Net
Transfers
In (Out) | | Ending
Value at
March 31,
2014 | |
Non-Agency
Collateralized
Mortgage
Obligation | | $ | 10,657,536 | | | $ | 665,232 | | | $ | — | | | $ | (1,106,365 | ) | | $ | — | | | $ | 10,216,403 | | |
* Net realized and unrealized gains (losses) are included in the related amounts in the statement of operations.
Level 3 Valuation Process: Investments classified within Level 3 of the fair value hierarchy are valued by the Adviser in good faith under procedures adopted by authority of the Fund's Board of Directors. The Adviser employs various methods to determine fair valuations including regular review of key inputs and assumptions and review of related market activity, if any. However, there are generally no observable trade activities in these securities. The Adviser reports to the Board of Trustees at their regularly scheduled quarterly meetings, or more often if warranted. The report includes a summary of the results of the process, the key inputs and assumptions noted, and any changes to the inputs and assumptions used. When appropriate, the Adviser will recommend changes to the procedures and process employed. The value determined for an investment using the fair value procedures may differ significantly from the value realized upon the sale of such investment. Transfers of investments between different levels of the fair value hierarchy are recorded at market value as of the end of the reporting period. There were no transfers between Level 1, 2, or 3 during the year period March 31, 2014. The following table summarizes the quantitative inputs and assumptions used for items categorized as items categorized as Level 3 of the fair value hierarchy as of March 31, 2014:
| Financial Assets | | Fair Value at
March 31,
2014 | | Valuation
Technique(s) | | Unobservable
Inputs | | Price/Range | |
Non-Agency Collateralized
Mortgage Obligation
| | $10,216,403
| | Pricing Model*
| | Prices
Discount | | $49.79-$61.63 ($55.04)
1.5%-18.3% (6.3%) | |
* The Pricing Model technique for Level 3 securities involves preparing a proprietary broker price opinion (BPO) model using valuation information provided by the loan servicer based on local market resources and sales trends published by the National Association of Realtors, and a broker, and then applying an appropriate discount to that valuation. The discount reflects market conditions such as lack of liquidity of the investment, the costs associated with foreclosure and liquidation, the historical performance of the loan pool and the characteristics of the remaining loans including whether or not the loans are performing.
NOTE 8 — Distribution to Shareholders
On March 31, 2014, the Board of Directors declared a dividend from net investment income of $0.08 per share payable April 2, 2014 to shareholders of record on March 31, 2014. For financial statement purposes, this dividend was recorded on the ex-dividend date, April 1, 2014.
42
FPA NEW INCOME, INC.
NOTES TO FINANCIAL STATEMENTS
Continued
NOTE 9 — Collateral Requirements
The Fund has implemented the disclosure requirements pursuant to FASB Accounting Standards Update No. 2011-11, Disclosures about Offsetting Assets and Liabilities, that requires disclosures to make financial statements that are prepared under U.S. GAAP more comparable to those prepared under International Financial Reporting Standards. Under this guidance the Fund discloses both gross and net information about instruments and transactions eligible for offset such as instruments and transactions subject to an agreement similar to a master netting arrangement. In addition, the Fund discloses collateral received and posted in connection with master netting agreements or similar arrangements.
The following table presents the Fund's repurchase agreements by counterparty net of amounts available for offset under an ISDA Master agreement or similar agreements and net of the related collateral received or pledged by the Fund as of March 31, 2014, are as follows:
| Counterparty | | Gross Assets
in the Statement of
Assets and Liabilities | | Collateral
Received | | Assets (Liabilities)
Available for Offset | | Net Amount
of Assets* | |
State Street Bank
and Trust Company | | $ | 38,112,000 | | | $ | 38,112,000 | ** | | | — | | | | — | | |
* Represents the net amount receivable from the counterparty in the event of default.
** Collateral with a value of $38,877,313 has been received in connection with a master repurchase agreement. Excess of collateral received from the individual master repurchase agreement is not shown for financial reporting purposes.
43
FPA NEW INCOME, INC.
SHAREHOLDER EXPENSE EXAMPLE
March 31, 2014
Fund Expenses
As a shareholder of the Fund, you incur two types of costs: (1) transaction costs, and (2) ongoing costs, including advisory and administrative fees; shareholder service fees; and other Fund expenses. The Example is intended to help you understand your ongoing costs (in dollars) of investing in the Fund and to compare these costs with the ongoing costs of investing in other mutual funds. The Example is based on an investment of $1,000 invested at the beginning of the year and held for the entire year.
Actual Expenses
The information in the table under the heading "Actual Performance" provides information about actual account values and actual expenses. You may use the information in this column, together with the amount you invested, to estimate the expenses that you paid over the period. Simply divide your account value by $1,000 (for example, an $8,600 account value divided by $1,000= 8.6), then multiply the result by the number in the first column in the row entitled "Expenses Paid During Period" to estimate the expenses you paid on your account during this period.
Hypothetical Example for Comparison Purposes
The information in the table under the heading "Hypothetical Performance (5% return before expenses)" provides information about hypothetical account values and hypothetical expenses based on the Fund's actual expense ratio and an assumed rate of return of 5% per year before expenses, which is not the Fund's actual return. The hypothetical account values and expenses may not be used to estimate the
actual ending account balance or expenses you paid for the period. You may use this information to compare the ongoing costs of investing in the Fund and other funds. To do so, compare this 5% hypothetical example with the 5% hypothetical examples that appear in the shareholder reports of other funds.
Please note that the expenses shown in the table are meant to highlight your ongoing costs only and do not reflect any transactional costs. Therefore, the information under the heading "Hypothetical Performance (5% return before expenses)" is useful in comparing ongoing costs only, and will not help you determine the relative total costs of owning different funds. In addition, if these transactional costs were included, your costs would have been higher.
| | | Actual
Performance | | Hypothetical
Performance
(5% return
before
expenses) | |
Beginning Account Value
September 30, 2013 | | $ | 1,000.00 | | | $ | 1,000.00 | | |
Ending Account Value
March 31, 2014 | | $ | 1,007.80 | | | $ | 1,022.12 | | |
Expenses Paid During
Period* | | $ | 2.85 | | | $ | 2.88 | | |
* Expenses are equal to the Fund's annualized expense ratio of 0.57%, multiplied by the average account value over the period and prorated for the six-months ended March 31, 2014 (182/365 days).
44
FPA NEW INCOME, INC.
DIRECTOR AND OFFICER INFORMATION
| Name, Age & Address | | Position(s)
With Fund/
Years Served | | Principal Occupation(s)
During the Past 5 Years | | Portfolios in
Fund Complex
Overseen | | Other Directorships | |
Allan M. Rudnick – (73)* | | Director and Chairman†
Years Served: 4 | | Private Investor. Formerly, Co-Founder,
Chief Executive Officer, Chairman and
Chief Investment Officer of Kayne Anderson Rudnick Investment Management from 1989 to 2007 | | | 7 | | | | |
Thomas P. Merrick – (77)* | | Director†
Years Served: 5 | | Private Consultant. President of Strategic Planning Consultants for more than the past five years. Former Executive Committee Member and Vice President of Fluor Corporation, responsible for strategic planning, from 1984 to 1998. | | | 7 | | | | |
Alfred E. Osborne, Jr. – (69)* | | Director†
Years Served: 14 | | Senior Associate Dean of the John E. Anderson School of Management at UCLA. | | | 7 | | | Wedbush, Inc., Nuverra Environmental Solutions, Inc., and Kaiser Aluminum Corporation. | |
A. Robert Pisano – (71)* | | Director†
Years Served: 1 | | Consultant. Formerly President and Chief Operating Officer of the Motion Picture Association of America, Inc. from 2005 to 2011. | | | 7 | | | Entertainment Partners, Resources Global Professionals and The Motion Picture and Television Fund | |
Patrick B. Purcell – (71)* | | Director†
Years Served: 8 | | Retired. Formerly Executive Vice President, Chief Financial Officer and Chief Administrative Officer of Paramount Pictures from 1983 to 1998. | | | 7 | | | The Motion Picture and Television Fund | |
Robert L. Rodriguez – (65) | | Director†
Portfolio Manager
Years Served: 30 | | Chief Executive Officer of the Adviser. | | | 2 | | | | |
Thomas H. Atteberry – (60) | | Chief Executive Officer & Portfolio Manager
Years Served: 9 | | Partner of the Adviser. Formerly Vice President of First Pacific Advisors, Inc. from 1997 to 2006. | | | | | |
J. Richard Atwood – (53) | | Treasurer
Years Served: 17 | | Chief Operating Officer of the Adviser. | | | | | |
Christopher H. Thomas – (57) | | Chief Compliance Officer
Years Served: 19 | | Vice President and Chief Compliance Officer of the Adviser. | | | | | |
45
FPA NEW INCOME, INC.
DIRECTOR AND OFFICER INFORMATION
Continued
| Name, Age & Address | | Position(s)
With Fund/
Years Served | | Principal Occupation(s)
During the Past 5 Years | | Portfolios in
Fund Complex
Overseen | | Other Directorships | |
Sherry Sasaki – (59) | | Secretary
Years Served: 30 | | Assistant Vice President and Secretary of the Adviser. | | | | | |
E. Lake Setzler – (47) | | Assistant Treasurer
Years Served: 8 | | Vice President and Controller of the Adviser. | | | | | |
Michael P. Gomez – (28) | | Assistant Vice President
Years Served: 2 | | Assistant Vice President of the Adviser since 2010. Formerly In-Charge Associate of PricewaterhouseCoopers from 2007 to 2010. | | | | | |
† Directors serve until their resignation, removal or retirement.
* Audit Committee member
Additional information on the Directors is available in the Statement of Additional Information. Each of the above listed individuals can be contacted at 11400 W. Olympic Blvd., Suite 1200, Los Angeles, CA 90064.
46
INVESTMENT ADVISER
First Pacific Advisors, LLC
11400 West Olympic Boulevard, Suite 1200
Los Angeles, California 90064
DISTRIBUTOR
UMB Distribution Services, LLC
803 West Michigan Street
Milwaukee, Wisconsin 53233
LEGAL COUNSEL
K&L Gates LLP
San Francisco, California
TICKER: FPNIX
CUSIP: 302544101
INDEPENDENT REGISTERED PUBLIC ACCOUNTING FIRM
Deloitte & Touche LLP
Los Angeles, California
CUSTODIAN
State Street Bank and Trust Company
Boston, Massachusetts
TRANSFER & SHAREHOLDER SERVICE AGENT
UMB Fund Services, Inc.
P.O. Box 2175
Milwaukee, WI 53201-2175
803 W. Michigan St.
Milwaukee, WI 53233-2301
(800) 638-3060
This report has been prepared for the information of shareholders of FPA New Income, Inc., and is not authorized for distribution to prospective investors unless preceded or accompanied by a prospectus.
The Fund's complete proxy voting record for the 12 months ended June 30, 2013 is available without charge, upon request, by calling (800) 982-4372 and on the SEC's website at www.sec.gov.
The Fund's schedule of portfolio holdings, filed the first and third quarter of the Fund's fiscal year on Form N-Q with the SEC, is available on the SEC's website at www.sec.gov. Form N-Q is available at the SEC's Public Reference Room in Washington, D.C., and information on the operations of the Public Reference Room may be obtained by calling (202) 942-8090. To obtain information on Form N-Q from the Fund, shareholders can call (800) 982-4372.
Additional information about the Fund is available online at www.fpafunds.com. This information includes, among other things, holdings, top sectors and performance, and is updated on or about the 15th business day after the end of each quarter.
Item 2. | | Code of Ethics. Not Applicable to this semi-annual report. |
| | |
Item 3. | | Audit Committee Financial Expert. Not Applicable to this semi-annual report. |
| | |
Item 4. | | Principal Accountant Fees and Services. Not Applicable to this semi- annual report. |
| | |
Item 5. | | Audit Committee of Listed Registrants. Not Applicable. |
| | |
Item 6. | | Schedule of Investments. The schedule of investments is included as part of the report to stockholders filed under Item 1 of this Form. |
| | |
Item 7. | | Disclosure of Proxy Voting Policies and Procedures for Closed-End Management Investment Companies. Not Applicable. |
| | |
Item 8. | | Portfolio Managers of Closed-End Management Investment Companies. Not Applicable. |
| | |
Item 9. | | Purchases of Equity Securities by Closed-End Management Investment Company and Affiliated Purchasers. Not Applicable. |
| | |
Item 10. | | Submission of Matters to a Vote of Security Holders. There has been no material change to the procedures by which shareholders may recommend nominees to the registrant’s board of directors. |
| | |
Item 11. | | Controls and Procedures. |
| | |
| | (a) | The principal executive officer and principal financial officer of the registrant have concluded that the registrant’s disclosure controls and procedures (as defined in Rule 30a-3(c) under the Investment Company Act of 1940) are effective based on their evaluation of the disclosure controls and procedures as of a date within 90 days of the filing date of this report. |
| | | |
| | (b) | There have been no significant changes in the registrant’s internal controls over financial reporting (as defined in Rule 30a-3(d) under the Investment Company Act of 1940) that occurred during the second fiscal quarter of the period covered by this report that have materially affected, or is reasonably likely to materially affect, the registrant’s internal controls over financial reporting. |
Item 12. | | Exhibits. |
| | | |
| | (a)(1) | Code of ethics as applies to the registrant’s principal executive and financial officers, as required to be disclosed under Item 2 of Form N-CSR. Not Applicable to this semi-annual report. |
| | | |
| | (a)(2) | Separate certification for the registrant’s principal executive officer and principal financial officer, as required by Rule 30a-2(a) under the Investment Company Act of 1940. Attached hereto. |
| | | |
| | (a)(3) | Not Applicable |
| | | |
| | (b) | Separate certification for the registrant’s principal executive officer and principal financial officer, as required by Rule 30a-2(b) under the Investment Company Act of 1940. Attached hereto. |
SIGNATURES
Pursuant to the requirements of the Securities Exchange Act of 1934 and the Investment Company Act of 1940, the registrant has duly caused this report to be signed on its behalf by the undersigned, thereunto duly authorized.
FPA NEW INCOME, INC.
By: | /s/ THOMAS H. ATTEBERRY | |
Thomas H. Atteberry, Chief Executive Officer | |
(Principal Executive Officer) | |
| |
Date: May 21, 2014 | |
Pursuant to the requirements of the Securities Exchange Act of 1934 and the Investment Company Act of 1940, this report has been signed below by the following persons on behalf of the registrant and in the capacities and on the dates indicated.
FPA NEW INCOME, INC.
By: | /s/ THOMAS H. ATTEBERRY | |
Thomas H. Atteberry, Chief Executive Officer | |
(Principal Executive Officer) | |
| |
Date: May 21, 2014 | |
By: | /s/ J. RICHARD ATWOOD | |
J. Richard Atwood, Treasurer | |
(Principal Financial Officer) | |
| |
Date: May 21, 2014 | |