UNITED STATES
SECURITIES AND EXCHANGE COMMISSION
Washington, D.C. 20549
FORM N-CSR
CERTIFIED SHAREHOLDER REPORT OF REGISTERED
MANAGEMENT INVESTMENT COMPANIES
Investment Company Act file number | 811-1735 |
|
FPA NEW INCOME, INC. |
(Exact name of registrant as specified in charter) |
|
11601 WILSHIRE BLVD., STE. 1200 LOS ANGELES, CALIFORNIA | | 90025 |
(Address of principal executive offices) | | (Zip code) |
|
(Name and address of agent for service) J. RICHARD ATWOOD, PRESIDENT FPA NEW INCOME, INC. 11601 WILSHIRE BLVD., STE. 1200 LOS ANGELES, CALIFORNIA 90025 | Copy to: MARK D. PERLOW, ESQ. DECHERT LLP ONE BUSH STREET, STE. 1600 SAN FRANCISCO, CA 94104 |
|
Registrant’s telephone number, including area code: | (310) 473-0225 | |
|
Date of fiscal year end: | September 30 | |
|
Date of reporting period: | March 31, 2017 | |
| | | | | | | | | |
Item 1: Report to Shareholders.

Distributor:
UMB DISTRIBUTION SERVICES, LLC
235 West Galena Street
Milwaukee, Wisconsin 53212
FPA NEW INCOME, INC.
LETTER TO SHAREHOLDERS
Dear Shareholders:
FPA New Income, Inc. (the "Fund") had a total return of 0.60% in the first quarter of 2017 and a total return of 2.53% for the trailing 12 months.
As of March 31, the portfolio had a yield-to-worst1 of 2.71% and an effective duration2 of 1.57 years. The Treasury yield curve flattened during the quarter with increasing yields for maturities up to three years and decreasing yields for maturities greater than three years. At the same time, credit spreads across both high-quality and lower credit assets compressed. We took advantage of the overall net increase in high-quality yields to extend the portfolio's duration. Meanwhile, lower credit spreads led us to reduce the portfolio's credit exposure. We remain cautious on credit risk given the current low spread environment that offers less compensation for credit risk relative to the risk-free Treasury rate. The portfolio's credit-sensitive holdings decreased to 14.7% at the end of the first quarter compared to 18.6% of the portfolio at the end of 2016. Cash decreased during the quarter to 3.8% of the portfolio, versus 9.6% at year end.
Portfolio Attribution
The largest positive contribution to performance during the first quarter came from asset-backed securities3 associated with sub-prime auto loans. In addition to the coupon return, our specific bonds benefited from higher prices because lower spreads offset the rise in Treasury rates. The second-largest contribution to performance stemmed from collateralized loan obligations4, due to coupon payments and higher prices caused by lower spreads. Bonds backed by cell phone towers were the third-largest contributor to performance, primarily because one of our holdings was called at a significant price premium.
The only sector to produce a negative return was the agency mortgage interest-only bonds due to lower prices as a result of rising interest rates. The very short average life of the mortgages underlying these interest-only bonds (less than 2-years) means that the pace of prepayments typically doesn't slow in reaction to rising interest rates. Consequently, in contrast to a typical interest-only bond, the price of these bonds tends to fall when interest rates rise and vice versa. As discussed in more detail below, we sold the majority of our agency mortgage interest-only bonds. The other detractors from performance were not as meaningful.
1 Yield-to-worst is the lowest possible yield that can be received on a bond without the issuer actually defaulting. It does not represent the yield that an investor should expect to receive. As of March 31, 2017, the SEC yield was 2.84%. This yield figure reflects the theoretical income that a bond portfolio would generate, including dividends and interest, during the period after deducting the Fund's expenses for the period. The Fund's actual net earnings for a given period under generally accepted accounting principles may differ from this standardized yield. The SEC yield is expressed as an annual percentage based on the price of the Fund at the beginning of the month.
2 Duration is a measure of the sensitivity of the price (the value of principal) of a fixed-income investment to a change in interest rates.
3 Asset backed securities are financial securities backed by a loan, lease or receivables against assets other than real estate and mortgage-backed securities.
4 Collateralized loan obligations (CLO) are securities backed by a pool of debt, often low-rated corporate loans.
1
FPA NEW INCOME, INC.
LETTER TO SHAREHOLDERS
(Continued)
Portfolio Positioning
The table below shows the change in portfolio allocations over the first quarter:
| Sector | | % Portfolio
3/31/2017 | | % Portfolio
12/31/2016 | |
ABS | | | 54.1 | % | | | 47.8 | % | |
Mortgage Backed (CMO5) | | | 15.7 | % | | | 13.2 | % | |
Stripped Mortgage-backed | | | 10.2 | % | | | 11.4 | % | |
Corporate | | | 6.2 | % | | | 6.2 | % | |
Cash and equivalents | | | 3.8 | % | | | 9.6 | % | |
CMBS6 | | | 4.0 | % | | | 5.2 | % | |
Mortgage Pass-through | | | 2.9 | % | | | 3.4 | % | |
U.S. Treasury | | | 3.0 | % | | | 3.0 | % | |
Municipal | | | 0.1 | % | | | 0.3 | % | |
Total | | | 100 | % | | | 100 | % | |
Yield | | | 2.71 | % | | | 2.69 | % | |
Duration (years) | | | 1.57 | | | | 1.25 | | |
Average Life (years) | | | 1.93 | | | | 1.90 | | |
In our Q4 2016 letter, we commented that we intended to increase the duration of the portfolio if the higher interest rate environment persisted. It turned out that rates increased even further for Treasury maturities up to three years, with rates for longer maturities decreasing slightly:
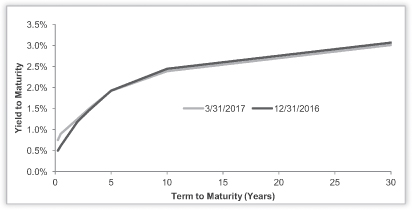
Source: Bloomberg
5 Collateralized mortgage obligations are mortgage-backed bonds that separate mortgage pools into different maturity classes.
6 Commercial mortgage backed securities are securities backed by commercial mortgages rather than residential mortgages.
2
FPA NEW INCOME, INC.
LETTER TO SHAREHOLDERS
(Continued)
We availed ourselves of this more attractive market and actively deployed capital into longer-duration bonds. We invested almost a quarter of the portfolio into bonds with a weighted average effective duration of approximately 2.7 years. Importantly, we bought these bonds at yields that we believe are well positioned to provide a positive total return if yields were to increase by 100 basis points over the next 12 months.
Specifically, we increased our holdings of asset-backed securities, primarily by increasing our CLO holdings to 10.8%7 of the portfolio, up from 6.4%. These investments are similar to the CLO investments we described in our Q4 2016 letter, except that slightly more than half of this quarter's CLO investments were fixed rate bonds, whereas all of last quarter's CLO investments were floating rate bonds. Going forward, we will likely limit our CLO exposure to approximately 10-15% of the portfolio. This asset class sells off periodically, and we want to ensure that we have enough capacity to take advantage of those sell-offs. We also bought longer duration auto, equipment and credit asset-backed securities.
We added to our investment in agency mortgage bonds backed by relocation mortgages. Relocation mortgages are agency-guaranteed mortgages provided to individuals who move to a new location on a temporary assignment (e.g., military transfers or temporary assignments by corporations). While they are technically 30-year mortgages, relocation mortgages behave differently because the borrowers tend to move after three to five years, resulting in a significant increase in prepayment activity. Based on available yields, we have periodically found that CMOs backed by relocation mortgage collateral have been a good fit for our portfolio.
To fund these investments, we used cash on hand and the proceeds from bond sales. We sold all of our agency single-family mortgage interest-only bonds backed by 10-year residential mortgages, and a large portion of our agency single-family mortgage interest-only bonds backed by 15-year residential mortgages. In total, our residential agency mortgage interest-only bond exposure decreased to 0.05% of the portfolio at the end of the first quarter, compared to 0.69% at the end of 2016.8 In our view, these bonds are so seasoned that they behave more like principal and interest bonds rather than interest-only bonds in that they have positive duration rather than negative duration. Consequently, they no longer served one of their original purposes, which was to provide a positive return in a rising-rate environment. From an expected total return standpoint, going forward we did not feel that the expected return and the potential variability of that return was attractive enough to merit retaining this investment. We also sold agency CMOs, most of which were backed by seasoned 15-year single-family mortgages, and asset-backed securities backed by automobile loans, equipment or credit card receivables. Aside from the interest-only bonds, the bonds that were sold had aged such that, going forward, they had expected weighted average lives of less than a year and offered less attractive returns compared to the new bond purchases. The net result of this activity was that the portfolio's duration increased and cash decreased significantly during the quarter.
Finally, there have been a number of news items recently highlighting concerns about falling used car prices and rising auto loan delinquencies. We discussed our investment in auto loan asset-backed securities in our March 31, 2016 quarterly letter. Our comments from that letter remain true today:
"Our approach is to research the underwriting history of the loan issuers. We invest with issuers that are prudent underwriters and servicers, and that have the financial strength to survive a wave of higher loan losses. We also apply high loss assumptions. We assume that future default rates and losses will be greater than or equal to the worst losses an issuer has ever experienced. Typically, we assume that losses will mimic those seen during the financial crisis or during the recession in the early 2000s. Thus, we are not alarmed by news of rising delinquency rates because we have already assumed a much higher level of delinquencies and defaults. Moreover, our analysis typically assumes that used car values will be zero, so we are not anxious about falling used car prices. In summary, we seek bonds that will retain their value under a wide range of loss levels rather than bonds that only work within a narrow performance band."
7 The reported CLO holdings represent 12.2% of the portfolio, but they include three investments (representing a total of 1.4% of the portfolio) which had been called as of March 31, 2017.
8 A portion of the decrease was due to amortization of the remaining holdings.
3
FPA NEW INCOME, INC.
LETTER TO SHAREHOLDERS
(Continued)
Market Commentary
Our fourth quarter 2016 letter discussed the change in investor perceptions about economic growth and the resulting impact on Treasury yields. We also discussed interest rate risk and return in a special commentary we published Nov. 14, 2016, entitled "Today's Case for FPA New Income Inc." found on our website.
The following is an explanation of how we measure whether we are getting paid sufficiently to take on interest rate risk in the high-quality portion of the portfolio. We define high quality as those securities that have a credit rating of at least A- by a rating agency. Note that if more than one rating agency rates a security, we use the lowest published rating for this definition.
The chart below shows the change in Treasury yields from the low point in yields in early July 2016 to the end of the first quarter of 2017. The prevailing market sentiment is that these higher yields are driven by President Trump-induced expectations of higher economic growth and inflation (the so-called "Trump Trade").
| Treasury Maturity | | Yield as of
7/8/2016 | | Yield as of
3/31/17 | | Difference (bps) | |
| 2 Year | | | 0.61 | % | | | 1.25 | % | | | 64 | | |
| 3 Year | | | 0.70 | % | | | 1.49 | % | | | 79 | | |
| 5 Year | | | 0.95 | % | | | 1.92 | % | | | 97 | | |
| 7 Year | | | 1.19 | % | | | 2.21 | % | | | 102 | | |
| 10 Year | | | 1.36 | % | | | 2.39 | % | | | 103 | | |
| 30 Year | | | 2.10 | % | | | 3.01 | % | | | 91 | | |
Source: Bloomberg
With Treasury yields higher, are we now getting compensated to take on significantly more interest rate risk, and as such, how much longer should the effective duration of the portfolio be? How do we evaluate investments in the high-quality portion of the portfolio?
For securities rated A- or better, price changes have historically been driven predominantly by "macro" factors such as monetary policy, fiscal policy, the shape of the yield curve, and the level and direction of inflation, not by the willingness and ability of the debtor to repay the bond. Since macroeconomic forces have a high degree of uncertainty, we attempt to employ a more quantifiable approach in determining if a bond's expected return is commensurate with the interest-rate related price risk.
Our approach stress tests a bond by assuming its yield (Treasury yield plus spread) rises by 100 basis points in one year. In general, we buy bonds that we expect to have a positive total return in that scenario. We picked 100 basis points because such an increase is not an unusual event over a one-year time period. The table above illustrates this point: The yield on Treasury securities with a maturity of five years or more has increased by around 100 basis points since July 2016. Our stress test uses one year because it is consistent with one of our investment objectives — a positive return for the portfolio over a one-year time horizon.
4
FPA NEW INCOME, INC.
LETTER TO SHAREHOLDERS
(Continued)
The table below takes Treasury yields as of July 8, 2016 and subjects them to this stress test. The analysis illustrates that none of these Treasuries would pass our stress test at that time, as evidenced by the negative expected total return for
each security:
| Treasury Maturity | | Yield as of
7/8/2016 | | Yield plus
100 basis points | | Stress Test
Total Return | |
| 2 Year | | | 0.61 | % | | | 1.61 | % | | | -0.39 | % | |
| 3 Year | | | 0.70 | % | | | 1.70 | % | | | -1.19 | % | |
| 5 Year | | | 0.95 | % | | | 1.95 | % | | | -2.84 | % | |
| 7 Year | | | 1.19 | % | | | 2.19 | % | | | -4.35 | % | |
| 10 Year | | | 1.36 | % | | | 2.36 | % | | | -6.49 | % | |
| 30 Year | | | 2.10 | % | | | 3.10 | % | | | -16.24 | % | |
Source: Bloomberg.
Consequently, as of June 30, 2016, the Fund had the following characteristics for the total portfolio and the high-quality portion only. The effective duration and average life reflected the limited availability of high-quality bonds at prices that offer protection against 100 basis points of rising yields.
| As of 6/30/2016 | | Total Fund | | High Quality
Portion only | |
Yield-to-Worst | | | 2.93 | % | | | 1.88 | % | |
Effective Duration | | 1.34 years | | 1.33 years | |
Average Life | | 1.75 years | | 1.76 years | |
At the end of the first quarter of 2017, the same analysis on the Treasury yield curve produces the following results:
| Treasury Maturity | | Yield as of
3/31/2017 | | Yield plus
100 basis points | | Stress Test
Total Return | |
| 2 Year | | | 1.25 | % | | | 2.25 | % | | | 0.27 | % | |
| 3 Year | | | 1.49 | % | | | 2.49 | % | | | -0.40 | % | |
| 5 Year | | | 1.92 | % | | | 2.92 | % | | | -1.83 | % | |
| 7 Year | | | 2.21 | % | | | 3.21 | % | | | -3.22 | % | |
| 10 Year | | | 2.39 | % | | | 3.39 | % | | | -5.25 | % | |
| 30 Year | | | 3.01 | % | | | 4.01 | % | | | -14.00 | % | |
Source: Bloomberg.
5
FPA NEW INCOME, INC.
LETTER TO SHAREHOLDERS
(Continued)
At March 31, 2017, the two-year Treasury offered a positive expected total return, and the expected total return for the three-year Treasury had improved to -0.40%, up from -1.19% in July 2016. At the end of Q1 2017, the portfolio had the following statistics:
| As of 3/31/2017 | | Total Fund | | High Quality
Portion only | |
Yield-to-Worst | | | 2.71 | % | | | 2.33 | % | |
Effective Duration | | 1.57 years | | 1.68 years | |
Average Life | | 1.93 years | | 1.99 years | |
Over the past approximately nine months the upward shift in Treasury yields has allowed us to reinvest principal amortization, maturities and cash into higher yielding and longer duration assets. The high-quality portion of the portfolio increased in yield by 45 basis points, the effective duration increased by 0.35 years, and the average life increased by 0.23 years. Despite the increase in yield for the high-quality portion of the portfolio, the overall portfolio yields declined over this period due to the aforementioned reduction in the portfolio's credit exposure.
This analysis offers a couple of insights. First, the rise in interest rates seen over the second half of 2016 has not changed the risk versus reward profile for Treasury securities by very much. In our opinion, the potential exists for three-year maturity Treasuries or other high-quality three-year maturity bonds to offer enough yield (including spread) to be considered for investment, but longer duration investments are unlikely to appeal to us over the short- to intermediate-term unless one subscribes to a very dramatic shift in market perception. Second, a critical benefit of our stress test analysis is that it is a quantifiable, repeatable component of our investment process and gives shareholders a clear sense of how we will deploy capital as the bond market shifts with investor perceptions of inflation and economic growth.
Though rising Treasury yields have, ceteris paribus, made bonds more attractive, unfortunately narrowing credit spreads have partially offset those higher Treasury yields. For example, spreads on three-year maturity AAA-rated auto asset-backed securities have declined by four basis points since the end of 2016, and by 28 basis points since the first quarter of 2016,9 yet the yield on those bonds has increased by five basis points and 50 basis points over those respective time periods. Despite increasing yields on non-Treasury bonds (so called "spread product"), the spread compression in some sectors is concerning. Spreads in high-quality bonds are not anomalous relative to the broad history, but some high-quality asset classes are near the lows in spreads over recent history. Because we are disciplined about buying bonds that pass the duration stress test described above, we have protection against a normalization in spreads. Nonetheless, we are cautious as we invest in high-quality spread product.
With respect to credit-sensitive spread products, we have been more than cautious; we have been reluctant. The spread on the Bloomberg Barclays High Yield Index ended the quarter at 412 basis points, down approximately 30 basis points since the end of 2016, and 105 basis points below Election Day levels (a measuring point for the start of the Trump Trade that has propelled equity and credit markets). The decline is larger still — 287 basis points — since the first quarter of 2016. For context, the historical average, excluding the financial crisis, is 574 basis points.
9 Source: Citibank research (CitiVelocity).
6
FPA NEW INCOME, INC.
LETTER TO SHAREHOLDERS
(Continued)
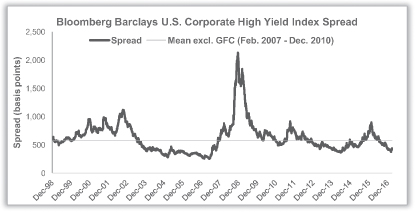
Source: Bloomberg Barclays.
At 412 basis points, the current spread is in the 21st percentile of historical spreads. We are not spread investors, but the data reinforces our view that the 5.85% yield on the 'high' yield index does not adequately compensate us for credit risk.

Source: Bloomberg Barclays.
7
FPA NEW INCOME, INC.
LETTER TO SHAREHOLDERS
(Continued)
We have been diligent in investing only in those opportunities in credit — whether in high yield, bank debt, structured product, or elsewhere — where the prospective returns offer a compelling value. In response, we reduced the portfolio's total credit exposure. As credit prices continue to soar, the opportunity cost of avoiding it continues to fall. The current market dynamics lead us to cautiously favor investments in the high-quality portion of the fixed income market versus the credit portion of the market.
Proxy Comments
During this past quarter we held a shareholder meeting where shareholders approved proposals that were designed to modernize the investment policies of the Fund. First, we want to thank every shareholder for taking the time to evaluate and vote on the proposals. Second, we are gratified by the trust our shareholders have in our investment approach.
There were two key guideline changes that will assist us in pursuing the Fund's investment objective, which is to seek to provide long-term total return, which includes income and capital appreciation, while considering capital preservation. The first of these two changes is the ability to use options, futures, swaps and shorting for the purpose of hedging an investment's risk to currency fluctuations in cases where the investment is not denominated in the US dollar. Our investment guidelines have always allowed up to 25% of the Fund's assets to be invested in non-US dollar bonds. With no view on the direction of foreign currency movements, it has always been difficult to utilize this non-US dollar capacity without subjecting our investors to potentially uncompensated foreign currency risk. The ability to hedge foreign currency exposure gives us the flexibility to use this non-US dollar capacity if the right opportunity presents itself. To date, we have found very few non-US dollar ideas that we felt, on a hedged basis, would offer a more attractive return profile and assist us in accomplishing our stated investment objective. As such, we do not expect this non-US dollar capacity to be used extensively. If we make any investments in this area, we intend to explain why we feel the investment is appropriate, and how we offset the currency risk.
The second key change to our investment guidelines was the elimination of the investment policy that prohibited the Fund from acquiring more than 10% of an outstanding issue. For more than five years, we have had investment opportunities in smaller bond issues where we were prevented from taking a full or meaningful position because of our inability to own more than 10% of an outstanding issue. With the change in the guidelines, we will be able to own more than 10% of an outstanding issue. However, from a risk management standpoint, there are limits to this capability. First, pursuant to investment limitations applicable to diversified investment companies such as the Fund, the above-10% capability will only extend to a quarter of the Fund's portfolio; the 10% limit remains in effect for the rest of the portfolio. Second, depending on the specifics of the investment, these investments may be categorized as illiquid investments, which are capped at 15% of the portfolio.
We thank you for your continued support and we continue to work diligently to maintain your trust.
Respectfully submitted,

Thomas H. Atteberry
Portfolio Manager

Abhijeet Patwardhan
Portfolio Manager
April 2017
8
FPA NEW INCOME, INC.
LETTER TO SHAREHOLDERS
(Continued)
The discussions of Fund investments represent the views of the Fund's managers at the time of this report and are subject to change without notice. References to individual securities are for informational purposes only and should not be construed as recommendations to purchase or sell individual securities.
FUND RISKS
Investments in mutual funds carry risks and investors may lose principal value. Stock markets are volatile and can decline significantly in response to adverse issuer, political, regulatory, market, or economic developments. The funds may purchase foreign securities which are subject to interest rate, currency exchange rate, economic and political risks: this may be enhanced when investing in emerging markets. The securities of smaller, less well-known companies can be more volatile than those of larger companies. The return of principal in a bond fund is not guaranteed. Bond funds have the same issuer, interest rate, inflation and credit risks that are associated with underlying bonds owned by the fund. Lower rated bonds, convertible securities and other types of debt obligations involve greater risks than higher rated bonds. Mortgage securities and collateralized mortgage obligations (CMOs) are subject to prepayment risk and the risk of default on the underlying mortgages or other assets; derivatives may increase volatility. High yield securities can be volatile and subject to much higher instances of default.
FORWARD LOOKING STATEMENT DISCLOSURE
As mutual fund managers, one of our responsibilities is to communicate with shareholders in an open and direct manner. Insofar as some of our opinions and comments in our letters to shareholders are based on our current expectations, they are considered "forward-looking statements" which may or may not prove to be accurate over the long term. While we believe we have a reasonable basis for our comments and we have confidence in our opinions, actual results may differ materially from those we anticipate. You can identify forward-looking statements by words such as "believe," "expect," "may," "anticipate," and other similar expressions when discussing prospects for particular portfolio holdings and/or the markets, generally. We cannot, however, assure future results and disclaim any obligation to update or alter any forward-looking statements, whether as a result of new information, future events, or otherwise. Further, information provided in this report should not be construed as a recommendation to purchase or sell any particular security.
FPA NEW INCOME, INC.
PORTFOLIO SUMMARY
March 31, 2017
(Unaudited)
Bonds & Debentures | | | | | 102.5 | % | |
Asset-Backed Securities | | | 54.1 | % | | | |
Residential Mortgage-Backed Securities | | | 18.7 | % | | | |
Commercial Mortgage-Backed Securities | | | 14.1 | % | | | |
U.S. Treasuries | | | 9.3 | % | | | |
Corporate Bonds & Notes | | | 3.4 | % | | | |
Corporate Bank Debt | | | 2.8 | % | | | |
Municipals | | | 0.1 | % | | | |
Short-term Investments | | | | | 1.0 | % | |
Other Assets And Liabilities, Net | | | | | (3.5 | )% | |
Net Assets | | | | | 100.0 | % | |
9
FPA NEW INCOME, INC.
PORTFOLIO OF INVESTMENTS
March 31, 2017
(Unaudited)
BONDS & DEBENTURES | | Principal
Amount | | Fair
Value | |
COMMERCIAL MORTGAGE-BACKED SECURITIES — 14.1% | |
AGENCY — 0.1% | |
Government National Mortgage Association 2013-55 A — 1.317% 5/16/2034 | | $ | 609,231 | | | $ | 604,616 | | |
Government National Mortgage Association 2012-2 A — 1.862% 6/16/2031 | | | 1,732,634 | | | | 1,732,464 | | |
Government National Mortgage Association 2011-49 A — 2.45% 7/16/2038 | | | 959,301 | | | | 960,752 | | |
Government National Mortgage Association 2010-155 B — 2.525% 6/16/2039 | | | 2,399,580 | | | | 2,398,498 | | |
Government National Mortgage Association 2010-148 AC — 7.00% 12/16/2050@ | | | 111,939 | | | | 116,296 | | |
| | | $ | 5,812,626 | | |
AGENCY STRIPPED — 10.0% | |
Government National Mortgage Association 2004-10 IO — 0.00% 1/16/2044@ | | $ | 9,880,003 | | | $ | 99 | | |
Government National Mortgage Association 2002-56 IO — 0.043% 6/16/2042@ | | | 28,585 | | | | 29 | | |
Government National Mortgage Association 2009-119 IO — 0.084% 12/16/2049@ | | | 14,062,364 | | | | 203,623 | | |
Government National Mortgage Association 2009-105 IO — 0.165% 11/16/2049@ | | | 10,807,096 | | | | 155,298 | | |
Government National Mortgage Association 2008-8 IO — 0.234% 11/16/2047@ | | | 17,250,690 | | | | 175,440 | | |
Government National Mortgage Association 2009-71 IO — 0.26% 7/16/2049@ | | | 3,376,814 | | | | 50,483 | | |
Government National Mortgage Association 2012-45 IO — 0.366% 4/16/2053@ | | | 18,662,938 | | | | 563,080 | | |
Government National Mortgage Association 2009-4 IO — 0.39% 1/16/2049@ | | | 3,057,880 | | | | 45,104 | | |
Government National Mortgage Association 2009-86 IO — 0.404% 10/16/2049@ | | | 24,786,552 | | | | 480,363 | | |
Government National Mortgage Association 2012-125 IO — 0.438% 2/16/2053@ | | | 81,604,772 | | | | 2,578,009 | | |
Government National Mortgage Association 2009-49 IO — 0.466% 6/16/2049@ | | | 14,316,824 | | | | 288,914 | | |
Government National Mortgage Association 2007-77 IO — 0.477% 11/16/2047@ | | | 27,882,679 | | | | 526,146 | | |
Government National Mortgage Association 2010-123 IO — 0.479% 9/16/2050@ | | | 18,060,054 | | | | 476,244 | | |
Government National Mortgage Association 2008-24 IO — 0.496% 11/16/2047@ | | | 2,836,769 | | | | 53,530 | | |
Government National Mortgage Association 2013-29 IO — 0.528% 5/16/2053@ | | | 98,296,374 | | | | 3,470,344 | | |
Government National Mortgage Association 2005-9 IO — 0.55% 1/16/2045@ | | | 3,189,553 | | | | 22,391 | | |
Government National Mortgage Association 2009-60 IO — 0.603% 6/16/2049@ | | | 8,734,470 | | | | 196,438 | | |
Government National Mortgage Association 2009-30 IO — 0.613% 3/16/2049@ | | | 7,935,513 | | | | 233,225 | | |
Government National Mortgage Association 2008-45 IO — 0.669% 2/16/2048@ | | | 6,358,202 | | | | 114,384 | | |
Government National Mortgage Association 2014-157 IO — 0.669% 5/16/2055@ | | | 166,713,395 | | | | 8,498,982 | | |
Government National Mortgage Association 2011-165 IO — 0.707% 10/16/2051@ | | | 144,365,676 | | | | 3,421,467 | | |
Government National Mortgage Association 2012-25 IO — 0.716% 8/16/2052@ | | | 116,752,428 | | | | 4,116,609 | | |
Government National Mortgage Association 2004-43 IO — 0.746% 6/16/2044@ | | | 15,755,857 | | | | 418,633 | | |
Government National Mortgage Association 2014-120 IO — 0.748% 4/16/2056@ | | | 63,948,934 | | | | 3,198,412 | | |
Government National Mortgage Association 2012-150 IO — 0.763% 11/16/2052@ | | | 81,195,881 | | | | 4,225,482 | | |
Government National Mortgage Association 2013-63 IO — 0.769% 9/16/2051@ | | | 79,443,023 | | | | 4,213,928 | | |
Government National Mortgage Association 2012-58 IO — 0.775% 2/16/2053@ | | | 240,898,422 | | | | 10,197,230 | | |
Government National Mortgage Association 2015-86 IO — 0.777% 5/16/2052@ | | | 73,496,056 | | | | 4,365,232 | | |
Government National Mortgage Association 2014-138 IO — 0.784% 4/16/2056@ | | | 27,540,862 | | | | 1,537,273 | | |
Government National Mortgage Association 2015-41 IO — 0.791% 9/16/2056@ | | | 48,695,539 | | | | 2,922,356 | | |
Government National Mortgage Association 2013-13 IO — 0.798% 7/16/2047@ | | | 118,653,288 | | | | 5,680,787 | | |
Government National Mortgage Association 2013-61 IO — 0.799% 5/16/2053@ | | | 130,182,232 | | | | 6,335,501 | | |
Government National Mortgage Association 2014-164 IO — 0.804% 1/16/2056@ | | | 296,555,367 | | | | 16,167,635 | | |
Government National Mortgage Association 2012-79 IO — 0.813% 3/16/2053@ | | | 155,709,078 | | | | 7,112,791 | | |
Government National Mortgage Association 2012-85 IO — 0.816% 9/16/2052@ | | | 158,168,279 | | | | 7,548,059 | | |
Government National Mortgage Association 2012-114 IO — 0.822% 1/16/2053@ | | | 53,884,135 | | | | 3,264,021 | | |
Government National Mortgage Association 2014-77 IO — 0.83% 12/16/2047@ | | | 69,242,657 | | | | 3,687,448 | | |
10
FPA NEW INCOME, INC.
PORTFOLIO OF INVESTMENTS (Continued)
March 31, 2017
(Unaudited)
BONDS & DEBENTURES — Continued | | Principal
Amount | | Fair
Value | |
Government National Mortgage Association 2015-47 IO — 0.843% 10/16/2056@ | | $ | 194,450,744 | | | $ | 12,790,814 | | |
Government National Mortgage Association 2014-135 IO — 0.844% 1/16/2056@ | | | 328,194,627 | | | | 18,964,956 | | |
Government National Mortgage Association 2013-30 IO — 0.846% 9/16/2053@ | | | 196,087,189 | | | | 9,928,816 | | |
Government National Mortgage Association 2013-80 IO — 0.847% 3/16/2052@ | | | 55,743,261 | | | | 3,320,777 | | |
Government National Mortgage Association 2013-125 IO — 0.849% 10/16/2054@ | | | 24,472,722 | | | | 1,096,136 | | |
Government National Mortgage Association 2014-110 IO — 0.855% 1/16/2057@ | | | 80,282,019 | | | | 5,494,140 | | |
Government National Mortgage Association 2013-45 IO — 0.862% 12/16/2053@ | | | 79,821,913 | | | | 2,987,599 | | |
Government National Mortgage Association 2014-153 IO — 0.863% 4/16/2056@ | | | 242,639,318 | | | | 15,174,590 | | |
Government National Mortgage Association 2014-175 IO — 0.865% 4/16/2056@ | | | 245,725,931 | | | | 15,596,716 | | |
Government National Mortgage Association 2008-92 IO — 0.874% 10/16/2048@ | | | 21,686,007 | | | | 685,061 | | |
Government National Mortgage Association 2014-28 IO — 0.886% 10/16/2054@ | | | 69,959,099 | | | | 4,122,249 | | |
Government National Mortgage Association 2015-19 IO — 0.887% 1/16/2057@ | | | 122,791,552 | | | | 8,457,710 | | |
Government National Mortgage Association 2015-7 IO — 0.898% 1/16/2057@ | | | 20,546,642 | | | | 1,326,836 | | |
Government National Mortgage Association 2015-101 IO — 0.91% 3/16/2052@ | | | 189,304,184 | | | | 12,018,355 | | |
Government National Mortgage Association 2006-55 IO — 0.916% 8/16/2046@ | | | 8,777,718 | | | | 143,779 | | |
Government National Mortgage Association 2008-48 IO — 0.927% 4/16/2048@ | | | 10,188,155 | | | | 259,798 | | |
Government National Mortgage Association 2011-143 IO — 0.929% 4/16/2053@ | | | 59,451,004 | | | | 4,098,552 | | |
Government National Mortgage Association 2015-169 IO — 0.94% 7/16/2057@ | | | 234,224,859 | | | | 17,741,901 | | |
Government National Mortgage Association 2015-128 IO — 0.951% 12/16/2056@ | | | 210,277,106 | | | | 14,244,550 | | |
Government National Mortgage Association 2014-187 IO — 0.963% 5/16/2056@ | | | 230,807,181 | | | | 15,471,005 | | |
Government National Mortgage Association 2015-160 IO — 0.969% 1/16/2056@ | | | 277,755,431 | | | | 19,216,176 | | |
Government National Mortgage Association 2012-53 IO — 0.97% 3/16/2047@ | | | 96,083,300 | | | | 4,445,688 | | |
Government National Mortgage Association 2015-150 IO — 0.981% 9/16/2057@ | | | 257,456,815 | | | | 20,183,971 | | |
Government National Mortgage Association 2016-45 IO — 1.004% 2/16/2058@ | | | 133,937,852 | | | | 10,065,322 | | |
Government National Mortgage Association 2016-34 IO — 1.007% 1/16/2058@ | | | 226,436,955 | | | | 17,411,213 | | |
Government National Mortgage Association 2016-65 IO — 1.009% 1/16/2058@ | | | 249,777,917 | | | | 19,469,214 | | |
Government National Mortgage Association 2015-114 IO — 1.035% 3/15/2057@ | | | 189,817,614 | | | | 12,629,363 | | |
Government National Mortgage Association 2004-108 IO — 1.037% 12/16/2044@ | | | 2,522,777 | | | | 92,964 | | |
Government National Mortgage Association 2015-108 IO — 1.059% 10/16/2056@ | | | 54,938,487 | | | | 4,010,647 | | |
Government National Mortgage Association 2016-106 IO — 1.068% 9/16/2058@ | | | 276,219,475 | | | | 23,105,787 | | |
Government National Mortgage Association 2016-125 IO — 1.089% 12/16/2057@ | | | 144,085,525 | | | | 11,663,219 | | |
Government National Mortgage Association 2016-85 IO — 1.121% 3/16/2057@ | | | 164,637,524 | | | | 13,501,841 | | |
Government National Mortgage Association 2016-119 IO — 1.127% 4/16/2058@ | | | 408,912,758 | | | | 33,812,873 | | |
Government National Mortgage Association 2016-67 IO — 1.168% 7/16/2057@ | | | 123,184,257 | | | | 9,944,369 | | |
Government National Mortgage Association 2016-94 IO — 1.17% 12/16/2057@ | | | 222,217,365 | | | | 18,437,908 | | |
Government National Mortgage Association 2014-49 IO — 1.246% 8/16/2054@ | | | 111,149,342 | | | | 7,693,713 | | |
Government National Mortgage Association 2006-30 IO — 2.157% 5/16/2046@ | | | 1,658,197 | | | | 44,290 | | |
| | | $ | 496,197,888 | | |
NON-AGENCY — 4.0% | |
A10 Term Asset Financing LLC 2016-1 A1 — 2.42% 3/15/2035** | | $ | 10,128,000 | | | $ | 10,091,297 | | |
A10 Term Asset Financing LLC 2013-2 A — 2.62% 11/15/2027** | | | 1,357,075 | | | | 1,353,600 | | |
Bear Stearns Commercial Mortgage Securities Trust
2005-PWR7 B — 5.214% 2/11/2041@ | | | 6,101,938 | | | | 6,101,327 | | |
Bear Stearns Commercial Mortgage Securities Trust
2007-PW17 A1A — 5.65% 6/11/2050@ | | | 12,512,863 | | | | 12,620,976 | | |
Citigroup Commercial Mortgage Trust 2006-C4 B — 5.995% 3/15/2049@ | | | 7,164,603 | | | | 7,183,508 | | |
11
FPA NEW INCOME, INC.
PORTFOLIO OF INVESTMENTS (Continued)
March 31, 2017
(Unaudited)
BONDS & DEBENTURES — Continued | | Principal
Amount | | Fair
Value | |
COMM Mortgage Trust 2014-FL5 B — 3.062% 10/15/2031**,@ | | $ | 12,720,000 | | | $ | 12,761,944 | | |
COMM Mortgage Trust 2014-FL5 C — 3.062% 10/15/2031**,@ | | | 8,240,000 | | | | 8,123,608 | | |
Credit Suisse Commercial Mortgage Trust Series
2016-MFF E — 6.912% 11/15/2033**,@ | | | 30,398,000 | | | | 30,512,366 | | |
Latitude Management Real Estate Capita
2016-CRE2 A — 2.477% 11/24/2031**,@,†† | | | 11,903,000 | | | | 11,903,000 | | |
Morgan Stanley Capital I Trust 2006-HQ9 D — 5.862% 7/12/2044@ | | | 9,865,000 | | | | 9,878,475 | | |
Ores NPL LLC 2014-LV3 B — 6.00% 3/27/2024** | | | 36,620,726 | | | | 36,631,712 | | |
Rialto Capital Management LLC 2014-LT5 B — 5.00% 5/15/2024**,†† | | | 6,735,236 | | | | 6,735,236 | | |
Rialto Real Estate Fund LP 2015-LT7 B — 5.071% 12/25/2032**,†† | | | 17,716,000 | | | | 17,361,680 | | |
SCG Trust 2013-SRP1 AJ — 2.862% 11/15/2026**,@ | | | 14,152,000 | | | | 14,083,572 | | |
Wachovia Bank Commercial Mortgage Trust Series
2007-C34 A3 — 5.678% 5/15/2046 | | | 9,380,925 | | | | 9,424,357 | | |
| | | $ | 194,766,658 | | |
| TOTAL COMMERICAL MORTGAGE-BACKED SECURITIES (Cost $764,545,319) | | $ | 696,777,172 | | |
RESIDENTIAL MORTGAGE-BACKED SECURITIES — 18.7% | |
AGENCY COLLATERALIZED MORTGAGE OBLIGATION — 6.6% | |
Federal Home Loan Mortgage Corporation 2809 UC — 4.00% 6/15/2019 | | $ | 150,249 | | | $ | 152,358 | | |
Federal Home Loan Mortgage Corporation 3957 BV — 4.00% 10/15/2029 | | | 1,451,287 | | | | 1,460,505 | | |
Federal Home Loan Mortgage Corporation 2990 TD — 4.00% 5/15/2035 | | | 19,237 | | | | 19,599 | | |
Federal Home Loan Mortgage Corporation 3986 P — 4.00% 3/15/2039 | | | 30,061 | | | | 30,125 | | |
Federal Home Loan Mortgage Corporation 2614 BY — 4.50% 5/15/2018 | | | 251,258 | | | | 254,577 | | |
Federal Home Loan Mortgage Corporation 2645 BY — 4.50% 7/15/2018 | | | 56,549 | | | | 57,255 | | |
Federal Home Loan Mortgage Corporation 2649 AN — 4.50% 7/15/2018 | | | 564,844 | | | | 572,435 | | |
Federal Home Loan Mortgage Corporation 2656 PE — 4.50% 7/15/2018 | | | 112,116 | | | | 113,743 | | |
Federal Home Loan Mortgage Corporation 3969 MP — 4.50% 4/15/2039 | | | 5,532 | | | | 5,540 | | |
Federal Home Loan Mortgage Corporation 2568 XD — 5.00% 2/15/2018 | | | 63,941 | | | | 64,642 | | |
Federal Home Loan Mortgage Corporation 2494 CF — 5.50% 9/15/2017 | | | 126,132 | | | | 127,051 | | |
Federal Home Loan Mortgage Corporation 2503 B — 5.50% 9/15/2017 | | | 95,990 | | | | 96,630 | | |
Federal Home Loan Mortgage Corporation 2453 BD — 6.00% 5/15/2017 | | | 6,274 | | | | 6,279 | | |
Federal National Mortgage Association 2012-117 DA — 1.50% 12/25/2039 | | | 3,517,303 | | | | 3,463,164 | | |
Federal National Mortgage Association 2013-30 CA — 1.50% 4/25/2043 | | | 15,704,956 | | | | 14,566,282 | | |
Federal National Mortgage Association 2014-80 GD — 2.00% 2/25/2042 | | | 29,881,121 | | | | 29,703,741 | | |
Federal National Mortgage Association 2017-16 WB — 2.25% 1/25/2045 | | | 22,023,381 | | | | 21,741,446 | | |
Federal National Mortgage Association 2017-25 BE — 2.25% 1/25/2046 | | | 48,825,000 | | | | 48,192,121 | | |
Federal National Mortgage Association 2017-16 JA — 3.00% 2/25/2043 | | | 33,997,759 | | | | 34,624,246 | | |
Federal National Mortgage Association 2016-104 QA — 3.00% 11/25/2043 | | | 50,624,025 | | | | 51,446,225 | | |
Federal National Mortgage Association 2017-15 DA — 3.00% 12/25/2044 | | | 26,883,634 | | | | 27,337,965 | | |
Federal National Mortgage Association 2017-5 JA — 3.00% 2/25/2046 | | | 46,236,948 | | | | 47,032,173 | | |
Federal National Mortgage Association 2017-28 A — 3.50% 5/25/2045 | | | 27,011,000 | | | | 27,923,432 | | |
Federal National Mortgage Association 2003-128 NG — 4.00% 1/25/2019 | | | 77,800 | | | | 78,855 | | |
Federal National Mortgage Association 2004-7 JK — 4.00% 2/25/2019 | | | 661,160 | | | | 669,420 | | |
Federal National Mortgage Association 2008-18 MD — 4.00% 3/25/2019 | | | 176,123 | | | | 178,361 | | |
12
FPA NEW INCOME, INC.
PORTFOLIO OF INVESTMENTS (Continued)
March 31, 2017
(Unaudited)
BONDS & DEBENTURES — Continued | | Principal
Amount | | Fair
Value | |
Federal National Mortgage Association 2004-76 CL — 4.00% 10/25/2019 | | $ | 175,279 | | | $ | 177,761 | | |
Federal National Mortgage Association 2009-76 MA — 4.00% 9/25/2024 | | | 117,630 | | | | 118,769 | | |
Federal National Mortgage Association 2011-113 NE — 4.00% 3/25/2040 | | | 1,641,874 | | | | 1,663,164 | | |
Federal National Mortgage Association 2012-95 AB — 4.00% 11/25/2040 | | | 962,231 | | | | 964,960 | | |
Federal National Mortgage Association 2009-70 NU — 4.25% 8/25/2019 | | | 905,774 | | | | 917,766 | | |
Federal National Mortgage Association 2003-30 HW — 4.50% 4/25/2018 | | | 100,603 | | | | 101,514 | | |
Federal National Mortgage Association 2008-18 NB — 4.50% 5/25/2020 | | | 320,196 | | | | 323,945 | | |
Federal National Mortgage Association 2011-7 PA — 4.50% 10/25/2039 | | | 58,405 | | | | 58,622 | | |
Federal National Mortgage Association 2012-40 GC — 4.50% 12/25/2040 | | | 2,226,584 | | | | 2,248,063 | | |
Federal National Mortgage Association 2012-67 PB — 4.50% 12/25/2040 | | | 2,303,591 | | | | 2,325,959 | | |
Federal National Mortgage Association 2002-74 PE — 5.00% 11/25/2017 | | | 56,272 | | | | 56,747 | | |
Federal National Mortgage Association 2003-24 PD — 5.00% 4/25/2018 | | | 335,163 | | | | 339,399 | | |
Federal National Mortgage Association 2003-46 BG — 5.00% 6/25/2018 | | | 343,846 | | | | 348,454 | | |
Federal National Mortgage Association 2004-60 LB — 5.00% 4/25/2034 | | | 3,479,258 | | | | 3,666,477 | | |
Federal National Mortgage Association 2011-19 WB — 5.50% 10/25/2018 | | | 1,156,711 | | | | 1,180,956 | | |
| | | $ | 324,410,726 | | |
AGENCY POOL ADJUSTABLE RATE — 0.0% | |
Federal National Mortgage Association 865963 — 3.137% 3/1/2036@ | | $ | 1,495,325 | | | $ | 1,579,138 | | |
AGENCY POOL FIXED RATE — 2.9% | |
Federal Home Loan Mortgage Corporation G15139 — 4.50% 6/1/2019 | | $ | 256,167 | | | $ | 262,753 | | |
Federal Home Loan Mortgage Corporation P60959 — 4.50% 9/1/2020 | | | 478,525 | | | | 491,885 | | |
Federal Home Loan Mortgage Corporation G14030 — 4.50% 12/1/2020 | | | 280,585 | | | | 291,036 | | |
Federal Home Loan Mortgage Corporation G15169 — 4.50% 9/1/2026 | | | 5,401,877 | | | | 5,611,206 | | |
Federal Home Loan Mortgage Corporation G15272 — 4.50% 9/1/2026 | | | 5,661,635 | | | | 5,867,611 | | |
Federal Home Loan Mortgage Corporation G15875 — 4.50% 9/1/2026 | | | 6,501,930 | | | | 6,776,131 | | |
Federal Home Loan Mortgage Corporation G18056 — 5.00% 6/1/2020 | | | 404,988 | | | | 421,900 | | |
Federal Home Loan Mortgage Corporation G13812 — 5.00% 12/1/2020 | | | 1,499,519 | | | | 1,540,981 | | |
Federal Home Loan Mortgage Corporation G15036 — 5.00% 6/1/2024 | | | 5,296,617 | | | | 5,491,692 | | |
Federal Home Loan Mortgage Corporation G13667 — 5.00% 8/1/2024 | | | 232,343 | | | | 244,344 | | |
Federal Home Loan Mortgage Corporation G15435 — 5.00% 11/1/2024 | | | 10,362,862 | | | | 10,765,267 | | |
Federal Home Loan Mortgage Corporation G15173 — 5.00% 6/1/2026 | | | 4,184,032 | | | | 4,350,659 | | |
Federal Home Loan Mortgage Corporation G15407 — 5.00% 6/1/2026 | | | 5,556,799 | | | | 5,881,056 | | |
Federal Home Loan Mortgage Corporation G15874 — 5.00% 6/1/2026 | | | 3,042,322 | | | | 3,160,476 | | |
Federal Home Loan Mortgage Corporation G12730 — 5.50% 7/1/2017 | | | 675 | | | | 677 | | |
Federal Home Loan Mortgage Corporation G12829 — 5.50% 10/1/2017 | | | 1,532 | | | | 1,543 | | |
Federal Home Loan Mortgage Corporation G14187 — 5.50% 12/1/2020 | | | 3,226,255 | | | | 3,299,040 | | |
Federal Home Loan Mortgage Corporation J01270 — 5.50% 2/1/2021 | | | 80,464 | | | | 84,959 | | |
Federal Home Loan Mortgage Corporation G14035 — 5.50% 12/1/2021 | | | 302,135 | | | | 317,252 | | |
Federal Home Loan Mortgage Corporation G15230 — 5.50% 12/1/2024 | | | 7,425,224 | | | | 7,749,706 | | |
Federal Home Loan Mortgage Corporation G15458 — 5.50% 12/1/2024 | | | 1,096,856 | | | | 1,163,597 | | |
Federal Home Loan Mortgage Corporation G14460 — 6.00% 1/1/2024 | | | 471,873 | | | | 503,717 | | |
Federal Home Loan Mortgage Corporation G12139 — 6.50% 9/1/2019 | | | 17,199 | | | | 17,276 | | |
Federal Home Loan Mortgage Corporation P50543 — 6.50% 4/1/2037 | | | 71,594 | | | | 77,432 | | |
Federal National Mortgage Association AB6251 — 2.00% 9/1/2022 | | | 848,953 | | | | 855,110 | | |
13
FPA NEW INCOME, INC.
PORTFOLIO OF INVESTMENTS (Continued)
March 31, 2017
(Unaudited)
BONDS & DEBENTURES — Continued | | Principal
Amount | | Fair
Value | |
Federal National Mortgage Association AB7515 — 2.00% 1/1/2023 | | $ | 422,306 | | | $ | 425,259 | | |
Federal National Mortgage Association AA4546 — 4.00% 5/1/2024 | | | 1,437,690 | | | | 1,510,050 | | |
Federal National Mortgage Association AL5956 — 4.00% 5/1/2027 | | | 1,423,467 | | | | 1,497,487 | | |
Federal National Mortgage Association 254906 — 4.50% 10/1/2018 | | | 154,667 | | | | 157,204 | | |
Federal National Mortgage Association 255547 — 4.50% 1/1/2020 | | | 64,796 | | | | 66,784 | | |
Federal National Mortgage Association MA0323 — 4.50% 2/1/2020 | | | 245,537 | | | | 252,588 | | |
Federal National Mortgage Association MA0358 — 4.50% 3/1/2020 | | | 129,903 | | | | 133,450 | | |
Federal National Mortgage Association MA0419 — 4.50% 5/1/2020 | | | 229,282 | | | | 236,196 | | |
Federal National Mortgage Association AL6725 — 4.50% 9/1/2020 | | | 2,736,118 | | | | 2,799,623 | | |
Federal National Mortgage Association 735920 — 4.50% 10/1/2020 | | | 61,289 | | | | 63,435 | | |
Federal National Mortgage Association 995158 — 4.50% 12/1/2020 | | | 107,759 | | | | 111,711 | | |
Federal National Mortgage Association 889531 — 4.50% 5/1/2022 | | | 39,289 | | | | 40,698 | | |
Federal National Mortgage Association AL6212 — 4.50% 1/1/2027 | | | 6,415,845 | | | | 6,573,338 | | |
Federal National Mortgage Association AE0126 — 5.00% 6/1/2020 | | | 5,342,116 | | | | 5,523,694 | | |
Federal National Mortgage Association 310097 — 5.00% 10/1/2020 | | | 335,581 | | | | 340,275 | | |
Federal National Mortgage Association AE0792 — 5.00% 12/1/2020 | | | 1,390,891 | | | | 1,439,197 | | |
Federal National Mortgage Association AE0314 — 5.00% 8/1/2021 | | | 8,669,797 | | | | 8,882,900 | | |
Federal National Mortgage Association AD0285 — 5.00% 9/1/2022 | | | 731,353 | | | | 763,898 | | |
Federal National Mortgage Association AE0812 — 5.00% 7/1/2025 | | | 1,588,094 | | | | 1,644,587 | | |
Federal National Mortgage Association AL5764 — 5.00% 9/1/2025 | | | 5,434,601 | | | | 5,633,600 | | |
Federal National Mortgage Association AL6798 — 5.00% 9/1/2025 | | | 7,478,671 | | | | 7,678,058 | | |
Federal National Mortgage Association AL4056 — 5.00% 6/1/2026 | | | 6,536,172 | | | | 6,788,990 | | |
Federal National Mortgage Association 257100 — 5.50% 1/1/2018 | | | 79,333 | | | | 80,842 | | |
Federal National Mortgage Association 745500 — 5.50% 12/1/2018 | | | 434,124 | | | | 439,612 | | |
Federal National Mortgage Association 745119 — 5.50% 12/1/2019 | | | 1,982,728 | | | | 2,054,332 | | |
Federal National Mortgage Association 995284 — 5.50% 3/1/2020 | | | 225,276 | | | | 226,995 | | |
Federal National Mortgage Association 745190 — 5.50% 6/1/2020 | | | 84,545 | | | | 85,633 | | |
Federal National Mortgage Association 889318 — 5.50% 7/1/2020 | | | 1,271,203 | | | | 1,310,789 | | |
Federal National Mortgage Association 745749 — 5.50% 3/1/2021 | | | 206,356 | | | | 216,560 | | |
Federal National Mortgage Association AL5867 — 5.50% 8/1/2023 | | | 1,089,101 | | | | 1,128,436 | | |
Federal National Mortgage Association AE0237 — 5.50% 11/1/2023 | | | 951,444 | | | | 981,538 | | |
Federal National Mortgage Association AL5812 — 5.50% 5/1/2025 | | | 4,366,665 | | | | 4,535,595 | | |
Federal National Mortgage Association AL0471 — 5.50% 7/1/2025 | | | 201,732 | | | | 215,771 | | |
Federal National Mortgage Association AL4433 — 5.50% 9/1/2025 | | | 1,676,200 | | | | 1,775,338 | | |
Federal National Mortgage Association AL4901 — 5.50% 9/1/2025 | | | 2,167,794 | | | | 2,257,223 | | |
Federal National Mortgage Association 735439 — 6.00% 9/1/2019 | | | 109,487 | | | | 112,808 | | |
Federal National Mortgage Association 745238 — 6.00% 12/1/2020 | | | 390,178 | | | | 400,788 | | |
Federal National Mortgage Association 745832 — 6.00% 4/1/2021 | | | 2,573,015 | | | | 2,682,059 | | |
Federal National Mortgage Association AD0951 — 6.00% 12/1/2021 | | | 1,202,853 | | | | 1,263,320 | | |
Federal National Mortgage Association AL0294 — 6.00% 10/1/2022 | | | 102,791 | | | | 109,983 | | |
Federal National Mortgage Association 890225 — 6.00% 5/1/2023 | | | 973,686 | | | | 1,034,064 | | |
Federal National Mortgage Association 890403 — 6.00% 5/1/2023 | | | 753,406 | | | | 779,873 | | |
Federal National Mortgage Association 725951 — 7.50% 8/1/2017 | | | 497 | | | | 499 | | |
Government National Mortgage Association 782281 — 6.00% 3/15/2023 | | | 1,406,491 | | | | 1,514,297 | | |
| | | $ | 140,996,683 | | |
14
FPA NEW INCOME, INC.
PORTFOLIO OF INVESTMENTS (Continued)
March 31, 2017
(Unaudited)
BONDS & DEBENTURES — Continued | | Principal
Amount | | Fair
Value | |
AGENCY STRIPPED — 0.0% | |
Federal Home Loan Mortgage Corporation 217 PO — 0.00% 1/1/2032@@@ | | $ | 240,379 | | | $ | 215,810 | | |
Federal Home Loan Mortgage Corporation 3706 AI — 3.50% 7/15/2020 | | | 180,829 | | | | 44 | | |
Federal Home Loan Mortgage Corporation 3854 GI — 3.50% 11/15/2024 | | | 437,600 | | | | 3,369 | | |
Federal Home Loan Mortgage Corporation 3763 NI — 3.50% 5/15/2025 | | | 2,285,463 | | | | 172,566 | | |
Federal Home Loan Mortgage Corporation 3917 AI — 4.50% 7/15/2026 | | | 17,603,159 | | | | 1,782,075 | | |
Federal Home Loan Mortgage Corporation 217 IO — 6.50% 1/1/2032 | | | 231,459 | | | | 57,228 | | |
Federal National Mortgage Association 2010-137 BI — 3.50% 2/25/2024 | | | 728,416 | | | | 7,283 | | |
Federal National Mortgage Association 2011-66 BI — 3.50% 3/25/2025 | | | 522,177 | | | | 8,964 | | |
Federal National Mortgage Association 2010-25 NI — 5.00% 3/25/2025 | | | 457,863 | | | | 19,120 | | |
Federal National Mortgage Association 2003-64 XI — 5.00% 7/25/2033 | | | 654,897 | | | | 123,473 | | |
| | | $ | 2,389,932 | | |
NON-AGENCY COLLATERALIZED MORTGAGE OBLIGATION — 9.2% | |
BCAP LLC Trust 2010-RR8 2A6 — 2.662% 11/26/2036**,@ | | $ | 3,738,455 | | | $ | 3,717,826 | | |
Citicorp Mortgage Securities REMIC Pass-Through Certificates Trust
Series 2005-5 2A3 — 5.00% 8/25/2020 | | | 58,700 | | | | 58,354 | | |
Citigroup Mortgage Loan Trust, Inc. 2014-A A — 4.00% 1/25/2035**,@ | | | 12,807,241 | | | | 13,180,972 | | |
Credit Suisse Mortgage Trust Series 2010-9R 1A4 — 3.75% 8/27/2037** | | | 12,553,098 | | | | 12,567,460 | | |
Nationstar HECM Loan Trust 2016-3A A — 2.013% 8/25/2026**,†† | | | 2,635,951 | | | | 2,638,850 | | |
Nationstar HECM Loan Trust 2015-2A A — 2.883% 11/25/2025**,†† | | | 1,610,668 | | | | 1,611,183 | | |
Nationstar HECM Loan Trust 2016-1A A — 2.981% 2/25/2026**,†† | | | 4,632,379 | | | | 4,632,379 | | |
Nomura Resecuritization Trust 2016-1R 3A1 — 5.00% 9/28/2036**,@ | | | 6,540,453 | | | | 6,768,495 | | |
RiverView HECM Trust 2007-1 A — 1.49% 5/25/2047**,@ | | | 27,297,831 | | | | 24,584,154 | | |
RMAT LLC 2015-PR1 A1 — 4.826% 6/25/2035**,@@ | | | 18,012,121 | | | | 17,930,074 | | |
Sequoia Mortgage Trust 2012-1 1A1 — 2.865% 1/25/2042@ | | | 2,000,188 | | | | 1,994,942 | | |
Stanwich Mortgage Loan Trust Series 2011-1 A — 0.561% 8/15/2050**,@,†† | | | 1,252,324$ | | | | 660,512 | | |
Stanwich Mortgage Loan Trust Series 2009-2 A — 1.007% 2/15/2049**,@,†† | | | 94,807 | | | | 42,398 | | |
Stanwich Mortgage Loan Trust Series 2010-1 A — 1.246% 9/30/2047**,@,†† | | | 246,480 | | | | 124,670 | | |
Stanwich Mortgage Loan Trust Series 2010-2 A — 1.674% 2/28/2057**,@,†† | | | 1,316,318 | | | | 663,687 | | |
Stanwich Mortgage Loan Trust Series 2010-4 A — 1.718% 8/31/2049**,@,†† | | | 704,682 | | | | 355,865 | | |
Stanwich Mortgage Loan Trust Series 2010-3 A — 2.912% 7/31/2038**,@,†† | | | 644,472 | | | | 322,429 | | |
Stanwich Mortgage Loan Trust Series 2011-2 A — 20.61% 9/15/2050**,@,†† | | | 1,038,750 | | | | 555,943 | | |
Sunset Mortgage Loan Co. LLC 2014-NPL2 A — 3.721% 11/16/2044**,@@ | | | 8,216,952 | | | | 8,222,170 | | |
Sunset Mortgage Loan Co. LLC 2015-NPL1 A — 4.459% 9/18/2045**,@@ | | | 14,783,147 | | | | 14,906,029 | | |
Towd Point Mortgage Trust 2016-3 A1 — 2.25% 4/25/2056**,@ | | | 26,175,628 | | | | 25,924,818 | | |
Towd Point Mortgage Trust 2015-1 AES — 3.00% 10/25/2053** | | | 29,623,531 | | | | 29,829,681 | | |
Towd Point Mortgage Trust 2015-2 1A1 — 3.25% 11/25/2060**,@ | | | 40,094,164 | | | | 40,616,194 | | |
Towd Point Mortgage Trust 2015-4 A1 — 3.50% 4/25/2055**,@ | | | 37,337,459 | | | | 37,967,301 | | |
Towd Point Mortgage Trust 2015-2 2A1 — 3.75% 11/25/2057**,@ | | | 30,788,537 | | | | 31,438,055 | | |
VOLT XL LLC 2015-NP14 A1 — 4.375% 11/27/2045**,@@ | | | 22,316,149 | | | | 22,539,097 | | |
VOLT XXV LLC 2015-NPL8 A1 — 3.50% 6/26/2045**,@@ | | | 24,336,403 | | | | 24,372,842 | | |
VOLT XXVII LLC 2014-NPL7 A1 — 3.375% 8/27/2057**,@@ | | | 27,621,077 | | | | 27,627,446 | | |
VOLT XXXI LLC 2015-NPL2 A1 — 3.375% 2/25/2055**,@@ | | | 1,025,369 | | | | 1,025,658 | | |
VOLT XXXIII LLC 2015-NPL5 A1 — 3.50% 3/25/2055**,@@ | | | 31,075,752 | | | | 31,115,591 | | |
VOLT XXXIV LLC 2015-NPL7 A1 — 3.25% 2/25/2055**,@@ | | | 21,579,963 | | | | 21,566,993 | | |
VOLT XXXIX LLC 2015-NP13 A1 — 4.125% 10/25/2045**,@@ | | | 309,661 | | | | 311,946 | | |
15
FPA NEW INCOME, INC.
PORTFOLIO OF INVESTMENTS (Continued)
March 31, 2017
(Unaudited)
BONDS & DEBENTURES — Continued | | Principal
Amount | | Fair
Value | |
VOLT XXXV LLC 2015-NPL9 A1 — 3.50% 6/26/2045**,@@ | | $ | 14,012,018 | | | $ | 14,028,864 | | |
VOLT XXXVI LLC 2015-NP10 A1 — 3.625% 7/25/2045**,@@ | | | 12,449,555 | | | | 12,474,327 | | |
VOLT XXXVIII LLC 2015-NP12 A1 — 3.875% 9/25/2045**,@@ | | | 17,891,662 | | | | 17,986,575 | | |
| | | $ | 454,363,780 | | |
| TOTAL RESIDENTIAL MORTGAGE-BACKED SECURITIES (Cost $924,258,171) | | $ | 923,740,259 | | |
ASSET-BACKED SECURITIES — 54.1% | |
AUTO — 19.2% | |
Ally Auto Receivables Trust 2015-1 A3 — 1.39% 9/16/2019 | | $ | 22,294,216 | | | $ | 22,293,539 | | |
Ally Auto Receivables Trust 2017-1 B — 2.35% 3/15/2022 | | | 3,743,000 | | | | 3,731,908 | | |
Ally Auto Receivables Trust 2017-1 C — 2.48% 5/16/2022 | | | 7,059,000 | | | | 7,042,689 | | |
AmeriCredit Automobile Receivables Trust 2014-2 B — 1.60% 7/8/2019 | | | 1,485,000 | | | | 1,486,106 | | |
AmeriCredit Automobile Receivables Trust 2014-1 B — 1.68% 7/8/2019 | | | 1,311,435 | | | | 1,312,159 | | |
AmeriCredit Automobile Receivables Trust 2015-2 B — 1.82% 7/8/2020 | | | 6,678,000 | | | | 6,691,192 | | |
AmeriCredit Automobile Receivables Trust 2014-3 B — 1.92% 11/8/2019 | | | 13,383,000 | | | | 13,419,806 | | |
AmeriCredit Automobile Receivables Trust 2015-3 B — 2.08% 9/8/2020 | | | 19,000,000 | | | | 19,078,734 | | |
AmeriCredit Automobile Receivables Trust 2015-4 B — 2.11% 1/8/2021 | | | 28,000,000 | | | | 28,078,154 | | |
AmeriCredit Automobile Receivables Trust 2013-5 C — 2.29% 11/8/2019 | | | 2,312,000 | | | | 2,319,281 | | |
AmeriCredit Automobile Receivables Trust 2013-3 C — 2.38% 6/10/2019 | | | 763,299 | | | | 765,062 | | |
AmeriCredit Automobile Receivables Trust 2015-1 C — 2.51% 1/8/2021 | | | 1,727,000 | | | | 1,738,392 | | |
AmeriCredit Automobile Receivables Trust 2017-1 C — 2.71% 8/18/2022 | | | 7,547,000 | | | | 7,585,287 | | |
BMW Vehicle Lease Trust 2017-1 A4 — 2.18% 6/22/2020 | | | 18,527,000 | | | | 18,625,327 | | |
California Republic Auto Receivables Trust 2013-2 A2 — 1.23% 3/15/2019 | | | 1,854,539 | | | | 1,853,485 | | |
Capital Auto Receivables Asset Trust 2016-3 A3 — 1.54% 8/20/2020 | | | 9,410,000 | | | | 9,395,627 | | |
Capital Auto Receivables Asset Trust 2015-2 A3 — 1.73% 9/20/2019 | | | 35,877,000 | | | | 35,936,150 | | |
Capital Auto Receivables Asset Trust 2014-3 A4 — 1.83% 4/22/2019 | | | 9,382,000 | | | | 9,393,022 | | |
Capital Auto Receivables Asset Trust 2014-1 B — 2.22% 1/22/2019 | | | 8,337,000 | | | | 8,360,849 | | |
Capital Auto Receivables Asset Trust 2013-4 C — 2.67% 2/20/2019 | | | 3,845,000 | | | | 3,864,456 | | |
Capital Auto Receivables Asset Trust 2016-1 B — 2.67% 12/21/2020 | | | 4,211,000 | | | | 4,267,735 | | |
Credit Acceptance Auto Loan Trust 2014-2A A — 1.88% 3/15/2022** | | | 9,497,674 | | | | 9,506,050 | | |
Credit Acceptance Auto Loan Trust 2015-1A A — 2.00% 7/15/2022** | | | 2,161,409 | | | | 2,164,386 | | |
Credit Acceptance Auto Loan Trust 2014-1A B — 2.29% 4/15/2022** | | | 8,076,381 | | | | 8,078,562 | | |
Credit Acceptance Auto Loan Trust 2016-2A A — 2.42% 11/15/2023** | | | 9,956,000 | | | | 9,965,885 | | |
Credit Acceptance Auto Loan Trust 2015-1A B — 2.61% 1/17/2023** | | | 3,160,000 | | | | 3,172,691 | | |
Credit Acceptance Auto Loan Trust 2014-2A B — 2.67% 9/15/2022** | | | 11,719,000 | | | | 11,765,228 | | |
Credit Acceptance Auto Loan Trust 2016-3A B — 2.94% 10/15/2024** | | | 15,192,000 | | | | 15,244,377 | | |
Credit Acceptance Auto Loan Trust 2015-2A B — 3.04% 8/15/2023** | | | 27,401,000 | | | | 27,601,244 | | |
Credit Acceptance Auto Loan Trust 2016-2A B — 3.18% 5/15/2024** | | | 22,937,000 | | | | 23,150,078 | | |
Credit Acceptance Auto Loan Trust 2016-3A C — 3.60% 4/15/2025** | | | 12,661,000 | | | | 12,755,405 | | |
Credit Acceptance Auto Loan Trust 2015-2A C — 3.76% 2/15/2024** | | | 550,000 | | | | 557,470 | | |
DT Auto Owner Trust 2016-2A A — 1.73% 8/15/2019** | | | 3,084,530 | | | | 3,083,364 | | |
DT Auto Owner Trust 2015-2A B — 1.88% 5/15/2019** | | | 7,023,796 | | | | 7,025,391 | | |
DT Auto Owner Trust 2016-4A B — 2.02% 8/17/2020** | | | 13,677,000 | | | | 13,637,970 | | |
DT Auto Owner Trust 2015-3A B — 2.46% 11/15/2019** | | | 27,649,000 | | | | 27,702,246 | | |
DT Auto Owner Trust 2017-1A C — 2.70% 11/15/2022** | | | 16,282,000 | | | | 16,275,056 | | |
16
FPA NEW INCOME, INC.
PORTFOLIO OF INVESTMENTS (Continued)
March 31, 2017
(Unaudited)
BONDS & DEBENTURES — Continued | | Principal
Amount | | Fair
Value | |
DT Auto Owner Trust 2016-2A B — 2.92% 5/15/2020** | | $ | 5,392,000 | | | $ | 5,424,613 | | |
Exeter Automobile Receivables Trust 2016-3A A — 1.84% 11/16/2020** | | | 20,749,638 | | | | 20,687,106 | | |
Exeter Automobile Receivables Trust 2017-1A B — 3.00% 12/15/2021** | | | 8,763,000 | | | | 8,806,851 | | |
First Investors Auto Owner Trust 2014-1A A3 — 1.49% 1/15/2020** | | | 1,828,558 | | | | 1,828,212 | | |
First Investors Auto Owner Trust 2016-2A A2 — 1.87% 11/15/2021** | | | 5,514,000 | | | | 5,503,990 | | |
First Investors Auto Owner Trust 2016-1A A2 — 2.26% 4/15/2021** | | | 16,653,000 | | | | 16,707,947 | | |
First Investors Auto Owner Trust 2015-2A A2 — 2.28% 9/15/2021** | | | 16,556,000 | | | | 16,623,640 | | |
First Investors Auto Owner Trust 2017-1A B — 2.67% 4/17/2023** | | | 4,126,000 | | | | 4,122,805 | | |
First Investors Auto Owner Trust 2015-2A B — 2.75% 9/15/2021** | | | 4,443,000 | | | | 4,450,410 | | |
First Investors Auto Owner Trust 2017-1A C — 2.95% 4/17/2023** | | | 7,790,000 | | | | 7,787,841 | | |
Ford Credit Auto Owner Trust 2013-A C — 1.36% 10/15/2018 | | | 5,700,000 | | | | 5,699,754 | | |
GM Financial Automobile Leasing Trust 2016-3 C — 2.38% 5/20/2020 | | | 7,768,000 | | | | 7,751,472 | | |
GM Financial Automobile Leasing Trust 2017-1 C — 2.74% 8/20/2020 | | | 21,903,000 | | | | 21,938,590 | | |
Honda Auto Receivables Owner Trust 2015-2 A3 — 1.04% 2/21/2019 | | | 24,849,316 | | | | 24,811,850 | | |
Hyundai Auto Lease Securitization Trust 2016-C B — 1.86% 5/17/2021** | | | 13,264,000 | | | | 13,145,430 | | |
Prestige Auto Receivables Trust 2014-1A A3 — 1.52% 4/15/2020** | | | 5,658,716 | | | | 5,660,069 | | |
Prestige Auto Receivables Trust 2015-1 A3 — 1.53% 2/15/2021** | | | 11,307,790 | | | | 11,313,568 | | |
Prestige Auto Receivables Trust 2016-1A A3 — 1.99% 6/15/2020** | | | 7,917,000 | | | | 7,939,560 | | |
Prestige Auto Receivables Trust 2015-1 B — 2.04% 4/15/2021** | | | 10,395,000 | | | | 10,411,861 | | |
Prestige Auto Receivables Trust 2016-2A B — 2.19% 11/15/2022** | | | 25,223,000 | | | | 25,058,163 | | |
Prestige Auto Receivables Trust 2016-2A C — 2.88% 11/15/2022** | | | 12,060,000 | | | | 12,090,473 | | |
Santander Drive Auto Receivables Trust 2015-3 A3 — 1.49% 6/17/2019 | | | 6,707,601 | | | | 6,708,561 | | |
Santander Drive Auto Receivables Trust 2016-2 A3 — 1.56% 5/15/2020 | | | 12,436,000 | | | | 12,439,057 | | |
Santander Drive Auto Receivables Trust 2014-5 B — 1.76% 9/16/2019 | | | 4,703,577 | | | | 4,706,982 | | |
Santander Drive Auto Receivables Trust 2013-3 C — 1.81% 4/15/2019 | | | 9,708,701 | | | | 9,716,705 | | |
Santander Drive Auto Receivables Trust 2014-4 B — 1.82% 5/15/2019 | | | 1,793,148 | | | | 1,793,822 | | |
Santander Drive Auto Receivables Trust 2015-2 B — 1.83% 1/15/2020 | | | 3,322,000 | | | | 3,326,546 | | |
Santander Drive Auto Receivables Trust 2013-2 C — 1.95% 3/15/2019 | | | 726,047 | | | | 726,527 | | |
Santander Drive Auto Receivables Trust 2015-5 B — 1.96% 5/15/2020 | | | 44,367,000 | | | | 44,457,198 | | |
Santander Drive Auto Receivables Trust 2015-1 B — 1.97% 11/15/2019 | | | 16,734,565 | | | | 16,760,184 | | |
Santander Drive Auto Receivables Trust 2015-3 B — 2.07% 4/15/2020 | | | 26,274,000 | | | | 26,348,820 | | |
Santander Drive Auto Receivables Trust 2014-2 C — 2.33% 11/15/2019 | | | 7,224,525 | | | | 7,244,188 | | |
Santander Drive Auto Receivables Trust 2015-1 C — 2.57% 4/15/2021 | | | 9,270,000 | | | | 9,344,490 | | |
Santander Drive Auto Receivables Trust 2017-1 C — 2.58% 5/16/2022 | | | 7,621,000 | | | | 7,623,885 | | |
Santander Drive Auto Receivables Trust 2014-4 C — 2.60% 11/16/2020 | | | 16,794,000 | | | | 16,897,668 | | |
Santander Drive Auto Receivables Trust 2013-5 D — 2.73% 10/15/2019 | | | 16,422,000 | | | | 16,578,129 | | |
Santander Drive Auto Receivables Trust 2014-2 D — 2.76% 2/18/2020 | | | 8,332,000 | | | | 8,434,820 | | |
Santander Drive Auto Receivables Trust 2013-4 C — 3.25% 1/15/2020 | | | 595,914 | | | | 598,505 | | |
Santander Drive Auto Receivables Trust 2012-5 D — 3.30% 9/17/2018 | | | 3,631,252 | | | | 3,633,251 | | |
Westlake Automobile Receivables Trust 2015-1A B — 1.68% 11/16/2020** | | | 1,900,482 | | | | 1,900,700 | | |
Westlake Automobile Receivables Trust 2015-2A B — 1.83% 1/15/2021** | | | 15,900,000 | | | | 15,908,839 | | |
Westlake Automobile Receivables Trust 2015-3A B — 2.21% 5/17/2021** | | | 23,804,000 | | | | 23,833,015 | | |
Westlake Automobile Receivables Trust 2015-1A C — 2.29% 11/16/2020** | | | 550,000 | | | | 551,146 | | |
Westlake Automobile Receivables Trust 2015-2A C — 2.45% 1/15/2021** | | | 550,000 | | | | 551,240 | | |
Westlake Automobile Receivables Trust 2016-3A C — 2.46% 1/18/2022** | | | 19,575,000 | | | | 19,448,743 | | |
Westlake Automobile Receivables Trust 2017-1A C — 2.70% 10/17/2022** | | | 11,439,000 | | | | 11,457,018 | | |
17
FPA NEW INCOME, INC.
PORTFOLIO OF INVESTMENTS (Continued)
March 31, 2017
(Unaudited)
BONDS & DEBENTURES — Continued | | Principal
Amount | | Fair
Value | |
Westlake Automobile Receivables Trust 2015-3A C — 3.05% 5/17/2021** | | $ | 550,000 | | | $ | 552,687 | | |
World Omni Automobile Lease Securitization Trust 2015-A A4 — 1.73% 12/15/2020 | | | 15,000,000 | | | | 15,013,922 | | |
World Omni Automobile Lease Securitization Trust 2015-A B — 1.94% 12/15/2020 | | | 12,350,000 | | | | 12,368,421 | | |
World Omni Automobile Lease Securitization Trust 2017-A A4 — 2.32% 8/15/2022 | | | 5,473,000 | | | | 5,481,211 | | |
World Omni Automobile Lease Securitization Trust 2017-A B — 2.48% 8/15/2022 | | | 10,102,000 | | | | 10,116,237 | | |
| | $ | 951,211,085 | | |
COLLATERALIZED LOAN OBLIGATION — 12.2% | |
Black Diamond CLO, Ltd. 2013-1A A1 — 2.473% 2/6/2026**,@ | | $ | 20,985,000 | | | $ | 20,985,399 | | |
BlueMountain CLO Ltd. 2013-4A — 3.36% 4/15/2025**,†† | | | 8,598,000 | | | | 8,598,000 | | |
Cent CLO 19, Ltd. 2013-19A A1A — 2.369% 10/29/2025**,@ | | | 16,376,000 | | | | 16,404,773 | | |
Cerberus Loan Funding XVIII LP 2017-1A A — 1.00% 4/15/2027**,†† | | | 42,107,000 | | | | 42,107,000 | | |
Cerberus Onshore II CLO-2 LLC 2014-1A A — 2.78% 10/15/2023**,@ | | | 4,176,866 | | | | 4,175,734 | | |
Cerberus Onshore II CLO-2 LLC 2014-1A B — 3.722% 10/15/2023**,@ | | | 6,612,000 | | | | 6,610,988 | | |
CIFC Funding 2013-III Ltd. 2013-3A A2BR — 3.40% 10/24/2025** | | | 6,498,000 | | | | 6,500,898 | | |
CIFC Funding 2013-IV Ltd. 2013-4A A2R — 2.72% 11/27/2024**,†† | | | 14,822,000 | | | | 14,766,847 | | |
CVP Cascade CLO-1, Ltd. 2013-CLO1 A1 — 2.473% 1/16/2026**,@ | | | 15,744,000 | | | | 15,744,079 | | |
Elm Trust 2016-1A A2 — 4.163% 6/20/2025**,†† | | | 13,183,000 | | | | 13,253,035 | | |
Flagship VII Ltd. 2013-7A A2R — 2.70% 1/20/2026**,†† | | | 17,551,000 | | | | 17,551,000 | | |
Fortress Credit Opportunities III CLO LP 2014-3A A1TR — 1.00% 4/28/2026**,@,†† | | | 48,830,000 | | | | 48,830,000 | | |
Fortress Credit Opportunities III CLO LP 2014-3A A1T — 2.909% 4/28/2026**,@ | | | 21,187,000 | | | | 21,236,196 | | |
Fortress Credit Opportunities V CLO Ltd. 2014-5A A1FR — 3.40% 10/15/2026**,†† | | | 25,265,000 | | | | 25,265,000 | | |
Fortress Credit Opportunities V CLO Ltd. 2014-5A A2R — 3.75% 10/15/2026**,†† | | | 6,584,000 | | | | 6,584,000 | | |
Fortress Credit Opportunities VII CLO, Ltd. 2016-7I E — 8.424% 12/15/2028@ | | | 20,895,000 | | | | 21,049,414 | | |
Grayson CLO, Ltd. 2006-1A A1B — 1.394% 11/1/2021**,@ | | | 8,678,000 | | | | 8,631,443 | | |
Longfellow Place CLO Ltd. 2013-1A CR — 3.709% 1/15/2024**,@ | | | 30,189,000 | | | | 30,235,793 | | |
MidOcean Credit CLO I 2012-1A A2R — 3.523% 1/15/2024**,@ | | | 18,780,000 | | | | 19,060,047 | | |
Nelder Grove CLO Ltd. 2014-1A AFR — 3.00% 8/28/2026** | | | 7,465,000 | | | | 7,441,552 | | |
NewMark Capital Funding CLO Ltd. 2014-2A AFR — 3.077% 6/30/2026**,†† | | | 5,750,000 | | | | 5,750,000 | | |
NewMark Capital Funding CLO Ltd. 2014-2A BFR — 3.669% 6/30/2026**,†† | | | 10,199,000 | | | | 10,199,000 | | |
NewMark Capital Funding CLO, Ltd. 2013-1A A2 — 2.184% 6/2/2025**,@ | | | 7,250,000 | | | | 7,255,727 | | |
Nomad CLO, Ltd. 2013-1A A1 — 2.223% 1/15/2025**,@ | | | 5,865,000 | | | | 5,864,977 | | |
Northwoods Capital X Ltd. 2013-10A A2R — 2.648% 11/4/2025**,†† | | | 29,490,000 | | | | 29,475,255 | | |
Northwoods Capital X Ltd. 2013-10A B2R — 3.442% 11/4/2025**,†† | | | 4,000,000 | | | | 3,998,000 | | |
Oaktree CLO Ltd. 2014-2A A1BR — 2.953% 10/20/2026**,†† | | | 10,752,000 | | | | 10,752,000 | | |
Oaktree EIF II Series A1, Ltd. 2014-A1A A — 2.509% 8/15/2025**,@ | | | 11,177,000 | | | | 11,178,509 | | |
Ocean Trails CLO V 2014-5A C2R — 4.70% 10/13/2026** | | | 6,814,000 | | | | 6,835,423 | | |
OHA Loan Funding LLC 2014-1A A2R — 2.95% 10/20/2026**,†† | | | 20,832,000 | | | | 20,832,000 | | |
Peaks CLO 1, Ltd. 2014-1A C — 4.523% 6/15/2026**,@ | | | 12,077,000 | | | | 12,085,369 | | |
Saranac CLO I Ltd. 2013-1A B — 3.082% 10/26/2024**,@ | | | 13,199,000 | | | | 13,250,898 | | |
Saranac CLO II Ltd. 2014-2A B — 3.102% 2/20/2025**,@ | | | 3,750,000 | | | | 3,765,323 | | |
Senior Credit Fund SPV LLC 2016-1A — 3.033% 12/19/2025†† | | | 34,234,000 | | | | 34,158,685 | | |
Telos CLO, Ltd. 2013-4A A — 2.323% 7/17/2024**,@ | | | 7,956,000 | | | | 7,970,289 | | |
Telos CLO, Ltd. 2014-5A A — 2.573% 4/17/2025**,@ | | | 31,420,000 | | | | 31,532,829 | | |
THL Credit Wind River CLO, Ltd. 2013-2A A2A — 2.464% 1/18/2026**,@ | | | 6,300,000 | | | | 6,300,491 | | |
Washington Mill CLO Ltd. 2014-1A A2R — 2.90% 4/20/2026**,†† | | | 8,859,000 | | | | 8,859,000 | | |
Washington Mill CLO Ltd. 2014-1A B2R — 3.60% 4/20/2026**,†† | | | 11,052,000 | | | | 11,052,000 | | |
18
FPA NEW INCOME, INC.
PORTFOLIO OF INVESTMENTS (Continued)
March 31, 2017
(Unaudited)
BONDS & DEBENTURES — Continued | | Principal
Amount | | Fair
Value | |
Westwood CDO II, Ltd. 2007-2A A2 — 1.388% 4/25/2022**,@ | | $ | 5,083,000 | | | $ | 5,075,680 | | |
| | $ | 601,222,653 | | |
CREDIT CARD — 4.9% | |
Cabela's Credit Card Master Note Trust 2016-1 A1 — 1.78% 6/15/2022 | | $ | 51,561,000 | | | $ | 51,456,192 | | |
Capital One Multi-Asset Execution Trust 2016-A6 A6 — 1.82% 9/15/2022 | | | 38,371,000 | | | | 38,342,671 | | |
Capital One Multi-Asset Execution Trust 2017-A1 A1 — 2.00% 1/17/2023 | | | 48,839,000 | | | | 48,862,326 | | |
Discover Card Execution Note Trust 2014-A4 A4 — 2.12% 12/15/2021 | | | 42,672,000 | | | | 43,048,686 | | |
Synchrony Credit Card Master Note Trust 2012-6 A — 1.36% 8/17/2020 | | | 57,633,000 | | | | 57,642,856 | | |
Synchrony Credit Card Master Note Trust 2016-3 B — 1.91% 9/15/2022 | | | 3,847,000 | | | | 3,808,543 | | |
| | $ | 243,161,274 | | |
EQUIPMENT — 8.7% | |
ARI Fleet Lease Trust 2015-A A2 — 1.11% 11/15/2018** | | $ | 10,015,196 | | | $ | 9,996,786 | | |
ARI Fleet Lease Trust 2016-A A2 — 1.82% 7/15/2024** | | | 20,553,821 | | | | 20,548,765 | | |
Ascentium Equipment Receivables LLC 2015-2A B — 2.62% 12/10/2019** | | | 4,102,000 | | | | 4,112,591 | | |
Ascentium Equipment Receivables Trust 2016-1A A2 — 1.75% 11/13/2018** | | | 816,295 | | | | 816,501 | | |
Avis Budget Rental Car Funding AESOP LLC 2014-2A A — 2.50% 2/20/2021** | | | 6,084,000 | | | | 6,117,840 | | |
Avis Budget Rental Car Funding AESOP LLC 2015-1A A — 2.50% 7/20/2021** | | | 39,477,000 | | | | 39,469,420 | | |
Avis Budget Rental Car Funding AESOP LLC 2015-2A A — 2.63% 12/20/2021** | | | 22,566,000 | | | | 22,584,597 | | |
CCG Receivables Trust 2015-1 A2 — 1.46% 11/14/2018** | | | 12,643,488 | | | | 12,618,352 | | |
Chesapeake Funding II LLC 2016-2A A1 — 1.88% 6/15/2028** | | | 29,535,000 | | | | 29,463,132 | | |
Chesapeake Funding II LLC 2016-1A A1 — 2.11% 3/15/2028** | | | 33,142,937 | | | | 33,165,909 | | |
Chesapeake Funding LLC 2014-1A A — 1.254% 3/7/2026**,@ | | | 15,722,089 | | | | 15,677,171 | | |
Enterprise Fleet Financing LLC 2014-2 A2 — 1.05% 3/20/2020** | | | 9,645,248 | | | | 9,639,898 | | |
Enterprise Fleet Financing LLC 2015-2 A2 — 1.59% 2/22/2021** | | | 33,804,619 | | | | 33,819,179 | | |
Enterprise Fleet Financing LLC 2016-2 A2 — 1.74% 2/22/2022** | | | 18,592,000 | | | | 18,555,543 | | |
Enterprise Fleet Financing LLC 2017-1 A3 — 2.60% 7/20/2022** | | | 9,453,000 | | | | 9,435,994 | | |
GreatAmerica Leasing Receivables Funding LLC 2017-1 A4 — 2.36% 1/20/2023** | | | 6,562,000 | | | | 6,540,634 | | |
GreatAmerica Leasing Receivables Funding LLC 2017-1 C — 2.89% 1/22/2024** | | | 2,609,000 | | | | 2,599,691 | | |
Hertz Fleet Lease Funding LP 2016-1 A2 — 1.96% 4/10/2030** | | | 21,046,000 | | | | 21,030,554 | | |
Leaf Receivables Funding 11 LLC 2016-1 A2 — 1.72% 7/15/2018**,†† | | | 16,712,271 | | | | 16,701,675 | | |
MMAF Equipment Finance LLC 2012-AA A4 — 1.35% 10/10/2018** | | | 2,622 | | | | 2,622 | | |
MMAF Equipment Finance LLC 2013-AA A4 — 1.68% 5/11/2020** | | | 9,564,606 | | | | 9,556,880 | | |
NextGear Floorplan Master Owner Trust 2015-2A A — 2.38% 10/15/2020** | | | 10,000,000 | | | | 10,042,271 | | |
Prop Series 2017-1A — 5.30% 3/15/2042†† | | | 40,745,788 | | | | 40,726,556 | | |
Verizon Owner Trust 2016-2A A — 1.68% 5/20/2021** | | | 8,830,000 | | | | 8,798,819 | | |
Verizon Owner Trust 2017-1A B — 2.45% 9/20/2021** | | | 33,682,000 | | | | 33,746,721 | | |
Volvo Financial Equipment LLC Series 2017-1A A4 — 2.21% 11/15/2021** | | | 5,916,000 | | | | 5,902,690 | | |
Wheels SPV 2 LLC 2015-1A A2 — 1.27% 4/22/2024** | | | 8,428,207 | | | | 8,411,545 | | |
| | $ | 430,082,336 | | |
OTHER — 9.1% | |
Conn's Receivables Funding LLC 2016-A A — 4.68% 4/16/2018** | | $ | 1,455,310 | | | $ | 1,456,840 | | |
Conn's Receivables Funding LLC 2016-A B — 8.96% 8/15/2018** | | | 28,435,000 | | | | 28,793,727 | | |
InSite Issuer LLC — 8.595% 8/15/2020**,†† | | | 12,001,000 | | | | 12,361,030 | | |
New Residential Advance Receivables Trust 2015-ON1
2016-T4 AT4 — 3.107% 12/15/2050**,†† | | | 50,294,000 | | | | 50,243,706 | | |
19
FPA NEW INCOME, INC.
PORTFOLIO OF INVESTMENTS (Continued)
March 31, 2017
(Unaudited)
BONDS & DEBENTURES — Continued | | Principal
Amount | | Fair
Value | |
New Residential Advance Receivables Trust Advance Receivables Backed
2016-T1 AT1 — 2.751% 6/15/2049** | | $ | 32,011,000 | | | $ | 31,955,941 | | |
New Residential Advance Receivables Trust Advance Receivables Backed Notes
2016-T2 AT2 — 2.575% 10/15/2049**,†† | | | 50,834,000 | | | | 50,250,121 | | |
AT1 — 3.214% 2/15/2051**,†† | | | 46,789,000 | | | | 46,799,294 | | |
Ocwen Master Advance Receivables Trust 2016-T1 AT1 — 2.521% 8/17/2048** | | | 51,028,000 | | | | 50,948,269 | | |
Oportun Funding III LLC 2016-B A — 3.69% 7/8/2021** | | | 10,122,000 | | | | 10,142,108 | | |
Oportun Funding IV LLC 2016-C A — 3.28% 11/8/2021** | | | 9,739,000 | | | | 9,653,956 | | |
Panhandle-Plains Student Finance Corporation 2001-1 A2 — 2.478% 12/1/2031†† | | | 6,800,000 | | | | 6,757,500 | | |
PFS Financing Corporation 2014-BA A — 1.512% 10/15/2019**,@ | | | 33,006,000 | | | | 32,953,557 | | |
PFS Financing Corporation 2015-AA A — 1.532% 4/15/2020**,@ | | | 29,100,000 | | | | 29,090,685 | | |
PFS Financing Corporation 2015-AA B — 1.812% 4/15/2020**,@ | | | 500,000 | | | | 496,493 | | |
PFS Financing Corporation 2016-A A — 2.112% 2/18/2020**,@ | | | 57,776,000 | | | | 58,013,916 | | |
STORE Master Funding LLC 2012-1A A — 5.77% 8/20/2042** | | | 465,855 | | | | 480,469 | | |
Unison Ground Lease Funding LLC 2013-1 B — 5.78% 3/15/2020**,†† | | | 10,932,000 | | | | 10,803,997 | | |
Unison Ground Lease Funding LLC 2013-2 B — 6.268% 3/15/2020** | | | 3,768,000 | | | | 3,518,898 | | |
WCP ISSUER LLC 2013-1 B — 6.657% 8/15/2020**,†† | | | 15,000,000 | | | | 15,470,385 | | |
| | $ | 450,190,892 | | |
| TOTAL ASSET-BACKED SECURITIES (Cost $2,673,268,997) | | $ | 2,675,868,240 | | |
CORPORATE BONDS & NOTES — 3.4% | |
CONSUMER, CYCLICAL — 0.4% | |
Northwest Airlines 1999-2 Class C Pass Through Trust — 8.304% 9/1/2010†† | | $ | 17,800,245 | | | $ | 6,230,086 | | |
Northwest Airlines 2000-1 Class G Pass Through Trust — 7.15% 10/1/2019 | | | 9,015,347 | | | | 9,375,960 | | |
Continental Airlines 2000-1 Class B Pass Through Trust — 8.388% 11/1/2020 | | | 192,780 | | | | 192,549 | | |
US Airways 1998-1B Pass Through Trust — 7.35% 1/30/2018 | | | 3,780,561 | | | | 3,794,928 | | |
US Airways 1998-1C Pass Through Trust — 6.82% 1/30/2019†† | | | 2,383,509 | | | | 77,464 | | |
US Airways 1998-1C Pass Through Trust — 7.96% 1/20/2018†† | | | 4,341,206 | | | | 1,562,834 | | |
| | | $ | 21,233,821 | | |
DIVERSIFIED — 0.8% | |
Boart Longyear Management Pty, Ltd. — 10.00% 10/1/2018** | | $ | 51,802,000 | | | $ | 38,851,500 | | |
ENERGY — 0.9% | |
Atwood Oceanics, Inc. — 6.50% 2/1/2020 | | $ | 49,686,000 | | | $ | 44,344,755 | | |
FINANCIAL — 0.5% | |
Berkshire Hathaway Finance Corporation — 1.299% 8/15/2019@ | | $ | 12,753,000 | | | $ | 12,786,391 | | |
N671US Trust — 7.50% 9/15/2020**,†† | | | 9,589,611 | | | | 9,661,533 | | |
| | | $ | 22,447,924 | | |
INDUSTRIAL — 0.3% | |
Air 2 US — 8.027% 10/1/2019** | | $ | 3,519,703 | | | $ | 3,634,094 | | |
Air 2 US — 10.127% 10/1/2020**,†† | | | 39,258,228 | | | | 12,170,050 | | |
| | | $ | 15,804,144 | | |
20
FPA NEW INCOME, INC.
PORTFOLIO OF INVESTMENTS (Continued)
March 31, 2017
(Unaudited)
BONDS & DEBENTURES — Continued | | Principal
Amount | | Fair
Value | |
TECHNOLOGY — 0.5% | |
Apple, Inc. — 1.90% 2/7/2020 | | $ | 25,563,000 | | | $ | 25,637,795 | | |
TOTAL CORPORATE BONDS & NOTES
(Cost $192,387,965) | | $ | 168,319,939 | | |
CORPORATE BANK DEBT — 2.8% | |
ACCTL — 6.387% 5/16/2022**,†† | | $ | 19,380,610 | | | $ | 19,295,142 | | |
BARXPL TL-B 1L — 0.00% 9/9/2021** | | | 31,850,985 | | | | 32,173,635 | | |
Intelsat Jackson Holding SA — 0.00% 6/30/2019** | | | 13,504,000 | | | | 13,167,615 | | |
MB1LTL — 6.00% 11/30/2022**,†† | | | 17,007,570 | | | | 16,885,286 | | |
MB2LTL — 10.25% 11/30/2023**,†† | | | 6,816,000 | | | | 6,749,680 | | |
OTGDDTL — 1.00% 8/23/2021**,†† | | | 1,560,000 | | | | 14,508 | | |
OTGTL — 9.50% 8/23/2021**,†† | | | 20,360,000 | | | | 20,142,148 | | |
SDTL — 7.00% 11/22/2021**,†† | | | 14,031,750 | | | | 13,891,292 | | |
ZW1L — 6.00% 11/16/2022**,†† | | | 13,595,925 | | | | 13,511,766 | | |
ZW2L — 10.00% 11/16/2023**,†† | | | 4,870,000 | | | | 4,811,317 | | |
| TOTAL CORPORATE BANK DEBT (Cost $139,835,381) | | $ | 140,642,389 | | |
MUNICIPALS — 0.1% | |
Wayne County GO, (TXBL-NTS), — 4.25% 12/1/2018 (Cost $6,277,000) | | $ | 6,277,000 | | | $ | 6,363,183 | | |
U.S. TREASURIES — 9.3% | |
U.S. Treasury Bills — 0.01% 4/13/2017@@@ | | $ | 61,000,000 | | | $ | 60,987,550 | | |
U.S. Treasury Bills — 0.50% 7/31/2017 | | | 60,000,000 | | | | 59,936,952 | | |
U.S. Treasury Bills — 0.625% 6/30/2017 | | | 60,000,000 | | | | 59,972,346 | | |
U.S. Treasury Bills — 0.875% 5/15/2017 | | | 60,000,000 | | | | 60,002,448 | | |
U.S. Treasury Bills — 1.00% 12/15/2017 | | | 70,843,000 | | | | 70,837,375 | | |
U.S. Treasury Bills — 1.375% 8/31/2020 | | | 114,135,000 | | | | 113,099,807 | | |
U.S. Treasury Bills — 1.375% 10/31/2020 | | | 34,456,000 | | | | 34,077,990 | | |
| TOTAL U.S. TREASURIES (Cost $461,302,731) | | $ | 458,914,468 | | |
| TOTAL BONDS & DEBENTURES — 102.5% (Cost $5,161,875,564) | | $ | 5,070,625,650 | | |
| TOTAL INVESTMENT SECURITIES — 102.5% (Cost $5,161,875,564) | | $ | 5,070,625,650 | | |
21
FPA NEW INCOME, INC.
PORTFOLIO OF INVESTMENTS (Continued)
March 31, 2017
(Unaudited)
| | | Principal
Amount | | Fair
Value | |
SHORT-TERM INVESTMENTS — 1.0% | |
State Street Bank Repurchase Agreement — 0.09% 4/3/2017 | |
(Dated 03/31/2017, repurchase price of $51,044,383, collateralized by
$54,505,000, principal amount U.S. Treasury Bond 2.75% 2042,
fair value $52,068,190) | | $ | 51,044,000 | | | $ | 51,044,000 | | |
| TOTAL SHORT-TERM INVESTMENTS (Cost $51,044,000) | | $ | 51,044,000 | | |
| TOTAL INVESTMENTS — 103.5% (Cost $5,212,919,564) | | $ | 5,121,669,650 | | |
Other Assets and Liabilities, net — (3.5)% | | | (173,534,657 | ) | |
NET ASSETS — 100.0% | | $ | 4,948,134,993 | | |
@ Variable/Floating Rate Security — Interest rate changes on these instruments are based on changes in a designated base rate. The rates shown are those in effect on March 31, 2017.
** Restricted securities. These restricted securities constituted 53.13% of total net assets at March 31, 2017, most of which are considered liquid by the Adviser. These securities are not registered and may not be sold to the public. There are legal and/or contractual restrictions on resale. The Fund does not have the right to demand that such securities be registered. The values of these securities are determined by valuations provided by pricing services, brokers, dealers, market makers, or in good faith under policies adopted by authority of the Fund's Board of Directors.
†† These securities have been valued in good faith under policies adopted by authority of the Board of Director in accordance with the Fund's fair value procedures. These securities constituted 14.85% of total net assets at March 31, 2017.
@@@ Zero coupon bond. Coupon amount represents effective yield to maturity.
@@ Step Coupon — Coupon rate increases in increments to maturity. Rate disclosed is as of March 31, 2017.
22
FPA NEW INCOME, INC.
PORTFOLIO OF INVESTMENTS —
RESTRICTED SECURITIES
March 31, 2017
(Unaudited)
Issuer | | Acquisition
Date(s) | |
Cost | | Fair
Value | | Fair Value
as a % of
Net Assets | |
A10 Term Asset
Financing LLC 2016-1 A1
2.42% 3/15/2035 | | 5/19/2016 | | $ | 10,127,007 | | | $ | 10,091,297 | | | | 0.20 | % | |
A10 Term Asset
Financing LLC 2013-2 A
2.62% 11/15/2027 | | 10/30/2013 | | | 1,356,890 | | | | 1,353,600 | | | | 0.03 | % | |
ACCTL 6.387% 5/16/2022 | | 9/19/2016 | | | 19,202,331 | | | | 19,295,142 | | | | 0.39 | % | |
ARI Fleet Lease Trust 2016-A A2
1.82% 7/15/2024 | | 02/17/2016 | | | 20,552,454 | | | | 20,548,765 | | | | 0.42 | % | |
ARI Fleet Lease Trust 2015-A A2
1.11% 11/15/2018 | | 04/15/2015,
07/20/2015,
03/11/2016,
03/18/2016 | | | 10,006,700 | | | | 9,996,786 | | | | 0.20 | % | |
Air 2 US 10.127% 10/1/2020 | | 7/24/2014, 8/22/2014,
2/12/2015 | | | 9,396,339 | | | | 12,170,050 | | | | 0.25 | % | |
Air 2 US 8.027% 10/1/2019 | | 7/1/2014, 10/27/2014 | | | 3,711,379 | | | | 3,634,094 | | | | 0.07 | % | |
Ascentium Equipment
Receivables LLC 2015-2A B
2.62% 12/10/2019 | | 02/18/2016 | | | 4,091,049 | | | | 4,112,591 | | | | 0.08 | % | |
Ascentium Equipment
Receivables Trust 2016-1A A2
1.75% 11/13/2018 | | 4/18/2016 | | | 816,283 | | | | 816,501 | | | | 0.02 | % | |
Avis Budget Rental Car Funding
AESOP LLC 2015-1A A
2.50% 7/20/2021 | | 2/22/2017, 3/13/2017 | | | 39,352,613 | | | | 39,469,420 | | | | 0.80 | % | |
Avis Budget Rental Car Funding
AESOP LLC 2015-2A A
2.63% 12/20/2021 | | 1/31/2017, 3/8/2017,
3/13/2017 | | | 22,492,301 | | | | 22,584,597 | | | | 0.46 | % | |
Avis Budget Rental Car Funding
AESOP LLC 2014-2A A
2.50% 2/20/2021 | | 1/31/2017 | | | 6,095,431 | | | | 6,117,840 | | | | 0.12 | % | |
BARXPL TL-B 1L 9/9/2021 | | 10/07/2016,
10/14/2016,
12/19/2016 | | | 31,718,006 | | | | 32,173,635 | | | | 0.65 | % | |
BCAP LLC Trust 2010-RR8 2A6
2.662% 11/26/2036 | | 12/08/2015 | | | 3,718,071 | | | | 3,717,826 | | | | 0.07 | % | |
Black Diamond CLO, Ltd.
2013-1A A1
2.473% 2/6/2026 | | 9/16/2016, 9/30/2016,
1/25/2017 | | | 21,004,549 | | | | 20,985,399 | | | | 0.42% | | |
23
FPA NEW INCOME, INC.
PORTFOLIO OF INVESTMENTS —
RESTRICTED SECURITIES
(Continued)
March 31, 2017 (Unaudited)
Issuer | | Acquisition
Date(s) | |
Cost | | Fair
Value | | Fair Value
as a % of
Net Assets | |
BlueMountain CLO Ltd. 2013-4A
3.36% 4/15/2025 | | 03/31/2017 | | $ | 8,598,000 | | | $ | 8,598,000 | | | | 0.17 | % | |
Boart Longyear Management
Pty, Ltd. 10.00% 10/1/2018 | | 9/20/2013, 9/24/2014,
10/6/2014,
10/24/2014,
11/13/2014,
11/21/2014,
12/5/2014,
12/10/2014,
2/20/2015, 3/2/2015 | | | 52,499,447 | | | | 38,851,500 | | | | 0.79 | % | |
CCG Receivables Trust
2015-1 A2 1.46% 11/14/2018 | | 9/9/2015 | | | 12,642,881 | | | | 12,618,352 | | | | 0.25 | % | |
CIFC Funding 2013-III Ltd.
2013-3A A2BR
3.40% 10/24/2025 | | 3/10/2017 | | | 6,498,000 | | | | 6,500,898 | | | | 0.13 | % | |
CIFC Funding 2013-IV Ltd.
2013-4A A2R
2.72% 11/27/2024 | | 2/15/2017 | | | 14,822,000 | | | | 14,766,847 | | | | 0.30 | % | |
COMM Mortgage
Trust 2014-FL5 B
3.062% 10/15/2031 | | 11/29/2016 | | | 12,668,775 | | | | 12,761,944 | | | | 0.26 | % | |
COMM Mortgage
Trust 2014-FL5 C
3.062% 10/15/2031 | | 9/15/2016 | | | 7,948,020 | | | | 8,123,608 | | | | 0.16 | % | |
CVP Cascade CLO-1, Ltd.
2013-CLO1 A1
2.473% 1/16/2026 | | 11/01/2016 | | | 15,731,703 | | | | 15,744,079 | | | | 0.32 | % | |
Cent CLO 19, Ltd.
2013-19A A1A
2.369% 10/29/2025 | | 9/15/2016 | | | 16,368,115 | | | | 16,404,773 | | | | 0.33 | % | |
Cerberus Loan Funding
XVIII LP 2017-1A A
1.00% 4/15/2027 | | 03/30/2017 | | | 42,107,000 | | | | 42,107,000 | | | | 0.85 | % | |
Cerberus Onshore II
CLO-2 LLC 2014-1A B
3.722% 10/15/2023 | | 11/20/2014 | | | 6,568,997 | | | | 6,610,988 | | | | 0.13 | % | |
Cerberus Onshore II
CLO-2 LLC 2014-1A A
2.78% 10/15/2023 | | 11/20/2014,
02/12/2015 | | | 4,176,906 | | | | 4,175,734 | | | | 0.08 | % | |
24
FPA NEW INCOME, INC.
PORTFOLIO OF INVESTMENTS —
RESTRICTED SECURITIES
(Continued)
March 31, 2017 (Unaudited)
Issuer | | Acquisition
Date(s) | |
Cost | | Fair
Value | | Fair Value
as a % of
Net Assets | |
Chesapeake Funding II LLC
2016-1A A1
2.11% 3/15/2028 | | 03/24/2016 | | $ | 33,138,474 | | | $ | 33,165,909 | | | | 0.67 | % | |
Chesapeake Funding II LLC
2016-2A A1
1.88% 6/15/2028 | | 6/14/2016 | | | 29,533,545 | | | | 29,463,132 | | | | 0.60 | % | |
Chesapeake Funding LLC
2014-1A A
1.254% 3/7/2026 | | 03/04/2014,
10/22/2015 | | | 15,709,824 | | | | 15,677,171 | | | | 0.32 | % | |
Citigroup Mortgage Loan
Trust, Inc. 2014-A A
4.00% 1/25/2035 | | 02/24/2014,
07/28/2015 | | | 13,219,310 | | | | 13,180,972 | | | | 0.27 | % | |
Conn's Receivables
Funding LLC 2016-A B
8.96% 8/15/2018 | | 03/11/2016 | | | 28,433,882 | | | | 28,793,727 | | | | 0.58 | % | |
Conn's Receivables
Funding LLC 2016-A A
4.68% 4/16/2018 | | 03/11/2016 | | | 1,455,310 | | | | 1,456,840 | | | | 0.03 | % | |
Credit Acceptance Auto Loan
Trust 2015-2A B
3.04% 8/15/2023 | | 06/20/2016 | | | 27,413,190 | | | | 27,601,244 | | | | 0.56 | % | |
Credit Acceptance Auto Loan
Trust 2016-2A B
3.18% 5/15/2024 | | 5/4/2016 | | | 22,931,694 | | | | 23,150,078 | | | | 0.47 | % | |
Credit Acceptance Auto Loan
Trust 2016-3A B
2.94% 10/15/2024 | | 10/19/2016 | | | 15,190,321 | | | | 15,244,377 | | | | 0.31 | % | |
Credit Acceptance Auto Loan
Trust 2016-3A C
3.60% 4/15/2025 | | 10/19/2016 | | | 12,658,744 | | | | 12,755,405 | | | | 0.26 | % | |
Credit Acceptance Auto Loan
Trust 2014-2A B
2.67% 9/15/2022 | | 9/18/2014, 7/30/2015 | | | 11,731,473 | | | | 11,765,228 | | | | 0.24 | % | |
Credit Acceptance Auto Loan
Trust 2016-2A A
2.42% 11/15/2023 | | 5/4/2016, 6/22/2016 | | | 9,965,247 | | | | 9,965,885 | | | | 0.20 | % | |
Credit Acceptance Auto Loan
Trust 2014-2A A
1.88% 3/15/2022 | | 3/2/2015, 7/29/2015,
8/6/2015 | | | 9,503,758 | | | | 9,506,050 | | | | 0.19 | % | |
25
FPA NEW INCOME, INC.
PORTFOLIO OF INVESTMENTS —
RESTRICTED SECURITIES
(Continued)
March 31, 2017 (Unaudited)
Issuer | | Acquisition
Date(s) | |
Cost | | Fair
Value | | Fair Value
as a % of
Net Assets | |
Credit Acceptance Auto Loan
Trust 2014-1A B
2.29% 4/15/2022 | | 6/16/2015 | | $ | 8,069,014 | | | $ | 8,078,562 | | | | 0.16 | % | |
Credit Acceptance Auto Loan
Trust 2015-1A B
2.61% 1/17/2023 | | 7/31/2015 | | | 3,161,176 | | | | 3,172,691 | | | | 0.06 | % | |
Credit Acceptance Auto Loan
Trust 2015-1A A
2.00% 7/15/2022 | | 06/20/2016 | | | 2,166,189 | | | | 2,164,386 | | | | 0.04 | % | |
Credit Acceptance Auto Loan
Trust 2015-2A C
3.76% 2/15/2024 | | 8/12/2015 | | | 549,994 | | | | 557,470 | | | | 0.01 | % | |
Credit Suisse Commercial
Mortgage Trust Series
2016-MFF E
6.912% 11/15/2033 | | 11/04/2016,
12/20/2016 | | | 30,398,000 | | | | 30,512,366 | | | | 0.62 | % | |
Credit Suisse Mortgage Trust
Series 2010-9R 1A4
3.75% 8/27/2037 | | 02/10/2016 | | | 12,731,010 | | | | 12,567,460 | | | | 0.25 | % | |
DT Auto Owner Trust 2015-3A B
2.46% 11/15/2019 | | 10/07/2015 | | | 27,646,244 | | | | 27,702,246 | | | | 0.56 | % | |
DT Auto Owner Trust 2017-1A C
2.70% 11/15/2022 | | 2/6/2017 | | | 16,278,658 | | | | 16,275,056 | | | | 0.33 | % | |
DT Auto Owner Trust 2016-4A B
2.02% 8/17/2020 | | 9/28/2016 | | | 13,676,302 | | | | 13,637,970 | | | | 0.28 | % | |
DT Auto Owner Trust 2015-2A B
1.88% 5/15/2019 | | 6/10/2015 | | | 7,023,423 | | | | 7,025,391 | | | | 0.14 | % | |
DT Auto Owner Trust 2016-2A B
2.92% 5/15/2020 | | 4/6/2016 | | | 5,391,912 | | | | 5,424,613 | | | | 0.11 | % | |
DT Auto Owner Trust 2016-2A A
1.73% 8/15/2019 | | 4/6/2016 | | | 3,084,457 | | | | 3,083,364 | | | | 0.06 | % | |
Elm Trust 2016-1A A2
4.163% 6/20/2025 | | 12/08/2016 | | | 13,182,764 | | | | 13,253,035 | | | | 0.27 | % | |
Enterprise Fleet
Financing LLC 2015-2 A2
1.59% 2/22/2021 | | 7/22/2015 | | | 33,802,647 | | | | 33,819,179 | | | | 0.68 | % | |
Enterprise Fleet
Financing LLC 2016-2 A2
1.74% 2/22/2022 | | 7/12/2016 | | | 18,590,912 | | | | 18,555,543 | | | | 0.37 | % | |
26
FPA NEW INCOME, INC.
PORTFOLIO OF INVESTMENTS —
RESTRICTED SECURITIES
(Continued)
March 31, 2017 (Unaudited)
Issuer | | Acquisition
Date(s) | |
Cost | | Fair
Value | | Fair Value
as a % of
Net Assets | |
Enterprise Fleet
Financing LLC 2014-2 A2
1.05% 3/20/2020
| | 08/26/2014,
03/25/2015,
04/28/2015,
05/28/2015,
02/17/2016 | | $ | 9,642,707 | | | $ | 9,639,898 | | | | 0.19 | % | |
Enterprise Fleet
Financing LLC 2017-1 A3
2.60% 7/20/2022 | | 1/24/2017 | | | 9,450,712 | | | | 9,435,994 | | | | 0.19 | % | |
Exeter Automobile Receivables
Trust 2016-3A A
1.84% 11/16/2020 | | 10/03/2016 | | | 20,748,412 | | | | 20,687,106 | | | | 0.42 | % | |
Exeter Automobile Receivables
Trust 2017-1A B
3.00% 12/15/2021 | | 1/30/2017
1/30/2017
1/30/2017 | | | 8,761,092 | | | | 8,806,851 | | | | 0.18 | % | |
First Investors Auto Owner
Trust 2016-1A A2
2.26% 4/15/2021 | | 02/10/2016 | | | 16,653,000 | | | | 16,707,947 | | | | 0.34 | % | |
First Investors Auto Owner
Trust 2015-2A A2
2.28% 9/15/2021 | | 06/10/2016 | | | 16,579,938 | | | | 16,623,640 | | | | 0.34 | % | |
First Investors Auto Owner
Trust 2017-1A C
2.95% 4/17/2023 | | 2/14/2017 | | | 7,789,797 | | | | 7,787,841 | | | | 0.16 | % | |
First Investors Auto Owner
Trust 2016-2A A2
1.87% 11/15/2021 | | 9/12/2016 | | | 5,513,676 | | | | 5,503,990 | | | | 0.11 | % | |
First Investors Auto Owner
Trust 2015-2A B
2.75% 9/15/2021 | | 8/18/2015 | | | 4,442,671 | | | | 4,450,410 | | | | 0.09 | % | |
First Investors Auto Owner
Trust 2017-1A B
2.67% 4/17/2023 | | 2/14/2017, 2/21/2017 | | | 4,126,172 | | | | 4,122,805 | | | | 0.08 | % | |
First Investors Auto Owner
Trust 2014-1A A3
1.49% 1/15/2020 | | 04/03/2014 | | | 1,828,368 | | | | 1,828,212 | | | | 0.04 | % | |
Flagship VII Ltd. 2013-7A A2R
2.70% 1/20/2026 | | 3/22/2017 | | | 17,551,000 | | | | 17,551,000 | | | | 0.35 | % | |
27
FPA NEW INCOME, INC.
PORTFOLIO OF INVESTMENTS —
RESTRICTED SECURITIES
(Continued)
March 31, 2017 (Unaudited)
Issuer | | Acquisition
Date(s) | |
Cost | | Fair
Value | | Fair Value
as a % of
Net Assets | |
Fortress Credit Opportunities III
CLO LP 2014-3A A1TR
1.00% 4/28/2026 | | 3/22/2017 | | $ | 48,830,000 | | | $ | 48,830,000 | | | | 0.99 | % | |
Fortress Credit Opportunities III
CLO LP 2014-3A A1T
2.909% 4/28/2026 | | 10/27/2016 | | | 21,166,626 | | | | 21,236,196 | | | | 0.43 | % | |
Fortress Credit Opportunities V
CLO Ltd. 2014-5A A1FR
3.40% 10/15/2026 | | 3/28/2017 | | | 25,265,000 | | | | 25,265,000 | | | | 0.51 | % | |
Fortress Credit Opportunities V
CLO Ltd. 2014-5A A2R
3.75% 10/15/2026 | | 3/28/2017 | | | 6,584,000 | | | | 6,584,000 | | | | 0.13 | % | |
Grayson CLO, Ltd. 2006-1A A1B
1.394% 11/1/2021 | | 9/8/2016 | | | 8,523,241 | | | | 8,631,443 | | | | 0.17 | % | |
GreatAmerica Leasing Receivables
Funding LLC 2017-1 A4
2.36% 1/20/2023 | | 2/7/2017 | | | 6,561,715 | | | | 6,540,634 | | | | 0.13 | % | |
GreatAmerica Leasing Receivables
Funding LLC 2017-1 C
2.89% 1/22/2024 | | 2/7/2017 | | | 2,608,857 | | | | 2,599,691 | | | | 0.05 | % | |
Hertz Fleet Lease
Funding LP 2016-1 A2
1.96% 4/10/2030 | | 4/13/2016 | | | 21,045,640 | | | | 21,030,554 | | | | 0.42 | % | |
Hyundai Auto Lease
Securitization Trust 2016-C B
1.86% 5/17/2021 | | 1/10/2017 | | | 13,183,118 | | | | 13,145,430 | | | | 0.27 | % | |
InSite Issuer LLC
8.595% 8/15/2020 | | 8/19/2013, 2/12/2015,
10/20/2015 | | | 12,025,651 | | | | 12,361,030 | | | | 0.25 | % | |
Intelsat Jackson Holding
SA 6/30/2019 | | 04/10/2017,
03/28/2017, 03/23/2017,
03/22/2017, 03/13/2017,
04/07/2017 and
03/10/2017 | | | 13,322,565 | | | | 13,167,615 | | | | 0.27 | % | |
Latitude Management
Real Estate Capita
2016-CRE2 A
2.477% 11/24/2031 | | 10/21/2016 | | | 11,903,000 | | | | 11,903,000 | | | | 0.24 | % | |
Leaf Receivables
Funding 11 LLC 2016-1 A2
1.72% 7/15/2018 | | 5/18/2016 | | | 16,712,271 | | | | 16,701,675 | | | | 0.34 | % | |
28
FPA NEW INCOME, INC.
PORTFOLIO OF INVESTMENTS —
RESTRICTED SECURITIES
(Continued)
March 31, 2017 (Unaudited)
Issuer | | Acquisition
Date(s) | |
Cost | | Fair
Value | | Fair Value
as a % of
Net Assets | |
Longfellow Place
CLO Ltd. 2013-1A CR
3.709% 1/15/2024 | | 12/13/2016 | | $ | 30,189,000 | | | $ | 30,235,793 | | | | 0.61 | % | |
MB1LTL 6.00% 11/30/2022 | | 12/02/2016 | | | 16,845,432 | | | | 16,885,286 | | | | 0.34 | % | |
MB2LTL 10.25% 11/30/2023 | | 12/02/2016 | | | 6,717,125 | | | | 6,749,680 | | | | 0.14 | % | |
MMAF Equipment
Finance LLC 2013-AA A4
1.68% 5/11/2020 | | 6/15/2016 | | | 9,613,847 | | | | 9,556,880 | | | | 0.19 | % | |
MMAF Equipment
Finance LLC 2012-AA A4
1.35% 10/10/2018 | | 06/05/2015 | | | 2,625 | | | | 2,622 | | | | 0.00 | % | |
MidOcean Credit
CLO I 2012-1A A2R
3.523% 1/15/2024 | | 1/18/2017 | | | 18,997,575 | | | | 19,060,047 | | | | 0.39 | % | |
N671US Trust 7.50% 9/15/2020 | | 08/16/2012 | | | 9,589,611 | | | | 9,661,533 | | | | 0.20 | % | |
Nationstar HECM Loan Trust
2016-1A A 2.981% 2/25/2026 | | 02/25/2016 | | | 4,632,379 | | | | 4,632,379 | | | | 0.09 | % | |
Nationstar HECM Loan Trust
2016-3A A 2.013% 8/25/2026 | | 8/11/2016, 9/25/2016 | | | 2,635,951 | | | | 2,638,850 | | | | 0.05 | % | |
Nationstar HECM Loan Trust
2015-2A A 2.883% 11/25/2025 | | 11/19/2015 | | | 1,610,668 | | | | 1,611,183 | | | | 0.03 | % | |
Nelder Grove CLO Ltd.
2014-1A AFR
3.00% 8/28/2026 | | 2/8/2017 | | | 7,465,000 | | | | 7,441,552 | | | | 0.15 | % | |
New Residential Advance
Receivables Trust
2015-ON1 2016-T4 AT4
3.107% 12/15/2050 | | 11/22/2016 | | | 50,294,000 | | | | 50,243,706 | | | | 1.02 | % | |
New Residential Advance
Receivables Trust Advance
Receivables Backed
2016-T1 AT1
2.751% 6/15/2049 | | 6/23/2016 | | | 32,005,732 | | | | 31,955,941 | | | | 0.65 | % | |
New Residential Advance
Receivables Trust
Advance Receivables
Backed Notes 2016-T2 AT2
2.575% 10/15/2049 | | 10/14/2016 | | | 50,834,000 | | | | 50,250,121 | | | | 1.02 | % | |
New Residential Advance
Receivables Trust
Advance Receivables
Backed Notes 2017-T1 AT1
3.214% 2/15/2051 | | 2/1/2017 | | | 46,789,000 | | | | 46,799,294 | | | | 0.95% | | |
29
FPA NEW INCOME, INC.
PORTFOLIO OF INVESTMENTS —
RESTRICTED SECURITIES
(Continued)
March 31, 2017 (Unaudited)
Issuer | | Acquisition
Date(s) | |
Cost | | Fair
Value | | Fair Value
as a % of
Net Assets | |
NewMark Capital Funding
CLO Ltd. 2014-2A BFR
3.669% 6/30/2026 | | 3/2/2017 | | $ | 10,199,000 | | | $ | 10,199,000 | | | | 0.21 | % | |
NewMark Capital Funding
CLO Ltd. 2014-2A AFR
3.077% 6/30/2026 | | 3/2/2017 | | | 5,750,000 | | | | 5,750,000 | | | | 0.12 | % | |
NewMark Capital Funding
CLO, Ltd. 2013-1A A2
2.184% 6/2/2025 | | 11/01/2016 | | | 7,238,960 | | | | 7,255,727 | | | | 0.15 | % | |
NextGear Floorplan Master
Owner Trust 2015-2A A
2.38% 10/15/2020 | | 2/1/2017 | | | 10,061,879 | | | | 10,042,271 | | | | 0.20 | % | |
Nomad CLO, Ltd. 2013-1A A1
2.223% 1/15/2025 | | 10/27/2016 | | | 5,865,000 | | | | 5,864,977 | | | | 0.12 | % | |
Nomura Resecuritization
Trust 2016-1R 3A1
5.00% 9/28/2036 | | 5/5/2016 | | | 6,827,180 | | | | 6,768,495 | | | | 0.14 | % | |
Northwoods Capital X Ltd.
2013-10A A2R
2.648% 11/4/2025 | | 3/29/2017 | | | 29,490,000 | | | | 29,475,255 | | | | 0.60 | % | |
Northwoods Capital X Ltd.
2013-10A B2R
3.442% 11/4/2025 | | 3/29/2017 | | | 4,000,000 | | | | 3,998,000 | | | | 0.08 | % | |
OHA Loan Funding LLC
2014-1A A2R
2.95% 10/20/2026 | | 3/9/2017 | | | 20,832,000 | | | | 20,832,000 | | | | 0.42 | % | |
OTGDDTL 1.00% 8/23/2021 | | 8/26/2016 | | | — | | | | 14,508 | | | | 0.00 | % | |
OTGTL 9.50% 8/23/2021 | | 8/26/2016 | | | 19,998,707 | | | | 20,142,148 | | | | 0.41 | % | |
Oaktree CLO Ltd. 2014-2A A1BR
2.953% 10/20/2026 | | 2/17/2017 | | | 10,752,000 | | | | 10,752,000 | | | | 0.22 | % | |
Oaktree EIF II Series A1, Ltd.
2014-A1A A
2.509% 8/15/2025 | | 10/19/2016 | | | 11,150,077 | | | | 11,178,509 | | | | 0.23 | % | |
Ocean Trails CLO V 2014-5A C2R
4.70% 10/13/2026 | | 3/9/2017 | | | 6,814,000 | | | | 6,835,423 | | | | 0.14 | % | |
Ocwen Master Advance Receivables
Trust 2016-T1 AT1
2.521% 8/17/2048 | | 8/3/2016 | | | 51,028,000 | | | | 50,948,269 | | | | 1.03% | | |
Oportun Funding III LLC 2016-B A
3.69% 7/8/2021 | | 6/22/2016 | | | 10,121,084 | | | | 10,142,108 | | | | 0.20 | % | |
Oportun Funding IV LLC 2016-C A
3.28% 11/8/2021 | | 10/14/2016 | | | 9,738,526 | | | | 9,653,956 | | | | 0.19 | % | |
30
FPA NEW INCOME, INC.
PORTFOLIO OF INVESTMENTS —
RESTRICTED SECURITIES
(Continued)
March 31, 2017 (Unaudited)
Issuer | | Acquisition
Date(s) | |
Cost | | Fair
Value | | Fair Value
as a % of
Net Assets | |
Ores NPL LLC 2014-LV3 B
6.00% 3/27/2024 | | 3/21/2014, 2/12/2015 | | $ | 36,552,774 | | | $ | 36,631,712 | | | | 0.74 | % | |
PFS Financing Corporation
2016-A A 2.112% 2/18/2020 | | 02/09/2016 | | | 57,781,928 | | | | 58,013,916 | | | | 1.17 | % | |
PFS Financing Corporation
2014-BA A 1.512% 10/15/2019 | | 2/18/2015, 6/15/2015,
10/23/2015,
11/17/2015 | | | 32,900,548 | | | | 32,953,557 | | | | 0.67 | % | |
PFS Financing Corporation
2015-AA A 1.532% 4/15/2020 | | 4/8/2015, 7/30/2015 | | | 29,097,219 | | | | 29,090,685 | | | | 0.59 | % | |
PFS Financing Corporation
2015-AA B 1.812% 4/15/2020 | | 4/8/2015 | | | 500,000 | | | | 496,493 | | | | 0.01 | % | |
Peaks CLO 1, Ltd. 2014-1A C
4.523% 6/15/2026 | | 12/07/2016 | | | 11,853,482 | | | | 12,085,369 | | | | 0.24 | % | |
Prestige Auto Receivables Trust
2016-2A B 2.19% 11/15/2022 | | 10/21/2016 | | | 25,218,959 | | | | 25,058,163 | | | | 0.51 | % | |
Prestige Auto Receivables Trust
2016-2A C 2.88% 11/15/2022 | | 10/21/2016 | | | 12,062,461 | | | | 12,090,473 | | | | 0.24 | % | |
Prestige Auto Receivables Trust
2015-1 A3 1.53% 2/15/2021 | | 3/18/2015, 5/29/2015 | | | 11,307,967 | | | | 11,313,568 | | | | 0.23 | % | |
Prestige Auto Receivables Trust
2015-1 B 2.04% 4/15/2021 | | 3/18/2015 | | | 10,394,556 | | | | 10,411,861 | | | | 0.21 | % | |
Prestige Auto Receivables Trust
2016-1A A3 1.99% 6/15/2020 | | 03/16/2016 | | | 7,917,000 | | | | 7,939,560 | | | | 0.16 | % | |
Prestige Auto Receivables Trust
2014-1A A3 1.52% 4/15/2020 | | 3/18/2014, 11/05/2015 | | | 5,658,288 | | | | 5,660,069 | | | | 0.11 | % | |
RMAT LLC 2015-PR1 A1
4.826% 6/25/2035 | | 06/23/2015 | | | 18,012,121 | | | | 17,930,074 | | | | 0.36 | % | |
Rialto Capital Management LLC
2014-LT5 B
5.00% 5/15/2024 | | 11/20/2014 | | | 6,748,601 | | | | 6,735,236 | | | | 0.14 | % | |
Rialto Real Estate Fund LP
2015-LT7 B
5.071% 12/25/2032 | | 6/15/2015 | | | 17,716,000 | | | | 17,361,680 | | | | 0.35 | % | |
RiverView HECM Trust 2007-1 A
1.49% 5/25/2047 | | 01/9/2013, 02/12/2015 | | | 25,176,133 | | | | 24,584,154 | | | | 0.50% | | |
SCG Trust 2013-SRP1 AJ
2.862% 11/15/2026 | | 12/07/2016 | | | 14,082,087 | | | | 14,083,572 | | | | 0.28 | % | |
SDTL 7.00% 11/22/2021 | | 12/22/2016 | | | 13,764,441 | | | | 13,891,292 | | | | 0.28 | % | |
STORE Master Funding LLC
2012-1A A
5.77% 8/20/2042 | | 08/31/2012 | | | 464,574 | | | | 480,469 | | | | 0.01 | % | |
31
FPA NEW INCOME, INC.
PORTFOLIO OF INVESTMENTS —
RESTRICTED SECURITIES
(Continued)
March 31, 2017 (Unaudited)
Issuer | | Acquisition
Date(s) | |
Cost | | Fair
Value | | Fair Value
as a % of
Net Assets | |
Saranac CLO I Ltd. 2013-1A B
3.082% 10/26/2024 | | 2/24/2017 | | $ | 13,235,732 | | | $ | 13,250,898 | | | | 0.27 | % | |
Saranac CLO II Ltd. 2014-2A B
3.102% 2/20/2025 | | 3/8/2017 | | | 3,761,649 | | | | 3,765,323 | | | | 0.08 | % | |
Stanwich Mortgage Loan Trust
Series 2010-2 A
1.674% 2/28/2057 | | 05/21/2010, 09/22/2011 | | | 695,779 | | | | 663,687 | | | | 0.01 | % | |
Stanwich Mortgage Loan Trust
Series 2011-1 A
.561% 8/15/2050 | | 05/10/2011, 09/22/2011 | | | 661,359 | | | | 660,512 | | | | 0.01 | % | |
Stanwich Mortgage Loan Trust
Series 2011-2 A
20.61% 9/15/2050 | | 06/10/2011, 09/22/2011 | | | 559,302 | | | | 555,943 | | | | 0.01 | % | |
Stanwich Mortgage Loan Trust
Series 2010-4 A
1.718% 8/31/2049 | | 08/04/2010, 09/22/2011 | | | 329,799 | | | | 355,865 | | | | 0.01 | % | |
Stanwich Mortgage Loan Trust
Series 2010-3 A
2.912% 7/31/2038 | | 06/02/2010, 09/22/2011 | | | 312,822 | | | | 322,429 | | | | 0.01 | % | |
Stanwich Mortgage Loan Trust
Series 2010-1 A
1.246% 9/30/2047 | | 04/22/2010, 09/22/2011 | | | 129,352 | | | | 124,670 | | | | 0.00 | % | |
Stanwich Mortgage Loan Trust
Series 2009-2 A
1.007% 2/15/2049 | | 09/22/2011, 07/01/2013 | | | 42,337 | | | | 42,398 | | | | 0.00 | % | |
Sunset Mortgage Loan Co. LLC
2015-NPL1 A
4.459% 9/18/2045 | | 10/02/2015 | | | 14,783,147 | | | | 14,906,029 | | | | 0.30 | % | |
Sunset Mortgage Loan Co. LLC
2014-NPL2 A
3.721% 11/16/2044 | | 11/25/2014 | | | 8,216,952 | | | | 8,222,170 | | | | 0.17 | % | |
THL Credit Wind River
CLO, Ltd. 2013-2A A2A
2.464% 1/18/2026 | | 9/12/2016 | | | 6,309,423 | | | | 6,300,491 | | | | 0.13 | % | |
Telos CLO, Ltd. 2014-5A A
2.573% 4/17/2025 | | 11/01/2016 | | | 31,442,558 | | | | 31,532,829 | | | | 0.64% | | |
Telos CLO, Ltd. 2013-4A A
2.323% 7/17/2024 | | 8/29/2016 | | | 7,917,723 | | | | 7,970,289 | | | | 0.16 | % | |
Towd Point Mortgage Trust
2015-2 1A1 3.25% 11/25/2060 | | 05/28/2015 | | | 40,644,174 | | | | 40,616,194 | | | | 0.82 | % | |
Towd Point Mortgage Trust
2015-4 A1 3.50% 4/25/2055 | | 09/25/2015 | | | 38,029,085 | | | | 37,967,301 | | | | 0.77 | % | |
32
FPA NEW INCOME, INC.
PORTFOLIO OF INVESTMENTS —
RESTRICTED SECURITIES
(Continued)
March 31, 2017 (Unaudited)
Issuer | | Acquisition
Date(s) | |
Cost | | Fair
Value | | Fair Value
as a % of
Net Assets | |
Towd Point Mortgage Trust
2015-2 2A1 3.75% 11/25/2057 | | 06/10/2015 | | $ | 31,520,534 | | | $ | 31,438,055 | | | | 0.64 | % | |
Towd Point Mortgage Trust
2015-1 AES 3.00% 10/25/2053 | | 11/04/2015, 12/09/2015 | | | 29,761,865 | | | | 29,829,681 | | | | 0.60 | % | |
Towd Point Mortgage Trust
2016-3 A1 2.25% 4/25/2056 | | 7/22/2016 | | | 26,138,446 | | | | 25,924,818 | | | | 0.52 | % | |
Unison Ground Lease Funding LLC
2013-1 B 5.78% 3/15/2020 | | 3/12/2013, 7/16/2013,
2/12/2015 | | | 10,827,688 | | | | 10,803,997 | | | | 0.22 | % | |
Unison Ground Lease Funding LLC
2013-2 B 6.268% 3/15/2020 | | 3/12/2013, 2/12/2015 | | | 3,767,016 | | | | 3,518,898 | | | | 0.07 | % | |
VOLT XL LLC
2015-NP14 A1
4.375% 11/27/2045 | | 12/08/2015 | | | 22,298,702 | | | | 22,539,097 | | | | 0.46 | % | |
VOLT XXV LLC
2015-NPL8 A1
3.50% 6/26/2045 | | 06/17/2015 | | | 24,310,423 | | | | 24,372,842 | | | | 0.49 | % | |
VOLT XXVII LLC
2014-NPL7 A1
3.375% 8/27/2057 | | 10/24/2014 | | | 27,583,333 | | | | 27,627,446 | | | | 0.56 | % | |
VOLT XXXI LLC
2015-NPL2 A1
3.375% 2/25/2055 | | 01/20/2016 | | | 1,005,477 | | | | 1,025,658 | | | | 0.02 | % | |
VOLT XXXIII LLC
2015-NPL5 A1
3.50% 3/25/2055 | | 3/13/2015,
01/13/2016 | | | 31,012,739 | | | | 31,115,591 | | | | 0.63 | % | |
VOLT XXXIV LLC
2015-NPL7 A1
3.25% 2/25/2055 | | 04/24/2015 | | | 21,557,939 | | | | 21,566,993 | | | | 0.44 | % | |
VOLT XXXIX LLC
2015-NP13 A1
4.125% 10/25/2045 | | 10/22/2015 | | | 309,381 | | | | 311,946 | | | | 0.01 | % | |
VOLT XXXV LLC
2015-NPL9 A1
3.50% 6/26/2045 | | 06/26/2015 | | | 13,999,101 | | | | 14,028,864 | | | | 0.28% | | |
VOLT XXXVI LLC
2015-NP10 A1
3.625% 7/25/2045 | | 07/10/2015 | | | 12,437,196 | | | | 12,474,327 | | | | 0.25 | % | |
VOLT XXXVIII LLC
2015-NP12 A1
3.875% 9/25/2045 | | 09/11/2015 | | | 17,877,113 | | | | 17,986,575 | | | | 0.36 | % | |
Verizon Owner Trust
2017-1A B 2.45% 9/20/2021 | | 3/7/2017 | | | 33,677,106 | | | | 33,746,720 | | | | 0.68 | % | |
33
FPA NEW INCOME, INC.
PORTFOLIO OF INVESTMENTS —
RESTRICTED SECURITIES
(Continued)
March 31, 2017 (Unaudited)
Issuer | | Acquisition
Date(s) | |
Cost | | Fair
Value | | Fair Value
as a % of
Net Assets | |
Verizon Owner Trust
2016-2A A 1.68% 5/20/2021 | | 3/8/2017 | | $ | 8,775,486 | | | $ | 8,798,819 | | | | 0.18 | % | |
Volvo Financial Equipment LLC
Series 2017-1A A4
2.21% 11/15/2021 | | 2/13/2017 | | | 5,915,855 | | | | 5,902,690 | | | | 0.12 | % | |
WCP ISSUER LLC
2013-1 B 6.657% 8/15/2020 | | 8/1/2013, 2/12/2015 | | | 15,000,000 | | | | 15,470,385 | | | | 0.31 | % | |
Washington Mill CLO Ltd.
2014-1A B2R 3.60% 4/20/2026 | | 2/24/2014 | | | 11,052,000 | | | | 11,052,000 | | | | 0.22 | % | |
Washington Mill CLO Ltd.
2014-1A A2R 2.90% 4/20/2026 | | 2/24/2014 | | | 8,859,000 | | | | 8,859,000 | | | | 0.18 | % | |
Westlake Automobile Receivables
Trust 2015-3A B
2.21% 5/17/2021 | | 10/09/2015 | | | 23,801,242 | | | | 23,833,015 | | | | 0.48 | % | |
Westlake Automobile Receivables
Trust 2016-3A C
2.46% 1/18/2022 | | 10/14/2016 | | | 19,573,702 | | | | 19,448,743 | | | | 0.39 | % | |
Westlake Automobile Receivables
Trust 2015-2A B
1.83% 1/15/2021 | | 6/18/2015 | | | 15,898,839 | | | | 15,908,839 | | | | 0.32 | % | |
Westlake Automobile Receivables
Trust 2017-1A C
2.70% 10/17/2022 | | 3/9/2017 | | | 11,438,360 | | | | 11,457,018 | | | | 0.23 | % | |
Westlake Automobile Receivables
Trust 2015-1A B
1.68% 11/16/2020 | | 3/4/2015, 5/29/2015 | | | 1,901,383 | | | | 1,900,700 | | | | 0.04 | % | |
Westlake Automobile Receivables
Trust 2015-3A C
3.05% 5/17/2021 | | 10/09/2015 | | | 549,934 | | | | 552,687 | | | | 0.01 | % | |
Westlake Automobile Receivables
Trust 2015-2A C
2.45% 1/15/2021 | | 6/18/2015 | | | 549,980 | | | | 551,240 | | | | 0.01% | | |
Westlake Automobile Receivables
Trust 2015-1A C
2.29% 11/16/2020 | | 3/4/2015 | | | 549,936 | | | | 551,146 | | | | 0.01 | % | |
Westwood CDO II, Ltd.
2007-2A A2 1.388% 4/25/2022 | | 8/3/2016 | | | 5,007,444 | | | | 5,075,680 | | | | 0.10 | % | |
Wheels SPV 2 LLC 2015-1A A2
1.27% 4/22/2024 | | 6/2/2015, 6/10/2015 | | | 8,427,398 | | | | 8,411,545 | | | | 0.17 | % | |
ZW1L 6.00% 11/16/2022 | | 11/17/2016 | | | 13,467,073 | | | | 13,511,766 | | | | 0.27 | % | |
ZW2L 10.00% 11/16/2023 | | 11/17/2016 | | | 4,799,701 | | | | 4,811,317 | | | | 0.10 | % | |
TOTAL RESTRICTED SECURITIES | | | | $ | 2,637,748,032 | | | $ | 2,629,083,120 | | | | 53.13 | % | |
34
FPA NEW INCOME, INC.
STATEMENT OF ASSETS AND LIABILITIES
March 31, 2017
(Unaudited)
ASSETS | |
Investment securities — at fair value (identified cost $5,161,875,564) | | $ | 5,070,625,650 | | |
Short-term investments — at amortized cost (maturities 60 days or less) | | | 51,044,000 | | |
Cash | | | 634 | | |
Receivable for: | |
Interest | | | 18,308,888 | | |
Capital Stock sold | | | 9,322,028 | | |
Prepaid expenses and other assets | | | 50,097 | | |
Total assets | | | 5,149,351,297 | | |
LIABILITIES | |
Payable for: | |
Investment securities purchased | | | 195,747,565 | | |
Capital Stock repurchased | | | 3,299,920 | | |
Advisory fees | | | 1,481,777 | | |
Accrued expenses and other liabilities | | | 687,042 | | |
Total liabilities | | | 201,216,304 | | |
NET ASSETS | | $ | 4,948,134,993 | | |
SUMMARY OF SHAREHOLDERS' EQUITY | |
Capital Stock — par value $0.01 per share; authorized
600,000,000 shares; outstanding 493,568,199 shares | | $ | 4,935,682 | | |
Additional Paid-in Capital | | | 5,372,471,202 | | |
Accumulated net realized loss on investments | | | (359,115,849 | ) | |
Undistributed net investment income | | | 21,093,872 | | |
Net unrealized depreciation | | | (91,249,914 | ) | |
NET ASSETS | | $ | 4,948,134,993 | | |
NET ASSET VALUE | |
Offering and redemption price per share | | $ | 10.03 | | |
See accompanying Notes to Financial Statements.
35
FPA NEW INCOME, INC.
STATEMENT OF OPERATIONS
For the Six Months Ended March 31, 2017
(Unaudited)
INVESTMENT INCOME | |
Interest | | $ | 76,940,225 | | |
EXPENSES | |
Advisory fees | | | 12,434,645 | | |
Transfer agent fees and expenses | | | 1,033,130 | | |
Reports to shareholders | | | 384,452 | | |
Legal fees | | | 205,741 | | |
Director fees and expenses | | | 150,971 | | |
Administrative services fees | | | 132,537 | | |
Professional fees | | | 119,837 | | |
Filing fees | | | 97,088 | | |
Custodian fees | | | 76,145 | | |
Audit and tax services fees | | | 38,899 | | |
Other | | | 51,962 | | |
Total expenses | | | 14,725,407 | | |
Reimbursement from Adviser | | | (2,539,240 | ) | |
Net expenses | | | 12,186,167 | | |
Net investment income | | | 64,754,058 | | |
NET REALIZED AND UNREALIZED GAIN (LOSS) | |
Net realized gain (loss) on: | |
Investments | | | (14,665,532 | ) | |
Net change in unrealized appreciation (depreciation) of: | |
Investments | | | (6,299,553 | ) | |
Net realized and unrealized loss | | | (20,965,085 | ) | |
NET INCREASE IN NET ASSETS RESULTING FROM OPERATIONS | | $ | 43,788,973 | | |
See accompanying Notes to Financial Statements.
36
FPA NEW INCOME, INC.
STATEMENTS OF CHANGES IN NET ASSETS
| | | Six Months Ended
March 31, 2017
(Unaudited) | | Year Ended
September 30, 2016 | |
INCREASE (DECREASE) IN NET ASSETS | |
Operations: | |
Net investment income | | $ | 64,754,058 | | | $ | 101,385,439 | | |
Net realized loss | | | (14,665,532 | ) | | | (62,080,983 | ) | |
Net change in unrealized appreciation (depreciation) | | | (6,299,553 | ) | | | 40,170,259 | | |
Net increase in net assets resulting from operations | | | 43,788,973 | | | | 79,474,715 | | |
Distributions to shareholders from: | |
Net investment income | | | (62,452,894 | ) | | | (92,044,210 | ) | |
Total distributions | | | (62,452,894 | ) | | | (92,044,210 | ) | |
Capital Stock transactions: | |
Proceeds from Capital Stock sold | | | 775,390,405 | | | | 1,437,172,413 | | |
Proceeds from shares issued to shareholders upon
reinvestment of dividends and distributions | | | 53,983,923 | | | | 79,183,886 | | |
Cost of Capital Stock repurchased | | | (911,185,041 | )* | | | (2,091,695,469 | )* | |
Net decrease from Capital Stock transactions | | | (81,810,713 | ) | | | (575,339,170 | ) | |
Total change in net assets | | | (100,474,634 | ) | | | (587,908,665 | ) | |
NET ASSETS | |
Beginning of period | | | 5,048,609,627 | | | | 5,636,518,292 | | |
End of period | | $ | 4,948,134,993 | | | $ | 5,048,609,627 | | |
CHANGE IN CAPITAL STOCK OUTSTANDING | |
Shares of Capital Stock sold | | | 77,555,392 | | | | 143,835,897 | | |
Shares issued to shareholders upon reinvestment of
dividends and distributions | | | 5,409,946 | | | | 7,933,898 | | |
Shares of Capital Stock repurchased | | | (91,155,122 | ) | | | (209,364,243 | ) | |
Change in Capital Stock outstanding | | | (8,189,784 | ) | | | (57,594,448 | ) | |
* Net of redemption fees of $83,016 and $548,198 for the period ended March 31, 2017 and year ended September 30, 2016, respectively.
See accompanying Notes to Financial Statements.
37
FPA NEW INCOME, INC.
FINANCIAL HIGHLIGHTS
Selected Data for Each Share of Capital Stock Outstanding Throughout Each Period
| | | Six
Months
Ended
March 31,
2017 | | Year Ended September 30, | |
| | | (Unaudited) | | 2016 | | 2015 | | 2014 | | 2013 | | 2012 | |
Per share operating performance: | |
Net asset value at beginning of period | | $ | 10.06 | | | $ | 10.08 | | | $ | 10.24 | | | $ | 10.45 | | | $ | 10.70 | | | $ | 10.84 | | |
Income from investment operations: | |
Net investment income* | | | 0.13 | | | | 0.19 | | | | 0.15 | | | | 0.30 | | | | 0.28 | | | | 0.27 | | |
Net realized and unrealized
loss on investment securities | | | (0.03 | ) | | | (0.04 | ) | | | (0.06 | ) | | | (0.15 | ) | | | (0.21 | ) | | | (0.04 | ) | |
Total from investment operations | | $ | 0.10 | | | $ | 0.15 | | | $ | 0.09 | | | $ | 0.15 | | | $ | 0.07 | | | $ | 0.23 | | |
Less distributions: | |
Dividends from net investment income | | | (0.13 | ) | | | (0.17 | ) | | | (0.25 | ) | | | (0.36 | ) | | | (0.32 | ) | | | (0.37 | ) | |
Redemption fees | | | — | ** | | | — | ** | | | — | ** | | | — | ** | | | — | ** | | | — | ** | |
Net asset value at end of period | | $ | 10.03 | | | $ | 10.06 | | | $ | 10.08 | | | $ | 10.24 | | | $ | 10.45 | | | $ | 10.70 | | |
Total investment return*** | | | 0.95 | % | | | 1.52 | % | | | 0.84 | % | | | 1.47 | % | | | 0.66 | % | | | 2.18 | % | |
Ratios/supplemental data: | |
Net assets, end of period (in $000's) | | $ | 4,948,135 | | | $ | 5,048,610 | | | $ | 5,636,518 | | | $ | 5,829,865 | | | $ | 5,032,567 | | | $ | 5,091,681 | | |
Ratio of expenses of average net assets: | |
Before reimbursement from Adviser | | | 0.59 | %† | | | 0.58 | % | | | 0.58 | % | | | 0.56 | % | | | 0.58 | % | | | 0.57 | % | |
After reimbursement from Adviser | | | 0.49 | %† | | | 0.55 | % | | | N/A | | | | N/A | | | | N/A | | | | N/A | | |
Ratio of net investment income
to average net assets: | |
Before reimbursement from Adviser | | | 2.50 | %† | | | 1.87 | % | | | 1.50 | % | | | 2.59 | % | | | 2.74 | % | | | 2.21 | % | |
After reimbursement from Adviser | | | 2.60 | %† | | | 1.90 | % | | | N/A | | | | N/A | | | | N/A | | | | N/A | | |
Portfolio turnover rate | | | 33 | %† | | | 44 | % | | | 64 | % | | | 97 | % | | | 84 | % | | | 77 | % | |
* Per share amount is based on average shares outstanding.
** Rounds to less than $0.01 per share.
*** Return is based on net asset value per share, adjusted for reinvestment of distributions, and does not reflect deduction of the sales charge.
† Annualized.
See accompanying Notes to Financial Statements.
38
FPA NEW INCOME, INC.
NOTES TO FINANCIAL STATEMENTS
March 31, 2017
(Unaudited)
NOTE 1 — Significant Accounting Policies
FPA New Income, Inc. (the "Fund") is registered under the Investment Company Act of 1940, as a diversified, open-end, management investment company. The Fund's primary investment objective is to seek current income and long-term total return. Capital preservation is also a consideration. The Fund qualifies as an investment company pursuant to Financial Accounting Standard Board (FASB) Accounting Standards Codification (ASC) No. 946, Financial Services — Investment Companies. The following is a summary of significant accounting policies consistently followed by the Fund in the preparation of its financial statements.
A. Security Valuation
The Fund's investments are reported at fair value as defined by accounting principles generally accepted in the United States of America, ("U.S. GAAP"). The Fund generally determines its net asset value as of approximately 4:00 p.m. New York time each day the New York Stock Exchange is open. Further discussion of valuation methods, inputs and classifications can be found under Disclosure of Fair Value Measurements.
B. Securities Transactions and Related Investment Income
Securities transactions are accounted for on the date the securities are purchased or sold. Dividend income and distributions to shareholders are recorded on the ex-dividend date. Interest income and expenses are recorded on an accrual basis. Market discounts and premiums on fixed income securities are amortized over the expected life of the securities. Realized gains or losses are based on the specific identification method.
C. Use of Estimates
The preparation of the financial statements in accordance with U.S. GAAP requires management to make estimates and assumptions that affect the amounts reported. Actual results could differ from those estimates.
D. Recent Accounting Pronouncements
In December 2016, the FASB released an accounting standard update ("ASU") 2016-19 that makes technical changes to various section of the ASC, including Topic 820, Fair Value Measurement. The changes to Topic 820 are intended to clarify the difference between a valuation approach and a valuation technique. The changes to ASC 820-10-50-2 require a reporting entity to disclose, for Level 2 and Level 3 fair value measurements, a change in either or both a valuation approach and a valuation technique and the reason(s) for the changes. The changes to Topic 820 are effective for fiscal years, and interim periods within those fiscal years, beginning after December 15, 2016. At this time, management is evaluating the implications of the ASU and has not yet determined its impact on the financial statements and disclosures.
E. New and Amended Financial Reporting Rules and Forms
On October 13, 2016, the U.S. Securities Exchange Commission ("SEC") adopted new rules and forms, and amended existing rules and forms. The new and amended rules and forms are intended to modernize the reporting of information provided by funds and to improve the quality and type of information that funds provide to the SEC and investors. The new and amended rules and forms will be effective for the Fund for reporting periods beginning on and after June 1, 2018. Management is evaluating the new and amended rules and forms to determine the impact to the Fund.
In December 2016, the FASB released an accounting standard update ("ASU") 2016-19 that makes technical changes to various section of the ASC, including Topic 820, Fair Value Measurement. The changes to Topic 820 are intended to clarify the difference between a valuation approach and a valuation technique. The changes to ASC 820-10-50-2 require a reporting entity to disclose, for Level 2 and Level 3 fair value measurements, a change in either or both a valuation approach and a valuation technique and the reason(s) for the changes. The changes to Topic 820 are effective for fiscal years, and interim periods within those fiscal years, beginning after December 15, 2016. At this time, management is evaluating the implications of the ASU and has not yet determined its impact on the financial statements and disclosures.
39
FPA NEW INCOME, INC.
NOTES TO FINANCIAL STATEMENTS
Continued
On October 13, 2016, the U.S. Securities Exchange Commission ("SEC") adopted new rules and forms, and amended existing rules and forms. The new and amended rules and forms are intended to modernize the reporting of information provided by funds and to improve the quality and type of information that funds provide to the SEC and investors. The new and amended rules and forms will be effective for the Fund for reporting periods beginning on and after June 1, 2018. Management is evaluating the new and amended rules and forms to determine the impact to the Fund.
NOTE 2 — Risk Considerations
Investing in the Fund may involve certain risks including, but not limited to, those described below.
Market Risk: Because the values of the Fund's investments will fluctuate with market conditions, so will the value of your investment in the Fund. You could lose money on your investment in the Fund or the Fund could underperform other investments.
Interest Rate Risk: The values of, and the income generated by, most debt securities held by the Fund may be affected by changing interest rates and by changes in the effective maturities and credit rating of these securities. For example, the value of debt securities in the Fund's portfolio generally will decline when interest rates rise and increase when interest rates fall. In addition, falling interest rates may cause an issuer to redeem, call or refinance a security before its stated maturity, which may result in the Fund having to reinvest the proceeds in lower yielding securities.
Mortgage-Backed and Other Asset-Backed Securities Risk: The values of some mortgage-backed and other asset-backed securities may expose the Fund to a lower rate of return upon reinvestment of principal. When interest rates rise, the value of mortgage-related securities generally will decline; however, when interest rates are declining, the value of mortgage related-securities with prepayment features may not increase as much as other fixed income securities. The rate of prepayments on underlying mortgages will affect the price and volatility of a mortgage-related security, and may shorten or extend the effective maturity of the security beyond what was anticipated at the time of purchase. If an unanticipated rate of prepayment on underlying mortgages increases the effective maturity of a mortgage-related security, the volatility of the security can be expected to increase. The value of these securities may also fluctuate in response to the market's perception of the creditworthiness of the issuers. Additionally, although mortgages and mortgage-related securities are generally supported by some form of government or private guarantee and/or insurance, there is no assurance that private guarantors or insurers will meet their obligations.
Stripped Mortgage-Backed Interest Only ("I/O") and Principal Only ("P/O") Securities: Stripped mortgage backed securities are usually structured with two classes that receive different proportions of the interest and principal distributions on a pool of mortgage assets. In certain cases, one class will receive all of the interest payments on the underlying mortgages (the I/O class), while the other class will receive all of the principal payments (the P/O class). The Fund currently has investments in I/O and P/O securities. The yield to maturity on IOs is sensitive to the rate of principal repayments (including prepayments) on the related underlying mortgage assets, and principal payments may have a material effect on yield-to-maturity. If the underlying mortgage assets experience greater than anticipated prepayments of principal, a Fund may not fully recoup its initial investment in I/Os.
Credit Risk: Debt securities are subject to credit risk, meaning that the issuer of the debt security may default or fail to make timely payments of principal or interest. The values of any of the Fund's investments may also decline in response to events affecting the issuer or its credit rating. The lower rated debt securities in which the Fund may invest are considered speculative and are generally subject to greater volatility and risk of loss than investment grade securities, particularly in deteriorating economic conditions. The Fund invests a significant portion of its assets in securities of issuers that hold mortgage-and asset-backed securities and direct investments in securities backed by commercial and residential mortgage loans and other financial assets. The value and related income of these securities is sensitive to changes in economic conditions, including delinquencies and/or defaults. Continuing shifts in the market's perception of credit quality on securities backed by commercial and residential mortgage loans and other financial assets may result in increased volatility of market price and periods of illiquidity that can negatively impact the valuation of certain securities held by the Fund.
Repurchase Agreements: Repurchase agreements permit the Fund to maintain liquidity and earn income over periods of time as short as overnight. Repurchase agreements held by the Fund are fully collateralized by U.S. Government securities,
40
FPA NEW INCOME, INC.
NOTES TO FINANCIAL STATEMENTS
Continued
or securities issued by U.S. Government agencies, or securities that are within the three highest credit categories assigned by established rating agencies (Aaa, Aa, or A by Moody's or AAA, AA or A by Standard & Poor's) or, if not rated by Moody's or Standard & Poor's, are of equivalent investment quality as determined by the Adviser. Such collateral is in the possession of the Fund's custodian. The collateral is evaluated daily to ensure its market value equals or exceeds the current market value of the repurchase agreements including accrued interest. In the event of default on the obligation to repurchase, the Fund has the right to liquidate the collateral and apply the proceeds in satisfaction of the obligation.
The Fund may enter into repurchase agreements, under the terms of a Master Repurchase Agreement ("MRA"). The MRA permits the Fund, under certain circumstances including an event of default (such as bankruptcy or insolvency), to offset payables and/or receivables under the MRA with collateral held and/or posted to the counterparty and create one single net payment due to or from the Fund. However, bankruptcy or insolvency laws of a particular jurisdiction may impose restrictions on or prohibitions against such a right of offset in the event of a MRA counterparty's bankruptcy or insolvency. Pursuant to the terms of the MRA, the Fund receives securities as collateral with a market value in excess of the repurchase price to be received by the Fund upon the maturity of the repurchase transaction. Upon a bankruptcy or insolvency of the MRA counterparty, the Fund recognizes a liability with respect to such excess collateral to reflect the Fund's obligation under bankruptcy law to return the excess to the counterparty. Repurchase agreements outstanding at the end of the period are listed in the Fund's Portfolio of Investments.
NOTE 3 — Purchases and Sales of Investment Securities
Cost of purchases of investment securities (excluding short-term investments) aggregated $1,710,770,242 for the period ended March 31, 2017. The proceeds and cost of securities sold resulting in net realized losses of $14,665,532 aggregated $758,334,707 and $773,000,239, respectively, for the period ended March 31, 2017. Realized gains or losses are based on the specific identification method.
NOTE 4 — Advisory Fees and Other Affiliated Transactions
Pursuant to an Investment Advisory Agreement (the "Agreement"), advisory fees were paid by the Fund to First Pacific Advisors, LLC (the "Adviser"). Under the terms of this Agreement, the Fund pays the Adviser a monthly fee calculated at the annual rate of 0.5% of the Fund's average daily net assets. In addition, the adviser contractually agreed to reimburse expenses in excess of 0.49% of the average net assets of the Fund (excluding brokerage fees and commissions, interest, taxes, shareholder service fees, fees and expenses of other funds in which the Fund invests, and extraordinary expenses) through January 31, 2018. The Agreement obligates the Adviser to reduce its fee to the extent necessary to reimburse the Fund for any annual expenses (exclusive of interest, taxes, the cost of any supplemental statistical and research information, and extraordinary expenses such as litigation) in excess of 11/2% of the first $15 million and 1% of the remaining average net assets of the Fund for the year.
For the period ended March 31, 2017, the Fund paid aggregate fees and expenses of $150,971 to all Directors who are not affiliated persons of the Adviser. Certain officers of the Fund are also officers of the Adviser.
NOTE 5 — Federal Income Tax
No provision for federal income tax is required because the Fund has elected to be taxed as a "regulated investment company" under the Internal Revenue Code (the "Code") and intends to maintain this qualification and to distribute each year to its shareholders, in accordance with the minimum distribution requirements of the Code, its taxable net investment income and taxable net realized gains on investments.
The cost of investment securities held at March 31, 2017, was $5,161,879,703 for federal income tax purposes. Gross unrealized appreciation and depreciation for all investments (excluding short-term investments) at March 31, 2017, for federal income tax purposes was $14,492,079 and $105,746,131, respectively resulting in net unrealized depreciation of $91,254,052. The Fund recognizes interest and penalties, if any, related to unrecognized tax benefits as income tax expense in the Statement of Operations. During the year, the Fund did not incur any interest or penalties. The Fund is not subject to examination by U.S. federal tax authorities for years ended on or before September 30, 2012 or by state tax authorities for years ended on or before September 30, 2011.
41
FPA NEW INCOME, INC.
NOTES TO FINANCIAL STATEMENTS
Continued
NOTE 6 — Redemption Fees
A redemption fee of 2% applies to redemptions within 90 days of purchase. For the period ended March 31, 2017, the Fund collected $83,016 in redemption fees. The impact of these fees is less than $0.01 per share.
NOTE 7 — Disclosure of Fair Value Measurements
The Fund uses the following methods and inputs to establish the fair value of its assets and liabilities. Use of particular methods and inputs may vary over time based on availability and relevance as market and economic conditions evolve.
Equity securities are generally valued each day at the official closing price of, or the last reported sale price on, the exchange or market on which such securities principally are traded, as of the close of business on that day. If there have been no sales that day, equity securities are generally valued at the last available bid price. Securities that are unlisted and fixed-income and convertible securities listed on a national securities exchange for which the over-the-counter ("OTC") market more accurately reflects the securities' value in the judgment of the Fund's officers, are valued at the most recent bid price. However, most fixed income securities are generally valued at prices obtained from pricing vendors and brokers. Vendors value such securities based on one or more of the following inputs: transactions, bids, offers quotations from dealers and trading systems, spreads and other relationships observed in the markets among comparable securities, benchmarks, underlying equity of the issuer, and proprietary pricing models such as cash flows, financial or collateral performance and other reference data (includes prepayments, defaults, collateral, credit enhancements, and interest rate volatility). Short-term corporate notes with maturities of 60 days or less at the time of purchase are valued at amortized cost.
Securities for which representative market quotations are not readily available or are considered unreliable by the Adviser are valued as determined in good faith under procedures adopted by the authority of the Fund's Board of Directors. Various inputs may be reviewed in order to make a good faith determination of a security's value. These inputs include, but are not limited to, the type and cost of the security; contractual or legal restrictions on resale of the security; relevant financial or business developments of the issuer; actively traded similar or related securities; conversion or exchange rights on the security; related corporate actions; significant events occurring after the close of trading in the security; and changes in overall market conditions. Fair valuations and valuations of investments that are not actively trading involve judgment and may differ materially from valuations of investments that would have been used had greater market activity occurred.
The Fund classifies its assets based on three valuation methodologies. Level 1 values are based on quoted market prices in active markets for identical assets. Level 2 values are based on significant observable market inputs, such as quoted prices for similar assets and quoted prices in inactive markets or other market observable inputs as noted above including spreads, cash flows, financial performance, prepayments, defaults, collateral, credit enhancements, and interest rate volatility. Level 3 values are based on significant unobservable inputs that reflect the Fund's determination of assumptions that market participants might reasonably use in valuing the assets. These assumptions consider inputs such as proprietary pricing models, cash flows, prepayments, defaults, and collateral. The valuation levels are not necessarily an indication of the risk associated with investing in those securities. The valuation levels are not necessarily an indication of the risk associated with investing in those securities. The following table presents the valuation levels of the Fund's investments as of March 31, 2017:
Investments | | Level 1 | | Level 2 | | Level 3 | | Total | |
Commercial Mortgage-Backed Securities | |
Agency | | | — | | | $ | 5,812,626 | | | | — | | | $ | 5,812,626 | | |
Agency Stripped | | | — | | | | 496,197,888 | | | | — | | | | 496,197,888 | | |
Non-Agency | | | — | | | | 158,766,742 | | | $ | 35,999,916 | | | | 194,766,658 | | |
42
FPA NEW INCOME, INC.
NOTES TO FINANCIAL STATEMENTS
Continued
Investments | | Level 1 | | Level 2 | | Level 3 | | Total | |
Residential Mortgage-Backed Securities | |
Agency Collateralized Mortgage Obligation | | | — | | | $ | 324,410,726 | | | | — | | | $ | 324,410,726 | | |
Agency Pool Adjustable Rate | | | — | | | | 1,579,138 | | | | — | | | | 1,579,138 | | |
Agency Pool Fixed Rate | | | — | | | | 140,996,683 | | | | — | | | | 140,996,683 | | |
Agency Stripped | | | — | | | | 2,389,932 | | | | — | | | | 2,389,932 | | |
Non-Agency Collateralized Mortgage Obligation | | | — | | | | 442,755,864 | | | $ | 11,607,916 | | | | 454,363,780 | | |
Asset-Backed Securities | |
Auto | | | — | | | | 951,211,085 | | | | — | | | | 951,211,085 | | |
Collateralized Loan Obligation | | | — | | | | 289,191,831 | | | | 312,030,822 | | | | 601,222,653 | | |
Credit Card | | | — | | | | 243,161,274 | | | | — | | | | 243,161,274 | | |
Equipment | | | — | | | | 372,654,105 | | | | 57,428,231 | | | | 430,082,336 | | |
Other | | | — | | | | 257,504,859 | | | | 192,686,033 | | | | 450,190,892 | | |
Corporate Bonds & Notes | | | — | | | | 138,617,972 | | | | 29,701,967 | | | | 168,319,939 | | |
Corporate Bank Debt | | | — | | | | 45,341,250 | | | | 95,301,139 | | | | 140,642,389 | | |
Municipals | | | — | | | | 6,363,183 | | | | — | | | | 6,363,183 | | |
U.S. Treasuries | | | — | | | | 458,914,468 | | | | — | | | | 458,914,468 | | |
Short-Term Investment | | | — | | | | 51,044,000 | | | | — | | | | 51,044,000 | | |
| | | — | | | $ | 4,386,913,626 | | | $ | 734,756,024 | | | $ | 5,121,669,650 | | |
The following table summarizes the Fund's Level 3 investment securities and related transactions during the period ended March 31, 2017:
Investment | | Beginning
Value at
September 30,
2016 | | Net
Realized
and
Unrealized
Gains
(Losses)* | | Purchases | | (Sales) | | Gross
Transfers
In(Out) | | Ending
Value at
March 31,
2017 | | Net Change
in Unrealized
Appreciation
(Depreciation)
related to
Investments
held at
March 31,
2017 | |
Commercial
Mortgage-
Backed
Agency
Stripped | | $ | 24,719,119 | | | $ | (1,613,332 | ) | | | — | | | | — | | | $ | (23,105,787 | ) | | | — | | | | — | | |
Commercial
Mortgage-
Backed
Securities
Non-Agency | | | 24,773,680 | | | | — | | | $ | 11,903,000 | | | $ | (676,764 | ) | | | — | | | $ | 35,999,916 | | | $ | (2,196 | ) | |
43
FPA NEW INCOME, INC.
NOTES TO FINANCIAL STATEMENTS
Continued
| Investment | | Beginning
Value at
September 30,
2016 | | Net
Realized
and
Unrealized
Gains
(Losses)* | | Purchases | | (Sales) | | Gross
Transfers
In(Out) | | Ending
Value at
March 31,
2017 | | Net Change
in Unrealized
Appreciation
(Depreciation)
related to
Investments
held at
March 31,
2017 | |
Residential
Mortgage-
Backed
Non-Agency
Collateralized
Mortgage
Obligation | | $ | 16,913,546 | | | $ | (43,753 | ) | | | — | | | $ | (5,261,877 | ) | | | — | | | $ | 11,607,916 | | | $ | 1,387 | | |
Asset-Backed
Securities Auto | | | 13,672,192 | | | | (34,222 | ) | | | — | | | | — | | | $ | (13,637,970 | ) | | | — | | | | — | | |
Asset-Backed
Securities
Collateralized
Loan Obligation | | | — | | | | 8,649 | | | $ | 312,022,172 | | | | — | | | | — | | | | 312,030,822 | | | | 6,279 | | |
Asset-Backed
Securities
Equipment | | | — | | | | (20,822 | ) | | | 41,032,507 | | | | (1,197,941 | ) | | | — | | | | 57,428,231 | | | | (21,757 | ) | |
Other Asset-
Backed
Securities | | | 63,978,631 | | | | (594,800 | ) | | | 147,916,690 | | | | (1,000,000 | ) | | | — | | | | 192,686,033 | | | | (607,958 | ) | |
Corporate
Bonds & Notes | | | 42,782,387 | | | | (2,856,790 | ) | | | — | | | | (10,223,630 | ) | | | — | | | | 29,701,967 | | | | (3,883,795 | ) | |
Corporate
Bank Debt | | | 106,314,525 | | | | (329,477 | ) | | | 68,548,240 | | | | (47,058,514 | ) | | | (32,173,635 | ) | | | 95,301,139 | | | | (96,963 | ) | |
Municipals | | | 23,869,420 | | | | 109,588 | | | | — | | | | (17,615,825 | ) | | | (6,363,183 | ) | | | — | | | | — | | |
| | $ | 317,023,500 | | | $ | (5,374,959 | ) | | $ | 581,422,609 | | | $ | (83,034,551 | ) | | $ | (75,280,575 | ) | | $ | 734,756,024 | | | $ | (4,600,611 | ) | |
* Net realized and unrealized gains (losses) are included in the related amounts in the statement of operations.
Level 3 Valuation Process: Investments classified within Level 3 of the fair value hierarchy are valued by the Adviser in good faith under procedures adopted by authority of the Fund's Board of Directors. The Adviser employs various methods to determine fair valuations including regular review of key inputs and assumptions, and review of related market activity, if any. However, there are generally no observable trade activities in these securities. The Adviser reports to the Board of Directors at their regularly scheduled quarterly meetings, or more often if warranted. The report includes a summary of the results of the process, the key inputs and assumptions noted, and any changes to the inputs and assumptions used. When appropriate, the Adviser will recommend changes to the procedures and process employed. The value determined for an investment using the fair value procedures may differ significantly from the value realized upon the sale of such investment.
44
FPA NEW INCOME, INC.
NOTES TO FINANCIAL STATEMENTS
Continued
Transfers of investments between different levels of the fair value hierarchy are recorded at market value as of the end of the reporting period. There were no transfers between Level 1 and 2.
There were transfers of $75,280,575 out of Level 3 into Level 2 during the period ended March 31, 2017.
The transfers are a result of change in pricing vendor commencing coverage and pricing of the securities during the period and a change in observable inputs.
The following table summarizes the quantitative inputs and assumptions used for items categorized as items categorized as Level 3 of the fair value hierarchy as of March 31, 2017:
| Financial Assets | | Fair Value at
March 31,
2017 | | Valuation
Technique(s) | | Unobservable
Inputs | | Price/Range | |
Commercial Mortgage-Backed
Securities Non-Agency | | $ | 35,999,916 | | | Third-Party
Broker Quote* | | Quotes/Prices | | $98.00-$100.00 | |
Residential Mortgage-Backed
Non-agency CMO | | $ | 8,882,412 | | | Third-Party
Broker Quote* | | Quotes/Prices | | $100.00-$100.11 | |
| | $ | 2,725,504 | | | Pricing Model** | | Prices | | $42.45-$57.40 ($50.35) | |
| | | | | | Discount | | 0.0%-9.70% (1.69%) | |
Asset-Backed Securities
Collateralized Loan Obligation | | $ | 312,030,822 | | | Third-Party
Broker Quote* | | Quotes/Prices | | $99.63-$100.00 | |
| Equipment | | $ | 57,428,231 | | | Third-Party
Broker Quote* | | Quotes/Prices | | $99.94-$99.95 | |
| Other | | $ | 192,686,033 | | | Third-Party
Broker Quote* | | Quotes/Prices | | $99.83-$103.14 | |
| Corporate Bonds and Notes | | $ | 29,701,967 | | | Third-Party
Broker Quote* | | Quotes/Prices | | $3.25-$100.75 | |
Corporate Bank Debt | | $ | 95,301,139 | | | Pricing Model*** | | Reference prices | | $98.93 | |
* The Third-Party Broker Quote technique involves obtaining an independent third-party broker quote for the security.
** The Pricing Model technique for Level 3 securities involves preparing a proprietary broker price opinion (BPO) model using valuation information provided by the loan servicer based on local market resources and sales trends published by the National Association of Realtors, and a broker, and then applying an appropriate discount to that valuation. The discount reflects market conditions such as lack of liquidity of the investment, the costs associated with foreclosure and liquidation, the historical performance of the loan pool and the characteristics of the remaining loans including whether or not the loans are performing.
*** The Pricing Model technique for Level 3 securities involves calculating the difference between the fair value of the funded portion of the securitiy and the price at which the Fund is committed to fund the unfunded committment.
NOTE 8 — Distribution to Shareholders
On April 3, 2017 the Fund declared a dividend from net investment income of $0.07 per share payable April 4, 2017 to shareholders of record on March 31, 2017. For financial statement purposes, this dividend was recorded on the ex-dividend date, April 3, 2017.
45
FPA NEW INCOME, INC.
NOTES TO FINANCIAL STATEMENTS
Continued
NOTE 9 — Collateral Requirements
FASB Accounting Standards Update No. 2011-11, Disclosures about Offsetting Assets and Liabilities, requires disclosures to make financial statements that are prepared under U.S. GAAP more comparable to those prepared under International Financial Reporting Standards. Under this guidance the Fund discloses both gross and net information about instruments and transactions eligible for offset such as instruments and transactions subject to an agreement similar to a master netting arrangement. In addition, the Fund discloses collateral received and posted in connection with master netting agreements or similar arrangements.
The following table presents the Fund's repurchase agreements by counterparty net of amounts available for offset under an ISDA Master agreement or similar agreements and net of the related collateral received or pledged by the Fund as of March 31, 2017, are as follows:
Counterparty | | Gross Assets
in the Statement of
Assets and Liabilities | | Collateral
Received | | Assets (Liabilities)
Available for Offset | | Net Amount
of Assets* | |
State Street Bank
and Trust Company | | $ | 51,044,000 | | | $ | 51,044,000 | ** | | | — | | | | — | | |
* Represents the net amount receivable from the counterparty in the event of default.
** Collateral with a value of $52,068,190 has been received in connection with a master repurchase agreement. Excess of collateral received from the individual master repurchase agreement is not shown for financial reporting purposes.
46
FPA NEW INCOME, INC.
SHAREHOLDER EXPENSE EXAMPLE
March 31, 2017 (Unaudited)
Fund Expenses
Mutual fund shareholders generally incur two types of costs: (1) transaction costs, and (2) ongoing costs, including advisory and administrative fees; shareholder service fees; and other Fund expenses. The Example is intended to help you understand your ongoing costs (in dollars) of investing in the Fund and to compare these costs with the ongoing costs of investing in other mutual funds. The Example is based on an investment of $1,000 invested at the beginning of the year and held for the entire year.
Actual Expenses
The information in the table under the heading "Actual Performance" provides information about actual account values and actual expenses. You may use the information in this column, together with the amount you invested, to estimate the expenses that you paid over the period. Simply divide your account value by $1,000 (for example, an $8,600 account value divided by $1,000= 8.6), then multiply the result by the number in the first column in the row entitled "Expenses Paid During Period" to estimate the expenses you paid on your account during this period.
Hypothetical Example for Comparison Purposes
The information in the table under the heading "Hypothetical Performance (5% return before expenses)" provides information about hypothetical account values and hypothetical expenses based on the Fund's actual expense ratio and an assumed rate of return of 5% per year before expenses, which is not the Fund's actual return. The hypothetical account values and expenses may not be used to estimate the actual ending account balance or expenses you paid for the period. You may use this information to compare the ongoing costs of investing in the Fund and other
funds. To do so, compare this 5% hypothetical example with the 5% hypothetical examples that appear in the shareholder reports of other funds.
Please note that the expenses shown in the table are meant to highlight your ongoing costs only and do not reflect any transactional costs. Therefore, the information under the heading "Hypothetical Performance (5% return before expenses)" is useful in comparing ongoing costs only, and will not help you determine the relative total costs of owning different funds. In addition, if these transactional costs were included, your costs would have been higher. Even though the Fund does not charge transaction fees, if you purchase shares through a broker, the broker may charge you a fee. You should evaluate other mutual funds' transaction fees and any applicable broker fees to assess the total cost of ownership for comparison purposes.
| | | Actual
Performance | | Hypothetical
Performance
(5% return
before
expenses) | |
Beginning Account Value
September 30, 2016 | | $ | 1,000.00 | | | $ | 1,000.00 | | |
Ending Account Value
March 31, 2017 | | $ | 1,009.50 | | | $ | 1,022.69 | | |
Expenses Paid During
Period* | | $ | 2.45 | | | $ | 2.47 | | |
* Expenses are equal to the Fund's annualized expense ratio of 0.49%, multiplied by the average account value over the period and prorated for the six-months ended March 31, 2017 (182/365 days).
47
FPA NEW INCOME, INC.
DIRECTOR AND OFFICER INFORMATION
(Unaudited)
| Name and Year of Birth | | Position(s)
With Fund
Years Served | | Principal Occupation(s)
During the Past 5 Years | | Portfolios in
Fund Complex
Overseen | �� | Other Directorships | |
Allan M. Rudnick – 1940† | | Director and Chairman*
Years Served: 4 | | Private Investor. Formerly Co-Founder, Chief Executive Officer, Chairman and Chief Investment Officer of Kayne Anderson Rudnick Investment Management from 1989 to 2007. | | | 7 | | | | |
Sandra Brown – 1955† | | Director*
Years Served: <1 | | Consultant. Formerly CEO and President of Transamerica Financial Advisers, Inc., 1999 to 2009; President, Transamerica Securities Sales Corp. 1998 to 2009; VP, Bank of America Mutual Fund Administration 1990 to 1998. | | | 7 | | | | |
Mark L. Lipson – 1949† | | Director*
Years Served: 1 | | Consultant. ML2Advisors, LLC. Former member of the Management Committee and Western Region Head at Bessemer Trust Company from 2007 to 2014. | | | 7 | | | | |
Alfred E. Osborne, Jr. – 1944† | | Director*
Years Served: 17 | | Senior Associate Dean of the John E. Anderson School of Management at UCLA. | | | 7 | | | Wedbush, Inc., Nuverra Environmental Solutions, Inc., and Kaiser Aluminun, Inc. | |
A. Robert Pisano – 1943† | | Director*
Years Served: 4 | | Consultant. Formerly President and Chief Operating Officer of the Motion Picture Association of America, Inc. from 2005 to 2011. | | | 7 | | | Entertainment Partners, and Resources Global Professionals | |
Patrick B. Purcell – 1943† | | Director*
Years Served: 10 | | Retired. Formerly Executive Vice President, Chief Financial and Administrative Officer of Paramount Pictures from 1983 to 1998. | | | 7 | | | | |
J. Richard Atwood – 1960 | | Director* and President
Years Served: 19 | | Managing Partner of the Adviser. | | | 7 | | | | |
Thomas H. Atteberry – 1953 | | Portfolio Manager
Years Served: 11 | | Partner of the Adviser. | | | | | |
Abhijeet Patwardhan – 1979 | | Portfolio Manager
Years Served: 1 | | Managing Director (since 2015) and a Director of Research (since 2015) of the Adviser. Formerly Senior Vice President (2014 to 2015) and Vice President (2010 to 2013) of the Adviser. | | | | | |
48
FPA NEW INCOME, INC.
DIRECTOR AND OFFICER INFORMATION
(Unaudited) Continued
| Name and Year of Birth | | Position(s)
With Fund
Years Served | | Principal Occupation(s)
During the Past 5 Years | | Portfolios in
Fund Complex
Overseen | | Other Directorships | |
David C. Lebisky – 1972 | | Chief Compliance Officer
Years Served: <1 | | President of Lebisky Compliance Consulting LLC (since October 2015). Consultant, Duff & Phelps Compliance Consulting (since 2016). Senior Consultant, Freeh Group International Solutions, LLC (a global risk management firm) (since 2015). Formerly, Director of Regulatory Administration, Scotia Institutional Investments US, LP (2010 to 2014). | | | | | |
E. Lake Setzler – 1967 | | Treasurer
Years Served: 10 | | Senior Vice President and Controller of the Adviser. | | | | | |
Francine S. Hayes – 1967 | | Secretary
Years Served: 1 | | Vice President and Senior Counsel of State Street Bank and Trust Company | | | | | |
* Directors serve until their resignation, removal or retirement.
† Audit Committee member
The Statement of Additional Information includes additional information about the Directors and is available, without charge, upon request by calling (800) 982-4372.
49
FPA NEW INCOME, INC.
RESULTS OF SPECIAL MEETING
March 31, 2017
(Unaudited)
A Special Meeting of Shareholders (the "Meeting") of FPA New Income, Inc. (the "Fund") was held on February 28, 2017 in Los Angeles, California. The voting results for the proposals considered at the Meeting are as follows:
Proposal 1 — Approval of the Restatement of the Fund's Fundamental Investment Objective. The shareholders of the Fund approved the restatement of the Fund's fundamental investment objective in order to simplify and clarify the Fund's investment objective.
Proposal No 1. | | Total Shares
Voted For: | | Total Shares
Voted Against: | | Total Shares
Abstained: | |
To approve the Restatement of the Fund's
Fundamental Investment Objective | | | 235,463,815 | | | | 15,869,554 | | | | 5,791,843 | | |
Proposal 2 — Approval of the Amendment or Elimination of the Fund's Fundamental Investment Restrictions. The shareholders of the Fund approved the amendment or elimination of sixteen of the Fund's fundamental investment restrictions in order to modernize the Fund's fundamental investment restrictions and to increase the Fund's flexibility.
Proposal No 2. | | Total Shares
Voted For: | | Total Shares
Voted Against: | | Total Shares
Abstained: | |
To approve the Amendment of
the Fundamental Investment
Restrictions Regarding: | |
2.A. Borrowing and Senior Securities | | | 232,479,449 | | | | 18,044,562 | | | | 6,601,196 | | |
2.B. Concentration of Investments | | | 233,168,242 | | | | 17,447,039 | | | | 6,509,924 | | |
2.C. Making Loans | | | 232,125,189 | | | | 18,354,895 | | | | 6,645,124 | | |
2.D. Real Estate | | | 232,879,655 | | | | 17,706,724 | | | | 6,538,828 | | |
2.E. Commodities | | | 232,034,758 | | | | 18,112,539 | | | | 6,977,908 | | |
2.F. Underwriting Securities | | | 232,407,242 | | | | 18,069,921 | | | | 6,648,042 | | |
To approve the elimination of
certain Fundamental Investment
Restrictions Regarding: | |
2.G. Pledging, Mortgaging or
Hypothecating Fund Assets | | | 227,516,360 | | | | 22,774,379 | | | | 6,843,463 | | |
2.H. Investing More Than 5% in
Securities of One Issuer | | | 231,907,810 | | | | 18,569,690 | | | | 6,647,705 | | |
2.I. Time Deposits | | | 233,303,799 | | | | 17,047,249 | | | | 6,774,160 | | |
2.J. Margin Activities and Short Selling | | | 230,200,958 | | | | 20,268,851 | | | | 6,655,397 | | |
2.K. Acquiring More Than 10% of Any
Class of Securities of an Issuer | | | 225,736,071 | | | | 22,763,677 | | | | 8,625,455 | | |
2.L. Writing and Selling Options | | | 228,911,778 | | | | 19,613,960 | | | | 8,599,469 | | |
2.M. Investments in Other Investment
Companies | | | 229,967,339 | | | | 20,402,914 | | | | 6,754,953 | | |
2.N. Investments for Control | | | 225,559,774 | | | | 24,748,552 | | | | 6,816,882 | | |
2.O. Unseasoned Companies | | | 228,987,481 | | | | 20,888,507 | | | | 7,249,212 | | |
2.P. Investments in which
Director/Officer is Invested | | | 224,331,935 | | | | 26,164,189 | | | | 6,629,082 | | |
50
FPA NEW INCOME, INC.
(Unaudited)
INVESTMENT ADVISER
First Pacific Advisors, LLC
11601 Wilshire Boulevard, Suite 1200
Los Angeles, CA 90025
TRANSFER & SHAREHOLDER SERVICE AGENT
UMB Fund Services, Inc.
P.O. Box 2175
Milwaukee, WI 53201-2175
or
235 West Galena Street
Milwaukee, WI 53212-3948
(800) 638-3060
CUSTODIAN AND ADMINISTRATOR
State Street Bank and Trust Company
Boston, Massachusetts
TICKER: FPNIX
CUSIP: 302544101
DISTRIBUTOR
UMB Distribution Services, LLC
235 West Galena Street
Milwaukee, Wisconsin 53212-3948
LEGAL COUNSEL
Dechert LLP
San Francisco, California
INDEPENDENT REGISTERED PUBLIC ACCOUNTING FIRM
Deloitte & Touche LLP
Los Angeles, California
This report has been prepared for the information of shareholders of FPA NEW INCOME, INC., and is not authorized for distribution to prospective investors unless preceded or accompanied by an effective prospectus.
The Fund's complete proxy voting record for the 12 months ended June 30, 2016 is available without charge, upon request by calling (800) 982-4372 and on the SEC's website at www.sec.gov.
The Fund's schedule of portfolio holdings, filed the first and third quarter of the Fund's fiscal year on Form N-Q with the SEC, is available on the SEC's website at www.sec.gov. Form N-Q is available at the SEC's Public Reference Room in Washington, D.C., and information on the operations of the Public Reference Room may be obtained by calling (202) 551-8090. To obtain Form N-Q from the Fund, shareholders can call (800) 982-4372.
Additional information about the Fund is available online at www.fpafunds.com. This information includes, among other things, holdings, top sectors, and performance, and is updated on or about the 15th business day after the end of each quarter.
Item 2. Code of Ethics.
Not applicable to this semi-annual report.
Item 3. Audit Committee Financial Expert.
Not applicable to this semi-annual report.
Item 4. Principal Accountant Fees and Services.
Not applicable to this semi-annual report.
Item 5. Audit Committee of Listed Registrants.
Not applicable to this semi-annual report.
Item 6. Investments.
(a) Schedule of Investments is included as a part of the report to shareholders filed under Item 1 of this Form N-CSR.
(b) Not applicable.
Item 7. Disclosure of Proxy Voting Policies and Procedures for Closed-End Management Investment Companies.
Not applicable.
Item 8. Portfolio Managers of Closed-End Management Investment Companies.
Not applicable.
Item 9. Purchases of Equity Securities by Closed-End Management Investment Company and Affiliated Purchasers.
Not applicable.
Item 10. Submission of Matters to a Vote of Security Holders.
There have been no material changes to the procedures by which the shareholders may recommend nominees to the registrant’s board of directors.
Item 11. Controls and Procedures.
(a) The principal executive officer and principal financial officer of the registrant have concluded that the registrant’s disclosure controls and procedures (as defined in Rule 30a-3(c) under the Investment Company Act of 1940) are effective based on their evaluation of the disclosure controls and procedures as of a date within 90 days of the filing date of this report.
(b) There have been no significant changes in the registrant’s internal controls over financial reporting (as defined in Rule 30a-3(d) under the Investment Company Act of 1940) that occurred during the registrant’s second fiscal quarter of the period covered by this report that have materially affected, or is reasonably likely to materially affect, the registrant’s internal controls over financial reporting.
Item 12. Exhibits.
(a)(1) Not applicable.
(a)(2) The certifications required by Rule 30a-2(a) under the Investment Company Act of 1940 are attached hereto.
(a)(3) Not applicable.
(b) The certifications required by Rule 30a-2(b) under the Investment Company Act of 1940 and Section 906 of the Sarbanes-Oxley Act of 2002 are attached hereto.
SIGNATURES
Pursuant to the requirements of the Securities Exchange Act of 1934 and the Investment Company Act of 1940, the registrant has duly caused this report to be signed on its behalf by the undersigned, thereunto duly authorized.
FPA NEW INCOME, INC.
By: | /s/ J. Richard Atwood | |
| J. Richard Atwood | |
| President (principal executive officer) | |
| | |
Date: | May 31, 2017 | |
Pursuant to the requirements of the Securities Exchange Act of 1934 and the Investment Company Act of 1940, this report has been signed below by the following persons on behalf of the registrant and in the capacities and on the dates indicated.
By: | /s/ J. Richard Atwood | |
| J. Richard Atwood | |
| President (principal executive officer) | |
| | |
Date: | May 31, 2017 | |
By: | /s/ E. Lake Setzler III | |
| E. Lake Setzler III | |
| Treasurer (principal financial officer) | |
| | |
Date: | May 31, 2017 | |