UNITED STATES
SECURITIES AND EXCHANGE COMMISSION
Washington, D.C. 20549
FORM N-CSR
CERTIFIED SHAREHOLDER REPORT OF REGISTERED
MANAGEMENT INVESTMENT COMPANIES
Investment Company Act file number: 811-01735
fpa NEW Income, inc.
(Exact name of registrant as specified in charter)
11601 WILSHIRE BLVD., STE. 1200
LOS ANGELES, CALIFORNIA 90025
(Address of principal executive offices)(Zip code)
| (Name and Address of Agent for Service) | Copy to: |
J. RICHARD ATWOOD, PRESIDENT FPA NEW INCOME, INC. 11601 WILSHIRE BLVD., STE. 1200 LOS ANGELES, CALIFORNIA 90025 | MARK D. PERLOW, ESQ. DECHERT LLP ONE BUSH STREET, STE. 1600 SAN FRANCISCO, CA 94104 |
Registrant’s telephone number, including area code: (310) 473-0225
Date of fiscal year end: September 30
Date of reporting period: March 31, 2020
Item 1: Report to Shareholders.

Distributor:
UMB DISTRIBUTION SERVICES, LLC
235 West Galena Street
Milwaukee, Wisconsin 53212
Beginning on January 1, 2021, as permitted by regulations adopted by the Securities and Exchange Commission, we intend to no longer mail paper copies of the Fund's shareholder reports, unless you specifically request paper copies of the reports from the Fund or from your financial intermediary, such as a broker-dealer or bank. Instead, the reports will be made available on the FPA Funds website (fpa.com/funds), and you will be notified by mail each time a report is posted and provided with a website link to access the report. If you already elected to receive shareholder reports electronically, you will not be affected by this change and you need not take any action. If you prefer to receive shareholder reports and other communications electronically, you may update your mailing preferences with your financial intermediary, or enroll in e-delivery at fpa.com (for accounts held directly with the Fund).
You may elect to continue to receive paper copies of all future reports free of charge. If you invest through a financial intermediary, you may contact your financial intermediary to request that you continue to receive paper copies of your shareholder reports. If you invest directly with the Fund, you may inform the Fund that you wish to continue receiving paper copies of your shareholder reports by contacting us at (800) 638-3060. Your election to receive reports in paper will apply to all funds held with the FPA Funds or through your financial intermediary.
FPA NEW INCOME, INC.
LETTER TO SHAREHOLDERS
Dear Fellow Shareholders,
FPA New Income, Inc. (the "Fund") returned -1.38% in the first quarter of 2020.
As of March 31, the portfolio had a yield-to-worst1 of 4.01% and an effective duration of 1.35 years. The spread of the COVID-19 virus around the world led to a historic sell-off in global financial markets as overall worldwide economic growth turned into a severe economic recession of uncertain length. Risk-free rates declined significantly in response to aggressive monetary easing by central banks and the prices of risk assets fell, resulting in higher credit spreads across all segments of the fixed income market. We spent the last several years increasing the overall credit quality of the portfolio, most notably via a reduction in holdings rated below investment grade. Out of concern that fixed income markets were too expensive, we also spent the last several years reducing the portfolio's exposure to rising credit spreads. Despite these actions, the portfolio was not immune to the historic decline in bond prices. However, because of our steps to insulate the portfolio from a decline in bond prices, the Fund's drawdown during the sell-off was relatively muted compared to its peers in the Morningstar Short-Term Bond Category, which returned -2.14% for the quarter. Recently, in response to the decline in risk-free rates, we shortened the portfolio's duration. As prices fell and yields rose for short-duration high-quality bonds (rated single-A or higher), we selectively added to these holdings. Finally, we also deployed a modest amount of capital into credit (defined as investments rated BBB or lower). Given the uncertainty in the economic outlook and the volatility in financial markets, all of our investment activity will be undertaken with the goal of achieving a positive return in 2020 while also maintaining adequate liquidity in the portfolio. Cash and equivalents increased from 7.1% of the portfolio as of Dec. 31, 2019, to 7.7% at March 31, 2020.
Portfolio Attribution2
The following table shows contributors to and detractors from the portfolio's first quarter performance:
| | | Average Weight (%) | | Q1 2020
Total Return (%) | | Contribution
to return (%) | |
ABS | | | 54.81 | | | | -1.67 | | | | -1.04 | | |
Auto | | | 19.99 | | | | -1.26 | | | | -0.31 | | |
Equipment | | | 17.21 | | | | -1.49 | | | | -0.28 | | |
CLO | | | 9.25 | | | | -3.69 | | | | -0.36 | | |
1 Yield to Worst ("YTW") is presented gross of fees and reflects the lowest possible yield on a callable bond without the issuer defaulting. It does not represent the yield an investor should expect to receive. As of March 31, 2020, the Fund's subsidized/unsubsidized 30-day SEC standardized yield ("SEC Yield") was 2.64%/2.57% respectively. The SEC Yield calculation is an annualized measure of the Fund's dividend and interest payments for the last 30 days, less Fund expenses. Subsidized yield reflects fee waivers and/or expense reimbursements during the period. Without waivers and/or reimbursements, yields would be reduced. Unsubsidized yield does not adjust for any fee waivers and/or expense reimbursements in effect. The SEC Yield calculation is based on the price of the Fund at the beginning of the month.
2 See the end of this Commentary for additional information pertaining to attribution for the quarter ending March 31, 2020. Top contributors and detractors to the Fund's performance are based on contribution to return for the periods noted. Contribution is presented gross of investment management fees, transactions costs, and Fund operating expenses, which if included, would reduce the returns presented. This information is not a recommendation for a specific security or sector and these securities/sectors may not be in the Fund at the time you receive this report. The information provided does not reflect all positions purchased, sold or recommended by FPA during the quarter. A copy of the methodology used and a list of every sector's contribution to the overall Fund's performance during the quarter is available by contacting FPA at crm@fpa.com. The portfolio holdings as of the most recent quarter-end may be obtained at www.fpa.com.
Past performance is no guarantee, nor is it indicative, of future results.
1
FPA NEW INCOME, INC.
LETTER TO SHAREHOLDERS
(Continued)
| | | Average Weight (%) | | Q1 2020
Total Return (%) | | Contribution
to return (%) | |
Credit Cards | | | 4.28 | | | | -0.77 | | | | -0.05 | | |
Other | | | 4.08 | | | | -1.13 | | | | -0.05 | | |
CMO | | | 8.43 | | | | -0.19 | | | | 0.01 | | |
Agency | | | 2.29 | | | | 2.22 | | | | 0.05 | | |
Non-Agency | | | 6.14 | | | | -1.11 | | | | -0.04 | | |
CMBS | | | 8.47 | | | | -1.53 | | | | -0.14 | | |
Agency | | | 1.51 | | | | 1.91 | | | | 0.03 | | |
Non-Agency | | | 4.56 | | | | -0.29 | | | | -0.04 | | |
Stripped | | | 2.41 | | | | -5.41 | | | | -0.14 | | |
Mortgage Pass-Through | | | 6.42 | | | | 2.22 | | | | 0.15 | | |
Treasury | | | 7.34 | | | | 3.10 | | | | 0.23 | | |
Agencies | | | 1.16 | | | | 1.05 | | | | 0.01 | | |
Cash and equivalents | | | 7.03 | | | | 0.32 | | | | 0.02 | | |
MBS Stripped | | | 0.01 | | | | -2.52 | | | | 0.00 | | |
Corporate | | | 6.35 | | | | -6.13 | | | | -0.40 | | |
Bank Debt | | | 4.27 | | | | -7.60 | | | | -0.35 | | |
Corporate Bonds | | | 1.74 | | | | -2.81 | | | | -0.04 | | |
Common Stock | | | 0.33 | | | | -2.90 | | | | -0.01 | | |
Total | | | 100.00 | | | | -1.17 | | | | -1.17 | | |
During the first quarter, the largest contributors to performance were Treasuries, which appreciated in price as Treasury yields declined during the quarter. The second- and third-largest contributors to performance were agency mortgage pools and agency collateralized mortgage obligations (CMOs), both of which also appreciated in price due to lower Treasury yields (though the price increases were tempered by wider spreads).
Credit spreads increased during the quarter across all sectors and ratings within fixed income to levels not seen since the 2008-09 financial crisis. The asset-backed securities (ABS) holdings, which are predominantly rated single-A and higher, were the largest detractors from performance during the quarter. The ABS holdings themselves performed relatively well during the quarter, with a total return of approximately -1.7%. But because they averaged about 55% of the portfolio, they were a relatively large detractor from overall performance.
The second-largest detractors from performance were corporate bank debt (i.e., leveraged loans) and bond holdings, which are predominantly rated less than BBB. Approximately two-thirds of the portfolio's corporate holdings are in bank debt, with the rest mostly in high-yield bonds. The leveraged loan and high-yield markets experienced historic price declines during the quarter. As a result, despite representing just 6% of the portfolio on average, the corporate holdings were a relatively large detractor from performance.
The third-largest detractors from performance were GNMA project loan interest-only bonds, which were also subject to significantly wider spreads during the quarter. The GNMA project loan interest-only bonds appear in the table above as stripped commercial mortgage-backed securities (CMBS).
As discussed in more detail below, we view the Fund's negative performance as a temporary mark-to-market impact on the portfolio. Given the overall high-quality nature of the portfolio's holdings, we do not believe the portfolio's capital is permanently impaired. As such, we believe we are well-positioned to recover much of
2
FPA NEW INCOME, INC.
LETTER TO SHAREHOLDERS
(Continued)
this negative performance over time as our high-quality short-maturity holdings mature and/or credit spreads normalize.
Portfolio Activity
The table below shows the portfolio's exposures as of March 31, 2020 compared to Dec. 31, 2019:
Fund3 | | As of
12/31/2019 | | As of
3/31/2020 | |
Yield-to-worst | | | 2.71 | % | | | 4.01 | % | |
Subsidized SEC Yield4 | | | 2.50 | % | | | 2.64 | % | |
Effective Duration (years) | | | 1.57 | | | | 1.35 | | |
Fund | | % Portfolio
12/31/2019 | | % Portfolio
3/31/2020 | |
ABS5 | | | 52.1 | | | | 62.5 | | |
Mortgage Backed (CMO)6 | | | 9.3 | | | | 8.4 | | |
Stripped Mortgage-backed | | | 2.6 | | | | 2.4 | | |
Corporate | | | 6.3 | | | | 6.9 | | |
CMBS6 | | | 6.1 | | | | 7.9 | | |
Mortgage Pass-through | | | 8.4 | | | | 2.9 | | |
U.S. Treasury | | | 6.9 | | | | 0.0 | | |
Agencies | | | 1.2 | | | | 1.3 | | |
Cash and equivalents | | | 7.1 | | | | 7.7 | | |
Total | | | 100.0 | | | | 100.0 | | |
With the goal of a positive 12 month return in mind, our investment activity during the quarter centered around shortening the portfolio's duration while opportunistically adding investments in structured products as markets sold off. Early in the quarter, we sold longer-duration agency mortgage pools, Treasuries, agency mortgage CMOs, agency CMBS and non-agency mortgages as interest rates declined because they no longer offered enough yield to compensate for the duration risk. We purchased high-quality, short-duration auto ABS, equipment ABS, credit card ABS, CMBS and collateralized loan obligations (CLOs). We also selectively added to existing credit positions as the market sold off, and made an investment in a short-term working capital-based corporate bridge loan.
Market Commentary
The spread of COVID-19 around the world led investors and policymakers to reset their expectations for economic growth as social distancing and "stay at home" orders brought much of the world economy to a halt.
3 Source: FactSet. Portfolio composition will change due to ongoing management of the Fund. Totals may not add due to rounding.
4 As of March 31, 2020, FPNIX subsidized/unsubsidized 30-day SEC standardized yield ("SEC Yield") was 2.64%/2.57% respectively.
5 ABS (Asset Backed Securities) are securities backed by a loan, lease or receivables against assets other than real estate.
6 Collateralized mortgage obligations ("CMO") are mortgage-backed securities that separate mortgage pools into different maturity classes. Commercial mortgage-backed securities ("CMBS") are securities backed by commercial mortgages rather than residential mortgages.
3
FPA NEW INCOME, INC.
LETTER TO SHAREHOLDERS
(Continued)
The U.S. economy is likely already in recession owing to a broad collapse in consumer spending that affected travel, leisure, clothing, capital goods, cars, etc. Few areas of the economy have been spared. This decline in consumer spending negatively impacts employment and business investment. From a societal standpoint, the most important question is when will there be a cure and/or treatment? From an economic perspective, substantial containment of the virus directly affects when and at what pace economic activity can resume. That, in turn, will determine the depth and length of the recession and, subsequently, the vigor and speed of the recovery. Ever the weighing machine, financial markets responded to the uncertainty in historic fashion.
As shown in the following chart, Treasury yields declined to unprecedented levels during the quarter as the Treasury market responded first to the likely arrival of a recession and then to the Federal Reserve's aggressive response. Notably, two- to three-year maturity Treasuries, which fit the duration profile that we have recently targeted for investment, declined in yield by approximately 130 basis points (bps), while longer-maturity bonds declined by over 120 bps.
Treasury Yield Curve
Source: Bloomberg
The chart below is most pertinent to our portfolio given our large exposure to investment grade structured products. This chart shows that spreads on AAA-rated ABS bonds and CLOs increased to the second-highest levels on record and are far higher than in recent years.
4
FPA NEW INCOME, INC.
LETTER TO SHAREHOLDERS
(Continued)
Spread to worst (bps) | | 12/26/2019 | | Q1'20 Peak Spread | | 4/9/2020 | |
AAA 3 yr Credit Cards | | | 26 | | | | 200 | | | | 80 | | |
AAA 3 yr. Prime Auto ABS | | | 33 | | | | 200 | | | | 95 | | |
AAA 2 yr Subprime Auto ABS | | | 44 | | | | 300 | | | | 300 | | |
AAA 3 yr. Ag/Heavy Equipment ABS | | | 53 | | | | 300 | | | | 175 | | |
AAA 5 yr CMBS | | | 62 | | | | 300 | | | | 230 | | |
US 3.0 CLO Secondary Spreads AAA | | | 120 | | | | 400 | | | | 260 | | |
Source: J.P. Morgan. Chart data from January 5, 2006 through April 9, 2020.
Selling pressure in the market for high-quality, short-duration assets exacerbated the price declines and spread increases in AAA-rated asset-backed securities. Some fund managers (though not FPA) faced redemptions due to poor performance. In addition, some fund managers (again, not FPA) were forced to sell bonds to raise cash for margin calls on other investments. In times like these, investment managers tend to unload bonds they think they can sell at prices closest to par. That typically ends up being the highest-quality, shortest bonds.
As shown in the table above, following a significant increase, spreads began to decline toward the end of the quarter following a push by the Federal Reserve to improve market liquidity and lower financing costs for borrowers. To do that, the Fed resurrected old programs (e.g. the term asset-backed securities loan facility, or TALF) and announced new programs designed to improve liquidity in the bond market.
5
FPA NEW INCOME, INC.
LETTER TO SHAREHOLDERS
(Continued)
The chart below shows the yield and spread on the Bloomberg Barclays High-Yield Index. It illustrates a similar theme, with yields and spreads reaching levels not seen since 2008-09.
| | | 12/31/2019 | | Q1'20 Peak Spread | | 4/9/2020 | |
Spread (bps) | | | 357 | | | | 1,123 | | | | 804 | | |
YTW | | | 5.19 | % | | | 11.69 | % | | | 8.48 | % | |
Source: Bloomberg Barclays. Chart data is from November 1, 1998 through April 9, 2020.
Unfortunately, the pandemic isn't the only thing roiling financial markets. Investors are also digesting the impact of a price war in the oil market, which saw oil prices collapse from over $60 per barrel at the start of the year to $20 per barrel in March. Fluctuations in energy markets have significant repercussions for high-yield energy companies. For this reason, we tend to focus on the non-energy BB component of the high-yield market to get a better sense of how expensive or cheap the core market is (while ignoring the fringes that tend to be more volatile). By that measure as well, the high-yield market reached levels not seen since the 2008-09 financial crisis.
6
FPA NEW INCOME, INC.
LETTER TO SHAREHOLDERS
(Continued)
| | | 12/31/2019 | | Q1'20 Peak Spread | | 4/9/2020 | |
Spread (bps) | | | 177 | | | | 794 | | | | 495 | | |
YTW | | | 3.41 | % | | | 8.44 | % | | | 5.40 | % | |
Source: Bloomberg Barclays. Chart data is from January 1, 1994 through April 9, 2020.
In the span of one month during the first quarter, the BB component of the high-yield index excluding energy declined in price by over 17% versus its Q1 peak! That represented the second-largest monthly price decline on record.
In similar fashion, the leveraged loan index also had its second-largest price decline. The following chart shows the yield and spread on the leveraged loan index.
7
FPA NEW INCOME, INC.
LETTER TO SHAREHOLDERS
(Continued)
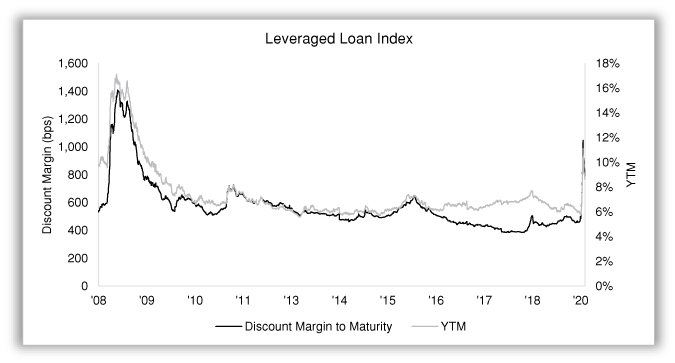
| | | 12/31/2019 | | Q1'20 Peak Spread | | 4/9/2020 | |
Discount Margin to Maturity (bps) | | | 471 | | | | 1,047 | | | | 758 | | |
YTM | | | 6.43 | % | | | 11.10 | % | | | 8.26 | % | |
Source: Credit Suisse. Chart data is from June 30, 2008 through April 8, 2020.
While the magnitude and pace of the declines in credit markets were extraordinary, so too were the magnitude and pace of the price recovery. Though still far from achieving their pre-pandemic levels, the high-yield index and leveraged loan markets both gained 7-8% within a week of reaching their respective nadirs, due in no small part to the Federal Reserve's initiatives to support the market.
Several years ago, we began positioning the portfolio to preserve capital. We did not do that because we knew there was going to be a global pandemic. Rather, we felt the market was priced to perfection. Consequently, it did not make sense for us to have a lot of exposure to various forms of risk when there's no room for bad things to happen. Below are the steps we took prior to the virus infecting the markets:
 We shortened the portfolio's duration. As we have discussed in the past, we actively manage the portfolio's duration by striving to own bonds that we expect will produce a breakeven or positive total return over 12 months if we assume that yields increase by 100 bps during that time. The purpose of this approach is to own holdings with an attractive risk versus reward profile at all times with respect to interest rate risk rather than owning a specific duration at all times. As interest rates
8
FPA NEW INCOME, INC.
LETTER TO SHAREHOLDERS
(Continued)
declined at the beginning of the first quarter, prior to the increase in spreads, we took that opportunity to sell some of the portfolio's longer-duration holdings and redeployed the proceeds into shorter-duration bonds. Doing so provides protection against rising interest rates (which may be helpful now, when Treasuries yield less than 50 bps going out to five years). This duration shortening also provides protection against an increase in credit spreads since it reduces the mark-to-market risk of our bonds in the event that spreads increase.
 We actively reduced our exposure to higher spreads. For several quarters, we have commented that spreads on high-quality bonds are low relative to historical norms. To account for this, we have been adjusting our usual 100 bps duration test (described above). Specifically, we limited our purchases to bonds we thought could produce a breakeven total return if the yield on the bond increased by more than 100 bps with the amount over 100 bps determined based on the spread increase required to return the bond's spread to what we viewed as a more normal level. We had no expectation that spreads would increase as much as they did this past quarter, but in combination with the reduction in duration described above, this reduction in spread exposure decreased the short-term decline in the portfolio's price once spreads increased.
 We increased the overall quality of our holdings. For years we have commented that credit markets, in general, do not compensate investors for the underlying fundamental credit risk. In line with those comments, we had been reducing the portfolio's credit exposure for the past several years. Further, as spreads in high-quality bonds declined prior to this past quarter, we also did not see value in the lower tiers of the investment grade bond market, particularly BBB bonds. In fact, we published a note describing our concerns with the BBB bond market, "Risk Is Where You're Not Looking" (available on our website at https://fpa.com/news-special-commentaries/special-commentaries/2019/01/02/risk-is-where-you're-not-looking). We also eschewed investing in esoteric and newly created asset classes like marketplace lending because we did not see adequate compensation for the credit risk — even in the investment-grade tranches — especially in light of the limited performance history of those asset classes across economic cycles. Thus, in addition to reducing the portfolio's exposure to bonds rated BBB or lower, we migrated toward widely-held, more liquid bonds rated AAA and AA within the rest of the portfolio. Finally, we took the further step of increasing the portfolio's holdings of Treasury bonds because we determined that the low spread environment sufficiently lowered the opportunity cost of owning Treasuries and that the
9
FPA NEW INCOME, INC.
LETTER TO SHAREHOLDERS
(Continued)
better liquidity of Treasury bonds would be valuable in a market sell-off. The chart below shows the portfolio's exposure over time to Treasuries, AAA-rated bonds and credit-sensitive securities:

 We do not use margin or leverage. For decades, the New Income Fund has owned its investments outright, without margin or leverage. That means the Fund sacrificed the higher returns that leverage can create in good times. However, we believe leverage makes investors engage in uneconomic decision making. Leverage may lead investors to overpay for assets because of a focus on the levered return rather than the unlevered return. Leverage also may lead investors to sell at the wrong time, such as when price declines trigger margin calls. We saw that phenomenon over the past few weeks. These sales harm a fund's investors because the fund is selling at unattractive prices. In addition, the margin calls sop up a fund's liquidity right when it should be buying attractively priced investments. Since the Fund operates without leverage, we are never forced to sell and we are always prepared to be an opportunistic buyer. Our prohibition against leverage also helps us maintain enough liquidity to meet our investors' redemption requests on time.
In total, these steps helped insulate the portfolio from the dramatic spread increases seen throughout fixed income markets in the first quarter. But despite our efforts, the portfolio did experience a decline in the value of its holdings, though those declines were less than what befell many of our peers.7 We believe these price declines will have a short-term impact on performance.
There are two determinants of performance: short-term mark-to-market price changes and permanent impairments of capital. We believe that we do not have a permanent impairment of the fund's capital. Thus, as we
7 As represented by the Morningstar Short-Term Bond Category, which had 1Q 2020 performance of -2.14%. Past performance is no guarantee, nor is it indicative, of future results.
10
FPA NEW INCOME, INC.
LETTER TO SHAREHOLDERS
(Continued)
noted earlier, we believe our portfolio experienced a short-term mark-to-market price decline that we believe will be recovered over time as our short maturity holdings mature and we earn the coupon on our holdings.
Because of our underwriting of our investments, we believe the portfolio's price movements are short term and not reflective of a permanent impairment of capital. The table below breaks down the portfolio by sector and rating.
Fund | | Cash | | US govt/
Agency
guaranteed | | AAA | | AA | | A | | BBB | | BB | | B | | CCC | | NR | | Total | |
ABS | | | — | | | | — | | | | 50 | % | | | 9 | % | | | 3 | % | | | 0 | % | | | 0 | % | | | — | | | | — | | | | — | | | | 63 | % | |
Mortgage-backed (CMO) | | | — | | | | 2 | % | | | 5 | % | | | 1 | % | | | — | | | | — | | | | — | | | | — | | | | — | | | | — | | | | 8 | % | |
Stripped Mortgage-backed | | | — | | | | — | | | | — | | | | 2 | % | | | — | | | | — | | | | — | | | | — | | | | — | | | | — | | | | 2 | % | |
Corporate | | | — | | | | — | | | | — | | | | — | | | | 0 | % | | | 0 | % | | | — | | | | 1 | % | | | 3 | % | | | 3 | % | | | 7 | % | |
CMBS | | | — | | | | 2 | % | | | 6 | % | | | 0 | % | | | 0 | % | | | — | | | | 0 | % | | | — | | | | — | | | | — | | | | 8 | % | |
Mortgage Pass-through | | | — | | | | 3 | % | | | — | | | | — | | | | — | | | | — | | | | — | | | | — | | | | — | | | | — | | | | 3 | % | |
U.S. Treasury | | | — | | | | — | | | | — | | | | — | | | | — | | | | — | | | | — | | | | — | | | | — | | | | — | | | | — | | |
Agencies | | | — | | | | 1 | % | | | — | | | | — | | | | — | | | | — | | | | — | | | | — | | | | — | | | | — | | | | 1 | % | |
Cash and equivalents | | | 3 | % | | | 5 | % | | | — | | | | — | | | | — | | | | — | | | | — | | | | — | | | | — | | | | — | | | | 8 | % | |
Total | | | 3 | % | | | 13 | % | | | 61 | % | | | 12 | % | | | 4 | % | | | 0 | % | | | 0 | % | | | 1 | % | | | 3 | % | | | 3 | % | | | 100 | % | |
Source: FPA. Ratings reflect the Barclays Capital Family of Indices ratings rules and use the median if more than two ratings are available from all Nationally Recognized Statistical Ratings Organizations (NRSROs). Lower of the two is used if only two ratings are available from all NRSROs. Portfolio composition will change due to ongoing management of the Fund.
As of the end of the quarter, approximately 16% of the portfolio was in cash and government obligations. Beyond that, over 75% of the portfolio is held in investments rated AAA to A-, mostly in ABS.
The NRSRO ratings are the only available third-party arbiter of credit quality that has worldwide acceptance. However, we have never relied on these ratings to make our investment decisions. While the world has only recently woken up to the possibility of a recession, we have been worrying about a recession for years. For the past 10+ years, we have been buying bonds on the assumption that we would see a repeat of the 2008-09 financial crisis. That approach continues today. Here are a few examples that highlight our underwriting process:
 The Fund's prime auto ABS bonds, representing approximately 18% of the portfolio at quarter end, were chosen based on their ability to withstand large losses in the underlying prime auto loans. Based on our analysis, the Fund's bonds can withstand losses that, on average, are 20 times greater than the losses experienced by these same auto lenders during the last financial crisis.
 In a similar manner, the Fund's subprime auto ABS bonds, representing approximately 5% of the portfolio at quarter end, can withstand losses that are over three times greater than what the same lenders experienced during the 2008-09 financial crisis. Importantly, we have only invested with issuers that have a history of managing their businesses through a recession.
 The Fund's non-agency mortgage-backed securities represent approximately 6% of the portfolio at quarter end and have an average loan-to-value ratio of less than 40% of the home value at the time we made the investment. Taking into account home price appreciation that has occurred since the time of our investment, the loan-to-value on these bonds is now less than 30%.
11
FPA NEW INCOME, INC.
LETTER TO SHAREHOLDERS
(Continued)
 Collateralized loan obligations represent approximately 10% of the portfolio at quarter end. Among that group, 80% of those holdings are rated AAA with an expected weighted average life of two years. We underwrote the AAA bonds on the assumption that losses on the underlying leveraged loans would be three times greater than what occurred during the 2008-09 financial crisis.
Though we are now likely in the throes of a sudden and severe recession, we have been preparing for such a situation for a long time. Because of our long-held downside-focused investment approach, we are confident that the portfolio's capital is not permanently impaired.
As we manage the portfolio to our goal of a positive return in 2020, the portfolio should benefit from two sources of return. First, approximately 13% of the portfolio has an expected average life of nine months or less. Based on our underwriting, we expect the majority of those investments to convert to cash by the end of 2020, and anticipate capturing the discount at which those bonds are priced.8 Second, we expect to earn the coupon on the Fund's investments. Thus far, the portfolio has only earned three months of coupon. Receipt of the remaining nine months of this year's coupon should further offset price declines in the portfolio.
Going forward, we will employ the same approach that led us to protect the portfolio in advance of the pandemic and contributed to our relatively small drawdown. That is, our investment process will focus on fundamental value and absolute return, taking into account the impact that this new economic environment could have on asset values and borrowers' cash flow. Consistent discipline is the best tool to navigate the investment landscape. Unfortunately, as of the writing of this letter, the Fed had already announced unprecedented actions to support the financial markets, including purchases of investment grade and high-yield bonds. Those actions have made our jobs more difficult because the intervention pushed bond prices up significantly, divorcing them from economic reality. Because of these new monetary policy measures (some would say price-fixing), bond prices are no longer an accurate measure of a borrower's economic health. Just because a high-yield bond trades as if it won't default does not mean that it won't default. We believe default-adjusted returns are worse now because the probability and severity of default is certainly higher than it was three months ago, and yet yields do not currently reflect that.
Investors should ask themselves how their portfolios would have performed had the Federal Reserve not stepped in to support the markets. We have always managed our portfolio without assuming that we would have a Fed put (the so-called "Fed put" is the market's expectation that the Fed will prop up financial markets) because we cannot predict which companies the Fed and the government will choose to be the winners and losers in a crisis. For the reasons outlined above, we feel confident that we would have protected our investors' capital because we acted prudently. Can others say the same?
Investors now face a choice: Invest prudently or follow the Fed. Prudent investors will avoid taking on uncompensated risk and will have a portfolio that is better positioned to withstand further short-term declines in asset prices and to benefit from better long-term risk-adjusted performance. Those who follow the Fed will no longer be investors. Rather, they will be following the money, hoping that their investments will end up on the list of government-anointed winners. We choose prudence. What do you choose?
8 Investments that have a weighted average life of nine months in many instances have a principal payment schedule that is longer than nine months, but they have an average principal repayment time of nine months.
12
FPA NEW INCOME, INC.
LETTER TO SHAREHOLDERS
(Continued)
Macro Commentary or Rinse, Lather, Repeat
Why the cute title? It's because this is the fourth consecutive time that an economic expansion has been heavily influenced by monetary and regulatory policies designed to stimulate — or 'lather up' — asset prices through leverage. The following is a list of these downturns along with the asset classes that were lathered with excess leverage:
 1990 savings and loan crisis and commercial real estate loans
 2001 dot-com bubble, Long Term Capital Management bailout and high yield corporate debt
 2008 sub-prime mortgage debt and financial institutions
 2020 corporate leverage, government leverage.
Each of the preceding economic expansions had a different catalyst that caused them to end. The catalyst is not the point. The commonality of each expansion is over leverage (easy credit to a segment of the economy) and asset price appreciation that results in a very similar set of events once the economic downturn has started. Another similarity is that the policy response, whether it be fiscal and or monetary, is more expansive each time. The common element in each policy response is the encouragement of leverage as the tool for igniting a recovery. The end result is that over time, the whole economic system is more levered and therefore the next successive downturn is more dramatic than the last.
An examination of this current downturn illustrates the problem. To battle the current downturn, the Treasury Department and Federal Reserve resurrected every asset-buying program from the 2008-09 Great Financial Crisis (plus others) to allow the Treasury Department — aided by leverage from the Federal Reserve — to buy a wider variety of investment-grade and some less-than-investment-grade assets. Additionally, the central bank undertook an unlimited buying program of Treasury, agency debt and agency mortgage assets. Many Fed followers predict that by the time those programs are completed, the Fed's balance sheet will reach $9 trillion, or more than double what it was at the beginning of this year. We have no idea if that is correct, but we do know that, longer term, the balance sheet will continue to grow. What we also know is that the Fed's actions will have both intended and unintended consequences. Given what happened in the past, one consequence is that we can expect the Fed's asset purchases to remain on its balance sheet in perpetuity. Graph 1, below, shows the magnitude of the central bank's latest buying spree.
13
FPA NEW INCOME, INC.
LETTER TO SHAREHOLDERS
(Continued)
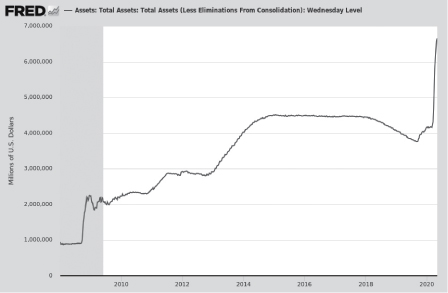
Source: Board of Governors of the Federal Reserve System (US)
The Federal Open Market Committee (FOMC) also reduced the Fed Funds interest rate to the 0% -.25% range. The Treasury yield curve shown earlier in this commentary reflects the effects of both the Fed's asset purchases and interest rate cut. At this time there appears to be very little upside potential for Treasury bonds unless an investor is confident that Treasury yields will be negative. The Federal Reserve Bank has stated that a negative Fed Funds Rate is not its objective.
Based on this and past reactions, the primary objective of the Fed's actions seems to be to keep the capital markets functioning. The regulatory changes post-2008 worked to prevent the banks/broker-dealers from taking on excessive leverage and limited their exposure to certain market trading activities. However, as we have often noted, the new rules preclude this group of entities from acting as a buffer in times of heavy selling. Their absence leads to increased market volatility and creates pressure on the Treasury department and Federal Reserve Bank to step in and try to create a functioning marketplace. As a data point, from March 11, 2020 to March 31, 2020 exchange-traded bond funds (ETFs) and mutual funds saw a net outflow of $316 billion, the largest outflow ever in such a short period of time.9
14
FPA NEW INCOME, INC.
LETTER TO SHAREHOLDERS
(Continued)
To some degree, the capital markets are now in part a function of government intervention. Hopefully, that will not morph into government control. By law, the Fed's mandate is full employment and stable prices (or avoiding inflation above a 2% target), and neither one is tied to orderly capital markets. However, the concern is that today's Federal Reserve Bank thinks it has three mandates — full employment, stable prices and orderly financial markets, and the last one is of its own making and not rooted in the law.
The federal government acted with unusual speed to help cushion the pandemic's economic effects with a $2.2 trillion relief package to businesses and households. The key question now is, can the government bureaucracy efficiently deliver that aid? Households with previously established direct deposit links with the IRS began to receive one-time relief payments around April 15, while other households may not see checks until later in the summer. Meanwhile, the small business lending program faced start-up delays and quickly ran out of money. Without going into detail, the small business loans are designed to provide the recipients with bridge financing to stave off bankruptcy during the "stay at home" order. Timing is critical for this strategy to work, and delays and insufficient funds could make it less effective, resulting in both a deeper downturn and a slower recovery. The government's programs are not a stimulus package but a relief package meant to partially replace lost revenue and wages. If it's timely, the programs may help minimize the GDP downturn, but it will not boost GDP later. However, there is one thing that is guaranteed to surge: the interest expense from the massive increase in borrowing. Pre-coronavirus forecasts from the Congressional Budget Office estimated the size of the federal government deficit would hover around $1 trillion for several years to come. Those estimates are now understated, with budget deficits potentially growing multiple times larger and lasting much longer. It is difficult to see a scenario where such a dramatic increase in debt has no impact on interest rates and inflation over the long term. It is just that today, that impact is still an unknown risk.
Both the central bank and federal government actions are focused on the near term, while the economy is in "stay at home" mode. The more important investment question, however, is what will the economy be like once this social policy is changed? Is the "stay at home" order just removed or relaxed over time? Will the virus reappear in the fall, or will relaxing "stay at home" orders immediately trigger further spreading of the virus? Will we have adequate testing to prevent that? How quickly will we have effective treatments for the disease caused by the virus, thus reducing deaths? Will we be able to develop a vaccine? All of these are questions that pertain to the rest of 2020. So again, what about longer term? Societal norms could change significantly because of the tremendous shock associated with the virus and our mitigation efforts. Psychologists say it takes 4-6 weeks to change a habit or behavior, and since the current mitigation effort could easily last 6-8 weeks, there are likely to be some permanent changes in behavior and our economy. Below is a list of the household, government and company behavior changes envisioned by Torsten Slok, an economist at Deutsche Bank. There are several other lists that predict similar behavior changes.
Reasons why growth over the coming quarters will be more muted
Household sector
 Increase in precautionary savings for households, similar to what we saw after the Great Depression in the 1930s
 More space between seats at restaurants, cinemas, sport events, concerts, conferences, trains, buses, and airplanes
15
FPA NEW INCOME, INC.
LETTER TO SHAREHOLDERS
(Continued)
 Fewer people traveling on vacation and going out until we have a vaccine, all contributing to lower consumer spending
 Older generations staying at home until a vaccine is released, less willingness to put parents in retirement homes
 Limits on the number of people in supermarkets at the same time, more online shopping, more online doctor visits
 Fewer people going to fitness centers, doing group sports
 More people driving their own car to avoid public transportation
 Health insurance premiums going up
Corporate sector
 Less business travel globally, more video conferencing
 Staggered work schedules, more distance between seats in offices, fewer cubicles
 More permanent work from home solutions, more disaster planning
 Fewer buybacks, lower dividend payouts
 Health insurance costs going up, higher insurance premiums
 Increased pressure for paid sick leave, health benefits, labor protection, including for gig workers
Government sector
 Global restrictions on travel to high-risk areas, more fever scanners at airports, borders
 More regulation forcing households and corporates to hold, say, three months of cash in emergency savings
 More regulation and spending to ensure health care system is better prepared
 Increased health safety regulations for retirement homes
 Stocking of medical supplies, including ventilators, domestically, a desire to be less dependent on other countries
 More systematic planning and preparedness, perhaps introduce better automatic stabilizers
 More supply of government bonds, increasing risk of a debt crisis
Source: Deutsche Bank Research report dated April 2020.
We are not saying that all of these changes will occur, but they represent a framework for how to monitor and analyze the economic impact on households, businesses and governments. One general behavioral change that could sum up the potential post-virus economy is that the focus for companies could shift from efficiency to resiliency, and households could retreat from their free-spending ways to set aside more savings. Government spending should adjust by building stockpiles of critical supplies and building infrastructure to respond to these crises, but that may be wishful thinking. Government actions tend to reflect politicians' desires to meet the immediate wants rather than the long-term needs of their respective populations.
16
FPA NEW INCOME, INC.
LETTER TO SHAREHOLDERS
(Continued)
The aftermath of all the financial market events listed at the beginning of this commentary had various impacts on capital markets, along with abrupt behavior changes from corporations, governments and households. Some were transient and others were more enduring. As an example, the reaction from the Federal Reserve Bank tended to be more intrusive with each succeeding event. With each economic downturn, the Fed's efforts to prop up financial markets were expanded. With each expansion of the so-called central bank put, it becomes harder to measure fixed income risk, whether it be interest rate risk or credit risk. Those risks became more socialized as the central bank stepped in to control them and took on some of the risks that would otherwise be borne by private investors. We expect that this time will not be different.
From our perspective, proper compensation for risk has become a cloudier equation. This does not change our focus on absolute value returns, it merely makes it more difficult to execute. For now, that means every potential investment will be subject to a few additional questions before we commit your capital.
Thank you for your continued trust and support.
Respectfully submitted,

Thomas H. Atteberry
Portfolio Manager

Abhijeet Patwardhan
Portfolio Manager
April 2020
Important Disclosures
This update is for informational and discussion purposes only and does not constitute, and should not be construed as, an offer or solicitation for the purchase or sale of any securities, products or services discussed, and neither does it provide investment advice. Any such offer or solicitation shall only be made pursuant to the Fund's Prospectus, which supersedes the information contained herein in its entirety.
The views expressed herein and any forward-looking statements are as of the date of the publication and are those of the portfolio management team. Future events or results may vary significantly from those expressed and are subject to change at any time in response to changing circumstances and industry developments. This information and data has been prepared from sources believed reliable, but the accuracy and completeness of the information cannot be guaranteed and is not a complete summary or statement of all available data.
17
FPA NEW INCOME, INC.
LETTER TO SHAREHOLDERS
(Continued)
Thomas Atteberry and Abhijeet Patwardhan have been portfolio managers for the Fund since November 2004 and November 2015, respectively, and manage the Fund in a manner that is substantially similar to the prior portfolio manager, Robert Rodriguez. Mr. Rodriguez ceased serving as the Fund's portfolio manager effective December 2009.
Portfolio composition will change due to ongoing management of the Fund. References to individual securities or sectors are for informational purposes only and should not be construed as recommendations by the Fund, the portfolio managers, the Adviser, or the distributor. It should not be assumed that future investments will be profitable or will equal the performance of the security or sector examples discussed. The portfolio holdings as of the most recent quarter-end may be obtained at www.fpa.com.
The statements made herein may be forward-looking and/or based on current expectations, projections, and/or information currently available. Actual results may differ from those anticipated. The portfolio managers and/or FPA cannot assure future results and disclaims any obligation to update or alter any statistical data and/or references thereto, as well as any forward-looking statements, whether as a result of new information, future events, or otherwise. Such statements may or may not be accurate over the long-term.
Investments, including investments in mutual funds, carry risks and investors may lose principal value. Capital markets are volatile and can decline significantly in response to adverse issuer, political, regulatory, market, or economic developments. The Fund may purchase foreign securities, including American Depository Receipts (ADRs) and other depository receipts, which are subject to interest rate, currency exchange rate, economic and political risks; this may be enhanced when investing in emerging markets. Foreign investments, especially those of companies in emerging markets, can be riskier, less liquid, harder to value, and more volatile than investments in the United States. The securities of smaller, less well-known companies can be more volatile than those of larger companies.
The return of principal in a bond fund is not guaranteed. Bond funds have the same issuer, interest rate, inflation and credit risks that are associated with underlying bonds owned by the Fund. Lower rated bonds, convertible securities and other types of debt obligations involve greater risks than higher rated bonds.
Interest rate risk is the risk that when interest rates go up, the value of fixed income securities, such as bonds, typically go down and investors may lose principal value. Credit risk is the risk of loss of principal due to the issuer's failure to repay a loan. Generally, the lower the quality rating of a security, the greater the risk that the issuer will fail to pay interest fully and return principal in a timely manner. If an issuer defaults the security may lose some or all of its value.
Mortgage securities and collateralized mortgage obligations (CMOs) are subject to prepayment risk and the risk of default on the underlying mortgages or other assets; such derivatives may increase volatility. Convertible securities are generally not investment grade and are subject to greater credit risk than higher-rated investments. High yield securities can be volatile and subject to much higher instances of default.
Value style investing presents the risk that the holdings or securities may never reach their full market value because the market fails to recognize what the portfolio management team considers the true business value or because the portfolio management team has misjudged those values. In addition, value style investing may fall out of favor and underperform growth or other styles of investing during given periods.
The ratings agencies that provide ratings are Standard and Poor's, Moody's, and Fitch. Credit ratings range from AAA (highest) to D (lowest). Bonds rated BBB or above are considered investment grade. Credit ratings of BB and below are lower-rated securities (junk bonds). High-yielding, non-investment grade bonds (junk bonds)
18
FPA NEW INCOME, INC.
LETTER TO SHAREHOLDERS
(Continued)
involve higher risks than investment grade bonds. Bonds with credit ratings of CCC or below have high default risk.
The Fund is not authorized for distribution unless preceded or accompanied by a current prospectus. The prospectus can be accessed at: https://fpa.com/request-funds-literature.
Index / Benchmark Definitions
Comparison to any index is for illustrative purposes only and should not be relied upon as a fully accurate measure of comparison. The Fund will be less diversified than the indices noted herein, and may hold non-index securities or securities that are not comparable to those contained in an index. Indices will hold positions that are not within the Fund's investment strategy. Indices are unmanaged, do not reflect any commissions, fees or expenses which would be incurred by an investor purchasing the underlying securities. The Fund does not include outperformance of any index or benchmark in its investment objectives. Investors cannot invest directly in an index.
Bloomberg Barclays US Aggregate Bond Index provides a measure of the performance of the U.S. investment grade bonds market, which includes investment grade U.S. Government bonds, investment grade corporate bonds, mortgage pass-through securities and asset-backed securities that are publicly offered for sale in the United States. The securities in the Index must have at least 1 year remaining in maturity. In addition, the securities must be denominated in U.S. dollars and must be fixed rate, nonconvertible, and taxable.
Bloomberg Barclays US Aggregate 1-3 Year Index provides a measure of the performance of the U.S. investment grade bonds market, which includes investment grade U.S. Government bonds, investment grade corporate bonds, mortgage pass-through securities and asset-backed securities that are publicly offered for sale in the United States. The securities in the Index must have a remaining maturity of 1 to 3 years. In addition, the securities must be denominated in U.S. dollars and must be fixed rate, nonconvertible, and taxable.
Bloomberg Barclays U.S. High Yield Index measures the market of USD-denominated, non-investment grade, fixed-rate, taxable corporate bonds.
Bloomberg Barclays BB U.S. High Yield Index ex. Energy measures the market of USD-denominated, non-investment grade, fixed-rate, taxable corporate bonds rated BB excluding energy sector.
Credit Suisse Leveraged Loan Index is designed to mirror the investable universe of U.S. dollar institutional leveraged loans, including U.S. and international borrowers.
The Consumer Price Index (CPI) is an unmanaged index representing the rate of the inflation of U.S. consumer prices as determined by the U.S. Department of Labor Statistics. The CPI is presented to illustrate the Fund's purchasing power against changes in the prices of goods as opposed to a benchmark, which is used to compare the Fund's performance. There can be no guarantee that the CPI will reflect the exact level of inflation at any given time. This index reflects non-seasonally adjusted returns.
CPI + 100 bps is the measure of the CPI plus an additional 100 basis points.
Basis Point (bps) is equal to one hundredth of one percent, or 0.01%. 100 basis points = 1%.
Corporate holdings include bank debt, corporate bonds and common stock.
A discount margin to maturity is the average expected return of a floating-rate security (typically a bond) that's earned in addition to the index underlying, or reference rate of, the security. The size of the discount margin depends on the price of the floating- or variable-rate security.
19
FPA NEW INCOME, INC.
LETTER TO SHAREHOLDERS
(Continued)
Effective Duration (years) is the duration calculation for bonds with embedded options. Effective duration takes into account that expected cash flows will fluctuate as interest rates change.
Weighted Average Life (years) is the average length of time that each dollar of unpaid principal on a loan, a mortgage or an amortizing bond remains outstanding.
Repo (Repurchase Agreement) is a form of short-term borrowing for dealers in government securities.
Yield to Maturity is the rate of return anticipated on a bond if held until the end of its lifetime. YTM is considered a long-term bond yield expressed as an annual rate. The YTM calculation takes into account the bond's current market price, par value, coupon interest rate and time to maturity. It is also assumed that all coupon payments are reinvested at the same rate as the bond's current yield.
Morningstar Bond Categories
Short-Term Bond Category. Short-term bond portfolios invest primarily in corporate and other investment-grade U.S. fixed-income issues and typically have durations of 1.0 to 3.5 years. These portfolios are attractive to fairly conservative investors, because they are less sensitive to interest rates than portfolios with longer durations. Morningstar calculates monthly breakpoints using the effective duration of the Morningstar Core Bond Index in determining duration assignment. Short-term is defined as 25% to 75% of the three-year average effective duration of the MCBI. Short-Term Bond Category consists of 558 funds.
Morningstar does not adjust total return for sales charges or for redemption fees.
©2020 Morningstar, Inc. All Rights Reserved. The information contained herein: (1) is proprietary to Morningstar and/or its content providers; (2) may not be copied or distributed; and (3) is not warranted by Morningstar to be accurate, complete or timely. Neither Morningstar nor its content providers are responsible for any damages or losses arising from any use of this information. Past performance is no guarantee of future results.
The FPA Funds are distributed by UMB Distribution Services, LLC, 235 W. Galena Street, Milwaukee, WI, 53212.
20
FPA NEW INCOME, INC.
LETTER TO SHAREHOLDERS
(Continued)
The discussions of Fund investments represent the views of the Fund's managers at the time of this report and are subject to change without notice. References to individual securities are for informational purposes only and should not be construed as recommendations to purchase or sell individual securities.
FUND RISKS
Investments in mutual funds carry risks and investors may lose principal value. Stock markets are volatile and can decline significantly in response to adverse issuer, political, regulatory, market, or economic developments. The funds may purchase foreign securities which are subject to interest rate, currency exchange rate, economic and political risks: this may be enhanced when investing in emerging markets. The securities of smaller, less well-known companies can be more volatile than those of larger companies. The return of principal in a bond fund is not guaranteed. Bond funds have the same issuer, interest rate, inflation and credit risks that are associated with underlying bonds owned by the fund. Lower rated bonds, convertible securities and other types of debt obligations involve greater risks than higher rated bonds. Mortgage securities and collateralized mortgage obligations (CMOs) are subject to prepayment risk and the risk of default on the underlying mortgages or other assets; derivatives may increase volatility. High yield securities can be volatile and subject to much higher instances of default.
FORWARD LOOKING STATEMENT DISCLOSURE
As mutual fund managers, one of our responsibilities is to communicate with shareholders in an open and direct manner. Insofar as some of our opinions and comments in our letters to shareholders are based on our current expectations, they are considered "forward-looking statements" which may or may not prove to be accurate over the long term. While we believe we have a reasonable basis for our comments and we have confidence in our opinions, actual results may differ materially from those we anticipate. You can identify forward-looking statements by words such as "believe," "expect," "may," "anticipate," and other similar expressions when discussing prospects for particular portfolio holdings and/or the markets, generally. We cannot, however, assure future results and disclaim any obligation to update or alter any forward-looking statements, whether as a result of new information, future events, or otherwise. Further, information provided in this report should not be construed as a recommendation to purchase or sell any particular security.
21
FPA NEW INCOME, INC.
PORTFOLIO SUMMARY
March 31, 2020 (Unaudited)
Common Stocks | | | | | 0.3 | % | |
Energy | | | 0.3 | % | | | | | |
Industrials | | | 0.0 | % | | | | | |
Bonds & Debentures | | | | | 97.1 | % | |
Asset-Backed Securities | | | 63.0 | % | | | | | |
Residential Mortgage-Backed Securities | | | 12.6 | % | | | | | |
Commercial Mortgage-Backed Securities | | | 9.8 | % | | | | | |
U.S. Treasuries | | | 5.0 | % | | | | | |
Corporate Bank Debt | | | 4.9 | % | | | | | |
Corporate Bonds & Notes | | | 1.8 | % | | | | | |
Short-term Investments | | | | | 1.5 | % | |
Other Assets And Liabilities, Net | | | | | 1.1 | % | |
Net Assets | | | | | 100.0 | % | |
22
FPA NEW INCOME, INC.
PORTFOLIO OF INVESTMENTS
March 31, 2020
(Unaudited)
COMMON STOCKS | | Shares or
Principal
Amount | |
Fair Value | |
ENERGY — 0.3% | |
PHI Group, Inc.(a)(b) | | | 1,203,928 | | | $ | 7,825,532 | | |
PHI Group, Inc., Restricted(a)(b)(c)(e) | | | 2,602,492 | | | | 16,916,198 | | |
| | | $ | 24,741,730 | | |
INDUSTRIALS — 0.0% | |
Boart Longyear Ltd.(a) | | | 874,320 | | | $ | 247,385 | | |
| TOTAL COMMON STOCKS — 0.3% (Cost $31,764,951) | | $ | 24,989,115 | | |
BONDS & DEBENTURES | |
COMMERCIAL MORTGAGE-BACKED SECURITIES — 9.8% | |
AGENCY — 1.6% | |
Federal Home Loan Mortgage Corp. K042 A1 — 2.267% 6/25/2024 | | $ | 14,709,750 | | | $ | 15,007,296 | | |
Federal Home Loan Mortgage Corp. K024 A2 — 2.573% 9/25/2022 | | | 5,758,105 | | | | 5,924,666 | | |
Government National Mortgage Association 2009-119 IO —
0.219% 12/16/2049(d) | | | 7,890,384 | | | | 23,561 | | |
Government National Mortgage Association 2014-175 IO —
0.759% 4/16/2056(d) | | | 178,751,640 | | | | 7,637,807 | | |
Government National Mortgage Association 2014-169 A —
2.600% 11/16/2042 | | | 3,358,578 | | | | 3,397,198 | | |
Government National Mortgage Association 2015-21 A —
2.600% 11/16/2042 | | | 4,961,019 | | | | 5,013,154 | | |
Government National Mortgage Association 2014-148 A —
2.650% 11/16/2043 | | | 10,537,353 | | | | 10,649,859 | | |
Government National Mortgage Association 2019-39 A —
3.100% 5/16/2059 | | | 64,931,729 | | | | 66,699,612 | | |
Government National Mortgage Association 2011-9 C, VRN —
3.485% 9/16/2041(d) | | | 2,190,267 | | | | 2,207,227 | | |
Government National Mortgage Association 2010-148 AC —
7.000% 12/16/2050(d) | | | 21,226 | | | | 21,597 | | |
| | | $ | 116,581,977 | | |
AGENCY STRIPPED — 2.3% | |
Government National Mortgage Association 2004-10 IO —
0.000% 1/16/2044(d) | | $ | 3,762,616 | | | $ | 4 | | |
Government National Mortgage Association 2012-45 IO —
0.000% 4/16/2053(d) | | | 7,716,626 | | | | 31,556 | | |
Government National Mortgage Association 2002-56 IO —
0.043% 6/16/2042(d) | | | 16,288 | | | | 15 | | |
23
FPA NEW INCOME, INC.
PORTFOLIO OF INVESTMENTS (Continued)
March 31, 2020
(Unaudited)
BONDS & DEBENTURES — Continued | | Principal
Amount | | Fair Value | |
Government National Mortgage Association 2009-105 IO —
0.183% 11/16/2049(d) | | $ | 4,867,357 | | | $ | 16,351 | | |
Government National Mortgage Association 2009-86 IO —
0.250% 10/16/2049(d) | | | 11,347,404 | | | | 51,961 | | |
Government National Mortgage Association 2009-71 IO —
0.264% 7/16/2049(d) | | | 3,105,182 | | | | 23,333 | | |
Government National Mortgage Association 2009-49 IO —
0.280% 6/16/2049(d) | | | 5,120,230 | | | | 18,524 | | |
Government National Mortgage Association 2012-125 IO —
0.343% 2/16/2053(d) | | | 68,212,621 | | | | 1,424,607 | | |
Government National Mortgage Association 2008-8 IO —
0.352% 11/16/2047(d) | | | 4,567,508 | | | | 15,585 | | |
Government National Mortgage Association 2009-4 IO —
0.390% 1/16/2049(d) | | | 2,760,714 | | | | 20,010 | | |
Government National Mortgage Association 2012-25 IO —
0.417% 8/16/2052(d) | | | 71,978,589 | | | | 889,591 | | |
Government National Mortgage Association 2010-123 IO —
0.484% 9/16/2050(d) | | | 3,736,148 | | | | 30,648 | | |
Government National Mortgage Association 2009-60 IO —
0.509% 6/16/2049(d) | | | 6,932,501 | | | | 60,794 | | |
Government National Mortgage Association 2014-157 IO —
0.548% 5/16/2055(d) | | | 108,016,963 | | | | 3,129,651 | | |
Government National Mortgage Association 2009-30 IO —
0.570% 3/16/2049(d) | | | 5,071,837 | | | | 135,582 | | |
Government National Mortgage Association 2013-45 IO —
0.572% 12/16/2053(d) | | | 62,570,604 | | | | 1,017,673 | | |
Government National Mortgage Association 2007-77 IO —
0.580% 11/16/2047(d) | | | 20,732,090 | | | | 249,117 | | |
Government National Mortgage Association 2015-41 IO —
0.592% 9/16/2056(d) | | | 31,855,655 | | | | 1,209,257 | | |
Government National Mortgage Association 2008-24 IO —
0.604% 11/16/2047(d) | | | 246,926 | | | | 3 | | |
Government National Mortgage Association 2005-9 IO —
0.627% 1/16/2045(d) | | | 761,955 | | | | 1,878 | | |
Government National Mortgage Association 2013-125 IO —
0.648% 10/16/2054(d) | | | 18,891,984 | | | | 452,253 | | |
Government National Mortgage Association 2012-58 IO —
0.649% 2/16/2053(d) | | | 180,866,177 | | | | 3,747,818 | | |
Government National Mortgage Association 2012-79 IO —
0.655% 3/16/2053(d) | | | 106,867,782 | | | | 2,662,985 | | |
24
FPA NEW INCOME, INC.
PORTFOLIO OF INVESTMENTS (Continued)
March 31, 2020
(Unaudited)
BONDS & DEBENTURES — Continued | | Principal
Amount | | Fair Value | |
Government National Mortgage Association 2012-150 IO —
0.678% 11/16/2052(d) | | $ | 60,673,914 | | | $ | 1,982,453 | | |
Government National Mortgage Association 2014-110 IO —
0.689% 1/16/2057(d) | | | 63,626,631 | | | | 2,674,208 | | |
Government National Mortgage Association 2014-77 IO —
0.713% 12/16/2047(d) | | | 43,820,687 | | | | 1,380,426 | | |
Government National Mortgage Association 2014-138 IO —
0.728% 4/16/2056(d) | | | 25,905,585 | | | | 1,036,524 | | |
Government National Mortgage Association 2015-19 IO —
0.733% 1/16/2057(d) | | | 86,234,989 | | | | 3,885,059 | | |
Government National Mortgage Association 2015-7 IO —
0.735% 1/16/2057(d) | | | 51,856,877 | | | | 2,313,833 | | |
Government National Mortgage Association 2015-86 IO —
0.741% 5/16/2052(d) | | | 61,167,668 | | | | 2,485,768 | | |
Government National Mortgage Association 2004-43 IO —
0.744% 6/16/2044(d) | | | 9,308,195 | | | | 115,655 | | |
Government National Mortgage Association 2014-135 IO —
0.748% 1/16/2056(d) | | | 239,560,159 | | | | 9,036,281 | | |
Government National Mortgage Association 2014-153 IO —
0.752% 4/16/2056(d) | | | 198,451,691 | | | | 8,332,014 | | |
Government National Mortgage Association 2014-187 IO —
0.753% 5/16/2056(d) | | | 123,569,500 | | | | 5,262,479 | | |
Government National Mortgage Association 2012-114 IO —
0.760% 1/16/2053(d) | | | 39,526,983 | | | | 1,621,120 | | |
Government National Mortgage Association 2014-164 IO —
0.775% 1/16/2056(d) | | | 223,472,248 | | | | 8,380,276 | | |
Government National Mortgage Association 2015-47 IO —
0.803% 10/16/2056(d) | | | 148,310,570 | | | | 6,894,588 | | |
Government National Mortgage Association 2015-101 IO —
0.819% 3/16/2052(d) | | | 131,953,500 | | | | 5,993,447 | | |
Government National Mortgage Association 2015-108 IO —
0.835% 10/16/2056(d) | | | 27,835,326 | | | | 1,286,259 | | |
Government National Mortgage Association 2008-45 IO —
0.852% 2/16/2048(d) | | | 2,585,105 | | | | 4,922 | | |
Government National Mortgage Association 2006-55 IO —
0.855% 8/16/2046(d) | | | 6,608,438 | | | | 70,189 | | |
Government National Mortgage Association 2015-114 IO —
0.886% 3/15/2057(d) | | | 134,359,358 | | | | 6,018,171 | | |
Government National Mortgage Association 2015-150 IO —
0.889% 9/16/2057(d) | | | 200,825,263 | | | | 11,142,609 | | |
25
FPA NEW INCOME, INC.
PORTFOLIO OF INVESTMENTS (Continued)
March 31, 2020
(Unaudited)
BONDS & DEBENTURES — Continued | | Principal
Amount | | Fair Value | |
Government National Mortgage Association 2015-160 IO —
0.901% 1/16/2056(d) | | $ | 227,519,179 | | | $ | 11,029,789 | | |
Government National Mortgage Association 2015-169 IO —
0.916% 7/16/2057(d) | | | 215,615,880 | | | | 11,920,734 | | |
Government National Mortgage Association 2015-128 IO —
0.920% 12/16/2056(d) | | | 186,183,942 | | | | 9,110,799 | | |
Government National Mortgage Association 2008-48 IO —
0.968% 4/16/2048(d) | | | 8,705,695 | | | | 124,711 | | |
Government National Mortgage Association 2016-65 IO —
0.982% 1/16/2058(d) | | | 220,696,718 | | | | 13,279,741 | | |
Government National Mortgage Association 2016-125 IO —
0.985% 12/16/2057(d) | | | 118,094,672 | | | | 7,138,162 | | |
Government National Mortgage Association 2016-106 IO —
1.015% 9/16/2058(d) | | | 229,591,261 | | | | 14,956,883 | | |
Government National Mortgage Association 2008-92 IO —
1.206% 10/16/2048(d) | | | 12,176,584 | | | | 110,628 | | |
Government National Mortgage Association 2004-108 IO —
1.919% 12/16/2044(d) | | | 377,780 | | | | 18 | | |
Government National Mortgage Association 2006-30 IO —
2.392% 5/16/2046(d) | | | 842,862 | | | | 9,132 | | |
| | | $ | 162,786,074 | | |
NON-AGENCY — 5.9% | |
Aventura Mall Trust 2013-AVM A — 3.743% 12/5/2032(d)(e) | | $ | 37,824,000 | | | $ | 38,074,671 | | |
Bear Stearns Commercial Mortgage Securities Trust 2005-PWR7 B —
5.117% 2/11/2041(d) | | | 2,048,180 | | | | 2,048,755 | | |
Citigroup Commercial Mortgage Trust 2012-GC8 A4 —
3.024% 9/10/2045 | | | 4,148,778 | | | | 4,149,177 | | |
Citigroup Commercial Mortgage Trust 2017-C4 A2 —
3.190% 10/12/2050 | | | 18,524,000 | | | | 19,003,386 | | |
COMM 2012-CCRE2 Mortgage Trust 2012-CR2 A4 —
3.147% 8/15/2045 | | | 15,226,000 | | | | 15,422,930 | | |
COMM Mortgage Trust 2012-CR5 A3 — 2.540% 12/10/2045 | | | 5,942,220 | | | | 5,955,612 | | |
COMM Mortgage Trust 2013-LC6 A4 — 2.941% 1/10/2046 | | | 8,502,748 | | | | 8,618,304 | | |
COMM Mortgage Trust 2014-FL5 B, 1M LIBOR + 2.150% —
3.045% 10/15/2031(d)(e) | | | 730,827 | | | | 694,937 | | |
COMM Mortgage Trust 2014-FL5 C, 1M LIBOR + 2.150% —
3.045% 10/15/2031(d)(e) | | | 8,340,000 | | | | 7,765,444 | | |
DBUBS Mortgage Trust 2011-LC2A A4 — 4.537% 7/10/2044(e) | | | 44,816,836 | | | | 45,374,908 | | |
GS Mortgage Securities Corp. Trust 2012-ALOH A —
3.551% 4/10/2034(e) | | | 21,003,000 | | | | 20,888,668 | | |
26
FPA NEW INCOME, INC.
PORTFOLIO OF INVESTMENTS (Continued)
March 31, 2020
(Unaudited)
BONDS & DEBENTURES — Continued | | Principal
Amount | | Fair Value | |
J.P. Morgan Chase Commercial Mortgage Securities Trust 2016-WIKI A —
2.798% 10/5/2031(e) | | $ | 7,922,000 | | | $ | 7,561,211 | | |
JP Morgan Chase Commercial Mortgage Securities Trust C 2012-HSBC A —
3.093% 7/5/2032(e) | | | 47,349,537 | | | | 48,271,882 | | |
JPMBB Commercial Mortgage Securities Trust 2015-C30 ASB —
3.559% 7/15/2048 | | | 7,605,000 | | | | 7,775,138 | | |
Latitude Management Real Estate Capita 2016-CRE2 A,
1M LIBOR + 1.700% — 3.329% 11/24/2031(d)(e) | | | 2,122,296 | | | | 2,092,217 | | |
UBS Commercial Mortgage Trust 2012-C1 A3 — 3.400% 5/10/2045 | | | 6,615,816 | | | | 6,672,852 | | |
VNDO E Mortgage Trust 2012-6AVE A — 2.996% 11/15/2030(e) | | | 5,604,681 | | | | 5,674,649 | | |
VNDO E Mortgage Trust 2012-6AVE B — 3.298% 11/15/2030(e) | | | 13,266,000 | | | | 13,198,955 | | |
Wells Fargo Commercial Mortgage Trust 2019-C51 A1 —
2.276% 6/15/2052 | | | 10,384,927 | | | | 10,417,785 | | |
Wells Fargo Commercial Mortgage Trust 2012-LC5 A3 —
2.918% 10/15/2045 | | | 34,087,330 | | | | 34,412,686 | | |
WFRBS Commercial Mortgage Trust 2012-C9 A3 —
2.870% 11/15/2045 | | | 11,229,629 | | | | 11,253,239 | | |
WFRBS Commercial Mortgage Trust 2012-C8 A3 —
3.001% 8/15/2045 | | | 63,956,000 | | | | 64,553,343 | | |
WFRBS Commercial Mortgage Trust 2013-C11 A5 —
3.071% 3/15/2045 | | | 6,240,000 | | | | 6,300,380 | | |
WFRBS Commercial Mortgage Trust 2013-UBS1 A3 —
3.591% 3/15/2046 | | | 30,588,000 | | | | 30,706,269 | | |
| | | $ | 416,887,398 | | |
TOTAL COMMERICAL MORTGAGE-BACKED SECURITIES
(Cost $745,949,606) | | $ | 696,255,449 | | |
RESIDENTIAL MORTGAGE-BACKED SECURITIES — 12.6% | |
AGENCY COLLATERALIZED MORTGAGE OBLIGATION — 2.4% | |
Federal Home Loan Mortgage Corp. 4170 QE — 2.000% 5/15/2032 | | $ | 2,019,459 | | | $ | 2,058,084 | | |
Federal Home Loan Mortgage Corp. 3979 HD — 2.500% 12/15/2026 | | | 1,977,395 | | | | 2,030,966 | | |
Federal Home Loan Mortgage Corp. 4304 DA — 2.500% 1/15/2027 | | | 756,762 | | | | 778,174 | | |
Federal Home Loan Mortgage Corp. 4010 DE — 2.500% 2/15/2027 | | | 2,339,615 | | | | 2,407,259 | | |
Federal Home Loan Mortgage Corp. 3914 MA — 3.000% 6/15/2026 | | | 1,607,715 | | | | 1,676,032 | | |
Federal Home Loan Mortgage Corp. 4297 CA — 3.000% 12/15/2030 | | | 2,781,618 | | | | 2,871,909 | | |
Federal Home Loan Mortgage Corp. 4664 TA — 3.000% 9/15/2037 | | | 4,307,603 | | | | 4,430,726 | | |
Federal Home Loan Mortgage Corp. 4504 DN — 3.000% 10/15/2040 | | | 9,077,071 | | | | 9,178,662 | | |
Federal Home Loan Mortgage Corp. 3862 MB — 3.500% 5/15/2026 | | | 13,420,731 | | | | 14,104,638 | | |
27
FPA NEW INCOME, INC.
PORTFOLIO OF INVESTMENTS (Continued)
March 31, 2020
(Unaudited)
BONDS & DEBENTURES — Continued | | Principal
Amount | | Fair Value | |
Federal Home Loan Mortgage Corp. 3828 VE — 4.500% 1/15/2024 | | $ | 798,904 | | | $ | 851,365 | | |
Federal Home Loan Mortgage Corp. 4395 NT — 4.500% 7/15/2026 | | | 6,228,372 | | | | 6,614,381 | | |
Federal National Mortgage Association 2014-21 ED — 2.250% 4/25/2029 | | | 508,960 | | | | 518,375 | | |
Federal National Mortgage Association 2013-135 KM — 2.500% 3/25/2028 | | | 1,185,340 | | | | 1,216,793 | | |
Federal National Mortgage Association 4387 VA — 3.000% 2/15/2026 | | | 430,366 | | | | 446,079 | | |
Federal National Mortgage Association 2017-30 G — 3.000% 7/25/2040 | | | 7,422,473 | | | | 7,724,791 | | |
Federal National Mortgage Association 2013-93 PJ — 3.000% 7/25/2042 | | | 1,564,196 | | | | 1,638,921 | | |
Federal National Mortgage Association 2017-16 JA — 3.000% 2/25/2043 | | | 16,905,777 | | | | 17,418,774 | | |
Federal National Mortgage Association 2018-16 HA — 3.000% 7/25/2043 | | | 18,210,061 | | | | 18,817,432 | | |
Federal National Mortgage Association 2011-98 VE — 3.500% 6/25/2026 | | | 13,677,000 | | | | 13,929,628 | | |
Federal National Mortgage Association 2011-80 KB — 3.500% 8/25/2026 | | | 10,687,107 | | | | 11,124,709 | | |
Federal National Mortgage Association 2012-144 PD — 3.500% 4/25/2042 | | | 3,292,189 | | | | 3,476,311 | | |
Federal National Mortgage Association 2017-45 KD — 3.500% 2/25/2044 | | | 11,179,478 | | | | 11,519,058 | | |
Federal National Mortgage Association 2017-52 KC — 3.500% 4/25/2044 | | | 13,121,235 | | | | 13,548,596 | | |
Federal National Mortgage Association 2017-59 DC — 3.500% 5/25/2044 | | | 18,025,384 | | | | 18,537,512 | | |
Federal National Mortgage Association 2012-40 GC — 4.500% 12/25/2040 | | | 740,073 | | | | 755,650 | | |
Federal National Mortgage Association 2010-43 MK — 5.500% 5/25/2040 | | | 1,403,936 | | | | 1,551,204 | | |
| | | $ | 169,226,029 | | |
AGENCY POOL ADJUSTABLE RATE — 0.0% | |
Federal National Mortgage Association 865963,
12M USD LIBOR + 1.755% — 3.755% 3/1/2036(d) | | $ | 534,886 | | | $ | 560,950 | | |
AGENCY POOL FIXED RATE — 2.9% | |
Federal Home Loan Mortgage Corp. J24941 — 2.000% 8/1/2023 | | $ | 1,326,962 | | | $ | 1,364,473 | | |
Federal Home Loan Mortgage Corp. J20834 — 2.500% 10/1/2027 | | | 971,761 | | | | 1,012,603 | | |
Federal Home Loan Mortgage Corp. J16678 — 3.000% 9/1/2026 | | | 3,642,997 | | | | 3,821,011 | | |
Federal Home Loan Mortgage Corp. J17544 — 3.000% 12/1/2026 | | | 5,240,388 | | | | 5,509,559 | | |
Federal Home Loan Mortgage Corp. J17774 — 3.000% 1/1/2027 | | | 1,055,198 | | | | 1,106,430 | | |
Federal Home Loan Mortgage Corp. G15418 — 3.000% 11/1/2027 | | | 1,367,853 | | | | 1,438,112 | | |
Federal Home Loan Mortgage Corp. G16406 — 3.000% 1/1/2028 | | | 16,297,087 | | | | 17,113,810 | | |
Federal Home Loan Mortgage Corp. G16620 — 3.000% 8/1/2028 | | | 7,228,743 | | | | 7,593,268 | | |
Federal Home Loan Mortgage Corp. G16478 — 3.000% 5/1/2030 | | | 23,167,008 | | | | 24,299,055 | | |
Federal Home Loan Mortgage Corp. G16592 — 3.000% 2/1/2032 | | | 13,637,599 | | | | 14,308,257 | | |
Federal Home Loan Mortgage Corp. G15169 — 4.500% 9/1/2026 | | | 1,180,264 | | | | 1,245,031 | | |
Federal Home Loan Mortgage Corp. G15272 — 4.500% 9/1/2026 | | | 477,923 | | | | 497,904 | | |
Federal Home Loan Mortgage Corp. G15875 — 4.500% 9/1/2026 | | | 1,699,184 | | | | 1,785,361 | | |
Federal Home Loan Mortgage Corp. G15036 — 5.000% 6/1/2024 | | | 334,394 | | | | 341,667 | | |
Federal Home Loan Mortgage Corp. G13667 — 5.000% 8/1/2024 | | | 40,981 | | | | 42,016 | | |
Federal Home Loan Mortgage Corp. G15173 — 5.000% 6/1/2026 | | | 338,053 | | | | 348,066 | | |
Federal Home Loan Mortgage Corp. G15407 — 5.000% 6/1/2026 | | | 1,402,967 | | | | 1,461,142 | | |
28
FPA NEW INCOME, INC.
PORTFOLIO OF INVESTMENTS (Continued)
March 31, 2020
(Unaudited)
BONDS & DEBENTURES — Continued | | Principal
Amount | | Fair Value | |
Federal Home Loan Mortgage Corp. J01270 — 5.500% 2/1/2021 | | $ | 6,478 | | | $ | 6,556 | | |
Federal Home Loan Mortgage Corp. G15230 — 5.500% 12/1/2024 | | | 830,683 | | | | 860,541 | | |
Federal Home Loan Mortgage Corp. G15458 — 5.500% 12/1/2024 | | | 217,308 | | | | 225,567 | | |
Federal Home Loan Mortgage Corp. G14460 — 6.000% 1/1/2024 | | | 76,695 | | | | 79,333 | | |
Federal Home Loan Mortgage Corporation J16662 — 3.000% 9/1/2026 | | | 1,341,856 | | | | 1,407,006 | | |
Federal Home Loan Mortgage Corporation J17197 — 3.000% 11/1/2026 | | | 2,305,669 | | | | 2,417,614 | | |
Federal Home Loan Mortgage Corporation ZK3908 — 3.000% 2/1/2027 | | | 818,108 | | | | 857,617 | | |
Federal Home Loan Mortgage Corporation ZK3970 — 3.000% 3/1/2027 | | | 678,846 | | | | 711,630 | | |
Federal National Mortgage Association AB6251 — 2.000% 9/1/2022 | | | 218,296 | | | | 224,467 | | |
Federal National Mortgage Association AB7515 — 2.000% 1/1/2023 | | | 146,100 | | | | 150,230 | | |
Federal National Mortgage Association MA2449 — 2.500% 11/1/2025 | | | 8,809,331 | | | | 9,172,447 | | |
Federal National Mortgage Association AB6192 — 2.500% 9/1/2027 | | | 1,554,379 | | | | 1,619,421 | | |
Federal National Mortgage Association MA2726 — 3.000% 8/1/2026 | | | 2,494,499 | | | | 2,617,304 | | |
Federal National Mortgage Association AJ6973 — 3.000% 11/1/2026 | | | 1,278,501 | | | | 1,340,243 | | |
Federal National Mortgage Association AJ9387 — 3.000% 12/1/2026 | | | 677,626 | | | | 710,350 | | |
Federal National Mortgage Association AU3826 — 3.000% 12/1/2026 | | | 18,853,340 | | | | 19,752,041 | | |
Federal National Mortgage Association MA0953 — 3.000% 1/1/2027 | | | 3,238,293 | | | | 3,394,680 | | |
Federal National Mortgage Association AL1345 — 3.000% 2/1/2027 | | | 1,202,823 | | | | 1,260,911 | | |
Federal National Mortgage Association AB4673 — 3.000% 3/1/2027 | | | 1,333,486 | | | | 1,397,884 | | |
Federal National Mortgage Association AK9467 — 3.000% 3/1/2027 | | | 1,419,412 | | | | 1,487,960 | | |
Federal National Mortgage Association AL5254 — 3.000% 11/1/2027 | | | 1,775,877 | | | | 1,861,639 | | |
Federal National Mortgage Association AL3773 — 3.000% 6/1/2028 | | | 2,131,976 | | | | 2,235,601 | | |
Federal National Mortgage Association AL5638 — 3.000% 6/1/2028 | | | 1,025,529 | | | | 1,075,055 | | |
Federal National Mortgage Association AL4693 — 3.000% 8/1/2028 | | | 1,186,350 | | | | 1,243,643 | | |
Federal National Mortgage Association MA3480 — 3.000% 8/1/2028 | | | 4,913,979 | | | | 5,160,504 | | |
Federal National Mortgage Association MA3485 — 3.000% 9/1/2028 | | | 2,590,320 | | | | 2,720,271 | | |
Federal National Mortgage Association 890837 — 3.000% 10/1/2028 | | | 14,315,611 | | | | 15,011,429 | | |
Federal National Mortgage Association BM4299 — 3.000% 3/1/2030 | | | 34,405,164 | | | | 36,066,693 | | |
Federal National Mortgage Association FM1102 — 4.000% 3/1/2031 | | | 8,123,094 | | | | 8,556,822 | | |
Federal National Mortgage Association AL4056 — 5.000% 6/1/2026 | | | 958,145 | | | | 988,284 | | |
Federal National Mortgage Association AL5867 — 5.500% 8/1/2023 | | | 63,578 | | | | 65,582 | | |
Federal National Mortgage Association AL0471 — 5.500% 7/1/2025 | | | 54,827 | | | | 57,491 | | |
Federal National Mortgage Association AL4433 — 5.500% 9/1/2025 | | | 328,031 | | | | 338,690 | | |
Federal National Mortgage Association AL4901 — 5.500% 9/1/2025 | | | 270,144 | | | | 278,568 | | |
Federal National Mortgage Association AD0951 — 6.000% 12/1/2021 | | | 107,437 | | | | 109,562 | | |
Federal National Mortgage Association AL0294 — 6.000% 10/1/2022 | | | 22,321 | | | | 23,078 | | |
Federal National Mortgage Association 890225 — 6.000% 5/1/2023 | | | 197,576 | | | | 204,865 | | |
Government National Mortgage Association 782281 — 6.000% 3/15/2023 | | | 399,504 | | | | 415,450 | | |
| | | $ | 209,394,794 | | |
29
FPA NEW INCOME, INC.
PORTFOLIO OF INVESTMENTS (Continued)
March 31, 2020
(Unaudited)
BONDS & DEBENTURES — Continued | | Principal
Amount | | Fair Value | |
AGENCY STRIPPED — 1.3% | |
Federal Home Loan Mortgage Corp. 217 PO — 0.000% 1/1/2032(f) | | $ | 145,927 | | | $ | 139,108 | | |
Federal Home Loan Mortgage Corp. 3763 NI — 3.500% 5/15/2025 | | | 680,590 | | | | 18,818 | | |
Federal Home Loan Mortgage Corp. 3917 AI — 4.500% 7/15/2026 | | | 5,907,493 | | | | 329,087 | | |
Federal Home Loan Mortgage Corp. 217 IO — 6.500% 1/1/2032 | | | 140,513 | | | | 30,469 | | |
Federal National Mortgage Association 2010-25 NI — 5.000% 3/25/2025 | | | 4,627 | | | | 91 | | |
Federal National Mortgage Association 2003-64 XI — 5.000% 7/25/2033 | | | 386,826 | | | | 60,841 | | |
Resolution Funding Corp. — 0.000% 10/15/2020(f) | | | 89,328,000 | | | | 89,029,627 | | |
| | | $ | 89,608,041 | | |
NON-AGENCY COLLATERALIZED MORTGAGE OBLIGATION — 6.0% | |
BRAVO Residential Funding Trust 2019-1 A1C — 3.500% 3/25/2058(e) | | $ | 30,342,057 | | | $ | 29,895,058 | | |
CIM Trust 2017-7 A, VRN — 3.000% 4/25/2057(d)(e) | | | 19,927,657 | | | | 19,443,461 | | |
CIM Trust 2018-R3 A1, VRN — 5.000% 12/25/2057(d)(e) | | | 49,158,046 | | | | 47,401,048 | | |
Citicorp Mortgage Securities REMIC Pass-Through
Certificates Trust Series 2005-5 2A3 — 5.000% 8/25/2020 | | | 2,072 | | | | 2,065 | | |
Citigroup Mortgage Loan Trust, Inc. 2014-A A — 4.000% 1/25/2035(d)(e) | | | 6,025,720 | | | | 5,993,615 | | |
Finance of America HECM Buyout 2020-HB1 M1, VRN —
2.105% 2/25/2030(d)(e) | | | 10,431,000 | | | | 10,750,199 | | |
Finance of America HECM Buyout — 2.656% 12/27/2049(e) | | | 25,633,494 | | | | 24,919,096 | | |
Mill City Mortgage Loan Trust 2018-2 A1, VRN —
3.500% 5/25/2058(d)(e) | | | 34,817,891 | | | | 35,277,331 | | |
Nationstar HECM Loan Trust 2019-2A M1, VRN —
2.359% 11/25/2029(b)(d)(e) | | | 7,922,000 | | | | 7,626,747 | | |
Nationstar HECM Loan Trust 2019-1A M1, VRN —
2.664% 6/25/2029(b)(d)(e) | | | 10,270,000 | | | | 9,935,918 | | |
Nationstar HECM Loan Trust 2018-2A M1, VRN —
3.552% 7/25/2028(b)(d)(e) | | | 8,381,000 | | | | 8,370,608 | | |
Nomura Resecuritization Trust 2016-1R 3A1 — 5.000% 9/28/2036(d)(e) | | | 2,967,202 | | | | 2,937,411 | | |
Towd Point Mortgage Trust 2016-3 A1 — 2.250% 4/25/2056(d)(e) | | | 10,519,346 | | | | 10,422,401 | | |
Towd Point Mortgage Trust 2015-1 AES — 3.000% 10/25/2053(d)(e) | | | 4,280,128 | | | | 4,264,687 | | |
Towd Point Mortgage Trust 2018-1 A1, VRN — 3.000% 1/25/2058(d)(e) | | | 26,318,989 | | | | 26,397,699 | | |
Towd Point Mortgage Trust 2018-2 A1, VRN — 3.250% 3/25/2058(d)(e) | | | 62,729,115 | | | | 63,292,479 | | |
Towd Point Mortgage Trust 2018-5 A1A, VRN — 3.250% 7/25/2058(d)(e) | | | 44,093,902 | | | | 44,502,899 | | |
Towd Point Mortgage Trust 2015-2 1A1 — 3.250% 11/25/2060(d)(e) | | | 12,922,922 | | | | 12,960,330 | | |
Towd Point Mortgage Trust 2015-4 A1 — 3.500% 4/25/2055(d)(e) | | | 12,824,972 | | | | 12,859,944 | | |
Towd Point Mortgage Trust 2015-2 2A1 — 3.750% 11/25/2057(d)(e) | | | 7,554,089 | | | | 7,578,665 | | |
Towd Point Mortgage Trust 2018-6 A1A, VRN — 3.750% 3/25/2058(d)(e) | | | 44,732,170 | | | | 45,680,523 | | |
| | | $ | 430,512,184 | | |
TOTAL RESIDENTIAL MORTGAGE-BACKED SECURITIES
(Cost $890,283,578) | | $ | 899,301,998 | | |
30
FPA NEW INCOME, INC.
PORTFOLIO OF INVESTMENTS (Continued)
March 31, 2020
(Unaudited)
BONDS & DEBENTURES — Continued | | Principal
Amount | | Fair Value | |
ASSET-BACKED SECURITIES — 63.0% | |
AUTO — 23.0% | |
Ally Auto Receivables Trust 2019-3 A3 — 1.930% 5/15/2024 | | $ | 70,270,000 | | | $ | 69,544,055 | | |
Ally Auto Receivables Trust 2017-1 B — 2.350% 3/15/2022 | | | 3,758,000 | | | | 3,709,594 | | |
Ally Auto Receivables Trust 2017-1 C — 2.480% 5/16/2022 | | | 7,059,000 | | | | 6,970,532 | | |
AmeriCredit Automobile Receivables Trust 2017-4 A3 —
2.040% 7/18/2022 | | | 6,302,128 | | | | 6,201,969 | | |
AmeriCredit Automobile Receivables Trust 2017-1 C —
2.710% 8/18/2022 | | | 7,547,000 | | | | 7,487,519 | | |
BMW Vehicle Lease Trust 2017-2 A4 — 2.190% 3/22/2021 | | | 5,140,974 | | | | 5,140,932 | | |
BMW Vehicle Owner Trust 2019-A A3 — 1.920% 1/25/2024 | | | 32,758,000 | | | | 32,417,975 | | |
CarMax Auto Owner Trust 2017-4 A3 — 2.110% 10/17/2022 | | | 5,867,911 | | | | 5,803,312 | | |
CarMax Auto Owner Trust 2019-3 A3 — 2.180% 8/15/2024 | | | 48,284,000 | | | | 48,448,393 | | |
CarMax Auto Owner Trust 2018-1 A3 — 2.480% 11/15/2022 | | | 16,005,775 | | | | 15,812,443 | | |
CarMax Auto Owner Trust 2018-2 A3 — 2.980% 1/17/2023 | | | 22,270,000 | | | | 22,416,993 | | |
CarMax Auto Owner Trust 2018-2 A4 — 3.160% 7/17/2023 | | | 6,059,000 | | | | 5,943,933 | | |
CarMax Auto Owner Trust 2019-1 A4 — 3.260% 8/15/2024 | | | 24,353,000 | | | | 25,245,511 | | |
CarMax Auto Owner Trust 2019-1 B — 3.450% 11/15/2024 | | | 13,090,000 | | | | 13,670,285 | | |
CarMax Auto Owner Trust 2018-4 A4 — 3.480% 2/15/2024 | | | 22,031,000 | | | | 21,856,924 | | |
Credit Acceptance Auto Loan Trust 2017-3A A — 2.650% 6/15/2026(e) | | | 8,988,417 | | | | 8,864,696 | | |
Credit Acceptance Auto Loan Trust 2017-3A B — 3.210% 8/17/2026(e) | | | 36,562,000 | | | | 36,317,707 | | |
Enterprise Fleet Financing LLC 2020-1 A2 — 1.780% 12/22/2025(e) | | | 28,774,000 | | | | 28,561,271 | | |
First Investors Auto Owner Trust 2017-1A B — 2.670% 4/17/2023(e) | | | 4,174,000 | | | | 4,134,986 | | |
First Investors Auto Owner Trust 2017-1A C — 2.950% 4/17/2023(e) | | | 8,149,000 | | | | 7,972,338 | | |
Ford Credit Auto Lease Trust 2020-A A4 — 1.880% 5/15/2023 | | | 16,674,000 | | | | 16,183,734 | | |
Ford Credit Auto Lease Trust 2019-B B — 2.360% 1/15/2023 | | | 32,914,000 | | | | 32,238,473 | | |
Ford Credit Auto Owner Trust 2019-C A3 — 1.870% 3/15/2024 | | | 30,639,000 | | | | 30,254,352 | | |
GM Financial Automobile Leasing Trust 2020-1 B — 1.840% 12/20/2023 | | | 13,417,000 | | | | 12,528,811 | | |
GM Financial Automobile Leasing Trust 2019-3 A4 — 2.030% 7/20/2023 | | | 5,929,000 | | | | 5,784,223 | | |
GM Financial Automobile Leasing Trust 2019-3 B — 2.160% 7/20/2023 | | | 21,492,000 | | | | 20,425,161 | | |
GM Financial Automobile Leasing Trust 2018-1 A4 — 2.680% 12/20/2021 | | | 15,743,000 | | | | 15,639,583 | | |
GM Financial Automobile Leasing Trust 2019-2 B — 2.890% 3/20/2023 | | | 12,206,000 | | | | 11,841,653 | | |
GM Financial Automobile Leasing Trust 2019-1 B — 3.370% 12/20/2022 | | | 43,632,000 | | | | 42,760,582 | | |
Honda Auto Receivables Owner Trust 2020-1 A3 — 1.610% 4/22/2024 | | | 51,001,000 | | | | 51,065,083 | | |
Honda Auto Receivables Owner Trust 2019-3 A3 — 1.780% 8/15/2023 | | | 33,626,000 | | | | 32,626,497 | | |
Honda Auto Receivables Owner Trust 2019-4 A3 — 1.830% 1/18/2024 | | | 32,441,000 | | | | 31,996,766 | | |
Honda Auto Receivables Owner Trust 2019-2 A4 — 2.540% 3/21/2025 | | | 21,573,000 | | | | 21,983,728 | | |
Honda Auto Receivables Owner Trust 2018-1I A4 — 2.830% 5/15/2024 | | | 37,617,000 | | | | 37,543,316 | | |
Honda Auto Receivables Owner Trust 2019-1 A4 — 2.900% 6/18/2024 | | | 14,962,000 | | | | 14,783,806 | | |
31
FPA NEW INCOME, INC.
PORTFOLIO OF INVESTMENTS (Continued)
March 31, 2020
(Unaudited)
BONDS & DEBENTURES — Continued | | Principal
Amount | | Fair Value | |
Hyundai Auto Lease Securitization Trust 2020-A A4 —
2.000% 12/15/2023(e) | | $ | 8,740,000 | | | $ | 8,472,248 | | |
Hyundai Auto Lease Securitization Trust 2019-B A4 —
2.030% 6/15/2023(e) | | | 10,870,000 | | | | 10,601,276 | | |
Hyundai Auto Lease Securitization Trust 2020-A B —
2.120% 5/15/2024(e) | | | 7,377,000 | | | | 6,939,310 | | |
Hyundai Auto Lease Securitization Trust 2019-B B —
2.130% 11/15/2023(e) | | | 41,387,000 | | | | 39,219,145 | | |
Hyundai Auto Lease Securitization Trust 2017-C A4 —
2.210% 9/15/2021(e) | | | 6,774,074 | | | | 6,774,019 | | |
Hyundai Auto Lease Securitization Trust 2018-A A4 —
2.890% 3/15/2022(e) | | | 23,622,000 | | | | 23,552,613 | | |
Hyundai Auto Lease Securitization Trust 2019-A B —
3.250% 10/16/2023(e) | | | 12,636,000 | | | | 12,321,490 | | |
Hyundai Auto Receivables Trust 2019-A A4 — 2.710% 5/15/2025 | | | 22,000,000 | | | | 21,642,267 | | |
Hyundai Auto Receivables Trust 2018-A A4 — 2.940% 6/17/2024 | | | 27,125,000 | | | | 26,889,284 | | |
Mercedes-Benz Auto Lease Trust 2020-A A4 — 1.880% 9/15/2025 | | | 21,265,000 | | | | 20,533,731 | | |
Mercedes-Benz Auto Lease Trust 2019-B A4 — 2.050% 8/15/2025 | | | 20,719,000 | | | | 20,133,454 | | |
Mercedes-Benz Auto Lease Trust 2018-A A4 — 2.510% 10/16/2023 | | | 6,318,000 | | | | 6,319,669 | | |
Mercedes-Benz Auto Receivables Trust 2019-1 A3 — 1.940% 3/15/2024 | | | 48,937,000 | | | | 47,534,906 | | |
Mercedes-Benz Auto Receivables Trust 2018-1 A4 — 3.150% 10/15/2024 | | | 32,591,000 | | | | 32,409,670 | | |
Nissan Auto Lease Trust 2020-A A4 — 1.880% 4/15/2025 | | | 25,925,000 | | | | 25,033,631 | | |
Nissan Auto Lease Trust 2017-B A4 — 2.170% 12/15/2021 | | | 1,591,047 | | | | 1,591,047 | | |
Nissan Auto Lease Trust 2019-B A4 — 2.290% 4/15/2025 | | | 21,027,000 | | | | 20,610,848 | | |
Nissan Auto Receivables Owner Trust 2019-C A3 — 1.930% 7/15/2024 | | | 35,456,000 | | | | 35,800,554 | | |
Nissan Auto Receivables Owner Trust 2018-A A3 — 2.650% 5/16/2022 | | | 20,908,205 | | | | 20,977,834 | | |
Nissan Auto Receivables Owner Trust 2019-A A3 — 2.900% 10/16/2023 | | | 5,864,000 | | | | 5,978,851 | | |
Nissan Auto Receivables Owner Trust 2018-B A4 — 3.160% 12/16/2024 | | | 27,408,000 | | | | 27,335,909 | | |
Prestige Auto Receivables Trust 2019-1A B — 2.530% 1/16/2024(e) | | | 17,546,000 | | | | 17,516,205 | | |
Prestige Auto Receivables Trust 2017-1A C — 2.810% 1/17/2023(e) | | | 30,628,000 | | | | 30,258,029 | | |
Toyota Auto Receivables Owner Trust 2020-A A3 — 1.660% 5/15/2024 | | | 55,845,000 | | | | 53,885,159 | | |
Toyota Auto Receivables Owner Trust 2019-C A3 — 1.910% 9/15/2023 | | | 37,055,000 | | | | 36,657,559 | | |
Toyota Auto Receivables Owner Trust 2019-D A3 — 1.920% 1/16/2024 | | | 34,225,000 | | | | 33,911,229 | | |
Volkswagen Auto Lease Trust 2019-A A4 — 2.020% 8/20/2024 | | | 16,152,000 | | | | 16,076,581 | | |
Volkswagen Auto Loan Enhanced Trust 2018-1 A4 — 3.150% 7/22/2024 | | | 8,455,000 | | | | 8,653,811 | | |
Westlake Automobile Receivables Trust 2020-1A B —
1.940% 4/15/2025(e) | | | 62,080,000 | | | | 60,857,601 | | |
Westlake Automobile Receivables Trust 2018-1A C —
2.920% 5/15/2023(e) | | | 10,232,277 | | | | 10,157,891 | | |
World Omni Auto Receivables Trust 2020-A A3 — 1.700% 1/17/2023 | | | 41,597,000 | | | | 39,141,338 | | |
32
FPA NEW INCOME, INC.
PORTFOLIO OF INVESTMENTS (Continued)
March 31, 2020
(Unaudited)
BONDS & DEBENTURES — Continued | | Principal
Amount | | Fair Value | |
World Omni Auto Receivables Trust 2019-C A3 — 1.960% 12/16/2024 | | $ | 40,212,000 | | | $ | 39,474,448 | | |
World Omni Auto Receivables Trust 2018-A A3 — 2.500% 4/17/2023 | | | 26,045,379 | | | | 26,084,822 | | |
World Omni Auto Receivables Trust 2018-A B — 2.890% 4/15/2025 | | | 4,865,000 | | | | 4,951,667 | | |
World Omni Auto Receivables Trust 2018-B A4 — 3.030% 6/17/2024 | | | 1,982,000 | | | | 1,945,140 | | |
World Omni Auto Receivables Trust 2019-A A3 — 3.040% 5/15/2024 | | | 30,746,000 | | | | 31,048,694 | | |
World Omni Auto Receivables Trust 2019-A B — 3.340% 6/16/2025 | | | 10,560,000 | | | | 10,611,941 | | |
World Omni Automobile Lease Securitization Trust 2019-B A4 —
2.070% 2/18/2025 | | | 21,951,000 | | | | 21,326,582 | | |
World Omni Automobile Lease Securitization Trust 2019-B B —
2.130% 2/18/2025 | | | 12,293,000 | | | | 11,699,163 | | |
World Omni Automobile Lease Securitization Trust 2018-B B —
3.430% 3/15/2024 | | | 11,060,000 | | | | 10,622,486 | | |
| | | $ | 1,639,729,238 | | |
COLLATERALIZED LOAN OBLIGATION — 10.1% | |
Adams Mill CLO Ltd. 2014-1A B2R — 3.350% 7/15/2026(e) | | $ | 8,136,000 | | | $ | 8,105,620 | | |
B&M CLO Ltd. 2014-1A A2R, 3M USD LIBOR + 1.600% —
3.443% 4/16/2026(d)(e) | | | 12,409,000 | | | | 12,170,003 | | |
Black Diamond CLO Ltd. 2014-1A A1R, 3M USD
LIBOR + 1.150% — 2.986% 10/17/2026(d)(e) | | | 10,219,531 | | | | 10,076,539 | | |
California Street CLO XII Ltd. 2013-12A B2R — 3.389% 10/15/2025(e) | | | 15,800,000 | | | | 15,794,754 | | |
Cerberus Corporate Credit Solutions Fund, 3M USD
LIBOR + 1.530% — 3.361% 10/15/2030(d)(e) | | | 13,879,000 | | | | 13,074,698 | | |
Cerberus Loan Funding XVIII LP 2017-1A A, 3M USD
LIBOR + 1.750% — 3.581% 4/15/2027(d)(e) | | | 29,314,791 | | | | 29,071,243 | | |
Cerberus Loan Funding XXI LP 2017-4A A, 3M USD
LIBOR + 1.450% — 3.281% 10/15/2027(d)(e) | | | 37,928,888 | | | | 37,211,463 | | |
Elm Trust 2016-1A A2 — 4.163% 6/20/2025(e) | | | 2,847,910 | | | | 2,843,565 | | |
Elm Trust 2018-2A A2 — 4.605% 10/20/2027(e) | | | 22,693,000 | | | | 22,541,912 | | |
Fortress Credit Opportunities IX CLO Ltd. 2017-9A A1T, 3M USD
LIBOR + 1.550% — 3.242% 11/15/2029(d)(e) | | | 63,296,000 | | | | 60,530,155 | | |
Fortress Credit Opportunities IX CLO Ltd. 2017-9A E, 3M USD
LIBOR + 7.250% — 8.942% 11/15/2029(d)(e) | | | 12,772,000 | | | | 6,385,885 | | |
Fortress Credit Opportunities VII CLO Ltd. 2016-7I E, 3M USD
LIBOR + 7.490% — 8.231% 12/15/2028(d) | | | 20,977,000 | | | | 16,625,699 | | |
Halcyon Loan Advisors Funding Ltd. 2015-3A A1R, 3M USD
LIBOR + 0.900% — 2.719% 10/18/2027(d)(e) | | | 38,060,561 | | | | 36,314,837 | | |
Halcyon Loan Advisors Funding Ltd. 2015-1A AR, 3M USD
LIBOR + 0.920% — 2.747% 4/20/2027(d)(e) | | | 30,347,581 | | | | 29,276,675 | | |
Halcyon Loan Advisors Funding Ltd. 2014-3A AR, 3M USD
LIBOR + 1.100% — 2.902% 10/22/2025(d)(e) | | | 6,158,812 | | | | 6,052,388 | | |
33
FPA NEW INCOME, INC.
PORTFOLIO OF INVESTMENTS (Continued)
March 31, 2020
(Unaudited)
BONDS & DEBENTURES — Continued | | Principal
Amount | | Fair Value | |
Hercules Capital Funding Trust 2018-1A A — 4.605% 11/22/2027(e) | | $ | 21,762,000 | | | $ | 21,661,486 | | |
Hercules Capital Funding Trust 2019-1A A — 4.703% 2/20/2028(e) | | | 47,606,000 | | | | 47,255,068 | | |
Ivy Hill Middle Market Credit Fund VII Ltd. 7A AR, 3M USD
LIBOR + 1.530% — 3.349% 10/20/2029(d)(e) | | | 7,430,000 | | | | 7,050,008 | | |
Ivy Hill Middle Market Credit Fund X Ltd. 10A A1AR, 3M USD
LIBOR + 1.250% — 3.069% 7/18/2030(d)(e) | | | 26,085,000 | | | | 24,553,080 | | |
Nassau Ltd. 2017-IA A1AS, 3M USD
LIBOR + 1.150%, FRN — 2.960% 10/15/2029(b)(d)(e) | | | 24,398,000 | | | | 23,134,037 | | |
Saranac CLO III Ltd. 2014-3A ALR, 3M USD
LIBOR + 1.100% — 2.295% 6/22/2030(d)(e) | | | 26,217,000 | | | | 24,872,435 | | |
Silvermore CLO Ltd. 2014-1A A1R, 3M USD
LIBOR + 1.170% — 2.862% 5/15/2026(d)(e) | | | 10,993,870 | | | | 10,658,876 | | |
Sound Point CLO XVII 2017-3A A1A, 3M USD
LIBOR + 1.220%, FRN — 3.039% 10/20/2030(d)(e) | | | 2,685,000 | | | | 2,488,023 | | |
Sound Point CLO XVII 2017-3A A1B, 3M USD
LIBOR + 1.220%, FRN — 3.039% 10/20/2030(d)(e) | | | 3,435,000 | | | | 3,183,002 | | |
Telos CLO Ltd. 2014-5A A1R, 3M USD LIBOR + 0.950% —
2.786% 4/17/2028(d)(e) | | | 31,990,867 | | | | 30,972,533 | | |
Telos CLO Ltd. 2013-3A AR, 3M USD LIBOR + 1.300% —
3.136% 7/17/2026(d)(e) | | | 17,042,146 | | | | 16,475,001 | | |
Telos CLO Ltd. 2013-3A BR, 3M USD LIBOR + 2.000% —
3.836% 7/17/2026(d)(e) | | | 20,894,000 | | | | 19,877,549 | | |
THL Credit Wind River CLO Ltd. 2016-1A AR, 3M USD
LIBOR + 1.050% — 2.881% 7/15/2028(d)(e) | | | 27,873,000 | | | | 27,017,996 | | |
VCO CLO LLC 2018-1A A, 3M USD LIBOR + 1.500% —
3.319% 7/20/2030(d)(e) | | | 26,276,000 | | | | 25,172,408 | | |
Venture Xxv CLO Ltd. 2016-25A AR, 3M USD
LIBOR + 1.230% — 3.049% 4/20/2029(d)(e) | | | 35,216,000 | | | | 33,909,662 | | |
Wellfleet CLO Ltd. 2016-1A AR, 3M USD
LIBOR + 0.910% — 2.729% 4/20/2028(d)(e) | | | 26,029,000 | | | | 25,221,060 | | |
West CLO Ltd. 2014-2A A1BR — 2.724% 1/16/2027(e) | | | 4,379,061 | | | | 4,372,352 | | |
West CLO Ltd. 2013-1A A2BR — 3.393% 11/7/2025(e) | | | 2,977,098 | | | | 2,966,201 | | |
Zais CLO 14 Ltd. 2020-14A A1A, 3M USD
LIBOR + 1.400%, FRN — 1.000% 4/15/2032(d)(e) | | | 52,951,000 | | | | 49,773,887 | | |
Zais CLO 2 Ltd. 2014-2A A1BR — 2.920% 7/25/2026(e) | | | 1,930,302 | | | | 1,925,847 | | |
Zais CLO 7 Ltd. 2017-2A A, 3M USD
LIBOR + 1.290%, FRN — 3.121% 4/15/2030(d)(e) | | | 15,670,000 | | | | 14,570,624 | | |
| | | $ | 723,186,571 | | |
34
FPA NEW INCOME, INC.
PORTFOLIO OF INVESTMENTS (Continued)
March 31, 2020
(Unaudited)
BONDS & DEBENTURES — Continued | | Principal
Amount | | Fair Value | |
CREDIT CARD — 6.4% | |
American Express Credit Account Master Trust 2017-6 B —
2.200% 5/15/2023 | | $ | 39,998,000 | | | $ | 39,465,559 | | |
American Express Credit Account Master Trust 2019-2 A —
2.670% 11/15/2024 | | | 16,863,000 | | | | 17,328,206 | | |
American Express Credit Account Master Trust 2019-1 A —
2.870% 10/15/2024 | | | 79,915,000 | | | | 82,116,451 | | |
American Express Credit Account Master Trust 2018-8 A —
3.180% 4/15/2024 | | | 35,343,000 | | | | 36,172,666 | | |
Barclays Dryrock Issuance Trust 2019-1 A — 1.960% 5/15/2025 | | | 57,546,000 | | | | 56,322,077 | | |
Cabela's Credit Card Master Note Trust 2015-2 A1 — 2.250% 7/17/2023 | | | 9,884,000 | | | | 9,833,978 | | |
Capital One Multi-Asset Execution Trust 2019-A2 A2 — 1.720% 8/15/2024 | | | 2,495,000 | | | | 2,519,495 | | |
Capital One Multi-Asset Execution Trust 2017-A4 A4 — 1.990% 7/17/2023 | | | 29,840,000 | | | | 29,838,914 | | |
Discover Card Execution Note Trust 2019-A1 A1 — 3.040% 7/15/2024 | | | 8,877,000 | | | | 9,144,012 | | |
Golden Credit Card Trust 2018-1A A — 2.620% 1/15/2023(e) | | | 32,022,000 | | | | 31,810,850 | | |
Synchrony Card Funding LLC 2019-A2 A — 2.340% 6/15/2025 | | | 64,171,000 | | | | 63,333,434 | | |
Synchrony Card Funding LLC 2019-A1 A — 2.950% 3/15/2025 | | | 19,862,000 | | | | 19,830,064 | | |
Synchrony Card Issuance Trust 2018-A1 A1 — 3.380% 9/15/2024 | | | 57,741,000 | | | | 55,776,195 | | |
| | | $ | 453,491,901 | | |
EQUIPMENT — 18.7% | |
ARI Fleet Lease Trust 2019-A A2A — 2.410% 11/15/2027(e) | | $ | 23,167,000 | | | $ | 22,838,603 | | |
ARI Fleet Lease Trust 2018-A A3 — 2.840% 10/15/2026(e) | | | 13,974,000 | | | | 13,894,670 | | |
Ascentium Equipment Receivables 2019-2A A3 — 2.190% 11/10/2026(e) | | | 44,282,000 | | | | 41,877,288 | | |
Ascentium Equipment Receivables Trust 2017-2A A3 —
2.310% 12/10/2021(e) | | | 8,348,352 | | | | 8,221,721 | | |
Ascentium Equipment Receivables Trust 2019-1A A3 —
2.830% 5/12/2025(e) | | | 58,897,000 | | | | 58,263,810 | | |
Avis Budget Rental Car Funding AESOP LLC 2015-1A A —
2.500% 7/20/2021(e) | | | 32,438,000 | | | | 32,379,411 | | |
Avis Budget Rental Car Funding AESOP LLC 2015-2A A —
2.630% 12/20/2021(e) | | | 22,666,000 | | | | 22,465,007 | | |
Avis Budget Rental Car Funding AESOP LLC 2017-2A A —
2.970% 3/20/2024(e) | | | 8,580,000 | | | | 8,045,663 | | |
Avis Budget Rental Car Funding AESOP LLC 2019-1A A —
3.450% 3/20/2023(e) | | | 13,010,000 | | | | 12,888,134 | | |
CCG Receivables Trust 2018-1 A2 — 2.500% 6/16/2025(e) | | | 4,176,180 | | | | 4,168,225 | | |
Chesapeake Funding II LLC 2019-2A A1 — 1.950% 9/15/2031(e) | | | 44,434,370 | | | | 43,888,441 | | |
Chesapeake Funding II LLC 2017-4A A1 — 2.120% 11/15/2029(e) | | | 11,274,433 | | | | 11,039,681 | | |
Coinstar Funding LLC Series 2017-1A A2 — 5.216% 4/25/2047(e) | | | 12,473,285 | | | | 11,731,344 | | |
Daimler Trucks Retail Trust 2019-1 A4 — 2.790% 5/15/2025(e) | | | 23,397,000 | | | | 23,478,883 | | |
35
FPA NEW INCOME, INC.
PORTFOLIO OF INVESTMENTS (Continued)
March 31, 2020
(Unaudited)
BONDS & DEBENTURES — Continued | | Principal
Amount | | Fair Value | |
Dell Equipment Finance Trust 2019-2 A3 — 1.910% 10/22/2024(e) | | $ | 16,374,000 | | | $ | 15,910,103 | | |
Dell Equipment Finance Trust 2019-2 B — 2.060% 10/22/2024(e) | | | 21,992,000 | | | | 21,675,779 | | |
Dell Equipment Finance Trust 2019-1 B — 2.940% 3/22/2024(e) | | | 27,810,000 | | | | 27,787,377 | | |
Enterprise Fleet Financing LLC 2017-3 A2 — 2.130% 5/22/2023(e) | | | 4,737,939 | | | | 4,648,777 | | |
Enterprise Fleet Financing LLC 2017-2 A3 — 2.220% 1/20/2023(e) | | | 23,511,000 | | | | 23,186,417 | | |
Enterprise Fleet Financing LLC 2019-2 A2 — 2.290% 2/20/2025(e) | | | 46,144,000 | | | | 45,950,629 | | |
Enterprise Fleet Financing LLC 2017-1 A3 — 2.600% 7/20/2022(e) | | | 9,653,000 | | | | 9,580,577 | | |
GreatAmerica Leasing Receivables Funding LLC 2019-1 A4 —
3.210% 2/18/2025(e) | | | 10,720,000 | | | | 10,720,512 | | |
GreatAmerica Leasing Receivables Funding LLC Series 2020-1 A3 —
1.760% 8/15/2023(e) | | | 19,348,000 | | | | 19,115,588 | | |
GreatAmerica Leasing Receivables Funding LLC Series 2017-1 A4 —
2.360% 1/20/2023(e) | | | 4,851,811 | | | | 4,779,411 | | |
GreatAmerica Leasing Receivables Funding LLC Series 2018-1 A4 —
2.830% 6/17/2024(e) | | | 8,631,000 | | | | 8,391,857 | | |
GreatAmerica Leasing Receivables Funding LLC Series 2017-1 C —
2.890% 1/22/2024(e) | | | 2,609,000 | | | | 2,556,468 | | |
GreatAmerica Leasing Receivables Funding LLC Series 2018-1 B —
2.990% 6/17/2024(e) | | | 920,000 | | | | 914,962 | | |
Hertz Fleet Lease Funding LP 2018-1 A2 — 3.230% 5/10/2032(e) | | | 11,769,883 | | | | 11,661,040 | | |
HPEFS Equipment Trust 2020-1A B — 1.890% 2/20/2030(e) | | | 13,617,000 | | | | 13,281,134 | | |
HPEFS Equipment Trust 2019-1A B — 2.320% 9/20/2029(e) | | | 6,292,000 | | | | 6,192,146 | | |
John Deere Owner Trust 2019-B A3 — 2.210% 12/15/2023 | | | 15,542,000 | | | | 15,368,690 | | |
John Deere Owner Trust 2018-A A4 — 2.910% 1/15/2025 | | | 24,496,000 | | | | 24,212,207 | | |
John Deere Owner Trust 2019 A A4 — 3.000% 1/15/2026 | | | 13,310,000 | | | | 13,503,670 | | |
John Deere Owner Trust 2018-B A4 — 3.230% 6/16/2025 | | | 26,991,000 | | | | 27,172,201 | | |
Kubota Credit Owner Trust 2018-1A A3 — 3.100% 8/15/2022(e) | | | 41,762,000 | | | | 41,126,149 | | |
Kubota Credit Owner Trust 2018-1A A4 — 3.210% 1/15/2025(e) | | | 6,709,000 | | | | 6,713,380 | | |
MMAF Equipment Finance LLC 2017-B A4 — 2.410% 11/15/2024(e) | | | 16,545,000 | | | | 16,430,365 | | |
MMAF Equipment Finance LLC 2017-B A3 — 2.210% 10/17/2022(e) | | | 12,959,283 | | | | 12,652,680 | | |
MMAF Equipment Finance LLC 2019 A A3 — 2.840% 11/13/2023(e) | | | 23,174,000 | | | | 23,109,319 | | |
NextGear Floorplan Master Owner Trust 2019-2A A2 —
2.070% 10/15/2024(e) | | | 29,251,000 | | | | 29,355,139 | | |
NextGear Floorplan Master Owner Trust 2017-1A A2 —
2.540% 4/18/2022(e) | | | 22,933,000 | | | | 22,918,988 | | |
NextGear Floorplan Master Owner Trust 2017-2A B —
3.020% 10/17/2022(e) | | | 20,252,000 | | | | 20,025,226 | | |
NextGear Floorplan Master Owner Trust 2019-1A A2 —
3.210% 2/15/2024(e) | | | 15,798,000 | | | | 14,868,480 | | |
36
FPA NEW INCOME, INC.
PORTFOLIO OF INVESTMENTS (Continued)
March 31, 2020
(Unaudited)
BONDS & DEBENTURES — Continued | | Principal
Amount | | Fair Value | |
NextGear Floorplan Master Owner Trust 2018-1A A2 —
3.220% 2/15/2023(e) | | $ | 12,191,000 | | | $ | 12,121,662 | | |
NextGear Floorplan Master Owner Trust 2018-2A A2 —
3.690% 10/15/2023(e) | | | 21,126,000 | | | | 20,006,867 | | |
Prop Series 2017-1A — 5.300% 3/15/2042(b) | | | 21,143,494 | | | | 20,817,374 | | |
Verizon Owner Trust 2019 A A1A — 2.930% 9/20/2023 | | | 43,497,000 | | | | 44,210,290 | | |
Verizon Owner Trust 2019 A B — 3.020% 9/20/2023 | | | 18,870,000 | | | | 18,350,667 | | |
Verizon Owner Trust 2017-2A A — 1.920% 12/20/2021(e) | | | 14,359,666 | | | | 14,282,452 | | |
Verizon Owner Trust 2019-C A1A — 1.940% 4/22/2024 | | | 79,492,000 | | | | 74,895,216 | | |
Verizon Owner Trust 2017-3A A1A — 2.060% 4/20/2022(e) | | | 10,541,089 | | | | 10,541,493 | | |
Verizon Owner Trust 2019-C B — 2.060% 4/22/2024 | | | 42,152,000 | | | | 40,298,109 | | |
Verizon Owner Trust 2017-2A B — 2.220% 12/20/2021(e) | | | 24,147,000 | | | | 24,054,121 | | |
Verizon Owner Trust 2017-3A B — 2.380% 4/20/2022(e) | | | 19,491,000 | | | | 18,921,072 | | |
Verizon Owner Trust 2019-B B — 2.400% 12/20/2023 | | | 42,076,000 | | | | 41,324,535 | | |
Verizon Owner Trust 2017-1A B — 2.450% 9/20/2021(e) | | | 33,818,000 | | | | 33,354,720 | | |
Verizon Owner Trust 2018-1A B — 3.050% 9/20/2022(e) | | | 24,278,000 | | | | 23,779,121 | | |
Verizon Owner Trust 2018-A B — 3.380% 4/20/2023 | | | 26,414,000 | | | | 25,901,740 | | |
Volvo Financial Equipment LLC Series 2017-1A A4 —
2.210% 11/15/2021(e) | | | 5,966,000 | | | | 5,826,570 | | |
Volvo Financial Equipment LLC Series 2018-1A A3 —
2.540% 2/15/2022(e) | | | 29,020,977 | | | | 28,999,231 | | |
Volvo Financial Equipment LLC Series 2019-1A A4 —
3.130% 11/15/2023(e) | | | 17,060,000 | | | | 17,273,642 | | |
Wheels SPV 2 LLC 2019-1A A3 — 2.350% 5/22/2028(e) | | | 32,817,000 | | | | 32,933,891 | | |
Wheels SPV 2 LLC 2018-1A A3 — 3.240% 4/20/2027(e) | | | 12,759,000 | | | | 12,685,321 | | |
| | | $ | 1,329,568,246 | | |
OTHER — 4.8% | |
CoreVest American Finance Trust 2018-1 A — 3.804% 6/15/2051(e) | | $ | 33,844,980 | | | $ | 34,112,217 | | |
New Residential Advance Receivables Trust
Advance Receivables Backed 2019-T3 AT3 — 2.512% 9/15/2052(e) | | | 31,799,000 | | | | 31,895,729 | | |
New Residential Mortgage LLC 2018-FNT1 A — 3.610% 5/25/2023(e) | | | 21,856,637 | | | | 21,132,800 | | |
New Residential Mortgage LLC 2018-FNT2 A — 3.790% 7/25/2054(e) | | | 26,681,958 | | | | 25,771,105 | | |
NRZ Excess Spread-Collateralized Notes Series 2018-PLS1 A —
3.193% 1/25/2023(e) | | | 10,210,542 | | | | 10,080,025 | | |
NRZ Excess Spread-Collateralized Notes Series 2018-PLS2 A —
3.265% 2/25/2023(e) | | | 11,673,083 | | | | 11,404,841 | | |
PFS Financing Corp. 2017-BA A2 — 2.220% 7/15/2022(e) | | | 22,138,000 | | | | 22,185,690 | | |
PFS Financing Corp. 2017-D A — 2.400% 10/17/2022(e) | | | 16,852,000 | | | | 16,795,726 | | |
PFS Financing Corp. 2017-BA B — 2.570% 7/15/2022(e) | | | 7,305,000 | | | | 7,306,663 | | |
PFS Financing Corp. 2017-D B — 2.740% 10/17/2022(e) | | | 7,798,000 | | | | 7,838,865 | | |
37
FPA NEW INCOME, INC.
PORTFOLIO OF INVESTMENTS (Continued)
March 31, 2020
(Unaudited)
BONDS & DEBENTURES — Continued | | Principal
Amount | | Fair Value | |
PFS Financing Corp. 2019-A A2 — 2.860% 4/15/2024(e) | | $ | 20,397,000 | | | $ | 19,790,985 | | |
PFS Financing Corp. 2018-B A — 2.890% 2/15/2023(e) | | | 28,344,000 | | | | 28,048,823 | | |
PFS Financing Corp. 2018-B B — 3.080% 2/15/2023(e) | | | 7,809,000 | | | | 7,606,354 | | |
PFS Financing Corp. 2019-A B — 3.130% 4/15/2024(e) | | | 4,897,000 | | | | 4,605,804 | | |
PFS Financing Corp. 2018-D A — 3.190% 4/17/2023(e) | | | 35,001,000 | | | | 34,423,746 | | |
PFS Financing Corp. 2018-D B — 3.450% 4/17/2023(e) | | | 17,375,000 | | | | 16,833,260 | | |
PFS Financing Corp. 2018-F A — 3.520% 10/15/2023(e) | | | 34,024,000 | | | | 34,040,447 | | |
PFS Financing Corp. 2018-F B — 3.770% 10/15/2023(e) | | | 5,641,000 | | | | 5,610,847 | | |
| | | $ | 339,483,927 | | |
| TOTAL ASSET-BACKED SECURITIES (Cost $4,577,276,535) | | $ | 4,485,459,883 | | |
CORPORATE BONDS & NOTES — 1.8% | |
BASIC MATERIALS — 0.9% | |
PT Boart Longyear Management Pty Ltd. PIK, 10.00% Cash or
12.00% PIK — 10.000% 12/31/2022 | | $ | 67,602,030 | | | $ | 60,841,827 | | |
COMMUNICATIONS — 0.3% | |
Cisco Systems, Inc. — 2.450% 6/15/2020 | | $ | 19,864,000 | | | $ | 19,885,257 | | |
CONSUMER, CYCLICAL — 0.0% | |
Continental Airlines 2000-1 Class B Pass Through Trust —
8.388% 5/1/2022 | | $ | 2,523 | | | $ | 2,609 | | |
CONSUMER, NON-CYCLICAL — 0.6% | |
StoneMor Partners LP / Cornerstone Family Services of West Virginia
Subsidiary — 9.875% 6/30/2024(e) | | $ | 48,449,455 | | | $ | 46,390,353 | | |
TECHNOLOGY — 0.0% | |
Oracle Corp. — 3.875% 7/15/2020 | | $ | 842,000 | | | $ | 846,385 | | |
| TOTAL CORPORATE BONDS & NOTES (Cost $135,220,170) | | $ | 127,966,431 | | |
CORPORATE BANK DEBT — 4.9% | |
ABG Intermediate Holding 2 LLC, 1M USD
LIBOR + 3.500% — 4.500% 9/27/2024(c)(d) | | $ | 8,155,000 | | | $ | 6,360,900 | | |
Boart Longyear Management Pty Ltd. TL, 10.00% Cash or 11.00% PIK —
11.000% 10/23/2020(c) | | | 5,027,741 | | | | 4,600,936 | | |
38
FPA NEW INCOME, INC.
PORTFOLIO OF INVESTMENTS (Continued)
March 31, 2020
(Unaudited)
BONDS & DEBENTURES — Continued | | Principal
Amount | | Fair Value | |
Franchise Group New Holding LLC — 8.000% 5/14/2020(b)(c) | | $ | 91,701,000 | | | $ | 90,167,576 | | |
Frontier Communications Corp., 1M USD LIBOR + 3.000% —
4.799% 2/27/2022(c)(d) | | | 26,697,000 | | | | 25,362,150 | | |
General Nutrition Centers, Inc., 1M USD LIBOR + 7.000% —
7.990% 12/31/2022(c)(d) | | | 40,877,000 | | | | 34,745,450 | | |
Hanjin International Corp., 1M USD LIBOR + 2.500% —
3.489% 10/18/2020(c)(d) | | | 8,130,000 | | | | 6,341,400 | | |
JC Penney Corp., Inc., 3M USD LIBOR + 4.250% —
5.863% 6/23/2023(c)(d) | | | 32,422,601 | | | | 12,969,040 | | |
Logix Holding Co. LLC TL 1L, 1M USD LIBOR + 5.750% —
6.739% 12/22/2024(c)(d) | | | 14,021,354 | | | | 12,829,539 | | |
MB2LTL, 2M USD LIBOR + 9.250% — 10.510% 11/30/2023(b)(c)(d) | | | 6,816,000 | | | | 6,219,600 | | |
McDermott Technology Americas, Inc. — 10.627% 10/21/2020(b)(c) | | | 18,400,000 | | | | 16,468,000 | | |
MEC Filo TL 1, 9.500% — 11.500% 2/12/2021(b)(c)(d) | | | 19,768,000 | | | | 19,768,000 | | |
Mediaco Holding, Inc. Class A, 1M USD LIBOR + 6.400% —
8.400% 11/25/2024(b)(c)(d) | | | 12,330,508 | | | | 12,215,859 | | |
OTGTL, 3M USD LIBOR + 7.000% — 8.744% 8/23/2021(b)(c)(d) | | | 25,573,000 | | | | 23,294,957 | | |
Polyconcept North America Holdings, Inc., 3M USD LIBOR + 4.500% —
5.950% 8/16/2023(c)(d) | | | 24,615,618 | | | | 19,692,495 | | |
Transform SR Holdings LLC Term Loan B, 1M USD LIBOR + 7.250% —
8.897% 2/12/2024(c)(d) | | | 3,127,000 | | | | 2,845,570 | | |
Xplornet Communication, Inc., 3M USD LIBOR + 4.000% —
5.450% 9/9/2021(c)(d) | | | 34,952,697 | | | | 33,379,826 | | |
ZW1L, 3M USD LIBOR + 5.000% — 6.780% 11/16/2022(b)(c)(d) | | | 14,583,525 | | | | 13,337,509 | | |
ZW2L, 3M USD LIBOR + 9.000% — 10.800% 11/16/2023(b)(c)(d) | | | 3,362,964 | | | | 3,067,864 | | |
| TOTAL CORPORATE BANK DEBT (Cost $384,580,205) | | $ | 343,666,671 | | |
U.S. TREASURY — 5.0% | |
U.S. Treasury Bills — 0.191% 4/7/2020(f)(Cost $356,800,401) | | $ | 356,812,000 | | | $ | 356,809,431 | | |
| TOTAL BONDS & DEBENTURES — 97.1% (Cost $7,090,110,495) | | $ | 6,909,459,863 | | |
| TOTAL INVESTMENT SECURITIES — 97.4% (Cost $7,121,875,446) | | $ | 6,934,448,978 | | |
39
FPA NEW INCOME, INC.
PORTFOLIO OF INVESTMENTS (Continued)
March 31, 2020
(Unaudited)
SHORT-TERM INVESTMENTS — 1.5% | | Principal
Amount | | Fair Value | |
State Street Bank Repurchase Agreement — 0.00% 4/1/2020
(Dated 03/31/2020, repurchase price of $109,901,000, collateralized by
$107,650,000 principal amount U.S. Treasury Notes — 1.625% 2022,
fair value $112,102,619) | | $ | 109,901,000 | | | $ | 109,901,000 | | |
| TOTAL SHORT-TERM INVESTMENTS (Cost $109,901,000) | | $ | 109,901,000 | | |
| TOTAL INVESTMENTS — 98.9% (Cost $7,231,776,446) | | $ | 7,044,349,978 | | |
Other assets and liabilities, net — 1.1% | | | 76,586,276 | | |
NET ASSETS — 100.0% | | $ | 7,120,936,254 | | |
(a) Non-income producing security.
(b) Investments categorized as a significant unobservable input (Level 3) (See Note 6 of the Notes to Financial Statements).
(c) Restricted securities. These restricted securities constituted 5.06% of total net assets at March 31, 2020, most of which are considered liquid by the Adviser. These securities are not registered and may not be sold to the public. There are legal and/or contractual restrictions on resale. The Fund does not have the right to demand that such securities be registered. The values of these securities are determined by valuations provided by pricing services, brokers, dealers, market makers, or in good faith under policies adopted by authority of the Fund's Board of Directors.
(d) Variable/Floating Rate Security — The rate shown is based on the latest available information as of March 31, 2020. For Corporate Bank Debt, the rate shown may represent a weighted average interest rate. Certain variable rate securities are not based on a published rate and spread but are determined by the issuer or agent and are based on current market conditions. These securities do not indicate a reference rate and spread in their description.
(e) Security exempt from registration under Rule 144A of the Securities Act of 1933. These securities may be resold in transactions exempt from registration, typically only to qualified institutional buyers. Unless otherwise indicated, these securities are not considered to be illiquid.
(f) Zero coupon bond. Coupon amount represents effective yield to maturity.
40
FPA NEW INCOME, INC.
PORTFOLIO OF INVESTMENTS — RESTRICTED SECURITIES
March 31, 2020
(Unaudited)
Issuer | | Acquisition
Date(s) | | Cost | | Fair Value | | Fair
Value as a %
of Net Assets | |
ABG Intermediate Holding
2 LLC, 1M USD
LIBOR + 3.500% — 4.500%
9/27/2024 | | 3/6/2020, 3/12/2020 | | $ | 7,681,625 | | | $ | 6,360,900 | | | | 0.09 | % | |
Boart Longyear Management
Pty Ltd. TL, 10.00% Cash or
11.00% PIK — 11.000%
10/23/2020(c)
| | 9/1/2017, 6/29/2018,
9/29/2018, 12/31/2018,
1/11/2019, 3/29/2019,
6/28/2019, 9/30/2019,
12/31/2019, 3/31/2020 | | | 4,994,285 | | | | 4,600,936 | | | | 0.06 | % | |
Franchise Group New Holding
LLC — 8.000% 5/14/2020 | | 2/14/2020 | | | 90,167,557 | | | | 90,167,576 | | | | 1.26 | % | |
Frontier Communications Corp.,
1M USD LIBOR + 3.000% —
4.799% 2/27/2022 | | 12/10/2019 | | | 25,762,605 | | | | 25,362,150 | | | | 0.35 | % | |
General Nutrition Centers, Inc.,
1M USD LIBOR + 7.000% —
7.990% 12/31/2022
| | 12/21/2018, 12/04/2019,
12/11/2019, 3/12/2020 | | | 40,732,060 | | | | 34,745,450 | | | | 0.49 | % | |
Hanjin International Corp.,
1M USD LIBOR + 2.500% —
3.489% 10/18/2020 | | 10/18/2020 | | | 8,022,371 | | | | 6,341,400 | | | | 0.09 | % | |
JC Penney Corp., Inc.,
3M USD LIBOR + 4.250% —
5.863% 6/23/2023
| | 10/04/2017, 10/5/2017,
10/6/2017, 10/11/2017,
11/19/2018, 11/27/2018,
1/11/2019, 2/8/2019,
3/11/2019, 5/29/2019 | | | 30,652,313 | | | | 12,969,040 | | | | 0.18 | % | |
Logix Holding Co. LLC TL 1L,
1M USD LIBOR + 5.750% —
6.739% 12/22/2024
| | 8/11/2017, 1/11/2019,
6/18/2019, 6/19/2019 | | | 13,946,127 | | | | 12,829,539 | | | | 0.18 | % | |
MB2LTL, 2M USD
LIBOR + 9.250% — 10.510%
11/30/2023 | | 12/2/2016, 1/31/2017 | | | 6,753,386 | | | | 6,219,600 | | | | 0.09 | % | |
McDermott Technology
Americas, Inc. — 10.627%
10/21/2020 | | 2/28/2020 | | | 18,400,000 | | | | 16,468,000 | | | | 0.23 | % | |
41
FPA NEW INCOME, INC.
PORTFOLIO OF INVESTMENTS — RESTRICTED SECURITIES (Continued)
March 31, 2020
(Unaudited)
Issuer | | Acquisition
Date(s) | | Cost | | Fair Value | | Fair
Value as a %
of Net Assets | |
MEC Filo TL 1, 9.500% —
11.500% 2/12/2021 | | 11/7/2019 | | $ | 19,630,241 | | | $ | 19,768,000 | | | | 0.28 | % | |
Mediaco Holding, Inc.
Class A, 1M USD
LIBOR + 6.400% —
8.400% 11/25/2024
| | 11/25/2019, 12/12/2019,
12/13/2019, 12/18/2019,
3/27/2020, 3/31/2020 | | | 12,214,296 | | | | 12,215,859 | | | | 0.17 | % | |
OTGTL, 3M USD
LIBOR + 7.000% — 8.744%
8/23/2021
| | 8/26/2016, 2/28/2017,
5/26/2017, 6/14/2017,
8/30/2017, 11/30/2017,
1/26/2018, 3/8/2018,
5/09/2018, 5/15/2018,
6/13/2018, 7/13/2018,
8/17/2018, 10/10/2018 | | | 25,397,037 | | | | 23,294,957 | | | | 0.33 | % | |
PHI GROUP, Inc., Restricted | | 8/19/2019 | | | 21,626,709 | | | | 16,916,198 | | | | 0.24 | % | |
Polyconcept North America
Holdings, Inc., 3M USD
LIBOR + 4.500% — 5.950%
8/16/2023 | | 11/18/2019 | | | 24,385,524 | | | | 19,692,495 | | | | 0.28 | % | |
Transform SR Holdings LLC
Term Loan B, 1M USD
LIBOR + 7.250% — 8.897%
2/12/2024
| | 11/22/2019,12/16/2019,
02/07/2020 | | | 3,127,000 | | | | 2,845,570 | | | | 0.04 | % | |
Xplornet Communication, Inc.,
3M USD LIBOR + 4.000% —
5.450% 9/9/2021
| | 9/8/2016, 5/22/2017,
10/18/2017, 6/13/2019,
6/28/2019, 9/24/2019,
3/6/2020, 3/10/2020,
3/13/2020 | | | 34,875,342 | | | | 33,379,826 | | | | 0.47 | % | |
42
FPA NEW INCOME, INC.
PORTFOLIO OF INVESTMENTS — RESTRICTED SECURITIES (Continued)
March 31, 2020
(Unaudited)
Issuer | | Acquisition
Date(s) | | Cost | | Fair Value | | Fair
Value as a %
of Net Assets | |
ZW1L, 3M USD
LIBOR + 5.000% — 6.780%
11/16/2022 | | 11/17/2016, 12/10/2019 | | $ | 14,507,296 | | | $ | 13,337,509 | | | | 0.19 | % | |
ZW2L, 3M USD
LIBOR + 9.000% —
10.800% 11/16/2023 | | 11/17/2016, 12/10/2019 | | | 3,329,342 | | | | 3,067,864 | | | | 0.04 | % | |
TOTAL RESTRICTED
SECURITIES | | | | $ | 406,205,116 | | | $ | 360,582,869 | | | | 5.06 | % | |
See accompanying Notes to Financial Statements.
43
FPA NEW INCOME, INC.
STATEMENT OF ASSETS AND LIABILITIES
March 31, 2020
(Unaudited)
ASSETS | |
Investment securities — at fair value (identified cost $7,121,875,446) | | $ | 6,934,448,978 | | |
Short-term investments — at amortized cost (maturities 60 days or less) | | | 109,901,000 | | |
Cash | | | 18,993 | | |
Receivable for: | |
Investment securities sold | | | 131,050,695 | | |
Interest | | | 17,309,001 | | |
Capital Stock sold | | | 16,393,046 | | |
Total assets | | | 7,209,121,713 | | |
LIABILITIES | |
Payable for: | |
Investment securities purchased | | | 61,202,758 | | |
Capital Stock repurchased | | | 23,655,000 | | |
Advisory fees | | | 2,832,577 | | |
Accrued expenses and other liabilities | | | 495,124 | | |
Total liabilities | | | 88,185,459 | | |
NET ASSETS | | $ | 7,120,936,254 | | |
SUMMARY OF SHAREHOLDERS' EQUITY | |
Capital Stock — par value $0.01 per share; authorized 1,000,000,000 shares;
outstanding 727,801,271 shares | | $ | 7,278,013 | | |
Additional Paid-in Capital | | | 7,696,139,815 | | |
Distributable earnings | | | (582,481,574 | ) | |
NET ASSETS | | $ | 7,120,936,254 | | |
NET ASSET VALUE | |
Offering and redemption price per share | | $ | 9.78 | | |
See accompanying Notes to Financial Statements.
44
FPA NEW INCOME, INC.
STATEMENT OF OPERATIONS
For the Six Months Ended March 31, 2020
(Unaudited)
INVESTMENT INCOME | |
Interest | | $ | 111,372,913 | | |
EXPENSES | |
Advisory fees | | | 18,875,698 | | |
Transfer agent fees and expenses | | | 1,576,300 | | |
Administrative services fees | | | 189,536 | | |
Other professional fees | | | 171,504 | | |
Director fees and expenses | | | 128,853 | | |
Filing fees | | | 125,327 | | |
Custodian fees | | | 113,696 | | |
Reports to shareholders | | | 107,948 | | |
Legal fees | | | 49,186 | | |
Audit and tax services fees | | | 27,763 | | |
Other | | | 23,610 | | |
Total expenses | | | 21,389,421 | | |
Reimbursement from Adviser | | | (2,513,445 | ) | |
Net expenses | | | 18,875,976 | | |
Net investment income | | | 92,496,937 | | |
NET REALIZED AND UNREALIZED APPRECIATION (DEPRECIATION) | |
Net realized gain (loss) on: | |
Investments | | | 44,491,224 | | |
Net change in unrealized appreciation (depreciation) of: | |
Investments | | | (212,348,523 | ) | |
Net realized and unrealized loss | | | (167,857,299 | ) | |
NET DECREASE IN NET ASSETS RESULTING FROM OPERATIONS | | $ | (75,360,362 | ) | |
See accompanying Notes to Financial Statements.
45
FPA NEW INCOME, INC.
STATEMENTS OF CHANGES IN NET ASSETS
| | | Six Months Ended
March 31, 2020
(Unaudited) | | Year Ended
September 30, 2019 | |
INCREASE (DECREASE) IN NET ASSETS | |
Operations: | |
Net investment income | | $ | 92,496,937 | | | $ | 183,793,779 | | |
Net realized gain (loss) | | | 44,491,224 | | | | (47,606,856 | ) | |
Net change in unrealized appreciation (depreciation) | | | (212,348,523 | ) | | | 139,208,490 | | |
Net increase (decrease) in net assets resulting from
operations | | | (75,360,362 | ) | | | 275,395,413 | | |
Distributions to shareholders | | | (95,546,344 | ) | | | (224,500,483 | ) | |
Capital Stock transactions: | |
Proceeds from Capital Stock sold | | | 1,945,219,635 | | | | 3,391,626,872 | | |
Proceeds from shares issued to shareholders upon reinvestment of
dividends and distributions | | | 85,141,140 | | | | 197,443,145 | | |
Cost of Capital Stock repurchased | | | (2,065,921,576 | ) | | | (2,017,185,013 | ) | |
Net increase (decrease) from Capital Stock transactions | | | (35,560,801 | ) | | | 1,571,885,004 | | |
Total change in net assets | | | (206,467,507 | ) | | | 1,622,779,934 | | |
NET ASSETS | |
Beginning of period | | | 7,327,403,761 | | | | 5,704,623,827 | | |
End of period | | $ | 7,120,936,254 | | | $ | 7,327,403,761 | | |
CHANGE IN CAPITAL STOCK OUTSTANDING | |
Shares of Capital Stock sold | | | 194,530,590 | | | | 341,922,692 | | |
Shares issued to shareholders upon reinvestment of
dividends and distributions | | | 8,547,761 | | | | 19,920,545 | | |
Shares of Capital Stock repurchased | | | (207,882,891 | ) | | | (203,171,906 | ) | |
Change in Capital Stock outstanding | | | (4,804,540 | ) | | | 158,671,331 | | |
See accompanying Notes to Financial Statements.
46
FPA NEW INCOME, INC.
FINANCIAL HIGHLIGHTS
Selected Data for Each Share of Capital Stock Outstanding Throughout Each Period
| | | Six
Months
Ended
March 31,
2020 | | Year Ended September 30, | |
| | | (Unaudited) | | 2019 | | 2018 | | 2017 | | 2016 | | 2015 | |
Per share operating performance: | |
Net asset value at beginning of period | | $ | 10.00 | | | $ | 9.94 | | | $ | 10.05 | | | $ | 10.06 | | | $ | 10.08 | | | $ | 10.24 | | |
Income from investment operations: | |
Net investment income* | | | 0.12 | | | | 0.28 | | | | 0.29 | | | | 0.25 | | | | 0.19 | | | | 0.15 | | |
Net realized and unrealized gain (loss)
on investment securities | | | (0.21 | ) | | | 0.13 | | | | (0.18 | ) | | | 0.01 | | | | (0.04 | ) | | | (0.06 | ) | |
Total from investment operations | | | (0.09 | ) | | | 0.41 | | | | 0.11 | | | | 0.26 | | | | 0.15 | | | | 0.09 | | |
Less distributions: | |
Dividends from net investment income | | | (0.13 | ) | | | (0.35 | ) | | | (0.22 | ) | | | (0.27 | ) | | | (0.17 | ) | | | (0.25 | ) | |
Redemption fees | | | — | | | | — | | | | — | | | | — | ** | | | — | ** | | | — | ** | |
Net asset value at end of period | | $ | 9.78 | | | $ | 10.00 | | | $ | 9.94 | | | $ | 10.05 | | | $ | 10.06 | | | $ | 10.08 | | |
Total investment return*** | | | (0.95 | %) | | | 4.20 | % | | | 1.91 | % | | | 2.58 | % | | | 1.52 | % | | | 0.84 | % | |
Ratios/supplement data: | |
Net assets, end of period (in $000's) | | $ | 7,120,936 | | | $ | 7,327,404 | | | $ | 5,704,624 | | | $ | 5,125,433 | | | $ | 5,048,610 | | | $ | 5,636,518 | | |
Ratio of expenses to average net assets: | |
Before reimbursement from Adviser | | | 0.57 | %† | | | 0.57 | % | | | 0.58 | % | | | 0.59 | % | | | 0.58 | % | | | 0.58 | % | |
After reimbursement from Adviser | | | 0.50 | %† | | | 0.50 | % | | | 0.49 | % | | | 0.49 | % | | | 0.55 | % | | | N/A | | |
Ratio of net investment income to
average net assets: | |
Before reimbursement from Adviser | | | 2.38 | %† | | | 2.73 | % | | | 2.88 | % | | | 2.45 | % | | | 1.87 | % | | | 1.50 | % | |
After reimbursement from Adviser | | | 2.45 | %† | | | 2.80 | % | | | 2.96 | % | | | 2.55 | % | | | 1.90 | % | | | N/A | | |
Portfolio turnover rate | | | 93 | %† | | | 25 | % | | | 29 | % | | | 59 | % | | | 44 | % | | | 64 | % | |
* Per share amount is based on average shares outstanding.
** Rounds to less than $0.01 per share.
*** Return is based on net asset value per share, adjusted for reinvestment of distributions, and does not reflect deduction of the sales charge.
† Annualized.
See accompanying Notes to Financial Statements.
47
FPA NEW INCOME, INC.
NOTES TO FINANCIAL STATEMENTS
March 31, 2020
(Unaudited)
NOTE 1 — Significant Accounting Policies
FPA New Income, Inc. (the "Fund") is registered under the Investment Company Act of 1940, as a diversified, open-end, management investment company. The Fund's primary investment objective is to seek current income and long-term total return. Capital preservation is also a consideration. The Fund qualifies as an investment company pursuant to Financial Accounting Standard Board (FASB) Accounting Standards Codification (ASC) No. 946, Financial Services — Investment Companies. The following is a summary of significant accounting policies consistently followed by the Fund in the preparation of its financial statements.
A. Security Valuation
The Fund's investments are reported at fair value as defined by accounting principles generally accepted in the United States of America, ("U.S. GAAP"). The Fund generally determines its net asset value as of approximately 4:00 p.m. New York time each day the New York Stock Exchange is open. Further discussion of valuation methods, inputs and classifications can be found under Disclosure of Fair Value Measurements.
B. Securities Transactions and Related Investment Income
Securities transactions are accounted for on the date the securities are purchased or sold. Dividend income and distributions to shareholders are recorded on the ex-dividend date. Interest income and expenses are recorded on an accrual basis. Market discounts and premiums on fixed income securities are amortized over the expected life of the securities. Realized gains or losses are based on the specific identification method.
C. Use of Estimates
The preparation of the financial statements in accordance with U.S. GAAP requires management to make estimates and assumptions that affect the amounts reported. Actual results could differ from those estimates.
D. Recent Accounting Pronouncements
In August 2018, the Financial Accounting Standards Board (FASB) issued Accounting Standards Update (ASU) No. 2018-13, Fair Value Measurement (Topic 820) — Disclosure Framework — Changes to the Disclosure Requirements for Fair Value Measurement. The amendments eliminate certain disclosure requirements for fair value measurements for all entities, requires public entities to disclose certain new information and modifies some disclosure requirements. The new guidance is effective for all entities for fiscal years beginning after December 15, 2019 and for interim periods within those fiscal years. An entity is permitted to early adopt either the entire standard or only the provisions that eliminate or modify requirements. The Adviser is currently evaluating the impact of this new guidance on the Fund's financial statements.
NOTE 2 — Risk Considerations
Investing in the Fund may involve certain risks including, but not limited to, those described below.
Market Risk: Because the values of the Fund's investments will fluctuate with market conditions, so will the value of your investment in the Fund. You could lose money on your investment in the Fund or the Fund could underperform other investments.
Interest Rate and Credit Risk: The values of, and the income generated by, most debt securities held by the Fund may be affected by changing interest rates and by changes in the effective maturities and credit rating of
48
FPA NEW INCOME, INC.
NOTES TO FINANCIAL STATEMENTS (Continued)
(Unaudited)
these securities. For example, the value of debt securities in the Fund's portfolio generally will decline when interest rates rise and increase when interest rates fall. In addition, falling interest rates may cause an issuer to redeem, call or refinance a security before its stated maturity, which may result in the Fund having to reinvest the proceeds in lower yielding securities.
Mortgage-Backed and Other Asset-Backed Securities Risk: The values of some mortgage-backed and other asset-backed securities may expose the Fund to a lower rate of return upon reinvestment of principal. When interest rates rise, the value of mortgage-related securities generally will decline; however, when interest rates are declining, the value of mortgage related-securities with prepayment features may not increase as much as other fixed income securities. The rate of prepayments on underlying mortgages will affect the price and volatility of a mortgage-related security, and may shorten or extend the effective maturity of the security beyond what was anticipated at the time of purchase. If an unanticipated rate of prepayment on underlying mortgages increases the effective maturity of a mortgage-related security, the volatility of the security can be expected to increase. The value of these securities may also fluctuate in response to the market's perception of the creditworthiness of the issuers. Additionally, although mortgages and mortgage-related securities are generally supported by some form of government or private guarantee and/or insurance, there is no assurance that private guarantors or insurers will meet their obligations.
Stripped Mortgage-Backed Interest Only ("I/O") and Principal Only ("P/O") Securities: Stripped mortgage backed securities are usually structured with two classes that receive different proportions of the interest and principal distributions on a pool of mortgage assets. In certain cases, one class will receive all of the interest payments on the underlying mortgages (the I/O class), while the other class will receive all of the principal payments (the P/O class). The Fund currently has investments in I/O and P/O securities. The yield to maturity on IOs is sensitive to the rate of principal repayments (including prepayments) on the related underlying mortgage assets, and principal payments may have a material effect on yield-to-maturity. If the underlying mortgage assets experience greater than anticipated prepayments of principal, a Fund may not fully recoup its initial investment in I/Os.
Credit Risk: Debt securities are subject to credit risk, meaning that the issuer of the debt security may default or fail to make timely payments of principal or interest. The values of any of the Fund's investments may also decline in response to events affecting the issuer or its credit rating. The lower rated debt securities in which the Fund may invest are considered speculative and are generally subject to greater volatility and risk of loss than investment grade securities, particularly in deteriorating economic conditions. The Fund invests a significant portion of its assets in securities of issuers that hold mortgage-and asset-backed securities and direct investments in securities backed by commercial and residential mortgage loans and other financial assets. The value and related income of these securities is sensitive to changes in economic conditions, including delinquencies and/or defaults. Continuing shifts in the market's perception of credit quality on securities backed by commercial and residential mortgage loans and other financial assets may result in increased volatility of market price and periods of illiquidity that can negatively impact the valuation of certain securities held by the Fund.
Repurchase Agreements: Repurchase agreements permit the Fund to maintain liquidity and earn income over periods of time as short as overnight. Repurchase agreements held by the Fund are fully collateralized by U.S. Government securities, or securities issued by U.S. Government agencies, or securities that are within the three highest credit categories assigned by established rating agencies (Aaa, Aa, or A by Moody's or AAA, AA or A by Standard & Poor's) or, if not rated by Moody's or Standard & Poor's, are of equivalent investment quality
49
FPA NEW INCOME, INC.
NOTES TO FINANCIAL STATEMENTS (Continued)
(Unaudited)
as determined by the Adviser. Such collateral is in the possession of the Fund's custodian. The collateral is evaluated daily to ensure its fair value equals or exceeds the current fair value of the repurchase agreements including accrued interest. In the event of default on the obligation to repurchase, the Fund has the right to liquidate the collateral and apply the proceeds in satisfaction of the obligation.
The Fund may enter into repurchase agreements, under the terms of a Master Repurchase Agreement ("MRA"). The MRA permits the Fund, under certain circumstances including an event of default (such as bankruptcy or insolvency), to offset payables and/or receivables under the MRA with collateral held and/or posted to the counterparty and create one single net payment due to or from the Fund. However, bankruptcy or insolvency laws of a particular jurisdiction may impose restrictions on or prohibitions against such a right of offset in the event of a MRA counterparty's bankruptcy or insolvency. Pursuant to the terms of the MRA, the Fund receives securities as collateral with a fair value in excess of the repurchase price to be received by the Fund upon the maturity of the repurchase transaction. Upon a bankruptcy or insolvency of the MRA counterparty, the Fund recognizes a liability with respect to such excess collateral to reflect the Fund's obligation under bankruptcy law to return the excess to the counterparty. Repurchase agreements outstanding at the end of the period are listed in the Fund's Portfolio of Investments.
Many countries have experienced outbreaks of infectious illnesses in recent decades, including swine flu, avian influenza, SARS and, more recently, COVID-19. The global outbreak of COVID-19 in early 2020 has resulted in various disruptions, including travel and border restrictions, quarantines, supply chain disruptions, lower consumer demand and general market uncertainty. The effects of COVID-19 have and may continue to adversely affect the global economy, financial markets and the economies of certain nations and individual issuers, any of which may negatively impact the Fund and its holdings. Similar consequences could arise as a result of the spread of other infectious diseases.
NOTE 3 — Purchases and Sales of Investment Securities
Cost of purchases of investment securities (excluding short-term investments) aggregated $3,442,172,673 for the period ended March 31, 2020. The proceeds and cost of securities sold resulting in net realized gains of $44,491,224 aggregated $3,236,079,995 and $3,191,588,771, respectively, for the period ended March 31, 2020. Realized gains or losses are based on the specific identification method.
NOTE 4 — Advisory Fees and Other Affiliated Transactions
First Pacific Advisors, LP (the "Adviser"). Under the terms of this Agreement, the Fund pays the Adviser a monthly fee calculated at the annual rate of 0.5% of the Fund's average daily net assets. In addition, the adviser contractually agreed to reimburse expenses in excess of 0.49% of the average net assets of the Fund (excluding brokerage fees and commissions, interest, taxes, shareholder service fees, fees and expenses of other funds in which the Fund invests, and extraordinary expenses) through January 31, 2021. The Agreement obligates the Adviser to reduce its fee to the extent necessary to reimburse the Fund for any annual expenses (exclusive of interest, taxes, the cost of any supplemental statistical and research information, and extraordinary expenses such as litigation) in excess of 1.5% of the first $15 million and 1% of the remaining average net assets of the Fund for the year.
For the period ended March 31, 2020, the Fund paid aggregate fees and expenses of $128,853 to all Directors who are not affiliated persons of the Adviser. Certain officers of the Fund are also officers of the Adviser.
NOTE 5 — Federal Income Tax
No provision for federal income tax is required because the Fund has elected to be taxed as a "regulated investment company" under the Internal Revenue Code (the "Code") and intends to maintain this qualification and to distribute each year to its shareholders, in accordance with the minimum distribution requirements of the Code, its taxable net investment income and taxable net realized gains on investments.
50
FPA NEW INCOME, INC.
NOTES TO FINANCIAL STATEMENTS (Continued)
(Unaudited)
The cost of investment securities held at March 31, 2020, was $7,121,886,282 for federal income tax purposes. Gross unrealized appreciation and depreciation for all investment at March 31, 2020, for federal income tax purposes was $25,616,094 and $213,053,397, respectively resulting in net unrealized depreciation of $187,437,303. As of and during the period ended March 31, 2020, the Fund did not have any liability for unrecognized tax benefits. The Fund recognizes interest and penalties, if any, related to unrecognized tax benefits as income tax expense in the Statement of Operations. During the year, the Fund did not incur any interest or penalties. The statute of limitations remains open for the last 3 years, once a return is filed. No examinations are in progress at this time. The statute of limitations remains open for the last 3 years, once a return is filed. No examinations are in progress at this time.
NOTE 6 — Disclosure of Fair Value Measurements
The Fund uses the following methods and inputs to establish the fair value of its assets and liabilities. Use of particular methods and inputs may vary over time based on availability and relevance as market and economic conditions evolve.
Equity securities are generally valued each day at the official closing price of, or the last reported sale price on, the exchange or market on which such securities principally are traded, as of the close of business on that day. If there have been no sales that day, equity securities are generally valued at the last available bid price. Securities that are unlisted and fixed-income and convertible securities listed on a national securities exchange for which the over-the-counter ("OTC") market more accurately reflects the securities' value in the judgment of the Fund's officers, are valued at the most recent bid price. However, most fixed income securities are generally valued at prices obtained from pricing vendors and brokers. Vendors value such securities based on one or more of the following inputs: transactions, bids, offers quotations from dealers and trading systems, spreads and other relationships observed in the markets among comparable securities, benchmarks, underlying equity of the issuer, and proprietary pricing models such as cash flows, financial or collateral performance and other reference data (includes prepayments, defaults, collateral, credit enhancements, and interest rate volatility). Short-term corporate notes with maturities of 60 days or less at the time of purchase are valued at amortized cost.
Securities for which representative market quotations are not readily available or are considered unreliable by the Adviser are valued as determined in good faith under procedures adopted by the authority of the Fund's Board of Directors. Various inputs may be reviewed in order to make a good faith determination of a security's value. These inputs include, but are not limited to, the type and cost of the security; contractual or legal restrictions on resale of the security; relevant financial or business developments of the issuer; actively traded similar or related securities; conversion or exchange rights on the security; related corporate actions; significant events occurring after the close of trading in the security; and changes in overall market conditions. Fair valuations and valuations of investments that are not actively trading involve judgment and may differ materially from valuations of investments that would have been used had greater market activity occurred.
The Fund classifies its assets based on three valuation methodologies. Level 1 values are based on quoted market prices in active markets for identical assets. Level 2 values are based on significant observable market inputs, such as quoted prices for similar assets and quoted prices in inactive markets or other market observable inputs as noted above including spreads, cash flows, financial performance, prepayments, defaults, collateral, credit enhancements, and interest rate volatility. Level 3 values are based on significant unobservable inputs that reflect the Fund's determination of assumptions that market participants might reasonably use in valuing the assets. These assumptions consider inputs such as proprietary pricing models, cash flows, prepayments, defaults,
51
FPA NEW INCOME, INC.
NOTES TO FINANCIAL STATEMENTS (Continued)
(Unaudited)
and collateral. The valuation levels are not necessarily an indication of the risk associated with investing in those securities. The following table presents the valuation levels of the Fund's investments as of March 31, 2020:
Investments | | Level 1 | | Level 2 | | Level 3 | | Total | |
Common Stocks | |
Energy | | | — | | | | — | | | $ | 24,741,730 | | | $ | 24,741,730 | | |
Industrials | | $ | 247,385 | | | | — | | | | — | | | | 247,385 | | |
Commercial Mortgage-Backed Securities | |
Agency | | | — | | | $ | 116,581,977 | | | | — | | | | 116,581,977 | | |
Agency Stripped | | | — | | | | 162,786,074 | | | | — | | | | 162,786,074 | | |
Non-Agency | | | — | | | | 416,887,398 | | | | — | | | | 416,887,398 | | |
Residential Mortgage-Backed Securities | |
Agency Collateralized Mortgage Obligation | | | — | | | | 169,226,029 | | | | — | | | | 169,226,029 | | |
Agency Pool Adjustable Rate | | | — | | | | 560,950 | | | | — | | | | 560,950 | | |
Agency Pool Fixed Rate | | | — | | | | 209,394,794 | | | | — | | | | 209,394,794 | | |
Agency Stripped | | | — | | | | 89,608,041 | | | | — | | | | 89,608,041 | | |
Non-Agency Collateralized Mortgage
Obligation | | | — | | | | 404,578,911 | | | | 25,933,273 | | | | 430,512,184 | | |
Asset-Backed Securities | |
Auto | | | — | | | | 1,639,729,238 | | | | — | | | | 1,639,729,238 | | |
Collateralized Loan Obligation | | | — | | | | 700,052,534 | | | | 23,134,037 | | | | 723,186,571 | | |
Credit Card | | | — | | | | 453,491,901 | | | | — | | | | 453,491,901 | | |
Equipment | | | — | | | | 1,308,750,872 | | | | 20,817,374 | | | | 1,329,568,246 | | |
Other | | | — | | | | 339,483,927 | | | | — | | | | 339,483,927 | | |
Corporate Bonds & Notes | | | — | | | | 127,966,431 | | | | — | | | | 127,966,431 | | |
Corporate Bank Debt | | | — | | | | 159,127,306 | | | | 184,539,365 | | | | 343,666,671 | | |
U.S. Treasury | | | — | | | | 356,809,431 | | | | — | | | | 356,809,431 | | |
Short-Term Investment | | | — | | | | 109,901,000 | | | | — | | | | 109,901,000 | | |
| | | $ | 247,385 | | | $ | 6,764,936,814 | | | $ | 279,165,779 | | | $ | 7,044,349,978 | | |
52
FPA NEW INCOME, INC.
NOTES TO FINANCIAL STATEMENTS (Continued)
(Unaudited)
The following table summarizes the Fund's Level 3 investment securities and related transactions during the period ended March 31, 2020:
Investments | | Beginning
Value at
September 30,
2019 | | Net Realized and
Unrealized Gains
(Losses)* | | Purchases | | (Sales) | | Gross
Transfers
In/(Out) | | Ending
Value at
March 31,
2020 | | Net Change
in Unrealized
Appreciation
(Depreciation)
related to
Investments held
at March 31,
2020 | |
Common Stocks | | $ | 31,631,350 | | | $ | (6,889,620 | ) | | | — | | | | — | | | | — | | | $ | 24,741,730 | | | $ | 6,889,620 | | |
Residential Mortgage-
Backed Securities
Non-Agency
Collateralized
Mortgage Obligation | | | — | | | | (295,241 | ) | | $ | 7,921,989 | | | | — | | | $ | 18,306,525 | | | | 25,933,273 | | | | (295,253 | ) | |
Asset-Backed Securities
Collateralized Loan
Obligations | | | — | | | | (1,263,963 | ) | | | 24,398,000 | | | | — | | | | — | | | | 23,134,037 | | | | (1,263,963 | ) | |
Asset-Backed Securities
Equipment | | | 22,765,958 | | | | 46,739 | | | | — | | | | (1,995,323 | ) | | | — | | | | 20,817,374 | | | | 45,446 | | |
Corporate Bank Debt | | | 76,885,246 | | | | (4,355,812 | ) | | | 140,636,150 | | | | (28,626,219 | ) | | | — | | | | 184,539,365 | | | | (6,341,813 | ) | |
| | | $ | 131,282,554 | | | $ | (12,757,897 | ) | | $ | 172,956,139 | | | $ | (30,621,542 | ) | | $ | 18,306,525 | | | $ | 279,165,779 | | | $ | (965,963 | ) | |
* Net realized and unrealized gains (losses) are included in the related amounts in the statement of operations.
Level 3 Valuation Process: Investments classified within Level 3 of the fair value hierarchy are valued by the Adviser in good faith under procedures adopted by authority of the Fund's Board of Directors. The Adviser employs various methods to determine fair valuations including regular review of key inputs and assumptions, and review of related market activity, if any. However, there are generally no observable trade activities in these securities. The Adviser reports to the Board of Directors at their regularly scheduled quarterly meetings, or more often if warranted. The report includes a summary of the results of the process, the key inputs and assumptions noted, and any changes to the inputs and assumptions used. When appropriate, the Adviser will recommend changes to the procedures and process employed. The value determined for an investment using the fair value procedures may differ significantly from the value realized upon the sale of such investment.
Transfers of investments between different levels of the fair value hierarchy are recorded at fair value as of the end of the reporting period. There were transfers of $18,306,525 out of Level 2 into Level 3 during the period ended March 31, 2020. The transfers are a result of change in pricing vendor commencing coverage and pricing of the securities during the period and a change in observable inputs.
53
FPA NEW INCOME, INC.
NOTES TO FINANCIAL STATEMENTS (Continued)
(Unaudited)
The following table summarizes the quantitative inputs and assumptions used for items categorized as items categorized as Level 3 of the fair value hierarchy as of March 31, 2020:
Financial Assets | | Fair Value at
March 31,
2020 | | Valuation
Technique(s) | | Unobservable
Inputs | | Price/Range | |
Common Stocks
| | $ | 7,825,532
| | | Restricted
Assets (a) | | Quotes/Prices
| | $ | 6.50
| | |
| | | 16,916,198
| | | Restricted
Assets (a) | | Quotes/Prices
| | $ | 6.50
| | |
| | | $ | 24,741,730 | | | | | | | | |
Residential Mortgage-Backed
Securities Non-Agency
Collateralized Mortgage Obligation | | | 8,370,608 | | | Third-Party | | Quotes/Prices | | $ | 99.88 | | |
| | | | | | Broker Quote (b) | | | | | | | |
| | | 7,626,747
| | | Third-Party
Broker Quote (b) | | Quotes/Prices
| | $ | 96.27
| | |
| | | 9,935,918
| | | Third-Party
Broker Quote (b) | | Quotes/Prices
| | $ | 96.75
| | |
| | | $ | 25,933,273 | | | | | | | | |
Asset-Backed Securities
Collateralized Loan Obligation
| | $ | 23,134,037
| | | Third-Party
Broker Quote (b) | | Quotes/Prices
| | $ | 89.42
| | |
Asset-Backed Securities-Equipment
| | $ | 20,817,374
| | | Third-Party
Broker Quote (b) | | Quotes/Prices
| | $ | 98.46
| | |
Corporate Bank Debt | | $ | 6,219,600 | | | Pricing Vendor | | Prices | | $ | 91.25 | | |
| | | 23,294,957 | | | Pricing Vendor | | Prices | | $ | 91.09 | | |
| | | 13,337,509 | | | Pricing Vendor | | Prices | | $ | 91.46 | | |
| | | | 3,067,864 | | | Pricing Vendor | | Prices | | $ | 91.23 | | |
| | | 90,167,576 | | | Pricing Model (c) | | Amortized Cost | | $ | 98.33 | | |
| | | 12,215,859 | | | Pricing Model (c) | | Amortized Cost | | $ | 99.07 | | |
| | | 19,768,000
| | | Most Recent
Capitalization
(Funding) (d) | | Cost
| | $ | 100.00
| | |
| | | 16,468,000
| | | Pricing Model (e)
| | Market Comparable
Vendor Pricing | | $ | 89.50
| | |
| | | $ | 184,539,365 | | | | | | | | | | | | | | |
(a) The fair value is based on recent trade activity obtained from market makers in the security.
(b) The Third Party Broker Quote technique involves obtaining an independent third-party broker quote for the security.
54
FPA NEW INCOME, INC.
NOTES TO FINANCIAL STATEMENTS (Continued)
(Unaudited)
(c) The Pricing Model technique for Level 3 securities involves amortized cost. If the financial condition of the underlying assets were to deteriorate, of if the market comparables were to fall, the value of the investment could be lower.
(d) The significant unobservable inputs used in the fair value measurement are based on its most recent funding. If the financial condition of the underlying assets were to deteriorate, or if the market comparables were to fall, the value of the investment could be lower.
(e) The Pricing model technique for Level 3 securities involves using a vendor-provided price from a comparable security. If the financial condition of the underlying assets were to deteriorate, or if the market comparables were to fall, the value of the investment could be lower.
NOTE 7 — Collateral Requirements
FASB Accounting Standards Update No. 2011-11, Disclosures about Offsetting Assets and Liabilities, requires disclosures to make financial statements that are prepared under U.S. GAAP more comparable to those prepared under International Financial Reporting Standards. Under this guidance the Fund discloses both gross and net information about instruments and transactions eligible for offset such as instruments and transactions subject to an agreement similar to a master netting arrangement. In addition, the Fund discloses collateral received and posted in connection with master netting agreements or similar arrangements.
The following table presents the Fund's repurchase agreements by counterparty net of amounts available for offset under an ISDA Master agreement or similar agreements and net of the related collateral received or pledged by the Fund as of March 31, 2020, are as follows:
| | | | | Gross Amounts Not Offset in the
Statement of Assets and Liabilities | | | |
Counterparty | | Gross Assets
(Liabilities)
in the Statement of
Assets and Liabilities | | Collateral
(Received)
Pledged | | Assets (Liabilities)
Available for Offset | | Net Amount
of Assets
(Liabilities)* | |
State Street Bank and
Trust Company: | |
Repurchases Agreement | | $ | 109,901,000 | | | $ | (109,901,000 | )** | | | — | | | | — | | |
* Represents the net amount receivable from the counterparty in the event of default.
** Collateral with a value of $112,102,619 has been received in connection with a master repurchase agreement. Excess of collateral received from the individual master repurchase agreement is not shown for financial reporting purposes.
55
FPA NEW INCOME, INC.
SHAREHOLDER EXPENSE EXAMPLE
March 31, 2020 (Unaudited)
Fund Expenses
Mutual fund shareholders generally incur two types of costs: (1) transaction costs, and (2) ongoing costs, including advisory and administrative fees; shareholder service fees; and other Fund expenses. The Example is intended to help you understand your ongoing costs (in dollars) of investing in the Fund and to compare these costs with the ongoing costs of investing in other mutual funds. The Example is based on an investment of $1,000 invested at the beginning of the year and held for the entire year.
Actual Expenses
The information in the table under the heading "Actual Performance" provides information about actual account values and actual expenses. You may use the information in this column, together with the amount you invested, to estimate the expenses that you paid over the period. Simply divide your account value by $1,000 (for example, an $8,600 account value divided by $1,000 = 8.6), then multiply the result by the number in the first column in the row entitled "Expenses Paid During Period" to estimate the expenses you paid on your account during this period.
Hypothetical Example for Comparison Purposes
The information in the table under the heading "Hypothetical Performance (5% return before expenses)" provides information about hypothetical account values and hypothetical expenses based on the Fund's actual expense ratio and an assumed rate of return of 5% per year before expenses, which is not the Fund's actual return. The hypothetical account values and expenses may not be used to estimate the actual ending account balance or expenses you paid for the period. You may use this information to
compare the ongoing costs of investing in the Fund and other funds. To do so, compare this 5% hypothetical example with the 5% hypothetical examples that appear in the shareholder reports of other funds.
Please note that the expenses shown in the table are meant to highlight your ongoing costs only and do not reflect any transactional costs. Therefore, the information under the heading "Hypothetical Performance (5% return before expenses)" is useful in comparing ongoing costs only, and will not help you determine the relative total costs of owning different funds. In addition, if these transactional costs were included, your costs would have been higher. Even though the Fund does not charge transaction fees, if you purchase shares through a broker, the broker may charge you a fee. You should evaluate other mutual funds' transaction fees and any applicable broker fees to assess the total cost of ownership for comparison purposes.
| | | Actual
Performance | | Hypothetical
Performance
(5% return
before
expenses) | |
Beginning Account Value
September 30, 2019 | | $ | 1,000.00 | | | $ | 1,000.00 | | |
Ending Account Value
March 31, 2020 | | $ | 990.50 | | | $ | 1,022.50 | | |
Expenses Paid During
Period* | | $ | 2.49 | | | $ | 2.53 | | |
* Expenses are equal to the Fund's annualized expense ratio of 0.50%, multiplied by the average account value over the period and prorated for the six-months ended March 31, 2020 (183/366 days).
56
FPA NEW INCOME, INC.
DIRECTOR AND OFFICER INFORMATION
(Unaudited)
Sandra Brown, Mark L. Lipson, Alfred E. Osborne, Jr., A. Robert Pisano, and Patrick B. Purcell are all Directors of the Fund who are not "interested persons" of the Fund, as that term is defined in the 1940 Act (collectively, the "Independent Directors"). Directors serve until their resignation, removal or retirement. The Statement of Additional Information includes additional information about the Directors and is available, without charge, upon request by calling (800) 982-4372.
Name, Address(1)
and Year of Birth | | Position(s)
Held with
the Fund | | Year First
Elected as
Director of
the Fund | | Principal Occupation(s)
During the
Past Five Years | | Number of
FPA Funds
Overseen
by Director | | Other
Directorships
Held by Director
During the Past
Five Years | |
Independent Directors | |
Sandra Brown,
1955 | | Director | | | 2016 | | | Consultant (since 2009). Formerly, CEO and President of Transamerica Financial Advisers, Inc. (1999-2009); President, Transamerica Securities Sales Corp. (1998-2009); Vice President, Bank of America Mutual Fund Administration (1990-1998). Director/Trustee of FPA Capital, Inc., FPA Funds Trust, FPA New Income, Inc., FPA Paramount Fund, Inc., FPA U.S. Value Fund, Inc. and Source Capital, Inc. (since October 2016). | | | 8 | | | None | |
Mark L. Lipson,
1949 | | Director & Chairman | | | 2015 | | | Registered Investment Adviser, ML2 Advisors, LLC (since 2014). Formerly Managing Director, Bessemer Trust (2007-2014) and US Trust (2003-2006); Chairman and CEO of the Northstar Mutual Funds (1993-2001); and President and CEO of the National Mutual Funds (1988-1993). Director/Trustee of FPA Capital, Inc., FPA Funds Trust, FPA New Income, Inc., FPA Paramount Fund, Inc., FPA U.S. Value Fund, Inc. and Source Capital, Inc. (since October 2015). | | | 8 | | | None | |
Alfred E. Osborne, Jr.,
1944 | | Director | | | 1999 | | | Senior Associate Dean, (since July 2003), Interim Dean (July 2018-June 2019), Professor and Faculty Director Price Center for Entrepreneurship and Innovation at the John E. Anderson School of Management at UCLA. Dr. Osborne has been at UCLA since 1972. Director/Trustee of FPA Capital Fund, Inc. and FPA New Income, Inc. (since 1999), of FPA Funds Trust (since 2002), of FPA Paramount Fund, Inc., FPA U.S. Value Fund, Inc. and Source Capital, Inc. (since 2013). | | | 8 | | | Kaiser Aluminum, and Wedbush, Inc. | |
57
FPA NEW INCOME, INC.
DIRECTOR AND OFFICER INFORMATION (Continued)
(Unaudited)
Name, Address(1)
and Year of Birth | | Position(s)
Held with
the Fund | | Year First
Elected as
Director of
the Fund | | Principal Occupation(s)
During the
Past Five Years | | Number of
FPA Funds
Overseen
by Director | | Other
Directorships
Held by Director
During the Past
Five Years | |
A. Robert Pisano,
1943 | | Director | | | 2013 | | | Consultant (since 2012). Formerly, President and Chief Operating Officer of The Motion Picture Association of America, Inc. (October 2005-2011). Formerly, National Executive Director and Chief Executive Officer of The Screen Actors Guild (2001-2005). Director/Trustee of FPA Paramount Fund, Inc. and FPA U.S. Value Fund, Inc. (since 2012), and of FPA Capital, Inc., FPA Funds Trust, FPA New Income, Inc. and Source Capital, Inc. (since 2013). | | | 8 | | | Resources Global Professionals | |
Patrick B. Purcell,
1943 | | Director | | | 2006 | | | Retired (since 2000). Formerly, Consultant to Paramount Pictures 1998-2000; Executive Vice President, Chief Financial and Administrative Officer of Paramount Pictures (1983-1998). Director/Trustee of FPA Capital, Inc., FPA Funds Trust and FPA New Income, Inc. (since 2006), of Source Capital, Inc. (since 2010), of FPA U.S. Value Fund, Inc. and FPA Paramount Fund, Inc. (since 2012). | | | 8 | | | None | |
"Interested" Director(2) | |
J. Richard Atwood,
1960 | | Director | | | 2016 | | | Director and President of FPA GP, Inc., the General Partner of the Adviser (since October 2018). Director/Trustee of each FPA Fund (since 2016). President of each FPA Fund (since 2015). Formerly, Managing Partner of FPA (2006-2018). Formerly, until 2015, Treasurer of each FPA Fund for more than the past five years. | | | 8 | | | None | |
(1) The address of each Director is 11601 Wilshire Boulevard, Suite 1200, Los Angeles, California 90025.
(2) "Interested person" within the meaning of the 1940 Act by virtue of their affiliation with the Fund's Adviser.
58
FPA NEW INCOME, INC.
DIRECTOR AND OFFICER INFORMATION (Continued)
(Unaudited)
Officers of the Fund. Officers of the Fund are elected annually by the Board.
Name, Address(1)
and Year of Birth | | Position
with Fund | | Year First
Elected as
Officer of the
Fund | | Principal Occupation(s)
During the Past Five Years | |
Thomas H. Atteberry,
1953 | | Vice President and Portfolio Manager | | | 2004 | | | Partner of FPA. Formerly Chief Executive Officer of FPA New Income (until February 2015). Vice president and Portfolio Manager of FPA New Income (since 2004). | |
Abhijeet Patwardhan,
1979 | | Vice President and Portfolio Manager | | | 2015 | | | Partner (since January 2017) and a Director of Research (since April 2015) of FPA; Managing Director of FPA from November 2015 to January 2017, Senior Vice President of FPA from January 2014 to November 2015; Analyst and Vice President of FPA from June 2010 to December 2013. Vice President and Portfolio Manager of FPA Flexible Fixed Income Fund (since December 2018). | |
J. Richard Atwood,
1960 | | President | | | 1997 | | | Director and President of FPA GP, Inc., the General Partner of FPA (since October 2018). Director/Trustee of each FPA Fund (since May 2016). President of each FPA Fund (since February 2015). Formerly, Managing Partner of FPA (2006-2018). Formerly, until February 2015, Treasurer of each FPA Fund for more than the past five years. | |
Karen E. Richards,
1969 | | Chief Compliance Officer | | | 2019 | | | Chief Compliance Officer of FPA (since August 2018). Formerly, Deputy Chief Compliance Officer of First Republic Investment Management, LLC (from February 2016 to March 2018), and Vice President, Senior Compliance Officer of Pacific Investment Management Company (from June 2010 to January 2016). | |
E. Lake Setzler III,
1967 | | Treasurer | | | 2006 | | | Senior Vice President (since January 2013) and Controller of FPA; and Treasurer of each FPA Fund (since February 2015). Formerly, until February 2015, Assistant Treasurer of each FPA Fund (February 2006 to February 2015). | |
Rebecca D. Gilding,
1979 | | Secretary | | | 2019 | | | Vice President and Counsel, State Street Bank and Trust Company (since April 2016). Formerly, Assistant Vice President and Associate Counsel, Brown Brothers Harriman & Co. (September 2013 to April 2016). | |
(1) The address for each Officer (except Ms. Gilding) is 11601 Wilshire Boulevard, Suite 1200, Los Angeles, California 90025. Ms. Gilding address is State Street Bank and Trust Company, One Lincoln Street, Boston, Massachusetts 02111.
59
FPA NEW INCOME, INC.
(Unaudited)
INVESTMENT ADVISER
First Pacific Advisors, LP
11601 Wilshire Boulevard, Suite 1200
Los Angeles, CA 90025
TRANSFER & SHAREHOLDER SERVICE AGENT
UMB Fund Services, Inc.
P.O. Box 2175
Milwaukee, WI 53201-2175
or
235 West Galena Street
Milwaukee, WI 53212-3948
(800) 638-3060
CUSTODIAN AND ADMINISTRATOR
State Street Bank and Trust Company
One Lincoln Street
Boston, Massachusetts 02111
TICKER SYMBOL: FPNIX
CUSIP: 302544101
DISTRIBUTOR
UMB Distribution Services, LLC
235 West Galena Street
Milwaukee, Wisconsin 53212-3948
LEGAL COUNSEL
Dechert LLP
One Bush Street, Suite 1600
San Francisco, California 94104
INDEPENDENT REGISTERED PUBLIC
ACCOUNTING FIRM
Ernst & Young LLP
725 South Figueroa Street
Los Angeles, California 90017
This report has been prepared for the information of shareholders of FPA NEW INCOME, INC., and is not authorized for distribution to prospective investors unless preceded or accompanied by an effective prospectus. The financial information included in this report has been taken from the records of the Fund without examination by independent auditors.
A description of the policies and procedures that the Adviser uses to vote proxies related to the Fund's portfolio securities is set forth in the Fund's Statement of Additional Information which is available without charge, upon request, on the Fund's website at www.fpa.com or by calling (800) 982-4372 and on the Securities and Exchange Commission's website at www.sec.gov.
The Fund's complete proxy voting record for the 12 months ended June 30, 2019 is available without charge, upon request by calling (800) 982-4372 and on the SEC's website at www.sec.gov.
The Fund's schedule of portfolio holdings, filed the first and third quarter of the Fund's fiscal year on Form N-PORT with the SEC, is available on the SEC's website at www.sec.gov.
Additional information about the Fund is available online at www.fpa.com. This information includes, among other things, holdings, top sectors, and performance, and is updated on or about the 15th business day after the end of each quarter.
Item 2. Code of Ethics.
Not applicable to this semi-annual report.
Item 3. Audit Committee Financial Expert.
Not applicable to this semi-annual report.
Item 4. Principal Accountant Fees and Services.
Not applicable to this semi-annual report.
Item 5. Audit Committee of Listed Registrants.
Not applicable to this semi-annual report.
Item 6. Investments.
| (a) | Schedule of Investments is included as a part of the report to shareholders filed under Item 1 of this Form N-CSR. |
Item 7. Disclosure of Proxy Voting Policies and Procedures for Closed-End Management Investment Companies.
Not applicable.
Item 8. Portfolio Managers of Closed-End Management Investment Companies.
Not applicable.
Item 9. Purchases of Equity Securities by Closed-End Management Investment Company and Affiliated Purchasers.
Not applicable.
Item 10. Submission of Matters to a Vote of Security Holders.
There have been no material changes to the procedures by which the shareholders may recommend nominees to the registrant’s board of directors.
Item 11. Controls and Procedures.
| (a) | The principal executive officer and principal financial officer of the registrant have concluded that the registrant’s disclosure controls and procedures (as defined in Rule 30a-3(c) under the Investment Company Act of 1940) are effective based on their evaluation of the disclosure controls and procedures as of a date within 90 days of the filing date of this report. |
| (b) | There have been no significant changes in the registrant’s internal controls over financial reporting (as defined in Rule 30a-3(d) under the Investment Company Act of 1940) that occurred during the registrant’s second fiscal quarter of the period covered by this report that have materially affected, or is reasonably likely to materially affect, the registrant’s internal controls over financial reporting. |
Item 12. Disclosure of Securities Lending Activities for Closed-End Management Investment Companies
Not applicable.
Item 13. Exhibits.
SIGNATURES
Pursuant to the requirements of the Securities Exchange Act of 1934 and the Investment Company Act of 1940, the registrant has duly caused this report to be signed on its behalf by the undersigned, thereunto duly authorized.
FPA NEW INCOME, INC.
| By: | /s/ J. Richard Atwood | |
| | J. Richard Atwood | |
| | President (principal executive officer) | |
Date: June 1, 2020
Pursuant to the requirements of the Securities Exchange Act of 1934 and the Investment Company Act of 1940, this report has been signed below by the following persons on behalf of the registrant and in the capacities and on the dates indicated.
| By: | /s/ J. Richard Atwood | |
| | J. Richard Atwood | |
| | President (principal executive officer) | |
Date: June 1, 2020
| By: | /s/ E. Lake Setzler III | |
| | E. Lake Setzler III | |
| | Treasurer (principal financial officer) | |
Date: June 1, 2020