UNITED STATES
SECURITIES AND EXCHANGE COMMISSION
Washington, D.C. 20549
FORM N-CSR
CERTIFIED SHAREHOLDER REPORT OF REGISTERED
MANAGEMENT INVESTMENT COMPANIES
Investment Company Act file number: 811-01735
fpa NEW Income, inc.
(Exact name of registrant as specified in charter)
11601 WILSHIRE BLVD., STE. 1200
LOS ANGELES, CALIFORNIA 90025
(Address of principal executive offices)(Zip code)
| (Name and Address of Agent for Service) | Copy to: |
J. RICHARD ATWOOD, PRESIDENT FPA NEW INCOME, INC. 11601 WILSHIRE BLVD., STE. 1200 LOS ANGELES, CALIFORNIA 90025 | MARK D. PERLOW, ESQ. DECHERT LLP ONE BUSH STREET, STE. 1600 SAN FRANCISCO, CA 94104 |
Registrant’s telephone number, including area code: (310) 473-0225
Date of fiscal year end: September 30
Date of reporting period: March 31, 2022
Item 1: Report to Shareholders.
| (a) | The Report to Shareholders is attached herewith. |

Distributor:
UMB DISTRIBUTION SERVICES, LLC
235 West Galena Street
Milwaukee, Wisconsin 53212
FPA NEW INCOME, INC.
LETTER TO SHAREHOLDERS
Introduction
Dear Fellow Shareholders,
FPA New Income, Inc. (the "Fund") returned -1.74% in the first quarter of 2022.
As of March 31, 2022, the portfolio had a yield-to-worst1 of 2.90% and an effective duration of 1.31 years. Inflation remains high and persistent, leading the Federal Reserve to raise the Fed Funds rate during the quarter and guide the market toward a significantly higher Fed Funds rate path going forward. The Federal Reserve also provided guidance on quantitative tightening, or the reduction in its bond holdings.2 In tandem, these actions led to a significant increase in Treasury yields, with two- and three-year maturity Treasury yields increasing by 155-160 basis points (bps) during the quarter (see U.S. Treasury yield curve chart in the Market Comment section). Longer maturity Treasury yields also increased, but to a lesser extent, resulting in a flatter yield curve and portending weaker economic growth in the future. In addition, spreads increased across fixed income asset classes, though spreads are within historic norms. As a consequence of higher Treasury yields and spreads, bond prices were negatively impacted across the market, leading to one of the worst quarters for bonds in decades.
Higher yields make high quality (investments rated single-A or higher) duration cheaper and therefore we believe more attractive to own, particularly since most of the recent increase in yields is due to higher risk-free rates. However, the prospect of risk-free rates and spreads rising further creates the possibility of near-term mark-to-market risk associated with rising yields. Separately, we believe higher risk-free rates have made credit (investments rated BBB or lower) more attractive on an absolute basis, but without a meaningful increase in spreads, we think the opportunity set in credit remains limited. As such, we proceed with caution, balancing near-term capital preservation and long-term returns.
The Fund's credit exposure (investments rated BBB or lower) increased from 8.5% as of December 31, 2021, to 9.2% as of March 31, 2022. Cash and equivalents increased from 0.6% of the portfolio to 2.3% over the same period.
Portfolio Attribution3
The largest contributors to performance during the quarter were the Fund's corporate holdings. The corporate holdings benefited from coupon payments and dividends on common stocks, which offset lower prices caused by higher spreads for bank loans and high risk-free rates and spreads for high-yield bonds. The second-largest contributors to performance during the quarter were collateralized loan obligations (CLOs), where coupon
1 Yield-to-Worst ("YTW") is presented gross of fees and reflects the lowest possible yield on a callable bond without the issuer defaulting. It does not represent the yield an investor should expect to receive. As of March 31, 2022, the Fund's subsidized and unsubsidized 30-day SEC standardized yields ("SEC Yield") were 1.45% and 1.35%, respectively. The SEC Yield calculation is an annualized measure of the Fund's dividend and interest payments for the last 30 days, less the Fund expenses. Subsidized yield reflects fee waivers and/or expense reimbursements during the period. Without waivers and/or reimbursements, yields would be reduced. Unsubsidized yield does not adjust for any fee waivers and/or expense reimbursements in effect. The SEC Yield calculation shows investors what they would earn in yield over the course of a 12-month period if the fund continued earning the same rate for the rest of the year.
2 Source: Board of Governors of the Federal Reserve System; https://www.federalreserve.gov/newsevents/pressreleases/monetary20220126c.htm
3 This information is not a recommendation for a specific security or sector and these securities/sectors may not be in the Fund at the time you receive this report. The information provided does not reflect all positions or sectors purchased, sold or recommended by FPA during the quarter. The portfolio holdings as of the most recent quarter-end may be obtained at www.fpa.com.
Past performance is no guarantee, nor is it indicative, of future results.
1
FPA NEW INCOME, INC.
LETTER TO SHAREHOLDERS
(Continued)
payments offset lower prices caused by higher spreads. There were no other meaningful contributors to performance at the sector level.
The largest detractors from performance during the quarter were Treasury bonds as a result of an increase in Treasury yields leading to lower prices. The second- and third-largest detractors from performance were asset-backed securities (ABS) backed by auto loans or leases and ABS backed by equipment, which declined in price due to a combination of higher risk-free rates and spreads.
Overall, though the portfolio's return was negative during the quarter, we believe the portfolio performed relatively well due to its short duration and large exposure to floating rate bonds, which fared well during the quarter.
Portfolio Activity
The table below shows the portfolio's sector-level exposures as of March 31, 2022, compared to December 31, 2021:
| Sector | | % Portfolio
3/31/2022 | | % Portfolio
12/31/2021 | |
ABS | | | 66.6 | | | | 57.7 | | |
Mortgage Backed (CMO)4 | | | 6.6 | | | | 7.4 | | |
Stripped Mortgage-backed | | | 0.4 | | | | 0.4 | | |
Corporate | | | 5.0 | | | | 4.2 | | |
CMBS4 | | | 7.3 | | | | 6.9 | | |
Mortgage Pass-through | | | 2.2 | | | | 0.1 | | |
U.S. Treasury | | | 9.6 | | | | 22.7 | | |
Cash and equivalents | | | 2.3 | | | | 0.6 | | |
Total | | | 100.0 | % | | | 100.0 | % | |
Yield-to-worst5 | | | 2.90 | % | | | 1.42 | % | |
Effective Duration (years) | | | 1.31 | | | | 1.39 | | |
Average Life (years) | | | 2.02 | | | | 1.89 | | |
Treasury yields increased significantly during the quarter. In combination with higher spreads on highly-rated debt, overall yields on high-quality bonds (rated single-A or higher) increased meaningfully. As described further below, we use yields as a guide for the duration of our investments. When yields increase, we incrementally add duration because higher yields typically can compensate for the additional duration risk. We believe this
4 Collateralized mortgage obligations ("CMO") are mortgage-backed bonds that separate mortgage pools into different maturity classes. Commercial mortgage-backed securities ("CMBS") are securities backed by commercial mortgages rather than residential mortgages.
5 Yield-to-Worst ("YTW") is presented gross of fees and reflects the lowest possible yield on a callable bond without the issuer defaulting. It does not represent the yield an investor should expect to receive. As of March 31, 2022, the Fund's subsidized and unsubsidized 30-day SEC standardized yields ("SEC Yield") were 1.45% and 1.35%, respectively. The SEC Yield calculation is an annualized measure of the Fund's dividend and interest payments for the last 30 days, less the Fund expenses. Subsidized yield reflects fee waivers and/or expense reimbursements during the period. Without waivers and/or reimbursements, yields would be reduced. Unsubsidized yield does not adjust for any fee waivers and/or expense reimbursements in effect. The SEC Yield calculation shows investors what they would earn in yield over the course of a 12-month period if the fund continued earning the same rate for the rest of the year.
Past performance is no guarantee, nor is it indicative, of future results.
2
FPA NEW INCOME, INC.
LETTER TO SHAREHOLDERS
(Continued)
approach augments the long-term risk versus reward profile of the Fund. In line with this approach, during the quarter, in addition to Treasuries, we bought fixed rate, high-quality bonds with an average yield-to-worst and duration of 3.0% and 2.2 years, respectively. These investments included asset-backed securities (ABS) backed by equipment, ABS backed by subprime quality auto loans, ABS backed by prime quality auto loans or leases, agency mortgage pools, and ABS backed by insurance premium loans.
We also bought investment grade corporate bonds with a yield-to-worst of 5.5% and duration of 3.4 years, though we include these bonds within the Fund's credit holdings because they are rated BBB. Elsewhere within credit, absolute yields have increased but, overall, yields and spreads are not attractive. As such, aside from the aforementioned investment grade corporate bonds, our credit investments this quarter were limited to adding to existing bank loan positions as prices on these investments declined during the quarter. These investments and the Fund's high-quality bond investments were funded with a combination of cash and selling existing short duration holdings and Treasuries.
Market Commentary
The bond market has had a terrible start to the year. In fact, we are in the midst of the worst bond market in at least 40 years.6 Inflation led to a significant increase in risk-free rates that has roiled bond markets, resulting in negative returns for nearly all types of bonds. The silver lining of this negative performance is that bonds are now meaningfully more attractive, creating an opportunity to enhance the Fund's long-term return profile.
The table below shows the Q1 2022 return on various bond indices.
| 2-year Treasury | | | -2.44 | % | |
Bloomberg 1-3 yr. U.S. Aggregate Bond Index | | | -2.50 | % | |
| 10-year Treasury | | | -8.52 | % | |
| 30-year Treasury | | | -15.56 | % | |
Bloomberg U.S. Aggregate Bond Index | | | -5.93 | % | |
Bloomberg Global Aggregate Bond Index | | | -6.16 | % | |
Bloomberg High Yield Index | | | -4.84 | % | |
Bloomberg Emerging Market Bond Index | | | -9.23 | % | |
To put the returns above into context, two-year Treasuries have had the worst start to the year in at least 45 years. 10-year Treasury bonds had the third-worst quarterly performance since the Civil War, surpassed only by worse returns in 1931 and the 1980s.7
These poor returns were driven by a significant increase in risk-free rates that is related to inflation. Inflation is a problem that has not gone away as quickly as central bankers had expected. As shown in the chart below, inflation continues at a torrid pace. It has been exacerbated by Russia's invasion of Ukraine, which has negatively impacted commodity supplies and spurred countries to localize supply chains on geopolitical concerns.
6 The Wall Street Journal, (https://www.wsj.com/articles/bond-market-suffers-worst-quarter-in-decades-11648737087#:~:text=Yields%20on%20Treasurys%20have%20logged,rising%20the%20most%20since%201994.&text=U.S.%20bonds'%20worst%20quarter%20in,biggest%20dip%20in%20recent%20memory.)
7 Source: Bloomberg, Deutsche Bank. As of 3/31/2022.
3
FPA NEW INCOME, INC.
LETTER TO SHAREHOLDERS
(Continued)
CPI Urban Consumers less Food and Energy

Source: Bureau of Labor Statistics. Chart data thru March 31, 2022. The "Consumer Price Index for All Urban Consumers: All Items Less Food & Energy" is an aggregate of prices paid by urban consumers for a typical basket of goods, excluding food and energy. This measurement, known as "Core CPI," is widely used by economists because food and energy prices can be volatile. The all urban consumer group represents about 93 percent of the total U.S. population. It is based on the expenditures of almost all residents of urban or metropolitan areas, including professionals, the self-employed, the unemployed, and retired people, as well as urban wage earners and clerical workers. Not included in the CPI are the spending patterns of people living in rural nonmetropolitan areas, those in farm households, people in the Armed Forces, and those in institutions, such as prisons and mental hospitals.
With inflation running hot and U.S. monetary policy still very easy, the Fed was forced to aggressively pivot to a tighter monetary policy stance. As of December 2021, the market expected three 25-basis point hikes from the Fed over the course of 2022. In March 2022, the Fed released updated projections for the Fed Funds rate — their plan for how they expect to tighten monetary policy.8 Those projections led to a dramatic change in market expectations. By the end of March 2022, the market expected more than eight 25-basis-point hikes by the end of 2022. The result is that the market's expectation for the Fed Funds rate by the end of 2022 increased from 0.8% to 2.4%, representing 158 bps of additional increases that was priced into the market during Q1 2022.9
8 Source: The Federal Reserve. https://www.federalreserve.gov/monetarypolicy/files/fomcprojtabl20220316.pdf.
9 Source: Bloomberg. As of 3/31/2022.
4
FPA NEW INCOME, INC.
LETTER TO SHAREHOLDERS
(Continued)
In addition to promoting a steeper path to the Fed Funds rate, the Fed also began to outline its plans to reduce its bond holdings. During the pandemic, the Fed bought bonds to stimulate the economy, a process called quantitative easing. Now the Fed is about to reduce those bond holdings, a process known as quantitative tightening, which will lead to hundreds of billions of dollars of bonds getting absorbed by the rest of the market.
Together, the higher Fed Funds rate expectations and planned reduction in the Fed's bond holdings led to a dramatic increase in Treasury yields during the quarter. This chart shows the Treasury yield curve as of December 2021 and March 2022, along with the changes in yield over the past three and 12 months.

| | Maturity | |
| | 1M | | 2M | | 3M | | 6M | | 1Y | | 2Y | | 3Y | | 5Y | | 7Y | | 10Y | | 20Y | | 30Y | |
Q1 change in yields (bps) | | | 9 | | | | 24 | | | | 45 | | | | 83 | | | | 122 | | | | 160 | | | | 156 | | | | 120 | | | | 99 | | | | 83 | | | | 67 | | | | 54 | | |
Twelve Month change in yields (bps) | | | 11 | | | | 27 | | | | 47 | | | | 98 | | | | 154 | | | | 218 | | | | 217 | | | | 152 | | | | 101 | | | | 60 | | | | 29 | | | | 4 | | |
Source: Bloomberg. Chart data as of the dates shown.
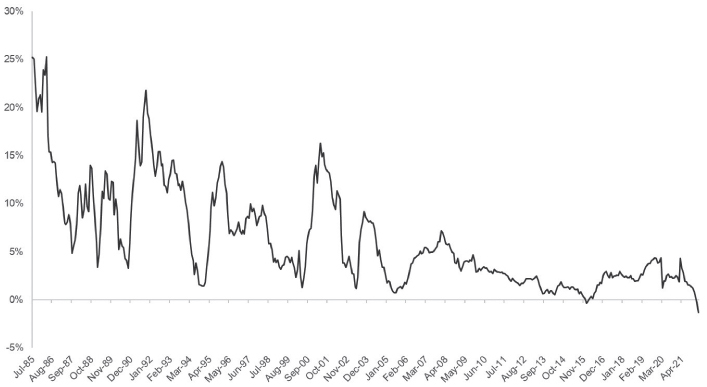
The increase in risk-free rates shown above pummeled bond prices and led to historically poor returns across the fixed income market. Yet, while the changes in yield shown above are certainly large, they are not unprecedented, which raises the question of why bond returns were so terrible this time around. The answer is that these yield increases occurred against the backdrop of historically expensive bond valuations. To put bond valuations in perspective, the following chart shows the ratio of yield to duration for two-year Treasury bonds along with historical quarterly changes in two-year Treasury yields. The yield-to-duration ratio measures a bond's ability to produce positive returns in a rising interest rate environment. When the ratio is higher, returns are better, all things
5
FPA NEW INCOME, INC.
LETTER TO SHAREHOLDERS
(Continued)
being equal, because there is more yield to offset a decline in price caused by rising interest rates. Leading up to 2022, this ratio was near its all-time low meaning that there was historically little yield to compensate for yield-driven price declines. As the bars in the chart demonstrate, the magnitude of this past quarter's large yield change is rare but not unprecedented, having occurred before in the 70's and early 80's. What is unprecedented is that this time, bonds were historically expensive when that large yield change occurred. As a result, when a large yield change led to a large move in bond prices, there was not enough yield available to offset the price decline, resulting in negative returns. This same dynamic played out for longer maturity bonds as well.
Two-year U.S. Treasury

Source: Bloomberg. As of 3/31/2022.
Yet historically expensive bond valuations should not have caught people off guard. In fact, we pointed out last year how expensive bonds were and tried to caution investors that they should be aware of the duration risk in the market. On our end, we responded to the expensive market by positioning the Fund with a shorter duration.
We made our decision to shorten duration using our absolute value approach to investing. Many other fixed income investors invest by predicting where interest rates will go and then they use your money to make their speculative bets. The reality is that it is hard to get those bets right and, even if one gets it right, it is hard to do so consistently. We have been upfront with our investors that we do not have a view on what will happen in the future — we do not have macroeconomic views and we do not know where rates or markets will go. At best, we have informed opinions, but we would never bet your money — and ours — on those opinions because we seek consistent, repeatable results.
6
FPA NEW INCOME, INC.
LETTER TO SHAREHOLDERS
(Continued)
To that end, we invest in a way that tries to protect on the downside. We take this approach because bonds generally do not have much upside potential. As such, it is important to try to protect against bad outcomes, which almost inevitably happen. We are focused on capital preservation in the long-term with respect to the ultimate repayment of our bonds. We are also focused on capital preservation in the short-term with respect to mark-to-market risk, where duration or interest rate risk can be a big driver of bond prices.
To seek to mitigate the short-term mark-to-market downside risk, we actively manage the Fund's duration by using our duration stress test as a guide. We try to buy bonds that we expect will have approximately a breakeven return or greater over a 12-month period if we assume that yields increase by 100 bps during that 12-month period. The time frame of our duration test lines up with the Fund's 12-month positive return goal. This test ends up embedding into the portfolio a cushion against rising interest rates. That cushion is generally around an increase of 100 bps of yield on individual bonds, which means that if rates rise by 100 bps or less over 12 months, the Fund generally breaks even or makes money on those bonds (before fees). Further, because of how the portfolio ages over time, floating rate bond exposure and other factors, at the portfolio level, oftentimes the portfolio ends up having much more cushion than 100 bps.
Having consistently employed this test to manage the Fund's duration, having paid attention to bond valuation and having proactively sought to insulate the portfolio against expensive bond prices, FPA New Income, Inc., though down this past quarter, was down less than other fixed income investments, including the Morningstar short-term bond category average, which lost 2.9%; the 1-3 year Aggregate Bond Index, which lost 2.5%; and the Aggregate bond index, which lost 5.9%.10
Of course, the silver lining of higher yields is that bonds are potentially more attractive. A more attractive bond market means that we believe the Fund is also now more attractive. FPA New Income, Inc.'s yield-to-worst has increased by approximately 150 bps in the past three months, while its duration is 0.1 years shorter. The table below compares the Fund's yield-to-worst and duration to the Aggregate Bond Index and 1-3 year Aggregate Bond Index. The table also shows the Fund's and each index's ratio of yield-to-worst to duration. While offering a similar or better yield than either Index, the Fund is also better insulated against rising interest rates, all things being equal. Importantly, the Fund's yield is not owed to a significant exposure to credit: 91% of the Fund is held in investments rated single-A or higher, Treasuries and cash and equivalents as of March 31, 2022.
Characteristics11

10 Source: Morningstar Direct. FPA New Income, Inc. performance for the quarter was -1.74%.
11 Source: FactSet, Bloomberg. Comparison to the Bloomberg U.S. Aggregate Bond Index and the Bloomberg U.S. Aggregate 1-3 Year Index is for illustrative purposes only. FPNIX does not include outperformance of any index or benchmark in its investment objectives. An investor cannot invest directly in an index. Please refer to page 1 for net performance of the Fund since inception. Please see footnote 1 for the Fund's SEC Yield. Please refer to the end of the presentation for Important Disclosures and Index definitions.
7
FPA NEW INCOME, INC.
LETTER TO SHAREHOLDERS
(Continued)
Notably, the Fund's yield-to-worst does not capture the potential benefit of the Fund's floating rate investments, which represent approximately 31% of the Fund. If market expectations are to be believed, the coupons on these floating rate investments could increase by 200-225 bps in 2022. We do not expect that increase to appear all at once and it is contingent on what the Fed ends up doing with respect to rate hikes, but it represents potential additional yield that is not captured in the yield-to-worst and yield-to-worst to duration ratio shown above, which means that there could be additional yield and insulation against rising rates in the portfolio. In comparison, the Aggregate bond index and 1-3 year Aggregate bond index do not have floating rate bonds.12
Part of the reason the yield-to-worst of New Income has increased so much over the quarter is due to the Fund's bonds trading at lower prices, but a big part of the reason is the new investments that we made to take advantage of more attractive yields. Not only does our duration test provide insulation against rising rates, but it also guides us to buy shorter duration bonds when yields fall and, conversely, buy longer duration bonds when yields increase. Conceptually, this approach makes sense — when yields are lower, duration is more expensive and we should own less duration, i.e., we should buy shorter duration bonds. Last year, when yields were lower, we bought shorter duration bonds, and we believe that positioned the Fund well for the increase in yields we are now experiencing.
With respect to our approach in the current market environment, now that yields are higher, duration is cheaper, so we should buy more duration, i.e., longer duration bonds. As noted earlier, the majority of the yield increase in the bond market is due to higher risk-free rates, not spreads. As such, when the market gets cheaper, especially when it is because of higher risk-free rates, we think we should lean into that opportunity because it improves the long-term return prospects of the Fund. For us, leaning in does not mean buying 30-year bonds or even 10-year bonds. Rather, we incrementally add higher yielding, longer duration bonds by using our 100 bps duration test as a guide. As an example of how this works, in Q4 2021, we bought highly-rated fixed rate bonds with an average duration of 2.1 years and a 1.5% yield. In Q1 2022, as referenced earlier, we bought similar types of bonds with an average duration of 2.2 years and a yield of 3.0%. The additional duration is incremental but it meaningfully improves the portfolio, particularly at these much higher yields. Adding duration in this manner helps to insulate the Fund against rising interest rates while putting the Fund in a better position if rates decline because, in a declining rate environment, having more duration improves the potential total return.
Why might rates decline? One possibility is a recession. The Fed's aggressive tightening has put economists and the market on recession alert. An inversion of the yield curve, which occurs when two-year Treasury yields are greater than 10-year Treasury yields, has historically presaged a recession. The yield curve briefly inverted in the first quarter, suggesting that there may be a recession at some point (while the inverted curve has a strong record in predicting recessions, its track record on predicting the timing is so-so). If the Fed has to change course on its current policy because of a recession and tighten less or not at all, rates could decline. It would not be unprecedented for the Fed to quickly reverse course. In the six months between September 2018 and March 2019, the market's expectations for the Fed Funds rate at the end of 2019 swung from an expectation of more than
12 Floating Rate Bonds or Notes (FRNs) are fixed income securities that pay a coupon determined by a reference rate which resets periodically. As the reference rate resets, the payment received is not fixed and fluctuates overtime. FRNs are in demand among investors when it is expected that interest rates will increase. FRNs can be beneficial as they offer investors an opportunity to earn higher coupon payments should the reference rate rise. FRNs also offer lower duration than fixed rate notes which protects value in a rising rate environment. FRNs present risk if interest rates decrease, which would result in lower coupon payments. All payments on FRNs are subject to the creditworthiness of the issuer. (Source: RBC Capital Markets, An Overview of Floating Rate Notes, https://www.rbccm.com/assets/rbccm/docs/expertise/fixed-income/us/rbc-floating-rate-notes-fact-sheet.pdf.)
Past performance is no guarantee, nor is it indicative, of future results.
8
FPA NEW INCOME, INC.
LETTER TO SHAREHOLDERS
(Continued)
2 hikes to a rate cut!13 Note that this reversal in policy expectations was not COVID-induced, as this occurred several quarters before COVID was on anyone's radar.
Longer term, rates could decline because of the trajectory of the U.S. economy. For decades, the U.S. economy and much of the developed world have been in a disinflationary or even deflationary mode. During that time, assets with duration have performed well over the long run because of central banks' stimulus efforts. While inflation is currently high, it is not clear that the U.S. economy has fundamentally changed such that we will be in an inflationary mode over the long term. There are, of course, reasons to believe that we could be in an inflationary environment for some period of time, including the geopolitically driven near-sourcing of supply chains referenced earlier. However, if the U.S. economy is still a disinflationary economy long term, owning more duration is better for returns than owning less, especially if one buys duration with the goal of insulating against rising rates as we do. To reiterate, we are not making a macroeconomic bet; we are simply buying optionality on lower rates and doing so with some insulation against rates rising further.
Having said that, this approach is not without risk because it is hard to predict how much and how quickly rates could rise in the short term. We have tried to insulate the portfolio against rising rates but sometimes the market overwhelms even our disciplined and conservative approach. The goal in the short term is to generate positive returns over a rolling 12-month period. The following chart shows the history of the Fund's rolling 12-month returns.
FPA New Income Rolling 12 Month Total Return
Source: Morningstar Direct. As of 3/31/2022. Past performance is no guarantee, nor is it indicative, of future results.
9
FPA NEW INCOME, INC.
LETTER TO SHAREHOLDERS
(Continued)
Historically, we have been successful in generating positive rolling 12-month returns, in fact, we have been successful 99% of the time but we do not always meet this target despite what we believe is a significant amount of protection against rising interest rates. Seeking more protection against rising rates makes it tough to ever own bonds and one might as well sit in cash all of the time. By the same token, one should probably never take any risk at all. Furthermore, there is an opportunity cost to holding cash.
Nevertheless, positive returns or not, our limited short-term drawdowns are in service to the longer-term goal of delivering to our investors better total returns with a smoother ride when compared to alternatives, which is what we are ultimately aiming for. The following chart shows the total return for FPA New Income versus the rest of the short-term bond category and the 1-3 year Aggregate Bond Index over the past 10 years. Over the past 10 years, we have been able to deliver more cumulative total return than the index and the short-term bond category. Importantly, we have been able to do this with less volatility, as demonstrated by the smoother line and table below showing the Fund's higher sharpe ratio and sortino ratio and lower maximum drawdown over this time period.
Growth of $10,000 over ten years

4/1/2012-3/31/2022 | | Sharpe
Ratio | | Sortino
Ratio | | Max
Drawdown | |
FPA New Income | | | 0.87 | | | | 1.16 | | | | -2.88 | % | |
Morningstar US Fund Short-Term Bond Category | | | 0.44 | | | | 0.62 | | | | -5.31 | % | |
Bloomberg U.S. 1-3 Year Aggregate Bond Index | | | 0.50 | | | | 0.72 | | | | -3.22 | % | |
Source: Morningstar Direct. As of 3/31/2022. FPNIX Inception is July 11, 1984.
Moreover, not to be dismissed, we have accomplished this performance with less agita along the way. By "agita" we mean that our investors do not have to worry that we are making speculative bets or worry about style drift. We strive for and have demonstrated a disciplined, consistent and transparent process that purposely tries not to surprise and that has been demonstrated over time.
10
FPA NEW INCOME, INC.
LETTER TO SHAREHOLDERS
(Continued)
The past few months have no doubt been turbulent. We do not like to lose money, even in the short term. While our performance relative to peers and indices offers us some small solace, it pains us nonetheless that the Fund did not make money in the first quarter. We share in the pain of negative returns — both portfolio managers of the Fund have a significant personal investment in the Fund alongside our investors. However, focusing solely on the short term comes at the expense of seeking to maximize long-term profits for the Fund's investors. As such, consistent with our past discipline and as detailed above, while balancing near-term capital preservation, we intend to take advantage of the opportunities presented today to make long-term investments in the Fund's returns. We take this step with you as both portfolio managers added to their investments in the Fund in recent months.
Respectfully submitted,

| | 
| |
Thomas H. Atteberry
Portfolio Manager
April 2022 | | Abhijeet Patwardhan
Portfolio Manager | |
Important Disclosures
This Commentary is for informational and discussion purposes only and does not constitute, and should not be construed as, an offer or solicitation for the purchase or sale of any securities, products or services discussed, and neither does it provide investment advice. Any such offer or solicitation shall only be made pursuant to the Fund's Prospectus, which supersedes the information contained herein in its entirety.
The views expressed herein and any forward-looking statements are as of the date of the publication and are those of the portfolio management team. Future events or results may vary significantly from those expressed and are subject to change at any time in response to changing circumstances and industry developments. This information and data has been prepared from sources believed reliable, but the accuracy and completeness of the information cannot be guaranteed and is not a complete summary or statement of all available data. You should not construe the contents of this document as legal, tax, accounting, investment or other advice or recommendations.
Thomas Atteberry and Abhijeet Patwardhan have been portfolio managers for the Fund since November 2004 and November 2015, respectively, and manage the Fund in a manner that is substantially similar to the prior portfolio manager, Robert Rodriguez. Mr. Rodriguez ceased serving as the Fund's portfolio manager effective December 2009.
Portfolio composition will change due to ongoing management of the Fund. References to individual securities or sectors are for informational purposes only and should not be construed as recommendations by the Fund, the portfolio managers, the Adviser, or the distributor. It should not be assumed that future investments will be profitable or will equal the performance of the security or sector examples discussed. The portfolio holdings as of the most recent quarter-end may be obtained at www.fpa.com.
The statements made herein may be forward-looking and/or based on current expectations, projections, and/or information currently available. Actual results may differ from those anticipated. The portfolio managers and/or FPA cannot assure future results and disclaims any obligation to update or alter any statistical data and/or
11
FPA NEW INCOME, INC.
LETTER TO SHAREHOLDERS
(Continued)
references thereto, as well as any forward-looking statements, whether as a result of new information, future events, or otherwise. Such statements may or may not be accurate over the long-term.
Investments, including investments in mutual funds, carry risks and investors may lose principal value. Capital markets are volatile and can decline significantly in response to adverse issuer, political, regulatory, market, or economic developments. The Fund may purchase foreign securities, including American Depository Receipts (ADRs) and other depository receipts, which are subject to interest rate, currency exchange rate, economic and political risks; this may be enhanced when investing in emerging markets. Foreign investments, especially those of companies in emerging markets, can be riskier, less liquid, harder to value, and more volatile than investments in the United States. The securities of smaller, less well-known companies can be more volatile than those of larger companies.
The return of principal in a bond fund is not guaranteed. Bond funds have the same issuer, interest rate, inflation and credit risks that are associated with underlying bonds owned by the Fund. Lower rated bonds, convertible securities and other types of debt obligations involve greater risks than higher rated bonds.
Interest rate risk is the risk that when interest rates go up, the value of fixed income instruments, such as bonds, typically go down and investors may lose principal value. Credit risk is the risk of loss of principal due to the issuer's failure to repay a loan. Generally, the lower the quality rating of a fixed income instrument, the greater the risk that the issuer will fail to pay interest fully and return principal in a timely manner. If an issuer defaults the fixed income instrument may lose some or all of its value.
Mortgage securities and collateralized mortgage obligations (CMOs) are subject to prepayment risk and the risk of default on the underlying mortgages or other assets; such derivatives may increase volatility. Convertible securities are generally not investment grade and are subject to greater credit risk than higher-rated investments. High yield securities can be volatile and subject to much higher instances of default.
Collateralized debt obligations ("CDOs"), which include collateralized loan obligations ("CLOs"), collateralized bond obligations ("CBOs"), and other similarly structured securities, carry additional risks in addition to interest rate risk and default risk. This includes, but is not limited to: (i) distributions from the underlying collateral may not be adequate to make interest or other payments; (ii) the quality of the collateral may decline in value or default; and (iii) the complex structure of the security may not be fully understood at the time of investment and may produce disputes with the issuer or unexpected investment results. Investments in CDOs are also more difficult to value than other investments.
Value style investing presents the risk that the holdings or securities may never reach their full market value because the market fails to recognize what the portfolio management team considers the true business value or because the portfolio management team has misjudged those values. In addition, value style investing may fall out of favor and underperform growth or other styles of investing during given periods.
The ratings agencies that provide ratings are Standard and Poor's, Moody's, and Fitch. Credit ratings range from AAA (highest) to D (lowest). Bonds rated BBB or above are considered investment grade. Credit ratings of BB and below are lower-rated securities (junk bonds). High-yielding, non-investment grade bonds (junk bonds) involve higher risks than investment grade bonds. Bonds with credit ratings of CCC or below have high default risk.
Please refer to the Fund's Prospectus for a complete overview of the primary risks associated with the Fund.
12
FPA NEW INCOME, INC.
LETTER TO SHAREHOLDERS
(Continued)
The Fund is not authorized for distribution unless preceded or accompanied by a current prospectus. The prospectus can be accessed at: https://fpa.com/docs/default-source/funds/fpa-new-income/literature/fpa-new-income-prospectus_01-28-22_web-ready.pdf?sfvrsn=4d13909d_4.
Index / Category Definitions
Comparison to any index is for illustrative purposes only and should not be relied upon as a fully accurate measure of comparison. The Fund will be less diversified than the indices noted herein and may hold non-index securities or securities that are not comparable to those contained in an index. Indices will hold positions that are not within the Fund's investment strategy. Indices are unmanaged, do not reflect any commissions, fees or expenses which would be incurred by an investor purchasing the underlying securities. The Fund does not include outperformance of any index or benchmark in its investment objectives. Investors cannot invest directly in an index.
Bloomberg US Aggregate Bond Index provides a measure of the performance of the U.S. investment grade bonds market, which includes investment grade U.S. Government bonds, investment grade corporate bonds, mortgage pass-through securities and asset-backed securities that are publicly offered for sale in the United States. The securities in the Index must have at least 1 year remaining in maturity. In addition, the securities must be denominated in U.S. dollars and must be fixed rate, nonconvertible, and taxable.
Bloomberg US Aggregate 1-3 Year Bond Index provides a measure of the performance of the U.S. investment grade bonds market, which includes investment grade U.S. Government bonds, investment grade corporate bonds, mortgage pass-through securities and asset-backed securities that are publicly offered for sale in the United States. The securities in the Index must have a remaining maturity of 1 to 3 years. In addition, the securities must be denominated in U.S. dollars and must be fixed rate, nonconvertible, and taxable.
Bloomberg U.S. High Yield Index measures the market of USD-denominated, non-investment grade, fixed-rate, taxable corporate bonds.
The Consumer Price Index (CPI) is an unmanaged index representing the rate of the inflation of U.S. consumer prices as determined by the U.S. Department of Labor Statistics. There can be no guarantee that the CPI will reflect the exact level of inflation at any given time. This index reflects non-seasonally adjusted returns.
CPI + 100 bps is the measure of the CPI plus an additional 100 basis points.
Morningstar Short-term Bond Category portfolios invest primarily in corporate and other investment-grade U.S. fixed-income issues and typically have durations of 1.0 to 3.5 years. These portfolios are attractive to fairly conservative investors, because they are less sensitive to interest rates than portfolios with longer durations. Morningstar calculates monthly breakpoints using the effective duration of the Morningstar Core Bond Index in determining duration assignment. Short-term is defined as 25% to 75% of the three-year average effective duration of the Morningstar Core Bond Index. As of March 31, 2022, there were 603 funds in this category.
Other Definitions
Basis Point (bps) is equal to one hundredth of one percent, or 0.01%. 100 basis points = 1%.
Coupon or coupon payment is the annual interest rate paid on a bond, expressed as a percentage of the face value and paid from issue date until maturity.
Corporate holdings include bank debt, corporate bonds and common stock.
13
FPA NEW INCOME, INC.
LETTER TO SHAREHOLDERS
(Continued)
Credit Spread or Spread is the difference in yield between a U.S. Treasury bond and another debt security of the same maturity but different credit quality
A discount margin to maturity is the average expected return of a floating-rate security (typically a bond) that's earned in addition to the index underlying, or reference rate of, the security. The size of the discount margin depends on the price of the floating- or variable-rate security.
Effective Duration (years) is the duration calculation for bonds with embedded options. Effective duration takes into account that expected cash flows will fluctuate as interest rates change.
GDP is Gross Domestic Product and it measures the monetary value of all finished goods and services (i.e., bought by the final user) made within a country during a specific period.
Mark-to-market is a method of measuring the fair value of accounts that can fluctuate over time, such as assets and liabilities.
Maximum drawdown is the maximum observed loss from a peak to a trough of a portfolio, before a new peak is attained. Maximum drawdown is an indicator of downside risk over a specified time period.
Nominal yield is the coupon rate on a bond.
A bond premium occurs when the price of the bond has increased in the secondary market. A bond might trade at a premium because its interest rate is higher than current rates in the market.
Real yield is the nominal yield of a bond minus the rate of inflation
Reflation is a fiscal or monetary policy designed to expand output, stimulate spending, and curb the effects of deflation, which usually occurs after a period of economic uncertainty or a recession.
Repo (Repurchase Agreement) is a form of short-term borrowing for dealers in government securities.
The risk-free rate reflects the yield of the Treasury bond matching the investment's duration.
Sharpe Ratio measures risk-adjusted performance. The Sharpe ratio is calculated by subtracting the risk-free rate — such as that of the 10-year U.S. Treasury bond — from the rate of return for a portfolio and dividing the result by the standard deviation of the portfolio returns.
Sortino Ratio differentiates between good and bad volatility in the Sharpe ratio. This differentiation of upwards and downwards volatility allows the calculation to provide a risk-adjusted measure of a security or fund's performance without penalizing it for upward price changes.
Weighted Average Life (years) is the average length of time that each dollar of unpaid principal on a loan, a mortgage or an amortizing bond remains outstanding.
Yield to Maturity is the rate of return anticipated on a bond if held until the end of its lifetime. YTM is considered a long-term bond yield expressed as an annual rate. The YTM calculation takes into account the bond's current market price, par value, coupon interest rate and time to maturity. It is also assumed that all coupon payments are reinvested at the same rate as the bond's current yield.
©2022 Morningstar, Inc. All Rights Reserved. The information contained herein: (1) is proprietary to Morningstar and/or its content providers; (2) may not be copied or distributed; and (3) is not warranted by Morningstar to be accurate, complete or timely. Neither Morningstar nor its content providers are responsible for any damages or losses arising from any use of this information. Past performance is no guarantee of future results.
The FPA Funds are distributed by UMB Distribution Services, LLC, ("UMBDS"), 235 W. Galena Street, Milwaukee, WI, 53212. UMBDS is not affiliated with FPA.
14
FPA NEW INCOME, INC.
LETTER TO SHAREHOLDERS
(Continued)
The discussions of Fund investments represent the views of the Fund's managers at the time of this report and are subject to change without notice. References to individual securities are for informational purposes only and should not be construed as recommendations to purchase or sell individual securities.
FUND RISKS
Investments in mutual funds carry risks and investors may lose principal value. Stock markets are volatile and can decline significantly in response to adverse issuer, political, regulatory, market, or economic developments. The funds may purchase foreign securities which are subject to interest rate, currency exchange rate, economic and political risks: this may be enhanced when investing in emerging markets. The securities of smaller, less well-known companies can be more volatile than those of larger companies. The return of principal in a bond fund is not guaranteed. Bond funds have the same issuer, interest rate, inflation and credit risks that are associated with underlying bonds owned by the fund. Lower rated bonds, convertible securities and other types of debt obligations involve greater risks than higher rated bonds. Mortgage securities and collateralized mortgage obligations (CMOs) are subject to prepayment risk and the risk of default on the underlying mortgages or other assets; derivatives may increase volatility. High yield securities can be volatile and subject to much higher instances of default.
FORWARD LOOKING STATEMENT DISCLOSURE
As mutual fund managers, one of our responsibilities is to communicate with shareholders in an open and direct manner. Insofar as some of our opinions and comments in our letters to shareholders are based on our current expectations, they are considered "forward-looking statements" which may or may not prove to be accurate over the long term. While we believe we have a reasonable basis for our comments and we have confidence in our opinions, actual results may differ materially from those we anticipate. You can identify forward-looking statements by words such as "believe," "expect," "may," "anticipate," and other similar expressions when discussing prospects for particular portfolio holdings and/or the markets, generally. We cannot, however, assure future results and disclaim any obligation to update or alter any forward-looking statements, whether as a result of new information, future events, or otherwise. Further, information provided in this report should not be construed as a recommendation to purchase or sell any particular security.
15
FPA NEW INCOME, INC.
PORTFOLIO SUMMARY
March 31, 2022 (Unaudited)
Common Stocks | | | | | 1.3 | % | |
Energy | | | 0.5 | % | | | | | |
Industrials | | | 0.7 | % | | | | | |
Retailing | | | 0.1 | % | | | | | |
Bonds & Debentures | | | | | 96.2 | % | |
Asset-Backed Securities | | | 66.6 | % | | | | | |
U.S. Treasuries | | | 9.6 | % | | | | | |
Residential Mortgage-Backed Securities | | | 8.9 | % | | | | | |
Commercial Mortgage-Backed Securities | | | 7.6 | % | | | | | |
Corporate Bank Debt | | | 2.7 | % | | | | | |
Corporate Bonds & Notes | | | 0.8 | % | | | | | |
Short-term Investments | | | | | 2.6 | % | |
Other Assets And Liabilities, Net | | | | | (0.1 | )% | |
Net Assets | | | | | 100.0 | % | |
16
FPA NEW INCOME, INC.
PORTFOLIO OF INVESTMENTS
March 31, 2022
(Unaudited)
COMMON STOCKS | | Shares or
Principal
Amount | | Fair
Value | |
ENERGY — 0.5% | |
PHI Group, Inc., Restricted(a)(b)(c) | | | 3,806,420 | | | $ | 58,238,226 | | |
| | | $ | 58,238,226 | | |
INDUSTRIALS — 0.7% | |
Boart Longyear Group Ltd.(d) | | | 43,018,605 | | | $ | 78,867,539 | | |
| | | $ | 78,867,539 | | |
RETAILING — 0.1% | |
Copper Earn Out Trust(a)(b)(c) | | | 69,361 | | | $ | 814,992 | | |
Copper Property CTL Pass Through Trust(a)(b)(c) | | | 520,208 | | | | 8,193,276 | | |
| | | $ | 9,008,268 | | |
| TOTAL COMMON STOCKS — 1.3% (Cost $139,264,410) | | $ | 146,114,033 | | |
BONDS & DEBENTURES | |
COMMERCIAL MORTGAGE-BACKED SECURITIES — 7.6% | |
AGENCY — 0.1% | |
Federal Home Loan Mortgage Corp. K042 A1 — 2.267% 6/25/2024 | | $ | 7,991,127 | | | $ | 7,963,403 | | |
| | | $ | 7,963,403 | | |
AGENCY STRIPPED — 0.4% | |
Government National Mortgage Association 2012-45 IO —
0.000% 4/16/2053(e) | | $ | 2,192,670 | | | $ | 470 | | |
Government National Mortgage Association 2012-25 IO —
0.061% 8/16/2052(e) | | | 19,166,379 | | | | 20,521 | | |
Government National Mortgage Association 2013-45 IO —
0.097% 12/16/2053(e) | | | 23,796,505 | | | | 88,939 | | |
Government National Mortgage Association 2012-125 IO —
0.180% 2/16/2053(e) | | | 45,354,090 | | | | 269,122 | | |
Government National Mortgage Association 2013-125 IO —
0.203% 10/16/2054(e) | | | 9,488,630 | | | | 129,722 | | |
Government National Mortgage Association 2014-157 IO —
0.233% 5/16/2055(e) | | | 32,165,227 | | | | 376,610 | | |
Government National Mortgage Association 2014-110 IO —
0.304% 1/16/2057(e) | | | 19,479,953 | | | | 325,687 | | |
Government National Mortgage Association 2015-19 IO —
0.304% 1/16/2057(e) | | | 30,343,715 | | | | 572,431 | | |
Government National Mortgage Association 2015-169 IO —
0.317% 7/16/2057(e) | | | 47,392,320 | | | | 959,377 | | |
Government National Mortgage Association 2015-41 IO —
0.318% 9/16/2056(e) | | | 8,999,164 | | | | 166,925 | | |
17
FPA NEW INCOME, INC.
PORTFOLIO OF INVESTMENTS (Continued)
March 31, 2022
(Unaudited)
BONDS & DEBENTURES — Continued | | Principal
Amount | | Fair
Value | |
Government National Mortgage Association 2012-79 IO —
0.395% 3/16/2053(e) | | $ | 49,587,198 | | | $ | 499,497 | | |
Government National Mortgage Association 2015-108 IO —
0.413% 10/16/2056(e) | | | 2,195,559 | | | | 62,760 | | |
Government National Mortgage Association 2014-153 IO —
0.416% 4/16/2056(e) | | | 45,720,808 | | | | 1,060,869 | | |
Government National Mortgage Association 2015-150 IO —
0.422% 9/16/2057(e) | | | 8,520,523 | | | | 228,964 | | |
Government National Mortgage Association 2012-150 IO —
0.536% 11/16/2052(e) | | | 36,657,547 | | | | 410,946 | | |
Government National Mortgage Association 2015-7 IO —
0.553% 1/16/2057(e) | | | 22,700,323 | | | | 595,030 | | |
Government National Mortgage Association 2014-175 IO —
0.565% 4/16/2056(e) | | | 72,996,122 | | | | 1,760,009 | | |
Government National Mortgage Association 2014-138 IO —
0.600% 4/16/2056(e) | | | 8,110,558 | | | | 203,900 | | |
Government National Mortgage Association 2014-77 IO —
0.631% 12/16/2047(e) | | | 14,461,648 | | | | 201,481 | | |
Government National Mortgage Association 2014-187 IO —
0.654% 5/16/2056(e) | | | 80,088,553 | | | | 2,143,026 | | |
Government National Mortgage Association 2012-114 IO —
0.656% 1/16/2053(e) | | | 21,478,519 | | | | 383,321 | | |
Government National Mortgage Association 2016-125 IO —
0.822% 12/16/2057(e) | | | 65,193,510 | | | | 2,703,588 | | |
Government National Mortgage Association 2016-65 IO —
0.853% 1/16/2058(e) | | | 32,151,355 | | | | 940,180 | | |
Government National Mortgage Association 2020-75 IO —
0.900% 2/16/2062(e) | | | 106,269,398 | | | | 7,737,709 | | |
Government National Mortgage Association 2020-42 IO —
0.936% 3/16/2062(e) | | | 131,991,325 | | | | 9,722,996 | | |
Government National Mortgage Association 2016-106 IO —
0.980% 9/16/2058(e) | | | 91,102,073 | | | | 4,220,431 | | |
Government National Mortgage Association 2020-71 IO —
1.103% 1/16/2062(e) | | | 58,221,081 | | | | 4,640,575 | | |
Government National Mortgage Association 2020-43 IO —
1.267% 11/16/2061(e) | | | 44,054,440 | | | | 3,652,637 | | |
| | | $ | 44,077,723 | | |
NON-AGENCY — 7.1% | |
A10 Bridge Asset Financing 2021-D A1FX — 2.589% 10/1/2038(b)(f) | | $ | 12,705,000 | | | $ | 12,705,000 | | |
A10 Bridge Asset Financing LLC 2020-C A — 2.021% 8/15/2040(f) | | | 12,034,519 | | | | 12,019,052 | | |
18
FPA NEW INCOME, INC.
PORTFOLIO OF INVESTMENTS (Continued)
March 31, 2022
(Unaudited)
BONDS & DEBENTURES — Continued | | Principal
Amount | | Fair
Value | |
ACRE Commercial Mortgage Ltd. 2021-FL4 A, 1M USD LIBOR +
0.830% — 1.298% 12/18/2037(e)(f) | | $ | 13,879,936 | | | $ | 13,778,338 | | |
ACRES Commercial Realty Ltd. 2021-FL1 A, 1M USD LIBOR +
1.200% — 1.641% 6/15/2036(e)(f) | | | 59,792,000 | | | | 59,263,457 | | |
ACRES Commercial Realty Ltd. 2021-FL2 A, 1M USD LIBOR +
1.400% — 1.841% 1/15/2037(e)(f) | | | 13,444,000 | | | | 13,374,811 | | |
Arbor Realty Commercial Real Estate Notes Ltd. 2021-FL1 A,
1M USD LIBOR + 0.970% — 1.367% 12/15/2035(e)(f) | | | 54,525,000 | | | | 54,173,870 | | |
Arbor Realty Commercial Real Estate Notes Ltd. 2021-FL2 A,
1M USD LIBOR + 1.100% — 1.497% 5/15/2036(e)(f) | | | 45,859,000 | | | | 45,323,601 | | |
Arbor Realty Commercial Real Estate Notes Ltd. 2022-FL1 A,
1M USD LIBOR + 1.450% — 1.500% 1/15/2037(e)(f) | | | 57,822,000 | | | | 57,519,377 | | |
Arbor Realty Commercial Real Estate Notes Ltd. 2021-FL4 A,
1M USD LIBOR + 1.350% — 1.747% 11/15/2036(e)(f) | | | 59,062,000 | | | | 58,526,030 | | |
AREIT Trust 2019-CRE3 A, 1M USD LIBOR + 1.1340% —
1.185% 9/14/2036(e)(f) | | | 2,111,655 | | | | 2,104,345 | | |
BDS 2021-FL8 A, 1M USD LIBOR + 0.920% — 1.388% 1/18/2036(e)(f) | | | 21,607,164 | | | | 21,302,256 | | |
BDS Ltd. 2019-FL4 A, 1M USD LIBOR + 1.100% —
1.541% 8/15/2036(e)(f) | | | 23,921,041 | | | | 23,803,277 | | |
BDS Ltd. 2019-FL4 AS, 1M USD LIBOR + 1.400% —
1.841% 8/15/2036(e)(f) | | | 6,613,000 | | | | 6,527,405 | | |
Bear Stearns Commercial Mortgage Securities Trust 2005-PWR7 B —
4.883% 2/11/2041(e) | | | 1,068,911 | | | | 1,063,672 | | |
BPCRE Ltd. 2021-FL1 A, 1M USD LIBOR + 0.850% —
1.291% 2/15/2037(e)(f) | | | 753,683 | | | | 744,832 | | |
BX Commercial Mortgage Trust 2021-VOLT E, 1M USD LIBOR +
2.000% — 2.397% 9/15/2036(e)(f) | | | 28,900,000 | | | | 27,807,251 | | |
BXMT Ltd. 2021-FL4 A, 1M USD LIBOR + 1.050% —
1.447% 5/15/2038(e)(f) | | | 62,883,000 | | | | 62,521,178 | | |
COMM 2013-CCRE7 Mortgage Trust 2013-CR7 A4 —
3.213% 3/10/2046 | | | 11,610,442 | | | | 11,629,407 | | |
CoreVest American Finance Trust 2018-1 A — 3.804% 6/15/2051(f) | | | 13,812,400 | | | | 13,837,142 | | |
HERA Commercial Mortgage Ltd. 2021-FL1 A, 1M USD LIBOR +
1.050% — 1.518% 2/18/2038(e)(f) | | | 54,659,000 | | | | 53,910,560 | | |
JP Morgan Chase Commercial Mortgage Securities Trust 2013-LC11 A4 —
2.694% 4/15/2046 | | | 2,731,285 | | | | 2,715,869 | | |
JPMBB Commercial Mortgage Securities Trust 2015-C30 ASB —
3.559% 7/15/2048 | | | 4,581,170 | | | | 4,609,360 | | |
KREF Ltd. 2021-FL2 A, 1M USD LIBOR + 1.070% —
1.511% 2/15/2039(e)(f) | | | 19,179,000 | | | | 18,855,099 | | |
19
FPA NEW INCOME, INC.
PORTFOLIO OF INVESTMENTS (Continued)
March 31, 2022
(Unaudited)
BONDS & DEBENTURES — Continued | | Principal
Amount | | Fair
Value | |
LCCM Trust 2021-FL2 A, 1M USD LIBOR + 1.200% —
1.597% 12/13/2038(e)(f) | | $ | 9,154,000 | | | $ | 9,093,240 | | |
LoanCore Issuer Ltd. 2021-CRE4 A, 1M USD LIBOR + 0.914% —
0.964% 7/15/2035(e)(f) | | | 22,256,887 | | | | 22,042,787 | | |
LoanCore Issuer Ltd. 2021-CRE5 A, 1M USD LIBOR + 1.300% —
1.697% 7/15/2036(e)(f) | | | 8,879,000 | | | | 8,722,496 | | |
MF1 Ltd. 2020-FL4 A, 1M USD LIBOR + 1.814% —
2.143% 11/15/2035(e)(f) | | | 17,415,000 | | | | 17,237,203 | | |
Ready Capital Mortgage Financing LLC 2021-FL5 A, 1M USD LIBOR +
1.000% — 1.457% 4/25/2038(e)(f) | | | 24,440,442 | | | | 24,358,464 | | |
Shelter Growth CRE Issuer Ltd. 2021-FL3 A, 1M USD LIBOR +
1.080% — 1.477% 9/15/2036(e)(f) | | | 16,771,354 | | | | 16,593,363 | | |
STWD Ltd. 2021-FL2 A, 1M USD LIBOR + 1.200% —
1.668% 4/18/2038(e)(f) | | | 33,755,000 | | | | 33,480,673 | | |
TRTX Issuer Ltd. 2019-FL3 A, 1M USD LIBOR + 1.264% —
1.315% 10/15/2034(e)(f) | | | 9,738,482 | | | | 9,714,256 | | |
TRTX Issuer Ltd. 2022-FL5 A, 1M USD LIBOR + 1.650% —
1.700% 2/15/2039(e)(f) | | | 37,857,000 | | | | 37,872,760 | | |
VCC Trust 2020-MC1 A — 4.500% 6/25/2045(e)(f) | | | 1,225,107 | | | | 1,225,413 | | |
VMC Finance LLC 2021-HT1 A, 3M USD LIBOR + 1.650% —
2.118% 1/18/2037(e)(f) | | | 26,553,640 | | | | 26,022,573 | | |
| | | $ | 784,478,417 | | |
TOTAL COMMERICAL MORTGAGE-BACKED SECURITIES
(Cost $866,620,580) | | $ | 836,519,543 | | |
RESIDENTIAL MORTGAGE-BACKED SECURITIES — 8.9% | |
AGENCY COLLATERALIZED MORTGAGE OBLIGATION — 0.2% | |
Federal Home Loan Mortgage Corp. 4170 QE — 2.000% 5/15/2032 | | $ | 962,868 | | | $ | 983,971 | | |
Federal Home Loan Mortgage Corp. 3979 HD — 2.500% 12/15/2026 | | | 715,517 | | | | 732,516 | | |
Federal Home Loan Mortgage Corp. 4304 DA — 2.500% 1/15/2027 | | | 245,118 | | | | 248,737 | | |
Federal Home Loan Mortgage Corp. 4010 DE — 2.500% 2/15/2027 | | | 830,566 | | | | 851,218 | | |
Federal Home Loan Mortgage Corp. 4387 VA — 3.000% 2/15/2026 | | | 256,770 | | | | 257,566 | | |
Federal Home Loan Mortgage Corp. 3914 MA — 3.000% 6/15/2026 | | | 611,352 | | | | 632,666 | | |
Federal Home Loan Mortgage Corp. 3862 MB — 3.500% 5/15/2026 | | | 5,539,552 | | | | 5,775,920 | | |
Federal Home Loan Mortgage Corp. 3828 VE — 4.500% 1/15/2024 | | | 391,561 | | | | 403,514 | | |
Federal Home Loan Mortgage Corp. 4395 NT — 4.500% 7/15/2026 | | | 2,308,639 | | | | 2,405,237 | | |
Federal National Mortgage Association 2014-21 ED — 2.250% 4/25/2029 | | | 145,488 | | | | 147,358 | | |
Federal National Mortgage Association 2013-135 KM —
2.500% 3/25/2028 | | | 344,078 | | | | 348,127 | | |
20
FPA NEW INCOME, INC.
PORTFOLIO OF INVESTMENTS (Continued)
March 31, 2022
(Unaudited)
BONDS & DEBENTURES — Continued | | Principal
Amount | | Fair
Value | |
Federal National Mortgage Association 2017-30 G — 3.000% 7/25/2040 | | $ | 808,755 | | | $ | 811,343 | | |
Federal National Mortgage Association 2013-93 PJ — 3.000% 7/25/2042 | | | 866,349 | | | | 861,672 | | |
Federal National Mortgage Association 2011-80 KB — 3.500% 8/25/2026 | | | 4,016,919 | | | | 4,166,169 | | |
Federal National Mortgage Association 2012-144 PD — 3.500% 4/25/2042 | | | 1,767,857 | | | | 1,777,845 | | |
Federal National Mortgage Association 2010-43 MK — 5.500% 5/25/2040 | | | 646,257 | | | | 675,421 | | |
| | | $ | 21,079,280 | | |
AGENCY POOL ADJUSTABLE RATE — 0.0% | |
Federal National Mortgage Association 865963,
12M USD LIBOR + 1.906% — 2.360% 3/1/2036(e) | | $ | 286,456 | | | $ | 299,710 | | |
| | | $ | 299,710 | | |
AGENCY POOL FIXED RATE — 2.2% | |
Federal Home Loan Mortgage Corp. ZA2796 — 2.500% 11/1/2027 | | $ | 2,591,591 | | | $ | 2,589,214 | | |
Federal Home Loan Mortgage Corp. J22472 — 2.500% 2/1/2028 | | | 1,934,268 | | | | 1,935,036 | | |
Federal Home Loan Mortgage Corp. ZS8495 — 2.500% 8/1/2028 | | | 920,748 | | | | 919,904 | | |
Federal Home Loan Mortgage Corp. J32374 — 2.500% 11/1/2028 | | | 102,837,968 | | | | 102,814,531 | | |
Federal Home Loan Mortgage Corp. G15169 — 4.500% 9/1/2026 | | | 429,965 | | | | 441,513 | | |
Federal Home Loan Mortgage Corp. G15272 — 4.500% 9/1/2026 | | | 128,345 | | | | 131,095 | | |
Federal Home Loan Mortgage Corp. G15875 — 4.500% 9/1/2026 | | | 587,347 | | | | 601,649 | | |
Federal Home Loan Mortgage Corp. G15036 — 5.000% 6/1/2024 | | | 20,196 | | | | 20,595 | | |
Federal Home Loan Mortgage Corp. G13667 — 5.000% 8/1/2024 | | | 900 | | | | 909 | | |
Federal Home Loan Mortgage Corp. G15173 — 5.000% 6/1/2026 | | | 51,080 | | | | 51,896 | | |
Federal Home Loan Mortgage Corp. G15407 — 5.000% 6/1/2026 | | | 292,855 | | | | 298,653 | | |
Federal Home Loan Mortgage Corp. G15230 — 5.500% 12/1/2024 | | | 110,258 | | | | 112,331 | | |
Federal Home Loan Mortgage Corp. G15458 — 5.500% 12/1/2024 | | | 22,446 | | | | 22,766 | | |
Federal Home Loan Mortgage Corp. G14460 — 6.000% 1/1/2024 | | | 712 | | | | 726 | | |
Federal National Mortgage Association AQ9360 — 2.500% 1/1/2028 | | | 1,053,329 | | | | 1,053,021 | | |
Federal National Mortgage Association FS0499 — 2.500% 11/1/2030 | | | 56,784,672 | | | | 56,768,073 | | |
Federal National Mortgage Association FS0452 — 2.500% 10/1/2031 | | | 6,539,023 | | | | 6,537,111 | | |
Federal National Mortgage Association FS0494 — 2.500% 2/1/2035 | | | 65,521,652 | | | | 65,502,500 | | |
Federal National Mortgage Association FM1102 — 4.000% 3/1/2031 | | | 3,413,568 | | | | 3,510,385 | | |
Federal National Mortgage Association AL4056 — 5.000% 6/1/2026 | | | 92,091 | | | | 93,525 | | |
Federal National Mortgage Association AL5867 — 5.500% 8/1/2023 | | | 5,544 | | | | 5,628 | | |
Federal National Mortgage Association AL0471 — 5.500% 7/1/2025 | | | 11,376 | | | | 11,665 | | |
Federal National Mortgage Association AL4433 — 5.500% 9/1/2025 | | | 18,364 | | | | 18,860 | | |
Federal National Mortgage Association AL4901 — 5.500% 9/1/2025 | | | 22,022 | | | | 22,373 | | |
Federal National Mortgage Association AL0294 — 6.000% 10/1/2022 | | | 534 | | | | 538 | | |
Federal National Mortgage Association 890225 — 6.000% 5/1/2023 | | | 15,442 | | | | 15,699 | | |
Government National Mortgage Association 782281 — 6.000% 3/15/2023 | | | 49,578 | | | | 50,210 | | |
| | | $ | 243,530,406 | | |
21
FPA NEW INCOME, INC.
PORTFOLIO OF INVESTMENTS (Continued)
March 31, 2022
(Unaudited)
BONDS & DEBENTURES — Continued | | Principal
Amount | | Fair
Value | |
AGENCY STRIPPED — 0.0% | |
Federal Home Loan Mortgage Corp. 217 PO — 0.000% 1/1/2032(g) | | $ | 84,355 | | | $ | 72,769 | | |
Federal Home Loan Mortgage Corp. 3917 AI — 4.500% 7/15/2026 | | | 1,298,764 | | | | 21,772 | | |
Federal Home Loan Mortgage Corp. 217 IO — 6.500% 1/1/2032 | | | 81,225 | | | | 16,631 | | |
Federal National Mortgage Association 2010-25 NI — 5.000% 3/25/2025 | | | 147 | | | | 3 | | |
Federal National Mortgage Association 2003-64 XI — 5.000% 7/25/2033 | | | 226,004 | | | | 40,163 | | |
| | | $ | 151,338 | | |
NON-AGENCY COLLATERALIZED MORTGAGE OBLIGATION — 6.5% | |
Bravo Residential Funding Trust 2019-1 A1C — 3.500% 3/25/2058(f) | | $ | 7,550,524 | | | $ | 7,536,343 | | |
Cascade Funding Mortgage Trust 2021-HB6 A — 0.898% 6/25/2036(e)(f) | | | 18,700,513 | | | | 18,472,723 | | |
CFMT LLC 2021-HB5 A — 0.801% 2/25/2031(e)(f) | | | 37,948,631 | | | | 37,534,593 | | |
CFMT LLC 2020-HB4 A — 0.946% 12/26/2030(e)(f) | | | 11,109,313 | | | | 11,024,771 | | |
CFMT LLC 2021-HB7 A — 1.151% 10/27/2031(e)(f) | | | 20,951,606 | | | | 20,623,787 | | |
CFMT LLC 2021-HB7 M1 — 2.125% 10/27/2031(e)(f) | | | 15,406,000 | | | | 14,824,149 | | |
CIM Trust 2017-7 A — 3.000% 4/25/2057(e)(f) | | | 4,331,510 | | | | 4,323,731 | | |
CIM Trust 2018-R3 A1 — 5.000% 12/25/2057(e)(f) | | | 21,751,116 | | | | 21,872,307 | | |
Citigroup Mortgage Loan Trust, Inc. 2014-A A — 4.000% 1/25/2035(e)(f) | | | 3,038,096 | | | | 2,976,114 | | |
Finance of America HECM Buyout 2020-HB2 A —
1.710% 7/25/2030(e)(f) | | | 40,215,627 | | | | 38,890,381 | | |
Mill City Mortgage Loan Trust 2018-2 A1 — 3.500% 5/25/2058(e)(f) | | | 12,271,056 | | | | 12,221,756 | | |
Nomura Resecuritization Trust 2016-1R 3A1 — 5.000% 9/28/2036(e)(f) | | | 510,172 | | | | 510,061 | | |
PRET LLC 2021-NPL5 A1 — 2.487% 10/25/2051(f)(h) | | | 72,218,741 | | | | 69,877,322 | | |
Pretium Mortgage Credit Partners I LLC 2021-NPL2 A1 —
1.992% 6/27/2060(f)(h) | | | 32,540,095 | | | | 31,214,877 | | |
Pretium Mortgage Credit Partners I LLC 2021-NPL4 A1 —
2.363% 10/27/2060(f)(h) | | | 57,407,417 | | | | 55,597,924 | | |
Pretium Mortgage Credit Partners I LLC 2021-NPL6 A1 —
2.487% 7/25/2051(f)(h) | | | 24,770,700 | | | | 24,055,327 | | |
PRPM LLC 2021-2 A1 — 2.115% 3/25/2026(e)(f) | | | 23,609,692 | | | | 22,808,176 | | |
PRPM LLC 2021-9 A1 — 2.363% 10/25/2026(e)(f) | | | 25,576,063 | | | | 24,670,378 | | |
PRPM LLC 2021-10 A1 — 2.487% 10/25/2026(f)(h) | | | 32,417,635 | | | | 31,420,952 | | |
PRPM LLC 2021-11 A1 — 2.487% 11/25/2026(f)(h) | | | 39,547,237 | | | | 37,844,246 | | |
RCO VII Mortgage LLC 2021-2 A1 — 2.116% 9/25/2026(f)(h) | | | 33,718,332 | | | | 32,480,751 | | |
Towd Point Mortgage Trust 2018-1 A1 — 3.000% 1/25/2058(e)(f) | | | 11,515,864 | | | | 11,479,913 | | |
Towd Point Mortgage Trust 2018-2 A1 — 3.250% 3/25/2058(e)(f) | | | 31,468,403 | | | | 31,331,598 | | |
Towd Point Mortgage Trust 2018-5 A1A — 3.250% 7/25/2058(e)(f) | | | 18,341,766 | | | | 18,328,574 | | |
Towd Point Mortgage Trust 2018-6 A1A — 3.750% 3/25/2058(e)(f) | | | 17,592,245 | | | | 17,654,933 | | |
VCAT LLC 2021 NPL2 A1 — 2.115% 3/27/2051(f)(h) | | | 24,348,093 | | | | 23,599,350 | | |
VCAT LLC 2021-NPL1 A1 — 2.289% 12/26/2050(f)(h) | | | 6,090,369 | | | | 5,919,968 | | |
VOLT C LLC 2021-NPL9 — 1.992% 5/25/2051(f)(h) | | | 22,180,189 | | | | 21,421,471 | | |
22
FPA NEW INCOME, INC.
PORTFOLIO OF INVESTMENTS (Continued)
March 31, 2022
(Unaudited)
BONDS & DEBENTURES — Continued | | Principal
Amount | | Fair
Value | |
VOLT XCIV LLC 2021-NPL3 A1 — 2.240% 2/27/2051(f)(h) | | $ | 26,754,346 | | | $ | 25,683,476 | | |
VOLT XCV LLC 2021-NPL4 — 2.240% 3/27/2051(f)(h) | | | 29,797,642 | | | | 29,141,635 | | |
| | | $ | 705,341,587 | | |
TOTAL RESIDENTIAL MORTGAGE-BACKED SECURITIES
(Cost $990,663,532) | | $ | 970,402,321 | | |
ASSET-BACKED SECURITIES — 66.6% | |
AUTO — 25.1% | |
American Credit Acceptance Receivables Trust 2021-4 B —
0.860% 2/13/2026(f) | | $ | 9,955,000 | | | $ | 9,693,811 | | |
American Credit Acceptance Receivables Trust 2021-2 C —
0.970% 7/13/2027(f) | | | 55,165,000 | | | | 53,823,674 | | |
American Credit Acceptance Receivables Trust 2021-3 C —
0.980% 11/15/2027(f) | | | 40,171,000 | | | | 38,795,039 | | |
American Credit Acceptance Receivables Trust 2021-4 C —
1.320% 2/14/2028(f) | | | 36,195,000 | | | | 34,780,579 | | |
American Credit Acceptance Receivables Trust 2022-1 B —
1.680% 9/14/2026(f) | | | 22,408,000 | | | | 21,935,868 | | |
American Credit Acceptance Receivables Trust 2022-1 C —
2.120% 3/13/2028(f) | | | 45,613,000 | | | | 44,261,313 | | |
AmeriCredit Automobile Receivables Trust 2021-3 A3 —
0.760% 8/18/2026 | | | 21,998,000 | | | | 21,370,054 | | |
AmeriCredit Automobile Receivables Trust 2020-2 C —
1.480% 2/18/2026 | | | 6,808,000 | | | | 6,697,223 | | |
BMW Vehicle Lease Trust 2021-2 A3 — 0.330% 12/26/2024 | | | 41,858,000 | | | | 40,692,167 | | |
BMW Vehicle Lease Trust 2022-1 A4 — 1.230% 5/27/2025 | | | 30,512,000 | | | | 29,399,856 | | |
CarMax Auto Owner Trust 2022-1 A3 — 1.470% 12/15/2026 | | | 61,620,000 | | | | 59,652,979 | | |
CarMax Auto Owner Trust 2020-3 C — 1.690% 4/15/2026 | | | 1,064,000 | | | | 1,020,783 | | |
CarMax Auto Owner Trust 2020-2 A4 — 2.050% 5/15/2025 | | | 14,689,000 | | | | 14,566,868 | | |
Drive Auto Receivables Trust 2021-3 A3 — 0.790% 10/15/2025 | | | 36,396,000 | | | | 35,626,276 | | |
Drive Auto Receivables Trust 2021-2 C — 0.870% 10/15/2027 | | | 51,629,000 | | | | 49,339,176 | | |
Drive Auto Receivables Trust 2021-3 B — 1.110% 5/15/2026 | | | 72,790,000 | | | | 70,386,023 | | |
Drive Auto Receivables Trust 2021-3 C — 1.470% 1/15/2027 | | | 72,790,000 | | | | 69,521,787 | | |
DT Auto Owner Trust 2021-3A B — 0.580% 11/17/2025(f) | | | 20,559,000 | | | | 19,840,412 | | |
DT Auto Owner Trust 2021-2A B — 0.810% 1/15/2027(f) | | | 10,619,000 | | | | 10,394,112 | | |
DT Auto Owner Trust 2021-1A C — 0.840% 10/15/2026(f) | | | 3,462,000 | | | | 3,348,168 | | |
DT Auto Owner Trust 2021-3A C — 0.870% 5/17/2027(f) | | | 18,106,000 | | | | 17,173,804 | | |
DT Auto Owner Trust 2021-4A B — 1.020% 5/15/2026(f) | | | 13,540,000 | | | | 13,129,263 | | |
DT Auto Owner Trust 2020-3A C — 1.470% 6/15/2026(f) | | | 6,384,000 | | | | 6,274,691 | | |
23
FPA NEW INCOME, INC.
PORTFOLIO OF INVESTMENTS (Continued)
March 31, 2022
(Unaudited)
BONDS & DEBENTURES — Continued | | Principal
Amount | | Fair
Value | |
DT Auto Owner Trust 2021-4A C — 1.500% 9/15/2027(f) | | $ | 13,540,000 | | | $ | 12,981,702 | | |
DT Auto Owner Trust 2022-1A C — 2.960% 11/15/2027(f) | | | 18,926,000 | | | | 18,605,827 | | |
Exeter Automobile Receivables Trust 2021-4A B — 1.050% 5/15/2026 | | | 42,765,000 | | | | 41,745,427 | | |
Exeter Automobile Receivables Trust 2021-4A C — 1.460% 10/15/2027 | | | 41,400,000 | | | | 39,682,148 | | |
Exeter Automobile Receivables Trust 2022-1A B — 2.180% 6/15/2026 | | | 94,894,000 | | | | 93,508,102 | | |
Exeter Automobile Receivables Trust 2022-1A C — 2.560% 6/15/2028 | | | 49,707,000 | | | | 48,621,235 | | |
First Investors Auto Owner Trust 2021-2A A — 0.480% 3/15/2027(f) | | | 100,368,631 | | | | 98,051,390 | | |
Flagship Credit Auto Trust 2021-2 C — 1.270% 6/15/2027(f) | | | 17,609,000 | | | | 16,733,010 | | |
Flagship Credit Auto Trust 2021-4 B — 1.490% 2/15/2027(f) | | | 8,567,000 | | | | 8,189,228 | | |
Ford Credit Auto Lease Trust 2021-B A3 — 0.370% 10/15/2024 | | | 89,517,000 | | | | 87,043,520 | | |
Ford Credit Auto Lease Trust 2021-B A4 — 0.400% 12/15/2024 | | | 55,829,000 | | | | 53,907,796 | | |
Ford Credit Auto Lease Trust 2021-B B — 0.660% 1/15/2025 | | | 22,156,000 | | | | 21,433,907 | | |
Ford Credit Auto Lease Trust 2021-B C — 0.900% 5/15/2026 | | | 21,928,000 | | | | 20,957,763 | | |
Ford Credit Auto Owner Trust 2020-B B — 1.190% 1/15/2026 | | | 400,000 | | | | 389,214 | | |
Ford Credit Auto Owner Trust 2022-A A3 — 1.290% 6/15/2026 | | | 33,165,000 | | | | 32,321,584 | | |
GM Financial Automobile Leasing Trust 2021-2 B — 0.690% 5/20/2025 | | | 4,991,000 | | | | 4,833,892 | | |
GM Financial Automobile Leasing Trust 2022-1 A3 — 1.900% 3/20/2025 | | | 91,758,000 | | | | 90,637,011 | | |
GM Financial Automobile Leasing Trust 2022-1 A4 — 1.960% 2/20/2026 | | | 43,831,000 | | | | 43,126,500 | | |
GM Financial Automobile Leasing Trust 2022-1 B — 2.230% 2/20/2026 | | | 12,446,000 | | | | 12,240,339 | | |
GM Financial Automobile Leasing Trust 2022-1 C — 2.640% 2/20/2026 | | | 32,069,000 | | | | 31,552,304 | | |
GM Financial Consumer Automobile Receivables Trust 2022-1 A3 —
1.260% 11/16/2026 | | | 29,166,000 | | | | 28,345,934 | | |
GM Financial Consumer Automobile Receivables Trust 2020-3 C —
1.370% 1/16/2026 | | | 2,760,000 | | | | 2,688,528 | | |
Honda Auto Receivables Owner Trust 2021-4 A3 — 0.880% 1/21/2026 | | | 44,179,000 | | | | 42,741,725 | | |
Hyundai Auto Lease Securitization Trust 2021-C A3 —
0.380% 9/16/2024(f) | | | 80,238,000 | | | | 77,898,725 | | |
Hyundai Auto Lease Securitization Trust 2021-B A4 —
0.380% 8/15/2025(f) | | | 2,176,000 | | | | 2,111,710 | | |
Hyundai Auto Lease Securitization Trust 2021-A A4 —
0.420% 12/16/2024(f) | | | 10,288,000 | | | | 10,079,434 | | |
Hyundai Auto Lease Securitization Trust 2021-A B —
0.610% 10/15/2025(f) | | | 3,663,000 | | | | 3,584,441 | | |
Hyundai Auto Lease Securitization Trust 2022-A A3 —
1.160% 1/15/2025(f) | | | 59,677,000 | | | | 58,233,843 | | |
Hyundai Auto Lease Securitization Trust 2022-A A4 —
1.320% 12/15/2025(f) | | | 35,890,000 | | | | 34,906,241 | | |
Hyundai Auto Receivables Trust 2021-C A3 — 0.740% 5/15/2026 | | | 29,067,000 | | | | 27,961,704 | | |
Nissan Auto Lease Trust 2021-A A3 — 0.520% 8/15/2024 | | | 68,261,000 | | | | 66,540,086 | | |
Prestige Auto Receivables Trust 2021-1A B — 1.190% 4/15/2026(f) | | | 37,756,000 | | | | 36,366,390 | | |
24
FPA NEW INCOME, INC.
PORTFOLIO OF INVESTMENTS (Continued)
March 31, 2022
(Unaudited)
BONDS & DEBENTURES — Continued | | Principal
Amount | | Fair
Value | |
Prestige Auto Receivables Trust 2021-1A C — 1.530% 2/15/2028(f) | | $ | 13,545,000 | | | $ | 12,880,595 | | |
Santander Drive Auto Receivables Trust 2021-4 B — 0.880% 6/15/2026 | | | 97,273,000 | | | | 94,006,193 | | |
Santander Drive Auto Receivables Trust 2021-4 C — 1.260% 2/16/2027 | | | 63,342,000 | | | | 60,458,590 | | |
Santander Drive Auto Receivables Trust 2022-1 B — 2.360% 8/17/2026 | | | 99,413,000 | | | | 97,582,956 | | |
Santander Drive Auto Receivables Trust 2022-1 C — 2.560% 4/17/2028 | | | 33,202,000 | | | | 32,514,758 | | |
Santander Retail Auto Lease Trust 2021-C A3 — 0.500% 3/20/2025(f) | | | 52,215,000 | | | | 50,764,634 | | |
Santander Retail Auto Lease Trust 2021-A A3 — 0.510% 7/22/2024(f) | | | 1,084,000 | | | | 1,055,376 | | |
Santander Retail Auto Lease Trust 2021-B A3 — 0.510% 8/20/2024(f) | | | 2,000,000 | | | | 1,938,235 | | |
Santander Retail Auto Lease Trust 2021-A C — 1.140% 3/20/2026(f) | | | 1,886,000 | | | | 1,813,827 | | |
Santander Retail Auto Lease Trust 2022-A A3 — 1.340% 7/21/2025(f) | | | 34,544,000 | | | | 33,473,955 | | |
Santander Retail Auto Lease Trust 2022-A A4 — 1.420% 1/20/2026(f) | | | 18,847,000 | | | | 18,261,951 | | |
Santander Retail Auto Lease Trust 2022-A B — 1.610% 1/20/2026(f) | | | 10,319,000 | | | | 9,960,007 | | |
Tesla Auto Lease Trust 2021-B A2 — 0.360% 9/22/2025(f) | | | 38,207,000 | | | | 37,556,488 | | |
Volkswagen Auto Loan Enhanced Trust 2021-1 A3 — 1.020% 6/22/2026 | | | 52,430,000 | | | | 50,639,636 | | |
Westlake Automobile Receivables Trust 2021-2A B — 0.620% 7/15/2026(f) | | | 31,908,000 | | | | 30,963,128 | | |
Westlake Automobile Receivables Trust 2021-2A C — 0.890% 7/15/2026(f) | | | 50,584,000 | | | | 48,438,414 | | |
Westlake Automobile Receivables Trust 2021-3A A3 —
0.950% 6/16/2025(f) | | | 64,905,000 | | | | 63,620,504 | | |
Westlake Automobile Receivables Trust 2021-1A C — 0.950% 3/16/2026(f) | | | 6,817,000 | | | | 6,612,245 | | |
Westlake Automobile Receivables Trust 2020-3A C —
1.240% 11/17/2025(f) | | | 16,438,000 | | | | 16,188,402 | | |
Westlake Automobile Receivables Trust 2021-3A B — 1.290% 1/15/2027(f) | | | 69,723,000 | | | | 67,753,214 | | |
Westlake Automobile Receivables Trust 2021-3A C — 1.580% 1/15/2027(f) | | | 69,605,000 | | | | 66,841,326 | | |
Westlake Automobile Receivables Trust 2022-1A C — 3.110% 3/15/2027 | | | 52,910,000 | | | | 52,299,181 | | |
World Omni Auto Receivables Trust 2020-C C — 1.390% 5/17/2027 | | | 3,415,000 | | | | 3,290,446 | | |
World Omni Select Auto Trust 2021-A A3 — 0.530% 3/15/2027 | | | 52,776,000 | | | | 51,289,374 | | |
| | | $ | 2,749,948,021 | | |
COLLATERALIZED LOAN OBLIGATION — 20.5% | |
ABPCI Direct Lending Fund CLO X LP 2020-10A A1A, 3M USD
LIBOR + 1.950% — 2.204% 1/20/2032(e)(f) | | $ | 19,397,000 | | | $ | 19,399,483 | | |
ABPCI Direct Lending Fund IX LLC 2020-9A A1, 3M USD
LIBOR + 1.400% — 1.668% 11/18/2031(e)(f) | | | 43,972,000 | | | | 43,763,792 | | |
AMMC CLO 16 Ltd. 2015-16A AR2, 3M USD LIBOR + 0.980% —
1.218% 4/14/2029(e)(f) | | | 64,521,536 | | | | 64,475,145 | | |
Avery Point VI CLO Ltd. 2015-6A AR2, 3M USD LIBOR + 0.900% —
1.215% 8/5/2027(e)(f) | | | 21,069,326 | | | | 20,954,182 | | |
Barings CLO Ltd. 2018-III 2018-3A A1, 3M USD LIBOR + 0.950% —
1.204% 7/20/2029(e)(f) | | | 23,133,897 | | | | 23,065,143 | | |
Blackrock DLF VIII-L CLO Trust 2021-1A A, 3M USD LIBOR +
1.350% — 1.591% 4/17/2032(e)(f) | | | 19,716,722 | | | | 19,716,051 | | |
25
FPA NEW INCOME, INC.
PORTFOLIO OF INVESTMENTS (Continued)
March 31, 2022
(Unaudited)
BONDS & DEBENTURES — Continued | | Principal
Amount | | Fair
Value | |
Blackrock Mount Adams CLO IX LP 2021-9A A1, 3M USD LIBOR +
1.370% — 2.304% 9/22/2031(e)(f) | | $ | 31,531,000 | | | $ | 31,422,407 | | |
Brightwood Capital MM CLO Ltd. 2021-2A A, 3M USD LIBOR +
1.650% — 1.891% 11/15/2030(e)(f) | | | 85,599,000 | | | | 85,341,861 | | |
BTC Holdings Fund I LLC — 2.780% 1/28/2027(b)(c) | | | 11,717,796 | | | | 11,717,796 | | |
BTC Offshore Holdings Fund, 3M USD LIBOR + 2.650% —
2.910% 10/20/2029(b)(c) | | | 18,000,000 | | | | 18,000,000 | | |
Cerberus Loan Funding XXIX LP 2020-2A A, 3M USD LIBOR +
1.900% — 2.141% 10/15/2032(e)(f) | | | 82,252,000 | | | | 82,268,533 | | |
Cerberus Loan Funding XXV LP 2018-4RA A1TR, 3M USD LIBOR +
1.530% — 1.654% 10/15/2030(e)(f) | | | 18,629,000 | | | | 18,561,805 | | |
Cerberus Loan Funding XXVI LP 2019-1A AR, 3M USD LIBOR +
1.500% — 1.741% 4/15/2031(e)(f) | | | 10,764,000 | | | | 10,723,796 | | |
Cerberus Loan Funding XXVIII LP 2020-1A A, 3M USD LIBOR +
1.850% — 2.091% 10/15/2031(e)(f) | | | 70,979,000 | | | | 70,993,267 | | |
Cerberus Loan Funding XXXI LP 2021-1A A, 3M USD LIBOR +
1.500% — 1.741% 4/15/2032(e)(f) | | | 45,931,000 | | | | 45,831,376 | | |
Cerberus Loan Funding XXXIV LP 2021-4A A, 3M USD LIBOR +
1.500% — 1.741% 8/13/2033(e)(f) | | | 27,891,302 | | | | 27,847,095 | | |
Cerberus Loan Funding XXXVI LP 2021-6A A, 3M USD LIBOR +
1.400% — 1.641% 11/22/2033(e)(f) | | | 78,117,635 | | | | 78,006,786 | | |
Diamond CLO Ltd. 2019-1A A1R, 3M USD LIBOR + 1.200% —
1.458% 4/25/2029(e)(f) | | | 82,657 | | | | 82,648 | | |
Ellington CLO IV Ltd. 2019-4A AR, 3M USD LIBOR + 1.580% —
1.821% 4/15/2029(e)(f) | | | 26,441,252 | | | | 26,422,162 | | |
Fortress Credit Opportunities IX CLO Ltd. 2017-9A A1TR, 3M USD
LIBOR + 1.550% — 1.672% 10/15/2033(e)(f) | | | 118,776,000 | | | | 117,990,891 | | |
Fortress Credit Opportunities XI CLO Ltd. 2018-11A A1T, 3M USD
LIBOR + 1.300% — 1.541% 4/15/2031(e)(f) | | | 37,820,000 | | | | 37,535,480 | | |
Fortress Credit Opportunities XVII CLO Ltd. 2022-17A A, 3M USD
LIBOR + 1.370% — 1.587% 1/15/2030(e)(f) | | | 62,732,000 | | | | 62,241,749 | | |
Galaxy XXIII CLO Ltd. 2017-23A AR, 3M USD LIBOR + 0.870% —
1.129% 4/24/2029(e)(f) | | | 40,572,412 | | | | 40,430,855 | | |
Golub Capital Partners CLO 36m Ltd. 2018-36A A, 3M USD LIBOR +
1.300% — 1.615% 2/5/2031(e)(f) | | | 67,200,000 | | | | 66,890,746 | | |
Golub Capital Partners CLO 42M Ltd. 2019-42A A2, 3M USD LIBOR +
2.000% — 2.254% 4/20/2031(e)(f) | | | 13,772,000 | | | | 13,719,777 | | |
Golub Capital Partners TALF LLC 2020-2A A, 3M USD LIBOR +
1.850% — 2.165% 2/5/2030(e)(f) | | | 22,470,989 | | | | 22,480,247 | | |
26
FPA NEW INCOME, INC.
PORTFOLIO OF INVESTMENTS (Continued)
March 31, 2022
(Unaudited)
BONDS & DEBENTURES — Continued | | Principal
Amount | | Fair
Value | |
Halcyon Loan Advisors Funding Ltd. 2015-3A A1R, 3M USD LIBOR +
0.900% — 1.141% 10/18/2027(e)(f) | | $ | 1,973,801 | | | $ | 1,973,475 | | |
Lake Shore MM CLO III LLC 2019-2A A1R, 3M USD LIBOR +
1.480% — 1.721% 10/17/2031(e)(f) | | | 23,662,000 | | | | 23,557,130 | | |
Lake Shore MM CLO III LLC 2019-2A A2R — 2.525% 10/17/2031(f) | | | 11,083,000 | | | | 10,524,528 | | |
Lake Shore MM CLO IV Ltd. 2021-1A X, 3M USD LIBOR +
1.180% — 1.312% 10/15/2033(e)(f) | | | 17,293,000 | | | | 17,241,968 | | |
LCM XX LP 20A AR, 3M USD LIBOR + 1.040% —
1.294% 10/20/2027(e)(f) | | | 3,385,169 | | | | 3,375,301 | | |
Madison Park Funding XI Ltd. 2013-11A, 3M USD LIBOR + 0.900% —
1.159% 7/23/2029(e)(f) | | | 94,743,534 | | | | 94,429,838 | | |
Madison Park Funding XXIII Ltd. 2017-23A AR, 3M USD LIBOR +
0.970% — 1.238% 7/27/2031(e)(f) | | | 81,487,000 | | | | 80,916,998 | | |
Madison Park Funding XXV Ltd. 2017-25A, 3M USD LIBOR +
0.970% — 1.228% 4/25/2029(e)(f) | | | 74,465,000 | | | | 74,228,276 | | |
Magnetite XVI Ltd. 2015-16A AR, 3M USD LIBOR + 0.800% —
1.041% 1/18/2028(e)(f) | | | 9,725,383 | | | | 9,696,002 | | |
Nassau Ltd. 2017-IA A1AS, 3M USD LIBOR + 1.150% —
1.391% 10/15/2029(e)(f) | | | 22,587,372 | | | | 22,486,700 | | |
Neuberger Berman CLO XV 2013-15A A1R2, 3M USD LIBOR +
0.920% — 1.161% 10/15/2029(e)(f) | | | 67,786,000 | | | | 67,418,261 | | |
OCP CLO Ltd. 2017-13A A1AR, 3M USD LIBOR + 0.960% —
1.201% 7/15/2030(e)(f) | | | 72,247,000 | | | | 71,663,894 | | |
Octagon Investment Partners 35 Ltd. 2018-1A A1A, 3M USD LIBOR +
1.060% — 1.314% 1/20/2031(e)(f) | | | 44,563,000 | | | | 44,405,247 | | |
Octagon Investment Partners XV Ltd. 2013-1A A1RR, 3M USD LIBOR +
0.970% — 1.218% 7/19/2030(e)(f) | | | 108,749,000 | | | | 108,317,484 | | |
OFSI BSL VIII Ltd. 2017-1A AR, 3M USD LIBOR + 1.000% —
1.241% 8/16/2029(e)(f) | | | 70,518,143 | | | | 70,316,249 | | |
Owl Rock CLO VI Ltd. 2021-6A A, 3M USD LIBOR + 1.450% —
1.572% 6/21/2032(e)(f) | | | 66,692,000 | | | | 66,385,684 | | |
Palmer Square Loan Funding Ltd. 2021-1A A1, 3M USD LIBOR +
0.900% — 1.154% 4/20/2029(e)(f) | | | 50,429,299 | | | | 50,366,313 | | |
Parliament CLO II Ltd. 2021-2A A, 3M USD LIBOR + 1.350% —
1.830% 8/20/2032(e)(f) | | | 40,733,000 | | | | 40,352,717 | | |
Parliament Funding II Ltd. 2020-1A AR, 3M USD LIBOR + 1.250% —
1.490% 10/20/2031(e)(f) | | | 40,598,000 | | | | 40,406,865 | | |
Saranac CLO III Ltd. 2014-3A ALR, 3M USD LIBOR + 1.600% —
2.534% 6/22/2030(e)(f) | | | 25,900,433 | | | | 25,822,939 | | |
27
FPA NEW INCOME, INC.
PORTFOLIO OF INVESTMENTS (Continued)
March 31, 2022
(Unaudited)
BONDS & DEBENTURES — Continued | | Principal
Amount | | Fair
Value | |
Telos CLO Ltd. 2014-5A A1R, 3M USD LIBOR + 0.950% —
1.191% 4/17/2028(e)(f) | | $ | 2,606,515 | | | $ | 2,605,720 | | |
Telos CLO Ltd. 2013-3A BR, 3M USD LIBOR + 2.000% —
2.241% 7/17/2026(e)(f) | | | 14,215,917 | | | | 14,205,923 | | |
TICP CLO III-2 Ltd. 2018-3R A, 3M USD LIBOR + 0.840% —
1.094% 4/20/2028(e)(f) | | | 3,717,606 | | | | 3,715,208 | | |
VCP CLO II Ltd. 2021-2A A1, 3M USD LIBOR + 1.670% —
1.911% 4/15/2031(e)(f) | | | 101,155,000 | | | | 101,106,142 | | |
Venture XXV CLO Ltd. 2016-25A ARR, 3M USD LIBOR + 1.020% —
1.274% 4/20/2029(e)(f) | | | 22,537,747 | | | | 22,513,677 | | |
Wellfleet CLO Ltd. 2016-1A AR, 3M USD LIBOR + 0.910% —
1.164% 4/20/2028(e)(f) | | | 14,220,945 | | | | 14,190,583 | | |
Wind River CLO Ltd. 2016-1A AR, 3M USD LIBOR + 1.050% —
1.289% 7/15/2028(e)(f) | | | 8,220,528 | | | | 8,220,413 | | |
Woodmont Trust 2019-6A A1R, 3M USD LIBOR + 1.480% —
1.604% 7/15/2031(e)(f) | | | 62,588,000 | | | | 62,378,706 | | |
Woodmont Trust 2019-6A A1R2, 3M USD LIBOR + 1.480% —
1.694% 7/15/2031(e)(f) | | | 16,952,000 | | | | 16,895,312 | | |
Zais CLO 7 Ltd. 2017-2A A, 3M USD LIBOR + 1.290% —
1.531% 4/15/2030(e)(f) | | | 15,314,220 | | | | 15,239,180 | | |
| | | $ | 2,244,839,806 | | |
EQUIPMENT — 10.4% | |
ARI Fleet Lease Trust 2021-A A2 — 0.370% 3/15/2030(f) | | $ | 25,430,000 | | | $ | 25,000,729 | | |
Avis Budget Rental Car Funding AESOP LLC 2017-2A A —
2.970% 3/20/2024(f) | | | 8,580,000 | | | | 8,618,092 | | |
CCG Receivables Trust 2021-2 A2 — 0.540% 3/14/2029(f) | | | 52,397,000 | | | | 50,994,987 | | |
Chesapeake Funding II LLC 2020-1A A1 — 0.870% 8/15/2032(f) | | | 10,869,605 | | | | 10,786,117 | | |
CNH Equipment Trust 2021-B A3 — 0.440% 8/17/2026 | | | 2,000,000 | | | | 1,938,085 | | |
CNH Equipment Trust 2022-A A3 — 2.830% 7/15/2027 | | | 19,831,000 | | | | 19,829,534 | | |
Coinstar Funding LLC 2017-1A A2 — 5.216% 4/25/2047(f) | | | 12,216,765 | | | | 12,209,921 | | |
Dell Equipment Finance Trust 2021-1 A3 — 0.430% 5/22/2026(f) | | | 2,900,000 | | | | 2,842,419 | | |
Dell Equipment Finance Trust 2021-2 A3 — 0.530% 12/22/2026(f) | | | 50,627,000 | | | | 49,137,584 | | |
Dell Equipment Finance Trust 2021-2 C — 0.940% 12/22/2026(f) | | | 11,180,000 | | | | 10,707,349 | | |
Dell Equipment Finance Trust 2020-2 D — 1.920% 3/23/2026(f) | | | 5,444,000 | | | | 5,394,336 | | |
Dell Equipment Finance Trust 2022-1 A3 — 2.490% 8/23/2027 | | | 110,213,000 | | | | 108,848,298 | | |
Dell Equipment Finance Trust 2022-1 B — 2.720% 8/23/2027 | | | 17,115,000 | | | | 16,863,112 | | |
Dell Equipment Finance Trust 2022-1 C — 2.940% 8/23/2027 | | | 17,567,000 | | | | 17,310,399 | | |
Donlen Fleet Lease Funding 2 LLC 2021-2 A2 — 0.560% 12/11/2034(f) | | | 55,571,174 | | | | 54,534,077 | | |
Encina Equipment Finance LLC 2021-1A A2 — 0.740% 12/15/2026(f) | | | 23,299,000 | | | | 22,966,719 | | |
Enterprise Fleet Financing LLC 2021-2 A2 — 0.480% 5/20/2027(f) | | | 79,433,000 | | | | 76,904,894 | | |
28
FPA NEW INCOME, INC.
PORTFOLIO OF INVESTMENTS (Continued)
March 31, 2022
(Unaudited)
BONDS & DEBENTURES — Continued | | Principal
Amount | | Fair
Value | |
Enterprise Fleet Financing LLC 2021-3 A2 — 0.770% 8/20/2027(f) | | $ | 56,875,000 | | | $ | 55,078,905 | | |
Enterprise Fleet Funding LLC 2021-1 A3 — 0.700% 12/21/2026(f) | | | 2,050,000 | | | | 1,937,280 | | |
GMF Floorplan Owner Revolving Trust 2019-2 A — 2.900% 4/15/2026(f) | | | 30,866,000 | | | | 30,892,125 | | |
GreatAmerica Leasing Receivables Funding LLC 2020-1 A4 —
1.850% 2/16/2026(f) | | | 1,060,000 | | | | 1,052,762 | | |
Hertz Vehicle Financing LLC 2021-1A A — 1.210% 12/26/2025(f) | | | 73,571,000 | | | | 69,546,034 | | |
Hertz Vehicle Financing LLC 2022-4A A — 3.730% 9/25/2026 | | | 72,329,000 | | | | 72,419,411 | | |
HPEFS Equipment Trust 2022-1A A3 — 1.380% 5/21/2029(f) | | | 65,430,000 | | | | 63,634,162 | | |
HPEFS Equipment Trust 2022-1A B — 1.790% 5/21/2029(f) | | | 26,862,000 | | | | 26,084,939 | | |
HPEFS Equipment Trust 2022-1A C — 1.960% 5/21/2029(f) | | | 17,858,000 | | | | 17,258,527 | | |
John Deere Owner Trust 2022 2022-A A3 — 2.320% 9/16/2026 | | | 39,342,000 | | | | 38,792,156 | | |
Kubota Credit Owner Trust 2020-1A A4 — 2.260% 7/15/2026(f) | | | 14,855,000 | | | | 14,761,737 | | |
Kubota Credit Owner Trust 2022-1A A3 — 2.670% 10/15/2026 | | | 88,222,000 | | | | 86,883,805 | | |
NextGear Floorplan Master Owner Trust 2021-1A A —
0.850% 7/15/2026(f) | | | 3,947,000 | | | | 3,767,502 | | |
NextGear Floorplan Master Owner Trust 2020-1A A2 —
1.550% 2/15/2025(f) | | | 8,748,000 | | | | 8,688,830 | | |
NextGear Floorplan Master Owner Trust 2022-1A A2 —
2.800% 3/15/2027 | | | 72,271,000 | | | | 72,280,113 | | |
Pawneee Equipment Receivables LLC 2021-1 A2 — 1.100% 7/15/2027(f) | | | 21,232,000 | | | | 20,577,636 | | |
Prop Series 2017-1A — 5.300% 3/15/2042(b) | | | 17,526,050 | | | | 16,007,822 | | |
Verizon Owner Trust 2019-C B — 2.060% 4/22/2024 | | | 42,152,000 | | | | 42,004,911 | | |
Volvo Financial Equipment LLC 2020-1A A3 — 0.510% 10/15/2024(f) | | | 2,370,000 | | | | 2,335,354 | | |
Wheels SPV 2 LLC 2020-1A A3 — 0.620% 8/20/2029(f) | | | 6,513,000 | | | | 6,337,843 | | |
| | | $ | 1,145,228,506 | | |
OTHER — 10.6% | |
ABPCI Direct Lending Fund ABS I Ltd. 2020-1A A —
3.199% 12/20/2030(f) | | $ | 37,774,000 | | | $ | 35,793,131 | | |
ABPCI Direct Lending Fund ABS II LLC 2022-2A A1,
3M USD LIBOR + 2.100% — 2.372% 3/1/2032(b)(e)(f) | | | 26,204,000 | | | | 26,204,000 | | |
Cologix Data Centers US Issuer LLC 2021-1A A2 —
3.300% 12/26/2051(f) | | | 32,205,000 | | | | 31,083,181 | | |
Conn's Receivables Funding LLC 2020-A B — 4.270% 6/16/2025(f) | | | 2,897,689 | | | | 2,897,315 | | |
Elm Trust 2020-4A A2 — 2.286% 10/20/2029(f) | | | 9,925,000 | | | | 9,440,654 | | |
Elm Trust 2020-3A A2 — 2.954% 8/20/2029(f) | | | 11,435,000 | | | | 10,941,783 | | |
FCI Funding LLC 2021-1A A — 1.130% 4/15/2033(f) | | | 11,820,501 | | | | 11,699,609 | | |
Golub Capital Partners ABS Funding Ltd. 2021-1A A2 —
2.773% 4/20/2029(f) | | | 56,366,000 | | | | 53,773,164 | | |
29
FPA NEW INCOME, INC.
PORTFOLIO OF INVESTMENTS (Continued)
March 31, 2022
(Unaudited)
BONDS & DEBENTURES — Continued | | Principal
Amount | | Fair
Value | |
Golub Capital Partners ABS Funding Ltd. 2021-2A A —
2.944% 10/19/2029(f) | | $ | 95,445,000 | | | $ | 90,372,289 | | |
Golub Capital Partners ABS Funding Ltd. 2020-1A A2 —
3.208% 1/22/2029(f) | | | 44,967,000 | | | | 44,227,338 | | |
Gracie Point International Funding 2021-1A, 1M USD LIBOR +
0.750% — 0.981% 11/1/2023(e)(f) | | | 23,485,280 | | | | 23,478,056 | | |
Monroe Capital ABS Funding Ltd. 2021-1A A2 — 2.815% 4/22/2031(f) | | | 45,379,000 | | | | 42,922,499 | | |
New Residential Advance Receivables Trust Advance Receivables
Backed Notes 2020-APT1 AT1 — 1.035% 12/16/2052(f) | | | 21,590,000 | | | | 21,211,026 | | |
NRZ Advance Receivables Trust 2015-ON1 2020-T3 AT3 —
1.317% 10/15/2052(f) | | | 15,151,200 | | | | 15,070,235 | | |
Oasis Securitization Funding LLC 2021-1A A — 2.579% 2/15/2033(f) | | | 4,859,482 | | | | 4,846,267 | | |
Ocwen Master Advance Receivables Trust 2020-T1 AT1 —
1.278% 8/15/2052(f) | | | 78,523,295 | | | | 78,523,295 | | |
Oportun Funding XIV LLC 2021-A — 1.210% 3/8/2028(f) | | | 10,137,000 | | | | 9,951,888 | | |
Oportun Issuance Trust 2021-C A — 2.180% 10/8/2031(f) | | | 64,181,000 | | | | 61,962,410 | | |
Owl Rock Technology Financing LLC 2020-1A A, 3M USD LIBOR +
2.950% — 3.076% 1/15/2031(e)(f) | | | 85,004,000 | | | | 84,756,978 | | |
PFS Financing Corp. 2021-A A — 0.710% 4/15/2026(f) | | | 42,758,000 | | | | 40,514,454 | | |
PFS Financing Corp. 2021-B A — 0.770% 8/15/2026(f) | | | 52,919,000 | | | | 49,739,499 | | |
PFS Financing Corp. 2021-A B — 0.960% 4/15/2026(f) | | | 5,986,000 | | | | 5,714,667 | | |
PFS Financing Corp. 2020-G A — 0.970% 2/15/2026(f) | | | 63,808,000 | | | | 61,096,753 | | |
PFS Financing Corp. 2020-E A — 1.000% 10/15/2025(f) | | | 43,430,000 | | | | 42,366,725 | | |
PFS Financing Corp. 2021-B B — 1.090% 8/15/2026(f) | | | 11,978,000 | | | | 11,378,372 | | |
PFS Financing Corp. 2020-A A — 1.270% 6/15/2025(f) | | | 58,602,000 | | | | 57,608,526 | | |
PFS Financing Corp. 2020-G B — 1.570% 2/15/2026(f) | | | 3,303,000 | | | | 3,208,933 | | |
PFS Financing Corp. 2020-A B — 1.770% 6/15/2025(f) | | | 9,400,000 | | | | 9,277,006 | | |
PFS Financing Corp. 2022-A A — 2.470% 2/16/2027(f) | | | 105,379,000 | | | | 103,265,614 | | |
PFS Financing Corp. 2022-A B — 2.770% 2/16/2027(f) | | | 21,651,000 | | | | 21,221,087 | | |
SMB Private Education Loan Trust 2021-A A1, 1M USD LIBOR +
0.500% — 0.897% 1/15/2053(e)(f) | | | 1,879,902 | | | | 1,878,438 | | |
SpringCastle America Funding LLC 2020-AA A — 1.970% 9/25/2037(f) | | | 23,659,516 | | | | 23,333,353 | | |
TVEST LLC 2020-A A — 4.500% 7/15/2032(f) | | | 6,393,480 | | | | 6,390,219 | | |
Vantage Data Centers Issuer LLC 2020-1A A2 — 1.645% 9/15/2045(f) | | | 16,435,000 | | | | 15,446,172 | | |
VCP RRL ABS I Ltd. 2021-1A A — 2.152% 10/20/2031(f) | | | 49,232,588 | | | | 47,539,480 | | |
| | | $ | 1,159,134,416 | | |
| TOTAL ASSET-BACKED SECURITIES (Cost $7,443,807,321) | | $ | 7,299,150,749 | | |
30
FPA NEW INCOME, INC.
PORTFOLIO OF INVESTMENTS (Continued)
March 31, 2022
(Unaudited)
BONDS & DEBENTURES — Continued | | Principal
Amount | | Fair
Value | |
CORPORATE BONDS & NOTES — 0.8% | |
COMMUNICATIONS — 0.1% | |
Frontier Communications Holdings LLC — 5.875% 10/15/2027(f) | | $ | 5,925,000 | | | $ | 5,895,375 | | |
| | | $ | 5,895,375 | | |
FINANCIAL — 0.7% | |
OWL Rock Core Income Corp. — 4.700% 2/8/2027(f) | | $ | 38,832,000 | | | $ | 37,351,487 | | |
OWL Rock Core Income Corp. — 5.500% 3/21/2025 | | | 45,959,000 | | | | 45,857,711 | | |
| | | $ | 83,209,198 | | |
| TOTAL CORPORATE BONDS & NOTES (Cost $90,553,233) | | $ | 89,104,573 | | |
CORPORATE BANK DEBT — 2.7% | |
ABG Intermediate Holdings 2 LLC, 3M USD LIBOR + 3.250% —
4.000% 9/29/2024(c)(e) | | $ | 38,164,232 | | | $ | 37,814,266 | | |
Applied Systems, Inc., 3M USD LIBOR + 2.000% - 3.000% —
4.006% - 5.500% 9/19/2024(c)(e) | | | 23,269,000 | | | | 23,205,010 | | |
Asurion LLC, 1M USD LIBOR + 3.000% — 3.457% 11/3/2024(c)(e) | | | 59,015,220 | | | | 58,228,547 | | |
Axiom Global, Inc. 5.500% 10/1/2026(c) | | | 23,072,142 | | | | 22,437,659 | | |
Capstone Acquisition Holdings, Inc. 2020 Term Loan, 1M USD LIBOR +
4.750% — 5.750% 11/12/2027(c)(e) | | | 18,724,697 | | | | 18,701,291 | | |
Capstone Acquisition Holdings, Inc. 2020 Delayed Draw Term Loan,
1M USD LIBOR — 4.750% — 5.750% 11/12/2027(c)(e)(i) | | | 2,851,367 | | | | 1,085,583 | | |
Frontier Communications Corp., 3M USD LIBOR + 3.750% —
4.813% 5/1/2028(c)(e) | | | 23,561,010 | | | | 23,148,692 | | |
Hanjin International Corp., 3M USD LIBOR + 5.000% —
5.960% 12/23/2022(c)(e) | | | 30,859,000 | | | | 30,550,410 | | |
Heartland Dental LLC, 1M USD LIBOR + 4.000% —
4.447% 4/30/2025(c)(e) | | | 38,702,086 | | | | 38,339,448 | | |
JC Penney Corp., Inc., 3M USD LIBOR + 4.250% —
5.250% 6/23/2023(c)(e) | | | 27,218,054 | | | | 2,722 | | |
McDermott Super Senior Exit LC — 0.500% 6/30/2024(c)(e)(i) | | | 16,770,000 | | | | (3,270,150 | ) | |
Mediaco Holding, Inc. Class A, 8.400%, PIK —
1.000% 11/25/2024(a)(b)(c)(e) | | | 11,758,659 | | | | 10,935,553 | | |
Polyconcept North America Holdings, Inc., 6M USD LIBOR + 4.500% —
6.000% 8/16/2023(c)(e) | | | 24,360,855 | | | | 24,178,148 | | |
Windstream Services LLC, 1M USD LIBOR + 6.250% —
7.250% 9/21/2027(c)(e) | | | 13,236,237 | | | | 13,120,420 | | |
| TOTAL CORPORATE BANK DEBT (Cost $303,628,346) | | $ | 298,477,599 | | |
31
FPA NEW INCOME, INC.
PORTFOLIO OF INVESTMENTS (Continued)
March 31, 2022
(Unaudited)
BONDS & DEBENTURES — Continued | | Principal
Amount | | Fair
Value | |
U.S. TREASURIES — 9.6% | |
U.S. Treasury Notes — 0.750% 11/15/2024 | | $ | 626,444,000 | | | $ | 598,590,420 | | |
U.S. Treasury Notes — 1.500% 2/15/2025 | | | 460,494,000 | | | | 447,691,070 | | |
| TOTAL U.S. TREASURIES (Cost $1,078,598,339) | | $ | 1,046,281,490 | | |
| TOTAL BONDS & DEBENTURES — 96.2% (Cost $10,773,871,351) | | $ | 10,539,936,275 | | |
TOTAL INVESTMENT SECURITIES — 97.5%
(Cost $10,913,135,761) | | $ | 10,686,050,308 | | |
SHORT-TERM INVESTMENTS — 2.6% | |
State Street Bank Repurchase Agreement — 0.00% 4/1/2022
(Dated 03/31/2022, repurchase price of $281,860,000, collateralized by
$284,028,700 principal amount U.S. Treasury Notes — 0.500% —
1.250% 2024 — 2028 and U.S. Treasury Bond — 2.000% — 3.375%
2048 — 2051, fair value $287,497,313)(j) | | $ | 281,860,000 | | | $ | 281,860,000 | | |
| TOTAL SHORT-TERM INVESTMENTS (Cost $281,860,000) | | $ | 281,860,000 | | |
| TOTAL INVESTMENTS — 100.1% (Cost $11,194,995,761) | | $ | 10,967,910,308 | | |
Other Assets and Liabilities, net — (0.1)% | | | | | (13,753,462 | ) | |
NET ASSETS — 100.0% | | $ | 10,954,156,846 | | |
32
FPA NEW INCOME, INC.
PORTFOLIO OF INVESTMENTS (Continued)
March 31, 2022
(Unaudited)
(a) These securities have been valued in good faith under policies adopted by authority of the Board of Directors in accordance with the Fund's fair value procedures. These securities constituted 0.71% of total net assets at March 31, 2022.
(b) Investments categorized as a significant unobservable input (Level 3) (See Note 6 of the Notes to Financial Statements).
(c) Restricted securities. These restricted securities constituted 3.61% of total net assets at March 31, 2022, most of which are considered liquid by the Adviser. These securities are not registered and may not be sold to the public. There are legal and/or contractual restrictions on resale. The Fund does not have the right to demand that such securities be registered. The values of these securities are determined by valuations provided by pricing services, brokers, dealers, market makers, or in good faith under policies adopted by authority of the Fund's Board of Directors.
(d) Non-income producing security.
(e) Variable/Floating Rate Security — The rate shown is based on the latest available information as of March 31, 2022. For Corporate Bank Debt, the rate shown may represent a weighted average interest rate. Certain variable rate securities are not based on a published rate and spread but are determined by the issuer or agent and are based on current market conditions. These securities do not indicate a reference rate and spread in their description.
(f) Security exempt from registration under Rule 144A of the Securities Act of 1933. These securities may be resold in transactions exempt from registration, typically only to qualified institutional buyers. Unless otherwise indicated, these securities are not considered to be illiquid.
(g) Zero coupon bond. Coupon amount represents effective yield to maturity.
(h) Step Coupon — Coupon rate increases in increments to maturity. Rate disclosed is as of March 31, 2022.
(i) All or a portion of this holding is subject to unfunded loan commitments. The stated interest rate reflects the weighted average of the reference rate and spread for the funded portion, if any, and the commitment fees on the portion of the loan that is unfunded.
(j) Security pledged as collateral (See Note 7 of the Notes to Financial Statements).
33
FPA NEW INCOME, INC.
PORTFOLIO OF INVESTMENTS — RESTRICTED SECURITIES
March 31, 2022
(Unaudited)
Issuer | | Acquisition
Date (s) | | Cost | | Fair Value | | Fair
Value as a %
of Net Assets | |
ABG Intermediate Holdings
2 LLC, 3M USD LIBOR +
3.250% — 4.000% 9/29/2024 | | 02/28/2022, 03/02/2022 | | $ | 37,869,597 | | | $ | 37,814,266 | | | | 0.35 | % | |
Applied Systems, Inc., 3M USD
LIBOR + 3.000% —
4.006% 9/19/2024 | | 07/28/2021, 08/03/2021,
08/04/2021 | | | 23,219,937 | | | | 23,205,010 | | | | 0.21 | % | |
Asurion LLC, 1M USD
LIBOR + 3.000% —
3.457% 11/3/2024 | | 08/17/2021 | | | 58,651,977 | | | | 58,228,547 | | | | 0.53 | % | |
Axiom Global, Inc. 1M USD
LIBOR + 4.750% —
5.500% 10/1/2026 | | 11/18/2021, 11/19/2021 | | | 22,851,723 | | | | 22,437,659 | | | | 0.21 | % | |
BTC Holdings Fund I LLC —
2.780% 1/28/2027 | | 09/01/2021 | | | 11,717,796 | | | | 11,717,796 | | | | 0.11 | % | |
BTC Offshore Holdings Fund,
3M USD LIBOR + 2.650% —
2.910% 10/20/2029 | | 10/25/2021, 01/20/2022 | | | 18,000,000 | | | | 18,000,000 | | | | 0.16 | % | |
Capstone Acquisition Holdings,
Inc. 2020 Term Loan, 1M USD
LIBOR + 4.750% —
5.750% 11/12/2027 | | 04/30/2021 | | | 18,584,708 | | | | 18,701,291 | | | | 0.17 | % | |
Capstone Acquisition Holdings,
Inc. 2020 Delayed Draw
Term Loan, 1M USD
LIBOR + 4.750% —
5.750% 11/12/2027 | | 04/30/2021 | | | 1,077,672 | | | | 1,085,583 | | | | 0.01 | % | |
Copper Earn Out Trust | | 12/07/2020 | | | — | | | | 814,992 | | | | 0.01 | % | |
Copper Property CTL Pass
Through Trust | | 10/05/2017, 10/06/2017,
10/11/2017, 11/19/2018,
11/27/2018, 01/11/2019,
02/08/2019, 03/11/2019,
05/29/2019, 06/08/2020 | | | 25,752,396 | | | | 8,193,276 | | | | 0.07 | % | |
Frontier Communications Corp.,
3M USD LIBOR + 3.750% —
4.813% 5/1/2028 | | 04/09/2021 | | | 23,353,254 | | | | 23,148,692 | | | | 0.21 | % | |
Hanjin International Corp.,
3M USD LIBOR + 5.000% —
5.960% 12/23/2022 | | 12/23/2020, 02/25/2021 | | | 30,798,994 | | | | 30,550,410 | | | | 0.28 | % | |
Heartland Dental LLC, 1M USD
LIBOR + 4.000% —
4.447% 4/30/2025 | | 08/02/2021, 08/03/2021,
08/12/2021 | | | 38,530,918 | | | | 38,339,448 | | | | 0.35 | % | |
34
FPA NEW INCOME, INC.
PORTFOLIO OF INVESTMENTS — RESTRICTED SECURITIES (Continued)
March 31, 2022
(Unaudited)
Issuer | | Acquisition
Date (s) | | Cost | | Fair Value | | Fair
Value as a %
of Net Assets | |
JC Penney Corp., Inc., 3M USD
LIBOR + 4.250% —
5.250% 6/23/2023 | | 02/03/2021 | | $ | — | | | $ | 2,722 | | | | 0.00 | % | |
McDermott Super Senior Exit
LC — 0.500% 6/30/2024 | | 02/28/2020 | | | (88,874 | ) | | | (3,270,150 | ) | | | (0.03 | )% | |
Mediaco Holding, Inc.
Class A, 6.400% —
9.400% 11/25/2024 | | 10/01/2021, 11/01/2021,
12/01/2021, 01/01/2022,
02/01/2022 | | | 11,690,651 | | | | 10,935,553 | | | | 0.10 | % | |
PHI Group, Inc., Restricted | | 08/19/2019 | | | 31,131,405 | | | | 58,238,226 | | | | 0.53 | % | |
Polyconcept North America
Holdings, Inc., 6M USD
LIBOR + 4.500% —
6.000% 8/16/2023 | | 03/31/2020, 6/30/2020,
10/1/2020, 12/31/2020 | | | 24,268,069 | | | | 24,178,148 | | | | 0.22 | % | |
Windstream Services LLC,
1M USD LIBOR + 6.250% —
7.250% 9/21/2027 | | 08/11/2020 | | | 12,819,720 | | | | 13,120,420 | | | | 0.12 | % | |
TOTAL RESTRICTED
SECURITIES | | | | $ | 390,229,943 | | | $ | 395,441,889 | | | | 3.61 | % | |
See accompanying Notes to Financial Statements.
35
FPA NEW INCOME, INC.
STATEMENT OF ASSETS AND LIABILITIES
March 31, 2022
(Unaudited)
ASSETS | |
Investment securities — at fair value (identified cost $10,913,135,761) | | $ | 10,686,050,308 | | |
Short-term investments — repurchase agreements | | | 281,860,000 | | |
Cash | | | 1,454,816 | | |
Receivable for: | |
Interest | | | 18,785,186 | | |
Capital Stock sold | | | 14,581,719 | | |
Investment securities sold | | | 97,486 | | |
Prepaid expenses and other assets | | | 151,475 | | |
Total assets | | | 11,002,980,990 | | |
LIABILITIES | |
Payable for: | |
Capital Stock repurchased | | | 41,058,739 | | |
Investment securities purchased | | | 3,760,724 | | |
Advisory fees | | | 3,740,701 | | |
Accrued expenses and other liabilities | | | 263,980 | | |
Total liabilities | | | 48,824,144 | | |
NET ASSETS | | $ | 10,954,156,846 | | |
SUMMARY OF SHAREHOLDERS' EQUITY | |
Capital Stock — par value $0.01 per share; authorized 1,500,000,000 shares;
outstanding 1,120,983,571 shares | | $ | 11,209,836 | | |
Additional Paid-in Capital | | | 11,631,049,757 | | |
Distributable earnings | | | (688,102,747 | ) | |
NET ASSETS | | $ | 10,954,156,846 | | |
NET ASSET VALUE | |
Offering and redemption price per share | | $ | 9.77 | | |
See accompanying Notes to Financial Statements.
36
FPA NEW INCOME, INC.
STATEMENT OF OPERATIONS
For the Six Months Ended March 31, 2022
(Unaudited)
INVESTMENT INCOME | |
Interest | | $ | 77,286,771 | | |
Dividends | | | 17,115,864 | | |
Total investment income | | | 94,402,635 | | |
EXPENSES | |
Advisory fees | | | 28,652,602 | | |
Transfer agent fees and expenses | | | 2,620,787 | | |
Filing fees | | | 317,197 | | |
Administrative services fees | | | 204,188 | | |
Custodian fees | | | 199,472 | | |
Other professional fees | | | 185,355 | | |
Reports to shareholders | | | 146,402 | | |
Director fees and expenses | | | 134,680 | | |
Legal fees | | | 37,890 | | |
Audit and tax services fees | | | 21,082 | | |
Other | | | 43,288 | | |
Total expenses | | | 32,562,943 | | |
Reimbursement from Adviser | | | (5,634,966 | ) | |
Net expenses | | | 26,927,977 | | |
Net investment income | | | 67,474,658 | | |
NET REALIZED AND UNREALIZED GAIN (LOSS) | |
Net realized gain (loss) on: | |
Investments | | | (69,254,252 | ) | |
Net change in unrealized appreciation (depreciation) of: | |
Investments | | | (215,306,213 | ) | |
Net realized and unrealized loss | | | (284,560,465 | ) | |
NET DECREASE IN NET ASSETS RESULTING FROM OPERATIONS | | $ | (217,085,807 | ) | |
See accompanying Notes to Financial Statements.
37
FPA NEW INCOME, INC.
STATEMENTS OF CHANGES IN NET ASSETS
| | | Six Months Ended
March 31, 2022
(Unaudited) | | Year Ended
September 30, 2021 | |
INCREASE (DECREASE) IN NET ASSETS | |
Operations: | |
Net investment income | | $ | 67,474,658 | | | $ | 134,721,248 | | |
Net realized gain (loss) | | | (69,254,252 | ) | | | 5,012,330 | | |
Net change in unrealized appreciation (depreciation) | | | (215,306,213 | ) | | | 12,648,319 | | |
Net increase (decrease) in net assets resulting
from operations | | | (217,085,807 | ) | | | 152,381,897 | | |
Distributions to shareholders | | | (65,867,700 | ) | | | (140,308,667 | ) | |
Capital Stock transactions: | |
Proceeds from Capital Stock sold | | | 2,534,461,112 | | | | 6,759,358,095 | | |
Proceeds from shares issued to shareholders upon reinvestment of
dividends and distributions | | | 56,940,808 | | | | 121,733,658 | | |
Cost of Capital Stock repurchased | | | (3,298,482,444 | ) | | | (3,595,882,725 | ) | |
Net increase (decrease) from Capital Stock transactions | | | (707,080,524 | ) | | | 3,285,209,028 | | |
Total change in net assets | | | (990,034,031 | ) | | | 3,297,282,258 | | |
NET ASSETS | |
Beginning of period | | | 11,944,190,877 | | | | 8,646,908,619 | | |
End of period | | $ | 10,954,156,846 | | | $ | 11,944,190,877 | | |
CHANGE IN CAPITAL STOCK OUTSTANDING | |
Shares of Capital Stock sold | | | 254,675,397 | | | | 674,770,411 | | |
Shares issued to shareholders upon reinvestment of
dividends and distributions | | | 5,733,910 | | | | 12,160,026 | | |
Shares of Capital Stock repurchased | | | (331,682,174 | ) | | | (358,947,128 | ) | |
Change in Capital Stock outstanding | | | (71,272,867 | ) | | | 327,983,309 | | |
See accompanying Notes to Financial Statements.
38
FPA NEW INCOME, INC.
FINANCIAL HIGHLIGHTS
Selected Data for Each Share of Capital Stock Outstanding Throughout Each Period
| | | Six
Months
Ended
March 31,
2022 | | Year Ended September 30, | |
| | | (Unaudited) | | 2021 | | 2020 | | 2019 | | 2018 | | 2017 | |
Per share operating performance: | |
Net asset value at beginning
of period | | $ | 10.02 | | | $ | 10.00 | | | $ | 10.00 | | | $ | 9.94 | | | $ | 10.05 | | | $ | 10.06 | | |
Income from investment operations: | |
Net investment income(a) | | | 0.06 | | | | 0.13 | | | | 0.23 | | | | 0.28 | | | | 0.29 | | | | 0.25 | | |
Net realized and unrealized gain
(loss) on investment securities | | | (0.25 | ) | | | 0.03 | | | | 0.01 | (b) | | | 0.13 | | | | (0.18 | ) | | | 0.01 | | |
Total from investment operations | | | (0.19 | ) | | | 0.16 | | | | 0.24 | | | | 0.41 | | | | 0.11 | | | | 0.26 | | |
Less distributions: | |
Dividends from net investment
income | | | (0.06 | ) | | | (0.14 | ) | | | (0.24 | ) | | | (0.35 | ) | | | (0.22 | ) | | | (0.27 | ) | |
Redemption fees | | | — | | | | — | | | | — | | | | — | | | | — | | | | — | (c) | |
Net asset value at end of period | | $ | 9.77 | | | $ | 10.02 | | | $ | 10.00 | | | $ | 10.00 | | | $ | 9.94 | | | $ | 10.05 | | |
Total investment return(d) | | | (1.93 | )% | | | 1.56 | % | | | 2.41 | % | | | 4.20 | % | | | 1.91 | % | | | 2.58 | % | |
Ratios/supplemental data: | |
Net assets, end of period (in 000's) | | $ | 10,954,157 | | | $ | 11,944,191 | | | $ | 8,646,909 | | | $ | 7,327,404 | | | $ | 5,704,624 | | | $ | 5,125,433 | | |
Ratio of expenses to average net assets: | |
Before reimbursement from
Adviser | | | 0.57 | %(e) | | | 0.58 | % | | | 0.57 | % | | | 0.57 | % | | | 0.58 | % | | | 0.59 | % | |
After reimbursement from
Adviser | | | 0.47 | %(e) | | | 0.48 | % | | | 0.49 | %(f) | | | 0.50 | % | | | 0.49 | % | | | 0.49 | % | |
Ratio of net investment income to
average net assets: | |
Before reimbursement from
Adviser | | | 1.08 | %(e) | | | 1.18 | % | | | 2.24 | % | | | 2.73 | % | | | 2.88 | % | | | 2.45 | % | |
After reimbursement from
Adviser | | | 1.18 | %(e) | | | 1.28 | % | | | 2.32 | % | | | 2.80 | % | | | 2.96 | % | | | 2.55 | % | |
Portfolio turnover rate | | | 115 | %(e) | | | 81 | % | | | 54 | % | | | 25 | % | | | 29 | % | | | 59 | % | |
(a) Per share amount is based on average shares outstanding.
(b) Due to timing of sales and repurchase of capital shares, the net realized and unrealized gain (loss) per share is not in accordance with the Fund's change in net realized and unrealized gain (loss) on investment transactions for the period.
(c) Rounds to less than $0.01 per share.
(d) Return is based on net asset value per share, adjusted for reinvestment of distributions, and does not reflect deduction of the sales charge.
(e) Annualized.
(f) Includes voluntary fee waiver which reduced the ratio of expenses to average net assets after reimbursement from Adviser by 0.01%.
See accompanying Notes to Financial Statements.
39
FPA NEW INCOME, INC.
NOTES TO FINANCIAL STATEMENTS
March 31, 2022
(Unaudited)
NOTE 1 — Significant Accounting Policies
FPA New Income, Inc. (the "Fund") is registered under the Investment Company Act of 1940, as a diversified, open-end, management investment company. The Fund's primary investment objective is to seek current income and long-term total return. Capital preservation is also a consideration. The Fund qualifies as an investment company pursuant to Financial Accounting Standard Board (FASB) Accounting Standards Codification
(ASC) No. 946, Financial Services — Investment Companies. The following is a summary of significant accounting policies consistently followed by the Fund in the preparation of its financial statements.
A. Security Valuation
The Fund's investments are reported at fair value as defined by accounting principles generally accepted in the United States of America, ("U.S. GAAP"). The Fund generally determines its net asset value as of approximately 4:00 p.m. New York time each day the New York Stock Exchange is open. Further discussion of valuation methods, inputs and classifications can be found under Disclosure of Fair Value Measurements.
B. Securities Transactions and Related Investment Income
Securities transactions are accounted for on the date the securities are purchased or sold. Dividend income and distributions to shareholders are recorded on the ex-dividend date. Interest income and expenses are recorded on an accrual basis. Market discounts and premiums on fixed income securities are amortized over the expected life of the securities using effective interest rate method. Realized gains or losses are based on the specific identification method. The books and records of the Fund are maintained in U.S. dollars as follows: (1) the foreign currency fair value of investment securities, and other assets and liabilities stated in foreign currencies, are translated using the daily spot rate; and (2) purchases, sales, income and expenses are translated at the rate of exchange prevailing on the respective dates of such transactions. The resultant exchange gains and losses are included in net realized or net unrealized gain (loss) in the statement of operations.
C. Use of Estimates
The preparation of the financial statements in accordance with U.S. GAAP requires management to make estimates and assumptions that affect the amounts reported. Actual results could differ from those estimates.
D. Recent Accounting Pronouncements
In March 2020, the FASB issued ASU 2020-04, Reference Rate Reform (Topic 848) Facilitation of the Effects of Reference Rate Reform on Financial Reporting, which provides optional expedients and exceptions for applying U.S. GAAP to contracts, hedging relationships, and other transaction to ease the potential burden in accounting for (or recognizing the effects of) reference rate reform on financial reporting if certain criteria are met. The guidance is effective from March 12, 2020 through December 31, 2022. The Adviser is currently evaluating the impact of this new guidance on the Fund's financial statements.
NOTE 2 — Risk Considerations
Investing in the Fund may involve certain risks including, but not limited to, those described below.
Market Risk: Because the values of the Fund's investments will fluctuate with market conditions, so will the value of your investment in the Fund. You could lose money on your investment in the Fund or the Fund could underperform other investments.
40
FPA NEW INCOME, INC.
NOTES TO FINANCIAL STATEMENTS (Continued)
(Unaudited)
Interest Rate and Credit Risk: The values of, and the income generated by, most debt securities held by the Fund may be affected by changing interest rates and by changes in the effective maturities and credit rating of these securities. For example, the value of debt securities in the Fund's portfolio generally will decline when interest rates rise and increase when interest rates fall. In addition, falling interest rates may cause an issuer to redeem, call or refinance a security before its stated maturity, which may result in the Fund having to reinvest the proceeds in lower yielding securities.
Mortgage-Backed and Other Asset-Backed Securities Risk: The values of some mortgage-backed and other asset-backed securities may expose the Fund to a lower rate of return upon reinvestment of principal. When interest rates rise, the value of mortgage-related securities generally will decline; however, when interest rates are declining, the value of mortgage related-securities with prepayment features may not increase as much as other fixed income securities. The rate of prepayments on underlying mortgages will affect the price and volatility of a mortgage-related security and may shorten or extend the effective maturity of the security beyond what was anticipated at the time of purchase. If an unanticipated rate of prepayment on underlying mortgages increases the effective maturity of a mortgage-related security, the volatility of the security can be expected to increase. The value of these securities may also fluctuate in response to the market's perception of the creditworthiness of the issuers. Additionally, although mortgages and mortgage-related securities are generally supported by some form of government or private guarantee and/or insurance, there is no assurance that private guarantors or insurers will meet their obligations.
Stripped Mortgage-Backed Interest Only ("I/O") and Principal Only ("P/O") Securities: Stripped mortgage-backed securities are usually structured with two classes that receive different proportions of the interest and principal distributions on a pool of mortgage assets. In certain cases, one class will receive all of the interest payments on the underlying mortgages (the I/O class), while the other class will receive all of the principal payments (the P/O class). The Fund currently has investments in I/O securities. The yield to maturity on I/Os is sensitive to the rate of principal repayments (including prepayments) on the related underlying mortgage assets, and principal payments may have a material effect on yield-to-maturity. If the underlying mortgage assets experience greater than anticipated prepayments of principal, a Fund may not fully recoup its initial investment in I/Os.
Credit Risk: Debt securities are subject to credit risk, meaning that the issuer of the debt security may default or fail to make timely payments of principal or interest. The values of any of the Fund's investments may also decline in response to events affecting the issuer or its credit rating. The lower rated debt securities in which the Fund may invest are considered speculative and are generally subject to greater volatility and risk of loss than investment grade securities, particularly in deteriorating economic conditions. The Fund invests a significant portion of its assets in securities of issuers that hold mortgage-and asset-backed securities and direct investments in securities backed by commercial and residential mortgage loans and other financial assets. The value and related income of these securities is sensitive to changes in economic conditions, including delinquencies and/or defaults. Continuing shifts in the market's perception of credit quality on securities backed by commercial and residential mortgage loans and other financial assets may result in increased volatility of market price and periods of illiquidity that can negatively impact the valuation of certain securities held by the Fund.
Repurchase Agreements: Repurchase agreements permit the Fund to maintain liquidity and earn income over periods of time as short as overnight. Repurchase agreements held by the Fund are fully collateralized by U.S. Government securities, or securities issued by U.S. Government agencies, or securities that are within the three highest credit categories assigned by established rating agencies (Aaa, Aa, or A by Moody's or AAA, AA or A by Standard & Poor's) or, if not rated by Moody's or Standard & Poor's, are of equivalent investment quality
41
FPA NEW INCOME, INC.
NOTES TO FINANCIAL STATEMENTS (Continued)
(Unaudited)
as determined by the Adviser. Such collateral is in the possession of the Fund's custodian. The collateral is evaluated daily to ensure its fair value equals or exceeds the current fair value of the repurchase agreements including accrued interest. In the event of default on the obligation to repurchase, the Fund has the right to liquidate the collateral and apply the proceeds in satisfaction of the obligation.
The Fund may enter into repurchase agreements, under the terms of a Master Repurchase Agreement ("MRA"). The MRA permits the Fund, under certain circumstances including an event of default (such as bankruptcy or insolvency), to offset payables and/or receivables under the MRA with collateral held and/or posted to the counterparty and create one single net payment due to or from the Fund. However, bankruptcy or insolvency laws of a particular jurisdiction may impose restrictions on or prohibitions against such a right of offset in the event of a MRA counterparty's bankruptcy or insolvency. Pursuant to the terms of the MRA, the Fund receives securities as collateral with a fair value in excess of the repurchase price to be received by the Fund upon the maturity of the repurchase transaction. Upon a bankruptcy or insolvency of the MRA counterparty, the Fund recognizes a liability with respect to such excess collateral to reflect the Fund's obligation under bankruptcy law to return the excess to the counterparty. Repurchase agreements outstanding at the end of the period are listed in the Fund's Portfolio of Investments.
Many countries have experienced outbreaks of infectious illnesses in recent decades, including swine flu, avian influenza, SARS and, more recently, COVID-19. The global outbreak of COVID-19 in early 2020 has resulted in various disruptions, including travel and border restrictions, quarantines, supply chain disruptions, lower consumer demand and general market uncertainty. The full effects, duration and costs of the COVID-19 pandemic are impossible to predict, and the circumstances surrounding the COVID-19 pandemic will continue to evolve, including the risk of future increased rates of infection due to low vaccination rates and/or the lack of effectiveness of current vaccines against new variants. Similar consequences could arise as a result of the spread of other infectious diseases. Management will continue to monitor the impact COVID-19 has on the Fund and reflect the consequences as appropriate in the Fund's accounting and financial reporting.
NOTE 3 — Purchases and Sales of Investment Securities
Cost of purchases of investment securities (excluding short-term investments) aggregated $6,355,203,676 for the period ended March 31, 2022. The proceeds and cost of securities sold resulting in net realized loss of $69,254,252 aggregated $6,575,615,637 and $6,644,869,889, respectively, for the period ended March 31, 2022.
NOTE 4 — Advisory Fees and Other Affiliated Transactions
Pursuant to an Investment Advisory Agreement (the "Agreement"), advisory fees were paid by the Fund to First Pacific Advisors, LP (the "Adviser"). Under the terms of this Agreement, the Fund pays the Adviser a monthly fee calculated at the annual rate of 0.50% of the Fund's average daily net assets. In addition, as of March 31, 2021, the Adviser has contractually agreed to reimburse expenses in excess of 0.47% of the average daily net assets of the Fund (excluding interest, taxes, brokerage fees and commissions payable by the Fund in connection with the purchase or sale of portfolio securities, and extraordinary expenses, including litigation expenses not incurred in the Fund's ordinary course of business) through March 31, 2022.
The Agreement obligates the Adviser to reduce its fee to the extent necessary to reimburse the Fund for any annual expenses (exclusive of interest, taxes, the cost of any supplemental statistical and research information, and extraordinary expenses such as litigation) in excess of 1.50% of the first $15 million and 1.00% of the remaining average net assets of the Fund for the year. The Advisor has agreed with respect to the Fund to voluntarily waive advisory fees to limit expenses in excess of 0.45% of the average net assets of the Fund. This Agreement is for the period commencing March 31, 2022 and terminating on March 31, 2023. This Agreement
42
FPA NEW INCOME, INC.
NOTES TO FINANCIAL STATEMENTS (Continued)
(Unaudited)
may be terminated at any time by the Fund's Board of Directors and will terminate automatically in the event of the termination of the New Investment Advisory Agreement. Any amendment to this agreement shall be in writing signed by the parties hereto.
For the period ended March 31, 2022, the Fund paid aggregate fees and expenses of $134,680 to all Directors who are not affiliated persons of the Adviser. Certain officers of the Fund are also officers of the Adviser.
NOTE 5 — Federal Income Tax
No provision for federal income tax is required because the Fund has elected to be taxed as a "regulated investment company" under the Internal Revenue Code (the "Code") and intends to maintain this qualification and to distribute each year to its shareholders, in accordance with the minimum distribution requirements of the Code, its taxable net investment income and taxable net realized gains on investments.
The cost of investment securities held at March 31, 2022 was $10,913,579,045 for federal income tax purposes. Gross unrealized appreciation and depreciation for all investment at March 31, 2022, for federal income tax purposes was $30,813,215 and $258,341,952, respectively resulting in net unrealized depreciation of $227,528,737. As of and during the period ended March 31, 2022, the Fund did not have any liability for unrecognized tax benefits. The Fund recognizes interest and penalties, if any, related to unrecognized tax benefits as income tax expense in the Statement of Operations. During the year, the Fund did not incur any interest or penalties. The statute of limitations remains open for the last 3 years, once a return is filed. No examinations are in progress at this time.
NOTE 6 — Disclosure of Fair Value Measurements
The Fund uses the following methods and inputs to establish the fair value of its assets and liabilities. Use of particular methods and inputs may vary over time based on availability and relevance as market and economic conditions evolve.
Equity securities are generally valued each day at the official closing price of, or the last reported sale price on, the exchange or market on which such securities principally are traded, as of the close of business on that day. If there have been no sales that day, equity securities are generally valued at the last available bid price. Securities that are unlisted and fixed-income and convertible securities listed on a national securities exchange for which the over-the-counter ("OTC") market more accurately reflects the securities' value in the judgment of the Fund's officers, are valued at the most recent bid price. However, most fixed income securities are generally valued at prices obtained from pricing vendors and brokers.
Vendors value such securities based on one or more of the following inputs: transactions, bids, offers quotations from dealers and trading systems, spreads and other relationships observed in the markets among comparable securities, benchmarks, underlying equity of the issuer, and proprietary pricing models such as cash flows, financial or collateral performance and other reference data (includes prepayments, defaults, collateral, credit enhancements, and interest rate volatility). Short-term corporate notes with maturities of 60 days or less at the time of purchase are valued at amortized cost.
Securities for which representative market quotations are not readily available or are considered unreliable by the Adviser are valued as determined in good faith under procedures adopted by the authority of the Fund's Board of Directors. Various inputs may be reviewed in order to make a good faith determination of a security's value. These inputs include, but are not limited to, the type and cost of the security; contractual or legal restrictions on resale of the security; relevant financial or business developments of the issuer; actively traded similar or related securities; conversion or exchange rights on the security; related corporate actions; significant events
43
FPA NEW INCOME, INC.
NOTES TO FINANCIAL STATEMENTS (Continued)
(Unaudited)
occurring after the close of trading in the security; and changes in overall market conditions. Fair valuations and valuations of investments that are not actively trading involve judgment and may differ materially from valuations of investments that would have been used had greater market activity occurred.
The Fund classifies its assets based on three valuation methodologies. Level 1 values are based on quoted market prices in active markets for identical assets. Level 2 values are based on significant observable market inputs, such as quoted prices for similar assets and quoted prices in inactive markets or other market observable inputs as noted above including spreads, cash flows, financial performance, prepayments, defaults, collateral, credit enhancements, and interest rate volatility. Level 3 values are based on significant unobservable inputs that reflect the Fund's determination of assumptions that market participants might reasonably use in valuing the assets. The valuation levels are not necessarily an indication of the risk associated with investing in those securities.
The following table presents the valuation levels of the Fund's investments as of March 31, 2022:
Investments | | Level 1 | | Level 2 | | Level 3 | | Total | |
Common Stocks | |
Energy | | | — | | | | — | | | $ | 58,238,226 | | | $ | 58,238,226 | | |
Industrials | | $ | 78,867,539 | | | | — | | | | — | | | | 78,867,539 | | |
Retailing | | | — | | | | — | | | | 9,008,268 | | | | 9,008,268 | | |
Commercial Mortgage-Backed Securities | |
Agency | | | — | | | $ | 7,963,403 | | | | — | | | | 7,963,403 | | |
Agency Stripped | | | — | | | | 44,077,723 | | | | — | | | | 44,077,723 | | |
Non-Agency | | | — | | | | 771,773,417 | | | | 12,705,000 | | | | 784,478,417 | | |
Residential Mortgage-Backed Securities | |
Agency Collateralized Mortgage Obligation | | | — | | | | 21,079,280 | | | | — | | | | 21,079,280 | | |
Agency Pool Adjustable Rate | | | — | | | | 299,710 | | | | — | | | | 299,710 | | |
Agency Pool Fixed Rate | | | — | | | | 243,530,406 | | | | — | | | | 243,530,406 | | |
Agency Stripped | | | — | | | | 151,338 | | | | — | | | | 151,338 | | |
Non-Agency Collateralized Mortgage
Obligation | | | — | | | | 705,341,587 | | | | — | | | | 705,341,587 | | |
Asset-Backed Securities | |
Auto | | | — | | | | 2,749,948,021 | | | | — | | | | 2,749,948,021 | | |
Collateralized Loan Obligation | | | — | | | | 2,215,122,010 | | | | 29,717,796 | | | | 2,244,839,806 | | |
Equipment | | | — | | | | 1,129,220,684 | | | | 16,007,822 | | | | 1,145,228,506 | | |
Other | | | — | | | | 1,132,930,416 | | | | 26,204,000 | | | | 1,159,134,416 | | |
Corporate Bonds & Notes | | | — | | | | 89,104,573 | | | | — | | | | 89,104,573 | | |
Corporate Bank Debt | | | — | | | | 287,542,046 | | | | 10,935,553 | | | | 298,477,599 | | |
U.S. Treasuries | | | — | | | | 1,046,281,490 | | | | — | | | | 1,046,281,490 | | |
Short-Term Investments | | | — | | | | 281,860,000 | | | | — | | | | 281,860,000 | | |
| | | $ | 78,867,539 | | | $ | 10,726,226,104 | | | $ | 162,816,665 | | | $ | 10,967,910,308 | | |
44
FPA NEW INCOME, INC.
NOTES TO FINANCIAL STATEMENTS (Continued)
(Unaudited)
The following table summarizes the Fund's Level 3 investment securities and related transactions during the period ended March 31, 2022:
Investments | | Beginning
Value at
September 30,
2021 | | Net Realized and
Unrealized Gains
(Losses)* | | Purchases | | (Sales) | | Gross
Transfers
In/(Out) | | Ending
Value at
March 31,
2022 | | Net Change
in Unrealized
Appreciation
(Depreciation)
related to
Investments held
at March 31,
2022 | |
Common Stocks | | $ | 93,664,143 | | | $ | (5,788,336 | ) | | | — | | | | — | | | $ | (20,629,313 | ) | | $ | 67,246,494 | | | $ | (1,929,105 | ) | |
Commercial Mortagage-
Backed Securities
Non-Agency | | | — | | | | 58 | | | $ | 12,704,942 | | | | — | | | | — | | | | 12,705,000 | | | | — | | |
Residential Mortgage-
Backed Securities
Non-Agency
Collateralized
Mortgage Obligation | | | 35,620,000 | | | | (1,237,581 | ) | | | | | | $ | (1,901,668 | ) | | | (32,480,751 | ) | | | — | | | | — | | |
Asset-Backed Securities
Collateralized Loan
Obligation | | | 17,800,000 | | | | — | | | | 18,000,000 | | | | (6,082,204 | ) | | | — | | | | 29,717,796 | | | | — | | |
Asset-Backed Securities
Equipment | | | 18,223,505 | | | | (355,026 | ) | | | — | | | | (1,860,657 | ) | | | — | | | | 16,007,822 | | | | (358,172 | ) | |
Asset-Backed Securities
Other | | | | | | | 26,204,000 | | | | — | | | | — | | | | 26,204,000 | | | | — | | |
Corporate Bank Debt | | | 17,737,844 | | | | (36,138 | ) | | | 49,847 | | | | (6,816,000 | ) | | | — | | | | 10,935,553 | | | | (14,716 | ) | |
| | | $ | 183,045,492 | | | $ | (7,417,023 | ) | | $ | 56,958,789 | | | $ | (16,660,529 | ) | | $ | (53,110,064 | ) | | $ | 162,816,665 | | | $ | (2,301,993 | ) | |
* Net realized and unrealized gains (losses) are included in the related amounts in the statement of operations.
Transfers of investments between different levels of the fair value hierarchy are recorded at fair value as of the end of the reporting period. There were transfers of $32,480,751 out of Level 3 into Level 2, $78,867,539 out of Level 3 into Level 1 and $58,238,226 out of Level 1 into Level 3. Transfers out of Level 3 were due to change in valuation technique from recent trade activity to vendor priced. Transfers into Level 3 were due to change in valuation technique from vendor priced to third party broker quoted.
The following table summarizes the quantitative inputs and assumptions used for items categorized as Level 3 of the fair value hierarchy as of March 31, 2022:
Financial Assets | | Fair Value at
March 31, 2022 | | Valuation Technique(s) | | Unobservable
Inputs | | Price/Range | | Weighted
Average Price | |
Common Stocks | | $ | 9,008,268 | | | Pricing Model (a) | | Quotes/Prices | | $ | 11.75-$15.75 | | | $ | 15.39 | | |
| | | $ | 58,238,226 | | | Pricing Model (b) | | Executed Trades | | $ | 15.30 | | | $ | 15.30 | | |
Commercial Mortgage-Backed
Securities — Non-Agency | | $ | 12,705,000 | | | Third-Party Broker Quote (b) | | Quotes/Prices | | $ | 100.00 | | | $ | 100.00 | | |
Asset-Backed Securities —
Collateralized Loan Obligation | | $ | 29,717,796 | | | Third-Party Broker Quote (c) | | Quotes/Prices | | $ | 100.00 | | | $ | 100.00 | | |
Asset-Backed Securities —
Equipment | | $ | 16,007,822 | | | Third-Party Broker Quote (c) | | Quotes/Prices | | $ | 91.34 | | | $ | 91.34 | | |
45
FPA NEW INCOME, INC.
NOTES TO FINANCIAL STATEMENTS (Continued)
(Unaudited)
Financial Assets | | Fair Value at
March 31, 2022 | | Valuation Technique(s) | | Unobservable
Inputs | | Price/Range | | Weighted
Average Price | |
Asset-Backed Securities — Other | | $ | 26,204,000 | | | Third-Party Broker Quote (b) | | Quotes/Prices | | $ | 100.00 | | | $ | 100.00 | | |
Corporate Bank Debt | | $ | 10,935,553 | | | Pricing Model (d) | | Discounts | | | 2.10 | % | | | 2.10 | % | |
(a) The Pricing Model technique for Level 3 securities involves recently quoted funding prices of the security.
(b) The Pricing Model technique for Level 3 securities involves the last executed trade in the security.
(c) The Third Party Broker Quote technique involves obtaining an independent third-party broker quote for the security.
(d) The Pricing Model technique for Level 3 securities involves external valuation by an independent third party who utilitzed a discounted cash flow model.
NOTE 7 — Collateral Requirements
FASB Accounting Standards Update No. 2011-11, Disclosures about Offsetting Assets and Liabilities, requires disclosures to make financial statements that are prepared under U.S. GAAP more comparable to those prepared under International Financial Reporting Standards. Under this guidance the Fund discloses both gross and net information about instruments and transactions eligible for offset such as instruments and transactions subject to an agreement similar to a master netting arrangement. In addition, the Fund discloses collateral received and posted in connection with master netting agreements or similar arrangements.
The following table presents the Fund's repurchase agreements by counterparty net of amounts available for offset under an ISDA Master agreement or similar agreements and net of the related collateral received or pledged by the Fund as of March 31, 2022, are as follows:
| | | | | Gross Amounts Not Offset in the
Statement of Assets and Liabilities | | | |
Counterparty | | Gross Assets
(Liabilities)
in the Statement of
Assets and Liabilities | | Security
Collateral
(Received)
Pledged | | Assets (Liabilities)
Available for Offset | | Net Amount
of Assets
(Liabilities)(a) | |
State Street Bank and
Trust Company: | |
Repurchase Agreement | | $ | 281,860,000 | | | $ | (281,860,000 | )(b) | | | — | | | | — | | |
(a) Represents the net amount receivable from the counterparty in the event of default.
(b) Collateral with a value of $287,497,313 has been received in connection with a master repurchase agreement. Excess of collateral received from the individual master repurchase agreement is not shown for financial reporting purposes.
NOTE 8 — Commitments
As of March 31, 2022, the Fund was liable for the following unfunded commitments:
Asset Class | | Unfunded
Commitment | |
Corporate Bank Debt | | $ | 18,532,219 | | |
46
FPA NEW INCOME, INC.
SHAREHOLDER EXPENSE EXAMPLE
March 31, 2022 (Unaudited)
Fund Expenses
Mutual fund shareholders generally incur two types of costs: (1) transaction costs, and (2) ongoing costs, including advisory and administrative fees; shareholder service fees; and other Fund expenses. The Example is intended to help you understand your ongoing costs (in dollars) of investing in the Fund and to compare these costs with the ongoing costs of investing in other mutual funds. The Example is based on an investment of $1,000 invested at the beginning of the year and held for the entire year.
Actual Expenses
The information in the table under the heading "Actual Performance" provides information about actual account values and actual expenses. You may use the information in this column, together with the amount you invested, to estimate the expenses that you paid over the period. Simply divide your account value by $1,000 (for example, an $8,600 account value divided by $1,000 = 8.6), then multiply the result by the number in the first column in the row entitled "Expenses Paid During Period" to estimate the expenses you paid on your account during this period.
Hypothetical Example for Comparison Purposes
The information in the table under the heading "Hypothetical Performance (5% return before expenses)" provides information about hypothetical account values and hypothetical expenses based on the Fund's actual expense ratio and an assumed rate of return of 5% per year before expenses, which is not the Fund's actual return. The hypothetical account values and expenses may not be used to estimate the actual ending account balance or expenses you paid for the period. You may use this information to compare the ongoing costs of investing in the Fund and other funds. To do so, compare this 5% hypothetical example with the 5% hypothetical examples that appear in the shareholder reports of other funds.
Please note that the expenses shown in the table are meant to highlight your ongoing costs only and do not reflect any transactional costs. Therefore, the information under the heading "Hypothetical Performance (5% return before expenses)" is useful in comparing ongoing costs only, and will not help you determine the relative total costs of owning different funds. In addition, if these transactional costs were included, your costs would have been higher. Even though the Fund does not charge transaction fees, if you purchase shares through a broker, the broker may charge you a fee. You should evaluate other mutual funds' transaction fees and any applicable broker fees to assess the total cost of ownership for comparison purposes.
| | | Actual Performance | | Hypothetical Performance
(5% return before expenses) | |
Beginning Account Value September 30, 2021 | | $ | 1,000.00 | | | $ | 1,000.00 | | |
Ending Account Value March 31, 2022 | | $ | 980.70 | | | $ | 1,022.59 | | |
Expenses Paid During Period(a) | | $ | 2.32 | | | $ | 2.37 | | |
(a) Expenses are equal to the Fund's annualized expense ratio of 0.47%, multiplied by the average account value over the period and prorated for the six-months ended March 31, 2022 (182/365 days).
47
FPA NEW INCOME, INC.
DIRECTOR AND OFFICER INFORMATION
(Unaudited)
Sandra Brown, Mark L. Lipson, Alfred E. Osborne, Jr., and Robert F. Goldrich are all Directors of the Fund who are not "interested persons" of the Fund, as that term is defined in the 1940 Act (collectively, the "Independent Directors"). Directors serve until their resignation, removal or retirement. The Statement of Additional Information includes additional information about the Directors and is available, without charge, upon request by calling (800) 982-4372.
Name, Address(1)
and Year of Birth | | Position(s)
Held with
the Fund | | Year First
Elected as
Director of
the Fund | | Principal Occupation(s)
During the
Past Five Years | | Number of
FPA Funds
Overseen
by Director | | Other
Directorships
Held by Director
During the Past
Five Years | |
Independent Directors | |
Sandra Brown,
1955 | | Director | | | 2016 | | | Consultant (since 2009). Formerly, CEO and President of Transamerica Financial Advisers, Inc. (1999-2009); President, Transamerica Securities Sales Corp. (1998-2009); Vice President, Bank of America Mutual Fund Administration (1990-1998). Director/Trustee of each FPA Fund (Bragg Capital Trust since 2020). | | | 7 | | | None | |
Robert F. Goldrich,
1962 | | Director | | | 2022 | | | President/CFO of the Leon Levy Foundation. Director/Trustee of each FPA Fund (since 2022). | | | 7 | | | Uluru, Inc
(2015-2017) | |
Mark L. Lipson,
1949 | | Director & Chairman | | | 2015 | | | Managing Member, ML2 Advisors, LLC (since 2014). Formerly Managing Director, Bessemer Trust (2007-2014) and US Trust (2003-2006); Chairman and CEO of the Northstar Mutual Funds (1993-2001); and President and CEO of the National Mutual Funds (1988-1993). Director/Trustee of each FPA Fund (Bragg Capital Trust since 2020). | | | 7 | | | None | |
Alfred E. Osborne, Jr.,
1944 | | Director | | | 1999 | | | Senior Associate Dean, (2003-present), Interim Dean (July 2018-June 2019), Professor and Faculty Director (since 2003) Price Center for Entrepreneurship and Innovation at the John E. Anderson School of Management at UCLA. Dr. Osborne has been at UCLA since 1972. Director/Trustee of each FPA Fund (Bragg Capital Trust since 2020). | | | 7 | | | Kaiser Aluminum, Wedbush Capital and Waverley Capital Acquisition Corporation | |
48
FPA NEW INCOME, INC.
DIRECTOR AND OFFICER INFORMATION (Continued)
(Unaudited)
Name, Address(1)
and Year of Birth | | Position(s)
Held with
the Fund | | Year First
Elected as
Director of
the Fund | | Principal Occupation(s)
During the
Past Five Years | | Number of
FPA Funds
Overseen
by Director | | Other
Directorships
Held by Director
During the Past
Five Years | |
"Interested" Director(2) | |
J. Richard Atwood,
1960 | | Director | | | 2016 | | | Director and President of FPA GP, Inc., the General Partner of the Adviser (since 2018). Director/Trustee of each FPA Fund (Bragg Capital Trust since 2020). President of each FPA Fund (Bragg Capital Trust since 2020). Formerly, Managing Partner of FPA (2006-2018). | | | 7 | | | None | |
(1) The address of each Director is 11601 Wilshire Boulevard, Suite 1200, Los Angeles, California 90025.
(2) "Interested person" within the meaning of the 1940 Act by virtue of their affiliation with the Fund's Adviser.
49
FPA NEW INCOME, INC.
DIRECTOR AND OFFICER INFORMATION (Continued)
(Unaudited)
Officers of the Fund. Officers of the Fund are elected annually by the Board.
Name, Address(1)
and Year of Birth | | Position
with Fund | | Year First
Elected as
Officer of the
Fund | | Principal Occupation(s)
During the Past Five Years | |
Thomas. H. Atteberry,
1953 | | Vice President and Portfolio Manager | | | 2004 | | | Partner of FPA (since 2006). Vice President and Portfolio Manager of FPA Flexible Fixed Income Fund (since 2018). | |
Abhijeet Patwardhan,
1979 | | Vice President and Portfolio Manager | | | 2015 | | | Partner (since 2017) and a Director of Research (since 2015) of FPA; Managing Director of FPA from 2015 to 2017, Senior Vice President of FPA from 2014 to 2015; Analyst and Vice President of FPA from 2010 to 2013. Vice President and Portfolio Manager of FPA Flexible Fixed Income Fund (since 2018). | |
J. Richard Atwood,
1960 | | President | | | 1997 | | | Director and President of FPA GP, Inc., the General Partner of FPA (since 2018). Director/Trustee (except Bragg Capital Trust since 2020) and President (except Bragg Capital Trust since 2020) of each FPA Fund. Formerly, Managing Partner of FPA (2006-2018). | |
Karen E. Richards,
1969 | | Chief Compliance Officer | | | 2019 | | | Chief Compliance Officer of FPA (since 2018); and Chief Compliance Officer of each FPA Fund (since 2019, except Bragg Capital Trust since 2020). Formerly, Deputy Chief Compliance Officer of First Republic Investment Management, LLC (from 2016 to 2018), and Vice President, Senior Compliance Officer of Pacific Investment Management Company (from 2010 to 2016). | |
E. Lake Setzler III,
1967 | | Treasurer | | | 2006 | | | Managing Director and CFO (since 2022) of FPA; and Treasurer of each FPA Fund (except Bragg Capital Trust since 2020). Formerly, Senior Vice President and Controller of FPA. | |
Rebecca D. Gilding,
1979 | | Secretary | | | 2019 | | | Vice President and Counsel, State Street Bank and Trust Company (since 2016); and Secretary of each FPA Fund (since 2019, except Bragg Capital Trust since 2020). Formerly, Assistant Vice President and Associate Counsel, Brown Brothers Harriman & Co. (2013 to 2016). | |
(1) The address for each Officer (except Ms. Gilding) is 11601 Wilshire Boulevard, Suite 1200, Los Angeles, California 90025. Ms. Gilding's address is State Street Bank and Trust Company, One Lincoln Street, Boston, Massachusetts 02111.
50
FPA NEW INCOME, INC.
(Unaudited)
INVESTMENT ADVISER
First Pacific Advisors, LP
11601 Wilshire Boulevard, Suite 1200
Los Angeles, CA 90025
TRANSFER & SHAREHOLDER SERVICE AGENT
UMB Fund Services, Inc.
P.O. Box 2175
Milwaukee, WI 53201-2175
or
235 West Galena Street
Milwaukee, WI 53212-3948
(800) 638-3060
CUSTODIAN AND ADMINISTRATOR
State Street Bank and Trust Company
One Lincoln Street
Boston, Massachusetts 02111
TICKER SYMBOL: FPNIX
CUSIP: 302544101
DISTRIBUTOR
UMB Distribution Services, LLC
235 West Galena Street
Milwaukee, Wisconsin 53212-3948
LEGAL COUNSEL
Dechert LLP
One Bush Street, Suite 1600
San Francisco, California 94104
INDEPENDENT REGISTERED PUBLIC ACCOUNTING FIRM
Ernst & Young LLP
725 South Figueroa Street
Los Angeles, California 90017
This report has been prepared for the information of shareholders of FPA NEW INCOME, INC., and is not authorized for distribution to prospective investors unless preceded or accompanied by an effective prospectus. The financial information included in this report has been taken from the records of the Fund without examination by independent auditors.
A description of the policies and procedures that the Adviser uses to vote proxies related to the Fund's portfolio securities is set forth in the Fund's Statement of Additional Information which is available without charge, upon request, on the Fund's website at www.fpa.com or by calling (800) 982-4372 and on the Securities and Exchange Commission's website at www.sec.gov.
The Fund's complete proxy voting record for the 12 months ended June 30, 2021 is available without charge, upon request by calling (800) 982-4372 and on the SEC's website at www.sec.gov.
The Fund's schedule of portfolio holdings, filed the first and third quarter of the Fund's fiscal year on Form N-PORT with the SEC, is available on the SEC's website at www.sec.gov.
Additional information about the Fund is available online at www.fpa.com. This information includes, among other things, holdings, top sectors, and performance, and is updated on or about the 15th business day after the end of each quarter.
Item 2. Code of Ethics.
Not applicable to this semi-annual report.
Item 3. Audit Committee Financial Expert.
Not applicable to this semi-annual report.
Item 4. Principal Accountant Fees and Services.
Not applicable to this semi-annual report.
Item 5. Audit Committee of Listed Registrants.
Not applicable to this semi-annual report.
Item 6. Investments.
| (a) | Schedule of Investments is included as a part of the report to shareholders filed under Item 1 of this Form N-CSR. |
Item 7. Disclosure of Proxy Voting Policies and Procedures for Closed-End Management Investment Companies.
Not applicable.
Item 8. Portfolio Managers of Closed-End Management Investment Companies.
Not applicable.
Item 9. Purchases of Equity Securities by Closed-End Management Investment Company and Affiliated Purchasers.
Not applicable.
Item 10. Submission of Matters to a Vote of Security Holders.
There have been no material changes to the procedures by which the shareholders may recommend nominees to the registrant’s board of directors.
Item 11. Controls and Procedures.
| (a) | The principal executive officer and principal financial officer of the registrant have concluded that the registrant’s disclosure controls and procedures (as defined in Rule 30a-3(c) under the Investment Company Act of 1940) are effective based on their evaluation of the disclosure controls and procedures as of a date within 90 days of the filing date of this report. |
| (b) | There have been no significant changes in the registrant’s internal controls over financial reporting (as defined in Rule 30a-3(d) under the Investment Company Act of 1940) that occurred during the registrant’s second fiscal quarter of the period covered by this report that have materially affected, or is reasonably likely to materially affect, the registrant’s internal controls over financial reporting. |
Item 12. Disclosure of Securities Lending Activities for Closed-End Management Investment Companies
Not applicable.
Item 13. Exhibits.
SIGNATURES
Pursuant to the requirements of the Securities Exchange Act of 1934 and the Investment Company Act of 1940, the registrant has duly caused this report to be signed on its behalf by the undersigned, thereunto duly authorized.
FPA NEW INCOME, INC.
| By: | /s/ J. Richard Atwood | |
| | J. Richard Atwood | |
| | President (principal executive officer) | |
Date: June 3, 2022
Pursuant to the requirements of the Securities Exchange Act of 1934 and the Investment Company Act of 1940, this report has been signed below by the following persons on behalf of the registrant and in the capacities and on the dates indicated.
| By: | /s/ J. Richard Atwood | |
| | J. Richard Atwood | |
| | President (principal executive officer) | |
Date: June 3, 2022
| By: | /s/ E. Lake Setzler III | |
| | E. Lake Setzler III | |
| | Treasurer (principal financial officer) | |
Date: June 3, 2022