UNITED STATES
SECURITIES AND EXCHANGE COMMISSION
Washington, D.C. 20549
FORM N-CSR
CERTIFIED SHAREHOLDER REPORT OF REGISTERED
MANAGEMENT INVESTMENT COMPANIES
Investment Company Act file number: 811-01735
fpa NEW Income, inc.
(Exact name of registrant as specified in charter)
11601 WILSHIRE BLVD., STE. 1200
LOS ANGELES, CALIFORNIA 90025
(Address of principal executive offices)(Zip code)
| (Name and Address of Agent for Service) | Copy to: |
J. RICHARD ATWOOD, PRESIDENT FPA NEW INCOME, INC. 11601 WILSHIRE BLVD., STE. 1200 LOS ANGELES, CALIFORNIA 90025 | MARK D. PERLOW, ESQ. DECHERT LLP ONE BUSH STREET, STE. 1600 SAN FRANCISCO, CA 94104 |
Registrant’s telephone number, including area code: (310) 473-0225
Date of fiscal year end: September 30
Date of reporting period: March 31, 2023
Item 1: Report to Shareholders.
| (a) | The Report to Shareholders is attached herewith. |

Distributor:
UMB DISTRIBUTION SERVICES, LLC
235 West Galena Street Milwaukee, Wisconsin 53212
FPA NEW INCOME, INC.
LETTER TO SHAREHOLDERS
Dear Fellow Shareholders,
FPA New Income, Inc. (the "Fund") returned 2.02% in the first quarter of 2023.
Sector | | As of 3/31/2023 | |
Yield-to-worst1 | | | 6.04 | % | |
Effective Duration | | | 1.81 years | | |
High Quality Exposure2 | | | 90.1 | % | |
Credit Exposure3 | | | 9.9 | % | |
In February, the Federal Reserve raised the Fed Funds rate by 25 basis points (bps) to quell inflation. Thereafter, macroeconomic data was uneven and two bank failures in early March led to expectations that a contraction in credit would be disinflationary and avoid some of the Federal Reserve's anticipated monetary policy tightening. As a result, while the Federal Reserve ended up instituting a second 25 bps increase in the Fed Funds rate in March, risk-free rates declined during the quarter for maturities longer than a year.4 Up until the bank failures, spreads declined across the market but then increased following the bank failures on concerns about additional failures and weakening credit and economic growth. Overall, investment-grade debt spreads rose during the quarter while spreads on high-yield rated debt declined. The net result is that yields across the bond market are generally lower than they were a few months ago. Nevertheless, on an absolute basis, we still see an attractive opportunity to buy longer duration bonds rated single-A or higher ("High Quality"), which we believe will enhance the Fund's long-term returns and the Fund's short-term upside versus downside return profile. We do not generally view investments rated BBB or lower ("Credit") as attractively priced, but we continue to search and will opportunistically invest in Credit when we believe that the price adequately compensates us for the risk of permanent capital impairment and near-term mark-to-market risk. The Fund's Credit exposure remained unchanged as of March 31, 2023 from Dec. 31, 2022 at 9.9%. Cash and equivalents represented 4.2% of the portfolio at March 31, 2023 versus 3.7% on December 31, 2022. In addition, 5.7% of the Fund was held in Treasuries at the end of the quarter.
Please note that the Fund does not own any direct investments in banks and has not owned such investments for at least a decade.
1 Yield-to-worst ("YTW") is presented gross of fees and reflects the lowest possible yield on a callable bond without the issuer defaulting. It does not represent the yield an investor should expect to receive. As of March 31, 2023, the Fund's subsidized/unsubsidized 30-day SEC standardized yield ("SEC Yield") was 4.02%/3.88% respectively. The SEC Yield calculation is an annualized measure of the Fund's dividend and interest payments for the last 30 days, less the Fund expenses. Subsidized yield reflects fee waivers and/or expense reimbursements during the period. Without waivers and/or reimbursements, yields would be reduced. Unsubsidized yield does not adjust for any fee waivers and/or expense reimbursements in effect. The SEC Yield calculation shows investors what they would earn in yield over the course of a 12-month period if the fund continued earning the same rate for the rest of the year.
2 High Quality is defined as investments rated A or higher, Treasuries, and cash and equivalents.
3 Credit is defined as investments rated BBB or lower, including non-rated investments.
4 Source: Bloomberg.
1
FPA NEW INCOME, INC.
LETTER TO SHAREHOLDERS
(Continued)
Portfolio Attribution5
The largest contributors to performance during the quarter were collateralized loan obligations (CLOs) backed by corporate loans, with most of the return due to income from coupon payments. Most of these bonds are floating rate and have benefited from increases in their coupons as rates have risen. The second- and third-largest contributors to performance during the quarter were asset-backed securities (ABS) backed by equipment and ABS backed by auto loans or leases, respectively. The return on these ABS was driven by higher prices due to lower risk risk-free rates, with coupon payments also contributing to the return.
While there were individual bonds that detracted from performance during the quarter, there were no meaningful detractors at the sector level.
Portfolio Activity6
The table below shows the portfolio's sector-level exposures at March 31, 2023 compared to December 31, 2022:
| Sector | | % Portfolio
3/31/2023 | | % Portfolio
12/31/2022 | |
ABS | | | 63.5 | | | | 63.4 | | |
Mortgage Backed (CMO)7 | | | 5.5 | | | | 5.3 | | |
Stripped Mortgage-backed | | | 0.4 | | | | 0.4 | | |
Corporate | | | 6.2 | | | | 6.2 | | |
CMBS7 | | | 12.5 | | | | 11.9 | | |
Mortgage Pass-through | | | 2.0 | | | | 2.1 | | |
U.S. Treasury | | | 5.7 | | | | 7.0 | | |
Cash and equivalents | | | 4.2 | | | | 3.7 | | |
Total | | | 100.0 | % | | | 100.0 | % | |
Yield-to-worst1 | | | 6.04 | % | | | 6.14 | % | |
Effective Duration (years) | | | 1.81 | | | | 1.70 | | |
Average Life (years) | | | 2.41 | | | | 2.34 | | |
We continue to take advantage of higher yields by actively buying longer duration, High Quality bonds. The duration of these investments has been guided by our duration test, which seeks to identify the longest duration bonds that we expect will produce at least a breakeven return over a 12-month period if we assume that a bond's yield will increase by 100 bps during those 12 months. Consistent with this test, during the first quarter of 2023, we bought High Quality bonds including ABS backed by equipment, ABS backed by prime quality auto loans, ABS backed by cellular towers, agency-guaranteed commercial mortgage-backed securities (CMBS),
5 This information is not a recommendation for a specific security or sector and these securities/sectors may not be in the Fund at the time you receive this report. The information provided does not reflect all positions purchased, sold or recommended by FPA during the quarter. The portfolio holdings as of the most recent quarter-end may be obtained at www.fpa.com.
6 Portfolio composition will change due to ongoing management of the Fund.
7 Collateralized mortgage obligations ("CMO") are mortgage-backed bonds that separate mortgage pools into different maturity classes. Commercial mortgage-backed securities ("CMBS") are securities backed by commercial mortgages rather than residential mortgages.
Past performance is no guarantee, nor is it indicative, of future results.
2
FPA NEW INCOME, INC.
LETTER TO SHAREHOLDERS
(Continued)
residential mortgage-backed securities backed by re-performing single family mortgages, non-agency CMBS backed by single family homes, and utility cost recovery bonds. On average, these investments had a duration of 3.9 years.8 In addition, we extended the duration of the Fund's Treasury holdings. Finally, we bought a floating rate, High Quality CLO backed by middle market loans.
Within Credit we bought BBB-rated corporate bonds, some of which were paid for by trading shorter duration bonds for longer duration bonds from the same issuers.
In addition to those BBB bond trades, to fund this quarter's investments, we traded Treasuries for other similar duration investments and short duration ABS for longer duration ABS from the same issuer. Beyond those trades, this quarter's investments were funded with a combination of cash, proceeds from maturing investments and sales of existing short duration investments, the latter of which had an average duration of less than a year.
Market Commentary
As shown below, by some measures, inflation has begun to decrease but it still remains well above the Federal Reserve's target of 2%:
CPI Urban Consumers less Food and Energy year/year change
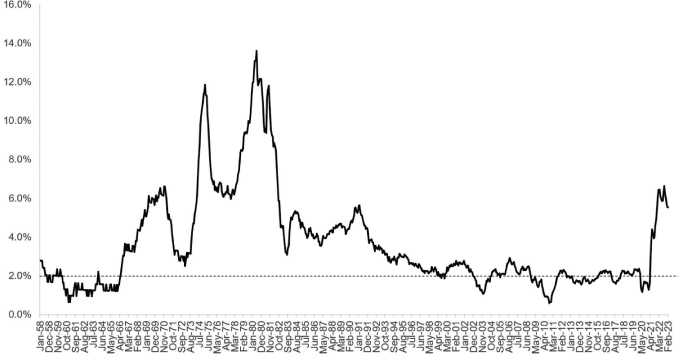
Source: US Department of Labor. As of 2/28/2023. The Consumer Price Index, or CPI, reflects the average change over time in prices paid by urban consumers for a market basket of consumer goods and services. The Federal Reserve seeks to achieve an average of 2% inflation rate (https://www.federalreserve.gov/newsevents/pressreleases/monetary20221102a.htm). Dotted line reflects the represents the Federal Reserve target.
8 Based on prices as of 3/31/2023.
3
FPA NEW INCOME, INC.
LETTER TO SHAREHOLDERS
(Continued)
Continuing its efforts to lower inflation, the Federal Reserve instituted two 25 bps increases in the Fed Funds rate during the quarter, though the weeks leading up to the second of the two rate hikes were fraught with indecision. After the first 25 bps rate hike on February 21, macroeconomic data suggested a hotter than expected economy, leading to speculation that the second hike — scheduled for March 22 — could see a 50 bps increase in the Fed Funds rate.9 However, the failure of Silicon Valley Bank on March 8 (and the failure of Signature Bank a few days later) upended the speculation of a larger Fed Funds hike at the March 22 FOMC meeting.10 Fears of systemic issues in the banking system sparked a sharp rally in Treasury yields and a period of heightened volatility in the bond market. The following chart shows daily changes in 2-year Treasury yields and highlights that the one-day decrease in yields following the collapse of Silicon Valley Bank was the largest in over 30 years and a six standard deviation event in comparison to the last 45 years.11
2 Year U.S. Treasury Yield — Daily Change (basis points)
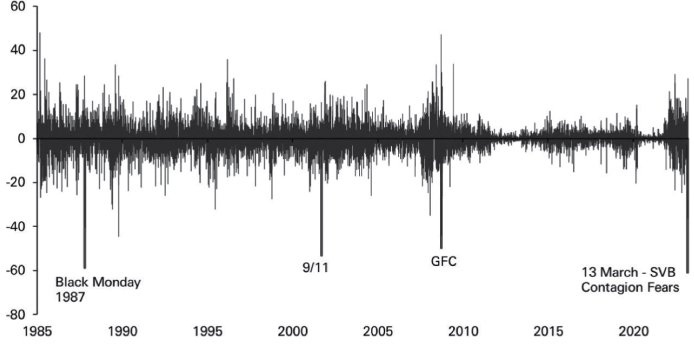
Source: Bloomberg Finance LP, Deutsche Bank; 10 charts from an unprecedented week in markets (DB); March 17, 2023
9 Source: Bloomberg. https://www.federalreserve.gov/newsevents/pressreleases/files/monetary20230228a1.pdf.
10 Source: https://www.federalreserve.gov/newsevents/pressreleases/monetary20230322b.htm.
11 MUFG Research 3-31-23.
4
FPA NEW INCOME, INC.
LETTER TO SHAREHOLDERS
(Continued)
The FDIC guaranteed all deposits (regardless of size) at the two failed banks and the Fed stepped in to fulfill its 'lender of last resort' function, restoring calm to the market (at least temporarily). Indeed, the Fed felt that enough order had been restored to the banking system and the market that the Fed could proceed with its second 25 bps hike on March 22 to avoid losing ground in the inflation fight.12 Nevertheless, these bank failures led to a significant contraction in financial conditions, as shown below:
Bloomberg United States Financial Conditions Index

Source: Bloomberg; March 2023
12 "Latest Fed Increase Came Down to the Wire. 'That Was a Rough Weekend.'", Wall Street Journal, Nick Timiraos, April 6, 2023.
5
FPA NEW INCOME, INC.
LETTER TO SHAREHOLDERS
(Continued)
Anticipating that much of the Fed's inflation-fighting work would be accomplished by the disinflationary effects of a contraction in bank lending, the market significantly lowered its expectations of future Fed Funds rate hikes. The chart below shows market pricing for the expected Fed Funds rate in May, June, July and September of 2023. As shown below, the bank failures reset the market's expectations for the Fed Funds rate meaningfully lower:
Fed Funds Rate Expectations
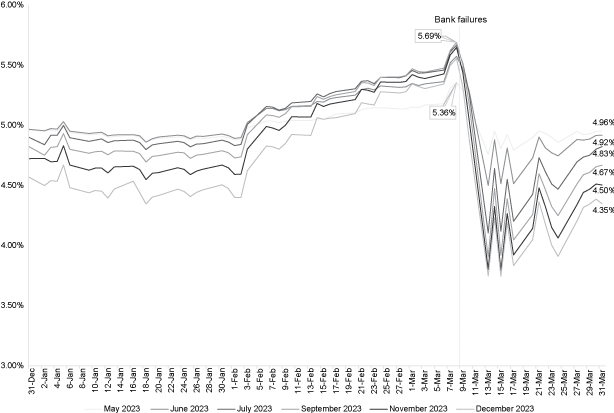
Source: Bloomberg; As of 3/31/2023.
6
FPA NEW INCOME, INC.
LETTER TO SHAREHOLDERS
(Continued)
The chart below shows the market's expectations for the future path of the Fed Funds rate as of March 31, 2023. In comparison to market expectations at December 30, 2022 the market expects the Fed to begin cutting rates sooner.
Implied Overnight Rate & Number of Hikes/Cuts
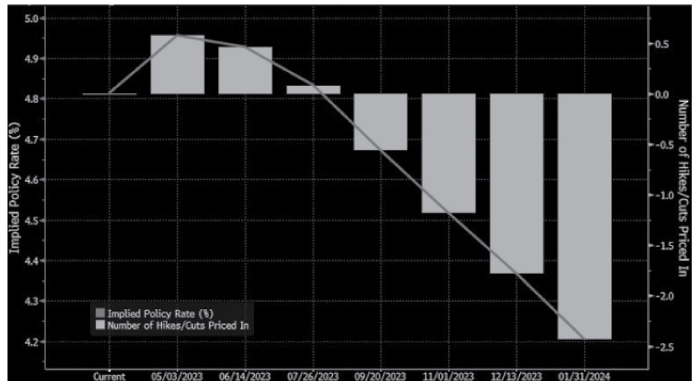
Source: Bloomberg; As of 3/31/2023.
7
FPA NEW INCOME, INC.
LETTER TO SHAREHOLDERS
(Continued)
Reflecting expectations of lower rates and a weaker economy, the following chart shows that Treasury yields declined during the quarter for maturities beyond a year:
U.S. Treasury Yield Curve
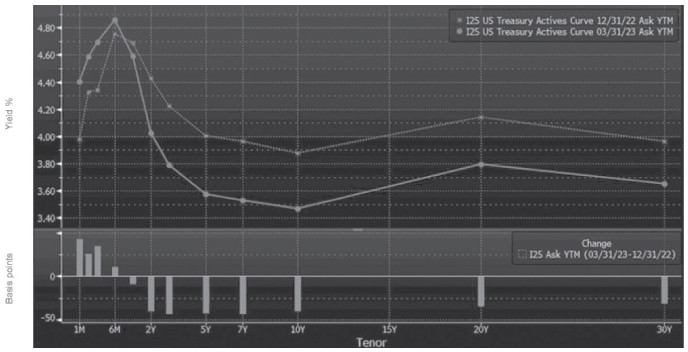
| | Maturity | |
| | 1Y | | 2Y | | 3Y | | 5Y | | 7Y | | 10Y | | 20Y | | 30Y | |
Q1 2023 change in yields (bps) | | | -10 | | | | -40 | | | | -44 | | | | -43 | | | | -43 | | | | -41 | | | | -35 | | | | -31 | | |
Source: Bloomberg; March 31, 2023
Spreads for investment grade and high-yield rated debt declined until early March but then reversed course following the bank failures. Overall, spreads on investment grade bonds ended the quarter higher, while yields ended the quarter lower, as shown in the first chart below of the Aggregate Bond Index. The second chart below shows that both yield and spread on high-yield debt ended the quarter lower as measured by the BB component of the high-yield index, excluding energy, an index that we believe is a better indication of high-yield bond pricing because it excludes noise related to the more volatile energy sector and changes in ratings composition found in the overall high-yield index over time.
8
FPA NEW INCOME, INC.
LETTER TO SHAREHOLDERS
(Continued)
Bloomberg U.S. Aggregate Bond Index
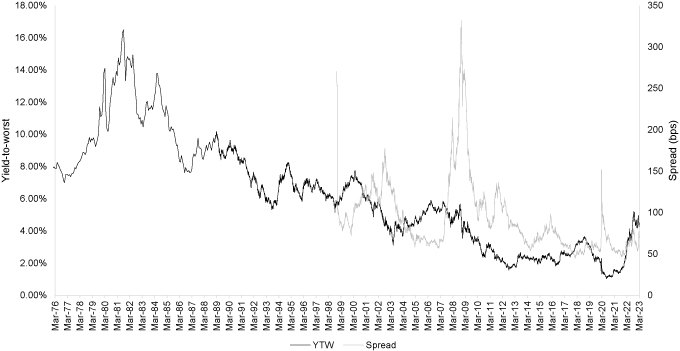
Source: Bloomberg. As of 3/31/2023. YTW is yield-to-worst. Spread reflects the quoted spread of a bond that is relative to the security off which it is priced, typically an on the-run treasury. Past performance is no guarantee, nor is it indicative, of future results. Please refer to the end of the presentation for Important Disclosures and Index definitions.
9
FPA NEW INCOME, INC.
LETTER TO SHAREHOLDERS
(Continued)
Bloomberg U.S. Corporate High Yield BB excl. Energy
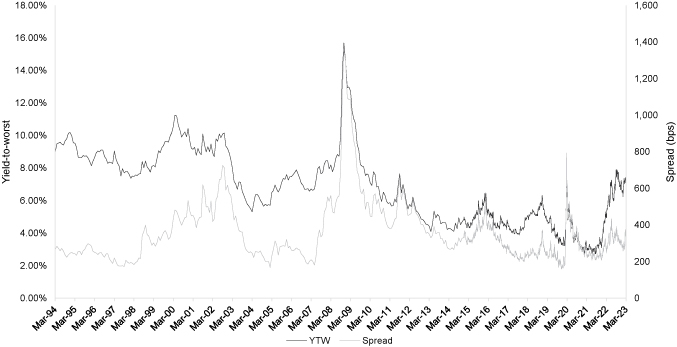
Source: Bloomberg. As of 3/31/2023. YTW is yield-to-worst. Spread reflects the quoted spread of a bond that is relative to the security off which it is priced, typically an on the-run treasury. Past performance is no guarantee, nor is it indicative, of future results. Please refer to the end of the presentation for Important Disclosures and Index definitions.
While the changes in yield and spread over the past few months are not apparent in the preceding charts, we purposely show this data over longer time horizons to put today's valuations in a long-term, rather than a short-term perspective. Notwithstanding that yields on highly rated debt are lower today than they were over the past six months, it remains true that yields are higher than they have been in at least a decade and — on an absolute basis — we still view yields on longer duration investment grade bonds as attractive. Employing the duration test described above, we believe that buying longer duration fixed rate bonds will improve the Fund's long-term returns and short-term upside versus downside return profile. Over the long term, these longer-duration investments allow the Fund to earn what we view as an attractive absolute return over a multi-year period. In the short term, if yields were to increase by 100 bps over the next 12 months, we expect that these longer duration investments would produce at least a breakeven return, limiting the short-term drawdown and preserving capital that we could then seek to redeploy into higher yielding investments. Alternatively, if yields were to decline in the short term for whatever reason, these longer duration investments would meaningfully improve the Fund's short-term total return. As an example, on March 31, 2023 if one were to buy the Treasury bond held in the Fund which matures in January 2028 (4.8-year maturity and 4.4-year duration) at the then-prevailing yield of 3.61%, one could expect a total return of +0.13% over 12 months if that bond's yield were to increase by 100 bps, and a
10
FPA NEW INCOME, INC.
LETTER TO SHAREHOLDERS
(Continued)
total return of +7.08% if its yield were to decrease by 100 bps.13 The asymmetry of this return profile points to the improvement in the short-term upside versus downside return profile that we believe is available by buying longer duration bonds.
To that end, having started 2022 with a focus on 1-2 year maturity bonds, as rates have risen over the past several quarters, we have been incrementally increasing the duration of the portfolio by focusing our investment activity on increasingly longer and longer duration bonds. Due to our active management and defensive positioning at the start of 2022, last year's returns put the Fund among the top 10% of funds in Morningstar's Short-term Bond category (the Category). Over the past twelve months, we have increased the duration of New Income by 0.5 years whereas the Category's average short-term bond fund has actually slightly shortened its duration. In fact, New Income has added more duration than all but four other short-term bond funds in the Category and New Income had a better return than those four funds last year. That's what we believe active management is supposed to do — position defensively and preserve capital when the market is expensive and then go on offense when the market gets cheaper. With respect to duration risk, that means that one should own shorter duration bonds when yields are low and then add duration when yields are higher.
On the other hand, while the absolute yield available in high-yield rated debt is also higher than it has been in many years, we do not generally view this type of debt as attractive for the Fund, particularly since these yields are now lower than they were a few months ago. Though we continue to scour the market in search of attractive opportunities in Credit, when researching these types of investments, we often find that the potential absolute return is insufficient in comparison to the potential for permanent impairment of capital. We also often find that the extra return that is available compared to highly rated debt is insufficient in comparison to the incremental risk of permanent impairment of capital borne by lower rated bonds.
One might note from these comments that we think about risk in terms of what could happen, not what will happen. Certainly as it relates to duration and interest rate risk, we don't know what's going to happen and one should never assume a continuation of the status quo. When we describe our duration test, we start by explaining the downside — what happens if rates increase. We then explain the potential upside — what happens if rates decrease "for whatever reason". We typically use those exact words — "for whatever reason" — because we can't predict the path of the economy, nor can we predict exogenous events that might lead to a flight to quality and lower risk-free rates. As we describe above, we experienced one of these "for whatever reason" events this quarter when fears of widespread bank failures swept the market and Treasury yields declined significantly. Fortunately, we have been buying long duration bonds and these contributed to the Fund's first quarter performance when yields declined.
The path of interest rates is hard to predict because there are so many variables that affect them. Moreover, a large driver of interest rates is the macroeconomy, which we believe is not accurately measured. Macroeconomic data — to the extent it accurately measures the thing it's trying to measure — is released and then can be
13 Source: Bloomberg. Simulated 12-month total return scenario assuming 100 basis point gradual increase or decrease in interest rates over 12 months. The hypothetical stress test data provided herein is for illustrative and informational purposes only, and is intended to demonstrate the mathematical impact of a change in interest rates on Treasury yields. No representation is being made that any account, product or strategy will or is likely to achieve profits, losses, or results similar to those shown. Hypothetical results do not reflect trading in actual accounts, and does not reflect the impact that economic, market or other factors may have on the management of the account. Hypothetical results have certain inherent limitations There are frequently sharp differences between simulated results and the actual results subsequently achieved by any particular account, product or strategy.
11
FPA NEW INCOME, INC.
LETTER TO SHAREHOLDERS
(Continued)
subsequently (and sometimes substantially) revised. You might think inflation declined but then you might find out later that it didn't, or vice versa. Market prices, however, aren't subject to revision, and we can judge whether we think it accurately measures the thing it's supposed to measure: risk. When we think the price is accurate, we buy. Otherwise, we don't buy. This might seem simplistic. We posit that other investors make investing too complicated by trying to predict what will happen and when. Yet our approach, while simple, is not easy. It requires a lot of discipline. Namely, it requires the willingness and ability to not buy when the price doesn't reflect the risk. Again, that might sound simple but the returns posted by a lot of investors last year suggest that others had a hard time staying disciplined when the market was extremely expensive prior to 2022. Indeed, it is hard to resist the temptation to spend money, particularly during prolonged periods of inflated prices, because it's hard to decide to make less money when everyone else is making more. Though it's hard, that's what we seek to do because we believe that disciplined investing will leave us well-positioned to take advantage of markets (like today's) where we believe prices more accurately reflect risk, especially as it relates to duration risk.
Finally, we noted earlier that the Fund does not and has not had any direct investments in banks for at least a decade. To be clear, we did not foresee the collapse of Silicon Valley Bank and Signature Bank and the subsequent decline in bank bond prices. We did, however, see that the prices of bank bonds leading up to these failures didn't, in our eyes, accurately reflect the risk involved. Though there is a lot of financial disclosure, we have found it hard to get a handle on the underlying risks. Even if we could get comfortable with the risks at the end of a reporting period, we don't have visibility into changes in that risk profile between reporting periods. And yet the yields offered on bank bonds not only didn't seem to offer us enough compensation for our inability to know what we don't know, they also didn't offer much more compensation, if any, than other bonds that are much more straightforward with respect to their risk. An equity investor may win if they can handicap risks and buy bank equity at an attractive valuation. In most instances, particularly for buy-and-hold investors, there's no "winning" in bonds. There's just not losing. That's why we try to win by not losing. We have made and will make mistakes. We try to minimize them. Over the long term, we believe that's a winning strategy.
Thank you for your confidence and continued support.
Respectfully submitted,

| |
Abhijeet Patwardhan
Portfolio Manager
April 2023 | |
12
FPA NEW INCOME, INC.
LETTER TO SHAREHOLDERS
(Continued)
Important Disclosures
This Commentary is for informational and discussion purposes only and does not constitute, and should not be construed as, an offer or solicitation for the purchase or sale of any securities, products or services discussed, and neither does it provide investment advice. Any such offer or solicitation shall only be made pursuant to the Fund's Prospectus, which supersedes the information contained herein in its entirety.
The views expressed herein and any forward-looking statements are as of the date of the publication and are those of the portfolio management team. Future events or results may vary significantly from those expressed and are subject to change at any time in response to changing circumstances and industry developments. This information and data has been prepared from sources believed reliable, but the accuracy and completeness of the information cannot be guaranteed and is not a complete summary or statement of all available data. You should not construe the contents of this document as legal, tax, accounting, investment or other advice or recommendations.
Abhijeet Patwardhan has been portfolio manager for the Fund since November 2015. Thomas Atteberry managed/co-managed the Fund from November 2004 through June 2022. Effective July 1, 2022, Mr. Atteberry transitioned to a Senior Advisory role. There were no material changes to the investment process due to this transition.
Portfolio composition will change due to ongoing management of the Fund. References to individual securities or sectors are for informational purposes only and should not be construed as recommendations by the Fund, the portfolio manager, the Adviser, or the distributor. It should not be assumed that future investments will be profitable or will equal the performance of the security or sector examples discussed. The portfolio holdings as of the most recent quarter-end may be obtained at www.fpa.com.
The statements made herein may be forward-looking and/or based on current expectations, projections, and/or information currently available. Actual results may differ from those anticipated. The portfolio manager and/or FPA cannot assure future results and disclaims any obligation to update or alter any statistical data and/or references thereto, as well as any forward-looking statements, whether as a result of new information, future events, or otherwise. Such statements may or may not be accurate over the long-term.
Investments, including investments in mutual funds, carry risks and investors may lose principal value. Capital markets are volatile and can decline significantly in response to adverse issuer, political, regulatory, market, or economic developments. The Fund may purchase foreign securities, including depository receipts, which are subject to interest rate, currency exchange rate, economic and political risks; these risks may be elevated when investing in emerging markets. Foreign investments, especially those of companies in emerging markets, can be riskier, less liquid, harder to value, and more volatile than investments in the United States. The securities of smaller, less well-known companies can be more volatile than those of larger companies.
The return of principal in a bond fund is not guaranteed. Bond funds have the same issuer, interest rate, inflation and credit risks that are associated with underlying bonds owned by the Fund. Lower rated bonds, convertible securities and other types of debt obligations involve greater risks than higher rated bonds.
Interest rate risk is the risk that when interest rates go up, the value of fixed income instruments, such as bonds, typically go down and investors may lose principal value. Credit risk is the risk of loss of principal due to the issuer's failure to repay a loan. Generally, the lower the quality rating of a fixed income instrument, the greater the risk that the issuer will fail to pay interest fully and return principal in a timely manner. If an issuer defaults the fixed income instrument may lose some or all of its value.
13
FPA NEW INCOME, INC.
LETTER TO SHAREHOLDERS
(Continued)
Mortgage securities and collateralized mortgage obligations (CMOs) are subject to prepayment risk and the risk of default on the underlying mortgages or other assets; such derivatives may increase volatility. Convertible securities are generally not investment grade and are subject to greater credit risk than higher-rated investments. High yield securities can be volatile and subject to much higher instances of default.
Collateralized debt obligations ("CDOs"), which include collateralized loan obligations ("CLOs"), collateralized bond obligations ("CBOs"), and other similarly structured securities, carry additional risks in addition to interest rate risk and default risk. This includes, but is not limited to: (i) distributions from the underlying collateral may not be adequate to make interest or other payments; (ii) the quality of the collateral may decline in value or default; and (iii) the complex structure of the security may not be fully understood at the time of investment and may produce disputes with the issuer or unexpected investment results. Investments in CDOs are also more difficult to value than other investments.
Value style investing presents the risk that the holdings or securities may never reach their full market value because the market fails to recognize what the portfolio management team considers the true business value or because the portfolio management team has misjudged those values. In addition, value style investing may fall out of favor and underperform growth or other styles of investing during given periods.
The ratings agencies that provide ratings are the Nationally Recognized Statistical Ratings Organizations (NRSROs) DBRS, Inc., Fitch Ratings, Inc., Kroll Bond Rating Agency, Inc., Moody's Investors Service, Inc., and S&P Global Ratings. Credit ratings range from AAA (highest) to D (lowest). Bonds rated BBB or above are considered investment grade. Credit ratings of BB and below are lower-rated securities (junk bonds). High-yielding, non-investment grade bonds (junk bonds) involve higher risks than investment grade bonds. Bonds with credit ratings of CCC or below have higher default risk.
Please refer to the Fund's Prospectus for a complete overview of the primary risks associated with the Fund.
The Fund is not authorized for distribution unless preceded or accompanied by a current prospectus. The prospectus can be accessed at: https://fpa.com/request-funds-literature.
Index / Category Definitions
Comparison to any index is for illustrative purposes only and should not be relied upon as a fully accurate measure of comparison. The Fund will be less diversified than the indices noted herein and may hold non-index securities or securities that are not comparable to those contained in an index. Indices will hold positions that are not within the Fund's investment strategy. Indices are unmanaged, do not reflect any commissions, fees or expenses which would be incurred by an investor purchasing the underlying securities. The Fund does not include outperformance of any index or benchmark in its investment objectives. Investors cannot invest directly in an index.
Bloomberg U.S. Aggregate Bond Index provides a measure of the performance of the U.S. investment grade bonds market, which includes investment grade U.S. Government bonds, investment grade corporate bonds, mortgage pass-through securities and asset-backed securities that are publicly offered for sale in the United States. The securities in the Index must have at least 1 year remaining in maturity. In addition, the securities must be denominated in U.S. dollars and must be fixed rate, nonconvertible, and taxable.
Bloomberg U.S. Aggregate 1-3 Year Bond Index provides a measure of the performance of the U.S. investment grade bonds market, which includes investment grade U.S. Government bonds, investment grade corporate bonds, mortgage pass-through securities and asset-backed securities that are publicly offered for sale
14
FPA NEW INCOME, INC.
LETTER TO SHAREHOLDERS
(Continued)
in the United States. The securities in the Index must have a remaining maturity of 1 to 3 years. In addition, the securities must be denominated in U.S. dollars and must be fixed rate, nonconvertible, and taxable.
Bloomberg U.S. High Yield Index measures the market of USD-denominated, non-investment grade, fixed-rate, taxable corporate bonds. Bloomberg U.S. High Yield BB ex Energy Index measures the market of USD-denominated, non-investment grade, fixed-rate, taxable BB-rated corporate bonds excluding energy sector. Bloomberg U.S. High Yield B ex Energy Index measures the market of USD-denominated, non-investment grade, fixed-rate, taxable B-rated corporate bonds excluding energy sector.
The Consumer Price Index (CPI) is an unmanaged index representing the rate of the inflation of U.S. consumer prices as determined by the U.S. Department of Labor Statistics. There can be no guarantee that the CPI will reflect the exact level of inflation at any given time. This index reflects non-seasonally adjusted returns.
CPI + 100 bps is the measure of the CPI plus an additional 100 basis points.
Morningstar Short-term Bond Category portfolios invest primarily in corporate and other investment-grade U.S. fixed-income issues and typically have durations of 1.0 to 3.5 years. These portfolios are attractive to fairly conservative investors, because they are less sensitive to interest rates than portfolios with longer durations. Morningstar calculates monthly breakpoints using the effective duration of the Morningstar Core Bond Index in determining duration assignment. Short-term is defined as 25% to 75% of the three-year average effective duration of the Morningstar Core Bond Index. As of March 31, 2023, there were 597 funds in this category.
Other Definitions
Basis Point (bps) is equal to one hundredth of one percent, or 0.01%. 100 basis points = 1%.
Coupon or coupon payment is the annual interest rate paid on a bond, expressed as a percentage of the face value and paid from issue date until maturity.
Corporate Holdings include bank debt, corporate bonds and common stock.
Credit Spread or Spread is the difference in yield between a U.S. Treasury bond and another debt security of the same maturity but different credit quality.
Discount Margin is the average expected return of a floating-rate security (typically a bond) that's earned in addition to the index underlying, or reference rate of, the security. The size of the discount margin depends on the price of the floating- or variable-rate security.
Effective Duration (years) is the duration calculation for bonds with embedded options. Effective duration takes into account that expected cash flows will fluctuate as interest rates change.
Mark-to-market is a method of recording the price or value of a security, portfolio, or account to reflect the current market value rather than book value.
Maximum Drawdown is the maximum observed loss from a peak to a trough of a portfolio, before a new peak is attained. Maximum drawdown is an indicator of downside risk over a specified time period.
A bond premium occurs when the price of the bond has increased in the secondary market. A bond might trade at a premium because its interest rate is higher than current rates in the market.
Standard Deviation is a statistic that measures the dispersion of a dataset relative to its mean and is calculated as the square root of the variance.
Weighted Average Life (years) is the average length of time that each dollar of unpaid principal on a loan, a mortgage or an amortizing bond remains outstanding.
15
FPA NEW INCOME, INC.
LETTER TO SHAREHOLDERS
(Continued)
Yield-to-Maturity (YTM) is the expected rate of return anticipated on a bond if held until it matures. YTM is considered a long-term bond yield expressed as an annual rate. The YTM calculation takes into account the bond's current market price, par value, coupon interest rate and time to maturity. It is also assumed that all coupon payments are reinvested at the same rate as the bond's current yield.
©2023 Morningstar, Inc. All Rights Reserved. The information contained herein: (1) is proprietary to Morningstar and/or its content providers; (2) may not be copied or distributed; and (3) is not warranted by Morningstar to be accurate, complete or timely. Neither Morningstar nor its content providers are responsible for any damages or losses arising from any use of this information. Past performance is no guarantee of future results.
The FPA Funds are distributed by UMB Distribution Services, LLC, ("UMBDS"), 235 W. Galena Street, Milwaukee, WI, 53212. UMBDS is not affiliated with FPA.
16
FPA NEW INCOME, INC.
LETTER TO SHAREHOLDERS
(Continued)
The discussions of Fund investments represent the views of the Fund's managers at the time of this report and are subject to change without notice. References to individual securities are for informational purposes only and should not be construed as recommendations to purchase or sell individual securities.
FUND RISKS
Investments in mutual funds carry risks and investors may lose principal value. Stock markets are volatile and can decline significantly in response to adverse issuer, political, regulatory, market, or economic developments. The funds may purchase foreign securities which are subject to interest rate, currency exchange rate, economic and political risks: this may be enhanced when investing in emerging markets. The securities of smaller, less well-known companies can be more volatile than those of larger companies. The return of principal in a bond fund is not guaranteed. Bond funds have the same issuer, interest rate, inflation and credit risks that are associated with underlying bonds owned by the fund. Lower rated bonds, convertible securities and other types of debt obligations involve greater risks than higher rated bonds. Mortgage securities and collateralized mortgage obligations (CMOs) are subject to prepayment risk and the risk of default on the underlying mortgages or other assets; derivatives may increase volatility. High yield securities can be volatile and subject to much higher instances of default.
FORWARD LOOKING STATEMENT DISCLOSURE
As mutual fund managers, one of our responsibilities is to communicate with shareholders in an open and direct manner. Insofar as some of our opinions and comments in our letters to shareholders are based on our current expectations, they are considered "forward-looking statements" which may or may not prove to be accurate over the long term. While we believe we have a reasonable basis for our comments and we have confidence in our opinions, actual results may differ materially from those we anticipate. You can identify forward-looking statements by words such as "believe," "expect," "may," "anticipate," and other similar expressions when discussing prospects for particular portfolio holdings and/or the markets, generally. We cannot, however, assure future results and disclaim any obligation to update or alter any forward-looking statements, whether as a result of new information, future events, or otherwise. Further, information provided in this report should not be construed as a recommendation to purchase or sell any particular security.
17
FPA NEW INCOME, INC.
PORTFOLIO SUMMARY
March 31, 2023 (Unaudited)
Common Stocks | | | | | 1.3 | % | |
Industrials | | | 0.7 | % | | | | | |
Energy | | | 0.5 | % | | | | | |
Retailing | | | 0.1 | % | | | | | |
Bonds & Debentures | | | | | 96.5 | % | |
Asset-Backed Securities | | | 63.5 | % | | | | | |
Commercial Mortgage-Backed Securities | | | 12.9 | % | | | | | |
U.S. Treasuries | | | 7.8 | % | | | | | |
Residential Mortgage-Backed Securities | | | 7.5 | % | | | | | |
Corporate Bonds & Notes | | | 3.1 | % | | | | | |
Corporate Bank Debt | | | 1.7 | % | | | | | |
Short-term Investments | | | | | 2.0 | % | |
Other Assets And Liabilities, Net | | | | | 0.2 | % | |
Net Assets | | | | | 100.0 | % | |
18
FPA NEW INCOME, INC.
PORTFOLIO OF INVESTMENTS
March 31, 2023
(Unaudited)
COMMON STOCKS | | Shares or
Principal
Amount | | Fair
Value | |
INDUSTRIALS — 0.7% | |
Boart Longyear Group Ltd.(a)(m) | | | 43,018,605 | | | $ | 57,511,581 | | |
| | | $ | 57,511,581 | | |
ENERGY — 0.5% | |
PHI Group, Inc., Restricted(a)(b)(c)(d)(m) | | | 3,806,420 | | | $ | 47,580,250 | | |
| | | $ | 47,580,250 | | |
RETAILING — 0.1% | |
Copper Earn Out Trust(b)(c)(d) | | | 69,361 | | | $ | 294,784 | | |
Copper Property CTL Pass Through Trust(d) | | | 520,208 | | | | 5,774,309 | | |
| | | $ | 6,069,093 | | |
| TOTAL COMMON STOCKS — 1.3% (Cost $139,264,410) | | $ | 111,160,924 | | |
BONDS & DEBENTURES | |
COMMERCIAL MORTGAGE-BACKED SECURITIES — 12.9% | |
AGENCY — 4.1% | |
Federal Home Loan Mortgage Corp. K057 A2 — 2.570% 7/25/2026 | | $ | 87,324,000 | | | $ | 82,784,270 | | |
Federal Home Loan Mortgage Corp. K058 A2 — 2.653% 8/25/2026 | | | 13,173,000 | | | | 12,489,437 | | |
Federal Home Loan Mortgage Corp. K054 A2 — 2.745% 1/25/2026 | | | 3,600,000 | | | | 3,444,952 | | |
Federal Home Loan Mortgage Corp. K066 A2 — 3.117% 6/25/2027 | | | 7,223,000 | | | | 6,916,353 | | |
Federal Home Loan Mortgage Corp. K065 A2 — 3.243% 4/25/2027 | | | 9,702,802 | | | | 9,338,055 | | |
Federal Home Loan Mortgage Corp. K051 A2 — 3.308% 9/25/2025 | | | 38,614,000 | | | | 37,550,544 | | |
Federal Home Loan Mortgage Corp. K061 A2 — 3.347% 11/25/2026(e) | | | 78,855,000 | | | | 76,363,892 | | |
Federal Home Loan Mortgage Corp. K073 A2 — 3.350% 1/25/2028 | | | 2,600,000 | | | | 2,500,846 | | |
Federal Home Loan Mortgage Corp. K062 A2 — 3.413% 12/25/2026 | | | 41,061,276 | | | | 39,808,821 | | |
Federal Home Loan Mortgage Corp. K063 A2 — 3.430% 1/25/2027(e) | | | 16,539,000 | | | | 16,043,903 | | |
Federal Home Loan Mortgage Corp. K072 A2 — 3.444% 12/25/2027 | | | 12,338,034 | | | | 11,924,176 | | |
Federal Home Loan Mortgage Corp. K077 A2 — 3.850% 5/25/2028(e) | | | 4,086,000 | | | | 4,010,808 | | |
Federal Home Loan Mortgage Corp. K081 A2 — 3.900% 8/25/2028(e) | | | 10,562,000 | | | | 10,388,643 | | |
Federal Home Loan Mortgage Corp. K082 A2 — 3.920% 9/25/2028(e) | | | 6,772,000 | | | | 6,663,720 | | |
Federal Home Loan Mortgage Corp. K079 A2 — 3.926% 6/25/2028 | | | 10,920,000 | | | | 10,755,111 | | |
Federal Home Loan Mortgage Corp. K080 A2 — 3.926% 7/25/2028(e) | | | 2,081,000 | | | | 2,049,535 | | |
Federal Home Loan Mortgage Corp. K083 A2 — 4.050% 9/25/2028(e) | | | 3,204,000 | | | | 3,172,450 | | |
Federal Home Loan Mortgage Corp. K085 A2 — 4.060% 10/25/2028(e) | | | 13,986,000 | | | | 13,794,881 | | |
| | | $ | 350,000,397 | | |
19
FPA NEW INCOME, INC.
PORTFOLIO OF INVESTMENTS (Continued)
March 31, 2023
(Unaudited)
BONDS & DEBENTURES — Continued | | Principal
Amount | | Fair
Value | |
AGENCY STRIPPED — 0.4% | |
Government National Mortgage Association 2012-45 IO —
0.000% 4/16/2053(e) | | $ | 1,044,624 | | | $ | 1 | | |
Government National Mortgage Association 2013-45 IO —
0.089% 12/16/2053(e) | | | 22,185,535 | | | | 23,832 | | |
Government National Mortgage Association 2012-125 IO —
0.175% 2/16/2053(e) | | | 37,966,986 | | | | 222,885 | | |
Government National Mortgage Association 2014-110 IO —
0.181% 1/16/2057(e) | | | 13,774,269 | | | | 136,090 | | |
Government National Mortgage Association 2014-157 IO —
0.191% 5/16/2055(e) | | | 24,947,128 | | | | 192,073 | | |
Government National Mortgage Association 2013-125 IO —
0.205% 10/16/2054(e) | | | 8,106,615 | | | | 114,337 | | |
Government National Mortgage Association 2015-169 IO —
0.260% 7/16/2057(e) | | | 45,594,333 | | | | 669,425 | | |
Government National Mortgage Association 2015-41 IO —
0.276% 9/16/2056(e) | | | 7,381,923 | | | | 96,667 | | |
Government National Mortgage Association 2015-19 IO —
0.295% 1/16/2057(e) | | | 28,298,872 | | | | 461,424 | | |
Government National Mortgage Association 2015-108 IO —
0.336% 10/16/2056(e) | | | 1,524,134 | | | | 69,399 | | |
Government National Mortgage Association 2014-153 IO —
0.341% 4/16/2056(e) | | | 29,605,738 | | | | 380,798 | | |
Government National Mortgage Association 2015-150 IO —
0.364% 9/16/2057(e) | | | 7,702,151 | | | | 166,032 | | |
Government National Mortgage Association 2012-79 IO —
0.383% 3/16/2053(e) | | | 39,612,016 | | | | 404,704 | | |
Government National Mortgage Association 2012-25 IO —
0.398% 8/16/2052(e) | | | 879,584 | | | | 784 | | |
Government National Mortgage Association 2012-150 IO —
0.437% 11/16/2052(e) | | | 17,390,109 | | | | 133,544 | | |
Government National Mortgage Association 2015-7 IO —
0.454% 1/16/2057(e) | | | 17,071,920 | | | | 358,457 | | |
Government National Mortgage Association 2016-65 IO —
0.496% 1/16/2058(e) | | | 29,648,484 | | | | 740,011 | | |
Government National Mortgage Association 2014-175 IO —
0.538% 4/16/2056(e) | | | 67,656,338 | | | | 1,516,036 | | |
Government National Mortgage Association 2014-138 IO —
0.563% 4/16/2056(e) | | | 5,947,187 | | | | 126,983 | | |
20
FPA NEW INCOME, INC.
PORTFOLIO OF INVESTMENTS (Continued)
March 31, 2023
(Unaudited)
BONDS & DEBENTURES — Continued | | Principal
Amount | | Fair
Value | |
Government National Mortgage Association 2014-77 IO —
0.589% 12/16/2047(e) | | $ | 11,584,754 | | | $ | 124,124 | | |
Government National Mortgage Association 2012-114 IO —
0.613% 1/16/2053(e) | | | 15,914,616 | | | | 276,657 | | |
Government National Mortgage Association 2014-187 IO —
0.620% 5/16/2056(e) | | | 68,128,967 | | | | 1,656,488 | | |
Government National Mortgage Association 2016-125 IO —
0.809% 12/16/2057(e) | | | 59,614,677 | | | | 2,301,282 | | |
Government National Mortgage Association 2020-75 IO —
0.869% 2/16/2062(e) | | | 101,206,759 | | | | 6,633,445 | | |
Government National Mortgage Association 2020-42 IO —
0.937% 3/16/2062(e) | | | 127,538,716 | | | | 8,480,942 | | |
Government National Mortgage Association 2016-106 IO —
0.969% 9/16/2058(e) | | | 85,824,629 | | | | 3,848,170 | | |
Government National Mortgage Association 2020-71 IO —
1.087% 1/16/2062(e) | | | 55,955,442 | | | | 4,052,360 | | |
Government National Mortgage Association 2020-43 IO —
1.260% 11/16/2061(e) | | | 42,735,734 | | | | 3,350,828 | | |
| | | $ | 36,537,778 | | |
NON-AGENCY — 8.4% | |
A10 Bridge Asset Financing LLC 2021-D A1FX — 2.589% 10/1/2038(f) | | $ | 7,007,184 | | | $ | 6,733,888 | | |
ACRE Commercial Mortgage Ltd. 2021-FL4 A, 1M USD LIBOR +
0.830% — 5.591% 12/18/2037(e)(f) | | | 6,602,977 | | | | 6,487,801 | | |
ACRES Commercial Realty Ltd. 2021-FL1 A, 1M USD LIBOR +
1.200% — 5.909% 6/15/2036(e)(f) | | | 59,792,000 | | | | 58,294,055 | | |
ACRES Commercial Realty Ltd. 2021-FL2 A, 1M USD LIBOR +
1.400% — 6.109% 1/15/2037(e)(f) | | | 13,444,000 | | | | 13,093,418 | | |
Arbor Realty Commercial Real Estate Notes Ltd. 2021-FL1 A,
1M USD LIBOR + 0.970% — 5.776% 12/15/2035(e)(f) | | | 54,525,000 | | | | 53,763,733 | | |
Arbor Realty Commercial Real Estate Notes Ltd. 2021-FL2 A,
1M USD LIBOR + 1.100% — 5.784% 5/15/2036(e)(f) | | | 45,859,000 | | | | 44,994,558 | | |
Arbor Realty Commercial Real Estate Notes Ltd. 2022-FL1 A,
SOFR30A + 1.450% — 6.008% 1/15/2037(e)(f) | | | 57,822,000 | | | | 56,785,997 | | |
Arbor Realty Commercial Real Estate Notes Ltd. 2021-FL4 A,
1M USD LIBOR + 1.350% — 6.034% 11/15/2036(e)(f) | | | 59,062,000 | | | | 57,538,992 | | |
Arbor Realty Commercial Real Estate Notes Ltd. 2022-FL2 A,
1M TSFR + 1.850% — 6.677% 5/15/2037(e)(f) | | | 35,540,000 | | | | 34,918,157 | | |
AREIT Trust 2019-CRE3 A, 1M TSFR + 1.384% —
6.044% 9/14/2036(e)(f) | | | 387,702 | | | | 377,581 | | |
21
FPA NEW INCOME, INC.
PORTFOLIO OF INVESTMENTS (Continued)
March 31, 2023
(Unaudited)
BONDS & DEBENTURES — Continued | | Principal
Amount | | Fair
Value | |
BBCMS Trust 2015-SRCH A1 — 3.312% 8/10/2035(f) | | $ | 11,600,381 | | | $ | 10,836,058 | | |
BDS Ltd. 2021-FL8 A, 1M USD LIBOR + 0.920% —
5.681% 1/18/2036(e)(f) | | | 17,835,583 | | | | 17,293,023 | | |
BX Commercial Mortgage Trust 2021-VOLT E, 1M USD LIBOR +
2.000% — 6.684% 9/15/2036(e)(f) | | | 28,900,000 | | | | 26,948,085 | | |
COMM Mortgage Trust 2014-CR20 A3 — 3.326% 11/10/2047 | | | 9,170,189 | | | | 8,846,239 | | |
HERA Commercial Mortgage Ltd. 2021-FL1 A, 1M USD LIBOR +
1.050% — 5.811% 2/18/2038(e)(f) | | | 47,287,571 | | | | 45,641,642 | | |
Independence Plaza Trust 2018-INDP A — 3.763% 7/10/2035(f) | | | 11,081,000 | | | | 10,443,068 | | |
JPMBB Commercial Mortgage Securities Trust 2015-C30 ASB —
3.559% 7/15/2048 | | | 2,975,097 | | | | 2,901,722 | | |
JPMBB Commercial Mortgage Securities Trust 2015-C31 A3 —
3.801% 8/15/2048 | | | 7,598,510 | | | | 7,240,203 | | |
KREF Ltd. 2021-FL2 A, 1M USD LIBOR + 1.070% —
5.779% 2/15/2039(e)(f) | | | 19,179,000 | | | | 18,719,362 | | |
LCCM Trust 2021-FL2 A, 1M USD LIBOR + 1.200% —
5.884% 12/13/2038(e)(f) | | | 9,154,000 | | | | 8,864,816 | | |
LoanCore Issuer Ltd. 2021-CRE4 A, SOFR30A + 0.914% —
5.473% 7/15/2035(e)(f) | | | 10,907,101 | | | | 10,751,012 | | |
LoanCore Issuer Ltd. 2021-CRE5 A, 1M USD LIBOR + 1.300% —
5.984% 7/15/2036(e)(f) | | | 8,879,000 | | | | 8,767,711 | | |
MF1 Ltd. 2020-FL4 A, 1M TSFR + 1.814% — 6.474% 11/15/2035(e)(f) | | | 11,454,568 | | | | 11,429,506 | | |
Progress Residential Trust 2021-SFR7 A — 1.692% 8/17/2040(f) | | | 14,323,782 | | | | 12,101,583 | | |
Progress Residential Trust 2021-SFR9 A — 2.013% 11/17/2040(f) | | | 8,797,640 | | | | 7,516,954 | | |
Progress Residential Trust 2021-SFR11 A — 2.283% 1/17/2039(f) | | | 13,079,014 | | | | 11,274,734 | | |
Progress Residential Trust 2021-SFR10 A — 2.393% 12/17/2040(f) | | | 57,350,570 | | | | 49,074,298 | | |
Ready Capital Mortgage Financing LLC 2021-FL5 A, 1M USD LIBOR +
1.000% — 5.845% 4/25/2038(e)(f) | | | 15,996,648 | | | | 15,629,003 | | |
Shelter Growth CRE Issuer Ltd. 2021-FL3 A, 1M USD LIBOR +
1.080% — 5.764% 9/15/2036(e)(f) | | | 11,877,096 | | | | 11,613,815 | | |
STWD Ltd. 2021-FL2 A, 1M USD LIBOR + 1.200% —
5.909% 4/18/2038(e)(f) | | | 33,755,000 | | | | 33,036,120 | | |
TRTX Issuer Ltd. 2022-FL5 A, SOFR30A + 1.650% —
6.208% 2/15/2039(e)(f) | | | 37,857,000 | | | | 36,775,354 | | |
VMC Finance LLC 2021-HT1 A, 1M USD LIBOR + 1.650% —
6.411% 1/18/2037(e)(f) | | | 20,143,100 | | | | 19,546,916 | | |
| | | $ | 718,239,404 | | |
TOTAL COMMERICAL MORTGAGE-BACKED SECURITIES
(Cost $1,148,369,950) | | $ | 1,104,777,579 | | |
22
FPA NEW INCOME, INC.
PORTFOLIO OF INVESTMENTS (Continued)
March 31, 2023
(Unaudited)
BONDS & DEBENTURES — Continued | | Principal
Amount | | Fair
Value | |
RESIDENTIAL MORTGAGE-BACKED SECURITIES — 7.5% | |
AGENCY COLLATERALIZED MORTGAGE OBLIGATION — 0.1% | |
Federal Home Loan Mortgage Corp. 4170 QE — 2.000% 5/15/2032 | | $ | 604,069 | | | $ | 584,318 | | |
Federal Home Loan Mortgage Corp. 3979 HD — 2.500% 12/15/2026 | | | 410,466 | | | | 400,241 | | |
Federal Home Loan Mortgage Corp. 4304 DA — 2.500% 1/15/2027 | | | 103,636 | | | | 102,276 | | |
Federal Home Loan Mortgage Corp. 4010 DE — 2.500% 2/15/2027 | | | 503,586 | | | | 490,408 | | |
Federal Home Loan Mortgage Corp. 3914 MA — 3.000% 6/15/2026 | | | 388,130 | | | | 379,075 | | |
Federal Home Loan Mortgage Corp. 3862 MB — 3.500% 5/15/2026 | | | 3,484,166 | | | | 3,421,464 | | |
Federal Home Loan Mortgage Corp. 3828 VE — 4.500% 1/15/2024 | | | 173,750 | | | | 172,966 | | |
Federal National Mortgage Association 2014-21 ED —
2.250% 4/25/2029 | | | 45,393 | | | | 44,275 | | |
Federal National Mortgage Association 2013-135 KM —
2.500% 3/25/2028 | | | 107,709 | | | | 106,664 | | |
Federal National Mortgage Association 2013-93 PJ — 3.000% 7/25/2042 | | | 702,633 | | | | 679,844 | | |
Federal National Mortgage Association 2011-80 KB — 3.500% 8/25/2026 | | | 2,218,772 | | | | 2,178,540 | | |
Federal National Mortgage Association 2012-144 PD — 3.500% 4/25/2042 | | | 1,429,335 | | | | 1,391,463 | | |
Federal National Mortgage Association 2010-43 MK — 5.500% 5/25/2040 | | | 453,501 | | | | 458,970 | | |
| | | $ | 10,410,504 | | |
AGENCY POOL ADJUSTABLE RATE — 0.0% | |
Federal National Mortgage Association 865963, 12M USD LIBOR +
1.906% — 3.753% 3/1/2036(e) | | $ | 269,595 | | | $ | 265,195 | | |
AGENCY POOL FIXED RATE — 2.0% | |
Federal Home Loan Mortgage Corp. ZA2796 — 2.500% 11/1/2027 | | $ | 1,910,597 | | | $ | 1,836,198 | | |
Federal Home Loan Mortgage Corp. J22472 — 2.500% 2/1/2028 | | | 1,375,470 | | | | 1,322,795 | | |
Federal Home Loan Mortgage Corp. ZS8495 — 2.500% 8/1/2028 | | | 686,260 | | | | 657,276 | | |
Federal Home Loan Mortgage Corp. J32374 — 2.500% 11/1/2028 | | | 76,474,062 | | | | 73,357,239 | | |
Federal Home Loan Mortgage Corp. G15169 — 4.500% 9/1/2026 | | | 241,775 | | | | 240,933 | | |
Federal Home Loan Mortgage Corp. G15272 — 4.500% 9/1/2026 | | | 53,894 | | | | 53,706 | | |
Federal Home Loan Mortgage Corp. G15875 — 4.500% 9/1/2026 | | | 283,273 | | | | 282,287 | | |
Federal Home Loan Mortgage Corp. G15036 — 5.000% 6/1/2024 | | | 5,534 | | | | 5,518 | | |
Federal Home Loan Mortgage Corp. G13667 — 5.000% 8/1/2024 | | | 54 | | | | 54 | | |
Federal Home Loan Mortgage Corp. G15173 — 5.000% 6/1/2026 | | | 9,370 | | | | 9,337 | | |
Federal Home Loan Mortgage Corp. G15407 — 5.000% 6/1/2026 | | | 66,165 | | | | 65,937 | | |
Federal Home Loan Mortgage Corp. G15230 — 5.500% 12/1/2024 | | | 22,652 | | | | 22,613 | | |
Federal Home Loan Mortgage Corp. G15458 — 5.500% 12/1/2024 | | | 880 | | | | 879 | | |
Federal Home Loan Mortgage Corp. G14460 — 6.000% 1/1/2024 | | | 602 | | | | 601 | | |
Federal National Mortgage Association AQ9360 — 2.500% 1/1/2028 | | | 762,905 | | | | 733,197 | | |
Federal National Mortgage Association FS0499 — 2.500% 11/1/2030 | | | 39,172,622 | | | | 37,653,602 | | |
23
FPA NEW INCOME, INC.
PORTFOLIO OF INVESTMENTS (Continued)
March 31, 2023
(Unaudited)
BONDS & DEBENTURES — Continued | | Principal
Amount | | Fair
Value | |
Federal National Mortgage Association FS0452 — 2.500% 10/1/2031 | | $ | 4,757,336 | | | $ | 4,568,740 | | |
Federal National Mortgage Association FS0494 — 2.500% 2/1/2035 | | | 47,365,308 | | | | 45,466,177 | | |
Federal National Mortgage Association FM1102 — 4.000% 3/1/2031 | | | 2,041,479 | | | | 2,014,123 | | |
Federal National Mortgage Association AL4056 — 5.000% 6/1/2026 | | | 11,969 | | | | 11,912 | | |
Federal National Mortgage Association AL5867 — 5.500% 8/1/2023 | | | 906 | | | | 903 | | |
Federal National Mortgage Association AL0471 — 5.500% 7/1/2025 | | | 3,642 | | | | 3,630 | | |
Federal National Mortgage Association AL4433 — 5.500% 9/1/2025 | | | 6,060 | | | | 6,055 | | |
Federal National Mortgage Association AL4901 — 5.500% 9/1/2025 | | | 2,049 | | | | 2,042 | | |
| | | $ | 168,315,754 | | |
AGENCY STRIPPED — 0.0% | |
Federal Home Loan Mortgage Corp. 217 PO — 0.000% 1/1/2032(g) | | $ | 67,652 | | | $ | 56,003 | | |
Federal Home Loan Mortgage Corp. 217 IO — 6.500% 1/1/2032 | | | 65,142 | | | | 11,465 | | |
Federal National Mortgage Association 2010-25 NI — 5.000% 3/25/2025 | | | 23 | | | | — | | |
Federal National Mortgage Association 2003-64 XI — 5.000% 7/25/2033 | | | 183,705 | | | | 25,844 | | |
| | | $ | 93,312 | | |
NON-AGENCY COLLATERALIZED MORTGAGE OBLIGATION — 5.4% | |
Cascade Funding Mortgage Trust 2021-HB6 A — 0.898% 6/25/2036(e)(f) | | $ | 13,475,967 | | | $ | 12,778,455 | | |
CFMT LLC 2021-HB5 A — 0.801% 2/25/2031(e)(f) | | | 22,244,462 | | | | 21,563,085 | | |
CFMT LLC 2020-HB4 A — 0.946% 12/26/2030(e)(f) | | | 5,718,608 | | | | 5,564,951 | | |
CFMT LLC 2021-HB7 A — 1.151% 10/27/2031(e)(f) | | | 16,279,150 | | | | 15,269,307 | | |
CFMT LLC 2021-HB7 M1 — 2.125% 10/27/2031(e)(f) | | | 15,406,000 | | | | 14,171,191 | | |
Citigroup Mortgage Loan Trust, Inc. 2014-A A —
4.000% 1/25/2035(e)(f) | | | 2,555,037 | | | | 2,395,123 | | |
PRET LLC 2021-NPL6 A1 — 2.487% 7/25/2051(f)(h) | | | 16,427,611 | | | | 15,377,533 | | |
PRET LLC 2021-NPL5 A1 — 2.487% 10/25/2051(f)(h) | | | 60,811,371 | | | | 56,157,373 | | |
Pretium Mortgage Credit Partners I LLC 2021-NPL2 A1 —
1.992% 6/27/2060(f)(h) | | | 26,033,021 | | | | 23,761,333 | | |
Pretium Mortgage Credit Partners I LLC 2021-NPL4 A1 —
2.363% 10/27/2060(f)(h) | | | 42,466,878 | | | | 39,030,832 | | |
PRPM LLC 2021-2 A1 — 2.115% 3/25/2026(e)(f) | | | 17,766,267 | | | | 16,849,037 | | |
PRPM LLC 2021-9 A1 — 2.363% 10/25/2026(f)(h) | | | 20,665,524 | | | | 19,256,999 | | |
PRPM LLC 2021-10 A1 — 2.487% 10/25/2026(f)(h) | | | 27,207,119 | | | | 25,081,342 | | |
PRPM LLC 2021-11 A1 — 2.487% 11/25/2026(f)(h) | | | 32,822,225 | | | | 30,221,599 | | |
RCO VII Mortgage LLC 2021-2 A1 — 2.116% 9/25/2026(f)(h) | | | 17,438,593 | | | | 16,290,540 | | |
Towd Point Mortgage Trust 2020-4 A1 — 1.750% 10/25/2060(f) | | | 9,413,111 | | | | 8,060,785 | | |
Towd Point Mortgage Trust 2018-2 A1 — 3.250% 3/25/2058(e)(f) | | | 22,507,085 | | | | 21,308,252 | | |
Towd Point Mortgage Trust 2018-5 A1A — 3.250% 7/25/2058(e)(f) | | | 13,179,865 | | | | 12,518,411 | | |
Towd Point Mortgage Trust 2023-1 A1 — 3.750% 1/25/2063(f) | | | 25,897,542 | | | | 23,718,194 | | |
VCAT LLC 2021-NPL2 A1 — 2.115% 3/27/2051(f)(h) | | | 18,128,556 | | | | 17,107,280 | | |
VCAT LLC 2021-NPL1 A1 — 2.289% 12/26/2050(f)(h) | | | 3,422,811 | | | | 3,255,793 | | |
24
FPA NEW INCOME, INC.
PORTFOLIO OF INVESTMENTS (Continued)
March 31, 2023
(Unaudited)
BONDS & DEBENTURES — Continued | | Principal
Amount | | Fair
Value | |
VOLT C LLC 2021-NPL9 A1 — 1.992% 5/25/2051(f)(h) | | $ | 16,891,623 | | | $ | 15,544,762 | | |
VOLT XCIV LLC 2021-NPL3 A1 — 2.240% 2/27/2051(f)(h) | | | 23,948,584 | | | | 22,829,351 | | |
VOLT XCV LLC 2021-NPL4 A1 — 2.240% 3/27/2051(f)(h) | | | 22,879,814 | | | | 21,520,138 | | |
| | | $ | 459,631,666 | | |
TOTAL RESIDENTIAL MORTGAGE-BACKED SECURITIES
(Cost $678,144,213) | | $ | 638,716,431 | | |
ASSET-BACKED SECURITIES — 63.5% | |
AUTO — 18.8% | |
American Credit Acceptance Receivables Trust 2021-4 C —
1.320% 2/14/2028(f) | | $ | 21,719,000 | | | $ | 21,079,304 | | |
American Credit Acceptance Receivables Trust 2022-1 C —
2.120% 3/13/2028(f) | | | 45,613,000 | | | | 43,969,039 | | |
AmeriCredit Automobile Receivables Trust 2020-2 C —
1.480% 2/18/2026 | | | 6,808,000 | | | | 6,515,677 | | |
BMW Vehicle Lease Trust 2022-1 A4 — 1.230% 5/27/2025 | | | 30,512,000 | | | | 29,270,247 | | |
BMW Vehicle Owner Trust 2022-A A4 — 3.440% 12/26/2028 | | | 25,298,000 | | | | 24,377,689 | | |
Capital One Prime Auto Receivables Trust 2022-2 A4 —
3.690% 12/15/2027 | | | 15,513,000 | | | | 15,032,682 | | |
CarMax Auto Owner Trust 2022-1 A3 — 1.470% 12/15/2026 | | | 61,620,000 | | | | 58,662,764 | | |
CarMax Auto Owner Trust 2020-3 C — 1.690% 4/15/2026 | | | 1,064,000 | | | | 1,010,514 | | |
Carmax Auto Owner Trust 2022-3 A4 — 4.060% 2/15/2028 | | | 63,819,000 | | | | 61,178,431 | | |
CarMax Auto Owner Trust 2023-1 A4 — 4.650% 1/16/2029 | | | 10,892,000 | | | | 10,904,630 | | |
Carmax Auto Owner Trust 2022-3 B — 4.690% 2/15/2028 | | | 19,152,000 | | | | 18,385,012 | | |
Drive Auto Receivables Trust 2021-3 C — 1.470% 1/15/2027 | | | 72,790,000 | | | | 69,486,746 | | |
DT Auto Owner Trust 2021-3A C — 0.870% 5/17/2027(f) | | | 18,106,000 | | | | 17,228,078 | | |
DT Auto Owner Trust 2021-4A C — 1.500% 9/15/2027(f) | | | 13,540,000 | | | | 12,640,592 | | |
DT Auto Owner Trust 2022-1A C — 2.960% 11/15/2027(f) | | | 18,926,000 | | | | 18,044,052 | | |
Exeter Automobile Receivables Trust 2021-4A C —
1.460% 10/15/2027 | | | 41,400,000 | | | | 39,417,114 | | |
Exeter Automobile Receivables Trust 2022-1A C — 2.560% 6/15/2028 | | | 49,707,000 | | | | 47,255,833 | | |
Flagship Credit Auto Trust 2021-2 C — 1.270% 6/15/2027(f) | | | 17,609,000 | | | | 16,579,495 | | |
Flagship Credit Auto Trust 2021-4 B — 1.490% 2/15/2027(f) | | | 8,567,000 | | | | 8,003,796 | | |
Ford Credit Auto Lease Trust 2021-B C — 0.900% 5/15/2026 | | | 21,928,000 | | | | 21,069,043 | | |
Ford Credit Auto Owner Trust 2020-B B — 1.190% 1/15/2026 | | | 400,000 | | | | 382,922 | | |
Ford Credit Auto Owner Trust 2022-A A3 — 1.290% 6/15/2026 | | | 33,165,000 | | | | 31,753,995 | | |
Ford Credit Auto Owner Trust 2023-A A4 — 4.560% 12/15/2028 | | | 14,487,000 | | | | 14,490,396 | | |
GM Financial Automobile Leasing Trust 2022-1 A4 —
1.960% 2/20/2026 | | | 43,831,000 | | | | 42,238,282 | | |
25
FPA NEW INCOME, INC.
PORTFOLIO OF INVESTMENTS (Continued)
March 31, 2023
(Unaudited)
BONDS & DEBENTURES — Continued | | Principal
Amount | | Fair
Value | |
GM Financial Automobile Leasing Trust 2022-1 B —
2.230% 2/20/2026 | | $ | 12,446,000 | | | $ | 11,874,690 | | |
GM Financial Automobile Leasing Trust 2022-1 C —
2.640% 2/20/2026 | | | 32,069,000 | | | | 30,585,257 | | |
GM Financial Consumer Automobile Receivables Trust 2022-1 A3 —
1.260% 11/16/2026 | | | 29,166,000 | | | | 27,715,963 | | |
GM Financial Consumer Automobile Receivables Trust 2020-3 C —
1.370% 1/16/2026 | | | 2,760,000 | | | | 2,626,342 | | |
GM Financial Consumer Automobile Receivables Trust 2022-3 A4 —
3.710% 12/16/2027 | | | 25,555,000 | | | | 25,127,370 | | |
GM Financial Consumer Automobile Receivables Trust 2023-1 A4 —
4.590% 7/17/2028 | | | 15,767,000 | | | | 15,930,472 | | |
GM Financial Revolving Receivables Trust 2021-1 A —
1.170% 6/12/2034(f) | | | 38,305,000 | | | | 33,845,712 | | |
Honda Auto Receivables Owner Trust 2021-4 A3 — 0.880% 1/21/2026 | | | 44,179,000 | | | | 42,170,097 | | |
Honda Auto Receivables Owner Trust 2022-2 A4 — 3.760% 12/18/2028 | | | 6,350,000 | | | | 6,116,667 | | |
Hyundai Auto Lease Securitization Trust 2022-A A4 —
1.320% 12/15/2025(f) | | | 35,890,000 | | | | 34,481,375 | | |
Hyundai Auto Receivables Trust 2021-C A3 — 0.740% 5/15/2026 | | | 29,067,000 | | | | 27,752,521 | | |
Hyundai Auto Receivables Trust 2022-B A4 — 3.800% 8/15/2028 | | | 14,340,000 | | | | 14,059,924 | | |
Mercedes-Benz Auto Receivables Trust 2023-1 A4 — 4.310% 4/16/2029 | | | 10,006,000 | | | | 9,919,135 | | |
Nissan Auto Receivables Owner Trust 2022-B A4 — 4.450% 11/15/2029 | | | 13,366,000 | | | | 13,369,104 | | |
Prestige Auto Receivables Trust 2021-1A B — 1.190% 4/15/2026(f) | | | 37,756,000 | | | | 35,817,222 | | |
Prestige Auto Receivables Trust 2021-1A C — 1.530% 2/15/2028(f) | | | 13,545,000 | | | | 12,356,562 | | |
Santander Drive Auto Receivables Trust 2021-4 C — 1.260% 2/16/2027 | | | 63,342,000 | | | | 60,644,049 | | |
Santander Drive Auto Receivables Trust 2022-1 B — 2.360% 8/17/2026 | | | 99,413,000 | | | | 96,408,312 | | |
Santander Drive Auto Receivables Trust 2022-1 C — 2.560% 4/17/2028 | | | 33,202,000 | | | | 31,765,735 | | |
Santander Retail Auto Lease Trust 2021-A C — 1.140% 3/20/2026(f) | | | 1,886,000 | | | | 1,791,920 | | |
Santander Retail Auto Lease Trust 2022-A A3 — 1.340% 7/21/2025(f) | | | 34,544,000 | | | | 33,048,874 | | |
Santander Retail Auto Lease Trust 2022-A A4 — 1.420% 1/20/2026(f) | | | 18,847,000 | | | | 17,870,904 | | |
Santander Retail Auto Lease Trust 2022-A B — 1.610% 1/20/2026(f) | | | 10,319,000 | | | | 9,723,233 | | |
Toyota Auto Loan Extended Note Trust 2022-1A A —
3.820% 4/25/2035(f) | | | 54,519,000 | | | | 52,901,285 | | |
Toyota Auto Receivables Owner Trust 2022-C A4 — 3.770% 2/15/2028 | | | 10,600,000 | | | | 10,236,083 | | |
Toyota Auto Receivables Owner Trust 2023-A A4 — 4.420% 8/15/2028 | | | 16,189,000 | | | | 16,195,560 | | |
Volkswagen Auto Loan Enhanced Trust 2021-1 A3 —
1.020% 6/22/2026 | | | 52,430,000 | | | | 50,145,756 | | |
Westlake Automobile Receivables Trust 2021-2A C —
0.890% 7/15/2026(f) | | | 50,584,000 | | | | 47,988,312 | | |
26
FPA NEW INCOME, INC.
PORTFOLIO OF INVESTMENTS (Continued)
March 31, 2023
(Unaudited)
BONDS & DEBENTURES — Continued | | Principal
Amount | | Fair
Value | |
Westlake Automobile Receivables Trust 2021-3A B —
1.290% 1/15/2027(f) | | $ | 69,723,000 | | | $ | 66,808,613 | | |
Westlake Automobile Receivables Trust 2021-3A C —
1.580% 1/15/2027(f) | | | 69,605,000 | | | | 65,258,460 | | |
Westlake Automobile Receivables Trust 2022-1A C —
3.110% 3/15/2027(f) | | | 52,910,000 | | | | 50,674,468 | | |
World Omni Auto Receivables Trust 2020-C C — 1.390% 5/17/2027 | | | 3,415,000 | | | | 3,155,226 | | |
World Omni Auto Receivables Trust 2023-A A4 — 4.660% 5/15/2029 | | | 14,612,000 | | | | 14,638,658 | | |
| | | $ | 1,601,980,194 | | |
COLLATERALIZED LOAN OBLIGATION — 13.1% | |
ABPCI Direct Lending Fund CLO X LP 2020-10A A1A,
3M USD LIBOR + 1.950% — 6.758% 1/20/2032(e)(f) | | $ | 19,397,000 | | | $ | 19,135,684 | | |
ABPCI Direct Lending Fund IX LLC 2020-9A A1R, 3M USD LIBOR +
1.400% — 6.215% 11/18/2031(e)(f) | | | 43,972,000 | | | | 43,155,352 | | |
Blackrock Mount Adams CLO IX LP 2021-9A A1, 3M USD LIBOR +
1.370% — 6.317% 9/22/2031(e)(f) | | | 31,531,000 | | | | 31,054,346 | | |
Brightwood Capital MM CLO Ltd. 2021-2A A, 3M USD LIBOR +
1.650% — 6.442% 11/15/2030(e)(f) | | | 84,934,863 | | | | 83,720,380 | | |
BTC Holdings Fund I LLC — 7.550% 1/28/2027(b)(d) | | | 3,639,965 | | | | 3,639,965 | | |
BTC Offshore Holdings Fund, 3M USD LIBOR + 2.650% —
7.450% 10/20/2029(b)(d)(e) | | | 18,000,000 | | | | 18,000,000 | | |
Cerberus Loan Funding XXVIII LP 2020-1A A, 3M USD LIBOR +
1.850% — 6.642% 10/15/2031(e)(f) | | | 54,114,029 | | | | 53,618,020 | | |
Cerberus Loan Funding XXIX LP 2020-2A A, 3M USD LIBOR +
1.900% — 6.692% 10/15/2032(e)(f) | | | 113,123,000 | | | | 112,025,820 | | |
Cerberus Loan Funding XXXI LP 2021-1A A, 3M USD LIBOR +
1.500% — 6.292% 4/15/2032(e)(f) | | | 40,454,746 | | | | 39,892,303 | | |
Cerberus Loan Funding XL LLC 2023-1A A, 3M TSFR + 2.400% —
7.189% 3/22/2035(e)(f) | | | 10,299,000 | | | | 10,272,017 | | |
Fortress Credit Opportunities IX CLO Ltd. 2017-9A A1TR,
3M USD LIBOR + 1.550% — 6.342% 10/15/2033(e)(f) | | | 118,776,000 | | | | 115,111,642 | | |
Fortress Credit Opportunities XI CLO Ltd. 2018-11A A1T,
3M USD LIBOR + 1.300% — 6.092% 4/15/2031(e)(f) | | | 37,820,000 | | | | 37,282,200 | | |
Fortress Credit Opportunities XVII CLO Ltd. 2022-17A A,
3M TSFR + 1.370% — 6.028% 1/15/2030(e)(f) | | | 50,228,546 | | | | 49,368,884 | | |
Golub Capital Partners CLO 36M Ltd. 2018-36A A, 3M USD LIBOR +
1.300% — 6.106% 2/5/2031(e)(f) | | | 67,200,000 | | | | 65,963,117 | | |
Golub Capital Partners CLO 42M Ltd. 2019-42A A2, 3M USD LIBOR +
2.000% — 6.808% 4/20/2031(e)(f) | | | 13,772,000 | | | | 13,383,960 | | |
27
FPA NEW INCOME, INC.
PORTFOLIO OF INVESTMENTS (Continued)
March 31, 2023
(Unaudited)
BONDS & DEBENTURES — Continued | | Principal
Amount | | Fair
Value | |
Golub Capital Partners CLO 45M Ltd. 2019-45A B1, 3M USD LIBOR +
2.550% — 7.358% 10/20/2031(e)(f) | | $ | 17,314,000 | | | $ | 16,819,685 | | |
Lake Shore MM CLO III LLC 2019-2A A2R — 2.525% 10/17/2031(f) | | | 11,083,000 | | | | 10,132,799 | | |
Lake Shore MM CLO III LLC 2019-2A A1R, 3M USD LIBOR +
1.480% — 6.272% 10/17/2031(e)(f) | | | 23,662,000 | | | | 22,956,636 | | |
Lake Shore MM CLO IV Ltd. 2021-1A X, 3M USD LIBOR +
1.180% — 5.972% 10/15/2033(e)(f) | | | 12,681,532 | | | | 12,472,921 | | |
LCM XX LP 20A AR, 3M USD LIBOR + 1.040% —
5.848% 10/20/2027(e)(f) | | | 1,814,813 | | | | 1,809,249 | | |
Owl Rock CLO VI Ltd. 2021-6A A, 3M USD LIBOR + 1.450% —
6.413% 6/21/2032(e)(f) | | | 66,692,000 | | | | 65,242,449 | | |
Parliament CLO II Ltd. 2021-2A A, 3M USD LIBOR + 1.350% —
6.265% 8/20/2032(e)(f) | | | 40,531,123 | | | | 39,551,607 | | |
Parliament Funding II Ltd. 2020-1A AR, 3M USD LIBOR +
1.250% — 6.058% 10/20/2031(e)(f) | | | 40,371,278 | | | | 39,611,046 | | |
Saranac CLO III Ltd. 2014-3A ALR, 3M USD LIBOR + 1.600% —
6.547% 6/22/2030(e)(f) | | | 20,885,751 | | | | 20,739,655 | | |
VCP CLO II Ltd. 2021-2A A1, 3M USD LIBOR + 1.670% —
6.462% 4/15/2031(e)(f) | | | 101,155,000 | | | | 99,951,255 | | |
Woodmont Trust 2019-6A A1R, 3M USD LIBOR + 1.480% —
6.272% 7/15/2031(e)(f) | | | 62,588,000 | | | | 61,575,514 | | |
Woodmont Trust 2019-6A A1R2, 3M USD LIBOR + 1.480% —
6.272% 7/15/2031(e)(f) | | | 16,952,000 | | | | 16,677,767 | | |
Zais CLO 7 Ltd. 2017-2A A, 3M USD LIBOR + 1.290% —
6.082% 4/15/2030(e)(f) | | | 12,712,681 | | | | 12,581,575 | | |
| | | $ | 1,115,745,848 | | |
CREDIT CARD — 1.2% | |
American Express Credit Account Master Trust 2022-2 A —
3.390% 5/15/2027 | | $ | 53,566,000 | | | $ | 52,037,184 | | |
Discover Card Execution Note Trust 2022-A2 A — 3.320% 5/15/2027 | | | 50,645,000 | | | | 48,905,668 | | |
| | | $ | 100,942,852 | | |
EQUIPMENT — 13.8% | |
ARI Fleet Lease Trust 2022-A A3 — 3.430% 1/15/2031(f) | | $ | 10,094,000 | | | $ | 9,736,628 | | |
Avis Budget Rental Car Funding AESOP LLC 2021-2A A —
1.660% 2/20/2028(f) | | | 4,211,000 | | | | 3,728,780 | | |
Avis Budget Rental Car Funding AESOP LLC 2019-3A A —
2.360% 3/20/2026(f) | | | 8,591,000 | | | | 8,183,782 | | |
Avis Budget Rental Car Funding AESOP LLC 2023-1A A —
5.250% 4/20/2029(f) | | | 13,136,000 | | | | 13,216,417 | | |
28
FPA NEW INCOME, INC.
PORTFOLIO OF INVESTMENTS (Continued)
March 31, 2023
(Unaudited)
BONDS & DEBENTURES — Continued | | Principal
Amount | | Fair
Value | |
Avis Budget Rental Car Funding AESOP LLC 2023-4A A —
5.490% 6/20/2029(b)(f) | | $ | 38,251,000 | | | $ | 38,216,046 | | |
CNH Equipment Trust 2021-B A3 — 0.440% 8/17/2026 | | | 1,872,542 | | | | 1,791,489 | | |
CNH Equipment Trust 2022-A A3 — 2.940% 7/15/2027 | | | 19,831,000 | | | | 19,028,081 | | |
CNH Equipment Trust 2022-B A4 — 3.910% 3/15/2028 | | | 7,414,000 | | | | 7,207,668 | | |
Coinstar Funding LLC 2017-1A A2 — 5.216% 4/25/2047(f) | | | 12,088,505 | | | | 9,382,864 | | |
Dell Equipment Finance Trust 2021-2 C — 0.940% 12/22/2026(f) | | | 11,180,000 | | | | 10,654,382 | | |
Dell Equipment Finance Trust 2022-1 A3 — 2.490% 8/23/2027(f) | | | 110,213,000 | | | | 107,456,352 | | |
Dell Equipment Finance Trust 2022-1 B — 2.720% 8/23/2027(f) | | | 17,115,000 | | | | 16,515,590 | | |
Dell Equipment Finance Trust 2022-1 C — 2.940% 8/23/2027(f) | | | 17,567,000 | | | | 16,936,960 | | |
Dell Equipment Finance Trust 2022-2 B — 4.400% 7/22/2027(f) | | | 5,100,000 | | | | 5,003,670 | | |
Dell Equipment Finance Trust 2022-2 C — 4.740% 7/22/2027(f) | | | 4,700,000 | | | | 4,586,888 | | |
Enterprise Fleet Financing LLC 2022-3 A3 — 4.290% 7/20/2029(f) | | | 9,703,000 | | | | 9,308,036 | | |
Enterprise Fleet Financing LLC 2022-2 A3 — 4.790% 5/21/2029(f) | | | 32,246,000 | | | | 32,141,571 | | |
Enterprise Fleet Financing LLC 2023-1 A3 — 5.420% 10/22/2029(f) | | | 28,811,000 | | | | 29,521,162 | | |
Enterprise Fleet Financing LLC 2022-4 A3 — 5.650% 10/22/2029(f) | | | 18,980,000 | | | | 19,070,745 | | |
Enterprise Fleet Funding LLC 2021-1 A3 — 0.700% 12/21/2026(f) | | | 2,050,000 | | | | 1,926,946 | | |
Ford Credit Floorplan Master Owner Trust A 2020-2 A —
1.060% 9/15/2027 | | | 5,070,000 | | | | 4,631,641 | | |
Ford Credit Floorplan Master Owner Trust A 2018-4 A —
4.060% 11/15/2030 | | | 69,096,000 | | | | 66,808,618 | | |
GMF Floorplan Owner Revolving Trust 2019-2 A —
2.900% 4/15/2026(f) | | | 30,866,000 | | | | 30,108,428 | | |
GreatAmerica Leasing Receivables Funding LLC 2022-1 A4 —
5.350% 7/16/2029(f) | | | 17,738,000 | | | | 18,094,172 | | |
Hertz Vehicle Financing III LP 2021-2A A — 1.680% 12/27/2027(f) | | | 44,631,000 | | | | 39,531,159 | | |
Hertz Vehicle Financing LLC 2022-2A A — 2.330% 6/26/2028(f) | | | 38,642,000 | | | | 34,284,006 | | |
Hertz Vehicle Financing LLC 2022-4A A — 3.730% 9/25/2026(f) | | | 45,319,000 | | | | 43,517,905 | | |
Hertz Vehicle Financing LLC 2022-5A A — 3.890% 9/25/2028(f) | | | 72,333,000 | | | | 69,765,330 | | |
HPEFS Equipment Trust 2022-1A B — 1.790% 5/21/2029(f) | | | 26,862,000 | | | | 25,508,523 | | |
HPEFS Equipment Trust 2022-1A C — 1.960% 5/21/2029(f) | | | 17,858,000 | | | | 16,751,811 | | |
HPEFS Equipment Trust 2022-2A B — 4.200% 9/20/2029(f) | | | 9,732,000 | | | | 9,419,897 | | |
HPEFS Equipment Trust 2022-2A C — 4.430% 9/20/2029(f) | | | 5,634,000 | | | | 5,448,237 | | |
John Deere Owner Trust 2022-A A3 — 2.320% 9/16/2026 | | | 39,342,000 | | | | 38,010,899 | | |
John Deere Owner Trust 2022-B A4 — 3.800% 5/15/2029 | | | 17,226,000 | | | | 16,831,406 | | |
John Deere Owner Trust 2023-A A4 — 5.010% 12/17/2029 | | | 15,675,000 | | | | 15,969,692 | | |
Kubota Credit Owner Trust 2022-1A A3 — 2.670% 10/15/2026(f) | | | 88,222,000 | | | | 84,975,113 | | |
Kubota Credit Owner Trust 2022-2A A4 — 4.170% 6/15/2028(f) | | | 34,050,000 | | | | 33,343,381 | | |
Kubota Credit Owner Trust 2023-1A A4 — 5.070% 2/15/2029(f) | | | 9,456,000 | | | | 9,464,865 | | |
29
FPA NEW INCOME, INC.
PORTFOLIO OF INVESTMENTS (Continued)
March 31, 2023
(Unaudited)
BONDS & DEBENTURES — Continued | | Principal
Amount | | Fair
Value | |
NextGear Floorplan Master Owner Trust 2021-1A A —
0.850% 7/15/2026(f) | | $ | 3,947,000 | | | $ | 3,729,983 | | |
NextGear Floorplan Master Owner Trust 2022-1A A2 —
2.800% 3/15/2027(f) | | | 72,271,000 | | | | 69,164,185 | | |
Pawnee Equipment Receivables LLC 2021-1 A2 — 1.100% 7/15/2027(f) | | | 13,540,763 | | | | 13,031,254 | | |
Prop 2017-1A — 5.300% 3/15/2042(b) | | | 16,739,471 | | | | 14,395,945 | | |
Verizon Master Trust 2022-4 A — 3.400% 11/20/2028(h) | | | 77,914,000 | | | | 76,000,393 | | |
Verizon Master Trust 2022-4 B — 3.640% 11/20/2028(h) | | | 34,616,000 | | | | 33,550,270 | | |
Verizon Master Trust 2022-6 A — 3.670% 1/22/2029(h) | | | 37,943,000 | | | | 37,028,210 | | |
Verizon Master Trust 2022-4 C — 3.890% 11/20/2028(h) | | | 8,987,000 | | | | 8,706,478 | | |
| | | $ | 1,181,685,858 | | |
OTHER — 16.6% | |
ABPCI Direct Lending Fund ABS I Ltd. 2020-1A A —
3.199% 12/20/2030(f) | | $ | 37,774,000 | | | $ | 34,061,911 | | |
ABPCI Direct Lending Fund ABS II LLC 2022-2A A1,
3M TSFR + 2.100% — 6.769% 3/1/2032(e)(f) | | | 26,204,000 | | | | 25,831,196 | | |
American Tower Trust I — 5.490% 3/15/2028(f) | | | 62,552,000 | | | | 63,884,827 | | |
Brazos Securitization LLC — 5.014% 3/1/2034(f) | | | 10,409,000 | | | | 10,438,222 | | |
Cleco Securitization I LLC — 4.016% 3/1/2033 | | | 22,763,219 | | | | 21,637,733 | | |
Cologix Data Centers US Issuer LLC 2021-1A A2 —
3.300% 12/26/2051(f) | | | 58,068,000 | | | | 51,153,245 | | |
DataBank Issuer 2021-1A A2 — 2.060% 2/27/2051(f) | | | 14,750,000 | | | | 13,305,758 | | |
Elm Trust 2020-4A A2 — 2.286% 10/20/2029(f) | | | 9,712,930 | | | | 9,133,392 | | |
Elm Trust 2020-3A A2 — 2.954% 8/20/2029(f) | | | 11,082,479 | | | | 10,316,249 | | |
FCI Funding LLC 2021-1A A — 1.130% 4/15/2033(f) | | | 4,563,170 | | | | 4,438,299 | | |
Golub Capital Partners ABS Funding Ltd. 2021-1A A2 —
2.773% 4/20/2029(f) | | | 56,366,000 | | | | 52,050,985 | | |
Golub Capital Partners ABS Funding Ltd. 2021-2A A —
2.944% 10/19/2029(f) | | | 95,445,000 | | | | 83,516,685 | | |
Golub Capital Partners ABS Funding Ltd. 2020-1A A2 —
3.208% 1/22/2029(f) | | | 44,967,000 | | | | 41,635,890 | | |
Gracie Point International Funding 2021-1A A, 1M USD LIBOR +
0.750% — 5.412% 11/1/2023(e)(f) | | | 21,659,246 | | | | 21,638,993 | | |
Kansas Gas Service Securitization I LLC — 5.486% 8/1/2034 | | | 29,418,000 | | | | 29,690,002 | | |
Louisiana Local Government Environmental Facilities & Community
Development Auth Rev. (TXBL-LA ULT RESTORATION
CORP P) — 3.615% 2/1/2029 | | | 43,730,376 | | | | 42,531,714 | | |
Monroe Capital ABS Funding Ltd. 2021-1A A2 — 2.815% 4/22/2031(f) | | | 45,379,000 | | | | 42,272,217 | | |
30
FPA NEW INCOME, INC.
PORTFOLIO OF INVESTMENTS (Continued)
March 31, 2023
(Unaudited)
BONDS & DEBENTURES — Continued | | Principal
Amount | | Fair
Value | |
Oklahoma Development Finance Authority — 3.877% 5/1/2037 | | $ | 26,761,000 | | | $ | 26,060,601 | | |
Oklahoma Development Finance Authority — 4.135% 12/1/2033 | | | 30,374,000 | | | | 29,770,710 | | |
Oklahoma Development Finance Authority — 4.285% 2/1/2034 | | | 11,115,184 | | | | 11,036,932 | | |
Oportun Funding XIV LLC 2021-A A — 1.210% 3/8/2028(f) | | | 10,137,000 | | | | 9,621,972 | | |
Oportun Issuance Trust 2021-C A — 2.180% 10/8/2031(f) | | | 64,181,000 | | | | 57,529,647 | | |
Owl Rock Technology Financing LLC 2020-1A A,
3M USD LIBOR + 2.950% — 7.029% 1/15/2031(e)(f) | | | 85,004,000 | | | | 84,072,526 | | |
PFS Financing Corp. 2021-A A — 0.710% 4/15/2026(f) | | | 42,758,000 | | | | 41,276,576 | | |
PFS Financing Corp. 2021-B A — 0.770% 8/15/2026(f) | | | 52,919,000 | | | | 49,722,375 | | |
PFS Financing Corp. 2021-A B — 0.960% 4/15/2026(f) | | | 5,986,000 | | | | 5,685,982 | | |
PFS Financing Corp. 2020-G A — 0.970% 2/15/2026(f) | | | 63,808,000 | | | | 61,476,864 | | |
PFS Financing Corp. 2021-B B — 1.090% 8/15/2026(f) | | | 11,978,000 | | | | 11,045,819 | | |
PFS Financing Corp. 2020-G B — 1.570% 2/15/2026(f) | | | 3,303,000 | | | | 3,168,053 | | |
PFS Financing Corp. 2022-A A — 2.470% 2/15/2027(f) | | | 105,379,000 | | | | 102,004,701 | | |
PFS Financing Corp. 2022-A B — 2.770% 2/15/2027(f) | | | 21,651,000 | | | | 20,424,148 | | |
PFS Financing Corp. 2022-C A — 3.890% 5/15/2027(f) | | | 77,233,000 | | | | 76,231,898 | | |
PFS Financing Corp. 2022-D A — 4.270% 8/15/2027(f) | | | 71,781,000 | | | | 70,673,835 | | |
PFS Financing Corp. 2022-C B — 4.390% 5/15/2027(f) | | | 11,913,000 | | | | 11,297,119 | | |
PG&E Recovery Funding LLC — 5.045% 7/15/2034 | | | 26,507,000 | | | | 26,606,908 | | |
PG&E Wildfire Recovery Funding LLC — 4.022% 6/1/2033 | | | 53,606,000 | | | | 52,175,878 | | |
SBA Tower Trust — 1.631% 5/15/2051(f) | | | 5,410,000 | | | | 4,670,244 | | |
SBA Tower Trust — 2.328% 7/15/2052(f) | | | 16,130,000 | | | | 14,365,980 | | |
SBA Tower Trust — 6.599% 1/15/2028(f) | | | 12,423,000 | | | | 13,138,047 | | |
SpringCastle America Funding LLC 2020-AA A — 1.970% 9/25/2037(f) | | | 16,733,816 | | | | 15,472,623 | | |
Texas Natural Gas Securitization Finance Corp. — 5.102% 4/1/2035 | | | 8,561,000 | | | | 8,785,906 | | |
TVEST LLC 2020-A A — 4.500% 7/15/2032(f) | | | 2,384,983 | | | | 2,367,995 | | |
Vantage Data Centers Issuer LLC 2020-1A A2, 1M USD LIBOR +
1.650% — 1.645% 9/15/2045(f) | | | 19,214,000 | | | | 17,298,007 | | |
VCP RRL ABS I Ltd. 2021-1A A — 2.152% 10/20/2031(f) | | | 40,476,996 | | | | 37,266,049 | | |
| | | $ | 1,420,784,713 | | |
| TOTAL ASSET-BACKED SECURITIES (Cost $5,599,596,739) | | $ | 5,421,139,465 | | |
CORPORATE BONDS & NOTES — 3.1% | |
COMMUNICATIONS — 0.3% | |
Amazon.com, Inc. — 1.650% 5/12/2028 | | $ | 22,427,000 | | | $ | 19,828,825 | | |
Frontier Communications Holdings LLC — 5.875% 10/15/2027(f) | | | 5,925,000 | | | | 5,400,934 | | |
| | | $ | 25,229,759 | | |
31
FPA NEW INCOME, INC.
PORTFOLIO OF INVESTMENTS (Continued)
March 31, 2023
(Unaudited)
BONDS & DEBENTURES — Continued | | Principal
Amount | | Fair
Value | |
FINANCIAL — 2.3% | |
Ares Capital Corp. — 2.875% 6/15/2028 | | $ | 41,510,000 | | | $ | 34,195,029 | | |
Blackstone Private Credit Fund — 3.250% 3/15/2027 | | | 33,271,000 | | | | 28,201,611 | | |
OWL Rock Core Income Corp. — 5.500% 3/21/2025 | | | 45,959,000 | | | | 44,739,749 | | |
OWL Rock Core Income Corp. — 4.700% 2/8/2027 | | | 40,949,000 | | | | 37,044,550 | | |
OWL Rock Core Income Corp. — 7.750% 9/16/2027(f) | | | 49,529,000 | | | | 48,503,898 | | |
| | | $ | 192,684,837 | | |
TECHNOLOGY — 0.5% | |
Hlend Senior Notes — 8.170% 3/15/2028(b)(c)(d) | | $ | 42,500,000 | | | $ | 42,500,000 | | |
| TOTAL CORPORATE BONDS & NOTES (Cost $267,361,528) | | $ | 260,414,596 | | |
CORPORATE BANK DEBT — 1.7% | |
Asurion LLC, 1M USD LIBOR + 3.000% — 7.840% 11/3/2024(d)(e)(i) | | $ | 39,468,562 | | | $ | 39,369,890 | | |
Axiom Global, Inc., 1M USD LIBOR + 5.500% —
9.459% 10/1/2026(d)(e)(i) | | | 22,777,855 | | | | 21,809,796 | | |
Capstone Acquisition Holdings, Inc. 2020 Delayed Draw Term Loan,
1M USD SOFR + 4.750% — 9.657% 11/12/2027(d)(e)(i)(j) | | | 1,078,202 | | | | 1,022,944 | | |
Capstone Acquisition Holdings, Inc. 2020 Term Loan,
1M USD SOFR + 4.750% — 9.657% 11/12/2027(d)(e)(i) | | | 18,535,080 | | | | 17,793,677 | | |
Frontier Communications Corp., 3M USD LIBOR + 3.750% —
8.625% 5/1/2028(d)(e)(i) | | | 23,323,020 | | | | 22,098,561 | | |
Heartland Dental LLC, 1M USD LIBOR + 3.750% —
8.840% 4/30/2025(d)(e)(i) | | | 38,312,141 | | | | 35,981,613 | | |
JC Penney Corp., Inc., 1M USD LIBOR + 9.500% —
9.500% 6/23/2023(d)(e)(i) | | | 27,218,054 | | | | 2,722 | | |
Lealand Finance Company B.V. Super Senior Exit LC —
5.250% 6/30/2024(d)(e)(i)(j)(k) | | | 16,770,000 | | | | (3,270,150 | ) | |
Windstream Services LLC, 1M USD LIBOR + 6.250% —
11.157% 9/21/2027(d)(e)(i) | | | 13,099,252 | | | | 11,581,966 | | |
| TOTAL CORPORATE BANK DEBT (Cost $155,529,787) | | $ | 146,391,019 | | |
32
FPA NEW INCOME, INC.
PORTFOLIO OF INVESTMENTS (Continued)
March 31, 2023
(Unaudited)
BONDS & DEBENTURES — Continued | | Principal
Amount | | Fair
Value | |
U.S. TREASURIES — 7.8% | |
U.S. Treasury Bills — 3.653% 4/6/2023(g) | | $ | 182,564,000 | | | $ | 182,493,713 | | |
U.S. Treasury Notes — 3.500% 1/31/2028 | | | 486,903,000 | | | | 484,425,394 | | |
| TOTAL U.S. TREASURIES (Cost $665,500,896) | | $ | 666,919,107 | | |
| TOTAL BONDS & DEBENTURES — 96.5% (Cost $8,514,503,113) | | $ | 8,238,358,197 | | |
TOTAL INVESTMENT SECURITIES — 97.8%
(Cost $8,653,767,523) | | $ | 8,349,519,121 | | |
SHORT-TERM INVESTMENTS — 2.0% | |
State Street Bank Repurchase Agreement — 1.44% 4/3/2023
(Dated 03/31/2023, repurchase price of $173,905,866, collateralized by
$179,024,000 principal amount U.S. Treasury Notes — 1.750% —
3.875% 2024 — 2025, fair value $177,362,794)(l) | | $ | 173,885,000 | | | $ | 173,885,000 | | |
| TOTAL SHORT-TERM INVESTMENTS (Cost $173,885,000) | | $ | 173,885,000 | | |
| TOTAL INVESTMENTS — 99.8% (Cost $8,827,652,523) | | $ | 8,523,404,121 | | |
Other Assets and Liabilities, net — 0.2% | | | | | 20,177,567 | | |
NET ASSETS — 100.0% | | $ | 8,543,581,688 | | |
33
FPA NEW INCOME, INC.
PORTFOLIO OF INVESTMENTS (Continued)
March 31, 2023
(Unaudited)
(a) Non-income producing security.
(b) Investments categorized as a significant unobservable input (Level 3) (See Note 6 of the Notes to Financial Statements).
(c) These securities have been valued in good faith under policies adopted by authority of the Board of Directors in accordance with the Fund's fair value procedures. These securities constituted 1.06% of total net assets at March 31, 2023.
(d) Restricted securities. These restricted securities constituted 3.09% of total net assets at March 31, 2023, most of which are considered liquid by the Adviser. These securities are not registered and may not be sold to the public. There are legal and/or contractual restrictions on resale. The Fund does not have the right to demand that such securities be registered. The values of these securities are determined by valuations provided by pricing services, brokers, dealers, market makers, or in good faith under policies adopted by authority of the Fund's Board of Directors.
(e) Variable/Floating Rate Security — The rate shown is based on the latest available information as of March 31, 2023. For Corporate Bank Debt, the rate shown may represent a weighted average interest rate. Certain variable rate securities are not based on a published rate and spread but are determined by the issuer or agent and are based on current market conditions. These securities do not indicate a reference rate and spread in their description.
(f) Security exempt from registration under Rule 144A of the Securities Act of 1933. These securities may be resold in transactions exempt from registration, typically only to qualified institutional buyers. Unless otherwise indicated, these securities are not considered to be illiquid.
(g) Zero coupon bond. Coupon amount represents effective yield to maturity.
(h) Step Coupon — Coupon rate increases in increments to maturity. Rate disclosed is as of March 31, 2023.
(i) For corporate bank debt, the rate shown may represent a weighted average interest rate.
(j) All or a portion of this holding is subject to unfunded loan commitments. The stated interest rate reflects the weighted average of the reference rate and spread for the funded portion, if any, and the commitment fees on the portion of the loan that is unfunded.
(k) As of March 31, 2023, the Fund had entered into commitments to fund various delayed draw debt-related investments. Such commitments are subject to the satisfaction of certain conditions set forth in the documents governing those investments and there can be no assurance that such conditions will be satisfied. At March 31, 2023, unfunded commitments totaled $16,770,000.
(l) Security pledged as collateral (See Note 7 of the Notes to Financial Statements).
(m) Affiliated Security.
34
FPA NEW INCOME, INC.
PORTFOLIO OF INVESTMENTS — RESTRICTED SECURITIES
March 31, 2023
(Unaudited)
Issuer | | Acquisition
Date (s) | | Cost | | Fair Value | | Fair
Value as a %
of Net Assets | |
Asurion LLC,
1M USD LIBOR +
3.000% — 7.840% 11/3/2024 | | 08/17/2021 | | $ | 39,363,991 | | | $ | 39,369,890 | | | | 0.46 | % | |
Axiom Global, Inc., 1M USD
LIBOR + 5.500% —
9.459% 10/1/2026 | | 11/18/2021, 11/19/2021 | | | 22,608,560 | | | | 21,809,796 | | | | 0.25 | % | |
BTC Holdings Fund I LLC —
7.550% 1/28/2027 | | 09/01/2021 | | | 3,639,965 | | | | 3,639,965 | | | | 0.04 | % | |
BTC Offshore Holdings Fund,
3M USD LIBOR + 2.650% —
7.450% 10/20/2029 | | 10/25/2021, 01/20/2022 | | | 18,000,000 | | | | 18,000,000 | | | | 0.21 | % | |
Capstone Acquisition Holdings,
Inc., 2020 Delayed Draw Term
Loan, 1M USD SOFR +
4.750% — 9.657% 11/12/2027 | | 04/30/2021 | | | 1,074,634 | | | | 1,022,944 | | | | 0.01 | % | |
Capstone Acquisition Holdings,
Inc., 2020 Term Loan, 1M USD
SOFR + 4.750% —
9.657% 11/12/2027 | | 04/30/2021 | | | 18,420,967 | | | | 17,793,677 | | | | 0.21 | % | |
Copper Earn Out Trust | | 12/07/2020 | | | — | | | | 294,784 | | | | 0.00 | % | |
Copper Property CTL Pass
Through Trust | | 10/05/2017, 10/06/2017,
10/11/2017, 11/19/2018,
11/27/2018, 01/11/2019,
02/08/2019, 03/11/2019,
05/29/2019, 06/08/2020 | | | 25,752,396 | | | | 5,774,309 | | | | 0.07 | % | |
Frontier Communications Corp.,
3M USD LIBOR + 3.750% —
8.625% 5/1/2028 | | 04/09/2021 | | | 23,151,130 | | | | 22,098,561 | | | | 0.26 | % | |
Heartland Dental LLC, 1M USD
LIBOR + 3.750% —
8.840% 4/30/2025 | | 08/02/2021, 08/03/2021,
08/12/2021 | | | 38,197,556 | | | | 35,981,613 | | | | 0.42 | % | |
Hlend Senior Notes —
8.170% 3/15/2028 | | 02/16/2023 | | | 42,500,000 | | | | 42,500,000 | | | | 0.50 | % | |
JC Penney Corp., Inc., 1M USD
LIBOR + 9.500% —
9.500% 6/23/2023 | | 02/03/2021 | | | — | | | | 2,722 | | | | 0.00 | % | |
Lealand Finance Company
B.V. Super Senior Exit LC —
5.250% 6/30/2024 | | 02/28/2020 | | | (49,362 | ) | | | (3,270,150 | ) | | | (0.04 | )% | |
35
FPA NEW INCOME, INC.
PORTFOLIO OF INVESTMENTS — RESTRICTED SECURITIES (Continued)
March 31, 2023
(Unaudited)
Issuer | | Acquisition
Date (s) | | Cost | | Fair Value | | Fair
Value as a %
of Net Assets | |
PHI Group, Inc., Restricted | | 08/19/2019 | | $ | 31,131,405 | | | $ | 47,580,250 | | | | 0.56 | % | |
Windstream Services LLC,
1M USD LIBOR + 6.250% —
11.157% 9/21/2027 | | 08/11/2020 | | | 12,762,311 | | | | 11,581,966 | | | | 0.14 | % | |
TOTAL RESTRICTED
SECURITIES | | | | $ | 276,553,553 | | | $ | 264,180,327 | | | | 3.09 | % | |
See accompanying Notes to Financial Statements.
36
FPA NEW INCOME, INC.
STATEMENT OF ASSETS AND LIABILITIES
March 31, 2023
(Unaudited)
ASSETS | |
Investment securities — at fair value (identified cost $8,540,255,509) | | $ | 8,244,427,290 | | |
Investments in affiliates — at fair value (identified cost $113,512,014) | | | 105,091,831 | | |
Short-term investments — repurchase agreements | | | 173,885,000 | | |
Cash | | | 2,854,012 | | |
Receivable for: | |
Interest | | | 33,025,960 | | |
Capital Stock sold | | | 24,858,496 | | |
Investment securities sold | | | 21,948,303 | | |
Prepaid expenses and other assets | | | 101,976 | | |
Total assets | | | 8,606,192,868 | | |
LIABILITIES | |
Payable for: | |
Investment securities purchased | | | 48,570,543 | | |
Capital Stock repurchased | | | 9,458,230 | | |
Advisory fees | | | 2,565,201 | | |
Accrued expenses and other liabilities | | | 2,017,206 | | |
Other commitments and contingencies — Note 8 | |
Total liabilities | | | 62,611,180 | | |
NET ASSETS | | $ | 8,543,581,688 | | |
SUMMARY OF SHAREHOLDERS' EQUITY | |
Capital Stock — par value $0.01 per share; authorized 1,500,000,000 shares;
outstanding 892,735,213 shares | | $ | 8,927,352 | | |
Additional Paid-in Capital | | | 9,448,931,387 | | |
Distributable earnings | | | (914,277,051 | ) | |
NET ASSETS | | $ | 8,543,581,688 | | |
NET ASSET VALUE | |
Offering and redemption price per share | | $ | 9.57 | | |
See accompanying Notes to Financial Statements.
37
FPA NEW INCOME, INC.
STATEMENT OF OPERATIONS
For the Six Months Ended March 31, 2023
(Unaudited)
INVESTMENT INCOME | |
Interest | | $ | 161,327,290 | | |
Dividends | | | 1,088,171 | | |
Total investment income | | | 162,415,461 | | |
EXPENSES | |
Advisory fees | | | 21,875,985 | | |
Transfer agent fees and expenses | | | 2,851,574 | | |
Reports to shareholders | | | 298,282 | | |
Administrator fees | | | 225,661 | | |
Other professional fees | | | 200,952 | | |
Filing fees | | | 186,499 | | |
Director fees and expenses | | | 116,673 | | |
Custodian fees | | | 67,848 | | |
Legal fees | | | 50,047 | | |
Audit and tax services fees | | | 22,178 | | |
Other | | | 52,965 | | |
Total expenses | | | 25,948,664 | | |
Reimbursement from Adviser | | | (6,259,729 | ) | |
Net expenses | | | 19,688,935 | | |
Net investment income | | | 142,726,526 | | |
NET REALIZED AND UNREALIZED GAIN (LOSS) | |
Net realized gain (loss) on: | |
Investments | | | (50,190,243 | ) | |
Net change in unrealized appreciation (depreciation) of: | |
Investments | | | 133,240,123 | | |
Investments in affiliates | | | (3,025,489 | ) | |
Net realized and unrealized gain | | | 80,024,391 | | |
NET INCREASE IN NET ASSETS RESULTING FROM OPERATIONS | | $ | 222,750,917 | | |
See accompanying Notes to Financial Statements.
38
FPA NEW INCOME, INC.
STATEMENTS OF CHANGES IN NET ASSETS
| | | Six Months Ended
March 31, 2023
(Unaudited) | | Year Ended
September 30, 2022 | |
INCREASE (DECREASE) IN NET ASSETS | |
Operations: | |
Net investment income | | $ | 142,726,526 | | | $ | 168,824,901 | | |
Net realized loss | | | (50,190,243 | ) | | | (166,885,511 | ) | |
Net change in unrealized appreciation (depreciation) | | | 130,214,634 | | | | (422,683,796 | ) | |
Net increase (decrease) in net assets resulting
from operations | | | 222,750,917 | | | | (420,744,406 | ) | |
Distributions to shareholders | | | (143,508,454 | ) | | | (167,625,868 | ) | |
Capital Stock transactions: | |
Proceeds from Capital Stock sold | | | 1,631,921,622 | | | | 4,152,249,227 | | |
Proceeds from shares issued to shareholders upon reinvestment
of dividends and distributions | | | 127,031,613 | | | | 145,427,559 | | |
Cost of Capital Stock repurchased | | | (2,760,278,600 | ) | | | (6,187,832,799 | ) | |
Net decrease from Capital Stock transactions | | | (1,001,325,365 | ) | | | (1,890,156,013 | ) | |
Total change in net assets | | | (922,082,902 | ) | | | (2,478,526,287 | ) | |
NET ASSETS | |
Beginning of period | | | 9,465,664,590 | | | | 11,944,190,877 | | |
End of period | | $ | 8,543,581,688 | | | $ | 9,465,664,590 | | |
CHANGE IN CAPITAL STOCK OUTSTANDING | |
Shares of Capital Stock sold | | | 171,871,361 | | | | 422,004,794 | | |
Shares issued to shareholders upon reinvestment of
dividends and distributions | | | 13,385,558 | | | | 14,933,014 | | |
Shares of Capital Stock repurchased | | | (290,882,277 | ) | | | (630,833,675 | ) | |
Change in Capital Stock outstanding | | | (105,625,358 | ) | | | (193,895,867 | ) | |
See accompanying Notes to Financial Statements.
39
FPA NEW INCOME, INC.
FINANCIAL HIGHLIGHTS
Selected Data for Each Share of Capital Stock Outstanding Throughout Each Period
| | | Six
Months
Ended
March 31,
2023 | | Year Ended September 30, | |
| | | (Unaudited) | | 2022 | | 2021 | | 2020 | | 2019 | | 2018 | |
Per share operating performance: | |
Net asset value at beginning
of period | | $ | 9.48 | | | $ | 10.02 | | | $ | 10.00 | | | $ | 10.00 | | | $ | 9.94 | | | $ | 10.05 | | |
Income from investment operations: | |
Net investment income(a) | | | 0.15 | | | | 0.15 | | | | 0.13 | | | | 0.23 | | | | 0.28 | | | | 0.29 | | |
Net realized and unrealized gain
(loss) on investment securities | | | 0.10 | | | | (0.53 | ) | | | 0.03 | | | | 0.01 | (b) | | | 0.13 | | | | (0.18 | ) | |
Total from investment operations | | | 0.25 | | | | (0.38 | ) | | | 0.16 | | | | 0.24 | | | | 0.41 | | | | 0.11 | | |
Less distributions: | |
Dividends from net investment
income | | | (0.16 | ) | | | (0.16 | ) | | | (0.14 | ) | | | (0.24 | ) | | | (0.35 | ) | | | (0.22 | ) | |
Net asset value at end of period | | $ | 9.57 | | | $ | 9.48 | | | $ | 10.02 | | | $ | 10.00 | | | $ | 10.00 | | | $ | 9.94 | | |
Total investment return(c) | | | 2.63 | % | | | (3.87 | )% | | | 1.56 | % | | | 2.41 | % | | | 4.20 | % | | | 1.91 | % | |
Ratios/supplemental data: | |
Net assets, end of period (in 000's) | | $ | 8,543,582 | | | $ | 9,465,665 | | | $ | 11,944,191 | | | $ | 8,646,909 | | | $ | 7,327,404 | | | $ | 5,704,624 | | |
Ratio of expenses to average net
assets: | |
Before reimbursement from
Adviser | | | 0.59 | %(d) | | | 0.59 | % | | | 0.58 | % | | | 0.57 | % | | | 0.57 | % | | | 0.58 | % | |
After reimbursement from
Adviser | | | 0.45 | %(d) | | | 0.46 | % | | | 0.48 | % | | | 0.49 | %(e) | | | 0.50 | % | | | 0.49 | % | |
Ratio of net investment income to
average net assets: | |
Before reimbursement from
Adviser | | | 3.12 | %(d) | | | 1.43 | % | | | 1.18 | % | | | 2.24 | % | | | 2.73 | % | | | 2.88 | % | |
After reimbursement from
Adviser | | | 3.26 | %(d) | | | 1.56 | % | | | 1.28 | % | | | 2.32 | %(f) | | | 2.80 | % | | | 2.96 | % | |
Portfolio turnover rate | | | 36 | %(d) | | | 103 | % | | | 81 | % | | | 54 | % | | | 25 | % | | | 29 | % | |
(a) Per share amount is based on average shares outstanding.
(b) Due to timing of sales and repurchase of capital shares, the net realized and unrealized gain (loss) per share is not in accordance with the Fund's change in net realized and unrealized gain (loss) on investment transactions for the period.
(c) Return is based on net asset value per share, adjusted for reinvestment of distributions.
(d) Annualized.
(e) Includes voluntary fee waiver which reduced the ratio of expenses to average net assets after reimbursement from Adviser by 0.01%.
(f) Includes voluntary fee waiver which increased the ratio of net investment income to average net assets after reimbursement from Adviser by 0.01%.
See accompanying Notes to Financial Statements.
40
FPA NEW INCOME, INC.
NOTES TO FINANCIAL STATEMENTS
March 31, 2023
(Unaudited)
NOTE 1 — Significant Accounting Policies
FPA New Income, Inc. (the "Fund") is registered under the Investment Company Act of 1940, as a diversified, open-end, management investment company. The Fund's primary investment objective is to seek current income and long-term total return. Capital preservation is also a consideration. The Fund qualifies as an investment company pursuant to Financial Accounting Standard Board (FASB) Accounting Standards Codification (ASC) No. 946, Financial Services — Investment Companies. The following is a summary of significant accounting policies consistently followed by the Fund in the preparation of its financial statements.
A. Security Valuation
The Fund's investments are reported at fair value as defined by accounting principles generally accepted in the United States of America, ("U.S. GAAP"). The Fund generally determines its net asset value as of approximately 4:00 p.m. New York time each day the New York Stock Exchange is open. Further discussion of valuation methods, inputs and classifications can be found under Disclosure of Fair Value Measurements.
B. Securities Transactions and Related Investment Income
Securities transactions are accounted for on the date the securities are purchased or sold. Dividend income and distributions to shareholders are recorded on the ex-dividend date. Interest income and expenses are recorded on an accrual basis. Market discounts and premiums on fixed income securities are amortized over the expected life of the securities using the effective interest rate method. Realized gains or losses are based on the specific identification method. The books and records of the Fund are maintained in U.S. dollars as follows: (1) the foreign currency fair value of investment securities, and other assets and liabilities stated in foreign currencies, are translated using the daily spot rate; and (2) purchases, sales, income and expenses are translated at the rate of exchange prevailing on the respective dates of such transactions. The resultant exchange gains and losses are included in net realized or net unrealized gain (loss) in the statement of operations.
C. Use of Estimates
The preparation of the financial statements in accordance with U.S. GAAP requires management to make estimates and assumptions that affect the amounts reported. Actual results could differ from those estimates.
D. Recent Accounting Pronouncements
In March 2020, the FASB issued ASU 2020-04, Reference Rate Reform (Topic 848) Facilitation of the Effects of Reference Rate Reform on Financial Reporting, which provides optional expedients and exceptions for applying U.S. GAAP to contracts, hedging relationships, and other transaction to ease the potential burden in accounting for (or recognizing the effects of) reference rate reform on financial reporting if certain criteria are met. The guidance is effective from March 12, 2020 through December 31, 2024.
In June 2022, the FASB issued Accounting Standards Update No. 2022-03, Fair Value Measurement of Equity Securities Subject to Contractual Sale Restrictions ("ASU 2022-03"). ASU 2022-03 clarifies the guidance in ASC 820, related to the measurement of the fair value of an equity security subject to contractual sale restrictions, where it eliminates the ability to apply a discount to fair value of these securities, and introduces disclosure requirements related to such equity securities. The guidance is effective for fiscal years, and interim periods within those fiscal years, beginning after December 15, 2023, and allows for early adoption. Management is currently evaluating the impact of applying this update.
41
FPA NEW INCOME, INC.
NOTES TO FINANCIAL STATEMENTS (Continued)
(Unaudited)
Effective January 24, 2023, the SEC adopted rule and form amendments to require mutual funds and ETFs to transmit concise and visually engaging streamlined annual and semiannual reports to shareholders that highlight key information deemed important for retail investors to assess and monitor their fund investments. Other information, including financial statements, will no longer appear in the funds' streamlined shareholder reports but must be available online, delivered free of charge upon request, and filed on a semiannual basis on Form N-CSR. The rule and form amendments have a compliance date of July 24, 2024. At this time, management is evaluating the impact of these rule and form amendment changes on the content of the current shareholder report and the newly created annual and semiannual streamlined shareholder reports.
NOTE 2 — Risk Considerations
Investing in the Fund may involve certain risks including, but not limited to, those described below.
Market Risk: Because the values of the Fund's investments will fluctuate with market conditions, so will the value of your investment in the Fund. You could lose money on your investment in the Fund or the Fund could underperform other investments.
Interest Rate and Credit Risk: The values of, and the income generated by, most debt securities held by the Fund may be affected by changing interest rates and by changes in the effective maturities and credit rating of these securities. For example, the value of debt securities in the Fund's portfolio generally will decline when interest rates rise and increase when interest rates fall. In addition, falling interest rates may cause an issuer to redeem, call or refinance a security before its stated maturity, which may result in the Fund having to reinvest the proceeds in lower yielding securities.
Mortgage-Backed and Other Asset-Backed Securities Risk: The values of some mortgage-backed and other asset-backed securities may expose the Fund to a lower rate of return upon reinvestment of principal. When interest rates rise, the value of mortgage-related securities generally will decline; however, when interest rates are declining, the value of mortgage related-securities with prepayment features may not increase as much as other fixed income securities. The rate of prepayments on underlying mortgages will affect the price and volatility of a mortgage-related security and may shorten or extend the effective maturity of the security beyond what was anticipated at the time of purchase. If an unanticipated rate of prepayment on underlying mortgages increases the effective maturity of a mortgage-related security, the volatility of the security can be expected to increase. The value of these securities may also fluctuate in response to the market's perception of the creditworthiness of the issuers. Additionally, although mortgages and mortgage-related securities are generally supported by some form of government or private guarantee and/or insurance, there is no assurance that private guarantors or insurers will meet their obligations.
Stripped Mortgage-Backed Interest Only ("I/O") and Principal Only ("P/O") Securities: Stripped mortgage- backed securities are usually structured with two classes that receive different proportions of the interest and principal distributions on a pool of mortgage assets. In certain cases, one class will receive all of the interest payments on the underlying mortgages (the I/O class), while the other class will receive all of the principal payments (the P/O class). The Fund currently has investments in I/O securities. The yield to maturity on I/Os is sensitive to the rate of principal repayments (including prepayments) on the related underlying mortgage assets, and principal payments may have a material effect on yield-to-maturity. If the underlying mortgage assets experience greater than anticipated prepayments of principal, a Fund may not fully recoup its initial investment in I/Os.
42
FPA NEW INCOME, INC.
NOTES TO FINANCIAL STATEMENTS (Continued)
(Unaudited)
Credit Risk: Debt securities are subject to credit risk, meaning that the issuer of the debt security may default or fail to make timely payments of principal or interest. The values of any of the Fund's investments may also decline in response to events affecting the issuer or its credit rating. The lower rated debt securities in which the Fund may invest are considered speculative and are generally subject to greater volatility and risk of loss than investment grade securities, particularly in deteriorating economic conditions. The Fund invests a significant portion of its assets in securities of issuers that hold mortgage-and asset-backed securities and direct investments in securities backed by commercial and residential mortgage loans and other financial assets. The value and related income of these securities is sensitive to changes in economic conditions, including delinquencies and/or defaults. Continuing shifts in the market's perception of credit quality on securities backed by commercial and residential mortgage loans and other financial assets may result in increased volatility of market price and periods of illiquidity that can negatively impact the valuation of certain securities held by the Fund.
Repurchase Agreements: Repurchase agreements permit the Fund to maintain liquidity and earn income over periods of time as short as overnight. Repurchase agreements held by the Fund are fully collateralized by U.S. Government securities, or securities issued by U.S. Government agencies, or securities that are within the three highest credit categories assigned by established rating agencies (Aaa, Aa, or A by Moody's or AAA, AA or A by Standard & Poor's) or, if not rated by Moody's or Standard & Poor's, are of equivalent investment quality as determined by the Adviser. Such collateral is in the possession of the Fund's custodian. The collateral is evaluated daily to ensure its fair value equals or exceeds the current fair value of the repurchase agreements including accrued interest. In the event of default on the obligation to repurchase, the Fund has the right to liquidate the collateral and apply the proceeds in satisfaction of the obligation.
The Fund may enter into repurchase agreements, under the terms of a Master Repurchase Agreement ("MRA"). The MRA permits the Fund, under certain circumstances including an event of default (such as bankruptcy or insolvency), to offset payables and/or receivables under the MRA with collateral held and/or posted to the counterparty and create one single net payment due to or from the Fund. However, bankruptcy or insolvency laws of a particular jurisdiction may impose restrictions on or prohibitions against such a right of offset in the event of a MRA counterparty's bankruptcy or insolvency. Pursuant to the terms of the MRA, the Fund receives securities as collateral with a fair value in excess of the repurchase price to be received by the Fund upon the maturity of the repurchase transaction. Upon a bankruptcy or insolvency of the MRA counterparty, the Fund recognizes a liability with respect to such excess collateral to reflect the Fund's obligation under bankruptcy law to return the excess to the counterparty. Repurchase agreements outstanding at the end of the period are listed in the Fund's Portfolio of Investments.
NOTE 3 — Purchases and Sales of Investment Securities
Cost of purchases of investment securities (excluding short-term investments) aggregated $1,510,417,485 for the period ended March 31, 2023. The proceeds and cost of securities sold resulting in net realized loss of $50,190,243 aggregated $2,566,030,800 and $2,616,221,043, respectively, for the period ended March 31, 2023.
NOTE 4 — Advisory Fees and Other Affiliated Transactions
Pursuant to an Investment Advisory Agreement (the "Agreement"), advisory fees were paid by the Fund to First Pacific Advisors, LP (the "Adviser"). Under the terms of this Agreement, the Fund pays the Adviser a monthly fee calculated at the annual rate of 0.50% of the Fund's average daily net assets. In addition, as of February 1, 2023, the Adviser has contractually agreed to reimburse expenses in excess of 0.45% of the average daily net assets of the Fund (excluding interest, taxes, brokerage fees and commissions payable by the Fund in connection with the purchase or sale of portfolio securities, and extraordinary expenses, including litigation expenses not incurred in the Fund's ordinary course of business) January 31, 2024.
43
FPA NEW INCOME, INC.
NOTES TO FINANCIAL STATEMENTS (Continued)
(Unaudited)
The Agreement obligates the Adviser to reduce its fee to the extent necessary to reimburse the Fund for any annual expenses (exclusive of interest, taxes, the cost of any supplemental statistical and research information, and extraordinary expenses such as litigation) in excess of 1.50% of the first $15 million and 1.00% of the remaining average net assets of the Fund for the year. This agreement may only be terminated earlier by the Fund's Board of Directors (the "Board") or upon termination of the Advisory Agreement.
For the period ended March 31, 2023, the Fund paid aggregate fees and expenses of $116,673 to all Directors who are not affiliated persons of the Adviser. Certain officers of the Fund are also officers of the Adviser.
NOTE 5 — Federal Income Tax
No provision for federal income tax is required because the Fund has elected to be taxed as a "regulated investment company" under the Internal Revenue Code (the "Code") and intends to maintain this qualification and to distribute each year to its shareholders, in accordance with the minimum distribution requirements of the Code, its taxable net investment income and taxable net realized gains on investments.
The cost of investment securities held at March 31, 2023 was $8,654,210,807 for federal income tax purposes. Gross unrealized appreciation and depreciation for all investments at March 31, 2023, for federal income tax purposes was $28,460,036 and $333,151,722, respectively resulting in net unrealized depreciation of $304,691,686.
As of and during the period ended March 31, 2023, the Fund did not have any liability for unrecognized tax benefits. The Fund recognizes interest and penalties, if any, related to unrecognized tax benefits as income tax expense in the Statement of Operations. During the year, the Fund did not incur any interest or penalties. The statute of limitations remains open for the last 3 years, once a return is filed. No examinations are in progress at this time.
NOTE 6 — Disclosure of Fair Value Measurements
The Fund uses the following methods and inputs to establish the fair value of its assets and liabilities. Use of particular methods and inputs may vary over time based on availability and relevance as market and economic conditions evolve.
Equity securities are generally valued each day at the official closing price of, or the last reported sale price on, the exchange or market on which such securities principally are traded, as of the close of business on that day. If there have been no sales that day, equity securities are generally valued at the last available bid price. Securities that are unlisted and fixed-income and convertible securities listed on a national securities exchange for which the over-the-counter ("OTC") market more accurately reflects the securities' value in the judgment of the Fund's officers, are valued at the most recent bid price. However, most fixed income securities are generally valued at prices obtained from pricing vendors and brokers.
Vendors value such securities based on one or more of the following inputs: transactions, bids, offers quotations from dealers and trading systems, spreads and other relationships observed in the markets among comparable securities, benchmarks, underlying equity of the issuer, and proprietary pricing models such as cash flows, financial or collateral performance and other reference data (includes prepayments, defaults, collateral, credit enhancements, and interest rate volatility). Short-term corporate notes with maturities of 60 days or less at the time of purchase are valued at amortized cost.
Securities for which representative market quotations are not readily available or are considered unreliable by the Adviser are valued as determined in good faith under procedures adopted by the authority of the Fund's Board of Directors. Various inputs may be reviewed in order to make a good faith determination of a security's value. These inputs include, but are not limited to, the type and cost of the security; contractual or legal restrictions on resale of the security; relevant financial or business developments of the issuer; actively traded similar or
44
FPA NEW INCOME, INC.
NOTES TO FINANCIAL STATEMENTS (Continued)
(Unaudited)
related securities; conversion or exchange rights on the security; related corporate actions; significant events occurring after the close of trading in the security; and changes in overall market conditions. Fair valuations and valuations of investments that are not actively trading involve judgment and may differ materially from valuations of investments that would have been used had greater market activity occurred.
The Fund classifies its assets based on three valuation methodologies. Level 1 values are based on quoted market prices in active markets for identical assets. Level 2 values are based on significant observable market inputs, such as quoted prices for similar assets and quoted prices in inactive markets or other market observable inputs as noted above including spreads, cash flows, financial performance, prepayments, defaults, collateral, credit enhancements, and interest rate volatility. Level 3 values are based on significant unobservable inputs that reflect the Fund's determination of assumptions that market participants might reasonably use in valuing the assets. The valuation levels are not necessarily an indication of the risk associated with investing in those securities.
The following table presents the valuation levels of the Fund's investments as of March 31, 2023:
Investments | | Level 1 | | Level 2 | | Level 3 | | Total | |
Common Stocks | |
Energy | | | — | | | | — | | | $ | 47,580,250 | | | $ | 47,580,250 | | |
Industrials | | $ | 57,511,581 | | | | — | | | | — | | | | 57,511,581 | | |
Retailing | | | — | | | $ | 5,774,309 | | | | 294,784 | | | | 6,069,093 | | |
Commercial Mortgage-Backed Securities | |
Agency | | | — | | | | 350,000,397 | | | | — | | | | 350,000,397 | | |
Agency Stripped | | | — | | | | 36,537,778 | | | | — | | | | 36,537,778 | | |
Non-Agency | | | — | | | | 718,239,404 | | | | — | | | | 718,239,404 | | |
Residential Mortgage-Backed Securities | |
Agency Collateralized Mortgage Obligation | | | — | | | | 10,410,504 | | | | — | | | | 10,410,504 | | |
Agency Pool Adjustable Rate | | | — | | | | 265,195 | | | | — | | | | 265,195 | | |
Agency Pool Fixed Rate | | | — | | | | 168,315,754 | | | | — | | | | 168,315,754 | | |
Agency Stripped | | | — | | | | 93,312 | | | | — | | | | 93,312 | | |
Non-Agency Collateralized Mortgage
Obligation | | | — | | | | 459,631,666 | | | | — | | | | 459,631,666 | | |
Asset-Backed Securities | |
Auto | | | — | | | | 1,601,980,194 | | | | — | | | | 1,601,980,194 | | |
Collateralized Loan Obligation | | | — | | | | 1,094,105,883 | | | | 21,639,965 | | | | 1,115,745,848 | | |
Credit Card | | | — | | | | 100,942,852 | | | | — | | | | 100,942,852 | | |
Equipment | | | — | | | | 1,129,073,867 | | | | 52,611,991 | | | | 1,181,685,858 | | |
Other | | | — | | | | 1,420,784,713 | | | | — | | | | 1,420,784,713 | | |
Corporate Bonds & Notes | | | — | | | | 217,914,596 | | | | 42,500,000 | | | | 260,414,596 | | |
Corporate Bank Debt | | | — | | | | 146,391,019 | | | | — | | | | 146,391,019 | | |
U.S. Treasuries | | | — | | | | 666,919,107 | | | | — | | | | 666,919,107 | | |
Short-Term Investments | | | — | | | | 173,885,000 | | | | — | | | | 173,885,000 | | |
| | | $ | 57,511,581 | | | $ | 8,301,265,550 | | | $ | 164,626,990 | | | $ | 8,523,404,121 | | |
45
FPA NEW INCOME, INC.
NOTES TO FINANCIAL STATEMENTS (Continued)
(Unaudited)
The following table summarizes the Fund's Level 3 investment securities and related transactions during the period ended March 31, 2023:
Investments | | Beginning
Value at
September 30,
2022 | | Net Realized and
Unrealized Gains
(Losses)(a) | | Purchases | | (Sales) | | Gross
Transfers
In/(Out) | | Ending
Value at
March 31,
2023 | | Net Change
in Unrealized
Appreciation
(Depreciation)
related to
Investments held
at March 31,
2023 | |
Common Stocks | | $ | 54,724,440 | | | $ | (1,075,097 | ) | | | — | | | | — | | | $ | (5,774,309 | ) | | $ | 47,875,034 | | | $ | (86,701 | ) | |
Asset-Backed Securities
Collateralized Loan
Obligation | | | 22,787,445 | | | | — | | | | — | | | $ | (1,147,480 | ) | | | — | | | | 21,639,965 | | | | — | | |
Asset-Backed Securities
Equipment | | | 14,837,423 | | | | (145,106 | ) | | $ | 38,234,712 | | | | (315,038 | ) | | | — | | | | 52,611,991 | | | | (145,401 | ) | |
Corporate Bonds & Notes | | | — | | | | — | | | | 42,500,000 | | | | — | | | | — | | | | 42,500,000 | | | | — | | |
Corporate Bank Debt | | | 10,660,190 | | | | 802,380 | | | | — | | | | (11,462,570 | ) | | | — | | | | — | | | | — | | |
| | | $ | 103,009,498 | | | $ | (417,823 | ) | | $ | 80,734,712 | | | $ | (12,925,088 | ) | | $ | (5,774,309 | ) | | $ | 164,626,990 | | | $ | (232,102 | ) | |
(a) Net realized and unrealized gains (losses) are included in the related amounts in the statement of operations.
Transfers of investments between different levels of the fair value hierarchy are recorded at fair value as of the end of the reporting period. There were transfers of $5,774,309 out of Level 3 into Level 2. Transfers out of Level 3 were due to change in valuation technique from recent trade activity to vendor priced.
The following table summarizes the quantitative inputs and assumptions used for items categorized as Level 3 of the fair value hierarchy as of March 31, 2023
Financial Assets | | Fair Value at
March 31, 2023 | | Valuation Technique(s) | | Unobservable
Inputs | | Price/Range | | Weighted
Average Price | |
Common Stocks | | $ | 294,784 | | | Pricing Model (a) | | Quotes/Prices | | $ | 4.25 | | | $ | 4.25 | | |
| | | $ | 47,580,250 | | | Pricing Model (b) | | Last Reported Trade | | $ | 12.50 | | | $ | 12.50 | | |
Asset-Backed Securities —
Collateralized Loan Obligation | | $ | 21,639,965 | | | Third-Party Broker Quote (c) | | Quotes/Prices | | $ | 100.00 | | | $ | 100.00 | | |
Asset-Backed Securities —
Equipment | | $ | 52,611,991 | | | Third-Party Broker Quote (c) | | Quotes/Prices | | $ | 83.00-$100.00 | | | $ | 95.35 | | |
Corporate Bonds & Notes | | $ | 42,500,000 | | | Pricing Model (d) | | Cost | | $ | 100.00 | | | $ | 100.00 | | |
(a) The Pricing Model technique for Level 3 securities involves recently quoted funding prices of the security.
(b) The Pricing Model technique for Level 3 securities involves the last reported trade in the security.
(c) The Third Party Broker Quote technique involves obtaining an independent third-party broker quote for the security.
(d) The fair value of the investment is based on the initial purchase price or more recent capital activity. If the financial condition of the underlying assets were to deteriorate, or if the market comparables were to fall, the value of the investment could be lower.
46
FPA NEW INCOME, INC.
NOTES TO FINANCIAL STATEMENTS (Continued)
(Unaudited)
The following represents the impact on fair value measurements to changes in unobservable inputs:
| Unobservable Inputs(a) | | Increase in Inputs Impact on
Valuation | | Decrease in Inputs Impact on
Valuation | |
Discounted External Valuation | | Decrease | | Increase | |
(a) Unobservable Inputs from Quotes/Prices and Last Executed Trade were not included because the Fund does not develop the quantitative inputs and they are not readily available.
NOTE 7 — Collateral Requirements
FASB Accounting Standards Update No. 2011-11, Disclosures about Offsetting Assets and Liabilities, requires disclosures to make financial statements that are prepared under U.S. GAAP more comparable to those prepared under International Financial Reporting Standards. Under this guidance the Fund discloses both gross and net information about instruments and transactions eligible for offset such as instruments and transactions subject to an agreement similar to a master netting arrangement. In addition, the Fund discloses collateral received and posted in connection with master netting agreements or similar arrangements.
The following table presents the Fund's repurchase agreements by counterparty net of amounts available for offset under an ISDA Master agreement or similar agreements and net of the related collateral received or pledged by the Fund as of March 31, 2023, are as follows:
| | | | | Gross Amounts Not Offset in the
Statement of Assets and Liabilities | | | |
Counterparty | | Gross Assets
(Liabilities)
in the Statement of
Assets and Liabilities | | Security
Collateral
(Received)
Pledged | | Assets (Liabilities)
Available for Offset | | Net Amount
of Assets
(Liabilities)(a) | |
State Street Bank and
Trust Company: | |
Repurchase Agreement | | $ | 173,885,000 | | | $ | (173,885,000 | )(b) | | | — | | | | — | | |
(a) Represents the net amount receivable from the counterparty in the event of default.
(b) Collateral with a value of $177,362,794 has been received in connection with a master repurchase agreement. Excess of collateral received from the individual master repurchase agreement is not shown for financial reporting purposes.
NOTE 8 — Commitments and Contingencies
In the normal course of business, the Fund's investment activities involve executions, settlement and financing of various transactions resulting in receivables from, and payables to, brokers, dealers and the Fund's custodian. These activities may expose the Fund to risk in the event that such parties are unable to fulfill contractual obligations. Management does not anticipate any material losses from counterparties with whom it conducts business. Consistent with standard business practice, the Fund enters into contracts that contain a variety of indemnifications. The maximum exposure of the Fund under these arrangements and activities is unknown.
47
FPA NEW INCOME, INC.
NOTES TO FINANCIAL STATEMENTS (Continued)
(Unaudited)
Commitments to extend credit or invest capital include loan or debt-related proceeds the Fund is obligated to advance, such as delayed draws or revolving credit arrangements, or delayed draws of investments in limited partnerships. Commitments generally have fixed expiration dates or other termination clauses. Unrealized gains or losses associated with unfunded commitments are recorded in the consolidated financial statements and reflected as an adjustment to the fair value of the related security in the Consolidated Schedule of Investments. The paramount of the unfunded commitments is not recognized by the Fund until it becomes funded. As of March 31, 2023, the value of loans disclosed in the Schedule of Investments does not include unfunded commitments and the Fund was liable for the following unfunded commitments:
Asset Class | | Unfunded
Commitment | |
Corporate Bank Debt | | $ | 16,770,000 | | |
NOTE 9 — Affiliated Investments
A company is considered an affiliate of the Fund under the Investment Company Act of 1940 if the Fund's holdings in that company represent 5% or more of the outstanding voting shares of that company. Further details on such holdings and related transactions during the period ended March 31, 2023, appear below:
| | | Shares
Held as of
September 30,
2022 | | Beginning
Value as of
September 30,
2022 | | Purchases
at Cost | | Proceeds
from Sales | | Net
Realized
Gain/(Loss)
sales of
Affiliated
Investments | | Change in
Unrealized
Appreciation/
Depreciation | | Transfers
In (Out) | | Ending
Value as of
March 31,
2023 | | Shares
as of
March 31,
2023 | | Dividend
Income
from
Affiliated
Investments | |
Common Stocks — 1.2% | |
Energy — 0.5% | |
PHI Group, Inc.,
Restricted(a)(b)(c)(d) | | | 3,806,420 | | | $ | 47,580,250 | | | | — | | | | — | | | | — | | | | — | | | | — | | | $ | 47,580,250 | | | | 3,806,420 | | | | — | | |
Industrials — 0.7% | |
Boart Longyear Group
Ltd.(a) | | | 43,018,605 | | | | 60,537,070 | | | | — | | | | — | | | | — | | | $ | (3,025,489 | ) | | | — | | | | 57,511,581 | | | | 43,018,605 | | | | — | | |
Total Affiliate
Investments — 1.2% | | | | $ | 108,117,320 | | | | — | | | | — | | | | — | | | $ | (3,025,489 | ) | | | — | | | $ | 105,091,831 | | | | | | — | | |
(a) Non-income producing security.
(b) Investments categorized as a significant unobservable input (Level 3) (See Note 6 of the Notes to Financial Statements).
(c) These securities have been valued in good faith under policies adopted by authority of the Board of Directors in accordance with the Fund's fair value procedures. These securities constituted 1.06% of total net assets at March 31, 2023.
(d) Restricted securities. These restricted securities constituted 3.09% of total net assets at March 31, 2023, most of which are considered liquid by the Adviser. These securities are not registered and may not be sold to the public. There are legal and/or contractual restrictions on resale. The Fund does not have the right to demand that such securities be registered. The values of these securities are determined by valuations provided by pricing services, brokers, dealers, market makers, or in good faith under policies adopted by authority of the Fund's Board of Directors.
48
FPA NEW INCOME, INC.
SHAREHOLDER EXPENSE EXAMPLE
March 31, 2023 (Unaudited)
Fund Expenses
Mutual fund shareholders generally incur two types of costs: (1) transaction costs, and (2) ongoing costs, including advisory and administrative fees; shareholder service fees; and other Fund expenses. The Example is intended to help you understand your ongoing costs (in dollars) of investing in the Fund and to compare these costs with the ongoing costs of investing in other mutual funds. The Example is based on an investment of $1,000 invested at the beginning of the year and held for the entire year.
Actual Expenses
The information in the table under the heading "Actual Performance" provides information about actual account values and actual expenses. You may use the information in this column, together with the amount you invested, to estimate the expenses that you paid over the period. Simply divide your account value by $1,000 (for example, an $8,600 account value divided by $1,000 = 8.6), then multiply the result by the number in the first column in the row entitled "Expenses Paid During Period" to estimate the expenses you paid on your account during this period.
Hypothetical Example for Comparison Purposes
The information in the table under the heading "Hypothetical Performance (5% return before expenses)" provides information about hypothetical account values and hypothetical expenses based on the Fund's actual expense ratio and an assumed rate of return of 5% per year before expenses, which is not the Fund's actual return. The hypothetical account values and expenses may not be used to estimate the actual ending account balance or expenses you paid for the period. You may use this information to compare the ongoing costs of investing in the Fund and other funds. To do so, compare this 5% hypothetical example with the 5% hypothetical examples that appear in the shareholder reports of other funds.
Please note that the expenses shown in the table are meant to highlight your ongoing costs only and do not reflect any transactional costs. Therefore, the information under the heading "Hypothetical Performance (5% return before expenses)" is useful in comparing ongoing costs only, and will not help you determine the relative total costs of owning different funds. In addition, if these transactional costs were included, your costs would have been higher. Even though the Fund does not charge transaction fees, if you purchase shares through a broker, the broker may charge you a fee. You should evaluate other mutual funds' transaction fees and any applicable broker fees to assess the total cost of ownership for comparison purposes.
| | | Actual Performance | | Hypothetical Performance
(5% return before expenses) | |
Beginning Account Value September 30, 2022 | | $ | 1,000.00 | | | $ | 1,000.00 | | |
Ending Account Value March 31, 2023 | | $ | 1,026.30 | | | $ | 1,022.69 | | |
Expenses Paid During Period(a) | | $ | 2.27 | | | $ | 2.27 | | |
(a) Expenses are equal to the Fund's annualized expense ratio of 0.45%, multiplied by the average account value over the period and prorated for the six-months ended March 31, 2023 (182/365 days).
49
FPA NEW INCOME, INC.
DIRECTOR AND OFFICER INFORMATION
(Unaudited)
Sandra Brown, Mark L. Lipson, Alfred E. Osborne, Jr., and Robert F. Goldrich are all Directors of the Fund who are not "interested persons" of the Fund, as that term is defined in the 1940 Act (collectively, the "Independent Directors"). Directors serve until their resignation, removal or retirement. The Statement of Additional Information includes additional information about the Directors and is available, without charge, upon request by calling (800) 982-4372.
Name, Address(1)
and Year of Birth | | Position(s)
Held with
the Fund | | Year First
Elected as
Director of
the Fund | | Principal Occupation(s)
During the
Past Five Years | | Number of
FPA Funds
Overseen
by Director | | Other
Directorships
Held by Director
During the Past
Five Years | |
Independent Directors | |
Sandra Brown,
1955 | | Director | | | 2016 | | | Consultant (since 2009). Formerly, CEO and President of Transamerica Financial Advisers, Inc. (1999-2009); President, Transamerica Securities Sales Corp. (1998-2009); Vice President, Bank of America Mutual Fund Administration (1990-1998). Director/Trustee of each FPA Fund (Bragg Capital Trust since 2020). | | | 7 | | | None | |
Robert F. Goldrich,
1962 | | Director | | | 2022 | | | Senior Vice President for Strategic Initiatives of CMW Strategies LLC (since 2022). Former President/CFO of the Leon Levy Foundation (2015-2022). Director/Trustee of each FPA Fund (since 2022). | | | 7 | | | Uluru, Inc (2015-2017) | |
Mark L. Lipson,
1949 | | Director & Chairman | | | 2015 | | | Managing Member, ML2 Advisors, LLC (since 2014). Formerly Managing Director, Bessemer Trust (2007-2014) and US Trust (2003-2006); Chairman and CEO of the Northstar Mutual Funds (1993-2001); and President and CEO of the National Mutual Funds (1988-1993). Director/Trustee of each FPA Fund (Bragg Capital Trust since 2020). | | | 7 | | | None | |
Alfred E. Osborne, Jr.,
1944 | | Director | | | 1999 | | | Formerly UCLA professor, retired effective July 2022. Dr. Osborne served at UCLA's John E. Anderson School of Management in several capacities for 50 years. He was formerly Senior Associate Dean, (July 2003-June 2022), Interim Dean (July 2018-June 2019), Professor (July 1972-June 2022) and Faculty Director, Price Center for Entrepreneurship and Innovation (July 1984-June 2022). Director/Trustee of each FPA Fund (Bragg Capital Trust since 2020). | | | 7 | | | Kaiser Aluminum, Wedbush Capital and Waverley Capital Acquisition Corporation | |
50
FPA NEW INCOME, INC.
DIRECTOR AND OFFICER INFORMATION (Continued)
(Unaudited)
Name, Address(1)
and Year of Birth | | Position(s)
Held with
the Fund | | Year First
Elected as
Director of
the Fund | | Principal Occupation(s)
During the
Past Five Years | | Number of
FPA Funds
Overseen
by Director | | Other
Directorships
Held by Director
During the Past
Five Years | |
"Interested" Director(2) | |
J. Richard Atwood,
1960 | | Director | | | 2016 | | | Director and President of FPA GP, Inc., the General Partner of the Adviser (since 2018). Director/Trustee of each FPA Fund (Bragg Capital Trust since 2020). President of each FPA Fund (Bragg Capital Trust since 2020). Formerly, Managing Partner of FPA (2006-2018). | | | 7 | | | None | |
(1) The address of each Director is 11601 Wilshire Boulevard, Suite 1200, Los Angeles, California 90025.
(2) "Interested person" within the meaning of the 1940 Act by virtue of their affiliation with the Fund's Adviser.
51
FPA NEW INCOME, INC.
DIRECTOR AND OFFICER INFORMATION (Continued)
(Unaudited)
Officers of the Fund. Officers of the Fund are elected annually by the Board.
Name, Address(1)
and Year of Birth | | Position
with Fund | | Year First
Elected as
Officer of the
Fund | | Principal Occupation(s)
During the Past Five Years | |
Abhijeet Patwardhan,
1979 | | Vice President and Portfolio Manager | | | 2015 | | | Partner (since 2017) and a Director of Research (since 2015) of FPA; Managing Director of FPA from 2015 to 2017, Senior Vice President of FPA from 2014 to 2015; Analyst and Vice President of FPA from 2010 to 2013. Vice President and Portfolio Manager of FPA Flexible Fixed Income Fund (since 2018). | |
J. Richard Atwood,
1960 | | President | | | 1997 | | | Director and President of FPA GP, Inc., the General Partner of FPA (since 2018). Director/Trustee (except Bragg Capital Trust since 2020) and President (except Bragg Capital Trust since 2020) of each FPA Fund. Formerly, Managing Partner of FPA (2006-2018). | |
Karen E. Richards,
1969 | | Chief Compliance Officer | | | 2019 | | | Chief Compliance Officer of FPA (since 2018); and Chief Compliance Officer of each FPA Fund (since 2019, except Bragg Capital Trust since 2020). Formerly, Deputy Chief Compliance Officer of First Republic Investment Management, LLC (from 2016 to 2018), and Vice President, Senior Compliance Officer of Pacific Investment Management Company (from 2010 to 2016). | |
E. Lake Setzler III,
1967 | | Treasurer | | | 2006 | | | Managing Director and CFO (since 2022) of FPA; and Treasurer of each FPA Fund (except Bragg Capital Trust since 2020). Formerly, Senior Vice President and Controller of FPA. | |
Rebecca D. Gilding,
1979 | | Secretary | | | 2019 | | | Vice President and Senior Counsel, State Street Bank and Trust Company (since 2016); and Secretary of each FPA Fund (since 2019, except Bragg Capital Trust since 2020). Formerly, Assistant Vice President and Associate Counsel, Brown Brothers Harriman & Co. (2013 to 2016). | |
(1) The address for each Officer (except Ms. Gilding) is 11601 Wilshire Boulevard, Suite 1200, Los Angeles, California 90025. Ms. Gilding's address is State Street Bank and Trust Company, One Congress Street, Suite 1, Boston, Massachusetts 02114-2016.
52
FPA NEW INCOME, INC.
(Unaudited)
INVESTMENT ADVISER
First Pacific Advisors, LP
11601 Wilshire Boulevard, Suite 1200
Los Angeles, CA 90025
TRANSFER & SHAREHOLDER SERVICE AGENT
UMB Fund Services, Inc.
P.O. Box 2175
Milwaukee, WI 53201-2175
or
235 West Galena Street
Milwaukee, WI 53212-3948
(800) 638-3060
CUSTODIAN AND ADMINISTRATOR
State Street Bank and Trust Company
One Congress Street, Suite 1,
Boston, Massachusetts 02114-2016
TICKER SYMBOL: FPNIX
CUSIP: 302544101
DISTRIBUTOR
UMB Distribution Services, LLC
235 West Galena Street
Milwaukee, Wisconsin 53212-3948
LEGAL COUNSEL
Dechert LLP
One Bush Street, Suite 1600
San Francisco, California 94104
INDEPENDENT REGISTERED PUBLIC ACCOUNTING FIRM
Ernst & Young LLP
725 South Figueroa Street
Los Angeles, California 90017
This report has been prepared for the information of shareholders of FPA NEW INCOME, INC., and is not authorized for distribution to prospective investors unless preceded or accompanied by an effective prospectus. The financial information included in this report has been taken from the records of the Fund without examination by independent auditors.
A description of the policies and procedures that the Adviser uses to vote proxies related to the Fund's portfolio securities is set forth in the Fund's Statement of Additional Information which is available without charge, upon request, on the Fund's website at www.fpa.com or by calling (800) 982-4372 and on the Securities and Exchange Commission's website at www.sec.gov.
The Fund's complete proxy voting record for the 12 months ended June 30, 2022 is available without charge, upon request by calling (800) 982-4372 and on the SEC's website at www.sec.gov.
The Fund's schedule of portfolio holdings, filed the first and third quarter of the Fund's fiscal year on Form N-PORT with the SEC, is available on the SEC's website at www.sec.gov.
Additional information about the Fund is available online at www.fpa.com. This information includes, among other things, holdings, top sectors, and performance, and is updated on or about the 15th business day after the end of each quarter.
Item 2. Code of Ethics.
Not applicable to this semi-annual report.
Item 3. Audit Committee Financial Expert.
Not applicable to this semi-annual report.
Item 4. Principal Accountant Fees and Services.
Not applicable to this semi-annual report.
Item 5. Audit Committee of Listed Registrants.
Not applicable to this semi-annual report.
Item 6. Investments.
| (a) | Schedule of Investments is included as a part of the report to shareholders filed under Item 1 of this Form N-CSR. |
Item 7. Disclosure of Proxy Voting Policies and Procedures for Closed-End Management Investment Companies.
Not applicable.
Item 8. Portfolio Managers of Closed-End Management Investment Companies.
Not applicable.
Item 9. Purchases of Equity Securities by Closed-End Management Investment Company and Affiliated Purchasers.
Not applicable.
Item 10. Submission of Matters to a Vote of Security Holders.
There have been no material changes to the procedures by which the shareholders may recommend nominees to the registrant’s board of directors.
Item 11. Controls and Procedures.
| (a) | The principal executive officer and principal financial officer of the registrant have concluded that the registrant’s disclosure controls and procedures (as defined in Rule 30a-3(c) under the Investment Company Act of 1940) are effective based on their evaluation of the disclosure controls and procedures as of a date within 90 days of the filing date of this report. |
| (b) | There have been no significant changes in the registrant’s internal controls over financial reporting (as defined in Rule 30a-3(d) under the Investment Company Act of 1940) that occurred during the period covered by this report that have materially affected, or is reasonably likely to materially affect, the registrant’s internal controls over financial reporting. |
Item 12. Disclosure of Securities Lending Activities for Closed-End Management Investment Companies
Not applicable.
Item 13. Exhibits.
SIGNATURES
Pursuant to the requirements of the Securities Exchange Act of 1934 and the Investment Company Act of 1940, the registrant has duly caused this report to be signed on its behalf by the undersigned, thereunto duly authorized.
| FPA NEW INCOME, INC. | |
| | | |
| By: | /s/ J. Richard Atwood | |
| | J. Richard Atwood | |
| | President (principal executive officer) | |
Date: May 25, 2023
Pursuant to the requirements of the Securities Exchange Act of 1934 and the Investment Company Act of 1940, this report has been signed below by the following persons on behalf of the registrant and in the capacities and on the dates indicated.
| By: | /s/ J. Richard Atwood | |
| | J. Richard Atwood | |
| | President (principal executive officer) | |
Date: May 25, 2023
| By: | /s/ E. Lake Setzler III | |
| | E. Lake Setzler III | |
| | Treasurer (principal financial officer) | |
Date: May 25, 2023