UNITED STATES
SECURITIES AND EXCHANGE COMMISSION
Washington, D.C. 20549
FORM N-CSR
CERTIFIED SHAREHOLDER REPORT OF REGISTERED
MANAGEMENT INVESTMENT COMPANIES
Investment Company Act file number | 811-01735 |
|
FPA NEW INCOME, INC. |
(Exact name of registrant as specified in charter) |
|
11601 WILSHIRE BLVD., STE. 1200 LOS ANGELES, CALIFORNIA | | 90025 |
(Address of principal executive offices) | | (Zip code) |
|
(Name and address of agent for service) | Copy to: |
| |
J. RICHARD ATWOOD, PRESIDENT FPA NEW INCOME, INC. 11601 WILSHIRE BLVD., STE. 1200 LOS ANGELES, CALIFORNIA 90025 | MARK D. PERLOW, ESQ. DECHERT LLP ONE BUSH STREET, STE. 1600 SAN FRANCISCO, CA 94104 |
|
Registrant’s telephone number, including area code: | (310) 473-0225 | |
|
Date of fiscal year end: | September 30 | |
|
Date of reporting period: | March 31, 2019 | |
| | | | | | | | | |
Item 1: Report to Shareholders.

Distributor:
UMB DISTRIBUTION SERVICES, LLC
235 West Galena Street
Milwaukee, Wisconsin 53212
Beginning on January 1, 2021, as permitted by regulations adopted by the Securities and Exchange Commission, we intend to no longer mail paper copies of the Fund's shareholder reports, unless you specifically request paper copies of the reports from the Fund or from your financial intermediary, such as a broker-dealer or bank. Instead, the reports will be made available on the FPA Funds website (fpa.com/funds), and you will be notified by mail each time a report is posted and provided with a website link to access the report. If you already elected to receive shareholder reports electronically, you will not be affected by this change and you need not take any action. If you prefer to receive shareholder reports and other communications electronically, you may update your mailing preferences with your financial intermediary, or enroll in e-delivery at fpa.com (for accounts held directly with the Fund).
You may elect to continue to receive paper copies of all future reports free of charge. If you invest through a financial intermediary, you may contact your financial intermediary to request that you continue to receive paper copies of your shareholder reports. If you invest directly with the Fund, you may inform the Fund that you wish to continue receiving paper copies of your shareholder reports by contacting us at (800) 638-3060. Your election to receive reports in paper will apply to all funds held with the FPA Funds or through your financial intermediary.
FPA NEW INCOME, INC.
LETTER TO SHAREHOLDERS
Dear Fellow Shareholders,
FPA New Income, Inc. (the "Fund") returned 1.15% in the first quarter of 2019.
As of March 31, the portfolio had a yield-to-worst of 3.29% and an effective duration of 1.69 years1.
Treasury yields declined during the quarter and we saw the Treasury yield curve2 invert for the first time in over 11 years. Specifically, the metric that many market observers watch — the difference between the 2-year Treasury and the 10-year Treasury — stayed positive throughout the quarter, however, the metric that has been a better predictor of recessions — the difference between the 3-month Treasury yield and the 10-year Treasury — inverted briefly before reversing. Concurrently, credit spreads3 in both investment grade and high-yield bonds decreased meaningfully. On an absolute return basis, the combination of lower spreads and lower yields creates expensive bond markets, particularly in credit (which we define as investments rated BBB or lower). While we search and wait for attractive credit investments, we deploy capital into high-quality bonds (rated greater than BBB) that provide interest rate duration for the portfolio. The portfolio's credit-sensitive holdings decreased to 6.6% as of March 31, compared to 7.3% on Dec. 31, 2018.
Portfolio Attribution4
The largest contributors to performance during the first quarter were agency mortgage pools. The portfolio has benefitted from our efforts last year to add duration via agency mortgage pools. These mortgage pools appreciated in price due to declining interest rates and lower spreads.
The second-largest contributors to performance were asset-backed securities (ABS) backed by auto loans (prime or subprime loans) with the return due to coupon payments, in addition to higher prices caused by lower interest rates. The third-largest contributors to performance were collateralized loan obligations (CLO). Our CLO returns were driven mostly by coupon payments and, to a lesser extent, higher prices as a result of lower spreads.
The only detractors from performance in the first quarter were corporate high-yield bonds, predominantly due to a price decline in the bonds of an energy-related company which filed for bankruptcy during the quarter.
1 Yield-to-worst is the lowest possible yield that can be received on a bond without the issuer defaulting. It does not represent the yield that an investor should expect to receive. As of March 31, 2019, the Fund's subsidized/unsubsidized 30-Day SEC Standardized Yield ("SEC Yield") was 3.10%/3.03% respectively. The SEC Yield calculation begins with the Fund's dividend payments for the last 30 days, subtracts Fund expenses and uses this number to estimate returns for a year. Subsidized yield reflects fee waivers and/or expense reimbursements during the period. Without waivers and/or reimbursements, yields would be reduced. Unsubsidized yield does not adjust for any fee waivers and/or expense reimbursements in effect. The SEC Yield calculation is based on the price of the Fund at the beginning of the month. The SEC yield reflects prospective data and thus assumes payments collected by the Fund may fluctuate. Duration is a measure of the sensitivity of the price (the value of principal) of a fixed-income investment to a change in interest rates.
2 A yield curve is a line that plots the interest rates, at a set point in time, of bonds having equal credit quality but differing maturity dates.
3 A credit spread is the difference in yield between a U.S. Treasury bond and another debt security of the same maturity but different credit quality.
4 Top contributors and detractors to the Fund's performance are based on contribution to return for the periods noted. This information is not a recommendation for a specific security or sector and these securities/sectors may not be in the Fund at the time you receive this report. The information provided does not reflect all positions purchased, sold or recommended by FPA during the quarter. A copy of the methodology used and a list of every sector's contribution to the overall Fund's performance during the quarter is available by contacting FPA at crm@fpa.com. The portfolio holdings as of the most recent quarter-end may be obtained at www.fpa.com. Past performance is no guarantee, nor is it indicative, of future results. Please see Important Disclosures at the end of this commentary.
1
FPA NEW INCOME, INC.
LETTER TO SHAREHOLDERS
(Continued)
This bankruptcy filing was expected and the holding was 0.6% of the Fund's portfolio as of March 31. We are engaged with the various stakeholders in this process and are actively monitoring the situation. As such, we will reserve further comment for a future date.
Portfolio Activity
The table below shows the portfolio's exposures as of Dec. 31, 2018 and March 31, 2019:
| Sector | | % Portfolio
12/31/2018 | | % Portfolio
3/31/2019 | | Quarter/Quarter
Change (bps)5 | |
ABS | | | 49.9 | % | | | 50.0 | % | | | 10 | | |
Mortgage Backed (CMO6) | | | 12.9 | % | | | 11.2 | % | | | -170 | | |
Stripped Mortgage-backed | | | 4.0 | % | | | 3.6 | % | | | -40 | | |
Corporate | | | 5.7 | % | | | 5.2 | % | | | -50 | | |
CMBS7 | | | 3.7 | % | | | 4.9 | % | | | 120 | | |
Mortgage Pass-through | | | 13.7 | % | | | 14.3 | % | | | 60 | | |
U.S. Treasury | | | 5.0 | % | | | 5.0 | % | | | 0 | | |
Cash and equivalents | | | 5.1 | % | | | 5.8 | % | | | 70 | | |
Total | | | 100.0 | % | | | 100.0 | % | | | | | |
Yield-to-worst | | | 3.79 | % | | | 3.29 | % | | | -49 | | |
Effective Duration (years) | | | 1.85 | | | | 1.69 | | | | -0.19 | | |
Average Life8 (years) | | | 2.42 | | | | 2.15 | | | | -0.26 | | |
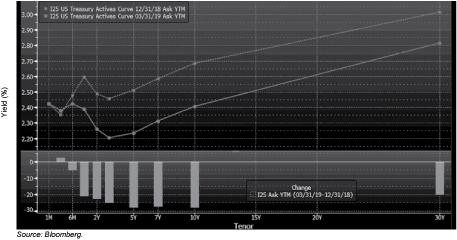
The Treasury market has been on 'Mr. Powell's wild ride' since the end of the year. For the past several months, intermediate and long Treasury yields declined due to recession fears sparked by weak global economic data and weak inflation. Against that backdrop, the U.S. Federal Reserve (Fed) entered 2019 with a stated bias toward tighter monetary policy via higher interest rates and a gradual reduction in the size of the Fed's balance sheet. In late March, Chairman Jerome Powell reversed course toward looser monetary policy with interest rate increases on hold for "some time," and a slower wind down of the balance sheet. These dynamics and the impact on Treasury yields9 are reflected in the graph below, which shows that Treasury rates declined further and the Treasury yield curve became slightly flatter or more inverted, depending on how one measures the shape of the curve.
5 Change in basis points (bps), except for effective duration and average life, which represents the change in years. Portfolio composition will change due to ongoing management of the Fund.
6 Collateralized mortgage obligations ("CMO") are mortgage-backed bonds that separate mortgage pools into different maturity classes.
7 Commercial mortgage-backed securities ("CMBS") are securities backed by commercial mortgages rather than residential mortgages.
8 The average life is the length of time the principal of a debt issue is expected to be outstanding.
9 Yield to maturity (YTM) is the total return anticipated on a bond if the bond is held until it matures.
2
FPA NEW INCOME, INC.
LETTER TO SHAREHOLDERS
(Continued)
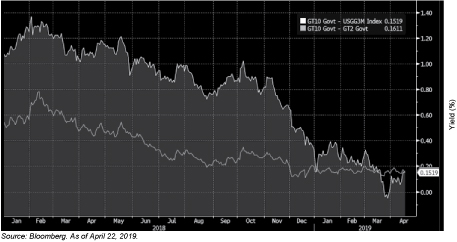
The graph below illustrates what we mentioned earlier. The yield curve, as measured by the difference between the 2-year Treasury and the 10-year Treasury, did not invert whereas the difference between the 3-month Treasury and the 10-year Treasury, the more reliable predictor of future recessions in our view, did briefly invert in late March.
3
FPA NEW INCOME, INC.
LETTER TO SHAREHOLDERS
(Continued)
A yield curve inversion where the short-term yield is higher than the long-term yield, if it persists, historically has signaled an economic downturn of some magnitude in the near future. Commentators' opinions on this market event ranged from "this time is different, so a recession is not in the cards," to "based on history, the chances of a recession in the next 12 to 18 months is elevated." As described further below, we acknowledge both prospects and invest knowing our limitations, namely that our ability to predict the ultimate outcome and its timing are, at best, an educated guess.
At the same time that the Treasury market expressed recession fears, risk assets appreciated in price. Following a broad sell-off in high-yield bonds and leveraged loans at the end of 2018, we were hopeful that we were seeing the green shoots of a cheaper credit market, ripe with opportunities for us to harvest. That didn't last long. Within the first week of 2019, credit spreads rallied dramatically and credit markets have been "en fuego" ever since, as shown by the significant decline in spreads in the following graph. The graph below shows the decline in spreads on the BB-rated component of the high-yield index (excluding energy), which we focus on because it shows us what the 'fairway' of the market is doing and strips out the effects of the more volatile components of the high-yield index:
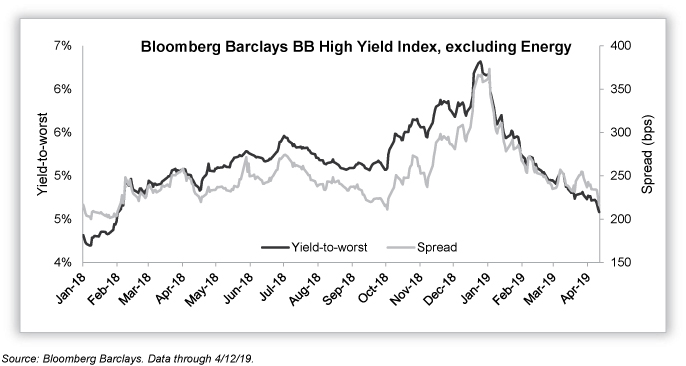
While high-yield spreads have not quite reached the low points of 2018, the magnitude of the high-yield market rally feels greater because spreads have declined at the same time that Treasury yields have declined, resulting in lower overall yields than what lower spreads alone would suggest. This market has been doubly painful for us since we focus on absolute return, and we therefore place a lot of value on overall yields, not spread alone.
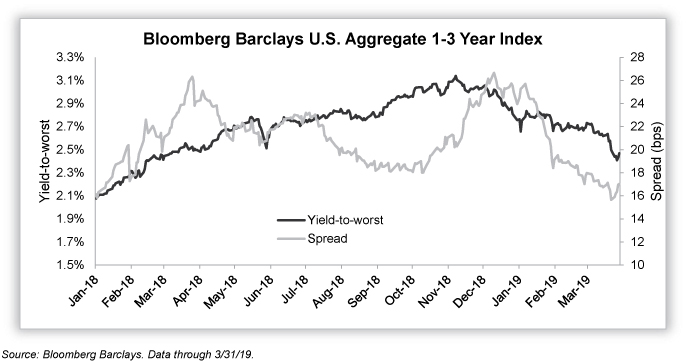
This combination of spread and yield compression appeared in high-quality bonds as well, as shown in the following graph.
4
FPA NEW INCOME, INC.
LETTER TO SHAREHOLDERS
(Continued)
If history is any guide, when the shape of the yield curve looks like it does now, high-yield credit spreads tend to increase because the risk associated with these lower-quality bonds rises in anticipation of an economic slowdown or recession. For the same reason, the spread on high-quality bonds tends to increase too, though not as dramatically.
It is counterintuitive then that one part of the financial markets (Treasury yields) tells us that economic growth is in peril while other parts of the financial markets (spreads and equities) tell us that everything is great. These conditions can exist simultaneously, we would guess, because the Fed's U-turn on monetary policy reinforced, yet again, the notion that the Fed has effectively added financial stability to its mandate. In our opinion, the market therefore believes the Fed would step in to support financial markets and asset prices.
Under these conditions, undisciplined investing that chases returns may benefit. What do disciplined investors like us do? We wait for better buying opportunities at lower prices. Elevated prices for risk assets have steered us toward highly-rated bonds that we believe do not bear a lot of spread-related short-term mark-to-market risk. Within these high-quality bonds, we are trying to buy as much duration as we can within the confines of our duration test. That test limits us to bonds that we expect will produce positive returns over 12 months if yields rise by 100 basis points over that timeframe. One might wonder why it makes sense to extend duration when an inverted yield curve offers better or similar yields for shorter duration bonds. The rationale for our approach is twofold. First, while it is true that one can buy slightly higher yields for shorter duration Treasury bonds, the yield curve for bonds that are not risk-free and offer a spread that is not inverted means that these longer duration bonds with spread offer more yield than shorter duration bonds with spread. Second, historically, Treasury yields have declined when the yield curve is flat or inverted. If history repeats, our long duration bonds offer some price appreciation potential in an environment of declining interest rates. We believe the value in our approach is that the bonds we buy have upside return potential above today's yields in the event that yields decline, while potentially insulating the portfolio from capital losses in the event that yields rise.
Today's portfolio reflects this investment approach. Most of the portfolio's cash was invested in highly-rated agency mortgages, asset-backed securities and commercial mortgage-backed securities with a duration of
5
FPA NEW INCOME, INC.
LETTER TO SHAREHOLDERS
(Continued)
approximately three years. We were able to find a few attractive credit investments but these opportunities today are rare. The credit exposure in the portfolio (defined as investments rated BBB or lower) stands at 6.6%, reflecting an expensive credit market.
Market Commentary
This quote from Grant's Interest Rate Observer dated March 5, 2019 is a good introduction to this quarter's market commentary.
"Socialists eventually run out of other people's money, as Margaret Thatcher observed, but central banks print their own."
We start there because there has been a lot of discussion in this country about Modern Monetary Theory (MMT). A simplified description of MMT is as follows:
A country with its own currency does not have to worry about accumulating too much debt because it can always print more money to make the interest payments. The only constraint of spending is inflation, which can break out if the public and private sectors spend too much at the same time. As long as there are enough workers and enough equipment to meet growing demand without igniting inflation, the government can spend what it needs to maintain employment and meet its objectives. Think of this theory as government deficits financed by printing money versus the traditional debt-financed deficit.
This is not a new theory. As recently as April 2016, ex-Fed Chairman Ben Bernanke wrote in a Brookings Institute blog post that printing money to finance deficits is an appropriate policy tool. He does not advocate printing money as a primary policy tool for central bankers, but Bernanke thinks it should be considered after zero interest rate policy (ZIRP), negative interest rate policy (NIRP) and quantitative easing (QE) have been implemented and their efficacy has become limited.
MMT attempts to facilitate more aggressive fiscal policy tools as a way to improve an economy in a recession. In addition, some within the political arena view MMT as an elegant solution to a debt problem. For instance, MMT could be used to finance Medicare-for-all, badly needed infrastructure projects and to plug social security deficits. Debt financing of these ideas normally costs money in the form of interest expense and, concomitantly, increased taxes to pay that interest. If that interest cost is greater than nominal growth, or the amount of debt growth outstanding is greater than nominal growth, the result is increased (i.e., worse) government debt ratios. If this increased indebtedness is financed via money printing, the debt issue could go away as long as the printed money is permanently in the system. One means of executing this money printing is for the U.S. Treasury to issue zero coupon perpetual bonds and have the Federal Reserve purchase the bonds. (One could say printing money is similar and simpler.) Voila, political objectives are met without any cost to the taxpayer or the nation, or so say the proponents of MMT.
How did MMT gain mainstream traction? At the exit of the Great Financial Crisis, the Fed implemented ZIRP by pegging the Fed Funds rate at or near zero. Europe and Japan went further and used negative short-term interest rates to provide even more monetary stimulus. Next came QE. The Fed bought long maturity Treasury bonds and agency mortgages. Europe and Japan again went a step further and bought high-quality corporate bonds and Exchange Traded Funds. The idea was to drive up high-quality asset prices, thereby financing corporate capital expenditures. In addition, investors became wealthier from the trickle-down effects of higher prices for risk assets. The expectation was that the increased wealth would spur individuals to spend more, which would then beget greater economic growth (the virtuous cycle).
However, after 10 years of these policies, developed market GDP growth is still sluggish and inflation is still below central bank targets of 2%. In Europe and Japan, economic growth continues to be below expectations
6
FPA NEW INCOME, INC.
LETTER TO SHAREHOLDERS
(Continued)
after a very aggressive utilization of these new, unconventional monetary policy tools. Granted, in macroeconomic terms, 10 years is not a long time. But these unconventional policies have not produced impressive results thus far, and the ultimate outcome is still to be determined.
The current slowdown in economic growth in Europe, China, Japan and the United States has policy makers concerned that the existing set of monetary tools may not be enough to revive the economy once it goes into a recession. If the old toolkit doesn't work, what's next? MMT.
We are not surprised that the 2020 presidential election is turning into a broad and contentious debate about the merits of MMT since it offers a convenient solution for spendthrift candidates. Wise or not, the specter of MMT creates uncertainties around both monetary and fiscal policy.
We do not pretend to have any analytical advantage in evaluating the efficacy of MMT or its impact on the economy, inflation and fixed income markets. However, we have some idea of how well ZIRP, NIRP, and QE have worked. In our opinion, the results are mixed, with some of the negative implications just starting to surface. We are observers of policy actions and it would appear that each new policy idea is less proven and more extreme then the last. This leads us to have some level of conviction that during the next economic downturn — and there will be one at some point — the debate and potential use of these tools will create increased levels of market volatility along with greater uncertainty regarding the economic impact.
Does any of this affect how we deploy capital? We like to say that such topics are informative but not determinative of our investments. One of the reasons we employ the duration test described earlier is to compensate for these kinds of potential non-consensus policy implementations. In our opinion, what is appropriate is to stay dedicated to an investment discipline. By using this approach, our expectation is that our clients will have confidence in how we will act and visibility on how the portfolio will perform amid changes in the market.
Thank you for your continued trust and support.
Respectfully submitted,

Thomas H. Atteberry
Portfolio Manager

Abhijeet Patwardhan
Portfolio Manager
April 2019
7
FPA NEW INCOME, INC.
LETTER TO SHAREHOLDERS
(Continued)
The discussions of Fund investments represent the views of the Fund's managers at the time of this report and are subject to change without notice. References to individual securities are for informational purposes only and should not be construed as recommendations to purchase or sell individual securities.
FUND RISKS
Investments in mutual funds carry risks and investors may lose principal value. Stock markets are volatile and can decline significantly in response to adverse issuer, political, regulatory, market, or economic developments. The funds may purchase foreign securities which are subject to interest rate, currency exchange rate, economic and political risks: this may be enhanced when investing in emerging markets. The securities of smaller, less well-known companies can be more volatile than those of larger companies. The return of principal in a bond fund is not guaranteed. Bond funds have the same issuer, interest rate, inflation and credit risks that are associated with underlying bonds owned by the fund. Lower rated bonds, convertible securities and other types of debt obligations involve greater risks than higher rated bonds. Mortgage securities and collateralized mortgage obligations (CMOs) are subject to prepayment risk and the risk of default on the underlying mortgages or other assets; derivatives may increase volatility. High yield securities can be volatile and subject to much higher instances of default.
FORWARD LOOKING STATEMENT DISCLOSURE
As mutual fund managers, one of our responsibilities is to communicate with shareholders in an open and direct manner. Insofar as some of our opinions and comments in our letters to shareholders are based on our current expectations, they are considered "forward-looking statements" which may or may not prove to be accurate over the long term. While we believe we have a reasonable basis for our comments and we have confidence in our opinions, actual results may differ materially from those we anticipate. You can identify forward-looking statements by words such as "believe," "expect," "may," "anticipate," and other similar expressions when discussing prospects for particular portfolio holdings and/or the markets, generally. We cannot, however, assure future results and disclaim any obligation to update or alter any forward-looking statements, whether as a result of new information, future events, or otherwise. Further, information provided in this report should not be construed as a recommendation to purchase or sell any particular security.
8
FPA NEW INCOME, INC.
PORTFOLIO SUMMARY
March 31, 2019 (Unaudited)
Common Stocks | | | | | | | 0.0 | %* | |
Industrials | | | 0.0 | %* | | | | | |
Bonds & Debentures | | | | | 99.6 | % | |
Asset-Backed Securities | | | 49.9 | % | | | | | |
Residential Mortgage-Backed Securities | | | 25.5 | % | | | | | |
U.S. Treasuries | | | 10.4 | % | | | | | |
Commercial Mortgage-Backed Securities | | | 8.6 | % | | | | | |
Corporate Bank Debt | | | 2.7 | % | | | | | |
Corporate Bonds & Notes | | | 2.5 | % | | | | | |
Short-term Investments | | | | | 0.1 | % | |
Other Assets And Liabilities, Net | | | | | 0.3 | % | |
Net Assets | | | | | 100.0 | % | |
* Less than 0.05%
9
FPA NEW INCOME, INC.
PORTFOLIO OF INVESTMENTS
March 31, 2019
(Unaudited)
COMMON STOCK — 0.0% | | Shares or
Principal
Amount | |
Fair Value | |
INDUSTRIALS — 0.0% | |
Boart Longyear Ltd.(a) (Cost $633,546) | | | 262,296,050 | | | $ | 744,973 | | |
BONDS & DEBENTURES | |
COMMERCIAL MORTGAGE-BACKED SECURITIES — 8.6% | |
AGENCY — 0.4% | |
Government National Mortgage Association 2013-55 A —
1.317% 5/16/2034 | | $ | 325,002 | | | $ | 320,987 | | |
Government National Mortgage Association 2011-49 A —
2.45% 7/16/2038 | | | 35,170 | | | | 35,095 | | |
Government National Mortgage Association 2015-41 AF, VRN —
3.063% 9/16/2056(b) | | | 20,496,990 | | | | 20,927,121 | | |
Government National Mortgage Association 2011-9 C, VRN —
3.512% 9/16/2041(b) | | | 5,815,787 | | | | 5,856,994 | | |
Government National Mortgage Association 2010-148 AC —
7.00% 12/16/2050(b) | | | 36,230 | | | | 36,476 | | |
| | | $ | 27,176,673 | | |
AGENCY STRIPPED — 4.6% | |
Government National Mortgage Association 2004-10 IO —
0.00% 1/16/2044(b) | | $ | 4,810,629 | | | $ | 5 | | |
Government National Mortgage Association 2012-45 IO —
0.01% 4/16/2053(b) | | | 11,181,611 | | | | 66,422 | | |
Government National Mortgage Association 2002-56 IO —
0.043% 6/16/2042(b) | | | 17,329 | | | | 18 | | |
Government National Mortgage Association 2009-119 IO —
0.105% 12/16/2049(b) | | | 13,637,441 | | | | 99,492 | | |
Government National Mortgage Association 2009-86 IO —
0.109% 10/16/2049(b) | | | 16,045,010 | | | | 83,240 | | |
Government National Mortgage Association 2009-105 IO —
0.166% 11/16/2049(b) | | | 5,005,131 | | | | 21,944 | | |
Government National Mortgage Association 2009-71 IO —
0.262% 7/16/2049(b) | | | 3,206,872 | | | | 25,958 | | |
Government National Mortgage Association 2008-8 IO —
0.29% 11/16/2047(b) | | | 6,624,245 | | | | 52,339 | | |
Government National Mortgage Association 2009-49 IO —
0.357% 6/16/2049(b) | | | 8,013,270 | | | | 73,571 | | |
Government National Mortgage Association 2012-125 IO —
0.385% 2/16/2053(b) | | | 71,187,807 | | | | 1,798,653 | | |
Government National Mortgage Association 2009-4 IO —
0.39% 1/16/2049(b) | | | 2,874,512 | | | | 21,545 | | |
10
FPA NEW INCOME, INC.
PORTFOLIO OF INVESTMENTS (Continued)
March 31, 2019
(Unaudited)
BONDS & DEBENTURES — Continued | | Principal
Amount | | Fair Value | |
Government National Mortgage Association 2009-60 IO —
0.509% 6/16/2049(b) | | $ | 7,081,302 | | | $ | 65,242 | | |
Government National Mortgage Association 2010-123 IO —
0.517% 9/16/2050(b) | | | 6,316,413 | | | | 103,682 | | |
Government National Mortgage Association 2012-25 IO —
0.545% 8/16/2052(b) | | | 86,480,977 | | | | 1,674,583 | | |
Government National Mortgage Association 2005-9 IO —
0.546% 1/16/2045(b) | | | 1,353,465 | | | | 11,839 | | |
Government National Mortgage Association 2007-77 IO —
0.551% 11/16/2047(b) | | | 21,296,317 | | | | 296,208 | | |
Government National Mortgage Association 2009-30 IO —
0.57% 3/16/2049(b) | | | 5,190,072 | | | | 139,398 | | |
Government National Mortgage Association 2008-24 IO —
0.596% 11/16/2047(b) | | | 386,730 | | | | 2,651 | | |
Government National Mortgage Association 2015-41 IO —
0.628% 9/16/2056(b) | | | 33,717,521 | | | | 1,517,393 | | |
Government National Mortgage Association 2013-45 IO —
0.647% 12/16/2053(b) | | | 69,840,677 | | | | 1,554,584 | | |
Government National Mortgage Association 2014-157 IO —
0.65% 5/16/2055(b) | | | 144,652,813 | | | | 5,779,082 | | |
Government National Mortgage Association 2012-79 IO —
0.674% 3/16/2053(b) | | | 117,096,192 | | | | 3,711,411 | | |
Government National Mortgage Association 2012-58 IO —
0.70% 2/16/2053(b) | | | 216,500,217 | | | | 6,155,058 | | |
Government National Mortgage Association 2012-150 IO —
0.723% 11/16/2052(b) | | | 71,322,143 | | | | 2,740,646 | | |
Government National Mortgage Association 2013-125 IO —
0.723% 10/16/2054(b) | | | 21,291,650 | | | | 736,433 | | |
Government National Mortgage Association 2014-77 IO —
0.726% 12/16/2047(b) | | | 50,607,903 | | | | 1,976,026 | | |
Government National Mortgage Association 2004-43 IO —
0.741% 6/16/2044(b) | | | 11,964,261 | | | | 154,465 | | |
Government National Mortgage Association 2014-138 IO —
0.743% 4/16/2056(b) | | | 29,222,614 | | | | 1,391,987 | | |
Government National Mortgage Association 2015-86 IO —
0.762% 5/16/2052(b) | | | 69,209,727 | | | | 3,414,946 | | |
Government National Mortgage Association 2012-114 IO —
0.766% 1/16/2053(b) | | | 46,120,393 | | | | 2,087,750 | | |
Government National Mortgage Association 2015-19 IO —
0.772% 1/16/2057(b) | | | 91,642,611 | | | | 4,873,343 | | |
Government National Mortgage Association 2014-110 IO —
0.773% 1/16/2057(b) | | | 72,671,237 | | | | 3,762,691 | | |
11
FPA NEW INCOME, INC.
PORTFOLIO OF INVESTMENTS (Continued)
March 31, 2019
(Unaudited)
BONDS & DEBENTURES — Continued | | Principal
Amount | | Fair Value | |
Government National Mortgage Association 2015-7 IO —
0.789% 1/16/2057(b) | | $ | 58,736,123 | | | $ | 3,176,003 | | |
Government National Mortgage Association 2014-153 IO —
0.79% 4/16/2056(b) | | | 210,177,354 | | | | 10,507,670 | | |
Government National Mortgage Association 2014-175 IO —
0.797% 4/16/2056(b) | | | 207,578,163 | | | | 10,664,826 | | |
Government National Mortgage Association 2014-164 IO —
0.802% 1/16/2056(b) | | | 266,678,457 | | | | 12,159,498 | | |
Government National Mortgage Association 2014-135 IO —
0.82% 1/16/2056(b) | | | 289,960,429 | | | | 14,536,354 | | |
Government National Mortgage Association 2015-101 IO —
0.825% 3/16/2052(b) | | | 153,502,409 | | | | 7,682,519 | | |
Government National Mortgage Association 2008-45 IO —
0.85% 2/16/2048(b) | | | 2,625,280 | | | | 4,921 | | |
Government National Mortgage Association 2015-47 IO —
0.851% 10/16/2056(b) | | | 160,530,816 | | | | 8,405,988 | | |
Government National Mortgage Association 2006-55 IO —
0.872% 8/16/2046(b) | | | 7,541,328 | | | | 84,356 | | |
Government National Mortgage Association 2014-187 IO —
0.881% 5/16/2056(b) | | | 179,482,538 | | | | 9,566,796 | | |
Government National Mortgage Association 2015-169 IO —
0.925% 7/16/2057(b) | | | 223,462,951 | | | | 13,880,826 | | |
Government National Mortgage Association 2012-53 IO —
0.931% 3/16/2047(b) | | | 58,289,663 | | | | 2,135,687 | | |
Government National Mortgage Association 2015-114 IO —
0.937% 3/15/2057(b) | | | 159,293,977 | | | | 9,303,103 | | |
Government National Mortgage Association 2015-128 IO —
0.938% 12/16/2056(b) | | | 198,674,713 | | | | 11,100,453 | | |
Government National Mortgage Association 2015-150 IO —
0.942% 9/16/2057(b) | | | 225,845,008 | | | | 14,665,336 | | |
Government National Mortgage Association 2015-108 IO —
0.946% 10/16/2056(b) | | | 34,494,648 | | | | 1,962,756 | | |
Government National Mortgage Association 2015-160 IO —
0.947% 1/16/2056(b) | | | 251,805,228 | | | | 15,324,514 | | |
Government National Mortgage Association 2008-48 IO —
0.968% 4/16/2048(b) | | | 8,860,805 | | | | 126,262 | | |
Government National Mortgage Association 2016-65 IO —
1.002% 1/16/2058(b) | | | 241,476,794 | | | | 18,134,279 | | |
Government National Mortgage Association 2016-106 IO —
1.031% 9/16/2058(b) | | | 240,049,089 | | | | 17,835,911 | | |
Government National Mortgage Association 2016-125 IO —
1.062% 12/16/2057(b) | | | 137,585,967 | | | | 10,745,519 | | |
12
FPA NEW INCOME, INC.
PORTFOLIO OF INVESTMENTS (Continued)
March 31, 2019
(Unaudited)
BONDS & DEBENTURES — Continued | | Principal
Amount | | Fair Value | |
Government National Mortgage Association 2008-92 IO —
1.176% 10/16/2048(b) | | $ | 12,421,445 | | | $ | 123,685 | | |
Government National Mortgage Association 2004-108 IO —
1.93% 12/16/2044(b) | | | 399,916 | | | | 3,455 | | |
Government National Mortgage Association 2006-30 IO —
2.391% 5/16/2046(b) | | | 873,174 | | | | 9,547 | | |
Government National Mortgage Association — 3.10% 5/16/2059 | | | 68,607,000 | | | | 68,362,985 | | |
| | | $ | 304,895,854 | | |
NON-AGENCY — 3.6% | |
A10 Term Asset Financing LLC 2017-1A A1FX — 2.34% 3/15/2036(c) | | $ | 5,145,892 | | | $ | 5,143,652 | | |
Aventura Mall Trust M 2013-AVM A — 3.743% 12/5/2032(b)(c) | | | 37,824,000 | | | | 38,462,045 | | |
Bear Stearns Commercial Mortgage Securities Trust 2005-PWR7 B —
5.142% 2/11/2041(b) | | | 4,748,953 | | | | 4,760,901 | | |
Citigroup Commercial Mortgage Trust 2017-C4 A2 — 3.19% 10/12/2050 | | | 18,524,000 | | | | 18,736,079 | | |
COMM Mortgage Trust 2013-LC6 A4 — 2.941% 1/10/2046 | | | 3,497,000 | | | | 3,503,620 | | |
COMM Mortgage Trust 2014-FL5 B, 1M LIBOR + 2.150% —
3.875% 10/15/2031(b)(c) | | | 945,912 | | | | 943,219 | | |
COMM Mortgage Trust 2014-FL5 C, 1M LIBOR + 2.150% —
3.875% 10/15/2031(b)(c) | | | 8,340,000 | | | | 8,299,639 | | |
Credit Suisse Commercial Mortgage Trust Series 2016-MFF E,
1M LIBOR + 6.000% — 8.484% 11/15/2033(b)(c) | | | 34,278,000 | | | | 34,252,110 | | |
DBUBS Mortgage Trust 2011-LC2A A4 — 4.537% 7/10/2044(c) | | | 44,816,836 | | | | 46,135,580 | | |
J.P. Morgan Chase Commercial Mortgage Securities Trust I 2016-WIKI A —
2.798% 10/5/2031(c) | | | 7,922,000 | | | | 7,885,021 | | |
JP Morgan Chase Commercial Mortgage Securities Trust 2010-C1 A3 —
5.058% 6/15/2043(c) | | | 7,277,000 | | | | 7,438,022 | | |
Latitude Management Real Estate Capita 2016-CRE2 A,
1M LIBOR + 1.700% — 4.19% 11/24/2031(b)(c) | | | 14,526,895 | | | | 14,562,181 | | |
OBP Depositor LLC Trust P 2010-OBP A — 4.646% 7/15/2045(c) | | | 4,000,000 | | | | 4,086,289 | | |
Wells Fargo Commercial Mortgage Trust 2015-C26 A2 —
2.663% 2/15/2048 | | | 7,829,941 | | | | 7,801,210 | | |
WFRBS Commercial Mortgage Trust 2013-UBS1 A3 —
3.591% 3/15/2046 | | | 30,588,000 | | | | 30,908,009 | | |
| | | $ | 232,917,577 | | |
TOTAL COMMERICAL MORTGAGE-BACKED SECURITIES
(Cost $611,044,008) | | $ | 564,990,104 | | |
13
FPA NEW INCOME, INC.
PORTFOLIO OF INVESTMENTS (Continued)
March 31, 2019
(Unaudited)
BONDS & DEBENTURES — Continued | | Principal
Amount | | Fair Value | |
RESIDENTIAL MORTGAGE-BACKED SECURITIES — 25.5% | |
AGENCY COLLATERALIZED MORTGAGE OBLIGATION — 4.0% | |
Federal Home Loan Mortgage Corp. 4170 QE — 2.00% 5/15/2032 | | $ | 1,768,914 | | | $ | 1,740,715 | | |
Federal Home Loan Mortgage Corp. 3979 HD — 2.50% 12/15/2026 | | | 2,834,820 | | | | 2,826,748 | | |
Federal Home Loan Mortgage Corp. 4304 DA — 2.50% 1/15/2027 | | | 1,047,633 | | | | 1,044,419 | | |
Federal Home Loan Mortgage Corp. 4010 DE — 2.50% 2/15/2027 | | | 3,336,349 | | | | 3,326,711 | | |
Federal Home Loan Mortgage Corp. 3914 MA — 3.00% 6/15/2026 | | | 2,166,571 | | | | 2,186,729 | | |
Federal Home Loan Mortgage Corp. 4297 CA — 3.00% 12/15/2030 | | | 3,827,965 | | | | 3,849,626 | | |
Federal Home Loan Mortgage Corp. 4664 TA — 3.00% 9/15/2037 | | | 6,108,376 | | | | 6,135,795 | | |
Federal Home Loan Mortgage Corp. 4504 DN — 3.00% 10/15/2040 | | | 12,610,128 | | | | 12,671,153 | | |
Federal Home Loan Mortgage Corp. 3862 MB — 3.50% 5/15/2026 | | | 18,302,683 | | | | 18,696,123 | | |
Federal Home Loan Mortgage Corp. 3828 VE — 4.50% 1/15/2024 | | | 989,258 | | | | 1,032,404 | | |
Federal Home Loan Mortgage Corp. 4395 NT — 4.50% 7/15/2026 | | | 8,811,535 | | | | 9,140,187 | | |
Federal National Mortgage Association 2012-117 DA — 1.50% 12/25/2039 | | | 1,153,313 | | | | 1,059,729 | | |
Federal National Mortgage Association 2014-80 GD — 2.00% 2/25/2042 | | | 18,439,625 | | | | 17,936,465 | | |
Federal National Mortgage Association 2014-21 ED — 2.25% 4/25/2029 | | | 750,717 | | | | 743,878 | | |
Federal National Mortgage Association 2013-135 KM — 2.50% 3/25/2028 | | | 1,630,627 | | | | 1,624,792 | | |
Federal National Mortgage Association 4387 VA — 3.00% 2/15/2026 | | | 496,741 | | | | 501,070 | | |
Federal National Mortgage Association 2017-30 G — 3.00% 7/25/2040 | | | 9,643,870 | | | | 9,642,841 | | |
Federal National Mortgage Association 2013-93 PJ — 3.00% 7/25/2042 | | | 2,013,360 | | | | 2,029,076 | | |
Federal National Mortgage Association 2017-16 JA — 3.00% 2/25/2043 | | | 23,951,803 | | | | 23,932,658 | | |
Federal National Mortgage Association 2018-16 HA — 3.00% 7/25/2043 | | | 24,034,866 | | | | 24,032,311 | | |
Federal National Mortgage Association 2017-15 DA — 3.00% 12/25/2044 | | | 18,061,692 | | | | 18,074,776 | | |
Federal National Mortgage Association 2011-98 VE — 3.50% 6/25/2026 | | | 13,677,000 | | | | 13,848,869 | | |
Federal National Mortgage Association 2011-80 KB — 3.50% 8/25/2026 | | | 13,578,000 | | | | 13,773,409 | | |
Federal National Mortgage Association 2012-144 PD — 3.50% 4/25/2042 | | | 4,284,227 | | | | 4,364,960 | | |
Federal National Mortgage Association 2017-45 KD — 3.50% 2/25/2044 | | | 18,001,409 | | | | 18,184,910 | | |
Federal National Mortgage Association 2017-52 KC — 3.50% 4/25/2044 | | | 18,269,317 | | | | 18,460,539 | | |
Federal National Mortgage Association 2017-59 DC — 3.50% 5/25/2044 | | | 25,243,976 | | | | 25,501,161 | | |
Federal National Mortgage Association 2009-76 MA — 4.00% 9/25/2024 | | | 2,135 | | | | 2,136 | | |
Federal National Mortgage Association 2012-95 AB — 4.00% 11/25/2040 | | | 97,084 | | | | 97,462 | | |
Federal National Mortgage Association 2009-70 NU — 4.25% 8/25/2019 | | | 538 | | | | 539 | | |
Federal National Mortgage Association 2012-40 GC — 4.50% 12/25/2040 | | | 1,100,692 | | | | 1,125,231 | | |
Federal National Mortgage Association 2012-67 PB — 4.50% 12/25/2040 | | | 865,505 | | | | 871,031 | | |
Federal National Mortgage Association 2004-60 LB — 5.00% 4/25/2034 | | | 1,542,359 | | | | 1,579,860 | | |
Federal National Mortgage Association 2010 43 MK — 5.50% 5/25/2040 | | | 1,905,358 | | | | 2,036,810 | | |
| | | $ | 262,075,123 | | |
AGENCY POOL ADJUSTABLE RATE — 0.0% | |
Federal National Mortgage Association 865963,
12M USD LIBOR + 1.705% — 4.429% 3/1/2036(b) | | $ | 721,946 | | | $ | 753,395 | | |
14
FPA NEW INCOME, INC.
PORTFOLIO OF INVESTMENTS (Continued)
March 31, 2019
(Unaudited)
BONDS & DEBENTURES — Continued | | Principal
Amount | | Fair Value | |
AGENCY POOL FIXED RATE — 14.3% | |
Federal Home Loan Mortgage Corp. J24941 — 2.00% 8/1/2023 | | $ | 2,079,284 | | | $ | 2,074,248 | | |
Federal Home Loan Mortgage Corp. J21434 — 2.50% 12/1/2027 | | | 19,742,182 | | | | 19,752,622 | | |
Federal Home Loan Mortgage Corp. G16178 — 2.50% 11/1/2028 | | | 22,871,117 | | | | 22,883,211 | | |
Federal Home Loan Mortgage Corp. G16618 — 2.50% 1/1/2030 | | | 37,735,870 | | | | 37,755,825 | | |
Federal Home Loan Mortgage Corp. J16678 — 3.00% 9/1/2026 | | | 4,832,788 | | | | 4,879,137 | | |
Federal Home Loan Mortgage Corp. J17544 — 3.00% 12/1/2026 | | | 6,990,118 | | | | 7,078,443 | | |
Federal Home Loan Mortgage Corp. G16406 — 3.00% 1/1/2028 | | | 21,394,960 | | | | 21,712,104 | | |
Federal Home Loan Mortgage Corp. G16476 — 3.00% 4/1/2028 | | | 30,605,691 | | | | 31,011,547 | | |
Federal Home Loan Mortgage Corp. G16620 — 3.00% 8/1/2028 | | | 9,663,187 | | | | 9,791,328 | | |
Federal Home Loan Mortgage Corp. G16478 — 3.00% 5/1/2030 | | | 30,059,217 | | | | 30,373,284 | | |
Federal Home Loan Mortgage Corp. G16592 — 3.00% 2/1/2032 | | | 17,449,078 | | | | 17,658,655 | | |
Federal Home Loan Mortgage Corp. G16473 — 3.50% 1/1/2028 | | | 35,111,598 | | | | 36,055,577 | | |
Federal Home Loan Mortgage Corp. G16613 — 3.50% 8/1/2028 | | | 9,102,421 | | | | 9,338,607 | | |
Federal Home Loan Mortgage Corp. V62149 — 3.50% 9/1/2028 | | | 6,307,571 | | | | 6,467,295 | | |
Federal Home Loan Mortgage Corp. J26472 — 3.50% 11/1/2028 | | | 7,275,881 | | | | 7,480,588 | | |
Federal Home Loan Mortgage Corp. G15169 — 4.50% 9/1/2026 | | | 1,672,644 | | | | 1,731,657 | | |
Federal Home Loan Mortgage Corp. G15272 — 4.50% 9/1/2026 | | | 1,011,358 | | | | 1,026,784 | | |
Federal Home Loan Mortgage Corp. G15875 — 4.50% 9/1/2026 | | | 2,486,389 | | | | 2,561,415 | | |
Federal Home Loan Mortgage Corp. G15036 — 5.00% 6/1/2024 | | | 994,428 | | | | 1,008,861 | | |
Federal Home Loan Mortgage Corp. G13667 — 5.00% 8/1/2024 | | | 86,064 | | | | 87,904 | | |
Federal Home Loan Mortgage Corp. G15173 — 5.00% 6/1/2026 | | | 754,363 | | | | 767,033 | | |
Federal Home Loan Mortgage Corp. G15407 — 5.00% 6/1/2026 | | | 2,302,087 | | | | 2,376,778 | | |
Federal Home Loan Mortgage Corp. J01270 — 5.50% 2/1/2021 | | | 24,440 | | | | 24,871 | | |
Federal Home Loan Mortgage Corp. G15230 — 5.50% 12/1/2024 | | | 1,837,362 | | | | 1,880,737 | | |
Federal Home Loan Mortgage Corp. G15458 — 5.50% 12/1/2024 | | | 422,858 | | | | 436,617 | | |
Federal Home Loan Mortgage Corp. G14460 — 6.00% 1/1/2024 | | | 163,627 | | | | 168,664 | | |
Federal National Mortgage Association AB6251 — 2.00% 9/1/2022 | | | 384,423 | | | | 383,167 | | |
Federal National Mortgage Association AB7515 — 2.00% 1/1/2023 | | | 234,902 | | | | 234,164 | | |
Federal National Mortgage Association AQ7281 — 2.00% 12/1/2027 | | | 1,149,820 | | | | 1,135,616 | | |
Federal National Mortgage Association BM4743 — 2.00% 8/1/2030 | | | 43,040,387 | | | | 42,508,705 | | |
Federal National Mortgage Association MA1502 — 2.50% 7/1/2023 | | | 20,051,909 | | | | 20,117,094 | | |
Federal National Mortgage Association AB6192 — 2.50% 9/1/2027 | | | 1,977,796 | | | | 1,977,763 | | |
Federal National Mortgage Association AR6882 — 2.50% 2/1/2028 | | | 3,612,819 | | | | 3,612,757 | | |
Federal National Mortgage Association BM4406 — 2.50% 9/1/2028 | | | 15,444,222 | | | | 15,443,959 | | |
Federal National Mortgage Association BM5514 — 2.50% 2/1/2029 | | | 43,659,477 | | | | 43,658,735 | | |
Federal National Mortgage Association BM4386 — 2.50% 8/1/2030 | | | 14,499,641 | | | | 14,499,394 | | |
Federal National Mortgage Association BM1595 — 2.50% 3/1/2031 | | | 2,376,434 | | | | 2,376,394 | | |
Federal National Mortgage Association MA2726 — 3.00% 8/1/2026 | | | 3,444,039 | | | | 3,496,671 | | |
Federal National Mortgage Association AJ6973 — 3.00% 11/1/2026 | | | 1,711,325 | | | | 1,727,852 | | |
15
FPA NEW INCOME, INC.
PORTFOLIO OF INVESTMENTS (Continued)
March 31, 2019
(Unaudited)
BONDS & DEBENTURES — Continued | | Principal
Amount | | Fair Value | |
Federal National Mortgage Association AJ9387 — 3.00% 12/1/2026 | | $ | 876,299 | | | $ | 884,761 | | |
Federal National Mortgage Association AU3826 — 3.00% 12/1/2026 | | | 24,605,915 | | | | 24,866,305 | | |
Federal National Mortgage Association AL1345 — 3.00% 2/1/2027 | | | 1,585,349 | | | | 1,600,659 | | |
Federal National Mortgage Association AB4673 — 3.00% 3/1/2027 | | | 1,728,510 | | | | 1,748,984 | | |
Federal National Mortgage Association AK9467 — 3.00% 3/1/2027 | | | 1,826,198 | | | | 1,843,834 | | |
Federal National Mortgage Association AL3458 — 3.00% 5/1/2028 | | | 35,874,426 | | | | 36,276,926 | | |
Federal National Mortgage Association AL4693 — 3.00% 8/1/2028 | | | 1,537,821 | | | | 1,552,672 | | |
Federal National Mortgage Association MA3480 — 3.00% 8/1/2028 | | | 6,621,602 | | | | 6,704,172 | | |
Federal National Mortgage Association AU6681 — 3.00% 9/1/2028 | | | 15,025,594 | | | | 15,203,568 | | |
Federal National Mortgage Association AU6682 — 3.00% 9/1/2028 | | | 76,134,347 | | | | 77,036,135 | | |
Federal National Mortgage Association MA3485 — 3.00% 9/1/2028 | | | 3,337,552 | | | | 3,376,041 | | |
Federal National Mortgage Association 890837 — 3.00% 10/1/2028 | | | 18,161,299 | | | | 18,365,063 | | |
Federal National Mortgage Association BM4485 — 3.00% 9/1/2030 | | | 50,035,026 | | | | 50,596,404 | | |
Federal National Mortgage Association BM3539 — 3.00% 10/1/2030 | | | 36,463,204 | | | | 36,906,495 | | |
Federal National Mortgage Association BM4536 — 3.00% 8/1/2031 | | | 53,655,365 | | | | 54,290,897 | | |
Federal National Mortgage Association BM3973 — 3.00% 4/1/2032 | | | 55,358,971 | | | | 56,014,681 | | |
Federal National Mortgage Association AB1940 — 3.50% 12/1/2025 | | | 1,889,167 | | | | 1,931,725 | | |
Federal National Mortgage Association MA3075 — 3.50% 7/1/2027 | | | 30,604,942 | | | | 31,418,733 | | |
Federal National Mortgage Association MA3132 — 3.50% 9/1/2027 | | | 6,713,157 | | | | 6,887,465 | | |
Federal National Mortgage Association MA3251 — 3.50% 1/1/2028 | | | 8,355,326 | | | | 8,572,274 | | |
Federal National Mortgage Association MA3321 — 3.50% 3/1/2028 | | | 4,874,248 | | | | 5,000,809 | | |
Federal National Mortgage Association CA1631 — 3.50% 10/1/2028 | | | 8,151,181 | | | | 8,350,092 | | |
Federal National Mortgage Association MA3514 — 3.50% 11/1/2028 | | | 21,374,979 | | | | 21,896,586 | | |
Federal National Mortgage Association MA3542 — 3.50% 12/1/2028 | | | 19,685,771 | | | | 20,166,157 | | |
Federal National Mortgage Association BM1231 — 3.50% 11/1/2031 | | | 16,429,770 | | | | 16,851,238 | | |
Federal National Mortgage Association AA4546 — 4.00% 5/1/2024 | | | 696,861 | | | | 717,485 | | |
Federal National Mortgage Association AL5956 — 4.00% 5/1/2027 | | | 783,232 | | | | 806,412 | | |
Federal National Mortgage Association AL4056 — 5.00% 6/1/2026 | | | 1,892,448 | | | | 1,935,597 | | |
Federal National Mortgage Association AL5867 — 5.50% 8/1/2023 | | | 131,246 | | | | 133,552 | | |
Federal National Mortgage Association AL0471 — 5.50% 7/1/2025 | | | 89,720 | | | | 93,209 | | |
Federal National Mortgage Association AL4433 — 5.50% 9/1/2025 | | | 613,666 | | | | 631,095 | | |
Federal National Mortgage Association AL4901 — 5.50% 9/1/2025 | | | 636,912 | | | | 652,785 | | |
Federal National Mortgage Association AD0951 — 6.00% 12/1/2021 | | | 296,321 | | | | 300,295 | | |
Federal National Mortgage Association AL0294 — 6.00% 10/1/2022 | | | 41,182 | | | | 42,523 | | |
Federal National Mortgage Association 890225 — 6.00% 5/1/2023 | | | 385,886 | | | | 395,877 | | |
Government National Mortgage Association 782281 — 6.00% 3/15/2023 | | | 694,142 | | | | 720,220 | | |
| | | $ | 942,327,789 | | |
16
FPA NEW INCOME, INC.
PORTFOLIO OF INVESTMENTS (Continued)
March 31, 2019
(Unaudited)
BONDS & DEBENTURES — Continued | | Principal
Amount | | Fair Value | |
AGENCY STRIPPED — 0.0% | |
Federal Home Loan Mortgage Corp. 217 PO — 0.00% 1/1/2032(d) | | $ | 173,252 | | | $ | 155,458 | | |
Federal Home Loan Mortgage Corp. 3763 NI — 3.50% 5/15/2025 | | | 1,130,602 | | | | 55,387 | | |
Federal Home Loan Mortgage Corp. 3917 AI — 4.50% 7/15/2026 | | | 8,956,918 | | | | 648,492 | | |
Federal Home Loan Mortgage Corp. 217 IO — 6.50% 1/1/2032 | | | 166,823 | | | | 38,525 | | |
Federal National Mortgage Association 2010-25 NI — 5.00% 3/25/2025 | | | 53,439 | | | | 1,040 | | |
Federal National Mortgage Association 2003-64 XI — 5.00% 7/25/2033 | | | 483,005 | | | | 90,932 | | |
| | | $ | 989,834 | | |
NON-AGENCY COLLATERALIZED MORTGAGE OBLIGATION — 7.2% | |
CIM Trust 2017-7 A, VRN — 3.00% 4/25/2057(b)(c) | | $ | 26,827,653 | | | $ | 26,582,663 | | |
CIM Trust 2018-R3 A1, VRN — 5.00% 12/25/2057(b)(c) | | | 45,559,396 | | | | 47,388,597 | | |
Citicorp Mortgage Securities REMIC Pass-Through
Certificates Trust Series 2005-5 2A3 — 5.00% 8/25/2020 | | | 14,387 | | | | 14,435 | | |
Citigroup Mortgage Loan Trust, Inc. 2014-A A — 4.00% 1/25/2035(b)(c) | | | 8,374,362 | | | | 8,538,289 | | |
Finance of America Structured Securities Trust 2018-HB1 M1, VRN —
3.774% 9/25/2028(b)(c)(e) | | | 15,845,000 | | | | 15,886,197 | | |
Mill City Mortgage Loan Trust 2018-2 A1, VRN — 3.50% 5/25/2058(b)(c) | | | 43,589,479 | | | | 43,651,271 | | |
Mill City Mortgage Loan Trust 2018-3 A1, VRN — 3.50% 8/25/2058(b)(c) | | | 24,567,462 | | | | 24,590,713 | | |
Nationstar HECM Loan Trust 2017-2A M1 — 2.815% 9/25/2027(b)(c) | | | 12,414,000 | | | | 12,317,022 | | |
Nationstar HECM Loan Trust 2018-2A M1, VRN — 3.552% 7/25/2028 | | | 8,381,000 | | | | 8,446,120 | | |
Nomura Resecuritization Trust 2016-1R 3A1 — 5.00% 9/28/2036(b)(c) | | | 4,059,667 | | | | 4,122,990 | | |
Stanwich Mortgage Loan Trust Series 2011-2 A —
0.00% 9/15/2050(b)(c)(e)(f) | | | 177,977 | | | | 95,254 | | |
Stanwich Mortgage Loan Trust Series 2010-2 A —
0.021% 2/28/2057(b)(c)(e)(f) | | | 199,194 | | | | 100,434 | | |
Stanwich Mortgage Loan Trust Series 2011-1 A —
0.668% 8/15/2050(b)(c)(e)(f) | | | 60,246 | | | | 31,775 | | |
Stanwich Mortgage Loan Trust Series 2010-4 A —
1.939% 8/31/2049(b)(c)(e)(f) | | | 11,865 | | | | 5,992 | | |
Towd Point Mortgage Trust 2016-3 A1 — 2.25% 4/25/2056(b)(c) | | | 15,038,710 | | | | 14,768,758 | | |
Towd Point Mortgage Trust 2015-1 AES — 3.00% 10/25/2053(b)(c) | | | 11,630,152 | | | | 11,564,381 | | |
Towd Point Mortgage Trust 2018-1 A1, VRN — 3.00% 1/25/2058(b)(c) | | | 32,010,066 | | | | 31,680,721 | | |
Towd Point Mortgage Trust 2018-2 A1, VRN — 3.25% 3/25/2058(b)(c) | | | 56,272,217 | | | | 56,051,039 | | |
Towd Point Mortgage Trust 2018-5 A1A, VRN — 3.25% 7/25/2058(b)(c) | | | 53,416,073 | | | | 53,212,162 | | |
Towd Point Mortgage Trust 2015-2 1A1 — 3.25% 11/25/2060(b)(c) | | | 21,985,659 | | | | 21,974,998 | | |
Towd Point Mortgage Trust 2015-4 A1 — 3.50% 4/25/2055(b)(c) | | | 21,819,048 | | | | 21,830,850 | | |
Towd Point Mortgage Trust 2015-2 2A1 — 3.75% 11/25/2057(b)(c) | | | 14,705,127 | | | | 14,757,593 | | |
Towd Point Mortgage Trust 2018-6 A1A, VRN — 3.75% 3/25/2058(b)(c) | | | 53,840,176 | | | | 54,303,061 | | |
| | | $ | 471,915,315 | | |
17
FPA NEW INCOME, INC.
PORTFOLIO OF INVESTMENTS (Continued)
March 31, 2019
(Unaudited)
BONDS & DEBENTURES — Continued | | Principal
Amount | | Fair Value | |
TOTAL RESIDENTIAL MORTGAGE-BACKED SECURITIES
(Cost $1,664,710,158) | | $ | 1,678,061,456 | | |
ASSET-BACKED SECURITIES — 49.9% | |
AUTO — 15.4% | |
Ally Auto Receivables Trust 2017-1 B — 2.35% 3/15/2022 | | $ | 3,758,000 | | | $ | 3,724,592 | | |
Ally Auto Receivables Trust 2017-1 C — 2.48% 5/16/2022 | | | 7,059,000 | | | | 7,006,245 | | |
AmeriCredit Automobile Receivables Trust 2017-4 A3 — 2.04% 7/18/2022 | | | 15,679,000 | | | | 15,585,737 | | |
AmeriCredit Automobile Receivables Trust 2017-1 C — 2.71% 8/18/2022 | | | 7,547,000 | | | | 7,530,289 | | |
Avis Budget Rental Car Funding AESOP LLC 2017-2A A —
2.97% 3/20/2024(c) | | | 8,580,000 | | | | 8,527,184 | | |
Avis Budget Rental Car Funding AESOP LLC 2019-1A A —
3.45% 3/20/2023(c) | | | 13,010,000 | | | | 13,142,140 | | |
BMW Vehicle Lease Trust 2017-1 A4 — 2.18% 6/22/2020 | | | 18,527,000 | | | | 18,477,802 | | |
BMW Vehicle Lease Trust 2017-2 A4 — 2.19% 3/22/2021 | | | 9,585,000 | | | | 9,536,282 | | |
Capital Auto Receivables Asset Trust 2016-1 B — 2.67% 12/21/2020 | | | 4,211,000 | | | | 4,207,523 | | |
CarMax Auto Owner Trust 2017-4 A3 — 2.11% 10/17/2022 | | | 8,714,000 | | | | 8,638,619 | | |
CarMax Auto Owner Trust 2018-1 A3 — 2.48% 11/15/2022 | | | 18,953,000 | | | | 18,939,460 | | |
CarMax Auto Owner Trust 2018-2 A3 — 2.98% 1/17/2023 | | | 22,270,000 | | | | 22,420,182 | | |
Carmax Auto Owner Trust 2019-1 A4 — 3.26% 8/15/2024 | | | 24,353,000 | | | | 24,636,106 | | |
Carmax Auto Owner Trust 2019-1 B — 3.45% 11/15/2024 | | | 13,090,000 | | | | 13,245,716 | | |
Carmax Auto Owner Trust 2018-4 A4 — 3.48% 2/15/2024 | | | 22,031,000 | | | | 22,603,275 | | |
Credit Acceptance Auto Loan Trust 2017-2A A — 2.55% 2/17/2026(c) | | | 50,778,000 | | | | 50,583,495 | | |
Credit Acceptance Auto Loan Trust 2017-3A A — 2.65% 6/15/2026(c) | | | 17,185,000 | | | | 17,127,064 | | |
Credit Acceptance Auto Loan Trust 2016-3A B — 2.94% 10/15/2024(c) | | | 20,876,000 | | | | 20,809,790 | | |
Credit Acceptance Auto Loan Trust 2016-2A B — 3.18% 5/15/2024(c) | | | 22,937,000 | | | | 22,936,982 | | |
Credit Acceptance Auto Loan Trust 2017-3A B — 3.21% 8/17/2026(c) | | | 36,562,000 | | | | 36,513,281 | | |
DT Auto Owner Trust 2017-4A C — 2.86% 7/17/2023(c) | | | 9,173,000 | | | | 9,165,616 | | |
Exeter Automobile Receivables Trust 2018-1A B — 2.75% 4/15/2022(c) | | | 10,910,000 | | | | 10,887,884 | | |
Exeter Automobile Receivables Trust 2017-1A B — 3.00% 12/15/2021(c) | | | 7,644,770 | | | | 7,646,197 | | |
First Investors Auto Owner Trust 2017-1A B — 2.67% 4/17/2023(c) | | | 4,174,000 | | | | 4,158,474 | | |
First Investors Auto Owner Trust 2017-1A C — 2.95% 4/17/2023(c) | | | 8,149,000 | | | | 8,106,768 | | |
GM Financial Automobile Leasing Trust 2017-2 B — 2.43% 6/21/2021 | | | 22,329,000 | | | | 22,228,332 | | |
GM Financial Automobile Leasing Trust 2017-1 B — 2.48% 8/20/2020 | | | 6,143,000 | | | | 6,124,691 | | |
GM Financial Automobile Leasing Trust 2018-1 A4 — 2.68% 12/20/2021 | | | 15,743,000 | | | | 15,712,632 | | |
GM Financial Automobile Leasing Trust 2017-1 C — 2.74% 8/20/2020 | | | 21,903,000 | | | | 21,832,004 | | |
GM Financial Automobile Leasing Trust 2017-2 C — 2.84% 6/21/2021 | | | 3,750,000 | | | | 3,737,533 | | |
GM Financial Automobile Leasing Trust 2019-1 B — 3.37% 12/20/2022 | | | 43,632,000 | | | | 43,878,612 | | |
Great American Auto Leasing, Inc. 2019-1 A4 — 3.21% 2/18/2025(c) | | | 10,720,000 | | | | 10,823,807 | | |
Honda Auto Receivables Owner Trust 2018-1I A4 — 2.78% 5/15/2024 | | | 37,617,000 | | | | 37,726,958 | | |
18
FPA NEW INCOME, INC.
PORTFOLIO OF INVESTMENTS (Continued)
March 31, 2019
(Unaudited)
BONDS & DEBENTURES — Continued | | Principal
Amount | | Fair Value | |
Honda Auto Receivables Owner Trust 2019-1 A4 — 2.90% 6/18/2024 | | $ | 14,962,000 | | | $ | 15,070,356 | | |
Hyundai Auto Lease Securitization Trust 2016-C B — 1.86% 5/17/2021(c) | | | 13,264,000 | | | | 13,257,491 | | |
Hyundai Auto Lease Securitization Trust 2017-C A4 —
2.21% 9/15/2021(c) | | | 10,394,000 | | | | 10,341,354 | | |
Hyundai Auto Lease Securitization Trust 2018-A A4 —
2.89% 3/15/2022(c) | | | 23,622,000 | | | | 23,633,287 | | |
Hyundai Auto Lease Securitization Trust 2019-A B —
3.25% 10/16/2023(c) | | | 12,636,000 | | | | 12,705,581 | | |
Hyundai Auto Receivables Trust 2018-A A4 — 2.94% 6/17/2024 | | | 27,125,000 | | | | 27,365,336 | | |
Mercedes-Benz Auto Lease Trust 2018-A A4 — 2.51% 10/16/2023 | | | 6,318,000 | | | | 6,306,450 | | |
Mercedes-Benz Auto Receivables Trust 2018-1 A4 — 3.15% 10/15/2024 | | | 24,004,000 | | | | 24,442,618 | | |
Nissan Auto Lease Trust 2017-A A3 — 1.91% 4/15/2020 | | | 18,752,036 | | | | 18,721,389 | | |
Nissan Auto Lease Trust 2017-B A4 — 2.17% 12/15/2021 | | | 11,332,000 | | | | 11,278,051 | | |
Nissan Auto Receivables Owner Trust 2018-A A3 — 2.65% 5/16/2022 | | | 27,120,000 | | | | 27,144,682 | | |
Nissan Auto Receivables Owner Trust 2018-B A4 — 3.16% 12/16/2024 | | | 26,643,000 | | | | 27,046,426 | | |
Prestige Auto Receivables Trust 2016-2A B — 2.19% 11/15/2022(c) | | | 25,223,000 | | | | 25,170,438 | | |
Prestige Auto Receivables Trust 2017-1A B — 2.39% 5/16/2022(c) | | | 12,205,000 | | | | 12,141,390 | | |
Prestige Auto Receivables Trust 2017-1A C — 2.81% 1/17/2023(c) | | | 30,628,000 | | | | 30,400,161 | | |
Prestige Auto Receivables Trust 2016-2A C — 2.88% 11/15/2022(c) | | | 12,327,000 | | | | 12,294,236 | | |
Santander Drive Auto Receivables Trust 2017-3 B — 2.19% 3/15/2022 | | | 30,359,000 | | | | 30,271,089 | | |
Santander Drive Auto Receivables Trust 2017-1 C — 2.58% 5/16/2022 | | | 7,621,000 | | | | 7,601,602 | | |
Santander Drive Auto Receivables Trust 2018-1 B — 2.63% 7/15/2022 | | | 18,533,000 | | | | 18,508,444 | | |
Santander Drive Auto Receivables Trust 2016-2 C — 2.66% 11/15/2021 | | | 4,228,294 | | | | 4,225,892 | | |
Santander Drive Auto Receivables Trust 2017-2 C — 2.79% 8/15/2022 | | | 12,325,000 | | | | 12,327,210 | | |
Westlake Automobile Receivables Trust 2017-1A C —
2.70% 10/17/2022(c) | | | 11,439,000 | | | | 11,417,532 | | |
Westlake Automobile Receivables Trust 2018-1A C —
2.92% 5/15/2023(c) | | | 12,425,000 | | | | 12,415,640 | | |
World Omni Auto Receivables Trust 2018-A A3 — 2.50% 4/17/2023 | | | 31,463,000 | | | | 31,324,582 | | |
World Omni Auto Receivables Trust 2019-A B — 3.34% 6/16/2025 | | | 10,560,000 | | | | 10,700,369 | | |
World Omni Automobile Lease Securitization Trust 2017-A A4 —
2.32% 8/15/2022 | | | 5,495,000 | | | | 5,477,073 | | |
World Omni Automobile Lease Securitization Trust 2017-A B —
2.48% 8/15/2022 | | | 10,143,000 | | | | 10,082,648 | | |
World Omni Automobile Lease Securitization Trust 2018-B B —
3.43% 3/15/2024 | | | 11,060,000 | | | | 11,130,281 | | |
| | | $ | 1,011,022,880 | | |
COLLATERALIZED LOAN OBLIGATION — 11.1% | |
Adams Mill CLO Ltd. 2014-1A B2R — 3.35% 7/15/2026(c) | | $ | 8,136,000 | | | $ | 7,974,557 | | |
B&M CLO Ltd. 2014-1A A2R, FRN — 4.379% 4/16/2026(b)(c) | | | 12,409,000 | | | | 12,413,244 | | |
19
FPA NEW INCOME, INC.
PORTFOLIO OF INVESTMENTS (Continued)
March 31, 2019
(Unaudited)
BONDS & DEBENTURES — Continued | | Principal
Amount | | Fair Value | |
Black Diamond CLO Ltd. 2014-1A A1R, 3M USD
LIBOR + 1.150% — 3.923% 10/17/2026(b)(c) | | $ | 31,202,290 | | | $ | 31,201,947 | | |
Cerberus Loan Funding XVIII LP 2017-1A A, 3M USD
LIBOR + 1.750% — 4.537% 4/15/2027(b) | | | 43,577,000 | | | | 43,595,172 | | |
Cerberus Loan Funding XXI LP 2017-4A A, FRN —
4.237% 10/15/2027(b)(c) | | | 34,803,000 | | | | 34,802,722 | | |
Elm Trust 2016-1A A2 — 4.163% 6/20/2025(c) | | | 9,043,518 | | | | 9,052,506 | | |
Elm Trust 2018-2A A2 — 4.605% 10/20/2027(c) | | | 22,693,000 | | | | 22,930,450 | | |
Fortress Credit Opportunities IX CLO Ltd. 2017-9A A1T, FRN —
4.234% 11/15/2029(b)(c) | | | 36,720,000 | | | | 36,496,632 | | |
Fortress Credit Opportunities IX CLO Ltd. 2017-9A E, FRN —
9.934% 11/15/2029(b)(c) | | | 12,772,000 | | | | 12,173,095 | | |
Fortress Credit Opportunities VII CLO, Ltd. 2016-7I E, 3M USD
LIBOR + 7.490% — 10.101% 12/15/2028(b) | | | 20,977,000 | | | | 19,014,874 | | |
Halcyon Loan Advisors Funding 2015-3A A1R, 3M USD
LIBOR + 0.90% — 3.68% 10/18/2027(b)(c) | | | 43,913,000 | | | | 43,682,940 | | |
Halcyon Loan Advisors Funding 2015-1A AR, FRN —
3.681% 4/20/2027(b)(c) | | | 50,464,000 | | | | 50,250,083 | | |
Halcyon Loan Advisors Funding 2014-3A AR, 3M USD
LIBOR + 1.100% — 3.861% 10/22/2025(b)(c) | | | 14,512,307 | | | | 14,506,749 | | |
Hercules Capital Funding Trust 2018-1A A — 4.605% 11/22/2027(c) | | | 21,762,000 | | | | 22,243,824 | | |
Hercules Capital Funding Trust 2019-1A A — 4.703% 2/20/2028(c) | | | 47,606,000 | | | | 48,059,804 | | |
Ivy Hill Middle Market Credit Fund VII Ltd. — 4.03% 7/18/2030(b)(c) | | | 26,085,000 | | | | 26,035,360 | | |
Ivy Hill Middle Market Credit Fund VII Ltd. 7A AR, FRN —
4.291% 10/20/2029(b)(c) | | | 7,430,000 | | | | 7,411,351 | | |
Oaktree CLO Ltd. 2014-2A A1BR — 2.953% 10/20/2026(c) | | | 9,492,390 | | | | 9,414,951 | | |
Saranac CLO III Ltd. 2014-3A ALR, FRN — 3.707% 6/22/2030(b)(c) | | | 26,217,000 | | | | 26,326,430 | | |
Senior Credit Fund SPV LLC 2016-1A — 4.83% 12/19/2025(b) | | | 32,776,515 | | | | 32,788,184 | | |
Silvermore CLO Ltd. 2014-1A A1R, 3M USD LIBOR + 1.170% —
3.854% 5/15/2026(b)(c) | | | 18,576,654 | | | | 18,577,193 | | |
Symphony CLO XII Ltd. 2013-12A B2R — 3.389% 10/15/2025(c) | | | 15,800,000 | | | | 15,585,373 | | |
Telos CLO Ltd. 2013-3A AR, 3M USD LIBOR + 1.300% —
4.073% 7/17/2026(b)(c) | | | 23,124,000 | | | | 23,125,064 | | |
Telos CLO Ltd. 2013-3A BR, 3M USD LIBOR + 2.000% —
4.773% 7/17/2026(b)(c) | | | 20,894,000 | | | | 20,854,385 | | |
Telos CLO Ltd. 2014-5A A1R, FRN — 3.723% 4/17/2028(b)(c) | | | 32,022,000 | | | | 31,788,880 | | |
THL Credit Wind River CLO Ltd. 2016-1A AR, FRN —
3.837% 7/15/2028(b) | | | 27,873,000 | | | | 27,738,178 | | |
VCO CLO LLC 2018-1A A, FRN — 4.261% 7/20/2030(b)(c) | | | 26,276,000 | | | | 26,309,502 | | |
Wellfleet CLO Ltd. 2016-1A AR, FRN — 3.671% 4/20/2028(b)(c) | | | 26,029,000 | | | | 25,780,319 | | |
20
FPA NEW INCOME, INC.
PORTFOLIO OF INVESTMENTS (Continued)
March 31, 2019
(Unaudited)
BONDS & DEBENTURES — Continued | | Principal
Amount | | Fair Value | |
West CLO Ltd. 2014-2A A1BR — 2.724% 1/16/2027(c) | | $ | 9,227,000 | | | $ | 9,126,250 | | |
West CLO Ltd. 2013-1A A2BR — 3.393% 11/7/2025(c) | | | 12,780,000 | | | | 12,631,445 | | |
Zais CLO 2 Ltd. 2014-2A A1BR — 2.92% 7/25/2026(c) | | | 6,041,263 | | | | 5,991,471 | | |
| | | $ | 727,882,935 | | |
CREDIT CARD — 4.8% | |
American Express Credit Account Master Trust 2017-6 B —
2.20% 5/15/2023 | | $ | 39,998,000 | | | $ | 39,606,956 | | |
Cabela's Credit Card Master Note Trust 2016-1 A1 — 1.78% 6/15/2022 | | | 51,561,000 | | | | 51,454,423 | | |
Capital One Multi-Asset Execution Trust 2016-A6 A6 — 1.82% 9/15/2022 | | | 38,371,000 | | | | 38,182,418 | | |
Capital One Multi-Asset Execution Trust 2017-A1 A1 — 2.00% 1/17/2023 | | | 49,036,000 | | | | 48,760,231 | | |
Discover Card Execution Note Trust 2014-A4 A4 — 2.12% 12/15/2021 | | | 42,672,000 | | | | 42,618,801 | | |
Golden Credit Card Trust 2018-1A A — 2.62% 1/15/2023(c) | | | 32,022,000 | | | | 31,942,627 | | |
Synchrony Card Issuance Trust 2018-A1 A1 — 3.38% 9/15/2024 | | | 56,311,000 | | | | 57,305,368 | | |
Synchrony Credit Card Master Note Trust 2016-3 B — 1.91% 9/15/2022 | | | 3,847,000 | | | | 3,829,690 | | |
| | | $ | 313,700,514 | | |
EQUIPMENT — 12.0% | |
ARI Fleet Lease Trust 2018-A A3 — 2.84% 10/15/2026(c) | | $ | 13,974,000 | | | $ | 13,976,997 | | |
Ascentium Equipment Receivables Trust 2017-2A A3 —
2.31% 12/10/2021(c) | | | 11,172,000 | | | | 11,077,470 | | |
Avis Budget Rental Car Funding AESOP LLC 2014-2A A —
2.50% 2/20/2021(c) | | | 6,184,000 | | | | 6,165,483 | | |
Avis Budget Rental Car Funding AESOP LLC 2015-1A A —
2.50% 7/20/2021(c) | | | 48,657,000 | | | | 48,441,960 | | |
Avis Budget Rental Car Funding AESOP LLC 2015-2A A —
2.63% 12/20/2021(c) | | | 22,666,000 | | | | 22,552,187 | | |
CCG Receivables Trust 2018-1 A2 — 2.50% 6/16/2025(c) | | | 11,729,103 | | | | 11,707,389 | | |
Chesapeake Funding II LLC 2017-4A A1 — 2.12% 11/15/2029(c) | | | 20,516,035 | | | | 20,327,167 | | |
Coinstar Funding LLC Series 2017-1A A2 — 5.216% 4/25/2047(c) | | | 8,310,968 | | | | 8,447,674 | | |
Dell Equipment Finance Trust 2017-2 A3 — 2.19% 10/24/2022(c) | | | 6,988,000 | | | | 6,962,910 | | |
Enterprise Fleet Financing LLC 2017-2 A2 — 1.97% 1/20/2023(c) | | | 8,409,448 | | | | 8,370,429 | | |
Enterprise Fleet Financing LLC 2017-3 A2 — 2.13% 5/22/2023(c) | | | 12,924,838 | | | | 12,855,202 | | |
Enterprise Fleet Financing LLC 2017-2 A3 — 2.22% 1/20/2023(c) | | | 23,511,000 | | | | 23,266,429 | | |
Enterprise Fleet Financing LLC 2017-1 A3 — 2.60% 7/20/2022(c) | | | 9,653,000 | | | | 9,617,861 | | |
GreatAmerica Leasing Receivables Funding LLC Series 2017-1 A4 —
2.36% 1/20/2023(c) | | | 6,662,000 | | | | 6,618,215 | | |
GreatAmerica Leasing Receivables Funding LLC Series 2018-1 A4 —
2.83% 6/17/2024 | | | 8,631,000 | | | | 8,629,654 | | |
GreatAmerica Leasing Receivables Funding LLC Series 2017-1 C —
2.89% 1/22/2024(c) | | | 2,609,000 | | | | 2,600,335 | | |
21
FPA NEW INCOME, INC.
PORTFOLIO OF INVESTMENTS (Continued)
March 31, 2019
(Unaudited)
BONDS & DEBENTURES — Continued | | Principal
Amount | | Fair Value | |
GreatAmerica Leasing Receivables Funding LLC Series 2018-1 B —
2.99% 6/17/2024 | | $ | 920,000 | | | $ | 920,700 | | |
Hertz Fleet Lease Funding LP 2017-1 A2 — 2.13% 4/10/2031(c) | | | 13,513,718 | | | | 13,460,470 | | |
Hertz Fleet Lease Funding LP 2018-1 A2 — 3.23% 5/10/2032(c) | | | 16,932,000 | | | | 16,962,984 | | |
John Deere Owner Trust 2018-A A4 — 2.91% 1/15/2025 | | | 24,496,000 | | | | 24,659,134 | | |
John Deere Owner Trust 2018-B A4 — 3.23% 6/16/2025 | | | 26,991,000 | | | | 27,388,278 | | |
John Deere Owner Trust 2019 A A4 — 3.24% 1/15/2026 | | | 13,310,000 | | | | 13,437,266 | | |
Kubota Credit Owner Trust 2018-1A A3 — 3.10% 8/15/2022(c) | | | 41,762,000 | | | | 41,911,704 | | |
MMAF Equipment Finance LLC 2017-B A3 — 2.21% 10/17/2022(c) | | | 19,510,000 | | | | 19,368,800 | | |
MMAF Equipment Finance LLC 2019 A A3 — 3.27% 11/13/2023(c) | | | 23,174,000 | | | | 23,244,076 | | |
NextGear Floorplan Master Owner Trust 2017-1A A2 —
2.54% 4/18/2022(c) | | | 22,933,000 | | | | 22,857,890 | | |
NextGear Floorplan Master Owner Trust 2017-2A B —
3.02% 10/17/2022(c) | | | 20,252,000 | | | | 20,186,693 | | |
NextGear Floorplan Master Owner Trust 2018-1A A2 —
3.22% 2/15/2023(c) | | | 12,191,000 | | | | 12,228,197 | | |
Prop Series 2017-1A — 5.30% 3/15/2042(e) | | | 25,815,390 | | | | 25,393,351 | | |
Verizon Owner Trust 2017-2A A — 1.92% 12/20/2021 | | | 26,475,000 | | | | 26,326,038 | | |
Verizon Owner Trust 2017-3A A1A — 2.06% 4/20/2022(c) | | | 20,678,000 | | | | 20,540,196 | | |
Verizon Owner Trust 2017-2A B — 2.22% 12/20/2021 | | | 24,147,000 | | | | 23,967,102 | | |
Verizon Owner Trust 2017-3A B — 2.38% 4/20/2022(c) | | | 19,491,000 | | | | 19,364,827 | | |
Verizon Owner Trust 2017-1A B — 2.45% 9/20/2021(c) | | | 33,818,000 | | | | 33,640,526 | | |
Verizon Owner Trust 2019 A A1A — 2.93% 9/20/2023 | | | 36,729,000 | | | | 37,011,167 | | |
Verizon Owner Trust 2019 A B — 3.02% 9/20/2023 | | | 16,656,000 | | | | 16,796,030 | | |
Verizon Owner Trust 2018-1A B — 3.05% 9/20/2022(c) | | | 24,278,000 | | | | 24,398,963 | | |
Verizon Owner Trust 2018-A B — 3.38% 4/20/2023 | | | 26,414,000 | | | | 26,872,526 | | |
Volvo Financial Equipment LLC Series 2017-1A A4 —
2.21% 11/15/2021(c) | | | 5,966,000 | | | | 5,921,910 | | |
Volvo Financial Equipment LLC Series 2018-1A A3 —
2.54% 2/15/2022(c) | | | 40,208,000 | | | | 40,136,566 | | |
Volvo Financial Equipment LLC Series 2019-1A A4 —
3.13% 11/15/2023(c) | | | 17,060,000 | | | | 17,215,684 | | |
Wheels SPV 2 LLC 2018-1A A3 — 3.24% 4/20/2027(c) | | | 12,759,000 | | | | 12,889,641 | | |
| | | $ | 788,718,081 | | |
OTHER — 6.6% | |
Conn Funding II LP 2017-B B — 4.52% 4/15/2021(c) | | $ | 4,313,105 | | | $ | 4,326,018 | | |
New Residential Advance Receivables Trust 2016-T4 AT4 —
3.107% 12/15/2050(c) | | | 50,491,000 | | | | 50,543,359 | | |
New Residential Advance Receivables Trust Advance
Receivables Backed Notes 2016-T2 AT2 — 2.575% 10/15/2049(c) | | | 25,417,000 | | | | 25,337,402 | | |
22
FPA NEW INCOME, INC.
PORTFOLIO OF INVESTMENTS (Continued)
March 31, 2019
(Unaudited)
BONDS & DEBENTURES — Continued | | Principal
Amount | | Fair Value | |
New Residential Advance Receivables Trust Advance
Receivables Backed Notes 2017-T1 AT1 — 3.214% 2/15/2051(c) | | $ | 46,976,000 | | | $ | 47,106,729 | | |
New Residential Mortgage LLC 2018-FNT1 A — 3.61% 5/25/2023(c) | | | 27,540,424 | | | | 27,639,110 | | |
New Residential Mortgage LLC 2018-FNT2 A — 3.79% 7/25/2054(c) | | | 33,887,088 | | | | 34,171,801 | | |
NRZ Excess Spread-Collateralized Notes Series 2018-PLS1 A —
3.193% 1/25/2023(c) | | | 13,445,529 | | | | 13,384,226 | | |
NRZ Excess Spread-Collateralized Notes Series 2018-PLS2 A —
3.265% 2/25/2023(c) | | | 15,183,728 | | | | 15,132,160 | | |
Panhandle-Plains Student Finance Corp. 2001-1 A2 —
3.97% 12/1/2031(e) | | | 3,000,000 | | | | 2,981,250 | | |
PFS Financing Corp. 2017-BA A2 — 2.22% 7/15/2022(c) | | | 22,138,000 | | | | 21,878,908 | | |
PFS Financing Corp. 2017-D A — 2.40% 10/17/2022(c) | | | 16,852,000 | | | | 16,745,671 | | |
PFS Financing Corp. 2017-BA B — 2.57% 7/15/2022(c) | | | 7,305,000 | | | | 7,239,828 | | |
PFS Financing Corp. 2017-D B — 2.74% 10/17/2022(c) | | | 7,798,000 | | | | 7,742,799 | | |
PFS Financing Corp. 2018-B A — 2.89% 2/15/2023(c) | | | 28,344,000 | | | | 28,248,089 | | |
PFS Financing Corp. 2018-B B — 3.08% 2/15/2023(c) | | | 7,809,000 | | | | 7,802,992 | | |
PFS Financing Corp. 2018-D A — 3.19% 4/17/2023(c) | | | 35,001,000 | | | | 35,205,189 | | |
PFS Financing Corp. 2018-D B — 3.45% 4/17/2023(c) | | | 17,375,000 | | | | 17,463,607 | | |
PFS Financing Corp. 2018-F A — 3.52% 10/16/2023(c) | | | 31,951,000 | | | | 32,455,168 | | |
PFS Financing Corp. 2018-F B — 3.77% 10/16/2023(c) | | | 5,641,000 | | | | 5,737,867 | | |
PFS Financing Corp. 2016-BA A — 1.87% 10/15/2021(c) | | | 3,481,000 | | | | 3,461,935 | | |
Unison Ground Lease Funding LLC 2013-1 B — 5.78% 3/15/2043(c)(e) | | | 11,146,000 | | | | 11,070,851 | | |
Unison Ground Lease Funding LLC 2013-2 B — 6.268% 3/15/2043(c) | | | 3,768,000 | | | | 3,761,138 | | |
WCP ISSUER LLC 2013-1 B — 6.657% 8/15/2043(c)(e) | | | 15,060,000 | | | | 15,063,228 | | |
| | | $ | 434,499,325 | | |
| TOTAL ASSET-BACKED SECURITIES (Cost $3,275,975,301) | | $ | 3,275,823,735 | | |
CORPORATE BONDS & NOTES — 2.5% | |
BASIC MATERIALS — 0.9% | |
PT Boart Longyear Management Pty Ltd. PIK, 10.00% Cash or
12.00% PIK — 10.00% 12/31/2022 | | $ | 67,602,030 | | | $ | 59,658,791 | | |
COMMUNICATIONS — 0.3% | |
Cisco Systems, Inc. — 2.45% 6/15/2020 | | $ | 19,864,000 | | | $ | 19,826,189 | | |
CONSUMER, CYCLICAL — 0.1% | |
Continental Airlines 2000-1 Class B Pass Through Trust —
8.388% 5/1/2022 | | $ | 2,523 | | | $ | 2,761 | | |
Northwest Airlines 2000-1 Class G Pass Through Trust — 7.15% 4/1/2021 | | | 3,224,132 | | | | 3,204,787 | | |
23
FPA NEW INCOME, INC.
PORTFOLIO OF INVESTMENTS (Continued)
March 31, 2019
(Unaudited)
BONDS & DEBENTURES — Continued | | Principal
Amount | | Fair Value | |
Northwest Airlines 1999-2 Class C Pass Through Trust —
8.304% 9/1/2010(e)(f) | | $ | 13,505,171 | | | $ | — | | |
US Airways 1999-1C Pass Through Trust — 7.96% 7/20/2019(e)(f) | | | 3,802,540 | | | | — | | |
| | | $ | 3,207,548 | | |
CONSUMER, NON-CYCLICAL — 0.3% | |
StoneMor Partners LP / Cornerstone Family Services of West Virginia
Subsidiary — 7.875% 6/1/2021 | | $ | 23,042,000 | | | $ | 20,717,638 | | |
ENERGY — 0.7% | |
PHI, Inc. — 5.25% 3/15/2019 | | $ | 58,999,000 | | | $ | 36,726,877 | | |
Bristow Group, Inc. — 8.75% 3/1/2023(c) | | | 14,505,000 | | | | 10,552,388 | | |
| | | $ | 47,279,265 | | |
INDUSTRIAL — 0.2% | |
Manitowoc Co., Inc. (The) — 12.75% 8/15/2021(c) | | $ | 11,397,000 | | | $ | 12,141,885 | | |
Air 2 US — 8.027% 10/1/2020(c) | | | 642,229 | | | | 646,645 | | |
| | | $ | 12,788,530 | | |
TECHNOLOGY — 0.0% | |
Oracle Corp. — 3.875% 7/15/2020 | | $ | 842,000 | | | $ | 855,861 | | |
| TOTAL CORPORATE BONDS & NOTES (Cost $212,981,629) | | $ | 164,333,822 | | |
CORPORATE BANK DEBT — 2.7% | |
ABG Intermediate Holdings 2 LLC, 1M USD
LIBOR + 7.750% — 10.249% 9/29/2025(b)(g) | | $ | 21,567,384 | | | $ | 21,028,199 | | |
Boart Longyear Management Pty Ltd TL, 10.000% Cash or 11.00% PIK —
11.000% 10/23/2020(b)(g) | | | 4,757,758 | | | | 4,703,852 | | |
General Nutrition Centers, Inc., 1M USD LIBOR + 7.000% —
9.500% 12/31/2022(b)(g) | | | 19,406,000 | | | | 19,616,167 | | |
JC Penney Corp., Inc., 1M USD LIBOR + 4.250% —
6.879% 6/23/2023(b)(g) | | | 30,032,034 | | | | 26,428,190 | | |
Logix Holding Co. LLC TL 1L, 1M USD LIBOR + 5.750% —
8.249% 12/22/2024(b)(g) | | | 11,136,915 | | | | 11,006,056 | | |
MB2LTL, 3M USD LIBOR + 9.250% — 11.880% 11/30/2023(b)(e)(g) | | | 6,816,000 | | | | 6,850,080 | | |
OTGTL, 3M USD LIBOR + 7.000% — 9.744% 8/23/2021(b)(e)(g) | | | 25,573,000 | | | | 25,494,747 | | |
SDTL, 11/22/2021(b)(e)(g) | |
1M USD LIBOR + 4.500% — 6.999% | | | 5,814,185 | | | | 5,800,638 | | |
6M USD LIBOR + 4.500% — 7.383% | | | 6,001,000 | | | | 5,987,017 | | |
24
FPA NEW INCOME, INC.
PORTFOLIO OF INVESTMENTS (Continued)
March 31, 2019
(Unaudited)
BONDS & DEBENTURES — Continued | | Principal
Amount | | Fair Value | |
Transform SR Holdings LLC TL B, 1M USD LIBOR + 7.250% —
9.741% 2/11/2024(b)(g) | | $ | 8,797,000 | | | $ | 8,713,780 | | |
Xplornet Communication, Inc., 3M USD LIBOR + 4.000% —
6.601% 9/9/2021(b)(g) | | | 21,392,595 | | | | 21,482,016 | | |
ZW1L, 1M USD LIBOR + 5.00% — 7.50% 11/16/2022(b)(e)(g) | | | 13,323,325 | | | | 13,339,979 | | |
ZW2L, 1M USD LIBOR + 9.00% — 11.49% 11/16/2023(b)(e)(g) | | | 4,870,000 | | | | 4,894,399 | | |
| TOTAL CORPORATE BANK DEBT (Cost $176,747,567) | | $ | 175,345,120 | | |
U.S. TREASURIES — 10.4% | |
U.S. Treasury Bills — 2.379% 4/4/2019(d) | | $ | 9,723,000 | | | $ | 9,721,088 | | |
U.S. Treasury Bills — 2.446% 4/11/2019(d) | | | 57,765,000 | | | | 57,726,892 | | |
U.S. Treasury Bills — 2.433% 4/18/2019(d) | | | 131,319,000 | | | | 131,170,491 | | |
U.S. Treasury Bills — 2.428% 4/25/2019(d) | | | 156,934,000 | | | | 156,687,629 | | |
U.S. Treasury Bills — 2.445% 5/2/2019(d) | | | 1,000,000 | | | | 997,955 | | |
U.S. Treasury Notes — 2.00% 7/31/2022 | | | 100,607,000 | | | | 99,887,137 | | |
U.S. Treasury Notes — 1.875% 8/31/2022 | | | 119,563,000 | | | | 118,185,228 | | |
U.S. Treasury Notes — 1.875% 9/30/2022 | | | 108,643,000 | | | | 107,395,376 | | |
| TOTAL U.S. TREASURIES (Cost $673,926,513) | | $ | 681,771,796 | | |
| TOTAL BONDS & DEBENTURES — 99.6% (Cost $6,615,385,176) | | $ | 6,540,326,033 | | |
| TOTAL INVESTMENT SECURITIES — 99.6% (Cost $6,616,018,722) | | $ | 6,541,071,006 | | |
SHORT-TERM INVESTMENTS — 0.1% | |
State Street Bank Repurchase Agreement — 0.50% 4/1/2019
(Dated 03/29/2019, repurchase price of $8,661,361, collateralized by
$8,780,000 principal amount U.S. Treasury Notes — 2.375% 2022,
fair value $8,837,290) | | $ | 8,661,000 | | | $ | 8,661,000 | | |
| TOTAL SHORT-TERM INVESTMENTS (Cost $8,661,000) | | $ | 8,661,000 | | |
| TOTAL INVESTMENTS — 99.7% (Cost $6,624,679,722) | | $ | 6,549,732,006 | | |
Other assets and liabilities, net — 0.3% | | | 17,360,913 | | |
NET ASSETS — 100.0% | | $ | 6,567,092,919 | | |
25
FPA NEW INCOME, INC.
PORTFOLIO OF INVESTMENTS (Continued)
March 31, 2019
(Unaudited)
(a) Non-income producing security.
(b) Variable/Floating Rate Security — The rate shown is based on the latest available information as of March 31, 2019. For Senior Loan Notes, the rate shown may represent a weighted average interest rate. Certain variable rate securities are not based on a published rate and spread but are determined by the issuer or agent and are based on current market conditions. These securities do not indicate a reference rate and spread in their description.
(c) Security exempt from registration under Rule 144A of the Securities Act of 1933. These securities may be resold in transactions exempt from registration, typically only to qualified institutional buyers. Unless otherwise indicated, these securities are not considered to be illiquid.
(d) Zero coupon bond. Coupon amount represents effective yield to maturity.
(e) Investments categorized as a significant unobservable input (Level 3) (See Note 6 of the Notes to Financial Statements).
(f) These securities have been valued in good faith under policies adopted by authority of the Board of Director in accordance with the Fund's fair value procedures. These securities constituted 0.00% of total net assets at March 31, 2019.
(g) Restricted securities. These restricted securities constituted 2.66% of total net assets at March 31, 2019, most of which are considered liquid by the Adviser. These securities are not registered and may not be sold to the public. There are legal and/or contractual restrictions on resale. The Fund does not have the right to demand that such securities be registered. The values of these securities are determined by valuations provided by pricing services, brokers, dealers, market makers, or in good faith under policies adopted by authority of the Fund's Board of Directors.
See accompanying Notes to Financial Statements.
26
FPA NEW INCOME FUND
PORTFOLIO OF INVESTMENTS — RESTRICTED SECURITIES
March 31, 2019
(Unaudited)
Issuer | | Acquisition
Date(s) | | Cost | | Fair Value | | Fair
Value as a %
of Net Assets | |
ABG Intermediate Holdings
2 LLC, 1M USD
LIBOR + 7.750% — 10.249%
9/29/2025
| | 9/26/2017, 4/11/2018,
6/21/2018, 6/25/2018,
7/3/2018, 11/2/2018,
12/3/2018, 1/11/2019,
2/12/2019 | | $ | 21,532,874 | | | $ | 21,028,199 | | | | 0.32 | % | |
Boart Longyear Management
Pty Ltd TL, 10.000% Cash or
11.00% PIK — 11.000%
10/23/2020
| | 3/29/2018, 9/29/2019,
12/31/2018, 1/11/2019,
3/29/2019 | | | 4,670,183 | | | | 4,703,852 | | | | 0.07 | % | |
General Nutrition Centers, Inc.,
1M USD LIBOR + 7.000% —
9.500% 12/31/2022 | | 12/21/2018 | | | 19,406,000 | | | | 19,616,167 | | | | 0.30 | % | |
JC Penney Corp., Inc.,
1M USD LIBOR + 4.250% —
6.879% 6/23/2023
| | 10/4/2017, 10/5/2017,
10/6/2017, 10/11/2017,
11/19/2018, 11/27/2018,
1/11/2019, 2/8/2019,
3/11/2019 | | | 28,268,349 | | | | 26,428,190 | | | | 0.40 | % | |
Logix Holding Co. LLC TL 1L,
1M USD LIBOR + 5.750% —
8.249% 12/22/2024 | | 8/11/2017, 1/14/2019 | | | 11,044,980 | | | | 11,006,056 | | | | 0.17 | % | |
MB2LTL, 3M USD
LIBOR + 9.250% — 11.880%
11/30/2023 | | 12/2/2016 | | | 6,740,018 | | | | 6,850,080 | | | | 0.10 | % | |
OTGTL, 3M USD
LIBOR + 7.000% — 9.744%
8/23/2021 | | 8/26/2016, 1/26/2018,
10/10/2018 | | | 25,309,092 | | | | 25,494,747 | | | | 0.39 | % | |
SDTL, 11/22/2021
| | 8/26/2016, 11/30/2017,
1/26/2018, 3/8/2018,
5/9/2018, 5/15/2018,
7/13/2018, 8/17/2018 | | | | | | | |
1M USD LIBOR + 4.500% —
6.999% | | | | | 5,749,597 | | | | 5,800,638 | | | | 0.09 | % | |
6M USD LIBOR + 4.500% —
7.383% | | | | | 5,931,240 | | | | 5,987,017 | | | | 0.09 | % | |
27
FPA NEW INCOME FUND
PORTFOLIO OF INVESTMENTS — RESTRICTED SECURITIES (Continued)
March 31, 2019
(Unaudited)
Issuer | | Acquisition
Date(s) | | Cost | | Fair Value | | Fair
Value as a %
of Net Assets | |
Transform SR Holdings LLC
TL B, 1M USD
LIBOR + 7.250% — 9.741%
2/11/2024 | | 2/11/2019, 2/19/2019 | | $ | 8,709,166 | | | $ | 8,713,780 | | | | 0.13 | % | |
Xplornet Communication, Inc.,
3M USD LIBOR + 4.000% —
6.601% 9/9/2021 | | 12/22/2016, 1/11/2019 | | | 21,335,721 | | | | 21,482,016 | | | | 0.33 | % | |
ZW1L, 1M USD
LIBOR + 5.00% — 7.50%
11/16/2022 | | 9/6/2016 | | | 13,237,093 | | | | 13,339,979 | | | | 0.20 | % | |
ZW2L, 1M USD
LIBOR + 9.00% — 11.49%
11/16/2023 | | 11/17/2016 | | | 4,816,254 | | | | 4,894,399 | | | | 0.07 | % | |
TOTAL RESTRICTED
SECURITIES | | | | $ | 176,747,567 | | | $ | 175,345,120 | | | | 2.66 | % | |
See accompanying Notes to Financial Statements.
28
FPA NEW INCOME, INC.
STATEMENT OF ASSETS AND LIABILITIES
March 31, 2019
(Unaudited)
ASSETS | |
Investment securities — at fair value (identified cost $6,616,018,722) | | $ | 6,541,071,006 | | |
Short-term investments — at amortized cost (maturities 60 days or less) | | | 8,661,000 | | |
Cash | | | 206 | | |
Receivable for: | |
Interest | | | 22,378,148 | | |
Capital Stock sold | | | 11,939,889 | | |
Investment securities sold | | | 3,913,975 | | |
Total assets | | | 6,587,964,224 | | |
LIABILITIES | |
Payable for: | |
Investment securities purchased | | | 11,315,677 | | |
Capital Stock repurchased | | | 6,673,284 | | |
Advisory fees | | | 2,393,078 | | |
Distributions from net investment income | | | 101 | | |
Accrued expenses and other liabilities | | | 489,165 | | |
Total liabilities | | | 20,871,305 | | |
NET ASSETS | | $ | 6,567,092,919 | | |
SUMMARY OF SHAREHOLDERS' EQUITY | |
Capital Stock — par value $0.01 per share; authorized 700,000,000 shares;
outstanding 662,361,032 shares | | $ | 6,623,610 | | |
Additional Paid-in Capital | | | 7,044,471,719 | | |
Distributable earnings | | | (484,002,410 | ) | |
NET ASSETS | | $ | 6,567,092,919 | | |
NET ASSET VALUE | |
Offering and redemption price per share | | $ | 9.91 | | |
See accompanying Notes to Financial Statements.
29
FPA NEW INCOME, INC.
STATEMENT OF OPERATIONS
For the Six Months Ended March 31, 2019
(Unaudited)
INVESTMENT INCOME | |
Dividends | | $ | 569 | | |
Interest | | | 106,515,989 | | |
Total investment income | | | 106,516,558 | | |
EXPENSES | |
Advisory fees | | | 15,181,206 | | |
Transfer agent fees and expenses | | | 1,113,464 | | |
Administrative services fees | | | 145,735 | | |
Director fees and expenses | | | 137,902 | | |
Other professional fees | | | 131,725 | | |
Reports to shareholders | | | 119,635 | | |
Custodian fees | | | 99,230 | | |
Filing fees | | | 81,684 | | |
Legal fees | | | 60,653 | | |
Audit and tax services fees | | | 41,543 | | |
Other | | | 27,590 | | |
Total expenses | | | 17,140,367 | | |
Reimbursement from Adviser | | | (2,262,505 | ) | |
Net expenses | | | 14,877,862 | | |
Net investment income | | | 91,638,696 | | |
NET REALIZED AND UNREALIZED GAIN (LOSS) | |
Net realized gain (loss) on: | |
Investments | | | (6,060,136 | ) | |
Net change in unrealized appreciation (depreciation) of: | |
Investments | | | 39,338,719 | | |
Net realized and unrealized gain | | | 33,278,583 | | |
NET INCREASE IN NET ASSETS RESULTING FROM OPERATIONS | | $ | 124,917,279 | | |
See accompanying Notes to Financial Statements.
30
FPA NEW INCOME, INC.
STATEMENTS OF CHANGES IN NET ASSETS
| | | Six Months Ended
March 31, 2019
(Unaudited) | | Year Ended
September 30, 2018 | |
INCREASE (DECREASE) IN NET ASSETS | |
Operations: | |
Net investment income | | $ | 91,638,696 | | | $ | 159,357,741 | | |
Net realized loss | | | (6,060,136 | ) | | | (2,863,146 | ) | |
Net change in unrealized appreciation (depreciation) | | | 39,338,719 | | | | (55,570,820 | ) | |
Net increase in net assets resulting from operations | | | 124,917,279 | | | | 100,923,775 | | |
Distributions to shareholders | | | (135,727,718 | ) | | | (158,423,878 | ) | |
Capital Stock transactions: | |
Proceeds from Capital Stock sold | | | 1,727,837,860 | | | | 1,928,497,160 | | |
Proceeds from shares issued to shareholders upon reinvestment of
dividends and distributions | | | 118,372,993 | | | | 140,658,458 | | |
Cost of Capital Stock repurchased | | | (972,931,322 | ) | | | (1,432,464,308 | ) | |
Net increase from Capital Stock transactions | | | 873,279,531 | | | | 636,691,310 | | |
Total change in net assets | | | 862,469,092 | | | | 579,191,207 | | |
NET ASSETS | |
Beginning of period | | | 5,704,623,827 | | | | 5,125,432,620 | | |
End of period | | $ | 6,567,092,919 | | | $ | 5,704,623,827 | | |
CHANGE IN CAPITAL STOCK OUTSTANDING | |
Shares of Capital Stock sold | | | 174,866,661 | | | | 193,790,432 | | |
Shares issued to shareholders upon reinvestment of
dividends and distributions | | | 11,991,878 | | | | 14,159,602 | | |
Shares of Capital Stock repurchased | | | (98,431,987 | ) | | | (143,941,604 | ) | |
Change in Capital Stock outstanding | | | 88,426,552 | | | | 64,008,430 | | |
See accompanying Notes to Financial Statements.
31
FPA NEW INCOME, INC.
FINANCIAL HIGHLIGHTS
Selected Data for Each Share of Capital Stock Outstanding Throughout Each Period
| | | Six
Months
Ended
March 31,
2019 | | Year Ended September 30, | |
| | | (Unaudited) | | 2018 | | 2017 | | 2016 | | 2015 | | 2014 | |
Per share operating performance: | |
Net asset value at beginning of period | | $ | 9.94 | | | $ | 10.05 | | | $ | 10.06 | | | $ | 10.08 | | | $ | 10.24 | | | $ | 10.45 | | |
Income from investment operations: | |
Net investment income* | | | 0.15 | | | | 0.29 | | | | 0.25 | | | | 0.19 | | | | 0.15 | | | | 0.30 | | |
Net realized and unrealized gain (loss)
on investment securities | | | 0.04 | | | | (0.18 | ) | | | 0.01 | | | | (0.04 | ) | | | (0.06 | ) | | | (0.15 | ) | |
Total from investment operations | | | 0.19 | | | | 0.11 | | | | 0.26 | | | | 0.15 | | | | 0.09 | | | | 0.15 | | |
Less distributions: | |
Dividends from net investment income | | | (0.22 | ) | | | (0.22 | ) | | | (0.27 | ) | | | (0.17 | ) | | | (0.25 | ) | | | (0.36 | ) | |
Redemption fees | | | — | | | | — | | | | — | ** | | | — | ** | | | — | ** | | | — | ** | |
Net asset value at end of period | | $ | 9.91 | | | $ | 9.94 | | | $ | 10.05 | | | $ | 10.06 | | | $ | 10.08 | | | $ | 10.24 | | |
Total investment return*** | | | 1.98 | % | | | 1.91 | % | | | 2.58 | % | | | 1.52 | % | | | 0.84 | % | | | 1.47 | % | |
Ratios/supplemental data: | |
Net assets, end of period (in $000's) | | $ | 6,567,093 | | | $ | 5,704,624 | | | $ | 5,125,433 | | | $ | 5,048,610 | | | $ | 5,636,518 | | | $ | 5,829,865 | | |
Ratio of expenses of average net assets: | |
Before reimbursement from Adviser | | | 0.56 | %† | | | 0.58 | % | | | 0.59 | % | | | 0.58 | % | | | 0.58 | % | | | 0.56 | % | |
After reimbursement from Adviser | | | 0.49 | %† | | | 0.49 | % | | | 0.49 | % | | | 0.55 | % | | | N/A | | | | N/A | | |
Ratio of net investment income to
average net assets: | |
Before reimbursement from Adviser | | | 2.94 | %† | | | 2.88 | % | | | 2.45 | % | | | 1.87 | % | | | 1.50 | % | | | 2.59 | % | |
After reimbursement from Adviser | | | 3.02 | %† | | | 2.96 | % | | | 2.55 | % | | | 1.90 | % | | | N/A | | | | N/A | | |
Portfolio turnover rate | | | 21 | %† | | | 29 | % | | | 59 | % | | | 44 | % | | | 64 | % | | | 97 | % | |
* Per share amount is based on average shares outstanding.
** Rounds to less than $0.01 per share.
*** Return is based on net asset value per share, adjusted for reinvestment of distributions, and does not reflect deduction of the sales charge.
† Annualized.
See accompanying Notes to Financial Statements.
32
FPA NEW INCOME, INC.
NOTES TO FINANCIAL STATEMENTS
March 31, 2019
(Unaudited)
NOTE 1 — Significant Accounting Policies
FPA New Income, Inc. (the "Fund") is registered under the Investment Company Act of 1940, as a diversified, open-end, management investment company. The Fund's primary investment objective is to seek current income and long-term total return. Capital preservation is also a consideration. The Fund qualifies as an investment company pursuant to Financial Accounting Standard Board (FASB) Accounting Standards Codification (ASC) No. 946, Financial Services — Investment Companies. The following is a summary of significant accounting policies consistently followed by the Fund in the preparation of its financial statements.
A. Security Valuation
The Fund's investments are reported at fair value as defined by accounting principles generally accepted in the United States of America, ("U.S. GAAP"). The Fund generally determines its net asset value as of approximately 4:00 p.m. New York time each day the New York Stock Exchange is open. Further discussion of valuation methods, inputs and classifications can be found under Disclosure of Fair Value Measurements.
B. Securities Transactions and Related Investment Income
Securities transactions are accounted for on the date the securities are purchased or sold. Dividend income and distributions to shareholders are recorded on the ex-dividend date. Interest income and expenses are recorded on an accrual basis. Market discounts and premiums on fixed income securities are amortized over the expected life of the securities. Realized gains or losses are based on the specific identification method.
C. Use of Estimates
The preparation of the financial statements in accordance with U.S. GAAP requires management to make estimates and assumptions that affect the amounts reported. Actual results could differ from those estimates.
D. Recent Accounting Pronouncements
In August 2018, the Financial Accounting Standards Board (FASB) issued Accounting Standards Update (ASU) No. 2018-13, Fair Value Measurement (Topic 820) — Disclosure Framework — Changes to the Disclosure Requirements for Fair Value Measurement. The amendments eliminate certain disclosure requirements for fair value measurements for all entities, requires public entities to disclose certain new information and modifies some disclosure requirements. The new guidance is effective for all entities for fiscal years beginning after December 15, 2019 and for interim periods within those fiscal years. An entity is permitted to early adopt either the entire standard or only the provisions that eliminate or modify requirements. The Adviser is currently evaluating the impact of this new guidance on the Fund's financial statements.
NOTE 2 — Risk Considerations
Investing in the Fund may involve certain risks including, but not limited to, those described below.
Market Risk: Because the values of the Fund's investments will fluctuate with market conditions, so will the value of your investment in the Fund. You could lose money on your investment in the Fund or the Fund could underperform other investments.
Interest Rate and Credit Risk: The values of, and the income generated by, most debt securities held by the Fund may be affected by changing interest rates and by changes in the effective maturities and credit rating of
33
FPA NEW INCOME, INC.
NOTES TO FINANCIAL STATEMENTS (Continued)
(Unaudited)
these securities. For example, the value of debt securities in the Fund's portfolio generally will decline when interest rates rise and increase when interest rates fall. In addition, falling interest rates may cause an issuer to redeem, call or refinance a security before its stated maturity, which may result in the Fund having to reinvest the proceeds in lower yielding securities.
Mortgage-Backed and Other Asset-Backed Securities Risk: The values of some mortgage-backed and other asset-backed securities may expose the Fund to a lower rate of return upon reinvestment of principal. When interest rates rise, the value of mortgage-related securities generally will decline; however, when interest rates are declining, the value of mortgage related-securities with prepayment features may not increase as much as other fixed income securities. The rate of prepayments on underlying mortgages will affect the price and volatility of a mortgage-related security, and may shorten or extend the effective maturity of the security beyond what was anticipated at the time of purchase. If an unanticipated rate of prepayment on underlying mortgages increases the effective maturity of a mortgage-related security, the volatility of the security can be expected to increase. The value of these securities may also fluctuate in response to the market's perception of the creditworthiness of the issuers. Additionally, although mortgages and mortgage-related securities are generally supported by some form of government or private guarantee and/or insurance, there is no assurance that private guarantors or insurers will meet their obligations.
Stripped Mortgage-Backed Interest Only ("I/O") and Principal Only ("P/O") Securities: Stripped mortgage backed securities are usually structured with two classes that receive different proportions of the interest and principal distributions on a pool of mortgage assets. In certain cases, one class will receive all of the interest payments on the underlying mortgages (the I/O class), while the other class will receive all of the principal payments (the P/O class). The Fund currently has investments in I/O and P/O securities. The yield to maturity on IOs is sensitive to the rate of principal repayments (including prepayments) on the related underlying mortgage assets, and principal payments may have a material effect on yield-to-maturity. If the underlying mortgage assets experience greater than anticipated prepayments of principal, a Fund may not fully recoup its initial investment in I/Os.
Credit Risk: Debt securities are subject to credit risk, meaning that the issuer of the debt security may default or fail to make timely payments of principal or interest. The values of any of the Fund's investments may also decline in response to events affecting the issuer or its credit rating. The lower rated debt securities in which the Fund may invest are considered speculative and are generally subject to greater volatility and risk of loss than investment grade securities, particularly in deteriorating economic conditions. The Fund invests a significant portion of its assets in securities of issuers that hold mortgage-and asset-backed securities and direct investments in securities backed by commercial and residential mortgage loans and other financial assets. The value and related income of these securities is sensitive to changes in economic conditions, including delinquencies and/or defaults. Continuing shifts in the market's perception of credit quality on securities backed by commercial and residential mortgage loans and other financial assets may result in increased volatility of market price and periods of illiquidity that can negatively impact the valuation of certain securities held by the Fund.
Repurchase Agreements: Repurchase agreements permit the Fund to maintain liquidity and earn income over periods of time as short as overnight. Repurchase agreements held by the Fund are fully collateralized by U.S. Government securities, or securities issued by U.S. Government agencies, or securities that are within the three highest credit categories assigned by established rating agencies (Aaa, Aa, or A by Moody's or AAA, AA or A by Standard & Poor's) or, if not rated by Moody's or Standard & Poor's, are of equivalent investment quality
34
FPA NEW INCOME, INC.
NOTES TO FINANCIAL STATEMENTS (Continued)
(Unaudited)
as determined by the Adviser. Such collateral is in the possession of the Fund's custodian. The collateral is evaluated daily to ensure its fair value equals or exceeds the current fair value of the repurchase agreements including accrued interest. In the event of default on the obligation to repurchase, the Fund has the right to liquidate the collateral and apply the proceeds in satisfaction of the obligation.
The Fund may enter into repurchase agreements, under the terms of a Master Repurchase Agreement ("MRA"). The MRA permits the Fund, under certain circumstances including an event of default (such as bankruptcy or insolvency), to offset payables and/or receivables under the MRA with collateral held and/or posted to the counterparty and create one single net payment due to or from the Fund. However, bankruptcy or insolvency laws of a particular jurisdiction may impose restrictions on or prohibitions against such a right of offset in the event of a MRA counterparty's bankruptcy or insolvency. Pursuant to the terms of the MRA, the Fund receives securities as collateral with a fair value in excess of the repurchase price to be received by the Fund upon the maturity of the repurchase transaction. Upon a bankruptcy or insolvency of the MRA counterparty, the Fund recognizes a liability with respect to such excess collateral to reflect the Fund's obligation under bankruptcy law to return the excess to the counterparty. Repurchase agreements outstanding at the end of the period are listed in the Fund's Portfolio of Investments.
NOTE 3 — Purchases and Sales of Investment Securities
Cost of purchases of investment securities (excluding short-term investments) aggregated $1,475,396,580 for the period ended March 31, 2019. The proceeds and cost of securities sold resulting in net realized loss of $6,060,136 aggregated $603,047,527 and $609,107,663, respectively, for the period ended March 31, 2019. Realized gains or losses are based on the specific identification method.
NOTE 4 — Advisory Fees and Other Affiliated Transactions
Pursuant to an Investment Advisory Agreement (the "Agreement"), advisory fees were paid by the Fund to First Pacific Advisors, LP (the "Adviser"). Under the terms of this Agreement, the Fund pays the Adviser a monthly fee calculated at the annual rate of 0.5% of the Fund's average daily net assets. In addition, the adviser contractually agreed to reimburse expenses in excess of 0.49% of the average net assets of the Fund (excluding brokerage fees and commissions, interest, taxes, shareholder service fees, fees and expenses of other funds in which the Fund invests, and extraordinary expenses) through January 31, 2020. The Agreement obligates the Adviser to reduce its fee to the extent necessary to reimburse the Fund for any annual expenses (exclusive of interest, taxes, the cost of any supplemental statistical and research information, and extraordinary expenses such as litigation) in excess of 11/2% of the first $15 million and 1% of the remaining average net assets of the Fund for the year.
For the period ended March 31, 2019, the Fund paid aggregate fees and expenses of $137,902 to all Directors who are not affiliated persons of the Adviser. Certain officers of the Fund are also officers of the Adviser.
NOTE 5 — Federal Income Tax
No provision for federal income tax is required because the Fund has elected to be taxed as a "regulated investment company" under the Internal Revenue Code (the "Code") and intends to maintain this qualification and to distribute each year to its shareholders, in accordance with the minimum distribution requirements of the Code, its taxable net investment income and taxable net realized gains on investments.
The cost of investment securities held at March 31, 2019, was $6,616,022,023 for federal income tax purposes. Gross unrealized appreciation and depreciation for all investment at March 31, 2019, for federal income
35
FPA NEW INCOME, INC.
NOTES TO FINANCIAL STATEMENTS (Continued)
(Unaudited)
tax purposes was $43,009,464 and $117,960,481, respectively resulting in net unrealized depreciation of $74,951,017. As of and during the period ended March 31, 2019, the Fund did not have any liability for unrecognized tax benefits. The Fund recognizes interest and penalties, if any, related to unrecognized tax benefits as income tax expense in the Statement of Operations. During the year, the Fund did not incur any interest or penalties. The statute of limitations remains open for the last 3 years, once a return is filed. No examinations are in progress at this time.
NOTE 6 — Disclosure of Fair Value Measurements
The Fund uses the following methods and inputs to establish the fair value of its assets and liabilities. Use of particular methods and inputs may vary over time based on availability and relevance as market and economic conditions evolve.
Equity securities are generally valued each day at the official closing price of, or the last reported sale price on, the exchange or market on which such securities principally are traded, as of the close of business on that day. If there have been no sales that day, equity securities are generally valued at the last available bid price. Securities that are unlisted and fixed-income and convertible securities listed on a national securities exchange for which the over-the-counter ("OTC") market more accurately reflects the securities' value in the judgment of the Fund's officers, are valued at the most recent bid price. However, most fixed income securities are generally valued at prices obtained from pricing vendors and brokers. Vendors value such securities based on one or more of the following inputs: transactions, bids, offers quotations from dealers and trading systems, spreads and other relationships observed in the markets among comparable securities, benchmarks, underlying equity of the issuer, and proprietary pricing models such as cash flows, financial or collateral performance and other reference data (includes prepayments, defaults, collateral, credit enhancements, and interest rate volatility). Short-term corporate notes with maturities of 60 days or less at the time of purchase are valued at amortized cost.
Securities for which representative market quotations are not readily available or are considered unreliable by the Adviser are valued as determined in good faith under procedures adopted by the authority of the Fund's Board of Directors. Various inputs may be reviewed in order to make a good faith determination of a security's value. These inputs include, but are not limited to, the type and cost of the security; contractual or legal restrictions on resale of the security; relevant financial or business developments of the issuer; actively traded similar or related securities; conversion or exchange rights on the security; related corporate actions; significant events occurring after the close of trading in the security; and changes in overall market conditions. Fair valuations and valuations of investments that are not actively trading involve judgment and may differ materially from valuations of investments that would have been used had greater market activity occurred.
The Fund classifies its assets based on three valuation methodologies. Level 1 values are based on quoted market prices in active markets for identical assets. Level 2 values are based on significant observable market inputs, such as quoted prices for similar assets and quoted prices in inactive markets or other market observable inputs as noted above including spreads, cash flows, financial performance, prepayments, defaults, collateral, credit enhancements, and interest rate volatility. Level 3 values are based on significant unobservable inputs that reflect the Fund's determination of assumptions that market participants might reasonably use in valuing the assets. These assumptions consider inputs such as proprietary pricing models, cash flows, prepayments, defaults,
36
FPA NEW INCOME, INC.
NOTES TO FINANCIAL STATEMENTS (Continued)
(Unaudited)
and collateral. The valuation levels are not necessarily an indication of the risk associated with investing in those securities. The following table presents the valuation levels of the Fund's investments as of March 31, 2019:
Investments | | Level 1 | | Level 2 | | Level 3 | | Total | |
Common Stock | |
Industrials | | $ | 744,973 | | | | — | | | | — | | | $ | 744,973 | | |
Commercial Mortgage-Backed Securities | |
Agency | | | — | | | $ | 27,176,673 | | | | — | | | | 27,176,673 | | |
Agency Stripped | | | — | | | | 304,895,854 | | | | — | | | | 304,895,854 | | |
Non-Agency | | | — | | | | 232,917,577 | | | | — | | | | 232,917,577 | | |
Residential Mortgage-Backed Securities | |
Agency Collateralized Mortgage Obligation | | | — | | | | 262,075,123 | | | | — | | | | 262,075,123 | | |
Agency Pool Adjustable Rate | | | — | | | | 753,395 | | | | — | | | | 753,395 | | |
Agency Pool Fixed Rate | | | — | | | | 942,327,789 | | | | — | | | | 942,327,789 | | |
Agency Stripped | | | — | | | | 989,834 | | | | — | | | | 989,834 | | |
Non-Agency Collateralized Mortgage
Obligation | | | — | | | | 455,795,663 | | | $ | 16,119,652 | | | | 471,915,315 | | |
Asset-Backed Securities | |
Auto | | | — | | | | 1,011,022,880 | | | | — | | | | 1,011,022,880 | | |
Collateralized Loan Obligation | | | — | | | | 727,882,935 | | | | — | | | | 727,882,935 | | |
Credit Card | | | — | | | | 313,700,514 | | | | — | | | | 313,700,514 | | |
Equipment | | | — | | | | 763,324,730 | | | | 25,393,351 | | | | 788,718,081 | | |
Other | | | — | | | | 405,383,996 | | | | 29,115,329 | | | | 434,499,325 | | |
Corporate Bonds & Notes | | | — | | | | 164,333,822 | | | | — | | | | 164,333,822 | | |
Corporate Bank Debt | | | — | | | | 112,978,260 | | | | 62,366,860 | | | | 175,345,120 | | |
U.S. Treasuries | | | — | | | | 681,771,796 | | | | — | | | | 681,771,796 | | |
Short-Term Investment | | | — | | | | 8,661,000 | | | | — | | | | 8,661,000 | | |
| | | $ | 744,973 | | | $ | 6,415,991,841 | | | $ | 132,995,192 | | | $ | 6,549,732,006 | | |
37
FPA NEW INCOME, INC.
NOTES TO FINANCIAL STATEMENTS (Continued)
(Unaudited)
The following table summarizes the Fund's Level 3 investment securities and related transactions during the period ended March 31, 2019:
Investments | | Beginning
Value at
September 30,
2018 | | Net Realized and
Unrealized Gains
(Losses)* | | Purchases | | (Sales) | | Gross
Transfers
In/(Out) | | Ending
Value at
March 31,
2019 | | Net Change
in Unrealized
Appreciation
(Depreciation)
related to
Investments held
at March 31,
2019 | |
Residential Mortgage-
Backed Securities
Non-Agency
Collateralized
Mortgage Obligation | | $ | 400,727 | | | $ | 69,607 | | | $ | 15,844,023 | | | $ | (194,705 | ) | | | — | | | $ | 16,119,652 | | | $ | 96,817 | | |
Asset-Backed Securities
Collateralized Loan
Obligations | | | 60,193,015 | | | | (12,266 | ) | | | 236,280 | | | | (1,593,485 | ) | | $ | (58,823,544 | ) | | | — | | | | — | | |
Asset-Backed Securities
Equipment | | | 33,758,225 | | | | 110,925 | | | | 131,100 | | | | (8,606,899 | ) | | | — | | | | 25,393,351 | | | | 105,780 | | |
Other Asset-Backed
Securities | | | 43,059,404 | | | | (880,571 | ) | | | 272,475 | | | | (13,335,979 | ) | | | — | | | | 29,115,329 | | | | (509,204 | ) | |
Corporate Bonds & Notes | | | 10,677,335 | | | | (3,778,838 | ) | | | 25,931 | | | | (6,924,428 | ) | | | — | | | | — | | | | — | | |
Corporate Bank Debt | | | 63,585,396 | | | | (235,783 | ) | | | 11,979,089 | | | | (12,961,842 | ) | | | — | | | | 62,366,860 | | | | (330,787 | ) | |
| | | $ | 211,674,102 | | | $ | (4,726,926 | ) | | $ | 28,488,898 | | | $ | (43,617,338 | ) | | $ | (58,823,544 | ) | | $ | 132,995,192 | | | $ | (637,394 | ) | |
Level 3 Valuation Process: Investments classified within Level 3 of the fair value hierarchy are valued by the Adviser in good faith under procedures adopted by authority of the Fund's Board of Directors. The Adviser employs various methods to determine fair valuations including regular review of key inputs and assumptions, and review of related market activity, if any. However, there are generally no observable trade activities in these securities. The Adviser reports to the Board of Directors at their regularly scheduled quarterly meetings, or more often if warranted. The report includes a summary of the results of the process, the key inputs and assumptions noted, and any changes to the inputs and assumptions used. When appropriate, the Adviser will recommend changes to the procedures and process employed. The value determined for an investment using the fair value procedures may differ significantly from the value realized upon the sale of such investment.
Transfers of investments between different levels of the fair value hierarchy are recorded at fair value as of the end of the reporting period. There were no transfers between Level 1 and 2.
There were transfers of $58,823,544 out of Level 3 into Level 2 during the period ended March 31, 2019. The transfers are a result of change in pricing vendor commencing coverage and pricing of the securities during the period and a change in observable inputs.
38
FPA NEW INCOME, INC.
NOTES TO FINANCIAL STATEMENTS (Continued)
(Unaudited)
The following table summarizes the quantitative inputs and assumptions used for items categorized as items categorized as Level 3 of the fair value hierarchy as of March 31, 2019:
Financial Assets | | Fair Value at
March 31,
2019 | | Valuation
Technique(s) | | Unobservable
Inputs | | Price/Range | |
Residential Mortgage-Backed
Securities Non-Agency
Collateralized Mortgage Obligation | | $ | 15,886,197 | | |
Third-Party
Broker Quote (a)
| |
Quotes/Prices
| | $100.26
| |
| | | 233,455 | | | Pricing Model (b) | | Prices | | $50.42-$55.61 ($52.84) | |
| | | | | | Discount | | 0.00%-4.10% (3.30%) | |
| | $ | 16,119,652 | | | | | | | | |
Asset-Backed Securities Equipment
| | $ | 25,393,351 | | | Third-Party
Broker Quote (a) | | Quotes/Prices
| | $98.37
| |
Other Asset-Backed Securities
| | $ | 29,115,329 | | | Third-Party
Broker Quote (a) | | Quotes/Prices
| | $99.38-$100.02
| |
Corporate Bank Debt | | $ | 62,366,860 | | | Pricing Vendor | | Prices | | $99.69-$100.77 | |
(a) The Third Party Broker Quote technique involves obtaining an independent third-party broker quote for the security
(b) The Pricing Model technique for Level 3 securities involves preparing a proprietary broker price opinion (BPO) model using valuation information provided by the loan servicer based on local market resources and sales trends published by the National Association of Realtors, and a broker, and then applying an appropriate discount to that valuation. The discount reflects market conditions such as lack of liquidity of the investment, the costs associated with foreclosure and liquidation, the historical performance of the loan pool and the characteristics of the remaining loans including whether or not the loans are performing.
NOTE 7 — Collateral Requirements
FASB Accounting Standards Update No. 2011-11, Disclosures about Offsetting Assets and Liabilities, requires disclosures to make financial statements that are prepared under U.S. GAAP more comparable to those prepared under International Financial Reporting Standards. Under this guidance the Fund discloses both gross and net information about instruments and transactions eligible for offset such as instruments and transactions subject to an agreement similar to a master netting arrangement. In addition, the Fund discloses collateral received and posted in connection with master netting agreements or similar arrangements.
39
FPA NEW INCOME, INC.
NOTES TO FINANCIAL STATEMENTS (Continued)
(Unaudited)
The following table presents the Fund's repurchase agreements by counterparty net of amounts available for offset under an ISDA Master agreement or similar agreements and net of the related collateral received or pledged by the Fund as of March 31, 2019, are as follows:
| | | | | Gross Amounts Not Offset in the
Statement of Assets and Liabilities | | | |
Counterparty | | Gross Assets
(Liabilities)
in the Statement of
Assets and Liabilities | | Collateral
Received
(Pledged) | | Assets (Liabilities)
Available for Offset | | Net Amount
of Assets
(Liabilities)* | |
State Street Bank and
Trust Company: | |
Repurchase Agreement | | $ | 8,661,000 | | | $ | (8,661,000 | )** | | | — | | | | — | | |
* Represents the net amount receivable from the counterparty in the event of default.
** Collateral with a value of $8,837,290 has been received in connection with a master repurchase agreement. Excess of collateral received from the individual master repurchase agreement is not shown for financial reporting purposes.
40
FPA NEW INCOME, INC.
SHAREHOLDER EXPENSE EXAMPLE
March 31, 2019 (Unaudited)
Fund Expenses
Mutual fund shareholders generally incur two types of costs: (1) transaction costs, and (2) ongoing costs, including advisory and administrative fees; shareholder service fees; and other Fund expenses. The Example is intended to help you understand your ongoing costs (in dollars) of investing in the Fund and to compare these costs with the ongoing costs of investing in other mutual funds. The Example is based on an investment of $1,000 invested at the beginning of the year and held for the entire year.
Actual Expenses
The information in the table under the heading "Actual Performance" provides information about actual account values and actual expenses. You may use the information in this column, together with the amount you invested, to estimate the expenses that you paid over the period. Simply divide your account value by $1,000 (for example, an $8,600 account value divided by $1,000 = 8.6), then multiply the result by the number in the first column in the row entitled "Expenses Paid During Period" to estimate the expenses you paid on your account during this period.
Hypothetical Example for Comparison Purposes
The information in the table under the heading "Hypothetical Performance (5% return before expenses)" provides information about hypothetical account values and hypothetical expenses based on the Fund's actual expense ratio and an assumed rate of return of 5% per year before expenses, which is not the Fund's actual return. The hypothetical account values and expenses may not be used to estimate the actual ending account balance or expenses you paid for the period. You may use this information to
compare the ongoing costs of investing in the Fund and other funds. To do so, compare this 5% hypothetical example with the 5% hypothetical examples that appear in the shareholder reports of other funds.
Please note that the expenses shown in the table are meant to highlight your ongoing costs only and do not reflect any transactional costs. Therefore, the information under the heading "Hypothetical Performance (5% return before expenses)" is useful in comparing ongoing costs only, and will not help you determine the relative total costs of owning different funds. In addition, if these transactional costs were included, your costs would have been higher. Even though the Fund does not charge transaction fees, if you purchase shares through a broker, the broker may charge you a fee. You should evaluate other mutual funds' transaction fees and any applicable broker fees to assess the total cost of ownership for comparison purposes.
| | | Actual
Performance | | Hypothetical
Performance
(5% return
before
expenses) | |
Beginning Account Value
September 30, 2018 | | $ | 1,000.00 | | | $ | 1,000.00 | | |
Ending Account Value
March 31, 2019 | | $ | 1,019.80 | | | $ | 1,022.49 | | |
Expenses Paid During
Period* | | $ | 2.47 | | | $ | 2.47 | | |
* Expenses are equal to the Fund's annualized expense ratio of 0.49%, multiplied by the average account value over the period and prorated for the six-months ended March 31, 2019 (182/365 days).
41
FPA NEW INCOME, INC.
DIRECTOR AND OFFICER INFORMATION
(Unaudited)
Sandra Brown, Mark L. Lipson, Alfred E. Osborne, Jr., A. Robert Pisano, and Patrick B. Purcell are all Directors of the Fund who are not "interested persons" of the Fund, as that term is defined in the 1940 Act (collectively, the "Independent Directors"). Directors serve until their resignation, removal or retirement. The Statement of Additional Information includes additional information about the Directors and is available, without charge, upon request by calling (800) 982-4372.
Name, Address(1)
and Year of Birth | | Position(s)
Held with
the Fund | | Year First
Elected as
Director of
the Fund | | Principal Occupation(s)
During the
Past Five Years | | Number of
FPA Funds
Overseen
by Director | | Other
Directorships
Held by Director
During the Past
Five Years | |
Independent Directors | |
Sandra Brown,
1955 | | Director | | | 2016 | | | Consultant (since 2009). Formerly, CEO and President of Transamerica Financial Advisers, Inc. (1999-2009); President, Transamerica Securities Sales Corp. (1998-2009); Vice President, Bank of America Mutual Fund Administration (1990-1998). Director/Trustee of FPA Capital, Inc., FPA Funds Trust, FPA New Income, Inc., FPA Paramount Fund, Inc., FPA U.S. Value Fund, Inc. and Source Capital, Inc. (since October 2016). | | | 8 | | | None | |
Mark L. Lipson,
1949 | | Director & Chairman | | | 2015 | | | Registered Investment Adviser, ML2 Advisors, LLC (since 2014). Formerly Managing Director, Bessemer Trust (2007-2014) and US Trust (2003-2006); Chairman and CEO of the Northstar Mutual Funds (1993-2001); and President and CEO of the National Mutual Funds (1988-1993). Director/Trustee of FPA Capital, Inc., FPA Funds Trust, FPA New Income, Inc., FPA Paramount Fund, Inc., FPA U.S. Value Fund, Inc. and Source Capital, Inc. (since October 2015). | | | 8 | | | None | |
Alfred E. Osborne, Jr.,
1944 | | Director | | | 1999 | | | Interim Dean, Professor and Faculty Director, Price Center for Entrepreneurship and Innovation at the John E. Anderson School of Management at UCLA (since July 2018). Dr. Osborne has been at UCLA since 1972. Director/Trustee of FPA Capital Fund, Inc. and FPA New Income, Inc. (since 1999), of FPA Funds Trust (since 2002), of FPA Paramount Fund, Inc., FPA U.S. Value Fund, Inc. and Source Capital, Inc. (since 2013). | | | 8 | | | Kaiser Aluminum, and Wedbush, Inc. | |
42
FPA NEW INCOME, INC.
DIRECTOR AND OFFICER INFORMATION (Continued)
(Unaudited)
Name, Address(1)
and Year of Birth | | Position(s)
Held with
the Fund | | Year First
Elected as
Director of
the Fund | | Principal Occupation(s)
During the
Past Five Years | | Number of
FPA Funds
Overseen
by Director | | Other
Directorships
Held by Director
During the Past
Five Years | |
A. Robert Pisano,
1943 | | Director | | | 2013 | | | Consultant (since 2012). Formerly, President and Chief Operating Officer of The Motion Picture Association of America, Inc. (October 2005-2011). Formerly, National Executive Director and Chief Executive Officer of The Screen Actors Guild (2001-2005). Director/Trustee of FPA Paramount Fund, Inc. and FPA U.S. Value Fund, Inc. (since 2012), and of FPA Capital, Inc., FPA Funds Trust, FPA New Income, Inc. and Source Capital, Inc. (since 2013). | | | 8 | | | Entertainment Partners and Resources Global Professionals | |
Patrick B. Purcell,
1943 | | Director | | | 2006 | | | Retired (since 2000). Formerly, Consultant to Paramount Pictures 1998-2000; Executive Vice President, Chief Financial and Administrative Officer of Paramount Pictures (1983-1998). Director/Trustee of FPA Capital, Inc., FPA Funds Trust and FPA New Income, Inc. (since 2006), of Source Capital, Inc. (since 2010), of FPA U.S. Value Fund, Inc. and FPA Paramount Fund, Inc. (since 2012). | | | 8 | | | None | |
"Interested" Director(2) | |
J. Richard Atwood,
1960 | | Director | | | 2016 | | | Director and President of FPA GP, Inc., the General Partner of the Adviser (since October 2018). Director/Trustee of each FPA Fund (since 2016). President of each FPA Fund (since 2015). Formerly, Managing Partner of FPA (2006-2018). Formerly, until 2015, Treasurer of each FPA Fund for more than the past five years. | | | 8 | | | None | |
(1) The address of each Director is 11601 Wilshire Boulevard, Suite 1200, Los Angeles, California 90025.
(2) "Interested person" within the meaning of the 1940 Act by virtue of their affiliation with the Fund's Adviser.
43
FPA NEW INCOME, INC.
DIRECTOR AND OFFICER INFORMATION (Continued)
(Unaudited)
Officers of the Fund. Officers of the Fund are elected annually by the Board.
Name, Address(1)
and Year of Birth | | Position
with Fund | | Year First
Elected as
Officer of the
Fund | | Principal Occupation(s)
During the Past Five Years | |
Thomas H. Atteberry,
1953 | | Vice President and Portfolio Manager | | | 2004 | | | Partner of FPA. | |
Abhijeet Patwardhan,
1979 | | Vice President and Portfolio Manager | | | 2015 | | | Partner (since January 2017) and a Director of Research (since April 2015) of FPA; Managing Director of FPA from November 2015 to January 2017, Senior Vice President of FPA from January 2014 to November 2015; Analyst and Vice President of FPA from June 2010 to December 2013. Vice President and Portfolio Manager of FPA Flexible Fixed Income Fund (since December 2018). | |
J. Richard Atwood,
1960 | | President | | | 1997 | | | Director and President of FPA GP, Inc., the General Partner of FPA (since October 2018). Director/Trustee of each FPA Fund (since May 2016). President of each FPA Fund (since February 2015). Formerly, Managing Partner of FPA (2006-2018). Formerly, until February 2015, Treasurer of each FPA Fund for more than the past five years. | |
Karen E. Richards,
1969 | | Chief Compliance Officer | | | 2019 | | | Chief Compliance Officer of FPA (since August 2018). Formerly, Deputy Chief Compliance Officer of First Republic Investment Management, LLC (from February 2016 to March 2018), and Vice President, Senior Compliance Officer of Pacific Investment Management Company (from June 2010 to January 2016). | |
E. Lake Setzler III,
1967 | | Treasurer | | | 2006 | | | Senior Vice President (since January 2013) and Controller of FPA; and Treasurer of each FPA Fund (since February 2015). Formerly, until February 2015, Assistant Treasurer of each FPA Fund (February 2006 to February 2015). | |
Rebecca D. Gilding,
1979 | | Secretary | | | 2019 | | | Vice President and Counsel, State Street Bank and Trust Company (since April 2016). Formerly, Assistant Vice President and Associate Counsel, Brown Brothers Harriman & Co. (September 2013 to April 2016). | |
(1) The address for each Officer (except Ms. Gilding) is 11601 Wilshire Boulevard, Suite 1200, Los Angeles, California 90025. Ms. Gilding's address is State Street Bank and Trust Company, One Lincoln Street, Boston, Massachusetts 02111.
44
FPA NEW INCOME, INC.
(Unaudited)
INVESTMENT ADVISER
First Pacific Advisors, LP
11601 Wilshire Boulevard, Suite 1200
Los Angeles, CA 90025
TRANSFER & SHAREHOLDER SERVICE AGENT
UMB Fund Services, Inc.
P.O. Box 2175
Milwaukee, WI 53201-2175
or
235 West Galena Street
Milwaukee, WI 53212-3948
(800) 638-3060
CUSTODIAN AND ADMINISTRATOR
State Street Bank and Trust Company
One Lincoln Street
Boston, Massachusetts 02111
TICKER SYMBOL: FPNIX
CUSIP: 302544101
DISTRIBUTOR
UMB Distribution Services, LLC
235 West Galena Street
Milwaukee, Wisconsin 53212-3948
LEGAL COUNSEL
Dechert LLP
One Bush Street, Suite 1600
San Francisco, California 94104
INDEPENDENT REGISTERED PUBLIC ACCOUNTING FIRM
Ernst & Young LLP
725 South Figueroa Street,
Los Angeles, California 90017
This report has been prepared for the information of shareholders of FPA NEW INCOME, INC., and is not authorized for distribution to prospective investors unless preceded or accompanied by an effective prospectus. The financial information included in this report has been taken from the records of the Fund without examination by independent auditors.
A description of the policies and procedures that the Adviser uses to vote proxies related to the Fund's portfolio securities is set forth in the Fund's Statement of Additional Information which is available without charge, upon request, on the Fund's website at www.fpa.com or by calling (800) 982-4372 and on the Securities and Exchange Commission's website at www.sec.gov.
The Fund's complete proxy voting record for the 12 months ended June 30, 2018 is available without charge, upon request by calling (800) 982-4372 and on the SEC's website at www.sec.gov.
The Fund's schedule of portfolio holdings, filed the first and third quarter of the Fund's fiscal year on Form N-Q with the SEC, is available on the SEC's website at www.sec.gov. To obtain Form N-Q from the Fund, shareholders can call (800) 982-4372.
Additional information about the Fund is available online at www.fpa.com. This information includes, among other things, holdings, top sectors, and performance, and is updated on or about the 15th business day after the end of each quarter.
Item 2. Code of Ethics.
Not applicable to this semi-annual report.
Item 3. Audit Committee Financial Expert.
Not applicable to this semi-annual report.
Item 4. Principal Accountant Fees and Services.
Not applicable to this semi-annual report.
Item 5. Audit Committee of Listed Registrants.
Not applicable to this semi-annual report.
Item 6. Investments.
(a) Schedule of Investments is included as a part of the report to shareholders filed under Item 1 of this Form N-CSR.
(b) Not applicable.
Item 7. Disclosure of Proxy Voting Policies and Procedures for Closed-End Management Investment Companies.
Not applicable.
Item 8. Portfolio Managers of Closed-End Management Investment Companies.
Not applicable.
Item 9. Purchases of Equity Securities by Closed-End Management Investment Company and Affiliated Purchasers.
Not applicable.
Item 10. Submission of Matters to a Vote of Security Holders.
There have been no material changes to the procedures by which the shareholders may recommend nominees to the registrant’s board of directors.
Item 11. Controls and Procedures.
(a) The principal executive officer and principal financial officer of the registrant have concluded that the registrant’s disclosure controls and procedures (as defined in Rule 30a-3(c) under the Investment Company Act of 1940) are effective based on their evaluation of the disclosure controls and procedures as of a date within 90 days of the filing date of this report.
(b) There have been no significant changes in the registrant’s internal controls over financial reporting (as defined in Rule 30a-3(d) under the Investment Company Act of 1940) that occurred during the registrant’s second fiscal quarter of the period covered by this report that have materially affected, or is reasonably likely to materially affect, the registrant’s internal controls over financial reporting.
Item 12. Disclosure of Securities Lending Activities for Closed-End Management Investment Companies
Not applicable.
Item 13. Exhibits.
(a)(1) Not applicable.
(a)(2) The certifications required by Rule 30a-2(a) under the Investment Company Act of 1940 are attached hereto.
(a)(3) Not applicable.
(a)(4) Not applicable.
(b) The certifications required by Rule 30a-2(b) under the Investment Company Act of 1940 and Section 906 of the Sarbanes-Oxley Act of 2002 are attached hereto.
SIGNATURES
Pursuant to the requirements of the Securities Exchange Act of 1934 and the Investment Company Act of 1940, the registrant has duly caused this report to be signed on its behalf by the undersigned, thereunto duly authorized.
FPA NEW INCOME, INC. | |
| |
By: | /s/ J. Richard Atwood | |
| J. Richard Atwood | |
| President (principal executive officer) | |
| | |
Date: | June 5, 2019 | |
Pursuant to the requirements of the Securities Exchange Act of 1934 and the Investment Company Act of 1940, this report has been signed below by the following persons on behalf of the registrant and in the capacities and on the dates indicated.
By: | /s/ J. Richard Atwood | |
| J. Richard Atwood | |
| President (principal executive officer) | |
| | |
Date: | June 5, 2019 | |
By: | /s/ E. Lake Setzler III | |
| E. Lake Setzler III | |
| Treasurer (principal financial officer) | |
| | |
Date: | June 5, 2019 | |