(Address and telephone number of Registrant's principal executive offices)
QUEBECOR WORLD (USA) INC.
291 State Street, North Haven, CT 06473
Telephone: (203) 288-2468
(Name, address (including zip code) and telephone number (including area code) of agent for service in the United States)
Securities registered or to be registered pursuant to Section 12(b) of the Act.
Subordinate voting shares
New York Stock Exchange
______________________
_________________________
Title of each class
Name of each exchange on which registered
Securities Registered or to be registered pursuant to Section 12(g) of the Act
N/A
(Title of Class)
Securities for which there is a reporting obligation pursuant to Section 15(d) of the Act.
Guarantees of Debt Securities issued by Quebecor World Capital Corporation, an indirect subsidiary of Registrant
(Title of Class)
For annual reports, indicate by check mark the information filed with this Form:
[•] Annual Information form [•] Audited annual financial statements
Indicate the number of outstanding shares of each of the issuer's classes of capital or common stock as of the close of the period covered by the annual report.
85,604,746 Subordinate Voting shares Outstanding
46,987,120 Multiple Voting Shares Outstanding
12,000,000 First Preferred Shares Series 3 Outstanding
8,000,000 First Preferred Shares Series 4 Outstanding
7,000,000 First Preferred Shares Series 5 Outstanding
Indicate by check mark whether the Registrant by filing the information contained in this Form is also thereby furnishing the information to the Commission pursuant to Rule 12g3-2(b) under theSecurities Exchange Act of 1934 (the "Exchange Act"). If "Yes" is marked, indicate the filing number assigned to the Registrant in connection with such Rule.
Yes 82- No •
Indicate by check mark whether the Registrant (1) has filed all reports required to be filed by Section 13 or 15(d) of the Exchange Act during the preceding 12 months (or for such shorter period that the Registrant was required to file such reports) and (2) has been subject to such filing requirements for the past 90 days.
Yes • No
Material included in this Form 40-F:
The Annual Information Form of the Registrant dated March 24, 2005.
Management's Discussion and Analysis of Financial Condition and Results of Operation and Audited Consolidated Financial Statements of the Registrant for the years ended December 31, 2004, 2003 and 2002.
*************
DISCLOSURE CONTROLS AND PROCEDURES; INTERNAL CONTROL OVER FINANCIAL REPORTING
Disclosure controls and procedures are defined by the Securities and Exchange Commission (the "Commission") as those controls and other procedures that are designed to ensure that information required to be disclosed in our filings and submissions under the Securities Exchange Act of 1934, as amended (the "Exchange Act"), is recorded, processed, summarized and reported within the time periods specified in the rules and forms of the Commission. Our Chief Executive Officer and Chief Financial Officer have evaluated the effectiveness of our disclosure controls and procedures (as defined in Exchange Act Rules 13a-15(e) and 15d-15(e)) as of the end of the period covered by this annual report on Form 40-F and have determined that such disclosure controls and procedures are effective.
There was no change in our internal control over financial reporting that occurred during the period covered by this annual report on Form 40-F that has materially affected, or is reasonably likely to materially affect, our internal control over financial reporting.
AUDIT COMMITTEE
Quebecor World Inc. (the "Registrant") has a separately-designated standing audit committee established in accordance with Section 3(a)(58)(A) of the Exchange Act. The members of the Registrant's audit committee are Robert Coallier (Chairman), Reginald K. Brack, Robert Normand and Alain Rhéaume.
AUDIT COMMITTEE FINANCIAL EXPERT
The Board of Directors of the Registrant has reviewed the definition of "audit committee financial expert" under paragraph 8(b) of General Instruction B to Form 40-F and determined that the Registrant has at least one audit committee financial expert. The names of the audit committee financial experts of the Registrant are Messrs. Robert Coallier, Robert Normand and Alain Rhéaume. The Commission has indicated that the designation of Messrs. Coallier, Normand and Rhéaume as the audit committee financial experts of the Registrant do not (i) make any of Messrs. Coallier, Normand and Rhéaume an "expert" for any purpose, including without limitation for purposes of Section 11 of the Securities Act of 1933, as amended, as a result of this designation; (ii) impose any duties, obligations or liability on Messrs. Coallier, Normand and Rhéaume that are greater than those imposed on them as members of the audit committee and the Board of Directors in the absence of such designation; or (iii) affect the duties, obligations or liability of any other member of the audit committee or the Board of Directors.
PRINCIPAL ACCOUNTANT FEES AND SERVICES
Fees payable to the Registrant's external auditor, KPMG LLP, for the years ended December 31, 2004, and December 31, 2003, totalled $5,858,000 and $5,760,000, respectively, as detailed in the following table:
Fees
Financial Year Ended December 31, 2004
Financial Year Ended December 31, 2003
Audit Fees(1)
$3,990,000
$3,459,000
Audit-Related Fees(2)
$466,000
$774,000
Tax Fees(3)
$1,339,000
$1,441,000
All other Fees(4)
$63,000
$86,000
Total Fees:
$5,858,000
$5,760,000
(1)
Refers to all aggregate fees billed by the Registrant's external auditor for audit services.
(2)
Refers to the aggregate fees billed for assurance and related services by the Registrant's external auditor that are reasonably related to the performance of the audit or review of the Registrant's financial statements and are not reported under (1) above, including professional services rendered by the Registrant's external auditor for accounting consultations on proposed transactions, and consultations related to accounting and reporting standards. In 2004, such fees included fees incurred in respect of: audit or attest services related to the review and preparation of prospectuses and to compliance with the Sarbanes-Oxley Act; employee benefits plans; due diligence and other work related to the disposition of businesses, such work being unrelated to the audit of the Corporation's financial statements; accounting consultations with respect to proposed transactions; as well as other audit-related services.
(3)
Refers to the aggregate fees billed for professional services rendered by the Registrant's external auditor for tax compliance, tax advice, and tax planning.
(4)
Refers to the aggregate fees billed for products and services provided by the Registrant's external auditor, other than the services reported under (1), (2) and (3) above. In 2004, such fees included fees incurred in respect of forensic and litigation services, training services and various other services.
Pre-approval policies and procedures
The Registrant's audit committee has adopted a pre-approval policy pursuant to which the Registrant may not engage the Registrant's external auditor to carry out certain non-audit services that are deemed inconsistent with the independence of auditors under U.S. and Canadian applicable laws. The audit committee must pre-approve all audit services as well as permitted non-audit services. However, in certain circumstances, the audit committee may delegate to one or more of its members the authority to grant such pre-approval, provided that the decisions of any members to whom authority is so delegated is presented to the full audit committee at its next scheduled meeting.
For the years ended December 31, 2004 and 2003, none of the non-audit services described above were approved by the audit committee pursuant to the "minimis exception" to the pre-approval requirement for non-audit services.
OFF-BALANCE SHEET ARRANGEMENTS
The Registrant and its subsidiaries have certain arrangements and commitments that have financial implications. These arrangements are described in Notes 8 and 19 to our audited consolidated financial statements for the year ended December 31, 2004 included hereto.
TABULAR DISCLOSURE OF CONTRACTUAL OBLIGATIONS
Contractual Cash Obligations($ millions)
2005
2006
2007
2008
2009
2010 and thereafter
Long-term debt and convertible notes
$
—
$
251
$
681
$
202
$
—
$
772
Capital leases
12
8
4
3
8
10
Operating leases
110
79
60
38
30
100
Capital asset purchase commitments
101
31
—
—
—
—
Total contractual cash obligations
$
223
$
369
$
745
$
243
$
38
$
882
For further details on our long-term debt and convertible notes, Capital leases, Operating leases and Capital asset purchase commitments see Notes 12, 14 and 19 of our audited consolidated financial statements for the year ended December 31, 2004 included hereto.
CODE OF ETHICS
The Registrant has adopted a Code of Business Conduct, which is a code of ethics (as defined in paragraph 9(b) of General Instruction B of Form 40-F) that applies to all of the Registrant's employees, directors and officers, including the Registrant's principal executive officer, principal financial officer, principal accounting officer or controller, or persons performing similar functions. The text of the Code of Business Conduct of the Registrant is available on the Registrant's web site at www.quebecorworld.com in Investors Center under Corporate Governance.
UNDERTAKING
Quebecor World Inc. undertakes to make available, in person or by telephone, representatives to respond to inquiries made by the Commission staff, and to furnish promptly, when requested to do so by the Commission staff, information relating to: the securities in relation to which the obligation to file an annual report on Form 40-F arises; or transactions in said securities.
SIGNATURES
Pursuant to the requirements of the Exchange Act, the Registrant certified that it meets all of the requirements for filing on Form 40-F and has duly caused this annual report to be signed on its behalf by the undersigned, thereto duly authorized.
In this Annual Information Form, unless the context otherwise requires, "Corporation" refers to Quebecor World Inc., its partnerships, subsidiaries and divisions and their respective predecessors. Unless otherwise indicated, all references to "dollars," "US$" and "$" are in United States dollars. Unless otherwise indicated, the information contained herein is given as at December 31, 2004.
The Corporation was incorporated on February 23, 1989 pursuant to theCanada Business Corporations Act under the name "Quebecor Printing Inc." On January 1, 1990, the Corporation (as it was then known), Quebecor Printing Group Inc., Quebecor Printing (Canada) Inc., 166599 Canada Inc., Ronalds Printing Atlantic Limited and 148461 Canada Inc. amalgamated under the name "Quebecor Printing Inc." pursuant to theCanada Business Corporations Act. This corporate reorganization was undertaken in order to consolidate the assets of the printing sector of Quebecor Inc., its parent company, which, prior to such reorganization, consisted of a number of divisions and subsidiaries. The Corporation's Articles were amended:
on December 7, 1990, in order to subdivide each outstanding share into five shares;
on December 14, 1990, in order to create Series 1 Preferred Shares;
on February 24, 1992, in order to delete private company restrictions;
on April 10, 1992, in order to :
create three new classes of shares, namely Subordinate Voting Shares, Multiple Voting Shares and First Preferred Shares, issuable in series,
reclassify and change the 39,965,005 outstanding Common Shares into 39,965,005 Multiple Voting Shares,
reclassify and change the 5,360 outstanding Series 1 Preferred Shares into 5,360 Series 1 First Preferred Shares, and
cancel the unissued Preferred Shares and Common Shares;
on April 25, 1994, in order to split the Subordinate Voting Shares and the Multiple Voting Shares, so that each shareholder would receive three shares for each two shares held;
on April 25, 1996, in order to permit the appointment of one or more directors during the course of the year;
on November 5, 1997, in order to create Series 2 First Preferred Shares and Series 3 First Preferred Shares;
on April 25, 2000, in order to change the name of the Corporation to "Quebecor World Inc.";
on February 21, 2001, in order to create Series 4 First Preferred Shares; and
on August 10, 2001, in order to create Series 5 First Preferred Shares.
The head office of the Corporation is located at 612 Saint-Jacques Street, Montreal, Quebec, Canada, H3C 4M8. The telephone number of the Corporation at its head office is (514) 954-0101. The fax number is (514) 954-9624 and its web site iswww.quebecorworld.com
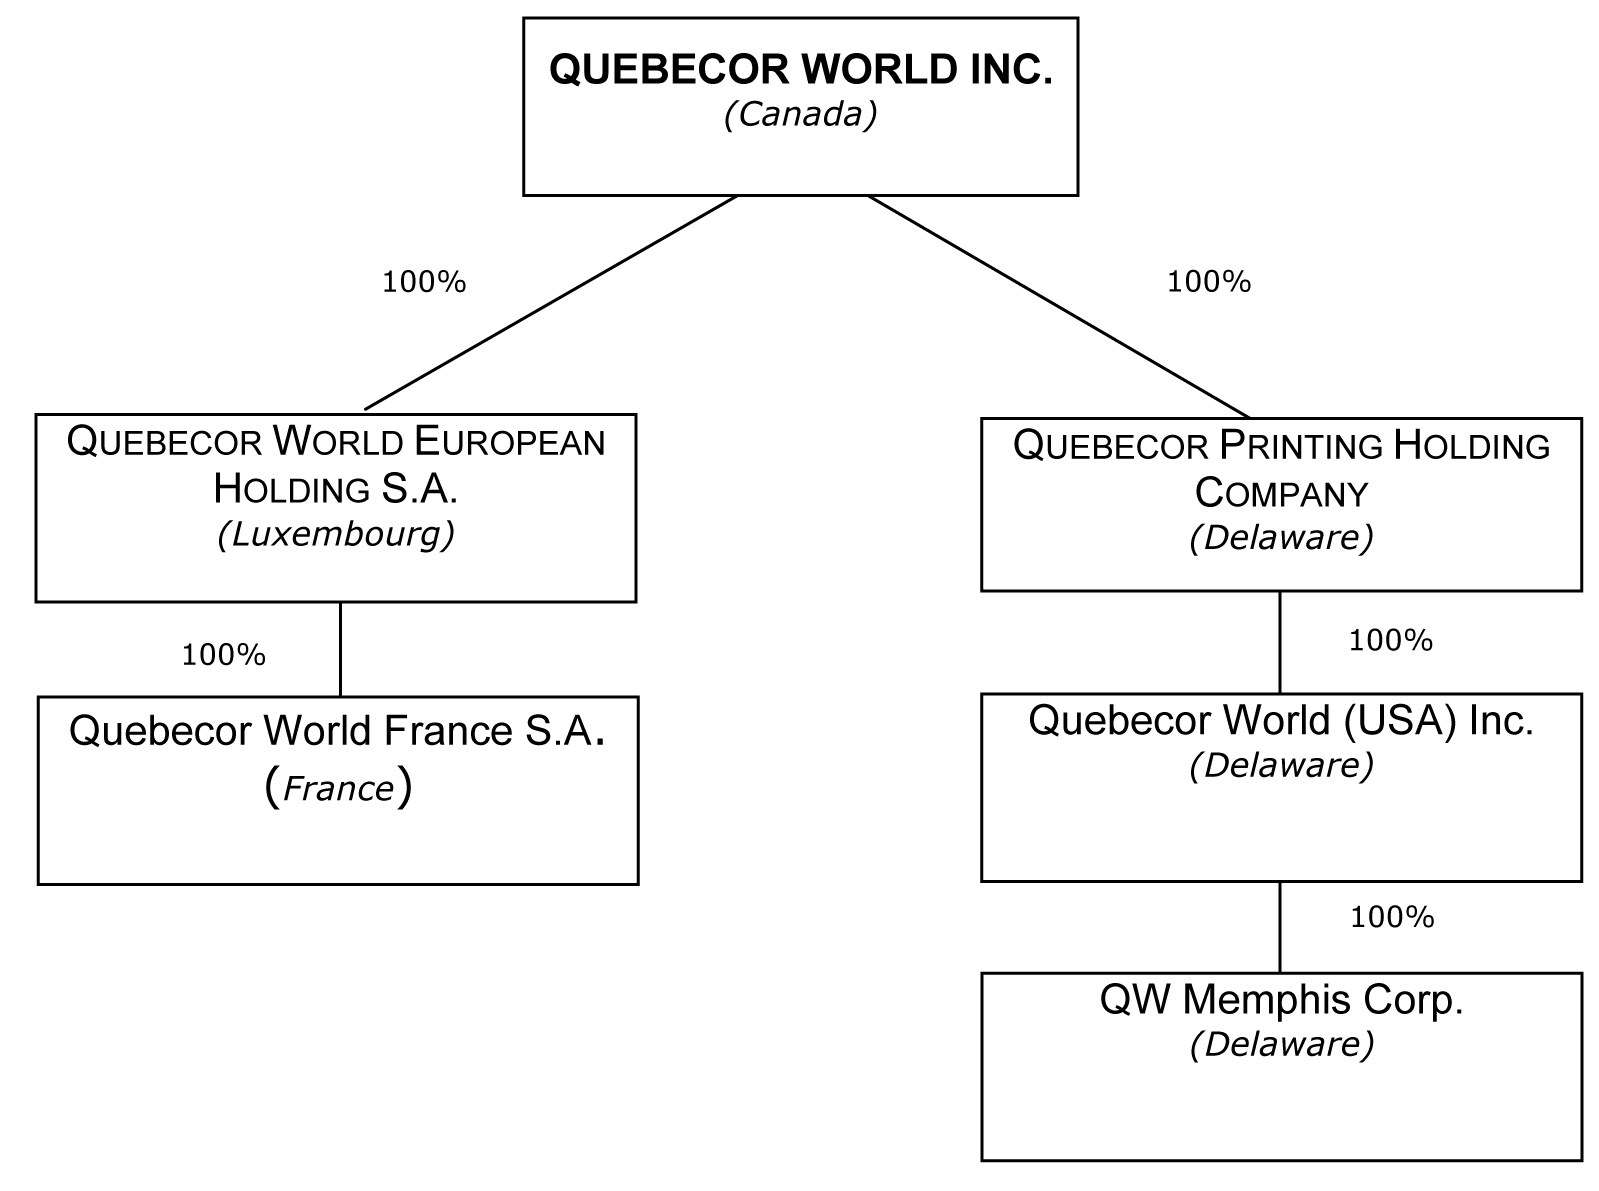
The following organizational chart shows the Corporation's principal subsidiaries as at March 1, 2005, their jurisdiction of incorporation or continuation and the percentage of voting rights held or controlled, directly or indirectly, by the Corporation. The Corporation does not own or control, directly or indirectly, any non-voting securities of such subsidiaries. The subsidiaries whose total assets and revenues represented (a) individually, less than 10% of the consolidated assets or revenues of the Corporation as at December 31, 2004, and (b) in the aggregate, less than 20% of the consolidated assets and revenues of the Corporation as at December 31, 2004, have not been included.
The Corporation is one of the largest commercial print media services companies in the world. It is the market leader in most of its product categories and geographies. The market-leading position has been built through a combination of integrating acquisitions, investing in key strategic technologies and a commitment to building long-term partnerships with the world's leading print media customers.
The Corporation has more than 160 plants and related facilities located throughout the United States, Canada, France, the United Kingdom, Spain, Switzerland, Sweden, Finland, Austria, Belgium, Brazil, Chile, Argentina, Peru, Columbia, Mexico and India.
The Corporation offers its customers a broad range of printed products and related communication services, such as magazines, retail inserts, catalogs, specialty printing and direct mail, books, directories, pre-media, logistics and other value-added services
The Corporation operates in the commercial print media segment of the printing industry and its business groups are located in three main geographical regions, to wit: North America, which historically represents approximately 80% of the Corporation's revenues, Europe and Latin America.
The table below shows the revenues and operating income (loss) per segment.
Years Ended December 31,
2004
2003
$
%
$
%
($ in millions)
Revenues:
North America
5,132.4
77
5,062.7
79
Europe
1,297.4
20
1,151.4
18
Latin America
192.4
3
177.3
3
Intersegment and Other
(0.1)
–
0.1
–
Total
6,622.1
100
6,391.5
100
Operating income (loss):*
North America
433.7
90
304.1
96
Europe
50.1
10
24.3
8
Latin America
1.3
–
(3.7)
(1)
Other
(1.7)
–
(8.8)
(3)
Total
483.4
100
315.9
100
*Before impairment of assets, restructuring and other charges
Commercial printing is a very fragmented, capital-intensive manufacturing industry. The North American, European and Latin American printing industries are highly competitive in most product categories and geographic regions. The Corporation believes that the ten largest competitors in the North American and European commercial printing markets have an aggregate of about 25% of the total share of each of their respective markets. In North America alone, there are about 32,000 commercial printers.
Commercial printers tend to compete within each product category based on price, quality, range of services offered, distribution capabilities, customer service, availability of printing time on appropriate equipment and state-of-the-art technology. Small competitors are generally limited to servicing customers for a specific product category within a regional market. Larger and more diversified commercial printers with greater geographic coverage have the ability to serve national and global customers across multiple product segments.
Management believes that both the North American and European printing markets are consolidating and that acquisition targets will continue to be available as larger commercial printers displace medium-size printers and regional competitors. Industry trends in Latin America, which are mirroring historical developments in North America, should also provide acquisition opportunities. Over the past decade, North American and European publishers have outsourced their printing operations. A recent example would be the Corporation's acquisition of the European printing assets of Hachette Filipacchi Media in France and Belgium. The Corporation's ongoing partnership with the Brazilian publisher Editora Abril, S.A., which commenced in 2000, is a reflection of a similar trend taking root in Latin America. This segregation of publishing and printing activity should provide independent printers greater acquisition opportunities and enable them to seek printing business with previously captive customer s. Management believes that the Corporation is well positioned to continue to take advantage of the consolidation of the North American, European and Latin American commercial printing markets.
6
The Corporation is one of the few commercial printers that has the ability to serve customers on a regional, national and global basis. As a result, the Corporation has been able to build a substantial business within each of the North American and European segments and to pursue its expansion in Latin America.
In the United States, the Corporation is one of the largest commercial printers with 80 plants and related facilities and approximately 21,600 employees operating in 31 states. The Corporation is a leader in the printing of books, magazines, retail inserts, catalogs, specialty printing, and direct mail.
The Corporation is the largest commercial printer in Canada, with 31 facilities in six provinces and approximately 5,400 employees. It offers a diversified mix of printed products and related value-added services to the domestic market and internationally, including substantial exports to the United States.
In Europe, the Corporation operates in France, Belgium, Switzerland, the United Kingdom, Spain, Sweden, Austria and Finland, with 30 facilities and approximately 5,700 employees serving customers in8 European countries. It is the largest independent commercial printer in Europe.
The Corporation also operates in Latin America with eight facilities and approximately 2,300 employees, as well as in India, where it has one facility and 60 employees.
The Corporation's revenues by product are as follows:
For the year ended December 31, 2004
North America
Europe
Latin America
Inter- segment
Total
$
%
$
%
$
%
$
%
Magazines
1,042.3
20
701.8
54
34.5
18
1,778.6
27
Retail Inserts
1,407.2
28
241.2
18
16.0
8
1,664.4
25
Catalogs
803.4
16
224.7
17
17.8
9
1,045.9
16
Books
572.7
11
59.6
5
66.9
35
699.2
10
Specialty Printing and Direct Mail
556.1
11
7.5
1
9.5
5
573.1
9
Directories
329.4
6
8.8
1
46.9
24
0.5
385.6
6
Pre-Media, Logistics and other Value-Added Services
419.5
8
53.3
4
2.5
1
475.3
7
Inter-segment
1.8
–
0.5
–
(1.7)
–
(0.6)
–
–
Total
5,132.4
100
1,297.4
100
192.4
100
(0.1)
6,622.1
100
For the year ended December 31, 2003
North America
Europe
Latin America
Inter- segment
Total
$
%
$
%
$
%
$
%
Magazines
1,051.5
21
616.3
53
26.6
15
1,694.4
26
Retail Inserts
1,291.3
26
215.4
19
13.1
8
1,519.8
24
Catalogs
805.1
16
211.7
18
15.0
8
1,031.8
16
Books
578.6
11
42.4
4
77.1
43
698.1
11
Specialty Printing and Direct Mail
603.6
12
7.6
1
7.8
4
619.0
10
Directories
306.0
6
10.0
1
40.4
23
0.2
356.6
6
Pre-Media, Logistics and other Value-Added Services
421.6
8
47.4
4
2.8
2
471.8
7
Inter-segment
5.0
–
0.6
–
(5.5)
(3)
(0.1)
–
–
Total
5,062.7
100
1,151.4
100
177.3
100
0.1
6,391.5
100
7
Magazines and Catalogs
The Corporation is the world's leading printer of consumer magazines. It prints more than 1,000 magazine titles. The Corporation prints 42 percent of the top 100 magazine titles in the United States. It operates a global print platform with operations in the United States, Canada, Europe and Latin America.
Management believes that the Corporation is the industry leader in producing weekend newspaper magazines. These are four-color magazines inserted in major-market weekend newspapers. In the United States, the Corporation prints two syndicated weekend magazines as well as locally edited and distributed weekend newspaper magazines. The Corporation also prints comic books for leading companies.
The Corporation has invested in pre-media (computer-to-plate) and post-press technology to enhance its ability to service this market. For the production of medium to long-run magazines, the Corporation is at an advantage because its plants have selective-binding and ink-jet-imaging capabilities and can utilize the Corporation's mail analysis system.
The Corporation is the largest printer of catalogs in the world. It prints several hundred different catalogs on an annual basis for many of North America's direct mail retailers.The Corporation offers special catalog services such as list services, to help customers compile effective lists for distribution, selective-binding capacity to allow customers to vary catalog content to meet their customers' demographic and purchase patterns, and ink-jet addressing and messaging to personalize messages for each recipient. This technology partially offsets postage-cost increases by eliminating pages of products that do not fit a buyer's demographic or purchasing profile. The Corporation's global network also allows the Corporation to offer its customers one-stop shopping for all of their catalog needs in North America, Europe and Latin America.
Retail
The Corporation's major retail inserts customers include large retailers. In North America, the Corporation's 13 rotogravure process printing plants offer both the coast-to-coast manufacturing network and the long-run efficiencies required to serve the larger retail customers. The Corporation has five rotogravure process printing plants in France, one in Belgium and one in Nordic countries. In Canada, the Corporation prints inserts and circulars using web offset and rotogravure processes in accordance with customer requirements. The Corporation also offers digital engraving and related pre-press processes, which both enhances quality and shortens time-to-market.
Commercial and Direct
Products in these categories include annual reports, corporate prospectuses, promotional literature, calendars, posters, direct-mail products, highly personalized catalog wraps and promotions for the auto industry and other custom items. The Corporation's web and sheetfed printing presses of a smaller size permit the Corporation to offer custom colors, coatings, finishes and specialized binding required to produce a wide variety of print products. The Corporation provides numerous print-related services to customers, including typesetting, pre-press, circulation fulfillment, list management, mailing and distribution, in particular through desktop-publishing and electronic pre-media technology.
Quebecor Merrill Canada Inc., a subsidiary of the Corporation, offers services of manufacturing operations to serve the market for financial documents, prospectuses, annual reports and related printing.
The Corporation's Direct division is a leader in the application of versioning, ink jet addressing, print-on-demand technology and computer-to-plate techniques which are critical to the customized production and compressed cycle times that customers demand today.
8
Book
The Corporation is a North American industry leader in book manufacturing. The Book Group is an industry leader in the application of new technologies for book production including electronic pre-media, information networking, digital printing, computer-to-plate and electronic data interchange. With plants in the United States, Spain, and Latin America, the Corporation serves internationally more than 1,000 publisher customers.
In keeping with its full-service approach, the Corporation also provides on-demand digital printing services for small quantities of books, brochures, technical documents and similar products to be produced quickly and at a relatively low cost.
Directory
The Corporation specializes in telephone directories and is the largest directory printer in Canada and among the largest directory printers in North America and Latin America. The presence of the Corporation's directory group in the North American market dates back to the late nineteenth century with the printing of Bell Canada's first directories. The Corporation prints telephone and other directories for a large number of companies. In 1994, the Corporation began production of directories for the Indian domestic market at its directory facility near New Delhi, India, and, in 2002, it started printing directories in Spain.
Pre-Media, Logistics and Other Value-Added Services
The Corporation is a leader in the transition from conventional pre-press to an all-digital workflow, providing a complete spectrum of film, and digital preparation services, from traditional past-up and colour separation to state-of-the-art, all-digital pre-media, as well as digital emerging and digital archiving. Such pre-media services include the colour electronic pre-media system, which takes art work from idea to final product, and desktop publishing, giving the customer greater control over the finished product. These pre-media services are especially helpful to smaller customers, who may not have the capital to employ such equipment or who may have to rely on third-party vendors, which may result in coordination and delay problems. Our specialized digital and pre-media facilities, which are strategically located close to and, in certain cases, onsite at, customers' facilities, provide our customers high quality, twenty-four hour preparatory services linked directly to the Corpo ration's various printing facilities. In addition, its computer systems enable the Corporation to electronically exchange both images and textual material directly between the Corporation and the customers' business locations. The integrated pre-media operations provide the Corporation with competitive advantages over traditional pre-press shops that are not able to provide the same level of integrated services. Quebecor World Premedia Service brings together the full range of digital technologies and pre-media assets within the Corporation that allows it to focus on providing a more comprehensive range of solutions to the customer base of the Corporation.
Other value-added services, including mail list, shipping and distribution expertise, ink-jet personalizing and customer-targeted binding, are rapidly becoming requirements of numerous customers.
The establishment of Quebecor World Logistics Inc., a subsidiary of the Corporation, has made the Corporation one of the largest and most technologically advanced print transport companies, as well as one of the largest customers by volume of the U.S. Postal Service. Quebecor World Logistics Inc. provides complete logistics services including customized door-to-door planning, management, transportation, delivery and tracking solutions, thereby providing customers with cost-effective, efficient and trackable distribution services.
The Corporation uses principally two types of printing processes, rotogravure and offset, which are the most commonly used commercial printing processes. Both processes have undergone substantial technological advances over the past decade, resulting in significant improvements in speed and print quality.
Rotogravure
With 101 rotogravure presses, the Corporation is one of the largest world-wide printers using the rotogravure process. The process uses a copper-coated printing cylinder which is mechanically engraved using high-precision, computer-controlled and diamond-cutting heads. Although the engraving of the printing cylinder is relatively expensive, the printing cylinder itself is extremely durable and cost effective per long run. The rotogravure process has an excellent reputation for the quality of its four-color reproductions on various grades of paper and the very high speed at which it is capable of running.
The rotogravure process is well suited to long-run printing of advertising inserts and circulars, Sunday newspaper magazines and other high-circulation magazines and catalogs. The Corporation believes that its coast-to-coast network of rotogravure facilities in the United States offers both the capacity and locations required by large merchandisers and publishers. The acquisition, in March 2002, of the European printing assets of Hachette Filipacchi Medias provides an advantageous position in the rotogravure market in Europe. The Corporation's advanced ability in rotogravure digital pre-media also ensures more efficient and accurate production of the same insert simultaneously in multiple locations, thereby offering the customer the efficiency and cost savings of manufacturing and distribution closer to its end-use markets in reduced time frames.
Offset
In the offset process, an inked impression from a thin metal plate is first made on a rubber cylinder, after which it is offset to paper. There are several types of offset printing processes: sheetfed and web, heatset and coldset. Sheetfed presses print on sheets of paper, whereas web presses print on rolls of paper. Short-run printing is generally best served by sheetfed offset, whereas web offset is generally the best process for longer runs.
Heatset web offset involves a press which uses an oven to instantly set or dry the oil-based inks. This permits high speed and better quality and is best suited for printing on glossier papers (coated paper). Heatset web offset is used to print retail inserts, magazines, catalogs and books. The Corporation owns 445 heatset web offset presses.
Coldset web offset involves a press that does not use an oven to dry the ink, instead using oil-based inks that are absorbed into the paper and dried by oxidation. Coldset web offset is used mainly to print newspapers, books, directories, and some retail inserts. The Corporation owns 52 coldset web offset presses.
The Corporation owns 178 sheetfed offset presses, which print books, promotional material, covers and direct-mail products.
The sales and marketing activities of the Corporation are highly integrated and reflect an increasingly global approach to meeting customers' needs that is complemented by product-specific sales efforts. Sales representatives are located in plants or in regional offices throughout North America, Europe, and Latin America, generally close to their customers and prospects. Each sales representative has the ability to sell into any plant in the Corporation's global network. This enables the customer to coordinate simultaneous printing throughout the Corporation's network through one sales representative. Certain of the larger customers centralize the purchase of printing services and, in this regard, the Corporation's ability to provide broad geographical services is clearly an advantage over smaller regional competitors.
Since 1995, the Corporation has proceeded to complete ISO 9000 series certification and ISO-14001 certification at various plants where it operates and it is continuing to ensure that more and more plants will be ISO 9000 series and ISO-14001 certified. The ISO 9000 series of international standards certify that a company meets quality control requirements in its production processes. The ISO-14001 certification is an internationally recognized environmental management system, the goal of which is the continual improvement of the environmental management.
The Corporation believes that its size and network of locations throughout North America, Europe and Latin America is an advantage over smaller competitors in terms of shipping and distribution. Because of its volume, the Corporation is able to set up pool-shipping systems, which enable customers to ship their products at significant discounts. The discount is achieved through agreements with the postal services, which provides the mailer/customer with a discount if the mailer/customer pays the freight costs to transport the mail closer to the postal services delivery office. The Corporation uses its custom-built mail analysis system, which automatically combines different customers into truck-load shipments and analyzes the cost-savings benefit to the customer. The mail analysis system then generates the necessary forms, bills of lading and freight invoices for the customer.
Ink-jet personalizing is increasingly being used by many publishers and catalogers. Ink-jet addressing eliminates the additional process of printing paper labels and improves mailing efficiency. Catalogers use ink-jet personalizing in a number of ways. Ink-jet addressing allows both the cover and the order form to be labelled and to show customer-coding information. Furthermore, as catalogers continue to look for methods to increase the level of personalization, the ink-jet process is being used more frequently to add personal messages, specific inserts to frequent buyers, or unique coding information for order entry. Another advantage to ink-jet printing and selective binding is the Corporation's ability to merge lists of names for the same customer or to co-mail different customers to achieve increased postal pre-sort discounts.
Management believes that the Corporation has certain competitive strengths which enable it to provide enhanced customer service while maintaining a low-cost position in the industry. Such advantages include broad geographic coverage, a single source of printing services, technological capabilities, economies of scale and a large manufacturing base.
Broad Geographic Coverage. Certain of the Corporation's largest customers utilize simultaneous printing in several of the Corporation's locations. The Corporation is one of the few commercial printers that can service these customers in virtually all of their markets, allowing them to coordinate their requirements. In addition, multi-plant simultaneous printing makes delivery more efficient and lowers distribution costs for national products.
Single Sourcing. By providing its customers a wide variety of printing, pre-press, post-press and distribution services, the Corporation is able to become a more integral element in its customers' publishing process while simultaneously expanding its sources of revenues. As large customers have centralized their purchasing of printing services, the Corporation's ability to provide a single source for comprehensive printing services and broad geographical coverage is a competitive advantage, since customers are not required to contract with numerous smaller specialized and regional competitors.
11
Technological Capabilities. The Corporation is committed to the effective use of state-of-the-art technology, including the development of new printing technologies, upgrade of existing printing assets and further development of integrated services. The Corporation's technological capabilities have enabled it to lower its cost position and to better serve its customers by improving quality, flexibility, speed and cost of production. Keeping pace with the technological developments in the industry requires substantial capital expenditures. The breadth of the Corporation's business enables it to spread technological investments over numerous facilities and product segments and its size enables it to lower its relative cost position by spreading fixed capital investment over a greater base of revenues.
As part of the strategic plan, the Corporation has recently announced its intention to invest in new equipment and technology to reach the next productivity level and to further improve efficiencies and customer service. In July 2004, the Corporation announced a major capital investment to purchase 22 new web offset presses over the next three years in order to retool certain segments of its U.S. manufacturing platform. The investment in this new equipment and accompanying technology will improve efficiency and throughput as well as enhance customer service by providing publishers and retailers with a more complete integrated and flexible multi-plant manufacturing network. Targeted investments have been made in specific markets where the potential for growth has been identified.
Economies of Scale. The Corporation enjoys significant economies of scale which, in the opinion of management, provide the Corporation with a cost advantage. The Corporation also purchases a significant amount of printing equipment. Management believes that such purchasing power enables the Corporation to purchase both raw materials, primarily paper and ink, and equipment, on enhanced terms. This purchasing power also ensures availability of raw materials in tight markets. In 1998, the Corporation opened a global procurement office in Fribourg, Switzerland. Global procurement allows the Corporation to achieve economies of scale for materials and equipment.
By consolidating platforms into fewer but larger and more specialized plants, the Corporation reduces administrative costs and achieves better economies of scale. In addition, increased plant specialization allows for greater efficiency and improved distribution reduces the final cost to customers and improves speed of delivery.
The growth of new media provides the Corporation with further opportunities to exploit its economies of scale. Increasingly, clients seek to repurpose information so that it can be used in both printed and electronic forms. The Corporation has implemented digital workflows and has provided tools such as its Digital Asset Management System and Automated Publishing System to facilitate the re-use of information in a more cost effective manner than its competitors.
Large Manufacturing Base. The Corporation's diversity and breadth of plant and press capability, product mix and large customer base facilitate greater capacity utilization. Most presses can produce a variety of printed products, and the Corporation frequently allocates orders among its facilities to optimize their equipment utilization. In addition, the Corporation's large manufacturing base combined with its technological capabilities frequently enable the Corporation to improve customer service and operating margins by transferring technology and maximizing the printing capabilities of its facilities. Because the Corporation serves a wide variety of markets, it is able to redeploy equipment, thereby maximizing its utility and extending its useful life. Diversity in plant and press capability enables the Corporation, through central scheduling of the Corporation's presses, to assign a particular order to the machine best suited for it.
Management believes that further consolidation of the fragmented printing industry will occur due to the advantages of size, the high cost of capital equipment and technology and the demand of many large customers for broad, technologically advanced, continent-wide and international printing services. The Corporation's competitive and financial strengths and its substantial experience in integrating acquired businesses provide it with the ability to take advantage of this industry dynamic. Having established a critical size and the geographic and product diversity required to compete, the Corporation is focused on continuing the expansion of its customer base, markets and scope of services in North America, Europe and Latin America.
The Corporation cooperates with large suppliers in the area of research and development of new printing technologies, materials and processes. The Corporation's capital-improvement programs include adding, replacing and/or upgrading existing equipment.
The Corporation has continued to invest in faster, more efficient and higher quality presses. In July 2004, the Corporation announced its intention to purchase 22 new presses targeted for the magazine, catalog, retail and book platforms of its U.S. operations. This will allow the Corporation to further improve efficiency and to meet the current and future needs of publishers. As at December 31, 2004, the Corporation has placed firm orders for 9 new presses for a total cost of approximately $120 million. The plan represents new investments of approximately $330 million to be disbursed over the next three years.
Pre-media has continued to witness dramatic enhancements in the digital electronic area, with new computer software and hardware installed to help customers create their pages more quickly and more efficiently. The Corporation has been an industry leader in bringing new imaging services on-line that streamline the process of preparing pages for print. The Corporation was one of the first printers to install desktop publishing, direct-to-film and computer-to-plate systems for offset printing, which eliminates entirely the costly and time-consuming film step in print production. It has furthermore established one of the industry's most sophisticated data communications networks, capable of transmitting a customer's publication files quickly and efficiently from the customer's location to multiple plant locations.
Management believes that only printers capable of investing and integrating new technology will continue to expand. The Corporation continues to upgrade its U.S. rotogravure network to produce magazines, catalogs, inserts and flyers, and Sunday Magazines. The Corporation became the first commercial printer to install the latest generation of short cut-off tabloid offset presses. These presses print more pages at faster speeds and use less paper than conventional tabloid presses. The Corporation has also invested in new and emerging digital and web-based technologies to improve services, cut costs and expand its range of products.
The Corporation operates a North American-wide telecommunications network, which enhances the Corporation's ability to move digital files between its facilities and customers quickly, share work among plants, and expand distribution and printing operations.
The principal raw materials used in the Corporation's products are paper and ink. In 2004, the Corporation spent approximately $2.3 billion on raw materials.The Corporation exercises its purchasing power to obtain pricing, terms, quality, quality control and service in line with its status as one of the largest industry customers.
The Corporation negotiates with a limited number of suppliers to maximize its purchasing power, but does not rely on any one supplier. Purchasing activity at both the local plant and corporate level is coordinated in order to increase and benefit from economies of scale. Inventory-control operations are also integrated into the purchasing functions of the Corporation, which has resulted in improvements in inventory turns. Plant inventories are also managed and tracked on a regional basis, increasing the utilization of existing inventories. In addition, most of the Corporation's long-term contracts with its customers include price-adjustment clauses based on the cost of materials in order to minimize the effects of fluctuation in the price of paper and ink.
The Corporation takes pride in offering world-wide procurement service to its customers. The procurement office, located in Fribourg, Switzerland, gives the Corporation a major competitive advantage. By consolidating the activities formerly carried out at four regional offices, the Corporation has been able to reduce administrative costs, standardize procurement and provide customers with assured supply at attractive prices.
The commercial printing business in North America and Europe is highly competitive in most product categories and geographic segments. Industry analysts consider most of the industry's markets to be currently oversupplied, and competition is significant. Competition is largely based on price, quality, range of services offered, distribution capabilities, customer service, availability of printing time on appropriate equipment and state-of-the-art technology.
The operations of the Corporation's business are seasonal, with approximately 60% of historical operating income recognized in the second half of the fiscal year, primarily due to the higher number of magazine pages, new product launches and back-to-school, retail and holiday catalog promotions.
As of December 31, 2004, the Corporation employed approximately 35,000 people, 8,800 of whom were covered by68 separate collective agreements. Of these, 8 collective agreements covering 1,100 employees have expired or will expire in 2005. These agreements are limited to single plants and groups of employees within these plants.
The Corporation is subject to various laws, regulations and government policies relating to the generation, storage, transportation, and disposal of solid waste, to air and water releases into the environment of various substances, and to environmental protection in general. The Corporation believes it is in compliance with applicable laws and requirements in all material respects.
The Corporation is also subject to various laws and regulations, which allow regulatory authorities to compel (or seek reimbursement for) cleanup of environmental contamination at the Corporation's own sites and at off-site facilities where its waste is or has been disposed of. The Corporation has established a provision for expenses associated with environmental remediation obligations when such amounts can be reasonably estimated. The amount of the provision is adjusted as new information is known. The Corporation believes the provision is adequate to cover the potential costs associated with those contamination issues.
The Corporation expects to incur ongoing capital and operating costs to maintain compliance with existing and future applicable environmental laws and requirements. Furthermore, the Corporation does not anticipate that maintaining compliance with such environmental statutes will have a material adverse effect upon the Corporation's competitive or consolidated financial position.
The Corporation believes that it has internal controls and personnel dedicated to compliance with all applicable environmental laws and that it provides for adequate monitoring and management of the environmental risk related to its operations.
For year 2004, the Corporation believes that there is no new environmental matter (environmental incident, promulgation of new environmental laws and regulations, soil and groundwater contamination discovery, etc.) to be reported that could have a material impact on the Corporation.
Since 2001, global printing overcapacity has created an environment of reduced prices and margins in all of the Corporation's markets. In this challenging environment, the Corporation's approach has been to continue to secure and increase new and existing volume and to adopt an uncompromising focus on cost containment and cost reduction. The Corporation's cost reduction initiatives, undertaken during the last two years, involved workforce reduction, closure or downsizing of facilities, decommisioning of under-performing assets, lowering of overhead expenses, in part by consolidating corporate functions and relocating sales and administrative offices into plants. Also, most of the capital expenditures that were made in the last three fiscal years were targeted to improve the Corporation's cost structure and for customer-driven projects.
In 2004, after a thorough review of its asset base, the Corporation embarked on a major three-year strategic investment program involving the purchase of 22 new presses for its U.S. manufacturing operations. The investment is focused on the Corporation's magazine, catalog, retail and book platforms. This represents an investment of approximately $330 million. The first 12 presses will be commissioned in 2005 and 2006 and an additional 10 in 2006 and 2007. In addition, the Corporation is also making strategic investments to upgrade and improve its asset base in Europe and Latin America. In the fourth quarter of 2004, the Corporation approved investments to upgrade its offset platform in France and its gravure facility in Belgium
In 2004, key capital expenditures in North America included the following: (a) the final phase of expansion and improvement of the Magazine & Catalog platform that included the installation of a new gravure press in the Augusta, Georgia facility to service L.L. Bean; (b) the continuation of phase 2 of the educational book market expansion initiated in 2003 at the Dubuque, Iowa facility; and (c) the Corporation made capital investments related to the relocation of selected equipment from the Effingham, Illinois plant. The key capital expenditure in Europe was the purchase of a 48-page press for the Sormlands, Sweden facility. This wide-web press is the first in its kind to be installed in Sweden.
In 2003, key capital expenditures in North America included the following: (a) the expansion and improvement of the Magazine & Catalog platform which included the purchase of new gravure presses in the Augusta, Georgia, and Franklin, Kentucky facilities to service L.L. Bean and other retail customers, and the acquisition of a 48-page short cut-off press in the Elk Grove Village, Illinois facility for additional press capacity to service Williams-Sonoma; (b) in the Retail platform, the Corporation completed the expansion of the Riverside, California facility, including the relocation of the Ontario, California facility to a new 196,000 square foot facility nearby Riverside; (c) the phase 2 of the educational book market expansion has been initiated in the Dubuque, Iowa facility; (d) a new 4 unit Goss press was added at the Web Press facility in Vancouver to increase capacity; and (e) in addition, the Corporation concluded the buyout of leased presses installed in 8 facilities for $7 1 million. The key capital expenditure in Europe was the completion of the addition of a 48-page commercial press in the Spanish platform to increase overall capacity and to replace an older press.
In 2002, the key capital expenditures in North America included the following: (a) a new 3.08 meters gravure press at Franklin, Kentucky facility to service L.L. Bean and retail customers and (b) several smaller projects related to the Corporation's restructuring activities. The key capital expenditure in Europe was the addition of a new 48-page commercial press to increase capacity in the Spanish platform and, in Latin America, the continued expansion of the Directory business in Mexico DF.
In February 2005, the Corporation announced its intent to sell its facility in Torcy, France, to a group led by local management. This transaction is part of the Corporation's plan to reorganize and improve efficiency in its French offset platform.
In November 2004, the Corporation purchased the remaining 50% of the issued and outstanding shares of Helio Charleroi in Belgium, for a cash consideration of $45.8 million.
In 2004, the Corporation also acquired a minority interest in its Spanish operations for a cash consideration of $1.7 million and in its North American operations for a cash consideration of $3.0 million.
In 2003, the Corporation acquired minority interests in its Spanish operations for a cash consideration of $3.1 million and in its North American operations for a cash consideration of $4.4 million.
In March 2002, the Corporation acquired all of the issued and outstanding shares of European Graphic Group S.A. ("E2G"), a subsidiary of Hachette Filipacchi Medias in Europe for a cash consideration of $3.3 million. The acquired assets included printing and bindery facilities in France, as well as Hachette's 50% ownership stake in the rotogravure printing plant of Helio Charleroi in Belgium. As part of the transaction, the Corporation has entered into a long-term printing contract for Hachette's magazines in Europe. The Corporation also entered into a binding agreement to purchase, in 2004, the remaining 50% interest of Helio Charleroi in Belgium.
The Corporation maintains, for general corporate purposes, a $1 billion bank facility composed of three tranches. In November 2004, the Corporation extended for an additional year the two tranches totalling $750 million previously maturing in November 2006 and renewed for three years the $250 million tranche previously maturing in November 2004. Therefore, all tranches will mature in November 2007. All three tranches can be extended on a yearly basis. The facility contains certain restrictions, including the obligation to maintain certain financial ratios.
The 6.50% Senior Debentures due on August 1, 2027 were redeemable at the option of the holders at par value on August 1, 2004. Out of a total principal amount of $150 million, $147 million Senior Debentures have been tendered and repurchased at par.
In 2004, the Corporation discontinued its Canadian Commercial paper program.
In November 2003, the Corporation issued, at discount, 4.875% and 6.125% Senior Notes for a principal amount of $600.0 million comprised of two tranches. The first tranche of $200.0 million matures on November 15, 2008 and the second tranche of $400.0 million matures on November 15, 2013.
Also, in November 2003, following a tender offer to purchase all of the $300.0 million principal amount of the 7.75% Senior Notes due February 15, 2009, the Corporation repurchased 89.6% of the 7.75% Senior Notes at premium for a cash consideration of $283 million. The remaining Senior Notes were redeemed in February 2004 for a total cash consideration of $33 million. The Senior Notes were originally issued by World Color Press ("WCP") and revalued at the time WCP was acquired by the Corporation in order to reflect their value based on the Corporation's borrowing rate for similar financial instruments.
16
In December 2003, the Corporation exercised its option and redeemed all of the $258 million principal amount of the 8.375% Senior Notes at a premium for a total cash consideration of $268 million.
In September 2004, the Corporation renewed and amended its 1999 agreement to sell, with limited recourse, a portion of its U.S. trade receivables on a revolving basis (the "U.S. Program"). The amendment provides the Corporation with the option to extend the term of the U.S. Program for an additional year. This increases the Corporation's liquidity horizon up to 24 months. The U.S. Program limit is $510.0 million. As at December 31, 2004, the amount outstanding under the U.S. Program was $500.0 million.
In 2004, the Corporation sold, with limited recourse, a portion of its Canadian trade receivables on a revolving basis under the terms of a Canadian securitization agreement dated March 2003 (the "Canadian Program"). The Canadian Program limit is Cdn$135.0 million. As at December 31, 2004, the amount outstanding under the Canadian Program was Cdn$ 126.0 million ($104.8 million).
In 2004, the Corporation also sold, with limited recourse, a portion of its French and Spanish trade receivables on a revolving basis under the terms of a European securitization agreement dated June 2001 (the "European Program"). The European Program limit is 153.0 million Euro. As at December 31, 2004, the amount outstanding under the European Program was 133.5 million Euro ($180.7 million).
The 2004 restructuring initiatives resulted in the consolidation of five facilities in North America, one in Europe and other workforce reductions across the Corporation. They included the reorganization of the Corporation's Nordic gravure platform by closing the Stockholm plant, the closure of the Effingham, Illinois facility in the Magazine platform and an important downsizing at the Kingsport, Tennessee facility in the Book platform. As a result of these initiatives, 2,228 employee positions have been eliminated in 2004, 290 will be completed in 2005 and 567 new jobs will be created in other facilities.
In November 2004, the Corporation reorganized its corporate functions to strengthen its operating structure and improve efficiency. As a result thereof, the position of Chief Operating Officer North America and some of its accompanying corporate functions were abolished.
Under the 2003 restructuring initiatives, 1,769 employee positions were eliminated throughout the Corporation's global platform.
The 2002 restructuring initiatives were initiated in France due to difficult market conditions, severe price competition and a decrease in sales volume. In addition, reduction in force programs were initiated in North America and mostly completed in 2003.
The Corporation's Board of Directors is currently composed of twelve members. The term of office of each director expires upon the election of his or her successor unless the director resigns from office or his or her office becomes vacant by death, removal or other cause. The following table sets forth as at March 1st, 2005, the names, places of residence and principal occupation of the directors and the year of their appointment, as well as the committees on which each director serves as a member, as the case may be.
All the information in this section has been provided by the persons concerned.
Name and place of residence
Principal Occupation(1)
Director since
Committee Member
Reginald K. Brack Connecticut, United States
Corporate Director
2000
Audit Committee Executive Committee Nominating and Corporate Governance Committee
Derek H. Burney, O.C. Ontario, Canada
Corporate Director
2003
Executive Committee Human Resources and Compensation Committee Nominating and Corporate Governance Committee (chairman)
Robert Coallier Quebec, Canada
Global Chief Business Development Officer, Molson Coors Brewing Company
1991
Audit Committee (chairman) Executive Committee Nomination and Corporate Governance Committee
James Doughan Arizona, United States
Corporate Director
2001
Pension Committee
The Honourable Richard C. Holbrooke New York, United States
Vice-Chairman of the Board of Perseus, LLC (Private equity fund management company)
2003
Pension Committee
Eileen A. Mercier Ontario, Canada
Corporate Director
1999
Pension Committee (chairwoman)
The Right Honourable Brian Mulroney, P.C., C.C., LL.D. Quebec,Canada
Chairman of the Board of the Corporation and Senior Partner, Ogilvy Renault(Barristers and Solicitors)
1997
Executive Committee (chairman)
Jean Neveu Quebec,Canada
Chairman of the Board of Quebecor (Communications holding company) and Chairman of the Board of TVA Group Inc. (Television broadcasting company)
1989
Robert Normand Quebec, Canada
Corporate Director
1999
Audit Committee Human Resources and Compensation Committee
Érik Péladeau Quebec,Canada
Vice Chairman of the Board of the Corporation, Chairman of the Board of Quebecor Media Inc.(Communications company) and Vice Chairman of the Board of Quebecor Inc. (Communications holding company)
1989
18
Name and place of residence
Principal Occupation(1)
Director since
Committee Member
Pierre Karl Péladeau Quebec,Canada
President and Chief Executive Officer of the Corporation, President and Chief Executive Officer of Quebecor Inc. (Communications holding company)
1989
Executive Commitee
Alain Rhéaume Quebec, Canada
Executive Vice President, President, Fido at Rogers Wireless Inc. (Integrated wireless voice and data communications company)
1997
Audit Committee Human Resources and Compensation Committee (chairman) Nominating and Corporate Governance Committee
(1) Except as stated below, each of the aforementioned directors has, during the past five years, carried on his or her current occupation or held other management positions with the same or other associated companies or firms, including affiliates and predecessors, indicated opposite his or her name.
Derek H. Burney, O.C., Ontario (Canada). Mr. Burney is a Senior Distinguished Fellow at the Centre for Trade Policy and Adjunct Professor at the Norman Paterson School of International Affairs at Carleton University. Mr. Burney was the President and Chief Executive Officer of CAE Inc., from October 1999 until August 2004. From January 1993 until October 1999, he was Chairman of the Board and Chief Executive Officer of Bell Canada International. Mr. Burney is also the Chairman of New Brunswick Power Holding Corp. and a director of Shell Canada Limited.
Robert Coallier, Québec (Canada). Mr. Coallier is Global Chief Business Development Officer of Molson Coors Brewing Company since February 2005. From July 2004 to February 2005, he was Executive Vice President, Corporate Strategy and International Operations of Molson Inc. and, from July 2002 to June 2004, he was President and Chief Executive Officer of Cervejarias Kaiser (a brewing company in Brazil and a subsidiary of Molson Inc.). From May 2000 until July 2002, Mr. Coallier was Executive Vice President and Chief Financial Officer of Molson Inc. Prior to May 2000, he occupied the position of Vice President and Chief Financial Officer of C-MAC Industries Inc. (parent company of a multinational industrial group in the field of state-of-the-art microelectronics).
James Doughan, Arizona (United States). Mr. Doughan is a corporate director since July 2000. He acted as a consultant to Gaylord Container from August 1999 to July 2000. He was President and Chief Executive Officer of Abitibi-Consolidated Inc. (a pulp and paper company) from 1997 until 1999.
The Honourable Richard C. Holbrooke, New York (United States). Mr. Holbrooke is Vice Chairman of the Board of Perseus, LLC, a leading private equity firm. He most recently served as the United States Ambassador to the United Nations and he was also a member of President Clinton's cabinet (1999-2001).
Eileen A. Mercier, Ontario (Canada). Ms. Mercier is a corporate director since November 2003. She was Vice Chair of the Board, Workplace Safety and Insurance Board (Ontario) (a workers' compensation system), from July 1996 until November 2003. Ms. Mercier will not seek renewal of her mandate.
Alain Rhéaume, Québec (Canada). Since November 2004, Mr. Rhéaume is Executive Vice-President and President, Fido at Rogers Wireless Inc. He was President and Chief Operating Officer of Microcell Solutions Inc., from May 2003 until November 2004, and President and Chief Executive Officer of Microcell PCS, from February 2001 until April 2003. Prior to that, Mr. Rhéaume was Executive Vice President, Chief Financial Officer and Treasurer of Microcell Telecommunications Inc.
The Right Honourable Brian Mulroney Quebec (Canada)
Chairman of the Board
Érik Péladeau Quebec (Canada)
Vice Chairman of the Board
Pierre Karl Péladeau Quebec (Canada)
President and Chief Executive Officer
Claude Hélie Quebec (Canada)
Executive Vice President and Chief Financial Officer
Antonio Fernandez Madrid (Spain)
Chief Operating Officer, Europe
Yvan Lesniak Marne la Vallée, France
Managing Director of Operations, Quebecor World France
Guy Trahan Buenos Aires (Argentina)
President, Quebecor World Latin America
David Blair Ontario (Canada)
Senior Vice President, Manufacturing, Environment and Technology
Marc Doré Quebec (Canada)
Senior Vice President, Material and Property Management
Carl Gauvreau Quebec (Canada)
Senior Vice President and Chief Accounting Officer
Louis St-Arnaud Quebec (Canada)
Senior Vice President, Legal Affairs and Corporate Secretary
Michèle Bolduc Quebec (Canada)
Vice President, Legal Affairs
Louise Desjardins Quebec (Canada)
Vice President, Taxation
Sylvain Levert Quebec (Canada)
Vice President, Procurement
Roger Martel Quebec (Canada)
Vice President, Internal Audit
Jeremy Roberts Quebec (Canada)
Vice President, Corporate Finance and Treasurer
Hugues Simard(1) Quebec (Canada)
Vice President, Development and Planning
Julie Tremblay Quebec (Canada)
Vice President, Human Resources
Diane Dubé Quebec (Canada)
Corporate Controller
Roland Ribotti Quebec (Canada)
Assistant Treasurer
Tony Ross Quebec (Canada)
Director, Communications
Marie-Élizabeth Chlumecky Quebec (Canada)
Assistant Secretary
Claudine Tremblay Quebec (Canada)
Assistant Secretary
(1)Hugues Simard is also President, Commercial Group
20
All the officers have held the positions and principal occupations indicated above or other occupations within the Quebecor Group of companies for the past five years, except for the following:
Michèle Bolduc is Vice President, Legal Affairs of the Corporation since November 2004. From January 2000 until November 2004, she was Vice President and General Counsel, Operations at BCE Emergis Inc., a subsidiary of BCE in the electronic commerce. From 1993 until 2000, she was Assistant General Counsel at Bell Canada.
Louise Desjardins is Vice President, Taxation of the Corporation since May 2004. From February 2000 until April 2004, she served as Director, Taxation of Abitibi-Consolidated Inc. and, from August 1995 until March 2000, she was Director, Taxation of St-Lawrence Cement.
Roland Ribotti is Assistant Treasurer of the Corporation since January 2005. From May 2003 to January 2005, he was Director - Investor Relations for Bell Canada Enterprises. From August 1999 to May 2003, he was a Director and then a Senior Director at CDP Capital Communications, a private placement susbsidiary of the Caisse de Dépôt et Placement du Québec. Prior to that, he held various financial positions within the Treasury and Mergers and Acquisitions groups for Bell Canada.
Tony Ross is Director, Communications since August 2000. From 1997 to August 2000, he was Executive Producer at Canadian Broadcasting Corporation (a television broadcasting company).
Marie-Élizabeth Chlumecky is Assistant Secretary of the Corporation since August 2004. From May 2001 to August 2004, she was Legal Counsel to Quebecor Media Inc., and Secretary of Nurun Inc. and Mindready Solutions Inc. and Assistant Corporate Secretary of Netgraphe Inc. Prior to that, she held positions as Legal Counsel to Transat A.T. Inc. and Secretariat Manager of BCE Inc.
To the knowledge of the Corporation and based upon information provided to it by the directors and officers, none of them:
is, as at the date of this Annual Information Form, or has been, within 10 years before the date of this Annual Information Form, a director or executive officer of any company that, while such person was acting in that capacity:
was subject of a cease trade or similar order or an order that denied the relevant company access to any exemption under securities legislation, for a period of more than 30 consecutive days;
was subject to an event that resulted, after the director or executive officer ceased to be a director or executive officer, in the company being the subject of a cease trade or similar order or an order that denied the relevant company access to any exemption under securities legislation, for a period of more than 30 consecutive days; or
within a year of that person ceasing to act in that capacity, became bankrupt, made a proposal under any legislation relating to bankruptcy or insolvency or was subject to or instituted any proceedings, arrangement or compromise with creditors or had a receiver, receiver manager or trustee appointed to hold its assets; or
21
has, within the 10 years before the date of this Annual Information Form, become bankrupt, made a proposal under any legislation relating to bankruptcy or insolvency, or become subject to or instituted any proceedings, arrangement or compromise with creditors, or had a receiver, receiver manager or trustee appointed to hold the assets of the director or executive officer; or
has been subject to:
any penalties or sanctions imposed by a court relating to securities legislation or by a securities regulatory authority or has entered into a settlement agreement with a securities regulatory authority; or
any other penalties or sanctions imposed by a court or regulatory body that would likely be considered important to a reasonable investor in making an investment decision;
except for the following:
Mr. Robert Normand, who served as a director of Concert Industries Ltd., when it and its Canadian operating subsidiaries announced on August 5, 2003 that they had filed for protection under theCompanies' Creditors Arrangement Act("CCAA"). Concert Industries Ltd. was restructured and a plan of compromise and arrangement for its operating subsidiaries was approved, in December 2004, allowing them to emerge from the CCAA proceedings. Mr. Normand no longer serves as director of Concert Industries Ltd; and
Mr. Alain Rhéaume, who was an officer of Microcell Telecommunications Inc., which, in January 2003, effected a recapitalization plan approved by the company's creditors and obtained a court order under the CCAA implementing such plan.
None of the directors and officers of the Corporation were imposed penalties by a securities regulatory authority, except for Mr. Yvan Lesniak, in respect of whom the Ontario Securities Commission imposed a Cdn$1,000 fine for the late filing of an insider report. Mr. Lesniak is not responsible for the late filing. The Corporation has put in place safeguards in order to prevent late filings of insider reports.
The Audit Committee Report is presented in the Management Proxy Circular under Section 5 – Audit Committee Disclosure, which Section is incorporated by reference herein. The Management Proxy Circular is available on the Corporation's website atwww.quebecorworld.com, on the Canadian Securities Administrators' website atwww.sedar.com and on the EDGAR section of the United States Securities and Exchange Commission's website atwww.sec.gov.
In the normal course of business, the Corporation is involved in various legal proceedings and claims. In the opinion of the Corporation's management and that of its subsidiaries, the outcome of these legal proceedings and claims is not expected to have a material adverse effect on the Corporation's business, financial condition or results of operations.
A discussion of risks affecting the Corporation and its business appears under the heading "RISKS AND UNCERTAINTIES" on pages 46 to 48 of the Corporation's Management's Discussion and Analysis of Financial Condition and Results of Operations for the year ended December 31, 2004, which discussion is incorporated by reference herein. The Corporation's Management's Discussion and Analysis is available on its website atwww.quebecorworld.com, on the Canadian Securities Administrators' website atwww.sedar.com and on the EDGAR section of the United States Securities and Exchange Commission'swebsite atwww.sec.gov.
The authorized share capital of the Corporation consists of an unlimited number of Subordinate Voting Shares (the "Subordinate Voting Shares"), an unlimited number of Multiple Voting Shares (the "Multiple Voting Shares") and an unlimited number of First Preferred Shares issuable in Series (the "Preferred Shares"), all without par value.
The Subordinate Voting Shares carry one (1) vote per share. They are entitled to receive dividends in such amounts and payable in such time as the directors determine, subject always to the rights of the holders of any Preferred Shares.
The Multiple Voting Shares carry ten (10) votes per share. They are entitled to receive dividends in such amounts and they are payable in such time as the directors determine, subject always to the rights of the holders of any Preferred Shares. They are convertible at any time into Subordinate Voting Shares on a one-to-one basis. They are not publicly traded.
The Articles of the Corporation do not contain any rights or provisions applicable to holders of Subordinate Voting Shares of the Corporation where a take-over bid is made for the Multiple Voting Shares. However, the Corporation's significant shareholder, Quebecor Inc., has provided undertakings in favour of the holders of Subordinate Voting Shares in certain circumstances where a take-over bid is made for the Multiple Voting Shares. A summary thereof is contained in the Corporation's Management Proxy Circular dated March 24, 2005, , under "Section 1 - VOTING AND PROXIES – Undertakings in Favour of Holders of Subordinate Voting Shares", which summary is incorporated herein by reference. Also, the Agreement dated March 28, 2004 entered into between Quebecor Inc., 4032677 Canada Inc., the Corporation and Computershare Trust Company of Canada may be found on the Canadian Securities Administrators' website atwww.sedar.com.
The Series 2 Cumulative Redeemable First Preferred Shares (the "Series 2 Preferred Shares") were converted into Series 3 Cumulative Redeemable First Preferred Shares (the "Series 3 Preferred Shares") in December 2002.
The Series 3 Preferred Shares are entitled to a fixed cumulative preferential cash dividend of Cdn$1.5380 per share per annum, payable quarterly from December 1, 2002 to November 30, 2007. Thereafter, a new fixed cumulative preferential cash dividend will be set by the Corporation for another five-year period. On December 1, 2007 and at every 5th anniversary thereafter, these Series 3 Preferred Shares may be converted into Series 2 Preferred Shares under certain conditions.
The Series 4 Cumulative Redeemable First Preferred Shares (the "Series 4 Preferred Shares") are entitled to a fixed cumulative preferential cash dividend of Cdn$1.6875 per share per annum, payable quarterly, if declared. On and after March 15, 2006, the Series 4 Preferred Shares are redeemable at the option of the Corporation at Cdn$25.00, or with regulatory approval, the Series 4 Preferred Shares may be converted into equity shares by the Corporation. On and after June 15, 2006, these Series 4 Preferred Shares may be converted at the option of the holder into equity security, subject to the right of the Corporation prior to the conversion date to redeem for cash or find substitute purchasers for such Series 4 Preferred Shares.
The Series 5 Cumulative Redeemable First Preferred Shares (the "Series 5 Preferred Shares") are entitled to a fixed cumulative preferential cash dividend of Cdn$1.725 per share per annum, payable quarterly, if declared. On and after December 1, 2007, the Series 5 Preferred Shares are redeemable at the option of the Corporation at Cdn$25.00, or with regulatory approval, the Series 5 Preferred Shares may be converted into equity shares by the Corporation. On and after March 1, 2008, these Series 5 Preferred Shares may be converted at the option of the holder into equity security, subject to the right of the Corporation prior to the conversion date to redeem for cash or find substitute purchasers for such Series 5 Preferred Shares.
23
The number of Preferred Shares in each Series and the related characteristics, rights and privileges are to be determined by the Board of Directors prior to each issue. All the Preferred Shares are non-voting and they participate in priority to the Subordinate Voting Shares and Multiple Voting Shares in the event of liquidation, dissolution, winding-up or other distribution of the Corporation's assets. Each Series of Preferred Shares ranks pari passu with every other Series of Preferred Shares.
The Corporation has declared and paid semi-annual dividends, since October 23, 1992, and quarterly dividends, since 1998. The following table presents the annual dividends declared and paid by the Corporation on all of its shares since 1998:
Multiple Voting Shares and Subordinate Voting Shares
Series 2 Preferred Shares
Series 3 Preferred Shares
Series 4 Preferred Shares
Series 5 Preferred Shares
1998
$0.24
Cdn$1.3151
N/A
N/A
N/A
1999
$0.28
Cdn$1.2500
N/A
N/A
N/A
2000
$0.33
Cdn$1.2500
N/A
N/A
N/A
2001
$0.46
Cdn$1.2500
N/A
Cdn$1.2703
Cdn$0.50687
2002
$0.49
Cdn$1.2500
N/A
Cdn$1.6875
Cdn$1.7250
2003
$0.52
N/A
Cdn$1.5380
Cdn$1.6875
Cdn$1.7250
2004
$0.52
N/A
Cdn$1.5380
Cdn$1.68755
Cdn$1.7250
On March 1, 2005
$0.14
N/A
Cdn$0.3845
Cdn$0.421875
Cdn$0.43125
On February 15, 2005, the Board of Directors has agreed to increase the dividend payment of March 1, 2005 on its Multiple Voting Shares and Subordinates Voting Shares from $0.13 to $0.14.
The Corporation's Subordinate Voting Shares are listed and posted for trading on The Toronto Stock Exchange and on the New York Stock Exchange and its Preferred Shares on the Toronto Stock Exchange.
The following tables set forth the market price range and trading volumes of the Corporation's listed shares for each month of the most recently completed financial year. The high and low prices reflect the highest and lowest prices at which a board lot trade was executed in a trading session during the month and the close price for each relevant month.
TORONTO STOCK EXCHANGE — SERIES 3 PREFERRED SHARES
Symbol: "IQW.PR.D"
Fiscal year ended December 31, 2004
High Cdn$
Low Cdn$
Close Price Cdn$
Trading Volumes
January
25.90
24.25
25.20
977,452
February
25.50
25.00
25.10
929,112
March
25.75
24.90
25.05
267,557
April
25.50
24.85
25.00
507,737
May
25.31
24.50
24.95
472,115
June
25.05
24.75
24.90
164,266
July
25.50
24.75
24.94
332,278
August
25.21
24.77
24.92
829,980
September
25.60
24.85
25.30
901,362
October
25.50
25.05
25.20
390,015
November
25.55
25.01
25.33
430,899
December
25.75
25.25
25.50
291,763
TORONTO STOCK EXCHANGE — SERIES 4 PREFERRED SHARES
Symbol: "IQW.PR.B"
Fiscal year ended December 31, 2004
High Cdn$
Low Cdn$
Close Price Cdn$
Trading Volumes
January
27.48
26.50
27.48
203,765
February
27.50
26.50
26.76
1,239,723
March
27.20
26.55
26.85
129,398
April
27.00
26.50
26.70
261,070
May
27.05
26.40
26.55
216,626
June
26.92
26.30
26.65
106,355
July
27.25
26.25
26.90
968,514
August
27.05
26.45
26.65
330,554
September
26.70
26.25
26.60
90,397
October
26.95
26.25
26.65
43,136
November
27.00
26.25
26.47
123,911
December
26.99
26.22
26.75
31,361
25
TORONTO STOCK EXCHANGE — SERIES 5 PREFERRED SHARES
Symbol: "IQW.PR.C"
Fiscal year ended December 31, 2004
High Cdn$
Low Cdn$
Close Price Cdn$
Trading Volumes
January
27.70
26.90
27.70
100,916
February
27.70
26.70
26.90
1,010,529
March
27.41
26.65
27.34
413,335
April
27.45
26.70
27.00
78,788
May
27.10
26.25
26.85
60,529
June
27.10
26.65
27.10
113,441
July
27.45
26.91
27.35
61,444
August
27.50
26.94
27.15
471,384
September
27.50
26.65
27.50
341,846
October
27.80
27.20
27.50
240,616
November
28.00
26.95
27.39
150,378
December
28.00
26.85
27.55
405,989
NEW YORK STOCK EXCHANGE — SUBORDINATE VOTING SHARES
Symbol: "IQW"
Fiscal year ended December 31, 2004
High US$
Low US$
Close Price US$
Trading Volumes
January
20.98
19.41
19.82
638,400
February
20.44
18.30
19.58
807,000
March
20.43
18.02
18.41
495,000
April
19.26
16.92
17.23
570,800
May
21.49
17.00
20.38
723,800
June
22.13
20.15
21.98
462,400
July
23.22
20.98
22.13
683,700
August
22.52
20.69
21.97
405,400
September
22.76
21.14
22.38
407,700
October
23.59
20.17
20.79
634,200
November
22.11
20.45
21.00
411,300
December
21.75
18.88
21.54
753,100
26
8.4 RATINGS
As at December 31, 2004, the following investment grade ratings applied to the long-term unsecured debt of the Corporation:
Senior Unsecured Debt
Short Term Debt
Preferred Shares
Standard & Poors Rating Services ("S&P")
BBB-
Not rated
P-3
BBB-: The fourth highest category granted by S&P for Long-term debt. The minus attributed by S&P indicated that the Senior Notes are to be considered at the lower end of the category.
Moody's Investors Service ("Moody's")
Baa3
Not rated
¾
Baa3: The fourth highest category granted by Moody's for Long-term debt. The number 3 attributed by Moody's indicates that the Senior Notes are to be considered at the lower end of the category.
Dominion Bond Rating Service Ltd ("DBRS")
BBB(low)
Not rated
Pfd-3L
BBB(low): The fourth highest category granted by DBRS for Long-term debt. The low attributed by DBRS indicates that the Senior Notes are to be considered at the lower end of the category.
A security rating is not a recommendation to buy, sell or hold securities and may be subject to revision or withdrawal at any time by the rating organization.
For purposes of this Item, reference is made toNote 20 of the Corporation's Audited and Consolidated Financial Statements for the year ended December 31, 2004, and to the disclosure that is made under "Section 6 – ADDITIONAL INFORMATION – Interest of Informed Persons in Material Transactions" of the Management Proxy Circular dated March 24, 2005. The aforesaid Note 20 and Section 6 are incorporated by reference herein.
The Corporation's Audited and Consolidated Financial Statements for the year ended December 31, 2004 and Management Proxy Circular dated March 24, 2005 may be found on the Corporation's website atwww.quebecorworld.com, on the Canadian Securities Administrators' website atwww.sedar.com and on the EDGAR section of the United States Securities and Exchange Commission's website atwww.sec.gov.
Senior Note Indenture relating to US$200,000,000 4 7/8% Senior Notes due 2008 and US$400,000,000 6 1/8% Senior Notes due 2013 dated as of November 3, 2003 among Quebecor World Capital Corporation, as issuer, the Corporation, as guarantor, and Citibank, N.A., as trustee.
27
The Corporation's wholly-owned subsidiary, Quebecor World Capital Corporation, issued US$200.0 million in aggregate principal amount of 4 7/8% Senior Notes due 2008 and US$400.0 million in aggregate principal amount of 6 1/8% Senior Notes due 2013 under an indenture dated as of November 3, 2003 among Quebecor World Capital Corporation, the Corporation and Citibank, N.A., as trustee. The Senior Notes are fully guaranteed as to payment of principal, premium, if any, and interest by the Corporation. The Senior Notes are redeemable, at the option of the issuer, under certain circumstances and at the redemption prices set forth in the indenture. The indenture contains customary restrictive covenants with respect to the Corporation and its subsidiaries and customary events of default. If an event of default occurs and is continuing, other than the bankruptcy or insolvency of the Corporation or certain of its subsidiaries, the trustee or the ho lders of at least 25% in principal amount of the then-outstanding Notes may declare all the Notes to be due and payable immediately.
The Indenture may be found on the Canadian Securities Administrators' website atwww.sedar.com and on the EDGAR section of the United States Securities and Exchange Commission's website atwww.sec.gov.
Agreement dated March 28, 2004 entered into between Quebecor Inc., 4032677 Canada Inc., the Corporation and Computershare Trust Company of Canada.
This Agreement is summarized under "Section 1 - VOTING AND PROXIES – "Undertakings in Favourof Holders of Subordinate Voting Shares", of the Corporation's Management Proxy Circular, which summary is incorporated by reference herein. This Agreement may be found on the Canadian Securities Administrators' website atwww.sedar.com.
The Corporation's transfer Agent for its Subordinate Voting Shares and the Preferred Shares is Computershare Trust Company of Canada whose head office is situated in Toronto (Ontario). Share transfer service is available at Computershare's Montreal (Quebec) and Toronto (Ontario) offices, as well as at the principal office of Computershare Trust Company, Inc. in Denver (Colorado) and New York (New York).
Additional information relating to the Corporation may be found on its website atwww.quebecorworld.com, on the Canadian Securities Administrators' website atwww.sedar.com and on the EDGAR section of the United States Securities and Exchange Commission's website atwww.sec.gov.
Additional information, including directors' and officers' remuneration and indebtedness, principal holders of the Corporation's securities and securities authorized for issuance under equity compensation plans, if applicable, is contained in the Corporation's Management Proxy Circular for its most recent annual meeting of shareholders.
Additional financial information is provided in the Corporation' Audited and Consolidated Financial Statements for the year ended December 31, 2004 and Management's Discussion and Analysis of Financial Condition and Results of Operations for its most recently completed financial year.
Except for historical information contained herein, the statements in this document are forward-looking and made pursuant to the safe harbor provisions of the Private Securities Litigation Reform Act of 1995. Forward-looking statements involve known and unknown risks and uncertainties, which may cause actual results in future periods to differ materially from forecasted results. Those risks include, among others, changes in customer demand for products, changes in raw material and equipment costs and availability, seasonal changes in customer orders, pricing actions by competitors and general changes in economic conditions. Forward-looking statements generally can be identified by the use of forward-looking terminology such as "may", "will", "expect", "intend", "estimate", "anticipate", "plan", "foresee", "believe" or "continue" or the negatives of these terms or variations of them or si milar terminology.
*****
29
MANAGEMENT'S DISCUSSION AND ANALYSIS OF FINANCIAL CONDITION AND RESULTS OF OPERATIONS
OVERVIEW
Quebecor World Inc. is one of the largest commercial print media services companies in the world. Quebecor World is the market leader in most of its product categories and geographies. This market-leading position has been built through a combination of integrating acquisitions, investing in key strategic technologies and a commitment to building long-term partnerships with the world's leading print media customers.
Quebecor World has facilities in the United States, Canada, France, the United Kingdom, Spain, Switzerland, Sweden, Finland, Austria, Belgium, Brazil, Chile, Argentina, Peru, Colombia, Mexico and India.
The Company offers its customers a broad range of printed products and related communication services, such as magazines, retail inserts, catalogs, specialty printing and direct mail, books, directories, pre-media, logistics and other value-added services.
The Company operates in the commercial print media segment of the printing industry and its business groups are located in three geographical regions: North America, which historically represents approximately 80% of the Company's revenues, Europe and Latin America.
The primary drivers affecting the Company are consumer confidence and economic growth rates. These key drivers of demand for commercial print media affect the level of advertising and merchandising activity. The Company uses magazine advertising pages as a key indicator of demand for printing products and services. This indicator, as measured in the United States by the Publishers Information Bureau, showed some positive signs in the last eight months (figure 1).
U.S. Magazine Advertising Pages 2000-2004 (Monthly) Percentage Year-Over-Year Change
The Company's 2004 results saw overall volume increases in most of its business groups. Consolidated revenues, operating income and margin improved in 2004 compared to last year, with the strongest results delivered by the North American platform. However, pricing pressures caused by global printing overcapacity continued to adversely impact revenues, partially offsetting gains obtained from volume increases. Despite the negative price pressures, the Company generated record revenues in 2004. The year 2004 was marked by a gradual recovery during the first nine months, while the fourth quarter showed a significant improvement.
Since 2001, global printing overcapacity has created an environment of reduced prices and margins in all of the Company's markets. In this challenging environment, the Company's approach has been to continue to secure and increase new and existing volume and to adopt an uncompromising focus on cost containment and cost reduction. The Company's cost reduction initiatives, undertaken during the last two years, involved workforce reductions, closure or downsizing of facilities, decommissioning of under-performing assets, lowering of overhead expenses, in part by consolidating corporate functions and relocating sales and administrative offices into plants. This determined focus on cost containment has reduced Quebecor World's long-term cost structure and improved efficiency across the platform.
During the second quarter of 2004, the Company announced a long-term strategic plan that resulted in additional restructuring initiatives. The Company recorded impairment of assets and restructuring charges for the closing of one facility and the downsizing of another in its North American platform. During the fourth quarter of 2004, the Company continued its plan to reorganize its Nordic gravure platform by closing the Stockholm plant and relocating some of the equipment to facilities in Finland and Belgium. The Company also approved the consolidation of a number of smaller facilities and other workforce reductions. Furthermore, the Company recorded a $38 million impairment on certain assets. The completion of the 2004 initiatives affected 2,518 employee positions in total; however, there were 567 new positions created in other facilities.
As part of the strategic plan, the Company announced its intention to invest in new equipment and technology to reach the next productivity level and to further improve efficiencies and customer service. In July 2004, the Company announced a major capital investment to purchase 22 new presses over the next three years for its U.S. manufacturing platform. The investment in this new equipment and accompanying technology will improve efficiency and through-put as well as enhance customer service by providing publishers and retailers with a more complete integrated and flexible multi-plant manufacturing network. Targeted investments have been made in specific markets where the potential for growth has been identified.
Revenue by Product — Worldwide ($ millions) For the quarter and the year ended December 31
9
The Company's annual reporting period usually lasts 52 weeks. Every five or six years, the annual reporting period lasts 53 weeks, as is the case in 2004. The additional week has an impact on the comparison of the 2004 results with those from 2003 and 2002. The estimated impact on revenues and operating income is $91 million and $5 million respectively for the fourth quarter of 2004.
Financial data has been prepared in conformity with Canadian Generally Accepted Accounting Principles ("GAAP"). However, certain measures used in this discussion and analysis do not have any standardized meaning under Canadian GAAP. When used, these measures are defined in such terms to allow the reconciliation to the closest GAAP measure. Numerical reconciliations are provided in figures 8 and 9. It is unlikely that these measures could be compared to similar measures presented by other companies.
The Company's functional currency is the Canadian dollar and its reporting currency is the U.S. dollar.
FOURTH QUARTER IN REVIEW
The Company's consolidated revenues for the fourth quarter were $1,895 million, a 9% increase when compared to $1,742 million for the same period in 2003. Excluding the favorable impact of currency translation (see figure 3) and the additional week in 2004, revenues were up 1% due mainly to an increase in volume in virtually all business groups partially offset by continued price pressures.
Impact of Foreign Currency ($ millions)
Periods ended December 31, 2004
Three months
Twelve months
Foreign currency favorable impact on revenues
$
53.2
$
190.1
Foreign currency favorable impact on operating income
$
1.4
$
5.2
Figure 3
The Company assesses performance based on operating income before impairment of assets, restructuring and other charges. The following operating analyses are before impairment of assets, restructuring and other charges.
In the fourth quarter of 2004, operating income, before impairment of assets, restructuring and other charges, increased by 89% to $163 million compared to $86 million in 2003. Operating margin, on the same basis, increased to 8.6% from 5.0% in 2003. The increases in both operating income and margin are due mainly to the increase in volume, cost containment initiatives and headcount reduction, partially offset by price pressures.
In 2004, operating income was affected by recording net specific charges of $9 million in the fourth quarter for various items including provisions for leases and workers' compensation claims related to closed plants, mainly in North America. In 2003, the Company incurred specific charges that reduced operating income by $23 million of which $14 million was related to North America, mainly for provisions for leases and for doubtful accounts, $3 million to Europe and the balance to Latin America and other provisions.
Cost of sales for the fourth quarter of 2004 increased 7% compared to last year, mostly explained by the additional week in 2004. Gross profit margin was 20.0% in the fourth quarter of 2004 compared to 18.8% in 2003. The 2004 and 2003 cost of sales included specific charges of $6 million and $5 million, respectively. Excluding these specific charges as well as the unfavorable impact of currency translation, gross profit margin for the quarter still increased to 20.4% compared to 19.1% last year. Part of the increase in cost of goods sold is explained by an increase in sales for the quarter across the platform. Savings from headcount reductions were offset by the overall increase in sales volume resulting in an increase in labour expense of $9 million for the fourth quarter 2004. The increase in labor expense (2%) was less than the increase in revenues (6%) for the quarter, increasing gross margin and reflecting the impact of restructuring measures to date. Gains on other materials and higher paper prices on scrap paper sales contributed to a reduction in cost of materials by approximately $17 million. Excluding the negative impact of currency translation, these items contributed to improve the gross profit margin for the fourth quarter of 2004.
Selling, general and administrative expenses were $130 million compared with $156 million in 2003, a decrease of $26 million. Excluding the specific charges of $4 million in 2004 and $18 million in 2003, as well as the unfavorable impact of currency translation of $4 million, selling, general and administrative expenses were favorable by $16 million in the fourth quarter of 2004 compared to last year. The savings were mostly explained by workforce reduction which contributed to the decrease in salaries and benefits as well as travel and entertainment expenses.
Depreciation and amortization were $86 million in the fourth quarter of 2004 and 2003. Excluding the impact of currency translation, depreciation and amortization decreased by 3% for the fourth quarter of 2004.
During the fourth quarter, the Company continued its restructuring initiatives and recorded an impairment of assets, restructuring and other charges of $53 million, which included the closing of facilities and a workforce reduction each having an impact on all three segments. These measures are described in section "Impairment of Assets and Restructuring Initiatives".
Financial expenses were $32 million in the fourth quarter of 2004, compared to $80 million in 2003. Two non-recurrent events affected the 2003 fourth quarter financial expenses. First, the Company redeemed the 8.375% Senior Notes and repurchased 89.6% of the 7.75% Senior Notes, which resulted in a $30 million charge on extinguishment of long-term debt. Furthermore, the financial expenses for the fourth quarter of 2003 included a $5 million exchange loss on the currency translation adjustment due to the reduction of a net investment in Latin America. Excluding these two events, financial expenses were down $13 million in the fourth quarter of 2004 compared to 2003. A lower average volume of debt mainly explained the reduction in the fourth quarter of 2004 combined with the net impact of the mix of the debt portfolio.
Income taxes were $33 million in the fourth quarter of 2004 compared to $37 million in 2003. Income taxes before impairment of assets, restructuring and other charges were $40 million in the fourth quarter of 2004 compared to $43 million in 2003. The fourth quarter of 2003, income taxes before impairment of assets, restructuring and other charges included two non-recurring items; an unfavorable adjustment of the average tax rate applied on cumulative temporary differences within different states in the United States for $28 million, and an additional charge of $18 million reflecting a revised expectation of tax asset recovery and liabilities from prior years. When excluding these items, income taxes before impairment of assets, restructuring and other charges increased in the fourth quarter of 2004. The increase in income taxes was due to an increase in profits before taxes in countries with a higher overall tax rate and as a result of valuation allowances recorded on certain tax assets.
10
For the fourth quarter ended December 31, 2004, the Company reported a diluted earnings per share of $0.26 compared to a loss per share of $0.48 in 2003. These results incorporated impairment of assets, restructuring and other charges of $53 million ($47 million net of taxes) or $0.34 per share compared with $21 million ($16 million net of taxes) or $0.12 per share in 2003. Excluding the effect of impairment of assets, restructuring and other charges, the fourth quarter of 2004 resulted in earnings per share of $0.60 compared with a loss per share of $0.36 in the same period of 2003. The specific charges of $9 million ($5 million net of taxes) for the fourth quarter of 2004 and $23 million ($18 million net of taxes) for the same period in 2003, negatively impacted earnings per share by $0.04 in 2004 and $0.14 in 2003.
In 2003, a series of non-recurring items such as a $30 million charge on extinguishment of long-term debt, a $5 million loss from currency translation adjustment and the combined effect on the income tax expense of the items described above ($46 million) reduced earnings per share by $0.53.
YEAR 2004 IN REVIEW
The Company's consolidated revenues for 2004 were $6,622 million, a 4% increase when compared to $6,392 million in 2003. Excluding the favorable impact of currency translation (see figure 3) and the additional week in 2004, revenues were down 1% due to continued pressure on prices.
On a full year basis, the Company incurred specific charges that reduced operating income by $19 million for various items including provisions for leases, favorable legal claim settlements, and workers' compensation claims related to closed plants, mainly in North America. In 2003, the Company incurred specific charges that reduced operating income by $79 million of which $58 million was related to North America, $8 million to Latin America, $6 million to Europe and the balance to other provisions.
For the full year of 2004, operating income, before impairment of assets, restructuring and other charges, increased by 53% to $483 million compared to $316 million in 2003. Operating margin, on the same basis, increased to 7.3% from 4.9% in 2003. The significant increases in both operating income and margin are due mainly to the increase in volume, cost containment initiatives and headcount reduction, partially offset by price pressures.
Segmented Results of Operations ($ millions) Selected Performance Indicators
North America
Europe
Latin America
Inter-Segment and Others
Total
2004
2003
2004
2003
2004
2003
2004
2003
2004
2003
Three months ended December 31
Revenues
$
1,460.3
$
1,354.9
$
376.6
$
340.3
$
56.2
$
47.9
$
1.6
$
(1.5
)
$
1,894.7
$
1,741.6
Operating income (loss) before depreciation and amortization and before IAROC
209.9
144.0
35.5
35.0
0.9
3.4
9.9
(3.3
)
256.2
179.1
Operating income (loss) before IAROC
138.5
71.0
16.5
18.1
(1.8
)
0.9
9.6
(3.6
)
162.8
86.4
IAROC
16.5
17.9
31.6
1.2
4.6
2.2
0.5
0.2
53.2
21.5
Operating income (loss)
122.0
53.1
(15.1
)
16.9
(6.4
)
(1.3
)
9.1
(3.8
)
109.6
64.9
Operating margin before depreciation and amortization and before IAROC
14.4
%
10.6
%
9.4
%
10.3
%
1.7
%
7.1
%
13.5
%
10.3
%
Operating margin before IAROC
9.5
%
5.2
%
4.4
%
5.3
%
(3.2
)%
1.9
%
8.6
%
5.0
%
Operating margin
8.4
%
3.9
%
(4.0
)%
5.0
%
(11.4
)%
(2.5
)%
5.8
%
3.7
%
Capital expenditures
$
24.1
$
28.3
$
7.2
$
8.0
$
0.5
$
1.0
$
—
$
0.2
$
31.8
$
37.5
Change in non-cash balances related to operations, cash flow (outflow)
121.4
261.3
42.4
23.4
12.6
10.0
(3.3
)
(18.7
)
173.1
276.0
Year ended December 31
Revenues
$
5,132.4
$
5,062.7
$
1,297.4
$
1,151.4
$
192.4
$
177.3
$
(0.1
)
$
0.1
$
6,622.1
$
6,391.5
Operating (loss) income before depreciation and amortization and before IAROC
712.6
588.2
120.5
87.5
12.3
6.9
(0.5
)
(7.3
)
844.9
675.3
Operating income (loss) before IAROC
433.7
304.1
50.1
24.3
1.3
(3.7
)
(1.7
)
(8.8
)
483.4
315.9
IAROC
74.8
78.5
40.6
6.8
5.7
11.8
1.0
1.2
122.1
98.3
Operating income (loss)
358.9
225.6
9.5
17.5
(4.4
)
(15.5
)
(2.7
)
(10.0
)
361.3
217.6
Operating margin before depreciation and amortization and before IAROC
13.9
%
11.6
%
9.3
%
7.6
%
6.4
%
3.9
%
12.8
%
10.6
%
Operating margin before IAROC
8.5
%
6.0
%
3.9
%
2.1
%
0.7
%
(2.1
)%
7.3
%
4.9
%
Operating margin
7.0
%
4.5
%
0.7
%
1.5
%
(2.3
)%
(8.7
)%
5.5
%
3.4
%
Capital expenditures
$
106.5
$
187.9
$
22.2
$
45.6
$
3.8
$
8.9
$
0.1
$
0.7
$
132.6
$
243.1
Change in non-cash balances related to operations, cash flow (outflow)
(202.0
)
(0.1
)
1.1
4.5
18.0
5.2
23.6
2.0
(159.3
)
11.6
IAROC: Impairment of assets, restructuring and other charges.
Figure 4
11
Cost of sales for the full year of 2004 increased 3% compared to last year, mostly explained by the additional week in 2004. Gross profit margin was 19.6% in 2004 compared to 18.8% in 2003. The 2004 and 2003 cost of sales included specific charges of $9 million and $41 million, respectively. Excluding these specific charges as well as the unfavorable impact of currency translation, gross profit margin for the year was 19.9% compared to 19.5% last year. Despite an increase in sales volume across the platform in 2004, labor decreased by $12 million. Gains on other materials and higher paper prices on scrap paper sales contributed to a reduction in cost of materials by approximately $51 million. These elements were partly offset by operational inefficiencies in certain plants, mainly those involved with installation and transfer of equipment, in the third quarter. Excluding the negative impact of currency translation, these items contributed to improve the gross profit margin for 2004.
Selling, general and administrative expenses were $480 million compared with $551 million in 2003, a decrease of $71 million. Excluding the specific charges of $9 million in 2004 and $38 million in 2003, as well as the unfavorable impact of currency translation of $16 million, selling, general and administrative expenses were favorable by $58 million in 2004, compared to last year. On a year-to-date basis, the savings were explained by workforce reductions which contributed to the decrease in salaries and benefits as well as travel and entertainment expenses.
Depreciation and amortization were $335 million and $336 million in 2004 and 2003, respectively. Excluding the impact of currency translation, depreciation and amortization decreased by 3% in 2004.
The Company continued its restructuring initiatives in 2004 and recorded a net restructuring charge of $122 million, which reflected closure of facilities in North America and Europe, further workforce reductions, and additional impairment of assets across the platform. These measures are described in the section "Impairment of Assets and Restructuring Initiatives".
Financial expenses were $133 million in 2004, compared to $207 million in 2003. Two non-recurrent events affected the 2003 financial expenses. First, the Company redeemed the 8.375% Senior Notes and repurchased 89.6% of the 7.75% Senior Notes which resulted in a $30 million charge on extinguishment of long-term debt. Furthermore, the financial expenses for 2003 included a $5 million exchange loss on the currency translation adjustment due to the reduction of a net investment in Latin America. Excluding these two events, financial expenses were down by $39 million in 2004 compared to 2003. Part of the decrease is a direct effect of the above-mentioned repurchase and redemption of Senior Notes. These transactions lowered the 2004 expense by $8 million. A lower average volume of debt mainly explains the rest of the reduction in 2004 combined with the net impact of the mix of the debt portfolio and reduced losses on foreign exchange compared with 2003.
Income taxes were $79 million in 2004 compared to $39 million in 2003. Income taxes before impairment of assets, restructuring and other charges were $106 million in 2004 compared to $66 million in 2003. The 2003 income taxes before impairment of assets, restructuring and other charges included two non-recurring items which occurred in 2003; an unfavorable adjustment of the average tax rate applied on cumulative temporary differences within different states in the United States for $28 million and an additional charge of $25 million reflecting revised expectation of tax asset recovery and liabilities from prior years. When excluding these items, income taxes before impairment of assets, restructuring and other charges increased in the year 2004. The increase in income taxes was due to an increase in profits before taxes in countries with a higher overall tax rate and as a result of valuation allowances recorded on tax assets.
For the year ended December 31, 2004, the Company reported a diluted earnings per share of $0.80 compared to a loss per share of $0.50 in 2003. These results incorporated impairment of assets, restructuring and other charges of $122 million ($95 million net of taxes) or $0.71 per share compared with $98 million ($71 million net of taxes) or $0.53 per share in 2003. Excluding the effect of impairment of assets, restructuring and other charges, 2004 diluted earnings per share were $1.51 compared with $0.03 in 2003. The specific charges of $19 million ($12 million net of taxes) for 2004 and $79 million ($57 million net of taxes) in 2003, also negatively impacted earnings per share by $0.09 in 2004 and $0.42 in 2003.
In 2003, a series of non-recurring items such as a $30 million charge on extinguishment of long-term debt, a $5 million loss from currency translation adjustment and the combined effect on the income tax expense of the items described above ($53 million) reduced earnings per share by $0.56.
Selected Annual Information ($ millions, except per share data)
Years ended December 31,(1)
2004
2003
2002
Consolidated Results
Revenues
$
6,622.1
$
6,391.5
$
6,271.7
Operating income before depreciation and amortization and before IAROC
844.9
675.3
882.8
Operating income before IAROC
483.4
315.9
547.2
IAROC
122.1
98.3
19.6
Operating income
361.3
217.6
527.6
Net income (loss)
143.7
(31.4
)
279.3
Financial Position
Total assets
6,244.4
6,256.9
6,207.4
Total long-term debt and convertible notes
1,950.1
2,009.0
1,822.1
Per Share Data
Earnings (loss)
Basic
0.80
(0.50
)
1.78
Diluted
0.80
(0.50
)
1.76
Diluted before IAROC
1.51
0.03
1.92
Dividends on preferred shares
1.26
1.17
0.96
Dividends on equity shares
0.52
0.52
0.49
IAROC: Impairment of assets, restructuring and other charges.
Figure 5
(1)
Annual information for 2004 consisted of 53 weeks whereas information for 2003 and 2002 consisted of 52 weeks.
YEAR 2003 IN REVIEW
In 2003 and 2002, certain reclassifications have been made to conform with the basis of presentation adopted in 2004.
12
In 2003, the difficult economic environment and the global overcapacity in the print media industry resulted in increased competition and severe pressure on prices. In reaction to this environment, the Company's approach was to secure and increase new and existing volume and to contain and reduce costs. These measures were implemented across the platform, on the operational side as well as in the administrative functions.
Revenue increased from $6,272 million in 2002 to $6,392 million in 2003, an increase of 2%, explained by the favorable impact of currency translation and the acquisition of the printing assets of Hachette Filipacchi Medias. The reduction in revenues, when excluding these factors, was a reflection of the pricing pressure in all business segments, despite the overall volume increase.
In 2003, the Company incurred specific charges that reduced operating income totalling $79 million of which $58 million related to North America, and included a $15 million adjustment caused by the rapid growth and systems issues in the North American Logistics business, a $16 million provision for doubtful accounts and $9 million for lease provisions. In Latin America and Europe, specific charges amounted to $8 million and $6 million, respectively. From the total specific charges, a portion of $38 million increased selling, general and administrative expenses.
Operating income, before impairment of assets, restructuring and other charges, fell by 42% to $316 million in 2003, from $547 million in 2002. Operating margin, on the same basis, declined to 4.9% in 2003 from 8.7% in 2002. Reduced capacity utilization and pricing pressures were largely responsible for the lower operating margin. Operating margin was also negatively affected by increases in pension, utilities and medical expenses.
Depreciation and amortization were $336 million in 2003, compared to $316 million in 2002. This increase was primarily due to new capital expenditures including the purchase of presses that were previously under operating leases.
Selling, general and administrative expenses were $551 million in 2003 compared with $523 million in 2002, an increase of $28 million. Excluding specific charges totalling $38 million, as well as the impact of currency translation of $23 million, selling, general and administrative expenses improved by $33 million or 6%. This resulted from workforce reductions and other cost containment measures despite increases in employee benefit expenses, such as medical, pension and accounting for stock-based compensation.
In 2003, impairment of assets, restructuring and other charges of $98 million were recorded following management's detailed review of the Company's operations and administrative functions.
Financial expenses were $207 million in 2003, compared to $155 million in 2002. The 2003 results included a $30 million charge on extinguishment of long-term debt related to the redemption of the 8.375% senior notes and the repurchase of 89.6% of the 7.75% senior notes in the fourth quarter of 2003. The 2003 financial expenses also included an exchange loss of $5 million from the currency translation adjustment account for the reduction of a net investment in Latin America. Excluding these two events, financial expenses increased by $17 million from 2002. Despite the higher level of debt at year-end, the average volume for 2003 was similar to the previous year. The higher expenses were mainly due to the net impact of the currency mix of the debt portfolio, the higher fixed component of the debt denominated in U.S. dollars and losses on foreign exchange due to the weaker U.S. dollars.
Income tax expenses were $39 million in 2003 compared with $91 million in 2002. The income taxes in 2003 included the following two items; an adjustment of the average tax rate applied on cumulative temporary differences within different states in the United States for $28 million; and an additional charge of $25 million reflecting a revised expectation of tax asset recovery and liabilities from prior years. When excluding these items, the income tax would be a recovery, since earnings before taxes were generated in jurisdictions with lower tax rates, whereas income taxes on restructuring and other charges were recovered in jurisdictions with higher tax rates.
For the year ended December 31, 2003, the Company reported a loss per share of $0.50 compared to a diluted earnings per share of $1.76 in 2002. These results incorporated impairment of assets, restructuring and other charges of $98 million ($71 million net of taxes) or $0.53 per share compared with $20 million ($24 million net of taxes) or $0.16 per share in 2002. Excluding the effect of impairment of assets, restructuring and other charges, 2003 resulted in diluted earnings per share of $0.03 compared with $1.92 in 2002. The specific charges of $79 million ($57 million net of taxes) also negatively impacted earnings per share by $0.42. The refinancing of the long-term debt, which generated a charge on extinguishment of long-term debt of $30 million ($18 million net of taxes) and a $5 million loss from the currency translation adjustment further lowered earnings per share by $0.17. The impact of the special tax items as described above also reduced earnings per share by $0.39 ($53 million reduction of net income).
SEGMENT REVIEW
The following is a review of activities by business group. The operating analysis is before impairment of assets, restructuring and other charges.
North America
North American revenues for the fourth quarter of 2004 were $1,460 million, up 8% from $1,355 million in 2003. On a full year basis, revenues increased 1% to $5,132 million in 2004 from $5,063 million in 2003. Excluding the effect of currency translation, revenues increased by 6% in the fourth quarter and remained flat for the year compared to 2003. The impact of the additional week in 2004, as previously mentioned in the overview, is felt mostly in the results of the North American segment. However, none of the business groups are significantly impacted by this item.
The following is a review of the North American activities by business group. The North American segment is made up of the following business groups: Magazine, Catalog, Retail, Book & Directory, Commercial & Direct, Canada and Other Domestic Revenues.
Magazine
Magazine revenues for the fourth quarter of 2004 were $233 million, up 6% from $220 million in 2003. On a full year basis, revenues increased by 2% to $857 million in 2004, from $838 million in 2003. The increase was due mainly to a favorable product mix in the fourth quarter and also a 2% and 3% volume increase in the fourth quarter and full year, respectively. Operating income and margin decreased in the fourth quarter due to the operational inefficiencies in start-up and freight costs at two facilities related to the closure of the Effingham, Illinois facility in the third quarter. Operating income for the full year was slightly higher due to cost saving initiatives, however, the operating margin decreased due to the effects of the Effingham closure.
13
The Magazine group is continuing to secure market share by extending current contracts and increasing volume for customers such as Hearst, Forbes, Bauer and Wenner.
Selling, general and administrative expenses decreased in both the fourth quarter and full year compared to 2003 due mainly to the savings from cost containment initiatives and headcount reductions. Year-over-year headcount was reduced by 687 employees or approximately 11%.
Catalog
Catalog revenues for the fourth quarter of 2004 were $192 million, up 8% from $178 million in 2003. On a full year basis, revenues decreased by 2% to $672 million in 2004, from $685 million in 2003. Volume was up 14% for the quarter and 3% for the full year. Prices were slightly down for both the quarter and full year. Operating margins for both the fourth quarter and the full year increased mainly due to the volume increase in the fourth quarter.
The Catalog group is continuing to secure market share by extending current contracts and increasing volume for customers such as JC Penney, Brylane and Oriental Trade Company.
Selling, general and administrative expenses were slightly higher in the fourth quarter of 2004 compared to 2003. On a full year basis, selling, general and administrative expenses decreased compared to 2003 due mainly to savings from cost containment initiatives and headcount reductions. Year-over-year headcount was reduced by 171 employees or approximately 4%.
Retail
Retail revenues for the fourth quarter of 2004 were $296 million, up 14% from $260 million in 2003. On a full year basis, revenues increased by 7% to $997 million in 2004, from $930 million in 2003. The increase was due mainly to an increase in volume of 11% for the quarter and 6% for the full year, partly offset by the negative impact for the year of lower priced work and price pressures. Operating income and margin improved compared to last year as a result of savings from cost control initiatives and operational efficiency gains.
The Company's North American Retail network, built through strategic investments in both gravure and offset technologies, provides customers with a unique coast-to-coast platform allowing for large-run national campaigns or shorter-run multi-versioned ones. Competition is fierce but the group reported significant volume increases with customers such as Home Depot, JC Penney, CVS and Lowe's.
Selling, general and administrative expenses decreased in both the fourth quarter and full year compared to 2003 due mainly to the savings from cost containment initiatives and headcount reductions. Year-over-year headcount decreased by 164 employees or approximately 5%.
Book & Directory
Book & Directory revenues for the fourth quarter of 2004 were $203 million, up 11% from $184 million in 2003. Excluding the favorable impact of paper sales, revenues for the fourth quarter increased 6% compared to 2003. On a full year basis, revenues decreased slightly to $747 million in 2004, from $750 million in 2003. Volume for the Book group was up 8% for the quarter, as a result of strong demand in the adult trade and educational book market and was up 2% for the full year. For the Directory group, volume was up 29% for the fourth quarter and 20% for the full year. Prices were down both for the quarter and for the year in both segments. The price erosion in Directory is explained by more volume from independent directory publishers replacing one major contract terminated in 2003, as well as less demand for 4-color work. For the Book group, prices decreased due to a heavier mix of one and two-color work and competitive market conditions.
While competition for the Directory market share for the major telecom business continues to remain fierce, the Company has and will continue to defend and grow its market share in this robust domestic market through early contract renewals and new business in the independent markets.
During the third quarter, the Company embarked on an initiative to more closely link our Latin American Book and Directory facilities with their North American counterparts to expand the capacity and capabilities to its overall customer base. This initiative will continue through 2005.
Operating income increased in both the fourth quarter and full year of 2004 compared to 2003 due to productivity gains and other cost containment initiatives. The operating margin for the fourth quarter slightly decreased, while it increased for the year compared to 2003. Selling, general and administrative expenses were lower compared to 2003 due mainly to the savings from cost containment initiatives and headcount reductions.
During the second quarter of 2004, the Company announced restructuring initiatives that included the downsizing of the Kingsport, Tennessee facility in the Book Group. For the year, total headcount in Book & Directory operations decreased by 748 employees, or approximately 14%.
Revenue by Business Group($ millions) For the quarter and the year ended December 31
Commercial & Direct
Commercial & Direct revenues for the fourth quarter of 2004 were $142 million, down 14% from $165 million in 2003. On a full year basis, revenues decreased 11% to $540 million in 2004, from $605 million in 2003. The decrease in revenues was mainly due to a drop in volume and prices in Commercial in both the fourth quarter and full year, due to intense competition. In Commercial, volume was down 12% and 19% for the fourth quarter and the full year, respectively, compared to 2003. In Direct, volume was up 2% for the fourth quarter and flat for the full year compared to 2003, while prices were positive for both periods due to a favorable product mix. Operating income in Commercial & Direct decreased in both the fourth quarter and full year due mainly to the volume and pricing pressures in the Commercial market. The operating margin for the fourth quarter was flat, while it increased for the year compared to 2003, due to cost containment initiatives.
14
Selling, general and administrative expenses decreased in both the fourth quarter and full year compared to 2003 due mainly to the savings from cost containment initiatives and headcount reductions. Year-over-year headcount decreased by 295 employees or approximately 10%.
Canada
The Canadian business group operates mainly in the Retail, Magazine, Catalog, Directory, Book and Specialty Printing markets. Canadian revenues for the fourth quarter of 2004 were $289 million, up 11% from $259 million in 2003. On a full year basis, revenues increased by 4% to $946 million in 2004, from $910 million in 2003. Excluding the favorable impact of currency translation, revenues increased 3% for the quarter but decreased 4% for the full year compared to 2003. Volume increased 10% in the fourth quarter and 6% for the full year compared to the same periods in 2003, due mainly to gains in the Retail market from current and new customers, partially offset by a shortfall in the Magazine market. Despite a volume increase, market conditions remained extremely competitive as reflected in the pricing. Operating income and margin improved compared to last year as a result of savings from cost control initiatives and operational efficiency gains.
Selling, general and administrative expenses decreased in both the fourth quarter and full year compared to 2003 due mainly to the savings from cost containment initiatives and headcount reductions. Year-over-year headcount decreased by 453 employees or approximately 8%.
Other Revenue
Other sources of revenue in North America include Quebecor World Premedia and Logistics.
Premedia revenues for the fourth quarter were $17 million, down 3% from $18 million in 2003. On a full year basis, revenues were $69 million in 2004, down 8% from $75 million in 2003. Volume increased by 55% in the fourth quarter of 2004 and 36% for the full year due mainly to renewals and new gains for low margin services type of work. Prices were negatively impacted by the economic environment where customers continue to look for ways to reduce their costs, mainly by taking more of the higher margin services in-house. While operating income and margin for the full year decreased due to the loss of the higher margin services, both increased for the fourth quarter compared to last year due mainly to the increased volume.
Selling, general and administrative expenses decreased in both the fourth quarter and full year compared to 2003 due mainly to the savings from cost containment initiatives and headcount reductions. Year-over-year headcount decreased by 53 employees or approximately 11%.
Logistics revenues for the fourth quarter were $89 million, up 18% from $76 million in 2003. On a full year basis, revenues were $309 million in 2004, up 13% from $273 million in 2003. The revenue increase was due mainly to higher retail commodity shipments and higher fuel prices. Operating income and margins increased due to the increased volume offset by increased costs due to new government hours of service regulations for freight carriers and pricing pressures from airfreight fuel surcharge and security fees.
Selling, general and administrative expenses decreased in both the fourth quarter and full year compared to 2003 due mainly to the savings from cost containment initiatives and open administrative positions.
Europe
The European business group operates mainly in the Magazine, Retail, Catalog and Book markets. European revenues for the fourth quarter of 2004 were $376 million, up 11% from $340 million in 2003. On a full-year basis, revenues were $1,297 million, up 13% from $1,151 million in 2003. Excluding the positive impact of currency translation, revenues were up 2% for both the fourth quarter and the full year compared to the same periods last year. Overall volume increased by 3% in the fourth quarter and 4% year-to-date compared to last year. The increase in volume was primarily in the Magazine and Retail markets, in part due to additional capacity provided by two new presses in Spain and Sweden. However, price erosion continued to have a negative impact in virtually all countries throughout the year.
The operating income and margin for the European segment decreased in the fourth quarter compared to 2003. On a full year basis, operating income and margin increased compared to 2003. France's operating margin for the fourth quarter was slightly positive but still lower than last year. On a full year basis, operating margin was negative but showed an improvement from last year. These elements are indicative of the positive impact of the 2003 restructuring initiatives. Outside France, operating income and margin increased for the full year compared to 2003. However, both the operating income and margin decreased in the fourth quarter due primarily to the inefficiencies caused by the phase-out of a facility in Sweden and the competitive price market in Belgium. During the second quarter of 2004, the Company was informed that an important printing contract at its facility in Corby, England, expiring in 2005, would not be renewed. In the fourth quarter of 2004, the Company and its employee representatives at this facility began a consultation period regarding a possible work-force reduction. Furthermore, management is currently evaluating and developing a sales strategy to replace the expected lost volume.
Selling, general and administrative expenses decreased in both the fourth quarter and full year compared to 2003 due mainly to the savings from cost containment initiatives and headcount reductions. Year-over-year headcount decreased by 189 employees or approximately 3%.
Latin America
Latin America operates mainly in the Book, Directory, Magazine, and Retail markets. Latin America's revenues for the fourth quarter of 2004 were $56 million, up 17% from $48 million in 2003. On a full-year basis, revenues were $192 million in 2004, up 9% from $177 million in 2003. Excluding the favorable impact of currency translation and paper sales, revenues increased 1% for the quarter and were flat for the full year compared to 2003. In general, prices were down for the fourth quarter and full year in Latin America as compared to the same periods in 2003. Overall volume increased by 6% for the fourth quarter and 9% for the full year as compared to last year. Volume increased in the Book market in Argentina and Recife, Brazil but was partially offset by shortfalls in Colombia and Sao Paulo, Brazil. Volume also generally increased in the Directory market in virtually all regions.
15
Selling, general and administrative expenses decreased in both the fourth quarter and full year compared to 2003 due mainly to the savings from cost containment initiatives and headcount reductions. Year-over-year headcount decreased by 367 employees or approximately 15%.
CRITICAL ACCOUNTING ESTIMATES
The preparation of financial statements in conformity with Canadian GAAP requires the Company to make estimates and assumptions which affect the reported amounts of assets and liabilities, the disclosure on contingent assets and liabilities at the date of the financial statements and reported amounts of revenues and expenses during the reporting period. The Ontario Securities Commission defines critical accounting estimates as those requiring assumptions made about matters that are highly uncertain at the time the estimate is made, and when the use of different reasonable estimates or changes to the accounting estimates would have a material impact on a Company's financial condition or results of operations.
Based on this definition, the Company has identified the following critical accounting estimates:
Revenue Recognition
The Company recognizes revenue either when the production process is completed or when services are performed, or on the basis of production and service activity at the pro rata billing value of the work completed. When progress needs to be measured, the method used always reflects the output achieved. For example, one method is based on the number of units produced for each of the significant production processes, where each of these units is attributed a certain profit based on the stage of the production. Other methods may be based on the hours of labor recorded or the costs incurred, but this is only allowed when it reflects the true output of the project. The underlying work in process is valued at the pro rata billing value of the work completed. Usually, the time lag is short between recognition of revenue and the final billing.
Goodwill
Goodwill is not amortized but tested for impairment annually, or more frequently if events or changes in circumstances indicate a possible impairment. The Company compares the reporting unit's carrying value to its market value determined through a discounted cash flow analysis. In preparing discounted cash flows, the Company uses its judgment in estimating future profitability, growth, capital spending and discount rate. As an additional overall check on the reasonableness of the fair value attributed to reporting units, the Company performs a market comparable companies analysis, which takes into consideration 1) valuation multiples of comparable public companies to which a control premium is applied and 2) publicly-known acquisition multiples of recent transactions in the industry. If the carrying value of the reporting unit exceeds the market value, the Company would then evaluate the impairment loss by comparing the fair value of the goodwill to its carrying amount.
Based on the results of the latest impairment test performed, the Company concluded that no impairment existed. In the event that actual outcome differs from management's estimates, an impairment could be necessary.
Impairment of Long-Lived Assets
The Company tests the recoverability of long-lived assets, including property, machinery and equipment and other long-term assets, when events or changes in circumstances indicate that their carrying amounts may not be recoverable. Examples of such events and changes include: the decommissioning of an asset, assets rendered idle after plant shutdown, costs that significantly exceed the amount initially estimated for the acquisition or construction of an asset and adverse economic changes affecting a group of assets and causing continuing underperformance.
An impairment is recognized when the carrying amount of a long-lived asset is not recoverable and exceeds its fair value. A long-lived asset, or group of assets is considered unrecoverable when its carrying value exceeds the estimated undiscounted future cash flows directly associated with it. The Company estimates future cash flows based on historical and budgeted performance as well as assumptions on future economic environment, pricing and volume and in some cases, alternative use for assets being reviewed. The fair value measurement is determined based on market prices when available, or on the discounted cash flow approach.
As a result of initiatives undertaken in 2004, recoverability tests were performed for downsized plants and plants receiving transferred assets. Recoverability tests were also performed for plants where events or changes in circumstances indicated that their carrying amounts may not be recoverable. In cases where projected undiscounted future cash flows were not sufficient to recover the net book value of assets, an impairment was recorded on those long-term assets in order to reduce their carrying amounts to their fair market value. Consequently, an impairment of $38 million was recorded in the fourth quarter of 2004 for a total impairment for the year 2004 of $74 million.
With the exception of the above mentioned items, the Company believes that no other impairments are necessary for its long-lived assets. In the event that actual outcome differs from management's estimates, additional impairments could be necessary.
Pension and Postretirement Benefits
The Company maintains defined benefit plans and postretirement benefits for its employees and ensures that contributions are sustained at a level sufficient to cover benefits. Actuarial valuations of the Company's various pension plans were performed during the last three years. Plan assets are measured at fair value and consist of equity securities and corporate and government fixed income securities. Pension and other postretirement costs and obligations are based on various economic and demographic assumptions determined with the help of actuaries and are reviewed each year. Key assumptions include the discount rate, the expected long-term rate of return on plan assets, the rate of compensation increase and the health care cost trend rate (see figure 7).
The discount rate assumption used to calculate the present value of the plans' projected benefit payments was determined using a measurement date of September 30, 2004 and based on yields of long-term high-quality fixed income investments.
Weighted average assumptions used in the measurement of the Company's pension benefits
2004
2003
Accrued benefit obligation as of December 31:
Discount rate
6.0%
6.0%
Rate of compensation increase
3.4%
3.5%
Benefit costs for year ended December 31:
Discount rate
6.0%
6.7%
Expected return on plan assets
7.8%
8.2%
Rate of compensation increase
3.5%
3.4%
Figure 7
16
Reconciliation of non GAAP measures ($ millions)
Year ended December 31
2004
2003
2002
Operating Income
Operating income
$
361.3
$
217.6
$
527.6
Impairment of assets, restructuring and other charges ("IAROC")
122.1
98.3
19.6
Operating income before IAROC
$
483.4
$
315.9
$
547.2
Operating income
$
361.3
$
217.6
$
527.6
Depreciation of property, plant and equipment
334.5
333.2
313.2
Amortization of deferred charges
27.0
26.2
22.4
Operating income before depreciation and amortization
$
722.8
$
577.0
$
863.2
IAROC
122.1
98.3
19.6
Operating income before depreciation and amortization and IAROC
$
844.9
$
675.3
$
882.8
Earnings (loss) per share
Net income (loss)
$
143.7
$
(31.4
)
$
279.3
IAROC (net of income taxes of $27.1 million in 2004,
$27.0 million in 2003 and $(4.5) million in 2002)
95.0
71.3
24.1
Net income before IAROC
$
238.7
$
39.9
$
303.4
Net income available to holders of preferred shares
37.5
36.5
28.9
Net income available to holders of equity shares before IAROC
$
201.2
$
3.4
$
274.5
Diluted average number of equity shares outstanding (in millions)
132.6
136.0
145.4
Earnings (loss) per share
Diluted
$
0.80
$
(0.50
)
$
1.76
Diluted, before IAROC
$
1.51
$
0.03
$
1.92
Free Cash Flow
Cash provided by operating activities
$
487.8
$
461.3
$
513.4
Dividends on preferred shares
(38.8
)
(37.7
)
(36.2
)
Additions to property, plant and equipment
(132.6
)
(243.1
)
(184.5
)
Net proceeds from disposal of other assets
3.0
2.8
27.1
Free cash flow from operations
$
319.4
$
183.3
$
319.8
Debt-to-capitalization
Bank indebtedness
$
—
$
1.3
$
0.3
Current portion of long-term debt and convertible notes
11.7
23.9
38.5
Long-term debt
1,825.8
1,874.4
1,668.6
Convertible notes
112.6
110.7
115.0
Total debt
$
1,950.1
$
2,010.3
$
1,822.4
Minority interest
8.3
24.7
20.9
Shareholders' equity
2,612.6
2,503.4
2,703.8
Capitalization
$
4,571.0
$
4,538.4
$
4,547.1
Debt-to-capitalization
43:57
44:56
40:60
Book value per share
Shareholders' equity
$
2,612.6
$
2,503.4
$
2,703.8
Preferred shares
(456.6
)
(456.6
)
(456.6
)
$
2,156.0
$
2,046.8
$
2,247.2
Ending number of equity shares (in millions)
132.6
132.0
141.1
Book value per share
$
16.26
$
15.51
$
15.92
Figure 8
17
Reconciliation of non GAAP measures ($ millions)
Three months ended December 31
2004
2003
Operating Income
Operating income
$
109.6
$
64.9
Impairment of assets, restructuring and other charges ("IAROC")
53.2
21.5
Operating income before IAROC
$
162.8
$
86.4
Operating income
$
109.6
$
64.9
Depreciation of property, plant and equipment
85.8
85.3
Amortization of deferred charges
7.6
7.4
Operating income before depreciation and amortization
$
203.0
$
157.6
IAROC
53.2
21.5
Operating income before depreciation and amortization and IAROC
$
256.2
$
179.1
Earnings (loss) per share
Net income (loss)
$
44.5
$
(53.9
)
IAROC (net of income taxes of $6.5 million in 2004, and $5.8 million in 2003)
46.7
15.7
Net income (loss) before IAROC
$
91.2
$
(38.2
)
Net income available to holders of preferred shares
10.6
9.7
Net income (loss) available to holders of equity shares before IAROC
$
80.6
$
(47.9
)
Diluted average number of equity shares outstanding (in millions)
132.7
131.9
Earnings (loss) per share
Diluted
$
0.26
$
(0.48
)
Diluted, before IAROC
$
0.60
$
(0.36
)
Free Cash Flow
Cash provided by operating activities
$
380.9
$
395.8
Dividends on preferred shares
(12.7
)
(11.8
)
Additions to property, plant and equipment
(31.8
)
(37.5
)
Net proceeds from disposal of other assets
1.3
0.6
Free cash flow from operations
$
337.7
$
347.1
Figure 9
18
Selected Quarterly Financial Data (in millions of dollars, except per share data)
2004
2003
2002
First
Second
Third
Fourth
Year
First
Second
Third
Fourth
Year
First
Second
Third
Fourth
Year
Consolidated Results
Revenues
$
1,553.0
$
1,541.4
$
1,633.0
$
1,894.7
$
6,622.1
$
1,539.6
$
1,513.5
$
1,596.8
$
1,741.6
$
6,391.5
$
1,475.8
$
1,469.7
$
1,624.7
$
1,701.5
$
6,271.7
Operating income before depreciation and amortization and before IAROC
187.2
199.3
202.2
256.2
844.9
161.7
129.5
205.0
179.1
675.3
186.1
207.2
247.5
242.0
882.8
Operating income before IAROC
98.0
108.0
114.6
162.8
483.4
74.3
38.7
116.5
86.4
315.9
103.2
123.8
164.1
156.1
547.2
IAROC
4.3
51.7
12.9
53.2
122.1
—
81.8
(5.0
)
21.5
98.3
—
—
—
19.6
19.6
Operating income (loss)
93.7
56.3
101.7
109.6
361.3
74.3
(43.1
)
121.5
64.9
217.6
103.2
123.8
164.1
136.5
527.6
Net income (loss)
35.8
15.3
48.1
44.5
143.7
24.5
(61.7
)
59.7
(53.9
)
(31.4
)
46.0
64.2
98.5
70.6
279.3
Cash provided (used) by operating activities
(46.8
)
112.3
41.4
380.9
487.8
(172.1
)
177.8
59.8
395.8
461.3
(27.0
)
109.4
130.2
300.8
513.4
Free cash flow (outflow) from operations*
(89.5
)
71.3
(0.1
)
337.7
319.4
(250.1
)
72.3
14.0
347.1
183.3
(80.1
)
40.1
97.4
262.4
319.8
Operating margin before depreciation and amortization and before IAROC**
12.1
%
12.9
%
12.4
%
13.5
%
12.8
%
10.5
%
8.6
%
12.8
%
10.3
%
10.6
%
12.6
%
14.1
%
15.2
%
14.2
%
14.1
%
Operating margin before IAROC**
6.3
%
7.0
%
7.0
%
8.6
%
7.3
%
4.8
%
2.6
%
7.3
%
5.0
%
4.9
%
7.0
%
8.4
%
10.1
%
9.2
%
8.7
%
Operating margin**
6.0
%
3.7
%
6.2
%
5.8
%
5.5
%
4.8
%
(2.8)
%
7.6
%
3.7
%
3.4
%
7.0
%
8.4
%
10.1
%
8.0
%
8.4
%
Segmented Information
Revenues
North America
$
1,192.4
$
1,188.1
$
1,291.6
$
1,460.3
$
5,132.4
$
1,230.4
$
1,195.2
$
1,282.2
$
1,354.9
$
5,062.7
$
1,212.8
$
1,182.4
$
1,325.8
$
1,366.2
$
5,087.2
Europe
315.4
309.7
295.7
376.6
1,297.4
263.6
274.3
273.2
340.3
1,151.4
216.3
244.1
253.6
288.5
1,002.5
Latin America
46.8
44.4
45.0
56.2
192.4
45.1
43.7
40.6
47.9
177.3
46.9
43.4
45.3
47.9
183.5
Operating income (loss) before IAROC
North America
87.0
95.5
112.7
138.5
433.7
81.3
43.3
108.5
71.0
304.1
105.3
121.7
155.7
135.9
518.6
Europe
11.9
12.4
9.3
16.5
50.1
(1.9
)
1.9
6.2
18.1
24.3
3.5
6.8
11.3
10.5
32.1
Latin America
0.2
1.8
1.1
(1.8
)
1.3
(1.9
)
(3.5
)
0.8
0.9
(3.7
)
2.3
2.7
5.2
4.0
14.2
Operating margins before IAROC**
North America
7.3
%
8.0
%
8.7
%
9.5
%
8.5
%
6.6
%
3.6
%
8.5
%
5.2
%
6.0
%
8.7
%
10.3
%
11.7
%
10.0
%
10.2
%
Europe
3.8
%
4.0
%
3.1
%
4.4
%
3.9
%
(0.7
)%
0.7
%
2.3
%
5.3
%
2.1
%
1.6
%
2.8
%
4.5
%
3.6
%
3.2
%
Latin America
0.4
%
4.0
%
2.5
%
(3.2
)%
0.7
%
(4.2
)%
(8.0
)%
2.1
%
1.9
%
(2.1
)%
4.9
%
6.1
%
11.6
%
8.4
%
7.8
%
Per Share Data
Earnings (loss)
Diluted
$
0.20
$
0.05
$
0.29
$
0.26
$
0.80
$
0.12
$
(0.51
)
0.38
$
(0.48
)
$
(0.50
)
$
0.28
$
0.40
$
0.64
$
0.44
$
1.76
Diluted before IAROC
$
0.23
$
0.31
$
0.37
$
0.60
$
1.51
$
0.12
$
(0.07
)
0.34
$
(0.36
)
$
0.03
$
0.28
$
0.40
$
0.64
$
0.61
$
1.92
Dividends on equity shares
$
0.13
$
0.13
$
0.13
$
0.13
$
0.52
$
0.13
$
0.13
0.13
$
0.13
$
0.52
$
0.12
$
0.12
$
0.12
$
0.13
$
0.49
IAROC: Impairment of assets, restructuring and other charges
*
Cash provided from operating activities, less capital expenditures net of proceeds from disposals, and preferred share dividends.
**
Margins calculated on revenues.
Figure 10
19-20
The expected long-term rate of return on pension plan assets was obtained by calculating a weighted average rate based on targeted asset allocations of the plans. The expected returns of each asset class are based on a combination of historical performance analyses and forward looking views of the financial markets. The targeted asset allocation of the plans is generally 65% for equity and 35% for fixed income securities. The rate of compensation increase is used to project current plan earnings in order to estimate pension benefits at future dates. This assumption was determined based on historical pay increases, forecast of salary budgets, collective bargaining influence and competitive factors.
For postretirement benefits, the assumptions related to the health care cost trend rate are based on increases experienced by plan participants in recent years and national average cost increases.
The Company believes that the assumptions are reasonable based on information currently available, however, in the event that actual outcome differs from management's estimates, the provision for pension and postretirement benefit expenses and obligations may be adjusted.
Health Care Costs
The Company provides health care benefits to employees in North America and covers approximately 75% of the costs under these employee health care plans. The Company actively manages its health care spendings with its vendors to maximize discounts in an attempt to limit the cost escalation experienced over the past years. Health care costs and liabilities are estimated with the help of actuaries. For the year 2004, the Company's health care cost increased by 4% compared to 2003. Trend assumption is the most important factor in estimating future costs. The Company uses the most recent twelve months of claims trended forward to estimate the next year's liability.
Allowance for Doubtful Accounts
The Company maintains an allowance for doubtful accounts for expected losses from customers who are unable to pay their debts. The allowance is reviewed periodically and is based on an analysis of specific significant accounts outstanding, the age of the receivable, customer creditworthiness, and historical collection experience. In addition, the Company maintains an allowance to cover a fixed percentage of all accounts for customers under Chapter 11 and other critical accounts. These accounts may take several years before a settlement is reached. However, the allowance is periodically reassessed based on new developments.
Income Taxes
The Company uses its best judgment in determining its effective tax rate. There are many factors in the normal course of business that affect the effective tax rate, since the ultimate tax outcome of some transactions and calculations is uncertain until assessed by the taxation authorities.
Future income tax assets are recognized and a corresponding provision is recorded if such assets are unlikely to be realized. The provision is based on management's estimates of taxable income for each jurisdiction in which the Company operates, and the period over which the future tax assets are expected to be recoverable.
The Company is at all times under audit by various tax authorities in each of the jurisdictions in which it operates. A number of years may elapse before a particular matter for which management has established a reserve, is audited and resolved. The number of years with open tax audits varies depending on the tax jurisdiction.
Management believes that its estimates are reasonable and reflect the probable outcome of known tax contingencies, although the final outcome and its timing are difficult to predict. In addition, the Company has not recognized a future tax liability for the undistributed earnings of its subsidiaries in the current and prior years because the Company does not expect those unremitted earnings to reverse and become taxable in the foreseeable future.
In the event that actual outcome differs from management's estimates, the provision may be adjusted.
Insurance
The Company is exposed, in the normal course of business, to a variety of operational risks, some of which are transferred to third parties by way of insurance agreements. The Company has a policy of self-insurance when the foreseeable losses from self-insurance are low relative to the cost of purchasing third-party insurance.
U.S. workers' compensation claims tend to be relatively low in value on a case-by-case basis, and the Company self-insures against the majority of such claims. The Company maintains third-party insurance coverage against workers' compensation claims which could be unusually large in nature. In addition, the third-party insurance provides a cap on total exposure to workers' compensation claims.
With respect to the workers' compensation self-insurance, the Company maintains a provision to cover liabilities for all open claims related to both current and past policies and relies on claims experience and the advice of its actuaries and plan administrators in determining an adequate liability for all open claims. The workers' compensation liability is estimated based on reserves for claims that are established by an independent administrator and the reserves are increased to reflect the estimated future development of the claims based on Company specific factors provided by its actuaries. The liability for workers' compensation claims is the estimated total cost of the claims on a fully-developed basis. Certain claims may take several years to be settled. Each year, the status of open claims is reviewed and the liability is reassessed. The difference is recorded to income or expense.
While the Company believes that the assumptions used are appropriate, in the event that actual outcome differs from management's estimates, the provision for worker's compensation costs may be adjusted.
The Company maintains insurance for exposure related to property and casualty losses. It has also chosen to retain a portion of such losses in the form of a deductible, in order to reduce the cost of protecting its assets. The Company manages the self-insured portion of its property insurance program through its captive insurance subsidiary. As at December 31, 2004, the Company's potential exposure under its self-insured property program was capped at $5 million, subject to ongoing deductibles and other factors related to the nature of each specific claim.
The Company believes that it has in place a combination of third-party insurance and self-insurance that provides adequate protection against significant unexpected losses while minimizing costs and limiting its overall exposure.
STOCK OPTION PLAN
During the year 2004, the Company issued a total of 1,181,023 options compared to 916,911 in 2003. Shares reserved for issuance total 7.5 million as at December 31, 2004, of which 4.5 million were outstanding. At December 31, 2003, 7.6 million were reserved for issuance of which 3.7 were outstanding.
In 2003, the Company changed its method of accounting for stock-based compensation and decided to adopt the fair value based method of accounting for all of its stock-based compensation. The Company adopted these changes using the prospective application transitional alternative. Accordingly, the fair value based method is applied to awards granted, modified or settled on or after January 1, 2003. The compensation cost charged against income for the stock option plan was $4 million for the year 2004 compared to $2 million for 2003.
21
FINANCIAL CONDITION, LIQUIDITY AND CAPITAL RESOURCES
The Company measures its liquidity performance using the calculation of free cash flow as described in figures 8 and 9. Free cash flow reflects liquidity available for business acquisitions, dividends on equity shares and repayments of long-term debt. In 2004, free cash flow from operations was $319 million, compared to $183 million in 2003. The increase in free cash flow was due to higher EBITDA from operations and lower capital expenditures in 2004.
Operating Activities
Cash flow from operating activities was $488 million in 2004, compared to $461 million in 2003. The increase was mainly attributable to higher EBITDA in 2004. The deficiency in working capital was $35 million in 2004, compared to $173 million in 2003. The change is due mainly to a decrease in trade payables and accrued liabilities as well as an increase in trade receivables, which was partly offset by a higher level of securitization. The Company manages its trade payables in order to take advantage of prompt payment discounts. Also, the Company maximizes the use of its accounts receivable securitization program, since the cost of these programs is relatively low compared to that of the credit facility. The amount of trade receivables under securitization varies from month to month, based on the previous month's volume (December securitization is based on receivables at the end of November).
Financing Activities
The Company is subject to certain financial covenants in some of its major financing agreements. The key financial ratios are the earnings before interest, tax and depreciation and amortization (EBITDA) coverage ratio and the debt-to-capitalization ratio. As at December 31, 2004, the Company is in compliance with all significant debt covenants.
The Company maintains a $1 billion revolving bank facility for general corporate purposes. In November 2004, the Company extended for an additional year the two tranches totalling $750 million previously maturing in November 2006 and renewed for three years the $250 million tranche previously maturing in November 2004. Therefore, all tranches will mature in November 2007. A total of $750 million is available to both the Company and its U.S. subsidiary and $250 million is available to the U.S. subsidiary only. All tranches are cross-guaranteed by the Company and the U.S. subsidiary and can be extended annually.
The 6.50% Senior Debentures due on August 1, 2027 were redeemable at the option of the holders at par value on August 1, 2004. Out of a total principal amount of $150 million, $147 million Senior Debentures have been tendered and repurchased at par. The Company repaid the senior debentures by using its long-term revolving bank facility.
In February 2004, the Company redeemed all of the 7.75% Senior Notes callable on or after February 15, 2004 that were not tendered in November 2003, for a total cash consideration of $33 million.
During the first quarter, the Company discontinued its Canadian Commercial paper program. At December 31, 2003, Cdn$ 0.4 million ($0.3 million) was outstanding under the program.
Dividends paid to shareholders of Multiple Voting Shares and Subordinate Voting Shares totaled $0.52 per share in 2004 and 2003 and $0.49 per share in 2002.
The Company paid dividends of Cdn$ 1.54 per share on the First Preferred Shares, Series 3 in 2004 and 2003. The Company paid dividends of Cdn$ 1.69 per share on the First Preferred Shares, Series 4 in 2004, 2003 and 2002 and Cdn$ 1.73 per share on the First Preferred Shares, Series 5, in 2004, 2003 and 2002.
Investing Activities
The Company invested $32 million in capital projects during the fourth quarter of 2004, compared to $38 million for the fourth quarter last year. On a year-to-date basis, $133 million has been invested in capital projects in 2004 compared to $243 million in 2003, when the Company purchased 19 presses that were previously under an operating lease in North America for $71 million. In 2004, approximately 80% of investments were for organic growth, including expenditures for new capacity requirements and productivity improvement, and 20% was for maintenance of the Company's structure.
Key expenditures for the year 2004 included the following items:
• North America
The final phase of expansion and improvement of the Magazine & Catalog platform that included the installation of a new gravure press in the Augusta, Georgia facility to service L.L. Bean.
The completion of phase 2 of the educational book market expansion initiated in 2003 at the Dubuque, Iowa facility.
Also, the Company made capital investments related to the relocation of selected equipment from the Effingham, Illinois plant.
• Europe
The purchase of a 48-page press for the Sormlands, Sweden facility. This wide-web press is the first of its kind to be installed in Sweden.
Other capital investments were dedicated to normal replacement of assets as well as environmental compliance and systems development and implementation.
In July 2004, the Company announced its intention to purchase 22 new presses targeted for the magazine, catalog, retail and book platforms of its U.S. operations. This will allow the Company to further improve efficiency and to meet the current and future needs of publishers. As at December 31, 2004, the Company has placed firm orders for 9 new presses for a total cost of approximately $120 million. The plan represents new investments of approximately $330 million to be disbursed over the next three years.
Total Debt and Accounts Receivable Securitization ($ millions)
December 31, 2004
December 31, 2003
Bank indebtedness
$
—
$
1.3
Current portion of long-term debt and convertible notes
11.7
23.9
Long-term debt
1,825.8
1,874.4
Convertible notes
112.6
110.7
Total debt
$
1,950.1
$
2,010.3
Accounts receivable securitization
785.5
766.6
Total debt and accounts receivable securitization
$
2,735.6
$
2,776.9
Minority interest
8.3
24.7
Shareholders' equity
2,612.6
2,503.4
Capitalization, including securitization
$
5,356.5
$
5,305.0
Debt-to-capitalization, including securitization
51:49
52:48
These ratios are non-GAAP measures.
Figure 11
22
In November 2004, the Company purchased the remaining 50% of the issued and outstanding shares of Helio Charleroi in Belgium for a cash consideration of $46 million. During the year, the Company also acquired minority interests in North America and Spain.
FINANCIAL POSITION
For the year ended December 31, 2004, the debt-to-capitalization ratio was 43:57, compared to 44:56 in 2003. As at December 31, 2004, total debt plus accounts receivable securitization was $2,736 million, $41 million lower than last year (see figure 11).
For major leases terminating in 2005, the terminal value that the Company would pay to acquire the equipment under leases (mainly presses and binders) is approximately $60 million, of which $36 million is guaranteed by the Company. Historically, the Company has acquired most of the equipment under leases when it is used for production. The total terminal value of these leases expiring after 2005 is approximately $120 million, of which $52 million is guaranteed.
The Company is monitoring the funding of its pension plans very closely. During the year ended December 31, 2004, the Company made total contributions of $77 million ($68 million in 2003) which exceeded the minimum requirements as determined by the Company's actuaries by $15 million.
As at December 31, 2004, the following investment grade ratings applied to the long-term unsecured debt of the Company:
Rating Agency
Rating
Moody's Investors Service
Baa3
Standard & Poor's
BBB–
Dominion Bond Rating Service Limited
BBB (low)
The Company believes that the liquidity, capital resources and cash flows from operations are sufficient to fund planned capital expenditures, working capital requirements, pension contributions, interest and principal payment obligations for the foreseeable future. The total mandatory principal payments on long-term debt, convertible notes and capital leases are $12 million in 2005. Minimum pension contributions are estimated at $57 million for 2005.
IMPAIRMENT OF ASSETS AND RESTRUCTURING INITIATIVES
In 2004, the Company continued its detailed review of its operations and administrative functions to further reduce the cost base and improve efficiencies. Furthermore, in 2004 the Company initiated a long-term strategic plan. This resulted in additional impairment of assets, restructuring and other charges.
YEAR 2004
In 2004, the Company recorded an impairment of assets, restructuring and other charges of $122.1 million. Non-cash items amounted to $83.3 million and cash items to $38.8 million. Of the $38.8 million in cash items, $25.0 million was spent in North America, $11.4 million in Europe and $1.8 million in Latin America.
Impairment of assets
The execution of the 2004 restructuring initiatives resulted in certain assets being permanently idled. In addition, the initiatives and other events triggered a recoverability test on other groups of assets. Accordingly, for the year, the Company recorded an impairment on long-lived assets of $73.3 million and $1.1 million of impairment on other assets. The $74.4 million included $40.9 million for North America, $29.2 million for Europe and $3.9 million for Latin America.
During the fourth quarter of 2004, the Company recorded a $37.9 million impairment of long-lived assets and $0.1 million impairment of other assets. The $38.0 million included $8.2 million for North America, $26.1 million for Europe and $3.3 million for Latin America.
The impairment of assets recorded for the second and third quarter was respectively $32.9 million and $3.5 million.
The impairment of long-lived assets has been measured as the excess of the carrying amount of an asset over its fair value, based on quoted market prices when available, or using the discounted cash flow method.
Restructuring and other charges
It should be noted that according to Emerging Issues Committee Abstract 135, when a Company approves a restructuring initiative, only the charge for which the liability has been already contracted should be recorded. Thus, each quarter, the charge recorded includes a portion for the current quarter initiatives and a portion related to initiatives previously approved.
During the fourth quarter, the Company recorded cash costs of $13.2 million, of which $9.7 million was for new initiatives and $3.5 million resulting from the continuation of the second and third quarter initiatives. Furthermore, the $13.2 million included $9.0 million for workforce reductions and $4.2 million for lease obligations, facility carrying costs and dismantling of equipment covering both current and previous initiatives. Restructuring initiatives were pursued and resulted in the approval of the consolidation of four small facilities in North America, one in Europe and other workforce reductions across the Company. The cash costs of these initiatives was estimated at $14.5 million, of which $9.7 million was recorded in the fourth quarter and $4.8 million remains to be booked in 2005, when the liabilities related to the initiatives will have been contracted. The non-cash cost of these initiatives included $0.9 million for the curtailment of one of the Company's U.S. pension plans. The fourth quarter initiatives affected 551 employees in total, however, the Company estimated that 88 new jobs will be created in other facilities. In summary, 322 jobs have been eliminated in 2004 and 229 will be eliminated in 2005.
Contractual Cash Obligations ($ millions)
2005
2006
2007
2008
2009
2010 and thereafter
Long-term debt and convertible notes
$
—
$
251
$
681
$
202
$
—
$
772
Capital leases
12
8
4
3
8
10
Operating leases
110
79
60
38
30
100
Capital asset purchase commitments
101
31
—
—
—
—
Total contractual cash obligations
$
223
$
369
$
745
$
243
$
38
$
882
Figure 12
23
In the third quarter, the Company approved the closure of the Stockholm facility in Sweden, the consolidation of a small facility in North America and other workforce reductions across the Company. The cash cost of these initiatives was initially estimated at $17.5 million, of which $6.9 million, mostly related to workforce reductions, was recorded in the third quarter. The number of employees affected by the third quarter restructuring initiatives has been revised to 280 employees in total, however, the Company estimates that 29 new jobs will be created in other facilities. In summary, 261 employee positions have been eliminated and 19 will be eliminated in 2005. The Company also recorded $1.5 million resulting from the continuation of the second quarter initiatives and $2.7 million for the pension obligation related to the Effingham multiemployer benefit plan. Further information should become available over the next few months, which will allow the Company to measure and recognize other liabilities related to this pension obligation.
In the second quarter of 2004, the Company initiated other restructuring initiatives to improve asset utilization and enhance efficiency. The restructuring initiatives included the closure of the Effingham, Illinois facility in the Magazine platform, an important downsizing at the Kingsport, Tennessee facility in the Book platform and other workforce reductions across the Company. The cash cost of these initiatives was initially estimated at $18.3 million, of which $11.2 million was recorded in the second quarter of 2004. These costs excluded a pension obligation related to the Effingham multiemployer benefit plan that could not be reasonably estimated at that time. The non-cash cost of these initiatives included $8.0 million for the curtailment and settlement of one of the Company's U.S. pension plans. The number of employees affected by the second quarter restructuring initiatives has been revised to 1,332 employees in total. However, the Company estimates that 450 new jobs will be created in other facilities. In summary, 1,291 employee positions have been eliminated and 41 will be eliminated in 2005.
In the first quarter of 2004, the Company initiated restructuring initiatives and recorded $5.0 million for workforce reductions. Under these initiatives, 354 employee positions have been eliminated and 1 remains to come.
During the third and fourth quarter, the execution of the 2004 initiatives resulted in a net reversal of $0.1 million and $0.2 million, respectively.
In summary, as of December 31, 2004, 2,228 employee positions have been eliminated under the 2004 initiatives, 290 will be completed in 2005 and 567 new jobs will be created in other facilities. In 2005, excluding the pension obligation related to the Effingham multiemployer benefit plan, $17.8 million of cash restructuring charges related to the 2004 initiatives remain to be recorded when the liability related to the initiatives will have been contracted.
In 2004, the review and execution of the prior years initiatives resulted in a net reversal of $1.4 million comprised of a cash overspending of $6.6 million, and $8.0 million reversal of prior years' restructuring and other charges, mostly due to the cancellation of the termination of 75 employee positions.
During the fourth quarter, the execution of the prior year's initiatives resulted in a net overspending of $1.3 million comprised of a cash overspending of $1.5 million, and a $0.2 million reversal of prior years' restructuring and other charges.
YEAR 2003
In 2003, the Company recorded an impairment of assets, restructuring and other charges of $98.3 million. Non-cash items amounted to $60.4 million and cash items to $37.9 million. Of the $37.9 million in cash items, $31.7 million was spent in North America, $1.8 million in Europe and $3.6 million in Latin America.
Impairment of assets
During 2003, the Company reviewed the status of assets that became permanently idle following the prior years' restructuring initiatives and difficult economic conditions. The Company determined that these assets would not be redeployed as it had originally contemplated under an economic recovery scenario or that they would not generate sufficient cash flow, and as such, recorded an impairment of long-lived assets of $54.4 million. 2003 initiatives resulted in an impairment of long-lived assets of $2.8 million and $3.2 million related to previous years' initiatives. The $60.4 million included $46.7 million for North America, $5.0 million for Europe and $8.2 million for Latin America.
Restructuring and other charges
During the fourth quarter of 2003, the Company continued its restructuring initiatives and recorded a cash cost of $16.1 million related to a reduction in workforce of 878 employee positions and a reversal of $0.3 million related to second quarter and third quarter initiatives.
In the third quarter of 2003, the Company initiated new restructuring initiatives and recorded a charge of $1.9 million for workforce reductions and the execution of the June initiatives resulted in a reversal of $2.2 million of restructuring charges. In the second quarter of 2003, the Company initiated restructuring initiatives and other charges following the continued volume declines in certain business segments. A cash charge of $23.4 million was taken consisting of $17.6 million in workforce reductions and $5.8 million of additional closure costs of four smaller facilities.
As of December 31, 2003, under the 2003 restructuring initiatives, 1,769 employee position terminations were completed. The workforce reductions affected all fixed cost areas of the Company, both at the plant and corporate levels.
In 2003, the review and the execution of the 2002 and 2001 initiatives resulted in a net reversal of $1.0 million comprised of a cash overspending of $12.9 million, and a $13.9 million reversal of prior year restructuring and other charges. The cash overspending was related to costs of closed facilities not yet disposed of, office leases not yet subleased, and other completed initiatives.
YEAR 2002
In 2002, the Company recorded an impairment of assets, restructuring and other charges of $19.6 million comprised of $46.4 million for 2002 initiatives, $13.3 million for overspending on 2001 initiatives and $40.1 million for the reversal of unused reserves from 2001 initiatives due to the continuation of a contract with a customer, previously expected to be terminated, that provided sufficient work to utilize equipment originally targeted for a shutdown. Cash items amounted to $20.1 million and non-cash items amounted to a net reversal of $0.5 million.
The 2002 initiatives were initiated in France due to difficult market conditions, severe price competition and a decrease in sales volume. In addition, reduction in force programs were initiated in North America and mostly completed in 2003. The charges of $46.4 million consisted of $6.5 million related to impairment of long-lived assets, $30.0 million in workforce reduction costs and other restructuring charges, and $9.9 million mostly for the write-down of the investment in Q-Media Services Corporation, which went into receivership at the end of 2002. The $30.0 million in workforce reduction costs and other restructuring charges included $18.6 million for France and $8.6 million for North America.
CONTINUITY OF RESTRUCTURING RESERVE
As at January 1, 2004, the balance of the restructuring reserve was $45.8 million. This amount related mostly to the workforce reductions, across the platform and lease and facility carrying costs. The Company utilized $50.6 million of the current and prior years' restructuring and other charges reserves during the twelve-month period ended December 31, 2004. The reserve at year end is $35.2 million, of which $27.5 million is expected to be utilized in 2005 and the rest in the following years.
24
FINANCIAL INSTRUMENTS
The Company uses a number of financial instruments including: cash and cash equivalents, trade receivables, receivables from related parties, bank indebtedness, trade payables, accrued liabilities, payables to related parties, long-term debt and convertible notes. The carrying amounts of these financial instruments, except for long-term debt and convertible notes, approximate their fair values due to their short-term nature. The fair values of long-term debt and convertible notes are estimated based on discounted cash flows using period-end market yields of similar instruments with the same maturity.
The Company uses various derivative financial instruments to manage its exposure to fluctuations in foreign currency exchange rates, interest rates and commodity prices. The Company does not hold or use any derivative instruments for speculative purposes and adheres to a financial risk management policy.
The Company manages interest rate exposure by having a balanced schedule of debt maturities, as well as a combination of fixed and floating interest rate obligations. In addition, the Company has entered into interest rate swap agreements to manage this exposure. Contracts outstanding at December 31, 2004 had a notional value of $233 million ($33 million in 2003). Interest expense is adjusted to include amounts payable or receivable under the swap agreements. The total adjustment recorded to interest expense was a revenue of $2 million for 2004 (a charge of $5 million for 2003).
The Company enters into foreign-exchange forward contracts to hedge foreign denominated sales and related receivables, raw materials and equipment purchases. The contracts outstanding at December 31, 2004 had a notional value of $297 million and expire between 2005 and 2007. The foreign exchange translation gains and losses and the deferred premiums and discounts are recognized as an adjustment to the corresponding revenues and exchange gain or losses when the transaction is recorded. The total amounts recorded to these accounts for 2004 for these contracts were a revenue of $17 million, and a gain of $2 million (a revenue of $10 million, and a gain of $1 million for 2003). For Canada and Europe, the foreign-denominated revenues as a percentage of their total revenues were approximately 30% and 10%, respectively in 2004.
The Company has entered into foreign-exchange forward contracts to hedge its net investment in a foreign subsidiary. The contracts outstanding at December 31, 2004 had a notional value of $312 million and expire in 2006 and 2007. The foreign exchange translation gains and losses, as well as any realized and unrealized gains and losses on the derivative instruments, are recorded to the cumulative translation adjustment account. The total amount recorded to the cumulative translation adjustment account for these contracts was a credit of $63 million, net of income taxes, as at December 31, 2004.
The Company enters into foreign-exchange forward contracts and cross currency swaps to hedge foreign denominated asset exposures. The contracts outstanding at December 31, 2004 had a notional value of $228 million and $121 million, respectively and expire between 2005 and 2006. The foreign exchange gains and losses on such foreign denominated assets are recorded to income. The changes in the fair value of the derivative instruments are also recorded to income, to compensate the foreign exchange gain and loss on the translation of the foreign denominated assets. The total adjustment recorded to foreign exchange gain or loss related to these contracts for 2004 was a gain of $28 million (a loss of $17 million 2003).
The Company also enters into natural gas swap contracts to manage its exposure to the price of this commodity. Contracts outstanding at December 31, 2004 cover a notional quantity of 219,000 gigajoules in Canada and 2,015,000 MMBTU in the United States. These contracts expire between January 2005 and December 2005. Natural gas cost is adjusted to include amounts payable or receivable under the commodity hedge agreements. The total adjustment to gas cost 2004 was a gain of $2 million (a loss of $1 million for 2003).
While the counterparties of these agreements expose the Company to credit loss in the event of non-performance, the Company believes that the possibility of incurring such a loss is remote due to the creditworthiness of the counterparties.
Realized and unrealized gains or losses associated with derivative instruments, which have been terminated or have ceased to be effective prior to maturity, are deferred on the balance sheet and recognized in income during the period in which the underlying hedged transaction is recognized. For 2004, the total amount deferred as a liability in relation to terminated derivative instruments was $9 million ($15 million for 2003) and the total amount recognized in income was $6 million ($6 million for 2003).
The fair values of the derivative financial instruments are estimated using period-end market rates and reflect the amount that the Company would receive or pay if the instruments were closed out at these dates (see figure 13).
OFF-BALANCE SHEET ARRANGEMENTS
Guarantees
In the normal course of business, the Company enters into numerous agreements that contingently require it to make payments to a third party based on changes in an underlying item that is related to an asset, a liability or an equity of the guaranteed party, or failure of another party to perform under an obligating agreement.
Significant guarantees the Company has provided to third parties include the following:
Fair Value of Derivative Financial Instruments ($ millions)
2004
2003
Book Value
Fair Value
Book Value
Fair Value
Derivative financial instruments
Interest rate swap agreements
$
—
$
(5.1
)
$
—
$
(3.2
)
Foreign exchange forward contracts
72.8
109.8
43.1
73.3
Cross currency interest rate swaps
(16.7
)
(16.7
)
(47.7
)
(47.7
)
Commodity swaps
(0.1
)
(1.4
)
—
1.0
Figure 13
25
Operating leases
The Company has guaranteed a portion of the residual values of certain of its assets under operating leases with expiry dates between 2005 and 2009, for the benefit of the lessor. If the fair value of the assets, at the end of their respective lease term, is less than the residual value guaranteed, then the Company must, under certain conditions, compensate the lessor for a portion of the shortfall. The maximum exposure in respect of these guarantees is $103 million. Of this amount, $36 million will expire in 2005 and $10 million in 2006. As at December 31, 2004, the Company has recorded a liability of $10 million associated with these guarantees.
Sub-lease agreements
The Company has, for some of its assets under operating leases, entered into sub-lease agreements with expiration dates between 2005 and 2008. If the sub-lessee defaults under the agreement, the Company must, under certain conditions, compensate the lessor for the default. The maximum exposure in respect of these guarantees is $6 million. As at December 31, 2004, the Company has not recorded a liability associated with these guarantees, since it is not probable that the sub-lessee will default under the agreement. Recourse against the sub-lessee is also available, up to the total amount due.
Business and real estate disposals
In the sale of all or a part of a business or real estate, in addition to possible indemnifications relating to failure to perform covenants and breach of representations and warranties, the Company may agree to indemnify against claims from its past conduct of the business. Typically, the term and amount of such indemnification will be limited by the agreement. The nature of these indemnification agreements precludes the Company from estimating the maximum potential liability that could be required to be paid to guaranteed parties. As such, the Company has not accrued any amount in the consolidated balance sheet with respect to this item.
Debt agreements
Under the terms of certain debt agreements, the Company has guaranteed the obligation of its US subsidiaries. In this context, the Company would have to indemnify the other parties against changes in regulations relative to withholding taxes, which would occur only if the Company was to perform the payments on behalf of its US subsidiaries. These indemnifications extend for the term of the related financings and do not provide any limit on the maximum potential liabilities. The nature of the indemnification agreements precludes the Company from estimating the maximum potential liability it could be required to pay. However, the majority of the obligations to which such guarantees apply, contain make-whole provisions which effectively limit the exposure associated with such an occurrence. Moreover, within the current structure of the transactions, the Company is not exposed to such liabilities. As such, the Company has not accrued any amount in the consolidated balance sheet with respect to this item.
Asset securitization
The Company is a party to securitization agreements to sell with limited recourse, and on a revolving basis, a portion of its Canadian, US, French and Spanish trade receivables, to unrelated trusts. The program limits under each of the Canadian, US and European securitization programs are Cdn$135 million, $510 million and 153 million Euro, respectively. The amounts outstanding under each program as at December 31, 2004 were Cdn$126 million, $500 million and 134 million Euro, respectively (Cdn$132 million, $488 million and 143 million Euro, respectively as at December 31, 2003).
As at December 31, 2004, the Company had a retained interest in the trade receivables sold of $151 million, which is recorded in the Company's trade receivables. As at December 31, 2004, an aggregate amount of $936 million ($902 million as at December 2003) of accounts receivable has been sold under the three programs, and securitization fees, recorded in selling, general and administrative expenses totalled $15 million for 2004 ($15 million for 2003). Servicing revenues and expenses did not have a material impact on the Company's results.
In September 2004, the Company renewed and amended its U.S. trade receivables securitization program. The $510.0 million program continues to be renewable annually and has been extended through September 2005. An amendment to the program gives the Company the option to extend the term of the program for an additional year. This increases the Company's liquidity horizon to 24 months.
The Company is subject to certain requirements under the securitization programs. In addition to financial covenants that mirror those contained in the bank facility, the Company is subject to other covenants typically found in investment grade securitization agreements. If such other covenants fail to be maintained, one or more of the securitization agreements could be terminated. If a termination event were to occur based on failure to meet one of these other covenants, the Company believes that it would be able to meet its cash obligations from other financing sources, such as its revolving bank facility, the issuance of debt or the issuance of equity. The Company believes that it would remain in compliance with the bank financial covenants if it refinanced the securitization programs with debt.
Leases
The Company rents premises and machinery and equipment under operating leases with third parties, which expire at various dates up to 2016 and for which undiscounted minimum lease payments total $417 million as at December 31, 2004. The minimum lease payments for the year 2004 were $97 million. Of the total minimum lease payments, approximately 40% is for machinery and equipment. The Company has guaranteed a portion of the total residual values for a maximum exposure of $103 million.
RELATED PARTY TRANSACTIONS
The Company entered into transactions with the parent company and its other subsidiaries, which were accounted for at prices and conditions prevailing in the market. Intercompany revenues from the parent company's media subsidiaries involved mostly printing of magazines.
During the year 2004, the Company transferred the benefit of a deduction for Part VI.I tax to subsidiaries of its parent company for a consideration of Cdn$12 million ($10 million), recorded in receivables from related parties. This reduced the Company's available future income tax assets by Cdn$13 million ($11 million), and decreased the additional paid-in capital by Cdn$0.6 million ($0.5 million). The transaction was recorded at the carrying amount.
Related Party Transactions ($ millions)
2004
2003
2002
Year ended December 31,
Revenues
$
52.1
$
42.5
$
38.0
Purchases
5.4
2.2
1.0
Management fees billed by Quebecor Inc.
4.2
3.9
3.5
IT services billed by VTL (net of incurred expenses billed to VTL of $3.7)
3.7
—
—
Figure 14
26
During the fourth quarter of 2004, the Company reached an agreement with one of the parent company's subsidiaries, Videotron Telecom Ltd. (VTL), to outsource its information technology (IT) infrastructure and managed services in North America for a duration of 7 years in order to reduce overall cost of its IT platform. As a part of this agreement, VTL purchased a part of the Company's IT infrastructure equipment at a cost of $2 million. The outsourcing of services to VTL are estimated to cost the Company approximately $15 million annually. The transfer of equipment was completed in October and recorded at the carrying amount and no gain or loss was realized.
In 2000, the Company entered into a strategic agreement with Nurun inc. ("Nurun"). The agreement included a commitment from the Company to use Nurun services (information technology and E-Commerce services) for a minimum of $40 million over a five-year period. In 2004, an addendum was made to the agreement, extending the term for another five years from the date of the addendum. In addition, the minimum service revenues of $40 million committed to Nurun was modified to include services directly requested by the Company and its affiliates (Quebecor Inc. and Quebecor Media inc. and their subsidiaries) as well as business referred, under certain conditions, to Nurun by the Company and its affiliates. Finally, if the aggregate amount of the service revenues for the term of the agreement is lower than the minimum $40 million, the Company has agreed to pay an amount to Nurun equal to 30% of the difference between the minimum guaranteed revenues and the aggregate amount of revenues. As of December 31 2004, the cumulative services paid to Nurun under this agreement, amounted to $7 million.
OUTSTANDING SHARE DATA
Figure 15 discloses the Company's outstanding share data as at the latest practicable date.
Outstanding Share Data ($ millions and thousands of shares)
January 28, 2005
Issued and outstanding shares
Book value
Equity Multiple Voting Shares
46,987
$
93.5
Equity Subordinate Voting Shares
85,689
1,157.0
First Preferred Shares, Series 3
12,000
212.5
First Preferred Shares, Series 4
8,000
130.2
First Preferred Shares, Series 5
7,000
113.9
Figure 15
RISKS AND UNCERTAINTIES
The Company operates in the printing industry, which has a variety of risk factors and uncertainties. Due to the risks and uncertainties outlined below, the Company's operating environment and financial results may be materially affected.
Seasonality
The Company's business is sensitive to general economic cycles and may be adversely affected by the cyclical nature of the markets the Company serves, as well as by local, regional, national and global economic conditions. The operations of the Company's business are seasonal, with approximately 60% of historical operating income recognized in the third and fourth quarters of the fiscal year, primarily as a result of the higher number of magazine pages, new product launches and back-to-school, retail and holiday catalog promotions. Within any year, this seasonality could adversely affect the Company's cash flows and results of operations.
Operational Risk
The industry that the Company operates is highly competitive in most product categories and geographic regions. Competition is largely based on price, quality, range of services offered, distribution capabilities, customer service, availability of printing time on appropriate equipment and state-of-the-art technology. The Company competes for commercial business not only with large national printers, but also with smaller regional printers. Over the past four years, the printing industry has experienced a reduction in demand for printed materials and it is currently experiencing excess capacity. Furthermore, some of the industries that the Company services have been subject to consolidation efforts, leading to a smaller number of potential customers. Primarily as a result of this excess capacity and customer consolidation, there has been, and may continue to be, downward pricing pressures and increased competition in the printing industry. Any failure by the Company to compete effectively in the markets it serves could have an adverse, material effect on the results of operations, financial condition and cash flows.
The Company is unable to predict market conditions and only has a limited ability to affect changes in market conditions for printing services. The Company cannot be certain that prices and demand for printing services will not decline from current levels. Changes to the level of supply and demand could cause prices to continue to decline, and prolonged periods of low prices, weak demand and/or excess supply could have a material adverse effect on the Company's business growth, results of operations and liquidity.
Risks associated with Capital Investments
Because production technologies continue to evolve, the Company must make capital expenditures to maintain its facilities and may be required to make significant capital expenditures to remain technologically and economically competitive. The Company may therefore be required to invest significant capital in improving production technologies. If the Company cannot obtain adequate capital, the operating results and financial condition may be adversely affected.
The Company is also subject to certain risks associated with the installation of new technology and equipment which may cause temporary disruption of operations and losses from operational inefficiencies. These disruptions are closely monitored in order to bring them under control within a short period of time. The impact on operational efficiency is affected by the length of the period of remediation.
Environmental Risk
The Company is subject to various laws, regulations and government policies relating to the generation, storage, transportation and disposal of solid waste, release of various substances into the environment and to environmental protection in general. The Company believes it is in compliance with applicable laws and requirements in all material respects.
The Company is also subject to various laws and regulations, which allow regulatory authorities to compel (or seek reimbursement for) cleanup of environmental contamination at the Company's own sites and at off-site facilities where its waste is or has been disposed of. The Company has established a provision for expenses associated with environmental remediation obligations when such amounts can be reasonably estimated. The amount of the provision is adjusted as new information is known. The Company believes the provision is adequate to cover the potential costs associated with those contamination issues.
The Company expects to incur ongoing capital and operating costs to maintain compliance with existing and future applicable environmental laws and requirements. Furthermore, the Company does not anticipate that maintaining compliance with such environmental statutes will have a material adverse effect upon the Company's competitive or consolidated financial position.
The Company believes that it has internal controls and personnel dedicated to compliance with all applicable environment laws and that it provides for adequate monitoring and management of the environmental risk related to its operations.
27
For 2004, the Company believes that there are no new environmental matters (environmental incident, promulgation of new environmental laws and regulations, soil and underground contamination discovery, etc.) to be reported that could have a material impact on the Company's consolidated financial statements.
Labor Agreements
While relations with employees have been stable to date and there has not been any material disruption in operations resulting from labor disputes, the Company cannot be certain that it will be able to maintain a productive and efficient labor environment. The Company cannot predict the outcome of any future negotiations relating to the renewal of the collective bargaining agreements, nor can it assure with certainty that work stoppages, strikes or other forms of labor protests pending the outcome of any future negotiations would not occur. Any strikes or other forms of labor protests in the future could disrupt the Company's operations and may have a material impact on business, financial condition or operating results.
As at December 31, 2004, the Company had 68 collective bargaining agreements in North America. Of this total, 14 agreements expired during 2004 and 11 are still under negotiation. In addition, 8 collective bargaining agreements, covering 1,100 employees, will expire in 2005. The Company has approximately 27,000 employees in North America. From this number, approximately 9,100 are unionized. Moreover, 87 of the plants and related facilities in North America are non-unionized.
Commodity Risk
The Company uses paper and ink as its primary raw materials. The price of paper is volatile over time and may cause significant fluctuations in the Company's net sales and cost of sales. The Company uses its purchasing power as one of the major buyers in the printing industry to obtain the best prices, terms, quality control and service. To maximize its purchasing power, the Company also negotiates with a limited number of suppliers. In addition, most of the Company's long-term contracts with its customers include price-adjustment clauses based on the cost of materials. The Company believes that it has adequate allocations with paper and ink suppliers to meet the needs of its customers.
Credit Risk
The Company estimates that concentrations of credit risk with respect to trade receivables are limited due to its diverse operations and large customer base. The total sales related to the Company's top 100 customers represented approximately 50% of total revenues in 2004.
As of December 31, 2004, the Company has no significant concentrations of credit risk and believes that the product and geographic diversity of its customer base reduces credit risk, as well as having a positive impact on local markets or product-line demand.
Financial Risk
The Company is exposed to a number of risks associated with fluctuations in foreign currency exchange rates, interest rates and commodity prices. The Company uses a number of derivative financial instruments to mitigate these risks such as foreign exchange forward contracts and cross currency swaps, interest rate swap agreements and commodity swap agreements. For more information, refer to section: Financial Instruments. The Company has established operating policies and processes, which prohibit the speculative use of financial instruments, document critical transactions and demonstrate the effectiveness of the financial instruments.
RECENT ACCOUNTING PRONOUNCEMENTS AND CHANGES IN ACCOUNTING POLICIES
Significant differences between Generally Accepted Accounting Principles (GAAP) in Canada and the United States are presented in Note 22 to the Consolidated Financial Statements. The Company generates more than 65% of its revenues from the United States. In an effort to expand its investor base in the United States, the Company has made efforts to follow new disclosure guidelines and to harmonize disclosure based on accounting pronouncements in both Canada and the United States.
In March 2003, the Canadian Institute of Chartered Accountants ("CICA") issued Section 3110, Asset Retirement Obligations, which addresses financial accounting and reporting for legal obligations associated with the retirement of tangible long-lived assets that result from the acquisition, construction, development or normal use of the assets. The standard requires an entity to record the fair value of a liability for an asset retirement obligation in the period in which it is incurred and when a reasonable estimate of fair value can be made. The standard defines the fair value as the amount at which the liability could be settled in a current transaction between willing parties, other than in a forced or liquidation transaction. An entity is subsequently required to allocate the asset retirement cost and amortize it over its useful life. The Company adopted these new recommendations, as of January 1, 2004. The effect of adopting the new recommendations did not have a significant impact on the consolidated financial statements at the initial adoption date.
In April 2003, the CICA issued Section 3063, Impairment of Long-lived Assets, which establishes standards for the recognition, measurement and disclosure of the impairment of long-lived assets held for use. Accounting for the potential impairment of long-lived assets held for use is a two-step process with the first step determining when impairment should be recognized, and the second step measuring the amount of the impairment. An impairment loss is recognized when the carrying amount of an asset held for use exceeds the sum of the undiscounted cash flows expected from its use and eventual disposition. The impairment loss is measured as the amount by which the asset's carrying amount exceeds its fair value. In accordance with the CICA guideline, the Company adopted the new recommendations as of January 1, 2004. The effect of adopting the new recommendations did not have a significant impact on the consolidated financial statements at the initial adoption date.
In June 2003, the CICA issued amendments to Accounting Guideline 13, Hedging Relationships. The amendments clarify certain of the requirements and provide additional implementation guidance related to the identification, designation and documentation of the hedging relationships, and an assessment of their effectiveness. The requirements of the guideline are applicable to all hedging relationships in effect for fiscal years beginning on or after July 1, 2003. Retroactive application is not permitted. All hedging relationships must be assessed as of the beginning of the first year of application to determine whether the hedging criteria in the guideline are met. Hedge accounting is to be discontinued for any hedging relationships that do not meet the requirements of the guideline. The Company adopted the new recommendations effective January 1, 2004. The effect of adopting the new recommendations did not have a significant impact on the consolidated financial statements at the initial adoption date.
In July 2003, the CICA issued Section 1100, Generally Accepted Accounting Principles ("Canadian GAAP"), and Section 1400, General Standards of Financial Statement Presentation. These sections establish standards for financial reporting and fair presentation in accordance with Canadian GAAP, and provide guidance on sources to consult when a matter is not dealt with explicitly in the primary sources of Canadian GAAP. The Company adopted these new recommendations as of January 1, 2004. The effect of adopting the new recommendations did not have a significant impact on the consolidated financial statements at the initial adoption date.
28
In January 2004, the Emerging Issues Committee released Abstract 144 ("EIC-144"), Accounting by a Customer for Certain Consideration Received from a Vendor. This abstract addresses how a customer or reseller of a vendor's products should account for consideration received from a vendor. It requires that any cash consideration received from the vendor be considered as an adjustment of the prices of a vendor's products and services unless certain conditions are met, in which case it might be either an adjustment to the costs incurred by the reseller or payment for assets or services delivered to the vendor. The Company adopted these new recommendations as of July 1, 2004. The effect of adopting the new recommendations did not have a significant impact on the consolidated financial statements at the initial adoption date.
In June 2003, the CICA issued Accounting Guideline No 15 ("AcG-15"), Consolidation of Variable Interest Entities, which presents the views of the Accounting Standards Board ("AcSB") on the application of consolidation principles on variable interest entities ("VIEs"). An entity is a VIE when its total equity investment is not sufficient to permit the entity to finance its activities without financial support from other parties or when the equity investors lack either voting control, an obligation to absorb expected losses or the right to receive expected residual returns. AcG-15 provides guidance in identifying VIEs and in determining whether consolidation is required. The guideline is effective for annual and interim periods beginning on or after November 1, 2004. The Company will adopt this guideline as of January 1, 2005 and has evaluated that it will have no significant impact on its consolidated financial statements.
In November 2003, the AcSB approved a revision to Section 3860, Financial Instruments – Disclosure and Presentation that would require for certain obligations that must, or could be settled through delivery of an entity's own equity instruments to be presented as liabilities. This revision is effective for fiscal years beginning on or after November 1, 2004. The Company will implement this in its 2005 fiscal year and does not expect any significant impact on its consolidated financial statements.
FORWARD LOOKING STATEMENTS
Except for historical information contained herein, the statements in this document are forward-looking and made pursuant to the safe harbor provisions of the Private Securities Litigation Reform Act of 1995. Forward-looking statements involve known and unknown risks and uncertainties, which may cause actual results in future periods to differ materially from forecasted results. Those risks include, among others, changes in customer demand for products, changes in raw material and equipment costs and availability, seasonal changes in customer orders, pricing actions by competitors and general changes in economic conditions.
On behalf of Management,
Claude Hélie Executive Vice President Chief Financial Officer
Carl Gauvreau Senior Vice President Chief Accounting Officer
Montreal, Canada February 7, 2005
29
MANAGEMENT'S RESPONSIBILITY FOR FINANCIAL STATEMENTS
The accompanying consolidated financial statements of Quebecor World Inc. and its subsidiaries are the responsibility of management and are approved by the Board of Directors of Quebecor World Inc.
These financial statements have been prepared by management in conformity with Canadian generally accepted accounting principles and include amounts that are based on best estimates and judgments.
Management of the Company and of its subsidiaries, in furtherance of the integrity and objectivity of data in the financial statements, have developed and maintain systems of internal accounting controls and support a program of internal audit. Management believes that the systems of internal accounting controls provide reasonable assurance that financial records are reliable and form a proper basis for the preparation of the financial statements and that assets are properly accounted for and safeguarded.
The Board of Directors carries out its responsibility for the financial statements principally through its Audit Committee, consisting solely of outside directors. The Audit Committee reviews the Company's annual consolidated financial statements and formulates the appropriate recommendations to the Board of Directors. The auditors appointed by the shareholders have full access to the Audit Committee, with and without management being present.
These financial statements have been examined by the auditors appointed by the shareholders, KPMG LLP, chartered accountants, and their report is presented hereafter.
The Right Honourable Brian Mulroney Chairman of the Board
Claude Hélie Executive Vice President and Chief Financial Officer
Carl Gauvreau Senior Vice President Chief Accounting Officer
Montreal, Canada February 7, 2005
AUDITORS' REPORT TO THE SHAREHOLDERS
We have audited the consolidated balance sheets of Quebecor World Inc. and its subsidiaries as at December 31, 2004 and 2003 and the consolidated statements of income, shareholders' equity and cash flows for the years ended December 31, 2004, 2003 and 2002. These financial statements are the responsibility of the Company's management. Our responsibility is to express an opinion on these financial statements based on our audits.
We conducted our audits in accordance with Canadian generally accepted auditing standards. Those standards require that we plan and perform an audit to obtain reasonable assurance whether the financial statements are free of material misstatement. An audit includes examining, on a test basis, evidence supporting the amounts and disclosures in the financial statements. An audit also includes assessing the accounting principles used and significant estimates made by management, as well as evaluating the overall financial statement presentation.
In our opinion, these consolidated financial statements present fairly, in all material respects, the financial position of the Company as at December 31, 2004 and 2003 and the results of its operations and its cash flows for the years ended December 31, 2004, 2003 and 2002 in accordance with Canadian generally accepted accounting principles.
Chartered Accountants Montreal, Canada February 7, 2005
30
CONSOLIDATED STATEMENTS OF INCOME
Years ended December 31 (in millions of US dollars, except per share amounts)
Notes
2004
2003
2002
Revenues
$
6,622.1
$
6,391.5
$
6,271.7
Operating expenses:
Cost of sales
5,323.3
5,188.8
4,885.9
Selling, general and administrative
480.1
550.9
522.6
Depreciation and amortization
335.3
335.9
316.0
Impairment of assets, restructuring and other charges
3
122.1
98.3
19.6
6,260.8
6,173.9
5,744.1
Operating income
361.3
217.6
527.6
Financial expenses
4
133.2
206.8
154.6
Income before income taxes
228.1
10.8
373.0
Income taxes
5
78.9
39.1
90.9
Income (loss) before minority interest
149.2
(28.3
)
282.1
Minority interest
5.5
3.1
2.8
Net income (loss)
$
143.7
$
(31.4
)
$
279.3
Net income available to holders of preferred shares
37.5
36.5
28.9
Net income (loss) available to holders of equity shares
$
106.2
$
(67.9
)
$
250.4
Earnings (loss) per share:
6
Basic
$
0.80
$
(0.50
)
$
1.78
Diluted
$
0.80
$
(0.50
)
$
1.76
Weighted average number of equity shares outstanding: (in millions)
6
Basic
132.4
136.0
140.7
Diluted
132.6
136.0
145.4
See Notes to Consolidated Financial Statements.
31
CONSOLIDATED STATEMENTS OF SHAREHOLDERS' EQUITY
Years ended December 31 (in millions of US dollars, except per share amounts and thousands of shares)
Equity Multiple Voting Shares
Equity Subordinate Voting Shares
First Preferred Shares Series 2, 3, 4 and 5
Notes
Issued and outstanding shares
Amount
Issued and outstanding shares
Amount
Issued and outstanding shares
Amount
Total capital stock
Additional paid-in capital
Retained earnings
Translation adjustment
Total shareholders' equity
Balance, December 31, 2001
54,736
$
112.7
85,448
$
1,224.0
27,000
$
456.6
$
1,793.3
$
104.6
$
721.8
$
(146.5
)
$
2,473.2
Net income
—
—
—
—
—
—
—
—
279.3
—
279.3
Translation adjustment
17
—
—
—
—
—
—
—
—
—
30.9
30.9
Conversion of Equity Multiple Voting Shares into Equity Subordinate Voting Shares
(7,749
)
(19.2
)
7,749
19.2
—
—
—
—
—
—
—
Conversion of First Preferred Shares:
15
Series 2
—
—
—
—
(12,000
)
(212.5
)
(212.5
)
—
—
—
(212.5
)
Series 3
—
—
—
—
12,000
212.5
212.5
—
—
—
212.5
Share repurchased
15
—
—
(148
)
(2.1
)
—
—
(2.1
)
—
(1.4
)
—
(3.5
)
Shares issued from stock plans
16
—
—
1,109
22.7
—
—
22.7
—
—
—
22.7
Related party transactions
20
—
—
—
—
—
—
—
(1.0
)
—
—
(1.0
)
Dividends on equity shares ($0.49 per share)
—
—
—
—
—
—
—
—
(69.0
)
—
(69.0
)
Dividends on preferred shares ($0.96 (Cdn$1.50) per share))
—
—
—
—
—
—
—
—
(28.8
)
—
(28.8
)
Balance, December 31, 2002
46,987
$
93.5
94,158
$
1,263.8
27,000
$
456.6
$
1,813.9
$
103.6
$
901.9
$
(115.6
)
$
2,703.8
Net loss
—
—
—
—
—
—
—
—
(31.4
)
—
(31.4
)
Reduction of a net investment in a foreign operation
4
—
—
—
—
—
—
—
—
—
5.3
5.3
Translation adjustment
17
—
—
—
—
—
—
—
—
—
91.1
91.1
Shares repurchased
15
—
—
(10,000
)
(134.3
)
—
—
(134.3
)
—
(39.3
)
—
(173.6
)
Shares issued from stock plans
16
—
—
806
13.5
—
—
13.5
—
—
—
13.5
Related party transactions
20
—
—
—
—
—
—
—
0.4
—
—
0.4
Stock-based compensation
16
—
—
—
—
—
—
—
1.9
—
—
1.9
Dividends on equity shares ($0.52 per share)
—
—
—
—
—
—
—
—
(71.1
)
—
(71.1
)
Dividends on preferred shares ($1.17 (Cdn $1.63) per share)
—
—
—
—
—
—
—
—
(36.5
)
—
(36.5
)
Balance, December 31, 2003
46,987
$
93.5
84,964
$
1,143.0
27,000
$
456.6
$
1,693.1
$
105.9
$
723.6
$
(19.2
)
$
2,503.4
Net income
—
—
—
—
—
—
—
—
143.7
—
143.7
Reduction of a net investment in a foreign operation
4
—
—
—
—
—
—
—
—
—
(1.0
)
(1.0
)
Translation adjustment
17
—
—
—
—
—
—
—
—
—
56.8
56.8
Shares issued from stock plans
16
—
—
640
12.2
—
—
12.2
—
—
—
12.2
Related party transactions
20
—
—
—
—
—
—
—
(0.5
)
—
—
(0.5
)
Stock-based compensation
16
—
—
—
—
—
—
—
4.3
—
—
4.3
Dividends on equity shares ($0.52 per share)
—
—
—
—
—
—
—
—
(68.8
)
—
(68.8
)
Dividends on preferred shares ($1.26 (Cdn $1.63) per share)
—
—
—
—
—
—
—
—
(37.5
)
—
(37.5
)
Balance, December 31, 2004
46,987
$
93.5
85,604
$
1,155.2
27,000
$
456.6
$
1,705.3
$
109.7
$
761.0
$
36.6
$
2,612.6
See Notes to Consolidated Financial Statements.
32-33
CONSOLIDATED STATEMENTS OF CASH FLOWS
Years ended December 31 (in millions of US dollars)
Notes
2004
2003
2002
Operating activities:
Net income (loss)
$
143.7
$
(31.4
)
$
279.3
Non-cash items in net income (loss):
Depreciation of property, plant and equipment
334.5
333.2
313.2
Impairment of assets and non-cash portion of restructuring and other charges
3
83.3
60.4
(0.5
)
Future income taxes
5
42.8
15.1
56.7
Amortization of deferred charges
27.0
26.2
22.4
Loss on extinguishment of long-term debt
4
2.0
30.2
—
Other
13.8
16.0
8.3
Changes in non-cash balances related to operations:
Trade receivables
(28.8
)
157.0
(91.0
)
Inventories
(6.1
)
30.8
(21.0
)
Trade payables and accrued liabilities
(83.1
)
(121.4
)
(18.4
)
Other current assets and liabilities
46.3
(56.3
)
43.7
Other non-current assets and liabilities
(87.6
)
1.5
(79.3
)
(159.3
)
11.6
(166.0
)
Cash provided by operating activities
487.8
461.3
513.4
Financing activities:
Net change in bank indebtedness
(1.3
)
1.0
0.2
Net proceeds from issuance of equity shares
16
12.2
13.5
22.7
Repurchase of shares for cancellation
15
—
(173.6
)
(3.5
)
Issuance of long-term debt
12
—
592.0
—
Repayments of long-term debt
(218.3
)
(582.4
)
(96.9
)
Net (repayments) borrowings under revolving bank facility and commercial paper
110.0
108.9
(283.6
)
Dividends on equity shares
(68.8
)
(71.1
)
(69.0
)
Dividends on preferred shares
(38.8
)
(37.7
)
(36.2
)
Dividends to minority shareholders
(0.8
)
(0.4
)
(2.0
)
Other
—
5.7
—
Cash used in financing activities
(205.8
)
(144.1
)
(468.3
)
Investing activities:
Business acquisitions, net of cash and cash equivalents
7
(50.5
)
(7.5
)
(0.3
)
Additions to property, plant and equipment
(132.6
)
(243.1
)
(184.5
)
Net proceeds from disposal of assets
3.0
2.8
27.1
Other
—
(0.8
)
19.6
Cash used in investing activities
(180.1
)
(248.6
)
(138.1
)
Effect of exchange rate changes on cash and cash equivalents
(58.2
)
(56.2
)
10.2
Net increase (decrease) in cash and cash equivalents
43.7
12.4
(82.8
)
Cash and cash equivalents, beginning of year
15.1
2.7
85.5
Cash and cash equivalents, end of year
$
58.8
$
15.1
$
2.7
See Notes to Consolidated Financial Statements.
34
CONSOLIDATED BALANCE SHEETS
December 31 (in millions of US dollars)
Notes
2004
2003
Assets
Current assets:
Cash and cash equivalents
$
58.8
$
15.1
Trade receivables
8
400.4
346.9
Receivables from related parties
20
19.7
16.5
Inventories
9
419.5
400.1
Income taxes receivable
33.0
6.2
Future income taxes
5
43.2
105.8
Prepaid expenses
24.5
17.4
Total current assets
999.1
908.0
Property, plant and equipment, net
10
2,373.6
2,581.0
Goodwill
11
2,651.9
2,591.0
Other assets
219.8
176.9
Total assets
$
6,244.4
$
6,256.9
Liabilities and Shareholders' Equity
Current liabilities:
Bank indebtedness
$
—
$
1.3
Trade payables and accrued liabilities
931.9
987.7
Payables to related parties
2.7
0.1
Income and other taxes payable
83.7
61.3
Future income taxes
5
4.4
6.2
Current portion of long-term debt and convertible notes
12 & 14
11.7
23.9
Total current liabilities
1,034.4
1,080.5
Long-term debt
12
1,825.8
1,874.4
Other liabilities
13
248.1
258.1
Future income taxes
5
402.6
405.1
Convertible notes
14
112.6
110.7
Minority interest
8.3
24.7
Shareholders' equity:
Capital stock
15
1,705.3
1,693.1
Additional paid-in capital
109.7
105.9
Retained earnings
761.0
723.6
Translation adjustment
17
36.6
(19.2
)
2,612.6
2,503.4
Total liabilities and shareholders' equity
$
6,244.4
$
6,256.9
See Notes to Consolidated Financial Statements.
On behalf of the Board:
The Right Honourable Brian Mulroney, Director
Pierre Karl Péladeau, Director
35
NOTES TO CONSOLIDATED FINANCIAL STATEMENTS
Years ended December 31, 2004, 2003 and 2002 (Tabular amounts are expressed in millions of US dollars, except for earnings per share and option amounts)
1. SUMMARY OF SIGNIFICANT ACCOUNTING POLICIES
(a) Principles of consolidation
The consolidated financial statements include the accounts of Quebecor World Inc. and all its subsidiaries (the "Company") and are prepared in conformity with Canadian generally accepted accounting principles.
(b) Use of estimates
The preparation of financial statements in conformity with Canadian generally accepted accounting principles requires management to make estimates and assumptions that affect the reported amounts of assets and liabilities and disclosure of contingent assets and liabilities at the date of the financial statements and the reported amounts of revenues and expenses during the reporting period. Financial results as determined by actual events could differ from those estimates.
Examples of significant estimates include: the key economic assumptions used in determining the allowance for doubtful accounts, the provision for obsolescence and some of the amounts accrued for restructuring and other charges; the composition of future income tax assets; the useful life of capital assets; certain actuarial and economic assumptions used in determining pension costs, accrued pension benefit obligations and pension plan assets; and the assumptions in property, plant and equipment and goodwill impairment tests.
(c) Foreign currency translation
The Company's functional currency is the Canadian dollar and its reporting currency for the presentation of its consolidated financial statements is the US dollar.
Financial statements of self-sustaining foreign operations are translated using the rate in effect at the balance sheet date for asset and liability items and the average exchange rates during the year for revenues and expenses. Adjustments arising from this translation are deferred and recorded in translation adjustment and are included in income only when a reduction in the investment in these foreign operations is realized.
Other foreign currency transactions are translated using the temporal method. Translation gains and losses are included in financial expenses.
(d) Revenue recognition
The Company provides a wide variety of print and print-related services and products to its customers, which usually require that the specifics be agreed upon prior to process. Sales are recognized by the Company either when the production process is completed or services are performed, or on the basis of production and service activity at the pro rata billing value of work completed.
(e) Cash and cash equivalents
Cash and cash equivalents consist of highly liquid investments purchased three months or less from maturity and are stated at cost, which approximates market value.
(f) Trade receivables
Any gains or losses on the sale of trade receivables are calculated by comparing the carrying amount of the trade receivables sold to the total of the cash proceeds on sale and the fair value of the retained interest in such receivables on the date of transfer. Fair values are determined on a discounted cash flow basis. Costs, including losses on the sale of trade receivables, are recognized in income in the period incurred and included in selling, general and administrative expenses.
(g) Inventories
Raw materials and supplies are valued at the lower of cost, as determined using the first in, first out method, or market being replacement cost. The work in process is valued at the pro rata billing value of the work completed.
(h) Property, plant and equipment
Property, plant and equipment are stated at cost. Cost represents acquisition or construction costs including preparation, installation and testing charges and interest incurred with respect to property, plant and equipment until they are ready for commercial production. Repair and maintenance are expensed as incurred.
Depreciation is provided using the straight-line basis over the estimated useful lives as follows:
Assets
Estimated useful lives
Buildings and leasehold improvements
15 to 40 years
Machinery and equipment
3 to 18 years
36
(i) Goodwill and intangible assets
Goodwill represents the excess of the purchase price over the fair value of net assets of acquired businesses. Goodwill is not amortized and is tested for impairment annually, or more frequently if events or changes in circumstances indicate that the asset might be impaired. When the carrying amount of a reporting unit's goodwill exceeds the implied fair value of the goodwill, an impairment loss is recognized in an amount equal to the excess and is presented as a separate line item in the income statement before extraordinary items and discontinued operations.
Intangible assets which have indefinite lives, are not amortized, and are tested for impairment annually, or more frequently if events or changes in circumstances indicate that the asset might be impaired. The impairment test compares the carrying amount of the intangible asset with its fair value, and an impairment loss is recognized in income for the excess, if any. Intangible assets with definite useful lives are amortized over their useful life.
(j) Income taxes
The Company follows the asset and liability method of accounting for income taxes. Under the asset and liability method, future income tax assets and liabilities are recognized for the estimated future tax consequences attributable to differences between the financial statement carrying amounts of existing assets and liabilities and their respective tax bases. Future income tax assets and liabilities are measured using enacted or substantively enacted tax rates in effect for the year in which those temporary differences are expected to be recovered or settled. The effect on future income tax assets and liabilities of a change in tax rates is recognized in income in the period that includes the enactment, or substantively enactment, date. Future income tax assets are recognized and if realization is not considered more likely than not, a valuation allowance is provided.
(k) Stock-based compensation
The Company uses the fair value based method of accounting for all stock options granted to its employees, whereby a compensation expense is recognized over the vesting period of the options, with a corresponding increase to additional paid-in capital. When stock options are exercised, capital stock is credited by the sum of the consideration paid together with the related portion previously recorded to paid-in capital.
The Company adopted prospectively the fair value based method of accounting for stock-based compensation on January 1, 2003. Prior to this date, the Company, as permitted by Section 3870, had chosen to continue using the settlement based method and no compensation cost was recorded on the grant of stock options to employees. However, pro forma net income and diluted earnings per share for awards granted in 2002 are disclosed in Note 16 using the fair value based method.
For the employee share plans, the Company's contribution on the employee's behalf is recognized as compensation expense. Any consideration paid by the employee on purchase of stock together with any related compensation expense is recorded as an increase to capital stock.
Deferred Stock Units ("DSU") are recognized in compensation expense and accrued liabilities as they are awarded. DSU are remeasured at each reporting period, until settlement, using the trading price of the Subordinate Voting Shares.
(l) Derivative financial and commodity instruments
The Company uses various derivative financial instruments to manage its exposure to fluctuations in foreign currency exchange rates, interest rates and commodity pricing. The Company does not hold or use any derivative instruments for speculative purposes.
The Company enters into foreign exchange forward contracts to hedge anticipated foreign denominated sales and related receivables, raw materials and equipment purchases. Foreign exchange translation gains and losses are recognized as an adjustment of revenues, cost of goods sold and fixed assets, respectively when the transaction is recorded. The portion of the forward premium or discount on the contract relating to the period prior to consummation of the transaction is also recognized as an adjustment of revenues, cost of goods sold and fixed assets, respectively when the transaction is recorded.
The Company enters into foreign exchange forward contracts to hedge its net investments in foreign subsidiaries. Foreign exchange translation gains and losses are recorded under translation adjustment. Any realized or unrealized gain or loss on such derivative instruments is also recognized in translation adjustment.
The Company enters into foreign exchange forward contracts and cross currency swaps to hedge foreign denominated asset exposures. Foreign exchange translation gains and losses are recorded in income. Changes in the spot rates on the derivative instruments are recorded in income. The forward premium or discount on forward exchange contracts and the interest component of the cross currency swaps are amortized as an adjustment of interest expense over the term of the contract.
37
The Company enters into interest rate swaps in order to manage the impact of fluctuating interest rates on its short-term and long-term debt. These swap agreements require the periodic exchange of payments without the exchange of the notional principal amount on which the payments are based. The Company designates its interest rate hedge agreements as hedges of the interest cost of the underlying debt. Interest expense on the debt is adjusted to include amounts payable or receivable under the interest rate swaps.
The Company uses Treasury Lock Agreements in order to manage the impact of fluctuating interest rates on forecasted issuance of long-term debts. The Company designates its Treasury Lock Agreements as hedges of the future interest payments resulting from the issuance of long-term debt. The single payment from the derivative instrument at its maturity date is deferred and amortized over the term of the long-term debt.
The Company also enters into commodity swaps to manage a portion of its natural gas exposure. The Company is committed to exchange, on a monthly basis, the difference between a fixed price and a floating natural gas price index. The Company designates its commodity hedge agreements as hedges of the natural gas cost. Natural gas cost is adjusted to include amounts payable or receivable under the commodity hedge agreements.
Realized and unrealized gains or losses associated with derivative instruments, which have been terminated or have ceased to be effective prior to maturity, are deferred on the balance sheet and recognized in income in the period in which the underlying hedged transaction is recognized. In the event a designated hedged item is sold, extinguished or has matured prior to the termination of the related derivative instrument, any realized or unrealized gain or loss on such derivative instrument is recognized in income.
(m) Employee future benefits
i) Pensions
Pension costs are determined using actuarial methods and are funded through contributions determined in accordance with the projected benefit method pro rated on service as future salary levels affect the amount of future benefits. Pension expense is charged to operations and includes:
•
The cost of pension benefits provided in exchange for employees' services rendered during the year;
•
The amortization of the initial net transition asset on a straight-line basis over the expected average remaining service life of the active employees covered by the plans;
•
The amortization of prior service costs and amendments on a straight-line basis over the expected average remaining service life of the active employees covered by the plans;
•
The interest cost of pension obligations and the expected return on plan assets. For the purpose of calculating the expected return on plan assets, those assets are valued at market-related value, based on a combination of rigorous historical performance analysis and the forward-looking views of the financial markets as revealed through the yield on long-term bonds and the price-to-earnings ratios of the major stock market indices;
•
The amortization of cumulative unrecognized net actuarial gains and losses in excess of 10% of the greater of the benefit obligation or fair value of plan assets over the expected average remaining service life of active employees covered by the plans; and
•
When an event gives rise to both a curtailment and a settlement, the curtailment is accounted for prior to the settlement.
The Company participates in a number of multiemployer defined benefit pension plans covering approximately 3,800 employees. These multiemployer plans are accounted for following the standards on defined contribution plans as the Company has insufficient information to apply defined benefit plan accounting.
ii) Other postretirement benefits
The Company determines the cost of postretirement benefits other than pensions using the accrued benefit method. These benefits, which are funded by the Company as they become due, include life insurance programs and medical benefits. The Company amortizes the cumulative unrecognized net actuarial gains and losses in excess of 10% of the projected benefit obligation over the expected average remaining service life of active employees covered by the plans.
(n) Environmental expenditures
Environmental expenditures that relate to current operations are expensed or capitalized as appropriate. Expenditures that relate to an existing condition caused by past operations and which are not expected to contribute to current or future operations are expensed. Liabilities are recorded when environmental assessments and/or remedial efforts are likely, and when the costs, based on a specific plan of action in terms of the technology to be used and the extent of the corrective action required, can be reasonably estimated.
(o) Reclassifications
Certain reclassifications have been made to prior years' amounts to conform with the basis of presentation adopted in the current year.
38
2. ACCOUNTING CHANGES
In 2004, the Company has made certain changes in accounting policies to conform with new accounting standards.
(a) Asset retirement obligations
In March 2003, the Canadian Institute of Chartered Accountants ("CICA") issued Section 3110, Asset Retirement Obligations, which addresses financial accounting and reporting for legal obligations associated with the retirement of tangible long-lived assets that result from the acquisition, construction, development or normal use of the assets. The standard requires an entity to record the fair value of a liability for an asset retirement obligation in the period in which it is incurred and when a reasonable estimate of fair value can be made. The standard defines the fair value as the amount at which the liability could be settled in a current transaction between willing parties, other than in a forced or liquidation transaction. An entity is subsequently required to allocate the asset retirement cost and amortize it over its useful life. The Company adopted these new recommendations, as of January 1, 2004. The effect of adopting the new recommendations did not have a significant impact on the consolidated financial statements at the initial adoption date.
(b) Impairment of long-lived assets
In April 2003, the CICA issued Section 3063, Impairment of Long-lived Assets, which establishes standards for the recognition, measurement and disclosure of the impairment of long-lived assets held for use. Accounting for the potential impairment of long-lived assets held for use is a two-step process with the first step determining when impairment should be recognized, and the second step measuring the amount of the impairment. An impairment loss is recognized when the carrying amount of an asset held for use exceeds the sum of the undiscounted cash flows expected from its used and eventual disposition. The impairment loss is measured as the amount by which the asset's carrying amount exceeds its fair value. In accordance with the CICA guideline, the Company adopted the new recommendations as of January 1, 2004. The effect of adopting the new recommendations did not have a significant impact on the consolidated financial statements at the initial adoption date.
(c) Hedging relationships
In June 2003, the CICA issued amendments to Accounting Guideline 13, Hedging Relationships. The amendments clarify certain of the requirements and provide additional implementation guidance related to the identification, designation and documentation of the hedging relationships, and an assessment of their effectiveness. The requirements of the guideline are applicable to all hedging relationships in effect for fiscal years beginning on or after July 1, 2003. Retroactive application is not permitted. All hedging relationships must be assessed as of the beginning of the first year of application to determine whether the hedging criteria in the guideline are met. Hedge accounting is to be discontinued for any hedging relationships that does not meet the requirements of the guideline. The Company adopted the new recommendations effective January 1, 2004. The effect of adopting the new recommendations did not have a significant impact on the consolidated financial statements at the initial adoption date.
(d) Generally accepted accounting principles and General standards of financial statement presentation
In July 2003, the CICA issued Section 1100, Generally Accepted Accounting Principles ("Canadian GAAP"), and Section 1400, General Standards of Financial Statement Presentation. These sections establish standards for financial reporting and fair presentation in accordance with Canadian GAAP, and provide guidance on sources to consult when a matter is not dealt with explicitly in the primary sources of Canadian GAAP. The Company adopted these new recommendations as of January 1, 2004. The effect of adopting the new recommendations did not have a significant impact on the consolidated financial statements at the initial adoption date.
(e) Accounting by a customer for certain consideration received from a vendor
In January 2004, the Emerging Issues Committee released Abstract 144 ("EIC-144"), Accounting by a Customer for Certain Consideration Received from a Vendor. This abstract addresses how a customer or reseller of a vendor's products should account for consideration received from a vendor. It requires that any cash consideration received from the vendor be considered as an adjustment of the prices of a vendor's products and services unless certain conditions are met, in which case it might be either an adjustment to the costs incurred by the reseller or payment for assets or services delivered to the vendor. The Company adopted these new recommendations as of July 1, 2004. The effect of adopting the new recommendations did not have a significant impact on the consolidated financial statements at the initial adoption date.
39
3. IMPAIRMENT OF ASSETS, RESTRUCTURING AND OTHER CHARGES
In 2004, the Company recorded an impairment of assets, restructuring and other charges of $122.1 million. Non-cash items amounted to $83.3 million and cash items to $38.8 million. The cash items are detailed as follows and discussed below.
Breakdown of the 2004 restructuring charges by quarter and segment.
Overspending of 2001-2003 initiatives
Reversal of previous years' reserves
New initiatives in 2004
Net reversal of 2004 initiatives
Total
First Quarter
$
1.3
$
(2.0
)
$
5.0
$
—
$
4.3
Second Quarter
2.6
(3.0
)
11.2
—
10.8
Third Quarter
1.2
(2.8
)
11.1
(0.1
)
9.4
Fourth Quarter
1.5
(0.2
)
13.2
(0.2
)
14.3
$
6.6
$
(8.0
)
$
40.5
$
(0.3
)
$
38.8
North America
Europe
Latin America
Other
Total
First Quarter
$
3.3
$
0.6
$
0.2
$
0.2
$
4.3
Second Quarter
8.3
2.1
0.4
—
10.8
Third Quarter
6.0
3.2
(0.1
)
0.3
9.4
Fourth Quarter
7.4
5.5
1.3
0.1
14.3
$
25.0
$
11.4
$
1.8
$
0.6
$
38.8
Impairment of assets
The execution of the 2004 restructuring initiatives resulted in certain assets being permanently idled. In addition, the initiatives and other events triggered a recoverability test on other groups of assets. Accordingly, for the year, the Company recorded an impairment on long-lived assets of $73.3 million and $1.1 million of impairment on other assets. The $74.4 million included $40.9 million for North America, $29.2 million for Europe and $3.9 million for Latin America.
During the fourth quarter of 2004, the Company recorded a $37.9 million impairment on long-lived assets and a $0.1 million impairment on other assets. The $38.0 million included $8.2 million for North America, $26.1 million for Europe and $3.3 million for Latin America.
The impairment of assets recorded for the second and third quarter was respectively $32.9 million and $3.5 million.
The impairment of long-lived assets has been measured as the excess of the carrying amount of an asset over its fair value, based on quoted market prices when available, or using the discounted cash flow method.
40
2004 restructuring charges
It should be noted that according to Emerging Issues Committee Abstract 135, when a Company approves a restructuring initiative, only the charge for which the liability has been already contracted should be recorded. Thus, each quarter, the charge recorded includes a portion for the current quarter initiatives and a portion related to initiatives previously approved.
During the fourth quarter, the Company recorded cash costs of $13.2 million, of which $9.7 million was for new initiatives and $3.5 million resulting from the continuation of the second and third quarter initiatives. Furthermore, the $13.2 million included $9.0 million for workforce reduction and $4.2 million for lease obligations, facility carrying costs and dismantling of equipment covering both current and previous initiatives. Restructuring initiatives were pursued and resulted in the approval of the consolidation of four small facilities in North America, one in Europe and other workforce reductions across the Company. The cash costs of these initiatives was estimated at $14.5 million, of which $9.7 million was recorded in the fourth quarter and $4.8 million remains to be booked in 2005, when the liabilities related to the initiatives will have been contracted. The non-cash cost of these initiatives included $0.9 million for the curtailment of one of the Company's U.S. pension plans. The fourth quarter initiatives affected 551 employees in total, however the Company estimated that 88 new jobs will be created in other facilities. In summary, 322 jobs have been eliminated in 2004 and 229 will be eliminated in 2005.
In the third quarter, the Company approved the closure of the Stockholm facility in Sweden, the consolidation of a small facility in North America and other workforce reductions across the Company. The cash cost of these initiatives was initially estimated at $17.5 million, of which $6.9 million, mostly related to workforce reduction, was recorded in the third quarter. The number of employees affected by the third quarter restructuring initiatives has been revised to 280 employees in total, however the Company estimates that 29 new jobs will be created in other facilities. In summary, 261 employee positions have been eliminated and 19 will be eliminated in 2005. The Company also recorded $1.5 million resulting from the continuation of the second quarter initiatives and $2.7 million for the pension obligation related to the Effingham multiemployer benefit plan. Further information should become available over the next few months, which will allow the Company to measure and recognize other liabilities related to this pension obligation.
In the second quarter of 2004, the Company initiated other restructuring initiatives to improve asset utilization and enhance efficiency. The restructuring initiatives included the closure of the Effingham, Illinois facility in the Magazine platform, an important downsizing at the Kingsport, Tennessee facility in the Book platform and other workforce reductions across the Company. The cash cost of these initiatives was initially estimated at $18.3 million, of which $11.2 million was recorded in the second quarter of 2004. These costs excluded a pension obligation related to the Effingham multiemployer benefit plan that could not be reasonably estimated at that time. The non-cash cost of these initiatives included $8.0 million for the curtailment and the settlement of one of the Company's U.S. pension plans. The number of employees affected by the second quarter restructuring initiatives has been revised to 1,332 employees in total. However, the Company estimates that 450 new jobs will be created in other facilities. In summary, 1,291 employee positions have been eliminated and 41 will be eliminated during in 2005.
In the first quarter of 2004, the Company initiated restructuring initiatives and recorded $5.0 million for workforce reductions. Under these initiatives, 354 employee positions have been eliminated and 1 remains to come.
During the third and fourth quarter, the execution of the 2004 initiatives resulted in a net reversal of $0.1 million and $0.2 million, respectively.
In summary, as of December 31, 2004, 2,228 employee positions have been eliminated under the 2004 initiatives, 290 will be completed in 2005 and 567 new jobs will be created in other facilities. In 2005, excluding the pension obligation related to the Effingham multiemployer benefit plan, $17.8 million of cash restructuring charges related to the 2004 initiatives remain to be recorded when the liability related to the initiatives will have been contracted.
Prior years' restructuring and other charges
In 2004, the review and execution of the prior years' initiatives resulted in a net reversal of $1.4 million comprised of a cash overspending of $6.6 million, and $8.0 million reversal of prior years' restructuring and other charges, mostly due to the cancellation or the termination of 75 employee positions.
During the fourth quarter, the execution of the prior years' initiatives resulted in a net overspending of $1.3 million comprised of a cash overspending of $1.5 million, and a $0.2 million reversal of prior year restructuring and other charges.
41
2003 Impairment of assets, restructuring and other charges
In 2003, the Company recorded an impairment of assets, restructuring and other charges of $98.3 million. Non-cash items amounted to $60.4 million, and cash items to $37.9 million. The cash items are detailed as follows and discussed below.
Breakdown of the 2003 restructuring charges by quarter and segment.
Overspending of 2001-2002 initiatives
Reversal of previous years' reserves
New initiatives in 2003
Net reversal of 2003 initiatives
Total
Second Quarter
$
9.6
$
(4.6
)
$
23.4
$
—
$
28.4
Third Quarter
1.1
(5.8
)
1.9
(2.2
)
(5.0
)
Fourth Quarter
2.2
(3.5
)
16.1
(0.3
)
14.5
$
12.9
$
(13.9
)
$
41.4
$
(2.5
)
$
37.9
North America
Europe
Latin America
Other
Total
Second Quarter
$
19.2
$
7.2
$
1.3
$
0.7
$
28.4
Third Quarter
2.4
(7.5
)
0.1
—
(5.0
)
Fourth Quarter
10.1
2.1
2.2
0.1
14.5
$
31.7
$
1.8
$
3.6
$
0.8
$
37.9
Impairment of assets
During 2003, the Company reviewed the status of assets that became permanently idle following the prior years' restructuring initiatives and difficult economic conditions. The Company determined that these assets would not be redeployed as it had originally contemplated under an economic recovery scenario or that they would not generate sufficient cash flow, and as such, recorded an impairment of long-lived assets of $54.4 million. 2003 initiatives resulted in an impairment of long-lived assets of $2.8 million and $3.2 million related to previous years' initiatives. The $60.4 million included $46.7 million for North America, $5.0 million for Europe and $8.2 million for Latin America.
Restructuring and other charges
During the fourth quarter of 2003, the Company continued its restructuring initiatives and recorded a cash cost of $16.1 million related to a reduction in workforce of 878 employee positions and a reversal of $0.3 million related to second quarter and third quarter initiatives.
In the third quarter of 2003, the Company initiated new restructuring initiatives and recorded a charge of $1.9 million for workforce reduction and the execution of the June initiatives resulted in a reversal of $2.2 million of restructuring charges.
In the second quarter of 2003, the Company initiated restructuring initiatives and other charges following the continued volume declines in certain business segments. A cash charge of $23.4 million was taken consisting of $17.6 million in workforce reduction and $5.8 million of additional closure costs of four smaller facilities.
As of December 31, 2003, under the 2003 restructuring initiatives, 1,769 employee position terminations were completed. The workforce reductions affected all fixed cost areas of the Company both at the plant and corporate levels.
2002 and 2001 restructuring initiatives
In 2003, the review and the execution of the 2002 and 2001 initiatives resulted in a net reversal of $1.0 million comprised of a cash overspending of $12.9 million, and a $13.9 million reversal of prior year restructuring and other charges. The cash overspending was related to the cost of closed facilities not yet disposed of, office leases not yet subleased and other completed initiatives.
42
2002 Impairment of assets, restructuring and other charges
In 2002, the Company recorded an impairment of assets, restructuring and other charges of $19.6 million comprised of $46.4 million for 2002 initiatives, $13.3 million for overspending on 2001 initiatives, and $40.1 million for the reversal of unused reserves from 2001 initiatives due to the continuation of a contract with a customer, previously expected to be terminated, that provided sufficient work to utilize equipment originally targeted for a shutdown. Cash items amounted to $20.1 million and non-cash items amounted to a net reversal of $0.5 million.
The 2002 initiatives were initiated in France due to difficult market conditions, severe price competition and a decrease in sales volume. In addition, reduction in force programs were initiated in North America and mostly completed in 2003. The charges of $46.4 million consisted of $6.5 million related to impairment of long-lived assets, $30.0 million in workforce reduction costs and other restructuring charges, and $9.9 million mostly for the write-down of the investment in Q-Media Services Corporation, which went into receivership at the end of 2002. The $30.0 million in workforce reduction costs and other restructuring charges included $18.6 million for Europe and $8.6 million for North America.
Continuity of restructuring reserve
As at January 1, 2004, the balance of the restructuring reserve was $45.8 million. This amount related mostly to the workforce reductions across the platform and lease and facility carrying costs. The Company utilized $50.6 million of the current and prior years' restructuring and other charges reserves during the twelve-month period ended December 31, 2004.
The following table sets forth the Company's 2004 restructuring reserve and activities against the reserves carried forward from 2003:
Restructuring charges
Other charges
Total
Balance as at December 31, 2003
$
44.6
$
1.2
$
45.8
Overspending of 2001-2003 initiatives
6.6
—
6.6
Reversal of previous years' reserve
(8.0
)
—
(8.0
)
New initiatives in 2004
40.2
—
40.2
38.8
—
38.8
Reserved utilized in 2004
(49.7
)
(0.9
)
(50.6
)
Foreign currency changes
1.2
—
1.2
Balance as at December 31, 2004
$
34.9
$
0.3
$
35.2
Cash disbursement related to this reserve is expected to be as follows:
Workforce reduction costs
Leases, closed facilities carrying costs and other
Total
2005
$
21.3
$
6.2
$
27.5
2006
—
3.5
3.5
2007
—
2.6
2.6
2008
—
1.1
1.1
2009 and thereafter
—
0.5
0.5
$
21.3
$
13.9
$
35.2
43
4. FINANCIAL EXPENSES
2004
2003
2002
Interest on long-term debt and convertible notes
$
124.7
$
151.8
$
146.1
Interest on short-term debt
4.4
9.0
5.6
Amortization of deferred financing costs
2.9
3.6
3.5
Exchange losses
1.7
9.2
3.4
Exchange loss (gain) from reduction of a net investment in a foreign operation
(1.0
)
5.3
—
Loss on extinguishment of long-term debt
2.0
30.2
—
134.7
209.1
158.6
Interest capitalized to the cost of equipment
(1.5
)
(2.3
)
(4.0
)
$
133.2
$
206.8
$
154.6
Cash interest payments
$
130.8
$
160.9
$
149.0
In February 2004, the Company redeemed the remainder of the 7.75% senior notes callable on or after February 15, 2004 that were not tendered in 2003, for a total cash consideration of $32.5 million. The loss on extinguishment was $2.0 million. In 2003, the Company repurchased 89.6% of the $300 million aggregate principal amount of the 7.75% senior notes pursuant to a tender offer. The Company also exercised its option to redeem all $257.6 million aggregate principal amount of the 8.375% senior notes. These extinguishments of long-term debt resulted in a loss of $30.2 million consisting of premium paid, write-off of discounts and deferred costs related to those transactions.
5. INCOME TAXES
The domestic and foreign components of income before income taxes are as follows:
2004
2003
2002
Domestic
$
9.7
$
(11.8
)
$
5.1
Foreign
218.4
22.6
367.9
$
228.1
$
10.8
$
373.0
Total income tax expense was allocated as follows:
2004
2003
2002
Income taxes
$
78.9
$
39.1
$
90.9
Shareholders' equity:
Translation adjustment
6.7
—
—
Dividends on preferred shares
3.8
5.3
3.0
$
89.4
$
44.4
$
93.9
Income tax expense (recovery) attributable to income consists of:
2004
2003
2002
Current:
Domestic
$
1.9
$
8.2
$
3.1
Foreign
34.2
15.8
31.1
36.1
24.0
34.2
Future:
Domestic
5.9
(12.6
)
(17.2
)
Foreign
36.9
27.7
73.9
42.8
15.1
56.7
$
78.9
$
39.1
$
90.9
44
The following table reconciles the difference between the domestic statutory tax rate and the effective tax rate used by the Company in the determination of net income:
2004
2003
2002
Domestic statutory tax rate
33.7
%
35.1
%
37.2
%
Effect of foreign tax rate differences
(15.1
)
(360.9
)
(12.7
)
International rates
18.6
(325.8
)
24.5
Increase (reduction) resulting from:
Change in valuation allowance
11.6
455.9
1.8
Permanent differences
3.1
(30.1
)
(4.7
)
Changes in enacted and average tax rates on cumulative temporary differences
(0.8
)
258.8
—
Large corporation tax
0.3
6.4
0.2
Other
1.8
(3.8
)
2.6
Effective tax rate
34.6
%
361.4
%
24.4
%
Income taxes paid (received)
$
67.0
$
22.2
$
(3.6
)
The tax effects of significant items comprising the Company's net future tax liability are as follows:
2004
2003
Future tax assets:
Operating loss carryforwards
$
180.6
$
285.6
Tax credit carryforwards
14.0
25.4
Trade receivables
10.1
18.7
Acquisition and restructuring reserves
12.9
29.7
Pension, postretirement and workers compensation benefits
36.6
47.9
Accrued compensation
45.4
23.3
Other
20.6
40.3
Gross future tax assets
320.2
470.9
Future tax liabilities:
Property, plant and equipment
(371.9
)
(457.2
)
Inventories
(32.7
)
(44.3
)
Capital leases
(25.2
)
(37.7
)
Goodwill and other assets
(68.0
)
(50.8
)
Other
(15.6
)
(48.5
)
Gross future tax liabilities
(513.4
)
(638.5
)
Valuation allowance
(170.6
)
(137.9
)
Net future tax liability
(363.8
)
(305.5
)
Less current portion of:
Future tax assets
43.2
105.8
Future tax liabilities
(4.4
)
(6.2
)
Future tax liability
$
(402.6
)
$
(405.1
)
The 2004 and 2003 amounts above include a valuation allowance of $170.6 million and $137.9 million respectively, relating to loss carryforwards and other tax benefits available. The valuation allowance for future tax assets as of January 1, 2003 was $84.8 million. The net change in the total valuation allowance for the years ended December 31, 2004 and 2003 were explained by $26.4 million and $49.4 million respectively, allocated to income from operations.
45
Subsequent recognition of the tax benefits relating to the valuation allowance for future tax assets as of December 31, 2004 will be allocated as follows:
Income tax benefit will be reported:
In the consolidated statement of income
$
145.6
As a reduction of goodwill
25.0
$
170.6
At December 31, 2004, the Company had net operating loss carryforwards for income tax purposes available to reduce future taxable income of $94.8 million, expiring from 2006 to 2018, and $365.3 million which can be carried forward indefinitely. In the United States, the Company had no Federal net operating loss carryforwards. The amount of US Federal alternative minimum tax credit available was $3.5 million, for which a full valuation allowance has been taken. The Company also had state net operating loss and state tax credit carryforwards valued net of federal tax benefit of approximately $29.9 million and $10.5 million, respectively. These loss and tax credit carryforwards expire between 2006 and 2024. Limitations on the utilization of these tax assets may apply and the Company has accordingly provided a valuation allowance in the amount of $19.3 million.
The Company has not recognized a future tax liability for the undistributed earnings of its subsidiaries in the current and prior years, because the Company currently does not expect those unremitted earnings to reverse and become taxable to the Company in the foreseeable future. Future income taxes will be recognized when the Company expects that it will recover those undistributed earnings in a taxable manner, such as through receipt of dividends or sale of the investments. Such liability is not reasonably determinable at the present time.
6. EARNINGS (LOSS) PER SHARE
Basic earnings per share are calculated by dividing net income available to holders of equity shares by the weighted average number of equity shares outstanding during the year. Net income available to holders of equity shares is computed by subtracting dividends on the preferred shares from net income. Diluted earnings per share are calculated by using the weighted average number of equity shares outstanding adjusted to include potentially the dilutive effect of convertible notes and stock options.
The following table sets forth the computation of basic and diluted earnings per share:
2004
2003
2002
Net income (loss) available to holders of equity shares
$
106.2
$
(67.9
)
$
250.4
Income impact on assumed conversion of convertible notes, net of applicable income taxes
—
—
4.8
Net income (loss) adjusted for dilution effect
$
106.2
$
(67.9
)
$
255.2
(in millions)
Weighted average number of equity shares outstanding
132.4
136.0
140.7
Effect of dilutive convertible notes and stock options
0.2
—
4.7
Weighted average number of diluted equity shares outstanding
132.6
136.0
145.4
Earnings (loss) per share:
Basic
$
0.80
$
(0.50
)
$
1.78
Diluted
$
0.80
$
(0.50
)
$
1.76
In 2004, diluted earnings per share does not include the effects of the convertible notes, as the effect of their inclusion is anti-dilutive. In 2003, net loss available to holders of equity shares does not include the effects of the convertible notes and stock options as the effect of their inclusion was anti-dilutive.
7. BUSINESS ACQUISITIONS
Acquisitions
During the years ended December 31, 2004, 2003 and 2002, the Company acquired the following businesses, which have been accounted for by the purchase method, and earnings are included in the consolidated statements of income since the date of acquisition.
46
2004
In November 2004, the Company purchased the remaining 50% of the issued and outstanding shares of Helio Charleroi in Belgium, for a cash consideration of $45.8 million, of which $17.0 million has been recorded in goodwill.
In September 2004, the Company acquired a minority interest in its North American operations for a cash consideration of $2.4 million, of which $1.8 million has been recorded in goodwill.
In April 2004, the Company acquired a minority interest in its Spanish operations for a cash consideration of $1.7 million, of which $1.5 million has been recorded in goodwill.
In March 2004, the Company acquired a minority interest in its North American operations for a cash consideration of $0.6 million, of which $0.4 million has been recorded in goodwill.
2003
In May 2003, the Company acquired minority interests in North American operations for a cash consideration of $4.4 million, of which $3.0 million has been recorded in goodwill.
In March 2003, the Company acquired minority interests in its Spanish operations for a cash consideration of $3.1 million, of which $2.2 million has been recorded in goodwill.
2002
In March 2002, the Company purchased all of the issued and outstanding shares of European Graphic Group S.A. ("E2G"), a subsidiary of Hachette Filipacchi Medias in France, for a cash consideration of $3.3 million. The purchase price will be adjusted by contingent considerations of a maximum of 6.1 million Euro ($7.6 million), based on achieving a specific performance level. An amount of 1.5 million Euro (1.8 million) was paid in 2004 and the final contingent considerations will be paid in 2007. The contingent considerations, if any, will be recorded as an increase of the fixed assets. E2G owns printing and bindery facilities in France and Belgium and a 50% ownership of Bayard Hachette Routage in France. No goodwill resulted from this acquisition. The allocation purchase price process was completed as at March 31, 2003 and the effect of these adjustments did not have a significant impact on the consolidated financial statements.
During the year, the Company also acquired minority interests in North America and Europe for a cash consideration of $4.5 million, of which $1.3 million was recorded in goodwill.
Net assets acquired at fair value:
2004
2003
2002
Assets acquired:
Cash and cash equivalents
$
—
$
—
$
7.5
Non-cash operating working capital
(0.8
)
—
1.0
Property, plant and equipment
11.8
—
63.6
Goodwill
20.7
5.2
1.3
Other assets
0.2
—
—
Minority interest
22.6
2.3
3.2
Liabilities assumed:
Long-term debt
—
—
55.5
Other liabilities
—
—
4.8
Future income taxes
4.0
—
0.1
Minority interest
—
—
8.4
Net assets acquired
$
50.5
$
7.5
$
7.8
Consideration:
Cash
$
50.5
$
7.5
$
7.8
47
8. TRADE RECEIVABLES
Asset securitization
In September 2004, the Company renewed and amended its 1999 agreement to sell, with limited recourse, a portion of its US trade receivables on a revolving basis (the "US Program"). The amendment provides the Company with the option to extend the term of the US Program for an additional year. The US Program limit is $510.0 million. As at December 31, 2004, the amount outstanding under the US Program was $500.0 million ($488.0 million as at December 31, 2003).
In 2004, the Company sold, with limited recourse, a portion of its Canadian trade receivables on a revolving basis under the terms of a Canadian securitization agreement dated March 2003 (the "Canadian Program"). The Canadian Program limit is Cdn$ 135.0 million. As at December 31, 2004, the amount outstanding under the Canadian program was Cdn$ 126.0 million ($104.8 million) (Cdn$ 132.0 million ($101.0 million) as at December 31, 2003).
In 2004, the Company also sold, with limited recourse, a portion of its French and Spanish trade receivables on a revolving basis under the terms of a European securitization agreement dated June 2001 (the "European Program"). The European Program limit is 153.0 million Euro. As at December 31, 2004, the amount outstanding under the European Program was 133.5 million Euro ($180.7 million) (142.5 million Euro ($177.6 million) as at December 31, 2003).
The Company has retained the responsibility for servicing, administering and collecting trade receivables sold. No servicing asset or liability has been recorded, since the fees the Company receives for servicing the receivables approximate the related costs.
At December 31, 2004, an aggregate of $936.1 million ($902.2 million as at December 31, 2003) of trade receivables have been sold under the three programs, of which $150.6 million ($135.6 million as at December 31, 2003) were kept by the Company as a retained interest, resulting in a net aggregate consideration of $785.5 million ($766.6 million as at December 31, 2003) on the sale. The retained interest is recorded in the Company's trade receivables, and its fair market value approximates its cost, given the short nature of the collection period of the trade receivables sold. The rights of the Company on the retained interest are subordinated to the rights of the investors under the programs. There is no recourse under the programs on the Company's other assets for failure of debtors to pay when due, other than the retained interest of the Company.
Securitization fees vary based on commercial paper rates in Canada, the United States and Europe and, generally, provide a lower effective funding cost than available under the Company's bank facilities.
Proceeds from revolving sales between the securitization trusts and the Company in 2004 totalled $4.8 billion ($4.7 billion in 2003).
9. INVENTORIES
2004
2003
Raw materials and supplies
$
268.4
$
241.1
Work in process
151.1
159.0
$
419.5
$
400.1
48
10. PROPERTY, PLANT AND EQUIPMENT
Cost
Accumulated depreciation
Net book value
December 31, 2004
Land
$
92.5
$
—
$
92.5
Buildings and leasehold improvements
876.6
270.6
606.0
Machinery and equipment
3,902.0
2,270.8
1,631.2
Projects under development
43.9
—
43.9
$
4,915.0
$
2,541.4
$
2,373.6
December 31, 2003
Land
$
88.5
$
—
$
88.5
Buildings and leasehold improvements
834.8
211.1
623.7
Machinery and equipment
3,766.8
1,933.9
1,832.9
Projects under development
35.9
—
35.9
$
4,726.0
$
2,145.0
$
2,581.0
As at December 31, 2004, the cost of property, plant and equipment and the corresponding accumulated depreciation balance included amounts of $185.0 million ($386.6 million as at December 31, 2003) and $78.0 million ($233.3 million as at December 31, 2003) respectively, for the assets held under capital leases. Depreciation expenses of property, plant and equipment held under capital leases amounted to $7.0 million in 2004 ($17.6 million in 2003 and $19.4 million in 2002).
11. GOODWILL
The changes in the carrying amount of goodwill for the year ended December 31, 2004 are as follows:
North America
Europe
Latin America
Total
Balance as at December 31, 2003
$
2,192.2
$
391.1
$
7.7
$
2,591.0
Goodwill acquired
2.2
18.5
—
20.7
Foreign currency changes
3.9
35.8
0.5
40.2
Balance as at December 31, 2004
$
2,198.3
$
445.4
$
8.2
$
2,651.9
12. LONG-TERM DEBT
Maturity
2004
2003
Revolving bank facility $1.0 B (a)
2007
$
417.8
$
279.3
Senior Notes 4.875% and 6.125% (b)
2008, 2013
597.2
596.8
Senior Notes 8.42% and 8.52% (c)
2010, 2012
250.0
250.0
Senior Notes 7.20% (d)
2006
250.0
250.0
Senior Debentures 7.25% (e)
2007
150.0
150.0
Senior Debentures 6.50% (f)
2027
3.2
150.0
Senior Notes 8.54% and 8.69% (g)
2015, 2020
121.0
121.0
Senior Notes 7.75% (h)
—
—
30.7
Commercial paper (i)
—
—
0.3
Other debts and capital leases (j)
2005-2016
48.3
64.2
1,837.5
1,892.3
Less current portion
11.7
17.9
$
1,825.8
$
1,874.4
49
(a)
In November 2004, the Company extended, for an additional year, its existing revolving bank facility. The bank facility is composed of three tranches each maturing in November 2007. All three tranches can be extended on a yearly basis. The facility contains certain restrictions, including the obligation to maintain certain financial ratios. The facility can be used for general corporate purposes. The Company paid fees for the unused portion of $1.2 million in 2004 ($1.0 million in 2003 and 2002).
The revolving bank facility bears interest at variable rates based on LIBOR or Bankers' Acceptances rates. At December 31, 2004, the drawings under this facility are denominated in Canadian and US dollars and bear interest at 3.57% and 3.39% respectively.
(b)
In November 2003, the Company issued, at discount, Senior Notes for a principal amount of $600.0 million comprised of two tranches. The first tranche of $200.0 million matures on November 15, 2008 and the second tranche of $400.0 million matures on November 15, 2013. Issuance costs of $4.8 million were paid on this transaction.
(c)
In July 2000, the Company issued Senior Notes for a principal amount of $250.0 million comprised of two tranches. The first tranche of $175.0 million matures on July 15, 2010, while the second tranche of $75.0 million matures on July 15, 2012. These notes contain certain restrictions which are generally less restrictive than those of the revolving bank facility.
(d)
In March 2001, the Company issued Senior Notes for a principal amount of $250.0 million maturing in March 2006. A portion of $33.0 million of the notes bears a floating interest rate, but has been swapped to fixed at the same rate as the coupon on the fixed rate portion (see Note 18 (c)). These notes contain certain restrictions which are generally less restrictive than those of the revolving bank facility.
(e)
The Senior Debentures mature on January 15, 2007.
(f)
The Senior Debentures due on August 1, 2027 were redeemable at the option of the holder at their par value on August 1, 2004. Out of a principal amount of $150.0 million, $146.8 million Senior Debentures were tendered and repurchased at par value.
(g)
In September 2000, the Company issued Senior Notes for a principal amount of $121.0 million comprised of two tranches. The first tranche of $91.0 million matures on September 15, 2015 and the second tranche of $30.0 million matures on September 15, 2020. These Notes contain certain restrictions which are generally less restrictive than those of the revolving bank facility.
(h)
In November 2003, following a tender offer at a premium for 100% of the face value of $300.0 million, the Company repurchased 89.6% of the notes or $268.7 million. The remaining Senior Notes were redeemed in February 2004 for a total cash consideration of $32.5 million. The Notes were originally issued by World Color Press ("WCP") and revalued at the time WCP was acquired by the Company in order to reflect their fair value based on the Company's borrowing rate for similar financial instruments. In August 2001, the Company obtained the consent from the noteholders to generally conform the restrictions on the notes with the Company's other senior public debentures. At the same time, the Notes which were Senior Subordinated Notes became Senior Notes.
(i)
In 2004, the Company discontinued its Canadian Commercial paper program. At December 31, 2003, Cdn $0.4 million ($0.3 million) was outstanding under the Commercial paper program.
(j)
Other debts and capital leases are partially secured by assets. An amount of $23.0 million ($29.6 million as at December 31, 2003) is denominated in Euro, an amount of $3.3 million ($4.2 million as at December 31, 2003) in Swedish kronas and an amount of $1.4 million ($1.9 million as at December 31, 2003) in Canadian dollars. At December 31, 2004, these debts and capital leases bear interest at rates ranging from 0.0% to 10.8%.
The Company was in compliance with all significant debt covenants at December 31, 2004.
50
Principal repayments on long-term debt are as follows:
2005
$
11.7
2006
258.6
2007
571.8
2008
205.4
2009
8.1
2010 and thereafter
781.9
13. OTHER LIABILITIES
2004
2003
Postretirement benefits
$
73.5
$
66.5
Pension liability
56.9
63.0
Workers' compensation accrual
30.3
18.1
Reserve for environmental matters
15.9
16.2
Derivative financial instruments
26.4
59.5
Other
45.1
34.8
$
248.1
$
258.1
14. CONVERTIBLE NOTES
Maturity
2004
2003
Convertible senior subordinated notes 6.00% (a)
2007
$
112.6
$
110.7
Convertible subordinated debentures 7.00% (b)
—
—
6.0
112.6
116.7
Less current portion
—
6.0
$
112.6
$
110.7
(a)
The convertible senior subordinated notes mature on October 1, 2007. The notes were issued by WCP and revalued at the time WCP was acquired by the Company in order to reflect their fair value based on the Company's borrowing rate for similar financial instruments. The equity component of the notes, which corresponds to the option of the holder to convert the notes into equity shares of the Company, was valued at the date of acquisition and classified as additionnal paid-in capital. Since the acquisition of WCP by the Company, each $1,000 tranche is convertible into 30.5884 Subordinate Voting Shares of the Company which corresponds to a price of $26.24 per share and $197.25 in cash. The notes are convertible at the option of the holder at any time, and redeemable at the option of the Company at a decreasing premium from October 2002 to the final maturity. Pursuant to the terms of the convertible notes, the Company repurchased $7.6 million of the notes in 1999 following a tender offer at par for 100% of the face value of $151.8 million. The Company subsequently repurchased notes in the open market in 2000 for the principal amount of $24.7 million thereof. The aggregate principal amount of the notes, as at December 31, 2004, was $119.5 million ($119.5 million as at December 31, 2003). The number of equity shares to be issued upon conversion of the convertible notes would be 3,656,201.
(b)
In March 2001, a subsidiary of the Company issued convertible subordinated debentures and were repaid at maturity in May 2004.
51
15. CAPITAL STOCK
(a) Authorized capital stock
Equity shares:
Multiple Voting Shares, authorized in an unlimited number, without par value, carrying ten votes per share, convertible at any time into Subordinate Voting Shares on a one-to-one basis.
Subordinate Voting Shares, authorized in an unlimited number, without par value, carrying one vote per share.
Preferred shares, authorized in an unlimited number, without par value, issuable in series; the number of preferred shares in each series and the related characteristics, rights and privileges are to be determined by the Board of Directors prior to each issue.
The Series 2 Cumulative Redeemable First Preferred Shares were converted into Series 3 Cumulative Redeemable First Preferred Shares in December 2002.
The Series 3 Cumulative Redeemable First Preferred Shares are entitled to a fixed cumulative preferential cash dividend of Cdn $1.5380 per share per annum, payable quarterly from December 1, 2002 to November 30, 2007. Thereafter, a new fixed cumulative preferential cash dividend will be set by the Company for another five-year period. On December 1, 2007, and at every 5th anniversary thereafter, these preferred shares may be converted into Series 2 Cumulative Redeemable First Preferred Shares under certain conditions.
The Series 4 Cumulative Redeemable First Preferred Shares are entitled to a fixed cumulative preferential cash dividend of Cdn $1.6875 per share per annum, payable quarterly, if declared. On and after March 15, 2006, these preferred shares are redeemable at the option of the Company at Cdn $25.00, or with regulatory approval, the preferred shares may be converted into equity shares by the Company. On and after June 15, 2006, these preferred shares may be converted at the option of the holder into equity shares, subject to the right of the Company prior to the conversion date to redeem for cash or find substitute purchasers for such preferred shares.
The Series 5 Cumulative Redeemable First Preferred Shares are entitled to a fixed cumulative preferential cash dividend of Cdn $1.725 per share per annum, payable quarterly, if declared. On and after December 1, 2007, these preferred shares are redeemable at the option of the Company at Cdn $25.00, or with regulatory approval, the preferred shares may be converted into equity shares by the Company. On and after March 1, 2008, these preferred shares may be converted at the option of the holder into equity shares, subject to the right of the Company prior to the conversion date to redeem for cash or find substitute purchasers for such preferred shares.
Each series of Preferred Shares ranks pari passu with every other series of Preferred Shares.
(b) Issued and outstanding Redeemable First Preferred Shares
In December 2002, the holders of the Series 2 Cumulative Redeemable First Preferred Shares elected to convert more than 11,000,000 preferred shares into Series 3 Cumulative Redeemable First Preferred Shares. Consequently, in accordance with the Articles of the Company for these preferred shares, all remaining Series 2 Cumulative Redeemable First Preferred Shares were automatically converted into Series 3 Cumulative Redeemable First Preferred Shares.
(c) Share repurchase
In June 2003, the Company repurchased for cancellation a total of 10,000,000 Subordinate Voting Shares pursuant to its Substantial Issuer Bid dated April 24, 2003 for a net cash consideration, including redemption fees, of Cdn $241.1 million ($173.6 million). The Substantial Issuer Bid expired at midnight (Montreal time) on the evening of June 2, 2003. The excess of the price paid over the book value of the shares repurchased, amounting to $39.3 million, was charged to retained earnings.
In 2001, the Company initiated a normal course issuer bid for a maximum of 8,800,000 Subordinate Voting Shares over the period from April 6, 2001 to April 5, 2002. During 2002, under this normal course issuer bid program, the Company repurchased for cancellation 148,500 Subordinate Voting Shares for a net cash consideration of Cdn $5.2 million ($3.5 million).
16. STOCK-BASED COMPENSATION PLANS
(a) Employee share purchase plans
The Employee Stock Purchase Plan gives eligible employees in the United States the opportunity to acquire shares of the Company's capital stock for up to 4% of their gross salaries and to have the Company contribute, on the employees' behalf, a further amount equal to 17.5% of the total amount invested by the employee. The number of shares that may be issued and sold under the plan is limited to 2,000,000 Subordinate Voting Shares, subject to adjustments in the event of stock dividends, stock splits and similar events. At December 31, 2004, 4,107 employees (6,559 as at December 31, 2003 and 6,199 as at December 2002) were participating in the plan. The total number of plan shares issued for employees was 417,769 in 2004, including the Company's contribution of 62,221, (600,310 in 2003, including the Company's contribution of 89,408 and 468,267 in 2002, including the Company's contribution of 69,742) which represented compensation expenses amounting to $1.1 million in 2004 ($1.9 million in 2003 and $1.6 million in 2002).
52
The Employee Share Investment Plan gives eligible employees in Canada the opportunity to subscribe for up to 4% of their gross salaries to purchase shares of the Company's capital stock and to have the Company invest, on the employee's behalf, a further 20% of the amount invested by the employee. The number of shares that may be issued and sold under this plan is limited to 3,000,000 Subordinate Voting Shares, subject to adjustments in the event of stock dividends, stock splits and similar events. At December 31, 2004, 1,403 employees (2,281 at December 31, 2003 and 2,249 at December 2002) were participating in the plan. The total number of shares issued for employees, was 166,705 in 2004, including the Company's contribution of 25,930 (179,189 in 2003, including the Company's contribution of 30,085 and 117,162 in 2002, including the Company's contribution of 15,435), which represented compensation expenses amounting to Cdn $0.6 million ($0.5 million) in 2004 (Cdn $0.6 million ($0.4 million) in 2003 and 2002).
(b) Stock option plan
Under the stock option plan, a total of 7,519,796 Subordinate Voting Shares have been reserved for plan participants. As of December 31, 2004, the number of Subordinate Voting Shares related to the stock options outstanding was 4,542,045. The subscription price was usually equal to the share market price at the date the options were granted. The options vest over either four or five years. The options may be exercised during a period not exceeding ten years from the date they have been granted.
During the second quarter of 2004, the Board of Directors approved a special option grant of 1,000,000 Subordinate Voting Shares of the Company. The subscription price was equal to the share market price at the grant date and the options will be eligible for vesting on the anniversary date. Of the 1,000,000 options granted, half will be vested over four years based on current policy. The other half will be vested based on the performance over four years as follows: 300,000 options will vest at a rate of 25% per year, based on targeted annual growth of 15%, as measured by the growth in EPS per the December 31 audited consolidated financial statements of each year (the target earnings per share range between $1.70 and $2.08); and 200,000 options will vest at 25% per year, based on targeted compounded annual growth of 10%, as measured by the growth in the 30-day average share price preceding each anniversary date (the target share prices range between Cdn $28.55 and Cdn $37.99). Should the targets not be attained, the annual portion will not vest but may vest on any following anniversary date if subsequent targets are realized. The vesting of performance options can be achieved on an annual or cumulative basis such that previously missed annual vesting targets can vest based on cumulative compounded annual growth performance.
The fair value of options granted during 2003, was estimated using the Black-Scholes option pricing model. In 2004, the fair value of options granted during the year was estimated using the binomial option pricing model. The following weighted average assumptions were used:
2004
2003
Weighted-average grant date fair value of options
$
7.01
$
5.74
Assumptions:
Risk-free interest rate
4.01% - 4.59%
4.61% - 4.73%
Dividend yield
2% - 3%
2% - 4%
Expected volatility
30%
26% - 28%
Expected life
7 years
7 years
During the year, under the stock option plan and the special option grant, a compensation expense of $4.3 million ($1.9 million in 2003), was recognized with a corresponding increase in additional paid-in capital.
The number of stock options outstanding fluctuated as follows:
2004
2003
2002
Options
Weighted average exercise price
Options
Weighted average exercise price
Options
Weighted average exercise price
Balance, beginning of year
3,699,061
$
22.52
3,525,376
$
20.42
4,563,330
$
20.07
Issued
1,181,023
23.83
916,911
22.54
474,321
22.51
Exercised
(55,363
)
14.38
(27,346
)
13.93
(525,069
)
16.77
Cancelled
(282,676
)
24.40
(715,880
)
23.01
(987,206
)
22.33
Balance, end of year
4,542,045
$
23.81
3,699,061
$
22.52
3,525,376
$
20.42
Options exercisable, end of year
2,306,882
$
23.81
1,939,486
$
22.21
1,271,529
$
19.54
53
The following table summarizes information about stock options outstanding and exercisable at December 31, 2004:
Options outstanding
Options exercisable
Range of exercise prices
Number outstanding
Weighted average remaining contractual life (in years)
Weighted average exercise price
Number exercisable
Weighted average exercise price
$11 - $15
36,511
0.14
$
12.53
36,511
$
12.53
$15 - $18
100,103
2.32
16.73
100,103
16.73
$18 - $21
444,161
6.01
19.02
230,411
19.19
$21 - $24
1,609,238
5.44
22.49
1,002,243
22.43
$24 - $29
2,315,027
7.23
26.02
919,106
27.55
$29 - $31
37,005
7.15
30.93
18,508
30.93
4,542,045
6.31
$
23.81
2,306,882
$
23.81
Prior to January 1, 2003, the Company used the settlement based method for its stock-based compensation plans. Had compensation cost been determined using the fair value based method at the date of grant for awards granted in 2002 under all plans, the Company's pro forma net income (loss), earnings (loss) per share and diluted earnings (loss) per share would have been as presented in the table below.
2004
2003
2002
Pro forma net income (loss)
$
143.3
$
(31.8
)
$
278.8
Pro forma earnings (loss) per share:
Basic
$
0. 80
$
(0.50
)
$
1.78
Diluted
$
0. 80
$
(0.50
)
$
1.75
The pro forma disclosure omits the effect of awards granted before January 1, 2002. These pro forma amounts include a compensation cost calculated using the Black-Scholes option pricing model with the following assumptions.
Weighted-average grant date fair value of options
$ 4.83
Assumptions:
Risk-free interest rate
4.48% - 5.07%
Dividend yield
2%
Expected volatility
25%
Expected life
7 years
(c) Deferred Stock Unit Plan
The deferred stock unit plan ("DSU plan") is for the benefit of the Company's directors. Under the DSU plan, a portion of each director's compensation package is received in the form of units. The value of a unit is based on the weighted average trading price of the Subordinate Voting Shares. Subject to certain limitations, the units will be redeemed by the Company when the director ceases to be a DSU participant. For the purpose of redeeming units, the value of a unit shall correspond to the fair market value of a Subordinate Voting Share on the date of redemption.
As of December 31, 2004, the number of units outstanding under this plan was 153,948 (83,972 in 2003 and 31,250 in 2002), which represented compensation expense amounting to $1.6 million in 2004 ($0.9 million in 2003 and $0.7 million in 2002).
17. TRANSLATION ADJUSTMENT
The change in the translation adjustment included in shareholders' equity is the result of the fluctuation of the exchange rates on translation of net assets of self-sustaining foreign operations, exchange gains or losses on intercompany account balances that form part of the net investments and foreign exchange gains or losses related to derivative financial instruments used to hedge the net investments, net of income taxes.
54
18. FINANCIAL INSTRUMENTS AND CONCENTRATIONS OF CREDIT RISK
(a) Fair value of financial instruments
The carrying values of cash and cash equivalents, trade receivables, receivables from related parties, bank indebtedness, trade payables, payables to related parties and accrued liabilities approximate their fair values because of the short-term nature of these items.
The following table summarizes the book value and fair value at December 31, 2004 and 2003 of those financial instruments having a fair value different from their book value as at December 31. The fair values of the financial liabilities are estimated based on discounted cash flows using year-end market yields of similar instruments having the same maturity. The fair values of the derivative financial instruments are estimated using year-end market rates, and reflect the amount that the Company would receive or pay if the instruments were closed out at these dates.
2004
2003
Book Value
Fair Value
Book Value
Fair Value
Financial liabilities
Long-term debt(1)
$
(1,837.5
)
$
(1,943.6
)
$
(1,892.3
)
$
(2,005.9
)
Convertible notes(1)
(112.6
)
(121.9
)
(116.7
)
(127.4
)
Derivative financial instruments
Interest rate swap agreements
—
(5.1
)
—
(3.2
)
Foreign exchange forward contracts
72.8
109.8
43.1
73.3
Cross currency interest rate swaps
(16.7
)
(16.7
)
(47.7
)
(47.7
)
Commodity swaps
(0.1
)
(1.4
)
—
1.0
(1) Including current portion
(b) Foreign exchange risk management
The Company enters into foreign exchange forward contracts and cross-currency interest rate swaps to hedge the settlement of foreign denominated sales, related receivables, raw materials, equipment purchases and foreign dominated debt, and to manage its foreign exchange exposure on net investments and foreign denominated assets. The amounts of outstanding contracts at year-end, presented by currency, are included in the tables below:
(i)
Foreign exchange forward contracts
2004
2003
Currencies (sold/bought)
Notional amounts(2)
Average rate(3)
Notional amounts(2)
Average rate(3)
$/Cdn $
Less than 1 year
$
120.2
0.6534
$
129.1
0.6666
Between 1 and 3 years
367.0
0.6323
261.7
0.6263
Between 3 and 5 years
—
—
133.9
0.6219
Euro/$
Less than 1 year
186.1
0.7477
94.0
0.8084
SEK/$
Less than 1 year
42.1
6.6918
15.7
7.3237
GBP/Euro
Less than 1 year
21.8
0.6956
19.4
0.7058
Between 1 and 3 years
1.8
0.7068
1.4
0.7166
Other
Less than 1 year
88.5
—
17.7
—
Between 1 and 3 years
9.4
—
0.5
—
$
836.9
$
673.4
(2) Transactions in foreign currencies are translated into dollars using the closing exchange rate as at December 31, 2004 and 2003.
(3) Rates are expressed as the number of units of the currency sold for one unit of the currency bought.
55
(ii)
Cross-currency swaps
2004
2003
Currencies (sold/bought)
Notional amounts(2)
Average rate(3)
Notional amounts(2)
Average rate(3)
Euro/$
Less than 1 year
$
83.3
0.7461
$
98.3
1.0440
Between 1 and 3 years
34.6
0.8226
91.9
0.9521
SEK/$
Less than 1 year
3.1
7.4
21.5
8.8565
$
121.0
$
211.7
(1) Transactions in foreign currencies are translated into dollars using the closing exchange rate as at December 31, 2004 and 2003.
(2) Rates are expressed as the number of units of the currency sold for one unit of the currency bought.
(c) Interest rate risk management
The Company has entered into interest rate swaps to manage its interest rate exposure. The Company is committed to exchange, at specific intervals, the difference between the fixed and floating interest rate calculated by reference to the notional amounts.
The amounts of outstanding contracts at December 31, 2004 are included in the table below:
Maturity
Notional amount
Pay/Receive
Fixed Rate
Floating Rate
March 2006
$
33.0
Company pays fixed/ receives floating
7.20%
Libor 3 months/ plus 1.36%
November 2008
$
200.0
Company pays floating/ receives fixed
4.875%
Libor 3 months/ plus 1.53%
The amounts of outstanding contracts at December 31, 2003 are included in the table below:
Maturity
Notional amount
Pay/Receive
Fixed Rate
Floating Rate
March 2006
$
33.0
Company pays fixed/ receives floating
7.20%
Libor 3 months/ plus 1.36%
(d) Commodity risk
The Company has entered into commodity swap agreements to manage a portion of its North American natural gas exposure. The Company is committed to exchange, on a monthly basis, the difference between a fixed price and a floating natural gas price index calculated by reference to the notional amounts.
The amounts of outstanding contracts at year-end are included in the table below:
2004
2003
Countries/Unit
Notional quantity
Average price(1)
Notional quantity
Average price(1)
Canada / millions of Gigajoules
Less than 1 year
0.2
$
5.76
0.3
$
4.42
US / millions of MMBTU
Less than 1 year
2.0
$
6.89
2.2
$
5.09
(1) Transactions in foreign currencies are translated into dollars using the closing exchange rate as at December 31, 2004 and 2003.
56
(e) Credit risk
The Company is exposed to credit losses resulting from defaults by counterparties when using financial instruments.
When the Company enters into derivative financial instruments, the counterparties are international and Canadian banks having a minimum credit rating of A– by Standard & Poor's or of A3 by Moody's and are subject to concentration limits. The Company does not foresee any failure by the counterparties in meeting their obligations.
The Company, in the normal course of business, continuously monitors the financial condition of its customers and reviews the credit history of each new customer. At December 31, 2004, no customer balance represents a significant portion of the Company's consolidated trade receivables. The Company establishes an allowance for doubtful accounts that corresponds to the specific credit risk of its customers, historical trends and other information on the state of the economy.
The Company believes that the product and geographic diversity of its customer base is instrumental in reducing its credit risk, as well as the impact on the Company of fluctuations in local market or product-line demand. The Company has long-term contracts with most of its largest customers. These contracts usually include price adjustment clauses based on the cost of paper, ink and labour. The Company does not believe that it is exposed to an unusual level of customer credit risk.
19. COMMITMENTS AND CONTINGENCIES
(a) Leases
The Company rents premises and machinery and equipment under operating leases which expire at various dates up to 2016 and for which minimum lease payments total $416.7 million.
Annual minimum payments under these leases are as follows:
2005
$
109.9
2006
79.3
2007
59.7
2008
38.3
2009
29.9
2010 and thereafter
99.6
Rental expenses for operating leases were $96.6 million, $89.1 million and $91.4 million for the years 2004, 2003 and 2002.
(b) Machinery and equipment
As at December 31, 2004, the Company had commitments to purchase 9 new presses for its North American segment at a cost of approximately $110 million and other equipment for a total value of approximately $22 million.
(c) Environment
The Company is subject to various laws, regulations and government policies principally in North America and Europe, relating to health and safety, to the generation, storage, transportation, disposal and environmental emissions of various substances, and to environment protection in general. The Company believes it is in compliance with such laws, regulations and government policies, in all material respects. Furthermore, the Company does not anticipate that maintaining compliance with such environmental statutes will have a material adverse effect upon the Company's competitive or consolidated financial position.
(d) Guarantees
Significant guarantees the Company has provided to third parties include the following:
Operating leases
The Company has guaranteed a portion of the residual values of certain of its assets under operating leases with expiry dates between 2005 and 2009, for the benefit of the lessor. If the fair value of the assets, at the end of their respective lease term, is less than the residual value guaranteed, then the Company must, under certain conditions, compensate the lessor for a portion of the shortfall. The maximum exposure in respect of these guarantees is $103 million. Of this amount, $35.9 million expire in 2005 and $9.7 million in 2006. As at December 31, 2004, the Company has recorded a liability of $9.7 million associated with these guarantees.
Sub-lease agreements
The Company has, for some of its assets under operating leases, entered into sub-lease agreements with expiry dates between 2005 and 2008. If the sub-lessee defaults under the agreement, the Company must, under certain conditions, compensate the lessor for the defaults. The maximum exposure in respect of these guarantees is $6.0 million. As at December 31, 2004, the Company has not recorded a liability associated with these guarantees, since it is not probable that the sub-lessee will default under the agreement. Recourse against the sub-lessee is also available, up to the total amount due.
57
Business and real estate disposals
In the sale of all or a part of a business or real estate, in addition to possible indemnification relating to failure to perform covenants and breach of representations and warranties, the Company may agree to indemnify against claims from its past conduct of the business. Typically, the term and amount of such indemnification will be limited by the agreement. The nature of these indemnification agreements prevents the Company from estimating the maximum potential liability that could be required to pay to guaranteed parties. The Company has not accrued any amount in the consolidated balance sheet with respect to this item.
Debt agreements
Under the terms of certain debt agreements, the Company has guaranteed the obligation of its US subsidiaries. In this context, the Company would have to indemnify the other parties against changes in regulation relative to withholding taxes, which would occur only if the Company was to perform the payments on behalf of its US subsidiaries. These indemnifications extend for the term of the related financings and do not provide any limit on the maximum potential liabilities. The nature of the indemnification agreements prevent the Company from estimating the maximum potential liability it could be required to pay. However, the majority of the obligations to which such guarantees apply, contain make-whole provisions which effectively limit the exposure associated with such an occurrence. Moreover, within the current structure of the transactions, the Company is not exposed to such liabilities. As such, the Company has not accrued any amount in the consolidated balance sheet with respect to this item.
20. RELATED PARTY TRANSACTIONS
The Company entered into the following transactions, at prices and conditions prevailing on the market, with related parties (the parent company and its other subsidiaries) and were accounted for using the amount of cash consideration:
2004
2003
2002
Revenues
$
52.1
$
42.5
$
38.0
Purchases
5.4
2.2
1.0
Management fees billed by Quebecor Inc.
4.2
3.9
3.5
IT services billed by VTL (net of incurred expenses billed to VTL of $3.7 million)
3.7
—
—
During the year, the Company transferred the benefit of a deduction for Part VI. I tax to subsidiaries of its parent company for a consideration of Cdn $12.4 million ($10.3 million), (Cdn$ 11.4 million ($8.7 million) in 2003 and Cdn$ 9.9 million ($6.4 million) in 2002) recorded in receivables from related parties. This reduced the Company's available future income tax assets by Cdn$ 13.0 million ($10.8 million), (Cdn$ 10.8 million ($8.3 million) in 2003 and Cdn$ 11.5 million ($7.4 million) in 2002), and decreased the additional paid-in capital by Cdn$ 0.6 million ($0.5 million) (increase of Cdn$ 0.6 million ($0.4 million) in 2003 and a decrease of Cdn$ 1.6 million ($1.0 million) in 2002). The transaction was recorded at the carrying amount.
During the year, the Company reached an agreement with one of the parent company's subsidiaries, Videotron Telecom Ltd (VTL), to outsource its information technology (IT) infrastructure in North America for a duration of 7 years. As part of this agreement, VTL has purchased some of the Company's IT infrastructure equipment at a cost of $2.4 million. The outsourcing of services to VTL are estimated to cost the Company $15.1 million annually. The transfer of the equipment was completed in October and recorded at the carrying amount and no gain or loss was realized.
In 2000, the Company entered into a strategic agreement with Nurun Inc. ("Nurun"). The agreement included a commitment from the Company to use Nurun services (information technology and E-Commerce services) for a minimum of $40 million over a five-year period. In 2004, an addendum was made to the agreement, extending the term for another five years from the date of the addendum. In addition, the minimum service revenues of $40 million commited to Nurun was modified to include services directly requested by the Company and its affiliates (Quebecor Inc. and Quebecor Media inc. and their subsidiaries) as well as business referred, under certain condition, to Nurun by the Company and its affiliates. Finally, if the aggregate amount of the service revenues for the term of the agreement is lower than the minimum $40 million, the Company has agreed to pay an amount to Nurun equal to 30% of the difference between the minimum guaranteed revenues and the aggregate amount of revenues. As of December 31, 2004, the cumulative services paid to Nurun under this agreement, amounted to $6.9 million.
21. PENSION AND OTHER POSTRETIREMENT BENEFITS
The Company maintains defined benefit and contribution pension plans for its employees. The Company's policy is to maintain its contribution at a level sufficient to cover benefits. The effective date of the most recent actuarial valuation for funding purposes were between April 2002 to December 2003, and the date of the next required actuarial valuation ranges between December 2004 to December 2006.
The Company provides postretirement benefits to eligible employees. The costs of these benefits, which are principally health care, are accounted for during employees' active service period.
The following table is based on a September 30th measurement date. The table provides a reconciliation of the changes in the plan's benefit obligations and fair value of plan assets for the fiscal years ended December 31, 2004 and December 31, 2003, and a statement of the funded status as at December 31, 2004 and December 31, 2003:
58
Pension Benefits
Postretirement Benefits
2004
2003
2004
2003
Changes in benefit obligations
Benefit obligation, beginning of year
$
971.0
$
809.5
$
100.3
$
92.3
Service cost
37.8
35.4
1.5
1.3
Interest cost
58.0
54.5
5.8
6.0
Plan participants' contributions
5.3
5.0
2.1
2.1
Plan amendments
(1.5
)
2.4
(13.0
)
—
Curtailment (gain) loss
1.2
(0.4
)
(6.0
)
—
Actuarial (gain) loss
(16.4
)
85.0
(16.2
)
6.1
Benefits paid
(61.0
)
(59.4
)
(9.0
)
(8.4
)
Foreign currency changes
25.7
39.0
0.6
0.9
Benefit obligation, end of year
$
1,020.1
$
971.0
$
66.1
$
100.3
Changes in plan assets
Fair value of plan assets, beginning of year
$
480.8
$
404.1
$
—
$
—
Actual return on plan assets
57.3
64.9
—
—
Employer contributions
120.5
41.2
6.9
6.3
Plan participants' contributions
5.3
5.0
2.1
2.1
Transfer / Adjustment
—
1.4
—
—
Benefits paid
(61.0
)
(59.4
)
(9.0
)
(8.4
)
Foreign currency changes
16.3
23.6
—
—
Fair value of plan assets, end of year
$
619.2
$
480.8
$
—
$
—
Reconciliation of funded status
Funded status
$
(400.9
)
$
(490.2
)
$
(66.1
)
$
(100.3
)
Unrecognized net transition asset
(4.7
)
(5.1
)
—
—
Unrecognized prior service cost (benefit)
18.4
19.9
(13.6
)
(0.6
)
Unrecognized actuarial loss
372.3
401.9
4.4
28.5
Adjustment for fourth quarter contributions
3.6
47.0
1.8
1.7
Net amount recognized
$
(11.3
)
$
(26.5
)
$
(73.5
)
$
(70.7
)
Included in the above benefit obligation and fair value of plan assets at year-end are the following amounts in respect of plans that are not fully funded:
Pension Benefits
Postretirement Benefits
2004
2003
2004
2003
Benefit obligation
$
(1,020.1
)
$
(971.0
)
$
(66.1
)
$
(100.3
)
Fair value of plan assets
619.2
480.8
—
—
Funded status — plan deficit
$
(400.9
)
$
(490.2
)
$
(66.1
)
$
(100.3
)
The following table provides the amounts recognized in the consolidated balance sheets:
Pension Benefits
Postretirement Benefits
2004
2003
2004
2003
Accrued benefit liability
$
(56.9
)
$
(63.0
)
$
(73.5
)
$
(70.7
)
Accrued benefit asset(1)
45.6
36.5
—
—
Net amount recognized
$
(11.3
)
$
(26.5
)
$
(73.5
)
$
(70.7
)
(1) Included in other assets.
59
The plan assets held in trust at the measurement date and their weighted average allocations were as follows:
Asset category
2004
2003
Equity securities
62
%
70
%
Corporate bonds
33
27
Others
5
3
At December 31, 2004, the equity securities did not include any of the Company's or related parties' shares.
The following table provides the components of net periodic benefit cost:
Pension Benefits
Postretirement Benefits
2004
2003
2002
2004
2003
2002
Defined benefit plans
Service cost
$
37.8
$
35.4
$
31.5
$
1.5
$
1.3
$
0.9
Interest cost
58.0
54.5
52.3
5.8
6.0
5.3
Actual return on plan assets
(57.3
)
(64.9
)
40.5
—
—
—
Actuarial (gain) loss
(16.4
)
85.3
33.6
(16.1
)
6.1
16.5
Plan amendments
(1.5
)
2.4
6.4
(13.0
)
—
(0.7
)
Curtailment loss
1.9
2.1
—
—
—
—
Settlement loss
1.8
—
—
—
—
—
Benefit cost before adjustments to recognize the long-term nature of the plans
24.3
114.8
164.3
(21.8
)
13.4
22.0
Difference between expected return and actual return on plan assets
6.7
14.8
(91.2
)
—
—
—
Difference between actuarial (gain) loss recognized for the year and actual actuarial (gain) loss on accrued benefit obligation for the year
28.8
(79.9
)
(31.0
)
18.1
(4.7
)
(16.3
)
Difference between amortization of past service costs for the year and actual plan amendments for the year
3.0
(2.4
)
(6.4
)
12.9
(0.1
)
0.1
Amortization of transitional obligation (asset)
(0.8
)
(0.7
)
(0.6
)
—
—
—
Valuation allowance
—
—
(0.1
)
—
—
—
Net periodic cost
62.0
46.6
35.0
9.2
8.6
5.8
Defined contribution plans
12.7
19.7
21.9
—
—
—
Total periodic benefit cost
$
74.7
$
66.3
$
56.9
$
9.2
$
8.6
$
5.8
60
The defined contribution pension plan benefit cost included contributions to multiemployer plans of $7.3 million for the year ended December 31, 2004 ($7.9 million in 2003 and $8.1 million in 2002), and $2.7 for the pension obligation related to the Effingham multiemployer benefit plan, as described in Note 3. In February 2004, the Company has suspended the employer contribution matching program except where required by union contracts.
Effective January 1, 2005, the Company will partially reinstate the matching contributions up to an annual maximum of $500 for the following employees:
•
Hourly employees with earnings of $70,000 or less
•
Salaried employees with earnings of $50,000 or less
There are no changes in the employer contribution matching program where required by union contracts.
The total cash amount paid or payable for employee future benefits for all plans, consisting of cash contributed by the Company to its funded pension plans, cash payment directly to beneficiaries for its unfunded other benefit plans and cash contributed to its defined contribution plans, was $ 83.8 million for the year ended December 31, 2004 ($74.4 million in 2003 and $77.2 million in 2002).
The weighted average assumptions used in the measurement of the Company's benefit obligation and cost are as follows:
Pension Benefits
Postretirement Benefits
2004
2003
2002
2004
2003
2002
Accrued benefit obligation as of December 31:
Discount rate
6.0%
6.0%
6.7%
6.1%
6.0%
6.8%
Rate of compensation increase
3.4%
3.5%
3.4%
—
—
—
Benefit costs for years ended December 31:
Discount rate
6.0%
6.7%
7.0%
6.0%
6.8%
7.2%
Expected return on plan assets
7.8%
8.2%
8.2%
—
—
—
Rate of compensation increase
3.5%
3.4%
3.4%
—
—
—
The assumed health care cost trend rate used in measuring the accumulated postretirement benefit obligation was 9.9% at the end of 2004 (10.2% at the end of 2003) and is expected to decrease gradually to 5% in 2009 and remain at that level thereafter. A one percentage point change in assumed health care cost trend would have the following effects:
Postretirement Benefits
1% increase
1% decrease
Effect on service and interest costs
$
0.6
$
(0.6
)
Effect on benefit obligation
4.6
(4.0
)
61
22. SIGNIFICANT DIFFERENCES BETWEEN GENERALLY ACCEPTED ACCOUNTING PRINCIPLES IN CANADA AND THE UNITED STATES
The Company's consolidated financial statements have been prepared in accordance with Canadian generally accepted accounting principles ("GAAP"), which differ in some respects from those applicable in the United States. The following are the significant differences in accounting principles as they pertain to the consolidated financial statements.
(a) Reconciliation of net income (loss) and earnings (loss) per share and presentation of financial statements
The application of GAAP in the United States would have the following effects on net income as reported:
2004
2003
2002
Net income (loss), as reported in the consolidated statements of income per GAAP in Canada
$
143.7
$
(31.4
)
$
279.3
Adjustments before income taxes:
��
Stock-based compensation (a) (i)
(0.1
)
(1.9
)
2.1
Convertible senior subordinated notes (a) (ii)
2.6
2.4
2.3
Hedge accounting (a) (iii)
(7.6
)
23.6
—
Reduction of a net investment in a foreign operation (a) (iv)
(1.0
)
—
—
(6.1
)
24.1
4.4
Income taxes (a) (i) (iii)
2.7
(7.9
)
(0.6
)
Asset retirement obligations, net of income taxes of $(0.8) (a) (v)
1.2
(1.2
)
—
Net adjustments
(2.2
)
15.0
3.8
Net income (loss), as adjusted per GAAP in the United States
$
141.5
$
(16.4
)
$
283.1
Net income available to holders of preferred shares
37.5
36.5
28.9
Net income (loss) per GAAP in the United States available to holders of equity shares
104.0
(52.9
)
254.2
Income impact on assumed conversion of convertible notes, net of applicable income taxes
—
—
3.8
Net income (loss) per GAAP in the United States adjusted for dilution effect
$
104.0
$
(52.9
)
$
258.0
Weighted average number of equity shares outstanding (in millions):
Basic
132.4
136.0
140.7
Diluted
132.6
136.0
145.4
Earnings (loss) per share as adjusted per GAAP in the United States:
Basic
$
0.79
$
(0.39
)
$
1.81
Diluted
$
0.78
$
(0.39
)
$
1.77
62
(i)
Stock-based compensation
Under GAAP in the United States, prior to fiscal year of 2003, in accordance with the provisions of Statement of Financial Accounting Standards ("SFAS") No. 123, "Accounting for Stock-Based Compensation", the Company applied Accounting Principles Board Opinion No. 25, "Accounting for Stock Issued to Employees" (APB 25) and related interpretations in accounting for its employee share plans and stock option plans. Effective January 1, 2003, the Company changed its method of accounting for stock-based compensation and decided to use the fair value based method of accounting for all its stock-based compensation plans. In accordance with the provisions of SFAS No. 148, "Accounting for Stock-Based Compensation — Transition and Disclosure, an amendment of SFAS No. 123", the Company adopted these changes using the prospective method. This adoption of SFAS no. 123 and No. 148 harmonizes accounting standards with CICA Handbook Section 3870.
Employee stock purchase plan in the United States: Under the provisions of APB 25, applied by the Company prior to fiscal 2003, an Employee Share Plan was accounted for as non-compensatory. Under GAAP in Canada, the Company's contributions were accounted for as compensation expenses.
Stock option plans: The Company awarded in 1999 a special performance grant to certain executives. Under the provisions of APB 25, which the Company applied prior to fiscal 2003, those grants were accounted for as a variable plan. Compensation costs of this grant are still being recognized over the vesting period. There were no similar requirements under GAAP in Canada.
(ii)
Convertible senior subordinated notes
Under GAAP in Canada, the equity component of the convertible notes is recorded under shareholders' equity as additional paid-in capital. The difference between the carrying amount of the debt component and its face value is amortized as imputed interest to income over the life of the convertible senior subordinated note. Regarding the repurchase of convertible notes, the Company is required to allocate the consideration paid on extinguishment to the liability and equity components of the convertible notes based on their fair values at the date of the transaction. The amount of gain (loss) relating to the liability element is recorded to income and the difference between the carrying amount and the amount considered to be settled relating to the conversion option element is treated as an equity transaction. Under GAAP in the United States, the allocation to equity is not permitted, no imputed interest is needed in relation to the equity component and the gain (loss) on repurchase is recorded through income in the period of extinguishment.
(iii)
Accounting for derivative instruments and hedging activities
Effective January 1, 2001, the Company adopted Statement of Financial Accounting Standards No. 133, "Accounting for Derivative Instruments and Hedging Activities", as amended (SFAS 133). SFAS 133 establishes accounting and reporting standards for derivative instruments and hedging activities and requires that all derivatives be recorded as either assets or liabilities in the balance sheet at fair value. In order to apply hedge accounting under SFAS 133, hedging relationships must be formally documented and highly effective at offsetting changes in hedged items.
The Company did not apply the hedge accounting under SFAS No. 133 for some foreign exchange forward contracts and cross currency swaps that hedge anticipated foreign denominated sales and the related receivables, and foreign denominated asset exposures, under GAAP in the United States during 2003. However, the Company considers those derivative instruments to be effective foreign currency risk management tools and economic hedges of the changes attributable to the foreign currencies in which the forecasted transactions and assets are denominated. Under GAAP in Canada, hedge accounting was applied to all such transactions.
(iv)
Reduction of a net investment in a foreign operation
Under GAAP in Canada, a gain or loss equivalent to a proportionate amount of the exchange gain or loss accumulated in the translation adjustment has to be recognized in income when there has been a reduction of a net investment in a foreign operation. Under GAAP in the United States, a gain or loss should only be recognized in income in the case of a substantial or complete liquidation of a net investment in a foreign operation.
(v)
Asset retirement obligations
Effective January 1, 2003, the Company adopted Statement of Financial Accounting Standards No. 143, "Accounting for Asset Retirement Obligations", (SFAS 143), which addresses financial accounting for legal obligations associated with the retirement of tangible long-lived assets and the associated asset retirement costs. SFAS 143 requires the recognition of the fair value of a liability for an asset retirement obligation in the period in which it is incurred. When a liability is initially recorded, the cost is capitalized by increasing the carrying amount of the related long-lived asset. Over time, the liability is increased at each period to reflect an interest element considered in its initial measurement at fair value, and the capitalized cost is amortized over the useful life of the related asset. Under GAAP in Canada, accounting for asset retirement obligations was adopted in 2004.
63
(b) Effect on consolidated balance sheets
The application of GAAP in the United States would have the following effects on the consolidated balance sheets, as reported:
2004
2003
Canada
United States
Canada
United States
Assets
Current future income taxes (a) (iii) (b) (i) (ii)
$
43.2
$
58.7
$
105.8
$
106.7
Other current assets (a) (iii) (b) (i)
—
38.8
—
15.6
Property, plant and equipment, net (a) (v)
2,373.6
2,373.6
2,581.0
2,582.7
Other assets (a) (iii) (b) (i) (ii)
219.8
258.6
176.9
218.3
Liabilities and Shareholders' Equity
Trade payables and accrued liabilities (a) (iii) (b) (i) (ii)
931.9
974.2
987.7
1,062.7
Current future income taxes (a) (iii) (b) (i) (ii)
4.4
25.3
6.2
6.2
Other liabilities (a) (iii) (v) (b) (i) (ii)
248.1
481.6
258.1
526.3
Long-term future income taxes (a) (i) (iii) (v) (b) (i) (ii)
Accumulated other comprehensive income (loss) (a) (iii) (iv) (b) (i) (ii) (c)
—
(95.4
)
—
(206.0
)
(i)
Accounting for derivative instruments and hedging activities
Effective since January 1, 2001, the Company adopted Statement of Financial Accounting Standards No. 133, "Accounting for Derivative Instruments and Hedging Activities", as amended (SFAS 133). The Company recorded the cumulative effect of change in other comprehensive income (loss) upon the adoption of SFAS 133 in 2001.
The Company utilizes interest rate and commodity SWAPS to enhance its ability to manage risk relating to cash flow exposure. On the earlier of the date into which the derivative contract is entered or the date of transaction, the Company designates the derivative as a hedge. Changes in the derivative fair values of contracts that are designated effective and qualify as cash flow hedges are deferred and recorded as a component of accumulated other comprehensive income (loss) until the underlying transaction is recorded in earnings. When the hedged item affects earnings, gains or losses are reclassified from accumulated other comprehensive income (loss) to the consolidated statement of income on the same line as the underlying transaction. The ineffective portion of a hedging derivative's change in fair value is recognized immediately in earnings.
Under GAAP in Canada, these derivative financial instruments are accounted for on an accrual basis. Realized and unrealized gains and losses are deferred and recognized in income in the same period and in the same financial statement category as the income or expense arising from the corresponding hedged positions.
64
(ii)
Pension and postretirement plans
GAAP in the United States requires recognition of an additional minimum liability that is at least equal to the unfunded accumulated benefit obligation, when the accumulated benefit obligation exceeds the fair value of plan assets. If an additional minimum liability is recognized, a portion is recognized as an intangible asset up to the amount of unrecognized prior service cost and net transition obligations, and the excess is recognized in a separate component in the other comprehensive income, net of tax benefits. Under GAAP in Canada, such adjustment is not required.
(iii)
Share issue costs
Under GAAP in the United States, share issue costs are deducted from the value proceeds of the capital stock issued. Under GAAP in Canada, share issue costs are included in the Retained Earnings in the year when incurred.
(c) Comprehensive income
Moreover, the application of GAAP in the United States requires the disclosure of comprehensive income (loss) in a separate financial statement, which includes the net income as well as revenues, charges, gains and losses recorded directly to equity.
2004
2003
2002
Net income (loss), as adjusted per GAAP in the United States
$
141.5
$
(16.4
)
$
283.1
Gain (loss) on hedging activities, net of income taxes of $(10.8) ($(5.5) in 2003 and $(3.2) in 2002) (b) (i)
22.0
39.2
(22.2
)
Additional minimum liability, net of income taxes of $(27.4) ($37.3 in 2003 and $53.8 in 2002) (b) (ii)
31.8
(32.1
)
(109.2
)
Currency translation adjustment (a) (iv)
56.8
96.4
30.9
Other comprehensive income (loss)
110.6
103.5
(100.5
)
Comprehensive income as per GAAP in the United States
$
252.1
$
87.1
$
182.6
23. SEGMENT DISCLOSURES
The Company operates in the printing industry. Its business groups are located in three main segments: North America, Europe and Latin America. These segments are managed separately, since they all require specific market strategies. The Company assesses the performance of each segment based on operating income before impairment of assets, restructuring and other charges.
65
Accounting policies relating to each segment are identical to those used for the purposes of the consolidated financial statements. Intersegment sales are made at fair market values, which approximate those prevailing on the markets serviced. Management of financial expenses and income tax expense is centralized and, consequently, these expenses are not allocated among these segments.
North America(1)
Europe
Latin America
Other
Inter- segment
Total
Revenues
2004
$
5,132.4
$
1,297.4
$
192.4
$
0.5
$
(0.6
)
$
6,622.1
2003
5,062.7
1,151.4
177.3
0.3
(0.2
)
6,391.5
2002
5,087.2
1,002.5
183.5
0.5
(2.0
)
6,271.7
Depreciation and amortization
2004
253.5
69.9
10.7
1.2
—
335.3
2003
261.4
62.7
10.2
1.6
—
335.9
2002
250.5
57.3
7.0
1.2
—
316.0
Impairment of assets, restructuring and other charges
2004
74.8
40.6
5.7
1.0
—
122.1
2003
78.5
6.8
11.8
1.2
—
98.3
2002
(9.0
)
22.1
1.0
5.5
—
19.6
Operating income (loss)
2004
358.9
9.5
(4.4
)
(2.7
)
—
361.3
2003
225.6
17.5
(15.5
)
(10.0
)
—
217.6
2002
527.6
10.0
13.2
(23.2
)
—
527.6
Additions to property, plant and equipment
2004
106.5
22.2
3.8
0.1
—
132.6
2003
187.9
45.6
8.9
0.7
—
243.1
2002
139.9
29.5
14.1
1.0
—
184.5
Property, plant and equipment
2004
1,778.3
509.2
83.0
3.1
—
2,373.6
2003
1,951.3
535.2
90.5
4.0
—
2,581.0
Goodwill
2004
2,198.3
445.4
8.2
—
—
2,651.9
2003
2,192.2
391.1
7.7
—
—
2,591.0
Total assets
2004
4,673.9
1,226.5
221.2
122.8
—
6,244.4
2003
4,828.3
1,149.5
207.1
72.0
—
6,256.9
(1)
Includes Revenues amounting to $943.1 million ($907.8 million in 2003 and $867.0 million in 2002) and, property, plant and equipment amounting to $284.8 million ($294.1 million in 2003) for Canada.
The Company carries out international commercial printing operations, and offers to its customers a broad range of printed products and related communication services, such as magazines, retail inserts, catalogs, specialty printing and direct mail, books, directories, pre-media, logistics, and other value-added services.
Revenues by product are as follows:
2004
2003
2002
Magazine
$
1,778.6
26.9
%
$
1,694.4
26.5
%
$
1,645.8
26.3
%
Retail inserts
1,664.4
25.1
1,519.8
23.8
1,428.2
22.8
Catalogs
1,045.9
15.8
1,031.8
16.1
1,018.5
16.2
Books
699.2
10.5
698.1
10.9
733.7
11.7
Specialty printing and direct mail
573.1
8.7
619.0
9.7
604.0
9.6
Directories
385.6
5.8
356.6
5.6
391.4
6.2
Pre-media, logistics and other value-added services
475.3
7.2
471.8
7.4
450.1
7.2
$
6,622.1
100.0
%
$
6,391.5
100.0
%
$
6,271.7
100.0
%
66
CERTIFICATION OF ANNUAL FILINGS
I, Pierre Karl Péladeau, President and Chief Executive Officer of Quebecor World Inc., certify that:
I have reviewed the annual filings (as this term is defined in Regulation 52-109 respecting Certification of Disclosure in Issuers' Annual and Interim Filings) ofQuebecor World Inc., (the issuer) for the period ending December 31, 2004;
Based on my knowledge, the annual filings do not contain any untrue statement of a material fact or omit to state a material fact required to be stated or that is necessary to make a statement not misleading in light of the circumstances under which it was made, with respect to the period covered by the annual filings; and
Based on my knowledge, the annual financial statements together with the other financial information included in the annual filings fairly present in all material aspects the financial condition, results of operations and cash flows of the issuer, as of the date and for the periods presented in the annual filings.
Date: March 31, 2005
/s/Pierre Karl Péladeau
Pierre Karl Péladeau President and Chief Executive Officer
67
CERTIFICATION OF ANNUAL FILINGS
I, Claude Hélie, Executive Vice President and Chief Financial Officer of Quebecor World Inc., certify that:
I have reviewed the annual filings (as this term is defined in Regulation 52-109 respecting Certification of Disclosure in Issuers' Annual and Interim Filings) ofQuebecor World Inc., (the issuer) for the period ending December 31, 2004;
Based on my knowledge, the annual filings do not contain any untrue statement of a material fact or omit to state a material fact required to be stated or that is necessary to make a statement not misleading in light of the circumstances under which it was made, with respect to the period covered by the annual filings; and
Based on my knowledge, the annual financial statements together with the other financial information included in the annual filings fairly present in all material aspects the financial condition, results of operations and cash flows of the issuer, as of the date and for the periods presented in the interim filings.
Date: March 31, 2005
/s/Claude Hélie
Claude Hélie Executive Vice President and Chief Financial Officer
68
Certification of Annual Filings
I, Pierre Karl Péladeau, President and Chief Executive Officer of Quebecor World Inc., certify that:
I have reviewed the annual filings (as this term is defined in Regulation 52-109 respecting Certification of Disclosure in Issuers' Annual and Interim Filings) of Quebecor World Inc., (the issuer) for the period ending December 31, 2004;
Based on my knowledge, the annual filings do not contain any untrue statement of a material fact or omit to state a material fact required to be stated or that is necessary to make a statement not misleading in light of the circumstances under which it was made, with respect to the period covered by the annual filings; and
Based on my knowledge, the annual financial statements together with the other financial information included in the annual filings fairly present in all material respects the financial condition, results of operations and cash flows of the issuer, as of the date and for the periods presented in the annual filings;
Date: March 31, 2005
(Signed) Pierre Karl Péladeau Pierre Karl Péladeau President and Chief Executive Officer
Certification of Annual Filings
I, Claude Hélie, Executive Vice President and Chief Financial Officer of Quebecor World Inc., certify that:
I have reviewed the annual filings (as this term is defined in Regulation 52-109 respecting Certification of Disclosure in Issuers' Annual and Interim Filings) of Quebecor World Inc., (the issuer) for the period ending December 31, 2004;
Based on my knowledge, the annual filings do not contain any untrue statement of a material fact or omit to state a material fact required to be stated or that is necessary to make a statement not misleading in light of the circumstances under which it was made, with respect to the period covered by the annual filings; and
Based on my knowledge, the annual financial statements together with the other financial information included in the annual filings fairly present in all material respects the financial condition, results of operations and cash flows of the issuer, as of the date and for the periods presented in the annual filings;
Date: March 31, 2005
(Signed) Claude Hélie Claude Hélie Executive Vice President, Finance and Chief Financial Officer
The following documents are attached to this annual report on Form 40-F:
23.1
Consent of KPMG LLP
31.1
Certification of Pierre Karl Péladeau, Chief Executive Officer, pursuant to Section 302 of the Sarbanes-Oxley Act of 2002
31.2
Certification of Claude Hélie, Executive Vice President, Finance and Chief Financial Officer, pursuant to Section 302 of the Sarbanes-Oxley Act of 2002
32.1
Certification of Pierre Karl Péladeau, Chief Executive Officer, pursuant to Section 906 of the Sarbanes-Oxley Act of 2002
32.2
Certification of Claude Hélie, Executive Vice President, Finance and Chief Financial Officer, pursuant to Section 906 of the Sarbanes-Oxley Act of 2002
EXHIBIT 23.1
EXHIBIT 31.1
CERTIFICATIONS
I, Pierre Karl Péladeau, President and Chief Executive Officer of Quebecor World Inc., certify that:
I have reviewed this annual report on Form 40-F of Quebecor World Inc.;
Based on my knowledge, this report does not contain any untrue statement of a material fact or omit to state a material fact necessary to make the statements made, in light of the circumstances under which such statements were made, not misleading with respect to the period covered by this report;
Based on my knowledge, the financial statements, and other financial information included in this report, fairly present in all material respects the financial condition, results of operations and cash flows of the issuer as of, and for, the periods presented in this report;
The issuer's other certifying officer(s) and I are responsible for establishing and maintaining disclosure controls and procedures (as defined in Exchange Act Rules 13a-15(e) and 15d-15(e)) for the issuer and have:
designed such disclosure controls and procedures, or caused such disclosure controls and procedures to be designed under our supervision, to ensure that material information relating to the issuer, including its consolidated subsidiaries, is made known to us by others within those entities, particularly during the period in which this report is being prepared;
[omitted pursuant to the guidance of Release No. 33-8283 (June 5, 2003)]
evaluated the effectiveness of the issuer's disclosure controls and procedures and presented in this report our conclusions about the effectiveness of the disclosure controls and procedures, as of the end of the period covered by this report; and
disclosed in this report any change in the issuer's internal control over financial reporting that occurred during the period covered by the annual report that has materially affected, or is reasonably likely to materially affect, the issuer's internal control over financial reporting; and
The issuer's other certifying officer(s) and I have disclosed, based on our most recent evaluation of internal control over financial reporting, to the issuer's auditors and the audit committee of the issuer's board of directors (or persons performing the equivalent functions):
all significant deficiencies and material weaknesses in the design or operation of internal control over financial reporting which are reasonably likely to adversely affect the issuer's ability to record, process, summarize and report financial information; and
any fraud, whether or not material, that involves management or other employees who have a significant role in the issuer's internal control over financial reporting.
Date: March 31, 2005
/s/ Pierre Karl Péladeau Pierre Karl Péladeau President and Chief Executive Officer
EXHIBIT 31.2
CERTIFICATIONS
I, Claude Hélie, Executive Vice President and Chief Financial Officer of Quebecor World Inc., certify that:
I have reviewed this annual report on Form 40-F of Quebecor World Inc.;
Based on my knowledge, this report does not contain any untrue statement of a material fact or omit to state a material fact necessary to make the statements made, in light of the circumstances under which such statements were made, not misleading with respect to the period covered by this report;
Based on my knowledge, the financial statements, and other financial information included in this report, fairly present in all material respects the financial condition, results of operations and cash flows of the issuer as of, and for, the periods presented in this report;
The issuer's other certifying officer(s) and I are responsible for establishing and maintaining disclosure controls and procedures (as defined in Exchange Act Rules 13a-15(e) and 15d-15(e)) for the issuer and have:
designed such disclosure controls and procedures, or caused such disclosure controls and procedures to be designed under our supervision, to ensure that material information relating to the issuer, including its consolidated subsidiaries, is made known to us by others within those entities, particularly during the period in which this report is being prepared;
[omitted pursuant to the guidance of Release 33-8283 (June 5, 2003)]
evaluated the effectiveness of the issuer's disclosure controls and procedures and presented in this report our conclusions about the effectiveness of the disclosure controls and procedures, as of the end of the period covered by this report; and
disclosed in this report any change in the issuer's internal control over financial reporting that occurred during the period covered by the annual report that has materially affected, or is reasonably likely to materially affect, the issuer's internal control over financial reporting; and
The issuer's other certifying officer(s) and I have disclosed, based on our most recent evaluation of internal control over financial reporting, to the issuer's auditors and the audit committee of the issuer's board of directors (or persons performing the equivalent functions):
all significant deficiencies and material weaknesses in the design or operation of internal control over financial reporting which are reasonably likely to adversely affect the issuer's ability to record, process, summarize and report financial information; and
any fraud, whether or not material, that involves management or other employees who have a significant role in the issuer's internal control over financial reporting.
Date: March 31, 2005
/s/ Claude Hélie Claude Hélie Executive Vice President and Chief Financial Officer
EXHIBIT 32.1
CERTIFICATION PURSUANT TO
18 U.S.C. SECTION 1350,
AS ADOPTED PURSUANT TO
SECTION 906 OF THE SARBANES-OXLEY ACT OF 2002
In connection with the Annual Report of Quebecor World Inc. (the "Company") on Form 40-F for the year ended December 31, 2003 as filed with the Securities and Exchange Commission on the date hereof (the "Report"), I, Pierre Karl Péladeau, President and Chief Executive Officer of the Company, certify, pursuant to 18 U.S.C. § 1350, as adopted pursuant to § 906 of the Sarbanes-Oxley of 2002, that:
The Report fully complies with the requirements of section 13(a) or 15(d) of the Securities Exchange Act of 1934; and
The information contained in the Report fairly presents, in all material respects, the financial condition and results of operations of the Company.
/s/ Pierre Karl Péladeau Pierre Karl Péladeau President and Chief Executive Officer
Dated: March 31, 2005
EXHIBIT 32.2
CERTIFICATION PURSUANT TO
18 U.S.C. SECTION 1350,
AS ADOPTED PURSUANT TO
SECTION 906 OF THE SARBANES-OXLEY ACT OF 2002
In connection with the Annual Report of Quebecor World Inc. (the "Company") on Form 40-F for the year ended December 31, 2003 as filed with the Securities and Exchange Commission on the date hereof (the "Report"), I, Claude Hélie, Executive Vice President and Chief Financial Officer of the Company, certify, pursuant to 18 U.S.C. § 1350, as adopted pursuant to § 906 of the Sarbanes-Oxley of 2002, that:
The Report fully complies with the requirements of section 13(a) or 15(d) of the Securities Exchange Act of 1934; and
The information contained in the Report fairly presents, in all material respects, the financial condition and results of operations of the Company.
/s/ Claude Hélie Claude Hélie Executive Vice President and Chief Financial Officer
Dated: March 31, 2005
We use cookies on this site to provide a more responsive and personalized service. Continuing to browse, clicking I Agree, or closing this banner indicates agreement. See our Cookie Policy for more information.