Table of Contents
UNITED STATES
SECURITIES AND EXCHANGE COMMISSION
Washington, D.C. 20549
FORM N-CSR
CERTIFIED SHAREHOLDER REPORT OF REGISTERED MANAGEMENT
INVESTMENT COMPANIES
Investment Company Act file number 811-07455
Virtus Opportunities Trust
(Exact name of registrant as specified in charter)
101 Munson Street
Greenfield, MA 01301-9668
(Address of principal executive offices) (Zip code)
Kevin J. Carr, Esq.
Vice President, Chief Legal Officer, Counsel and Secretary for Registrant
100 Pearl Street
Hartford, CT 06103-4506
(Name and address of agent for service)
Registrant’s telephone number, including area code:(800) 243-1574
Date of fiscal year end: September 30
Date of reporting period: September 30, 2012
Form N-CSR is to be used by management investment companies to file reports with the Commission not later than 10 days after the transmission to stockholders of any report that is required to be transmitted to stockholders under Rule 30e-1 under the Investment Company Act of 1940 (17 CFR 270.30e-1). The Commission may use the information provided on Form N-CSR in its regulatory, disclosure review, inspection, and policymaking roles.
A registrant is required to disclose the information specified by Form N-CSR, and the Commission will make this information public. A registrant is not required to respond to the collection of information contained in Form N-CSR unless the Form displays a currently valid Office of Management and Budget (“OMB”) control number. Please direct comments concerning the accuracy of the information collection burden estimate and any suggestions for reducing the burden to Secretary, Securities and Exchange Commission, 100 F Street, NE, Washington, DC 20549. The OMB has reviewed this collection of information under the clearance requirements of 44 U.S.C. § 3507.
Table of Contents
Item 1. Reports to Stockholders.
The Report to Shareholders is attached herewith.
Table of Contents

Annual Report
Virtus Bond Fund*
Virtus CA Tax-Exempt Bond Fund
Virtus Herzfeld Fund
Virtus High Yield Fund
Virtus Multi-Sector Fixed Income Fund
Virtus Senior Floating Rate Fund*
Virtus Wealth Masters Fund
* Prospectus Supplement applicable to these funds appears at the back of this Annual Report.
TRUST NAME: VIRTUS OPPORTUNITIES TRUST | September 30, 2012 |  | ||
| Not FDIC Insured | No Bank Guarantee | May Lose Value | ||
Table of Contents
| 1 | ||||||||||
| 2 | ||||||||||
| 4 | ||||||||||
| Fund | Fund Summary | Schedule of Investments | ||||||||
| 6 | 20 | |||||||||
| 8 | 24 | |||||||||
| 10 | 27 | |||||||||
| 12 | 28 | |||||||||
Virtus Multi-Sector Fixed Income Fund (“Multi-Sector Fixed Income Fund”) | 14 | 33 | ||||||||
Virtus Senior Floating Rate Fund (“Senior Floating Rate Fund”) | 16 | 43 | ||||||||
| 18 | 50 | |||||||||
| 52 | ||||||||||
| 54 | ||||||||||
| 56 | ||||||||||
| 60 | ||||||||||
| 64 | ||||||||||
| 74 | ||||||||||
| 75 | ||||||||||
Consideration of Advisory and Subadvisory Agreements by the Board of Trustees | 76 | |||||||||
| 78 | ||||||||||
Proxy Voting Procedures and Voting Record (Form N-PX)
The adviser and subadvisers vote proxies relating to portfolio securities in accordance with procedures that have been approved by the Board of Trustees of the Trust (“Trustees,” the “Board”). You may obtain a description of these procedures, along with information regarding how the Funds voted proxies during the most recent 12-month period ended June 30, free of charge, by calling toll-free 1-800-243-1574. This information is also available through the Securities and Exchange Commission’s (the “SEC”) website at http://www.sec.gov.
Form N-Q Information
The Trust files a complete schedule of portfolio holdings for each Fund with the SEC for the first and third quarters of each fiscal year on Form N-Q. Form N-Q is available on the SEC’s website at http://www.sec.gov. Form N-Q may be reviewed and copied at the SEC’s Public Reference Room. Information on the operation of the SEC’s Public Reference Room can be obtained by calling toll-free 1-800-SEC-0330.
This report is not authorized for distribution to prospective investors in the Funds presented in this book unless preceded or accompanied by an effective prospectus which includes information concerning the sales charge, each Fund’s record and other pertinent information.
Table of Contents
Dear Fellow Shareholders of Virtus Mutual Funds:

Investors were subject to the vagaries of the financial markets over the annual reporting period. Markets gained momentum throughout the first quarter of 2012, slid backwards in the second quarter, only to rebound strongly in the third quarter and end the 12-month period in positive territory.
An extended rally helped equity and fixed income markets produce respectable returns for the year ended September 30, 2012. U.S. equities, as measured by the S&P 500® Index, gained an impressive 30.20 percent, far surpassing international equities, which rose 20.98 percent, as represented by the MSCI All Country World Index (net). U.S. fixed income markets rose 5.16 percent for the year, as measured by the |
Barclays Capital U.S. Aggregate Bond Index. A consistent “flight to quality” among global investors kept demand high for the 10-year U.S. Treasury and its yield low, at just 1.64 percent at the end of September.
As we enter the final quarter of 2012, the economic strength of the United States, Europe, and China remains tenuous. The onus is on U.S. government to avoid the dangers of the “fiscal cliff” and on corporations to produce robust earnings, in particular strong revenue growth, which will play a pivotal role in determining future market direction.
Market uncertainty is a timely reminder of the importance of portfolio diversification. While diversification cannot guarantee a profit or prevent loss, owning a variety of asset classes may cushion your portfolio against inevitable market fluctuations. Your financial advisor can help you ensure that your portfolio is adequately diversified.
Thank you for entrusting Virtus with your assets. We appreciate your business and remain committed to your long-term financial success.
Sincerely,

George R. Aylward
President, Virtus Mutual Funds
October 2012
Whenever you have questions about your account, or require additional information, please visit us on the Web at www.virtus.com or call our shareowner service group toll-free at 1-800-243-1574.
Performance data quoted represents past results. Past performance is no guarantee of future results and current performance may be higher or lower than the performance shown above.
1
Table of Contents
VIRTUS OPPORTUNITIES TRUST
For the six-month period of April 1, 2012 to September 30, 2012 (Unaudited)
We believe it is important for you to understand the impact of costs on your investment. All mutual funds have operating expenses. As a shareholder of a Virtus Opportunities Trust Fund (each, a “Fund”) you may incur two types of costs: (1) transaction costs, including sales charges on purchases of Class A shares and contingent deferred sales charges on Class C shares; and (2) ongoing costs, including investment advisory fees, distribution and service fees, and other expenses. Class I shares are sold without sales charges. These examples are intended to help you understand your ongoing costs (in dollars) of investing in a Fund and to compare these costs with the ongoing costs of investing in other mutual funds. These examples are based on an investment of $1,000 invested at the beginning of the period and held for the entire six-month period. The following Expense Table illustrates your Fund’s costs in two ways.
Actual Expenses
The first section of the accompanying table provides information about actual account values and actual expenses. You may use the information in this section, together with the amount you invested, to estimate the expenses that you paid over the period. Simply divide your account value by $1,000 (for example, an $8,600 account value divided by $1,000 = 8.6), then multiply the result by the number given for your Fund under the heading “Expenses Paid During Period” to estimate the expenses you paid on your account during the period.
Hypothetical Example for Comparison Purposes
The second section of the accompanying table provides information about hypothetical account values and hypothetical expenses based on the Fund’s actual expense ratio and an assumed rate of return of 5% per year before expenses, which is not your Fund’s actual return. The hypothetical account values and expenses may not be used to estimate the actual ending account balance or expenses you paid for the period. You may use this information to compare the ongoing costs of investing in your Fund and other funds. To do so, compare these 5% hypothetical examples with the 5% hypothetical examples that appear in the shareholder reports of the other funds.
Please note that the expenses shown in the accompanying table are meant to highlight your ongoing costs only and do not reflect any transactional costs, such as sales charges or contingent deferred sales charges. Therefore, the second section of the accompanying table is useful in comparing ongoing costs only, and will not help you determine the relative total costs of owning different funds. In addition, if these transactional costs were included, your costs would have been higher. The calculations assume no shares were bought or sold during the period. Your actual costs may have been higher or lower, depending on the amount of your investment and the timing of any purchases or redemptions.
| Expense Table | ||||||||||||||||
| Beginning Account Value April 1, 2012 | Ending Account Value September 30, 2012 | Annualized Expense Ratio | Expenses Paid During Period* | |||||||||||||
Bond Fund |
| |||||||||||||||
Actual | ||||||||||||||||
Class A | $ | 1,000.00 | $ | 1,045.70 | 0.85 | % | $ | 4.35 | ||||||||
Class B | 1,000.00 | 1,041.60 | 1.60 | 8.17 | ||||||||||||
Class C | 1,000.00 | 1,041.40 | 1.60 | 8.17 | ||||||||||||
Class I | 1,000.00 | 1,047.10 | 0.60 | 3.07 | ||||||||||||
Hypothetical (5% return before expenses) |
| |||||||||||||||
Class A | 1,000.00 | 1,020.70 | 0.85 | 4.30 | ||||||||||||
Class B | 1,000.00 | 1,016.90 | 1.60 | 8.10 | ||||||||||||
Class C | 1,000.00 | 1,016.90 | 1.60 | 8.10 | ||||||||||||
Class I | 1,000.00 | 1,021.96 | 0.60 | 3.04 | ||||||||||||
CA Tax-Exempt Bond Fund |
| |||||||||||||||
Actual | ||||||||||||||||
Class A | $ | 1,000.00 | $ | 1,045.10 | 0.85 | % | $ | 4.35 | ||||||||
Class I | 1,000.00 | 1,046.40 | 0.60 | 3.07 | ||||||||||||
Hypothetical (5% return before expenses) |
| |||||||||||||||
Class A | 1,000.00 | 1,020.70 | 0.85 | 4.30 | ||||||||||||
Class I | 1,000.00 | 1,021.96 | 0.60 | 3.04 | ||||||||||||
Herzfeld Fund** |
| |||||||||||||||
Actual | ||||||||||||||||
Class A | $ | 1,000.00 | $ | 1,021.00 | 1.60 | % | $ | 1.06 | ||||||||
Class C | 1,000.00 | 1,021.00 | 2.35 | 1.56 | ||||||||||||
Class I | 1,000.00 | 1,021.00 | 1.35 | 0.89 | ||||||||||||
Hypothetical (5% return before expenses since inception) |
| |||||||||||||||
Class A | 1,000,00 | 1,002.24 | 1.60 | 1.05 | ||||||||||||
Class C | 1,000,00 | 1,001.75 | 2.35 | 1.54 | ||||||||||||
Class I | 1,000,00 | 1,002.39 | 1.35 | 0.89 | ||||||||||||
Hypothetical (5% return before expenses) |
| |||||||||||||||
Class A | 1,000.00 | 1,017.00 | 1.60 | 8.10 | ||||||||||||
Class C | 1,000.00 | 1,013.26 | 2.35 | 11.90 | ||||||||||||
Class I | 1,000.00 | 1,018.12 | 1.35 | 6.83 | ||||||||||||
High Yield Fund |
| |||||||||||||||
Actual | ||||||||||||||||
Class A | $ | 1,000.00 | $ | 1,062.30 | 1.15 | % | $ | 5.93 | ||||||||
Class B | 1,000.00 | 1,059.10 | 1.90 | 9.78 | ||||||||||||
Class C | 1,000.00 | 1,058.50 | 1.90 | 9.78 | ||||||||||||
Class I*** | 1,000.00 | 1,023.70 | 0.90 | 1.32 | ||||||||||||
Hypothetical (5% return before expenses since inception) |
| |||||||||||||||
Class I*** | 1,000.00 | 1,005.93 | 0.90 | 1.31 | ||||||||||||
Hypothetical (5% return before expenses) |
| |||||||||||||||
Class A | 1,000.00 | 1,019.18 | 1.15 | 5.82 | ||||||||||||
Class B | 1,000.00 | 1,015.38 | 1.90 | 9.62 | ||||||||||||
Class C | 1,000.00 | 1,015.38 | 1.90 | 9.62 | ||||||||||||
Class I | 1,000.00 | 1,020.44 | 0.90 | 4.56 | ||||||||||||
2
Table of Contents
VIRTUS OPPORTUNITIES TRUST
Disclosure of Fund Expenses (Continued)
For the six-month period of April 1, 2012 to September 30, 2012 (Unaudited)
| Expense Table | ||||||||||||||||
| Beginning Account Value April 1, 2012 | Ending Account Value September 30, 2012 | Annualized Expense Ratio | Expenses Paid During Period* | |||||||||||||
Multi-Sector Fixed Income Fund |
| |||||||||||||||
Actual | ||||||||||||||||
Class A | $ | 1,000.00 | $ | 1,053.80 | 1.13 | % | $ | 5.80 | ||||||||
Class B | 1,000.00 | 1,049.10 | 1.87 | 9.58 | ||||||||||||
Class C | 1,000.00 | 1,049.50 | 1.88 | 9.63 | ||||||||||||
Class I | 1,000.00 | 1,055.10 | 0.88 | 4.52 | ||||||||||||
Hypothetical (5% return before expenses) |
| |||||||||||||||
Class A | 1,000.00 | 1,019.28 | 1.13 | 5.72 | ||||||||||||
Class B | 1,000.00 | 1,015.53 | 1.87 | 9.47 | ||||||||||||
Class C | 1,000.00 | 1,015.48 | 1.88 | 9.52 | ||||||||||||
Class I | 1,000.00 | 1,020.54 | 0.88 | 4.46 | ||||||||||||
Senior Floating Rate Fund |
| |||||||||||||||
Actual | ||||||||||||||||
Class A | $ | 1,000.00 | $ | 1,034.20 | 1.29 | % | $ | 6.56 | ||||||||
Class C | 1,000.00 | 1,030.30 | 2.04 | 10.35 | ||||||||||||
Class I | 1,000.00 | 1,035.50 | 1.04 | 5.29 | ||||||||||||
Hypothetical (5% return before expenses) |
| |||||||||||||||
Class A | 1,000.00 | 1,018.47 | 1.29 | 6.53 | ||||||||||||
Class C | 1,000.00 | 1,014.67 | 2.04 | 10.33 | ||||||||||||
Class I | 1,000.00 | 1,019.73 | 1.04 | 5.27 | ||||||||||||
Wealth Masters Fund** |
| |||||||||||||||
Actual | ||||||||||||||||
Class A | $ | 1,000.00 | $ | 1,022.00 | 1.45 | % | $ | 0.96 | ||||||||
Class C | 1,000.00 | 1,021.00 | 2.20 | 1.46 | ||||||||||||
Class I | 1,000.00 | 1,022.00 | 1.20 | 0.80 | ||||||||||||
Hypothetical (5% return before expenses since inception) |
| |||||||||||||||
Class A | 1,000.00 | 1,002.33 | 1.45 | 0.95 | ||||||||||||
Class C | 1,000.00 | 1,001.83 | 2.20 | 1.44 | ||||||||||||
Class I | 1,000.00 | 1,002.49 | 1.20 | 0.79 | ||||||||||||
Hypothetical (5% return before expenses) |
| |||||||||||||||
Class A | 1,000.00 | 1,017.66 | 1.45 | 7.34 | ||||||||||||
Class C | 1,000.00 | 1,013.86 | 2.20 | 11.14 | ||||||||||||
Class I | 1,000.00 | 1,018.93 | 1.20 | 6.08 | ||||||||||||
| * | Expenses are equal to the relevant Funds’ annualized expense ratio, which is net of waived fees and reimbursed expenses, if applicable, multiplied by the average account value over the period, multiplied by the number of days (183) expenses were accrued in the most recent fiscal half-year, then divided by 366 to reflect the one-half year period. |
| ** | Inception date is September 5, 2012. Expenses are equal to the Fund’s annualized expense ratio which is net of waived fees, reimbursed expenses, if applicable, multiplied by the average account value over the period multiplied by the number of days (24) expenses were accrued in the most recent fiscal half-year then divided by 366 to reflect the one-half year period. |
| *** | Inception date of Class I for the High Yield Fund is August 8, 2012. Expenses are equal to the Fund’s annualized expense ratio which is net of waived fees, reimbursed expenses, if applicable, multiplied by the average account value over the period multiplied by the number of days (53) expenses were accrued in the most recent fiscal half-year then divided by 366 to reflect the one half-year period. |
For Funds which may invest in other funds, the annualized expense ratios noted above do not reflect fees and expenses associated with the underlying funds. If such fees and expenses had been included, the expenses would have been higher.
You can find more information about the Funds’ expenses in the Financial Statements section that follows. For additional information on operating expenses and other shareholder costs, refer to the prospectus.
3
Table of Contents
ADR (American Depositary Receipt)
Represents shares of foreign companies traded in U.S. dollars on U.S. exchanges that are held by a U.S. bank or a trust. Foreign companies use ADRs in order to make it easier for Americans to buy their shares.
Barclays Capital California Municipal Bond Index
The Barclays Capital California Municipal Bond Index measures long term investment grade, tax-exempt and fixed rate bonds issued in California. The index is calculated on a total return basis.
Barclays Capital High Yield Bond 2% Issuer Cap Index
The Barclays Capital High Yield Bond 2% Issuer Cap Index is a market capitalization-weighted index that measures fixed rate non-investment grade debt securities of U.S. and non-U.S. corporations. No single issuer accounts for more than 2% of market cap. The index is calculated on a total return basis.
Barclays Capital U.S. Aggregate Bond Index
The Barclays Capital U.S. Aggregate Bond Index measures the U.S. investment grade fixed rate bond market. The index is calculated on a total return basis.
Exchange-Traded Funds (ETF)
Portfolios of stocks or bonds that track a specific market index.
Federal Reserve (the “Fed”)
The central bank of the United States, responsible for controlling the money supply, interest rates and credit with the goal of keeping the U.S. economy and currency stable. Governed by a seven-member board, the system includes 12 regional Federal Reserve Banks, 25 branches and all national and state banks that are part of the system.
iShares®
Represents shares of an open-end exchange-traded fund.
JPMorgan Emerging Markets Bond Index Plus
The JPMorgan Emerging Markets Bond Index Plus measures traded external debt instruments in emerging markets. The index is calculated on a total return basis.
MSCI All Country World Index (net)
The MSCI All Country World Index (net) is a free float-adjusted market capitalization-weighted index that measures equity performance of developed and emerging markets. The index is calculated on a total return basis with net dividends reinvested. The index is unmanaged and not available for direct investment.
PIK (Payment-in-Kind Security)
A bond which pays interest in the form of additional bonds, or preferred stock which pays dividends in the form of additional preferred stock.
Quantitative Easing (QE3)
A government monetary policy occasionally used to increase the money supply by buying government securities or other securities from the market. Quantitative easing increases the money supply by flooding financial institutions with capital in an effort to promote increased lending and liquidity.
REIT (Real Estate Investment Trust)
A publicly traded company that owns, develops and operates income-producing real estate such as apartments, office buildings, hotels, shopping centers and other commercial properties.
S&P 500® Index
The S&P 500® Index is a free-float market capitalization-weighted index of 500 of the largest U.S. companies. The index is calculated on a total return basis with dividends reinvested.
4
Table of Contents
KEY INVESTMENT TERMS (Continued)
S&P/LSTA U.S. Leveraged Loan Index
The S&P/LSTA Leveraged Loan Index is a daily total return index that uses LSTA/LPC Mark-to-Market Pricing to calculate market value change. On a real-time basis, the Index tracks the current outstanding balance and spread over LIBOR for fully funded term loans. The facilities included in the Index represent a broad cross section of leveraged loans syndicated in the United States, including dollar-denominated loans to overseas issuers.
Sponsored ADR (American Depositary Receipt)
An ADR which is issued with the cooperation of the company whose stock will underlie the ADR. Sponsored ADRs generally carry the same rights normally given to stockholders, such as voting rights. ADRs must be sponsored to be able to trade on a major U.S. exchange such as the New York Stock Exchange (NYSE).
When-issued and Forward Commitments (Delayed Delivery)
Securities purchased on a when-issued or forward commitment basis are also known as delayed delivery transactions. Delayed delivery transactions involve a commitment by a Fund to purchase or sell a security at a future date, ordinarily up to 90 days later. When-issued or forward commitments enable a Fund to lock in what is believed to be an attractive price or yield on a particular security for a period of time, regardless of future changes in interest rates.
5
Table of Contents
| Bond Fund | Ticker Symbols: Class A: SAVAX Class B: SAVBX Class C: SAVCX Class I: SAVYX |
| ¢ | The Fund is diversified and has an investment objective of high total return from both current income and capital appreciation. |
| ¢ | For the fiscal year ended September 30, 2012, the Fund’s Class A shares at NAV returned 9.34%, Class B shares returned 8.48%, Class C shares returned 8.55%, and Class I shares returned 9.64%. For the same period, the Barclays Capital U.S. Aggregate Bond Index, which serves as the broad-based and style-specific benchmark index appropriate for comparison, returned 5.16%. |
All performance figures assume reinvestment of distributions and exclude the effect of sales charges. Past performance is no guarantee of future results and current performance may be higher or lower than the performance shown above.
How did the market perform during the Fund’s fiscal year?
| ¢ | The Fiscal year ended September 30, 2012, produced a roller coaster ride for financial markets. 10 year Treasury rates finished the year unchanged overall, despite traversing a 100 basis point range intra-period. Credit securities performed extremely well over the course of the year, led by corporate credit. The high yield and emerging markets components of the Barclays Capital U.S. Aggregate Bond Index excelled, exceeding Treasury returns by 17 and 16 percentage points respectively. High grade financials also did well, out-performing Treasuries by 10 percentage points. |
| ¢ | The episode began with a pair of policy mistakes by the world’s two leading economies. The European Union fumbled with the debt problem on its periphery while the United States turned a simple debt ceiling adjustment into an existential crisis. Markets collapsed, prompting a determined central bank response, with the European Central Bank (ECB) creating a huge pan-European lending facility and the Federal Reserve (the Fed) implementing the massive “operation twist” bond purchase program. The Euro-group followed with a comprehensive Greek restructuring and bailout. The result was the strongest quarterly rally for many markets since 1998. |
| ¢ | Financial markets buckled shortly thereafter however, due to the combined weight of a slowing |
U.S. economy and renewed concerns about Europe. U.S. employment growth stalled and Greece surprised the world by repudiating its austerity program. As a result, depositors fled the Spanish banking system and investors shunned the riskier sectors of the bond market, hiding in safe haven investments. Between March 30 and the end of May, U.S. High Grade, High-Yield, and Emerging Markets debt spreads widened by 50, 120, and 100 basis points respectively. |
| ¢ | The policy response was overwhelming this time. The ECB promised to do “whatever was necessary” and launched an unlimited bond purchase program. The Fed followed suit with a quantitative easing program (QE3), focusing on mortgage-backed securities. The market response was profound, with risky assets more than retracing prior losses and finishing the year with large gains. |
What factors affected the Fund’s performance during its fiscal year?
| ¢ | The Fund benefited from its overweight to corporate credit. Exposures to high yield and high grade credit exceeded benchmark by 16 and 5 percentage points respectively. Issue selection within these sectors also enhanced performance. In particular, banks, insurance, and brokerage credits contributed positively to excess returns. Mortgage credit contributed as well; as commercial mortgage-backed securities (a 5 percentage point overweight) returned 7 1/2% over the period. |
| ¢ | The complement to the credit overweight was an underweight to Treasuries, agencies and mortgage-backed securities. These low risk sectors lagged, with absolute returns of between 2 and 3%, validating the strategic underweight. A crossover trade into municipals produced modest results, with returns of roughly 4%. |
The preceding information is the opinion of portfolio management. Any such opinions are subject to change at any time based upon market or other conditions and should not be relied upon as investment advice. Past performance is no guarantee of future results, and there is no guarantee that market forecasts will be realized.
There is no guarantee that the Fund will meet its objective.
Debt securities are subject to various risks, the most prominent of which are credit and interest rate risk. The issuer of a security may fail to make payments in a timely manner. Values of debt securities may rise and fall in response to changes in interest rates. This risk may be enhanced with longer-term maturities. Changes in interest rates can cause both extension and prepayment risks for asset and mortgage-backed securities. These securities are also subject to risks associated with the repayment of underlying collateral. Investing internationally, especially in emerging markets, involves additional risks such as currency, political, accounting, economic, and market risk. There is a greater level of credit risk and price volatility involved with high-yield securities than investment grade securities.
| Asset Allocation | ||||||
The following table presents asset allocations within certain sectors and as a percentage of total investments as of September 30, 2012.
|
| |||||
Corporate Bonds | 40 | % | ||||
Mortgage-Backed Securities | 31 | |||||
U.S. Government Securities | 19 | |||||
Loan Agreements | 1 | |||||
Preferred Stock | 1 | |||||
Municipal Securities | 1 | |||||
Other | 7 | |||||
|
| |||||
Total | 100 | % | ||||
|
| |||||
For information regarding the indexes and certain investment terms, see the Key Investment Terms starting on page 4.
6
Table of Contents
Bond Fund (Continued)
| Average Annual Total Returns1 for periods ended 9/30/12 | ||||||||||||
| 1 year | 5 years | 10 years | ||||||||||
| Class A Shares at NAV2 | 9.34 | % | 6.83 | % | 5.63 | % | ||||||
| Class A Shares at POP3 | 5.24 | 6.02 | 5.23 | |||||||||
| Class B Shares at NAV2 | 8.48 | 6.02 | 4.83 | |||||||||
| Class B Shares with CDSC4 | 4.48 | 6.02 | 4.83 | |||||||||
| Class C Shares at NAV2 and with CDSC4 | 8.55 | 6.04 | 4.84 | |||||||||
| Class I Shares at NAV | 9.64 | 7.10 | 5.91 | |||||||||
| Barclays Capital U.S. Aggregate Bond Index | 5.16 | 6.53 | 5.33 | |||||||||
Fund Expense Ratios5: A Shares: Gross 1.04%, Net 0.85%; B Shares: Gross 1.79%, Net 1.60%; C Shares: Gross 1.79%, Net 1.60%; I Shares: Gross 0.79%, Net 0.60%.
All returns represent past performance which is no guarantee of future results. Current performance may be higher or lower than the performance shown. The investment return and principal value of an investment will fluctuate so that an investor’s shares, when redeemed, may be worth more or less than their original cost. The above table and graph below do not reflect the deduction of taxes that a shareholder would pay on fund distributions or the redemption of shares. Please visit Virtus.com for performance data current to the most recent month-end.
| 1 | Total returns are historical and include changes in share price and the reinvestment of both dividends and capital gains distributions. |
| 2 | “NAV” (Net Asset Value) total returns do not include the effect of any sales charge. |
| 3 | “POP” (Public Offering Price) total returns include the effect of the maximum front-end 3.75% sales charge. |
| 4 | “CDSC” (Contingent Deferred Sales Charge) is applied to redemptions of certain classes of shares that do not have a sales charge applied at the time of purchase. CDSC charges for B shares decline from 5% to 0% over a five year period. CDSC charges for certain redemptions of Class A shares made within 18 months of purchase in which a finder’s fee was paid and all redemptions of Class C shares within the first year are 1% and 0% thereafter. |
| 5 | The expense ratios of the Fund are set forth according to the prospectus for the Fund effective January 31, 2012, as supplemented and revised and may differ from the expense ratios disclosed in the Financial Highlights tables in this report. See the Financial Highlights for more current expense ratios. Net Expense: Expenses reduced by voluntary fee waiver which may be discontinued at any time. Gross Expense: Does not reflect the effect of the voluntary fee waiver. |
Growth of $10,000 For periods ended 9/30
This chart assumes an initial investment of $10,000 made on September 30, 2002, for Class A, Class B, Class C, and Class I shares including any applicable sales charges or fees. Performance assumes reinvestment of dividends and capital gain distributions.
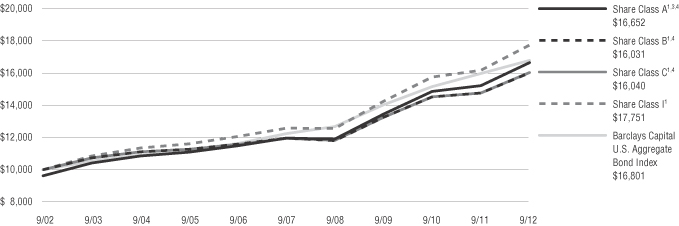
The indexes are unmanaged and not available for direct investment; therefore, their performance does not reflect the expenses associated with active management of an actual portfolio.
For information regarding the indexes and certain investment terms, see the Key Investment Terms starting on page 4.
7
Table of Contents
| CA Tax-Exempt Bond Fund | Ticker Symbols: Class A: CTESX Class I: CTXEX |
| ¢ | The Fund is diversified and has an investment objective to obtain a high level of current income exempt from California state and local income taxes, as well as federal income tax, consistent with the preservation of capital. |
| ¢ | For the fiscal year ended September 30, 2012, the Fund’s Class A shares at NAV returned 9.40% and Class I shares returned 9.68%. For the same period, the Barclays Capital U.S. Aggregate Bond Index, a broad-based fixed income index, returned 5.16%, and the Barclays Capital California Municipal Bond Index, the Fund’s style-specific benchmark appropriate for comparison, returned 9.57%. |
All performance figures assume reinvestment of distributions and exclude the effect of sales charges. Past performance is no guarantee of future results and current performance may be higher or lower than the performance shown above.
How did the market perform during the Fund’s fiscal year?
The municipal bond market provided investors an exceptional return over the past twelve months as yields declined to generational low levels. The market has been buoyed by declining U.S. Treasury rates, improving municipal credit fundamentals, strong demand for municipal bonds, large amounts of bond calls and manageable levels of new issuance. The positive momentum of these fundamental and technical factors has helped the municipal bond market to be one of the best performing U.S. asset classes over the past year.
Revenue collections across the country have steadily improved over the past couple years and now are approaching or even exceeding pre-recession levels for many states. However, despite a general improvement in the credit profile of municipal issuers, fiscal challenges persist across the country. State and local governments need to continue implementing budget improving initiatives such as reducing their workforce, engaging in pension reform, increasing or implementing new fees and taxes and even entering into shared-services agreements to adjust to the current fiscal realities.
Since the end of the fourth quarter of 2011, open-end mutual funds have experienced over $40 billion of net inflows. These 40-plus weeks of inflows have helped drive municipal yields to historically low levels, as mutual funds continue to invest this steady stream of investor purchases into the market.
After a relatively slow start to the year, the new issue market has experienced a revival. Issuers appear to be taking advantage of historically low municipal interest rates and high investor demand for municipal bonds to refund older, higher cost debt with new issues. However, with municipalities still hesitant to take on incremental debt service during a time of continuing fiscal challenges, we do not expect to see issuance levels exceed market demand in the near term.
As we head into the fourth quarter of 2012, uncertainty surrounding the U.S. and global economy and the European sovereign debt problems will remain the focus of all fixed income investors. While those macro concerns will clearly remain front and center for municipal bond investors, additional factors relating to municipal credit, new issue volume and the supply and demand for municipal bonds will also be important determinants of performance as we move into next year.
What factors affected the Fund’s performance during its fiscal year?
Relative portfolio performance was impacted by the Fund’s exposure to short- to intermediate-term holdings, bonds with shorter call options and high quality issues.
Relative portfolio performance benefited from the Fund’s lower exposure to long maturity bonds, healthcare issues, lower quality issues and zero coupon securities.
The preceding information is the opinion of portfolio management. Any such opinions are subject to change at any time based upon market or other conditions and should not be relied upon as investment advice. Past performance is no guarantee of future results, and there is no guarantee that market forecasts will be realized.
There is no guarantee that the Fund will meet its objective.
Debt securities are subject to various risks, the most prominent of which are credit and interest rate risk. The issuer of a security may fail to make payments in a timely manner. Values of debt securities may rise and fall in response to changes in interest rates. This risk may be enhanced with longer-term maturities. A fund that focuses its investments in a particular geographic location will be highly sensitive to financial, economic, political, and other developments affecting the fiscal stability of that location. Events negatively impacting a municipal security, or the municipal bond market in general, may cause the fund to decrease in value. A portion of income may be subject to some state and/or local taxes and, for certain investors, a portion may be subject to the federal alternative minimum tax.
| Asset Allocation | ||||
The following table presents asset allocations within certain sectors and as a percentage of total investments as of September 30, 2012.
|
| |||
Pre-Refunded | 21 | % | ||
General Revenue | 19 | |||
General Obligation | 14 | |||
Water & Sewer Revenue | 13 | |||
Higher Education Revenue | 8 | |||
Transportation Revenue | 7 | |||
Development Revenue | 6 | |||
Other (includes short-term investments) | 12 | |||
|
| |||
Total | 100 | % | ||
|
| |||
For information regarding the indexes and certain investment terms, see the Key Investment Terms starting on page 4.
8
Table of Contents
CA Tax-Exempt Bond Fund (Continued)
| Average Annual Total Returns1 for periods ended 9/30/12 | ||||||||||||||||||||
| 1 year | 5 years | 10 years | Since Inception | Inception Date | ||||||||||||||||
| Class A Shares at NAV2 | 9.40 | % | 5.47 | % | 4.09 | % | — | — | ||||||||||||
| Class A Shares at POP3,4 | 6.39 | 4.89 | 3.80 | — | — | |||||||||||||||
| Class I Shares at NAV | 9.68 | 5.74 | — | 5.12 | % | 9/29/06 | ||||||||||||||
| Barclays Capital U.S. Aggregate Bond Index | 5.16 | 6.53 | 5.33 | 6.29 | 5 | — | ||||||||||||||
| Barclays Capital California Municipal Bond Index | 9.57 | 6.10 | 5.11 | 5.57 | 5 | — | ||||||||||||||
Fund Expense Ratios6: A Shares: Gross 1.05%, Net 0.85%; I Shares: Gross 0.80%, Net 0.60%.
All returns represent past performance which is no guarantee of future results. Current performance may be higher or lower than the performance shown. The investment return and principal value of an investment will fluctuate so that an investor’s shares, when redeemed, may be worth more or less than their original cost. The above table and graph below do not reflect the deduction of taxes that a shareholder would pay on fund distributions or the redemption of shares. Please visit Virtus.com for performance data current to the most recent month-end.
| 1 | Total returns are historical and include changes in share price and the reinvestment of both dividends and capital gains distributions. |
| 2 | “NAV” (Net Asset Value) total returns do not include the effect of any sales charge. |
| 3 | “POP” (Public Offering Price) total returns include the effect of the maximum front-end 2.75% sales charge. |
| 4 | “CDSC” (Contingent Deferred Sales Charge) is applied to redemptions of certain classes of shares that do not have a sales charge applied at the time of purchase. CDSC charges for certain redemptions of Class A shares made within 18 months of purchase in which a finder’s fee was paid are 1% and 0% thereafter. |
| 5 | The since inception index returns are from the inception date of Class I. |
| 6 | The expense ratios of the Fund are set forth according to the prospectus for the Fund effective January 31, 2012, as supplemented and revised and may differ from the expense ratios disclosed in the Financial Highlights tables in this report. See the Financial Highlights for more current expense ratios. Net Expense: Expenses reduced by voluntary fee waiver which may be discontinued at any time. Gross Expense: Does not reflect the effect of the voluntary fee waiver. |
Growth of $10,000 For periods ended 9/30
This chart assumes an initial investment of $10,000 made on September 30, 2002 for Class A shares including any applicable sales charges or fees. Performance assumes reinvestment of dividends and capital gain distributions.
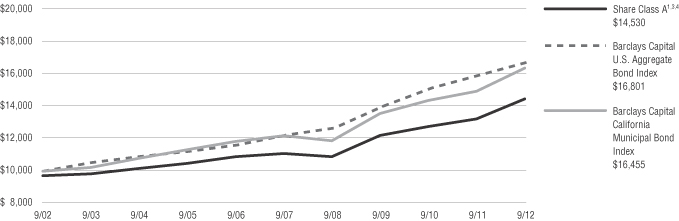
The indexes are unmanaged and not available for direct investment; therefore, their performance does not reflect the expenses associated with active management of an actual portfolio.
For information regarding the indexes and certain investment terms, see the Key Investment Terms starting on page 4.
9
Table of Contents
| Herzfeld Fund† | Ticker Symbols: Class A: VHFAX Class C: VHFCX Class I: VHFIX |
| ¢ | The Fund is diversified and has an investment objective of seeking capital appreciation and current income. |
| ¢ | For the fiscal period September 5, 2012 (inception date) through September 30, 2012, the Fund’s Class A shares at NAV returned 2.10%*, Class C shares returned 2.10%*, and Class I shares returned 2.10%.* For the same period, the S&P 500® Index, a broad-based fixed equity index, and the Fund’s style-specific benchmark appropriate for comparison returned 2.79%*. |
* Returns less than 1 year are not annualized.
All performance figures assume reinvestment of distributions and exclude the effect of sales charges. Past performance is no guarantee of future results and current performance may be higher or lower than the performance shown above.
There is no guarantee that the Fund will meet its objectives.
| Asset Allocation | ||||
The following table presents asset allocations within certain sectors and as a percentage of total investments as of September 30, 2012.
|
| |||
Equity Funds | 45 | % | ||
International Equity Funds | 21 | |||
Fixed Income Funds | 13 | |||
International Fixed Income Funds | 4 | |||
Other (includes short-term investments) | 17 | |||
|
| |||
Total | 100 | % | ||
|
| |||
Closed-end funds may trade at a discount from their net asset values, which may affect whether the fund will realize gains or losses. They may also employ leverage, which may increase volatility. The market price of equity securities may be affected by financial market, industry, or issuer-specific events. Focus on a particular style or on small or medium-sized companies may enhance that risk. Debt securities are subject to various risks, the most prominent of which are credit and interest rate risk. The issuer of a security may fail to make payments in a timely manner. Values of debt securities may rise and fall in response to changes in interest rates. This risk may be enhanced with longer-term maturities. Investing internationally, especially in emerging markets, involves additional risks such as currency, political, accounting, economic, and market risk. U.S. government securities may be subject to price fluctuations. An agency may default on an obligation not backed by the United States. Any guarantee on U.S. government securities does not apply to the value of the fund’s shares. Because the fund can invest in other funds, it indirectly bears its proportionate share of the operating expenses and management fees of the underlying fund(s). For additional information on these and other risk considerations, please see the fund’s prospectus.
| † | The Fund is less than six months old — No commentary required. |
For information regarding the indexes and certain investment terms, see the Key Investment Terms starting on page 4.
10
Table of Contents
THIS PAGE INTENTIONALLY BLANK.
Table of Contents
| High Yield Fund | Ticker Symbols: Class A: PHCHX Class B: PHCCX Class C: PGHCX Class I: PHCIX |
| ¢ | The Fund is diversified and has a primary investment objective of high current income and a secondary objective of capital growth. |
| ¢ | For the fiscal year ended September 30, 2012, the Fund’s Class A shares at NAV returned 19.19%, Class B shares returned 18.46%, and Class C shares returned 18.59%. Class I shares from August 8, 2012 (inception date) through September 30, 2012 returned 2.37%*. For the fiscal year ended September 30, 2012, the Barclays Capital U.S. Aggregate Bond Index, a broad-based fixed income index, returned 5.16%, and the Barclays Capital U.S. High Yield 2% Issuer Capped Bond Index, the Fund‘s style-specific index appropriate for comparison, returned 19.35%. |
* Returns less than 1 year are not annualized.
All performance figures assume reinvestment of distributions and exclude the effect of sales charges. Past performance is no guarantee of future results and current performance may be higher or lower than the performance shown above.
How did the market perform during the Fund’s fiscal year?
| ¢ | The U.S. High-Yield market posted outsized returns over the past year with the two most commonly referenced benchmarks, the Barclays Capital U.S. High Yield 2% Issuer Capped Bond Index and the Bank of America Merrill Lynch U.S. High Yield Master II Index, returning 19.35% and 18.94 respectively. Even with the presence of increased global geopolitical noise, returns in higher beta asset classes in addition to the High Yield market, performed very well with the S&P 500® Index returning over 30% and the Russell 2000® Index returning north of 31%. |
| ¢ | Within the High-Yield market itself, the lower rated credit tiers outperformed. |
| ¢ | The market, as a whole, benefitted from an environment flush with liquidity thanks to banks liquidity injection measures. New issuance was very robust with issuers taking advantage of low yields and increased market demand for higher yielding paper to push out their maturities. The |
asset class has seen sizable inflows, both in mutual funds and in ever growing ETFs, further providing a positive technical for the market. |
What factors affected the Fund’s performance during its fiscal year?
| ¢ | The Fund’s overweight to Single B’s rating category helped performance as that particular credit tier outperformed the Index. The Fund also benefitted positively from issue selection within the Double BB’s rating category. |
| ¢ | The top 3 industries positively impacting performance during the quarter were Refining, Technology and Lodging. The Bottom 3 industries negatively impacting performance were Home Construction, Wireless and Other Industrial. |
| ¢ | The Fund also took advantage of opportunities outside of the High-Yield market by selectively investing in structured product and foreign issuers which had a positive impact on performance during the fiscal year. |
The preceding information is the opinion of portfolio management. Any such opinions are subject to change at any time based upon market or other conditions and should not be relied upon as investment advice. Past performance is no guarantee of future results, and there is no guarantee that market forecasts will be realized.
There is no guarantee that the Fund will meet its objectives.
Debt securities are subject to various risks, the most prominent of which are credit and interest rate risk. The issuer of a security may fail to make payments in a timely manner. Values of debt securities may rise and fall in response to changes in interest rates. This risk may be enhanced with longer-term maturities. There is a greater level of credit risk and price volatility involved with high-yield securities than investment grade securities. Investing internationally, especially in emerging markets, involves additional risks such as currency, political, accounting, economic, and market risk. A fund that focuses its investments in a particular industry or sector will be more sensitive to conditions that affect that industry or sector than a non-concentrated fund.
| Asset Allocation | ||||
The following table presents asset allocations within certain sectors as a percentage of total investments as of September 30, 2012.
|
| |||
Financials | 20 | % | ||
Consumer Discretionary | 19 | |||
Energy | 12 | |||
Industrials | 11 | |||
Telecommunication Services | 9 | |||
Health Care | 6 | |||
Materials | 6 | |||
Other (includes short-term investments) | 17 | |||
|
| |||
Total | 100 | % | ||
|
| |||
For information regarding the indexes and certain investment terms, see the Key Investment Terms starting on page 4.
12
Table of Contents
High Yield Fund (Continued)
| Average Annual Total Returns1 for periods ended 9/30/12 | ||||||||||||||||||||
| 1 year | 5 years | 10 years | Since Inception | Inception Date | ||||||||||||||||
| Class A Shares at NAV2 | 19.19 | % | 5.12 | % | 7.03 | % | — | — | ||||||||||||
| Class A Shares at POP3,4 | 14.72 | 4.32 | 6.62 | — | — | |||||||||||||||
| Class B Shares at NAV2 | 18.46 | 4.38 | 6.23 | — | — | |||||||||||||||
| Class B Shares with CDSC4 | 14.46 | 4.38 | 6.23 | — | — | |||||||||||||||
| Class C Shares at NAV2 and with CDSC4 | 18.59 | 4.40 | 6.26 | — | — | |||||||||||||||
| Class I Shares at NAV2 | — | — | — | 2.37 | % | 8/8/12 | ||||||||||||||
| Barclays Capital U.S. Aggregate Bond Index | 5.16 | 6.53 | 5.33 | 0.68 | 5 | — | ||||||||||||||
| Barclays Capital U.S. High Yield 2% Issuer Capped Bond Index | 19.35 | 9.50 | 10.93 | 1.89 | 5 | — | ||||||||||||||
Fund Expense Ratios6: A Shares: Gross 1.35%, Net 1.15% B Shares: Gross 2.10%, Net 1.90% C Shares: Gross 2.10%, Net 1.90% Class I: Gross 1.10% Net 0.90%.
All returns represent past performance which is no guarantee of future results. Current performance may be higher or lower than the performance shown. The investment return and principal value of an investment will fluctuate so that an investor’s shares, when redeemed, may be worth more or less than their original cost. The above table and graph below do not reflect the deduction of taxes that a shareholder would pay on fund distributions or the redemption of shares. Please visit Virtus.com for performance data current to the most recent month-end.
| 1 | Total returns are historical and include changes in share price and the reinvestment of both dividends and capital gains distributions. |
| 2 | “NAV” (Net Asset Value) total returns do not include the effect of any sales charge. |
| 3 | “POP” (Public Offering Price) total returns include the effect of the maximum front-end 3.75% sales charge. |
| 4 | “CDSC” (Contingent Deferred Sales Charge) is applied to redemptions of certain classes of shares that do not have a sales charge applied at the time of purchase. CDSC charges for B shares decline from 5% to 0% over a five year period. CDSC charges for certain redemptions of Class A shares made within 18 months of purchase in which a finder’s fee was paid and all redemptions of Class C shares within the first year are 1% and 0% thereafter. |
| 5 | The since inception index returns are from the inception date of Class I. |
| 6 | The expense ratios of the Fund are set forth according to the prospectus for the Fund effective January 31, 2012 as supplemented and revised and may differ from the expense ratios disclosed in the Financial Highlights tables in this report. See the Financial Highlights for more current expense ratios. Net Expense: Expenses reduced by voluntary fee waiver which may be discontinued at any time. Gross Expense: Does not reflect the effect of the voluntary fee waiver. |
Growth of $10,000 For periods ended 9/30
This chart assumes an initial investment of $10,000 made on September 30, 2002, for Class A, Class B, and Class C shares including any applicable sales charges or fees. Performance assumes reinvestment of dividends and capital gain distributions.
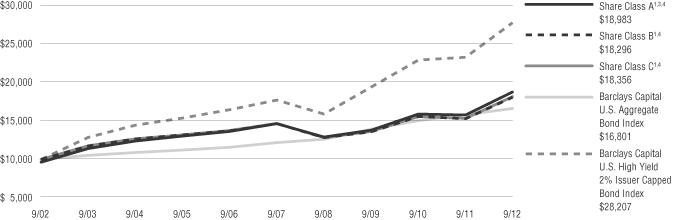
The indexes are unmanaged and not available for direct investment; therefore, their performance does not reflect the expenses associated with active management of an actual portfolio.
For information regarding the indexes and certain investment terms, see the Key Investment Terms starting on page 4.
13
Table of Contents
| Multi-Sector Fixed Income Fund | Ticker Symbols: Class A: NAMFX Class B: NBMFX Class C: NCMFX Class I: VMFIX |
| ¢ | The Fund is diversified and has an investment objective to maximize current income while preserving capital. |
| ¢ | For the fiscal year ended September 30, 2012, the Fund’s Class A shares at NAV returned 15.51%, Class B shares returned 14.59%, Class C shares returned 14.65%, and Class I shares returned 15.80%. For the same period, the Barclays Capital U.S. Aggregate Bond Index, which is both the Fund’s broad-based and style-specific fixed income index, returned 5.16%. |
All performance figures assume reinvestment of distributions and exclude the effect of sales charges. Past performance is no guarantee of future results and current performance may be higher or lower than the performance shown above.
How did the market perform during the Fund’s fiscal year?
| ¢ | Most spread sectors outperformed U.S. Treasuries during the Fund’s fiscal year the overall economic picture remains supportive of fixed income spread sectors as economic growth is still expected to be positive, but subdued enough to likely keep inflation at low levels and keep the Federal Reserve (the Fed) from raising short term interest rates in the immediate future. Spread sectors were also supported by positive credit fundamentals, continued demand for spread product, and the Fed’s announcement of QE3 late in the third quarter of 2012. |
| ¢ | Despite the rally, there were periods of volatility during the Fund’s fiscal year as headwinds still exist. Uncertainty remains surrounding the debt crisis in Europe and overall global growth concerns loom. Adding to investor concerns is a lack of clarity domestically in the US regarding presidential elections, an impending fiscal cliff, and fears of a slowing economy. |
| ¢ | Over the last 12 months yields declined across the U.S. Treasury curve and the curve flattened. |
What factors affected the Fund’s performance during its fiscal year?
| ¢ | The outperformance of fixed income spread sectors relative to U.S. Treasuries was the key driver of the Fund’s strong performance for the fiscal year. |
| ¢ | Among fixed income sectors the Fund’s allocation to emerging markets high-yield securities, corporate high-yield securities and high-yield loans, corporate high quality, and non-agency commercial mortgage-backed securities were all significant positive contributors to performance for the fiscal year. |
| ¢ | The Fund’s higher quality bias in corporate high-yield securities detracted from performance as lower quality outperformed during the period. |
The preceding information is the opinion of portfolio management. Any such opinions are subject to change at any time based upon market or other conditions and should not be relied upon as investment advice. Past performance is no guarantee of future results, and there is no guarantee that market forecasts will be realized.
There is no guarantee that the Fund will meet its objective.
Debt securities are subject to various risks, the most prominent of which are credit and interest rate risk. The issuer of a security may fail to make payments in a timely manner. Values of debt securities may rise and fall in response to changes in interest rates. This risk may be enhanced with longer-term maturities. There is a greater level of credit risk and price volatility involved with high-yield securities than investment grade securities. Changes in interest rates can cause both extension and prepayment risks for asset-backed securities and mortgage-backed securities. These securities are also subject to risks associated with the repayment of underlying collateral. There may be no ready market for loan participation interests. The fund may have to sell the interests at a substantial discount. Such interests are subject to the credit risk of the underlying corporate borrower. Investing internationally, especially in emerging
markets, involves additional risks such as currency, political, accounting, economic, and market risk.
| Asset Allocation | ||||
The following table presents asset allocations within certain sectors and as a percentage of total investments as of September 30, 2012.
|
| |||
Corporate Bonds | 52 | % | ||
Loan Agreements | 16 | |||
Mortgage-Backed Securities | 12 | |||
Foreign Government Securities | 12 | |||
Asset-Backed Securities | 4 | |||
Preferred Stock | 2 | |||
Other (includes short-term investments) | 2 | |||
|
| |||
Total | 100 | % | ||
|
| |||
For information regarding the indexes and certain investment terms, see the Key Investment Terms starting on page 4.
14
Table of Contents
Multi-Sector Fixed Income Fund (Continued)
| Average Annual Total Returns1 for periods ended 9/30/12 | ||||||||||||||||||||
| 1 year | 5 years | 10 years | Since Inception | Inception Date | ||||||||||||||||
| Class A Shares at NAV2 | 15.51 | % | 7.49 | % | 7.90 | % | — | — | ||||||||||||
| Class A Shares at POP3,4 | 11.18 | 6.68 | 7.49 | — | — | |||||||||||||||
| Class B Shares at NAV2 | 14.59 | 6.66 | 7.09 | — | — | |||||||||||||||
| Class B Shares with CDSC4 | 10.24 | 6.66 | 7.09 | — | — | |||||||||||||||
| Class C Shares at NAV2 and with CDSC4 | 14.65 | 6.70 | 7.11 | — | — | |||||||||||||||
| Class I Shares at NAV | 15.80 | — | — | 10.87 | % | 10/1/09 | ||||||||||||||
| Barclays Capital U.S. Aggregate Bond Index | 5.16 | 6.53 | 5.33 | 6.07 | 5 | — | ||||||||||||||
Fund Expense Ratios6: A Shares: 1.16%, B Shares: 1.91%, C Shares: 1.91%, I Shares: 0.91%.
All returns represent past performance which is no guarantee of future results. Current performance may be higher or lower than the performance shown. The investment return and principal value of an investment will fluctuate so that an investor’s shares, when redeemed, may be worth more or less than their original cost. The above table and graph below do not reflect the deduction of taxes that a shareholder would pay on fund distributions or the redemption of shares. Please visit Virtus.com for performance data current to the most recent month-end.
| 1 | Total returns are historical and include changes in share price and the reinvestment of both dividends and capital gains distributions. |
| 2 | “NAV” (Net Asset Value) total returns do not include the effect of any sales charge. |
| 3 | “POP” (Public Offering Price) total returns include the effect of the maximum front-end 3.75% sales charge. |
| 4 | “CDSC” (Contingent Deferred Sales Charge) is applied to redemptions of certain classes of shares that do not have a sales charge applied at the time of purchase. CDSC charges for B shares decline from 5% to 0% over a five year period. CDSC charges for certain redemptions of Class A shares made within 18 months of purchase in which a finder’s fee was paid and all redemptions of Class C shares within the first year are 1% and 0% thereafter. |
| 5 | The since inception index returns are from the inception date of Class I Shares. |
| 6 | The expense ratios of the Fund are set forth according to the prospectus for the Fund effective January 31, 2012, as supplemented and revised and may differ from the expense ratios disclosed in the Financial Highlights tables in this report. See the Financial Highlights for more current expense ratios. |
Growth of $10,000 For periods ended 9/30
This chart assumes an initial investment of $10,000 made on September 30, 2002, for Class A, Class B, and Class C shares including any applicable sales charges or fees. Performance assumes reinvestment of dividends and capital gain distributions.
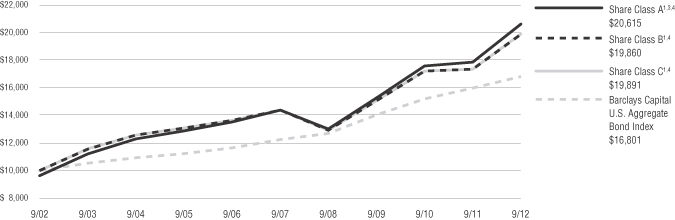
The index is unmanaged and not available for direct investment; therefore, its performance does not reflect the expenses associated with active management of an actual portfolio.
For information regarding the indexes and certain investment terms, see the Key Investment Terms starting on page 4.
15
Table of Contents
| Senior Floating Rate Fund | Ticker Symbols: Class A: PSFRX Class C: PFSRX Class I: PSFIX |
| ¢ | The Fund is diversified and has an investment objective of high total return from both current income and capital appreciation. |
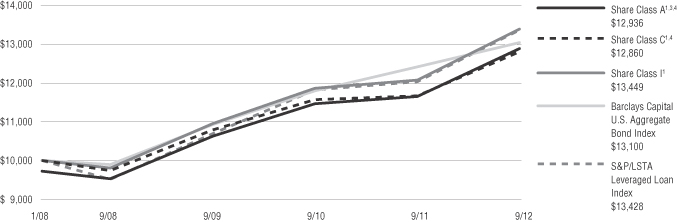
| ¢ | For the fiscal year ended September 30, 2012, the Fund’s Class A shares at NAV returned 10.75%, Class C shares returned 9.92%, and Class I shares returned 11.04%. For the same period, the Barclays Capital U.S. Aggregate Bond Index, a fixed income index, returned 5.16%, and the S&P/LSTA Leveraged Loan Index, the Fund’s style-specific benchmark, returned 11.27%. |
All performance figures assume reinvestment of distributions and exclude the effect of sales charges. Past performance is no guarantee of future results and current performance may be higher or lower than the performance shown above.
How did the market perform during the Fund’s fiscal year?
| ¢ | The U.S. Leveraged Loan Market, as represented by the S&P/LSTA Leveraged Loan Index and the Credit Suisse Leveraged Loan Index, returned 11.27% and 10.73%, respectively for the fiscal year ended September 30, 2012, outperforming most higher quality fixed income sectors. However, bank loans underperformed lower quality sectors such as high yield and emerging markets. |
| ¢ | Within the bank loan market the lower quality rating tiers outperformed over the past year due to very liquid capital markets, strong fundamentals and resurgent demand from collateralized loan obligations and retail investors. Specifically, Distressed, CCC/Split CCC and single B loans outperformed the index while split B, Not Rated and BB loans underperformed the index. |
| ¢ | Bank loans performed very well over the past year as prices recovered from the technical weakness of the third quarter of 2011 after the U.S. Federal Reserve (the Fed) announced its policy to hold rates down for an extended period of time. Technicals improved over the past year as retail fund flows turned positive, CLO demand grew and the bond for loan takeout trade continued. |
What factors affected the Fund’s performance during its fiscal year?
| ¢ | The positive return of the U.S. Leveraged Loan Market contributed to the positive return for the Fund during the year. |
| ¢ | Overall, positive issue selection in the Fund relative to the index benefitted performance. Specifically, the Fund’s issue selection within the information technology, gaming/leisure and financial sectors helped performance of the Fund. Issue selection within the diversified media and broadcasting sectors detracted from performance. The Fund’s out-of-index sector allocation to high-yield and emerging markets also positively contributed to performance. |
| ¢ | Selection in the Fund in the BB, split B and Not Rated credit tiers relative to the index contributed positively to performance as returns for the Fund in these credit tiers exceeded index returns. An underweight to the distressed credit tier and selection within the CCC/Split CCC credit tier detracted from Fund performance relative to the index. |
The preceding information is the opinion of portfolio management. Any such opinions are subject to change at any time based upon market or other conditions and should not be relied upon as investment advice. Past performance is no guarantee of future results, and there is no guarantee that market forecasts will be realized.
There is no guarantee that the Fund will meet its objective.
Debt securities are subject to various risks, the most prominent of which are credit and interest rate risk. The issuer of a security may fail to make payments in a timely manner. Values of debt securities may rise and fall in response to changes in interest rates. This risk may be enhanced with longer-term maturities. There may be no ready market for loan participation interests. The fund may have to sell the interests at a substantial discount. Such interests are subject to the credit risk of the underlying corporate borrower. There is a greater level of credit risk and price volatility involved with high-yield securities than investment grade securities. When a fund leverages its portfolio, the value of its shares may be more volatile and all other risks may be compounded. Certain
securities may be difficult to sell at a time and price beneficial to the fund.
| Asset Allocation | ||||
The following table presents asset allocations within certain sectors and as a percentage of total investments as of September 30, 2012.
|
| |||
Consumer Discretionary | 28 | % | ||
Health Care | 15 | |||
Information Technology | 13 | |||
Financials | 9 | |||
Industrials | 8 | |||
Materials | 7 | |||
Telecommunication Services | 5 | |||
Other (includes short-term investments) | 15 | |||
|
| |||
Total | 100 | % | ||
|
| |||
For information regarding the indexes and certain investment terms, see the Key Investment Terms starting on page 4.
16
Table of Contents
Senior Floating Rate Fund (Continued)
| Average Annual Total Returns1 for periods ended 9/30/12 | ||||||||||||
| 1 Year | Since Inception | Inception Date | ||||||||||
| Class A Shares at NAV2 | 10.75 | % | 6.31 | % | 1/31/08 | |||||||
| Class A Shares at POP3,4 | 7.71 | 5.68 | 1/31/08 | |||||||||
| Class C Shares at NAV2 and with CDSC4 | 9.92 | 5.54 | 1/31/08 | |||||||||
| Class I Shares at NAV | 11.04 | 6.56 | 1/31/08 | |||||||||
| Barclays Capital U.S. Aggregate Bond Index | 5.16 | 5.96 | 5 | — | ||||||||
| S&P/LSTA Leveraged Loan Index | 11.27 | 6.53 | 5 | — | ||||||||
Fund Expense Ratios6: A Shares: Gross 1.22%, Net 1.20%; C Shares: Gross 1.97%, Net 1.95%; I Shares: Gross 0.97%, Net 0.95%.
All returns represent past performance which is no guarantee of future results. Current performance may be higher or lower than the performance shown. The investment return and principal value of an investment will fluctuate so that an investor’s shares, when redeemed, may be worth more or less than their original cost. The above table and graph below do not reflect the deduction of taxes that a shareholder would pay on fund distributions or the redemption of shares. Please visit Virtus.com for performance data current to the most recent month-end.
| 1 | Total returns are historical and include changes in share price and the reinvestment of both dividends and capital gains distributions. |
| 2 | “NAV” (Net Asset Value) total returns do not include the effect of any sales charge. |
| 3 | “POP” (Public Offering Price) total returns include the effect of the maximum front-end 4.75% sales charge. |
| 4 | “CDSC” (Contingent Deferred Sales Charge) is applied to redemptions of certain classes of shares that do not have a sales charge applied at the time of purchase. CDSC charges for certain redemptions of Class A shares made within 18 months of purchase in which a finder’s fee was paid and all redemptions of Class C shares within the first year are 1% and 0% thereafter. |
| 5 | The since inception index returns are from the Fund’s inception date. |
| 6 | The expense ratios of the Fund are set forth according to the prospectus for the Fund effective January 31, 2012, as supplemented and revised and may differ from the expense ratios disclosed in the Financial Highlights tables in this report. See the Financial Highlights for more current expense ratios. Net Expense: Expenses reduced by voluntary fee waiver which may be discontinued at any time. Gross Expense: Does not reflect the effect of the voluntary fee waiver. |
Growth of $10,000 For periods ended 9/30
This chart assumes an initial investment of $10,000 made on January 31, 2008 (inception date of the Fund), for Class A, Class C and Class I shares including any applicable sales charges or fees. Performance assumes reinvestment of dividends and capital gain distributions.
The indexes are unmanaged and not available for direct investment; therefore, their performance does not reflect the expenses associated with active management of an actual portfolio.
For information regarding the indexes and certain investment terms, see the Key Investment Terms starting on page 4.
17
Table of Contents
| Wealth Masters Fund† | Ticker Symbols: Class A: VWMAX Class C: VWMCX Class I: VWMIX |
| ¢ | The Fund is diversified and has an investment objective of seeking capital appreciation. |
| ¢ | For the fiscal period September 5, 2012 (inception date) through September 30, 2012, the Fund’s Class A shares at NAV returned 2.20%*, Class C shares returned 2.10%*, and Class I shares returned 2.20%.* For the same period, the S&P 500® Index, a broad-based equity index, and the Fund’s style-specific benchmark, returned 2.79%.* |
* Returns less than 1 year are not annualized.
All performance figures assume reinvestment of distributions and exclude the effect of sales charges. Past performance is no guarantee of future results and current performance may be higher or lower than the performance shown above.
There is no guarantee the fund will meet its objective.
| Asset Allocation | ||||
The following table presents asset allocations within certain sectors and as a percentage of total investments as of September 30, 2012.
|
| |||
Consumer Discretionary | 37 | % | ||
Financials | 19 | |||
Information Technology | 18 | |||
Industrials | 7 | |||
Consumer Staples | 6 | |||
Health Care | 5 | |||
Energy | 4 | |||
Other (includes short-term investments) | 4 | |||
|
| |||
Total | 100 | % | ||
|
| |||
The market price of equity securities may be affected by financial market, industry, or issuer-specific events. Focus on a particular style or on small or medium-sized companies may enhance that risk. A fund that focuses its investments in a particular industry or sector will be more sensitive to conditions that affect that industry or sector than a non-concentrated fund. The performance of the fund and its index may vary somewhat due to factors such as fund flows, transaction costs, and timing differences associated with additions to and deletions from its index.
| † | The Fund is less than six months old — No commentary required. |
For information regarding the indexes and certain investment terms, see the Key Investment Terms starting on page 4.
18
Table of Contents
THIS PAGE INTENTIONALLY BLANK.
Table of Contents
SCHEDULE OF INVESTMENTS
SEPTEMBER 30, 2012
($ reported in thousands)
| PAR VALUE | VALUE | |||||||
| U.S. GOVERNMENT SECURITIES—19.3% | ||||||||
U.S. Treasury Bond | $ | 3,440 | $ | 3,954 | ||||
U.S. Treasury Note | 3,655 | 3,657 | ||||||
1.000%, 8/31/16 | 9,030 | 9,222 | ||||||
1.375%, 11/30/18 | 1,600 | 1,650 | ||||||
2.000%, 11/15/21 | 2,025 | 2,115 | ||||||
| TOTAL U.S. GOVERNMENT SECURITIES (Identified Cost $20,065) | 20,598 | |||||||
| MUNICIPAL BONDS—1.0% | ||||||||
| Michigan—0.1% | ||||||||
City of Flat Rock Finance Authority, Taxable Series A, 6.750%, 10/1/16 | 75 | 78 | ||||||
| Rhode Island—0.9% | ||||||||
City of Woonsocket Pension Funding Taxable (AGM Insured) 5.660%, 7/15/13 | 1,000 | 1,025 | ||||||
| TOTAL MUNICIPAL BONDS (Identified Cost $1,085) | 1,103 | |||||||
| FOREIGN GOVERNMENT SECURITIES—0.5% | ||||||||
United Mexican States | 515 | 573 | ||||||
| TOTAL FOREIGN GOVERNMENT SECURITIES (Identified Cost $507) | 573 | |||||||
| MORTGAGE-BACKED SECURITIES—31.3% | ||||||||
| Agency—22.5% | ||||||||
FHLMC | 4 | 4 | ||||||
7.000%, 4/1/16 | 10 | 10 | ||||||
7.000%, 1/1/33 | 124 | 146 | ||||||
6.500%, 2/1/35 | 1,593 | 1,872 | ||||||
5.000%, 12/1/35 | 73 | 82 | ||||||
FNMA | 4 | 4 | ||||||
6.000%, 10/1/14 | 61 | 63 | ||||||
6.500%, 6/1/16 | 52 | 56 | ||||||
6.000%, 7/1/17 | 32 | 34 | ||||||
5.500%, 9/1/17 | 72 | 78 | ||||||
0.000%, 10/9/19 | 900 | 792 | ||||||
5.000%, 4/1/20 | 184 | 200 | ||||||
5.000%, 8/1/21 | 46 | 51 | ||||||
6.000%, 5/1/29 | 81 | 92 | ||||||
6.500%, 5/1/30 | 3 | 4 | ||||||
7.500%, 3/1/31 | 63 | 77 | ||||||
7.000%, 7/1/31 | 50 | 60 | ||||||
7.000%, 9/1/31 | 72 | 84 | ||||||
6.500%, 3/1/32 | 66 | 77 | ||||||
5.000%, 5/1/33 | 1,074 | 1,217 | ||||||
6.000%, 11/1/34 | 482 | 542 | ||||||
5.500%, 4/1/36 | 241 | 269 | ||||||
5.500%, 9/1/36 | 1,153 | 1,273 | ||||||
6.500%, 5/1/37 | 796 | 898 | ||||||
6.000%, 9/1/37 | 35 | 39 | ||||||
6.000%, 1/1/38 | 74 | 83 | ||||||
6.000%, 2/1/38 | 74 | 83 | ||||||
6.000%, 3/1/38 | 424 | 476 | ||||||
| PAR VALUE | VALUE | |||||||
| Agency—continued | ||||||||
6.500%, 3/1/38 | $ | 1,928 | $ | 2,218 | ||||
6.000%, 7/1/38 | 1,311 | 1,474 | ||||||
6.000%, 8/1/38 | 203 | 228 | ||||||
6.000%, 8/1/38 | 383 | 430 | ||||||
6.000%, 8/1/38 | 1,021 | 1,148 | ||||||
6.000%, 8/1/38 | 86 | 95 | ||||||
5.000%, 6/1/39 | 1,576 | 1,762 | ||||||
5.000%, 9/1/39 | 382 | 430 | ||||||
5.500%, 9/1/39 | 948 | 1,047 | ||||||
4.500%, 9/1/40 | 464 | 525 | ||||||
3.500%, 8/1/42 | 2,543 | 2,743 | ||||||
FNMA 99-M2, B | 709 | 815 | ||||||
FNMA TBA | 2,100 | 2,216 | ||||||
GNMA | — | (8) | — | (8) | ||||
6.500%, 9/15/28 | 59 | 70 | ||||||
7.500%, 9/15/29 | 121 | 148 | ||||||
|
| |||||||
| 24,015 | ||||||||
|
| |||||||
| Non-Agency—8.8% | ||||||||
American Tower Trust 07-1A, | 190 | 200 | ||||||
Bear Stearns Commercial Mortgage Securities, Inc. | 1,130 | 1,212 | ||||||
07-T28, A3 | 1,250 | 1,309 | ||||||
Citigroup – Deutsche Bank Commercial Mortgage Trust | 1,335 | 1,424 | ||||||
Credit Suisse Mortgage Capital Certificates | 67 | 68 | ||||||
08-C1, AM 144A | 1,155 | 1,149 | ||||||
Greenwich Capital Commercial Funding Corp. | 25 | 29 | ||||||
Morgan Stanley Capital I | 1,110 | 1,313 | ||||||
05-IQ10, A4B | 855 | 941 | ||||||
08-T29, A4 | 1,450 | 1,775 | ||||||
|
| |||||||
| 9,420 | ||||||||
| TOTAL MORTGAGE-BACKED SECURITIES (Identified Cost $31,230) | 33,435 | |||||||
| CORPORATE BONDS AND NOTES—39.8% | ||||||||
| Consumer Discretionary—2.5% | ||||||||
AMC Entertainment, Inc. | 195 | 221 | ||||||
Cablevision Systems Corp. | 260 | 260 | ||||||
| PAR VALUE | VALUE | |||||||
| Consumer Discretionary—continued | ||||||||
CCO Holdings LLC (CCO Holdings Capital Corp.) | $ | 440 | $ | 473 | ||||
Landry’s, Inc. 144A | 260 | 276 | ||||||
NBC Universal Media LLC | 145 | 138 | ||||||
Spencer Spirit Holdings, Inc. 144A | 155 | 166 | ||||||
Time Warner Cable, Inc. | 390 | 452 | ||||||
4.000%, 9/1/21 | 265 | 292 | ||||||
United Artists Theatre Circuit, Inc. Series BD-1 | 14 | 14 | ||||||
Univision Communications, Inc. 144A | 430 | 432 | ||||||
|
| |||||||
| 2,724 | ||||||||
|
| |||||||
| Consumer Staples—1.9% | ||||||||
Heineken NV 144A | 570 | 594 | ||||||
Kraft Foods Group, Inc. | 195 | 201 | ||||||
144A 3.500%, 6/6/22(3) | 285 | 301 | ||||||
144A 5.000%, 6/4/42(3) | 385 | 430 | ||||||
Pantry Inc. (The) 144A | 115 | 118 | ||||||
Sysco Corp. | 350 | 361 | ||||||
|
| |||||||
| 2,005 | ||||||||
|
| |||||||
| Energy—3.6% | ||||||||
BreitBurn Energy Partners LP (BreitBurn Finance Corp.) 144A | 175 | 182 | ||||||
Bristow Group, Inc. | 35 | 36 | ||||||
Continental Resources, Inc. 144A | 430 | 450 | ||||||
Copano Energy LLC (Copano Energy Finance Corp.) | 30 | 31 | ||||||
Drill Rigs Holdings, Inc. 144A | 110 | 110 | ||||||
OGX Austria GmbH 144A | 560 | 507 | ||||||
Petrobras International Finance Co. | 515 | 580 | ||||||
Petropower I Funding Trust 144A | 32 | 33 | ||||||
Plains All American Pipeline LP (Plains All American Finance Corp.) | 365 | 388 | ||||||
SandRidge Energy, Inc. | 575 | 595 | ||||||
Seadrill Ltd. 144A | 200 | 201 | ||||||
Transocean, Inc. | 360 | 362 | ||||||
See Notes to Financial Statements
20
Table of Contents
VIRTUS BOND FUND
SCHEDULE OF INVESTMENTS (Continued)
SEPTEMBER 30, 2012
($ reported in thousands)
| PAR VALUE | VALUE | |||||||
| Energy—continued | ||||||||
Woodside Finance Ltd. 144A | $ | 315 | $ | 346 | ||||
|
| |||||||
| 3,821 | ||||||||
|
| |||||||
| Financials—17.5% | ||||||||
Ally Financial, Inc. | 315 | 330 | ||||||
AvalonBay Communities, Inc. | 430 | 429 | ||||||
Banco Santander Chile 144A | 450 | 452 | ||||||
Bank of America Corp. | 250 | 275 | ||||||
5.625%, 7/1/20 | 235 | 268 | ||||||
Boston Properties LP | 380 | 400 | ||||||
Capital One Financial Corp. | 355 | 405 | ||||||
Chubb Corp. | 250 | 266 | ||||||
Citigroup, Inc. | 510 | 538 | ||||||
CNA Financial Corp. | 660 | 771 | ||||||
CNL Lifestyle Properties, Inc. | 225 | 214 | ||||||
CVS Pass-Through-Trust 144A | 251 | 322 | ||||||
Developers Diversified Realty Corp. | 540 | 697 | ||||||
Digital Realty Trust LP | 625 | 696 | ||||||
Duke Realty LP | 545 | 617 | ||||||
Felcor Lodging LP | 310 | 334 | ||||||
Ford Motor Credit Co. LLC | 380 | 416 | ||||||
General Electric Capital Corp. | 630 | 639 | ||||||
GFI Group, Inc. | 620 | 547 | ||||||
Goldman Sachs Group, Inc. (The) | 255 | 274 | ||||||
6.000%, 6/15/20 | 360 | 415 | ||||||
5.750%, 1/24/22 | 500 | 576 | ||||||
Intelsat Jackson Holdings SA 144A | 175 | 175 | ||||||
International Lease Finance Corp. 4.875%, 4/1/15 | 250 | 260 | ||||||
JPMorgan Chase & Co. | 365 | 389 | ||||||
4.400%, 7/22/20 | 425 | 468 | ||||||
3.250%, 9/23/22 | 735 | 745 | ||||||
KeyCorp | 405 | 474 | ||||||
Lincoln National Corp. | 530 | 554 | ||||||
MetLife, Inc. | 435 | 483 | ||||||
| PAR VALUE | VALUE | |||||||
| Financials—continued | ||||||||
Morgan Stanley | $ | 330 | $ | 362 | ||||
5.500%, 7/28/21 | 200 | 219 | ||||||
6.375%, 7/24/42 | 435 | 480 | ||||||
Oppenheimer Holdings, Inc. | 130 | 133 | ||||||
Prudential Financial, Inc. | 250 | 316 | ||||||
8.875%, 6/15/38(2) | 360 | 445 | ||||||
5.875%, 9/15/42(2) | 190 | 195 | ||||||
Regions Financial Corp. | 520 | 558 | ||||||
Resona Bank Ltd. 144A | 830 | 889 | ||||||
Santander Holdings USA, Inc. 3.000%, 9/24/15 | 200 | 202 | ||||||
UBS AG | 500 | 523 | ||||||
UPCB Finance Ltd. VI 144A | 590 | 628 | ||||||
Wells Fargo & Co. | 270 | 313 | ||||||
|
| |||||||
| 18,692 | ||||||||
|
| |||||||
| Health Care—3.1% | ||||||||
Aviv Healthcare Properties LP (Aviv Healthcare Capital Corp.) | 635 | 676 | ||||||
Biomet, Inc. | 115 | 120 | ||||||
144A 6.500%, 10/1/20(3) | 135 | 133 | ||||||
Boston Scientific Corp. | 305 | 363 | ||||||
Express Scripts Holding Co. | 570 | 585 | ||||||
144A 2.650%, 2/15/17(3) | 570 | 597 | ||||||
Gilead Sciences, Inc. | 325 | 370 | ||||||
Tenet Healthcare Corp. | 170 | 188 | ||||||
Watson Pharmaceuticals, Inc. | 285 | 289 | ||||||
|
| |||||||
| 3,321 | ||||||||
|
| |||||||
| Industrials—2.4% | ||||||||
Belden, Inc. 144A | 110 | 113 | ||||||
DynCorp International, Inc. | 530 | 460 | ||||||
Hutchison Whampoa International Ltd. 144A | 250 | 296 | ||||||
Iron Mountain, Inc. | 390 | 393 | ||||||
Phillips 66 | 515 | 564 | ||||||
144A 5.875%, 5/1/42(3) | 340 | 404 | ||||||
Weatherford International Ltd. | 310 | 324 | ||||||
|
| |||||||
| 2,554 | ||||||||
|
| |||||||
| PAR VALUE | VALUE | |||||||
| Information Technology—1.5% | ||||||||
EarthLink, Inc. | $ | 390 | $ | 391 | ||||
First Data Corp. 144A | 430 | 429 | ||||||
Lender Processing Services, Inc. | 330 | 332 | ||||||
Xerox Corp. | 425 | 452 | ||||||
|
| |||||||
| 1,604 | ||||||||
|
| |||||||
| Materials—2.3% | ||||||||
American Rock Salt Co. LLC 144A | 570 | 520 | ||||||
BHP Billiton Finance USA Ltd. | 375 | 383 | ||||||
Dow Chemical Co. (The) | 465 | 465 | ||||||
5.900%, 2/15/15 | 455 | 507 | ||||||
Reynolds Group Issuer, Inc. (Reynolds Group Issuer LLC) 144A | 265 | 265 | ||||||
Vale Overseas Ltd. | 330 | 347 | ||||||
|
| |||||||
| 2,487 | ||||||||
|
| |||||||
| Telecommunication Services—1.4% | ||||||||
AT&T, Inc. | 425 | 481 | ||||||
CenturyLink, Inc. Series S, | 495 | 560 | ||||||
Digicel Group Ltd. 144A | 200 | 211 | ||||||
GCI, Inc. | 200 | 217 | ||||||
|
| |||||||
| 1,469 | ||||||||
|
| |||||||
| Utilities—3.6% | ||||||||
Atmos Energy Corp. | 305 | 369 | ||||||
Calpine Corp. | ||||||||
144A 7.875%, 7/31/20(3) | 145 | 159 | ||||||
144A 7.500%, 2/15/21(3) | 375 | 407 | ||||||
CMS Energy Corp. | 545 | 633 | ||||||
Dominion Resources, Inc. | 100 | 136 | ||||||
Eagle Rock Energy Partners LP (Eagle Rock Energy Finance Corp.) 144A | 525 | 519 | ||||||
El Paso Pipeline Partners Operating Co. LLC | 505 | 659 | ||||||
Energy Transfer Partners LP | 285 | 316 | ||||||
Virginia Electric & Power Co. Series A | 545 | 625 | ||||||
|
| |||||||
| 3,823 | ||||||||
| TOTAL CORPORATE BONDS AND NOTES (Identified Cost $39,676) | 42,500 | |||||||
See Notes to Financial Statements
21
Table of Contents
VIRTUS BOND FUND
SCHEDULE OF INVESTMENTS (Continued)
SEPTEMBER 30, 2012
($ reported in thousands)
| PAR VALUE | VALUE | |||||||
| LOAN AGREEMENTS(2)—1.2% | ||||||||
| Consumer Discretionary—0.6% | ||||||||
Party City Holdings, Inc. | $ 125 | $ | 127 | |||||
Roundy’s Supermarkets, Inc. Tranche B, | 299 | 293 | ||||||
Transtar Holding Co. Second Lien, | 250 | 256 | ||||||
|
| |||||||
| 676 | ||||||||
|
| |||||||
| Financials—0.3% | ||||||||
Pinnacle Foods Finance LLC Tranche E, | 299 | 299 | ||||||
|
| |||||||
| Materials—0.3% | ||||||||
Emerald Performance Materials LLC | 274 | 277 | ||||||
| TOTAL LOAN AGREEMENTS (Identified Cost $1,233) | 1,252 | |||||||
| SHARES | ||||||||
| PREFERRED STOCK—2.1% | ||||||||
| Financials—1.5% | ||||||||
Citigroup Capital XIII | 16,200 | 451 | ||||||
General Electric Capital Corp. | 590,000 | 657 | ||||||
GMAC Capital Trust I | 32,800 | 824 | ||||||
JPMorgan Chase & Co. | 280,000 | 318 | ||||||
| TOTAL PREFERRED STOCK (Identified Cost $2,095) | 2,250 | |||||||
| TOTAL LONG TERM INVESTMENTS—95.2% | ||||||||
| (Identified Cost $95,891) | 101,711 | (10) | ||||||
| SHARES | VALUE | |||||||
| SHORT-TERM INVESTMENTS—5.8% | ||||||||
| Money Market Mutual Funds—5.8% | ||||||||
BlackRock Liquidity Funds TempFund Portfolio – Insitutional Shares (seven-day effective yield 0.140%) | 6,180,803 | $ | 6,181 | |||||
| TOTAL SHORT-TERM INVESTMENTS (Identified Cost $6,181) | 6,181 | |||||||
| TOTAL INVESTMENTS—101.0% (Identified Cost $102,072) | 107,892 | (1) | ||||||
Other assets and liabilities, net—(1.0)% |
| (1,078 | ) | |||||
|
| |||||||
| NET ASSETS—100.0% | $ | 106,814 | ||||||
|
| |||||||
Abbreviations:
| AGM | Assured Guaranty Municipal Corp. |
| FHLMC | Federal Home Loan Mortgage Corporation (“Freddie Mac”). |
| FNMA | Federal National Mortgage Association (“Fannie Mae”). |
| GNMA | Government National Mortgage Association (“Ginnie Mae”) |
| TBA | To be announced |
Footnote Legend:
| (1) | Federal Income Tax Information: For tax information at September 30, 2012, see Note 11 Federal Income Tax Information in the Notes to Financial Statements. |
| (2) | Variable or step coupon security; interest rate shown reflects the rate in effect at September 30, 2012. |
| (3) | Security exempt from registration under Rule 144A of the Securities Act of 1933. These securities may be resold in transactions exempt from registration, normally to qualified institutional buyers. At September 30, 2012, these securities amounted to a value of $13,484 or 12.6% of net assets. |
| (4) | Security valued at fair value as determined in good faith by or under the direction of the Trustees. This security is disclosed as a level 3 security in the disclosure table located after the Schedule of Investments. |
| (5) | Illiquid security. |
| (6) | No contractual maturity date |
| (7) | Interest payments may be deferred. |
| (8) | Amounts are less than $500. |
| (9) | This security has a delayed delivery settlement date. |
| (10) | A portion of the Fund’s assets have been segregated for delayed delivery settlements. |
| (11) | Non-cumulative |
| Country Weightings (Unaudited)† | ||||
United States | 93 | % | ||
Australia | 1 | |||
Brazil | 1 | |||
Cayman Islands | 1 | |||
Japan | 1 | |||
Mexico | 1 | |||
Netherlands | 1 | |||
Other | 1 | |||
Total | 100 | % | ||
† % of total investments as of September 30, 2012 |
| |||
At September 30, 2012, the Fund had entered into futures contracts as follows:
| Expiration Date | Number of Contracts | Value of Contracts When Opened | Market Value of Contracts | Unrealized Appreciation (Depreciation) | ||||||||||||||||
U.S. 10YR Note Futures | December-12 | (35 | ) | $ | (4,602 | ) | $ | (4,672 | ) | $ | (70 | ) | ||||||||
Security abbreviation definitions are located under the Key Investment Terms starting on page 4.
See Notes to Financial Statements
22
Table of Contents
VIRTUS BOND FUND
SCHEDULE OF INVESTMENTS (Continued)
SEPTEMBER 30, 2012
($ reported in thousands)
The following table provides a summary of inputs used to value the Fund’s investments as of September 30, 2012 (See Security Valuation Note 2A in the Notes to Financial Statements):
| Total Value at September 30, 2012 | Level 1 – Quoted Prices | Level 2 – Significant Observable Inputs | Level 3 – Significant Unobservable Inputs | |||||||||||||
Debt Securities: | ||||||||||||||||
Corporate Bonds and Notes | $ | 42,500 | $ | — | $ | 42,486 | $ | 14 | ||||||||
Foreign Government Securities | 573 | — | 573 | — | ||||||||||||
Loan Agreements | 1,252 | — | 1,252 | — | ||||||||||||
Mortgage-Backed Securities | 33,435 | — | 33,435 | — | ||||||||||||
Municipal Bonds | 1,103 | — | 1,103 | — | ||||||||||||
U.S. Government Securities | 20,598 | — | 20,598 | — | ||||||||||||
Equity Securities: | ||||||||||||||||
Preferred Stock | 2,250 | — | 2,250 | — | ||||||||||||
Short-Term Investments | 6,181 | 6,181 | — | — | ||||||||||||
|
|
|
|
|
|
|
| |||||||||
Total Investments | $ | 107,892 | $ | 6,181 | $ | 101,697 | $ | 14 | ||||||||
|
|
|
|
|
|
|
| |||||||||
Other Financial Instruments | ||||||||||||||||
Futures Contracts* | $ | (70 | ) | $ | (70 | ) | $ | — | $ | — | ||||||
|
|
|
|
|
|
|
| |||||||||
| * | Valued at the unrealized appreciation (depreciation) on the investment. |
The following is a reconciliation of assets of the Fund for Level 3 investments for which significant unobservable inputs were used to determine fair value.
| Corporate Bonds and Notes | ||||
Investments in Securities | ||||
Balance as of September 30, 2011: | $ | 18 | ||
Accrued discount/(premium) | — | (c) | ||
Realized gain (loss) | — | |||
Change in unrealized appreciation (depreciation) | 1 | |||
Purchases | — | |||
Sales(b) | (5 | ) | ||
Transfers into Level 3(a) | — | |||
Transfers from Level 3(a) | — | |||
|
| |||
Balance as of September 30, 2012 | $ | 14 | (d) | |
|
| |||
| (a) | “Transfers into and/or from” represent the ending value as of September 30, 2012, for any investment security where a change in the pricing level occurred from the beginning to the end of the period. |
| (b) | Includes paydowns on securities, if applicable. |
| (c) | Amount less than $500. |
| (d) | Includes internally fair valued security. Refer to the last paragraph under “Note 2A. Security Valuation” in the Notes to Financial Statements for a description of the valuation process in place and a qualitative discussion about sensitive inputs used in Level 3 internally fair valued measurements. |
See Notes to Financial Statements
23
Table of Contents
VIRTUS CA TAX-EXEMPT BOND FUND
SCHEDULE OF INVESTMENTS
SEPTEMBER 30, 2012
($ reported in thousands)
| PAR VALUE | VALUE | |||||||
| MUNICIPAL TAX-EXEMPT BONDS(2)—97.2% | ||||||||
| Development Revenue—5.8% | ||||||||
Hercules Redevelopment Agency, Tax-Allocation (AMBAC Insured) | $ | 500 | $ | 336 | ||||
Ontario Redevelopment Financing Authority, (NATL Insured) | 500 | 501 | ||||||
San Diego Redevelopment Agency, | ||||||||
Tax Allocation Series B (AMBAC Insured) | 1,000 | 1,000 | ||||||
Tax Allocation Series A (AMBAC Insured) | 500 | 504 | ||||||
Santa Clara Redevelopment Agency, (NATL Insured) 5.000%, 6/1/22 | 1,000 | 1,020 | ||||||
|
| |||||||
| 3,361 | ||||||||
|
| |||||||
| General Obligation—13.8% | ||||||||
Brea Olinda Unified School District, Series A (NATL, FGIC Insured) | 150 | 172 | ||||||
Gilroy Unified School District, (NATL, FGIC Insured) 5.000%, 8/1/27 | 500 | 513 | ||||||
Los Angeles Unified School District, 2002 Election Series C (AGM Insured) | 500 | 571 | ||||||
Series A-1 (NATL Insured) 4.500%, 1/1/28 | 500 | 543 | ||||||
New Haven Unified School District, (AGC Insured) | 1,500 | 555 | ||||||
Norwalk – La Mirada Unified School District, 2002 Election Series D (AGM Insured) 0.000%, 8/1/33 | 1,475 | 532 | ||||||
Placer Union High School District, (AGM Insured) | 1,500 | 580 | ||||||
Rancho Santiago Community College District, 2002 Election Series C (AGM Insured) 0.000%, 9/1/27 | 1,200 | 639 | ||||||
San Rafael City High School District, 2002 Election Series B (NATL, FGIC Insured) 0.000%, 8/1/26 | 1,000 | 559 | ||||||
State of California, | ||||||||
5.500%, 3/1/26 | 500 | 584 | ||||||
5.000%, 6/1/32 | 675 | 748 | ||||||
5.000%, 9/1/32 | 500 | 569 | ||||||
5.000%, 11/1/32 | 250 | 280 | ||||||
4.500%, 10/1/36 | 500 | 526 | ||||||
5.000%, 12/1/37 | 250 | 275 | ||||||
6.000%, 4/1/38 | 250 | 298 | ||||||
|
| |||||||
| 7,944 | ||||||||
|
| |||||||
| PAR VALUE | VALUE | |||||||
| General Revenue—19.1% | ||||||||
Anaheim Public Financing Authority, Series C (AGM Insured) | $ | 1,600 | $ | 1,843 | ||||
City of Pomona, Certificates of Participation (AMBAC Insured) | 1,000 | 1,045 | ||||||
Commonwealth of Puerto Rico Sales Tax Financing Corp., | 500 | 537 | ||||||
Golden State Tobacco Securitization Corp., Series A-1 | 1,250 | 959 | ||||||
Los Angeles County Public Works Financing Authority, Series A (AGM Insured) | 320 | 355 | ||||||
North City West School Facilities Financing Authority, Series B (AMBAC Insured) | 1,000 | 1,189 | ||||||
Sacramento Area Flood Control Agency, (BHAC Insured) | 350 | 414 | ||||||
5.000%, 10/1/37 | 750 | 840 | ||||||
South Bay Regional Public Communications Authority, Series B (ACA Insured) | 535 | 516 | ||||||
State of California Public Works Board, Department of Health Services, | 460 | 509 | ||||||
Department of General Services, Series A | 500 | 603 | ||||||
Various Capital Projects, Series G-1 | 500 | 578 | ||||||
Department of Forestry & Fire Protection, Series E | 500 | 534 | ||||||
University of California, Department of Mental Health, Series A | 1,000 | 1,072 | ||||||
|
| |||||||
| 10,994 | ||||||||
|
| |||||||
| Higher Education Revenue—7.7% | ||||||||
California Educational Facilities Authority, | ||||||||
Univesity of Southern California, Series A | 250 | 322 | ||||||
Stanford University, | 500 | 711 | ||||||
Pomona Colllege, Series A | 500 | 536 | ||||||
California State University, | 635 | 711 | ||||||
| PAR VALUE | VALUE | |||||||
| Higher Education Revenue—continued | ||||||||
University of California, Series D (NATL, FGIC Insured) | $ | 500 | $ | 566 | ||||
Regents Medical, Series A 4.750%, 5/15/31 | 500 | 537 | ||||||
Series G (NATL, FGIC Insured) 4.750%, 5/15/35 | 525 | 541 | ||||||
Series B 4.750%, 5/15/38 | 500 | 518 | ||||||
|
| |||||||
| 4,442 | ||||||||
|
| |||||||
| Medical Revenue—4.4% | ||||||||
California Health Facilities Financing Authority, Cedars-Sinai Medical Center, | 500 | 536 | ||||||
Providence Health & Services, Series C | 295 | 360 | ||||||
Kaiser Permanente, Series A 5.250%, 4/1/39 | 500 | 536 | ||||||
California Statewide Communities Development Authority, Kaiser Permanente, Series B | 500 | 530 | ||||||
St. Joseph Health System, | 500 | 556 | ||||||
|
| |||||||
| 2,518 | ||||||||
|
| |||||||
| Natural Gas Revenue—1.4% | ||||||||
Roseville Natural Gas Financing Authority, | 750 | 799 | ||||||
|
| |||||||
| Power Revenue—4.0% | ||||||||
Imperial Irrigation District, Series B 5.000%, 11/1/36 | 300 | 335 | ||||||
Northern California Power Agency, 5.000%, 7/1/32 | 200 | 232 | ||||||
Sacramento Municipal Utilities District Financing Authority, (NATL Insured) | 500 | 528 | ||||||
5.000%, 8/15/26 | 500 | 599 | ||||||
Southern California Public Power Authority, Series 1, | 500 | 583 | ||||||
|
| |||||||
| 2,277 | ||||||||
|
| |||||||
| Pre-Refunded—20.8% | ||||||||
California Health Facilities Financing Authority, Stanford Hospital and Clinics, Series A | 125 | 132 | ||||||
Providence Health & Services, Series C Pre-refunded 10/1/18 @100 | 5 | 7 | ||||||
California Infrastructure & Economic Development Bank, Pre-refunded 7/1/26 @100 (AMBAC Insured) | 755 | 1,035 | ||||||
See Notes to Financial Statements
24
Table of Contents
VIRTUS CA TAX-EXEMPT BOND FUND
SCHEDULE OF INVESTMENTS (Continued)
SEPTEMBER 30, 2012
($ reported in thousands)
| PAR VALUE | VALUE | |||||||
| Pre-Refunded—continued | ||||||||
California State University, Series A (NATL, FGIC Insured) | $ | 250 | $ | 257 | ||||
Contra Costa County Home Mortgage, (GNMA Collateralized) | 500 | 557 | ||||||
El Dorado Irrigation District & El Dorado Water Agency, Certificates of Participation, Series A (NATL, FGIC Insured) | 365 | 373 | ||||||
Grossmont-Cuyamaca Community College District, Election of 2002 Series A Pre-refunded 8/1/13 @100 (NATL Insured) | 210 | 218 | ||||||
Los Angeles Harbor Department, 7.600%, 10/1/18(3) | 660 | 787 | ||||||
Metropolitan Water District of Southern California, Series B-1 Pre-refunded 10/1/13 @ 100 (NATL, FGIC Insured) | 860 | 901 | ||||||
Series B-1 Pre-refunded 10/1/13 @100 (NATL, FGIC Insured) 5.000%, 10/1/36 | 140 | 147 | ||||||
Northern California Power Agency, Series A Pre-refunded 7/1/21 @ 100 (AMBAC Insured) | 195 | 272 | ||||||
Riverside County Single Family, Series B (GNMA Collateralized) | 1,000 | 1,263 | ||||||
Series A (GNMA Collateralized) 7.800%, 5/1/21(3) | 4,000 | 5,808 | ||||||
Stockton Housing Facility, Series A Pre-refunded 9/20/17 @ 100 (GNMA Collateralized) | 180 | 181 | ||||||
|
| |||||||
| 11,938 | ||||||||
|
| |||||||
| Transportation Revenue—6.9% | ||||||||
Bay Area Toll Authority, | 500 | 569 | ||||||
Series F-1 5.125%, 4/1/39 | 580 | 655 | ||||||
City of Long Beach Airport, | 200 | 224 | ||||||
Imperial County Transportation Authority, Series E | 500 | 546 | ||||||
Los Angeles International Airport, Series A | 510 | 572 | ||||||
San Diego County Regional Airport Authority, | 250 | 272 | ||||||
Series B 5.000%, 7/1/40 | 500 | 545 | ||||||
San Francisco Municipal Transporation Agency, | 500 | 559 | ||||||
|
| |||||||
| 3,942 | ||||||||
|
| |||||||
| PAR VALUE | VALUE | |||||||
| Water & Sewer Revenue—13.3% | ||||||||
Alameda County Water District Financing Authority, | $ | 1,000 | $ | 993 | ||||
City of San Francisco Public Utilities Commission, Water Revenue | 250 | 267 | ||||||
4.000%, 11/1/41 | 500 | 514 | ||||||
City of Santa Rosa Wastewater Revenue, Series A | 500 | 582 | ||||||
Delta Diablo Sanitation District, Certificates of Participation (NATL Insured) | 1,070 | 990 | ||||||
East Bay Municipal Utility District, (NATL Insured) | 500 | 545 | ||||||
Irvine Ranch Water District, Certificates of Participation, | 500 | 589 | ||||||
Los Angeles Department of Water & Power, | 700 | 877 | ||||||
Orange County Sanitation District, Series A | 750 | 772 | ||||||
Sacramento Suburban Water District, | 250 | 306 | ||||||
Santa Margarita-Dana Point Authority, | 600 | 672 | ||||||
Westlands Water District, Certificates of Participation (NATL Insured) | 500 | 507 | ||||||
|
| |||||||
| 7,614 | ||||||||
| TOTAL MUNICIPAL TAX-EXEMPT BONDS (Identified Cost $50,942) | 55,829 | |||||||
| TOTAL LONG TERM INVESTMENTS—97.2% | ||||||||
| (Identified cost $50,942) | 55,829 | |||||||
| SHARES | ||||||||
| SHORT-TERM INVESTMENTS—1.8% | ||||||||
| Money Market Mutual Funds—1.8% | ||||||||
BlackRock Liquidity Funds TempFund Portfolio – Insitutional Shares (seven-day effective yield 0.140%) | 1,019,845 | 1,020 | ||||||
| TOTAL SHORT-TERM INVESTMENTS | ||||||||
| (Identified Cost $1,020) | 1,020 | |||||||
| TOTAL INVESTMENTS—99.0% (Identified Cost $51,962) | 56,849 | (1) | ||||||
Other assets and liabilities, net—1.0% |
| 593 | ||||||
|
| |||||||
| NET ASSETS—100.0% | $ | 57,442 | ||||||
|
| |||||||
Abbrevations:
| ACA | American Capital Access Financial Guarantee Corp. |
| AGC | Assured Guaranty Corp. |
| AGM | Assured Guaranty Municipal Corp. |
| AMBAC | American Municipal Bond Assurance Corp. |
| BHAC | Berkshire Hathaway Assurance Corp. |
| FGIC | Financial Guaranty Insurance Company |
| GNMA | Government National Mortgage Association (“Ginnie Mae”) |
| NATL | National Public Finance Guarantee Corp. |
| XLCA | XL Capital Assurance |
Footnote Legend:
| (1) | Federal Income Tax Information: For tax information at September 30, 2012, see Note 11 Federal Income Tax Information in the Notes to Financial Statements. |
| (2) | At September 30, 2012, the concentration of the Fund’s investments by state or territory determined as a percentage of net assets is as follows: California 97%. At September 30, 2012, 62% of the securities in the portfolio are backed by insurance of financial institutions and financial guaranty assurance agencies. Insurers with a concentration greater than 10% of net assets are as follows: NATL 23.0%, and GNMA 13.8%. |
| (3) | Escrowed to maturity. |
See Notes to Financial Statements
25
Security abbreviation definitions are located under the Key Investment Terms starting on page 4.
Table of Contents
VIRTUS CA TAX-EXEMPT BOND FUND
SCHEDULE OF INVESTMENTS (Continued)
SEPTEMBER 30, 2012
($ reported in thousands)
The following table provides a summary of inputs used to value the Fund’s investments as of September 30, 2012 (See Security Valuation Note 2A in the Notes to Financial Statements):
| Total Value at September 30, 2012 | Level 1 – Quoted Prices | Level 2 – Significant Observable Inputs | ||||||||||
Debt Securities: | ||||||||||||
Municipal Tax-Exempt Bonds | $ | 55,829 | $ | — | $ | 55,829 | ||||||
Equity Securities: | ||||||||||||
Short-Term Investments | 1,020 | 1,020 | — | |||||||||
|
|
|
|
|
| |||||||
Total Investments | $ | 56,849 | $ | 1,020 | $ | 55,829 | ||||||
|
|
|
|
|
| |||||||
There are no Level 3 (significant unobservable inputs) priced securities.
See Notes to Financial Statements
26
Table of Contents
SCHEDULE OF INVESTMENTS
SEPTEMBER 30, 2012
($ reported in thousands)
| SHARES | VALUE | |||||||
| CLOSED-END FUNDS—90.3% | ||||||||
| Equity Funds—48.7% | ||||||||
Adams Express Co. | 3,000 | $ | 34 | |||||
Advent Claymore Enhanced Growth & Income Fund | 1,708 | 17 | ||||||
Agic Equity & Convertible Income Fund | 2,000 | 35 | ||||||
Alpine Total Dynamic Dividend Fund | 5,000 | 22 | ||||||
ASA Gold and Precious Metals Ltd. | 1,000 | 25 | ||||||
BlackRock Enhanced Equity Dividend Trust | 6,000 | 45 | ||||||
Calamos Global Dynamic Income Fund | 2,200 | 19 | ||||||
Central Securities Corp. | 1,900 | 38 | ||||||
Cohen & Steers Infrastructure Fund, Inc. | 2,000 | 37 | ||||||
Eaton Vance Risk-Managed Diversified Equity Income Fund | 2,500 | 26 | ||||||
Eaton Vance Tax Managed Global Buy Write Opportunities Fund | 400 | 4 | ||||||
Eaton Vance Tax-Advantaged Global Dividend Opportunities Fund | 1,600 | 32 | ||||||
Eaton Vance Tax-Managed Diversified Equity Income Fund | 2,500 | 24 | ||||||
Eaton Vance Tax-Managed Global Diversified Equity Income Fund | 4,700 | 41 | ||||||
General American Investors Co., Inc. | 1,000 | 29 | ||||||
Guggenheim Enhanced Equitystrategy Fund | 856 | 15 | ||||||
Liberty All Star Equity Fund | 4,900 | 24 | ||||||
Petroleum & Resources Corp. | 1,000 | 26 | ||||||
RMR Real Estate Income Fund | 1,851 | 33 | ||||||
Royce Value Trust, Inc. | 300 | 4 | ||||||
Source Capital, Inc. | 500 | 26 | ||||||
Tri-Continental Corp. | 2,500 | 41 | ||||||
|
| |||||||
| 597 | ||||||||
|
| |||||||
| SHARES | VALUE | |||||||
| Fixed Income Funds—14.5% | ||||||||
Advent Claymore Convertible Securities and Income Fund | 1,500 | $ | 25 | |||||
American Select Portfolio | 3,000 | 33 | ||||||
Montgomery Street Income Securities, Inc. | 2,000 | 34 | ||||||
Nuveen Build America Bond Opportunity Fund | 1,800 | 40 | ||||||
Nuveen Build American Bond Term Fund | 1,500 | 32 | ||||||
Western Asset/Claymore Inflation-Linked Opportunities & Income Fund | 1,000 | 13 | ||||||
|
| |||||||
| 177 | ||||||||
|
| |||||||
| International Equity Funds—22.9% | ||||||||
Agic International & Premium Strategy Fund | 3,000 | 30 | ||||||
BlackRock International Growth and Income Trust | 5,500 | 40 | ||||||
Clough Global Equity Fund | 2,500 | 32 | ||||||
Clough Global Opportunities Fund | 1,000 | 12 | ||||||
Delaware Enhanced Global Dividend and Income Fund | 5,000 | 56 | ||||||
Korea Fund, Inc. (The) | 800 | 32 | ||||||
Morgan Stanley Asia Pacific Fund, Inc. | 2,500 | 35 | ||||||
Nuveen Global Value Opportunities Fund | 800 | 12 | ||||||
Singapore Fund, Inc. (The) | 800 | 11 | ||||||
Thai Fund, Inc. (The) | 1,222 | 21 | ||||||
|
| |||||||
| 281 | ||||||||
|
| |||||||
| SHARES | VALUE | |||||||
| International Fixed Income Fund—4.2% | ||||||||
Nuveen Multi-Currency Short-Term Government Income Fund | 3,850 | $ | 51 | |||||
| TOTAL CLOSED-END FUNDS (Identified Cost $1,088) | 1,106 | |||||||
| TOTAL LONG TERM INVESTMENTS—90.3% | ||||||||
| (Identified cost $1,088) | 1,106 | |||||||
| SHORT-TERM INVESTMENTS—16.9% | ||||||||
| Money Market Mutual Funds—16.9% | ||||||||
BlackRock Liquidity Funds TempFund Portfolio – Insitutional Shares (seven-day effective yield 0.140%) | 207,199 | 207 | ||||||
| TOTAL SHORT-TERM INVESTMENTS (Identified Cost $207) | 207 | |||||||
| TOTAL INVESTMENTS—107.2% | ||||||||
| (Identified Cost $1,295) | 1,313 | (1) | ||||||
Other assets and liabilities, net—(7.2)% |
| (89 | ) | |||||
|
| |||||||
| NET ASSETS—100.0% | $ | 1,224 | ||||||
|
| |||||||
Footnote Legend:
| (1) | Federal Income Tax Information: For tax information at September 30, 2012, see Note 11 Federal Income Tax Information in the Notes to Financial Statements. |
The following table provides a summary of inputs used to value the Fund’s investments as of September 30, 2012 (See Security Valuation Note 2A in the Notes to Financial Statements):
| Total Value at September 30, 2012 | Level 1 – Quoted Prices | |||||||
Equity Securities: | ||||||||
Closed-End Funds | $ | 1,106 | $ | 1,106 | ||||
Short-Term Investments | 207 | 207 | ||||||
|
|
|
| |||||
Total Investments | $ | 1,313 | $ | 1,313 | ||||
|
|
|
| |||||
There are no Level 2 (significant observable inputs) or Level 3 (significant unobservable inputs) priced securities.
See Notes to Financial Statements
27
Table of Contents
SCHEDULE OF INVESTMENTS
SEPTEMBER 30, 2012
($ reported in thousands)
| PAR VALUE | VALUE | |||||||
| FOREIGN GOVERNMENT SECURITIES—2.6% | ||||||||
Bolivarian Republic of Venezuela RegS | $ | 170 | $ | 156 | ||||
Federative Republic of Brazil 8.500%, 1/5/24 | 1,040 | BRL | 600 | |||||
Republic of Argentina Provincia de Neuquen 144A | 235 | 208 | ||||||
Republic of Iceland 144A | 275 | 300 | ||||||
Republic of South Africa | 3,720 | ZAR | 460 | |||||
Republic of Turkey | 625 | TRY | 355 | |||||
United Mexican States | 2,445 | MXN | 196 | |||||
Series M, 6.500%, 6/9/22 | 3,645 | MXN | 308 | |||||
| TOTAL FOREIGN GOVERNMENT SECURITIES | ||||||||
| (Identified Cost $2,525) | 2,583 | |||||||
| MORTGAGE-BACKED SECURITIES—3.1% | ||||||||
| Non-Agency—3.1% | ||||||||
Countrywide Alternative Loan Trust 06-13T1, A5 | 324 | 243 | ||||||
Countrywide Home Loan Mortgage Pass-Through-Trust 05-22, 3A1 | 417 | 348 | ||||||
Goldman Sachs Mortgage Pass-Through Securities Mortgage Loan Trust 05-RP1, 1A3 144A | 239 | 256 | ||||||
MASTR Reperforming Loan Trust 05-1, 1A5 144A | 313 | 326 | ||||||
Morgan Stanley Mortgage Loan Trust 07-11AR, 2A3 | 545 | 288 | ||||||
Nomura Asset Acceptance Corp. 06-AF2, 1A6 | 659 | 323 | ||||||
Structured Adjustable Rate Mortgage Loan Trust 07-5, 2A1 5.040%, 6/25/37(3) | 1,061 | 1,012 | ||||||
SunTrust Adjustable Rate Mortgage Loan Trust 07-S1, 5A1 | 337 | 332 | ||||||
| TOTAL MORTGAGE-BACKED SECURITIES (Identified Cost $2,789) | 3,128 | |||||||
| ASSET-BACKED SECURITIES—0.9% | ||||||||
ABSC Long Beach Home Equity Loan Trust 00-LB1, M1F 8.240%, 3/21/29(3) | 317 | 244 | ||||||
Equity One ABS, Inc. | 242 | 184 | ||||||
Residential Funding Mortgage Securities II, Inc. 06-H11, M1 6.010%, 2/25/36(3) | 200 | 200 | ||||||
| PAR VALUE | VALUE | |||||||
| ASSET-BACKED SECURITIES—continued | ||||||||
Structured Asset Securities Corp. 07-EQ1, A2 | $ | 153 | $ | 117 | ||||
Terwin Mortgage Trust | 147 | 140 | ||||||
| TOTAL ASSET-BACKED SECURITIES (Identified Cost $859) | 885 | |||||||
| CORPORATE BONDS AND NOTES—80.0% | ||||||||
| Consumer Discretionary—15.8% | ||||||||
American Axle & Manufacturing, Inc. | 350 | 356 | ||||||
Ameristar Casinos, Inc. | 500 | 540 | ||||||
Boyd Gaming Corp. 144A | 500 | 512 | ||||||
Cablevision Systems Corp. | 430 | 482 | ||||||
Caesars Entertainment Operating Co., Inc. | 345 | 228 | ||||||
Caesars Operating Escrow LLC (Caesars Escrow Corp.) 144A 9.000%, 2/15/20(2) | 500 | 508 | ||||||
CCO Holdings LLC (CCO Holdings Capital Corp.) | 280 | 301 | ||||||
5.250%, 9/30/22 | 250 | 253 | ||||||
Chrysler Group LLC (Chrysler Group, Inc.) | 200 | 214 | ||||||
Claire’s Stores, Inc. 144A | 335 | 349 | ||||||
Dana Holding Corp. | 730 | 792 | ||||||
DISH DBS Corp. 144A | 590 | 606 | ||||||
HD Supply, Inc. 144A | 500 | 544 | ||||||
HOA Restaurant Group LLC (HOA Finance Corp.) 144A | 400 | 367 | ||||||
Landry’s, Inc. 144A | 150 | 159 | ||||||
Mediacom LLC (Mediacom Capital Corp.) | 285 | 307 | ||||||
MGM Resorts International 144A 6.750%, 10/1/20(2)(3) | 1,270 | 1,273 | ||||||
Nara Cable Funding Ltd. 144A 8.875%, 12/1/18(2) | 675 | 619 | ||||||
Northwest Airlines Pass-Through-Trust 01-1, B | 349 | 363 | ||||||
Peninsula Gaming LLC (Peninsula Gaming Corp.) | 450 | 511 | ||||||
Rent-A-Center, Inc. | 495 | 537 | ||||||
Sally Holdings LLC (Sally Capital, Inc.) | 300 | 321 | ||||||
| PAR VALUE | VALUE | |||||||
| Consumer Discretionary—continued | ||||||||
Scientific Games International, Inc. | $ | 450 | $ | 502 | ||||
Seminole Indian Tribe of Florida 144A | 250 | 276 | ||||||
Sinclair Television Group, Inc. 6.125%, 10/1/22 | 500 | 503 | ||||||
Spencer Spirit Holdings, Inc. 144A | 375 | 401 | ||||||
U.S. Airways Pass-Through-Trust 99-1A 8.360%, 1/20/19 | 329 | 359 | ||||||
11-1 A 7.125%, 10/22/23 | 438 | 477 | ||||||
UAL Pass-Through-Trust 07-01A 6.636%, 7/2/22 | 379 | 396 | ||||||
UCI International, Inc. | 480 | 480 | ||||||
United Artists Theatre Circuit, Inc. Series AW-0 9.300%, 7/1/15(5)(6) | 1 | 1 | ||||||
Series BE-9 9.300%, 7/1/15(5)(6) | 6 | 6 | ||||||
Series BD-1 9.300%, 7/1/15(5)(6) | 178 | 180 | ||||||
Series 95-A 9.300%, 7/1/15(5)(6) | 158 | 160 | ||||||
Unitymedia Hessen GmbH & Co. KG (Unitymedia NRW GmbH) 144A | 720 | 778 | ||||||
Univision Communications, Inc. 144A | 250 | 269 | ||||||
Valassis Communication, Inc. 6.625%, 2/1/21 | 885 | 918 | ||||||
Visteon Corp. | 250 | 264 | ||||||
|
| |||||||
| 16,112 | ||||||||
|
| |||||||
| Consumer Staples—0.9% | ||||||||
Rite Aid Corp. | 350 | 362 | ||||||
Select Medical Holdings Corp. 6.429%, 9/15/15(3) | 270 | 271 | ||||||
Yankee Candle Co. Holdings LLC (Yankee Finance, Inc.) Series B, 9.750%, 2/15/17 | 335 | 352 | ||||||
|
| |||||||
| 985 | ||||||||
|
| |||||||
| Energy—10.7% | ||||||||
Atwood Oceanics, Inc. | 375 | 403 | ||||||
Bill Barrett Corp. | 250 | 266 | ||||||
BreitBurn Energy Partners LP (BreitBurn Finance Corp.) 144A 7.875%, 4/15/22(2) | 295 | 307 | ||||||
Calumet Specialty Products Partners LP (Calumet Finance Corp.) | 230 | 248 | ||||||
144A 9.625%, 8/1/20(2) | 200 | 217 | ||||||
Carrizo Oil & Gas, Inc. | 230 | 248 | ||||||
Chesapeake Energy Corp. | 510 | 512 | ||||||
See Notes to Financial Statements
28
Table of Contents
VIRTUS HIGH YIELD FUND
SCHEDULE OF INVESTMENTS (Continued)
SEPTEMBER 30, 2012
($ reported in thousands)
| PAR VALUE | VALUE | |||||||
| Energy—continued | ||||||||
Compagnie Generale de Geophysique-Veritas | $ | 235 | $ | 243 | ||||
Copano Energy LLC (Copano Energy Finance Corp.) | 470 | 494 | ||||||
Crosstex Energy LP (Crosstex Energy Finance Corp.) | 335 | 359 | ||||||
Energy XXI Gulf Coast, Inc. | 210 | 237 | ||||||
EP Energy LLC (EP Energy Finance, Inc.) 144A | 415 | 453 | ||||||
EV Energy Partners LP (EV Energy Finance Corp.) | 125 | 130 | ||||||
Expro Finance Luxembourg SCA 144A | 172 | 178 | ||||||
Forest Oil Corp. | 350 | 349 | ||||||
Frontier Oil Corp. | 220 | 235 | ||||||
Gulfmark Offshore, Inc. 144A 6.375%, 3/15/22(2) | 400 | 416 | ||||||
Hercules Offshore, Inc. 144A 10.500%, 10/15/17(2) | 240 | 254 | ||||||
Linn Energy LLC (Linn Energy Finance Corp.) | 490 | 521 | ||||||
National JSC Naftogaz of Ukraine 9.500%, 9/30/14 | 500 | 511 | ||||||
OGX Austria GmbH 144A | 750 | 679 | ||||||
Parker Drilling Co. 144A | 400 | 433 | ||||||
PDC Energy, Inc. 144A | 255 | 255 | ||||||
Petroleos de Venezuela SA | 500 | 454 | ||||||
QEP Resources, Inc. | 365 | 414 | ||||||
Quicksilver Resources, Inc. | 400 | 344 | ||||||
SESI LLC | 500 | 538 | ||||||
Targa Resources Partners LP (Targa Resources Partners Finance Corp.) 144A | 560 | 596 | ||||||
TNK-BP Finance S.A. | 345 | 420 | ||||||
Venoco, Inc. | 180 | 186 | ||||||
|
| |||||||
| 10,900 | ||||||||
|
| |||||||
| Financials—16.8% | ||||||||
Agile Property Holdings Ltd. 144A 8.875%, 4/28/17(2) | 520 | 529 | ||||||
Air Lease Corp. 144A | 755 | 774 | ||||||
| PAR VALUE | VALUE | |||||||
| Financials—continued | ||||||||
Alfa Bank OJSC (Alfa Bond Issuance plc) 144A | $ | 200 | $ | 202 | ||||
Alfa Invest Ltd. RegS | 200 | 217 | ||||||
Ally Financial, Inc. | 2,000 | 1,765 | ||||||
ALROSA Finance SA 144A | 280 | 319 | ||||||
Alta Mesa Holdings LP (Alta Mesa Finance Services Corp.) | 275 | 276 | ||||||
Antero Resources Finance Corp. | 500 | 544 | ||||||
Avis Budget Car Rental LLC (Avis Budget Finance, Inc.) | 1,000 | 1,147 | ||||||
Banco ABC Brasil SA 144A | 310 | 333 | ||||||
Banco Bilbao Vizcaya Argentaria Bancomer SA 144A | 250 | 274 | ||||||
Banco do Brasil SA 144A | 475 | 568 | ||||||
Bank of Georgia JSC 144A | 240 | 245 | ||||||
CIT Group, Inc. 144A | 1,000 | 1,088 | ||||||
CNL Lifestyle Properties, Inc. | 500 | 476 | ||||||
Felcor Lodging LP | 1,000 | 1,078 | ||||||
General Motors Financial Co., Inc. | 200 | 205 | ||||||
Genworth Financial, Inc. 7.625%, 9/24/21 | 525 | 536 | ||||||
GRD Holdings III Corp. 144A | 320 | 322 | ||||||
Ineos Finance plc 144A 7.500%, 5/1/20(2) | 220 | 224 | ||||||
ING U.S., Inc. 144A 5.500%, 7/15/22(2) | 240 | 250 | ||||||
Intelsat Jackson Holdings SA 7.250%, 10/15/20 | 980 | 1,056 | ||||||
International Lease Finance Corp. | ||||||||
6.250%, 5/15/19 | 455 | 491 | ||||||
5.875%, 8/15/22 | 840 | 868 | ||||||
Kazkommerts Bank International BV 144A | 600 | 597 | ||||||
Morgan Stanley 144A 10.090%, 5/3/17 | 450 | BRL | 239 | |||||
Regions Bank | 250 | 296 | ||||||
Reynolds Group Issuer, Inc. (Reynolds Group Issuer LLC) | ||||||||
8.500%, 5/15/18 | 400 | 408 | ||||||
7.875%, 8/15/19 | 250 | 271 | ||||||
Springleaf Finance Corp. | ||||||||
5.850%, 6/1/13 | 250 | 250 | ||||||
5.400%, 12/1/15 | 250 | 226 | ||||||
United Rentals Financing Escrow Corp. 144A | 380 | 409 | ||||||
| PAR VALUE | VALUE | |||||||
| Financials—continued | ||||||||
UPCB Finance Ltd. | ||||||||
V 144A 7.250%, 11/15/21(2) | $ | 250 | $ | 273 | ||||
VI 144A 6.875%, 1/15/22(2) | 150 | 160 | ||||||
Vimpel Communications OJSC (VIP Finance Ireland Ltd.) 144A | 200 | 214 | ||||||
|
| |||||||
| 17,130 | ||||||||
|
| |||||||
| Health Care—5.8% | ||||||||
Aviv Healthcare Properties LP (Aviv Healthcare Capital Corp.) 7.750%, 2/15/19 | 465 | 495 | ||||||
Biomet, Inc. | 344 | 367 | ||||||
Community Health Systems, Inc. (CHS) | ||||||||
5.125%, 8/15/18 | 245 | 255 | ||||||
7.125%, 7/15/20 | 180 | 192 | ||||||
Grifols, Inc. | 500 | 555 | ||||||
HCA, Inc. | ||||||||
6.500%, 2/15/20 | 300 | 334 | ||||||
7.500%, 2/15/22 | 765 | 870 | ||||||
Health Management Associates, Inc. 144A | 250 | 272 | ||||||
Hologic, Inc. 144A 6.250%, 8/1/20(2) | 55 | 59 | ||||||
Kinetic Concepts, Inc. 144A 10.500%, 11/1/18(2) | 355 | 377 | ||||||
Sky Growth Acquisition Corp. 144A | 350 | 353 | ||||||
Symbion, Inc. | 320 | 330 | ||||||
Tenet Healthcare Corp. 6.250%, 11/1/18 | 250 | 277 | ||||||
United Surgical Partners, Inc. (United Surgical Patners Finance Corp.) 144A | 500 | 545 | ||||||
Valeant Pharmaceuticals International, Inc. 144A 7.250%, 7/15/22(2) | 300 | 318 | ||||||
VPI Escrow Corp. 144A 6.375%, 10/15/20(2) | 290 | 297 | ||||||
|
| |||||||
| 5,896 | ||||||||
|
| |||||||
| Industrials—10.0% | ||||||||
ADS Tactical, Inc. 144A 11.000%, 4/1/18(2) | 245 | 246 | ||||||
ADS Waste Holdings, Inc. 144A 8.250%, 10/1/20(2) | 250 | 256 | ||||||
Aircastle Ltd. | 715 | 795 | ||||||
Allison Transmission, Inc. 144A | 975 | 1,050 | ||||||
American Standard Americas 144A | 495 | 473 | ||||||
Bombardier, Inc. 144A 7.750%, 3/15/20(2) | 395 | 455 | ||||||
Briggs & Stratton Corp. 6.875%, 12/15/20 | 155 | 170 | ||||||
See Notes to Financial Statements
29
Table of Contents
VIRTUS HIGH YIELD FUND
SCHEDULE OF INVESTMENTS (Continued)
SEPTEMBER 30, 2012
($ reported in thousands)
| PAR VALUE | VALUE | |||||||
| Industrials—continued | ||||||||
CDRT Holding Corp. PIK 144A 9.250%, 10/1/17(2) | $ | 260 | $ | 252 | ||||
Cemex Finance LLC 144A 9.500%, 12/14/16(2) | 550 | 571 | ||||||
CHC Helicopter SA | 280 | 289 | ||||||
Deluxe Corp. | 235 | 251 | ||||||
Dycom Investments, Inc. 7.125%, 1/15/21 | 1,000 | 1,080 | ||||||
DynCorp International, Inc. | 1,110 | 963 | ||||||
GeoEye, Inc. | 205 | 225 | ||||||
Harland Clarke Holdings Corp. 144A | 125 | 120 | ||||||
Iron Mountain, Inc. 5.750%, 8/15/24 | 425 | 428 | ||||||
JMC Steel Group 144A 8.250%, 3/15/18(2) | 490 | 502 | ||||||
Kratos Defense & Security Solutions, Inc. | 250 | 271 | ||||||
Masco Corp. | 275 | 301 | ||||||
Pactiv LLC | 535 | 527 | ||||||
SBA Telecommunications, Inc. 144A | 315 | 332 | ||||||
ServiceMaster Co. 144A 7.000%, 8/15/20(2) | 95 | 98 | ||||||
U.S. Airways Pass-Through-Trust 98-1 | 500 | 523 | ||||||
|
| |||||||
| 10,178 | ||||||||
|
| |||||||
| Information Technology—3.2% | ||||||||
Audatex North America, Inc. 144A | 290 | 311 | ||||||
CommScope, Inc. 144A 8.250%, 1/15/19(2) | 475 | 515 | ||||||
CoreLogic, Inc. | 1,000 | 1,088 | ||||||
Digicel Ltd. 144A | 325 | 354 | ||||||
First Data Corp. | 1,000 | 975 | ||||||
|
| |||||||
| 3,243 | ||||||||
|
| |||||||
| Materials—5.1% | ||||||||
American Rock Salt Co. LLC 144A | 1,000 | 912 | ||||||
Ardagh Packaging Finance plc 144A | 275 | 292 | ||||||
Cascades, Inc. | 880 | 926 | ||||||
Edgen Murray Corp. 12.250%, 1/15/15 | 260 | 279 | ||||||
FMG Resources Property Ltd. 144A | 300 | 281 | ||||||
| PAR VALUE | VALUE | |||||||
| Materials—continued | ||||||||
Ineos Finance plc 144A 8.375%, 2/15/19(2) | $ | 140 | $ | 148 | ||||
Libbey Glass, Inc. 144A 6.875%, 5/15/20(2) | 250 | 270 | ||||||
Nufarm Australia Ltd. 144A | 190 | 193 | ||||||
Sappi Papier Holding GmbH | 250 | 268 | ||||||
144A 6.625%, 4/15/21(2) | 500 | 483 | ||||||
Severstal OAO (Steel Capital SA) 144A 6.250%, 7/26/16(2)(7) | 695 | 728 | ||||||
Taseko Mines Ltd. | 165 | 159 | ||||||
Vedanta Resources plc 144A | 250 | 259 | ||||||
|
| |||||||
| 5,198 | ||||||||
|
| |||||||
| Telecommunication Services—8.1% | ||||||||
Cincinnati Bell, Inc. | 230 | 247 | ||||||
Clearwire Communications LLC (Clearwire Finance, Inc.) 144A | 200 | 199 | ||||||
Digicel Group Ltd. 144A 8.250%, 9/30/20(2) | 500 | 527 | ||||||
Frontier Communications Corp. | ||||||||
8.125%, 10/1/18 | 295 | 333 | ||||||
7.125%, 1/15/23 | 410 | 428 | ||||||
GCI, Inc. | 665 | 722 | ||||||
Hughes Satellite Systems Corp. | 250 | 278 | ||||||
ITC DeltaCom, Inc. | 845 | 908 | ||||||
Level 3 Financing, Inc. 144A | 200 | 203 | ||||||
MetroPCS Wireless, Inc. | 570 | 599 | ||||||
Sprint Capital Corp. | 1,575 | 1,457 | ||||||
Virgin Media Finance plc | 250 | 286 | ||||||
WideOpenWest Finance LLC (WideOpenWest Capital Corp.) 144A 10.250%, 7/15/19(2) | 350 | 371 | ||||||
Wind Acquisition Finance S.A. 144A 11.750%, 7/15/17(2) | 300 | 284 | ||||||
144A 7.250%, 2/15/18(2) | 370 | 352 | ||||||
Windstream Corp. | ||||||||
8.125%, 9/1/18 | 95 | 103 | ||||||
7.000%, 3/15/19 | 750 | 769 | ||||||
7.750%, 10/15/20 | 250 | 269 | ||||||
|
| |||||||
| 8,335 | ||||||||
|
| |||||||
| Utilities—3.6% | ||||||||
AmeriGas Partners LP (AmeriGas Finance Corp.) | ||||||||
6.250%, 8/20/19 | 230 | 240 | ||||||
7.000%, 5/20/22 | 300 | 324 | ||||||
Atlas Pipeline Partners LP (Atlas Pipeline Finance Corp.) 144A | 155 | 158 | ||||||
| PAR VALUE | VALUE | |||||||
| Utilities—continued | ||||||||
Calpine Corp. | $ | 245 | $ | 269 | ||||
144A 7.500%, 2/15/21(2) | 490 | 532 | ||||||
Covanta Holding Corp. | 750 | 819 | ||||||
NRG Energy, Inc. | ||||||||
7.625%, 5/15/19 | 830 | 884 | ||||||
144A 6.625%, 3/15/23(2) | 70 | 72 | ||||||
Texas Competitive Electric Holdings Co., LLC (Texas Competitive Holdings Finance, Inc.) 144A | 500 | 394 | ||||||
|
| |||||||
| 3,692 | ||||||||
| TOTAL CORPORATE BONDS AND NOTES (Identified Cost $77,854) | 81,669 | |||||||
| LOAN AGREEMENTS(3)—11.1% | ||||||||
| Consumer Discretionary—3.1% | ||||||||
BJ’s Wholesale Club, Inc. Second Lien | 85 | 86 | ||||||
Cannery Casino Resorts LLC | 166 | 166 | ||||||
Cengage Learning Acquisitions, Inc. | 322 | 308 | ||||||
Chrysler Group LLC (Chrysler Group Co-Issuer, Inc.) | 296 | 303 | ||||||
Clear Channel Communications, Inc. | 256 | 241 | ||||||
Tranche B, 3.870%, 1/29/16 | 581 | 477 | ||||||
Cumulus Media Holdings, Inc. Second Lien, | 325 | 329 | ||||||
Granite Broadcasting Corp. Tranche B | 195 | 196 | ||||||
Landry’s, Inc. (Landry’s Restaurants, Inc.) Tranche B, | 398 | 405 | ||||||
SRAM LLC Second Lien, | 235 | 239 | ||||||
Station GVR Acquisition LLC (Green Valley Ranch Gaming LLC) | 183 | 184 | ||||||
Transtar Holding Co. Second Lien, 10.750%, 12/21/17 | 200 | 204 | ||||||
|
| |||||||
| 3,138 | ||||||||
|
| |||||||
| Consumer Staples—0.3% | ||||||||
SuperValu, Inc. | 364 | 367 | ||||||
|
| |||||||
See Notes to Financial Statements
30
Table of Contents
VIRTUS HIGH YIELD FUND
SCHEDULE OF INVESTMENTS (Continued)
SEPTEMBER 30, 2012
($ reported in thousands)
| PAR VALUE | VALUE | |||||||
| Energy—1.0% | ||||||||
Chesapeake Energy Corp. | $ | 210 | $ | 211 | ||||
Frac Tech Services LLC | 445 | 430 | ||||||
NGPL PipeCo LLC | 267 | 273 | ||||||
TI Group Automotive Systems LLC | 159 | 160 | ||||||
|
| |||||||
| 1,074 | ||||||||
|
| |||||||
| Financials—2.1% | ||||||||
Asurion LLC (Asurion Corp.) Second Lien, | 103 | 106 | ||||||
First American Payment Systems LP | 99 | 100 | ||||||
Homeward Residential, Inc. | 299 | 304 | ||||||
iStar Financial, Inc. | 375 | 375 | ||||||
Tranche A-2, 7.000%, 3/19/17 | 250 | 255 | ||||||
Lonestar Intermediate Super Holdings LLC | 92 | 98 | ||||||
Nuveen Investments, Inc. Second Lien, | 191 | 193 | ||||||
Realogy Corp. | 30 | 30 | ||||||
Extended First Lien, | 385 | 381 | ||||||
Springleaf Financial Funding Co. (American General Finance Corp.) | 300 | 294 | ||||||
|
| |||||||
| 2,136 | ||||||||
|
| |||||||
| Health Care—0.7% | ||||||||
AMN Healthcare, Inc. Tranche B, 6.000%, 4/5/18 | 429 | 436 | ||||||
MModal, Inc. Tranche B, | 250 | 248 | ||||||
|
| |||||||
| 684 | ||||||||
|
| |||||||
| Industrials—0.6% | ||||||||
Aveta, Inc. | 120 | 122 | ||||||
(NAMM Holdings, Inc.) | 120 | 121 | ||||||
Harland Clarke Holdings Corp. Tranche B-2 | 194 | 175 | ||||||
Zuffa LLC | 184 | 185 | ||||||
|
| |||||||
| 603 | ||||||||
|
| |||||||
| Information Technology—2.1% | ||||||||
Blue Coat Systems, Inc. First Lien, 7.500%, 2/15/18 | 283 | 286 | ||||||
DynCorp International LLC | 163 | 163 | ||||||
| PAR VALUE | VALUE | |||||||
| Information Technology—continued | ||||||||
First Data Corp. | $ | 289 | $ | 286 | ||||
Tranche B 5.220%, 3/24/17 | 125 | 123 | ||||||
Freescale Semiconductor, Inc. Tranche B-1, | 450 | 440 | ||||||
Infor (US), Inc. (Lawson Software, Inc.) Tranche B | 399 | 402 | ||||||
Veyance Technologies, Inc. 0.000%, 7/31/15 | 230 | 220 | ||||||
Zayo Group LLC (Zayo Capital, Inc.) | 188 | 190 | ||||||
|
| |||||||
| 2,110 | ||||||||
|
| |||||||
| Materials—0.4% | ||||||||
Essar Steel Algoma, Inc. (Algoma Steel, Inc.) | 420 | 424 | ||||||
|
| |||||||
| Telecommunication Services—0.8% | ||||||||
Hawaiian Telcom Communications, Inc. | 250 | 254 | ||||||
Level 3 Financing, Inc. Tranche A, | 562 | 567 | ||||||
|
| |||||||
| 821 | ||||||||
| TOTAL LOAN AGREEMENTS (Identified Cost $11,148) | 11,357 | |||||||
| SHARES | ||||||||
| PREFERRED STOCK—1.0% | ||||||||
| Financials—1.0% | ||||||||
Citigroup Capital XVII | 20,000 | 499 | ||||||
GMAC Capital Trust I | 20,800 | 522 | ||||||
| TOTAL PREFERRED STOCK (Identified Cost $1,020) | 1,021 | |||||||
| TOTAL LONG TERM INVESTMENTS—98.7% | ||||||||
| (Identified cost $96,195) | 100,643 | |||||||
| SHORT-TERM INVESTMENTS—0.9% | ||||||||
| Money Market Mutual Funds—0.9% | ||||||||
BlackRock Liquidity Funds TempFund Portfolio – Insitutional Shares (seven-day effective yield 0.140%) | 965,920 | 966 | ||||||
| TOTAL SHORT-TERM INVESTMENTS (Identified Cost $966) | 966 | |||||||
| TOTAL INVESTMENTS—99.6% (Identified Cost $97,161) | 101,609 | (1) | ||||||
Other assets and liabilities, net—0.4% |
| 445 | ||||||
|
| |||||||
| NET ASSETS—100.0% | $ | 102,054 | ||||||
|
| |||||||
Abbreviations:
| PIK | Payment-in-Kind Security |
Footnote Legend:
| (1) | Federal Income Tax Information: For tax information at September 30, 2012, see Note 11 Federal Income Tax Information in the Notes to Financial Statements. |
| (2) | Security exempt from registration under Rule 144A of the Securities Act of 1933. These securities may be resold in transactions exempt from registration, normally to qualified institutional buyers. At September 30, 2012, these securities amounted to a value of $33,855 or 33.2% of net assets. |
| (3) | Variable or step coupon security; interest rate shown reflects the rate in effect at September 30, 2012. |
| (4) | Regulation S security. Security is offered and sold outside of the United States, therefore, it is exempt from registration with the SEC under rules 903 and 904 of the Securities Act of 1933. |
| (5) | Security valued at fair value as determined in good faith by or under the direction of the Trustees. This security is disclosed as a Level 3 security in the disclosure table located after the Schedule of Investments. |
| (6) | Illiquid security. |
| (7) | Security in default. |
Foreign Currencies:
| BRL | Brazilian Real |
| MXN | Mexican Peso |
| TRY | Turkish Lira |
| ZAR | South African Rand |
| Country Weightings (Unaudited)† | ||||
United States | 81 | % | ||
Luxembourg | 3 | |||
Bermuda | 2 | |||
Brazil | 2 | |||
Canada | 2 | |||
Ireland | 1 | |||
United Kingdom | 1 | |||
Other | 8 | |||
Total | 100 | % | ||
† % of total investments as of September 30, 2012 |
| |||
See Notes to Financial Statements
31
Security abbreviation definitions are located under the Key Investment Terms starting on page 4.
Table of Contents
VIRTUS HIGH YIELD FUND
SCHEDULE OF INVESTMENTS (Continued)
SEPTEMBER 30, 2012
($ reported in thousands)
The following table provides a summary of inputs used to value the Fund’s investments as of September 30, 2012 (See Security Valuation Note 2A in the Notes to Financial Statements):
| Total Value at September 30, 2012 | Level 1 – Quoted Prices | Level 2 – Significant Observable Inputs | Level 3 – Significant Unobservable Inputs | |||||||||||||
Debt Securities: | ||||||||||||||||
Asset-Backed Securities | $ | 885 | $ | — | $ | 885 | $ | — | ||||||||
Corporate Bonds and Notes | 81,669 | — | 81,322 | 347 | ||||||||||||
Foreign Government Securities | 2,583 | — | 2,583 | — | ||||||||||||
Loan Agreements | 11,357 | — | 11,357 | — | ||||||||||||
Mortgage-Backed Securities | 3,128 | — | 3,128 | — | ||||||||||||
Equity Securities: | ||||||||||||||||
Preferred Stock | 1,021 | — | 1,021 | — | ||||||||||||
Short-Term Investments | 966 | 966 | — | — | ||||||||||||
|
|
|
|
|
|
|
| |||||||||
Total Investments | $ | 101,609 | $ | 966 | $ | 100,296 | $ | 347 | ||||||||
|
|
|
|
|
|
|
| |||||||||
The following is a reconciliation of assets of the Fund for Level 3 investments for which significant unobservable inputs were used to determine fair value.
| Corporate Bonds and Notes | ||||
Investments in Securities | ||||
Balance as of September 30, 2011: | $ | 511 | ||
Accrued discount/(Premium) | 5 | |||
Realized gain (loss) | (4,799 | ) | ||
Change in unrealized appreciation (depreciation) | 4,890 | |||
Purchases | — | |||
Sales(b) | (260 | ) | ||
Transfers into Level 3(a) | — | |||
Transfers from Level 3(a) | — | |||
|
| |||
Balance as of September 30, 2012 | $ | 347 | (c) | |
|
| |||
| (a) | “Transfers into and/or from” represent the ending value as of September 30, 2012, for any investment security where a change in the pricing level occurred from the beginning to the end of the period. |
| (b) | Includes paydowns on securities, if applicable. |
| (c) | Includes internally fair valued securities. Refer to the last paragraph under “Note 2A. Security Valuation” in the Notes to Financial Statements for a description of the valuation process in place and a qualitative discussion about sensitive inputs used in Level 3 internally fair valued measurements. |
See Notes to Financial Statements
32
Table of Contents
VIRTUS MULTI-SECTOR FIXED INCOME FUND
SCHEDULE OF INVESTMENTS
SEPTEMBER 30, 2012
($ reported in thousands)
| PAR VALUE | VALUE | |||||||
| MUNICIPAL BONDS—0.2% | ||||||||
| Kentucky—0.1% | ||||||||
Commonwealth of Kentucky Taxable 3.165%, 4/1/18 | $ | 505 | $ | 526 | ||||
|
| |||||||
| Michigan—0.0% | ||||||||
Tobacco Settlement Finance Authority Taxable | 155 | 125 | ||||||
|
| |||||||
| Virginia—0.1% | ||||||||
Tobacco Settlement Financing Corp. Taxable Series 07-A1, | 345 | 234 | ||||||
| TOTAL MUNICIPAL BONDS (Identified Cost $979) | 885 | |||||||
| FOREIGN GOVERNMENT SECURITIES—11.9% | ||||||||
Bolivarian Republic of Venezuela | 545 | 499 | ||||||
RegS 7.000%, 12/1/18(5) | 510 | 439 | ||||||
RegS 9.250%, 9/15/27(5) | 360 | 326 | ||||||
9.375%, 1/13/34 | 2,145 | 1,914 | ||||||
Commonwealth of Australia Series 118, | 2,880 | AUD | 3,053 | |||||
Commonwealth of Canada 1.750%, 3/1/13 | 4,455 | 4,545 | ||||||
Commonwealth of New Zealand | 2,104 | NZD | 1,781 | |||||
Series 415, | 220 | NZD | 198 | |||||
Federative Republic of Brazil | 1,235 | BRL | 765 | |||||
8.500%, 1/5/24 | 6,195 | BRL | 3,575 | |||||
Kingdom of Norway | 9,493 | NOK | 1,705 | |||||
Kingdom of Spain | 460 | EUR | 586 | |||||
Kingdom of Sweden | 5,310 | SEK | 886 | |||||
Republic of Argentina Provincia de Bueno Aires Series GDP, 144A | 500 | 363 | ||||||
Provincia de Neuquen 144A | 628 | 556 | ||||||
PIK Interest Capitalization 8.280%, 12/31/33 | 5,186 | 4,097 | ||||||
Series GDP 144A 12.500%, 12/15/35(3)(4) | 1,740 | 231 | ||||||
Republic of Colombia 12.000%, 10/22/15 | 925,000 | COP | 633 | |||||
4.375%, 3/21/23 | 1,867,000 | COP | 1,019 | |||||
| PAR VALUE | VALUE | |||||||
| FOREIGN GOVERNMENT SECURITIES—continued | ||||||||
Republic of Croatia 144A 6.375%, 3/24/21(4) | 1,045 | $ | 1,159 | |||||
Republic of Iceland 144A 5.875%, 5/11/22(4) | $ | 925 | 1,009 | |||||
Republic of Indonesia | 6,200,000 | IDR | 656 | |||||
Republic of Lithuania | 500 | 635 | ||||||
144A 6.625%, 2/1/22(4) | 450 | 558 | ||||||
Republic of Peru | 1,065 | PEN | 508 | |||||
RegS 6.900%, 8/12/37(5) | 2,010 | PEN | 932 | |||||
Republic of South Africa Series R206 | 11,845 | ZAR | 1,465 | |||||
Series R-208 | 15,265 | ZAR | 1,855 | |||||
Republic of Turkey | 5,855 | TRY | 3,321 | |||||
Republic of Ukraine 144A 7.950%, 6/4/14(4) | 550 | 551 | ||||||
Slovak Republic 144A 4.375%, 5/21/22(4) | 850 | 894 | ||||||
State of Qatar 144A 4.500%, 1/20/22(4) | 550 | 622 | ||||||
United Mexican States Series M, 6.000%, 6/18/15 | 30,592 | MXN | 2,455 | |||||
Series M, 6.500%, 6/9/22 | 30,825 | MXN | 2,604 | |||||
| TOTAL FOREIGN GOVERNMENT SECURITIES (Identified Cost $43,873) | 46,395 | |||||||
| MORTGAGE-BACKED SECURITIES—12.4% | ||||||||
| Non-Agency—12.4% | ||||||||
Bear Stearns Commercial Mortgage Securities, Inc. 06-T22, AM | 900 | 987 | ||||||
06-PW12, AM | 650 | 722 | ||||||
05-PW10, AM | 895 | 953 | ||||||
06-PW13, AM | 1,360 | 1,512 | ||||||
07-T28, A4 | 800 | 953 | ||||||
07-PW18, AM | 1,525 | 1,662 | ||||||
Chase Mortgage Finance Corp. 07-A1, 10A1 | 880 | 874 | ||||||
Citigroup – Deutsche Bank Commercial Mortgage Trust | 610 | 670 | ||||||
07-CD4, A4 | 475 | 541 | ||||||
| PAR VALUE | VALUE | |||||||
| Non-Agency—continued | ||||||||
Countrywide Alternative Loan Trust | $ | 902 | $ | 672 | ||||
06-13T1, A5 | 843 | 632 | ||||||
Countrywide Home Loan Mortgage Pass-Through-Trust | 537 | 544 | ||||||
05-22, 3A1 | 1,000 | 834 | ||||||
Credit Suisse Mortgage Capital Certificates | 433 | 444 | ||||||
07-C2, A3 5.542%, 1/15/49(3) | 1,555 | 1,743 | ||||||
Extended Stay America Trust 10-ESHA, D, 144A | 1,255 | 1,265 | ||||||
GE Capital Commercial Mortgage Corp. 03-C1, C | 595 | 602 | ||||||
GMAC Commercial Mortgage Securities, Inc. 04-C2, A3 | 379 | 391 | ||||||
GMAC Mortgage Corp. Loan Trust 06-HLTV, A4 | 897 | 874 | ||||||
Goldman Sachs Mortgage Pass-Through Securities Mortgage Loan Trust 05-RP1, 1A3 144A | 1,352 | 1,449 | ||||||
Goldman Sachs Mortgage Securities Corp. II 07-GG10, A4 | 1,300 | 1,489 | ||||||
JPMorgan Chase Commercial Mortgage Securities Corp. | 750 | 830 | ||||||
06-CB17, AM 5.464%, 12/12/43 | 1,200 | 1,227 | ||||||
06-LDP7, AM 5.870%, 4/15/45(3) | 1,000 | 1,125 | ||||||
06-LDP7, A4 6.061%, 4/15/45(3) | 1,800 | 2,076 | ||||||
07-LD12, A4 5.882%, 2/15/51(3) | 750 | 883 | ||||||
Lehman Brothers – UBS Commercial Mortgage Trust | 740 | 811 | ||||||
07-C2, A3 5.430%, 2/15/40 | 1,100 | 1,259 | ||||||
07-C7, A3 5.866%, 9/15/45(3) | 600 | 715 | ||||||
See Notes to Financial Statements
33
Table of Contents
VIRTUS MULTI-SECTOR FIXED INCOME FUND
SCHEDULE OF INVESTMENTS (Continued)
SEPTEMBER 30, 2012
($ reported in thousands)
| PAR VALUE | VALUE | |||||||
| Non-Agency—continued | ||||||||
Lehman Brothers Commercial Conduit Mortgage Trust 07-C3, A4 | $ | 500 | $ | 594 | ||||
MASTR Alternative Loans Trust 04-6, 10A1 | 762 | 774 | ||||||
MASTR Reperforming Loan Trust 05-1, 1A5 144A | 833 | 867 | ||||||
Merrill Lynch Mortgage Investors, Inc. 98-C1, C | 1,260 | 1,403 | ||||||
Merrill Lynch Mortgage Trust 06-C1, AM | 715 | 790 | ||||||
Morgan Stanley Capital I, Inc. | 9 | 9 | ||||||
07-IQ14, A4 | 970 | 1,110 | ||||||
Morgan Stanley Mortgage Loan Trust 07-11AR, 2A3 | 1,635 | 864 | ||||||
Nomura Asset Acceptance Corp. | 1,671 | 1,697 | ||||||
04-R3, A1 144A 6.500%, 2/25/35(4) | 524 | 531 | ||||||
06-AF2, 1A6 6.196%, 8/25/36(3) | 1,976 | 968 | ||||||
Opteum Mortgage Acceptance Corp. | 1,220 | 1,166 | ||||||
Residential Accredit Loans, Inc. 04-QS16, 1A5 | 1,234 | 1,204 | ||||||
Residential Funding Mortgage Securities I, Inc. 05-S1, 1A2 | 1,650 | 1,683 | ||||||
SunTrust Adjustable Rate Mortgage Loan Trust 07-S1, 5A1 | 998 | 984 | ||||||
Wachovia Bank Commercial Mortgage Trust | ||||||||
06-C25, AM 5.923%, 5/15/43(3) | 1,125 | 1,238 | ||||||
07-C30, A5 5.342%, 12/15/43 | 1,610 | 1,823 | ||||||
07-C32, A3 5.750%, 6/15/49(3) | 360 | 415 | ||||||
07-C33, A4 | 550 | 648 | ||||||
Washington Mutual Commercial Mortgage Securities Trust | 624 | 613 | ||||||
| PAR VALUE | VALUE | |||||||
| Non-Agency—continued | ||||||||
Wells Fargo Mortgage Backed Securities Trust 07-16, 1A7 | $ | 322 | $ | 307 | ||||
| TOTAL MORTGAGE-BACKED SECURITIES (Identified Cost $44,504) | 48,427 | |||||||
| ASSET-BACKED SECURITIES—4.3% | ||||||||
ABSC Long Beach Home Equity Loan Trust | 930 | 716 | ||||||
AmeriCredit Automobile Receivables Trust | 300 | 325 | ||||||
11-5, E 6.760%, 3/8/19 | 600 | 657 | ||||||
Banc of America Funding Corp. 06-2, 3A1 | 514 | 525 | ||||||
Bombardier Capital Mortgage Securitization Corp. 99-A, A3 | 574 | 570 | ||||||
Citicorp Residential Mortgage Securities, Inc. 07-2, A3 | 1,323 | 1,323 | ||||||
Conseco Financial Corp. 01-3, A4 | 521 | 546 | ||||||
Countrywide Asset-Backed Certificates | 475 | 464 | ||||||
05-12, 1A4 | 1,150 | 1,128 | ||||||
Dominos Pizza Master Issuer LLC | 1,241 | 1,384 | ||||||
Equity One ABS, Inc. | 866 | 660 | ||||||
GSAA Home Equity Trust 05-12, AF3W | 1,145 | 1,150 | ||||||
Hertz Vehicle Financing LLC 11-1A, A2, 144A | 655 | 706 | ||||||
IndyMac Manufactured Housing Contract 98-1, A3 6.370%, 9/25/28 | 380 | 396 | ||||||
Lehman XS Trust | 870 | 850 | ||||||
Origen Manufactured Housing Contract Trust 04-B, M1 | 746 | 794 | ||||||
| PAR VALUE | VALUE | |||||||
| ASSET-BACKED SECURITIES—continued | ||||||||
Popular ABS Mortgage Pass-Through-Trust | $ | 267 | $ | 255 | ||||
Residential Funding Mortgage Securities II, Inc. | 1,052 | 1,064 | ||||||
07-HI1, A3 5.720%, 3/25/37 | 925 | 926 | ||||||
Structured Asset Securities Corp. 07-EQ1, A2 | 561 | 430 | ||||||
TAL Advantage LLC | 967 | 1,008 | ||||||
Terwin Mortgage Trust 04-15AL, A1 144A | 424 | 405 | ||||||
Trip Rail Master Funding LLC 11-1A, A1A, 144A | 369 | 379 | ||||||
| TOTAL ASSET-BACKED SECURITIES (Identified Cost $16,091) | 16,661 | |||||||
| CORPORATE BONDS AND NOTES—52.3% | ||||||||
| Consumer Discretionary—6.0% | ||||||||
American Axle & Manufacturing Holdings, Inc. 144A 9.250%, 1/15/17(4) | 315 | 354 | ||||||
American Axle & Manufacturing, Inc. | 945 | 962 | ||||||
Arcos Dorados B.V. 144A 7.500%, 10/1/19(4) | 175 | 196 | ||||||
Arcos Dorados Holdings, Inc. 144A | 1,125 | BRL | 597 | |||||
Boyd Gaming Corp. | 215 | 227 | ||||||
144A 9.000%, 7/1/20(4) | 425 | 436 | ||||||
Cengage Learning Acquisitions, Inc. 144A 10.500%, 1/15/15(4) | 400 | 335 | ||||||
Claire’s Stores, Inc. 144A 9.000%, 3/15/19(4) | 880 | 917 | ||||||
Clear Channel Communications, Inc. 9.000%, 3/1/21 | 500 | 447 | ||||||
Dana Holding Corp. | 426 | 456 | ||||||
DISH DBS Corp. 144A | 1,200 | 1,233 | ||||||
Gap, Inc. (The) | 300 | 334 | ||||||
Gateway Casinos & Entertainment Ltd. 144A | 200 | CAD | 214 | |||||
Globo Comunicacao e Participacoes SA 144A | 930 | 1,008 | ||||||
See Notes to Financial Statements
34
Table of Contents
VIRTUS MULTI-SECTOR FIXED INCOME FUND
SCHEDULE OF INVESTMENTS (Continued)
SEPTEMBER 30, 2012
($ reported in thousands)
| PAR VALUE | VALUE | |||||||
| Consumer Discretionary—continued | ||||||||
HD Supply, Inc. 144A | $ | 390 | $ | 424 | ||||
HOA Restaurant Group LLC (HOA Finance Corp.) 144A 11.250%, 4/1/17(4) | 715 | 656 | ||||||
International Game Technology 7.500%, 6/15/19 | 580 | 696 | ||||||
inVentive Health, Inc. 144A 10.000%, 8/15/18(4) | 400 | 354 | ||||||
Landry’s, Inc. 144A | 475 | 503 | ||||||
Lotte Shopping Co. Ltd. 144A 3.375%, 5/9/17(4) | 800 | 834 | ||||||
Mediacom LLC (Mediacom Capital Corp.) | 750 | 832 | ||||||
MGM Resorts International 144A | 990 | 992 | ||||||
Nara Cable Funding Ltd. 144A | 1,100 | 1,009 | ||||||
Northwest Airlines Pass-Through-Trust | 738 | 768 | ||||||
02-1, G2 6.264%, 11/20/21 | 963 | 1,016 | ||||||
Ono Finance II plc 144A | 150 | 128 | ||||||
Penn National Gaming, Inc. | 700 | 787 | ||||||
Pittsburgh Glass Works LLC 144A | 650 | 608 | ||||||
QVC, Inc. | 1,070 | 1,184 | ||||||
144A 5.125%, 7/2/22(4) | 240 | 254 | ||||||
River Rock Entertainment Authority (The) | 232 | 145 | ||||||
Seneca Gaming Corp. 144A 8.250%, 12/1/18(4) | 70 | 74 | ||||||
U.S. Airways Pass-Through-Trust | 987 | 1,076 | ||||||
11-1 A 7.125%, 10/22/23 | 713 | 778 | ||||||
UAL Pass-Through-Trust 09-2 9.750%, 1/15/17 | 486 | 557 | ||||||
07-01A 6.636%, 7/2/22 | 694 | 725 | ||||||
Univision Communications, Inc. | 125 | 134 | ||||||
144A 6.750%, 9/15/22(4) | 565 | 568 | ||||||
Wyndham Worldwide Corp. | 590 | 712 | ||||||
|
| |||||||
| 23,530 | ||||||||
|
| |||||||
| Consumer Staples—0.4% | ||||||||
BAT International Finance plc 144A | 885 | 909 | ||||||
Flowers Foods, Inc. 4.375%, 4/1/22 | 650 | 670 | ||||||
|
| |||||||
| 1,579 | ||||||||
|
| |||||||
| PAR VALUE | VALUE | |||||||
| Energy—8.5% | ||||||||
Afren plc 144A | $ | 475 | $ | 545 | ||||
Antero Resources Finance Corp. | 250 | 278 | ||||||
Atwood Oceanics, Inc. | 825 | 887 | ||||||
Bill Barrett Corp. | 650 | 692 | ||||||
BreitBurn Energy Partners LP (BreitBurn Finance Corp.) 144A | 1,005 | 1,045 | ||||||
Calumet Specialty Products Partners LP (Calumet Finance Corp.) | 763 | 824 | ||||||
Carrizo Oil & Gas, Inc. | 686 | 739 | ||||||
Chesapeake Energy Corp. | 320 | 321 | ||||||
Cimarex Energy Co. | 1,025 | 1,086 | ||||||
Compagnie Generale de Geophysique-Veritas | ||||||||
7.750%, 5/15/17 | 110 | 114 | ||||||
6.500%, 6/1/21 | 725 | 750 | ||||||
Energy Partners Ltd. | 500 | 505 | ||||||
Energy XXI Gulf Coast, Inc. | 500 | 564 | ||||||
EP Energy LLC (EP Energy Finance, Inc.) 144A | 840 | 917 | ||||||
EV Energy Partners LP (EV Energy Finance Corp.) | 325 | 339 | ||||||
Expro Finance Luxembourg SCA 144A | 460 | 476 | ||||||
Frontier Oil Corp. | 210 | 225 | ||||||
Gazprom OAO (Gaz Capital SA) | 935 | 1,039 | ||||||
144A 8.146%, 4/11/18(4) | 460 | 560 | ||||||
144A 6.510%, 3/7/22(4) | 315 | 370 | ||||||
Gulfmark Offshore, Inc. 144A | 760 | 790 | ||||||
Hercules Offshore, Inc. 144A | 640 | 678 | ||||||
Linn Energy LLC (Linn Energy Finance Corp.) 144A | 512 | 515 | ||||||
Lukoil International Finance BV | 525 | 632 | ||||||
144A 6.125%, 11/9/20(4)(10) | 500 | 564 | ||||||
MIE Holdings Corp. 144A 9.750%, 5/12/16(4) | 550 | 573 | ||||||
National JSC Naftogaz of Ukraine | 600 | 613 | ||||||
| PAR VALUE | VALUE | |||||||
| Energy—continued | ||||||||
OGX Austria GmbH 144A 8.500%, 6/1/18(4) | $ | 800 | $ | 724 | ||||
Parker Drilling Co. 144A 9.125%, 4/1/18 | 775 | 839 | ||||||
PDC Energy, Inc. 144A 7.750%, 10/15/22(4) | 805 | 805 | ||||||
Petrobras International Finance Co. | 500 | 564 | ||||||
Petroleos de Venezuela SA | ||||||||
Series 2014 | 1,005 | 910 | ||||||
RegS | 375 | 298 | ||||||
RegS | 4,275 | 3,880 | ||||||
Petroleos Mexicanos 6.000%, 3/5/20 | 270 | 323 | ||||||
5.500%, 1/21/21 | 550 | 645 | ||||||
5.500%, 6/27/44 | 650 | 715 | ||||||
Petroplus Finance Ltd. 144A | 535 | 78 | ||||||
Petropower I Funding Trust 144A | 186 | 190 | ||||||
QEP Resources, Inc. 6.875%, 3/1/21 | 480 | 545 | ||||||
Rowan Cos., Inc. | 870 | 934 | ||||||
SESI LLC | 650 | 699 | ||||||
Swift Energy Co. | 500 | 542 | ||||||
Targa Resources Partners LP (Targa Resources Partners Finance Corp.) 144A | 1,050 | 1,118 | ||||||
TNK-BP Finance S.A. 144A | 100 | 121 | ||||||
TNK-BP Finance SA RegS 7.500%, 7/18/16(5) | 1,165 | 1,346 | ||||||
Venoco, Inc. | ||||||||
11.500%, 10/1/17 | 600 | 621 | ||||||
8.875%, 2/15/19 | 225 | 197 | ||||||
Weatherford International Ltd. | 318 | 414 | ||||||
|
| |||||||
| 33,149 | ||||||||
|
| |||||||
| Financials—19.6% | ||||||||
Abbey National Treasury Services plc 144A | 815 | 832 | ||||||
ABN Amro Bank N.V. 144A | 850 | 912 | ||||||
ADCB Finance Cayman Ltd. 144A | 560 | 590 | ||||||
Agile Property Holdings Ltd. 144A | 240 | 256 | ||||||
Air Lease Corp. 144A 5.625%, 4/1/17(4) | 770 | 789 | ||||||
See Notes to Financial Statements
35
Table of Contents
VIRTUS MULTI-SECTOR FIXED INCOME FUND
SCHEDULE OF INVESTMENTS (Continued)
SEPTEMBER 30, 2012
($ reported in thousands)
| PAR VALUE | VALUE | |||||||
| Financials—continued | ||||||||
Alfa Invest Ltd. RegS | $ | 755 | $ | 817 | ||||
Allstate Corp. | 680 | 700 | ||||||
ALROSA Finance SA 144A | 1,065 | 1,211 | ||||||
Alta Mesa Holdings LP (Alta Mesa Finance Services Corp.) | 775 | 779 | ||||||
American International Group, Inc. | 350 | 395 | ||||||
8.175%, 5/15/58(3) | 650 | 795 | ||||||
Banco ABC Brasil SA 144A | 1,025 | 1,101 | ||||||
Banco Bilbao Vizcaya Argentaria Bancomer SA 144A 6.500%, 3/10/21(4) | 425 | 466 | ||||||
144A 6.750%, 9/30/22(4) | 1,000 | 1,092 | ||||||
Banco Bradesco SA 144A 5.900%, 1/16/21(4) | 1,150 | 1,233 | ||||||
Banco de Credito del Peru 144A | 600 | 633 | ||||||
Banco do Brasil SA 144A 5.375%, 1/15/21(4) | 600 | 630 | ||||||
Banco Internacional del Peru SAA 144A | 1,060 | 1,121 | ||||||
Banco Santander Chile 144A 3.875%, 9/20/22(4) | 945 | 948 | ||||||
Banco Votorantim SA 144A | 550 | 616 | ||||||
Bancolombia SA | 1,015 | 1,025 | ||||||
Bank of Georgia JSC 144A | 515 | 526 | ||||||
Barclays Bank plc | 435 | 468 | ||||||
144A 5.926%(3)(4)(8)(9) | 600 | 577 | ||||||
Blackstone Holdings Finance Co., LLC 144A | 385 | 444 | ||||||
Boston Properties LP | 900 | 948 | ||||||
Brandywine Operating Partnership LP | 560 | 602 | ||||||
Capital One Capital IV | 1,000 | 1,018 | ||||||
Chubb Corp. | 680 | 724 | ||||||
CIT Group, Inc. | 300 | 313 | ||||||
144A 5.500%, 2/15/19(4) | 750 | 816 | ||||||
Citigroup, Inc. | 1,110 | 1,230 | ||||||
City National Corp. | 475 | 516 | ||||||
Discover Bank | 250 | 323 | ||||||
7.000%, 4/15/20 | 700 | 843 | ||||||
| PAR VALUE | VALUE | |||||||
| Financials—continued | ||||||||
Eurasian Development Bank 144A | $ | 925 | $ | 938 | ||||
Fidelity National Financial, Inc. | ||||||||
6.600%, 5/15/17 | 750 | 840 | ||||||
5.500%, 9/1/22 | 240 | 257 | ||||||
Fifth Third Capital Trust IV 6.500%, 4/15/37(3) | 800 | 802 | ||||||
First Niagara Financial Group, Inc. 6.750%, 3/19/20 | 1,160 | 1,335 | ||||||
First Tennessee Bank N.A. | 705 | 762 | ||||||
Ford Motor Credit Co. LLC 6.625%, 8/15/17 | 255 | 296 | ||||||
8.125%, 1/15/20 | 650 | 819 | ||||||
General Motors Financial Co., Inc. 144A | 900 | 924 | ||||||
Genworth Financial, Inc. | 500 | 514 | ||||||
7.625%, 9/24/21 | 700 | 715 | ||||||
Glen Meadow Pass-Through-Trust 144A | 970 | 818 | ||||||
GRD Holdings III Corp. 144A | 520 | 524 | ||||||
HBOS plc 144A | 115 | 117 | ||||||
HSBC Finance Corp. | 500 | 580 | ||||||
Huntington Bancshares, Inc. 7.000%, 12/15/20 | 500 | 608 | ||||||
Hutchison Whampoa International Ltd. Series 12 144A | 980 | 1,012 | ||||||
ING Bank NV 144A | 600 | 667 | ||||||
ING U.S., Inc. 144A | 1,050 | 1,096 | ||||||
International Lease Finance Corp. | 1,399 | 1,511 | ||||||
Jefferies Group, Inc. | 500 | 574 | ||||||
Kazkommerts Bank International BV | 500 | 497 | ||||||
RegS 8.000%, 11/3/15(5) | 250 | 235 | ||||||
Korea Development Bank | 1,300 | 1,399 | ||||||
Korea Finance Corp. | 700 | 791 | ||||||
Legg Mason, Inc. 144A 5.500%, 5/21/19(4) | 200 | 215 | ||||||
Lincoln National Corp. | 300 | 294 | ||||||
Lloyds Banking Group Capital No.1 plc 144A | 600 | 600 | ||||||
| PAR VALUE | VALUE | |||||||
| Financials—continued | ||||||||
Lloyds TSB Bank plc 144A 6.500%, 9/14/20(4) | $ | 750 | $ | 790 | ||||
Macquarie Bank Ltd. 144A 6.625%, 4/7/21(4) | 150 | 161 | ||||||
Macquarie Group Ltd. 144A 7.625%, 8/13/19(4) | 500 | 580 | ||||||
Morgan Stanley | 100 | 110 | ||||||
144A 10.090%, 5/3/17(4) | 1,000 | BRL | 531 | |||||
National Retail Properties, Inc. | 600 | 681 | ||||||
Nordea Bank AB 144A | 1,360 | 1,352 | ||||||
ORIX Corp. | 343 | 371 | ||||||
PKO Finance AB 144A | 1,315 | 1,319 | ||||||
Progressive Corp. (The) | 1,200 | 1,296 | ||||||
Prudential Financial, Inc. | 2,155 | 2,209 | ||||||
Regions Bank | 750 | 887 | ||||||
Regions Financial Corp. | 210 | 225 | ||||||
Reliance Holdings USA, Inc. 144A | 1,000 | 1,065 | ||||||
Resona Bank Ltd. 144A | 750 | 804 | ||||||
Royal Bank of Scotland Group plc (The) | 370 | 425 | ||||||
7.648%(3)(8)(9) | 550 | 539 | ||||||
Royal Bank of Scotland plc (The) | 750 | 855 | ||||||
Russian Agricultural Bank OJSC (RSHB Capital SA) 144A 9.000%, 6/11/14(4) | 100 | 111 | ||||||
144A 6.299%, 5/15/17(4) | 380 | 418 | ||||||
144A 5.298%, 12/27/17(4) | 400 | 423 | ||||||
Santander U.S. Debt S.A. 144A 3.724%, 1/20/15(4) | 800 | 794 | ||||||
Sberbank of Russia (Sberbank CapItal SA) 144A 5.717%, 6/16/21 | 715 | 771 | ||||||
144A 6.125%, 2/7/22(4)(10) | 1,800 | 1,989 | ||||||
Shinhan Bank 144A | 650 | 715 | ||||||
SLM Corp. | 765 | 777 | ||||||
Societe Generale S.A. 144A | 650 | 527 | ||||||
Sovereign Bank | 400 | 460 | ||||||
Spansion LLC | 350 | 348 | ||||||
Springleaf Finance Corp. | 750 | 677 | ||||||
SunTrust Bank, Inc. | 250 | 262 | ||||||
Turkiye Garanti Bankasi AS 144A | 985 | 992 | ||||||
See Notes to Financial Statements
36
Table of Contents
VIRTUS MULTI-SECTOR FIXED INCOME FUND
SCHEDULE OF INVESTMENTS (Continued)
SEPTEMBER 30, 2012
($ reported in thousands)
| PAR VALUE | VALUE | |||||||
| Financials—continued | ||||||||
United Rentals Financing Escrow Corp. 144A | $ | 900 | $ | 970 | ||||
UPCB Finance Ltd. VI 144A | 665 | 708 | ||||||
Vanguard Health Holding Co. II, LLC (Vanguard Holding Co. II, Inc.) | 466 | 498 | ||||||
Vnesheconombank (VEB Finance plc) 144A | 500 | 588 | ||||||
VTB Bank OJSC (VTB Capital SA) 144A | 1,225 | 1,280 | ||||||
Webster Financial Corp. | 205 | 206 | ||||||
Willis Group Holdings plc North America, Inc. | 500 | 595 | ||||||
5.750%, 3/15/21 | 465 | 525 | ||||||
Yankee Candle Co. Holdings LLC (Yankee Finance, Inc.) PIK Interest Capitalization | 440 | 458 | ||||||
Zions Bancorp | 225 | 246 | ||||||
4.500%, 3/27/17 | 710 | 733 | ||||||
|
| |||||||
| 76,300 | ||||||||
|
| |||||||
| Health Care—1.5% | ||||||||
Community Health Systems, Inc. (CHS) | 800 | 832 | ||||||
7.125%, 7/15/20 | 330 | 352 | ||||||
Davita, Inc. | 945 | 988 | ||||||
HCA, Inc. | 1,295 | 1,444 | ||||||
Hologic, Inc. 144A | 100 | 106 | ||||||
Patheon, Inc. 144A | 110 | 113 | ||||||
Rotech Healthcare, Inc. | 75 | 74 | ||||||
Symbion, Inc. | 740 | 762 | ||||||
U.S. Oncology, Inc. | 300 | 0 | ||||||
VPI Escrow Corp. 144A | 920 | 943 | ||||||
|
| |||||||
| 5,614 | ||||||||
|
| |||||||
| Industrials—7.1% | ||||||||
ADS Tactical, Inc. 144A | 600 | 602 | ||||||
Aircastle Ltd. | 1,290 | 1,435 | ||||||
America West Airlines, Inc. Pass-Through-Trust Series 00-1, G | 843 | 898 | ||||||
| PAR VALUE | VALUE | |||||||
| Industrials—continued | ||||||||
Atlas Air Pass-Through-Trust | $ | 626 | $ | 646 | ||||
99-1, A1 7.200%, 1/2/19 | 714 | 722 | ||||||
00-1. A 8.707%, 1/2/19 | 267 | 285 | ||||||
AWAS Aviation Capital Ltd. 144A | 1,118 | 1,191 | ||||||
Bombardier, Inc. 144A | 1,115 | 1,285 | ||||||
CDRT Holding Corp. PIK 144A | 860 | 834 | ||||||
Celulosa Arauco y Constitucion SA | 750 | 783 | ||||||
Cemex Finance LLC 144A | 700 | 726 | ||||||
CHC Helicopter SA | 725 | 749 | ||||||
Continental Airlines Pass-Through-Trust | ||||||||
98-1, A 6.648%, 3/15/19 | 281 | 304 | ||||||
97-4, A 6.900%, 1/2/18 | 452 | 493 | ||||||
99-1, A 6.545%, 2/2/19 | 780 | 855 | ||||||
01-A1 6.703%, 6/15/21 | 241 | 263 | ||||||
Deluxe Corp. | 510 | 545 | ||||||
DP World Ltd. 144A | 400 | 431 | ||||||
Embraer SA | 1,040 | 1,116 | ||||||
Harland Clarke Holdings Corp. 144A | 475 | 456 | ||||||
Iron Mountain, Inc. | 1,560 | 1,572 | ||||||
JMC Steel Group 144A | 570 | 584 | ||||||
Kratos Defense & Security Solutions, Inc. | 625 | 678 | ||||||
Masco Corp. | 1,560 | 1,709 | ||||||
Nortek, Inc. | 500 | 535 | ||||||
Owens Corning, Inc. | 595 | 668 | ||||||
Pactiv LLC | 1,645 | 1,620 | ||||||
Production Resource Group, Inc. | 250 | 176 | ||||||
SBA Telecommunications, Inc. 144A | 820 | 864 | ||||||
ServiceMaster Co. 144A | 340 | 350 | ||||||
Steelcase, Inc. | 675 | 725 | ||||||
Teekay Corp. | 300 | 317 | ||||||
Thermadyne Holdings Corp. | 500 | 535 | ||||||
| PAR VALUE | VALUE | |||||||
| Industrials—continued | ||||||||
U.S. Airways Pass-Through-Trust | ||||||||
01-1G 7.076%, 9/20/22 | $ | 962 | $ | 983 | ||||
12-1A 5.900%, 10/1/24 | 500 | 529 | ||||||
Verso Paper Holdings LLC (Verso Paper, Inc.) 144A 11.750%, 1/15/19(4) | 275 | 213 | ||||||
Voto-Votorantim Ltd. 144A | 750 | 870 | ||||||
|
| |||||||
| 27,547 | ||||||||
|
| |||||||
| Information Technology—0.6% | ||||||||
Broadridge Financial Solutions, Inc. | 525 | 563 | ||||||
Digicel Ltd. 144A | 848 | 924 | ||||||
EarthLink, Inc. | 225 | 226 | ||||||
Sorenson Communications, Inc. 144A | 500 | 441 | ||||||
Tech Data Corp. | 95 | 97 | ||||||
|
| |||||||
| 2,251 | ||||||||
|
| |||||||
| Materials—4.1% | ||||||||
ArcelorMittal | 950 | 936 | ||||||
Ardagh Packaging Finance plc (Ardagh Packaging Holdings, Inc.) 144A | 635 | 683 | ||||||
Braskem Finance Ltd. 144A | 500 | 530 | ||||||
Carpenter Technology Corp. | 600 | 632 | ||||||
Cascades, Inc. | 1,100 | 1,158 | ||||||
Cemex SAB de CV 144A | 251 | 258 | ||||||
Edgen Murray Corp. | 650 | 697 | ||||||
FMG Resources Property Ltd. 144A | 650 | 634 | ||||||
Gerdau Holdings, Inc. 144A | 250 | 289 | ||||||
Ineos Finance plc 144A | 705 | 745 | ||||||
Mexichem SAB de CV 144A | 485 | 492 | ||||||
Norske Skog Canada Ltd. | 645 | 13 | ||||||
Nufarm Australia Ltd. 144A | 875 | 890 | ||||||
Owens-Brockway Glass Container, Inc. | 475 | 547 | ||||||
Packaging Corp. of America | 945 | 976 | ||||||
See Notes to Financial Statements
37
Table of Contents
VIRTUS MULTI-SECTOR FIXED INCOME FUND
SCHEDULE OF INVESTMENTS (Continued)
SEPTEMBER 30, 2012
($ reported in thousands)
| PAR VALUE | VALUE | |||||||
| Materials—continued | ||||||||
PTT Global Chemical PCL 144A | $ | 800 | $ | 808 | ||||
Sappi Papier Holding GmbH | ||||||||
144A 7.750%, 7/15/17(4) | 650 | 698 | ||||||
144A 8.375%, 6/15/19(4) | 440 | 472 | ||||||
144A 6.625%, 4/15/21(4) | 970 | 936 | ||||||
Severstal OAO (Steel Capital SA) | ||||||||
144A 6.250%, 7/26/16(4)(10) | 445 | 466 | ||||||
144A 6.700%, 10/25/17(4)(10) | 425 | 456 | ||||||
United States Steel Corp. | 860 | 854 | ||||||
Vale Overseas Ltd. | 920 | 967 | ||||||
Vedanta Resources plc 144A | 775 | 804 | ||||||
Verso Paper Holdings LLC (Verso Paper, Inc.) Series B, | 336 | 200 | ||||||
|
| |||||||
| 16,141 | ||||||||
|
| |||||||
| Telecommunication Services—2.9% | ||||||||
Axtel SAB de CV 144A | 200 | 126 | ||||||
CenturyLink, Inc. | 750 | 818 | ||||||
Cincinnati Bell, Inc. | 705 | 756 | ||||||
Crown Castle Towers LLC 144A | 500 | 563 | ||||||
Digicel Group Ltd. 144A | 370 | 390 | ||||||
Frontier Communications Corp. | 945 | 986 | ||||||
ITC DeltaCom, Inc. | 400 | 430 | ||||||
Level 3 Financing, Inc. 144A 7.000%, 6/1/20(4) | 725 | 735 | ||||||
Sprint Capital Corp. | 625 | 578 | ||||||
Sprint Nextel Corp. | 1,410 | 1,459 | ||||||
Telecom Italia Capital SA | 1,000 | 1,103 | ||||||
Telefonica Emisiones, S.A.U. | 580 | 569 | ||||||
Telemar Norte Leste SA 144A | 305 | 320 | ||||||
Wind Acquisition Finance S.A. 144A | 850 | 805 | ||||||
Windstream Corp. | 1,530 | 1,649 | ||||||
|
| |||||||
| 11,287 | ||||||||
|
| |||||||
| PAR VALUE | VALUE | |||||||
| Utilities—1.6% | ||||||||
AmeriGas Partners LP (AmeriGas Finance Corp.) | $ | 660 | $ | 690 | ||||
7.000%, 5/20/22 | 450 | 486 | ||||||
Atlas Pipeline Partners LP (Atlas Pipeline Finance Corp.) 144A 6.625%, 10/1/20(4) | 495 | 505 | ||||||
Calpine Corp. 144A | 1,250 | 1,387 | ||||||
Centrais Eletricas Brasileiras SA | 100 | 119 | ||||||
RegS 5.750%, 10/27/21(5) | 900 | 1,001 | ||||||
Covanta Holding Corp. | 1,065 | 1,163 | ||||||
Midwest Generation LLC Series B | 62 | 56 | ||||||
NRG Energy, Inc. | 105 | 114 | ||||||
7.625%, 5/15/19 | 500 | 533 | ||||||
144A 6.625%, 3/15/23(4) | 75 | 77 | ||||||
Texas Competitive Electric Holdings Co., LLC (Texas Competitive Electric Holdings Finance, Inc.) Series A | 200 | 56 | ||||||
|
| |||||||
| 6,187 | ||||||||
| TOTAL CORPORATE BONDS AND NOTES | ||||||||
| (Identified Cost $195,165) | 203,585 | |||||||
| LOAN AGREEMENTS(3)—15.7% | ||||||||
| Consumer Discretionary—4.6% | ||||||||
Advantage Sales & Marketing, Inc. Second Lien, | 385 | 385 | ||||||
Affinity Gaming LLC (Herbst Gaming LLC). | 589 | 597 | ||||||
August Holding Co., Inc. (Schrader) | 324 | 328 | ||||||
First Lien, LUX | 421 | 427 | ||||||
BJ’s Wholesale Club, Inc. Second Lien | 208 | 211 | ||||||
Caesars Entertainment Operating Co., Inc. (Harrah’s Operating Company, Inc.) | 300 | 298 | ||||||
Tranche B-6, | 1,033 | 941 | ||||||
Cannery Casino Resorts LLC | 496 | 497 | ||||||
| PAR VALUE | VALUE | |||||||
| Consumer Discretionary—continued | ||||||||
Cengage Learning Acquisitions, Inc. | $ | 772 | $ | 738 | ||||
Chrysler Group LLC (Chrysler Group Co-Issuer, Inc.) Tranche B, | 247 | 252 | ||||||
Clear Channel Communications, Inc. Tranche A, | 295 | 278 | ||||||
Tranche B, | 237 | 195 | ||||||
Cumulus Media Holdings, Inc. First Lien, | 397 | 400 | ||||||
Second Lien, | 500 | 507 | ||||||
Entercom Radio LLC Tranche B, | 509 | 516 | ||||||
Focus Brands, Inc. First Lien, 6.250%, 2/21/18 | 689 | 698 | ||||||
Fram Group Holdings, Inc. (Prestone Holdings, Inc.) Second Lien, | 500 | 455 | ||||||
Gateway Casinos & Entertainment Ltd. Tranche B, | 461 | CAD | 466 | |||||
Getty Images, Inc. | 298 | 299 | ||||||
Granite Broadcasting Corp. | 498 | 500 | ||||||
HD Supply, Inc. Tranche B, | 1,027 | 1,063 | ||||||
HHI Holdings LLC | 842 | 842 | ||||||
Hubbard Radio LLC Second Lien, | 600 | 612 | ||||||
Kalispel Tribal Economic Authority Second Lien | 464 | 457 | ||||||
Landry’s, Inc. (Landry’s Restaurants, Inc.) Tranche B, | 1,095 | 1,113 | ||||||
Michaels Stores, Inc. Tranche B-2, | 509 | 515 | ||||||
Oberthur Technologies, Inc. | 725 | 720 | ||||||
Ozburn-Hessey Holding Co., LLC First Lien, | 346 | 332 | ||||||
Radio One, Inc. | 220 | 222 | ||||||
Seven Seas Cruises, Inc. Tranche B, | 757 | 763 | ||||||
See Notes to Financial Statements
38
Table of Contents
VIRTUS MULTI-SECTOR FIXED INCOME FUND
SCHEDULE OF INVESTMENTS (Continued)
SEPTEMBER 30, 2012
($ reported in thousands)
| PAR VALUE | VALUE | |||||||
| Consumer Discretionary—continued | ||||||||
Sports Authority, Inc. (The) Tranche B, | $ | 319 | $ | 320 | ||||
SRAM LLC Second Lien, 8.500%, 12/7/18 | 229 | 233 | ||||||
Station GVR Acquisition LLC (Green Valley Ranch Gaming LLC) | 571 | 573 | ||||||
Transtar Holding Co. Second Lien, | 275 | 281 | ||||||
Visant Corp. (Jostens) Tranche B, | 706 | 682 | ||||||
Vision Solutions, Inc. First Lien, | 430 | 429 | ||||||
|
| |||||||
| 18,145 | ||||||||
|
| |||||||
| Consumer Staples—0.5% | ||||||||
Pinnacle Foods Finance LLC Tranche E, | 152 | 152 | ||||||
Tranche E, | 267 | 267 | ||||||
SuperValu, Inc. | 1,317 | 1,327 | ||||||
U.S. Foodservice, Inc. (U.S. Foods, Inc.) | 246 | 244 | ||||||
|
| |||||||
| 1,990 | ||||||||
|
| |||||||
| Energy—1.0% | ||||||||
Chesapeake Energy Corp. 8.500%, 12/2/17 | 835 | 839 | ||||||
Frac Tech Services LLC 6.250%, 5/6/16 | 1,106 | 1,068 | ||||||
NGPL PipeCo LLC | 530 | 541 | ||||||
Samson Investment Co. 0.000%, 9/25/18 | 399 | 402 | ||||||
TI Group Automotive Systems LLC | 1,094 | 1,102 | ||||||
|
| |||||||
| 3,952 | ||||||||
|
| |||||||
| Financials—1.6% | ||||||||
Asurion LLC (Asurion Corp.) Second Lien, | 178 | 185 | ||||||
CNO Financial Group, Inc. 0.000%, 9/28/18 | 341 | 343 | ||||||
Homeward Residential, Inc. | 1,162 | 1,180 | ||||||
iStar Financial, Inc. | ||||||||
Tranche A-2, | 465 | 466 | ||||||
Tranche A-2, 7. | 250 | 255 | ||||||
| PAR VALUE | VALUE | |||||||
| Financials—continued | ||||||||
Lonestar Intermediate Super Holdings LLC | $ | 108 | $ | 115 | ||||
Nuveen Investments, Inc. Second Lien, | 864 | 873 | ||||||
Ocwen Financial Corp. 7.000%, 9/1/16 | 156 | 157 | ||||||
Realogy Corp. | ||||||||
Extended First Lien, 4.478%, 10/10/16 | 1,224 | 1,212 | ||||||
Extended LOC, | 96 | 95 | ||||||
RPI Finance Trust | 846 | 853 | ||||||
Springleaf Financial Funding Co. (American General Finance Corp.) | 420 | 412 | ||||||
Walter Investment Management Corp. First Lien, | 283 | 286 | ||||||
|
| |||||||
| 6,432 | ||||||||
|
| |||||||
| Health Care—1.5% | ||||||||
AMN Healthcare, Inc. Tranche B, | 665 | 675 | ||||||
Aptalis Pharma, Inc. (Axcan Intermediate Holdings, Inc.) Tranche B-1, | 408 | 409 | ||||||
Ardent Health Services LLC | 482 | 486 | ||||||
InVentiv Health, Inc. (Ventive Health, Inc.) | 293 | 285 | ||||||
Kinetic Concepts, Inc. Tranche B-1, | 746 | 758 | ||||||
MModal, Inc. Tranche B, 6.750%, 8/16/19 | 1,100 | 1,093 | ||||||
National Specialty Hospitals, Inc. Tranche B, | 405 | 399 | ||||||
Par Pharmaceutical 0.000%, 8/2/19 | 676 | 676 | ||||||
Select Medical Corp. Series A Tranche B, | 302 | 303 | ||||||
Smile Brands Group, Inc. Tranche B, | 368 | 371 | ||||||
Surgery Center Holdings, Inc. | 395 | 395 | ||||||
|
| |||||||
| 5,850 | ||||||||
|
| |||||||
| Industrials—1.5% | ||||||||
ADS Waste Holdings, Inc. 0.000%, 9/11/19 | 504 | 508 | ||||||
| PAR VALUE | VALUE | |||||||
| Industrials—continued | ||||||||
Aveta, Inc. | ||||||||
(NAMM Holdings, Inc.) 8.500%, 4/4/17 | $ | 234 | $ | 236 | ||||
(MMM Holdings, Inc.) 8.500%, 4/4/17 | 234 | 236 | ||||||
AWAS Finance Luxemborg S.A. | 500 | 504 | ||||||
Brickman Group Holdings, Inc. Tranche B-1, | 509 | 514 | ||||||
Brock Holdings Ill, Inc. Second Lien, | 285 | 288 | ||||||
CHG Companies, Inc. First Lien, | 312 | 312 | ||||||
Goodman Global, Inc. Second Lien, | 127 | 129 | ||||||
Harland Clarke Holdings Corp. Tranche B-2 | 675 | 609 | ||||||
Husky Injection Molding System (Yukon Acquisition, Inc.) | 557 | 562 | ||||||
Protection One, Inc. 5.750%, 3/21/19 | 368 | 373 | ||||||
Vertrue LLC (V2V Holdings LLC) First Lien, | 137 | 51 | ||||||
Zuffa LLC | 1,345 | 1,354 | ||||||
|
| |||||||
| 5,676 | ||||||||
|
| |||||||
| Information Technology—2.7% | ||||||||
Applied Systems, Inc. Second Lien, | 333 | 333 | ||||||
Avaya, Inc. | 241 | 235 | ||||||
Tranche B-3, | 484 | 443 | ||||||
AVG Technologies N.V. | 287 | 286 | ||||||
Blue Coat Systems, Inc. First Lien, | 547 | 551 | ||||||
DynCorp International LLC | 632 | 636 | ||||||
First Data Corp. | 457 | 449 | ||||||
5.217%, 3/24/17 | 880 | 870 | ||||||
Freescale Semiconductor, Inc. | 739 | 724 | ||||||
Tranche B-2, | 358 | 360 | ||||||
Infor (US), Inc. (Lawson Software, Inc.) Tranche B | 1,247 | 1,257 | ||||||
See Notes to Financial Statements
39
Table of Contents
VIRTUS MULTI-SECTOR FIXED INCOME FUND
SCHEDULE OF INVESTMENTS (Continued)
SEPTEMBER 30, 2012
($ reported in thousands)
| PAR VALUE | VALUE | |||||||
| Information Technology—continued | ||||||||
Ipreo Holdings LLC | $ | 495 | $ | 501 | ||||
Novell, Inc. (Attachmate Corp.) First Lien, | 638 | 644 | ||||||
Smart Modular Technologies (Global), Inc. | 248 | 210 | ||||||
Sophia LP (DataTel, Inc.) | 530 | 537 | ||||||
Sorenson Communications, Inc. Tranche C, | 207 | 206 | ||||||
SRA International, Inc. | 490 | 486 | ||||||
Veyance Technologies, Inc. | 850 | 813 | ||||||
Wall Street Systems Holdings, Inc. Second Lien, | 335 | 335 | ||||||
Zayo Group LLC (Zayo Capital, Inc.) | 543 | 549 | ||||||
|
| |||||||
| 10,425 | ||||||||
|
| |||||||
| Materials—1.2% | ||||||||
AZ Chem US, Inc. | 514 | 525 | ||||||
CPG International I, Inc. | 312 | 313 | ||||||
Essar Steel Algoma, Inc. (Algoma Steel, Inc.) | 1,590 | 1,606 | ||||||
General Chemical Corp. Tranche B, | 303 | 303 | ||||||
NewPage Corp. | 350 | 355 | ||||||
Noranda Aluminum Acquisition Corp. Tranche B, | 821 | 832 | ||||||
Waupaca Foundry, Inc. | 815 | 821 | ||||||
|
| |||||||
| 4,755 | ||||||||
|
| |||||||
| Telecommunication Services—1.0% | ||||||||
Hawaiian Telcom Communications, Inc. | 480 | 487 | ||||||
Level 3 Financing, Inc. Tranche A, 2.706%, 2/1/16 | 67 | 68 | ||||||
Tranche A, | 1,000 | 1,003 | ||||||
Tranche A, | 244 | 246 | ||||||
Presidio, Inc. | 219 | 218 | ||||||
Sidera Networks, Inc. | 528 | 525 | ||||||
| PAR VALUE | VALUE | |||||||
| Telecommunication Services—continued | ||||||||
Univision Communications, Inc. First Lien, | $ | 758 | $ | 751 | ||||
West Corp. Tnrache B-6, | 484 | 491 | ||||||
|
| |||||||
| 3,789 | ||||||||
|
| |||||||
| Utilities—0.1% | ||||||||
Texas Compeptitive Electric Holdings Co. LLC Extended, | 375 | 259 | ||||||
| TOTAL LOAN AGREEMENTS (Identified Cost $60,525) | 61,273 | |||||||
| SHARES | ||||||||
| PREFERRED STOCK—1.9% | ||||||||
| Financials—1.7% | ||||||||
Ally Financial, Inc. 144A | 321 | 300 | ||||||
Ally Financial, Inc. Series A, 8.500% | 20,000 | 489 | ||||||
Banco Bilbao Vizcaya Argentaria S.A. International S.A. Unipersonal | 675 | 510 | ||||||
Banco do Brasil S.A. 144A | 600 | 714 | ||||||
Bank of America Corp. Series K, | 375 | 408 | ||||||
Citigroup Capital XVII Series E | 44,460 | 1,108 | ||||||
FNMA Series S, | 38 | 32 | ||||||
General Electric Capital Corp. | 1,300,000 | 1,372 | ||||||
JPMorgan Chase & Co. | 247 | 281 | ||||||
PNC Financial Services Group, Inc. Series K | 350 | 363 | ||||||
U.S. Bancorp Series G | 22,600 | 632 | ||||||
UOB Cayman Ltd. 144A | 500 | 528 | ||||||
Zions Bancorp, Series C, ADR | 9 | 235 | ||||||
|
| |||||||
| 6,972 | ||||||||
|
| |||||||
| Industrials—0.2% | ||||||||
Seaspan Corp. Series C, | 20 | 562 | ||||||
| TOTAL PREFERRED STOCK (Identified Cost $7,571) | 7,534 | |||||||
| SHARES | VALUE | |||||||
| COMMON STOCKS—0.0% | ||||||||
| Consumer Discretionary—0.0% | ||||||||
Mark IV Industries | 446 | $ | 12 | |||||
| TOTAL COMMON STOCKS (Identified Cost $4) | 12 | |||||||
| TOTAL LONG TERM INVESTMENTS—98.7% | ||||||||
| (Identified cost $368,712) | 384,772 | |||||||
| SHORT-TERM INVESTMENTS—2.3% | ||||||||
| Money Market Mutual Funds—2.3% | ||||||||
BlackRock Liquidity Funds TempFund Portfolio – Institutional Shares (seven-day effective yield 0.140%) | 9,131,635 | 9,132 | ||||||
| TOTAL SHORT-TERM INVESTMENTS (Identified Cost $9,132) | 9,132 | |||||||
| TOTAL INVESTMENTS—101.0% (Identified Cost $377,844) | 393,904 | (1) | ||||||
Other assets and liabilities, net—(1.0)% |
| (3,934 | ) | |||||
|
| |||||||
| NET ASSETS—100.0% | $ | 389,970 | ||||||
|
| |||||||
Abbreviations:
| ADR | American Depositary Receipt |
| FNMA | Federal National Mortgage Association (“Fannie Mae”) |
| PIK | Payment-in-Kind Security |
Footnote Legend:
| (1) | Federal Income Tax Information: For tax information at September 30, 2012, see Note 3 Federal Income Tax Information in the Notes to Financial Statements. |
| (2) | Security in default. |
| (3) | Variable or step coupon security; interest rate shown reflects the rate in effect at September 30, 2012. |
| (4) | Security exempt from registration under Rule 144A of the Securities Act of 1933. These securities may be resold in transactions exempt from registration, normally to qualified institutional buyers. At September 30, 2012, these securities amounted to a value of $111,312 or 28.5% of net assets. |
| (5) | Regulation S Security. Security is offered ans sold outside of the United States. |
| (6) | Illiquid security. |
| (7) | Security valued at fair value as determined in good faith by or under the direction of the Trustees. This security is disclosed as a Level 3 security in the disclosure table located after the Schedule of Investments. |
See Notes to Financial Statements
40
Table of Contents
VIRTUS MULTI-SECTOR FIXED INCOME FUND
SCHEDULE OF INVESTMENTS (Continued)
SEPTEMBER 30, 2012
($ reported in thousands)
| (8) | No contractual maturity date |
| (9) | Interest payments may be deferred. |
| (10) | This note was issued for the sole purpose of funding a loan agreement between the issuer and the borrower. As the credit risk for this security lies solely with the borrower, the name represented here is that of the borrower. |
Foreign Currencies:
| AUD | Australian Dollar |
| BRL | Brazilian Real |
| CAD | Canadian Dollar |
| COP | Colombian Peso |
| EUR | European Currency Unit |
| IDR | Indonesian Rupiah |
| MXN | Mexican Peso |
| NOK | Norwegian Krone |
| NZD | New Zealand Dollar |
| PEN | Peruvian Nuevo Sol |
| SEK | Swedish Krona |
| TRY | Turkish Lira |
| ZAR | South African Rand |
| Country Weightings (Unaudited)† | ||||
United States | 66 | % | ||
Brazil | 4 | |||
Canada | 3 | |||
Luxembourg | 2 | |||
Mexico | 2 | |||
United Kingdom | 2 | |||
Venezuela | 2 | |||
Other | 19 | |||
Total | 100 | % | ||
† % of total investments as of September 30, 2012 |
| |||
The following table provides a summary of inputs used to value the Fund’s investments as of September 30, 2012 (See Security Valuation Note 2A in the Notes to Financial Statements):
| Total Value at September 30, 2012 | Level 1 – Quoted Prices | Level 2 – Significant Observable Inputs | Level 3 – Significant Unobservable Inputs | |||||||||||||
Debt Securities: | ||||||||||||||||
Asset-Backed Securities | $ | 16,661 | $ | — | $ | 16,661 | $ | — | ||||||||
Corporate Bonds And Notes | 203,585 | — | 203,572 | 13 | ||||||||||||
Foreign Government Securities | 46,395 | — | 46,395 | — | ||||||||||||
Loan Agreements | 61,273 | — | 61,222 | 51 | ||||||||||||
Mortgage-Backed Securities | 48,427 | — | 48,427 | — | ||||||||||||
Municipal Bonds | 885 | — | 885 | — | ||||||||||||
Equity Securities: | ||||||||||||||||
Preferred Stock | 7,534 | 1,429 | 6,105 | — | ||||||||||||
Common Stocks | 12 | — | — | 12 | ||||||||||||
Short-Term Investments | 9,132 | 9,132 | — | — | ||||||||||||
|
|
|
|
|
|
|
| |||||||||
Total Investments | $ | 393,904 | $ | 10,561 | $ | 383,267 | $ | 76 | ||||||||
|
|
|
|
|
|
|
| |||||||||
Securities held by the Fund with an end of period value of $562 were transferred from Level 2 to Level 1 since starting to use an exchange price.
Security abbreviation definitions are located under the Key Investment Terms starting on page 4.
See Notes to Financial Statements
41
Table of Contents
VIRTUS MULTI-SECTOR FIXED INCOME FUND
SCHEDULE OF INVESTMENTS (Continued)
SEPTEMBER 30, 2012
($ reported in thousands)
The following is a reconciliation of assets of the Fund for Level 3 investments for which significant unobservable inputs were used to determine fair value.
| Total | Corporate Bonds and Notes | Loan Agreements | Common Stocks |
| ||||||||||||||
Investments in Securities | ||||||||||||||||||
Balance as of September 30, 2011: | $ | 5 | $ | 0 | $ | — | $ | 5 | ||||||||||
Accrued Discount/(Premium) | — | — | — | — | ||||||||||||||
Realized Gain (Loss) | — | — | — | — | ||||||||||||||
Change in Unrealized Appreciation | 4 | 0 | — | 4 | ||||||||||||||
Purchases | 3 | — | — | 3 | ||||||||||||||
Sales(b) | — | — | — | — | ||||||||||||||
Transfers into Level 3(a) | 64 | 13 | 51 | — | ||||||||||||||
Transfers From Level 3(a) | — | — | — | — | ||||||||||||||
|
|
|
|
|
|
|
|
| ||||||||||
Balanced as of September 30, 2012 | $ | 76 | $ | 13 | (c) | $ | 51 | $ | 12 | |||||||||
|
|
|
|
|
|
|
|
| ||||||||||
| (a) | “Transfers into and/or from” represent the ending value as of September 30, 2012, for any investment security where a change in the pricing level occurred from the beginning to the end of the period. |
| (b) | Includes paydowns on securities, if applicable. |
| (c) | Includes internally fair valued security currently priced at zero ($0). |
See Notes to Financial Statements
42
Table of Contents
VIRTUS SENIOR FLOATING RATE FUND
SCHEDULE OF INVESTMENTS
SEPTEMBER 30, 2012
($ reported in thousands)
| PAR VALUE | VALUE | |||||||
| FOREIGN GOVERNMENT SECURITIES—0.4% | ||||||||
Bolivarian Republic of Venezuela RegS | $ | 735 | $ | 673 | ||||
Republic of Argentina PIK Interest Capitalization | 1,202 | 950 | ||||||
| TOTAL FOREIGN GOVERNMENT SECURITIES | ||||||||
| (Identified Cost $1,526) | 1,623 | |||||||
| ASSET-BACKED SECURITIES—0.5% | ||||||||
Miramax LLC 11-1A, A, 144A | 750 | 789 | ||||||
New Century Home Equity Loan Trust 05-A, A4W | 977 | 885 | ||||||
Terwin Mortgage Trust 04-15AL, A1 144A | 614 | 586 | ||||||
| TOTAL ASSET-BACKED SECURITIES (Identified Cost $2,194) | 2,260 | |||||||
| CORPORATE BONDS AND NOTES—8.9% | ||||||||
| Consumer Discretionary—2.1% | ||||||||
American Axle & Manufacturing Holdings, Inc. 144A | 315 | 354 | ||||||
American Axle & Manufacturing, Inc. | 1,170 | 1,190 | ||||||
Boyd Gaming Corp. | 150 | 158 | ||||||
CCO Holdings LLC (CCO Holdings Capital Corp.) | 2,000 | 2,020 | ||||||
Cengage Learning Acquisitions, Inc. 144A | 450 | 377 | ||||||
DISH DBS Corp. 144A | 750 | 771 | ||||||
Gateway Casinos & Entertainment Ltd. 144A | 140 | CAD | 150 | |||||
HD Supply, Inc. 144A | 450 | 489 | ||||||
HOA Restaurant Group LLC (HOA Finance Corp.) 144A | 1,040 | 954 | ||||||
inVentiv Health, Inc. 144A | 270 | 239 | ||||||
Landry’s, Inc. 144A | 450 | 477 | ||||||
Nara Cable Funding Ltd. 144A | 525 | 482 | ||||||
Ono Finance II plc 144A | 315 | 269 | ||||||
Pittsburgh Glass Works LLC 144A | 225 | 210 | ||||||
Univision Communications, Inc. | 1,100 | 1,106 | ||||||
|
| |||||||
| 9,246 | ||||||||
|
| |||||||
| PAR VALUE | VALUE | |||||||
| Energy—1.7% | ||||||||
Afren plc 144A | $ | 760 | $ | 872 | ||||
Calumet Specialty Products Partners LP (Calumet Finance Corp.) | 433 | 468 | ||||||
Carrizo Oil & Gas, Inc. | 450 | 485 | ||||||
Compagnie Generale de Geophysique-Veritas | 546 | 568 | ||||||
Energy Partners Ltd. | 1,250 | 1,262 | ||||||
Hercules Offshore, Inc. 144A 7.125%, 4/1/17(3) | 750 | 781 | ||||||
144A 10.500%, 10/15/17(3) | 685 | 725 | ||||||
Petroleos de Venezuela SA RegS 8.500%, 11/2/17(4) | 1,870 | 1,697 | ||||||
Petroplus Finance Ltd. 144A 6.750%, 5/1/14(3)(6) | 1,350 | 196 | ||||||
Venoco, Inc. | 875 | 766 | ||||||
|
| |||||||
| 7,820 | ||||||||
|
| |||||||
| Financials—1.3% | ||||||||
Air Lease Corp. 144A | 1,100 | 1,127 | ||||||
Alta Mesa Holdings LP (Alta Mesa Finance Services Corp.) | 750 | 754 | ||||||
CIT Group, Inc. | 750 | 782 | ||||||
Ford Motor Credit Co. LLC | 205 | 238 | ||||||
SLM Corp. | 315 | 320 | ||||||
8.450%, 6/15/18 | 475 | 556 | ||||||
Spansion LLC | 275 | 274 | ||||||
United Rentals Financing Escrow Corp. 144A | 1,000 | 1,078 | ||||||
Yankee Candle Co. Holdings LLC (Yankee Finance, Inc.) PIK Interest Capitalization | 605 | 629 | ||||||
|
| |||||||
| 5,758 | ||||||||
|
| |||||||
| Health Care—0.3% | ||||||||
Community Health Systems, Inc. (CHS) | 1,055 | 1,097 | ||||||
Rotech Healthcare, Inc. | 100 | 98 | ||||||
|
| |||||||
| 1,195 | ||||||||
|
| |||||||
| Industrials—1.7% | ||||||||
ADS Tactical, Inc. 144A | 875 | 877 | ||||||
Aircastle Ltd. | 1,020 | 1,104 | ||||||
| PAR VALUE | VALUE | |||||||
| Industrials—continued | ||||||||
Atlas Air Pass-Through-Trust 98-1, A | $ | 907 | $ | 937 | ||||
AWAS Aviation Capital Ltd. 144A 7.000%, 10/17/16(3) | 1,164 | 1,240 | ||||||
Cemex Finance LLC 144A | 500 | 519 | ||||||
Kratos Defense & Security Solutions, Inc. | 575 | 624 | ||||||
Production Resource Group, Inc. | 500 | 352 | ||||||
ServiceMaster Co. 144A | 900 | 927 | ||||||
U.S. Airways Pass-Through-Trust 98-1 | 714 | 745 | ||||||
Verso Paper Holdings LLC (Verso Paper, Inc.) 144A | 205 | 159 | ||||||
|
| |||||||
| 7,484 | ||||||||
|
| |||||||
| Information Technology—0.4% | ||||||||
First Data Corp. 144A | 1,000 | 999 | ||||||
Sorenson Communications, Inc. 144A | 750 | 662 | ||||||
|
| |||||||
| 1,661 | ||||||||
|
| |||||||
| Materials—1.0% | ||||||||
Ardagh Packaging Finance plc (Ardagh Packaging Holdings, Inc.) 144A | 200 | 215 | ||||||
Cemex SAB de CV 144A | 539 | 553 | ||||||
FMG Resources Property Ltd. 144A | 750 | 731 | ||||||
Norske Skog Canada Ltd. | 300 | 6 | ||||||
Reynolds Group Issuer, Inc. (Reynolds Group Issuer LLC) | 500 | 513 | ||||||
144A 5.750%, 10/15/20(3) | 940 | 941 | ||||||
Sappi Papier Holding GmbH 144A | 670 | 720 | ||||||
Severstal OAO (Steel Capital SA) 144A | 890 | 933 | ||||||
Verso Paper Holdings LLC (Verso Paper, Inc.) Series B, | 251 | 149 | ||||||
|
| |||||||
| 4,761 | ||||||||
|
| |||||||
| Telecommunication Services—0.4% | ||||||||
ITC DeltaCom, Inc. | 700 | 753 | ||||||
Level 3 Financing, Inc. 144A | 1,105 | 1,120 | ||||||
|
| |||||||
| 1,873 | ||||||||
| TOTAL CORPORATE BONDS AND NOTES (Identified Cost $40,707) | 39,798 | |||||||
See Notes to Financial Statements
43
Table of Contents
VIRTUS SENIOR FLOATING RATE FUND
SCHEDULE OF INVESTMENTS (Continued)
SEPTEMBER 30, 2012
($ reported in thousands)
| PAR VALUE | VALUE | |||||||
| LOAN AGREEMENTS(2)—93.2% | ||||||||
| Consumer Discretionary—27.6% | ||||||||
99 Cents Only Stores Tranche B-1, | $ | 993 | $ | 1,005 | ||||
Academy Sports and Outdoors 6.000%, 8/3/18 | 1,588 | 1,597 | ||||||
Acosta, Inc. | 1,957 | 1,970 | ||||||
Advantage Sales & Marketing, Inc. First Lien, | 253 | 255 | ||||||
Second Lien, 9.250%, 6/18/18 | 615 | 616 | ||||||
Affinity Gaming LLC (Herbst Gaming LLC). | 1,058 | 1,071 | ||||||
Allison Transmission, Inc. | 1,191 | 1,196 | ||||||
Ameristar Casinos, Inc. Tranche B, 4.000%, 4/16/18 | 985 | 993 | ||||||
AOT Bedding Super Holdings 0.000%, 9/29/19 | 2,000 | 1,995 | ||||||
August Holding Co., Inc. (Schrader) First Lien, US | 435 | 441 | ||||||
First Lien, LUX | 565 | 573 | ||||||
Avis Budget Car Rental LLC | 69 | 70 | ||||||
BJ’s Wholesale Club, Inc. | 1,000 | 1,006 | ||||||
Second Lien | 315 | 320 | ||||||
Boyd Gaming Corp. | 1,281 | 1,281 | ||||||
Bresnan Broadband Holdings LLC Tranche B, | 983 | 989 | ||||||
Caesars Entertainment Operating Co., Inc. (Harrah’s Operating Company, Inc.) Tranche B-2, 3.220%, 1/28/15 | 1,000 | 972 | ||||||
Tranche B-4, 9.500%, 10/31/16 | 1,556 | 1,602 | ||||||
Tranche B, 9.250%, 4/25/17 | 900 | 893 | ||||||
Tranche B-6, 5.467%, 1/28/18 | 1,520 | 1,385 | ||||||
Cannery Casino Resorts LLC 0.000%, 9/12/18 | 910 | 911 | ||||||
Cengage Learning Acquisitions, Inc. | 878 | 841 | ||||||
Cequel Communications LLC 4.000%, 2/14/19 | 1,791 | 1,802 | ||||||
Charter Communications Operating LLC Tranche D, | 3,336 | 3,360 | ||||||
Chrysler Group LLC (Chrysler Group Co-Issuer, Inc.) Tranche B, | 2,960 | 3,026 | ||||||
Clear Channel Communications, Inc. Tranche A, | 1,063 | 1,003 | ||||||
Tranche B, 3.866%, 1/29/16 | 4,098 | 3,363 | ||||||
| PAR VALUE | VALUE | |||||||
| Consumer Discretionary—continued | ||||||||
Cogeco Cable (Atlantic Broadband Sub) | $ | 910 | $ | 919 | ||||
Cumulus Media Holdings, Inc. | 1,983 | 1,999 | ||||||
Second Lien, 7.500%, 9/16/19 | 1,000 | 1,013 | ||||||
Dave & Buster’s, Inc. | 1,410 | 1,412 | ||||||
Emmis Operating Co. Tranche B, | 173 | 171 | ||||||
Entercom Radio LLC Tranche B, 6.250%, 11/23/18 | 2,262 | 2,292 | ||||||
Federal – Mogul Corp. | 1,324 | 1,293 | ||||||
0.000%, 12/28/15 | 676 | 660 | ||||||
Focus Brands, Inc. First Lien, | 1,322 | 1,340 | ||||||
Fram Group Holdings, Inc. (Prestone Holdings, Inc.) | ||||||||
First Lien, 6.500%, 7/29/17 | 1,485 | 1,479 | ||||||
Second Lien, 10.500%, 1/29/18 | 500 | 455 | ||||||
Gateway Casinos & Entertainment Ltd. Tranche B, | 918 | CAD | 927 | |||||
General Nutrition Center Tranche B, 5.250%, 3/2/18 | 1,749 | 1,753 | ||||||
Getty Images, Inc. | ||||||||
Tranche B-1, 3.966%, 11/5/15 | 939 | 941 | ||||||
5.250%, 11/7/16 | 1,111 | 1,113 | ||||||
Granite Broadcasting Corp. Tranche B | 1,193 | 1,199 | ||||||
Gymboree Corp. (The) | 1,137 | 1,111 | ||||||
Harbor Freight Tools USA, Inc. (Central Purchasing LLC) | 1,500 | 1,510 | ||||||
HD Supply, Inc. Tranche B, | 2,310 | 2,390 | ||||||
HHI Holdings LLC | 1,478 | 1,478 | ||||||
Hubbard Radio LLC | ||||||||
First Lien, 5.250%, 4/28/17 | 899 | 909 | ||||||
Second Lien, 8.750%, 4/30/18 | 600 | 612 | ||||||
Intelsat Jackson Holding S.A. (Intelsat Jackson Holding Ltd.) | ||||||||
3.220%, 2/1/14 | 1,000 | 997 | ||||||
Tranche B, | 1,975 | 1,982 | ||||||
Isle of Capri Casinos | 1,478 | 1,491 | ||||||
Kalispel Tribal Economic Authority Second Lien | 927 | 913 | ||||||
KAR Auction Services, Inc. | 988 | 994 | ||||||
Lamar Media Corp. Tranche B, | 827 | 836 | ||||||
Landry’s, Inc. (Landry’s Restaurants, Inc.) Tranche B, | 2,761 | 2,808 | ||||||
Las Vegas Sands LLC | ||||||||
Tranche DD-I, | 65 | 65 | ||||||
| PAR VALUE | VALUE | |||||||
| Consumer Discretionary—continued | ||||||||
Non-Extended Tranche B, | $ | 314 | $ | 315 | ||||
Extended Tranche B, | 1,051 | 1,049 | ||||||
Extended Tranche DD-I, | 212 | 211 | ||||||
Leslie’s Poolmart, Inc. Tranche B, | 1,007 | 1,004 | ||||||
Live Nation Entertainment, Inc. Tranche B, | 488 | 491 | �� | |||||
MCC LLC (Mediacom Broadband Group) | ||||||||
Tranche F, 4.500%, 10/23/17 | 978 | 975 | ||||||
4.000%, 1/20/20 | 1,000 | 995 | ||||||
Metaldyne LLC | 1,033 | 1,049 | ||||||
MGM Resorts International (MGM Mirage) Extended Tranche E, | 2,225 | 2,245 | ||||||
Michaels Stores, Inc. Tranche B-2, | 1,317 | 1,331 | ||||||
Midcontinent Communications Tranche B, | 1,131 | 1,128 | ||||||
MTL Publishing LLC (EMI Music Publishing Group North America Holdings, Inc.) | 1,626 | 1,648 | ||||||
Neiman Marcus Group, Inc. (The) | 3,000 | 3,021 | ||||||
Nielsen Finance LLC | ||||||||
Tranche A, 2.228%, 8/9/13 | 93 | 93 | ||||||
Tranche B, 3.978%, 5/2/16 | 1,572 | 1,581 | ||||||
Oberthur Technologies, Inc. Tranche B-3, | 1,100 | 1,092 | ||||||
OSI Restaurant Partners, LLC | ||||||||
Tranche RC, 1.300%, 6/14/13 | 138 | 138 | ||||||
2.500%, 6/14/14 | 1,388 | 1,383 | ||||||
Ozburn-Hessey Holding Co., LLC First Lien, | 779 | 748 | ||||||
Party City Holdings, Inc. | 1,000 | 1,014 | ||||||
Peninsula Gaming LLC | 1,000 | 1,017 | ||||||
Penn National Gaming, Inc. Tranche B, | 1,492 | 1,502 | ||||||
Pilot Travel Centers LLC | ||||||||
Initial Tranche B, 4.250%, 3/30/18 | 695 | 698 | ||||||
First Amendment Tranche B, 4.250%, 8/7/19 | 82 | 83 | ||||||
Playboy Enterprises, Inc. | 456 | 461 | ||||||
Radio One, Inc. | 600 | 605 | ||||||
Remy International, Inc. Tranche B, | 480 | 482 | ||||||
See Notes to Financial Statements
44
Table of Contents
VIRTUS SENIOR FLOATING RATE FUND
SCHEDULE OF INVESTMENTS (Continued)
SEPTEMBER 30, 2012
($ reported in thousands)
| PAR VALUE | VALUE | |||||||
| Consumer Discretionary—continued | ||||||||
San Juan Cable LLC Tranche B (Firs Lien), | $ | 988 | $ | 989 | ||||
ServiceMaster Co. (The) Tranche B, | 933 | 937 | ||||||
Seven Seas Cruises, Inc. Tranche B, | 1,739 | 1,752 | ||||||
Sports Authority, Inc. (The) Tranche B, | 1,081 | 1,084 | ||||||
SRAM LLC | ||||||||
First Lien, 5.250%, 6/7/18 | 394 | 399 | ||||||
Second Lien, 8.500%, 12/7/18 | 571 | 581 | ||||||
Station GVR Acquisition LLC (Green Valley Ranch Gaming LLC) | 1,243 | 1,248 | ||||||
TI Group Automotive Systems LLC | 2,060 | 2,075 | ||||||
Toys “R” Us, Inc. | 1,838 | 1,837 | ||||||
Transtar Holding Co. 5.500%, 12/21/16 | 1,921 | 1,920 | ||||||
Second Lien, | 450 | 460 | ||||||
Tribune Co. Tranche B 5.250%, 6/4/14 | 2,250 | 1,709 | ||||||
U.S. Security Associates Holdings, Inc. | ||||||||
Tranche DD, | 162 | 163 | ||||||
Tranche B, | 829 | 832 | ||||||
UCI International, Inc. 5.500%, 7/26/17 | 1,253 | 1,266 | ||||||
Visant Corp. (Jostens) Tranche B, | 2,698 | 2,605 | ||||||
Vision Solutions, Inc. First Lien, | 759 | 756 | ||||||
VWR Funding, Inc. 4.466%, 4/3/17 | 1,222 | 1,229 | ||||||
WideOpenWest Finance LLC (WideOpenWest Capital Corp.) | 2,244 | 2,268 | ||||||
Yankee Cable Acquisition LLC | 982 | 985 | ||||||
|
| |||||||
| 123,052 | ||||||||
|
| |||||||
| Consumer Staples—4.8% | ||||||||
American Rock Salt Co. LLC | 1,214 | 1,201 | ||||||
Dean Foods Co. Tranche B, | 1,567 | 1,564 | ||||||
Del Monte Foods Co. 4.500%, 3/8/18 | 2,553 | 2,557 | ||||||
Dole Food Co. Tranche B-2, 5.140%, 7/8/18 | 691 | 694 | ||||||
Pinnacle Foods Finance LLC Tranche E, | 1,359 | 1,363 | ||||||
Tranche E, | 213 | 214 | ||||||
| PAR VALUE | VALUE | |||||||
| Consumer Staples—continued | ||||||||
Revlon Consumer Products Corp. Tranche B, | $ | 1,878 | $ | 1,889 | ||||
Reynolds Group Holdings, Inc. | 2,053 | 2,064 | ||||||
Rite Aid Corp. Tranche 5, 4.500%, 3/3/18 | 1,912 | 1,913 | ||||||
Solvest Ltd. (Dole) Tranche C-2, | 1,237 | 1,242 | ||||||
Spectrum Brands Holdings, Inc. | 924 | 930 | ||||||
SuperValu, Inc. | 1,666 | 1,679 | ||||||
U.S. Foodservice, Inc. (U.S. Foods, Inc.) | ||||||||
Non-Extended, | 1,473 | 1,459 | ||||||
5.750%, 3/31/17 | 493 | 488 | ||||||
Yankee Candle Co., Inc. 5.250%, 4/2/19 | 1,990 | 2,012 | ||||||
|
| |||||||
| 21,269 | ||||||||
|
| |||||||
| Energy—3.3% | ||||||||
Buffalo Gulf Coast Terminals LLC | 660 | 674 | ||||||
Chesapeake Energy Corp. | 3,375 | 3,390 | ||||||
CITGO Petroleum Corp. Tranche C, | 230 | 234 | ||||||
Energy Transfer Equity LP | 2,000 | 2,004 | ||||||
EP Energy LLC (Everest Acquisition LLC) Tranche B-1, | 850 | 859 | ||||||
Frac Tech Services LLC 6.250%, 5/6/16 | 1,921 | 1,856 | ||||||
Gibson Energy ULC Tranche B, | 2,878 | 2,914 | ||||||
Helix Energy Solutions Group, Inc. Extended, | 984 | 986 | ||||||
NGPL PipeCo LLC 6.750%, 9/15/17 | 1,176 | 1,200 | ||||||
Samson Investment Co. 0.000%, 9/25/18 | 687 | 692 | ||||||
|
| |||||||
| 14,809 | ||||||||
|
| |||||||
| Financials—7.9% | ||||||||
Asurion LLC (Asurion Corp.) | ||||||||
First Lien, 5.500%, 5/24/18 | 1,804 | 1,818 | ||||||
Second Lien, 9.000%, 5/24/19 | 557 | 578 | ||||||
Atlantic Broadband First Lien, | 2,095 | 2,104 | ||||||
Capital Automotive LP Tranche B, | 2,110 | 2,129 | ||||||
CNO Financial Group, Inc. | 696 | 699 | ||||||
Delos Aircraft, Inc. 4.750%, 4/12/16 | 728 | 738 | ||||||
First American Payment Systems LP 7.000%, 11/1/16 | 1,063 | 1,068 | ||||||
| PAR VALUE | VALUE | |||||||
| Financials—continued | ||||||||
Homeward Residential, Inc. | $ | 1,639 | $ | 1,665 | ||||
iPayment, Inc . | 470 | 467 | ||||||
iStar Financial, Inc. | ||||||||
Tranche A-1, 5.000%, 6/28/13 | 501 | 503 | ||||||
Tranche A-2, 7.000%, 6/30/14 | 846 | 847 | ||||||
Tranche A-2, 7.000%, 3/19/17 | 500 | 510 | ||||||
Lonestar Intermediate Super Holdings LLC | 300 | 320 | ||||||
MIP Delaware, LLC (MIPL (LUX) S.A.R.L) | 644 | 648 | ||||||
MoneyGram Payment Systems Worldwide, Inc. | 1,914 | 1,917 | ||||||
Nuveen Investments, Inc. | ||||||||
First Lien Additional Extended, | 1,880 | 1,873 | ||||||
First Lien Extended, | 1,045 | 1,039 | ||||||
Second Lien, 8.250%, 2/28/19 | 1,792 | 1,811 | ||||||
Ocwen Financial Corp. | 626 | 630 | ||||||
Re/Max International, Inc. | 880 | 886 | ||||||
Realogy Corp. | ||||||||
Extended, 2.230%, 10/10/16 | 534 | 529 | ||||||
Extended First Lien, | 6,342 | 6,278 | ||||||
RPI Finance Trust | 1,344 | 1,356 | ||||||
Springleaf Financial Funding Co. (American General Finance Corp.) | 950 | 932 | ||||||
TransUnion LLC | 1,532 | 1,553 | ||||||
UPC Financing Partnership | 1,600 | 1,612 | ||||||
Walter Investment Management Corp. First Lien, | 708 | 715 | ||||||
|
| |||||||
| 35,225 | ||||||||
|
| |||||||
| Health Care—15.8% | ||||||||
Alere, Inc. | ||||||||
Tranche B, 4.750%, 6/30/17 | 990 | 995 | ||||||
Tranche B-1, 4.750%, 6/30/17 | 993 | 998 | ||||||
AMN Healthcare, Inc. Tranche B, | 1,253 | 1,272 | ||||||
Aptalis Pharma, Inc. (Axcan Intermediate Holdings, Inc.) Tranche B-1, | 1,027 | 1,029 | ||||||
Ardent Health Services LLC | 1,848 | 1,862 | ||||||
Bausch & Lomb, Inc. | 1,995 | 2,020 | ||||||
BSN Medical, Inc. (Boston Luxembourg III S.Á R.L) | 1,000 | 1,009 | ||||||
See Notes to Financial Statements
45
Table of Contents
VIRTUS SENIOR FLOATING RATE FUND
SCHEDULE OF INVESTMENTS (Continued)
SEPTEMBER 30, 2012
($ reported in thousands)
| PAR VALUE | VALUE | |||||||
| Health Care—continued | ||||||||
Capsugel Holdings U.S., Inc. | $ | 822 | $ | 827 | ||||
Catalent Pharma Solutions, Inc. (Cardinal Health 409, Inc.) | ||||||||
Tranche 1, 4.216%, 9/15/16 | 972 | 975 | ||||||
Tranche 2, 5.250%, 9/15/17 | 265 | 267 | ||||||
Community Health Systems, Inc. Extended, | 3,275 | 3,294 | ||||||
ConvaTec, Inc. | 1,508 | 1,517 | ||||||
CRC Health Corp. Tranche B-2, | 1,457 | 1,419 | ||||||
DaVita, Inc. | 3,043 | 3,055 | ||||||
Drumm Investors LLC (Golden Living) | 1,728 | 1,670 | ||||||
Emdeon, Inc. Tranche B-1, | 744 | 750 | ||||||
Generic Drug Holdings, Inc. | ||||||||
6.500%, 4/8/16 | 750 | 752 | ||||||
Tranche DD, 6.500%, 4/8/16 | 103 | 103 | ||||||
Grifols, Inc. Tranche B, 4.500%, 6/1/17 | 985 | 994 | ||||||
HCA, Inc. Tranche B-3, 3.466%, 5/1/18 | 2,326 | 2,331 | ||||||
HCR ManoCare, Inc. (HCR Healthcare LLC) | 821 | 813 | ||||||
Health Management Associates, Inc. Tranche B, | 2,562 | 2,587 | ||||||
Hologic, Inc. | 3,375 | 3,422 | ||||||
Houghton International, Inc. Tranche B-1, | 969 | 979 | ||||||
Iasis Healthcare LLC Tranche B, | 1,970 | 1,978 | ||||||
InVentiv Health, Inc. (Ventive Health, Inc) | 1,254 | 1,216 | ||||||
Kindred Healthcare, Inc. | 1,234 | 1,223 | ||||||
Kinetic Concepts, Inc. Tranche B-1, | 2,037 | 2,070 | ||||||
MModal, Inc. Tranche B, | 1,625 | 1,615 | ||||||
MultiPlan, Inc. Tranche B, | 851 | 856 | ||||||
National Mentor Holdings, Inc. Tranche B, | 985 | 989 | ||||||
National Specialty Hospitals, Inc. Tranche B, | 1,216 | 1,198 | ||||||
NBTY, Inc. Tranche B-1, | 831 | 836 | ||||||
Onex Carestream Finance LP (Carestream Health, Inc.) | 1,236 | 1,228 | ||||||
Par Pharmaceutical 0.000%, 8/2/19 | 1,383 | 1,383 | ||||||
| PAR VALUE | VALUE | |||||||
| Health Care—continued | ||||||||
Pharmaceutical Product Development, Inc. (Jaguar Holdings LLC) | $ | 1,985 | $ | 2,007 | ||||
Quintiles Transnational Corp. Tranche B, | 1,481 | 1,492 | ||||||
Rural/Metro Operating Co., LLC First Lien, | 823 | 823 | ||||||
Select Medical Corp. | ||||||||
Tranche B, 5.750%, 6/1/18 | 1,484 | 1,489 | ||||||
Series A Tranche B, 5.750%, 6/1/18 | 332 | 333 | ||||||
Sheridan Holdings, Inc. Tranche B, | 1,322 | 1,335 | ||||||
Smile Brands Group, Inc. Tranche B, | 737 | 742 | ||||||
Surgery Center Holdings, Inc. | 1,228 | 1,228 | ||||||
Surgical Care Affiliates LLC Tranche A, | 1,481 | 1,483 | ||||||
U.S. Renal Care, Inc. | 486 | 493 | ||||||
United Surgical Partners International, Inc. Tranche B, | 995 | 1,008 | ||||||
Universal Health Services, Inc. Tranche B, | 847 | 851 | ||||||
Valeant Pharmaceuticals International, Inc. | 265 | 267 | ||||||
4.750%, 2/13/19 | 631 | 634 | ||||||
4.750%, 2/13/19 | 929 | 933 | ||||||
0.000%, 2/27/19 | 1,600 | 1,608 | ||||||
0.000%, 9/27/19 | 800 | 802 | ||||||
Vanguard Health Holding Co., LLC (Vanguard Health System, Inc.) | 1,440 | 1,451 | ||||||
Warner Chilcott Co. LLC Tranche B-2, | 321 | 322 | ||||||
Warner Chilcott Corp. | ||||||||
4.250%, 3/15/18 | 244 | 245 | ||||||
Tranche B-1, | 642 | 645 | ||||||
(WC Luxco S.A.R.L.) Tranche B-3, | 442 | 443 | ||||||
|
| |||||||
| 70,166 | ||||||||
|
| |||||||
| Industrials—6.8% | ||||||||
ADS Waste Holdings, Inc. | 1,018 | 1,025 | ||||||
Altegrity, Inc. (U.S. Investigations Services, Inc.) | 1,138 | 1,068 | ||||||
Aveta, Inc. | 529 | 534 | ||||||
(NAMM Holdings, Inc.) 8.500%, 4/4/17 | 529 | 534 | ||||||
| PAR VALUE | VALUE | |||||||
| Industrials—continued | ||||||||
AWAS Finance Luxemborg S.A. | $ | 1,100 | $ | 1,108 | ||||
Booz Allen & Hamilton, Inc. | 1,000 | 1,007 | ||||||
Brickman Group Holdings, Inc. Tranche B-1, | 1,587 | 1,604 | ||||||
Brock Holdings Ill, Inc. | 846 | 850 | ||||||
Second Lien, 10.000%, 3/16/18 | 450 | 455 | ||||||
Ceridian Corp. | 3,203 | 3,225 | ||||||
CHG Companies, Inc. First Lien, | 1,089 | 1,089 | ||||||
Delta Air Lines | 988 | 995 | ||||||
Douglas Dynamics LLC | 906 | 898 | ||||||
Ducommun, Inc. | 545 | 551 | ||||||
Emergency Medical Services | 845 | 852 | ||||||
Genpact Ltd. | 500 | 503 | ||||||
Goodman Global, Inc. Second Lien, | 345 | 351 | ||||||
Harland Clarke Holdings Corp. Tranche B-2 | 1,507 | 1,360 | ||||||
Husky Injection Molding System (Yukon Acquisition, Inc.) | 1,393 | 1,407 | ||||||
Navistar, Inc. | 900 | 912 | ||||||
Protection One, Inc. | 1,703 | 1,726 | ||||||
SI Organization, Inc. Tranche B, | 983 | 980 | ||||||
Star West Generation LLC Tranche B, | 1,058 | 1,060 | ||||||
Swift Transportation Corp. Tranche B-2, | 1,065 | 1,072 | ||||||
TASC, Inc. Tranche B, | 493 | 493 | ||||||
Terex Corp. | 1,584 | 1,595 | ||||||
Vertrue LLC (V2V Holdings LLC) First Lien, | 762 | 286 | ||||||
WCA Waste Corp. (WCA Waste Systems, Inc.) | 946 | 951 | ||||||
WireCo Worldgroup, Inc. | 450 | 458 | ||||||
Zuffa LLC | 1,454 | 1,463 | ||||||
|
| |||||||
| 30,412 | ||||||||
|
| |||||||
See Notes to Financial Statements
46
Table of Contents
VIRTUS SENIOR FLOATING RATE FUND
SCHEDULE OF INVESTMENTS (Continued)
SEPTEMBER 30, 2012
($ reported in thousands)
| PAR VALUE | VALUE | |||||||
| Information Technology—13.2% | ||||||||
Aeroflex, Inc. Tranche B, | $ | 850 | $ | 851 | ||||
Applied Systems, Inc. | 948 | 950 | ||||||
Second Lien, 9.500%, 6/8/17 | 334 | 334 | ||||||
Autotrader.com, Inc. Tranche B-1, 4.000%, 12/15/16 | 1,179 | 1,187 | ||||||
Avaya, Inc. Tranche B-1, | 2,006 | 1,953 | ||||||
AVG Technologies N.V. | 778 | 774 | ||||||
Blue Coat Systems, Inc. First Lien, 7.500%, 2/15/18 | 1,197 | 1,208 | ||||||
CCC Information Services | 644 | 647 | ||||||
CDW LLC (CDW Corp.) Extended, 4.000%, 7/15/17 | 2,566 | 2,536 | ||||||
Commscope, Inc. Tranche 1, 4.250%, 1/14/18 | 1,507 | 1,516 | ||||||
CPI International Acquisition, Inc. (Catalyst Holdings, Inc.) | 1,228 | 1,240 | ||||||
DynCorp International LLC | 1,081 | 1,086 | ||||||
Edwards (Cayman Islands II) Ltd. First Lien, | 857 | 864 | ||||||
Epicor Software Corp. (Eagle Parent Inc.) Tranche B, | 2,963 | 2,988 | ||||||
First Data Corp. Tranche B | 1,864 | 1,835 | ||||||
5.217%, 3/24/17 | 2,516 | 2,488 | ||||||
4.217%, 3/26/18 | 2,500 | 2,385 | ||||||
Freescale Semiconductor, Inc. Tranche B-1, | 2,330 | 2,281 | ||||||
Tranche B-2, | 408 | 410 | ||||||
Go Daddy Operating Co. LLC Tranche B-1, | 995 | 994 | ||||||
Interactive Data Corp. Tranche B, 4.500%, 2/11/18 | 2,386 | 2,404 | ||||||
Ipreo Holdings LLC | 990 | 1,002 | ||||||
Lawson Software, Inc. Tranche B 0.000%, 4/5/18 | 4,090 | 4,111 | ||||||
MedAssets, Inc. | 762 | 768 | ||||||
Microsemi Corp. Tranche B, 4.000%, 2/2/18 | 948 | 956 | ||||||
Mirion Technologies, Inc. | 1,244 | 1,250 | ||||||
Mood Media Corp. First Lien 7.750%, 5/6/18 | 1,763 | 1,762 | ||||||
Novell, Inc. (Attachmate Corp.) | 2,012 | 2,032 | ||||||
NuSil Technology LLC | 617 | 618 | ||||||
| PAR VALUE | VALUE | |||||||
| Information Technology—continued | ||||||||
NXP BV (NXP Funding LLC) | $ | 1,592 | $ | 1,629 | ||||
RedPrairie Corp. | 1,215 | 1,223 | ||||||
Scitor Corp. | 882 | 874 | ||||||
Smart Modular Technologies (Global), Inc. | 495 | 421 | ||||||
Sophia LP (DataTel, Inc.) | 1,177 | 1,193 | ||||||
Sorenson Communications, Inc. Tranche C, | 414 | 411 | ||||||
Sourcehov LLC (Corpsource Finance Holdings LLC) Tranche B (First Lien), | 1,234 | 1,227 | ||||||
Spansion LLC | 622 | 628 | ||||||
SRA International, Inc. | 1,226 | 1,216 | ||||||
SSI Investments II Ltd. (Skillsoft) 0.000%, 5/26/17 | 1,034 | 1,046 | ||||||
SymphonyIRI Group, Inc. (Information Resources, Inc.) Tranche 2011, | 494 | 495 | ||||||
Verifone, Inc. Tranche B, | 561 | 562 | ||||||
Vertafore, Inc. First Lien, | 1,474 | 1,479 | ||||||
Veyance Technologies, Inc. 0.000%, 7/31/15 | 1,200 | 1,148 | ||||||
Wall Street Systems Holdings, Inc. First Lien, | 370 | 370 | ||||||
Second Lien, | 330 | 330 | ||||||
Zayo Group LLC (Zayo Capital, Inc.) | 1,237 | 1,251 | ||||||
|
| |||||||
| 58,933 | ||||||||
|
| |||||||
| Materials—6.7% | ||||||||
Avantor Performance Materials Holdings, Inc. | 635 | 637 | ||||||
AZ Chem US, Inc. | 797 | 814 | ||||||
Berry Plastics Holding Corp. Tranche C, | 2,269 | 2,261 | ||||||
Chemtura Corp. | 750 | 759 | ||||||
CPG International I, Inc. | 756 | 759 | ||||||
Essar Steel Algoma, Inc. (Algoma Steel, Inc.) | 1,950 | 1,969 | ||||||
General Chemical Corp. Tranche B, | 1,393 | 1,396 | ||||||
| PAR VALUE | VALUE | |||||||
| Materials—continued | ||||||||
Harko C.V.(OM Group, Inc.) Tranche B, | $ | 1,178 | $ | 1,187 | ||||
Huntsman International LLC Extended Tranche B, | 1,286 | 1,288 | ||||||
Ineos US Finance LLC | 2,488 | 2,517 | ||||||
JMC Steel Group, Inc. | 831 | 837 | ||||||
Momentive Performance Materials (Blitz 06-103 GmbH) Tranche B-1B, | 870 | 844 | ||||||
Momentive Specialty Chemicals, Inc. (Hexion Specialty Chemicals, Inc.) Tranche C-1B, | 2,234 | 2,207 | ||||||
Tranche C-2B, 4.125%, 5/5/15 | 963 | 952 | ||||||
NewPage Corp. | 1,150 | 1,166 | ||||||
Noranda Aluminum Acquisition Corp. Tranche B, | 1,294 | 1,310 | ||||||
Nortek, Inc. | 1,477 | 1,488 | ||||||
Novelis, Inc. Tranche B, | 565 | 566 | ||||||
Omnova Solutions, Inc. Extended, | 983 | 991 | ||||||
PQ Corp. (Niagara Acquisition, Inc.) First Lien, | 2,042 | 2,037 | ||||||
Pro Mach, Inc. | 978 | 976 | ||||||
Trinseo Materials Operating S.C.A. (Styron S.A.R.L) | 510 | 491 | ||||||
Univar, Inc. Tranche B, | 1,375 | 1,370 | ||||||
Waupaca Foundry, Inc. | 1,000 | 1,008 | ||||||
|
| |||||||
| 29,830 | ||||||||
|
| |||||||
| Telecommunication Services—5.3% | ||||||||
Calpine Corp. | 750 | 746 | ||||||
Hawaiian Telcom Communications, Inc. | 1,000 | 1,016 | ||||||
Level 3 Financing, Inc. Tranche A, | 500 | 506 | ||||||
Tranche A, | 875 | 877 | ||||||
0.000%, 8/1/19 | 2,150 | 2,150 | ||||||
Tranche A, | 1,875 | 1,891 | ||||||
MetroPCS Wireless, Inc. Tranche B-3, | 1,791 | 1,797 | ||||||
nTelos, Inc. Tranche B, | 893 | 894 | ||||||
Presidio, Inc. | 1,783 | 1,774 | ||||||
See Notes to Financial Statements
47
Table of Contents
VIRTUS SENIOR FLOATING RATE FUND
SCHEDULE OF INVESTMENTS (Continued)
SEPTEMBER 30, 2012
($ reported in thousands)
| PAR VALUE | VALUE | |||||||
| Telecommunication Services—continued | ||||||||
Securus Technologies Holdings, Inc. (Securus Technologies, Inc.) First Lien, | $ | 1,185 | $ | 1,185 | ||||
Sidera Networks, Inc. (RCN Corp.) | 1,130 | 1,124 | ||||||
Syniverse Holdings, Inc. | 1,496 | 1,504 | ||||||
Telesat Canada, Inc. Tranche B, | 1,796 | 1,813 | ||||||
Univision Communications, Inc. First Lien, | 3,770 | 3,732 | ||||||
West Corp. Tranche B-4, | 1,964 | 1,985 | ||||||
Tnrache B-6, 5.750%, 6/30/18 | 606 | 615 | ||||||
|
| |||||||
| 23,609 | ||||||||
|
| |||||||
| Utilities—1.8% | ||||||||
AES Corp. (The) | 1,970 | 1,983 | ||||||
Calpine Corp. | 1,970 | 1,978 | ||||||
NRG Energy, Inc. | 2,874 | 2,893 | ||||||
Texas Compeptitive Electric Holdings Co. LLC Extended, | 1,945 | 1,343 | ||||||
|
| |||||||
| 8,197 | ||||||||
| TOTAL LOAN AGREEMENTS (Identified Cost $411,417) | 415,502 | |||||||
| TOTAL LONG TERM INVESTMENTS—103.0% | ||||||||
| (Identified cost $455,844) | 459,183 | |||||||
| SHARES | VALUE | |||||||
| SHORT-TERM INVESTMENTS—3.5% | ||||||||
| Money Market Mutual Funds—3.5% | ||||||||
BlackRock Liquidity Funds TempFund Portfolio – Insitutional Shares (seven-day effective yield 0.140%) | 15,513,335 | $ | 15,513 | |||||
| TOTAL SHORT-TERM INVESTMENTS (Identified Cost $15,513) | 15,513 | |||||||
| TOTAL INVESTMENTS—106.5% | ||||||||
| (Identified Cost $471,357) | 474,696 | (1)(9) | ||||||
Other assets and liabilities, net—(6.5)% |
| (29,028 | ) | |||||
|
| |||||||
| NET ASSETS—100.0% | $ | 445,668 | ||||||
|
| |||||||
Abbreviations:
| PIK | Payment-in-Kind Security |
Footnote Legend:
| (1) | Federal Income Tax Information: For tax information at September 30, 2012, see Note 11 Federal Income Tax Information in the Notes to Financial Statements. |
| (2) | Variable or step coupon security; interest rate shown reflects the rate in effect at September 30, 2012. |
| (3) | Security exempt from registration under Rule 144A of the Securities Act of 1933. These securities may be resold in transactions exempt from registration, normally to qualified institutional buyers. At September 30, 2012, these securities amounted to a value of $22,628 or 5.1% of net assets. |
| (4) | Regulation S security. Security is offered and sold outside of the United States, therefore, it is exempt from registration with the SEC under rules 903 and 904 of the Securities Act of 1933. |
| (5) | Illiquid security. |
| (6) | Security in default. |
| (7) | This note was issued for the sole purpose of funding a loan agreement between the issuer and the borrower. As the credit risk for this security lies solely with the borrower, the name represented here is that of the borrower. |
| (8) | Security valued at fair value as determined in good faith by or under the direction of the Trustees. This security is disclosed as level 3 security in the disclosure table located after the schedule of Investments. |
| (9) | A portion of the Fund’s assets have been segregated for delayed delivery settlements. |
Foreign Currencies:
| CAD | Canadian Dollar |
| Country Weightings (Unaudited)† | ||||
United States | 94 | % | ||
Canada | 2 | |||
United Kingdom | 1 | |||
Venezuela | 1 | |||
Other | 2 | |||
Total | 100 | % | ||
† % of total investments as of September 30, 2012 |
| |||
The following table provides a summary of inputs used to value the Fund’s investments as of September 30, 2012 (See Security Valuation Note 2A in the Notes to Financial Statements):
| Total Value at September 30, 2012 | Level 1 – Quoted Prices | Level 2 – Significant Observable Inputs | Level 3 – Significant Unobservable Inputs | |||||||||||||
Debt Securities: | ||||||||||||||||
Asset-Backed Securities | $ | 2,260 | $ | — | $ | 2,260 | $ | — | ||||||||
Corporate Bonds and Notes | 39,798 | — | 39,792 | 6 | ||||||||||||
Foreign Government Securities | 1,623 | — | 1,623 | — | ||||||||||||
Loan Agreements | 415,502 | — | 415,216 | 286 | ||||||||||||
Equity Securities: | ||||||||||||||||
Short-Term Investments | 15,513 | 15,513 | — | — | ||||||||||||
|
|
|
|
|
|
|
| |||||||||
Total Investments | $ | 474,696 | $ | 15,513 | $ | 458,891 | $ | 292 | ||||||||
|
|
|
|
|
|
|
| |||||||||
Security abbreviation definitions are located under the Key Investment Terms starting on page 4.
See Notes to Financial Statements
48
Table of Contents
VIRTUS SENIOR FLOATING RATE FUND
SCHEDULE OF INVESTMENTS (Continued)
SEPTEMBER 30, 2012
($ reported in thousands)
The following is a reconciliation of assets of the Fund for Level 3 investments for which significant unobservable inputs were used to determine fair value.
| Total | Corporate Bonds and Notes | Loan Agreements | ||||||||||
Investments in Securities | ||||||||||||
Balance as of September 30, 2011: | $ | — | $ | — | $ | — | ||||||
Accrued discount/(premium) | — | — | — | |||||||||
Realized gain (loss) | — | — | — | |||||||||
Change in unrealized appreciation (depreciation) | — | — | — | |||||||||
Purchases | — | — | — | |||||||||
Sales(b) | — | — | — | |||||||||
Transfers into Level 3(a) | 292 | 6 | 286 | |||||||||
Transfers from Level 3(a) | — | — | — | |||||||||
|
|
|
|
|
| |||||||
Balance as of September 30, 2012 | $ | 292 | $ | 6 | $ | 286 | ||||||
|
|
|
|
|
| |||||||
| (a) | “Transfers into and/or from” represent the ending value as of September 30, 2012, for any investment security where a change in the pricing level occurred from the beginning to the end of the period. |
| (b) | Includes paydowns on securities, if applicable. |
See Notes to Financial Statements
49
Table of Contents
SCHEDULE OF INVESTMENTS
SEPTEMBER 30, 2012
($ reported in thousands)
| SHARES | VALUE | |||||||
| COMMON STOCKS—99.6% | ||||||||
| Consumer Discretionary—37.3% | ||||||||
Amazon.com, Inc.(2) | 30 | $ | 8 | |||||
AMC Networks, Inc.(2) | 183 | 8 | ||||||
Apollo Group, Inc. Class A(2) | 267 | 8 | ||||||
AutoNation, Inc.(2) | 182 | 8 | ||||||
AutoZone, Inc.(2) | 21 | 8 | ||||||
Buckle, Inc. (The) | 169 | 8 | ||||||
Cabela’s, Inc. Class A(2) | 142 | 8 | ||||||
Cablevision Systems Corp. Class A | 478 | 7 | ||||||
Carnival Corp. | 209 | 8 | ||||||
CBS Corp. Class B | 206 | 7 | ||||||
Columbia Sportswear Co. | 152 | 8 | ||||||
Comcast Corp. Class A | 216 | 8 | ||||||
Discovery Communications, Inc. Class A(2) | 130 | 8 | ||||||
DISH Network Corp. Class A | 245 | 7 | ||||||
DR Horton, Inc. | 349 | 7 | ||||||
DSW, Inc. Class A | 117 | 8 | ||||||
Expedia, Inc. | 132 | 8 | ||||||
Family Dollar Stores, Inc. | 122 | 8 | ||||||
Ford Motor Co. | 750 | 7 | ||||||
Fossil, Inc.(2) | 87 | 7 | ||||||
Gap, Inc. (The) | 216 | 8 | ||||||
Garmin Ltd. | 186 | 8 | ||||||
Halozyme Therapeutics Inc(2) | 982 | 7 | ||||||
Hyatt Hotels Corp. Class A(2) | 193 | 8 | ||||||
Kohl’s Corp. | 148 | 7 | ||||||
Las Vegas Sands Corp. | 174 | 8 | ||||||
Lennar Corp. Class A | 208 | 7 | ||||||
Liberty Global, Inc. Class A(2) | 131 | 8 | ||||||
Liberty Media Corp – Liberty Capital(2) | 76 | 8 | ||||||
Liberty Media Corp. – Interactive Class A(2) | 428 | 8 | ||||||
Liberty Ventures(2) | 154 | 8 | ||||||
Ltd. Brands, Inc. | 151 | 7 | ||||||
Madison Square Garden Co/The(2) | 188 | 7 | ||||||
Marriott International, Inc. Class A | 193 | 7 | ||||||
MGM MIRAGE(2) | 728 | 8 | ||||||
Morningstar, Inc. | 125 | 8 | ||||||
News Corp. Class A | 314 | 8 | ||||||
NIKE, Inc. Class B | 81 | 8 | ||||||
Nordstrom, Inc. | 139 | 8 | ||||||
Penske Automotive Group, Inc. | 255 | 8 | ||||||
Ralph Lauren Corp. | 50 | 7 | ||||||
Sears Holdings Corp.(2) | 135 | 7 | ||||||
Starbucks Corp. | 153 | 8 | ||||||
Tesla Motors, Inc.(2) | 259 | 7 | ||||||
TripAdvisor, Inc.(2) | 226 | 7 | ||||||
Under Armour, Inc. Class A(2) | 138 | 8 | ||||||
Urban Outfitters, Inc.(2) | 202 | 8 | ||||||
Viacom, Inc. Class B | 144 | 8 | ||||||
Wendy’s Co/The | 1,716 | 8 | ||||||
Wynn Resorts Ltd. | 68 | 8 | ||||||
|
| |||||||
| 384 | ||||||||
|
| |||||||
| Consumer Staples—6.0% | ||||||||
Brown-Forman Corp. Class B | 121 | 8 | ||||||
Campbell Soup Co. | 223 | 8 | ||||||
Dole Food Co., Inc.(2) | 549 | 7 | ||||||
Estee Lauder Cos., Inc. (The) Class A | 126 | 8 | ||||||
Monster Beverage Corp.(2) | 143 | 8 | ||||||
| SHARES | VALUE | |||||||
| Consumer Staples—continued | ||||||||
PriceSmart, Inc. | 102 | $ | 7 | |||||
Tootsie Roll Industries, Inc. | 291 | 8 | ||||||
Wal-Mart Stores, Inc. | 105 | 8 | ||||||
|
| |||||||
| 62 | ||||||||
|
| |||||||
| Energy—4.4% | ||||||||
Continental Resources, Inc.(2) | 97 | 7 | ||||||
CVR Energy, Inc. | 207 | 8 | ||||||
Kinder Morgan Management LLC(2) | 104 | 8 | ||||||
Occidental Petroleum Corp. | 89 | 8 | ||||||
RPC, Inc. | 626 | 7 | ||||||
W&T Offshore, Inc. | 399 | 8 | ||||||
|
| |||||||
| 46 | ||||||||
|
| |||||||
| Financials—18.5% | ||||||||
Altisource Portfolio Solutions SA | 88 | 7 | ||||||
Berkley (W.R.) Corp. | 208 | 8 | ||||||
Berkshire Hathaway, Inc. Class B(2) | 87 | 8 | ||||||
BOK Financial Corp. | 135 | 8 | ||||||
Boston Properties, Inc. | 69 | 8 | ||||||
Brown & Brown, Inc. | 296 | 8 | ||||||
Charles Schwab Corp. (The) | 575 | 7 | ||||||
Credit Acceptance Corp.(2) | 87 | 7 | ||||||
Equity Lifestyle Properties, Inc. | 113 | 8 | ||||||
Equity Residential | 136 | 8 | ||||||
Erie Indemnity Co. Class A | 121 | 8 | ||||||
Franklin Resources, Inc. | 62 | 8 | ||||||
Greenlight Capital Re Ltd.(2) | 313 | 8 | ||||||
Host Hotels & Resorts, Inc. | 470 | 7 | ||||||
Howard Hughes Corp/The(2) | 107 | 7 | ||||||
Leucadia National Corp. | 331 | 7 | ||||||
Loews Corp. | 189 | 8 | ||||||
Mercury General Corp. | 199 | 8 | ||||||
Ocwen Financial Corp.(2) | 278 | 8 | ||||||
Progressive Corp. (The) | 367 | 8 | ||||||
Raymond James Financial, Inc. | 208 | 8 | ||||||
Saul Centers, Inc. | 170 | 7 | ||||||
Simon Property Group, Inc. | 50 | 7 | ||||||
Taubman Centers, Inc. | 99 | 7 | ||||||
Vornado Realty Trust | 95 | 8 | ||||||
|
| |||||||
| 191 | ||||||||
|
| |||||||
| Health Care—4.6% | ||||||||
Bruker Corp.(2) | 601 | 8 | ||||||
Cerner Corp.(2) | 105 | 8 | ||||||
Opko Health, Inc.(2) | 1,821 | 7 | ||||||
Pharmacyclics, Inc.(2) | 126 | 8 | ||||||
Stryker Corp. | 139 | 8 | ||||||
Teva Pharmaceutical Industries Ltd. | 195 | 8 | ||||||
|
| |||||||
| 47 | ||||||||
|
| |||||||
| Industrials—7.5% | ||||||||
American Railcar Industries, Inc.(2) | 250 | 7 | ||||||
Cintas Corp. | 192 | 8 | ||||||
Colfax Corp(2) | 213 | 8 | ||||||
Covanta Holding Corp. | 454 | 8 | ||||||
Danaher Corp. | 142 | 8 | ||||||
Fastenal Co. | 178 | 7 | ||||||
FedEx Corp. | 93 | 8 | ||||||
Harbinger Group Inc(2) | 858 | 7 | ||||||
| SHARES | VALUE | |||||||
| Industrials—continued | ||||||||
Rollins, Inc. | 330 | $ | 8 | |||||
Ryanair Holdings plc ADR(2) | 239 | 8 | ||||||
|
| |||||||
| 77 | ||||||||
|
| |||||||
| Information Technology—17.7% | ||||||||
Amkor Technology, Inc.(2) | 1,724 | 8 | ||||||
Anixter International, Inc.(2) | 125 | 7 | ||||||
Broadcom Corp. Class A(2) | 216 | 7 | ||||||
Dell, Inc. | 754 | 7 | ||||||
eBay, Inc.(2) | 158 | 8 | ||||||
EchoStar Corp Class A(2) | 275 | 8 | ||||||
Google, Inc. Class A(2) | 11 | 8 | ||||||
IAC/InterActiveCorp. | 147 | 8 | ||||||
Intel Corp. | 338 | 8 | ||||||
Intuit, Inc. | 134 | 8 | ||||||
Marvell Technology Group Ltd. | 796 | 7 | ||||||
Microsoft Corp. | 250 | 7 | ||||||
Molex, Inc. | 284 | 7 | ||||||
National Instruments Corp. | 296 | 7 | ||||||
Oracle Corp. | 241 | 8 | ||||||
Paychex, Inc. | 226 | 8 | ||||||
Pegasystems, Inc. | 258 | 7 | ||||||
QUALCOMM, Inc. | 121 | 8 | ||||||
Rackspace Hosting, Inc.(2) | 117 | 8 | ||||||
Realpage, Inc.(2) | 327 | 7 | ||||||
Salesforce.com, Inc.(2) | 50 | 8 | ||||||
Syntel, Inc. | 123 | 8 | ||||||
TeleTech Holdings, Inc.(2) | 458 | 8 | ||||||
Yahoo!, Inc.(2) | 495 | 8 | ||||||
|
| |||||||
| 183 | ||||||||
|
| |||||||
| Materials—3.6% | ||||||||
Airgas, Inc. | 92 | 8 | ||||||
Kronos Worldwide, Inc. | 482 | 7 | ||||||
Novagold Resources, Inc.(2) | 1,263 | 7 | ||||||
Titanium Metals Corp. | 588 | 7 | ||||||
Westlake Chemical Corp. | 104 | 8 | ||||||
|
| |||||||
| 37 | ||||||||
| TOTAL COMMON STOCKS (Identified Cost $1,011) | 1,027 | |||||||
| TOTAL LONG TERM INVESTMENTS—99.6% | ||||||||
| (Identified cost $1,011) | 1,027 | |||||||
| SHORT-TERM INVESTMENTS—0.1% | ||||||||
| Money Market Mutual Funds—0.1% | ||||||||
BlackRock Liquidity Funds TempFund Portfolio – Insitutional Shares (seven-day effective yield 0.140%) | 692 | 1 | ||||||
| TOTAL SHORT-TERM INVESTMENTS (Identified Cost $1) | 1 | |||||||
| TOTAL INVESTMENTS—99.7% (Identified Cost $1,012) | 1,028 | (1) | ||||||
Other assets and liabilities, net—0.3% |
| 3 | ||||||
|
| |||||||
| NET ASSETS—100.0% | $ | 1,031 | ||||||
|
| |||||||
See Notes to Financial Statements
50
Table of Contents
VIRTUS WEALTH MASTERS FUND
SCHEDULE OF INVESTMENTS (Continued)
SEPTEMBER 30, 2012
($ reported in thousands)
Abbreviations:
| ADR | American Depositary Receipt |
Footnote Legend:
| (1) | Federal Income Tax Information: For tax information at September 30, 2012, see Note 11 Federal Income Tax Information in the Notes to Financial Statements. |
| (2) | Non-income producing. |
| Country Weightings (Unaudited)† | ||||
United States | 93 | % | ||
Bermuda | 1 | |||
Canada | 1 | |||
Cayman Islands | 1 | |||
Israel | 1 | |||
Panama | 1 | |||
United Kingdom | 1 | |||
Other | 1 | |||
Total | 100 | % | ||
† % of total investments as of September 30, 2012 |
| |||
The following table provides a summary of inputs used to value the Fund’s investments as of September 30, 2012 (See Security Valuation Note 2A in the Notes to Financial Statements):
| Total Value at September 30, 2012 | Level 1 – Quoted Prices | |||||||
Equity Securities: | ||||||||
Common Stocks | $ | 1,027 | $ | 1,027 | ||||
Short-Term Investments | 1 | 1 | ||||||
|
|
|
| |||||
Total Investments | $ | 1,028 | $ | 1,028 | ||||
|
|
|
| |||||
There are no Level 2 (significant observable inputs) or Level 3 (significant unobservable inputs) priced securities.
Security abbreviation definitions are located under the Key Investment Terms starting on page 4.
See Notes to Financial Statements
51
Table of Contents
VIRTUS OPPORTUNITIES TRUST
STATEMENTS OF ASSETS AND LIABILITIES
SEPTEMBER 30, 2012
(Reported in thousands except shares and per share amounts)
|
|
|
|
|
|
|
| |||||||||
| Bond Fund | CA Tax-Exempt Bond Fund | Herzfeld Fund | High Yield Fund | |||||||||||||
| Assets | ||||||||||||||||
Investment in securities at value(1) | $ | 107,892 | $ | 56,849 | $ | 1,313 | $ | 101,609 | ||||||||
Cash | 15 | — | — | 66 | ||||||||||||
Deposits with broker | 39 | — | — | — | ||||||||||||
| Receivables | ||||||||||||||||
Investment securities sold | 3,761 | — | 10 | 3,397 | ||||||||||||
Fund shares sold | 199 | 1 | 200 | 86 | ||||||||||||
Receivable from adviser | — | — | 24 | — | ||||||||||||
Dividends and interest receivable | 745 | 780 | 1 | 1,856 | ||||||||||||
Variation margin for futures contracts | 1 | — | — | — | ||||||||||||
Prepaid trustee retainer | 1 | — | (2) | — | (2) | 1 | ||||||||||
Prepaid expenses | 27 | 13 | — | 31 | ||||||||||||
|
|
|
|
|
|
|
| |||||||||
Total assets | 112,680 | 57,643 | 1,548 | 107,046 | ||||||||||||
|
|
|
|
|
|
|
| |||||||||
| Liabilities | ||||||||||||||||
| Payables | ||||||||||||||||
Fund shares repurchased | 10 | 62 | — | 11 | ||||||||||||
Investment securities purchased | 5,731 | — | 301 | 4,834 | ||||||||||||
Dividend distributions | — | 77 | — | — | ||||||||||||
Investment advisory fee | 24 | 11 | — | 38 | ||||||||||||
Distribution and service fees | 22 | 6 | — | (2) | 23 | |||||||||||
Administration fee | 13 | 6 | — | (2) | 11 | |||||||||||
Transfer agent fees and expenses | 23 | 5 | — | (2) | 31 | |||||||||||
Trustees’ fees and expenses | — | (2) | — | (2) | — | (2) | — | (2) | ||||||||
Professional fees | 29 | 29 | 20 | 34 | ||||||||||||
Other accrued expenses | 14 | 5 | 3 | 10 | ||||||||||||
|
|
|
|
|
|
|
| |||||||||
Total liabilities | 5,866 | 201 | 324 | 4,992 | ||||||||||||
|
|
|
|
|
|
|
| |||||||||
| Net Assets | $ | 106,814 | $ | 57,442 | $ | 1,224 | $ | 102,054 | ||||||||
|
|
|
|
|
|
|
| |||||||||
| Net Assets Consist of: | ||||||||||||||||
Capital paid in on shares of beneficial interest | $ | 107,742 | $ | 51,786 | $ | 1,203 | $ | 126,700 | ||||||||
Accumulated undistributed net investment income (loss) | 42 | — | (2) | 3 | 90 | |||||||||||
Accumulated undistributed net realized gain (loss) | (6,720 | ) | 769 | — | (2) | (29,184 | ) | |||||||||
Net unrealized appreciation (depreciation) on investments | 5,750 | 4,887 | 18 | 4,448 | ||||||||||||
|
|
|
|
|
|
|
| |||||||||
| Net Assets | $ | 106,814 | $ | 57,442 | $ | 1,224 | $ | 102,054 | ||||||||
|
|
|
|
|
|
|
| |||||||||
| Class A | ||||||||||||||||
Net asset value (net assets/shares outstanding) per share | $ | 11.61 | $ | 12.96 | $ | 10.21 | $ | 4.28 | ||||||||
Maximum offering price per share NAV/(1–2.75%) | $ | — | $ | 13.33 | $ | — | $ | — | ||||||||
Maximum offering price per share NAV/(1–3.75%) | $ | 12.06 | $ | — | $ | — | $ | 4.45 | ||||||||
Maximum offering price per share NAV/(1–5.75%) | $ | — | $ | — | $ | 10.83 | $ | — | ||||||||
Shares of beneficial interest outstanding, $1.00 par value, unlimited authorization | 5,841,389 | 2,223,157 | 10,323 | 23,040,108 | ||||||||||||
Net Assets | $ | 67,804 | $ | 28,803 | $ | 105 | $ | 98,701 | ||||||||
| Class B | ||||||||||||||||
Net asset value (net assets/shares outstanding) and offering price per share | $ | 11.34 | $ | — | $ | — | $ | 4.19 | ||||||||
Shares of beneficial interest outstanding, $1.00 par value, unlimited authorization | 64,110 | — | — | 73,171 | ||||||||||||
Net Assets | $ | 727 | $ | — | $ | — | $ | 307 | ||||||||
| Class C | ||||||||||||||||
Net asset value (net assets/shares outstanding) and offering price per share | $ | 11.38 | $ | — | $ | 10.21 | $ | 4.23 | ||||||||
Shares of beneficial interest outstanding, $1.00 par value, unlimited authorization | 769,387 | — | 10,000 | 696,618 | ||||||||||||
Net Assets | $ | 8,756 | $ | — | $ | 102 | $ | 2,944 | ||||||||
| Class I | ||||||||||||||||
Net asset value (net assets/shares outstanding) and offering price per share | $ | 11.76 | $ | 12.95 | $ | 10.21 | $ | 4.28 | ||||||||
Shares of beneficial interest outstanding, $1.00 par value, unlimited authorization | 2,510,551 | 2,212,240 | 99,569 | 23,919 | ||||||||||||
Net Assets | $ | 29,527 | $ | 28,639 | $ | 1,017 | $ | 102 | ||||||||
(1) Investment in securities at cost | $ | 102,072 | $ | 51,962 | $ | 1,295 | $ | 97,161 | ||||||||
(2) Amount is less than $500. | ||||||||||||||||
See Notes to Financial Statements
52
Table of Contents
VIRTUS OPPORTUNITIES TRUST
STATEMENTS OF ASSETS AND LIABILITIES (Continued)
SEPTEMBER 30, 2012
(Reported in thousands except shares and per share amounts)
|
|
|
|
|
| |||||||
| Multi-Sector Fixed Income Fund | Senior Floating Rate Fund | Wealth Masters Fund | ||||||||||
| Assets | ||||||||||||
Investment in securities at value(1) | $ | 393,904 | $ | 474,696 | $ | 1,028 | ||||||
Foreign currency at value(2) | 2 | 5 | — | |||||||||
Cash | 1,126 | 5,297 | — | |||||||||
| Receivables | ||||||||||||
Investment securities sold | 5,933 | 12,633 | 262 | |||||||||
Fund shares sold | 2,505 | 2,273 | — | |||||||||
Receivable from adviser | — | — | 26 | |||||||||
Dividends and interest receivable | 5,079 | 2,375 | 1 | |||||||||
Variation margin for futures contracts | — | — | — | |||||||||
Prepaid trustee retainer | 3 | 3 | — | (3) | ||||||||
Prepaid expenses | 35 | 27 | — | |||||||||
|
|
|
|
|
| |||||||
Total assets | 408,587 | 497,309 | 1,317 | |||||||||
|
|
|
|
|
| |||||||
| Liabilities | ||||||||||||
Payables | ||||||||||||
Fund shares repurchased | 522 | 1,275 | — | |||||||||
Investment securities purchased | 17,283 | 29,527 | 261 | |||||||||
Borrowings (Note 13) | — | 20,000 | — | |||||||||
Dividend distributions | 312 | 263 | — | |||||||||
Investment advisory fee | 171 | 218 | — | |||||||||
Distribution and service fees | 134 | 130 | — | (3) | ||||||||
Administration fee | 41 | 47 | — | (3) | ||||||||
Transfer agent fees and expenses | 65 | 63 | — | (3) | ||||||||
Trustees’ fees and expenses | 1 | 1 | — | (3) | ||||||||
Interest expenses | — | 4 | — | |||||||||
Professional fees | 33 | 35 | 24 | |||||||||
Other accrued expenses | 55 | 78 | 1 | |||||||||
|
|
|
|
|
| |||||||
Total liabilities | 18,617 | 51,641 | 286 | |||||||||
|
|
|
|
|
| |||||||
| Net Assets | $ | 389,970 | $ | 445,668 | $ | 1,031 | ||||||
|
|
|
|
|
| |||||||
| Net Assets Consist of: | ||||||||||||
Capital paid in on shares of beneficial interest | $ | 369,418 | $ | 441,594 | $ | 1,009 | ||||||
Accumulated undistributed net investment income (loss) | 88 | 679 | 1 | |||||||||
Accumulated undistributed net realized gain (loss) | 4,399 | 56 | 5 | |||||||||
Net unrealized appreciation (depreciation) on investments | 16,065 | 3,339 | 16 | |||||||||
|
|
|
|
|
| |||||||
| Net Assets | $ | 389,970 | $ | 445,668 | $ | 1,031 | ||||||
|
|
|
|
|
| |||||||
| Class A | ||||||||||||
Net asset value (net assets/shares outstanding) per share | $ | 11.15 | $ | 9.79 | $ | 10.22 | ||||||
Maximum offering price per share NAV/(1–2.75%) | $ | — | $ | 10.07 | $ | — | ||||||
Maximum offering price per share NAV/(1–3.75%) | $ | 11.58 | $ | — | $ | — | ||||||
Maximum offering price per share NAV/(1–5.75%) | $ | — | $ | — | $ | 10.84 | ||||||
Shares of beneficial interest outstanding, no par value, unlimited authorization | 17,633,515 | 26,182,290 | 10,401 | |||||||||
Net Assets | $ | 196,554 | $ | 256,397 | $ | 106 | ||||||
| Class B | ||||||||||||
Net asset value (net assets/shares outstanding) and offering price per share | $ | 11.12 | $ | — | $ | — | ||||||
Shares of beneficial interest outstanding, no par value, unlimited authorization | 896,868 | — | — | |||||||||
Net Assets | $ | 9,974 | $ | — | $ | — | ||||||
| Class C | ||||||||||||
Net asset value (net assets/shares outstanding) and offering price per share | $ | 11.23 | $ | 9.80 | $ | 10.21 | ||||||
Shares of beneficial interest outstanding, no par value, unlimited authorization | 9,671,728 | 9,697,401 | 10,479 | |||||||||
Net Assets | $ | 108,595 | $ | 95,078 | $ | 107 | ||||||
| Class I | ||||||||||||
Net asset value (net assets/shares outstanding) and offering price per share | $ | 11.15 | $ | 9.78 | $ | 10.22 | ||||||
Shares of beneficial interest outstanding, no par value, unlimited authorization | 6,713,533 | 9,627,655 | 80,000 | |||||||||
Net Assets | $ | 74,847 | $ | 94,193 | $ | 818 | ||||||
(1)Investment in securities at cost | $ | 377,844 | $ | 471,357 | $ | 1,012 | ||||||
(2)Foreign currency at cost | $ | 2 | $ | 5 | $ | — | ||||||
(3)Amount is less than $500. | ||||||||||||
See Notes to Financial Statements
53
Table of Contents
VIRTUS OPPORTUNITIES TRUST
YEAR ENDED SEPTEMBER 30, 2012
($ reported in thousands)
|
|
|
|
|
|
|
| |||||||||
| Bond Fund | CA Tax-Exempt Bond Fund | Herzfeld Fund(2) | High Yield Fund | |||||||||||||
| Investment Income | ||||||||||||||||
Dividends | $ | 105 | $ | 2 | $ | 4 | $ | 52 | ||||||||
Interest | 5,983 | 2,611 | — | 7,630 | ||||||||||||
Security lending | 1 | — | — | 2 | ||||||||||||
|
|
|
|
|
|
|
| |||||||||
Total investment income | 6,089 | 2,613 | 4 | 7,684 | ||||||||||||
|
|
|
|
|
|
|
| |||||||||
| Expenses | ||||||||||||||||
Investment advisory fees | 689 | 261 | 1 | 627 | ||||||||||||
Service fees, Class A | 165 | 74 | — | (1) | 234 | |||||||||||
Distribution and service fees, Class B | 9 | — | — | 4 | ||||||||||||
Distribution and service fees, Class C | 83 | — | — | (1) | 24 | |||||||||||
Administration fees | 201 | 76 | — | (1) | 127 | |||||||||||
Transfer agent fee and expenses | 156 | 39 | — | (1) | 158 | |||||||||||
Custodian fees | 9 | 1 | — | (1) | 4 | |||||||||||
Printing fees and expenses | 19 | 8 | — | (1) | 16 | |||||||||||
Professional fees | 33 | 37 | 21 | 39 | ||||||||||||
Registration fees | 51 | 29 | 3 | 39 | ||||||||||||
Trustees’ fees and expenses | 9 | 3 | — | (1) | 5 | |||||||||||
Miscellaneous expenses | 14 | 5 | 1 | 12 | ||||||||||||
|
|
|
|
|
|
|
| |||||||||
Total expenses | 1,438 | 533 | 26 | 1,289 | ||||||||||||
Less expenses reimbursed and/or waived by investment adviser | (263 | ) | (112 | ) | (25 | ) | (159 | ) | ||||||||
|
|
|
|
|
|
|
| |||||||||
Net expenses | 1,175 | 421 | 1 | 1,130 | ||||||||||||
|
|
|
|
|
|
|
| |||||||||
| Net investment income (loss) | 4,914 | 2,192 | 3 | 6,554 | ||||||||||||
|
|
|
|
|
|
|
| |||||||||
| Net Realized and Unrealized Gain (Loss) on Investments | ||||||||||||||||
Net realized gain (loss) on investments | 7,118 | 873 | — | (1) | (2,762 | ) | ||||||||||
Net realized gain (loss) on futures | (101 | ) | — | — | — | |||||||||||
Net realized gain (loss) on foreign currency transactions | — | — | — | (2 | ) | |||||||||||
Capital gain distributions on underlying funds | — | — | — | (1) | — | |||||||||||
Net change in unrealized appreciation (depreciation) | 2,168 | 2,225 | 18 | 12,921 | ||||||||||||
Net change in unrealized appreciation (depreciation) | — | — | — | — | (1) | |||||||||||
Net change in unrealized appreciation (depreciation) | (70 | ) | — | — | — | |||||||||||
|
|
|
|
|
|
|
| |||||||||
| Net gain (loss) on investments | 9,115 | 3,098 | 18 | 10,157 | ||||||||||||
|
|
|
|
|
|
|
| |||||||||
Net increase (decrease) in net assets resulting from operations | $ | 14,029 | $ | 5,290 | $ | 21 | $ | 16,711 | ||||||||
|
|
|
|
|
|
|
| |||||||||
(1) Amount is less than $500.
(2) From inception date September 5, 2012.
See Notes to Financial Statements
54
Table of Contents
VIRTUS OPPORTUNITIES TRUST
STATEMENTS OF OPERATIONS (Continued)
YEAR ENDED SEPTEMBER 30, 2012
($ reported in thousands)
|
|
|
|
|
| |||||||
| Multi-Sector Fixed Income Fund | Senior Floating Rate Fund | Wealth Masters Fund(2) | ||||||||||
| Investment Income | ||||||||||||
Dividends | $ | 181 | $ | 20 | $ | 2 | ||||||
Interest | 21,024 | 25,869 | — | |||||||||
Foreign taxes withheld | (24 | ) | — | — | ||||||||
|
|
|
|
|
| |||||||
Total investment income | 21,181 | 25,889 | 2 | |||||||||
|
|
|
|
|
| |||||||
| Expenses | ||||||||||||
Investment advisory fees | 1,699 | 2,470 | 1 | |||||||||
Service fees, Class A | 414 | 582 | — | (1) | ||||||||
Distribution and service fees, Class B | 104 | — | — | |||||||||
Distribution and service fees, Class C | 872 | 929 | — | (1) | ||||||||
Administration fees | 407 | 540 | — | (1) | ||||||||
Transfer agent fee and expenses | 373 | 439 | — | (1) | ||||||||
Custodian fees | 13 | (6 | ) | — | (1) | |||||||
Printing fees and expenses | 46 | 48 | — | (1) | ||||||||
Professional fees | 41 | 92 | 26 | |||||||||
Registration fees | 90 | 109 | 3 | |||||||||
Trustees’ fees and expenses | 17 | 23 | — | (1) | ||||||||
Interest expense and fees | — | 192 | — | |||||||||
Miscellaneous expenses | 37 | 134 | — | (1) | ||||||||
|
|
|
|
|
| |||||||
Total expenses | 4,113 | 5,552 | 30 | |||||||||
Less expenses reimbursed and/or waived by investment adviser | — | — | (29 | ) | ||||||||
|
|
|
|
|
| |||||||
Net expenses | 4,113 | 5,552 | 1 | |||||||||
|
|
|
|
|
| |||||||
Net investment income (loss) | 17,068 | 20,337 | 1 | |||||||||
|
|
|
|
|
| |||||||
| Net Realized and Unrealized Gain (Loss) on Investments | ||||||||||||
Net realized gain (loss) on investments | 6,445 | 876 | 5 | |||||||||
Net realized gain (loss) on foreign currency transactions | (11 | ) | (1 | ) | — | |||||||
Net change in unrealized appreciation (depreciation) | 19,867 | 20,221 | 16 | |||||||||
Net change in unrealized appreciation (depreciation) | 43 | — | (1) | — | ||||||||
|
|
|
|
|
| |||||||
| Net gain (loss) on investments | 26,344 | 21,096 | 21 | |||||||||
|
|
|
|
|
| |||||||
Net increase (decrease) in net assets resulting from operations | $ | 43,412 | $ | 41,433 | $ | 22 | ||||||
|
|
|
|
|
| |||||||
(1) Amount is less than $500.
(2) From inception date September 5, 2012.
See Notes to Financial Statements
55
Table of Contents
VIRTUS OPPORTUNITIES TRUST
STATEMENTS OF CHANGES IN NET ASSETS
(Reported in thousands)
|
|
|
| |||||||||||||
| Bond Fund | CA Tax-Exempt Bond Fund | |||||||||||||||
| Year Ended September 30, 2012 | Year Ended September 30, 2011 | Year Ended September 30, 2012 | Year Ended September 30, 2011 | |||||||||||||
| INCREASE/(DECREASE) IN NET ASSETS | ||||||||||||||||
| From Operations | ||||||||||||||||
Net investment income (loss) | $ | 4,914 | $ | 6,875 | $ | 2,192 | $ | 2,337 | ||||||||
Net realized gain (loss) | 7,017 | 5,090 | 873 | 262 | ||||||||||||
Net change in unrealized appreciation (depreciation) | 2,098 | (8,367 | ) | 2,225 | (600 | ) | ||||||||||
|
|
|
|
|
|
|
| |||||||||
Increase (decrease) in net assets resulting from operations | 14,029 | 3,598 | 5,290 | 1,999 | ||||||||||||
|
|
|
|
|
|
|
| |||||||||
| From Distributions to Shareholders | ||||||||||||||||
Net investment income, Class A | (2,140 | ) | (2,743 | ) | (1,124 | ) | (1,183 | ) | ||||||||
Net investment income, Class B | (24 | ) | (68 | ) | — | — | ||||||||||
Net investment income, Class C | (208 | ) | (287 | ) | — | — | ||||||||||
Net investment income, Class I | (2,609 | ) | (3,815 | ) | (1,153 | ) | (1,127 | ) | ||||||||
|
|
|
|
|
|
|
| |||||||||
Decrease in net assets from distributions to shareholders | (4,981 | ) | (6,913 | ) | (2,277 | ) | (2,310 | ) | ||||||||
|
|
|
|
|
|
|
| |||||||||
| From Share Transactions (See Note 6) | ||||||||||||||||
Change in net assets from share transactions, Class A | (405 | ) | (1,413 | ) | (2,423 | ) | (2,057 | ) | ||||||||
Change in net assets from share transactions, Class B | (499 | ) | (1,604 | ) | — | — | ||||||||||
Change in net assets from share transactions, Class C | 295 | (522 | ) | — | — | |||||||||||
Change in net assets from share transactions, Class I | (51,398 | ) | (42,454 | ) | (253 | ) | (641 | ) | ||||||||
|
|
|
|
|
|
|
| |||||||||
Increase (decrease) in net assets from share transactions | (52,007 | ) | (45,993 | ) | (2,676 | ) | (2,698 | ) | ||||||||
|
|
|
|
|
|
|
| |||||||||
Net increase (decrease) in net assets | (42,959 | ) | (49,308 | ) | 337 | (3,009 | ) | |||||||||
| Net Assets | ||||||||||||||||
Beginning of fiscal year | 149,773 | 199,081 | 57,105 | 60,114 | ||||||||||||
|
|
|
|
|
|
|
| |||||||||
End of fiscal year | $ | 106,814 | $ | 149,773 | $ | 57,442 | $ | 57,105 | ||||||||
|
|
|
|
|
|
|
| |||||||||
Accumulated undistributed net investment income (loss) at end of fiscal year | $ | 42 | $ | 107 | $ | — | (1) | $ | 85 | |||||||
(1) Amount is less than $500.
See Notes to Financial Statements
56
Table of Contents
VIRTUS OPPORTUNITIES TRUST
STATEMENTS OF CHANGES IN NET ASSETS (Continued)
(Reported in thousands)
|
|
|
| |||||||||
| Herzfeld Fund | High Yield Fund | |||||||||||
| From Inception September 5, 2012 to September 30, 2012 | Year Ended September 30, 2012 | Year Ended September 30, 2011 | ||||||||||
| INCREASE/(DECREASE) IN NET ASSETS | ||||||||||||
| From Operations | ||||||||||||
Net investment income (loss) | $ | 3 | $ | 6,554 | $ | 6,973 | ||||||
Net realized gain (loss) | — | (1) | (2,764 | ) | 2,806 | |||||||
Net change in unrealized appreciation (depreciation) | 18 | 12,921 | (10,310 | ) | ||||||||
|
|
|
|
|
| |||||||
Increase (decrease) in net assets resulting from operations | 21 | 16,711 | (531 | ) | ||||||||
|
|
|
|
|
| |||||||
| From Distributions to Shareholders | ||||||||||||
Net investment income, Class A | — | (6,523 | ) | (6,751 | ) | |||||||
Net investment income, Class B | — | (24 | ) | (36 | ) | |||||||
Net investment income, Class C | — | (149 | ) | (137 | ) | |||||||
Net investment income, Class I | — | (1 | ) | — | ||||||||
|
|
|
|
|
| |||||||
Decrease in net assets from distributions to shareholders | — | (6,697 | ) | (6,924 | ) | |||||||
|
|
|
|
|
| |||||||
| From Share Transactions (See Note 6) | ||||||||||||
Change in net assets from share transactions, Class A | 103 | 2,436 | (7,545 | ) | ||||||||
Change in net assets from share transactions, Class B | — | (140 | ) | (226 | ) | |||||||
Change in net assets from share transactions, Class C | 100 | 681 | 80 | |||||||||
Change in net assets from share transactions, Class I | 1,000 | 101 | — | |||||||||
|
|
|
|
|
| |||||||
Increase (decrease) in net assets from share transactions | 1,203 | 3,078 | (7,691 | ) | ||||||||
|
|
|
|
|
| |||||||
Net increase (decrease) in net assets | 1,224 | 13,092 | (15,146 | ) | ||||||||
| Net Assets | ||||||||||||
Beginning of fiscal year | — | 88,962 | 104,108 | |||||||||
|
|
|
|
|
| |||||||
End of fiscal year | $ | 1,224 | $ | 102,054 | $ | 88,962 | ||||||
|
|
|
|
|
| |||||||
Accumulated undistributed net investment income (loss) at end of fiscal year | $ | 3 | $ | 90 | $ | 186 | ||||||
(1) Amount is less than $500.
See Notes to Financial Statements
57
Table of Contents
VIRTUS OPPORTUNITIES TRUST
STATEMENTS OF CHANGES IN NET ASSETS (Continued)
(Reported in thousands)
|
|
|
| |||||||||||||
| Multi-Sector Fixed Income Fund | Senior Floating Rate Fund | |||||||||||||||
| Year Ended September 30, 2012 | Year Ended September 30, 2011 | Year Ended September 30, 2012 | Year Ended September 30, 2011 | |||||||||||||
| INCREASE/(DECREASE) IN NET ASSETS | ||||||||||||||||
| From Operations | ||||||||||||||||
Net investment income (loss) | $ | 17,068 | $ | 13,227 | $ | 20,337 | $ | 14,825 | ||||||||
Net realized gain (loss) | 6,434 | 5,461 | 875 | (430 | ) | |||||||||||
Net change in unrealized appreciation (depreciation) | 19,910 | (17,122 | ) | 20,221 | (20,018 | ) | ||||||||||
|
|
|
|
|
|
|
| |||||||||
Increase (decrease) in net assets resulting from operations | 43,412 | 1,566 | 41,433 | (5,623 | ) | |||||||||||
|
|
|
|
|
|
|
| |||||||||
| From Distributions to Shareholders | ||||||||||||||||
Net investment income, Class A | (9,818 | ) | (8,833 | ) | (11,416 | ) | (11,142 | ) | ||||||||
Net investment income, Class B | (549 | ) | (716 | ) | — | — | ||||||||||
Net investment income, Class C | (4,470 | ) | (3,861 | ) | (3,856 | ) | (3,931 | ) | ||||||||
Net investment income, Class I | (2,771 | ) | (941 | ) | (4,430 | ) | (5,057 | ) | ||||||||
Net realized short-term gains, Class A | — | — | — | (882 | ) | |||||||||||
Net realized short-term gains, Class C | — | — | — | (281 | ) | |||||||||||
Net realized short-term gains, Class I | — | — | — | (307 | ) | |||||||||||
Net realized long-term gains, Class A | — | — | — | (132 | ) | |||||||||||
Net realized long-term gains, Class C | — | — | — | (43 | ) | |||||||||||
Net realized long-term gains, Class I | — | — | — | (47 | ) | |||||||||||
|
|
|
|
|
|
|
| |||||||||
Decrease in net assets from distributions to shareholders | (17,608 | ) | (14,351 | ) | (19,702 | ) | (21,822 | ) | ||||||||
|
|
|
|
|
|
|
| |||||||||
| From Share Transactions (See Note 6) | ||||||||||||||||
Change in net assets from share transactions, Class A | 45,197 | 18,567 | 28,683 | 131,559 | ||||||||||||
Change in net assets from share transactions, Class B | (1,590 | ) | (2,385 | ) | — | — | ||||||||||
Change in net assets from share transactions, Class C | 30,591 | 12,197 | (2,515 | ) | 69,106 | |||||||||||
Change in net assets from share transactions, Class I | 48,745 | 16,230 | 18,135 | 44,829 | ||||||||||||
|
|
|
|
|
|
|
| |||||||||
Increase (decrease) in net assets from share transactions | 122,943 | 44,609 | 44,303 | 245,494 | ||||||||||||
|
|
|
|
|
|
|
| |||||||||
Net increase (decrease) in net assets | 148,747 | 31,824 | 66,034 | 218,049 | ||||||||||||
| Net Assets | ||||||||||||||||
Beginning of fiscal year | 241,223 | 209,399 | 379,634 | 161,585 | ||||||||||||
|
|
|
|
|
|
|
| |||||||||
End of fiscal year | $ | 389,970 | $ | 241,223 | $ | 445,668 | | $ | 379,634 | | ||||||
|
|
|
|
|
|
|
| |||||||||
Accumulated undistributed net investment income (loss) at end of fiscal year | $ | 88 | $ | 409 | $ | 679 | $ | — | ||||||||
See Notes to Financial Statements
58
Table of Contents
VIRTUS OPPORTUNITIES TRUST
STATEMENTS OF CHANGES IN NET ASSETS (Continued)
(Reported in thousands)
|
| |||
| Wealth Masters Fund | ||||
| From Inception September 5, 2012 to September 30, 2012 | ||||
| INCREASE/(DECREASE) IN NET ASSETS | ||||
| From Operations | ||||
Net investment income (loss) | $ | 1 | ||
Net realized gain (loss) | 5 | |||
Net change in unrealized appreciation (depreciation) | 16 | |||
|
| |||
Increase (decrease) in net assets resulting from operations | 22 | |||
|
| |||
| From Share Transactions (See Note 6) | ||||
Change in net assets from share transactions, Class A | 104 | |||
Change in net assets from share transactions, Class C | 105 | |||
Change in net assets from share transactions, Class I | 800 | |||
|
| |||
Increase (decrease) in net assets from share transactions | 1,009 | |||
|
| |||
Net increase (decrease) in net assets | 1,031 | |||
| Net Assets | ||||
Beginning of fiscal year | — | |||
|
| |||
End of fiscal year | $ | 1,031 | ||
|
| |||
Accumulated undistributed net investment income (loss) at end of fiscal year | $ | 1 | ||
See Notes to Financial Statements
59
Table of Contents
VIRTUS OPPORTUNITIES TRUST
SELECTED PER SHARE DATA AND RATIOS FOR A SHARE OUTSTANDING
THROUGHOUT EACH PERIOD
| Net Asset Value, Beginning of Period | Net Investment Income (Loss)(2) | Net Realized and Unrealized Gain (Loss) | Total from Investment Operations | Dividends from Net Investment Income | Distributions from Net Realized Gains | Total Distributions | Change in Net Asset Value | Net Asset Value, End of Period | Total Return(1) | Net Assets, End of Period (in thousands) | Ratio of Net Operating Expenses to Average Net Assets(8) | Ratio of Gross Expenses to Average Net Assets (before waivers and reimbursements)(8) | Ratio of Net Investment Income (Loss) to Average Net Assets | Portfolio Turnover Rate | |||||||||||||||||||||||||||||||||||||||||||||||||||||||||||||
Bond Fund | |||||||||||||||||||||||||||||||||||||||||||||||||||||||||||||||||||||||||||
Class A | |||||||||||||||||||||||||||||||||||||||||||||||||||||||||||||||||||||||||||
10/1/11 to 9/30/12 | $ | 10.96 | 0.35 | 0.67 | 1.02 | (0.37 | ) | — | (0.37 | ) | 0.65 | $ | 11.61 | 9.34 | % | $ | 67,804 | 0.85 | % | 1.02 | % | 3.12 | % | 210 | % | ||||||||||||||||||||||||||||||||||||||||||||||||||
10/1/10 to 9/30/11 | 11.18 | 0.46 | (0.21 | ) | 0.25 | (0.47 | ) | — | (0.47 | ) | (0.22 | ) | 10.96 | 2.39 | 64,449 | 0.85 | 1.04 | 4.16 | 169 | ||||||||||||||||||||||||||||||||||||||||||||||||||||||||
10/1/09 to 9/30/10 | 10.57 | 0.46 | 0.62 | 1.08 | (0.47 | ) | — | (0.47 | ) | 0.61 | 11.18 | 10.42 | 67,147 | 0.84 | (10) | 0.98 | 4.26 | 160 | |||||||||||||||||||||||||||||||||||||||||||||||||||||||||
10/1/08 to 9/30/09 | 9.75 | 0.42 | 0.82 | 1.24 | (0.42 | ) | — | (0.42 | ) | 0.82 | 10.57 | 13.12 | 66,232 | 0.85 | 1.01 | 4.15 | 274 | ||||||||||||||||||||||||||||||||||||||||||||||||||||||||||
10/1/07 to 9/30/08 | 10.21 | 0.42 | (0.45 | ) | (0.03 | ) | (0.43 | ) | — | (0.43 | ) | (0.46 | ) | 9.75 | (0.49 | ) | 23,823 | 1.12 | (7) | 1.17 | 4.10 | 325 | |||||||||||||||||||||||||||||||||||||||||||||||||||||
Class B | |||||||||||||||||||||||||||||||||||||||||||||||||||||||||||||||||||||||||||
10/1/11 to 9/30/12 | $ | 10.71 | 0.27 | 0.64 | 0.91 | (0.28 | ) | — | (0.28 | ) | 0.63 | $ | 11.34 | 8.48 | % | $ | 727 | 1.60 | % | 1.77 | % | 2.43 | % | 210 | % | ||||||||||||||||||||||||||||||||||||||||||||||||||
10/1/10 to 9/30/11 | 10.93 | 0.37 | (0.20 | ) | 0.17 | (0.39 | ) | — | (0.39 | ) | (0.22 | ) | 10.71 | 1.64 | 1,171 | 1.60 | 1.80 | 3.38 | 169 | ||||||||||||||||||||||||||||||||||||||||||||||||||||||||
10/1/09 to 9/30/10 | 10.34 | 0.37 | 0.60 | 0.97 | (0.38 | ) | — | (0.38 | ) | 0.59 | 10.93 | 9.60 | 2,812 | 1.59 | (10) | 1.72 | 3.50 | 160 | |||||||||||||||||||||||||||||||||||||||||||||||||||||||||
10/1/08 to 9/30/09 | 9.55 | 0.34 | 0.80 | 1.14 | (0.35 | ) | — | (0.35 | ) | 0.79 | 10.34 | 12.23 | 4,212 | 1.59 | 1.75 | 3.52 | 274 | ||||||||||||||||||||||||||||||||||||||||||||||||||||||||||
10/1/07 to 9/30/08 | 10.01 | 0.33 | (0.43 | ) | (0.10 | ) | (0.36 | ) | — | (0.36 | ) | (0.46 | ) | 9.55 | (1.23 | ) | 4,075 | 1.87 | (7) | 1.92 | 3.35 | 325 | |||||||||||||||||||||||||||||||||||||||||||||||||||||
Class C | |||||||||||||||||||||||||||||||||||||||||||||||||||||||||||||||||||||||||||
10/1/11 to 9/30/12 | $ | 10.75 | 0.26 | 0.65 | 0.91 | (0.28 | ) | — | (0.28 | ) | 0.63 | $ | 11.38 | 8.55 | % | $ | 8,756 | 1.60 | % | 1.77 | % | 2.36 | % | 210 | % | ||||||||||||||||||||||||||||||||||||||||||||||||||
10/1/10 to 9/30/11 | 10.96 | 0.37 | (0.19 | ) | 0.18 | (0.39 | ) | — | (0.39 | ) | (0.21 | ) | 10.75 | 1.63 | 7,984 | 1.60 | 1.79 | 3.41 | 169 | ||||||||||||||||||||||||||||||||||||||||||||||||||||||||
10/1/09 to 9/30/10 | 10.37 | 0.37 | 0.60 | 0.97 | (0.38 | ) | — | (0.38 | ) | 0.59 | 10.96 | 9.57 | 8,663 | 1.59 | (10) | 1.73 | 3.50 | 160 | |||||||||||||||||||||||||||||||||||||||||||||||||||||||||
10/1/08 to 9/30/09 | 9.58 | 0.34 | 0.80 | 1.14 | (0.35 | ) | — | (0.35 | ) | 0.79 | 10.37 | 12.19 | 8,048 | 1.59 | 1.75 | 3.43 | 274 | ||||||||||||||||||||||||||||||||||||||||||||||||||||||||||
10/1/07 to 9/30/08 | 10.04 | 0.31 | (0.41 | ) | (0.10 | ) | (0.36 | ) | — | (0.36 | ) | (0.46 | ) | 9.58 | (1.14 | ) | 2,839 | 1.86 | (7) | 1.92 | 3.33 | 325 | |||||||||||||||||||||||||||||||||||||||||||||||||||||
Class I | |||||||||||||||||||||||||||||||||||||||||||||||||||||||||||||||||||||||||||
10/1/11 to 9/30/12 | $ | 11.10 | 0.39 | 0.66 | 1.05 | (0.39 | ) | — | (0.39 | ) | 0.66 | $ | 11.76 | 9.64 | % | $ | 29,527 | 0.60 | % | 0.77 | % | 3.39 | % | 210 | % | ||||||||||||||||||||||||||||||||||||||||||||||||||
10/1/10 to 9/30/11 | 11.30 | 0.49 | (0.19 | ) | 0.30 | (0.50 | ) | — | (0.50 | ) | (0.20 | ) | 11.10 | 2.67 | 76,169 | 0.60 | 0.79 | 4.39 | 169 | ||||||||||||||||||||||||||||||||||||||||||||||||||||||||
10/1/09 to 9/30/10 | 10.68 | 0.49 | 0.62 | 1.11 | (0.49 | ) | — | (0.49 | ) | 0.62 | 11.30 | 10.65 | 120,459 | 0.59 | (10) | 0.73 | 4.51 | 160 | |||||||||||||||||||||||||||||||||||||||||||||||||||||||||
10/1/08 to 9/30/09 | 9.86 | 0.45 | 0.83 | 1.28 | (0.46 | ) | — | (0.46 | ) | 0.82 | 10.68 | 13.34 | 144,835 | 0.59 | 0.75 | 4.52 | 274 | ||||||||||||||||||||||||||||||||||||||||||||||||||||||||||
10/1/07 to 9/30/08 | 10.32 | 0.53 | (0.54 | ) | (0.01 | ) | (0.45 | ) | — | (0.45 | ) | (0.46 | ) | 9.86 | (0.16 | ) | 141,830 | 0.76 | (7) | 0.85 | 4.38 | 325 | |||||||||||||||||||||||||||||||||||||||||||||||||||||
CA Tax-Exempt | |||||||||||||||||||||||||||||||||||||||||||||||||||||||||||||||||||||||||||
| Bond Fund | |||||||||||||||||||||||||||||||||||||||||||||||||||||||||||||||||||||||||||
Class A | |||||||||||||||||||||||||||||||||||||||||||||||||||||||||||||||||||||||||||
10/1/11 to 9/30/12 | $ | 12.30 | 0.46 | 0.68 | 1.14 | (0.48 | ) | — | (0.48 | ) | 0.66 | $ | 12.96 | 9.40 | % | $ | 28,803 | 0.85 | % | 1.04 | % | 3.65 | % | 16 | % | ||||||||||||||||||||||||||||||||||||||||||||||||||
10/1/10 to 9/30/11 | 12.34 | 0.48 | (0.04 | ) | 0.44 | (0.48 | ) | — | (0.48 | ) | (0.04 | ) | 12.30 | 3.75 | 29,688 | 0.85 | 1.05 | 4.04 | 12 | ||||||||||||||||||||||||||||||||||||||||||||||||||||||||
10/1/09 to 9/30/10 | 12.29 | 0.48 | 0.04 | 0.52 | (0.47 | ) | — | (0.47 | ) | 0.05 | 12.34 | 4.43 | 31,945 | 0.85 | 1.03 | 3.94 | 10 | ||||||||||||||||||||||||||||||||||||||||||||||||||||||||||
10/1/08 to 9/30/09 | 11.41 | 0.47 | 0.90 | 1.37 | (0.48 | ) | (0.01 | ) | (0.49 | ) | 0.88 | 12.29 | 12.31 | 33,728 | 0.85 | 1.02 | 4.10 | 8 | |||||||||||||||||||||||||||||||||||||||||||||||||||||||||
10/1/07 to 9/30/08 | 12.09 | 0.46 | (0.68 | ) | (0.22 | ) | (0.46 | ) | — | (0.46 | ) | (0.68 | ) | 11.41 | (1.94 | ) | 34,197 | 0.85 | 1.01 | 3.82 | 10 | ||||||||||||||||||||||||||||||||||||||||||||||||||||||
Class I | |||||||||||||||||||||||||||||||||||||||||||||||||||||||||||||||||||||||||||
10/1/11 to 9/30/12 | $ | 12.29 | 0.49 | 0.68 | 1.17 | (0.51 | ) | — | (0.51 | ) | 0.66 | $ | 12.95 | 9.68 | % | $ | 28,639 | 0.60 | % | 0.79 | % | 3.90 | % | 16 | % | ||||||||||||||||||||||||||||||||||||||||||||||||||
10/1/10 to 9/30/11 | 12.33 | 0.51 | (0.04 | ) | 0.47 | (0.51 | ) | — | (0.51 | ) | (0.04 | ) | 12.29 | 4.01 | 27,417 | 0.60 | 0.80 | 4.29 | 12 | ||||||||||||||||||||||||||||||||||||||||||||||||||||||||
10/1/09 to 9/30/10 | 12.28 | 0.51 | 0.04 | 0.55 | (0.50 | ) | — | (0.50 | ) | 0.05 | 12.33 | 4.69 | 28,169 | 0.60 | 0.78 | 4.19 | 10 | ||||||||||||||||||||||||||||||||||||||||||||||||||||||||||
10/1/08 to 9/30/09 | 11.41 | 0.50 | 0.88 | 1.38 | (0.50 | ) | (0.01 | ) | (0.51 | ) | 0.87 | 12.28 | 12.50 | 25,624 | 0.60 | 0.77 | 4.35 | 8 | |||||||||||||||||||||||||||||||||||||||||||||||||||||||||
10/1/07 to 9/30/08 | 12.08 | 0.49 | (0.67 | ) | (0.18 | ) | (0.49 | ) | — | (0.49 | ) | (0.67 | ) | 11.41 | (1.61 | ) | 27,893 | 0.60 | 0.76 | 4.07 | 10 | ||||||||||||||||||||||||||||||||||||||||||||||||||||||
The footnote legend is at the end of the financial highlights.
See Notes to Financial Statements
60
Table of Contents
VIRTUS OPPORTUNITIES TRUST
FINANCIAL HIGHLIGHTS
SELECTED PER SHARE DATA AND RATIOS FOR A SHARE OUTSTANDING
THROUGHOUT EACH PERIOD
| Net Asset Value, Beginning of Period | Net Investment Income (Loss)(2) | Net Realized and Unrealized Gain (Loss) | Total from Investment Operations | Dividends from Net Investment Income | Distributions from Net Realized Gains | Total Distributions | Change in Net Asset Value | Net Asset Value, End of Period | Total Return(1) | Net Assets, End of Period (in thousands) | Ratio of Net Operating Expenses to Average Net Assets(8) | Ratio of Gross Expenses to Average Net Assets (before waivers and reimbursements)(8) | Ratio of Net Investment Income (Loss) to Average Net Assets | Portfolio Turnover Rate | |||||||||||||||||||||||||||||||||||||||||||||||||||||||||||||
Herzfeld Fund | |||||||||||||||||||||||||||||||||||||||||||||||||||||||||||||||||||||||||||
Class A | |||||||||||||||||||||||||||||||||||||||||||||||||||||||||||||||||||||||||||
9/5/12(6) to 9/30/12 | $ | 10.00 | 0.04 | 0.17 | 0.21 | — | — | — | 0.21 | $ | 10.21 | 2.10 | %(4) | $ | 105 | 1.60 | %(3) | 37.91 | %(3) | 5.93 | % | 3 | %(4) | ||||||||||||||||||||||||||||||||||||||||||||||||||||
Class C | |||||||||||||||||||||||||||||||||||||||||||||||||||||||||||||||||||||||||||
9/5/12(6) to 9/30/12 | $ | 10.00 | 0.03 | 0.18 | 0.21 | — | — | — | 0.21 | $ | 10.21 | 2.10 | %(4) | $ | 102 | 2.35 | %(3) | 38.62 | %(3) | 5.21 | % | 3 | %(4) | ||||||||||||||||||||||||||||||||||||||||||||||||||||
Class I | |||||||||||||||||||||||||||||||||||||||||||||||||||||||||||||||||||||||||||
9/5/12(6) to 9/30/12 | $ | 10.00 | 0.03 | 0.18 | 0.21 | — | — | — | 0.21 | $ | 10.21 | 2.10 | %(4) | $ | 1,017 | 1.35 | %(3) | 38.61 | %(3) | 4.39 | % | 3 | %(4) | ||||||||||||||||||||||||||||||||||||||||||||||||||||
High Yield Fund | |||||||||||||||||||||||||||||||||||||||||||||||||||||||||||||||||||||||||||
Class A | |||||||||||||||||||||||||||||||||||||||||||||||||||||||||||||||||||||||||||
10/1/11 to 9/30/12 | $ | 3.85 | 0.28 | 0.44 | 0.72 | (0.29 | ) | — | (0.29 | ) | 0.43 | $ | 4.28 | 19.19 | % | $ | 98,701 | 1.15 | % | 1.31 | % | 6.82 | % | 92 | % | ||||||||||||||||||||||||||||||||||||||||||||||||||
10/1/10 to 9/30/11 | 4.17 | 0.29 | (0.32 | ) | (0.03 | ) | (0.29 | ) | — | (0.29 | ) | (0.32 | ) | 3.85 | (0.82 | ) | 86,530 | 1.21 | (7) | 1.35 | 6.93 | 106 | |||||||||||||||||||||||||||||||||||||||||||||||||||||
10/1/09 to 9/30/10 | 3.89 | 0.31 | 0.28 | 0.59 | (0.31 | ) | — | (0.31 | ) | 0.28 | 4.17 | 15.43 | 101,326 | 1.35 | 1.35 | (3) | 7.69 | 92 | |||||||||||||||||||||||||||||||||||||||||||||||||||||||||
10/1/08 to 9/30/09 | 3.98 | 0.31 | (0.08 | ) | 0.23 | (0.32 | ) | — | (0.32 | ) | (0.09 | ) | 3.89 | 7.02 | 90,560 | 1.37 | 1.37 | 8.88 | 134 | ||||||||||||||||||||||||||||||||||||||||||||||||||||||||
10/1/07 to 9/30/08 | 4.89 | 0.34 | (0.90 | ) | (0.56 | ) | (0.35 | ) | — | (0.35 | ) | (0.91 | ) | 3.98 | (12.10 | ) | 92,907 | 1.34 | 1.34 | 7.41 | 100 | ||||||||||||||||||||||||||||||||||||||||||||||||||||||
Class B | |||||||||||||||||||||||||||||||||||||||||||||||||||||||||||||||||||||||||||
10/1/11 to 9/30/12 | $ | 3.77 | 0.24 | 0.44 | 0.68 | (0.26 | ) | — | (0.26 | ) | 0.42 | $ | 4.19 | 18.46 | % | $ | 307 | 1.90 | % | 2.06 | % | 6.07 | % | 92 | % | ||||||||||||||||||||||||||||||||||||||||||||||||||
10/1/10 to 9/30/11 | 4.08 | 0.25 | (0.31 | ) | (0.06 | ) | (0.25 | ) | — | (0.25 | ) | (0.31 | ) | 3.77 | (1.66 | ) | 404 | 1.96 | (7) | 2.10 | 6.17 | 106 | |||||||||||||||||||||||||||||||||||||||||||||||||||||
10/1/09 to 9/30/10 | �� | 3.82 | 0.27 | 0.27 | 0.54 | (0.28 | ) | — | (0.28 | ) | 0.26 | 4.08 | 14.65 | 663 | 2.10 | 2.10 | (3) | 6.95 | 92 | ||||||||||||||||||||||||||||||||||||||||||||||||||||||||
10/1/08 to 9/30/09 | 3.92 | 0.28 | (0.09 | ) | 0.19 | (0.29 | ) | — | (0.29 | ) | (0.10 | ) | 3.82 | 6.13 | 1,019 | 2.12 | 2.12 | 8.21 | 134 | ||||||||||||||||||||||||||||||||||||||||||||||||||||||||
10/1/07 to 9/30/08 | 4.81 | 0.30 | (0.88 | ) | (0.58 | ) | (0.31 | ) | — | (0.31 | ) | (0.89 | ) | 3.92 | (12.59 | ) | 1,366 | 2.08 | 2.08 | 6.63 | 100 | ||||||||||||||||||||||||||||||||||||||||||||||||||||||
Class C | |||||||||||||||||||||||||||||||||||||||||||||||||||||||||||||||||||||||||||
10/1/11 to 9/30/12 | $ | 3.80 | 0.25 | 0.44 | 0.69 | (0.26 | ) | — | (0.26 | ) | 0.43 | $ | 4.23 | 18.59 | % | $ | 2,944 | 1.90 | % | 2.07 | % | 6.07 | % | 92 | % | ||||||||||||||||||||||||||||||||||||||||||||||||||
10/1/10 to 9/30/11 | 4.11 | 0.25 | (0.31 | ) | (0.06 | ) | (0.25 | ) | — | (0.25 | ) | (0.31 | ) | 3.80 | (1.65 | ) | 2,028 | 1.95 | (7) | 2.10 | 6.18 | 106 | |||||||||||||||||||||||||||||||||||||||||||||||||||||
10/1/09 to 9/30/10 | 3.85 | 0.27 | 0.27 | 0.54 | (0.28 | ) | — | (0.28 | ) | 0.26 | 4.11 | 14.53 | 2,119 | 2.10 | 2.10 | (3) | 6.93 | 92 | |||||||||||||||||||||||||||||||||||||||||||||||||||||||||
10/1/08 to 9/30/09 | 3.94 | 0.28 | (0.08 | ) | 0.20 | (0.29 | ) | — | (0.29 | ) | (0.09 | ) | 3.85 | 6.36 | 1,585 | 2.12 | 2.12 | 8.06 | 134 | ||||||||||||||||||||||||||||||||||||||||||||||||||||||||
10/1/07 to 9/30/08 | 4.84 | 0.30 | (0.89 | ) | (0.59 | ) | (0.31 | ) | — | (0.31 | ) | (0.90 | ) | 3.94 | (12.72 | ) | 1,465 | 2.09 | 2.09 | 6.66 | 100 | ||||||||||||||||||||||||||||||||||||||||||||||||||||||
Class I | |||||||||||||||||||||||||||||||||||||||||||||||||||||||||||||||||||||||||||
8/8/12(6) to 9/30/12 | $ | 4.23 | 0.04 | 0.06 | 0.10 | (0.05 | ) | — | (0.05 | ) | 0.05 | $ | 4.28 | 2.37 | %(4) | $ | 102 | 0.90 | %(3) | 1.08 | %(3) | 6.86 | %(3) | 92 | %(4) | ||||||||||||||||||||||||||||||||||||||||||||||||||
The footnote legend is at the end of the financial highlights.
See Notes to Financial Statements
61
Table of Contents
VIRTUS OPPORTUNITIES TRUST
FINANCIAL HIGHLIGHTS
SELECTED PER SHARE DATA AND RATIOS FOR A SHARE OUTSTANDING
THROUGHOUT EACH PERIOD
| Net Asset Value, Beginning of Period | Net Investment Income (Loss)(2) | Net Realized and Unrealized Gain (Loss) | Total from Investment Operations | Dividends from Net Investment Income | Distributions from Net Realized Gains | Total Distributions | Change in Net Asset Value | Net Asset Value, End of Period | Total Return(1) | Net Assets, End of Period (in thousands) | Ratio of Net Expenses to Average Net Assets(8) | Ratio of Gross Expenses to Average Net Assets(8) | Ratio of Net Investment Income to Average Net Assets | Portfolio Turnover Rate | |||||||||||||||||||||||||||||||||||||||||||||||||||||||||||||
Multi-Sector Fixed | |||||||||||||||||||||||||||||||||||||||||||||||||||||||||||||||||||||||||||
| Income Fund | |||||||||||||||||||||||||||||||||||||||||||||||||||||||||||||||||||||||||||
Class A | |||||||||||||||||||||||||||||||||||||||||||||||||||||||||||||||||||||||||||
10/1/11 to 9/30/12 | $ | 10.24 | 0.62 | 0.93 | 1.55 | (0.64 | ) | — | (0.64 | ) | 0.91 | $ | 11.15 | 15.51 | % | $ | 196,554 | 1.13 | % | 1.13 | % | 5.73 | % | 76 | % | ||||||||||||||||||||||||||||||||||||||||||||||||||
10/1/10 to 9/30/11 | 10.77 | 0.66 | (0.47 | ) | 0.19 | (0.72 | ) | — | (0.72 | ) | (0.53 | ) | 10.24 | 1.58 | 137,395 | 1.16 | 1.16 | 6.07 | 45 | ||||||||||||||||||||||||||||||||||||||||||||||||||||||||
10/1/09 to 9/30/10 | 9.96 | 0.67 | 0.79 | 1.46 | (0.65 | ) | — | (0.65 | ) | 0.81 | 10.77 | 15.14 | 125,962 | 1.16 | 1.16 | 6.46 | 74 | ||||||||||||||||||||||||||||||||||||||||||||||||||||||||||
10/1/08 to 9/30/09 | 9.23 | 0.59 | 0.85 | 1.44 | (0.71 | ) | — | (0.71 | ) | 0.73 | 9.96 | 17.34 | 121,968 | 1.16 | 1.16 | 6.90 | 85 | ||||||||||||||||||||||||||||||||||||||||||||||||||||||||||
10/1/07 to 9/30/08 | 10.89 | 0.68 | (1.66 | ) | (0.98 | ) | (0.68 | ) | — | (0.68 | ) | (1.66 | ) | 9.23 | (9.46 | ) | 88,744 | 1.15 | 1.15 | 6.54 | 91 | ||||||||||||||||||||||||||||||||||||||||||||||||||||||
Class B | |||||||||||||||||||||||||||||||||||||||||||||||||||||||||||||||||||||||||||
10/1/11 to 9/30/12 | $ | 10.22 | 0.54 | 0.92 | 1.46 | (0.56 | ) | — | (0.56 | ) | 0.90 | $ | 11.12 | 14.59 | % | $ | 9,974 | 1.88 | % | 1.88 | % | 5.02 | % | 76 | % | ||||||||||||||||||||||||||||||||||||||||||||||||||
10/1/10 to 9/30/11 | 10.75 | 0.58 | (0.47 | ) | 0.11 | (0.64 | ) | — | (0.64 | ) | (0.53 | ) | 10.22 | 0.82 | 10,685 | 1.91 | 1.91 | 5.31 | 45 | ||||||||||||||||||||||||||||||||||||||||||||||||||||||||
10/1/09 to 9/30/10 | 9.95 | 0.59 | 0.79 | 1.38 | (0.58 | ) | — | (0.58 | ) | 0.80 | 10.75 | 14.20 | 13,590 | 1.91 | 1.91 | �� | 5.72 | 74 | |||||||||||||||||||||||||||||||||||||||||||||||||||||||||
10/1/08 to 9/30/09 | 9.22 | 0.53 | 0.84 | 1.37 | (0.64 | ) | — | (0.64 | ) | 0.73 | 9.95 | 16.47 | 13,276 | 1.91 | 1.91 | 6.18 | 85 | ||||||||||||||||||||||||||||||||||||||||||||||||||||||||||
10/1/07 to 9/30/08 | 10.88 | 0.60 | (1.66 | ) | (1.06 | ) | (0.60 | ) | — | (0.60 | ) | (1.66 | ) | 9.22 | (10.16 | ) | 11,969 | 1.90 | 1.90 | 5.80 | 91 | ||||||||||||||||||||||||||||||||||||||||||||||||||||||
Class C | |||||||||||||||||||||||||||||||||||||||||||||||||||||||||||||||||||||||||||
10/1/11 to 9/30/12 | $ | 10.31 | 0.54 | 0.94 | 1.48 | (0.56 | ) | — | (0.56 | ) | 0.92 | $ | 11.23 | 14.65 | % | $ | 108,595 | 1.88 | % | 1.88 | % | 4.98 | % | 76 | % | ||||||||||||||||||||||||||||||||||||||||||||||||||
10/1/10 to 9/30/11 | 10.84 | 0.58 | (0.47 | ) | 0.11 | (0.64 | ) | — | (0.64 | ) | (0.53 | ) | 10.31 | 0.80 | 70,735 | 1.91 | 1.91 | 5.32 | 45 | ||||||||||||||||||||||||||||||||||||||||||||||||||||||||
10/1/09 to 9/30/10 | 10.02 | 0.59 | 0.80 | 1.39 | (0.57 | ) | — | (0.57 | ) | 0.82 | 10.84 | 14.29 | 62,214 | 1.91 | 1.91 | 5.71 | 74 | ||||||||||||||||||||||||||||||||||||||||||||||||||||||||||
10/1/08 to 9/30/09 | 9.27 | 0.52 | 0.87 | 1.39 | (0.64 | ) | — | (0.64 | ) | 0.75 | 10.02 | 16.59 | 41,374 | 1.90 | 1.90 | 5.93 | 85 | ||||||||||||||||||||||||||||||||||||||||||||||||||||||||||
10/1/07 to 9/30/08 | 10.94 | 0.61 | (1.68 | ) | (1.07 | ) | (0.60 | ) | — | (0.60 | ) | (1.67 | ) | 9.27 | (10.20 | ) | 16,828 | 1.90 | 1.90 | 5.80 | 91 | ||||||||||||||||||||||||||||||||||||||||||||||||||||||
Class I | |||||||||||||||||||||||||||||||||||||||||||||||||||||||||||||||||||||||||||
10/1/11 to 9/30/12 | $ | 10.24 | 0.64 | 0.93 | 1.57 | (0.66 | ) | — | (0.66 | ) | 0.91 | $ | 11.15 | 15.80 | % | $ | 74,847 | 0.88 | % | 0.88 | % | 5.93 | % | 76 | % | ||||||||||||||||||||||||||||||||||||||||||||||||||
10/1/10 to 9/30/11 | 10.76 | 0.69 | (0.46 | ) | 0.23 | (0.75 | ) | — | (0.75 | ) | (0.52 | ) | 10.24 | 1.93 | 22,408 | 0.91 | 0.91 | 6.32 | 45 | ||||||||||||||||||||||||||||||||||||||||||||||||||||||||
10/1/09(6) to 9/30/10 | 9.95 | 0.70 | 0.79 | 1.49 | (0.68 | ) | — | (0.68 | ) | 0.81 | 10.76 | 15.41 | (4) | 7,633 | 0.91 | (3) | 0.91 | (3) | 6.78 | (3) | 74 | ||||||||||||||||||||||||||||||||||||||||||||||||||||||
See Notes to Financial Statements
The footnote legend is at the end of the financial highlights.
62
Table of Contents
VIRTUS OPPORTUNITIES TRUST
FINANCIAL HIGHLIGHTS
SELECTED PER SHARE DATA AND RATIOS FOR A SHARE OUTSTANDING
THROUGHOUT EACH PERIOD
| Net Asset Value, Beginning of Period | Net Investment Income (Loss)(2) | Net Realized and Unrealized Gain (Loss) | Total from Investment Operations | Dividends from Net Investment Income | Distributions from Net Realized Gains | Total Return of Capital | Total Distributions | Change in Net Asset Value | Net Asset Value, End of Period | Total Return(1) | Net Assets, End of Period (in thousands) | Ratio of Net Expenses to Average Net Assets(8) | Ratio of Gross Expenses to Average Net Assets(8) | Ratio of Net Investment Income to Average Net Assets | Portfolio Turnover Rate | |||||||||||||||||||||||||||||||||||||||||||||||||||||||||||||||||
Senior Floating Rate Fund | ||||||||||||||||||||||||||||||||||||||||||||||||||||||||||||||||||||||||||||||||
Class A | ||||||||||||||||||||||||||||||||||||||||||||||||||||||||||||||||||||||||||||||||
10/1/11 to 9/30/12 | $ | 9.28 | 0.49 | 0.49 | 0.98 | (0.47 | ) | — | — | (0.47 | ) | 0.51 | $ | 9.79 | 10.75 | % | $ | 256,397 | 1.23 | % | 1.23 | % | 5.06 | % | 56 | % | ||||||||||||||||||||||||||||||||||||||||||||||||||||||
10/1/10 to 9/30/11 | 9.80 | 0.45 | (0.27 | ) | 0.18 | (0.49 | ) | (0.07 | ) | (0.14 | ) | (0.70 | ) | (0.52 | ) | 9.28 | 1.62 | 215,427 | 1.20 | (9) | 1.19 | (9) | 4.58 | 69 | ||||||||||||||||||||||||||||||||||||||||||||||||||||||||
10/1/09 to 9/30/10 | 9.87 | 0.67 | 0.09 | 0.76 | (0.64 | ) | (0.19 | ) | — | (0.83 | ) | (0.07 | ) | 9.80 | 8.05 | 98,790 | 1.20 | (9) | 1.15 | (9) | 6.86 | 41 | ||||||||||||||||||||||||||||||||||||||||||||||||||||||||||
10/1/08 to 9/30/09 | 9.41 | 0.54 | 0.47 | 1.01 | (0.55 | ) | — | (5) | — | (0.55 | ) | 0.46 | 9.87 | 11.74 | 52,987 | 1.20 | 1.33 | 6.00 | 63 | |||||||||||||||||||||||||||||||||||||||||||||||||||||||||||||
1/31/08(6) to 9/30/08 | 10.00 | 0.41 | (0.61 | ) | (0.20 | ) | (0.39 | ) | — | — | (0.39 | ) | (0.59 | ) | 9.41 | (2.12 | )(4) | 14,349 | 1.20 | (3) | 1.80 | (3) | 6.25 | (3) | 27 | (4) | ||||||||||||||||||||||||||||||||||||||||||||||||||||||
Class C | ||||||||||||||||||||||||||||||||||||||||||||||||||||||||||||||||||||||||||||||||
10/1/11 to 9/30/12 | $ | 9.29 | 0.41 | 0.50 | 0.91 | (0.40 | ) | — | — | (0.40 | ) | 0.51 | $ | 9.80 | 9.92 | % | $ | 95,078 | 1.98 | % | 1.98 | % | 4.31 | % | 56 | % | ||||||||||||||||||||||||||||||||||||||||||||||||||||||
10/1/10 to 9/30/11 | 9.81 | 0.36 | (0.26 | ) | 0.10 | (0.41 | ) | (0.07 | ) | (0.14 | ) | (0.62 | ) | (0.52 | ) | 9.29 | 0.85 | 92,623 | 1.95 | (9) | 1.94 | (9) | 3.69 | 69 | ||||||||||||||||||||||||||||||||||||||||||||||||||||||||
10/1/09 to 9/30/10 | 9.87 | 0.59 | 0.10 | 0.69 | (0.56 | ) | (0.19 | ) | — | (0.75 | ) | (0.06 | ) | 9.81 | 7.35 | 30,116 | 1.95 | (9) | 1.92 | (9) | 6.02 | 41 | ||||||||||||||||||||||||||||||||||||||||||||||||||||||||||
10/1/08 to 9/30/09 | 9.41 | 0.44 | 0.51 | 0.95 | (0.49 | ) | — | (5) | — | (0.49 | ) | 0.46 | 9.87 | 10.94 | 2,740 | 1.95 | 2.05 | 4.82 | 63 | |||||||||||||||||||||||||||||||||||||||||||||||||||||||||||||
1/31/08(6) to 9/30/08 | 10.00 | 0.37 | (0.61 | ) | (0.24 | ) | (0.35 | ) | — | — | (0.35 | ) | (0.59 | ) | 9.41 | (2.59 | )(4) | 359 | 1.95 | (3) | 2.57 | (3) | 5.58 | (3) | 27 | (4) | ||||||||||||||||||||||||||||||||||||||||||||||||||||||
Class I | ||||||||||||||||||||||||||||||||||||||||||||||||||||||||||||||||||||||||||||||||
10/1/11 to 9/30/12 | $ | 9.27 | 0.51 | 0.49 | 1.00 | (0.49 | ) | — | — | (0.49 | ) | 0.51 | $ | 9.78 | 11.04 | % | $ | 94,193 | 0.98 | % | 0.98 | % | 5.31 | % | 56 | % | ||||||||||||||||||||||||||||||||||||||||||||||||||||||
10/1/10 to 9/30/11 | 9.80 | 0.46 | (0.27 | ) | 0.19 | (0.51 | ) | (0.07 | ) | (0.14 | ) | (0.72 | ) | (0.53 | ) | 9.27 | 1.78 | 71,584 | 0.95 | (9) | 0.93 | (9) | 4.67 | 69 | ||||||||||||||||||||||||||||||||||||||||||||||||||||||||
10/1/09 to 9/30/10 | 9.86 | 0.64 | 0.15 | 0.79 | (0.66 | ) | (0.19 | ) | — | (0.85 | ) | (0.06 | ) | 9.80 | 8.44 | 32,679 | 0.95 | (9) | 0.89 | (9) | 6.56 | 41 | ||||||||||||||||||||||||||||||||||||||||||||||||||||||||||
10/1/08 to 9/30/09 | 9.41 | 0.58 | 0.45 | 1.03 | (0.58 | ) | — | (5) | — | (0.58 | ) | 0.45 | 9.86 | 11.94 | 394 | 0.95 | 1.13 | 6.54 | 63 | |||||||||||||||||||||||||||||||||||||||||||||||||||||||||||||
1/31/08(6) to 9/30/08 | 10.00 | 0.43 | (0.61 | ) | (0.18 | ) | (0.41 | ) | — | — | (0.41 | ) | (0.59 | ) | 9.41 | (1.96 | )(4) | 232 | 0.95 | (3) | 1.56 | (3) | 6.51 | (3) | 27 | (4) | ||||||||||||||||||||||||||||||||||||||||||||||||||||||
Wealth Masters Fund | ||||||||||||||||||||||||||||||||||||||||||||||||||||||||||||||||||||||||||||||||
Class A | ||||||||||||||||||||||||||||||||||||||||||||||||||||||||||||||||||||||||||||||||
9/5/12(6) to 9/30/12 | $ | 10.00 | 0.01 | 0.21 | 0.22 | — | — | — | — | 0.22 | $ | 10.22 | 2.20 | %(4) | $ | 106 | 1.45 | %(3) | 44.72 | %(3) | 0.78 | %(3) | 26 | %(4) | ||||||||||||||||||||||||||||||||||||||||||||||||||||||||
Class C | ||||||||||||||||||||||||||||||||||||||||||||||||||||||||||||||||||||||||||||||||
9/5/12(6) to 9/30/12 | $ | 10.00 | — | (5) | 0.21 | 0.21 | — | — | — | — | 0.21 | $ | 10.21 | 2.10 | %(4) | $ | 107 | 2.20 | %(3) | 45.67 | %(3) | 0.04 | %(3) | 26 | %(4) | |||||||||||||||||||||||||||||||||||||||||||||||||||||||
Class I | ||||||||||||||||||||||||||||||||||||||||||||||||||||||||||||||||||||||||||||||||
9/5/12(6) to 9/30/12 | $ | 10.00 | 0.01 | 0.21 | 0.22 | — | — | — | — | 0.22 | $ | 10.22 | 2.20 | %(4) | $ | 818 | 1.20 | %(3) | 44.40 | %(3) | 1.04 | %(3) | 26 | %(4) | ||||||||||||||||||||||||||||||||||||||||||||||||||||||||
Footnote Legend
| (1) | Sales charges, where applicable, are not reflected in the total return calculation. |
| (2) | Computed using average shares outstanding. |
| (3) | Annualized. |
| (4) | Not annualized. |
| (5) | Amount is less than $0.005. |
| (6) | Inception date. |
| (7) | Due to a change in expense ratio, the ratio shown is a blended expense ratio. |
| (8) | The Funds will also indirectly bear their prorated share of expenses of the underlying funds in which they invest. Such expenses are not included in the calculation of this ratio. |
| (9) | See Note 3C in the Notes to Financial Statements for information on recapture of expenses previously waived. |
| (10) | Includes extraordinary expenses. |
See Notes to Financial Statements
63
Table of Contents
VIRTUS OPPORTUNITIES TRUST
SEPTEMBER 30, 2012
| Note 1. Organization |
Virtus Opportunities Trust (the “Trust”) is organized as a Delaware statutory trust and is registered under the Investment Company Act of 1940, as amended (“1940 Act”), as an open-end management investment company.
As of the date of this report, 27 funds are offered for sale, of which seven (each a “Fund”) are reported in this annual report.
The Fund’s investment objectives are outlined in each Fund’s Summary Page.
All the Funds offer Class A and Class C shares with the exception of the CA Tax-Exempt Bond Fund which does not offer Class C shares. All Funds offer Class I shares. Class B shares are no longer available for purchase by new or existing shareholders, except for existing shareholders through Qualifying Transactions. For more information regarding Qualifying Transactions, refer to the prospectus.
Class A shares of the CA Tax-Exempt Bond Fund and Senior Floating Rate Fund are sold with a front-end sales charge of up to 2.75% with some exceptions. Class A shares of the Bond Fund, High Yield Fund, and Multi-Sector Fixed Income Fund are sold with a front-end sales charge of up to 3.75% with some exceptions. Class A shares of the Herzfeld and Wealth Masters Funds are sold with a front-end sales charge of up to 5.75% with some exceptions.
Generally, Class A shares are not subject to any charges by the Funds when redeemed; however, a 0.50% – 1% contingent deferred sales charge (“CDSC”) may be imposed on certain redemptions made within a certain period following purchases on which a finder’s fee has been paid. The period for which such CDSC applies for the Funds is 18 months. The CDSC period begins on the last day of the month preceding the month in which the purchase was made.
Class B shares were generally sold with a CDSC, which declines from 5% to zero depending on the period of time the shares are held. Class C shares are generally sold with a 1% CDSC if applicable if redeemed within one year of purchase. Class I shares are sold without a front-end sales charge or CDSC.
Virtus Mutual Funds may impose an annual fee on accounts having balances of less than $2,500. The small account fee may be waived in certain circumstances, as disclosed in the prospectuses and/or statements of additional information. The fees collected will be used to offset certain expenses of the Funds.
Each Class of shares has identical voting, dividend, liquidation and other rights and the same terms and conditions, except that each class bears different distribution and/or service fees under a Board approved 12b-1 and/or shareholder servicing plan and has exclusive voting rights with respect to such plans. Class I shares are not subject to a 12b-1 plan. Income and other expenses and realized and unrealized gains and losses of each Fund are borne pro rata by the holders of each class of shares.
| Note 2. Significant Accounting Policies |
The following is a summary of significant accounting policies consistently followed by the Trust in the preparation of its financial statements. The preparation of financial statements in conformity with accounting principles generally accepted in the United States of America requires management to make estimates and assumptions that affect the reported amounts of assets and liabilities, and disclosure of contingent assets and liabilities at the date of the financial statements and the reported amount of increases and decreases in net assets from operations during the reporting period. Actual results could differ from those estimates and those differences could be significant.
| A. | Security Valuation |
Security valuation procedures for each Fund which include nightly price variance, as well as back testing such as bi-weekly unchanged price, monthly secondary source and transaction analysis which have been approved by the Board. All internally fair valued securities are approved by a valuation committee appointed under the direction of the Board. The Valuation Committee (the “Valuation Committee”) is comprised of the treasurer, assistant treasurer, secretary and chief compliance officer of the Trust. All internally fair valued securities referred to below are updated daily and reviewed in detail by the Valuation Committee monthly unless changes occur within the period. The Valuation Committee reviews the validity of any model inputs and any changes to model when applicable. Internal fair valuations are reviewed by the Board at least quarterly.
Each Fund utilizes a fair value hierarchy which prioritizes the inputs to valuation techniques used to measure fair value into three broad levels.
| • Level 1 – | quoted prices in active markets for identical securities |
| • Level 2 – | prices determined using other significant observable inputs (including quoted prices for similar securities, interest rates, prepayment speeds, credit risk, etc.) |
| • Level 3 – | prices determined using significant unobservable inputs (including the valuation committee’s own assumptions in determining the fair value of investments) |
A description of the valuation techniques applied to a Fund’s major categories of assets and liabilities measured at fair value on a recurring basis is as follows:
Equity securities are valued at the official closing price (typically last sale) on the exchange on which the securities are primarily traded, or if no closing price is available, at the last bid price and are categorized as Level 1 in the hierarchy. Restricted equity securities and private placements that are not widely traded, are illiquid or are internally fair valued by the valuation committee, are generally categorized as Level 3 in the hierarchy.
Certain non-U.S. securities may be fair valued in cases where closing prices are not readily available or are deemed not reflective of readily available market prices. For example, significant events (such as movement in the U.S. securities market, or other regional and local developments) may occur between the time that non-U.S. markets close (where the security is principally traded) and the time that a Fund calculates its net asset value (“NAV”) (generally 4 p.m. Eastern time, the close of the New York Stock Exchange (“NYSE”)) that may impact the value of securities traded in these non-U.S. markets. In such cases the Funds fair value non-U.S. securities using an independent pricing service which considers the correlation of the trading patterns of the non-U.S. security to the intraday trading in the U.S. markets for investments such as ADRs, financial futures, ETFs, and certain indexes as well as prices for similar securities. Such fair valuations are categorized as Level 2 in the hierarchy. Because the frequency of significant events is not predictable, fair valuation of certain non-U.S. common stocks may occur on a frequent basis.
64
Table of Contents
VIRTUS OPPORTUNITIES TRUST
NOTES TO FINANCIAL STATEMENTS (Continued)
SEPTEMBER 30, 2012
Debt securities, including restricted securities, are valued based on evaluated quotations received from independent pricing services or from dealers who make markets in such securities. For most bond types, the pricing service utilizes matrix pricing which considers one or more of the following factors: yield or price of bonds of comparable quality, coupon, maturity, current cash flows, type, and current day trade information, as well as dealer-supplied prices. These valuations are generally categorized as Level 2 in the hierarchy. Structured debt instruments such as mortgage-backed and asset-backed securities may also incorporate collateral analysis and utilize cash flow models for valuation and are generally categorized as Level 2 in the hierarchy. Pricing services do not provide pricing for all securities and therefore indicative bids from dealers are utilized which are based on pricing models used by market makers in the security and are generally categorized as Level 2 in the hierarchy. Debt securities that are not widely traded, are illiquid, or are internally fair valued by the valuation committee are generally categorized as Level 3 in the hierarchy.
Listed derivatives such as treasury futures, that are actively traded are valued based on quoted prices from the exchange and are categorized as Level 1 in the hierarchy. Over-the-counter derivative contracts, which include forward currency contracts and equity-linked instruments, do not require material subjectivity as pricing inputs are observed from actively quoted markets and are categorized as Level 2 in the hierarchy.
Investments in open-end mutual funds are valued at their closing NAV determined as of the close of business of the NYSE each business day and are categorized as Level 1 in the hierarchy.
A summary of the inputs used to value the Funds’ net assets by each major security type is disclosed at the end of the Schedule of Investments for each Fund. The inputs or methodologies used for valuing securities are not necessarily an indication of the risk associated with investing in those securities.
The Bond Fund and the High Yield Fund own the following internally fair valued securities and which are categorized as Level 3 in the hierarchy:
Bond Fund | High Yield Fund | |
| United Artists Theatre Circuit, Inc. | United Artists Theatre Circuit, Inc. | |
| Series BD-1 9.300%, 7/1/15 | Series AW-0 9.300%, 7/1/15 | |
| Series BE-9 9.300%, 7/1/15 | ||
| Series BD-1 9.300%, 7/1/15 | ||
| Series 95-A 9.300%, 7/1/15 |
The significant unobservable inputs used in the fair value measurement of these corporate bonds are based on comparable liquid assets adjusted for accretion rate, current yield, current swap rates, and discount rates related to differences in capital structure and liquidity. Significant increases (decreases) in any of these inputs in isolation would result in a significantly lower (higher) fair value measurement. Generally, a change in the observable market assumptions would have direct impacts to the discount rates used related to capital structure and/or liquidity discounts.
| B. | Security Transactions and Investment Income |
Security transactions are recorded on the trade date. Realized gains and losses from sales of securities are determined on the identified cost basis. Dividend income is recognized on the ex-dividend date, or in the case of certain foreign securities, as soon as a Fund is notified. Interest income is recorded on the accrual basis. Each Fund amortizes premiums and accretes discounts using the effective interest method.
Dividend income from REIT Investments is recorded using management’s estimate of the income included in distributions received from the REIT investments. Distributions received in excess of this estimated amount are recorded as a reduction of the cost of investments or reclassified to capital gains. The actual amounts of income, return of capital, and capital gains are only determined by each REIT after its fiscal year-end, and may differ from the estimated amounts.
| C. | Income Taxes |
Each Fund is treated as a separate taxable entity. It is the intention of each Fund to comply with the requirements of Subchapter M of the Internal Revenue Code and to distribute substantially all of its taxable income to its shareholders. Therefore, no provision for federal income taxes or excise taxes has been made.
Certain Funds may be subject to foreign taxes on income, gains on investments or currency repatriation, a portion of which may be recoverable. Each Fund will accrue such taxes and recoveries as applicable based upon current interpretations of the tax rules and regulations that exist in the markets in which it invests.
Management of the Fund has concluded that there are no significant uncertain tax positions that would require recognition in the financial statements. As of September 30, 2012, the tax years that remain subject to examination by the major tax jurisdictions under the statute of limitations are from the year 2009 forward (with limited exceptions).
| D. | Distributions to Shareholders |
Distributions are recorded by each Fund on the ex-dividend date. For the CA Tax-Exempt Fund, the Multi-Sector Fixed Income Fund and the Senior Floating Rate Fund income distributions are declared and recorded daily and distributed monthly. Income and capital gain distributions are determined in accordance with income tax regulations which may differ from accounting principles generally accepted in the United States of America. These differences may include the treatment of non-taxable dividends, market premium and discount, non-deductible expenses, expiring capital loss carryovers, foreign currency gain or loss, gain or loss on futures contracts, partnerships, operating losses and losses deferred due to wash sales. Permanent book and tax basis differences relating to shareholder distributions will result in reclassifications to capital paid in on shares of beneficial interest.
| E. | Expenses |
Expenses incurred together by a Fund and other affiliated mutual funds are allocated in proportion to the net assets of each such fund, except where allocation of direct expense to each fund or an alternative allocation method can be more appropriately used.
65
Table of Contents
VIRTUS OPPORTUNITIES TRUST
NOTES TO FINANCIAL STATEMENTS (Continued)
SEPTEMBER 30, 2012
In addition to the net annual operating expenses that a Fund bears directly, the shareholders of the Funds indirectly bear the pro-rata expenses of the underlying mutual funds in which the Fund invests.
| F. | Foreign Currency Translation |
Non U.S. investment securities and other assets and liabilities denominated in foreign currencies are translated into U.S. dollar amounts at the foreign currency exchange rate effective at the end of the reporting period. Cost of investments is translated at the currency exchange rate effective at the trade date. The gain or loss resulting from a change in currency exchange rates between the trade and settlement date of a portfolio transaction is treated as a gain or loss on non-U.S. currency. Likewise, the gain or loss resulting from a change in currency exchange rates between the date income is accrued and paid is treated as a gain or loss on foreign currency. The Funds do not isolate that portion of the results of
operations arising from changes in foreign exchange rates on investments from the fluctuations arising from changes in the market prices of securities held. Such fluctuations are included with the net realized and unrealized gain or loss on investments.
| G. | Derivative Financial Instruments |
Disclosures on derivative instruments and hedging activities are intended to improve financial reporting for derivative instruments by enhanced disclosure that enables the investors to understand how and why a fund uses derivatives, how derivatives are accounted for, and how derivative instruments affect a fund’s results of operations and financial position. Summarized below are the specific types of derivative instruments used by the Funds.
Futures Contracts: A futures contract is an agreement between two parties to purchase (long) or sell (short) a security at a set price for delivery on a future date. Upon entering into a futures contract, the Fund is required to pledge to the broker an amount of cash and/or securities equal to the “initial margin” requirements of the futures exchange on which the contract is traded. Pursuant to the contract, the Fund agrees to receive from or pay to the broker an amount of cash equal to the daily fluctuation in value of the contract. Such receipts or payments are known as variation margin and are recorded by the Fund for financial statement purposes on a daily basis as unrealized gains or losses. When the contract expires or is closed, gain or loss equal to the difference between the value of the contract at the time it was opened and the value at the time it was closed is realized. This is presented in the Statement of Operations as net realized gain (loss) on futures contracts.
A Fund utilizes futures to optimize performance by managing interest rate risk. This permits the fund manager to assemble the portfolio believed to be most attractive while mitigating vulnerability to changes in market interest rates. The potential risks to the Fund are that 1) the use of futures may result in larger losses or smaller gains than the use of more traditional investments, 2) the prices of futures and the price movements of the securities that the future is intended to simulate may not correlate well, 3) the Fund’s success in using futures will be dependent upon the subadviser’s ability to correctly predict such price movements, 4) liquidity of futures can be adversely affected by market factors, and the prices of such securities may move in unexpected ways, and 5) if the Fund cannot close out a futures position, it may be compelled to continue to make daily cash payments to the broker to meet margin requirements, thus increasing transaction costs.
| H. | When-issued Purchases and Forward Commitments (Delayed Delivery) |
Certain Funds may engage in when-issued or forward commitment transactions. Securities purchased on a when-issued or forward commitment basis are also known as delayed delivery transactions. Delayed delivery transactions involve a commitment by a Fund to purchase or sell a security at a future date (ordinarily up to 90 days later). When-issued or forward commitments enable a Fund to lock in what is believed to be an attractive price or yield on a particular security for a period of time, regardless of future changes in interest rates. Each Fund records when-issued and delayed delivery securities on the trade date. Each Fund maintains collateral for the securities purchased. Securities purchased on a when-issued or delayed delivery basis begin earning interest on the settlement date.
| I. | Loan Agreements |
Certain Funds may invest in direct debt instruments which are interests in amounts owed by a corporate, governmental, or other borrower to lenders or lending syndicates. A Fund’s investments in loans may be in the form of participations in loans or assignments of all or a portion of loans from third parties. A loan is often administered by a bank or other financial institution (the lender) that acts as agent for all holders. The agent administers the terms of the loan, as specified in the loan agreement. When investing in a loan participation, the Fund has the right to receive payments of principal, interest and any fees to which it is entitled only from the lender selling the loan agreement and only upon receipt by the lender of payments from the borrower. The Fund generally has no right to enforce compliance with the terms of the loan agreement with the borrower. As a result, the Fund may be subject to the credit risk of both the borrower and the lender that is selling the loan agreement. When the Fund purchases assignments from lenders it acquires direct rights against the borrower on the loan. Direct indebtedness of emerging countries involves a risk that the government entities responsible for the repayment of the debt may be unable, or unwilling, to pay the principal and interest when due.
The Funds currently hold assignment loans.
| J. | Securities Lending |
Certain Funds may loan securities to qualified brokers through an agreement with The Bank of New York Mellon (“BNY Mellon”), the Funds’ custodian. Under the terms of the agreement, a Fund is required to maintain collateral with a market value not less than 100% of the market value of loaned securities. Collateral is adjusted daily in connection with changes in the market value of securities on loan. Collateral may consist of cash and securities issued by the U.S. Government or its agencies. Cash collateral is invested in a short-term money market fund. Dividends earned on the collateral and premiums paid by the broker are recorded as income by the Fund net of fees and rebates charged by BNY Mellon for its services in connection with this securities lending program. Lending portfolio securities involves a risk of delay in the recovery of the loaned securities or in the declining value of the collateral.
Effective November 7, 2011, securities lending was suspended on all Virtus Mutual Funds.
66
Table of Contents
VIRTUS OPPORTUNITIES TRUST
NOTES TO FINANCIAL STATEMENTS (Continued)
SEPTEMBER 30, 2012
| Note 3. Investment | Advisory Fee and Related Party Transactions |
($ reported in thousands except as noted)
| A. | Adviser |
Virtus Investment Advisers, Inc. (the “Adviser”), an indirect wholly-owned subsidiary of Virtus Investment Partners, Inc. (“Virtus”), is the Adviser to the Trust. The Adviser manages the Funds’ investment programs and general operations of the Funds, including oversight of the Funds’ subadvisers.
As compensation for its services, the Adviser is entitled to a fee based upon the following annual rates as a percentage of the average daily net assets of each Fund:
| 1st $1 Billion | Over $1 Billion | |||||||
Bond Fund | 0.45 | % | 0.40 | % | ||||
Herzfeld Fund | 1.00 | 0.95 | ||||||
Wealth Masters Fund | 0.85 | 0.80 | ||||||
| 1st $1 Billion | $1+ Billion – $2 Billion | $2 + Billion | ||||||||||
CA Tax-Exempt Bond Fund | 0.45 | % | 0.40 | % | 0.35 | % | ||||||
High Yield Fund | 0.65 | 0.60 | 0.55 | |||||||||
Multi-Sector Fixed Income Fund | 0.55 | 0.50 | 0.45 | |||||||||
Senior Floating Rate Fund | 0.60 | 0.55 | 0.50 | |||||||||
| B. | Subadvisers |
The Subadvisers manages the investments of each Fund, for which they are paid a fee by the Adviser. The Subadvisers with respect to the Funds they serve are as follows:
Fund | Subadviser | Fund | Subadviser | |||
| Bond Fund | NF(1) | Multi-Sector Fixed Income Fund | NF(1) | |||
| CA Tax-Exempt Bond Fund | NF(1) | Senior Floating Rate Fund | NF(1) | |||
Herzfeld Fund | Herzfeld(2) | Wealth Masters Fund | Horizon(3) | |||
High Yield Fund | NF(1) |
| (1) | Newfleet Asset Management, LLC an indirect wholly-owned subsidiary of Virtus. |
| (2) | Thomas J, Herzfeld Advisors, Inc. |
| (3) | Horizon Asset Management, LLC |
| C. | Expense Limits and Fee Waivers |
The Adviser has voluntarily agreed to limit each Fund’s total operating expenses (excluding interest, taxes, extraordinary expenses and acquired fund fees and expenses), so that such expenses do not exceed the below percentages of the average daily net asset values for the following Funds. The Adviser may discontinue these voluntary expense caps at any time.
| Class A | Class B | Class C | Class I | |||||||||||||
Bond Fund | 0.85 | % | 1.60 | % | 1.60 | % | 0.60 | % | ||||||||
CA Tax-Exempt Bond Fund | 0.85 | — | — | 0.60 | ||||||||||||
High Yield Fund | 1.15 | 1.90 | 1.90 | 0.90 | ||||||||||||
Senior Floating Rate Fund(1) | 1.20 | — | 1.95 | 0.95 | ||||||||||||
| (1) | Excluding leverage expenses, if any. |
The Adviser has contractually agreed to limit the following Funds’ total operating expenses (excluding interest, taxes, extraordinary expenses and acquired fund fees and expenses):
| Class A | Class C | Class I | Through Date | |||||||||||||
Herzfeld Fund | 1.60 | % | 2.35 | % | 1.35 | % | 9/30/13 | |||||||||
Wealth Masters Fund | 1.45 | 2.20 | 1.20 | 9/30/13 | ||||||||||||
The Adviser may recapture operating expenses waived or reimbursed under these arrangements, within three fiscal years following the end of the fiscal year in which such waiver or reimbursement occurred. Each Fund must pay its ordinary operating expenses before the Adviser is entitled to any reimbursement and must remain in compliance with any applicable expense limitations or if none, the expense limitation in effect at the time of the waiver or reimbursement. All or a portion of the following Adviser reimbursed expenses may be recaptured by the fiscal year ending:
| Expiration Date | ||||||||||||||||
| 2013 | 2014 | 2015 | Total | |||||||||||||
Bond Fund | $ | 293 | $ | 305 | $ | 263 | $ | 861 | ||||||||
CA Tax-Exempt Bond Fund | 106 | 113 | 112 | 331 | ||||||||||||
Herzfeld Fund | — | — | 25 | 25 | ||||||||||||
High Yield Fund | — | 145 | 159 | 304 | ||||||||||||
Wealth Masters Fund | — | — | 29 | 29 | ||||||||||||
67
Table of Contents
VIRTUS OPPORTUNITIES TRUST
NOTES TO FINANCIAL STATEMENTS (Continued)
SEPTEMBER 30, 2012
| D. | Distributor |
VP Distributors, LLC (“VP Distributors”), an indirect wholly-owned subsidiary of Virtus, serves as the distributor of each Fund’s shares and has advised the Funds that for the fiscal year (the “period”) ended September 30, 2012, it retained net commissions of $87 Class A shares and deferred sales charges of $-5, $4, and $54 for Class A shares, Class B shares and Class C shares respectively.
In addition, each Fund pays VP Distributors distribution and/or service fees under Board approved 12b-1 and/or shareholder service plans as a percentage of the average daily net assets of each respective class at the annual rates of 0.25% for Class A shares, 1.00% for Class B and 1.00% for Class C shares, Class I shares are not subject to a 12b-1 plan.
Under certain circumstances, shares of certain Virtus Mutual Funds may be exchanged for shares of the same class of certain other Virtus Mutual Funds on the basis of the relative net asset values per share at the time of the exchange. On exchanges with share classes that carry a CDSC, the CDSC schedule of the original shares purchased continues to apply.
| E. | Administrator and Transfer Agent |
VP Distributors also serves as the Trust’s Administrator. For the period ended September 30, 2012, the Funds incurred administration fees from the Trust totaling $1,013 which are included in the Statements of Operations.
VP Distributors also serves as the Trust’s transfer agent. For the period ended September 30, 2012, the Funds incurred transfer agent fees from the Trust totaling $1,045 which are included in the Statements of Operations. A portion is paid to outside entities that also provide services to the Trust.
| F. | Affiliated Shareholders |
At September 30, 2012, Virtus and its affiliates including BMO Bankcorp (a minority investor in Virtus) and its affiliates and the retirement plans of Virtus and its affiliates held shares of the Funds which may be redeemed at any time that aggregated the following:
| Shares | Aggregate Net Asset Value | |||||||
| Herzfeld Fund | ||||||||
Class A | 10,000 | $ | 102 | |||||
Class C | 10,000 | 102 | ||||||
Class I | 80,000 | 817 | ||||||
| Multi-Sector Fixed Income Fund | ||||||||
Class I | 19,923 | 222 | ||||||
| Senior Floating Rate Fund, | ||||||||
Class I | 1,264,280 | 12,365 | ||||||
| Wealth Masters Fund | ||||||||
Class A | 10,000 | 102 | ||||||
Class C | 10,000 | 102 | ||||||
Class I | 80,000 | 818 | ||||||
| Note 4. Purchases and Sales of Securities |
($ reported in thousands)
Purchases and sales of securities (excluding U.S. Government and agency securities, forward currency contracts, futures and short-term securities) during the period ended September 30, 2012, were as follows:
| Purchases | Sales | |||||||
Bond Fund | $ | 92,793 | $ | 130,017 | ||||
CA Tax-Exempt Bond Fund | 8,948 | 12,852 | ||||||
Herzfeld Fund | 1,111 | 22 | ||||||
High Yield Fund | 91,383 | 86,374 | ||||||
Multi-Sector Fixed Income Fund | 319,085 | 193,124 | ||||||
Senior Floating Rate Fund | 294,381 | 231,282 | ||||||
Wealth Masters Fund | 1,268 | 262 | ||||||
Purchases and sales of long term U.S. Government and agency securities for the Funds during the period ended September 30, 2012, were as follows:
| Purchases | Sales | |||||||
Bond Fund | $ | 215,026 | $ | 231,380 | ||||
Multi-Sector Fixed Income Fund | 36,732 | 41,224 | ||||||
68
Table of Contents
VIRTUS OPPORTUNITIES TRUST
NOTES TO FINANCIAL STATEMENTS (Continued)
SEPTEMBER 30, 2012
| Note 5. Derivative Transactions |
($ reported in thousands)
Certain Funds invested in derivative instruments during the reporting period in the form of futures contracts. The primary type of risk associated with the futures contracts is interest rate risk. A Fund may utilize futures in an effort to optimize performance by managing interest rate risk. This permits the portfolio manager to assemble the portfolio believed to be the most attractive while mitigating vulnerability to changes in market interest rates.
For additional information on futures contracts in which the Funds invested in during the reporting period, refer to the Schedule of Investments and Note 2G.
The following is a summary of Bond Fund’s derivative instrument holdings categorized by primary risk exposure as of September 30, 2012 ($ reported in thousands):
Statements of Assets and Liabilities | Statements of Operations | |||||||||
| Assets: Variation margin for futures contracts(1) | $1 | Net realized gain (loss) on futures | $(101) | |||||||
| Liabilities: None | — | Net change in unrealized appreciation (depreciation) on futures | (70) | |||||||
| Net asset (liability) balance | $1 | Total realized and unrealized gain (loss) | $(171) | |||||||
|
|
|
| |||||||
| (1) | Variation margin shown on the Statement of Assets and Liabilities is the daily change in the unrealized appreciation (depreciation) for open futures contracts. |
For the fiscal year ended September 30, 2012, Bond Fund’s average volume of derivative activities is as follows:
| Futures Contracts – Sold(2) | ||||
| $(1,966) | ||||
| (2) | Notional Amount. |
| Note 6. Capital | Share Transactions |
(reported in thousands)
Transactions in shares of capital stock, during the periods ended as indicated below, were as follows:
| Bond Fund | CA Tax-Exempt Bond Fund | |||||||||||||||||||||||||||||||
| Year Ended September 30, 2012 | Year Ended September 30, 2011 | Year Ended September 30, 2012 | Year Ended September 30, 2011 | |||||||||||||||||||||||||||||
| SHARES | AMOUNT | SHARES | AMOUNT | SHARES | AMOUNT | SHARES | AMOUNT | |||||||||||||||||||||||||
| Class A | ||||||||||||||||||||||||||||||||
| Sale of shares | 610 | $ | 6,882 | 600 | $ | 6,673 | 26 | $ | 323 | 45 | $ | 523 | ||||||||||||||||||||
| Reinvestment of distributions | 144 | 1,615 | 181 | 2,008 | 60 | 756 | 64 | 758 | ||||||||||||||||||||||||
| Shares repurchased | (791 | ) | (8,902 | ) | (911 | ) | (10,094 | ) | (276 | ) | (3,502 | ) | (282 | ) | (3,338 | ) | ||||||||||||||||
|
|
|
|
|
|
|
|
|
|
|
|
|
|
|
| |||||||||||||||||
| Net Increase / (Decrease) | (37 | ) | $ | (405 | ) | (130 | ) | $ | (1,413 | ) | (190 | ) | $ | (2,423 | ) | (173 | ) | $ | (2,057 | ) | ||||||||||||
|
|
|
|
|
|
|
|
|
|
|
|
|
|
|
| |||||||||||||||||
| Class B | ||||||||||||||||||||||||||||||||
| Sale of shares | — | (1) | $ | 1 | 11 | $ | 118 | — | $ | — | — | $ | — | |||||||||||||||||||
| Reinvestment of distributions | 2 | 18 | 4 | 48 | — | — | — | — | ||||||||||||||||||||||||
| Shares repurchased | (47 | ) | (518 | ) | (163 | ) | (1,770 | ) | — | — | — | — | ||||||||||||||||||||
|
|
|
|
|
|
|
|
|
|
|
|
|
|
|
| |||||||||||||||||
| Net Increase / (Decrease) | (45 | ) | $ | (499 | ) | (148 | ) | $ | (1,604 | ) | — | $ | — | — | $ | — | ||||||||||||||||
|
|
|
|
|
|
|
|
|
|
|
|
|
|
|
| |||||||||||||||||
| Class C | ||||||||||||||||||||||||||||||||
| Sale of shares | 243 | $ | 2,678 | 132 | $ | 1,432 | — | $ | — | — | $ | — | ||||||||||||||||||||
| Reinvestment of distributions | 15 | 166 | 21 | 224 | — | — | — | — | ||||||||||||||||||||||||
| Shares repurchased | (231 | ) | (2,549 | ) | (200 | ) | (2,178 | ) | — | — | — | — | ||||||||||||||||||||
|
|
|
|
|
|
|
|
|
|
|
|
|
|
|
| |||||||||||||||||
| Net Increase / (Decrease) | 27 | $ | 295 | (47 | ) | $ | (522 | ) | — | $ | — | — | $ | — | ||||||||||||||||||
|
|
|
|
|
|
|
|
|
|
|
|
|
|
|
| |||||||||||||||||
| Class I | ||||||||||||||||||||||||||||||||
| Sale of shares | 1,509 | $ | 17,183 | 481 | $ | 5,394 | 139 | $ | 1,754 | 63 | $ | 732 | ||||||||||||||||||||
| Reinvestment of distributions | 213 | 2,421 | 322 | 3,604 | 24 | 309 | 24 | 288 | ||||||||||||||||||||||||
| Shares repurchased | (6,076 | ) | (71,002 | ) | (4,596 | ) | (51,452 | ) | (182 | ) | (2,316 | ) | (140 | ) | (1,661 | ) | ||||||||||||||||
|
|
|
|
|
|
|
|
|
|
|
|
|
|
|
| |||||||||||||||||
| Net Increase / (Decrease) | (4,354 | ) | $ | (51,398 | ) | (3,793 | ) | $ | (42,454 | ) | (19 | ) | $ | (253 | ) | (53 | ) | $ | (641 | ) | ||||||||||||
|
|
|
|
|
|
|
|
|
|
|
|
|
|
|
| |||||||||||||||||
69
Table of Contents
VIRTUS OPPORTUNITIES TRUST
NOTES TO FINANCIAL STATEMENTS (Continued)
SEPTEMBER 30, 2012
| Herzfeld Fund | High Yield Fund | |||||||||||||||||||||||||||||||
| From Inception September 5, 2012 to September 30, 2012 | Year Ended September 30, 2012 | Year Ended September 30, 2011 | ||||||||||||||||||||||||||||||
| SHARES | AMOUNT | SHARES | AMOUNT | SHARES | AMOUNT | |||||||||||||||||||||||||||
| Class A | ||||||||||||||||||||||||||||||||
| Sale of shares | 10 | $ | 103 | 3,582 | $ | 14,812 | 3,313 | $ | 13,834 | |||||||||||||||||||||||
| Reinvestment of distributions | — | — | 1,222 | 5,020 | 1,196 | 4,964 | ||||||||||||||||||||||||||
| Shares repurchased | — | — | (4,246 | ) | (17,396 | ) | (6,354 | ) | (26,343 | ) | ||||||||||||||||||||||
|
|
|
|
|
|
|
|
|
|
|
| |||||||||||||||||||||
| Net Increase / (Decrease) | 10 | $ | 103 | 558 | $ | 2,436 | (1,845 | ) | $ | (7,545 | ) | |||||||||||||||||||||
|
|
|
|
|
|
|
|
|
|
|
| |||||||||||||||||||||
| Class B | ||||||||||||||||||||||||||||||||
| Sale of shares | — | $ | — | 9 | $ | 35 | 1 | $ | 5 | |||||||||||||||||||||||
| Reinvestment of distributions | — | — | 4 | 17 | 6 | 25 | ||||||||||||||||||||||||||
| Shares repurchased | — | — | (47 | ) | (192 | ) | (63 | ) | (256 | ) | ||||||||||||||||||||||
|
|
|
|
|
|
|
|
|
|
|
| |||||||||||||||||||||
| Net Increase / (Decrease) | — | $ | — | (34 | ) | $ | (140 | ) | (56 | ) | $ | (226 | ) | |||||||||||||||||||
|
|
|
|
|
|
|
|
|
|
|
| |||||||||||||||||||||
| Class C | ||||||||||||||||||||||||||||||||
| Sale of shares | 10 | $ | 100 | 264 | $ | 1,077 | 119 | $ | 485 | |||||||||||||||||||||||
| Reinvestment of distributions | — | — | 28 | 116 | 21 | 87 | ||||||||||||||||||||||||||
| Shares repurchased | — | — | (129 | ) | (512 | ) | (122 | ) | (492 | ) | ||||||||||||||||||||||
|
|
|
|
|
|
|
|
|
|
|
| |||||||||||||||||||||
| Net Increase / (Decrease) | 10 | $ | 100 | 163 | $ | 681 | 18 | $ | 80 | |||||||||||||||||||||||
|
|
|
|
|
|
|
|
|
|
|
| |||||||||||||||||||||
| Class I | ||||||||||||||||||||||||||||||||
| Sale of shares | 100 | $ | 1,000 | $ | 24 | $ | 100 | — | $ | — | ||||||||||||||||||||||
| Reinvestment of distributions | — | — | — | (1) | 1 | — | — | |||||||||||||||||||||||||
| Shares repurchased | — | — | — | — | — | — | ||||||||||||||||||||||||||
|
|
|
|
|
|
|
|
|
|
|
| |||||||||||||||||||||
| Net Increase / (Decrease) | 100 | $ | 1,000 | $ | 24 | $ | 101 | — | $ | — | ||||||||||||||||||||||
|
|
|
|
|
|
|
|
|
|
|
| |||||||||||||||||||||
| Multi-Sector Fixed Income Fund | Senior Floating Rate Fund | |||||||||||||||||||||||||||||||
| Year Ended September 30, 2012 | Year Ended September 30, 2011 | Year Ended September 30, 2012 | Year Ended September 30, 2011 | |||||||||||||||||||||||||||||
| SHARES | AMOUNT | SHARES | AMOUNT | SHARES | AMOUNT | SHARES | AMOUNT | |||||||||||||||||||||||||
| Class A | ||||||||||||||||||||||||||||||||
| Sale of shares | 8,003 | $ | 85,521 | 5,460 | $ | 59,356 | 12,281 | $ | 117,828 | 24,334 | $ | 239,562 | ||||||||||||||||||||
| Reinvestment of distributions | 732 | 7,902 | 619 | 6,720 | 1,078 | 10,384 | 1,106 | 10,824 | ||||||||||||||||||||||||
| Shares repurchased | (4,516 | ) | (48,226 | ) | (4,363 | ) | (47,509 | ) | (10,387 | ) | (99,529 | ) | (12,306 | ) | (118,827 | ) | ||||||||||||||||
|
|
|
|
|
|
|
|
|
|
|
|
|
|
|
| |||||||||||||||||
| Net Increase / (Decrease) | 4,219 | $ | 45,197 | 1,716 | $ | 18,567 | 2,972 | $ | 28,683 | 13,134 | $ | 131,559 | ||||||||||||||||||||
|
|
|
|
|
|
|
|
|
|
|
|
|
|
|
| |||||||||||||||||
| Class B | ||||||||||||||||||||||||||||||||
| Sale of shares | 3 | $ | 34 | 17 | $ | 190 | — | $ | — | — | $ | — | ||||||||||||||||||||
| Reinvestment of distributions | 35 | 375 | 35 | 382 | — | — | — | — | ||||||||||||||||||||||||
| Shares repurchased | (186 | ) | (1,999 | ) | (271 | ) | (2,957 | ) | — | — | — | — | ||||||||||||||||||||
|
|
|
|
|
|
|
|
|
|
|
|
|
|
|
| |||||||||||||||||
| Net Increase / (Decrease) | (148 | ) | $ | (1,590 | ) | (219 | ) | $ | (2,385 | ) | — | $ | — | — | $ | — | ||||||||||||||||
|
|
|
|
|
|
|
|
|
|
|
|
|
|
|
| |||||||||||||||||
| Class C | ||||||||||||||||||||||||||||||||
| Sale of shares | 3,878 | $ | 42,083 | 2,287 | $ | 25,013 | 2,056 | $ | 19,804 | 9,035 | $ | 89,551 | ||||||||||||||||||||
| Reinvestment of distributions | 276 | 2,996 | 207 | 2,261 | 291 | 2,806 | 302 | 2,954 | ||||||||||||||||||||||||
| Shares repurchased | (1,341 | ) | (14,488 | ) | (1,375 | ) | (15,077 | ) | (2,617 | ) | (25,125 | ) | (2,438 | ) | (23,399 | ) | ||||||||||||||||
|
|
|
|
|
|
|
|
|
|
|
|
|
|
|
| |||||||||||||||||
| Net Increase / (Decrease) | 2,813 | $ | 30,591 | 1,119 | $ | 12,197 | (270 | ) | $ | (2,515 | ) | 6,899 | $ | 69,106 | ||||||||||||||||||
|
|
|
|
|
|
|
|
|
|
|
|
|
|
|
| |||||||||||||||||
| Class I | ||||||||||||||||||||||||||||||||
| Sale of shares | 5,681 | $ | 61,113 | 2,166 | $ | 23,722 | 6,486 | $ | 62,017 | 11,585 | $ | 114,694 | ||||||||||||||||||||
| Reinvestment of distributions | 162 | 1,754 | 37 | 404 | 280 | 2,694 | 329 | 3,228 | ||||||||||||||||||||||||
| Shares repurchased | (1,318 | ) | (14,122 | ) | (725 | ) | (7,896 | ) | (4,858 | ) | $ | (46,576 | ) | (7,529 | ) | $ | (73,093 | ) | ||||||||||||||
|
|
|
|
|
|
|
|
|
|
|
|
|
|
|
| |||||||||||||||||
| Net Increase / (Decrease) | 4,525 | $ | 48,745 | 1,478 | $ | 16,230 | 1,908 | $ | 18,135 | 4,385 | $ | 44,829 | ||||||||||||||||||||
|
|
|
|
|
|
|
|
|
|
|
|
|
|
|
| |||||||||||||||||
(1) Amount is less than 500.
70
Table of Contents
VIRTUS OPPORTUNITIES TRUST
NOTES TO FINANCIAL STATEMENTS (Continued)
SEPTEMBER 30, 2012
| Wealth Masters Fund | ||||||||||||
| From Inception September 5, 2012 to September 30, 2012 | ||||||||||||
| SHARES | AMOUNT | |||||||||||
| Class A | ||||||||||||
| Sale of shares | 10 | $ | 104 | |||||||||
| Reinvestment of distributions | — | — | ||||||||||
| Shares repurchased | — | — | ||||||||||
|
|
|
| |||||||||
| Net Increase / (Decrease) | 10 | $ | 104 | |||||||||
|
|
|
| |||||||||
| Class C | ||||||||||||
| Sale of shares | 10 | $ | 105 | |||||||||
| Reinvestment of distributions | — | — | ||||||||||
| Shares repurchased | — | — | ||||||||||
|
|
|
| |||||||||
| Net Increase / (Decrease) | 10 | $ | 105 | |||||||||
|
|
|
| |||||||||
| Class I | ||||||||||||
| Sale of shares | 80 | $ | 800 | |||||||||
| Reinvestment of distributions | — | — | ||||||||||
| Shares repurchased | — | — | ||||||||||
|
|
|
| |||||||||
| Net Increase / (Decrease) | 80 | $ | 800 | |||||||||
|
|
|
| |||||||||
| Note 7. 10% Shareholders |
As of September 30, 2012, certain Funds had individual shareholder account(s) and/or omnibus shareholder account(s) (comprised of a group of individual shareholders), which individually amounted to more than 10% of the total shares outstanding of each such Fund as detailed below:
| % of Shares Outstanding | Number of Accounts | |||||||
CA Tax-Exempt Bond Fund | 34 | % | 2 | |||||
Herzfeld Fund | 83 | 1 | * | |||||
Multi-Sector Fixed Income Fund | 14 | 1 | ||||||
Senior Floating Rate Fund | 39 | 1 | ||||||
Wealth Masters Fund | 99 | 1 | * | |||||
| * | Includes affiliated shareholder accounts. |
| Note 8. Credit Risk and Asset Concentration |
In countries with limited or developing markets, investments may present greater risks than in more developed markets and the prices of such investments may be volatile. The consequences of political, social or economic changes in these markets may have disruptive effects on the market prices of these investments and the income they generate, as well as a Fund’s ability to repatriate such amounts.
High-yield/high-risk securities typically entail greater price volatility and/or principal and interest rate risk. There is a greater chance that an issuer will not be able to make principal and interest payments on time. Analysis of the creditworthiness of issuers of high-yield securities may be complex, and as a result, it may be more difficult for the adviser and/or subadviser to accurately predict risk.
Many municipalities insure repayment for their obligations. Although bond insurance reduces the risk of loss due to default by an issuer, such bonds remain subject to the risk that the market may fluctuate for other reasons, and there is no assurance that the insurance company will meet its obligations. Insured securities have been identified in the Schedule of Investments. A real or perceived decline in creditworthiness of a bond insurer can have an adverse impact on the value of insured bonds held in the Funds.
Certain Funds may invest a high percentage of their assets in specific sectors of the market in their pursuit of a greater investment return. Fluctuations in these sectors of concentration may have a greater impact on a Fund, positive or negative, than if the Fund did not concentrate its investments in such sectors.
At September 30, 2012, certain Funds held securities issued by various companies in specific sectors or countries as detailed below:
Fund | Sector | Percentage of Total Investments | ||||
| Senior Floating Rate Fund | Consumer Discretionary | 28 | % | |||
| Wealth Masters Fund | Consumer Discretionary | 37 | % | |||
| Note 9. Indemnifications |
Under the Trust’s organizational documents, their trustees and officers are indemnified against certain liabilities arising out of the performance of their duties to the Funds. In addition, in the normal course of business the Funds enter into contracts that contain a variety of indemnifications. The Funds’ maximum exposure under these arrangements is unknown as this would involve future claims that may be made against the Funds and that have not occurred. However, the Funds have not had prior claims or losses pursuant to these arrangements and expect the risk loss to be remote.
71
Table of Contents
VIRTUS OPPORTUNITIES TRUST
NOTES TO FINANCIAL STATEMENTS (Continued)
SEPTEMBER 30, 2012
| Note 10. Other |
On July 20, and September 17, 2012, the Bond Fund had an institutional investor redeem 2,386,764 and 2,468,304 shares of class I for $27,997 and $28,978 ($ reported in thousands) which comprised 17% and 21% of the shares outstanding on the dates of redemptions, respectively.
| Note 11. Federal Income Tax Information |
($ reported in thousands)
At September 30, 2012, federal tax cost and aggregate gross unrealized appreciation (depreciation) of securities held by the Funds were as follows:
Fund | Federal Tax Cost | Unrealized Appreciation | Unrealized (Depreciation) | Net Unrealized Appreciation (Depreciation) | ||||||||||||
Bond Fund | $ | 102,189 | $ | 5,881 | $ | (178 | ) | $ | 5,703 | |||||||
CA Tax-Exempt Bond | 51,962 | 5,336 | (449 | ) | 4,887 | |||||||||||
Herzfeld Fund | 1,295 | 19 | (1 | ) | 18 | |||||||||||
High Yield Fund | 97,175 | 5,134 | (700 | ) | 4,434 | |||||||||||
Multi-Sector Fixed Income | 377,932 | 19,809 | (3,837 | ) | 15,972 | |||||||||||
Senior Floating Rate Fund | 471,463 | 6,743 | (3,510 | ) | 3,233 | |||||||||||
Wealth Masters Fund | 1,012 | 24 | (8 | ) | 16 | |||||||||||
The Funds have capital loss available to offset future realized capital gains, through the indicated expiration dates shown below:
| 2015 | 2016 | 2017 | 2018 | 2019 | No Expiration | Total | ||||||||||||||||||||||
Bond Fund | $ | 1,794 | $ | 1,080 | $ | 3,798 | $ | — | $ | — | $ | — | $ | 6,672 | ||||||||||||||
High Yield Fund | — | — | 16,844 | 9,151 | — | — | 25,995 | |||||||||||||||||||||
The Trust may not realize the benefit of these losses to the extent each Fund does not realize gains on investments prior to the expiration of the capital loss carryovers.
Under the Regulated Investment Company Modernization Act of 2010 (the “Act”), net capital losses recognized for tax years beginning after December 22, 2010 may be carried forward indefinitely, and their character is retained as short-term and/or long-term losses. Previously, net capital losses were carried forward for eight years and treated as short-term losses. As a transition rule, the Act requires that post-enactment net capital losses be used before pre-enactment net capital losses.
For the Period ended September 30, 2012, the following Funds utilized losses deferred in prior years against current year capital gains:
Bond Fund | $ | 6,713 | ||
CA Tax-Exempt Bond | 104 | |||
High Yield Fund | 333 | |||
Multi-Sector Fixed Income Fund | 1,663 |
Capital losses realized after October 31 and certain late year ordinary losses may be deferred and treated as occurring on the first day of the following fiscal year. For the fiscal period ended September 30,2012, the Funds deferred and recognized post-October losses as follow:
| Capital Loss Deferred | Capital Loss Recognized | |||||||
High Yield Fund | $ | 3,176 | $ | — | ||||
Senior Floating Rate Fund | — | 714 | ||||||
The components of distributable earnings on a tax basis (excluding unrealized appreciation (depreciation) which are disclosed above) consist of the following:
| Undistributed Ordinary Income | Undistributed Long-Term Capital Gains | Undistributed Tax-Exempt Income | ||||||||||
Bond Fund | $ | 41 | $ | — | $ | — | ||||||
CA Tax-Exempt Bond | — | 769 | — | (1) | ||||||||
Herzfeld Fund | 3 | — | (1) | — | ||||||||
High Yield Fund | 90 | — | — | |||||||||
Multi-Sector Fixed Income | 394 | 4,181 | — | |||||||||
Senior Floating Rate Fund | 678 | 162 | — | |||||||||
Wealth Masters Fund | 5 | — | (1) | — | ||||||||
(1) Amount less than $500.
For the period ended September 30, 2012, the CA Tax-Exempt Bond Fund distributed $2,273 of exempt interest dividends.
The differences between the book and tax basis components of distributable earnings relate principally to the timing of recognition of income and gains for federal income tax purposes. Short-term gain distributions reported in the Statements of Changes in Net Assets, if any, are reported as ordinary income for federal tax purposes. Distributions are determined on a tax basis and may differ from net investment income and realized capital gains for financial reporting purposes.
72
Table of Contents
VIRTUS OPPORTUNITIES TRUST
NOTES TO FINANCIAL STATEMENTS (Continued)
SEPTEMBER 30, 2012
| Note 12. Reclassification of Capital Accounts |
($ reported in thousands)
For financial reporting purposes, book basis capital accounts are adjusted to reflect the tax character of permanent book/tax differences. Permanent reclassifications can arise from differing treatment of certain income and gain transactions, nondeductible current year net operating losses, expiring capital loss carryovers and investments in passive foreign investment companies. The reclassifications have no impact on the net assets or net asset value of the Funds. As of September 30, 2012, the Funds recorded reclassifications to increase (decrease) the accounts as listed below ($ reported in thousands):
| Capital Paid in on Shares of Beneficial Interest | Undistributed Net Investment Income (Loss) | Accumulated Net Realized Gain (Loss) | ||||||||||
Bond Fund | $ | — | $ | 2 | $ | (2 | ) | |||||
Herzfeld Fund | — | — | (1) | — | (1) | |||||||
High Yield Fund | 45 | 47 | (92 | ) | ||||||||
Multi-Sector Fixed Income | — | (1) | 219 | (219 | ) | |||||||
Senior Floating Rate Fund | — | (1) | 44 | (44 | ) | |||||||
(1) Amount less than $500.
| Note 13. Borrowings |
($ reported in thousands)
On April 30, 2012, the Senior Floating Rate Fund entered into a Credit Agreement (the “Agreement”) with a commercial bank (the “Bank”) that allows the Fund to borrow cash from the Bank, up to a limit of $100,000. Borrowings under the Agreement are collateralized by investments of the Fund. Interest is charged at LIBOR (London Interbank Offered Rate) plus an additional percentage rate on the amount borrowed and on the undrawn balance (the commitment fee). Total fees paid and accrued for the period ended September 30, 2012, were commitment fees of $84 and interest expenses of $108 which are combined in interest expense and fees on the Statement of Operations. The Agreement is renewable and can also be converted to a 1-year fixed term facility. The Bank has the ability to require repayment of outstanding borrowings under the Agreement upon certain circumstances such as an event of default. From April 30, 2012 to September 30, 2012, the average daily borrowings under the Agreement and the weighted daily average interest rate were $21,234 and 1.190%, respectively. Borrowings outstanding at September 30, 2012 as shown on the Statement of Assets and Liabilities are as follows:
| Interest Rate | Term | |||||||
$ 20,000 | �� | 1.166 | % | 30 days | ||||
| Note 14. Illiquid and Restricted Securities |
Investments are generally considered illiquid if they cannot be disposed of within seven days in the ordinary course of business at the approximate amount at which such securities have been valued by a Fund. Additionally, the following information is also considered in determining liquidity: the frequency of trades and quotes for the investment, whether the investment is listed for trading on a recognized domestic exchange and/or whether two or more brokers are willing to purchase or sell the security at a comparable price, the extent of market making activity in the investment and the nature of the market for investment. Illiquid securities are footnoted as such at the end of each Fund’s Schedule of Investments where applicable.
Restricted securities are not illiquid securities as defined above registered under the Securities Act of 1933 as amended (the “1933 Act”). Generally, 144A securities are excluded from this category, except where defined as illiquid.
Each Fund will bear any costs, including those involved in registration under the 1933 Act, in connection with the disposition of such securities.
At September 30, 2012, the Funds did not hold any illiquid and restricted Securities.
| Note 15. Recent Accounting Pronouncement |
In December 2011, the Financial Accounting Standards Board issued Accounting Standards Update (“ASU”) No. 2011-11 regarding “Disclosures about Offsetting Assets and Liabilities”. The amendments, which will be effective for annual reporting periods beginning on or after January 1, 2013 and interim periods within those annual periods, require an entity to disclose information about offsetting and related arrangements for assets and liabilities, financial instruments and derivatives that are either currently offset in accordance with current requirements or are subject to enforceable master netting arrangements or similar agreements. At this time, management is evaluating the implications of AUS No. 2011-11 and its impact on the financial statements has not yet been determined.
| Note 16. Subsequent Event Evaluations |
Management has evaluated the impact of all subsequent events on the Funds through the date the financial statements were available for issuance, and has determined that there are no subsequent events requiring recognition or disclosure in the financial statements.
73
Table of Contents

REPORT OF INDEPENDENT REGISTERED PUBLIC ACCOUNTING FIRM
To the Board of Trustees of
Virtus Opportunities Trust and
Shareholders of the Funds, as defined:
In our opinion, the accompanying statements of assets and liabilities, including the schedules of investments of Virtus Bond Fund, Virtus CA Tax-Exempt Bond Fund, Virtus Herzfeld Fund, Virtus High Yield Fund, Virtus Multi-Sector Fixed Income Fund, Virtus Senior Floating Rate Fund, and Virtus Wealth Masters Fund, each a series of Virtus Opportunities Trust, (the “Funds”), and the related statements of operations and of changes in net assets and the financial highlights present fairly, in all material respects, the financial positions of the Funds at September 30, 2012, the results of each of their operations, the changes in each of their net assets and the financial highlights for each of the periods indicated, in conformity with accounting principles generally accepted in the United States of America. These financial statements and financial highlights (hereafter referred to as “financial statements”) are the responsibility of the Funds’ management; our responsibility is to express an opinion on these financial statements based on our audits. We conducted our audits of these financial statements in accordance with the standards of the Public Company Accounting Oversight Board (United States). Those standards require that we plan and perform the audit to obtain reasonable assurance about whether the financial statements are free of material misstatement. An audit includes examining, on a test basis, evidence supporting the amounts and disclosures in the financial statements, assessing the accounting principles used and significant estimates made by management, and evaluating the overall financial statement presentation. We believe that our audits, which included confirmation of securities at September 30, 2012 by correspondence with the custodians and brokers, provide a reasonable basis for our opinion.

Philadelphia, Pennsylvania
November 21, 2012
74
Table of Contents
VIRTUS OPPORTUNITIES TRUST
SEPTEMBER 30, 2012
For the fiscal year ended September 30, 2012, the Funds make the following disclosures for federal income tax purposes. Below is listed the percentages, or the maximum amount allowable, of its ordinary income dividends (“QDI”) to qualify for the lower tax rates applicable to individual shareholders, and the percentage of ordinary income dividends earned by the Funds which qualifies for the dividends received deduction (“DRD”) for corporate shareholders. The Funds designate the amounts below as long-term capital gains dividends (“LTCG”) ($ reported in thousands), or if subsequently different, the amounts will be designated in the next annual report. The actual percentage for the calendar year will be designated in year-end tax statements.
Fund | QDI | DRD | LTCG | |||||||||
Bond Fund | — | % | — | % | $ | — | ||||||
CA Tax-Exempt Bond | — | — | 769 | |||||||||
Herzfeld Fund | 53 | 26 | — | (1) | ||||||||
High Yield Fund | — | — | — | |||||||||
Multi-Sector Fixed Income | — | — | 4,181 | |||||||||
Senior Floating Rate Fund | — | — | 162 | |||||||||
Wealth Masters Fund | 12 | 10 | — | (1) | ||||||||
For federal income tax purposes, 100% of the income dividends paid by the CA Tax-Exempt Bond Fund qualify as exempt-interest dividends.
| (1) | Amount less than $500. |
75
Table of Contents
CONSIDERATION OF ADVISORY AND SUBADVISORY AGREEMENTS
FOR
VIRTUS HERZFELD FUND
VIRTUS WEALTH MASTERS FUND
(EACH A “FUND”, COLLECTIVELY, THE “FUNDS”)
BY THE BOARD OF TRUSTEES
The Board of Trustees (the “Board”) of Virtus Opportunities Trust (the “Trust”) is responsible for determining whether to approve the establishment and continuation of the investment advisory agreement (the “Advisory Agreement”) between the Funds and Virtus Investment Advisers, Inc. (“VIA”) and of each subadvisory agreement (each, a “Subadvisory Agreement”, collectively the “Subadvisory Agreements” and together with the Advisory Agreement, the “Agreements”) among each Fund, VIA and Thomas J. Herzfeld Advisors, Inc. (“Herzfeld”) and Horizon Asset Management, LLC (“Horizon”), respectively (each a “Subadviser” and collectively, the “Subadvisers”). At an in-person meeting held on June 4-6, 2012, the Board, including a majority of the Trustees who are not interested persons of the Trust as defined in Section 2(a)(19) of the Investment Company Act of 1940, as amended (the “Independent Trustees”), considered and approved the establishment of the Agreements, as further discussed below.
In connection with the approval of the Agreements, the Board requested and evaluated information provided by VIA and each Subadviser which, in the Board’s view, constituted information necessary for the Board to form a judgment as to whether approval of each of the Agreements would be in the best interests of each Fund and its respective shareholders.
The Board was separately advised by independent legal counsel throughout the process. For each Agreement, the Board considered all the criteria separately with respect to the applicable Fund and its shareholders. In their deliberations, the Board considered various factors, including those discussed below, none of which were controlling, and each Trustee may have attributed different weights to the various factors. The Board also discussed the proposed approval of the Agreements in private sessions with their independent legal counsel at which no representatives of management were present.
In considering whether to approve the Agreements with respect to each Fund, the Board reviewed and analyzed the factors it deemed relevant, including: (1) the nature, extent and quality of the services to be provided to the Funds by VIA and the Subadvisers; (2)applicable comparative performance information; (3) the level and method of computing the Funds’ advisory and subadvisory fees, and comparisons of the Funds’ proposed advisory fee rates with those of a group of other funds with similar investment objectives; (4) the profitability of VIA under the Advisory Agreement; (5) any “fall-out” benefits to VIA, the Subadvisers and their respective affiliates (i.e., ancillary benefits realized by VIA, the Subadvisers or their affiliates from VIA’s or the respective Subadviser’s relationship with the Fund(s)); (6) fees paid to VIA and the Subadvisers by comparable accounts, as applicable; (7) possible conflicts of interest; and (8) the terms of the Agreements.
Nature, Extent and Quality of Services
The Trustees received in advance of the meeting information in the form of questionnaires completed by VIA and each Subadviser, each concerning a number of topics, including such company’s investment philosophy, resources, operations and compliance structure. The Trustees also received a presentation by VIA’s senior management personnel, during which among other items, VIA’s history, investment process, investment strategies, personnel, compliance procedures and the firm’s overall performance were reviewed and discussed. The Trustees noted that the Funds are managed using a “manager of managers” structure that generally involves the use of one or more subadvisers to manage some or all of each Fund’s portfolio. Under this structure, VIA is responsible for evaluating and selecting subadvisers on an ongoing basis and making any recommendations to the Board regarding hiring, retaining or replacing subadvisers. In considering the Agreement with VIA, the Board considered VIA’s process for supervising and managing the Funds’ subadvisers, including (a) VIA’s ability to select and monitor the subadvisers; (b) VIA’s ability to provide the services necessary to monitor the subadvisers’ compliance with the Funds’ respective investment objectives, policies and restrictions as well as provide other oversight activities; and (c) VIA’s ability and willingness to identify instances in which a subadviser should be replaced and to carry out the required changes. The Trustees also considered: (a) the experience and capability of VIA’s management and other personnel; (b) the financial condition of VIA, and whether it had the financial wherewithal to provide a high level and quality of services to the Funds; (c) the quality of VIA’s own regulatory and legal compliance policies, procedures and systems; (d) the nature, extent and quality of administrative and other services expected to be provided by VIA and its affiliates to each Fund; (e) VIA’s expected supervision of the Funds’ other service providers; and (f) VIA’s risk management processes. It was noted that VP Distributors, LLC, an affiliate of VIA, was expected to serve as administrator, distributor and transfer agent to the Funds. The Board also took into account its knowledge of VIA’s management and the quality of the performance of its duties with respect to other Virtus Mutual Funds through Board meetings, discussions and reports during the preceding year, as well as information from the Trust’s Chief Compliance Officer (“CCO”) regarding the Funds’ compliance policies and procedures proposed to be established pursuant to Rule 38a-1 under the 1940 Act.
With respect to the services to be provided by each of the Subadvisers, the Board considered information provided to the Board by each Subadviser, including the Subadviser’s Form ADV, as well as for certain Subadvisers a presentation provided by the Subadviser’s senior portfolio management personnel. With respect to each Subadvisory Agreement, the Board noted that the Subadviser would provide portfolio management, compliance with the respective Fund’s investment policies and procedures, compliance with applicable securities laws and assurances thereof. In considering approval of the Subadvisory Agreements, the Board also considered each Subadviser’s investment management process, including (a) the experience and capability of the Subadviser’s management and other personnel committed by the Subadviser to the respective Fund; (b) the financial condition of the Subadviser; (c) the quality of the Subadviser’s regulatory and legal compliance policies, procedures and systems; and (d) the Subadviser’s brokerage and trading practices, including with respect to best execution and soft dollars. The Board also took into account the Subadviser’s risk assessment and monitoring process. The Board noted each Subadviser’s regulatory history, including whether it was currently involved in any regulatory actions or investigations as well as material litigation, and any settlements and amelioratory actions undertaken, as appropriate.
After considering all of the information provided to them, the Trustees concluded that the nature, extent and quality of the services expected to be provided by VIA and the Subadvisers were satisfactory and that there was a reasonable basis on which to conclude that each would provide a high quality of investment services to the applicable Fund(s).
76
Table of Contents
CONSIDERATION OF ADVISORY AND SUBADVISORY AGREEMENTS
FOR
VIRTUS HERZFELD FUND
VIRTUS WEALTH MASTERS FUND
(EACH A “FUND”, COLLECTIVELY, THE “FUNDS”)
BY THE BOARD OF TRUSTEES (Continued)
Investment Performance
Because the Funds had not commenced operations, the Board could not evaluate prior investment performance for each Fund. With respect to the Wealth Masters Fund, the Board reviewed and was satisfied with comparative performance information of an index that would be used as the basis of the Fund’s investment strategy
Management Fees and Total Expenses
The Board considered the fees proposed for advisory services as well as the expected total expense levels of each Fund. Among other data provided, the Board noted that the proposed management fee and total expenses for each Fund were within the range of other funds deemed to be comparable to the Fund by management. The Board noted that each Fund was expected to have an expense cap in place to limit the total expenses incurred by the Fund and its shareholders. The Board also noted that the subadvisory fee for each Fund would be paid by VIA out of its advisory fee rather than paid separately by the Fund. In this regard, the Board took into account management’s discussion with respect to the advisory/subadvisory fee structure, including the amount of the advisory fee retained by VIA after payment of the subadvisory fee. The Board also took into account the expected size of each Fund and the impact on expenses.
The Board concluded that the proposed advisory and subadvisory fees for each Fund were fair and reasonable in light of the usual and customary charges made for services of the same nature and quality and the other factors considered.
Profitability
The Board also considered certain information relating to profitability that had been provided by VIA. In this regard, the Board considered information regarding the expected profitability of VIA for its management of the Funds, as well as the expected profitability of its affiliates for managing and providing other services to each Fund, such as distribution and administrative services provided to the Funds by a VIA affiliate. In addition to the fees paid to VIA and its affiliates, the Board considered any other benefits derived by VIA or its affiliates from their relationship with the Funds. Attention was paid to the methodology used to allocate costs to each Fund, in recognition of the fact that allocation methodologies are inherently subjective and various allocation methodologies may each be reasonable while producing different results. The Board concluded that the expected profitability to VIA and its affiliates from the Funds was reasonable in light of the quality of the services to be rendered to the Funds by VIA and its affiliates.
In considering the profitability to the Subadvisers in connection with their relationships to the Funds, the Board noted that the fees under the Subadvisory Agreements are paid by VIA out of the fees that VIA receives under the Advisory Agreement, so that Fund shareholders are not directly impacted by those fees. In considering the reasonableness of the fees payable by VIA to the Subadvisers, the Board relied on the ability of VIA to negotiate the Subadvisory Agreement and the fees thereunder at arm’s length. For each of the above reasons, the Board concluded that the profitability to the Subadvisers and their affiliates from their respective relationships with the Funds was not a material factor in approval of the Subadvisory Agreements.
Economies of Scale
The Board received and discussed information concerning whether VIA should be expected to realize economies of scale as the Funds’ assets grow. The Board noted that the management fees for the Funds included breakpoints based on assets under management, and that expense caps were also expected to be implemented for the Funds. The Board also took into account management’s discussion of each Fund’s management fee and subadvisory fee structure. The Board also took into account the expected size of the Funds. The Board noted that VIA and the Funds may realize certain economies of scale if the assets of the Funds were to be materially higher than anticipated, particularly in relationship to certain fixed costs, and that shareholders of each Fund would have an opportunity to benefit from these economies of scale.
For similar reasons as stated above with respect to the Subadvisers’ profitability, and based upon the expected size of the Fund to be managed by each Subadviser, the Board concluded that the potential for economies of scale in the Subadvisers’ management of the Funds was not a material factor in the approval of the Subadvisory Agreements at this time.
Other Factors. The Board considered other benefits that may be realized by VIA and the Subadviser and their respective affiliates from their relationships with the Funds. Among them, the Board recognized that VP Distributors, LLC, an affiliate of VIA, serves as the distributor for the Trust, and, as such, was expected to receive payments pursuant to Rule 12b-1 from the Funds to compensate it for providing shareholder services and selling activities, which could lead to growth in the Funds’ assets and corresponding benefits from such growth, including economies of scale. The Board also noted that VP Distributors, LLC also was expected to provide administrative and transfer agency services to the Funds. The Board noted management’s discussion of the fact that there were no other direct benefits to the Subadviser or VIA in providing investment advisory services to the Funds, other than the fees to be earned under the Agreements, although there may be certain indirect benefits gained, including to the extent that serving the Funds could provide the opportunity to provide advisory services to additional portfolios of the Trust or certain reputational benefits.
Based on all of the foregoing considerations, the Board, including a majority of the Independent Trustees, determined that approval of each Agreement was in the best interests of each Fund and its respective shareholders. Accordingly, the Board, and the Independent Trustees voting separately, approved the Agreements with respect to each Fund.
77
Table of Contents
(Unaudited)
Information pertaining to the trustees and officers of the Trust as of September 30, 2012, is set forth below. The statement of additional information (SAI) includes additional information about the trustees and is available without charge, upon request, by calling (800) 243-1574. The address of each individual, unless otherwise noted, is 100 Pearl Street, Hartford, CT 06103-4506. There is no stated term of office for trustees of the Trust.
Independent Trustees
| Name, Year of Birth, Year Elected and Number of Funds Overseen | Principal Occupation(s) During Past 5 Years and Other Directorships Held by Trustee | |
| Leroy Keith, Jr. YOB: 1939 Elected: 2000 47 Funds | Chairman (since 2010), Bloc Global Services Group, LLC (construction and redevelopment company); Managing Director (2007 to 2008), Almanac Capital Management (commodities business); Director/Trustee (since 2010), Wells Fargo Advantage Funds (149 series) and their predecessors, Evergreen Funds (1989 to 2010); Director (2003 to 2010), Diversapack Co. (soft packaging company). | |
| Philip R. McLoughlin Chairman YOB: 1946 Elected: 1999 62 Funds | Partner (since 2006), Cross Pond Partners, LLC (strategy consulting firm); Managing Director (2009 to 2010), SeaCap Asset Management Fund I, L.P. and SeaCap Partners, LLC (2009 to 2010) (investment management); Director (since 1991) and Chairman (since 2010), World Trust Fund; Chairman and Trustee (since 2003), Virtus Variable Insurance Trust (9 portfolios); Director (since 1995), DTF Tax-Free Income Fund, Inc.; Director (since 1995), Duff & Phelps Utility and Corporate Bond Trust, Inc.; Director (since 2009), DNP Select Income Fund Inc.; Director (since 2011), Duff & Phelps Global Utility Income Fund Inc.; Trustee (since 2011),Virtus Global Multi-Sector Fixed Income Fund; Trustee (since 2011), Virtus Total Return Fund; Director (1985 to 2009), Argo Group International Holdings Inc. and its predecessor, PXRE Corporation (insurance). | |
| Geraldine M. McNamara YOB: 1951 Elected: 2001 51 Funds | Retired. Director (since 2003), DTF Tax-Free Income Fund, Inc.; Director (since 2003), Duff & Phelps Utility and Corporate Bond Trust, Inc.; Director (since 2009), DNP Select Income Fund Inc.; Director (since 2011) Duff & Phelps Global Utility Income Fund Inc. | |
| James M. Oates YOB: 1946 Elected: 2000 47 Funds | Managing Director (since 1994), Wydown Group (consulting firm); Chairman and Trustee (since 2005), John Hancock Variable Insurance Trust and John Hancock Funds II (collectively, 210 portfolios); Director (since 1996), Stifel Financial; Chairman and Director (since 1999), Connecticut River Bank and Director (since 1998), Connecticut River Bancorp; Chairman (since 2000), Emerson Investment Management, Inc.; Director (since 2002), New Hampshire Trust Company; Non-Executive Chairman (2007 to 2011), Hudson Castle Group, Inc. (formerly IBEX Capital Markets, Inc.) (financial services). | |
| Richard E. Segerson YOB: 1946 Elected: 2000 47 Funds | Managing Director (since 1998), Northway Management Company. | |
| Ferdinand L.J. Verdonck YOB: 1942 Elected: 2005 47 Funds | Director (since 1998), The J.P. Morgan European Investment Trust; Director (since 2005), Galapagos N.V. (biotechnology); Mr. Verdonck is also a director of several non-U.S. companies. | |
Interested Trustee
The individual listed below is an “interested person” of the Trust, as defined in Section 2(a)(19) of the 1940 Act, as amended, and the rules and regulations thereunder.
| Name, Year of Birth, Year Elected and Number of Funds Overseen | Principal Occupation(s) During Past 5 Years and Other Directorships Held by Trustee | |
| George R. Aylward* Trustee and President YOB: 1964 Elected: 2006 49 Funds | Director, President and Chief Executive Officer (since 2008), Virtus Investment Partners, Inc. and/or certain of its subsidiaries; various senior officer positions with Virtus affiliates (since 2005); Chairman, President and Chief Executive Officer (since 2006), The Zweig Fund, Inc. and The Zweig Total Return Fund, Inc.; Trustee and President (since 2011), Virtus Global Multi-Sector Income Fund and Virtus Total Return Fund. | |
* Mr. Aylward is an “interested person,” as defined in the 1940 Act, by reason of his position as President and Chief Executive Officer of Virtus Investment Partners, Inc. (“Virtus”), the ultimate parent company of the Adviser, and various positions with its affiliates, including the Adviser.
78
Table of Contents
FUND MANAGEMENT TABLES (Continued)
(Unaudited)
Officers of the Trust Who Are Not Trustees
| Name, Address and Year of Birth | Position(s) Held with Trust and Length of Time Served | Principal Occupation(s) During Past 5 Years | ||
| W. Patrick Bradley YOB: 1972 | Vice President since 2011, Chief Financial Officer and Treasurer since 2006. | Senior Vice President, Fund Services (since 2010), Virtus Investment Partners, Inc. and/or certain of its subsidiaries; various officer positions (since 2006) with Virtus affiliates; Vice President (since 2011), Chief Financial Officer and Treasurer (since 2004), Virtus Variable Insurance Trust; Vice President, Chief Financial Officer and Treasurer (since 2011), Virtus Global Multi-Sector Income Fund and Virtus Total Return Fund; Vice President (since 2012) and Treasurer (Chief Financial Officer) (since 2007), The Zweig Fund, Inc. and Zweig Total Return Fund, Inc.; Vice President and Assistant Treasurer (since 2011), Duff & Phelps Global Utility Income Fund Inc. | ||
| Kevin J. Carr YOB: 1954 | Vice President, Chief Legal Officer, Counsel and Secretary since 2005. | Senior Vice President (since 2009), Vice President, Counsel and Secretary (2008 to 2009), Virtus Investment Partners, Inc. and/or certain of its subsidiaries; various senior officer positions (since 2005) with Virtus affiliates; Vice President, Chief Legal Officer, Counsel and Secretary (since 2010), Virtus Variable Insurance Trust; Vice President, Chief Legal Officer, Counsel and Secretary (since 2011), Virtus Global Multi-Sector Income Fund and Virtus Total Return Fund; Vice President and Assistant Secretary (since 2012), Secretary and Chief Legal Officer (2005-2012), The Zweig Fund, Inc. and Zweig Total Return Fund, Inc.; Vice President and Assistant Secretary (since 2011), Duff & Phelps Global Utility Income Fund Inc. | ||
| Nancy J. Engberg YOB: 1956 | Vice President and Chief Compliance Officer since 2011. | Vice President (since 2008) and Chief Compliance Officer (2008 to 2011), Virtus Investment Partners, Inc. and/or certain of its subsidiaries; various officer positions (since 2003) with Virtus affiliates; Vice President (since 2010), Chief Compliance Officer (since 2011), Virtus Variable Insurance Trust; Vice President and Chief Compliance Officer (since 2011), Virtus Global Multi-Sector Income Fund and Virtus Total Return Fund; Vice President and Chief Compliance Officer (since 2012), The Zweig Fund, Inc. and Zweig Total Return Fund, Inc. | ||
| Francis G. Waltman YOB: 1962 | Senior Vice President since 2008. | Executive Vice President, Product Development (since 2009), Virtus Investment Partners, Inc. and/or certain of its subsidiaries; various senior officer positions (since 2006) with Virtus affiliates; Senior Vice President (since 2010), Virtus Variable Insurance Trust; Senior Vice President (since 2011), Virtus Global Multi-Sector Income Fund and Virtus Total Return Fund. | ||
79
Table of Contents
Virtus Bond Fund,
a series of Virtus Opportunities Trust
Supplement dated October 5, 2012 to the Summary Prospectus and
Statutory Prospectus dated January 31, 2012, as supplemented
IMPORTANT NOTICE TO INVESTORS
Effective October 3, 2012, a number of modifications affecting the Virtus Bond Fund have taken place. These changes are described more fully below.
| Ÿ | The fund’s portfolio management strategies and risks have been modified. |
Accordingly, the disclosure under “Principal Investment Strategies” in the fund’s summary prospectus and in the summary section of the statutory prospectus is hereby replaced with the following:
The fund seeks to generate high total return from both current income and capital appreciation by investing primarily in intermediate-term debt securities across 14 fixed income sectors. The fund seeks to achieve its objective by applying a time-tested approach of active sector rotation, extensive credit research and disciplined risk management designed to capitalize on opportunities across undervalued areas of the fixed income markets.
Under normal circumstances, the fund invests at least 80% of its assets in fixed income debt obligations of various types of issuers, to include some or all of the following:
| ð | Securities issued or guaranteed as to principal and interest by the U.S. Government, its agencies, authorities or instrumentalities, including collateralized mortgage obligations (“CMOs”), real estate mortgage investment conduits (“REMICs”), and other pass-through securities; |
| ð | Debt securities issued by foreign issuers, including foreign governments and their political subdivisions; |
| ð | Investment-grade securities (primarily of U.S. issuers, secondarily of non-U.S. issuers), which are securities with credit ratings within the four highest rating categories of a nationally recognized statistical rating organization; and |
| ð | High-yield debt instruments, including bank loans (which are generally floating-rate). |
The disclosure under “Principal Risks” in the fund’s summary prospectus and the summary section of the statutory prospectus is hereby modified to add the following:
| ð | Emerging Market Risk. The risk that prices of emerging markets securities will be more volatile, or will be more greatly affected by negative conditions, than those of their counterparts in more established foreign markets. |
| ð | Foreign Investing Risk. The risk that the prices of foreign securities may be more volatile than those of their domestic counterparts. |
| ð | Loan Participation Risk. The risk that there may not be a readily available market for loan participation interests and, in some cases, the fund may have to dispose of such securities at a substantial discount from face value. Loan participations also involve the credit risk associated with the underlying corporate borrower. |
The disclosure under “Principal Investment Strategies” on page 110 of the fund’s statutory prospectus is hereby replaced with the following:
Under normal circumstances, the fund invests at least 80% of its assets in fixed income debt obligations of various types of issuers. The fund’s average duration will be similar to that of its benchmark, the Barclays Capital U.S. Aggregate Bond Index. At least 65% of the fund’s assets will be invested in investment-grade securities, which are securities rated, at the time of investment, within the four highest rating categories of a nationally recognized statistical rating organization, or if unrated, those that the subadviser determines, pursuant to procedures reviewed and approved by the Board of Trustees, are of comparable quality. The fund may invest up to 35% of its total assets in securities rated below investment grade at time of purchase. The fund may continue to hold securities whose credit quality falls below investment grade.
The fund seeks to achieve its objective by applying a time-tested approach and extensive credit research designed to capitalize on opportunities across undervalued areas of the bond markets. Under normal circumstances, the fund’s investments will include some or all of the following:
| Ÿ | Securities issued or guaranteed as to principal and interest by the U.S. Government, its agencies, authorities or instrumentalities, including collateralized mortgage obligations (“CMOs”), real estate mortgage investment conduits (“REMICs”), and other pass-through securities; |
| Ÿ | Debt securities issued by foreign issuers, including foreign governments and their political subdivisions, and issuers located in emerging markets; |
| Ÿ | Investment grade securities (primarily of U.S. issuers, secondarily of non-U.S. issuers), including short-term securities; and |
| Ÿ | High-yield debt instruments, including bank loans (which are generally floating-rate). |
The fund may invest in all or some of these sectors. The fund’s policy of investing 80% of its assets in bonds may be changed only upon 60 days’ written notice to shareholders.
Table of Contents
The fund employs active sector rotation and disciplined risk management to portfolio construction. The fund seeks diversification among various sectors of the fixed income markets, which, as of the date of this Prospectus, may include some or all of the following: corporate investment grade; corporate high yield; bank loans; non-agency commercial mortgage-backed securities (“CMBS”); agency and non-agency residential mortgage-backed securities (“RMBS”); non-U.S. dollar securities; emerging market high yield; Yankee investment grade bonds; asset-backed securities; taxable municipal bonds; tax-exempt municipal bonds; and securities issued or guaranteed as to principal and interest by the U.S. government, its agencies, authorities, or instrumentalities.
The fund’s investable assets are typically allocated among various sectors of the fixed income market using a top-down, relative value approach that looks at factors such as yield and spreads, supply and demand, investment environment, and sector fundamentals. The subadviser then selects particular investments using a bottom-up, fundamental research-driven analysis that includes assessment of credit risk, company management, issue structure, technical market conditions, and valuations. Securities selected for investment are those that the subadviser believes offer the best potential to achieve the fund’s investment objective of providing a high level of total return, including a competitive level of current income. The subadviser seeks to adjust the proportion of fund investments primarily in the sectors described above and the selections within sectors to obtain higher relative returns. The subadviser regularly reviews the fund’s portfolio construction, endeavoring to minimize risk exposure by closely monitoring portfolio characteristics such as sector concentration and portfolio duration and by investing no more than 5% of the fund���s total assets in securities of any single issuer (excluding the U.S. government, its agencies, authorities or instrumentalities).
The fund manages duration utilizing a duration neutral strategy. Duration measures the interest rate sensitivity of a fixed income security by assessing and weighting the present value of the security’s payment pattern. Generally, the longer the maturity the greater the duration and, therefore, the greater effect interest rate changes have on the price of the security. Under normal circumstances, the fund’s average duration is maintained at a level similar to that of its benchmark, the Barclays Capital U.S. Aggregate Bond Index. As of September 30, 2012, the modified adjusted duration of the Barclays Capital U.S. Aggregate Bond Index was 4.85 years; the modified adjusted duration of the fund is expected to be similar in duration to the benchmark. Typically, for a fund maintaining a modified adjusted duration of 4.85 years, a one percent increase in interest rates would cause a 4.85% decrease in the value of the fund’s fixed income assets. Similarly, a one percent decrease in interest rates typically would cause the value of the fund’s fixed income assets to increase by 4.85%.
| Ÿ | The following disclosure hereby replaces the current disclosure under “Portfolio Management” in the fund’s summary prospectus and in the summary section of the statutory prospectus: |
| ð | David L. Albrycht, CFA, Chief Investment Officer and Senior Portfolio Manager at Newfleet. Mr. Albrycht has served as a Portfolio Manager of the fund since October 2012. |
| ð | Christopher J. Kelleher, CFA, CPA, Managing Director and Senior Portfolio Manager at Newfleet. Mr. Kelleher has served as a Portfolio Manager of the fund since October 2012. |
| Ÿ | Certain of the risks associated with the fund’s Principal Investment Strategies have changed. Accordingly, the table under “More Information About Risks Related to Principal Investment Strategies” on page 108 is hereby modified by adding an “x” in the following rows, thereby indicating that the named risk applies to the fund: Foreign Investing, Currency Rate, Emerging Market Investing and Loan Participations. |
| Ÿ | The table under “Newfleet” on page 157 regarding portfolio managers is amended by replacing the row pertaining to the fund with the following: |
| Virtus Bond Fund | David L. Albrycht, CFA (since October 2012) Christopher J. Kelleher, CFA, CPA (since October 2012) |
| Ÿ | The narrative under the table is amended by adding the following: |
Christopher J. Kelleher, CFA, CPA. Mr. Kelleher is Managing Director and Senior Portfolio Manager (since January 2012) at Newfleet. Prior to joining Newfleet, Mr. Kelleher was retired for two years from Goodwin, where he was Managing Director and Senior Portfolio Manager (1997 to January 2010). Previously, he was an investment officer with Phoenix Life Insurance Company (1983 to 1997), formerly an affiliate of Goodwin and VIA. Mr. Kelleher also is co-portfolio manager for Virtus Balanced Fund and Virtus Low Duration Income Fund. He has more than 25 years of investment experience in all bond market sectors, including both publicly traded and private placements.
| Ÿ | The table under “Additional Investment Techniques” on page 128 is hereby modified by adding an “x” to the following rows, thereby indicating that the named technique may be used by the fund: Convertible Securities, Equity Securities, When-Issued and Delayed Delivery Securities and Zero Coupon, Step Coupon, Deferred Coupon and PIK Bonds. Additionally, the “x” in each of the following rows is hereby removed, thereby indicating that the named techniques are no longer “additional investment techniques” of the fund: Foreign Investing and Variable, Floating Rate and Variable Amount Securities. |
All other disclosure concerning the fund, including fees and expenses, remains unchanged.
Investors should retain this supplement with the Summary Prospectus and the Statutory Prospectus for future reference.
VOT 8020/Bond PM&StratChanges (10/2012)
Table of Contents
Virtus Senior Floating Rate Fund,
a series of Virtus Opportunities Trust
Supplement dated August 2, 2012 to the Summary Prospectus and
Statutory Prospectus, each dated January 31, 2012, as supplemented
IMPORTANT NOTICE TO INVESTORS
Effective August 1, 2012, Francesco Ossino was added to the portfolio management team for Virtus Senior Floating Rate Fund. Accordingly, the fund’s summary prospectus and statutory prospectus are revised as described below.
The disclosure under “Portfolio Management” in the fund’s summary prospectus and the summary section of the statutory prospectus is hereby replaced with the following:
| ð | David L. Albrycht, CFA, Chief Investment Officer – Multi-Sector Fixed Income Strategies and Senior Portfolio Manager at Newfleet, is a manager of the fund. Mr. Albrycht has been Portfolio Manager since the fund’s inception in 2008. |
| ð | Kyle A. Jennings, CFA, Senior Managing Director and Head of Credit Research at Newfleet, is a manager of the fund. Mr. Jennings has been Portfolio Manager since the fund’s inception in 2008. |
| ð | Francesco Ossino, Senior Managing Director and Sector Head of the Bank Loan asset class at Newfleet, is a manager of the fund. Mr. Ossino has been Portfolio Manager since August 2012. |
The table under “Newfleet” in the section “Portfolio Management” on page 127 of the statutory prospectus is hereby revised by replacing the row for Virtus Senior Floating Rate Fund with the following:
| Virtus Senior Floating Rate Fund | David L. Albrycht, CFA (since 2008) Kyle A. Jennings, CFA (since 2008) Francesco Ossino (since August 2012) |
The disclosure following the table is hereby revised by adding the following to the biographical information for the Newfleet portfolio managers:
Francesco Ossino. Mr. Ossino is Senior Managing Director and Sector Head of the Bank Loan asset class at Newfleet, with a primary focus on floating rate bank loan products. Prior to joining Virtus in August 2012, Mr. Ossino was a portfolio manager at Hartford Investment Management Company (2004 – 2012), where he managed mutual funds focused on bank loans and a commingled bank loan portfolio for institutional investors. Previously, he held a variety of credit analyst and portfolio management positions at CIGNA (2002 – 2004), HVB Bank (2000 – 2002) and FleetBoston Financial (1996 – 2000).
Investors should retain this supplement with the Summary Prospectus and the Statutory Prospectus for future reference.
VOT 8020/SFR PMs (8/2012)
Table of Contents
VIRTUS OPPORTUNITIES TRUST
101 Munson Street
Greenfield, MA 01301-9668
Trustees
George R. Aylward
Leroy Keith, Jr.
Philip R. McLoughlin, Chairman
Geraldine M. McNamara
James M. Oates
Richard E. Segerson
Ferdinand L.J. Verdonck
Officers
George R. Aylward, President
Francis G. Waltman, Senior Vice President
Nancy J. Engberg, Vice President and Chief Compliance Officer
W. Patrick Bradley, Vice President, Chief Financial Officer and Treasurer
Kevin J. Carr, Vice President, Chief Legal Officer, Counsel and Secretary
Investment Adviser
Virtus Investment Advisers, Inc.
100 Pearl Street
Hartford, CT 06103-4506
Principal Underwriter
VP Distributors, LLC
100 Pearl Street
Hartford, CT 06103-4506
Transfer Agent
VP Distributors, LLC
100 Pearl Street
Hartford, CT 06103-4506
Custodian
The Bank of New York Mellon
One Wall Street
New York, NY 10005-2588
Independent Registered Public Accounting Firm
PricewaterhouseCoopers LLC
2001 Market Street
Philadelphia, PA 19103-7042
How to Contact Us
Mutual Fund Services 1-800-243-1574
Adviser Consulting Group 1-800-243-4361
Telephone Orders 1-800-367-5877
Text Telephone 1-800-243-1926
Web site http://Virtus.com
Important Notice to Shareholders
The Securities and Exchange Commission has modified mailing regulations for semiannual and annual shareholder fund reports to allow mutual fund companies to send a single copy of these reports to shareholders who share the same mailing address. If you would like additional copies, please call Mutual Fund Services at 1-800-243-1574.
Table of Contents

P.O. Box 9874
Providence, RI 02940-8074
For more information about Virtus Mutual Funds, please call your financial representative, contact us at 1-800-243-1574 or Virtus.com.
8008B | 11-12 |
Table of Contents

Annual Report
Virtus Emerging Markets Debt Fund
Virtus Emerging Markets Equity Income Fund
Virtus Global Commodities Stock Fund*
Virtus Global Dividend Fund
Virtus Global Opportunities Fund
Virtus Global Real Estate Securities Fund
Virtus Greater Asia ex Japan Opportunities Fund
Virtus Greater European Opportunities Fund
Virtus International Equity Fund
Virtus International Real Estate Securities Fund
Virtus International Small-Cap Fund
* Prospectus Supplement applicable to this fund appears at the back of this Annual Report.
TRUST NAME: VIRTUS OPPORTUNITIES TRUST | September 30, 2012 |  | ||
| Not FDIC Insured | No Bank Guarantee | May Lose Value | ||
Table of Contents
Proxy Voting Procedures and Voting Record (Form N-PX)
The adviser and subadvisers vote proxies relating to portfolio securities in accordance with procedures that have been approved by the Board of Trustees of the Trust (“Trustees,” the “Board”). You may obtain a description of these procedures, along with information regarding how the Funds voted proxies during the most recent 12-month period ended June 30, free of charge, by calling toll-free 1-800-243-1574. This information is also available through the Securities and Exchange Commission’s (the “SEC”) website at http://www.sec.gov.
Form N-Q Information
The Trust files a complete schedule of portfolio holdings for each Fund with the SEC for the first and third quarters of each fiscal year on Form N-Q. Form N-Q is available on the SEC’s website at http://www.sec.gov. Form N-Q may be reviewed and copied at the SEC’s Public Reference Room. Information on the operation of the SEC’s Public Reference Room can be obtained by calling toll-free 1-800-SEC-0330.
This report is not authorized for distribution to prospective investors in the Funds presented in this book unless preceded or accompanied by an effective prospectus which includes information concerning the sales charge, each Fund’s record and other pertinent information.
Table of Contents
Dear Fellow Shareholders of Virtus Mutual Funds:

Investors were subject to the vagaries of the financial markets over the annual reporting period. Markets gained momentum throughout the first quarter of 2012, slid backwards in the second quarter, only to rebound strongly in the third quarter and end the 12-month period in positive territory.
An extended rally helped equity and fixed income markets produce respectable returns for the year ended September 30, 2012. U.S. equities, as measured by the S&P 500® Index, gained an impressive 30.20 percent, far surpassing international equities, which rose 20.98 percent, as represented by the MSCI All Country World Index (net). U.S. fixed income markets rose 5.16 percent for the year, as |
measured by the Barclays Capital U.S. Aggregate Bond Index. A consistent “flight to quality” among global investors kept demand high for the 10-year U.S. Treasury and its yield low, at just 1.64 percent at the end of September.
As we enter the final quarter of 2012, the economic strength of the United States, Europe, and China remains tenuous. The onus is on U.S. government to avoid the dangers of the “fiscal cliff” and on corporations to produce robust earnings, in particular strong revenue growth, which will play a pivotal role in determining future market direction.
Market uncertainty is a timely reminder of the importance of portfolio diversification. While diversification cannot guarantee a profit or prevent loss, owning a variety of asset classes may cushion your portfolio against inevitable market fluctuations. Your financial advisor can help you ensure that your portfolio is adequately diversified.
Thank you for entrusting Virtus with your assets. We appreciate your business and remain committed to your long-term financial success.
Sincerely,

George R. Aylward
President, Virtus Mutual Funds
October 2012
Whenever you have questions about your account, or require additional information, please visit us on the Web at www.virtus.com or call our shareowner service group toll-free at 1-800-243-1574.
Performance data quoted represents past results. Past performance is no guarantee of future results and current performance may be higher or lower than the performance shown above.
1
Table of Contents
VIRTUS OPPORTUNITIES TRUST
For the six-month period of April 1, 2012 to September 30, 2012 (Unaudited)
We believe it is important for you to understand the impact of costs on your investment. All mutual funds have operating expenses. As a shareholder of a Virtus Opportunities Trust Fund (each, a “Fund”) you may incur two types of costs: (1) transaction costs, including sales charges on purchases of Class A shares and contingent deferred sales charges on Class C shares; and (2) ongoing costs, including investment advisory fees, distribution and service fees, and other expenses. Class I shares are sold without sales charges. These examples are intended to help you understand your ongoing costs (in dollars) of investing in a Fund and to compare these costs with the ongoing costs of investing in other mutual funds. These examples are based on an investment of $1,000 invested at the beginning of the period and held for the entire six-month period. The following Expense Table illustrates your Fund’s costs in two ways.
Actual Expenses
The first section of the accompanying table provides information about actual account values and actual expenses. You may use the information in this section, together with the amount you invested, to estimate the expenses that you paid over the period. Simply divide your account value by $1,000 (for example, an $8,600 account value divided by $1,000 = 8.6), then multiply the result by the number given for your Fund under the heading “Expenses Paid During Period” to estimate the expenses you paid on your account during the period.
Hypothetical Example for Comparison Purposes
The second section of the accompanying table provides information about hypothetical account values and hypothetical expenses based on the Fund’s actual expense ratio and an assumed rate of return of 5% per year before expenses, which is not your Fund’s actual return. The hypothetical account values and expenses may not be used to estimate the actual ending account balance or expenses you paid for the period. You may use this information to compare the ongoing costs of investing in your Fund and other funds. To do so, compare these 5% hypothetical examples with the 5% hypothetical examples that appear in the shareholder reports of the other funds.
Please note that the expenses shown in the accompanying table are meant to highlight your ongoing costs only and do not reflect any transactional costs, such as sales charges or contingent deferred sales charges. Therefore, the second section of the accompanying table is useful in comparing ongoing costs only, and will not help you determine the relative total costs of owning different funds. In addition, if these transactional costs were included, your costs would have been higher. The calculations assume no shares were bought or sold during the period. Your actual costs may have been higher or lower, depending on the amount of your investment and the timing of any purchases or redemptions.
| Expense Table | ||||||||||||||||
| Beginning Account Value April 1, 2012 | Ending Account Value September 30, 2012 | Annualized Expense Ratio | Expenses Paid During Period* | |||||||||||||
Emerging Markets Debt Fund** |
| |||||||||||||||
Actual | ||||||||||||||||
Class A | $ | 1,000.00 | $ | 1,009.00 | 1.35 | % | $ | 0.89 | ||||||||
Class C | 1,000.00 | 1,009.00 | 2.10 | 1.38 | ||||||||||||
Class I | 1,000.00 | 1,010.00 | 1.10 | 0.72 | ||||||||||||
Hypothetical (5% return before expenses since inception) |
| |||||||||||||||
Class A | 1,000.00 | 1,002.39 | 1.35 | 0.89 | ||||||||||||
Class C | 1,000.00 | 1,001.90 | 2.10 | 1.38 | ||||||||||||
Class I | 1,000.00 | 1,002.56 | 1.10 | 0.72 | ||||||||||||
Hypothetical (5% return before expenses) |
| |||||||||||||||
Class A | 1,000.00 | 1,018.17 | 1.35 | 6.83 | ||||||||||||
Class C | 1,000.00 | 1,014.37 | 2.10 | 10.63 | ||||||||||||
Class I | 1,000.00 | 1,019.43 | 1.10 | 5.57 | ||||||||||||
Emerging Markets Equity Income Fund** |
| |||||||||||||||
Actual | ||||||||||||||||
Class A | $ | 1,000.00 | $ | 1,059.00 | 1.75 | % | $ | 1.17 | ||||||||
Class C | 1,000.00 | 1,058.00 | 2.50 | 1.69 | ||||||||||||
Class I | 1,000.00 | 1,059.00 | 1.50 | 1.01 | ||||||||||||
Hypothetical (5% return before expenses since inception) |
| |||||||||||||||
Class A | 1,000.00 | 1,002.14 | 1.75 | 1.14 | ||||||||||||
Class C | 1,000.00 | 1,001.64 | 2.50 | 1.64 | ||||||||||||
Class I | 1,000.00 | 1,002.29 | 1.50 | 0.99 | ||||||||||||
Hypothetical (5% return before expenses) |
| |||||||||||||||
Class A | 1,000.00 | 1,016.14 | 1.75 | 8.86 | ||||||||||||
Class C | 1,000.00 | 1,012.34 | 2.50 | 12.66 | ||||||||||||
Class I | 1,000.00 | 1,017.41 | 1.50 | 7.59 | ||||||||||||
Global Commodities Stock Fund |
| |||||||||||||||
Actual | ||||||||||||||||
Class A | $ | 1,000.00 | $ | 1,046.20 | 1.65 | % | $ | 8.44 | ||||||||
Class C | 1,000.00 | 1,043.30 | 2.40 | 12.26 | ||||||||||||
Class I | 1,000.00 | 1,048.30 | 1.40 | 7.17 | ||||||||||||
Hypothetical (5% return before expenses) |
| |||||||||||||||
Class A | 1,000.00 | 1,016.65 | 1.65 | 8.35 | ||||||||||||
Class C | 1,000.00 | 1,012.85 | 2.40 | 12.15 | ||||||||||||
Class I | 1,000.00 | 1,017.91 | 1.40 | 7.09 | ||||||||||||
Global Dividend Fund |
| |||||||||||||||
Actual | ||||||||||||||||
Class A | $ | 1,000.00 | $ | 1,066.60 | 1.33 | % | $ | 6.87 | ||||||||
Class C | 1,000.00 | 1,062.90 | 2.08 | 10.73 | ||||||||||||
Class I | 1,000.00 | 1,068.70 | 1.07 | 5.53 | ||||||||||||
Hypothetical (5% return before expenses) |
| |||||||||||||||
Class A | 1,000.00 | 1,018.27 | 1.33 | 6.73 | ||||||||||||
Class C | 1,000.00 | 1,014.47 | 2.08 | 10.53 | ||||||||||||
Class I | 1,000.00 | 1,019.58 | 1.07 | 5.42 | ||||||||||||
Global Opportunities Fund |
| |||||||||||||||
Actual | ||||||||||||||||
Class A | $ | 1,000.00 | $ | 1,041.00 | 1.55 | % | $ | 7.91 | ||||||||
Class B | 1,000.00 | 1,037.60 | 2.30 | 11.72 | ||||||||||||
Class C | 1,000.00 | 1,036.60 | 2.30 | 11.71 | ||||||||||||
Class I*** | 1,000.00 | 1,055.40 | 1.30 | 1.93 | ||||||||||||
Hypothetical (5% return before expenses since inception) |
| |||||||||||||||
Class I*** | 1,000.00 | 1,005.35 | 1.30 | 1.89 | ||||||||||||
Hypothetical (5% return before expenses) |
| |||||||||||||||
Class A | 1,000.00 | 1,017.15 | 1.55 | 7.85 | ||||||||||||
Class B | 1,000.00 | 1,013.36 | 2.30 | 11.64 | ||||||||||||
Class C | 1,000.00 | 1,013.36 | 2.30 | 11.64 | ||||||||||||
Class I | 1,000.00 | 1,018.42 | 1.30 | 6.58 | ||||||||||||
2
Table of Contents
VIRTUS OPPORTUNITIES TRUST
Disclosure of Fund Expenses (Continued)
For the six-month period of April 1, 2012 to September 30, 2012 (Unaudited)
| Expense Table | ||||||||||||||||
| Beginning Account Value April 1, 2012 | Ending Account Value September 30, 2012 | Annualized Expense Ratio | Expenses Paid During Period* | |||||||||||||
Global Real Estate Securities Fund |
| |||||||||||||||
Actual | ||||||||||||||||
Class A | $ | 1,000.00 | $ | 1,051.20 | 1.40 | % | $ | 7.18 | ||||||||
Class C | 1,000.00 | 1,046.80 | 2.15 | 11.00 | ||||||||||||
Class I | 1,000.00 | 1,052.40 | 1.15 | 5.90 | ||||||||||||
Hypothetical (5% return before expenses) |
| |||||||||||||||
Class A | 1,000.00 | 1,017.91 | 1.40 | 7.09 | ||||||||||||
Class C | 1,000.00 | 1,014.12 | 2.15 | 10.88 | ||||||||||||
Class I | 1,000.00 | 1,019.18 | 1.15 | 5.82 | ||||||||||||
Greater Asia ex Japan Opportunities Fund |
| |||||||||||||||
Actual | ||||||||||||||||
Class A | $ | 1,000.00 | $ | 1,082.70 | 1.80 | % | $ | 9.37 | ||||||||
Class C | 1,000.00 | 1,078.80 | 2.55 | 13.25 | ||||||||||||
Class I | 1,000.00 | 1,084.00 | 1.55 | 8.08 | ||||||||||||
Hypothetical (5% return before expenses) |
| |||||||||||||||
Class A | 1,000.00 | 1,015.89 | 1.80 | 9.11 | ||||||||||||
Class C | 1,000.00 | 1,012.09 | 2.55 | 12.91 | ||||||||||||
Class I | 1,000.00 | 1,017.15 | 1.55 | 7.85 | ||||||||||||
Greater European Opportunities Fund |
| |||||||||||||||
Actual | ||||||||||||||||
Class A | $ | 1,000.00 | $ | 1,063.70 | 1.45 | % | $ | 7.48 | ||||||||
Class C | 1,000.00 | 1,058.60 | 2.20 | 11.32 | ||||||||||||
Class I | 1,000.00 | 1,064.30 | 1.20 | 6.19 | ||||||||||||
Hypothetical (5% return before expenses) |
| |||||||||||||||
Class A | 1,000.00 | 1,017.66 | 1.45 | 7.34 | ||||||||||||
Class C | 1,000.00 | 1,013.86 | 2.20 | 11.14 | ||||||||||||
Class I | 1,000.00 | 1,018.92 | 1.20 | 6.08 | ||||||||||||
International Equity Fund |
| |||||||||||||||
Actual | ||||||||||||||||
Class A | $ | 1,000.00 | $ | 1,027.30 | 1.50 | % | $ | 7.60 | ||||||||
Class C | 1,000.00 | 1,021.90 | 2.25 | 11.37 | ||||||||||||
Class I | 1,000.00 | 1,027.70 | 1.25 | 6.34 | ||||||||||||
Hypothetical (5% return before expenses) |
| |||||||||||||||
Class A | 1,000.00 | 1,017.46 | 1.50 | 7.59 | ||||||||||||
Class C | 1,000.00 | 1,013.66 | 2.25 | 11.39 | ||||||||||||
Class I | 1,000.00 | 1,018.67 | 1.25 | 6.33 | ||||||||||||
International Real Estate Securities Fund |
| |||||||||||||||
Actual | ||||||||||||||||
Class A | $ | 1,000.00 | $ | 1,089.10 | 1.50 | % | $ | 7.83 | ||||||||
Class C | 1,000.00 | 1,083.60 | 2.25 | 11.72 | ||||||||||||
Class I | 1,000.00 | 1,089.50 | 1.25 | 6.53 | ||||||||||||
Hypothetical (5% return before expenses) |
| |||||||||||||||
Class A | 1,000.00 | 1,017.41 | 1.50 | 7.59 | ||||||||||||
Class C | 1,000.00 | 1,013.61 | 2.25 | 11.39 | ||||||||||||
Class I | 1,000.00 | 1,018.67 | 1.25 | 6.33 | ||||||||||||
| Expense Table | ||||||||||||||||
| Beginning Account Value April 1, 2012 | Ending Account Value September 30, 2012 | Annualized Expense Ratio | Expenses Paid During Period* | |||||||||||||
International Small-Cap Fund** |
| |||||||||||||||
Actual | ||||||||||||||||
Class A | $ | 1,000.00 | $ | 1,009.00 | 1.60 | % | $ | 1.05 | ||||||||
Class C | 1,000.00 | 1,009.00 | 2.35 | 1.55 | ||||||||||||
Class I | 1,000.00 | 1,010.00 | 1.35 | 0.89 | ||||||||||||
Hypothetical (5% return before expenses since inception) |
| |||||||||||||||
Class A | 1,000.00 | 1,002.24 | 1.60 | 1.04 | ||||||||||||
Class C | 1,000.00 | 1,001.73 | 2.35 | 1.55 | ||||||||||||
Class I | 1,000.00 | 1,002.39 | 1.35 | 0.89 | ||||||||||||
Hypothetical (5% return before expenses) |
| |||||||||||||||
Class A | 1,000.00 | 1,016.90 | 1.60 | 8.10 | ||||||||||||
Class C | 1,000.00 | 1,013.10 | 2.35 | 11.90 | ||||||||||||
Class I | 1,000.00 | 1,018.17 | 1.35 | 6.83 | ||||||||||||
| * | Expenses are equal to the relevant Funds’ annualized expense ratio, which is net of waived fees, reimbursed expenses, if applicable, multiplied by the average account value over the period, multiplied by the number of days (183) expenses were accrued in the most recent fiscal half-year, then divided by 366 to reflect the one-half year period. |
| ** | Inception date is September 5, 2012. Expenses are equal to the Fund’s annualized expense ratio which is net of waived fees, reimbursed expenses, if applicable, multiplied by the average account value over the period multiplied by the number of days (24) expenses were accrued in the most recent fiscal half-year, then divided by 366 to reflect the one half-year period. |
| *** | Inception date of Class I for the Global Opportunities Fund is August 8, 2012. Expenses are equal to the Fund’s annualized expense ratio which is net of waived fees, reimbursed expenses, if applicable, multiplied by the average account value over the period multiplied by the number of days (53) expenses were accrued in the most recent fiscal half-year, then divided by 366 to reflect the one half-year period. |
For Funds which may invest in other funds, the annualized expense ratios noted above do not reflect fees and expenses associated with the underlying funds. If such fees and expenses had been included, the expenses would have been higher.
You can find more information about the Funds’ expenses in the Financial Statements section that follows. For additional information on operating expenses and other shareholder costs, refer to the prospectus.
3
Table of Contents
ADR (American Depositary Receipt)
Represents shares of foreign companies traded in U.S. dollars on U.S. exchanges that are held by a U.S. bank or a trust. Foreign companies use ADRs in order to make it easier for Americans to buy their shares.
Barclays Capital U.S. Aggregate Bond Index
The Barclays Capital U.S. Aggregate Bond Index measures the U.S. investment grade fixed rate bond market. The index is calculated on a total return basis.
European Central Bank (“ECB”)
The European Central Bank (ECB) responsible for conducting monetary policy for the eurozone. The ECB was established as the core of the Eurosystem and the European System of Central Banks (ESCB). The ESCB comprises the ECB and the national central banks (NCBs) of all 17 EU Member States whether they have adopted the Euro or not.
Exchange-Traded Funds (ETF)
Portfolios of stocks or bonds that track a specific market index.
Federal Reserve (the “Fed”)
The central bank of the United States, responsible for controlling the money supply, interest rates and credit with the goal of keeping the U.S. economy and currency stable. Governed by a seven-member board, the system includes 12 regional Federal Reserve Banks, 25 branches and all national and state banks that are part of the system.
FTSE EPRA/NAREIT Developed Rental ex U.S. Index (Net)
The FTSE EPRA/NAREIT Developed Rental ex U.S. Index is a free-float market capitalization index measuring international real estate securities, which meet minimum size, liquidity and investment focus criteria. The index is a sub-set of the FTSE EPRA/NAREIT Investment Focus Index Series, which separates the existing constituents into both Rental and Non-Rental Indices. A company is classified as Rental if the rental revenue from properties is greater than or equal to 70% of total revenue. The classification is based on revenue sources as disclosed in the latest published financial statement. The index is calculated on a total return basis with net dividends reinvested.
FTSE EPRA/NAREIT Developed Rental Index (Net)
The FTSE EPRA/NAREIT Developed Rental Index is a free-float market capitalization index measuring global real estate securities, which meet minimum size, liquidity and investment focus criteria. The index is a sub-set of the FTSE EPRA/ NAREIT Investment Focus Index Series, which separates the existing constituents into both Rental and Non-Rental Indices. A company is classified as Rental if the rental revenue from properties is greater than or equal to 70% of total revenue. The classification is based on revenue sources as disclosed in the latest published financial statement. The index is calculated on a total return basis with net dividends reinvested.
Global Dividend Linked Benchmark
The Global Dividend Linked Benchmark consists of the MSCI World Infrastructure Sector Capped Index. This is a market capitalization weighted index that measures performance of global infrastructure companies by capturing broad and diversified opportunities across telecommunication, utilities, energy, transportation and social infrastructure sectors. The telecommunication infrastructure and utilities sector each represent one-third of the index weight, while energy, transportation and social infrastructure sectors have a combined weight of the remaining one-third of the index. Performance of the Global Dividend Linked Benchmark prior to 9/1/2008 represents an allocation consisting of 65% MSCI USA/Utilities Index, 20% MSCI World Telecom Services Index, and 15% MSCI World ex USA/Utilities Index. The index is unmanaged and not available for direct investment.
iShares®
Represents shares of an open-end exchange-traded fund.
J.P. Morgan Emerging Markets Bond Index Global Diversified (EMBI Global Diversified)
The J.P. Morgan Emerging Markets Bond Index Global Diversified (EMBI Global Diversified) is a uniquely-weighted version of the J.P. Morgan EMBI Global Index. The index limits the weights of those countries with larger debt stock by only including specified portions of these countries’ eligible current face amounts of debt outstanding. The countries covered in the EMBI Global Diversified Index are identical to those covered by the EMBI Global Index. The EMBI Global Index tracks total returns
4
Table of Contents
KEY INVESTMENT TERMS (Continued)
for U.S. dollar-denominated debt instruments issued by emerging market sovereign and quasi-sovereign entities: Brady bonds, loans, Eurobonds. The index is unmanaged and not available for direct investment.
MSCI AC Asia Pacific ex Japan Index (Net)
The MSCI AC Asia Pacific Japan Index (net) is a free float-adjusted market capitalization weighted index that measures equity market performance of developed and emerging markets in Asia (excluding Japan), as well as Australia and New Zealand. The index is calculated on a total return basis with net dividends reinvested. The index is unmanaged and not available for direct investment.
MSCI AC World Commodity Producer Sector Capped Index (Net)
The MSCI AC World Commodity Producer Sector Capped Index (net) is a market capitalization weighted index that measures performance of developed and emerging market commodity producers within the energy, metals and agriculture sectors. Each of the three sectors is equally weighted within the index. The index is calculated on a total return basis with net dividends reinvested. The index is unmanaged and not available for direct investment.
MSCI AC World Ex U.S. Small Cap Index (Net)
The MSCI AC World Index ex U.S. Small Cap Index (Net) is a free float-adjusted market capitalization-weighted index that measures small cap equity performance of developed and emerging markets, excluding the U.S. The index is calculated on a total return basis with net dividends reinvested. The index is unmanaged and not available for direct investment.
MSCI AC World Index (Net)
The MSCI AC World Index (net) is a free float-adjusted market capitalization-weighted index that measures equity performance of developed and emerging markets. The index is calculated on a total return basis with net dividends reinvested. The index is unmanaged and not available for direct investment.
MSCI EAFE® Index (Net)
The MSCI EAFE® (Europe, Australasia, Far East) Index is a free float-adjusted market capitalization index that measures equity market performance of developed markets, excluding the U.S. and Canada. The index is calculated on a total return basis with net dividends reinvested.
MSCI Emerging Markets Index (Net)
The MSCI Emerging Markets Index (net) is a free float-adjusted market capitalization-weighted index designed to measure equity market performance in the global emerging markets. The index is calculated on a total return basis with net dividends reinvested. The index is unmanaged and not available for direct investment.
MSCI Europe Index (Net)
The MSCI Europe Index is a free float-adjusted market capitalization weighted index that is designed to measure the equity market performance of the developed markets in Europe. Currently, the MSCI Europe Index consists of the following 16 developed market country indices: Austria, Belgium, Denmark, Finland, France, Germany, Greece, Ireland, Italy, the Netherlands, Norway, Portugal, Spain, Sweden, Switzerland and the United Kingdom.
MSCI WorldSM Index (Net)
A free float-adjusted market capitalization index that measures developed global market equity performance. The index is calculated on a total return basis with net dividends reinvested.
MSCI World Infrastructure Sector Capped Index
The MSCI World Infrastructure Sector Capped Index is a market capitalization weighted index that measures performance of global infrastructure companies by capturing broad and diversified opportunities across telecommunication, utilities, energy, transportation and social infrastructure sectors. The telecommunication infrastructure and utilities sector each represent one-third of the index weight, while energy, transportation and social infrastructure sectors have a combined weight of the remaining one-third of the index. Prior to September 1, 2008, the index allocation was 65% MSCI USA/utilities index, 20% MSCI World Telcom Services index and 15% MSCI World ex USA utilities index.
5
Table of Contents
KEY INVESTMENT TERMS (Continued)
PIK (Payment-in-Kind Security)
A bond which pays interest in the form of additional bonds, or preferred stock which pays dividends in the form of additional preferred stock.
Quantitative Easing (QE3)
A government monetary policy occasionally used to increase the money supply by buying government securities or other securities from the market. Quantitative easing increases the money supply by flooding financial institutions with capital in an effort to promote increased lending and liquidity.
REIT (Real Estate Investment Trust)
A publicly traded company that owns, develops and operates income-producing real estate such as apartments, office buildings, hotels, shopping centers and other commercial properties.
S&P 500® Index
The S&P 500® Index is a free-float market capitalization-weighted index of 500 of the largest U.S. companies. The index is calculated on a total return basis with dividends reinvested.
Sponsored ADR (American Depositary Receipt)
An ADR which is issued with the cooperation of the company whose stock will underlie the ADR. Sponsored ADRs generally carry the same rights normally given to stockholders, such as voting rights. ADRs must be sponsored to be able to trade on a major U.S. exchange such as the New York Stock Exchange (“NYSE”).
Thomson Reuters/Jefferies CRB Index
The Thomson Reuters/Jefferies CRB Index is a weighted index designed to measure commodity performance. The index is calculated using 19 commodity sectors and rebalanced monthly to its fixed target weightings. The index is unmanaged and not available for direct investment.
When-issued and forward comitments (delayed delivery)
Securities purchased on a when-issued or forward commitment basis are also known as delayed delivery transactions. Delayed delivery transactions involve a commitment by a Fund to purchase or sell a security at a future date, ordinarily up to 90 days later. When-issued or forward commitments enable a Fund to lock in what is believed to be an attractive price or yield on a particular security for a period of time, regardless of future changes in interest rates.
6
Table of Contents
Ticker Symbols: Class A: VEDAX Class C: VEDCX Class I: VIEDX |
| ¢ | The Fund is diversified and has an investment objective of seeking total return from current income and capital appreciation. |
| ¢ | For the fiscal period September 5, 2012 (inception date) through September 30, 2012, the Fund’s Class A shares at NAV returned 0.90%*, Class C shares returned 0.90%*, and Class I shares returned 1.00%.* For the same period, the Barclays Capital U.S. Aggregate Bond Index, a broad-based fixed income index, returned 0.20%*, and the JPMorgan Emerging Markets Bond Global Diversified Index, the Fund’s style-specific benchmark appropriate for comparison, returned 1.14%.* |
* Returns less than 1 year are not annualized.
All performance figures assume reinvestment of distributions and exclude the effect of sales charges. Past performance is no guarantee of future results and current performance may be higher or lower than the performance shown above.
There is no guarantee that the Fund will meet its objective.
| Asset Allocation | ||||||||
The following table presents asset allocations within certain sectors and as a percentage of total investments as of September 30, 2012.
|
| |||||||
Corporate Bonds and Notes | 63 | % | ||||||
Financials | 27 | % | ||||||
Energy | 16 | |||||||
Materials | 8 | |||||||
Industrials | 5 | |||||||
Other Sectors | 7 | |||||||
Foreign Government Securities | 36 | |||||||
Other (includes short-term investments) |
| 1 | ||||||
|
| |||||||
Total | 100 | % | ||||||
|
| |||||||
Debt securities are subject to various risks, the most prominent of which are credit and interest rate risk. The issuer of a security may fail to make payments in a timely manner. Values of debt securities may rise and fall in response to changes in interest rates. This risk may be enhanced with longer-term maturities. There is a greater level of credit risk and price volatility involved with high yield securities than investment grade securities. Changes in interest rates can cause both extension and prepayment risks for asset and mortgage-backed securities. These securities are also subject to risks associated with the repayment of underlying collateral. There may be no ready market for loan participation interests. The fund may have to sell the interests at a substantial discount. Such interests are subject to the credit risk of the underlying corporate borrower. Investing internationally, especially in emerging markets, involves additional risks such as currency, political, accounting, economic, and market risk.
| † | The Fund is less than six months old – No commentary required. |
For information regarding the indexes and certain investment terms, see the Key Investment Terms starting on page 4.
7
Table of Contents
THIS PAGE INTENTIONALLY BLANK.
Table of Contents
| Emerging Markets Equity Income Fund† | Ticker Symbols: Class A: VEIAX Class C: VEICX Class I: VEIIX |
| ¢ | The Fund is diversified and has an investment objective of seeking capital appreciation and income. |
| ¢ | For the period September 5, 2012 (inception date) through September 30, 2012, the Fund’s Class A shares at NAV returned 5.90%*, Class C shares returned 5.80%*, and Class I shares returned 5.90%.* For the same period, the S&P 500® Index, a broad-based equity index, returned 2.79%*, and the MSCI Emerging Markets Index (Net), the Fund’s style-specific benchmark appropriate for comparison, returned 6.87%.* |
* Returns less than 1 year are not annualized.
All performance figures assume reinvestment of distributions and exclude the effect of sales charges. Past performance is no guarantee of future results and current performance may be higher or lower than the performance shown above.
There is no guarantee that the Fund will meet its objective.
| Asset Allocation | ||||
The following table presents asset allocations within certain sectors and as a percentage of total investments as of September 30, 2012.
|
| |||
Financials | 22 | % | ||
Energy | 14 | |||
Information Technology | 12 | |||
Materials | 11 | |||
Consumer Discretionary | 10 | |||
Consumer Staples | 5 | |||
Telecommunication Services | 5 | |||
Other (includes short-term investments) | 21 | |||
|
| |||
Total | 100 | % | ||
|
| |||
The market price of equity securities may be affected by financial market, industry, or issuer-specific events. Focus on a particular style or on small or medium-sized companies may enhance that risk. Investing internationally, especially in emerging markets, involves additional risks such as currency, political, accounting, economic, and market risk. A fund that focuses its investments in a particular geographic location will be highly sensitive to financial, economic, political, and other developments affecting the fiscal stability of that location.
| † | The Fund is less than six months old – No commentary required. |
For information regarding the indexes and certain investment terms, see the Key Investment Terms starting on page 4.
9
Table of Contents
THIS PAGE INTENTIONALLY BLANK.
Table of Contents
| Global Commodities Stock Fund | Ticker Symbols: Class A: VGCAX Class C: VGCCX Class I: VGCIX |
| ¢ | The Fund is diversified and has an investment objective of capital appreciation. |
| ¢ | For the fiscal year ended September 30, 2012, the Fund’s Class A shares at NAV returned 22.30%, Class C shares returned 21.40%, and Class I shares returned 22.67%. For the same period, the S&P 500® Index, a broad-based equity index, returned 30.20%, and the MSCI AC World Commodity Producer Sector Capped Index (net), the Fund’s style-specific benchmark appropriate for comparison, returned 13.43%. |
All performance figures assume reinvestment of distributions and exclude the effect of sales charges. Past performance is no guarantee of future results and current performance may be higher or lower than the performance shown above.
How did the market perform during the Fund’s fiscal year?
| ¢ | In the year ended Sept. 29, 2012 the S&P 500® Index rose 27.3%, and with dividends returned 30.20%. It was not only a strong performance, it was very strong compared to other major global indices. |
| ¢ | Its strength derived primarily from the relatively strong performance of the U.S. economy — both in prospective terms, based on forecasts, and in actual terms—compared with other industrial economies, most notably the nations in the European Union, particularly the eurozone. |
| ¢ | Although the U.S. economy weakened through the twelve months, which meant corporate earnings and forecasts also weakened, it remained well above recession levels at a time when Britain and the eurozone were hovering above recession or actually in recession. |
| ¢ | Commodity prices, as measured by the Thomson Reuters/Jefferies CRB Index also weakened—from 303 to as low as 267 in June. Thereafter, they rallied, led primarily by the grains, precious metals, and crude oil. |
| ¢ | The price of West Texas Intermediate Crude Oil rose from $77.69 in June to as high as $100 on Sept. 14th amid fears of an Israeli-Iranian crisis, pulling back to $92 at quarter-end. |
| ¢ | Gold had been in a huge rally in the summer of 2011, touching a record of $1,917 on September 10, 2011, but it fell sharply after Mario Draghi took over at the European Central Bank (ECB) on November 1, 2011, immediately cut the lending rate, and more importantly, introduced a large-scale rollover of short-term ECB loans to banks within the system into three-year loans at the short-term rate. That seemed to end the Euro crisis and investors fled from precious metals into financial assets. |
| ¢ | By last June, new Euro worries were developing and gold, which was as low as $1,530 in May, began a rally that would carry it to $1,780 in September. |
| ¢ | In recent months, investor focus has shifted somewhat from focus on the economy and earnings to the U.S. elections, which many observers feel could have unusually large implications for the capital markets. |
What factors affected the Fund’s performance during its fiscal year?
The big decisions we made were:
| ¢ | We decided in the spring to increase in the Fund’s exposure to non-economy-driven commodity companies in agriculture and precious metals. |
| ¢ | As the drought intensified in the U.S. Midwest, we increased the Fund’s exposure to companies involved in supplying inputs to grain producers, and reduced exposure to companies engaged in production and distribution of meats. |
| ¢ | We slashed the Fund’s exposure to the most cyclical of the commodity groups—base metals. |
| ¢ | We increased the Fund’s precious metals weighting while reducing the Fund’s exposure to bullion-related financial products, believing that the gold mining stocks were at an historically low valuation relative to gold. |
| ¢ | Within the Energy sector, we reduced the Fund’s exposure to North American oil producers and increased the Fund’s weighting in companies supplying advanced technology for exploration and production of oil and gas—onshore and offshore. |
The preceding information is the opinion of portfolio management. Any such opinions are subject to change at any time based upon market or other conditions and should not be relied upon as investment advice. Past performance is no guarantee of future results, and there is no guarantee that market forecasts will be realized.
There is no guarantee that the Fund will meet its objective.
The market price of equity securities may be affected by financial market, industry, or issuer-specific events. Focus on a particular style or on small or medium-sized companies may enhance that risk. Investing internationally, especially in emerging markets, involves additional risks such as currency, political, accounting, economic, and market risk. Commodity-linked instruments may experience a return different than the commodity they attempt to track and may also be exposed to counter party risk. The value of an ETF may be more volatile than the underlying portfolio of securities the ETF is designed to track. The costs of owning the ETF may exceed the cost of investing directly in the underlying securities.
| Asset Allocation | ||||
The following table presents asset allocations within certain sectors and as a percentage of total investments as of September 30, 2012.
|
| |||
Materials | 56 | % | ||
Energy | 27 | |||
Industrials | 6 | |||
Consumer Staples | 1 | |||
Other (includes short-term investments) | 10 | |||
|
| |||
Total | 100 | % | ||
|
| |||
For information regarding the indexes and certain investment terms, see the Key Investment Terms starting on page 4.
11
Table of Contents
Global Commodities Stock Fund (Continued)
| Average Annual Total Returns1 for period ended 9/30/12 | ||||||||||||
| 1 year | Since Inception | Inception Date | ||||||||||
| Class A Shares at NAV2 | 22.30 | % | -0.13 | % | 3/15/11 | |||||||
| Class A Shares at POP3,4 | 15.27 | -3.89 | 3/15/11 | |||||||||
| Class C Shares at NAV2 and with CDSC4 | 21.40 | -0.84 | 3/15/11 | |||||||||
| Class I Shares at NAV2 | 22.67 | 0.14 | 3/15/11 | |||||||||
| S&P 500® Index | 30.20 | 10.20 | 5 | — | ||||||||
| MSCI AC World Commodity Producer Sector Capped Index (net) | 13.43 | -6.48 | 5 | — | ||||||||
Fund Expense Ratios6: A Shares: Gross 5.48%, Net 1.65%; C Shares: Gross 6.23%, Net 2.40%; I Shares: Gross 5.23%, Net 1.40%.
All returns represent past performance which is no guarantee of future results. Current performance may be higher or lower than the performance shown. The investment return and principal value of an investment will fluctuate so that an investor’s shares, when redeemed, may be worth more or less than their original cost. The above table and graph below do not reflect the deduction of taxes that a shareholder would pay on fund distributions or the redemption of shares. Please visit Virtus.com for performance data current to the most recent month-end.
| 1 | Total returns are historical and include changes in share price and the reinvestment of both dividends and capital gains distributions. |
| 2 | “NAV” (Net Asset Value) total returns do not include the effect of any sales charge. |
| 3 | “POP” (Public Offering Price) total returns include the effect of the maximum front-end 5.75% sales charge. |
| 4 | “CDSC” (Contingent Deferred Sales Charge) is applied to redemptions of certain classes of shares that do not have a sales charge applied at the time of purchase. CDSC charges for B shares decline from 5% to 0% over a five year period. CDSC charges for certain redemptions of Class A shares made within 18 months of purchase in which a finder’s fee was paid and all redemptions of Class C shares within the first year are 1% and 0% thereafter. |
| 5 | The since inception index returns are from the Fund’s inception date. |
| 6 | The expense ratios of the Fund are set forth according to the prospectus for the Fund effective January 31, 2012 and may differ from the expense ratios disclosed in the Financial Highlights tables in this report. See the Financial Highlights for more current expense ratios. Net Expense: Expenses reduced by the contractual fee waiver in effect through March 31, 2012. Effective April 1, 2012, the waiver is voluntary and may discontinue at any time. Gross Expense: Does not reflect the effect of the fee waiver. |
Growth of $10,000 For periods ended 9/30
This chart assumes an initial investment of $10,000 made on March 15, 2011 (inception date of the Fund), for Class A, Class C, and Class I shares including any applicable sales charges or fees. Performance assumes reinvestment of dividends and capital gain distributions.
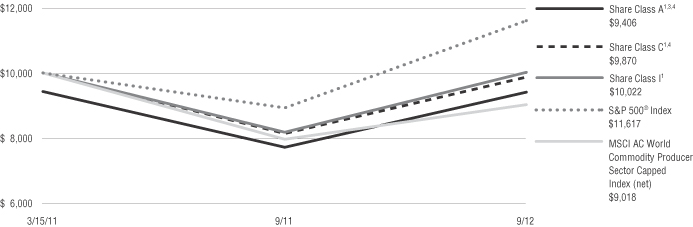
The indexes are unmanaged and not available for direct investment; therefore, their performance does not reflect the expenses associated with active management of an actual portfolio.
For information regarding the indexes and certain investment terms, see the Key Investment Terms starting on page 4.
12
Table of Contents
| Global Dividend Fund | Ticker Symbols: Class A: PGUAX Class C: PGUCX Class I: PGIUX |
| ¢ | The Fund is diversified and has an investment objective of both capital appreciation and current income. |
| ¢ | For the fiscal year ended September 30, 2012, the Fund’s Class A shares at NAV returned 20.80%, Class C shares returned 19.97%, and Class I shares returned 21.19%. For the same period, the S&P 500® Index, a broad-based equity index, returned 30.20%, and the Global Dividend Linked Benchmark, the Fund’s style-specific benchmark appropriate for comparison, returned 16.06%. |
All performance figures assume reinvestment of distributions and exclude the effect of sales charges. Past performance is no guarantee of future results and current performance may be higher or lower than the performance shown above.
How did the market perform during the Fund’s fiscal year?
| ¢ | Over the last 12 months the market has rallied significantly, overcoming some periods of caution and volatility as investors have moved between risk-off and risk-on. During the first half of the fiscal year, the equity markets rebounded primarily due to easing concerns about a double dip U.S. recession on the back of better than expected economic data. However, the rally was narrowly-based on low volume, with gains in the second fiscal quarter driven predominately by technology and financials. |
| ¢ | The broader equity markets experienced a return to volatility in the third fiscal quarter tied to concerns over the European sovereign debt crisis and global economic growth. Prospects of a Greek exit from the European Union weighed heavily on markets, only to be replaced by uncertainties about the Spanish banking system. Perhaps the most positive data point came at the very end of the quarter when eurozone members agreed to recapitalize Spanish banks and purchase Italian sovereign bonds. In the U.S., weak job numbers, a very contentious election cycle, and prospects for a post-election fiscal cliff all contributed to a partial retrenchment of gains from the first half of the year. |
| ¢ | In the last quarter of fiscal 2012, broader equity markets again experienced a strong rebound as investors put aside, at least temporarily, concerns about Europe and the U.S. fiscal cliff. Central bankers around the world provided support, encouraging investors to take on more risk. The European Central Bank (ECB) pledged to do |
whatever was necessary to save the Euro and the Federal Reserve Board announced an open-ended QE3 (quantitative easing) program. Fears of Greece leaving the European Union receded, and Spain indicated it may ask for a bailout from the European Union. However, given that few of the global economic problems have actually been resolved, we would expect continued market volatility. |
What factors affected the Fund’s performance during its fiscal year?
| ¢ | For the fiscal year ended September 30, 2012, the Fund posted solid absolute performance and handily beat its style specific benchmark, driven by stock selection. While the Fund’s portfolio has performed in line with the broader world equity market over the last year, it has been difficult to keep pace with the U.S. equity market. |
| ¢ | The overweight in U.S. and underweight in European communications companies within the Fund’s portfolio resulted in a robust contribution over the last 12 months. Fundamental trends in Europe continue to be difficult, which has led some European telecommunications companies to announce cuts to dividends. In the U.S., the strong demand for wireless data has been positive for the Fund’s holdings, particularly the tower companies, as all the wireless companies are upgrading their networks to the next generation technology (LTE). |
| ¢ | Utility stock selection was a major contributor to performance primarily reflecting the Fund’s overweight in the relatively safe-haven U.S. versus a struggling Europe and an uncertain Japan. U.S. regulated names remain fundamentally attractive given solid growth prospects underpinned by supportive regulatory environments. European utilities have been under pressure for close to three years due to higher regulatory risks and an unattractive power pricing environment. Over the past year, concerns about the European macro environment and the possible impact on fundamentals from associated austerity measures have weighed on these stocks. |
| ¢ | The Fund’s energy holdings posted the strongest performance for last year, outperforming the broader equity market, primarily due to acquisitions and restructurings. The North American shale gas and oil phenomena continue to provide opportunities for pipeline companies. Strong growth prospects are driving high earnings and dividend visibility. Although pricing of natural gas |
liquids (NGL) has caused some stock price volatility this year, the Fund generally has limited exposure to the commodity side of NGLs. |
| ¢ | Transportation holdings have been the most volatile during the course of the year due to a significant European presence but finished the year solidly in positive territory. The long-term contracts and remuneration schemes under which these companies operate provide support to fundamentals. Stock selection within transportation contributed positively to the Fund’s performance. Direct exposure to Southern Europe has been limited as the Fund’s holdings derive material portions of earnings from the United Kingdom, North America, or Latin America. |
The preceding information is the opinion of portfolio management. Any such opinions are subject to change at any time based upon market or other conditions and should not be relied upon as investment advice. Past performance is no guarantee of future results, and there is no guarantee that market forecasts will be realized.
There is no guarantee that the Fund will meet its objective.
The market price of equity securities may be affected by financial market, industry, or issuer-specific events. Focus on a particular style or on small or medium-sized companies may enhance that risk. Investing internationally involves additional risks such as currency, political, accounting, economic, and market risk. A fund that focuses its investments in infrastructure-related companies will be more sensitive to conditions affecting their business or operations. A fund that focuses its investments in a particular industry or sector will be more sensitive to conditions that affect that industry or sector than a non-concentrated fund.
| Asset Allocation | ||||
The following table presents asset allocations within certain sectors and as a percentage of total investments as of September 30, 2012.
|
| |||
Utilities | 31 | % | ||
Energy | 23 | |||
Telecommunication Services | 23 | |||
Industrials | 15 | |||
Consumer Discretionary | 3 | |||
Financials | 2 | |||
Other (includes short-term investments) | 3 | |||
|
| |||
Total | 100 | % | ||
|
| |||
For information regarding the indexes and certain investment terms, see the Key Investment Terms starting on page 4.
13
Table of Contents
Global Dividend Fund (Continued)
| Average Annual Total Returns1 for periods ended 9/30/12 | ||||||||||||||||
| 1 year | 5 years | Since Inception | Inception Date | |||||||||||||
| Class A Shares at NAV2 | 20.80 | % | 2.48 | % | 7.31 | % | 12/30/04 | |||||||||
| Class A Shares at POP3,4 | 13.86 | 1.27 | 6.49 | 12/30/04 | ||||||||||||
| Class C Shares at NAV2 and with CDSC4 | 19.97 | 1.73 | 6.51 | 12/30/04 | ||||||||||||
| Class I Shares at NAV | 21.19 | — | 2.61 | 6/6/08 | ||||||||||||
| S&P 500® Index | 30.20 | 1.05 | —5 | — | ||||||||||||
| Global Dividend Linked Benchmark | 16.06 | 0.31 | —6 | — | ||||||||||||
Fund Expense Ratios7: A Shares: 1.34%; C Shares: 2.09%, I Shares: 1.09%.
All returns represent past performance which is no guarantee of future results. Current performance may be higher or lower than the performance shown. The investment return and principal value of an investment will fluctuate so that an investor’s shares, when redeemed, may be worth more or less than their original cost. The above table and graph below do not reflect the deduction of taxes that a shareholder would pay on fund distributions or the redemption of shares. Please visit Virtus.com for performance data current to the most recent month-end.
| 1 | Total returns are historical and include changes in share price and the reinvestment of both dividends and capital gains distributions. |
| 2 | “NAV” (Net Asset Value) total returns do not include the effect of any sales charge. |
| 3 | “POP” (Public Offering Price) total returns include the effect of the maximum front-end 5.75% sales charge. |
| 4 | “CDSC” (Contingent Deferred Sales Charge) is applied to redemptions of certain classes of shares that do not have a sales charge applied at the time of purchase. CDSC charges for certain redemptions of Class A shares made within 18 months of purchase in which a finder’s fee was paid and all redemptions of Class C shares within the first year are 1% and 0% thereafter. |
| 5 | The index returned 4.43% for Class A and Class C shares and 3.61% for Class I shares since the inception date of the respective class. |
| 6 | The index returned 6.45% for Class A and Class C shares and 0.05% for Class I shares since the inception date of the respective class. |
| 7 | The expense ratios of the Fund are set forth according to the prospectus for the Fund effective January 31, 2012, as supplemented and revised and may differ from the expense ratios disclosed in the Financial Highlights tables in this report. See the Financial Highlights for more current expense ratios. |
Growth of $10,000 For periods ended 9/30
This chart assumes an initial investment of $10,000 made on December 30, 2004 (inception date of the Fund), for Class A and Class C shares including any applicable sales charges or fees. Performance assumes reinvestment of dividends and capital gain distributions.
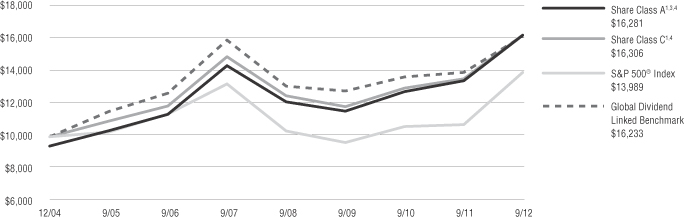
The indexes are unmanaged and not available for direct investment; therefore, their performance does not reflect the expenses associated with active management of an actual portfolio.
For information regarding the indexes and certain investment terms, see the Key Investment Terms starting on page 4.
14
Table of Contents
| Global Opportunities Fund | Ticker Symbols: Class A: NWWOX Class B: WWOBX Class C: WWOCX Class I: WWOIX |
| ¢ | The Fund is diversified and has an investment objective of capital appreciation. |
| ¢ | For the fiscal year ended September 30, 2012, the Fund’s Class A shares at NAV returned 25.80%, Class B shares returned 24.93%, and Class C shares returned 24.93%. Class I shares from August 8, 2012 (inception date) through September 30, 2012 returned 5.54%* For the fiscal year ended September 30, 2012, the S&P 500® Index, a broad-based equity index, returned 30.20%, and the MSCI AC World Index (Net), the Fund’s style-specific benchmark appropriate for comparison, returned 20.98%. |
| * | Returns less than 1 year are not annualized. |
All performance figures assume reinvestment of distributions and exclude the effect of sales charges. Past performance is no guarantee of future results and current performance may be higher or lower than the performance shown above.
How did the market perform during the Fund’s fiscal year?
| ¢ | The U.S. Federal Reserve Board announced another round of quantitative easing which, contrary to expectations, had a mildly stimulating effect on equity markets. |
| ¢ | The European Central Bank (ECB) announced that its Outright Monetary Transactions (“OMT”) program will aggressively buy short-term sovereign debt. This is expected to give countries like Spain more time to resolve their debt issues. However, in order to receive assistance from the ECB, countries must agree to implement austerity measures which have proven politically unpalatable. By opening the monetary tap, the ECB helped lift the mood in eurozone financial markets, especially the government debt market. |
| ¢ | Economic growth in emerging countries remained slow during the year. Governments in India and Brazil are taking steps they hope will create conditions for sustainable long-term growth. India’s efforts are proving far more palatable to shareholders than Brazil’s. India’s central government liberalized its foreign direct investment (FDI) policy. |
| ¢ | In Brazil, the government has taken headline-grabbing measures to reduce the cost of doing business in the country including lowering bank profit margins on loans and cutting the price of electricity. After “asking” banks to cut interest margins, the Brazilian government went a step further and had state-owned banks extend credit at lower interest rates, reducing their profitability. To remain competitive, private sector banks followed. The changes are expected to affect lending margins negatively and make the banks less valuable to shareholders. On electricity prices, the Brazilian government’s proposed changes aim to cut the cost of electricity by 16% for households and by up to 28% for industry. The proposed changes will affect utilities unevenly. Holders of concession contracts which are closer to mid-point renegotiation (20 years) or expiry (40 years) will be considerably more affected than those holding concessions with more time to run. After reviewing the scope and abruptness of the government’s changes, we decided it was prudent to reduce our exposure to the government regulated companies most exposed to Brazilian concessions. |
What factors affected the Fund’s performance during its fiscal year?
| ¢ | The Fund’s stock selection in Information Technology, as well as its overweight exposure to the sector, contributed to performance versus the MSCI AC World Index (Net) during the fiscal year. |
| ¢ | Stock selection in the Consumer Staples sector was beneficial to the Fund’s relative performance. The Fund’s overweight to Consumer Staples also helped as the sector outperformed the MSCI AC World Index (Net). |
| ¢ | While the Fund’s overweight to the Financials sector was positive, its stock selection within the space hurt relative performance. |
| ¢ | The Fund’s stock selection and its underweight in the Consumer Discretionary sector detracted from relative performance during the year. |
| ¢ | The Fund’s lack of exposure to Japan was beneficial to its performance during the year as the country was one of the weaker performers in the MSCI AC World Index (Net). |
| ¢ | The Fund’s selection of United States companies was positive for performance. The Fund’s overweight to the country was also a contributor to performance. |
| ¢ | The Fund’s stock selection, as well as its underweight, in both Australia and the United Kingdom detracted from performance during the fiscal year. Absolute contributors: Philip Morris International, Apple, British American Tobacco, MasterCard and Amazon.com. Absolute detractors: Tesco, Chipotle Mexican Grill, Las Vegas Sands, Sands China and Domino’s Pizza Group. Relative contributors: Philip Morris International, Apple, Amazon.com, Visa and MasterCard. Relative detractors: McDonald’s, Tesco, Housing Development Finance, Nestle India and Newcrest Mining. |
| ¢ | The portfolio has evolved over the course of the year. The Fund invested in attractively priced, high-quality companies that the Fund believes have the potential to grow earnings faster than the market on a sustainable basis. Some portfolio drivers over the next three-to-five years will be quite different from those of the last three years. During the last fiscal quarter, we added names in the Financials sector and trimmed some names in the Consumer Staples sector. |
| ¢ | The Fund expects investors to remain somewhat risk adverse and anticipate that they will continue to seek out companies that offer sustainable, quality growth and pay attractive dividends reliably. It is important for the Fund’s investors to understand that, when markets in emerging countries rally, the Fund’s overall performance is likely to lag that of the benchmark. The Fund’s fundamental, bottom-up investment process was designed to build portfolios that participate in rising markets and protect capital during market declines. The Fund’s goal is to outperform over full market cycles. |
| ¢ | We also would like to reiterate that the kind of quality stable growth we look for often appears as part of a stable long-term history that we believe is set to continue. However, this is not always the case. The key for our investment approach is to invest in a stable earnings stream going forward. Sometimes stable growth follows a volatile or apparently |
For information regarding the indexes and certain investment terms, see the Key Investment Terms starting on page 4.
15
Table of Contents
| Global Opportunities Fund (Continued) |
risky period, as was the case, for example, with tobacco investments 12 years ago. We remain comfortable with the quality of the portfolio and its ability to grind out reasonable returns over the longer term driven by earnings growth generated by our portfolio holdings. |
The preceding information is the opinion of portfolio management. Any such opinions are subject to change at any time based upon market or other conditions and should not be relied upon as investment advice. Past performance is no guarantee of future results, and there is no guarantee that market forecasts will be realized.
There is no guarantee that the Fund will meet its objective.
Investing internationally, especially in emerging markets, involves additional risks such as currency, political, accounting, economic, and market risk. The market price of equity securities may be affected by financial market, industry, or issuer-specific events. Focus on a particular style or on small or medium-sized companies may enhance that risk. A fund that focuses its investments in a particular industry or sector will be more sensitive to conditions that affect that industry or sector than a non-concentrated fund.
| Asset Allocation | ||||
The following table presents asset allocations within certain sectors and as a percentage of total investments as of September 30, 2012.
|
| |||
Consumer Staples | 27 | % | ||
Financials | 23 | |||
Consumer Discretionary | 18 | |||
Information Technology | 16 | |||
Health Care | 5 | |||
Materials | 5 | |||
Energy | 2 | |||
Other (includes short-term investments) | 4 | |||
|
| |||
Total | 100 | % | ||
|
| |||
For information regarding the indexes and certain investment terms, see the Key Investment Terms starting on page 4.
16
Table of Contents
Global Opportunities Fund (Continued)
| Average Annual Total Returns1 for periods ended 9/30/12 | ||||||||||||||||||||
| 1 year | 5 years | 10 years | Since Inception | Inception Date | ||||||||||||||||
| Class A Shares at NAV2 | 25.80 | % | -1.75 | % | 7.87 | % | — | — | ||||||||||||
| Class A Shares at POP3,4 | 18.57 | -2.91 | 7.24 | — | — | |||||||||||||||
| Class B Shares at NAV2 | 24.93 | -2.45 | 7.07 | — | — | |||||||||||||||
| Class B Shares with CDSC4 | 20.93 | -2.45 | 7.07 | — | — | |||||||||||||||
| Class C Shares at NAV2 and with CDSC4 | 24.93 | -2.48 | 7.04 | — | — | |||||||||||||||
| Class I Shares at NAV2 | — | — | — | 5.54 | % | 8/8/12 | ||||||||||||||
| S&P 500® Index | 30.20 | 1.05 | 8.01 | 3.11 | 5 | — | ||||||||||||||
| MSCI AC World Index (Net) | 20.98 | -2.07 | 8.61 | 3.22 | 5 | — | ||||||||||||||
Fund Expense Ratios6: A Shares: Gross 1.67%, Net 1.55%; B Shares: Gross 2.42%, Net 2.30%; C Shares: Gross 2.42%, Net 2.30%; I Shares: Gross 1.42%, Net 1.30%.
All returns represent past performance which is no guarantee of future results. Current performance may be higher or lower than the performance shown. The investment return and principal value of an investment will fluctuate so that an investor’s shares, when redeemed, may be worth more or less than their original cost. The above table and graph below do not reflect the deduction of taxes that a shareholder would pay on fund distributions or the redemption of shares. Please visit Virtus.com for performance data current to the most recent month-end.
| 1 | Total returns are historical and include changes in share price and the reinvestment of both dividends and capital gains distributions. |
| 2 | “NAV” (Net Asset Value) total returns do not include the effect of any sales charge. |
| 3 | “POP” (Public Offering Price) total returns include the effect of the maximum front-end 5.75% sales charge. |
| 4 | “CDSC” (Contingent Deferred Sales Charge) is applied to redemptions of certain classes of shares that do not have a sales charge applied at the time of purchase. CDSC charges for B shares decline from 5% to 0% over a five year period. CDSC charges for certain redemptions of Class A shares made within 18 months of purchase in which a finder’s fee was paid and all redemptions of Class C shares within the first year are 1% and 0% thereafter. |
| 5 | The since inception index returns are from Class I inception date (8/8/12). |
| 6 | The expense ratios of the Fund are set forth according to the prospectus for the Fund effective January 31, 2012, as supplemented and revised and may differ from the expense ratios disclosed in the Financial Highlights tables in this report. See the Financial Highlights for more current expense ratios. Net Expense: Expenses reduced by voluntary fee waiver which may be discontinued at any time. Gross Expense: Does not reflect the effect of the voluntary fee waiver. |
Growth of $10,000 For periods ended 9/30
This chart assumes an initial investment of $10,000 made on September 30, 2002, for Class A, Class B, and Class C shares including any applicable sales charges or fees. Performance assumes reinvestment of dividends and capital gain distributions.
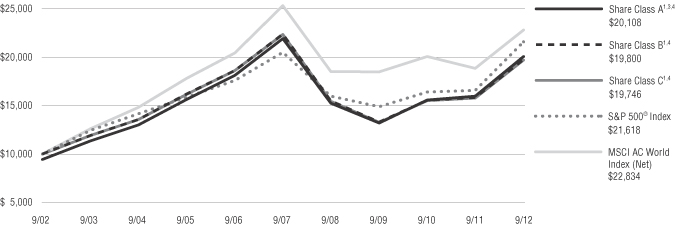
The indexes are unmanaged and not available for direct investment; therefore, their performance does not reflect the expenses associated with active management of an actual portfolio.
For information regarding the indexes and certain investment terms, see the Key Investment Terms starting on page 4.
17
Table of Contents
| Global Real Estate Securities Fund | Ticker Symbols: Class A: VGSAX Class C: VGSCX Class I: VGISX |
| ¢ | The Fund is non-diversified and has a primary investment objective of long-term capital appreciation and a secondary investment objective of income. |
| ¢ | For the fiscal year ended September 30, 2012, the Fund’s Class A shares at NAV returned 29.21%, Class C shares returned 28.18%, and Class I shares returned 29.50%. For the same period, the S&P 500® Index, a broad-based equity index, returned 30.20%, and the FTSE EPRA/NAREIT Developed Rental Index (Net), the Fund’s style specific benchmark appropriate for comparison, returned 28.13%. |
All performance figures assume reinvestment of distributions and exclude the effect of sales charges. Past performance is no guarantee of future results and current performance may be higher or lower than the performance shown above.
How did the market perform during the Fund’s fiscal year?
| ¢ | The global economic and market landscape during the year ended September 30, 2012 remained quite challenging, as many of the macro themes which drove the market lower during the third quarter of 2011, namely the European sovereign debt crisis and slowing global economic growth, resurfaced late in the first quarter of 2012 and continued into the second quarter, causing market volatility to increase and equities markets to reverse some of their early 2012 gains. With government elections in Greece and France causing renewed uncertainties about the viability of the Euro currency and a further deterioration in Spain’s financial sector adding additional pressure, European sovereign bond spreads in countries such as Italy and Spain reversed all of the positive momentum that occurred after the execution of two long-term refinancing operation (LTRO) programs by the European Central Bank (ECB). |
| ¢ | Alongside the increased market volatility stemming from the renewed flare-up of the European financial crisis, global economic growth began to stall again during the second quarter of 2012, repeating a pattern from 2011 with which market participants are all too familiar. While global economic growth remains in positive territory for many of the large developed and emerging market economies, the repeat of the sequential deceleration trend caused investors to move away from risk-oriented assets during the Spring of 2012 and increased market |
participants’ expectations for further European Central Bank easing. In this regard Chinese economic growth remained an area of intense focus as market participants continued to try to determine if the slow-down in growth was consistent with a soft or hard landing and to attempt to gauge the potential policy response out of Beijing, which has been fairly muted this time relative to the 2008 financial crisis. |
| ¢ | The latest rounds of quantitative easing by the U.S. Federal Bank and the Bank of Japan, alongside the increased commitment by the ECB to conditionally intervene in European sovereign bond markets, arrived late in the third quarter of 2012. This drove a more positive market outcome during the quarter, and a quieter summer, than was experienced one year ago. However, as many of the central banks themselves have pointed out, they have essentially exhausted the monetary tools at their disposal and it is now really up to the leaders of governments and their fiscal policy making bodies to paint the way forward. |
What factors affected the Fund’s performance during its fiscal year?
| ¢ | Despite the on-going tough macro headwinds, an environment of slow but positive economic growth, aligned with a falling cost of capital, is an environment in which high-quality global real estate companies can perform well. In this type of environment, real estate space demand is picking up enough to drive increases in cash flow through higher property occupancies and in some property sectors and markets, higher rents, but is not robust enough to justify material amounts of new construction for which financing also remains limited. On a regional basis, these positive dynamics were more clearly evident in Asia-Pacific ex Japan and North America over the last year and, not surprisingly, the European markets were the most challenged. On a country level, Hong Kong and Singapore were the top performers, while Spain and Israel were the top laggards. Within the U.S., the Industrial and Regional Mall property sectors demonstrated the best total returns over the last twelve months and Manufactured Homes and Apartments were the laggards. |
| ¢ | For the period ended September 30, 2012, the Fund outperformed its style-specific benchmark. Overall, country allocation and security selection contributed positively to performance; however, security selection was the primary driver of the positive performance. |
| ¢ | The most significant individual positive contributor to relative performance during the fiscal year was stock selection within the U.S. Specifically, the Fund’s overweight exposure to a mid-cap self-storage REIT and a mid-cap west-coast focused office REIT were the primary drivers of this positive security selection. The second most meaningful contributor to relative performance was stock selection within Australia. Specifically, the Fund’s overweight exposure to an Australia and U.K/Europe focused logistics REIT and a global regional mall REIT were the primary positive contributors. |
| ¢ | The most significant detractor from relative performance during the fiscal year was stock selection within Canada. More specifically, the Fund’s lack of exposure to a large apartment focused REIT was the leading contributor to this negative security selection. The second most important detractor from relative performance was the Fund’s slight overweight exposure to Italy. The Fund’s one Italian holding did post a small positive total return over the reporting period; however Italy as a whole significantly trailed the performance of the broader universe. |
The preceding information is the opinion of portfolio management. Any such opinions are subject to change at any time based upon market or other conditions and should not be relied upon as investment advice. Past performance is no guarantee of future results, and there is no guarantee that market forecasts will be realized.
There is no guarantee that the Fund will meet its objective.
The market price of equity securities may be affected by financial market, industry, or issuer-specific events. Focus on a particular style or on small or medium-sized companies may enhance that risk. The fund may be negatively affected by factors specific to the real estate market, including interest rate,
For information regarding the indexes and certain investment terms, see the Key Investment Terms starting on page 4.
18
Table of Contents
| Global Real Estate Securities Fund (Continued) |
leverage, property, and management. Investing internationally, especially in emerging markets, involves additional risks such as currency, political, accounting, economic, and market risk. A fund that focuses its investments in a particular industry or sector will be more sensitive to conditions that affect that industry or sector than a non-concentrated fund. A fund that focuses its investments in a particular geographic location will be highly sensitive to financial, economic, political, and other developments affecting the fiscal stability of that location.
| Asset Allocation | ||||
The following table presents asset allocations within certain sectors and as a percentage of total investments as of September 30, 2012.
|
| |||
Retail REITs | 32 | % | ||
Specialized REITs | 14 | |||
Office REITs | 14 | |||
Diversified REITs | 12 | |||
Residential REITs | 10 | |||
Real Estate Operating Companies | 9 | |||
Industrial REITs | 3 | |||
Other (includes short-term investments) | 6 | |||
|
| |||
Total | 100 | % | ||
|
| |||
For information regarding the indexes and certain investment terms, see the Key Investment Terms starting on page 4.
19
Table of Contents
Global Real Estate Securities Fund (Continued)
| Average Annual Total Returns1 for periods ended 9/30/12 | ||||||||||||
| 1 year | Since Inception | Inception Date | ||||||||||
| Class A Shares at NAV2 | 29.21 | % | 33.67 | % | 3/2/09 | |||||||
| Class A Shares at POP3,4 | 21.78 | 31.48 | 3/2/09 | |||||||||
| Class C Shares at NAV2 and with CDSC4 | 28.18 | 32.69 | 3/2/09 | |||||||||
| Class I Shares at NAV | 29.50 | 34.04 | 3/2/09 | |||||||||
| S&P 500® Index | 30.20 | 24.94 | 5 | — | ||||||||
| FTSE EPRA/NAREIT Developed Rental Index (Net) | 28.13 | 34.09 | 5 | — | ||||||||
Fund Expense Ratios6: A Shares: Gross 3.16%, Net 1.40%; C Shares: Gross 3.91%, Net 2.15%; Class I Shares: Gross 2.91%, Net 1.15%.
All returns represent past performance which is no guarantee of future results. Current performance may be higher or lower than the performance shown. The investment return and principal value of an investment will fluctuate so that an investor’s shares, when redeemed, may be worth more or less than their original cost. The above table and graph below do not reflect the deduction of taxes that a shareholder would pay on fund distributions or the redemption of shares. Please visit Virtus.com for performance data current to the most recent month-end.
| 1 | Total returns are historical and include changes in share price and the reinvestment of both dividends and capital gains distributions. |
| 2 | “NAV” (Net Asset Value) total returns do not include the effect of any sales charge. |
| 3 | “POP” (Public Offering Price) total returns include the effect of the maximum front-end 5.75% sales charge. |
| 4 | “CDSC” (Contingent Deferred Sales Charge) is applied to redemptions of certain classes of shares that do not have a sales charge applied at the time of purchase. CDSC charges for certain redemptions of Class A shares made within 18 months of purchase in which a finder’s fee was paid and all redemptions of Class C shares within the first year are 1% and 0% thereafter. |
| 5 | The since inception index returns are from the Fund’s inception date. |
| 6 | The expense ratios of the Fund are set forth according to the prospectus for the Fund effective January 31, 2012, as supplemented and revised and may differ from the expense ratios disclosed in the Financial Highlights tables in this report. See the Financial Highlights for more current expense ratios. Net Expense: Expenses reduced by voluntary fee waiver which may be discontinued at any time. Gross Expense: Does not reflect the effect of the voluntary fee waiver. |
Growth of $10,000 For periods ended 9/30
This chart assumes an initial investment of $10,000 made on March 2, 2009 (inception date of the Fund), for Class A, Class C and Class I shares including any applicable sales charges or fees. Performance assumes reinvestment of dividends and capital gain distributions.
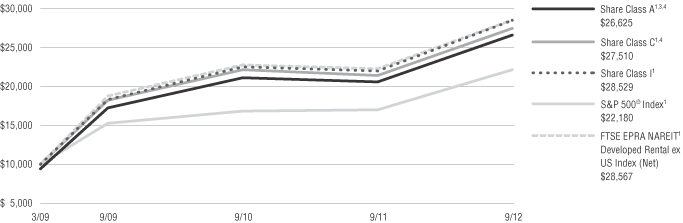
The indexes are unmanaged and not available for direct investment; therefore, their performance does not reflect the expenses associated with active management of an actual portfolio.
For information regarding the indexes and certain investment terms, see the Key Investment Terms starting on page 4.
20
Table of Contents
| Greater Asia ex Japan Opportunities Fund | Ticker Symbols: Class A: VGAAX Class C: VGACX Class I: VGAIX |
| ¢ | The Fund is diversified and has an investment objective of long-term capital appreciation. |
| ¢ | For the fiscal year ended September 30, 2012, the Fund’s Class A shares at NAV returned 15.56%, Class C shares returned 14.74%, and Class I shares returned 15.80%. For the same period, the S&P 500® Index, a broad-based equity index, returned 30.20%, and the MSCI AC Asia Pacific ex Japan Index (Net) the Fund’s style-specific benchmark appropriate for comparison returned 20.43%. |
All performance figures assume reinvestment of distributions and exclude the effect of sales charges. Past performance is no guarantee of future results and current performance may be higher or lower than the performance shown above.
How did the market perform during the Fund’s fiscal year?
| ¢ | Economic growth in emerging countries continued to slow during the year, introducing new government-related risks in some countries. |
| ¢ | In an effort to address some of the structural issues that have slowed economic growth, India’s central government liberalized its foreign direct investment (FDI) policy, approving 51% FDI in multi-brand retail companies with a minimum investment of US$100 million. It also relaxed conditions for 100% FDI in single-brand retail. There are conditions attached. One is that a minimum of 50% of FDI is spent on back-end infrastructure such as logistics and storage. Another is that at least 30% of manufactured or processed products purchased are from domestic Indian small and micro suppliers. If Indian states also adopt the new standards, multinational retailers are likely to bring global best practices to India. For example, creating supply chain efficiencies from farm to market by improving roads and creating a cold chain of refrigerated warehouses and trucks could result in less waste and lower food prices. This has the potential to reduce inflation over time. |
| ¢ | The Indian government also announced a plan to reduce fuel subsidies. It will increase the price of diesel fuel by 14%, which will help reduce the |
negative effect of higher energy prices on government finances. For years, the Indian government has subsidized fuel prices and relied on state-owned oil companies to sell fuel below cost. From 2010 to 2011, the Indian government spent more than US$17 billion, or 1% of gross domestic product (GDP), supporting the price of fuel—close to the 1.3% of GDP it spent on health care. |
What factors affected the Fund’s performance during its fiscal year?
| ¢ | The Fund’s stock selection in the Consumer Staples and Consumer Discretionary sectors contributed to performance versus the MSCI AC Asia Pacific ex Japan Index (Net) during the fiscal year. |
| ¢ | The Fund’s stock selection and its underweight in both Financials and Information Technology detracted from relative performance during the year. |
| ¢ | The Fund’s stock selection in Indonesia was beneficial to performance. |
| ¢ | The Fund’s stock selection, as well as its underweight, in Taiwan contributed to its performance during the fiscal year. |
| ¢ | The Fund’s overweight to Bangladesh stocks hurt relative performance during the year. |
| ¢ | While the Fund’s underweight exposure to Australia was positive for performance, it was not enough to offset the negative effect of stock selection within the country. |
| ¢ | Absolute contributors: ITC, Jubilant FoodWorks, HDFC Bank, Guinness Anchor and Puregold Price Club. Absolute detractors: Delta Brac Housing Finance, Marico Bangladesh, John Keells Holdings, Genting and Newcrest Mining. Relative contributors: Jubilant FoodWorks, Puregold Price Club, Guinness Anchor, BHP Billiton and Unilever Pakistan. Relative detractors: Samsung Electronics Delta Brac Housing Finance, John Keells Holdings, Nestle India and Marico Bangladesh. |
| ¢ | It is important for investors to understand that, when markets in emerging countries rally, the Fund’s overall performance is likely to lag that of its benchmark. The Fund’s investment process tends to outperform during periods of market |
weakness and capture a reasonable portion of the upside when markets are strong. The Fund’s goal is to outperform over full market cycles. |
| ¢ | We also would like to reiterate that the kind of quality stable growth we look for often appears as part of a stable long-term history that we believe is set to continue. However, this is not always the case. The key for our investment approach is to invest in a stable earnings stream going forward. Sometimes stable growth follows a volatile or apparently risky period, as was the case, for example, with tobacco investments 12 years ago. We remain comfortable with the quality of the portfolio and its ability to grind out reasonable returns over the longer term driven by earnings growth generated by our portfolio holdings. |
The preceding information is the opinion of portfolio management. Any such opinions are subject to change at any time based upon market or other conditions and should not be relied upon as investment advice. Past performance is no guarantee of future results, and there is no guarantee that market forecasts will be realized.
There is no guarantee that the Fund will meet its objective.
The market price of equity securities may be affected by financial market, industry, or issuer-specific events. Focus on a particular style or on small or medium-sized companies may enhance that risk. A fund that focuses its investments in a particular industry or sector will be more sensitive to conditions that affect that industry or sector than a non-concentrated fund. Investing internationally, especially in emerging markets, involves additional risks such as currency, political, accounting, economic, and market risk. A fund that focuses its investments in a particular geographic location will be highly sensitive to financial, economic, political, and other developments affecting the fiscal stability of that location.
For information regarding the indexes and certain investment terms, see the Key Investment Terms starting on page 4.
21
Table of Contents
| Greater Asia ex Japan Opportunities Fund (Continued) |
| Asset Allocation | ||||
The following table presents asset allocations within certain sectors and as a percentage of total investments as of September 30, 2012.
|
| |||
Consumer Staples | 36 | % | ||
Financials | 20 | |||
Consumer Discretionary | 17 | |||
Industrials | 7 | |||
Utilities | 6 | |||
Health Care | 4 | |||
Information Technology | 4 | |||
Other (includes short-term investments) | 6 | |||
|
| |||
Total | 100 | % | ||
|
| |||
For information regarding the indexes and certain investment terms, see the Key Investment Terms starting on page 4.
22
Table of Contents
Greater Asia ex Japan Opportunities Fund (Continued)
| Average Annual Total Returns1 for period ended 9/30/12 | ||||||||||||
| 1 year | Since Inception | Inception Date | ||||||||||
| Class A Shares at NAV2 | 15.56 | % | 20.13 | % | 4/21/09 | |||||||
| Class A Shares at POP3,4 | 8.92 | 18.08 | 4/21/09 | |||||||||
| Class C Shares at NAV2 and with CDSC4 | 14.74 | 19.25 | 4/21/09 | |||||||||
| Class I Shares at NAV | 15.80 | 20.46 | 4/21/09 | |||||||||
| S&P 500® Index | 30.20 | 18.45 | 5 | — | ||||||||
| MSCI AC Asia Pacific ex Japan Index (Net) | 20.43 | 18.40 | 5 | — | ||||||||
Fund Expense Ratios6: A Shares: Gross 3.07%, Net 1.80%; C Shares: Gross 3.82%, Net 2.55%; Class I Shares: Gross 2.82%, Net 1.55%.
All returns represent past performance which is no guarantee of future results. Current performance may be higher or lower than the performance shown. The investment return and principal value of an investment will fluctuate so that an investor’s shares, when redeemed, may be worth more or less than their original cost. The above table and graph below do not reflect the deduction of taxes that a shareholder would pay on fund distributions or the redemption of shares. Please visit Virtus.com for performance data current to the most recent month-end.
| 1 | Total returns are historical and include changes in share price and the reinvestment of both dividends and capital gains distributions. |
| 2 | “NAV” (Net Asset Value) total returns do not include the effect of any sales charge. |
| 3 | “POP” (Public Offering Price) total returns include the effect of the maximum front-end 5.75% sales charge. |
| 4 | “CDSC” (Contingent Deferred Sales Charge) is applied to redemptions of certain classes of shares that do not have a sales charge applied at the time of purchase. CDSC charges for certain redemptions of Class A shares made within 18 months of purchase in which a finder’s fee was paid and all redemptions of Class C shares within the first year are 1% and 0% thereafter. |
| 5 | The since inception index returns are from the Fund’s inception date. |
| 6 | The expense ratios of the Fund are set forth according to the prospectus for the Fund effective January 31, 2012, as supplemented and revised and may differ from the expense ratios disclosed in the Financial Highlights tables in this report. See the Financial Highlights for more current expense ratios. Net Expense: Expenses reduced by voluntary fee waiver which may be discontinued at any time. Gross Expense: Does not reflect the effect of the voluntary fee waiver. |
Growth of $10,000 For period ended 9/30
This chart assumes an initial investment of $10,000 made on April 21, 2009 (inception date of the Fund), for Class A, Class C and Class I shares including any applicable sales charges or fees. Performance assumes reinvestment of dividends and capital gain distributions.
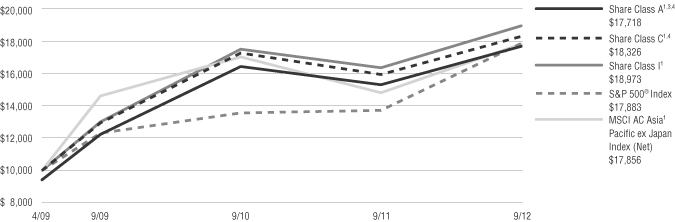
The indexes are unmanaged and not available for direct investment; therefore, their performance does not reflect the expenses associated with active management of an actual portfolio.
For information regarding the indexes and certain investment terms, see the Key Investment Terms starting on page 4.
23
Table of Contents
| Greater European Opportunities Fund | Ticker Symbols: Class A: VGEAX Class C: VGECX Class I: VGEIX |
| ¢ | The Fund is diversified and has an investment objective of long-term capital appreciation. |
| ¢ | For the fiscal year ended September 30, 2012, the Fund’s Class A shares at NAV returned 26.75%, Class C shares returned 25.73%, and Class I shares returned 26.99%. For the same period, the S&P 500® Index, a broad-based equity index, returned 30.20%, and the MSCI Europe Index (Net), the Fund‘s style-specific benchmark appropriate for comparison, returned 17.31%. |
All performance figures assume reinvestment of distributions and exclude the effect of sales charges. Past performance is no guarantee of future results and current performance may be higher or lower than the performance shown above.
How did the market perform during the Fund’s fiscal year?
| ¢ | The European Central Bank (ECB) announced that its Outright Monetary Transactions (OMT) program will aggressively buy short-term sovereign debt. This is expected to give countries like Spain more time to resolve their debt issues. However, in order to receive assistance from the ECB, countries must agree to implement austerity measures which have proven politically unpalatable. By opening the monetary tap, the ECB helped lift the mood in eurozone financial markets, especially the government debt market. |
| ¢ | The eurozone appears to be making progress toward a banking union, which would harmonize banking regulation and oversight across the region. We believe this would be a positive step and demonstrates that the eurozone can and will take action when absolutely necessary. Economic growth in Europe is likely to remain subdued for some time as the region works through structural issues. |
| ¢ | eurozone markets may remain volatile as Spain addresses a multitude of issues, including calls for secession in Catalonia. Uncertainty and volatility often create opportunities to invest in high-quality companies at attractive valuations. While not overly optimistic about the macroeconomic outlook in Europe, we have confidence in our |
ability to pick stocks with the potential to deliver strong growth over the longer term. |
What factors affected the Fund’s performance during its fiscal year?
| ¢ | The Fund’s stock selection in Consumer Staples, as well as its overweight exposure to the sector, contributed to performance versus the MSCI Europe Index (Net) during the fiscal year. |
| ¢ | Stock selection in the Industrials sector was beneficial to the Fund’s relative performance. The Fund’s overweight to Industrials also helped as the sector outperformed the MSCI Europe Index (Net). |
| ¢ | While the Fund’s stock selection in the Financials sector detracted from relative performance, its underweight to the sector was beneficial. |
| ¢ | The Fund’s stock selection and its underweight in the Materials sector detracted from results. |
| ¢ | The Fund’s stock selection in France contributed to performance during the year. |
| ¢ | The MSCI Europe Index (Net) has no exposure to the United States; therefore, the Fund’s overweight to the country helped performance. |
| ¢ | The Fund’s stock selection, as well as its underweight, in Germany detracted from performance during the fiscal year. |
| ¢ | While the Fund’s out-of-index allocation to Norway was positive for performance, it was not enough to offset the negative effect of stock selection within the country. |
| ¢ | Absolute contributors: Anheuser-Busch InBev, Philip Morris International, Novo Nordisk, Bureau Veritas and Diageo. Absolute detractors: Admiral Group, Domino Printing Sciences, Tesco, bioMerieux, and Danone. Relative contributors: Anheuser-Busch InBev, Philip Morris International, Novo Nordisk, Bureau Veritas and Core Laboratories. Relative detractors: Admiral Group, bioMerieux, Bayer, Tesco and Danone. |
The preceding information is the opinion of portfolio management. Any such opinions are subject to change at any time based upon market or other conditions and should not be relied upon as investment advice. Past performance is no guarantee of future results, and there is no guarantee that market forecasts will be realized.
There is no guarantee that the Fund will meet its objective.
The market price of equity securities may be affected by financial market, industry, or issuer-specific events. Focus on a particular style or on small or medium-sized companies may enhance that risk. A fund that focuses its investments in a particular industry or sector will be more sensitive to conditions that affect that industry or sector than a non-concentrated fund. Investing internationally, especially in emerging markets, involves additional risks such as currency, political, accounting, economic, and market risk. A fund that focuses its investments in a particular geographic location will be highly sensitive to financial, economic, political, and other developments affecting the fiscal stability of that location.
| Asset Allocation | ||||
| The following table presents asset allocations within certain sectors and as a percentage of total investments as of September 30, 2012. | ||||
Consumer Staples | 30 | % | ||
Consumer Discretionary | 17 | |||
Financials | 13 | |||
Industrials | 11 | |||
Health Care | 8 | |||
Information Technology | 8 | |||
Energy | 5 | |||
Materials | 5 | |||
Other (includes short-term investments) | 3 | |||
|
| |||
Total | 100 | % | ||
|
| |||
For information regarding the indexes and certain investment terms, see the Key Investment Terms starting on page 4.
24
Table of Contents
Greater European Opportunities Fund (Continued)
| Average Annual Total Returns1 for period ended 9/30/12 | ||||||||||||
| 1 year | Since Inception | Inception Date | ||||||||||
| Class A Shares at NAV2 | 26.75 | % | 17.79 | % | 4/21/09 | |||||||
| Class A Shares at POP3,4 | 19.46 | 15.78 | 4/21/09 | |||||||||
| Class C Shares at NAV2 and with CDSC4 | 25.73 | 16.90 | 4/21/09 | |||||||||
| Class I Shares at NAV | 26.99 | 18.08 | 4/21/09 | |||||||||
| S&P 500® Index | 30.20 | 19.01 | 5 | — | ||||||||
| MSCI Europe Index (Net) | 17.31 | 13.16 | 5 | — | ||||||||
Fund Expense Ratios6: A Shares: Gross 3.03%, Net 1.45%; C Shares: Gross 3.78%, Net 2.20%; Class I Shares: Gross 2.78%, Net 1.20%.
All returns represent past performance which is no guarantee of future results. Current performance may be higher or lower than the performance shown. The investment return and principal value of an investment will fluctuate so that an investor’s shares, when redeemed, may be worth more or less than their original cost. The above table and graph below do not reflect the deduction of taxes that a shareholder would pay on fund distributions or the redemption of shares. Please visit Virtus.com for performance data current to the most recent month-end.
| 1 | Total returns are historical and include changes in share price and the reinvestment of both dividends and capital gains distributions. |
| 2 | “NAV” (Net Asset Value) total returns do not include the effect of any sales charge. |
| 3 | “POP” (Public Offering Price) total returns include the effect of the maximum front-end 5.75% sales charge. |
| 4 | “CDSC” (Contingent Deferred Sales Charge) is applied to redemptions of certain classes of shares that do not have a sales charge applied at the time of purchase. CDSC charges for certain redemptions of Class A shares made within 18 months of purchase in which a finder’s fee was paid and all redemptions of Class C shares within the first year are 1% and 0% thereafter. |
| 5 | The since inception index returns are from the Fund’s inception date. |
| 6 | The expense ratios of the Fund are set forth according to the prospectus for the Fund effective January 31, 2012, as supplemented and revised and may differ from the expense ratios disclosed in the Financial Highlights tables in this report. See the Financial Highlights for more current expense ratios. Net Expense: Expenses reduced by voluntary fee waiver which may be discontinued at any time. Gross Expense: Does not reflect the effect of the voluntary fee waiver. |
Growth of $10,000 For periods ended 9/30
This chart assumes an initial investment of $10,000 made on April 21, 2009 (inception date of the Fund), for Class A, Class C and Class I shares including any applicable sales charges or fees. Performance assumes reinvestment of dividends and capital gain distributions.
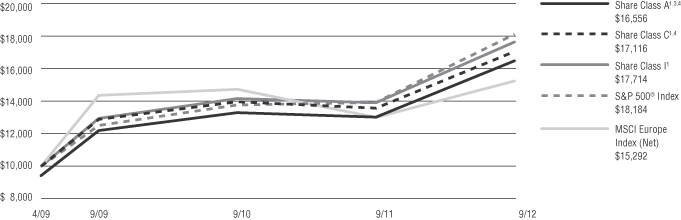
The indexes are unmanaged and not available for direct investment; therefore, their performance does not reflect the expenses associated with active management of an actual portfolio.
For information regarding the indexes and certain investment terms, see the Key Investment Terms starting on page 4.
25
Table of Contents
| International Equity Fund | Ticker Symbols: Class A: VIEAX Class C: VIECX Class I: VIIEX |
| ¢ | The Fund is diversified and has an investment objective of long-term capital appreciation. |
| ¢ | For the fiscal year ended September 30, 2012, the Fund’s Class A shares at NAV returned 16.58%, Class C shares returned 15.37%, and Class I shares returned 16.47%. For the same period, the S&P 500® Index, a broad-based equity index, returned 30.20%, and the MSCI EAFE® Index (Net), the Fund’s style-specific benchmark appropriate for comparison, returned 13.75%. |
All performance figures assume reinvestment of distributions and exclude the effect of sales charges. Past performance is no guarantee of future results and current performance may be higher or lower than the performance shown above.
How did the market perform during the Fund’s fiscal year?
| ¢ | International equity markets posted double digit gains over the Fund’s fiscal year with the MSCI EAFE® Index (Net) rising 13.75% over the period. The vast majority of the market’s strength was concentrated in the second and fourth quarters while prices reversed in the third quarter. Of the major markets, Hong Kong was the best performing. Despite the sovereign debt crisis, European markets also performed well in relative terms, although this was partially offset by some minor currency weakness over the period. Japan was the worst performing market, actually posting a small negative return for the year. |
What factors affected the Fund’s performance during its fiscal year?
| ¢ | During the fiscal year the Fund generated strong relative performance. Stock selection was the most important factor in the generation of this relative performance, although country allocation was also a significantly positive factor. Stock selection was strongest in the Eurozone, Malaysia, Singapore, Japan and the United Kingdom. The overweight allocation to the Hong Kong market was a positive factor for relative performance, as was the underweight allocation to Japan. Currency allocation was a small negative contributor over the period. The Fund was very defensively positioned with a heavy emphasis on value and quality. The key characteristics of the Fund’s portfolio relative to the MSCI EAFE® Index (Net) were that the Fund’s dividend yield and return on equity were significantly higher while its debt-to-equity ratio was significantly lower. Overweighted sectors included telecoms, energy and utilities which proved defensive in a weak market. The Fund’s weighting in banks was very low; there was a zero weighting to European banks throughout the fiscal year. |
The preceding information is the opinion of portfolio management. Any such opinions are subject to change at any time based upon market or other conditions and should not be relied upon as investment advice. Past performance is no guarantee of future results, and there is no guarantee that market forecasts will be realized.
There is no guarantee that the Fund will meet its objective.
Investing internationally, especially in emerging markets, involves additional risks such as currency, political, accounting, economic, and market risk. The market price of equity securities may be affected by financial market, industry, or issuer-specific events. Focus on a particular style or on small or medium-sized companies may enhance that risk.
| Asset Allocation | ||||
The following table presents asset allocations within certain sectors and as a percentage of total investments as of September 30, 2012.
|
| |||
Industrials | 14 | % | ||
Telecommunication Services | 12 | |||
Energy | 11 | |||
Health Care | 11 | |||
Consumer Staples | 10 | |||
Information Technology | 10 | |||
Materials | 10 | |||
Other (includes short-term investments) | 22 | |||
|
| |||
Total | 100 | % | ||
|
| |||
For information regarding the indexes and certain investment terms, see the Key Investment Terms starting on page 4.
26
Table of Contents
International Equity Fund (Continued)
| Average Annual Total Returns1 for periods ended 9/30/12 | ||||||||||||
| 1 year | Since Inception | Inception Date | ||||||||||
| Class A Shares at NAV2 | 16.58 | % | 7.19 | % | 9/16/10 | |||||||
| Class A Shares at POP3,4 | 9.88 | 4.12 | 9/16/10 | |||||||||
| Class C Shares at NAV2 and with CDSC4 | 15.37 | 6.20 | 9/16/10 | |||||||||
| Class I Shares at NAV | 16.47 | 7.27 | 9/16/10 | |||||||||
| S&P 500® Index | 30.20 | 15.33 | 5 | — | ||||||||
| MSCI EAFE® Index (net) | 13.75 | 2.76 | 5 | — | ||||||||
Fund Expense Ratios6: A Shares: Gross 2.12%, Net 1.50%; C Shares: Gross 2.87%, Net 2.25%; Class I Shares: Gross 1.87%, Net 1.25%.
All returns represent past performance which is no guarantee of future results. Current performance may be higher or lower than the performance shown. The investment return and principal value of an investment will fluctuate so that an investor’s shares, when redeemed, may be worth more or less than their original cost. The above table and graph below do not reflect the deduction of taxes that a shareholder would pay on fund distributions or the redemption of shares. Please visit Virtus.com for performance data current to the most recent month-end.
| 1 | Total returns are historical and include changes in share price and the reinvestment of both dividends and capital gains distributions. |
| 2 | “NAV” (Net Asset Value) total returns do not include the effect of any sales charge. |
| 3 | “POP” (Public Offering Price) total returns include the effect of the maximum front-end 5.75% sales charge. |
| 4 | “CDSC” (Contingent Deferred Sales Charge) is applied to redemptions of certain classes of shares that do not have a sales charge applied at the time of purchase. CDSC charges for certain redemptions of Class A shares made within 18 months of purchase in which a finder’s fee was paid and all redemptions of Class C shares within the first year are 1% and 0% thereafter. |
| 5 | The since inception index returns are from the Fund’s inception date. |
| 6 | The expense ratios of the Fund are set forth according to the prospectus for the Fund effective January 31, 2012, as supplemented and revised and may differ from the expense ratios disclosed in the Financial Highlights tables in this report. See the Financial Highlights for more current expense ratios. Net Expense: Expenses reduced by voluntary fee waiver which may be discontinued at any time. Gross Expense: Does not reflect the effect of the voluntary fee waiver. |
Growth of $10,000 For period ended 9/30
This chart assumes an initial investment of $10,000 made on September 16, 2010 (inception date of the Fund), for Class A, Class C and Class I shares including any applicable sales charges or fees. Performance assumes reinvestment of dividends and capital gain distributions.
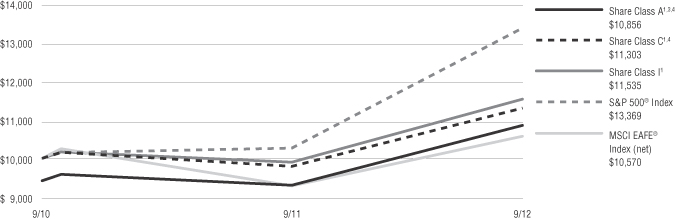
The indexes are unmanaged and not available for direct investment; therefore, their performance does not reflect the expenses associated with active management of an actual portfolio.
For information regarding the indexes and certain investment terms, see the Key Investment Terms starting on page 4.
27
Table of Contents
| International Real Estate Securities Fund | Ticker Symbols: Class A: PXRAX Class C: PXRCX Class I: PXRIX |
| ¢ | The Fund is non-diversified and has a primary investment objective of long-term capital appreciation and a secondary investment objective of income. |
| ¢ | For the fiscal year ended September 30, 2012, the Fund’s Class A shares at NAV returned 27.35%, Class C shares returned 26.36%, and Class I shares returned 27.74%. For the same period, the S&P 500® Index, a broad-based equity index, returned 30.20%, the FTSE EPRA/NAREIT Developed Rental ex U.S. Index (Net), the Fund’s style-specific benchmark appropriate for comparison, returned 24.61%. |
All performance figures assume reinvestment of distributions and exclude the effect of sales charges. Past performance is no guarantee of future results and current performance may be higher or lower than the performance shown above.
How did the market perform during the Fund’s fiscal year?
| ¢ | The global economic and market landscape during the year ended September 30, 2012 remained quite challenging, as many of the macro themes which drove the market lower during the third quarter of 2011, namely the European sovereign debt crisis and slowing global economic growth, resurfaced late in the first quarter of 2012 and continued into the second quarter, causing market volatility to increase and equities markets to reverse some of their early 2012 gains. With government elections in Greece and France causing renewed uncertainties about the viability of the Euro currency and a further deterioration in Spain’s financial sector adding additional pressure, European sovereign bond spreads in countries such as Italy and Spain reversed all of the positive momentum that occurred after the execution of two long-term refinancing operation (LTRO) programs by the European Central Bank (ECB). |
| ¢ | Alongside the increased market volatility stemming from the renewed flare-up of the European financial crisis, global economic growth began to stall again during the second quarter of 2012, repeating a pattern from 2011 with which market participants are all too familiar. While global economic growth |
remains in positive territory for many of the large developed and emerging market economies, the repeat of the sequential deceleration trend caused investors to move away from risk-oriented assets during the Spring of 2012 and increased market participants’ expectations for further European Central Bank easing. In this regard Chinese economic growth remained an area of intense focus as market participants continued to try to determine if the slow-down in growth was consistent with a soft or hard landing and to attempt to gauge the potential policy response out of Beijing, which has been fairly muted this time relative to the 2008 financial crisis. |
| ¢ | The latest rounds of quantitative easing by the U.S. Federal Bank and the Bank of Japan, alongside the increased commitment by the ECB to conditionally intervene in European sovereign bond markets, arrived late in the third quarter of 2012. This drove a more positive market outcome during the quarter, and a quieter summer, than was experienced one year ago. However, as many of the central banks themselves have pointed out, they have essentially exhausted the monetary tools at their disposal and it is now really up to the leaders of governments and their fiscal policy making bodies to paint the way forward. |
What factors affected the Fund’s performance during its fiscal year?
| ¢ | Despite the on-going tough macro headwinds, an environment of slow but positive economic growth, aligned with a falling cost of capital, is an environment in which high-quality global real estate companies can perform well. In this type of environment, real estate space demand is picking up enough to increase property occupancies, but is not robust enough to justify material amounts of new construction for which financing also remains limited. On a regional basis, these positive dynamics were more clearly evident in Asia-Pacific ex Japan and North America over the last year and, not surprisingly, the European markets were the most challenged. On a country level, Hong Kong and Singapore were the top performers, while Spain and Israel were the top laggards. |
| ¢ | For the period ended September 30, 2012, the Fund outperformed its style-specific benchmark. |
Overall, country allocation and security selection contributed positively to performance; however, security selection was the primary driver of the positive performance. |
| ¢ | The most significant positive contributor to relative performance during the fiscal year was the Fund’s allocation to and stock selection within Australia. Specifically, the Fund’s overweight exposure to an Australia and U.K/Europe focused logistics REIT and a global regional mall REIT were the primary positive contributors. The second most meaningful positive contributor to relative performance was the Fund’s allocation to and stock selection within Singapore. Namely, the Fund’s overweight exposure to a Japan/China focused logistics REIT was the most important driver of this performance. |
| ¢ | The most significant detractor from relative performance during the fiscal year was our allocation to and stock selection within Canada. More specifically, our lack of exposure to a large apartment focused REIT was the leading contributor to this negative security selection. The second most important detractor from relative performance was our slight overweight exposure to Italy. The Fund’s one Italian holding did post a small positive total return over the reporting period; however Italy as a whole significantly trailed the performance of the broader universe. |
The preceding information is the opinion of portfolio management. Any such opinions are subject to change at any time based upon market or other conditions and should not be relied upon as investment advice. Past performance is no guarantee of future results, and there is no guarantee that market forecasts will be realized.
There is no guarantee that the Fund will meet its objective.
The market price of equity securities may be affected by financial market, industry, or issuer-specific events. Focus on a particular style or on small or medium-sized companies may enhance that risk. The fund may be negatively affected by factors specific to the real estate market, including interest rate, leverage, property, and management. Investing internationally, especially in emerging markets,
For information regarding the indexes and certain investment terms, see the Key Investment Terms starting on page 4.
28
Table of Contents
| International Real Estate Securities Fund (Continued) |
involves additional risks such as currency, political, accounting, economic, and market risk. A fund that focuses its investments in a particular industry or sector will be more sensitive to conditions that affect that industry or sector than a non-concentrated fund. A fund that focuses its investments in a particular geographic location will be highly sensitive to financial, economic, political, and other developments affecting the fiscal stability of that location.
| Asset Allocation | ||||
The following table presents asset allocations within certain sectors and as a percentage of total investments as of September 30, 2012.
|
| |||
Retail REITs | 39 | % | ||
Real Estate Operating Companies | 21 | |||
Diversified REITs | 18 | |||
Office REITs | 11 | |||
Industrial REITs | 3 | |||
Diversified Real Estate Activities | 3 | |||
Specialized REITs | 2 | |||
Other (includes short-term investments) | 3 | |||
|
| |||
Total | 100 | % | ||
|
| |||
For information regarding the indexes and certain investment terms, see the Key Investment Terms starting on page 4.
29
Table of Contents
International Real Estate Securities Fund (Continued)
| Average Annual Total Returns1 for periods ended 9/30/12 | ||||||||||||
| 1 Year | Since Inception | Inception Date | ||||||||||
| Class A Shares at NAV2 | 27.35 | % | -2.62 | % | 10/1/07 | |||||||
| Class A Shares at POP3,4 | 20.02 | -3.77 | 10/1/07 | |||||||||
| Class C Shares at NAV2 and with CDSC4 | 26.36 | -3.38 | 10/1/07 | |||||||||
| Class I Shares at NAV | 27.74 | -2.40 | 10/1/07 | |||||||||
| S&P 500® Index | 30.20 | 0.79 | 5 | — | ||||||||
| FTSE EPRA/NAREIT Developed Rental ex U.S. Index (Net) | 24.61 | -4.08 | 5 | — | ||||||||
Fund Expense Ratios6: A Shares: Gross 1.77%, Net 1.50%; C Shares: Gross 2.52%, Net 2.25%; Class I Shares: Gross 1.52%, Net 1.25%.
All returns represent past performance which is no guarantee of future results. Current performance may be higher or lower than the performance shown. The investment return and principal value of an investment will fluctuate so that an investor’s shares, when redeemed, may be worth more or less than their original cost. The above table and graph below do not reflect the deduction of taxes that a shareholder would pay on fund distributions or the redemption of shares. Please visit Virtus.com for performance data current to the most recent month-end.
| 1 | Total returns are historical and include changes in share price and the reinvestment of both dividends and capital gains distributions. |
| 2 | “NAV” (Net Asset Value) total returns do not include the effect of any sales charge. |
| 3 | “POP” (Public Offering Price) total returns include the effect of the maximum front-end 5.75% sales charge. |
| 4 | “CDSC” (Contingent Deferred Sales Charge) is applied to redemptions of certain classes of shares that do not have a sales charge applied at the time of purchase. CDSC charges for certain redemptions of Class A shares made within 18 months of purchase in which a finder’s fee was paid and all redemptions of Class C shares within the first year are 1% and 0% thereafter. |
| 5 | The since inception index returns are from the Fund’s inception date. |
| 6 | The expense ratios of the Fund are set forth according to the prospectus for the Fund effective January 31, 2012, as supplemented and revised and may differ from the expense ratios disclosed in the Financial Highlights tables in this report. See the Financial Highlights for more current expense ratios. Net Expense: Expenses reduced by voluntary fee waiver which may be discontinued at any time. Gross Expense: Does not reflect the effect of the voluntary fee waiver. |
Growth of $10,000 For periods ended 9/30
This chart assumes an initial investment of $10,000 made on October 1, 2007 (inception date of the Fund), for Class A, Class C and Class I shares including any applicable sales charges or fees. Performance assumes reinvestment of dividends and capital gain distributions.
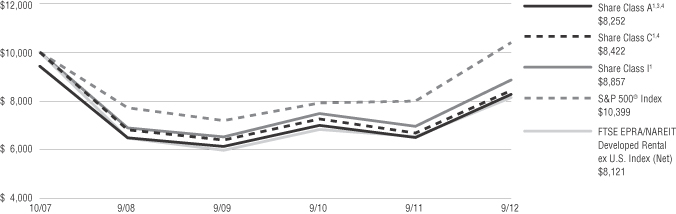
The indexes are unmanaged and not available for direct investment; therefore, their performance does not reflect the expenses associated with active management of an actual portfolio.
For information regarding the indexes and certain investment terms, see the Key Investment Terms starting on page 4.
30
Table of Contents
| International Small-Cap Fund† | Ticker Symbols: Class A: VISAX Class C: VCISX Class I: VIISX |
| ¢ | The Fund is diversified and has an investment objective of capital appreciation. |
| ¢ | For the fiscal period September 5, 2012 (inception date) through September 30, 2012, the Fund’s Class A shares at NAV returned 0.90%*, Class C shares returned 0.90%*, and Class I shares returned 1.00%.* For the same period, the S&P 500® Index, a broad-based equity index, returned 2.79%*, and the MSCI AC World Ex U.S. Small Cap Index (Net), the Fund’s style-specific benchmark appropriate for comparison, returned 5.50%.* |
* Returns less than 1 year are not annualized.
All performance figures assume reinvestment of distributions and exclude the effect of sales charges. Past performance is no guarantee of future results and current performance may be higher or lower than the performance shown above.
There is no guarantee that the Fund will meet its objective.
| Asset Allocation | ||||
The following table presents asset allocations within certain sectors and as a percentage of total investments as of September 30, 2012.
|
| |||
Industrials | 20 | % | ||
Consumer Discretionary | 14 | |||
Materials | 14 | |||
Financials | 11 | |||
Information Technology | 11 | |||
Health Care | 7 | |||
Energy | 4 | |||
Other (includes short-term investments) | 19 | |||
|
| |||
Total | 100 | % | ||
|
| |||
The market price of equity securities may be affected by financial market, industry, or issuer-specific events. Focus on a particular style or on small or medium-sized companies may enhance that risk. Investing internationally, especially in emerging markets, involves additional risks such as currency, political, accounting, economic, and market risk. Because the fund has a limited number of securities, it may be more susceptible to factors adversely affecting its securities than a less concentrated fund.
| † | The Fund is less than six months old – No commentary required. |
For information regarding the indexes and certain investment terms, see the Key Investment Terms starting on page 4.
31
Table of Contents
THIS PAGE INTENTIONALLY BLANK.
Table of Contents
VIRTUS EMERGING MARKETS DEBT FUND
SCHEDULE OF INVESTMENTS
SEPTEMBER 30, 2012
($ reported in thousands)
| PAR VALUE | VALUE | |||||||
| FOREIGN GOVERNMENT SECURITIES—34.7% | ||||||||
Bolivarian Republic of Venezuela | $ | 230 | $ | 211 | ||||
RegS 7.000%, 12/1/18(4) | 70 | 60 | ||||||
7.650%, 4/21/25 | 375 | 295 | ||||||
9.375%, 1/13/34 | 325 | 290 | ||||||
Dominican Republic 144A 7.500%, 5/6/21(3) | 100 | 113 | ||||||
Federative Republic of Brazil 10.250%, 1/10/28 | 250 | BRL | 161 | |||||
Kingdom of Spain | 30 | EUR | 38 | |||||
Republic of Angola (Northern Lights III BV) RegS | 250 | 276 | ||||||
Republic of Argentina PIK Interest Capitalization 8.280%, 12/31/33 | 777 | 613 | ||||||
Republic of Chile | 83,500 | CLP | 186 | |||||
Republic of Colombia | ||||||||
12.000%, 10/22/15 | 163,000 | COP | 112 | |||||
4.375%, 3/21/23 | 123,000 | COP | 67 | |||||
Republic of Croatia 144A 6.375%, 3/24/21(3) | 300 | 333 | ||||||
Republic of El Salvador 144A | 250 | 281 | ||||||
Republic of Iceland 144A 5.875%, 5/11/22(3) | 250 | 273 | ||||||
Republic of Indonesia | 2,000,000 | IDR | 245 | |||||
144A 3.750%, 4/25/22(3) | 200 | 212 | ||||||
Republic of Iraq 144A | 250 | 229 | ||||||
Republic of Ivory Coast 144A | 100 | 86 | ||||||
Republic of Lithuania 144A 7.375%, 2/11/20(3) | 250 | 317 | ||||||
Republic of Peru 144A 6.900%, 8/12/37(3) | 825 | PEN | 391 | |||||
Republic of Romania | ||||||||
144A 6.875%, 4/12/21(3) | 200 | 231 | ||||||
144A 6.750%, 2/7/22(3) | 250 | 282 | ||||||
Republic of Slovak 144A | 300 | 316 | ||||||
Republic of South Africa Series R-208 | 2,025 | ZAR | 246 | |||||
Republic of Turkey | ||||||||
5.125%, 3/25/22 | 200 | 221 | ||||||
6.750%, 5/30/40 | 225 | 284 | ||||||
Republic of Ukraine | ||||||||
144A 7.950%, 6/4/14(3) | 200 | 201 | ||||||
144A 7.750%, 9/23/20(3) | 325 | 323 | ||||||
Republic of Zambia 144A 5.375%, 9/20/22(3) | 200 | 202 | ||||||
Russian Federation | ||||||||
144A 4.500%, 4/4/22(3) | 200 | 223 | ||||||
144A 5.625%, 4/4/42(3) | 250 | 300 | ||||||
| PAR VALUE | VALUE | |||||||
United Mexican States | ||||||||
Series M, 6.000%, 6/18/15 | 3,855 | MXN | $ | 309 | ||||
Series M, 6.500%, 6/9/22 | 2,250 | MXN | 190 | |||||
6.050%, 1/11/40 | $ | 480 | 640 | |||||
| TOTAL FOREIGN GOVERNMENT SECURITIES (Identified Cost $8,659) | 8,757 | |||||||
| CORPORATE BONDS AND NOTES—62.9% | ||||||||
| Australia—0.3% | ||||||||
FMG Resources Property Ltd. 144A | 75 | 73 | ||||||
|
| |||||||
| Austria—0.9% | ||||||||
Sappi Papier Holding GmbH 144A | 200 | 215 | ||||||
|
| |||||||
| Bermuda—0.8% | ||||||||
Digicel Group Ltd. 144A | 200 | 211 | ||||||
|
| |||||||
| Brazil—9.1% | ||||||||
Banco ABC Brasil SA 144A | 100 | 107 | ||||||
Banco do Brasil S.A. 144A | 200 | 239 | ||||||
Banco Votorantim SA 144A | 125 | 140 | ||||||
Braskem Finance Ltd. 144A 5.750%, 4/15/21 (Materials)(3) | 250 | 265 | ||||||
Embraer SA | 250 | 268 | ||||||
Gerdau Holdings, Inc. 144A | 125 | 144 | ||||||
Itau Unibanco Holding SA RegS | 250 | 262 | ||||||
OGX Austria GmbH 144A | 225 | 196 | ||||||
Telemar Norte Leste SA 144A | 250 | 263 | ||||||
Vale SA | 200 | 204 | ||||||
| PAR VALUE | VALUE | |||||||
| Brazil—continued | ||||||||
Voto-Votorantim Ltd. 144A 6.750%, 4/5/21 (Industrials)(3) | $ | 175 | $ | 203 | ||||
|
| |||||||
| 2,291 | ||||||||
|
| |||||||
| Cayman Islands—5.7% | ||||||||
Agile Property Holdings Ltd. 144A | 100 | 102 | ||||||
Hutchison Whampoa International Ltd. Series 11, 144A | 300 | 328 | ||||||
IPIC GMTN Ltd. 144A | 250 | 333 | ||||||
MIE Holdings Corp. 144A | 200 | 209 | ||||||
Odebrecht Finance Ltd. 144A | 300 | 333 | ||||||
Petrobras International Finance Co. | 100 | 124 | ||||||
|
| |||||||
| 1,429 | ||||||||
|
| |||||||
| Chile—1.4% | ||||||||
Banco Santander Chile 144A | 200 | 201 | ||||||
Celulosa Arauco y Constitucion SA | 150 | 156 | ||||||
|
| |||||||
| 357 | ||||||||
|
| |||||||
| Colombia—1.0% | ||||||||
Bancolombia SA | 250 | 253 | ||||||
|
| |||||||
| Georgia—0.8% | ||||||||
Bank of Georgia JSC 144A | 200 | 204 | ||||||
|
| |||||||
| India—0.6% | ||||||||
ICICI Bank Ltd. 144A | 150 | 152 | ||||||
|
| |||||||
| Indonesia—3.2% | ||||||||
Pertamina Persero PT | 200 | 223 | ||||||
144A 6.000%, 5/3/42(3) | 275 | 299 | ||||||
See Notes to Financial Statements
33
Table of Contents
VIRTUS EMERGING MARKETS DEBT FUND
SCHEDULE OF INVESTMENTS (Continued)
SEPTEMBER 30, 2012
($ reported in thousands)
| PAR VALUE | VALUE | |||||||
| Indonesia—continued | ||||||||
Perusahaan Listrik Negara PT 144A | $ | 250 | $ | 281 | ||||
|
| |||||||
| 803 | ||||||||
|
| |||||||
| Ireland—0.8% | ||||||||
Alfa Bank OJSC (Alfa Bond Issuance plc) 144A | 200 | 202 | ||||||
|
| |||||||
| Israel—0.9% | ||||||||
Israel Electric Corp. Ltd. RegS | 200 | 218 | ||||||
|
| |||||||
| Italy—0.4% | ||||||||
Telecom Italia Capital SA | 100 | 110 | ||||||
|
| |||||||
| Kazakhstan—2.1% | ||||||||
Eurasian Development Bank 144A | 200 | 203 | ||||||
Kazkommerts Bank International BV 144A | 100 | 99 | ||||||
KazMunayGas National Co. 144A | 200 | 240 | ||||||
|
| |||||||
| 542 | ||||||||
|
| |||||||
| Luxembourg—6.0% | ||||||||
ALROSA Finance SA 144A | 200 | 227 | ||||||
ArcelorMittal | 100 | 99 | ||||||
Gazprom Neft OAO (GPN Capital SA) 144A | 200 | 199 | ||||||
Gazprom OAO (Gaz Capital SA) RegS | 275 | 323 | ||||||
Sberbank of Russia (Sberbank CapItal SA) | 250 | 270 | ||||||
Wind Acquisition Finance S.A. 144A | 200 | 191 | ||||||
| PAR VALUE | VALUE | |||||||
| Luxembourg—continued | ||||||||
Yapi Ve Kredi Bankasi (Unicredit Luxembourg S.A.) 144A | $ | 200 | $ | 206 | ||||
|
| |||||||
| 1,515 | ||||||||
|
| |||||||
| Mexico—2.6% | ||||||||
Banco Bilbao Vizcaya Argentaria Bancomer SA 144A | 150 | 164 | ||||||
Mexichem SAB de CV 144A | 200 | 203 | ||||||
Petroleos Mexicanos | 225 | 280 | ||||||
|
| |||||||
| 647 | ||||||||
|
| |||||||
| Netherlands—1.1% | ||||||||
MDC-GMTN B.V. 144A | 250 | 289 | ||||||
|
| |||||||
Peru—2.6% | ||||||||
Banco Bilbao Vizcaya Argentaria S.A. Banco Continental SA 144A | 125 | 128 | ||||||
Banco de Credito del Peru (Panama) 144A | 200 | 215 | ||||||
Banco Internacional del Peru SAA 144A | 100 | 106 | ||||||
Volcan Compania Minera SAA 144A | 200 | 217 | ||||||
|
| |||||||
| 666 | ||||||||
|
| |||||||
| Russia—5.2% | ||||||||
OAO Lukoil International Finance BV 144A | 350 | 395 | ||||||
Russian Agricultural Bank OJSC (RSHB Capital SA) 144A | 125 | 138 | ||||||
Severstal OAO (Steel Capital SA) 144A | 100 | 107 | ||||||
TNK-BP Finance S.A. 144A 7.250%, 2/2/20 (Energy)(3) | 150 | 182 | ||||||
| PAR VALUE | VALUE | |||||||
| Russia—continued | ||||||||
Vimpel Communications OJSC (VIP Finance Ireland Ltd.) 144A | $ | 250 | $ | 287 | ||||
Vnesheconombank (VEB Finance plc) 144A | 175 | 206 | ||||||
|
| |||||||
| 1,315 | ||||||||
|
| |||||||
| South Africa—0.8% | ||||||||
Transnet SOC Ltd. 144A | 200 | 203 | ||||||
|
| |||||||
| Sweden—0.8% | ||||||||
PKO Finance AB 144A | 200 | 201 | ||||||
|
| |||||||
| Thailand—0.8% | ||||||||
PTT Global Chemical PCL 144A | 200 | 202 | ||||||
|
| |||||||
| Trinidad and Tobago—0.4% | ||||||||
Petroleum Co. of Trinidad & Tobago Ltd. RegS | 83 | 89 | ||||||
|
| |||||||
| Turkey—1.6% | ||||||||
Turkiye Vakiflar Bankasi Tao 144A | 200 | 211 | ||||||
Turkiye Garanti Bankasi AS 144A | 200 | 202 | ||||||
|
| |||||||
| 413 | ||||||||
|
| |||||||
| Ukraine—1.6% | ||||||||
DP World Ltd. 144A | 250 | 269 | ||||||
National JSC Naftogaz of Ukraine | 125 | 128 | ||||||
|
| |||||||
| 397 | ||||||||
|
| |||||||
| United Arab Emirates—2.2% | ||||||||
Abu Dhabi National Energy Co. 144A | 275 | 318 | ||||||
Dolphin Energy Ltd. 144A 5.500%, 12/15/21 (Energy)(3) | 200 | 231 | ||||||
|
| |||||||
| 549 | ||||||||
|
| |||||||
See Notes to Financial Statements
34
Table of Contents
VIRTUS EMERGING MARKETS DEBT FUND
SCHEDULE OF INVESTMENTS (Continued)
SEPTEMBER 30, 2012
($ reported in thousands)
| PAR VALUE | VALUE | |||||||
| United Kingdom—0.4% | ||||||||
Lloyds TSB Bank plc 144A | $ | 100 | $ | 105 | ||||
|
| |||||||
| United States—2.6% | ||||||||
Cemex Finance LLC 144A | 150 | 156 | ||||||
Morgan Stanley 144A | 250 | BRL | 133 | |||||
Pactiv LLC | 100 | 98 | ||||||
Reliance Holdings USA, Inc. 144A | 250 | 266 | ||||||
|
| |||||||
| 653 | ||||||||
|
| |||||||
| Venezuela—4.5% | ||||||||
Petroleos de Venezuela SA RegS | 1,250 | 1,134 | ||||||
|
| |||||||
| Virgin Islands (British)—1.7% | ||||||||
Arcos Dorados Holdings, Inc. 144A | 275 | BRL | 146 | |||||
| PAR VALUE | VALUE | |||||||
| Virgin Islands (British)—continued | ||||||||
Sinochem Overseas Capital Co. Ltd. 144A | $ | 275 | $ | 292 | ||||
|
| |||||||
| 438 | ||||||||
| TOTAL CORPORATE BONDS AND NOTES (Identified Cost $15,772) | 15,876 | |||||||
| TOTAL LONG TERM INVESTMENTS—97.6% | ||||||||
| (Identified Cost $24,431) | 24,633 | |||||||
| TOTAL INVESTMENTS—97.6% (Identified Cost $24,431) | 24,633 | (1) | ||||||
Other assets and liabilities, net—2.4% |
| 614 | ||||||
|
| |||||||
| NET ASSETS—100.0% | $ | 25,247 | ||||||
|
| |||||||
Abbreviations:
| PIK | Payment-in-Kind Security |
Footnote Legend:
| (1) | Federal Income Tax Information: For tax information at September 30, 2012, see Note 11 Federal Income Tax Information in the Notes to Financial Statements. |
| (2) | Variable or step coupon security; interest rate shown reflects the rate in effect at September 30, 2012. |
| (3) | Security exempt from registration under Rule 144A of the Securities Act of 1933. These securities may be resold in transactions exempt from registration, normally to qualified institutional buyers. At September 30, 2012, these securities amounted to a value of $16,172 or 64.1% of net assets. |
| (4) | Regulation S security. Security is offered and sold outside of the United States, therefore, it is exempt from registration with the SEC under rules 903 and 904 of the Securities Act of 1933. |
| (5) | This note was issued for the sole purpose of funding a loan agreement between the issuer and the borrower. As the credit risk for this security lies solely with the borrower, the name represented here is that of the borrower. |
Foreign Currencies:
| BRL | Brazilian Real |
| CLP | Chilean Peso |
| COP | Colombian Peso |
| EUR | European Currency Unit |
| IDR | Indonesian Rupiah |
| MXN | Mexican Peso |
| PEN | Peruvian Nuevo Sol |
| ZAR | South African Rand |
| Country Weightings (Unaudited)† | ||||
Brazil | 10 | % | ||
Russia | 8 | |||
Venezuela | 8 | |||
Mexico | 7 | |||
Cayman Islands | 6 | |||
Luxembourg | 6 | |||
Indonesia | 5 | |||
Other | 50 | |||
Total | 100 | % | ||
† % of total investments as of September 30, 2012 |
| |||
The following table provides a summary of inputs used to value the Fund’s investments as of September 30, 2012 (See Security Valuation Note 2A in the Notes to Financial Statements):
| Total Value at September 30, 2012 | Level 2 – Significant Observable Inputs | |||||||
Debt Securities: | ||||||||
Corporate Bonds And Notes | $ | 15,876 | $ | 15,876 | ||||
Foreign Government Securities | 8,757 | 8,757 | ||||||
|
|
|
| |||||
Total Investments | $ | 24,633 | $ | 24,633 | ||||
|
|
|
| |||||
There are no Level 1 (quoted prices) or Level 3 (significant unobservable inputs) priced securities.
Security abbreviation definitions are located under the Key Investment Terms starting on page 4.
See Notes to Financial Statements
35
Table of Contents
VIRTUS EMERGING MARKETS EQUITY INCOME FUND
SCHEDULE OF INVESTMENTS
SEPTEMBER 30, 2012
($ reported in thousands)
| SHARES | VALUE | |||||||
| PREFERRED STOCK—3.0% | ||||||||
| Consumer Staples—1.7% | ||||||||
Cia de Bebidas das Americas | 2,400 | $ | 91 | |||||
| Materials—1.3% | ||||||||
Bradespar S.A. | 5,000 | 69 | ||||||
| TOTAL PREFERRED STOCK (Identified Cost $153) | 160 | |||||||
| COMMON STOCKS—83.2% | ||||||||
| Consumer Discretionary—9.5% | ||||||||
Anta Sports Products Ltd. (China) | 70,000 | 54 | ||||||
Arcelik AS (Turkey) | 3,116 | 17 | ||||||
Astra International tbk PT (Indonesia) | 52,000 | 40 | ||||||
Ford Otomotiv Sanayi AS (Turkey) | 993 | 10 | ||||||
Great Wall Motor Co., Ltd. (China) | 14,500 | 38 | ||||||
Lojas Renner S.A. (Brazil) | 1,100 | 37 | ||||||
MRV Engenharia e Participacoes S.A. (Brazil) | 3,700 | 22 | ||||||
Naspers Ltd. (South Africa) | 443 | 27 | ||||||
Parkson Holdings Bhd (Malaysia) | 7,600 | 12 | ||||||
Teco Electric and Machinery Co., Ltd. (Taiwan) | 38,000 | 26 | ||||||
Truworths International Ltd. (South Africa) | 2,032 | 23 | ||||||
TSRC Corp. (Taiwan) | 67,000 | 149 | ||||||
UMW Holdings Bhd (Malaysia) | 14,700 | 48 | ||||||
|
| |||||||
| 503 | ||||||||
|
| |||||||
| Consumer Staples—3.1% | ||||||||
Cia Brasileira de Distribuicao Grupo Pao de Acucar (Brazil) | 600 | 27 | ||||||
Kimberly-Clark de Mexico S.A.B. de C.V. Class A (Mexico) | 12,100 | 29 | ||||||
President Chain Store Corp. (Taiwan) | 7,000 | 37 | ||||||
Spar Group Ltd. (The) (South Africa) | 2,124 | 33 | ||||||
Tiger Brands Ltd. (South Africa) | 185 | 6 | ||||||
Wal-Mart de Mexico S.A.B. de C.V. (Mexico) | 11,600 | 33 | ||||||
|
| |||||||
| 165 | ||||||||
|
| |||||||
| Energy—14.5% | ||||||||
China Petroleum & Chemical Corp. Class H (China) | 68,000 | 64 | ||||||
CNOOC Ltd. (China) | 66,000 | 135 | ||||||
Cosan S.A. Industria e Comercio (Brazil) | 2,000 | 36 | ||||||
Ecopetrol S.A. Sponsored ADR (Colombia) | 2,676 | 158 | ||||||
Gazprom OAO (Gazstream S.A.) Sponsored ADR (Russia) | 8,397 | 85 | ||||||
Lukoil OAO Sponsored ADR (Russia) | 1,050 | 65 | ||||||
PetroChina Co., Ltd. Class H (China) | 74,000 | 97 | ||||||
PTT PCL (Thailand) | 1,500 | 16 | ||||||
Sasol Ltd. (South Africa) | 982 | 44 | ||||||
Surgutneftegas OAO Sponsored ADR (Russia) | 1,660 | 15 | ||||||
| SHARES | VALUE | |||||||
| Energy—continued | ||||||||
Tupras-Turkiye Petro Rafinerileri AS (Turkey) | 1,405 | $ | 32 | |||||
Ultrapar Participacoes S.A. (Brazil) | 400 | 9 | ||||||
Yanzhou Coal Mining Co., Ltd. Class H (China) | 6,000 | 9 | ||||||
|
| |||||||
| 765 | ||||||||
|
| |||||||
| Financials—22.0% | ||||||||
ABSA Group Ltd. (South Africa) | 484 | 8 | ||||||
African Bank Investments Ltd. (South Africa) | 9,182 | 36 | ||||||
Alliance Financial Group Bhd (Malaysia) | 25,900 | 35 | ||||||
AMMB Holdings Bhd (Malaysia) | 20,500 | 43 | ||||||
Banco do Estado do Rio Grande do Sul S.A. (Brazil) | 2,800 | 24 | ||||||
Banco Santander Chile S.A. (Chile) | 2,125,911 | 150 | ||||||
Bank of China Ltd. (China) | 217,000 | 83 | ||||||
Bank of the Philippine Islands (Philippines) | 13,310 | 25 | ||||||
China Construction Bank Corp. (China) | 153,000 | 106 | ||||||
China Minsheng Banking Corp Ltd. (China) | 26,000 | 21 | ||||||
Compartamos SAB de C.V. (Mexico) | 28,500 | 33 | ||||||
Farglory Land Development Co., Ltd. (Taiwan) | 27,000 | 51 | ||||||
Grupo Financiero Inbursa Sab de CV (Mexico) | 16,300 | 46 | ||||||
Guangzhou R&F Properties Co., Ltd. (China) | 20,800 | 24 | ||||||
Highwealth Construction Corp. (Taiwan) | 8,000 | 13 | ||||||
Industrial & Commercial Bank of China Ltd. (China) | 211,000 | 125 | ||||||
Krung Thai Bank PCL (Thailand) | 9,300 | 6 | ||||||
Malayan Banking Bhd (Malaysia) | 18,100 | 53 | ||||||
Porto Seguro S.A. (Brazil) | 1,500 | 15 | ||||||
Powszechna Kasa Oszczednosci Bank Polski S.A. (Poland) | 4,835 | 54 | ||||||
Powszechny Zaklad Ubezpieczen S.A. (Poland) | 377 | 42 | ||||||
Redefine Properties Ltd. (South Africa) | 22,896 | 26 | ||||||
Sberbank of Russia (Russia) | 3,404 | 40 | ||||||
Siam Commercial Bank PCL (Thailand) | 10,000 | 55 | ||||||
Soho China Ltd. (China) | 22,500 | 14 | ||||||
Standard Bank Group Ltd. (South Africa) | 2,994 | 38 | ||||||
|
| |||||||
| 1,166 | ||||||||
|
| |||||||
| Health Care—0.1% | ||||||||
Netcare Ltd. (South Africa) | 2,542 | 54 | ||||||
|
| |||||||
| Industrials—4.7% | ||||||||
Aboitiz Equity Ventures, Inc. (Philippines) | 48,700 | 57 | ||||||
Grupo Carso Sab de CV (Mexico) | 5,000 | 17 | ||||||
| SHARES | VALUE | |||||||
| Industrials—continued | ||||||||
Jiangsu Expressway Co., Ltd. (China) | 58,000 | $ | 48 | |||||
Lonking Holdings Ltd. (China) | 105,000 | 18 | ||||||
Obrascon Huarte Lain Brasil S.A. (Brazil) | 4,600 | 42 | ||||||
Reunert Ltd. (South Africa) | 4,466 | 37 | ||||||
Zhejiang Expressway Co., Ltd. (China) | 42,000 | 29 | ||||||
|
| |||||||
| 248 | ||||||||
|
| |||||||
| Information Technology—12.2% | ||||||||
Asseco Poland S.A. (Poland) | 795 | 11 | ||||||
Chicony Electronics Co., Ltd. (Taiwan) | 24,000 | 56 | ||||||
Cielo S.A. (Brazil) | 500 | 12 | ||||||
Compal Electronics, Inc. (Taiwan) | 52,000 | 47 | ||||||
HTC Corp. (Taiwan) | 5,000 | 48 | ||||||
Lite-On Technology Corp. (Taiwan) | 20,000 | 26 | ||||||
MediaTek, Inc. (Taiwan) | 5,000 | 53 | ||||||
MStar Semiconductor, Inc. (Taiwan) | 4,000 | 32 | ||||||
Novatek Microelectronics Corp. (Taiwan) | 11,000 | 40 | ||||||
Quanta Computer, Inc. (Taiwan) | 3,000 | 8 | ||||||
Richtek Technology Corp. (Taiwan) | 5,000 | 30 | ||||||
Taiwan Semiconductor Manufacturing Co., Ltd. (Taiwan) | 76,000 | 233 | ||||||
Tencent Holdings Ltd. (China) | 1,400 | 48 | ||||||
|
| |||||||
| 644 | ||||||||
|
| |||||||
| Materials—9.3% | ||||||||
Cia Siderurgica Nacional S.A. (Brazil) | 9,100 | 51 | ||||||
Dongyue Group (China) | 125,000 | 56 | ||||||
Eregli Demir Ve Celik Fabrikalari TAS (Turkey) | 5,066 | 6 | ||||||
Grupo Mexico S.A.B. de C.V. Series B (Mexico) | 17,800 | 59 | ||||||
Impala Platinum Holdings Ltd. (South Africa) | 763 | 13 | ||||||
Jiangxi Copper Co., Ltd. (China) | 33,000 | 83 | ||||||
Kumba Iron Ore Ltd. (South Africa) | 2,029 | 123 | ||||||
Southern Copper Corp. (Peru) | 2,433 | 84 | ||||||
Vale Indonesia tbk PT (Indonesia) | 55,500 | 17 | ||||||
|
| |||||||
| 492 | ||||||||
|
| |||||||
| Telecommunication Services—4.9% | ||||||||
China Mobile Ltd. (China) | 11,000 | 122 | ||||||
Mobile TeleSystems OJSC Sponsored ADR (Russia) | 871 | 15 | ||||||
MTN Group Ltd. (South Africa) | 2,538 | 49 | ||||||
Tim Participacoes S.A. (Brazil) | 7,600 | 29 | ||||||
Turk Telekomunikasyon AS (Turkey) | 11,670 | 47 | ||||||
|
| |||||||
| 262 | ||||||||
|
| |||||||
| Utilities—2.9% | ||||||||
CEZ AS (Czech Republic) | 547 | 20 | ||||||
EDP—Energias do Brasil S.A. (Brazil) | 1,100 | 7 | ||||||
See Notes to Financial Statements
36
Table of Contents
VIRTUS EMERGING MARKETS EQUITY INCOME FUND
SCHEDULE OF INVESTMENTS (Continued)
SEPTEMBER 30, 2012
($ reported in thousands)
| SHARES | VALUE | |||||||
| Utilities—continued | ||||||||
Empresa Nacional de Electricidad S.A.Chile (Chile) | 53,123 | $ | 86 | |||||
Guangdong Investments Ltd. (China) | 26,000 | 20 | ||||||
Petronas Gas Berhad (Malaysia) | 3,000 | 19 | ||||||
|
| |||||||
| 152 | ||||||||
| TOTAL COMMON STOCKS (Identified Cost $4,227) | 4,401 | |||||||
| EXCHANGE-TRADED FUNDS—13.3% | ||||||||
iPath MSCI India Index ETN(2) | 2,654 | 156 | ||||||
iShares MSCI South Korea Index Fund | 9,281 | 549 | ||||||
TOTAL EXCHANGE-TRADED FUNDS (Identified Cost $646) |
| 705 | ||||||
| TOTAL LONG TERM INVESTMENTS—99.5% (Identified cost $5,026) | 5,266 | |||||||
| SHORT-TERM INVESTMENTS—0.5% | ||||||||
| Money Market Mutual Funds—0.5% | ||||||||
BlackRock Liquidity Funds TempFund Portfolio—Institutional Shares (seven-day effective yield 0.140%) | 25,182 | 25 | ||||||
| TOTAL SHORT-TERM INVESTMENTS (Identified Cost $25) | 25 | |||||||
| TOTAL INVESTMENTS—100.0% (Identified Cost $5,051) | 5,291 | (1) | ||||||
Other assets and liabilities, net—0.0% |
| 3 | ||||||
|
| |||||||
| NET ASSETS—100.0% | $ | 5,294 | ||||||
|
| |||||||
Abbreviations:
| ADR | American Depositary Receipt |
Footnote Legend:
| (1) | Federal Income Tax Information: For tax information at September 30, 2012, see Note 11 Federal Income Tax Information in the Notes to Financial Statements. |
| (2) | Non-income producing. |
| Country Weightings (Unaudited)† | ||||
China | 23 | % | ||
Taiwan | 16 | |||
Korea | 10 | |||
Brazil | 9 | |||
South Africa | 9 | |||
Chile | 4 | |||
Russia | 4 | |||
Other | 25 | |||
Total | 100 | % | ||
† % of total investments as of September 30, 2012 |
| |||
The following table provides a summary of inputs used to value the Fund’s investments as of September 30, 2012 (See Security Valuation Note 2A in the Notes to Financial Statements):
| Total Value at September 30, 2012 | Level 1 – Quoted Prices | |||||||
Equity Securities: | ||||||||
Preferred Stock | $ | 160 | $ | 160 | ||||
Common Stocks | 4,401 | 4,401 | ||||||
Exchange-Traded Funds | 705 | 705 | ||||||
Short-Term Investments | 25 | 25 | ||||||
|
|
|
| |||||
Total Investments | $ | 5,291 | $ | 5,291 | ||||
|
|
|
| |||||
There are no Level 2 (significant observable inputs) or Level 3 (significant unobservable inputs) priced securities.
Security abbreviation definitions are located under the Key Investment Terms starting on page 4.
See Notes to Financial Statements
37
Table of Contents
VIRTUS GLOBAL COMMODITIES STOCK FUND
SCHEDULE OF INVESTMENTS
SEPTEMBER 30, 2012
($ reported in thousands)
| SHARES | VALUE | |||||||
| COMMON STOCKS—90.4% | ||||||||
| Consumer Staples—1.2% | ||||||||
BRF – Brasil Foods SA ADR (Brazil) | 8,041 | $ | 139 | |||||
S&W Seed Co. (United States)(2) | 15,245 | 93 | ||||||
|
| |||||||
| 232 | ||||||||
|
| |||||||
| Energy—26.9% | ||||||||
Athabasca Oil Corp. (Canada)(2) | 18,087 | 242 | ||||||
Baytex Energy Corp. (Canada) | 3,930 | 187 | ||||||
Cenovus Energy, Inc. (Canada) | 14,133 | 492 | ||||||
Core Laboratories N.V. (Netherlands) | 2,726 | 331 | ||||||
Ensco plc Class A (United Kingdom) | 7,886 | 430 | ||||||
FX Energy, Inc. (United States)(2) | 34,330 | 256 | ||||||
MEG Energy Corp. (Canada)(2) | 8,771 | 334 | ||||||
National Oilwell Varco, Inc. (United States) | 2,826 | 226 | ||||||
Newfield Exploration Co. (United States)(2) | 4,899 | 153 | ||||||
OYO Geospace Corp. (United States)(2) | 3,807 | 466 | ||||||
Penn West Petroleum Ltd. (Canada) | 8,438 | 120 | ||||||
Seadrill Ltd. (Bermuda) | 19,472 | 764 | ||||||
Tesoro Corp. (United States) | 3,738 | 157 | ||||||
Tidewater, Inc. (United States) | 3,521 | 171 | ||||||
Valero Energy Corp. (United States) | 30,640 | 971 | ||||||
|
| |||||||
| 5,300 | ||||||||
|
| |||||||
| Industrials—6.5% | ||||||||
AGCO Corp. (United States)(2) | 9,099 | 432 | ||||||
Cervus Equipment Corp. (Canada) | 2,325 | 46 | ||||||
Kubota Corp. ADR (Japan) | 5,572 | 282 | ||||||
Lindsay Corp. (United States) | 3,630 | 261 | ||||||
Raven Industries, Inc. (United States) | 5,183 | 153 | ||||||
Rocky Mountain Dealerships, Inc. (Canada) | 11,044 | 122 | ||||||
|
| |||||||
| 1,296 | ||||||||
|
| |||||||
| SHARES | VALUE | |||||||
| Materials—55.8% | ||||||||
Agrium, Inc. (Canada) | 6,049 | $ | 626 | |||||
Alamos Gold, Inc. (Canada) | 12,548 | 244 | ||||||
Allied Nevada Gold Corp. (United States)(2) | 6,839 | 267 | ||||||
BHP Billiton Ltd. Sponsored ADR (Australia) | 6,709 | 460 | ||||||
CF Industries Holdings, Inc. (United States) | 4,454 | 990 | ||||||
Detour Gold Corp. (Canada)(2) | 14,270 | 398 | ||||||
Du Pont (E.I.) de Nemours & Co. (United States) | 3,047 | 153 | ||||||
Eldorado Gold Corp. (Canada) | 18,146 | 277 | ||||||
Franco-Nevada Corp. (Canada) | 15,911 | 938 | ||||||
Goldcorp, Inc. (Canada) | 14,901 | 683 | ||||||
Grupo Mexico S.A.B. de C.V. Series B (Mexico) | 106,724 | 353 | ||||||
Major Drilling Group International (Canada) | 42,618 | 435 | ||||||
MBAC Fertilizer Corp. (Canada)(2) | 79,366 | 266 | ||||||
Monsanto Co. (United States) | 9,054 | 824 | ||||||
New Gold, Inc. (Canada)(2) | 60,180 | 735 | ||||||
Perseus Mining Ltd. (Australia)(2) | 85,097 | 258 | ||||||
Potash Corp. of Saskatchewan, Inc. (Canada) | 9,883 | 429 | ||||||
Royal Gold, Inc. (United States) | 7,033 | 702 | ||||||
Silver Wheaton Corp. (Canada) | 4,342 | 173 | ||||||
Sociedad Quimica y Minera de Chile SA Sponsored ADR (Chile) | 10,532 | 649 | ||||||
Syngenta AG ADR (Switzerland) | 9,519 | 713 | ||||||
Tahoe Resources, Inc. (Canada)(2) | 20,911 | 426 | ||||||
|
| |||||||
| 10,999 | ||||||||
| TOTAL COMMON STOCKS (Identified Cost $15,462) | 17,827 | |||||||
| EXCHANGE-TRADED FUNDS—5.7% | ||||||||
PowerShares DB Gold Fund (United States)(2) | 18,241 | 1,114 | ||||||
| TOTAL EXCHANGE-TRADED FUNDS (Identified Cost $1,003) | 1,114 | |||||||
| TOTAL LONG TERM INVESTMENTS—96.1% | ||||||||
| (Identified cost $16,465) | 18,941 | |||||||
| SHARES | VALUE | |||||||
| SHORT-TERM INVESTMENTS—4.2% | ||||||||
| Money Market Mutual Funds—4.2% | ||||||||
Dreyfus Cash Management Fund – Institutional Shares (seven-day effective yield 0.060%) | 831,577 | $ | 832 | |||||
| TOTAL SHORT-TERM INVESTMENTS (Identified Cost $832) | 832 | |||||||
| TOTAL INVESTMENTS—100.3% | ||||||||
| (Identified Cost $17,297) | 19,773 | (1) | ||||||
Other assets and liabilities, net—(0.3)% |
| (62 | ) | |||||
|
| |||||||
| NET ASSETS—100.0% | $ | 19,711 | ||||||
|
| |||||||
Abbreviations:
| ADR | American Depositary Receipt |
Footnote Legend:
| (1) | Federal Income Tax Information: For tax information at September 30, 2012, see Note 11 Federal Income Tax Information in the Notes to Financial Statements. |
| (2) | Non-income producing. |
| Country Weightings (Unaudited)† | ||||
United States | 41 | % | ||
Canada | 36 | |||
Australia | 4 | |||
Bermuda | 4 | |||
Switzerland | 4 | |||
Chile | 3 | |||
United Kingdom | 2 | |||
Other | 6 | |||
Total | 100 | % | ||
† % of total investments as of September 30, 2012 |
| |||
The following table provides a summary of inputs used to value the Fund’s investments as of September 30, 2012 (See Security Valuation Note 2A in the Notes to Financial Statements):
| Total Value at September 30, 2012 | Level 1 – Quoted Prices | |||||||
Equity Securities: | ||||||||
Common Stocks | $ | 17,827 | $ | 17,827 | ||||
Exchange-Traded Funds | 1,114 | 1,114 | ||||||
Short-Term Investments | 832 | 832 | ||||||
|
|
|
| |||||
Total Investments | $ | 19,773 | $ | 19,773 | ||||
|
|
|
| |||||
There are no Level 2 (significant observable inputs) or Level 3 (significant unobservable inputs) priced securities.
Securities held by the Fund with an end of fiscal period value of $258 were transferred from Level 2 to Level 1 based on our valuation procedures for non-U.S. securities.
Security abbreviation definitions are located under the Key Investment Terms starting on page 4.
See Notes to Financial Statements
38
Table of Contents
SCHEDULE OF INVESTMENTS
SEPTEMBER 30, 2012
($ reported in thousands)
| SHARES | VALUE | |||||||
| COMMON STOCKS—94.9% | ||||||||
| Consumer Discretionary—2.8% | ||||||||
Eutelsat Communications SA (France) | 37,230 | $ | 1,197 | |||||
SES SA (Luxembourg) | 53,300 | 1,449 | ||||||
|
| |||||||
| 2,646 | ||||||||
|
| |||||||
| Energy—22.9% | ||||||||
Enbridge, Inc. (Canada) | 148,620 | 5,801 | ||||||
Kinder Morgan, Inc. (United States) | 77,530 | 2,754 | ||||||
Spectra Energy Corp. (United States) | 112,920 | 3,315 | ||||||
TransCanada Corp. (Canada) | 98,660 | 4,489 | ||||||
Williams Cos., Inc. (The) (United States) | 149,220 | 5,218 | ||||||
|
| |||||||
| 21,577 | ||||||||
|
| |||||||
| Financials—2.2% | ||||||||
American Tower Corp. (United States) | 28,360 | 2,025 | ||||||
|
| |||||||
| Industrials—14.4% | ||||||||
Abertis Infraestructuras S.A. (Spain) | 92,170 | 1,356 | ||||||
Atlantia SpA (Italy) | 104,141 | 1,617 | ||||||
Auckland International Airport Ltd. (New Zealand) | 454,150 | 986 | ||||||
Ferrovial SA (Spain) | 76,630 | 997 | ||||||
Flughafen Zuerich AG (Switzerland) | 2,618 | 1,074 | ||||||
Fraport AG Frankfurt Airport Services Worldwide (Germany) | 22,340 | 1,292 | ||||||
Koninklijke Vopak N.V. (Netherlands) | 38,490 | 2,703 | ||||||
Transurban Group (Australia) | 446,320 | 2,778 | ||||||
Vinci SA (France) | 18,590 | 792 | ||||||
|
| |||||||
| 13,595 | ||||||||
|
| |||||||
| Telecommunication Services—22.5% | ||||||||
AT&T, Inc. (United States) | 130,110 | 4,905 | ||||||
BCE, Inc. (Canada) | 20,530 | 902 | ||||||
BT Group plc (United Kingdom) | 282,190 | 1,051 | ||||||
Crown Castle International Corp. (United States)(2) | 39,580 | 2,537 | ||||||
Nippon Telegraph & Telephone Corp. ADR (Japan) | 35,700 | 847 | ||||||
Singapore Telecommunications Ltd. (Singapore) | 584,400 | 1,524 | ||||||
TELUS Corp. (Canada) | 28,200 | 1,779 | ||||||
Verizon Communications, Inc. (United States) | 49,450 | 2,253 | ||||||
Vodafone Group plc Sponsored ADR (United Kingdom) | 155,420 | 4,429 | ||||||
Windstream Corp. (United States) | 100,970 | 1,021 | ||||||
|
| |||||||
| 21,248 | ||||||||
|
| |||||||
| SHARES | VALUE | |||||||
| Utilities—30.1% | ||||||||
Allette, Inc. (United States) | 14,800 | $ | 618 | |||||
APA Group (Australia) | 173,500 | 853 | ||||||
CenterPoint Energy, Inc. (United States) | 53,820 | 1,146 | ||||||
Centrica plc (United Kingdom) | 149,690 | 792 | ||||||
CMS Energy Corp. (United States) | 50,000 | 1,178 | ||||||
Consolidated Edison, Inc. (United States) | 17,600 | 1,054 | ||||||
Dominion Resources, Inc. (United States) | 27,940 | 1,479 | ||||||
DTE Energy Co. (United States) | 14,520 | 870 | ||||||
E.ON AG (Germany) | 25,430 | 603 | ||||||
FirstEnergy Corp. (United States) | 36,530 | 1,611 | ||||||
National Grid plc (United Kingdom) | 103,210 | 1,138 | ||||||
NextEra Energy, Inc. (United States) | 26,800 | 1,885 | ||||||
NiSource, Inc. (United States) | 46,240 | 1,178 | ||||||
Northeast Utilities (United States) | 22,510 | 861 | ||||||
Northwest Natural Gas Co. (United States) | 16,370 | 806 | ||||||
NV Energy, Inc. (United States) | 56,410 | 1,016 | ||||||
ONEOK, Inc. (United States) | 28,930 | 1,398 | ||||||
Pinnacle West Capital Corp. (United States) | 20,970 | 1,107 | ||||||
Questar Corp. (United States) | 37,460 | 762 | ||||||
Sempra Energy (United States) | 25,960 | 1,674 | ||||||
SevernTrent plc (United Kingdom) | 41,705 | 1,131 | ||||||
SP AusNet (Australia) | 833,400 | 903 | ||||||
Terna Rete Elettrica Nazionale SpA (Italy) | 214,640 | 800 | ||||||
United Utilities Group plc (United Kingdom) | 84,190 | 973 | ||||||
Wisconsin Energy Corp. (United States) | 40,020 | 1,508 | ||||||
XCEL Energy, Inc. (United States) | 38,210 | 1,059 | ||||||
|
| |||||||
| 28,403 | ||||||||
TOTAL COMMON STOCKS (Identified Cost $71,019) |
| 89,494 | ||||||
| TOTAL LONG TERM INVESTMENTS—94.9% | ||||||||
| (Identified Cost $71,019) | 89,494 | |||||||
| SHARES | VALUE | |||||||
| SHORT-TERM INVESTMENTS—3.3% | ||||||||
| Money Market Mutual Funds—3.3% | ||||||||
Dreyfus Cash Management Fund – Institutional Shares (seven-day effective yield 0.060%) | 3,135,242 | $ | 3,135 | |||||
| TOTAL SHORT-TERM INVESTMENTS (Identified Cost $3,135) | 3,135 | |||||||
TOTAL INVESTMENTS—98.2% (Identified Cost $74,154) |
| 92,629 | (1) | |||||
Other assets and liabilities, net—1.8% |
| 1,665 | ||||||
|
| |||||||
| NET ASSETS—100.0% | $ | 94,294 | ||||||
|
| |||||||
Abbreviations:
| ADR | American Depositary Receipt |
Footnote Legend:
| (1) | Federal Income Tax Information: For tax information at September 30, 2012, see Note 11 Federal Income Tax Information in the Notes to Financial Statements. |
| (2) | Non-income producing. |
| Country Weightings (Unaudited)† | ||||
United States | 52 | % | ||
Canada | 14 | |||
United Kingdom | 10 | |||
Australia | 5 | |||
Italy | 3 | |||
Netherlands | 3 | |||
Spain | 2 | |||
Other | 11 | |||
Total | 100 | % | ||
† % of total investments as of September 30, 2012 |
| |||
Security abbreviation definitions are located under the Key Investment Terms starting on page 4.
See Notes to Financial Statements
39
Table of Contents
VIRTUS GLOBAL DIVIDEND FUND
SCHEDULE OF INVESTMENTS (Continued)
SEPTEMBER 30, 2012
($ reported in thousands)
The following table provides a summary of inputs used to value the Fund’s investments as of September 30, 2012 (See Security Valuation Note 2A in the Notes to Financial Statements):
| Total Value at September 30, 2012 | Level 1 – Quoted Prices | |||||||
Investments in Securities: | ||||||||
Equity Securities: | ||||||||
Common Stocks | $ | 89,494 | $ | 89,494 | ||||
Short-Term Investments | 3,135 | 3,135 | ||||||
|
|
|
| |||||
Total Investments | $ | 92,629 | $ | 92,629 | ||||
|
|
|
| |||||
There are no Level 2 (significant observable inputs) or Level 3 (significant unobservable inputs) priced securities.
Securities held by the Fund with an end of fiscal period value of $21,272 were transferred from Level 2 into Level 1 based on our valuation procedures for non-U.S. securities.
See Notes to Financial Statements
40
Table of Contents
VIRTUS GLOBAL OPPORTUNITIES FUND
SCHEDULE OF INVESTMENTS
SEPTEMBER 30, 2012
($ reported in thousands)
| SHARES | VALUE | |||||||
| COMMON STOCKS—97.5% | ||||||||
| Consumer Discretionary—17.9% | ||||||||
Amazon.com, Inc. (United States)(2) | 15,043 | $ | 3,826 | |||||
Bureau Veritas SA (France) | 16,100 | 1,653 | ||||||
Chipotle Mexican Grill, Inc. (United States)(2) | 3,940 | 1,251 | ||||||
Las Vegas Sands Corp. (United States) | 65,453 | 3,035 | ||||||
McDonald’s Corp. (United States) | 31,606 | 2,900 | ||||||
Norstar Founders Group Ltd. (Cayman Islands)(2)(3) | 272,000 | 0 | ||||||
Paddy Power plc (Ireland) | 16,516 | 1,222 | ||||||
Persimmon plc (United Kingdom)(2) | 85,804 | 1,051 | ||||||
Sands China Ltd. (Hong Kong) | 446,755 | 1,668 | ||||||
Starbucks Corp. (United States) | 18,500 | 939 | ||||||
|
| |||||||
| 17,545 | ||||||||
|
| |||||||
| Consumer Staples—26.9% | ||||||||
Anheuser-Busch InBev N.V. (Belgium) | 22,229 | 1,890 | ||||||
British American Tobacco plc (United Kingdom) | 95,491 | 4,903 | ||||||
Casey’s General Stores, Inc. (United States) | 17,125 | 979 | ||||||
Coca-Cola Co. (The) (United States) | 123,234 | 4,674 | ||||||
Hindustan Unilever Ltd. (India) | 52,697 | 545 | ||||||
ITC Ltd. (India) | 508,122 | 2,624 | ||||||
Mead Johnson Nutrition Co. (United States) | 18,166 | 1,331 | ||||||
Nestle S.A. Registered Shares (Switzerland) | 35,465 | 2,236 | ||||||
Philip Morris International, Inc. (United States) | 50,623 | 4,553 | ||||||
Unilever N.V. (Netherlands) | 73,852 | 2,613 | ||||||
|
| |||||||
| 26,348 | ||||||||
|
| |||||||
| Energy—2.1% | ||||||||
Core Laboratories N.V. (Netherlands) | 9,232 | 1,122 | ||||||
Enbridge, Inc. (Canada) | 23,807 | 930 | ||||||
|
| |||||||
| 2,052 | ||||||||
|
| |||||||
| Financials—23.0% | ||||||||
Berkshire Hathaway, Inc. Class B (United States)(2) | 19,977 | 1,762 | ||||||
Citigroup, Inc. (United States) | 119,177 | 3,899 | ||||||
Housing Development Finance Corp. (India) | 212,493 | 3,120 | ||||||
Housing Development Finance Corp. Bank Ltd. (India) | 214,545 | 2,559 | ||||||
Housing Development Finance Corp. Bank Ltd. ADR (India) | 11,249 | 423 | ||||||
HSBC Holdings plc (United Kingdom) | 203,028 | 1,880 | ||||||
JPMorgan Chase & Co. (United States) | 89,956 | 3,641 | ||||||
Standard Chartered plc (United Kingdom) | 41,549 | 939 | ||||||
| SHARES | VALUE | |||||||
| Financials—continued | ||||||||
UBS AG Registered Shares (Switzerland)(2) | 163,936 | $ | 1,996 | |||||
Wells Fargo & Co. (United States) | 67,643 | 2,336 | ||||||
|
| |||||||
| 22,555 | ||||||||
|
| |||||||
| Health Care—5.1% | ||||||||
Novo Nordisk A/S Class B (Denmark) | 10,588 | 1,673 | ||||||
Valeant Pharmaceuticals International, Inc. (Canada)(2) | 59,790 | 3,300 | ||||||
|
| |||||||
| 4,973 | ||||||||
|
| |||||||
| Industrials—1.0% | ||||||||
SGS SA Registered Shares (Switzerland) | 466 | 957 | ||||||
|
| |||||||
| Information Technology—16.2% | ||||||||
Apple, Inc. (United States) | 3,908 | 2,607 | ||||||
Baidu, Inc. ADR (China)(2) | 6,592 | 770 | ||||||
Cognizant Technology Solutions Corp. Class A (United States)(2) | 35,543 | 2,485 | ||||||
FactSet Research Systems, Inc. (United States) | 9,175 | 885 | ||||||
MasterCard, Inc. Class A (United States) | 10,658 | 4,812 | ||||||
SAP AG (Germany) | 23,055 | 1,633 | ||||||
Visa, Inc. Class A (United States) | 19,959 | 2,680 | ||||||
|
| |||||||
| 15,872 | ||||||||
|
| |||||||
| Materials—5.3% | ||||||||
Fresnillo plc (United Kingdom) | 51,474 | 1,540 | ||||||
Goldcorp, Inc. (Canada) | 40,431 | 1,856 | ||||||
Newcrest Mining Ltd. (Australia) | 59,872 | 1,810 | ||||||
|
| |||||||
| 5,206 | ||||||||
| TOTAL COMMON STOCKS (Identified Cost $75,797) | 95,508 | |||||||
| TOTAL LONG TERM INVESTMENTS—97.5% | ||||||||
| (Identified Cost $75,797) | 95,508 | |||||||
| SHORT-TERM INVESTMENTS—2.4% | ||||||||
| Money Market Mutual Funds—2.4% | ||||||||
Dreyfus Cash Management Fund – Institutional Shares (seven-day effective yield 0.060%) | 2,357,747 | 2,358 | ||||||
| TOTAL SHORT-TERM INVESTMENTS (Identified Cost $2,358) | 2,358 | |||||||
| TOTAL INVESTMENTS—99.9% | ||||||||
| (Identified Cost $78,155) | 97,866 | (1) | ||||||
Other assets and liabilities, net—0.1% |
| 91 | ||||||
|
| |||||||
| NET ASSETS—100.0% | $ | 97,957 | ||||||
|
| |||||||
Abbreviations:
| ADR | American Depositary Receipt |
Footnote Legend:
| (1) | Federal Income Tax Information: For tax information at September 30, 2012, see Note 11 Federal Income Tax Information in the Notes to Financial Statements. |
| (2) | Non-income producing. |
| (3) | Security valued at fair value as determined in good faith by or under the direction of the Trustees. This security is disclosed as a level 3 security in the disclosure table located after the Schedule of Investments. |
| Country Weightings (Unaudited)† | ||||
United States | 52 | % | ||
United Kingdom | 11 | |||
India | 9 | |||
Canada | 6 | |||
Switzerland | 5 | |||
Netherlands | 4 | |||
Belgium | 2 | |||
Other | 11 | |||
Total | 100 | % | ||
† % of total investments as of September 30, 2012 |
| |||
Security abbreviation definitions are located under the Key Investment Terms starting on page 4.
See Notes to Financial Statements
41
Table of Contents
VIRTUS GLOBAL OPPORTUNITIES FUND
SCHEDULE OF INVESTMENTS (Continued)
SEPTEMBER 30, 2012
($ reported in thousands)
The following table provides a summary of inputs used to value the Fund’s investments as of September 30, 2012 (See Security Valuation Note 2A in the Notes to Financial Statements):
| Total Value at September 30, 2012 | Level 1 – Quoted Prices | Level 3 – Significant Unobservable Inputs | ||||||||||
Investments in Securities: | ||||||||||||
Equity Securities: | ||||||||||||
Common Stocks | $ | 95,508 | $ | 95,508 | $ | 0 | (1) | |||||
Short-Term Investments | 2,358 | 2,358 | — | |||||||||
|
|
|
|
|
| |||||||
Total Investments | $ | 97,866 | $ | 97,866 | $ | 0 | (1) | |||||
|
|
|
|
|
| |||||||
There are no Level 2 (significant observable inputs) priced securities.
| (1) | Includes internally fair valued security currently priced at zero($0). |
Securities held by the Fund with an end of fiscal period value of $26,621 were transferred from Level 2 into Level 1 based on our valuation procedures for non-U.S. securities.
See Notes to Financial Statements
42
Table of Contents
VIRTUS GLOBAL REAL ESTATE SECURITIES FUND
SCHEDULE OF INVESTMENTS
SEPTEMBER 30, 2012
($ reported in thousands)
| SHARES | VALUE | |||||||
| COMMON STOCKS—96.2% | ||||||||
| Australia—8.4% | ||||||||
BGP Holdings plc(2)(3)(4) | 13,566 | $ | 0 | |||||
CFS Retail Property Trust | 67,700 | 136 | ||||||
Dexus Property Group | 342,440 | 337 | ||||||
GPT Group | 60,500 | 213 | ||||||
Westfield Group | 85,950 | 906 | ||||||
Westfield Retail Trust | 89,450 | 268 | ||||||
|
| |||||||
| 1,860 | ||||||||
|
| |||||||
| Canada—6.8% | ||||||||
Allied Properties Real Estate Investment Trust | 7,785 | 253 | ||||||
Brookfield Properties, Inc. | 18,470 | 307 | ||||||
Canadian Real Estate Investment Trust | 5,225 | 223 | ||||||
Cominar Real Estate Investment Trust | 7,295 | 179 | ||||||
First Capital Realty, Inc. | 9,320 | 178 | ||||||
RioCan Real Estate Investment Trust | 13,062 | 368 | ||||||
|
| |||||||
| 1,508 | ||||||||
|
| |||||||
| Finland—0.5% | ||||||||
Citycon OYJ(2) | 5,241 | 16 | ||||||
Citycon OYJ | 29,700 | 89 | ||||||
|
| |||||||
| 105 | ||||||||
|
| |||||||
| France—4.1% | ||||||||
Fonciere Des Regions | 1,104 | 83 | ||||||
Klepierre | 5,520 | 194 | ||||||
Societe Immobiliere de Location Pour L’industrie Et Le Commerce | 455 | 47 | ||||||
Unibail-Rodamco | 2,963 | 590 | ||||||
|
| |||||||
| 914 | ||||||||
|
| |||||||
| Germany—0.9% | ||||||||
GSW Immobilien AG | 5,064 | 188 | ||||||
|
| |||||||
| Hong Kong—4.6% | ||||||||
Hang Lung Properties Ltd. | 36,000 | 123 | ||||||
Hongkong Land Holdings Ltd. | 60,900 | 366 | ||||||
Hysan Development Co. Ltd. | 31,000 | 141 | ||||||
Link (The) | 81,504 | 386 | ||||||
|
| |||||||
| 1,016 | ||||||||
|
| |||||||
| Italy—0.2% | ||||||||
Beni Stabili SpA | 75,478 | 40 | ||||||
|
| |||||||
| Japan—3.1% | ||||||||
AEON Mall Co., Ltd. | 6,670 | 163 | ||||||
Japan Prime Realty Investment Corp. | 58 | 175 | ||||||
Japan Real Estate Investment Corp. | 14 | 141 | ||||||
Nippon Building Fund, Inc. | 20 | 216 | ||||||
|
| |||||||
| 695 | ||||||||
|
| |||||||
| Netherlands—1.4% | ||||||||
Corio N.V. | 3,515 | 149 | ||||||
Eurocommercial Properties N.V. | 4,065 | 154 | ||||||
|
| |||||||
| 303 | ||||||||
|
| |||||||
| SHARES | VALUE | |||||||
| Norway—0.6% | ||||||||
Norwegian Property ASA | 78,775 | $ | 120 | |||||
|
| |||||||
| Singapore—3.2% | ||||||||
CapitaCommercial Trust | 40,000 | 49 | ||||||
CapitaMall Trust | 73,450 | 121 | ||||||
CapitaRetail China Trust | 124,275 | 148 | ||||||
Global Logistic Properties Ltd. | 119,500 | 245 | ||||||
Mapletree Logistics Trust | 160,545 | 147 | ||||||
|
| |||||||
| 710 | ||||||||
|
| |||||||
| Sweden—1.0% | ||||||||
Castellum AB | 10,840 | 147 | ||||||
Fabege AB | 8,300 | 79 | ||||||
|
| |||||||
| 226 | ||||||||
|
| |||||||
| Switzerland—0.2% | ||||||||
PSP Swiss Property AG(2) | 565 | 51 | ||||||
|
| |||||||
| United Kingdom—6.9% | ||||||||
Big Yellow Group plc | 31,628 | 160 | ||||||
British Land Co. plc | 25,600 | 216 | ||||||
Derwent London plc | 3,710 | 117 | ||||||
Great Portland Estates plc | 9,871 | 72 | ||||||
Hammerson plc | 36,720 | 268 | ||||||
Land Securities Group plc | 33,631 | 414 | ||||||
Safestore Holdings plc | 74,726 | 124 | ||||||
SEGRO plc | 44,290 | 162 | ||||||
|
| |||||||
| 1,533 | ||||||||
|
| |||||||
| United States—54.3% | ||||||||
Alexandria Real Estate Equities, Inc. | 681 | 50 | ||||||
American Campus Communities, Inc. | 2,600 | 114 | ||||||
AvalonBay Communities, Inc. | 3,895 | 530 | ||||||
BioMed Realty Trust, Inc. | 13,218 | 247 | ||||||
Boston Properties, Inc. | 5,328 | 589 | ||||||
BRE Properties, Inc. | 1,891 | 89 | ||||||
Camden Property Trust | 5,210 | 336 | ||||||
Campus Crest Communities, Inc. | 140 | 1 | ||||||
CubeSmart | 3,187 | 41 | ||||||
DCT Industrial Trust, Inc. | 27,923 | 181 | ||||||
DDR Corp. | 16,184 | 249 | ||||||
Digital Realty Trust, Inc. | 2,785 | 195 | ||||||
Duke Realty Corp. | 6,930 | 102 | ||||||
EastGroup Properties, Inc. | 1,700 | 90 | ||||||
Equity Lifestyle Properties, Inc. | 2,123 | 145 | ||||||
Equity Residential | 10,494 | 604 | ||||||
Essex Property Trust, Inc. | 2,319 | 344 | ||||||
Extra Space Storage, Inc. | 13,699 | 455 | ||||||
General Growth Properties, Inc. | 16,119 | 314 | ||||||
HCP, Inc. | 6,479 | 288 | ||||||
Health Care REIT, Inc. | 7,502 | 433 | ||||||
Host Hotels & Resorts, Inc. | 17,908 | 287 | ||||||
Kilroy Realty Corp. | 9,963 | 446 | ||||||
Kimco Realty Corp. | 12,685 | 257 | ||||||
LaSalle Hotel Properties | 8,115 | 217 | ||||||
Macerich Co. (The) | 6,273 | 359 | ||||||
Prologis, Inc. | 12,831 | 449 | ||||||
Public Storage | 4,760 | 662 | ||||||
Regency Centers Corp. | 820 | 40 | ||||||
Simon Property Group, Inc. | 10,181 | 1,546 | ||||||
| SHARES | VALUE | |||||||
| United States—continued | ||||||||
SL Green Realty Corp. | 4,031 | $ | 323 | |||||
Tanger Factory Outlet Centers | 7,700 | 249 | ||||||
Taubman Centers, Inc. | 5,805 | 445 | ||||||
UDR, Inc. | 6,473 | 161 | ||||||
Ventas, Inc. | 9,722 | 605 | ||||||
Vornado Realty Trust | 3,875 | 314 | ||||||
Weingarten Realty Investors | 8,670 | 244 | ||||||
|
| |||||||
| 12,001 | ||||||||
TOTAL COMMON STOCKS (Identified Cost $18,695) |
| 21,270 | ||||||
| TOTAL LONG TERM INVESTMENTS—96.2% (Identified Cost $18,695) | 21,270 | |||||||
| SHORT-TERM INVESTMENTS—4.1% | ||||||||
| Money Market Mutual Funds—4.1% | ||||||||
Dreyfus Cash Management Fund – Institutional Shares (seven-day effective yield 0.060%) | 900,973 | 901 | ||||||
| TOTAL SHORT-TERM INVESTMENTS (Identified Cost $901) | 901 | |||||||
| TOTAL INVESTMENTS—100.3% (Identified Cost $19,596) | 22,171 | (1) | ||||||
Other assets and liabilities, net—(0.3)% |
| (57 | ) | |||||
|
| |||||||
| NET ASSETS—100.0% | $ | 22,114 | ||||||
|
| |||||||
Abbreviations:
| REIT | Real Estate Investment Trust |
Footnote Legend:
| (1) | Federal Income Tax Information: For tax information at September 30, 2012, see Note 11 Federal Income Tax Information in the Notes to Financial Statements. |
| (2) | Non-income producing. |
| (3) | Illiquid security. |
| (4) | Security valued at fair value as determined in good faith by or under the direction of the Trustees. This security is disclosed as a level 3 security in the disclosure table located after the Schedule of Investments. |
| Country Weightings (Unaudited)† | ||||
United States | 58 | % | ||
Australia | 8 | |||
Canada | 7 | |||
United Kingdom | 7 | |||
Hong Kong | 5 | |||
France | 4 | |||
Singapore | 3 | |||
Other | 8 | |||
Total | 100 | % | ||
† % of total investments as of September 30, 2012 |
| |||
Security abbreviation definitions are located under the Key Investment Terms starting on page 4.
See Notes to Financial Statements
43
Table of Contents
VIRTUS GLOBAL REAL ESTATE SECURITIES FUND
SCHEDULE OF INVESTMENTS (Continued)
SEPTEMBER 30, 2012
($ reported in thousands)
The following table provides a summary of inputs used to value the Fund’s investments as of September 30, 2012 (See Security Valuation Note 2A in the Notes to Financial Statements):
| Total Value at September 30, 2012 | Level 1 – Quoted Prices | Level 2 – Significant Observable Inputs | Level 3 – Significant Unobservable Inputs | |||||||||||||
Investments in Securities: | ||||||||||||||||
Equity Securities: | ||||||||||||||||
Common Stocks | $ | 21,270 | $ | 21,254 | $ | 16 | $ | 0 | (1) | |||||||
Short-Term Investments | 901 | 901 | — | — | ||||||||||||
|
|
|
|
|
|
|
| |||||||||
Total Investments | $ | 22,171 | $ | 22,155 | $ | 16 | $ | 0 | (1) | |||||||
|
|
|
|
|
|
|
| |||||||||
| (1) | Includes internally fair valued security currently priced at zero($0). |
Securities held by the Fund with an end of fiscal period value of $6,961 were transferred from Level 2 into Level 1 based on our valuation procedures for non-U.S. securities.
See Notes to Financial Statements
44
Table of Contents
VIRTUS GREATER ASIA ex JAPAN OPPORTUNITIES FUND
SCHEDULE OF INVESTMENTS
SEPTEMBER 30, 2012
($ reported in thousands)
| SHARES | VALUE | |||||||
| COMMON STOCKS—97.9% | ||||||||
| Consumer Discretionary—16.6% | ||||||||
BEC World plc (Thailand) | 33,300 | $ | 83 | |||||
Genting Bhd (Malaysia) | 33,900 | 97 | ||||||
Genting Malaysia Bhd (Malaysia) | 107,500 | 123 | ||||||
Jollibee Foods Corp. (Philippines) | 18,500 | 45 | ||||||
Jubilant Foodworks Ltd. (India)(2) | 7,700 | 200 | ||||||
Kangwon Land, Inc. (South Korea) | 2,260 | 51 | ||||||
L’Occitane International SA (Hong Kong) | 53,559 | 141 | ||||||
Parkson Retail Asia Ltd. (Singapore)(2) | 29,600 | 35 | ||||||
SA International Holdings Ltd. (Cayman Islands) | 115,525 | 79 | ||||||
Sands China Ltd. (Hong Kong) | 47,264 | 176 | ||||||
Super Retail Group Ltd. (Australia) | 13,320 | 108 | ||||||
Television Broadcasts Ltd. (Hong Kong) | 10,722 | 79 | ||||||
Titan Industries Ltd. (India) | 23,400 | 116 | ||||||
Wynn Macau Ltd. (Hong Kong) | 55,103 | 149 | ||||||
|
| |||||||
| 1,482 | ||||||||
|
| |||||||
| Consumer Staples—35.2% | ||||||||
British American Tobacco Bangldesh Co., Ltd. (Bangladesh) | 17,350 | 158 | ||||||
British American Tobacco Bhd (Malaysia) | 2,900 | 57 | ||||||
Ceylon Tobacco Co., plc (Sri Lanka) | 7,900 | 43 | ||||||
Coca-Cola Amatil Ltd. (Australia) | 10,645 | 150 | ||||||
Colgate Palmolive India Ltd. (India) | 3,000 | 69 | ||||||
Dabur India Ltd. (India) | 29,753 | 72 | ||||||
Dairy Farm International Holdings Ltd. (Hong Kong) | 8,250 | 92 | ||||||
Emami Ltd. (India)(2) | 10,950 | 104 | ||||||
GlaxoSmithKline Consumer Healthcare Ltd. (India) | 1,200 | 68 | ||||||
Gudang Garam tbk PT (Indonesia) | 10,957 | 53 | ||||||
Guinness Anchor Bhd (Malaysia) | 40,135 | 200 | ||||||
Hengan International Group Co., Ltd. (China) | 8,613 | 81 | ||||||
Hindustan Unilever Ltd. (India) | 25,777 | 267 | ||||||
ITC Ltd. (India) | 79,209 | 409 | ||||||
LG Household & Health Care Ltd. (South Korea) | 294 | 168 | ||||||
Marico Bangladesh Ltd. (Bangladesh) | 13,050 | 61 | ||||||
Nestle India Ltd. (India) | 2,708 | 226 | ||||||
Nestle Malaysia Bhd (Malaysia) | 7,100 | 143 | ||||||
Nestle Pakistan Ltd. (Pakistan) | 2,214 | 98 | ||||||
Orion Corp. (South Korea) | 88 | 77 | ||||||
Puregold Price Club, Inc. (Philippines) | 116,800 | 83 | ||||||
Tingyi Cayman Islands Holding Corp. (Cayman Islands) | 14,651 | 44 | ||||||
Tsingtao Brewery Co., Ltd. (China) | 21,083 | 116 | ||||||
Unilever Indonesia tbk PT (Indonesia) | 49,197 | 134 | ||||||
Unilever Pakistan Ltd. (Pakistan) | 1,139 | 117 | ||||||
Want Want China Holdings Ltd. (China) | 36,065 | 46 | ||||||
|
| |||||||
| 3,136 | ||||||||
|
| |||||||
| SHARES | VALUE | |||||||
| Financials—19.9% | ||||||||
Bangkok Bank plc (Thailand) | 14,000 | $ | 91 | |||||
Commercial Bank of Ceylon plc (Sri Lanka) | 40,180 | 36 | ||||||
Delta Brac Housing Finance Corp., Ltd. (Bangladesh) | 69,000 | 58 | ||||||
Global Logistic Properties Ltd. (Singapore) | 59,600 | 122 | ||||||
Housing Development Finance Corp. (India) | 28,559 | 419 | ||||||
Housing Development Finance Corp. Bank Ltd. (India) | 31,655 | 378 | ||||||
HSBC Holdings plc (United Kingdom) | 22,503 | 212 | ||||||
Jammu & Kashmir Bank Ltd. (India)(2) | 2,900 | 51 | ||||||
Malayan Banking Bhd (Malaysia) | 42,400 | 125 | ||||||
Public Bank Bhd (Malaysia) | 25,100 | 118 | ||||||
Standard Chartered plc (United Kingdom) | 6,901 | 159 | ||||||
|
| |||||||
| 1,769 | ||||||||
|
| |||||||
| Health Care—3.8% | ||||||||
Cipla Ltd. (India) | 13,296 | 96 | ||||||
GlaxoSmithKline Pharmaceuticals Ltd. (India) | 1,100 | 41 | ||||||
Kalbe Farma tbk PT (Indonesia) | 228,300 | 112 | ||||||
Sun Pharmaceutical Industries Ltd. (India) | 6,386 | 84 | ||||||
|
| |||||||
| 333 | ||||||||
|
| |||||||
| Industrials—7.0% | ||||||||
Jardine Matheson Holdings Ltd. (Hong Kong) | 1,618 | 92 | ||||||
Jardine Strategic Holdings Ltd. (Bermuda) | 1,706 | 58 | ||||||
Jasa Marga tbk PT (Indonesia) | 103,800 | 64 | ||||||
Keells (John) Holdings plc (Sri Lanka) | 100,733 | 178 | ||||||
S1 Corp. (South Korea) | 640 | 39 | ||||||
SM Investments Corp. (Philippines) | 3,170 | 56 | ||||||
Taiwan Secom Co., Ltd. (Taiwan) | 34,246 | 75 | ||||||
UGL Ltd. (Australia) | 5,400 | 59 | ||||||
|
| |||||||
| 621 | ||||||||
|
| |||||||
| Information Technology—4.1% | ||||||||
Baidu, Inc. ADR (China)(2) | 2,185 | 255 | ||||||
Tata Consultancy Services Ltd. (India) | 4,500 | 111 | ||||||
|
| |||||||
| 366 | ||||||||
|
| |||||||
| Materials—3.6% | ||||||||
Asian Paints Ltd. (India) | 1,100 | 82 | ||||||
Newcrest Mining Ltd. (Australia) | 5,633 | 170 | ||||||
Semen Gresik (Persero) tbk PT (Indonesia) | 47,286 | 72 | ||||||
|
| |||||||
| 324 | ||||||||
|
| |||||||
| Telecommunication Services—1.7% | ||||||||
China Mobile Ltd. (China) | 13,800 | 153 | ||||||
|
| |||||||
| SHARES | VALUE | |||||||
| Utilities—6.0% | ||||||||
Power Assets Holdings Ltd. (Hong Kong) | 48,969 | $ | 416 | |||||
Power Grid Corp. of India Ltd. (India)(2) | 53,550 | 122 | ||||||
|
| |||||||
| 538 | ||||||||
| TOTAL COMMON STOCKS (Identified Cost $6,639) | 8,722 | |||||||
| TOTAL LONG TERM INVESTMENTS—97.9% (Identified Cost $6,639) | 8,722 | |||||||
| SHORT-TERM INVESTMENTS—0.4% | ||||||||
| Money Market Mutual Funds—0.4% | ||||||||
Dreyfus Cash Management Fund – Institutional Shares (seven-day effective yield 0.060%) | 38,864 | 39 | ||||||
| TOTAL SHORT-TERM INVESTMENTS (Identified Cost $39) | 39 | |||||||
| TOTAL INVESTMENTS—98.3% (Identified Cost $6,678) | 8,761 | (1) | ||||||
Other assets and liabilities, net—1.7% |
| 149 | ||||||
|
| |||||||
| NET ASSETS—100.0% | $ | 8,910 | ||||||
|
| |||||||
Abbreviations:
| ADR | American Depositary Receipt |
Footnote Legend:
| (1) | Federal Income Tax Information: For tax information at September 30, 2012, see Note 8 Federal Income Tax Information in the Notes to Financial Statements. |
| (2) | Non-income producing. |
| Country Weightings (Unaudited)† | ||||
India | 33 | % | ||
Hong Kong | 13 | |||
Malaysia | 10 | |||
China | 7 | |||
Australia | 6 | |||
Indonesia | 5 | |||
United Kingdom | 4 | |||
Other | 22 | |||
Total | 100 | % | ||
† % of total investments as of September 30, 2012 |
| |||
Security abbreviation definitions are located under the Key Investment Terms starting on page 4.
See Notes to Financial Statements
45
Table of Contents
VIRTUS GREATER ASIA ex JAPAN OPPORTUNITIES FUND
SCHEDULE OF INVESTMENTS (Continued)
SEPTEMBER 30, 2012
($ reported in thousands)
The following table provides a summary of inputs used to value the Fund’s investments as of September 30, 2012 (See Security Valuation Note 2A in the Notes to Financial Statements):
| Total Value at September 30, 2012 | Level 1 – Quoted Prices | |||||||
Investments in Securities: | ||||||||
Equity Securities: | ||||||||
Common Stocks | $ | 8,722 | $ | 8,722 | ||||
Short-Term Investments | 39 | 39 | ||||||
|
|
|
| |||||
Total Investments | $ | 8,761 | $ | 8,761 | ||||
|
|
|
| |||||
There are no Level 2 (significant observable inputs) or Level 3 (significant unobservable inputs) priced securities.
Securities held by the Fund with an end of fiscal period value of $5,542 were transferred from Level 2 into Level 1 based on our valuation procedures for non-U.S. securities.
See Notes to Financial Statements
46
Table of Contents
VIRTUS GREATER EUROPEAN OPPORTUNITIES FUND
SCHEDULE OF INVESTMENTS
SEPTEMBER 30, 2012
($ reported in thousands)
| SHARES | VALUE | |||||||
| COMMON STOCKS—97.4% | ||||||||
| Consumer Discretionary—17.2% | ||||||||
Barrat Developments plc (United Kingdom)(2) | 55,275 | $ | 151 | |||||
Bureau Veritas SA (France) | 3,135 | 322 | ||||||
DKSH Holding AG (Switzerland)(2) | 1,450 | 91 | ||||||
Domino’s Pizza plc (United Kingdom) | 14,532 | 125 | ||||||
Luxottica Group SpA (Italy) | 3,350 | 118 | ||||||
Paddy Power plc (Ireland) | 2,846 | 211 | ||||||
Pearson plc (United Kingdom)(2) | 4,489 | 88 | ||||||
Persimmon plc (United Kingdom)(2) | 5,815 | 71 | ||||||
|
| |||||||
| 1,177 | ||||||||
|
| |||||||
| Consumer Staples—30.3% | ||||||||
Anheuser-Busch InBev N.V. (Belgium) | 3,041 | 259 | ||||||
British American Tobacco plc (United Kingdom) | 5,507 | 283 | ||||||
Diageo plc (United Kingdom) | 6,952 | 195 | ||||||
Groupe Danone S.A. (France) | 2,148 | 132 | ||||||
Imperial Tobacco Group plc (United Kingdom) | 2,221 | 82 | ||||||
L’Oreal S.A. (France) | 550 | 68 | ||||||
Lindt & Spruengli AG (Switzerland)(2) | 10 | 32 | ||||||
Nestle S.A. Registered Shares (Switzerland) | 3,659 | 231 | ||||||
Pernod-Ricard S.A. (France) | 735 | 82 | ||||||
Philip Morris International, Inc. (United States) | 2,594 | 233 | ||||||
SABMiller plc (United Kingdom) | 3,521 | 155 | ||||||
Unilever N.V. (Netherlands) | 9,169 | 324 | ||||||
|
| |||||||
| 2,076 | ||||||||
|
| |||||||
| Energy—4.5% | ||||||||
Core Laboratories N.V. (Netherlands) | 568 | 69 | ||||||
Royal Dutch Shell plc A Shares (United Kingdom) | 3,055 | 106 | ||||||
Statoil ASA (Norway) | 5,250 | 135 | ||||||
|
| |||||||
| 310 | ||||||||
|
| |||||||
| Financials—12.6% | ||||||||
BNP Paribas SA (France) | 2,975 | 141 | ||||||
Exor SpA (Italy) | 3,034 | 76 | ||||||
HSBC Holdings plc (United Kingdom) | 21,975 | 203 | ||||||
Reinet Investments SCA (Luxembourg)(2) | 4,535 | 85 | ||||||
Standard Chartered plc (United Kingdom) | 5,125 | 116 | ||||||
UBS AG Registered Shares (Switzerland)(2) | 19,771 | 241 | ||||||
|
| |||||||
| 862 | ||||||||
|
| |||||||
| SHARES | VALUE | |||||||
| Health Care—7.9% | ||||||||
Cie Generale D’optique Essilor International SA (France) | 841 | $ | 79 | |||||
Fresenius Medical Care AG & Co. KGaA (Germany) | 1,839 | 135 | ||||||
GlaxoSmithKline plc (United Kingdom) | 885 | 20 | ||||||
Novartis AG Registered Shares (Switzerland) | 2,154 | 132 | ||||||
Novo Nordisk A/S Class B (Denmark) | 1,114 | 176 | ||||||
|
| |||||||
| 542 | ||||||||
|
| |||||||
| Industrials—11.0% | ||||||||
Andritz AG (Austria) | 1,242 | 70 | ||||||
Brenntag AG (Germany) | 550 | 70 | ||||||
Bunzl plc (United Kingdom) | 3,626 | 65 | ||||||
Indutrade AB (Sweden) | 3,418 | 101 | ||||||
Kuehne & Nagel International AG (Switzerland) | 621 | 70 | ||||||
Prosegur Cia de Seguridad SA (Spain) | 15,195 | 70 | ||||||
Rolls-Royce Holdings plc (United Kingdom) | 9,737 | 133 | ||||||
SGS SA (Switzerland) | 85 | 175 | ||||||
|
| |||||||
| 754 | ||||||||
|
| |||||||
| Information Technology—8.4% | ||||||||
Accenture plc Class A (Ireland) | 2,637 | 185 | ||||||
Amadeus IT Holding SA A Shares (Spain) | 3,100 | 72 | ||||||
Domino Printing Sciences plc (United Kingdom) | 7,973 | 71 | ||||||
SAP AG (Germany) | 2,494 | 177 | ||||||
Wirecard AG (Germany)(2) | 3,074 | 70 | ||||||
|
| |||||||
| 575 | ||||||||
|
| |||||||
| Materials—4.5% | ||||||||
Air Liquide SA (France) | 836 | 104 | ||||||
Fresnillo plc (United Kingdom) | 5,686 | 170 | ||||||
Novozymes A/S Class B (Denmark) | 1,325 | 36 | ||||||
|
| |||||||
| 310 | ||||||||
|
| |||||||
| Telecommunication Services—1.0% | ||||||||
Millicom International Cellular SA (Luxembourg) | 775 | 73 | ||||||
| TOTAL COMMON STOCKS (Identified Cost $4,963) | 6,679 | |||||||
| TOTAL LONG TERM INVESTMENTS—97.4% | ||||||||
| (Identified cost $4,963) | 6,679 | |||||||
| SHARES | VALUE | |||||||
| SHORT-TERM INVESTMENTS—2.4% | ||||||||
| Money Market Mutual Funds—2.4% | ||||||||
Dreyfus Cash Management Fund – Institutional Shares (seven-day effective yield 0.060%) | 165,994 | $ | 166 | |||||
| TOTAL SHORT-TERM INVESTMENTS (Identified Cost $166) | 166 | |||||||
| TOTAL INVESTMENTS—99.8% | ||||||||
| (Identified Cost $5,129) | 6,845 | (1) | ||||||
Other assets and liabilities, net—0.2% |
| 10 | ||||||
|
| |||||||
| NET ASSETS—100.0% | $ | 6,855 | ||||||
|
| |||||||
Footnote Legend:
| (1) | Federal Income Tax Information: For tax information at September 30, 2012, see Note 8 Federal Income Tax Information in the Notes to Financial Statements. |
| (2) | Non-income producing. |
| Country Weightings (Unaudited)† | ||||
United Kingdom | 30 | % | ||
Switzerland | 14 | |||
France | 13 | |||
Germany | 7 | |||
Ireland | 6 | |||
Netherlands | 6 | |||
United States | 6 | |||
Other | 18 | |||
Total | 100 | % | ||
† % of total investments as of September 30, 2012 |
| |||
Security abbreviation definitions are located under the Key Investment Terms starting on page 4.
See Notes to Financial Statements
47
Table of Contents
VIRTUS GREATER EUROPEAN OPPORTUNITIES FUND
SCHEDULE OF INVESTMENT (Continued)
SEPTEMBER 30, 2012
($ reported in thousands)
The following table provides a summary of inputs used to value the Fund’s investments as of September 30, 2012 (See Security Valuation Note 2A in the Notes to Financial Statements):
| Total Value at September 30, 2012 | Level 1 – Quoted Prices | |||||||
Equity Securities: | ||||||||
Common Stocks | $ | 6,679 | $ | 6,679 | ||||
Short-Term Investments | 166 | 166 | ||||||
|
|
|
| |||||
Total Investments | $ | 6,845 | $ | 6,845 | ||||
|
|
|
| |||||
There are no Level 2 (significant observable inputs) or Level 3 (significant unobservable inputs) priced securities.
Securities held by the Fund with an end of fiscal period value of $4,131 were transferred from Level 2 into Level 1 based on our valuation procedures for non-U.S. securities.
See Notes to Financial Statements
48
Table of Contents
VIRTUS INTERNATIONAL EQUITY FUND
SCHEDULE OF INVESTMENTS
SEPTEMBER 30, 2012
($ reported in thousands)
| SHARES | VALUE | |||||||
| COMMON STOCKS—95.7% | ||||||||
| Consumer Discretionary—5.4% | ||||||||
adidas AG (Germany) | 3,780 | $ | 310 | |||||
British Sky Broadcasting Group plc (United Kingdom) | 23,400 | 281 | ||||||
Reed Elsevier N.V. (Netherlands) | 35,800 | 479 | ||||||
Sumitomo Rubber Industries Ltd. (Japan) | 31,900 | 379 | ||||||
|
| |||||||
| 1,449 | ||||||||
|
| |||||||
| Consumer Staples—10.4% | ||||||||
British American Tobacco plc (United Kingdom) | 5,300 | 272 | ||||||
Colruyt SA (Belgium) | 11,040 | 481 | ||||||
Nestle S.A. Registered Shares (Switzerland) | 13,010 | 820 | ||||||
Swedish Match AB (Sweden) | 5,780 | 234 | ||||||
Tesco plc (United Kingdom) | 57,400 | 308 | ||||||
Unilever N.V. (Netherlands) | 8,172 | 289 | ||||||
Woolworths Ltd. (Australia) | 12,120 | 361 | ||||||
|
| |||||||
| 2,765 | ||||||||
|
| |||||||
| Energy—11.2% | ||||||||
BP plc (United Kingdom) | 41,300 | 291 | ||||||
CNOOC Ltd. (China) | 226,000 | 464 | ||||||
Royal Dutch Shell plc A Shares (United Kingdom) | 14,360 | 496 | ||||||
Royal Dutch Shell plc B Shares (United Kingdom) | 10,900 | 387 | ||||||
Sakari Resources Ltd. (Singapore) | 157,500 | 240 | ||||||
Total SA (France) | 14,770 | 733 | ||||||
Woodside Petroleum Ltd. (Australia) | 10,710 | 368 | ||||||
|
| |||||||
| 2,979 | ||||||||
|
| |||||||
| Financials—8.0% | ||||||||
Legal & General Group plc (United Kingdom) | 160,000 | 341 | ||||||
Malayan Banking Bhd (Malaysia) | 139,545 | 411 | ||||||
QBE Insurance Group Ltd. (Australia) | 30,780 | 414 | ||||||
Tokyu REIT, Inc. (Japan) | 59 | 304 | ||||||
United Overseas Bank Ltd. (Singapore) | 19,200 | 307 | ||||||
Zurich Financial Services AG (Switzerland)(2) | 1,470 | 366 | ||||||
|
| |||||||
| 2,143 | ||||||||
|
| |||||||
| Health Care—10.8% | ||||||||
GlaxoSmithKline plc (United Kingdom) | 16,000 | 369 | ||||||
Novartis AG Registered Shares (Switzerland) | 11,190 | 685 | ||||||
Roche Holding AG (Switzerland) | 4,170 | 779 | ||||||
Sanofi (France) | 6,060 | 516 | ||||||
Teva Pharmaceutical Industries Ltd. (Israel) | 12,917 | 524 | ||||||
|
| |||||||
| 2,873 | ||||||||
|
| |||||||
| SHARES | VALUE | |||||||
| Industrials—13.6% | ||||||||
Brambles Ltd. (Australia) | 62,000 | $ | 451 | |||||
ComfortDelgro Corp., Ltd. (Singapore) | 226,000 | 316 | ||||||
Deutsche Post AG Registered Shares (Germany) | 14,987 | 293 | ||||||
Kone Oyj (Finland) | 3,430 | 237 | ||||||
Koninklijke Vopak N.V. (Netherlands) | 4,550 | 320 | ||||||
Legrand SA (France) | 10,870 | 410 | ||||||
Makita Corp. (Japan) | 11,700 | 454 | ||||||
Mitsubishi Electric Corp. (Japan) | 49,000 | 362 | ||||||
Panalpina Welttransport Holding AG Registered Shares (Switzerland) | 1,980 | 189 | ||||||
Schindler Holding AG (Switzerland) | 1,356 | 167 | ||||||
Toyota Tsusho Corp. (Japan) | 20,300 | 434 | ||||||
|
| |||||||
| 3,633 | ||||||||
|
| |||||||
| Information Technology—9.7% | ||||||||
Advantech Co., Ltd. (Taiwan) | 63,000 | 230 | ||||||
ASM Pacific Technology Ltd. (Hong Kong) | 33,200 | 393 | ||||||
Computershare Ltd. (Australia) | 41,800 | 360 | ||||||
MediaTek, Inc. (Taiwan) | 24,000 | 253 | ||||||
SAP AG (Germany) | 6,610 | 468 | ||||||
Venture Corp., Ltd. (Singapore) | 40,000 | 262 | ||||||
VTech Holdings Ltd. (Hong Kong) | 29,200 | 358 | ||||||
Wincor Nixdorf AG (Germany) | 7,072 | 277 | ||||||
|
| |||||||
| 2,601 | ||||||||
|
| |||||||
| Materials—9.8% | ||||||||
Air Liquide SA (France) | 3,730 | 462 | ||||||
CRH plc (Ireland)(2) | 15,000 | 289 | ||||||
Fuchs Petrolub AG (Germany) | 6,427 | 407 | ||||||
Givaudan SA Registered Shares (Switzerland)(2) | 172 | 163 | ||||||
Lafarge Malayan Cement BHD (Malaysia) | 79,800 | 233 | ||||||
Rio Tinto Ltd. (Australia) | 3,330 | 184 | ||||||
Shin-Etsu Chemical Co., Ltd. (Japan) | 6,900 | 388 | ||||||
Symrise AG (Germany) | 9,044 | 306 | ||||||
Syngenta AG Registered Shares (Switzerland) | 470 | 176 | ||||||
|
| |||||||
| 2,608 | ||||||||
|
| |||||||
| Telecommunication Services—11.8% | ||||||||
Axiata Group BHD (Malaysia) | 179,800 | 382 | ||||||
Belgacom SA (Belgium) | 9,800 | 299 | ||||||
Bezeq The Israeli Telecommunication Corp., Ltd. (Israel) | 202,246 | 235 | ||||||
China Mobile Ltd. (China) | 33,500 | 371 | ||||||
Chunghwa Telecom Co., Ltd. (Taiwan) | 87,600 | 281 | ||||||
Koninklijke KPN N.V. (Netherlands) | 52,750 | 403 | ||||||
StarHub Ltd. (Singapore) | 59,900 | 181 | ||||||
Telenor ASA (Norway) | 14,260 | 278 | ||||||
| SHARES | VALUE | |||||||
| Telecommunication Services—continued | ||||||||
Telstra Corp., Ltd. (Australia) | 58,000 | $ | 236 | |||||
Vodafone Group plc (United Kingdom) | 169,700 | 482 | ||||||
|
| |||||||
| 3,148 | ||||||||
|
| |||||||
| Utilities—5.0% | ||||||||
National Grid plc (United Kingdom) | 27,200 | 300 | ||||||
Power Assets Holdings Ltd. (Hong Kong) | 49,000 | 416 | ||||||
Scottish & Southern Energy plc (United Kingdom) | 14,000 | 315 | ||||||
United Utilities Group plc (United Kingdom) | 27,200 | 314 | ||||||
|
| |||||||
| 1,345 | ||||||||
| TOTAL COMMON STOCKS (Identified Cost $24,036) | 25,544 | |||||||
| TOTAL LONG TERM INVESTMENTS—95.7% | ||||||||
| (Identified Cost $24,036) | 25,544 | (3) | ||||||
| SHORT-TERM INVESTMENTS—3.9% | ||||||||
| Money Market Mutual Funds—3.9% | ||||||||
Dreyfus Cash Management Fund – Institutional Shares (seven-day effective yield 0.060%) | 1,043,140 | 1,043 | ||||||
| TOTAL SHORT-TERM INVESTMENTS (Identified Cost $1,043) | 1,043 | |||||||
| TOTAL INVESTMENTS—99.6% (Identified Cost $25,079) | 26,587 | (1) | ||||||
Other assets and liabilities, net—0.4% |
| 119 | ||||||
|
| |||||||
| NET ASSETS—100.0% | $ | 26,706 | ||||||
|
| |||||||
Abbreviations:
| REIT | Real Estate Investment Trust |
Footnote Legend:
| (1) | Federal Income Tax Information: For tax information at September 30, 2012, see Note 11 Federal Income Tax Information in the Notes to Financial Statements. |
| (2) | Non-income producing. |
| (3) | A portion of the Fund’s assets have been segregated for forward currency contracts. |
Security abbreviation definitions are located under the Key Investment Terms starting on page 4.
See Notes to Financial Statements
49
Table of Contents
VIRTUS INTERNATIONAL EQUITY FUND
SCHEDULE OF INVESTMENTS (Continued)
SEPTEMBER 30, 2012
($ reported in thousands)
| Country Weightings (Unaudited)† | ||||
United Kingdom | 16 | % | ||
Switzerland | 12 | |||
Australia | 9 | |||
Japan | 9 | |||
France | 8 | |||
Germany | 8 | |||
Netherlands | 5 | |||
Other | 33 | |||
Total | 100 | % | ||
† % of total investments as of September 30, 2012 |
| |||
At September 30, 2012, the Fund had entered into forward currency contracts as follows (reported in 000’s):
| Contracts to Receive | In Exchange for | Counterparty | Settlement Date | Value | Unrealized Appreciation (Depreciation) | |||||||||||||||
| AUD | 2,300 | USD | 2,380 | State Street Bank and Trust Co. | 10/15/12 | $ | 2,382 | $ | 2 | |||||||||||
| AUD | 100 | USD | 102 | State Street Bank and Trust Co. | 10/15/12 | $ | 103 | $ | 1 | |||||||||||
|
| |||||||||||||||||||
| 3 | ||||||||||||||||||||
|
| |||||||||||||||||||
| Contracts to Sell | In Exchange for | Counterparty | Settlement Date | Value | Unrealized Appreciation (Depreciation) | |||||||||||||||
| AUD | 1,800 | USD | 1,808 | State Street Bank and Trust Co. | 10/15/12 | $ | 1,864 | $ | (56 | ) | ||||||||||
| AUD | 600 | USD | 617 | State Street Bank and Trust Co. | 10/15/12 | $ | 621 | $ | (4 | ) | ||||||||||
| AUD | 2,300 | USD | 2,350 | State Street Bank and Trust Co. | 3/20/13 | $ | 2,352 | $ | (2 | ) | ||||||||||
|
| |||||||||||||||||||
| (62 | ) | |||||||||||||||||||
|
| |||||||||||||||||||
| $ | (59 | ) | ||||||||||||||||||
|
| |||||||||||||||||||
AUD Australian Dollar | USD United States Dollar |
The following table provides a summary of inputs used to value the Fund’s investments as of September 30, 2012 (See Security Valuation Note 2A in the Notes to Financial Statements):
| Total Value at September 30, 2012 | Level 1 – Quoted Prices | Level 2 – Significant Observable Inputs | ||||||||||
Investments in Securities: | ||||||||||||
Equity Securities: | ||||||||||||
Common Stocks | $ | 25,544 | $ | 25,544 | $ | — | ||||||
Short-term Investments | 1,043 | 1,043 | — | |||||||||
|
|
|
|
|
| |||||||
Total Investments | $ | 26,587 | $ | 26,587 | $ | — | ||||||
|
|
|
|
|
| |||||||
Other Financial Instruments: | ||||||||||||
Forward Currency Contracts* | $ | (59 | ) | $ | — | $ | (59 | ) | ||||
|
|
|
|
|
| |||||||
There are no Level 3 (significant unobservable inputs) priced securities.
Securities held by the Fund with an end of fiscal period value of $24,193 were transferred from Level 2 into Level 1 based on our valuation procedures for non-U.S. securities.
| * | Valued at the unrealized appreciation (depreciation) on the investment. |
See Notes to Financial Statements
50
Table of Contents
VIRTUS INTERNATIONAL REAL ESTATE SECURITIES FUND
SCHEDULE OF INVESTMENTS
SEPTEMBER 30, 2012
($ reported in thousands)
| SHARES | VALUE | |||||||
| COMMON STOCKS—97.0% | ||||||||
| Australia—19.4% | ||||||||
BGP Holdings plc(2)(3)(4) | 588,920 | $ | 0 | |||||
CFS Retail Property Trust | 228,552 | 458 | ||||||
Dexus Property Group | 1,177,115 | 1,160 | ||||||
GPT Group | 211,000 | 744 | ||||||
Westfield Group | 301,473 | 3,177 | ||||||
Westfield Retail Trust | 321,173 | 963 | ||||||
|
| |||||||
| 6,502 | ||||||||
|
| |||||||
| Canada—15.0% | ||||||||
Allied Properties Real Estate Investment Trust | 25,315 | 823 | ||||||
Brookfield Properties, Inc. | 63,450 | 1,055 | ||||||
Canadian Real Estate Investment Trust | 16,995 | 726 | ||||||
Cominar Real Estate Investment Trust | 23,965 | 588 | ||||||
First Capital Realty, Inc. | 30,885 | 590 | ||||||
RioCan Real Estate Investment Trust | 45,050 | 1,268 | ||||||
|
| |||||||
| 5,050 | ||||||||
|
| |||||||
| Finland—0.9% | ||||||||
Citycon OYJ(2) | 14,646 | 44 | ||||||
Citycon OYJ | 83,000 | 248 | ||||||
|
| |||||||
| 292 | ||||||||
|
| |||||||
| France—10.3% | ||||||||
Fonciere Des Regions | 3,960 | 298 | ||||||
Klepierre | 18,606 | 653 | ||||||
Societe Immobiliere de Location Pour L’industrie Et Le Commerce | 3,047 | 315 | ||||||
Unibail-Rodamco | 10,915 | 2,175 | ||||||
|
| |||||||
| 3,441 | ||||||||
|
| |||||||
| Germany—1.9% | ||||||||
GSW Immobilien AG | 17,390 | 645 | ||||||
|
| |||||||
| Hong Kong—10.7% | ||||||||
Hang Lung Properties Ltd. | 120,000 | 410 | ||||||
Hongkong Land Holdings Ltd. | 213,100 | 1,281 | ||||||
Hysan Development Co. Ltd. | 94,000 | �� | 428 | |||||
Link (The) | 311,441 | 1,476 | ||||||
|
| |||||||
| 3,595 | ||||||||
|
| |||||||
| Italy—0.8% | ||||||||
Beni Stabili SpA | 516,257 | 272 | ||||||
|
| |||||||
| Japan—7.2% | ||||||||
AEON Mall Co., Ltd. | 23,530 | 576 | ||||||
Japan Prime Realty Investment Corp. | 214 | 645 | ||||||
Japan Real Estate Investment Corp. | 41 | 413 | ||||||
Nippon Building Fund, Inc. | 72 | 776 | ||||||
|
| |||||||
| 2,410 | ||||||||
|
| |||||||
| SHARES | VALUE | |||||||
| Netherlands—3.0% | ||||||||
Corio N.V. | 10,861 | $ | 462 | |||||
Eurocommercial Properties N.V. | 14,597 | 553 | ||||||
|
| |||||||
| 1,015 | ||||||||
|
| |||||||
| Norway—1.3% | ||||||||
Norwegian Property ASA | 284,600 | 435 | ||||||
|
| |||||||
| Singapore—7.7% | ||||||||
CapitaCommercial Trust | 152,400 | 186 | ||||||
CapitaMall Trust | 262,650 | 432 | ||||||
CapitaRetail China Trust | 432,725 | 517 | ||||||
Global Logistic Properties Ltd. | 437,500 | 895 | ||||||
Mapletree Logistics Trust | 605,544 | 555 | ||||||
|
| |||||||
| 2,585 | ||||||||
|
| |||||||
| Sweden—2.4% | ||||||||
Castellum AB | 37,366 | 505 | ||||||
Fabege AB | 33,000 | 314 | ||||||
|
| |||||||
| 819 | ||||||||
|
| |||||||
| Switzerland—0.7% | ||||||||
PSP Swiss Property AG(2) | 2,491 | 226 | ||||||
|
| |||||||
| United Kingdom—15.7% | ||||||||
Big Yellow Group plc | 113,188 | 574 | ||||||
British Land Co. plc | 95,305 | 803 | ||||||
Derwent London plc | 12,846 | 406 | ||||||
Great Portland Estates plc | 37,018 | 270 | ||||||
Hammerson plc | 125,309 | 913 | ||||||
Land Securities Group plc | 108,685 | 1,336 | ||||||
Safestore Holdings plc | 241,876 | 402 | ||||||
SEGRO plc | 156,457 | 573 | ||||||
|
| |||||||
| 5,277 | ||||||||
TOTAL COMMON STOCKS (Identified Cost $25,555) |
| 32,564 | ||||||
| TOTAL LONG TERM INVESTMENTS—97.0% | ||||||||
| (Identified Cost $25,555) | 32,564 | |||||||
| SHORT-TERM INVESTMENTS—2.7% | ||||||||
| Money Market Mutual Funds—2.7% | ||||||||
Dreyfus Cash Management Fund – Institutional Shares (seven-day effective yield 0.060%) | 894,338 | 894 | ||||||
| TOTAL SHORT-TERM INVESTMENTS (Identified Cost $894) | 894 | |||||||
TOTAL INVESTMENTS—99.7% (Identified Cost $26,449) |
| 33,458 | (1) | |||||
Other assets and liabilities, net—0.3% |
| 84 | ||||||
|
| |||||||
| NET ASSETS—100.0% | $ | 33,542 | ||||||
|
| |||||||
Footnote Legend:
| (1) | Federal Income Tax Information: For tax information at September 30, 2012, see Note 11 Federal Income Tax Information in the Notes to Financial Statements. |
| (2) | Non-income producing. |
| (3) | Illiquid security. |
| (4) | Security valued at fair value as determined in good faith by or under the direction of the Trustees. This security is disclosed as a level 3 security in the disclosure table located after the Schedule of Investments. |
| Country Weightings (Unaudited)† | ||||
Australia | 19 | % | ||
United Kingdom | 16 | |||
Canada | 15 | |||
Hong Kong | 11 | |||
France | 10 | |||
Singapore | 8 | |||
Japan | 7 | |||
Other | 14 | |||
Total | 100 | % | ||
† % of total investments as of September 30, 2012 |
| |||
Security abbreviation definitions are located under the Key Investment Terms starting on page 4.
See Notes to Financial Statements
51
Table of Contents
VIRTUS INTERNATIONAL REAL ESTATE SECURITIES FUND
SCHEDULE OF INVESTMENTS (Continued)
SEPTEMBER 30, 2012
($ reported in thousands)
The following table provides a summary of inputs used to value the Fund’s investments as of September 30, 2012 (See Security Valuation Note 2A in the Notes to Financial Statements):
| Total Value at September 30, 2012 | Level 1 – Quoted Prices | Level 2 – Significant Observable Inputs | Level 3 – Significant Unobservable Inputs | |||||||||||||
Investments in Securities: | ||||||||||||||||
Equity Securities: | ||||||||||||||||
Common Stocks | $ | 32,564 | $ | 32,520 | $ | 44 | $ | 0 | (1) | |||||||
Short-Term Investments | 894 | 894 | — | — | ||||||||||||
|
|
|
|
|
|
|
| |||||||||
Total Investments | $ | 33,458 | $ | 33,414 | $ | 44 | $ | 0 | (1) | |||||||
|
|
|
|
|
|
|
| |||||||||
| (1) | Includes internally fair valued security currently priced at zero $0. |
Securities held by the Fund with an end of fiscal period value of $24,053 were transferred from Level 2 into Level 1 based on our valuation procedures for non-U.S. securities.
See Notes to Financial Statements
52
Table of Contents
VIRTUS INTERNATIONAL SMALL-CAP FUND
SCHEDULE OF INVESTMENT (Continued)
SEPTEMBER 30, 2012
($ reported in thousands)
| SHARES | VALUE | |||||||
| COMMON STOCKS—91.5% | ||||||||
| Consumer Discretionary—15.0% | ||||||||
Goldlion Holdings Ltd. (Hong Kong) | 215,200 | $ | 94 | |||||
Maisons France Confort (France) | 2,800 | 92 | ||||||
Rightmove plc (United Kingdom) | 700 | 18 | ||||||
Van de Velde NV (Belgium) | 1,600 | 73 | ||||||
Watts Co., Ltd. (Japan) | 4,700 | 62 | ||||||
Wotif.Com Holdings Ltd. (Australia) | 29,700 | 119 | ||||||
|
| |||||||
| 458 | ||||||||
|
| |||||||
| Consumer Staples—3.7% | ||||||||
Distell Group Ltd. (South Africa) | 3,100 | 35 | ||||||
Dongsuh Co., Inc. (South Korea) | 2,700 | 77 | ||||||
|
| |||||||
| 112 | ||||||||
|
| |||||||
| Energy—4.6% | ||||||||
Schoeller-Bleckmann Oilfield Equipment AG (Austria) | 600 | 62 | ||||||
TGS Nopec Geophysical Co., ASA (Norway) | 2,400 | 78 | ||||||
|
| |||||||
| 140 | ||||||||
|
| |||||||
| Financials—12.1% | ||||||||
ARA Asset Management Ltd. 144A (Singapore)(2) | 83,700 | 108 | ||||||
Century 21 Real Estate of Japan Ltd. (Japan) | 13 | 50 | ||||||
Euroz Ltd. (Australia) | 71,939 | 69 | ||||||
Hiscox Ltd. (Bermuda) | 13,500 | 106 | ||||||
Rathbone Brothers plc (United Kingdom) | 1,600 | 34 | ||||||
|
| |||||||
| 367 | ||||||||
|
| |||||||
| Health Care—7.6% | ||||||||
Haw Par Corp. Ltd. (Singapore) | 12,400 | 67 | ||||||
Nakanishi, Inc. (Japan) | 600 | 65 | ||||||
Stallergenes SA (France) | 440 | 26 | ||||||
Win International Co., Ltd. (Japan) | 9,500 | 74 | ||||||
|
| |||||||
| 232 | ||||||||
|
| |||||||
| Industrials—21.4% | ||||||||
AIT Corp. (Japan) | 9,700 | 135 | ||||||
Amadeus Fire AG (Germany) | 2,050 | 93 | ||||||
Clasquin (France) | 2,207 | 53 | ||||||
Freight Management Holdings Bhd (Malaysia) | 1,000 | 0 | ||||||
Pfeiffer Vacuum Technology AG (Germany) | 560 | 60 | ||||||
Richelieu Hardware Ltd. (Canada) | 3,200 | 112 | ||||||
Rotork plc (United Kingdom) | 1,750 | 64 | ||||||
Thermador Groupe (France) | 1,300 | 94 | ||||||
Vicom Ltd. (Singapore) | 10,000 | 40 | ||||||
|
| |||||||
| 651 | ||||||||
|
| |||||||
| SHARES | VALUE | |||||||
| Information Technology—11.8% | ||||||||
Carsales.Com Ltd. (Australia) | 4,000 | $ | 32 | |||||
Computer Modelling Group Ltd. (Canada) | 1,800 | 35 | ||||||
Domino Printing Sciences plc (United Kingdom) | 6,650 | 60 | ||||||
Iress Ltd. (Australia) | 6,100 | 47 | ||||||
MercadoLibre, Inc. (Argentina) | 1,250 | 103 | ||||||
Pro-Ship, Inc. (Japan) | 4,100 | 82 | ||||||
|
| |||||||
| 359 | ||||||||
|
| |||||||
| Materials—15.3% | ||||||||
Assore Ltd. (South Africa) | 2,450 | 97 | ||||||
Corp. Moctezuma SAB de CV (Mexico) | 52,400 | 115 | ||||||
KPX Chemical Co., Ltd. (South Korea) | 2,600 | 114 | ||||||
Uyemura (C) & Co., Ltd. (Japan) | 2,200 | 78 | ||||||
Victrex plc (United Kingdom) | 2,900 | 62 | ||||||
|
| |||||||
| 466 | ||||||||
TOTAL COMMON STOCKS (Identified Cost $2,764) |
| 2,785 | ||||||
| TOTAL LONG TERM INVESTMENTS—91.5% (Identified Cost $2,764) | 2,785 | |||||||
| SHORT-TERM INVESTMENTS—16.7% | ||||||||
| Money Market Mutual Funds—16.7% | ||||||||
BlackRock Liquidity Funds TempFund Portfolio – Insitutional Shares (seven-day effective yield 0.140%) | 507,123 | 507 | ||||||
| TOTAL SHORT-TERM INVESTMENTS (Identified Cost $507) | 507 | |||||||
TOTAL INVESTMENTS—108.2% (Identified Cost $3,271) |
| 3,292 | (1) | |||||
Other assets and liabilities, net—(8.2)% |
| (250 | ) | |||||
|
| |||||||
| NET ASSETS—100.0% | $ | 3,042 | ||||||
|
| |||||||
Footnote Legend:
| (1) | Federal Income Tax Information: For tax information at September 30, 2012, see Note 11 Federal Income Tax Information in the Notes to Financial Statements. |
| (2) | Security exempt from registration under Rule 144A of the Securities Act of 1933. These securities may be resold in transactions exempt from registration, normally to qualified institutional buyers. At September 30, 2012, these securities amounted to a value of $108 or 3.6% of net assets. |
| Country Weightings (Unaudited) † | ||||
Japan | 17 | % | ||
United States | 15 | |||
Australia | 8 | |||
France | 8 | |||
Singapore | 7 | |||
United Kingdom | 7 | |||
South Korea | 6 | |||
Other | 32 | |||
Total | 100 | % | ||
†% of total investments as of September 30, 2012 |
| |||
See Notes to Financial Statements
53
Table of Contents
VIRTUS INTERNATIONAL SMALL-CAP FUND
SCHEDULE OF INVESTMENT (Continued)
SEPTEMBER 30, 2012
($ reported in thousands)
The following table provides a summary of inputs used to value the Fund’s investments as of September 30, 2012 (See Security Valuation Note 2A in the Notes to Financial Statements):
| Total Value at September 30, 2012 | Level 1 – Quoted Prices | |||||||
Equity Securities: | ||||||||
Common Stocks | $ | 2,785 | $ | 2,785 | ||||
Short-Term Investments | 507 | 507 | ||||||
|
|
|
| |||||
Total Investments | $ | 3,292 | $ | 3,292 | ||||
|
|
|
| |||||
There are no Level 2 (significant observable inputs) or Level 3 (significant unobservable inputs) priced securities.
See Notes to Financial Statements
54
Table of Contents
VIRTUS OPPORTUNITIES TRUST
STATEMENTS OF ASSETS AND LIABILITIES
SEPTEMBER 30, 2012
(Reported in thousands except shares and per share amounts)
|
|
|
|
|
|
|
| |||||||||
| Emerging Markets Debt Fund | Emerging Markets Equity Income Fund | Global Commodities Stock Fund | Global Dividend Fund | |||||||||||||
| Assets | ||||||||||||||||
Investment in securities at value(1) | $ | 24,633 | $ | 5,291 | $ | 19,773 | $ | 92,629 | ||||||||
Foreign currency at value(2) | — | 3 | 1 | — | (3) | |||||||||||
Cash | 947 | — | 3 | — | ||||||||||||
Receivables | ||||||||||||||||
Investment securities sold | 486 | — | — | — | ||||||||||||
Fund shares sold | — | — | — | 1,714 | ||||||||||||
Receivable from adviser | 23 | 26 | — | — | ||||||||||||
Dividends and interest receivable | 439 | 2 | 3 | 140 | ||||||||||||
Tax reclaims | — | — | — | 34 | �� | |||||||||||
Prepaid trustee retainer | — | (3) | — | (3) | — | (3) | 1 | |||||||||
Prepaid expenses | — | — | 15 | 19 | ||||||||||||
|
|
|
|
|
|
|
| |||||||||
Total assets | 26,528 | 5,322 | 19,795 | 94,537 | ||||||||||||
|
|
|
|
|
|
|
| |||||||||
| Liabilities | ||||||||||||||||
Payables | ||||||||||||||||
Fund shares repurchased | — | — | — | 111 | ||||||||||||
Investment securities purchased | 1,243 | — | 38 | — | ||||||||||||
Investment advisory fee | — | — | 13 | 50 | ||||||||||||
Distribution and service fees | — | (3) | — | (3) | — | (3) | 14 | |||||||||
Administration fee | 2 | — | (3) | 2 | 10 | |||||||||||
Transfer agent fees and expenses | 1 | — | (3) | 1 | 15 | |||||||||||
Trustees’ fee and expenses | — | (3) | — | (3) | — | (3) | — | (3) | ||||||||
Professional fee | 28 | 24 | 26 | 26 | ||||||||||||
Other accrued expenses | 7 | 4 | 4 | 17 | ||||||||||||
|
|
|
|
|
|
|
| |||||||||
Total liabilities | 1,281 | 28 | 84 | 243 | ||||||||||||
|
|
|
|
|
|
|
| |||||||||
| Net Assets | $ | 25,247 | $ | 5,294 | $ | 19,711 | $ | 94,294 | ||||||||
|
|
|
|
|
|
|
| |||||||||
| Net Assets Consist of: | ||||||||||||||||
Capital paid in on shares of beneficial interest | $ | 25,009 | $ | 5,000 | $ | 19,302 | $ | 90,020 | ||||||||
Accumulated undistributed net investment income (loss) | 60 | (1 | ) | (14 | ) | 17 | ||||||||||
Accumulated undistributed net realized gain (loss) | (15 | ) | 55 | (2,053 | ) | (14,217 | ) | |||||||||
Net unrealized appreciation (depreciation) on investments | 193 | 240 | 2,476 | 18,474 | ||||||||||||
|
|
|
|
|
|
|
| |||||||||
| Net Assets | $ | 25,247 | $ | 5,294 | $ | 19,711 | $ | 94,294 | ||||||||
|
|
|
|
|
|
|
| |||||||||
| Class A | ||||||||||||||||
Net asset value (net assets/shares outstanding) per share | $ | 10.09 | $ | 10.59 | $ | 9.96 | $ | 12.88 | ||||||||
Maximum offering price per share NAV/(1-4.75%) | $ | 10.49 | $ | — | $ | — | $ | — | ||||||||
Maximum offering price per share NAV/(1-5.75%) | $ | — | $ | 11.24 | $ | 10.57 | $ | 13.67 | ||||||||
Shares of beneficial interest outstanding, no par value, unlimited authorization | 10,000 | 10,000 | 93,957 | 2,822,108 | ||||||||||||
Net Assets | $ | 101 | $ | 106 | $ | 936 | $ | 36,347 | ||||||||
| Class C | ||||||||||||||||
Net asset value (net assets/shares outstanding) and offering price per share | $ | 10.09 | $ | 10.58 | $ | 9.87 | $ | 12.85 | ||||||||
Shares of beneficial interest outstanding, no par value, unlimited authorization | 10,901 | 10,000 | 11,875 | 709,229 | ||||||||||||
Net Assets | $ | 110 | $ | 106 | $ | 117 | $ | 9,117 | ||||||||
| Class I | ||||||||||||||||
Net asset value (net assets/shares outstanding) and offering price per share | $ | 10.10 | $ | 10.59 | $ | 9.98 | $ | 12.89 | ||||||||
Shares of beneficial interest outstanding, no par value, unlimited authorization | 2,480,000 | 480,000 | 1,869,372 | 3,789,351 | ||||||||||||
Net Assets | $ | 25,036 | $ | 5,082 | $ | 18,658 | $ | 48,830 | ||||||||
(1) Investment in securities at cost | $ | 24,440 | $ | 5,051 | $ | 17,297 | $ | 74,154 | ||||||||
(2) Foreign currency at cost | $ | — | $ | 3 | $ | 1 | $ | — | (3) | |||||||
(3) Amount is less than $500. | ||||||||||||||||
See Notes to Financial Statements
55
Table of Contents
VIRTUS OPPORTUNITIES TRUST
STATEMENTS OF ASSETS AND LIABILITIES (Continued)
SEPTEMBER 30, 2012
(Reported in thousands except shares and per share amounts)
|
|
|
|
|
|
|
| |||||||||
| Global Opportunities Fund | Global Real Estate Securities Fund | Greater Asia ex Japan Opportunities Fund | Greater European Opportunities Fund | |||||||||||||
| Assets | ||||||||||||||||
Investment in securities at value(1) | $ | 97,866 | $ | 22,171 | $ | 8,761 | $ | 6,845 | ||||||||
Foreign currency at value(2) | 7 | 2 | 51 | 1 | ||||||||||||
Receivables | ||||||||||||||||
Investment securities sold | — | 54 | 94 | 33 | ||||||||||||
Fund shares sold | 132 | 358 | 25 | 1 | ||||||||||||
Receivable from adviser | — | — | 9 | — | ||||||||||||
Dividends and interest receivable | 133 | 50 | 17 | 9 | ||||||||||||
Tax reclaims | 50 | 1 | — | 7 | ||||||||||||
Prepaid trustee retainer | 1 | — | (3) | — | (3) | — | (3) | |||||||||
Prepaid expenses | 34 | 13 | 13 | 12 | ||||||||||||
|
|
|
|
|
|
|
| |||||||||
Total assets | 98,223 | 22,649 | 8,970 | 6,908 | ||||||||||||
|
|
|
|
|
|
|
| |||||||||
| Liabilities | ||||||||||||||||
Cash overdraft | 20 | — | — | 2 | ||||||||||||
Payables | ||||||||||||||||
Fund shares repurchased | 1 | 10 | — | 2 | ||||||||||||
Investment securities purchased | — | 477 | 29 | 12 | ||||||||||||
Foreign capital gain taxes payable | 85 | — | 2 | — | ||||||||||||
Investment advisory fee | 66 | 5 | — | 2 | ||||||||||||
Distribution and service fees | 17 | 3 | 2 | 1 | ||||||||||||
Administration fee | 11 | 2 | 1 | 1 | ||||||||||||
Transfer agent fees and expenses | 26 | 3 | 1 | — | (3) | |||||||||||
Trustees’ fee and expenses | — | (3) | — | (3) | — | (3) | — | (3) | ||||||||
Professional fee | 22 | 26 | 22 | 27 | ||||||||||||
Other accrued expenses | 18 | 9 | 3 | 6 | ||||||||||||
|
|
|
|
|
|
|
| |||||||||
Total liabilities | 266 | 535 | 60 | 53 | ||||||||||||
|
|
|
|
|
|
|
| |||||||||
| Net Assets | $ | 97,957 | $ | 22,114 | $ | 8,910 | $ | 6,855 | ||||||||
|
|
|
|
|
|
|
| |||||||||
| Net Assets Consist of: | ||||||||||||||||
Capital paid in on shares of beneficial interest | $ | 95,588 | $ | 19,605 | $ | 6,536 | $ | 4,890 | ||||||||
Accumulated undistributed net investment income (loss) | 233 | 121 | 31 | 37 | ||||||||||||
Accumulated undistributed net realized gain (loss) | (17,488 | ) | (187 | ) | 262 | 212 | ||||||||||
Net unrealized appreciation (depreciation) on investments | 19,624 | 2,575 | 2,081 | 1,716 | ||||||||||||
|
|
|
|
|
|
|
| |||||||||
| Net Assets | $ | 97,957 | $ | 22,114 | $ | 8,910 | $ | 6,855 | ||||||||
|
|
|
|
|
|
|
| |||||||||
| Class A | ||||||||||||||||
Net asset value (net assets/shares outstanding) per share | $ | 9.91 | $ | 22.40 | $ | 15.44 | $ | 14.20 | ||||||||
Maximum offering price per share NAV/(1-5.75%) | $ | 10.51 | $ | 23.77 | $ | 16.38 | $ | 15.07 | ||||||||
Shares of beneficial interest outstanding, no par value, unlimited authorization | 7,225,287 | 388,204 | 541,877 | 458,689 | ||||||||||||
Net Assets | $ | 71,592 | $ | 8,695 | $ | 8,366 | $ | 6,513 | ||||||||
| Class B | ||||||||||||||||
Net asset value (net assets/shares outstanding) and offering price per share | $ | 8.82 | $ | — | $ | — | $ | — | ||||||||
Shares of beneficial interest outstanding, no par value, unlimited authorization | 118,869 | — | — | — | ||||||||||||
Net Assets | $ | 1,048 | $ | — | $ | — | $ | — | ||||||||
| Class C | ||||||||||||||||
Net asset value (net assets/shares outstanding) and offering price per share | $ | 8.77 | $ | 22.14 | $ | 15.19 | $ | 14.10 | ||||||||
Shares of beneficial interest outstanding, no par value, unlimited authorization | 193,788 | 61,256 | 15,150 | 13,260 | ||||||||||||
Net Assets | $ | 1,700 | $ | 1,356 | $ | 230 | $ | 187 | ||||||||
| Class I | ||||||||||||||||
Net asset value (net assets/shares outstanding) and offering price per share | $ | 9.91 | $ | 22.51 | $ | 15.50 | $ | 14.23 | ||||||||
Shares of beneficial interest outstanding, no par value, unlimited authorization | 2,382,829 | 535,760 | 20,229 | 10,891 | ||||||||||||
Net Assets | $ | 23,617 | $ | 12,063 | $ | 314 | $ | 155 | ||||||||
(1) Investment in securities at cost | $ | 78,155 | $ | 19,596 | $ | 6,678 | $ | 5,129 | ||||||||
(2) Foreign currency at cost | $ | 7 | $ | 2 | $ | 51 | $ | 1 | ||||||||
(3) Amount is less than $500. | ||||||||||||||||
See Notes to Financial Statements
56
Table of Contents
VIRTUS OPPORTUNITIES TRUST
STATEMENTS OF ASSETS AND LIABILITIES (Continued)
SEPTEMBER 30, 2012
(Reported in thousands except shares and per share amounts)
|
|
|
|
|
| |||||||
| International Equity Fund | International Real Estate Securities Fund | International Small-Cap Fund | ||||||||||
| Assets | ||||||||||||
Investment in securities at value(1) | $ | 26,587 | $ | 33,458 | $ | 3,292 | ||||||
Foreign currency at value(2) | 80 | 8 | 1 | |||||||||
Receivables | ||||||||||||
Investment securities sold | — | 172 | — | |||||||||
Fund shares sold | — | 45 | — | |||||||||
Receivable from adviser | — | — | 28 | |||||||||
Dividends and interest receivable | 109 | 74 | 7 | |||||||||
Tax reclaims | 25 | 31 | — | |||||||||
Prepaid trustee retainer | — | (3) | — | (3) | — | (3) | ||||||
Prepaid expenses | 25 | 24 | — | |||||||||
Unrealized appreciation on forward currency contracts | 3 | — | — | |||||||||
|
|
|
|
|
| |||||||
Total assets | 26,829 | 33,812 | 3,328 | |||||||||
|
|
|
|
|
| |||||||
| Liabilities | ||||||||||||
Cash overdraft | 3 | — | — | |||||||||
Payables | ||||||||||||
Fund shares repurchased | — | 6 | — | |||||||||
Investment securities purchased | — | 203 | 257 | |||||||||
Investment advisory fee | 19 | 17 | — | |||||||||
Distribution and service fees | — | (3) | 2 | — | (3) | |||||||
Administration fee | 3 | 4 | — | (3) | ||||||||
Transfer agent fees and expenses | 1 | 4 | 1 | |||||||||
Trustees’ fee and expenses | — | (3) | — | (3) | — | (3) | ||||||
Professional fee | 30 | 26 | 24 | |||||||||
Other accrued expenses | 5 | 8 | 4 | |||||||||
Unrealized depreciation on forward currency contracts | 62 | — | — | |||||||||
|
|
|
|
|
| |||||||
Total liabilities | 123 | 270 | 286 | |||||||||
|
|
|
|
|
| |||||||
| Net Assets | $ | 26,706 | $ | 33,542 | $ | 3,042 | ||||||
|
|
|
|
|
| |||||||
| Net Assets Consist of: | ||||||||||||
Capital paid in on shares of beneficial interest | $ | 25,605 | $ | 54,093 | $ | 3,014 | ||||||
Accumulated undistributed net investment income (loss) | 223 | (142 | ) | 7 | ||||||||
Accumulated undistributed net realized gain (loss) | (573 | ) | (27,419 | ) | — | |||||||
Net unrealized appreciation (depreciation) on investments | 1,451 | 7,010 | 21 | |||||||||
|
|
|
|
|
| |||||||
| Net Assets | $ | 26,706 | $ | 33,542 | $ | 3,042 | ||||||
|
|
|
|
|
| |||||||
| Class A | ||||||||||||
Net asset value (net assets/shares outstanding) per share | $ | 10.87 | $ | 6.50 | $ | 10.09 | ||||||
Maximum offering price per share NAV/(1-5.75%) | $ | 11.53 | $ | 6.90 | $ | 10.71 | ||||||
Shares of beneficial interest outstanding, no par value, unlimited authorization | 17,769 | 602,662 | 10,000 | |||||||||
Net Assets | $ | 193 | $ | 3,916 | $ | 101 | ||||||
| Class C | ||||||||||||
Net asset value (net assets/shares outstanding) and offering price per share | $ | 10.77 | $ | 6.48 | $ | 10.09 | ||||||
Shares of beneficial interest outstanding, no par value, unlimited authorization | 10,677 | 236,187 | 10,596 | |||||||||
Net Assets | $ | 115 | $ | 1,531 | $ | 107 | ||||||
| Class I | ||||||||||||
Net asset value (net assets/shares outstanding) and offering price per share | $ | 10.82 | $ | 6.49 | $ | 10.10 | ||||||
Shares of beneficial interest outstanding, no par value, unlimited authorization | 2,439,154 | 4,327,200 | 280,740 | |||||||||
Net Assets | $ | 26,398 | $ | 28,095 | $ | 2,834 | ||||||
(1) Investment in securities at cost | $ | 25,079 | $ | 26,449 | $ | 3,271 | ||||||
(2) Foreign currency at cost | $ | 78 | $ | 8 | $ | 1 | ||||||
(3) Amount is less than $500. | ||||||||||||
See Notes to Financial Statements
57
Table of Contents
VIRTUS OPPORTUNITIES TRUST
YEAR ENDED SEPTEMBER 30, 2012
($ reported in thousands)
|
|
|
|
|
|
|
| |||||||||
| Emerging Markets Debt Fund(2) | Emerging Markets Equity Income Fund(2) | Global Commodities Stock Fund | Global Dividend Fund | |||||||||||||
| Investment Income | ||||||||||||||||
Dividends | $ | 1 | $ | 4 | $ | 318 | $ | 3,170 | ||||||||
Interest | 77 | — | (1) | — | — | |||||||||||
Security lending | — | — | — | (1) | — | |||||||||||
Foreign taxes withheld | — | — | (1) | (18 | ) | (165 | ) | |||||||||
|
|
|
|
|
|
|
| |||||||||
Total investment income | 78 | 4 | 300 | 3,005 | ||||||||||||
|
|
|
|
|
|
|
| |||||||||
| Expenses | ||||||||||||||||
Investment advisory fees | 12 | 4 | 195 | 498 | ||||||||||||
Service fees, Class A | — | (1) | — | (1) | 1 | 71 | ||||||||||
Distribution and service fees, Class C | — | (1) | — | (1) | 1 | 70 | ||||||||||
Administration fees | 2 | — | (1) | 26 | 101 | |||||||||||
Transfer agent fee and expenses | 1 | — | (1) | 10 | 101 | |||||||||||
Custodian fees | 1 | 1 | 5 | 19 | ||||||||||||
Printing fees and expenses | 3 | — | (1) | (3 | ) | 17 | ||||||||||
Professional fees | 31 | 26 | 30 | 31 | ||||||||||||
Registration fees | 3 | 3 | 45 | 43 | ||||||||||||
Trustees’ fee and expenses | — | (1) | — | (1) | 1 | 4 | ||||||||||
Miscellaneous expenses | — | (1) | — | (1) | 2 | 7 | ||||||||||
|
|
|
|
|
|
|
| |||||||||
Total expenses | 53 | 34 | 313 | 962 | ||||||||||||
Less expenses reimbursed and/or waived by investment adviser | (35 | ) | (29 | ) | (38 | ) | — | |||||||||
|
|
|
|
|
|
|
| |||||||||
Net expenses | 18 | 5 | 275 | 962 | ||||||||||||
|
|
|
|
|
|
|
| |||||||||
Net investment income (loss) | 60 | (1 | ) | 25 | 2,043 | |||||||||||
|
|
|
|
|
|
|
| |||||||||
| Net Realized and Unrealized Gain (Loss) on Investments | ||||||||||||||||
Net realized gain (loss) on investments | (15 | ) | 54 | (1,720 | ) | 735 | ||||||||||
Net realized gain (loss) on foreign currency transactions | — | (1) | 1 | 3 | 3 | |||||||||||
Net change in unrealized appreciation (depreciation) | 193 | 240 | 5,331 | 11,292 | ||||||||||||
Net change in unrealized appreciation (depreciation) | — | (1) | — | (1) | — | (1) | — | (1) | ||||||||
|
|
|
|
|
|
|
| |||||||||
| Net gain (loss) on investments | 178 | 295 | 3,614 | 12,030 | ||||||||||||
|
|
|
|
|
|
|
| |||||||||
Net increase (decrease) in net assets resulting from operations | $ | 238 | $ | 294 | $ | 3,639 | $ | 14,073 | ||||||||
|
|
|
|
|
|
|
| |||||||||
(1) Amount is less than $500.
(2) From inception date September 5, 2012.
See Notes to Financial Statements
58
Table of Contents
VIRTUS OPPORTUNITIES TRUST
STATEMENTS OF OPERATIONS (Continued)
YEAR ENDED SEPTEMBER 30, 2012
($ reported in thousands)
|
|
|
|
|
|
|
| |||||||||
| Global Opportunities Fund | Global Real Estate Securities Fund | Greater Asia ex Japan Opportunities Fund | Greater European Opportunities Fund | |||||||||||||
| Investment Income | ||||||||||||||||
Dividends | $ | 1,721 | $ | 352 | $ | 205 | $ | 165 | ||||||||
Interest | — | (1) | — | (1) | — | (1) | — | (1) | ||||||||
Security lending | 1 | — | — | (1) | 1 | |||||||||||
Foreign taxes withheld | (49 | ) | (17 | ) | (10 | ) | (13 | ) | ||||||||
|
|
|
|
|
|
|
| |||||||||
Total investment income | 1,673 | 335 | 195 | 153 | ||||||||||||
|
|
|
|
|
|
|
| |||||||||
| Expenses | ||||||||||||||||
Investment advisory fees | 688 | 93 | 85 | 49 | ||||||||||||
Service fees, Class A | 192 | 16 | 20 | 13 | ||||||||||||
Distribution and service fees, Class B | 10 | — | — | — | ||||||||||||
Distribution and service fees, Class C | 13 | 8 | 2 | 2 | ||||||||||||
Administration fees | 107 | 14 | 11 | 7 | ||||||||||||
Transfer agent fee and expenses | 124 | 16 | 6 | 4 | ||||||||||||
Custodian fees | 33 | 20 | 35 | 14 | ||||||||||||
Printing fees and expenses | 18 | 4 | 2 | 2 | ||||||||||||
Professional fees | 34 | 32 | 61 | 31 | ||||||||||||
Registration fees | 42 | 41 | 40 | 38 | ||||||||||||
Trustees’ fee and expenses | 4 | — | (1) | — | (1) | — | (1) | |||||||||
Miscellaneous expenses | 8 | 2 | 3 | 2 | ||||||||||||
|
|
|
|
|
|
|
| |||||||||
Total expenses | 1,273 | 246 | 265 | 162 | ||||||||||||
Less expenses reimbursed and/or waived by investment adviser | (5 | ) | (98 | ) | (111 | ) | (78 | ) | ||||||||
|
|
|
|
|
|
|
| |||||||||
Net expenses | 1,268 | 148 | 154 | 84 | ||||||||||||
|
|
|
|
|
|
|
| |||||||||
Net investment income (loss) | 405 | 187 | 41 | 69 | ||||||||||||
|
|
|
|
|
|
|
| |||||||||
| Net Realized and Unrealized Gain (Loss) on Investments | ||||||||||||||||
Net realized gain (loss) on investments | 5,545 | (95 | ) | 299 | 235 | |||||||||||
Net realized gain (loss) on foreign currency transactions | (111 | ) | (2 | ) | (9 | ) | (2 | ) | ||||||||
Net change in unrealized appreciation (depreciation) | 11,357 | 2,394 | 831 | 1,038 | ||||||||||||
Net change in unrealized appreciation (depreciation) | 2 | — | (1) | (1 | ) | 1 | ||||||||||
Net change in foreign taxes on unrealized capital gains | (85 | ) | — | — | — | |||||||||||
|
|
|
|
|
|
|
| |||||||||
| Net gain (loss) on investments | 16,708 | 2,297 | 1,120 | 1,272 | ||||||||||||
|
|
|
|
|
|
|
| |||||||||
Net increase (decrease) in net assets resulting from operations | $ | 17,113 | $ | 2,484 | $ | 1,161 | $ | 1,341 | ||||||||
|
|
|
|
|
|
|
| |||||||||
(1) Amount is less than $500.
See Notes to Financial Statements
59
Table of Contents
VIRTUS OPPORTUNITIES TRUST
STATEMENTS OF OPERATIONS (Continued)
YEAR ENDED SEPTEMBER 30, 2012
($ reported in thousands)
|
|
|
|
|
| |||||||
| International Equity Fund | International Real Estate Securities Fund | International Small-Cap Fund(2) | ||||||||||
| Investment Income | ||||||||||||
Dividends | $ | 906 | $ | 1,279 | $ | 11 | ||||||
Interest | — | (1) | — | (1) | — | (1) | ||||||
Foreign taxes withheld | (68 | ) | (109 | ) | (1 | ) | ||||||
|
|
|
|
|
| |||||||
Total investment income | 838 | 1,170 | 10 | |||||||||
|
|
|
|
|
| |||||||
| Expenses | ||||||||||||
Investment advisory fees | 170 | 280 | 2 | |||||||||
Service fees, Class A | 1 | 8 | — | (1) | ||||||||
Distribution and service fees, Class C | 1 | 12 | — | (1) | ||||||||
Administration fees | 26 | 37 | — | (1) | ||||||||
Transfer agent fee and expenses | 10 | 30 | 1 | |||||||||
Custodian fees | 8 | 18 | 1 | |||||||||
Printing fees and expenses | 4 | 6 | — | (1) | ||||||||
Professional fees | 38 | 31 | 26 | |||||||||
Registration fees | 40 | 39 | 3 | |||||||||
Trustees’ fee and expenses | 1 | 2 | — | (1) | ||||||||
Miscellaneous expenses | 4 | 4 | — | (1) | ||||||||
|
|
|
|
|
| |||||||
Total expenses | 303 | 467 | 33 | |||||||||
Less expenses reimbursed and/or waived by investment adviser | (51 | ) | (96 | ) | (30 | ) | ||||||
|
|
|
|
|
| |||||||
Net expenses | 252 | 371 | 3 | |||||||||
|
|
|
|
|
| |||||||
Net investment income (loss) | 586 | 799 | 7 | |||||||||
|
|
|
|
|
| |||||||
| Net Realized and Unrealized Gain (Loss) on Investments | ||||||||||||
Net realized gain (loss) on investments | (330 | ) | (1,587 | ) | — | |||||||
Net realized gain (loss) on foreign currency transactions | (16 | ) | (16 | ) | — | (1) | ||||||
Net change in unrealized appreciation (depreciation) | 3,274 | 7,109 | 21 | |||||||||
Net change in unrealized appreciation (depreciation) | (201 | ) | 4 | — | (1) | |||||||
|
|
|
|
|
| |||||||
| Net gain (loss) on investments | 2,727 | 5,510 | 21 | |||||||||
|
|
|
|
|
| |||||||
Net increase (decrease) in net assets resulting from operations | $ | 3,313 | $ | 6,309 | $ | 28 | ||||||
|
|
|
|
|
| |||||||
(1) Amount is less than $500.
(2) From inception date September 5, 2012.
See Notes to Financial Statements
60
Table of Contents
VIRTUS OPPORTUNITIES TRUST
STATEMENTS OF CHANGES IN NET ASSETS
(Reported in thousands)
|
|
|
| |||||
| Emerging Markets Debt Fund | Emerging Markets Equity Income Fund | |||||||
| From inception September 5, 2012 to September 30, 2012 | From inception September 5, 2012 to September 30, 2012 | |||||||
| INCREASE/(DECREASE) IN NET ASSETS | ||||||||
| From Operations | ||||||||
Net investment income (loss) | $ | 60 | $ | (1 | ) | |||
Net realized gain (loss) | (15 | ) | 55 | |||||
Net change in unrealized appreciation (depreciation) | 193 | 240 | ||||||
|
|
|
| |||||
Increase (decrease) in net assets resulting from operations | 238 | 294 | ||||||
|
|
|
| |||||
| From Share Transactions (See Note 6) | ||||||||
Change in net assets from share transactions, Class A | 100 | 100 | ||||||
Change in net assets from share transactions, Class C | 109 | 100 | ||||||
Change in net assets from share transactions, Class I | 24,800 | 4,800 | ||||||
|
|
|
| |||||
Increase (decrease) in net assets from share transactions | 25,009 | 5,000 | ||||||
|
|
|
| |||||
Net increase (decrease) in net assets | 25,247 | 5,294 | ||||||
| Net Assets | ||||||||
Beginning of fiscal year | — | — | ||||||
|
|
|
| |||||
End of fiscal year | $ | 25,247 | $ | 5,294 | ||||
|
|
|
| |||||
Accumulated undistributed net investment income (loss) at end of fiscal year | $ | 60 | $ | (1 | ) | |||
(1) Amount is less than $500.
See Notes to Financial Statements
61
Table of Contents
VIRTUS OPPORTUNITIES TRUST
STATEMENTS OF CHANGES IN NET ASSETS (Continued)
(Reported in thousands)
|
|
|
| |||||||||||||
| Global Commodities Stock Fund | Global Dividend Fund | |||||||||||||||
| Year Ended September 30, 2012 | Year Ended September 30, 2011 | Year Ended September 30, 2012 | Year Ended September 30, 2011 | |||||||||||||
| INCREASE/(DECREASE) IN NET ASSETS | ||||||||||||||||
| From Operations | ||||||||||||||||
Net investment income (loss) | $ | 25 | $ | 6 | $ | 2,043 | $ | 2,061 | ||||||||
Net realized gain (loss) | (1,717 | ) | (298 | ) | 738 | (722 | ) | |||||||||
Net change in unrealized appreciation (depreciation) | 5,331 | (2,855 | ) | 11,292 | 2,041 | |||||||||||
|
|
|
|
|
|
|
| |||||||||
Increase (decrease) in net assets resulting from operations | 3,639 | (3,147 | ) | 14,073 | 3,380 | |||||||||||
|
|
|
|
|
|
|
| |||||||||
| From Distributions to Shareholders | ||||||||||||||||
Net investment income, Class A | — | (1) | — | (817 | ) | (690 | ) | |||||||||
Net investment income, Class C | — | — | (150 | ) | (138 | ) | ||||||||||
Net investment income, Class I | (83 | ) | — | (1,277 | ) | (1,131 | ) | |||||||||
|
|
|
|
|
|
|
| |||||||||
Decrease in net assets from distributions to shareholders | (83 | ) | — | (2,244 | ) | (1,959 | ) | |||||||||
|
|
|
|
|
|
|
| |||||||||
| From Share Transactions (See Note 6) | ||||||||||||||||
Change in net assets from share transactions, Class A | 566 | 256 | 8,865 | (2,286 | ) | |||||||||||
Change in net assets from share transactions, Class C | (2 | ) | 121 | 1,898 | (1,230 | ) | ||||||||||
Change in net assets from share transactions, Class I | (404 | ) | 18,765 | 8,579 | (3,830 | ) | ||||||||||
|
|
|
|
|
|
|
| |||||||||
Increase (decrease) in net assets from share transactions | 160 | 19,142 | 19,342 | (7,346 | ) | |||||||||||
|
|
|
|
|
|
|
| |||||||||
Net increase (decrease) in net assets | 3,716 | 15,995 | 31,171 | (5,925 | ) | |||||||||||
| Net Assets | ||||||||||||||||
Beginning of fiscal year | 15,995 | — | 63,123 | 69,048 | ||||||||||||
|
|
|
|
|
|
|
| |||||||||
End of fiscal year | $ | 19,711 | $ | 15,995 | $ | 94,294 | $ | 63,123 | ||||||||
|
|
|
|
|
|
|
| |||||||||
Accumulated undistributed net investment income (loss) at end of fiscal year | $ | (14 | ) | $ | 20 | $ | 17 | $ | 215 | |||||||
(1) Amount is less than $500.
See Notes to Financial Statements
62
Table of Contents
VIRTUS OPPORTUNITIES TRUST
STATEMENTS OF CHANGES IN NET ASSETS (Continued)
(Reported in thousands)
|
|
|
| |||||||||||||
| Global Opportunities Fund | Global Real Estate Securities Fund | |||||||||||||||
| Year Ended September 30, 2012 | Year Ended September 30, 2011 | Year Ended September 30, 2012 | Year Ended September 30, 2011 | |||||||||||||
| INCREASE/(DECREASE) IN NET ASSETS | ||||||||||||||||
| From Operations | ||||||||||||||||
Net investment income (loss) | $ | 405 | $ | 384 | $ | 187 | $ | 120 | ||||||||
Net realized gain (loss) | 5,434 | 5,506 | (97 | ) | 167 | |||||||||||
Net change in unrealized appreciation (depreciation) | 11,274 | (4,121 | ) | 2,394 | (928 | ) | ||||||||||
|
|
|
|
|
|
|
| |||||||||
Increase (decrease) in net assets resulting from operations | 17,113 | 1,769 | 2,484 | (641 | ) | |||||||||||
|
|
|
|
|
|
|
| |||||||||
| From Distributions to Shareholders | ||||||||||||||||
Net investment income, Class A | (275 | ) | (590 | ) | (34 | ) | (132 | ) | ||||||||
Net investment income, Class B | — | (6 | ) | — | — | |||||||||||
Net investment income, Class C | — | (4 | ) | (1 | ) | (12 | ) | |||||||||
Net investment income, Class I | — | — | (5 | ) | (22 | ) | ||||||||||
Net realized short-term gains, Class A | — | — | (46 | ) | (57 | ) | ||||||||||
Net realized short-term gains, Class C | — | — | (4 | ) | (6 | ) | ||||||||||
Net realized short-term gains, Class I | — | — | (6 | ) | (9 | ) | ||||||||||
Net realized long-term gains, Class A | — | — | (75 | ) | (27 | ) | ||||||||||
Net realized long-term gains, Class C | — | — | (7 | ) | (3 | ) | ||||||||||
Net realized long-term gains, Class I | — | — | (9 | ) | (4 | ) | ||||||||||
|
|
|
|
|
|
|
| |||||||||
Decrease in net assets from distributions to shareholders | (275 | ) | (600 | ) | (187 | ) | (272 | ) | ||||||||
|
|
|
|
|
|
|
| |||||||||
| From Share Transactions (See Note 6) | ||||||||||||||||
Change in net assets from share transactions, Class A | 1,538 | (5,293 | ) | 2,120 | 3,570 | |||||||||||
Change in net assets from share transactions, Class B | (90 | ) | (416 | ) | — | — | ||||||||||
Change in net assets from share transactions, Class C | 627 | (4 | ) | 726 | 298 | |||||||||||
Change in net assets from share transactions, Class I | 22,400 | — | 10,601 | (17 | ) | |||||||||||
|
|
|
|
|
|
|
| |||||||||
Increase (decrease) in net assets from share transactions | 24,475 | (5,713 | ) | 13,447 | 3,851 | |||||||||||
|
|
|
|
|
|
|
| |||||||||
Net increase (decrease) in net assets | 41,313 | (4,544 | ) | 15,744 | 2,938 | |||||||||||
| Net Assets | ||||||||||||||||
Beginning of fiscal year | 56,644 | 61,188 | 6,370 | 3,432 | ||||||||||||
|
|
|
|
|
|
|
| |||||||||
End of fiscal year | $ | 97,957 | $ | 56,644 | $ | 22,114 | $ | 6,370 | ||||||||
|
|
|
|
|
|
|
| |||||||||
Accumulated undistributed net investment income (loss) at end of fiscal year | $ | 233 | $ | 214 | $ | 121 | $ | (76 | ) | |||||||
(1) Amount is less than $500.
See Notes to Financial Statements
63
Table of Contents
VIRTUS OPPORTUNITIES TRUST
STATEMENTS OF CHANGES IN NET ASSETS (Continued)
(Reported in thousands)
|
|
|
| |||||||||||||
| Greater Asia ex Japan Opportunities Fund | Greater European Opportunities Fund | |||||||||||||||
| Year Ended September 30, 2012 | Year Ended September 30, 2011 | Year Ended September 30, 2012 | Year Ended September 30, 2011 | |||||||||||||
| INCREASE/(DECREASE) IN NET ASSETS | ||||||||||||||||
| From Operations | ||||||||||||||||
Net investment income (loss) | $ | 41 | $ | 44 | $ | 69 | $ | 66 | ||||||||
Net realized gain (loss) | 290 | 381 | 233 | 65 | ||||||||||||
Net change in unrealized appreciation (depreciation) | 830 | (1,057 | ) | 1,039 | (242 | ) | ||||||||||
|
|
|
|
|
|
|
| |||||||||
Increase (decrease) in net assets resulting from operations | 1,161 | (632 | ) | 1,341 | (111 | ) | ||||||||||
|
|
|
|
|
|
|
| |||||||||
| From Distributions to Shareholders | ||||||||||||||||
Net investment income, Class A | (12 | ) | (77 | ) | (58 | ) | (99 | ) | ||||||||
Net investment income, Class C | — | (1) | — | — | (1) | (2 | ) | |||||||||
Net investment income, Class I | (2 | ) | (2 | ) | (3 | ) | (3 | ) | ||||||||
Net realized short-term gains, Class A | (38 | ) | (1,159 | ) | (8 | ) | (96 | ) | ||||||||
Net realized short-term gains, Class C | (1 | ) | (26 | ) | — | (1) | (3 | ) | ||||||||
Net realized short-term gains, Class I | (2 | ) | (26 | ) | — | (1) | (3 | ) | ||||||||
Net realized long-term gains, Class A | (309 | ) | (243 | ) | (182 | ) | (341 | ) | ||||||||
Net realized long-term gains, Class C | (8 | ) | (5 | ) | (6 | ) | (11 | ) | ||||||||
Net realized long-term gains, Class I | (15 | ) | (5 | ) | (8 | ) | (10 | ) | ||||||||
|
|
|
|
|
|
|
| |||||||||
Decrease in net assets from distributions to shareholders | (387 | ) | (1,543 | ) | (265 | ) | (568 | ) | ||||||||
|
|
|
|
|
|
|
| |||||||||
| From Share Transactions (See Note 6) | ||||||||||||||||
Change in net assets from share transactions, Class A | (1,485 | ) | 960 | 920 | 574 | |||||||||||
Change in net assets from share transactions, Class C | (12 | ) | (158 | ) | 12 | 22 | ||||||||||
Change in net assets from share transactions, Class I | 37 | 36 | (74 | ) | 91 | |||||||||||
|
|
|
|
|
|
|
| |||||||||
Increase (decrease) in net assets from share transactions | (1,460 | ) | 838 | 858 | 687 | |||||||||||
|
|
|
|
|
|
|
| |||||||||
Net increase (decrease) in net assets | (686 | ) | (1,337 | ) | 1,934 | 8 | ||||||||||
| Net Assets | ||||||||||||||||
Beginning of fiscal year | 9,596 | 10,933 | 4,921 | 4,913 | ||||||||||||
|
|
|
|
|
|
|
| |||||||||
End of fiscal year | $ | 8,910 | $ | 9,596 | $ | 6,855 | $ | 4,921 | ||||||||
|
|
|
|
|
|
|
| |||||||||
Accumulated undistributed net investment income (loss) at end of fiscal year | $ | 31 | $ | 12 | $ | 37 | $ | 28 | ||||||||
(1) Amount is less than $500.
See Notes to Financial Statements
64
Table of Contents
VIRTUS OPPORTUNITIES TRUST
STATEMENTS OF CHANGES IN NET ASSETS (Continued)
(Reported in thousands)
|
|
|
| |||||||||||||
| International Equity Fund | International Real Estate Securities Fund | |||||||||||||||
| Year Ended September 30, 2012 | Year Ended September 30, 2011 | Year Ended September 30, 2012 | Year Ended September 30, 2011 | |||||||||||||
| INCREASE/(DECREASE) IN NET ASSETS | ||||||||||||||||
| From Operations | ||||||||||||||||
Net investment income (loss) | $ | 586 | $ | 523 | $ | 799 | $ | 1,681 | ||||||||
Net realized gain (loss) | (346 | ) | 66 | (1,603 | ) | 1,138 | ||||||||||
Net change in unrealized appreciation (depreciation) | 3,073 | (1,660 | ) | 7,113 | (6,401 | ) | ||||||||||
|
|
|
|
|
|
|
| |||||||||
Increase (decrease) in net assets resulting from operations | 3,313 | (1,071 | ) | 6,309 | (3,582 | ) | ||||||||||
|
|
|
|
|
|
|
| |||||||||
| From Distributions to Shareholders | ||||||||||||||||
Net investment income, Class A | (5 | ) | (2 | ) | (72 | ) | (282 | ) | ||||||||
Net investment income, Class C | (3 | ) | (1 | ) | (15 | ) | (56 | ) | ||||||||
Net investment income, Class I | (624 | ) | (212 | ) | (639 | ) | (2,445 | ) | ||||||||
Net realized short-term gains, Class A | (3 | ) | — | — | — | |||||||||||
Net realized short-term gains, Class C | (2 | ) | — | — | — | |||||||||||
Net realized short-term gains, Class I | (331 | ) | — | — | — | |||||||||||
|
|
|
|
|
|
|
| |||||||||
Decrease in net assets from distributions to shareholders | (968 | ) | (215 | ) | (726 | ) | (2,783 | ) | ||||||||
|
|
|
|
|
|
|
| |||||||||
| From Share Transactions (See Note 6) | ||||||||||||||||
Change in net assets from share transactions, Class A | (821 | ) | 952 | (58 | ) | 1,447 | ||||||||||
Change in net assets from share transactions, Class C | 6 | — | (1) | 306 | 714 | |||||||||||
Change in net assets from share transactions, Class I | 6,437 | 11,801 | (914 | ) | 5,809 | |||||||||||
|
|
|
|
|
|
|
| |||||||||
Increase (decrease) in net assets from share transactions | 5,622 | 12,753 | (666 | ) | 7,970 | |||||||||||
|
|
|
|
|
|
|
| |||||||||
Net increase (decrease) in net assets | 7,967 | 11,467 | 4,917 | 1,605 | ||||||||||||
| Net Assets | ||||||||||||||||
Beginning of fiscal year | 18,739 | 7,272 | 28,625 | 27,020 | ||||||||||||
|
|
|
|
|
|
|
| |||||||||
End of fiscal year | $ | 26,706 | $ | 18,739 | $ | 33,542 | $ | 28,625 | ||||||||
|
|
|
|
|
|
|
| |||||||||
Accumulated undistributed net investment income (loss) at end of fiscal year | $ | 223 | $ | 293 | $ | (142 | ) | $ | (691 | ) | ||||||
(1) Amount is less than $500.
See Notes to Financial Statements
65
Table of Contents
VIRTUS OPPORTUNITIES TRUST
STATEMENTS OF CHANGES IN NET ASSETS (Continued)
(Reported in thousands)
|
| |||
| International Small-Cap Fund | ||||
| From inception September 5, 2012 to September 30, 2012 | ||||
| INCREASE/(DECREASE) IN NET ASSETS | ||||
| From Operations | ||||
Net investment income (loss) | $ | 7 | ||
Net change in unrealized appreciation (depreciation) | 21 | |||
|
| |||
Increase (decrease) in net assets resulting from operations | 28 | |||
|
| |||
| From Share Transactions (See Note 6) | ||||
Change in net assets from share transactions, Class A | 100 | |||
Change in net assets from share transactions, Class C | 106 | |||
Change in net assets from share transactions, Class I | 2,808 | |||
|
| |||
Increase (decrease) in net assets from share transactions | 3,014 | |||
|
| |||
Net increase (decrease) in net assets | 3,042 | |||
| Net Assets | ||||
Beginning of fiscal year | — | |||
|
| |||
End of fiscal year | $ | 3,042 | ||
|
| |||
Accumulated undistributed net investment income (loss) at end of fiscal year | $ | 7 | ||
See Notes to Financial Statements
66
Table of Contents
VIRTUS OPPORTUNITIES TRUST
SELECTED PER SHARE DATA AND RATIOS FOR A SHARE OUTSTANDING
THROUGHOUT EACH PERIOD
| Net Asset Value, Beginning of Period | Net Investment Income (Loss)(2) | Net Realized and Unrealized Gain (Loss) | Total from Investment Operations | Dividends from Net Investment Income | Distributions from Net Realized Gains | Total Distributions | Change in Net Asset Value | Net Asset Value, End of Period | Total Return(1) | Net Assets, End of Period (in thousands) | Ratio of Net Operating Expenses to Average Net Assets(8) | Ratio of Gross Expenses to Average Net Assets (before waivers and reimbursements)(8) | Ratio of Net Investment Income (Loss) to Average Net Assets | Portfolio Turnover Rate | |||||||||||||||||||||||||||||||||||||||||||||||||||||||||||||
Emerging Markets | |||||||||||||||||||||||||||||||||||||||||||||||||||||||||||||||||||||||||||
| Debt Fund | |||||||||||||||||||||||||||||||||||||||||||||||||||||||||||||||||||||||||||
Class A | |||||||||||||||||||||||||||||||||||||||||||||||||||||||||||||||||||||||||||
9/5/12(6) to 9/30/12 | $ | 10.00 | 0.02 | 0.07 | 0.09 | — | — | — | 0.09 | $ | 10.09 | 0.90 | %(4) | $ | 101 | 1.35 | %(3) | 3.49 | %(3) | 3.35 | %(3) | 13 | %(4) | ||||||||||||||||||||||||||||||||||||||||||||||||||||
Class C | |||||||||||||||||||||||||||||||||||||||||||||||||||||||||||||||||||||||||||
9/5/12(6) to 9/30/12 | $ | 10.00 | 0.02 | 0.07 | 0.09 | — | — | — | 0.09 | $ | 10.09 | 0.90 | %(4) | $ | 110 | 2.10 | %(3) | 4.26 | %(3) | 2.63 | %(3) | 13 | %(4) | ||||||||||||||||||||||||||||||||||||||||||||||||||||
Class I | |||||||||||||||||||||||||||||||||||||||||||||||||||||||||||||||||||||||||||
| 9/5/12(6) to 9/30/12 | $ | 10.00 | 0.02 | 0.08 | 0.10 | — | — | — | 0.10 | $ | 10.10 | 1.00 | %(4) | $ | 25,036 | 1.10 | %(3) | 3.24 | %(3) | 3.61 | %(3) | 13 | %(4) | ||||||||||||||||||||||||||||||||||||||||||||||||||||
Emerging Markets Equity | |||||||||||||||||||||||||||||||||||||||||||||||||||||||||||||||||||||||||||
| Income Fund | |||||||||||||||||||||||||||||||||||||||||||||||||||||||||||||||||||||||||||
Class A | |||||||||||||||||||||||||||||||||||||||||||||||||||||||||||||||||||||||||||
9/5/12(6) to 9/30/12 | $ | 10.00 | (0.01 | ) | 0.60 | 0.59 | — | — | — | 0.59 | $ | 10.59 | 5.90 | %(4) | $ | 106 | 1.75 | %(3) | 10.28 | %(3) | (0.78 | )%(3) | 37 | %(4) | |||||||||||||||||||||||||||||||||||||||||||||||||||
Class C | |||||||||||||||||||||||||||||||||||||||||||||||||||||||||||||||||||||||||||
9/5/12(6) to 9/30/12 | $ | 10.00 | (0.01 | ) | 0.59 | 0.58 | — | — | — | 0.58 | $ | 10.58 | 5.80 | %(4) | $ | 106 | 2.50 | %(3) | 11.03 | %(3) | (1.54 | )%(3) | 37 | %(4) | |||||||||||||||||||||||||||||||||||||||||||||||||||
Class I | |||||||||||||||||||||||||||||||||||||||||||||||||||||||||||||||||||||||||||
9/5/12(6) to 9/30/12 | $ | 10.00 | — | (5) | 0.59 | 0.59 | — | — | — | 0.59 | $ | 10.59 | 5.90 | %(4) | $ | 5,082 | 1.50 | %(3) | 10.03 | %(3) | (0.54 | )%(3) | 37 | %(4) | |||||||||||||||||||||||||||||||||||||||||||||||||||
Global Commodities | |||||||||||||||||||||||||||||||||||||||||||||||||||||||||||||||||||||||||||
| Stock Fund | |||||||||||||||||||||||||||||||||||||||||||||||||||||||||||||||||||||||||||
Class A | |||||||||||||||||||||||||||||||||||||||||||||||||||||||||||||||||||||||||||
10/1/11 to 9/30/12 | $ | 8.16 | — | (5) | 1.82 | 1.82 | (0.02 | ) | — | (0.02 | ) | 1.80 | $ | 9.96 | 22.30 | % | $ | 936 | 1.65 | % | 1.91 | % | (0.03 | )% | 96 | % | |||||||||||||||||||||||||||||||||||||||||||||||||
3/15/11(6) to 9/30/11 | 10.00 | (0.01 | ) | (1.83 | ) | (1.84 | ) | — | — | — | (1.84 | ) | 8.16 | (18.40 | )(4) | 204 | 1.65 | (3) | 5.40 | (3) | (0.14 | )(3) | 32 | (4) | |||||||||||||||||||||||||||||||||||||||||||||||||||
Class C | |||||||||||||||||||||||||||||||||||||||||||||||||||||||||||||||||||||||||||
10/1/11 to 9/30/12 | $ | 8.13 | (0.08 | ) | 1.82 | 1.74 | — | — | — | 1.74 | $ | 9.87 | 21.40 | % | $ | 117 | 2.40 | % | 2.60 | % | (0.86 | )% | 96 | % | |||||||||||||||||||||||||||||||||||||||||||||||||||
3/15/11(6) to 9/30/11 | 10.00 | (0.05 | ) | (1.82 | ) | (1.87 | ) | — | — | — | (1.87 | ) | 8.13 | (18.70 | )(4) | 99 | 2.40 | (3) | 6.73 | (3) | (0.90 | )(3) | 32 | (4) | |||||||||||||||||||||||||||||||||||||||||||||||||||
Class I | |||||||||||||||||||||||||||||||||||||||||||||||||||||||||||||||||||||||||||
10/1/11 to 9/30/12 | $ | 8.17 | 0.01 | 1.84 | 1.85 | (0.04 | ) | — | (0.04 | ) | 1.81 | $ | 9.98 | 22.67 | % | $ | 18,658 | 1.40 | % | 1.59 | % | 0.14 | % | 96 | % | ||||||||||||||||||||||||||||||||||||||||||||||||||
3/15/11(6) to 9/30/11 | 10.00 | 0.01 | (1.84 | ) | (1.83 | ) | — | — | — | (1.83 | ) | 8.17 | (18.30 | )(4) | 15,692 | 1.40 | (3) | 2.92 | (3) | 0.14 | (3) | 32 | (4) | ||||||||||||||||||||||||||||||||||||||||||||||||||||
The footnote legend is at the end of the financial highlights.
See Notes to Financial Statements
67
Table of Contents
VIRTUS OPPORTUNITIES TRUST
FINANCIAL HIGHLIGHTS
SELECTED PER SHARE DATA AND RATIOS FOR A SHARE OUTSTANDING
THROUGHOUT EACH PERIOD
| Net Asset Value, Beginning of Period | Net Investment Income (Loss)(2) | Net Realized and Unrealized Gain (Loss) | Total from Investment Operations | Dividends from Net Investment Income | Distributions from Net Realized Gains | Total Distributions | Change in Net Asset Value | Net Asset Value, End of Period | Total Return(1) | Net Assets, End of Period (in thousands) | Ratio of Net Operating Expenses to Average Net Assets(8) | Ratio of Gross Expenses to Average Net Assets (before waivers and reimbursements)(8) | Ratio of Net Investment Income (Loss) to Average Net Assets | Portfolio Turnover Rate | |||||||||||||||||||||||||||||||||||||||||||||||||||||||||||||
Global Dividend | |||||||||||||||||||||||||||||||||||||||||||||||||||||||||||||||||||||||||||
| Fund | |||||||||||||||||||||||||||||||||||||||||||||||||||||||||||||||||||||||||||
Class A | |||||||||||||||||||||||||||||||||||||||||||||||||||||||||||||||||||||||||||
10/1/11 to 9/30/12 | $ | 10.97 | 0.31 | 1.95 | 2.26 | (0.35 | ) | — | (0.35 | ) | 1.91 | $ | 12.88 | 20.80 | % | $ | 36,347 | 1.32 | % | 1.32 | % | 2.59 | % | 21 | % | ||||||||||||||||||||||||||||||||||||||||||||||||||
10/1/10 to 9/30/11 | 10.71 | 0.33 | 0.25 | 0.58 | (0.32 | ) | — | (0.32 | ) | 0.26 | 10.97 | 5.40 | 23,120 | 1.34 | 1.34 | 2.89 | 16 | ||||||||||||||||||||||||||||||||||||||||||||||||||||||||||
10/1/09 to 9/30/10 | 9.97 | 0.26 | 0.77 | 1.03 | (0.29 | ) | — | (0.29 | ) | 0.74 | 10.71 | 10.48 | 24,794 | 1.33 | 1.33 | 2.51 | 22 | ||||||||||||||||||||||||||||||||||||||||||||||||||||||||||
10/1/08 to 9/30/09 | 10.91 | 0.31 | (0.87 | ) | (0.56 | ) | (0.30 | ) | (0.08 | ) | (0.38 | ) | (0.94 | ) | 9.97 | (4.76 | ) | 77,049 | 1.31 | 1.33 | 3.50 | 46 | |||||||||||||||||||||||||||||||||||||||||||||||||||||
10/1/07 to 9/30/08 | 13.70 | 0.31 | (2.31 | ) | (2.00 | ) | (0.28 | ) | (0.51 | ) | (0.79 | ) | (2.79 | ) | 10.91 | (15.63 | ) | 75,664 | 1.15 | 1.22 | 2.39 | 60 | |||||||||||||||||||||||||||||||||||||||||||||||||||||
Class C | |||||||||||||||||||||||||||||||||||||||||||||||||||||||||||||||||||||||||||
10/1/11 to 9/30/12 | $ | 10.95 | 0.23 | 1.93 | 2.16 | (0.26 | ) | — | (0.26 | ) | 1.90 | $ | 12.85 | 19.97 | % | $ | 9,117 | 2.07 | % | 2.07 | % | 1.88 | % | 21 | % | ||||||||||||||||||||||||||||||||||||||||||||||||||
10/1/10 to 9/30/11 | 10.69 | 0.24 | 0.26 | 0.50 | (0.24 | ) | — | (0.24 | ) | 0.26 | 10.95 | 4.51 | 6,138 | 2.09 | 2.09 | 2.11 | 16 | ||||||||||||||||||||||||||||||||||||||||||||||||||||||||||
10/1/09 to 9/30/10 | 9.95 | 0.20 | 0.75 | 0.95 | (0.21 | ) | — | (0.21 | ) | 0.74 | 10.69 | 9.70 | 7,160 | 2.10 | 2.10 | 1.98 | 22 | ||||||||||||||||||||||||||||||||||||||||||||||||||||||||||
10/1/08 to 9/30/09 | 10.89 | 0.26 | (0.89 | ) | (0.63 | ) | (0.23 | ) | (0.08 | ) | (0.31 | ) | (0.94 | ) | 9.95 | (5.49 | ) | 6,188 | 2.09 | 2.10 | 2.85 | 46 | |||||||||||||||||||||||||||||||||||||||||||||||||||||
10/1/07 to 9/30/08 | 13.66 | 0.23 | (2.31 | ) | (2.08 | ) | (0.18 | ) | (0.51 | ) | (0.69 | ) | (2.77 | ) | 10.89 | (16.18 | ) | 1,856 | 1.90 | 1.97 | 1.72 | 60 | |||||||||||||||||||||||||||||||||||||||||||||||||||||
Class I | |||||||||||||||||||||||||||||||||||||||||||||||||||||||||||||||||||||||||||
10/1/11 to 9/30/12 | $ | 10.97 | 0.35 | 1.95 | 2.30 | (0.38 | ) | — | (0.38 | ) | 1.92 | $ | 12.89 | 21.19 | % | $ | 48,830 | 1.07 | % | 1.07 | % | 2.85 | % | 21 | % | ||||||||||||||||||||||||||||||||||||||||||||||||||
10/1/10 to 9/30/11 | 10.72 | 0.36 | 0.24 | 0.60 | (0.35 | ) | — | (0.35 | ) | 0.25 | 10.97 | 5.56 | 33,865 | 1.09 | 1.09 | 3.16 | 16 | ||||||||||||||||||||||||||||||||||||||||||||||||||||||||||
10/1/09 to 9/30/10 | 9.96 | 0.31 | 0.76 | 1.07 | (0.31 | ) | — | (0.31 | ) | 0.76 | 10.72 | 10.96 | 37,094 | 1.10 | 1.10 | 3.04 | 22 | ||||||||||||||||||||||||||||||||||||||||||||||||||||||||||
10/1/08 to 9/30/09 | 10.90 | 0.34 | (0.87 | ) | (0.53 | ) | (0.33 | ) | (0.08 | ) | (0.41 | ) | (0.94 | ) | 9.96 | (4.54 | ) | 344 | 1.09 | 1.10 | 3.80 | 46 | |||||||||||||||||||||||||||||||||||||||||||||||||||||
6/6/08(6) to 9/30/08 | 13.41 | 0.07 | (2.40 | ) | (2.33 | ) | (0.18 | ) | — | (0.18 | ) | (2.51 | ) | 10.90 | (17.51 | )(4) | 82 | 0.90 | (3) | 1.01 | (3) | 1.83 | (3) | 60 | (4) | ||||||||||||||||||||||||||||||||||||||||||||||||||
Global Opportunities | |||||||||||||||||||||||||||||||||||||||||||||||||||||||||||||||||||||||||||
| Fund | |||||||||||||||||||||||||||||||||||||||||||||||||||||||||||||||||||||||||||
Class A | |||||||||||||||||||||||||||||||||||||||||||||||||||||||||||||||||||||||||||
10/1/11 to 9/30/12 | $ | 7.91 | 0.05 | 1.99 | 2.04 | (0.04 | ) | — | (0.04 | ) | 2.00 | $ | 9.91 | 25.80 | % | $ | 71,592 | 1.55 | % | 1.55 | % | 0.53 | % | 73 | % | ||||||||||||||||||||||||||||||||||||||||||||||||||
10/1/10 to 9/30/11 | 7.79 | 0.05 | 0.15 | 0.20 | (0.08 | ) | — | (0.08 | ) | 0.12 | 7.91 | 2.54 | 54,916 | 1.55 | 1.67 | 0.65 | 56 | ||||||||||||||||||||||||||||||||||||||||||||||||||||||||||
10/1/09 to 9/30/10 | 6.67 | 0.09 | 1.11 | 1.20 | (0.08 | ) | — | (0.08 | ) | 1.12 | 7.79 | 18.09 | 59,088 | 1.57 | (7) | 1.66 | 1.21 | 78 | |||||||||||||||||||||||||||||||||||||||||||||||||||||||||
10/1/08 to 9/30/09 | 7.82 | 0.07 | (1.14 | ) | (1.07 | ) | (0.08 | ) | — | (0.08 | ) | (1.15 | ) | 6.67 | (13.53 | ) | 53,644 | 1.86 | 1.86 | 1.16 | 168 | ||||||||||||||||||||||||||||||||||||||||||||||||||||||
10/1/07 to 9/30/08 | 11.59 | 0.13 | (3.59 | ) | (3.46 | ) | (0.09 | ) | (0.22 | ) | (0.31 | ) | (3.77 | ) | 7.82 | (30.50 | ) | 73,003 | 1.65 | 1.65 | 1.31 | 62 | |||||||||||||||||||||||||||||||||||||||||||||||||||||
Class B | |||||||||||||||||||||||||||||||||||||||||||||||||||||||||||||||||||||||||||
10/1/11 to 9/30/12 | $ | 7.06 | (0.02 | ) | 1.78 | 1.76 | — | — | — | 1.76 | $ | 8.82 | 24.93 | % | $ | 1,048 | 2.30 | % | 2.30 | % | (0.28 | )% | 73 | % | |||||||||||||||||||||||||||||||||||||||||||||||||||
10/1/10 to 9/30/11 | 6.97 | (0.01 | ) | 0.13 | 0.12 | (0.03 | ) | — | (0.03 | ) | 0.09 | 7.06 | 1.76 | 915 | 2.30 | 2.42 | (0.14 | ) | 56 | ||||||||||||||||||||||||||||||||||||||||||||||||||||||||
10/1/09 to 9/30/10 | 6.00 | 0.03 | 0.99 | 1.02 | (0.05 | ) | — | (0.05 | ) | 0.97 | 6.97 | 17.09 | 1,294 | 2.32 | (7) | 2.41 | 0.43 | 78 | |||||||||||||||||||||||||||||||||||||||||||||||||||||||||
10/1/08 to 9/30/09 | 7.06 | 0.02 | (1.02 | ) | (1.00 | ) | (0.06 | ) | — | (0.06 | ) | (1.06 | ) | 6.00 | (14.10 | ) | 1,369 | 2.61 | 2.61 | 0.35 | 168 | ||||||||||||||||||||||||||||||||||||||||||||||||||||||
10/1/07 to 9/30/08 | 10.48 | 0.04 | (3.22 | ) | (3.18 | ) | (0.02 | ) | (0.22 | ) | (0.24 | ) | (3.42 | ) | 7.06 | (30.93 | ) | 2,379 | 2.39 | 2.39 | 0.49 | 62 | |||||||||||||||||||||||||||||||||||||||||||||||||||||
Class C | |||||||||||||||||||||||||||||||||||||||||||||||||||||||||||||||||||||||||||
10/1/11 to 9/30/12 | $ | 7.02 | (0.02 | ) | 1.77 | 1.75 | — | — | — | 1.75 | $ | 8.77 | 24.93 | % | $ | 1,700 | 2.30 | % | 2.30 | % | (0.25 | )% | 73 | % | |||||||||||||||||||||||||||||||||||||||||||||||||||
10/1/10 to 9/30/11 | 6.93 | (0.01 | ) | 0.13 | 0.12 | (0.03 | ) | — | (0.03 | ) | 0.09 | 7.02 | 1.77 | 813 | 2.30 | 2.42 | (0.11 | ) | 56 | ||||||||||||||||||||||||||||||||||||||||||||||||||||||||
10/1/09 to 9/30/10 | 5.97 | 0.03 | 0.98 | 1.01 | (0.05 | ) | — | (0.05 | ) | 0.96 | 6.93 | 17.01 | 806 | 2.32 | (7) | 2.41 | 0.48 | 78 | |||||||||||||||||||||||||||||||||||||||||||||||||||||||||
10/1/08 to 9/30/09 | 7.03 | 0.02 | (1.02 | ) | (1.00 | ) | (0.06 | ) | — | (0.06 | ) | (1.06 | ) | 5.97 | (14.16 | ) | 776 | 2.62 | 2.62 | 0.37 | 168 | ||||||||||||||||||||||||||||||||||||||||||||||||||||||
10/1/07 to 9/30/08 | 10.44 | 0.05 | (3.22 | ) | (3.17 | ) | (0.02 | ) | (0.22 | ) | (0.24 | ) | (3.41 | ) | 7.03 | (30.95 | ) | 1,149 | 2.40 | 2.40 | 0.55 | 62 | |||||||||||||||||||||||||||||||||||||||||||||||||||||
Class I | |||||||||||||||||||||||||||||||||||||||||||||||||||||||||||||||||||||||||||
8/8/12(6) to 9/30/12(6) | $ | 9.38 | — | (5) | 0.53 | 0.53 | — | — | — | 0.53 | $ | 9.91 | 5.54 | %(4) | $ | 23,617 | 1.30 | %(3) | 1.30 | %(3) | 0.02 | %(3) | 73 | %(4) | |||||||||||||||||||||||||||||||||||||||||||||||||||
The footnote legend is at the end of the financial highlights.
See Notes to Financial Statements
68
Table of Contents
VIRTUS OPPORTUNITIES TRUST
FINANCIAL HIGHLIGHTS
SELECTED PER SHARE DATA AND RATIOS FOR A SHARE OUTSTANDING
THROUGHOUT EACH PERIOD
| Net Asset Value, Beginning of Period | Net Investment Income (Loss)(2) | Net Realized and Unrealized Gain (Loss) | Total from Investment Operations | Dividends from Net Investment Income | Distributions from Net Realized Gains | Total Distributions | Change in Net Asset Value | Net Asset Value, End of Period | Total Return(1) | Net Assets, End of Period (in thousands) | Ratio of Net Operating Expenses to Average Net Assets(8) | Ratio of Gross Expenses to Average Net Assets (before waivers and reimbursements)(8) | Ratio of Net Investment Income (Loss) to Average Net Assets | Portfolio Turnover Rate | |||||||||||||||||||||||||||||||||||||||||||||||||||||||||||||
Global Real Estate | |||||||||||||||||||||||||||||||||||||||||||||||||||||||||||||||||||||||||||
| Securities Fund | |||||||||||||||||||||||||||||||||||||||||||||||||||||||||||||||||||||||||||
Class A | |||||||||||||||||||||||||||||||||||||||||||||||||||||||||||||||||||||||||||
10/1/11 to 9/30/12 | $ | 17.78 | 0.33 | 4.77 | 5.10 | (0.11 | ) | (0.37 | ) | (0.48 | ) | 4.62 | $ | 22.40 | 29.21 | % | $ | 8,695 | 1.40 | % | 2.37 | % | 1.61 | % | 31 | % | |||||||||||||||||||||||||||||||||||||||||||||||||
10/1/10 to 9/30/11 | 19.84 | 0.50 | (0.90 | ) | (0.40 | ) | (1.01 | ) | (0.65 | ) | (1.66 | ) | (2.06 | ) | 17.78 | (2.57 | ) | 5,275 | 1.40 | 3.16 | 2.48 | 41 | |||||||||||||||||||||||||||||||||||||||||||||||||||||
10/1/09 to 9/30/10 | 18.33 | 0.40 | 3.31 | 3.71 | (1.55 | ) | (0.65 | ) | (2.20 | ) | 1.51 | 19.84 | 22.42 | 2,492 | 1.40 | 4.07 | 2.21 | 28 | |||||||||||||||||||||||||||||||||||||||||||||||||||||||||
3/2/09(6) to 9/30/09 | 10.00 | 0.30 | 8.03 | 8.33 | — | — | — | 8.33 | 18.33 | 83.30 | (4) | 1,586 | 1.40 | (3) | 9.62 | (3) | 3.68 | (3) | 29 | (4) | |||||||||||||||||||||||||||||||||||||||||||||||||||||||
Class C | |||||||||||||||||||||||||||||||||||||||||||||||||||||||||||||||||||||||||||
10/1/11 to 9/30/12 | $ | 17.65 | 0.17 | 4.72 | 4.89 | (0.03 | ) | (0.37 | ) | (0.40 | ) | 4.49 | $ | 22.14 | 28.18 | % | $ | 1,356 | 2.15 | % | 3.11 | % | 0.83 | % | 31 | % | |||||||||||||||||||||||||||||||||||||||||||||||||
10/1/10 to 9/30/11 | 19.67 | 0.35 | (0.88 | ) | (0.53 | ) | (0.84 | ) | (0.65 | ) | (1.49 | ) | (2.02 | ) | 17.65 | (3.25 | ) | 486 | 2.15 | 3.91 | 1.73 | 41 | |||||||||||||||||||||||||||||||||||||||||||||||||||||
10/1/09 to 9/30/10 | 18.25 | 0.27 | 3.29 | 3.56 | (1.49 | ) | (0.65 | ) | (2.14 | ) | 1.42 | 19.67 | 21.55 | 262 | 2.15 | 4.83 | 1.50 | 28 | |||||||||||||||||||||||||||||||||||||||||||||||||||||||||
3/2/09(6) to 9/30/09 | 10.00 | 0.24 | 8.01 | 8.25 | — | — | — | 8.25 | 18.25 | 82.50 | (4) | 194 | 2.15 | (3) | 10.45 | (3) | 2.94 | (3) | 29 | (4) | |||||||||||||||||||||||||||||||||||||||||||||||||||||||
Class I | |||||||||||||||||||||||||||||||||||||||||||||||||||||||||||||||||||||||||||
10/1/11 to 9/30/12 | $ | 17.85 | 0.45 | 4.71 | 5.16 | (0.13 | ) | (0.37 | ) | (0.50 | ) | 4.66 | $ | 22.51 | 29.50 | % | $ | 12,063 | 1.15 | % | 1.93 | % | 2.04 | % | 31 | % | |||||||||||||||||||||||||||||||||||||||||||||||||
10/1/10 to 9/30/11 | 19.91 | 0.63 | (0.97 | ) | (0.34 | ) | (1.07 | ) | (0.65 | ) | (1.72 | ) | (2.06 | ) | 17.85 | (2.26 | ) | 609 | 1.15 | 2.92 | 3.07 | 41 | |||||||||||||||||||||||||||||||||||||||||||||||||||||
10/1/09 to 9/30/10 | 18.36 | 0.47 | 3.30 | 3.77 | (1.57 | ) | (0.65 | ) | (2.22 | ) | 1.55 | 19.91 | 22.77 | 678 | 1.15 | 3.90 | 2.63 | 28 | |||||||||||||||||||||||||||||||||||||||||||||||||||||||||
| 3/2/09(6) to 9/30/09 | 10.00 | 0.32 | 8.04 | 8.36 | — | — | — | 8.36 | 18.36 | 83.60 | (4) | 183 | 1.15 | (3) | 6.04 | (3) | 3.93 | (3) | 29 | (4) | |||||||||||||||||||||||||||||||||||||||||||||||||||||||
Greater Asia ex Japan | |||||||||||||||||||||||||||||||||||||||||||||||||||||||||||||||||||||||||||
| Opportunities Fund | |||||||||||||||||||||||||||||||||||||||||||||||||||||||||||||||||||||||||||
Class A | |||||||||||||||||||||||||||||||||||||||||||||||||||||||||||||||||||||||||||
10/1/11 to 9/30/12 | $ | 13.93 | 0.07 | 1.99 | 2.06 | (0.02 | ) | (0.53 | ) | (0.55 | ) | 1.51 | $ | 15.44 | 15.56 | % | $ | 8,366 | 1.80 | % | 3.11 | % | 0.49 | % | 40 | % | |||||||||||||||||||||||||||||||||||||||||||||||||
10/1/10 to 9/30/11 | 16.89 | 0.06 | (1.09 | ) | (1.03 | ) | (0.10 | ) | (1.83 | ) | (1.93 | ) | (2.96 | ) | 13.93 | (6.88 | ) | 9,125 | 1.80 | 3.06 | 0.39 | 60 | |||||||||||||||||||||||||||||||||||||||||||||||||||||
10/1/09 to 9/30/10 | 13.01 | 0.14 | 4.19 | 4.33 | (0.13 | ) | (0.32 | ) | (0.45 | ) | 3.88 | 16.89 | 34.27 | 10,305 | 1.80 | 3.05 | 1.00 | 78 | |||||||||||||||||||||||||||||||||||||||||||||||||||||||||
4/21/09(6) to 9/30/09 | 10.00 | 0.10 | 2.91 | 3.01 | — | — | — | 3.01 | 13.01 | 30.10 | (4) | 6,431 | 1.80 | (3) | 3.78 | (3) | 1.88 | (3) | 26 | (4) | |||||||||||||||||||||||||||||||||||||||||||||||||||||||
Class C | |||||||||||||||||||||||||||||||||||||||||||||||||||||||||||||||||||||||||||
10/1/11 to 9/30/12 | $ | 13.79 | (0.03 | ) | 1.96 | 1.93 | — | (0.53 | ) | (0.53 | ) | 1.40 | $ | 15.19 | 14.74 | % | $ | 230 | 2.55 | % | 3.87 | % | (0.22 | )% | 40 | % | |||||||||||||||||||||||||||||||||||||||||||||||||
10/1/10 to 9/30/11 | 16.77 | (0.07 | ) | (1.08 | ) | (1.15 | ) | — | (1.83 | ) | (1.83 | ) | (2.98 | ) | 13.79 | (7.61 | ) | 223 | 2.55 | 3.81 | (0.47 | ) | 60 | ||||||||||||||||||||||||||||||||||||||||||||||||||||
10/1/09 to 9/30/10 | 12.96 | 0.07 | 4.16 | 4.23 | (0.10 | ) | (0.32 | ) | (0.42 | ) | 3.81 | 16.77 | 33.39 | 430 | 2.55 | 3.83 | 0.46 | 78 | |||||||||||||||||||||||||||||||||||||||||||||||||||||||||
4/21/09(6) to 9/30/09 | 10.00 | 0.06 | 2.90 | 2.96 | — | — | — | 2.96 | 12.96 | 29.60 | (4) | 130 | 2.55 | (3) | 4.54 | (3) | 1.12 | (3) | 26 | (4) | |||||||||||||||||||||||||||||||||||||||||||||||||||||||
Class I | |||||||||||||||||||||||||||||||||||||||||||||||||||||||||||||||||||||||||||
10/1/11 to 9/30/12 | $ | 13.99 | 0.10 | 2.00 | 2.10 | (0.06 | ) | (0.53 | ) | (0.59 | ) | 1.51 | $ | 15.50 | 15.80 | % | $ | 314 | 1.55 | % | 2.76 | % | 0.70 | % | 40 | % | |||||||||||||||||||||||||||||||||||||||||||||||||
10/1/10 to 9/30/11 | 16.94 | 0.08 | (1.06 | ) | (0.98 | ) | (0.14 | ) | (1.83 | ) | (1.97 | ) | (2.95 | ) | 13.99 | (6.57 | ) | 248 | 1.55 | 2.78 | 0.50 | 60 | |||||||||||||||||||||||||||||||||||||||||||||||||||||
10/1/09 to 9/30/10 | 13.02 | 0.18 | 4.21 | 4.39 | (0.15 | ) | (0.32 | ) | (0.47 | ) | 3.92 | 16.94 | 34.69 | 198 | 1.55 | 2.80 | 1.25 | 78 | |||||||||||||||||||||||||||||||||||||||||||||||||||||||||
4/21/09(6) to 9/30/09 | 10.00 | 0.11 | 2.91 | 3.02 | — | — | — | 3.02 | 13.02 | 30.20 | (4) | 130 | 1.55 | (3) | 3.54 | (3) | 2.11 | (3) | 26 | (4) | |||||||||||||||||||||||||||||||||||||||||||||||||||||||
The footnote legend is at the end of the financial highlights.
See Notes to Financial Statements
69
Table of Contents
VIRTUS OPPORTUNITIES TRUST
FINANCIAL HIGHLIGHTS
SELECTED PER SHARE DATA AND RATIOS FOR A SHARE OUTSTANDING
THROUGHOUT EACH PERIOD
| Net Asset Value, Beginning of Period | Net Investment Income (Loss)(2) | Net Realized and Unrealized Gain (Loss) | Total from Investment Operations | Dividends from Net Investment Income | Distributions from Net Realized Gains | Total Distributions | Change in Net Asset Value | Net Asset Value, End of Period | Total Return(1) | Net Assets, End of Period (in thousands) | Ratio of Net Operating Expenses to Average Net Assets(8) | Ratio of Gross Expenses to Average Net Assets (before waivers and reimbursements)(8) | Ratio of Net Investment Income (Loss) to Average Net Assets | Portfolio Turnover Rate | |||||||||||||||||||||||||||||||||||||||||||||||||||||||||||||
Greater European | |||||||||||||||||||||||||||||||||||||||||||||||||||||||||||||||||||||||||||
| Opportunities Fund | |||||||||||||||||||||||||||||||||||||||||||||||||||||||||||||||||||||||||||
Class A | |||||||||||||||||||||||||||||||||||||||||||||||||||||||||||||||||||||||||||
10/1/11 to 9/30/12 | $ | 11.80 | 0.16 | 2.87 | 3.03 | (0.15 | ) | (0.48 | ) | (0.63 | ) | 2.40 | $ | 14.20 | 26.75 | % | $ | 6,513 | 1.45 | % | 2.82 | % | 1.26 | % | 49 | % | |||||||||||||||||||||||||||||||||||||||||||||||||
10/1/10 to 9/30/11 | 13.56 | 0.17 | (0.36 | ) | (0.19 | ) | (0.29 | ) | (1.28 | ) | (1.57 | ) | (1.76 | ) | 11.80 | (2.09 | ) | 4,571 | 1.45 | 3.03 | 1.26 | 46 | |||||||||||||||||||||||||||||||||||||||||||||||||||||
10/1/09 to 9/30/10 | 12.97 | 0.21 | 0.95 | 1.16 | (0.15 | ) | (0.42 | ) | (0.57 | ) | 0.59 | 13.56 | 9.14 | 4,629 | 1.45 | 2.75 | 1.60 | 48 | |||||||||||||||||||||||||||||||||||||||||||||||||||||||||
4/21/09(6) to 9/30/09 | 10.00 | 0.12 | 2.85 | 2.97 | — | — | — | 2.97 | 12.97 | 29.70 | (4) | 6,236 | 1.45 | (3) | 3.60 | (3) | 2.38 | (3) | 14 | (4) | |||||||||||||||||||||||||||||||||||||||||||||||||||||||
Class C | |||||||||||||||||||||||||||||||||||||||||||||||||||||||||||||||||||||||||||
10/1/11 to 9/30/12 | $ | 11.69 | 0.07 | 2.85 | 2.92 | (0.03 | ) | (0.48 | ) | (0.51 | ) | 2.41 | $ | 14.10 | 25.73 | % | $ | 187 | 2.20 | % | 3.57 | % | 0.52 | % | 49 | % | |||||||||||||||||||||||||||||||||||||||||||||||||
10/1/10 to 9/30/11 | 13.45 | 0.07 | (0.36 | ) | (0.29 | ) | (0.19 | ) | (1.28 | ) | (1.47 | ) | (1.76 | ) | 11.69 | (2.77 | ) | 144 | 2.20 | 3.78 | 0.53 | 46 | |||||||||||||||||||||||||||||||||||||||||||||||||||||
10/1/09 to 9/30/10 | 12.93 | 0.07 | 0.98 | 1.05 | (0.11 | ) | (0.42 | ) | (0.53 | ) | 0.52 | 13.45 | 8.28 | 142 | 2.20 | 3.50 | 0.56 | 48 | |||||||||||||||||||||||||||||||||||||||||||||||||||||||||
4/21/09(6) to 9/30/09 | 10.00 | 0.07 | 2.86 | 2.93 | — | — | — | 2.93 | 12.93 | 29.30 | (4) | 196 | 2.20 | (3) | 4.27 | (3) | 1.31 | (3) | 14 | (4) | |||||||||||||||||||||||||||||||||||||||||||||||||||||||
Class I | |||||||||||||||||||||||||||||||||||||||||||||||||||||||||||||||||||||||||||
10/1/11 to 9/30/12 | $ | 11.83 | 0.17 | 2.90 | 3.07 | (0.19 | ) | (0.48 | ) | (0.67 | ) | 2.40 | $ | 14.23 | 26.99 | % | $ | 155 | 1.20 | % | 2.57 | % | 1.32 | % | 49 | % | |||||||||||||||||||||||||||||||||||||||||||||||||
10/1/10 to 9/30/11 | 13.60 | 0.17 | (0.34 | ) | (0.17 | ) | (0.32 | ) | (1.28 | ) | (1.60 | ) | (1.77 | ) | 11.83 | (1.84 | ) | 206 | 1.20 | 2.78 | 1.33 | 46 | |||||||||||||||||||||||||||||||||||||||||||||||||||||
10/1/09 to 9/30/10 | 12.98 | 0.24 | 0.96 | 1.20 | (0.16 | ) | (0.42 | ) | (0.58 | ) | 0.62 | 13.60 | 9.48 | 142 | 1.20 | 2.56 | 1.83 | 48 | |||||||||||||||||||||||||||||||||||||||||||||||||||||||||
| 4/21/09(6) to 9/30/09 | 10.00 | 0.14 | 2.84 | 2.98 | — | — | — | 2.98 | 12.98 | 29.80 | (4) | 130 | 1.20 | (3) | 3.34 | (3) | 2.63 | (3) | 14 | (4) | |||||||||||||||||||||||||||||||||||||||||||||||||||||||
International Equity Fund | |||||||||||||||||||||||||||||||||||||||||||||||||||||||||||||||||||||||||||
Class A | |||||||||||||||||||||||||||||||||||||||||||||||||||||||||||||||||||||||||||
10/1/11 to 9/30/12 | $ | 9.79 | 0.21 | 1.36 | 1.57 | (0.30 | ) | (0.19 | ) | (0.49 | ) | 1.08 | $ | 10.87 | 16.58 | % | $ | 193 | 1.50 | % | 1.80 | % | 2.02 | % | 25 | % | |||||||||||||||||||||||||||||||||||||||||||||||||
10/1/10 to 9/30/11 | 10.17 | 0.29 | (0.57 | ) | (0.28 | ) | (0.10 | ) | — | (0.10 | ) | (0.38 | ) | 9.79 | (2.85 | ) | 952 | 1.50 | 2.11 | 2.73 | 65 | ||||||||||||||||||||||||||||||||||||||||||||||||||||||
9/16/10(6) to 9/30/10 | 10.00 | — | (5) | 0.17 | 0.17 | — | — | — | 0.17 | 10.17 | 1.70 | (4) | 102 | 1.50 | (3) | 19.64 | (3) | 1.36 | (3) | 0 | (4) | ||||||||||||||||||||||||||||||||||||||||||||||||||||||
Class C | |||||||||||||||||||||||||||||||||||||||||||||||||||||||||||||||||||||||||||
10/1/11 to 9/30/12 | $ | 9.76 | 0.20 | 1.25 | 1.45 | (0.25 | ) | (0.19 | ) | (0.44 | ) | 1.01 | $ | 10.77 | 15.37 | % | $ | 115 | 2.25 | % | 2.51 | % | 1.94 | % | 25 | % | |||||||||||||||||||||||||||||||||||||||||||||||||
10/1/10 to 9/30/11 | 10.16 | 0.18 | (0.53 | ) | (0.35 | ) | (0.05 | ) | — | (0.05 | ) | (0.40 | ) | 9.76 | (3.58 | ) | 98 | 2.25 | 3.15 | 1.70 | 65 | ||||||||||||||||||||||||||||||||||||||||||||||||||||||
9/16/10(6) to 9/30/10 | 10.00 | — | (5) | 0.16 | 0.16 | — | — | — | 0.16 | 10.16 | 1.60 | (4) | 102 | 2.25 | (3) | 20.39 | (3) | 0.61 | (3) | 0 | (4) | ||||||||||||||||||||||||||||||||||||||||||||||||||||||
Class I | |||||||||||||||||||||||||||||||||||||||||||||||||||||||||||||||||||||||||||
10/1/11 to 9/30/12 | $ | 9.80 | 0.30 | 1.26 | 1.56 | (0.35 | ) | (0.19 | ) | (0.54 | ) | 1.02 | $ | 10.82 | 16.47 | % | $ | 26,398 | 1.25 | % | 1.50 | % | 2.94 | % | 25 | % | |||||||||||||||||||||||||||||||||||||||||||||||||
10/1/10 to 9/30/11 | 10.18 | 0.34 | (0.60 | ) | (0.26 | ) | (0.12 | ) | — | (0.12 | ) | (0.38 | ) | 9.80 | (2.62 | ) | 17,689 | 1.25 | 1.88 | 3.16 | 65 | ||||||||||||||||||||||||||||||||||||||||||||||||||||||
| 9/16/10(6) to 9/30/10 | 10.00 | 0.01 | 0.17 | 0.18 | — | — | — | 0.18 | 10.18 | 1.70 | (4) | 7,068 | 1.25 | (3) | 19.39 | (3) | 1.62 | (3) | 0 | (4) | |||||||||||||||||||||||||||||||||||||||||||||||||||||||
The footnote legend is at the end of the financial highlights.
See Notes to Financial Statements
70
Table of Contents
VIRTUS OPPORTUNITIES TRUST
FINANCIAL HIGHLIGHTS
SELECTED PER SHARE DATA AND RATIOS FOR A SHARE OUTSTANDING
THROUGHOUT EACH PERIOD
| Net Asset Value, Beginning of Period | Net Investment Income (Loss)(2) | Net Realized and Unrealized Gain (Loss) | Total from Investment Operations | Dividends from Net Investment Income | Distributions from Net Realized Gains | Total Distributions | Change in Net Asset Value | Net Asset Value, End of Period | Total Return(1) | Net Assets, End of Period (in thousands) | Ratio of Net Operating Expenses to Average Net Assets(8) | Ratio of Gross Expenses to Average Net Assets (before waivers and reimbursements)(8) | Ratio of Net Investment Income (Loss) to Average Net Assets | Portfolio Turnover Rate | |||||||||||||||||||||||||||||||||||||||||||||||||||||||||||||
International Real Estate | |||||||||||||||||||||||||||||||||||||||||||||||||||||||||||||||||||||||||||
| Securities Fund | |||||||||||||||||||||||||||||||||||||||||||||||||||||||||||||||||||||||||||
Class A | |||||||||||||||||||||||||||||||||||||||||||||||||||||||||||||||||||||||||||
10/1/11 to 9/30/12 | $ | 5.23 | 0.16 | 1.24 | 1.40 | (0.13 | ) | — | (0.13 | ) | 1.27 | $ | 6.50 | 27.35 | % | $ | 3,916 | 1.50 | % | 1.85 | % | 2.69 | % | 41 | % | ||||||||||||||||||||||||||||||||||||||||||||||||||
10/1/10 to 9/30/11 | 6.30 | 0.31 | (0.69 | ) | (0.38 | ) | (0.69 | ) | — | (0.69 | ) | (1.07 | ) | 5.23 | (7.15 | ) | 3,243 | 1.50 | 1.77 | 5.03 | 41 | ||||||||||||||||||||||||||||||||||||||||||||||||||||||
10/1/09 to 9/30/10 | 6.00 | 0.13 | 0.65 | 0.78 | (0.48 | ) | — | (0.48 | ) | 0.30 | 6.30 | 14.44 | 2,474 | 1.50 | 1.70 | 2.21 | 20 | ||||||||||||||||||||||||||||||||||||||||||||||||||||||||||
10/1/08 to 9/30/09 | 6.72 | 0.21 | (0.66 | ) | (0.45 | ) | (0.27 | ) | — | (0.27 | ) | (0.72 | ) | 6.00 | (5.59 | ) | 32,178 | 1.50 | 1.66 | 4.71 | 54 | ||||||||||||||||||||||||||||||||||||||||||||||||||||||
10/1/07(6) to 9/30/08 | 10.00 | 0.21 | (3.32 | ) | (3.11 | ) | (0.17 | ) | — | (0.17 | ) | (3.28 | ) | 6.72 | (31.46 | ) | 60,907 | 1.50 | 2.11 | 2.74 | 8 | ||||||||||||||||||||||||||||||||||||||||||||||||||||||
Class C | |||||||||||||||||||||||||||||||||||||||||||||||||||||||||||||||||||||||||||
10/1/11 to 9/30/12 | $ | 5.20 | 0.12 | 1.24 | 1.36 | (0.08 | ) | — | (0.08 | ) | 1.28 | $ | 6.48 | 26.36 | % | $ | 1,531 | 2.25 | % | 2.60 | % | 2.04 | % | 41 | % | ||||||||||||||||||||||||||||||||||||||||||||||||||
10/1/10 to 9/30/11 | 6.26 | 0.24 | (0.67 | ) | (0.43 | ) | (0.63 | ) | — | (0.63 | ) | (1.06 | ) | 5.20 | (7.90 | ) | 962 | 2.25 | 2.52 | 3.91 | 41 | ||||||||||||||||||||||||||||||||||||||||||||||||||||||
10/1/09 to 9/30/10 | 6.00 | 0.13 | 0.61 | 0.74 | (0.48 | ) | — | (0.48 | ) | 0.26 | 6.26 | 13.73 | 494 | 2.25 | 2.51 | 2.28 | 20 | ||||||||||||||||||||||||||||||||||||||||||||||||||||||||||
10/1/08 to 9/30/09 | 6.70 | 0.19 | (0.67 | ) | (0.48 | ) | (0.22 | ) | — | (0.22 | ) | (0.70 | ) | 6.00 | (6.30 | ) | 413 | 2.25 | 2.40 | 4.21 | 54 | ||||||||||||||||||||||||||||||||||||||||||||||||||||||
10/1/07(6) to 9/30/08 | 10.00 | 0.20 | (3.38 | ) | (3.18 | ) | (0.12 | ) | — | (0.12 | ) | (3.30 | ) | 6.70 | (32.09 | ) | 141 | 2.23 | 3.00 | 2.52 | 8 | ||||||||||||||||||||||||||||||||||||||||||||||||||||||
Class I | |||||||||||||||||||||||||||||||||||||||||||||||||||||||||||||||||||||||||||
10/1/11 to 9/30/12 | $ | 5.23 | 0.17 | 1.25 | 1.42 | (0.16 | ) | — | (0.16 | ) | 1.26 | $ | 6.49 | 27.74 | % | $ | 28,095 | 1.25 | % | 1.59 | % | 2.92 | % | 41 | % | ||||||||||||||||||||||||||||||||||||||||||||||||||
10/1/10 to 9/30/11 | 6.31 | 0.35 | (0.72 | ) | (0.37 | ) | (0.71 | ) | — | (0.71 | ) | (1.08 | ) | 5.23 | (7.04 | ) | 24,420 | 1.25 | 1.52 | 5.65 | 41 | ||||||||||||||||||||||||||||||||||||||||||||||||||||||
10/1/09 to 9/30/10 | 5.99 | 0.19 | 0.61 | 0.80 | (0.48 | ) | — | (0.48 | ) | 0.32 | 6.31 | 14.83 | 24,052 | 1.25 | 1.51 | 3.31 | 20 | ||||||||||||||||||||||||||||||||||||||||||||||||||||||||||
10/1/08 to 9/30/09 | 6.72 | 0.23 | (0.67 | ) | (0.44 | ) | (0.29 | ) | — | (0.29 | ) | (0.73 | ) | 5.99 | (5.43 | ) | 71 | 1.25 | 1.41 | 4.87 | 54 | ||||||||||||||||||||||||||||||||||||||||||||||||||||||
| 10/1/07(6) to 9/30/08 | 10.00 | 0.25 | (3.35 | ) | (3.10 | ) | (0.18 | ) | — | (0.18 | ) | (3.28 | ) | 6.72 | (31.32 | ) | 69 | 1.24 | 2.16 | 3.00 | 8 | ||||||||||||||||||||||||||||||||||||||||||||||||||||||
International Small-Cap | |||||||||||||||||||||||||||||||||||||||||||||||||||||||||||||||||||||||||||
| Fund | |||||||||||||||||||||||||||||||||||||||||||||||||||||||||||||||||||||||||||
Class A | |||||||||||||||||||||||||||||||||||||||||||||||||||||||||||||||||||||||||||
9/5/12(6) to 9/30/12 | $ | 10.00 | 0.02 | 0.07 | 0.09 | — | — | — | 0.09 | $ | 10.09 | 0.90 | %(4) | $ | 101 | 1.60 | %(3) | 16.64 | %(3) | 3.65 | %(3) | 0 | %(4) | ||||||||||||||||||||||||||||||||||||||||||||||||||||
Class C | |||||||||||||||||||||||||||||||||||||||||||||||||||||||||||||||||||||||||||
9/5/12(6) to 9/30/12 | $ | 10.00 | 0.02 | 0.07 | 0.09 | — | — | — | 0.09 | $ | 10.09 | 0.90 | %(4) | $ | 107 | 2.35 | %(3) | 17.43 | %(3) | 2.86 | %(3) | 0 | %(4) | ||||||||||||||||||||||||||||||||||||||||||||||||||||
Class I | |||||||||||||||||||||||||||||||||||||||||||||||||||||||||||||||||||||||||||
9/5/12(6) to 9/30/12 | $ | 10.00 | 0.03 | 0.07 | 0.10 | — | — | — | 0.10 | $ | 10.10 | 1.00 | %(4) | $ | 2,834 | 1.35 | %(3) | 16.39 | %(3) | 3.89 | %(3) | 0 | %(4) | ||||||||||||||||||||||||||||||||||||||||||||||||||||
Footnote Legend
| (1) | Sales charges, where applicable, are not reflected in the total return calculation. |
| (2) | Computed using average shares outstanding. |
| (3) | Annualized. |
| (4) | Not annualized. |
| (5) | Amount is less than $0.005. |
| (6) | Inception date. |
| (7) | Due to a change in expense ratio, the ratio shown is a blended expense ratio. |
| (8) | The Funds will also indirectly bear their prorated share of expenses of the underlying funds in which they invest. Such expenses are not included in the calculation of this ratio. |
See Notes to Financial Statements
71
Table of Contents
VIRTUS OPPORTUNITIES TRUST
SEPTEMBER 30, 2012
| Note | 1. Organization |
Virtus Opportunities Trust (the “Trust”) is organized as a Delaware statutory trust and is registered under the Investment Company Act of 1940, as amended (“1940 Act”), as an open-end management investment company.
As of the date of this report, 27 funds are offered for sale, of which 11 (each a “Fund”) are reported in this annual report.
The Fund’s investment objectives are outlined in each Fund’s Summary Page.
All the Funds offer Class A, Class C shares and Class I shares. Class B shares are no longer available for purchase by new or existing shareholders, except for existing shareholders through Qualifying Transactions, For more information regarding Qualifying Transactions, refer to the prospectus.
Class A shares of Emerging Markets Debt Fund are sold with a front-end sales charge of up to 3.75%. Class A shares of the remaining Funds are sold with a front-end sales charge of up to 5.75% with some exceptions. Generally, Class A shares are not subject to any charges by the Funds when redeemed; however, a 0.50% – 1% contingent deferred sales charge (“CDSC”) may be imposed on certain redemptions made within a certain period following purchases on which a finder’s fee has been paid. The period for which such CDSC applies for the Funds is 18 months. The CDSC period begins on the last day of the month preceding the month in which the purchase was made.
Class B shares were generally sold with a CDSC, which declines from 5% to zero depending on the period of time the shares are held. Class C shares are generally sold with a 1% CDSC if applicable, if redeemed within one year of purchase. Class I shares are sold without a front-end sales charge or CDSC.
Virtus Mutual Funds may impose an annual fee on accounts having balances of less than $2,500. The small account fee may be waived in certain circumstances, as disclosed in the prospectuses and/or statements of additional information. The fees collected will be used to offset certain expenses of the Funds.
Each Class of shares has identical voting, dividend, liquidation and other rights and the same terms and conditions, except that each class bears different distribution and/or service fees under a Board approved 12b-1 and/or shareholder servicing plan and has exclusive voting rights with respect to such plans. Class I shares are not subject to a 12b-1 plan. Income and other expenses and realized and unrealized gains and losses of each Fund are borne pro rata by the holders of each class of shares.
| Note | 2. Significant Accounting Policies |
The following is a summary of significant accounting policies consistently followed by the Trust in the preparation of its financial statements. The preparation of financial statements in conformity with accounting principles generally accepted in the United States of America requires management to make estimates and assumptions that affect the reported amounts of assets and liabilities, and disclosure of contingent assets and liabilities at the date of the financial statements and the reported amount of increases and decreases in net assets from operations during the reporting period. Actual results could differ from those estimates and those differences could be significant.
| A. | Security Valuation |
Security valuation procedures for each Fund which include nightly price variance, as well as back testing such as bi-weekly unchanged price, monthly secondary source and transaction analysis which been approved by the Board. All internally fair valued securities, referred to below, are approved by a valuation committee (the “Valuation Committee”) appointed by the Board. The Valuation Committee is comprised of the treasurer, assistant treasurers, secretary and chief compliance officer of the Trust. All internally fair valued securities are updated daily and reviewed in detail by the Valuation Committee monthly unless changes occur within the period. The Valuation Committee reviews the validity of any model inputs and any changes to model when applicable. Internal fair valuations are reviewed by the Board at least quarterly.
Each Fund utilizes a fair value hierarchy which prioritizes the inputs to valuation techniques used to measure fair value into three broad levels.
| • Level 1 – | quoted prices in active markets for identical securities |
| • Level 2 – | prices determined using other significant observable inputs (including quoted prices for similar securities, interest rates, prepayment speeds, credit risk, etc.) |
| • Level 3 – | prices determined using significant unobservable inputs (including the valuation committee’s own assumptions in determining the fair value of investments) |
A description of the valuation techniques applied to a Fund’s major categories of assets and liabilities measured at fair value on a recurring basis is as follows:
Equity securities are valued at the official closing price (typically last sale) on the exchange on which the securities are primarily traded, or if no closing price is available, at the last bid price and are categorized as Level 1 in the hierarchy. Restricted equity securities and private placements that are not widely traded, are illiquid or are internally fair valued by the valuation committee, are generally categorized as Level 3 in the hierarchy.
Certain non-U.S. securities may be fair valued in cases where closing prices are not readily available or are deemed not reflective of readily available market prices. For example, significant events (such as movement in the U.S. securities market, or other regional and local developments) may occur between the time that non-U.S. markets close (where the security is principally traded) and the time that a Fund calculates its net asset value (“NAV”) (generally, 4 p.m. Eastern time the close of the New York Stock Exchange (“NYSE”)) that may impact the value of securities traded in these non-U.S. markets. In such cases the Funds fair value non-U.S. securities using an independent pricing service which considers the correlation of the trading patterns of the non-U.S. security to the intraday trading in the U.S. markets for investments such as ADRs, financial futures, ETFs, and certain indexes as well as prices for similar securities. Such fair valuations are categorized as Level 2 in the hierarchy. Because the frequency of significant events is not predictable, fair valuation of certain non-U.S. common stocks may occur on a frequent basis.
72
Table of Contents
VIRTUS OPPORTUNITIES TRUST
NOTES TO FINANCIAL STATEMENTS (Continued)
SEPTEMBER 30, 2012
Debt securities, including restricted securities, are valued based on evaluated quotations received from independent pricing services or from dealers who make markets in such securities. For most bond types, the pricing service utilizes matrix pricing which considers one or more of the following factors: yield or price of bonds of comparable quality, coupon, maturity, current cash flows, type, and current day trade information, as well as dealer-supplied prices. These valuations are generally categorized as Level 2 in the hierarchy. Structured debt instruments such as mortgage-backed and asset-backed securities may also incorporate collateral analysis and utilize cash flow models for valuation and are generally categorized as Level 2 in the hierarchy. Pricing services do not provide pricing for all securities and therefore indicative bids from dealers are utilized which are based on pricing models used by market makers in the security and are generally categorized as Level 2 in the hierarchy. Debt securities that are not widely traded, are illiquid, or are internally fair valued by the valuation committee are generally categorized as Level 3 in the hierarchy.
Listed derivatives such as treasury futures, that are actively traded are valued based on quoted prices from the exchange and are categorized as Level 1 in the hierarchy. Over-the-counter derivative contracts, which include forward currency contracts and equity-linked instruments, do not require material subjectivity as pricing inputs are observed from actively quoted markets and are categorized as Level 2 in the hierarchy.
Investments in open-end mutual funds are valued at their closing NAV determined as of the close of business of the NYSE each business day and are categorized as Level 1 in the hierarchy.
A summary of the inputs used to value the Funds’ net assets by each major security type is disclosed at the end of the Schedule of Investments for each Fund. The inputs or methodologies used for valuing securities are not necessarily an indication of the risk associated with investing in those securities.
| B. | Security Transactions and Investment Income |
Security transactions are recorded on the trade date. Realized gains and losses from the sales of securities are determined on the identified cost basis. Dividend income is recognized on the ex-dividend date, or in the case of certain foreign securities, as soon as a Fund is notified. Interest income is recorded on the accrual basis. Each Fund amortizes premiums and accretes discounts using the effective interest method.
Dividend income from REIT investments is recorded using management’s estimate of the income included in distributions received from the REIT investments. Distributions received in excess of this estimated amount are recorded as a reduction of the cost of investments or reclassified to capital gains. The actual amounts of income, return of capital, and capital gains are only determined by each REIT after its fiscal year-end, and may differ from the estimated amounts.
| C. | Income Taxes |
Each Fund is treated as a separate taxable entity. It is the intention of each Fund to comply with the requirements of Subchapter M of the Internal Revenue Code and to distribute substantially all of its taxable income to its shareholders. Therefore, no provision for federal income taxes or excise taxes has been made.
Certain Funds may be subject to foreign taxes on income, gains on investments or currency repatriation, a portion of which may be recoverable. Each Fund will accrue such taxes and recoveries as applicable based upon current interpretations of the tax rules and regulations that exist in the markets in which it invests.
Management of the Fund has concluded that there are no significant uncertain tax positions that would require recognition in the financial statements. As of September 30, 2012, the tax years that remain subject to examination by the major tax jurisdictions under the statute of limitations are from the year 2009 forward (with limited exceptions).
| D. | Distributions to Shareholders |
Distributions are recorded by each Fund on the ex-dividend date. Income and capital gain distributions are determined in accordance with income tax regulations which may differ from accounting principles generally accepted in the United States of America. These differences may include the treatment of non-taxable dividends, market premium and discount, non-deductible expenses, expiring capital loss carryovers, foreign currency gain or loss, gain or loss on futures contracts, partnerships, operating losses and losses deferred due to wash sales. Permanent book and tax basis differences relating to shareholder distributions will result in reclassifications to capital paid in on shares of beneficial interest.
| E. | Expenses |
Expenses incurred by together by a Fund and other affiliated mutual funds are allocated in proportion to the net assets of each Fund, except where allocation of direct expense to each such fund or an alternative allocation method can be more appropriately used.
In addition to the net annual operating Expenses that a Funds bears directly, the shareholders of the Funds indirectly bear the Fund’s pro-rata expenses of any underlying mutual funds in which the Funds invests.
| F. | Foreign Currency Translation |
Non U.S. investment securities and other assets and liabilities denominated in foreign currencies are translated into U.S. dollar amounts at the foreign currency exchange rate effective at the end of the reporting period. Cost of investments is translated at the currency exchange rate effective at the trade date. The gain or loss resulting from a change in currency exchange rates between the trade and settlement date of a portfolio transaction is treated as a gain or loss on non-U.S. currency. Likewise, the gain or loss resulting from a change in currency exchange rates between the date income is accrued and paid is treated as a gain or loss on foreign currency. The Funds do not isolate that portion of the results of operations arising from changes in foreign exchange rates on investments from the fluctuations arising from changes in the market prices of securities held. Such fluctuations are included with the net realized and unrealized gain or loss on investments.
73
Table of Contents
VIRTUS OPPORTUNITIES TRUST
NOTES TO FINANCIAL STATEMENTS (Continued)
SEPTEMBER 30, 2012
| G. | Derivative Financial Instruments |
Disclosures on derivative instruments and hedging activities are intended to improve financial reporting for derivative instruments by enhanced disclosure that enables the investors to understand how and why a fund uses derivatives, how derivatives are accounted for, and how derivative instruments affect a fund’s results of operations and financial position. Summarized below are the specific types of derivative instruments used by the Funds.
Forward Currency Contracts: A forward currency contract involves an obligation to purchase or sell a specific currency at a future date, which may be any number of days from the date of the contract agreed upon by the parties, at a price set at the time of the contract. These contracts are traded directly between currency traders and their customers. The contract is marked-to-market daily and the change in market value is recorded by each Fund as an unrealized gain or loss in the Statement of Operations. When the contract is closed or offset with the same counterparty, on settlement date, the Fund records a realized gain or loss equal to the change in the value of the contract when it was opened and the value at the time it was closed or offset. This is presented in the Statement of Operations as net realized gain (loss) from foreign currency transactions.
Funds enter into forward currency contracts in conjunction with the planned purchase or sale of foreign denominated securities in order to hedge the U.S. dollar cost or proceeds. The Funds also, from time to time, hedge the currency exposure of foreign denominated securities, held in the portfolio, back to U.S. dollars during perceived times of U.S. dollar strength. This is done in order to protect the U.S. dollar value of the portfolio. Forward currency contracts involve, to varying degrees, elements of market risk in excess of the amount recognized in the Statement of Assets and Liabilities. Risks arise from the possible movements in foreign exchange rates or if the counterparty does not perform under the contract.
| H. | Securities Lending |
Certain Funds may loan securities to qualified brokers through an agreement with The Bank of New York Mellon (“BNY Mellon”), the Funds’ custodian. Under the terms of the agreement, a Fund is required to maintain collateral with a market value not less than 100% of the market value of loaned securities. Collateral is adjusted daily in connection with changes in the market value of securities on loan. Collateral may consist of cash and securities issued by the U.S. Government or its agencies. Cash collateral is invested in a short-term money market fund. Dividends earned on the collateral and premiums paid by the broker are recorded as income by the Fund net of fees and rebates charged by BNY Mellon for its services in connection with this securities lending program. Lending portfolio securities involves a risk of delay in the recovery of the loaned securities or in the declining value of the collateral.
Effective November 7, 2011, securities lending was suspended on all Virtus Mutual Funds.
| Note | 3. Investment Advisory Fee and Related Party Transactions ($ reported in thousands except as noted) |
| A. | Adviser |
Virtus Investment Advisers, Inc. (the “Adviser”), an indirect wholly-owned subsidiary of Virtus Investment Partners, Inc. (“Virtus”), is the Adviser to the Trust. The Adviser manages the Funds’ investment program and general operations of the Funds, including oversight of the Funds’ subadvisers.
As compensation for its services to the Funds, the Adviser is entitled to a fee based upon the following annual rates as a percentage of the daily net assets of each Fund:
| 1st $1 Billion | Over $1 Billion | |||||||
Emerging Markets Debt Fund | 0.75 | % | 0.70 | % | ||||
Emerging Markets Equity Income Fund | 1.05 | 1.00 | ||||||
Greater Asia ex Japan Opportunities Fund | 1.00 | 0.95 | ||||||
Greater European Opportunities Fund | 0.85 | 0.80 | ||||||
International Small-Cap Fund | 1.00 | 0.95 | ||||||
| 1st $1 Billion | $1+ Billion – $2 Billion | $2 + Billion | ||||||||||
Global Commodities Stock Fund | 1.00 | % | 0.95 | % | 0.90 | % | ||||||
Global Dividend Fund | 0.65 | 0.60 | 0.55 | |||||||||
Global Opportunities Fund | 0.85 | 0.80 | 0.75 | |||||||||
Global Real Estate Securities Fund | 0.85 | 0.80 | 0.75 | |||||||||
International Real Estate Securities Fund | 1.00 | 0.95 | 0.90 | |||||||||
| 1st $2 Billion | $2 +��Billion – $4 Billion | $4 + Billion | ||||||||||
International Equity Fund | 0.85 | % | 0.80 | % | 0.75 | % | ||||||
74
Table of Contents
VIRTUS OPPORTUNITIES TRUST
NOTES TO FINANCIAL STATEMENTS (Continued)
SEPTEMBER 30, 2012
| B. | Subadvisers |
A Subadviser manages the investments of each Fund, for which the Subadviser is paid a fee by the Adviser. The Subadvisers with respect to the Funds they serve are as follows:
Fund | Subadviser | Fund | Subadviser | |||
Emerging Markets Debt Fund | NF(6) | Greater Asia ex Japan Opportunities Fund | Vontobel(4) | |||
Emerging Markets Equity Income fund | KBI(2) | Greater European Opportunities Fund | Vontobel(4) | |||
| Global Commodities Stock Fund | BMO(5) | International Equity Fund | Pyrford(3) | |||
| Global Dividend Fund | DPIM(1) | International Real Estate Securities Fund | DPIM(1) | |||
| Global Opportunities Fund | Vontobel(4) | International Small-Cap Fund | KAR(7) | |||
| Global Real Estate Securities Fund | DPIM(1) |
| (1) | Duff & Phelps Investment Management Co., an indirect, wholly-owned subsidiary of Virtus. |
| (2) | Kleinwort Benson Investors, International, Ltd |
| (3) | Pyrford International Ltd. An indirect wholly-owned subsidiary of the Bank of Montreal (“BoM”). BoM, through its subsidiary BMO Bankcorp, is a minority investor of Virtus. |
| (4) | Vontobel Asset Management, Inc. |
| (5) | BMO Asset Management Corp. (f/k/a Harris Investment Management, Inc.), an indirect, wholly-owned subsidiary of BoM. BoM, through its subsidiary BMO Bankcorp, is a minority investor of Virtus. |
| (6) | Newfleet Asset Management, LLC an indirect wholly-owned subsidiary of Virtus. |
| (7) | Kayne Anderson Rudnick Investment Management, LLC an indirect wholly-owned subsidiary of Virtus. |
| C. | Expense Limits and Fee Waivers |
The Adviser has voluntarily agreed to limit each Fund’s total operating expenses (excluding taxes, extraordinary expenses and acquired fund fees and expenses), so that such expenses do not exceed the below percentages of the average daily net asset values for the following Funds. The Adviser may discontinue these voluntary expense caps at any time.
| Class A | Class B | Class C | Class I | |||||||||||||
Global Commodities Stock Fund | 1.65 | % | — | % | 2.40 | % | 1.40 | % | ||||||||
Global Opportunities Fund | 1.55 | 2.30 | 2.30 | 1.30 | ||||||||||||
Global Real Estate Securities Fund | 1.40 | — | 2.15 | 1.15 | ||||||||||||
Greater Asia ex Japan Opportunities Fund | 1.80 | — | 2.55 | 1.55 | ||||||||||||
Greater European Opportunities Fund | 1.45 | — | 2.20 | 1.20 | ||||||||||||
International Equity Fund | 1.50 | — | 2.25 | 1.25 | ||||||||||||
International Real Estate Securities Fund | 1.50 | — | 2.25 | 1.25 | ||||||||||||
The Adviser has contractually agreed to limit the following Fund’s total operating expenses (excluding interest, taxes, and extraordinary expenses).
| Class A | Class C | Class I | Through Date | |||||||||||||
Emerging Markets Debt Fund | 1.35 | % | 2.10 | % | 1.10 | % | 9/30/13 | |||||||||
Emerging Markets Equity Income Fund | 1.75 | 2.50 | 1.50 | 9/30/13 | ||||||||||||
International Small-Cap Fund | 1.60 | 2.35 | 1.35 | 9/30/13 | ||||||||||||
For certain Funds the Adviser may recapture operating expenses waived or reimbursed under these arrangements, within three fiscal years following the end of the fiscal year in which such waiver or reimbursement occurred. The Fund must pay its ordinary operating expenses before the Adviser is entitled to any reimbursement and must remain in compliance with any applicable expense limitations or if none, the expense limitation in effect at the time of the waiver or reimbursement. All or a portion of the following Adviser reimbursed expenses may be recaptured as follows:
| Fiscal Year Ended | ||||||||||||||||
Fund | 2013 | 2014 | 2015 | Total | ||||||||||||
Emerging Markets Debt Fund | $ | — | $ | — | $ | 35 | $ | 35 | ||||||||
Emerging Markets Equity Income Fund | — | — | 29 | 29 | ||||||||||||
Global Commodities Stock | — | 85 | 38 | 123 | ||||||||||||
Global Opportunities Fund | 48 | 76 | 5 | 129 | ||||||||||||
Global Real Estate Securities Fund | 91 | 86 | 98 | 275 | ||||||||||||
Greater Asia ex Japan Opportunities Fund | 99 | 149 | 111 | 359 | ||||||||||||
Greater European Opportunities Fund | 79 | 83 | 78 | 240 | ||||||||||||
International Equity Fund | 16 | 106 | 51 | 173 | ||||||||||||
International Real Estate Securities Fund | 73 | 82 | 96 | 251 | ||||||||||||
International Small Cap | — | — | 30 | 30 | ||||||||||||
| D. | Distributor |
($ reported in thousands)
VP Distributors, LLC (“VP Distributors”), an indirect wholly-owned subsidiary of Virtus, serves as the distributor of each Fund’s shares and has advised the Funds that for the fiscal year (the “period”) ended September 30, 2012, it retained Net commissions of $38 Class A shares and deferred sales charges of $242, $—*, and $5 for Class A shares, Class B shares and Class C shares respectively.
* Amount less than $500.
75
Table of Contents
VIRTUS OPPORTUNITIES TRUST
NOTES TO FINANCIAL STATEMENTS (Continued)
SEPTEMBER 30, 2012
In addition, each Fund pays VP Distributors distribution and/or service fees under Board approved 12b-1 and/or shareholder service plans as a percentage of the average daily net assets of each respective class at the annual rates as follows: Class A shares 0.25%; Class B shares 1.00%; Class C shares 1.00%; Class I shares are not subject to a 12b-1 plan.
Under certain circumstances, shares of certain Virtus Mutual Funds may be exchanged for shares of the same class of certain other Virtus Mutual Funds on the basis of the relative net asset values per share at the time of the exchange. On exchanges with share classes that carry a CDSC, the CDSC schedule of the original shares purchased continues to apply.
| E. | Administrator and Transfer Agent |
($ reported in thousands)
VP Distributors also serves as the Trust’s Administrator. For the period ended September 30, 2012, the Funds incurred administration fees from the Trust totaling $248 which are included in the Statements of Operations.
VP Distributors also serves as the Trust’s transfer agent. For the period ended September 30, 2012, the Funds incurred transfer agent fees from the Trust totaling $249 which are included in the Statements of Operations. A portion is paid to outside entities that also provide service to the Trust.
| F. | Affiliated Shareholders |
($ reported in thousands)
At September 30, 2012, Virtus and its affiliates including BMO Bankcorp (a minority investor in Virtus) and its affiliates and the retirement plans of Virtus and its affiliates held shares of the Funds which may be redeemed at any time that aggregated the following:
| Shares | Aggregate Net Asset Value | |||||||
| Emerging Markets Debt Fund | ||||||||
Class A | 10,000 | $ | 101 | |||||
Class C | 10,000 | 101 | ||||||
Class I | 2,480,000 | 25,048 | ||||||
| Emerging Markets Equity Income Fund | ||||||||
Class A | 10,000 | 106 | ||||||
Class C | 10,000 | 106 | ||||||
Class I | 480,000 | 5,083 | ||||||
| Global Commodities Stock Fund | ||||||||
Class A | 10,020 | 100 | ||||||
Class C | 10,000 | 99 | ||||||
Class I | 1,793,930 | 17,903 | ||||||
| Global Dividend Fund | ||||||||
Class I | 2,635,939 | 33,977 | ||||||
| Global Opportunities Fund | ||||||||
Class I | 10,650 | 106 | ||||||
| Global Real Estate Securities Fund | ||||||||
Class A | 100,890 | 2,260 | ||||||
Class C | 25,099 | 560 | ||||||
Class I | 415,971 | 9,364 | ||||||
| International Equity Fund | ||||||||
Class A | 10,506 | 114 | ||||||
Class C | 10,420 | 112 | ||||||
| International Real Estate Securities Fund | ||||||||
Class A | 265,167 | 1,724 | ||||||
Class C | 12,997 | 84 | ||||||
Class I | 3,083,457 | 20,012 | ||||||
| International Small-Cap Fund | ||||||||
Class A | 10,000 | 101 | ||||||
Class C | 10,000 | 101 | ||||||
Class I | 280,000 | 2,828 | ||||||
| 4. | Purchases and Sales of Securities |
($ reported in thousands)
Purchases and sales of securities (excluding U.S. Government securities and agency securities, forward currency contracts, futures and short-term securities) during the period ended September 30, 2012, were as follows:
| Purchases | Sales | |||||||
Emerging Markets Debt Fund | $ | 26,198 | $ | 2,028 | ||||
Emerging Markets Equity Income Fund | 6,531 | 1,559 | ||||||
Global Commodities Stock Fund | 18,235 | 18,240 | ||||||
Global Dividend Fund | 31,152 | 16,101 | ||||||
Global Opportunities Fund | 79,394 | 57,269 | ||||||
Global Real Estate Securities Fund | 16,177 | 3,412 | ||||||
76
Table of Contents
VIRTUS OPPORTUNITIES TRUST
NOTES TO FINANCIAL STATEMENTS (Continued)
SEPTEMBER 30, 2012
| Purchases | Sales | |||||||
Greater Asia ex Japan Opportunities Fund | $ | 3,298 | $ | 5,364 | ||||
Greater European Opportunities Fund | 3,299 | 2,760 | ||||||
International Equity Fund | 9,697 | 4,786 | ||||||
International Real Estate Securities Fund | 11,809 | 12,827 | ||||||
International Small-Cap Fund | 2,764 | — | ||||||
Purchases and sales of long term U.S. Government and agency securities for the Funds during the period ended September 30, 2012 were as follows:
| Purchases | Sales | |||||||
Emerging Markets Debt Fund | $ | 289 | $ | — | ||||
| 5. | Derivative Transactions |
($ reported in thousands)
Certain Funds invested in derivative instruments during the reporting period in the form of forward currency contracts. The primary type of risk associated with the forward currency contracts is foreign exchange risk, associated with the conversion of foreign currency to U.S. dollars. A Fund may invest in forward currency contracts in an attempt to manage such risk and protect the U.S. dollar value of the portfolio.
For additional information on forward currency contracts in which the Funds invested in during the reporting period, refer to the Schedule of Investments and Note 2G.
The following is a summary of International Equity Fund’s derivative instrument holdings categorized by primary risk exposure as of September 30, 2012 ($ reported in thousands):
Statements of Assets and Liabilities | Statements of Operations | |||||||||
Assets: Unrealized appreciation on forward currency contracts | $ | 3 | Net realized gain (loss) on foreign currency transactions | $ | 8 | |||||
Liabilities: Unrealized depreciation on forward currency contracts | (62 | ) | Net change in unrealized appreciation (depreciation) on foreign currency translation | (206 | ) | |||||
|
|
|
| |||||||
Net asset (liability) balance | $ | (59 | ) | Total realized and unrealized gain(loss) on foreign currency transactions | $ | (198 | ) | |||
|
|
|
| |||||||
For the fiscal year ended September 30, 2012, International Equity Fund’s average volume of derivative activities is as follows:
| Forward Currency Contracts – Purchased(1) | Forward Currency Contracts – Sold(2) | |||||||
| $205 | $(2,085) | |||||||
| (1) | Value at Settlement Date Payable. |
| (2) | Value at Settlement Date Receivable. |
| Note | 6. Capital Share Transactions |
(reported in thousands)
Transactions in shares of capital stock, during the periods ended as indicated below, were as follows:
| Emerging Markets Debt Fund | Emerging Markets Equity Income Fund | |||||||||||||||||||||||
| Period Ended September 30, 2012 | Period Ended September 30, 2012 | |||||||||||||||||||||||
| SHARES | AMOUNT | SHARES | AMOUNT | |||||||||||||||||||||
| Class A | ||||||||||||||||||||||||
| Sale of shares | 10 | $ | 100 | 10 | $ | 100 | ||||||||||||||||||
| Reinvestment of distributions | — | — | — | — | ||||||||||||||||||||
| Shares repurchased | — | — | — | — | ||||||||||||||||||||
|
|
|
|
|
|
|
| |||||||||||||||||
| Net Increase / (Decrease) | 10 | $ | 100 | 10 | $ | 100 | ||||||||||||||||||
|
|
|
|
|
|
|
| |||||||||||||||||
| Class C | ||||||||||||||||||||||||
| Sale of shares | 11 | $ | 109 | 10 | $ | 100 | ||||||||||||||||||
|
|
|
|
|
|
|
| |||||||||||||||||
| Net Increase / (Decrease) | 11 | $ | 109 | 10 | $ | 100 | ||||||||||||||||||
|
|
|
|
|
|
|
| |||||||||||||||||
| Class I | ||||||||||||||||||||||||
| Sale of shares | 2,480 | $ | 24,800 | 480 | $ | 4,800 | ||||||||||||||||||
|
|
|
|
|
|
|
| |||||||||||||||||
| Net Increase / (Decrease) | 2,480 | $ | 24,800 | 480 | $ | 4,800 | ||||||||||||||||||
|
|
|
|
|
|
|
| |||||||||||||||||
77
Table of Contents
VIRTUS OPPORTUNITIES TRUST
NOTES TO FINANCIAL STATEMENTS (Continued)
SEPTEMBER 30, 2012
| Global Commodities Stock Fund | Global Dividend Fund | |||||||||||||||||||||||||||||||
| Year Ended September 30, 2012 | Year Ended September 30, 2011 | Year Ended September 30, 2012 | Year Ended September 30, 2011 | |||||||||||||||||||||||||||||
| SHARES | AMOUNT | SHARES | AMOUNT | SHARES | AMOUNT | SHARES | AMOUNT | |||||||||||||||||||||||||
| Class A | ||||||||||||||||||||||||||||||||
| Sale of shares | 140 | $ | 1,240 | 25 | $ | 256 | 1,597 | $ | 19,592 | 649 | $ | 7,571 | ||||||||||||||||||||
| Reinvestment of distributions | — | (1) | — | (1) | — | — | 62 | 753 | 56 | 633 | ||||||||||||||||||||||
| Shares repurchased | (71 | ) | (674 | ) | — | (1) | — | (1) | (944 | ) | (11,480 | ) | (911 | ) | (10,490 | ) | ||||||||||||||||
|
|
|
|
|
|
|
|
|
|
|
|
|
|
|
| |||||||||||||||||
| Net Increase / (Decrease) | 69 | $ | 566 | 25 | $ | 256 | 715 | $ | 8,865 | (206 | ) | $ | (2,286 | ) | ||||||||||||||||||
|
|
|
|
|
|
|
|
|
|
|
|
|
|
|
| |||||||||||||||||
| Class C | ||||||||||||||||||||||||||||||||
| Sale of shares | 1 | $ | 9 | 12 | $ | 121 | 274 | $ | 3,393 | 110 | $ | 1,266 | ||||||||||||||||||||
| Reinvestment of distributions | — | — | — | — | 9 | 113 | 8 | 89 | ||||||||||||||||||||||||
| Shares repurchased | (1 | ) | (11 | ) | — | — | (135 | ) | (1,608 | ) | (227 | ) | (2,585 | ) | ||||||||||||||||||
|
|
|
|
|
|
|
|
|
|
|
|
|
|
|
| |||||||||||||||||
| Net Increase / (Decrease) | — | (1) | $ | (2 | ) | 12 | $ | 121 | 148 | $ | 1,898 | (109 | ) | $ | (1,230 | ) | ||||||||||||||||
|
|
|
|
|
|
|
|
|
|
|
|
|
|
|
| |||||||||||||||||
| Class I | ||||||||||||||||||||||||||||||||
| Sale of shares | 488 | $ | 4,563 | 2,050 | $ | 20,000 | 1,600 | $ | 19,736 | 412 | $ | 4,880 | ||||||||||||||||||||
| Reinvestment of distributions | 9 | 83 | — | — | 101 | 1,234 | 97 | 1,084 | ||||||||||||||||||||||||
| Shares repurchased | (548 | ) | (5,050 | ) | (130 | ) | (1,235 | ) | (999 | ) | (12,391 | ) | (883 | ) | (9,794 | ) | ||||||||||||||||
|
|
|
|
|
|
|
|
|
|
|
|
|
|
|
| |||||||||||||||||
| Net Increase / (Decrease) | (51 | ) | $ | (404 | ) | 1,920 | $ | 18,765 | 702 | $ | 8,579 | (374 | ) | $ | (3,830 | ) | ||||||||||||||||
|
|
|
|
|
|
|
|
|
|
|
|
|
|
|
| |||||||||||||||||
| Global Opportunities Fund | Global Real Estate Securities Fund | |||||||||||||||||||||||||||||||
| Year Ended September 30, 2012 | Year Ended September 30, 2011 | Year Ended September 30, 2012 | Year Ended September 30, 2011 | |||||||||||||||||||||||||||||
| SHARES | AMOUNT | SHARES | AMOUNT | SHARES | AMOUNT | SHARES | AMOUNT | |||||||||||||||||||||||||
| Class A | ||||||||||||||||||||||||||||||||
| Sale of shares | 4,217 | $ | 37,925 | 153 | $ | 1,256 | 307 | $ | 6,515 | 207 | $ | 4,284 | ||||||||||||||||||||
| Reinvestment of distributions | 29 | 247 | 65 | 524 | 8 | 153 | 11 | 207 | ||||||||||||||||||||||||
| Shares repurchased | (3,966 | ) | (36,634 | ) | (859 | ) | (7,073 | ) | (224 | ) | (4,548 | ) | (46 | ) | (921 | ) | ||||||||||||||||
|
|
|
|
|
|
|
|
|
|
|
|
|
|
|
| |||||||||||||||||
| Net Increase / (Decrease) | 280 | $ | 1,538 | (641 | ) | $ | (5,293 | ) | 91 | $ | 2,120 | 172 | $ | 3,570 | ||||||||||||||||||
|
|
|
|
|
|
|
|
|
|
|
|
|
|
|
| |||||||||||||||||
| Class B | ||||||||||||||||||||||||||||||||
| Sale of shares | 30 | $ | 240 | 5 | $ | 39 | — | $ | — | — | $ | — | ||||||||||||||||||||
| Reinvestment of distributions | — | — | 1 | 6 | — | — | — | — | ||||||||||||||||||||||||
| Shares repurchased | (41 | ) | (330 | ) | (62 | ) | (461 | ) | — | — | — | — | ||||||||||||||||||||
|
|
|
|
|
|
|
|
|
|
|
|
|
|
|
| |||||||||||||||||
| Net Increase / (Decrease) | (11 | ) | $ | (90 | ) | (56 | ) | $ | (416 | ) | — | $ | — | — | $ | — | ||||||||||||||||
|
|
|
|
|
|
|
|
|
|
|
|
|
|
|
| |||||||||||||||||
| Class C | ||||||||||||||||||||||||||||||||
| Sale of shares | 113 | $ | 911 | 23 | $ | 172 | 40 | $ | 864 | 17 | $ | 356 | ||||||||||||||||||||
| Reinvestment of distributions | — | — | — | (1) | 3 | 1 | 11 | 1 | 21 | |||||||||||||||||||||||
| Shares repurchased | (35 | ) | (284 | ) | (24 | ) | (179 | ) | (7 | ) | (149 | ) | (4 | ) | (79 | ) | ||||||||||||||||
|
|
|
|
|
|
|
|
|
|
|
|
|
|
|
| |||||||||||||||||
| Net Increase / (Decrease) | 78 | $ | 627 | (1 | ) | $ | (4 | ) | 34 | $ | 726 | 14 | $ | 298 | ||||||||||||||||||
|
|
|
|
|
|
|
|
|
|
|
|
|
|
|
| |||||||||||||||||
| Class I | ||||||||||||||||||||||||||||||||
| Sale of shares | 2,383 | $ | 22,400 | — | $ | — | 516 | $ | 10,922 | 41 | $ | 841 | ||||||||||||||||||||
| Reinvestment of distributions | — | — | — | — | 1 | 20 | 2 | 36 | ||||||||||||||||||||||||
| Shares repurchased | — | — | — | — | (16 | ) | (341 | ) | (43 | ) | (894 | ) | ||||||||||||||||||||
|
|
|
|
|
|
|
|
|
|
|
|
|
|
|
| |||||||||||||||||
| Net Increase / (Decrease) | 2,383 | $ | 22,400 | — | $ | — | 501 | $ | 10,601 | — | (1) | $ | (17 | ) | ||||||||||||||||||
|
|
|
|
|
|
|
|
|
|
|
|
|
|
|
| |||||||||||||||||
| (1) | Amount is less than 500. |
78
Table of Contents
VIRTUS OPPORTUNITIES TRUST
NOTES TO FINANCIAL STATEMENTS (Continued)
SEPTEMBER 30, 2012
| Greater Asia ex Japan Opportunities Fund | Greater European Opportunities Fund | |||||||||||||||||||||||||||||||
| Year Ended September 30, 2012 | Year Ended September 30, 2011 | Year Ended September 30, 2012 | Year Ended September 30, 2011 | |||||||||||||||||||||||||||||
| SHARES | AMOUNT | SHARES | AMOUNT | SHARES | AMOUNT | SHARES | AMOUNT | |||||||||||||||||||||||||
| Class A | ||||||||||||||||||||||||||||||||
| Sale of shares | 12 | $ | 170 | 289 | $ | 4,571 | 64 | $ | 852 | 10 | $ | 127 | ||||||||||||||||||||
| Reinvestment of distributions | 28 | 360 | 99 | 1,475 | 21 | 247 | 43 | 536 | ||||||||||||||||||||||||
| Shares repurchased | (153 | ) | (2,015 | ) | (342 | ) | (5,086 | ) | (14 | ) | (179 | ) | (7 | ) | (89 | ) | ||||||||||||||||
|
|
|
|
|
|
|
|
|
|
|
|
|
|
|
| |||||||||||||||||
| Net Increase / (Decrease) | (113 | ) | $ | (1,485 | ) | 46 | $ | 960 | 71 | $ | 920 | 46 | $ | 574 | ||||||||||||||||||
|
|
|
|
|
|
|
|
|
|
|
|
|
|
|
| |||||||||||||||||
| Class C | ||||||||||||||||||||||||||||||||
| Sale of shares | 1 | $ | 18 | 4 | $ | 68 | — | (1) | $ | 6 | 1 | $ | 7 | |||||||||||||||||||
| Reinvestment of distributions | 1 | 8 | 2 | 30 | 1 | 6 | 1 | 16 | ||||||||||||||||||||||||
| Shares repurchased | (3 | ) | (38 | ) | (16 | ) | (256 | ) | — | (1) | — | (1) | — | (1) | (1 | ) | ||||||||||||||||
|
|
|
|
|
|
|
|
|
|
|
|
|
|
|
| |||||||||||||||||
| Net Increase / (Decrease) | (1 | ) | $ | (12 | ) | (10 | ) | $ | (158 | ) | 1 | $ | 12 | 2 | $ | 22 | ||||||||||||||||
|
|
|
|
|
|
|
|
|
|
|
|
|
|
|
| |||||||||||||||||
| Class I | ||||||||||||||||||||||||||||||||
| Sale of shares | 16 | $ | 223 | 344 | $ | 5,237 | 8 | $ | 100 | 7 | $ | 91 | ||||||||||||||||||||
| Reinvestment of distributions | 1 | 18 | 2 | 32 | — | (1) | 5 | — | (1) | — | (1) | |||||||||||||||||||||
| Shares repurchased | (15 | ) | (204 | ) | (340 | ) | (5,233 | ) | (15 | ) | (179 | ) | — | — | ||||||||||||||||||
|
|
|
|
|
|
|
|
|
|
|
|
|
|
|
| |||||||||||||||||
| Net Increase / (Decrease) | 2 | $ | 37 | 6 | $ | 36 | (7 | ) | $ | (74 | ) | 7 | $ | 91 | ||||||||||||||||||
|
|
|
|
|
|
|
|
|
|
|
|
|
|
|
| |||||||||||||||||
| International Equity Fund | International Real Estate Securities Fund | |||||||||||||||||||||||||||||||
| Year Ended September 30, 2012 | Year Ended September 30, 2011 | Year Ended September 30, 2012 | Year Ended September 30, 2011 | |||||||||||||||||||||||||||||
| SHARES | AMOUNT | SHARES | AMOUNT | SHARES | AMOUNT | SHARES | AMOUNT | |||||||||||||||||||||||||
| Class A | ||||||||||||||||||||||||||||||||
| Sale of shares | 8 | $ | 88 | 90 | $ | 976 | 200 | $ | 1,197 | 465 | $ | 2,901 | ||||||||||||||||||||
| Reinvestment of distributions | 1 | 7 | — | (1) | 2 | 12 | 66 | 47 | 275 | |||||||||||||||||||||||
| Shares repurchased | (88 | ) | (916 | ) | (3 | ) | (26 | ) | (230 | ) | (1,321 | ) | (284 | ) | (1,729 | ) | ||||||||||||||||
|
|
|
|
|
|
|
|
|
|
|
|
|
|
|
| |||||||||||||||||
| Net Increase / (Decrease) | (79 | ) | $ | (821 | ) | 87 | $ | 952 | (18 | ) | $ | (58 | ) | 228 | $ | 1,447 | ||||||||||||||||
|
|
|
|
|
|
|
|
|
|
|
|
|
|
|
| |||||||||||||||||
| Class C | ||||||||||||||||||||||||||||||||
| Sale of shares | — | (1) | $ | 2 | — | $ | — | 94 | $ | 550 | 228 | $ | 1,444 | |||||||||||||||||||
| Reinvestment of distributions | — | (1) | 4 | — | (1) | — | (1) | 2 | 12 | 9 | 52 | |||||||||||||||||||||
| Shares repurchased | — | — | — | — | (45 | ) | (256 | ) | (131 | ) | (782 | ) | ||||||||||||||||||||
|
|
|
|
|
|
|
|
|
|
|
|
|
|
|
| |||||||||||||||||
| Net Increase / (Decrease) | — | (1) | $ | 6 | — | (1) | $ | — | (1) | 51 | $ | 306 | 106 | $ | 714 | |||||||||||||||||
|
|
|
|
|
|
|
|
|
|
|
|
|
|
|
| |||||||||||||||||
| Class I | ||||||||||||||||||||||||||||||||
| Sale of shares | 724 | $ | 7,394 | 1,913 | $ | 20,502 | 1,993 | $ | 11,674 | 1,636 | $ | 10,525 | ||||||||||||||||||||
| Reinvestment of distributions | 96 | 945 | 18 | 205 | 116 | 630 | 421 | 2,444 | ||||||||||||||||||||||||
| Shares repurchased | (186 | ) | (1,902 | ) | (821 | ) | (8,906 | ) | (2,447 | ) | (13,218 | ) | (1,204 | ) | (7,160 | ) | ||||||||||||||||
|
|
|
|
|
|
|
|
|
|
|
|
|
|
|
| |||||||||||||||||
| Net Increase / (Decrease) | 634 | $ | 6,437 | 1,110 | $ | 11,801 | (338 | ) | $ | (914 | ) | 853 | $ | 5,809 | ||||||||||||||||||
|
|
|
|
|
|
|
|
|
|
|
|
|
|
|
| |||||||||||||||||
| (1) | Amount is less than 500. |
79
Table of Contents
VIRTUS OPPORTUNITIES TRUST
NOTES TO FINANCIAL STATEMENTS (Continued)
SEPTEMBER 30, 2012
| International Small-Cap Fund | ||||||||||||||||||||
| Year Ended September 30, 2012 | ||||||||||||||||||||
| SHARES | AMOUNT | |||||||||||||||||||
| Class A | ||||||||||||||||||||
| Sale of shares | 10 | $ | 100 | |||||||||||||||||
| Reinvestment of distributions | — | — | ||||||||||||||||||
| Shares repurchased | — | — | ||||||||||||||||||
|
|
|
| |||||||||||||||||
| Net Increase / (Decrease) | 10 | $ | 100 | |||||||||||||||||
|
|
|
| |||||||||||||||||
| Class C | ||||||||||||||||||||
| Sale of shares | 11 | $ | 106 | |||||||||||||||||
|
|
|
| |||||||||||||||||
| Net Increase / (Decrease) | 11 | $ | 106 | |||||||||||||||||
|
|
|
| |||||||||||||||||
| Class I | ||||||||||||||||||||
| Sale of shares | 281 | $ | 2,808 | |||||||||||||||||
|
|
|
| |||||||||||||||||
| Net Increase / (Decrease) | 281 | $ | 2,808 | |||||||||||||||||
|
|
|
| |||||||||||||||||
| Note | 7. 10% Shareholders |
As of September 30, 2012, certain Funds had individual shareholder account(s) and/or omnibus shareholder account(s) (comprised of a group of individual shareholders), which individually amounted to more than 10% of the total shares outstanding of each such Fund as detailed below:
| % of Shares Outstanding | Number of Accounts | |||||||
Emerging Markets Debt Fund | 99 | % | 1 | * | ||||
Emerging Markets Equity Income Fund | 96 | 1 | * | |||||
Global Commodities Stock Fund† | 91 | 1 | * | |||||
Global Dividend Fund† | 36 | 1 | * | |||||
Global Opportunities Fund | 24 | 1 | ||||||
Global Real Estate Securities Fund | 52 | 2 | ||||||
Greater Asia ex Japan Opportunities Fund | 82 | 2 | ||||||
Greater European Opportunities Fund | 89 | 2 | ||||||
International Equity Fund | 89 | 3 | ||||||
International Real Estate Securities Fund† | 70 | 2 | * | |||||
International Small-Cap Fund | 93 | 1 | * | |||||
| * | Includes affiliated shareholder accounts. |
| † | The Fund is owned by Virtus Alternatives Diversifier Fund. Virtus Alternatives Diversifier Fund does not invest in the underlying Funds for the purpose of exercising management or control; however, investments made may represent a significant portion of an underlying Fund’s net assets. At September 30, 2012, Virtus Alternatives Diversifier Fund was the owner of record of approximately 91% of the Global Commodities Stock Fund, 60% of the International Real Estate Securities Fund, and 36% of the Global Dividend Fund. |
| Note | 8. Credit Risk and Asset Concentration |
In countries with limited or developing markets, investments may present greater risks than in more developed markets and the prices of such investments may be volatile. The consequences of political, social or economic changes in these markets may have disruptive effects on the market prices of these investments and the income they generate, as well as a Fund’s ability to repatriate such amounts.
High-yield/high-risk securities typically entail greater price volatility and/or principal and interest rate risk. There is a greater chance that an issuer will not be able to make principal and interest payments on time. Analysis of the creditworthiness of issuers of high-yield securities may be complex, and as a result, it may be more difficult for the adviser and/or subadviser to accurately predict risk.
Certain Funds may invest a high percentage of their assets in specific sectors of the market in their pursuit of a greater investment return. Fluctuations in these sectors of concentration may have a greater impact on a Fund, positive or negative, than if the Fund did not concentrate its investments in such sectors.
80
Table of Contents
VIRTUS OPPORTUNITIES TRUST
NOTES TO FINANCIAL STATEMENTS (Continued)
SEPTEMBER 30, 2012
At September 30, 2012, certain Funds held securities issued by various companies in specific sectors as detailed below:
Fund | Sector | Percentage of Total Investments | ||||
| Emerging Markets Debt Fund | Financial | 27 | % | |||
| Global Commodities Stock Fund | Materials | 56 | ||||
| Global Commodities Stock Fund | Energy | 27 | ||||
| Global Dividend Fund | Utilities | 31 | ||||
| Global Opportunities Fund | Consumer Staples | 27 | ||||
| Global Real Estate Securities Fund | Retail REITS | 32 | ||||
| Greater Asia ex Japan Opportunities Fund | Consumer Staples | 36 | ||||
| Greater European Opportunities Fund | Consumer Staples | 30 | ||||
| International Real Estate Securities Fund | Retail REITS | 39 | ||||
| Note | 9. Indemnifications |
Under the Trust’s organizational documents, their trustees and officers are indemnified against certain liabilities arising out of the performance of their duties to the Funds. In addition, in the normal course of business the Funds enter into contracts that contain a variety of indemnifications. The Funds’ maximum exposure under these arrangements is unknown as this would involve future claims that may be made against the Funds and that have not occurred. However, the Funds have not had prior claims or losses pursuant to these arrangements and expect the risk of loss to be remote.
| Note | 10. Illiquid and Restricted Securities |
Investments are generally considered illiquid if they cannot be disposed of within seven days in the ordinary course of business at the approximate amount at which such securities have been valued by a Fund. Additionally, the following information is also considered in determining liquidity: the frequency of trades and quotes for the investment, whether the investment is listed for trading on a recognized domestic exchange and/or whether two or more brokers are willing to purchase or sell the security at a comparable price, the extent of market making activity in the investment and the nature of the market for investment. Illiquid securities are footnoted as such at the end of each Fund’s Schedule of Investments where applicable.
Restricted securities are not illiquid securities as defined above registered under the Securities Act of 1933 as amended (the “1933 Act”). Generally, 144A securities are excluded from this category, except where defined as illiquid.
Each Fund will bear any costs, including those involved in registration under the 1933 Act, in connection with the disposition of such securities.
At September 30, 2012, the Funds did not hold any illiquid and restricted Securities.
| Note | 11. Federal Income Tax Information |
($ reported in thousands)
At September 30, 2012, federal tax cost and aggregate gross unrealized appreciation (depreciation) of securities held by the Funds were as follows:
Fund | Federal Tax Cost | Unrealized Appreciation | Unrealized (Depreciation) | Net Unrealized Appreciation (Depreciation) | ||||||||||||
Emerging Markets Debt Fund | $ | 24,439 | $ | 263 | $ | (69 | ) | $ | 194 | |||||||
Emerging Markets Equity Income Fund | 5,055 | 267 | (31 | ) | 236 | |||||||||||
Global Commodities Stock Fund | 18,068 | 2,030 | (325 | ) | 1,705 | |||||||||||
Global Dividend Fund | 74,707 | 18,805 | (883 | ) | 17,922 | |||||||||||
Global Opportunities Fund | 78,559 | 19,871 | (564 | ) | 19,307 | |||||||||||
Global Real Estate Securities Fund | 20,170 | 2,051 | (50 | ) | 2,001 | |||||||||||
Greater Asia ex Japan Opportunities Fund | 6,716 | 2,220 | (175 | ) | 2,045 | |||||||||||
Greater European Opportunities Fund | 5,192 | 1,679 | (26 | ) | 1,653 | |||||||||||
International Equity Fund | 25,252 | 2,183 | (848 | ) | 1,335 | |||||||||||
International Real Estate Securities Fund | 31,847 | 1,956 | (345 | ) | 1,611 | |||||||||||
International Small-Cap Fund | 3,275 | 65 | (48 | ) | 17 | |||||||||||
The Funds have capital loss carryovers available to offset future realized capital gains, through the indicated expiration dates shown below:
| 2017 | 2018 | 2019 | No Expiration | Total | ||||||||||||||||
Emerging Markets Debt Fund | $ | — | $ | — | $ | — | $ | 15 | $ | 15 | ||||||||||
Global Commodities Stock Fund | — | — | — | 511 | 511 | |||||||||||||||
Global Dividend Fund | 739 | 8,762 | 3,627 | — | 13,128 | |||||||||||||||
Global Opportunities Fund | — | 17,083 | — | — | 17,083 | |||||||||||||||
International Equity Fund | — | — | — | 219 | 219 | |||||||||||||||
International Real Estate Securities Fund | 231 | 19,858 | 883 | 597 | 21,569 | |||||||||||||||
The Trust may not realize the benefit of these losses to the extent each Fund does not realize gains on investments prior to the expiration of the capital loss carryovers.
Under the Regulated Investment Company Modernization Act of 2010 (the “Act”), net capital losses recognized for tax years beginning after December 22, 2010 may be carried forward indefinitely, and their character is retained as short-term and/or long-term losses. Previously, net capital losses were carried forward for eight years and treated as short-term losses. As a transition rule, the Act requires that post-enactment net capital losses be used before pre-enactment net capital losses.
81
Table of Contents
VIRTUS OPPORTUNITIES TRUST
NOTES TO FINANCIAL STATEMENTS (Continued)
SEPTEMBER 30, 2012
For the year ended September 30, 2012 the following Funds utilized losses deferred in prior years against current year capital gains:
Global Dividend Fund | $ | 525 | ||
Global Opportunities Fund | 5,797 |
Capital losses realized after October 31 and certain late year ordinary losses may be deferred and treated as occurring on the first day of the following fiscal year. For the fiscal year ended September 30, 2012, the Funds deferred and recognized losses as follow:
| Capital Loss Deferred | Capital Loss Recognized | Currency Loss Recognized | ||||||||||
Global Commodities Stock Fund | $ | 1,202 | $ | — | $ | — | ||||||
Global Dividend Fund | 536 | 699 | 3 | |||||||||
Global Opportunities Fund | — | — | 25 | |||||||||
Global Real Estate Securities Fund | 67 | — | 2 | |||||||||
Greater Asia ex Japan Opportunities Fund | — | — | — | (1) | ||||||||
Greater European Opportunities Fund | — | — | 4 | |||||||||
International Equity Fund | 309 | 23 | 19 | |||||||||
International Real Estate Securities Fund | 2,639 | 524 | 361 | |||||||||
(1) Amount less than $500.
The components of distributable earnings on a tax basis (excluding unrealized appreciation (depreciation) which are disclosed above) consist of the following:
| Undistributed Ordinary Income | Undistributed Long-Term Capital Gains | |||||||
Emerging Markets Debt Fund | $ | 59 | $ | — | ||||
Emerging Markets Equity Income Fund | 57 | — | ||||||
Global Commodities Stock Fund | 416 | — | ||||||
Global Dividend Fund | 17 | — | ||||||
Global Opportunities Fund | 233 | — | ||||||
Global Real Estate Securities Fund | 574 | — | ||||||
Greater Asia ex Japan Opportunities Fund | 55 | 275 | ||||||
Greater European Opportunities Fund | 89 | 224 | ||||||
International Equity Fund | 294 | — | ||||||
International Real Estate Securities Fund | 2,046 | — | ||||||
International Small-Cap Fund | 11 | — | ||||||
The differences between the book and tax basis components of distributable earnings relate principally to the timing of recognition of income and gains for federal income tax purposes. Short-term gain distributions reported in the Statements of Changes in Net Assets, if any, are reported as ordinary income for federal tax purposes. Distributions are determined on a tax basis and may differ from net investment income and realized capital gains for financial reporting purposes.
| Note | 12. Reclassification of Capital Accounts |
($ reported in thousands)
For financial reporting purposes, book basis capital accounts are adjusted to reflect the tax character of permanent book/tax differences. Permanent reclassifications can arise from differing treatment of certain income and gain transactions, nondeductible current year net operating losses, expiring capital loss carryovers and investments in passive foreign investment companies. The reclassifications have no impact on the net assets or net asset value of the Funds. As of September 30, 2012, the Funds recorded reclassifications to increase (decrease) the accounts as listed below:
| Capital Paid in on Shares of Beneficial Interest | Undistributed Net Investment Income (Loss) | Accumulated Net Realized Gain (Loss) | ||||||||||
Emerging Markets Debt Fund | $ | — | $ | — | (1) | $ | — | (1) | ||||
Emerging Markets Equity Income Fund | — | — | (1) | — | (1) | |||||||
Global Commodities Stock Fund | — | 24 | (24 | ) | ||||||||
Global Dividend Fund | — | 3 | (3 | ) | ||||||||
Global Opportunities Fund | — | (111 | ) | 111 | ||||||||
Global Real Estate Securities Fund | — | 50 | (50 | ) | ||||||||
Greater Asia ex Japan Opportunities Fund | — | (8 | ) | 8 | ||||||||
Greater European Opportunities Fund | — | 1 | (1 | ) | ||||||||
International Equity Fund | — | (24 | ) | 24 | ||||||||
International Real Estate Securities Fund | — | 476 | (476 | ) | ||||||||
International Small-Cap Fund | — | — | (1) | — | (1) | |||||||
(1) Amount less than $500.
82
Table of Contents
VIRTUS OPPORTUNITIES TRUST
NOTES TO FINANCIAL STATEMENTS (Continued)
SEPTEMBER 30, 2012
| Note | 13. Recent Accounting Pronouncement |
In December 2011, the Financial Accounting Standards Board issued Accounting Standards Update (“ASU”) No. 2011-11 regarding “Disclosures about Offsetting Assets and Liabilities”. The amendments, which will be effective for annual reporting periods beginning on or after January 1, 2013 and interim periods within those annual periods, require an entity to disclose information about offsetting and related arrangements for assets and liabilities, financial instruments and derivatives that are either currently offset in accordance with current requirements or are subject to enforceable master netting arrangements or similar agreements. At this time, management is evaluating the implications of ASU No. 2011-11 and its impact on the financial statements has not yet been determined.
| Note | 14. Subsequent Event Evaluations |
Management has evaluated the impact of all subsequent events on the Funds through the date the financial statements were available for issuance, and has determined that there are no subsequent events requiring recognition or disclosure in the financial statements.
83
Table of Contents

REPORT OF INDEPENDENT REGISTERED PUBLIC ACCOUNTING FIRM
To the Board of Trustees of
Virtus Opportunities Trust and
Shareholders of the Funds, as defined:
In our opinion, the accompanying statements of assets and liabilities, including the schedules of investments of Virtus Emerging Markets Debt Fund, Virtus Emerging Markets Equity Income Fund, Virtus Global Commodities Stock Fund, Virtus Global Dividend Fund, Virtus Global Opportunities Fund, Virtus Global Real Estate Securities Fund, Virtus Greater Asia ex Japan Opportunities Fund, Virtus Greater European Opportunities Fund, Virtus International Equity Fund, Virtus International Real Estate Securities Fund, and Virtus International Small Cap Fund, each a series of Virtus Opportunities Trust, (the “Funds”), and the related statements of operations and of changes in net assets and the financial highlights present fairly, in all material respects, the financial positions of the Funds at September 30, 2012, the results of each of their operations, the changes in each of their net assets and the financial highlights for each of the periods indicated, in conformity with accounting principles generally accepted in the United States of America. These financial statements and financial highlights (hereafter referred to as “financial statements”) are the responsibility of the Funds’ management; our responsibility is to express an opinion on these financial statements based on our audits. We conducted our audits of these financial statements in accordance with the standards of the Public Company Accounting Oversight Board (United States). Those standards require that we plan and perform the audit to obtain reasonable assurance about whether the financial statements are free of material misstatement. An audit includes examining, on a test basis, evidence supporting the amounts and disclosures in the financial statements, assessing the accounting principles used and significant estimates made by management, and evaluating the overall financial statement presentation. We believe that our audits, which included confirmation of securities at September 30, 2012 by correspondence with the custodians and brokers, provide a reasonable basis for our opinion.

Philadelphia, Pennsylvania
November 21, 2012
84
Table of Contents
VIRTUS OPPORTUNITIES TRUST
SEPTEMBER 30, 2012
For the fiscal year ended September 30, 2012, the Funds make the following disclosures for federal income tax purposes. Below is listed the percentages, or the maximum amount allowable, of its ordinary income dividends (“QDI”) to qualify for the lower tax rates applicable to individual shareholders, and the percentage of ordinary income dividends earned by the Funds which qualifies for the dividends received deduction (“DRD”) for corporate shareholders. The Funds designate the amounts below as long-term capital gains dividends (“LTCG”) ($ reported in thousands), or if subsequently different, the amounts will be designated in the next annual report. The actual percentage for the calendar year will be designated in year-end tax statements.
Fund | QDI | DRD | LTCG | |||||||||
Emerging Markets Debt Fund | 0 | % | 0 | % | $ | — | ||||||
Emerging Markets Equity Income Fund | 2 | — | — | |||||||||
Global Commodities Stock Fund | 63 | 13 | — | |||||||||
Global Dividend Fund | 100 | 67 | — | |||||||||
Global Opportunities Fund | 100 | 100 | — | |||||||||
Global Real Estate Securities Fund | 17 | — | — | |||||||||
Greater Asia ex Japan Opportunities Fund | 100 | — | 275 | |||||||||
Greater European Opportunities Fund | 100 | 10 | 231 | |||||||||
International Equity Fund | 100 | — | — | |||||||||
International Real Estate Securities Fund | 29 | — | — | |||||||||
International Small-Cap Fund | 68 | 1 | — | |||||||||
For the period ended September 30, 2012, the Funds are disclosing the following information pursuant to notice requirements of Section 853(a) and 855(d) of the Internal Revenue Code, as amended, and the Treasury Regulations thereunder ($ reported in thousands).
| Foreign Source Income Recognized | Foreign Taxes Paid on Foreign Source Income | |||||||
Emerging Markets Equity Income Fund | $ | 4 | $ | — | (1) | |||
Global Commodities Stock Fund | 257 | 18 | ||||||
Greater Asia ex Japan Opportunities Fund | 205 | 10 | ||||||
Greater European Opportunities Fund | 156 | 12 | ||||||
International Equity Fund | 906 | 68 | ||||||
International Real Estate Securities Fund | 1,279 | 109 | ||||||
International Small-Cap Fund | 10 | — | (1) | |||||
(1) Amount less than $500.
85
Table of Contents
CONSIDERATION OF ADVISORY AND SUBADVISORY AGREEMENTS
FOR
VIRTUS EMERGING MARKETS DEBT FUND
VIRTUS EMERGING MARKETS EQUITY INCOME FUND
VIRTUS INTERNATIONAL SMALL-CAP FUND
(EACH A “FUND”, COLLECTIVELY, THE “FUNDS”)
BY THE BOARD OF TRUSTEES
The Board of Trustees (the “Board”) of Virtus Opportunities Trust (the “Trust”) is responsible for determining whether to approve the establishment and continuation of the investment advisory agreement (the “Advisory Agreement”) between the Funds and Virtus Investment Advisers, Inc. (“VIA”) and of each subadvisory agreement (each, a “Subadvisory Agreement”, collectively the “Subadvisory Agreements” and together with the Advisory Agreement, the “Agreements”) among each Fund, VIA and Newfleet Asset Management, LLC (“Newfleet”), Kleinwort Benson Investors International Ltd. (“KBII”) and Kayne Anderson Rudnick Investment Management, LLC (“KAR”), respectively (each a “Subadviser” and collectively, the “Subadvisers”). At in-person meetings held on June 4-6, 2012 and August 22-24, 2012, the Board, including a majority of the Trustees who are not interested persons of the Trust as defined in Section 2(a)(19) of the Investment Company Act of 1940, as amended (the “Independent Trustees”), considered and approved the establishment of the Agreements, as further discussed below.
In connection with the approval of the Agreements, the Board requested and evaluated information provided by VIA and each Subadviser which, in the Board’s view, constituted information necessary for the Board to form a judgment as to whether approval of each of the Agreements would be in the best interests of each Fund and its respective shareholders. The Board noted the affiliation of certain of the Subadvisers with VIA and any potential conflicts of interest.
The Board was separately advised by independent legal counsel throughout the process. For each Agreement, the Board considered all the criteria separately with respect to the applicable Fund and its shareholders. In their deliberations, the Board considered various factors, including those discussed below, none of which were controlling, and each Trustee may have attributed different weights to the various factors. The Board also discussed the proposed approval of the Agreements in private sessions with their independent legal counsel at which no representatives of management were present.
In considering whether to approve the Agreements with respect to each Fund, the Board reviewed and analyzed the factors it deemed relevant, including: (1) the nature, extent and quality of the services to be provided to the Funds by VIA and the Subadvisers; (2) applicable comparative performance information; (3) the level and method of computing the Funds’ advisory and subadvisory fees, and comparisons of the Funds’ proposed advisory fee rates with those of a group of other funds with similar investment objectives; (4) the profitability of VIA under the Advisory Agreement; (5) any “fall-out” benefits to VIA, the Subadvisers and their respective affiliates (i.e., ancillary benefits realized by VIA, the Subadvisers or their affiliates from VIA’s or the respective Subadviser’s relationship with the Fund(s)); (6) fees paid to VIA and the Subadvisers by comparable accounts, as applicable; (7) possible conflicts of interest; and (8) the terms of the Agreements.
Nature, Extent and Quality of Services
The Trustees received in advance of the meeting information in the form of questionnaires completed by VIA and each Subadviser, each concerning a number of topics, including such company’s investment philosophy, resources, operations and compliance structure. The Trustees also received a presentation by VIA’s senior management personnel, during which among other items, VIA’s history, investment process, investment strategies, personnel, compliance procedures and the firm’s overall performance were reviewed and discussed. The Trustees noted that the Funds are managed using a “manager of managers” structure that generally involves the use of one or more subadvisers to manage some or all of each Fund’s portfolio. Under this structure, VIA is responsible for evaluating and selecting subadvisers on an ongoing basis and making any recommendations to the Board regarding hiring, retaining or replacing subadvisers. In considering the Agreement with VIA, the Board considered VIA’s process for supervising and managing the Funds’ subadvisers, including (a) VIA’s ability to select and monitor the subadvisers; (b) VIA’s ability to provide the services necessary to monitor the subadvisers’ compliance with the Funds’ respective investment objectives, policies and restrictions as well as provide other oversight activities; and (c) VIA’s ability and willingness to identify instances in which a subadviser should be replaced and to carry out the required changes. The Trustees also considered: (a) the experience and capability of VIA’s management and other personnel; (b) the financial condition of VIA, and whether it had the financial wherewithal to provide a high level and quality of services to the Funds; (c) the quality of VIA’s own regulatory and legal compliance policies, procedures and systems; (d) the nature, extent and quality of administrative and other services expected to be provided by VIA and its affiliates to each Fund; (e) VIA’s expected supervision of the Funds’ other service providers; and (f) VIA’s risk management processes. It was noted that VP Distributors, LLC, an affiliate of VIA, was expected to serve as administrator, distributor and transfer agent to the Funds. The Board also took into account its knowledge of VIA’s management and the quality of the performance of its duties with respect to other Virtus Mutual Funds through Board meetings, discussions and reports during the preceding year, as well as information from the Trust’s Chief Compliance Officer (“CCO”) regarding the Funds’ compliance policies and procedures proposed to be established pursuant to Rule 38a-1 under the 1940 Act.
With respect to the services to be provided by each of the Subadvisers, the Board considered information provided to the Board by each Subadviser, including the Subadviser’s Form ADV, as well as for certain Subadvisers a presentation provided by the Subadviser’s senior portfolio management personnel. With respect to each Subadvisory Agreement, the Board noted that the Subadviser would provide portfolio management, compliance with the respective Fund’s investment policies and procedures, compliance with applicable securities laws and assurances thereof. In considering approval of the Subadvisory Agreements, the Board also considered each Subadviser’s investment management process, including (a) the experience and capability of the Subadviser’s management and other personnel committed by the Subadviser to the respective Fund; (b) the financial condition of the Subadviser; (c) the quality of the Subadviser’s regulatory and legal compliance policies, procedures and systems; and (d) the Subadviser’s brokerage and trading practices, including with respect to best execution and soft dollars. The Board also took into account the Subadviser’s risk assessment and monitoring process. The Board noted each Subadviser’s regulatory history, including whether it was currently involved in any regulatory actions or investigations as well as material litigation, and any settlements and amelioratory actions undertaken, as appropriate.
After considering all of the information provided to them, the Trustees concluded that the nature, extent and quality of the services expected to be provided by VIA and the Subadvisers were satisfactory and that there was a reasonable basis on which to conclude that each would provide a high quality of investment services to the applicable Fund(s).
86
Table of Contents
CONSIDERATION OF ADVISORY AND SUBADVISORY AGREEMENTS
FOR
VIRTUS EMERGING MARKETS DEBT FUND
VIRTUS EMERGING MARKETS EQUITY INCOME FUND
VIRTUS INTERNATIONAL SMALL-CAP FUND
(EACH A “FUND”, COLLECTIVELY, THE “FUNDS”)
BY THE BOARD OF TRUSTEES (Continued)
Investment Performance
Because the Funds had not commenced operations, the Board could not evaluate prior investment performance for each Fund. The Board was advised by VIA and Newfleet that they did not believe any of the other accounts they managed were comparable to the Funds for comparison purposes, so the Board could not evaluate prior investment performance for comparable accounts. The Board requested and was satisfied with the investment performance of other accounts managed by KBII and KAR, as compared with the benchmark for each.
Management Fees and Total Expenses
The Board considered the fees proposed for advisory services as well as the expected total expense levels of each Fund. Among other data provided, the Board noted that the proposed management fee and total expenses for each Fund were within the range of other funds deemed to be comparable to the Fund by management. The Board noted that each Fund was expected to have an expense cap in place to limit the total expenses incurred by the Fund and its shareholders. The Board also noted that the subadvisory fee for each Fund would be paid by VIA out of its advisory fee rather than paid separately by the Fund. In this regard, the Board took into account management’s discussion with respect to the advisory/subadvisory fee structure, including the amount of the advisory fee retained by VIA after payment of the subadvisory fee. The Board also took into account the expected size of each Fund and the impact on expenses.
The Board concluded that the proposed advisory and subadvisory fees for each Fund were fair and reasonable in light of the usual and customary charges made for services of the same nature and quality and the other factors considered.
Profitability
The Board also considered certain information relating to profitability that had been provided by VIA. In this regard, the Board considered information regarding the expected profitability of VIA for its management of the Funds, as well as the expected profitability of its affiliates for managing and providing other services to each Fund, such as distribution and administrative services provided to the Funds by a VIA affiliate. In addition to the fees paid to VIA and its affiliates, including certain of the Subadvisers, the Board considered any other benefits derived by VIA or its affiliates from their relationship with the Funds. Attention was paid to the methodology used to allocate costs to each Fund, in recognition of the fact that allocation methodologies are inherently subjective and various allocation methodologies may each be reasonable while producing different results. The Board concluded that the expected profitability to VIA and its affiliates from the Funds was reasonable in light of the quality of the services to be rendered to the Funds by VIA and its affiliates.
In considering the profitability to the Subadvisers in connection with their relationships to the Funds, the Board noted that the fees under the Subadvisory Agreements are paid by VIA out of the fees that VIA receives under the Advisory Agreement, so that Fund shareholders are not directly impacted by those fees. In considering the reasonableness of the fees payable by VIA to the affiliated Subadvisers, the Board noted that, because such Subadvisers are affiliates of VIA, such profitability might be directly or indirectly shared by VIA. In addition, with respect to KBII, the unaffiliated Subadviser, the Board relied on the ability of VIA to negotiate the Subadvisory Agreement and the fees thereunder at arm’s length. For each of the above reasons, the Board concluded that the profitability to the Subadvisers and their affiliates from their respective relationships with the Funds was not a material factor in approval of the Subadvisory Agreements.
Economies of Scale
The Board received and discussed information concerning whether VIA should be expected to realize economies of scale as the Funds’ assets grow. The Board noted that the management fees for the Funds included breakpoints based on assets under management, and that expense caps were also expected to be implemented for the Funds. The Board also took into account management’s discussion of each Fund’s management fee and subadvisory fee structure. The Board also took into account the expected size of the Funds. The Board noted that VIA and the Funds may realize certain economies of scale if the assets of the Funds were to be materially higher than anticipated, particularly in relationship to certain fixed costs, and that shareholders of each Fund would have an opportunity to benefit from these economies of scale.
For similar reasons as stated above with respect to the Subadvisers’ profitability, and based upon the expected size of the Fund to be managed by each Subadviser, the Board concluded that the potential for economies of scale in the Subadvisers’ management of the Funds was not a material factor in the approval of the Subadvisory Agreements at this time.
Other Factors. The Board considered other benefits that may be realized by VIA and the Subadviser and their respective affiliates from their relationships with the Funds. Among them, the Board recognized that VP Distributors, LLC, an affiliate of VIA, serves as the distributor for the Trust, and, as such, was expected to receive payments pursuant to Rule 12b-1 from the Funds to compensate it for providing shareholder services and selling activities, which could lead to growth in the Funds’ assets and corresponding benefits from such growth, including economies of scale. The Board also noted that VP Distributors, LLC also was expected to provide administrative and transfer agency services to the Funds. The Board noted management’s discussion of the fact that, while certain of the Subadvisers are affiliates of VIA, there are no other direct benefits to the Subadviser or VIA in providing investment advisory services to the Funds, other than the fees to be earned under the Agreements, although there may be certain indirect benefits gained, including to the extent that serving the Funds could provide the opportunity to provide advisory services to additional portfolios of the Trust or certain reputational benefits.
Based on all of the foregoing considerations, the Board, including a majority of the Independent Trustees, determined that approval of each Agreement was in the best interests of each Fund and its respective shareholders. Accordingly, the Board, and the Independent Trustees voting separately, approved the Agreements with respect to each Fund.
87
Table of Contents
Information pertaining to the trustees and officers of the Trust as of September 30, 2012, is set forth below. The statement of additional information (SAI) includes additional information about the trustees and is available without charge, upon request, by calling (800) 243-1574. The address of each individual, unless otherwise noted, is 100 Pearl Street, Hartford, CT 06103-4506. There is no stated term of office for trustees of the Trust.
Independent Trustees
| Name, Year of Birth, Year Elected and Number of Funds Overseen | Principal Occupation(s) During Past 5 Years and Other Directorships Held by Trustee | |
Leroy Keith, Jr. YOB: 1939 Elected: 2000 47 Funds | Chairman (since 2010), Bloc Global Services Group, LLC (construction and redevelopment company); Managing Director (2007 to 2008), Almanac Capital Management (commodities business); Director/Trustee (since 2010), Wells Fargo Advantage Funds (149 series) and their predecessors, Evergreen Funds (1989 to 2010); Director (2003 to 2010), Diversapack Co. (soft packaging company). | |
Philip R. McLoughlin Chairman YOB: 1946 Elected: 1999 62 Funds | Partner (since 2006), Cross Pond Partners, LLC (strategy consulting firm); Managing Director (2009 to 2010), SeaCap Asset Management Fund I, L.P. and SeaCap Partners, LLC (2009 to 2010) (investment management); Director (since 1991) and Chairman (since 2010), World Trust Fund; Chairman and Trustee (since 2003), Virtus Variable Insurance Trust (9 portfolios); Director (since 1995), DTF Tax-Free Income Fund, Inc.; Director (since 1995), Duff & Phelps Utility and Corporate Bond Trust, Inc.; Director (since 2009), DNP Select Income Fund Inc.; Director (since 2011), Duff & Phelps Global Utility Income Fund Inc.; Trustee (since 2011), Virtus Global Multi-Sector Fixed Income Fund; Trustee (since 2011), Virtus Total Return Fund; Director (1985 to 2009), Argo Group International Holdings Inc. and its predecessor, PXRE Corporation (insurance). | |
Geraldine M. McNamara YOB: 1951 Elected: 2001 51 Funds | Retired. Director (since 2003), DTF Tax-Free Income Fund, Inc.; Director (since 2003), Duff & Phelps Utility and Corporate Bond Trust, Inc.; Director (since 2009), DNP Select Income Fund Inc.; Director (since 2011) Duff & Phelps Global Utility Income Fund Inc. | |
James M. Oates YOB: 1946 Elected: 2000 47 Funds | Managing Director (since 1994), Wydown Group (consulting firm); Chairman and Trustee (since 2005), John Hancock Variable Insurance Trust and John Hancock Funds II (collectively, 210 portfolios); Director (since 1996), Stifel Financial; Chairman and Director (since 1999), Connecticut River Bank and Director (since 1998), Connecticut River Bancorp; Chairman (since 2000), Emerson Investment Management, Inc.; Director (since 2002), New Hampshire Trust Company; Non-Executive Chairman (2007 to 2011), Hudson Castle Group, Inc. (formerly IBEX Capital Markets, Inc.) (financial services). | |
Richard E. Segerson YOB: 1946 Elected: 2000 47 Funds | Managing Director (since 1998), Northway Management Company. | |
Ferdinand L.J. Verdonck YOB: 1942 Elected: 2005 47 Funds | Director (since 1998), The J.P. Morgan European Investment Trust; Director (since 2005), Galapagos N.V. (biotechnology); Mr. Verdonck is also a director of several non-U.S. companies. | |
88
Table of Contents
FUND MANAGEMENT TABLES (Continued)
Interested Trustee
The individual listed below is an “interested person” of the Trust, as defined in Section 2(a)(19) of the Investment Company Act of 1940, as amended, and the rules and regulations thereunder.
| Name, Year of Birth, Year Elected and Number of Funds Overseen | Principal Occupation(s) During Past 5 Years and Other Directorships Held by Trustee | |
George R. Aylward* Trustee and President YOB: 1964 Elected: 2006 49 Funds | Director, President and Chief Executive Officer (since 2008), Virtus Investment Partners, Inc. and/or certain of its subsidiaries; various senior officer positions with Virtus affiliates (since 2005); Chairman, President and Chief Executive Officer (since 2006), The Zweig Fund, Inc. and The Zweig Total Return Fund, Inc.; Trustee and President (since 2011), Virtus Global Multi-Sector Income Fund and Virtus Total Return Fund. | |
1 Mr. Aylward is an “interested person,” as defined in the 1940 Act, by reason of his position as President and Chief Executive Officer of Virtus Investment Partners, Inc. (“Virtus”), the ultimate parent company of the Adviser, and various positions with its affiliates including the Adviser.
Officers of the Trust Who Are Not Trustees
Name, Address and Year of Birth | Position(s) Held with Trust and Length of Time Served | Principal Occupation(s) During Past 5 Years | ||
W. Patrick Bradley YOB: 1972 | Vice President since 2011, Chief Financial Officer and Treasurer since 2006. | Senior Vice President, Fund Services (since 2010), Virtus Investment Partners, Inc. and/or certain of its subsidiaries; various officer positions (since 2006) with Virtus affiliates; Vice President (since 2011), Chief Financial Officer and Treasurer (since 2004), Virtus Variable Insurance Trust; Vice President, Chief Financial Officer and Treasurer (since 2011), Virtus Global Multi-Sector Income Fund and Virtus Total Return Fund; Vice President (since 2012) and Treasurer (Chief Financial Officer) (since 2007), The Zweig Fund, Inc. and Zweig Total Return Fund, Inc.; Vice President and Assistant Treasurer (since 2011), Duff & Phelps Global Utility Income Fund Inc. | ||
Kevin J. Carr YOB: 1954 | Vice President, Chief Legal Officer, Counsel and Secretary since 2005. | Senior Vice President (since 2009), Vice President, Counsel and Secretary (2008 to 2009), Virtus Investment Partners, Inc. and/or certain of its subsidiaries; various senior officer positions (since 2005) with Virtus affiliates; Vice President, Chief Legal Officer, Counsel and Secretary (since 2010), Virtus Variable Insurance Trust; Vice President, Chief Legal Officer, Counsel and Secretary (since 2011), Virtus Global Multi-Sector Income Fund and Virtus Total Return Fund; Vice President and Assistant Secretary (since 2012), Secretary and Chief Legal Officer (2005-2012), The Zweig Fund, Inc. and Zweig Total Return Fund, Inc.; Vice President and Assistant Secretary (since 2011), Duff & Phelps Global Utility Income Fund Inc. | ||
Nancy J. Engberg YOB: 1956 | Vice President and Chief Compliance Officer since 2011. | Vice President (since 2008) and Chief Compliance Officer (2008 to 2011), Virtus Investment Partners, Inc. and/or certain of its subsidiaries; various officer positions (since 2003) with Virtus affiliates; Vice President (since 2010), Chief Compliance Officer (since 2011), Virtus Variable Insurance Trust; Vice President and Chief Compliance Officer (since 2011), Virtus Global Multi-Sector Income Fund and Virtus Total Return Fund; Vice President and Chief Compliance Officer (since 2012), The Zweig Fund, Inc. and Zweig Total Return Fund, Inc. | ||
Francis G. Waltman YOB: 1962 | Senior Vice President since 2008. | Executive Vice President, Product Development (since 2009), Virtus Investment Partners, Inc. and/or certain of its subsidiaries; various senior officer positions (since 2006) with Virtus affiliates; Senior Vice President (since 2010), Virtus Variable Insurance Trust; Senior Vice President (since 2011), Virtus Global Multi-Sector Income Fund and Virtus Total Return Fund. | ||
89
Table of Contents
Virtus Global Commodities Stock Fund,
a series of Virtus Opportunities Trust
Supplement dated June 21, 2012 to the Summary Prospectus and
Statutory Prospectus dated January 31, 2012, as supplemented
IMPORTANT NOTICE TO INVESTORS
On June 1, 2012, Harris Investment Management, Inc., the investment subadviser to Virtus Global Commodities Stock Fund and a wholly-owned subsidiary of BMO Financial Corp., merged with its affiliate, M&I Investment Management Corp., and changed its name to BMO Asset Management Corp. Accordingly, all references in the fund’s summary prospectus and statutory prospectus to “Harris Investment Management, Inc.” and “Harris” are hereby replaced with “BMO Asset Management Corp.” and “BMO AM,” respectively. BMO Asset Management Corp. is located at 115 South LaSalle Street, 11th Floor, P.O. Box 755, Chicago, IL 60603.
Investors should retain this supplement with the Prospectuses for future reference.
VOT 8020/HIM NameChange (6/2012)
Table of Contents
VIRTUS OPPORTUNITIES TRUST
101 Munson Street
Greenfield, MA 01301-9668
Trustees
George R. Aylward
Leroy Keith, Jr.
Philip R. McLoughlin, Chairman
Geraldine M. McNamara
James M. Oates
Richard E. Segerson
Ferdinand L.J. Verdonck
Officers
George R. Aylward, President
Francis G. Waltman, Senior Vice President
Nancy J. Engberg, Vice President and
Chief Compliance Officer
W. Patrick Bradley, Vice President,
Chief Financial Officer and Treasurer
Kevin J. Carr, Vice President, Chief Legal
Officer, Counsel and Secretary
Investment Adviser
Virtus Investment Advisers, Inc.
100 Pearl Street
Hartford, CT 06103-4506
Principal Underwriter
VP Distributors, LLC
100 Pearl Street
Hartford, CT 06103-4506
Transfer Agent
VP Distributors, LLC
100 Pearl Street
Hartford, CT 06103-4506
Custodian
The Bank of New York Mellon
One Wall Street
New York, NY 10005-2588
Independent Registered Public Accounting Firm
PricewaterhouseCoopers LLC
2001 Market Street
Philadelphia, PA 19103-7042
How to Contact Us
Mutual Fund Services 1-800-243-1574
Adviser Consulting Group 1-800-243-4361
Telephone Orders 1-800-367-5877
Text Telephone1-800-243-1926
Web sitehttp://Virtus.com
Important Notice to Shareholders
The Securities and Exchange Commission has modified mailing regulations for semiannual and annual shareholder fund reports to allow mutual fund companies to send a single copy of these reports to shareholders who share the same mailing address. If you would like additional copies, please call Mutual Fund Services at 1-800-243-1574.
Table of Contents

P.O. Box 9874
Providence, RI 02940-8074
For more information about Virtus Mutual Funds, please call your financial representative, contact us at 1-800-243-1574 or Virtus.com.
8008 | 11-12 |
Table of Contents


Annual
Report
Virtus Foreign Opportunities Fund
| TRUST NAME: VIRTUS OPPORTUNITIES TRUST | September 30, 2012 |  | ||
| No Bank Guarantee | Not FDIC Insured | May Lose Value |
Table of Contents
Virtus Foreign Opportunities Fund
(“Foreign Opportunities Fund”)
| 1 | ||||
| 2 | ||||
| 4 | ||||
| 5 | ||||
| 8 | ||||
| 11 | ||||
| 12 | ||||
| 13 | ||||
| 14 | ||||
| 16 | ||||
| 23 | ||||
| 24 | ||||
| 25 |
PROXY VOTING PROCEDURES AND VOTING RECORD (FORM N-PX)
The adviser and subadviser vote proxies relating to portfolio securities in accordance with procedures that have been approved by the Board of Trustees of the Trust (“Trustees,” the “Board”). You may obtain a description of these procedures, along with information regarding how the Fund voted proxies during the most recent 12-month period ended June 30, free of charge, by calling toll-free 1-800-243-1574. This information is also available through the Securities and Exchange Commission’s (the “SEC”) website at http://www.sec.gov.
FORM N-Q INFORMATION
The Trust files a complete schedule of portfolio holdings for the Fund with the SEC for the first and third quarters of each fiscal year on Form N-Q. Form N-Q is available on the SEC’s website at http://www.sec.gov. Form N-Q may be reviewed and copied at the SEC’s Public Reference Room. Information on the operation of the SEC’s Public Reference Room can be obtained by calling toll-free 1-800-SEC-0330.
This report is not authorized for distribution to prospective investors in the Virtus Foreign Opportunities Fund unless preceded or accompanied by an effective prospectus which includes information concerning the sales charge, the Fund’s record and other pertinent information.
Table of Contents
Dear Fellow Shareholders of Virtus Mutual Funds:

Investors were subject to the vagaries of the financial markets over the annual reporting period. Markets gained momentum throughout the first quarter of 2012, slid backwards in the second quarter, only to rebound strongly in the third quarter and end the 12-month period in positive territory.
An extended rally helped equity and fixed income markets produce respectable returns for the year ended September 30, 2012. U.S. equities, as measured by the S&P 500® Index, gained an impressive 30.20 percent, far surpassing international equities, which rose 20.98 percent, as represented by the MSCI All Country World Index (net). U.S. fixed income markets rose |
5.16 percent for the year, as measured by the Barclays Capital U.S. Aggregate Bond Index. A consistent “flight to quality” among global investors kept demand high for the 10-year U.S. Treasury and its yield low, at just 1.64 percent at the end of September.
As we enter the final quarter of 2012, the economic strength of the United States, Europe, and China remains tenuous. The onus is on U.S. government to avoid the dangers of the “fiscal cliff” and on corporations to produce robust earnings, in particular strong revenue growth, which will play a pivotal role in determining future market direction.
Market uncertainty is a timely reminder of the importance of portfolio diversification. While diversification cannot guarantee a profit or prevent loss, owning a variety of asset classes may cushion your portfolio against inevitable market fluctuations. Your financial advisor can help you ensure that your portfolio is adequately diversified.
Thank you for entrusting Virtus with your assets. We appreciate your business and remain committed to your long-term financial success.
Sincerely,

George R. Aylward
President, Virtus Mutual Funds
October 2012
Whenever you have questions about your account, or require additional information, please visit us on the Web at www.virtus.com or call our shareowner service group toll-free at 1-800-243-1574.
Performance data quoted represents past results. Past performance is no guarantee of future results and current performance may be higher or lower than performance shown above.
1
Table of Contents
VIRTUS FOREIGN OPPORTUNITIES FUND
Disclosure of Fund Expenses (Unaudited)
For the six-month period of April 1, 2012 to September 30, 2012
We believe it is important for you to understand the impact of costs on your investment. All mutual funds have operating expenses. As a shareholder of the Virtus Foreign Opportunities Fund (the “Fund”) you may incur two types of costs: (1) transaction costs, including sales charges on purchases of Class A shares and contingent deferred sales charges on Class C shares; and (2) ongoing costs, including investment advisory fees, distribution and service fees, and other expenses. Class I shares are sold without a sales charge and do not incur distribution and service fees. These examples are intended to help you understand your ongoing costs (in dollars) of investing in the Fund and to compare these costs with the ongoing costs of investing in other mutual funds. These examples are based on an investment of $1,000 invested at the beginning of the period and held for the entire six-month period. The following Expense Table illustrates your Fund’s costs in two ways.
Actual Expenses
The first section of the accompanying table provides information about actual account values and actual expenses. You may use the information in this section, together with the amount you invested, to estimate the expenses that you paid over the period. Simply divide your account value by $1,000 (for example, an $8,600 account value divided by $1,000 = 8.6), then multiply the result by the number in the first section under the heading “Expenses Paid During Period” to estimate the expenses you paid on your account during the period.
Hypothetical Example for Comparison Purposes
The second section of the accompanying table provides information about hypothetical account values and hypothetical expenses based on the Fund’s actual expense ratio and an assumed rate of return of 5% per year before expenses, which is not your Fund’s actual return. The hypothetical account values and expenses may not be used to estimate the actual ending account balance or expenses you paid for the period. You may use this information to compare the ongoing costs of investing in your Fund and other funds. To do so, compare these 5% hypothetical examples with the 5% hypothetical examples that appear in the shareholder reports of the other funds.
Please note that the expenses shown in the accompanying table are meant to highlight your ongoing costs only and do not reflect any transactional costs, such as sales charges or contingent deferred sales charges. Therefore, the second section of the accompanying table is useful in comparing ongoing costs only, and will not help you determine the relative total costs of owning different funds. In addition, if these transactional costs were included, your costs would have been higher. The calculations assume no shares were bought or sold during the period. Your actual costs may have been higher or lower, depending on the amount of your investment and the timing of any purchases or redemptions.
2
Table of Contents
VIRTUS FOREIGN OPPORTUNITIES FUND
Disclosure of Fund Expenses (Unaudited) (Continued)
For the six-month period of April 1, 2012 to September 30, 2012
| Expense Table | ||||||||||||||||
Beginning April 1, 2012 | Ending September 30, 2012 | Annualized Expense Ratio | Expenses Paid During Period* | |||||||||||||
Actual | ||||||||||||||||
Class A | $ | 1,000.00 | $ | 1,045.50 | 1.45 | % | $ | 7.41 | ||||||||
Class C | 1,000.00 | 1,041.60 | 2.20 | 11.23 | ||||||||||||
Class I | 1,000.00 | 1,046.80 | 1.20 | 6.14 | ||||||||||||
Hypothetical (5% return before expenses) |
| |||||||||||||||
Class A | 1,000.00 | 1,017.66 | 1.45 | 7.34 | ||||||||||||
Class C | 1,000.00 | 1,013.86 | 2.20 | 11.14 | ||||||||||||
Class I | 1,000.00 | 1,018.92 | 1.20 | 6.08 | ||||||||||||
| * | Expenses are equal to the Fund’s annualized expense ratio which is net of waived fees and reimbursed expenses, if applicable, multiplied by the average account value over the period, multiplied by the number of days (183) expenses were accrued in the most recent fiscal half-year, then divided by 366 to reflect the one-half year period. |
| The Fund may invest in other funds, and the annualized expense ratios noted above do not reflect fees and expenses associated with the underlying funds. If such fees and expenses were included, the expenses would have been higher. |
| You can find more information about the Fund’s expenses in the Financial Statements section that follows. For additional information on operating expenses and other shareholder costs, refer to the prospectus. |
3
Table of Contents
| VIRTUS FOREIGN OPPORTUNITIES FUND |
American Depositary Receipt (ADR)
Represents shares of foreign companies traded in U.S. dollars on U.S. exchanges that are held by a U.S. bank or trust. Foreign companies use ADRs in order to make it easier for Americans to buy their shares.
Barclays Capital U.S. Aggregate Bond Index
The Barclays Capital U.S. Aggregate Bond Index measures the U.S. investment grade fixed rate bond market. The index is calculated on a total return basis.
European Central Bank (“ECB”)
The European Central Bank (ECB) responsible for conducting monetary policy for the euro area. The ECB was established as the core of the Eurosystem and the European System of Central Banks (ESCB). The ESCB comprises the ECB and the national central banks (NCBs) of all 17 EU Member States whether they have adopted the Euro or not.
MSCI All Country World Index (net)
The MSCI AC World Index (net) is a free float-adjusted market capitalization-weighted index that measures equity performance of developed and emerging markets. The index is calculated on a total return basis with net dividends reinvested. The index is unmanaged and not available for direct investment.
MSCI EAFE® Index (net)
A free float-adjusted market capitalization index that measures developed foreign market equity performance, excluding the U.S. and Canada. The index is calculated on a total return basis with gross dividends reinvested.
Sponsored American Depositary Receipt (ADR)
An ADR which is issued with the cooperation of the company whose stock will underlie the ADR. Sponsored ADRs generally carry the same rights normally given to stockholders, such as voting rights. ADRs must be sponsored to be able to trade on a major U.S. exchange such as the New York Stock Exchange (NYSE).
S&P 500® Index
The S&P 500® Index is a free-float market capitalization-weighted index of 500 of the largest U.S. companies. The index is calculated on a total return basis with dividends reinvested.
4
Table of Contents
| Virtus Foreign Opportunities Fund | Ticker Symbols: Class A: JVIAX Class C: JVICX Class I: JVXIX |
| ¢ | The Fund is diversified and has an investment objective of long-term capital appreciation. |
| ¢ | For the fiscal year ended September 30, 2012, the Fund’s Class A shares at NAV returned 24.34%, Class C shares returned 23.43% and Class I shares returned 24.64%. For the same period, the S&P® 500 Index, a broad-based equity index, returned 30.20% and the MSCI EAFE® Index (net), the Fund’s style-specific index appropriate for comparison, returned 13.75%. |
All performance figures assume reinvestment of distribution and exclude the effect of sales charges. Past performance is no guarantee of future results and current performance may be higher or lower than the performance shown.
How did the market perform during the Fund’s fiscal year?
| ¢ | The Eurozone has significant structural issues that will take some time to resolve. The European Central Bank (ECB) began aggressively purchasing short-term sovereign debt through its Outright Monetary Transactions (OMT) program. By opening the monetary tap, the ECB lifted the mood in Eurozone financial markets. |
| ¢ | Emerging countries continued to experience slower economic growth. India’s central government liberalized its foreign direct investment (FDI) policy. |
| ¢ | In Brazil, the government has taken headline-grabbing measures to reduce the cost of doing business in the country including lowering bank profit margins on loans and cutting the price of electricity. After “asking” banks to cut interest margins, the Brazilian government went a step further and had state-owned banks extend credit at lower interest rates, reducing their profitability. To remain competitive, private sector banks followed. The changes are expected to affect lending margins negatively and make the banks less valuable to shareholders. On electricity prices, |
the Brazilian government’s proposed changes aim to cut the cost of electricity by 16% for households and by up to 28% for industry. The proposed changes will affect utilities unevenly. Holders of concession contracts which are closer to mid-point renegotiation (20 years) or expiry (40 years) will be considerably more affected than those holding concessions with more time to run. After reviewing the scope and abruptness of the government’s changes, we decided it was prudent to reduce our exposure to the government regulated companies most exposed to Brazilian concessions. |
What factors affected the Fund’s performance during its fiscal year?
| ¢ | The Fund’s stock selection in Consumer Staples, as well as its overweight exposure to the sector, contributed to performance versus the MSCI EAFE Index during the fiscal year. |
| ¢ | Stock selection in the Industrials sector was beneficial to the Fund’s relative performance. The Fund’s underweight to Industrials also helped as the sector underperformed the MSCI EAFE® Index. |
| ¢ | The Fund’s stock selection and its underweight in the Financials sector detracted from relative performance during the year. |
| ¢ | The Fund’s underweight to the Consumer Discretionary sector detracted from results. However, the Fund’s stock selection within the space more than offset this negative impact. |
| ¢ | The Fund’s underweight to Japan was a strong contributor to the Fund’s performance during the year as the country was one of the weaker performers in the MSCI EAFE® Index. |
| ¢ | The MSCI EAFE® Index has no exposure to Brazil; therefore, the Fund’s overweight to the country helped performance. |
| ¢ | The Fund’s stock selection, as well as its underweight, in Australia, detracted from performance during the fiscal year. |
For information regarding the indexes and certain investment terms, see Key Investment Terms starting on page 4.
5
Table of Contents
Virtus Foreign Opportunities Fund (Continued)
| ¢ | While Fund’s selection of German stocks was positive for performance, it was not enough to offset the negative effect of the Fund’s underweight exposure to the country. Absolute contributors: Phillip Morris International, British American Tobacco, Novo Nordisk, Anheuser-Busch InBev and Diageo Absolute detractors: Nitori Holdings, Tesco, Admiral Group, bioMerieux and Newcrest Mining Relative contributors: Phillip Morris International, Novo Nordisk, Anheuser-Busch InBev, Souza Cruz and British American Tobacco Relative detractors: Nitori Holdings, Tesco, Novartis, Admiral Group and Bayer |
| ¢ | The portfolio has evolved over the course of the year. We invested in attractively priced, high-quality companies that we believe have the potential to grow earnings faster than the market on a sustainable basis. Some portfolio drivers over the next three-to-five years will be quite different from those of the last three years. During the last fiscal quarter, we added names in the Financials sector and trimmed some names in the Consumer Staples sector. |
The preceding information is the opinion of portfolio management. Any such opinions are subject to change at any time based upon market or other conditions and should not be relied upon as investment advice. Past performance is no guarantee of future results, and there is no guarantee that market forecasts will be realized
There is no guarantee that the Fund will meet its objective.
The market price of equity securities may be affected by financial market, industry, or issuer-specific events. Focus on a particular style or on small or medium-sized companies may enhance that risk. A fund that focuses its investments in a particular industry or sector will be more sensitive to conditions that affect that industry or sector than a non-concentrated fund. Investing internationally, especially in emerging markets, involves additional risks such as currency, political, accounting, economic and market risk.
| Asset Allocations | ||||
The following table presents asset allocations within certain sectors and as a percentage of total investments as of September 30, 2012.
|
| |||
Consumer Staples | 40 | % | ||
Financials | 17 | |||
Consumer Discretionary | 11 | |||
Health Care | 9 | |||
Materials | 6 | |||
Energy | 5 | |||
Information Technology | 5 | |||
Other (includes short-term investments) | 7 | |||
|
| |||
Total | 100 | % | ||
|
| |||
6
For information regarding the indexes and certain investment terms, see the Key Investment Terms on page 4.
Table of Contents
Virtus Foreign Opportunities Fund (Continued)
| Average Annual Total Returns1 for periods ended 9/30/12 | ||||||||||||||||||||
1 Year | 5 Years | 10 Years | Since Inception | Inception Date | ||||||||||||||||
| Class A Shares at NAV 2 | 24.34 | % | –0.73 | % | 11.27 | % | — | — | ||||||||||||
| Class A Shares at POP 3,4 | 17.19 | –1.90 | 10.61 | — | — | |||||||||||||||
| Class C Shares at NAV 2 and with CDSC 4 | 23.43 | –1.48 | — | 9.24 | % | 10/10/03 | ||||||||||||||
| Class I Shares at NAV | 24.64 | –0.46 | — | 4.07 | 5/15/06 | |||||||||||||||
| S&P 500® Index | 30.20 | 1.05 | 8.01 | —5 | — | |||||||||||||||
| MSCI EAFE® Index (net) | 13.75 | –5.24 | 8.20 | —6 | — | |||||||||||||||
Fund Expense Ratios7: A Shares: 1.47%; C Shares: 2.22%; I Shares: 1.22%.
All returns represent past performance which is no guarantee of future results. Current performance may be higher or lower than the performance shown. The investment return and principal value of an investment will fluctuate so that an investor’s shares, when redeemed, may be worth more or less than their original cost. The above table and graph below do not reflect the deduction of taxes that a shareholder would pay on fund distributions or the redemption of fund shares. Please visit Virtus.com for performance data current to the most recent month-end.
| 1 | Total returns are historical and include changes in share price and the reinvestment of both dividends and capital gains distributions. |
| 2 | “NAV” (Net Asset Value) total returns do not include the effect of any sales charge. |
| 3 | “POP” (Public Offering Price) total returns include the effect of the maximum front-end 5.75% sales charge. |
| 4 | “CDSC” (contingent deferred sales charge) is applied to redemptions of certain classes of shares that do not have a sales charge applied at the time of purchase. CDSC charges for certain redemptions of Class A shares made within 18 months of purchases in which a finder’s fee was paid and all Class C shares are 1% within the first year and 0% thereafter. |
| 5 | The index returned 6.11% for Class C shares and 3.88% for Class I shares since the inception date of the respective share class. |
| 6 | The index returned 5.67% for Class C shares and –0.80% for Class I shares since the inception date of the respective share class. |
| 7 | The expense ratios of the Fund are set forth according to the prospectus for the Fund effective January 31, 2012, and may differ from the expense ratios disclosed in the Financial Highlights tables in this report. See the Financial Highlights for more current expense ratios. |
Growth of $10,000 for periods ended 9/30
This chart assumes an initial investment of $10,000 made on September 30, 2002 for Class A shares including any applicable sales charges or fees. Performance assumes reinvestment of dividends and capital gain distributions.
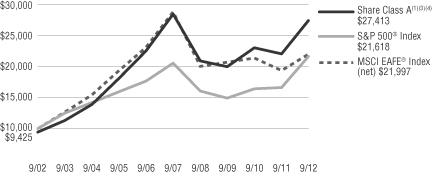
The indexes are unmanaged and not available for direct investment; therefore, their performance does not reflect the expenses associated with active management of an actual portfolio.
7
Table of Contents
VIRTUS FOREIGN OPPORTUNITIES FUND
SEPTEMBER 30, 2012
($ reported in thousands)
| SHARES | VALUE | |||||||
| PREFERRED STOCK—0.3% | ||||||||
| Utilities—0.3% | ||||||||
AES Tiete S.A., 10.85% (Brazil) | 236,473 | $ | 2,614 | |||||
| TOTAL PREFERRED STOCK (Identified Cost $1,922) | 2,614 | |||||||
| COMMON STOCKS—96.5% | ||||||||
| Consumer Discretionary—10.9% | ||||||||
Barrat Developments plc (United Kingdom)(2) | 2,079,099 | 5,691 | ||||||
Bureau Veritas SA (France) | 242,962 | 24,953 | ||||||
DKSH Holding AG (Switzerland)(2) | 147,200 | 9,195 | ||||||
Domino’s Pizza plc (United Kingdom) | 1,644,227 | 14,099 | ||||||
L’Occitane International SA (Hong Kong) | 2,679,249 | 7,083 | ||||||
Nitori Co., Ltd. (Japan) | 113,350 | 10,530 | ||||||
Paddy Power plc (Ireland) | 254,155 | 18,809 | ||||||
Persimmon plc (United Kingdom)(2) | 920,721 | 11,277 | ||||||
Sands China Ltd. (Hong Kong) | 5,527,767 | 20,638 | ||||||
|
| |||||||
| 122,275 | ||||||||
|
| |||||||
| Consumer Staples—39.8% | ||||||||
Anheuser-Busch InBev N.V. (Belgium) | 357,642 | 30,411 | ||||||
British American Tobacco plc (United Kingdom) | 1,355,911 | 69,616 | ||||||
Coca-Cola Amatil Ltd. (Australia) | 736,322 | 10,357 | ||||||
Diageo plc (United Kingdom) | 1,015,053 | 28,512 | ||||||
Hindustan Unilever Ltd. (India) | 526,040 | 5,444 | ||||||
Imperial Tobacco Group plc (United Kingdom) | 580,074 | 21,469 | ||||||
ITC Ltd. (India) | 5,757,778 | 29,736 | ||||||
Lindt & Spruengli AG (Switzerland)(2) | 5,424 | 17,163 | ||||||
Nestle India Ltd. (India) | 112,898 | 9,422 | ||||||
| SHARES | VALUE | |||||||
| Consumer Staples (continued) | ||||||||
Nestle S.A. Registered Shares (Switzerland) | 692,335 | $ | 43,653 | |||||
Pernod-Ricard SA (France) | 143,099 | 16,055 | ||||||
Philip Morris International, Inc. (United States) | 701,284 | 63,073 | ||||||
SABMiller plc (United Kingdom) | 754,077 | 33,121 | ||||||
Tesco plc (United Kingdom) | 2,199,335 | 11,790 | ||||||
Unilever N.V. (Netherlands) | 1,326,227 | 46,919 | ||||||
Wal-Mart de Mexico S.A.B. de C.V. (Mexico) | 4,136,192 | 11,649 | ||||||
|
| |||||||
| 448,390 | ||||||||
|
| |||||||
| Energy—5.3% | ||||||||
Core Laboratories N.V. (Netherlands) | 191,736 | 23,292 | ||||||
Enbridge, Inc. (Canada) | 427,905 | 16,714 | ||||||
Royal Dutch Shell plc A Shares (United Kingdom) | 401,930 | 13,894 | ||||||
TransCanada Corp. (Canada) | 116,700 | 5,311 | ||||||
|
| |||||||
| 59,211 | ||||||||
|
| |||||||
| Financials—17.3% | ||||||||
Daito Trust Construction Co., Ltd. (Japan) | 103,300 | 10,391 | ||||||
Housing Development Finance Corp. (India) | 3,527,890 | 51,796 | ||||||
Housing Development Finance Corp. Bank Ltd. (India) | 3,531,136 | 42,120 | ||||||
Housing Development Finance Corp. Bank Ltd. ADR (India) | 38,648 | 1,452 | ||||||
HSBC Holdings plc (United Kingdom) | 3,378,508 | 31,277 | ||||||
Standard Chartered plc (United Kingdom) | 1,025,138 | 23,176 | ||||||
UBS AG Registered Shares (Switzerland)(2) | 2,825,279 | 34,396 | ||||||
|
| |||||||
| 194,608 | ||||||||
|
| |||||||
See Notes to Financial Statements
8
Table of Contents
VIRTUS FOREIGN OPPORTUNITIES FUND
SCHEDULE OF INVESTMENTS (Continued)
SEPTEMBER 30, 2012
($ reported in thousands)
| SHARES | VALUE | |||||||
| COMMON STOCKS (continued) | ||||||||
| Health Care—9.1% | ||||||||
Cie Generale D’optique Essilor International SA (France) | 158,707 | $ | 14,861 | |||||
GlaxoSmithKline plc (United Kingdom) | 320,508 | 7,388 | ||||||
Novo Nordisk A/S Class B (Denmark) | 241,668 | 38,178 | ||||||
Valeant Pharmaceuticals International, Inc. (Canada)(2) | 770,603 | 42,532 | ||||||
|
| |||||||
| 102,959 | ||||||||
|
| |||||||
| Industrials—3.3% | ||||||||
Bunzl plc (United Kingdom) | 537,538 | 9,626 | ||||||
Rolls-Royce Holdings plc (United Kingdom)(2) | 1,193,940 | 16,253 | ||||||
SGS SA Registered Shares (Switzerland) | 5,410 | 11,114 | ||||||
|
| |||||||
| 36,993 | ||||||||
|
| |||||||
| Information Technology—4.7% | ||||||||
Baidu, Inc. ADR (China)(2) | 101,137 | 11,815 | ||||||
SAP AG (Germany) | 393,398 | 27,860 | ||||||
Tata Consultancy Services Ltd. (India) | 534,883 | 13,142 | ||||||
|
| |||||||
| 52,817 | ||||||||
|
| |||||||
| SHARES | VALUE | |||||||
| Materials—6.1% | ||||||||
Fresnillo plc (United Kingdom) | 635,296 | $ | 19,009 | |||||
Goldcorp, Inc. (Canada) | 563,916 | 25,893 | ||||||
Newcrest Mining Ltd. (Australia) | 796,097 | 24,064 | ||||||
|
| |||||||
| 68,966 | ||||||||
| TOTAL COMMON STOCKS (Identified Cost $785,642) | 1,086,219 | |||||||
| TOTAL LONG TERM INVESTMENTS—96.8% (Identified cost $787,564) | 1,088,833 | |||||||
| SHORT-TERM INVESTMENTS—2.9% | ||||||||
| Money Market Mutual Funds—2.9% | ||||||||
Dreyfus Cash Management Fund – Institutional Shares (seven-day effective yield 0.060%) | 33,198,988 | 33,199 | ||||||
| TOTAL SHORT-TERM INVESTMENTS (Identified Cost $33,199) | 33,199 | |||||||
| TOTAL INVESTMENTS—99.7% (Identified Cost $820,763) | 1,122,032 | (1) | ||||||
Other assets and liabilities, |
| 3,716 | ||||||
|
| |||||||
| NET ASSETS—100.0% | $ | 1,125,748 | ||||||
|
| |||||||
See Notes to Financial Statements
9
Table of Contents
VIRTUS FOREIGN OPPORTUNITIES FUND
SCHEDULE OF INVESTMENTS (Continued)
SEPTEMBER 30, 2012
| Country Weightings (Unaudited)† | ||||
United Kingdom | 28 | % | ||
India | 14 | |||
Switzerland | 10 | |||
United States | 9 | |||
Canada | 8 | |||
Netherlands | 6 | |||
France | 5 | |||
Other | 20 | |||
Total | 100 | % | ||
† % of total investments as of September 30, 2012 |
| |||
Abbreviations:
| ADR | American Depositary Receipt |
Footnote Legend:
| (1) | Federal Income Tax Information: For tax information at September 30, 2012, see Note 8 Federal Income Tax Information in the Notes to Financial Statements. |
| (2) | Non-income producing. |
The following table provides a summary of inputs used to value the Fund’s investments as of September 30, 2012 (See Security Valuation Note 2A in the Notes to Financial Statements):
| Total Value at September 30, 2012 | Level 1 – Quoted Prices | |||||||
Equity Securities: | ||||||||
Preferred Stock | $ | 2,614 | $ | 2,614 | ||||
Common Stocks | 1,086,219 | 1,086,219 | ||||||
Short-Term Investments | 33,199 | 33,199 | ||||||
|
|
|
| |||||
Total Investments | $ | 1,122,032 | $ | 1,122,032 | ||||
|
|
|
| |||||
There are no Level 2 (significant observable inputs) or Level 3 (significant unobservable inputs) priced securities.
Securities held by the Fund with an end of period value of $657,247 were transferred from Level 2 into Level 1 based on our valuation procedures for non-U.S. securities.
See Notes to Financial Statements
10
Table of Contents
VIRTUS FOREIGN OPPORTUNITIES FUND
STATEMENT OF ASSETS AND LIABILITIES
SEPTEMBER 30, 2012
(Reported in thousands except shares and per share amounts)
| Assets | ||||
Investment in securities at value(1) | $ | 1,122,032 | ||
Foreign currency at value(2) | 105 | |||
Receivables | ||||
Investment securities sold | 962 | |||
Fund shares sold | 5,594 | |||
Dividends and interest receivable | 2,600 | |||
Tax reclaims | 1,373 | |||
Prepaid trustee retainer | 8 | |||
Prepaid expenses | 58 | |||
|
| |||
Total assets | 1,132,732 | |||
|
| |||
| Liabilities | ||||
Cash overdraft | 363 | |||
Payables | ||||
Fund shares repurchased | 4,806 | |||
Investment securities purchased | 374 | |||
Investment advisory fees | 798 | |||
Distribution and service fees | 124 | |||
Administration fees | 123 | |||
Transfer agent fees and expenses | 275 | |||
Trustees’ fees and expenses | 2 | |||
Professional fees | 19 | |||
Other accrued expenses | 100 | |||
|
| |||
Total liabilities | 6,984 | |||
|
| |||
| Net Assets | $ | 1,125,748 | ||
|
| |||
| Net Assets Consist of: | ||||
Capital paid in on shares of beneficial interest | $ | 1,075,635 | ||
Accumulated undistributed net investment income (loss) | 8,455 | |||
Accumulated undistributed net realized gain (loss) | (259,594 | ) | ||
Net unrealized appreciation (depreciation) on investments | 301,252 | |||
|
| |||
| Net Assets | $ | 1,125,748 | ||
|
| |||
| Class A | ||||
Net asset value (net assets/shares outstanding) per share | $ | 25.42 | ||
Maximum offering price per share NAV/(1–5.75%) | $ | 26.97 | ||
Shares of beneficial interest outstanding, $0.001 par value, unlimited authorization | 15,661,289 | |||
Net Assets | $ | 398,166 | ||
| Class C | ||||
Net asset value (net assets/shares outstanding) and offering price per share | $ | 25.27 | ||
Shares of beneficial interest outstanding, $0.001 par value, unlimited authorization | 2,161,976 | |||
Net Assets | $ | 54,634 | ||
| Class I | ||||
Net asset value (net assets/shares outstanding) and offering price per share | $ | 25.43 | ||
Shares of beneficial interest outstanding, $0.001 par value, unlimited authorization | 26,458,358 | |||
Net Assets | $ | 672,948 | ||
(1) Investment in securities at cost | $ | 820,763 | ||
(2) Foreign currency at cost | $ | 106 | ||
See Notes to Financial Statements
11
Table of Contents
VIRTUS FOREIGN OPPORTUNITIES FUND
YEAR ENDED SEPTEMBER 30, 2012
($ reported in thousands)
| Investment Income | ||||
Dividends | $ | 29,840 | ||
Interest | — | (1) | ||
Security lending | 37 | |||
Foreign taxes withheld | (1,215 | ) | ||
|
| |||
Total investment income | 28,662 | |||
|
| |||
| Expenses | ||||
Investment advisory fees | 9,212 | |||
Service fees, Class A | 884 | |||
Distribution and service fees, Class C | 490 | |||
Administration fees | 1,424 | |||
Transfer agent fees and expenses | 1,710 | |||
Custodian fees | 336 | |||
Printing fees and expenses | 96 | |||
Professional fees | 55 | |||
Registration fees | 72 | |||
Trustees’ fees and expenses | 61 | |||
Miscellaneous expenses | 77 | |||
|
| |||
Total expenses | 14,417 | |||
|
| |||
| Net investment income (loss) | 14,245 | |||
|
| |||
| Net Realized and Unrealized Gain (Loss) on Investments | ||||
Net realized gain (loss) on investments | 112,150 | |||
Net realized gain (loss) on foreign currency transactions | (549 | ) | ||
Net change in unrealized appreciation (depreciation) on investments | 104,827 | |||
Net change in unrealized appreciation (depreciation) on foreign currency translation | (93 | ) | ||
|
| |||
| Net gain (loss) on investments | 216,335 | |||
|
| |||
| Net increase (decrease) in net assets resulting from operations | $ | 230,580 | ||
|
|
| (1) | Amount is less than $500. |
See Notes to Financial Statements
12
Table of Contents
VIRTUS FOREIGN OPPORTUNITIES FUND
STATEMENT OF CHANGES IN NET ASSETS
(Reported in thousands)
| Year Ended September 30, 2012 | Year Ended September 30, 2011 | |||||||
| INCREASE/(DECREASE) IN NET ASSETS | ||||||||
| From Operations | ||||||||
Net investment income (loss) | $ | 14,245 | $ | 18,693 | ||||
Net realized gain (loss) | 111,601 | 31,216 | ||||||
Net change in unrealized appreciation (depreciation) | 104,734 | (85,899 | ) | |||||
|
|
|
| |||||
| Increase (decrease) in net assets resulting from operations | 230,580 | (35,990 | ) | |||||
|
|
|
| |||||
| From Distributions to Shareholders | ||||||||
Net investment income, Class A | (6,356 | ) | (7,322 | ) | ||||
Net investment income, Class C | (218 | ) | (526 | ) | ||||
Net investment income, Class I | (14,928 | ) | (10,694 | ) | ||||
|
|
|
| |||||
| Decrease in net assets from distributions to shareholders | (21,502 | ) | (18,542 | ) | ||||
|
|
|
| |||||
| From Share Transactions | ||||||||
| Sale of shares | ||||||||
Class A (4,161 and 3,115 shares, respectively) | 98,265 | 69,970 | ||||||
Class C (374 and 175 shares, respectively) | 8,914 | 3,871 | ||||||
Class I (11,066 and 5,496 shares, respectively) | 259,528 | 125,479 | ||||||
| Reinvestment of distributions | ||||||||
Class A (262 and 299 shares, respectively) | 5,769 | 6,670 | ||||||
Class C (8 and 16 shares, respectively) | 171 | 366 | ||||||
Class I (602 and 435 shares, respectively) | 13,255 | 9,694 | ||||||
| Shares repurchased | ||||||||
Class A (5,403 and 9,127 shares, respectively) | (123,580 | ) | (206,103 | ) | ||||
Class C (443 and 924 shares, respectively) | (10,199 | ) | (20,587 | ) | ||||
Class I (13,179 and 6,137 shares, respectively) | (312,001 | ) | (139,196 | ) | ||||
|
|
|
| |||||
| Increase (decrease) in net assets from share transactions | (59,878 | ) | (149,836 | ) | ||||
|
|
|
| |||||
| Net increase (decrease) in net assets | 149,200 | (204,368 | ) | |||||
| Net Assets | ||||||||
Beginning of fiscal year | 976,548 | 1,180,916 | ||||||
|
|
|
| |||||
| End of fiscal year | $ | 1,125,748 | $ | 976,548 | ||||
|
|
|
| |||||
Accumulated undistributed net investment income (loss) at end of the fiscal year | $ | 8,455 | $ | 16,261 | ||||
| . |
See Notes to Financial Statements
13
Table of Contents
VIRTUS FOREIGN OPPORTUNITIES FUND
SELECTED PER SHARE DATA AND RATIOS FOR A SHARE OUTSTANDING
THROUGHOUT EACH PERIOD
| Net Asset Value, Beginning of Period | Net Investment Income (Loss)(2) | Net Realized and Unrealized Gain (Loss) | Total from Investment Operations | Dividends from Net Investment Income | Distributions from Net Realized Gains | Total Distributions | Change in Net Asset Value | Net Asset Value, End of Period | Total Return(1) | Net Assets, End of Period (000’s) | Ratio of Net Expenses to Average Net Assets(4) | Ratio of Gross Expenses to Average Net Assets (before waivers and reimbursements)(4) | Ratio of Net Investment Income (Loss) to Average Net Assets | Portfolio Turnover Rate | |||||||||||||||||||||||||||||||||||||||||||||||||||||||||||||
Class A | |||||||||||||||||||||||||||||||||||||||||||||||||||||||||||||||||||||||||||
10/1/11 to 9/30/12 | $ | 20.83 | 0.27 | 4.73 | 5.00 | (0.41 | ) | — | (0.41 | ) | 4.59 | $ | 25.42 | 24.34 | % | $ | 398,166 | 1.45 | % | 1.45 | % | 1.16 | % | 47 | % | ||||||||||||||||||||||||||||||||||||||||||||||||||
10/1/10 to 9/30/11 | 22.06 | 0.34 | (1.23 | ) | (0.89 | ) | (0.34 | ) | — | (0.34 | ) | (1.23 | ) | 20.83 | (4.15 | ) | 346,594 | 1.47 | 1.47 | 1.48 | 31 | ||||||||||||||||||||||||||||||||||||||||||||||||||||||
10/1/09 to 9/30/10 | 19.40 | 0.37 | 2.54 | 2.91 | (0.25 | ) | — | (0.25 | ) | 2.66 | 22.06 | 15.34 | 493,214 | 1.47 | 1.47 | 1.82 | 34 | ||||||||||||||||||||||||||||||||||||||||||||||||||||||||||
10/1/08 to 9/30/09 | 20.54 | 0.34 | (1.29 | ) | (0.95 | ) | (0.18 | ) | (0.01 | ) | (0.19 | ) | (1.14 | ) | 19.40 | (4.41 | ) | 505,009 | 1.48 | 1.48 | 2.09 | 63 | |||||||||||||||||||||||||||||||||||||||||||||||||||||
10/1/07 to 9/30/08 | 28.58 | 0.20 | (7.59 | ) | (7.39 | ) | (0.17 | ) | (0.48 | ) | (0.65 | ) | (8.04 | ) | 20.54 | (26.48 | ) | 620,952 | 1.37 | (3) | 1.39 | 0.78 | 129 | ||||||||||||||||||||||||||||||||||||||||||||||||||||
Class C | |||||||||||||||||||||||||||||||||||||||||||||||||||||||||||||||||||||||||||
10/1/11 to 9/30/12 | $ | 20.57 | 0.10 | 4.70 | 4.80 | (0.10 | ) | — | (0.10 | ) | 4.70 | $ | 25.27 | 23.43 | % | $ | 54,634 | 2.20 | % | 2.20 | % | 0.42 | % | 47 | % | ||||||||||||||||||||||||||||||||||||||||||||||||||
10/1/10 to 9/30/11 | 21.81 | 0.17 | (1.22 | ) | (1.05 | ) | (0.19 | ) | — | (0.19 | ) | (1.24 | ) | 20.57 | (4.85 | ) | 45,742 | 2.22 | 2.22 | 0.74 | 31 | ||||||||||||||||||||||||||||||||||||||||||||||||||||||
10/1/09 to 9/30/10 | 19.21 | 0.21 | 2.52 | 2.73 | (0.13 | ) | — | (0.13 | ) | 2.60 | 21.81 | 14.42 | 64,480 | 2.22 | 2.21 | 1.04 | 34 | ||||||||||||||||||||||||||||||||||||||||||||||||||||||||||
10/1/08 to 9/30/09 | 20.27 | 0.22 | (1.27 | ) | (1.05 | ) | — | (0.01 | ) | (0.01 | ) | (1.06 | ) | 19.21 | (5.18 | ) | 70,201 | 2.23 | 2.23 | 1.33 | 63 | ||||||||||||||||||||||||||||||||||||||||||||||||||||||
10/1/07 to 9/30/08 | 28.31 | 0.01 | (7.52 | ) | (7.51 | ) | (0.05 | ) | (0.48 | ) | (0.53 | ) | (8.04 | ) | 20.27 | (27.04 | ) | 95,523 | 2.12 | (3) | 2.15 | 0.03 | 129 | ||||||||||||||||||||||||||||||||||||||||||||||||||||
See Notes to Financial Statements
14
Table of Contents
VIRTUS FOREIGN OPPORTUNITIES FUND
FINANCIAL HIGHLIGHTS (Continued)
SELECTED PER SHARE DATA AND RATIOS FOR A SHARE OUTSTANDING
THROUGHOUT EACH PERIOD
| Net Asset Value, Beginning of Period | Net Investment Income (Loss)(2) | Net Realized and Unrealized Gain (Loss) | Total from Investment Operations | Dividends from Net Investment Income | Distributions from Net Realized Gains | Total Distributions | Change in Net Asset Value | Net Asset Value, End of Period | Total Return(1) | Net Assets, End of Period (000’s) | Ratio of Net Expenses to Average Net Assets(4) | Ratio of Gross Expenses to Average Net Assets (before waivers and reimbursements)(4) | Ratio of Net Investment Income (Loss) to Average Net Assets | Portfolio Turnover Rate | |||||||||||||||||||||||||||||||||||||||||||||||||||||||||||||
Class I | |||||||||||||||||||||||||||||||||||||||||||||||||||||||||||||||||||||||||||
10/1/11 to 9/30/12 | $ | 20.89 | 0.34 | 4.72 | 5.06 | (0.52 | ) | — | (0.52 | ) | 4.54 | $ | 25.43 | 24.64 | % | $ | 672,948 | 1.20 | % | 1.20 | % | 1.46 | % | 47 | % | ||||||||||||||||||||||||||||||||||||||||||||||||||
10/1/10 to 9/30/11 | 22.12 | 0.42 | (1.26 | ) | (0.84 | ) | (0.39 | ) | — | (0.39 | ) | (1.23 | ) | 20.89 | (3.88 | ) | 584,212 | 1.22 | 1.22 | 1.83 | 31 | ||||||||||||||||||||||||||||||||||||||||||||||||||||||
10/1/09 to 9/30/10 | 19.45 | 0.42 | 2.54 | 2.96 | (0.29 | ) | — | (0.29 | ) | 2.67 | 22.12 | 15.60 | 623,222 | 1.22 | 1.22 | 2.08 | 34 | ||||||||||||||||||||||||||||||||||||||||||||||||||||||||||
10/1/08 to 9/30/09 | 20.58 | 0.40 | (1.28 | ) | (0.88 | ) | (0.24 | ) | (0.01 | ) | (0.25 | ) | (1.13 | ) | 19.45 | (4.03 | ) | 554,974 | 1.23 | 1.23 | 2.42 | 63 | |||||||||||||||||||||||||||||||||||||||||||||||||||||
10/1/07 to 9/30/08 | 28.61 | 0.27 | (7.61 | ) | (7.34 | ) | (0.21 | ) | (0.48 | ) | (0.69 | ) | (8.03 | ) | 20.58 | (26.31 | ) | 399,898 | 1.12 | (3) | 1.15 | 1.01 | 129 | ||||||||||||||||||||||||||||||||||||||||||||||||||||
| (1) | Sales charges, where applicable, are not reflected in the total return calculation. |
| (2) | Computed using average shares outstanding. |
| (3) | Blended net expense ratio. |
| (4) | The Fund may invest in other funds, and the annualized expense ratios do not reflect fees and expenses associated with the underlying funds. |
See Notes to Financial Statements
15
Table of Contents
VIRTUS FOREIGN OPPORTUNITIES FUND
SEPTEMBER 30, 2012
| Note | 1. Organization |
Virtus Opportunities Trust (the “Trust”) is organized as a Delaware statutory trust and is registered under the Investment Company Act of 1940, as amended (“1940 Act”), as an open-end management investment company.
As of the date of this report, 27 funds are offered for sale, of which the Foreign Opportunities Fund (the “Fund”) is reported in this annual report. The Fund’s investment objective is outlined in the Fund Summary page.
The Fund offers Class A shares, Class C shares and Class I shares.
Class A shares are sold with a front-end sales charge of up to 5.75% with some exceptions. Generally, Class A shares are not subject to any charges by the Fund when redeemed; however, a 1% contingent deferred sales charge (“CDSC”) may be imposed on certain redemptions made within a certain period following purchases on which a finder’s fee has been paid. The period for which the CDSC applies for the Fund is 18 months. The CDSC period begins on the last day of the month preceding the month in which the purchase was made.
Class C shares are generally sold with a 1% CDSC, applicable if redeemed within one year of purchase. Class I shares are sold without a front-end sales charge or CDSC.
Virtus Mutual Funds may impose an annual fee on accounts having balances of less than $2,500. The small account fee may be waived in certain circumstances, as disclosed in the prospectuses and/or statements of additional information. The fees collected will be used to offset certain expenses of the Funds.
Each Class of shares has identical voting, dividend, liquidation and other rights and the same terms and conditions, except that each class bears different distribution and/or service fees under a Board-approved 12b-1 and/or shareholder service plan and has exclusive voting rights with respect to such plans. Class I shares are not subject to a 12b-1 plan. Income and other expenses and realized and unrealized gains and losses of the Fund are borne pro rata by the holders of each class of shares.
| Note | 2. Significant Accounting Policies |
The following is a summary of significant accounting policies consistently followed by the Trust in the preparation of its financial statements. The preparation of financial statements in conformity with accounting principles generally accepted in the United States of America requires management to make estimates and assumptions that affect the reported amounts of assets and liabilities, disclosure of contingent assets and liabilities at the date of the financial statements and the reported amount of increases and decreases in net assets from operations during the reporting period. Actual results could differ from those estimates and those differences could be significant.
| A. | Security Valuation |
Security Valuation procedures for the Fund which include nightly price variance, as well as back-testing such as bi-weekly unchanged price, monthly secondary source and transaction analysis which have been approved by the Board. All internally fair valued securities are approved by a valuation committee (the “Valuation Committee”) appointed by the Board. The Valuation Committee is comprised of the treasurer, assistant treasurer, secretary and chief compliance officer of the Trust. All internally fair valued securities are updated daily and reviewed in detail by the Valuation Committee monthly unless changes occur within the period. The Valuation Committee reviews the
16
Table of Contents
VIRTUS FOREIGN OPPORTUNITIES FUND
NOTES TO FINANCIAL STATEMENTS (Continued)
SEPTEMBER 30, 2012
validity of any model inputs and any changes to the model when applicable. Internal fair valuations are reviewed by the Board at least quarterly.
The Fund utilizes a fair value hierarchy which prioritizes the inputs to valuation techniques used to measure fair value into three broad levels.
| • Level 1 – | quoted prices in active markets for identical securities |
| • Level 2 – | prices determined using other significant observable inputs (including quoted prices for similar securities, interest rates, prepayment speeds, credit risk, etc.) |
| • Level 3 – | prices determined using significant unobservable inputs (including the valuation committee’s own assumptions in determining the fair value of investments) |
A description of the valuation techniques applied to the Fund’s major categories of assets and liabilities measured at fair value on a recurring basis is as follows:
Equity securities are valued at the official closing price (typically last sale) on the exchange on which the securities are primarily traded, or if no closing price is available, at the last bid price and are categorized as Level 1 in the hierarchy. Restricted equity securities and private placements that are not widely traded, are illiquid or are internally fair valued by the Valuation Committee, are generally categorized as Level 3 in the hierarchy.
Certain non-U.S. securities may be fair valued in cases where closing prices are not readily available or are deemed not reflective of readily available market prices. For example, significant events (such as movement in the U.S. securities market, or other regional and local developments) may occur between the time that non-U.S. markets close (where the security is principally traded) and the time that the Fund calculates its net asset value (“NAV”) (generally 4 p.m. Eastern time, the close of the New York Stock Exchange (“NYSE”)) that may impact the value of securities traded in these non-U.S. markets. In such cases the Fund fair values non-U.S. securities using an independent pricing service which considers the correlation of the trading patterns of the non-U.S. security to the intraday trading in the U.S. markets for investments such as ADRs, financial futures, ETFs, and certain indexes as well as prices for similar securities. Such fair valuations are categorized as Level 2 in the hierarchy. Because the frequency of significant events is not predictable, fair valuation of certain non-U.S. common stocks may occur on a frequent basis.
Listed derivatives that are actively traded are valued based on quoted prices from the exchange and are categorized as Level 1 in the hierarchy. Over-the-counter derivative contracts, which include forward currency contracts and equity-linked instruments, do not require material subjectivity as pricing inputs are observed from actively quoted markets and are categorized as Level 2 in the hierarchy.
Investments in open-end mutual funds are valued at their closing NAV determined as of the close of regular trading on the NYSE each business day and are categorized as Level 1 in the hierarchy.
A summary of the inputs used to value the Fund’s net assets by each major security type is disclosed at the end of the Schedule of Investments for the Fund. The inputs or methodologies used for valuing securities are not necessarily an indication of the risk associated with investing in those securities.
17
Table of Contents
VIRTUS FOREIGN OPPORTUNITIES FUND
NOTES TO FINANCIAL STATEMENTS (Continued)
SEPTEMBER 30, 2012
| B. | Security Transactions and Investment Income |
Security transactions are recorded on the trade date. Realized gains and losses from the sale of securities are determined on the identified cost basis. Dividend income is recognized on the ex-dividend date, or in the case of certain foreign securities, as soon as the Fund is notified. Interest income is recorded on the accrual basis. The Fund amortizes premiums and accretes discounts using the effective interest method.
| C. | Income Taxes |
The Fund is treated as a separate taxable entity. It is the intention of the Fund to comply with the requirements of Subchapter M of the Internal Revenue Code and to distribute substantially all of its taxable income to its shareholders. Therefore, no provision for federal income taxes or excise taxes has been made.
The Fund may be subject to foreign taxes on income, gains on investments or currency repatriation, a portion of which may be recoverable. The Fund will accrue such taxes and recoveries as applicable based upon current interpretations of the tax rules and regulations that exist in the markets in which it invests.
Management of the Fund has concluded that there are no significant uncertain tax positions that would require recognition in the financial statements. As of September 30, 2012, the tax years that remain subject to examination by the major tax jurisdictions under the statute of limitations is from the year 2009 forward (with limited exceptions).
| D. | Distributions to Shareholders |
Distributions are recorded by the Fund on the ex-dividend date. Income and capital gain distributions are determined in accordance with income tax regulations which may differ from accounting principles generally accepted in the United States of America. These differences may include the treatment of non-taxable dividends, market premium and discount, non-deductible expenses, expiring capital loss carryovers, foreign currency gain or loss, gain or loss on futures contracts, partnerships, operating losses and losses deferred due to wash sales. Permanent book and tax basis differences relating to shareholder distributions will result in reclassifications to capital paid in on shares of beneficial interest.
| E. | Expenses |
Expenses incurred by together by the Fund and other affiliated mutual funds are allocated in proportion to the net assets of each such fund, except where allocation of direct expense to each fund or an alternative allocation method can be more appropriately used.
In addition to the net operating expenses that the Fund bears directly, the shareholders of the Fund indirectly bear the Fund’s pro-rata expenses of any underlying mutual funds in which the Fund invests.
| F. | Foreign Currency Translation |
Non U.S. investment securities and other assets and liabilities denominated in foreign currencies are translated into U.S. dollar amounts at the foreign currency exchange rate effective at the end of the reporting period. Cost of investments is translated at the currency exchange rate effective at the trade date. The gain or loss resulting from a change in currency exchange rates between the trade and settlement date of a portfolio
18
Table of Contents
VIRTUS FOREIGN OPPORTUNITIES FUND
NOTES TO FINANCIAL STATEMENTS (Continued)
SEPTEMBER 30, 2012
transaction is treated as a gain or loss on non-U.S. currency. Likewise, the gain or loss resulting from a change in currency exchange rates between the date income is accrued and paid is treated as a gain or loss on foreign currency. The Funds do not isolate that portion of the results of operations arising from changes in foreign exchange rates on investments from the fluctuations arising from changes in the market prices of securities held. Such fluctuations are included with the net realized and unrealized gain or loss on investments.
| G. | Securities Lending |
The Fund may loan securities to qualified brokers through an agreement with The Bank of New York Mellon (“BNY Mellon”). Under the terms of the agreement, the Fund is required to maintain collateral with a market value not less than 100% of the market value of loaned securities. Collateral is adjusted daily in connection with changes in the market value of securities on loan. Collateral may consist of cash, or securities issued or guaranteed by the U.S. Government or its agencies. Cash collateral is invested in a short-term money market fund. Dividends earned on the collateral and premiums paid by the broker are recorded as income by the Fund net of fees and rebates charged by BNY Mellon for its services as securities lending agent and in connection with this securities lending program. Lending portfolio securities involves a risk of delay in the recovery of the loaned securities or in the foreclosure on collateral.
Effective November 7, 2011, securities lending was suspended on all Virtus Mutual Funds.
Note 3. Investment Advisory Fees and Related Party Transactions
($ reported in thousands except as noted)
| A. | Adviser |
Virtus Investment Advisers, Inc. (the “Adviser”), an indirect, wholly-owned subsidiary of Virtus Investment Partners, Inc. (“Virtus”), is the Adviser to the Trust. The Adviser manages the Fund’s investment program and general operations of the Fund, including oversight of the Fund’s subadviser.
As compensation for its services to the Fund, the Adviser is entitled to a fee based upon the following annual rates as a percentage of the average daily net assets of the Fund: 0.85% of 1st $2 billion; 0.80% $2+ billion through $4 billion; and 0.75% $4+ billion.
| B. | Subadviser |
The Subadviser manages the investments of the Fund for which it is paid a fee by the Adviser, Vontobel Asset Management, Inc. (the “Subadviser”) is the Subadviser to the Fund.
| C. | Distributor |
VP Distributors, LLC (“VP Distributors”), an indirect wholly-owned subsidiary of Virtus, serves as the distributor of the Fund’s shares and has advised the Fund that for the fiscal year (the “period”) ended September 30, 2012, it retained net commissions of $23 for Class A shares and deferred sales charges of $2 for Class C shares.
In addition, the Fund pays VP Distributors distribution and/or service fees under Board approved 12b-1 and shareholder services plans, as a percentage of the average daily
19
Table of Contents
VIRTUS FOREIGN OPPORTUNITIES FUND
NOTES TO FINANCIAL STATEMENTS (Continued)
SEPTEMBER 30, 2012
net assets of each respective class at the annual rates as follows: Class A shares 0.25% and Class C shares 1.00%. Class I shares are not subject to a 12b-1 plan.
Under certain circumstances, shares of certain Virtus Mutual Funds may be exchanged for shares of the same class of certain other Virtus Mutual Funds on the basis of the relative NAV per share at the time of the exchange. On exchanges with share classes that carry a CDSC, the CDSC schedule of the original shares purchased continues to apply.
| D. | Administrator and Transfer Agent |
VP Distributors also serves as the Trust’s Administrator. For the period ended September 30, 2012, the Fund incurred administration fees from the Trust totaling $1,067 which are included in the Statement of Operations.
VP Distributors also serves as the Trust’s Transfer Agent. For the period ended September 30, 2012, the Fund incurred transfer agent fees from the Trust totaling $1,598 which are included in the Statement of Operations. A portion of these fees was paid to outside entities that also provide services to the Trust.
| E. | Affiliated Shareholders |
At September 30, 2012, Virtus and its affiliates, BMO Bankcorp. (a minority investor in Virtus) and its affiliates, and the retirement plans of Virtus and its affiliates, held shares of the Fund which may be redeemed at any time that aggregated the following:
| Shares | Aggregate Net Asset Value | |||||||
Class A shares | 4,165 | $ | 106 | |||||
Class I shares | 496,736 | 12,632 | ||||||
Note 4. Purchases and Sales of Securities
($ reported in thousands)
Purchases and sales of securities for the Fund (excluding U.S. Government and agency securities, and short-term securities) during the period ended September 30, 2012, were as follows:
| Purchases | Sales | |||||||
| $ | 490,621 | $ | 578,686 | |||||
There were no purchases or sales of long-term U.S. Government and agency securities.
Note 5. 10% Shareholders
As of September 30, 2012, the Fund had individual shareholder account(s) and/or omnibus shareholder account(s) (comprised of a group of individual shareholders), which individually amounted to more than 10% of the total shares outstanding of the Fund as detailed below.
| % of Shares Outstanding | Number of Accounts | |||||||
| 23 | % | 1 | ||||||
The shareholder is not affiliated with Virtus.
20
Table of Contents
VIRTUS FOREIGN OPPORTUNITIES FUND
NOTES TO FINANCIAL STATEMENTS (Continued)
SEPTEMBER 30, 2012
Note 6. Credit Risk and Asset Concentrations
In countries with limited or developing markets, investments may present greater risks than in more developed markets and the prices of such investments may be volatile. The consequences of political, social or economic changes in these markets may have disruptive effects on the market prices of these investments and the income they generate, as well as the Fund’s ability to repatriate such amounts.
The Fund may invest a high percentage of its assets in specific sectors of the market in its pursuit of a greater investment return. Fluctuations in these sectors of concentration may have a greater impact on the Fund, positive or negative, than if the Fund did not concentrate its investments in such sectors.
At September 30, 2012, the Fund held securities issued by various companies in the consumer staples sector, representing 40% of the total investments of the Fund.
Note 7. Indemnifications
Under the Trust’s organizational documents, its trustees and officers are indemnified against certain liabilities arising out of the performance of their duties to the Fund. In addition in the normal course of business, the Fund enters into contracts that provide a variety of indemnifications to other parties. The Fund’s maximum exposure under these arrangements is unknown as this would involve future claims that may be made against the Fund and that have not occurred. However, the Fund has not had prior claims or losses pursuant to these arrangements and expect the risk of loss to be remote.
Note 8. Federal Income Tax Information
($ reported in thousands)
At September 30, 2012, federal tax cost and aggregate gross unrealized appreciation (depreciation) of securities held by the Fund were as follows:
Federal | Unrealized | Unrealized | Net Unrealized | |||
| $830,292 | $295,803 | $(4,063) | $291,740 |
The Fund has capital loss carryovers available to offset future realized capital gains, through the indicated expiration dates shown below:
2017 | 2018 | Total | ||
| $25,825 | $224,240 | $250,065 |
The Fund may not realize the benefit of these losses to the extent the Fund does not realize gains on investments prior to the expiration of the capital loss carryovers.
Under the Regulated Investment Company Modernization Act of 2010 (the “Act”), net capital losses recognized for tax years beginning after December 22, 2010 may be carried forward indefinitely, and their character is retained as short-term and/or long-term losses. Previously, net capital losses were carried forward for eight years and treated as short-term losses. As a transition rule, the Act requires that post-enactment net capital losses be used before pre-enactment net capital losses.
21
Table of Contents
VIRTUS FOREIGN OPPORTUNITIES FUND
NOTES TO FINANCIAL STATEMENTS (Continued)
SEPTEMBER 30, 2012
The Fund utilized losses of $110,129, deferred in prior years against current year capital gains.
Capital losses realized after October 31 and certain late year ordinary losses may be deferred and treated as occurring on the first day of the following fiscal year. For the fiscal year ended September 30, 2012, the Fund deferred capital losses of $0, currency losses of $0, and recognized post-October capital losses of $0, and currency losses of $713.
The components of distributable earnings on a tax basis (excluding unrealized appreciation (depreciation) which is disclosed above) consist of undistributed ordinary income of $8,455 and undistributed long-term capital gains of $0.
The differences between the book and tax basis components of distributable earnings relate principally to the timing of recognition of income and gains for federal income tax purposes. Short-term gain distributions reported in the Statements of Changes in Net Assets, if any, are reported as ordinary income for federal tax purposes. Distributions are determined on a tax basis and may differ from net investment income and realized capital gains for financial reporting purposes.
Note 9. Reclassifications of Capital Accounts
($ reported in thousands)
For financial reporting purposes, book basis capital accounts are adjusted to reflect the tax character of permanent book/tax differences. Permanent reclassifications can arise from differing treatment of certain income and gain transactions, nondeductible current year net operating losses, expiring capital loss carryovers and investments in passive foreign investment companies. The reclassifications have no impact on the net assets or net asset value of the Fund. As of September 30, 2012, the Fund recorded reclassifications to increase (decrease) the accounts as listed below:
Capital Paid | Undistributed | Accumulated | ||
| $— | $(549) | $549 |
Note 10. Recent Accounting Pronouncement
In December 2011, the Financial Accounting Standards Board issued Accounting Standards Update (“ASU”) No. 2011-11 regarding “Disclosures about Offsetting Assets and Liabilities”. The amendments, which will be effective for annual reporting periods beginning on or after January 1, 2013 and interim periods within those annual periods, require an entity to disclose information about offsetting and related arrangements for assets and liabilities, financial instruments and derivatives that are either currently offset in accordance with current requirements or are subject to enforceable master netting arrangements or similar agreements. At this time, management is evaluating the implications of ASU No. 2011-11 and its impact on the financial statements has not yet been determined.
Note 11. Subsequent Event Evaluations
Management has evaluated the impact of all subsequent events on the Fund through the date the financial statements were available for issuance, and has determined that there are no subsequent events requiring recognition or disclosure in the financial statements.
22
Table of Contents

REPORT OF INDEPENDENT REGISTERED PUBLIC
ACCOUNTING FIRM
To the Board of Trustees of
Virtus Opportunities Trust and Shareholders of
Virtus Foreign Opportunities Fund:
In our opinion, the accompanying statement of assets and liabilities, including the schedule of investments, and the related statements of operations and of changes in net assets and the financial highlights present fairly, in all material respects, the financial position of Virtus Foreign Opportunities Fund, (the “Fund”), a series of Virtus Opportunities Trust, at September 30, 2012, the results of its operations for the year then ended, the changes in its net assets for each of the two years in the period then ended and the financial highlights for each of the five years in the period then ended, in conformity with accounting principles generally accepted in the United States of America. These financial statements and financial highlights (hereafter referred to as “financial statements”) are the responsibility of the Fund’s management; our responsibility is to express an opinion on these financial statements based on our audits. We conducted our audits of these financial statements in accordance with the standards of the Public Company Accounting Oversight Board (United States). Those standards require that we plan and perform the audit to obtain reasonable assurance about whether the financial statements are free of material misstatement. An audit includes examining, on a test basis, evidence supporting the amounts and disclosures in the financial statements, assessing the accounting principles used and significant estimates made by management, and evaluating the overall financial statement presentation. We believe that our audits, which included confirmation of securities at September 30, 2012 by correspondence with the custodian and brokers, provide a reasonable basis for our opinion.

Philadelphia, Pennsylvania
November 21, 2012
23
Table of Contents
VIRTUS FOREIGN OPPORTUNITIES FUND
SEPTEMBER 30, 2012 (Unaudited)
For the fiscal year ended September 30, 2012, the Fund makes the following disclosures for federal income tax purposes. Below is listed the percentage, or the maximum amount allowable, of its ordinary income dividends (“QDI”) to qualify for the lower tax rates applicable to individual shareholders, and the percentage of ordinary income dividends earned by the Fund which qualifies for the dividends received deduction (“DRD”) for corporate shareholders. The actual percentage of QDI and DRD for the calendar year will be designated in year-end tax statements. The Fund designates the amount below, or if subsequently different, as long-term capital gains dividends (“LTCG”) ($ reported in thousands).
QDI | DRD | LTCG | ||
| 100% | 19% | $0 |
For the fiscal year ended September 30, 2012, the Fund recognized $27,203 ($ reported in thousands), of foreign source income on which the Fund paid foreign taxes of $1,216 ($ reported in thousands). This information is being furnished to you pursuant to notice requirements of Section 853(a) and 855(d) of the Internal Revenue Code, as amended, and the Treasury Regulations thereunder.
24
Table of Contents
FUND MANAGEMENT TABLES (UNAUDITED)
Information pertaining to the Trustees and officers of the Trust as of September 30, 2012, is set forth below. The statement of additional information (SAI) includes additional information about the Trustees and is available without charge, upon request, by calling (800) 243-1574. The address of each individual, unless otherwise noted, is 100 Pearl Street, Hartford, CT 06103-4506. There is no stated term of office for Trustees of the Trust.
Independent Trustees
Name, Year of Birth, Year Elected and Number of Funds | Principal Occupation(s) During Past 5 Years and Other Directorships Held by Trustee | |
Leroy Keith, Jr. YOB: 1939 Elected: 2000 47 Funds | Chairman (since 2010), Bloc Global Services Group, LLC (construction and redevelopment company); Managing Director (2007 to 2008), Almanac Capital Management (commodities business); Director/Trustee (since 2010), Wells Fargo Advantage Funds (149 series) and their predecessors, Evergreen Funds (1989 to 2010); Director (2003 to 2010), Diversapack Co. (soft packaging company). | |
Philip R. McLoughlin Chairman YOB: 1946 Elected: 1999 62 Funds | Partner (since 2006), Cross Pond Partners, LLC (strategy consulting firm); Managing Director (2009 to 2010), SeaCap Asset Management Fund I, L.P. and SeaCap Partners, LLC (2009 to 2010) (investment management); Director (since 1991) and Chairman (since 2010), World Trust Fund; Chairman and Trustee (since 2003), Virtus Variable Insurance Trust (9 portfolios); Director (since 1995), DTF Tax-Free Income Fund, Inc.; Director (since 1995), Duff & Phelps Utility and Corporate Bond Trust, Inc.; Director (since 2009), DNP Select Income Fund Inc.; Director (since 2011), Duff & Phelps Global Utility Income Fund Inc.; Trustee (since 2011),Virtus Global Multi-Sector Fixed Income Fund; Trustee (since 2011), Virtus Total Return Fund; Director (1985 to 2009), Argo Group International Holdings Inc. and its predecessor, PXRE Corporation (insurance). | |
Geraldine M. McNamara YOB: 1951 Elected: 2001 51 Funds | Retired. Director (since 2003), DTF Tax-Free Income Fund, Inc.; Director (since 2003), Duff & Phelps Utility and Corporate Bond Trust, Inc.; Director (since 2009), DNP Select Income Fund Inc.; Director (since 2011) Duff & Phelps Global Utility Income Fund Inc. | |
James M. Oates YOB: 1946 Elected: 2000 47 Funds | Managing Director (since 1994), Wydown Group (consulting firm); Chairman and Trustee (since 2005), John Hancock Variable Insurance Trust and John Hancock Funds II (collectively, 210 portfolios); Director (since 1996), Stifel Financial; Chairman and Director (since 1999), Connecticut River Bank and Director (since 1998), Connecticut River Bancorp; Chairman (since 2000), Emerson Investment Management, Inc.; Director (since 2002), New Hampshire Trust Company; Non-Executive Chairman (2007 to 2011), Hudson Castle Group, Inc. (formerly IBEX Capital Markets, Inc.) (financial services). | |
Richard E. Segerson YOB: 1946 Elected: 2000 47 Funds | Managing Director (since 1998), Northway Management Company. | |
Ferdinand L.J. Verdonck YOB: 1942 Elected: 2005 47 Funds | Director (since 1998), The J.P. Morgan European Investment Trust; Director (since 2005), Galapagos N.V. (biotechnology); Mr. Verdonck is also a director of several non-U.S. companies. |
25
Table of Contents
FUND MANAGEMENT TABLES (UNAUDITED) (Continued)
Interested Trustee
The individual listed below is an “interested person” of the Trust, as defined in Section 2(a)(19) of the 1940 Act, as amended, and the rules and regulations thereunder.
| Name, Year of Birth, Year Elected and Number of Funds Overseen | Principal Occupation(s) During Past 5 Years and | |
George R. Aylward* Trustee and President YOB: 1964 Elected: 2006 49 Funds | Director, President and Chief Executive Officer (since 2008), Virtus Investment Partners, Inc. and/or certain of its subsidiaries; various senior officer positions with Virtus affiliates (since 2005); Chairman, President and Chief Executive Officer (since 2006), The Zweig Fund, Inc. and The Zweig Total Return Fund, Inc.; Trustee and President (since 2011), Virtus Global Multi-Sector Income Fund and Virtus Total Return Fund. |
| * | Mr. Aylward is an “interested person,” as defined in the 1940 Act, by reason of his position as President and Chief Executive Officer of Virtus Investment Partners, Inc. (“Virtus”), the ultimate parent company of the Adviser, and various positions with its affiliates, including the Adviser. |
26
Table of Contents
FUND MANAGEMENT TABLES (UNAUDITED) (Continued)
Officers of the Trust Who Are Not Trustees
Name, Address and Year of Birth | Position(s) Held with Time Served | Principal Occupation(s) During Past 5 Years | ||
W. Patrick Bradley YOB: 1972 | Vice President since 2011, Chief Financial Officer and Treasurer since 2006. | Senior Vice President, Fund Services (since 2010), Virtus Investment Partners, Inc. and/or certain of its subsidiaries; various officer positions (since 2006) with Virtus affiliates; Vice President (since 2011), Chief Financial Officer and Treasurer (since 2004), Virtus Variable Insurance Trust; Vice President, Chief Financial Officer and Treasurer (since 2011), Virtus Global Multi-Sector Income Fund and Virtus Total Return Fund; Vice President (since 2012) and Treasurer (Chief Financial Officer) (since 2007), The Zweig Fund, Inc. and Zweig Total Return Fund, Inc.; Vice President and Assistant Treasurer (since 2011), Duff & Phelps Global Utility Income Fund Inc. | ||
Kevin J. Carr YOB: 1954 | Vice President, Chief Legal Officer, Counsel and Secretary since 2005. | Senior Vice President (since 2009), Vice President, Counsel and Secretary (2008 to 2009), Virtus Investment Partners, Inc. and/or certain of its subsidiaries; various senior officer positions (since 2005) with Virtus affiliates; Vice President, Chief Legal Officer, Counsel and Secretary (since 2010), Virtus Variable Insurance Trust; Vice President, Chief Legal Officer, Counsel and Secretary (since 2011), Virtus Global Multi-Sector Income Fund and Virtus Total Return Fund; Vice President and Assistant Secretary (since 2012), Secretary and Chief Legal Officer (2005-2012), The Zweig Fund, Inc. and Zweig Total Return Fund, Inc.; Vice President and Assistant Secretary (since 2011), Duff & Phelps Global Utility Income Fund Inc. | ||
Nancy J. Engberg YOB: 1956 | Vice President and Chief Compliance Officer | Vice President (since 2008) and Chief Compliance Officer (2008 to 2011), Virtus Investment Partners, Inc. and/or certain of its subsidiaries; various officer positions (since 2003) with Virtus affiliates; Vice President (since 2010), Chief Compliance Officer (since 2011), Virtus Variable Insurance Trust; Vice President and Chief Compliance Officer (since 2011), Virtus Global Multi-Sector Income Fund and Virtus Total Return Fund; Vice President and Chief Compliance Officer (since 2012), The Zweig Fund, Inc. and Zweig Total Return Fund, Inc. | ||
Francis G. Waltman YOB: 1962 | Senior Vice President since 2008. | Executive Vice President, Product Development (since 2009), Virtus Investment Partners, Inc. and/or certain of its subsidiaries; various senior officer positions (since 2006) with Virtus affiliates; Senior Vice President (since 2010), Virtus Variable Insurance Trust; Senior Vice President (since 2011), Virtus Global Multi-Sector Income Fund and Virtus Total Return Fund. |
27
Table of Contents
VIRTUS OPPORTUNITIES TRUST
101 Munson Street
Greenfield, MA 01301-9668
Trustees
George R. Aylward
Leroy Keith, Jr.
Philip R. McLoughlin, Chairman
Geraldine M. McNamara
James M. Oates
Richard E. Segerson
Ferdinand L.J. Verdonck
Officers
George R. Aylward, President
Francis G. Waltman, Senior Vice President
Nancy J. Engberg, Vice President and Chief Compliance Officer
W. Patrick Bradley, Vice President, Chief Financial Officer and Treasurer
Kevin J. Carr, Vice President, Chief Legal Officer, Counsel and Secretary
Investment Adviser
Virtus Investment Advisers, Inc.
100 Pearl Street
Hartford, CT 06103-4506
Principal Underwriter
VP Distributors, LLC
100 Pearl Street
Hartford, CT 06103-4506
Transfer Agent
VP Distributors, LLC
100 Pearl Street
Hartford, CT 06103-4506
Custodian
The Bank of New York Mellon
One Wall Street
New York, NY 10005-2588
Independent Registered Public Accounting Firm
PricewaterhouseCoopers LLC
2001 Market Street
Philadelphia, PA 19103-7042
How to Contact Us
Mutual Fund Services 1-800-243-1574
Adviser Consulting Group 1-800-243-4361
Telephone Orders 1-800-367-5877
Text Telephone 1-800-243-1926
Web site Virtus.com
Important Notice to Shareholders
The Securities and Exchange Commission has modified mailing regulations for semiannual and annual shareholder fund reports to allow mutual fund companies to send a single copy of these reports to shareholders who share the same mailing address. If you would like additional copies, please call Mutual Fund Services at 1-800-243-1574.
Table of Contents
For more information about
Virtus Mutual Funds, please call
your financial representative,
contact us at 1-800-243-1574
or Virtus.com
| 8011 | 11-12 |

P.O. Box 9874
Providence, RI 02940 -8074
Table of Contents


Annual
Report
Virtus Multi-Sector Short Term Bond Fund
| TRUST NAME: VIRTUS OPPORTUNITIES TRUST | September 30, 2012 |  | ||
| No Bank Guarantee | Not FDIC Insured | May Lose Value |
Table of Contents
Virtus Multi-Sector Short Term Bond Fund
(“Multi-Sector Short Term Bond Fund”)
| 1 | ||||
| 2 | ||||
| 4 | ||||
| 5 | ||||
| 8 | ||||
| 38 | ||||
| 39 | ||||
| 40 | ||||
| 41 | ||||
| 42 | ||||
| 51 | ||||
| 52 | ||||
| 53 |
PROXY VOTING PROCEDURES AND VOTING RECORD (FORM N-PX)
The adviser and subadviser vote proxies relating to portfolio securities in accordance with procedures that have been approved by the Board of Trustees of the Trust (“Trustees,” the “Board”). You may obtain a description of these procedures, along with information regarding how the Fund voted proxies during the most recent 12-month period ended June 30, free of charge, by calling toll-free 1-800-243-1574. This information is also available through the Securities and Exchange Commission’s (the “SEC”) website at http://www.sec.gov.
FORM N-Q INFORMATION
The Trust files a complete schedule of portfolio holdings for the Fund with the SEC for the first and third quarters of each fiscal year on Form N-Q. Form N-Q is available on the SEC’s website at http://www.sec.gov. Form N-Q may be reviewed and copied at the SEC’s Public Reference Room. Information on the operation of the SEC’s Public Reference Room can be obtained by calling toll-free 1-800-SEC-0330.
This report is not authorized for distribution to prospective investors in the Virtus Multi-Sector Short Term Bond Fund unless preceded or accompanied by an effective prospectus which includes information concerning the sales charge, Fund’s record and other pertinent information.
Table of Contents
Dear Fellow Shareholders of Virtus Mutual Funds:

Investors were subject to the vagaries of the financial markets over the annual reporting period. Markets gained momentum throughout the first quarter of 2012, slid backwards in the second quarter, only to rebound strongly in the third quarter and end the 12-month period in positive territory.
An extended rally helped equity and fixed income markets produce respectable returns for the year ended September 30, 2012. U.S. equities, as measured by the S&P 500® Index, gained an impressive 30.20 percent, far surpassing international equities, which rose 20.98 percent, as represented by the MSCI All Country World Index (net). U.S. fixed income markets rose |
5.16 percent for the year, as measured by the Barclays Capital U.S. Aggregate Bond Index. A consistent “flight to quality” among global investors kept demand high for the 10-year U.S. Treasury and its yield low, at just 1.64 percent at the end of September.
As we enter the final quarter of 2012, the economic strength of the United States, Europe, and China remains tenuous. The onus is on U.S. government to avoid the dangers of the “fiscal cliff” and on corporations to produce robust earnings, in particular strong revenue growth, which will play a pivotal role in determining future market direction.
Market uncertainty is a timely reminder of the importance of portfolio diversification. While diversification cannot guarantee a profit or prevent loss, owning a variety of asset classes may cushion your portfolio against inevitable market fluctuations. Your financial advisor can help you ensure that your portfolio is adequately diversified.
Thank you for entrusting Virtus with your assets. We appreciate your business and remain committed to your long-term financial success.
Sincerely,

George R. Aylward
President, Virtus Mutual Funds
October 2012
Whenever you have questions about your account, or require additional information, please visit us on the Web at www.virtus.com or call our shareowner service group toll-free at 1-800-243-1574.
Performance data quoted represents past results. Past performance is no guarantee of future results and current performance may be higher or lower than performance shown above.
1
Table of Contents
VIRTUS MULTI-SECTOR SHORT TERM BOND FUND
Disclosure of Fund Expenses (Unaudited)
For the six-month period of April 1, 2012 to September 30, 2012
We believe it is important for you to understand the impact of costs on your investment. All mutual funds have operating expenses. As a shareholder of the Virtus Multi-Sector Short Term Bond Fund (the “Fund”) you may incur two types of costs: (1) transaction costs, including sales charges on purchases of Class A shares and contingent deferred sales charges on Class B and Class T shares; and (2) ongoing costs, including investment advisory fees, distribution and service fees, and other expenses. Class C shares are sold without a sales charge. Class I shares are sold without a sales charge and do not incur distribution and service fees. These examples are intended to help you understand your ongoing costs (in dollars) of investing in the Fund and to compare these costs with the ongoing costs of investing in other mutual funds. These examples are based on an investment of $1,000 invested at the beginning of the period and held for the entire six-month period. The following Expense Table illustrates your Fund’s costs in two ways.
Actual Expenses
The first section of the accompanying table provides information about actual account values and actual expenses. You may use the information in this section, together with the amount you invested, to estimate the expenses that you paid over the period. Simply divide your account value by $1,000 (for example, an $8,600 account value divided by $1,000 = 8.6), then multiply the result by the number given in the first section under the heading “Expenses Paid During Period” to estimate the expenses you paid on your account during the period.
Hypothetical Example for Comparison Purposes
The second section of the accompanying table provides information about hypothetical account values and hypothetical expenses based on the Fund’s actual expense ratio and an assumed rate of return of 5% per year before expenses, which is not your Fund’s actual return. The hypothetical account values and expenses may not be used to estimate the actual ending account balance or expenses you paid for the period. You may use this information to compare the ongoing costs of investing in your Fund and other funds. To do so, compare these 5% hypothetical examples with the 5% hypothetical examples that appear in the shareholder reports of the other funds.
Please note that the expenses shown in the accompanying table are meant to highlight your ongoing costs only and do not reflect any transactional costs, such as sales charges or contingent deferred sales charges. Therefore, the second section of the accompanying table is useful in comparing ongoing costs only, and will not help you determine the relative total costs of owning different funds. In addition, if those transactional costs were included, your costs would have been higher. The calculations assume no shares were bought or sold during the period. Your actual costs may have been higher or lower, depending on the amount of your investment and the timing of any purchases or redemptions.
2
Table of Contents
VIRTUS MULTI-SECTOR SHORT TERM BOND FUND
Disclosure of Fund Expenses (Unaudited) (Continued)
For the six-month period of April 1, 2012 to September 30, 2012
| Expense Table | ||||||||||||||||
| Beginning Account Value April 1, 2012 | Ending Account Value September 30, 2012 | Annualized Expense Ratio | Expenses Paid During Period* | |||||||||||||
Multi-Sector Short Term Bond Fund |
| |||||||||||||||
Actual | ||||||||||||||||
| Class A | $ | 1,000.00 | $ | 1,039.90 | 1.02 | % | $ | 5.20 | ||||||||
| Class B | 1,000.00 | 1,037.60 | 1.51 | 7.69 | ||||||||||||
| Class C | 1,000.00 | 1,038.10 | 1.27 | 6.47 | ||||||||||||
| Class T | 1,000.00 | 1,035.70 | 1.77 | 9.01 | ||||||||||||
| Class I | 1,000.00 | 1,039.10 | 0.77 | 3.93 | ||||||||||||
Hypothetical (5% return before expenses) |
| |||||||||||||||
| Class A | 1,000.00 | 1,019.84 | 1.02 | 5.16 | ||||||||||||
| Class B | 1,000.00 | 1,017.36 | 1.51 | 7.64 | ||||||||||||
| Class C | 1,000.00 | 1,018.57 | 1.27 | 6.43 | ||||||||||||
| Class T | 1,000.00 | 1,016.04 | 1.77 | 8.96 | ||||||||||||
| Class I | 1,000.00 | 1,021.10 | 0.77 | 3.90 | ||||||||||||
| * | Expenses are equal to the Fund’s annualized expense ratio which is net of fees waived and expenses reimbursed if any multiplied by the average account value over the period, multiplied by the number of days (183) expenses were accrued in the most recent fiscal half-year, then divided by 366 to reflect the one-half year period. |
| The Fund may invest in other funds, and the annualized expense ratios noted above do not reflect fees and expenses associated with the underlying funds. If such fees and expenses were included, the expenses would have been higher. |
| You can find more information about the Fund’s expenses in the Financial Statements section that follows. For additional information on operating expenses and other shareholder costs, refer to the prospectus. |
3
Table of Contents
VIRTUS MULTI-SECTOR SHORT TERM BOND FUND
BofA Merrill Lynch 1–2.99 Year Medium Quality Corporate Bonds Index
The BofA Merrill Lynch 1–2.99 Year Medium Quality Corporate Bonds Index measures performance of U.S. investment grade corporate bond issues rated “BBB” and “A” by Standard & Poor’s/Moody’s with maturities between one and three years. The index is calculated on a total return basis.
Barclays Capital U.S. Aggregate Bond Index
The Barclays Capital U.S. Aggregate Bond Index measures the U.S. investment grade fixed rate bond market. The index is calculated on a total return basis.
Exchange-Traded Funds (ETF)
Portfolios of stocks or bonds that track a specific market index.
Federal Reserve (the “Fed”)
The central bank of the United States, responsible for controlling the money supply, interest rates and credit with the goal of keeping the U.S. economy and currency stable. Governed by a seven-member board, the system includes 12 regional Federal Reserve Banks, 25 branches and all national and state banks that are part of the system.
MSCI All Country World Index (Net)
The MSCI AC World Index (Net) is a free float-adjusted market capitalization-weighted index that measures equity performance of developed and emerging markets. The index is calculated on a total return basis with net dividends reinvested. The index is unmanaged and not available for direct investment.
Quantitative Easing (QE3)
A government monetary policy occasionally used to increase the money supply by buying government securities or other securities from the market. Quantitative Easing increases the money supply by flooding financial institutions with capital in an effort to promote increased lending and liquidity.
PIK (Payment-in-Kind Security)
A bond which pays some or all interest in the form of additional bonds, or preferred stock which pays dividends in the form of additional preferred stock.
REIT (Real Estate Investment Trust)
A publicly traded company that owns, develops and operates income-producing real estate such as apartments, office buildings, hotels, shopping centers and other commercial properties.
S&P 500® Index
The S&P 500® Index is a free-float market capitalization-weighted index of 500 of the largest U.S. companies. The index is calculated on a total return basis with dividends reinvested.
4
Table of Contents
| Multi-Sector Short Term Bond Fund | Ticker Symbols: Class A: NARAX Class B: PBARX Class C: PSTCX Class T: PMSTX Class I: PIMSX |
| ¢ | The Fund is diversified and has an investment objective to seek to provide high current income while attempting to limit changes in the Fund’s net asset value per share caused by interest rate changes. |
| ¢ | For the fiscal year ended September 30, 2012, the Fund’s Class A shares at NAV returned 10.58%; Class B shares returned 9.87%; Class C shares returned 10.19%; Class T shares returned 9.67%; and Class I shares returned 10.62%. For the same period, the Barclays Capital U.S. Aggregate Bond Index, a broad-based fixed income index, returned 5.16%; and the BofA Merrill Lynch 1–2.99 Year Medium Quality Corporate Bonds Index, the Fund’s style-specific index appropriate for comparison, returned 4.94%. |
All performance figures assume reinvestment of distributions and exclude the effect of sales charges. Past performance is no guarantee of future results and current performance may be higher or lower than the performance shown.
How did the market perform during the Fund’s fiscal year?
| ¢ | Most spread sectors outperformed U.S. Treasuries during the Fund’s fiscal year. The overall economic picture remains supportive of fixed income spread sectors as economic growth is still expected to be positive, but subdued enough to likely keep inflation at low levels and keep the Federal Reserve (the Fed) from raising short term interest rates in the immediate future. Spread sectors were also supported by positive credit fundamentals, continued demand for spread product, and the Fed’s announcement of QE3 late in the third quarter of 2012. |
| ¢ | Despite the rally, there were periods of volatility during the Fund’s fiscal year as headwinds still exist. Uncertainty remains |
surrounding the debt crisis in Europe and overall global growth concerns loom. Adding to investor concerns is a lack of clarity domestically in the U.S. regarding presidential elections, impending fiscal cliff, and fears of a slowing economy. |
| ¢ | Over the last 12 months yields declined across the U.S. Treasury curve and the curve flattened. |
What factors affected the Fund’s performance during its fiscal year?
| ¢ | The outperformance of fixed income spread sectors relative to U.S. Treasuries was the key driver of the Fund’s strong performance for the fiscal year. |
| ¢ | Among fixed income sectors the Fund’s allocation to corporate high-yield securities, high- yield loans, corporate high quality, non-agency commercial mortgage-backed securities, and non-agency residential mortgage-backed securities were all significant positive contributors to performance for the fiscal year. |
| ¢ | The Fund’s higher quality bias in corporate high-yield securities detracted from performance as lower quality outperformed during the period. |
For information regarding the indexes and certain investment terms, see the Key Investment Terms on page 4.
5
Table of Contents
| Multi-Sector Short Term Bond Fund (Continued) |
The preceding information is the opinion of portfolio management. Any such opinions are subject to change at any time based upon market or other conditions and should not be relied upon as investment advice. Past performance is no guarantee of future results, and there is no guarantee that market forecasts will be realized.
There is no guarantee that the Fund will meet its objective.
Debt securities are subject to various risks, the most prominent of which are credit and interest rate risk. The issuer of a security may fail to make payments in a timely manner. Values of debt securities may rise and fall in response to changes in interest rates. This risk may be enhanced with longer-term maturities. There is a greater level of credit risk and price volatility involved with high yield securities than investment grade securities. Changes in interest rates can cause both extension and prepayment risks for asset and mortgage-backed securities. These securities are also subject to risks associated with the repayment of underlying collateral. There may be no ready market for loan participation interests. The Fund may have to sell the interests at a substantial discount. Such interests are subject to the credit risk of the underlying corporate borrower. Investing internationally, especially in emerging markets, involves additional risks such as currency, political, accounting, economic, and market risk.
| Asset Allocations | ||||
The following table presents the portfolio holdings within certain sectors as a percentage of total investments as of September 30, 2012.
|
| |||
Corporate Bonds | 34 | % | ||
Mortgage-Backed Securities | 26 | |||
Asset-Backed Securities | 12 | |||
Loan Agreements | 13 | |||
Foreign Government Securities | 11 | |||
Other (includes short-term investments) | 4 | |||
|
| |||
Total | 100 | % | ||
|
| |||
For information regarding the indexes and certain investment terms, see the Key Investment Terms on page 4.
6
Table of Contents
Multi-Sector Short Term Bond Fund (Continued)
| Average Annual Total Returns1 for periods ended 9/30/12 | ||||||||||||||||||||
| 1 Year | 5 Years | 10 Years | Since Inception | Inception Date | ||||||||||||||||
| Class A Shares at NAV2 | 10.58 | % | 6.56 | % | 5.90 | % | — | — | ||||||||||||
| Class A Shares at POP3,4 | 8.10 | 6.08 | 5.66 | — | — | |||||||||||||||
| Class B Shares at NAV2 | 9.87 | 6.02 | 5.38 | — | — | |||||||||||||||
| Class B Shares with CDSC4 | 8.29 | 6.02 | 5.38 | — | — | |||||||||||||||
| Class C Shares at NAV2 | 10.19 | 6.32 | 5.68 | — | — | |||||||||||||||
| Class T Shares at NAV2 and with CDSC4 | 9.67 | 5.80 | — | 4.65 | % | 6/2/03 | ||||||||||||||
| Class I Shares at NAV | 10.62 | — | — | 7.88 | 6/6/08 | |||||||||||||||
| Barclays Capital U.S. Aggregate Bond Index | 5.16 | 6.53 | 5.33 | —5 | — | |||||||||||||||
| BofA Merrill Lynch 1–2.99 Year Medium Quality Corporate Bonds Index | 4.94 | 4.69 | 4.40 | —6 | — | |||||||||||||||
Fund Expense Ratios7: A Shares: 1.05%; B Shares: 1.55%; C Shares: 1.30%; T Shares: 1.80%; I Shares: 0.80%.
All returns represent past performance which is no guarantee of future results. Current performance may be higher or lower than the performance shown. The investment return and principal value of an investment will fluctuate so that an investor’s shares, when redeemed, may be worth more or less than their original cost. The above table and graph below do not reflect the deduction of taxes that a shareholder would pay on fund distributions or the redemption of fund shares. Please visit Virtus.com for performance data current to the most recent month-end.
| 1 | Total returns are historical and include changes in share price and the reinvestment of both dividends and capital gain distributions. |
| 2 | “NAV” (Net Asset Value) total returns do not include the effect of any sales charge. |
| 3 | “POP” (Public Offering Price) total returns include the effect of the maximum front-end 2.25% sales charge. |
| 4 | CDSC (Contingent Deferred Sales Charge) is applied to redemptions of certain classes of shares that do not have a sales charge applied at the time of purchase. CDSC charges for Class B shares decline from 2% to 0% over a three-year period. CDSC charges for certain redemptions of Class A shares made within 18 months of purchase in which a finder’s fee was paid and all redemptions of Class T shares are 1% within the first year and 0% thereafter. |
| 5 | The index returned 5.11% for Class T shares and 6.50% for Class I shares since the inception date of the respective share class. |
| 6 | The index returned 4.03% for Class T shares and 4.59% for Class I shares since the inception date of the respective share class. |
| 7 | The expense ratios of the Fund are set forth according to the prospectus for the Fund effective January 31, 2012, as supplemented and revised and may differ from the expense ratios disclosed in the Financial Highlights tables in this report. See the Financial Highlights for more current expense ratios. |
Growth of $10,000 for periods ended 9/30
This chart assumes an initial investment of $10,000 made on September 30, 2002, for Class A, Class B and Class C shares including any applicable sales charges or fees. Performance assumes reinvestment of dividends and capital gain distributions.
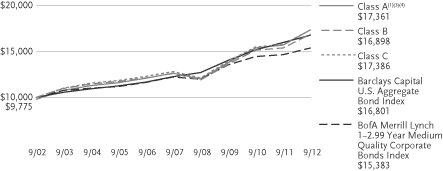
The indexes are unmanaged and not available for direct investment; therefore, their performance does not reflect the expenses associated with active management of an actual portfolio.
7
Table of Contents
VIRTUS MULTI-SECTOR SHORT TERM BOND FUND
SEPTEMBER 30, 2012
($ reported in thousands)
| PAR VALUE | VALUE | |||||||
| U.S. GOVERNMENT SECURITIES—1.0% | ||||||||
U.S. Treasury Note | ||||||||
0.250%, 4/30/14 | $ | 31,500 | $ | 31,511 | ||||
0.875%, 12/31/16 | 27,715 | 28,150 | ||||||
2.000%, 11/15/21 | 5,000 | 5,222 | ||||||
| TOTAL U.S. GOVERNMENT SECURITIES | ||||||||
| (Identified Cost $64,340) | 64,883 | |||||||
| MUNICIPAL BONDS—0.4% | ||||||||
| Connecticut—0.2% | ||||||||
State of Connecticut | 13,215 | 16,457 | ||||||
|
| |||||||
| Kentucky—0.1% | ||||||||
Commonwealth of Kentucky Taxable | 7,100 | 7,398 | ||||||
|
| |||||||
| Virginia—0.1% | ||||||||
Tobacco Settlement Financing Corp. Taxable | 4,850 | 3,291 | ||||||
| TOTAL MUNICIPAL BONDS (Identified Cost $27,348) | 27,146 | |||||||
| FOREIGN GOVERNMENT SECURITIES—11.5% | ||||||||
Bolivarian Republic of Venezuela | ||||||||
8.500%, 10/8/14 | 20,840 | 21,048 | ||||||
RegS 5.750%, 2/26/16(5) | 28,323 | 25,951 | ||||||
RegS | 8,350 | 7,181 | ||||||
Commonwealth of Australia | 49,590 | AUD | 52,574 | |||||
Commonwealth of Canada | 103,245 | CAD | 105,336 | |||||
Commonwealth of | 44,229 | NZD | 37,433 | |||||
| PAR VALUE | VALUE | |||||||
| FOREIGN GOVERNMENT SECURITIES (continued) | ||||||||
Federative Republic of Brazil | ||||||||
12.500%, 1/5/16 | 100,359 | BRL | $ | 62,153 | ||||
12.500%, 1/5/22 | 16,730 | BRL | 12,338 | |||||
8.500%, 1/5/24 | 5,000 | BRL | 2,886 | |||||
Kingdom of Norway Series 470 | 187,682 | NOK | 33,711 | |||||
Kingdom of Sweden Series 1041, 6.750%, 5/5/14 | 88,310 | SEK | 14,726 | |||||
Republic of Argentina | ||||||||
Provincia de Neuquen 144A 7.875%, 4/26/21(4) | $ | 6,544 | 5,791 | |||||
PIK Interest Capitalization 8.280%, 12/31/33 | 74,699 | 59,012 | ||||||
Series GDP 144A 12.500%, 12/15/35(3)(4) | 24,420 | 3,248 | ||||||
Republic of Colombia 12.000%, 10/22/15 | 9,935,000 | COP | 6,797 | |||||
Republic of Indonesia | ||||||||
Series FR-23, 11.000%, 12/15/12 | 26,600,000 | IDR | 2,813 | |||||
Series FR-30, 10.750%, 5/15/16 | 40,550,000 | IDR | 4,958 | |||||
Republic of Lithuania | ||||||||
144A | 10,600 | 11,660 | ||||||
144A | 5,955 | 7,384 | ||||||
Republic of Peru 144A | 50,140 | 23,907 | ||||||
Republic of South Africa | 448,625 | ZAR | 55,492 | |||||
Republic of Turkey 9.000%, 3/5/14 | 87,260 | TRY | 49,499 | |||||
Republic of Ukraine 144A 7.950%, 6/4/14(4) | 12,350 | 12,382 | ||||||
Russian Federation | ||||||||
144A | 18,000 | 18,941 | ||||||
See Notes to Financial Statements
8
Table of Contents
VIRTUS MULTI-SECTOR SHORT TERM BOND FUND
SCHEDULE OF INVESTMENTS (Continued)
SEPTEMBER 30, 2012
($ reported in thousands)
| PAR VALUE | VALUE | |||||||
| FOREIGN GOVERNMENT SECURITIES (continued) | ||||||||
RegS | $ | 1,610 | $ | 2,033 | ||||
State of Qatar 144A | 12,000 | 12,642 | ||||||
United Mexican States Series M, | 1,096,623 | MXN | 87,997 | |||||
| TOTAL FOREIGN GOVERNMENT SECURITIES | ||||||||
| (Identified Cost $720,662) | 739,893 | |||||||
| MORTGAGE-BACKED SECURITIES—26.2% | ||||||||
| Agency—3.7% | ||||||||
FHLMC | 990 | 1,099 | ||||||
FNMA | ||||||||
5.500%, 1/1/17 | 172 | 187 | ||||||
6.000%, 5/1/17 | 55 | 60 | ||||||
5.500%, 8/1/17 | 13 | 14 | ||||||
4.500%, 4/1/18 | 328 | 354 | ||||||
5.000%, 10/1/19 | 1,014 | 1,108 | ||||||
5.500%, 2/1/20 | 430 | 470 | ||||||
5.500%, 3/1/20 | 230 | 252 | ||||||
5.500%, 3/1/20 | 26 | 28 | ||||||
5.500%, 3/1/20 | 210 | 230 | ||||||
5.500%, 3/1/20 | 781 | 854 | ||||||
5.500%, 4/1/20 | 507 | 554 | ||||||
5.000%, 6/1/20 | 1,396 | 1,524 | ||||||
4.000%, 8/1/25 | 32,918 | 35,225 | ||||||
3.000%, 6/1/27 | 1,929 | 2,049 | ||||||
2.500%, 9/1/27 | 28,770 | 30,269 | ||||||
6.000%, 12/1/32 | 109 | 123 | ||||||
5.500%, 2/1/33 | 204 | 227 | ||||||
5.500%, 5/1/34 | 1,034 | 1,142 | ||||||
6.000%, 8/1/34 | 677 | 766 | ||||||
6.000%, 10/1/34 | 468 | 526 | ||||||
6.000%, 10/1/34 | 641 | 721 | ||||||
5.500%, 11/1/34 | 1,028 | 1,135 | ||||||
5.500%, 11/1/34 | 866 | 957 | ||||||
6.000%, 11/1/34 | 1,318 | 1,482 | ||||||
5.500%, 12/1/34 | 581 | 642 | ||||||
5.500%, 1/1/35 | 993 | 1,097 | ||||||
6.000%, 1/1/37 | 985 | 1,090 | ||||||
6.000%, 1/1/37 | 1,153 | 1,277 | ||||||
5.500%, 7/1/37 | 10 | 11 | ||||||
6.000%, 7/1/37 | 266 | 295 | ||||||
6.000%, 12/1/37 | 1,460 | 1,617 | ||||||
6.000%, 4/1/38 | 916 | 1,014 | ||||||
| PAR VALUE | VALUE | |||||||
| MORTGAGE-BACKED SECURITIES (continued) | ||||||||
| Agency (continued) | ||||||||
5.500%, 9/1/38 | $ | 1,071 | $ | 1,175 | ||||
5.500%, 12/1/38 | 820 | 899 | ||||||
4.500%, 4/1/40 | 25,683 | 27,875 | ||||||
5.000%, 7/1/40 | 5,191 | 5,687 | ||||||
5.000%, 7/1/40 | 7,528 | 8,234 | ||||||
5.000%, 8/1/40 | 30,794 | 34,526 | ||||||
4.000%, 10/1/40 | 455 | 491 | ||||||
4.000%, 2/1/41 | 8,868 | 9,567 | ||||||
4.000%, 3/1/41 | 12,138 | 13,098 | ||||||
4.500%, 5/1/41 | 13,778 | 14,980 | ||||||
4.000%, 9/1/41 | 12,598 | 13,594 | ||||||
3.500%, 4/1/42 | 17,639 | 18,932 | ||||||
GNMA | ||||||||
6.500%, 7/15/31 | 20 | 24 | ||||||
6.500%, 8/15/31 | 51 | 61 | ||||||
6.500%, 11/15/31 | 33 | 39 | ||||||
6.500%, 2/15/32 | 26 | 31 | ||||||
6.500%, 4/15/32 | 70 | 83 | ||||||
6.500%, 4/15/32 | 85 | 101 | ||||||
|
| |||||||
| 237,796 | ||||||||
|
| |||||||
| Non-Agency—22.5% | ||||||||
JPMorgan Mortgage Trust 06-A4, 3A1 5.454%, 6/25/36(3) | 4,636 | 4,214 | ||||||
ABN AMRO Mortgage Corp. 02-9, M | 2,014 | 1,994 | ||||||
American General Mortgage Loan Trust | ||||||||
09-1, A6, 144A | 13,850 | 14,164 | ||||||
10-1A, A1, 144A | 7,949 | 8,225 | ||||||
Americold LLC Trust 10-ARTA, A1 144A 3.847%, 1/14/29(4) | 12,380 | 13,348 | ||||||
Banc of America Alternative Loan Trust 03-10, 2A1 | 5,757 | 6,055 | ||||||
Banc of America Funding Corp. | 8,327 | 8,532 | ||||||
See Notes to Financial Statements
9
Table of Contents
VIRTUS MULTI-SECTOR SHORT TERM BOND FUND
SCHEDULE OF INVESTMENTS (Continued)
SEPTEMBER 30, 2012
($ reported in thousands)
| PAR VALUE | VALUE | |||||||
| MORTGAGE-BACKED SECURITIES (continued) | ||||||||
| Non-Agency (continued) | ||||||||
Banc of America Mortgage Securities, Inc. | ||||||||
04-11, 2A1 | $ | 5,300 | $ | 5,436 | ||||
05-1, 1A22 | 922 | 919 | ||||||
05-3, 2A2 | 2,290 | 2,336 | ||||||
Banc of America Re-REMIC Trust 144A | 3,300 | 3,333 | ||||||
Bank of America (Merrill Lynch) – Deutsche Bank 12-OSI, A2FX | 19,191 | 19,957 | ||||||
Bank of America (Merrill Lynch) Commercial Mortgage, Inc. | ||||||||
05-2, B | 10,141 | 10,711 | ||||||
05-6, AM | 1,630 | 1,820 | ||||||
Bayview Commercial Asset Trust 144A | 29,970 | 25,100 | ||||||
Bear Stearns Adjustable Rate Mortgage Trust | ||||||||
03-9, 4A1 | 16,529 | 16,913 | ||||||
04-10, 14A1 | 3,721 | 3,750 | ||||||
05-4, 2AA1 144A | 1,945 | 1,966 | ||||||
Bear Stearns Alternative Loan Trust A, 05-4, 24A1 | 24,382 | 22,965 | ||||||
Bear Stearns Asset Backed Securities Trust | 4,977 | 5,096 | ||||||
| PAR VALUE | VALUE | |||||||
| Non-Agency (continued) | ||||||||
Bear Stearns Commercial Mortgage Securities, Inc. | ||||||||
06-T22, AM | $ | 11,600 | $ | 12,714 | ||||
06-PW12, AM | 9,250 | 10,276 | ||||||
06-PW14, AM | 10,000 | 10,994 | ||||||
05-PW10, AM | 14,200 | 15,119 | ||||||
04-PWR3, A4 | 7,015 | 7,295 | ||||||
06-PW13, AM | 3,272 | 3,638 | ||||||
04-PWR5, A5 | 3,925 | 4,183 | ||||||
07-T28, A4 | 3,360 | 4,004 | ||||||
07-PW18, A4 | 16,950 | 20,094 | ||||||
07-PW18, AM | 12,400 | 13,511 | ||||||
Chase Mortgage Finance Corp. | 4,985 | 5,082 | ||||||
Citicorp Mortgage Securities, Inc. | ||||||||
07-1,A1 | 1,186 | 1,194 | ||||||
03-11, 2A10 | 4,023 | 4,053 | ||||||
04-4, A6 | 6,176 | 6,452 | ||||||
Citicorp Residential Mortgage Securities, Inc. 07-12,A6 6.265%, 6/25/37(3) | 12,683 | 12,581 | ||||||
Citigroup – Deutsche | ||||||||
05-CD1, AM | 6,410 | 7,041 | ||||||
06-CD2, A4 | 2,659 | 3,002 | ||||||
See Notes to Financial Statements
10
Table of Contents
VIRTUS MULTI-SECTOR SHORT TERM BOND FUND
SCHEDULE OF INVESTMENTS (Continued)
SEPTEMBER 30, 2012
($ reported in thousands)
| PAR VALUE | VALUE | |||||||
| MORTGAGE-BACKED SECURITIES (continued) | ||||||||
| Non-Agency (continued) | ||||||||
07-CD4, A4 | $ | 8,480 | $ | 9,656 | ||||
Commercial Mortgage Pass-Through-Certificates | ||||||||
11-THL, C , 144A 5.163%, 7/3/28(4) | 9,000 | 9,633 | ||||||
01-J2A, A2, 144A 6.096%, 7/16/34(4) | 36 | 36 | ||||||
Countrywide Alternative Loan Trust | ||||||||
04-36CBC, 2A1 | 12,687 | 12,755 | ||||||
06-13T1, A11 | 4,698 | 3,501 | ||||||
06-13T1, A5 | 1,700 | 1,275 | ||||||
Countrywide Home Loan Mortgage Pass-Through-Trust | ||||||||
02-35, 1A2 | 2,471 | 2,528 | ||||||
03-4, 1A15 | 4,005 | 4,180 | ||||||
03-28, A8 | 2,533 | 2,616 | ||||||
04-4, A6 | 2,074 | 2,108 | ||||||
05-22, 3A1 | 17,554 | 14,641 | ||||||
Credit Suisse First Boston Mortgage Securities Corp. | ||||||||
04-8, 7A1 | 11,421 | 11,490 | ||||||
03-CPN1, C | 7,964 | 7,871 | ||||||
05-11, 8A10 | 4,338 | 4,460 | ||||||
02-CKS4, B | 1,946 | 1,946 | ||||||
02-CKS4, C | 5,000 | 4,999 | ||||||
| PAR VALUE | VALUE | |||||||
| Non-Agency (continued) | ||||||||
Credit Suisse Mortgage Capital Certificates | ||||||||
06-C1, A3 | $ | 6,811 | $ | 6,991 | ||||
07-C2, A3 | 12,995 | 14,568 | ||||||
Deutsche Bank – UBS Mortgage Trust | 11,500 | 12,590 | ||||||
Extended Stay America Trust | ||||||||
10-ESHA, C 144A | 2,860 | 2,886 | ||||||
10-ESHA, D, 144A | 31,645 | 31,898 | ||||||
First Horizon Asset Securities, Inc. | 3,255 | 3,286 | ||||||
GE Capital Commercial Mortgage Corp. | 4,332 | 4,381 | ||||||
GMAC Commercial Mortgage Securities, Inc. | ||||||||
03-C1, D | 10,000 | 10,130 | ||||||
04-C2, A3 | 1,011 | 1,043 | ||||||
04-C2, A4 | 8,178 | 8,793 | ||||||
04-C3, A4 | 992 | 992 | ||||||
GMAC Mortgage Corp. Loan Trust | ||||||||
06-HLTV, A4 | 8,901 | 8,670 | ||||||
04-AR1, 12A | 11,875 | 12,249 | ||||||
05-AR1, 5A | 6,046 | 5,978 | ||||||
See Notes to Financial Statements
11
Table of Contents
VIRTUS MULTI-SECTOR SHORT TERM BOND FUND
SCHEDULE OF INVESTMENTS (Continued)
SEPTEMBER 30, 2012
($ reported in thousands)
| PAR VALUE | VALUE | |||||||
| MORTGAGE-BACKED SECURITIES (continued) | ||||||||
| Non-Agency (continued) | ||||||||
Goldman Sachs Mortgage Securities Corp. II | ||||||||
07-EOP, G, 144A | $ | 7,670 | $ | 7,671 | ||||
07-EOP, H, 144A | 1,850 | 1,850 | ||||||
11-ALF, B, 144A | 8,000 | 8,148 | ||||||
07-GG10, A4 | 23,670 | 27,111 | ||||||
Greenwich Capital Commercial Funding Corp. 04-GG1, A7 5.317%, 6/10/36(3) | 7,950 | 8,394 | ||||||
GSR Mortgage Loan Trust | ||||||||
04-15F, 2A2 | 5,223 | 5,313 | ||||||
05-5F, 2A8 | 7,216 | 7,305 | ||||||
05-AR4, 6A1 | 12,107 | 11,964 | ||||||
07-1F, 2A2 | 1,393 | 1,403 | ||||||
Heller Financial Commercial Mortgage Asset | 2,925 | 3,032 | ||||||
Indymac Index Mortgage Loan Trust 05-AR1, 3A1 | 2,218 | 2,018 | ||||||
JPMorgan Chase Commercial Mortgage Securities Corp. | ||||||||
09-IWST, A1, 144A | 14,781 | 16,134 | ||||||
10-CNTR, A1, 144A | 10,496 | 11,282 | ||||||
10-CNTR, A2, 144A | 4,550 | 5,038 | ||||||
04-C1, A3 | 5,565 | 5,770 | ||||||
| PAR VALUE | VALUE | |||||||
| Non-Agency (continued) | ||||||||
06-CB17, AM | $ | 18,335 | $ | 18,752 | ||||
06-LDP7, A4 | 24,197 | 27,908 | ||||||
06-LDP7, AM | 18,260 | 20,550 | ||||||
06-LDP9, A3 | 20,649 | 23,577 | ||||||
07-CB18, A3 | 5,938 | 6,311 | ||||||
07-LD12, A4 | 8,029 | 9,448 | ||||||
JPMorgan Chase Mortgage Trust | ||||||||
03-A2, 3A1 | 10,637 | 10,581 | ||||||
05-A1, 4A1 | 1,846 | 1,920 | ||||||
05-A2, 4A1 | 2,053 | 2,064 | ||||||
05-A4, 3A1 | 11,668 | 11,574 | ||||||
05-A8, 2A1 | 4,557 | 4,566 | ||||||
5.310%, 10/25/36(3) | 2,641 | 2,379 | ||||||
Lehman Brothers – UBS Commercial Mortgage Trust | ||||||||
04-C7, A6 4.786%, 10/15/29(3) | 10,536 | 11,289 | ||||||
06-C3, AM 5.712%, 3/15/39(3) | 7,615 | 8,342 | ||||||
06-C6, A4 5.372%, 9/15/39 | 13,750 | 15,881 | ||||||
07-C2, A2 5.303%, 2/15/40 | 1,214 | 1,215 | ||||||
07-C2, A3 5.430%, 2/15/40 | 7,825 | 8,952 | ||||||
07-C6, A2 5.845%, 7/15/40 | 5,351 | 5,510 | ||||||
07-C7, A3 5.866%, 9/15/45(3) | 10,300 | 12,272 | ||||||
MASTR Adjustable Rate Mortgages Trust 04-12,3A1 2.920%, 11/25/34(3) | 4,147 | 4,170 | ||||||
See Notes to Financial Statements
12
Table of Contents
VIRTUS MULTI-SECTOR SHORT TERM BOND FUND
SCHEDULE OF INVESTMENTS (Continued)
SEPTEMBER 30, 2012
($ reported in thousands)
| PAR VALUE | VALUE | |||||||
| MORTGAGE-BACKED SECURITIES (continued) | ||||||||
| Non-Agency (continued) | ||||||||
MASTR Alternative Loans Trust | ||||||||
04-7, 4A1 4.500%, 7/25/19 | $ | 8,873 | $ | 9,196 | ||||
04-6, 10A1 6.000%, 7/25/34 | 9,488 | 9,628 | ||||||
04-6, 7A1 6.000%, 7/25/34 | 9,638 | 9,730 | ||||||
05-2, 2A1 6.000%, 1/25/35 | 5,666 | 5,507 | ||||||
05-2, 1A1 6.500%, 3/25/35 | 14,741 | 14,266 | ||||||
MASTR Asset Securitization Trust | ||||||||
04-6, 4A1 5.000%, 7/25/19 | 1,502 | 1,565 | ||||||
05-1, 1A1 5.000%, 5/25/20 | 2,078 | 2,140 | ||||||
06-1, 1A2 5.750%, 5/25/36 | 2,772 | 2,787 | ||||||
Merrill Lynch Floating Trust 08-LAQA, A1 144A 0.766%, 7/9/21(3)(4) | 12,578 | 12,394 | ||||||
Merrill Lynch Mortgage Investors, Inc. 98-C1, B 6.750%, 11/15/26(3) | 10,000 | 11,513 | ||||||
Merrill Lynch Mortgage Trust | ||||||||
06-C1, AM 5.690%, 5/12/39(3) | 7,520 | 8,313 | ||||||
04-KEY2, A3 4.615%, 8/12/39 | 12,250 | 12,634 | ||||||
Merrill Lynch/Countrywide Commercial Mortgage Trust | ||||||||
06-3, A4 5.414%, 7/12/46(3) | 11,700 | 13,459 | ||||||
06-4, A3 5.172%, 12/12/49(3) | 9,500 | 10,850 | ||||||
Morgan Stanley Capital I | ||||||||
04-HQ4, A6 4.830%, 4/14/40 | 3,424 | 3,467 | ||||||
| PAR VALUE | VALUE | |||||||
| Non-Agency (continued) | ||||||||
06-T23, AM 5.820%, 8/12/41(3) | $ | 10,575 | $ | 12,007 | ||||
Morgan Stanley Capital I, Inc. | ||||||||
06-IQ12, A4 5.332%, 12/15/43 | 14,865 | 17,196 | ||||||
07-IQ14, A4 5.692%, 4/15/49(3) | 16,825 | 19,261 | ||||||
Morgan Stanley Mortgage Loan Trust | ||||||||
04-2AR, 3A 2.500%, 2/25/34(3) | 2,455 | 2,484 | ||||||
04-2AR, 4A 4.772%, 2/25/34(3) | 4,228 | 4,339 | ||||||
07-11AR, 2A3 2.770%, 6/25/37(3) | 3,101 | 1,638 | ||||||
Nomura Asset Acceptance Corp. | ||||||||
04-R1, A1 144A 6.500%, 3/25/34(4) | 3,774 | 3,831 | ||||||
04-R3, A1 144A 6.500%, 2/25/35(4) | 6,159 | 6,242 | ||||||
06-AF2, 1A6 6.196%, 8/25/36(3) | 13,593 | 6,663 | ||||||
ORES NPL LLC 4.000%, 9/25/44(4) | 8,740 | 8,813 | ||||||
Prudential Commercial Mortgage Trust 03-PWR1, D, 144A 4.775%, 2/11/36(4) | 4,950 | 4,863 | ||||||
Residential Accredit Loans, Inc. | ||||||||
03-QS6, A4 4.250%, 3/25/33 | 5,656 | 5,873 | ||||||
04-QS16, 1A5 5.500%, 12/25/34 | 823 | 803 | ||||||
Residential Asset Mortgage Products, Inc. | ||||||||
04-SL2, A3 7.000%, 10/25/31 | 4,449 | 4,647 | ||||||
04-SL1, A8 6.500%, 11/25/31 | 5,015 | 5,173 | ||||||
04-SL4, A3 6.500%, 7/25/32 | 2,432 | 2,517 | ||||||
See Notes to Financial Statements
13
Table of Contents
VIRTUS MULTI-SECTOR SHORT TERM BOND FUND
SCHEDULE OF INVESTMENTS (Continued)
SEPTEMBER 30, 2012
($ reported in thousands)
| PAR VALUE | VALUE | |||||||
| MORTGAGE-BACKED SECURITIES (continued) | ||||||||
| Non-Agency (continued) | ||||||||
Residential Funding Mortgage Securities I, Inc. | ||||||||
06-S12, 1A1 5.500%, 12/25/21 | $ | 3,921 | $ | 4,073 | ||||
05-S1, 1A2 5.500%, 2/25/35 | 2,750 | 2,805 | ||||||
06-S4, A2 6.000%, 4/25/36 | 1,724 | 1,593 | ||||||
RIAL 2012-LT1A 12-LT1A, A, 144A 4.750%, 2/15/25(4) | 1,163 | 1,164 | ||||||
S2 Hospitality LLC 12-LV1, A 144A 4.500%, 4/15/25(4) | 7,630 | 7,673 | ||||||
Springleaf Mortgage Loan Trust 11-1A, A1, 144A 4.050%, 1/25/38(3)(4) | 7,817 | 8,042 | ||||||
Structured Adjustable Rate Mortgage Loan Trust | 5,148 | 4,953 | ||||||
Structured Asset Securities Corp. | ||||||||
03-AL1, A, 144A 3.357%, 4/25/31(4) | 16,038 | 15,611 | ||||||
03-21, 2A2 5.250%, 8/25/33 | 4,348 | 4,454 | ||||||
04-21XS, 2A4A 4.900%, 12/25/34(3) | 4,101 | 4,150 | ||||||
SunTrust Adjustable Rate Mortgage Loan Trust 07-S1, 5A1 4.770%, 1/25/37(3) | 1,733 | 1,708 | ||||||
Timberstar Trust 06-1A, A, 144A 5.668%, 10/15/36(4) | 10,240 | 11,599 | ||||||
Wachovia Bank Commercial Mortgage Trust | ||||||||
03-C8, 5 5.000%, 11/15/35(3) | 5,500 | 5,633 | ||||||
04-C15, B 4.892%, 10/15/41 | 14,875 | 15,781 | ||||||
| PAR VALUE | VALUE | |||||||
| Non-Agency (continued) | ||||||||
05-C20, AMFX | $ | 6,000 | $ | 6,587 | ||||
06-C25, AM 5.736%, 5/15/43(3) | 18,625 | 20,498 | ||||||
07-C30, A5 5.342%, 12/15/43 | 39,765 | 45,015 | ||||||
05-C22, AM 5.340%, 12/15/44(3) | 17,245 | 18,648 | ||||||
07-C31, A4 5.509%, 4/15/47 | 21,625 | 24,791 | ||||||
07-C32, A3 5.920%, 6/15/49(3) | 14,977 | 17,248 | ||||||
07-C33, A5 6.122%, 2/15/51(3) | 1,265 | 1,477 | ||||||
07-C33, A4 6.122%, 2/15/51(3) | 14,930 | 17,602 | ||||||
Washington Mutual Commercial Mortgage Securities Trust | ||||||||
06-SL1, A, 144A 5.422%, 11/23/43(3)(4) | 14,156 | 13,924 | ||||||
07-SL3, A, 144A 6.110%, 3/23/45(3)(4) | 4,505 | 4,551 | ||||||
Washington Mutual Mortgage Pass-Through Certificates 04-CB1, 5A | 3,779 | 3,918 | ||||||
Wells Fargo Mortgage Backed Securities Trust | ||||||||
06-17, A1 | 502 | 529 | ||||||
03-G, A1 | 2,887 | 2,930 | ||||||
04-4, A9 | 4,704 | 4,858 | ||||||
04-CC, A1 | 5,788 | 5,772 | ||||||
05-12, 1A1 | 10,417 | 10,671 | ||||||
05-14, 2A1 | 7,586 | 8,055 | ||||||
06-6, 1A15 | 1,364 | 1,366 | ||||||
See Notes to Financial Statements
14
Table of Contents
VIRTUS MULTI-SECTOR SHORT TERM BOND FUND
SCHEDULE OF INVESTMENTS (Continued)
SEPTEMBER 30, 2012
($ reported in thousands)
| PAR VALUE | VALUE | |||||||
| MORTGAGE-BACKED SECURITIES (continued) | ||||||||
| Non-Agency (continued) | ||||||||
06-9, 1A15 | $ | 704 | $ | 708 | ||||
07-16, 1A1 | 14,392 | 14,968 | ||||||
07-16, 1A7 | 5,059 | 4,821 | ||||||
07-AR10, 2A1 | 7,757 | 8,039 | ||||||
WFDB Commercial Mortgage Trust | 15,000 | 16,179 | ||||||
|
| |||||||
| 1,442,104 | ||||||||
| TOTAL MORTGAGE-BACKED SECURITIES | ||||||||
| (Identified Cost $1,582,220) | 1,679,900 | |||||||
| ASSET-BACKED SECURITIES—12.4% | ||||||||
1st Financial Bank USA | ||||||||
10-C, B, 144A | 6,000 | 6,119 | ||||||
10-D, C, 144A | 3,000 | 3,084 | ||||||
ABSC Long Beach Home Equity Loan Trust 00-LB1, M1F | 3,306 | 2,546 | ||||||
Ally Auto Receivables Trust | 15,000 | 15,042 | ||||||
AmeriCredit Automobile Receivables Trust | ||||||||
11-3, C | 23,000 | 24,065 | ||||||
11-1, D | 11,119 | 11,849 | ||||||
11-5, D | 5,010 | 5,402 | ||||||
12-1, C | 2,000 | 2,049 | ||||||
12-3, C | 12,750 | 12,971 | ||||||
12-3, D | 11,562 | 11,730 | ||||||
| PAR VALUE | VALUE | |||||||
| ASSET-BACKED SECURITIES (continued) | ||||||||
12-4, D | $ | 6,700 | $ | 6,706 | ||||
11-3, E, 144A | 1,611 | 1,745 | ||||||
11-4, E, 144A | 3,950 | 4,284 | ||||||
11-5, E | 8,400 | 9,193 | ||||||
12-3, E, 144A | 4,812 | 5,010 | ||||||
Ameriquest Mortgage Securities, Inc. 03-10, AF6 4.710%, 11/25/33(3) | 3,897 | 3,965 | ||||||
Asset Backed Funding Certificates | 6,641 | 6,771 | ||||||
Avis Budget Rental Car Funding AESOP LLC 11-3A, A, 144A | 10,000 | 10,705 | ||||||
Banc of America Funding Corp. 06-2, 3A1 | 5,233 | 5,344 | ||||||
Bayview Financial Acquisition Trust | ||||||||
06-B, 1A2 | 730 | 738 | ||||||
07-A, 1A2 | 5,840 | 5,913 | ||||||
06-A, 1A2 | 289 | 289 | ||||||
Bombardier Capital Mortgage Securitization Corp. | 2,177 | 2,165 | ||||||
Bush Truck Leasing LLC 11-44, A, 144A | 2,658 | 2,650 | ||||||
BXG Receivables Note Trust | ||||||||
10-A, A 144A | 4,586 | 4,858 | ||||||
See Notes to Financial Statements
15
Table of Contents
VIRTUS MULTI-SECTOR SHORT TERM BOND FUND
SCHEDULE OF INVESTMENTS (Continued)
SEPTEMBER 30, 2012
($ reported in thousands)
| PAR VALUE | VALUE | |||||||
| ASSET-BACKED SECURITIES (continued) | ||||||||
10-A, A 144A | $ | 8,750 | $ | 8,767 | ||||
CarNow Auto Receivables Trust | ||||||||
12-1A, B, 144A | 2,150 | 2,154 | ||||||
12-1A, C, 144A | 3,750 | 3,761 | ||||||
CIT Equipment Collateral | ||||||||
10-VT1A, B 144A | 3,871 | 3,884 | ||||||
12-A1, B, 144A | 10,000 | 10,058 | ||||||
CIT Mortgage Loan Trust 10-VT1A, B 144A | 15,000 | 14,207 | ||||||
Citicorp Residential Mortgage Securities, Inc. | ||||||||
07-1, A6 | 5,043 | 4,907 | ||||||
07-2, A3 | 12,023 | 12,026 | ||||||
07-2, A4 | 7,000 | 6,575 | ||||||
CNH Equipment Trust | ||||||||
12-B, A4 | 10,000 | 10,106 | ||||||
12-B, B | 4,000 | 4,044 | ||||||
Conseco Financial Corp. | ||||||||
94-1, A5 | 507 | 536 | ||||||
01-3, A4 | 15,636 | 16,400 | ||||||
Countrywide Asset-Backed Certificates | ||||||||
04-13, AF4 | 2,050 | 2,000 | ||||||
04-10, AF6 | 5,414 | 5,310 | ||||||
04-12, AF6 | 2,633 | 2,576 | ||||||
| PAR VALUE | VALUE | |||||||
| ASSET-BACKED SECURITIES (continued) | ||||||||
Credit-Based Asset Servicing & Securitization LLC 05-CB6, A3 | $ | 1,294 | $ | 1,110 | ||||
Cronos Containers Program Ltd 12-2A, A 144A 3.810%, 9/18/27(4) | 10,000 | 9,996 | ||||||
Dominos Pizza Master Issuer LLC 12-1A, A2, 144A 5.216%, 1/25/42(4) | 32,480 | 36,221 | ||||||
Drug Royalty Corp., Inc. 12-1, A2 144A 5.800%, 7/15/24(4) | 6,128 | 6,127 | ||||||
DSC Floorplan Master Owner Trust 11-1, A, 144A 3.910%, 3/15/16(4) | 8,500 | 8,709 | ||||||
DT Auto Owner Trust | ||||||||
10-1A, C, 144A 3.460%, 1/15/14(4) | 1,516 | 1,517 | ||||||
09-1, B, 144A 5.920%, 10/15/15(4) | 605 | 608 | ||||||
11-2A, C, 144A 3.050%, 2/16/16(4) | 5,825 | 5,828 | ||||||
12-1A, C, 144A 3.380%, 10/16/17(4) | 9,975 | 10,007 | ||||||
Exeter Automobile Receivables Trust | ||||||||
12-1A, C 144A 5.270%, 10/16/17(4) | 8,500 | 9,158 | ||||||
12-2A, C 144A 3.060%, 7/16/18(4) | 4,050 | 4,049 | ||||||
12-2A, D 144A 5.060%, 6/17/19(4) | 5,500 | 5,500 | ||||||
Franklin Auto Trust 08-A, D 144A 8.180%, 5/20/16(4) | 6,411 | 6,434 | ||||||
Great America Leasing Receivables 09-1, B 144A 4.520%, 11/15/14(4) | 3,000 | 3,051 | ||||||
GSAA Home Equity Trust 05-12, AF3W 4.999%, 9/25/35(3) | 18,983 | 19,053 | ||||||
See Notes to Financial Statements
16
Table of Contents
VIRTUS MULTI-SECTOR SHORT TERM BOND FUND
SCHEDULE OF INVESTMENTS (Continued)
SEPTEMBER 30, 2012
($ reported in thousands)
| PAR VALUE | VALUE | |||||||
| ASSET-BACKED SECURITIES (continued) | ||||||||
Harley-Davidson Motorcycle Trust | ||||||||
09-4, B 3.190%, 9/15/14 | $ | 9,000 | $ | 9,022 | ||||
10-1, C 2.590%, 4/15/18 | 8,500 | 8,711 | ||||||
Hertz Vehicle Financing LLC | ||||||||
09-2A, A1, 144A 4.260%, 3/25/14(4) | 5,000 | 5,052 | ||||||
11-1A, A2, 144A 3.290%, 3/25/18(4) | 12,290 | 13,256 | ||||||
Home Equity Loan Trust 07-FRE1, 2AV1 | 8,944 | 7,312 | ||||||
Hyundai Auto Receivables Trust 12-B, C 1.950%, 10/15/18 | 10,000 | 10,055 | ||||||
IMC Home Equity Loan Trust 97-5, A9 7.310%, 11/20/28 | 5,137 | 5,169 | ||||||
IndyMac Manufactured Housing Contract 98-1, A3 6.370%, 9/25/28 | 1,558 | 1,625 | ||||||
JPMorgan Chase Funding Mortgage Loan Asset-Backed Certificates 04-1,1A4 4.111%, 8/25/30 | 565 | 564 | ||||||
Leaf II Receivables Funding LLC 12-1, D 144A | 5,859 | 5,766 | ||||||
Lehman Brothers Manufactured Housing Contract Trust 01-B, A3 4.350%, 4/15/40 | 7,319 | 7,723 | ||||||
Lehman XS Trust 05-5, 3A2B 5.420%, 11/25/35(3) | 8,475 | 8,281 | ||||||
| PAR VALUE | VALUE | |||||||
| ASSET-BACKED SECURITIES (continued) | ||||||||
Marriott Vacation Club Owner Trust | ||||||||
12-1A, A, 144A | $ | 12,303 | $ | 12,365 | ||||
10-1A, A 144A 3.540%, 10/20/32(4) | 1,227 | 1,267 | ||||||
10-1A, B 144A 4.520%, 10/20/32(4) | 2,392 | 2,461 | ||||||
Miramax LLC 11-1A, A, 144A 6.250%, 10/20/21(4) | 18,169 | 19,097 | ||||||
MMCA Automobile Trust 11-A, B, 144A 2.720%, 10/17/16(4) | 3,500 | 3,617 | ||||||
New Century Home Equity Loan Trust 05-A, A4W 5.035%, 8/25/35(3) | 15,307 | 13,869 | ||||||
Orange Lake Timeshare Trust 12-AA, B 144A 4.870%, 3/10/27(4) | 967 | 991 | ||||||
Popular ABS Mortgage Pass-Through-Trust 05-5, AF3 5.086%, 11/25/35(3) | 12,029 | 11,517 | ||||||
Renaissance Home Equity Loan Trust 05-3, AF4 5.140%, 11/25/35(3) | 5,405 | 4,062 | ||||||
Rental Car Finance Corp. 11-1A, B1, 144A 4.380%, 2/25/16(4) | 4,000 | 4,163 | ||||||
Residential Asset Mortgage Products, Inc. 03-RS8, AI7 5.015%, 9/25/33(3) | 2,907 | 2,885 | ||||||
Residential Funding Mortgage Securities II, Inc. | ||||||||
04-HI3, A5 5.480%, 6/25/34(3) | 3,520 | 3,256 | ||||||
06-H11, M1 6.010%, 2/25/36(3) | 6,661 | 6,667 | ||||||
07-HI1, A2 5.640%, 3/25/37 | 962 | 963 | ||||||
See Notes to Financial Statements
17
Table of Contents
VIRTUS MULTI-SECTOR SHORT TERM BOND FUND
SCHEDULE OF INVESTMENTS (Continued)
SEPTEMBER 30, 2012
($ reported in thousands)
| PAR VALUE | VALUE | |||||||
| ASSET-BACKED SECURITIES (continued) | ||||||||
07-HI1, A3 5.720%, 3/25/37 | $ | 22,995 | $ | 23,009 | ||||
Santander Drive Auto Receivables Trust | ||||||||
11-2, B 2.660%, 1/15/16 | 9,560 | 9,712 | ||||||
10-B, C 144A 3.020%, 10/17/16(4) | 20,925 | 21,309 | ||||||
12-2, D 3.870%, 2/15/18 | 12,000 | 12,351 | ||||||
12-5, C 2.700%, 8/15/18 | 4,850 | 4,924 | ||||||
Sierra Receivables Funding Co., LLC | ||||||||
07-2A, A1 144A 5.370%, 9/20/19(4) | 1,598 | 1,643 | ||||||
10-3A, B, 144A 4.440%, 11/20/25(4) | 8,103 | 8,351 | ||||||
11-1A, B, 144A 4.230%, 4/20/26(4) | 7,498 | 7,682 | ||||||
12-2A, B, 144A 3.420%, 3/20/29(4) | 10,838 | 10,876 | ||||||
SLM Corp. | ||||||||
12-B, A2, 144A 3.480%, 10/15/30(4) | 12,000 | 12,741 | ||||||
12-C, A2, 144A 3.310%, 10/15/46(4) | 11,700 | 12,365 | ||||||
SNAAC Auto Receivables Trust 12-1A, A, 144A 1.780%, 6/15/16(4) | 2,930 | 2,936 | ||||||
Structured Asset Securities Corp 03-AL2, A 3.357%, 1/25/31(4) | 18,078 | 18,126 | ||||||
Structured Asset Securities Corp. | ||||||||
01-SB1, A2 3.375%, 8/25/31 | 2,293 | 2,262 | ||||||
02-AL1, A3 3.450%, 2/25/32 | 7,510 | 7,443 | ||||||
SVO MOI Mortgage Corp. 10-AA, A,144A 3.650%, 7/20/27(4) | 4,741 | 4,831 | ||||||
TAL Advantage LLC 12-1A, A 144A 3.860%, 5/20/27(4) | 11,600 | 12,099 | ||||||
| PAR VALUE | VALUE | |||||||
| ASSET-BACKED SECURITIES (continued) | ||||||||
Terwin Mortgage Trust 04-15AL, A1 144A 5.796%, 7/25/34(3)(4) | $ | 8,093 | $ | 7,724 | ||||
Tidewater Auto Receivables Trust 10-A, A 144A 5.920%, 5/15/17(4) | 237 | 238 | ||||||
Trinity Rail Leasing LP 03-1A, A, 144A | 2,532 | 2,811 | ||||||
Trip Rail Master Funding LLC 11-1A, A1A, 144A 4.370%, 7/15/41(4) | 6,924 | 7,106 | ||||||
U-Haul S Fleet LLC 10-BT1A, 1 144A 4.899%, 10/25/23(4) | 28,303 | 30,747 | ||||||
World Omni Automobile Lease Securitization Trust 12-A, A3 0.930%, 11/16/15 | 5,700 | 5,741 | ||||||
| TOTAL ASSET-BACKED SECURITIES | ||||||||
| (Identified Cost $777,753) | 796,615 | |||||||
| CORPORATE BONDS AND NOTES—34.0% | ||||||||
| Consumer Discretionary—3.8% | ||||||||
Arcos Dorados Holdings, Inc. 144A 10.250%, 7/13/16(4) | 14,225 | BRL | 7,543 | |||||
Boyd Gaming Corp. 9.125%, 12/1/18 | 2,425 | 2,558 | ||||||
CBS Corp. 1.950%, 7/1/17 | 10,025 | 10,279 | ||||||
CCO Holdings LLC (CCO Holdings Capital Corp.) 7.375%, 6/1/20 | 6,700 | 7,512 | ||||||
Daimler Finance North America LLC 144A 2.625%, 9/15/16(4) | 11,000 | 11,478 | ||||||
Dana Holding Corp. 6.500%, 2/15/19 | 3,973 | 4,251 | ||||||
See Notes to Financial Statements
18
Table of Contents
VIRTUS MULTI-SECTOR SHORT TERM BOND FUND
SCHEDULE OF INVESTMENTS (Continued)
SEPTEMBER 30, 2012
($ reported in thousands)
| PAR VALUE | VALUE | |||||||
| CORPORATE BONDS AND NOTES (continued) | ||||||||
| Consumer Discretionary (continued) | ||||||||
DISH DBS Corp. 144A 4.625%, 7/15/17(4) | $ | 11,530 | $ | 11,847 | ||||
GTP Acquisition Partners I LLC 144A 4.347%, 6/15/16(4) | 3,000 | 3,165 | ||||||
HD Supply, Inc. 144A 8.125%, 4/15/19(4) | 2,935 | 3,192 | ||||||
Hyatt Hotels Corp. 3.875%, 8/15/16 | 7,000 | 7,448 | ||||||
Hyundai Capital Services, Inc. 144A 3.750%, 4/6/16(4) | 500 | 532 | ||||||
Hyundai Motor Manufacturing Czech Sro 144A 4.500%, 4/15/15(4) | 6,000 | 6,410 | ||||||
International Game Technology 7.500%, 6/15/19 | 1,115 | 1,338 | ||||||
Korea Expressway Corp. 144A 4.500%, 3/23/15 | 2,670 | 2,861 | ||||||
Lotte Shopping Co. Ltd. 144A 3.375%, 5/9/17(4) | 14,095 | 14,686 | ||||||
MGM Resorts International | ||||||||
7.500%, 6/1/16 | 6,000 | 6,450 | ||||||
144A 6.750%, 10/1/20(4) | 6,500 | 6,516 | ||||||
Nara Cable Funding Ltd. 144A 8.875%, 12/1/18(4) | 9,665 | 8,868 | ||||||
Nissan Motor Acceptance Corp. 144A 4.500%, 1/30/15(4) | 8,620 | 9,247 | ||||||
Northwest Airlines Pass-Through-Trust | ||||||||
01-1, B 7.691%, 4/1/17 | 12,600 | 13,104 | ||||||
02-1, G2 6.264%, 11/20/21 | 19,384 | 20,450 | ||||||
| PAR VALUE | VALUE | |||||||
| Consumer Discretionary (continued) | ||||||||
Ono Finance II plc 144A 10.875%, 7/15/19(4) | $ | 1,035 | $ | 885 | ||||
Penn National Gaming, Inc. 8.750%, 8/15/19 | 6,615 | 7,442 | ||||||
Pittsburgh Glass Works LLC 144A 8.500%, 4/15/16(4) | 4,135 | 3,866 | ||||||
QVC, Inc. | ||||||||
144A 7.125%, 4/15/17(4) | 4,550 | 4,801 | ||||||
144A 7.500%, 10/1/19(4) | 8,740 | 9,671 | ||||||
U.S. Airways Pass-Through-Trust | ||||||||
99-1A 8.360%, 1/20/19 | 3,337 | 3,637 | ||||||
11-1 A 7.125%, 10/22/23 | 8,181 | 8,918 | ||||||
UAL Pass-Through-Trust | ||||||||
09-2 9.750%, 1/15/17 | 27,097 | 31,026 | ||||||
07-01A 6.636%, 7/2/22 | 11,752 | 12,281 | ||||||
Wyndham Worldwide Corp. | ||||||||
6.000%, 12/1/16 | 133 | 150 | ||||||
5.750%, 2/1/18 | 1,660 | 1,870 | ||||||
|
| |||||||
| 244,282 | ||||||||
|
| |||||||
| Consumer Staples—0.2% | ||||||||
BAT International Finance plc 144A 9.500%, 11/15/18(4) | 1,410 | 1,966 | ||||||
Bunge Ltd. Finance Corp. 5.100%, 7/15/15 | 6,000 | 6,445 | ||||||
Sigma Alimentos SA de CV 144A 5.625%, 4/14/18(4) | 5,850 | 6,473 | ||||||
|
| |||||||
| 14,884 | ||||||||
|
| |||||||
| Energy—4.0% | ||||||||
Afren plc 144A | 4,790 | 5,495 | ||||||
See Notes to Financial Statements
19
Table of Contents
VIRTUS MULTI-SECTOR SHORT TERM BOND FUND
SCHEDULE OF INVESTMENTS (Continued)
SEPTEMBER 30, 2012
($ reported in thousands)
| PAR VALUE | VALUE | |||||||
| CORPORATE BONDS AND NOTES (continued) | ||||||||
| Energy (continued) | ||||||||
Anadarko Petroleum Corp. | ||||||||
6.375%, 9/15/17 | $ | 12,050 | $ | 14,531 | ||||
8.700%, 3/15/19 | 2,925 | 3,924 | ||||||
Calumet Specialty Products Partners LP (Calumet Finance Corp.) 9.375%, 5/1/19 | 7,491 | 8,090 | ||||||
Carrizo Oil & Gas, Inc. 8.625%, 10/15/18 | 3,989 | 4,298 | ||||||
Chesapeake Energy Corp. | 5,545 | 5,566 | ||||||
Compagnie Generale de Geophysique-Veritas | 2,334 | 2,429 | ||||||
EP Energy LLC (EP Energy Finance, Inc.) 144A | 4,000 | 4,285 | ||||||
Expro Finance Luxembourg SCA 144A | 4,529 | 4,687 | ||||||
Frontier Oil Corp. | 2,550 | 2,728 | ||||||
Gazprom OAO (Gaz Capital SA) | ||||||||
144A | 10,405 | 11,563 | ||||||
144A | 2,880 | 3,508 | ||||||
144A | 3,235 | 3,803 | ||||||
Hercules Offshore, Inc. 144A | 9,250 | 9,632 | ||||||
KazMunayGas National Co. 144A | 6,900 | 7,227 | ||||||
Kinder Morgan Energy Partners LP | 2,545 | 3,197 | ||||||
| PAR VALUE | VALUE | |||||||
| Energy (continued) | ||||||||
Korea National Oil Corp. | ||||||||
144A | $ | 4,345 | $ | 4,654 | ||||
144A | 5,000 | 5,202 | ||||||
Lukoil International Finance BV 144A | 4,900 | 5,333 | ||||||
Midcontinent Express Pipeline LLC 144A | 7,500 | 7,992 | ||||||
MIE Holdings Corp. 144A 9.750%, 5/12/16(4) | 2,985 | 3,112 | ||||||
National JSC Naftogaz of Ukraine | 2,900 | 2,962 | ||||||
OGX Austria GmbH 144A | 8,000 | 7,240 | ||||||
Petrobras International Finance Co. | ||||||||
3.875%, 1/27/16 | 12,430 | 13,151 | ||||||
3.500%, 2/6/17 | 2,000 | 2,092 | ||||||
Petroleos de Venezuela SA | ||||||||
Series 2014 | 16,540 | 14,977 | ||||||
RegS | 66,510 | 60,358 | ||||||
Petroplus Finance Ltd. 144A 6.750%, 5/1/14(4)(6)(10) | 5,455 | 791 | ||||||
Pride International, Inc. 8.500%, 6/15/19 | 4,065 | 5,403 | ||||||
Quicksilver Resources, Inc. 7.125%, 4/1/16 | 3,190 | 2,743 | ||||||
TNK-BP Finance SA | ||||||||
144A | 500 | 544 | ||||||
RegS | 13,235 | 15,293 | ||||||
See Notes to Financial Statements
20
Table of Contents
VIRTUS MULTI-SECTOR SHORT TERM BOND FUND
SCHEDULE OF INVESTMENTS (Continued)
SEPTEMBER 30, 2012
($ reported in thousands)
| PAR VALUE | VALUE | |||||||
| CORPORATE BONDS AND NOTES (continued) | ||||||||
| Energy (continued) | ||||||||
Venoco, Inc. | $ | 5,675 | $ | 4,966 | ||||
Weatherford International Ltd. | 4,110 | 5,350 | ||||||
|
| |||||||
| 257,126 | ||||||||
|
| |||||||
| Financials—16.0% | ||||||||
Abbey National Treasury Services plc 144A 3.875%, 11/10/14(4) | 11,599 | 11,839 | ||||||
ABN Amro Bank N.V. | ||||||||
144A | 9,000 | 9,130 | ||||||
144A | 4,425 | 4,747 | ||||||
ADCB Finance Cayman Ltd. 144A | 5,290 | 5,573 | ||||||
Air Lease Corp. 144A 5.625%, 4/1/17(4) | 12,995 | 13,320 | ||||||
Akbank TAS 144A | 8,900 | 9,245 | ||||||
Alfa Invest Ltd. RegS 7.875%, 9/25/17(5)(6) | 9,750 | 10,557 | ||||||
Allstate Corp. | 4,730 | 4,872 | ||||||
Alta Mesa Holdings LP (Alta Mesa Finance Services Corp.) | 8,150 | 8,191 | ||||||
American Express Credit Corp. | ||||||||
5.875%, 5/2/13 | 4,805 | 4,956 | ||||||
Series C, | 2,600 | 2,755 | ||||||
American Honda Finance Corp. 144A | 4,850 | 5,144 | ||||||
American International Group, Inc. | ||||||||
2.375%, 8/24/15 | 5,825 | 5,887 | ||||||
4.875%, 9/15/16 | 8,850 | 9,881 | ||||||
| PAR VALUE | VALUE | |||||||
| Financials (continued) | ||||||||
Associated Banc Corp. | $ | 4,590 | $ | 5,039 | ||||
Assurant, Inc. | 4,060 | 4,233 | ||||||
Banco Bilbao Vizcaya Argentaria Bancomer SA | ||||||||
3.250%, 5/16/14 | 4,000 | 3,970 | ||||||
144A | 5,000 | 5,275 | ||||||
Banco Bradesco SA | ||||||||
144A | 7,000 | 7,378 | ||||||
144A | 7,000 | 7,455 | ||||||
Banco Continental SA Via Continental Senior Trustees II Cayman Ltd. 144A | 10,000 | 10,875 | ||||||
Banco de Credito del Peru 144A | 14,800 | 15,614 | ||||||
Banco de Credito e Inversiones 144A 3.000%, 9/13/17(4) | 3,775 | 3,770 | ||||||
Banco Santander SA | ||||||||
144A | 7,500 | 7,697 | ||||||
144A | 3,800 | 3,926 | ||||||
144A | 5,000 | 5,150 | ||||||
Banco Votorantim SA 144A 5.250%, 2/11/16(4) | 8,500 | 9,010 | ||||||
Bangkok Bank Pcl/Hong Kong 144A 2.750%, 3/27/18(4) | 16,550 | 16,586 | ||||||
Bank of Georgia JSC 144A 7.750%, 7/5/17(4) | 5,810 | 5,929 | ||||||
Barclays Bank plc | ||||||||
5.200%, 7/10/14 | 1,610 | 1,719 | ||||||
144A 6.050%, 12/4/17(4) | 4,130 | 4,445 | ||||||
144A 5.926%(3)(4)(7)(8) | 3,773 | 3,627 | ||||||
See Notes to Financial Statements
21
Table of Contents
VIRTUS MULTI-SECTOR SHORT TERM BOND FUND
SCHEDULE OF INVESTMENTS (Continued)
SEPTEMBER 30, 2012
($ reported in thousands)
| PAR VALUE | VALUE | |||||||
| CORPORATE BONDS AND NOTES (continued) | ||||||||
| Financials (continued) | ||||||||
Bear Stearns Cos., Inc. LLC (The) 7.250%, 2/1/18 | $ | 4,365 | $ | 5,448 | ||||
BioMed Realty LP 3.850%, 4/15/16 | 9,375 | 9,863 | ||||||
Brandywine Operating Partnership LP 4.950%, 4/15/18 | 4,700 | 5,051 | ||||||
Capital One Financial Corp. 6.150%, 9/1/16 | 5,364 | 6,124 | ||||||
Chubb Corp. 6.375%, 3/29/67(3) | 8,205 | 8,738 | ||||||
CIT Group, Inc. 4.250%, 8/15/17 | 12,050 | 12,568 | ||||||
Citigroup, Inc. | ||||||||
4.875%, 5/7/15 | 12,075 | 12,842 | ||||||
0.678%, 6/9/16(3) | 3,400 | 3,142 | ||||||
5.500%, 2/15/17 | 3,635 | 4,027 | ||||||
CNA Financial Corp. 5.850%, 12/15/14 | 7,575 | 8,219 | ||||||
Comerica Bank | ||||||||
5.700%, 6/1/14 | 1,900 | 2,036 | ||||||
4.800%, 5/1/15 | 1,828 | 1,977 | ||||||
5.750%, 11/21/16 | 5,940 | 6,830 | ||||||
Corporacion Andina de Fomento 5.200%, 5/21/13 | 1,000 | 1,026 | ||||||
Countrywide Financial Corp. 6.250%, 5/15/16 | 12,000 | 13,087 | ||||||
Danske Bank A/S 144A 3.875%, 4/14/16(4) | 8,000 | 8,251 | ||||||
Deutsche Bank Financial LLC 5.375%, 3/2/15 | 2,933 | 3,106 | ||||||
Discover Bank 8.700%, 11/18/19 | 1,750 | 2,260 | ||||||
DNB Bank ASA 144A 3.200%, 4/3/17(4) | 24,700 | 25,802 | ||||||
Fidelity National Financial, Inc. | 6,475 | 7,248 | ||||||
Fifth Third Bancorp 4.500%, 6/1/18 | 6,745 | 7,469 | ||||||
| PAR VALUE | VALUE | |||||||
| Financials (continued) | ||||||||
Fifth Third Bank 4.750%, 2/1/15 | $ | 750 | $ | 803 | ||||
First Horizon National Corp. 5.375%, 12/15/15 | 1,950 | 2,133 | ||||||
First Tennessee Bank N.A. 5.650%, 4/1/16 | 12,730 | 13,754 | ||||||
Ford Motor Credit Co. LLC 144A | 10,000 | 10,599 | ||||||
Gazprom OAO (Gaz Capital SA) 144A 4.950%, 5/23/16(4)(6) | 5,000 | 5,294 | ||||||
General Electric Capital Corp. 0.822%, 5/5/26(3) | 8,000 | 6,769 | ||||||
General Motors Financial Co., Inc. 144A 4.750%, 8/15/17(4) | 11,440 | 11,745 | ||||||
Genworth Financial, Inc. | ||||||||
5.750%, 6/15/14 | 6,890 | 7,084 | ||||||
7.625%, 9/24/21 | 4,375 | 4,466 | ||||||
Glen Meadow Pass-Through-Trust 144A 6.505%, 2/12/67(3)(4) | 10,345 | 8,729 | ||||||
Goldman Sachs Group, Inc. (The) | ||||||||
5.350%, 1/15/16 | 3,225 | 3,564 | ||||||
5.625%, 1/15/17 | 2,800 | 3,086 | ||||||
7.500%, 2/15/19 | 2,451 | 3,040 | ||||||
Hana Bank | ||||||||
144A 4.500%, 10/30/15(4) | 11,000 | 11,889 | ||||||
144A 3.500%, 10/25/17(4) | 5,535 | 5,890 | ||||||
HBOS plc 144A 6.750%, 5/21/18(4) | 685 | 695 | ||||||
HCP, Inc. | ||||||||
3.750%, 2/1/16 | 8,000 | 8,492 | ||||||
3.750%, 2/1/19 | 4,940 | 5,180 | ||||||
Health Care REIT, Inc. | ||||||||
4.700%, 9/15/17 | 8,565 | 9,455 | ||||||
4.125%, 4/1/19 | 4,100 | 4,367 | ||||||
See Notes to Financial Statements
22
Table of Contents
VIRTUS MULTI-SECTOR SHORT TERM BOND FUND
SCHEDULE OF INVESTMENTS (Continued)
SEPTEMBER 30, 2012
($ reported in thousands)
| PAR VALUE | VALUE | |||||||
| CORPORATE BONDS AND NOTES (continued) | ||||||||
| Financials (continued) | ||||||||
Healthcare Realty Trust, Inc. 6.500%, 1/17/17 | $ | 3,000 | $ | 3,420 | ||||
HSBC Bank plc 144A 3.100%, 5/24/16(4) | 12,200 | 12,858 | ||||||
Huntington Bancshares, Inc. 7.000%, 12/15/20 | 1,025 | 1,246 | ||||||
Huntington National Bank (The) 4.900%, 1/15/14 | 1,400 | 1,406 | ||||||
Hutchison Whampoa International Ltd. 144A 3.500%, 1/13/17(4) | 9,000 | 9,548 | ||||||
Hyundai Capital Services, Inc. | ||||||||
144A 6.000%, 5/5/15(4) | 4,975 | 5,475 | ||||||
144A 4.375%, 7/27/16(4) | 1,500 | 1,617 | ||||||
144A 3.500%, 9/13/17(4) | 8,000 | 8,367 | ||||||
144A 2.125%, 10/2/17(4) | 2,940 | 2,941 | ||||||
ING Bank NV | ||||||||
144A 2.375%, 6/9/14(4) | 5,000 | 5,027 | ||||||
144A 4.000%, 3/15/16(4) | 9,000 | 9,519 | ||||||
International Lease Finance Corp. 5.650%, 6/1/14 | 5,820 | 6,126 | ||||||
Jefferies Group, Inc. 5.125%, 4/13/18 | 6,541 | 6,639 | ||||||
JPMorgan Chase & Co. 6.125%, 6/27/17 | 3,550 | 4,180 | ||||||
Kazkommerts Bank International BV | ||||||||
144A 7.875%, 4/7/14(4) | 4,135 | 4,114 | ||||||
RegS 8.000%, 11/3/15(5) | 1,000 | 940 | ||||||
| PAR VALUE | VALUE | |||||||
| Financials (continued) | ||||||||
KeyBank N.A. | ||||||||
5.800%, 7/1/14 | $ | 1,450 | $ | 1,560 | ||||
7.413%, 5/6/15 | 3,000 | 3,328 | ||||||
4.950%, 9/15/15 | 1,295 | 1,415 | ||||||
KeyCorp | 2,925 | 3,029 | ||||||
Kookmin Bank 144A 7.250%, 5/14/14(4) | 5,700 | 6,222 | ||||||
Korea Development Bank | ||||||||
4.375%, 8/10/15 | 2,525 | 2,735 | ||||||
3.875%, 5/4/17 | 7,000 | 7,618 | ||||||
3.500%, 8/22/17 | 9,750 | 10,495 | ||||||
Legg Mason, Inc. 144A 5.500%, 5/21/19(4) | 2,080 | 2,232 | ||||||
Lincoln National Corp. | ||||||||
8.750%, 7/1/19 | 2,340 | 3,067 | ||||||
6.050%, 4/20/67(3)(8) | 2,885 | 2,824 | ||||||
Macquarie Bank Ltd. 144A | 7,920 | 8,106 | ||||||
Manufacturers & Traders Trust Co. | 5,000 | 4,979 | ||||||
Mercantile Bankshares Corp. | 4,708 | 4,799 | ||||||
MetLife, Inc. | 910 | 1,089 | ||||||
Metropolitan Life Global Funding I 144A | 13,770 | 14,045 | ||||||
Morgan Stanley | ||||||||
6.000%, 5/13/14 | 1,970 | 2,088 | ||||||
3.800%, 4/29/16 | 5,850 | 6,046 | ||||||
5.750%, 10/18/16 | 3,455 | 3,799 | ||||||
144A | 10,525 | BRL | 5,591 | |||||
Nationwide Health Properties, Inc. | 4,825 | 4,914 | ||||||
See Notes to Financial Statements
23
Table of Contents
VIRTUS MULTI-SECTOR SHORT TERM BOND FUND
SCHEDULE OF INVESTMENTS (Continued)
SEPTEMBER 30, 2012
($ reported in thousands)
| PAR VALUE | VALUE | |||||||
| CORPORATE BONDS AND NOTES (continued) | ||||||||
| Financials (continued) | ||||||||
Nordea Bank AB 144A 2.125%, 1/14/14(4) | $ | 5,000 | $ | 5,056 | ||||
OJSC AK Transneft (TransCapitalInvest Ltd.) 144A | 5,715 | 6,061 | ||||||
ORIX Corp. | 5,228 | 5,657 | ||||||
PNC Funding Corp. | 3,130 | 3,604 | ||||||
Progressive Corp. (The) 6.700%, 6/15/37(3) | 2,740 | 2,959 | ||||||
Prudential Financial, Inc. | ||||||||
4.750%, 9/17/15 | 4,770 | 5,253 | ||||||
8.875%, 6/15/38(3)(8) | 11,200 | 13,832 | ||||||
Regions Bank | 12,001 | 14,191 | ||||||
Regions Financial Corp. 5.750%, 6/15/15 | 2,535 | 2,722 | ||||||
Reynolds Group Issuer, Inc. (Reynolds Group Issuer LLC) | 2,500 | 2,712 | ||||||
Royal Bank of Scotland Group plc (The) | 3,130 | 3,598 | ||||||
Royal Bank of Scotland plc (The) | ||||||||
Series 2 | 7,000 | 7,134 | ||||||
4.875%, 3/16/15 | 3,230 | 3,464 | ||||||
3.950%, 9/21/15 | 3,860 | 4,099 | ||||||
Russian Agricultural Bank OJSC (RSHB Capital SA) | ||||||||
144A | 780 | 865 | ||||||
144A | 2,905 | 3,195 | ||||||
144A | 8,200 | 8,673 | ||||||
| PAR VALUE | VALUE | |||||||
| Financials (continued) | ||||||||
Santander Holdings USA, Inc. | $ | 980 | $ | 991 | ||||
Santander U.S. Debt S.A. 144A | 8,100 | 8,040 | ||||||
Sberbank of Russia (Sberbank CapItal SA) | ||||||||
144A | 26,100 | 27,405 | ||||||
144A | 8,295 | 8,950 | ||||||
Senior Housing Properties Trust | 6,875 | 7,085 | ||||||
Shinhan Bank 144A 4.375%, 7/27/17(4) | 11,700 | 12,876 | ||||||
SLM Corp. | 17,805 | 18,085 | ||||||
Societe Generale S.A. | ||||||||
144A | 2,900 | 2,961 | ||||||
144A | 6,895 | 7,077 | ||||||
144A | 6,800 | 5,509 | ||||||
Sovereign Bank | 7,000 | 7,026 | ||||||
Spansion LLC | 2,955 | 2,940 | ||||||
State Street Corp. | 5,000 | 5,528 | ||||||
SunTrust Bank, Inc. | ||||||||
6.000%, 9/11/17 | 4,925 | 5,737 | ||||||
5.450%, 12/1/17 | 3,750 | 4,146 | ||||||
Svenska Handelsbanken AB 3.125%, 7/12/16 | 10,000 | 10,602 | ||||||
Turkiye | ||||||||
Vakiflar Bankasi Tao 144A 5.750%, 4/24/17(4) | 14,000 | 14,770 | ||||||
Garanti Bankasi AS 144A 4.000%, 9/13/17(4) | 2,000 | 2,001 | ||||||
See Notes to Financial Statements
24
Table of Contents
VIRTUS MULTI-SECTOR SHORT TERM BOND FUND
SCHEDULE OF INVESTMENTS (Continued)
SEPTEMBER 30, 2012
($ reported in thousands)
| PAR VALUE | VALUE | |||||||
| CORPORATE BONDS AND NOTES (continued) | ||||||||
| Financials (continued) | ||||||||
United Rentals Financing Escrow Corp. 144A 5.750%, 7/15/18(4) | $ | 7,895 | $ | 8,359 | ||||
Unum Group | 6,620 | 7,706 | ||||||
Vanguard Health Holding Co. II, LLC (Vanguard Holding Co. II, Inc.) 7.750%, 2/1/19 | 3,212 | 3,433 | ||||||
Ventas Realty LP (Ventas Capital Corp.) | 8,030 | 8,584 | ||||||
Vnesheconombank (VEB Finance plc) | ||||||||
144A | 5,415 | 5,806 | ||||||
144A | 1,500 | 1,632 | ||||||
VTB Bank OJSC (VTB Capital SA) | ||||||||
144A | 6,000 | 6,380 | ||||||
144A | 12,445 | 13,005 | ||||||
Wachovia Bank NA | 2,600 | 2,849 | ||||||
Webster Financial Corp. 5.125%, 4/15/14 | 2,500 | 2,516 | ||||||
Wells Fargo & Co. 5.125%, 9/15/16 | 5,000 | 5,624 | ||||||
Willis Group Holdings plc 4.125%, 3/15/16 | 6,000 | 6,370 | ||||||
Yapi Ve Kredi Bankasi (Unicredit Luxembourg S.A.) 144A | 2,000 | 2,055 | ||||||
| PAR VALUE | VALUE | |||||||
| Financials (continued) | ||||||||
Zions Bancorp | ||||||||
5.650%, 5/15/14 | $ | 1,775 | $ | 1,836 | ||||
7.750%, 9/23/14 | 6,194 | 6,780 | ||||||
4.500%, 3/27/17 | 8,120 | 8,384 | ||||||
|
| |||||||
| 1,029,470 | ||||||||
|
| |||||||
| Health Care—0.7% | ||||||||
Community Health Systems, Inc. (CHS) | ||||||||
5.125%, 8/15/18 | 9,320 | 9,693 | ||||||
7.125%, 7/15/20 | 3,185 | 3,402 | ||||||
HCA, Inc. 6.500%, 2/15/20 | 18,765 | 20,923 | ||||||
Patheon, Inc. 144A 8.625%, 4/15/17(4) | 720 | 738 | ||||||
Symbion, Inc. 8.000%, 6/15/16 | 6,517 | 6,712 | ||||||
U.S. Oncology, Inc. 0.000%, 2/16/49(9) | 1,263 | 0 | ||||||
|
| |||||||
| 41,468 | ||||||||
|
| |||||||
| Industrials—4.4% | ||||||||
ADS Tactical, Inc. 144A 11.000%, 4/1/18(4) | 7,416 | 7,435 | ||||||
Aircastle Ltd. 6.750%, 4/15/17 | 10,080 | 10,912 | ||||||
America West Airlines, Inc. Pass-Through-Trust | ||||||||
98-1A, 6.870%, 1/2/17 | 2,220 | 2,242 | ||||||
Series 99-1, G 7.930%, 1/2/19 | 9,367 | 9,859 | ||||||
Series 00-1, G 8.057%, 7/2/20 | 9,703 | 10,334 | ||||||
Atlas Air Pass-Through-Trust | ||||||||
98-1, A 7.380%, 1/2/18 | 10,904 | 11,258 | ||||||
99-1, A1 7.200%, 1/2/19 | 2,304 | 2,327 | ||||||
00-1. A 8.707%, 1/2/19 | 3,362 | 3,589 | ||||||
See Notes to Financial Statements
25
Table of Contents
VIRTUS MULTI-SECTOR SHORT TERM BOND FUND
SCHEDULE OF INVESTMENTS (Continued)
SEPTEMBER 30, 2012
($ reported in thousands)
| PAR VALUE | VALUE | |||||||
| CORPORATE BONDS AND NOTES (continued) | ||||||||
| Industrials (continued) | ||||||||
AWAS Aviation Capital Ltd. 144A 7.000%, 10/15/16(4) | $ | 11,089 | $ | 11,810 | ||||
Cemex Finance LLC 144A 9.500%, 12/14/16(4) | 5,600 | 5,810 | ||||||
Continental Airlines Pass-Through-Trust | ||||||||
98-1, A 6.648%, 9/15/17 | 5,439 | 5,874 | ||||||
97-4, A 6.900%, 1/2/18 | 5,604 | 6,109 | ||||||
99-1, A 6.545%, 2/2/19 | 9,236 | 10,113 | ||||||
01-A1 6.703%, 6/15/21 | 13,581 | 14,804 | ||||||
Corp Andina de Fomento 3.750%, 1/15/16 | 10,000 | 10,486 | ||||||
Delta Air Lines Pass-Through-Trust | ||||||||
11-1, A 5.300%, 4/15/19 | 16,454 | 17,853 | ||||||
09-1, A 7.750%, 12/17/19 | 558 | 638 | ||||||
Series 12-1A, 1A 4.750%, 5/7/20 | 22,200 | 22,755 | ||||||
Deluxe Corp. 7.000%, 3/15/19 | 4,970 | 5,312 | ||||||
Express Scripts Holding Co. 144A 3.500%, 11/15/16(4) | 10,000 | 10,813 | ||||||
Hutchison Whampoa International Ltd. 144A 4.625%, 9/11/15(4) | 3,900 | 4,221 | ||||||
JMC Steel Group 144A 8.250%, 3/15/18(4) | 6,030 | 6,181 | ||||||
Kratos Defense & Security Solutions, Inc. 10.000%, 6/1/17 | 8,570 | 9,299 | ||||||
| PAR VALUE | VALUE | |||||||
| Industrials (continued) | ||||||||
Owens Corning, Inc. 6.500%, 12/1/16 | $ | 11,150 | $ | 12,523 | ||||
PPL WEM Holdings plc 144A 3.900%, 5/1/16(4) | 5,495 | 5,784 | ||||||
Ryder System, Inc. 2.500%, 3/1/17 | 11,980 | 12,189 | ||||||
ServiceMaster Co. 144A 7.000%, 8/15/20(4) | 2,845 | 2,930 | ||||||
Toledo Edison Co. (The) 7.250%, 5/1/20 | 1,360 | 1,783 | ||||||
Transnet SOC Ltd. 144A 4.500%, 2/10/16(4) | 9,000 | 9,561 | ||||||
U.S. Airways Pass-Through-Trust | ||||||||
98-1 6.850%, 1/30/18 | 5,108 | 5,338 | ||||||
01-1G 7.076%, 3/20/21 | 15,867 | 16,224 | ||||||
12-1A 5.900%, 10/1/24 | 11,500 | 12,161 | ||||||
|
| |||||||
| 278,527 | ||||||||
|
| |||||||
| Information Technology—0.4% | ||||||||
Digicel Ltd. 144A | 7,886 | 8,596 | ||||||
EarthLink, Inc. 8.875%, 5/15/19 | 6,725 | 6,742 | ||||||
MDC-GMTN B.V. 144A 3.750%, 4/20/16(4) | 4,000 | 4,209 | ||||||
Sorenson Communications, Inc. 144A 10.500%, 2/1/15(4) | 3,400 | 3,001 | ||||||
Tech Data Corp. 3.750%, 9/21/17 | 790 | 804 | ||||||
Xerox Corp. 4.250%, 2/15/15 | 4,000 | 4,248 | ||||||
|
| |||||||
| 27,600 | ||||||||
|
| |||||||
See Notes to Financial Statements
26
Table of Contents
VIRTUS MULTI-SECTOR SHORT TERM BOND FUND
SCHEDULE OF INVESTMENTS (Continued)
SEPTEMBER 30, 2012
($ reported in thousands)
| PAR VALUE | VALUE | |||||||
| CORPORATE BONDS AND NOTES (continued) | ||||||||
| Materials—2.0% | ||||||||
Allegheny Technologies, Inc. 9.375%, 6/1/19 | $ | 7,245 | $ | 9,362 | ||||
Anglo American Capital plc 144A 9.375%, 4/8/19(4) | 1,950 | 2,559 | ||||||
Ardagh Packaging Finance plc (Ardagh Packaging Holdings, Inc.) 144A 7.375%, 10/15/17(4) | 8,145 | 8,766 | ||||||
Catalyst Paper Corp. | ||||||||
13.000%, 10/30/17 | 2,284 | 1,896 | ||||||
Cemex SAB de CV 144A 9.500%, 6/15/18(4) | 2,704 | 2,774 | ||||||
CRH America, Inc. | ||||||||
4.125%, 1/15/16 | 4,000 | 4,177 | ||||||
8.125%, 7/15/18 | 4,770 | 5,802 | ||||||
FMG Resources Property Ltd. | ||||||||
144A 6.000%, 4/1/17(4) | 2,485 | 2,324 | ||||||
144A 8.250%, 11/1/19(4) | 8,600 | 8,385 | ||||||
Gerdau Holdings, Inc. 144A 7.000%, 1/20/20(4) | 1,950 | 2,252 | ||||||
International Paper Co. 9.375%, 5/15/19 | 5,330 | 7,209 | ||||||
Libbey Glass, Inc. 144A 6.875%, 5/15/20(4) | 8,135 | 8,786 | ||||||
Norske Skog Canada Ltd | ||||||||
7.375%, 3/1/14(10)(11) | 1,055 | 21 | ||||||
PIK | ||||||||
Nufarm Australia Ltd. 144A 6.375%, 10/15/19(4) | 7,135 | 7,260 | ||||||
Reynolds Group Issuer, Inc. (Reynolds Group Issuer LLC) 144A 5.750%, 10/15/20(4) | 12,945 | 12,961 | ||||||
| PAR VALUE | VALUE | |||||||
| Materials (continued) | ||||||||
Sappi Papier Holding GmbH | ||||||||
144A 7.750%, 7/15/17(4) | $ | 12,830 | $ | 13,776 | ||||
144A 8.375%, 6/15/19(4) | 4,860 | 5,218 | ||||||
Severstal OAO (Steel Capital SA) | ||||||||
144A 6.250%, 7/26/16(4)(6) | 6,665 | 6,986 | ||||||
144A 6.700%, 10/25/17(4)(6) | 5,975 | 6,417 | ||||||
Sinopec Group Overseas Development Ltd. 144A 2.750%, 5/17/17(4) | 10,000 | 10,371 | ||||||
Verso Paper Holdings LLC (Verso Paper, Inc.) 8.750%, 2/1/19 | 225 | 110 | ||||||
|
| |||||||
| 127,412 | ||||||||
|
| |||||||
| Telecommunication Services—1.9% | ||||||||
America Movil SAB de CV 2.375%, 9/8/16 | 11,000 | 11,449 | ||||||
Axtel SAB de CV 144A 9.000%, 9/22/19(4) | 750 | 473 | ||||||
CenturyLink, Inc. 6.000%, 4/1/17 | 10,050 | 11,261 | ||||||
Crown Castle Towers LLC | ||||||||
144A 4.523%, 1/15/15(4) | 4,925 | 5,235 | ||||||
144A 3.214%, 8/15/15(4) | 4,950 | 5,151 | ||||||
144A 5.495%, 1/15/17(4) | 5,915 | 6,748 | ||||||
France Telecom SA 2.750%, 9/14/16 | 1,000 | 1,049 | ||||||
Frontier Communications Corp. 7.125%, 3/15/19 | 5,500 | 5,885 | ||||||
See Notes to Financial Statements
27
Table of Contents
VIRTUS MULTI-SECTOR SHORT TERM BOND FUND
SCHEDULE OF INVESTMENTS (Continued)
SEPTEMBER 30, 2012
($ reported in thousands)
| PAR VALUE | VALUE | |||||||
| CORPORATE BONDS AND NOTES (continued) | ||||||||
| Telecommunication Services (continued) | ||||||||
SBA Tower Trust 144A 4.254%, 4/15/15(4) | $ | 11,660 | $ | 12,283 | ||||
144A 2.933%, 12/15/17(4) | 13,275 | 13,649 | ||||||
Sprint Nextel Corp. 6.000%, 12/1/16 | 14,550 | 15,059 | ||||||
Telecom Italia Capital SA | ||||||||
6.175%, 6/18/14 | 4,900 | 5,157 | ||||||
7.175%, 6/18/19 | 2,395 | 2,640 | ||||||
Telefonica Emisiones SAU 6.421%, 6/20/16 | 7,500 | 7,922 | ||||||
Wind Acquisition Finance S.A. 144A 11.750%, 7/15/17(4) | 6,425 | 6,088 | ||||||
Windstream Corp. 7.750%, 10/15/20 | 12,125 | 13,065 | ||||||
|
| |||||||
| 123,114 | ||||||||
|
| |||||||
| Utilities—0.6% | ||||||||
AmeriGas Partners LP (AmeriGas Finance Corp.) | ||||||||
6.250%, 8/20/19 | 5,670 | 5,925 | ||||||
6.750%, 5/20/20 | 4,000 | 4,280 | ||||||
Centrais Eletricas Brasileiras SA 144A 6.875%, 7/30/19(4) | 10,875 | 12,961 | ||||||
Enel Finance International N.V. 144A 3.875%, 10/7/14(4) | 2,000 | 2,056 | ||||||
Korea Electric Power Corp. 144A 5.500%, 7/21/14(4) | 3,420 | 3,667 | ||||||
Korea Gas Corp. 144A 6.000%, 7/15/14(4) | 2,000 | 2,161 | ||||||
Korea Hydro & Nuclear Power Co., Ltd. 144A 3.125%, 9/16/15(4) | 1,000 | 1,046 | ||||||
| PAR VALUE | VALUE | |||||||
| Utilities (continued) | ||||||||
Midwest Generation LLC Series B 8.560%, 1/2/16 | $ | 810 | $ | 737 | ||||
NRG Energy, Inc. | ||||||||
7.625%, 1/15/18 | 1,485 | 1,615 | ||||||
8.500%, 6/15/19 | 2,750 | 2,984 | ||||||
TransAlta Corp. 4.750%, 1/15/15 | 2,220 | 2,340 | ||||||
|
| |||||||
| 39,772 | ||||||||
| TOTAL CORPORATE BONDS AND NOTES | ||||||||
| (Identified Cost $2,081,369) | 2,183,655 | |||||||
| LOAN AGREEMENTS(3)—13.3% | ||||||||
| Consumer Discretionary—3.4% | ||||||||
Acosta, Inc. 5.750%, 9/25/17 | 7,980 | 8,035 | ||||||
Advantage Sales & Marketing, Inc. First Lien, 5.250%, 12/18/17 | 712 | 717 | ||||||
Allison Transmission, Inc. 4.250%, 8/23/19 | 7,755 | 7,789 | ||||||
Avis Budget Car Rental LLC Tranche B, 6.250%, 9/22/18 | 373 | 376 | ||||||
Boyd Gaming Corp. 6.000%, 12/17/15 | 4,813 | 4,881 | ||||||
Caesars Entertainment Operating Co., Inc. (Harrah’s Operating Company, Inc.) | ||||||||
Tranche B-4, 9.500%, 10/31/16 | 5,946 | 6,122 | ||||||
Tranche B-6, 9.500%, 1/28/18 | 10,226 | 9,319 | ||||||
Cengage Learning Acquisitions, Inc. 2.470%, 7/3/14 | 6,886 | 6,589 | ||||||
See Notes to Financial Statements
28
Table of Contents
VIRTUS MULTI-SECTOR SHORT TERM BOND FUND
SCHEDULE OF INVESTMENTS (Continued)
SEPTEMBER 30, 2012
($ reported in thousands)
| PAR VALUE | VALUE | |||||||
| LOAN AGREEMENTS (continued) | ||||||||
| Consumer Discretionary (continued) | ||||||||
Charter Communications Operating LLC | ||||||||
Tranche C, 3.470%, 9/6/16 | $ | 3,251 | $ | 3,263 | ||||
Tranche D, 3.470%, 5/15/19 | 4,975 | 5,010 | ||||||
Chrysler Group LLC (Chrysler Group Co-Issuer, Inc.) Tranche B, 6.000%, 5/24/17 | 8,295 | 8,481 | ||||||
Cogeco Cable (Atlantic Broadband Sub) | 4,090 | 4,131 | ||||||
Cumulus Media Holdings, Inc. First Lien, | 9,917 | 9,993 | ||||||
Dunkin’ Brands, Inc. Tranche B-2, | 3,878 | 3,877 | ||||||
Entercom Radio LLC Tranche B, | 5,373 | 5,444 | ||||||
Fram Group Holdings, Inc. (Prestone Holdings, Inc.) First Lien, | 7,425 | 7,397 | ||||||
Gateway Casinos & Entertainment Ltd. | 3,214 | CAD | 3,246 | |||||
Getty Images, Inc. | 6,105 | 6,118 | ||||||
Gymboree Corp. (The) | 2,737 | 2,675 | ||||||
HD Supply, Inc. | 11,870 | 12,282 | ||||||
Hubbard Radio LLC First Lien, | 3,617 | 3,658 | ||||||
| PAR VALUE | VALUE | |||||||
| Consumer Discretionary (continued) | ||||||||
Intelsat Jackson Holding S.A. (Intelsat Jackson Holding Ltd.) | ||||||||
3.221%, 2/1/14 | $ | 2,335 | $ | 2,327 | ||||
Tranche B, | 3,950 | 3,964 | ||||||
Landry’s, Inc. (Landry’s Restaurants, Inc.) | 10,831 | 11,016 | ||||||
Leslie’s Poolmart, Inc. Tranche B, | 3,316 | 3,305 | ||||||
MTL Publishing LLC (EMI Music Publishing Group North America Holdings, Inc.) | 7,352 | 7,451 | ||||||
Neiman Marcus Group, Inc. (The) | 8,102 | 8,159 | ||||||
Nielsen Finance LLC | ||||||||
Tranche A, | 288 | 289 | ||||||
Tranche B, | 3,274 | 3,294 | ||||||
Ozburn-Hessey Holding Co., LLC First Lien, | 1,191 | 1,143 | ||||||
Penn National Gaming, Inc. Tranche B, | 2,963 | 2,980 | ||||||
Pilot Travel Centers LLC | ||||||||
Tranche B, | 3,191 | 3,205 | ||||||
Tranche B, | 418 | 421 | ||||||
Radio One, Inc. | 1,899 | 1,916 | ||||||
See Notes to Financial Statements
29
Table of Contents
VIRTUS MULTI-SECTOR SHORT TERM BOND FUND
SCHEDULE OF INVESTMENTS (Continued)
SEPTEMBER 30, 2012
($ reported in thousands)
| PAR VALUE | VALUE | |||||||
| LOAN AGREEMENTS (continued) | ||||||||
| Consumer Discretionary (continued) | ||||||||
ServiceMaster Co. (The) Tranche B, | $ | 4,243 | $ | 4,264 | ||||
Seven Seas Cruises, Inc. Tranche B, | 5,191 | 5,230 | ||||||
Sports Authority, Inc. (The) Tranche B, | 2,260 | 2,267 | ||||||
SRAM LLC First Lien, | 2,333 | 2,362 | ||||||
Station GVR Acquisition LLC (Green Valley Ranch Gaming LLC) | 5,592 | 5,614 | ||||||
Toys “R” Us, Inc. | 9,011 | 9,005 | ||||||
Visant Corp. (Jostens) Tranche B, | 9,055 | 8,743 | ||||||
VWR Funding, Inc. 4.466%, 4/3/17 | 3,202 | 3,222 | ||||||
WideOpenWest Finance LLC (WideOpenWest Capital Corp.) | 9,177 | 9,273 | ||||||
|
| |||||||
| 218,853 | ||||||||
|
| |||||||
| Consumer Staples—0.3% | ||||||||
American Rock Salt Co. LLC | 761 | 753 | ||||||
Michael Foods, Inc. Tranche B | 3,258 | 3,280 | ||||||
Pinnacle Foods Finance LLC Tranche E, | 7,102 | 7,124 | ||||||
3.731%, 10/17/18 | 2,179 | 2,184 | ||||||
| PAR VALUE | VALUE | |||||||
| Consumer Staples (continued) | ||||||||
Reynolds Group Holdings, Inc. | $ | 6,146 | $ | 6,178 | ||||
|
| |||||||
| 19,519 | ||||||||
|
| |||||||
| Energy—1.0% | ||||||||
Buffalo Gulf Coast Terminals LLC | 3,300 | 3,366 | ||||||
Chesapeake Energy Corp. | 7,880 | 7,914 | ||||||
CITGO Petroleum Corp. Tranche C, | 2,172 | 2,214 | ||||||
EP Energy LLC (Everest Acquisition LLC) Tranche B-1, | 6,150 | 6,217 | ||||||
Frac Tech Services LLC | 11,340 | 10,960 | ||||||
Gibson Energy ULC Tranche B, | 3,838 | 3,886 | ||||||
Helix Energy Solutions Group, Inc. Extended, | 9,250 | 9,262 | ||||||
NGPL PipeCo LLC | 6,570 | 6,707 | ||||||
Samson Investment Co. | 4,566 | 4,601 | ||||||
TI Group Automotive Systems LLC | 7,738 | 7,796 | ||||||
|
| |||||||
| 62,923 | ||||||||
|
| |||||||
| Financials—1.4% | ||||||||
Asurion LLC (Asurion Corp.) First Lien, | 8,855 | 8,924 | ||||||
Atlantic Broadband First Lien, | 7,880 | 7,915 | ||||||
See Notes to Financial Statements
30
Table of Contents
VIRTUS MULTI-SECTOR SHORT TERM BOND FUND
SCHEDULE OF INVESTMENTS (Continued)
SEPTEMBER 30, 2012
($ reported in thousands)
| PAR VALUE | VALUE | |||||||
| LOAN AGREEMENTS (continued) | ||||||||
| Financials (continued) | ||||||||
Capital Automotive LP Tranche B, 5.250%, 3/11/17 | $ | 4,985 | $ | 5,031 | ||||
CNO Financial Group, Inc. 0.000%, 9/28/18 | 2,682 | 2,695 | ||||||
Delos Aircraft, Inc. 4.750%, 4/12/16 | 244 | 247 | ||||||
iPayment, Inc . 5.750%, 5/8/17 | 1,410 | 1,401 | ||||||
iStar Financial, Inc. | ||||||||
Tranche A-1, 5.000%, 6/28/13 | 2,136 | 2,146 | ||||||
Tranche A-2, 5.000%, 6/30/14 | 3,724 | 3,729 | ||||||
Tranche A-2, 5.000%, 3/19/17 | 4,000 | 4,077 | ||||||
MIP Delaware, LLC (MIPL (LUX) S.A.R.L) 5.500%, 7/12/18 | 2,038 | 2,052 | ||||||
MoneyGram Payment Systems Worldwide, Inc. 4.250%, 11/17/17 | 575 | 575 | ||||||
Nuveen Investments, Inc. | ||||||||
First Lien Extended, 5.862%, 5/13/17 | 6,455 | 6,419 | ||||||
First Lien Additional Extended , 5.862%, 5/13/17 | 3,245 | 3,233 | ||||||
Second Lien, 5.862%, 2/28/19 | 2,000 | 2,021 | ||||||
Realogy Corp. | ||||||||
Extended First Lien, 4.478%, 10/10/16 | 11,426 | 11,312 | ||||||
Extended LOC, 4.478%, 10/10/16 | 892 | 883 | ||||||
RPI Finance Trust 4.000%, 11/9/18 | 11,124 | 11,221 | ||||||
Springleaf Financial Funding Co. (American General Finance Corp.) 5.500%, 5/10/17 | 9,025 | 8,854 | ||||||
| PAR VALUE | VALUE | |||||||
| Financials (continued) | ||||||||
TransUnion LLC 5.500%, 2/10/18 | $ | 2,846 | $ | 2,886 | ||||
Walter Investment Management Corp. First Lien, 0.000%, 6/30/16 | 2,957 | 2,987 | ||||||
|
| |||||||
| 88,608 | ||||||||
|
| |||||||
| Health Care—2.2% | ||||||||
Alere, Inc. | ||||||||
Tranche B-2, 4.750%, 6/30/17 | 4,975 | 5,001 | ||||||
Tranche B-1, 4.750%, 6/30/17 | 2,479 | 2,492 | ||||||
Aptalis Pharma, Inc. (Axcan Intermediate Holdings, Inc.) Tranche B-1, 5.500%, 2/10/17 | 3,070 | 3,078 | ||||||
Ardent Health Services LLC 6.500%, 9/15/15 | 3,916 | 3,945 | ||||||
Capsugel Holdings U.S., Inc. 3.862%, 8/1/18 | 2,878 | 2,896 | ||||||
Catalent Pharma Solutions, Inc. (Cardinal Health 409, Inc.) Tranche 2, 5.250%, 9/15/17 | 3,705 | 3,733 | ||||||
ConvaTec, Inc. 0.000%, 12/22/16 | 1,433 | 1,441 | ||||||
DaVita, Inc. 0.000%, 8/19/19 | 10,784 | 10,826 | ||||||
Emdeon, Inc. Tranche B-1, 5.000%, 11/2/18 | 2,480 | 2,500 | ||||||
HCR ManoCare, Inc. (HCR Healthcare LLC) 5.000%, 4/6/18 | 657 | 651 | ||||||
Health Management Associates, Inc. Tranche B, 4.500%, 11/16/18 | 4,573 | 4,616 | ||||||
See Notes to Financial Statements
31
Table of Contents
VIRTUS MULTI-SECTOR SHORT TERM BOND FUND
SCHEDULE OF INVESTMENTS (Continued)
SEPTEMBER 30, 2012
($ reported in thousands)
| PAR VALUE | VALUE | |||||||
| LOAN AGREEMENTS (continued) | ||||||||
| Health Care (continued) | ||||||||
Hologic, Inc. 4.500%, 8/1/19 | $ | 14,500 | $ | 14,701 | ||||
Houghton International, Inc. Tranche B-1, 6.750%, 1/29/16 | 2,995 | 3,025 | ||||||
Iasis Healthcare LLC Tranche B, 5.000%, 5/3/18 | 4,937 | 4,957 | ||||||
InVentiv Health, Inc. (Ventive Health, Inc) 6.500%, 8/4/16 | 3,103 | 3,010 | ||||||
Kinetic Concepts, Inc. Tranche B-1, 7.000%, 5/4/18 | 7,368 | 7,485 | ||||||
MultiPlan, Inc. Tranche B, 4.750%, 8/26/17 | 2,554 | 2,568 | ||||||
NBTY, Inc. Tranche B-1, 4.250%, 10/1/17 | 2,334 | 2,347 | ||||||
Onex Carestream Finance LP (Carestream Health, Inc.) 0.000%, 2/25/17 | 2,043 | 2,030 | ||||||
Par Pharmaceutical 0.000%, 8/2/19 | 7,433 | 7,431 | ||||||
Quintiles Transnational Corp. Tranche B, 5.000%, 6/8/18 | 4,444 | 4,477 | ||||||
Rural/Metro Operating Co., LLC First Lien, 5.750%, 6/30/18 | 3,127 | 3,127 | ||||||
Select Medical Corp. Series A Tranche B, 6.000%, 6/1/18 | 2,074 | 2,082 | ||||||
Sheridan Holdings, Inc. Tranche B, 6.000%, 6/29/18 | 8,653 | 8,744 | ||||||
Surgery Center Holdings, Inc. 6.500%, 2/6/17 | 4,058 | 4,058 | ||||||
| PAR VALUE | VALUE | |||||||
| Health Care (continued) | ||||||||
U.S. Renal Care, Inc. 6.250%, 7/3/19 | $ | 2,756 | $ | 2,798 | ||||
Universal Health Services, Inc. Tranche B, 3.750%, 11/15/16 | 1,934 | 1,944 | ||||||
Valeant Pharmaceuticals International, Inc. | ||||||||
Tranche B, 4.750%, 2/13/19 | 4,355 | 4,375 | ||||||
Tranche B, 4.750%, 2/13/19 | 5,973 | 5,999 | ||||||
Tranche B, 4.750%, 2/13/19 | 1,707 | 1,714 | ||||||
Tranche B, 4.750%, 2/13/19 | 1,352 | 1,358 | ||||||
Tranche B, 4.750%, 9/12/19 | 2,175 | 2,181 | ||||||
Vanguard Health Holding Co., LLC (Vanguard Health System, Inc.) 5.000%, 1/29/16 | 2,039 | 2,054 | ||||||
Warner Chilcott Co. LLC Tranche B-2, 4.250%, 3/15/18 | 1,905 | 1,912 | ||||||
Warner Chilcott Corp. | ||||||||
Tranche B-1, 4.250%, 3/15/18 | 1,447 | 1,452 | ||||||
Tranche B-1, 4.250%, 3/15/18 | 3,811 | 3,824 | ||||||
(WC Luxco S.A.R.L.) Tranche B-3, 4.250%, 3/15/18 | 2,620 | 2,629 | ||||||
|
| |||||||
| 143,461 | ||||||||
|
| |||||||
| Industrials—1.5% | ||||||||
ADS Waste Holdings, Inc. 0.000%, 9/11/19 | 4,102 | 4,132 | ||||||
AWAS Finance Luxemborg S.A. 5.750%, 7/16/18 | 8,285 | 8,347 | ||||||
See Notes to Financial Statements
32
Table of Contents
VIRTUS MULTI-SECTOR SHORT TERM BOND FUND
SCHEDULE OF INVESTMENTS (Continued)
SEPTEMBER 30, 2012
($ reported in thousands)
| PAR VALUE | VALUE | |||||||
| LOAN AGREEMENTS (continued) | ||||||||
| Industrials (continued) | ||||||||
Brickman Group Holdings, Inc. Tranche B-1, 5.500%, 10/14/16 | $ | 5,774 | $ | 5,834 | ||||
Brock Holdings Ill, Inc. First Lien, 6.000%, 3/16/17 | 1,524 | 1,532 | ||||||
Ceridian Corp. 5.977%, 5/9/17 | 11,864 | 11,948 | ||||||
Ducommun, Inc. 5.500%, 6/28/17 | 1,325 | 1,340 | ||||||
Genpact Ltd. 4.250%, 8/30/19 | 2,450 | 2,462 | ||||||
Goodman Global, Inc. First Lien 5.750%, 10/28/16 | 5,860 | 5,883 | ||||||
Harland Clarke Holdings Corp. Tranche B-2 5.466%, 6/30/17 | 5,813 | 5,246 | ||||||
Husky Injection Molding System (Yukon Acquisition, Inc.) 5.750%, 7/2/18 | 5,480 | 5,532 | ||||||
Protection One, Inc. 5.750%, 3/21/19 | 6,885 | 6,979 | ||||||
Spirit Aerosystems, Inc. Tranche B 3.750%, 4/18/19 | 13,930 | 14,072 | ||||||
Swift Transportation Corp. Tranche B-2, 5.000%, 12/21/17 | 1,229 | 1,237 | ||||||
Terex Corp. 5.500%, 4/28/17 | 6,336 | 6,380 | ||||||
WCA Waste Corp. (WCA Waste Systems, Inc.) 5.500%, 3/23/18 | 9,465 | 9,512 | ||||||
WireCo Worldgroup, Inc. 6.000%, 2/15/17 | 2,515 | 2,559 | ||||||
|
| |||||||
| 92,995 | ||||||||
|
| |||||||
| PAR VALUE | VALUE | |||||||
| Information Technology—1.9% | ||||||||
Avaya, Inc. | ||||||||
Tranche B-1, 3.177%, 10/24/14 | $ | 5,450 | $ | 5,306 | ||||
Tranche B-3, 3.177%, 10/26/17 | 3,059 | 2,801 | ||||||
Blue Coat Systems, Inc. First Lien, 7.500%, 2/15/18 | 4,770 | 4,812 | ||||||
CCC Information Services 5.750%, 11/11/15 | 406 | 407 | ||||||
CDW LLC (CDW Corp.) Extended, 4.000%, 7/15/17 | 6,784 | 6,705 | ||||||
Commscope, Inc. Tranche 1, 4.250%, 1/14/18 | 1,694 | 1,704 | ||||||
DynCorp International LLC 6.250%, 7/7/16 | 6,426 | 6,460 | ||||||
Edwards (Cayman Islands II) Ltd. First Lien, 5.500%, 5/31/16 | 3,001 | 3,026 | ||||||
First Data Corp. | ||||||||
5.217%, 3/24/17 | 6,045 | 5,976 | ||||||
Tranche B 5.217%, 3/24/17 | 7,935 | 7,811 | ||||||
Freescale Semiconductor, Inc. | ||||||||
Tranche B-1, 4.481%, 12/1/16 | 7,246 | 7,095 | ||||||
Tranche B-2, 4.481%, 2/28/19 | 5,502 | 5,526 | ||||||
Infor, Inc. (U.S.) (Lawson Software, Inc.) Tranche B 0.000%, 4/5/18 | 13,277 | 13,347 | ||||||
Interactive Data Corp. Tranche B, 4.500%, 2/11/18 | 5,279 | 5,319 | ||||||
MedAssets, Inc. 5.250%, 11/16/16 | 953 | 960 | ||||||
Mood Media Corp. First Lien | 4,577 | 4,575 | ||||||
See Notes to Financial Statements
33
Table of Contents
VIRTUS MULTI-SECTOR SHORT TERM BOND FUND
SCHEDULE OF INVESTMENTS (Continued)
SEPTEMBER 30, 2012
($ reported in thousands)
| PAR VALUE | VALUE | |||||||
| LOAN AGREEMENTS (continued) | ||||||||
| Information Technology (continued) | ||||||||
Novell, Inc. (Attachmate Corp.) First Lien, 7.250%, 11/22/17 | $ | 10,176 | $ | 10,281 | ||||
NuSil Technology LLC 5.250%, 4/7/17 | 1,061 | 1,063 | ||||||
Scitor Corp. 5.000%, 2/15/17 | 742 | 736 | ||||||
Sophia LP (DataTel, Inc.) 0.000%, 7/19/18 | 6,696 | 6,786 | ||||||
Spansion LLC 4.750%, 2/9/15 | 3,229 | 3,258 | ||||||
SRA International, Inc. 6.500%, 7/20/18 | 6,905 | 6,848 | ||||||
SSI Investments II Ltd. (Skillsoft) 0.000%, 5/26/17 | 3,367 | 3,407 | ||||||
Wall Street Systems Holdings, Inc. First Lien, 0.000%, 6/20/17 | 1,480 | 1,478 | ||||||
Zayo Group LLC (Zayo Capital, Inc.) 7.125%, 7/2/19 | 6,899 | 6,979 | ||||||
|
| |||||||
| 122,666 | ||||||||
|
| |||||||
| Materials—0.7% | ||||||||
Avantor Performance Materials Holdings, Inc. 5.000%, 6/24/17 | 2,328 | 2,333 | ||||||
AZ Chem US, Inc. 7.250%, 12/22/17 | 4,210 | 4,304 | ||||||
Berry Plastics Holding Corp. Tranche C, 2.216%, 4/3/15 | 2,056 | 2,048 | ||||||
CPG International I, Inc. 0.000%, 9/21/19 | 2,664 | 2,673 | ||||||
General Chemical Corp. Tranche B, 5.750%, 10/6/15 | 5,016 | 5,027 | ||||||
| PAR VALUE | VALUE | |||||||
| Materials (continued) | ||||||||
Harko C.V.(OM Group, Inc.) Tranche B, 5.750%, 8/2/17 | $ | 3,772 | $ | 3,800 | ||||
Huntsman International LLC Extended Tranche B, 2.795%, 4/19/17 | 8,065 | 8,082 | ||||||
Ineos US Finance LLC 6.500%, 5/4/18 | 8,970 | 9,077 | ||||||
JMC Steel Group, Inc. | 630 | 635 | ||||||
Momentive Performance Tranche B-1B 3.750%, 5/5/15 | 1,990 | 1,932 | ||||||
Momentive Performance Materials (Blitz 06-103 GmbH) Tranche B-1B, 3.750%, 5/5/15 | 1,740 | 1,689 | ||||||
Momentive Specialty Chemicals, Inc. (Hexion Specialty Chemicals, Inc.) | ||||||||
Tranche C-1B, | 1,275 | 1,259 | ||||||
Tranche C-2B, | 543 | 537 | ||||||
Novelis, Inc. | 2,383 | 2,388 | ||||||
Trinseo Materials Operating S.C.A. (Styron S.A.R.L) | 2,139 | 2,056 | ||||||
|
| |||||||
| 47,840 | ||||||||
|
| |||||||
| Telecommunication Services—0.8% | ||||||||
Calpine Corp. | 6,750 | 6,716 | ||||||
See Notes to Financial Statements
34
Table of Contents
VIRTUS MULTI-SECTOR SHORT TERM BOND FUND
SCHEDULE OF INVESTMENTS (Continued)
SEPTEMBER 30, 2012
($ reported in thousands)
| PAR VALUE | VALUE | |||||||
| LOAN AGREEMENTS (continued) | ||||||||
| Telecommunication Services (continued) | ||||||||
Level 3 Financing, Inc. | ||||||||
Tranche A, | $ | 1,433 | $ | 1,449 | ||||
Tranche A, | 5,645 | 5,660 | ||||||
2.706%, 8/1/19 | 9,850 | 9,850 | ||||||
Tranche A, | 6,319 | 6,372 | ||||||
nTelos, Inc. | 3,205 | 3,209 | ||||||
Presidio, Inc. | 11,280 | 11,223 | ||||||
West Corp. | 6,437 | 6,530 | ||||||
|
| |||||||
| 51,009 | ||||||||
|
| |||||||
| Utilities—0.1% | ||||||||
NRG Energy, Inc. | 4,444 | 4,473 | ||||||
Texas Compeptitive Electric Holdings Co. LLC Extended, | 5,925 | 4,091 | ||||||
|
| |||||||
| 8,564 | ||||||||
| TOTAL LOAN AGREEMENTS (Identified Cost $847,450) | 856,438 | |||||||
| PREFERRED STOCK—0.2% | ||||||||
| SHARES | ||||||||
| Financials—0.2% | ||||||||
Ally Financial, Inc. | 702 | 657 | ||||||
Banco Bilbao Vizcaya Argentaria S.A. International S.A. Unipersonal 5.919%(3) | 5,835 | 4,405 | ||||||
Banco do Brasil S.A. 144A 8.500%(3)(4) | 700 | 833 | ||||||
| SHARES | VALUE | |||||||
| PREFERRED STOCK (continued) | ||||||||
| Financials (continued) | ||||||||
JPMorgan Chase & Co. 7.90%(3) | 3,360 | $ | 3,816 | |||||
| TOTAL PREFERRED STOCK (Identified Cost $9,078) | 9,711 | |||||||
| COMMON STOCKS—0.0% | ||||||||
| Financials—0.0% | ||||||||
CIT Group, Inc.(2) | 26,344 | 1,038 | ||||||
|
| |||||||
| Materials—0.0% | ||||||||
Catalyst Paper | 131,825 | 112 | ||||||
| TOTAL COMMON STOCKS (Identified Cost $1,925) | 1,150 | |||||||
| TOTAL LONG TERM INVESTMENTS—99.0% | ||||||||
| (Identified Cost $6,112,145) | 6,359,391 | |||||||
| SHORT-TERM INVESTMENTS—2.0% | ||||||||
| Money Market Mutual Funds—2.0% | ||||||||
BlackRock Liquidity Funds TempFund Portfolio – Insitutional Shares (seven-day effective yield 0.140%) | 127,790,209 | $ | 127,790 | |||||
| TOTAL SHORT-TERM INVESTMENTS | ||||||||
| (Identified Cost $127,790) | 127,790 | |||||||
| TOTAL INVESTMENTS—101.0% (Identified Cost $6,239,935) | 6,487,181 | (1)(12) | ||||||
Other assets and liabilities, |
| (67,040 | ) | |||||
|
| |||||||
| NET ASSETS—100.0% | $ | 6,420,141 | ||||||
|
| |||||||
Abbreviations:
| FHLMC | Federal Home Loan Mortgage Corporation (“Freddie Mac”). |
| FNMA | Federal National Mortgage Association (“Fannie Mae”). |
| GNMA | Government National Mortgage Association (“Ginnie Mae”) |
| PIK | Payment-in-Kind Security |
| REIT | Real Estate Investment Trust |
| REMIC | Real Estate Mortgage Investment Conduit |
See Notes to Financial Statements
35
Table of Contents
VIRTUS MULTI-SECTOR SHORT TERM BOND FUND
SCHEDULE OF INVESTMENTS (Continued)
SEPTEMBER 30, 2012
($ reported in thousands)
Footnote Legend:
| (1) | Federal Income Tax Information: For tax information at September 30, 2012, see Note 9 Federal Income Tax Information in the Notes to Financial Statements. |
| (2) | Non-income producing. |
| (3) | Variable or step coupon security; interest rate shown reflects the rate in effect at September 30, 2012. |
| (4) | Security exempt from registration under Rule 144A of the Securities Act of 1933. These securities may be resold in transactions exempt from registration, normally to qualified institutional buyers. At September 30, 2012, these securities amounted to a value of $1,742,468 or 27.1% of net assets. |
| (5) | Regulation S security. Security is offered and sold outside of the United States, therefore, it is exempt from registration with the SEC under rules 903 and 904 of the Securities Act of 1933. |
| (6) | This note was issued for the sole purpose of funding a loan agreement between the issuer and the borrower. As the credit risk for this security lies solely with the borrower, the name represented here is that of the borrower. |
| (7) | No contractual maturity date |
| (8) | Interest payments may be deferred. |
| (9) | Security valued at fair value as determined in good faith by or under the direction of the Trustees. This security is disclosed as a Level 3 security in the disclosure table located after the Schedule of Investments. |
| (10) | Security in default. |
| (11) | Illiquid security. |
| (12) | A portion of the Fund’s assets have been segregated for delayed delivery settlements. |
Foreign Currencies:
| AUD | Australian Dollar |
| BRL | Brazilian Real |
| CAD | Canadian Dollar |
| COP | Colombian Peso |
| IDR | Indonesian Rupiah |
| MXN | Mexican Peso |
| NOK | Norwegian Krone |
| NZD | New Zealand Dollar |
| SEK | Swedish Krona |
| TRY | Turkish Lira |
| ZAR | South African Rand |
| Country Weightings (Unaudited)† | ||||
United States | 74 | % | ||
Brazil | 2 | |||
Canada | 2 | |||
Mexico | 2 | |||
South Korea | 2 | |||
Venezuela | 2 | |||
Luxembourg | 1 | |||
Other | 15 | |||
Total | 100 | % | ||
| † | % of total investments as of September 30, 2012 |
See Notes to Financial Statements
36
Table of Contents
VIRTUS MULTI-SECTOR SHORT TERM BOND FUND
SCHEDULE OF INVESTMENTS (Continued)
SEPTEMBER 30, 2012
($ reported in thousands)
The following table provides a summary of inputs used to value the Fund’s investments as of September 30, 2012 (see Security Valuation Note 2A in the Notes to Financial Statements):
| Investments in Securities: | Total Value at September 30, 2012 | Level 1 Quoted Prices | Level 2 Significant Observable Inputs | Level 3 Significant Unobservable Inputs | ||||||||||||
Debt Securities: | ||||||||||||||||
Asset-Backed Securities | $ | 796,615 | $ | — | $ | 796,615 | $ | — | ||||||||
Corporate Bonds and Notes | 2,183,655 | — | 2,183,634 | 21 | ||||||||||||
Foreign Government Securities | 739,893 | — | 739,893 | — | ||||||||||||
Loan Agreements | 856,438 | — | 856,438 | — | ||||||||||||
Mortgage-Backed Securities | 1,679,900 | — | 1,679,900 | — | ||||||||||||
Municipal Bonds | 27,146 | — | 27,146 | — | ||||||||||||
U.S. Government Securities | 64,883 | — | 64,883 | — | ||||||||||||
Equity Securities: | ||||||||||||||||
Common Stocks | 1,150 | 1,038 | — | 112 | ||||||||||||
Preferred Stock | 9,711 | — | 9,711 | — | ||||||||||||
Short-Term Investments | 127,790 | 127,790 | — | — | ||||||||||||
|
|
|
|
|
|
|
| |||||||||
Total Investments | $ | 6,487,181 | $ | 128,828 | $ | 6,358,220 | $ | 133 | ||||||||
|
|
|
|
|
|
|
| |||||||||
There were no transfers between Level 1 and Level 2 during the period.
The following is a reconciliation of assets of the Fund for Level 3 investments for which significant unobservable inputs were used to determine fair value:
| Total | Asset-Backed Securities | Corporate Bonds and Notes | Common Stocks | |||||||||||||
Investments in Securities | ||||||||||||||||
Balance as of September 30, 2011: | $ | 2,603 | $ | 1,671 | $ | 0 | $ | 932 | ||||||||
Accrued Discount/(Premium) | — | (c) | — | (c) | — | — | ||||||||||
Realized Gain (Loss) | (416 | ) | (319 | ) | — | (97 | ) | |||||||||
Change in Unrealized Appreciation (Depreciation) | 437 | 337 | — | 100 | ||||||||||||
Purchases | — | — | — | — | ||||||||||||
Sales(b) | (2,624 | ) | (1,689 | ) | — | (935 | ) | |||||||||
Transfers Into Level 3(a) | 133 | — | 21 | 112 | ||||||||||||
Transfers From Level 3(a) | — | — | — | — | ||||||||||||
|
|
|
|
|
|
|
| |||||||||
Balance as of September 30, 2012 | $ | 133 | $ | — | $ | 21 | (d) | $ | 112 | |||||||
|
|
|
|
|
|
|
| |||||||||
| (a) | “Transfers into and/or from” represent the ending value as of September 30, 2012, for any investment security where a change in the pricing level occurred from the beginning to the end of the period. |
| (b) | Includes paydowns on securities. |
| (c) | Amount less than $500. |
| (d) | Includes internally fair valued security currently priced at $0. |
See Notes to Financial Statements
37
Table of Contents
VIRTUS MULTI-SECTOR SHORT TERM BOND FUND
STATEMENT OF ASSETS AND LIABILITIES
SEPTEMBER 30, 2012
(Reported in thousands except shares and per share amounts)
| Assets | ||||
Investment in securities at value(1) | $ | 6,487,181 | ||
Foreign currency at value(2) | 18 | |||
Cash | 15,728 | |||
Receivables | ||||
Investment securities sold | 55,664 | |||
Fund shares sold | 58,371 | |||
Dividends and interest receivable | 58,390 | |||
Prepaid trustee retainer | 44 | |||
Prepaid expenses | 245 | |||
|
| |||
Total assets | 6,675,641 | |||
|
| |||
| Liabilities | ||||
Payables | ||||
Fund shares repurchased | 13,874 | |||
Investment securities purchased | 232,157 | |||
Dividend distributions | 2,910 | |||
Investment advisory fees | 2,431 | |||
Distribution and service fees | 1,599 | |||
Administration fees | 671 | |||
Transfer agent fees and expenses | 1,350 | |||
Trustees’ fees and expenses | 9 | |||
Professional fees | 43 | |||
Other accrued expenses | 456 | |||
|
| |||
Total liabilities | 255,500 | |||
|
| |||
| Net Assets | $ | 6,420,141 | ||
|
| |||
| Net Assets Consist of: | ||||
Capital paid in on shares of beneficial interest | $ | 6,227,809 | ||
Accumulated undistributed net investment income (loss) | (519 | ) | ||
Accumulated undistributed net realized gain (loss) | (54,519 | ) | ||
Net unrealized appreciation (depreciation) on investments | 247,370 | |||
|
| |||
| Net Assets | $ | 6,420,141 | ||
|
| |||
| Class A | ||||
Net asset value (net assets/shares outstanding) per share | $ | 4.94 | ||
Maximum offering price per share NAV/(1–2.25%) | $ | 5.05 | ||
Shares of beneficial interest outstanding, no par value, unlimited authorization | 615,529,718 | |||
Net Assets | $ | 3,038,093 | ||
| Class B | ||||
Net asset value (net assets/shares outstanding) and offering price per share | $ | 4.91 | ||
Shares of beneficial interest outstanding, no par value, unlimited authorization | 731,428 | |||
Net Assets | $ | 3,590 | ||
| Class C | ||||
Net asset value (net assets/shares outstanding) and offering price per share | $ | 4.99 | ||
Shares of beneficial interest outstanding, no par value, unlimited authorization | 213,873,254 | |||
Net Assets | $ | 1,067,276 | ||
| Class T | ||||
Net asset value (net assets/shares outstanding) and offering price per share | $ | 4.98 | ||
Shares of beneficial interest outstanding, no par value, unlimited authorization | 141,441,843 | |||
Net Assets | $ | 704,225 | ||
| Class I | ||||
Net asset value (net assets/shares outstanding) and offering price per share | $ | 4.94 | ||
Shares of beneficial interest outstanding, no par value, unlimited authorization | 325,230,252 | |||
Net Assets | $ | 1,606,957 | ||
(1) Investment in securities at cost | $ | 6,239,935 | ||
(2) Foreign currency at cost | $ | 18 | ||
See Notes to Financial Statements
38
Table of Contents
VIRTUS MULTI-SECTOR SHORT TERM BOND FUND
YEAR ENDED SEPTEMBER 30, 2012
(Reported in thousands)
| Investment Income | ||||
Interest | $ | 279,913 | ||
Dividends | 264 | |||
Foreign taxes withheld | (253 | ) | ||
|
| |||
Total investment income | 279,924 | |||
|
| |||
| Expenses | ||||
Investment advisory fees | 25,176 | |||
Service fees, Class A | 6,550 | |||
Distribution and service fees, Class B | 33 | |||
Distribution and service fees, Class C | 3,781 | |||
Distribution and service fees, Class T | 6,111 | |||
Administration fees | 6,915 | |||
Transfer agent fees and expenses | 6,270 | |||
Custodian fees | 165 | |||
Printing fees and expenses | 314 | |||
Professional fees | 78 | |||
Registration fees | 517 | |||
Trustees’ fees and expenses | 285 | |||
Miscellaneous expenses | 531 | |||
|
| |||
Total expenses | 56,726 | |||
|
| |||
| Net investment income (loss) | 223,198 | |||
|
| |||
| Net Realized and Unrealized Gain (Loss) on Investments | ||||
Net realized gain (loss) on investments | 44,260 | |||
Net realized gain (loss) on foreign currency transactions | (485 | ) | ||
Net change in unrealized appreciation (depreciation) on investments | 251,401 | |||
Net change in unrealized appreciation (depreciation) on foreign currency translation | 806 | |||
|
| |||
| Net gain (loss) on investments | 295,982 | |||
|
| |||
| Net increase (decrease) in net assets resulting from operations | $ | 519,180 | ||
|
|
See Notes to Financial Statements
39
Table of Contents
VIRTUS MULTI-SECTOR SHORT TERM BOND FUND
STATEMENT OF CHANGES IN NET ASSETS
(Reported in thousands)
| Year Ended September 30, 2012 | Year Ended September 30, 2011 | |||||||
| INCREASE/(DECREASE) IN NET ASSETS | ||||||||
| From Operations | ||||||||
Net investment income (loss) | $ | 223,198 | $ | 175,401 | ||||
Net realized gain (loss) | 43,775 | 20,972 | ||||||
Net change in unrealized appreciation (depreciation) | 252,207 | (159,475 | ) | |||||
|
|
|
| |||||
| Increase (decrease) in net assets resulting from operations | 519,180 | 36,898 | ||||||
|
|
|
| |||||
| From Distributions to Shareholders | ||||||||
Net investment income, Class A | (117,018 | ) | (103,854 | ) | ||||
Net investment income, Class B | (178 | ) | (333 | ) | ||||
Net investment income, Class C | (31,198 | ) | (24,202 | ) | ||||
Net investment income, Class T | (22,443 | ) | (18,103 | ) | ||||
Net investment income, Class I | (59,595 | ) | (33,009 | ) | ||||
|
|
|
| |||||
| Decrease in net assets from distributions to shareholders | (230,432 | ) | (179,501 | ) | ||||
|
|
|
| |||||
| From Share Transactions | ||||||||
| Sale of shares | ||||||||
Class A (243,732 and 269,573 shares, respectively) | 1,174,129 | 1,303,664 | ||||||
Class B (55 and 203 shares, respectively) | 263 | 976 | ||||||
Class C (124,342 and 67,718 shares, respectively) | 608,471 | 331,242 | ||||||
Class T (45,372 and 45,400 shares, respectively) | 220,411 | 221,546 | ||||||
Class I (211,432 and 155,201 shares, respectively) | 1,017,729 | 753,960 | ||||||
| Reinvestment of distributions | ||||||||
Class A (22,479 and 20,049 shares, respectively) | 108,432 | 96,821 | ||||||
Class B (33 and 58 shares, respectively) | 157 | 279 | ||||||
Class C (5,808 and 4,264 shares, respectively) | 28,350 | 20,801 | ||||||
Class T (2,957 and 2,269 shares, respectively) | 14,392 | 11,045 | ||||||
Class I (7,492 and 3,446 shares, respectively) | 36,212 | 16,639 | ||||||
| Shares repurchased | ||||||||
Class A (178,092 and 157,526 shares, respectively) | (852,783 | ) | (760,866 | ) | ||||
Class B (551 and 1,041 shares, respectively) | (2,626 | ) | (5,011 | ) | ||||
Class C (46,855 and 38,641 shares, respectively) | (227,897 | ) | (188,410 | ) | ||||
Class T (19,463 and 16,569 shares, respectively) | (94,472 | ) | (80,701 | ) | ||||
Class I (86,490 and 63,291 shares, respectively) | (416,145 | ) | (303,317 | ) | ||||
|
|
|
| |||||
| Increase (decrease) in net assets from share transactions | 1,614,623 | 1,418,668 | ||||||
|
|
|
| |||||
| Net increase (decrease) in net assets | 1,903,371 | 1,276,065 | ||||||
| Net Assets | ||||||||
Beginning of fiscal year | 4,516,770 | 3,240,705 | ||||||
|
|
|
| |||||
| End of fiscal year | $ | 6,420,141 | $ | 4,516,770 | ||||
|
|
|
| |||||
Accumulated undistributed net investment income (loss) at end of fiscal year | $ | (519 | ) | $ | 4,566 | |||
See Notes to Financial Statements
40
Table of Contents
VIRTUS MULTI-SECTOR SHORT TERM BOND FUND
SELECTED PER SHARE DATA AND RATIOS FOR A SHARE OUTSTANDING
THROUGHOUT EACH PERIOD
| Net Asset Value, Beginning of Period | Net Investment Income (Loss)(2) | Net Realized and Unrealized Gain (Loss) | Total from Investment Operations | Dividends from Net Investment Income | Total Distributions | Change in Net Asset Value | Net Asset Value, End Period | Total Return(1) | Net Assets, End of Period (000's) | Ratio of Expenses to Average Net Assets(6) | Ratio of Net Investment Income to Average Net Assets | Portfolio Turnover Rate | |||||||||||||||||||||||||||||||||||||||||||||||||||||
Class A | |||||||||||||||||||||||||||||||||||||||||||||||||||||||||||||||||
10/1/11 to 9/30/12 | $ | 4.67 | 0.21 | 0.27 | 0.48 | (0.21 | ) | (0.21 | ) | 0.27 | $ | 4.94 | 10.58 | % | $ | 3,038,093 | 1.01 | % | 4.31 | % | 52 | % | |||||||||||||||||||||||||||||||||||||||||||
10/1/10 to 9/30/11 | 4.80 | 0.22 | (0.12 | ) | 0.10 | (0.23 | ) | (0.23 | ) | (0.13 | ) | 4.67 | 2.02 | 2,463,360 | 1.05 | 4.59 | 35 | ||||||||||||||||||||||||||||||||||||||||||||||||
10/1/09 to 9/30/10 | 4.54 | 0.25 | 0.26 | 0.51 | (0.25 | ) | (0.25 | ) | 0.26 | 4.80 | 11.65 | 1,897,491 | 1.07 | 5.31 | 49 | ||||||||||||||||||||||||||||||||||||||||||||||||||
10/1/08 to 9/30/09 | 4.21 | 0.24 | 0.35 | 0.59 | (0.26 | ) | (0.26 | ) | 0.33 | 4.54 | 14.91 | 1,433,927 | 1.12 | 5.93 | 88 | ||||||||||||||||||||||||||||||||||||||||||||||||||
10/1/07 to 9/30/08 | 4.70 | 0.25 | (0.48 | ) | (0.23 | ) | (0.26 | ) | (0.26 | ) | (0.49 | ) | 4.21 | (5.07 | ) | 1,377,371 | 1.08 | 5.54 | 83 | ||||||||||||||||||||||||||||||||||||||||||||||
Class B | |||||||||||||||||||||||||||||||||||||||||||||||||||||||||||||||||
10/1/11 to 9/30/12 | $ | 4.65 | 0.18 | 0.27 | 0.45 | (0.19 | ) | (0.19 | ) | 0.26 | $ | 4.91 | 9.87 | % | $ | 3,590 | 1.51 | % | 3.86 | % | 52 | % | |||||||||||||||||||||||||||||||||||||||||||
10/1/10 to 9/30/11 | 4.78 | 0.20 | (0.12 | ) | 0.08 | (0.21 | ) | (0.21 | ) | (0.13 | ) | 4.65 | 1.53 | 5,550 | 1.55 | 4.10 | 35 | ||||||||||||||||||||||||||||||||||||||||||||||||
10/1/09 to 9/30/10 | 4.52 | 0.23 | 0.26 | 0.49 | (0.23 | ) | (0.23 | ) | 0.26 | 4.78 | 11.16 | 9,435 | 1.56 | 4.86 | 49 | ||||||||||||||||||||||||||||||||||||||||||||||||||
10/1/08 to 9/30/09 | 4.19 | 0.22 | 0.35 | 0.57 | (0.24 | ) | (0.24 | ) | 0.33 | 4.52 | 14.41 | 12,753 | 1.62 | 5.47 | 88 | ||||||||||||||||||||||||||||||||||||||||||||||||||
10/1/07 to 9/30/08 | 4.68 | 0.23 | (0.48 | ) | (0.25 | ) | (0.24 | ) | (0.24 | ) | (0.49 | ) | 4.19 | (5.57 | ) | 15,919 | 1.57 | 5.03 | 83 | ||||||||||||||||||||||||||||||||||||||||||||||
Class C | |||||||||||||||||||||||||||||||||||||||||||||||||||||||||||||||||
10/1/11 to 9/30/12 | $ | 4.72 | 0.20 | 0.27 | 0.47 | (0.20 | ) | (0.20 | ) | 0.27 | $ | 4.99 | 10.19 | % | $ | 1,067,276 | 1.27 | % | 4.04 | % | 52 | % | |||||||||||||||||||||||||||||||||||||||||||
10/1/10 to 9/30/11 | 4.85 | 0.21 | (0.12 | ) | 0.09 | (0.22 | ) | (0.22 | ) | (0.13 | ) | 4.72 | 1.75 | 616,170 | 1.30 | 4.33 | 35 | ||||||||||||||||||||||||||||||||||||||||||||||||
10/1/09 to 9/30/10 | 4.58 | 0.24 | 0.27 | 0.51 | (0.24 | ) | (0.24 | ) | 0.27 | 4.85 | 11.49 | 471,332 | 1.32 | 5.04 | 49 | ||||||||||||||||||||||||||||||||||||||||||||||||||
10/1/08 to 9/30/09 | 4.24 | 0.23 | 0.36 | 0.59 | (0.25 | ) | (0.25 | ) | 0.34 | 4.58 | 14.75 | 241,339 | 1.36 | 5.63 | 88 | ||||||||||||||||||||||||||||||||||||||||||||||||||
10/1/07 to 9/30/08 | 4.73 | 0.24 | (0.48 | ) | (0.24 | ) | (0.25 | ) | (0.25 | ) | (0.49 | ) | 4.24 | (5.28 | ) | 161,770 | 1.33 | 5.28 | 83 | ||||||||||||||||||||||||||||||||||||||||||||||
Class T | |||||||||||||||||||||||||||||||||||||||||||||||||||||||||||||||||
10/1/11 to 9/30/12 | $ | 4.71 | 0.17 | 0.28 | 0.45 | (0.18 | ) | (0.18 | ) | 0.27 | $ | 4.98 | 9.67 | % | $ | 704,225 | 1.76 | % | 3.56 | % | 52 | % | |||||||||||||||||||||||||||||||||||||||||||
10/1/10 to 9/30/11 | 4.84 | 0.19 | (0.13 | ) | 0.06 | (0.19 | ) | (0.19 | ) | (0.13 | ) | 4.71 | 1.24 | 530,162 | 1.80 | 3.84 | 35 | ||||||||||||||||||||||||||||||||||||||||||||||||
10/1/09 to 9/30/10 | 4.57 | 0.21 | 0.28 | 0.49 | (0.22 | ) | (0.22 | ) | 0.27 | 4.84 | 10.96 | 394,183 | 1.82 | 4.54 | 49 | ||||||||||||||||||||||||||||||||||||||||||||||||||
10/1/08 to 9/30/09 | 4.23 | 0.21 | 0.36 | 0.57 | (0.23 | ) | (0.23 | ) | 0.34 | 4.57 | 14.21 | 219,501 | 1.86 | 5.11 | 88 | ||||||||||||||||||||||||||||||||||||||||||||||||||
10/1/07 to 9/30/08 | 4.72 | 0.22 | (0.48 | ) | (0.26 | ) | (0.23 | ) | (0.23 | ) | (0.49 | ) | 4.23 | (5.78 | ) | 141,131 | 1.83 | 4.79 | 83 | ||||||||||||||||||||||||||||||||||||||||||||||
Class I | |||||||||||||||||||||||||||||||||||||||||||||||||||||||||||||||||
10/1/11 to 9/30/12 | $ | 4.68 | 0.22 | 0.27 | 0.49 | (0.23 | ) | (0.23 | ) | 0.26 | $ | 4.94 | 10.62 | % | $ | 1,606,957 | 0.77 | % | 4.55 | % | 52 | % | |||||||||||||||||||||||||||||||||||||||||||
10/1/10 to 9/30/11 | 4.81 | 0.23 | (0.12 | ) | 0.11 | (0.24 | ) | (0.24 | ) | (0.13 | ) | 4.68 | 2.28 | 901,528 | 0.80 | 4.83 | 35 | ||||||||||||||||||||||||||||||||||||||||||||||||
10/1/09 to 9/30/10 | 4.54 | 0.26 | 0.28 | 0.54 | (0.27 | ) | (0.27 | ) | 0.27 | 4.81 | 12.16 | 468,264 | 0.83 | 5.51 | 49 | ||||||||||||||||||||||||||||||||||||||||||||||||||
10/1/08 to 9/30/09 | 4.21 | 0.28 | 0.32 | 0.60 | (0.27 | ) | (0.27 | ) | 0.33 | 4.54 | 15.20 | 20,553 | 1.03 | 6.47 | 88 | ||||||||||||||||||||||||||||||||||||||||||||||||||
6/6/08(5) to 9/30/08 | 4.53 | 0.08 | (0.31 | ) | (0.23 | ) | (0.09 | ) | (0.09 | ) | (0.32 | ) | 4.21 | (5.11 | )(4) | 95 | 0.89 | (3) | 5.85 | (3) | 83 | (4) | |||||||||||||||||||||||||||||||||||||||||||
| (1) | Sales charges, where applicable, are not reflected in the total return calculation. |
| (2) | Computed using average shares outstanding. |
| (3) | Annualized. |
| (4) | Not annualized. |
| (5) | Inception date. |
| (6) | The Fund may invest in other funds and the annualized expense ratios do not reflect fees and expenses associated with the underlying funds. |
See Notes to Financial Statements
41
Table of Contents
VIRTUS MULTI-SECTOR SHORT TERM BOND FUND
SEPTEMBER 30, 2012
| Note | 1. Organization |
Virtus Opportunities Trust (the “Trust”) is organized as a Delaware statutory trust and is registered under the Investment Company Act of 1940, as amended (“1940 Act”), as an open-end management investment company.
As of the date of this report, 27 funds are offered for sale, of which the Virtus Multi-Sector Short Term Bond Fund (the “Fund”) is reported in this annual report. The Fund’s investment objective is outlined in the Fund Summary Page.
The Fund offers Class A shares, Class C shares, Class T shares and Class I shares. Class B shares are no longer available for purchase by new or existing shareholders, except by existing shareholders through Qualifying Transactions. (For information regarding Qualifying Transactions refer to the Trust’s prospectus.)
Class A shares are sold with a front-end sales charge of up to 2.25%. Generally, Class A shares are not subject to any charges by the Fund when redeemed; however, a 0.50% contingent deferred sales charge (“CDSC”) may be imposed on certain redemptions made within certain period following purchases on which a finder’s fee has been paid. The period for which the CDSC applies for the Fund is 18 months. The CDSC period begins on the last day of the month preceding the month in which the purchase was made.
Class B shares were sold with a CDSC which declines from 2% to zero depending on the period of time the shares are held. Class C shares are sold without a sales charge. Class T shares of the Fund are sold with a 1% contingent deferred sales charge, applicable, if redeemed within one year of purchase. Class I shares are sold without a front-end sales charge or CDSC.
Virtus Mutual Funds may impose an annual fee on accounts having balances of less than $2,500. The small account fee may be waived in certain circumstances, as disclosed in the prospectuses and/or statements of additional information. The fees collected will be used to offset certain expenses of the Funds.
Each Class of shares has identical voting, dividend, liquidation and other rights and the same terms and conditions, except that each class bears different distribution and/or service fees under a Board-approved 12b-1 and/or shareholder service plan and has exclusive voting rights with respect to such plans. Class I shares are not subject to a 12b-1 plan. Income and other expenses and realized and unrealized gains and losses of the Fund are borne pro rata by the holders of each class of shares.
| Note | 2. Significant Accounting Policies |
The following is a summary of significant accounting policies consistently followed by the Trust in the preparation of its financial statements. The preparation of financial statements in conformity with accounting principles generally accepted in the United States of America requires management to make estimates and assumptions that affect the reported amounts of assets and liabilities, disclosure of contingent assets and liabilities at the date of the financial statements and the reported amount of increases and decreases in net assets from operations during the reporting period. Actual results could differ from those estimates and those differences could be significant.
42
Table of Contents
VIRTUS MULTI-SECTOR SHORT TERM BOND FUND
NOTES TO FINANCIAL STATEMENTS (Continued)
SEPTEMBER 30, 2012
| A. | Security Valuation |
Security Valuation procedures for the Fund which include nightly price variance, as well as back-testing such as bi-weekly unchanged price, monthly secondary source and transaction analyses, have been approved by the Board. All internally fair valued securities are approved by a valuation committee (the “Valuation Committee”) appointed by the Board. The Valuation Committee is comprised of the treasurer, assistant treasurer, secretary and chief compliance officer of the Trust. All internally fair valued securities are updated daily and reviewed in detail by the Valuation Committee monthly unless changes occur within the period. The Valuation Committee reviews the validity of any model inputs and any changes to the model when applicable. Internal fair valuations are reviewed by the Board at least quarterly.
The Fund utilizes a fair value hierarchy which prioritizes the inputs to valuation techniques used to measure fair value into three broad levels.
| • Level 1 – | quoted prices in active markets for identical securities |
| • Level 2 – | prices determined using other significant observable inputs (including quoted prices for similar securities, interest rates, prepayment speeds, credit risk, etc.) |
| • Level 3 – | prices determined using significant unobservable inputs (including the valuation committee’s own assumptions in determining the fair value of investments) |
A description of the valuation techniques applied to the Fund’s major categories of assets and liabilities measured at fair value on a recurring basis is as follows:
Equity securities are valued at the official closing price (typically last sale) on the exchange on which the securities are primarily traded, or if no closing price is available, at the last bid price and are categorized as Level 1 in the hierarchy. Restricted equity securities and private placements that are not widely traded, are illiquid or are internally fair valued by the Valuation Committee, are generally categorized as Level 3 in the hierarchy.
Certain non-U.S. securities may be fair valued in cases where closing prices are not readily available or are deemed not reflective of readily available market prices. For example, significant events (such as movement in the U.S. securities market, or other regional and local developments) may occur between the time that non-U.S. markets close (where the security is principally traded) and the time that the Fund calculates its net asset value (“NAV”) (generally 4 p.m. Eastern time, the close of the New York Stock Exchange (“NYSE”)) that may impact the value of securities traded in these non-U.S. markets. In such cases the Fund fair values non-U.S. securities using an independent pricing service which considers the correlation of the trading patterns of the non-U.S. security to the intraday trading in the U.S. markets for investments such as ADRs, financial futures, ETFs, and certain indexes as well as prices for similar securities. Such fair valuations are categorized as Level 2 in the hierarchy. Because the frequency of significant events is not predictable, fair valuation of certain non-U.S. common stocks may occur on a frequent basis.
Debt securities, including restricted securities, are valued based on evaluated quotations received from independent pricing services or from dealers who make markets in such securities. For most bond types, the pricing service utilizes matrix
43
Table of Contents
VIRTUS MULTI-SECTOR SHORT TERM BOND FUND
NOTES TO FINANCIAL STATEMENTS (Continued)
SEPTEMBER 30, 2012
pricing which considers one or more of the following factors: yield or price of bonds of comparable quality, coupon, maturity, current cash flows, type, and current day trade information, as well as dealer-supplied prices. These valuations are generally categorized as Level 2 in the hierarchy. Structured debt instruments such as mortgage-backed and asset-backed securities may also incorporate collateral analysis and utilize cash flow models for valuation and are generally categorized as Level 2 in the hierarchy. Pricing services do not provide pricing for all securities and therefore indicative bids from dealers are utilized which are based on pricing models used by market makers in the security and are generally categorized as Level 2 in the hierarchy. Debt securities that are not widely traded, are illiquid, or are internally fair valued by the Valuation Committee are generally categorized as Level 3 in the hierarchy.
Listed derivatives that are actively traded are valued based on quoted prices from the exchange and are categorized as Level 1 in the hierarchy. Over-the-counter derivative contracts, which include forward currency contracts and equity-linked instruments, do not require material subjectivity as pricing inputs are observed from actively quoted markets and are categorized as Level 2 in the hierarchy.
Investments in open-end mutual funds are valued at their closing NAV determined as of the close of regular trading on the NYSE each business day and are categorized as Level 1 in the hierarchy.
A summary of the inputs used to value the Fund’s net assets by each major security type is disclosed at the end of the Schedule of Investments for the Fund. The inputs or methodologies used for valuing securities are not necessarily an indication of the risk associated with investing in those securities.
| B. | Security Transactions and Investment Income |
Security transactions are recorded on the trade date. Realized gains and losses from the sale of securities are determined on the identified cost basis. Dividend income is recognized on the ex-dividend date, or in the case of certain foreign securities, as soon as the Fund is notified. Interest income is recorded on the accrual basis. The Fund amortizes premiums and accretes discounts using the effective interest method.
| C. | Income Taxes |
The Fund is treated as a separate taxable entity. It is the intention of the Fund to comply with the requirements of Subchapter M of the Internal Revenue Code and to distribute substantially all of its taxable income to its shareholders. Therefore, no provision for federal income taxes or excise taxes has been made.
The Fund may be subject to foreign taxes on income, gains on investments or currency repatriation, a portion of which may be recoverable. The Fund will accrue such taxes and recoveries as applicable based upon current interpretations of the tax rules and regulations that exist in the markets in which it invests.
Management of the Fund has concluded that there are no significant uncertain tax positions that would require recognition in the financial statements. As of September 30, 2012, the tax years that remain subject to examination by the major tax jurisdictions under the statute of limitations are from the year 2009 forward (with limited exceptions).
44
Table of Contents
VIRTUS MULTI-SECTOR SHORT TERM BOND FUND
NOTES TO FINANCIAL STATEMENTS (Continued)
SEPTEMBER 30, 2012
| D. | Distributions to Shareholders |
Distributions are recorded by the Fund on the ex-dividend date. Income distributions are recorded daily. Income and capital gain distributions are determined in accordance with income tax regulations which may differ from accounting principles generally accepted in the United States of America. These differences may include the treatment of non-taxable dividends, market premium and discount, non-deductible expenses, expiring capital loss carryovers, foreign currency gain or loss, gain or loss on futures contracts, partnerships, operating losses and losses deferred due to wash sales. Permanent book and tax basis differences relating to shareholder distributions will result in reclassifications to capital paid in on shares of beneficial interest.
| E. | Expenses |
Expenses incurred together by the Fund and other affiliated mutual funds are allocated in proportion to the net assets of each such fund, except where allocation of direct expense to each fund or an alternative allocation method can be more appropriately used.
In addition to the net annual operating expenses that a fund bears directly, the shareholders of a fund indirectly bear the fund’s pro-rata expenses of any underlying mutual funds in which the fund invests.
| F. | Foreign Currency Translation |
Non U.S. investment securities and other assets and liabilities denominated in foreign currencies are translated into U.S. dollar amounts at the foreign currency exchange rate effective at the end of the reporting period. Cost of investments is translated at the currency exchange rate effective at the trade date. The gain or loss resulting from a change in currency exchange rates between the trade and settlement date of a portfolio transaction is treated as a gain or loss on non-U.S. currency. Likewise, the gain or loss resulting from a change in currency exchange rates between the date income is accrued and paid is treated as a gain or loss on foreign currency. The Funds do not isolate that portion of the results of operations arising from changes in foreign exchange rates on investments from the fluctuations arising from changes in the market prices of securities held. Such fluctuations are included with the net realized and unrealized gain or loss on investments.
| G. | When-issued Purchases and Forward Commitments (Delayed Delivery) |
The Fund may engage in when-issued or forward commitment transactions. Securities purchased on a when-issued or forward commitment basis are also known as delayed delivery transactions. Delayed delivery transactions involve a commitment by a fund to purchase or sell a security at a future date, ordinarily up to 90 days later. When-issued or forward commitments enable a fund to lock in what is believed to be an attractive price or yield on a particular security for a period of time, regardless of future changes in interest rates. The Fund records when-issued and delayed delivery securities on the trade date. The Fund maintains collateral for the securities purchased. Securities purchased on a when-issued or delayed delivery basis begin earning interest on the settlement date.
45
Table of Contents
VIRTUS MULTI-SECTOR SHORT TERM BOND FUND
NOTES TO FINANCIAL STATEMENTS (Continued)
SEPTEMBER 30, 2012
| H. | Loan Agreements |
The Fund may invest in direct debt instruments, which are interests in amounts owed by a corporate, governmental, or other borrower to lenders or lending syndicates. The Fund’s investments in loans may be in the form of participations in loans or assignments of all or a portion of loans from third parties. A loan is often administered by a bank or other financial institution (the lender) that acts as agent for all holders. The agent administers the terms of the loan, as specified in the loan agreement. When investing in a loan participation, the Fund has the right to receive payments of principal, interest and any fees to which it is entitled only from the lender selling the loan agreement and only upon receipt by the lender of payments from the borrower.
The Fund generally has no right to enforce compliance with the terms of the loan agreement with the borrower. As a result, the Fund may be subject to the credit risk of both the borrower and the lender that is selling the loan agreement. When the Fund purchases assignments from lenders it acquires direct rights against the borrower on the loan. Direct indebtedness of emerging countries involves a risk that the government entities responsible for the repayment of the debt may be unable, or unwilling, to pay the principal and interest when due.
Currently, the Fund only holds assignment loans.
| I. | Credit-linked Notes |
The Fund may invest in credit-linked notes, which are usually issued by a special purpose vehicle that is selling credit protection through a credit default swap. The performance of the notes is linked to the performance of the underlying reference obligation. The special purpose vehicle invests the proceeds from the notes to cover its contingent obligation. Credit-linked notes may also have risks with default by the referenced obligation, currency and/or interest rates.
Note 3. Investment Advisory Fees and Related Party Transactions
($ reported in thousands except as noted)
| A. | Adviser |
Virtus Investment Advisers, Inc. (the “Adviser”), an indirect, wholly-owned subsidiary of Virtus Investment Partners, Inc. (“Virtus”), is the Adviser to the Trust. The Adviser manages the Fund’s investment program and general operations of the Fund, including oversight of the Fund’s subadviser.
As compensation for its services to the Fund, the Adviser is entitled to a fee based upon the following annual rates as a percentage of the average daily net assets of the Fund: 0.55% of the first $1 billion; 0.50% of $1 billion to $2 billion; 0.45% of $2+ billion.
| B. | Subadviser |
The Subadviser manages the investments of the Fund for which it is paid a fee by the Adviser. Newfleet Asset Management, LLC (the “Subadviser”), an indirect, wholly-owned subsidiary of Virtus, is the Subadviser to the Fund.
| C. | Expense Limitations |
The Adviser has agreed to voluntarily limit the Fund’s total operating expenses (excluding interest, taxes, extraordinary expenses and acquired fund fees and
46
Table of Contents
VIRTUS MULTI-SECTOR SHORT TERM BOND FUND
NOTES TO FINANCIAL STATEMENTS (Continued)
SEPTEMBER 30, 2012
expenses, if any) so that such expenses do not exceed, on an annualized basis the following percentages of the Fund’s average net asset values: 1.10% for Class A shares, 1.60% for Class B shares, 1.35% for Class C shares, 1.85% for Class T shares and 0.85% for Class I shares. The Adviser may discontinue these voluntary expense caps at any time. The Fund is currently below its expense cap.
| D. | Distributor |
VP Distributors, LLC (“VP Distributors”), an indirect wholly-owned subsidiary of Virtus, serves as the distributor of the Fund’s shares and has advised the Fund for the fiscal year (the “period”) ended September 30, 2012, it retained net commissions of $144 Class A shares and deferred sales charges of $52, $3, $4 and $108 for Class A shares, Class B shares, Class C shares and Class T shares, respectively.
In addition, the Fund pays VP Distributors distribution and/or service fees under Board-approved 12b-1 and shareholder service plans as a percentage of the daily average net assets of each respective class, at the annual rate of 0.25% for Class A shares, 0.75% for Class B shares, 0.50% for Class C shares, and 1.00% for Class T shares. Class I shares are not subject to a 12b-1 plan.
Under certain circumstances, shares of certain Virtus Mutual Funds may be exchanged for shares of the same class of certain other Virtus Mutual Funds on the basis of the relative net asset values per share at the time of the exchange. On exchanges with share classes that carry a CDSC, the CDSC schedule of the original shares purchased continues to apply.
| E. | Administrator and Transfer Agent |
VP Distributors also serves as the Trust’s Administrator. For the period ended September 30, 2012, the Fund incurred administration fees from the Trust totaling $5,183 which are included in the Statement of Operations.
VP Distributors also serves as the Trust’s Transfer Agent. For the period ended September 30, 2012, the Fund incurred transfer agent fees from the Trust totaling $6,053 which are included in the Statement of Operations. A portion of these fees is paid to outside entities that also provide services to the Trust.
| F. | Affiliated Shareholders |
At September 30, 2012, Virtus and its affiliates, BMO Bankcorp (a minority investor in Virtus) and its affiliates, and the retirement plans of Virtus and its affiliates, held shares of the Fund which may be redeemed at any time that aggregated the following.
| Shares | Aggregate Net Asset Value | |||||||
Class C Shares | 4,234 | $ | 21 | |||||
Class I Shares | 377,553 | 1,865 | ||||||
47
Table of Contents
VIRTUS MULTI-SECTOR SHORT TERM BOND FUND
NOTES TO FINANCIAL STATEMENTS (Continued)
SEPTEMBER 30, 2012
Note 4. Purchases and Sales of Securities
Purchases and sales of securities for the Fund (excluding U.S. Government and agency securities, and short-term securities) during the fiscal year ended September 30, 2012, were as follows:
| Purchases | Sales | |||||||
| $ | 3,969,642 | $ | 2,476,286 | |||||
Purchases and sales of long-term U.S. Government and agency securities for the Fund during the period ended September 30, 2012, were as follows:
| Purchases | Sales | |||||||
| $ | 335,756 | $ | 252,900 | |||||
Note 5. 10% Shareholders
As of September 30, 2012, the Fund had individual shareholder account(s) and/or omnibus shareholder account(s) (comprised of a group of individual shareholders), which individually amounted to more than 10% of the total shares outstanding of the Fund as detailed below.
| % of Shares Outstanding | Number of Accounts | |||||||
| 22 | % | 1 | ||||||
The shareholder is not affiliated with Virtus.
Note 6. Credit Risk and Asset Concentrations
In countries with limited or developing markets, investments may present greater risks than in more developed markets and the prices of such investments may be volatile. The consequences of political, social or economic changes in these markets may have disruptive effects on the market prices of these investments and the income they generate, as well as the Fund’s ability to repatriate such amounts.
High-yield/high risk securities typically entail greater price volatility and/or principal and interest rate risk. There is a greater chance that an issuer will not be able to make principal and interest payments on time. Analysis of the creditworthiness of issuers of high-yield securities may be complex, and as a result, it may be more difficult for the Adviser and/or Subadviser to accurately predict risk.
The Fund may invest a high percentage of its assets in specific sectors of the market in its pursuit of a greater investment return. Fluctuations in these sectors of concentration may have a greater impact on the Fund, positive or negative, than if the Fund did not concentrate its investments in such sectors.
Note 7. Illiquid and Restricted Securities
Investments generally are considered illiquid if they cannot be disposed of in seven days in the ordinary course of business at the approximate amount at which such securities have been valued by the Fund. Additionally, the following information is also considered in determining illiquidity: the frequency of trades and quotes for the investment, whether the investment is listed for trading on a recognized domestic exchange and/or whether two or
48
Table of Contents
VIRTUS MULTI-SECTOR SHORT TERM BOND FUND
NOTES TO FINANCIAL STATEMENTS (Continued)
SEPTEMBER 30, 2012
more brokers are willing to purchase or sell the security at a comparable price, the extent of market making activity in the investment and the nature of the market for investment. Illiquid securities are footnoted as such at the end of the Fund’s Schedule of Investments where applicable.
Restricted securities are illiquid securities, as defined above not registered under the Securities Act of 1933 (the “1933 Act”), as amended. Generally, 144A securities are excluded from this category, except where defined as illiquid.
The Fund will bear any costs, including those involved in registration under the 1933 Act, in connection with the disposition of such securities.
At September 30, 2012, the Fund did not hold any illiquid and restricted securities.
Note 8. Indemnifications
Under the Trust’s organizational documents, its trustees and officers are indemnified against certain liabilities arising out of the performance of their duties to the Fund. In addition, in the normal course of business the Fund enters into contracts that provide a variety of indemnifications to other parties. The Fund’s maximum exposure under these arrangements is unknown as this would involve future claims that may be made against the Fund and that have not occurred. However, the Fund has not had prior claims or losses pursuant to these arrangements and expect the risk of loss to be remote.
Note 9. Federal Income Tax Information
($ reported in thousands)
At September 30, 2012, federal tax cost and aggregate gross unrealized appreciation (depreciation) of securities held by the Fund were as follows:
Federal | Unrealized | Unrealized | Net Unrealized | |||
| $6,241,194 | $271,823 | $(25,836) | $245,987 |
The Fund has capital loss carryovers available which may be used to offset future realized capital gains, through the indicated expiration dates shown below:
2018 | Total | |
| $53,778 | $53,778 |
The Fund may not realize the benefit of these losses to the extent the Fund does not realize gains on investments prior to the expiration of the capital loss carryovers.
Under the Regulated Investment Company Modernization Act of 2010 (the “Act”), net capital losses recognized for tax years beginning after December 22, 2010 may be carried forward indefinitely, and their character is retained as short-term and/or long-term losses. Previously, net capital losses were carried forward for eight years and treated as short-term losses. As a transition rule, the Act requires that post-enactment net capital losses be used before pre-enactment net capital losses.
The Fund utilized $44,823 in losses deferred in prior years against current year capital gains.
49
Table of Contents
VIRTUS MULTI-SECTOR SHORT TERM BOND FUND
NOTES TO FINANCIAL STATEMENTS (Continued)
SEPTEMBER 30, 2012
Capital losses realized after October 31 and certain late year ordinary losses may be deferred and treated as occurring on the first day of the following fiscal year. For the fiscal year ended September 30, 2012, the Fund deferred capital losses of $0 and recognized post-October capital losses of $0.
The components of distributable earnings on a tax basis (excluding unrealized appreciation (depreciation) which is disclosed above) consist of undistributed ordinary income of $0 and undistributed long-term capital gains of $0.
The differences between the book and tax basis components of distributable earnings relate principally to the timing of recognition of income and gains for federal income tax purposes. Short-term gain distributions reported in the Statements of Changes in Net Assets, if any, are reported as ordinary income for federal tax purposes. Distributions are determined on a tax basis and may differ from net investment income and realized capital gains for financial reporting purposes.
Note 10. Reclassification of Capital Accounts
($ reported in thousands)
For financial reporting purposes, book basis capital accounts are adjusted to reflect the tax character of permanent book/tax differences. Permanent reclassifications can arise from differing treatment of certain income and gain transactions, nondeductible current year net operating losses, expiring capital loss carryovers and investments in passive foreign investment companies. The reclassifications have no impact on the net assets or net asset value of the Fund. As of September 30, 2012, the Fund recorded reclassifications to increase (decrease) the accounts as listed below:
Capital Paid in | Undistributed |
| ||
| $(3,525) | $2,149 | $1,376 |
Note 11. Recent Accounting Pronouncement
In December 2011, the Financial Accounting Standards Board issued Accounting Standards Update (“ASU”) No. 2011-11 regarding “Disclosures about Offsetting Assets and Liabilities”. The amendments, which will be effective for annual reporting periods beginning on or after January 1, 2013 and interim periods within those annual periods, require an entity to disclose information about offsetting and related arrangements for assets and liabilities, financial instruments and derivatives that are either currently offset in accordance with current requirements or are subject to enforceable master netting arrangements or similar agreements. At this time, management is evaluating the implications of ASU No. 2011-11 and its impact on the financial statements has not yet been determined.
Note 12. Subsequent Event Evaluations
Management has evaluated the impact of all subsequent events on the Fund through the date the financial statements were available for issuance, and has determined that there are no subsequent events requiring recognition or disclosure in the financial statements.
50
Table of Contents

REPORT OF INDEPENDENT REGISTERED PUBLIC
ACCOUNTING FIRM
To the Board of Trustees of
Virtus Opportunities Trust and Shareholders of
Virtus Multi-Sector Short Term Bond Fund:
In our opinion, the accompanying statement of assets and liabilities, including the schedule of investments, and the related statements of operations and of changes in net assets and the financial highlights present fairly, in all material respects, the financial position of Virtus Multi-Sector Short Term Bond Fund, (the “Fund”), a series of Virtus Opportunities Trust, at September 30, 2012, the results of its operations for the year then ended, the changes in its net assets for each of the two years in the period then ended and the financial highlights for each of the periods indicated, in conformity with accounting principles generally accepted in the United States of America. These financial statements and financial highlights (hereafter referred to as “financial statements”) are the responsibility of the Fund’s management; our responsibility is to express an opinion on these financial statements based on our audits. We conducted our audits of these financial statements in accordance with the standards of the Public Company Accounting Oversight Board (United States). Those standards require that we plan and perform the audit to obtain reasonable assurance about whether the financial statements are free of material misstatement. An audit includes examining, on a test basis, evidence supporting the amounts and disclosures in the financial statements, assessing the accounting principles used and significant estimates made by management, and evaluating the overall financial statement presentation. We believe that our audits, which included confirmation of securities at September 30, 2012 by correspondence with the custodian and brokers, provide a reasonable basis for our opinion.

Philadelphia, Pennsylvania
November 21, 2012
51
Table of Contents
VIRTUS MULTI-SECTOR SHORT TERM BOND FUND
SEPTEMBER 30, 2012 (Unaudited)
For the fiscal year ended September 30, 2012, the Fund makes the following disclosures for federal income tax purposes. Below is listed the percentage, or the maximum amount allowable, of its ordinary income dividends (“QDI”) to qualify for the lower tax rates applicable to individual shareholders, and the percentage of ordinary income dividends earned by the Fund which qualifies for the dividends received deduction (“DRD”) for corporate shareholders. The actual percentage of QDI and DRD for the calendar year will be designated in year-end tax statements. The Fund designates the amount below, or if subsequently different, as long-term capital gains dividends (“LTCG”) ($ reported in thousands).
QDI | DRD | LTCG | ||
| 0% | 0% | $— |
52
Table of Contents
FUND MANAGEMENT TABLES (UNAUDITED)
Information pertaining to the Trustees and officers of the Trust as of September 30, 2012, is set forth below. The statement of additional information (SAI) includes additional information about the Trustees and is available without charge, upon request, by calling (800) 243-1574. The address of each individual, unless otherwise noted, is 100 Pearl Street, Hartford, CT 06103-4506. There is no stated term of office for Trustees of the Trust.
Independent Trustees
| Name, Year of Birth, Year Elected and Number of Funds Overseen | Principal Occupation(s) During Past 5 Years and Other Directorships Held by Trustee | |
Leroy Keith, Jr. YOB: 1939 Elected: 2000 47 Funds | Chairman (since 2010), Bloc Global Services Group, LLC (construction and redevelopment company); Managing Director (2007 to 2008), Almanac Capital Management (commodities business); Director/Trustee (since 2010), Wells Fargo Advantage Funds (149 series) and their predecessors, Evergreen Funds (1989 to 2010); Director (2003 to 2010), Diversapack Co. (soft packaging company). | |
Philip R. McLoughlin Chairman YOB: 1946 Elected: 1999 62 Funds | Partner (since 2006), Cross Pond Partners, LLC (strategy consulting firm); Managing Director (2009 to 2010), SeaCap Asset Management Fund I, L.P. and SeaCap Partners, LLC (2009 to 2010) (investment management); Director (since 1991) and Chairman (since 2010), World Trust Fund; Chairman and Trustee (since 2003), Virtus Variable Insurance Trust (9 portfolios); Director (since 1995), DTF Tax-Free Income Fund, Inc.; Director (since 1995), Duff & Phelps Utility and Corporate Bond Trust, Inc.; Director (since 2009), DNP Select Income Fund Inc.; Director (since 2011), Duff & Phelps Global Utility Income Fund Inc.; Trustee (since 2011), Virtus Global Multi-Sector Fixed Income Fund; Trustee (since 2011), Virtus Total Return Fund; Director (1985 to 2009), Argo Group International Holdings Inc. and its predecessor, PXRE Corporation (insurance). | |
Geraldine M. McNamara YOB: 1951 Elected: 2001 51 Funds | Retired. Director (since 2003), DTF Tax-Free Income Fund, Inc.; Director (since 2003), Duff & Phelps Utility and Corporate Bond Trust, Inc.; Director (since 2009), DNP Select Income Fund Inc.; Director (since 2011) Duff & Phelps Global Utility Income Fund Inc. | |
James M. Oates YOB: 1946 Elected: 2000 47 Funds | Managing Director (since 1994), Wydown Group (consulting firm); Chairman and Trustee (since 2005), John Hancock Variable Insurance Trust and John Hancock Funds II (collectively, 210 portfolios); Director (since 1996), Stifel Financial; Chairman and Director (since 1999), Connecticut River Bank and Director (since 1998), Connecticut River Bancorp; Chairman (since 2000), Emerson Investment Management, Inc.; Director (since 2002), New Hampshire Trust Company; Non-Executive Chairman (2007 to 2011), Hudson Castle Group, Inc. (formerly IBEX Capital Markets, Inc.) (financial services). | |
Richard E. Segerson YOB: 1946 Elected: 2000 47 Funds | Managing Director (since 1998), Northway Management Company. | |
Ferdinand L.J. Verdonck YOB: 1942 Elected: 2005 47 Funds | Director (since 1998), The J.P. Morgan European Investment Trust; Director (since 2005), Galapagos N.V. (biotechnology); Mr. Verdonck is also a director of several non-U.S. companies. |
53
Table of Contents
FUND MANAGEMENT TABLES (UNAUDITED) (Continued)
Interested Trustee
The individual listed below is an “interested person” of the Trust, as defined in Section 2(a)(19) of the 1940 Act, as amended, and the rules and regulations thereunder.
| Name, Year of Birth, Year elected and Number of Funds Overseen | Principal Occupation(s) During Past 5 Years and Other Directorships Held by Trustee | |
George R. Aylward* Trustee and President YOB: 1964 Elected: 2006 49 Funds | Director, President and Chief Executive Officer (since 2008), Virtus Investment Partners, Inc. and/or certain of its subsidiaries; various senior officer positions with Virtus affiliates (since 2005); Chairman, President and Chief Executive Officer (since 2006), The Zweig Fund, Inc. and The Zweig Total Return Fund, Inc.; Trustee and President (since 2011), Virtus Global Multi-Sector Income Fund and Virtus Total Return Fund. |
| * | Mr. Aylward is an “interested person,” as defined in the 1940 Act, by reason of his position as President and Chief Executive Officer of Virtus Investment Partners, Inc. (“Virtus”), the ultimate parent company of the Adviser, and various positions with its affiliates, including the Adviser. |
54
Table of Contents
FUND MANAGEMENT TABLES (UNAUDITED) (Continued)
Officers of the Trust Who Are Not Trustees
| Name, Address and Year of Birth | Position(s) Held with Trust and Length of Time Served | Principal Occupation(s) During Past 5 Years | ||
W. Patrick Bradley YOB: 1972 | Vice President since 2011, Chief Financial Officer and Treasurer since 2006. | Senior Vice President, Fund Services (since 2010), Virtus Investment Partners, Inc. and/or certain of its subsidiaries; various officer positions (since 2006) with Virtus affiliates; Vice President (since 2011), Chief Financial Officer and Treasurer (since 2004), Virtus Variable Insurance Trust; Vice President, Chief Financial Officer and Treasurer (since 2011), Virtus Global Multi-Sector Income Fund and Virtus Total Return Fund; Vice President (since 2012) and Treasurer (Chief Financial Officer) (since 2007), The Zweig Fund, Inc. and Zweig Total Return Fund, Inc.; Vice President and Assistant Treasurer (since 2011), Duff & Phelps Global Utility Income Fund Inc. | ||
Kevin J. Carr YOB: 1954 | Vice President, Chief Legal Officer, Counsel and Secretary | Senior Vice President (since 2009), Vice President, Counsel and Secretary (2008 to 2009), Virtus Investment Partners, Inc. and/or certain of its subsidiaries; various senior officer positions (since 2005) with Virtus affiliates; Vice President, Chief Legal Officer, Counsel and Secretary (since 2010), Virtus Variable Insurance Trust; Vice President, Chief Legal Officer, Counsel and Secretary (since 2011), Virtus Global Multi-Sector Income Fund and Virtus Total Return Fund; Vice President and Assistant Secretary (since 2012), Secretary and Chief Legal Officer (2005-2012), The Zweig Fund, Inc. and Zweig Total Return Fund, Inc.; Vice President and Assistant Secretary (since 2011), Duff & Phelps Global Utility Income Fund Inc. | ||
Nancy J. Engberg YOB: 1956 | Vice President and Chief Compliance Officer since 2011. | Vice President (since 2008) and Chief Compliance Officer (2008 to 2011), Virtus Investment Partners, Inc. and/or certain of its subsidiaries; various officer positions (since 2003) with Virtus affiliates; Vice President (since 2010), Chief Compliance Officer (since 2011), Virtus Variable Insurance Trust; Vice President and Chief Compliance Officer (since 2011), Virtus Global Multi-Sector Income Fund and Virtus Total Return Fund; Vice President and Chief Compliance Officer (since 2012), The Zweig Fund, Inc. and Zweig Total Return Fund, Inc. | ||
Francis G. Waltman YOB: 1962 | Senior Vice President since 2008. | Executive Vice President, Product Development (since 2009), Virtus Investment Partners, Inc. and/or certain of its subsidiaries; various senior officer positions (since 2006) with Virtus affiliates; Senior Vice President (since 2010), Virtus Variable Insurance Trust; Senior Vice President (since 2011), Virtus Global Multi-Sector Income Fund and Virtus Total Return Fund. |
55
Table of Contents
VIRTUS OPPORTUNITIES TRUST
101 Munson Street
Greenfield, MA 01301-9668
Trustees
George R. Aylward
Leroy Keith, Jr.
Philip R. McLoughlin, Chairman
Geraldine M. McNamara
James M. Oates
Richard E. Segerson
Ferdinand L.J. Verdonck
Officers
George R. Aylward, President
Francis G. Waltman, Senior Vice President
Nancy J. Engberg, Vice President and Chief Compliance Officer
W. Patrick Bradley, Vice President, Chief Financial Officer and Treasurer
Kevin J. Carr, Vice President, Chief Legal Officer, Counsel and Secretary
Investment Adviser
Virtus Investment Advisers, Inc.
100 Pearl Street
Hartford, CT 06103-4506
Principal Underwriter
VP Distributors, LLC
100 Pearl Street
Hartford, CT 06103-4506
Transfer Agent
VP Distributors, LLC
100 Pearl Street
Hartford, CT 06103-4506
Custodian
The Bank of New York Mellon
One Wall Street
New York, NY 10005-2588
Independent Registered Public Accounting Firm
PricewaterhouseCoopers LLC
2001 Market Street
Philadelphia, PA 19103-7042
How to Contact Us
Mutual Fund Services1-800-243-1574
Adviser Consulting Group1-800-243-4361
Telephone Orders1-800-367-5877
Text Telephone1-800-243-1926
Web siteVirtus.com
Important Notice to Shareholders
The Securities and Exchange Commission has modified mailing regulations for semiannual and annual shareholder fund reports to allow mutual fund companies to send a single copy of these reports to shareholders who share the same mailing address. If you would like additional copies, please call Mutual Fund Services at 1-800-243-1574.
Table of Contents
For more information about
Virtus Mutual Funds, please call
your financial representative,
contact us at 1-800-243-1574
or Virtus.com
| 8010 | 11-12 |

P.O. Box 9874
Providence, RI 02940 -8074
Table of Contents


Annual
Report
Virtus Real Estate Securities Fund
TRUST NAME: VIRTUS OPPORTUNITIES TRUST | September 30, 2012 | |||
| No Bank Guarantee | Not FDIC Insured | May lose Value |
Table of Contents
Virtus Real Estate Securities Fund
(“Real Estate Securities Fund”)
| 1 | ||||
| 2 | ||||
| 4 | ||||
| 5 | ||||
| 8 | ||||
| 10 | ||||
| 11 | ||||
| 12 | ||||
| 13 | ||||
| 15 | ||||
| 22 | ||||
| 23 | ||||
| 24 |
PROXY VOTING PROCEDURES AND VOTING RECORD (FORM N-PX)
The adviser and subadviser vote proxies relating to portfolio securities in accordance with procedures that have been approved by the Board of Trustees of the Trust (“Trustees,” the “Board”). You may obtain a description of these procedures, along with information regarding how the Fund voted proxies during the most recent 12-month period ended June 30, free of charge, by calling toll-free 1-800-243-1574. This information is also available through the Securities and Exchange Commission’s (“SEC”) website at http://www.sec.gov.
FORM N-Q INFORMATION
The Trust files a complete schedule of portfolio holdings for the Fund with the SEC for the first and third quarters of each fiscal year on Form N-Q. Form N-Q is available on the SEC’s website at http://www.sec.gov. Form N-Q may be reviewed and copied at the SEC’s Public Reference Room. Information on the operation of the SEC’s Public Reference Room can be obtained by calling toll-free 1-800-SEC-0330.
This report is not authorized for distribution to prospective investors in the Virtus Real Estate Securities Fund unless preceded or accompanied by an effective prospectus which includes information concerning the sales charge, the Fund’s record and other pertinent information.
Table of Contents
Dear Fellow Shareholders of Virtus Mutual Funds:
 |
Investors were subject to the vagaries of the financial markets over the annual reporting period. Markets gained momentum throughout the first quarter of 2012, slid backwards in the second quarter, only to rebound strongly in the third quarter and end the 12-month period in positive territory.
An extended rally helped equity and fixed income markets produce respectable returns for the year ended September 30, 2012. U.S. equities, as measured by the S&P 500® Index, gained an impressive 30.20 percent, far surpassing international equities, which rose 20.98 percent, as represented by the MSCI All Country World Index (net). U.S. fixed income markets rose |
5.16 percent for the year, as measured by the Barclays Capital U.S. Aggregate Bond Index. A consistent “flight to quality” among global investors kept demand high for the 10-year U.S. Treasury and its yield low, at just 1.64 percent at the end of September.
As we enter the final quarter of 2012, the economic strength of the United States, Europe, and China remains tenuous. The onus is on U.S. government to avoid the dangers of the “fiscal cliff” and on corporations to produce robust earnings, in particular strong revenue growth, which will play a pivotal role in determining future market direction.
Market uncertainty is a timely reminder of the importance of portfolio diversification. While diversification cannot guarantee a profit or prevent loss, owning a variety of asset classes may cushion your portfolio against inevitable market fluctuations. Your financial advisor can help you ensure that your portfolio is adequately diversified.
Thank you for entrusting Virtus with your assets. We appreciate your business and remain committed to your long-term financial success.
Sincerely,

George R. Aylward
President, Virtus Mutual Funds
October 2012
Whenever you have questions about your account, or require additional information, please visit us on the Web at www.virtus.com or call our shareowner service group toll-free at 1-800-243-1574.
Performance data quoted represents past results. Past performance is no guarantee of future results and current performance may be higher or lower than performance shown above.
1
Table of Contents
VIRTUS REAL ESTATE SECURITIES FUND
Disclosure of Fund Expenses (Unaudited)
For the six-month period of April 1, 2012 to September 30, 2012
We believe it is important for you to understand the impact of costs on your investment. All mutual funds have operating expenses. As a shareholder of the Virtus Real Estate Securities Fund (the “Fund”), you may incur two types of costs: (1) transaction costs, including sales charges on purchases of Class A shares and contingent deferred sales charges on Class B and Class C shares; and (2) ongoing costs, including investment advisory fees, distribution and service fees, and other expenses. Class I shares are sold without a sales charge and do not incur distribution and service fees. These examples are intended to help you understand your ongoing costs (in dollars) of investing in the Fund and to compare these costs with the ongoing costs of investing in other mutual funds. These examples are based on an investment of $1,000 invested at the beginning of the period and held for the entire six-month period. The following Expense Table illustrates your Fund’s costs in two ways.
Actual Expenses
The first section of the accompanying table provides information about actual account values and actual expenses. You may use the information in this section, together with the amount you invested, to estimate the expenses that you paid over the period. Simply divide your account value by $1,000 (for example, an $8,600 account value divided by $1,000 = 8.6), then multiply the result by the number in the first section under the heading entitled “Expenses Paid During Period” to estimate the expenses you paid on your account during the period.
Hypothetical Example for Comparison Purposes
The second section of the accompanying table provides information about hypothetical account values and hypothetical expenses based on the Fund’s actual expense ratio and an assumed rate of return of 5% per year before expenses, which is not your Fund’s actual return.The hypothetical account values and expenses may not be used to estimate the actual ending account balance or expenses you paid for the period. You may use this information to compare the ongoing costs of investing in your Fund and other funds. To do so, compare these 5% hypothetical examples with the 5% hypothetical examples that appear in the shareholder reports of the other funds.
Please note that the expenses shown in the accompanying table are meant to highlight your ongoing costs only and do not reflect any transactional costs, such as sales charges or contingent deferred sales charges. Therefore, the second section of the accompanying table is useful in comparing ongoing costs only, and will not help you determine the relative total costs of owning different funds. In addition, if these transactional costs were included, your costs would have been higher. The calculations assume no shares were bought or sold during the period. Your actual costs may have been higher or lower depending on the amount of your investment and timing of any purchases or redemptions.
2
Table of Contents
VIRTUS REAL ESTATE SECURITIES FUND
Disclosure of Fund Expenses (Unaudited) (Continued)
For the six-month period of April 1, 2012 to September 30, 2012
| Expense Table | ||||||||||||||||
Beginning Value | Ending Account Value September 30, 2012 | Annualized Expense Ratio | Expenses Paid During Period* | |||||||||||||
Actual | ||||||||||||||||
| Class A | $ | 1,000.00 | $ | 1,028.00 | 1.40 | % | $ | 7.10 | ||||||||
| Class B | 1,000.00 | 1,023.80 | 2.15 | 10.88 | ||||||||||||
| Class C | 1,000.00 | 1,024.20 | 2.15 | 10.88 | ||||||||||||
| Class I | 1,000.00 | 1,029.00 | 1.15 | 5.83 | ||||||||||||
Hypothetical (5% return before expenses) |
| |||||||||||||||
| Class A | 1,000.00 | 1,017.91 | 1.40 | 7.09 | ||||||||||||
| Class B | 1,000.00 | 1,014.12 | 2.15 | 10.88 | ||||||||||||
| Class C | 1,000.00 | 1,014.12 | 2.15 | 10.88 | ||||||||||||
| Class I | 1,000.00 | 1,019.18 | 1.15 | 5.82 | ||||||||||||
| * | Expenses are equal to the Fund’s annualized expense ratio, which is net of waived fees and reimbursed expenses, if applicable, multiplied by the average account value over the period, multiplied by the number of days (183) expenses were accrued in the most recent fiscal half-year, then divided by 366 to reflect the one-half year period. |
| The Fund may invest in other funds, and the annualized expense ratios noted above do not reflect fees and expenses associated with the underlying funds. If such fees and expenses were included, the expenses would have been higher. |
| You can find more information about the Fund’s expenses in the Financial Statements section that follows. For additional information on operating expenses and other shareholder costs, refer to the prospectus. |
3
Table of Contents
VIRTUS REAL ESTATE SECURITIES FUND
Barclays Capital U.S. Aggregate Bond Index
The Barclays Capital U.S. Aggregate Bond Index measures the U.S. investment grade fixed rate bond market. The index is calculated on a total return basis.
European Central Bank (“ECB”)
The European Central Bank (ECB) responsible for conducting monetary policy for the euro area. The ECB was established as the core of the Eurosystem and the European System of Central Banks (ESCB). The ESCB comprises the ECB and the national central banks (NCBs) of all 17 EU Member States whether they have adopted the Euro or not.
Federal Reserve (the “Fed”)
The central bank of the United States, responsible for controlling the money supply, interest rates and credit with the goal of keeping the U.S. economy and currency stable.
Governed by a seven-member board, the system includes 12 regional Federal Reserve Banks, 25 branches and all national and state banks that are part of the system.
FTSE NAREIT Equity REITs Index
The FTSE NAREIT Equity REITs Index is a free-float market capitalization index measuring equity tax-qualified real estate investment trusts, which meet minimum size and liquidity criteria, that are listed on the New York Stock Exchange, the American Stock Exchange and the NASDAQ National Market System. The index is calculated on a total return basis with dividends reinvested.
MSCI All Country World Index (net)
The MSCI AC World Index (net) is a free float-adjusted market capitalization-weighted index that measures equity performance of developed and emerging markets. The index is calculated on a total return basis with net dividends reinvested. The index is unmanaged and not available for direct investment.
REIT (Real Estate Investment Trust)
A publicly traded company that owns, develops and operates income-producing real estate such as apartments, office buildings, hotels, shopping centers and other commercial properties.
S&P 500® Index
The S&P 500® Index is a free-float market capitalization-weighted index of 500 of the largest U.S. companies. The index is calculated on a total return basis with dividends reinvested.
4
Table of Contents
| Real Estate Securities Fund | Ticker Symbols: Class A: PHRAX Class B: PHRBX Class C: PHRCX Class I: PHRIX |
| ¢ | The Fund is non-diversified and has an investment objective of capital appreciation and income with approximately equal emphasis. |
| ¢ | For the fiscal year ended September 30, 2012, the Fund’s Class A shares at NAV returned 32.49%, Class B shares returned 31.49%, Class C shares returned 31.48% and Class I shares returned 32.80%. For the same period, the S&P 500® Index, a broad-based equity index, returned 30.20%, and the FTSE NAREIT Equity REITs Index, the Fund’s style-specific index appropriate for comparison, returned 32.61%. |
All performance figures assume reinvestment of distributions and exclude the effect of sales charges. Past performance is no guarantee of future results and current performance may be higher or lower than the performance shown above.
How did the market perform during the Fund’s fiscal year?
| ¢ | The global economic and market landscape during the year ended September 30, 2012 remained quite challenging, as many of the macro themes which drove the market lower during the third quarter of 2011, namely the European sovereign debt crisis and slowing global economic growth, resurfaced late in the first quarter of 2012 and continued into the second quarter, causing market volatility to increase and equities markets to reverse some of their early 2012 gains. With government elections in Greece and France causing renewed uncertainties about the viability of the Euro currency and a further deterioration in Spain’s financial sector adding additional pressure, European sovereign bond spreads in countries such as Italy and Spain reversed all of the positive momentum that occurred after the execution of the two long-term refinancing operation (LTRO) programs by the European Central Bank (“ECB”). |
| ¢ | Alongside the increased market volatility stemming from the renewed flare-up of the European financial crisis, global economic growth began to stall again during the second quarter of 2012, repeating a pattern from 2011 with which market participants are all too familiar. While global economic growth remains in positive territory for many of the large developed and emerging market economies, the repeat of the sequential deceleration trend caused investors to move away from risk-oriented assets during the Spring of 2012 and increased market participants’ expectations for further European Central Bank easing. In this regard Chinese economic growth remained an area of intense focus as market participants continued to try to determine if the slow-down in growth was consistent with a soft or hard landing and to attempt to gauge the potential policy response out of Beijing, which has been fairly muted this time relative to the 2008 financial crisis. |
| ¢ | The latest rounds of quantitative easing by the U.S. Federal Reserve Bank and the Bank of Japan, alongside the increased commitment by the ECB to conditionally intervene in European sovereign bond markets, arrived late in the third quarter of 2012. This drove a more positive market outcome during the quarter, and a quieter summer, than was experienced one year ago. However, as many of the central banks themselves have pointed out, they have essentially exhausted the monetary tools at their disposal and it is now really up to the leaders of governments and their fiscal policy making bodies to paint the way forward. |
What factors affected the Fund’s performance during its fiscal year?
| ¢ | Despite the on-going tough macro headwinds, an environment of slow but positive economic growth, aligned with a falling cost of capital, is an environment in which high-quality global real estate companies can perform well. In this type of environment, real estate space demand is picking up enough to drive increases in |
For information regarding the indexes and certain investment terms, see the Key Investment Terms on page 4.
5
Table of Contents
| Real Estate Securities Fund (Continued) |
cash flow through higher property occupancies and in some property sectors and markets, higher rents, but is not robust enough to justify material amounts of new construction for which financing also remains limited. On a regional basis, these positive dynamics were more clearly evident in Asia-Pacific ex Japan and North America over the last year and, not surprisingly, the European markets were the most challenged. On a country level, Hong Kong and Singapore were the top performers, while Spain and Israel were the top laggards. Within the U.S., the Industrial and Regional Mall property sectors demonstrated the best total returns over the last twelve months and Manufactured Homes and Apartments were the laggards. |
| ¢ | For the period ended September 30, 2012, the Fund performed relatively in line with its style-specific benchmark on a net of fee basis. Overall from a performance attribution perspective, property sector allocation and security selection contributed positively to performance; however, security selection was the primary driver of the Fund’s relative performance. |
| ¢ | The most significant individual positive contributor to relative performance during the fiscal year was allocation to and stock selection with the Self Storage property sector. Specifically, the Fund’s overweight exposure to a mid-cap self storage REIT was the primary driver of this positive security selection. |
| ¢ | The most significant detractor from relative performance during the fiscal year was the Fund’s overweight allocation to the Apartment property sector given this property sector’s subpar return over the reporting period. |
The preceding information is the opinion of portfolio management. Any such opinions are subject to change at any time based upon market or other conditions and should not be relied upon as investment advice. Past performance is no guarantee of future results, and there is no guarantee that market forecasts will be realized.
There is no guarantee that the Fund will meet its objective.
The market price of equity securities may be affected by financial market, industry, or issuer-specific events. Focus on a particular style or on small or medium-sized companies may enhance that risk. The fund may be negatively affected by factors specific to the real estate market, including interest rate, leverage, property, and management. A fund that focuses its investments in a particular industry or sector will be more sensitive to conditions that affect that industry or sector than a non-concentrated fund.
| Asset Allocations | ||||
The following table presents asset allocations within certain sectors as a percentage of total investments at September 30, 2012. |
| |||
Regional Malls | 22 | % | ||
Apartments | 18 | |||
Office | 14 | |||
Health Care | 11 | |||
Self Storage | 11 | |||
Shopping Centers | 8 | |||
Industrials | 5 | |||
Other (includes short-term investments) | 11 | |||
|
| |||
Total | 100 | % | ||
|
| |||
6
Table of Contents
Real Estate Securities Fund (Continued)
| Average Annual Total Returns1 for periods ended 9/30/12 | ||||||||||||||||||||
| 1 Year | 5 Years | 10 Years | Since Inception | Inception Date | ||||||||||||||||
| Class A Shares at NAV 2 | 32.49 | % | 2.37 | % | 11.99 | % | — | — | ||||||||||||
| Class A Shares at POP 3,4 | 24.87 | 1.17 | 11.33 | — | — | |||||||||||||||
| Class B Shares at NAV 2 | 31.49 | 1.59 | 11.14 | — | — | |||||||||||||||
| Class B Shares with CDSC 4 | 27.49 | 1.59 | 11.14 | — | — | |||||||||||||||
| Class C Shares at NAV 2 and with CDSC4 | 31.48 | 1.60 | — | 10.15 | % | 7/25/03 | ||||||||||||||
| Class I Shares at NAV | 32.80 | 2.63 | — | 1.47 | 12/29/06 | |||||||||||||||
| S&P 500® Index | 30.20 | 1.05 | 8.01 | —5 | — | |||||||||||||||
| FTSE NAREIT Equity REITs Index | 32.61 | 2.11 | 11.39 | —6 | — | |||||||||||||||
Fund Expense Ratios7: A Shares: 1.46%, B Shares: 2.21%, C Shares: 2.21%, I Shares: 1.21%.
All returns represent past performance which is no guarantee of future results. Current performance may be higher or lower than the performance shown. The investment return and principal value of an investment will fluctuate so that an investor’s shares, when redeemed, may be worth more or less than their original cost. The above table and graph below do not reflect the deduction of taxes that a shareholder would pay on fund distributions or the redemption of fund shares. Please visit Virtus.com for performance data current to the most recent month-end.
| 1 | Total returns are historical and include changes in share price and the reinvestment of both dividends and capital gains distributions. |
| 2 | “NAV” (Net Asset Value) total returns do not include the effect of any sales charge. |
| 3 | “POP” (Public Offering Price) total returns include the effect of the maximum front-end 5.75% sales charge. |
| 4 | CDSC (contingent deferred sales charge) is applied to redemptions of certain classes of shares that do not have a sales charge applied at the time of purchase. CDSC charges for Class B shares decline from 5% to 0% over a five year period. CDSC charges for certain redemptions of Class A shares and all redemptions of Class C shares are 1% within the first year and 0% thereafter. |
| 5 | The index returned is 6.21% for Class C shares and 2.46% for Class I shares since the inception date of the respective share class. |
| 6 | The index returned is 10.22% for Class C shares and 1.21% for Class I shares since the inception date of the respective share class. |
| 7 | The expense ratios of the Fund are set forth according to the prospectus for the Fund effective January 31, 2012, and as supplemented and revised and may differ from the expense ratios disclosed in the Financial Highlights tables in this report. See the Financial Highlights for more current expense ratios. |
Growth of $10,000 for periods ended 9/30
This chart assumes an initial investment of $10,000 made on September 30, 2002, for Class A and Class B shares including any applicable sales charges or fees. Performance assumes reinvestment of dividends and capital gain distributions.
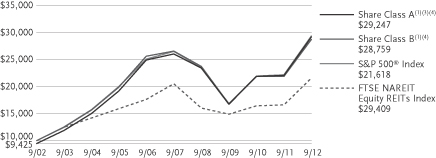
The indexes are unmanaged and not available for direct investment; therefore, their performance does not reflect the expenses associated with active management of an actual portfolio.
7
Table of Contents
VIRTUS REAL ESTATE SECURITIES FUND
SEPTEMBER 30, 2012
($ reported in thousands)
| SHARES | VALUE | |||||||
| COMMON STOCKS—99.2% | ||||||||
| REAL ESTATE INVESTMENT TRUSTS—99.2% | ||||||||
| DIVERSIFIED—4.2% | ||||||||
Digital Realty Trust, Inc. | 274,803 | $ | 19,195 | |||||
Vornado Realty Trust | 434,047 | 35,180 | ||||||
|
| |||||||
| 54,375 | ||||||||
|
| |||||||
| HEALTH CARE—11.4% | ||||||||
HCP, Inc. | 697,871 | 31,041 | ||||||
Health Care REIT, Inc. | 816,305 | 47,142 | ||||||
Ventas, Inc. | 1,093,281 | 68,057 | ||||||
|
| |||||||
| 146,240 | ||||||||
|
| |||||||
| INDUSTRIAL/OFFICE—19.6% | ||||||||
| Industrial—5.1% | ||||||||
DCT Industrial Trust, Inc. | 2,678,196 | 17,328 | ||||||
Prologis, Inc. | 1,357,425 | 47,550 | ||||||
|
| |||||||
| 64,878 | ||||||||
|
| |||||||
| Mixed—0.8% | ||||||||
Duke Realty Corp. | 682,391 | 10,031 | ||||||
| Office—13.7% | ||||||||
Alexandria Real Estate Equities, Inc. | 119,375 | 8,777 | ||||||
BioMed Realty Trust, Inc. | 1,451,835 | 27,178 | ||||||
Boston Properties, Inc. | 581,183 | 64,285 | ||||||
Kilroy Realty Corp. | 1,018,756 | 45,620 | ||||||
SL Green Realty Corp. | 373,291 | 29,889 | ||||||
|
| |||||||
| 175,749 | ||||||||
|
| |||||||
| 250,658 | ||||||||
|
| |||||||
| LODGING/RESORTS—4.3% | ||||||||
Host Hotels & Resorts, Inc. | 1,939,452 | 31,128 | ||||||
LaSalle Hotel Properties | 895,674 | 23,906 | ||||||
|
| |||||||
| 55,034 | ||||||||
|
| |||||||
| RESIDENTIAL—20.1% | ||||||||
| Apartments—18.0% | ||||||||
American Campus Communities, Inc. | 145,000 | 6,363 | ||||||
AvalonBay Communities, Inc. | 423,356 | 57,572 | ||||||
BRE Properties, Inc. | 231,320 | 10,847 | ||||||
Camden Property Trust | 555,200 | 35,805 | ||||||
| SHARES | VALUE | |||||||
| Apartments (continued) | ||||||||
Campus Crest Communities, Inc. | 25,745 | $ | 278 | |||||
Equity Residential | 1,148,165 | 66,054 | ||||||
Essex Property Trust, Inc. | 249,241 | 36,947 | ||||||
UDR, Inc. | 663,305 | 16,463 | ||||||
|
| |||||||
| 230,329 | ||||||||
|
| |||||||
| Manufactured Homes—2.1% | ||||||||
Equity Lifestyle | 386,964 | 26,360 | ||||||
|
| |||||||
| 256,689 | ||||||||
|
| |||||||
| RETAIL—29.7% | ||||||||
| Regional Malls—21.8% | ||||||||
General Growth | 1,774,775 | 34,572 | ||||||
Macerich Co. (The) | 667,775 | 38,217 | ||||||
Simon Property Group, Inc. | 1,055,791 | 160,280 | ||||||
Taubman Centers, Inc. | 605,680 | 46,474 | ||||||
|
| |||||||
| 279,543 | ||||||||
|
| |||||||
| Shopping Centers—7.9% | ||||||||
DDR Corp. | 1,470,026 | 22,579 | ||||||
Kimco Realty Corp. | 1,130,275 | 22,911 | ||||||
Regency Centers Corp. | 96,183 | 4,687 | ||||||
Tanger Factory Outlet Centers | 795,900 | 25,731 | ||||||
Weingarten Realty Investors | 896,500 | 25,201 | ||||||
|
| |||||||
| 101,109 | ||||||||
|
| |||||||
| 380,652 | ||||||||
|
| |||||||
| SELF STORAGE—9.9% | ||||||||
CubeSmart | 256,655 | 3,303 | ||||||
Extra Space | 1,546,502 | 51,421 | ||||||
Public Storage | 515,851 | 71,792 | ||||||
|
| |||||||
| 126,516 | ||||||||
| TOTAL COMMON STOCKS (Identified Cost $762,583) | 1,270,164 | |||||||
| TOTAL LONG TERM INVESTMENTS—99.2% | ||||||||
| (Identified cost $762,583) | 1,270,164 | |||||||
See Notes to Financial Statements
8
Table of Contents
VIRTUS REAL ESTATE SECURITIES FUND
SCHEDULE OF INVESTMENTS (Continued)
SEPTEMBER 30, 2012
($ reported in thousands)
| SHARES | VALUE | |||||||
| SHORT-TERM INVESTMENTS—1.6% | ||||||||
| Money Market Mutual Funds—1.6% | ||||||||
BlackRock Liquidity Funds TempFund Portfolio – Institutional Shares (seven-day effective yield 0.140%) | 20,597,472 | $ | 20,597 | |||||
| TOTAL SHORT-TERM INVESTMENTS (Identified Cost $20,597) | 20,597 | |||||||
| TOTAL INVESTMENTS—100.8% (Identified Cost $783,180) | 1,290,761 | (1) | ||||||
Other assets and liabilities, |
| $ | (10,760 | ) | ||||
|
| |||||||
| NET ASSETS—100.0% | $ | 1,280,001 | ||||||
|
| |||||||
Abbreviation:
| REIT | Real Estate Investment Trust |
FOOTNOTE LEGEND:
| (1) | Federal Income Tax Information: For tax information at September 30, 2012, see Note 7 Federal Income Tax Information in the Notes to Financial Statements. |
The following table provides a summary of inputs used to value the Fund’s investments as of September 30, 2012 (See Security Valuation Note 2A in the Notes to Financial Statements):
| Total Value at September 30, 2012 | Level 1 – Quoted Prices | |||||||
Equity Securities: |
| |||||||
Common Stocks | $ | 1,270,164 | $ | 1,270,164 | ||||
Short-Term Investments | 20,597 | 20,597 | ||||||
|
|
|
| |||||
Total Investments | $ | 1,290,761 | $ | 1,290,761 | ||||
|
|
|
| |||||
There are no Level 2 (significant observable inputs) or Level 3 (significant unobservable inputs) priced securities.
See Notes to Financial Statements
9
Table of Contents
VIRTUS REAL ESTATE SECURITIES FUND
STATEMENT OF ASSETS AND LIABILITIES
SEPTEMBER 30, 2012
(Reported in thousands except shares and per share amounts)
| Assets | ||||
Investment in securities at value(1) | $ | 1,290,761 | ||
Receivables | ||||
Investment securities sold | 1,293 | |||
Fund shares sold | 4,542 | |||
Dividends and interest receivable | 3,243 | |||
Prepaid trustee retainer | 10 | |||
Prepaid expenses | 68 | |||
|
| |||
Total assets | 1,299,917 | |||
|
| |||
| Liabilities | ||||
Payables | ||||
Fund shares repurchased | 4,671 | |||
Investment securities purchased | 13,494 | |||
Investment advisory fees | 797 | |||
Distribution and service fees | 223 | |||
Administration fees | 141 | |||
Transfer agent fees and expenses | 489 | |||
Trustees’ fees and expenses | 2 | |||
Professional fees | 30 | |||
Other accrued expenses | 69 | |||
|
| |||
Total liabilities | 19,916 | |||
|
| |||
| Net Assets | $ | 1,280,001 | ||
|
| |||
| Net Assets Consist of: | ||||
Capital paid in on shares of beneficial interest | $ | 836,050 | ||
Accumulated undistributed net realized gain (loss) | (63,630 | ) | ||
Net unrealized appreciation (depreciation) on investments | 507,581 | |||
|
| |||
| Net Assets | $ | 1,280,001 | ||
|
| |||
| Class A | ||||
Net asset value (net assets/shares outstanding) per share | $ | 34.19 | ||
Maximum offering price per share NAV/(1-5.75%) | $ | 36.28 | ||
Shares of beneficial interest outstanding, no par value, unlimited authorization | 23,106,997 | |||
Net Assets | $ | 789,925 | ||
| Class B | ||||
Net asset value (net assets/shares outstanding) and offering price per share | $ | 33.72 | ||
Shares of beneficial interest outstanding, no par value, unlimited authorization | 200,495 | |||
Net Assets | $ | 6,761 | ||
| Class C | ||||
Net asset value (net assets/shares outstanding) and offering price per share | $ | 34.14 | ||
Shares of beneficial interest outstanding, no par value, unlimited authorization | 1,785,128 | |||
Net Assets | $ | 60,941 | ||
| Class I | ||||
Net asset value (net assets/shares outstanding) and offering price per share | $ | 34.16 | ||
Shares of beneficial interest outstanding, no par value, unlimited authorization | 12,364,384 | |||
Net Assets | $ | 422,374 | ||
(1) Investment in securities at cost | $ | 783,180 | ||
See Notes to Financial Statements
10
Table of Contents
VIRTUS REAL ESTATE SECURITIES FUND
YEAR ENDED SEPTEMBER 30, 2012
($ reported in thousands)
| Investment Income | ||||
Dividends | $ | 25,031 | ||
|
| |||
Total investment income | 25,031 | |||
|
| |||
| Expenses | ||||
Investment advisory fees | 8,916 | |||
Service fees, Class A | 1,839 | |||
Distribution and service fees, Class B | 86 | |||
Distribution and service fees, Class C | 549 | |||
Administration fees | 1,580 | |||
Transfer agent fees and expenses | 2,966 | |||
Custodian fees | 21 | |||
Printing fees and expenses | 145 | |||
Professional fees | 40 | |||
Registration fees | 114 | |||
Trustees’ fees and expenses | 66 | |||
Miscellaneous expenses | 80 | |||
|
| |||
Total expenses | 16,402 | |||
|
| |||
| Net investment income (loss) | 8,629 | |||
|
| |||
| Net Realized and Unrealized Gain (Loss) on Investments | ||||
Net realized gain (loss) on investments | 36,859 | |||
Net change in unrealized appreciation (depreciation) on investments | 266,599 | |||
|
| |||
| Net gain (loss) on investments | 303,458 | |||
|
| |||
| Net increase (decrease) in net assets resulting from operations | $ | 312,087 | ||
|
|
See Notes to Financial Statements
11
Table of Contents
VIRTUS REAL ESTATE SECURITIES FUND
STATEMENT OF CHANGES IN NET ASSETS
(Reported in thousands)
| Year Ended September 30, 2012 | Year Ended September 30, 2011 | |||||||
| INCREASE/(DECREASE) IN NET ASSETS | ||||||||
| From Operations | ||||||||
Net investment income (loss) | $ | 8,629 | $ | 4,639 | ||||
Net realized gain (loss) | 36,859 | 86,780 | ||||||
Net change in unrealized appreciation (depreciation) | 266,599 | (86,995 | ) | |||||
|
|
|
| |||||
| Increase (decrease) in net assets resulting from operations | 312,087 | 4,424 | ||||||
|
|
|
| |||||
| From Distributions to Shareholders | ||||||||
Net investment income, Class A | (7,015 | ) | (6,346 | ) | ||||
Net investment income, Class B | (17 | ) | (36 | ) | ||||
Net investment income, Class C | (122 | ) | (116 | ) | ||||
Net investment income, Class I | (4,844 | ) | (4,332 | ) | ||||
|
|
|
| |||||
| Decrease in net assets from distributions to shareholders | (11,998 | ) | (10,830 | ) | ||||
|
|
|
| |||||
| From Share Transactions | ||||||||
| Sale of shares | ||||||||
Class A (9,636 and 9,066 shares, respectively) | 314,117 | 262,684 | ||||||
Class B (1 and 3 shares, respectively) | 42 | 73 | ||||||
Class C (335 and 337 shares, respectively) | 11,063 | 9,724 | ||||||
Class I (4,347 and 3,803 shares, respectively) | 142,058 | 110,554 | ||||||
| Reinvestment of distributions | ||||||||
Class A (198 and 203 shares, respectively) | 6,493 | 5,688 | ||||||
Class B (—(1) and 1 shares, respectively) | 14 | 29 | ||||||
Class C (3 and 3 shares, respectively) | 102 | 92 | ||||||
Class I (128 and 134 shares, respectively) | 4,194 | 3,757 | ||||||
| Shares repurchased | ||||||||
Class A (9,953 and 8,140 shares, respectively) | (319,749 | ) | (234,816 | ) | ||||
Class B (169 and 280 shares, respectively) | (5,317 | ) | (8,006 | ) | ||||
Class C (277 and 409 shares, respectively) | (8,823 | ) | (11,766 | ) | ||||
Class I (4,406 and 3,402 shares, respectively) | (143,728 | ) | (98,978 | ) | ||||
|
|
|
| |||||
| Increase (decrease) in net assets from share transactions | 466 | 39,035 | ||||||
|
|
|
| |||||
| Net increase (decrease) in net assets | 300,555 | 32,629 | ||||||
| Net Assets | ||||||||
Beginning of period | 979,446 | 946,817 | ||||||
|
|
|
| |||||
| End of period | $ | 1,280,001 | $ | 979,446 | ||||
|
|
|
| |||||
Accumulated undistributed net investment income (loss) at end of the fiscal year | $ | — | $ | — | ||||
| (1) | Amount less than 500. |
See Notes to Financial Statements
12
Table of Contents
VIRTUS REAL ESTATE SECURITIES FUND
SELECTED PER SHARE DATA AND RATIOS FOR A SHARE OUTSTANDING
THROUGHOUT EACH PERIOD
| Net Asset Value, Beginning of Period | Net Investment Income (Loss)(2) | Net Realized and Unrealized Gain (Loss) | Total from Investment Operations | Dividends from Net Investment Income | Distributions from Net Realized Gains | Total Distributions | Change in Net Asset Value | Net Asset Value, End of Period | Total Return(1) | Net Assets, End of Period (000’s) | Ratio of Net Expenses to Average Net Assets(4) | Ratio of Gross Expenses to Average Net Assets (before waivers and reimbursements)(4) | Ratio of Net Investment Income (Loss) to Average Net Assets | Portfolio Turnover Rate | |||||||||||||||||||||||||||||||||||||||||||||||||||||||||||||
Class A | |||||||||||||||||||||||||||||||||||||||||||||||||||||||||||||||||||||||||||
10/1/11 to 9/30/12 | $ | 26.05 | 0.21 | 8.24 | 8.45 | (0.31 | ) | (0.31 | ) | 8.14 | $ | 34.19 | 32.49 | % | $ | 789,925 | 1.41 | % | 1.41 | % | 0.67 | % | 24 | % | |||||||||||||||||||||||||||||||||||||||||||||||||||
10/1/10 to 9/30/11 | 26.10 | 0.11 | 0.12 | 0.23 | (0.28 | ) | — | (0.28 | ) | (0.05 | ) | 26.05 | 0.82 | 605,073 | 1.46 | 1.46 | 0.39 | 36 | |||||||||||||||||||||||||||||||||||||||||||||||||||||||||
10/1/09 to 9/30/10 | 20.21 | 0.32 | 5.90 | 6.22 | (0.33 | ) | — | (0.33 | ) | 5.89 | 26.10 | 30.93 | 576,760 | 1.48 | 1.48 | 1.39 | 35 | ||||||||||||||||||||||||||||||||||||||||||||||||||||||||||
10/1/08 to 9/30/09 | 29.19 | 0.47 | (8.99 | ) | (8.52 | ) | (0.46 | ) | — | (0.46 | ) | (8.98 | ) | 20.21 | (28.61 | ) | 552,518 | 1.59 | 1.59 | 2.88 | 48 | ||||||||||||||||||||||||||||||||||||||||||||||||||||||
10/1/07 to 9/30/08 | 34.10 | 0.45 | (3.88 | ) | (3.43 | ) | (0.47 | ) | (1.01 | ) | (1.48 | ) | (4.91 | ) | 29.19 | (9.94 | ) | 862,062 | 1.37 | (3) | 1.45 | 1.51 | 32 | ||||||||||||||||||||||||||||||||||||||||||||||||||||
Class B | |||||||||||||||||||||||||||||||||||||||||||||||||||||||||||||||||||||||||||
10/1/11 to 9/30/12 | $ | 25.71 | 0.02 | 8.06 | 8.08 | (0.07 | ) | (0.07 | ) | 8.01 | $ | 33.72 | 31.49 | % | $ | 6,761 | 2.16 | % | 2.16 | % | 0.07 | % | 24 | % | |||||||||||||||||||||||||||||||||||||||||||||||||||
10/1/10 to 9/30/11 | 25.76 | (0.01 | ) | 0.03 | 0.02 | (0.07 | ) | — | (0.07 | ) | (0.05 | ) | 25.71 | 0.03 | 9,461 | 2.21 | 2.21 | (0.05 | ) | 36 | |||||||||||||||||||||||||||||||||||||||||||||||||||||||
10/1/09 to 9/30/10 | 19.95 | 0.16 | 5.81 | 5.97 | (0.16 | ) | — | (0.16 | ) | 5.81 | 25.76 | 30.01 | 16,595 | 2.23 | 2.23 | 0.70 | 35 | ||||||||||||||||||||||||||||||||||||||||||||||||||||||||||
10/1/08 to 9/30/09 | 28.85 | 0.35 | (8.91 | ) | (8.56 | ) | (0.34 | ) | — | (0.34 | ) | (8.90 | ) | 19.95 | (29.20 | ) | 17,648 | 2.34 | 2.34 | 2.16 | 48 | ||||||||||||||||||||||||||||||||||||||||||||||||||||||
10/1/07 to 9/30/08 | 33.72 | 0.22 | (3.83 | ) | (3.61 | ) | (0.25 | ) | (1.01 | ) | (1.26 | ) | (4.87 | ) | 28.85 | (10.65 | ) | 35,376 | 2.12 | (3) | 2.20 | 0.76 | 32 | ||||||||||||||||||||||||||||||||||||||||||||||||||||
See Notes to Financial Statements
13
Table of Contents
VIRTUS REAL ESTATE SECURITIES FUND
FINANCIAL HIGHLIGHTS
SELECTED PER SHARE DATA AND RATIOS FOR A SHARE OUTSTANDING
THROUGHOUT EACH PERIOD
| Net Asset Value, Beginning of Period | Net Investment Income (Loss)(2) | Net Realized and Unrealized Gain (Loss) | Total from Investment Operations | Dividends from Net Investment Income | Distributions from Net Realized Gains | Total Distributions | Change in Net Asset Value | Net Asset Value, End of Period | Total Return(1) | Net Assets, End of Period (000’s) | Ratio of Net Expenses to Average Net Assets(4) | Ratio of Gross Expenses to Average Net Assets (before waivers and reimbursements)(4) | Ratio of Net Investment Income (Loss) to Average Net Assets | Portfolio Turnover Rate | |||||||||||||||||||||||||||||||||||||||||||||||||||||||||||||
Class C | |||||||||||||||||||||||||||||||||||||||||||||||||||||||||||||||||||||||||||
10/1/11 to 9/30/12 | $ | 26.02 | (0.03 | ) | 8.22 | 8.19 | (0.07 | ) | (0.07 | ) | 8.12 | $ | 34.14 | 31.48 | % | $ | 60,941 | 2.16 | % | 2.16 | % | (0.10 | )% | 24 | % | ||||||||||||||||||||||||||||||||||||||||||||||||||
10/1/10 to 9/30/11 | 26.06 | (0.09 | ) | 0.12 | 0.03 | (0.07 | ) | — | (0.07 | ) | (0.04 | ) | 26.02 | 0.08 | 44,853 | 2.21 | 2.21 | (0.30 | ) | 36 | |||||||||||||||||||||||||||||||||||||||||||||||||||||||
10/1/09 to 9/30/10 | 20.19 | 0.15 | 5.88 | 6.03 | (0.16 | ) | — | (0.16 | ) | 5.87 | 26.06 | 29.95 | 46,722 | 2.23 | 2.23 | 0.65 | 35 | ||||||||||||||||||||||||||||||||||||||||||||||||||||||||||
10/1/08 to 9/30/09 | 29.17 | 0.35 | (8.99 | ) | (8.64 | ) | (0.34 | ) | — | (0.34 | ) | (8.98 | ) | 20.19 | (29.17 | ) | 41,818 | 2.34 | 2.34 | 2.12 | 48 | ||||||||||||||||||||||||||||||||||||||||||||||||||||||
10/1/07 to 9/30/08 | 34.07 | 0.23 | (3.88 | ) | (3.65 | ) | (0.24 | ) | (1.01 | ) | (1.25 | ) | (4.90 | ) | 29.17 | (10.63 | ) | 71,278 | 2.12 | (3) | 2.20 | 0.76 | 32 | ||||||||||||||||||||||||||||||||||||||||||||||||||||
Class I | |||||||||||||||||||||||||||||||||||||||||||||||||||||||||||||||||||||||||||
10/1/11 to 9/30/12 | $ | 26.03 | 0.30 | 8.22 | 8.52 | (0.39 | ) | (0.39 | ) | 8.13 | $ | 34.16 | 32.80 | % | $ | 422,374 | 1.16 | % | 1.16 | % | 0.93 | % | 24 | % | |||||||||||||||||||||||||||||||||||||||||||||||||||
10/1/10 to 9/30/11 | 26.08 | 0.19 | 0.12 | 0.31 | (0.36 | ) | — | (0.36 | ) | (0.05 | ) | 26.03 | 1.08 | 320,059 | 1.21 | 1.21 | 0.65 | 36 | |||||||||||||||||||||||||||||||||||||||||||||||||||||||||
10/1/09 to 9/30/10 | 20.19 | 0.38 | 5.90 | 6.28 | (0.39 | ) | — | (0.39 | ) | 5.89 | 26.08 | 31.27 | 306,740 | 1.23 | 1.23 | 1.63 | 35 | ||||||||||||||||||||||||||||||||||||||||||||||||||||||||||
10/1/08 to 9/30/09 | 29.17 | 0.49 | (8.97 | ) | (8.48 | ) | (0.50 | ) | — | (0.50 | ) | (8.98 | ) | 20.19 | (28.45 | ) | 206,474 | 1.32 | 1.32 | 3.00 | 48 | ||||||||||||||||||||||||||||||||||||||||||||||||||||||
10/1/07 to 9/30/08 | 34.08 | 0.62 | (3.98 | ) | (3.36 | ) | (0.54 | ) | (1.01 | ) | (1.55 | ) | (4.91 | ) | 29.17 | (9.71 | ) | 106,159 | 1.12 | (3) | 1.20 | 2.11 | 32 | ||||||||||||||||||||||||||||||||||||||||||||||||||||
Footnote Legend
| (1) | Sales charges, where applicable, are not reflected in the total return calculation. |
| (2) | Computed using average shares outstanding. |
| (3) | Blended net expense ratio. |
| (4) | The Fund may invest in other funds, and the annualized expense ratios do not reflect fees and expenses associated with the underlying funds. |
See Notes to Financial Statements
14
Table of Contents
VIRTUS REAL ESTATE SECURITIES FUND
SEPTEMBER 30, 2012
| Note | 1. Organization |
Virtus Opportunities Trust (the “Trust”) is organized as a Delaware statutory trust and is registered under the Investment Company Act of 1940, as amended (“1940 Act”), as an open-end management investment company.
As of the date of this report, 27 funds are offered for sale, of which the Real Estate Securities Fund (the “Fund”) is reported in this annual report. The Fund’s investment objective is outlined in the Fund Summary Page.
The Fund offers Class A shares, Class C shares and Class I shares for sale. Class B shares are no longer available for purchase by new or existing shareholders, except by existing shareholders through Qualifying Transactions. (For information regarding Qualifying Transactions, refer to the Trust’s prospectus.)
Class A shares are sold with a front-end sales charge of up to 5.75% with some exceptions. Generally, Class A shares are not subject to any charges by the Fund when redeemed; however, a 1% contingent deferred sales charge (“CDSC”) may be imposed on certain redemptions made within a certain period following purchases on which a finder’s fee has been paid. The period for which the CDSC applies for the Fund is 18 months. The CDSC period begins on the last day of the month preceding the month in which the purchase was made.
Class B shares were sold with a CDSC which declines from 5% to zero depending on the period of time the shares are held.
Class C shares are generally sold with a 1% CDSC, applicable if redeemed within one year of purchase. Class I shares are sold without a front-end sales charge or CDSC.
Virtus Mutual Funds may impose an annual fee on accounts having balances of less than $2,500. The small account fee may be waived in certain circumstances, as disclosed in the prospectuses and/or statements of additional information. The fees collected will be used to offset certain expenses of the Funds.
Each Class of shares has identical voting, dividend, liquidation and other rights and the same terms and conditions, except that each class bears different distribution and/or service fees under a Board-approved 12b-1 and/or shareholder service plan and has exclusive voting rights with respect to such plans. Class I shares are not subject to a 12b-1 plan. Income and other expenses and realized and unrealized gains and losses of the Fund are borne pro rata by the holders of each class of shares.
| Note | 2. Significant Accounting Policies |
The following is a summary of significant accounting policies consistently followed by the Trust in the preparation of its financial statements. The preparation of financial statements in conformity with accounting principles generally accepted in the United States of America requires management to make estimates and assumptions that affect the reported amounts of assets and liabilities, disclosure of contingent assets and liabilities at the date of the financial statements and the reported amount of increases and decreases in net assets from operations during the reporting period. Actual results could differ from those estimates and those differences could be significant.
15
Table of Contents
VIRTUS REAL ESTATE SECURITIES FUND
NOTES TO FINANCIAL STATEMENTS (Continued)
SEPTEMBER 30, 2012
| A. | Security Valuation |
Security Valuation procedures for the Fund which include nightly price variance, as well as back-testing such as bi-weekly unchanged price, monthly secondary source and transaction analysis which have been approved by the Board. All internally fair valued securities are approved by a valuation committee (“Valuation Committee”) appointed by the Board. The Valuation Committee is comprised of the treasurer, assistant treasurer, secretary and chief compliance officer of the Trust. All internally fair valued securities are updated daily and reviewed in detail by the Valuation Committee monthly unless changes occur within the period. The Valuation Committee reviews the validity of any model inputs and any changes to the model when applicable. Internal fair valuations are reviewed by the Board at least quarterly.
The Fund utilizes a fair value hierarchy which prioritizes the inputs to valuation techniques used to measure fair value into three broad levels.
| Ÿ Level 1 – | quoted prices in active markets for identical securities |
| Ÿ Level 2 – | prices determined using other significant observable inputs (including quoted prices for similar securities, interest rates, prepayment speeds, credit risk, etc.) |
| Ÿ Level 3 – | prices determined using significant unobservable inputs (including the valuation committee’s own assumptions in determining the fair value of investments) |
A description of the valuation techniques applied to the Fund’s major categories of assets and liabilities measured at fair value on a recurring basis is as follows:
Equity securities are valued at the official closing price (typically last sale) on the exchange on which the securities are primarily traded, or if no closing price is available, at the last bid price and are categorized as Level 1 in the hierarchy. Restricted equity securities and private placements that are not widely traded, are illiquid or are internally fair valued by the valuation committee, are generally categorized as Level 3 in the hierarchy.
Certain non-U.S. securities may be fair valued in cases where closing prices are not readily available or are deemed not reflective of readily available market prices. For example, significant events (such as movement in the U.S. securities market, or other regional and local developments) may occur between the time that non-U.S. markets close (where the security is principally traded) and the time that the Fund calculates its net asset value (“NAV”) (generally 4 p.m. Eastern time, the close of the New York Stock Exchange (“NYSE”)) that may impact the value of securities traded in these non-U.S. markets. In such cases the Fund fair values non-U.S. securities using an independent pricing service which considers the correlation of the trading patterns of the non-U.S. security to the intraday trading in the U.S. markets for investments such as ADRs, financial futures, ETFs, and certain indexes as well as prices for similar securities. Such fair valuations are categorized as Level 2 in the hierarchy. Because the frequency of significant events is not predictable, fair valuation of certain non-U.S. common stocks may occur on a frequent basis.
Listed derivatives that are actively traded are valued based on quoted prices from the exchange and are categorized as Level 1 in the hierarchy. Over the counter derivative contracts, which include forward currency contracts and equity-linked instruments, do
16
Table of Contents
VIRTUS REAL ESTATE SECURITIES FUND
NOTES TO FINANCIAL STATEMENTS (Continued)
SEPTEMBER 30, 2012
not require material subjectivity as pricing inputs are observed from actively quoted markets and are categorized as Level 2 in the hierarchy.
Investments in open-end mutual funds are valued at their closing NAV determined as of the close of regular trading on the NYSE each business day and are categorized as Level 1 in the hierarchy.
A summary of the inputs used to value the Fund’s net assets by each major security type is disclosed at the end of the Schedule of Investments for the Fund. The inputs or methodologies used for valuing securities are not necessarily an indication of the risk associated with investing in those securities.
| B. | Security Transactions and Investment Income |
Security transactions are recorded on the trade date. Realized gains and losses from the sale of securities are determined on the identified cost basis. Dividend income is recognized on the ex-dividend date, or in the case of certain foreign securities, as soon as the Fund is notified. Interest income is recorded on the accrual basis. The Fund amortizes premiums and accretes discounts using the effective interest method.
Dividend income is recorded using management’s estimate of the income included in distributions received from the REIT investments. Distributions received in excess of this estimated amount are recorded as a reduction of the cost of investments or reclassified to capital gains. The actual amounts of income, return of capital, and capital gains are only determined by each REIT after its fiscal year-end, and may differ from the estimated amounts.
| C. | Income Taxes |
The Fund is treated as a separate taxable entity. It is the intention of the Fund to comply with the requirements of Subchapter M of the Internal Revenue Code and to distribute substantially all of its taxable income to its shareholders. Therefore, no provision for federal income taxes or excise taxes has been made.
The Fund may be subject to foreign taxes on income, gains on investments or currency repatriation, a portion of which may be recoverable. The Fund will accrue such taxes and recoveries as applicable based upon current interpretations of the tax rules and regulations that exist in the markets in which it invests.
Management of the Fund has concluded that there are no significant uncertain tax positions which would require recognition in the financial statements. As of September 30, 2012, the tax years that remain subject to examination by the major tax jurisdictions under the statute of limitations are from the year 2009 forward (with limited exceptions).
| D. | Distributions to Shareholders |
Distributions are recorded by the Fund on the ex-dividend date. Income and capital gain distributions are determined in accordance with income tax regulations which may differ from accounting principles generally accepted in the United States of America. These differences may include the treatment of non-taxable dividends, market premium and discount, non-deductible expenses, expiring capital loss carryovers, foreign currency gain or loss, gain or loss on futures contracts, partnerships, operating losses and losses deferred due to wash sales. Permanent book and tax basis differences relating to shareholder distributions will result in reclassifications to capital paid in on shares of beneficial interest.
17
Table of Contents
VIRTUS REAL ESTATE SECURITIES FUND
NOTES TO FINANCIAL STATEMENTS (Continued)
SEPTEMBER 30, 2012
| E. | Expenses |
Expenses incurred together by the Fund and other affiliated mutual funds are allocated in proportion to the net assets of each such Fund, except where allocation of direct expense to each Fund or an alternative allocation method can be more appropriately used.
In addition to the net operating expenses that a Fund bears directly, the shareholders of the Fund indirectly bear the Fund’s pro-rata expenses of any underlying mutual funds in which the Fund invests.
Note 3. Investment Advisory Fees and Related Party Transactions
($ reported in thousands except as noted)
| A. | Adviser |
Virtus Investment Advisers, Inc. (the “Adviser”), an indirect, wholly-owned subsidiary of Virtus Investment Partners, Inc. (“Virtus”), is the Adviser to the Trust. The Adviser manages the Fund’s investment program and general operations of the Fund, including oversight of the Fund’s subadviser.
As compensation for its services to the Fund, the Adviser is entitled to a fee based upon the following annual rates as a percentage of the average daily net assets of the Fund: 0.75% of 1st $1 billion; 0.70% $1+ billion through $2 billion and 0.65% $2+ billion.
| B. | Subadviser |
The Subadviser manages the investments of the Fund for which it is paid a fee by the Adviser. Duff & Phelps Investment Management Co. (the “Subadviser”), an indirect wholly-owned subsidiary of Virtus, is the Subadviser to the Fund.
| C. | Distributor |
VP Distributors, LLC (“VP Distributors”), an indirect wholly-owned subsidiary of Virtus, serves as the distributor of the Fund’s shares and has advised the Fund that for the fiscal year (the “period”) ended September 30, 2012, it retained net commissions of $68 for Class A shares and deferred sales charges of $1, $3 and $5 for Class A shares, Class B shares and Class C shares respectively.
In addition, the Fund pays VP Distributors distribution and/or service fees under Board-approved 12b-1 and shareholder services plans, as a percentage of the daily net assets of each respective class at the annual rates as follows: 0.25% for Class A shares, 1.00% for Class B shares, and 1.00% for Class C shares. Class I shares are not subject to a 12b-1 plan.
Under certain circumstances, shares of certain Virtus Mutual Funds may be exchanged for shares of the same class of certain other Virtus Mutual Funds on the basis of the relative NAV per share at the time of the exchange. On exchanges with share classes that carry a CDSC, the CDSC schedule of the original shares purchased continues to apply.
18
Table of Contents
VIRTUS REAL ESTATE SECURITIES FUND
NOTES TO FINANCIAL STATEMENTS (Continued)
SEPTEMBER 30, 2012
| D. | Administrator and Transfer Agent |
VP Distributors also serves as the Trust’s Administrator. For the period ended September 30, 2012, the Fund incurred administration fees from the Trust totaling $1,184 which are included in the Statement of Operations.
VP Distributors also serves as the Fund’s Transfer Agent. For the period ended September 30, 2012, the Fund incurred transfer agent fees from the Trust totaling $2,810 which are included in the Statement of Operations. A portion of these fees was paid to outside entities that also provide services to the Trust.
| E. | Affiliated Shareholders |
At September 30, 2012, Virtus and its affiliates, BMO Bankcorp. (a minority investor in Virtus) and its affiliates, and the retirement plans of Virtus and its affiliates, held shares of the Fund which may be redeemed at any time that aggregated the following:
| Shares | Aggregate Net Asset Value | |||||||
Class I shares | 427,717 | $ | 14,611 | |||||
Note 4. Purchases and Sales of Securities
($ reported in thousands)
Purchases and sales of securities for the Fund (excluding U.S. Government and agency securities and short-term securities) during the year ended September 30, 2012, were as follows:
| Purchases | Sales | |||||||
| $ | 287,461 | $ | 275,877 | |||||
There were no purchases or sales of long-term U.S. Government or agency securities.
Note 5. Credit Risk and Asset Concentrations
The Fund may invest a high percentage of its assets in specific sectors of the market in its pursuit of a greater investment return. Fluctuations in these sectors of concentration may have a greater impact on the Fund, positive or negative, than if the Fund did not concentrate its investments in such sectors.
Note 6. Indemnifications
Under the Trust’s organizational documents, its trustees and officers are indemnified against certain liabilities arising out of the performance of their duties to the Fund. In addition in the normal course of business, the Fund enters into contracts that provide a variety of indemnifications to other parties. The Fund’s maximum exposure under these arrangements is unknown as this would involve future claims that may be made against the Fund and that have not occurred. However, the Fund has not had prior claims or losses pursuant to these arrangements and expect the risk of loss to be remote.
19
Table of Contents
VIRTUS REAL ESTATE SECURITIES FUND
NOTES TO FINANCIAL STATEMENTS (Continued)
SEPTEMBER 30, 2012
Note 7. Federal Income Tax Information
($ reported in thousands)
At September 30, 2012, federal tax cost and aggregate gross unrealized appreciation (depreciation) of securities held by the Fund were as follows:
Federal | Unrealized | Unrealized | Net Unrealized | |||
| $821,451 | $469,822 | $(512) | $469,310 |
The Fund has capital loss carryovers available to offset future realized capital gains, through the indicated expiration dates shown below:
2018 | Total | |
| $25,358 | $25,358 |
The Fund may not realize the benefit of these losses to the extent the Fund does not realize gains on investments prior to the expiration of the capital loss carryovers.
Under the Regulated Investment Company Modernization Act of 2010 (the “Act”), net capital losses recognized for tax years beginning after December 22, 2010 may be carried forward indefinitely, and their character is retained as short-term and/or long-term losses. Previously, net capital losses were carried forward for eight years and treated as short-term losses. As a transition rule, the Act requires that post-enactment net capital losses be used before pre-enactment net capital losses.
The Fund utilized $35,335 in losses deferred in prior years against current year capital gains.
Capital losses realized after October 31 and certain late year ordinary losses may be deferred and treated as occurring on the first day of the following fiscal year. For the fiscal year ended September 30, 2012, the Fund deferred capital loss of $0 and recognized post-October capital losses of $0.
The components of distributable earnings on a tax basis (excluding unrealized appreciation (depreciation) which is disclosed above) consist of undistributed ordinary income of $0 and undistributed long-term capital gains of $0.
The differences between the book and tax basis components of distributable earnings relate principally to the timing of recognition of income and gains for federal income tax purposes. Short-term gain distributions reported in the Statements of Changes in Net Assets, if any, are reported as ordinary income for federal tax purposes. Distributions are determined on a tax basis and may differ from net investment income and realized capital gains for financial reporting purposes.
Note 8. Reclassification of Capital Accounts
($ reported in thousands)
For financial reporting purposes, book basis capital accounts are adjusted to reflect the tax character of permanent book/tax differences. Permanent reclassifications can arise from differing treatment of certain income and gain transactions, nondeductible current year net operating losses, expiring capital loss carryovers and investments in passive foreign investment companies. The reclassifications have no impact on the net assets or net asset
20
Table of Contents
VIRTUS REAL ESTATE SECURITIES FUND
NOTES TO FINANCIAL STATEMENTS (Continued)
SEPTEMBER 30, 2012
value of the Fund. As of September 30, 2012, the Fund recorded reclassifications to increase (decrease) the accounts as listed below:
Capital Paid | Undistributed | Accumulated | ||
| $(3,370) | $3,369 | $1 |
Note 9. Recent Accounting Pronouncement
In December 2011, the Financial Accounting Standards Board issued Accounting Standards Update (“ASU”) No. 2011-11 regarding “Disclosures about Offsetting Assets and Liabilities”. The amendments, which will be effective for annual reporting periods beginning on or after January 1, 2013 and interim periods within those annual periods, require an entity to disclose information about offsetting and related arrangements for assets and liabilities, financial instruments and derivatives that are either currently offset in accordance with current requirements or are subject to enforceable master netting arrangements or similar agreements. At this time, management is evaluating the implications of ASU No. 2011-11 and its impact on the financial statements has not yet been determined.
Note 10. Subsequent Event Evaluations
Management has evaluated the impact of all subsequent events on the Fund through the date the financial statements were available for issuance, and has determined that there are no subsequent events requiring recognition or disclosure in the financial statements.
21
Table of Contents

Report of Independent Registered Public
Accounting Firm
To the Board of Trustees of
Virtus Opportunities Trust and Shareholders of
Virtus Real Estate Securities Fund:
In our opinion, the accompanying statement of assets and liabilities, including the schedule of investments, and the related statements of operations and of changes in net assets and the financial highlights present fairly, in all material respects, the financial position of Virtus Real Estate Securities Fund (the “Fund”), a series of Virtus Opportunities Trust, at September 30, 2012, the results of its operations for the year then ended, the changes in its net assets for each of the two years in the period then ended and the financial highlights for each of the five years in the period then ended, in conformity with accounting principles generally accepted in the United States of America. These financial statements and financial highlights (hereafter referred to as “financial statements”) are the responsibility of the Fund’s management; our responsibility is to express an opinion on these financial statements based on our audits. We conducted our audits of these financial statements in accordance with the standards of the Public Company Accounting Oversight Board (United States). Those standards require that we plan and perform the audit to obtain reasonable assurance about whether the financial statements are free of material misstatement. An audit includes examining, on a test basis, evidence supporting the amounts and disclosures in the financial statements, assessing the accounting principles used and significant estimates made by management, and evaluating the overall financial statement presentation. We believe that our audits, which included confirmation of securities at September 30, 2012 by correspondence with the custodian and brokers, provide a reasonable basis for our opinion.
Philadelphia, Pennsylvania
November 21, 2012
22
Table of Contents
VIRTUS REAL ESTATE SECURITIES FUND
SEPTEMBER 30, 2012 (UNAUDITED)
For the fiscal year ended September 30, 2012, the Fund makes the following disclosures for federal income tax purposes. Below is listed the percentage, or the maximum amount allowable, of its ordinary income dividends (“QDI”) to qualify for the lower tax rates applicable to individual shareholders, and the percentage of ordinary income dividends earned by the Fund which qualifies for the dividends received deduction (“DRD”) for corporate shareholders. The actual percentage of QDI and DRD for the calendar year will be designated in year-end tax statements. The Fund designates the amount below, or if subsequently different, as long-term capital gains dividends (“LTCG”) ($ reported in thousands).
QDI | DRD | LTCG | ||
| 0% | 0% | $0 |
23
Table of Contents
FUND MANAGEMENT TABLES (UNAUDITED)
Information pertaining to the Trustees and officers of the Trust as of September 30, 2012, is set forth below. The statement of additional information (SAI) includes additional information about the Trustees and is available without charge, upon request, by calling (800) 243-1574. The address of each individual, unless otherwise noted, is 100 Pearl Street, Hartford, CT 06103-4506. There is no stated term of office for Trustees of the Trust.
Independent Trustees
| Name, Year of Birth, Year Elected and Number of Funds Overseen | Principal Occupation(s) Other Directorships Held by Trustee | |
Leroy Keith, Jr. YOB: 1939 Elected: 2000 47 Funds | Chairman (since 2010), Bloc Global Services Group, LLC (construction and redevelopment company); Managing Director (2007 to 2008), Almanac Capital Management (commodities business); Director/Trustee (since 2010), Wells Fargo Advantage Funds (149 series) and their predecessors, Evergreen Funds (1989 to 2010); Director (2003 to 2010), Diversapack Co. (soft packaging company). | |
Philip R. McLoughlin Chairman YOB: 1946 Elected: 1999 62 Funds | Partner (since 2006), Cross Pond Partners, LLC (strategy consulting firm); Managing Director (2009 to 2010), SeaCap Asset Management Fund I, L.P. and SeaCap Partners, LLC (2009 to 2010) (investment management); Director (since 1991) and Chairman (since 2010), World Trust Fund; Chairman and Trustee (since 2003), Virtus Variable Insurance Trust (9 portfolios); Director (since 1995), DTF Tax-Free Income Fund, Inc.; Director (since 1995), Duff & Phelps Utility and Corporate Bond Trust, Inc.; Director (since 2009), DNP Select Income Fund Inc.; Director (since 2011), Duff & Phelps Global Utility Income Fund Inc.; Trustee (since 2011), Virtus Global Multi-Sector Fixed Income Fund; Trustee (since 2011), Virtus Total Return Fund; Director (1985 to 2009), Argo Group International Holdings Inc. and its predecessor, PXRE Corporation (insurance). | |
Geraldine M. McNamara YOB: 1951 Elected: 2001 51 Funds | Retired. Director (since 2003), DTF Tax-Free Income Fund, Inc.; Director (since 2003), Duff & Phelps Utility and Corporate Bond Trust, Inc.; Director (since 2009), DNP Select Income Fund Inc.; Director (since 2011) Duff & Phelps Global Utility Income Fund Inc. | |
James M. Oates YOB: 1946 Elected: 2000 47 Funds | Managing Director (since 1994), Wydown Group (consulting firm); Chairman and Trustee (since 2005), John Hancock Variable Insurance Trust and John Hancock Funds II (collectively, 210 portfolios); Director (since 1996), Stifel Financial; Chairman and Director (since 1999), Connecticut River Bank and Director (since 1998), Connecticut River Bancorp; Chairman (since 2000), Emerson Investment Management, Inc.; Director (since 2002), New Hampshire Trust Company; Non-Executive Chairman (2007 to 2011), Hudson Castle Group, Inc. (formerly IBEX Capital Markets, Inc.) (financial services). | |
Richard E. Segerson YOB: 1946 Elected: 2000 47 Funds | Managing Director (since 1998), Northway Management Company. | |
Ferdinand L.J. Verdonck YOB: 1942 Elected: 2005 47 Funds | Director (since 1998), The J.P. Morgan European Investment Trust; Director (since 2005), Galapagos N.V. (biotechnology); Mr. Verdonck is also a director of several non-U.S. companies. |
24
Table of Contents
FUND MANAGEMENT TABLES (UNAUDITED) (Continued)
Interested Trustee
The individual listed below is an “interested person” of the Trust, as defined in Section 2(a)(19) of the 1940 Act, as amended, and the rules and regulations thereunder.
| Name, Year of Birth, Year Elected and Number of Funds Overseen | Principal Occupation(s) During Past 5 Years and | |
George R. Aylward* Trustee and President YOB: 1964 Elected: 2006 49 Funds | Director, President and Chief Executive Officer (since 2008), Virtus Investment Partners, Inc. and/or certain of its subsidiaries; various senior officer positions with Virtus affiliates (since 2005); Chairman, President and Chief Executive Officer (since 2006), The Zweig Fund, Inc. and The Zweig Total Return Fund, Inc.; Trustee and President (since 2011), Virtus Global Multi-Sector Income Fund and Virtus Total Return Fund. |
| * | Mr. Aylward is an “interested person,” as defined in the 1940 Act, by reason of his position as President and Chief Executive Officer of Virtus Investment Partners, Inc. (“Virtus”), the ultimate parent company of the Adviser, and various positions with its affiliates, including the Adviser. |
25
Table of Contents
FUND MANAGEMENT TABLES (UNAUDITED) (Continued)
Officers of the Trust Who Are Not Trustees
Name, Address and Year of Birth | Position(s) Held with Time Served | Principal Occupation(s) During Past 5 Years | ||
W. Patrick Bradley YOB: 1972 | Vice President since 2011, Chief Financial Officer and Treasurer since 2006. | Senior Vice President, Fund Services (since 2010), Virtus Investment Partners, Inc. and/or certain of its subsidiaries; various officer positions (since 2006) with Virtus affiliates; Vice President (since 2011), Chief Financial Officer and Treasurer (since 2004), Virtus Variable Insurance Trust; Vice President, Chief Financial Officer and Treasurer (since 2011), Virtus Global Multi-Sector Income Fund and Virtus Total Return Fund; Vice President (since 2012) and Treasurer (Chief Financial Officer) (since 2007), The Zweig Fund, Inc. and Zweig Total Return Fund, Inc.; Vice President and Assistant Treasurer (since 2011), Duff & Phelps Global Utility Income Fund Inc. | ||
Kevin J. Carr YOB: 1954 | Vice President, Chief Legal Officer, Counsel and Secretary since 2005. | Senior Vice President (since 2009), Vice President, Counsel and Secretary (2008 to 2009), Virtus Investment Partners, Inc. and/or certain of its subsidiaries; various senior officer positions (since 2005) with Virtus affiliates; Vice President, Chief Legal Officer, Counsel and Secretary (since 2010), Virtus Variable Insurance Trust; Vice President, Chief Legal Officer, Counsel and Secretary (since 2011), Virtus Global Multi-Sector Income Fund and Virtus Total Return Fund; Vice President and Assistant Secretary (since 2012), Secretary and Chief Legal Officer (2005-2012), The Zweig Fund, Inc. and Zweig Total Return Fund, Inc.; Vice President and Assistant Secretary (since 2011), Duff & Phelps Global Utility Income Fund Inc. | ||
Nancy J. Engberg YOB: 1956 | Vice President and Chief Compliance Officer since 2011. | Vice President (since 2008) and Chief Compliance Officer (2008 to 2011), Virtus Investment Partners, Inc. and/or certain of its subsidiaries; various officer positions (since 2003) with Virtus affiliates; Vice President (since 2010), Chief Compliance Officer (since 2011), Virtus Variable Insurance Trust; Vice President and Chief Compliance Officer (since 2011), Virtus Global Multi-Sector Income Fund and Virtus Total Return Fund; Vice President and Chief Compliance Officer (since 2012), The Zweig Fund, Inc. and Zweig Total Return Fund, Inc. | ||
Francis G. Waltman YOB: 1962 | Senior Vice President since 2008. | Executive Vice President, Product Development (since 2009), Virtus Investment Partners, Inc. and/or certain of its subsidiaries; various senior officer positions (since 2006) with Virtus affiliates; Senior Vice President (since 2010), Virtus Variable Insurance Trust; Senior Vice President (since 2011), Virtus Global Multi-Sector Income Fund and Virtus Total Return Fund. |
26
Table of Contents
VIRTUS OPPORTUNITIES TRUST
101 Munson Street
Greenfield, MA 01301-9668
Trustees
George R. Aylward
Leroy Keith, Jr.
Philip R. McLoughlin, Chairman
Geraldine M. McNamara
James M. Oates
Richard E. Segerson
Ferdinand L.J. Verdonck
Officers
George R. Aylward, President
Francis G. Waltman, Senior Vice President
Nancy J. Engberg, Vice President and Chief Compliance Officer
W. Patrick Bradley, Vice President, Chief Financial Officer and Treasurer
Kevin J. Carr, Vice President, Chief Legal Officer, Counsel and Secretary
Investment Adviser
Virtus Investment Advisers, Inc.
100 Pearl Street
Hartford, CT 06103-4506
Principal Underwriter
VP Distributors, LLC
100 Pearl Street
Hartford, CT 06103-4506
Transfer Agent
VP Distributors, LLC
100 Pearl Street
Hartford, CT 06103-4506
Custodian
The Bank of New York Mellon
One Wall Street
New York, NY 10005-2588
Independent Registered Public Accounting Firm
PricewaterhouseCoopers LLC
2001 Market Street
Philadelphia, PA 19103-7042
How to Contact Us
Mutual Fund Services 1-800-243-1574
Adviser Consulting Group 1-800-243-4361
Telephone Orders 1-800-367-5877
Text Telephone 1-800-243-1926
Web site Virtus.com
Important Notice to Shareholders
The Securities and Exchange Commission has modified mailing regulations for semiannual and annual shareholder fund reports to allow mutual fund companies to send a single copy of these reports to shareholders who share the same mailing address. If you would like additional copies, please call Mutual Fund Services at 1-800-243-1574.
Table of Contents
For more information about
Virtus mutual funds, please call
your financial representative,
contact us at 1-800-243-1574
or Virtus.com
| 8009 | 11-12 |

P.O. Box 9874
Providence, RI 02940 -8074
Table of Contents


Annual
Report
Virtus Allocator Premium AlphaSector™ Fund*
Virtus AlphaSector™ Rotation Fund
Virtus Dynamic AlphaSector™ Fund
Virtus Global Premium AlphaSector™ Fund
Virtus Premium AlphaSector™ Fund
Virtus Alternatives Diversifier Fund
| *Prospectus | Supplement applicable to this Fund appears at the back of this Annual Report. |
TRUST NAME: VIRTUS OPPORTUNITIES TRUST | September 30, 2012 |  | ||
| No Bank Guarantee | Not FDIC Insured | May lose Value |
Table of Contents
| 1 | ||||||||||||
| 2 | ||||||||||||
| 5 | ||||||||||||
| Fund | Fund Summary | Schedule of Investments | ||||||||||
Virtus Allocator Premium AlphaSector™ Fund | 7 | 25 | ||||||||||
Virtus AlphaSector™ Rotation Fund | 10 | 26 | ||||||||||
Virtus Dynamic AlphaSector™ Fund | 13 | 32 | ||||||||||
Virtus Global Premium AlphaSector™ Fund | 16 | 33 | ||||||||||
Virtus Premium AlphaSector™ Fund | 19 | 34 | ||||||||||
Virtus Alternatives Diversifier Fund | 22 | 42 | ||||||||||
| 44 | ||||||||||||
| 46 | ||||||||||||
| 48 | ||||||||||||
| 52 | ||||||||||||
| 53 | ||||||||||||
| 59 | ||||||||||||
| 76 | ||||||||||||
| 77 | ||||||||||||
| 78 | ||||||||||||
PROXY VOTING PROCEDURES AND VOTING RECORD (FORM N-PX)
The adviser and subadvisers vote proxies relating to portfolio securities in accordance with procedures that have been approved by the Board of Trustees (“Trustees” or the “Board”) of the Trust. You may obtain a description of these procedures, along with information regarding how the Funds voted proxies during the most recent 12-month period ended June 30, free of charge, by calling toll-free 1-800-243-1574. This information is also available through the Securities and Exchange Commission’s (the “SEC”) website at http://www.sec.gov.
FORM N-Q INFORMATION
The Trust files a complete schedule of portfolio holdings for each Fund with the SEC for the first and third quarters of each fiscal year on Form N-Q. Form N-Q is available on the SEC’s website at http://www.sec.gov. Form N-Q may be reviewed and copied at the SEC’s Public Reference Room. Information on the operation of the SEC’s Public Reference Room can be obtained by calling toll-free 1-800-SEC-0330.
This report is not authorized for distribution to prospective investors in the Funds presented in this book unless preceded or accompanied by an effective prospectus which includes information concerning the sales charge, each Fund’s record and other pertinent information.
Table of Contents
Dear Fellow Shareholders of Virtus Mutual Funds:

Investors were subject to the vagaries of the financial markets over the annual reporting period. Markets gained momentum throughout the first quarter of 2012, slid backwards in the second quarter, only to rebound strongly in the third quarter and end the 12-month period in positive territory.
An extended rally helped equity and fixed income markets produce respectable returns for the year ended September 30, 2012. U.S. equities, as measured by the S&P 500® Index, gained an impressive 30.20 percent, far surpassing international equities, which rose 20.98 percent, as represented by the MSCI All Country World Index (net). U.S. fixed income markets rose |
5.16 percent for the year, as measured by the Barclays Capital U.S. Aggregate Bond Index. A consistent “flight to quality” among global investors kept demand high for the 10-year U.S. Treasury and its yield low, at just 1.64 percent at the end of September.
As we enter the final quarter of 2012, the economic strength of the United States, Europe, and China remains tenuous. The onus is on U.S. government to avoid the dangers of the “fiscal cliff” and on corporations to produce robust earnings, in particular strong revenue growth, which will play a pivotal role in determining future market direction.
Market uncertainty is a timely reminder of the importance of portfolio diversification. While diversification cannot guarantee a profit or prevent loss, owning a variety of asset classes may cushion your portfolio against inevitable market fluctuations. Your financial advisor can help you ensure that your portfolio is adequately diversified.
Thank you for entrusting Virtus with your assets. We appreciate your business and remain committed to your long-term financial success.
Sincerely,

George R. Aylward
President, Virtus Mutual Funds
October 2012
Whenever you have questions about your account, or require additional information, please visit us on the Web at www.virtus.com or call our shareowner service group toll-free at 1-800-243-1574.
Performance data quoted represents past results. Past performance is no guarantee of future results and current performance may be higher or lower than performance shown above.
1
Table of Contents
Disclosure of Fund Expenses (Unaudited)
For the six-month period of April 1, 2012 to September 30, 2012
We believe it is important for you to understand the impact of costs on your investment. All mutual funds have operating expenses. As a shareholder of a Virtus Opportunities Trust fund (each, a “Fund”) you may incur two types of costs: (1) transaction costs, including sales charges on purchases of Class A shares and contingent deferred sales charges on Class C shares, and (2) ongoing costs, including investment advisory fees, distribution and service fees; and other expenses. Class I shares are sold without sales charges. These examples are intended to help you understand your ongoing costs (in dollars) of investing in a Fund and to compare these costs with the ongoing costs of investing in other mutual funds. These examples are based on an investment of $1,000 invested at the beginning of the period and held for the entire six-month period. The following Expense Table illustrates your Fund’s costs in two ways.
Actual Expenses
The first section of the accompanying table provides information about actual account values and actual expenses. You may use the information in this section, together with the amount you invested, to estimate the expenses that you paid over the period. Simply divide your account value by $1,000 (for example, an $8,600 account value divided by $1,000 = 8.6), then multiply the result by the number in the first section under the heading “Expenses Paid During Period” to estimate the expenses you paid on your account during the period.
Hypothetical Example for Comparison Purposes
The second section of the accompanying table provides information about hypothetical account values and hypothetical expenses based on the Fund’s actual expense ratio and an assumed rate of return of 5% per year before expenses, which is not your Fund’s actual return. The hypothetical account values and expenses may not be used to estimate the actual ending account balance or expenses you paid for the period. You may use this information to compare the ongoing costs of investing in your Fund and other funds. To do so, compare these 5% hypothetical examples with the 5% hypothetical examples that appear in the shareholder reports of the other funds.
Please note that the expenses shown in the accompanying table are meant to highlight your ongoing costs only and do not reflect any transactional costs, such as sales charges or contingent deferred sales charges. Therefore, the second section of the accompanying table is useful in comparing ongoing costs only, and will not help you determine the relative total costs of owning different funds. In addition, if these transactional costs were included, your costs would have been higher. The calculations assume no shares were bought or sold during the period. Your actual costs may have been higher or lower, depending on the amount of your investment and the timing of any purchases or redemptions.
2
Table of Contents
VIRTUS OPPORTUNITIES TRUST
Disclosure of Fund Expenses (Unaudited) (Continued)
For the six-month period of April 1, 2012 to September 30, 2012
| Expense Table | ||||||||||||||||
| Beginning Account Value April 1, 2012 | Ending Account Value September 30, 2012 | Annualized Expense Ratio | Expenses Paid During Period* | |||||||||||||
Allocator Premium AlphaSector™ Fund |
| |||||||||||||||
Actual |
| |||||||||||||||
| Class A | $ | 1,000.00 | $ | 1,036.20 | 1.72 | % | $8.76 | |||||||||
| Class C | 1,000.00 | 1,032.30 | 2.43 | 12.35 | ||||||||||||
| Class I | 1,000.00 | 1,037.20 | 1.48 | 7.54 | ||||||||||||
Hypothetical (5% return before expenses) |
| |||||||||||||||
| Class A | 1,000.00 | 1,016.29 | 1.72 | 8.71 | ||||||||||||
| Class C | 1,000.00 | 1,012.70 | 2.43 | 12.30 | ||||||||||||
| Class I | 1,000.00 | 1,017.51 | 1.48 | 7.49 | ||||||||||||
AlphaSector™ Rotation Fund |
| |||||||||||||||
Actual |
| |||||||||||||||
| Class A | $ | 1,000.00 | $ | 1,038.60 | 1.02 | % | $5.20 | |||||||||
| Class C | 1,000.00 | 1,035.20 | 1.75 | 8.90 | ||||||||||||
| Class I | 1,000.00 | 1,040.00 | 0.78 | 3.98 | ||||||||||||
Hypothetical (5% return before expenses) |
| |||||||||||||||
| Class A | 1,000.00 | 1,019.84 | 1.02 | 5.16 | ||||||||||||
| Class C | 1,000.00 | 1,016.14 | 1.75 | 8.86 | ||||||||||||
| Class I | 1,000.00 | 1,021.05 | 0.78 | 3.95 | ||||||||||||
Dynamic AlphaSector™ Fund** |
| |||||||||||||||
Actual | ||||||||||||||||
Class A | $ | 1,000.00 | $ | 1,047.60 | 2.63 | % | $13.46 | |||||||||
Class B | 1,000.00 | 1,044.10 | 3.34 | 17.07 | ||||||||||||
Class C | 1,000.00 | 1,043.00 | 3.37 | 17.21 | ||||||||||||
Class I | 1,000.00 | 1,048.30 | 2.39 | 12.24 | ||||||||||||
Hypothetical (5% return before expenses) |
| |||||||||||||||
Class A | 1,000.00 | 1,011.69 | 2.63 | 13.31 | ||||||||||||
Class B | 1,000.00 | 1,008.09 | 3.34 | 16.91 | ||||||||||||
Class C | 1,000.00 | 1,007.94 | 3.37 | 17.06 | ||||||||||||
Class I | 1,000.00 | 1,012.90 | 2.39 | 12.10 | ||||||||||||
Global Premium AlphaSector™ Fund |
| |||||||||||||||
Actual |
| |||||||||||||||
| Class A | $ | 1,000.00 | $ | 1,030.30 | 1.75 | % | $8.88 | |||||||||
| Class C | 1,000.00 | 1,026.40 | 2.50 | 12.67 | ||||||||||||
| Class I | 1,000.00 | 1,031.40 | 1.50 | 7.62 | ||||||||||||
Hypothetical (5% return before expenses) |
| |||||||||||||||
| Class A | 1,000.00 | 1,016.14 | 1.75 | 8.86 | ||||||||||||
| Class C | 1,000.00 | 1,012.34 | 2.50 | 12.66 | ||||||||||||
| Class I | 1,000.00 | 1,017.41 | 1.50 | 7.59 | ||||||||||||
3
Table of Contents
VIRTUS OPPORTUNITIES TRUST
Disclosure of Fund Expenses (Unaudited) (Continued)
For the six-month period of April 1, 2012 to September 30, 2012
| Expense Table | ||||||||||||||||
| Beginning Account Value April 1, 2012 | Ending Account Value September 30, 2012 | Annualized Expense Ratio | Expenses Paid During Period* | |||||||||||||
Premium AlphaSector™ Fund |
| |||||||||||||||
Actual |
| |||||||||||||||
| Class A | $ | 1,000.00 | $ | 1,032.00 | 1.64 | % | $ | 8.33 | ||||||||
| Class C | 1,000.00 | 1,028.70 | 2.38 | 12.07 | ||||||||||||
| Class I | 1,000.00 | 1,034.00 | 1.39 | 7.07 | ||||||||||||
Hypothetical (5% return before expenses) |
| |||||||||||||||
| Class A | 1,000.00 | 1,016.70 | 1.64 | 8.30 | ||||||||||||
| Class C | 1,000.00 | 1,012.95 | 2.38 | 12.05 | ||||||||||||
| Class I | 1,000.00 | 1,017.96 | 1.39 | 7.04 | ||||||||||||
Alternatives Diversifier Fund |
| |||||||||||||||
Actual |
| |||||||||||||||
| Class A | $ | 1,000.00 | $ | 1,027.80 | 0.45 | % | $ | 2.28 | ||||||||
| Class C | 1,000.00 | 1,023.40 | 1.20 | 6.07 | ||||||||||||
| Class I | 1,000.00 | 1,028.70 | 0.20 | 1.01 | ||||||||||||
Hypothetical (5% return before expenses) |
| |||||||||||||||
| Class A | 1,000.00 | 1,022.72 | 0.45 | 2.28 | ||||||||||||
| Class C | 1,000.00 | 1,018.92 | 1.20 | 6.08 | ||||||||||||
| Class I | 1,000.00 | 1,023.99 | 0.20 | 1.01 | ||||||||||||
| * | Expenses are equal to the relevant Fund’s annualized expense ratio, which is net of waived fees, reimbursed expenses, dividends and interest on short sales, if applicable, multiplied by the average account value over the period, multiplied by the number of days (183) expenses were accrued in the most recent fiscal half-year, then divided by 366 to reflect the one-half year period. |
| ** | Dynamic AlphaSector Fund’s annualized expense ratios include dividends and interest on short sales. |
| For Funds which may invest in other funds, the annualized expense ratios noted above do not reflect fees and expenses associated with the underlying funds. If such fees and expenses had been included, the expenses would have been higher. |
| You can find more information about the Funds’ expenses in the Financial Statements section that follows. For additional information on operating expenses and other shareholder costs, refer to the prospectus. |
4
Table of Contents
American Depositary Receipt (ADR)
Represents shares of foreign companies traded in U.S. dollars on U.S. exchanges that are held by a bank or a trust. Foreign companies use ADRs in order to make it easier for Americans to buy their shares.
AlphaSector™ Rotation Fund Composite Index
The composite index allocation is 100% S&P 500® Index. Prior to September 29, 2009, the composite index consisted of 80% S&P 500® Index and 20% Barclays Capital U.S. Aggregate Bond Index.
Alternatives Diversifier Composite Index
The Alternatives Diversifier composite index consists of: Diversified Trends Index (15%), UBS Global Investors (Real Estate) Index (20%), Global Infrastructure, represented by the MSCI World Infrastructure Sector Capped Index (since 9/1/2008) (15%), S&P North American Natural Resources Sector Index (10%), Deutsche Bank Liquid Commodity Index (15%), Deutsche Bank G10 Currency Harvest Index (15%), and Credit Suisse Leveraged Loan Index (10%). From 9/1/2008 to 3/1/2012 the composite consisted of HFRX Equity Market Neutral Index (20%), UBS Global Investors (Real Estate) Index (20%), Global Infrastructure, represented by the MSCI World Infrastructure Sector Capped Index (since 9/1/2008) (15%), S&P North American Natural Resources Sector Index (10%), Deutsche Bank Liquid Commodity Index (15%), Deutsche Bank G10 Currency Harvest Index (10%) and Credit Suisse Leveraged Loan Index (10%). Prior to 9/1/2008, the Global Infrastructure component was represented by a mix of MSCI US Utilities Index (65%), MSCI World Telecom Services Index (20%) and MSCI World ex US Utilities Index (15%).
Barclays Capital U.S. Aggregate Bond Index
The Barclays Capital U.S. Aggregate Bond Index measures the U.S. investment grade fixed rate bond market. The index is calculated on a total return basis.
Dow Jones Moderate Portfolio IndexSM
The Dow Jones Global Moderate Portfolio Index is a benchmark that takes 60% of the risk of the global securities market. It is a total returns index that is a time-varying weighted average of stocks, bonds, and cash. The Index is the efficient allocation of stocks, bonds, and cash in a portfolio with 60% of the risk of the Dow Jones Aggressive Portfolio Index. The index is calculated on a total return basis with dividends reinvested. The index is unmanaged and not available for direct investment.
Dynamic AlphaSector™ Linked Benchmark
The Dynamic AlphaSector™ Linked Benchmark consists of the S&P 500® Index, a free-float market capitalization-weighted index of 500 of the largest U.S. companies. The index is calculated on a total return basis with dividends reinvested. Performance of the Dynamic AlphaSector™ Linked Benchmark prior to 2/6/2012 is that of the Citigroup 90-Day Treasury Bill Index. The index is unmanaged and not available for direct investment.
European Central Bank (“ECB”)
The European Central Bank (ECB) responsible for conducting monetary policy for the eurozone. The ECB was established as the core of the Eurosystem and the European System of Central Banks (ESCB). The ESCB comprises the ECB and the national central banks (NCBs) of all 17 EU Member States whether they have adopted the Euro or not.
Exchange-Traded Funds (ETF)
Portfolios of stocks or bonds that track a specific market index.
5
Table of Contents
KEY INVESTMENT TERMS (continued)
Fund of funds
A mutual fund that invests in the shares of other open-end mutual funds according to an established asset allocation model, resulting in a diversified portfolio of asset classes and investment strategies appropriate for pursuit of the overall investment objective.
iShares®
Represents shares of an open-end exchange-traded fund.
Long position (“long”)
Ownership of a security, giving the investor the right to transfer ownership to someone else, the right to receive income paid by the security, and the right to any profits or losses as the security’s value changes.
MSCI All Country World Index (Net)
The MSCI AC World Index (Net) is a free float-adjusted market capitalization-weighted index that measures equity performance of developed and emerging markets. The index is calculated on a total return basis with net dividends reinvested. The index is unmanaged and not available for direct investment.
MSCI EAFE® Index
The MSCI EAFE® (Europe, Australasia, Far East) Index is a free float-adjusted market capitalization index that measures equity market performance of developed markets, excluding the U.S. and Canada. The index is calculated on a total return basis with gross dividends reinvested.
MSCI WorldSM Index (Net)
A free float-adjusted market capitalization index that measures developed global market equity performance. The index is calculated on a total return basis with net dividends reinvested.
Premium AlphaSector™ Index (“ASRP”)
ASRP is composed of the nine Select Sector SPDR® exchange traded funds (“ETFs”) which represent the primary sectors of the S&P 500® Index plus an ETF representing short-term U.S. Treasuries.
REIT (Real Estate Investment Trust)
A publicly traded company that owns, develops and operates income-producing real estate such as apartments, office buildings, hotels, shopping centers and other commercial properties.
S&P 500® Index
The S&P 500® Index is a free-float market capitalization-weighted index of 500 of the largest U.S. companies. The index is calculated on a total return basis with dividends reinvested.
SPDR®
Represents shares of an open-end exchange-traded fund.
Short position (“short”)
Stock shares that an investor has sold without actually owning (by borrowing the certificates from a broker) in anticipation of a decline in the stock value by a certain date. If the price falls, the investor buys the shares at the lower rate and makes a profit on the difference. It the price rises, the investor must buy at the higher price and sustains a loss.
6
Table of Contents
| Allocator Premium AlphaSector™ Fund | Ticker Symbols: Class A: VAAAV Class C: VAACX Class I: VAISX |
| ¢ | The Fund is diversified and has an investment objective of capital appreciation. In pursuing this objective, the Fund maintains an emphasis on preservation of capital. |
| ¢ | For the fiscal year ended September 30, 2012, the Fund’s Class A shares at NAV returned 11.08%, Class C shares returned 10.13%, and Class I shares returned 11.24%. For the same period, the S&P 500® Index, a broad-based equity index, returned 30.20%. Dow Jones Moderate Portfolio IndexSM, the Fund’s style-specific index appropriate for comparison, returned 15.58%. |
All performance figures assume reinvestment of distributions and exclude the effect of sales charges. Past performance is no guarantee of future results and current performance may be higher or lower than the performance shown above.
How did the market perform during the Fund’s fiscal period?
| ¢ | On the heels of a volatile third calendar quarter of 2011, U.S. and international equity markets experienced strong returns for the fiscal year ended September 30, 2012. |
| ¢ | The U.S. equity market offered significantly more robust returns than international markets in the fiscal year. Three of the four quarters were positive, with the S&P 500® Index advancing double-digits in the first and second fiscal quarters. |
| ¢ | Fixed income markets were generally constructive throughout the fiscal year, posting four positive quarters. |
What factors affected the Fund’s performance during its fiscal period?
| ¢ | The Fund’s focus is on providing downside protection and upside participation and its goal is to outperform strongly during bear markets and to provide quality returns in positive markets. During the strongest market periods, when one-year returns exceed 20% - 25%, we expect the Fund to lag the market |
moderately. By setting clearly defined expectations, the Fund serves the needs of investors, who are willing to forego an “extreme up” in order to benefit from downside protection. The 12-month period ended September 30, 2012 is an example of such an “extreme up” period. |
| ¢ | The domestic and international equity sleeves began the fiscal year with a significant cash-equivalent position after having de-risked in the volatile quarter ended September 30, 2011. This hurt relative performance primarily in the U.S. sleeve, as the S&P 500® Index advanced 11.82% in the quarter ended December 31, 2011. |
| ¢ | In the first calendar quarter of 2012, domestic and international equity markets experienced strong gains. The domestic equity sleeve of the Fund lagged the S&P 500® Index in the first calendar quarter of 2012 primarily due to lack of exposure to certain sectors (e.g. Financials) that our quantitative model deemed too risky. In the international equity sleeve, the maintenance of a cash-equivalent allocation into the New Year hurt relative performance. |
| ¢ | The fixed income sleeve of the Fund performed well in absolute and relative terms over the fiscal year. Outperformance vs. the Barclays Capital US Aggregate Index was due primarily to sector weighting differences. |
| ¢ | Alternatives also added to performance over the Fund’s fiscal year, especially Real Estate (proxied by the ETF iShares® Dow Jones U.S. Real Estate Index Fund) which gained over 30%. |
The preceding information is the opinion of portfolio management. Any such opinions are subject to change at any time based upon market or other conditions and should not be relied upon as investment advice. Past performance is no guarantee of future results, and there is no guarantee that market forecasts will be realized.
There is no guarantee that the Fund will meet its objective.
For information regarding the indexes and certain investment terms, see Key Investment Terms starting on page 5.
7
Table of Contents
| Allocator Premium AlphaSector™ Fund (Continued) |
A fund that focuses its investments in a particular industry or sector will be more sensitive to conditions that affect that industry or sector than a non-concentrated fund. Debt securities are subject to various risks, the most prominent of which are credit and interest rate risk. The issuer of a security may fail to make payments in a timely manner. Values of debt securities may rise and fall in response to changes in interest rates. This risk may be enhanced with longer term maturities. Investing internationally, especially in emerging markets, involves additional risks such as currency, political, accounting, economic, and market risk. The value of an ETF may be more volatile than the underlying portfolio of securities the ETF is designed to track. The costs of owning the ETF may exceed the cost of investing directly in the underlying securities. U.S. government securities may be subject to price fluctuations. An agency may default on an obligation not backed by the United States. Any guarantee on U.S. government securities does not apply to the value of the fund’s shares. There is a greater level of credit risk and price volatility involved with high yield securities than investment grade securities. The Fund’s exposure to different asset classes may not be optimal for market conditions at a given time. Asset allocation does not guarantee a profit or protect against a loss in declining markets.
| Asset Allocation | ||||
The following table presents asset allocations within certain sectors and as a percentage of total investments as of September 30, 2012.
|
| |||
Financials | 10 | % | ||
Consumer Discretionary | 4 | |||
Energy | 4 | |||
Health Care | 4 | |||
Information Technology | 4 | |||
Materials | 4 | |||
Other (includes short-term investments) | 70 | |||
|
| |||
Total | 100 | % | ||
|
| |||
For information regarding the indexes and certain investment terms, see Key Investment Terms starting on page 5.
8
Table of Contents
Allocator Premium AlphaSector™ Fund (Continued)
| Average Annual Total Returns1 for periods ended 9/30/12 | ||||||||||||
1 Year | Since Inception | Inception Date | ||||||||||
| Class A Shares at NAV2 | 11.08 | % | 4.89 | % | 3/15/11 | |||||||
| Class A Shares at POP3,4 | 4.69 | 0.93 | 3/15/11 | |||||||||
| Class C Shares at NAV2 and with CDSC4 | 10.13 | 4.09 | 3/15/11 | |||||||||
| Class I Shares at NAV | 11.24 | 5.13 | 3/15/11 | |||||||||
| S&P 500® Index | 30.20 | 10.20 | 5 | — | ||||||||
| Dow Jones Moderate Portfolio IndexSM | 15.58 | 5.96 | 5 | — | ||||||||
Fund Expense Ratios6: A Shares: Gross 2.17%, Net 1.75%; C Shares: Gross 2.92%, Net 2.50%; I Shares: Gross 1.92%, Net 1.50%.
All returns represent past performance which is no guarantee of future results. Current performance may be higher or lower than the performance shown. The investment return and principal value of an investment will fluctuate so that an investor’s shares, when redeemed, may be worth more or less than their original cost. The above table and graph below do not reflect the deduction of taxes that a shareholder would pay on fund distributions or the redemption of shares. Please visit Virtus.com for performance data current to the most recent month-end.
| 1 | Total returns are historical and include changes in share price and the reinvestment of both dividends and capital gains distributions. |
| 2 | “NAV” (Net Asset Value) total returns do not include the effect of any sales charge. |
| 3 | “POP” (Public Offering Price) total returns include the effect of the maximum front-end 5.75% sales charge. |
| 4 | “CDSC” (Contingent Deferred Sales Charge) is applied to redemptions of certain classes of shares that do not have a sales charge applied at the time of purchase. CDSC charges for certain redemptions of Class A shares made within 18 months of purchase in which a finder’s fee was paid and all redemptions of Class C shares within the first year are 1% and 0% thereafter. |
| 5 | The index returns are from the Fund’s inception date. |
| 6 | The expense ratios of the Fund are set forth according to the prospectus for the Fund effective January 31, 2012, as supplemented and revised, and may differ from the expense ratios disclosed in the Financial Highlights tables in this report. See the Financial Highlights for more current expense ratios. Net Expense: Expenses reduced by contractual fee waiver in effect through March 31, 2012. Effective April 1, 2012, the waiver is voluntary and may discontinue at anytime. Gross Expense: Does not reflect the effect of the fee waiver. Expense ratios do not reflect fees and expenses associated with the underlying funds. Class C share ratios do not reflect distributors contractual waiver for 12b-1 fees. |
Growth of $10,000 for periods ended 9/30
This chart assumes an initial investment of $10,000 made on March 15, 2011 (inception date of the Fund), for Class A, Class C and Class I shares including any applicable sales charges or fees. Performance assumes reinvestment of dividends and capital gain distributions.
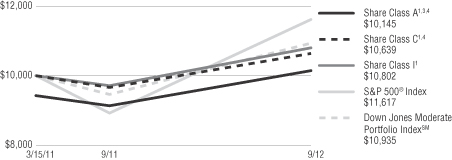
The indexes are unmanaged and not available for direct investment; therefore, their performance does not reflect the expenses associated with active management of an actual portfolio.
9
Table of Contents
| AlphaSector™ Rotation Fund | Ticker Symbols: Class A: PWBAX Class C: PWBCX Class I: VARIX |
| ¢ | The Fund is diversified and has an investment objective of long-term capital appreciation. |
| ¢ | For the fiscal year ended September 30, 2012, the Fund’s Class A shares at NAV returned 17.51%, Class C shares returned 16.60%, and Class I shares returned 17.71%. For the same period, the S&P 500® Index, a broad-based equity index, and the AlphaSector™ Rotation Fund Composite Linked Index, the Fund’s style-specific benchmark appropriate for comparison, each returned 30.20%. |
All performance figures assume reinvestment of distributions and exclude the effect of sales charges. Past performance is no guarantee of future results and current performance may be higher or lower than the performance shown above.
How did the market perform during the Fund’s fiscal year?
| ¢ | On the heels of the weak third calendar quarter of 2011, the market experienced very strong performance over the Fund’s fiscal year. Three of the four quarters in the Fund’s fiscal year experienced robust equity returns. |
| ¢ | The fourth quarter of 2011 and the first quarter of 2012 generated double-digit advances for the S&P 500® Index. |
| ¢ | The market pulled back in the second calendar quarter of 2012, but a strong rebound followed in the third calendar quarter. |
| ¢ | The net result of these mostly positive moves was a return of 30.20% for the S&P 500® Index for the fiscal year ended September 30, 2012. |
What factors affected the Fund’s performance during its fiscal year?
| ¢ | The Fund’s focus is on providing downside protection and upside participation and its goal is to outperform strongly during bear markets and to provide quality returns in positive markets. During the strongest market periods, when one-year returns exceed 20% - 25%, we expect the Fund to lag the market |
moderately. By setting clearly defined expectations, the Fund serves the needs of investors who are willing to forego an “extreme up” in order to benefit from downside protection. The 12-month period ended September 30, 2012 is an example of such an “extreme up” period. |
| ¢ | The Fund began the fiscal year with a 50% cash-equivalent position after having de-risked in the third calendar quarter of 2011. |
| ¢ | The Fund’s cash-equivalent position and exposure to lower beta sectors in the first fiscal quarter created a drag on performance as the S&P 500® Index returned 10.93% in October, 2011 and 11.82% for the first fiscal quarter. |
| ¢ | The Fund moved to a fully invested position in January 2012 and remained there for the balance of the fiscal year, albeit with differing sector exposures. |
| ¢ | In the first calendar quarter of 2012, the Fund lagged behind the very strong performance of the S&P 500® due to certain sectors (e.g. Financials) not yet being turned on. |
| ¢ | In the only negative quarter of the Fund’s fiscal year, the Fund outperformed (gross basis) the S&P 500® Index by avoiding certain sectors, (e.g. Energy). |
| ¢ | The Fund slightly trailed the S&P 500® Index in the fourth fiscal quarter, with small differences due to sector weighting. The fourth quarter witnessed the first time the Fund was fully invested in all nine sectors since August of 2011. |
The preceding information is the opinion of portfolio management. Any such opinions are subject to change at any time based upon market or other conditions and should not be relied upon as investment advice. Past performance is no guarantee of future results, and there is no guarantee that market forecasts will be realized.
There is no guarantee that the Fund will meet its objective.
For information regarding the indexes and certain investment terms, see Key Investment Terms starting on page 5.
10
Table of Contents
| AlphaSector™ Rotation Fund (Continued) |
A fund that focuses its investments in a particular industry or sector will be more sensitive to conditions that affect that industry or sector than a non-concentrated fund. The value of an ETF may be more volatile than the underlying portfolio of securities the ETF is designed to track. The costs of owning the ETF may exceed the cost of investing directly in the underlying securities. U.S. government securities may be subject to price fluctuations. An agency may default on an obligation not backed by the United States. Any guarantee on U.S. government securities does not apply to the value of the Fund’s shares. The Fund’s exposure to different asset classes may not be optimal for market conditions at a given time. Asset allocation does not guarantee a profit or protect against a loss in declining markets.
| Asset Allocation | ||||
The following table presents asset allocations within certain sectors and as a percentage of total investments as of September 30, 2012.
|
| |||
Health Care | 12 | % | ||
Consumer Discretionary | 11 | |||
Consumer Staples | 11 | |||
Energy | 11 | |||
Financials | 11 | |||
Industrials | 11 | |||
Utilities | 11 | |||
Other (includes short-term investments) | 22 | |||
|
| |||
Total | 100 | % | ||
|
| |||
For information regarding the indexes and certain investment terms, see Key Investment Terms starting on page 5.
11
Table of Contents
AlphaSector™ Rotation Fund (Continued)
| Average Annual Total Returns1 for periods ended 9/30/12 | ||||||||||||||||
1 Year | 5 Years | Since Inception | Inception Date | |||||||||||||
| Class A Shares at NAV2 | 17.51 | % | 1.33 | % | 5.62 | % | 8/1/03 | |||||||||
| Class A Shares at POP3,4 | 10.75 | 0.14 | 4.94 | 8/1/03 | ||||||||||||
| Class C Shares at NAV2 and with CDSC4 | 16.60 | 0.58 | 4.85 | 8/1/03 | ||||||||||||
| Class I Shares at NAV | 17.71 | — | 12.23 | 10/1/09 | ||||||||||||
| S&P 500® Index | 30.20 | 1.05 | —5 | — | ||||||||||||
| AlphaSector™ Rotation Fund Composite Linked Index | 30.20 | 3.14 | —6 | — | ||||||||||||
Fund Expense Ratios7: A Shares: 1.04%; C Shares: 1.79%; I Shares 0.79%.
All returns represent past performance which is no guarantee of future results. Current performance may be higher or lower than the performance shown. The investment return and principal value of an investment will fluctuate so that an investor’s shares, when redeemed, may be worth more or less than their original cost. The above table and graph below do not reflect the deduction of taxes that a shareholder would pay on fund distributions or the redemption of shares. Please visit Virtus.com for performance data current to the most recent month-end.
| 1 | Total returns are historical and include changes in share price and the reinvestment of both dividends and capital gains distributions. |
| 2 | “NAV” (Net Asset Value) total returns do not include the effect of any sales charge. |
| 3 | “POP” (Public Offering Price) total returns include the effect of the maximum front-end 5.75% sales charge. |
| 4 | “CDSC” (Contingent Deferred Sales Charge) is applied to redemptions of certain classes of shares that do not have a sales charge applied at the time of purchase. CDSC charges for certain redemptions of Class A shares made within 18 months of purchase in which a finder’s fee was paid and all redemptions of Class C shares within the first year are 1% and 0% thereafter. |
| 5 | The index returned 6.43% for Class A and Class C shares and 14.22% for Class I shares since the inception date of the respective share class. |
| 6 | The index returned 6.87% for Class A and Class C shares and 14.22% for Class I shares since the inception date of the respective share class. |
| 7 | The expense ratios of the Fund are set forth according to the prospectus for the Fund effective January 31, 2012, as supplemented and revised, and may differ from the expense ratios disclosed in the Financial Highlights tables in this report. See the Financial Highlights for more current expense ratios. Expense ratios do not reflect fees and expenses associated with the underlying funds. Class C share ratio does not reflect distributors contractual waiver for 12b-1 fees. |
Growth of $10,000 for periods ended 9/30
This chart assumes an initial investment of $10,000 made on August 1, 2003 (inception date of the Fund), for Class A and Class C shares including any applicable sales charges or fees. Performance assumes reinvestment of dividends and capital gain distributions.

The indexes are unmanaged and not available for direct investment; therefore, their performance does not reflect the expenses associated with active management of an actual portfolio.
12
Table of Contents
Dynamic AlphaSector™ Fund | Ticker Symbols: Class A: EMNAX Class B: EMNBX Class C: EMNCX Class I: VIMNX |
| ¢ | The Fund is diversified and has an investment objective of long-term capital appreciation while maintaining minimal portfolio exposure to general equity market risk. |
| ¢ | For the fiscal year ended September 30, 2012, the Fund’s Class A shares at NAV returned 8.91%, Class B shares returned 8.20%, Class C shares returned 8.10%, and Class I shares returned 9.43%. For the same period, the S&P 500® Index, a broad-based equity index, returned 30.20%, and the Dynamic AlphaSector™ Fund Linked Benchmark Index, which is the Fund’s style-specific index appropriate for comparison, returned 8.72%. |
The Citigroup 90-Day Treasury Bills Index, the Fund’s former style specific index, returned 0.05%.
All performance figures assume reinvestment of distributions and exclude the effect of sales charges. Past performance is no guarantee of future results and current performance may be higher or lower than the performance shown above.
How did the market perform during the Fund’s fiscal year?
| ¢ | After a volatile third calendar quarter of 2011, U.S. and international equity markets experienced strong returns for the fiscal year ended September 30, 2012. |
| ¢ | The U.S. equity market offered significantly more robust returns than international markets in the year ended September 30, 2012. Three of the four quarters were positive, with the S&P 500® Index advancing double-digits in the first and second fiscal quarters. |
| ¢ | Fixed income markets were generally constructive throughout the fiscal year, posting four positive quarters. |
What factors affected the Fund’s performance during its fiscal year?
It is important to note that there was a change in strategy and name for the Fund during the Fund’s fiscal year. The current name and strategy have
been in effect since February 6, 2012. Prior to that date, the Fund was known as the Virtus Market Neutral Fund, and operated with a different investment objective. The performance reported above for the fiscal year includes both periods. The commentary below focuses on the period in which the Fund operated with its current objective.
| ¢ | The Fund is an innovative mutual fund that features the ability to employ leverage and to short positions through a clearly-defined quantitative model. The Fund seeks its objective by taking long and short positions in ETFs and/or stocks representing the nine primary sectors of the S&P 500® Index. |
| ¢ | The Fund’s outperformance relative to the S&P 500® Index over the period can be attributed to superior sector selection. The Fund’s short position in Energy and Materials in the second and third quarter benefitted the Fund. |
| ¢ | The second quarter was negative for the Fund, but the Fund outperformed the S&P 500® Index. The Fund returned -0.42% for the quarter, easily besting the S&P 500® Index return of -2.14%. |
| ¢ | The Fund moved to a fully invested and leveraged position in August of 2012, and remained fully invested for the balance of the fiscal year. |
| ¢ | In the last quarter of the Fund’s fiscal year (July 1 – September 30), the Fund outperformed the S&P 500® Index, returning 5.31% vs the S&P 500® Index return of 4.89%. This outperformance was due to strong sector selection, as well as the opportunistic leverage. |
The preceding information is the opinion of portfolio management. Any such opinions are subject to change at any time based upon market or other conditions and should not be relied upon as investment advice. Past performance is no guarantee of future results, and there is no guarantee that market forecasts will be realized.
For information regarding the indexes and certain investment terms, see Key Investment Terms starting on page 5.
13
Table of Contents
| Dynamic AlphaSector™ Fund (Continued) |
There is no guarantee that the Fund will meet its objective.
A fund that focuses its investments in a particular industry or sector will be more sensitive to conditions that affect that industry or sector than a non-concentrated fund. When a fund leverages its portfolio, the value of its shares may be more volatile and all other risks may be compounded. The Fund may engage in short sales, and may experience a loss if the price of a borrowed security increases before the date on which the Fund replaces the security. The value of an ETF may be more volatile than the underlying portfolio of securities the ETF is designed to track. The costs of owning the ETF may exceed the cost of investing directly in the underlying securities. U.S. government securities may be subject to price fluctuations. An agency may default on an obligation not backed by the United States. Any guarantee on U.S. government securities does not apply to the value of the Fund’s shares. The Fund’s exposure to different asset classes may not be optimal for market conditions at a given time. Asset allocation does not guarantee a profit or protect against a loss in declining markets.
| Asset Allocation | ||||
The following table presents asset allocations within certain sectors as a percentage of total investments as of September 30, 2012.
|
| |||
Consumer Discretionary | 11 | % | ||
Consumer Staples | 11 | |||
Energy | 11 | |||
Financials | 11 | |||
Health Care | 11 | |||
Information Technology | 11 | |||
Materials | 11 | |||
Other (includes short-term investments) | 23 | |||
|
| |||
Total | 100 | % | ||
|
| |||
For information regarding the indexes and certain investment terms, see Key Investment Terms starting on page 5.
14
Table of Contents
Dynamic AlphaSector™ Fund (Continued)
| Average Annual Total Returns1 for periods ended 09/30/12 | ||||||||||||||||||||
| 1 Year | 5 Years | 10 Years | Since Inception | Inception Date | ||||||||||||||||
| Class A Shares at NAV2 | 8.91 | % | –0.36 | % | –1.81 | % | — | — | ||||||||||||
| Class A Shares at POP3,4 | 2.65 | –1.54 | –2.39 | — | — | |||||||||||||||
| Class B Shares at NAV2 | 8.20 | –1.15 | –2.55 | — | — | |||||||||||||||
| Class B Shares with CDSC4 | 4.20 | –1.34 | –2.55 | — | — | |||||||||||||||
| Class C Shares at NAV2 and with CDSC4 | 8.10 | –1.13 | –2.53 | — | — | |||||||||||||||
| Class I Shares at NAV | 9.43 | — | — | –0.74 | % | 10/1/09 | ||||||||||||||
| S&P 500® Index | 30.20 | 1.05 | 8.01 | 14.22 | 5 | — | ||||||||||||||
| Dynamic AlphaSector Benchmark Index | 8.72 | 2.32 | 2.58 | 2.91 | 5 | — | ||||||||||||||
Fund Expense Ratios6: A Shares: Gross 3.12%, Net 2.56%; B Shares: Gross 3.87%, Net 3.31%; C Shares: Gross 3.87%, Net 3.31%; I Shares: Gross 2.87%, Net 2.31%.
All returns represent past performance which is no guarantee of future results. Current performance may be higher or lower than the performance shown. The investment return and principal value of an investment will fluctuate so that an investor’s shares, when redeemed, may be worth more or less than their original cost. The above table and graph below do not reflect the deduction of taxes that a shareholder would pay on fund distributions or the redemption of shares. Please visit Virtus.com for performance data current to the most recent month-end.
| 1 | Total returns are historical and include changes in share price and the reinvestment of both dividends and capital gains distributions. |
| 2 | “NAV” (Net Asset Value) total returns do not include the effect of any sales charge. |
| 3 | “POP” (Public Offering Price) total returns include the effect of the maximum front-end 5.75% sales charge. |
| 4 | “CDSC” (Contingent Deferred Sales Charge) is applied to redemptions of certain classes of shares that do not have a sales charge applied at the time of purchase. CDSC charges for B shares decline from 5% to 0% over a six year period. CDSC charges for certain redemptions of Class A shares made within 18 months of purchase in which a finder’s fee was paid and all redemptions of Class C shares within the first year are 1.25% and 0% thereafter. |
| 5 | The since inception index returns are from the inception date of Class I. |
| 6 | The expense ratios of the Fund are set forth according to the prospectus for the Fund effective January 31, 2012, as supplemented and revised and may differ from the expense ratios disclosed in the Financial Highlights tables in this report. See the Financial Highlights for more current expense ratios. Net Expense: Expenses reduced by voluntary fee waiver which may be discontinued at any time. Gross Expense: Does not reflect the effect of the voluntary fee waiver. Net and gross expenses include 0.32% of dividends on short sales and interest expenses. Expense ratios do not reflect fees and expenses associated with the underlying funds. |
Growth of $10,000 For periods ended 9/30
This chart assumes an initial investment of $10,000 made on September 30, 2002, for Class A, Class B, and Class C shares including any applicable sales charges or fees. Performance assumes reinvestment of dividends and capital gain distributions.
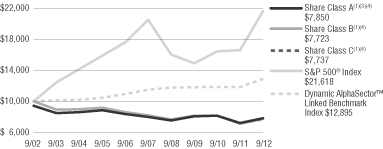
The indexes are unmanaged and not available for direct investment; therefore, their performance does not reflect the expenses associated with active management of an actual portfolio.
15
Table of Contents
| Global Premium AlphaSector™ Fund | Ticker Symbols: Class A: VGPAX Class C: VGPCX Class I: VGPIX |
| ¢ | The Fund is diversified and has an investment objective of capital appreciation. In pursuing this objective, the Fund maintains an emphasis on preservation of capital. |
| ¢ | For the fiscal year ended September 30, 2012, the Fund’s Class A shares at NAV returned 12.75%, Class C shares returned 12.04%, and Class I shares returned 13.15%. For the same period, the S&P 500® Index, a broad-based equity index, returned 30.20%. MSCI World® Index (net), the Fund’s style-specific index appropriate for comparison, returned 21.59%. |
All performance figures assume reinvestment of distributions and exclude the effect of sales charges. Past performance is no guarantee of future results and current performance may be higher or lower than the performance shown above.
How did the market perform during the Fund’s fiscal period?
| ¢ | On the heels of a volatile third calendar quarter of 2011, U.S. and International equity markets experienced strong returns for the fiscal year ended September 30, 2012. |
| ¢ | The U.S. equity market offered significantly more robust returns than international markets in the fiscal year. |
What factors affected the Fund’s performance during its fiscal period?
The Fund’s focus is on providing downside protection and upside participation and its goal is to outperform strongly during bear markets and to provide quality returns in positive markets. During the strongest market periods, when one-year returns exceed 20% - 25%, we expect the Fund to lag the market moderately. By setting clearly defined expectations, the Fund serves the needs of investors, who are willing to forego an “extreme up” in order to benefit from downside protection. The 12-month period ended September 30, 2012 is an example of such an “extreme up” period.
| ¢ | The domestic and international equity sleeves of the Fund began the fiscal year with a significant cash-equivalent position after having |
de-risked in the volatile quarter ended September 30, 2011. This cash-equivalent position as well as exposure to low beta sectors hurt relative performance primarily in the U.S. sleeve, as the S&P 500® Index advanced 11.82% in the quarter ended December 31, 2011. |
| ¢ | In the first calendar quarter of 2012, domestic and international equity markets experienced strong gains. The domestic equity sleeve of the Fund lagged the S&P 500® Index in the first calendar quarter of 2012 primarily due to lack of exposure to certain sectors (e.g. Financials) that our quantitative model deemed too risky. In the international equity sleeve, the maintenance of a cash allocation into the New Year hurt relative performance. |
| ¢ | In the only negative quarter of the Fund’s fiscal year (April 1-June 30), the Fund’s outperformance came from avoidance of certain sectors (e.g. Energy) in the domestic equity sleeve. |
| ¢ | Global equity markets improved in the fourth fiscal quarter, and the domestic equity sleeve of the Fund moved to all nine sectors being engaged in August. This was the first time all nine sectors were on since August of 2011. The domestic equity sleeve slightly trailed the S&P 500® Index during this quarter primarily due to differences in sector weightings. |
The preceding information is the opinion of portfolio management. Any such opinions are subject to change at any time based upon market or other conditions and should not be relied upon as investment advice. Past performance is no guarantee of future results, and there is no guarantee that market forecasts will be realized.
There is no guarantee that the Fund will meet its objective.
For information regarding the indexes and certain investment terms, see Key Investment Terms starting on page 5.
16
Table of Contents
| Global Premium AlphaSector™ Fund (Continued) |
A fund that focuses its investments in a particular industry or sector will be more sensitive to conditions that affect that industry or sector than a non-concentrated fund. Investing internationally, especially in emerging markets, involves additional risks such as currency, political, accounting, economic, and market risk. The value of an ETF may be more volatile than the underlying portfolio of securities the ETF is designed to track. The costs of owning the ETF may exceed the cost of investing directly in the underlying securities. U.S. government securities may be subject to price fluctuations. An agency may default on an obligation not backed by the United States. Any guarantee on U.S. government securities does not apply to the value of the fund’s shares. The Fund’s exposure to different asset classes may not be optimal for market conditions at a given time. Asset allocation does not guarantee a profit or protect against a loss in declining markets.
| Asset Allocation | ||||
The following table presents asset allocations within certain sectors and as a percentage of total investments as of September 30, 2012.
|
| |||
Consumer Discretionary | 7 | % | ||
Financials | 7 | |||
Health Care | 7 | |||
Consumer Staples | 6 | |||
Energy | 6 | |||
Information Technology | 6 | |||
Materials | 6 | |||
Other (includes short-term investments) | 55 | |||
|
| |||
Total | 100 | % | ||
|
| |||
For information regarding the indexes and certain investment terms, see Key Investment Terms starting on page 5.
17
Table of Contents
Global Premium AlphaSector™ Fund (Continued)
| Average Annual Total Returns1 for periods ended 9/30/12 | ||||||||||||
| 1 Year | Since Inception | Inception Date | ||||||||||
| Class A Shares at NAV2 | 12.75 | % | 4.11 | % | 3/15/11 | |||||||
| Class A Shares at POP3,4 | 6.27 | 0.19 | 3/15/11 | |||||||||
| Class C Shares at NAV2 and CDSC4 | 12.04 | 3.35 | 3/15/11 | |||||||||
| Class I Shares at NAV | 13.15 | 4.37 | 3/15/11 | |||||||||
| S&P 500® Index | 30.20 | 10.20 | 5 | — | ||||||||
| MSCI World® Index (net) | 21.59 | 4.54 | 5 | — | ||||||||
Fund Expense Ratios6: A Shares: Gross 2.88%, Net 1.75%; C Shares: Gross 3.63%, Net 2.50%; I Shares: Gross 2.63%, Net 1.50%.
All returns represent past performance which is no guarantee of future results. Current performance may be higher or lower than the performance shown. The investment return and principal value of an investment will fluctuate so that an investor’s shares, when redeemed, may be worth more or less than their original cost. The above table and graph below do not reflect the deduction of taxes that a shareholder would pay on fund distributions or the redemption of shares. Please visit Virtus.com for performance data current to the most recent month-end.
| 1 | Total returns are historical and include changes in share price and the reinvestment of both dividends and capital gains distributions. |
| 2 | “NAV” (Net Asset Value) total returns do not include the effect of any sales charge. |
| 3 | “POP” (Public Offering Price) total returns include the effect of the maximum front-end 5.75% sales charge. |
| 4 | “CDSC” (Contingent Deferred Sales Charge) is applied to redemptions of certain classes of shares that do not have a sales charge applied at the time of purchase. CDSC charges for certain redemptions of Class A shares made within 18 months of purchase in which a finder’s fee was paid and all redemptions of Class C shares within the first year are 1% and 0% thereafter. |
| 5 | The since inception index returns are from the Fund’s inception date. |
| 6 | The expense ratios of the Fund are set forth according to the prospectus for the Fund effective January 31, 2012, as supplemented and revised, and may differ from the expense ratios disclosed in the Financial Highlights tables in this report. See the Financial Highlights for more current expense ratios. Net Expense: Expenses reduced by contractual fee waiver in effect through March 31, 2012. Effective April 1, 2012, the waiver is voluntary and may discontinue at any time. Gross Expense: Does not reflect the effect of the fee waiver. Expense ratios do not reflect fees and expenses associated with the underlying funds. Class C share ratios do not reflect distributors contractual waiver for 12b-1 fees. |
Growth of $10,000 For periods ended 9/30
This chart assumes an initial investment of $10,000 made on March 15, 2011 (inception date of the Fund), for Class A, Class C and Class I shares including any applicable sales charges or fees. Performance assumes reinvestment of dividends and capital gain distributions.
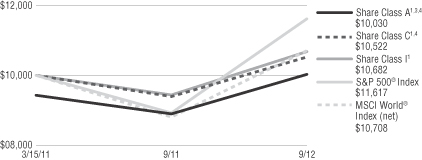
The indexes are unmanaged and not available for direct investment; therefore, their performance does not reflect the expenses associated with active management of an actual portfolio.
18
Table of Contents
| Premium AlphaSector™ Fund | Ticker Symbols: Class A: VAPAX Class C: VAPCX Class I: VAPIX |
| ¢ | The Fund is diversified and has an investment objective of long-term capital appreciation. |
| ¢ | For the fiscal year ended September 30, 2012, the Fund’s Class A shares at NAV returned 15.74%, Class C shares returned 14.91%, and Class I shares returned 15.98%. For the same period, the S&P 500® Index, a broad-based equity index, returned 30.20%. |
All performance figures assume reinvestment of distributions and exclude the effect of sales charges. Past performance is no guarantee of future results and current performance may be higher or lower than the performance shown above.
How did the market perform during the Fund’s fiscal year?
| ¢ | On the heels of the very weak third calendar quarter of 2011, the market experienced very strong performance over the Fund’s fiscal year. |
| ¢ | Three of the four quarters in the Fund’s fiscal year experienced robust equity returns. |
| ¢ | The fourth quarter of 2011 and the first quarter of 2012 generated double-digit advances for the S&P 500® Index. |
| ¢ | The market pulled back in the second calendar quarter of 2012, but a strong rebound followed in the third calendar quarter. |
| ¢ | The net result of these mostly positive moves was a return of 30.20% for the S&P 500® Index for the fiscal year ended September 30, 2012. |
What factors affected the Fund’s performance during its fiscal year?
The Fund’s focus is on providing downside protection and upside participation and its goal is to outperform strongly during bear markets and to provide quality returns in positive markets. During the strongest market periods, when one-year returns exceed 20% - 25%, we expect the Fund to lag the market moderately. By setting clearly defined expectations, the Fund serves the needs of investors who are willing to forego an “extreme up” in order
to benefit from downside protection. The 12-month period ended September 30, 2012 is an example of such an “extreme up” period.
| ¢ | The Fund began the fiscal year with a 50% cash equivalent position after having de-risked in the third calendar quarter of 2011. |
| ¢ | Most of the Fund’s underperformance relative to the S&P 500® Index over the fiscal year can be attributed to the cash equivalent position and exposure to lower beta sectors in the final calendar quarter of 2011, when the S&P 500® Index posted an 11.82% advance. |
| ¢ | The Fund moved to a fully invested position in January of 2012 and remained fully invested for the balance of the fiscal year, moving to all nine sectors being engaged in August of 2012. This was the first time since August of 2011 that all nine sectors were on. |
| ¢ | In the first calendar quarter of 2012, the Fund lagged behind the double-digit gain of the S&P 500® Index due to certain sectors (e.g. Financials) not yet being turned on. |
| ¢ | In the only negative quarter of the Fund’s fiscal year (April 1-June 30), the Fund’s relatively strong performance came from avoidance of certain sectors (e.g. Energy). |
| ¢ | The Fund slightly trailed the S&P 500® Index in the fourth fiscal quarter primarily due to differences in sector weightings. |
The preceding information is the opinion of portfolio management. Any such opinions are subject to change at any time based upon market or other conditions and should not be relied upon as investment advice. Past performance is no guarantee of future results, and there is no guarantee that market forecasts will be realized.
There is no guarantee that the Fund will meet its objective.
For information regarding the indexes and certain investment terms, see Key Investment Terms starting on page 5.
19
Table of Contents
| Premium AlphaSector™ Fund (Continued) |
The market price of equity securities may be affected by financial market, industry, or issuer-specific events. Focus on a particular style or on small or medium-sized companies may enhance that risk. A fund that focuses its investments in a particular industry or sector will be more sensitive to conditions that affect that industry or sector than a non-concentrated fund. The value of an ETF may be more volatile than the underlying portfolio of securities the ETF is designed to track. The costs of owning the ETF may exceed the cost of investing directly in the underlying securities. U.S. government securities may be subject to price fluctuations. An agency may default on an obligation not backed by the United States. Any guarantee on U.S. government securities does not apply to the value of the fund’s shares. The Fund’s exposure to different asset classes may not be optimal for market conditions at a given time. Asset allocation does not guarantee a profit or protect against a loss in declining markets.
| Asset Allocation | ||||
The following table presents asset allocations within certain sectors and as a percentage of total investments as of September 30, 2012.
|
| |||
Utilities | 12 | % | ||
Consumer Discretionary | 11 | |||
Consumer Staples | 11 | |||
Financials | 11 | |||
Health Care | 11 | |||
Industrials | 11 | |||
Materials | 11 | |||
Other (includes short-term investments) | 22 | |||
|
| |||
Total | 100 | % | ||
|
| |||
For information regarding the indexes and certain investment terms, see Key Investment Terms starting on page 5.
20
Table of Contents
Premium AlphaSector™ Fund (Continued)
| Average Annual Total Returns1 for periods ended 9/30/12 | ||||||||||||
1 Year | Since Inception | Inception Date | ||||||||||
| Class A Shares at NAV2 | 15.74 | % | 14.80 | % | 7/1/10 | |||||||
| Class A Shares at POP3,4 | 9.09 | 11.82 | 7/1/10 | |||||||||
| Class C Shares at NAV2 and CDSC4 | 14.91 | 13.96 | 7/1/10 | |||||||||
| Class I Shares at NAV | 15.98 | 15.06 | 7/1/10 | |||||||||
| S&P 500® Index | 30.20 | 18.72 | 5 | — | ||||||||
Fund Expense Ratios6: A Shares: 1.69%; C Shares: 2.44%; I Shares: 1.44%.
All returns represent past performance which is no guarantee of future results. Current performance may be higher or lower than the performance shown. The investment return and principal value of an investment will fluctuate so that an investor’s shares, when redeemed, may be worth more or less than their original cost. The above table and graph below do not reflect the deduction of taxes that a shareholder would pay on fund distributions or the redemption of shares. Please visit Virtus.com for performance data current to the most recent month-end.
| 1 | Total returns are historical and include changes in share price and the reinvestment of both dividends and capital gains distributions. |
| 2 | “NAV” (Net Asset Value) total returns do not include the effect of any sales charge. |
| 3 | “POP” (Public Offering Price) total returns include the effect of the maximum front-end 5.75% sales charge. |
| 4 | “CDSC” (Contingent Deferred Sales Charge) is applied to redemptions of certain classes of shares that do not have a sales charge applied at the time of purchase. CDSC charges for certain redemptions of Class A shares made within 18 months of purchase in which a finder’s fee was paid and all redemptions of Class C shares within the first year are 1% and 0% thereafter. |
| 5 | The since inception index returns are from the Fund’s inception date. |
| 6 | The expense ratios of the Fund are set forth according to the prospectus for the Fund effective January 31, 2012, as supplemented and revised, and may differ from the expense ratios disclosed in the Financial Highlights tables in this report. See the Financial Highlights for more current expense ratios. Net Expense: Expenses reduced by voluntary fee waiver. Gross Expense: Does not reflect the effect of the fee waiver. Expense ratios do not reflect fees and expenses associated with the underlying funds. |
Growth of $10,000 For periods ended 9/30
This chart assumes an initial investment of $10,000 made on July 1, 2010 (inception date of the Fund), for Class A, Class C and Class I shares including any applicable sales charges or fees. Performance assumes reinvestment of dividends and capital gain distributions.
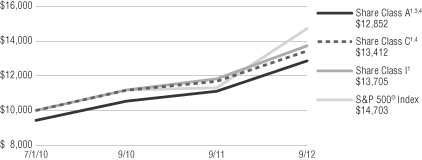
The indexes are unmanaged and not available for direct investment; therefore, their performance does not reflect the expenses associated with active management of an actual portfolio.
21
Table of Contents
| Alternatives Diversifier Fund | Ticker Symbols: Class A: PDPAX Class C: PDPCX Class I: VADIX |
| ¢ | The Fund is diversified and has an investment objective of long-term capital appreciation. |
| ¢ | For the fiscal year ended September 30, 2012, the Fund’s Class A shares at NAV returned 15.37%, Class C shares returned 14.45%, and Class I shares returned 15.63%. For the same period, the S&P 500® Index, a broad-based equity index, returned 30.20%, and the Alternatives Diversifier Composite Index, the Fund’s style-specific index appropriate for comparison, returned 13.57%. |
All performance figures assume reinvestment of distributions and exclude the effect of sales charges. Past performance is no guarantee of future results and current performance may be higher or lower than the performance shown above.
How did the market perform during the Fund’s fiscal year?
| ¢ | Equity markets globally, and especially in the United States, performed very well over the one-year period ended September 30, 2012. Despite lingering concerns over Europe’s fiscal health, a few brief “growth scares” linked to disappointing labor and manufacturing data, and U.S. election uncertainty, the markets largely ignored bad news. Corporate earnings continued to improve over the period, helping to drive stocks higher. |
| ¢ | Bond markets also generally did well, as interest rates fell and bond prices rose, and spread compression within most corporate-grade bonds also increased gains. Commodity markets were somewhat higher, with good returns out of grains and other “soft” commodities, as well as gains in precious metals. Industrial metals and various energy commodities were somewhat mixed, although many also were up year over year. |
What factors affected the Fund’s performance during its fiscal year?
| ¢ | The Fund is diversified across a number of asset classes, and most of those performed quite well. Its real estate holdings (REITs) were particularly strong performers, with international REITs far outstripping most broad equity indexes. Also of note was the solid performance from the Fund’s global infrastructure holdings, as these types of companies that invest in essential services and pay a higher dividend did well during the period. Most every asset category made positive contributions to returns, including senior-secured floating rate notes, commodity equities, and currencies. |
| ¢ | The Fund’s only real disappointment was a negative return from managed futures. While this asset class now represents the smallest allocation in the portfolio, it produced a slight drag on performance. |
| ¢ | Overall, we are pleased with the Fund’s strong returns for the period and how its lower-correlated holdings held up well, even during the strongly positive equity sessions that occurred throughout much of the period. |
The preceding information is the opinion of portfolio management. Any such opinions are subject to change at any time based upon market or other conditions and should not be relied upon as investment advice. Past performance is no guarantee of future results, and there is no guarantee that market forecasts will be realized.
There is no guarantee that the Fund will meet its objective.
For information regarding the indexes and certain investment terms, see Key Investment Terms starting on page 5.
22
Table of Contents
| Alternatives Diversifier Fund (Continued) |
A fund that focuses its investments in a particular industry or sector will be more sensitive to conditions that affect that industry or sector than a non-concentrated fund. Investing internationally, especially in emerging markets, involves additional risks such as currency, political, accounting, economic, and market risk. The Fund may be negatively affected by factors specific to the real estate market, including interest rate, leverage, property, and management. Investments in derivatives such as futures, options, forwards, and swaps may increase volatility or cause a loss greater than the principal investment. Events negatively affecting a particular commodity in which the Fund focuses its investments may cause the value of the Fund’s shares to decrease, perhaps significantly. Because the Fund can invest in other funds, it indirectly bears its proportionate share of the operating expenses and management fees of the underlying fund(s). The Fund’s exposure to different asset classes may not be optimal for market conditions at a given time. Asset allocation does not guarantee a profit or protect against a loss in declining markets. The Fund’s adviser can select affiliated and/or unaffiliated funds, which may create a conflict of interest.
| Asset Allocation | ||||
The following table presents asset allocations within certain sectors and as a percentage of total investments as of September 30, 2012.
|
| |||
Affiliated Equity Mutual Funds | 59 | % | ||
Exchange-Traded Funds | 33 | |||
Affiliated Fixed Income Mutual Funds | 7 | |||
Other (includes Short-term Investments) | 1 | |||
|
| |||
Total | 100 | % | ||
|
| |||
For information regarding the indexes and certain investment terms, see Key Investment Terms starting on page 5.
23
Table of Contents
Alternatives Diversifier Fund (Continued)
| Average Annual Total Returns1 for periods ended 9/30/12 | ||||||||||||||||
1 Year | 5 Year | Since Inception | Inception Date | |||||||||||||
| Class A Shares at NAV2 | 15.37 | % | 0.16 | % | 2.98 | % | 11/30/05 | |||||||||
| Class A Shares at POP3,4 | 8.73 | –1.02 | 2.09 | 11/30/05 | ||||||||||||
| Class C Shares at NAV2 and with CDSC4 | 14.45 | –0.59 | 2.21 | 11/30/05 | ||||||||||||
| Class I Shares at NAV | 15.63 | — | 8.04 | 10/1/09 | ||||||||||||
| S&P 500® Index | 30.20 | 1.05 | —5 | �� | ||||||||||||
| Alternatives Diversifier Composite Index | 13.57 | 0.84 | —6 | — | ||||||||||||
Fund Expense Ratios7: A Shares: Gross 0.65%, Net 0.20%; C Shares: Gross 1.40%, Net 0.20%; I Shares: Gross 0.40%, Net 0.20%.
All returns represent past performance which is no guarantee of future results. Current performance may be higher or lower than the performance shown. The investment return and principal value of an investment will fluctuate so that an investor’s shares, when redeemed, may be worth more or less than their original cost. The above table and graph below do not reflect the deduction of taxes that a shareholder would pay on fund distributions or the redemption of shares. Please visit Virtus.com for performance data current to the most recent month-end.
| 1 | Total returns are historical and include changes in share price and the reinvestment of both dividends and capital gains distributions. |
| 2 | “NAV” (Net Asset Value) total returns do not include the effect of any sales charge. |
| 3 | “POP” (Public Offering Price) total returns include the effect of the maximum front-end 5.75% sales charge. |
| 4 | “CDSC” (Contingent Deferred Sales Charge) is applied to redemptions of certain classes of shares that do not have a sales charge applied at the time of purchase. CDSC charges for certain redemptions of Class A shares made within 18 months of purchase in which a finder’s fee was paid and all redemptions of Class C shares within the first year are 1% and 0% thereafter. |
| 5 | The index returned 4.28% for Class A and Class C shares and 14.22% for Class I shares since the inception date of the respective share class. |
| 6 | The index returned 4.33% for Class A and Class C shares and 7.75% for Class I shares since the inception date of the respective share class. |
| 7 | The expense ratios of the Fund are set forth according to the prospectus for the Fund effective January 31, 2012, as supplemented and revised, and may differ from the expense ratios disclosed in the Financial Highlights tables in this report. See the financial highlights for more current expense ratios. Net Expense: Expenses reduced by voluntary fee waiver which may be discontinued at any time and does not reflect 12b-1 expenses. Gross Expense: Does not reflect the effect of the voluntary fee waiver. Expense ratios do not reflect fees and expenses associated with the underlying funds. |
Growth of $10,000 for periods ended 9/30
This chart assumes an initial investment of $10,000 made on November 30, 2005 (inception date of the Fund), for Class A and Class C shares including any applicable sales charges or fees. Performance assumes reinvestment of dividends and capital gain distributions.
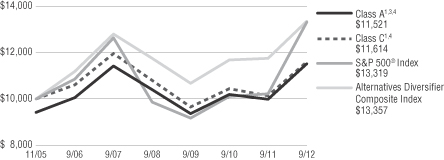
The indexes are unmanaged and not available for direct investment; therefore, their performance does not reflect the expenses associated with active management of an actual portfolio.
24
Table of Contents
VIRTUS ALLOCATOR PREMIUM ALPHASECTOR™ FUND
SEPTEMBER 30, 2012
($ reported in thousands)
| SHARES | VALUE | |||||||
| EXCHANGE-TRADED FUNDS—99.6% | ||||||||
Consumer Discretionary Select Sector SPDR Fund | 292,885 | $ | 13,698 | |||||
Consumer Staples Select Sector SPDR Fund | 369,867 | 13,252 | ||||||
Energy Select Sector SPDR Fund | 182,560 | 13,415 | ||||||
Financial Select Sector SPDR Fund | 877,600 | 13,691 | ||||||
Health Care Select Sector SPDR Fund | 342,450 | 13,736 | ||||||
Industrial Select Sector SPDR Fund | 358,180 | 13,088 | ||||||
iShares Barclays 7-10 Year Treasury Bond Fund | 184,500 | 20,011 | ||||||
iShares Barclays MBS Bond Fund | 182,710 | 19,945 | ||||||
iShares Barclays Treasury Inflation Protected Securities Bond Fund | 165,100 | 20,103 | ||||||
iShares Dow Jones U.S. Real Estate Index Fund | 257,235 | 16,563 | ||||||
iShares iBoxx $ High Yield Corporate Bond Fund | 216,590 | 20,006 | ||||||
iShares iBoxx Investment Grade Corporate Bond Fund | 166,010 | 20,215 | ||||||
iShares MSCI EAFE® Index Fund | 820,060 | 43,463 | ||||||
iShares MSCI Emerging Markets Index Fund | 1,055,800 | 43,626 | ||||||
Materials Select Sector SPDR Fund | 365,130 | 13,426 | ||||||
PowerShares DB Gold Fund(2) | 297,190 | 18,152 | ||||||
Technology Select Sector SPDR Fund | 433,250 | 13,357 | ||||||
Utilities Select Sector SPDR Fund | 356,490 | 12,976 | ||||||
| TOTAL EXCHANGE-TRADED FUNDS (Identified Cost $322,085) | 342,723 | |||||||
| TOTAL LONG TERM INVESTMENTS—99.6% | ||||||||
| (Identified Cost $322,085) | 342,723 | |||||||
| SHARES | VALUE | |||||||
| SHORT-TERM INVESTMENTS—0.0% | ||||||||
| Money Market Mutual Funds—0.0% | ||||||||
Dreyfus Cash Management Fund – Institutional | 120,214 | $ | 120 | |||||
| TOTAL SHORT-TERM INVESTMENTS (Identified Cost $120) | 120 | |||||||
| TOTAL INVESTMENTS—99.6% (Identified Cost $322,205) | 342,843 | (1) | ||||||
Other assets and liabilities, net—0.4% |
| 1,243 | ||||||
|
| |||||||
| NET ASSETS—100.0% | $ | 344,086 | ||||||
|
| |||||||
FOOTNOTE LEGEND:
| (1) | Federal Income Tax Information: For tax information at September 30, 2012, see Note 11 Federal Income Tax Information in the Notes to Financial Statements. |
| (2) | Non-income producing. |
The following table provides a summary of inputs used to value the Fund’s investments as of September 30, 2012 (See Security Valuation Note 2A in the Notes to Financial Statements):
| Total Value at September 30, 2012 | Level 1 Quoted Prices | |||||||
Equity Securities: | ||||||||
Exchange-Traded Funds | $ | 342,723 | $ | 342,723 | ||||
Short-Term Investments | 120 | 120 | ||||||
|
|
|
| |||||
Total Investments | $ | 342,843 | $ | 342,843 | ||||
|
|
|
| |||||
There are no Level 2 (significant observable inputs) or Level 3 (significant unobservable inputs) priced securities.
See Notes to Financial Statements
25
Table of Contents
VIRTUS ALPHASECTOR™ ROTATION FUND
SCHEDULE OF INVESTMENTS
SEPTEMBER 30, 2012
($ reported in thousands)
| SHARES | VALUE | |||||||
| COMMON STOCKS—66.0% | ||||||||
| Consumer Discretionary—11.1% | ||||||||
Abercrombie & Fitch Co. Class A | 3,040 | $ | 103 | |||||
Amazon.com, Inc.(2) | 13,530 | 3,441 | ||||||
Apollo Group, Inc. Class A(2) | 3,700 | 107 | ||||||
AutoNation, Inc.(2) | 1,540 | 67 | ||||||
AutoZone, Inc.(2) | 1,400 | 518 | ||||||
Bed Bath & Beyond, Inc.(2) | 8,660 | 546 | ||||||
Best Buy Co., Inc. | 10,190 | 175 | ||||||
Big Lots, Inc.(2) | 2,340 | 69 | ||||||
BorgWarner, Inc.(2) | 4,260 | 294 | ||||||
Cablevision Systems Corp. Class A | 8,060 | 128 | ||||||
CarMax, Inc.(2) | 8,580 | 243 | ||||||
Carnival Corp. | 16,680 | 608 | ||||||
CBS Corp. Class B | 22,200 | 806 | ||||||
Chipotle Mexican Grill, Inc.(2) | 1,180 | 375 | ||||||
Coach, Inc. | 10,680 | 598 | ||||||
Comcast Corp. Class A | 100,090 | 3,580 | ||||||
Darden Restaurants, Inc. | 4,790 | 267 | ||||||
DIRECTV Class A(2) | 23,420 | 1,229 | ||||||
Discovery Communications, Inc. Class A(2) | 9,220 | 550 | ||||||
Dollar Tree, Inc.(2) | 8,590 | 415 | ||||||
DR Horton, Inc. | 10,330 | 213 | ||||||
Expedia, Inc. | 3,490 | 202 | ||||||
Family Dollar Stores, Inc. | 3,620 | 240 | ||||||
Ford Motor Co. | 142,470 | 1,405 | ||||||
Fossil, Inc.(2) | 2,070 | 175 | ||||||
GameStop Corp. Class A | 4,600 | 97 | ||||||
Gannett Co., Inc. | 8,650 | 153 | ||||||
Gap, Inc. (The) | 11,120 | 398 | ||||||
Genuine Parts Co. | 5,810 | 355 | ||||||
Goodyear Tire & Rubber Co. (The)(2) | 8,980 | 109 | ||||||
H&R Block, Inc. | 10,270 | 178 | ||||||
Harley-Davidson, Inc. | 8,500 | 360 | ||||||
Harman International Industries, Inc. | 2,500 | 115 | ||||||
Hasbro, Inc. | 4,300 | 164 | ||||||
Home Depot, Inc. (The) | 56,390 | 3,404 | ||||||
International Game Technology | 9,830 | 129 | ||||||
Interpublic Group of Cos., Inc. (The) | 16,590 | 184 | ||||||
J.C. Penney Co., Inc. | 5,310 | 129 | ||||||
Johnson Controls, Inc. | 25,380 | 695 | ||||||
| SHARES | VALUE | |||||||
| Consumer Discretionary (continued) | ||||||||
Kohl’s Corp. | 8,050 | $ | 412 | |||||
Leggett & Platt, Inc. | 5,260 | 132 | ||||||
Lennar Corp. Class A | 6,120 | 213 | ||||||
Lowe’s Cos., Inc. | 42,540 | 1,286 | ||||||
Ltd. Brands, Inc. | 8,950 | 441 | ||||||
Macy’s, Inc. | 15,010 | 565 | ||||||
Marriott International, Inc. Class A | 9,390 | 367 | ||||||
Mattel, Inc. | 12,620 | 448 | ||||||
McDonald’s Corp. | 37,720 | 3,461 | ||||||
McGraw-Hill Cos., Inc. (The) | 10,410 | 568 | ||||||
Netflix, Inc.(2) | 2,060 | 112 | ||||||
Newell Rubbermaid, Inc. | 10,780 | 206 | ||||||
News Corp. Class A | 75,940 | 1,863 | ||||||
NIKE, Inc. Class B | 13,670 | 1,297 | ||||||
Nordstrom, Inc. | 5,700 | 314 | ||||||
O’Reilly Automotive, Inc.(2) | 4,440 | 371 | ||||||
Omnicom Group, Inc. | 9,910 | 511 | ||||||
priceline.com, Inc.(2) | 1,860 | 1,151 | ||||||
PulteGroup, Inc.(2) | 12,520 | 194 | ||||||
Ralph Lauren Corp. | 2,280 | 345 | ||||||
Ross Stores, Inc. | 8,370 | 541 | ||||||
Scripps Networks Interactive, Inc. Class A | 3,220 | 197 | ||||||
Staples, Inc. | 25,840 | 298 | ||||||
Starbucks Corp. | 28,350 | 1,439 | ||||||
Starwood Hotels & Resorts Worldwide, Inc. | 7,350 | 426 | ||||||
Target Corp. | 24,430 | 1,551 | ||||||
Tiffany & Co. | 4,440 | 275 | ||||||
Time Warner Cable, Inc. | 11,430 | 1,086 | ||||||
Time Warner, Inc. | 35,400 | 1,605 | ||||||
TJX Cos., Inc. | 27,460 | 1,230 | ||||||
TripAdvisor, Inc.(2) | 4,090 | 135 | ||||||
Urban Outfitters, Inc.(2) | 4,070 | 153 | ||||||
VF Corp. | 3,230 | 515 | ||||||
Viacom, Inc. Class B | 17,660 | 946 | ||||||
Walt Disney Co. (The) | 67,120 | 3,509 | ||||||
Washington Post Co. (The) Class B | 170 | 62 | ||||||
Whirlpool Corp. | 2,880 | 239 | ||||||
Wyndham Worldwide Corp. | 5,300 | 278 | ||||||
Wynn Resorts Ltd. | 2,960 | 342 | ||||||
Yum! Brands, Inc. | 17,000 | 1,128 | ||||||
|
| |||||||
| 53,036 | ||||||||
|
| |||||||
See Notes to Financial Statements
26
Table of Contents
VIRTUS ALPHASECTOR™ ROTATION FUND
SCHEDULE OF INVESTMENTS (Continued)
SEPTEMBER 30, 2012
($ reported in thousands)
| SHARES | VALUE | |||||||
| Energy—11.1% | ||||||||
Alpha Natural Resources, Inc.(2) | 7,680 | $ | 50 | |||||
Anadarko Petroleum Corp. | 20,760 | 1,452 | ||||||
Apache Corp. | 16,100 | 1,392 | ||||||
Baker Hughes, Inc. | 20,790 | 940 | ||||||
Cabot Oil & Gas Corp. | 16,250 | 730 | ||||||
Cameron International Corp.(2) | 14,090 | 790 | ||||||
Chesapeake Energy Corp. | 24,650 | 465 | ||||||
Chevron Corp. | 71,510 | 8,335 | ||||||
ConocoPhillips | 32,030 | 1,831 | ||||||
CONSOL Energy, Inc. | 12,980 | 390 | ||||||
Denbury Resources, Inc.(2) | 27,950 | 452 | ||||||
Devon Energy Corp. | 15,500 | 938 | ||||||
Diamond Offshore Drilling, Inc. | 4,070 | 268 | ||||||
Ensco plc Class A | 8,230 | 449 | ||||||
EOG Resources, Inc. | 11,750 | 1,317 | ||||||
EQT Corp. | 5,340 | 315 | ||||||
Exxon Mobil Corp. | 111,150 | 10,165 | ||||||
FMC Technologies, Inc.(2) | 15,260 | 707 | ||||||
Halliburton Co. | 39,640 | 1,335 | ||||||
Helmerich & Payne, Inc. | 3,840 | 183 | ||||||
Hess Corp. | 13,180 | 708 | ||||||
Kinder Morgan, Inc. | 20,350 | 723 | ||||||
Marathon Oil Corp. | 29,540 | 873 | ||||||
Marathon Petroleum Corp. | 12,090 | 660 | ||||||
Murphy Oil Corp. | 8,940 | 480 | ||||||
Nabors Industries Ltd.(2) | 19,090 | 268 | ||||||
National Oilwell Varco, Inc. | 19,310 | 1,547 | ||||||
Newfield Exploration Co.(2) | 4,740 | 148 | ||||||
Noble Corp. | 8,910 | 319 | ||||||
Noble Energy, Inc. | 8,670 | 804 | ||||||
Occidental Petroleum Corp. | 25,230 | 2,171 | ||||||
Peabody Energy Corp. | 13,960 | 311 | ||||||
Phillips 66 | 22,370 | 1,037 | ||||||
Pioneer Natural Resources Co. | 9,970 | 1,041 | ||||||
QEP Resources, Inc. | 6,270 | 198 | ||||||
Range Resources Corp. | 9,100 | 636 | ||||||
Rowan Cos. plc Class A(2) | 11,920 | 403 | ||||||
Schlumberger Ltd. | 49,410 | 3,574 | ||||||
Southwestern Energy Co.(2) | 15,750 | 548 | ||||||
Spectra Energy Corp. | 31,100 | 913 | ||||||
Sunoco, Inc. | 8,940 | 419 | ||||||
Tesoro Corp. | 15,620 | 654 | ||||||
Valero Energy Corp. | 27,370 | 867 | ||||||
Williams Cos., Inc. (The) | 31,540 | 1,103 | ||||||
| SHARES | VALUE | |||||||
| Energy (continued) | ||||||||
WPX Energy, Inc.(2) | 7,180 | $ | 119 | |||||
|
| |||||||
| 53,028 | ||||||||
|
| |||||||
| Financials—10.9% | ||||||||
ACE Ltd. | 9,490 | 717 | ||||||
Aflac, Inc. | 13,210 | 632 | ||||||
Allstate Corp. (The) | 13,580 | 538 | ||||||
American Express Co. | 27,620 | 1,570 | ||||||
American International Group, Inc.(2) | 32,540 | 1,067 | ||||||
American Tower Corp. | 11,060 | 790 | ||||||
Ameriprise Financial, Inc. | 5,900 | 334 | ||||||
AON plc | 9,030 | 472 | ||||||
Apartment Investment & Management Co. Class A | 4,040 | 105 | ||||||
Assurant, Inc. | 2,320 | 87 | ||||||
AvalonBay Communities, Inc. | 2,700 | 367 | ||||||
Bank of America Corp. | 301,800 | 2,665 | ||||||
Bank of New York Mellon Corp. (The) | 33,080 | 748 | ||||||
BB&T Corp. | 19,580 | 649 | ||||||
Berkshire Hathaway, Inc. Class B(2) | 51,540 | 4,546 | ||||||
BlackRock, Inc. | 3,620 | 645 | ||||||
Boston Properties, Inc. | 4,250 | 470 | ||||||
Capital One Financial Corp. | 16,270 | 928 | ||||||
CBRE Group, Inc.(2) | 8,450 | 156 | ||||||
Charles Schwab Corp. (The) | 30,690 | 393 | ||||||
Chubb Corp. (The) | 7,440 | 568 | ||||||
Cincinnati Financial Corp. | 4,100 | 155 | ||||||
Citigroup, Inc. | 82,120 | 2,687 | ||||||
CME Group, Inc. | 8,570 | 491 | ||||||
Comerica, Inc. | 5,500 | 171 | ||||||
Discover Financial Services | 14,420 | 573 | ||||||
E*Trade Financial Corp.(2) | 7,210 | 64 | ||||||
Equity Residential | 8,430 | 485 | ||||||
Federated Investors, Inc. Class B | 2,640 | 55 | ||||||
Fifth Third Bancorp | 25,970 | 403 | ||||||
First Horizon National Corp. | 7,160 | 69 | ||||||
Franklin Resources, Inc. | 3,870 | 484 | ||||||
Genworth Financial, Inc. Class A(2) | 13,730 | 72 | ||||||
Goldman Sachs Group, Inc. (The) | 12,620 | 1,435 | ||||||
Hartford Financial Services Group, Inc. (The) | 12,200 | 237 | ||||||
See Notes to Financial Statements
27
Table of Contents
VIRTUS ALPHASECTOR™ ROTATION FUND
SCHEDULE OF INVESTMENTS (Continued)
SEPTEMBER 30, 2012
($ reported in thousands)
| SHARES | VALUE | |||||||
| Financials (continued) | ||||||||
HCP, Inc. | 12,030 | $ | 535 | |||||
Health Care REIT, Inc. | 7,150 | 413 | ||||||
Host Hotels & Resorts, Inc. | 20,270 | 325 | ||||||
Hudson City Bancorp, Inc. | 13,310 | 106 | ||||||
Huntington Bancshares, Inc. | 24,470 | 169 | ||||||
IntercontinentalExchange, Inc.(2) | 2,050 | 273 | ||||||
Invesco Ltd. | 12,580 | 314 | ||||||
JPMorgan Chase & Co. | 106,750 | 4,321 | ||||||
KeyCorp | 26,750 | 234 | ||||||
Kimco Realty Corp. | 11,430 | 232 | ||||||
Legg Mason, Inc. | 3,490 | 86 | ||||||
Leucadia National Corp. | 5,690 | 129 | ||||||
Lincoln National Corp. | 7,980 | 193 | ||||||
Loews Corp. | 8,750 | 361 | ||||||
M&T Bank Corp. | 3,370 | 321 | ||||||
Marsh & McLennan Cos., Inc. | 15,240 | 517 | ||||||
MetLife, Inc. | 29,750 | 1,025 | ||||||
Moody’s Corp. | 5,420 | 239 | ||||||
Morgan Stanley | 38,720 | 648 | ||||||
NASDAQ OMX Group, Inc. (The) | 3,360 | 78 | ||||||
Northern Trust Corp. | 6,130 | 285 | ||||||
NYSE Euronext, Inc. | 6,890 | 170 | ||||||
People’s United Financial, Inc. | 9,960 | 121 | ||||||
Plum Creek Timber Co., Inc. | 4,570 | 200 | ||||||
PNC Financial Services Group, Inc. | 14,830 | 936 | ||||||
Principal Financial Group, Inc. | 7,770 | 209 | ||||||
Progressive Corp. (The) | 15,690 | 325 | ||||||
Prologis, Inc. | 12,960 | 454 | ||||||
Prudential Financial, Inc. | 13,050 | 711 | ||||||
Public Storage | 4,030 | 561 | ||||||
Regions Financial Corp. | 39,990 | 288 | ||||||
Simon Property Group, Inc. | �� | 8,490 | 1,289 | |||||
SLM Corp. | 13,150 | 207 | ||||||
State Street Corp. | 13,420 | 563 | ||||||
SunTrust Banks, Inc. | 15,220 | 430 | ||||||
T. Rowe Price Group, Inc. | 7,110 | 450 | ||||||
Torchmark Corp. | 2,740 | 141 | ||||||
Travelers Cos., Inc. (The) | 10,790 | 737 | ||||||
U.S. Bancorp | 53,260 | 1,827 | ||||||
Unum Group | 7,850 | 151 | ||||||
Ventas, Inc. | 8,210 | 511 | ||||||
Vornado Realty Trust | 4,740 | 384 | ||||||
| SHARES | VALUE | |||||||
| Financials (continued) | ||||||||
Wells Fargo & Co. | 138,050 | $ | 4,767 | |||||
XL Group plc | 8,740 | 210 | ||||||
Zions Bancorp | 5,110 | 106 | ||||||
|
| |||||||
| 52,380 | ||||||||
|
| |||||||
| Industrials—11.0% | ||||||||
3M Co. | 26,390 | 2,439 | ||||||
Avery Dennison Corp. | 4,960 | 158 | ||||||
Boeing Co. (The) | 28,600 | 1,991 | ||||||
Caterpillar, Inc. | 28,200 | 2,426 | ||||||
Cintas Corp. | 5,250 | 218 | ||||||
Cooper Industries plc | 6,470 | 486 | ||||||
CSX Corp. | 50,740 | 1,053 | ||||||
Cummins, Inc. | 13,200 | 1,217 | ||||||
Danaher Corp. | 26,550 | 1,464 | ||||||
Deere & Co. | 17,700 | 1,460 | ||||||
Donnelley (R.R.) & Sons Co. | 10,580 | 112 | ||||||
Dover Corp. | 8,950 | 532 | ||||||
Dun & Bradstreet Corp. | 1,820 | 145 | ||||||
Eaton Corp. | 16,700 | 789 | ||||||
Emerson Electric Co. | 31,170 | 1,505 | ||||||
Equifax, Inc. | 6,600 | 307 | ||||||
Expeditors International of Washington, Inc. | 8,520 | 310 | ||||||
Fastenal Co. | 10,910 | 469 | ||||||
FedEx Corp. | 12,670 | 1,072 | ||||||
First Solar, Inc.(2) | 1,010 | 22 | ||||||
Flowserve Corp. | 2,070 | 264 | ||||||
Fluor Corp. | 9,830 | 553 | ||||||
General Dynamics Corp. | 14,600 | 965 | ||||||
General Electric Co. | 316,390 | 7,185 | ||||||
Grainger (W.W.), Inc. | 3,180 | 663 | ||||||
Honeywell International, Inc. | 33,330 | 1,992 | ||||||
Illinois Tool Works, Inc. | 18,550 | 1,103 | ||||||
Ingersoll-Rand plc | 11,600 | 520 | ||||||
Iron Mountain, Inc. | 6,110 | 208 | ||||||
Jacobs Engineering Group, Inc.(2) | 5,250 | 212 | ||||||
Joy Global, Inc. | 4,290 | 241 | ||||||
L-3 Communications Holdings, Inc. | 3,910 | 280 | ||||||
Lockheed Martin Corp. | 11,540 | 1,078 | ||||||
Masco Corp. | 16,080 | 242 | ||||||
Norfolk Southern Corp. | 15,180 | 966 | ||||||
Northrop Grumman Corp. | 10,810 | 718 | ||||||
PACCAR, Inc. | 16,640 | 666 | ||||||
Pall Corp. | 6,890 | 437 | ||||||
See Notes to Financial Statements
28
Table of Contents
VIRTUS ALPHASECTOR™ ROTATION FUND
SCHEDULE OF INVESTMENTS (Continued)
SEPTEMBER 30, 2012
($ reported in thousands)
| SHARES | VALUE | |||||||
| Industrials (continued) | ||||||||
Parker Hannifin Corp. | 7,630 | $ | 638 | |||||
Pentair, Inc. | 4,000 | 178 | ||||||
Pitney Bowes, Inc. | 9,310 | 129 | ||||||
Precision Castparts Corp. | 5,880 | 960 | ||||||
Quanta Services, Inc.(2) | 8,620 | 213 | ||||||
Raytheon Co. | 14,700 | 840 | ||||||
Republic Services, Inc. | 12,060 | 332 | ||||||
Robert Half International, Inc. | 8,120 | 216 | ||||||
Robinson (C.H.) Worldwide, Inc. | 6,540 | 383 | ||||||
Rockwell Automation, Inc. | 7,390 | 514 | ||||||
Rockwell Collins, Inc. | 7,430 | 399 | ||||||
Roper Industries, Inc. | 3,960 | 435 | ||||||
Ryder System, Inc. | 3,760 | 147 | ||||||
Snap-On, Inc. | 2,350 | 169 | ||||||
Southwest Airlines Co. | 32,970 | 289 | ||||||
Stanley Black & Decker, Inc. | 6,800 | 519 | ||||||
Stericycle, Inc.(2) | 3,470 | 314 | ||||||
Textron, Inc. | 14,200 | 372 | ||||||
Tyco International Ltd. | 18,610 | 1,047 | ||||||
Union Pacific Corp. | 20,860 | 2,476 | ||||||
United Parcel Service, Inc. Class B | 29,620 | 2,120 | ||||||
United Technologies Corp. | 35,270 | 2,761 | ||||||
Waste Management, Inc. | 19,380 | 622 | ||||||
Xylem, Inc. | 7,510 | 189 | ||||||
|
| |||||||
| 52,730 | ||||||||
|
| |||||||
| Information Technology—9.5% | ||||||||
Accenture plc Class A | 11,070 | 775 | ||||||
Adobe Systems, Inc.(2) | 8,720 | 283 | ||||||
Advanced Micro Devices, Inc.(2) | 10,940 | 37 | ||||||
Akamai Technologies, Inc.(2) | 3,470 | 133 | ||||||
Altera Corp. | 6,010 | 204 | ||||||
Amphenol Corp. Class A | 2,980 | 175 | ||||||
Analog Devices, Inc. | 5,370 | 210 | ||||||
Apple, Inc.(2) | 16,370 | 10,923 | ||||||
Applied Materials, Inc. | 22,030 | 246 | ||||||
Autodesk, Inc.(2) | 4,310 | 144 | ||||||
Automatic Data Processing, Inc. | 8,600 | 505 | ||||||
BMC Software, Inc.(2) | 2,710 | 112 | ||||||
Broadcom Corp. Class A(2) | 9,250 | 320 | ||||||
CA, Inc. | 6,400 | 165 | ||||||
Cisco Systems, Inc. | 91,810 | 1,753 | ||||||
Citrix Systems, Inc.(2) | 3,430 | 263 | ||||||
| SHARES | VALUE | |||||||
| Information Technology (continued) | ||||||||
Cognizant Technology Solutions Corp. Class A(2) | 5,370 | $ | 376 | |||||
Computer Sciences Corp. | 2,860 | 92 | ||||||
Corning, Inc. | 26,610 | 350 | ||||||
Dell, Inc. | 26,090 | 257 | ||||||
eBay, Inc.(2) | 20,470 | 991 | ||||||
Electronic Arts, Inc.(2) | 6,060 | 77 | ||||||
EMC Corp.(2) | 36,910 | 1,007 | ||||||
F5 Networks, Inc.(2) | 1,390 | 146 | ||||||
Fidelity National Information Services, Inc. | 4,750 | 148 | ||||||
Fiserv, Inc.(2) | 2,510 | 186 | ||||||
FLIR Systems, Inc. | 2,920 | 58 | ||||||
Google, Inc. Class A(2) | 4,690 | 3,539 | ||||||
Harris Corp. | 2,190 | 112 | ||||||
Hewlett-Packard Co. | 28,190 | 481 | ||||||
Intel Corp. | 74,050 | 1,679 | ||||||
International Business Machines Corp. | 18,740 | 3,888 | ||||||
Intuit, Inc. | 5,030 | 296 | ||||||
Jabil Circuit, Inc. | 3,820 | 72 | ||||||
JDS Uniphase Corp.(2) | 5,220 | 65 | ||||||
Juniper Networks, Inc.(2) | 9,320 | 160 | ||||||
KLA-Tencor Corp. | 3,110 | 148 | ||||||
Lam Research Corp.(2) | 3,180 | 101 | ||||||
Linear Technology Corp. | 4,280 | 136 | ||||||
LSI Corp.(2) | 10,800 | 75 | ||||||
MasterCard, Inc. Class A | 1,870 | 844 | ||||||
Microchip Technology, Inc. | 3,580 | 117 | ||||||
Micron Technology, Inc.(2) | 18,380 | 110 | ||||||
Microsoft Corp. | 130,940 | 3,899 | ||||||
Molex, Inc. | 2,690 | 71 | ||||||
Motorola Solutions, Inc. | 5,110 | 258 | ||||||
NetApp, Inc.(2) | 6,570 | 216 | ||||||
NVIDIA Corp.(2) | 11,240 | 150 | ||||||
Oracle Corp. | 66,460 | 2,093 | ||||||
Paychex, Inc. | 5,770 | 192 | ||||||
QUALCOMM, Inc. | 29,750 | 1,859 | ||||||
Red Hat, Inc.(2) | 3,640 | 207 | ||||||
SAIC, Inc. | 4,840 | 58 | ||||||
Salesforce.com, Inc.(2) | 2,380 | 363 | ||||||
SanDisk Corp.(2) | 4,530 | 197 | ||||||
Seagate Technology plc | 6,150 | 191 | ||||||
Symantec Corp.(2) | 12,840 | 231 | ||||||
TE Connectivity Ltd. | 7,390 | 251 | ||||||
Teradata Corp.(2) | 3,190 | 241 | ||||||
Teradyne, Inc.(2) | 3,960 | 56 | ||||||
Texas Instruments, Inc. | 20,020 | 552 | ||||||
See Notes to Financial Statements
29
Table of Contents
VIRTUS ALPHASECTOR™ ROTATION FUND
SCHEDULE OF INVESTMENTS (Continued)
SEPTEMBER 30, 2012
($ reported in thousands)
| SHARES | VALUE | |||||||
| Information Technology (continued) | ||||||||
Total System Services, Inc. | 3,130 | $ | 74 | |||||
VeriSign, Inc.(2) | 2,960 | 144 | ||||||
Visa, Inc. Class A | 9,070 | 1,218 | ||||||
Western Digital Corp. | 4,080 | 158 | ||||||
Western Union Co. (The) | 10,760 | 196 | ||||||
Xerox Corp. | 24,560 | 180 | ||||||
Xilinx, Inc. | 4,900 | 164 | ||||||
Yahoo!, Inc.(2) | 18,490 | 295 | ||||||
|
| |||||||
| 45,273 | ||||||||
|
| |||||||
| Materials—10.9% | ||||||||
Air Products & Chemicals, Inc. | 24,620 | 2,036 | ||||||
Airgas, Inc. | 8,280 | 681 | ||||||
Alcoa, Inc. | 125,420 | 1,110 | ||||||
Allegheny Technologies, Inc. | 13,160 | 420 | ||||||
Ball Corp. | 18,380 | 778 | ||||||
Bemis Co., Inc. | 12,670 | 399 | ||||||
CF Industries Holdings, Inc. | 7,320 | 1,627 | ||||||
Cliffs Natural Resources, Inc. | 16,890 | 661 | ||||||
Dow Chemical Co. (The) | 137,480 | 3,981 | ||||||
Du Pont (E.I.) de Nemours & Co. | 106,760 | 5,367 | ||||||
Eastman Chemical Co. | 18,140 | 1,034 | ||||||
Ecolab, Inc. | 30,210 | 1,958 | ||||||
FMC Corp. | 16,260 | 900 | ||||||
Freeport-McMoRan Copper & Gold, Inc. | 108,930 | 4,311 | ||||||
International Flavors & Fragrances, Inc. | 9,820 | 585 | ||||||
International Paper Co. | 51,090 | 1,856 | ||||||
LyondellBasell Industries N.V. Class A | 38,930 | 2,011 | ||||||
MeadWestvaco Corp. | 20,850 | 638 | ||||||
Monsanto Co. | 61,160 | 5,567 | ||||||
Mosaic Co. (The) | 32,180 | 1,854 | ||||||
Newmont Mining Corp. | 44,700 | 2,504 | ||||||
Nucor Corp. | 37,130 | 1,421 | ||||||
Owens-Illinois, Inc.(2) | 20,330 | 381 | ||||||
PPG Industries, Inc. | 17,770 | 2,041 | ||||||
Praxair, Inc. | 34,210 | 3,554 | ||||||
Sealed Air Corp. | 21,600 | 334 | ||||||
Sherwin-Williams Co. (The) | 9,970 | 1,485 | ||||||
Sigma-Aldrich Corp. | 14,210 | 1,023 | ||||||
Titanium Metals Corp. | 10,560 | 135 | ||||||
United States Steel Corp. | 17,850 | 340 | ||||||
Vulcan Materials Co. | 15,530 | 734 | ||||||
Weyerhaeuser Co. | 15,120 | 395 | ||||||
|
| |||||||
| 52,121 | ||||||||
|
| |||||||
| SHARES | VALUE | |||||||
| Telecommunication Services—1.5% | ||||||||
AT&T, Inc. | 100,500 | $ | 3,789 | |||||
CenturyLink, Inc. | 11,230 | 454 | ||||||
Crown Castle International Corp.(2) | 5,090 | 326 | ||||||
Frontier Communications Corp. | 20,230 | 99 | ||||||
MetroPCS Communications, Inc.(2) | 6,490 | 76 | ||||||
Sprint Nextel Corp.(2) | 53,520 | 296 | ||||||
Verizon Communications, Inc. | 49,910 | 2,274 | ||||||
Windstream Corp. | 11,180 | 113 | ||||||
|
| |||||||
| 7,427 | ||||||||
| TOTAL COMMON STOCKS (Identified Cost $288,747) | 315,995 | |||||||
| EXCHANGE-TRADED FUNDS—33.6% | ||||||||
Consumer Staples Select Sector SPDR Fund | 1,486,040 | 53,245 | ||||||
Health Care Select Sector SPDR Fund | 1,339,910 | 53,744 | ||||||
Utilities Select Sector SPDR Fund | 1,475,960 | 53,725 | ||||||
| TOTAL EXCHANGE-TRADED FUNDS (Identified Cost $127,856) | 160,714 | |||||||
| TOTAL LONG TERM INVESTMENTS—99.6% | ||||||||
| (Identified Cost $416,603) | 476,709 | |||||||
| SHORT-TERM INVESTMENTS—0.2% | ||||||||
| Money Market Mutual Funds—0.2% | ||||||||
BlackRock Liquidity Funds TempFund Portfolio – Insitutional Shares (seven-day effective yield 0.140%) | 1,103,198 | 1,103 | ||||||
| TOTAL SHORT-TERM INVESTMENTS (Identified Cost $1,103) | 1,103 | |||||||
| TOTAL INVESTMENTS—99.8% (Identified Cost $417,706) | 477,812 | (1) | ||||||
Other assets and liabilities, |
| 1,115 | ||||||
|
| |||||||
| NET ASSETS—100.0% | $ | 478,927 | ||||||
|
| |||||||
See Notes to Financial Statements
30
Table of Contents
VIRTUS ALPHASECTOR™ ROTATION FUND
SCHEDULE OF INVESTMENTS (Continued)
SEPTEMBER 30, 2012
($ reported in thousands)
Abbreviations:
| REIT | Real Estate Investment Trust |
FOOTNOTE LEGEND:
| (1) | Federal Income Tax Information: For tax information at September 30, 2012, see Note 11 Federal Income Tax Information in the Notes to Financial Statements. |
| (2) | Non-income producing. |
The following table provides a summary of inputs used to value the Fund’s investments as of September 30, 2012 (See Security Valuation Note 2A in the Notes to Financial Statements):
| Total Value at September 30, 2012 | Level 1 Quoted Prices | |||||||
Equity Securities: | ||||||||
Common Stocks | $ | 315,995 | $ | 315,995 | ||||
Exchange-Traded Funds | 160,714 | 160,714 | ||||||
Short-Term Investments | 1,103 | 1,103 | ||||||
|
|
|
| |||||
Total Investments | $ | 477,812 | $ | 477,812 | ||||
|
|
|
| |||||
There are no Level 2 (significant observable inputs) or Level 3 (significant unobservable inputs) priced securities.
See Notes to Financial Statements
31
Table of Contents
VIRTUS DYNAMIC ALPHASECTOR™ FUND
SCHEDULE OF INVESTMENTS
SEPTEMBER 30, 2012
($ reported in thousands)
| SHARES | VALUE | |||||||
| EXCHANGE-TRADED FUNDS—129.5% | ||||||||
Consumer Discretionary Select Sector SPDR Fund | 783,600 | $ | 36,649 | |||||
Consumer Staples Select Sector SPDR Fund | 988,900 | 35,432 | ||||||
Energy Select Sector SPDR Fund | 488,600 | 35,902 | ||||||
Financial Select Sector SPDR Fund | 2,351,800 | 36,688 | ||||||
Health Care Select Sector SPDR Fund | 916,900 | 36,777 | ||||||
Industrial Select Sector SPDR Fund | 959,100 | 35,046 | ||||||
Materials Select Sector SPDR Fund | 977,700 | 35,950 | ||||||
Technology Select Sector SPDR Fund | 1,160,300 | 35,772 | ||||||
Utilities Select Sector SPDR Fund | 953,800 | 34,718 | ||||||
| TOTAL EXCHANGE-TRADED FUNDS (Identified Cost $308,933) | 322,934 | |||||||
| TOTAL LONG TERM INVESTMENTS—129.5% | ||||||||
| (Identified Cost $308,933) | 322,934 | |||||||
| SHORT-TERM INVESTMENTS—1.5% | ||||||||
| Money Market Mutual Funds—1.5% | ||||||||
Dreyfus Cash Management Fund – Institutional Shares (seven-day effective yield 0.060%) | 3,742,662 | 3,743 | ||||||
| TOTAL SHORT-TERM INVESTMENTS (Identified Cost $3,743) | 3,743 | |||||||
| TOTAL INVESTMENTS—131.0% (Identified Cost $312,676) | 326,677 | (1) | ||||||
Other assets and liabilities, |
| (77,331 | ) | |||||
|
| |||||||
| NET ASSETS—100.0% | $ | 249,346 | ||||||
|
| |||||||
FOOTNOTE LEGEND:
| (1) | Federal Income Tax Information: For tax information at September 30, 2012, see Note 11 Federal Income Tax Information in the Notes to Financial Statements. |
The following table provides a summary of inputs used to value the Fund’s investments as of September 30, 2012 (See Security Valuation Note 2A in the Notes to Financial Statements):
| Total Value at September 30, 2012 | Level 1 Quoted Prices | |||||||
Equity Securities: | ||||||||
Exchange-Traded Funds | $ | 322,934 | $ | 322,934 | ||||
Short-Term Investments | 3,743 | 3,743 | ||||||
|
|
|
| |||||
Total Investments | $ | 326,677 | $ | 326,677 | ||||
|
|
|
| |||||
There are no Level 2 (significant observable inputs) or Level 3 (significant unobservable inputs) priced securities.
See Notes to Financial Statements
32
Table of Contents
VIRTUS GLOBAL PREMIUM ALPHASECTOR™ FUND
SCHEDULE OF INVESTMENTS
SEPTEMBER 30, 2012
($ reported in thousands)
| SHARES | VALUE | |||||||
| EXCHANGE-TRADED FUNDS—99.8% | ||||||||
Consumer Discretionary Select Sector SPDR Fund | 95,490 | $ | 4,466 | |||||
Consumer Staples Select Sector SPDR Fund | 120,528 | 4,319 | ||||||
Energy Select Sector SPDR Fund | 59,530 | 4,374 | ||||||
Financial Select Sector SPDR Fund | 286,500 | 4,469 | ||||||
Health Care Select Sector SPDR Fund | 111,730 | 4,482 | ||||||
Industrial Select Sector SPDR Fund | 116,870 | 4,271 | ||||||
iShares MSCI EAFE® Index Fund | 267,530 | 14,179 | ||||||
iShares MSCI Emerging Markets Index Fund | 344,370 | 14,229 | ||||||
Materials Select Sector SPDR Fund | 119,130 | 4,381 | ||||||
Technology Select Sector SPDR Fund | 141,270 | 4,355 | ||||||
Utilities Select Sector SPDR Fund | 116,220 | 4,230 | ||||||
| TOTAL EXCHANGE-TRADED FUNDS (Identified Cost $61,420) | 67,755 | |||||||
| TOTAL LONG TERM INVESTMENTS—99.8% | ||||||||
| (Identified Cost $61,420) | 67,755 | |||||||
| TOTAL INVESTMENTS—99.8% (Identified Cost $61,420) | 67,755 | (1) | ||||||
Other assets and liabilities, net—0.2% | 107 | |||||||
|
| |||||||
| NET ASSETS—100.0% | $ | 67,862 | ||||||
|
| |||||||
FOOTNOTE LEGEND:
| (1) | Federal Income Tax Information: For tax information at September 30, 2012, see Note 11 Federal Income Tax Information in the Notes to Financial Statements. |
The following table provides a summary of inputs used to value the Fund’s investments as of September 30, 2012 (See Security Valuation Note 2A in the Notes to Financial Statements):
| Total Value at September 30, 2012 | Level 1 Quoted Prices | |||||||
Equity Securities: | ||||||||
Exchange-Traded Funds | $ | 67,755 | $ | 67,755 | ||||
|
|
|
| |||||
Total Investments | $ | 67,755 | $ | 67,755 | ||||
|
|
|
| |||||
There are no Level 2 (significant observable inputs) or Level 3 (significant unobservable inputs) priced securities.
See Notes to Financial Statements
33
Table of Contents
VIRTUS PREMIUM ALPHASECTOR™ FUND
SCHEDULE OF INVESTMENTS
SEPTEMBER 30, 2012
($ reported in thousands)
| SHARES | VALUE | |||||||
| COMMON STOCKS—99.9% | ||||||||
| Consumer Discretionary—11.0% | ||||||||
Abercrombie & Fitch Co. Class A | 22,805 | $ | 774 | |||||
Amazon.com, Inc.(2) | 100,805 | 25,637 | ||||||
Apollo Group, Inc. Class A(2) | 27,860 | 809 | ||||||
AutoNation, Inc.(2) | 11,426 | 499 | ||||||
AutoZone, Inc.(2) | 10,350 | 3,826 | ||||||
Bed Bath & Beyond, Inc.(2) | 64,613 | 4,071 | ||||||
Best Buy Co., Inc. | 73,659 | 1,266 | ||||||
Big Lots, Inc.(2) | 17,462 | 517 | ||||||
BorgWarner, Inc.(2) | 31,640 | 2,187 | ||||||
Cablevision Systems Corp. Class A | 59,491 | 943 | ||||||
CarMax, Inc.(2) | 63,418 | 1,795 | ||||||
Carnival Corp. | 123,998 | 4,518 | ||||||
CBS Corp. Class B | 165,051 | 5,996 | ||||||
Chipotle Mexican Grill, Inc.(2) | 8,701 | 2,763 | ||||||
Coach, Inc. | 79,134 | 4,433 | ||||||
Comcast Corp. Class A | 745,812 | 26,678 | ||||||
Darden Restaurants, Inc. | 35,496 | 1,979 | ||||||
DIRECTV Class A(2) | 174,127 | 9,135 | ||||||
Discovery Communications, Inc. Class A(2) | 68,469 | 4,083 | ||||||
Dollar Tree, Inc.(2) | 64,470 | 3,112 | ||||||
DR Horton, Inc. | 78,076 | 1,612 | ||||||
Expedia, Inc. | 25,881 | 1,497 | ||||||
Family Dollar Stores, Inc. | 26,813 | 1,778 | ||||||
Ford Motor Co. | 1,057,890 | 10,431 | ||||||
Fossil, Inc.(2) | 15,140 | 1,282 | ||||||
GameStop Corp. Class A | 34,143 | 717 | ||||||
Gannett Co., Inc. | 65,286 | 1,159 | ||||||
Gap, Inc. (The) | 82,705 | 2,959 | ||||||
Genuine Parts Co. | 43,034 | 2,626 | ||||||
Goodyear Tire & Rubber Co. (The)(2) | 68,119 | 830 | ||||||
H&R Block, Inc. | 76,383 | 1,324 | ||||||
Harley-Davidson, Inc. | 63,139 | 2,675 | ||||||
Harman International Industries, Inc. | 18,603 | 859 | ||||||
Hasbro, Inc. | 32,232 | 1,230 | ||||||
Home Depot, Inc. (The) | 420,149 | 25,364 | ||||||
International Game Technology | 74,322 | 973 | ||||||
| SHARES | VALUE | |||||||
| Consumer Discretionary (continued) | ||||||||
Interpublic Group of Cos., Inc. (The) | 123,812 | $ | 1,377 | |||||
J.C. Penney Co., Inc. | 40,421 | 982 | ||||||
Johnson Controls, Inc. | 190,322 | 5,215 | ||||||
Kohl’s Corp. | 59,775 | 3,062 | ||||||
Leggett & Platt, Inc. | 38,633 | 968 | ||||||
Lennar Corp. Class A | 45,017 | 1,565 | ||||||
Lowe’s Cos., Inc. | 316,346 | 9,566 | ||||||
Ltd. Brands, Inc. | 66,108 | 3,256 | ||||||
Macy’s, Inc. | 111,665 | 4,201 | ||||||
Marriott International, Inc. Class A | 69,724 | 2,726 | ||||||
Mattel, Inc. | 95,008 | 3,371 | ||||||
McDonald’s Corp. | 281,083 | 25,789 | ||||||
McGraw-Hill Cos., Inc. (The) | 77,956 | 4,256 | ||||||
Netflix, Inc.(2) | 15,234 | 829 | ||||||
Newell Rubbermaid, Inc. | 80,894 | 1,544 | ||||||
News Corp. Class A | 564,772 | 13,854 | ||||||
NIKE, Inc. Class B | 101,963 | 9,677 | ||||||
Nordstrom, Inc. | 42,271 | 2,333 | ||||||
O’Reilly Automotive, Inc.(2) | 32,810 | 2,744 | ||||||
Omnicom Group, Inc. | 73,588 | 3,794 | ||||||
priceline.com, Inc.(2) | 13,776 | 8,524 | ||||||
PulteGroup, Inc.(2) | 94,094 | 1,458 | ||||||
Ralph Lauren Corp. | 16,878 | 2,552 | ||||||
Ross Stores, Inc. | 62,012 | 4,006 | ||||||
Scripps Networks Interactive, Inc. Class A | 23,894 | 1,463 | ||||||
Staples, Inc. | 189,347 | 2,181 | ||||||
Starbucks Corp. | 210,813 | 10,699 | ||||||
Starwood Hotels & Resorts Worldwide, Inc. | 54,872 | 3,180 | ||||||
Target Corp. | 181,665 | 11,530 | ||||||
Tiffany & Co. | 32,930 | 2,038 | ||||||
Time Warner Cable, Inc. | 85,001 | 8,080 | ||||||
Time Warner, Inc. | 263,238 | 11,933 | ||||||
TJX Cos., Inc. | 204,194 | 9,146 | ||||||
TripAdvisor, Inc.(2) | 30,341 | 999 | ||||||
Urban Outfitters, Inc.(2) | 30,781 | 1,156 | ||||||
VF Corp. | 24,322 | 3,876 | ||||||
Viacom, Inc. Class B | 131,311 | 7,037 | ||||||
Walt Disney Co. (The) | 500,098 | 26,145 | ||||||
Washington Post Co. (The) Class B | 1,311 | 476 | ||||||
Whirlpool Corp. | 21,330 | 1,768 | ||||||
Wyndham Worldwide Corp. | 39,347 | 2,065 | ||||||
See Notes to Financial Statements
34
Table of Contents
VIRTUS PREMIUM ALPHASECTOR™ FUND
SCHEDULE OF INVESTMENTS (Continued)
SEPTEMBER 30, 2012
($ reported in thousands)
| SHARES | VALUE | |||||||
| Consumer Discretionary (continued) | ||||||||
Wynn Resorts Ltd. | 21,919 | $ | 2,530 | |||||
Yum! Brands, Inc. | 126,434 | 8,388 | ||||||
|
| |||||||
| 394,676 | ||||||||
|
| |||||||
| Consumer Staples—11.1% | ||||||||
Altria Group, Inc. | 519,790 | 17,356 | ||||||
Archer-Daniels-Midland Co. | 202,715 | 5,510 | ||||||
Avon Products, Inc. | 153,430 | 2,447 | ||||||
Beam, Inc. | 52,450 | 3,018 | ||||||
Brown-Forman Corp. Class B | 50,362 | 3,286 | ||||||
Campbell Soup Co. | 65,790 | 2,291 | ||||||
Clorox Co. (The) | 43,140 | 3,108 | ||||||
Coca-Cola Co. (The) | 1,094,970 | 41,532 | ||||||
Coca-Cola Enterprises, Inc. | 94,700 | 2,961 | ||||||
Colgate-Palmolive Co. | 130,445 | 13,986 | ||||||
ConAgra Foods, Inc. | 133,170 | 3,674 | ||||||
Constellation Brands, Inc. Class A(2) | 62,075 | 2,008 | ||||||
Costco Wholesale Corp. | 127,450 | 12,761 | ||||||
CVS Caremark Corp. | 370,080 | 17,919 | ||||||
Dean Foods Co.(2) | 81,085 | 1,326 | ||||||
Dr. Pepper Snapple Group, Inc. | 70,470 | 3,138 | ||||||
Estee Lauder Cos., Inc. (The) Class A | 77,240 | 4,756 | ||||||
General Mills, Inc. | 195,985 | 7,810 | ||||||
Heinz (H.J.) Co. | 99,490 | 5,567 | ||||||
Hershey Co. (The) | 49,575 | 3,514 | ||||||
Hormel Foods Corp. | 52,355 | 1,531 | ||||||
J.M. Smucker Co. (The) | 36,580 | 3,158 | ||||||
Kellogg Co. | 79,540 | 4,109 | ||||||
Kimberly-Clark Corp. | 117,500 | 10,079 | ||||||
Kraft Foods Group, Inc. Class A | 473,265 | 19,570 | ||||||
Kroger Co. (The) | 172,850 | 4,069 | ||||||
Lorillard, Inc. | 40,460 | 4,712 | ||||||
McCormick & Co., Inc. | 45,380 | 2,816 | ||||||
Mead Johnson Nutrition Co. | 63,010 | 4,617 | ||||||
Molson Coors Brewing Co. Class B | 55,775 | 2,513 | ||||||
Monster Beverage Corp.(2) | 49,920 | 2,704 | ||||||
PepsiCo, Inc. | 252,370 | 17,860 | ||||||
| SHARES | VALUE | |||||||
| Consumer Staples (continued) | ||||||||
Philip Morris International, Inc. | 476,775 | $ | 42,881 | |||||
Procter & Gamble Co. (The) | 778,995 | 54,031 | ||||||
Reynolds American, Inc. | 103,375 | 4,480 | ||||||
Safeway, Inc. | 94,535 | 1,521 | ||||||
SYSCO Corp. | 182,210 | 5,698 | ||||||
Tyson Foods, Inc. Class A | 107,570 | 1,723 | ||||||
Wal-Mart Stores, Inc. | 475,330 | 35,079 | ||||||
Walgreen Co. | 258,450 | 9,418 | ||||||
Whole Foods Market, Inc. | 53,645 | 5,225 | ||||||
|
| |||||||
| 395,762 | ||||||||
|
| |||||||
| Energy—11.0% | ||||||||
Alpha Natural Resources, Inc.(2) | 56,060 | 368 | ||||||
Anadarko Petroleum Corp. | 153,670 | 10,745 | ||||||
Apache Corp. | 119,170 | 10,305 | ||||||
Baker Hughes, Inc. | 153,850 | 6,959 | ||||||
Cabot Oil & Gas Corp. | 119,500 | 5,366 | ||||||
Cameron International Corp.(2) | 103,950 | 5,828 | ||||||
Chesapeake Energy Corp. | 182,500 | 3,444 | ||||||
Chevron Corp. | 529,340 | 61,700 | ||||||
ConocoPhillips | 237,110 | 13,558 | ||||||
CONSOL Energy, Inc. | 95,730 | 2,877 | ||||||
Denbury Resources, Inc.(2) | 206,280 | 3,333 | ||||||
Devon Energy Corp. | 114,740 | 6,942 | ||||||
Diamond Offshore Drilling, Inc. | 29,920 | 1,969 | ||||||
Ensco plc Class A | 61,200 | 3,339 | ||||||
EOG Resources, Inc. | 86,980 | 9,746 | ||||||
EQT Corp. | 39,060 | 2,305 | ||||||
Exxon Mobil Corp. | 822,840 | 75,249 | ||||||
FMC Technologies, Inc.(2) | 113,240 | 5,243 | ||||||
Halliburton Co. | 293,410 | 9,885 | ||||||
Helmerich & Payne, Inc. | 28,210 | 1,343 | ||||||
Hess Corp. | 97,560 | 5,241 | ||||||
Kinder Morgan, Inc. | 150,660 | 5,351 | ||||||
Marathon Oil Corp. | 217,590 | 6,434 | ||||||
Marathon Petroleum Corp. | 89,130 | 4,866 | ||||||
Murphy Oil Corp. | 66,080 | 3,548 | ||||||
Nabors Industries Ltd.(2) | 140,960 | 1,978 | ||||||
National Oilwell Varco, Inc. | 142,510 | 11,416 | ||||||
Newfield Exploration Co.(2) | 34,590 | 1,083 | ||||||
Noble Corp. | 66,160 | 2,367 | ||||||
Noble Energy, Inc. | 63,930 | 5,927 | ||||||
See Notes to Financial Statements
35
Table of Contents
VIRTUS PREMIUM ALPHASECTOR™ FUND
SCHEDULE OF INVESTMENTS (Continued)
SEPTEMBER 30, 2012
($ reported in thousands)
| SHARES | VALUE | |||||||
| Energy (continued) | ||||||||
Occidental Petroleum Corp. | 186,550 | $ | 16,054 | |||||
Peabody Energy Corp. | 103,920 | 2,316 | ||||||
Phillips 66 | 164,810 | 7,642 | ||||||
Pioneer Natural Resources Co. | 73,570 | 7,681 | ||||||
QEP Resources, Inc. | 46,940 | 1,486 | ||||||
Range Resources Corp. | 67,270 | 4,700 | ||||||
Rowan Cos. plc Class A(2) | 87,850 | 2,967 | ||||||
Schlumberger Ltd. | 365,800 | 26,458 | ||||||
Southwestern Energy Co.(2) | 117,200 | 4,076 | ||||||
Spectra Energy Corp. | 230,580 | 6,770 | ||||||
Sunoco, Inc. | 66,270 | 3,103 | ||||||
Tesoro Corp. | 115,820 | 4,853 | ||||||
Valero Energy Corp. | 203,720 | 6,454 | ||||||
Williams Cos., Inc. (The) | 232,490 | 8,130 | ||||||
WPX Energy, Inc.(2) | 52,070 | 864 | ||||||
|
| |||||||
| 392,269 | ||||||||
|
| |||||||
| Financials—11.1% | ||||||||
ACE Ltd. | 71,780 | 5,426 | ||||||
Aflac, Inc. | 99,550 | 4,766 | ||||||
Allstate Corp. (The) | 102,650 | 4,066 | ||||||
American Express Co. | 208,710 | 11,867 | ||||||
American International Group, Inc.(2) | 246,820 | 8,093 | ||||||
American Tower Corp. | 83,820 | 5,984 | ||||||
Ameriprise Financial, Inc. | 44,490 | 2,522 | ||||||
AON plc | 68,170 | 3,565 | ||||||
Apartment Investment & Management Co. Class A | 29,460 | 766 | ||||||
Assurant, Inc. | 16,760 | 625 | ||||||
AvalonBay Communities, Inc. | 20,450 | 2,781 | ||||||
Bank of America Corp. | 2,280,760 | 20,139 | ||||||
Bank of New York Mellon Corp. (The) | 250,420 | 5,664 | ||||||
BB&T Corp. | 149,000 | 4,941 | ||||||
Berkshire Hathaway, Inc. Class B(2) | 390,310 | 34,425 | ||||||
BlackRock, Inc. | 26,930 | 4,802 | ||||||
Boston Properties, Inc. | 31,690 | 3,505 | ||||||
Capital One Financial Corp. | 122,990 | 7,012 | ||||||
CBRE Group, Inc.(2) | 63,860 | 1,176 | ||||||
| SHARES | VALUE | |||||||
| Financials (continued) | ||||||||
Charles Schwab Corp. (The) | 232,350 | $ | 2,972 | |||||
Chubb Corp. (The) | 56,170 | 4,285 | ||||||
Cincinnati Financial Corp. | 30,840 | 1,168 | ||||||
Citigroup, Inc. | 620,580 | 20,305 | ||||||
CME Group, Inc. | 64,650 | 3,704 | ||||||
Comerica, Inc. | 41,310 | 1,283 | ||||||
Discover Financial Services | 108,950 | 4,329 | ||||||
E*Trade Financial Corp.(2) | 53,910 | 475 | ||||||
Equity Residential | 64,120 | 3,689 | ||||||
Federated Investors, Inc. Class B | 19,010 | 393 | ||||||
Fifth Third Bancorp | 196,600 | 3,049 | ||||||
First Horizon National Corp. | 54,480 | 525 | ||||||
Franklin Resources, Inc. | 29,170 | 3,648 | ||||||
Genworth Financial, Inc. Class A(2) | 108,410 | 567 | ||||||
Goldman Sachs Group, Inc. (The) | 95,360 | 10,840 | ||||||
Hartford Financial Services Group, Inc. (The) | 93,090 | 1,810 | ||||||
HCP, Inc. | 90,890 | 4,043 | ||||||
Health Care REIT, Inc. | 54,210 | 3,131 | ||||||
Host Hotels & Resorts, Inc. | 152,850 | 2,453 | ||||||
Hudson City Bancorp, Inc. | 100,590 | 801 | ||||||
Huntington Bancshares, Inc. | 182,450 | 1,259 | ||||||
IntercontinentalExchange, Inc.(2) | 15,230 | 2,032 | ||||||
Invesco Ltd. | 95,200 | 2,379 | ||||||
JPMorgan Chase & Co. | 808,610 | 32,732 | ||||||
KeyCorp | 202,770 | 1,772 | ||||||
Kimco Realty Corp. | 86,620 | 1,756 | ||||||
Legg Mason, Inc. | 25,370 | 626 | ||||||
Leucadia National Corp. | 41,780 | 950 | ||||||
Lincoln National Corp. | 60,180 | 1,456 | ||||||
Loews Corp. | 66,040 | 2,725 | ||||||
M&T Bank Corp. | 25,380 | 2,415 | ||||||
Marsh & McLennan Cos., Inc. | 116,110 | 3,940 | ||||||
MetLife, Inc. | 224,760 | 7,745 | ||||||
Moody’s Corp. | 41,240 | 1,822 | ||||||
Morgan Stanley | 292,690 | 4,900 | ||||||
NASDAQ OMX Group, Inc. (The) | 26,180 | 610 | ||||||
Northern Trust Corp. | 46,150 | 2,142 | ||||||
See Notes to Financial Statements
36
Table of Contents
VIRTUS PREMIUM ALPHASECTOR™ FUND
SCHEDULE OF INVESTMENTS (Continued)
SEPTEMBER 30, 2012
($ reported in thousands)
| SHARES | VALUE | |||||||
| Financials (continued) | ||||||||
NYSE Euronext, Inc. | 51,870 | $ | 1,279 | |||||
People’s United Financial, Inc. | 74,900 | 909 | ||||||
Plum Creek Timber Co., Inc. | 34,380 | 1,507 | ||||||
PNC Financial Services Group, Inc. | 112,050 | 7,070 | ||||||
Principal Financial Group, Inc. | 58,640 | 1,580 | ||||||
Progressive Corp. (The) | 118,640 | 2,461 | ||||||
Prologis, Inc. | 97,790 | 3,426 | ||||||
Prudential Financial, Inc. | 98,590 | 5,374 | ||||||
Public Storage | 30,420 | 4,233 | ||||||
Regions Financial Corp. | 301,940 | 2,177 | ||||||
Simon Property Group, Inc. | 64,100 | 9,731 | ||||||
SLM Corp. | 99,300 | 1,561 | ||||||
State Street Corp. | 101,380 | 4,254 | ||||||
SunTrust Banks, Inc. | 115,020 | 3,252 | ||||||
T. Rowe Price Group, Inc. | 53,810 | 3,406 | ||||||
Torchmark Corp. | 20,640 | 1,060 | ||||||
Travelers Cos., Inc. (The) | 81,540 | 5,566 | ||||||
U.S. Bancorp | 403,440 | 13,838 | ||||||
Unum Group | 59,740 | 1,148 | ||||||
Ventas, Inc. | 62,410 | 3,885 | ||||||
Vornado Realty Trust | 35,680 | 2,892 | ||||||
Wells Fargo & Co. | 1,045,560 | 36,103 | ||||||
XL Group plc | 64,670 | 1,554 | ||||||
Zions Bancorp | 37,890 | 783 | ||||||
|
| |||||||
| 395,905 | ||||||||
|
| |||||||
| Health Care—11.2% | ||||||||
Abbott Laboratories | 344,930 | 23,648 | ||||||
Aetna, Inc. | 89,020 | 3,525 | ||||||
Agilent Technologies, Inc. | 90,370 | 3,475 | ||||||
Alexion Pharmaceuticals, Inc.(2) | 49,650 | 5,680 | ||||||
Allergan, Inc. | 82,345 | 7,541 | ||||||
AmerisourceBergen Corp. | 67,555 | 2,615 | ||||||
Amgen, Inc. | 199,820 | 16,849 | ||||||
Bard (C.R.), Inc. | 21,480 | 2,248 | ||||||
Baxter International, Inc. | 143,990 | 8,677 | ||||||
Becton, Dickinson & Co. | 52,960 | 4,161 | ||||||
Biogen Idec, Inc.(2) | 62,585 | 9,340 | ||||||
Boston Scientific Corp.(2) | 371,165 | 2,131 | ||||||
| SHARES | VALUE | |||||||
| Health Care (continued) | ||||||||
Bristol-Myers Squibb Co. | 437,520 | $ | 14,766 | |||||
Cardinal Health, Inc. | 89,320 | 3,481 | ||||||
CareFusion Corp.(2) | 57,005 | 1,618 | ||||||
Celgene Corp.(2) | 111,845 | 8,545 | ||||||
Cerner Corp.(2) | 37,535 | 2,906 | ||||||
CIGNA Corp. | 77,160 | 3,640 | ||||||
Coventry Health Care, Inc. | 34,515 | 1,439 | ||||||
Covidien plc | 124,500 | 7,398 | ||||||
DaVita, Inc.(2) | 22,010 | 2,280 | ||||||
DENTSPLY International, Inc. | 36,265 | 1,383 | ||||||
Edwards Lifesciences Corp.(2) | 29,905 | 3,211 | ||||||
Eli Lilly & Co. | 264,790 | 12,554 | ||||||
Express Scripts Holding Co.(2) | 221,128 | 13,858 | ||||||
Forest Laboratories, Inc.(2) | 61,225 | 2,180 | ||||||
Gilead Sciences, Inc.(2) | 196,145 | 13,010 | ||||||
Hospira, Inc.(2) | 42,555 | 1,397 | ||||||
Humana, Inc. | 45,390 | 3,184 | ||||||
Intuitive Surgical, Inc.(2) | 10,321 | 5,115 | ||||||
Johnson & Johnson | 714,865 | 49,261 | ||||||
Laboratory Corp. of America Holdings(2) | 24,990 | 2,311 | ||||||
Life Technologies Corp.(2) | 45,990 | 2,248 | ||||||
McKesson Corp. | 63,013 | 5,421 | ||||||
Medtronic, Inc. | 265,775 | 11,460 | ||||||
Merck & Co., Inc. | 789,670 | 35,614 | ||||||
Mylan, Inc.(2) | 105,375 | 2,571 | ||||||
Patterson Cos., Inc. | 22,150 | 758 | ||||||
PerkinElmer, Inc. | 29,050 | 856 | ||||||
Perrigo Co. | 22,710 | 2,638 | ||||||
Pfizer, Inc. | 1,936,705 | 48,127 | ||||||
Quest Diagnostics, Inc. | 42,175 | 2,675 | ||||||
St. Jude Medical, Inc. | 83,255 | 3,508 | ||||||
Stryker Corp. | 76,230 | 4,243 | ||||||
Tenet Healthcare Corp.(2) | 112,890 | 708 | ||||||
Thermo Fisher Scientific, Inc. | 94,790 | 5,577 | ||||||
UnitedHealth Group, Inc. | 269,940 | 14,957 | ||||||
Varian Medical Systems, Inc.(2) | 28,720 | 1,732 | ||||||
Waters Corp.(2) | 22,640 | 1,887 | ||||||
Watson Pharmaceuticals, Inc.(2) | 34,535 | 2,941 | ||||||
WellPoint, Inc. | 86,540 | 5,020 | ||||||
See Notes to Financial Statements
37
Table of Contents
VIRTUS PREMIUM ALPHASECTOR™ FUND
SCHEDULE OF INVESTMENTS (Continued)
SEPTEMBER 30, 2012
($ reported in thousands)
| SHARES | VALUE | |||||||
| Health Care (continued) | ||||||||
Zimmer Holdings, Inc. | 46,180 | $ | 3,123 | |||||
|
| |||||||
| 399,491 | ||||||||
|
| |||||||
| Industrials—11.1% | ||||||||
3M Co. | 198,780 | 18,371 | ||||||
Avery Dennison Corp. | 38,110 | 1,213 | ||||||
Boeing Co. (The) | 215,360 | 14,993 | ||||||
Caterpillar, Inc. | 212,320 | 18,268 | ||||||
Cintas Corp. | 39,450 | 1,635 | ||||||
Cooper Industries plc | 48,560 | 3,645 | ||||||
CSX Corp. | 382,050 | 7,928 | ||||||
Cummins, Inc. | 99,420 | 9,168 | ||||||
Danaher Corp. | 199,940 | 11,027 | ||||||
Deere & Co. | 133,300 | 10,996 | ||||||
Donnelley (R.R.) & Sons Co. | 79,790 | 846 | ||||||
Dover Corp. | 67,330 | 4,005 | ||||||
Dun & Bradstreet Corp. | 13,630 | 1,085 | ||||||
Eaton Corp. | 125,830 | 5,947 | ||||||
Emerson Electric Co. | 234,710 | 11,329 | ||||||
Equifax, Inc. | 49,530 | 2,307 | ||||||
Expeditors International of Washington, Inc. | 64,100 | 2,331 | ||||||
Fastenal Co. | 82,130 | 3,531 | ||||||
FedEx Corp. | 95,420 | 8,074 | ||||||
First Solar, Inc.(2) | 8,190 | 181 | ||||||
Flowserve Corp. | 15,540 | 1,985 | ||||||
Fluor Corp. | 73,920 | 4,160 | ||||||
General Dynamics Corp. | 110,000 | 7,273 | ||||||
General Electric Co. | 2,382,710 | 54,111 | ||||||
Grainger (W.W.), Inc. | 23,880 | 4,976 | ||||||
Honeywell International, Inc. | 251,000 | 14,997 | ||||||
Illinois Tool Works, Inc. | 139,730 | 8,310 | ||||||
Ingersoll-Rand plc | 87,350 | 3,915 | ||||||
Iron Mountain, Inc. | 45,840 | 1,564 | ||||||
Jacobs Engineering Group, Inc.(2) | 39,420 | 1,594 | ||||||
Joy Global, Inc. | 32,150 | 1,802 | ||||||
L-3 Communications Holdings, Inc. | 29,320 | 2,103 | ||||||
Lockheed Martin Corp. | 86,920 | 8,117 | ||||||
Masco Corp. | 121,090 | 1,822 | ||||||
Norfolk Southern Corp. | 114,320 | 7,274 | ||||||
Northrop Grumman Corp. | 81,390 | 5,407 | ||||||
PACCAR, Inc. | 125,310 | 5,016 | ||||||
Pall Corp. | 51,720 | 3,284 | ||||||
| SHARES | VALUE | |||||||
| Industrials (continued) | ||||||||
Parker Hannifin Corp. | 57,380 | $ | 4,796 | |||||
Pentair, Inc. | 30,000 | 1,335 | ||||||
Pitney Bowes, Inc. | 69,920 | 966 | ||||||
Precision Castparts Corp. | 44,160 | 7,213 | ||||||
Quanta Services, Inc.(2) | 64,860 | 1,602 | ||||||
Raytheon Co. | 110,750 | 6,331 | ||||||
Republic Services, Inc. | 91,240 | 2,510 | ||||||
Robert Half International, Inc. | 61,000 | 1,624 | ||||||
Robinson (C.H.) Worldwide, Inc. | 49,040 | 2,871 | ||||||
Rockwell Automation, Inc. | 55,580 | 3,866 | ||||||
Rockwell Collins, Inc. | 55,890 | 2,998 | ||||||
Roper Industries, Inc. | 29,710 | 3,265 | ||||||
Ryder System, Inc. | 28,210 | 1,102 | ||||||
Snap-On, Inc. | 17,650 | 1,269 | ||||||
Southwest Airlines Co. | 248,450 | 2,179 | ||||||
Stanley Black & Decker, Inc. | 51,100 | 3,896 | ||||||
Stericycle, Inc.(2) | 26,030 | 2,356 | ||||||
Textron, Inc. | 106,970 | 2,799 | ||||||
Tyco International Ltd. | 140,140 | 7,884 | ||||||
Union Pacific Corp. | 157,110 | 18,649 | ||||||
United Parcel Service, Inc. Class B | 223,060 | 15,964 | ||||||
United Technologies Corp. | 265,620 | 20,795 | ||||||
Waste Management, Inc. | 144,530 | 4,637 | ||||||
Xylem, Inc. | 56,550 | 1,422 | ||||||
|
| |||||||
| 396,919 | ||||||||
|
| |||||||
| Information Technology—9.5% | ||||||||
Accenture plc Class A | 82,350 | 5,767 | ||||||
Adobe Systems, Inc.(2) | 65,480 | 2,125 | ||||||
Advanced Micro Devices, Inc.(2) | 86,590 | 292 | ||||||
Akamai Technologies, Inc.(2) | 25,900 | 991 | ||||||
Altera Corp. | 44,305 | 1,506 | ||||||
Amphenol Corp. Class A | 22,160 | 1,305 | ||||||
Analog Devices, Inc. | 40,190 | 1,575 | ||||||
Apple, Inc.(2) | 122,340 | 81,633 | ||||||
Applied Materials, Inc. | 164,670 | 1,839 | ||||||
Autodesk, Inc.(2) | 31,710 | 1,058 | ||||||
Automatic Data Processing, Inc. | 64,290 | 3,771 | ||||||
BMC Software, Inc.(2) | 20,230 | 839 | ||||||
Broadcom Corp. Class A(2) | 68,995 | 2,386 | ||||||
CA, Inc. | 47,590 | 1,226 | ||||||
See Notes to Financial Statements
38
Table of Contents
VIRTUS PREMIUM ALPHASECTOR™ FUND
SCHEDULE OF INVESTMENTS (Continued)
SEPTEMBER 30, 2012
($ reported in thousands)
| SHARES | VALUE | |||||||
| Information Technology (continued) | ||||||||
Cisco Systems, Inc. | 686,430 | $ | 13,104 | |||||
Citrix Systems, Inc.(2) | 25,760 | 1,972 | ||||||
Cognizant Technology Solutions Corp. Class A(2) | 40,420 | 2,826 | ||||||
Computer Sciences Corp. | 20,880 | 673 | ||||||
Corning, Inc. | 197,075 | 2,591 | ||||||
Dell, Inc. | 195,550 | 1,928 | ||||||
eBay, Inc.(2) | 153,050 | 7,409 | ||||||
Electronic Arts, Inc.(2) | 43,500 | 552 | ||||||
EMC Corp.(2) | 275,060 | 7,501 | ||||||
F5 Networks, Inc.(2) | 10,070 | 1,054 | ||||||
Fidelity National Information Services, Inc. | 35,445 | 1,107 | ||||||
Fiserv, Inc.(2) | 18,380 | 1,361 | ||||||
FLIR Systems, Inc. | 21,830 | 436 | ||||||
Google, Inc. Class A(2) | 34,570 | 26,083 | ||||||
Harris Corp. | 15,809 | 810 | ||||||
Hewlett-Packard Co. | 212,130 | 3,619 | ||||||
Intel Corp. | 554,630 | 12,579 | ||||||
International Business Machines Corp. | 140,190 | 29,082 | ||||||
Intuit, Inc. | 37,525 | 2,209 | ||||||
Jabil Circuit, Inc. | 27,900 | 522 | ||||||
JDS Uniphase Corp.(2) | 38,330 | 475 | ||||||
Juniper Networks, Inc.(2) | 70,260 | 1,202 | ||||||
KLA-Tencor Corp. | 22,980 | 1,096 | ||||||
Lam Research Corp.(2) | 23,170 | 736 | ||||||
Linear Technology Corp. | 31,540 | 1,005 | ||||||
LSI Corp.(2) | 82,300 | 569 | ||||||
MasterCard, Inc. Class A | 14,209 | 6,415 | ||||||
Microchip Technology, Inc. | 26,980 | 883 | ||||||
Micron Technology, Inc.(2) | 136,420 | 816 | ||||||
Microsoft Corp. | 979,035 | 29,156 | ||||||
Molex, Inc. | 20,390 | 536 | ||||||
Motorola Solutions, Inc. | 38,130 | 1,927 | ||||||
NetApp, Inc.(2) | 48,810 | 1,605 | ||||||
NVIDIA Corp.(2) | 84,300 | 1,125 | ||||||
Oracle Corp. | 496,895 | 15,647 | ||||||
Paychex, Inc. | 43,200 | 1,438 | ||||||
QUALCOMM, Inc. | 222,960 | 13,933 | ||||||
Red Hat, Inc.(2) | 26,790 | 1,525 | ||||||
SAIC, Inc. | 35,275 | 425 | ||||||
Salesforce.com, Inc.(2) | 17,760 | 2,712 | ||||||
SanDisk Corp.(2) | 33,870 | 1,471 | ||||||
Seagate Technology plc | 45,210 | 1,401 | ||||||
Symantec Corp.(2) | 96,160 | 1,731 | ||||||
TE Connectivity Ltd. | 54,890 | 1,867 | ||||||
| SHARES | VALUE | |||||||
| Information Technology (continued) | ||||||||
Teradata Corp.(2) | 23,570 | $ | 1,777 | |||||
Teradyne, Inc.(2) | 30,580 | 435 | ||||||
Texas Instruments, Inc. | 150,185 | 4,138 | ||||||
Total System Services, Inc. | 23,380 | 554 | ||||||
VeriSign, Inc.(2) | 22,220 | 1,082 | ||||||
Visa, Inc. Class A | 67,740 | 9,096 | ||||||
Western Digital Corp. | 30,355 | 1,176 | ||||||
Western Union Co. (The) | 81,650 | 1,488 | ||||||
Xerox Corp. | 181,210 | 1,330 | ||||||
Xilinx, Inc. | 36,030 | 1,204 | ||||||
Yahoo!, Inc.(2) | 138,155 | 2,207 | ||||||
|
| |||||||
| 337,914 | ||||||||
|
| |||||||
| Materials—11.0% | ||||||||
Air Products & Chemicals, Inc. | 186,300 | 15,407 | ||||||
Airgas, Inc. | 62,530 | 5,146 | ||||||
Alcoa, Inc. | 948,790 | 8,397 | ||||||
Allegheny Technologies, Inc. | 100,620 | 3,210 | ||||||
Ball Corp. | 139,090 | 5,885 | ||||||
Bemis Co., Inc. | 95,870 | 3,017 | ||||||
CF Industries Holdings, Inc. | 55,330 | 12,297 | ||||||
Cliffs Natural Resources, Inc. | 127,790 | 5,000 | ||||||
Dow Chemical Co. (The) | 1,040,080 | 30,121 | ||||||
Du Pont (E.I.) de Nemours & Co. | 807,670 | 40,602 | ||||||
Eastman Chemical Co. | 137,200 | 7,822 | ||||||
Ecolab, Inc. | 228,540 | 14,812 | ||||||
FMC Corp. | 122,990 | 6,811 | ||||||
Freeport-McMoRan Copper & Gold, Inc. | 824,050 | 32,616 | ||||||
International Flavors & Fragrances, Inc. | 74,220 | 4,422 | ||||||
International Paper Co. | 386,540 | 14,039 | ||||||
LyondellBasell Industries N.V. Class A | 294,480 | 15,213 | ||||||
MeadWestvaco Corp. | 158,480 | 4,850 | ||||||
Monsanto Co. | 462,660 | 42,111 | ||||||
Mosaic Co. (The) | 243,440 | 14,025 | ||||||
Newmont Mining Corp. | 338,160 | 18,940 | ||||||
Nucor Corp. | 280,880 | 10,746 | ||||||
Owens-Illinois, Inc.(2) | 153,810 | 2,885 | ||||||
PPG Industries, Inc. | 134,420 | 15,437 | ||||||
Praxair, Inc. | 258,850 | 26,889 | ||||||
See Notes to Financial Statements
39
Table of Contents
VIRTUS PREMIUM ALPHASECTOR™ FUND
SCHEDULE OF INVESTMENTS (Continued)
SEPTEMBER 30, 2012
($ reported in thousands)
| SHARES | VALUE | |||||||
| Materials (continued) | ||||||||
Sealed Air Corp. | 163,390 | $ | 2,526 | |||||
Sherwin-Williams Co. (The) | 75,440 | 11,234 | ||||||
Sigma-Aldrich Corp. | 107,520 | 7,738 | ||||||
Titanium Metals Corp. | 79,920 | 1,025 | ||||||
United States Steel Corp. | 136,480 | 2,603 | ||||||
Vulcan Materials Co. | 117,510 | 5,558 | ||||||
Weyerhaeuser Co. | 115,050 | 3,007 | ||||||
|
| |||||||
| 394,391 | ||||||||
|
| |||||||
| Telecommunication Services—1.6% | ||||||||
AT&T, Inc. | 752,970 | 28,387 | ||||||
CenturyLink, Inc. | 83,805 | 3,386 | ||||||
Crown Castle International Corp.(2) | 37,920 | 2,431 | ||||||
Frontier Communications Corp. | 155,230 | 760 | ||||||
MetroPCS Communications, Inc.(2) | 48,510 | 568 | ||||||
Sprint Nextel Corp.(2) | 403,410 | 2,227 | ||||||
Verizon Communications, Inc. | 373,820 | 17,035 | ||||||
Windstream Corp. | 84,350 | 853 | ||||||
|
| |||||||
| 55,647 | ||||||||
|
| |||||||
| Utilities—11.3% | ||||||||
AES Corp. (The) | 558,250 | 6,124 | ||||||
AGL Resources, Inc. | 105,030 | 4,297 | ||||||
Ameren Corp. | 218,635 | 7,143 | ||||||
American Electric Power Co., Inc. | 435,280 | 19,126 | ||||||
CenterPoint Energy, Inc. | 387,360 | 8,251 | ||||||
CMS Energy Corp. | 242,010 | 5,699 | ||||||
Consolidated Edison, Inc. | 263,575 | 15,786 | ||||||
Dominion Resources, Inc. | 512,405 | 27,127 | ||||||
DTE Energy Co. | 155,140 | 9,299 | ||||||
Duke Energy Corp. | 580,421 | 37,611 | ||||||
Edison International | 292,465 | 13,363 | ||||||
Entergy Corp. | 158,455 | 10,981 | ||||||
Exelon Corp. | 762,844 | 27,142 | ||||||
FirstEnergy Corp. | 373,705 | 16,480 | ||||||
Integrys Energy Group, Inc. | 70,850 | 3,698 | ||||||
NextEra Energy, Inc. | 377,795 | 26,570 | ||||||
NiSource, Inc. | 258,570 | 6,588 | ||||||
Northeast Utilities | 280,440 | 10,721 | ||||||
NRG Energy, Inc. | 203,620 | 4,356 | ||||||
| SHARES | VALUE | |||||||
| Utilities (continued) | ||||||||
ONEOK, Inc. | 183,280 | $ | 8,854 | |||||
Pepco Holdings, Inc. | 207,495 | 3,922 | ||||||
PG&E Corp. | 383,145 | 16,349 | ||||||
Pinnacle West Capital Corp. | 100,150 | 5,288 | ||||||
PPL Corp. | 520,885 | 15,132 | ||||||
Public Service Enterprise Group, Inc. | 452,140 | 14,550 | ||||||
SCANA Corp. | 117,340 | 5,664 | ||||||
Sempra Energy | 201,975 | 13,025 | ||||||
Southern Co. (The) | 781,805 | 36,033 | ||||||
TECO Energy, Inc. | 186,325 | 3,306 | ||||||
Wisconsin Energy Corp. | 205,920 | 7,757 | ||||||
XCEL Energy, Inc. | 439,450 | 12,177 | ||||||
|
| |||||||
| 402,419 | ||||||||
| TOTAL COMMON STOCKS (Identified Cost $3,253,994) | 3,565,393 | |||||||
| TOTAL LONG TERM INVESTMENTS—99.9% | ||||||||
| (Identified Cost $3,253,994) | 3,565,393 | |||||||
| SHORT-TERM INVESTMENTS—0.0% | ||||||||
| Money Market Mutual Funds—0.0% | ||||||||
BlackRock Liquidity Funds TempFund Portfolio – Insitutional Shares (seven-day effective yield 0.140%) | 1,757,334 | 1,757 | ||||||
| TOTAL SHORT-TERM INVESTMENTS | ||||||||
| (Identified Cost $1,757) | 1,757 | �� | ||||||
| TOTAL INVESTMENTS—99.9% (Identified Cost $3,255,751) | 3,567,150 | (1) | ||||||
Other assets and liabilities, |
| 2,603 | ||||||
|
| |||||||
| NET ASSETS—100.0% | $ | 3,569,753 | ||||||
|
| |||||||
Abbreviations:
| REIT | Real Estate Investment Trust |
See Notes to Financial Statements
40
Table of Contents
VIRTUS PREMIUM ALPHASECTOR™ FUND
SCHEDULE OF INVESTMENTS (Continued)
SEPTEMBER 30, 2012
($ reported in thousands)
FOOTNOTE LEGEND:
| (1) | Federal Income Tax Information: For tax information at September 30, 2012, see Note 11 Federal Income Tax Information in the Notes to Financial Statements. |
| (2) | Non-income producing. |
The following table provides a summary of inputs used to value the Fund’s investments as of September 30, 2012 (See Security Valuation Note 2A in the Notes to Financial Statements):
| Total Value at September 30, 2012 | Level 1 Quoted Prices | |||||||
Equity Securities: | ||||||||
Common Stocks | $ | 3,565,393 | $ | 3,565,393 | ||||
Short-Term Investments | 1,757 | 1,757 | ||||||
|
|
|
| |||||
Total Investments | $ | 3,567,150 | $ | 3,567,150 | ||||
|
|
|
| |||||
There are no Level 2 (significant observable inputs) or Level 3 (significant unobservable inputs) priced securities.
See Notes to Financial Statements
41
Table of Contents
VIRTUS ALTERNATIVES DIVERSIFIER FUND
SCHEDULE OF INVESTMENTS
SEPTEMBER 30, 2012
($ reported in thousands)
| SHARES | VALUE | |||||||
| AFFILIATED MUTUAL FUNDS—67.0% | ||||||||
| Equity Funds—59.4% | ||||||||
Virtus Global Commodities Stock Fund Class I | 1,793,930 | $ | 17,903 | |||||
Virtus Global Dividend Fund Class I | 2,635,939 | 33,977 | ||||||
Virtus Global Real Estate Securities Fund Class I | 415,971 | 9,364 | ||||||
Virtus International Real Estate Securities Fund Class I | 3,083,457 | 20,012 | ||||||
Virtus Real Estate Securities Class I | 412,802 | 14,101 | ||||||
|
| |||||||
| 95,357 | ||||||||
|
| |||||||
| Fixed Income Funds—7.6% | ||||||||
Virtus Senior Floating Rate Fund Class I | 1,245,354 | 12,180 | ||||||
| TOTAL MUTUAL FUNDS (Identified Cost $89,081) | 107,537 | |||||||
| EXCHANGE-TRADED FUNDS—33.1% | ||||||||
PowerShares DB Commodity Index Tracking Fund(2) | 813,000 | 23,317 | ||||||
PowerShares DB G10 Currency Harvest Fund(2) | 814,800 | 20,671 | ||||||
WisdomTree Managed Futures Strategy Fund(2) | 225,800 | 9,134 | ||||||
| TOTAL EXCHANGE-TRADED FUNDS (Identified Cost $48,581) | 53,122 | |||||||
| TOTAL LONG TERM INVESTMENTS—100.1% | ||||||||
| (Identified Cost $137,662) | 160,659 | |||||||
| SHARES | VALUE | |||||||
| SHORT-TERM INVESTMENTS—0.5% | ||||||||
| Money Market Mutual Funds—0.5% | ||||||||
BlackRock Liquidity Funds TempFund Portfolio – Insitutional Shares (seven-day effective yield 0.140%) | 722,093 | $ | 722 | |||||
| TOTAL SHORT-TERM INVESTMENTS (Identified Cost $722) | 722 | |||||||
| TOTAL INVESTMENTS—100.6% (Identified Cost $138,384) | 161,381 | (1) | ||||||
Other assets and liabilities, |
| (992 | ) | |||||
|
| |||||||
| NET ASSETS—100.0% | $ | 160,389 | ||||||
|
| |||||||
FOOTNOTE LEGEND:
| (1) | Federal Income Tax Information: For tax information at September 30, 2012, see Note 11 Federal Income Tax Information in the Notes to Financial Statements. |
| (2) | Non-income producing. |
The following table provides a summary of inputs used to value the Fund’s investments as of September 30, 2012 (See Security Valuation Note 2A in the Notes to Financial Statements):
| Total Value at September 30, 2012 | Level 1 Quoted Prices | |||||||
Equity Securities: | ||||||||
Exchange-Traded Funds | $ | 53,122 | $ | 53,122 | ||||
Mutual Funds | 107,537 | 107,537 | ||||||
Short-Term Investments | 722 | 722 | ||||||
|
|
|
| |||||
Total Investments | $ | 161,381 | $ | 161,381 | ||||
|
|
|
| |||||
There are no Level 2 (significant observable inputs) or Level 3 (significant unobservable inputs) priced securities.
See Notes to Financial Statements
42
Table of Contents
THIS PAGE INTENTIONALLY BLANK
Table of Contents
STATEMENT OF ASSETS AND LIABILITIES
SEPTEMBER 30, 2012
(Reported in thousands except shares and per share amounts)
| Allocator Premium AlphaSectorTM Fund | ||||
| Assets | ||||
Investment in unaffiliated securities at value(1) | $ | 342,843 | ||
Investment in affiliated funds at value(2) | — | |||
Receivables | ||||
Investment securities sold | — | |||
Fund shares sold | 3,106 | |||
Deposits with prime broker (Note 13) | — | |||
Receivable from adviser | — | |||
Dividends and interest receivable | 806 | |||
Tax reclaims | — | |||
Prepaid trustee retainer | 2 | |||
Prepaid expenses | 34 | |||
|
| |||
Total assets | 346,791 | |||
|
| |||
| Liabilities | ||||
Cash overdraft | — | |||
Payables | ||||
Fund shares repurchased | 335 | |||
Investment securities purchased | 1,801 | |||
Loan payable (Note 13) | — | |||
Investment advisory fees | 301 | |||
Distribution and service fees | 116 | |||
Administration fees | 36 | |||
Transfer agent fees and expenses | 54 | |||
Trustees’ fees and expenses | 1 | |||
Professional fees | 17 | |||
Other accrued expenses | 44 | |||
|
| |||
Total liabilities | 2,705 | |||
|
| |||
| Net Assets | $ | 344,086 | ||
|
| |||
| Net Assets Consist of: | ||||
Capital paid in on shares of beneficial interest | $ | 325,927 | ||
Accumulated undistributed net investment income (loss) | 54 | |||
Accumulated undistributed net realized gain (loss) | (2,533 | ) | ||
Net unrealized appreciation (depreciation) on investments | 20,638 | |||
|
| |||
| Net Assets | $ | 344,086 | ||
|
| |||
| Class A | ||||
Net asset value (net assets/shares outstanding) per share | $ | 10.67 | ||
Maximum offering price per share NAV/(1–5.75%) | $ | 11.32 | ||
Shares of beneficial interest outstanding, no par value, unlimited authorization | 6,199,335 | |||
Net Assets | $ | 66,122 | ||
| Class B | ||||
Net asset value (net assets/shares outstanding) and offering price per share | $ | — | ||
Shares of beneficial interest outstanding, no par value, unlimited authorization | — | |||
Net Assets | $ | — | ||
| Class C | ||||
Net asset value (net assets/shares outstanding) and offering price per share | $ | 10.60 | ||
Shares of beneficial interest outstanding, no par value, unlimited authorization | 12,385,435 | |||
Net Assets | $ | 131,330 | ||
| Class I | ||||
Net asset value (net assets/shares outstanding) and offering price per share | $ | 10.69 | ||
Shares of beneficial interest outstanding, no par value, unlimited authorization | 13,718,491 | |||
Net Assets | $ | 146,634 | ||
(1) Investment in unaffiliated securities at cost | $ | 322,205 | ||
(2) Investment in affiliated funds at cost | $ | — | ||
(3) Amount is less than $500. | ||||
See Notes to Financial Statements
44
Table of Contents
VIRTUS OPPORTUNITIES TRUST
STATEMENT OF ASSETS AND LIABILITIES (Continued)
SEPTEMBER 30, 2012
| AlphaSectorTM Rotation Fund | Dynamic AlphaSectorTM Fund | Global Premium AlphaSectorTM Fund | Premium AlphaSectorTM Fund | Alternatives Diversifier Fund | ||||||||||||||
| $ | 477,812 | $ | 326,677 | $ | 67,755 | $ | 3,567,150 | $ | 53,844 | |||||||||
| — | — | — | — | 107,537 | ||||||||||||||
| 82 | 1 | 2,736 | 638 | 500 | ||||||||||||||
| 1,315 | 7,086 | 291 | 17,603 | 216 | ||||||||||||||
| — | 1,697 | — | — | — | ||||||||||||||
| — | — | — | — | 22 | ||||||||||||||
| 1,515 | 1,704 | 228 | 5,102 | — | (3) | |||||||||||||
| — | 12 | — | — | — | ||||||||||||||
| 3 | 1 | — | (3) | 25 | 1 | |||||||||||||
| 44 | 48 | 20 | 141 | 22 | ||||||||||||||
|
|
|
|
|
|
|
|
|
| |||||||||
| 480,771 | 337,226 | 71,030 | 3,590,659 | 162,142 | ||||||||||||||
|
|
|
|
|
|
|
|
|
| |||||||||
| — | — | 2,710 | — | — | ||||||||||||||
| 795 | 193 | 338 | 7,670 | 1,588 | ||||||||||||||
| 505 | 12,643 | — | 7,887 | — | ||||||||||||||
| — | 74,569 | — | — | — | ||||||||||||||
| 176 | 327 | 54 | 3,178 | — | ||||||||||||||
| 168 | 39 | 22 | 888 | 61 | ||||||||||||||
| 51 | 24 | 7 | 378 | 17 | ||||||||||||||
| 111 | 38 | 13 | 626 | 65 | ||||||||||||||
| 1 | — | (3) | — | (3) | 6 | — | (3) | |||||||||||
| 18 | 18 | 16 | 22 | 17 | ||||||||||||||
| 19 | 29 | 8 | 251 | 5 | ||||||||||||||
|
|
|
|
|
|
|
|
|
| |||||||||
| 1,844 | 87,880 | 3,168 | 20,906 | 1,753 | ||||||||||||||
|
|
|
|
|
|
|
|
|
| |||||||||
| $ | 478,927 | $ | 249,346 | $ | 67,862 | $ | 3,569,753 | $ | 160,389 | |||||||||
|
|
|
|
|
|
|
|
|
| |||||||||
| $ | 408,613 | $ | 240,820 | $ | 62,142 | $ | 3,295,974 | $ | 223,959 | |||||||||
| 1,541 | 436 | 102 | 5,974 | 817 | ||||||||||||||
| 8,667 | (5,910 | ) | (717 | ) | (43,594 | ) | (87,384 | ) | ||||||||||
| 60,106 | 14,000 | 6,335 | 311,399 | 22,997 | ||||||||||||||
|
|
|
|
|
|
|
|
|
| |||||||||
| $ | 478,927 | $ | 249,346 | $ | 67,862 | $ | 3,569,753 | $ | 160,389 | |||||||||
|
|
|
|
|
|
|
|
|
| |||||||||
| $ | 12.15 | $ | 9.90 | $ | 10.56 | $ | 13.43 | $ | 11.10 | |||||||||
| $ | 12.89 | $ | 10.50 | $ | 11.20 | $ | 14.25 | $ | 11.78 | |||||||||
| 16,396,127 | 11,081,530 | 2,623,329 | 98,500,141 | 5,900,111 | ||||||||||||||
| $ | 199,268 | $ | 109,724 | $ | 27,699 | $ | 1,323,109 | $ | 65,463 | |||||||||
| $ | — | $ | 9.24 | $ | — | $ | — | $ | — | |||||||||
| — | 16,268 | — | — | — | ||||||||||||||
| $ | — | $ | 150 | $ | — | $ | — | $ | — | |||||||||
| $ | 12.03 | $ | 9.21 | $ | 10.50 | $ | 13.34 | $ | 10.93 | |||||||||
| 13,085,141 | 2,944,270 | 2,005,266 | 57,558,913 | 5,247,917 | ||||||||||||||
| $ | 157,461 | $ | 27,123 | $ | 21,051 | $ | 767,602 | $ | 57,336 | |||||||||
| $ | 12.15 | $ | 9.98 | $ | 10.58 | $ | 13.45 | $ | 11.12 | |||||||||
| 10,055,811 | 11,255,663 | 1,806,842 | 109,946,893 | 3,380,507 | ||||||||||||||
| $ | 122,198 | $ | 112,349 | $ | 19,112 | $ | 1,479,042 | $ | 37,590 | |||||||||
| $ | 417,706 | $ | 312,676 | $ | 61,420 | $ | 3,255,751 | $ | 49,303 | |||||||||
| $ | — | $ | — | $ | — | $ | — | $ | 89,081 | |||||||||
See Notes to Financial Statements
45
Table of Contents
STATEMENT OF OPERATIONS
YEAR ENDED SEPTEMBER 30, 2012
($ reported in thousands)
| Allocator Premium AlphaSectorSM Fund | ||||
| Investment Income | ||||
Dividends | $ | 5,200 | ||
Dividend income from affiliated funds | — | |||
Interest | — | |||
Foreign taxes withheld | — | |||
|
| |||
Total investment income | 5,200 | |||
|
| |||
| Expenses | ||||
Investment advisory fees | 2,188 | |||
Service fees, Class A | 99 | |||
Distribution and service fees, Class B | — | |||
Distribution and service fees, Class C | 880 | |||
Administration fees | 260 | |||
Transfer agent fees and expenses | 275 | |||
Custodian fees | 10 | |||
Printing fees and expenses | 14 | |||
Professional fees | 21 | |||
Registration fees | 98 | |||
Trustees’ fees and expenses | 9 | |||
Miscellaneous expenses | 10 | |||
|
| |||
Total expenses | 3,864 | |||
Dividends on short sales | — | |||
Interest expenses | — | |||
Less expenses reimbursed, waived and/or recaptured by investment adviser | 38 | |||
|
| |||
Net expenses | 3,902 | |||
|
| |||
| Net investment income (loss) | 1,298 | |||
|
| |||
| Net Realized and Unrealized Gain (Loss) on Investments | ||||
Net realized gain (loss) on unaffiliated investments | (104 | ) | ||
Net realized gain (loss) on affiliated investments | — | |||
Net realized gain (loss) on securities sold short | — | |||
Net realized gain (loss) on foreign currency transactions | — | |||
Capital gain distributions from affiliated funds | — | |||
Net change in unrealized appreciation (depreciation) on investments | 21,039 | |||
Net change in unrealized appreciation (depreciation) on securities sold short | — | |||
Net change in unrealized appreciation (depreciation) on foreign currency translation | — | |||
|
| |||
| Net gain (loss) on investments | 20,935 | |||
|
| |||
| Net increase (decrease) in net assets resulting from operations | $ | 22,233 | ||
|
| |||
| (1) | Amount is less than $500. |
See Notes to Financial Statements
46
Table of Contents
VIRTUS OPPORTUNITIES TRUST
STATEMENT OF OPERATIONS (Continued)
YEAR ENDED SEPTEMBER 30, 2012
| AlphaSectorSM Rotation Fund | Dynamic AlphaSectorSM Fund | Global Premium AlphaSectorSM Fund | Premium AlphaSectorSM Fund | Alternatives Diversifier Fund | ||||||||||||||
| $ | 10,274 | $ | 2,509 | $ | 1,617 | $ | 72,987 | $ | 722 | |||||||||
| — | — | — | — | 1,711 | ||||||||||||||
| — | — | (1) | — | — | — | |||||||||||||
| — | (1) | — | (1) | — | — | — | ||||||||||||
|
|
|
|
|
|
|
|
|
| |||||||||
| 10,274 | 2,509 | 1,617 | 72,987 | 2,433 | ||||||||||||||
|
|
|
|
|
|
|
|
|
| |||||||||
| 2,040 | 1,324 | 717 | 32,571 | — | ||||||||||||||
| 488 | 74 | 48 | 2,851 | 176 | ||||||||||||||
| — | 2 | — | — | — | ||||||||||||||
| 1,504 | 71 | 157 | 6,289 | 629 | ||||||||||||||
| 596 | 95 | 86 | 3,892 | 228 | ||||||||||||||
| 644 | 96 | 100 | 3,597 | 361 | ||||||||||||||
| 23 | 12 | 3 | 132 | — | (1) | |||||||||||||
| 38 | 17 | 3 | 196 | 19 | ||||||||||||||
| 23 | 48 | 16 | 41 | 24 | ||||||||||||||
| 75 | 71 | 61 | 291 | 39 | ||||||||||||||
| 25 | 2 | 4 | 157 | 10 | ||||||||||||||
| 33 | 7 | 4 | 165 | 13 | ||||||||||||||
|
|
|
|
|
|
|
|
|
| |||||||||
| 5,489 | 1,819 | 1,199 | 50,182 | 1,499 | ||||||||||||||
| — | 259 | — | — | — | ||||||||||||||
| — | 201 | — | — | — | ||||||||||||||
| (39 | ) | (205 | ) | (17 | ) | (53 | ) | (348 | ) | ||||||||
|
|
|
|
|
|
|
|
|
| |||||||||
| 5,450 | 2,074 | 1,182 | 50,129 | 1,151 | ||||||||||||||
|
|
|
|
|
|
|
|
|
| |||||||||
| 4,824 | 435 | 435 | 22,858 | 1,282 | ||||||||||||||
|
|
|
|
|
|
|
|
|
| |||||||||
| 17,276 | 1,068 | 562 | 104,369 | (758 | ) | |||||||||||||
| — | — | — | — | (1,216 | ) | |||||||||||||
| — | (2,676 | ) | — | — | — | |||||||||||||
| — | (29 | ) | — | — | — | |||||||||||||
| — | (1) | — | — | — | (1) | — | ||||||||||||
| 49,879 | 18,059 | 6,545 | 301,805 | 25,432 | ||||||||||||||
| — | (4,228 | ) | — | — | — | |||||||||||||
| — | 11 | — | — | �� | — | |||||||||||||
|
|
|
|
|
|
|
|
|
| |||||||||
| 67,155 | 12,205 | 7,107 | 406,174 | 23,458 | ||||||||||||||
|
|
|
|
|
|
|
|
|
| |||||||||
| $ | 71,979 | $ | 12,640 | $ | 7,542 | $ | 429,032 | $ | 24,740 | |||||||||
|
|
|
|
|
|
|
|
|
| |||||||||
See Notes to Financial Statements
47
Table of Contents
STATEMENT OF CHANGES IN NET ASSETS
($ reported in thousands)
| Allocator Premium AlphaSectorTM Fund | ||||||||
| Year Ended September 30, 2012 | From Inception March 5, 2011 to September 30, 2011 | |||||||
| INCREASE/(DECREASE) IN NET ASSETS | ||||||||
| From Operations | ||||||||
Net investment income (loss) | $ | 1,298 | $ | 141 | ||||
Net realized gain (loss) | (104 | ) | (2,430 | ) | ||||
Net change in unrealized appreciation (depreciation) | 21,039 | (401 | ) | |||||
|
|
|
| |||||
| Increase (decrease) in net assets resulting from operations | 22,233 | (2,690 | ) | |||||
|
|
|
| |||||
| From Distributions to Shareholders | ||||||||
Net investment income, Class A | (322 | ) | — | |||||
Net investment income, Class C | (284 | ) | — | |||||
Net investment income, Class I | (778 | ) | — | |||||
Net realized long-term gains, Class A | — | — | ||||||
Net realized long-term gains, Class B | — | — | ||||||
Net realized long-term gains, Class C | — | — | ||||||
Net realized long-term gains, Class I | — | — | ||||||
|
|
|
| |||||
| Decrease in net assets from distributions to shareholders | (1,384 | ) | — | |||||
|
|
|
| |||||
| From Share Transactions (See Note 5) | ||||||||
Change in net assets from share transactions, Class A | 49,957 | 12,807 | ||||||
Change in net assets from share transactions, Class B | — | — | ||||||
Change in net assets from share transactions, Class C | 90,479 | 33,744 | ||||||
Change in net assets from share transactions, Class I | 119,048 | 19,892 | ||||||
|
|
|
| |||||
| Increase (decrease) in net assets from share transactions | 259,484 | 66,443 | ||||||
|
|
|
| |||||
| Net increase (decrease) in net assets | 280,333 | 63,753 | ||||||
| Net Assets | ||||||||
Beginning of fiscal year | 63,753 | — | ||||||
|
|
|
| |||||
| End of fiscal year | $ | 344,086 | $ | 63,753 | ||||
|
|
|
| |||||
Accumulated undistributed net investment income (loss) at end of fiscal year | $ | 54 | $ | 141 | ||||
| (1) | Amount is less than $500. |
See Notes to Financial Statements
48
Table of Contents
VIRTUS OPPORTUNITIES TRUST
STATEMENT OF CHANGES IN NET ASSETS (Continued)
| AlphaSectorTM Rotation Fund | Dynamic AlphaSectorTM Fund | |||||||||||||
| Year Ended September 30, 2012 | Year Ended September 30, 2011 | Year Ended September 30, 2012 | Year Ended September 30, 2011 | |||||||||||
| $ | 4,824 | $ | 3,835 | $ | 435 | $ | (1,901 | ) | ||||||
| 17,276 | 39,711 | (1,637 | ) | (935 | ) | |||||||||
| 49,879 | (20,647 | ) | 13,842 | (4,875 | ) | |||||||||
|
|
|
|
|
|
|
| |||||||
| 71,979 | 22,899 | 12,640 | (7,711 | ) | ||||||||||
|
|
|
|
|
|
|
| |||||||
| (2,025 | ) | (2,842 | ) | — | — | |||||||||
| (477 | ) | (1,159 | ) | — | — | |||||||||
| (1,415 | ) | (1,806 | ) | — | — | |||||||||
| (3,678 | ) | — | — | (484 | ) | |||||||||
| — | — | — | (16 | ) | ||||||||||
| (2,930 | ) | — | — | (115 | ) | |||||||||
| (2,065 | ) | — | — | (1,925 | ) | |||||||||
|
|
|
|
|
|
|
| |||||||
| (12,590 | ) | (5,807 | ) | — | (2,540 | ) | ||||||||
|
|
|
|
|
|
|
| |||||||
| (10,816 | ) | (15,983 | ) | 97,804 | (8,750 | ) | ||||||||
| — | — | (123 | ) | (343 | ) | |||||||||
| (7,053 | ) | 6,700 | 23,714 | (1,416 | ) | |||||||||
| 22,396 | (30,758 | ) | 78,130 | (34,968 | ) | |||||||||
|
|
|
|
|
|
|
| |||||||
| 4,527 | (40,041 | ) | 199,525 | (45,477 | ) | |||||||||
|
|
|
|
|
|
|
| |||||||
| 63,916 | (22,949 | ) | 212,165 | (55,728 | ) | |||||||||
| 415,011 | 437,960 | 37,181 | 92,909 | |||||||||||
|
|
|
|
|
|
|
| |||||||
| $478,927 | $ | 415,011 | $ | 249,346 | $ | 37,181 | ||||||||
|
|
|
|
|
|
|
| |||||||
| $ | 1,541 | $ | 635 |
| $ | 436 | $ | (12 | ) | |||||
See Notes to Financial Statements
49
Table of Contents
VIRTUS OPPORTUNITIES TRUST
STATEMENT OF CHANGES IN NET ASSETS (Continued)
($ reported in thousands)
| Global Premium AlphaSector™ Fund | ||||||||
| Year Ended September 30, 2012 | From Inception March 5, 2011 to September 30, 2011 | |||||||
| INCREASE/(DECREASE) IN NET ASSETS | ||||||||
| From Operations | ||||||||
Net investment income (loss) | $ | 435 | $ | 49 | ||||
Net realized gain (loss) | 562 | (1,279 | ) | |||||
Net change in unrealized appreciation (depreciation) | 6,545 | (210 | ) | |||||
|
|
|
| |||||
| Increase (decrease) in net assets resulting from operations | 7,542 | (1,440 | ) | |||||
|
|
|
| |||||
| From Distributions to Shareholders | ||||||||
Net investment income, Class A | (101 | ) | (7 | ) | ||||
Net investment income, Class C | (26 | ) | — | (1) | ||||
Net investment income, Class I | (241 | ) | (7 | ) | ||||
Net realized short-term gains, Class A | — | — | ||||||
Net realized short-term gains, Class C | — | — | ||||||
Net realized short-term gains, Class I | — | — | ||||||
|
|
|
| |||||
| Decrease in net assets from distributions to shareholders | (368 | ) | (14 | ) | ||||
|
|
|
| |||||
| From Share Transactions (See Note 5) | ||||||||
Change in net assets from share transactions, Class A | 20,024 | 5,951 | ||||||
Change in net assets from share transactions, Class C | 14,429 | 5,225 | ||||||
Change in net assets from share transactions, Class I | 6,318 | 10,195 | ||||||
|
|
|
| |||||
| Increase (decrease) in net assets from share transactions | 40,771 | 21,371 | ||||||
|
|
|
| |||||
| Net increase (decrease) in net assets | 47,945 | 19,917 | ||||||
| Net Assets | ||||||||
Beginning of fiscal year | 19,917 | — | ||||||
|
|
|
| |||||
| End of fiscal year | $ | 67,862 | $ | 19,917 | ||||
|
|
|
| |||||
Accumulated undistributed net investment income (loss) at end of fiscal year | $ | 102 | $ | 35 | ||||
| (1) | Amount is less than $500. |
See Notes to Financial Statements
50
Table of Contents
VIRTUS OPPORTUNITIES TRUST
STATEMENT OF CHANGES IN NET ASSETS (Continued)
| Premium AlphaSector™ Fund | Alternatives Diversifier Fund | |||||||||||||
| Year Ended September 30, 2012 | Year Ended September 30, 2011 | Year Ended September 30, 2012 | Year Ended September 30, 2011 | |||||||||||
| $ | 22,858 | $ | 8,598 | $ | 1,282 | $ | 3,786 | |||||||
| 104,369 | (147,183 | ) | (1,974 | ) | 2,353 | |||||||||
| 301,805 | 5,392 | 25,432 | (7,718 | ) | ||||||||||
|
|
|
|
|
|
|
| |||||||
| 429,032 | (133,193 | ) | 24,740 | (1,579 | ) | |||||||||
|
|
|
|
|
|
|
| |||||||
| (8,316 | ) | (3,020 | ) | (432 | ) | (1,588 | ) | |||||||
| (520 | ) | (406 | ) | — | (949 | ) | ||||||||
| (11,441 | ) | (2,383 | ) | (356 | ) | (599 | ) | |||||||
| — | (309 | ) | — | — | ||||||||||
| — | (121 | ) | — | — | ||||||||||
| — | (133 | ) | — | — | ||||||||||
|
|
|
|
|
|
|
| |||||||
| (20,277 | ) | (6,372 | ) | (788 | ) | (3,136 | ) | |||||||
|
|
|
|
|
|
|
| |||||||
| 207,329 | 925,913 | (23,700 | ) | (34,937 | ) | |||||||||
| 224,349 | 457,390 | (17,771 | ) | (17,059 | ) | |||||||||
| 558,672 | 783,581 | (4,101 | ) | 6,577 | ||||||||||
|
|
|
|
|
|
|
| |||||||
| 990,350 | 2,166,884 | (45,572 | ) | (45,419 | ) | |||||||||
|
|
|
|
|
|
|
| |||||||
| 1,399,105 | 2,027,319 | (21,620 | ) | (50,134 | ) | |||||||||
| 2,170,648 | 143,329 | 182,009 | 232,143 | |||||||||||
|
|
|
|
|
|
|
| |||||||
| $ | 3,569,753 | $ | 2,170,648 | $ | 160,389 | $ | 182,009 | |||||||
|
|
|
|
|
|
|
| |||||||
$ | 5,974 |
| $ | 3,393 | $ | 817 | $ | 770 | ||||||
See Notes to Financial Statements
51
Table of Contents
STATEMENT OF CASH FLOWS
FOR THE PERIOD ENDED SEPTEMBER 30, 2012
| Dynamic AlphaSectorTM Fund | ||||
| Cash Flows Provided by Operating Activities | ||||
Net increase (decrease) in net assets from operations | $ | 12,640 | ||
|
| |||
Adjustments to reconcile net increase in net assets resulting from operations to net cash provided by operating activities: | ||||
Proceeds from sales and paydowns of long-term investments | 145,619 | |||
Purchase of long-term investments | (402,509 | ) | ||
Proceeds from securities sold short | 45,880 | |||
Purchases to cover short positions | (87,141 | ) | ||
Net purchases of short-term securities | (3,743 | ) | ||
Net change in unrealized (appreciation)/depreciation | (13,842 | ) | ||
Net realized loss from sales of long-term investments | (1,068 | ) | ||
Net realized loss from sales of securities sold short | 2,676 | |||
Increase in deposits with broker or borrowings | (1,697 | ) | ||
Decrease in deposits with broker for securities sold short | 37,210 | |||
Increase in dividends receivable | (1,675 | ) | ||
Increase in dividends on short sales | (65 | ) | ||
Increase in prepaid expenses | (23 | ) | ||
Increase in investment advisory fees payable | 289 | |||
Increase in other affiliates payable | 83 | |||
Decrease in Trustees’ fees payable | — | (1) | ||
Increase in other accrued expenses payable | (1 | ) | ||
|
| |||
Cash provided by operating activities | (267,367 | ) | ||
|
| |||
Cash used for financing activities: | ||||
Cash receipts from borrowings | 74,569 | |||
Proceeds from shares sold | 235,006 | |||
Shares redeemed | (42,382 | ) | ||
|
| |||
Cash used for financing activities | 267,193 | |||
|
| |||
Cash impact from foreign exchange fluctuations | 11 | |||
|
| |||
Net decrease in cash | (163 | ) | ||
|
| |||
Cash: | ||||
Cash and foreign currency at beginning of period | $ | 163 | ||
|
| |||
Cash and foreign currency at end of period | — | |||
|
| |||
Cash flow information: | ||||
Cash paid for interest | $ | 201 | ||
|
| |||
| (1) | Amount less than $500. |
See Notes to Financial Statements
52
Table of Contents
FINANCIAL HIGHLIGHTS
SELECTED PER SHARE DATA AND RATIOS FOR A SHARE OUTSTANDING
THROUGHOUT EACH PERIOD
| Net Asset Value, Beginning of Period | Net Investment Income (Loss)(2) | Net Realized and Unrealized Gain (Loss) | Total from Investment Operations | Dividends from Net Investment Income | Distributions from Net Realized Gains | Total Distributions | Change in Net Asset Value | Net Asset Value, End of Period | Total Return(1) | Net Assets, End of Period (In thousands) | Ratio of Net Operating Expenses to Average Net Assets(8) | Ratio of Gross Expenses to Average Net Assets (before waivers and reimbursements)(8) | Ratio of Net Investment Income (Loss) to Average Net Assets | Portfolio Turnover Rate | |||||||||||||||||||||||||||||||||||||||||||||||||||||||||||||
Allocator Premium AlphaSector™ Fund | |||||||||||||||||||||||||||||||||||||||||||||||||||||||||||||||||||||||||||
Class A | |||||||||||||||||||||||||||||||||||||||||||||||||||||||||||||||||||||||||||
10/1/11 to 9/30/12 | $9.69 | 0.09 | 0.98 | 1.07 | (0.09 | ) | — | (0.09 | ) | 0.98 | $ | 10.67 | 11.08 | % | $66,122 | 1.73 | % | 1.70 | % | 0.84 | % | 211 | % | ||||||||||||||||||||||||||||||||||||||||||||||||||||
3/15/11(6) to 9/30/11 | 10.00 | 0.07 | (0.38 | ) | (0.31 | ) | — | — | — | (0.31 | ) | 9.69 | (3.10 | )(4) | 12,232 | 1.75 | (3) | 2.17 | (3) | 1.35 | (3) | 153 | (4) | ||||||||||||||||||||||||||||||||||||||||||||||||||||
Class C | |||||||||||||||||||||||||||||||||||||||||||||||||||||||||||||||||||||||||||
10/1/11 to 9/30/12 | $9.66 | 0.02 | 0.96 | 0.98 | (0.04 | ) | — | (0.04 | ) | 0.94 | $ | 10.60 | 10.13 | % | $131,330 | 2.45 | % | 2.45 | % | 0.16 | % | 211 | % | ||||||||||||||||||||||||||||||||||||||||||||||||||||
3/15/11(6) to 9/30/11 | 10.00 | 0.02 | (0.36 | ) | (0.34 | ) | — | — | — | (0.34 | ) | 9.66 | (3.40 | )(4) | 32,390 | 2.50 | (3) | 2.85 | (3) | 0.43 | (3) | 153 | (4) | ||||||||||||||||||||||||||||||||||||||||||||||||||||
Class I | |||||||||||||||||||||||||||||||||||||||||||||||||||||||||||||||||||||||||||
10/1/11 to 9/30/12 | $9.71 | 0.12 | 0.96 | 1.08 | (0.10 | ) | — | (0.10 | ) | 0.98 | $ | 10.69 | 11.24 | % | $146,634 | 1.49 | % | 1.46 | % | 1.17 | % | 211 | % | ||||||||||||||||||||||||||||||||||||||||||||||||||||
3/15/11(6) to 9/30/11 | 10.00 | 0.10 | (0.39 | ) | (0.29 | ) | — | — | — | (0.29 | ) | 9.71 | (2.90 | )(4) | 19,131 | 1.50 | (3) | 2.01 | (3) | 1.82 | (3) | 153 | (4) | ||||||||||||||||||||||||||||||||||||||||||||||||||||
See Notes to Financial Statements
53
Table of Contents
VIRTUS OPPORTUNITIES TRUST
FINANCIAL HIGHLIGHTS (Continued)
SELECTED PER SHARE DATA AND RATIOS FOR A SHARE OUTSTANDING
THROUGHOUT EACH PERIOD
| Net Asset Value, Beginning of Period | Net Investment Income (Loss)(2) | Capital Gains Distributions Received from Affiliated Funds(2) | Net Realized and Unrealized Gain (Loss) | Total from Investment Operations | Dividends from Net Investment Income | Distributions from Net Realized Gains | Total Distributions | Change in Net Asset Value | Net Asset Value, End of Period | Total Return(1) | Net Assets, End of Period (In thousands) | Ratio of Net Operating Expenses to Average Net Assets(8) | Ratio of Gross Expenses to Average Net Assets (before waivers and reimbursements)(8) | Ratio of Net Investment Income (Loss) to Average Net Assets | Portfolio Turnover Rate | |||||||||||||||||||||||||||||||||||||||||||||||||||||||||||||||||
AlphaSector™ Rotation Fund | �� | |||||||||||||||||||||||||||||||||||||||||||||||||||||||||||||||||||||||||||||||
Class A | ||||||||||||||||||||||||||||||||||||||||||||||||||||||||||||||||||||||||||||||||
10/1/11 to 9/30/12 | $ | 10.67 | 0.14 | — | 1.68 | 1.82 | (0.12 | ) | (0.22 | ) | (0.34 | ) | 1.48 | $ | 12.15 | 17.51 | % | $ | 199,268 | 1.02 | % | 1.02 | % | 1.22 | % | 190 | % | |||||||||||||||||||||||||||||||||||||||||||||||||||||
10/1/10 to 9/30/11 | 10.18 | 0.11 | — | 0.54 | 0.65 | (0.16 | ) | — | (0.16 | ) | 0.49 | 10.67 | 6.20 | 184,613 | 1.04 | 1.04 | 0.97 | 134 | ||||||||||||||||||||||||||||||||||||||||||||||||||||||||||||||
10/1/09 to 9/30/10 | 9.34 | 0.14 | — | 0.76 | 0.90 | (0.06 | ) | — | (0.06 | ) | 0.84 | 10.18 | 9.63 | 192,375 | 1.06 | 1.06 | 1.41 | 245 | ||||||||||||||||||||||||||||||||||||||||||||||||||||||||||||||
10/1/08 to 9/30/09 | 9.95 | 0.15 | — | (0.48 | ) | (0.33 | ) | (0.15 | ) | (0.13 | ) | (0.28 | ) | (0.61 | ) | 9.34 | (2.81 | ) | 37,722 | 0.64 | 0.64 | 1.80 | 131 | |||||||||||||||||||||||||||||||||||||||||||||||||||||||||
10/1/07 to 9/30/08 | 12.81 | 0.18 | 0.29 | (2.92 | ) | (2.45 | ) | (0.24 | ) | (0.17 | ) | (0.41 | ) | (2.86 | ) | 9.95 | (19.66 | ) | 41,396 | 0.21 | (7) | 0.45 | 1.57 | 23 | ||||||||||||||||||||||||||||||||||||||||||||||||||||||||
Class C | ||||||||||||||||||||||||||||||||||||||||||||||||||||||||||||||||||||||||||||||||
10/1/11 to 9/30/12 | $ | 10.56 | 0.06 | — | 1.67 | 1.73 | (0.04 | ) | (0.22 | ) | (0.26 | ) | 1.47 | �� | $ | 12.03 | 16.60 | % | $ | 157,461 | 1.75 | % | 1.77 | % | 0.53 | % | 190 | % | ||||||||||||||||||||||||||||||||||||||||||||||||||||
10/1/10 to 9/30/11 | 10.09 | 0.04 | — | 0.52 | 0.56 | (0.09 | ) | — | (0.09 | ) | 0.47 | 10.56 | 5.49 | 144,813 | 1.71 | 1.79 | 0.33 | 134 | ||||||||||||||||||||||||||||||||||||||||||||||||||||||||||||||
10/1/09 to 9/30/10 | 9.29 | 0.07 | — | 0.75 | 0.82 | (0.02 | ) | — | (0.02 | ) | 0.80 | 10.09 | 8.79 | 133,453 | 1.81 | 1.81 | 0.68 | 245 | ||||||||||||||||||||||||||||||||||||||||||||||||||||||||||||||
10/1/08 to 9/30/09 | 9.88 | 0.08 | — | (0.45 | ) | (0.37 | ) | (0.09 | ) | (0.13 | ) | (0.22 | ) | (0.59 | ) | 9.29 | (3.41 | ) | 40,118 | 1.38 | 1.38 | 1.03 | 131 | |||||||||||||||||||||||||||||||||||||||||||||||||||||||||
10/1/07 to 9/30/08 | 12.74 | 0.09 | 0.30 | (2.92 | ) | (2.53 | ) | (0.16 | ) | (0.17 | ) | (0.33 | ) | (2.86 | ) | 9.88 | (20.35 | ) | 50,007 | 0.96 | (7) | 1.20 | 0.81 | 23 | ||||||||||||||||||||||||||||||||||||||||||||||||||||||||
Class I | ||||||||||||||||||||||||||||||||||||||||||||||||||||||||||||||||||||||||||||||||
10/1/11 to 9/30/12 | $ | 10.67 | 0.17 | — | 1.68 | 1.85 | (0.15 | ) | (0.22 | ) | (0.37 | ) | 1.48 | $ | 12.15 | 17.71 | % | $ | 122,198 | 0.77 | % | 0.77 | % | 1.53 | % | 190 | % | |||||||||||||||||||||||||||||||||||||||||||||||||||||
10/1/10 to 9/30/11 | 10.18 | 0.14 | — | 0.54 | 0.68 | (0.19 | ) | — | (0.19 | ) | 0.49 | 10.67 | 6.56 | 85,585 | 0.82 | 0.82 | 1.26 | 134 | ||||||||||||||||||||||||||||||||||||||||||||||||||||||||||||||
10/1/09(6) to 9/30/10 | 9.11 | 0.20 | — | 0.94 | 1.14 | (0.07 | ) | — | (0.07 | ) | 1.07 | 10.18 | 12.63 | (4) | 112,132 | 0.83 | (3) | 0.83 | (3) | 2.04 | (3) | 245 | ||||||||||||||||||||||||||||||||||||||||||||||||||||||||||
See Notes to Financial Statements
54
Table of Contents
VIRTUS OPPORTUNITIES TRUST
FINANCIAL HIGHLIGHTS (Continued)
SELECTED PER SHARE DATA AND RATIOS FOR A SHARE OUTSTANDING
THROUGHOUT EACH PERIOD
| Net Asset Value, Beginning of Period | Net Investment Income (Loss)(2) | Net Realized and Unrealized Gain (Loss) | Total from Investment Operations | Dividends from Net Investment Income | Distributions from Net Realized Gains | Total Distributions | Change in Net Asset Value | Net Asset Value, End of Period | Total Return(1) | Net Assets, End of Period (in thousands) | Ratio of Expenses (including dividends and interest on short sales after expense waivers and reimbursements) to Average Net Assets(8) | Ratio of Expenses (including dividends and interest on short sales before expense waivers and reimbursements) to Average Net Assets(8) | Ratio of Net Investment Income (Loss) to Average Net Assets | Portfolio Turnover Rate | |||||||||||||||||||||||||||||||||||||||||||||||||||||||||||||
Dynamic AlphaSector™ Fund | |||||||||||||||||||||||||||||||||||||||||||||||||||||||||||||||||||||||||||
Class A | |||||||||||||||||||||||||||||||||||||||||||||||||||||||||||||||||||||||||||
10/1/11 to 9/30/12 | $ | 9.09 | 0.08 | 0.73 | 0.81 | — | — | — | 0.81 | $ | 9.90 | 8.91 | % | $ | 109,724 | 2.78 | %(9) | 3.06 | % | 0.86 | % | 165 | % | ||||||||||||||||||||||||||||||||||||||||||||||||||||
10/1/10 to 9/30/11 | 10.57 | (0.28 | ) | (0.91 | ) | (1.19 | ) | — | (0.29 | ) | (0.29 | ) | (1.48 | ) | 9.09 | (11.59 | ) | 6,615 | 4.35 | 4.65 | (2.79 | ) | 186 | ||||||||||||||||||||||||||||||||||||||||||||||||||||
10/1/09 to 9/30/10 | 10.50 | (0.25 | ) | 0.32 | 0.07 | — | — | — | 0.07 | 10.57 | 0.67 | 17,556 | 3.76 | (7) | 4.04 | (2.33 | ) | 155 | |||||||||||||||||||||||||||||||||||||||||||||||||||||||||
10/1/08 to 9/30/09 | 9.81 | (0.01 | ) | 0.70 | 0.69 | — | — | — | 0.69 | 10.50 | 7.03 | 74,749 | 4.04 | 4.23 | (0.08 | ) | 253 | ||||||||||||||||||||||||||||||||||||||||||||||||||||||||||
10/1/07 to 9/30/08 | 10.53 | (0.09 | ) | (0.47 | ) | (0.56 | ) | (0.16 | ) | — | (0.16 | ) | (0.72 | ) | 9.81 | (5.36 | ) | 119,387 | 3.49 | 3.84 | (0.85 | ) | 285 | ||||||||||||||||||||||||||||||||||||||||||||||||||||
Class B | |||||||||||||||||||||||||||||||||||||||||||||||||||||||||||||||||||||||||||
10/1/11 to 9/30/12 | $ | 8.54 | (0.19 | ) | 0.89 | 0.70 | — | — | — | 0.70 | $ | 9.24 | 8.20 | % | $ | 150 | 4.23 | %(9) | 4.81 | % | (2.19 | )% | 165 | % | |||||||||||||||||||||||||||||||||||||||||||||||||||
10/1/10 to 9/30/11 | 10.04 | (0.33 | ) | (0.88 | ) | (1.21 | ) | — | (0.29 | ) | (0.29 | ) | (1.50 | ) | 8.54 | (12.42 | ) | 260 | 5.02 | 5.32 | (3.49 | ) | 186 | ||||||||||||||||||||||||||||||||||||||||||||||||||||
10/1/09 to 9/30/10 | 10.06 | (0.32 | ) | 0.30 | (0.02 | ) | — | — | — | (0.02 | ) | 10.04 | (0.20 | ) | 670 | 4.55 | (7) | 4.83 | (3.15 | ) | 155 | ||||||||||||||||||||||||||||||||||||||||||||||||||||||
10/1/08 to 9/30/09 | 9.47 | (0.08 | ) | 0.67 | 0.59 | — | — | — | 0.59 | 10.06 | 6.23 | 1,435 | 4.83 | 5.02 | (0.79 | ) | 253 | ||||||||||||||||||||||||||||||||||||||||||||||||||||||||||
10/1/07 to 9/30/08 | 10.17 | (0.12 | ) | (0.49 | ) | (0.61 | ) | (0.09 | ) | — | (0.09 | ) | (0.70 | ) | 9.47 | (6.04 | ) | 1,678 | 4.19 | 4.55 | (1.19 | ) | 285 | ||||||||||||||||||||||||||||||||||||||||||||||||||||
See Notes to Financial Statements
55
Table of Contents
VIRTUS OPPORTUNITIES TRUST
FINANCIAL HIGHLIGHTS (Continued)
SELECTED PER SHARE DATA AND RATIOS FOR A SHARE OUTSTANDING
THROUGHOUT EACH PERIOD
| Net Asset Value, Beginning of Period | Net Investment Income (Loss)(2) | Net Realized and Unrealized Gain (Loss) | Total from Investment Operations | Dividends from Net Investment Income | Distributions from Net Realized Gains | Total Distributions | Change in Net Asset Value | Net Asset Value, End of Period | Total Return(1) | Net Assets, End of Period (in thousands) | Ratio of Expenses (including dividends and interest on short sales after expense waivers and reimbursements) to Average Net Assets(8) | Ratio of Expenses (including dividends and interest on short sales before expense waivers and reimbursements) to Average Net Assets(8) | Ratio of Net Investment Income (Loss) to Average Net Assets | Portfolio Turnover Rate | |||||||||||||||||||||||||||||||||||||||||||||||||||||||||||||
Dynamic AlphaSector™ Fund continued | |||||||||||||||||||||||||||||||||||||||||||||||||||||||||||||||||||||||||||
Class C | |||||||||||||||||||||||||||||||||||||||||||||||||||||||||||||||||||||||||||
10/1/11 to 9/30/12 | $ | 8.52 | 0.01 | 0.68 | 0.69 | — | — | — | 0.69 | $ | 9.21 | 8.10 | % | $ | 27,123 | 3.61 | %(9) | 3.91 | % | 0.12 | % | 165 | % | ||||||||||||||||||||||||||||||||||||||||||||||||||||
10/1/10 to 9/30/11 | 10.00 | (0.33 | ) | (0.86 | ) | (1.19 | ) | — | (0.29 | ) | (0.29 | ) | (1.48 | ) | 8.52 | (12.26 | ) | 2,330 | 5.07 | 5.38 | (3.50 | ) | 186 | ||||||||||||||||||||||||||||||||||||||||||||||||||||
10/1/09 to 9/30/10 | 10.02 | (0.32 | ) | 0.30 | (0.02 | ) | — | — | — | (0.02 | ) | 10.00 | (0.20 | ) | 4,249 | 4.62 | (7) | 4.90 | (3.17 | ) | 155 | ||||||||||||||||||||||||||||||||||||||||||||||||||||||
10/1/08 to 9/30/09 | 9.43 | (0.07 | ) | 0.66 | 0.59 | — | — | — | 0.59 | 10.02 | 6.26 | 4,434 | 4.84 | 5.03 | (0.77 | ) | 253 | ||||||||||||||||||||||||||||||||||||||||||||||||||||||||||
10/1/07 to 9/30/08 | 10.12 | (0.12 | ) | (0.49 | ) | (0.61 | ) | (0.08 | ) | — | (0.08 | ) | (0.69 | ) | 9.43 | (6.04 | ) | 4,983 | 4.19 | 4.55 | (1.21 | ) | 285 | ||||||||||||||||||||||||||||||||||||||||||||||||||||
Class I | |||||||||||||||||||||||||||||||||||||||||||||||||||||||||||||||||||||||||||
10/1/11 to 9/30/12 | $ | 9.12 | 0.05 | 0.81 | 0.86 | — | — | — | 0.86 | $ | 9.98 | 9.43 | % | $ | 112,349 | 2.78 | %(9) | 3.06 | % | 0.49 | % | 165 | % | ||||||||||||||||||||||||||||||||||||||||||||||||||||
10/1/10 to 9/30/11 | 10.58 | (0.25 | ) | (0.92 | ) | (1.17 | ) | — | (0.29 | ) | (0.29 | ) | (1.46 | ) | 9.12 | (11.47 | ) | 27,976 | 4.03 | 4.33 | (2.48 | ) | 186 | ||||||||||||||||||||||||||||||||||||||||||||||||||||
10/1/09(6) to 9/30/10 | 10.49 | (0.23 | ) | 0.32 | 0.09 | — | — | — | 0.09 | 10.58 | 0.95 | (4) | 70,434 | 3.69 | (3)(7) | 3.97 | (3) | (2.20 | )(3) | 155 | |||||||||||||||||||||||||||||||||||||||||||||||||||||||
See Notes to Financial Statements
56
Table of Contents
VIRTUS OPPORTUNITIES TRUST
FINANCIAL HIGHLIGHTS (Continued)
SELECTED PER SHARE DATA AND RATIOS FOR A SHARE OUTSTANDING
THROUGHOUT EACH PERIOD
| Net Asset Value, Beginning of Period | Net Investment Income (Loss)(2) | Net Realized and Unrealized Gain (Loss) | Total from Investment Operations | Dividends from Net Investment Income | Distributions from Net Realized Gains | Total Distributions | Change in Net Asset Value | Net Asset Value, End of Period | Total Return(1) | Net Assets, End of Period (In thousands) | Ratio of Net Operating Expenses to Average Net Assets(8) | Ratio of Gross Expenses to Average Net Assets (before waivers and reimbursements)(8) | Ratio of Net Investment Income (Loss) to Average Net Assets | Portfolio Turnover Rate | |||||||||||||||||||||||||||||||||||||||||||||||||||||||||||||
Global Premium AlphaSector™ Fund | |||||||||||||||||||||||||||||||||||||||||||||||||||||||||||||||||||||||||||
Class A | |||||||||||||||||||||||||||||||||||||||||||||||||||||||||||||||||||||||||||
10/1/11 to 9/30/12 | $ | 9.42 | 0.08 | 1.12 | 1.20 | (0.06 | ) | — | (0.06 | ) | 1.14 | $ | 10.56 | 12.75 | % | $ | 27,699 | 1.75 | % | 1.78 | % | 0.83 | % | 258 | % | ||||||||||||||||||||||||||||||||||||||||||||||||||
3/15/11(6) to 9/30/11 | 10.00 | 0.07 | (0.63 | ) | (0.56 | ) | (0.02 | ) | — | (0.02 | ) | (0.58 | ) | 9.42 | (5.62 | )(4) | 5,467 | 1.75 | (3) | 2.88 | (3) | 1.23 | (3) | 199 | (4) | ||||||||||||||||||||||||||||||||||||||||||||||||||
Class C | |||||||||||||||||||||||||||||||||||||||||||||||||||||||||||||||||||||||||||
10/1/11 to 3/31/12(11) | $ | 9.40 | — | 1.12 | 1.12 | (0.02 | ) | — | (0.02 | ) | 1.10 | $ | 10.50 | 12.04 | % | $ | 21,051 | 2.50 | % | 2.53 | % | 0.01 | % | 258 | % | ||||||||||||||||||||||||||||||||||||||||||||||||||
3/15/11(6) to 9/30/11 | 10.00 | 0.01 | (0.61 | ) | (0.60 | ) | — | (5) | — | — | (0.60 | ) | 9.40 | (6.09 | )(4) | 4,885 | 2.50 | (3) | 3.81 | (3) | 0.17 | (3) | 199 | (4) | |||||||||||||||||||||||||||||||||||||||||||||||||||
Class I | |||||||||||||||||||||||||||||||||||||||||||||||||||||||||||||||||||||||||||
10/1/11 to 9/30/12 | $ | 9.42 | 0.09 | 1.14 | 1.23 | (0.07 | ) | — | (0.07 | ) | 1.16 | $ | 10.58 | 13.15 | % | $ | 19,112 | 1.50 | % | 1.52 | % | 0.90 | % | 258 | % | ||||||||||||||||||||||||||||||||||||||||||||||||||
3/15/11(6) to 9/30/11 | 10.00 | 0.07 | (0.63 | ) | (0.56 | ) | (0.02 | ) | — | (0.02 | ) | (0.58 | ) | 9.42 | (5.59 | )(4) | 9,565 | 1.50 | (3) | 2.85 | (3) | 1.37 | (3) | 199 | (4) | ||||||||||||||||||||||||||||||||||||||||||||||||||
Premium | |||||||||||||||||||||||||||||||||||||||||||||||||||||||||||||||||||||||||||
AlphaSector™ Fund | |||||||||||||||||||||||||||||||||||||||||||||||||||||||||||||||||||||||||||
Class A | |||||||||||||||||||||||||||||||||||||||||||||||||||||||||||||||||||||||||||
10/1/11 to | |||||||||||||||||||||||||||||||||||||||||||||||||||||||||||||||||||||||||||
9/30/12 | $ | 11.69 | 0.10 | 1.73 | 1.83 | (0.09 | ) | — | (0.09 | ) | 1.74 | $ | 13.43 | 15.74 | % | $ | 1,323,109 | 1.64 | % | 1.64 | % | 0.80 | % | 297 | % | ||||||||||||||||||||||||||||||||||||||||||||||||||
10/1/10 to | |||||||||||||||||||||||||||||||||||||||||||||||||||||||||||||||||||||||||||
9/30/11 | 11.17 | 0.10 | 0.52 | 0.62 | (0.08 | ) | (0.02 | ) | (0.10 | ) | 0.52 | 11.69 | 5.47 | 958,603 | 1.67 | (10) | 1.67 | 0.80 | 247 | ||||||||||||||||||||||||||||||||||||||||||||||||||||||||
7/1/10(6) to | |||||||||||||||||||||||||||||||||||||||||||||||||||||||||||||||||||||||||||
9/30/10 | 10.00 | 0.12 | 1.05 | 1.17 | — | — | — | 1.17 | 11.17 | 11.70 | (4) | 88,916 | 1.70 | (3) | 1.83 | (3) | 4.64 | (3) | 47 | (4) | |||||||||||||||||||||||||||||||||||||||||||||||||||||||
Class C | |||||||||||||||||||||||||||||||||||||||||||||||||||||||||||||||||||||||||||
10/1/11 to | |||||||||||||||||||||||||||||||||||||||||||||||||||||||||||||||||||||||||||
9/30/12 | $ | 11.62 | 0.01 | 1.72 | 1.73 | (0.01 | ) | — | (0.01 | ) | 1.72 | $ | 13.34 | 14.91 | % | $ | 767,602 | 2.38 | % | 2.39 | % | 0.09 | % | 297 | % | ||||||||||||||||||||||||||||||||||||||||||||||||||
10/1/10 to | |||||||||||||||||||||||||||||||||||||||||||||||||||||||||||||||||||||||||||
9/30/11 | 11.15 | 0.02 | 0.51 | 0.53 | (0.04 | ) | (0.02 | ) | (0.06 | ) | 0.47 | 11.62 | 4.68 | 457,630 | 2.38 | (10) | 2.42 | 0.13 | 247 | ||||||||||||||||||||||||||||||||||||||||||||||||||||||||
7/1/10(6) to | |||||||||||||||||||||||||||||||||||||||||||||||||||||||||||||||||||||||||||
9/30/10 | 10.00 | 0.09 | 1.06 | 1.15 | — | — | — | 1.15 | 11.15 | 11.50 | (4) | 29,864 | 2.45 | (3) | 2.67 | (3) | 3.51 | (3) | 47 | (4) | |||||||||||||||||||||||||||||||||||||||||||||||||||||||
Class I | |||||||||||||||||||||||||||||||||||||||||||||||||||||||||||||||||||||||||||
10/1/11 to | |||||||||||||||||||||||||||||||||||||||||||||||||||||||||||||||||||||||||||
9/30/12 | $ | 11.71 | 0.14 | 1.72 | 1.86 | (0.12 | ) | — | (0.12 | ) | 1.74 | $ | 13.45 | 15.98 | % | $ | 1,479,042 | 1.39 | % | 1.39 | % | 1.10 | % | 297 | % | ||||||||||||||||||||||||||||||||||||||||||||||||||
10/1/10 to | |||||||||||||||||||||||||||||||||||||||||||||||||||||||||||||||||||||||||||
9/30/11 | 11.17 | 0.14 | 0.52 | 0.66 | (0.10 | ) | (0.02 | ) | (0.12 | ) | 0.54 | 11.71 | 5.78 | 754,415 | 1.42 | (10) | 1.42 | 1.09 | 247 | ||||||||||||||||||||||||||||||||||||||||||||||||||||||||
7/1/10(6) to | |||||||||||||||||||||||||||||||||||||||||||||||||||||||||||||||||||||||||||
9/30/10 | 10.00 | 0.11 | 1.06 | 1.17 | — | — | — | 1.17 | 11.17 | 11.70 | (4) | 24,549 | 1.45 | (3) | 1.75 | (3) | 4.02 | (3) | 47 | (4) | |||||||||||||||||||||||||||||||||||||||||||||||||||||||
See Notes to Financial Statements
57
Table of Contents
VIRTUS OPPORTUNITIES TRUST
FINANCIAL HIGHLIGHTS (Continued)
SELECTED PER SHARE DATA AND RATIOS FOR A SHARE OUTSTANDING
THROUGHOUT EACH PERIOD
| Net Asset Value, Beginning of Period | Net Investment Income (Loss)(2) | Capital Gains Distributions Received from Affiliated Funds(2) | Net Realized and Unrealized Gain (Loss) | Total from Investment Operations | Dividends from Net Investment Income | Distributions from Net Realized Gains | Total Distributions | Change in Net Asset Value | Net Asset Value, End of Period | Total Return(1) | Net Assets, End of Period (in thousands) | Ratio of Net Operating Expenses to Average Net Assets(8) | Ratio of Gross Expenses to Average Net Assets (before waivers and reimbursements)(8) | Ratio of Net Investment Income (Loss) to Average Net Assets | Portfolio Turnover | |||||||||||||||||||||||||||||||||||||||||||||||||||||||||||||||||
Alternatives Diversifier Fund | ||||||||||||||||||||||||||||||||||||||||||||||||||||||||||||||||||||||||||||||||
Class A | ||||||||||||||||||||||||||||||||||||||||||||||||||||||||||||||||||||||||||||||||
10/1/11 to | ||||||||||||||||||||||||||||||||||||||||||||||||||||||||||||||||||||||||||||||||
9/30/12 | $ | 9.68 | 0.10 | — | 1.38 | 1.48 | (0.06 | ) | — | (0.06 | ) | 1.42 | $ | 11.10 | 15.37 | % | $ | 65,463 | 0.45 | % | 0.65 | % | 0.95 | % | 29 | % | ||||||||||||||||||||||||||||||||||||||||||||||||||||||
10/1/10 to | ||||||||||||||||||||||||||||||||||||||||||||||||||||||||||||||||||||||||||||||||
9/30/11 | 10.05 | 0.21 | 0.07 | (0.49 | ) | (0.21 | ) | (0.16 | ) | — | (0.16 | ) | (0.37 | ) | 9.68 | (2.12 | ) | 79,103 | 0.45 | 0.65 | 1.96 | 18 | ||||||||||||||||||||||||||||||||||||||||||||||||||||||||||
10/1/09 to | ||||||||||||||||||||||||||||||||||||||||||||||||||||||||||||||||||||||||||||||||
9/30/10 | 9.43 | 0.18 | 0.02 | 0.64 | 0.84 | (0.22 | ) | — | (0.22 | ) | 0.62 | 10.05 | 8.91 | 115,081 | 0.45 | 0.75 | 1.87 | 4 | ||||||||||||||||||||||||||||||||||||||||||||||||||||||||||||||
10/1/08 to | ||||||||||||||||||||||||||||||||||||||||||||||||||||||||||||||||||||||||||||||||
9/30/09 | 10.62 | 0.13 | 0.01 | (1.22 | ) | (1.08 | ) | (0.11 | ) | — | (0.11 | ) | (1.19 | ) | 9.43 | (10.00 | ) | 167,472 | 0.29 | 0.58 | 1.62 | 20 | ||||||||||||||||||||||||||||||||||||||||||||||||||||||||||
10/1/07 to | ||||||||||||||||||||||||||||||||||||||||||||||||||||||||||||||||||||||||||||||||
9/30/08 | 11.80 | 0.10 | 0.11 | (1.25 | ) | (1.04 | ) | (0.14 | ) | — | (0.14 | ) | (1.18 | ) | 10.62 | (8.94 | ) | 267,294 | 0.31 | 0.52 | 0.89 | 32 | ||||||||||||||||||||||||||||||||||||||||||||||||||||||||||
Class C | ||||||||||||||||||||||||||||||||||||||||||||||||||||||||||||||||||||||||||||||||
10/1/11 to | ||||||||||||||||||||||||||||||||||||||||||||||||||||||||||||||||||||||||||||||||
9/30/12 | $ | 9.55 | 0.02 | — | 1.36 | 1.38 | — | — | — | 1.38 | $ | 10.93 | 14.45 | % | $ | 57,336 | 1.20 | % | 1.40 | % | 0.20 | % | 29 | % | ||||||||||||||||||||||||||||||||||||||||||||||||||||||||
10/1/10 to | ||||||||||||||||||||||||||||||||||||||||||||||||||||||||||||||||||||||||||||||||
9/30/11 | 9.95 | 0.13 | 0.07 | (0.48 | ) | (0.28 | ) | (0.12 | ) | — | (0.12 | ) | (0.40 | ) | 9.55 | (2.82 | ) | 66,411 | 1.20 | 1.40 | 1.20 | 18 | ||||||||||||||||||||||||||||||||||||||||||||||||||||||||||
10/1/09 to | ||||||||||||||||||||||||||||||||||||||||||||||||||||||||||||||||||||||||||||||||
9/30/10 | 9.34 | 0.10 | 0.02 | 0.64 | 0.76 | (0.15 | ) | — | (0.15 | ) | 0.61 | 9.95 | 8.06 | 85,330 | 1.20 | 1.50 | 1.07 | 4 | ||||||||||||||||||||||||||||||||||||||||||||||||||||||||||||||
10/1/08 to | ||||||||||||||||||||||||||||||||||||||||||||||||||||||||||||||||||||||||||||||||
9/30/09 | 10.50 | 0.07 | 0.01 | (1.19 | ) | (1.11 | ) | (0.05 | ) | — | (0.05 | ) | (1.16 | ) | 9.34 | (10.55 | ) | 101,083 | 1.04 | 1.33 | 0.91 | 20 | ||||||||||||||||||||||||||||||||||||||||||||||||||||||||||
10/1/07 to | ||||||||||||||||||||||||||||||||||||||||||||||||||||||||||||||||||||||||||||||||
9/30/08 | 11.70 | 0.02 | 0.12 | (1.27 | ) | (1.13 | ) | (0.07 | ) | — | (0.07 | ) | (1.20 | ) | 10.50 | (9.71 | ) | 137,964 | 1.06 | 1.27 | 0.14 | 32 | ||||||||||||||||||||||||||||||||||||||||||||||||||||||||||
Class I | ||||||||||||||||||||||||||||||||||||||||||||||||||||||||||||||||||||||||||||||||
10/1/11 to | ||||||||||||||||||||||||||||||||||||||||||||||||||||||||||||||||||||||||||||||||
9/30/12 | $ | 9.70 | 0.13 | — | 1.38 | 1.51 | (0.09 | ) | — | (0.09 | ) | 1.42 | $ | 11.12 | 15.63 | % | $ | 37,590 | 0.20 | % | 0.40 | % | 1.21 | % | 29 | % | ||||||||||||||||||||||||||||||||||||||||||||||||||||||
10/1/10 to | ||||||||||||||||||||||||||||||||||||||||||||||||||||||||||||||||||||||||||||||||
9/30/11 | 10.06 | 0.23 | 0.06 | (0.48 | ) | (0.19 | ) | (0.17 | ) | — | (0.17 | ) | (0.36 | ) | 9.70 | (1.89 | )% | 36,495 | 0.20 | 0.39 | 2.16 | 18 | ||||||||||||||||||||||||||||||||||||||||||||||||||||||||||
10/1/09(6) to | ||||||||||||||||||||||||||||||||||||||||||||||||||||||||||||||||||||||||||||||||
9/30/10 | 9.27 | 0.18 | 0.01 | 0.84 | 1.03 | (0.24 | ) | — | (0.24 | ) | 0.79 | 10.06 | 11.11 | (4) | 31,732 | 0.20 | (3) | 0.51 | (3) | 1.83 | (3) | 4 | ||||||||||||||||||||||||||||||||||||||||||||||||||||||||||
Footnote Legend
| (1) | Sales charges, where applicable, are not reflected in the total return calculation. |
| (2) | Computed using average shares outstanding. |
| (3) | Annualized. |
| (4) | Not annualized. |
| (5) | Amount is less than $0.005. |
| (6) | Inception date. |
| (7) | Due to a change in expense ratio, the ratio shown is a blended expense ratio. |
| (8) | The Funds will also indirectly bear their prorated share of expenses of the underlying funds in which they invest. Such expenses are not included in the calculation of this ratio. |
| (9) | The expense ratio for interest and dividends on short sales for the period ended September 30, 2012 was 0.63% for Class A shares, Class B shares, Class C shares, and Class I shares. If interest and dividends were excluded the ratio would be lower. |
| (10) | See Note 3C in the Notes to Financial Statements for information on recapture of expense previously waived. |
| (11) | Effective December 1, 2010, the Adviser has discontinued charging an advisory fee. |
See Notes to Financial Statements
58
Table of Contents
NOTES TO FINANCIAL STATEMENTS
SEPTEMBER 30, 2012
| Note | 1. Organization |
Virtus Opportunities Trust (the “Trust”) is organized as a Delaware statutory trust and is registered under the Investment Company Act of 1940, as amended, (“1940 Act”) as an open-end management investment company.
As of the date of this report, 27 funds are offered for sale, of which six (each a “Fund”) are reported in this semiannual report.
All of the Funds offer Class A shares, Class C shares, and Class I shares. Class B shares are no longer available for purchase by new or existing shareholders, except for existing shareholders through Qualifying Transactions, (For more information regarding Qualifying Transactions, refer to the prospectus.) Class A shares are sold with a front-end sales charge of up to 5.75% with some exceptions. Generally, Class A shares are not subject to any charges by the Funds when redeemed; however, a 0.50% – 1% contingent deferred sales charge (“CDSC”) may be imposed on certain redemptions made within a certain period following purchases on which a finder’s fee has been paid. The period for which the CDSC applies for the Funds is 18 months. The CDSC period begins on the last day of the month preceding the month in which the purchase was made.
Class B shares were generally sold with a CDSC, which declines from 5% to zero depending on the period of time the shares are held. Class C shares are generally sold with a 1% (1.25% for Dynamic AlphaSector Fund) CDSC, applicable if redeemed within one year of purchase. Class I shares are sold without a front-end sales charge or CDSC.
Virtus Mutual Funds may impose an annual fee on accounts having balances of less than $2,500. The small account fee may be waived in certain circumstances, as disclosed in the prospectuses and/or statements of additional information. The fees collected will be used to offset certain expenses of the Funds.
Each Class of shares has identical voting, dividend, liquidation and other rights and the same terms and conditions, except that each class bears different distribution and/or service fees under a Board-approved 12b-1 and/or shareholder servicing plan and has exclusive voting rights with respect to such plans. Class I shares are not subject to a 12b-1 plan. Income and other expenses and realized and unrealized gains and losses of each Fund are borne pro rata by the holders of each class of shares.
| Note | 2. Significant Accounting Policies |
The following is a summary of significant accounting policies consistently followed by the Trust in the preparation of its financial statements. The preparation of financial statements in conformity with accounting principles generally accepted in the United States of America requires management to make estimates and assumptions that affect the reported amounts of assets and liabilities, and disclosure of contingent assets and liabilities at the date of the financial statements and the reported amount of increases and decreases in net assets from operations during the reporting period. Actual results could differ from those estimates and those differences could be significant.
| A. | Security Valuation |
Security valuation procedures for each Fund which include nightly price variance, as well as back-testing such as bi-weekly unchanged price, monthly secondary source and transaction analysis which have been approved by the Board. All internally fair valued securities, are approved by a valuation committee (the “Valuation Committee”) appointed by the Board.
59
Table of Contents
VIRTUS OPPORTUNITIES TRUST
NOTES TO FINANCIAL STATEMENTS (Continued)
SEPTEMBER 30, 2012
The Valuation Committee is comprised of the treasurer, assistant treasurer, secretary and chief compliance officer of the Trust. All internally fair valued securities, are updated daily and reviewed in detail by the Valuation Committee monthly unless changes occur within the period. The Valuation Committee reviews the validity of any model inputs and any changes to the model when applicable. Internal fair valuations are review by the Board at least quarterly.
Each Fund utilizes a fair value hierarchy which prioritizes the inputs to valuation techniques used to measure fair value into three broad levels.
| • Level 1 – | quoted prices in active markets for identical securities |
| • Level 2 – | prices determined using other significant observable inputs (including quoted prices for similar securities, interest rates, prepayment speeds, credit risk, etc.) |
| • Level 3 – | prices determined using significant unobservable inputs (including the valuation committee’s own assumptions in determining the fair value of investments) |
A description of the valuation techniques applied to a Fund’s major categories of assets and liabilities measured at fair value on a recurring basis is as follows:
Equity securities are valued at the official closing price (typically last sale) on the exchange on which the securities are primarily traded, or if no closing price is available, at the last bid price and are categorized as Level 1 in the hierarchy. Restricted equity securities and private placements that are not widely traded, are illiquid or are internally fair valued by the Valuation Committee, are generally categorized as Level 3 in the hierarchy.
Certain non-U.S. securities may be fair valued in cases where closing prices are not readily available or are deemed not reflective of readily available market prices. For example, significant events (such as movement in the U.S. securities market, or other regional and local developments) may occur between the time that non-U.S. markets close (where the security is principally traded) and the time that a Fund calculates its net asset value (“NAV”) (generally, 4 p.m. Eastern time the close of the New York Stock Exchange (“NYSE”)) that may impact the value of securities traded in these non-U.S. markets. In such cases the Funds fair value non-U.S. securities using an independent pricing service which considers the correlation of the trading patterns of the non-U.S. security to the intraday trading in the U.S. markets for investments such as ADRs, financial futures, ETFs, and certain indexes as well as prices for similar securities. Such fair valuations are categorized as Level 2 in the hierarchy. Because the frequency of significant events is not predictable, fair valuation of certain non-U.S. common stocks may occur on a frequent basis.
Debt securities, including restricted securities, are valued based on evaluated quotations received from independent pricing services or from dealers who make markets in such securities. For most bond types, the pricing service utilizes matrix pricing which considers one or more of the following factors: yield or price of bonds of comparable quality, coupon, maturity, current cash flows, type, and current day trade information, as well as dealer-supplied prices. These valuations are generally categorized as Level 2 in the hierarchy. Structured debt instruments such as mortgage-backed and asset-backed securities may also incorporate collateral analysis and utilize
60
Table of Contents
VIRTUS OPPORTUNITIES TRUST
NOTES TO FINANCIAL STATEMENTS (Continued)
SEPTEMBER 30, 2012
cash flow models for valuation and are generally categorized as Level 2 in the hierarchy. Pricing services do not provide pricing for all securities and therefore indicative bids from dealers are utilized which are based on pricing models used by market makers in the security and are generally categorized as Level 2 in the hierarchy. Debt securities that are not widely traded, are illiquid, or are internally fair valued by the valuation committee are generally categorized as Level 3 in the hierarchy.
Listed derivatives that are actively traded are valued based on quoted prices from the exchange and are categorized as Level 1 in the hierarchy. Over the counter derivative contracts, which include forward currency contracts and equity-linked instruments, do not require material subjectivity as pricing inputs are observed from actively quoted markets and are categorized as Level 2 in the hierarchy.
Investments in open-end mutual funds are valued at their closing NAV determined as of the close of regular trading on the NYSE each business day and are categorized as Level 1 in the hierarchy.
A summary of the inputs used to value the Funds’ net assets by each major security type is disclosed at the end of the Schedule of Investments for each Fund. The inputs or methodologies used for valuing securities are not necessarily an indication of the risk associated with investing in those securities.
| B. | Security Transactions and Investment Income |
Security transactions are recorded on the trade date. Realized gains and losses from sales of securities are determined on the identified cost basis. Dividend income is recognized on the ex-dividend date, or in the case of certain foreign securities, as soon as a Fund is notified. Interest income is recorded on the accrual basis. Each Fund amortizes premiums and accretes discounts using the effective interest method.
| C. | Income Taxes |
Each Fund is treated as a separate taxable entity. It is the intention of each Fund to comply with the requirements of Subchapter M of the Internal Revenue Code and to distribute substantially all of its taxable income to its shareholders. Therefore, no provision for federal income taxes or excise taxes has been made.
Certain Funds may be subject to foreign taxes on income, gains on investments or currency repatriation, a portion of which may be recoverable. Each Fund will accrue such taxes and recoveries as applicable based upon current interpretations of the tax rules and regulations that exist in the markets in which it invests.
Management of the Funds has concluded that there are no significant uncertain tax positions that would require recognition in the financial statements. As of September 30, 2012, the tax years that remain subject to examination by the major tax jurisdictions under the statute of limitations are from the year 2009 forward (with limited exceptions).
| D. | Distributions to Shareholders |
Distributions are recorded by each Fund on the ex-dividend date. Income and capital gain distributions are determined in accordance with income tax regulations which may differ from accounting principles generally accepted in the United States of America. These differences may include the treatment of non-taxable dividends, market premium and discount, non-deductible expenses, expiring capital loss carryovers, foreign
61
Table of Contents
VIRTUS OPPORTUNITIES TRUST
NOTES TO FINANCIAL STATEMENTS (Continued)
SEPTEMBER 30, 2012
currency gain or loss, gain or loss on futures contracts, partnerships, operating losses and losses deferred due to wash sales. Permanent book and tax basis differences relating to shareholder distributions will result in reclassifications to capital paid in on shares of beneficial interest.
| E. | Expenses |
Expenses incurred together by a Fund and other affiliated mutual funds are allocated in proportion to the net assets of each such fund, except where allocation of direct expense to each Fund or an alternative allocation method can be more appropriately used.
In addition to the net annual operating expenses that a Fund bears directly, the shareholders of the Funds indirectly bear the pro-rata expenses of any underlying mutual funds in which the Fund invests.
| F. | Foreign Currency Translation |
Non U.S. investment securities and other assets and liabilities denominated in foreign currencies are translated into U.S. dollar amounts at the foreign currency exchange rate effective at the end of the reporting period. Cost of investments is translated at the currency exchange rate effective at the trade date. The gain or loss resulting from a change in currency exchange rates between the trade and settlement date of a portfolio transaction is treated as a gain or loss on non-U.S. currency. Likewise, the gain or loss resulting from a change in currency exchange rates between the date income is accrued and paid is treated as a gain or loss on foreign currency. The Funds do not isolate that portion of the results of operations arising from changes in foreign exchange rates on investments from the fluctuations arising from changes in the market prices of securities held. Such fluctuations are included with the net realized and unrealized gain or loss on investments.
| G. | Securities Lending |
Certain Funds may loan securities to qualified brokers through an agreement with The Bank of New York Mellon (“BNY Mellon”), the Funds’ custodian. Under the terms of the agreement, each such Fund is required to maintain collateral with a market value not less than 100% of the market value of loaned securities. Collateral is adjusted daily in connection with changes in the market value of securities on loan. Collateral may consist of cash and securities issued by the U.S. Government and its agencies. Cash collateral is invested in a short-term money market fund. Dividends earned on the collateral and premiums paid by the broker are recorded as income by a Fund net of fees and rebates charged by BNY Mellon for its service as securities lending agent and in connection with this securities lending program. Lending portfolio securities involves a risk of delay in the recovery of the loaned securities or in the declining value of the collateral.
Effective November 7, 2011, securities lending was suspended on all Virtus Mutual Funds.
| H. | Short Sales |
($ reported in thousands)
Certain Funds may sell securities short. A short sale is a transaction in which a Fund sells a security it does not own in anticipation of a decline in market price. To sell a
62
Table of Contents
VIRTUS OPPORTUNITIES TRUST
NOTES TO FINANCIAL STATEMENTS (Continued)
SEPTEMBER 30, 2012
security short, a Fund must borrow the security. The Fund’s obligation to replace the security borrowed and sold short will be fully collateralized at all times by the proceeds from the short sale retained by the broker and by cash and securities deposited in a segregated account with the Fund’s custodian. If the price of the security sold short increases between the time of the short sale and the time the Fund replaces the borrowed security, the Fund will realize a loss, and if the price declines during the period, the Fund will realize a gain. Any realized gain will be decreased, and any realized loss increased, by the amount of transaction costs. On ex-dividend date, dividends on short sales are recorded as an expense to the Fund.
In accordance with the terms of its prime brokerage agreement, the Dynamic AlphaSector™ Fund may receive rebate income or be charged a fee on borrowed securities. Such income or fee is calculated on a daily basis based upon the market value of each borrowed security and a variable rate that is dependent upon the availability of such security. The Fund records these prime broker charges on a net basis as interest income or interest expense. For the fiscal year ended September 30, 2012, the Fund had net charges of $112 on borrowed securities. Such amounts are included in interest expense in the Statement of Operations.
At September 30, 2012 the Dynamic AlphaSector™ Fund did not hold any securities sold short.
| Note | 3. Investment Advisory Fee and Related Party Transactions |
($ reported in thousands except as noted)
| A. | Adviser |
Virtus Investment Advisers, Inc. (the “Adviser”), an indirect wholly-owned
subsidiary of Virtus Investment Partners, Inc. (“Virtus”), is the Adviser to the Trust. The Adviser manages the Funds’ investment programs and general operations of the Funds, including oversight of the Funds’ subadvisers.
As compensation for its services to the Funds, the Adviser is entitled to a fee based upon the following annual rates percentage of the average daily net assets of the following Funds:
| 1st $2 Billion | $2 + Billion – $4 Billion | $4 + Billion | ||||||||||
Allocator Premium AlphaSector™ Fund | 1.10 | % | 1.05 | % | 1.00 | % | ||||||
Global Premium AlphaSector™ Fund | 1.10 | 1.05 | 1.00 | |||||||||
| 1st $1 Billion | Over $1 Billion | |||||||
AlphaSector™ Rotation Fund | 0.45 | % | 0.40 | % | ||||
Dynamic AlphaSector™ Fund** | 1.50 | 1.40 | ||||||
Premium AlphaSector™ Fund – 1.10% of the average daily net assets.
Alternatives Diversifier Fund – the Adviser has discontinued charging an advisory fee.
| ** | Effective February 6, 2012, the advisory fee is calculated based on average daily managed assets. For the period of October 1, 2011, to February 5, 2012, the advisory fee was calculated based on average daily net assets. Beginning February 6, 2013, the advisory fee for this Fund will be subject to a performance adjustment, which may increase or decrease the advisory fee based upon how well the Fund has performed relative to the S&P 500® Index. |
63
Table of Contents
VIRTUS OPPORTUNITIES TRUST
NOTES TO FINANCIAL STATEMENTS (Continued)
SEPTEMBER 30, 2012
| B. | Subadvisers |
The Subadvisers manage the investments of each Fund for which they are paid a fee by the Adviser. A list of the Subadvisers and the Fund(s) they serve is as follows:
Subadviser(s) | ||
Allocator Premium AlphaSector™ Fund | F-Squared LLC(1)(3), Euclid(4) | |
AlphaSector™ Rotation Fund | F-Squared Inc.(2)(3), Euclid(4) | |
| Dynamic AlphaSector™ Fund | F-Squared LLC(1)(3), Euclid(4)(5) | |
Global Premium AlphaSector™ Fund | F-Squared LLC(1)(3), Euclid(4) | |
Premium AlphaSector™ Fund | F-Squared LLC(1)(3), Euclid(4) | |
Alternatives Diversifier Fund | Euclid(4) |
| (1) | F-Squared Institutional Advisors, LLC (“F-Squared LLC”) |
| (2) | F-Squared Investments, Inc. (“F-Squared Inc.”) |
| (3) | F-Squared Inc. or F-Squared LLC (collectively “F-Squared”) provides Euclid with a model portfolio. Final allocations and trading for each Fund are conducted by Euclid based on F-Squared’s recommendations. |
| (4) | Euclid Advisors LLC, an indirect wholly-owned subsidiary of Virtus. |
| (5) | Effective February 6, 2012. For the period of October 1, 2011, to February 5, 2012 The Boston Company Asset Management LLC was the subadvisor to this Fund. |
| C. | Expense Limits and Fee Waivers |
The Adviser has voluntarily agreed to limit certain Funds’ total operating expenses (excluding interest, taxes, extraordinary expenses and acquired funds fees and expenses, if any), so that such expenses do not exceed the following percentages of the Fund’s average daily net asset values as listed below. The Adviser may discontinue these voluntary expense caps at any time.
| Class A | Class C | Class I | ||||||||||
Allocator Premium AlphaSector™ Fund(1) | 1.75 | % | 2.50 | % | 1.50 | % | ||||||
Global Premium AlphaSector™ Fund(1) | 1.75 | 2.50 | 1.50 | |||||||||
Premium AlphaSector™ Fund | 1.70 | 2.45 | 1.45 | |||||||||
Alternatives Diversifier Fund(2) | 0.20 | 0.20 | 0.20 | |||||||||
| (1) | For the period of October 1, 2011 to March 31, 2012, the waiver was a contractual waiver. |
| (2) | Excluding 12b-1 fees and/or shareholder servicing fees. |
As of February 6, 2012, the adviser has voluntarily agreed to limit the “other expenses” of the Dynamic AlphaSectorTM Fund, so that such expenses do not exceed 0.15% of such Fund’s average daily net asset value. For purposes of this arrangement “other expenses” are all expenses necessary or appropriate for the operation of the Fund, excluding the Adviser’s investment advisory or management fee, Rule 12b-1 fees and/or shareholder servicing fees, front-end contingent deferred loads, taxes, interest, brokerage commissions, prime brokerage interest expenses, dividends on short sales, expenses incurred in connection with any merger or reorganization, extraordinary expenses, and acquired fund fees and expenses. The Adviser may discontinue this expense cap at any time.
For the period of October 1, 2011 to February 5, 2012 the adviser had voluntarily limited the expenses of Dynamic AlphaSector™ Fund Class A to 1.90%, Class B 2.65%, Class C 2.65% and Class I 1.65%. This arrangement terminated effective February 5, 2012.
64
Table of Contents
VIRTUS OPPORTUNITIES TRUST
NOTES TO FINANCIAL STATEMENTS (Continued)
SEPTEMBER 30, 2012
| D. | Expense Recapture |
For certain Funds the Adviser may recapture operating expenses waived or reimbursed, within three fiscal years following the end of the fiscal year in which such waiver or reimbursement occurred. The Fund must pay its ordinary operating expenses before the Adviser is entitled to any reimbursement and must remain in compliance with any applicable expense limitations or, if none, the expense limitation in effect at the time of the waiver or reimbursement. All or a portion of the following Adviser-reimbursed expenses ($ reported in thousands) may be recaptured as follows:
| Fiscal Year Ended | ||||||||||||||||
| 2013 | 2014 | 2015 | Total | |||||||||||||
Dynamic AlphaSector Fund | $ | 195 | $ | 221 | $ | 205 | $ | 621 | ||||||||
Global Premium AlphaSector | — | 60 | 12 | 72 | ||||||||||||
Premium AlphaSector Fund | 24 | — | — | 24 | ||||||||||||
Alternatives Diversifier Fund | 770 | 435 | 348 | 1,553 | ||||||||||||
| E. | Distributor |
($ reported in thousands)
VP Distributors, LLC (“VP Distributors”), an indirect wholly-owned subsidiary of Virtus, serves as the distributor of each Fund’s shares and has advised the Funds that for the fiscal year (the “period”) ended September 30, 2012, it retained net commissions of $948 of Class A shares and deferred sales charges of $62, $1 and $327 for Class A shares, Class B shares and Class C shares respectively.
In addition, each Fund pays VP Distributors distribution and/or service fees under Board-approved 12b-1 and/or shareholder services plans as a percentage of the average daily net assets of each respective class at the annual rates of 0.25%(1) for Class A shares and 1.00%(1)(2) for Class C shares. Class I shares are not subject to a 12b-1 plan.
Under certain circumstances, shares of certain Virtus Mutual Funds may be exchanged for shares of the same class of certain other Virtus Mutual Funds on the basis of the relative NAV per share at the time of the exchange. On exchanges with share classes that carry a CDSC, the CDSC schedule of the original shares purchased continues to apply.
| (1) | The Funds invest in ETFs. In addition to the fees listed the Funds bear their proportionate shares of any distribution and shareholder servicing fees of the ETFs. |
| (2) | The Funds’ distributor has contractually agreed to waive its 12b-1 fees applicable to Class C shares to the extent that the Funds’ investments in underlying ETFs with their own 12b-1 fees would otherwise cause the total 12b-1 fees paid directly or indirectly by the Fund to exceed the limits set forth in applicable law or regulation. |
| F. | Administrator and Transfer Agent |
($ reported in thousands)
VP Distributors also serves as the Trust’s Administrator. For the period ended September 30, 2012, the Funds incurred administration fees from the Trust totaling $3,866 which are included in the Statements of Operations.
VP Distributors also serves as the Trust’s Transfer Agent. For the period ended September 30, 2012, the Funds incurred transfer agent fees from the Trust totaling $4,862 which are included in the Statements of Operations. A portion of these fees was paid to outside entities that also provide services to the Trust.
65
Table of Contents
VIRTUS OPPORTUNITIES TRUST
NOTES TO FINANCIAL STATEMENTS (Continued)
SEPTEMBER 30, 2012
| G. | Affiliated Shareholders |
($ reported in thousand)
At September 30, 2012, Virtus and its affiliates, BMO Bankcorp. (a minority investor in Virtus) and its affiliates, and the retirement plans of Virtus and its affiliates, held shares of the Funds which may be redeemed at any time that aggregated the following:
| Shares | Aggregate Net Asset Value | |||||||
Global Premium AlphaSector™ Fund Class I | 77,395 | $ | 819 | |||||
Premium AlphaSector™ Fund | 1,864 | 25 | ||||||
| H. | Investments in Affiliates |
A summary of the Alternatives Diversifier Fund’s total long-term and short-term purchases and sales of the Class I shares of the affiliated underlying funds(1) during the fiscal year ended September 30, 2012 is as follows:
| Value, beginning of fiscal year | Purchases(2) | Sales Proceeds | ||||||||||
Dynamic AlphaSector Fund | $ | 25,414 | $ | — | $ | 25,450 | ||||||
Global Commodities Stock | 15,130 | 4,581 | 5,050 | |||||||||
Global Infrastructure Fund | 28,135 | 3,949 | 3,000 | |||||||||
Global Real Estate Securities Fund | — | 8,740 | — | |||||||||
International Real Estate Securities Fund | 17,672 | 6,424 | 7,460 | |||||||||
Real Estate Securities Fund | 23,612 | 257 | 16,740 | |||||||||
Senior Floating Rate Fund | 13,293 | 6,221 | 8,150 | |||||||||
|
|
|
|
|
| |||||||
| $ | 123,256 | $ | 30,172 | $ | 65,850 | |||||||
|
|
|
|
|
| |||||||
| Value, end of fiscal year | Dividend Income | Distributions of Realized Gains | ||||||||||
Dynamic AlphaSector Fund | $ | — | $ | — | $ | — | ||||||
Global Commodities Stock | 17,903 | 81 | — | |||||||||
Global Infrastructure Fund | 33,977 | 949 | — | |||||||||
Global Real Estate Securities Fund | 9,364 | — | — | |||||||||
International Real Estate Securities Fund | 20,012 | 424 | — | |||||||||
Real Estate Securities Fund | 14,101 | 257 | — | |||||||||
Senior Floating Rate Fund | 12,180 | — | — | |||||||||
|
|
|
|
|
| |||||||
| $ | 107,537 | $ | 1,711 | $ | — | |||||||
|
|
|
|
|
| |||||||
| (1) | The Alternatives Diversifier Fund does not invest in the underlying funds for the purpose of exercising management or control; however, investments made by the Fund within each of its |
66
Table of Contents
VIRTUS OPPORTUNITIES TRUST
NOTES TO FINANCIAL STATEMENTS (Continued)
SEPTEMBER 30, 2012
| principal investment strategies may represent a significant portion of an underlying fund’s net assets. At September 30, 2012, the Fund was the owner of record of approximately 91% of the Global Commodities Stock Fund, 60% of the International Real Estate Securities Fund and 36% of the Global Dividend Fund. |
| (2) | Includes reinvested dividends from income and capital gain distributions. |
| Note | 4. Purchases and Sales of Securities |
($ reported in thousands)
Purchases and sales of securities (excluding U.S. Government and agency securities, and short-term securities) during the period ended September 30, 2012, were as follows:
| Purchases | Sales | |||||||
Allocator Premium AlphaSector™ Fund | $ | 676,663 | $ | 417,261 | ||||
AlphaSector™ Rotation Fund | 859,572 | 861,336 | ||||||
Dynamic AlphaSector™ Fund | 412,499 | 143,003 | ||||||
Global Premium AlphaSector™ Fund | 201,690 | 160,842 | ||||||
Premium AlphaSector™ Fund | 9,779,538 | 8,792,990 | ||||||
Alternatives Diversifier Fund | 50,532 | 95,392 | ||||||
| Short Sales | Purchases to Cover Shorts | |||||||
Dynamic AlphaSector™ Fund | $ | 45,880 | $ | 87,141 | ||||
| Note | 5. Capital Share Transactions |
(reported in thousands)
Transactions in shares of capital stock, during the periods ended as indicated below, were as follows:
| Allocator Premium AlphaSector™ Fund | ||||||||||||||||
| Year Ended September 30, 2012 | From Inception March 15, 2011 to September 30, 2011 | |||||||||||||||
| SHARES | AMOUNT | SHARES | AMOUNT | |||||||||||||
| Class A | ||||||||||||||||
| Sale of shares | 6,058 | $ | 61,388 | 1,414 | $ | 14,297 | ||||||||||
| Reinvestment of distributions | 31 | 305 | — | — | ||||||||||||
| Shares repurchased | (1,151 | ) | (11,736 | ) | (152 | ) | (1,490 | ) | ||||||||
|
|
|
|
|
|
|
| |||||||||
| Net Increase/(Decrease) | 4,938 | $ | 49,957 | 1,262 | $ | 12,807 | ||||||||||
|
|
|
|
|
|
|
| |||||||||
| Class C | ||||||||||||||||
| Sale of shares | 10,032 | $ | 100,615 | 3,397 | $ | 34,172 | ||||||||||
| Reinvestment of distributions | 28 | 274 | — | — | ||||||||||||
| Shares repurchased | (1,028 | ) | (10,410 | ) | (44 | ) | (428 | ) | ||||||||
|
|
|
|
|
|
|
| |||||||||
| Net Increase/(Decrease) | 9,032 | $ | 90,479 | 3,353 | $ | 33,744 | ||||||||||
|
|
|
|
|
|
|
| |||||||||
| Class I | ||||||||||||||||
| Sale of shares | 13,694 | $ | 139,083 | 2,069 | $ | 20,856 | ||||||||||
| Reinvestment of distributions | 75 | 755 | — | — | ||||||||||||
| Shares repurchased | (2,022 | ) | (20,790 | ) | (99 | ) | (964 | ) | ||||||||
|
|
|
|
|
|
|
| |||||||||
| Net Increase/(Decrease) | 11,747 | $ | 119,048 | 1,970 | $ | 19,892 | ||||||||||
|
|
|
|
|
|
|
| |||||||||
67
Table of Contents
VIRTUS OPPORTUNITIES TRUST
NOTES TO FINANCIAL STATEMENTS (Continued)
SEPTEMBER 30, 2012
| AlphaSector™ Rotation Fund | ||||||||||||||||
| Year Ended September 30, 2012 | Year Ended September 30, 2011 | |||||||||||||||
| SHARES | AMOUNT | SHARES | AMOUNT | |||||||||||||
| Class A | ||||||||||||||||
| Sale of shares | 5,358 | $ | 60,143 | 7,622 | $ | 84,771 | ||||||||||
| Reinvestment of distributions | 446 | 4,914 | 229 | 2,572 | ||||||||||||
Plan of Reorganization (Note 8) | — | — | 1,740 | 20,108 | ||||||||||||
| Shares repurchased | (6,717 | ) | (75,873 | ) | (11,171 | ) | (123,434 | ) | ||||||||
|
|
|
|
|
|
|
| |||||||||
| Net Increase/(Decrease) | (913 | ) | $ | (10,816 | ) | (1,580 | ) | $ | (15,983 | ) | ||||||
|
|
|
|
|
|
|
| |||||||||
| Class C | ||||||||||||||||
| Sale of shares | 1,996 | $ | 22,420 | 3,894 | $ | 43,337 | ||||||||||
| Reinvestment of distributions | 207 | 2,251 | 68 | 751 | ||||||||||||
Plan of Reorganization (Note 8) | — | — | 1,628 | 18,644 | ||||||||||||
| Shares repurchased | (2,831 | ) | (31,724 | ) | (5,104 | ) | (56,032 | ) | ||||||||
|
|
|
|
|
|
|
| |||||||||
| Net Increase/(Decrease) | (628 | ) | $ | (7,053 | ) | 486 | $ | 6,700 | ||||||||
|
|
|
|
|
|
|
| |||||||||
| Class I | ||||||||||||||||
| Sale of shares | 6,369 | $ | 71,270 | 5,668 | $ | 63,210 | ||||||||||
| Reinvestment of distributions | 196 | 2,158 | 65 | 725 | ||||||||||||
Plan of Reorganization (Note 8) | — | — | 216 | 2,500 | ||||||||||||
| Shares repurchased | (4,532 | ) | (51,032 | ) | (8,935 | ) | (97,193 | ) | ||||||||
|
|
|
|
|
|
|
| |||||||||
| Net Increase/(Decrease) | 2,033 | $ | 22,396 | (2,986 | ) | $ | (30,758 | ) | ||||||||
|
|
|
|
|
|
|
| |||||||||
| Dynamic AlphaSector™ Fund | ||||||||||||||||
| Year Ended September 30, 2012 | Year Ended September 30, 2011 | |||||||||||||||
| SHARES | AMOUNT | SHARES | AMOUNT | |||||||||||||
| Class A | ||||||||||||||||
| Sale of shares | 11,370 | $ | 107,464 | 499 | $ | 5,065 | ||||||||||
| Reinvestment of distributions | — | — | 41 | 418 | ||||||||||||
| Shares repurchased | (1,016 | ) | (9,660 | ) | (1,472 | ) | (14,233 | ) | ||||||||
|
|
|
|
|
|
|
| |||||||||
| Net Increase/(Decrease) | 10,354 | $ | 97,804 | (932 | ) | $ | (8,750 | ) | ||||||||
|
|
|
|
|
|
|
| |||||||||
| Class B | ||||||||||||||||
| Sale of shares | — | $ | — | — | $ | 4 | ||||||||||
| Reinvestment of distributions | — | — | 1 | 10 | ||||||||||||
| Shares repurchased | (14 | ) | (123 | ) | (37 | ) | (357 | ) | ||||||||
|
|
|
|
|
|
|
| |||||||||
| Net Increase/(Decrease) | (14 | ) | $ | (123 | ) | (36 | ) | $ | (343 | ) | ||||||
|
|
|
|
|
|
|
| |||||||||
| Class C | ||||||||||||||||
| Sale of shares | 2,818 | $ | 24,988 | 10 | $ | 98 | ||||||||||
| Reinvestment of distributions | — | — | 8 | 79 | ||||||||||||
| Shares repurchased | (147 | ) | (1,274 | ) | (170 | ) | (1,593 | ) | ||||||||
|
|
|
|
|
|
|
| |||||||||
| Net Increase/(Decrease) | 2,671 | $ | 23,714 | (152 | ) | $ | (1,416 | ) | ||||||||
|
|
|
|
|
|
|
| |||||||||
| Class I | ||||||||||||||||
| Sale of shares | 11,614 | $ | 109,640 | 929 | $ | 9,361 | ||||||||||
| Reinvestment of distributions | — | — | 121 | 1,241 | ||||||||||||
| Shares repurchased | (3,424 | ) | (31,510 | ) | (4,638 | ) | (45,570 | ) | ||||||||
|
|
|
|
|
|
|
| |||||||||
| Net Increase/(Decrease) | 8,190 | $ | 78,130 | (3,588 | ) | $ | (34,968 | ) | ||||||||
|
|
|
|
|
|
|
| |||||||||
68
Table of Contents
VIRTUS OPPORTUNITIES TRUST
NOTES TO FINANCIAL STATEMENTS (Continued)
SEPTEMBER 30, 2012
| Global Premium AlphaSector™ Fund | ||||||||||||||||
| Year Ended September 30, 2012 | From Inception March 15, 2011 to September 30, 2011 | |||||||||||||||
| SHARES | AMOUNT | SHARES | AMOUNT | |||||||||||||
| Class A | ||||||||||||||||
| Sale of shares | 3,170 | $ | 31,188 | 598 | $ | 6,114 | ||||||||||
| Reinvestment of distributions | 10 | 99 | 1 | 7 | ||||||||||||
| Shares repurchased | (1,138 | ) | (11,263 | ) | (18 | ) | (170 | ) | ||||||||
|
|
|
|
|
|
|
| |||||||||
| Net Increase / (Decrease) | 2,042 | $ | 20,024 | 581 | $ | 5,951 | ||||||||||
|
|
|
|
|
|
|
| |||||||||
| Class C | ||||||||||||||||
| Sale of shares | 1,689 | $ | 16,438 | 539 | $ | 5,406 | ||||||||||
| Reinvestment of distributions | 3 | 25 | — | — | ||||||||||||
| Shares repurchased | (207 | ) | (2,034 | ) | (19 | ) | (181 | ) | ||||||||
|
|
|
|
|
|
|
| |||||||||
| Net Increase / (Decrease) | 1,485 | $ | 14,429 | 520 | $ | 5,225 | ||||||||||
|
|
|
|
|
|
|
| |||||||||
| Class I | ||||||||||||||||
| Sale of shares | 4,721 | $ | 45,889 | 1,030 | $ | 10,337 | ||||||||||
| Reinvestment of distributions | 25 | 240 | 1 | 7 | ||||||||||||
| Shares repurchased | (3,954 | ) | (39,811 | ) | (16 | ) | (149 | ) | ||||||||
|
|
|
|
|
|
|
| |||||||||
| Net Increase / (Decrease) | 792 | $ | 6,318 | 1,015 | $ | 10,195 | ||||||||||
|
|
|
|
|
|
|
| |||||||||
| Premium AlphaSector™ Fund | ||||||||||||||||
| Year Ended September 30, 2012 | Year Ended September 30, 2011 | |||||||||||||||
| SHARES | AMOUNT | SHARES | AMOUNT | |||||||||||||
| Class A | ||||||||||||||||
| Sale of shares | 57,032 | $ | 708,895 | 90,727 | $ | 1,127,913 | ||||||||||
| Reinvestment of distributions | 611 | 7,567 | 237 | 2,973 | ||||||||||||
| Shares repurchased | (41,148 | ) | (509,133 | ) | (16,918 | ) | (204,973 | ) | ||||||||
|
|
|
|
|
|
|
| |||||||||
| Net Increase / (Decrease) | 16,495 | $ | 207,329 | 74,046 | $ | 925,913 | ||||||||||
|
|
|
|
|
|
|
| |||||||||
| Class C | ||||||||||||||||
| Sale of shares | 26,259 | $ | 325,982 | 39,177 | $ | 487,360 | ||||||||||
| Reinvestment of distributions | 32 | 390 | 34 | 421 | ||||||||||||
| Shares repurchased | (8,126 | ) | (102,023 | ) | (2,496 | ) | (30,391 | ) | ||||||||
|
|
|
|
|
|
|
| |||||||||
| Net Increase / (Decrease) | 18,165 | $ | 224,349 | 36,715 | $ | 457,390 | ||||||||||
|
|
|
|
|
|
|
| |||||||||
| Class I | ||||||||||||||||
| Sale of shares | 78,872 | $ | 976,545 | 72,514 | $ | 906,893 | ||||||||||
| Reinvestment of distributions | 604 | 7,489 | 120 | 1,516 | ||||||||||||
| Shares repurchased | (33,976 | ) | (425,362 | ) | (10,385 | ) | (124,828 | ) | ||||||||
|
|
|
|
|
|
|
| |||||||||
| Net Increase / (Decrease) | 45,500 | $ | 558,672 | 62,249 | $ | 783,581 | ||||||||||
|
|
|
|
|
|
|
| |||||||||
69
Table of Contents
VIRTUS OPPORTUNITIES TRUST
NOTES TO FINANCIAL STATEMENTS (Continued)
SEPTEMBER 30, 2012
| Alternatives Diversifier Fund | ||||||||||||||||
| Year Ended September 30, 2012 | Year Ended September 30, 2011 | |||||||||||||||
| SHARES | AMOUNT | SHARES | AMOUNT | |||||||||||||
| Class A | ||||||||||||||||
| Sale of shares | 911 | $ | 9,669 | 1,812 | $ | 19,407 | ||||||||||
| Reinvestment of distributions | 36 | 370 | 134 | 1,411 | ||||||||||||
| Shares repurchased | (3,218 | ) | (33,739 | ) | (5,231 | ) | (55,755 | ) | ||||||||
|
|
|
|
|
|
|
| |||||||||
| Net Increase / (Decrease) | (2,271 | ) | $ | (23,700 | ) | (3,285 | ) | $ | (34,937 | ) | ||||||
|
|
|
|
|
|
|
| |||||||||
| Class C | ||||||||||||||||
| Sale of shares | 247 | $ | 2,567 | 736 | $ | 7,804 | ||||||||||
| Reinvestment of distributions | — | — | 57 | 593 | ||||||||||||
| Shares repurchased | (1,955 | ) | (20,338 | ) | (2,417 | ) | (25,456 | ) | ||||||||
|
|
|
|
|
|
|
| |||||||||
| Net Increase / (Decrease) | (1,708 | ) | $ | (17,771 | ) | (1,624 | ) | $ | (17,059 | ) | ||||||
|
|
|
|
|
|
|
| |||||||||
| Class I | ||||||||||||||||
| Sale of shares | 1,653 | $ | 17,300 | 2,273 | $ | 24,383 | ||||||||||
| Reinvestment of distributions | 22 | 223 | 25 | 261 | ||||||||||||
| Shares repurchased | (2,056 | ) | (21,624 | ) | (1,692 | ) | (18,067 | ) | ||||||||
|
|
|
|
|
|
|
| |||||||||
| Net Increase / (Decrease) | (381 | ) | $ | (4,101 | ) | 606 | $ | 6,577 | ||||||||
|
|
|
|
|
|
|
| |||||||||
| Note | 6. 10% Shareholders |
As of September 30, 2012, certain Funds had individual shareholder account(s) and/or omnibus shareholder account(s) (comprised of a group of individual shareholders), which individually amounted to more than 10% of the total shares outstanding of each such Fund as detailed below.
| % of Shares Outstanding | Number of Accounts | |||||||
Allocator Premium AlphaSector Fund | 37 | % | 2 | |||||
AlphaSector Rotation Fund | 22 | 2 | ||||||
Dynamic AlphaSector Fund | 56 | 4 | ||||||
Global Premium AlphaSector Fund | 13 | 1 | ||||||
Premium AlphaSector Fund | 21 | 2 | ||||||
Alternatives Diversifier Fund | 21 | 1 | ||||||
These accounts are not affiliated with Virtus.
| Note | 7. Credit Risk and Asset Concentration |
Certain Funds may invest a high percentage of their assets in specific sectors of the market in their pursuit of a greater investment return. Fluctuations in these sectors of concentration may have a greater impact on a Fund, positive or negative, than if the Fund did not concentrate its investments in such sectors.
| Note | 8. Plan of Reorganization |
(All amounts except for the per share amounts are reported in thousands)
At the Board Meeting held on November 17, 2010, all of the Trustees of the Virtus Opportunities Trust on behalf of Virtus AlphaSector™ Allocation Fund (“AlphaSector™
70
Table of Contents
VIRTUS OPPORTUNITIES TRUST
NOTES TO FINANCIAL STATEMENTS (Continued)
SEPTEMBER 30, 2012
Allocation,” the “Merging Fund”) including the Disinterested Trustees, considered and approved The Agreement and Plan of Reorganization (The “Plan”) as set forth. In the reorganization, all of the assets of the Merging Fund were acquired by AlphaSector™ Rotation (“AlphaSector Rotation”, the “Acquiring Fund”) in exchange for Class A, Class C and Class I shares of AlphaSector™ Rotation and the assumption of the liabilities of Merging Fund (the “Reorganization”). Class A, Class C and Class I shares of the Acquiring Fund were distributed to each shareholder in liquidation of Merging Fund. The purpose of the transaction was to eliminate the offering of overlapping Funds with similar investment objectives and similar investment strategies within the Trust, while simultaneously creating economies of scale for the surviving Fund that were intended to lower Fund expenses. For financial reporting purposes, assets received and shares issued by the Acquiring Fund were recorded at fair value; however, the cost basis of the investments received from the Merging Fund was carried forward to align ongoing reporting of the Acquiring Fund with respect to realized and unrealized gains and losses with amounts distributable to shareholders for tax purposes. The acquisitions were accomplished by a tax-free exchange of shares on March 25, 2011.
| Merging Fund | Shares Outstanding | Acquiring Fund | Shares Converted | Net Asset Value of Converted Shares | ||||||||||||||
| AlphaSector™ Allocation | Class A | 1,780 | AlphaSector™ Rotation | Class A | 1,740 | $ | 20,108 | |||||||||||
| Class C | 1,653 | Class C | 1,628 | 18,644 | ||||||||||||||
| Class I | 221 | Class I | 216 | 2,500 | ||||||||||||||
The net assets and net unrealized appreciation (depreciation) immediately before the acquisition were as follows:
| Merging Fund | Net Assets | Unrealized Appreciation (Depreciation) | Acquiring Fund | Net Assets | ||||||||||
| AlphaSector™ Allocation | $ | 41,252 | $ | 4,809 | AlphaSector™ Rotation | $ | 447,106 | |||||||
Assuming the acquisition had been completed on October 1, 2010, AlphaSector™ Rotation’s results of operations for the year ended September 30, 2011, would have been as follows:
| Net investment income (loss) | $ | 4,129 | (a) | |
| Net gain (loss) on investments | $ | 25,844 | (b) | |
| Net increase (decrease) in assets from operations | $ | 29,973 |
| (a) | $3,835, as reported in the Statement of Operations, plus $294 Net Investment Income from AlphaSector™ Allocation pre-merger. |
| (b) | $19,064, as reported in the Statement of Operations, plus $6,780 Net Realized and Unrealized Gain (Loss) on Investments from AlphaSector™ Allocation pre-merger. |
Because both AlphaSector™ Allocation and AlphaSector™ Rotation sold and redeemed shares throughout the period, providing pro-forma information on a per-share basis is not feasible. Because the combined Funds have been managed as an integrated single Fund since the completion date it is also not feasible to separate the income/(losses) and gains/(losses) of the merged AlphaSector™ Allocation Fund that have been included in the acquiring AlphaSector™ Rotation Fund’s Statement of Operations since March 25, 2011.
71
Table of Contents
VIRTUS OPPORTUNITIES TRUST
NOTES TO FINANCIAL STATEMENTS (Continued)
SEPTEMBER 30, 2012
| Note | 9. Indemnifications |
Under the Trust’s organizational documents, its trustees and officers are indemnified against certain liabilities arising out of the performance of their duties to the Funds. In addition in the normal course of business, the Funds enter into contracts that provide a variety of indemnifications to other parties. The Funds’ maximum exposure under these arrangements is unknown as this would involve future claims that may be made against the Funds and that have not occurred. However, the Funds have not had prior claims or losses pursuant to these arrangements and, expect the risk of loss to be remote.
| Note | 10. Exemptive Order |
On August 23, 2010, the SEC issued an amended order under Section 12(d) (1) (J) of the 1940 Act granting an exemption from Sections 12(d) (1) (A) and (B) of the 1940 Act and under Sections 6(c) and 17(b) of the 1940 Act granting an exemption from Section 17(a) of the 1940 Act, which permits the Trust to invest in other affiliated and unaffiliated funds, including exchange-traded funds, in each case subject to certain conditions.
| Note | 11. Federal Income Tax Information ($ reported in thousands) |
At September 30, 2012, federal tax cost and aggregate gross unrealized appreciation (depreciation) of securities held by the Funds were as follows:
Fund | Federal | Unrealized | Unrealized | Net Unrealized | ||||||||||||
Allocator Premium AlphaSectorTM Fund | $ | 324,410 | $ | 18,433 | $ | — | $ | 18,433 | ||||||||
AlphaSectorTM Rotation Fund | 420,839 | 60,096 | (3,123 | ) | 56,973 | |||||||||||
Dynamic AlphaSectorTM | 313,635 | 13,042 | — | 13,042 | ||||||||||||
Global Premium AlphaSectorTM Fund | 62,412 | 5,343 | — | 5,343 | ||||||||||||
Premium AlphaSectorTM Fund | 3,292,611 | 307,611 | (33,072 | ) | 274,539 | |||||||||||
Alternatives Diversifier Fund | 161,485 | 32,795 | (32,899 | ) | (104 | ) | ||||||||||
The Funds have capital loss carryovers available to offset future realized capital gains, through the indicated expiration dates shown below:
| 2017 | 2018 | No Expiration | Total | |||||||||||||
Allocator Premium AlphaSector™ Fund | $ | — | $ | — | $ | 329 | $ | 329 | ||||||||
| AlphaSector™ Rotation Fund | 1,872 | 1,440 | — | 3,312 | ||||||||||||
Dynamic AlphaSector™ Fund | — | — | 3,329 | 3,329 | ||||||||||||
Premium AlphaSector™ Fund | — | — | 6,734 | 6,734 | ||||||||||||
| Alternatives Diversifier Fund | — | 61,358 | 398 | 61,756 | ||||||||||||
72
Table of Contents
VIRTUS OPPORTUNITIES TRUST
NOTES TO FINANCIAL STATEMENTS (Continued)
SEPTEMBER 30, 2012
Under the Regulated Investment Company Modernization Act of 2010 (the “Act”), net capital losses recognized for tax years beginning after December 22, 2010 may be carried forward indefinitely, and their character is retained as short-term and/or long-term losses. Previously, net capital losses were carried forward for eight years and treated as short-term losses. As a transition rule, the Act requires that post-enactment net capital losses be used before pre-enactment net capital losses.
The Trust may not realize the benefit of these losses to the extent each Fund does not realize gains on investments prior to the expiration of the capital loss carryovers.
For the period ended September 30, 2012, the following funds utilized losses deferred in prior years against current year capital gains:
Allocator Premium AlphaSector™ Fund | $ | 753 | ||
AlphaSectorSM Rotation Fund | 2,237 | |||
Global Premium AlphaSector Fund | 1,107 |
The Dynamic AlphaSector Fund had $14,295 of capital loss carryovers which expired in 2012.
Capital losses realized after October 31 and certain late year ordinary losses may be deferred and treated as occurring on the first day of the following fiscal year. For the fiscal year ended September 30, 2012, the Funds deferred and recognized post-October losses as follows:
| Capital Loss Deferred | Capital Loss Recognized | |||||||
Dynamic AlphaSector Fund | $ | 1,621 | $ | 3,529 | ||||
Premium AlphaSector™ Fund | — | 133,969 | ||||||
Alternatives Diversifier Fund | $ | 2,526 | — | |||||
The components of distributable earnings on a tax basis (excluding unrealized appreciation (depreciation) which are disclosed above) consist of the following:
| Undistributed Ordinary Income | Undistributed Long-Term Capital Gains | |||||||
Allocator Premium AlphaSectorTM Fund | $ | 55 | $ | — | ||||
AlphaSectorTM Rotation Fund | 16,244 | 409 | ||||||
Dynamic AlphaSectorTM Fund | 435 | — | ||||||
Global Premium AlphaSectorTM Fund | 377 | — | ||||||
Premium AlphaSectorTM Fund | 5,974 | — | ||||||
Alternatives Diversifier Fund | 817 | — | ||||||
The differences between the book and tax basis components of distributable earnings relate principally to the timing of recognition of income and gains for federal income tax purposes. Short-term gain distributions reported in the Statements of Changes in Net Assets, if any, are reported as ordinary income for federal tax purposes. Distributions are determined on a tax basis and may differ from net investment income and realized capital gains for financial reporting purposes.
73
Table of Contents
VIRTUS OPPORTUNITIES TRUST
NOTES TO FINANCIAL STATEMENTS (Continued)
SEPTEMBER 30, 2012
| Note | 12. Reclassification of Capital Accounts |
($ reported in thousands)
For financial reporting purposes, book basis capital accounts are adjusted to reflect the tax character of permanent book/tax differences. Permanent reclassifications can arise from differing treatment of certain income and gain transactions, nondeductible current year net operating losses, expiring capital loss carryovers and investments in passive foreign investment companies. The reclassifications have no impact on the net assets or net asset value of the Funds. As of September 30, 2012, the Funds recorded reclassifications to increase (decrease) the accounts as listed below:
| Capital Paid in on Shares of Beneficial Interest | Undistributed Net Investment Income (Loss) | Accumulated Net Realized Gain (Loss) | ||||||||||
Allocator Premium AlphaSectorSM Fund | $ | — | $ | (1 | ) | $ | 1 | |||||
AlphaSectorSM Rotation Fund | — | — | (1) | — | (1) | |||||||
Dynamic AlphaSector Fund | (14,325 | ) | 13 | 14,312 | ||||||||
Alternatives Diversifier Fund | 471 | (447 | ) | (24 | ) | |||||||
| (1) | Amount less than $500. |
| Note | 13. Borrowings |
($ reported in thousands)
The Dynamic AlphaSector Fund (the “Fund”) intends to employ leverage in the form of borrowing on its long positions in circumstances where the Fund has determined to take long positions representing four or more sectors. The aggregate amount of leverage being used by the Fund at any time will depend on the number of sectors in which the Fund takes a long position, with the maximum amount of leverage being used where the Fund takes long positions in all nine sectors. In that event, the amount of leverage will not exceed 30% of the Fund’s net assets, including borrowings.
Effective February 6, 2012, the Fund entered into a collaterized loan agreement with Merrill Lynch Professional Clearing Corp. (“prime broker”) to provide margin financing. During the year ended September 30, 2012, the Fund utilized margin financing for 230 days at an average interest rate of 0.55% and with an average daily borrowing balance during the year of $25,189. As of September 30, 2012, outstanding margin debt amounted to $74,569, which is located under “Loan payable” on the Statement of Assets and Liabilities. In order to attain leveraged exposure, the Fund incurs a cost of Open Fed Funds Rate plus a spread on debit financing. For the year ended September 30, 2012, these costs amounted to $89 and are included within “interest expenses” on the Statement of Operations.
| Note | 14. Recent Accounting Pronouncement |
In December 2011, the Financial Accounting Standards Board issued Accounting Standards Update (“ASU”) No. 2011-11 regarding “Disclosures about Offsetting Assets and Liabilities”. The amendments, which will be effective for annual reporting periods beginning on or after January 1, 2013 and interim periods within those annual periods, require an entity to disclose information about offsetting and related arrangements for assets and liabilities, financial instruments and derivatives that are either currently offset in accordance with current requirements or are subject to enforceable master netting arrangements or similar
74
Table of Contents
VIRTUS OPPORTUNITIES TRUST
NOTES TO FINANCIAL STATEMENTS (Continued)
SEPTEMBER 30, 2012
agreements. At this time, management is evaluating the implications of ASU No. 2011-11 and its impact on the financial statements has not yet been determined.
| Note | 15. Subsequent Event Evaluations |
Management has evaluated the impact of all subsequent events on the Funds through the date the financial statements were available for issuance, and has determined that there are no subsequent events requiring recognition or disclosure in the financial statements.
75
Table of Contents

REPORT OF INDEPENDENT REGISTERED PUBLIC
ACCOUNTING FIRM
To the Board of Trustees of Virtus Opportunities Trust and
Shareholders of the Funds, as defined:
In our opinion, the accompanying statements of assets and liabilities, including the schedules of investments of Virtus Allocator Premium AlphaSector Fund, Virtus AlphaSector Rotation Fund, Virtus Dynamic AlphaSector Fund, Virtus Global Premium AlphaSector Fund, Virtus Premium AlphaSector Fund, and Virtus Alternatives Diversifier Fund, each a series of Virtus Opportunities Trust (the “Funds”), and the related statements of operations and of changes in net assets and the financial highlights of each fund and the statement of cash flows of Virtus Dynamic Alpha Sector Fund, present fairly, in all material respects, the financial positions of the Funds at September 30, 2012, the results of each of their operations, the changes in each of their net assets, the cash flows of Virtus Dynamic AlphaSector Fund and the financial highlights for each of the funds for each of the periods indicated, in conformity with accounting principles generally accepted in the United States of America. These financial statements and financial highlights (hereafter referred to as “financial statements”) are the responsibility of the Funds’ management; our responsibility is to express an opinion on these financial statements based on our audits. We conducted our audits of these financial statements in accordance with the standards of the Public Company Accounting Oversight Board (United States). Those standards require that we plan and perform the audit to obtain reasonable assurance about whether the financial statements are free of material misstatement. An audit includes examining, on a test basis, evidence supporting the amounts and disclosures in the financial statements, assessing the accounting principles used and significant estimates made by management, and evaluating the overall financial statement presentation. We believe that our audits, which included confirmation of securities at September 30, 2012 by correspondence with the custodian, brokers and underlying funds’ transfer agent, provide a reasonable basis for our opinion.

Philadelphia, Pennsylvania
November 21, 2012
76
Table of Contents
TAX INFORMATION NOTICE
SEPTEMBER 30, 2012 (UNAUDITED)
For the fiscal year ended September 30, 2012, the Funds make the following disclosures for federal income tax purposes. Below is listed the percentages, or the maximum amount allowable, of its ordinary income dividends (“QDI”) to qualify for the lower tax rates applicable to individual shareholders, and the percentage of ordinary income dividends earned by the Funds which qualifies for the dividends received deduction (“DRD”) for corporate shareholders. The Funds designate the amounts below as long-term capital gains dividends (“LTCG”) ($ reported in thousands), or if subsequently different, the amounts will be designated in the next annual report. The actual percentage for the calendar year will be designated in year-end tax statements.
Fund | QDI | DRD | LTCG | |||
| Allocator Premium AlphaSectorTM Fund | 100% | 100% | $— | |||
| AlphaSectorTM Rotation Fund | 48 | 50 | 515 | |||
| Dynamic AlphaSectorTM Fund | 100 | 100 | — | |||
| Global Premium AlphaSectorTM Fund | 100 | 100 | — | |||
| Premium AlphaSectorTM Fund | 100 | 100 | — | |||
| Alternatives Diversifier Fund | 100 | 63 | — |
For the fiscal year ended September 30, 2012, the Funds are disclosing the following information pursuant to notice requirements of Section 853(a) and 855(d) of the Internal Revenue Code, as amended, and the Treasury Regulations thereunder ($ reported in thousands):
Foreign Source | Foreign Taxes | |||||||
| Allocator Premium AlphaSector Fund | $ | 1,213 | $ | 174 | ||||
| Global Premium AlphaSector Fund | 616 | 84 | ||||||
| Alternatives Diversifier Fund | 751 | 111 | ||||||
77
Table of Contents
FUND MANAGEMENT TABLES (UNAUDITED)
Information pertaining to the trustees and officers of the Trust as of September 30, 2012, is set forth below. The statement of additional information (SAI) includes additional information about the trustees and is available without charge, upon request, by calling (800) 243-1574. The address of each individual, unless otherwise noted, is 100 Pearl Street, Hartford, CT 06103-4506. There is no stated term of office for trustees of the Trust.
Independent Trustees
| Name, Year of Birth, Year Elected and Number of Funds Overseen | Principal Occupation(s) During Past 5 Years and Other Directorships Held by Trustee | |
Leroy Keith, Jr. YOB: 1939 Elected: 2000 47 Funds | Chairman (since 2010), Bloc Global Services Group, LLC (construction and redevelopment company); Managing Director (2007 to 2008), Almanac Capital Management (commodities business); Director/Trustee (since 2010), Wells Fargo Advantage Funds (149 series) and their predecessors, Evergreen Funds (1989 to 2010); Director (2003 to 2010), Diversapack Co. (soft packaging company). | |
Philip R. McLoughlin Chairman YOB: 1946 Elected: 1999 62 Funds | Partner (since 2006), Cross Pond Partners, LLC (strategy consulting firm); Managing Director (2009 to 2010), SeaCap Asset Management Fund I, L.P. and SeaCap Partners, LLC (2009 to 2010) (investment management); Director (since 1991) and Chairman (since 2010), World Trust Fund; Chairman and Trustee (since 2003), Virtus Variable Insurance Trust (9 portfolios); Director (since 1995), DTF Tax-Free Income Fund, Inc.; Director (since 1995), Duff & Phelps Utility and Corporate Bond Trust, Inc.; Director (since 2009), DNP Select Income Fund Inc.; Director (since 2011), Duff & Phelps Global Utility Income Fund Inc.; Trustee (since 2011), Virtus Global Multi-Sector Fixed Income Fund; Trustee (since 2011), Virtus Total Return Fund; Director (1985 to 2009), Argo Group International Holdings Inc. and its predecessor, PXRE Corporation (insurance). | |
Geraldine M. McNamara YOB: 1951 Elected: 2001 51 Funds | Retired. Director (since 2003), DTF Tax-Free Income Fund, Inc.; Director (since 2003), Duff & Phelps Utility and Corporate Bond Trust, Inc.; Director (since 2009), DNP Select Income Fund Inc.; Director (since 2011) Duff & Phelps Global Utility Income Fund Inc. | |
James M. Oates YOB: 1946 Elected: 2000 47 Funds | Managing Director (since 1994), Wydown Group (consulting firm); Chairman and Trustee (since 2005), John Hancock Variable Insurance Trust and John Hancock Funds II (collectively, 210 portfolios); Director (since 1996), Stifel Financial; Chairman and Director (since 1999), Connecticut River Bank and Director (since 1998), Connecticut River Bancorp; Chairman (since 2000), Emerson Investment Management, Inc.; Director (since 2002), New Hampshire Trust Company; Non-Executive Chairman (2007 to 2011), Hudson Castle Group, Inc. (formerly IBEX Capital Markets, Inc.) (financial services). | |
Richard E. Segerson YOB: 1946 Elected: 2000 47 Funds | Managing Director (since 1998), Northway Management Company. | |
Ferdinand L.J. Verdonck YOB: 1942 Elected: 2005 47 Funds | Director (since 1998), The J.P. Morgan European Investment Trust; Director (since 2005), Galapagos N.V. (biotechnology); Mr. Verdonck is also a director of several non-U.S. companies. |
78
Table of Contents
FUND MANAGEMENT TABLES (UNAUDITED) (Continued)
Interested Trustee
The individual listed below is an “interested person” of the Trust, as defined in Section 2(a)(19) of the 1940 Act, as amended, and the rules and regulations thereunder.
| Name, Year of Birth, Year Elected and Number of Funds Overseen | Principal Occupation(s) During Past 5 Years and Other Directorships Held by Trustee | |
George R. Aylward* Trustee and President YOB: 1964 Elected: 2006 49 Funds | Director, President and Chief Executive Officer (since 2008), Virtus Investment Partners, Inc. and/or certain of its subsidiaries; various senior officer positions with Virtus affiliates (since 2005); Chairman, President and Chief Executive Officer (since 2006), The Zweig Fund, Inc. and The Zweig Total Return Fund, Inc.; Trustee and President (since 2011), Virtus Global Multi-Sector Income Fund and Virtus Total Return Fund. |
| * | Mr. Aylward is an “interested person,” as defined in the 1940 Act, by reason of his position as President and Chief Executive Officer of the ultimate parent company of the Adviser, and various positions with its affiliates, including the Adviser. |
79
Table of Contents
FUND MANAGEMENT TABLES (UNAUDITED) (Continued)
Officers of the Trust Who Are Not Trustees
Name, Address and Year of Birth | Position(s) Held with Time Served | Principal Occupation(s) During Past 5 Years | ||
W. Patrick Bradley YOB: 1972 | Vice President since 2011, Chief Financial Officer and Treasurer since 2006. | Senior Vice President, Fund Services (since 2010), Virtus Investment Partners, Inc. and/or certain of its subsidiaries; various officer positions (since 2006) with Virtus affiliates; Vice President (since 2011), Chief Financial Officer and Treasurer (since 2004), Virtus Variable Insurance Trust; Vice President, Chief Financial Officer and Treasurer (since 2011), Virtus Global Multi-Sector Income Fund and Virtus Total Return Fund; Vice President (since 2012) and Treasurer (Chief Financial Officer) (since 2007), The Zweig Fund, Inc. and Zweig Total Return Fund, Inc.; Vice President and Assistant Treasurer (since 2011), Duff & Phelps Global Utility Income Fund Inc. | ||
Kevin J. Carr YOB: 1954 | Vice President, Chief Legal Officer, Counsel and Secretary since 2005. | Senior Vice President (since 2009), Vice President, Counsel and Secretary (2008 to 2009), Virtus Investment Partners, Inc. and/or certain of its subsidiaries; various senior officer positions (since 2005) with Virtus affiliates; Vice President, Chief Legal Officer, Counsel and Secretary (since 2010), Virtus Variable Insurance Trust; Vice President, Chief Legal Officer, Counsel and Secretary (since 2011), Virtus Global Multi-Sector Income Fund and Virtus Total Return Fund; Vice President and Assistant Secretary (since 2012), Secretary and Chief Legal Officer (2005-2012), The Zweig Fund, Inc. and Zweig Total Return Fund, Inc.; Vice President and Assistant Secretary (since 2011), Duff & Phelps Global Utility Income Fund Inc. | ||
Nancy J. Engberg YOB: 1956 | Vice President and Chief Compliance Officer since 2011. | Vice President (since 2008) and Chief Compliance Officer (2008 to 2011), Virtus Investment Partners, Inc. and/or certain of its subsidiaries; various officer positions (since 2003) with Virtus affiliates; Vice President (since 2010), Chief Compliance Officer (since 2011), Virtus Variable Insurance Trust; Vice President and Chief Compliance Officer (since 2011), Virtus Global Multi-Sector Income Fund and Virtus Total Return Fund; Vice President and Chief Compliance Officer (since 2012), The Zweig Fund, Inc. and Zweig Total Return Fund, Inc. | ||
Francis G. Waltman YOB: 1962 | Senior Vice President since 2008. | Executive Vice President, Product Development (since 2009), Virtus Investment Partners, Inc. and/or certain of its subsidiaries; various senior officer positions (since 2006) with Virtus affiliates; Senior Vice President (since 2010), Virtus Variable Insurance Trust; Senior Vice President (since 2011), Virtus Global Multi-Sector Income Fund and Virtus Total Return Fund. | ||
80
Table of Contents
Virtus Allocator Premium AlphaSectorSM Fund,
a series of Virtus Opportunities Trust
Supplement dated June 21, 2012 to the Prospectuses
dated January 31, 2012, as supplemented
IMPORTANT NOTICETO INVESTORS
The following disclosure hereby replaces the disclosure under “Principal Investment Strategies” in the fund’s Summary Prospectus and the summary section of its Statutory Prospectus, and as described in the second paragraph under “Principal Investment Strategies” in its Statutory Prospectus:
The U.S. Equity allocation may be invested in ETFs and/or securities representing the primary sectors of the S&P 500® Index. The primary sectors of the S&P 500® Index are: consumer discretionary, consumer staples, energy, financials, healthcare, industrials, materials, technology, and utilities. The International Equity allocation may be invested in ETFs and/or securities representing both developed markets (EAFE) and emerging markets. The Fixed Income allocation may be invested in ETFs and/or securities representing fixed income sectors including: high yield, investment grade corporate, mortgages, intermediate treasuries and inflation-protected treasuries (TIPS). The Alternative allocation may be invested in ETFs and/or securities representing gold, real estate and broad-based equity securities. The fund may also invest in stocks (without restriction as to market capitalization), bonds (without restriction as to credit quality) and short-term securities. The fund may invest in a basket of securities to represent a sector if it determines that investment in the ETF for that sector is not feasible or otherwise not in the best interest of the fund. The fund may also deviate from a model allocation if it is determined that tracking the model allocation is likely to violate applicable legal or regulatory restrictions or otherwise result in adverse consequences for the fund. In times of market weakness, the fund has the ability to move partially or fully to short-term cash equivalents.
The table under “More Information About Risks Related to Principal Investment Strategies” on page 110 of the fund’s Statutory Prospectus is hereby amended by adding an “X” in the row named “Income,” thereby indicating that the named risk applies to the fund.
The following disclosure hereby replaces similar disclosure in the section “More Information About Risks Relating to Principal Investment Strategies” on page 115 of the fund’s Statutory Prospectus:
Income Risk
The income shareholders receive from the fund is based primarily on the dividends and interest the fund earns from its investments, which can vary widely over the short- and long-term. If prevailing market interest rates drop, distribution rates of the fund’s preferred stock holdings and any bond holdings could drop as well. The fund’s income also would likely be affected adversely when prevailing short-term interest rates increase. For investments in inflation-protected treasuries (TIPS), income may decline due to a decline in inflation (or deflation) or due to changes in inflation expectations.
Investors should retain this supplement with the Prospectuses for future reference.
VOT 8020/APASF-TIPS (6/2012)
Table of Contents
VIRTUS OPPORTUNITIES TRUST
101 Munson Street
Greenfield, MA 01301-9668
Trustees
George R. Aylward
Leroy Keith, Jr.
Philip R. McLoughlin, Chairman
Geraldine M. McNamara
James M. Oates
Richard E. Segerson
Ferdinand L.J. Verdonck
Officers
George R. Aylward, President
Francis G. Waltman, Senior Vice President
Nancy J. Engberg, Vice President and Chief Compliance Officer
W. Patrick Bradley, Vice President, Chief Financial Officer and Treasurer
Kevin J. Carr, Vice President, Chief Legal Officer, Counsel and Secretary
Investment Adviser
Virtus Investment Advisers, Inc.
100 Pearl Street
Hartford, CT 06103-4506
Principal Underwriter
VP Distributors, LLC
100 Pearl Street
Hartford, CT 06103-4506
Transfer Agent
VP Distributors, LLC
100 Pearl Street
Hartford, CT 06103-4506
Custodian
The Bank of New York Mellon
One Wall Street
New York, NY 10005-2588
Independent Registered Public
Accounting Firm
PricewaterhouseCoopers LLP
2001 Market Street
Philadelphia, PA 19103-7042
How to Contact Us
Mutual Fund Services 1-800-243-1574
Adviser Consulting Group 1-800-243-4361
Telephone Orders 1-800-367-5877
Text Telephone 1-800-243-1926
Web siteVirtus.com
Important Notice to Shareholders
The Securities and Exchange Commission has modified mailing regulations for semiannual and annual shareholder fund reports to allow mutual fund companies to send a single copy of these reports to shareholders who share the same mailing address. If you would like additional copies, please call Mutual Fund Services at 1-800-243-1574.
Table of Contents
For more information about
Virtus Mutual Funds, please call
your financial representative,
contact us at 1-800-243-1574
or Virtus.com
| 8453 | 11-12 |

P.O. Box 9874
Providence, RI 02940-8074
Table of Contents
Item 2. Code of Ethics.
| (a) | The registrant, as of the end of the period covered by this report, has adopted a code of ethics that applies to the registrant’s principal executive officer, principal financial officer, principal accounting officer or controller, or persons performing similar functions, regardless of whether these individuals are employed by the registrant or a third party. |
| (c) | There have been no amendments, during the period covered by this report, to a provision of the code of ethics that applies to the registrant’s principal executive officer, principal financial officer, principal accounting officer or controller, or persons performing similar functions, regardless of whether these individuals are employed by the registrant or a third party, and that relates to any element of the code of ethics described in Item 2(b) of the instructions for completion of Form N-CSR. |
| (d) | The registrant has not granted any waivers, during the period covered by this report, including an implicit waiver, from a provision of the code of ethics that applies to the registrant’s principal executive officer, principal financial officer, principal accounting officer or controller, or persons performing similar functions, regardless of whether these individuals are employed by the registrant or a third party, that relates to one or more of the items set forth in paragraph (b) of the instructions for completion of this Item. |
Item 3. Audit Committee Financial Expert.
| (a)(1) | The Registrant’s Board of Trustees has determined that the Registrant has an “audit committee financial expert” serving on its Audit Committee. |
| (a)(2) | James M. Oates has been determined by the Registrant to possess the technical attributes identified in Instruction 2(b) of Item 3 to Form N-CSR to qualify as an “audit committee financial expert.” Mr. Oates is an “independent” trustee pursuant to paragraph (a)(2) of Item 3 to Form N-CSR. |
| (a)(3) | Not applicable. |
Item 4. Principal Accountant Fees and Services.
Audit Fees
| (a) | The aggregate fees billed for each of the last two fiscal years for professional services rendered by the principal accountant for the audit of the registrant’s annual financial statements or services that are normally provided by the accountant in connection with statutory and regulatory filings or engagements for those fiscal years are $423,470 for 2011 and $548,950 for 2012. |
Table of Contents
Audit-Related Fees
| (b) | The aggregate fees billed in each of the last two fiscal years for assurance and related services by the principal accountant that are reasonably related to the performance of the audit of the registrant’s financial statements and are not reported under paragraph (a) of this Item are $61,804 for 2011 and $73,344 for 2012. Such audit-related fees include the review of the semi-annual financial statements, out of pocket expenses and cross fund fees. |
Tax Fees
| (c) | The aggregate fees billed in each of the last two fiscal years for professional services rendered by the principal accountant for tax compliance, tax advice, and tax planning are $66,325 for 2011 and $74,075 for 2012. “Tax Fees” are those primarily associated with review of the Trust’s tax provision and qualification as a regulated investment company (RIC) in connection with audits of the Trust’s financial statement, review of year-end distributions by the Fund to avoid excise tax for the Trust, periodic discussion with management on tax issues affecting the Trust, and reviewing and signing the Fund’s federal income returns. |
All Other Fees
| (d) | The aggregate fees billed in each of the last two fiscal years for products and services provided by the principal accountant, other than the services reported in paragraphs (a) through (c) of this Item are $0 for 2011 and $0 for 2012. |
| (e)(1) | Disclose the audit committee’s pre-approval policies and procedures described in paragraph (c)(7) of Rule 2-01 of Regulation S-X. |
The Virtus Opportunities Trust (the “Fund”) Board has adopted policies and procedures with regard to the pre-approval of services provided by PwC. Audit, audit-related and tax compliance services provided to the Fund on an annual basis require specific pre-approval by the Board. As noted above, the Board must also approve other non-audit services provided to the Fund and those non-audit services provided to the Fund’s Affiliated Service Providers that relate directly to the operations and financial reporting of the Fund. Certain of these non-audit services that the Board believes are a) consistent with the SEC’s auditor independence rules and b) routine and recurring services that will not impair the independence of the independent auditors may be approved by the Board without consideration on a specific case-by-case basis (“general pre-approval”). |
The Audit Committee has determined that James M. Oates, Chair of the Audit Committee, may provide pre-approval for such services that meet the above requirements in the event such approval is sought between regularly scheduled meetings. In any event, the Board is informed of each service approved subject to general pre-approval at the next regularly scheduled in-person board meeting. |
| (e)(2) | The percentage of services described in each of paragraphs (b) through (d) of this Item that were approved by the audit committee pursuant to paragraph (c)(7)(i)(C) of Rule 2-01 of Regulation S-X are as follows: |
| (b) | 0% for 2012 and 2011 |
| (c) | 0% for 2012 and 2011 |
| (d) | Not Applicable for 2012 and 2011 |
Table of Contents
| (f) | The percentage of hours expended on the principal accountant’s engagement to audit the registrant’s financial statements for the most recent fiscal year that were attributed to work performed by persons other than the principal accountant’s full-time, permanent employees was less than fifty percent. |
| (g) | The aggregate non-audit fees billed by the registrant’s accountant for services rendered to the registrant, and rendered to the registrant’s investment adviser (not including any sub-adviser whose role is primarily portfolio management and is subcontracted with or overseen by another investment adviser), and any entity controlling, controlled by, or under common control with the adviser that provides ongoing services to the registrant for each of the last two fiscal years of the registrant was $428,066 for 2011 and $436,127 for 2012. |
| (h) | The registrant’s audit committee of the board of directors has considered whether the provision of non-audit services that were rendered to the registrant’s investment adviser (not including any sub-adviser whose role is primarily portfolio management and is subcontracted with or overseen by another investment adviser), and any entity controlling, controlled by, or under common control with the investment adviser that provides ongoing services to the registrant that were not pre-approved pursuant to paragraph (c)(7)(ii) of Rule 2-01 of Regulation S-X is compatible with maintaining the principal accountant’s independence. |
Item 5. Audit Committee of Listed registrants.
Not applicable.
Item 6. Investments.
| (a) | Schedule of Investments in securities of unaffiliated issuers as of the close of the reporting period is included as part of the report to shareholders filed under Item 1 of this form. |
| (b) | Not applicable. |
| Item 7. | Disclosure of Proxy Voting Policies and Procedures for Closed-End Management Investment Companies. |
Not applicable.
Item 8. Portfolio Managers of Closed-End Management Investment Companies.
Not applicable.
Table of Contents
| Item 9. | Purchases of Equity Securities by Closed-End Management Investment Company and Affiliated Purchasers. |
Not applicable.
Item 10. Submission of Matters to a Vote of Security Holders.
There have been no material changes to the procedures by which the shareholders may recommend nominees to the registrant’s board of trustees, where those changes were implemented after the registrant last provided disclosure in response to the requirements of Item 407(c)(2)(iv) of Regulation S-K (17 CFR 229.407) (as required by Item 22(b)(15) of Schedule 14A (17 CFR 240.14a-101)), or this Item.
Item 11. Controls and Procedures.
| (a) | The registrant’s principal executive and principal financial officers, or persons performing similar functions, have concluded that the registrant’s disclosure controls and procedures (as defined in Rule 30a-3(c) under the Investment Company Act of 1940, as amended (the “1940 Act”) (17 CFR 270.30a-3(c))) are effective, as of a date within 90 days of the filing date of the report that includes the disclosure required by this paragraph, based on their evaluation of these controls and procedures required by Rule 30a-3(b) under the 1940 Act (17 CFR 270.30a-3(b)) and Rules 13a-15(b) or 15d-15(b) under the Securities Exchange Act of 1934, as amended (17 CFR 240.13a-15(b) or 240.15d-15(b)). |
| (b) | There were no changes in the registrant’s internal control over financial reporting (as defined in Rule 30a-3(d) under the 1940 Act (17 CFR 270.30a-3(d)) that occurred during the registrant’s second fiscal quarter of the period covered by this report that has materially affected, or is reasonably likely to materially affect, the registrant’s internal control over financial reporting. |
Item 12. Exhibits.
| (a)(1) | Code of ethics, or any amendment thereto, that is the subject of disclosure required by Item 2 is attached hereto. |
| (a)(2) | Certifications pursuant to Rule 30a-2(a) under the 1940 Act and Section 302 of the Sarbanes-Oxley Act of 2002 are attached hereto. |
| (a)(3) | Not applicable. |
| (b) | Certifications pursuant to Rule 30a-2(b) under the 1940 Act and Section 906 of the Sarbanes-Oxley Act of 2002 are attached hereto. |
Table of Contents
SIGNATURES
Pursuant to the requirements of the Securities Exchange Act of 1934 and the Investment Company Act of 1940, the registrant has duly caused this report to be signed on its behalf by the undersigned, thereunto duly authorized.
(Registrant) Virtus Opportunities Trust
By (Signature and Title)* /s/ George R. Aylward
George R. Aylward, President
(principal executive officer)
Date 12/6/12
Pursuant to the requirements of the Securities Exchange Act of 1934 and the Investment Company Act of 1940, this report has been signed below by the following persons on behalf of the registrant and in the capacities and on the dates indicated.
By (Signature and Title)* /s/ George R. Aylward
George R. Aylward, President
(principal executive officer)
Date 12/6/12
By (Signature and Title)* /s/ W. Patrick Bradley
W. Patrick Bradley, Vice President, Chief Financial Officer, and Treasurer
(principal financial officer)
Date 12/6/12
* Print the name and title of each signing officer under his or her signature.