Table of Contents
UNITED STATES
SECURITIES AND EXCHANGE COMMISSION
Washington, D.C. 20549
FORM N-CSR
CERTIFIED SHAREHOLDER REPORT OF REGISTERED MANAGEMENT
INVESTMENT COMPANIES
Investment Company Act file number 811-07455
Virtus Opportunities Trust
(Exact name of registrant as specified in charter)
101 Munson Street
Greenfield, MA 01301-9668
(Address of principal executive offices) (Zip code)
Kevin J. Carr, Esq.
Vice President, Chief Legal Officer, Counsel and Secretary for Registrant
100 Pearl Street
Hartford, CT 06103-4506
(Name and address of agent for service)
Registrant’s telephone number, including area code: (800) 243-1574
Date of fiscal year end: September 30
Date of reporting period: September 30, 2013
Form N-CSR is to be used by management investment companies to file reports with the Commission not later than 10 days after the transmission to stockholders of any report that is required to be transmitted to stockholders under Rule 30e-1 under the Investment Company Act of 1940 (17 CFR 270.30e-1). The Commission may use the information provided on Form N-CSR in its regulatory, disclosure review, inspection, and policymaking roles.
A registrant is required to disclose the information specified by Form N-CSR, and the Commission will make this information public. A registrant is not required to respond to the collection of information contained in Form N-CSR unless the Form displays a currently valid Office of Management and Budget (“OMB”) control number. Please direct comments concerning the accuracy of the information collection burden estimate and any suggestions for reducing the burden to Secretary, Securities and Exchange Commission, 100 F Street, NE, Washington, DC 20549. The OMB has reviewed this collection of information under the clearance requirements of 44 U.S.C. § 3507.
Table of Contents
Item 1. Reports to Stockholders.
The Report to Shareholders is attached herewith.
Table of Contents

ANNUAL REPORT
Virtus Bond Fund
Virtus CA Tax-Exempt Bond Fund
Virtus Disciplined Equity Style Fund
Virtus Disciplined Select Bond Fund
Virtus Disciplined Select Country Fund
Virtus Herzfeld Fund
Virtus High Yield Fund
Virtus Low Volatility Equity Fund
Virtus Multi-Sector Intermediate Bond Fund
Virtus Senior Floating Rate Fund
Virtus Wealth Masters Fund
September 30, 2013 TRUST NAME: VIRTUS OPPORTUNITIES TRUST |
 |
Not FDIC Insured
No Bank Guarantee
May Lose Value
Table of Contents
| 1 | ||||||||
| 2 | ||||||||
| 4 | ||||||||
| Fund | Fund Summary | Schedule of Investments | ||||||
| 6 | 29 | |||||||
| 8 | 36 | |||||||
Virtus Disciplined Equity Style Fund (“Disciplined Equity Style Fund”) | 10 | 39 | ||||||
Virtus Disciplined Select Bond Fund (“Disciplined Select Bond Fund”) | 12 | 40 | ||||||
Virtus Disciplined Select Country Fund (“Disciplined Select Country Fund”) | 14 | 41 | ||||||
| 16 | 42 | |||||||
| 19 | 43 | |||||||
| 21 | 48 | |||||||
| 23 | 49 | |||||||
Virtus Senior Floating Rate Fund (“Senior Floating Rate Fund”) | 25 | 58 | ||||||
| 27 | 67 | |||||||
| 69 | ||||||||
| 72 | ||||||||
| 75 | ||||||||
| 80 | ||||||||
| 85 | ||||||||
| 98 | ||||||||
| 99 | ||||||||
Consideration of Advisory and Subadvisory Agreements by the Board of Trustees | 100 | |||||||
| 102 | ||||||||
Proxy Voting Procedures and Voting Record (Form N-PX)
The subadvisers vote proxies relating to portfolio securities in accordance with procedures that have been approved by the Board of Trustees of the Trust (“Trustees,” the “Board”). You may obtain a description of these procedures, along with information regarding how the Funds voted proxies during the most recent 12-month period ended June 30, free of charge, by calling toll-free 1-800-243-1574. This information is also available through the Securities and Exchange Commission’s (the “SEC”) website at http://www.sec.gov.
Form N-Q Information
The Trust files a complete schedule of portfolio holdings for each Fund with the SEC for the first and third quarters of each fiscal year on Form N-Q. Form N-Q is available on the SEC’s website at http://www.sec.gov. Form N-Q may be reviewed and copied at the SEC’s Public Reference Room. Information on the operation of the SEC’s Public Reference Room can be obtained by calling toll-free 1-800-SEC-0330.
This report is not authorized for distribution to prospective investors in the Funds presented in this book unless preceded or accompanied by an effective prospectus which includes information concerning the sales charge, each Fund’s record and other pertinent information.
Table of Contents
Dear Fellow Shareholders of Virtus Mutual Funds:
 | The financial markets experienced significant volatility during the 12-month period that ended September 30, 2013. The S&P 500® Index, a benchmark for U.S. equities, gained 19.3% while the Barclays U.S. Aggregate Bond Index, which tracks the U.S. fixed income market, declined 1.7%, and the MSCI All Country World Index (net), a measure of international equities, rose 17.7%.
The bond markets were particularly volatile during the second half of this period. U.S. Treasury yields climbed over the last few months as the market prepared for the Federal Reserve’s tapering of its bond purchases, which never occurred. The 10-year Treasury yield was at 2.6% as of September 30, 2013, | |
compared with 1.7% a year earlier, and, as rates rose, most bond sectors suffered losses.
Despite this recent market unpredictability, there is reason for investors to be cautiously optimistic about the economy. The U.S. economy is showing signs of growth in hiring, consumer spending, and housing and, although China’s recovery remains tenuous, Europe appears to be coming out of its recession. The onus remains on the U.S. government to keep the country on strong fiscal footing and on corporations to produce robust earnings, which will play a pivotal role in determining future market direction.
Market uncertainty is a timely reminder of the importance of portfolio diversification. While diversification cannot guarantee a profit or prevent loss, owning a variety of asset classes may cushion your portfolio against inevitable market fluctuations. Your financial advisor can help you ensure that your portfolio is adequately diversified.
Thank you for entrusting Virtus with your assets. Should you have any questions or require support, the Virtus customer service team is ready to assist you at 1-866-270-7788. We appreciate your business and remain committed to your long-term financial success.
Sincerely,
George R. Aylward President, Virtus Mutual Funds
October 2013 | ||

Whenever you have questions about your account, or require additional information, please visit us on the Web at www.virtus.com or call our shareowner service group toll-free at 1-800-243-1574.
Performance data quoted represents past results. Past performance is no guarantee of future results and current performance may be higher or lower than the performance shown above.
1
Table of Contents
VIRTUS OPPORTUNITIES TRUST
Disclosure of Fund Expenses (Unaudited)
For the six-month period of April 1, 2013 to September 30, 2013
We believe it is important for you to understand the impact of costs on your investment. All mutual funds have operating expenses. As a shareholder of a Virtus Opportunities Trust Fund (each, a “Fund”) you may incur two types of costs: (1) transaction costs, including sales charges on purchases of Class A shares and contingent deferred sales charges on Class B and Class C shares; and (2) ongoing costs, including investment advisory fees, distribution and service fees, and other expenses. Class I shares are sold without sales charges. For further information regarding applicable sales charges, see Note 1 in the Notes to Financial Statements. These examples are intended to help you understand your ongoing costs (in dollars) of investing in a Fund and to compare these costs with the ongoing costs of investing in other mutual funds. These examples are based on an investment of $1,000 invested at the beginning of the period and held for the entire six-month period. The following Expense Table illustrates your Fund’s costs in two ways.
Actual Expenses
The first section of the accompanying table provides information about actual account values and actual expenses. You may use the information in this section, together with the amount you invested, to estimate the expenses that you paid over the period. Simply divide your account value by $1,000 (for example, an $8,600 account value divided by $1,000 = 8.6), then multiply the result by the number given for your Fund under the heading “Expenses Paid During Period” to estimate the expenses you paid on your account during the period.
Hypothetical Example for Comparison Purposes
The second section of the accompanying table provides information about hypothetical account values and hypothetical expenses based on the Fund’s actual expense ratio and an assumed rate of return of 5% per year before expenses, which is not your Fund’s actual return. The hypothetical account values and expenses may not be used to estimate the actual ending account balance or expenses you paid for the period. You may use this information to compare the ongoing costs of investing in your Fund and other funds. To do so, compare these 5% hypothetical examples with the 5% hypothetical examples that appear in the shareholder reports of the other funds.
Please note that the expenses shown in the accompanying table are meant to highlight your ongoing costs only and do not reflect any transactional costs, such as sales charges or contingent deferred sales charges. Therefore, the second section of the accompanying table is useful in comparing ongoing costs only, and will not help you determine the relative total costs of owning different funds. In addition, if these transactional costs were included, your costs would have been higher. The calculations assume no shares were bought or sold during the period. Your actual costs may have been higher or lower, depending on the amount of your investment and the timing of any purchases or redemptions.
| Expense Table | ||||||||||||||||
| Beginning Account Value April 1, 2013 | Ending Account Value September 30, 2013 | Annualized Expense Ratio | Expenses Paid During Period* | |||||||||||||
Bond Fund |
| |||||||||||||||
Actual | ||||||||||||||||
Class A | $ | 1,000.00 | $ | 979.30 | 0.85 | % | $ | 4.22 | ||||||||
Class B | 1,000.00 | 976.10 | 1.60 | 7.93 | ||||||||||||
Class C | 1,000.00 | 976.10 | 1.60 | 7.93 | ||||||||||||
Class I | 1,000.00 | 980.80 | 0.60 | 2.98 | ||||||||||||
Hypothetical (5% return before expenses) |
| |||||||||||||||
Class A | 1,000.00 | 1,020.75 | 0.85 | 4.32 | ||||||||||||
Class B | 1,000.00 | 1,016.95 | 1.60 | 8.12 | ||||||||||||
Class C | 1,000.00 | 1,016.95 | 1.60 | 8.12 | ||||||||||||
Class I | 1,000.00 | 1,022.02 | 0.60 | 3.05 | ||||||||||||
CA Tax-Exempt Bond Fund |
| |||||||||||||||
Actual | ||||||||||||||||
Class A | $ | 1,000.00 | $ | 967.50 | 0.85 | % | $ | 4.19 | ||||||||
Class I | 1,000.00 | 968.70 | 0.60 | 2.96 | ||||||||||||
Hypothetical (5% return before expenses) |
| |||||||||||||||
Class A | 1,000.00 | 1,020.75 | 0.85 | 4.32 | ||||||||||||
Class I | 1,000.00 | 1,022.02 | 0.60 | 3.05 | ||||||||||||
Disciplined Equity Style Fund |
| |||||||||||||||
Actual | ||||||||||||||||
Class A | $ | 1,000.00 | $ | 1,120.40 | 1.60 | % | $ | 8.50 | ||||||||
Class C | 1,000.00 | 1,117.10 | 2.35 | 12.47 | ||||||||||||
Class I | 1,000.00 | 1,122.20 | 1.35 | 7.18 | ||||||||||||
Hypothetical (5% return before expenses) |
| |||||||||||||||
Class A | 1,000.00 | 1,016.95 | 1.60 | 8.12 | ||||||||||||
Class C | 1,000.00 | 1,013.14 | 2.35 | 11.93 | ||||||||||||
Class I | 1,000.00 | 1,018.22 | 1.35 | 6.85 | ||||||||||||
Disciplined Select Bond Fund |
| |||||||||||||||
Actual | ||||||||||||||||
Class A | $ | 1,000.00 | $ | 955.70 | 1.40 | % | $ | 6.86 | ||||||||
Class C | 1,000.00 | 954.10 | 2.15 | 10.53 | ||||||||||||
Class I | 1,000.00 | 957.90 | 1.15 | 5.64 | ||||||||||||
Hypothetical (5% return before expenses) |
| |||||||||||||||
Class A | 1,000.00 | 1,017.96 | 1.40 | 7.11 | ||||||||||||
Class C | 1,000.00 | 1,014.15 | 2.15 | 10.91 | ||||||||||||
Class I | 1,000.00 | 1,019.23 | 1.15 | 5.84 | ||||||||||||
Disciplined Select Country Fund |
| |||||||||||||||
Actual | ||||||||||||||||
Class A | $ | 1,000.00 | $ | 1,083.10 | 1.70 | % | $ | 8.88 | ||||||||
Class C | 1,000.00 | 1,079.40 | 2.45 | 12.77 | ||||||||||||
Class I | 1,000.00 | 1,084.90 | 1.45 | 7.58 | ||||||||||||
Hypothetical (5% return before expenses) |
| |||||||||||||||
Class A | 1,000.00 | 1,016.44 | 1.70 | 8.63 | ||||||||||||
Class C | 1,000.00 | 1,012.63 | 2.45 | 12.44 | ||||||||||||
Class I | 1,000.00 | 1,017.71 | 1.45 | 7.36 | ||||||||||||
Herzfeld Fund |
| |||||||||||||||
Actual | ||||||||||||||||
Class A | $ | 1,000.00 | $ | 983.20 | 1.60 | % | $ | 7.95 | ||||||||
Class C | 1,000.00 | 980.00 | 2.35 | 11.66 | ||||||||||||
Class I | 1,000.00 | 984.20 | 1.35 | 6.72 | ||||||||||||
Hypothetical (5% return before expenses) |
| |||||||||||||||
Class A | 1,000.00 | 1,016.95 | 1.60 | 8.12 | ||||||||||||
Class C | 1,000.00 | 1,013.14 | 2.35 | 11.93 | ||||||||||||
Class I | 1,000.00 | 1,018.22 | 1.35 | 6.85 | ||||||||||||
2
Table of Contents
VIRTUS OPPORTUNITIES TRUST
Disclosure of Fund Expenses (Unaudited) (Continued)
For the six-month period of April 1, 2013 to September 30, 2013
| Expense Table | ||||||||||||||||
| Beginning Account Value April 1, 2013 | Ending Account Value September 30, 2013 | Annualized Expense Ratio | Expenses Paid During Period* | |||||||||||||
High Yield Fund |
| |||||||||||||||
Actual | ||||||||||||||||
Class A | $ | 1,000.00 | $ | 997.60 | 1.15 | % | $ | 5.76 | ||||||||
Class B | 1,000.00 | 993.90 | 1.90 | 9.50 | ||||||||||||
Class C | 1,000.00 | 993.90 | 1.90 | 9.50 | ||||||||||||
Class I | 1,000.00 | 998.90 | 0.90 | 4.51 | ||||||||||||
Hypothetical (5% return before expenses) |
| |||||||||||||||
Class A | 1,000.00 | 1,019.23 | 1.15 | 5.84 | ||||||||||||
Class B | 1,000.00 | 1,015.42 | 1.90 | 9.65 | ||||||||||||
Class C | 1,000.00 | 1,015.42 | 1.90 | 9.65 | ||||||||||||
Class I | 1,000.00 | 1,020.50 | 0.90 | 4.57 | ||||||||||||
Low Volatility Equity Fund** |
| |||||||||||||||
Actual | ||||||||||||||||
Class A | $ | 1,000.00 | $ | 1,024.00 | 1.55 | % | $ | 4.73 | ||||||||
Class C | 1,000.00 | 1,021.00 | 2.30 | 7.00 | ||||||||||||
Class I | 1,000.00 | 1,025.00 | 1.30 | 3.97 | ||||||||||||
Hypothetical (5% return before expenses since inception) |
| |||||||||||||||
Class A | 1,000.00 | 1,010.36 | 1.55 | 4.71 | ||||||||||||
Class C | 1,000.00 | 1,008.08 | 2.30 | 6.98 | ||||||||||||
Class I | 1,000.00 | 1,011.12 | 1.30 | 3.95 | ||||||||||||
Hypothetical (5% return before expenses) |
| |||||||||||||||
Class A | 1,000.00 | 1,017.20 | 1.55 | 7.87 | ||||||||||||
Class C | 1,000.00 | 1,013.39 | 2.30 | 11.68 | ||||||||||||
Class I | 1,000.00 | 1,018.47 | 1.30 | 6.60 | ||||||||||||
Multi-Sector Intermediate Bond Fund |
| |||||||||||||||
Actual | ||||||||||||||||
Class A | $ | 1,000.00 | $ | 984.40 | 1.10 | % | $ | 5.47 | ||||||||
Class B | 1,000.00 | 980.70 | 1.85 | 9.19 | ||||||||||||
Class C | 1,000.00 | 980.90 | 1.85 | 9.19 | ||||||||||||
Class I | 1,000.00 | 985.70 | 0.85 | 4.23 | ||||||||||||
Hypothetical (5% return before expenses) |
| |||||||||||||||
Class A | 1,000.00 | 1,019.48 | 1.10 | 5.58 | ||||||||||||
Class B | 1,000.00 | 1,015.68 | 1.85 | 9.39 | ||||||||||||
Class C | 1,000.00 | 1,015.68 | 1.85 | 9.39 | ||||||||||||
Class I | 1,000.00 | 1,020.75 | 0.85 | 4.32 | ||||||||||||
Senior Floating Rate Fund |
| |||||||||||||||
Actual | ||||||||||||||||
Class A | $ | 1,000.00 | $ | 1,009.10 | 1.20 | % | $ | 6.04 | ||||||||
Class C | 1,000.00 | 1,006.30 | 1.95 | 9.81 | ||||||||||||
Class I | 1,000.00 | 1,011.40 | 0.95 | 4.79 | ||||||||||||
Hypothetical (5% return before expenses) |
| |||||||||||||||
Class A | 1,000.00 | 1,018.98 | 1.20 | 6.09 | ||||||||||||
Class C | 1,000.00 | 1,015.17 | 1.95 | 9.90 | ||||||||||||
Class I | 1,000.00 | 1,020.25 | 0.95 | 4.82 | ||||||||||||
Wealth Masters Fund |
| |||||||||||||||
Actual | ||||||||||||||||
Class A | $ | 1,000.00 | $ | 1,149.90 | 1.45 | % | $ | 7.81 | ||||||||
Class C | 1,000.00 | 1,144.90 | 2.20 | 11.83 | ||||||||||||
Class I | 1,000.00 | 1,151.60 | 1.20 | 6.47 | ||||||||||||
Hypothetical (5% return before expenses) |
| |||||||||||||||
Class A | 1,000.00 | 1,017.71 | 1.45 | 7.36 | ||||||||||||
Class C | 1,000.00 | 1,013.90 | 2.20 | 11.17 | ||||||||||||
Class I | 1,000.00 | 1,018.98 | 1.20 | 6.09 | ||||||||||||
| * | Expenses are equal to the relevant Funds’ annualized expense ratio, which is net of waived fees and reimbursed expenses, if applicable, multiplied by the average account value over the period, multiplied by the number of days (183) expenses were accrued in the most recent fiscal half-year, then divided by 365 to reflect the one-half year period. |
| ** | June 13, 2013 is the date the Fund started accruing expenses. Expenses are equal to the relevant Funds’ annualized expense ratio, which is net of waived fees and reimbursed expenses, if applicable, multiplied by the average account value over the period, multiplied by the number of days (110) expenses were accrued in the most recent fiscal half-year, then divided by 365 to reflect the one half-year period. |
For Funds which may invest in other funds, the annualized expense ratios noted above do not reflect fees and expenses associated with the underlying funds. If such fees and expenses had been included, the expenses would have been higher.
You can find more information about the Funds’ expenses in the Financial Statements section that follows. For additional information on operating expenses and other shareholder costs, refer to the prospectus.
3
Table of Contents
ADR (American Depositary Receipt)
Represents shares of foreign companies traded in U.S. dollars on U.S. exchanges that are held by a U.S. bank or a trust. Foreign companies use ADRs in order to make it easier for Americans to buy their shares.
Barclays California Municipal Bond Index
The Barclays California Municipal Bond Index measures long term investment grade, tax-exempt and fixed rate bonds issued in California. The index is calculated on a total return basis. The index is unmanaged, its returns do not reflect any fees, expenses or sales charges and is not available for direct investment.
Barclays U.S. High Yield 2% Issuer Capped Bond Index
The Barclays U.S. High Yield 2% Issuer Capped Bond Index is a market capitalization-weighted index that measures fixed rate non-investment grade debt securities of U.S. and non-U.S. corporations. No single issuer accounts for more than 2% of market cap. The index is calculated on a total return basis. The index is unmanaged, its returns do not reflect any fees, expenses or sales charges and is not available for direct investment.
Barclays U.S. Aggregate Bond Index
The Barclays U.S. Aggregate Bond Index measures the U.S. investment grade fixed rate bond market. The index is calculated on a total return basis. The index is unmanaged, its returns do not reflect any fees, expenses or sales charges and is not available for direct investment.
Exchange-Traded Funds (ETF)
Portfolios of stocks or bonds that track a specific market index.
Federal Reserve (the “Fed”)
The central bank of the United States, responsible for controlling the money supply, interest rates and credit with the goal of keeping the U.S. economy and currency stable. Governed by a seven-member board, the system includes 12 regional Federal Reserve Banks, 25 branches and all national and state banks that are part of the system.
Herzfeld Composite Index (60% MSCI AC World Index (net)/40% Barclays U.S. Aggregate Bond Index)
The composite index consists of 60% MSCI AC World Index (net) and 40% Barclays U.S. Aggregate Bond Index. The MSCI AC World Index (net) is a free float-adjusted market capitalization-weighted index that measures equity performance of developed and emerging markets. The index is calculated on a total return basis with net dividends reinvested. The Barclays U.S. Aggregate Bond Index measures the U.S. investment grade fixed rate bond market. The index is calculated on a total return basis. The indexes are unmanaged, its returns do not reflect any fees, expenses, or sales charges, and is not available for direct investment.
iShares®
Represents shares of an open-end exchange-traded fund.
MSCI AC World Index (net)
The MSCI AC World Index (net) is a free float-adjusted market capitalization-weighted index that measures equity performance of developed and emerging markets. The index is calculated on a total return basis with net dividends reinvested. The index is unmanaged, its returns do not reflect any fees, expenses or sales charges and is not available for direct investment.
MSCI EAFE® Index (net)
The MSCI EAFE® Index (net) is a free float-adjusted market capitalization-weighted index that measures developed foreign market equity performance, excluding the U.S. and Canada. The index is calculated on a total return basis with net dividends reinvested. The index is unmanaged, its returns do not reflect any fees, expenses, or sales charges, and is not available for direct investment.
PIK (Payment-in-Kind Security)
A bond which pays interest in the form of additional bonds, or preferred stock which pays dividends in the form of additional preferred stock.
4
Table of Contents
KEY INVESTMENT TERMS (Continued)
Quantitative Easing
A government monetary policy occasionally used to increase the money supply by buying government securities or other securities from the market. Quantitative easing increases the money supply by flooding financial institutions with capital in an effort to promote increased lending and liquidity.
REIT (Real Estate Investment Trust)
A publicly traded company that owns, develops and operates income-producing real estate such as apartments, office buildings, hotels, shopping centers and other commercial properties.
Russell 3000® Index
The Russell 3000® Index is a market capitalization-weighted index that measures the performance of the 3,000 largest U.S. companies. The index is calculated on a total return basis with dividends reinvested. The index is unmanaged, its returns do not reflect any fees, expenses or sales charges and is not available for direct investment.
S&P 500® Index
The S&P 500® Index is a free-float market capitalization-weighted index of 500 of the largest U.S. companies. The index is calculated on a total return basis with dividends reinvested. The index is unmanaged, its returns do not reflect any fees, expenses or sales charges and is not available for direct investment.
S&P/LSTA U.S. Leveraged Loan Index
The S&P/LSTA Leveraged Loan Index is a daily total return index that uses LSTA/LPC Mark-to-Market Pricing to calculate market value change. On a real-time basis, the Index tracks the current outstanding balance and spread over LIBOR for fully funded term loans. The facilities included in the Index represent a broad cross section of leveraged loans syndicated in the United States, including dollar-denominated loans to overseas issuers. The index is unmanaged, its returns do not reflect any fees, expenses or sales charges and is not available for direct investment.
Sponsored ADR (American Depositary Receipt)
An ADR which is issued with the cooperation of the company whose stock will underlie the ADR. Sponsored ADRs generally carry the same rights normally given to stockholders, such as voting rights. ADRs must be sponsored to be able to trade on a major U.S. exchange such as the New York Stock Exchange (NYSE).
When-issued and Forward Commitments (Delayed Delivery)
Securities purchased on a when-issued or forward commitment basis are also known as delayed delivery transactions. Delayed delivery transactions involve a commitment by a Fund to purchase or sell a security at a future date, ordinarily up to 90 days later. When-issued or forward commitments enable a Fund to lock in what is believed to be an attractive price or yield on a particular security for a period of time, regardless of future changes in interest rates.
5
Table of Contents
Bond Fund
Fund Summary | Ticker Symbols: Class A: SAVAX Class B: SAVBX Class C: SAVCX Class I: SAVYX |
| ¢ | The Fund is diversified and has an investment objective of high total return from both current income and capital appreciation. |
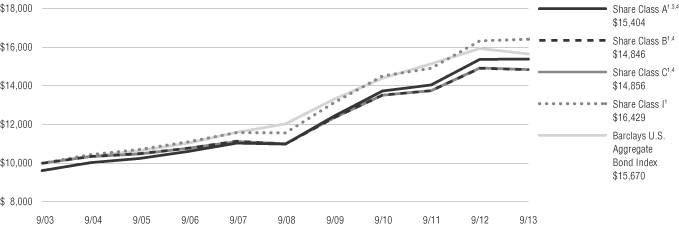
| ¢ | For the fiscal year ended September 30, 2013, the Fund’s Class A shares at NAV returned 0.17%, Class B shares returned -0.50%, Class C shares returned -0.51%, and Class I shares returned 0.49%. For the same period, the Barclays U.S. Aggregate Bond Index, which serves as the broad-based and style-specific benchmark index appropriate for comparison, returned -1.68%. |
All performance figures assume reinvestment of distributions and exclude the effect of sales charges. Past performance is no guarantee of future results and current performance may be higher or lower than the performance shown above.
How did the market perform during the Fund’s fiscal year?
| ¢ | Most fixed income spread sectors (the non-governmental sectors of the fixed income markets) outperformed U.S. Treasuries during the Fund’s fiscal year. The overall economic picture continued to be supportive of spread sectors as growth expectations remained positive but subdued enough to likely keep inflation at low levels and the Fed from raising short-term interest rates in the immediate future. Spread sectors were also supported by an overall improvement in the U.S. macroeconomic environment, positive credit fundamentals, and continued demand for spread product. |
| ¢ | Despite the rally, there were periods of volatility during the year as headwinds still exist. Various factors, including uncertainty surrounding the impact of the U.S. presidential elections, the “fiscal cliff,” and the effects of subsequent tax increases and sequestration, resulted in periods of weakness. Despite resolution of these issues, ambiguity remains relative to the Fed’s hint at the possibility of tapering bond purchases by the end of the year (which would mark the beginning of the end of quantitative easing), the looming U.S. debt ceiling debate, and overall global growth concerns. |
| ¢ | Over the last 12 months, yields increased across the U.S. Treasury curve and the curve steepened. |
What factors affected the Fund’s performance during its fiscal year?
| ¢ | The outperformance of fixed income spread sectors relative to U.S. Treasuries was the key driver of the Fund’s strong performance for the year. |
| ¢ | Among fixed income sectors, the Fund’s allocation to corporate high yield securities, high yield bank loans, non-agency commercial mortgage-backed securities, and corporate high quality securities were significant positive contributors to performance for the fiscal year. |
| ¢ | The Fund’s non-U.S. dollar allocation detracted from performance as did its Yankee bonds to a lesser extent. |
The preceding information is the opinion of portfolio management. Any such opinions are subject to change at any time based upon market or other conditions and should not be relied upon as investment advice. Past performance is no guarantee of future results, and there is no guarantee that market forecasts will be realized.
There is no guarantee that the Fund will meet its objective.
Debt securities are subject to various risks, the most prominent of which are credit and interest rate risk. The issuer of a security may fail to make payments in a timely manner. Values of debt securities may rise and fall in response to changes in interest rates. This risk may be enhanced with longer-term maturities. Changes in interest rates can cause both extension and prepayment risks for asset and mortgage-backed securities. These securities are also subject to risks associated with the repayment of underlying collateral. Investing internationally, especially in emerging markets, involves additional risks such as currency, political, accounting, economic, and market risk. There is a greater level of credit risk and price volatility involved with high-yield securities than investment grade securities.
| Asset Allocation | ||||
The following table presents asset allocations within certain sectors and as a percentage of total investments as of September 30, 2013.
|
| |||
Corporate Bonds | 56 | % | ||
Mortgage-Backed Securities | 22 | |||
Loan Agreements | 9 | |||
Foreign Government | 5 | |||
Preferred Stock | 3 | |||
Other (includes short-term investments) | 5 | |||
|
| |||
Total | 100 | % | ||
|
| |||
For information regarding the indexes and certain investment terms, see the Key Investment Terms starting on page 4.
6
Table of Contents
Bond Fund (Continued)
| Average Annual Total Returns1 for periods ended 9/30/13 | ||||||||||||
| 1 year | 5 years | 10 years | ||||||||||
| Class A Shares at NAV2 | 0.17 | % | 6.97 | % | 4.81 | % | ||||||
| Class A Shares at POP3 | -3.59 | 6.16 | 4.41 | |||||||||
| Class B Shares at NAV2 | -0.50 | 6.18 | 4.03 | |||||||||
| Class B Shares with CDSC4 | -4.37 | 6.18 | 4.03 | |||||||||
| Class C Shares at NAV2 and with CDSC4 | -0.51 | 6.17 | 4.04 | |||||||||
| Class I Shares at NAV | 0.49 | 7.24 | 5.09 | |||||||||
| Barclays U.S. Aggregate Bond Index | -1.68 | 5.41 | 4.59 | |||||||||
Fund Expense Ratios5: A Shares: Gross 1.03%, Net 0.85%; B Shares: Gross 1.78%, Net 1.60%; C Shares: Gross 1.78%, Net 1.60%; I Shares: Gross 0.78%, Net 0.60%.
All returns represent past performance which is no guarantee of future results. Current performance may be higher or lower than the performance shown. The investment return and principal value of an investment will fluctuate so that an investor’s shares, when redeemed, may be worth more or less than their original cost. The above table and graph below do not reflect the deduction of taxes that a shareholder would pay on fund distributions or the redemption of shares. Please visit Virtus.com for performance data current to the most recent month-end.
| 1 | Total returns are historical and include changes in share price and the reinvestment of both dividends and capital gains distributions. |
| 2 | “NAV” (Net Asset Value) total returns do not include the effect of any sales charge. |
| 3 | “POP” (Public Offering Price) total returns include the effect of the maximum front-end 3.75% sales charge. |
| 4 | “CDSC” (Contingent Deferred Sales Charge) is applied to redemptions of certain classes of shares that do not have a sales charge applied at the time of purchase. CDSC charges for B shares decline from 5% to 0% over a five year period. CDSC charges for certain redemptions of Class A shares made within 18 months of purchase in which a finder’s fee was paid and all redemptions of Class C shares within the first year are 1% and 0% thereafter. |
| 5 | The expense ratios of the Fund are set forth according to the prospectus for the Fund effective January 31, 2013, as supplemented and revised and may differ from the expense ratios disclosed in the Financial Highlights tables in this report. See the Financial Highlights for more current expense ratios. Net Expense: Expenses reduced by voluntary fee waiver which may be discontinued at any time. Gross Expense: Does not reflect the effect of the voluntary fee waiver. |
Growth of $10,000 For periods ended 9/30
This chart assumes an initial investment of $10,000 made on September 30, 2003, for Class A, Class B, Class C, and Class I shares including any applicable sales charges or fees. Performance assumes reinvestment of dividends and capital gain distributions.
The indexes are unmanaged and not available for direct investment; therefore, their performance does not reflect the expenses associated with active management of an actual portfolio.
For information regarding the indexes and certain investment terms, see the Key Investment Terms starting on page 4.
7
Table of Contents
Fund Summary | Ticker Symbols: Class A: CTESX Class I: CTXEX |
| ¢ | The Fund is diversified and has an investment objective to obtain a high level of current income exempt from California state and local income taxes, as well as federal income tax, consistent with the preservation of capital. |
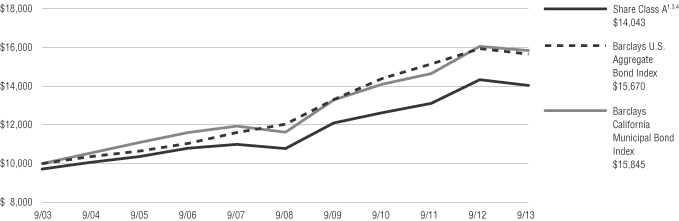
| ¢ | For the fiscal year ended September 30, 2013, the Fund’s Class A shares at NAV returned -2.12% and Class I shares returned -1.88%. For the same period, the Barclays U.S. Aggregate Bond Index, a broad-based fixed income index, returned -1.68%, and the Barclays California Municipal Bond Index, the Fund’s style-specific benchmark appropriate for comparison, returned -1.37%. |
All performance figures assume reinvestment of distributions and exclude the effect of sales charges. Past performance is no guarantee of future results and current performance may be higher or lower than the performance shown above.
How did the market perform during the Fund’s fiscal year?
| ¢ | The municipal bond market experienced weak absolute performance over the past 12 months as municipal interest rates increased by 0.70% in 10 years and by over 1.25% in 30 years. |
| ¢ | The pressure from rising U.S. Treasury yields, headline news surrounding Detroit’s bankruptcy filing, and Puerto Rico’s growing fiscal challenges resulted in significant outflows from open-end municipal bond mutual funds as their net asset values turned negative. |
| ¢ | According to the Investment Company Institute, open-end municipal bond mutual funds have experienced over $48 billion in outflows since March 2013. This constant wave of outflows has driven municipal yields higher as mutual funds are forced to sell securities to meet investor redemptions. Municipal bond fund outflows over the past seven months now exceed the $44 billion-plus of outflows from November 2010 to May 2012 induced by the comments of Wall Street banking analyst Meredith Whitney. |
| ¢ | Detroit’s bankruptcy filing in late July cast a shadow of concern over the municipal bond market and was a likely cause for some of the outflows. Decades of job losses and a decreasing population amounted to a crisis that can only be solved by declaring bankruptcy, according to the city’s emergency manager Kevyn Orr. Detroit currently owes about $20 billion, with $9.5 billion representing pension and healthcare-related obligations. |
| ¢ | Puerto Rico, with approximately $70 billion of outstanding debt, is another large municipal issuer that has been in the news recently. The island’s fundamental credit profile remains very weak and is likely to remain so for the foreseeable future in light of persistent budget deficits, high unemployment, extremely low pension fund levels, and high debt servicing requirements. As a result of our continued negative view on Puerto Rico’s credit profile, exposure has been eliminated. |
| ¢ | While there have been plenty of negative news reports surrounding Detroit’s bankruptcy filing and Puerto Rico’s growing credit problems, we don’t believe they paint an accurate picture of the broader credit profile of the municipal market. Municipal bonds remain one of the lowest risk asset classes, with credit metrics for the vast majority of municipalities continuing to improve as the economy recovers and tax revenues rebound. State revenue growth continues to improve following the recession, and while revenues are not quite back to pre-recession levels, the credit profile of many municipalities is meaningfully better. Specifically, California is expected to experience its first budget surplus in many years, mostly the result of increased revenues from higher sales and income taxes and effective austerity measures. As such, we do not expect default risk to become a systemic problem for the municipal bond sector. Underfunded pensions will likely be an ongoing challenge for municipalities and continues to be a concern that we will monitor closely. |
| ¢ | Entering the fourth quarter of 2013, the municipal market is keeping a close eye on the Fed’s plan for tapering asset purchases, news out of Detroit on its bankruptcy proceedings, and Puerto Rico’s fiscal condition and ability to finance its ongoing budget deficits. Expectations for the remainder of the year are for continued levels of manageable supply, slowing but continued demand for tax-exempt income, improving municipal credit fundamentals, and minimal disruption expected by tax reform discussions. |
| ¢ | September’s rebound in the municipal market helped mitigate the decline of the prior four months and gave reason for optimism. Should fund outflows moderate and reverse while the new bond supply remains light, the market could experience positive momentum going forward. If the municipal market fails to return to positive territory during the fourth quarter of 2013, it would be only the fourth year that the Barclays Municipal Bond Index posted a negative return since 1983. |
What factors affected the Fund’s performance during its fiscal year?
| ¢ | The relative performance of the Fund benefited from the portfolio’s lower exposure to long maturity bonds and the sale of Puerto Rico municipal bond exposure in February. |
| ¢ | The Fund’s exposure to discount coupon bonds, and a higher quality focus earlier in the year negatively impacted its relative performance. |
The preceding information is the opinion of portfolio management. Any such opinions are subject to change at any time based upon market or other conditions and should not be relied upon as investment advice. Past performance is no guarantee of future results, and there is no guarantee that market forecasts will be realized.
There is no guarantee that the Fund will meet its objective.
Debt securities are subject to various risks, the most prominent of which are credit and interest rate risk. The issuer of a security may fail to make payments in a timely manner. Values of debt securities may rise and fall in response to changes in interest rates. This risk may be enhanced with longer-term maturities. A fund that focuses its investments in a particular geographic location will be highly sensitive to financial, economic, political, and other developments affecting the fiscal stability of that location. Events negatively impacting a municipal security, or the municipal bond market in general, may cause the fund to decrease in value. A portion of income may be subject to some state and/or local taxes and, for certain investors, a portion may be subject to the federal alternative minimum tax.
| Asset Allocation | ||||
The following table presents asset allocations within certain sectors and as a percentage of total investments as of September 30, 2013.
|
| |||
General Revenue | 20 | % | ||
General Obligation | 20 | |||
Pre-Refunded | 17 | |||
Transportation Revenue | 9 | |||
Water & Sewer Revenue | 9 | |||
Medical Revenue | 6 | |||
Development Revenue | 6 | |||
Other (includes short-term investments) | 13 | |||
|
| |||
Total | 100 | % | ||
|
| |||
For information regarding the indexes and certain investment terms, see the Key Investment Terms starting on page 4.
8
Table of Contents
CA Tax-Exempt Bond Fund (Continued)
| Average Annual Total Returns1 for periods ended 9/30/13 | ||||||||||||||||||||
| 1 year | 5 years | 10 years | Since Inception | Inception Date | ||||||||||||||||
| Class A Shares at NAV2 | -2.12 | % | 5.43 | % | 3.74 | % | — | — | ||||||||||||
| Class A Shares at POP3,4 | -4.81 | 4.85 | 3.45 | — | — | |||||||||||||||
| Class I Shares at NAV | -1.88 | 5.68 | — | 4.09 | % | 9/29/06 | ||||||||||||||
| Barclays U.S. Aggregate Bond Index | -1.68 | 5.41 | 4.59 | 4.55 | 5 | — | ||||||||||||||
| Barclays California Municipal Bond Index | -1.37 | 6.38 | 4.71 | 5.11 | 5 | — | ||||||||||||||
Fund Expense Ratios6: A Shares: Gross 1.05%, Net 0.85%; I Shares: Gross 0.80%, Net 0.60%.
All returns represent past performance which is no guarantee of future results. Current performance may be higher or lower than the performance shown. The investment return and principal value of an investment will fluctuate so that an investor’s shares, when redeemed, may be worth more or less than their original cost. The above table and graph below do not reflect the deduction of taxes that a shareholder would pay on fund distributions or the redemption of shares. Please visit Virtus.com for performance data current to the most recent month-end.
| 1 | Total returns are historical and include changes in share price and the reinvestment of both dividends and capital gains distributions. |
| 2 | “NAV” (Net Asset Value) total returns do not include the effect of any sales charge. |
| 3 | “POP” (Public Offering Price) total returns include the effect of the maximum front-end 2.75% sales charge. |
| 4 | “CDSC” (Contingent Deferred Sales Charge) is applied to redemptions of certain classes of shares that do not have a sales charge applied at the time of purchase. CDSC charges for certain redemptions of Class A shares made within 18 months of purchase in which a finder’s fee was paid are 1% and 0% thereafter. |
| 5 | The since inception index returns are from the inception date of Class I. |
| 6 | The expense ratios of the Fund are set forth according to the prospectus for the Fund effective January 31, 2013, as supplemented and revised and may differ from the expense ratios disclosed in the Financial Highlights tables in this report. See the Financial Highlights for more current expense ratios. Net Expense: Expenses reduced by voluntary fee waiver which may be discontinued at any time. Gross Expense: Does not reflect the effect of the voluntary fee waiver. |
Growth of $10,000 For periods ended 9/30
This chart assumes an initial investment of $10,000 made on September 30, 2003 for Class A shares including any applicable sales charges or fees. Performance assumes reinvestment of dividends and capital gain distributions.
--
The indexes are unmanaged and not available for direct investment; therefore, their performance does not reflect the expenses associated with active management of an actual portfolio.
For information regarding the indexes and certain investment terms, see the Key Investment Terms starting on page 4.
9
Table of Contents
Fund Summary | Ticker Symbols: Class A: VDEAX Class C: VDECX Class I: VDEIX |
| ¢ | The Fund is diversified and has an investment objective of seeking capital appreciation. |
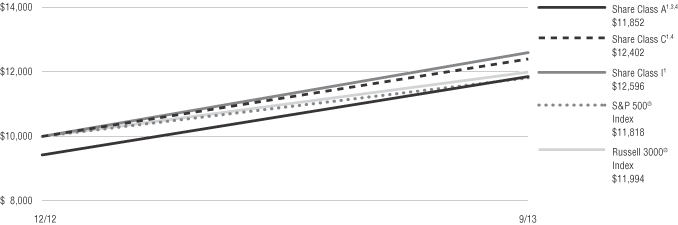
| ¢ | For the fiscal period December 18, 2012 (inception date) through September 30, 2013, the Fund’s Class A shares at NAV returned 25.75%*, Class C shares returned 25.02%*, and Class I shares returned 25.96%.* For the same period, the S&P 500® Index, a broad-based equity index, returned 18.18%*, and the Russell 3000® Index the Fund’s style-specific benchmark appropriate for comparison returned 19.94%*. |
* Returns less than 1 year are not annualized.
All performance figures assume reinvestment of distributions and exclude the effect of sales charges. Past performance is no guarantee of future results and current performance may be higher or lower than the performance shown above.
How did the market perform during the Fund’s fiscal period?
| ¢ | Amid growing concerns over slowing economic growth in European and emerging countries, U.S. investors seemed to focus domestically, especially on companies with domestic revenue and growth opportunities. This led to large rallies in small-capitalization securities and the relative outperformance of growth versus value equities. |
| ¢ | The broad market rallied significantly throughout the year, pulling back only slightly in the second quarter on concerns over a tapering of the Federal Reserve’s quantitative easing programs. |
| ¢ | Despite concerns about growth abroad and Fed tapering, as of September 30, 2013, the Russell 3000® Index returned 19.94% since the Fund’s inception on December 18, 2012. |
What factors affected the Fund’s performance during it’s fiscal period?
| ¢ | A structural overweighting towards small-capitalization securities provided a tailwind in the first and second quarters of 2013 as investors seemed to turn their eye towards U.S. companies with domestically focused revenue and growth prospects. |
| ¢ | While the Fund made several trades in the first quarter between growth and value equities, it spent the vast majority of the second and third quarter in growth equities. |
| ¢ | Return outliers, such as Facebook, Tesla, and Netflix, provided a boost in the third quarter for growth equities above value equities, allowing the Fund to capture a significant amount of outperformance. |
The preceding information is the opinion of portfolio management. Any such opinions are subject to change at any time based on market or other conditions and should not be relied upon as investment advice. Past performance is no guarantee of future results and there is no guarantee that market forecasts will be realized.
There is no guarantee that the Fund will meet its objectives.
| Asset Allocation | ||||
The following table presents asset allocations within certain sectors and as a percentage of total investments as of September 30, 2013.
|
| |||
Exchange Traded Funds | 99 | % | ||
Other (includes short-term investments) | 1 | |||
|
| |||
Total | 100 | % | ||
|
| |||
The market price of equity securities may be affected by financial market, industry, or issuer-specific events. Focus on a particular style or on small or medium sized companies may enhance that risk. The value of an ETF may be more volatile than the underlying portfolio of securities the ETF is designed to track. The costs of owning the ETF may exceed the cost of investing directly in the underlying securities.
For information regarding the indexes and certain investment terms, see the Key Investment Terms starting on page 4.
10
Table of Contents
Disciplined Equity Style Fund (Continued)
| Average Annual Total Returns1 for periods ended 9/30/13 | ||||||||
| Since Inception | Inception Date | |||||||
| Class A Shares at NAV2 | 25.75 | % | 12/18/12 | |||||
| Class A Shares at POP3,4 | 18.52 | 12/18/12 | ||||||
| Class C Shares at NAV2 | 25.02 | 12/18/12 | ||||||
| Class C Shares with CDSC4 | 24.02 | 12/18/12 | ||||||
| Class I Shares at NAV | 25.96 | 12/18/12 | ||||||
S&P 500® Index | 18.185 | — | ||||||
Russell 3000® Index | 19.945 | — | ||||||
Fund Expense Ratios6: A Shares: Gross 2.09%, Net 1.83%; C Shares: Gross 2.84%, Net 2.58%; I Shares: Gross 1.84%, Net 1.58%.
All returns represent past performance which is no guarantee of future results. Current performance may be higher or lower than the performance shown. The investment return and principal value of an investment will fluctuate so that an investor’s shares, when redeemed, may be worth more or less than their original cost. The above table and graph below do not reflect the deduction of taxes that a shareholder would pay on fund distributions or the redemption of shares. Please visit Virtus.com for performance data current to the most recent month-end.
| 1 | Total returns are historical and include changes in share price and the reinvestment of both dividends and capital gains distributions. |
| 2 | “NAV” (Net Asset Value) total returns do not include the effect of any sales charge. |
| 3 | “POP” (Public Offering Price) total returns include the effect of the maximum front-end 5.75% sales charge. |
| 4 | “CDSC” (Contingent Deferred Sales Charge) is applied to redemptions of certain classes of shares that do not have a sales charge applied at the time of purchase. CDSC charges for certain redemptions of Class A shares made within 18 months of purchase in which a finder’s fee was paid and all redemptions of Class C shares within the first year are 1% and 0% thereafter. |
| 5 | The since inception index returns are from the Fund’s inception date. |
| 6 | The expense ratios of the Fund are set forth according to the prospectus for the Fund effective January 31, 2013 and may differ from the expense ratios disclosed in the Financial Highlights tables in this report. See the Financial Highlights for more current expense ratios. Net Expense: Expenses reduced by the contractual fee waiver in effect through January 31, 2014. Gross Expense: Does not reflect the effect of the fee waiver. Expense ratios do reflect fees and expenses associated with the underlying funds. |
Growth of $10,000 For periods ended 9/30
This chart assumes an initial investment of $10,000 made on December 18, 2013 (inception date of the Fund), for Class A, Class C, and Class I shares including any applicable sales charges or fees. Performance assumes reinvestment of dividends and capital gain distributions.
For information regarding the indexes and certain investment terms, see the Key Investment Terms starting on page 4.
11
Table of Contents
Fund Summary | Ticker Symbols: Class A: VDBAX Class C: VDBCX Class I: VDBIX |
| ¢ | The Fund is diversified and has an investment objective of high total return from current income and capital appreciation. |
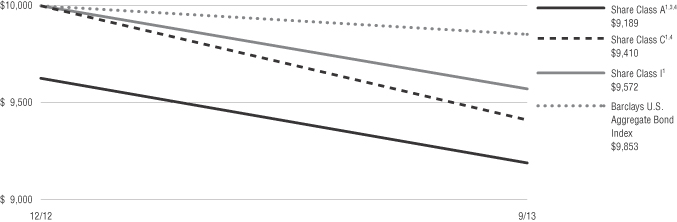
| ¢ | For the fiscal period December 18, 2012 (inception date) through September 30, 2013, the Fund’s Class A shares at NAV returned -4.53%*, Class C shares returned -4.95%*, and Class I shares returned -4.28%.* For the same period, the Barclays U.S. Aggregate Bond Index, a broad-based fixed income index, returned -1.47%*. |
* Returns less than 1 year are not annualized.
All performance figures assume reinvestment of distributions and exclude the effect of sales charges. Past performance is no guarantee of future results and current performance may be higher or lower than the performance shown above.
How did the market perform during the Fund’s fiscal period?
| ¢ | 2013 proved to be a difficult year for fixed income securities due to concerns about rising U.S. interest rates. |
| ¢ | The second quarter, in particular, was a rates-driven quarter, with 10-year Treasury rates climbing to near two-year highs on speculation of future tapering of bond purchases by the Fed. 7-Year Treasuries climbed 0.73%, while in comparison, 20-year Treasuries only rose 0.52%. |
| ¢ | Inflation-protected instruments were hit particularly hard across the entire yield curve, with 20-year TIPS rising the least, at 0.96%. |
What factors affected the Fund’s performance during its fiscal period?
| ¢ | There were few positions of safety over the year for the portfolio to move into. Duration, expressed in years, measures how sensitive a bond (or bond portfolio) is to interest rate changes. The higher a bond’s duration, the more sensitive it is to a rate change. When interest rates rise, bond prices go down. The Fund tactically reallocated towards the lowest duration position – credit-based securities – in the second quarter of 2013 and was able to avoid the majority of significant losses in Treasury Inflation-Protected Securities (TIPS). |
| ¢ | At the end of the fiscal year, the Fund’s benchmark, the Barclays U.S. Aggregate Bond Index returned -1.47% since the Fund’s inception on December 18, 2012. As of this writing, the effective duration for the Index is approximately five years, while the approximate duration for the Fund is seven to ten years (depending on portfolio construction). Due to the Fund’s higher duration, it closed out the fiscal year underperforming the benchmark. |
The preceding information is the opinion of portfolio management. Any such opinions are subject to change at any time based on market or other conditions and should not be relied upon as investment advice. Past performance is no guarantee of future results and there is no guarantee that market forecasts will be realized.
There is no guarantee that the Fund will meet its objectives.
| Asset Allocation | ||||
The following table presents asset allocations within certain sectors and as a percentage of total investments as of September 30, 2013.
|
| |||
Exchange Traded Funds | 99 | % | ||
Other (includes short-term investments) | 1 | |||
|
| |||
Total | 100 | % | ||
|
| |||
Debt securities are subject to various risks, the most prominent of which are credit and interest rate risk. The issuer of a security may fail to make payments in a timely manner. Values of debt securities may rise and fall in response to changes in interest rates. This risk may be enhanced with longer-term maturities. The value of an ETF may be more volatile than the underlying portfolio of securities the ETF is designed to track. The costs of owning the ETF may exceed the cost of investing directly in the underlying securities. There is a greater level of credit risk and price volatility involved with high yield securities than investment grade securities. Securities in the fund may go up or down in response to the prospects of individual companies and general economic conditions. Price changes may be short or long term. U.S. government securities may be subject to price fluctuations. An agency may default on an obligation not backed by the United States. Any guarantee on U.S. government securities does not apply to the value of the fund’s shares
For information regarding the indexes and certain investment terms, see the Key Investment Terms starting on page 4.
12
Table of Contents
Disciplined Select Bond Fund (Continued)
| Average Annual Total Returns1 for periods ended 9/30/13 | ||||||||
| Since Inception | Inception Date | |||||||
| Class A Shares at NAV2 | -4.53 | % | 12/18/12 | |||||
| Class A Shares at POP3,4 | -8.11 | 12/18/12 | ||||||
| Class C Shares at NAV2 | -4.95 | 12/18/12 | ||||||
| Class C Shares with CDSC4 | -5.90 | 12/18/12 | ||||||
| Class I Shares at NAV | -4.28 | 12/18/12 | ||||||
| Barclays U.S. Aggregate Bond Index | -1.47 | — | 5 | |||||
Fund Expense Ratios6: A Shares: Gross 1.81%, Net 1.59%; C Shares: Gross 2.56%, Net 2.34%; I Shares: Gross 1.56%, Net 1.34%.
All returns represent past performance which is no guarantee of future results. Current performance may be higher or lower than the performance shown. The investment return and principal value of an investment will fluctuate so that an investor’s shares, when redeemed, may be worth more or less than their original cost. The above table and graph below do not reflect the deduction of taxes that a shareholder would pay on fund distributions or the redemption of shares. Please visit Virtus.com for performance data current to the most recent month-end.
| 1 | Total returns are historical and include changes in share price and the reinvestment of both dividends and capital gains distributions. |
| 2 | “NAV” (Net Asset Value) total returns do not include the effect of any sales charge. |
| 3 | “POP” (Public Offering Price) total returns include the effect of the maximum front-end 5.75% sales charge. |
| 4 | “CDSC” (Contingent Deferred Sales Charge) is applied to redemptions of certain classes of shares that do not have a sales charge applied at the time of purchase. CDSC charges for certain redemptions of Class A shares made within 18 months of purchase in which a finder’s fee was paid and all redemptions of Class C shares within the first year are 1% and 0% thereafter. |
| 5 | The since inception index returns are from the Fund’s inception date. |
| 6 | The expense ratios of the Fund are set forth according to the prospectus for the Fund effective January 31, 2013 and may differ from the expense ratios disclosed in the Financial Highlights tables in this report. See the Financial Highlights for more current expense ratios. Net Expense: Expenses reduced by the contractual fee waiver in effect through January 31, 2014. Gross Expense: Does not reflect the effect of the fee waiver. Expense ratios do reflect fees and expenses associated with the underlying funds. |
Growth of $10,000 For periods ended 9/30
This chart assumes an initial investment of $10,000 made on December 18, 2012 (inception date of the Fund), for Class A, Class C, and Class I shares including any applicable sales charges or fees. Performance assumes reinvestment of dividends and capital gain distributions.
For information regarding the indexes and certain investment terms, see the Key Investment Terms starting on page 4.
13
Table of Contents
Disciplined Select Country Fund
Fund Summary | Ticker Symbols: Class A: VDCAX Class C: VDCCX Class I: VDCIX |
| ¢ | The Fund is diversified and has an investment objective of seeking capital appreciation. |
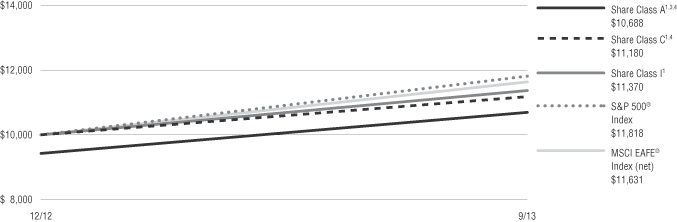
| ¢ | For the fiscal period December 18, 2012 (inception date) through September 30, 2013, the Fund’s Class A shares at NAV returned 13.40%*, Class C shares returned 12.80%*, and Class I shares returned 13.70%.* For the same period, S&P 500® Index, a broad-based equity index, returned 18.18%*, and the MSCI EAFE® Index (net), the Fund’s style-specific benchmark appropriate for comparison, returned 16.31%*. |
* Returns less than 1 year are not annualized.
All performance figures assume reinvestment of distributions and exclude the effect of sales charges. Past performance is no guarantee of future results and current performance may be higher or lower than the performance shown above.
How did the market perform during the Fund’s fiscal period?
| ¢ | Despite fourth quarter 2012 concerns over potentially slowing growth in Europe and reduced economic growth forecasts for emerging markets, the MSCI EAFE® Index (net) posted double-digit returns from the Fund’s inception on December 18, 2012 through the end of its fiscal year on September 30, 2013. |
| ¢ | International equities diverged from U.S. equities in the second quarter of 2013, with the S&P 500® Index gaining 2.9%, while the MSCI EAFE® Index (net) lost 1.0%. This divergence corrected in the third quarter of 2013, with the MSCI EAFE® Index (net) posting an 11.56% return and the S&P 500® Index only gaining 5.25% as the Fed and U.S. Congress introduced more uncertainty into the market. |
What factors affected the Fund’s performance during it’s fiscal period?
| ¢ | Throughout the fiscal year, a strong divergence in the performance of individual countries, especially in the second quarter, led to the removal of several countries from the portfolio, including Italy, Spain, and France. |
| ¢ | However, a strong rally at the beginning of the third quarter led to the reintroduction of many of those previously lagging countries – including Italy, Spain, and France – in July. |
| ¢ | This removal, and subsequent reintroduction, of several countries to the portfolio led to moderate total return underperformance for the Fund relative to the MSCI EAFE® Index (net), as these countries outperformed their peers during the period they were out of the portfolio. |
The preceding information is the opinion of portfolio management. Any such opinions are subject to change at any time based on market or other conditions and should not be relied upon as investment advice. Past performance is no guarantee of future results and there is no guarantee that market forecasts will be realized.
There is no guarantee that the Fund will meet its objectives.
| Asset Allocation | ||||
The following table presents asset allocations within certain sectors and as a percentage of total investments as of September 30, 2013.
|
| |||
Exchange Traded Funds | 99 | % | ||
Other (includes short-term investments) | 1 | |||
|
| |||
Total | 100 | % | ||
|
| |||
The market price of equity securities may be affected by financial market, industry, or issuer-specific events. Focus on a particular style or on small or medium sized companies may enhance that risk. The value of an ETF may be more volatile than the underlying portfolio of securities the ETF is designed to track. The costs of owning the ETF may exceed the cost of investing directly in the underlying securities. Investing internationally involves additional risks such as currency, political, accounting, economic and market risk.
For information regarding the indexes and certain investment terms, see the Key Investment Terms starting on page 4.
14
Table of Contents
Disciplined Select Country Fund (Continued)
| Average Annual Total Returns1 for periods ended 9/30/13 | ||||||||
| Since Inception | Inception Date | |||||||
| Class A Shares at NAV2 | 13.40 | % | 12/18/12 | |||||
| Class A Shares at POP3,4 | 6.88 | 12/18/12 | ||||||
| Class C Shares at NAV2 | 12.80 | 12/18/12 | ||||||
| Class C Shares with CDSC4 | 11.80 | 12/18/12 | ||||||
| Class I Shares at NAV | 13.70 | 12/18/12 | ||||||
S&P 500® Index | 18.18 | 5 | — | |||||
| MSCI EAFE® Index (net) | 16.31 | 5 | — | |||||
Fund Expense Ratios6: A Shares: Gross 2.50%, Net 2.21%; C Shares: Gross 3.25%, Net 2.96%; I Shares: Gross 2.25%, Net 1.96%.
All returns represent past performance which is no guarantee of future results. Current performance may be higher or lower than the performance shown. The investment return and principal value of an investment will fluctuate so that an investor’s shares, when redeemed, may be worth more or less than their original cost. The above table and graph below do not reflect the deduction of taxes that a shareholder would pay on fund distributions or the redemption of shares. Please visit Virtus.com for performance data current to the most recent month-end.
| 1 | Total returns are historical and include changes in share price and the reinvestment of both dividends and capital gains distributions. |
| 2 | “NAV” (Net Asset Value) total returns do not include the effect of any sales charge. |
| 3 | “POP” (Public Offering Price) total returns include the effect of the maximum front-end 5.75% sales charge. |
| 4 | “CDSC” (Contingent Deferred Sales Charge) is applied to redemptions of certain classes of shares that do not have a sales charge applied at the time of purchase. CDSC charges for certain redemptions of Class A shares made within 18 months of purchase in which a finder’s fee was paid and all redemptions of Class C shares within the first year are 1% and 0% thereafter. |
| 5 | The since inception index returns are from the Fund’s inception date. |
| 6 | The expense ratios of the Fund are set forth according to the prospectus for the Fund effective January 31, 2013 and may differ from the expense ratios disclosed in the Financial Highlights tables in this report. See the Financial Highlights for more current expense ratios. Net Expense: Expenses reduced by the contractual fee waiver in effect through January 31, 2014. Gross Expense: Does not reflect the effect of the fee waiver. Expense ratios do reflect fees and expenses associated with the underlying funds. |
Growth of $10,000 For periods ended 9/30
This chart assumes an initial investment of $10,000 made on December 18, 2012 (inception date of the Fund), for Class A, Class C, and Class I shares including any applicable sales charges or fees. Performance assumes reinvestment of dividends and capital gain distributions.
For information regarding the indexes and certain investment terms, see the Key Investment Terms starting on page 4.
15
Table of Contents
Fund Summary | Ticker Symbols: Class A: VHFAX Class C: VHFCX Class I: VHFIX |
| ¢ | The Fund is diversified and has an investment objective of seeking capital appreciation and current income. |
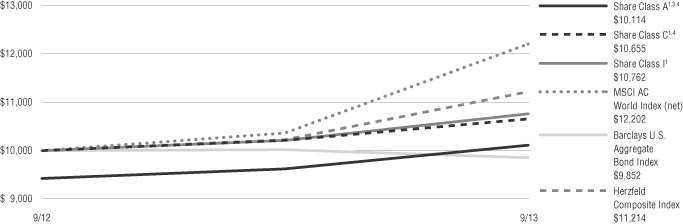
| ¢ | For the fiscal year ended September 30, 2013, the Fund’s Class A shares at NAV returned 5.10%, Class C shares returned 4.36%, and Class I shares returned 5.41%. For the same period, the MSCI AC World Index (net), a broad-based fixed equity index returned 17.73%, the Barclays U.S. Aggregate Bond Index returned -1.68% and the Herzfeld Fund Composite Index the Fund’s style specific benchmark appropriate for comparison returned 9.66%. |
All performance figures assume reinvestment of distributions and exclude the effect of sales charges. Past performance is no guarantee of future results and current performance may be higher or lower than the performance shown above.
How did the markets perform during the Fund’s fiscal year?
| ¢ | The Herzfeld Fund invests in all types of closed-end funds, including those that focus on equity and bond markets as well as funds that invest domestically and globally. There was a divergence in performance of these categories over the course of the fiscal year, which was in line with performance of the underlying sectors. From September 2012 through mid-May 2013, both equity and bond categories turned in strong performances. |
| ¢ | On May 22, 2013, Federal Reserve Chairman Ben Bernanke’s comments that the Fed’s policy of open market bond purchases may be tapered before year-end turned out to be a pivotal market event. Fear that interest rates were poised to rise caused widespread selling in fixed income markets and pressure on the net asset values (NAVs) and share prices of closed-end income funds. |
| ¢ | Investors redeemed bond-specialist open-end mutual funds as long-term yields rose. Selling by mutual funds to raise cash to meet these redemptions further exacerbated pressure on underlying bond markets. |
What factors affected the Fund’s performance during its fiscal year?
| ¢ | One of the Fund’s primary investment themes is to take advantage of inefficiencies in the closed-end |
fund market. Portfolio holdings are added when discounts are wider than the average discount for all closed-end funds, similar closed-end funds, and/or wider than the average discount for a particular closed-end fund. Turbulence in underlying markets during the latter part of the Fund’s fiscal year resulted in underperformance; however, it provided opportunities to add positions at attractive valuations to potentially benefit when valuations recover. |
| ¢ | The average valuation of all closed-end funds as measured by premiums and discounts widened by 7.10 percentage points, from an average premium of 0.38% on September 30, 2012 to a discount of 6.72% on September 30, 2013. |
| ¢ | The average discount of the bond fund category widened even more dramatically, by 9.27 percentage points, from an average premium of 3.24% to an average discount of 6.03%. |
| ¢ | Equity markets were also impacted by the negative sentiment surrounding the bond market correction, and they experienced additional volatility between June and September. Discounts for all closed-end equity categories widened over the course of the fiscal year. In particular, the average discount of specialized equity funds, many of which focus on providing income, widened by 4.61 percentage points from a discount of -3.3% as of September 30, 2012 to a discount of 7.94% as of September 30, 2013. |
| ¢ | Approximately three-quarters of all closed-end funds use leverage. The primary reason they do so is to boost earnings and distributions to common shareholders; however, leverage also has the effect of magnifying changes in NAV. This means that closed-end funds tend to outperform in rising markets and underperform in falling markets. Over the past fiscal year, leverage resulted in the closed-end bond funds in the portfolio underperforming underlying bond markets, in general. |
| ¢ | A combination of discounts widening and negative share price returns for the majority of closed-end funds in our investment universe made it difficult for the Fund to keep pace with its benchmark. |
| ¢ | The Fund had a particularly large cash position of 36% in mid-March 2013 and coming into the bond |
market declines. This available cash was used to buy into market weakness and discount widening. |
| ¢ | The Fund was overweight equity closed-end funds versus bond-specialist funds earlier in the year, which helped performance. After February, a larger portion of available cash was deployed into bond fund holdings. The shift in allocations is summarized here: |
| February 28, 2013 | May 31, 2013 | September 30, 2013 | ||||||||||
Equity Funds | 52 | % | 57 | % | 58 | % | ||||||
Bond Funds | 21 | % | 30 | % | 28 | % | ||||||
Cash | 27 | % | 13 | % | 14 | % | ||||||
| ¢ | The Fund took advantage of corporate actions for underlying holdings during the year. For instance, the Fund participated in tender offers for five holdings in the portfolio. Tender offers for closed-end funds typically allow shareholders to submit their holding in exchange for a price at or close to NAV. The number of shares accepted for payment varies depending on the terms of the offer and overall level of participation. |
| ¢ | The Fund also participated in two rights offerings during the period, another type of corporate action. Rights offerings permit shareholders to buy additional shares of a fund at a specified discount to the market price and/or NAV per share. This allowed the Fund to buy shares at attractive entry prices, typically at wider discounts than the average for that particular fund. In addition, while not participating in other ongoing rights offerings, the Fund was able to purchase funds whose share prices were under pressure from rights offerings. |
| ¢ | The percentage of the Fund allocated to closed-end bond fund holdings was increased aggressively following the bond market downturn in May. To a certain extent, the Fund suffered from being too early in entering those sectors of the market as prices of bond funds continued to decline and discounts continued to widen. |
| ¢ | Closed-end municipal bond funds were added to the portfolio in late May and accounted for approximately 5.2% of holdings as of September 30, 2013. Both underlying municipal bonds and closed-end municipal bond funds continue to be out-of-favor, putting pressure on share prices. |
For information regarding the indexes and certain investment terms, see the Key Investment Terms starting on page 4.
16
Table of Contents
| Herzfeld Fund (Continued) |
| ¢ | A defensive allocation of a precious metals-specialist fund was a drag on performance over the entire fiscal period. |
| ¢ | Our holdings in emerging market economies were also hard hit after Fed Chairman Bernanke’s Congressional testimony on May 22, 2013. For instance, our equity allocations to funds specializing in Thailand, Indonesia, and Singapore, which comprised 4.75% of the Fund before that date, lagged the MSCI AC World Index (net). Our fixed income allocations to the Asian and emerging market debt funds, which comprised 4.28% of the Fund prior to that date, underperformed our fixed income benchmark, the Barclays U.S. Aggregate Bond Index. |
| ¢ | Closed-end fund investors tend to overreact to negative news. This has resulted in sustained wide discounts since late May, and we expect discount levels to remain under pressure through 2013 year-end. Seasonal factors related to repositioning of investors’ portfolios for tax purposes typically result in the widest discounts occurring at or near calendar year-ends. We expect this will continue to put pressure on performance through calendar year 2013. |
The preceding information is opinion of portfolio management. Any such opinions are subject to change at any time based on market or other conditions and should not be relied upon as investment advice. Past performance is no guarantee of future results and there is no guarantee that market forecasts will be realized.
There is no guarantee that the Fund will meet its objectives.
| Asset Allocation | ||||
The following table presents asset allocations within certain sectors and as a percentage of total investments as of September 30, 2013.
|
| |||
Fixed Income Funds | 28 | % | ||
Equity Funds | 28 | |||
International Equity Funds | 23 | |||
International Fixed Income Funds | 3 | |||
Municipal Bond Funds | 5 | |||
Convertible Funds | 4 | |||
Other (includes short-term investments) | 9 | |||
|
| |||
Total | 100 | % | ||
|
| |||
Closed-end funds may trade at a discount from their net asset values, which may affect whether the fund will realize gains or losses. They may also employ leverage, which may increase volatility. The market price of equity securities may be affected by financial market, industry, or issuer-specific events. Focus on a particular style or on small or medium-sized companies may enhance that risk. Debt securities are subject to various risks, the most prominent of which are credit and interest rate risk. The issuer of a security may fail to make payments in a timely manner. Values of debt securities may rise and fall in response to changes in interest rates. This risk may be enhanced with longer-term maturities. Investing internationally, especially in emerging markets, involves additional risks such as currency, political, accounting, economic, and market risk. U.S. government securities may be subject to price fluctuations. An agency may default on an obligation not backed by the United States. Any guarantee on U.S. government securities does not apply to the value of the fund’s shares. Because the fund can invest in other funds, it indirectly bears its proportionate share of the operating expenses and management fees of the underlying fund(s). For additional information on these and other risk considerations, please see the fund’s prospectus.
For information regarding the indexes and certain investment terms, see the Key Investment Terms starting on page 4.
17
Table of Contents
Herzfeld Fund (Continued)
| Average Annual Total Returns1 for periods ended 9/30/13 | ||||||||||||
| 1 year | Since Inception | Inception Date | ||||||||||
| Class A Shares at NAV2 | 5.10 | % | 6.82 | % | 9/5/12 | |||||||
| Class A Shares at POP3,4 | -0.94 | 1.06 | 9/5/12 | |||||||||
| Class C Shares at NAV2 and with CDSC4 | 4.36 | 6.12 | 9/5/12 | |||||||||
| Class I Shares at NAV2 | 5.41 | 7.12 | 9/5/12 | |||||||||
MSCI AC World Index (net) | 17.73 | 20.47 | 5 | — | ||||||||
| Barclays U.S. Aggregate Bond Index | -1.68 | -1.39 | 5 | — | ||||||||
| Herzfeld Composite Index | 9.66 | 11.32 | 5 | — | ||||||||
Fund Expense Ratios6: A Shares: Gross 2.84%, Net 2.58%; C Shares: Gross 3.59%, Net 3.33%; I Shares: Gross 2.59%, Net 2.33%.
All returns represent past performance which is no guarantee of future results. Current performance may be higher or lower than the performance shown. The investment return and principal value of an investment will fluctuate so that an investor’s shares, when redeemed, may be worth more or less than their original cost. The above table and graph below do not reflect the deduction of taxes that a shareholder would pay on fund distributions or the redemption of shares. Please visit Virtus.com for performance data current to the most recent month-end.
| 1 | Total returns are historical and include changes in share price and the reinvestment of both dividends and capital gains distributions. |
| 2 | “NAV” (Net Asset Value) total returns do not include the effect of any sales charge. |
| 3 | “POP” (Public Offering Price) total returns include the effect of the maximum front-end 5.75% sales charge. |
| 4 | “CDSC” (Contingent Deferred Sales Charge) is applied to redemptions of certain classes of shares that do not have a sales charge applied at the time of purchase. CDSC charges for certain redemptions of Class A shares made within 18 months of purchase in which a finder’s fee was paid and all redemptions of Class C shares within the first year are 1% and 0% thereafter. |
| 5 | The since inception indexes returns are from the Fund’s inception date. |
| 6 | The expense ratios of the Fund are set forth according to the prospectus for the Fund effective January 31, 2013 and may differ from the expense ratios disclosed in the Financial Highlights tables in this report. See the Financial Highlights for more current expense ratios. Net Expense: Expenses reduced by the contractual fee waiver in effect through January 31, 2014. Gross Expense: Does not reflect the effect of the fee waiver. |
Growth of $10,000 For periods ended 9/30
This chart assumes an initial investment of $10,000 made on September 5, 2012 (inception date of the Fund), for Class A, Class C, and Class I shares including any applicable sales charges or fees. Performance assumes reinvestment of dividends and capital gain distributions.
For information regarding the indexes and certain investment terms, see the Key Investment Terms starting on page 4.
18
Table of Contents
Fund Summary | Ticker Symbols: Class A: PHCHX Class B: PHCCX Class C: PGHCX Class I: PHCIX |
| ¢ | The Fund is diversified and has a primary investment objective of high current income and a secondary objective of capital growth. |
| ¢ | For the fiscal year ended September 30, 2013, the Fund’s Class A shares at NAV returned 5.98%, Class B shares returned 5.06%, and Class C shares returned 5.00%. Class I shares returned 6.25%. For the fiscal year ended September 30, 2013, the Barclays U.S. Aggregate Bond Index, a broad-based fixed income index, returned -1.68%, and the Barclays U.S. High-Yield 2% Issuer Capped Bond Index, the Fund‘s style-specific index appropriate for comparison, returned 7.14%. |
All performance figures assume reinvestment of distributions and exclude the effect of sales charges. Past performance is no guarantee of future results and current performance may be higher or lower than the performance shown above.
How did the market perform during the Fund’s fiscal year?
| ¢ | High yield was the best-performing fixed income sector over the past year among the 14 sectors that we focus on. The high yield sector benefited from a benign credit environment, low default rate, the lack of a maturity wall, and massive liquidity being pumped into the global economy by large global central banks. |
| ¢ | Although interest rates have risen over the year, their rise has been tempered by the excessive political bickering in Washington D.C. and the Fed not reigning in the effects from its latest quantitative easing (QE) program. The high yield sector has continued to be viewed by investors as the best place to invest if income is a priority. |
| ¢ | Investors were rewarded by taking credit risk over the past year as CCC-rated bonds handily outpaced single-B’s and even more so BB’s. In general, the lack of a downturn in credit quality and lower duration of CCC’s helped spur the outperformance. |
| ¢ | Fundamentals have remained strong within the high yield sector as the default rate has stayed well below the historical average. Technicals have been mixed, with issuance continuing at the torrid pace of the last 18-24 months despite large negative outflows that permeated the asset class for much of 2013. |
What factors affected the Fund’s performance during its fiscal year?
| ¢ | The outperformance of the high yield sector contributed to the positive return for the Fund for the fiscal year. |
| ¢ | Positive contributors to the Fund during the year were issue selection within the high yield sector, as well as some of our deliberate overweights and underweights within certain industries. |
| ¢ | An overweight that helped performance was the aerospace/defense industry, while three underweights (media-cable, health care, and pipelines) also made positive performance contributions. The out-of-index bet on asset-backed securities was also another positive contributor. |
| ¢ | Detractors from performance were two-fold: 1) looking outside of the benchmark for alpha, with a bet on emerging markets and residential mortgage-backed securities, and 2) poor issue selection within the banking, supermarkets, and independent energy industries. |
The preceding information is the opinion of portfolio management. Any such opinions are subject to change at any time based upon market or other conditions and should not be relied upon as investment advice. Past performance is no guarantee of future results, and there is no guarantee that market forecasts will be realized.
There is no guarantee that the Fund will meet its objectives.
Debt securities are subject to various risks, the most prominent of which are credit and interest rate risk. The issuer of a security may fail to make payments in a timely manner. Values of debt securities may rise and fall in response to changes in interest rates. This risk may be enhanced with longer-term maturities. There is a greater level of credit risk and price volatility involved with high-yield securities than investment grade securities. Investing internationally, especially in emerging markets, involves additional risks such as currency, political, accounting, economic, and market risk. A fund that focuses its investments in a particular industry or sector will be more sensitive to conditions that affect that industry or sector than a non-concentrated fund.
| Asset Allocation | ||||
The following table presents asset allocations within certain sectors as a percentage of total investments as of September 30, 2013.
|
| |||
Consumer Discretionary | 24 | % | ||
Financials | 13 | |||
Telecommunication Services | 10 | |||
Energy | 9 | |||
Industrials | 9 | |||
Materials | 9 | |||
Health Care | 8 | |||
Other (includes short-term investments) | 18 | |||
|
| |||
Total | 100 | % | ||
|
| |||
For information regarding the indexes and certain investment terms, see the Key Investment Terms starting on page 4.
19
Table of Contents
High Yield Fund (Continued)
| Average Annual Total Returns1 for periods ended 9/30/13 | ||||||||||||||||||||
| 1 year | 5 years | 10 years | Since Inception | Inception Date | ||||||||||||||||
| Class A Shares at NAV2 | 5.98 | % | 9.13 | % | 5.79 | % | — | — | ||||||||||||
| Class A Shares at POP3,4 | 2.00 | 8.30 | 5.39 | — | — | |||||||||||||||
| Class B Shares at NAV2 | 5.06 | 8.29 | 4.99 | — | — | |||||||||||||||
| Class B Shares with CDSC4 | 1.08 | 8.29 | 4.99 | — | — | |||||||||||||||
| Class C Shares at NAV2 and with CDSC4 | 5.00 | 8.33 | 5.01 | — | — | |||||||||||||||
| Class I Shares at NAV2 | 6.25 | — | — | 7.62 | % | �� | 8/8/12 | |||||||||||||
| Barclays U.S. Aggregate Bond Index | -1.68 | 5.41 | 4.59 | -0.88 | 5 | — | ||||||||||||||
| Barclays U.S. High Yield 2% Issuer Capped Bond Index | 7.14 | 13.51 | 8.85 | 7.95 | 5 | — | ||||||||||||||
Fund Expense Ratios6: A Shares: Gross 1.31%, Net 1.15% B Shares: Gross 2.06%, Net 1.90% C Shares: Gross 2.06%, Net 1.90% Class I: Gross 1.06% Net 0.90%.
All returns represent past performance which is no guarantee of future results. Current performance may be higher or lower than the performance shown. The investment return and principal value of an investment will fluctuate so that an investor’s shares, when redeemed, may be worth more or less than their original cost. The above table and graph below do not reflect the deduction of taxes that a shareholder would pay on fund distributions or the redemption of shares. Please visit Virtus.com for performance data current to the most recent month-end.
| 1 | Total returns are historical and include changes in share price and the reinvestment of both dividends and capital gains distributions. |
| 2 | “NAV” (Net Asset Value) total returns do not include the effect of any sales charge. |
| 3 | “POP” (Public Offering Price) total returns include the effect of the maximum front-end 3.75% sales charge. |
| 4 | “CDSC” (Contingent Deferred Sales Charge) is applied to redemptions of certain classes of shares that do not have a sales charge applied at the time of purchase. CDSC charges for B shares decline from 5% to 0% over a five year period. CDSC charges for certain redemptions of Class A shares made within 18 months of purchase in which a finder’s fee was paid and all redemptions of Class C shares within the first year are 1% and 0% thereafter. |
| 5 | The since inception index returns are from the inception date of Class I. |
| 6 | The expense ratios of the Fund are set forth according to the prospectus for the Fund effective January 31, 2013 as supplemented and revised and may differ from the expense ratios disclosed in the Financial Highlights tables in this report. See the Financial Highlights for more current expense ratios. Net Expense: Expenses reduced by voluntary fee waiver which may be discontinued at any time. Gross Expense: Does not reflect the effect of the voluntary fee waiver. |
Growth of $10,000 For periods ended 9/30
This chart assumes an initial investment of $10,000 made on September 30, 2003, for Class A, Class B, and Class C shares including any applicable sales charges or fees. Performance assumes reinvestment of dividends and capital gain distributions.
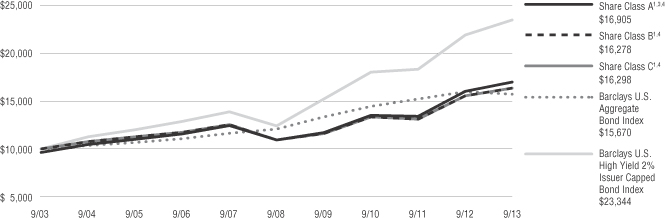
The indexes are unmanaged and not available for direct investment; therefore, their performance does not reflect the expenses associated with active management of an actual portfolio.
For information regarding the indexes and certain investment terms, see the Key Investment Terms starting on page 4.
20
Table of Contents
Fund Summary | Ticker Symbols: Class A: VLVAX Class C: VLVIX Class I: VLVCX |
| ¢ | The Fund is diversified and has an investment objective of seeking capital appreciation. |
| ¢ | For the fiscal period June 11, 2013 (inception date) through September 30, 2013, the Fund’s Class A shares at NAV returned 2.40%*, Class C shares returned 2.10%*, and Class I shares returned 2.50%.* For the same period, the S&P 500® Index, a broad-based fixed equity index, and the Fund’s style-specific benchmark appropriate for comparison returned 4.06%*. |
* Returns less than 1 year are not annualized.
All performance figures assume reinvestment of distributions and exclude the effect of sales charges. Past performance is no guarantee of future results and current performance may be higher or lower than the performance shown above.
There is no guarantee that the Fund will meet its objectives.
| † | The Fund is less than six months old — No commentary required. |
| Asset Allocation | ||||
The following table presents asset allocations within certain sectors and as a percentage of total investments as of September 30, 2013.
|
| |||
Exchange Traded Funds | 99 | % | ||
Other (includes short-term investments) | 1 | |||
|
| |||
Total | 100 | % | ||
|
| |||
The market price of equity securities may be affected by financial market, industry, or issuer-specific events. Focus on a particular style or on small or medium-sized companies may enhance that risk. The value of an ETF may be more volatile than the underlying portfolio of securities the ETF is designed to track. The costs of owning the ETF may exceed the cost of investing directly in the underlying securities. Securities in the fund may go up or down in response to the prospects of individual companies and general economic conditions. Price changes may be short or long term. Selling call options may limit a fund’’s opportunity to profit from the increase in price of its underlying portfolio. Buying call options risks the loss of the premium paid for those options.
For information regarding the indexes and certain investment terms, see the Key Investment Terms starting on page 4.
21
Table of Contents
THIS PAGE INTENTIONALLY BLANK.
Table of Contents
Multi-Sector Intermediate Bond Fund
Fund Summary | Ticker Symbols: Class A: NAMFX Class B: NBMFX Class C: NCMFX Class I: VMFIX |
| ¢ | The Fund is diversified and has an investment objective to maximize current income while preserving capital. |
| ¢ | For the fiscal year ended September 30, 2013, the Fund’s Class A shares at NAV returned 2.59%, Class B shares returned 1.83%, Class C shares returned 1.90%, and Class I shares returned 2.85%. For the same period, the Barclays U.S. Aggregate Bond Index, which is both the Fund’s broad-based and style-specific fixed income index, returned -1.68%. |
All performance figures assume reinvestment of distributions and exclude the effect of sales charges. Past performance is no guarantee of future results and current performance may be higher or lower than the performance shown above.
How did the market perform during the Fund’s fiscal year?
| ¢ | Most fixed income spread sectors (the non-governmental sectors of the fixed income markets) outperformed U.S. Treasuries during the Fund’s fiscal year. The overall economic picture continued to be supportive of spread sectors as growth expectations remained positive but subdued enough to likely keep inflation at low levels and the Fed from raising short-term interest rates in the immediate future. Spread sectors were also supported by an overall improvement in the U.S. macroeconomic environment, positive credit fundamentals, and continued demand for spread product. |
| ¢ | Despite the rally, there were periods of volatility during the year as headwinds still exist. Various factors, including uncertainty surrounding the impact of the U.S. presidential elections, the “fiscal cliff,” and the effects of subsequent tax increases and sequestration, resulted in periods of weakness. Despite resolution of these issues, ambiguity remains relative to the Fed’s hint at the possibility of tapering bond purchases by the end of the year (which would mark the beginning of the end of quantitative easing), the looming U.S. debt ceiling debate, and overall global growth concerns. |
| ¢ | Over the last 12 months, yields increased across the U.S. Treasury curve and the curve steepened. |
What factors affected the Fund’s performance during its fiscal year?
| ¢ | The outperformance of fixed income spread sectors relative to U.S. Treasuries was the key driver of the Virtus Multi-Sector Intermediate Bond Fund’s strong performance for the fiscal year. |
| ¢ | Among fixed income sectors, the Fund’s allocation to corporate high yield securities, high yield bank loans, corporate high quality, non-agency commercial mortgage-backed securities, and non-agency residential mortgage-backed securities were all significant positive contributors to performance for the fiscal year. |
| ¢ | During the fiscal year, the Fund’s allocation to the non-U.S. dollar sector detracted from performance, as did our higher quality bias in the corporate high yield sector as lower quality outperformed. |
The preceding information is the opinion of portfolio management. Any such opinions are subject to change at any time based upon market or other conditions and should not be relied upon as investment advice. Past performance is no guarantee of future results, and there is no guarantee that market forecasts will be realized.
There is no guarantee that the Fund will meet its objective.
Debt securities are subject to various risks, the most prominent of which are credit and interest rate risk. The issuer of a security may fail to make payments in a timely manner. Values of debt securities may rise and fall in response to changes in interest rates. This risk may be enhanced with longer-term maturities. There is a greater level of credit risk and price volatility involved with high-yield securities than investment grade securities. Changes in interest rates can cause both extension and prepayment risks for asset-backed securities and mortgage-backed securities. These securities are also subject to risks associated with the repayment of underlying collateral. There may be no ready market for loan participation interests. The fund may have to sell the interests at a substantial discount. Such interests are subject to the credit risk of the underlying corporate borrower. Investing internationally, especially in emerging markets, involves additional risks such as currency, political, accounting, economic, and market risk.
| Asset Allocation | ||||
The following table presents asset allocations within certain sectors and as a percentage of total investments as of September 30, 2013.
|
| |||
Corporate Bonds | 60 | % | ||
Loan Agreements | 12 | |||
Foreign Government Securities | 11 | |||
Mortgage-Backed Securities | 9 | |||
Asset-Backed Securities | 4 | |||
Preferred Stock | 3 | |||
Other (includes short-term investments) | 1 | |||
|
| |||
Total | 100 | % | ||
|
| |||
For information regarding the indexes and certain investment terms, see the Key Investment Terms starting on page 4.
23
Table of Contents
Multi-Sector Intermediate Bond Fund (Continued)
| Average Annual Total Returns1 for periods ended 9/30/13 | ||||||||||||||||||||
| 1 year | 5 years | 10 years | Since Inception | Inception Date | ||||||||||||||||
| Class A Shares at NAV2 | 2.59 | % | 10.21 | % | 6.55 | % | — | — | ||||||||||||
| Class A Shares at POP3,4 | -1.26 | 9.38 | 6.15 | — | — | |||||||||||||||
| Class B Shares at NAV2 | 1.83 | 9.37 | 5.75 | — | — | |||||||||||||||
| Class B Shares with CDSC4 | -2.03 | 9.37 | 5.75 | — | — | |||||||||||||||
| Class C Shares at NAV2 and with CDSC4 | 1.90 | 9.43 | 5.78 | — | — | |||||||||||||||
| Class I Shares at NAV | 2.85 | — | — | 8.80 | % | 10/1/09 | ||||||||||||||
| Barclays U.S. Aggregate Bond Index | -1.68 | 5.41 | 4.59 | 4.07 | 5 | — | ||||||||||||||
Fund Expense Ratios6: A Shares: 1.13%, B Shares: 1.88%, C Shares: 1.88%, I Shares: 0.88%.
All returns represent past performance which is no guarantee of future results. Current performance may be higher or lower than the performance shown. The investment return and principal value of an investment will fluctuate so that an investor’s shares, when redeemed, may be worth more or less than their original cost. The above table and graph below do not reflect the deduction of taxes that a shareholder would pay on fund distributions or the redemption of shares. Please visit Virtus.com for performance data current to the most recent month-end.
| 1 | Total returns are historical and include changes in share price and the reinvestment of both dividends and capital gains distributions. |
| 2 | “NAV” (Net Asset Value) total returns do not include the effect of any sales charge. |
| 3 | “POP” (Public Offering Price) total returns include the effect of the maximum front-end 3.75% sales charge. |
| 4 | “CDSC” (Contingent Deferred Sales Charge) is applied to redemptions of certain classes of shares that do not have a sales charge applied at the time of purchase. CDSC charges for B shares decline from 5% to 0% over a five year period. CDSC charges for certain redemptions of Class A shares made within 18 months of purchase in which a finder’s fee was paid and all redemptions of Class C shares within the first year are 1% and 0% thereafter. |
| 5 | The since inception index returns are from the inception date of Class I Shares. |
| 6 | The expense ratios of the Fund are set forth according to the prospectus for the Fund effective January 31, 2013, as supplemented and revised and may differ from the expense ratios disclosed in the Financial Highlights tables in this report. See the Financial Highlights for more current expense ratios. |
Growth of $10,000 For periods ended 9/30
This chart assumes an initial investment of $10,000 made on September 30, 2003, for Class A, Class B, and Class C shares including any applicable sales charges or fees. Performance assumes reinvestment of dividends and capital gain distributions.
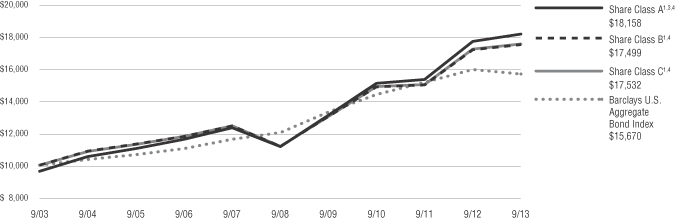
The index is unmanaged and not available for direct investment; therefore, its performance does not reflect the expenses associated with active management of an actual portfolio.
For information regarding the indexes and certain investment terms, see the Key Investment Terms starting on page 4.
24
Table of Contents
Fund Summary | Ticker Symbols: Class A: PSFRX Class C: PFSRX Class I: PSFIX |
| ¢ | The Fund is diversified and has an investment objective of high total return from both current income and capital appreciation. |
| ¢ | For the fiscal year ended September 30, 2013, the Fund’s Class A shares at NAV returned 4.84%, Class C shares returned 4.15%, and Class I shares returned 5.21%. For the same period, the Barclays U.S. Aggregate Bond Index, a fixed income index, returned -1.68%, and the S&P/LSTA Leveraged Loan Index, the Fund’s style-specific benchmark, returned 5.00%. |
All performance figures assume reinvestment of distributions and exclude the effect of sales charges. Past performance is no guarantee of future results and current performance may be higher or lower than the performance shown above.
How did the market perform during the Fund’s fiscal year?
| ¢ | The U.S. leveraged bank loan market, as represented by the S&P/LSTA Leveraged Loan Index, returned 5.0% for the fiscal year ended September 30, 2013, outperforming most other fixed income sectors with the exception of high yield. A combination of factors led to the strong relative performance of bank loans, including strong technicals due to broad demand for the asset class, a strong credit environment with below-average defaults, and rising U.S. Treasury rates. |
| ¢ | Within the bank loan market, lower quality rating tiers outperformed over the past year as a result of very liquid capital markets, strong fundamentals, and robust demand from CLOs (collateralized bond obligations) and retail investors. Specifically, distressed, CCC/Split-CCC, not rated, and single-B loans outperformed the index, while BB loans underperformed the index. |
| ¢ | Bank loans have performed very well over the past year given investors’ increased concern over rising interest rates and in an environment where the 10 year Treasury yield increased by 0.98% from near-record lows to 2.61% as of September 30, 2013. Bank loan market fundamentals remain strong as defaults have risen modestly to the 2.5% range but remain below the long-term average of 3.2%. Technicals have improved over the past year due |
to a combination of strong retail fund flows, growing CLO demand, and modest net new issuance. |
What factors affected the Fund’s performance during its fiscal year?
| ¢ | The positive return of the U.S. leveraged bank loan market contributed to the positive return for the Fund during the year. |
| ¢ | Overall, positive issue selection relative to the index benefited performance. Specifically, the Fund’s issue selection within the wireless, information technology, aerospace, and energy sectors helped performance. Issue selection within the diversified media, consumer durables, and financial sectors detracted from performance. |
| ¢ | Also making positive contributions to performance were the Fund’s out-of-index sector allocation to high yield and remaining fully invested. Security selection in the CCC and not rated credit tiers and an overweight to the split-B credit tier relative to the index contributed positively to performance. |
| ¢ | An underweight to the distressed credit tier and selection within the split BB credit tier detracted from Fund performance relative to the index. |
The preceding information is the opinion of portfolio management. Any such opinions are subject to change at any time based upon market or other conditions and should not be relied upon as investment advice. Past performance is no guarantee of future results, and there is no guarantee that market forecasts will be realized.
There is no guarantee that the Fund will meet its objective.
Debt securities are subject to various risks, the most prominent of which are credit and interest rate risk. The issuer of a security may fail to make payments in a timely manner. Values of debt securities may rise and fall in response to changes in interest rates. This risk may be enhanced with longer-term maturities. There may be no ready market for loan participation interests. The fund may have to sell the interests at a substantial discount. Such interests are subject to the credit risk of the underlying corporate borrower. There is a greater level of credit risk and price volatility involved with high-yield securities than investment grade securities. When a fund leverages its portfolio, the value of its shares may be more
volatile and all other risks may be compounded. Certain securities may be difficult to sell at a time and price beneficial to the fund.
| Asset Allocation | ||||
The following table presents asset allocations within certain sectors and as a percentage of total investments as of September 30, 2013.
|
| |||
Consumer Discretionary | 25 | % | ||
Information Technology | 14 | |||
Industrials | 11 | |||
Health Care | 10 | |||
Financials | 8 | |||
Consumer Staples | 7 | |||
Materials | 7 | |||
Other (includes short-term investments) | 18 | |||
|
| |||
Total | 100 | % | ||
|
| |||
For information regarding the indexes and certain investment terms, see the Key Investment Terms starting on page 4.
25
Table of Contents
Senior Floating Rate Fund (Continued)
| Average Annual Total Returns1 for periods ended 9/30/13 | ||||||||||||||||
| 1 year | 5 years | Since Inception | Inception Date | |||||||||||||
| Class A Shares at NAV2 | 4.84 | % | 7.34 | % | 6.04 | % | 1/31/08 | |||||||||
| Class A Shares at POP3,4 | 1.96 | 6.74 | 5.52 | 1/31/08 | ||||||||||||
| Class C Shares at NAV2 and with CDSC4 | 4.15 | 6.58 | 5.29 | 1/31/08 | ||||||||||||
| Class I Shares at NAV | 5.21 | 7.61 | 6.32 | 1/31/08 | ||||||||||||
| Barclays U.S. Aggregate Bond Index | -1.68 | 5.41 | 4.57 | 5 | — | |||||||||||
| S&P/LSTA Leveraged Loan Index | 5.00 | 8.20 | 6.25 | 5 | — | |||||||||||
Fund Expense Ratios6: A Shares: Gross 1.24%, Net 1.20%; C Shares: Gross 1.99%, Net 1.95%; I Shares: Gross 0.99%, Net 0.95%.
All returns represent past performance which is no guarantee of future results. Current performance may be higher or lower than the performance shown. The investment return and principal value of an investment will fluctuate so that an investor’s shares, when redeemed, may be worth more or less than their original cost. The above table and graph below do not reflect the deduction of taxes that a shareholder would pay on fund distributions or the redemption of shares. Please visit Virtus.com for performance data current to the most recent month-end.
| 1 | Total returns are historical and include changes in share price and the reinvestment of both dividends and capital gains distributions. |
| 2 | “NAV” (Net Asset Value) total returns do not include the effect of any sales charge. |
| 3 | “POP” (Public Offering Price) total returns include the effect of the maximum front-end 2.75% sales charge. |
| 4 | “CDSC” (Contingent Deferred Sales Charge) is applied to redemptions of certain classes of shares that do not have a sales charge applied at the time of purchase. CDSC charges for certain redemptions of Class A shares made within 18 months of purchase in which a finder’s fee was paid and all redemptions of Class C shares within the first year are 1% and 0% thereafter. |
| 5 | The since inception index returns are from the Fund’s inception date. |
| 6 | The expense ratios of the Fund are set forth according to the prospectus for the Fund effective January 31, 2013, as supplemented and revised and may differ from the expense ratios disclosed in the Financial Highlights tables in this report. See the Financial Highlights for more current expense ratios. Net Expense: Expenses reduced by voluntary fee waiver which may be discontinued at any time. Gross Expense: Does not reflect the effect of the voluntary fee waiver. |
Growth of $10,000 For periods ended 9/30
This chart assumes an initial investment of $10,000 made on January 31, 2008 (inception date of the Fund), for Class A, Class C and Class I shares including any applicable sales charges or fees. Performance assumes reinvestment of dividends and capital gain distributions.
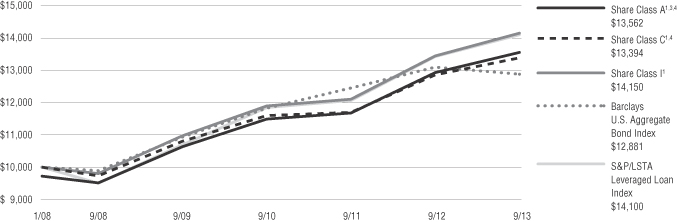
The indexes are unmanaged and not available for direct investment; therefore, their performance does not reflect the expenses associated with active management of an actual portfolio.
For information regarding the indexes and certain investment terms, see the Key Investment Terms starting on page 4.
26
Table of Contents
Fund Summary | Ticker Symbols: Class A: VWMAX Class C: VWMCX Class I: VWMIX |
| ¢ | The Fund is diversified and has an investment objective of seeking capital appreciation. |
| ¢ | For the fiscal year ended September 30, 2013, the Fund’s Class A shares at NAV returned 30.09%, Class C shares returned 29.11%, and Class I shares returned 30.37%. For the same period, the S&P 500® Index, a broad-based equity index, and the Fund’s style-specific benchmark, returned 19.34%. |
All performance figures assume reinvestment of distributions and exclude the effect of sales charges. Past performance is no guarantee of future results and current performance may be higher or lower than the performance shown above.
How did the markets perform during the Fund’s fiscal year?
| ¢ | During the 12-month fiscal period, the broader equity markets appreciated considerably, with the S&P 500® Index (“S&P”) returning 19.34%. However, the S&P components, by and large, did not experience improvements in their operating results commensurate with their stock price appreciation. |
| ¢ | In the first half of 2013, the 20 largest companies in the S&P generated revenues, on average, approximately 2.5% higher than in the prior year. Many of these companies have operating margins at or near their historic peaks, following cutbacks made in the wake of the financial crisis of 2008. Therefore, one must question whether the underlying companies have the revenue growth or margin expansion potential necessary for the S&P to deliver satisfactory returns going forward. |
What factors affected the Fund’s performance during its fiscal year?
| ¢ | The Virtus Wealth Masters Fund is designed to track the Horizon Kinetics ISE Wealth Index (“Wealth Index”). The Wealth Index is composed of publicly-listed companies owned and operated by the wealthiest, most successful investors, business executives, and entrepreneurs in the United States (“owner-operators”). The Fund allows investors to readily leverage the business acumen of the highly-skilled individuals represented in the Wealth Index. |
| ¢ | The Fund’s outperformance relative to its benchmark is largely explained by the predictive variables underlying the construction of the Wealth Index. The main criteria for inclusion in the Wealth Index are that the companies must have a wealthy individual in a decision-making role who must also own a significant vested interest in the common equity of the company. This provides an element of risk control to the Fund’s strategy; management’s equity stake suggests that the interests of company management are aligned with the interests of the common equity shareholders. |
| ¢ | By virtue of an owner-operator’s significant personal capital at risk, he or she generally enjoys greater freedom of action and an enhanced ability to focus on building long-term business value (e.g., shareholders’ equity). The owner-operator’s main avenue to personal wealth is derived from the long-term appreciation of common equity shares, not from the stock option grants, bonuses, or salary increases resulting from meeting short-term financial targets that typically serve as incentives for non- owner-operators. |
| ¢ | The Wealth Index is rebalanced quarterly, and uses an equal-weighting methodology. At the sector level, the Fund was overweight in consumer discretionary stocks relative to the benchmark, which contributed to outperformance. |
| ¢ | At the stock level, the five largest contributors to performance, and their owner-operators, were Tesla Motors, Inc. (Elon Musk), Nike, Inc. (Philip Knight), Starz LLC (John Malone), OPKO Health, Inc. (Phillip Frost), and Pharmacyclics, Inc. (Robert Duggan). |
| ¢ | The five largest detractors from performance were NovaGold Resources, Inc. (Thomas Kaplan), Apollo Group, Inc. (Peter Sperling), American Eagle Outfitters, Inc. (Jay Schottenstein), Broadcom Corp. (Henry Samueli), and RealPage, Inc. (Stephen Winn). |
The preceding information is the opinion of portfolio management. Any such opinions are subject to change at any time based on market or other conditions and should not be relied upon as investment advice. Past performance is no guarantee of future results and there is no guarantee that market forecasts will be realized.
There is no guarantee the fund will meet its objective.
| Asset Allocation | ||||
The following table presents asset allocations within certain sectors and as a percentage of total investments as of September 30, 2013.
|
| |||
Consumer Discretionary | 37 | % | ||
Financials | 16 | |||
Information Technology | 16 | |||
Industrials | 9 | |||
Health Care | 6 | |||
Energy | 5 | |||
Materials | 5 | |||
Other (includes short-term investments) | 6 | |||
|
| |||
Total | 100 | % | ||
|
| |||
The market price of equity securities may be affected by financial market, industry, or issuer-specific events. Focus on a particular style or on small or medium-sized companies may enhance that risk. A fund that focuses its investments in a particular industry or sector will be more sensitive to conditions that affect that industry or sector than a non-concentrated fund. The performance of the fund and its index may vary somewhat due to factors such as fund flows, transaction costs, and timing differences associated with additions to and deletions from its index.
For information regarding the indexes and certain investment terms, see the Key Investment Terms starting on page 4.
27
Table of Contents
Wealth Masters Fund (Continued)
| Average Annual Total Returns1 for periods ended 9/30/13 | ||||||||||||
| 1 year | Since Inception | Inception Date | ||||||||||
| Class A Shares at NAV2 | 30.09 | % | 30.54 | % | 9/5/12 | |||||||
| Class A Shares at POP3,4 | 22.61 | 23.51 | 9/5/12 | |||||||||
| Class C Shares at NAV2 and with CDSC4 | 29.11 | 29.51 | 9/5/12 | |||||||||
| Class I Shares at NAV2 | 30.37 | 30.81 | 9/5/12 | |||||||||
| S&P 500® Index | 19.34 | 21.07 | —5 | |||||||||
Fund Expense Ratios6: A Shares: Gross 1.68%, Net 1.45%; C Shares: Gross 2.43%, Net 2.20%; I Shares: Gross 1.43%, Net 1.20%.
All returns represent past performance which is no guarantee of future results. Current performance may be higher or lower than the performance shown. The investment return and principal value of an investment will fluctuate so that an investor’s shares, when redeemed, may be worth more or less than their original cost. The above table and graph below do not reflect the deduction of taxes that a shareholder would pay on fund distributions or the redemption of shares. Please visit Virtus.com for performance data current to the most recent month-end.
| 1 | Total returns are historical and include changes in share price and the reinvestment of both dividends and capital gains distributions. |
| 2 | “NAV” (Net Asset Value) total returns do not include the effect of any sales charge. |
| 3 | “POP” (Public Offering Price) total returns include the effect of the maximum front-end 5.75% sales charge. |
| 4 | “CDSC” (Contingent Deferred Sales Charge) is applied to redemptions of certain classes of shares that do not have a sales charge applied at the time of purchase. CDSC charges for certain redemptions of Class A shares made within 18 months of purchase in which a finder’s fee was paid and all redemptions of Class C shares within the first year are 1% and 0% thereafter. |
| 5 | The since inception index returns are from the Fund’s inception date. |
| 6 | The expense ratios of the Fund are set forth according to the prospectus for the Fund effective January 31, 2013 and may differ from the expense ratios disclosed in the Financial Highlights tables in this report. See the Financial Highlights for more current expense ratios. Net Expense: Expenses reduced by the contractual fee waiver in effect through January 31, 2014. Gross Expense: Does not reflect the effect of the fee waiver. |
Growth of $10,000 For periods ended 9/30
This chart assumes an initial investment of $10,000 made on September 5, 2012 (inception date of the Fund), for Class A, Class C, and Class I shares including any applicable sales charges or fees. Performance assumes reinvestment of dividends and capital gain distributions.
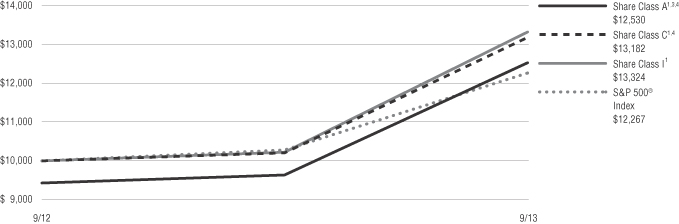
For information regarding the indexes and certain investment terms, see the Key Investment Terms starting on page 4.
28
Table of Contents
SCHEDULE OF INVESTMENTS
SEPTEMBER 30, 2013
($ reported in thousands)
| PAR VALUE | VALUE | |||||||
| MUNICIPAL BONDS—0.4% | ||||||||
| Georgia—0.3% | ||||||||
Rockdale County Water & Sewerage Authority, Taxable | $ | 255 | $ | 238 | ||||
|
| |||||||
| Michigan—0.1% | ||||||||
City of Flat Rock Finance Authority, Taxable Series A, | 65 | 68 | ||||||
| TOTAL MUNICIPAL BONDS (Identified Cost $321) | 306 | |||||||
| FOREIGN GOVERNMENT SECURITIES—5.3% | ||||||||
Bolivarian Republic of Venezuela | ||||||||
RegS 12.750%, 8/23/22(4) | 245 | 245 | ||||||
RegS 8.250%, 10/13/24(4) | 125 | 95 | ||||||
Commonwealth of Australia New South Wales Treasury Corp. Series 17 5.500%, 3/1/17 | 190 | AUD | 190 | |||||
Commonwealth of New Zealand Series 415, 6.000%, 4/15/15 | 120 | NZD | 104 | |||||
Federation of Russia | 10,050 | RUB | 325 | |||||
Hellenic Republic | ||||||||
2.000%, 2/24/23(2) | 130 | EUR | 110 | |||||
2.000%, 2/24/27(2) | 185 | EUR | 134 | |||||
Kingdom of Morocco 144A 4.250%, 12/11/22(3) | 270 | 246 | ||||||
Kingdom of Norway Series 21 Treasury Bill, 0.000%, 12/18/13 | 1,150 | NOK | 191 | |||||
Mongolia 144A 5.125%, 12/5/22(3) | 200 | 171 | ||||||
Republic of Colombia 4.375%, 3/21/23 | 490,000 | COP | 232 | |||||
Republic of Croatia 144A 6.375%, 3/24/21(3) | 280 | 289 | ||||||
Republic of Indonesia | ||||||||
Series FR-30, 10.750%, 5/15/16 | 1,745,000 | IDR | 163 | |||||
Series FR63, | 1,478,000 | IDR | 103 | |||||
Republic of Peru 144A 7.840%, 8/12/20(3) | 575 | PEN | 239 | |||||
Republic of Philippines 4.950%, 1/15/21 | 6,000 | PHP | 149 | |||||
Republic of Portugal Treasury Obligation | 130 | EUR | 154 | |||||
Republic of Turkey | 340 | TRY | 170 | |||||
Republic of Uruguay | 5,089 | UYU | 248 | |||||
| PAR VALUE | VALUE | |||||||
| FOREIGN GOVERNMENT SECURITIES—continued | ||||||||
United Mexican States | ||||||||
Series M, | 6,990 | MXN | $ | 553 | ||||
4.750%, 3/8/44 | $ | 515 | 466 | |||||
| TOTAL FOREIGN GOVERNMENT SECURITIES | ||||||||
| (Identified Cost $4,991) | 4,577 | |||||||
| MORTGAGE-BACKED SECURITIES—21.7% | ||||||||
| Agency—7.9% | ||||||||
FHLMC | ||||||||
7.500%, 4/1/14 | 1 | 1 | ||||||
7.000%, 4/1/16 | 6 | 6 | ||||||
7.000%, 1/1/33 | 94 | 110 | ||||||
5.000%, 12/1/35 | 54 | 60 | ||||||
FNMA | ||||||||
7.000%, 5/1/14 | 1 | 1 | ||||||
6.000%, 10/1/14 | 21 | 21 | ||||||
6.500%, 6/1/16 | 34 | 36 | ||||||
6.000%, 7/1/17 | 21 | 22 | ||||||
5.500%, 9/1/17 | 44 | 46 | ||||||
5.000%, 4/1/20 | 134 | 142 | ||||||
5.000%, 8/1/21 | 41 | 43 | ||||||
6.000%, 5/1/29 | 58 | 64 | ||||||
6.500%, 5/1/30 | 2 | 3 | ||||||
7.500%, 3/1/31 | 47 | 55 | ||||||
7.000%, 7/1/31 | 40 | 45 | ||||||
7.000%, 9/1/31 | 53 | 60 | ||||||
6.500%, 3/1/32 | 42 | 46 | ||||||
5.500%, 4/1/36 | 118 | 129 | ||||||
5.500%, 9/1/36 | 348 | 380 | ||||||
6.000%, 9/1/37 | 32 | 35 | ||||||
6.000%, 1/1/38 | 65 | 72 | ||||||
6.000%, 2/1/38 | 66 | 73 | ||||||
6.000%, 3/1/38 | 351 | 390 | ||||||
6.000%, 7/1/38 | 852 | 941 | ||||||
6.000%, 8/1/38 | 172 | 191 | ||||||
6.000%, 8/1/38 | 330 | 361 | ||||||
6.000%, 8/1/38 | 640 | 702 | ||||||
6.000%, 8/1/38 | 38 | 41 | ||||||
5.000%, 6/1/39 | 1,110 | 1,213 | ||||||
5.000%, 9/1/39 | 275 | 298 | ||||||
5.500%, 9/1/39 | 572 | 624 | ||||||
4.500%, 9/1/40 | 407 | 440 | ||||||
GNMA | ||||||||
8.500%, 11/15/22 | — | (10) | — | (10) | ||||
6.500%, 9/15/28 | 57 | 63 | ||||||
7.500%, 9/15/29 | 87 | 100 | ||||||
|
| |||||||
| 6,814 | ||||||||
|
| |||||||
| Non-Agency—13.8% | ||||||||
A-10 Securitization LLC | 260 | 258 | ||||||
Banc of America (Merrill Lynch) Commercial Mortgage, Inc. | 440 | 460 | ||||||
Banc of America Funding Corp. 04-B, 2A1 5.452%, 11/20/34(2) | 150 | 148 | ||||||
| PAR VALUE | VALUE | |||||||
| Non-Agency—continued | ||||||||
Banc of America Mortgage Securities, Inc. 05-3, 1A15 5.500%, 4/25/35 | $ | 213 | $ | 218 | ||||
Bayview Commercial Asset Trust 08-1, A2A, 144A 1.179%, 1/25/38(2)(3) | 244 | 241 | ||||||
BCAP LLC Trust 06-RR1, PE 5.000%, 11/25/36 | 500 | 500 | ||||||
Bear Stearns Commercial Mortgage Securities, Inc. | ||||||||
06-PW13, AM 5.582%, 9/11/41(2) | 235 | 257 | ||||||
07-T28, A3 5.793%, 9/11/42 | 904 | 920 | ||||||
07- PW15, RAM 5.363%, 2/11/44 | 250 | 254 | ||||||
Citigroup – Deutsche Bank Commercial Mortgage Trust 06-CD2, A3 5.547%, 1/15/46(2) | 1,335 | 1,381 | ||||||
Countrywide Home Loan Mortgage Pass-Through-Trust 04-6, 1A2 2.695%, 5/25/34(2) | 486 | 479 | ||||||
Credit Suisse Commercial Mortgage Trust | 262 | 243 | ||||||
Credit Suisse First Boston Mortgage Securities Corp. 04-CF2, 1M1, 144A 5.250%, 1/25/43(2)(3) | 235 | 254 | ||||||
Extended Stay America Trust 13-ESH7, A27, 144A 2.958%, 12/5/31(3) | 270 | 264 | ||||||
Goldman Sachs Mortgage Securities Corp. II | 950 | 1,054 | ||||||
Greenwich Capital Commercial Funding Corp. 07-GG9, A4 5.444%, 3/10/39 | 145 | 161 | ||||||
JPMorgan Chase Commercial Mortgage Securities Trust | ||||||||
10-CNTR, A1, 144A 3.300%, 8/5/32(3) | 419 | 438 | ||||||
06-LDP7, AM 6.056%, 4/15/45(2) | 475 | 522 | ||||||
JPMorgan Chase Mortgage Trust 04-A4, 2A1 2.463%, 9/25/34(2) | 374 | 378 | ||||||
Morgan Stanley Capital I Trust | ||||||||
07-T27, A4 5.816%, 6/11/42(2) | 565 | 638 | ||||||
05-IQ10, A4B 5.284%, 9/15/42(2) | 855 | 905 | ||||||
08-T29, A4 6.459%, 1/11/43(2) | 650 | 756 | ||||||
07-IQ14, A4 5.692%, 4/15/49(2) | 300 | 333 | ||||||
07-IQ14, AM 5.875%, 4/15/49(2) | 190 | 194 | ||||||
Motel 6 Trust 12-MTLB, D, 144A | 270 | 262 | ||||||
See Notes to Financial Statements
29
Table of Contents
VIRTUS BOND FUND
SCHEDULE OF INVESTMENTS (Continued)
SEPTEMBER 30, 2013
($ reported in thousands)
| PAR VALUE | VALUE | |||||||
| Non-Agency—continued | ||||||||
SMA Issuer I LLC | $ | 68 | $ | 68 | ||||
Washington Mutual Mortgage Pass-Through Certificates 03-S11, 3A5 5.950%, 11/25/33 | 341 | 359 | ||||||
|
| |||||||
| 11,945 | ||||||||
| TOTAL MORTGAGE-BACKED SECURITIES | ||||||||
| (Identified Cost $18,373) | 18,759 | |||||||
| ASSET-BACKED SECURITIES—4.4% | ||||||||
Avis Budget Rental Car Funding LLC (AESOP) | 375 | 374 | ||||||
Centre Point Funding LLC | 432 | 434 | ||||||
Countrywide Asset-Backed Certificates 05-1, AF5A 5.497%, 7/25/35(2) | 317 | 306 | ||||||
Fairway Outdoor Funding LLC 12-1A, A2, 144A 4.212%, 10/15/42(3) | 156 | 156 | ||||||
GSAA Home Equity Trust | 258 | 256 | ||||||
Orange Lake Timeshare Trust 12-AA, A 144A 3.450%, 3/10/27(3) | 125 | 129 | ||||||
Santander Drive Auto Receivables Trust | ||||||||
12-2, D 3.870%, 2/15/18 | 500 | 516 | ||||||
13-1, D 2.270%, 1/15/19 | 215 | 210 | ||||||
Security National Mortgage Loan Trust 04-1A, | 299 | 241 | ||||||
Sierra Timeshare Receivables Funding, LLC 12-3A, A 144A 1.870%, 8/20/29(3) | 315 | 316 | ||||||
Silverleaf Finance XV LLC | 177 | 178 | ||||||
TAL Advantage I LLC | 283 | 273 | ||||||
Tidewater Auto Receivables Trust 12-AA, B 144A 2.430%, 4/15/19(3) | 215 | 214 | ||||||
Westgate Resorts LLC | 233 | 234 | ||||||
| TOTAL ASSET-BACKED SECURITIES | ||||||||
| (Identified Cost $3,877) | 3,837 | |||||||
| CORPORATE BONDS—55.4% | ||||||||
| Consumer Discretionary—6.3% | ||||||||
Activision Blizzard, Inc. 144A | 220 | 222 | ||||||
| PAR VALUE | VALUE | |||||||
| Consumer Discretionary—continued | ||||||||
American Axle & Manufacturing, Inc. | $ | 220 | $ | 228 | ||||
Bon-Ton Department Stores, Inc. (The) | 165 | 155 | ||||||
Boyd Gaming Corp. 9.000%, 7/1/20 | 200 | 218 | ||||||
Brookfield Residential Properties, Inc. 144A 6.500%, 12/15/20(3) | 215 | 217 | ||||||
Claire’s Stores, Inc. 144A | 210 | 234 | ||||||
Clear Channel Communications, Inc. 144A | 90 | 89 | ||||||
Clear Channel Worldwide Holdings, Inc. Series B | 175 | 182 | ||||||
Dana Holding Corp. | 205 | 202 | ||||||
General Motors Co. 144A | 175 | 175 | ||||||
Hilton Worldwide Finance LLC (Hilton Worldwide Finance Corp.) 144A | 220 | 221 | ||||||
Hot Topic, Inc. 144A | 100 | 103 | ||||||
Isle of Capri Casinos, Inc. | 210 | 198 | ||||||
KOC Holding AS 144A | 200 | 170 | ||||||
Landry’s, Inc. 144A | 260 | 276 | ||||||
Live Nation Entertainment, Inc. 144A | 185 | 194 | ||||||
Meritor, Inc. | 170 | 169 | ||||||
MGM Resorts International | 215 | 226 | ||||||
Mohegan Tribal Gaming Authority 144A | 155 | 163 | ||||||
PNK Finance Corp. 144A | 175 | 179 | ||||||
QVC, Inc. 144A | 265 | 247 | ||||||
Seminole Hard Rock Entertainment, Inc. (Seminole Hard Rock International LLC) 144A | 65 | 62 | ||||||
ServiceMaster Co. | 160 | 152 | ||||||
Six Flags Entertainment Corp. 144A | 235 | 224 | ||||||
Station Casinos LLC | 230 | 244 | ||||||
Taylor Morrison Communities, Inc. 144A | 265 | 248 | ||||||
| PAR VALUE | VALUE | |||||||
| Consumer Discretionary—continued | ||||||||
Toll Brothers Finance Corp. | $ | 180 | $ | 200 | ||||
United Artists Theatre Circuit, Inc. Series BD-1 | 10 | 10 | ||||||
Wyndham Worldwide Corp. | 235 | 254 | ||||||
|
| |||||||
| 5,462 | ||||||||
|
| |||||||
| Consumer Staples—1.3% | ||||||||
Chiquita Brands International, Inc. 144A | 145 | 154 | ||||||
CVS Pass-Through-Trust 144A | 245 | 296 | ||||||
Flowers Foods, Inc. | 275 | 272 | ||||||
Ingles Markets, Inc. 144A | 170 | 165 | ||||||
Reynolds American, Inc. | 295 | 272 | ||||||
|
| |||||||
| 1,159 | ||||||||
|
| |||||||
| Energy—5.6% | ||||||||
Calumet Specialty Products Partners LP (Calumet Finance Corp.) | 160 | 178 | ||||||
CHC Helicopter SA | 160 | 171 | ||||||
Chesapeake Energy Corp. | 215 | 215 | ||||||
Compagnie Generale de Geophysique-Veritas | 200 | 205 | ||||||
Ecopetrol SA | 135 | 140 | ||||||
El Paso Pipeline Partners Operating Co. LLC | 505 | 618 | ||||||
EPL Oil & Gas, Inc. | 280 | 297 | ||||||
Gazprom OAO (Gaz Capital SA) 144A | 430 | 410 | ||||||
Novatek OAO (Novatek Finance Ltd.) 144A | 285 | 262 | ||||||
Petrobras International Finance Co. | 515 | 517 | ||||||
Petroleos de Venezuela SA RegS | 310 | 282 | ||||||
Petroleos Mexicanos | 355 | 323 | ||||||
Petropower I Funding Trust 144A | 11 | 11 | ||||||
Phillips 66 | 340 | 357 | ||||||
See Notes to Financial Statements
30
Table of Contents
VIRTUS BOND FUND
SCHEDULE OF INVESTMENTS (Continued)
SEPTEMBER 30, 2013
($ reported in thousands)
| PAR VALUE | VALUE | |||||||
| Energy—continued | ||||||||
QGOG Constellation SA 144A | $ | 220 | $ | 209 | ||||
Regency Energy Partners LP (Regency Energy Finance Corp.) 144A | 200 | 182 | ||||||
Weatherford International Ltd. | 310 | 307 | ||||||
Williams Cos., Inc. (The) | 200 | 181 | ||||||
|
| |||||||
| 4,865 | ||||||||
|
| |||||||
| Financials—24.0% | ||||||||
Air Lease Corp. | 215 | 211 | ||||||
Aircastle Ltd. | ||||||||
6.250%, 12/1/19 | 225 | 239 | ||||||
7.625%, 4/15/20 | 200 | 222 | ||||||
Akbank TAS 144A | 375 | TRY | 169 | |||||
Alfa Bank OJSC (Alfa Bond Issuance plc) RegS | 250 | 276 | ||||||
Allstate Corp. (The) | 310 | 302 | ||||||
ALROSA Finance SA 144A | 240 | 268 | ||||||
Avis Budget Car Rental LLC | 265 | 246 | ||||||
Banco de Credito e Inversiones 144A | 275 | 251 | ||||||
Banco Santander Brasil SA 144A | 415 | BRL | 173 | |||||
Banco Santander Chile 144A | 450 | 416 | ||||||
Banco Votorantim SA 144A | 300 | 311 | ||||||
Bancolombia SA | 260 | 237 | ||||||
Bank of America Corp. | ||||||||
5.750%, 8/15/16 | 250 | 276 | ||||||
5.625%, 7/1/20 | 235 | 263 | ||||||
Bank of India | ||||||||
144A 3.250%, 4/18/18(3) | 265 | 253 | ||||||
144A 3.625%, 9/21/18(3) | 265 | 251 | ||||||
Barclays Bank plc 144A | 250 | 278 | ||||||
Capital One Financial Corp. | 455 | 507 | ||||||
Carlyle Holdings Finance LLC 144A | 270 | 264 | ||||||
Chubb Corp. (The) | 250 | 268 | ||||||
Corporate Office Properties LP | 265 | 240 | ||||||
CPG Merger Sub LLC 144A | 70 | 72 | ||||||
Denali Borrower LLC (Denali Finance Corp.) 144A | 215 | 209 | ||||||
| PAR VALUE | VALUE | |||||||
| Financials—continued | ||||||||
Developers Diversified Realty Corp. | $ | 540 | $ | 662 | ||||
Development Bank of Kazakhstan JSC 144A | 290 | 268 | ||||||
Digital Realty Trust LP | 625 | 657 | ||||||
DuPont Fabros Technology LP 144A | 175 | 176 | ||||||
ESAL GmbH 144A | 200 | 178 | ||||||
Ford Motor Credit Co. LLC | 235 | 260 | ||||||
General Electric Capital Corp. | 95 | 101 | ||||||
General Motors Financial Co., Inc. 144A | 220 | 229 | ||||||
Genworth Holdings, | 320 | 321 | ||||||
Goldman Sachs Group, Inc. (The) Series D, | ||||||||
6.000%, 6/15/20 | 360 | 409 | ||||||
5.750%, 1/24/22 | 500 | 555 | ||||||
Hutchison Whampoa International Ltd. | 310 | 326 | ||||||
ING US, Inc. | 210 | 193 | ||||||
Intelsat Jackson Holdings SA 144A | 175 | 175 | ||||||
International Lease Finance Corp. | 240 | 253 | ||||||
Intesa San Paolo SpA | 215 | 215 | ||||||
Itau Unibanco Holding SA 144A | 295 | 271 | ||||||
Jefferies Group LLC | 60 | 67 | ||||||
JPMorgan Chase & Co. | 480 | 453 | ||||||
Kazakhstan Temir Zholy Finance BV 144A | 215 | 217 | ||||||
KeyCorp | 205 | 226 | ||||||
Korea Finance Corp. | 200 | 211 | ||||||
Legg Mason, Inc. | 240 | 261 | ||||||
Level 3 Financing, Inc. | 160 | 162 | ||||||
Liberty Mutual Group, Inc. 144A | 245 | 239 | ||||||
Lincoln National Corp. | 530 | 543 | ||||||
| PAR VALUE | VALUE | |||||||
| Financials—continued | ||||||||
Lukoil International Finance BV 144A | $ | 275 | $ | 256 | ||||
Macquarie Bank Ltd. 144A | 15 | 16 | ||||||
Macquarie Group Ltd. 144A | 210 | 228 | ||||||
Morgan Stanley | ||||||||
5.550%, 4/27/17 | 330 | 366 | ||||||
4.100%, 5/22/23 | 155 | 145 | ||||||
6.375%, 7/24/42 | 435 | 492 | ||||||
Nationstar Mortgage LLC | 110 | 111 | ||||||
Nordea Bank AB 144A | 265 | 262 | ||||||
Phosagro OAO (Phosagro Bond Funding Ltd.) 144A | 265 | 260 | ||||||
PKO Finance AB 144A | 255 | 250 | ||||||
Prudential Financial, Inc. | ||||||||
5.875%, 9/15/42(2) | 190 | 186 | ||||||
5.200%, 3/15/44(2)(8) | 770 | 698 | ||||||
Russian Agricultural Bank OJSC (RSHB Capital SA) 144A | 220 | 226 | ||||||
Sberbank of Russia (Sberbank Capital SA) | ||||||||
144A 4.950%, 2/7/17(3)(9) | 200 | 211 | ||||||
144A 5.125%, | 320 | 298 | ||||||
Schaeffler Holding Finance BV PIK Interest Capitalization, 144A | 200 | 211 | ||||||
SLM Corp. | 225 | 206 | ||||||
Spansion LLC | 170 | 178 | ||||||
Sun Merger Sub, Inc. 144A | 90 | 91 | ||||||
TMK OAO Via (TMK Capital) SA 144A | 210 | 200 | ||||||
Turkiye Garanti Bankasi AS 144A | 305 | 281 | ||||||
UBS AG | 500 | 553 | ||||||
UPCB Finance Ltd. | 165 | 176 | ||||||
Ventas Realty LP (Ventas Capital Corp.) | 250 | 234 | ||||||
VTB Bank OJSC (VTB Capital SA) 144A | 500 | 526 | ||||||
Yapi ve Kredi Bankasi AS 144A | 270 | 241 | ||||||
|
| |||||||
| 20,732 | ||||||||
|
| |||||||
See Notes to Financial Statements
31
Table of Contents
VIRTUS BOND FUND
SCHEDULE OF INVESTMENTS (Continued)
SEPTEMBER 30, 2013
($ reported in thousands)
| PAR VALUE | VALUE | |||||||
| Health Care—1.8% | ||||||||
Cardinal Health, Inc. | $ | 130 | $ | 121 | ||||
HCA, Inc. | 160 | 174 | ||||||
inVentiv Health, Inc. 144A | 110 | 111 | ||||||
MPH Intermediate Holding Co. 2 PIK Interest Capitalization, 144A | 90 | 92 | ||||||
Mylan, Inc. 144A | 325 | 296 | ||||||
Tenet Healthcare Corp. | ||||||||
144A 6.000%, 10/1/20(3) | 55 | 57 | ||||||
4.500%, 4/1/21 | 335 | 315 | ||||||
144A 8.125%, 4/1/22(3) | 220 | 230 | ||||||
Valeant Pharmaceuticals International, Inc. Escrow Corp. | ||||||||
144A 6.750%, 8/15/18(3) | 130 | 140 | ||||||
144A 7.500%, 7/15/21(3) | 25 | 27 | ||||||
|
| |||||||
| 1,563 | ||||||||
|
| |||||||
| Industrials—6.1% | ||||||||
AAR Corp. 144A | 190 | 199 | ||||||
ADT Corp. (The) 144A | 260 | 264 | ||||||
Ahern Rentals, Inc. 144A | 160 | 169 | ||||||
Air Canada 144A | 260 | 259 | ||||||
Air Canada Pass-Through-Trust 13-1, B 144A | 101 | 97 | ||||||
America West Airlines Pass-Through-Trust | 238 | 258 | ||||||
American Airlines Pass-Through-Trust 13-1, A 144A | 210 | 197 | ||||||
Automotores Gildemeister SA 144A | 215 | 169 | ||||||
Bombardier, Inc. 144A | 215 | 216 | ||||||
Builders FirstSource, Inc. 144A | 155 | 155 | ||||||
Carpenter Technology Corp. | 250 | 245 | ||||||
Continental Airlines Pass-Through-Trust | ||||||||
97-4, A 6.900%, 1/2/18 | 261 | 274 | ||||||
99-1, A 6.545%, 2/2/19 | 414 | 450 | ||||||
00-1, A1 8.048%, 11/1/20 | 457 | 519 | ||||||
Delta Air Lines Pass-Through-Trust 12-1A, 1A | 333 | 349 | ||||||
Nielsen Co. (The) 144A | 220 | 221 | ||||||
| PAR VALUE | VALUE | |||||||
| Industrials—continued | ||||||||
Northwest Airlines Pass-Through-Trust 02-1, G2 | $ | 356 | $ | 367 | ||||
Odebrecht Finance Ltd. 144A | 320 | BRL | 120 | |||||
Rexel SA 144A | 210 | 206 | ||||||
Sappi Papier Holding GmbH 144A | 200 | 209 | ||||||
Spirit Aerosystems, Inc. | 205 | 216 | ||||||
TransDigm, Inc. 144A | 145 | 157 | ||||||
|
| |||||||
| 5,316 | ||||||||
|
| |||||||
| Information Technology—2.2% | ||||||||
Ceridian Corp. 144A | 5 | 6 | ||||||
Dun & Bradstreet Corp. (The) | 270 | 265 | ||||||
EarthLink, Inc. | 165 | 160 | ||||||
First Data Corp. | ||||||||
11.250%, 3/31/16 | 198 | 199 | ||||||
144A 8.250%, 1/15/21(3) | 260 | 270 | ||||||
144A 11.750%, | 420 | 407 | ||||||
Freescale Semiconductor, Inc. 144A | 150 | 143 | ||||||
Xerox Corp. | 425 | 442 | ||||||
|
| |||||||
| 1,892 | ||||||||
|
| |||||||
| Materials—5.0% | ||||||||
Alpek SA de C.V. 144A | 310 | 307 | ||||||
Cemex SAB de CV 144A | 265 | 255 | ||||||
Eldorado Gold Corp. 144A | 95 | 92 | ||||||
EuroChem Mineral & Chemical Co. OJSC 144A | 275 | 275 | ||||||
Gerdau Holdings, Inc. | ||||||||
144A 7.000%, 1/20/20(3) | 100 | 106 | ||||||
144A 4.750%, 4/15/23(3) | 315 | 280 | ||||||
Hexion U.S. Finance Corp. | ||||||||
144A 8.875%, 2/1/18 | 130 | 135 | ||||||
6.625%, 4/15/20 | 130 | 131 | ||||||
Ineos Finance plc 144A | 200 | 221 | ||||||
Inversiones CMPC SA 144A | 375 | 349 | ||||||
NewMarket Corp. | 288 | 279 | ||||||
Nufarm Australia Ltd. 144A | 305 | 307 | ||||||
Reynolds Group Issuer, Inc. | ||||||||
9.000%, 4/15/19 | 135 | 142 | ||||||
8.250%, 2/15/21 | 140 | 142 | ||||||
| PAR VALUE | VALUE | |||||||
| Materials—continued | ||||||||
Tronox Finance LLC 144A | $ | 160 | $ | 159 | ||||
Turkiye Sise Ve Cam Fabrikalari AS 144A | 320 | 278 | ||||||
United States Steel Corp. | 265 | 270 | ||||||
Vale Overseas Ltd. | 330 | 318 | ||||||
Vedanta Resources plc 144A | 215 | 237 | ||||||
|
| |||||||
| 4,283 | ||||||||
|
| |||||||
| Telecommunication Services—2.2% | ||||||||
AT&T, Inc. | 425 | 430 | ||||||
CenturyLink, Inc. Series S, | 245 | 245 | ||||||
Cincinnati Bell, Inc. | 210 | 224 | ||||||
Frontier Communications Corp. | 220 | 222 | ||||||
Koninklijke KPN NV 144A | 210 | 212 | ||||||
Telefonica Emisiones SAU | 225 | 216 | ||||||
Windstream Corp. | 330 | 342 | ||||||
|
| |||||||
| 1,891 | ||||||||
|
| |||||||
| Utilities—0.9% | ||||||||
Abu Dhabi National Energy Co. 144A | 270 | 265 | ||||||
Electricite de France SA 144A | 280 | 265 | ||||||
Israel Electric Corp. Ltd. 144A | 250 | 258 | ||||||
|
| |||||||
| 788 | ||||||||
| TOTAL CORPORATE BONDS (Identified Cost $48,625) | 47,951 | |||||||
| CONVERTIBLE BONDS—0.4% | ||||||||
General Electric Capital Corp. Series A | 290 | 315 | ||||||
| TOTAL CONVERTIBLE BONDS (Identified Cost $290) | 315 | |||||||
| LOAN AGREEMENTS(2)—8.7% | ||||||||
| Consumer Discretionary—1.3% | ||||||||
Caesars Entertainment Operating Co., Inc. (Harrah’s Operating Company, Inc.) Tranche B-6, | 192 | 174 | ||||||
CBAC Borrower LLC Tranche B, | 49 | 51 | ||||||
See Notes to Financial Statements
32
Table of Contents
VIRTUS BOND FUND
SCHEDULE OF INVESTMENTS (Continued)
SEPTEMBER 30, 2013
($ reported in thousands)
| PAR VALUE | VALUE | |||||||
| Consumer Discretionary—continued | ||||||||
Clear Channel Communications, Inc. | ||||||||
Tranche B, | $ | 190 | $ | 180 | ||||
Tranche D, | 45 | 42 | ||||||
EB Sports Corp. | 170 | 169 | ||||||
Peppermill Casinos, Inc. Tranche B, | 215 | 220 | ||||||
Shingle Springs Tribal Gaming Authority | 116 | 116 | ||||||
Tribune Co. Tranche B, | 71 | 71 | ||||||
TWCC Holding Corp. Second Lien, | 82 | 84 | ||||||
|
| |||||||
| 1,107 | ||||||||
|
| |||||||
| Consumer Staples—0.6% | ||||||||
AdvancePierre Foods, Inc. Second Lien, | 210 | 214 | ||||||
Hostess Brands Acquisition LLC Tranche B, | 178 | 183 | ||||||
Rite Aid Corp. | ||||||||
Tranche 1, Second Lien, | 14 | 14 | ||||||
Tranche | 145 | 146 | ||||||
|
| |||||||
| 557 | ||||||||
|
| |||||||
| Energy—0.6% | ||||||||
Fieldwood Energy LLC | 111 | 111 | ||||||
FTS International, Inc. (Frac Tech International LLC) | 220 | 216 | ||||||
SES International Holdings Ltd. (Saxon) | 178 | 179 | ||||||
|
| |||||||
| 506 | ||||||||
|
| |||||||
| Financials—0.4% | ||||||||
Altisource Portfolio Solutions S.A.R.L Tranche B, | 120 | 121 | ||||||
Capital Automotive LP Second Lien, | 24 | 25 | ||||||
Nuveen Investments, Inc. Tranche B, Second Lien | 215 | 214 | ||||||
|
| |||||||
| 360 | ||||||||
|
| |||||||
| PAR VALUE | VALUE | |||||||
| Health Care—0.9% | ||||||||
Ardent Medical Services, Inc. | ||||||||
First Lien, | $ | 68 | $ | 69 | ||||
Second Lien, | 79 | 81 | ||||||
INC Research, LLC | 78 | 78 | ||||||
InVentiv Health, Inc. (Ventive Health, Inc.) | 110 | 107 | ||||||
MMM Holdings, Inc. | 64 | 64 | ||||||
MSO of Puerto Rico, Inc. | 46 | 47 | ||||||
Rural/Metro Operating Co. LLC First Lien, | 104 | 100 | ||||||
Surgery Center Holdings, Inc. First Lien | 112 | 112 | ||||||
United Surgical Partners International, Inc. Tranche B, | 80 | 80 | ||||||
|
| |||||||
| 738 | ||||||||
|
| |||||||
| Industrials—2.1% | ||||||||
Alliance Laundry Systems LLC Second Lien, | 25 | 25 | ||||||
Aluma Systems, Inc. (Brand Energy & Infrastructure) Tranche 1, | 31 | 31 | ||||||
American Airlines, Inc. Tranche B, | 191 | 190 | ||||||
AWAS Finance Luxemborg S.A. Tranche 2012, | 77 | 77 | ||||||
Brand Energy & Infrastructure Services, Inc. | ||||||||
Tranche B-1, First Lien, | 128 | 128 | ||||||
Second Lien, 11.000%, 10/23/19 | 105 | 108 | ||||||
Ceridian Corp. Tranche 2013, | 247 | 247 | ||||||
CHG Buyer Corp. Second Lien, | 64 | 65 | ||||||
Commercial Barge Line Co. First Lien | 264 | 257 | ||||||
Hawker Beechcraft Acquisition Company LLC | 215 | 217 | ||||||
International Equipment Solutions (IES Global B.V.) | 94 | 93 | ||||||
McJunkin Red Man Corp. | 155 | 157 | ||||||
Navistar, Inc. Tranche B, | 149 | 151 | ||||||
| PAR VALUE | VALUE | |||||||
| Industrials—continued | ||||||||
SESAC Holding Co. II LLC First Lien, | $ | 96 | $ | 97 | ||||
|
| |||||||
| 1,843 | ||||||||
|
| |||||||
| Information Technology—1.9% | ||||||||
Alcatel-Lucent U.S.A., Inc. | 225 | 227 | ||||||
Allflex Holdings III, Inc. Second Lien, | 109 | 111 | ||||||
Blue Coat Systems, Inc. | ||||||||
4.500%, 5/31/19 | 273 | 274 | ||||||
Second Lien | 138 | 139 | ||||||
IPC Systems, Inc. Tranche C, | 163 | 160 | ||||||
Kronos, Inc. Second Lien, | 110 | 114 | ||||||
Riverbed Technology, Inc. | 62 | 63 | ||||||
RP Crown Parent LLC First Lien | 152 | 154 | ||||||
SCS Holdings I, Inc. (Sirius Computer Solutions, Inc.) | 103 | 104 | ||||||
Sorenson Communications, Inc. | 159 | 161 | ||||||
Spansion LLC | 68 | 69 | ||||||
Wall Street Systems Holdings, Inc. Second Lien, | 110 | 111 | ||||||
|
| |||||||
| 1,687 | ||||||||
|
| |||||||
| Materials—0.7% | ||||||||
Fortescue Metals Group Ltd. (FMG Resources Ltd.) 2006, | 282 | 284 | ||||||
Houghton International, Inc. Holding Corp. (HII Holding Corp.) Second Lien, | 110 | 111 | ||||||
Noranda Aluminum Acquisition Corp. Tranche B, | 153 | 144 | ||||||
Tronox Pigments B.V. | 57 | 57 | ||||||
|
| |||||||
| 596 | ||||||||
|
| |||||||
| Telecommunication Services—0.2% | ||||||||
Integra Telecom Holdings, Inc. Tranche B, | 160 | 162 | ||||||
| TOTAL LOAN AGREEMENTS (Identified Cost $7,505) | 7,556 | |||||||
See Notes to Financial Statements
33
Table of Contents
VIRTUS BOND FUND
SCHEDULE OF INVESTMENTS (Continued)
SEPTEMBER 30, 2013
($ reported in thousands)
| SHARES | VALUE | |||||||
| PREFERRED STOCK(2)—2.6% | ||||||||
| Financials—2.6% | ||||||||
Bank of America Corp. Series U, 5.20% | $ | 150,000 | (12) | $ | 132 | |||
Citigroup Capital XIII | 16,200 | 445 | ||||||
Fifth Third Bancorp | 285,000 | (12) | 249 | |||||
General Electric Capital Corp. Series C, 5.25% | 300,000 | (12) | 278 | |||||
JPMorgan Chase & Co. Series Q, 5.15% | 255,000 | (12) | 224 | |||||
JPMorgan Chase & Co. | 280,000 | (12) | 304 | |||||
PNC Financial Services Group, Inc. (The) | 215,000 | (12) | 185 | |||||
Wells Fargo & Co. | 230,000 | (12) | 253 | |||||
Zions Bancorporation | 8,800 | 224 | ||||||
| TOTAL PREFERRED STOCK (Identified Cost $2,377) | 2,294 | |||||||
| TOTAL LONG TERM INVESTMENTS—98.9% | ||||||||
| (Identified Cost $86,359) | 85,595 | |||||||
| SHORT-TERM INVESTMENTS—0.7% | ||||||||
| Money Market Mutual Funds—0.7% | ||||||||
Fidelity Money Market Portfolio – Institutional Shares (Seven-day effective yield 0.090%) | 640,531 | 641 | ||||||
| TOTAL SHORT-TERM INVESTMENTS | ||||||||
| (Identified Cost $641) | 641 | |||||||
TOTAL INVESTMENTS—99.6% (Identified Cost $87,000) |
| 86,236 | (1) | |||||
Other assets and liabilities, net—0.4% |
| 313 | ||||||
|
| |||||||
| NET ASSETS—100.0% | $ | 86,549 | ||||||
|
| |||||||
Abbreviations:
| FHLMC | Federal Home Loan Mortgage Corporation (“Freddie Mac”). |
| FNMA | Federal National Mortgage Association (“Fannie Mae”). |
| GNMA | Government National Mortgage Association (“Ginnie Mae”) |
| PIK | Payment-in-Kind Security |
Footnote Legend:
| (1) | Federal Income Tax Information: For tax information at September 30, 2013, see Note 10 Federal Income Tax Information in the Notes to Financial Statements. |
| (2) | Variable or step coupon security; interest rate shown reflects the rate in effect at September 30, 2013. |
| (3) | Security exempt from registration under Rule 144A of the Securities Act of 1933. These securities may be resold in transactions exempt from registration, normally to qualified institutional buyers. At September 30, 2013, these securities amounted to a value of $26,750 or 30.9% of net assets. |
| (4) | Regulation S security. Security is offered and sold outside of the United States, therefore, it is exempt from registration with the SEC under rules 903 and 904 of the Securities Act of 1933. |
| (5) | Security valued at fair value as determined in good faith by or under the direction of the Trustees. This security is disclosed as a level 3 security in the disclosure table located after the Schedule of Investments. |
| (6) | Illiquid security. |
| (7) | No contractual maturity date |
| (8) | Interest payments may be deferred. |
| (9) | This note was issued for the sole purpose of funding a loan agreement between the issuer and the borrower. As the credit risk for this security lies solely with the borrower, the name represented here is that of the borrower. |
| (10) | 100% of the income received was in cash. |
| (10) | Amounts are less than $500 (not reported in 000s). |
| (11) | Principal amount is adjusted pursuant to the change in the Index. |
| (12) | Value shown as par value. |
Foreign Currencies:
| AUD | Australian Dollar |
| BRL | Brazilian Real |
| COP | Colombian Peso |
| EUR | European Currency Unit |
| IDR | Indonesian Rupiah |
| MXN | Mexican Peso |
| NOK | Norwegian Krone |
| NZD | New Zealand Dollar |
| PEN | Peruvian Nuevo Sol |
| PHP | Philippines Peso |
| RUB | Russian Ruble |
| TRY | Turkish Lira |
| UYU | Uruguayan Peso |
| Country Weightings (Unaudited)† | ||||
United States | 73 | % | ||
Luxembourg | 3 | |||
Brazil | 2 | |||
Mexico | 2 | |||
Turkey | 2 | |||
Cayman Islands | 1 | |||
Chile | 1 | |||
Other | 16 | |||
Total | 100 | % | ||
† % of total investments as of September 30, 2013 |
| |||
Security abbreviation definitions are located under the Key Investment Terms starting on page 4.
See Notes to Financial Statements
34
Table of Contents
VIRTUS BOND FUND
SCHEDULE OF INVESTMENTS (Continued)
SEPTEMBER 30, 2013
($ reported in thousands)
The following table provides a summary of inputs used to value the Fund’s investments as of September 30, 2013 (See Security Valuation Note 2A in the Notes to Financial Statements):
| Total Value at September 30, 2013 | Level 1 Quoted Prices | Level 2 Significant Observable Inputs | Level 3 Significant Unobservable Inputs | |||||||||||||
Debt Securities: | ||||||||||||||||
Asset-Backed Securities | $ | 3,837 | $ | — | $ | 3,837 | $ | — | ||||||||
Convertible Bonds | 315 | — | 315 | — | ||||||||||||
Corporate Bonds and Notes | 47,951 | — | 47,941 | 10 | ||||||||||||
Foreign Government Securities | 4,577 | — | 4,577 | — | ||||||||||||
Loan Agreements | 7,556 | — | 7,556 | — | ||||||||||||
Mortgage-Backed Securities | 18,759 | — | 18,759 | — | ||||||||||||
Municipal Bonds | 306 | — | 306 | — | ||||||||||||
Equity Securities: | ||||||||||||||||
Preferred Stock | 2,294 | 669 | 1,625 | — | ||||||||||||
Short-Term Investments | 641 | 641 | — | — | ||||||||||||
|
|
|
|
|
|
|
| |||||||||
Total Investments | $ | 86,236 | $ | 1,310 | $ | 84,916 | $ | 10 | ||||||||
|
|
|
|
|
|
|
| |||||||||
Securities held by the Fund with an end of period market value of $445 was transferred from level 2 into level 1 since starting to use an exchange price.
The following is a reconciliation of assets of the Fund for Level 3 investments for which significant unobservable inputs were used to determine fair value.
| Corporate Bonds and Notes | ||||
Investments in Securities | ||||
Balance as of September 30, 2012: | $ | 14 | ||
Accrued discount/(premium) | — | |||
Realized gain (loss) | — | |||
Change in unrealized appreciation (depreciation) | — | (c) | ||
Purchases | — | |||
Sales(b) | (4 | ) | ||
Transfers into Level 3(a) | — | |||
Transfers from Level 3(a) | — | |||
|
| |||
Balance as of September 30, 2013 | $ | 10 | (d) | |
|
| |||
| (a) | “Transfers into and/or from” represent the ending value as of September 30, 2013, for any investment security where a change in the pricing level occurred from the beginning to the end of the period. |
| (b) | Includes paydowns on securities. |
| (c) | Amount less than $500. |
| (d) | Includes internally fair valued security. See the last paragraph under “Note 2A Security Valuation” for a description of the valuation process in place and a qualitative discussion about sensitive inputs used in Level 3 internally fair valued measurements. |
See Notes to Financial Statements
35
Table of Contents
VIRTUS CA TAX-EXEMPT BOND FUND
SCHEDULE OF INVESTMENTS
SEPTEMBER 30, 2013
($ reported in thousands)
| PAR VALUE | VALUE | |||||||
| MUNICIPAL TAX-EXEMPT BONDS(2)—97.0% | ||||||||
| Development Revenue—5.9% | ||||||||
Hercules Redevelopment Agency, Tax-Allocation (AMBAC Insured) | $ | 500 | $ | 375 | ||||
San Diego Redevelopment Agency, | ||||||||
Tax Allocation Series B (AMBAC Insured) | 1,000 | 1,001 | ||||||
Tax Allocation Series A (AMBAC Insured) | 500 | 476 | ||||||
Santa Clara Redevelopment Agency, Bayshore North Project (NATL Insured) | 1,000 | 1,004 | ||||||
|
| |||||||
| 2,856 | ||||||||
|
| |||||||
| General Obligation—19.5% | ||||||||
Brea Olinda Unified School District, Series A (NATL, FGIC Insured) | 150 | 165 | ||||||
Contra Costa Community College District, | 245 | 247 | ||||||
Los Alamitos Unified School District, School Facilities Improvement Dist #1, 2008 Election-Series E | 250 | 264 | ||||||
Los Angeles Unified School District, 2002 Election Series C (AGM Insured) | 500 | 545 | ||||||
Series A-1 (NATL Insured) | 750 | 777 | ||||||
Norwalk—La Mirada Unified School District, 2002 Election Series D (AGM Insured) | 1,475 | 517 | ||||||
Placer Union High School District, (AGM Insured) | 1,500 | 541 | ||||||
Rancho Santiago Community College District, 2002 Election Series C (AGM Insured) | 1,200 | 618 | ||||||
Riverside Unified School District, Series C (AGM Insured) | 375 | 398 | ||||||
Ross Valley School District, 2010 Election Series B | 500 | 522 | ||||||
San Diego Community College District, | ||||||||
Election of 2002 | 250 | 271 | ||||||
Election of 2006 | 100 | 104 | ||||||
San Diego Unified School District, 1998 Election, Series C2 (AGM Insured) | 225 | 270 | ||||||
| PAR VALUE | VALUE | |||||||
| General Obligation—continued | ||||||||
San Rafael City High School District, 2002 Election Series B (NATL, FGIC Insured) | $ | 1,000 | $ | 547 | ||||
Sequoia Union High School District, | 250 | 258 | ||||||
State of California, | ||||||||
5.500%, 3/1/26 | 500 | 560 | ||||||
5.000%, 2/1/27 | 290 | 328 | ||||||
5.000%, 6/1/32 | 575 | 590 | ||||||
5.000%, 9/1/32 | 300 | 314 | ||||||
5.000%, 11/1/32 | 250 | 257 | ||||||
4.500%, 10/1/36 | 605 | 575 | ||||||
5.000%, 12/1/37 | 275 | 279 | ||||||
6.000%, 4/1/38 | 250 | 285 | ||||||
5.000%, 2/1/43 | 250 | 256 | ||||||
|
| |||||||
| 9,488 | ||||||||
|
| |||||||
| General Revenue—19.5% | ||||||||
Anaheim Public Financing Authority, Series C (AGM Insured) | 1,515 | 1,665 | ||||||
City of Pomona, Certificates of Participation, (AMBAC Insured) | 1,000 | 1,010 | ||||||
Golden State Tobacco Securitization Corp., | ||||||||
Enhanced Asset, Series A | 500 | 511 | ||||||
Series A-1 | 1,250 | 869 | ||||||
Los Angeles County Public Works Financing Authority, Series A (AGM Insured) | 235 | 261 | ||||||
North City West School Facilities Financing Authority, Series B (AMBAC Insured) | 1,000 | 1,154 | ||||||
Sacramento Area Flood Control Agency, (BHAC Insured) | 350 | 384 | ||||||
5.000%, 10/1/37 | 750 | 776 | ||||||
South Bay Regional Public Communications Authority, Hawthorne Projects, Series B (ACA Insured) | 535 | 474 | ||||||
State of California Public Works Board, Judicial Council Projects, Series A | 115 | 121 | ||||||
Department of General Services, Buildings 8&9 | 500 | 576 | ||||||
Capital Projects, Series G-1 | 550 | 608 | ||||||
Department of Forestry & Fire Protection, Series E | 500 | 520 | ||||||
| PAR VALUE | VALUE | |||||||
| General Revenue—continued | ||||||||
Judicial Council Projects, Series A | $ | 300 | $ | 301 | ||||
Ventura County Public Financing Authority, Series A | 250 | 278 | ||||||
|
| |||||||
| 9,508 | ||||||||
|
| |||||||
| Higher Education Revenue—4.6% | ||||||||
California Educational Facilities Authority, University of Southern California, Series A | 250 | 301 | ||||||
Pomona College, Series A | 500 | 519 | ||||||
California State University, Series A (NATL, FGIC Insured) | 635 | 667 | ||||||
University of California, Series D (NATL, FGIC Insured) | 710 | 755 | ||||||
|
| |||||||
| 2,242 | ||||||||
|
| |||||||
| Medical Revenue—6.0% | ||||||||
California Health Facilities Financing Authority, | ||||||||
Stanford Hospital and Clinics, Series A | 125 | 126 | ||||||
Cedars-Sinai Medical Center, | 500 | 504 | ||||||
Providence Health & Services, Series C | 295 | 333 | ||||||
Kaiser Permanente, Series A | 500 | 504 | ||||||
California Statewide Communities Development Authority, | ||||||||
Sutter Health, Series B, (AMBAC Insured) | 205 | 206 | ||||||
St. Joseph Health System, (FGIC Insured) | 500 | 530 | ||||||
San Benito Health Care District, (CA MTG Insured) | 140 | 151 | ||||||
University of California, Regents Medical, Series A | 550 | 556 | ||||||
|
| |||||||
| 2,910 | ||||||||
|
| |||||||
| Natural Gas Revenue—2.0% | ||||||||
Roseville Natural Gas Financing Authority, | ||||||||
5.000%, 2/15/24 | 750 | 783 | ||||||
5.000%, 2/15/27 | 195 | 195 | ||||||
|
| |||||||
| 978 | ||||||||
|
| |||||||
See Notes to Financial Statements
36
Table of Contents
VIRTUS CA TAX-EXEMPT BOND FUND
SCHEDULE OF INVESTMENTS (Continued)
SEPTEMBER 30, 2013
($ reported in thousands)
| PAR VALUE | VALUE | |||||||
| Power Revenue—5.1% | ||||||||
Imperial Irrigation District, Series B | $ | 300 | $ | 307 | ||||
Northern California Power Agency, Hydroelectric Project No 1 | 200 | 209 | ||||||
Sacramento Municipal Utility District, Cosumnes Project (NATL Insured) | 500 | 519 | ||||||
Series X | 350 | 385 | ||||||
Series B | 250 | 271 | ||||||
Series A | 250 | 259 | ||||||
Southern California Public Power Authority, Windy Project Series 1, | 500 | 543 | ||||||
|
| |||||||
| 2,493 | ||||||||
|
| |||||||
| Pre-Refunded—16.4% | ||||||||
California Health Facilities Financing Authority, Providence Health & Services, Series C (Pre-refunded 10/1/18 @100) | 5 | 6 | ||||||
California Infrastructure & Economic Development Bank, Bay Area Toll Bridges (Pre-refunded 7/1/26 @100) (AMBAC Insured) | 755 | 921 | ||||||
City of Stockton, O’Connors Woods Project Series A | 170 | 171 | ||||||
Contra Costa County Home Mortgage, (GNMA Collateralized) | 550 | 573 | ||||||
Metropolitan Water District of Southern California, | ||||||||
Series A, (Pre-refunded 4/1/22 @100) | 330 | 357 | ||||||
Series B-1 (Pre-refunded 10/1/13 @100) (NATL, FGIC Insured) | 140 | 140 | ||||||
Northern California Power Agency, Series A (Pre-refunded 7/1/21 | 195 | 256 | ||||||
Riverside County Single Family, Series A (GNMA Collateralized) | 4,000 | 5,532 | ||||||
|
| |||||||
| 7,956 | ||||||||
|
| |||||||
| Transportation Revenue—9.0% | ||||||||
Bay Area Toll Authority, | ||||||||
Series F-1 | 500 | 518 | ||||||
| PAR VALUE | VALUE | |||||||
| Transportation Revenue—continued | ||||||||
Series F-1 | $ | 580 | $ | 603 | ||||
City of Long Beach Airport, | 200 | 206 | ||||||
City of Los Angeles, International Airport, Series A | 510 | 518 | ||||||
Contra Costa Transportation Authority, Series B | 320 | 352 | ||||||
Imperial County Transportation Authority, Series E | 500 | 534 | ||||||
San Diego County Regional Airport Authority, | ||||||||
Senior Series A | 200 | 234 | ||||||
Subordinate Series A 5.000%, 7/1/40 | 250 | 248 | ||||||
Series B 5.000%, 7/1/40 | 500 | 496 | ||||||
San Francisco City & County Airports Community-San Francisco International | 150 | 153 | ||||||
San Francisco Municipal Transportation Agency, Subordinate Series A 5.000%, 3/1/42 | 500 | 510 | ||||||
|
| |||||||
| 4,372 | ||||||||
|
| |||||||
| Water & Sewer Revenue—9.0% | ||||||||
Alameda County Water District Financing Authority, | 365 | 279 | ||||||
California State Department of Water Resources, | ||||||||
Central Valley Projects | 35 | 39 | ||||||
Series AN | 235 | 252 | ||||||
City of Manteca Water Revenue, | 380 | 417 | ||||||
City of San Francisco Public Utilities Commission Water Revenue, | ||||||||
Series C 4.000%, 11/1/32 | 250 | 248 | ||||||
Series A 4.500%, 11/1/35 | 225 | 229 | ||||||
City of Santa Rosa Wastewater Revenue, Series A | 500 | 522 | ||||||
Contra Costa Water District, | 400 | 415 | ||||||
East Bay Municipal Utility District, Subordinate Series A, (NATL Insured) | 500 | 519 | ||||||
Ross Valley Public Financing Authority, Sanitary District #1, (AGM Insured) | 225 | 237 | ||||||
| PAR VALUE | VALUE | |||||||
| Water & Sewer Revenue—continued | ||||||||
Sacramento Suburban Water District, Series A | $ | 250 | $ | 281 | ||||
San Diego County Water Authority, Ref | 250 | 271 | ||||||
Santa Margarita-Dana Point Authority, Water Districts Improvements, Districts 2,3,4, | 630 | 660 | ||||||
|
| |||||||
| 4,369 | ||||||||
| TOTAL MUNICIPAL TAX-EXEMPT BONDS | ||||||||
| (Identified Cost $46,075) | 47,172 | |||||||
| TOTAL LONG TERM INVESTMENTS—97.0% | ||||||||
| (Identified Cost $46,075) | 47,172 | |||||||
| TOTAL INVESTMENTS—97.0% | ||||||||
| (Identified Cost $46,075) | 47,172 | (1) | ||||||
Other assets and liabilities, net—3.0% |
| 1,466 | ||||||
|
| |||||||
| NET ASSETS—100.0% | $ | 48,638 | ||||||
|
| |||||||
Abbrevations
| ACA | American Capital Access Financial Guarantee Corp. |
| AGM | Assured Guaranty Municipal Corp. |
| AMBAC | American Municipal Bond Assurance Corp. |
| BHAC | Berkshire Hathaway Assurance Corp. |
| CA MTG | California Mortgage Guarantee Program |
| FGIC | Financial Guaranty Insurance Company |
| GNMA | Government National Mortgage Association (“Ginnie Mae”) |
| NATL | National Public Finance Guarantee Corp. |
Footnote Legend
| (1) | Federal Income Tax Information: For tax information at September 30, 2013, see Note 10 Federal Income Tax Information in the Notes to Financial Statements. |
| (2) | At September 30, 2013, the concentration of the Fund’s investments by state or territory determined as a percentage of net assets is as follows: California 100%. At September 30, 2013, 52.2% of the securities in the portfolio are backed by insurance of financial institutions and financial guaranty assurance agencies. Insurers with a concentration greater than 10% of net assets are as follows: NATL 15.1%, AMBAC 12.4% and GNMA 13.1%. |
| (3) | Escrowed to maturity. |
Security abbreviation definitions are located under the Key Investment Terms starting on page 4.
See Notes to Financial Statements
37
Table of Contents
VIRTUS CA TAX-EXEMPT BOND FUND
SCHEDULE OF INVESTMENTS (Continued)
SEPTEMBER 30, 2013
($ reported in thousands)
The following table provides a summary of inputs used to value the Fund’s investments as of September 30, 2013 (See Security Valuation Note 2A in the Notes to Financial Statements):
| Total Value at September 30, 2013 | Level 2 Significant Observable Inputs | |||||||
Debt Securities: | ||||||||
Municipal Tax-Exempt Bonds | $ | 47,172 | $ | 47,172 | ||||
|
|
|
| |||||
Total Investments | $ | 47,172 | $ | 47,172 | ||||
|
|
|
| |||||
There are no Level 1 (quoted prices) or Level 3 (significant unobservable inputs) priced securities
See Notes to Financial Statements
38
Table of Contents
VIRTUS DISCIPLINED EQUITY STYLE FUND
SCHEDULE OF INVESTMENTS
SEPTEMBER 30, 2013
($ reported in thousands)
| SHARES | VALUE | |||||||
| EXCHANGE-TRADED FUNDS—99.7% | ||||||||
iShares Russell 1000® Growth Index Fund | 6,450 | $ | 505 | |||||
iShares Russell 2000® Growth Index Fund | 4,380 | 551 | ||||||
iShares Russell Midcap® Growth Index Fund | 6,580 | 515 | ||||||
| TOTAL EXCHANGE-TRADED FUNDS (Identified Cost $1,393) | 1,571 | |||||||
| TOTAL LONG TERM INVESTMENTS—99.7% | ||||||||
| (Identified Cost $1,393) | 1,571 | |||||||
| SHORT-TERM INVESTMENTS—1.0% | ||||||||
| Money Market Mutual Funds—1.0% | ||||||||
Fidelity Money Market Portfolio – Institutional Shares (Seven-day effective yield 0.090%) | 15,496 | 15 | ||||||
| TOTAL SHORT-TERM INVESTMENTS (Identified Cost $15) | 15 | |||||||
| TOTAL INVESTMENTS—100.7% (Identified Cost $1,408) | 1,586 | (1) | ||||||
Other assets and liabilities, net—(0.7)% |
| (11 | ) | |||||
|
| |||||||
| NET ASSETS—100.0% | $ | 1,575 | ||||||
|
| |||||||
Abbreviations:
Footnote Legend:
| (1) | Federal Income Tax Information: For tax information at September 30, 2013, see Note 10 Federal Income Tax Information in the Notes to Financial Statements. |
The following table provides a summary of inputs used to value the Fund’s investments as of September 30, 2013 (See Security Valuation Note 2A in the Notes to Financial Statements):
| Total Value at September 30, 2013 | Level 1 Quoted Prices | |||||||
Equity Securities: | ||||||||
Exchange-Traded Funds | $ | 1,571 | $ | 1,571 | ||||
Short-Term Investments | 15 | 15 | ||||||
|
|
|
| |||||
Total Investments | $ | 1,586 | $ | 1,586 | ||||
|
|
|
| |||||
There are no Level 2 (significant observable inputs) or Level 3 (significant unobservable inputs) priced securities.
See Notes to Financial Statements
39
Table of Contents
VIRTUS DISCIPLINED SELECT BOND FUND
SCHEDULE OF INVESTMENTS
SEPTEMBER 30, 2013
($ reported in thousands)
| SHARES | VALUE | |||||||
| EXCHANGE-TRADED FUNDS—100.9% | ||||||||
iShares Barclays Treasury Inflation Protected Securities Bond Fund | 4,650 | $ | 523 | |||||
iShares iBoxx $ High Yield Corporate Bond Fund | 1,440 | 132 | ||||||
iShares iBoxx Investment Grade Corporate Bond Fund | 3,440 | 391 | ||||||
| TOTAL EXCHANGE-TRADED FUNDS (Identified Cost $1,067) | 1,046 | |||||||
| TOTAL LONG TERM INVESTMENTS—100.9% | ||||||||
| (Identified Cost $1,067) | 1,046 | |||||||
| SHORT-TERM INVESTMENTS—0.6% | ||||||||
| Money Market Mutual Funds—0.6% | ||||||||
Fidelity Money Market Portfolio – Institutional Shares (Seven-day effective yield 0.090%) | 5,902 | 6 | ||||||
| TOTAL SHORT-TERM INVESTMENTS (Identified Cost $6) | 6 | |||||||
| TOTAL INVESTMENTS—101.5% | ||||||||
| (Identified Cost $1,073) | 1,052 | (1) | ||||||
Other assets and liabilities, net—(1.5)% |
| (15 | ) | |||||
|
| |||||||
| NET ASSETS—100.0% | $ | 1,037 | ||||||
|
| |||||||
Abbreviations:
Footnote Legend:
| (1) | Federal Income Tax Information: For tax information at September 30, 2013, see Note 10 Federal Income Tax Information in the Notes to Financial Statements. |
The following table provides a summary of inputs used to value the Fund’s investments as of September 30, 2013 (See Security Valuation Note 2A in the Notes to Financial Statements):
| Total Value at September 30, 2013 | Level 1 Quoted Prices | |||||||
Equity Securities: | ||||||||
Exchange-Traded Funds | $ | 1,046 | $ | 1,046 | ||||
Short-Term Investments | 6 | 6 | ||||||
|
|
|
| |||||
Total Investments | $ | 1,052 | $ | 1,052 | ||||
|
|
|
| |||||
There are no Level 2 (significant observable inputs) or Level 3 (significant unobservable inputs) priced securities.
See Notes to Financial Statements
40
Table of Contents
VIRTUS DISCIPLINED SELECT COUNTRY FUND
SCHEDULE OF INVESTMENTS
SEPTEMBER 30, 2013
($ reported in thousands)
| SHARES | VALUE | |||||||
| EXCHANGE-TRADED FUNDS—100.6% | ||||||||
iShares MSCI Australia Index Fund | 3,970 | $ | 100 | |||||
iShares MSCI France Index Fund | 4,220 | 113 | ||||||
iShares MSCI Germany Index Fund | 4,150 | 115 | ||||||
iShares MSCI Hong Kong Index Fund | 2,080 | 42 | ||||||
iShares MSCI Italy Index Fund Capped | 1,850 | 26 | ||||||
iShares MSCI Japan Index Fund | 24,180 | 288 | ||||||
iShares MSCI Netherlands Investable Market Index Fund | 1,560 | 37 | ||||||
iShares MSCI Spain Index Fund Capped | 1,050 | 37 | ||||||
iShares MSCI Sweden Index Fund | 1,130 | 39 | ||||||
iShares MSCI Switzerland Index Fund Capped | 4,110 | 129 | ||||||
iShares MSCI United Kingdom Index Fund | 13,960 | 274 | ||||||
| TOTAL EXCHANGE-TRADED FUNDS (Identified Cost $1,072) | 1,200 | |||||||
| TOTAL LONG TERM INVESTMENTS—100.6% | ||||||||
| (Identified Cost $1,072) | 1,200 | |||||||
| SHORT-TERM INVESTMENTS—0.7% | ||||||||
| Money Market Mutual Funds—0.7% | ||||||||
Fidelity Money Market Portfolio – Institutional Shares (Seven-day effective yield 0.090%) | 8,255 | 8 | ||||||
| TOTAL SHORT-TERM INVESTMENTS (Identified Cost $8) | 8 | |||||||
| TOTAL INVESTMENTS—101.3% | ||||||||
| (Identified Cost $1,080) | 1,208 | (1) | ||||||
Other assets and liabilities, net—(1.3)% |
| (15 | ) | |||||
|
| |||||||
| NET ASSETS—100.0% | $ | 1,193 | ||||||
|
| |||||||
Abbreviations:
Footnote Legend:
| (1) | Federal Income Tax Information: For tax information at September 30, 2013, see Note 10 Federal Income Tax Information in the Notes to Financial Statements. |
The following table provides a summary of inputs used to value the Fund’s investments as of September 30, 2013 (See Security Valuation Note 2A in the Notes to Financial Statements):
| Total Value at September 30, 2013 | Level 1 Quoted Prices | |||||||
Equity Securities: | ||||||||
Exchange-Traded Funds | $ | 1,200 | $ | 1,200 | ||||
Short-Term Investments | 8 | 8 | ||||||
|
|
|
| |||||
Total Investments | $ | 1,208 | $ | 1,208 | ||||
|
|
|
| |||||
There are no Level 2 (significant observable inputs) or Level 3 (significant unobservable inputs) priced securities.
See Notes to Financial Statements
41
Table of Contents
SCHEDULE OF INVESTMENTS
SEPTEMBER 30, 2013
($ reported in thousands)
| SHARES | VALUE | |||||||
| CLOSED-END FUNDS—92.7% | ||||||||
| Convertible Funds—7.9% | ||||||||
Advent Claymore Convertible Securities and Income Fund | 16,125 | $ | 283 | |||||
AllianzGI Equity & Convertible Income Fund | 6,982 | 130 | ||||||
Putnam High Income Securities Fund | 44,103 | 347 | ||||||
|
| |||||||
| 760 | ||||||||
|
| |||||||
| Equity Funds—27.7% | ||||||||
Adams Express Co. | 24,149 | 299 | ||||||
Advent Claymore Enhanced Growth & Income Fund | 3,708 | 36 | ||||||
Alpine Total Dynamic Dividend Fund | 102,204 | 411 | ||||||
ASA Gold and Precious Metals Ltd. | 4,500 | 60 | ||||||
BlackRock Enhanced Equity Dividend Trust | 8,000 | 60 | ||||||
Boulder Growth & Income Fund, Inc. | 10,000 | 76 | ||||||
Cohen & Steers Infrastructure Fund, Inc. | 13,500 | 267 | ||||||
Cohen & Steers REIT and Preferred Income Fund, Inc. | 12,491 | 194 | ||||||
Dividend and Income Fund | 3,000 | 43 | ||||||
Gabelli Healthcare & WellnessRx Trust (The) | 16,945 | 169 | ||||||
General American Investors Co., Inc. | 8,328 | 284 | ||||||
Liberty All Star Equity Fund | 38,225 | 207 | ||||||
LMP Capital and Income Fund, Inc. | 4,666 | 69 | ||||||
Nuveen Real Asset Income and Growth Fund | 12,033 | 225 | ||||||
Petroleum & Resources Corp. | 8,154 | 221 | ||||||
Tri-Continental Corp. | 2,500 | 46 | ||||||
|
| |||||||
| 2,667 | ||||||||
|
| |||||||
| Income Funds—24.5% | ||||||||
AllianceBernstein Income Fund | 12,000 | 85 | ||||||
American Select Portfolio | 38,543 | 370 | ||||||
Avenue Income Credit Strategies Fund | 147 | 3 | ||||||
BlackRock Build America Bond Trust | 7,000 | 132 | ||||||
BlackRock Credit Allocation Income Trust IV | 16,768 | 219 | ||||||
First Trust Mortgage Income Fund | 20,300 | 312 | ||||||
Guggenheim Build America Bonds Managed Duration Trust | 6,099 | 122 | ||||||
Montgomery Street Income Securities, Inc. | 5,300 | 83 | ||||||
Morgan Stanley Income Securities, Inc. | 10,278 | 171 | ||||||
Nuveen Build America Bond Opportunity Fund | 5,250 | 97 | ||||||
Pimco Dynamic Income Fund | 15,500 | 445 | ||||||
Putnam Master Intermediate Income Trust | 8,600 | 42 | ||||||
Putnam Premier Income Trust | 41,145 | 216 | ||||||
Western Asset/Claymore Inflation-Linked Opportunities & Income Fund | 5,000 | 58 | ||||||
|
| |||||||
| 2,355 | ||||||||
|
| |||||||
| SHARES | VALUE | |||||||
| Hybrid Fund—0.7% | ||||||||
Calamos Global Dynamic Income Fund | 8,000 | $ | 68 | |||||
|
| |||||||
| International Equity Funds—23.3% | ||||||||
Aberdeen Indonesia Fund, Inc. (The) | 3,900 | 39 | ||||||
Alpine Global Dynamic Dividend Fund | 69,333 | 330 | ||||||
BlackRock International Growth and Income Trust | 17,000 | 131 | ||||||
Brookfield Global Listed Infrastructure Income Fund, Inc. | 2,000 | 41 | ||||||
Clough Global Allocation Fund | 452 | 7 | ||||||
Clough Global Opportunities Fund | 5,000 | 64 | ||||||
Delaware Enhanced Global Dividend and Income Fund | 9,000 | 107 | ||||||
Japan Equity Fund, Inc. | 55,884 | 381 | ||||||
Japan Smaller Capitalization Fund, Inc. | 33,077 | 300 | ||||||
JF China Region Fund, Inc. | 3,112 | 46 | ||||||
Korea Fund, Inc. (The)(2) | 5,918 | 230 | ||||||
Macquarie Global Infrastructure Total Return Fund, Inc. | 3,900 | 84 | ||||||
Morgan Stanley Asia Pacific Fund, Inc. | 3,981 | 67 | ||||||
New Germany Fund, Inc. (The) | 4,320 | 89 | ||||||
Singapore Fund, Inc. (The) | 5,100 | 66 | ||||||
Templeton Dragon Fund, Inc. | 4,400 | 115 | ||||||
Thai Fund, Inc. (The) | 7,463 | 148 | ||||||
|
| |||||||
| 2,245 | ||||||||
|
| |||||||
| International Income Funds—3.4% | ||||||||
Aberdeen Asia-Pacific Income Fund, Inc. | 7,034 | 43 | ||||||
Morgan Stanley Emerging Markets Domestic Debt Fund, Inc. | 17,685 | 249 | ||||||
Nuveen Diversified Currency Opportunities Fund | 3,850 | 40 | ||||||
|
| |||||||
| 332 | ||||||||
|
| |||||||
| Municipal Bond Funds—5.2% | ||||||||
Nuveen Dividend Advantage Municipal Fund 3 | 16,000 | 203 | ||||||
Nuveen Dividend Advantage Municipal Income Fund | 20,434 | 259 | ||||||
Nuveen Municipal Market Opportunity Fund, Inc. | 3,000 | 37 | ||||||
|
| |||||||
| 499 | ||||||||
| TOTAL CLOSED-END FUNDS (Identified Cost $9,178) | 8,926 | |||||||
| RIGHTS—0.0% | ||||||||
Brookfield Global Listed Infrastructure Income Fund, Inc.(2) | 2,000 | 1 | ||||||
| TOTAL RIGHTS (Identified Cost $0) | 1 | |||||||
| TOTAL LONG TERM INVESTMENTS—92.7% | ||||||||
| (Identified cost $9,178) | 8,927 | |||||||
| SHARES | VALUE | |||||||
| SHORT-TERM INVESTMENTS—7.3% | ||||||||
| Money Market Mutual Funds—7.3% | ||||||||
Fidelity Money Market Portfolio – Institutional Shares (Seven-day effective yield 0.090%) | 698,571 | $ | 699 | |||||
| TOTAL SHORT-TERM INVESTMENTS (Identified Cost $699) | 699 | |||||||
| TOTAL INVESTMENTS—100.0% | ||||||||
| (Identified Cost $9,877) | 9,626 | (1) | ||||||
Other assets and liabilities, net—0.0% |
| (2 | ) | |||||
|
| |||||||
| NET ASSETS—100.0% | $ | 9,624 | ||||||
|
| |||||||
Abbreviations:
| REIT | Real Estate Investment Trust |
Footnote Legend:
| (1) | Federal Income Tax Information: For tax information at September 30, 2013, see Note 10 Federal Income Tax Information in the Notes to Financial Statements. |
| (2) | Non-income producing. |
The following table provides a summary of inputs used to value the Fund’s investments as of September 30, 2013 (See Security Valuation Note 2A in the Notes to Financial Statements):
| Total Value at September 30, 2013 | Level 1 Quoted Prices | |||||||
Equity Securities: | ||||||||
Closed-End Funds | $ | 8,926 | $ | 8,926 | ||||
Rights | 1 | 1 | ||||||
Short-Term Investments | 699 | 699 | ||||||
|
|
|
| |||||
Total Investments | $ | 9,626 | $ | 9,626 | ||||
|
|
|
| |||||
There are no Level 2 (significant observable inputs) or Level 3 (significant unobservable inputs) priced securities.
Security abbreviation definitions are located under the Key Investment Terms starting on page 4.
See Notes to Financial Statements
42
Table of Contents
SCHEDULE OF INVESTMENTS
SEPTEMBER 30, 2013
($ reported in thousands)
| PAR VALUE | VALUE | |||||||
| MORTGAGE-BACKED SECURITIES—1.4% | ||||||||
| Non-Agency—1.4% | ||||||||
Goldman Sachs Mortgage Pass-Through-Securities Mortgage Loan Trust 05-RP1, 1A3 144A | $ | 217 | $ | 232 | ||||
MASTR Reperforming Loan Trust 05-1, 1A5 144A | 291 | 304 | ||||||
Structured Adjustable Rate Mortgage Loan Trust 07-5, 2A1 | 832 | 700 | ||||||
| TOTAL MORTGAGE-BACKED SECURITIES (Identified Cost $1,166) | 1,236 | |||||||
| ASSET-BACKED SECURITIES—0.6% | ||||||||
Residential Funding Mortgage Securities II Home Loan Trust 06-H11, M1 | 200 | 199 | ||||||
Security National Mortgage Loan Trust 04-1A, AF3, 144A | 267 | 216 | ||||||
Terwin Mortgage Trust 04-15AL, A1 144A | 135 | 129 | ||||||
| TOTAL ASSET-BACKED SECURITIES (Identified Cost $557) | 544 | |||||||
| CORPORATE BONDS—80.5% | ||||||||
| Consumer Discretionary—20.3% | ||||||||
Activision Blizzard, Inc. | ||||||||
144A 5.625%, 9/15/21(3) | 250 | 251 | ||||||
144A 6.125%, 9/15/23(3) | 260 | 262 | ||||||
Allison Transmission, Inc. 144A | 475 | 507 | ||||||
American Axle & Manufacturing, Inc. | 275 | 285 | ||||||
Bon-Ton Department Stores, Inc. (The) | 345 | 324 | ||||||
Boyd Gaming Corp. | 500 | 545 | ||||||
Brookfield Residential Properties, Inc. 144A | 385 | 389 | ||||||
Caesars Entertainment Operating Co, Inc. | 500 | 472 | ||||||
CCO Holdings LLC | 250 | 232 | ||||||
CCO Holdings LLC (CCO Holdings Capital Corp.) | 280 | 287 | ||||||
Chrysler Group LLC (Chrysler Group, Inc.) | 200 | 225 | ||||||
| PAR VALUE | VALUE | |||||||
| Consumer Discretionary—continued | ||||||||
Cequel Communications Holdings I LLC 144A | $ | 650 | $ | 666 | ||||
Claire’s Stores, Inc. | ||||||||
144A 9.000%, 3/15/19(3) | 335 | 373 | ||||||
144A 7.750%, 6/1/20(3) | 250 | 246 | ||||||
Clear Channel Communications, Inc. 144A | 493 | 486 | ||||||
Clear Channel Worldwide Holdings, Inc. Series B | 550 | 571 | ||||||
General Motors Co. 144A | 265 | 266 | ||||||
Hilton Worldwide Finance LLC (Hilton Worldwide Finance Corp.) 144A | 440 | 442 | ||||||
Hot Topic, Inc. | 260 | 268 | ||||||
Isle of Capri Casinos, Inc. | 390 | 368 | ||||||
Landry’s, Inc. 144A | 355 | 376 | ||||||
Live Nation Entertainment, Inc. 144A | 325 | 341 | ||||||
Meritor, Inc. | 445 | 443 | ||||||
MGM Resorts International | 760 | 800 | ||||||
Mohegan Tribal Gaming Authority 144A | 450 | 472 | ||||||
Nara Cable Funding Ltd. 144A | 340 | 360 | ||||||
Pinnacle Entertainment, Inc. | 500 | 546 | ||||||
PNK Finance Corp. 144A | 540 | 553 | ||||||
Quiksilver, Inc. 144A | 200 | 211 | ||||||
Regal Entertainment Group | 500 | 474 | ||||||
Rent-A-Center, Inc. | ||||||||
6.625%, 11/15/20 | 250 | 264 | ||||||
144A 4.750%, 5/1/21(3) | 175 | 164 | ||||||
Sally Holdings LLC | 300 | 302 | ||||||
Seminole Hard Rock Entertainment, Inc. (Seminole Hard Rock International LLC) 144A | 290 | 279 | ||||||
ServiceMaster Co. | 265 | 252 | ||||||
Sinclair Television Group, Inc. | 560 | 535 | ||||||
Sirius XM Radio, Inc. 144A | 565 | 530 | ||||||
Six Flags Entertainment Corp. 144A | 365 | 349 | ||||||
| PAR VALUE | VALUE | |||||||
| Consumer Discretionary—continued | ||||||||
Sonic Automotive, Inc. | $ | 300 | $ | 276 | ||||
Taylor Morrison Communities, Inc. 144A | 560 | 524 | ||||||
UCI International, Inc. | 480 | 492 | ||||||
United Artists Theatre Circuit, Inc. | ||||||||
Series 95-A | 110 | 112 | ||||||
Series BD-1 | 124 | 126 | ||||||
Series AW-0 | 1 | 1 | ||||||
Series BE-9 | 4 | 4 | ||||||
Univision Communications, Inc. | ||||||||
144A 6.875%, 5/15/19(3) | 215 | 231 | ||||||
144A 8.500%, 5/15/21(3) | 365 | 401 | ||||||
Valassis Communication, Inc. | 885 | 878 | ||||||
William Carter Co. (The) 144A | 355 | 357 | ||||||
|
| |||||||
| 18,118 | ||||||||
|
| |||||||
| Consumer Staples—2.1% | ||||||||
Chiquita Brands International, Inc. 144A | 190 | 202 | ||||||
Ingles Markets, Inc. 144A | 550 | 532 | ||||||
Rite Aid Corp. 144A | 500 | 522 | ||||||
SUPERVALU, Inc. 144A | 300 | 287 | ||||||
Vector Group Ltd. | 300 | 312 | ||||||
|
| |||||||
| 1,855 | ||||||||
|
| |||||||
| Energy—7.9% | ||||||||
Alta Mesa Holdings LP | 275 | 291 | ||||||
Atlas Pipeline Partners LP 144A | 255 | 261 | ||||||
Calumet Specialty Products Partners LP (Calumet Finance Corp.) | 200 | 222 | ||||||
CHC Helicopter SA | 280 | 299 | ||||||
Chesapeake Energy Corp. | ||||||||
6.625%, 8/15/20 | 260 | 281 | ||||||
5.375%, 6/15/21 | 855 | 857 | ||||||
Compagnie Generale de Geophysique-Veritas | 235 | 241 | ||||||
Energy Transfer Equity LP | 275 | 296 | ||||||
See Notes to Financial Statements
43
Table of Contents
VIRTUS HIGH YIELD FUND
SCHEDULE OF INVESTMENTS (Continued)
SEPTEMBER 30, 2013
($ reported in thousands)
| PAR VALUE | VALUE | |||||||
| Energy—continued | ||||||||
Energy XXI Gulf Coast, Inc. 144A | $ | 500 | $ | 495 | ||||
EP Energy LLC | 415 | 469 | ||||||
EV Energy Partners LP | 125 | 126 | ||||||
Expro Finance Luxembourg SCA 144A | 100 | 105 | ||||||
Forest Oil Corp. | 350 | 352 | ||||||
Gulfmark Offshore, Inc. | 400 | 402 | ||||||
Linn Energy LLC | 490 | 495 | ||||||
Memorial Production Partners LP | 290 | 282 | ||||||
Parker Drilling Co. 144A | 275 | 276 | ||||||
QEP Resources, Inc. | 365 | 390 | ||||||
Quicksilver Resources, Inc. | 200 | 191 | ||||||
Sabine Pass Liquefaction LLC 144A | 285 | 280 | ||||||
Targa Resources Partners LP | 420 | 439 | ||||||
|
| |||||||
| 7,050 | ||||||||
|
| |||||||
| Financials—11.3% | ||||||||
Aircastle Ltd. | 240 | 266 | ||||||
Alfa Bank OJSC 144A | 200 | 208 | ||||||
Ally Financial, Inc. | 350 | 349 | ||||||
Avis Budget Car Rental LLC | 385 | 358 | ||||||
Banco ABC Brasil SA 144A | 310 | 312 | ||||||
CNL Lifestyle Properties, Inc. | 500 | 515 | ||||||
Country Garden Holdings Co., Ltd. 144A | 200 | 199 | ||||||
CPG Merger Sub LLC 144A | 90 | 92 | ||||||
Denali Borrower LLC (Denali Finance Corp.) 144A | 280 | 272 | ||||||
DuPont Fabros Technology LP 144A | 305 | 307 | ||||||
E*TRADE Financial Corp. | 265 | 284 | ||||||
Glen Meadow Pass-Through Trust 144A | 480 | 446 | ||||||
GRD Holdings III Corp. 144A | 320 | 341 | ||||||
| PAR VALUE | VALUE | |||||||
| Financials—continued | ||||||||
Griffey Intermediate, Inc. 144A | $ | 300 | $ | 228 | ||||
ING US, Inc. | 570 | 523 | ||||||
Intelsat Jackson Holdings SA 144A | 510 | 509 | ||||||
International Lease Finance Corp. | ||||||||
3.875%, 4/15/18 | 300 | 290 | ||||||
6.250%, 5/15/19 | 455 | 480 | ||||||
5.875%, 8/15/22 | 840 | 827 | ||||||
iStar Financial, Inc. | 335 | 327 | ||||||
Landry’s Holdings II, Inc. 144A | 175 | 184 | ||||||
Level 3 Financing, Inc. | 200 | 203 | ||||||
Michaels FinCo Holdings LLC (Michaels FinCo, Inc.) PIK Interest Capitalization, 144A | 255 | 259 | ||||||
Nationstar Mortgage LLC | ||||||||
6.500%, 8/1/18 | 130 | 131 | ||||||
6.500%, 7/1/21 | 275 | 265 | ||||||
SLM Corp. | 330 | 302 | ||||||
Spansion LLC | 255 | 267 | ||||||
Springleaf Finance Corp. | 300 | 310 | ||||||
TMK OAO Via (TMK Capital) SA 144A | 335 | 319 | ||||||
UPCB Finance Ltd. | ||||||||
Series V 144A 7.250%, 11/15/21(3) | 250 | 274 | ||||||
Series VI 144A 6.875%, 1/15/22(3) | 150 | 160 | ||||||
WideOpenWest Finance LLC | 265 | 289 | ||||||
|
| |||||||
| 10,096 | ||||||||
|
| |||||||
| Health Care—7.2% | ||||||||
Alere, Inc. 144A | 415 | 414 | ||||||
HCA, Inc. | ||||||||
6.500%, 2/15/20 | 775 | 842 | ||||||
7.500%, 2/15/22 | 415 | 457 | ||||||
Health Management Associates, Inc. | 250 | 275 | ||||||
IASIS Healthcare LLC | 590 | 615 | ||||||
inVentiv Health, Inc. 144A | 335 | 338 | ||||||
MPH Intermediate Holding Co. 2 PIK Interest Capitalization, 144A | 165 | 170 | ||||||
Par Pharmaceutical Cos., Inc. 144A | 350 | 364 | ||||||
| PAR VALUE | VALUE | |||||||
| Health Care—continued | ||||||||
Symbion, Inc. | $ | 320 | $ | 339 | ||||
Tenet Healthcare Corp. | ||||||||
144A 6.000%, 10/1/20(3) | 100 | 102 | ||||||
4.500%, 4/1/21 | 650 | 612 | ||||||
144A 8.125%, 4/1/22(3) | 435 | 455 | ||||||
United Surgical Partners International, Inc. | 500 | 551 | ||||||
Universal Hospital Services, Inc. | 300 | 311 | ||||||
Valeant Pharmaceuticals International, Inc. Escrow Corp. | ||||||||
144A 6.750%, 8/15/18(3) | 215 | 231 | ||||||
144A 7.500%, 7/15/21(3) | 40 | 43 | ||||||
144A 7.250%, 7/15/22(3) | 300 | 321 | ||||||
|
| |||||||
| 6,440 | ||||||||
|
| |||||||
| Industrials—8.9% | ||||||||
AAR Corp. 144A | 285 | 299 | ||||||
ADS Tactical, Inc. 144A | 245 | 223 | ||||||
ADS Waste Holdings, Inc. 144A | 250 | 265 | ||||||
ADT Corp. (The) 144A | 530 | 539 | ||||||
Ahern Rentals, Inc. 144A | 300 | 317 | ||||||
Air Canada 144A | 310 | 309 | ||||||
America West Airlines Pass-Through-Trust 00-1, G | 58 | 63 | ||||||
Ashton Woods USA LLC (Ashton Woods Finance Co.) 144A | 340 | 334 | ||||||
Bharti Airtel International Netherlands BV 144A | 275 | 249 | ||||||
Bombardier, Inc. 144A | 565 | 568 | ||||||
Builders FirstSource, Inc. 144A | 445 | 446 | ||||||
Dycom Investments, Inc. | 250 | 263 | ||||||
DynCorp International, Inc. | 460 | 476 | ||||||
Hellenic Railways | 225 | EUR | 294 | |||||
Iron Mountain, Inc. | 425 | 385 | ||||||
Kratos Defense & Security Solutions, Inc. | 400 | 437 | ||||||
Nielsen Co. (The) 144A | 350 | 351 | ||||||
Rexel SA 144A | 335 | 328 | ||||||
See Notes to Financial Statements
44
Table of Contents
VIRTUS HIGH YIELD FUND
SCHEDULE OF INVESTMENTS (Continued)
SEPTEMBER 30, 2013
($ reported in thousands)
| PAR VALUE | VALUE | |||||||
| Industrials—continued | ||||||||
Sappi Papier Holding GmbH 144A | $ | 250 | $ | 261 | ||||
Spectrum Brands Escrow Corp. 144A | 385 | 402 | ||||||
Spirit Aerosystems, Inc. | 315 | 331 | ||||||
TransDigm, Inc. 144A | 485 | 524 | ||||||
United Rentals North America, Inc. | 295 | 319 | ||||||
|
| |||||||
| 7,983 | ||||||||
|
| |||||||
| Information Technology—4.4% | ||||||||
Ceridian Corp. 144A | 40 | 47 | ||||||
CoreLogic, Inc. | 1,000 | 1,070 | ||||||
EarthLink, Inc. 144A | 510 | 500 | ||||||
First Data Corp. | ||||||||
11.250%, 3/31/16 | 976 | 981 | ||||||
144A 11.750%, 8/15/21(3) | 1,150 | 1,115 | ||||||
Softbank Corp. 144A | 200 | 192 | ||||||
|
| |||||||
| 3,905 | ||||||||
|
| |||||||
| Materials—8.3% | ||||||||
Ardagh Packaging Finance plc 144A | 275 | 292 | ||||||
Calumet Specialty Products Partners LP | 230 | 254 | ||||||
Cascades, Inc. | 880 | 933 | ||||||
Cemex SAB de CV | ||||||||
144A 9.500%, 6/15/18(3) | 225 | 250 | ||||||
144A 5.875%, 3/25/19(3) | 400 | 385 | ||||||
Eldorado Gold Corp. 144A | 190 | 184 | ||||||
EuroChem Mineral & Chemical Co. OJSC 144A | 235 | 235 | ||||||
Evraz Group SA 144A | 325 | 300 | ||||||
FMG Resources Property Ltd. 144A | 300 | 309 | ||||||
Hexion U.S. Finance Corp. | ||||||||
144A | 300 | 312 | ||||||
6.625%, 4/15/20 | 215 | 216 | ||||||
Ineos Finance plc | ||||||||
144A 8.375%, 2/15/19(3) | 140 | 155 | ||||||
144A 7.500%, 5/1/20(3) | 220 | 237 | ||||||
Libbey Glass, Inc. | 450 | 482 | ||||||
Pactiv LLC | 265 | 278 | ||||||
| PAR VALUE | VALUE | |||||||
| Materials—continued | ||||||||
Reynolds Group Issuer, Inc. | ||||||||
8.500%, 5/15/18 | $ | 400 | $ | 420 | ||||
9.000%, 4/15/19 | 275 | 290 | ||||||
8.250%, 2/15/21 | 270 | 273 | ||||||
Sappi Papier Holding GmbH 144A | 500 | 470 | ||||||
Tronox Finance LLC 144A | 335 | 333 | ||||||
United States Steel Corp. | 340 | 346 | ||||||
Vedanta Resources plc 144A | 395 | 436 | ||||||
|
| |||||||
| 7,390 | ||||||||
|
| |||||||
| Telecommunication Services—8.3% | ||||||||
CenturyLink, Inc. Series V | 600 | 589 | ||||||
Cincinnati Bell, Inc. | 280 | 298 | ||||||
Clearwire Communications LLC 144A | 300 | 315 | ||||||
Frontier Communications Corp. | 480 | 483 | ||||||
Hughes Satellite Systems Corp. | 250 | 271 | ||||||
Intelsat Luxembourg SA 144A | 855 | 888 | ||||||
MetroPCS Wireless, Inc. | 310 | 322 | ||||||
RCN Telecom Services LLC 144A | 500 | 490 | ||||||
SBA Telecommunications, Inc. | 315 | 314 | ||||||
Sprint Capital Corp. | ||||||||
6.900%, 5/1/19 | 265 | 274 | ||||||
6.875%, 11/15/28 | 520 | 467 | ||||||
Sprint Communications, Inc. | 270 | 250 | ||||||
Sprint Corp. 144A | 870 | 881 | ||||||
Verizon Communications, Inc. | 90 | 95 | ||||||
Vimpel Communications OJSC 144A | 200 | 216 | ||||||
Wind Acquisition Finance S.A. | ||||||||
144A 11.750%, 7/15/17(3) | 300 | 319 | ||||||
144A 7.250%, 2/15/18(3) | 370 | 385 | ||||||
Windstream Corp. 144A | 540 | 560 | ||||||
|
| |||||||
| 7,417 | ||||||||
|
| |||||||
| Utilities—1.9% | ||||||||
AES Corp. (The) | 500 | 552 | ||||||
AmeriGas Partners LP | 200 | 209 | ||||||
| PAR VALUE | VALUE | |||||||
| Utilities—continued | ||||||||
Calpine Corp. 144A | $ | 295 | $ | 315 | ||||
Energy Future Intermediate Holding Co. LLC ( Energy Future Intermediate Holding Finance, Inc.) | 250 | 265 | ||||||
Texas Competitive Electric Holdings Co., LLC (Texas Competitive Holdings Finance, Inc.) 144A | 500 | 348 | ||||||
|
| |||||||
| 1,689 | ||||||||
| TOTAL CORPORATE BONDS (Identified Cost $71,343) | 71,943 | |||||||
| LOAN AGREEMENTS(2)—13.4% | ||||||||
| Consumer Discretionary—4.3% | ||||||||
BJ’s Wholesale Club, Inc. Second Lien, | 85 | 87 | ||||||
CBAC Borrower LLC Tranche B, | 142 | 147 | ||||||
Clear Channel Communications, Inc. | ||||||||
Tranche B, 3.829%, 1/29/16 | 653 | 617 | ||||||
Tranche D, 6.929%, 1/30/19 | 514 | 478 | ||||||
Cumulus Media Holdings, Inc. Second Lien, | 315 | 320 | ||||||
EB Sports Corp. | 310 | 309 | ||||||
Granite Broadcasting Corp. Tranche B First Lien | 300 | 302 | ||||||
Landry’s, Inc. (Landry’s Restaurant, Inc.) Tranche B, | 391 | 394 | ||||||
Merrill Communications LLC Tranche B, | 279 | 281 | ||||||
Peppermill Casinos, Inc. Tranche B, | 337 | 344 | ||||||
Shingle Springs Tribal Gaming Authority | 173 | 173 | ||||||
Transtar Holding Co. Second Lien, | 200 | 204 | ||||||
TWCC Holding Corp. Second Lien, | 202 | 208 | ||||||
|
| |||||||
| 3,864 | ||||||||
|
| |||||||
| Consumer Staples—1.1% | ||||||||
AdvancePierre Foods, Inc. Second Lien, | 290 | 296 | ||||||
See Notes to Financial Statements
45
Table of Contents
VIRTUS HIGH YIELD FUND
SCHEDULE OF INVESTMENTS (Continued)
SEPTEMBER 30, 2013
($ reported in thousands)
| PAR VALUE | VALUE | |||||||
| Consumer Staples—continued | ||||||||
Crossmark Holdings, Inc. Second Lien, | $ | 190 | $ | 190 | ||||
Hostess Brands Acquisition LLC Tranche B, | 262 | 269 | ||||||
Rite Aid Corp. Tranche 2, | 180 | 181 | ||||||
|
| |||||||
| 936 | ||||||||
|
| |||||||
| Energy—0.9% | ||||||||
Fieldwood Energy LLC | 276 | 275 | ||||||
NGPL Pipeco LLC | 250 | 225 | ||||||
Sabine Oil & Gas LLC Second Lien, | 285 | 287 | ||||||
|
| |||||||
| 787 | ||||||||
|
| |||||||
| Financials—0.3% | ||||||||
Lonestar Intermediate Super Holdings LLC | 92 | 97 | ||||||
Nuveen Investments, Inc. Tranche B, Second Lien | 191 | 190 | ||||||
|
| |||||||
| 287 | ||||||||
|
| |||||||
| Health Care—0.9% | ||||||||
American Renal Holdings, Inc. | 292 | 288 | ||||||
Ardent Medical Services, Inc. | ||||||||
First Lien, | 166 | 167 | ||||||
Second Lien, 11.000%, 1/2/19 | 120 | 123 | ||||||
MMM Holdings, Inc. | 102 | 102 | ||||||
MSO of Puerto Rico, Inc. | 74 | 75 | ||||||
|
| |||||||
| 755 | ||||||||
|
| |||||||
| Industrials—1.0% | ||||||||
Alliance Laundry Systems LLC Second Lien, | 59 | 60 | ||||||
Brand Energy & Infrastructure Services, Inc. Second Lien, | 255 | 262 | ||||||
CHG Buyer Corp. Second Lien, | 153 | 156 | ||||||
International Equipment Solutions (IES Global B.V.) | 328 | 325 | ||||||
SESAC Holding Co. II LLC First Lien, | 101 | 102 | ||||||
|
| |||||||
| 905 | ||||||||
|
| |||||||
| PAR VALUE | VALUE | |||||||
| Information Technology—3.3% | ||||||||
Alcatel-Lucent U.S.A., Inc. | $ | 246 | $ | 248 | ||||
Allflex Holdings III, Inc. Second Lien, | 193 | 196 | ||||||
Avaya, Inc. Tranche B-3, | 309 | 278 | ||||||
Blue Coat Systems, Inc. Second Lien | 445 | 448 | ||||||
Deltek, Inc. Second Lien, | 268 | 270 | ||||||
IPC Systems, Inc. Tranche C, First Lien, | 277 | 272 | ||||||
Kronos, Inc. Second Lien, | 260 | 270 | ||||||
RP Crown Parent LLC Second Lien, | 415 | 424 | ||||||
Sorenson Communications, Inc. | 279 | 282 | ||||||
Wall Street Systems Holdings, Inc. Second Lien, | 275 | 277 | ||||||
|
| |||||||
| 2,965 | ||||||||
|
| |||||||
| Materials—0.9% | ||||||||
Essar Steel Algoma, Inc. (Algoma Steel, Inc.) Second Lien, | 416 | 424 | ||||||
Houghton International, Inc. Holding Corp. (HII Holding Corp.) Second Lien, | 370 | 372 | ||||||
|
| |||||||
| 796 | ||||||||
|
| |||||||
| Telecommunication Services—0.7% | ||||||||
Hawaiian Telcom Communications, Inc. | 248 | 248 | ||||||
Integra Telecom Holdings, Inc. Second Lien, | 126 | 130 | ||||||
Securus Technologies Holdings, Inc. (Securus Technologies, Inc.) | 285 | 281 | ||||||
|
| |||||||
| 659 | ||||||||
| TOTAL LOAN AGREEMENTS (Identified Cost $11,790) | 11,954 | |||||||
| SHARES | VALUE | |||||||
| PREFERRED STOCK(2)—1.1% | ||||||||
| Financials—1.1% | ||||||||
Citigroup, Inc. | 510,000 | (4) | $ | 446 | ||||
GMAC Capital Trust I | 20,800 | (4) | 556 | |||||
| TOTAL PREFERRED STOCK (Identified Cost $1,032) | 1,002 | |||||||
| TOTAL LONG TERM INVESTMENTS—97.0% | ||||||||
| (Identified Cost $85,888) | 86,679 | |||||||
| SHORT-TERM INVESTMENTS—3.6% | ||||||||
| Money Market Mutual Funds—3.6% | ||||||||
Fidelity Money Market Portfolio – Institutional Shares (Seven-day effective yield 0.090%) | 3,223,808 | 3,224 | ||||||
| TOTAL SHORT-TERM INVESTMENTS (Identified Cost $3,224) | 3,224 | |||||||
| TOTAL INVESTMENTS—100.6% | ||||||||
| (Identified Cost $89,112) | 89,903 | (1) | ||||||
Other assets and liabilities, net—(0.6)% |
| (503 | ) | |||||
|
| |||||||
| NET ASSETS—100.0% | $ | 89,400 | ||||||
|
| |||||||
Abbreviations:
| PIK | Payment-in-Kind Security |
Footnote Legend:
| (1) | Federal Income Tax Information: For tax information at September 30, 2013, see Note 10 Federal Income Tax Information in the Notes to Financial Statements. |
| (2) | Variable or step coupon security; interest rate shown reflects the rate in effect at September 30, 2013. |
| (3) | Security exempt from registration under Rule 144A of the Securities Act of 1933. These securities may be resold in transactions exempt from registration, normally to qualified institutional buyers. At September 30, 2013, these securities amounted to a value of $34,446 or 38.5% of net assets. |
| (4) | Value shown as par. |
| (5) | Security valued at fair value as determined in good faith by or under the direction of the Trustees. This security is disclosed as a Level 3 security in the disclosure table located after the Schedule of Investments. |
| (6) | Illiquid security. |
| (7) | This note was issued for the sole purpose of funding a loan agreement between the issuer and the borrower. As the credit risk for this security lies solely with the borrower, the name represented here is that of the borrower. |
| (8) | 100% of the income received was in cash. |
Foreign Currencies
| EUR | European Currency Unit |
Security abbreviation definitions are located under the Key Investment Terms starting on page 4.
See Notes to Financial Statements
46
Table of Contents
VIRTUS HIGH YIELD FUND
SCHEDULE OF INVESTMENTS (Continued)
SEPTEMBER 30, 2013
($ reported in thousands)
| Country Weightings (Unaudited)† | ||||
United States | 86 | % | ||
Luxembourg | 4 | |||
Canada | 3 | |||
Austria | 1 | |||
Ireland | 1 | |||
Mexico | 1 | |||
United Kingdom | 1 | |||
Other | 3 | |||
Total | 100 | % | ||
† % of total investments as of September 30, 2013 |
| |||
The following table provides a summary of inputs used to value the Fund’s investments as of September 30, 2013 (See Security Valuation Note 2A in the Notes to Financial Statements):
| Total Value at September 30, 2013 | Level 1 Quoted Prices | Level 2 Significant Observable Inputs | Level 3 Significant Unobservable Inputs | |||||||||||||
Debt Securities: | ||||||||||||||||
Asset-Backed Securities | $ | 544 | $ | — | $ | 544 | $ | — | ||||||||
Corporate Bonds and Notes | 71,943 | — | 71,700 | 243 | (c) | |||||||||||
Loan Agreements | 11,954 | — | 11,954 | — | ||||||||||||
Mortgage-Backed Securities | 1,236 | — | 1,236 | — | ||||||||||||
Equity Securities: | ||||||||||||||||
Preferred Stock | 1,002 | 556 | 446 | — | ||||||||||||
Short-Term Investments | 3,224 | 3,224 | — | |||||||||||||
|
|
|
|
|
|
|
| |||||||||
Total Investments | $ | 89,903 | $ | 3,780 | $ | 85,880 | $ | 243 | (c) | |||||||
|
|
|
|
|
|
|
| |||||||||
Securities with an end of period market value of $556 were transferred from level 2 into level 1 since starting to use an exchange price.
The following is a reconciliation of assets of the Fund for Level 3 investments for which significant unobservable inputs were used to determine fair value.
| Corporate Bonds and Notes | ||||
Investments in Securities | ||||
Balance as of September 30, 2012: | $ | 347 | ||
Accrued discount/(premium) | 3 | |||
Realized gain (loss) | — | |||
Change in unrealized appreciation (depreciation) | (3 | ) | ||
Purchases | — | |||
Sales(b) | (104 | ) | ||
Transfers into Level 3 (a) | — | |||
Transfers from Level 3(a) | — | |||
|
| |||
Balance as of September 30, 2013 | $ | 243 | (c) | |
|
| |||
| (a) | “Transfers into and/or from” represent the ending value as of September 30, 2013, for any investment security where a change in the pricing level occurred from the beginning to the end of the period. |
| (b) | Includes paydowns on securities. |
| (c) | Includes internally fair valued security. See the last paragraph under “Note 2A Security Valuation” for a description of the valuation process in place and a qualitative discussion about sensitive inputs used in Level 3 internally fair valued measurements. |
See Notes to Financial Statements
47
Table of Contents
VIRTUS LOW VOLATILITY EQUITY FUND
SCHEDULE OF INVESTMENTS
SEPTEMBER 30, 2013
($ reported in thousands)
| SHARES | VALUE | |||||||
| EXCHANGE-TRADED FUNDS—99.3% | ||||||||
iShares S&P 100® Index Fund(2)(3) | 21,200 | $ | 1,587 | |||||
| TOTAL EXCHANGE-TRADED FUNDS (Identified Cost $1,554) | 1,587 | |||||||
| PURCHASED OPTIONS—0.2% | ||||||||
| Call Options—0.2% | ||||||||
CBOE Volatility Index expiring 10/16/13 Strike Price $18(2) | 51 | 4 | ||||||
| TOTAL PURCHASED OPTIONS (Identified Cost $4) | 4 | |||||||
| TOTAL LONG TERM INVESTMENTS—99.4% | ||||||||
| (Identified Cost $1,557) | 1,591 | (1) | ||||||
| SHORT-TERM INVESTMENTS—0.6% | ||||||||
| Money Market Mutual Funds—0.6% | ||||||||
Fidelity Money Market Portfolio – Institutional Shares (Seven-day effective yield 0.090%) | 9,068 | 9 | ||||||
| TOTAL SHORT-TERM INVESTMENTS (Identified Cost $9) | 9 | |||||||
| TOTAL INVESTMENTS, BEFORE WRITTEN OPTIONS—100.1% | ||||||||
| (Identified Cost $1,567) | 1,600 | (1) | ||||||
| SHARES | VALUE | |||||||
| WRITTEN OPTIONS—0.0% | ||||||||
| Call Options—0.0% | ||||||||
S&P 500® Index Fund expiring 10/19/13 Strike price $1,780(2) | 9 | $ | (—(4) | ) | ||||
| TOTAL WRITTEN OPTIONS (Identified Cost $(2)) | (—(4) | ) | ||||||
| TOTAL INVESTMENTS, NET OF WRITTEN OPTIONS—100.1% | ||||||||
| (Identified Cost $1,565) | 1,600 | (1) | ||||||
Other assets and liabilities, net—(0.1)% |
| (2 | ) | |||||
|
| |||||||
| NET ASSETS—100.0% | $ | 1,598 | ||||||
|
| |||||||
Abbreviations:
Footnote Legend:
| (1) | Federal Income Tax Information: For tax information at September 30, 2013, see Note 10 Federal Income Tax Information in the Notes to Financial Statements. |
| (2) | Non-income producing. |
| (3) | All or a portion segregated as collateral for written options. |
| (4) | Amount is less than $500. |
The following table provides a summary of inputs used to value the Fund’s investments as of September 30, 2013 (See Security Valuation Note 2A in the Notes to Financial Statements):
| Total Value at September 30, 2013 | Level 1 Quoted Prices | |||||||
Equity Securities: | ||||||||
Exchange-Traded Funds | $ | 1,587 | $ | 1,587 | ||||
Purchased Options | 4 | 4 | ||||||
Short-Term Investments | 9 | 9 | ||||||
|
|
|
| |||||
Total Investments before Written Options | 1,600 | 1,600 | ||||||
|
|
|
| |||||
Written Options | (—(1 | )) | (—(1 | )) | ||||
|
|
|
| |||||
Liabilities | $ | (—(1 | )) | $ | (—(1 | )) | ||
|
|
|
| |||||
| (1) | Amount less than $500 |
There are no Level 2 (significant observable inputs) or Level 3 (significant unobservable inputs) priced securities.
See Notes to Financial Statements
48
Table of Contents
VIRTUS MULTI-SECTOR INTERMEDIATE BOND FUND
SCHEDULE OF INVESTMENTS
SEPTEMBER 30, 2013
($ reported in thousands)
| PAR VALUE | VALUE | |||||||
| MUNICIPAL BONDS—0.2% | ||||||||
| Kentucky—0.1% | ||||||||
Commonwealth of Kentucky Taxable | $ | 417 | $ | 430 | ||||
|
| |||||||
| Michigan—0.0% | ||||||||
Tobacco Settlement Finance Authority Taxable | 145 | 114 | ||||||
|
| |||||||
| Virginia—0.1% | ||||||||
Tobacco Settlement Financing Corp. Taxable Series 07-A1, | 335 | 232 | ||||||
| TOTAL MUNICIPAL BONDS (Identified Cost $876) | 776 | |||||||
| FOREIGN GOVERNMENT SECURITIES—11.0% | ||||||||
Argentine Republic PIK Interest Capitalization | 2,091 | 1,349 | ||||||
Bolivarian Republic of Venezuela | ||||||||
RegS 7.000%, 12/1/18(4) | 510 | 429 | ||||||
RegS 12.750%, 8/23/22(4) | 485 | 485 | ||||||
RegS 8.250%, 10/13/24(4) | 1,110 | 841 | ||||||
9.250%, 9/15/27 | 360 | 294 | ||||||
9.375%, 1/13/34 | 2,145 | 1,705 | ||||||
Commonwealth of Australia | ||||||||
Series 125 | 675 | AUD | 647 | |||||
New South Wales Treasury Corp. Series 17 | 610 | AUD | 612 | |||||
Commonwealth of Canada | 4,460 | CAD | 4,348 | |||||
Commonwealth of New Zealand Series 415, | 2,010 | NZD | 1,743 | |||||
Federation of Russia | 60,000 | RUB | 1,918 | |||||
Series 6207 | 45,960 | RUB | 1,485 | |||||
Federative Republic of Brazil | 4,990 | BRL | 2,034 | |||||
Hellenic Republic | ||||||||
2.000%, 2/24/23(2) | 580 | EUR | 490 | |||||
2.000%, 2/24/27(2) | 1,210 | EUR | 877 | |||||
Kingdom of Morocco 144A | 1,030 | 938 | ||||||
Kingdom of Norway Series 21 Treasury Bill, | 7,800 | NOK | 1,293 | |||||
Mongolia | ||||||||
144A 4.125%, 1/5/18(3) | 450 | 413 | ||||||
144A 5.125%, 12/5/22(3) | 825 | 705 | ||||||
Provincia de Bueno Aires Series GDP, 144A | 500 | 405 | ||||||
| PAR VALUE | VALUE | |||||||
| FOREIGN GOVERNMENT SECURITIES—continued | ||||||||
Provincia de Neuquen 144A | $ | 590 | $ | 561 | ||||
Republic of Colombia | ||||||||
12.000%, 10/22/15 | 925,000 | COP | 554 | |||||
4.375%, 3/21/23 | 1,867,000 | COP | 884 | |||||
Republic of Costa Rica 144A | 520 | 456 | ||||||
Republic of Croatia 144A | 1,045 | 1,079 | ||||||
Republic of Iceland 144A | 925 | 951 | ||||||
Republic of Indonesia | ||||||||
Series FR-30, | 7,010,000 | IDR | 654 | |||||
Series FR63, | 6,141,000 | IDR | 429 | |||||
Republic of Korea Treasury Bond, Series 1312, | 895,000 | KRW | 833 | |||||
Republic of Peru | ||||||||
144A | 1,065 | PEN | 443 | |||||
RegS | 2,010 | PEN | 753 | |||||
Republic of Philippines | 32,000 | PHP | 796 | |||||
Republic of Portugal Treasury Obligation | 520 | EUR | 615 | |||||
Republic of Serbia 144A | 700 | 698 | ||||||
Republic of Slovak 144A | 850 | 877 | ||||||
Republic of South Africa | ||||||||
Series R206, | 11,845 | ZAR | 1,187 | |||||
Series R208, | 6,720 | ZAR | 645 | |||||
Republic of Turkey | 2,090 | TRY | 1,040 | |||||
Republic of Uruguay | 17,500 | UYU(10) | 986 | |||||
United Mexican States Series M, | 30,592 | MXN | 2,423 | |||||
Series M, | 30,825 | MXN | 2,438 | |||||
| TOTAL FOREIGN GOVERNMENT SECURITIES | ||||||||
| (Identified Cost $44,696) | 42,313 | |||||||
| MORTGAGE-BACKED SECURITIES—8.4% | ||||||||
| Non-Agency—8.4% | ||||||||
A-10 Securitization LLC | 1,100 | 1,091 | ||||||
Banc of America Alternative Loan Trust 03-2, CB3 | 1,141 | 1,230 | ||||||
| PAR VALUE | VALUE | |||||||
| Non-Agency—continued | ||||||||
Banc of America Funding Corp. 06-2, 3A1 | $ | 469 | $ | 467 | ||||
Bear Stearns Commercial Mortgage Securities, Inc. | ||||||||
06-T22, AM | 900 | 972 | ||||||
06-PW12, AM | 650 | 707 | ||||||
05-PW10, AM | 895 | 959 | ||||||
06-PW13, AM | 1,360 | 1,487 | ||||||
07-PW18, AM | 1,525 | 1,698 | ||||||
Chase Mortgage Finance Corp. 07-A1, 10A1 | 712 | 653 | ||||||
Countrywide Alternative Loan Trust | 265 | 271 | ||||||
04-24CB, 1A1 | 158 | 158 | ||||||
Credit Suisse Commercial Mortgage Trust 07-C2, A3 | 1,555 | 1,723 | ||||||
Credit Suisse First Boston Mortgage Securities Corp. | 1,042 | 1,130 | ||||||
Extended Stay America Trust 13-ESHM, M 144A | 1,510 | 1,545 | ||||||
Goldman Sachs Mortgage Pass-Through-Securities Mortgage Loan Trust | ||||||||
05-RP1, 1A3 144A | 1,231 | 1,315 | ||||||
06-RP1, 1A4 144A | 909 | 976 | ||||||
Goldman Sachs Mortgage Securities Corp. II | 750 | 832 | ||||||
JPMorgan Chase Commercial Mortgage Securities Trust | ||||||||
10-CNTR, A2, 144A | 750 | 789 | ||||||
06-LDP7, AM | 1,500 | 1,648 | ||||||
Lehman Brothers – UBS Commercial Mortgage Trust 07-C7, A3 | 456 | 510 | ||||||
Lehman Brothers Commercial Mortgage Trust 07-C3, A4 | 500 | 564 | ||||||
See Notes to Financial Statements
49
Table of Contents
VIRTUS MULTI-SECTOR INTERMEDIATE BOND FUND
SCHEDULE OF INVESTMENTS (Continued)
SEPTEMBER 30, 2013
($ reported in thousands)
| PAR VALUE | VALUE | |||||||
| Non-Agency—continued | ||||||||
MASTR Alternative Loan Trust 04-6, 10A1 | $ | 636 | $ | 657 | ||||
MASTR Reperforming Loan Trust 05-1, 1A5 144A | 775 | 809 | ||||||
Merrill Lynch Mortgage Investors, Inc. 98-C1, C | 1,260 | 1,437 | ||||||
Merrill Lynch Mortgage Trust | 715 | 774 | ||||||
Morgan Stanley Capital I Trust | ||||||||
05-HQ5, A3 5.007%, 1/14/42 | 8 | 8 | ||||||
07-IQ14, AM 5.875%, 4/15/49(2) | 800 | 816 | ||||||
Motel 6 Trust 12-MTLB, D, 144A | 1,075 | 1,042 | ||||||
Nomura Asset Acceptance Corp. 04-R1, A1, 144A | 1,521 | 1,603 | ||||||
Residential Funding Mortgage Securities I, Inc. 05-S1, 1A2 | 1,602 | 1,607 | ||||||
SunTrust Adjustable Rate Mortgage Loan Trust | 760 | 745 | ||||||
Wachovia Bank Commercial Mortgage Trust | ||||||||
06-C25, AM | 1,125 | 1,219 | ||||||
07-C32, A3 | 360 | 401 | ||||||
Washington Mutual Commercial Mortgage Securities Trust | 278 | 274 | ||||||
| TOTAL MORTGAGE-BACKED SECURITIES | ||||||||
| (Identified Cost $30,819) | 32,117 | |||||||
| ASSET-BACKED SECURITIES—3.9% | ||||||||
AABS Ltd. 13-1, A | 671 | 673 | ||||||
Cheesecake Factory Holdings, Inc. 13-1A, A2, 144A | 615 | 614 | ||||||
Conseco Financial Corp. | 461 | 520 | ||||||
Countrywide Asset-Backed Certificates | ||||||||
05-1, AF5A 5.497%, 7/25/35(2) | 1,220 | 1,178 | ||||||
| PAR VALUE | VALUE | |||||||
| ASSET-BACKED SECURITIES—(continued) | ||||||||
05-12, 1A4 | $ | 1,150 | $ | 1,174 | ||||
Dominos Pizza Master Issuer LLC 12-1A, A2, 144A | 1,222 | 1,312 | ||||||
Drug Royalty LP II | 520 | 522 | ||||||
Fairway Outdoor Funding LLC 12-1A, A2, 144A | 581 | 579 | ||||||
GMAC Mortgage Corp. Loan Trust 06-HLTV, A4 | 655 | 653 | ||||||
GSAA Home Equity Trust | 1,156 | 1,149 | ||||||
IndyMac Manufactured Housing Contract 98-1, A3 | 331 | 342 | ||||||
Origen Manufactured Housing Contract Trust | 628 | 662 | ||||||
Popular ABS Mortgage Pass-Through-Trust 05-5, AF3 | 227 | 223 | ||||||
Residential Asset Mortgage Trust 04-RZ1, M1 | 1,081 | 1,061 | ||||||
Residential Funding Mortgage Securities II Home Loan Trust | ||||||||
03-HS3, AI4 5.050%, 9/25/33(2) | 731 | 762 | ||||||
07-HI1, A3 5.720%, 3/25/37 | 740 | 744 | ||||||
Security National Mortgage Loan Trust 04-1A, AF3, 144A | 1,303 | 1,051 | ||||||
TAL Advantage I LLC | 867 | 875 | ||||||
Terwin Mortgage Trust | 391 | 373 | ||||||
Trip Rail Master Funding LLC 11-1A, A1A, 144A | 319 | 337 | ||||||
| TOTAL ASSET-BACKED SECURITIES (Identified Cost $14,603) | 14,804 | |||||||
| CORPORATE BONDS—59.8% | ||||||||
| Consumer Discretionary—7.6% | ||||||||
Activision Blizzard, Inc. 144A | 435 | 438 | ||||||
| PAR VALUE | VALUE | |||||||
| Consumer Discretionary—continued | ||||||||
American Axle & Manufacturing, Inc. | $ | 900 | $ | 931 | ||||
Arcelik AS 144A | 540 | 466 | ||||||
Arcos Dorados Holdings, Inc. 144A | 1,125 | BRL | 503 | |||||
Bon-Ton Department Stores, Inc. (The) | 880 | 827 | ||||||
Boyd Gaming Corp. | 870 | 948 | ||||||
Brookfield Residential Properties, Inc. 144A | 1,065 | 1,076 | ||||||
Cencosud SA 144A | 535 | 507 | ||||||
Claire’s Stores, Inc. 144A | 975 | 1,085 | ||||||
Clear Channel Communications, Inc. | ||||||||
144A 9.000%, 12/15/19 | 54 | 53 | ||||||
9.000%, 3/1/21 | 500 | 486 | ||||||
Clear Channel Worldwide Holdings, Inc. Series B | 1,085 | 1,126 | ||||||
Dana Holding Corp. | 1,250 | 1,234 | ||||||
Gateway Casinos & Entertainment Ltd. 144A | 200 | CAD | 208 | |||||
General Motors Co. 144A | 660 | 662 | ||||||
Hilton Worldwide Finance LLC (Hilton Worldwide Finance Corp.) 144A | 970 | 974 | ||||||
Hot Topic, Inc. 144A | 595 | 614 | ||||||
International Game Technology | 580 | 678 | ||||||
Isle of Capri Casinos, Inc. | 1,320 | 1,244 | ||||||
KOC Holding AS 144A | 830 | 707 | ||||||
Landry’s, Inc. 144A | 475 | 504 | ||||||
Live Nation Entertainment, Inc. 144A | 1,055 | 1,106 | ||||||
Meritor, Inc. | 960 | 955 | ||||||
Mohegan Tribal Gaming Authority 144A | 1,000 | 1,050 | ||||||
Nara Cable Funding Ltd. 144A | �� | 550 | 583 | |||||
ONO Finance II plc 144A | 150 | 161 | ||||||
See Notes to Financial Statements
50
Table of Contents
VIRTUS MULTI-SECTOR INTERMEDIATE BOND FUND
SCHEDULE OF INVESTMENTS (Continued)
SEPTEMBER 30, 2013
($ reported in thousands)
| PAR VALUE | VALUE | |||||||
| Consumer Discretionary—continued | ||||||||
Pittsburgh Glass Works LLC 144A | $ | 650 | $ | 671 | ||||
PNK Finance Corp. 144A | 1,035 | 1,061 | ||||||
Rent-A-Center, Inc. 144A | 360 | 337 | ||||||
River Rock Entertainment Authority (The) | 198 | 161 | ||||||
Seminole Hard Rock Entertainment, Inc. (Seminole Hard Rock International LLC) 144A | 310 | 298 | ||||||
ServiceMaster Co. | 700 | 665 | ||||||
Sinclair Television Group, Inc. | 1,155 | 1,103 | ||||||
Sirius XM Radio, Inc. 144A | 1,185 | 1,111 | ||||||
Six Flags Entertainment Corp. 144A | 1,140 | 1,089 | ||||||
Station Casinos LLC | 970 | 1,031 | ||||||
Taylor Morrison Communities, Inc. 144A | 1,410 | 1,318 | ||||||
Toll Brothers Finance Corp. | 465 | 516 | ||||||
Virgin Media Secured Finance plc 144A | 415 | 407 | ||||||
Yankee Candle Co. Holdings LLC PIK Interest Capitalization | 440 | 451 | ||||||
|
| |||||||
| 29,345 | ||||||||
|
| |||||||
| Consumer Staples—0.4% | ||||||||
Chiquita Brands International, Inc. 144A | 550 | 586 | ||||||
Ingles Markets, Inc. 144A | 975 | 943 | ||||||
|
| |||||||
| 1,529 | ||||||||
|
| |||||||
| Energy—8.5% | ||||||||
Afren plc 144A | 475 | 547 | ||||||
Alta Mesa Holdings LP | 775 | 822 | ||||||
Atlas Pipeline Partners LP 144A | 495 | 507 | ||||||
Calumet Specialty Products Partners LP (Calumet Finance Corp.) | 295 | 327 | ||||||
| PAR VALUE | VALUE | |||||||
| Energy—continued | ||||||||
Carrizo Oil & Gas, Inc. | $ | 686 | $ | 751 | ||||
CHC Helicopter SA | 725 | 776 | ||||||
Chesapeake Energy Corp. | 1,050 | 1,053 | ||||||
Compagnie Generale de Geophysique-Veritas | 725 | 743 | ||||||
Ecopetrol SA | 235 | 244 | ||||||
EP Energy LLC | 840 | 949 | ||||||
EPL Oil & Gas, Inc. | 1,120 | 1,187 | ||||||
EV Energy Partners LP | 325 | 327 | ||||||
Expro Finance Luxembourg SCA 144A | 460 | 485 | ||||||
Frontier Oil Corp. | 210 | 227 | ||||||
Gazprom OAO (Gaz Capital SA) | ||||||||
144A 8.146%, 4/11/18(3) | 460 | 533 | ||||||
144A 3.850%, 2/6/20(3)(9) | 1,115 | 1,062 | ||||||
144A 6.510%, 3/7/22(3)(9) | 315 | 337 | ||||||
Gulfmark Offshore, Inc. | 960 | 965 | ||||||
Linn Energy LLC | ||||||||
6.500%, 5/15/19 | 512 | 494 | ||||||
144A 6.750%, 11/1/19(3) | 450 | 426 | ||||||
Lukoil International Finance BV 144A | 525 | 597 | ||||||
Memorial Production Partners LP | 980 | 953 | ||||||
MIE Holdings Corp. 144A | 550 | 567 | ||||||
Novatek OAO (Novatek Finance Ltd.) 144A | 1,105 | 1,014 | ||||||
Parker Drilling Co. 144A | 1,075 | 1,079 | ||||||
Petrobras International Finance Co. | 500 | 502 | ||||||
Petroleos de Venezuela SA | ||||||||
Series 2014 4.900%, 10/28/14 | 1,005 | 948 | ||||||
RegS 5.250%, 4/12/17(4) | 375 | 302 | ||||||
RegS 8.500%, 11/2/17(4) | 5,110 | 4,642 | ||||||
Petroleos Mexicanos | 650 | 590 | ||||||
Petropower I Funding Trust 144A | 64 | 63 | ||||||
Plains Exploration & Production Co. | 995 | 1,072 | ||||||
QEP Resources, Inc. | 480 | 512 | ||||||
| PAR VALUE | VALUE | |||||||
| Energy—continued | ||||||||
QGOG Constellation SA 144A | $ | 1,000 | $ | 953 | ||||
Regency Energy Partners LP (Regency Energy Finance Corp.) 144A | 1,160 | 1,056 | ||||||
Rosneft Finance SA RegS | 1,165 | 1,302 | ||||||
Rosneft Oil Co. ( Rosneft International Finance Ltd.) 144A | 300 | 277 | ||||||
Sabine Pass Liquefaction LLC 144A | 915 | 900 | ||||||
Targa Resources Partners LP | 787 | 822 | ||||||
Teekay Corp. | 300 | 323 | ||||||
Venoco, Inc. | 225 | 228 | ||||||
Weatherford International Ltd. | 318 | 400 | ||||||
Zhaikmunai LP 144A | 790 | 832 | ||||||
|
| |||||||
| 32,696 | ||||||||
|
| |||||||
| Financials—21.7% | ||||||||
ADCB Finance Cayman Ltd. 144A | 560 | 577 | ||||||
Air Lease Corp. | 1,095 | 1,076 | ||||||
Aircastle Ltd. | 1,840 | 2,042 | ||||||
Akbank TAS 144A | 1,565 | TRY | 704 | |||||
Alfa Bank OJSC (Alfa Bond Issuance plc) RegS | 755 | 835 | ||||||
Allstate Corp. (The) | 1,455 | 1,419 | ||||||
Ally Financial, Inc. | 585 | 583 | ||||||
ALROSA Finance SA 144A | 1,065 | 1,188 | ||||||
Avis Budget Car Rental LLC | 1,325 | 1,232 | ||||||
Banco ABC Brasil SA 144A | 1,025 | 1,030 | ||||||
Banco Bilbao Vizcaya Argentaria Bancomer SA | ||||||||
144A 6.500%, 3/10/21(3) | 425 | 442 | ||||||
144A 6.750%, 9/30/22(3) | 1,000 | 1,035 | ||||||
Banco Bradesco SA 144A | 1,150 | 1,150 | ||||||
Banco de Credito del Peru 144A | 657 | 583 | ||||||
See Notes to Financial Statements
51
Table of Contents
VIRTUS MULTI-SECTOR INTERMEDIATE BOND FUND
SCHEDULE OF INVESTMENTS (Continued)
SEPTEMBER 30, 2013
($ reported in thousands)
| PAR VALUE | VALUE | |||||||
| Financials—continued | ||||||||
Banco do Brasil SA 144A | $ | 600 | $ | 577 | ||||
Banco Internacional del Peru SAA 144A | 1,060 | 1,049 | ||||||
Banco Santander Brasil SA 144A | 900 | BRL | 376 | |||||
Banco Santander Chile 144A | 945 | 874 | ||||||
Banco Votorantim SA 144A | 1,660 | 1,722 | ||||||
Bancolombia SA | 1,015 | 926 | ||||||
Bank of Georgia JSC 144A | 515 | 530 | ||||||
Bank of India | ||||||||
144A 3.250%, 4/18/18(3) | 1,150 | 1,099 | ||||||
144A 3.625%, 9/21/18(3) | 1,125 | 1,065 | ||||||
Barclays Bank plc | 600 | 621 | ||||||
Braskem Finance Ltd. 144A | 500 | 490 | ||||||
Brazil Loan Trust 1 144A | 1,050 | 1,079 | ||||||
Chubb Corp. (The) | 680 | 729 | ||||||
City National Corp. | 475 | 511 | ||||||
CorpGroup Banking SA 144A | 1,075 | 919 | ||||||
CPG Merger Sub LLC 144A | 310 | 317 | ||||||
Credit Bank of Moscow 144A | 245 | 253 | ||||||
Denali Borrower LLC (Denali Finance Corp.) 144A | 955 | 929 | ||||||
Development Bank of Kazakhstan JSC 144A | 1,090 | 1,006 | ||||||
DuPont Fabros Technology LP 144A | 575 | 578 | ||||||
E*TRADE Financial | 840 | 899 | ||||||
ESAL GmbH 144A | 1,110 | 985 | ||||||
Eurasian Development Bank 144A | 925 | 865 | ||||||
Fidelity National Financial, Inc. | 240 | 253 | ||||||
Fifth Third Capital Trust IV | 800 | 796 | ||||||
| PAR VALUE | VALUE | |||||||
| Financials—continued | ||||||||
First Niagara Financial Group, Inc. | $ | 1,160 | $ | 1,345 | ||||
Ford Motor Credit Co. LLC | ||||||||
8.125%, 1/15/20 | 650 | 811 | ||||||
5.750%, 2/1/21 | 275 | 305 | ||||||
General Motors Financial Co., Inc. 144A | 900 | 936 | ||||||
Genworth Holdings, Inc. | 1,510 | 1,517 | ||||||
Glen Meadow Pass-Through Trust 144A | 970 | 902 | ||||||
GRD Holdings III Corp. 144A | 520 | 554 | ||||||
HBOS plc 144A | 115 | 128 | ||||||
Hertz Corp. (The) | 865 | 895 | ||||||
HSBC Finance Corp. | 500 | 571 | ||||||
Hutchison Whampoa International Ltd. Series 12, 144A | 1,130 | 1,188 | ||||||
ING US, Inc. | 1,210 | 1,110 | ||||||
International Lease Finance Corp. | 1,399 | 1,476 | ||||||
Intesa San Paolo SpA | 875 | 874 | ||||||
Itau Unibanco Holding SA 144A | 1,085 | 996 | ||||||
Jefferies Group LLC | ||||||||
8.500%, 7/15/19 | 500 | 605 | ||||||
6.875%, 4/15/21 | 160 | 177 | ||||||
Kazakhstan Temir Zholy Finance BV 144A | 795 | 802 | ||||||
Korea Finance | 700 | 739 | ||||||
Landry’s Holdings II, Inc. 144A | 425 | 447 | ||||||
Level 3 Financing, Inc. | 935 | 949 | ||||||
Lincoln National Corp. | 300 | 294 | ||||||
Lloyds TSB Bank plc 144A | 750 | 828 | ||||||
Lukoil International Finance BV 144A | 495 | 460 | ||||||
Macquarie Bank Ltd. 144A | 189 | 206 | ||||||
Macquarie Group Ltd. | ||||||||
144A 7.625%, | 500 | 589 | ||||||
144A 6.250%, | 675 | 733 | ||||||
| PAR VALUE | VALUE | |||||||
| Financials—continued | ||||||||
Michaels FinCo Holdings LLC (Michaels FinCo, Inc.) PIK Interest Capitalization, 144A | $ | 855 | $ | 870 | ||||
Morgan Stanley | ||||||||
144A 10.090%, | 2,400 | BRL | 1,045 | |||||
4.100%, 5/22/23 | 710 | 663 | ||||||
Nationstar Mortgage LLC | ||||||||
6.500%, 8/1/18 | 595 | 601 | ||||||
6.500%, 7/1/21 | 1,000 | 963 | ||||||
Nordea Bank AB 144A | 1,360 | 1,345 | ||||||
Phosagro OAO (Phosagro Bond Funding Ltd.) 144A | 875 | 860 | ||||||
PKO Finance AB | 1,315 | 1,291 | ||||||
Progressive Corp. (The) | 1,200 | 1,284 | ||||||
Prudential Financial, Inc. | ||||||||
5.875%, 9/15/42(2) | 2,155 | 2,112 | ||||||
5.200%, 3/15/44(2)(8) | 220 | 200 | ||||||
Reliance Holdings USA, Inc. 144A | 1,000 | 1,003 | ||||||
Royal Bank of Scotland Group plc (The) | ||||||||
6.400%, 10/21/19 | 370 | 423 | ||||||
5.625%, 8/24/20 | 750 | 828 | ||||||
7.648%, 8/29/49(2)(7)(8) | 550 | 569 | ||||||
Russian Agricultural Bank OJSC (RSHB Capital SA) | ||||||||
144A 6.299%, 5/15/17(3) | 380 | 407 | ||||||
144A 5.298%, 12/27/17(3) | 515 | 529 | ||||||
Santander U.S. Debt S.A.U. 144A | 800 | 811 | ||||||
Sberbank of Russia (Sberbank Capital SA) | ||||||||
144A 6.125%, 2/7/22(3)(9) | 1,800 | 1,886 | ||||||
144A 5.125%, 10/29/22(3)(9) | 990 | 923 | ||||||
Schaeffler Finance BV 144A | 467 | 455 | ||||||
Schaeffler Holding Finance BV PIK Interest Capitalization, 144A(13) 6.875%, 8/15/18(3) | 255 | 268 | ||||||
SLM Corp. | 1,495 | 1,369 | ||||||
Sovereign Bank | 400 | 477 | ||||||
Spansion LLC | 750 | 786 | ||||||
Sun Merger Sub, Inc. 144A | 525 | 534 | ||||||
SunTrust Bank, Inc. | 250 | 272 | ||||||
Telecom Italia Capital SA | 500 | 550 | ||||||
TMK OAO Via (TMK Capital) SA 144A | 1,130 | 1,076 | ||||||
See Notes to Financial Statements
52
Table of Contents
VIRTUS MULTI-SECTOR INTERMEDIATE BOND FUND
SCHEDULE OF INVESTMENTS (Continued)
SEPTEMBER 30, 2013
($ reported in thousands)
| PAR VALUE | VALUE | |||||||
| Financials—continued | ||||||||
Turkiye Garanti Bankasi AS 144A | $ | 985 | $ | 906 | ||||
UPCB Finance Ltd. Series VI 144A | 665 | 708 | ||||||
Vnesheconombank (VEB Finance plc) 144A | 500 | 529 | ||||||
VTB Bank OJSC (VTB Capital SA) 144A | 1,655 | 1,742 | ||||||
Webster Financial Corp. | 205 | 209 | ||||||
Yapi ve Kredi Bankasi AS 144A | 1,080 | 964 | ||||||
|
| |||||||
| 83,239 | ||||||||
|
| |||||||
| Health Care—1.6% | ||||||||
HCA, Inc. | 990 | 1,075 | ||||||
inVentiv Health, Inc. 144A | 460 | 465 | ||||||
MPH Intermediate Holding Co. 2 PIK Interest Capitalization, 144A | 490 | 504 | ||||||
Symbion, Inc. | 740 | 784 | ||||||
Tenet Healthcare Corp. | ||||||||
4.750%, 6/1/20 | 1,150 | 1,113 | ||||||
144A 6.000%, 10/1/20(3) | 180 | 184 | ||||||
4.500%, 4/1/21 | 470 | 442 | ||||||
144A 8.125%, 4/1/22(3) | 770 | 806 | ||||||
Valeant Pharmaceuticals International, Inc. Escrow Corp. | ||||||||
144A 6.750%, 8/15/18(3) | 710 | 763 | ||||||
144A 7.500%, 7/15/21(3) | 130 | 141 | ||||||
|
| |||||||
| 6,277 | ||||||||
|
| |||||||
| Industrials—8.6% | ||||||||
AAR Corp. 144A | 1,135 | 1,189 | ||||||
ADS Tactical, Inc. 144A | 600 | 546 | ||||||
ADT Corp. (The) 144A | 1,130 | 1,148 | ||||||
Ahern Rentals, Inc. 144A | 925 | 978 | ||||||
Air Canada 144A | 1,050 | 1,046 | ||||||
Air Canada Pass-Through-Trust 13-1, B 144A | 542 | 523 | ||||||
America West Airlines Pass-Through-Trust 00-1, G | 711 | 772 | ||||||
American Airlines Pass-Through-Trust 13-1, A | 1,200 | 1,125 | ||||||
| PAR VALUE | VALUE | |||||||
| Industrials—continued | ||||||||
Ashton Woods USA LLC (Ashton Woods Finance Co.) 144A | $ | 1,100 | $ | 1,081 | ||||
Atlas Air Pass-Through-Trust | ||||||||
98-1, A 7.380%, 1/2/18 | 441 | 454 | ||||||
99-1, A1 7.200%, 1/2/19 | 594 | 619 | ||||||
00-1, A 8.707%, 1/2/19 | 215 | 228 | ||||||
Automotores Gildemeister SA | ||||||||
144A 8.250%, 5/24/21(3) | 730 | 631 | ||||||
144A 6.750%, 1/15/23(3) | 300 | 236 | ||||||
AWAS Aviation Capital Ltd. 144A 7.000%, 10/17/16(3) | 993 | 1,027 | ||||||
Bharti Airtel International Netherlands BV 144A | 880 | 796 | ||||||
Bombardier, Inc. | 1,305 | 1,312 | ||||||
Builders FirstSource, Inc. 144A | 940 | 942 | ||||||
Carpenter Technology Corp. | 600 | 627 | ||||||
Continental Airlines Pass-Through-Trust 98-1, A | 212 | 223 | ||||||
97-4, A 6.900%, 1/2/18 | 407 | 427 | ||||||
99-1, A 6.545%, 2/2/19 | 712 | 775 | ||||||
00-1, A1 | 849 | 964 | ||||||
01-1, A1 | 239 | 256 | ||||||
DP World Ltd. 144A | 400 | 402 | ||||||
Embraer SA | 1,040 | 1,009 | ||||||
Hellenic Railways | 1,200 | EUR | 1,567 | |||||
Kratos Defense & Security Solutions, Inc. | 625 | 683 | ||||||
Nielsen Co. (The) 144A | 935 | 939 | ||||||
Northwest Airlines Pass-Through-Trust 02-1, G2 | 860 | 887 | ||||||
Odebrecht Finance Ltd. 144A | 650 | BRL | 243 | |||||
Rexel SA 144A | 1,130 | 1,107 | ||||||
Sappi Papier Holding GmbH | ||||||||
144A 7.750%, 7/15/17(3) | 650 | 679 | ||||||
144A 8.375%, 6/15/19(3) | 440 | 461 | ||||||
Spirit Aerosystems, Inc. | 1,225 | 1,289 | ||||||
Steelcase, Inc. | 675 | 751 | ||||||
TransDigm, Inc. 144A | 640 | 691 | ||||||
| PAR VALUE | VALUE | |||||||
| Industrials—continued | ||||||||
U.S. Airways Pass-Through-Trust | ||||||||
01-1G 7.076%, 3/20/21 | $ | 1,679 | $ | 1,754 | ||||
11-1 A 7.125%, 10/22/23 | 660 | 725 | ||||||
12-1A 5.900%, 10/1/24 | 499 | 522 | ||||||
UAL Pass-Through-Trust | 402 | 457 | ||||||
Voto-Votorantim Ltd. 144A | 750 | 803 | ||||||
|
| |||||||
| 32,894 | ||||||||
|
| |||||||
| Information Technology—2.2% | ||||||||
Ceridian Corp. 144A | 40 | 47 | ||||||
Digicel Ltd. 144A | 848 | 883 | ||||||
EarthLink, Inc. | ||||||||
8.875%, 5/15/19 | 225 | 218 | ||||||
144A 7.375%, 6/1/20(3) | 450 | 441 | ||||||
Equinix, Inc. | 465 | 453 | ||||||
First Data Corp. | ||||||||
144A 8.250%, 1/15/21(3) | 1,090 | 1,131 | ||||||
144A 11.750%, 8/15/21(3) | 2,370 | 2,299 | ||||||
Freescale Semiconductor, Inc. 144A | 940 | 898 | ||||||
NCR Corp. | 1,035 | 975 | ||||||
QVC, Inc. | 240 | 236 | ||||||
VeriSign, Inc. 144A | 810 | 765 | ||||||
|
| |||||||
| 8,346 | ||||||||
|
| |||||||
| Materials—5.6% | ||||||||
Alpek SA de C.V. 144A | 1,460 | 1,445 | ||||||
Calumet Specialty Products Partners LP | 763 | 841 | ||||||
Cascades, Inc. | 1,100 | 1,166 | ||||||
Cemex SAB de CV 144A | 976 | 1,086 | ||||||
Eldorado Gold Corp. 144A | 455 | 441 | ||||||
EuroChem Mineral & Chemical Co. OJSC 144A | 550 | 550 | ||||||
FMG Resources Property | 650 | 703 | ||||||
Gerdau Holdings, Inc. | ||||||||
144A 7.000%, 1/20/20(3) | 1,075 | 1,145 | ||||||
144A 4.750%, 4/15/23(3) | 590 | 525 | ||||||
Hexion U.S. Finance Corp. | ||||||||
144A 8.875%, 2/1/18 | 595 | 619 | ||||||
6.625%, 4/15/20 | 580 | 583 | ||||||
Huntsman International LLC | 440 | 419 | ||||||
See Notes to Financial Statements
53
Table of Contents
VIRTUS MULTI-SECTOR INTERMEDIATE BOND FUND
SCHEDULE OF INVESTMENTS (Continued)
SEPTEMBER 30, 2013
($ reported in thousands)
| PAR VALUE | VALUE | |||||||
| Materials—continued | ||||||||
Ineos Finance plc 144A | $ | 705 | $ | 780 | ||||
Mexichem SAB de CV 144A | 485 | 470 | ||||||
NewMarket Corp. | 1,174 | �� | 1,136 | |||||
Nufarm Australia Ltd. 144A | 1,160 | 1,166 | ||||||
Reynolds Group Issuer, Inc. | 1,670 | 1,691 | ||||||
Sappi Papier Holding GmbH 144A | 970 | 912 | ||||||
Severstal OAO (Steel Capital SA) 144A | 425 | 455 | ||||||
Tronox Finance LLC 144A | 865 | 861 | ||||||
Turkiye Sise Ve Cam Fabrikalari AS 144A | 695 | 604 | ||||||
United States Steel Corp. 6.875%, 4/1/21 | 1,360 | 1,384 | ||||||
Vale Overseas Ltd. | 1,355 | 1,306 | ||||||
Vedanta Resources plc 144A | 945 | 1,042 | ||||||
|
| |||||||
| 21,330 | ||||||||
|
| |||||||
| Telecommunication Services—2.4% | ||||||||
America Movil SAB de CV | 5,000 | MXN | 358 | |||||
CenturyLink, Inc. | 750 | 711 | ||||||
Frontier Communications Corp. | 945 | 952 | ||||||
Intelsat Luxembourg SA 144A | 675 | 701 | ||||||
Koninklijke KPN NV 144A | 885 | 892 | ||||||
SBA Telecommunications, Inc. | 820 | 818 | ||||||
Sprint Communications, Inc. | 1,305 | 1,207 | ||||||
Telefonica Emisiones, S.A.U. 5.462%, 2/16/21 | 975 | 999 | ||||||
Wind Acquisition | 850 | 904 | ||||||
Windstream Corp. | 1,530 | 1,587 | ||||||
|
| |||||||
| 9,129 | ||||||||
|
| |||||||
| PAR VALUE | VALUE | |||||||
| Utilities—1.1% | ||||||||
AmeriGas Partners LP | $ | 450 | $ | 470 | ||||
Calpine Corp. 144A | 810 | 865 | ||||||
Electricite de France SA 144A | 1,360 | 1,286 | ||||||
Enel SpA 144A | 375 | 380 | ||||||
Israel Electric Corp. Ltd. 144A | 500 | 517 | ||||||
NRG Energy, Inc. | ||||||||
7.625%, 1/15/18 | 105 | 117 | ||||||
7.625%, 5/15/19 | 680 | 721 | ||||||
6.625%, 3/15/23 | 75 | 74 | ||||||
Texas Competitive Electric Holdings Co., LLC Series A | 200 | 6 | ||||||
|
| |||||||
| 4,436 | ||||||||
| TOTAL CORPORATE BONDS (Identified Cost $229,723) | 229,221 | |||||||
| LOAN AGREEMENTS(2)—12.1% | ||||||||
| Consumer Discretionary—2.5% | ||||||||
Advantage Sales & Marketing, Inc. Second Lien, | 351 | 356 | ||||||
Affinity Gaming LLC (Herbst Gaming LLC). | 568 | 578 | ||||||
BJ’s Wholesale Club, Inc. Second Lien, | 208 | 213 | ||||||
Caesars Entertainment Operating Co., Inc. (Harrah’s Operating Company, Inc.) Tranche B-6, | 1,084 | 986 | ||||||
CBAC Borrower LLC Tranche B, | 292 | 302 | ||||||
Clear Channel Communications, Inc. | ||||||||
Tranche B, | 1,080 | 1,020 | ||||||
Tranche D, | 348 | 324 | ||||||
Cumulus Media Holdings, Inc. Second Lien, | 484 | 492 | ||||||
EB Sports Corp. | 625 | 623 | ||||||
Granite Broadcasting Corp. Tranche B First Lien | 1,141 | 1,148 | ||||||
Landry’s, Inc. (Landry’s Restaurant, Inc.) Tranche B, 4.750%, 4/24/18 | 1,075 | 1,085 | ||||||
| PAR VALUE | VALUE | |||||||
| Consumer Discretionary—continued | ||||||||
Peppermill Casinos, Inc. | $ | 1,064 | $ | 1,085 | ||||
Shingle Springs Tribal Gaming Authority | 665 | 665 | ||||||
Transtar Holding Co. Second Lien, | 380 | 388 | ||||||
TWCC Holding Corp. Second Lien, | 448 | 461 | ||||||
|
| |||||||
| 9,726 | ||||||||
|
| |||||||
| Consumer Staples—0.2% | ||||||||
AdvancePierre Foods, Inc. Second Lien, | 655 | 668 | ||||||
|
| |||||||
| Energy—0.9% | ||||||||
Fieldwood Energy LLC | 616 | 615 | ||||||
FTS International, Inc. (Frac Tech International LLC) | 556 | 547 | ||||||
NGPL Pipeco LLC | 497 | 446 | ||||||
Samson Investment Co. Second Lien, | 734 | 736 | ||||||
SES International Holdings Ltd. (Saxon) | 912 | 916 | ||||||
|
| |||||||
| 3,260 | ||||||||
|
| |||||||
| Financials—0.7% | ||||||||
Altisource Portfolio Solutions S.A.R.L Tranche B, | 531 | 536 | ||||||
Capital Automotive LP Second Lien, | 106 | 109 | ||||||
iPayment, Inc . | 577 | 558 | ||||||
Lonestar Intermediate Super Holdings LLC | 108 | 113 | ||||||
Nuveen Investments, Inc. Tranche B, Second Lien | 1,144 | 1,140 | ||||||
|
| |||||||
| 2,456 | ||||||||
|
| |||||||
| Health Care—1.0% | ||||||||
American Renal Holdings, Inc. Second Lien, | 909 | 898 | ||||||
Ardent Medical Services, Inc. | ||||||||
First Lien, | 344 | 346 | ||||||
See Notes to Financial Statements
54
Table of Contents
VIRTUS MULTI-SECTOR INTERMEDIATE BOND FUND
SCHEDULE OF INVESTMENTS (Continued)
SEPTEMBER 30, 2013
($ reported in thousands)
| PAR VALUE | VALUE | |||||||
| Health Care—continued | ||||||||
Second Lien, | $ | 289 | $ | 296 | ||||
INC Research, LLC | 343 | 345 | ||||||
InVentiv Health, Inc. (Ventive Health, Inc.) | 583 | 566 | ||||||
MMM Holdings, Inc. | 314 | 316 | ||||||
MSO of Puerto Rico, Inc. | 228 | 230 | ||||||
Rural/Metro Operating Co. LLC First Lien, | 701 | 668 | ||||||
Surgery Center Holdings, Inc. First Lien | 304 | 305 | ||||||
|
| |||||||
| 3,970 | ||||||||
|
| |||||||
| Industrials—2.7% | ||||||||
Alliance Laundry Systems LLC Second Lien, | 93 | 94 | ||||||
Aluma Systems, Inc. (Brand Energy & Infrastructure) Tranche 1, | 190 | 191 | ||||||
American Airlines, Inc. Tranche B, | 1,028 | 1,024 | ||||||
AWAS Finance Luxemborg S.A. Tranche 2012, | 617 | 619 | ||||||
Brand Energy & Infrastructure Services, Inc. Tranche B-1, | 791 | 796 | ||||||
Second Lien, | 395 | 405 | ||||||
Brock Holdings Ill, Inc. Second Lien, | 285 | 290 | ||||||
Ceridian Corp. Tranche 2013, | 1,296 | 1,298 | ||||||
CHG Buyer Corp. Second Lien, | 244 | 250 | ||||||
Commercial Barge Line Co. First Lien | 1,124 | 1,096 | ||||||
Hawker Beechcraft Acquisition Company LLC | 1,145 | 1,156 | ||||||
Husky Injection Molding | 535 | 536 | ||||||
International Equipment Solutions (IES Global B.V.) | 640 | 634 | ||||||
| PAR VALUE | VALUE | |||||||
| Industrials—continued | ||||||||
McJunkin Red Man Corp. | $ | 700 | $ | 705 | ||||
Navistar, Inc. Tranche B, | 729 | 740 | ||||||
SESAC Holding Co. II LLC First Lien, | 392 | 395 | ||||||
|
| |||||||
| 10,229 | ||||||||
|
| |||||||
| Information Technology—3.2% | ||||||||
Alcatel-Lucent U.S.A., Inc. | 851 | 858 | ||||||
Allflex Holdings III, Inc. Second Lien, | 599 | 609 | ||||||
Applied Systems, Inc. Second Lien, | 333 | 336 | ||||||
Avaya, Inc. Tranche B-3, | 613 | 551 | ||||||
Blue Coat Systems, Inc. | ||||||||
4.500%, 5/31/19 | 1,070 | 1,076 | ||||||
Second Lien | 985 | 992 | ||||||
Deltek, Inc. | ||||||||
First Lien, | 774 | 777 | ||||||
Second Lien, | 638 | 644 | ||||||
IPC Systems, Inc. Tranche C, First Lien, | 1,044 | 1,024 | ||||||
Kronos, Inc. Second Lien, | 605 | 628 | ||||||
Novell, Inc. (Attachmate Corp.) First Lien, | 515 | 517 | ||||||
RP Crown Parent LLC First Lien | 705 | 711 | ||||||
SCS Holdings I, Inc. (Sirius Computer Solutions, Inc.) | 477 | 484 | ||||||
Smart Modular Technologies (Global), Inc. | 240 | 219 | ||||||
Sorenson Communications, Inc. | 701 | 709 | ||||||
Spansion LLC | 320 | 323 | ||||||
SRA International, Inc. | 490 | 486 | ||||||
Vision Solutions, Inc. | 376 | 377 | ||||||
Wall Street Systems Holdings, Inc. First Lien, | 397 | 399 | ||||||
Second Lien, | 407 | 410 | ||||||
|
| |||||||
| 12,130 | ||||||||
|
| |||||||
| PAR VALUE | VALUE | |||||||
| Materials—0.8% | ||||||||
AZ Chem US, Inc. | $ | 589 | $ | 595 | ||||
Fortescue Metals Group Ltd. (FMG Resources Ltd.) 2006, | 325 | 326 | ||||||
Houghton International, Inc. Holding Corp. (HII Holding Corp.) Second Lien, | 630 | 634 | ||||||
Noranda Aluminum Acquisition Corp. Tranche B, | 1,313 | 1,238 | ||||||
Tronox Pigments B.V. | 234 | 236 | ||||||
|
| |||||||
| 3,029 | ||||||||
|
| |||||||
| Telecommunication Services—0.1% | ||||||||
Securus Technologies Holdings, Inc. (Securus Technologies, Inc.) Second Lien | 480 | 473 | ||||||
|
| |||||||
| Utilities—0.1% | ||||||||
Texas Compeptitive Electric Holdings Co. LLC 2017 Extended, | 375 | 253 | ||||||
| TOTAL LOAN AGREEMENTS (Identified Cost $45,943) | 46,194 | |||||||
| SHARES | ||||||||
| PREFERRED STOCK—3.4% | ||||||||
| Financials—3.2% | ||||||||
Ally Financial, Inc.(3) | 321 | 307 | ||||||
Ally Financial, Inc.(2) | 20,000 | (11) | 536 | |||||
Banco Bilbao Vizcaya Argentaria S.A. International S.A. Unipersonal | 675,000 | (11) | 607 | |||||
Banco do Brasil S.A. 144A | 600,000 | (11) | 666 | |||||
Bank of America Corp. Series U, | 330,000 | (11) | 290 | |||||
Bank of America Corp. Series K, | 375,000 | (11) | 408 | |||||
Citigroup Capital XVII Series E | 44,460 | (11) | 1,106 | |||||
Citigroup, Inc. Series D | 1,210,000 | (11) | 1,057 | |||||
Fifth Third Bancorp 5.10%(2) | 775,000 | (11) | 676 | |||||
See Notes to Financial Statements
55
Table of Contents
VIRTUS MULTI-SECTOR INTERMEDIATE BOND FUND
SCHEDULE OF INVESTMENTS (Continued)
SEPTEMBER 30, 2013
($ reported in thousands)
| SHARES | VALUE | |||||||
| Financials—continued | ||||||||
General Electric Capital Corp. Series C | 600,000 | (11) | $ | 556 | ||||
General Electric Capital Corp. Series B | 700,000 | (11) | 707 | |||||
JPMorgan Chase & Co. Series Q, | 1,595,000 | (11) | 1,404 | |||||
JPMorgan Chase & Co. Series | 247,000 | (11) | 268 | |||||
PNC Financial Services Group, Inc. Series K, 4.483% (The)(2) | 350,000 | (11) | 348 | |||||
PNC Financial Services Group, Inc. Series R, 4.85% (The)(2) | 965,000 | (11) | 830 | |||||
U.S. Bancorp Series G 6.00%(2) | 22,600 | (11) | 609 | |||||
Wells Fargo & Co. Series K, | 950,000 | (11) | 1,045 | |||||
Zions Bancorporation | 38,525 | 982 | ||||||
|
| |||||||
| 12,402 | ||||||||
|
| |||||||
| Industrials—0.2% | ||||||||
Seaspan Corp. Series C, | 20,000 | 542 | ||||||
| TOTAL PREFERRED STOCK (Identified Cost $13,146) | 12,944 | |||||||
| COMMON STOCKS—0.0% | ||||||||
| Consumer Discretionary—0.0% | ||||||||
Mark IV Industries | 446 | 18 | ||||||
|
| |||||||
| Industrials—0.0% | ||||||||
Velo Holdings, Inc.(5)(6) | 12,667 | 0 | ||||||
| TOTAL COMMON STOCKS (Identified Cost $4) | 18 | |||||||
| TOTAL LONG TERM INVESTMENTS—98.8% | ||||||||
| (Identified Cost $379,810) | 378,387 | |||||||
| SHORT-TERM INVESTMENTS—0.1% | ||||||||
| Money Market Mutual Funds—0.1% | ||||||||
Fidelity Money Market Portfolio – Institutional Shares (Seven-day effective yield 0.090%) | 572,830 | $ | 573 | |||||
| TOTAL SHORT-TERM INVESTMENTS (Identified Cost $573) | 573 | |||||||
| TOTAL INVESTMENTS—98.9% | ||||||||
| (Identified Cost $380,383) | 378,960 | (1) | ||||||
Other assets and liabilities, net—1.1% |
| 4,145 | ||||||
|
| |||||||
| NET ASSETS—100.0% | $ | 383,105 | ||||||
| �� |
|
| ||||||
Abbreviations:
| PIK | Payment-in-Kind Security |
Footnote Legend:
| (1) | Federal Income Tax Information: For tax information at September 30, 2013, see Note 10 Federal Income Tax Information in the Notes to Financial Statements. |
| (2) | Variable or step coupon security; interest rate shown reflects the rate in effect at September 30, 2013. |
| (3) | Security exempt from registration under Rule 144A of the Securities Act of 1933. These securities may be resold in transactions exempt from registration, normally to qualified institutional buyers. At September 30, 2013, these securities amounted to a value of $150,529 or 39.3% of net assets. |
| (4) | Regulation S security. Security is offered and sold outside of the United States, therefore, it is exempt from registration with the SEC under rules 903 and 904 of the Securities Act of 1933. |
| (5) | Illiquid security. |
| (6) | Security valued at fair value as determined in good faith by or under the direction of the Trustees. This security is disclosed as a Level 3 security in the disclosure table located after the Schedule of Investments. |
| (7) | No contractual maturity date |
| (8) | Interest payments may be deferred. |
| (9) | This note was issued for the sole purpose of funding a loan agreement between the issuer and the borrower. As the credit risk for this security lies solely with the borrower, the name represented here is that of the borrower. |
| (10) | Principal amount is adjusted pursuant to the change in the local inflation index. |
| (11) | Value shown as par value. |
| (12) | 69.7% of the income received was in cash and 30.3% in PIK. |
| (13) | 100% of the income received was in cash. |
Foreign Currencies:
| AUD | Australian Dollar |
| BRL | Brazilian Real |
| CAD | Canadian Dollar |
| COP | Colombian Peso |
| EUR | European Currency Unit |
| IDR | Indonesian Rupiah |
| KRW | South Korean Won |
| MXN | Mexican Peso |
| NOK | Norwegian Krone |
| NZD | New Zealand Dollar |
| PEN | Peruvian Nuevo Sol |
| PHP | Philippines Peso |
| RUB | Russian Ruble |
| TRY | Turkish Lira |
| UYU | Uruguayan Peso |
| ZAR | South African Rand |
| Country Weightings (Unaudited)† | ||||
United States | 60 | % | ||
Brazil | 4 | |||
Luxembourg | 4 | |||
Canada | 3 | |||
Mexico | 3 | |||
Venezuela | 3 | |||
Ireland | 1 | |||
Other | 22 | |||
Total | 100 | % | ||
† % of total investments as of September 30, 2013 |
| |||
Security abbreviation definitions are located under the Key Investment Terms starting on page 4.
See Notes to Financial Statements
56
Table of Contents
VIRTUS MULTI-SECTOR INTERMEDIATE BOND FUND
SCHEDULE OF INVESTMENTS (Continued)
SEPTEMBER 30, 2013
($ reported in thousands)
The following table provides a summary of inputs used to value the Fund’s investments as of September 30, 2013 (See Security Valuation Note 2A in the Notes to Financial Statements):
| Total Value at September 30, 2013 | Level 1 Quoted Prices | Level 2 Significant Observable Inputs | Level 3 Significant Unobservable Inputs | |||||||||||||
Debt Securities: | ||||||||||||||||
Asset-Backed Securities | $ | 14,804 | $ | — | $ | 14,131 | $ | 673 | ||||||||
Corporate Bonds and Notes | 229,221 | — | 229,221 | — | ||||||||||||
Foreign Government Securities | 42,313 | — | 42,313 | — | ||||||||||||
Loan Agreements | 46,194 | — | 46,194 | — | ||||||||||||
Mortgage-Backed Securities | 32,117 | — | 32,117 | — | ||||||||||||
Municipal Bonds | 776 | — | 776 | — | ||||||||||||
Equity Securities: | ||||||||||||||||
Preferred Stock | 12,944 | 4,081 | 8,863 | — | ||||||||||||
Common Stocks | 18 | — | — | 18 | ||||||||||||
Short-Term Investments | 573 | 573 | — | — | ||||||||||||
|
|
|
|
|
|
|
| |||||||||
Total Investments | $ | 378,960 | $ | 4,654 | $ | 373,615 | $ | 691 | ||||||||
|
|
|
|
|
|
|
| |||||||||
Securities with an end of period market value of $1,948 were transferred from level 2 into level 1 since starting to use an exchange price.
The following is a reconciliation of assets of the Fund for Level 3 investments for which significant unobservable inputs were used to determine fair value.
| Total | Asset-Backed Securities | Corporate Bonds and Notes | Loan Agreements | Common Stocks | ||||||||||||||||
Investments in Securities | ||||||||||||||||||||
Balance as of September 30, 2012: | $ | 76 | $ | — | $ | 13 | (c) | $ | 51 | $ | 12 | |||||||||
Accrued discount/(premium) | — | — | — | — | — | |||||||||||||||
Realized gain (loss) | (2 | ) | — | — | (2 | ) | — | |||||||||||||
Change in unrealized appreciation (depreciation) | 558 | (5 | ) | 608 | (51 | ) | 6 | |||||||||||||
Purchases | 744 | 703 | — | 40 | — | |||||||||||||||
Sales(b) | (685 | ) | (25 | ) | (621 | ) | (38 | ) | — | |||||||||||
Transfers into Level 3(a) | — | — | — | — | — | |||||||||||||||
Transfers from Level 3(a) | — | — | — | — | — | |||||||||||||||
|
|
|
|
|
|
|
|
|
| |||||||||||
Balance as of September 30, 2013 | $ | 691 | $ | 673 | $ | — | $ | — | $ | 18 | (c) | |||||||||
|
|
|
|
|
|
|
|
|
| |||||||||||
| (a) | “Transfers into and/or from” represent the ending value as of September 30, 2013, for any investment security where a change in the pricing level occurred from the beginning to the end of the period. |
| (b) | Includes paydowns on securities. |
| (c) | Includes internally fair valued security currently priced at zero $0. See the last paragraph under “Note 2A Security Valuation” for a description of the valuation process in place and qualitative discussion about sensitive inputs used in Level 3 internally fair valued measurements. |
See Notes to Financial Statements
57
Table of Contents
VIRTUS SENIOR FLOATING RATE FUND
SCHEDULE OF INVESTMENTS
SEPTEMBER 30, 2013
($ reported in thousands)
| PAR VALUE | VALUE | |||||||
| FOREIGN GOVERNMENT SECURITIES—0.0% | ||||||||
Bolivarian Republic of Venezuela RegS | $ | 525 | $ | 475 | ||||
| TOTAL FOREIGN GOVERNMENT SECURITIES | ||||||||
| (Identified Cost $505) | 475 | |||||||
| MORTGAGE-BACKED SECURITIES—0.4% | ||||||||
| Non-Agency—0.4% | ||||||||
Extended Stay America Trust 13-ESHM, M 144A | 2,375 | 2,429 | ||||||
Residential Asset Securitization Trust | 1,237 | 1,236 | ||||||
| TOTAL MORTGAGE-BACKED SECURITIES | ||||||||
| (Identified Cost $3,734) | 3,665 | |||||||
| ASSET-BACKED SECURITIES—0.4% | ||||||||
AABS Ltd. 13-1, A | 791 | 793 | ||||||
Drug Royalty LP II 12-1, | 874 | 878 | ||||||
New Century Home Equity Loan Trust 05-A, A4W | 909 | 860 | ||||||
Security National Mortgage Loan Trust 04-1A, AF3, 144A | 1,239 | 999 | ||||||
Terwin Mortgage Trust 04-15AL, A1 144A | 566 | 540 | ||||||
| TOTAL ASSET-BACKED SECURITIES | ||||||||
| (Identified Cost $4,174) | 4,070 | |||||||
| CORPORATE BONDS—8.5% | ||||||||
| Consumer Discretionary—1.8% | ||||||||
Boyd Gaming Corp. | 1,150 | 1,256 | ||||||
CCO Holdings LLC | 2,000 | 1,860 | ||||||
Cequel Communications Holdings I LLC 144A | 1,000 | 1,025 | ||||||
Clear Channel Communications, Inc. 144A | 1,000 | 985 | ||||||
Dish DBS Corp. | 1,000 | 1,006 | ||||||
Gateway Casinos & Entertainment Ltd. 144A | 140 | CAD | 146 | |||||
Isle of Capri Casinos, Inc. 5.875%, 3/15/21 | 830 | 782 | ||||||
Landry’s, Inc. 144A | 950 | 1,007 | ||||||
MGM Resorts International 7.625%, 1/15/17 | 500 | 561 | ||||||
| PAR VALUE | VALUE | |||||||
| Consumer Discretionary—continued | ||||||||
Nara Cable Funding Ltd. 144A | $ | 525 | $ | 557 | ||||
ONO Finance II plc 144A 10.875%, 7/15/19(3) | 315 | 337 | ||||||
Pittsburgh Glass Works LLC 144A | 225 | 232 | ||||||
ServiceMaster Co. | 745 | 708 | ||||||
Sinclair Television Group, Inc. | 1,870 | 1,786 | ||||||
Sirius XM Radio, Inc. 144A | 1,800 | 1,688 | ||||||
Taylor Morrison Communities, Inc. 144A | 750 | 701 | ||||||
Univision Communications, Inc. 144A | 1,135 | 1,220 | ||||||
Virgin Media Secured Finance plc 144A | 500 | 490 | ||||||
Yankee Candle Co. Holdings LLC PIK Interest Capitalization | 605 | 620 | ||||||
|
| |||||||
| 16,967 | ||||||||
|
| |||||||
| Consumer Staples—0.4% | ||||||||
Chiquita Brands International, Inc. 144A | 1,400 | 1,491 | ||||||
Hawk Acquisition Sub, Inc. 144A 4.250%, 10/15/20(3) | 2,170 | 2,075 | ||||||
|
| |||||||
| 3,566 | ||||||||
|
| |||||||
| Energy—1.0% | ||||||||
Alta Mesa Holdings LP | 750 | 795 | ||||||
Carrizo Oil & Gas, Inc. | 450 | 493 | ||||||
Chesapeake Energy Corp. | 1,535 | 1,539 | ||||||
Compagnie Generale de Geophysique-Veritas | 546 | 563 | ||||||
EPL Oil & Gas, Inc. | 1,250 | 1,325 | ||||||
Expro Finance Luxembourg SCA 144A | 100 | 105 | ||||||
Hercules Offshore, Inc. 144A | 750 | 802 | ||||||
Linn Energy LLC 144A | 500 | 474 | ||||||
Memorial Production Partners LP | 1,350 | 1,313 | ||||||
Petroleos de Venezuela SA RegS | 815 | 740 | ||||||
| PAR VALUE | VALUE | |||||||
| Energy—continued | ||||||||
Venoco, Inc. | $ | 875 | $ | 886 | ||||
|
| |||||||
| 9,035 | ||||||||
|
| |||||||
| Financials—1.8% | ||||||||
Air Lease Corp. | ||||||||
5.625%, 4/1/17 | 1,165 | 1,241 | ||||||
4.750%, 3/1/20 | 765 | 752 | ||||||
Aircastle Ltd. | 1,190 | 1,264 | ||||||
Ally Financial, Inc. | 1,400 | 1,395 | ||||||
Avis Budget Car Rental LLC | 455 | 466 | ||||||
Banco Santander Brasil SA 144A | 1,300 | BRL | 542 | |||||
Denali Borrower LLC (Denali Finance Corp.) 144A | 1,215 | 1,182 | ||||||
International Lease Finance Corp. | 2,290 | 2,213 | ||||||
iStar Financial, Inc. 4.875%, 7/1/18 | 1,415 | 1,380 | ||||||
Level 3 Financing, Inc. 7.000%, 6/1/20 | 1,105 | 1,122 | ||||||
Michaels FinCo Holdings LLC (Michaels FinCo, Inc.) PIK Interest Capitalization, 144A | 1,555 | 1,582 | ||||||
Nationstar Mortgage LLC | ||||||||
6.500%, 8/1/18 | 835 | 843 | ||||||
6.500%, 7/1/21 | 1,295 | 1,246 | ||||||
Schaeffler Holding Finance BV PIK Interest Capitalization, 144A | 335 | 353 | ||||||
SLM Corp. | ||||||||
4.625%, 9/25/17 | 315 | 320 | ||||||
5.500%, 1/25/23 | 1,020 | 934 | ||||||
Spansion LLC | 275 | 288 | ||||||
|
| |||||||
| 17,123 | ||||||||
|
| |||||||
| Health Care—0.5% | ||||||||
Community Health Systems, Inc. (CHS) | 1,055 | 1,076 | ||||||
inventive Health, Inc. 144A | 315 | 318 | ||||||
MPH Intermediate Holding Co. 2 PIK Interest Capitalization, 144A | 570 | 586 | ||||||
Tenet Healthcare Corp. | ||||||||
144A | 435 | 446 | ||||||
4.500%, 4/1/21 | 1,000 | 941 | ||||||
Valeant Pharmaceuticals International, Inc. Escrow Corp. 144A | 965 | 1,037 | ||||||
|
| |||||||
| 4,404 | ||||||||
|
| |||||||
See Notes to Financial Statements
58
Table of Contents
VIRTUS SENIOR FLOATING RATE FUND
SCHEDULE OF INVESTMENTS (Continued)
SEPTEMBER 30, 2013
($ reported in thousands)
| PAR VALUE | VALUE | |||||||
| Industrials—0.8% | ||||||||
Air Canada 144A 6.750%, 10/1/19(3) | $ | 965 | $ | 961 | ||||
Atlas Air Pass-Through-Trust 98-1, A | 639 | 658 | ||||||
Kratos Defense & Security Solutions, Inc. 10.000%, 6/1/17 | 1,075 | 1,175 | ||||||
Rexel SA 144A | 1,230 | 1,205 | ||||||
Sappi Papier Holding | 670 | 700 | ||||||
Spectrum Brands Escrow | 715 | 747 | ||||||
U.S. Airways Pass-Through-Trust 98-1 | 633 | 662 | ||||||
United Rentals North America, Inc. | 1,000 | 1,083 | ||||||
|
| |||||||
| 7,191 | ||||||||
|
| |||||||
| Information Technology—0.7% | ||||||||
Ceridian Corp. 144A 11.000%, 3/15/21(3) | 55 | 64 | ||||||
Equinix, Inc. | 580 | 566 | ||||||
First Data Corp. | ||||||||
11.250%, 3/31/16 | 2,291 | 2,302 | ||||||
144A | 1,015 | 1,053 | ||||||
144A | 2,540 | 2,464 | ||||||
|
| |||||||
| 6,449 | ||||||||
|
| |||||||
| Materials—1.5% | ||||||||
Ardagh Packaging Finance plc 144A | 1,200 | 1,289 | ||||||
Calumet Specialty Products Partners LP | 433 | 477 | ||||||
Cemex SAB de CV | ||||||||
144A | 1,499 | 1,668 | ||||||
144A | 815 | 784 | ||||||
FMG Resources Property Ltd. | 750 | 812 | ||||||
Hexion U.S. Finance Corp. | ||||||||
144A | 1,375 | 1,430 | ||||||
6.625%, 4/15/20 | 1,370 | 1,377 | ||||||
Huntsman International LLC | 890 | 848 | ||||||
Reynolds Group Issuer, Inc. | ||||||||
9.000%, 4/15/19 | 1,500 | 1,582 | ||||||
5.750%, 10/15/20 | 940 | 948 | ||||||
| PAR VALUE | VALUE | |||||||
| Materials—continued | ||||||||
Sealed Air Corp. 144A | $ | 225 | $ | 237 | ||||
Tronox Finance LLC 144A | 1,000 | 995 | ||||||
United States Steel Corp. | 1,235 | 1,257 | ||||||
Vedanta Resources plc 144A | 685 | 755 | ||||||
|
| |||||||
| 14,459 | ||||||||
|
| |||||||
| Telecommunication Services—0.2% | ||||||||
Intelsat Luxembourg SA 144A | 1,230 | 1,278 | ||||||
| TOTAL CORPORATE BONDS (Identified Cost $80,691) | 80,472 | |||||||
| LOAN AGREEMENTS(2)—93.3% | ||||||||
| Consumer Discretionary—25.8% | ||||||||
99 Cents Only Stores Tranche B-1, | 979 | 983 | ||||||
Academy Ltd. | 1,572 | 1,581 | ||||||
Acosta, Inc. Tranche D, | 1,957 | 1,964 | ||||||
Acquisitions Cogeco Cable II LP (Atlantic Broadband (Penn) Holdings, Inc.) Tranche B, | 901 | 893 | ||||||
Advantage Sales & Marketing, Inc. | 2,591 | 2,605 | ||||||
Second Lien, | 570 | 578 | ||||||
Affinia Group, Inc. | 670 | 673 | ||||||
Affinity Gaming LLC (Herbst Gaming LLC). | 1,019 | 1,037 | ||||||
Allison Transmission | 1,179 | 1,181 | ||||||
Armstrong World Industries, Inc. Tranche B, | 3,980 | 3,969 | ||||||
August Holding Co. (U.S.) Tranche B-1, First Lien | 917 | 919 | ||||||
(Luxemborg / U.K.) | 1,068 | 1,069 | ||||||
Bally Technologies, Inc. | 6,000 | 6,004 | ||||||
BJ’s Wholesale Club, Inc. | ||||||||
First Lien, | 1,988 | 1,985 | ||||||
Second Lien, | 315 | 322 | ||||||
| PAR VALUE | VALUE | |||||||
| Consumer Discretionary—continued | ||||||||
Boyd Gaming Corp. Tranche B, | $ | 5,047 | $ | 5,050 | ||||
Bright Horizons Family Solutions LLC (Bright Horizons Family Solutions, Inc.) Tranche B, | 1,489 | 1,490 | ||||||
Caesars Entertainment Operating Co., Inc. (Harrah’s Operating Company, Inc.) | ||||||||
Tranche B-4, | 1,540 | 1,540 | ||||||
Tranche B-6, | 5,822 | 5,295 | ||||||
Cannery Casino Resorts LLC First Lien, | 887 | 885 | ||||||
CBAC Borrower LLC Tranche B, | 1,854 | 1,914 | ||||||
Cequel Communications LLC | 1,773 | 1,774 | ||||||
Charter Communications Operations LLC | ||||||||
Tranche E, | 4,412 | 4,372 | ||||||
Tranche F, | 5,306 | 5,260 | ||||||
Chrysler Group LLC Tranche B, | 3,695 | 3,729 | ||||||
Clear Channel Communications, Inc. | ||||||||
Tranche B, | 2,000 | 1,889 | ||||||
Tranche D, | 10,933 | 10,162 | ||||||
CSC Holdings, Inc. (CSC Holdings, Inc. (Cablevision)) Tranche B, | 4,168 | 4,128 | ||||||
Cumulus Media Holdings, Inc. | ||||||||
First Lien, | 1,816 | 1,830 | ||||||
Second Lien, | 1,968 | 2,002 | ||||||
Dave & Buster’s, Inc. | 1,395 | 1,401 | ||||||
EB Sports Corp. | 1,000 | 997 | ||||||
Entercom Radio LLC Tranche B-1, | 2,218 | 2,235 | ||||||
Federal-Mogul Corp. | ||||||||
Tranche B, | 5,929 | 5,838 | ||||||
Tranche C, | 3,027 | 2,980 | ||||||
Fram Group Holdings, Inc. (Prestone Holdings, Inc.) | ||||||||
First Lien, | 950 | 935 | ||||||
Second Lien, | 500 | 486 | ||||||
See Notes to Financial Statements
59
Table of Contents
VIRTUS SENIOR FLOATING RATE FUND
SCHEDULE OF INVESTMENTS (Continued)
SEPTEMBER 30, 2013
($ reported in thousands)
| PAR VALUE | VALUE | |||||||
| Consumer Discretionary—continued | ||||||||
Gateway Casinos & Entertainment Ltd. | 808 | CAD | $ | 786 | ||||
General Nutrition Centers, Inc. Tranche B, | $ | 1,746 | 1,753 | |||||
Getty Images, Inc. | 2,910 | 2,614 | ||||||
Granite Broadcasting Corp. Tranche B First Lien | 2,265 | 2,280 | ||||||
Great Wolf Resorts | 2,993 | 2,987 | ||||||
Harbor Freight Tools | 1,489 | 1,503 | ||||||
Hilton Worldwide, Inc. (Hilton Hotels Corp.) Tranche B-2 | 11,513 | 11,511 | ||||||
Hubbard Radio LLC Tranche 1, 4.500%, 4/29/19 | 2,044 | 2,052 | ||||||
KAR Auction Services, Inc. | 2,613 | 2,625 | ||||||
Landry’s, Inc. (Landry’s Restaurant, Inc.) Tranche B, 4.750%, 4/24/18 | 2,713 | 2,736 | ||||||
Las Vegas Sands LLC | ||||||||
Tranche DD-I, | 64 | 64 | ||||||
Non-Extended Tranche B, | 311 | 311 | ||||||
Extended Tranche B, | 1,041 | 1,041 | ||||||
Extended Tranche DD-I, | 210 | 210 | ||||||
Laureate Education, Inc. | ||||||||
Series 2018, | 1,986 | 1,993 | ||||||
0.000%, 6/16/18(7) | 1,000 | 1,003 | ||||||
Leslie’s Poolmart, Inc. | 2,307 | 2,322 | ||||||
Liberty Cablevision of Puerto Rico LLC Tranche B, First Lien, | 978 | 984 | ||||||
Live Nation Entertainment | 3,394 | 3,383 | ||||||
MCC LLC (Mediacom Broadband Group) | ||||||||
Tranche G, | 990 | 993 | ||||||
Tranche H, | 1,995 | 1,978 | ||||||
Media General, Inc. | 5,000 | 5,019 | ||||||
Merrill Communications LLC Tranche B, | 1,716 | 1,729 | ||||||
Metaldyne LLC | 993 | 1,000 | ||||||
MGM Resorts International (MGM Grand Detroit LLC) | ||||||||
Tranche A, | 1,985 | 1,985 | ||||||
| PAR VALUE | VALUE | |||||||
| Consumer Discretionary—continued | ||||||||
Tranche B, | $ | 4,861 | $ | 4,851 | ||||
Michaels Stores, Inc. Tranche B, | 3,990 | 3,996 | ||||||
Neiman Marcus Group, Inc. (The) | 1,901 | 1,902 | ||||||
Nine Entertainment Group Ltd. (PBL Media Group Limited) Tranche B, | 3,483 | 3,469 | ||||||
Oceania Cruises, Inc. | 3,000 | 3,029 | ||||||
Party City Holdings, Inc. | 2,980 | 2,978 | ||||||
Peninsula Gaming LLC Tranche B, | 986 | 991 | ||||||
Penn National Gaming, Inc. Tranche B, | 1,790 | 1,794 | ||||||
Peppermill Casinos, Inc. Tranche B, | 2,313 | 2,360 | ||||||
Phillips-Van Heusen Corp. Tranche B, | 4,035 | 4,031 | ||||||
Pinnacle Entertainment, Inc. 3.750%, 8/13/20 | 5,647 | 5,651 | ||||||
Radio One, Inc. | 594 | 608 | ||||||
Remy International, Inc. Tranche B, | 1,985 | 1,994 | ||||||
Salem Communications Corp. | 973 | 977 | ||||||
Scientific Games International, Inc. | ||||||||
Tranche B-1, | 1,983 | 1,967 | ||||||
3.180%, 5/22/20 | 3,725 | 3,694 | ||||||
Seminole Hard Rock Entertainment, Inc. (Seminole Hard Rock International LLC) Tranche B, | 964 | 963 | ||||||
Seminole Tribe of Florida 3.000%, 4/29/20 | 3,709 | 3,706 | ||||||
ServiceMaster Co. (The) | ||||||||
Tranche C, | 1,613 | 1,575 | ||||||
Tranche B, | 1,918 | 1,880 | ||||||
Seven Sea Cruises S. DE R.L. Tranche B-1, | 2,718 | 2,745 | ||||||
Shingle Springs Tribal Gaming Authority | 1,755 | 1,755 | ||||||
Sports Authority, Inc. (The) Tranche B, | 1,070 | 1,076 | ||||||
| PAR VALUE | VALUE | |||||||
| Consumer Discretionary—continued | ||||||||
SRAM LLC First Lien, | $ | 2,811 | $ | 2,776 | ||||
Station Casinos LLC Tranche B, | 2,420 | 2,448 | ||||||
TI Group Auto Systems LLC | 1,576 | 1,595 | ||||||
Tower Automotive Holdings | 1,374 | 1,378 | ||||||
Transtar Holding Co. | ||||||||
First Lien, | 990 | 997 | ||||||
Second Lien, | 460 | 469 | ||||||
Tribune Co. Tranche B, | 1,044 | 1,046 | ||||||
TWCC Holding Corp. Second Lien, | 3,524 | 3,625 | ||||||
UCI International, Inc. (United Components) | 1,240 | 1,248 | ||||||
Univision Communications, Inc. | ||||||||
4.000%, 3/1/20 | 7,210 | 7,139 | ||||||
First Lien, | 5,102 | 5,089 | ||||||
Veyance Technologies, Inc. 5.250%, 9/8/17 | 1,990 | 1,988 | ||||||
Virgin Media Investment Holdings Ltd. Tranche B, | 3,847 | 3,831 | ||||||
WideOpenWest Finance LLC | ||||||||
Tranche B-1, | 286 | 287 | ||||||
Tranche B, | 2,098 | 2,116 | ||||||
Yankee Cable Acquisition LLC 5.250%, 3/1/20 | 927 | 933 | ||||||
Zuffa LLC | 3,684 | 3,691 | ||||||
|
| |||||||
| 245,465 | ||||||||
|
| |||||||
| Consumer Staples—7.4% | ||||||||
AdvancePierre Foods, Inc. | ||||||||
First Lien, | 1,082 | 1,089 | ||||||
Second Lien, | 1,035 | 1,056 | ||||||
American Rock Salt Co. LLC | 1,201 | 1,202 | ||||||
Aramark Corp. Tranche D, | 4,457 | 4,471 | ||||||
CIH International S.A R.L. | 5,985 | 5,955 | ||||||
Crossmark Holdings, Inc. | ||||||||
First Lien, | 3,021 | 2,993 | ||||||
Second Lien, | 520 | 520 | ||||||
Del Monte Corp. | 3,446 | 3,439 | ||||||
See Notes to Financial Statements
60
Table of Contents
VIRTUS SENIOR FLOATING RATE FUND
SCHEDULE OF INVESTMENTS (Continued)
SEPTEMBER 30, 2013
($ reported in thousands)
| PAR VALUE | VALUE | |||||||
| Consumer Staples—continued | ||||||||
Dole Food Co., Inc. Tranche B, | $ | 3,980 | $ | 3,982 | ||||
Heinz (H.J.) Co. | ||||||||
Tranche B-1, | 1,726 | 1,729 | ||||||
Tranche B-2, | 12,203 | 12,257 | ||||||
Hostess Brands Acquisition LLC Tranche B, | 4,047 | 4,162 | ||||||
Pinnacle Foods Finance | 4,000 | 3,965 | ||||||
Pinnacle Foods Finance LLC Tranche G, | 6,667 | 6,618 | ||||||
Revlon Consumer Prods Corp. | 1,000 | 1,000 | ||||||
Revlon Consumer Products Corp. | 1,605 | 1,609 | ||||||
Rite Aid Corp. | ||||||||
Tranche 6, | 5,970 | 5,970 | ||||||
Tranche 1, Second Lien, | 101 | 104 | ||||||
Tranche 2, | 1,417 | 1,425 | ||||||
Smart & Final, Inc. First Lien, | 1,986 | 1,987 | ||||||
Spectrum Brands, Inc. | 2,000 | 2,003 | ||||||
Supervalu, Inc. | 977 | 976 | ||||||
Yankee Candle Co., Inc. (The) | 1,805 | 1,808 | ||||||
|
| |||||||
| 70,320 | ||||||||
|
| |||||||
| Energy—2.3% | ||||||||
Buffalo Gulf Coast Terminals LLC | 654 | 660 | ||||||
Chesapeake Energy Corp. | 2,910 | 2,966 | ||||||
CITGO Petroleum Corp. Tranche C, | 199 | 204 | ||||||
Energy Transfer Equity LP | 900 | 905 | ||||||
EP Energy LLC (Everest Acquisition LLC) | ||||||||
Tranche B-3, | 567 | 567 | ||||||
Tranche B-2, | 732 | 734 | ||||||
Fieldwood Energy LLC | ||||||||
7.125%, 9/28/18 | 440 | 441 | ||||||
7.125%, 9/30/20 | 1,508 | 1,506 | ||||||
FTS International, Inc. (Frac Tech International LLC) | 1,921 | 1,889 | ||||||
MEG Energy Corp. | 3,476 | 3,490 | ||||||
| PAR VALUE | VALUE | |||||||
| Energy—continued | ||||||||
NGPL Pipeco LLC | $ | 1,103 | $ | 989 | ||||
Quicksilver Resources. Inc. Second Lien, | 2,250 | 2,171 | ||||||
Sabine Oil & Gas LLC Second Lien, | 1,290 | 1,299 | ||||||
Samson Investment Co. Second Lien, | 1,262 | 1,266 | ||||||
SES International Holdings Ltd. (Saxon) | 1,522 | 1,528 | ||||||
Tesoro Corp. | 995 | 997 | ||||||
|
| |||||||
| 21,612 | ||||||||
|
| |||||||
| Financials—7.0% | ||||||||
AGFS Funding | 1,617 | 1,620 | ||||||
AlixPartners LLP | 3,000 | 3,041 | ||||||
Altisource Portfolio Solutions S.A.R.L Tranche B, | 1,988 | 2,007 | ||||||
Asurion LLC | 1,499 | 1,453 | ||||||
Asurion LLC (Asurion Corp.) Tranche B-1, | 3,279 | 3,255 | ||||||
Capital Automotive LP | ||||||||
Tranche B-1, | 1,564 | 1,569 | ||||||
Second Lien, | 1,185 | 1,215 | ||||||
Clipper Acquisitions Corp. | 1,006 | 1,012 | ||||||
GEO Group, Inc. (The) | 3,990 | 4,020 | ||||||
Guggenheim Partners LLC | 3,000 | 3,012 | ||||||
Home Loan Servicing Solutions Ltd. | 3,990 | 4,035 | ||||||
iPayment, Inc . | 927 | 897 | ||||||
iStar Financial, Inc. | ||||||||
Tranche A-2, | 468 | 481 | ||||||
4.500%, 10/15/17 | 4,062 | 4,079 | ||||||
Lonestar Intermediate Super Holdings LLC | 300 | 314 | ||||||
MIP Delaware LLC | 1,406 | 1,414 | ||||||
National Financial Partners | 2,993 | 3,020 | ||||||
Nuveen Investments, Inc. | ||||||||
Tranche B, First Lien | 3,925 | 3,885 | ||||||
Tranche B, Second Lien | 4,292 | 4,276 | ||||||
| PAR VALUE | VALUE | |||||||
| Financials—continued | ||||||||
Ocean Rig | $ | 3,000 | $ | 3,036 | ||||
Re/Max International, Inc. | 1,247 | 1,243 | ||||||
Realogy Corp. | ||||||||
Extended LOC, | 445 | 448 | ||||||
Tranche B, | 7,527 | 7,585 | ||||||
RPI Finance Trust | 1,319 | 1,324 | ||||||
Springleaf Financial Funding Co. | 284 | 284 | ||||||
Starwood Property Trust, Inc. | 3,582 | 3,577 | ||||||
Trans Union LLC | 1,500 | 1,508 | ||||||
Walter Investment Management Corp. Tranche B, | 2,805 | 2,833 | ||||||
|
| |||||||
| 66,443 | ||||||||
|
| |||||||
| Health Care—10.5% | ||||||||
Alere, Inc. (IM U.S. Holdings LLC) | ||||||||
Tranche B, | 1,642 | 1,653 | ||||||
Tranche B-1, | 983 | 989 | ||||||
Alkermes, Inc. First Lien, | 992 | 989 | ||||||
American Renal Holdings, Inc. | ||||||||
Tranche B, First Lien, | 1,529 | 1,518 | ||||||
Second Lien, | 1,860 | 1,837 | ||||||
AMN Healthcare, Inc. Tranche B, | 1,476 | 1,485 | ||||||
Aptalis Pharma, Inc. (Axcan Intermediate Holdings, Inc.) Tranche B-1, | 1,016 | 1,018 | ||||||
Ardent Medical Services, Inc. | ||||||||
First Lien, | 860 | 866 | ||||||
Second Lien, | 375 | 384 | ||||||
Biomet | 2,985 | 3,002 | ||||||
BSN Medical Luxembourg Holding, S.A.R.L. (P&F Capital) | 2,000 | 2,009 | ||||||
Capsugel Holdings U.S., Inc. | 4,777 | 4,759 | ||||||
Catalent Pharma Solutions, Inc. (Cardinal Health 409, Inc.) | ||||||||
Tranche 1, 3.679%, 9/15/16 | 962 | 966 | ||||||
Tranche 2, 4.250%, 9/15/17 | 262 | 264 | ||||||
See Notes to Financial Statements
61
Table of Contents
VIRTUS SENIOR FLOATING RATE FUND
SCHEDULE OF INVESTMENTS (Continued)
SEPTEMBER 30, 2013
($ reported in thousands)
| PAR VALUE | VALUE | |||||||
| Health Care—continued | ||||||||
Community Health Systems, Inc. Extended, | $ | 3,275 | $ | 3,279 | ||||
ConvaTec, Inc. | 1,598 | 1,610 | ||||||
CRC Health Corp. Tranche B-2, | 1,439 | 1,446 | ||||||
DaVita, Inc. Tranche B-2 | 3,020 | 3,036 | ||||||
Drumm Investors LLC (Golden Living) | 1,709 | 1,642 | ||||||
Emdeon, Inc. Tranche B-2, | 3,055 | 3,056 | ||||||
Grifols, Inc. Tranche B, | 972 | 979 | ||||||
HCA, Inc. Tranche B-4, | 5,326 | 5,321 | ||||||
Health Management Associates, Inc. Tranche B, | 3,301 | 3,304 | ||||||
Hologic, Inc. Tranche B, | 2,946 | 2,956 | ||||||
Iasis Healthcare LLC Tranche B-2, | 2,012 | 2,018 | ||||||
INC Research, LLC | 556 | 560 | ||||||
InVentiv Health, Inc. (Ventive Health, Inc.) | 1,177 | 1,142 | ||||||
Kinetic Concepts, Inc. | ||||||||
Tranche D-2, | 947 | 952 | ||||||
Tranche D-1, | 583 | 587 | ||||||
MedAssets, Inc. Tranche B, | 155 | 156 | ||||||
MMM Holdings, Inc. | 468 | 471 | ||||||
MSO of Puerto Rico, Inc. | 340 | 342 | ||||||
Multiplan, Inc. Tranche B-1, | 4,448 | 4,461 | ||||||
National Mentor Holdings, Inc. | 975 | 987 | ||||||
NBTY, Inc. Tranche B-2, | 2,782 | 2,789 | ||||||
Par Pharmaceutical Cos, Inc. (Par Pharmaceutical, Inc.) Tranche B-1, | 1,369 | 1,366 | ||||||
Pharmaceutical Product Development, Inc. (Jaguar Holdings LLC) | 1,985 | 1,992 | ||||||
PRA Holdings, Inc. | 3,000 | 2,990 | ||||||
Quintiles Transnational Corp. Tranche B-2, | 1,461 | 1,467 | ||||||
Rural/Metro Operating Co. LLC First Lien, | 1,997 | 1,903 | ||||||
| PAR VALUE | VALUE | |||||||
| Health Care—continued | ||||||||
Rural/Metro, Inc. | $ | 1,001 | $ | 1,006 | ||||
Select Medical Corp. | 995 | 1,001 | ||||||
Sheridan Holdings, Inc. First Lien, | 1,854 | 1,862 | ||||||
Surgery Center Holdings, Inc. First Lien | 1,297 | 1,300 | ||||||
Surgical Care Affiliates LLC | 3,465 | 3,475 | ||||||
U.S. Renal Care, Inc. First Lien, | 2,482 | 2,513 | ||||||
United Surgical Partners International, Inc. Tranche B, | 2,100 | 2,114 | ||||||
Valeant Pharmaceuticals International, Inc. | 4,963 | 4,999 | ||||||
Valeant Pharmaceuticals International, Inc. Escrow Corp. | ||||||||
Series D2, Tranche B, 3.750%, 2/13/19 | 3,499 | 3,501 | ||||||
Series C2, Tranche B 3.750%, 12/11/19 | 1,022 | 1,026 | ||||||
Vanguard Health Holding Company II LLC Tranche B, | 2,128 | 2,130 | ||||||
VWR Funding, Inc. | ||||||||
Tranche B-1, | 166 | 166 | ||||||
4.429%, 4/3/17 | 1,209 | 1,211 | ||||||
Warner Chilcott Corp. | ||||||||
Tranche B-1, | 555 | 556 | ||||||
(WC Luxco S.A.R.L.) | 437 | 438 | ||||||
Tranche B-1, | 242 | 242 | ||||||
|
| |||||||
| 100,091 | ||||||||
|
| |||||||
| Industrials—11.6% | ||||||||
ADS Waste Holdings Tranche B, | 3,082 | 3,086 | ||||||
Air Canada | 4,265 | 4,267 | ||||||
Allegion | 3,000 | 3,010 | ||||||
Alliance Laundry Systems LLC | ||||||||
First Lien, | 2,424 | 2,432 | ||||||
Second Lien, | 110 | 111 | ||||||
Altegrity, Inc. (U.S. Investigations Services, Inc.) | 1,138 | 1,114 | ||||||
| PAR VALUE | VALUE | |||||||
| Industrials—continued | ||||||||
Aluma Systems, Inc. (Brand Energy & Infrastructure) Tranche 1, | $ | 247 | $ | 249 | ||||
American Airlines, Inc. | 7,637 | 7,603 | ||||||
Apex Tool Group LLC Tranche B, | 2,985 | 2,995 | ||||||
Avis Budget Car Rental LLC 3.000%, 3/15/19 | 2,814 | 2,810 | ||||||
AWAS Finance Luxemborg S.A. Tranche 2012, | 1,075 | 1,079 | ||||||
Brand Energy & Infrastructure Services, Inc. | ||||||||
Tranche B-1, First Lien, | 1,031 | 1,037 | ||||||
Second Lien, | 465 | 477 | ||||||
Brickman Group Holdings, Inc. | ||||||||
Tranche B-2, | 700 | 704 | ||||||
Tranche B-3, | 2,383 | 2,389 | ||||||
Brock Holdings Ill, Inc. | ||||||||
First Lien, | 823 | 828 | ||||||
Second Lien, | 450 | 457 | ||||||
Ceridian Corp. Tranche 2013, 4.429%, 5/9/17 | 6,874 | 6,889 | ||||||
CHG Buyer Corp. | ||||||||
First Lien, | 1,184 | 1,196 | ||||||
Second Lien, | 425 | 435 | ||||||
Commercial Barge Line Co. First Lien | 2,697 | 2,630 | ||||||
Doncasters Group Ltd. (Doncasters US LLC) Tranche B, | 1,648 | 1,658 | ||||||
Douglas Dynamics LLC | 896 | 901 | ||||||
Ducommun, Inc. | 1,475 | 1,493 | ||||||
DynCorp International, Inc. 6.750%, 7/7/16 | 944 | 952 | ||||||
Edwards Ltd. First Lien, 4.750%, 3/26/20 | 1,711 | 1,713 | ||||||
Envision Healthcare Corp. (Emergency Medical Services Corp.) | 3,722 | 3,726 | ||||||
Garda Security Group, Inc. Tranche B, | 693 | 696 | ||||||
Hawker Beechcraft Acquisition Company LLC | 1,600 | 1,615 | ||||||
See Notes to Financial Statements
62
Table of Contents
VIRTUS SENIOR FLOATING RATE FUND
SCHEDULE OF INVESTMENTS (Continued)
SEPTEMBER 30, 2013
($ reported in thousands)
| PAR VALUE | VALUE | |||||||
| Industrials—continued | ||||||||
HD Supply, Inc. | $ | 3,274 | $ | 3,283 | ||||
Husky Injection Molding | 1,337 | 1,340 | ||||||
International Equipment Solutions (IES Global B.V.) | 3,125 | 3,096 | ||||||
McJunkin Red Man Corp. 7.000%, 11/8/19 | 1,167 | 1,176 | ||||||
Mirion Technologies, Inc. 5.750%, 3/30/18 | 1,223 | 1,222 | ||||||
Mirror Bidco, Inc. | 620 | 625 | ||||||
Navistar, Inc. Tranche B, | 1,319 | 1,338 | ||||||
Nielsen Finance LLC Tranche E, | 1,648 | 1,653 | ||||||
OPE USIC Holdings, Inc. | 2,993 | 2,995 | ||||||
Protection One, Inc. | 3,173 | 3,193 | ||||||
Quikrete Co., Inc. | 4,000 | 4,006 | ||||||
Rexnord LLC | 5,000 | 4,949 | ||||||
SESAC Holding Co. II LLC First Lien, | 464 | 468 | ||||||
SI Organization, Inc. (The) Tranche B, | 973 | 951 | ||||||
Spin Holdco, Inc. First Lien, | 4,000 | 4,000 | ||||||
Spotless Holdings | 2,000 | 2,008 | ||||||
Swift Transportation Tranche B-2, | 706 | 710 | ||||||
TransDigm, Inc. Tranche C, | 8,005 | 7,985 | ||||||
US Airways, Inc. | ||||||||
Tranche B-2, 3.500%, 11/23/16 | 765 | 767 | ||||||
Tranche B-1, | 2,874 | 2,863 | ||||||
Utex Industries, Inc. | 1,995 | 1,995 | ||||||
WCA Waste Corp. | 937 | 939 | ||||||
WireCo Worldgroup, Inc. | 446 | 448 | ||||||
|
| |||||||
| 110,562 | ||||||||
|
| |||||||
| Information Technology—14.3% | ||||||||
Activision Blizzard | 6,666 | 6,671 | ||||||
Alcatel-Lucent U.S.A., Inc. | 4,809 | 4,853 | ||||||
Allflex Holdings III, Inc. | ||||||||
4.250%, 7/17/20 | 5,000 | 5,023 | ||||||
| PAR VALUE | VALUE | |||||||
| Information Technology—continued | ||||||||
Second Lien, | $ | 789 | $ | 801 | ||||
Applied Systems, Inc. | ||||||||
First Lien, | 1,423 | 1,432 | ||||||
Second Lien, | 334 | 337 | ||||||
Autotrader.com, Inc. | 1,167 | 1,181 | ||||||
Avaya, Inc. | ||||||||
Tranche B-3, | 1,645 | 1,477 | ||||||
Tranche B-5, | 1,463 | 1,389 | ||||||
Blue Coat Systems, Inc. | ||||||||
4.500%, 5/31/19 | 2,851 | 2,867 | ||||||
Second Lien | 3,154 | 3,178 | ||||||
BMC Software, Inc. 5.000%, 9/10/20 | 3,461 | 3,467 | ||||||
CCC Holdings, Inc. 4.000%, 12/20/19 | 2,690 | 2,684 | ||||||
CDW LLC | 9,327 | 9,194 | ||||||
Commscope, Inc. | 1,492 | 1,499 | ||||||
CPI International Acquisition, Inc. (Catalyst Holdings, Inc.) Tranche B, | 1,201 | 1,214 | ||||||
Dell, Inc. | 4,750 | 4,673 | ||||||
Deltek, Inc. | ||||||||
First Lien, | 3,384 | 3,398 | ||||||
Second Lien, | 1,529 | 1,542 | ||||||
Epicor Software Corp. (Eagle Parent Inc.) | 2,933 | 2,939 | ||||||
First Data Corp. | ||||||||
Tranche 2017, | 4,381 | 4,350 | ||||||
Tranche 2018, | 5,500 | 5,459 | ||||||
Freescale Semiconductor, Inc. | 2,000 | 2,006 | ||||||
Freescale Seminconductor, Inc. Tranche B-4, | 3,920 | 3,941 | ||||||
Genpact Ltd. | 1,236 | 1,237 | ||||||
Go Daddy Operating Co. LLC Tranche B-1, | 4,595 | 4,599 | ||||||
IMS Health, Inc. Tranche B-1, | 2,683 | 2,686 | ||||||
Infor (U.S.), Inc. (Lawson Software, Inc.) | ||||||||
Tranche B-2, | 3,641 | 3,667 | ||||||
| PAR VALUE | VALUE | |||||||
| Information Technology—continued | ||||||||
Tranche B-3, | $ | 4,531 | $ | 4,497 | ||||
Information Resources, Inc. (Symphonyiri Group, Inc.) | 1,122 | 1,125 | ||||||
Interactive Data Corp. | 2,380 | 2,373 | ||||||
ION Trading Technologies S.A.R.L. First Lien, | 1,375 | 1,376 | ||||||
IPC Systems, Inc. Tranche C, First Lien, | 1,966 | 1,927 | ||||||
Ipreo Holdings LLC | ||||||||
Tranche B-2, | 963 | 973 | ||||||
Tranche B-3, | 263 | 266 | ||||||
Kronos, Inc. | ||||||||
First Lien, | 391 | 392 | ||||||
Second Lien, | 715 | 742 | ||||||
Microsemi Corp. | 826 | 827 | ||||||
Mitchell International, Inc. | 2,250 | 2,253 | ||||||
Mmi International Ltd. | 1,950 | 1,891 | ||||||
Moneygram International, Inc. | 811 | 812 | ||||||
Mood Media Corp. | 1,048 | 1,052 | ||||||
Novell, Inc. (Attachmate Corp.) First Lien, | 1,622 | 1,628 | ||||||
Oberthur Technologies Finance SAS | 1,089 | 1,094 | ||||||
Presidio, Inc. | 1,765 | 1,768 | ||||||
Riverbed Technology, Inc. | 285 | 288 | ||||||
RP Crown Parent LLC | ||||||||
First Lien | 2,182 | 2,202 | ||||||
Second Lien, | 1,833 | 1,873 | ||||||
SCS Holdings I, Inc. (Sirius Computer Solutions, Inc.) | 561 | 571 | ||||||
Smart Modular Technologies (Global), Inc. | 480 | 438 | ||||||
Sophia LP Tranche B, | 1,117 | 1,124 | ||||||
Sorenson Communications, Inc. | 1,990 | 2,012 | ||||||
Spansion LLC | 786 | 793 | ||||||
See Notes to Financial Statements
63
Table of Contents
VIRTUS SENIOR FLOATING RATE FUND
SCHEDULE OF INVESTMENTS (Continued)
SEPTEMBER 30, 2013
($ reported in thousands)
| PAR VALUE | VALUE | |||||||
| Information Technology—continued | ||||||||
SRA International, Inc. | $ | 1,226 | $ | 1,216 | ||||
SSI Investments II Ltd. (Skillsoft) | 944 | 949 | ||||||
SunGard Data Systems, Inc. | ||||||||
Tranche D, | 2,510 | 2,541 | ||||||
Tranche E, | 588 | 591 | ||||||
Syniverse Holdings, Inc. | 970 | 967 | ||||||
Verifone, Inc. | ||||||||
Tranche B, | 209 | 209 | ||||||
4.250%, 10/3/19 | 1,459 | 1,464 | ||||||
Vision Solutions, Inc. | 662 | 664 | ||||||
Wall Street Systems Holdings, Inc. | ||||||||
First Lien, | 695 | 698 | ||||||
Second Lien, | 497 | 501 | ||||||
Websense, Inc. | 1,496 | 1,498 | ||||||
Zayo Group LLC (Zayo Capital, Inc.) | 2,217 | 2,222 | ||||||
|
| |||||||
| 135,581 | ||||||||
|
| |||||||
| Materials—6.5% | ||||||||
AI Chem & Cy S.C.A. | ||||||||
Tranche B-1, | 657 | 658 | ||||||
Tranche B-2, | 341 | 342 | ||||||
Air Distribution Technologies, Inc. (QS0001 Corp.) First Lien, | 411 | 413 | ||||||
American Builders & Contractors | 6,000 | 5,965 | ||||||
Arysta LifeScience SPC LLC 4.500%, 5/29/20 | 2,461 | 2,461 | ||||||
Avantor Performance Materials Holdings, Inc. | 629 | 630 | ||||||
AZ Chem US, Inc. | 903 | 913 | ||||||
Berlin Packaging, Inc. First Lien, | 2,500 | 2,509 | ||||||
Berry Plastics Group, Inc. Tranche D, | 4,627 | 4,585 | ||||||
CEMEX Espana S.A. Tranche A-1, | 894 | 874 | ||||||
| PAR VALUE | VALUE | |||||||
| Materials—continued | ||||||||
Chemtura Corp. | $ | 568 | $ | 572 | ||||
Cyanco Intermediate Corp. | 1,311 | 1,319 | ||||||
Distribution International, Inc. | 1,995 | 1,986 | ||||||
Essar Steel Algoma, Inc. (Algoma Steel, Inc.) Second Lien, | 1,931 | 1,966 | ||||||
Fairmount Minerals Ltd. Tranche B-2, | 1,083 | 1,087 | ||||||
Fortescue Metals Group Ltd. (FMG Resources Ltd.) 2006, | 5,009 | 5,033 | ||||||
General Chemical Corp. | 1,154 | 1,159 | ||||||
Houghton International, Inc. Holding Corp. First Lien, | 1,687 | 1,684 | ||||||
Houghton International, Inc. Holding Corp. (HII Holding Corp.) Second Lien, | 630 | 634 | ||||||
Huntsman International LLC Extended Tranche B, | 1,566 | 1,570 | ||||||
Ineos US Finance LLC | 8,186 | 8,106 | ||||||
JFB Firth Rixson, Inc. | 1,985 | 1,988 | ||||||
Noranda Aluminum Acquisition Corp. Tranche B, | 2,275 | 2,145 | ||||||
Novelis, Inc. | 632 | 634 | ||||||
Pact Group (USA), Inc. | 4,789 | 4,729 | ||||||
PQ Corp. | 1,985 | 1,996 | ||||||
Pro Mach, Inc. | 1,474 | 1,484 | ||||||
Reynolds Group Holdings, Inc. | 2,032 | 2,041 | ||||||
Tronox Pigments B.V. | 1,197 | 1,205 | ||||||
Univar, Inc. Tranche B, | 1,361 | 1,315 | ||||||
|
| |||||||
| 62,003 | ||||||||
|
| |||||||
| Telecommunication Services—5.2% | ||||||||
Cincinnati Bell, Inc. | 3,250 | 3,237 | ||||||
Cricket Communications, Inc. Tranche C, | 1,995 | 1,997 | ||||||
Crown Castle Operating Co. | 6,982 | 6,912 | ||||||
Global Tel*link Corp. | ||||||||
First Lien, | 2,008 | 1,983 | ||||||
9.000%, 11/23/20 | 660 | 645 | ||||||
| PAR VALUE | VALUE | |||||||
| Telecommunication Services—continued | ||||||||
Grande Communications Networks LLC | $ | 998 | $ | 997 | ||||
Hawaiian Telcom Communications, Inc. | 1,990 | 1,998 | ||||||
Integra Telecom Holdings, Inc. | ||||||||
Tranche B, | 1,187 | 1,196 | ||||||
Second Lien, | 449 | 462 | ||||||
Intelsat Jackson Holding S.A. (Intelsat Jackson Holding Ltd.) Tranche B-1, | 2,938 | 2,949 | ||||||
Level 3 Financing, Inc. | ||||||||
Tranche B-III 2019, | 1,875 | 1,876 | ||||||
Tranche B-II 2019, | 2,150 | 2,152 | ||||||
4.000%, 1/15/20 | 1,000 | 1,000 | ||||||
Tranche B, | 2,388 | 2,389 | ||||||
LTS Buyer LLC (Sidera Networks, Inc.) Tranche B, | 1,995 | 2,006 | ||||||
Securus Technologies Holdings, Inc. (Securus Technologies, Inc.) | ||||||||
First Lien, | 2,400 | 2,365 | ||||||
Second Lien | 685 | 676 | ||||||
Syniverse Holdings, Inc. | 1,440 | 1,439 | ||||||
Telesat Canada, Inc. Tranche B-2, | 3,772 | 3,758 | ||||||
TW Telecom Holdings, Inc. (Time Warner Telecom Holdings, Inc.) Tranche B, | 1,995 | 2,007 | ||||||
UPC Financing Partnership | 3,250 | 3,259 | ||||||
West Corp. Tranche B-8, | 2,532 | 2,538 | ||||||
Windstream Corp. Tranche B-4, | 1,231 | 1,230 | ||||||
|
| |||||||
| 49,071 | ||||||||
|
| |||||||
| Utilities—2.7% | ||||||||
AES Corp. | 1,525 | 1,536 | ||||||
Calpine Construction Finance Co. LP | ||||||||
3.000%, 5/3/20 | 5,151 | 5,050 | ||||||
3.250%, 1/31/22 | 1,995 | 1,966 | ||||||
Calpine Corp. | ||||||||
4.000%, 4/1/18 | 1,950 | 1,955 | ||||||
4.000%, 10/9/19 | 743 | 744 | ||||||
InterGen N.V. | 2,683 | 2,681 | ||||||
See Notes to Financial Statements
64
Table of Contents
VIRTUS SENIOR FLOATING RATE FUND
SCHEDULE OF INVESTMENTS (Continued)
SEPTEMBER 30, 2013
($ reported in thousands)
| PAR VALUE | VALUE | |||||||
| Utilities—continued | ||||||||
NRG Energy, Inc. | $ | 5,402 | $ | 5,375 | ||||
Sapphire Power | 1,995 | 2,006 | ||||||
Texas Compeptitive Electric Holdings Co. LLC 2017 Extended, | 5,945 | 4,013 | ||||||
|
| |||||||
| 25,326 | ||||||||
| TOTAL LOAN AGREEMENTS (Identified Cost $885,276) | 886,474 | |||||||
| SHARES | ||||||||
| COMMON STOCKS—0.0% | ||||||||
| Consumer Discretionary—0.0% | ||||||||
Velo Holdings, | 70,371 | 0 | ||||||
| TOTAL COMMON STOCKS (Identified Cost $0) | 0 | |||||||
| TOTAL LONG TERM INVESTMENTS—102.6% | ||||||||
| (Identified cost $974,380) | 975,156 | |||||||
| SHORT-TERM INVESTMENTS—6.3% | ||||||||
| Money Market Mutual Funds—6.3% | ||||||||
Fidelity Money Market Portfolio – Institutional Shares (Seven-day effective yield 0.090%) | 59,827,609 | 59,828 | ||||||
| TOTAL SHORT-TERM INVESTMENTS (Identified Cost $59,828) | 59,828 | |||||||
| TOTAL INVESTMENTS—108.9% | ||||||||
| (Identified Cost $1,034,208) | 1,034,984 | (1) | ||||||
Other assets and liabilities, |
| (84,413 | ) | |||||
|
| |||||||
| NET ASSETS—100.0% | $ | 950,571 | ||||||
|
| |||||||
Footnote Legend:
| (1) | Federal Income Tax Information: For tax information at September 30, 2013, see Note 10 Federal Income Tax Information in the Notes to Financial Statements. |
| (2) | Variable or step coupon security; interest rate shown reflects the rate in effect at September 30, 2013. |
| (3) | Security exempt from registration under Rule 144A of the Securities Act of 1933. These securities may be resold in transactions exempt from registration, normally to qualified institutional buyers. At September 30, 2013, these securities amounted to a value of $38,495 or 4.0% of net assets. |
| (4) | Regulation S security. Security is offered and sold outside of the United States, therefore, it is exempt from registration with the SEC under rules 903 and 904 of the Securities Act of 1933. |
| (5) | Security valued at fair value as determined in good faith by or under the direction of the Trustees. This security is disclosed as a Level 3 security in the disclosure table located after the Schedule of Investments. |
| (6) | Illiquid security. |
| (7) | This loan will settle after September 30, 2013, at which time the interest rate, based on the London Interbank Offered Rate (“LIBOR”) and the agreed upon spread on trade date, will be known. |
| (8) | 100% of the income received was in cash. |
Foreign Currencies:
| BRL | Brazilian Real |
| CAD | Canadian Dollar |
| Country Weightings (Unaudited)† | ||||
United States | 91 | % | ||
Australia | 2 | |||
Canada | 2 | |||
United Kingdom | 2 | |||
Luxembourg | 1 | |||
Other | 2 | |||
Total | 100 | % | ||
† % of total investments as of September 30, 2013 |
| |||
Security abbreviation definitions are located under the Key Investment Terms starting on page 4.
See Notes to Financial Statements
65
Table of Contents
VIRTUS SENIOR FLOATING RATE FUND
SCHEDULE OF INVESTMENTS (Continued)
SEPTEMBER 30, 2013
($ reported in thousands)
The following table provides a summary of inputs used to value the Fund’s investments as of September 30, 2013 (See Security Valuation Note 2A in the Notes to Financial Statements):
| Total Value at September 30, 2013 | Level 1 Quoted Prices | Level 2 Significant Observable Inputs | Level 3 Significant Unobservable Inputs | |||||||||||||
Debt Securities: | ||||||||||||||||
Asset-Backed Securities | $ | 4,070 | $ | — | $ | 3,277 | $ | 793 | ||||||||
Corporate Bonds And Notes | 80,472 | — | 80,472 | — | ||||||||||||
Foreign Government Securities | 475 | — | 475 | — | ||||||||||||
Loan Agreements | 886,474 | — | 886,474 | — | ||||||||||||
Mortgage-Backed Securities | 3,665 | — | 3,665 | — | ||||||||||||
Equity Securities: | ||||||||||||||||
Common Stocks | 0 | — | — | 0 | (c) | |||||||||||
Short-Term Investments | 59,828 | 59,828 | — | — | ||||||||||||
|
|
|
|
|
|
|
| |||||||||
Total Investments | $ | 1,034,984 | $ | 59,828 | $ | 974,363 | $ | 793 | ||||||||
|
|
|
|
|
|
|
| |||||||||
The following is a reconciliation of assets of the Fund for Level 3 investments for which significant unobservable inputs were used to determine fair value.
| Total | Asset-Backed Securities | Corporate Bonds and Notes | Loan Agreements | Common Stocks | ||||||||||||||||
Investments in Securities | ||||||||||||||||||||
Balance as of September 30, 2012: | $ | 292 | $ | — | $ | 6 | $ | 286 | $ | — | (c) | |||||||||
Accrued discount/(premium) | — | — | — | — | — | |||||||||||||||
Realized gain (loss) | (379 | ) | — | — | (379 | ) | — | |||||||||||||
Change in unrealized appreciation (depreciation) | 642 | (6 | ) | 243 | 405 | — | ||||||||||||||
Purchases | 829 | 829 | — | — | — | |||||||||||||||
Sales(b) | (591 | ) | (30 | ) | (249 | ) | (312 | ) | — | |||||||||||
Transfers into Level 3 (a) | — | — | — | — | ||||||||||||||||
Transfers from Level 3(a) | — | — | — | — | ||||||||||||||||
|
|
|
|
|
|
|
|
|
| |||||||||||
Balance as of September 30, 2013 | $ | 793 | $ | 793 | $ | — | $ | — | $ | — | (c) | |||||||||
|
|
|
|
|
|
|
|
|
| |||||||||||
| (a) | “Transfers into and/or from” represent the ending value as of September 30, 2013, for any investment security where a change in the pricing level occurred from the beginning to the end of the period. |
| (b) | Includes paydowns on securities. |
| (c) | Includes internally fair valued security currently priced at zero $0. See the last paragraph under “Note 2A Security Valuation” for a description of valuation process in place and qualitative discussion about sensitive inputs used in Level 3 internally fair valued measurements. |
See Notes to Financial Statements
66
Table of Contents
SCHEDULE OF INVESTMENTS
SEPTEMBER 30, 2013
($ reported in thousands)
| SHARES | VALUE | |||||||
| COMMON STOCKS—99.7% | ||||||||
| Consumer Discretionary—37.1% | ||||||||
Amazon.com, Inc.(2) | 1,068 | $ | 334 | |||||
AMC Networks, Inc.(2) | 5,005 | 343 | ||||||
American Eagle Outfitters, Inc. | 22,888 | 320 | ||||||
Apollo Group, Inc. Class A(2) | 16,113 | 335 | ||||||
AutoNation, Inc.(2) | 6,337 | 331 | ||||||
Buckle, Inc. (The) | 6,302 | 341 | ||||||
Cabela’s, Inc.(2) | 5,320 | 335 | ||||||
Cablevision Systems Corp. Class A | 19,177 | 323 | ||||||
Carnival Corp. | 9,117 | 298 | ||||||
CBS Corp. Class B | 6,031 | 333 | ||||||
Central European Media Enterprises Ltd. Class A(2) | 63,602 | 335 | ||||||
Choice Hotels International, Inc. | 7,999 | 345 | ||||||
Columbia Sportswear Co. | 5,643 | 340 | ||||||
Comcast Corp. Class A | 7,624 | 344 | ||||||
Dick’s Sporting Goods, Inc. | 6,415 | 342 | ||||||
Discovery Communications, Inc. Class A(2) | 4,131 | 349 | ||||||
DISH Network Corp. Class A | 7,151 | 322 | ||||||
DSW, Inc. Class A | 3,968 | 339 | ||||||
Expedia, Inc. | 6,408 | 332 | ||||||
Family Dollar Stores, Inc. | 4,603 | 331 | ||||||
Federal-Mogul Corp.(2) | 20,217 | 339 | ||||||
Fossil Group, Inc.(2) | 2,849 | 331 | ||||||
Gap, Inc. (The) | 8,136 | 328 | ||||||
Garmin Ltd. | 7,760 | 351 | ||||||
Horton (D.R.), Inc. | 16,736 | 325 | ||||||
Host Hotels & Resorts, Inc. | 18,552 | 328 | ||||||
Hyatt Hotels Corp. Class A(2) | 7,416 | 319 | ||||||
L Brands, Inc. | 5,634 | 344 | ||||||
Las Vegas Sands Corp. | 5,195 | 345 | ||||||
Lennar Corp. Class A | 9,617 | 340 | ||||||
Liberty Global plc Class A(2) | 4,313 | 342 | ||||||
Liberty Media Corp.(2) | 2,278 | 335 | ||||||
Liberty Media Corp. – Interactive Class A(2) | 13,815 | 324 | ||||||
Liberty Ventures Class A(2) | 3,729 | 329 | ||||||
Madison Square Garden Co. (The)(2) | 5,974 | 347 | ||||||
Marriott International, Inc. | 7,829 | 329 | ||||||
Marriott Vacations Worldwide Corp.(2) | 7,628 | 336 | ||||||
MGM Resorts International(2) | 16,971 | 347 | ||||||
Mohawk Industries, Inc.(2) | 2,595 | 338 | ||||||
Morningstar, Inc. | 4,289 | 340 | ||||||
News Corp.(2) | 20,294 | 326 | ||||||
NIKE, Inc. Class B | 4,872 | 354 | ||||||
Nordstrom, Inc. | 5,929 | 333 | ||||||
Penn National Gaming, Inc.(2) | 5,938 | 329 | ||||||
Penske Automotive Group, Inc. | 7,888 | 337 | ||||||
Ralph Lauren Corp. | 2,018 | 332 | ||||||
Sears Holdings Corp.(2) | 5,785 | 345 | ||||||
Sears Hometown and Outlet Stores, Inc.(2) | 10,613 | 337 | ||||||
Starbucks Corp. | 4,442 | 342 | ||||||
Starz – Liberty Capital(2) | 12,544 | 353 | ||||||
Tesla Motors, Inc.(2) | 1,844 | 357 | ||||||
Twenty-First Century Fox, Inc. | 10,241 | 343 | ||||||
Under Armour, Inc. Class A(2) | 4,338 | 345 | ||||||
Urban Outfitters, Inc.(2) | 8,875 | 326 | ||||||
Viacom, Inc. Class B | 4,066 | 340 | ||||||
| SHARES | VALUE | |||||||
| Consumer Discretionary—continued | ||||||||
Wendy’s Co. (The) | 40,154 | $ | 340 | |||||
Wynn Resorts Ltd. | 2,181 | 345 | ||||||
|
| |||||||
| 19,173 | ||||||||
|
| |||||||
| Consumer Staples—5.1% | ||||||||
Boston Beer Co., Inc. (The) Class A(2) | 1,363 | 333 | ||||||
Brown-Forman Corp. Class B | 4,790 | 326 | ||||||
Dole Food Co., Inc.(2) | 24,750 | 337 | ||||||
Estee Lauder Cos., Inc. (The) Class A | 4,714 | 329 | ||||||
Harbinger Group, Inc.(2) | 33,712 | 350 | ||||||
Monster Beverage Corp.(2) | 6,049 | 316 | ||||||
PriceSmart, Inc. | 3,586 | 342 | ||||||
Tootsie Roll Industries, Inc. | 10,697 | 330 | ||||||
|
| |||||||
| 2,663 | ||||||||
|
| |||||||
| Energy—5.3% | ||||||||
Chesapeake Energy Corp. | 12,729 | 330 | ||||||
Continental Resources, Inc.(2) | 3,347 | 359 | ||||||
CVR Energy, Inc. | 8,699 | 335 | ||||||
Hess Corp. | 4,301 | 333 | ||||||
RPC, Inc. | 22,185 | 343 | ||||||
Transocean Ltd. | 7,507 | 334 | ||||||
W&T Offshore, Inc. | 19,147 | 339 | ||||||
Western Refining, Inc. | 11,649 | 350 | ||||||
|
| |||||||
| 2,723 | ||||||||
|
| |||||||
| Financials—16.2% | ||||||||
Altisource Portfolio Solutions SA(2) | 2,426 | 340 | ||||||
Amtrust Financial Services, Inc. | 8,810 | 344 | ||||||
Berkley (W.R.) Corp. | 7,811 | 335 | ||||||
Berkshire Hathaway, Inc. Class B(2) | 2,867 | 325 | ||||||
BOK Financial Corp. | 5,210 | 330 | ||||||
Boston Properties, Inc. | 3,090 | 330 | ||||||
Brown & Brown, Inc. | 10,320 | 331 | ||||||
Charles Schwab Corp. (The) | 15,881 | 336 | ||||||
Credit Acceptance Corp.(2) | 3,067 | 340 | ||||||
Equity Lifestyle Properties, Inc. | 9,502 | 325 | ||||||
Equity Residential | 6,026 | 323 | ||||||
First Citizens BancShares, Inc. Class A | 1,654 | 340 | ||||||
Franklin Resources, Inc. | 6,535 | 330 | ||||||
Greenlight Capital Re Ltd. Class A(2) | 11,893 | 338 | ||||||
Hilltop Holdings, Inc.(2) | 18,663 | 345 | ||||||
Howard Hughes Corp. (The)(2) | 3,112 | 350 | ||||||
Leucadia National Corp. | 12,405 | 338 | ||||||
Loews Corp. | 7,123 | 333 | ||||||
Mercury General Corp. | 7,078 | 342 | ||||||
Ocwen Financial Corp.(2) | 5,902 | 329 | ||||||
Progressive Corp. (The) | 12,518 | 341 | ||||||
Raymond James Financial, Inc. | 7,779 | 324 | ||||||
Simon Property Group, Inc. | 2,238 | 332 | ||||||
Taubman Centers, Inc. | 4,924 | 332 | ||||||
Vornado Realty Trust | 3,915 | 329 | ||||||
|
| |||||||
| 8,362 | ||||||||
|
| |||||||
| Health Care—5.4% | ||||||||
Bruker Corp.(2) | 16,530 | 341 | ||||||
Cerner Corp.(2) | 6,789 | 357 | ||||||
| SHARES | VALUE | |||||||
| Health Care—continued | ||||||||
Forest Laboratories, Inc.(2) | 7,616 | $ | 326 | |||||
Halozyme Therapeutics, Inc.(2) | 34,555 | 381 | ||||||
MannKind Corp.(2)(3) | 56,951 | 325 | ||||||
Opko Health, Inc.(2) | 40,305 | 355 | ||||||
Pharmacyclics, Inc.(2) | 2,801 | 388 | ||||||
Teva Pharmaceutical Industries Ltd. | 8,960 | 338 | ||||||
|
| |||||||
| 2,811 | ||||||||
|
| |||||||
| Industrials—9.1% | ||||||||
Air Lease Corp. | 12,017 | 332 | ||||||
American Railcar Industries, Inc. | 8,696 | 341 | ||||||
Cintas Corp. | 6,591 | 338 | ||||||
Colfax Corp.(2) | 5,935 | 335 | ||||||
Covanta Holding Corp. | 15,605 | 334 | ||||||
Danaher Corp. | 4,862 | 337 | ||||||
Fastenal Co. | 6,740 | 339 | ||||||
FedEx Corp. | 2,894 | 330 | ||||||
Grainger (W.W.), Inc. | 1,249 | 327 | ||||||
Illinois Tool Works, Inc. | 4,421 | 337 | ||||||
MSC Industrial Direct Co., Inc. Class A | 4,223 | 344 | ||||||
Navistar International Corp.(2) | 8,865 | 323 | ||||||
Rollins, Inc. | 13,049 | 346 | ||||||
Werner Enterprises, Inc. | 14,449 | 337 | ||||||
|
| |||||||
| 4,700 | ||||||||
|
| |||||||
| Information Technology—16.3% | ||||||||
Amkor Technology, Inc.(2) | 78,661 | 337 | ||||||
Anixter International, Inc.(2) | 3,838 | 336 | ||||||
Broadcom Corp. Class A | 12,366 | 322 | ||||||
Dell, Inc. | 24,315 | 335 | ||||||
DST Systems, Inc. | 4,404 | 332 | ||||||
eBay, Inc.(2) | 6,159 | 344 | ||||||
EchoStar Corp. Class A(2) | 7,741 | 340 | ||||||
Google, Inc. Class A(2) | 374 | 328 | ||||||
IAC/InterActiveCorp. | 6,319 | 345 | ||||||
Intuit, Inc. | 5,057 | 335 | ||||||
Marvell Technology Group Ltd. | 27,138 | 312 | ||||||
Mentor Graphics Corp. | 14,783 | 346 | ||||||
Molex, Inc. | 8,735 | 336 | ||||||
National Instruments Corp. | 10,877 | 336 | ||||||
Oracle Corp. | 9,933 | 330 | ||||||
Paychex, Inc. | 8,248 | 335 | ||||||
Pegasystems, Inc. | 8,590 | 342 | ||||||
QUALCOMM, Inc. | 4,899 | 330 | ||||||
Rackspace Hosting, Inc.(2) | 6,299 | 332 | ||||||
RealPage, Inc.(2) | 14,418 | 334 | ||||||
Salesforce.com, Inc.(2) | 6,407 | 333 | ||||||
Syntel Co. | 4,269 | 342 | ||||||
Take-Two Interactive Software, Inc.(2) | 19,885 | 361 | ||||||
TeleTech Holdings, Inc.(2) | 13,285 | 333 | ||||||
Yahoo!, Inc.(2) | 10,933 | 363 | ||||||
|
| |||||||
| 8,419 | ||||||||
|
| |||||||
| Materials—5.2% | ||||||||
Airgas, Inc. | 3,211 | 341 | ||||||
Huntsman Corp. | 16,443 | 339 | ||||||
Kronos Worldwide, Inc. | 21,308 | 330 | ||||||
LyondellBasell Industries N.V. Class A | 4,632 | 339 | ||||||
See Notes to Financial Statements
67
Table of Contents
VIRTUS WEALTH MASTERS FUND
SCHEDULE OF INVESTMENTS (Continued)
SEPTEMBER 30, 2013
($ reported in thousands)
| SHARES | VALUE | |||||||
| Materials—continued | ||||||||
NewMarket Corp. | 1,196 | $ | 344 | |||||
Novagold Resources, Inc.(2) | 142,608 | 331 | ||||||
Scotts Miracle-Gro Co. (The) Class A | 6,093 | 335 | ||||||
Westlake Chemical Corp. | 3,233 | 339 | ||||||
|
| |||||||
| 2,698 | ||||||||
| TOTAL COMMON STOCKS (Identified Cost $50,539) | 51,549 | |||||||
| TOTAL LONG TERM INVESTMENTS—99.7% | ||||||||
| (Identified cost $50,539) | 51,549 | |||||||
| SHORT-TERM INVESTMENTS—0.1% | ||||||||
| Money Market Mutual Funds—0.1% | ||||||||
Fidelity Money Market Portfolio – Institutional Shares (Seven-day effective yield 0.090%) | 73,425 | 73 | ||||||
| TOTAL SHORT-TERM INVESTMENTS (Identified Cost $73) | 73 | |||||||
| SHARES | VALUE | |||||||
| SECURITIES LENDING COLLATERAL—0.1% | ||||||||
INVESCO Short-Term Investments Liquid Assets Portfolio (The) Institutional Shares (seven-day effective yield 0.070%)(4) | 42,000 | $ | 42 | |||||
| TOTAL SECURITIES LENDING COLLATERAL (Identified Cost $42) | 42 | |||||||
| TOTAL INVESTMENTS—99.9% (Identified Cost $50,654) | 51,664 | (1) | ||||||
Other assets and liabilities, net—0.1% |
| 60 | ||||||
|
| |||||||
| NET ASSETS—100.0% | $ | 51,724 | ||||||
|
| |||||||
Abbreviations:
Footnote Legend:
| (1) | Federal Income Tax Information: For tax information at September 30, 2013, see Note 10 Federal Income Tax Information in the Notes to Financial Statements. |
| (2) | Non-income producing. |
| (3) | All or a portion of security is on loan. |
| (4) | Represents security purchased with cash collateral received for securities on loan. |
The following table provides a summary of inputs used to value the Fund’s investments as of September 30, 2013 (See Security Valuation Note 2A in the Notes to Financial Statements):
| Total Value at September 30, 2013 | Level 1 Quoted Prices | |||||||
Equity Securities: | ||||||||
Common Stocks | $ | 51,549 | $ | 51,549 | ||||
Securities Lending Collateral | 42 | 42 | ||||||
Short-Term Investments | 73 | 73 | ||||||
|
|
|
| |||||
Total Investments | $ | 51,664 | $ | 51,664 | ||||
|
|
|
| |||||
There are no Level 2 (significant observable inputs) or Level 3 (significant unobservable inputs) priced securities.
Security abbreviation definitions are located under the Key Investment Terms starting on page 4.
See Notes to Financial Statements
68
Table of Contents
VIRTUS OPPORTUNITIES TRUST
STATEMENTS OF ASSETS AND LIABILITIES
SEPTEMBER 30, 2013
(Reported in thousands except shares and per share amounts)
|
|
|
|
|
|
|
| |||||||||
| Bond Fund | CA Tax-Exempt Bond Fund | Disciplined Equity Style Fund | Disciplined Select Bond Fund | |||||||||||||
| Assets | ||||||||||||||||
Investment in securities at value(1)(3) | $ | 86,236 | $ | 47,172 | $ | 1,586 | $ | 1,052 | ||||||||
Cash | 55 | 983 | — | — | ||||||||||||
Receivables | ||||||||||||||||
Investment securities sold | 566 | — | — | — | ||||||||||||
Fund shares sold | 96 | 1 | 6 | — | ||||||||||||
Receivable from adviser | — | — | 4 | 5 | ||||||||||||
Dividends and interest receivable | 914 | 677 | — | — | ||||||||||||
Prepaid expenses | 25 | 13 | — | — | ||||||||||||
Prepaid trustee retainer | — | (2) | — | (2) | — | (2) | — | (2) | ||||||||
|
|
|
|
|
|
|
| |||||||||
Total assets | 87,892 | 48,846 | 1,596 | 1,057 | ||||||||||||
|
|
|
|
|
|
|
| |||||||||
| Liabilities | ||||||||||||||||
Payables | ||||||||||||||||
Fund shares repurchased | 68 | 77 | — | — | ||||||||||||
Investment securities purchased | 1,126 | — | — | — | ||||||||||||
Dividend distributions | 51 | 73 | — | — | ||||||||||||
Investment advisory fee | 10 | 10 | — | — | ||||||||||||
Distribution and service fees | 18 | 5 | — | (2) | — | (2) | ||||||||||
Administration fee | 9 | 5 | — | (2) | — | (2) | ||||||||||
Transfer agent fees and expenses | 21 | 4 | — | (2) | — | (2) | ||||||||||
Trustees’ fees and expenses | — | (2) | — | (2) | — | (2) | — | (2) | ||||||||
Professional fees | 32 | 31 | 18 | 18 | ||||||||||||
Other accrued expenses | 8 | 3 | 3 | 2 | ||||||||||||
|
|
|
|
|
|
|
| |||||||||
Total liabilities | 1,343 | 208 | 21 | 20 | ||||||||||||
|
|
|
|
|
|
|
| |||||||||
| Net Assets | $ | 86,549 | $ | 48,638 | $ | 1,575 | $ | 1,037 | ||||||||
|
|
|
|
|
|
|
| |||||||||
| Net Assets Consist of: | ||||||||||||||||
Capital paid in on shares of beneficial interest | $ | 90,909 | $ | 46,573 | $ | 1,298 | $ | 1,096 | ||||||||
Accumulated undistributed net investment income (loss) | 51 | 25 | — | — | (2) | |||||||||||
Accumulated undistributed net realized gain (loss) | (3,647 | ) | 943 | 99 | (38 | ) | ||||||||||
Net unrealized appreciation (depreciation) on investments | (764 | ) | 1,097 | 178 | (21 | ) | ||||||||||
|
|
|
|
|
|
|
| |||||||||
| Net Assets | $ | 86,549 | $ | 48,638 | $ | 1,575 | $ | 1,037 | ||||||||
|
|
|
|
|
|
|
| |||||||||
| Class A | ||||||||||||||||
Net asset value (net assets/shares outstanding) per share | $ | 11.21 | $ | 12.10 | $ | 12.47 | $ | 9.44 | ||||||||
Maximum offering price per share NAV/(1–2.75%) | $ | — | $ | 12.70 | $ | — | — | |||||||||
Maximum offering price per share NAV/(1–3.75%) | $ | 11.77 | $ | — | $ | — | $ | — | ||||||||
Maximum offering price per share NAV/(1–5.75%) | $ | — | $ | — | $ | 13.23 | $ | 10.02 | ||||||||
Shares of beneficial interest outstanding, no par value(3), unlimited authorization | 5,109,588 | 1,868,190 | 26,111 | 16,668 | ||||||||||||
Net Assets | $ | 57,286 | $ | 22,612 | $ | 326 | $ | 157 | ||||||||
| Class B | ||||||||||||||||
Net asset value (net assets/shares outstanding) and offering price per share | $ | 10.95 | $ | — | $ | — | $ | — | ||||||||
Shares of beneficial interest outstanding, no par value(3), unlimited authorization | 36,613 | — | — | — | ||||||||||||
Net Assets | $ | 401 | $ | — | $ | — | $ | — | ||||||||
| Class C | ||||||||||||||||
Net asset value (net assets/shares outstanding) and offering price per share | $ | 10.99 | $ | — | $ | 12.40 | $ | 9.44 | ||||||||
Shares of beneficial interest outstanding, no par value(3), unlimited authorization | 621,281 | — | 19,112 | 12,093 | ||||||||||||
Net Assets | $ | 6,825 | $ | — | $ | 237 | $ | 114 | ||||||||
| Class I | ||||||||||||||||
Net asset value (net assets/shares outstanding) and offering price per share | $ | 11.37 | $ | 12.09 | $ | 12.49 | $ | 9.45 | ||||||||
Shares of beneficial interest outstanding, no par value(3), unlimited authorization | 1,938,665 | 2,151,960 | 81,095 | 81,031 | ||||||||||||
Net Assets | $ | 22,037 | $ | 26,026 | $ | 1,012 | $ | 766 | ||||||||
(1) Investment in securities at cost | $ | 87,000 | $ | 46,075 | $ | 1,408 | $ | 1,073 | ||||||||
(2) Amount is less than $500. | ||||||||||||||||
(3) All Funds with exception of Bond Fund have no par value. Bond Fund has a par value of $1.00. |
| |||||||||||||||
See Notes to Financial Statements
69
Table of Contents
VIRTUS OPPORTUNITIES TRUST
STATEMENTS OF ASSETS AND LIABILITIES (Continued)
SEPTEMBER 30, 2013
(Reported in thousands except shares and per share amounts)
|
|
|
|
|
|
|
| |||||||||
| Disciplined Select Country Fund | Herzfeld Fund | High Yield Fund | Low Volatility Equity Fund | |||||||||||||
| Assets | ||||||||||||||||
Investment in securities at value(1) | $ | 1,208 | $ | 9,626 | $ | 89,903 | $ | 1,600 | ||||||||
Cash | — | — | 88 | 3 | ||||||||||||
Deposits with prime broker for options | — | — | — | 1 | ||||||||||||
Receivables | ||||||||||||||||
Investment securities sold | — | — | 464 | — | ||||||||||||
Fund shares sold | — | — | 13 | — | ||||||||||||
Receivable from adviser | 4 | — | — | 7 | ||||||||||||
Dividends and interest receivable | — | (2) | 27 | 1,515 | — | |||||||||||
Prepaid expenses | — | 27 | 23 | 1 | ||||||||||||
Prepaid trustee retainer | — | (2) | — | (2) | — | (2) | — | (2) | ||||||||
|
|
|
|
|
|
|
| |||||||||
Total assets | 1,212 | 9,680 | 92,006 | 1,612 | ||||||||||||
|
|
|
|
|
|
|
| |||||||||
| Liabilities | ||||||||||||||||
Written options at value(3) | — | — | — | — | (2) | |||||||||||
Payables | ||||||||||||||||
Fund shares repurchased | — | 25 | 182 | — | ||||||||||||
Investment securities purchased | — | — | 2,190 | — | ||||||||||||
Dividend distributions | — | — | 90 | — | ||||||||||||
Investment advisory fee | — | 4 | 40 | — | ||||||||||||
Distribution and service fees | — | (2) | 5 | 19 | — | (2) | ||||||||||
Administration fee | — | (2) | 1 | 9 | — | (2) | ||||||||||
Transfer agent fees and expenses | — | (2) | 1 | 29 | — | (2) | ||||||||||
Trustees’ fees and expenses | — | (2) | — | (2) | — | (2) | — | (2) | ||||||||
Professional fees | 18 | 18 | 37 | 13 | ||||||||||||
Other accrued expenses | 1 | 2 | 10 | 1 | ||||||||||||
|
|
|
|
|
|
|
| |||||||||
Total liabilities | 19 | 56 | 2,606 | 14 | ||||||||||||
|
|
|
|
|
|
|
| |||||||||
| Net Assets | $ | 1,193 | $ | 9,624 | $ | 89,400 | $ | 1,598 | ||||||||
|
|
|
|
|
|
|
| |||||||||
| Net Assets Consist of: | ||||||||||||||||
Capital paid in on shares of beneficial interest | $ | 1,052 | $ | 9,783 | $ | 113,971 | $ | 1,561 | ||||||||
Accumulated undistributed net investment income (loss) | 4 | — | — | 10 | ||||||||||||
Accumulated undistributed net realized gain (loss) | 9 | 92 | (25,362 | ) | (8 | ) | ||||||||||
Net unrealized appreciation (depreciation) on investments | 128 | (251 | ) | 791 | 35 | |||||||||||
|
|
|
|
|
|
|
| |||||||||
| Net Assets | $ | 1,193 | $ | 9,624 | $ | 89,400 | $ | 1,598 | ||||||||
|
|
|
|
|
|
|
| |||||||||
| Class A | ||||||||||||||||
Net asset value (net assets/shares outstanding) per share | $ | 11.34 | $ | 10.45 | $ | 4.27 | $ | 10.24 | ||||||||
Maximum offering price per share NAV/(1–3.75%) | $ | — | $ | — | $ | 4.48 | $ | — | ||||||||
Maximum offering price per share NAV/(1–5.75%) | $ | 12.03 | $ | 11.09 | $ | — | $ | 10.86 | ||||||||
Shares of beneficial interest outstanding, no par value, unlimited authorization | 15,030 | 279,034 | 18,774,573 | 13,317 | ||||||||||||
Net Assets | $ | 171 | $ | 2,917 | $ | 80,155 | $ | 136 | ||||||||
| Class B | ||||||||||||||||
Net asset value (net assets/shares outstanding) and offering price per share | $ | — | $ | — | $ | 4.17 | $ | — | ||||||||
Shares of beneficial interest outstanding, no par value, unlimited authorization | — | — | 31,522 | — | ||||||||||||
Net Assets | $ | — | $ | — | $ | 131 | $ | — | ||||||||
| Class C | ||||||||||||||||
Net asset value (net assets/shares outstanding) and offering price per share | $ | 11.28 | $ | 10.43 | $ | 4.21 | $ | 10.21 | ||||||||
Shares of beneficial interest outstanding, no par value, unlimited authorization | 10,000 | 473,934 | 784,735 | 12,733 | ||||||||||||
Net Assets | $ | 113 | $ | 4,942 | $ | 3,302 | $ | 130 | ||||||||
| Class I | ||||||||||||||||
Net asset value (net assets/shares outstanding) and offering price per share | $ | 11.37 | $ | 10.46 | $ | 4.27 | $ | 10.25 | ||||||||
Shares of beneficial interest outstanding, no par value, unlimited authorization | 80,000 | 168,726 | 1,361,506 | 130,000 | ||||||||||||
Net Assets | $ | 909 | $ | 1,765 | $ | 5,812 | $ | 1,332 | ||||||||
(1) Investment in securities at cost | $ | 1,080 | $ | 9,877 | $ | 89,112 | $ | 1,567 | ||||||||
(2) Amount is less than $500. | ||||||||||||||||
(3) Written options at cost | — | — | — | (2 | ) | |||||||||||
See Notes to Financial Statements
70
Table of Contents
VIRTUS OPPORTUNITIES TRUST
STATEMENTS OF ASSETS AND LIABILITIES (Continued)
SEPTEMBER 30, 2013
(Reported in thousands except shares and per share amounts)
|
|
|
|
|
| |||||||
| Multi-Sector Intermediate Bond Fund | Senior Floating Rate Fund | Wealth Masters Fund | ||||||||||
| Assets | ||||||||||||
Investment in securities at value(1)(3) | $ | 378,960 | $ | 1,034,984 | $ | 51,664 | ||||||
Foreign currency at value(2) | — | 124 | — | |||||||||
Cash | 360 | 6,699 | — | |||||||||
Receivables | ||||||||||||
Investment securities sold | 4,150 | 6,046 | 218 | |||||||||
Fund shares sold | 578 | 9,641 | 40,954 | |||||||||
Dividends and interest receivable | 5,418 | 4,113 | 7 | |||||||||
Prepaid expenses | 41 | 54 | 25 | |||||||||
Prepaid trustee retainer | 2 | 5 | — | (4) | ||||||||
|
|
|
|
|
| |||||||
Total assets | 389,509 | 1,061,666 | 92,868 | |||||||||
|
|
|
|
|
| |||||||
| Liabilities | ||||||||||||
Payables | ||||||||||||
Fund shares repurchased | 1,003 | 2,967 | 2 | |||||||||
Investment securities purchased | 4,588 | 86,583 | 41,065 | |||||||||
Borrowings (Note 12) | — | 20,000 | — | |||||||||
Collateral on securities loaned | — | — | 42 | |||||||||
Dividend distributions | 328 | 443 | — | |||||||||
Investment advisory fee | 175 | 457 | 2 | |||||||||
Distribution and service fees | 131 | 225 | 2 | |||||||||
Administration fee | 41 | 97 | 1 | |||||||||
Transfer agent fees and expenses | 62 | 114 | 1 | |||||||||
Trustees’ fees and expenses | — | (4) | 1 | — | (4) | |||||||
Interest payable on line of credit | — | 1 | — | |||||||||
Professional fees | 38 | 37 | 27 | |||||||||
Other accrued expenses | 38 | 170 | 2 | |||||||||
|
|
|
|
|
| |||||||
Total liabilities | 6,404 | 111,095 | 41,144 | |||||||||
|
|
|
|
|
| |||||||
| Net Assets | $ | 383,105 | $ | 950,571 | $ | 51,724 | ||||||
|
|
|
|
|
| |||||||
| Net Assets Consist of: | ||||||||||||
Capital paid in on shares of beneficial interest | $ | 378,270 | $ | 949,913 | $ | 50,694 | ||||||
Accumulated undistributed net investment income (loss) | 271 | — | — | |||||||||
Accumulated undistributed net realized gain (loss) | 5,986 | (118 | ) | 20 | ||||||||
Net unrealized appreciation (depreciation) on investments | (1,422 | ) | 776 | 1,010 | ||||||||
|
|
|
|
|
| |||||||
| Net Assets | $ | 383,105 | $ | 950,571 | $ | 51,724 | ||||||
|
|
|
|
|
| |||||||
| Class A | ||||||||||||
Net asset value (net assets/shares outstanding) per share | $ | 10.77 | $ | 9.79 | $ | 13.12 | ||||||
Maximum offering price per share NAV/(1–2.75%) | $ | — | $ | 10.28 | $ | — | ||||||
Maximum offering price per share NAV/(1–3.75%) | $ | 11.31 | $ | — | $ | — | ||||||
Maximum offering price per share NAV/(1–5.75%) | $ | — | $ | — | $ | 13.92 | ||||||
Shares of beneficial interest outstanding, no par value, unlimited authorization | 17,130,296 | 39,423,203 | 394,090 | |||||||||
Net Assets | $ | 184,524 | $ | 386,113 | $ | 5,169 | ||||||
| Class B | ||||||||||||
Net asset value (net assets/shares outstanding) and offering price per share | $ | 10.74 | $ | — | $ | — | ||||||
Shares of beneficial interest outstanding, no par value, unlimited authorization | 707,613 | — | — | |||||||||
Net Assets | $ | 7,603 | $ | — | $ | — | ||||||
| Class C | ||||||||||||
Net asset value (net assets/shares outstanding) and offering price per share | $ | 10.86 | $ | 9.81 | $ | 13.04 | ||||||
Shares of beneficial interest outstanding, no par value, unlimited authorization | 9,635,114 | 18,625,510 | 133,592 | |||||||||
Net Assets | $ | 104,591 | $ | 182,667 | $ | 1,742 | ||||||
| Class I | ||||||||||||
Net asset value (net assets/shares outstanding) and offering price per share | $ | 10.77 | $ | 9.79 | $ | 13.14 | ||||||
Shares of beneficial interest outstanding, no par value, unlimited authorization | 8,018,049 | 39,009,467 | 3,410,406 | |||||||||
Net Assets | $ | 86,387 | $ | 381,791 | $ | 44,813 | ||||||
(1) Investment in securities at cost | $ | 380,383 | $ | 1,034,208 | $ | 50,654 | ||||||
(2) Foreign currency at cost | — | 124 | — | |||||||||
(3) Market value of securities on loan | — | — | 40 | |||||||||
(4) Amount less than $500. | ||||||||||||
See Notes to Financial Statements
71
Table of Contents
VIRTUS OPPORTUNITIES TRUST
YEAR ENDED SEPTEMBER 30, 2013
($ reported in thousands)
|
|
|
|
|
|
|
| |||||||||
| Bond Fund | CA Tax-Exempt Bond Fund | Disciplined Equity Style Fund(2) | Disciplined Select Bond Fund(2) | |||||||||||||
| Investment Income | ||||||||||||||||
Dividends | $ | 69 | $ | — | $ | 19 | $ | 23 | ||||||||
Interest | 4,619 | 2,274 | — | — | ||||||||||||
Foreign taxes withheld | — | (1) | — | — | — | |||||||||||
|
|
|
|
|
|
|
| |||||||||
Total investment income | 4,688 | 2,274 | 19 | 23 | ||||||||||||
|
|
|
|
|
|
|
| |||||||||
| Expenses | ||||||||||||||||
Investment advisory fees | 459 | 241 | 10 | 6 | ||||||||||||
Service fees, Class A | 161 | 65 | — | (1) | — | (1) | ||||||||||
Distribution and service fees, Class B | 6 | — | — | — | ||||||||||||
Distribution and service fees, Class C | 86 | — | 1 | 1 | ||||||||||||
Administration fees | 130 | 68 | 1 | 1 | ||||||||||||
Transfer agent fees and expenses | 124 | 36 | 1 | 1 | ||||||||||||
Registration fees | 51 | 27 | 37 | 37 | ||||||||||||
Printing fees and expenses | 9 | 4 | 4 | 4 | ||||||||||||
Custodian fees | 12 | 2 | 1 | — | (1) | |||||||||||
Professional fees | 32 | 36 | 21 | 21 | ||||||||||||
Trustees’ fees and expenses | 5 | 2 | — | (1) | — | (1) | ||||||||||
Miscellaneous expenses | 13 | 6 | 3 | 3 | ||||||||||||
|
|
|
|
|
|
|
| |||||||||
Total expenses | 1,088 | 487 | 79 | 74 | ||||||||||||
Less expenses reimbursed and/or waived by investment adviser | (222 | ) | (100 | ) | (64 | ) | (64 | ) | ||||||||
|
|
|
|
|
|
|
| |||||||||
Net expenses | 866 | 387 | 15 | 10 | ||||||||||||
|
|
|
|
|
|
|
| |||||||||
Net investment income (loss) | 3,822 | 1,887 | 4 | 13 | ||||||||||||
|
|
|
|
|
|
|
| |||||||||
| Net Realized and Unrealized Gain (Loss) on Investments | ||||||||||||||||
Net realized gain (loss) on investments | 3,042 | 945 | 104 | (38 | ) | |||||||||||
Net realized gain (loss) on foreign currency transactions | (15 | ) | — | — | — | |||||||||||
Net realized gain (loss) on futures | (65 | ) | — | — | — | |||||||||||
Net change in unrealized appreciation (depreciation) on investments | (6,584 | ) | (3,790 | ) | 178 | (21 | ) | |||||||||
Net change in unrealized appreciation (depreciation) on foreign currency translation | — | (1) | — | — | — | |||||||||||
Net change in unrealized appreciation (depreciation) on futures | 70 | — | — | — | ||||||||||||
|
|
|
|
|
|
|
| |||||||||
| Net gain (loss) on investments | (3,552 | ) | (2,845 | ) | 282 | (59 | ) | |||||||||
|
|
|
|
|
|
|
| |||||||||
Net increase (decrease) in net assets resulting from operations | $ | 270 | $ | (958 | ) | $ | 286 | $ | (46 | ) | ||||||
|
|
|
|
|
|
|
| |||||||||
(1) Amount is less than $500.
(2) From inception date December 18, 2012.
See Notes to Financial Statements
72
Table of Contents
VIRTUS OPPORTUNITIES TRUST
STATEMENTS OF OPERATIONS (Continued)
YEAR ENDED SEPTEMBER 30, 2013
($ reported in thousands)
|
|
|
|
|
|
|
| |||||||||
| Disciplined Select Country Fund(2) | Herzfeld Fund | High Yield Fund | Low Volatility Equity Fund(3) | |||||||||||||
| Investment Income | ||||||||||||||||
Dividends | $ | 17 | $ | 194 | $ | 60 | $ | 17 | ||||||||
Interest | — | — | (1) | 7,384 | — | |||||||||||
|
|
|
|
|
|
|
| |||||||||
Total investment income | 17 | 194 | 7,444 | 17 | ||||||||||||
|
|
|
|
|
|
|
| |||||||||
| Expenses | ||||||||||||||||
Investment advisory fees | 9 | 49 | 672 | 4 | ||||||||||||
Service fees, Class A | — | (1) | 3 | 248 | — | (1) | ||||||||||
Distribution and service fees, Class B | — | — | 2 | — | ||||||||||||
Distribution and service fees, Class C | 1 | 21 | 32 | — | (1) | |||||||||||
Administration fees | 1 | 6 | 132 | 1 | ||||||||||||
Transfer agent fees and expenses | 1 | 4 | 154 | — | (1) | |||||||||||
Registration fees | 37 | 53 | 56 | 13 | ||||||||||||
Printing fees and expenses | 4 | 2 | 11 | — | (1) | |||||||||||
Custodian fees | — | (1) | 2 | 10 | — | (1) | ||||||||||
Professional fees | 21 | 14 | 38 | 17 | ||||||||||||
Trustees’ fees and expenses | — | (1) | — | (1) | 5 | — | (1) | |||||||||
Miscellaneous expenses | 3 | 5 | 15 | 1 | ||||||||||||
|
|
|
|
|
|
|
| |||||||||
Total expenses | 77 | 159 | 1,375 | 36 | ||||||||||||
Less expenses reimbursed and/or waived by investment adviser | (64 | ) | (68 | ) | (161 | ) | (29 | ) | ||||||||
|
|
|
|
|
|
|
| |||||||||
Net expenses | 13 | 91 | 1,214 | 7 | ||||||||||||
|
|
|
|
|
|
|
| |||||||||
Net investment income (loss) | 4 | 103 | 6,230 | 10 | ||||||||||||
|
|
|
|
|
|
|
| |||||||||
| Net Realized and Unrealized Gain (Loss) on Investments | ||||||||||||||||
Net realized gain (loss) on investments | 9 | 70 | 3,629 | (11 | ) | |||||||||||
Net realized gain (loss) on foreign currency transactions | — | — | — | (1) | — | |||||||||||
Net realized gain (loss) on options | — | — | — | 3 | ||||||||||||
Capital gain distributions from underlying funds | — | 36 | — | — | ||||||||||||
Net change in unrealized appreciation (depreciation) on investments | 128 | (269 | ) | (3,657 | ) | 33 | ||||||||||
Net change in unrealized appreciation (depreciation) on foreign currency translation | — | — | — | (1) | — | |||||||||||
Net change in unrealized appreciation (depreciation) on options | — | — | — | 2 | ||||||||||||
|
|
|
|
|
|
|
| |||||||||
| Net gain (loss) on investments | 137 | (163 | ) | (28 | ) | 27 | ||||||||||
|
|
|
|
|
|
|
| |||||||||
Net increase (decrease) in net assets resulting from operations | $ | 141 | $ | (60 | ) | $ | 6,202 | $ | 37 | |||||||
|
|
|
|
|
|
|
| |||||||||
(1) Amount is less than $500.
(2) From inception date December 18, 2012.
(3) From inception date June 11, 2013.
See Notes to Financial Statements
73
Table of Contents
VIRTUS OPPORTUNITIES TRUST
STATEMENTS OF OPERATIONS (Continued)
YEAR ENDED SEPTEMBER 30, 2013
($ reported in thousands)
|
|
|
|
|
| |||||||
| Multi-Sector Intermediate Bond Fund | Senior Floating Rate Fund | Wealth Masters Fund | ||||||||||
| Investment Income | ||||||||||||
Dividends | $ | 245 | $ | 61 | $ | 57 | ||||||
Interest | 26,438 | 34,988 | — | (1) | ||||||||
Security lending | — | — | — | (1) | ||||||||
Foreign taxes withheld | (7 | ) | — | — | (1) | |||||||
|
|
|
|
|
| |||||||
Total investment income | 26,676 | 35,049 | 57 | |||||||||
|
|
|
|
|
| |||||||
| Expenses | ||||||||||||
Investment advisory fees | 2,354 | 3,859 | 32 | |||||||||
Service fees, Class A | 528 | 769 | 4 | |||||||||
Distribution and service fees, Class B | 89 | — | — | |||||||||
Distribution and service fees, Class C | 1,158 | 1,298 | 5 | |||||||||
Administration fees | 546 | 819 | 5 | |||||||||
Transfer agent fees and expenses | 468 | 668 | 4 | |||||||||
Interest expense and fees | — | 388 | �� | — | ||||||||
Registration fees | 87 | 129 | 52 | |||||||||
Printing fees and expenses | 36 | 47 | 1 | |||||||||
Custodian fees | 26 | 15 | 25 | |||||||||
Professional fees | 46 | 62 | 19 | |||||||||
Trustees’ fees and expenses | 19 | 25 | — | (1) | ||||||||
Miscellaneous expenses | 50 | 169 | 3 | |||||||||
|
|
|
|
|
| |||||||
Total expenses | 5,407 | 8,248 | 150 | |||||||||
Less expenses reimbursed and/or waived by investment adviser | — | — | (96 | ) | ||||||||
|
|
|
|
|
| |||||||
Total expenses | 5,407 | 8,248 | 54 | |||||||||
|
|
|
|
|
| |||||||
Net investment income (loss) | 21,269 | 26,801 | 3 | |||||||||
|
|
|
|
|
| |||||||
| Net Realized and Unrealized Gain (Loss) on Investments | ||||||||||||
Net realized gain (loss) on investments | 5,588 | 1,307 | 27 | |||||||||
Net realized gain (loss) on foreign currency transactions | (165 | ) | (4 | ) | — | |||||||
Net change in unrealized appreciation (depreciation) on investments | (17,483 | ) | (2,563 | ) | 994 | |||||||
Net change in unrealized appreciation (depreciation) on foreign currency translation | (4 | ) | — | (1) | — | |||||||
|
|
|
|
|
| |||||||
| Net gain (loss) on investments | (12,064 | ) | (1,260 | ) | 1,021 | |||||||
|
|
|
|
|
| |||||||
Net increase (decrease) in net assets resulting from operations | $ | 9,205 | $ | 25,541 | $ | 1,024 | ||||||
|
|
|
|
|
| |||||||
(1) Amount is less than $500.
See Notes to Financial Statements
74
Table of Contents
STATEMENTS OF CHANGES IN NET ASSETS
($ reported in thousands)
|
|
|
| |||||||||||||
| Bond Fund | CA Tax-Exempt Bond Fund | |||||||||||||||
| Year Ended September 30, 2013 | Year Ended September 30, 2012 | Year Ended September 30, 2013 | Year Ended September 30, 2012 | |||||||||||||
| INCREASE/(DECREASE) IN NET ASSETS | ||||||||||||||||
| From Operations | ||||||||||||||||
Net investment income (loss) | $ | 3,822 | $ | 4,914 | $ | 1,887 | $ | 2,192 | ||||||||
Net realized gain (loss) | 2,962 | 7,017 | 945 | 873 | ||||||||||||
Net change in unrealized appreciation (depreciation) | (6,514 | ) | 2,098 | (3,790 | ) | 2,225 | ||||||||||
|
|
|
|
|
|
|
| |||||||||
Increase (decrease) in net assets resulting from operations | 270 | 14,029 | (958 | ) | 5,290 | |||||||||||
|
|
|
|
|
|
|
| |||||||||
| From Distributions to Shareholders | ||||||||||||||||
Net investment income, Class A | (2,348 | ) | (2,140 | ) | (872 | ) | (1,124 | ) | ||||||||
Net investment income, Class B | (16 | ) | (24 | ) | — | — | ||||||||||
Net investment income, Class C | (252 | ) | (208 | ) | — | — | ||||||||||
Net investment income, Class I | (1,086 | ) | (2,609 | ) | (990 | ) | (1,153 | ) | ||||||||
Net realized long-term gains, Class A | — | — | (386 | ) | — | |||||||||||
Net realized long-term gains, Class I | — | — | (385 | ) | — | |||||||||||
|
|
|
|
|
|
|
| |||||||||
Decrease in net assets from distributions to shareholders | (3,702 | ) | (4,981 | ) | (2,633 | ) | (2,277 | ) | ||||||||
|
|
|
|
|
|
|
| |||||||||
| From Share Transactions (See Note 5) | ||||||||||||||||
Change in net assets from share transactions, Class A | (8,371 | ) | (405 | ) | (4,460 | ) | (2,423 | ) | ||||||||
Change in net assets from share transactions, Class B | (310 | ) | (499 | ) | — | — | ||||||||||
Change in net assets from share transactions, Class C | (1,638 | ) | 295 | — | — | |||||||||||
Change in net assets from share transactions, Class I | (6,514 | ) | (51,398 | ) | (753 | ) | (253 | ) | ||||||||
|
|
|
|
|
|
|
| |||||||||
Increase (decrease) in net assets from share transactions | (16,833 | ) | (52,007 | ) | (5,213 | ) | (2,676 | ) | ||||||||
|
|
|
|
|
|
|
| |||||||||
Net increase (decrease) in net assets | (20,265 | ) | (42,959 | ) | (8,804 | ) | 337 | |||||||||
| Net Assets | ||||||||||||||||
Beginning of period | 106,814 | 149,773 | 57,442 | 57,105 | ||||||||||||
|
|
|
|
|
|
|
| |||||||||
End of period | $ | 86,549 | $ | 106,814 | $ | 48,638 | $ | 57,442 | ||||||||
|
|
|
|
|
|
|
| |||||||||
Accumulated undistributed net investment income (loss) at end of period | $ | 51 | $ | 42 | $ | 25 | $ | — | (1) | |||||||
(1) Amount is less than $500.
See Notes to Financial Statements
75
Table of Contents
VIRTUS OPPORTUNITIES TRUST
STATEMENTS OF CHANGES IN NET ASSETS (Continued)
($ reported in thousands)
|
|
|
|
|
| |||||||
| Disciplined Equity Style Fund | Disciplined Select Bond Fund | Disciplined Select Country Fund | ||||||||||
| From Inception December 18, 2012 to September 30, 2013 | From Inception December 18, 2012 to September 30, 2013 | From Inception December 18, 2012 to September 30, 2013 | ||||||||||
| INCREASE/(DECREASE) IN NET ASSETS | ||||||||||||
| From Operations | ||||||||||||
Net investment income (loss) | $ | 4 | $ | 13 | $ | 4 | ||||||
Net realized gain (loss) | 104 | (38 | ) | 9 | ||||||||
Net change in unrealized appreciation (depreciation) | 178 | (21 | ) | 128 | ||||||||
|
|
|
|
|
| |||||||
Increase (decrease) in net assets resulting from operations | 286 | (46 | ) | 141 | ||||||||
|
|
|
|
|
| |||||||
| From Distributions to Shareholders | ||||||||||||
Net investment income, Class A | (— | )(1) | (2 | ) | — | |||||||
Net investment income, Class C | (— | )(1) | (1 | ) | — | |||||||
Net investment income, Class I | (4 | ) | (10 | ) | — | |||||||
Net realized short-term gains, Class A | (1 | ) | — | — | ||||||||
Net realized short-term gains, Class C | (1 | ) | — | — | ||||||||
Net realized short-term gains, Class I | (3 | ) | — | — | ||||||||
|
|
|
|
|
| |||||||
Decrease in net assets from distributions to shareholders | (9 | ) | (13 | ) | — | |||||||
|
|
|
|
|
| |||||||
| From Share Transactions (See Note 5) | ||||||||||||
Change in net assets from share transactions, Class A | 279 | 166 | 152 | |||||||||
Change in net assets from share transactions, Class C | 207 | 120 | 100 | |||||||||
Change in net assets from share transactions, Class I | 812 | 810 | 800 | |||||||||
|
|
|
|
|
| |||||||
Increase (decrease) in net assets from share transactions | 1,298 | 1,096 | 1,052 | |||||||||
|
|
|
|
|
| |||||||
Net increase (decrease) in net assets | 1,575 | 1,037 | 1,193 | |||||||||
| Net Assets | ||||||||||||
Beginning of period | — | — | — | |||||||||
|
|
|
|
|
| |||||||
End of period | $ | 1,575 | $ | 1,037 | $ | 1,193 | ||||||
|
|
|
|
|
| |||||||
Accumulated undistributed net investment income (loss) at end of period | $ | — | $ | — | (1) | $ | 4 | |||||
(1) Amount is less than $500.
See Notes to Financial Statements
76
Table of Contents
VIRTUS OPPORTUNITIES TRUST
STATEMENTS OF CHANGES IN NET ASSETS (Continued)
($ reported in thousands)
|
|
|
| |||||||||||||
| Herzfeld Fund | High Yield Fund | |||||||||||||||
| Year Ended September 30, 2013 | Year Ended September 30, 2012 | Year Ended September 30, 2013 | Year Ended September 30, 2012 | |||||||||||||
| INCREASE/(DECREASE) IN NET ASSETS | ||||||||||||||||
| From Operations | ||||||||||||||||
Net investment income (loss) | $ | 103 | $ | 3 | $ | 6,230 | $ | 6,554 | ||||||||
Net realized gain (loss) | 106 | — | (1) | 3,629 | (2,764 | ) | ||||||||||
Net change in unrealized appreciation (depreciation) | (269 | ) | 18 | (3,657 | ) | 12,921 | ||||||||||
|
|
|
|
|
|
|
| |||||||||
Increase (decrease) in net assets resulting from operations | (60 | ) | 21 | 6,202 | 16,711 | |||||||||||
|
|
|
|
|
|
|
| |||||||||
| From Distributions to Shareholders | ||||||||||||||||
Net investment income, Class A | (35 | ) | — | (5,953 | ) | (6,523 | ) | |||||||||
Net investment income, Class B | — | — | (11 | ) | (24 | ) | ||||||||||
Net investment income, Class C | (42 | ) | — | (174 | ) | (149 | ) | |||||||||
Net investment income, Class I | (41 | ) | — | (58 | ) | (1 | ) | |||||||||
Net realized short-term gains, Class A | (1 | ) | — | — | — | |||||||||||
Net realized short-term gains, Class C | (— | )(1) | — | — | — | |||||||||||
Net realized short-term gains, Class I | (1 | ) | — | — | — | |||||||||||
Net realized long-term gains, Class A | (— | )(1) | — | — | — | |||||||||||
Net realized long-term gains, Class C | (— | )(1) | — | — | — | |||||||||||
Net realized long-term gains, Class I | (— | )(1) | — | — | — | |||||||||||
|
|
|
|
|
|
|
| |||||||||
Decrease in net assets from distributions to shareholders | (120 | ) | — | (6,196 | ) | (6,697 | ) | |||||||||
|
|
|
|
|
|
|
| |||||||||
| From Share Transactions (See Note 5) | ||||||||||||||||
Change in net assets from share transactions, Class A | 2,876 | 103 | (18,586 | ) | 2,436 | |||||||||||
Change in net assets from share transactions, Class B | — | — | (179 | ) | (140 | ) | ||||||||||
Change in net assets from share transactions, Class C | 4,960 | 100 | 381 | 681 | ||||||||||||
Change in net assets from share transactions, Class I | 744 | 1,000 | 5,724 | 101 | ||||||||||||
|
|
|
|
|
|
|
| |||||||||
Increase (decrease) in net assets from share transactions | 8,580 | 1,203 | (12,660 | ) | 3,078 | |||||||||||
|
|
|
|
|
|
|
| |||||||||
Net increase (decrease) in net assets | 8,400 | 1,224 | (12,654 | ) | 13,092 | |||||||||||
| Net Assets | ||||||||||||||||
Beginning of period | 1,224 | — | 102,054 | 88,962 | ||||||||||||
|
|
|
|
|
|
|
| |||||||||
End of period | $ | 9,624 | $ | 1,224 | $ | 89,400 | $ | 102,054 | ||||||||
|
|
|
|
|
|
|
| |||||||||
Accumulated undistributed net investment income (loss) at end of period | $ | — | $ | 3 | $ | — | $ | 90 | ||||||||
(1) Amount is less than $500.
See Notes to Financial Statements
77
Table of Contents
VIRTUS OPPORTUNITIES TRUST
STATEMENTS OF CHANGES IN NET ASSETS (Continued)
($ reported in thousands)
|
|
|
| |||||||||
| Low Volatility Equity Fund | Multi-Sector Intermediate Bond Fund | |||||||||||
| From Inception June 11, 2013 to September 30, 2013 | Year Ended September 30, 2013 | Year Ended September 30, 2012 | ||||||||||
| INCREASE/(DECREASE) IN NET ASSETS | ||||||||||||
| From Operations | ||||||||||||
Net investment income (loss) | $ | 10 | $ | 21,269 | $ | 17,068 | ||||||
Net realized gain (loss) | (8 | ) | 5,423 | 6,434 | ||||||||
Net change in unrealized appreciation (depreciation) | 35 | (17,487 | ) | 19,910 | ||||||||
|
|
|
|
|
| |||||||
Increase (decrease) in net assets resulting from operations | 37 | 9,205 | 43,412 | |||||||||
|
|
|
|
|
| |||||||
| From Distributions to Shareholders | ||||||||||||
Net investment income, Class A | — | (10,445 | ) | (9,818 | ) | |||||||
Net investment income, Class B | — | (373 | ) | (549 | ) | |||||||
Net investment income, Class C | — | (4,820 | ) | (4,470 | ) | |||||||
Net investment income, Class I | — | (4,792 | ) | (2,771 | ) | |||||||
Net realized short-term gains, Class A | — | (151 | ) | — | ||||||||
Net realized short-term gains, Class B | — | (7 | ) | — | ||||||||
Net realized short-term gains, Class C | — | (82 | ) | — | ||||||||
Net realized short-term gains, Class I | — | (61 | ) | — | ||||||||
Net realized long-term gains, Class A | — | (2,107 | ) | — | ||||||||
Net realized long-term gains, Class B | — | (94 | ) | — | ||||||||
Net realized long-term gains, Class C | — | (1,141 | ) | — | ||||||||
Net realized long-term gains, Class I | — | (849 | ) | — | ||||||||
|
|
|
|
|
| |||||||
Decrease in net assets from distributions to shareholders | — | (24,922 | ) | (17,608 | ) | |||||||
|
|
|
|
|
| |||||||
| From Share Transactions (See Note 5) | ||||||||||||
Change in net assets from share transactions, Class A | 134 | (4,488 | ) | 45,197 | ||||||||
Change in net assets from share transactions, Class B | — | (2,090 | ) | (1,590 | ) | |||||||
Change in net assets from share transactions, Class C | 127 | 105 | 30,591 | |||||||||
Change in net assets from share transactions, Class I | 1,300 | 15,325 | 48,745 | |||||||||
|
|
|
|
|
| |||||||
Increase (decrease) in net assets from share transactions | 1,561 | 8,852 | 122,943 | |||||||||
|
|
|
|
|
| |||||||
Net increase (decrease) in net assets | 1,598 | (6,865 | ) | 148,747 | ||||||||
| Net Assets | ||||||||||||
Beginning of period | — | 389,970 | 241,223 | |||||||||
|
|
|
|
|
| |||||||
End of period | $ | 1,598 | $ | 383,105 | $ | 389,970 | ||||||
|
|
|
|
|
| |||||||
Accumulated undistributed net investment income (loss) at end of period | $ | 10 | $ | 271 | $ | 88 | ||||||
(1) Amount is less than $500.
See Notes to Financial Statements
78
Table of Contents
VIRTUS OPPORTUNITIES TRUST
STATEMENTS OF CHANGES IN NET ASSETS (Continued)
($ reported in thousands)
|
|
|
| |||||||||||||
| Senior Floating Rate Fund | Wealth Masters Fund | |||||||||||||||
| Year Ended September 30, 2013 | Year Ended September 30, 2012 | Year Ended September 30, 2013 | Year Ended September 30, 2012 | |||||||||||||
| INCREASE/(DECREASE) IN NET ASSETS | ||||||||||||||||
| From Operations | ||||||||||||||||
Net investment income (loss) | $ | 26,801 | $ | 20,337 | $ | 3 | $ | 1 | ||||||||
Net realized gain (loss) | 1,303 | 875 | 27 | 5 | ||||||||||||
Net change in unrealized appreciation (depreciation) | (2,563 | ) | 20,221 | 994 | 16 | |||||||||||
|
|
|
|
|
|
|
| |||||||||
Increase (decrease) in net assets resulting from operations | 25,541 | 41,433 | 1,024 | 22 | ||||||||||||
|
|
|
|
|
|
|
| |||||||||
| From Distributions to Shareholders | ||||||||||||||||
Net investment income, Class A | (13,583 | ) | (11,416 | ) | — | — | ||||||||||
Net investment income, Class C | (4,698 | ) | (3,856 | ) | — | — | ||||||||||
Net investment income, Class I | (9,239 | ) | (4,430 | ) | (5 | ) | — | |||||||||
Net realized short-term gains, Class A | (612 | ) | — | (2 | ) | — | ||||||||||
Net realized short-term gains, Class C | (255 | ) | — | (2 | ) | — | ||||||||||
Net realized short-term gains, Class I | (408 | ) | — | (7 | ) | — | ||||||||||
Net realized long-term gains, Class A | (90 | ) | — | (— | )(1) | — | ||||||||||
Net realized long-term gains, Class C | (35 | ) | — | (— | )(1) | — | ||||||||||
Net realized long-term gains, Class I | (37 | ) | — | (— | )(1) | — | ||||||||||
|
|
|
|
|
|
|
| |||||||||
Decrease in net assets from distributions to shareholders | (28,957 | ) | (19,702 | ) | (16 | ) | — | |||||||||
|
|
|
|
|
|
|
| |||||||||
| From Share Transactions (See Note 5) | ||||||||||||||||
Change in net assets from share transactions, Class A | 130,677 | 28,683 | 4,610 | 104 | ||||||||||||
Change in net assets from share transactions, Class C | 88,171 | (2,515 | ) | 1,509 | 105 | |||||||||||
Change in net assets from share transactions, Class I | 289,471 | 18,135 | 43,566 | 800 | ||||||||||||
|
|
|
|
|
|
|
| |||||||||
Increase (decrease) in net assets from share transactions | 508,319 | 44,303 | 49,685 | 1,009 | ||||||||||||
|
|
|
|
|
|
|
| |||||||||
Net increase (decrease) in net assets | 504,903 | 66,034 | 50,693 | 1,031 | ||||||||||||
| Net Assets | ||||||||||||||||
Beginning of period | 445,668 | 379,634 | 1,031 | — | ||||||||||||
|
|
|
|
|
|
|
| |||||||||
End of period | $ | 950,571 | $ | 445,668 | $ | 51,724 | $ | 1,031 | ||||||||
|
|
|
|
|
|
|
| |||||||||
Accumulated undistributed net investment income (loss) at end of period | $ | — | $ | 679 | $ | — | $ | 1 | ||||||||
(1) Amount is less than $500.
See Notes to Financial Statements
79
Table of Contents
FINANCIAL HIGHLIGHTS
SELECTED PER SHARE DATA AND RATIOS FOR A SHARE OUTSTANDING
THROUGHOUT EACH PERIOD
| Net Asset Value, Beginning of Period | Net Investment Income (Loss)(2) | Net Realized and Unrealized Gain (Loss) | Total from Investment Operations | Dividends from Net Investment Income | Distributions from Net Realized Gains | Total Distributions | Change in Net Asset Value | Net Asset Value, End of Period | Total Return(1) | Net Assets, End of Period (in thousands) | Ratio of Net Expenses to Average Net Assets(8) | Ratio of Gross Expenses to Average Net Assets (before waivers and reimburse ments)(8) | Ratio of Net Investment Income (Loss) to Average Net Assets | Portfolio Turnover Rate | ||||||||||||||||||||||||||||||||||||||||||||||||||||||||||||||
Bond Fund | |||||||||||||||||||||||||||||||||||||||||||||||||||||||||||||||||||||||||||||
Class A | |||||||||||||||||||||||||||||||||||||||||||||||||||||||||||||||||||||||||||||
10/1/12 to 9/30/13 | $ | 11.61 | 0.43 | (0.41 | ) | 0.02 | (0.42 | ) | — | (0.42 | ) | (0.40 | ) | $ | 11.21 | 0.17 | % | $ | 57,286 | 0.85 | % | 1.07 | % | 3.75 | % | 107 | % | ||||||||||||||||||||||||||||||||||||||||||||||||||
10/1/11 to 9/30/12 | 10.96 | 0.35 | 0.67 | 1.02 | (0.37 | ) | — | (0.37 | ) | 0.65 | 11.61 | 9.34 | 67,804 | 0.85 | 1.02 | 3.12 | 210 | ||||||||||||||||||||||||||||||||||||||||||||||||||||||||||||
10/1/10 to 9/30/11 | 11.18 | 0.46 | (0.21 | ) | 0.25 | (0.47 | ) | — | (0.47 | ) | (0.22 | ) | 10.96 | 2.39 | 64,449 | 0.85 | 1.04 | 4.16 | 169 | ||||||||||||||||||||||||||||||||||||||||||||||||||||||||||
10/1/09 to 9/30/10 | 10.57 | 0.46 | 0.62 | 1.08 | (0.47 | ) | — | (0.47 | ) | 0.61 | 11.18 | 10.42 | 67,147 | 0.84 | (10) | 0.98 | 4.26 | 160 | |||||||||||||||||||||||||||||||||||||||||||||||||||||||||||
10/1/08 to 9/30/09 | 9.75 | 0.42 | 0.82 | 1.24 | (0.42 | ) | — | (0.42 | ) | 0.82 | 10.57 | 13.12 | 66,232 | 0.85 | 1.01 | 4.15 | 274 | ||||||||||||||||||||||||||||||||||||||||||||||||||||||||||||
Class B | |||||||||||||||||||||||||||||||||||||||||||||||||||||||||||||||||||||||||||||
10/1/12 to 9/30/13 | $ | 11.34 | 0.33 | (0.38 | ) | (0.05 | ) | (0.34 | ) | — | (0.34 | ) | (0.39 | ) | $ | 10.95 | (0.50 | )% | $ | 401 | 1.60 | % | 1.82 | % | 2.95 | % | 107 | % | |||||||||||||||||||||||||||||||||||||||||||||||||
10/1/11 to 9/30/12 | 10.71 | 0.27 | 0.64 | 0.91 | (0.28 | ) | — | (0.28 | ) | 0.63 | 11.34 | 8.48 | 727 | 1.60 | 1.77 | 2.43 | 210 | ||||||||||||||||||||||||||||||||||||||||||||||||||||||||||||
10/1/10 to 9/30/11 | 10.93 | 0.37 | (0.20 | ) | 0.17 | (0.39 | ) | — | (0.39 | ) | (0.22 | ) | 10.71 | 1.64 | 1,171 | 1.60 | 1.80 | 3.38 | 169 | ||||||||||||||||||||||||||||||||||||||||||||||||||||||||||
10/1/09 to 9/30/10 | 10.34 | 0.37 | 0.60 | 0.97 | (0.38 | ) | — | (0.38 | ) | 0.59 | 10.93 | 9.60 | 2,812 | 1.59 | (10) | 1.72 | 3.50 | 160 | |||||||||||||||||||||||||||||||||||||||||||||||||||||||||||
10/1/08 to 9/30/09 | 9.55 | 0.34 | 0.80 | 1.14 | (0.35 | ) | — | (0.35 | ) | 0.79 | 10.34 | 12.23 | 4,212 | 1.59 | 1.75 | 3.52 | 274 | ||||||||||||||||||||||||||||||||||||||||||||||||||||||||||||
Class C | |||||||||||||||||||||||||||||||||||||||||||||||||||||||||||||||||||||||||||||
10/1/12 to 9/30/13 | $ | 11.38 | 0.34 | (0.39 | ) | (0.05 | ) | (0.34 | ) | — | (0.34 | ) | (0.39 | ) | $ | 10.99 | (0.51 | )% | $ | 6,825 | 1.60 | % | 1.82 | % | 2.99 | % | 107 | % | |||||||||||||||||||||||||||||||||||||||||||||||||
10/1/11 to 9/30/12 | 10.75 | 0.26 | 0.65 | 0.91 | (0.28 | ) | — | (0.28 | ) | 0.63 | 11.38 | 8.55 | 8,756 | 1.60 | 1.77 | 2.36 | 210 | ||||||||||||||||||||||||||||||||||||||||||||||||||||||||||||
10/1/10 to 9/30/11 | 10.96 | 0.37 | (0.19 | ) | 0.18 | (0.39 | ) | — | (0.39 | ) | (0.21 | ) | 10.75 | 1.63 | 7,984 | 1.60 | 1.79 | 3.41 | 169 | ||||||||||||||||||||||||||||||||||||||||||||||||||||||||||
10/1/09 to 9/30/10 | 10.37 | 0.37 | 0.60 | 0.97 | (0.38 | ) | — | (0.38 | ) | 0.59 | 10.96 | 9.57 | 8,663 | 1.59 | (10) | 1.73 | 3.50 | 160 | |||||||||||||||||||||||||||||||||||||||||||||||||||||||||||
10/1/08 to 9/30/09 | 9.58 | 0.34 | 0.80 | 1.14 | (0.35 | ) | — | (0.35 | ) | 0.79 | 10.37 | 12.19 | 8,048 | 1.59 | 1.75 | 3.43 | 274 | ||||||||||||||||||||||||||||||||||||||||||||||||||||||||||||
Class I | |||||||||||||||||||||||||||||||||||||||||||||||||||||||||||||||||||||||||||||
10/1/12 to 9/30/13 | $ | 11.76 | 0.47 | (0.41 | ) | 0.06 | (0.45 | ) | — | (0.45 | ) | (0.39 | ) | $ | 11.37 | 0.49 | % | $ | 22,037 | 0.60 | % | 0.82 | % | 3.98 | % | 107 | % | ||||||||||||||||||||||||||||||||||||||||||||||||||
10/1/11 to 9/30/12 | 11.10 | 0.39 | 0.66 | 1.05 | (0.39 | ) | — | (0.39 | ) | 0.66 | 11.76 | 9.64 | 29,527 | 0.60 | 0.77 | 3.39 | 210 | ||||||||||||||||||||||||||||||||||||||||||||||||||||||||||||
10/1/10 to 9/30/11 | 11.30 | 0.49 | (0.19 | ) | 0.30 | (0.50 | ) | — | (0.50 | ) | (0.20 | ) | 11.10 | 2.67 | 76,169 | 0.60 | 0.79 | 4.39 | 169 | ||||||||||||||||||||||||||||||||||||||||||||||||||||||||||
10/1/09 to 9/30/10 | 10.68 | 0.49 | 0.62 | 1.11 | (0.49 | ) | — | (0.49 | ) | 0.62 | 11.30 | 10.65 | 120,459 | 0.59 | (10) | 0.73 | 4.51 | 160 | |||||||||||||||||||||||||||||||||||||||||||||||||||||||||||
10/1/08 to 9/30/09 | 9.86 | 0.45 | 0.83 | 1.28 | (0.46 | ) | — | (0.46 | ) | 0.82 | 10.68 | 13.34 | 144,835 | 0.59 | 0.75 | 4.52 | 274 | ||||||||||||||||||||||||||||||||||||||||||||||||||||||||||||
CA Tax-Exempt | |||||||||||||||||||||||||||||||||||||||||||||||||||||||||||||||||||||||||||||
Bond Fund | |||||||||||||||||||||||||||||||||||||||||||||||||||||||||||||||||||||||||||||
Class A | |||||||||||||||||||||||||||||||||||||||||||||||||||||||||||||||||||||||||||||
10/1/12 to 9/30/13 | $ | 12.96 | 0.43 | (0.68 | ) | (0.25 | ) | (0.43 | ) | (0.18 | ) | (0.61 | ) | (0.86 | ) | $ | 12.10 | (2.12 | )% | $ | 22,612 | 0.85 | % | 1.04 | % | 3.39 | % | 22 | % | ||||||||||||||||||||||||||||||||||||||||||||||||
10/1/11 to 9/30/12 | 12.30 | 0.46 | 0.68 | 1.14 | (0.48 | ) | — | (0.48 | ) | 0.66 | 12.96 | 9.40 | 28,803 | 0.85 | 1.04 | 3.65 | 16 | ||||||||||||||||||||||||||||||||||||||||||||||||||||||||||||
10/1/10 to 9/30/11 | 12.34 | 0.48 | (0.04 | ) | 0.44 | (0.48 | ) | — | (0.48 | ) | (0.04 | ) | 12.30 | 3.75 | 29,688 | 0.85 | 1.05 | 4.04 | 12 | ||||||||||||||||||||||||||||||||||||||||||||||||||||||||||
10/1/09 to 9/30/10 | 12.29 | 0.48 | 0.04 | 0.52 | (0.47 | ) | — | (0.47 | ) | 0.05 | 12.34 | 4.43 | 31,945 | 0.85 | 1.03 | 3.94 | 10 | ||||||||||||||||||||||||||||||||||||||||||||||||||||||||||||
10/1/08 to 9/30/09 | 11.41 | 0.47 | 0.90 | 1.37 | (0.48 | ) | (0.01 | ) | (0.49 | ) | 0.88 | 12.29 | 12.31 | 33,728 | 0.85 | 1.02 | 4.10 | 8 | |||||||||||||||||||||||||||||||||||||||||||||||||||||||||||
The footnote legend is at the end of the financial highlights.
See Notes to Financial Statements
80
Table of Contents
VIRTUS OPPORTUNITIES TRUST
FINANCIAL HIGHLIGHTS
SELECTED PER SHARE DATA AND RATIOS FOR A SHARE OUTSTANDING
THROUGHOUT EACH PERIOD
| Net Asset Value, Beginning of Period | Net Investment Income (Loss)(2) | Net Realized and Unrealized Gain (Loss) | Total from Investment Operations | Dividends from Net Investment Income | Distributions from Net Realized Gains | Total Distributions | Change in Net Asset Value | Net Asset Value, End of Period | Total Return(1) | Net Assets, End of Period (in thousands) | Ratio of Net Expenses to Average Net Assets(8) | Ratio of Gross Expenses to Average Net Assets (before waivers and reimbursements)(8) | Ratio of Net Investment Income (Loss) to Average Net Assets | Portfolio Turnover Rate | ||||||||||||||||||||||||||||||||||||||||||||||||||||||||||||||
CA Tax-Exempt | |||||||||||||||||||||||||||||||||||||||||||||||||||||||||||||||||||||||||||||
Bond Fund (Continued) | |||||||||||||||||||||||||||||||||||||||||||||||||||||||||||||||||||||||||||||
Class I | |||||||||||||||||||||||||||||||||||||||||||||||||||||||||||||||||||||||||||||
10/1/12 to 9/30/13 | $ | 12.95 | 0.46 | (0.68 | ) | (0.22 | ) | (0.46 | ) | (0.18 | ) | (0.64 | ) | (0.86 | ) | $ | 12.09 | (1.88 | )% | $ | 26,026 | 0.60 | % | 0.79 | % | 3.65 | % | 22 | % | ||||||||||||||||||||||||||||||||||||||||||||||||
10/1/11 to 9/30/12 | 12.29 | 0.49 | 0.68 | 1.17 | (0.51 | ) | — | (0.51 | ) | 0.66 | 12.95 | 9.68 | 28,639 | 0.60 | 0.79 | 3.90 | 16 | ||||||||||||||||||||||||||||||||||||||||||||||||||||||||||||
10/1/10 to 9/30/11 | 12.33 | 0.51 | (0.04 | ) | 0.47 | (0.51 | ) | — | (0.51 | ) | (0.04 | ) | 12.29 | 4.01 | 27,417 | 0.60 | 0.80 | 4.29 | 12 | ||||||||||||||||||||||||||||||||||||||||||||||||||||||||||
10/1/09 to 9/30/10 | 12.28 | 0.51 | 0.04 | 0.55 | (0.50 | ) | — | (0.50 | ) | 0.05 | 12.33 | 4.69 | 28,169 | 0.60 | 0.78 | 4.19 | 10 | ||||||||||||||||||||||||||||||||||||||||||||||||||||||||||||
10/1/08 to 9/30/09 | 11.41 | 0.50 | 0.88 | 1.38 | (0.50 | ) | (0.01 | ) | (0.51 | ) | 0.87 | 12.28 | 12.50 | 25,624 | 0.60 | 0.77 | 4.35 | 8 | |||||||||||||||||||||||||||||||||||||||||||||||||||||||||||
| Disciplined Equity Style | |||||||||||||||||||||||||||||||||||||||||||||||||||||||||||||||||||||||||||||
Fund | |||||||||||||||||||||||||||||||||||||||||||||||||||||||||||||||||||||||||||||
Class A | |||||||||||||||||||||||||||||||||||||||||||||||||||||||||||||||||||||||||||||
12/18/12(6) to 9/30/13 | $ | 10.00 | — | 2.55 | 2.55 | (0.08 | ) | — | (5) | (0.08 | ) | 2.47 | $ | 12.47 | 25.75 | %(4) | $ | 326 | 1.60 | %(3) | 7.63 | %(3) | 0.02 | %(3) | 447 | %(4) | |||||||||||||||||||||||||||||||||||||||||||||||||||
Class C | |||||||||||||||||||||||||||||||||||||||||||||||||||||||||||||||||||||||||||||
12/18/12(6) to 9/30/13 | $ | 10.00 | (0.05 | ) | 2.53 | 2.48 | (0.08 | ) | — | (5) | (0.08 | ) | 2.40 | $ | 12.40 | 25.02 | %(4) | $ | 237 | 2.35 | %(3) | 8.53 | %(3) | (0.51 | )%(3) | 447 | %(4) | ||||||||||||||||||||||||||||||||||||||||||||||||||
Class I | |||||||||||||||||||||||||||||||||||||||||||||||||||||||||||||||||||||||||||||
| 12/18/12(6) to 9/30/13 | $ | 10.00 | 0.05 | 2.52 | 2.57 | (0.08 | ) | — | (5) | (0.08 | ) | 2.49 | $ | 12.49 | 25.96 | %(4) | $ | 1,012 | 1.35 | %(3) | 7.87 | %(3) | 0.59 | %(3) | 447 | %(4) | |||||||||||||||||||||||||||||||||||||||||||||||||||
| Disciplined Select Bond | |||||||||||||||||||||||||||||||||||||||||||||||||||||||||||||||||||||||||||||
Fund | |||||||||||||||||||||||||||||||||||||||||||||||||||||||||||||||||||||||||||||
Class A | |||||||||||||||||||||||||||||||||||||||||||||||||||||||||||||||||||||||||||||
12/18/12(6) to 9/30/13 | $ | 10.00 | 0.11 | (0.57 | ) | (0.46 | ) | (0.10 | ) | — | (0.10 | ) | (0.56 | ) | $ | 9.44 | (4.53 | )%(4) | $ | 157 | 1.40 | %(3) | 9.27 | %(3) | 1.46 | %(3) | 401 | %(4) | |||||||||||||||||||||||||||||||||||||||||||||||||
Class C | |||||||||||||||||||||||||||||||||||||||||||||||||||||||||||||||||||||||||||||
12/18/12(6) to 9/30/13 | $ | 10.00 | 0.05 | (0.54 | ) | (0.49 | ) | (0.07 | ) | — | (0.05 | ) | (0.56 | ) | $ | 9.44 | (4.95 | )%(4) | $ | 114 | 2.15 | %(3) | 10.14 | %(3) | 0.70 | %(3) | 401 | %(4) | |||||||||||||||||||||||||||||||||||||||||||||||||
Class I | |||||||||||||||||||||||||||||||||||||||||||||||||||||||||||||||||||||||||||||
| 12/18/12(6) to 9/30/13 | $ | 10.00 | 0.13 | (0.55 | ) | (0.42 | ) | (0.13 | ) | — | (0.13 | ) | (0.55 | ) | $ | 9.45 | (4.28 | )%(4) | $ | 766 | 1.15 | %(3) | 9.18 | %(3) | 1.71 | %(3) | 401 | %(4) | |||||||||||||||||||||||||||||||||||||||||||||||||
| Disciplined Select | |||||||||||||||||||||||||||||||||||||||||||||||||||||||||||||||||||||||||||||
Country Fund | |||||||||||||||||||||||||||||||||||||||||||||||||||||||||||||||||||||||||||||
Class A | |||||||||||||||||||||||||||||||||||||||||||||||||||||||||||||||||||||||||||||
12/18/12(6) to 9/30/13 | $ | 10.00 | 0.03 | 1.31 | 1.34 | — | — | — | 1.34 | $ | 11.34 | 13.40 | %(4) | $ | 171 | 1.70 | %(3) | 8.97 | %(3) | 0.38 | %(3) | 115 | %(4) | ||||||||||||||||||||||||||||||||||||||||||||||||||||||
Class C | |||||||||||||||||||||||||||||||||||||||||||||||||||||||||||||||||||||||||||||
12/18/12(6) to 9/30/13 | $ | 10.00 | (0.04 | ) | 1.32 | 1.28 | — | — | — | 1.28 | $ | 11.28 | 12.80 | %(4) | $ | 113 | 2.45 | %(3) | 9.87 | %(3) | (0.55 | )%(3) | 115 | %(4) | |||||||||||||||||||||||||||||||||||||||||||||||||||||
Class I | |||||||||||||||||||||||||||||||||||||||||||||||||||||||||||||||||||||||||||||
| 12/18/12(6) to 9/30/13 | $ | 10.00 | 0.04 | 1.33 | 1.37 | — | — | — | 1.37 | $ | 11.37 | 13.70 | %(4) | $ | 909 | 1.45 | %(3) | 8.87 | %(3) | 0.46 | %(3) | 115 | %(4) | ||||||||||||||||||||||||||||||||||||||||||||||||||||||
The footnote legend is at the end of the financial highlights.
See Notes to Financial Statements
81
Table of Contents
VIRTUS OPPORTUNITIES TRUST
FINANCIAL HIGHLIGHTS
SELECTED PER SHARE DATA AND RATIOS FOR A SHARE OUTSTANDING
THROUGHOUT EACH PERIOD
| Net Asset Value, Beginning of Period | Net Investment Income (Loss)(2) | Net Realized and Unrealized Gain (Loss) | Total from Investment Operations | Dividends from Net Investment Income | Distributions from Net Realized Gains | Total Distributions | Change in Net Asset Value | Net Asset Value, End of Period | Total Return(1) | Net Assets, End of Period (in thousands) | Ratio of Net Expenses to Average Net Assets(8) | Ratio of Gross Expenses to Average Net Assets (before waivers and reimbursements)(8) | Ratio of Net Investment Income (Loss) to Average Net Assets | Portfolio Turnover Rate | ||||||||||||||||||||||||||||||||||||||||||||||||||||||||||||||
Herzfeld Fund | |||||||||||||||||||||||||||||||||||||||||||||||||||||||||||||||||||||||||||||
Class A | |||||||||||||||||||||||||||||||||||||||||||||||||||||||||||||||||||||||||||||
10/1/12 to 9/30/13 | $ | 10.21 | 0.33 | 0.18 | 0.51 | (0.26 | ) | (0.01 | ) | (0.27 | ) | 0.24 | $ | 10.45 | 5.10 | % | $ | 2,917 | 1.60 | % | 2.60 | % | 3.13 | % | 22 | % | |||||||||||||||||||||||||||||||||||||||||||||||||||
9/5/12(6) to 9/30/12 | 10.00 | 0.04 | 0.17 | 0.21 | — | — | — | 0.21 | 10.21 | 2.10 | (4) | 105 | 1.60 | (3) | 37.91 | (3) | 5.93 | 3 | (4) | ||||||||||||||||||||||||||||||||||||||||||||||||||||||||||
Class C | |||||||||||||||||||||||||||||||||||||||||||||||||||||||||||||||||||||||||||||
10/1/12 to 9/30/13 | $ | 10.21 | 0.25 | 0.19 | 0.44 | (0.21 | ) | (0.01 | ) | (0.22 | ) | 0.22 | $ | 10.43 | 4.36 | % | $ | 4,942 | 2.35 | % | 3.25 | % | 2.40 | % | 22 | % | |||||||||||||||||||||||||||||||||||||||||||||||||||
9/5/12(6) to 9/30/12 | 10.00 | 0.03 | 0.18 | 0.21 | — | — | — | 0.21 | 10.21 | 2.10 | (4) | 102 | 2.35 | (3) | 38.62 | (3) | 5.21 | 3 | (4) | ||||||||||||||||||||||||||||||||||||||||||||||||||||||||||
Class I | |||||||||||||||||||||||||||||||||||||||||||||||||||||||||||||||||||||||||||||
10/1/12 to 9/30/13 | $ | 10.21 | 0.09 | 0.46 | 0.55 | (0.29 | ) | (0.01 | ) | (0.30 | ) | 0.25 | $ | 10.46 | 5.41 | % | $ | 1,765 | 1.35 | % | 3.71 | % | 0.86 | % | 22 | % | |||||||||||||||||||||||||||||||||||||||||||||||||||
| 9/5/12(6) to 9/30/12 | 10.00 | 0.03 | 0.18 | 0.21 | — | — | — | 0.21 | 10.21 | 2.10 | (4) | 1,017 | 1.35 | (3) | 38.61 | (3) | 4.39 | 3 | (4) | ||||||||||||||||||||||||||||||||||||||||||||||||||||||||||
High Yield Fund | |||||||||||||||||||||||||||||||||||||||||||||||||||||||||||||||||||||||||||||
Class A | |||||||||||||||||||||||||||||||||||||||||||||||||||||||||||||||||||||||||||||
10/1/12 to 9/30/13 | $ | 4.28 | 0.26 | (0.01 | ) | 0.25 | (0.26 | ) | — | (0.26 | ) | (0.01 | ) | $ | 4.27 | 5.98 | % | $ | 80,155 | 1.15 | % | 1.31 | % | 6.05 | % | 100 | % | ||||||||||||||||||||||||||||||||||||||||||||||||||
10/1/11 to 9/30/12 | 3.85 | 0.28 | 0.44 | 0.72 | (0.29 | ) | — | (0.29 | ) | 0.43 | 4.28 | 19.19 | 98,701 | 1.15 | 1.31 | 6.82 | 92 | ||||||||||||||||||||||||||||||||||||||||||||||||||||||||||||
10/1/10 to 9/30/11 | 4.17 | 0.29 | (0.32 | ) | (0.03 | ) | (0.29 | ) | — | (0.29 | ) | (0.32 | ) | 3.85 | (0.82 | ) | 86,530 | 1.21 | (7) | 1.35 | 6.93 | 106 | |||||||||||||||||||||||||||||||||||||||||||||||||||||||
10/1/09 to 9/30/10 | 3.89 | 0.31 | 0.28 | 0.59 | (0.31 | ) | — | (0.31 | ) | 0.28 | 4.17 | 15.43 | 101,326 | 1.35 | 1.35 | (3) | 7.69 | 92 | |||||||||||||||||||||||||||||||||||||||||||||||||||||||||||
10/1/08 to 9/30/09 | 3.98 | 0.31 | (0.08 | ) | 0.23 | (0.32 | ) | — | (0.32 | ) | (0.09 | ) | 3.89 | 7.02 | 90,560 | 1.37 | 1.37 | 8.88 | 134 | ||||||||||||||||||||||||||||||||||||||||||||||||||||||||||
Class B | |||||||||||||||||||||||||||||||||||||||||||||||||||||||||||||||||||||||||||||
10/1/12 to 9/30/13 | $ | 4.19 | 0.23 | (0.02 | ) | 0.21 | (0.23 | ) | — | (0.23 | ) | (0.02 | ) | $ | 4.17 | 5.06 | % | $ | 131 | 1.90 | % | 2.05 | % | 5.31 | % | 100 | % | ||||||||||||||||||||||||||||||||||||||||||||||||||
10/1/11 to 9/30/12 | 3.77 | 0.24 | 0.44 | 0.68 | (0.26 | ) | — | (0.26 | ) | 0.42 | 4.19 | 18.46 | 307 | 1.90 | 2.06 | 6.07 | 92 | ||||||||||||||||||||||||||||||||||||||||||||||||||||||||||||
10/1/10 to 9/30/11 | 4.08 | 0.25 | (0.31 | ) | (0.06 | ) | (0.25 | ) | — | (0.25 | ) | (0.31 | ) | 3.77 | (1.66 | ) | 404 | 1.96 | (7) | 2.10 | 6.17 | 106 | |||||||||||||||||||||||||||||||||||||||||||||||||||||||
10/1/09 to 9/30/10 | 3.82 | 0.27 | 0.27 | 0.54 | (0.28 | ) | — | (0.28 | ) | 0.26 | 4.08 | 14.65 | 663 | 2.10 | 2.10 | (3) | 6.95 | 92 | |||||||||||||||||||||||||||||||||||||||||||||||||||||||||||
10/1/08 to 9/30/09 | 3.92 | 0.28 | (0.09 | ) | 0.19 | (0.29 | ) | — | (0.29 | ) | (0.10 | ) | 3.82 | 6.13 | 1,019 | 2.12 | 2.12 | 8.21 | 134 | ||||||||||||||||||||||||||||||||||||||||||||||||||||||||||
Class C | |||||||||||||||||||||||||||||||||||||||||||||||||||||||||||||||||||||||||||||
10/1/12 to 9/30/13 | $ | 4.23 | 0.23 | (0.02 | ) | 0.21 | (0.23 | ) | — | (0.23 | ) | (0.02 | ) | $ | 4.21 | 5.00 | % | $ | 3,302 | 1.90 | % | 2.06 | % | 5.31 | % | 100 | % | ||||||||||||||||||||||||||||||||||||||||||||||||||
10/1/11 to 9/30/12 | 3.80 | 0.25 | 0.44 | 0.69 | (0.26 | ) | — | (0.26 | ) | 0.43 | 4.23 | 18.59 | 2,944 | 1.90 | 2.07 | 6.07 | 92 | ||||||||||||||||||||||||||||||||||||||||||||||||||||||||||||
10/1/10 to 9/30/11 | 4.11 | 0.25 | (0.31 | ) | (0.06 | ) | (0.25 | ) | — | (0.25 | ) | (0.31 | ) | 3.80 | (1.65 | ) | 2,028 | 1.95 | (7) | 2.10 | 6.18 | 106 | |||||||||||||||||||||||||||||||||||||||||||||||||||||||
10/1/09 to 9/30/10 | 3.85 | 0.27 | 0.27 | 0.54 | (0.28 | ) | — | (0.28 | ) | 0.26 | 4.11 | 14.53 | 2,119 | 2.10 | 2.10 | (3) | 6.93 | 92 | |||||||||||||||||||||||||||||||||||||||||||||||||||||||||||
10/1/08 to 9/30/09 | 3.94 | 0.28 | (0.08 | ) | 0.20 | (0.29 | ) | — | (0.29 | ) | (0.09 | ) | 3.85 | 6.36 | 1,585 | 2.12 | 2.12 | 8.06 | 134 | ||||||||||||||||||||||||||||||||||||||||||||||||||||||||||
Class I | |||||||||||||||||||||||||||||||||||||||||||||||||||||||||||||||||||||||||||||
10/1/12 to 9/30/13 | $ | 4.28 | 0.27 | (0.01 | ) | 0.26 | (0.27 | ) | — | (0.27 | ) | (0.01 | ) | $ | 4.27 | 6.25 | % | $ | 5,812 | 0.90 | % | 1.05 | % | 6.37 | % | 100 | % | ||||||||||||||||||||||||||||||||||||||||||||||||||
8/8/12(6) to 9/30/12 | 4.23 | 0.04 | 0.06 | 0.10 | (0.05 | ) | — | (0.05 | ) | 0.05 | 4.28 | 2.37 | (4) | 102 | 0.90 | (3) | 1.08 | (3) | 6.86 | (3) | 92 | (4) | |||||||||||||||||||||||||||||||||||||||||||||||||||||||
The footnote legend is at the end of the financial highlights.
See Notes to Financial Statements
82
Table of Contents
VIRTUS OPPORTUNITIES TRUST
FINANCIAL HIGHLIGHTS
SELECTED PER SHARE DATA AND RATIOS FOR A SHARE OUTSTANDING
THROUGHOUT EACH PERIOD
| Net Asset Value, Beginning of Period | Net Investment Income (Loss)(2) | Net Realized and Unrealized Gain (Loss) | Total from Investment Operations | Dividends from Net Investment Income | Distributions from Net Realized Gains | Total Distributions | Change in Net Asset Value | Net Asset Value, End of Period | Total Return(1) | Net Assets, End of Period (in thousands) | Ratio of Net Expenses to Average Net Assets(8) | Ratio of Gross Expenses to Average Net Assets(8) | Ratio of Net Investment Income to Average Net Assets | Portfolio Turnover Rate | ||||||||||||||||||||||||||||||||||||||||||||||||||||||||||||||
| Low Volatility Equity | |||||||||||||||||||||||||||||||||||||||||||||||||||||||||||||||||||||||||||||
Fund | |||||||||||||||||||||||||||||||||||||||||||||||||||||||||||||||||||||||||||||
Class A | |||||||||||||||||||||||||||||||||||||||||||||||||||||||||||||||||||||||||||||
6/11/13(6) to 9/30/13 | $ | 10.00 | 0.06 | 0.18 | 0.24 | — | — | — | 0.24 | $ | 10.24 | 2.40 | %(4) | $ | 136 | 1.55 | %(3) | 7.66 | %(3) | 2.00 | %(3) | 0 | % | ||||||||||||||||||||||||||||||||||||||||||||||||||||||
Class C | |||||||||||||||||||||||||||||||||||||||||||||||||||||||||||||||||||||||||||||
6/11/13(6) to 9/30/13 | $ | 10.00 | 0.03 | 0.18 | 0.21 | — | — | — | 0.21 | $ | 10.21 | 2.10 | %(4) | $ | 130 | 2.30 | %(3) | 8.49 | %(3) | 0.99 | %(3) | 0 | % | ||||||||||||||||||||||||||||||||||||||||||||||||||||||
Class I | |||||||||||||||||||||||||||||||||||||||||||||||||||||||||||||||||||||||||||||
6/11/13(6) to 9/30/13 | $ | 10.00 | 0.07 | 0.18 | 0.25 | — | — | — | 0.25 | $ | 10.25 | 2.50 | %(4) | $ | 1,332 | 1.30 | %(3) | 7.51 | %(3) | 2.23 | %(3) | 0 | % | ||||||||||||||||||||||||||||||||||||||||||||||||||||||
| Multi-Sector Intermediate | |||||||||||||||||||||||||||||||||||||||||||||||||||||||||||||||||||||||||||||
Bond Fund | |||||||||||||||||||||||||||||||||||||||||||||||||||||||||||||||||||||||||||||
Class A | |||||||||||||||||||||||||||||||||||||||||||||||||||||||||||||||||||||||||||||
10/1/12 to 9/30/13 | $ | 11.15 | 0.57 | (0.28 | ) | 0.29 | (0.55 | ) | (0.12 | ) | (0.67 | ) | (0.38 | ) | $ | 10.77 | 2.59 | % | $ | 184,524 | 1.10 | % | 1.10 | % | 5.13 | % | 77 | % | |||||||||||||||||||||||||||||||||||||||||||||||||
10/1/11 to 9/30/12 | 10.24 | 0.62 | 0.93 | 1.55 | (0.64 | ) | — | (0.64 | ) | 0.91 | 11.15 | 15.51 | 196,554 | 1.13 | 1.13 | 5.73 | 76 | ||||||||||||||||||||||||||||||||||||||||||||||||||||||||||||
10/1/10 to 9/30/11 | 10.77 | 0.66 | (0.47 | ) | 0.19 | (0.72 | ) | — | (0.72 | ) | (0.53 | ) | 10.24 | 1.58 | 137,395 | 1.16 | 1.16 | 6.07 | 45 | ||||||||||||||||||||||||||||||||||||||||||||||||||||||||||
10/1/09 to 9/30/10 | 9.96 | 0.67 | 0.79 | 1.46 | (0.65 | ) | — | (0.65 | ) | 0.81 | 10.77 | 15.14 | 125,962 | 1.16 | 1.16 | 6.46 | 74 | ||||||||||||||||||||||||||||||||||||||||||||||||||||||||||||
10/1/08 to 9/30/09 | 9.23 | 0.59 | 0.85 | 1.44 | (0.71 | ) | — | (0.71 | ) | 0.73 | 9.96 | 17.34 | 121,968 | 1.16 | 1.16 | 6.90 | 85 | ||||||||||||||||||||||||||||||||||||||||||||||||||||||||||||
Class B | |||||||||||||||||||||||||||||||||||||||||||||||||||||||||||||||||||||||||||||
10/1/12 to 9/30/13 | $ | 11.12 | 0.49 | (0.28 | ) | 0.21 | (0.47 | ) | (0.12 | ) | (0.59 | ) | (0.38 | ) | $ | 10.74 | 1.83 | % | $ | 7,603 | 1.85 | % | 1.85 | % | 4.39 | % | 77 | % | |||||||||||||||||||||||||||||||||||||||||||||||||
10/1/11 to 9/30/12 | 10.22 | 0.54 | 0.92 | 1.46 | (0.56 | ) | — | (0.56 | ) | 0.90 | 11.12 | 14.59 | 9,974 | 1.88 | 1.88 | 5.02 | 76 | ||||||||||||||||||||||||||||||||||||||||||||||||||||||||||||
10/1/10 to 9/30/11 | 10.75 | 0.58 | (0.47 | ) | 0.11 | (0.64 | ) | — | (0.64 | ) | (0.53 | ) | 10.22 | 0.82 | 10,685 | 1.91 | 1.91 | 5.31 | 45 | ||||||||||||||||||||||||||||||||||||||||||||||||||||||||||
10/1/09 to 9/30/10 | 9.95 | 0.59 | 0.79 | 1.38 | (0.58 | ) | — | (0.58 | ) | 0.80 | 10.75 | 14.20 | 13,590 | 1.91 | 1.91 | 5.72 | 74 | ||||||||||||||||||||||||||||||||||||||||||||||||||||||||||||
10/1/08 to 9/30/09 | 9.22 | 0.53 | 0.84 | 1.37 | (0.64 | ) | — | (0.64 | ) | 0.73 | 9.95 | 16.47 | 13,276 | 1.91 | 1.91 | 6.18 | 85 | ||||||||||||||||||||||||||||||||||||||||||||||||||||||||||||
Class C | |||||||||||||||||||||||||||||||||||||||||||||||||||||||||||||||||||||||||||||
10/1/12 to 9/30/13 | $ | 11.23 | 0.49 | (0.27 | ) | 0.22 | (0.47 | ) | (0.12 | ) | (0.59 | ) | (0.37 | ) | $ | 10.86 | 1.90 | % | $ | 104,591 | 1.85 | % | 1.85 | % | 4.39 | % | 77 | % | |||||||||||||||||||||||||||||||||||||||||||||||||
10/1/11 to 9/30/12 | 10.31 | 0.54 | 0.94 | 1.48 | (0.56 | ) | — | (0.56 | ) | 0.92 | $ | 11.23 | 14.65 | 108,595 | 1.88 | 1.88 | 4.98 | 76 | |||||||||||||||||||||||||||||||||||||||||||||||||||||||||||
10/1/10 to 9/30/11 | 10.84 | 0.58 | (0.47 | ) | 0.11 | (0.64 | ) | — | (0.64 | ) | (0.53 | ) | 10.31 | 0.80 | 70,735 | 1.91 | 1.91 | 5.32 | 45 | ||||||||||||||||||||||||||||||||||||||||||||||||||||||||||
10/1/09 to 9/30/10 | 10.02 | 0.59 | 0.80 | 1.39 | (0.57 | ) | — | (0.57 | ) | 0.82 | 10.84 | 14.29 | 62,214 | 1.91 | 1.91 | 5.71 | 74 | ||||||||||||||||||||||||||||||||||||||||||||||||||||||||||||
10/1/08 to 9/30/09 | 9.27 | 0.52 | 0.87 | 1.39 | (0.64 | ) | — | (0.64 | ) | 0.75 | 10.02 | 16.59 | 41,374 | 1.90 | 1.90 | 5.93 | 85 | ||||||||||||||||||||||||||||||||||||||||||||||||||||||||||||
Class I | |||||||||||||||||||||||||||||||||||||||||||||||||||||||||||||||||||||||||||||
10/1/12 to 9/30/13 | $ | 11.15 | 0.60 | (0.28 | ) | 0.32 | (0.58 | ) | (0.12 | ) | (0.70 | ) | (0.38 | ) | $ | 10.77 | 2.85 | % | $ | 86,387 | 0.85 | % | 0.85 | % | 5.38 | % | 77 | % | |||||||||||||||||||||||||||||||||||||||||||||||||
10/1/11 to 9/30/12 | 10.24 | 0.64 | 0.93 | 1.57 | (0.66 | ) | — | (0.66 | ) | 0.91 | 11.15 | 15.80 | 74,847 | 0.88 | 0.88 | 5.93 | 76 | ||||||||||||||||||||||||||||||||||||||||||||||||||||||||||||
10/1/10 to 9/30/11 | 10.76 | 0.69 | (0.46 | ) | 0.23 | (0.75 | ) | — | (0.75 | ) | (0.52 | ) | 10.24 | 1.93 | 22,408 | 0.91 | 0.91 | 6.32 | 45 | ||||||||||||||||||||||||||||||||||||||||||||||||||||||||||
10/1/09(6) to 9/30/10 | 9.95 | 0.70 | 0.79 | 1.49 | (0.68 | ) | — | (0.68 | ) | 0.81 | 10.76 | 15.41 | (4) | 7,633 | 0.91 | (3) | 0.91 | (3) | 6.78 | (3) | 74 | ||||||||||||||||||||||||||||||||||||||||||||||||||||||||
The footnote legend is at the end of the financial highlights.
See Notes to Financial Statements
83
Table of Contents
VIRTUS OPPORTUNITIES TRUST
FINANCIAL HIGHLIGHTS
SELECTED PER SHARE DATA AND RATIOS FOR A SHARE OUTSTANDING
THROUGHOUT EACH PERIOD
| Net Asset Value, Beginning of Period | Net Investment Income (Loss)(2) | Net Realized and Unrealized Gain (Loss) | Total from Investment Operations | Dividends from Net Investment Income | Distributions from Net Realized Gains | Total Return of Capital | Total Distributions | Change in Net Asset Value | Net Asset Value, End of Period | Total Return(1) | Net Assets, End of Period (in thousands) | Ratio of Net Expenses to Average Net Assets(8) | Ratio of Gross Expenses to Average Net Assets(8) | Ratio of Net Investment Income to Average Net Assets | Portfolio Turnover Rate | ||||||||||||||||||||||||||||||||||||||||||||||||||||||||||||||||||
| Senior Floating | ||||||||||||||||||||||||||||||||||||||||||||||||||||||||||||||||||||||||||||||||||
Rate Fund | ||||||||||||||||||||||||||||||||||||||||||||||||||||||||||||||||||||||||||||||||||
Class A | ||||||||||||||||||||||||||||||||||||||||||||||||||||||||||||||||||||||||||||||||||
10/1/12 to 9/30/13 | $ | 9.79 | 0.42 | 0.04 | 0.46 | (0.46 | ) | — | (5) | — | (0.46 | ) | — | $ | 9.79 | 4.84 | % | $ | 386,113 | 1.21 | % | 1.21 | % | 4.29 | % | 68 | % | |||||||||||||||||||||||||||||||||||||||||||||||||||||||
10/1/11 to 9/30/12 | 9.28 | 0.49 | 0.49 | 0.98 | (0.47 | ) | — | — | (0.47 | ) | 0.51 | 9.79 | 10.75 | 256,397 | 1.23 | 1.23 | 5.06 | 56 | ||||||||||||||||||||||||||||||||||||||||||||||||||||||||||||||||
10/1/10 to 9/30/11 | 9.80 | 0.45 | (0.27 | ) | 0.18 | (0.49 | ) | (0.07 | ) | (0.14 | ) | (0.70 | ) | (0.52 | ) | 9.28 | 1.62 | 215,427 | 1.20 | (9) | 1.19 | (9) | 4.58 | 69 | ||||||||||||||||||||||||||||||||||||||||||||||||||||||||||
10/1/09 to 9/30/10 | 9.87 | 0.67 | 0.09 | 0.76 | (0.64 | ) | (0.19 | ) | — | (0.83 | ) | (0.07 | ) | 9.80 | 8.05 | 98,790 | 1.20 | (9) | 1.15 | (9) | 6.86 | 41 | ||||||||||||||||||||||||||||||||||||||||||||||||||||||||||||
10/1/08 to 9/30/09 | 9.41 | 0.54 | 0.47 | 1.01 | (0.55 | ) | — | (5) | — | (0.55 | ) | 0.46 | 9.87 | 11.74 | 52,987 | 1.20 | 1.33 | 6.00 | 63 | |||||||||||||||||||||||||||||||||||||||||||||||||||||||||||||||
Class C | ||||||||||||||||||||||||||||||||||||||||||||||||||||||||||||||||||||||||||||||||||
10/1/12 to 9/30/13 | $ | 9.80 | 0.35 | 0.05 | 0.40 | (0.39 | ) | — | (5) | — | (0.39 | ) | 0.01 | $ | 9.81 | 4.15 | % | $ | 182,667 | 1.96 | % | 1.96 | % | 3.51 | % | 68 | % | |||||||||||||||||||||||||||||||||||||||||||||||||||||||
10/1/11 to 9/30/12 | 9.29 | 0.41 | 0.50 | 0.91 | (0.40 | ) | — | — | (0.40 | ) | 0.51 | 9.80 | 9.92 | 95,078 | 1.98 | 1.98 | 4.31 | 56 | ||||||||||||||||||||||||||||||||||||||||||||||||||||||||||||||||
10/1/10 to 9/30/11 | 9.81 | 0.36 | (0.26 | ) | 0.10 | (0.41 | ) | (0.07 | ) | (0.14 | ) | (0.62 | ) | (0.52 | ) | 9.29 | 0.85 | 92,623 | 1.95 | (9) | 1.94 | (9) | 3.69 | 69 | ||||||||||||||||||||||||||||||||||||||||||||||||||||||||||
10/1/09 to 9/30/10 | 9.87 | 0.59 | 0.10 | 0.69 | (0.56 | ) | (0.19 | ) | — | (0.75 | ) | (0.06 | ) | 9.81 | 7.35 | 30,116 | 1.95 | (9) | 1.92 | (9) | 6.02 | 41 | ||||||||||||||||||||||||||||||||||||||||||||||||||||||||||||
10/1/08 to 9/30/09 | 9.41 | 0.44 | 0.51 | 0.95 | (0.49 | ) | — | (5) | — | (0.49 | ) | 0.46 | 9.87 | 10.94 | 2,740 | 1.95 | 2.05 | 4.82 | 63 | |||||||||||||||||||||||||||||||||||||||||||||||||||||||||||||||
Class I | ||||||||||||||||||||||||||||||||||||||||||||||||||||||||||||||||||||||||||||||||||
10/1/12 to 9/30/13 | $ | 9.78 | 0.43 | 0.07 | 0.50 | (0.49 | ) | — | (5) | — | (0.49 | ) | 0.01 | $ | 9.79 | 5.21 | % | $ | 381,791 | 0.96 | % | 0.96 | % | 4.41 | % | 68 | % | |||||||||||||||||||||||||||||||||||||||||||||||||||||||
10/1/11 to 9/30/12 | 9.27 | 0.51 | 0.49 | 1.00 | (0.49 | ) | — | — | (0.49 | ) | 0.51 | 9.78 | 11.04 | 94,193 | 0.98 | 0.98 | 5.31 | 56 | ||||||||||||||||||||||||||||||||||||||||||||||||||||||||||||||||
10/1/10 to 9/30/11 | 9.80 | 0.46 | (0.27 | ) | 0.19 | (0.51 | ) | (0.07 | ) | (0.14 | ) | (0.72 | ) | (0.53 | ) | 9.27 | 1.78 | 71,584 | 0.95 | (9) | 0.93 | (9) | 4.67 | 69 | ||||||||||||||||||||||||||||||||||||||||||||||||||||||||||
10/1/09 to 9/30/10 | 9.86 | 0.64 | 0.15 | 0.79 | (0.66 | ) | (0.19 | ) | — | (0.85 | ) | (0.06 | ) | 9.80 | 8.44 | 32,679 | 0.95 | (9) | 0.89 | (9) | 6.56 | 41 | ||||||||||||||||||||||||||||||||||||||||||||||||||||||||||||
| 10/1/08 to 9/30/09 | 9.41 | 0.58 | 0.45 | 1.03 | (0.58 | ) | — | (5) | — | (0.58 | ) | 0.45 | 9.86 | 11.94 | 394 | 0.95 | 1.13 | 6.54 | 63 | |||||||||||||||||||||||||||||||||||||||||||||||||||||||||||||||
Wealth Masters | ||||||||||||||||||||||||||||||||||||||||||||||||||||||||||||||||||||||||||||||||||
Fund | ||||||||||||||||||||||||||||||||||||||||||||||||||||||||||||||||||||||||||||||||||
Class A | ||||||||||||||||||||||||||||||||||||||||||||||||||||||||||||||||||||||||||||||||||
10/1/12 to 9/30/13 | $ | 10.22 | (0.01 | ) | 3.05 | 3.04 | (0.09 | ) | (0.05 | ) | — | (0.14 | ) | 2.90 | $ | 13.12 | 30.09 | % | $ | 5,169 | 1.45 | % | 3.29 | % | (0.10 | )% | 22 | % | ||||||||||||||||||||||||||||||||||||||||||||||||||||||
9/5/12(6) to 9/30/12 | 10.00 | 0.01 | 0.21 | 0.22 | — | — | — | — | 0.22 | 10.22 | 2.20 | (4) | 106 | 1.45 | (3) | 44.72 | (3) | 0.78 | (3) | 26 | (4) | |||||||||||||||||||||||||||||||||||||||||||||||||||||||||||||
Class C | ||||||||||||||||||||||||||||||||||||||||||||||||||||||||||||||||||||||||||||||||||
10/1/12 to 9/30/13 | $ | 10.21 | (0.08 | ) | 3.03 | 2.95 | (0.07 | ) | (0.05 | ) | — | (0.12 | ) | 2.83 | $ | 13.04 | 29.11 | % | $ | 1,742 | 2.20 | % | 4.41 | % | (0.66 | )% | 22 | % | ||||||||||||||||||||||||||||||||||||||||||||||||||||||
9/5/12(6) to 9/30/12 | 10.00 | — | (5) | 0.21 | 0.21 | — | — | — | — | 0.21 | 10.21 | 2.10 | (4) | 107 | 2.20 | (3) | 45.67 | (3) | 0.04 | (3) | 26 | (4) | ||||||||||||||||||||||||||||||||||||||||||||||||||||||||||||
Class I | ||||||||||||||||||||||||||||||||||||||||||||||||||||||||||||||||||||||||||||||||||
10/1/12 to 9/30/13 | $ | 10.22 | 0.06 | 3.01 | 3.07 | (0.10 | ) | (0.05 | ) | — | (0.15 | ) | 2.92 | $ | 13.14 | 30.37 | % | $ | 44,813 | 1.20 | % | 4.64 | % | 0.52 | % | 22 | % | |||||||||||||||||||||||||||||||||||||||||||||||||||||||
9/5/12(6) to 9/30/12 | 10.00 | 0.01 | 0.21 | 0.22 | — | — | — | — | 0.22 | 10.22 | 2.20 | (4) | 818 | 1.20 | (3) | 44.40 | (3) | 1.04 | (3) | 26 | (4) | |||||||||||||||||||||||||||||||||||||||||||||||||||||||||||||
Footnote Legend
| (1) | Sales charges, where applicable, are not reflected in the total return calculation. |
| (2) | Computed using average shares outstanding. |
| (3) | Annualized. |
| (4) | Not annualized. |
| (5) | Amount is less than $0.005. |
| (6) | Inception date. |
| (7) | Due to a change in expense ratio, the ratio shown is a blended expense ratio. |
| (8) | The Funds will also indirectly bear their prorated share of expenses of the underlying funds in which they invest. Such expenses are not included in the calculation of this ratio. |
| (9) | See Note 3D in the Notes to Financial Statements for information on recapture of expenses previously waived. |
| (10) | Includes extraordinary expenses. |
See Notes to Financial Statements
84
Table of Contents
VIRTUS OPPORTUNITIES TRUST
SEPTEMBER 30, 2013
| Note 1. Organization |
Virtus Opportunities Trust (the “Trust”) is organized as a Delaware statutory trust and is registered under the Investment Company Act of 1940 (“1940 Act”), as amended, as an open-end management investment company.
As of the date of this report, 31 funds are offered for sale, of which 11 (each a “Fund”) are reported in this annual report.
The Fund’s investment objectives are outlined in each Fund’s Summary Page.
| There | is no guarantee that a Fund will achieve its objective. |
All the Funds offer Class A and Class C shares with the exception of the CA Tax-Exempt Bond Fund which does not offer Class C shares. All Funds offer Class I shares. Class B shares are no longer available for purchase by new or existing shareholders, except for existing shareholders through Qualifying Transactions. For more information regarding Qualifying Transactions, refer to each Fund’s prospectus.
Class A shares of the CA Tax-Exempt Bond Fund and Senior Floating Rate Fund are sold with a front-end sales charge of up to 2.75% with some exceptions. Class A shares of the Bond Fund, High Yield Fund, and Multi-Sector Intermediate Bond Fund are sold with a front-end sales charge of up to 3.75% with some exceptions. Class A shares of the Disciplined Equity Style, Disciplined Select Bond, Disciplined Select Country, Herzfeld, Low Volatility Equity and Wealth Masters Funds are sold with a front-end sales charge of up to 5.75% with some exceptions. Generally, Class A shares are not subject to any charges by the Funds when redeemed; however, a 0.50% – 1% contingent deferred sales charge (“CDSC”) may be imposed on certain redemptions made within a certain period following purchases on which a finder’s fee has been paid. The period for which such CDSC applies for the Funds is 18 months. The CDSC period begins on the last day of the month preceding the month in which the purchase was made.
Class B shares were generally sold with a CDSC, which declines from 5% to zero depending on the period of time the shares are held. Class C shares are generally sold with a 1% CDSC if applicable if redeemed within one year of purchase. Class I shares are sold without a front-end sales charge or CDSC.
Virtus Mutual Funds may impose an annual fee on accounts having balances of less than $2,500. The small account fee may be waived in certain circumstances, as disclosed in the prospectuses and/or statements of additional information. The fees collected will be used to offset certain expenses of the Funds.
Each Class of shares has identical voting, dividend, liquidation and other rights and the same terms and conditions, except that each class bears different distribution and/or service fees under a Board approved Rule 12b-1 and/or shareholder servicing plan (“12b-1 plan”) and has exclusive voting rights with respect to such plans. Class I shares are not subject to a 12b-1 plan. Income and other expenses and realized and unrealized gains and losses of each Fund are borne pro rata by the holders of each class of shares.
| Note 2. Significant Accounting Policies |
The following is a summary of significant accounting policies consistently followed by the Trust in the preparation of its financial statements. The preparation of financial statements in conformity with accounting principles generally accepted in the United States of America requires management to make estimates and assumptions that affect the reported amounts of assets and liabilities, and disclosure of contingent assets and liabilities at the date of the financial statements and the reported amount of increases and decreases in net assets from operations during the reporting period. Actual results could differ from those estimates and those differences could be significant.
| A. | Security Valuation |
Security valuation procedures for each Fund, which include, nightly price variance, as well as back-testing such as bi-weekly unchanged price, monthly secondary source and transaction analysis, have been approved by the Board of Trustees (the “Board” or the “Trustees”). All internally fair valued securities are approved by a valuation committee (“Valuation Committee”) appointed by the Board. The Valuation Committee is comprised of the treasurer, assistant treasurer, and two other appropriate investment professionals of the Virtus Product Management team who previously have been identified to the Board. All internally fair valued securities, referred to below, are updated daily and reviewed in detail by the Valuation Committee monthly unless changes occur within the period. The Valuation Committee reviews the validity of the model inputs and any changes to the model. Fair valuations are ratified by the Board of Directors at least quarterly.
Each Fund utilizes a fair value hierarchy which prioritizes the inputs to valuation techniques used to measure fair value into three broad levels.
| • Level 1 – | quoted prices in active markets for identical securities |
| • Level 2 – | prices determined using other significant observable inputs (including quoted prices for similar securities, interest rates, prepayment speeds, credit risk, etc.) |
| • Level 3 – | prices determined using significant unobservable inputs (including the valuation committee’s own assumptions in determining the fair value of investments) |
A description of the valuation techniques applied to a Fund’s major categories of assets and liabilities measured at fair value on a recurring basis is as follows:
Equity securities are valued at the official closing price (typically last sale) on the exchange on which the securities are primarily traded, or if no closing price is available, at the last bid price and are categorized as Level 1 in the hierarchy. Restricted equity securities and private placements that are not widely traded, are illiquid or are internally fair valued by the valuation committee, are generally categorized as Level 3 in the hierarchy.
Certain non-U.S. securities may be fair valued in cases where closing prices are not readily available or are deemed not reflective of readily available market prices. For example, significant events (such as movement in the U.S. securities market, or other regional and local developments) may occur between the time that non-U.S. markets close (where the security is principally traded) and the time that a Fund calculates its net asset value (“NAV”) (generally 4 p.m. Eastern time, the close of the New York Stock Exchange (“NYSE”)) that may impact the value of securities traded in
85
Table of Contents
VIRTUS OPPORTUNITIES TRUST
NOTES TO FINANCIAL STATEMENTS (Continued)
SEPTEMBER 30, 2013
these non-U.S. markets. In such cases the Funds fair value non-U.S. securities using an independent pricing service which considers the correlation of the trading patterns of the non-U.S. security to the intraday trading in the U.S. markets for investments such as ADRs, financial futures, ETFs, and certain indexes as well as prices for similar securities. Such fair valuations are categorized as Level 2 in the hierarchy. Because the frequency of significant events is not predictable, fair valuation of certain non-U.S. common stocks may occur on a frequent basis.
Debt securities, including restricted securities, are valued based on evaluated quotations received from independent pricing services or from dealers who make markets in such securities. For most bond types, the pricing service utilizes matrix pricing that considers one or more of the following factors: yield or price of bonds of comparable quality, coupon, maturity, current cash flows, type, and current day trade information, as well as dealer-supplied prices. These valuations are generally categorized as Level 2 in the hierarchy. Structured debt instruments such as mortgage-backed and asset-backed securities may also incorporate collateral analysis and utilize cash flow models for valuation and are generally categorized as Level 2 in the hierarchy. Pricing services do not provide pricing for all securities and therefore indicative bids from dealers are utilized which are based on pricing models used by market makers in the security and are generally categorized as Level 2 in the hierarchy. Debt securities that are not widely traded, are illiquid, or are internally fair valued by the valuation committee are generally categorized as Level 3 in the hierarchy.
Listed derivatives such as treasury futures, that are actively traded are valued based on quoted prices from the exchange and are categorized as Level 1 in the hierarchy. Over-the-counter derivative contracts, which include forward currency contracts and equity-linked instruments, do not require material subjectivity as pricing inputs are observed from actively quoted markets and are categorized as Level 2 in the hierarchy.
Investments in open-end mutual funds are valued at their closing NAV determined as of the close of business of the NYSE each business day and are categorized as Level 1 in the hierarchy.
Short-term notes having a maturity of 60 days or less are valued at amortized cost which approximates market and are generally categorized as Level 2 in the hierarchy.
A summary of the inputs used to value the Funds’ net assets by each major security type is disclosed at the end of the Schedule of Investments for each Fund. The inputs or methodologies used for valuing securities are not necessarily an indication of the risk associated with investing in those securities.
The Funds own the following internally fair valued securities and which are categorized as Level 3 in the hierarchy.
| Bond Fund | United Artists Theatre Circuit, Inc. | |
| High Yield Fund | United Artists Theatre Circuit, Inc. |
The significant unobservable inputs used in the fair value measurement of these corporate bonds are based on comparable liquid assets adjusted for accretion/amortization rate, current yield, current swap rates, and discount rates related to differences in capital structure and liquidity. Significant changes in any of these inputs in isolation would result in a significantly lower or higher fair value measurement. Generally, a change in the observable market assumptions would have direct impacts to the discount rates used related to capital structure and/or liquidity discounts.
| B. | Security Transactions and Investment Income |
Security transactions are recorded on the trade date. Realized gains and losses from sales of securities are determined on the identified cost basis. Dividend income is recognized on the ex-dividend date, or in the case of certain foreign securities, as soon as a Fund is notified. Interest income is recorded on the accrual basis. Each Fund amortizes premiums and accretes discounts using the effective interest method.
Dividend income from REIT Investments is recorded using management’s estimate of the income included in distributions received from the REIT investments. Distributions received in excess of this estimated amount are recorded as a reduction of the cost of investments or reclassified to capital gains. The actual amounts of income, return of capital, and capital gains are only determined by each REIT after its fiscal year-end, and may differ from the estimated amounts.
| C. | Income Taxes |
Each Fund is treated as a separate taxable entity. It is the intention of each Fund to comply with the requirements of Subchapter M of the Internal Revenue Code and to distribute substantially all of its taxable income to its shareholders. Therefore, no provision for federal income taxes or excise taxes has been made.
Certain Funds may be subject to foreign taxes on income, gains on investments or currency repatriation, a portion of which may be recoverable. Each Fund will accrue such taxes and recoveries as applicable based upon current interpretations of the tax rules and regulations that exist in the markets in which it invests.
Management of the Funds has concluded that there are no significant uncertain tax positions that would require recognition in the financial statements. As of September 30, 2013, the tax years that remain subject to examination by the major tax jurisdictions under the statute of limitations are from the year 2010 forward (with limited exceptions).
| D. | Distributions to Shareholders |
Distributions are recorded by each Fund on the ex-dividend date. For the Bond Fund(1), CA Tax-Exempt Fund, High Yield Fund(1), Multi-Sector Intermediate Bond Fund and Senior Floating Rate Fund income distributions are declared and recorded daily and distributed monthly. Income and capital gain distributions are determined in accordance with income tax regulations that may differ from accounting principles generally accepted in the United States of America. These differences may include the treatment of non-taxable dividends, market premium and discount, non-deductible expenses, expiring capital loss carryovers, foreign currency gain or loss, gain or loss on futures contracts, partnerships, operating losses and losses deferred due to wash sales. Permanent book and tax basis differences relating to shareholder distributions will result in reclassifications to capital paid in on shares of beneficial interest.
| (1) | Effective January 2, 2013. |
86
Table of Contents
VIRTUS OPPORTUNITIES TRUST
NOTES TO FINANCIAL STATEMENTS (Continued)
SEPTEMBER 30, 2013
| E. | Expenses |
Expenses incurred together by a Fund and other affiliated mutual funds are allocated in proportion to the net assets of each such fund, except where allocation of direct expense to each fund or an alternative allocation method can be more appropriately used.
In addition to the net annual operating expenses that a Fund bears directly, the shareholders of a Fund indirectly bears the pro-rata expenses of the underlying mutual funds in which a Fund invests.
| F. | Foreign Currency Translation |
Non-U.S. investment securities and other assets and liabilities denominated in foreign currencies are translated into U.S. dollar amounts at the foreign currency exchange rate effective at the end of the reporting period. Cost of investments is translated at the currency exchange rate effective at the trade date. The gain or loss resulting from a change in currency exchange rates between the trade and settlement date of a portfolio transaction is treated as a gain or loss on non-U.S. currency. Likewise, the gain or loss resulting from a change in currency exchange rates between the date income is accrued and paid is treated as a gain or loss on foreign currency. The Funds do not isolate that portion of the results of
operations arising from changes in foreign exchange rates on investments from the fluctuations arising from changes in the market prices of securities held. Such fluctuations are included with the net realized and unrealized gain or loss on investments.
| G. | Derivative Financial Instruments |
Disclosures on derivative instruments and hedging activities are intended to improve financial reporting for derivative instruments by enhanced disclosure that enables the investors to understand how and why a fund uses derivatives, how derivatives are accounted for, and how derivative instruments affect a fund’s results of operations and financial position. Summarized below is the specific type of derivative instruments used by the Funds.
Futures Contracts: A futures contract is an agreement between two parties to purchase (long) or sell (short) a security at a set price for delivery on a future date. Upon entering into a futures contract, the Fund is required to pledge to the broker an amount of cash and/or securities equal to the “initial margin” requirements of the futures exchange on which the contract is traded. Pursuant to the contract, the Fund agrees to receive from or pay to the broker an amount of cash equal to the daily fluctuation in value of the contract. Such receipts or payments are known as variation margin and are recorded by the Fund for financial statement purposes on a daily basis as unrealized gains or losses. When the contract expires or is closed, gain or loss equal to the difference between the value of the contract at the time it was opened and the value at the time it was closed is realized. This is presented in the Statement of Operations as net realized gain (loss) on futures contracts.
A Fund utilizes futures to optimize performance by managing interest rate risk. This permits the fund manager to assemble the portfolio believed to be most attractive while mitigating vulnerability to changes in market interest rates. The potential risks to the Fund are that 1) the use of futures may result in larger losses or smaller gains than the use of more traditional investments, 2) the prices of futures and the price movements of the securities that the future is intended to simulate may not correlate well, 3) the Fund’s success in using futures will be dependent upon the subadviser’s ability to correctly predict such price movements, 4) liquidity of futures can be adversely affected by market factors, and the prices of such securities may move in unexpected ways, and 5) if the Fund cannot close out a futures position, it may be compelled to continue to make daily cash payments to the broker to meet margin requirements, thus increasing transaction costs.
| Options contracts |
An options contract provides the purchaser with the right, but not the obligation, to buy (call option) or sell (put option) a financial instrument at an agreed upon price. Certain Funds may purchase or write both put and call options on portfolio securities. The Fund is subject to equity price risk in the normal course of pursuing its investment objectives. The Fund may use options contracts to hedge against changes in the values of equities.
When the Fund purchases an option, it pays a premium and an amount equal to that premium is recorded as an asset. When the Fund writes an option, it receives a premium and an amount equal to that premium is recorded as a liability. The asset or liability is adjusted daily to reflect the current market value of the option. Holdings of the Fund designated to cover outstanding written options are noted in the Schedules of Investments. Purchased options are reported as an asset within “Investment securities at value” in the Statement of Assets and Liabilities. Options written are reported as a liability within “Written options outstanding at value”. Changes in value of the purchased option is included in “Net change in unrealized appreciation/(depreciation) on investments” in the Statement of Operations. Changes in value of written options is included in “Net change in unrealized appreciation/(depreciation) on written options”.
If an option expires unexercised, the Fund realizes a gain or loss to the extent of the premium received or paid. If an option is exercised, the premium received or paid is recorded as an adjustment to the proceeds from the sale or the cost basis of the purchase. The difference between the premium and the amount received or paid on effecting a closing purchase or sale transaction is also treated as a realized gain or loss. Gain or loss on purchased options is included in “Net realized gain/(loss) on investments” in the Statement of Operations. Gain or loss on written options is presented separately as “Net realized gain/(loss) on written options” in the Statement of Operations.
The risk in writing call options is that the Fund gives up the opportunity for profit if the market price of the security increases and the option is exercised. The risk in writing put options is that the Fund may incur a loss if the market price of the security decreases and the option is exercised. The risk in buying options is that the Fund pays a premium whether or not the option is exercised. The use of such instruments may involve certain additional risks as a result of unanticipated movements in the market. Writers (sellers) of options are subject to unlimited risk of loss, as the seller will be obligated to deliver or take delivery of the security at a predetermined price which may, upon exercise of the option, be significantly different from the then-market value.
| H. | When-issued Purchases and Forward Commitments (Delayed Delivery) |
Certain Funds may engage in when-issued or forward commitment transactions. Securities purchased on a when-issued or forward commitment basis are also known as delayed delivery transactions. Delayed delivery transactions involve a commitment by a Fund to purchase or sell a security at a future date (ordinarily up to 90 days later). When-issued or forward commitments enable a Fund to lock in what is believed to be an
87
Table of Contents
VIRTUS OPPORTUNITIES TRUST
NOTES TO FINANCIAL STATEMENTS (Continued)
SEPTEMBER 30, 2013
attractive price or yield on a particular security for a period of time, regardless of future changes in interest rates. Each Fund records when-issued and delayed delivery securities on the trade date. Each Fund maintains collateral for the securities purchased. Securities purchased on a when-issued or delayed delivery basis begin earning interest on the settlement date.
| I. | Loan Agreements |
Certain Funds may invest in direct debt instruments which are interests in amounts owed by a corporate, governmental, or other borrower to lenders or lending syndicates. Loan Agreements are generally non-investment grade, often involve borrowers that are highly leveraged. The Funds may invest in obligations of borrowers who are in bankruptcy proceedings. Loan agreements are typically senior in the corporate capital structure of the borrower. A loan is often administered by a bank or other financial institution (the “lender”) that acts as agent for all holders. The agent administers the terms of the loan, as specified in the loan agreement. A Fund’s investments in loans may be in the form of participations in loans or assignments of all or a portion of loans from third parties. When investing in loan participations, the Fund has the right to receive payments of principal, interest and any fees to which it is entitled only from the lender selling the loan participation and only upon receipt by the lender of payments from the borrower. The Fund generally has no right to enforce compliance with the terms of the loan agreement with the borrower. As a result, the Fund may be subject to the credit risk of both the borrower and the lender that is selling the loan agreement. When the Fund purchases assignments from lenders it acquires direct rights against the borrower on the loan. All loan agreements currently held by the Funds are assignment loans.
A Fund may invest in multiple series or tranches of a loan, which may have varying terms and carry different associated risks. Loan agreements may involve foreign borrowers, and investments may be denominated in foreign currencies. Direct indebtedness of emerging countries involves a risk that the government entities responsible for the repayment of the debt may be unable, or unwilling, to pay the principal and interest when due.
The loan agreements have floating rate loan interests which generally pay interest at rates that are periodically determined by reference to a base lending rate plus a premium. The base lending rates are generally LIBOR (London Interbank Offered Rate), the prime rate offered by one or more US banks or the certificate of deposit rate. When a loan agreement is purchased the Fund may pay an assignment fee. On an ongoing basis, the Funds may receive a commitment fee based on the undrawn portion of the underlying line of credit portion of a loan agreement. Prepayment penalty fees are received upon the prepayment of a loan agreement by a borrower. Prepayment penalty, facility, commitment, consent and amendment fees are recorded to income as earned or paid.
The Funds currently hold assignment loans.
| J. | Securities Lending |
Certain Funds may loan securities to qualified brokers through an agreement with Brown Brothers Harriman (“BBH”), as a third party lending agent. Under the terms of agreement, the Fund is required to maintain collateral with a market value not less than 100% of the market value of loaned securities. Collateral is adjusted daily in connection with changes in the market value of securities on loan. Collateral may consist of cash and securities issued by the U.S. Government or its agencies. Cash collateral is invested in a short-term money market fund. Dividends earned on the collateral and premiums paid by the broker are recorded as income by the Fund net of fees and rebates charged by BBH for its services as securities lending agent and in connection with this securities lending program. Lending portfolio securities involves a risk of delay in the recovery of the loaned securities or in the declining value of the collateral.
At September 30, 2013, the Wealth Masters Fund had securities on loan with a market value of $40 and cash collateral of $42 (reported in thousands).
| Note 3. Investment | Advisory Fee and Related Party Transactions |
($ reported in thousands except as noted)
| A. | Adviser |
Virtus Investment Advisers, Inc. (the “Adviser”), an indirect wholly-owned subsidiary of Virtus Investment Partners, Inc. (“Virtus”), is the Adviser to the Trust. The Adviser manages the Funds’ investment programs and general operations of the Funds, including oversight of the Funds’ subadvisers.
As compensation for its services to the Funds, the Adviser is entitled to a fee based upon the following annual rates as a percentage of the average daily net assets of each Fund:
| 1st $1 Billion | $1+ Billion | |||||||
Bond Fund | 0.45 | % | 0.40 | % | ||||
Herzfeld Fund | 1.00 | 0.95 | ||||||
Wealth Masters Fund | 0.85 | 0.80 | ||||||
| 1st $1 Billion | $1+ Billion – $2 Billion | $2 + Billion | ||||||||||
CA Tax-Exempt Bond Fund | 0.45 | % | 0.40 | % | 0.35 | % | ||||||
High Yield Fund | 0.65 | 0.60 | 0.55 | |||||||||
Multi-Sector Intermediate Bond Fund | 0.55 | 0.50 | 0.45 | |||||||||
Senior Floating Rate Fund | 0.60 | 0.55 | 0.50 | |||||||||
| 1st $2 Billion | $2+ Billion – $4 Billion | $4+ Billion | ||||||||||
Disciplined Equity Style Fund | 1.00 | % | 0.95 | % | 0.90 | % | ||||||
Disciplined Select Bond Fund | 0.80 | 0.75 | 0.70 | |||||||||
Disciplined Select Country Fund | 1.10 | 1.05 | 1.00 | |||||||||
Low Volatility Equity Fund | 0.95 | 0.90 | 0.85 | |||||||||
88
Table of Contents
VIRTUS OPPORTUNITIES TRUST
NOTES TO FINANCIAL STATEMENTS (Continued)
SEPTEMBER 30, 2013
| B. | Subadvisers |
The subadvisers manage the investments of each Fund for which they are paid a fee by the Adviser. The subadvisers and the Fund(s) they service is as follows:
Fund | Subadviser | Fund | Subadviser | |||
| Bond Fund | NF(1) | High Yield Fund | NF(1) | |||
| CA Tax-Exempt Bond Fund | NF(1) | Low Volatility Equity Fund | Rampart(5) | |||
| Disciplined Equity Style Fund | Newfound(4) | Multi-Sector Intermediate Bond Fund | NF(1) | |||
| Disciplined Select Bond Fund | Newfound(4) | Senior Floating Rate Fund | NF(1) | |||
| Disciplined Select Country Fund | Newfound(4) | Wealth Masters Fund | Horizon(3) | |||
| Herzfeld Fund | Herzfeld(2) |
| (1) | Newfleet Asset Management, LLC an indirect wholly-owned subsidiary of Virtus. |
| (2) | Thomas J, Herzfeld Advisors, Inc. |
| (3) | Horizon Asset Management, LLC |
| (4) | Newfound Investments, LLC, an indirect wholly owned subsidiary of Virtus. |
| (5) | Rampart Investment Management Co. LLC |
| C. | Expense Limits and Fee Waivers |
The Adviser has voluntarily agreed to limit certain Fund’s total expenses (excluding interest, taxes, extraordinary expenses and acquired fund fees and expenses, if any), so that such expenses do not exceed the percentages of the Fund’s average daily net asset values as listed below. The Adviser may discontinue these voluntary expense caps at any time.
| Class A | Class B | Class C | Class I | |||||||||||||
Bond Fund | 0.85 | % | 1.60 | % | 1.60 | % | 0.60 | % | ||||||||
CA Tax-Exempt Bond Fund | 0.85 | — | — | 0.60 | ||||||||||||
High Yield Fund | 1.15 | 1.90 | 1.90 | 0.90 | ||||||||||||
Senior Floating Rate Fund(1) | 1.20 | — | 1.95 | 0.95 | ||||||||||||
| (1) | Excluding leverage expenses, if any. |
The Adviser has contractually agreed to limit the following Funds’ total operating expenses (excluding interest, taxes, extraordinary expenses and acquired fund fees and expenses):
| Class A | Class C | Class I | Through Date | |||||||||||||
Disciplined Equity Style Fund | 1.60 | % | 2.35 | % | 1.35 | % | 1/31/14 | |||||||||
Disciplined Select Bond Fund | 1.40 | 2.15 | 1.15 | 1/31/14 | ||||||||||||
Disciplined Select Country Fund | 1.70 | 2.45 | 1.45 | 1/31/14 | ||||||||||||
Herzfeld Fund | 1.60 | 2.35 | 1.35 | 1/31/14 | ||||||||||||
Low Volatility Equity Fund | 1.55 | 2.30 | 1.30 | 1/31/15 | ||||||||||||
Wealth Masters Fund | 1.45 | 2.20 | 1.20 | 1/31/14 | ||||||||||||
| D. | Expense Recapture |
For certain Funds the Adviser may recapture operating expenses waived or reimbursed under these arrangements, within three fiscal years following the end of the fiscal year in which such waiver or reimbursement occurred. The Fund must pay its ordinary operating expenses before the Adviser is entitled to any reimbursement and must remain in compliance with any applicable expense limitations or if none, the expense limitation in effect at the time of the waiver or reimbursement. All or a portion of the following Adviser reimbursed expenses may be recaptured as follows:
| Fiscal Year Ended | ||||||||||||||||
| 2014 | 2015 | 2016 | Total | |||||||||||||
Bond Fund | $ | 305 | $ | 263 | $ | 222 | $ | 790 | ||||||||
CA Tax-Exempt Bond Fund | 113 | 112 | 100 | 325 | ||||||||||||
Disciplined Equity Style Fund | — | — | 64 | 64 | ||||||||||||
Disciplined Select Bond Fund | — | — | 64 | 64 | ||||||||||||
Disciplined Select Country Fund | — | — | 64 | 64 | ||||||||||||
Herzfeld Fund | — | 25 | 68 | 93 | ||||||||||||
High Yield Fund | 145 | 159 | 161 | 465 | ||||||||||||
Low Volatility Equity Fund | — | — | 29 | 29 | ||||||||||||
Wealth Masters Fund | — | 29 | 96 | 125 | ||||||||||||
| E. | Distributor |
VP Distributors, LLC (“VP Distributors”), an indirect wholly-owned subsidiary of Virtus, serves as the distributor of each Fund’s shares and has advised the Funds that for the fiscal year (the “period”) ended September 30, 2013, it retained net commissions of $133 Class A shares and deferred sales charges of $20, $2, $82 and $2 for Class A shares, Class B shares, Class C shares and Class I shares respectively.
In addition, each Fund pays VP Distributors distribution and/or service fees under Board approved 12b-1 plan as a percentage of the average daily net assets of each respective class at the annual rates of 0.25% for Class A shares, 1.00% for Class B and 1.00% for Class C shares, Class I shares are not subject to a 12b-1 plan.
Under certain circumstances, shares of certain Virtus Mutual Funds may be exchanged for shares of the same class of certain other Virtus Mutual Funds on the basis of the relative net asset values per share at the time of the exchange. On exchanges with share classes that carry a CDSC, the CDSC schedule of the original shares purchased continues to apply.
89
Table of Contents
VIRTUS OPPORTUNITIES TRUST
NOTES TO FINANCIAL STATEMENTS (Continued)
SEPTEMBER 30, 2013
| F. | Administrator and Transfer Agent |
Effective January 1, 2013, with the approval of the Board, VP Distributors LLC, the Fund’s former Administrator and Transfer Agent, assigned its rights and obligations under the Administration Agreements and Transfer Agency and Service Agreement to Virtus Fund Services LLC, an indirect wholly-owned subsidiary of Virtus. For the period of October 1, 2012 to December 31, 2012, VP Distributors LLC, served as the Administrator and Transfer Agent to the Funds. For the period of January 1, 2013 to September 30, 2013 Virtus Fund Services LLC, served as the Administrator and Transfer Agent to the Funds.
For the period ended September 30, 2013, the Funds incurred administration fees from the Trust totaling $1,305 which are included in the Statements of Operations.
For the period ended September 30, 2013, the Funds incurred transfer agent fees from the Trust totaling $1,308 which are included in the Statements of Operations. A portion is paid to outside entities that also provide services to the Trust.
| G. | Affiliated Shareholders |
At September 30, 2013, Virtus and its affiliates, BMO Bankcorp (a minority investor in Virtus) and its affiliates, and the retirement plans of Virtus and its affiliates held shares of the Funds which may be redeemed at any time that aggregated the following:
| Shares | Aggregate Net Asset Value | |||||||
| Disciplined Equity Style Fund | ||||||||
Class A | 10,084 | $ | 126 | |||||
Class C | 10,082 | 125 | ||||||
Class I | 80,681 | 1,008 | ||||||
| Disciplined Select Bond Fund | ||||||||
Class A | 10,113 | 95 | ||||||
Class C | 10,068 | 95 | ||||||
Class I | 81,031 | 766 | ||||||
| Disciplined Select Country Fund | ||||||||
Class A | 10,000 | 113 | ||||||
Class C | 10,000 | 113 | ||||||
Class I | 80,000 | 910 | ||||||
| Herzfeld Fund | ||||||||
Class A | 10,269 | 107 | ||||||
Class C | 10,216 | 107 | ||||||
Class I | 82,313 | 861 | ||||||
| High Yield Fund | ||||||||
Class I | 25,474 | 109 | ||||||
| Low Volatility Equity Fund | ||||||||
Class A | 10,000 | 102 | ||||||
Class C | 10,000 | 102 | ||||||
Class I | 130,000 | 1,333 | ||||||
| Multi-Sector Intermediate Bond Fund | ||||||||
Class I | 10,655 | 115 | ||||||
| Senior Floating Rate Fund | ||||||||
Class I | 2,380,288 | 23,303 | ||||||
| Wealth Masters Fund | ||||||||
Class A | 10,133 | 133 | ||||||
Class C | 10,109 | 132 | ||||||
Class I | 3,125,260 | 41,066 | ||||||
| Note 4. Purchases and Sales of Securities |
($ reported in thousands)
Purchases and sales of securities (excluding U.S. Government and agency securities, forward currency contracts, futures and short-term securities) during the period ended September 30, 2013, were as follows:
| Purchases | Sales | |||||||
Bond Fund | $ | 104,645 | $ | 80,780 | ||||
CA Tax-Exempt Bond | 11,445 | 17,185 | ||||||
Disciplined Equity Style Fund | 6,862 | 5,574 | ||||||
Disciplined Select Bond Fund | 5,198 | 4,093 | ||||||
Disciplined Select Country Fund | 2,313 | 1,251 | ||||||
Herzfeld Fund | 9,005 | 956 | ||||||
High Yield Fund | 100,590 | 114,683 | ||||||
Low Volatility Equity Fund | 1,553 | — | ||||||
Multi-Sector Intermediate Bond Fund | 322,514 | 320,941 | ||||||
Senior Floating Rate Fund | 959,048 | 446,453 | ||||||
Wealth Masters Fund | 51,038 | 1,537 | ||||||
Purchases and sales of long term U.S. Government and agency securities for the Funds during the period ended September 30, 2013, were as follows:
| Purchases | Sales | |||||||
Bond Fund | $ | 2,813 | $ | 39,681 | ||||
Multi-Sector Intermediate Bond Fund | 2,450 | 2,317 | ||||||
90
Table of Contents
VIRTUS OPPORTUNITIES TRUST
NOTES TO FINANCIAL STATEMENTS (Continued)
SEPTEMBER 30, 2013
| Note 5. Capital | Share Transactions |
(reported in thousands)
Transactions in shares of capital stock, during the periods ended as indicated below, were as follows:
| Bond Fund | CA Tax-Exempt Bond Fund | |||||||||||||||||||||||||||||||
| Year Ended September 30, 2013 | Year Ended September 30, 2012 | Year Ended September 30, 2013 | Year Ended September 30, 2013 | |||||||||||||||||||||||||||||
| SHARES | AMOUNT | SHARES | AMOUNT | SHARES | AMOUNT | SHARES | AMOUNT | |||||||||||||||||||||||||
| Class A | ||||||||||||||||||||||||||||||||
| Sale of shares | 324 | $ | 3,770 | 610 | $ | 6,882 | 11 | $ | 143 | 26 | $ | 323 | ||||||||||||||||||||
| Reinvestment of distributions | 160 | 1,843 | 144 | 1,615 | 71 | 902 | 60 | 756 | ||||||||||||||||||||||||
| Shares repurchased | (1,216 | ) | (13,984 | ) | (791 | ) | (8,902 | ) | (437 | ) | (5,505 | ) | (276 | ) | (3,502 | ) | ||||||||||||||||
|
|
|
|
|
|
|
|
|
|
|
|
|
|
|
| |||||||||||||||||
| Net Increase / (Decrease) | (732 | ) | $ | (8,371 | ) | (37 | ) | $ | (405 | ) | (355 | ) | $ | (4,460 | ) | (190 | ) | $ | (2,423 | ) | ||||||||||||
|
|
|
|
|
|
|
|
|
|
|
|
|
|
|
| |||||||||||||||||
| Class B | ||||||||||||||||||||||||||||||||
| Sale of shares | 1 | $ | 9 | — | (1) | $ | 1 | — | $ | — | — | $ | — | |||||||||||||||||||
| Reinvestment of distributions | 1 | 14 | 2 | 18 | — | — | — | — | ||||||||||||||||||||||||
| Shares repurchased | (30 | ) | (333 | ) | (47 | ) | (518 | ) | — | — | — | — | ||||||||||||||||||||
|
|
|
|
|
|
|
|
|
|
|
|
|
|
|
| |||||||||||||||||
| Net Increase / (Decrease) | (28 | ) | $ | (310 | ) | (45 | ) | $ | (499 | ) | — | $ | — | — | $ | — | ||||||||||||||||
|
|
|
|
|
|
|
|
|
|
|
|
|
|
|
| |||||||||||||||||
| Class C | ||||||||||||||||||||||||||||||||
| Sale of shares | 194 | $ | 2,223 | 243 | $ | 2,678 | — | $ | — | — | $ | — | ||||||||||||||||||||
| Reinvestment of distributions | 19 | 211 | 15 | 166 | — | — | — | — | ||||||||||||||||||||||||
| Shares repurchased | (361 | ) | (4,072 | ) | (231 | ) | (2,549 | ) | — | — | — | — | ||||||||||||||||||||
|
|
|
|
|
|
|
|
|
|
|
|
|
|
|
| |||||||||||||||||
| Net Increase / (Decrease) | (148 | ) | $ | (1,638 | ) | 27 | $ | 295 | — | $ | — | — | $ | — | ||||||||||||||||||
|
|
|
|
|
|
|
|
|
|
|
|
|
|
|
| |||||||||||||||||
| Class I | ||||||||||||||||||||||||||||||||
| Sale of shares | 517 | $ | 6,083 | 1,509 | $ | 17,183 | 59 | $ | 744 | 139 | $ | 1,754 | ||||||||||||||||||||
| Reinvestment of distributions | 83 | 969 | 213 | 2,421 | 31 | 391 | 24 | 309 | ||||||||||||||||||||||||
| Shares repurchased | (1,172 | ) | (13,566 | ) | (6,076 | ) | (71,002 | ) | (150 | ) | (1,888 | ) | (182 | ) | (2,316 | ) | ||||||||||||||||
|
|
|
|
|
|
|
|
|
|
|
|
|
|
|
| |||||||||||||||||
| Net Increase / (Decrease) | (572 | ) | $ | (6,514 | ) | (4,354 | ) | $ | (51,398 | ) | (60 | ) | $ | (753 | ) | (19 | ) | $ | (253 | ) | ||||||||||||
|
|
|
|
|
|
|
|
|
|
|
|
|
|
|
| |||||||||||||||||
| Disciplined Equity Style Fund | Disciplined Select Bond Fund | |||||||||||||||||||||||
| From Inception December 18, 2012 to September 30, 2013 | From Inception December 18, 2012 to September 30, 2013 | |||||||||||||||||||||||
| SHARES | AMOUNT | SHARES | AMOUNT | |||||||||||||||||||||
Class A | ||||||||||||||||||||||||
| Sale of shares | 27 | $ | 289 | 17 | $ | 164 | ||||||||||||||||||
| Reinvestment of distributions | — | (1) | 1 | — | (1) | 2 | ||||||||||||||||||
| Shares repurchased | (1 | ) | (11 | ) | — | — | ||||||||||||||||||
|
|
|
|
|
|
|
| |||||||||||||||||
| Net Increase / (Decrease) | 26 | $ | 279 | 17 | $ | 166 | ||||||||||||||||||
|
|
|
|
|
|
|
| |||||||||||||||||
| Class B | ||||||||||||||||||||||||
| Sale of shares | — | $ | — | — | $ | — | ||||||||||||||||||
| Reinvestment of distributions | — | — | — | — | ||||||||||||||||||||
| Shares repurchased | — | — | — | — | ||||||||||||||||||||
|
|
|
|
|
|
|
| |||||||||||||||||
| Net Increase / (Decrease) | — | $ | — | — | $ | — | ||||||||||||||||||
|
|
|
|
|
|
|
| |||||||||||||||||
| Class C | ||||||||||||||||||||||||
| Sale of shares | 19 | $ | 207 | 12 | $ | 119 | ||||||||||||||||||
| Reinvestment of distributions | — | (1) | 1 | — | (1) | 1 | ||||||||||||||||||
| Shares repurchased | — | (1) | (1 | ) | — | — | ||||||||||||||||||
|
|
|
|
|
|
|
| |||||||||||||||||
| Net Increase / (Decrease) | 19 | $ | 207 | 12 | $ | 120 | ||||||||||||||||||
|
|
|
|
|
|
|
| |||||||||||||||||
| Class I | ||||||||||||||||||||||||
| Sale of shares | 80 | $ | 805 | 80 | $ | 800 | ||||||||||||||||||
| Reinvestment of distributions | 1 | 7 | 1 | 10 | ||||||||||||||||||||
| Shares repurchased | — | — | — | — | ||||||||||||||||||||
|
|
|
|
|
|
|
| |||||||||||||||||
| Net Increase / (Decrease) | 81 | $ | 812 | 81 | $ | 810 | ||||||||||||||||||
|
|
|
|
|
|
|
| |||||||||||||||||
| (1) | Amount less than 500. |
91
Table of Contents
VIRTUS OPPORTUNITIES TRUST
NOTES TO FINANCIAL STATEMENTS (Continued)
SEPTEMBER 30, 2013
| Disciplined Select Country Fund | Herzfeld Fund | |||||||||||||||||||||||||||
| From Inception December 18, 2012 to September 30, 2013 | Year Ended September 30, 2013 | From Inception September 5, 2012 to September 30, 2012 | ||||||||||||||||||||||||||
| SHARES | AMOUNT | SHARES | AMOUNT | SHARES | AMOUNT | |||||||||||||||||||||||
| Class A | ||||||||||||||||||||||||||||
| Sale of shares | 15 | $ | 152 | 270 | $ | 2,890 | 10 | $ | 103 | |||||||||||||||||||
| Reinvestment of distributions | — | — | 3 | 32 | — | — | ||||||||||||||||||||||
| Shares repurchased | — | — | (5 | ) | (46 | ) | — | — | ||||||||||||||||||||
|
|
|
|
|
|
|
|
|
|
|
| |||||||||||||||||
| Net Increase / (Decrease) | 15 | $ | 152 | 268 | $ | 2,876 | 10 | $ | 103 | |||||||||||||||||||
|
|
|
|
|
|
|
|
|
|
|
| |||||||||||||||||
| Class B | ||||||||||||||||||||||||||||
| Sale of shares | — | $ | — | — | $ | — | — | $ | — | |||||||||||||||||||
| Reinvestment of distributions | — | — | — | — | — | — | ||||||||||||||||||||||
| Shares repurchased | — | — | — | — | — | — | ||||||||||||||||||||||
|
|
|
|
|
|
|
|
|
|
|
| |||||||||||||||||
| Net Increase / (Decrease) | — | $ | — | — | $ | — | — | $ | — | |||||||||||||||||||
|
|
|
|
|
|
|
|
|
|
|
| |||||||||||||||||
| Class C | ||||||||||||||||||||||||||||
| Sale of shares | 10 | $ | 100 | 481 | $ | 5,140 | 10 | $ | 100 | |||||||||||||||||||
| Reinvestment of distributions | — | — | 4 | 37 | — | — | ||||||||||||||||||||||
| Shares repurchased | — | — | (21 | ) | (217 | ) | — | — | ||||||||||||||||||||
|
|
|
|
|
|
|
|
|
|
|
| |||||||||||||||||
| Net Increase / (Decrease) | 10 | $ | 100 | 464 | $ | 4,960 | 10 | $ | 100 | |||||||||||||||||||
|
|
|
|
|
|
|
|
|
|
|
| |||||||||||||||||
| Class I | ||||||||||||||||||||||||||||
| Sale of shares | 80 | $ | 800 | 100 | $ | 1,063 | 100 | $ | 1,000 | |||||||||||||||||||
| Reinvestment of distributions | — | — | 4 | 40 | — | — | ||||||||||||||||||||||
| Shares repurchased | — | — | (35 | ) | (359 | ) | — | — | ||||||||||||||||||||
|
|
|
|
|
|
|
|
|
|
|
| |||||||||||||||||
| Net Increase / (Decrease) | 80 | $ | 800 | 69 | $ | 744 | 100 | $ | 1,000 | |||||||||||||||||||
|
|
|
|
|
|
|
|
|
|
|
| |||||||||||||||||
| High Yield Fund | Low Volatility Equity Fund | |||||||||||||||||||||||||||
| Year Ended September 30, 2013 | Year Ended September 30, 2012 | From Inception June 11, 2013 to September 30, 2013 | ||||||||||||||||||||||||||
| SHARES | AMOUNT | SHARES | AMOUNT | SHARES | AMOUNT | |||||||||||||||||||||||
Class A | ||||||||||||||||||||||||||||
Sale of shares | 3,825 | $ | 16,511 | 3,582 | $ | 14,812 | 13 | $ | 134 | |||||||||||||||||||
Reinvestment of distributions | 1,095 | 4,758 | 1,222 | 5,020 | — | — | ||||||||||||||||||||||
Shares repurchased | (9,186 | ) | (39,855 | ) | (4,246 | ) | (17,396 | ) | — | — | ||||||||||||||||||
|
|
|
|
|
|
|
|
|
|
|
| |||||||||||||||||
Net Increase / (Decrease) | (4,266 | ) | $ | (18,586 | ) | 558 | $ | 2,436 | 13 | $ | 134 | |||||||||||||||||
|
|
|
|
|
|
|
|
|
|
|
| |||||||||||||||||
Class B | ||||||||||||||||||||||||||||
Sale of shares | — | $ | — | 9 | $ | 35 | ��� | $ | — | |||||||||||||||||||
Reinvestment of distributions | 2 | 11 | 4 | 17 | — | — | ||||||||||||||||||||||
Shares repurchased | (44 | ) | (190 | ) | (47 | ) | (192 | ) | — | — | ||||||||||||||||||
|
|
|
|
|
|
|
|
|
|
|
| |||||||||||||||||
Net Increase / (Decrease) | (42 | ) | $ | (179 | ) | (34 | ) | $ | (140 | ) | — | $ | — | |||||||||||||||
|
|
|
|
|
|
|
|
|
|
|
| |||||||||||||||||
Class C | ||||||||||||||||||||||||||||
Sale of shares | 237 | $ | 1,017 | 264 | $ | 1,077 | 13 | $ | 127 | |||||||||||||||||||
Reinvestment of distributions | 34 | 144 | 28 | 116 | — | — | ||||||||||||||||||||||
Shares repurchased | (182 | ) | (780 | ) | (129 | ) | (512 | ) | — | — | ||||||||||||||||||
|
|
|
|
|
|
|
|
|
|
|
| |||||||||||||||||
Net Increase / (Decrease) | 89 | $ | 381 | 163 | $ | 681 | 13 | $ | 127 | |||||||||||||||||||
|
|
|
|
|
|
|
|
|
|
|
| |||||||||||||||||
Class I | ||||||||||||||||||||||||||||
Sale of shares | 1,420 | $ | 6,079 | 24 | $ | 100 | 130 | $ | 1,300 | |||||||||||||||||||
Reinvestment of distributions | 12 | 54 | — | (1) | 1 | — | — | |||||||||||||||||||||
Shares repurchased | (94 | ) | (409 | ) | — | — | — | — | ||||||||||||||||||||
|
|
|
|
|
|
|
|
|
|
|
| |||||||||||||||||
Net Increase / (Decrease) | 1,338 | $ | 5,724 | 24 | $ | 101 | 130 | $ | 1,300 | |||||||||||||||||||
|
|
|
|
|
|
|
|
|
|
|
| |||||||||||||||||
| (1) | Amount less than 500. |
92
Table of Contents
VIRTUS OPPORTUNITIES TRUST
NOTES TO FINANCIAL STATEMENTS (Continued)
SEPTEMBER 30, 2013
| Multi-Sector Intermediate Bond Fund | Senior Floating Rate Fund | |||||||||||||||||||||||||||||||
| Year Ended September 30, 2013 | Year Ended September 30, 2012 | Year Ended September 30, 2013 | Year Ended September 30, 2012 | |||||||||||||||||||||||||||||
| SHARES | AMOUNT | SHARES | AMOUNT | SHARES | AMOUNT | SHARES | AMOUNT | |||||||||||||||||||||||||
| Class A | ||||||||||||||||||||||||||||||||
| Sale of shares | 6,732 | $ | 75,034 | 8,003 | $ | 85,521 | 23,426 | $ | 231,001 | 12,281 | $ | 117,828 | ||||||||||||||||||||
| Reinvestment of distributions | 991 | 10,979 | 732 | 7,902 | 1,353 | 13,312 | 1,078 | 10,384 | ||||||||||||||||||||||||
| Shares repurchased | (8,226 | ) | (90,501 | ) | (4,516 | ) | (48,226 | ) | (11,539 | ) | (113,636 | ) | (10,387 | ) | (99,529 | ) | ||||||||||||||||
|
|
|
|
|
|
|
|
|
|
|
|
|
|
|
| |||||||||||||||||
| Net Increase / (Decrease) | (503 | ) | $ | (4,488 | ) | 4,219 | $ | 45,197 | 13,240 | $ | 130,677 | 2,972 | $ | 28,683 | ||||||||||||||||||
|
|
|
|
|
|
|
|
|
|
|
|
|
|
|
| |||||||||||||||||
| Class B | ||||||||||||||||||||||||||||||||
| Sale of shares | 1 | $ | 7 | 3 | $ | 34 | — | $ | — | — | $ | — | ||||||||||||||||||||
| Reinvestment of distributions | 41 | 453 | 35 | 375 | — | — | — | — | ||||||||||||||||||||||||
| Shares repurchased | (231 | ) | (2,550 | ) | (186 | ) | (1,999 | ) | — | — | — | — | ||||||||||||||||||||
|
|
|
|
|
|
|
|
|
|
|
|
|
|
|
| |||||||||||||||||
| Net Increase / (Decrease) | (189 | ) | $ | (2,090 | ) | (148 | ) | $ | (1,590 | ) | — | $ | — | — | $ | — | ||||||||||||||||
|
|
|
|
|
|
|
|
|
|
|
|
|
|
|
| |||||||||||||||||
| Class C | ||||||||||||||||||||||||||||||||
| Sale of shares | 2,390 | $ | 26,943 | 3,878 | $ | 42,083 | 10,676 | $ | 105,397 | 2,056 | $ | 19,804 | ||||||||||||||||||||
| Reinvestment of distributions | 393 | 4,385 | 276 | 2,996 | 405 | 3,992 | 291 | 2,806 | ||||||||||||||||||||||||
| Shares repurchased | (2,820 | ) | (31,223 | ) | (1,341 | ) | (14,488 | ) | (2,153 | ) | (21,218 | ) | (2,617 | ) | (25,125 | ) | ||||||||||||||||
|
|
|
|
|
|
|
|
|
|
|
|
|
|
|
| |||||||||||||||||
| Net Increase / (Decrease) | (37 | ) | $ | 105 | 2,813 | $ | 30,591 | 8,928 | $ | 88,171 | (270 | ) | $ | (2,515 | ) | |||||||||||||||||
|
|
|
|
|
|
|
|
|
|
|
|
|
|
|
| |||||||||||||||||
| Class I | ||||||||||||||||||||||||||||||||
| Sale of shares | 6,255 | $ | 69,805 | 5,681 | $ | 61,113 | 35,281 | $ | 347,516 | 6,486 | $ | 62,017 | ||||||||||||||||||||
| Reinvestment of distributions | 329 | 3,645 | 162 | 1,754 | 694 | 6,824 | 280 | 2,694 | ||||||||||||||||||||||||
| Shares repurchased | (5,280 | ) | (58,125 | ) | (1,318 | ) | (14,122 | ) | (6,593 | ) | (64,869 | ) | (4,858 | ) | (46,576 | ) | ||||||||||||||||
|
|
|
|
|
|
|
|
|
|
|
|
|
|
|
| |||||||||||||||||
| Net Increase / (Decrease) | 1,304 | $ | 15,325 | 4,525 | $ | 48,745 | 29,382 | $ | 289,471 | 1,908 | $ | 18,135 | ||||||||||||||||||||
|
|
|
|
|
|
|
|
|
|
|
|
|
|
|
| |||||||||||||||||
| Wealth Masters Fund | ||||||||||||||||
| Year Ended September 30, 2013 | From inception September 5, 2012 to September 30, 2012 | |||||||||||||||
| SHARES | AMOUNT | SHARES | AMOUNT | |||||||||||||
| Class A | ||||||||||||||||
| Sale of shares | 401 | $ | 4,836 | 10 | $ | 104 | ||||||||||
| Reinvestment of distributions | — | (1) | 2 | — | — | |||||||||||
| Shares repurchased | (18 | ) | (228 | ) | — | — | ||||||||||
|
|
|
|
|
|
|
| |||||||||
| Net Increase / (Decrease) | 383 | $ | 4,610 | 10 | $ | 104 | ||||||||||
|
|
|
|
|
|
|
| |||||||||
| Class B | ||||||||||||||||
| Sale of shares | — | $ | — | — | $ | — | ||||||||||
| Reinvestment of distributions | — | — | — | — | ||||||||||||
| Shares repurchased | — | — | — | — | ||||||||||||
|
|
|
|
|
|
|
| |||||||||
| Net Increase / (Decrease) | — | $ | — | — | $ | — | ||||||||||
|
|
|
|
|
|
|
| |||||||||
| Class C | ||||||||||||||||
| Sale of shares | 129 | $ | 1,582 | 10 | $ | 105 | ||||||||||
| Reinvestment of distributions | — | (1) | 1 | — | — | |||||||||||
| Shares repurchased | (6 | ) | (74 | ) | — | — | ||||||||||
|
|
|
|
|
|
|
| |||||||||
| Net Increase / (Decrease) | 123 | $ | 1,509 | 10 | $ | 105 | ||||||||||
|
|
|
|
|
|
|
| |||||||||
| Class I | ||||||||||||||||
| Sale of shares | 3,347 | $ | 43,746 | 80 | $ | 800 | ||||||||||
| Reinvestment of distributions | 1 | 12 | — | — | ||||||||||||
| Shares repurchased | (17 | ) | (192 | ) | — | — | ||||||||||
|
|
|
|
|
|
|
| |||||||||
| Net Increase / (Decrease) | 3,331 | $ | 43,566 | 80 | $ | 800 | ||||||||||
|
|
|
|
|
|
|
| |||||||||
| (1) | Amount less than 500. |
93
Table of Contents
VIRTUS OPPORTUNITIES TRUST
NOTES TO FINANCIAL STATEMENTS (Continued)
SEPTEMBER 30, 2013
| Note 6. Derivative Transactions |
($ reported in thousands)
The Bond Fund and Low Volatility Equity Fund invested in derivative instruments during the fiscal period.
The Bond Fund invested in derivative instruments during the reporting period in the form of futures contracts. The primary type of risk associated with a futures contract is interest rate risk. The Fund may utilize futures in an effort to optimize performance by managing interest rate risk. This permits the portfolio manager to assemble the portfolio believed to be the most attractive while mitigating vulnerability to changes in market interest rates. For additional information on futures contracts in which the Fund invested in during the reporting period, refer to Note 2G.
At September 30, 2013, the Bond Fund did not hold futures contracts.
For the fiscal year ended September 30, 2013, the Fund’s average volume of derivative activities is as follows:
| Futures Contracts – Sold(1) | ||||
| $(1,874) | ||||
| (1) | Notional Amount. |
The Low Volatility Equity Fund invested in derivative instruments during the fiscal period in the form of writing index call options and buying call options on VIX futures. The primary risk associated with call options is that selling index call options may limit the Fund’s opportunity to profit from increases in the value of its equity portfolio, and the risk that buying call options may result in the loss of the premium paid for those options. The Fund invested in writing index call options and buying call options on VIX futures are both used as techniques for limiting the volatility of the Fund’s portfolio. For additional information on call options in which the Fund invested in during the reporting period, refer to Note 2G.
Call options | Number of | Premium | ||||||
Options outstanding at June 11, 2013 | 0 | $ | — | |||||
Options written | 36 | 9 | ||||||
Options closed | (9 | ) | (3 | ) | ||||
Options expired | (18 | ) | (4 | ) | ||||
Options exercised | 0 | 0 | ||||||
|
|
|
| |||||
Options outstanding at September 30, 2013 | 9 | 2 | ||||||
|
|
|
| |||||
The following is a summary of the Funds’ derivative instrument holdings categorized by primary risk exposure as of September 30, 2013:
Statements of Assets and Liabilities | Statements of Operations | |||||||||
| Assets: Variation margin for futures contracts(2) | $ | — | Net realized gain (loss) on futures | $ | (65) | |||||
| Net realized gain (loss) on options | 3 | |||||||||
| Liabilities: Written call options at value | — | (3) | Net change in unrealized appreciation (depreciation) on futures | 70 | ||||||
| Net change in unrealized appreciation (depreciation) on written options | 2 | |||||||||
|
|
|
| |||||||
| Net asset (liability) balance | $ | — | (3) | Total realized and unrealized gain (loss) | $ | 10 | ||||
|
|
|
| |||||||
| (2) | Variation margin shown on the Statement of Assets and Liabilities is the daily change in the unrealized appreciation (depreciation) for open futures contracts. |
| (3) | Amount is less than $500. |
| Note 7. 10% Shareholders |
As of September 30, 2013, certain Funds had individual shareholder account(s) and/or omnibus shareholder account(s) (comprised of a group of individual shareholders), which individually amounted to more than 10% of the total shares outstanding of each such Fund as detailed below:
| % of Shares Outstanding | Number of Accounts | |||||||
CA-Tax Exempt Bond Fund | 37 | % | 2 | |||||
Disciplined Equity Style Fund | 64 | 1 | * | |||||
Disciplined Select Bond Fund | 74 | 1 | * | |||||
Disciplined Select Country Fund | 76 | 1 | * | |||||
Herzfeld Fund | 10 | 1 | * | |||||
Multi-Sector Intermediate Bond Fund | 16 | 1 | ||||||
Senior Floating Rate Fund | 37 | 2 | ||||||
Wealth Masters Fund | 79 | 1 | * | |||||
| * | Includes affiliated shareholder accounts. |
94
Table of Contents
VIRTUS OPPORTUNITIES TRUST
NOTES TO FINANCIAL STATEMENTS (Continued)
SEPTEMBER 30, 2013
| Note 8. Credit Risk and Asset Concentration |
In countries with limited or developing markets, investments may present greater risks than in more developed markets and the prices of such investments may be volatile. The consequences of political, social or economic changes in these markets may have disruptive effects on the market prices of these investments and the income they generate, as well as a Fund’s ability to repatriate such amounts.
High-yield/high-risk securities typically entail greater price volatility and/or principal and interest rate risk. There is a greater chance that an issuer will not be able to make principal and interest payments on time. Analysis of the creditworthiness of issuers of high-yield securities may be complex, and as a result, it may be more difficult for the adviser and/or subadviser to accurately predict risk.
Many municipalities insure repayment for their obligations. Although bond insurance reduces the risk of loss due to default by an issuer, such bonds remain subject to the risk that the market may fluctuate for other reasons, and there is no assurance that the insurance company will meet its obligations. Insured securities have been identified in the Schedule of Investments. A real or perceived decline in creditworthiness of a bond insurer can have an adverse impact on the value of insured bonds held in the Funds.
Certain Funds may invest a high percentage of their assets in specific sectors of the market in their pursuit of a greater investment return. Fluctuations in these sectors of concentration may have a greater impact on a Fund, positive or negative, than if the Fund did not concentrate its investments in such sectors.
At September 30, 2013, the following Fund held securities issued by various companies in specific sectors or countries as detailed below:
Fund | Sector | Percentage of Total Investments | ||||
| Bond Fund | Financials | 27 | % | |||
| Multi-Sector Intermediate Bond Fund | Financials | 26 | ||||
| Senior Floating Rate | Consumer Discretionary | 25 | ||||
| Wealth Masters Fund | Consumer Discretionary | 37 | ||||
| Note 9. Indemnifications |
Under the Trust’s organizational documents, their trustees and officers are indemnified against certain liabilities arising out of the performance of their duties to the Funds. Each Trustee has also entered into an indemnification agreement with the Trust. In addition, in the normal course of business the Funds enter into contracts that provide a variety of indemnifications to other parties. The Funds’ maximum exposure under these arrangements is unknown as this would involve future claims that may be made against the Funds and that have not occurred. However, the Funds have not had prior claims or losses pursuant to these arrangements and expect the risk loss to be remote.
| Note 10. Federal Income Tax Information |
($ reported in thousands)
At September 30, 2013, federal tax cost and aggregate gross unrealized appreciation (depreciation) of securities held by the Funds were as follows:
Fund | Federal Tax Cost | Unrealized Appreciation | Unrealized (Depreciation) | Net Unrealized Appreciation (Depreciation) | ||||||||||||
Bond Fund | $ | 87,001 | $ | 1,754 | $ | (2,519 | ) | $ | (765 | ) | ||||||
CA Tax-Exempt Bond Fund | 46,075 | 2,364 | (1,267 | ) | 1,097 | |||||||||||
Disciplined Equity Style Fund | 1,408 | 178 | — | 178 | ||||||||||||
Disciplined Select Bond Fund | 1,102 | — | (50 | ) | (50 | ) | ||||||||||
Disciplined Select Country Fund | 1,082 | 127 | (1 | ) | 126 | |||||||||||
Herzfeld Fund | 9,878 | 173 | (425 | ) | (252 | ) | ||||||||||
High Yield Fund | 89,112 | 2,223 | (1,432 | ) | 791 | |||||||||||
Low Volatility Equity Fund Securities | 1,566 | 33 | — | 33 | ||||||||||||
Low Volatility Equity Fund Options | — | (1) | — | — | — | |||||||||||
Multi-Sector Intermediate Bond Fund | 380,460 | 9,652 | (11,152 | ) | (1,500 | ) | ||||||||||
Senior Floating Rate Fund | 1,034,220 | 5,861 | (5,097 | ) | 764 | |||||||||||
Wealth Masters Fund | 50,687 | 1,100 | (123 | ) | 977 | |||||||||||
(1) Amount less than $500
The Funds have capital loss available to offset future realized capital gains, through the indicated expiration dates shown below:
| 2017 | 2018 | No Expiration | Total | |||||||||||||
Bond Fund | $ | 3,645 | $ | — | $ | — | $ | 3,645 | ||||||||
Disciplined Select Bond Fund | — | — | 9 | 9 | ||||||||||||
High Yield Fund | 16,210 | 9,151 | — | 25,361 | ||||||||||||
Low Volatility Equity Fund | — | — | 6 | 6 | ||||||||||||
The Trust may not realize the benefit of these losses to the extent each Fund does not realize gains on investments prior to the expiration of the capital loss carryovers.
Under the Regulated Investment Company Modernization Act of 2010 (the “Act”), net capital losses recognized for tax years beginning after December 22, 2010 may be carried forward indefinitely, and their character is retained as short-term and/or long-term losses. Previously, net capital losses were carried forward for eight years and treated as short-term losses. As a transition rule, the Act requires that post-enactment net capital losses be used before pre-enactment net capital losses.
95
Table of Contents
VIRTUS OPPORTUNITIES TRUST
NOTES TO FINANCIAL STATEMENTS (Continued)
SEPTEMBER 30, 2013
For the Period ended September 30, 2013, the following Funds utilized losses deferred in prior years against current year capital gains:
Bond Fund | $ | 3,027 | ||
High Yield Fund | 634 |
Capital losses realized after October 31 and certain late year ordinary losses may be deferred and treated as occurring on the first day of the following fiscal year. For the fiscal period ended September 30, 2013, the Funds deferred and recognized post-October losses as follows:
Fund | Capital Loss | Capital Loss | ||||||
High Yield Fund | $ | — | $ | 3,176 | ||||
Senior Floating Rate Fund | 107 | — | ||||||
The components of distributable earnings on a tax basis (excluding unrealized appreciation (depreciation) which are disclosed above) consist of the following:
| Undistributed Ordinary Income | Undistributed Long-Term Capital Gains | Undistributed Tax-Exempt Income | ||||||||||
Bond Fund | $ | 51 | $ | — | $ | — | ||||||
CA Tax-Exempt Bond Fund | 11 | 932 | 25 | |||||||||
Disciplined Equity Style Fund | 100 | — | — | |||||||||
Disciplined Select Bond Fund | — | (1) | — | — | ||||||||
Disciplined Select Country Fund | 15 | — | — | |||||||||
Herzfeld Fund | 68 | 27 | — | |||||||||
High Yield Fund | — | — | — | |||||||||
Low Volatility Equity Fund | 10 | — | — | |||||||||
Multi-Sector Intermediate Bond Fund | 2,766 | 3,568 | — | |||||||||
Senior Floating Rate Fund | — | — | — | |||||||||
Wealth Masters Fund | 53 | 2 | — | |||||||||
(1) Amount less than $500.
For the period ended September 30, 2013, the CA Tax-Exempt Bond Fund distributed $1,860 of exempt interest dividends.
The differences between the book and tax basis components of distributable earnings relate principally to the timing of recognition of income and gains for federal income tax purposes. Short-term gain distributions reported in the Statements of Changes in Net Assets, if any, are reported as ordinary income for federal tax purposes. Distributions are determined on a tax basis and may differ from net investment income and realized capital gains for financial reporting purposes.
| Note 11. Reclassification of Capital Accounts |
($ reported in thousands)
For financial reporting purposes, book basis capital accounts are adjusted to reflect the tax character of permanent book/tax differences. Permanent reclassifications can arise from differing treatment of certain income and gain transactions, nondeductible current year net operating losses, expiring capital loss carryovers and investments in passive foreign investment companies. The reclassifications have no impact on the net assets or net asset value of the Funds. As of September 30, 2013, the Funds recorded reclassifications to increase (decrease) the accounts as listed below ($ reported in thousands):
| Capital Paid in on Shares of Beneficial Interest | Undistributed Net Investment Income (Loss) | Accumulated Net Realized Gain (Loss) | ||||||||||
Bond Fund | $ | — | $ | (111 | ) | $ | 111 | |||||
CA Tax-Exempt Bond Fund | — | — | — | |||||||||
Disciplined Equity Style Fund | — | — | — | |||||||||
Disciplined Select Bond Fund | — | — | — | |||||||||
Disciplined Select Country Fund | — | — | — | |||||||||
Herzfeld Fund | — | 11 | (11 | ) | ||||||||
High Yield Fund | (69 | ) | (124 | ) | 193 | |||||||
Low Volatility Equity Fund | — | — | — | |||||||||
Multi-Sector Intermediate Bond Fund | — | (657 | ) | 657 | ||||||||
Senior Floating Rate Fund | — | 40 | (40 | ) | ||||||||
Wealth Masters Fund | — | — | — | |||||||||
| Note 12. Borrowings |
($ reported in thousands)
On April 30, 2012, the Senior Floating Rate Fund entered into a Credit Agreement (the “Agreement”) with a commercial bank (the “Bank”) that allows the Fund to borrow cash from the Bank, up to a limit of $100,000. Borrowings under the Agreement are collateralized by investments of the Fund. Interest is charged at LIBOR (London Interbank Offered Rate) plus an additional percentage rate on the amount borrowed. Commitment fees are charged on the undrawn balance. Total commitment fees paid and accrued for the period ended September 30, 2013, were $161 and are included in interest expense and fees on the Statement of Operations. The Agreement is renewable by the Fund with the Bank’s consent. The Agreement can also be converted to a 364 day fixed term facility, one time at the Fund’s option. The Bank has the ability to require repayment of outstanding borrowings
96
Table of Contents
VIRTUS OPPORTUNITIES TRUST
NOTES TO FINANCIAL STATEMENTS (Continued)
SEPTEMBER 30, 2013
under the Agreement upon certain circumstances such as an event of default. From October 1, 2012 to September 30, 2013, the average daily borrowings under the Agreement and the weighted daily average interest rate were $20,000 and 1.111%, respectively. At September 30, 2013, the amount of such outstanding borrowings was as follows:
Outstanding | Interest Rate | |||
$20,000 | 1.029 | % | ||
| Note 13. Illiquid and Restricted Securities |
Investments are generally considered illiquid if they cannot be disposed of within seven days in the ordinary course of business at the approximate amount at which such securities have been valued by a Fund. Additionally, the following information is also considered in determining liquidity: the frequency of trades and quotes for the investment, whether the investment is listed for trading on a recognized domestic exchange and/or whether two or more brokers are willing to purchase or sell the security at a comparable price, the extent of market making activity in the investment and the nature of the market for investment. Illiquid securities are footnoted as such at the end of each Fund’s Schedule of Investments where applicable.
Restricted securities are illiquid securities as defined above, not registered under the Securities Act of 1933 as amended (the “1933 Act”). Generally, 144A securities are excluded from this category, except where defined as illiquid.
Each Fund will bear any costs, including those involved in registration under the 1933 Act, in connection with the disposition of such securities.
At September 30, 2013, the Funds did not hold any illiquid and restricted Securities.
| Note 14. Recent Accounting Pronouncement |
In December 2011, the Financial Accounting Standards Board issued Accounting Standards Update (“ASU”) No. 2011-11 regarding “Disclosures about Offsetting Assets and Liabilities”. The amendments, which will be effective for annual reporting periods beginning on or after January 1, 2013, and interim periods within those annual periods, require an entity to disclose information about offsetting and related arrangements for assets and liabilities, financial instruments and derivatives that are either currently offset in accordance with current requirements or are subject to enforceable master netting arrangements or similar agreements. At this time, management is evaluating the implications of AUS No. 2011-11 and its impact on the financial statements has not yet been determined.
| Note 15. Subsequent Event Evaluations |
Management has evaluated the impact of all subsequent events on the Funds through the date the financial statements were available for issuance, and has determined that there are no subsequent events requiring recognition or disclosure in the financial statements.
97
Table of Contents

REPORT OF INDEPENDENT REGISTERED PUBLIC ACCOUNTING FIRM
To the Board of Trustees of
Virtus Opportunities Trust and
Shareholders of the Funds, as defined:
In our opinion, the accompanying statements of assets and liabilities, including the schedules of investments, and the related statements of operations and of changes in net assets and the financial highlights present fairly, in all material respects, the financial position of Virtus Bond Fund, Virtus CA Tax-Exempt Bond Fund, Virtus Herzfeld Fund, Virtus High Yield Fund, Virtus Multi-Sector Fixed Income Fund, Virtus Senior Floating Rate Fund, Virtus Wealth Masters Fund, Virtus Disciplined Equity Style Fund, Virtus Disciplined Select Bond Fund, Virtus Disciplined Select Country Fund, and Virtus Low Volatility Equity Fund (the “Funds”), at September 30, 2013, the results of each of their operations, the changes in each of their net assets and the financial highlights for each of the periods indicated, in conformity with accounting principles generally accepted in the United States of America. These financial statements and financial highlights (hereafter referred to as “financial statements”) are the responsibility of the Funds’ management; our responsibility is to express an opinion on these financial statements based on our audits. We conducted our audits of these financial statements in accordance with the standards of the Public Company Accounting Oversight Board (United States). Those standards require that we plan and perform the audit to obtain reasonable assurance about whether the financial statements are free of material misstatement. An audit includes examining, on a test basis, evidence supporting the amounts and disclosures in the financial statements, assessing the accounting principles used and significant estimates made by management, and evaluating the overall financial statement presentation. We believe that our audits, which included confirmation of securities at September 30, 2013 by correspondence with the custodians and brokers, provide a reasonable basis for our opinion.

PricewaterhouseCoopers LLP
November 21, 2013
98
Table of Contents
VIRTUS OPPORTUNITIES TRUST
SEPTEMBER 30, 2013
For the fiscal year ended September 30, 2013, the Funds make the following disclosures for federal income tax purposes. Below is listed the percentages, or the maximum amount allowable, of its ordinary income dividends (“QDI”) to qualify for the lower tax rates applicable to individual shareholders, and the percentage of ordinary income dividends earned by the Funds which qualifies for the dividends received deduction (“DRD”) for corporate shareholders. The Funds designate the amounts below as long-term capital gains dividends (“LTCG”) ($ reported in thousands), or if subsequently different, the amounts will be designated in the next annual report. The actual percentage for the calendar year will be designated in year-end tax statements.
Fund | QDI | DRD | LTCG | |||||||||
Bond Fund | — | % | — | % | $ | — | ||||||
CA Tax-Exempt Bond Fund | — | — | 934 | |||||||||
Disciplined Equity Style Fund | 7 | 9 | — | |||||||||
Disciplined Select Bond Fund | — | — | — | |||||||||
Disciplined Select Country Fund | 76 | — | — | |||||||||
Herzfeld Fund | 28 | 8 | 27 | |||||||||
High Yield Fund | — | — | — | |||||||||
Low Volatility Equity Fund | 100 | 100 | — | |||||||||
Multi-Sector Intermediate Bond Fund | — | — | 3,579 | |||||||||
Senior Floating Rate Fund | — | — | — | |||||||||
Wealth Masters Fund | 82 | 74 | 2 | |||||||||
For federal income tax purposes, 100% of the income dividends paid by the CA Tax-Exempt Bond Fund qualify as exempt-interest dividends.
For the period ended September 30, 2013, the Funds are disclosing the following information pursuant to notice requirements of Section 853(a) and 855(d) of the Internal Revenue Code, as amended, and the Treasury Regulations thereunder ($ reported in thousands).
| Foreign Source Income Recognized | Foreign Taxes paid on Foreign Source Income | |||||||
Disciplined Select Country Fund | $ | 16 | $ | 2 | ||||
Herzfeld Fund | 6 | 2 | ||||||
99
Table of Contents
CONSIDERATION OF ADVISORY AND SUBADVISORY AGREEMENTS FOR
VIRTUS LOW VOLATILITY EQUITY FUND (THE “FUND”)
BY THE BOARD OF TRUSTEES
The Board of Trustees (the “Board”) of Virtus Opportunities Trust (the “Trust”) is responsible for determining whether to approve the establishment and continuation of the investment advisory agreement (the “Advisory Agreement”) between the Fund and Virtus Investment Advisers, Inc. (“VIA”) and the subadvisory agreement (the “Subadvisory Agreement“ and together with the Advisory Agreement, the “Agreements”) among the Fund, VIA and Rampart Investment Management Company, LLC (“Rampart”), (the “Subadviser”). At an in-person meeting held on June 3-5, 2013, the Board, including a majority of the Trustees who are not interested persons of the Trust as defined in Section 2(a)(19) of the Investment Company Act of 1940, as amended (the “Independent Trustees”), considered and approved the establishment of the Agreements, as further discussed below.
In connection with the approval of the Agreements, the Board requested and evaluated information provided by VIA and the Subadviser which, in the Board’s view, constituted information necessary for the Board to form a judgment as to whether approval of each of the Agreements would be in the best interests of the Fund and its shareholders.
The Board was separately advised by independent legal counsel throughout the process. For each Agreement, the Board considered all the criteria separately with respect to the Fund and its shareholders. In their deliberations, the Board considered various factors, including those discussed below, none of which were controlling, and each Trustee may have attributed different weights to the various factors. The Board also discussed the proposed approval of the Agreements in private sessions with their independent legal counsel at which no representatives of management were present.
In considering whether to approve the Agreements with respect to the Fund, the Board reviewed and analyzed the factors it deemed relevant, including: (1) the nature, extent and quality of the services to be provided to the Fund by VIA and the Subadviser; (2) applicable comparative model performance information; (3) the level and method of computing the Fund’s advisory and subadvisory fees, and comparisons of the Fund’s proposed advisory fee rates with those of a group of other funds with similar investment objectives; (4) the profitability of VIA under the Advisory Agreement; (5) any “fall-out” benefits to VIA, the Subadviser and their affiliates (i.e., ancillary benefits realized by VIA, the Subadviser or its affiliates from VIA’s or the Subadviser’s relationship with the Fund); (6) possible conflicts of interest; and (7) the terms of the Agreements.
Nature, Extent and Quality of Services
The Trustees received in advance of the meeting information in the form of questionnaires completed by VIA and the Subadviser, each concerning a number of topics, including such company’s investment philosophy, resources, operations and compliance structure. The Trustees also received a presentation by VIA’s senior management personnel, during which among other items, VIA’s history, investment process, investment strategies, personnel, compliance procedures and the firm’s overall performance were reviewed and discussed. The Trustees noted that the Fund is managed using a “manager of managers” structure that generally involves the use of one or more subadvisers to manage some or all of the Fund’s portfolio. Under this structure, VIA is responsible for the management of the Fund’s investment programs and day-to-day operations and for evaluating and selecting subadvisers on an ongoing basis and making any recommendations to the Board regarding hiring, retaining or replacing subadvisers. In considering the Agreement with VIA, the Board considered VIA’s process for supervising and managing the Fund’s subadviser, including (a) VIA’s ability to select and monitor the subadviser; (b) VIA’s ability to provide the services necessary to monitor the subadviser’s compliance with the Fund’s investment objectives, policies and restrictions as well as provide other oversight activities; and (c) VIA’s ability and willingness to identify instances in which a subadviser should be replaced and to carry out the required changes. The Trustees also considered: (a) the experience and capability of VIA’s management and other personnel; (b) the financial condition of VIA, and whether it had the financial wherewithal to provide a high level and quality of services to the Fund; (c) the quality of VIA’s own regulatory and legal compliance policies, procedures and systems; (d) the nature, extent and quality of administrative and other services expected to be provided by VIA and its affiliates to the Fund; (e) VIA’s expected supervision of the Fund’s other service providers; and (f) VIA’s risk management processes. It was noted that Virtus Fund Services, LLC, an affiliate of VIA, was expected to serve as administrator and transfer agent and that VP Distributors was expected to serve as distributor to the Fund. The Board also took into account its knowledge of VIA’s management and the quality of the performance of its duties with respect to other Virtus Mutual Funds through Board meetings, discussions and reports during the preceding year, as well as information from the Trust’s Chief Compliance Officer regarding the Fund’s compliance policies and procedures proposed to be established pursuant to Rule 38a-1 under the 1940 Act.
With respect to the services to be provided by the Subadviser, the Board considered information provided to the Board by the Subadviser, including the Subadviser’s Form ADV, as well as a presentation provided by the Subadviser’s senior portfolio management personnel. With respect to the Subadvisory Agreement, the Board noted that the Subadviser would provide portfolio management, compliance with the Fund’s investment policies and procedures, compliance with applicable securities laws and assurances thereof. In considering approval of the Subadvisory Agreement, the Board also considered the Subadviser’s investment management process, including (a) the experience and capability of the Subadviser’s management and other personnel committed by the Subadviser to the Fund; (b) the financial condition of the Subadviser; (c) the quality of the Subadviser’s regulatory and legal compliance policies, procedures and systems; and (d) the Subadviser’s brokerage and trading practices, including with respect to best execution and soft dollars. The Board also took into account the Subadviser’s risk assessment and monitoring process. The Board noted the Subadviser’s regulatory history, including whether it was currently involved in any regulatory actions or investigations as well as material litigation, and any settlements and amelioratory actions undertaken, as appropriate.
After considering all of the information provided to them, the Trustees concluded that the nature, extent and quality of the services expected to be provided by VIA and the Subadviser were satisfactory and that there was a reasonable basis on which to conclude that each would provide a high quality of investment services to the Fund.
Investment Performance
Because the Fund had not commenced operations, the Board could not evaluate prior investment performance for the Fund. The Board reviewed and was satisfied with the model performance information used that was based upon the Funds’ proposed investment strategies.
Management Fees and Total Expenses
The Board considered the fees proposed for advisory services as well as the expected total expense levels of the Fund. Among other data provided, the Board noted that the proposed management fee and total expenses for the Fund were within the range of other funds deemed to be comparable to the Fund by management. The Board noted that the Fund was expected to have an expense cap in place to limit the total expenses incurred by the Fund and its shareholders. The Board also noted that the subadvisory fee for the Fund would be paid by VIA out of its advisory fee rather than paid separately by the
100
Table of Contents
CONSIDERATION OF ADVISORY AND SUBADVISORY AGREEMENTS FOR
VIRTUS LOW VOLATILITY EQUITY FUND (THE “FUND”)
BY THE BOARD OF TRUSTEES (Continued)
Fund. In this regard, the Board took into account management’s discussion with respect to the advisory/subadvisory fee structure, including the amount of the advisory fee retained by VIA after payment of the subadvisory fee. The Board also took into account the expected size of the Fund and the impact on expenses.
The Board concluded that the proposed advisory and subadvisory fees for the Fund were fair and reasonable in light of the usual and customary charges made for services of the same nature and quality and the other factors considered.
Profitability
The Board also considered certain information relating to profitability that had been provided by VIA. In this regard, the Board considered information regarding the expected profitability of VIA for its management of the Fund, as well as the expected profitability of its affiliates for managing and providing other services to the Fund, such as distribution and administrative services provided to the Fund by a VIA affiliate. In addition to the fees paid to VIA and its affiliates, the Board considered any other benefits derived by VIA or its affiliates from their relationship with the Fund. The Board concluded that the expected profitability to VIA and its affiliates from the Fund was reasonable in light of the quality of the services to be rendered to the Fund by VIA and its affiliates.
In considering the profitability to the Subadviser in connection with its relationship to the Fund, the Board noted that the fees under the Subadvisory Agreement are paid by VIA out of the fees that VIA receives under the Advisory Agreement, so that Fund shareholders are not directly impacted by those fees. In considering the reasonableness of the fees payable by VIA to the affiliated Subadviser, the Board noted that, because the Subadviser is an affiliate of VIA, such profitability might be directly or indirectly shared by VIA. For each of the above reasons, the Board concluded that the profitability to the Subadviser and its affiliates from their relationship with the Fund was not a material factor in approval of the Subadvisory Agreement.
Economies of Scale
The Board received and discussed information concerning whether VIA should be expected to realize economies of scale as the Fund’s assets grow. The Board noted that expense caps were expected to be implemented for the Fund. The Board also took into account management’s discussion of the Fund’s management fee and subadvisory fee structure. The Board also took into account the expected size of the Fund. The Board noted that VIA and the Fund may realize certain economies of scale if the assets of the Fund were to be materially higher than anticipated, particularly in relationship to certain fixed costs, and that shareholders of the Fund would have an opportunity to benefit from these economies of scale.
For similar reasons as stated above with respect to the Subadviser’s profitability, and based upon the expected size of the Fund to be managed by the Subadviser, the Board concluded that the potential for economies of scale in the Subadviser’s management of the Fund was not a material factor in the approval of the Subadvisory Agreements at this time.
Other Factors. The Board considered other benefits that may be realized by VIA and the Subadviser and their respective affiliates from their relationships with the Fund. Among them, the Board recognized that VP Distributors, LLC, an affiliate of VIA, serves as the distributor for the Trust, and, as such, was expected to receive payments pursuant to Rule 12b-1 from the Fund to compensate it for providing shareholder services and selling activities, which could lead to growth in the Fund’s assets and corresponding benefits from such growth, including economies of scale. The Board also noted that Virtus Fund Services, LLC also was expected to provide administrative and transfer agency services to the Fund. The Board noted management’s discussion of the fact that there were no other direct benefits to the Subadviser or VIA in providing investment advisory services to the Fund, other than the fees to be earned under the Agreements, although there may be certain indirect benefits gained, including to the extent that serving the Fund could provide the opportunity to provide advisory services to additional portfolios of the Trust or certain reputational benefits.
Based on all of the foregoing considerations, the Board, including a majority of the Independent Trustees, determined that approval of each Agreement was in the best interests of the Fund and its shareholders. Accordingly, the Board, and the Independent Trustees voting separately, approved the Agreements with respect to the Fund.
101
Table of Contents
(Unaudited)
Information pertaining to the trustees and officers of the Trust as of September 30, 2013, is set forth below. The statement of additional information (SAI) includes additional information about the trustees and is available without charge, upon request, by calling (800) 243-1574. The address of each individual, unless otherwise noted, is 100 Pearl Street, Hartford, CT 06103-4506. There is no stated term of office for trustees of the Trust.
Independent Trustees
| Name, Year of Birth, Year Elected and Number of Funds Overseen | Principal Occupation(s) During Past 5 Years and Other Directorships Held by Trustee | |
Leroy Keith, Jr. YOB: 1939 Elected: 2000 48 Funds | Chairman (since 2010), Bloc Global Services Group, LLC (construction and redevelopment company); Managing Director (2007 to 2008), Almanac Capital Management (commodities business); Director/Trustee (since 2010), Wells Fargo Funds (139 series) and their predecessors, Evergreen Funds (1989 to 2010); Director (2003 to 2010), Diversapack Co. (soft packaging company); and Trustee (since 1980), Virtus Mutual Fund Complex. | |
Philip R. McLoughlin Chairman YOB: 1946 Elected: 1999 66 Funds | Partner (since 2006), Cross Pond Partners, LLC (strategy consulting firm); Managing Director (2009 to 2010), SeaCap Asset Management Fund I, L.P. and SeaCap Partners, LLC (investment management); Director (since 1991) and Chairman (since 2010), World Trust Fund; Trustee and Chairman (since 2011), Virtus Closed-End Funds (2 portfolios); Trustee (since 1989), Virtus Mutual Fund Complex; Director (since 1996), closed-end funds managed by Duff & Phelps Investment Management Co. (4 portfolios); and Director (1985 to 2009), Argo Group International Holdings Inc. and its predecessor, PXRE Corporation (insurance). | |
Geraldine M. McNamara YOB: 1951 Elected: 2001 52 Funds | Retired. Director (since 2003), closed-end funds managed by Duff & Phelps Investment Management Co. (4 portfolios); and Trustee (since 2001), Virtus Mutual Fund Complex. | |
James M. Oates YOB: 1946 Elected: 2000 50 Funds | Managing Director (since 1994), Wydown Group (consulting firm); Chairman and Trustee (since 2005), John Hancock Fund Complex (collectively, 234 portfolios); Director (since 1996), Stifel Financial; Chairman and Director (since 1999), Connecticut River Bank and Director (since 1998), Connecticut River Bancorp; Chairman (since 2000), Emerson Investment Management, Inc.; Director (since 2002), New Hampshire Trust Company; Non-Executive Chairman (2007 to 2011), Hudson Castle Group, Inc. (formerly IBEX Capital Markets, Inc.) (financial services); and Trustee (since 1987), Virtus Mutual Fund Complex. | |
Richard E. Segerson YOB: 1948 Elected: 2000 48 Funds | Retired. Managing Director (1998 to 2013), Northway Management Company; and Trustee (since 1993), Virtus Mutual Fund Complex. | |
Ferdinand L.J. Verdonck YOB: 1942 Elected: 2005 48 Funds | Director (since 1998), The J.P. Morgan European Investment Trust; Director (since 2005), Galapagos N.V. (biotechnology); Mr. Verdonck is also a director of several non-U.S. companies. | |
Interested Trustee
The individual listed below is an “interested person” of the Trust, as defined in Section 2(a)(19) of the 1940 Act, as amended, and the rules and regulations thereunder.
| Name, Year of Birth, Year Elected and Number of Funds Overseen | Principal Occupation(s) During Past 5 Years and Other Directorships Held by Trustee | |
George R. Aylward* Trustee and President YOB: 1964 Elected: 2006 61 Funds | Director, President and Chief Executive Officer (since 2008), Virtus Investment Partners, Inc. and/or certain of its subsidiaries; various senior officer positions with Virtus affiliates (since 2005); Trustee (since 2012), Virtus Variable Insurance Trust; Trustee and President (since 2011), Virtus Closed-End Funds (2 portfolios); and Chairman, President and Chief Executive Officer (since 2006), The Zweig Closed-End Funds (2 portfolios) Funds; and Director (since 2013), Virtus Global Funds, PLC. | |
* Mr. Aylward is an “interested person,” as defined in the 1940 Act, by reason of his position as President and Chief Executive Officer of Virtus Investment Partners, Inc. (“Virtus”), the ultimate parent company of the Adviser, and various positions with its affiliates, including the Adviser.
102
Table of Contents
FUND MANAGEMENT TABLES (Continued)
(Unaudited)
Officers of the Trust Who Are Not Trustees
Name, Address and Year of Birth | Position(s) Held with Trust and Length of Time Served | Principal Occupation(s) During Past 5 Years | ||
W. Patrick Bradley YOB: 1972 | Senior Vice President (since 2013), Vice President since 2011, Chief Financial Officer and Treasurer since 2006. | Senior Vice President, Fund Services (since 2010), Virtus Investment Partners, Inc. and/or certain of its subsidiaries; various officer positions (since 2006) with Virtus affiliates; Vice President (since 2011), Chief Financial Officer and Treasurer (since 2004), Virtus Variable Insurance Trust; Vice President, Chief Financial Officer and Treasurer (since 2011), Virtus Global Multi-Sector Income Fund and Virtus Total Return Fund; Vice President (since 2012) and Treasurer (Chief Financial Officer) (since 2007), The Zweig Fund, Inc. and Zweig Total Return Fund, Inc.; Vice President and Assistant Treasurer (since 2011), Duff & Phelps Global Utility Income Fund Inc. ; and Director (since 2013), Virtus Global Funds, PLC. | ||
Kevin J. Carr YOB: 1954 | Senior Vice President (since 2013), Vice President, Chief Legal Officer, Counsel and Secretary since 2005. | Senior Vice President (since 2009), Vice President, Counsel and Secretary (2008 to 2009), Virtus Investment Partners, Inc. and/or certain of its subsidiaries; various senior officer positions (since 2005) with Virtus affiliates; Vice President, Chief Legal Officer, Counsel and Secretary (since 2010), Virtus Variable Insurance Trust; Vice President and Assistant Secretary (since 2012), Vice President, Chief Legal Officer, Counsel and Secretary (2011-2012), Virtus Global Multi-Sector Income Fund and Virtus Total Return Fund; Vice President and Assistant Secretary (since 2012), Secretary and Chief Legal Officer (2005-2012), The Zweig Fund, Inc. and Zweig Total Return Fund, Inc.; and Vice President and Assistant Secretary (since 2011), Duff & Phelps Global Utility Income Fund Inc. | ||
Nancy J. Engberg YOB: 1956 | Vice President and Chief Compliance Officer since 2011. | Vice President (since 2008) and Chief Compliance Officer (2008 to 2011), Virtus Investment Partners, Inc. and/or certain of its subsidiaries; various officer positions (since 2003) with Virtus affiliates; Vice President (since 2010), Chief Compliance Officer (since 2011), Virtus Variable Insurance Trust; Vice President and Chief Compliance Officer (since 2011), Virtus Global Multi-Sector Income Fund and Virtus Total Return Fund; Vice President and Chief Compliance Officer (since 2012), The Zweig Fund, Inc. and Zweig Total Return Fund, Inc. | ||
Francis G. Waltman YOB: 1962 | Executive Vice President since 2013.
Senior Vice President 2008-2013. | Executive Vice President, Product Development (since 2009), Virtus Investment Partners, Inc. and/or certain of its subsidiaries; various senior officer positions (since 2006) with Virtus affiliates; Senior Vice President (since 2010), Virtus Variable Insurance Trust; Senior Vice President (since 2011), Virtus Global Multi-Sector Income Fund and Virtus Total Return Fund; and Director (since 2013), Virtus Global Funds, PLC. | ||
103
Table of Contents
VIRTUS OPPORTUNITIES TRUST
101 Munson Street
Greenfield, MA 01301-9668
Trustees
George R. Aylward
Leroy Keith, Jr.
Philip R. McLoughlin, Chairman
Geraldine M. McNamara
James M. Oates
Richard E. Segerson
Ferdinand L.J. Verdonck
Officers
George R. Aylward, President
Francis G. Waltman, Executive Vice President
W. Patrick Bradley, Senior Vice President, Chief Financial Officer and Treasurer
Kevin J. Carr, Senior Vice President, Chief Legal Officer, Counsel and Secretary
Nancy J. Engberg, Vice President and Chief Compliance Officer
Investment Adviser
Virtus Investment Advisers, Inc.
100 Pearl Street
Hartford, CT 06103-4506
Principal Underwriter
VP Distributors, LLC
100 Pearl Street
Hartford, CT 06103-4506
Administrator and Transfer Agent
Virtus Fund Services, LLC
100 Pearl Street
Hartford, CT 06103-4506
Custodian
JPMorgan Chase Bank NA
1 Chase Manhattan Plaza
New York, NY 10005-1401
Independent Registered Public Accounting Firm
PricewaterhouseCoopers LLC
2001 Market Street
Philadelphia, PA 19103-7042
How to Contact Us
Mutual Fund Services 1-800-243-1574
Adviser Consulting Group 1-800-243-4361
Telephone Orders 1-800-367-5877
Text Telephone 1-800-243-1926
Web site http://Virtus.com
Important Notice to Shareholders
The Securities and Exchange Commission has modified mailing regulations for semiannual and annual shareholder fund reports to allow mutual fund companies to send a single copy of these reports to shareholders who share the same mailing address. If you would like additional copies, please call Mutual Fund Services at 1-800-243-1574.
Table of Contents
| ||
P.O. Box 9874 Providence, RI 02940-8074 |

For more information about Virtus Mutual Funds,
please call your financial representative, or contact us
at 1-800-243-1574 or Virtus.com.
8008 | 11-13 |
Table of Contents

ANNUAL REPORT
Virtus Multi-Sector Short Term Bond Fund
September 30, 2013
TRUST NAME: VIRTUS OPPORTUNITIES TRUST
Not FDIC Insured
No Bank Guarantee
May Lose Value

Table of Contents
Virtus Multi-Sector Short Term Bond Fund
(“Multi-Sector Short Term Bond Fund”)
| 1 | ||||
| 2 | ||||
| 4 | ||||
| 5 | ||||
| 8 | ||||
| 40 | ||||
| 41 | ||||
| 42 | ||||
| 43 | ||||
| 44 | ||||
| 54 | ||||
| 55 | ||||
| 56 |
PROXY VOTING PROCEDURES AND VOTING RECORD (FORM N-PX)
The subadviser vote proxies relating to portfolio securities in accordance with procedures that have been approved by the Board of Trustees of the Trust (“Trustees,” the “Board”). You may obtain a description of these procedures, along with information regarding how the Fund voted proxies during the most recent 12-month period ended June 30, free of charge, by calling toll-free 1-800-243-1574. This information is also available through the Securities and Exchange Commission’s (the “SEC”) website at http://www.sec.gov.
FORM N-Q INFORMATION
The Trust files a complete schedule of portfolio holdings for the Fund with the SEC for the first and third quarters of each fiscal year on Form N-Q. Form N-Q is available on the SEC’s website at http://www.sec.gov. Form N-Q may be reviewed and copied at the SEC’s Public Reference Room. Information on the operation of the SEC’s Public Reference Room can be obtained by calling toll-free 1-800-SEC-0330.
This report is not authorized for distribution to prospective investors in the Virtus Multi-Sector Short Term Bond Fund unless preceded or accompanied by an effective prospectus which includes information concerning the sales charge, Fund’s record and other pertinent information.
Table of Contents
Dear Fellow Shareholders of Virtus Mutual Funds:
 | The financial markets experienced significant volatility during the 12-month period that ended September 30, 2013. The S&P 500® Index, a benchmark for U.S. equities, gained 19.3% while the Barclays U.S. Aggregate Bond Index, which tracks the U.S. fixed income market, declined 1.7%, and the MSCI All Country World Index (net), a measure of international equities, rose 17.7%.
The bond markets were particularly volatile during the second half of this period. U.S. Treasury yields climbed over the last few months as the market prepared for the Federal Reserve’s tapering of its bond purchases, which never occurred. The 10-year Treasury yield was at | |
2.6% as of September 30, 2013, compared with 1.7% a year earlier, and, as rates rose, most bond sectors suffered losses.
Despite this recent market unpredictability, there is reason for investors to be cautiously optimistic about the economy. The U.S. economy is showing signs of growth in hiring, consumer spending, and housing and, although China’s recovery remains tenuous, Europe appears to be coming out of its recession. The onus remains on the U.S. government to keep the country on strong fiscal footing and on corporations to produce robust earnings, which will play a pivotal role in determining future market direction.
Market uncertainty is a timely reminder of the importance of portfolio diversification. While diversification cannot guarantee a profit or prevent loss, owning a variety of asset classes may cushion your portfolio against inevitable market fluctuations. Your financial advisor can help you ensure that your portfolio is adequately diversified.
Thank you for entrusting Virtus with your assets. Should you have any questions or require support, the Virtus customer service team is ready to assist you at 1-866-270-7788. We appreciate your business and remain committed to your long-term financial success.
Sincerely,
George R. Aylward President, Virtus Mutual Funds
October 2013
Whenever you have questions about your account, or require additional information, please visit us on the Web at www.virtus.com or call our shareowner service group toll-free at 1-800-243-1574.
Performance data quoted represents past results. Past performance is no guarantee of future results and current performance may be higher or lower than performance shown above. | ||

1
Table of Contents
VIRTUS MULTI-SECTOR SHORT TERM BOND FUND
DISCLOSURE OF FUND EXPENSES (Unaudited)
FOR THE SIX-MONTH PERIOD OF APRIL 1, 2013 TO SEPTEMBER 30, 2013
We believe it is important for you to understand the impact of costs on your investment. All mutual funds have operating expenses. As a shareholder of the Virtus Multi-Sector Short Term Bond Fund (the “Fund”) you may incur two types of costs: (1) transaction costs, including sales charges on purchases of Class A shares and contingent deferred sales charges on Class B and Class T shares; and (2) ongoing costs, including investment advisory fees, distribution and service fees, and other expenses. Class C shares are sold without a sales charge. Class I shares are sold without a sales charge and do not incur distribution and service fees. For further information regarding applicable sales charges, see Note 1 in the Notes to Financial Statements. These examples are intended to help you understand your ongoing costs (in dollars) of investing in the Fund and to compare these costs with the ongoing costs of investing in other mutual funds. These examples are based on an investment of $1,000 invested at the beginning of the period and held for the entire six-month period. The following Expense Table illustrates your Fund’s costs in two ways.
Actual Expenses
The first section of the accompanying table provides information about actual account values and actual expenses. You may use the information in this section, together with the amount you invested, to estimate the expenses that you paid over the period. Simply divide your account value by $1,000 (for example, an $8,600 account value divided by $1,000 = 8.6), then multiply the result by the number given in the first section under the heading “Expenses Paid During Period” to estimate the expenses you paid on your account during the period.
Hypothetical Example for Comparison Purposes
The second section of the accompanying table provides information about hypothetical account values and hypothetical expenses based on the Fund’s actual expense ratio and an assumed rate of return of 5% per year before expenses, which is not your Fund’s actual return. The hypothetical account values and expenses may not be used to estimate the actual ending account balance or expenses you paid for the period. You may use this information to compare the ongoing costs of investing in your Fund and other funds. To do so, compare these 5% hypothetical examples with the 5% hypothetical examples that appear in the shareholder reports of the other funds.
Please note that the expenses shown in the accompanying table are meant to highlight your ongoing costs only and do not reflect any transactional costs, such as sales charges or contingent deferred sales charges. Therefore, the second section of the accompanying table is useful in comparing ongoing costs only, and will not help you determine the relative total costs of owning different funds. In addition, if those transactional costs were included, your costs would have been higher. The calculations assume no shares were bought or sold during the period. Your actual costs may have been higher or lower, depending on the amount of your investment and the timing of any purchases or redemptions.
2
Table of Contents
VIRTUS MULTI-SECTOR SHORT TERM BOND FUND
DISCLOSURE OF FUND EXPENSES (Unaudited) (Continued)
FOR THE SIX-MONTH PERIOD OF APRIL 1, 2013 to SEPTEMBER 30, 2013
| Expense Table | ||||||||||||||||
| Beginning Account Value April 1, 2013 | Ending Account Value September 30, 2013 | Annualized Expense Ratio | Expenses Paid During Period* | |||||||||||||
Multi-Sector Short Term Bond Fund |
| |||||||||||||||
Actual | ||||||||||||||||
| Class A | $ | 1,000.00 | $ | 995.20 | 1.00 | % | $ | 5.00 | ||||||||
| Class B | 1,000.00 | 992.60 | 1.50 | 7.49 | ||||||||||||
| Class C | 1,000.00 | 993.90 | 1.25 | 6.25 | ||||||||||||
| Class T | 1,000.00 | 991.40 | 1.75 | 8.74 | ||||||||||||
| Class I | 1,000.00 | 996.40 | 0.75 | 3.75 | ||||||||||||
Hypothetical (5% return before expenses) |
| |||||||||||||||
| Class A | 1,000.00 | 1,019.99 | 1.00 | 5.08 | ||||||||||||
| Class B | 1,000.00 | 1,017.45 | 1.50 | 7.61 | ||||||||||||
| Class C | 1,000.00 | 1,018.72 | 1.25 | 6.35 | ||||||||||||
| Class T | 1,000.00 | 1,016.18 | 1.75 | 8.88 | ||||||||||||
| Class I | 1,000.00 | 1,021.26 | 0.75 | 3.81 | ||||||||||||
| * | Expenses are equal to the Fund’s annualized expense ratio which is net of fees waived and expenses reimbursed if any multiplied by the average account value over the period, multiplied by the number of days (183) expenses were accrued in the most recent fiscal half-year, then divided by 365 to reflect the one-half year period. |
| The Fund may invest in other funds, and the annualized expense ratios noted above do not reflect fees and expenses associated with the underlying funds. If such fees and expenses were included, the expenses would have been higher. |
| You can find more information about the Fund’s expenses in the Financial Statements section that follows. For additional information on operating expenses and other shareholder costs, refer to the prospectus. |
3
Table of Contents
VIRTUS MULTI-SECTOR SHORT TERM BOND FUND
BofA Merrill Lynch 1–2.99 Year Medium Quality Corporate Bonds Index
The BofA Merrill Lynch 1–2.99 Year Medium Quality Corporate Bonds Index measures performance of U.S. investment grade corporate bond issues rated “BBB” and “A” by Standard & Poor’s/Moody’s with maturities between one and three years. The index is calculated on a total return basis. The index is unmanaged and not available for direct investment.
Barclays U.S. Aggregate Bond Index
The Barclays U.S. Aggregate Bond Index measures the U.S. investment grade fixed rate bond market. The index is calculated on a total return basis. The index is unmanaged and not available for direct investment.
Exchange-Traded Funds (ETF)
Portfolios of stocks or bonds that track a specific market index.
Federal Reserve (the “Fed”)
The central bank of the United States, responsible for controlling the money supply, interest rates and credit with the goal of keeping the U.S. economy and currency stable. Governed by a seven-member board, the system includes 12 regional Federal Reserve Banks, 25 branches and all national and state banks that are part of the system.
MSCI All Country World Index (net)
The MSCI All Country World Index (net) is a free float-adjusted market capitalization-weighted index that measures equity performance of developed and emer
PIK (Payment-in-Kind Security)
A bond which pays some or all interest in the form of additional bonds, or preferred stock which pays dividends in the form of additional preferred stock.
Quantitative Easing
A government monetary policy occasionally used to increase the money supply by buying government securities or other securities from the market. Quantitative Easing increases the money supply by flooding financial institutions with capital in an effort to promote increased lending and liquidity.
REIT (Real Estate Investment Trust)
A publicly traded company that owns, develops and operates income-producing real estate such as apartments, office buildings, hotels, shopping centers and other commercial properties.
S&P 500® Index
The S&P 500® Index is a free-float market capitalization-weighted index of 500 of the largest U.S. companies. The index is calculated on a total return basis with dividends reinvested. The index is unmanaged, its returns do not reflect any fees, expenses, or sales charges and is not available for direct investment.
4
Table of Contents
MULTI-SECTOR SHORT TERM BOND FUND
Fund Summary | Ticker Symbols: Class A: NARAX Class B: PBARX Class C: PSTCX Class T: PMSTX Class I: PIMSX |
| ¢ | The Fund is diversified and has an investment objective to seek to provide high current income while attempting to limit changes in the Fund’s net asset value per share caused by interest rate changes. |
| ¢ | For the fiscal year ended September 30, 2013, the Fund’s Class A shares at NAV returned 1.84%; Class B shares returned 1.34%; Class C shares returned 1.56%; Class T shares returned 1.06%; and Class I shares returned 2.09%. For the same period, the Barclays U.S. Aggregate Bond Index, a broad-based fixed income index, returned -1.68%; and the BofA Merrill Lynch 1–2.99 Year Medium Quality Corporate Bonds Index, the Fund’s style-specific index appropriate for comparison, returned 1.93%. |
All performance figures assume reinvestment of distributions and exclude the effect of sales charges. Past performance is no guarantee of future results and current performance may be higher or lower than the performance shown.
How did the market perform during the Fund’s fiscal year?
| ¢ | Most fixed income spread sectors (the non-governmental sectors of the fixed income markets) outperformed U.S. Treasuries during the Fund’s fiscal year. The overall economic picture continued to be supportive of spread sectors as growth expectations remained positive but subdued enough to likely keep inflation at low levels and the Fed from raising short-term interest rates in the immediate future. Spread sectors were also supported by an overall improvement in the U.S. macroeconomic environment, positive credit fundamentals, and continued demand for spread product. |
| ¢ | Despite the rally, there were periods of volatility during the year as headwinds still exist. Various factors, including uncertainty surrounding the impact of the U.S. presidential elections, the “fiscal cliff,” and the effects of subsequent tax increases and sequestration, resulted in periods of weakness. Despite resolution of these issues, ambiguity remains relative to the Fed’s hint at the possibility of tapering bond purchases by the end of the year (which would mark the beginning of the end of quantitative easing), the looming U.S. debt ceiling debate, and overall global growth concerns. |
| ¢ | Over the last 12 months, yields increased across the U.S. Treasury curve and the curve steepened. |
What factors affected the Fund’s performance during its fiscal year?
| ¢ | The outperformance of fixed income spread sectors relative to U.S. Treasuries was the key driver of the Fund’s strong performance for the fiscal year. |
| ¢ | Among fixed income sectors, the Fund’s allocations to corporate high yield securities, high yield bank loans, corporate high quality, asset-backed securities, and non-agency residential mortgage-backed securities were all significant positive contributors to performance for the fiscal year. |
| ¢ | During the fiscal year the Fund’s allocation to the non-U.S. dollar sector detracted from performance, as did its higher quality bias in the corporate high yield sector as lower quality securities outperformed. |
For information regarding the indexes and certain investment terms, see the Key Investment Terms on page 4.
5
Table of Contents
| MULTI-SECTOR SHORT TERM BOND FUND (Continued) |
The preceding information is the opinion of portfolio management. Any such opinions are subject to change at any time based upon market or other conditions and should not be relied upon as investment advice. Past performance is no guarantee of future results, and there is no guarantee that market forecasts will be realized.
There is no guarantee that the Fund will meet its objective.
Debt securities are subject to various risks, the most prominent of which are credit and interest rate risk. The issuer of a security may fail to make payments in a timely manner. Values of debt securities may rise and fall in response to changes in interest rates. This risk may be enhanced with longer-term maturities. There is a greater level of credit risk and price volatility involved with high yield securities than investment grade securities. Changes in interest rates can cause both extension and prepayment risks for asset and mortgage-backed securities. These securities are also subject to risks associated with the repayment of underlying collateral. There may be no ready market for loan participation interests. The Fund may have to sell the interests at a substantial discount. Such interests are subject to the credit risk of the underlying corporate borrower. Investing internationally, especially in emerging markets, involves additional risks such as currency, political, accounting, economic, and market risk.
| Asset Allocations | ||||
The following table presents the portfolio holdings within certain sectors as a percentage of total investments as of September 30, 2013.
|
| |||
Corporate Bonds | 36 | % | ||
Mortgage-Backed Securities | 21 | |||
Loan Agreements | 16 | |||
Asset-Backed Securities | 16 | |||
Foreign Government Securities | 8 | |||
Other (includes short-term investments) | 3 | |||
|
| |||
Total | 100 | % | ||
|
| |||
For information regarding the indexes and certain investment terms, see the Key Investment Terms on page 4.
6
Table of Contents
| MULTI-SECTOR SHORT TERM BOND FUND (Continued) |
| Average Annual Total Returns1 for periods ended 9/30/13 | ||||||||||||||||||||
| 1 Year | 5 Years | 10 Years | Since Inception | Inception Date | ||||||||||||||||
| Class A Shares at NAV2 | 1.84 | % | 8.07 | % | 5.10 | % | — | — | ||||||||||||
| Class A Shares at POP3,4 | -0.45 | 7.58 | 4.86 | — | — | |||||||||||||||
| Class B Shares at NAV2 | 1.34 | 7.53 | 4.57 | — | — | |||||||||||||||
| Class B Shares with CDSC4 | -0.13 | 7.53 | 4.57 | — | — | |||||||||||||||
| Class C Shares at NAV2 | 1.56 | 7.81 | 4.85 | — | — | |||||||||||||||
| Class T Shares at NAV2 and with CDSC4 | 1.06 | 7.30 | 4.31 | — | — | |||||||||||||||
| Class I Shares at NAV | 2.09 | 8.34 | — | 6.76 | % | 6/6/08 | ||||||||||||||
| Barclays U.S. Aggregate Bond Index | -1.68 | 5.41 | 4.59 | 4.90 | 5 | — | ||||||||||||||
| BofA Merrill Lynch 1–2.99 Year Medium Quality Corporate Bonds Index | 1.93 | 5.56 | 3.84 | 4.08 | 5 | — | ||||||||||||||
Fund Expense Ratios6: A Shares: 1.01%; B Shares: 1.51%; C Shares: 1.26%; T Shares: 1.76%; I Shares: 0.76%.
All returns represent past performance which is no guarantee of future results. Current performance may be higher or lower than the performance shown. The investment return and principal value of an investment will fluctuate so that an investor’s shares, when redeemed, may be worth more or less than their original cost. The above table and graph below do not reflect the deduction of taxes that a shareholder would pay on fund distributions or the redemption of fund shares. Please visit Virtus.com for performance data current to the most recent month-end.
| 1 | Total returns are historical and include changes in share price and the reinvestment of both dividends and capital gain distributions. |
| 2 | “NAV” (Net Asset Value) total returns do not include the effect of any sales charge. |
| 3 | “POP” (Public Offering Price) total returns include the effect of the maximum front-end 2.25% sales charge. |
| 4 | CDSC (Contingent Deferred Sales Charge) is applied to redemptions of certain classes of shares that do not have a sales charge applied at the time of purchase. CDSC charges for Class B shares decline from 2% to 0% over a three-year period. CDSC charges for certain redemptions of Class A shares made within 18 months of purchase in which a finder’s fee was paid and all redemptions of Class T shares are 1% within the first year and 0% thereafter. |
| 5 | The since inception index returns are from Share Class I’s inception date. |
| 6 | The expense ratios of the Fund are set forth according to the prospectus for the Fund effective January 31, 2013, as supplemented and revised and may differ from the expense ratios disclosed in the Financial Highlights tables in this report. See the Financial Highlights for more current expense ratios. |
Growth of $10,000 for periods ended 9/30
This chart assumes an initial investment of $10,000 made on September 30, 2003, for Class A, Class B and Class C shares including any applicable sales charges or fees. Performance assumes reinvestment of dividends and capital gain distributions.
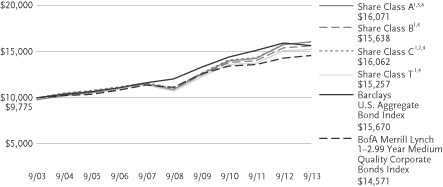
The indexes are unmanaged and not available for direct investment; therefore, their performance does not reflect the expenses associated with active management of an actual portfolio.
7
Table of Contents
VIRTUS MULTI-SECTOR SHORT TERM BOND FUND
SEPTEMBER 30, 2013
($ reported in thousands)
| PAR VALUE | VALUE | |||||||
| U.S. GOVERNMENT SECURITIES—1.2% | ||||||||
U.S. Treasury Note | ||||||||
0.250%, 4/30/14 | $ | 12,800 | $ | 12,813 | ||||
1.375%, 9/30/18 | 70,000 | 69,967 | ||||||
2.500%, 8/15/23 | 20,000 | 19,806 | ||||||
| TOTAL U.S. GOVERNMENT SECURITIES | ||||||||
| (Identified Cost $102,567) | 102,586 | |||||||
| MUNICIPAL BONDS—0.1% | ||||||||
| Kentucky—0.1% | ||||||||
Commonwealth of Kentucky Taxable 3.165%, 4/1/18 | 5,868 | 6,036 | ||||||
|
| |||||||
| Virginia—0.0% | ||||||||
Tobacco Settlement Financing Corp. Taxable Series 07-A1, 6.706%, 6/1/46 | 4,715 | 3,264 | ||||||
| TOTAL MUNICIPAL BONDS (Identified Cost $10,216) | 9,300 | |||||||
| FOREIGN GOVERNMENT SECURITIES—7.7% | ||||||||
Argentine Republic PIK Interest Capitalization 5.77% Interest, 2.51% Capitalization, 12/31/33(14) | 33,322 | 21,493 | ||||||
Bolivarian Republic of Venezuela | ||||||||
RegS 8.500%, 10/8/14(5) | 20,840 | 20,892 | ||||||
RegS 5.750%, 2/26/16(5) | 31,323 | 28,347 | ||||||
RegS 7.000%, 12/1/18(5) | 8,350 | 7,027 | ||||||
Commonwealth of Australia | ||||||||
Series 125 6.250%, 6/15/14 | 14,350 | AUD | 13,745 | |||||
New South Wales Treasury Corp. Series 17 5.500%, 3/1/17 | 10,665 | AUD | 10,695 | |||||
Commonwealth of Canada 2.000%, 3/1/14 | 103,515 | CAD | 100,907 | |||||
| PAR VALUE | VALUE | |||||||
| FOREIGN GOVERNMENT SECURITIES (continued) | ||||||||
Commonwealth of New Zealand Series 415, 6.000%, 4/15/15 | 40,545 | NZD | $ | 35,166 | ||||
Federative Republic of Brazil 12.500%, 1/5/16 | 92,159 | BRL | 44,701 | |||||
Kingdom of Norway Series 21 Treasury Bill, 0.000%, 12/18/13 | 134,200 | NOK | 22,243 | |||||
Mongolia 144A 4.125%, 1/5/18(4) | $ | 16,000 | 14,680 | |||||
Provincia de Neuquen 144A 7.875%, 4/26/21(4) | 6,151 | 5,844 | ||||||
Republic of Colombia 12.000%, 10/22/15 | 27,535,000 | COP | 16,495 | |||||
Republic of Indonesia Series FR-30, 10.750%, 5/15/16 | 132,050,000 | IDR | 12,319 | |||||
Republic of Korea Treasury Bond, Series 1312, 3.000%, 12/10/13 | 36,776,000 | KRW | 34,249 | |||||
Republic of Peru 144A 7.840%, 8/12/20(4) | 50,140 | PEN | 20,841 | |||||
Republic of Portugal Treasury Obligation 4.450%, 6/15/18 | 9,500 | EUR | 12,059 | |||||
Republic of Serbia 144A 5.250%, 11/21/17(4) | 8,900 | 8,878 | ||||||
Republic of South Africa Series R206, 7.500%, 1/15/14 | 310,470 | ZAR | 31,108 | |||||
Republic of Turkey 9.000%, 3/5/14 | 39,560 | TRY | 19,691 | |||||
Russian Federation | ||||||||
144A 7.850%, 3/10/18(4) | 1,005,000 | RUB | 32,134 | |||||
Series 6204 RUB, 7.500%, 3/15/18 | 740,650 | RUB | 23,596 | |||||
RegS 7.500%, 3/31/30(3)(5) | 1,430 | 1,685 | ||||||
State of Qatar 144A 3.125%, 1/20/17(4) | 12,000 | 12,540 | ||||||
See Notes to Financial Statements
8
Table of Contents
VIRTUS MULTI-SECTOR SHORT TERM BOND FUND
SCHEDULE OF INVESTMENTS (Continued)
SEPTEMBER 30, 2013
($ reported in thousands)
| PAR VALUE | VALUE | |||||||
| FOREIGN GOVERNMENT SECURITIES (continued) | ||||||||
United Mexican States Series M, 6.000%, 6/18/15 | 1,096,623 | MXN | $ | 86,841 | ||||
| TOTAL FOREIGN GOVERNMENT SECURITIES | ||||||||
| (Identified Cost $670,856) | 638,176 | |||||||
| MORTGAGE-BACKED SECURITIES—20.9% | ||||||||
| Agency—2.0% | ||||||||
FHLMC | ||||||||
6.000%, 8/1/34 | $ | 608 | 671 | |||||
4.000%, 8/1/42 | 11,157 | 11,668 | ||||||
FNMA | ||||||||
5.500%, 1/1/17 | 106 | 112 | ||||||
6.000%, 5/1/17 | 34 | 36 | ||||||
4.500%, 4/1/18 | 231 | 245 | ||||||
5.000%, 10/1/19 | 677 | 723 | ||||||
5.500%, 2/1/20 | 232 | 244 | ||||||
5.500%, 3/1/20 | 173 | 182 | ||||||
5.500%, 3/1/20 | 22 | 23 | ||||||
5.500%, 3/1/20 | 128 | 134 | ||||||
5.500%, 3/1/20 | 181 | 191 | ||||||
5.500%, 4/1/20 | 337 | 365 | ||||||
5.000%, 6/1/20 | 855 | 914 | ||||||
4.000%, 8/1/25 | 21,820 | 23,170 | ||||||
3.000%, 6/1/27 | 1,687 | 1,749 | ||||||
2.500%, 5/1/28 | 21,308 | 21,479 | ||||||
6.000%, 12/1/32 | 74 | 82 | ||||||
5.500%, 2/1/33 | 114 | 124 | ||||||
5.500%, 5/1/34 | 571 | 621 | ||||||
6.000%, 8/1/34 | 436 | 483 | ||||||
6.000%, 10/1/34 | 321 | 356 | ||||||
6.000%, 10/1/34 | 369 | 403 | ||||||
5.500%, 11/1/34 | 420 | 456 | ||||||
5.500%, 11/1/34 | 153 | 167 | ||||||
6.000%, 11/1/34 | 671 | 733 | ||||||
5.500%, 12/1/34 | 273 | 297 | ||||||
5.500%, 1/1/35 | 456 | 496 | ||||||
6.000%, 1/1/37 | 617 | 673 | ||||||
6.000%, 1/1/37 | 649 | 714 | ||||||
5.500%, 7/1/37 | 10 | 11 | ||||||
6.000%, 7/1/37 | 163 | 178 | ||||||
6.000%, 12/1/37 | 629 | 686 | ||||||
6.000%, 4/1/38 | 436 | 476 | ||||||
4.500%, 4/1/40 | 14,944 | 15,958 | ||||||
5.000%, 7/1/40 | 5,998 | 6,527 | ||||||
5.000%, 7/1/40 | 3,407 | 3,701 | ||||||
5.000%, 8/1/40 | 22,361 | 24,352 | ||||||
| PAR VALUE | VALUE | |||||||
| Agency (continued) | ||||||||
4.000%, 10/1/40 | $ | 275 | $ | 288 | ||||
4.000%, 3/1/41 | 8,347 | 8,751 | ||||||
4.500%, 5/1/41 | 9,710 | 10,386 | ||||||
3.500%, 4/1/42 | 14,218 | 14,496 | ||||||
GNMA | ||||||||
6.500%, 7/15/31 | 14 | 16 | ||||||
6.500%, 8/15/31 | 45 | 51 | ||||||
6.500%, 11/15/31 | 25 | 29 | ||||||
6.500%, 2/15/32 | 25 | 28 | ||||||
6.500%, 4/15/32 | 58 | 65 | ||||||
6.500%, 4/15/32 | 54 | 61 | ||||||
2.586%, 4/16/54 | 9,667 | 10,219 | ||||||
|
| |||||||
| 163,790 | ||||||||
|
| |||||||
| Non-Agency—18.9% | ||||||||
A10 Securitization LLC 13-1, A, 144A 2.400%, 11/15/25(4) | 4,925 | 4,902 | ||||||
ABN AMRO Mortgage Corp. 02-9, M 5.750%, 12/25/32 | 1,181 | 1,170 | ||||||
American General Mortgage Loan Trust | 17,220 | 17,595 | ||||||
Americold LLC Trust 10-ARTA, A1, 144A 3.847%, 1/14/29(4) | 11,149 | 11,672 | ||||||
Banc of America (Merrill Lynch) Commercial Mortgage, Inc. 05-2, B 5.291%, 7/10/43(3) | 10,916 | 11,417 | ||||||
Banc of America Alternative Loan Trust | ||||||||
03-2, CB3 5.750%, 4/25/33 | 23,003 | 24,781 | ||||||
03-10, 2A1 6.000%, 12/25/33 | 4,776 | 5,115 | ||||||
Banc of America Commercial Mortgage Trust 07-2, A4 5.793%, 4/10/49(3) | 14,232 | 15,933 | ||||||
See Notes to Financial Statements
9
Table of Contents
VIRTUS MULTI-SECTOR SHORT TERM BOND FUND
SCHEDULE OF INVESTMENTS (Continued)
SEPTEMBER 30, 2013
($ reported in thousands)
| PAR VALUE | VALUE | |||||||
| MORTGAGE-BACKED SECURITIES (continued) | ||||||||
| Non-Agency (continued) | ||||||||
Banc of America Funding Corp. | ||||||||
04-4, 3A1 4.750%, 10/25/19 | $ | 6,007 | $ | 6,142 | ||||
04-B, 2A1 5.452%, 11/20/34(3) | 1,331 | 1,319 | ||||||
06-2, 3A1 6.000%, 3/25/36 | 4,773 | 4,759 | ||||||
Banc of America Mortgage Securities, Inc. | ||||||||
04-11, 2A1 5.750%, 1/25/35 | 3,165 | 3,247 | ||||||
05-3, 2A2 5.500%, 3/25/35 | 741 | 740 | ||||||
05-3, 1A15 5.500%, 4/25/35 | 3,969 | 4,060 | ||||||
Bank of America (Merrill Lynch) – Deutsche Bank | 19,916 | 20,533 | ||||||
Bank of America Re-Remic Trust | 7,500 | 7,546 | ||||||
Bayview Commercial Asset Trust | ||||||||
07-5A, A2, 144A 1.079%, 10/25/37(3)(4) | 18,361 | 17,332 | ||||||
08-1, A2A, 144A 1.179%, 1/25/38(3)(4) | 17,330 | 17,062 | ||||||
08-1, A3, 144A 1.679%, 1/25/38(3)(4) | 29,970 | 26,693 | ||||||
BCAP LLC Trust | 3,125 | 3,122 | ||||||
Bear Stearns Adjustable Rate Mortgage Trust | ||||||||
03-9, 4A1 4.772%, 2/25/34(3) | 11,393 | 11,425 | ||||||
04-10, 14A1 5.137%, 1/25/35(3) | 2,748 | 2,723 | ||||||
| PAR VALUE | VALUE | |||||||
| Non-Agency (continued) | ||||||||
05-8, A3, 144A 5.280%, 8/25/35(3)(4) | $ | 913 | $ | 928 | ||||
Bear Stearns Alternate Loan Trust 05-4, 24A1 2.711%, 5/25/35(3) | 19,431 | 19,382 | ||||||
Bear Stearns Asset Backed Securities Trust 03-AC4. A 5.500%, 9/25/33(3) | 10,769 | 10,955 | ||||||
Bear Stearns Commercial Mortgage Securities, Inc. | ||||||||
06-T22, AM 5.764%, 4/12/38(3) | 11,600 | 12,532 | ||||||
06-PW12, AM 5.895%, 9/11/38(3) | 9,250 | 10,056 | ||||||
06-PW14, AM 5.243%, 12/11/38 | 10,000 | 10,889 | ||||||
05-PW10, AM 5.449%, 12/11/40(3) | 14,200 | 15,217 | ||||||
04-PWR3, A4 4.715%, 2/11/41 | 3,672 | 3,690 | ||||||
06-PW13, AM 5.582%, 9/11/41(3) | 3,272 | 3,578 | ||||||
04-PWR5, A5 4.978%, 7/11/42(3) | 3,925 | 4,021 | ||||||
07-PW15, RAM 5.363%, 2/11/44 | 22,100 | 22,428 | ||||||
07-PW17, A4 5.694%, 6/11/50(3) | 21,890 | 24,644 | ||||||
07-PW18, A4 5.700%, 6/11/50 | 16,950 | 19,128 | ||||||
07-PW18, AM 6.084%, 6/11/50(3) | 12,400 | 13,804 | ||||||
Citicorp Mortgage Securities, Inc. 07-1,A1 5.500%, 1/25/22 | 498 | 501 | ||||||
Citigroup – Deutsche Bank Commercial Mortgage Trust | ||||||||
05-CD1, AM 5.393%, 7/15/44(3) | 6,410 | 6,891 | ||||||
06-CD2, A4 5.484%, 1/15/46(3) | 2,659 | 2,861 | ||||||
See Notes to Financial Statements
10
Table of Contents
VIRTUS MULTI-SECTOR SHORT TERM BOND FUND
SCHEDULE OF INVESTMENTS (Continued)
SEPTEMBER 30, 2013
($ reported in thousands)
| PAR VALUE | VALUE | |||||||
| MORTGAGE-BACKED SECURITIES (continued) | ||||||||
| Non-Agency (continued) | ||||||||
07-CD4, A4 5.322%, 12/11/49 | $ | 8,480 | $ | 9,376 | ||||
Citigroup Commercial Mortgage 2.110%, 1/1/18 | 6,502 | 6,530 | ||||||
Countrywide Alternative Loan Trust | ||||||||
04-18CB, 1A1 6.000%, 9/25/34 | 16,444 | 17,086 | ||||||
04-36CBC, 2A1 5.500%, 2/25/35 | 8,513 | 8,312 | ||||||
Countrywide Home Loan Mortgage Pass-Through-Trust | ||||||||
02-35, 1A2 5.000%, 2/25/18 | 1,433 | 1,461 | ||||||
03-4, 1A15 5.500%, 4/25/33 | 2,731 | 2,847 | ||||||
03-28, A8 5.500%, 8/25/33 | 1,356 | 1,388 | ||||||
04-6, 1A2 2.695%, 5/25/34(3) | 2,577 | 2,537 | ||||||
04-4, A6 5.500%, 5/25/34 | 1,665 | 1,719 | ||||||
Credit Suisse Commercial Mortgage Trust | ||||||||
13-IVR3, A2, 144A 3.000%, 5/25/43(3)(4) | 6,258 | 5,801 | ||||||
07-C2, A3 5.542%, 1/15/49(3) | 12,995 | 14,399 | ||||||
Credit Suisse First Boston Mortgage Securities Corp. | ||||||||
03-27, 5A3 5.250%, 11/25/33 | 3,172 | 3,208 | ||||||
04-8, 7A1 6.000%, 12/25/34 | 9,252 | 9,584 | ||||||
05-11, 8A10 5.500%, 12/25/35 | 3,721 | 3,838 | ||||||
04-CF2, 1M1, 144A 5.250%, 1/25/43(3)(4) | 3,625 | 3,929 | ||||||
| PAR VALUE | VALUE | |||||||
| Non-Agency (continued) | ||||||||
Extended Stay America Trust | ||||||||
13-ESH7, A17, 144A 2.295%, 12/5/31(4) | $ | 29,200 | $ | 28,733 | ||||
13-ESH7, A27, 144A 2.958%, 12/5/31(4) | 8,340 | 8,152 | ||||||
GMAC Commercial Mortgage Securities, Inc. | 886 | 888 | ||||||
GMAC Mortgage Corp. Loan Trust | ||||||||
03-J7 5.500%, 11/25/33 | 2,425 | 2,499 | ||||||
04-AR1, 12A 3.296%, 6/25/34(3) | 10,464 | 10,684 | ||||||
05-AR1, 5A 5.271%, 3/18/35(3) | 4,798 | 4,780 | ||||||
Goldman Sachs Mortgage Securities Corp. II | ||||||||
07-EOP, G, 144A 2.790%, 3/6/20(3)(4) | 8,870 | 8,889 | ||||||
07-EOP, H, 144A 3.300%, 3/6/20(3)(4) | 6,238 | 6,262 | ||||||
07-EOP, J, 144A 4.085%, 3/6/20(3)(4) | 6,400 | 6,420 | ||||||
05-5F, 2A8 5.500%, 6/25/35 | 2,970 | 2,987 | ||||||
07-GG10, A4 5.993%, 8/10/45(3) | 23,995 | 26,620 | ||||||
Greenwich Capital Commercial Funding Corp. Commercial Mortgage Trust | ||||||||
04-GG1, A7 5.317%, 6/10/36(3) | 5,662 | 5,716 | ||||||
07-GG11, A4 5.736%, 12/10/49 | 13,631 | 15,314 | ||||||
GSR Mortgage Loan Trust | ||||||||
04-15F, 2A2 5.000%, 12/25/34 | 3,893 | 4,003 | ||||||
See Notes to Financial Statements
11
Table of Contents
VIRTUS MULTI-SECTOR SHORT TERM BOND FUND
SCHEDULE OF INVESTMENTS (Continued)
SEPTEMBER 30, 2013
($ reported in thousands)
| PAR VALUE | VALUE | |||||||
| MORTGAGE-BACKED SECURITIES (continued) | ||||||||
| Non-Agency (continued) | ||||||||
05-AR4, 6A1 5.250%, 7/25/35(3) | $ | 8,802 | $ | 8,753 | ||||
07-1F, 2A2 5.500%, 1/25/37 | 871 | 820 | ||||||
Heller Financial Commercial Mortgage Asset | 1,910 | 1,995 | ||||||
JPMorgan Chase Commercial Mortgage Securities Trust | ||||||||
13-ALC, A 144A 1.680%, 7/17/26(3)(4) | 8,700 | 8,698 | ||||||
10-CNTR, A1, 144A 3.300%, 8/5/32(4) | 12,465 | 13,058 | ||||||
10-CNTR, A2, 144A 4.311%, 8/5/32(4) | 4,550 | 4,790 | ||||||
04-C1, A3 4.719%, 1/15/38 | 2,770 | 2,786 | ||||||
06-LDP7, A4 6.056%, 4/15/45(3) | 12,301 | 13,514 | ||||||
06-LDP7, AM 6.056%, 4/15/45(3) | 22,312 | 24,517 | ||||||
06-LDP9, A3 5.336%, 5/15/47 | 20,649 | 22,708 | ||||||
07-LDPX, AM 5.464%, 1/15/49(3) | 24,049 | 24,176 | ||||||
07-LD12, A4 5.882%, 2/15/51(3) | 8,029 | 9,027 | ||||||
JPMorgan Chase Commercial Mortgage SecuritiesTrust | 13,185 | 14,008 | ||||||
JPMorgan Chase Mortgage Finance Corp. 07-A1, 1A1 2.761%, 2/25/37(3) | 3,970 | 3,979 | ||||||
JPMorgan Chase Mortgage Trust | ||||||||
03-A2, 3A1 2.105%, 11/25/33(3) | 8,361 | 8,246 | ||||||
| PAR VALUE | VALUE | |||||||
| Non-Agency (continued) | ||||||||
04-A4, 2A1 2.463%, 9/25/34(3) | $ | 5,745 | $ | 5,797 | ||||
05-A1, 4A1 3.783%, 2/25/35(3) | 1,318 | 1,326 | ||||||
05-A2, 4A1 5.027%, 4/25/35(3) | 1,621 | 1,601 | ||||||
05-A4, 3A1 2.343%, 7/25/35(3) | 9,968 | 9,882 | ||||||
06-A6, 3A3L 5.132%, 10/25/36(3) | 2,171 | 1,952 | ||||||
JPMorgan Mortgage Trust 06-A4, 3A1 5.222%, 6/25/36(3) | 8,467 | 7,311 | ||||||
Leaf II Receivables Funding LLC | 6,850 | 6,850 | ||||||
Lehman Brothers – UBS Commercial Mortgage Trust | ||||||||
04-C7, A6 4.786%, 10/15/29(3) | 10,536 | 10,768 | ||||||
06-C3, AM 5.712%, 3/15/39(3) | 7,615 | 8,225 | ||||||
06-C6, A4 5.372%, 9/15/39 | 13,750 | 15,120 | ||||||
07-C2, A3 5.430%, 2/15/40 | 6,495 | 7,146 | ||||||
07-C6, A4 5.858%, 7/15/40(3) | 17,143 | 18,823 | ||||||
07-C7, A3 5.866%, 9/15/45(3) | 11,201 | 12,535 | ||||||
MASTR Adjustable Rate Mortgages Trust 04-12,3A1 2.685%, 11/25/34(3) | 2,956 | 2,925 | ||||||
MASTR Alternative Loan Trust | ||||||||
04-7, 4A1 4.500%, 7/25/19 | 6,049 | 6,196 | ||||||
03-8, 2A1 5.750%, 11/25/33 | 10,323 | 10,712 | ||||||
04-6, 10A1 6.000%, 7/25/34 | 7,916 | 8,174 | ||||||
04-6, 7A1 6.000%, 7/25/34 | 7,866 | 8,075 | ||||||
See Notes to Financial Statements
12
Table of Contents
VIRTUS MULTI-SECTOR SHORT TERM BOND FUND
SCHEDULE OF INVESTMENTS (Continued)
SEPTEMBER 30, 2013
($ reported in thousands)
| PAR VALUE | VALUE | |||||||
| MORTGAGE-BACKED SECURITIES (continued) | ||||||||
| Non-Agency (continued) | ||||||||
05-2, 2A1 6.000%, 1/25/35 | $ | 4,834 | $ | 4,897 | ||||
05-2, 1A1 6.500%, 3/25/35 | 13,078 | 13,654 | ||||||
MASTR Asset Securitization Trust | ||||||||
04-6, 4A1 5.000%, 7/25/19 | 1,894 | 1,965 | ||||||
05-1, 1A1 5.000%, 5/25/20 | 1,331 | 1,373 | ||||||
Merrill Lynch – Countrywide Commercial Mortgage Trust | ||||||||
06-3, A4 5.414%, 7/12/46(3) | 11,700 | 12,793 | ||||||
06-4, A3 5.172%, 12/12/49(3) | 10,300 | 11,244 | ||||||
Merrill Lynch Mortgage Investors, Inc. | 10,000 | 11,599 | ||||||
Merrill Lynch Mortgage Trust | 7,520 | 8,143 | ||||||
Morgan Stanley Capital I Trust | ||||||||
06-T23, AM 5.987%, 8/12/41(3) | 10,575 | 11,572 | ||||||
06-IQ12, A4 5.332%, 12/15/43 | 14,865 | 16,290 | ||||||
07-IQ14, A4 5.692%, 4/15/49 | 17,390 | 19,324 | ||||||
07-IQ14, AM 5.875%, 4/15/49 | 19,699 | 20,099 | ||||||
07-LQ14, AMFX 5.877%, 4/15/49 | 5,000 | 5,042 | ||||||
07-LQ16, A4 5.809%, 12/12/49 | 22,735 | 25,599 | ||||||
Morgan Stanley Mortgage Loan Trust | ||||||||
04-2AR, 3A 2.247%, 2/25/34(3) | 2,358 | 2,297 | ||||||
| PAR VALUE | VALUE | |||||||
| Non-Agency (continued) | ||||||||
04-2AR, 4A 4.485%, 2/25/34(3) | $ | 2,429 | $ | 2,458 | ||||
Motel 6 Trust | 20,790 | 20,148 | ||||||
Nomura Asset Acceptance Corp. | ||||||||
04-R1, A1, 144A 6.500%, 3/25/34(4) | 13,555 | 14,287 | ||||||
04-R3, A1, 144A 6.500%, 2/25/35(4) | 7,939 | 8,279 | ||||||
05-WF1, 2A2 4.786%, 3/25/35 | 4,219 | 4,306 | ||||||
ORES NPL LLC | 2,624 | 2,625 | ||||||
Residential Accredit Loans, Inc. | 3,442 | 3,521 | ||||||
Residential Asset Mortgage Products, Inc. | ||||||||
04-SL2, A3 7.000%, 10/25/31 | 3,509 | 3,760 | ||||||
04-SL1, A8 6.500%, 11/25/31 | 3,852 | 3,968 | ||||||
04-SL4, A3 6.500%, 7/25/32 | 2,210 | 2,286 | ||||||
Residential Asset Securitization Trust | ||||||||
13-LT2, A, 144A 2.833%, 5/22/28(4) | 15,043 | 15,032 | ||||||
03,A11, A9 5.750%, 11/25/33 | 4,112 | 4,242 | ||||||
04-A1, A5 5.500%, 4/25/34 | 16,596 | 17,573 | ||||||
04-QS8, A6 5.500%, 6/25/34 | 7,842 | 8,082 | ||||||
Residential Funding Mortgage Securities I, Inc. | ||||||||
06-S12, 1A1 5.500%, 12/25/21 | 2,596 | 2,693 | ||||||
05-S1, 1A2 5.500%, 2/25/35 | 2,670 | 2,679 | ||||||
06-S4, A2 6.000%, 4/25/36 | 1,459 | 1,365 | ||||||
See Notes to Financial Statements
13
Table of Contents
VIRTUS MULTI-SECTOR SHORT TERM BOND FUND
SCHEDULE OF INVESTMENTS (Continued)
SEPTEMBER 30, 2013
($ reported in thousands)
| PAR VALUE | VALUE | |||||||
| MORTGAGE-BACKED SECURITIES (continued) | ||||||||
| Non-Agency (continued) | ||||||||
S2 Hospitality LLC 12-LV1, A, 144A 4.500%, 4/15/25(4) | $ | 672 | $ | 672 | ||||
SBA Tower Trust 144A 4.254%, 4/15/15(4) | 13,535 | 13,789 | ||||||
Sequoia Mortgage Trust 12-3, A1 3.500%, 7/25/42(3) | 667 | 654 | ||||||
SMA Issuer I LLC | 5,950 | 5,960 | ||||||
Springleaf Mortgage Loan Trust | ||||||||
11-1A, A1, 144A 4.050%, 9/25/41(4) | 5,767 | 5,944 | ||||||
09-1, A6, 144A 5.750%, 9/25/48(4) | 13,685 | 13,726 | ||||||
12-3A, A, 144A 1.570%, 12/25/59(4) | 5,073 | 5,024 | ||||||
Structured Adjustable Rate Mortgage Loan Trust | ||||||||
04-4, 3A4 2.551%, 4/25/34(3) | 4,563 | 4,501 | ||||||
04-4, 3A2 2.551%, 4/25/34(3) | 4,481 | 4,468 | ||||||
Structured Asset Securities Corp Assistance Loan Trust 03-AL1, A, 144A 3.357%, 4/25/31(4) | 13,155 | 12,894 | ||||||
Structured Asset Securities Corp. Mortgage Pass-Through Certificates | ||||||||
02-AL1, A3 3.450%, 2/25/32 | 6,200 | 6,117 | ||||||
03-21, 2A2 5.250%, 8/25/33 | 2,682 | 2,724 | ||||||
03-33H, 1A1 5.500%, 10/25/33 | 5,547 | 5,676 | ||||||
| PAR VALUE | VALUE | |||||||
| Non-Agency (continued) | ||||||||
04-21XS, 2A4A 4.900%, 12/25/34(3) | $ | 1,800 | $ | 1,808 | ||||
SunTrust Adjustable Rate Mortgage Loan Trust | 1,576 | 1,545 | ||||||
Wachovia Bank Commercial Mortgage Trust | ||||||||
03-C8, D 5.261%, 11/15/35(3) | 5,500 | 5,513 | ||||||
04-C15, B 4.892%, 10/15/41 | 14,875 | 15,346 | ||||||
05-C20, AMFX 5.179%, 7/15/42(3) | 11,936 | 12,677 | ||||||
06-C25, AM 5.915%, 5/15/43(3) | 18,625 | 20,183 | ||||||
06-C25, A4 5.915%, 5/15/43(3) | 10,000 | 10,887 | ||||||
07-C30, A5 5.342%, 12/15/43 | 39,765 | 44,001 | ||||||
07-C30, AM 5.383%, 12/15/43 | 24,070 | 25,629 | ||||||
07-C31, A4 5.509%, 4/15/47 | 12,177 | 13,331 | ||||||
07-31, AM 5.591%, 4/15/47(3) | 34,000 | 36,525 | ||||||
07-C32, A3 5.936%, 6/15/49(3) | 17,577 | 19,567 | ||||||
07-C33, A5 6.123%, 2/15/51(3) | 1,265 | 1,435 | ||||||
Washington Mutual Commercial Mortgage Securities Trust | ||||||||
06-SL1, A, 144A 5.424%, 11/23/43(3)(4) | 6,303 | 6,224 | ||||||
07-SL3, A, 144A 6.104%, 3/23/45(3)(4) | 1,177 | 1,195 | ||||||
Washington Mutual Mortgage Pass-Through Certificates | ||||||||
04-CB1, 5A 5.000%, 6/25/19 | 2,592 | 2,673 | ||||||
See Notes to Financial Statements
14
Table of Contents
VIRTUS MULTI-SECTOR SHORT TERM BOND FUND
SCHEDULE OF INVESTMENTS (Continued)
SEPTEMBER 30, 2013
($ reported in thousands)
| PAR VALUE | VALUE | |||||||
| MORTGAGE-BACKED SECURITIES (continued) | ||||||||
| Non-Agency (continued) | ||||||||
03-AR6, A1 2.440%, 6/25/33(3) | $ | 1,602 | $ | 1,624 | ||||
04-CB1, 2A 5.000%, 6/25/34 | 4,877 | 5,107 | ||||||
Wells Fargo Mortgage Backed Securities Trust | ||||||||
06-17, A1 5.500%, 11/25/21 | 326 | 330 | ||||||
03-G, A1 2.490%, 6/25/33(3) | 1,817 | 1,825 | ||||||
03-J, 5A1 2.554%, 10/25/33(3) | 922 | 920 | ||||||
04-4, A9 5.500%, 5/25/34 | 3,432 | 3,572 | ||||||
04-Z, 2A1 2.624%, 12/25/34(3) | 11,201 | 11,310 | ||||||
04-CC, A1 2.618%, 1/25/35(3) | 4,578 | 4,563 | ||||||
05-12, 1A1 5.500%, 11/25/35 | 8,038 | 8,147 | ||||||
05-14, 2A1 5.500%, 12/25/35 | 5,607 | 5,938 | ||||||
06-6, 1A15 5.750%, 5/25/36 | 792 | 783 | ||||||
06-16, A5 5.000%, 11/25/36 | 2,356 | 2,422 | ||||||
07-16, 1A1 6.000%, 12/28/37 | 8,704 | 9,066 | ||||||
07-AR10, 2A1 6.212%, 1/25/38(3) | 6,308 | 6,228 | ||||||
|
| |||||||
| 1,574,966 | ||||||||
| TOTAL MORTGAGE-BACKED SECURITIES | ||||||||
| (Identified Cost $1,689,284) | 1,738,756 | |||||||
| ASSET-BACKED SECURITIES—15.8% | ||||||||
1st Financial Bank U.S.A. | ||||||||
10-C, B, 144A 5.190%, 9/17/18(4) | 6,000 | 6,034 | ||||||
10-D, C, 144A 5.920%, 6/17/19(4) | 3,000 | 3,032 | ||||||
AABS Ltd. 13-1, A 4.875%, 1/10/38(3) | 11,955 | 11,985 | ||||||
| PAR VALUE | VALUE | |||||||
| ASSET-BACKED SECURITIES (continued) | ||||||||
AmeriCredit Automobile Receivables Trust | ||||||||
10-4, C 2.760%, 5/9/16 | $ | 2,833 | $ | 2,870 | ||||
11-1, C 2.850%, 8/8/16 | 800 | 816 | ||||||
11-2, C 3.190%, 10/12/16 | 1,500 | 1,532 | ||||||
10-4, D 4.200%, 11/8/16 | 7,700 | 7,972 | ||||||
11-1, D 4.260%, 2/8/17 | 11,119 | 11,591 | ||||||
11-5, D 5.050%, 12/8/17 | 5,010 | 5,368 | ||||||
12-1, C 2.670%, 1/8/18 | 4,625 | 4,769 | ||||||
12-3, C 2.420%, 5/8/18 | 16,750 | 17,002 | ||||||
12-3, D 3.030%, 7/9/18 | 19,762 | 20,079 | ||||||
12-4, D 2.680%, 10/9/18 | 7,150 | 7,161 | ||||||
13-2, D 2.420%, 5/8/19 | 20,600 | 20,176 | ||||||
Ameriquest Mortgage Securities, Inc. 03-10, AF6 5.210%, 11/25/33(3) | 2,300 | 2,392 | ||||||
Asset Backed Funding Certificates 05-AQ1, A6 | 5,020 | 5,167 | ||||||
Avis Budget Rental Car Funding LLC | ||||||||
(AESOP) 11-3A, A, 144A 3.410%, 11/20/16(4) | 12,848 | 13,531 | ||||||
(AESOP) 12-3A, A, 144A 2.100%, 3/20/19(4) | 23,085 | 23,028 | ||||||
(AESOP) 13-1A, A, 144A 1.920%, 9/20/19(4) | 18,200 | 17,835 | ||||||
Bayview Financial Acquisition Trust 07-A, 1A2 6.205%, 5/28/37(3) | 11,697 | 12,548 | ||||||
See Notes to Financial Statements
15
Table of Contents
VIRTUS MULTI-SECTOR SHORT TERM BOND FUND
SCHEDULE OF INVESTMENTS (Continued)
SEPTEMBER 30, 2013
($ reported in thousands)
| PAR VALUE | VALUE | |||||||
| ASSET-BACKED SECURITIES (continued) | ||||||||
Bayview Financial Mortgage-Pass-Through Trust | ||||||||
06-B, 1A2 5.800%, 4/28/36(3) | $ | 330 | $ | 337 | ||||
06-A, 1A2 5.483%, 2/28/41(3) | 220 | 224 | ||||||
06-A, 1A4 6.087%, 2/28/41(3) | 15,978 | 17,140 | ||||||
Beacon Container Finance LLC 12-1A, | 11,056 | 11,102 | ||||||
Bush Truck Leasing LLC 11-44, A, 144A 5.000%, 9/25/18(4) | 1,358 | 1,352 | ||||||
BXG Receivables Note Trust | ||||||||
10-A, A, 144A | 3,525 | 3,668 | ||||||
12-A, A, 144A 2.660%, 12/2/27(4) | 7,073 | 6,989 | ||||||
13-A, A, 144A 3.010%, 12/4/28(4) | 12,000 | 12,066 | ||||||
California Republic Auto Receivables Trust | ||||||||
12-1, B, 144A 1.760%, 1/16/18(4) | 13,570 | 13,476 | ||||||
13-1, B, 144A 2.240%, 1/15/19(4) | 11,600 | 11,620 | ||||||
Capital Auto Receivables Asset Trust 13-1, C 1.740%, 10/22/18 | 5,425 | 5,339 | ||||||
CarMax Auto Owner Trust 12-1, B 1.760%, 8/15/17 | 6,190 | 6,277 | ||||||
CarNow Auto Receivables Trust | ||||||||
12-1A, B, 144A 3.240%, 3/15/16(4) | 1,630 | 1,636 | ||||||
12-1A, C, 144A 4.940%, 3/15/16(4) | 3,750 | 3,808 | ||||||
13-1A, B, 144A 1.970%, 11/15/17(4) | 4,570 | 4,538 | ||||||
13-1A,C, 144A 2.980%, 11/15/17(4) | 7,244 | 7,202 | ||||||
| PAR VALUE | VALUE | |||||||
| ASSET-BACKED SECURITIES (continued) | ||||||||
Centre Point Funding LLC 12-2A, 1, 144A 2.610%, 8/20/21(4) | $ | 12,296 | $ | 12,368 | ||||
CFC LLC 13-1A, B, 144A | 6,740 | 6,648 | ||||||
Cheesecake Factory Holdings, Inc. | 23,934 | 23,864 | ||||||
CIT Equipment Collateral | 10,000 | 10,013 | ||||||
Citicorp Residential Mortgage Securities, Inc. | ||||||||
07-1, A6 5.702%, 3/25/37(3) | 4,346 | 4,517 | ||||||
07-12,A6 5.953%, 6/25/37(3) | 11,001 | 11,149 | ||||||
07-2, A4 5.953%, 6/25/37(3) | 7,000 | 6,865 | ||||||
CNH Equipment Trust | ||||||||
12-B, A4 1.160%, 6/15/20 | 10,000 | 10,043 | ||||||
12-B, B 1.780%, 6/15/20 | 4,000 | 4,043 | ||||||
Conseco Financial Corp. | ||||||||
94-1, A5 7.650%, 4/15/19 | 244 | 255 | ||||||
01-3, A4 6.910%, 5/1/33(3) | 13,824 | 15,613 | ||||||
Countrywide Asset-Backed Certificates | ||||||||
04-10, AF6 4.485%, 12/25/34(3) | 3,291 | 3,399 | ||||||
04-12, AF6 4.634%, 3/25/35(3) | 1,735 | 1,779 | ||||||
05-1, AF5A 5.497%, 7/25/35(3) | 13,600 | 13,132 | ||||||
05-12, 2A3 5.069%, 2/25/36(3) | 3,732 | 3,871 | ||||||
See Notes to Financial Statements
16
Table of Contents
VIRTUS MULTI-SECTOR SHORT TERM BOND FUND
SCHEDULE OF INVESTMENTS (Continued)
SEPTEMBER 30, 2013
($ reported in thousands)
| PAR VALUE | VALUE | |||||||
| ASSET-BACKED SECURITIES (continued) | ||||||||
Cronos Containers Program Ltd. | $ | 16,002 | $ | 16,156 | ||||
Direct Capital Funding IV LLC 13-1, D, 144A | 3,555 | 3,542 | ||||||
Dominos Pizza Master Issuer LLC 12-1A, A2, 144A | 39,540 | 42,466 | ||||||
Drug Royalty LP | ||||||||
I 12-1, A2, 144A | 5,074 | 5,207 | ||||||
II 12-1, A1, 144A 4.268%, 1/15/25(3)(4) | 6,334 | 6,429 | ||||||
II 12-1, A2, 144A | 12,026 | 12,087 | ||||||
DSC Floorplan Master Owner Trust 11-1, A, 144A | 8,500 | 8,560 | ||||||
DT Auto Owner Trust | ||||||||
12-1A, C, 144A | 9,975 | 10,026 | ||||||
13-1A, C, 144A | 17,775 | 17,820 | ||||||
144A | 17,000 | 16,997 | ||||||
Exeter Automobile Receivables Trust | ||||||||
12-1A, C, 144A | 8,500 | 8,777 | ||||||
12-2A, C, 144A | 8,050 | 7,891 | ||||||
13-2A, B 144A | 17,820 | 17,915 | ||||||
13-1A, C, 144A | 15,000 | 14,742 | ||||||
13-1A, D, 144A | 5,000 | 4,808 | ||||||
Fairway Outdoor Funding LLC 12-1A, | 13,355 | 13,312 | ||||||
| PAR VALUE | VALUE | |||||||
| ASSET-BACKED SECURITIES (continued) | ||||||||
Global Science Finance S.R.L. 13-1A, A, 144A | $ | 23,671 | $ | 22,979 | ||||
GMAC Mortgage Corp. Loan Trust 06-HLTV, A4 | 6,498 | 6,481 | ||||||
Great America Leasing Receivables 13-1, A4, 144A | 2,085 | 2,084 | ||||||
GSAA Home Equity Trust 05-12, AF3W | 16,233 | 16,125 | ||||||
GSAA Trust | 949 | 1,007 | ||||||
Harley-Davidson Motorcycle Trust 10-1, C | 8,500 | 8,602 | ||||||
Hertz Vehicle Financing LLC | ||||||||
09-2A, A2 144A | 5,000 | 5,270 | ||||||
13-1A, A1, 144A | 18,325 | 18,200 | ||||||
11-1A, A2, 144A | 12,290 | 12,958 | ||||||
Hilton Grand Vacations Trust | 9,532 | 9,544 | ||||||
Huntington Auto Trust 12-2, R, 144A | 75,344 | 3,202 | ||||||
Hyundai Auto Receivables Trust 12-B, C | 10,000 | 10,103 | ||||||
IMC Home Equity Loan Trust 97-5, A9 7.310%, 11/20/28 | 4,477 | 4,502 | ||||||
See Notes to Financial Statements
17
Table of Contents
VIRTUS MULTI-SECTOR SHORT TERM BOND FUND
SCHEDULE OF INVESTMENTS (Continued)
SEPTEMBER 30, 2013
($ reported in thousands)
| PAR VALUE | VALUE | |||||||
| ASSET-BACKED SECURITIES (continued) | ||||||||
IndyMac Manufactured Housing Contract 98-1, A3 6.370%, 9/25/28 | $ | 1,359 | $ | 1,404 | ||||
Leaf II Receivables Funding LLC 12-1, D, 144A 4.680%, | 5,859 | 5,772 | ||||||
Lehman Brothers Manufactured Housing Contract Trust 01-B, A3 4.350%, 4/15/40 | 5,888 | 6,074 | ||||||
Marriott Vacation Club Owner Trust | ||||||||
12-1A, A 144A 2.510%, | 18,677 | 18,838 | ||||||
10-1A, A 144A 3.540%, 10/20/32(4) | 927 | 959 | ||||||
10-1A, B 144A 4.520%, 10/20/32(4) | 1,808 | 1,891 | ||||||
Master Credit Card Trust 12-2A, A 144A 0.780%, 4/21/17(4) | 14,460 | 14,417 | ||||||
Miramax LLC 11-1A, A 144A 6.250%, 10/20/21(4) | 11,888 | 12,354 | ||||||
MMCA Auto Owner Trust 11-A, B 144A 2.720%, 10/17/16(4) | 3,500 | 3,563 | ||||||
Nations Equipment Finance Funding I LLC | ||||||||
13-1A, B 144A 3.818%, | 4,000 | 3,992 | ||||||
13-1A, C 144A 5.500%, 5/20/21(4) | 7,833 | 7,532 | ||||||
New Century Home Equity Loan Trust 05-A, A4W 5.035%, 8/25/35(3) | 18,180 | 17,201 | ||||||
Orange Lake Timeshare Trust | ||||||||
12-AA, A 144A 3.450%, 3/10/27(4) | 7,876 | 8,101 | ||||||
| PAR VALUE | VALUE | |||||||
| ASSET-BACKED SECURITIES (continued) | ||||||||
12-AA, B 144A 4.870%, 3/10/27(4) | $ | 741 | $ | 758 | ||||
Popular ABS Mortgage Pass-Through-Trust 05-5, AF3 4.895%, 11/25/35(3) | 10,214 | 10,058 | ||||||
Rental Car Finance Corp. | 4,000 | 4,111 | ||||||
Residential Asset Mortgage Products, Inc. 03-RS8, AI7 5.015%, 9/25/33(3) | 1,598 | 1,626 | ||||||
Residential Funding Mortgage Securities II Home Loan Trust | ||||||||
06-HI2, A3 5.790%, 2/25/36 | 5,991 | 6,077 | ||||||
06-H11, M1 6.010%, 2/25/36(3) | 6,661 | 6,626 | ||||||
07-HI1, A3 5.720%, 3/25/37 | 18,394 | 18,493 | ||||||
Santander Drive Auto Receivables Trust | ||||||||
11-2, B 2.660%, 1/15/16 | 9,560 | 9,615 | ||||||
10-B, C 144A 3.020%, 10/17/16(4) | 15,530 | 15,684 | ||||||
12-4, C 2.940%, 12/15/17 | 5,170 | 5,272 | ||||||
12-2, D 3.870%, 2/15/18 | 31,045 | 32,014 | ||||||
12-6, C 1.940%, 3/15/18 | 9,645 | 9,576 | ||||||
12-5, C 2.700%, 8/15/18 | 4,850 | 4,881 | ||||||
12-6, D 2.520%, 10/15/18 | 17,455 | 17,259 | ||||||
13-1, D 2.270%, 1/15/19 | 13,305 | 13,008 | ||||||
13-3, C 1.810%, 4/15/19 | 15,400 | 15,130 | ||||||
See Notes to Financial Statements
18
Table of Contents
VIRTUS MULTI-SECTOR SHORT TERM BOND FUND
SCHEDULE OF INVESTMENTS (Continued)
SEPTEMBER 30, 2013
($ reported in thousands)
| PAR VALUE | VALUE | |||||||
| ASSET-BACKED SECURITIES (continued) | ||||||||
Security National Mortgage Loan Trust 06-3A, A1 144A 0.459%, 1/25/37(3)(4) | $ | 2,393 | $ | 2,331 | ||||
Sierra Timeshare Receivables Funding, LLC | ||||||||
07-2A, A1 144A 5.370%, 9/20/19(4) | 981 | 986 | ||||||
10-3A, B 144A 4.440%, 11/20/25(4) | 5,190 | 5,333 | ||||||
11-1A, B 144A 4.230%, | 5,440 | 5,585 | ||||||
12-2A, B 144A 3.420%, | 6,977 | 7,066 | ||||||
12-3A, A 144A 1.870%, | 11,041 | 11,044 | ||||||
13-1A, A 144A 1.590%, 11/20/29(4) | 10,285 | 10,256 | ||||||
Silverleaf Finance XV LLC 12-D, A 144A 3.000%, 3/17/25(4) | 15,907 | 16,041 | ||||||
SLM Corp. | ||||||||
12-B, A2 144A 3.480%, 10/15/30(4) | 12,000 | 12,579 | ||||||
12-C, A2 144A 3.310%, 10/15/46(4) | 11,700 | 12,149 | ||||||
SNAAC Auto Receivables Trust 12-1A, A 144A 1.780%, | 770 | 772 | ||||||
Soundview Home Loan Trust | 10,824 | 10,376 | ||||||
Structured Asset Investment Loan Trust 2005-He1 05-HE1, M1 0.649%, 7/25/35(3) | 5,700 | 5,244 | ||||||
Structured Asset Securities Corp. | ||||||||
01-SB1, A2 3.375%, 8/25/31 | 3,162 | 3,107 | ||||||
05-S7, A2 144A 0.479%, 12/25/35(3)(4) | 7,037 | 6,717 | ||||||
| PAR VALUE | VALUE | |||||||
| ASSET-BACKED SECURITIES (continued) | ||||||||
SVO VOI Mortgage Corp. | ||||||||
10-AA, A 144A 3.650%, 7/20/27(4) | $ | 6,408 | $ | 6,598 | ||||
12-AA, A 144A 2.000%, 9/20/29(4) | 12,395 | 12,335 | ||||||
TAL Advantage I LLC | ||||||||
12-1A, A 144A 3.860%, | 14,560 | 14,705 | ||||||
13-1A, A 144A 2.830%, | 11,818 | 11,431 | ||||||
Terwin Mortgage Trust 04-15AL, A1 144A 5.775%, 7/25/34(3)(4) | 7,461 | 7,118 | ||||||
Textainer Marine Containers Ltd. 13-1A, A 144A 3.900%, | 20,000 | 20,164 | ||||||
Tidewater Auto Receivables Trust 12-AA, B 144A 2.430%, 4/15/19(4) | 7,488 | 7,460 | ||||||
Trinity Rail Leasing LP 03-1A, A 144A 5.640%, 10/12/26(4) | 4,788 | 5,250 | ||||||
Trip Rail Master Funding LLC | 15,504 | 16,385 | ||||||
U-Haul S Fleet LLC 10-BT1A, 1 144A 4.899%, 10/25/17(4) | 23,778 | 24,937 | ||||||
VFC LLC 13-1, A 144A 3.130%, 3/20/26(4) | 9,260 | 9,274 | ||||||
Volvo Financial Equipment LLLC 13-1A, B 144A 1.240%, | 15,835 | 15,658 | ||||||
Wachovia Asset Securitization Issuance II LLC 07-HE2A, A 144A 0.309%, 7/25/37(3)(4) | 12,569 | 10,659 | ||||||
Westgate Resorts LLC | ||||||||
12-2A, A 144A 3.000%, | 1,054 | 1,056 | ||||||
See Notes to Financial Statements
19
Table of Contents
VIRTUS MULTI-SECTOR SHORT TERM BOND FUND
SCHEDULE OF INVESTMENTS (Continued)
SEPTEMBER 30, 2013
($ reported in thousands)
| PAR VALUE | VALUE | |||||||
| ASSET-BACKED SECURITIES (continued) | ||||||||
13-1A, A 144A 2.250%, 8/20/25(4) | $ | 12,683 | $ | 12,608 | ||||
| TOTAL ASSET-BACKED SECURITIES (Identified Cost $1,307,428) | 1,314,523 | |||||||
| CORPORATE BONDS—36.7% | ||||||||
| Consumer Discretionary—1.8% | ||||||||
Arcos Dorados Holdings, Inc. 144A 10.250%, 7/13/16(4) | 14,225 | BRL | 6,354 | |||||
Boyd Gaming Corp. | ||||||||
9.125%, 12/1/18 | 2,425 | 2,649 | ||||||
9.000%, 7/1/20 | 5,350 | 5,832 | ||||||
CCO Holdings LLC 7.375%, 6/1/20 | 6,700 | 7,270 | ||||||
Claire’s Stores, Inc. 144A 9.000%, 3/15/19(4) | 4,070 | 4,528 | ||||||
Daimler Finance North America LLC | ||||||||
144A 2.625%, 9/15/16(4) | 11,000 | 11,341 | ||||||
144A 1.875%, 1/11/18(4) | 7,100 | 7,031 | ||||||
Dana Holding Corp. 6.500%, 2/15/19 | 3,973 | 4,241 | ||||||
General Motors Co. 144A 3.500%, 10/2/18(4) | 8,000 | 8,020 | ||||||
Hyatt Hotels Corp. 3.875%, 8/15/16 | 7,000 | 7,441 | ||||||
Hyundai Motor Manufacturing 144A 4.500%, 4/15/15(4) | 6,000 | 6,259 | ||||||
International Game Technology 7.500%, 6/15/19 | 1,115 | 1,304 | ||||||
KOC Holding AS 144A 3.500%, 4/24/20(4) | 13,595 | 11,576 | ||||||
MGM Resorts International 6.750%, 10/1/20 | 6,500 | 6,841 | ||||||
| PAR VALUE | VALUE | |||||||
| Consumer Discretionary (continued) | ||||||||
Nara Cable Funding Ltd. 144A 8.875%, 12/1/18(4) | $ | 4,885 | $ | 5,178 | ||||
ONO Finance II plc 144A 10.875%, 7/15/19(4) | 1,035 | 1,107 | ||||||
Penn National Gaming, Inc. 8.750%, 8/15/19 | 6,615 | 7,277 | ||||||
Pittsburgh Glass Works LLC 144A 8.500%, 4/15/16(4) | 4,135 | 4,269 | ||||||
ServiceMaster Co. 7.000%, 8/15/20 | 5,755 | 5,467 | ||||||
Sirius XM Radio, Inc. 144A 4.250%, 5/15/20(4) | 20,955 | 19,645 | ||||||
Toll Brothers Finance Corp. | 10,036 | 11,140 | ||||||
Wyndham Worldwide Corp. | 2,960 | 2,931 | ||||||
|
| |||||||
| 147,701 | ||||||||
|
| |||||||
| Consumer Staples—0.4% | ||||||||
Hawk Acquisition Sub, Inc. 144A 4.250%, 10/15/20(4) | 20,949 | 20,032 | ||||||
Sigma Alimentos SA de CV 144A 5.625%, 4/14/18(4) | 12,490 | 13,396 | ||||||
|
| |||||||
| 33,428 | ||||||||
|
| |||||||
| Energy—3.4% | ||||||||
Afren plc 144A 11.500%, | 4,790 | 5,520 | ||||||
Alta Mesa Holdings LP 9.625%, 10/15/18 | 8,150 | 8,639 | ||||||
Calumet Specialty Products Partners LP (Calumet Finance Corp.) 9.625%, 8/1/20 | 8,130 | 9,024 | ||||||
See Notes to Financial Statements
20
Table of Contents
VIRTUS MULTI-SECTOR SHORT TERM BOND FUND
SCHEDULE OF INVESTMENTS (Continued)
SEPTEMBER 30, 2013
($ reported in thousands)
| PAR VALUE | VALUE | |||||||
| CORPORATE BONDS (continued) | ||||||||
| Energy (continued) | ||||||||
Carrizo Oil & Gas, Inc. 8.625%, 10/15/18 | $ | 7,271 | $ | 7,962 | ||||
Compagnie Generale de Geophysique-Veritas 7.750%, 5/15/17 | 2,334 | 2,407 | ||||||
EP Energy LLC (Everest Acquisition Finance, Inc.) 6.875%, 5/1/19 | 4,000 | 4,290 | ||||||
Frontier Oil Corp. | 2,550 | 2,754 | ||||||
Gazprom OAO (Gaz Capital SA) | ||||||||
144A | 5,000 | 5,275 | ||||||
144A | 10,405 | 11,394 | ||||||
144A | 2,880 | 3,337 | ||||||
144A | 3,235 | 3,461 | ||||||
Hercules Offshore, Inc. 144A | 7,250 | 7,748 | ||||||
Kinder Morgan Energy Partners LP | 2,545 | 3,015 | ||||||
Linn Energy LLC 144A | 12,500 | 11,844 | ||||||
Lukoil International Finance BV 144A | 4,900 | 5,168 | ||||||
Midcontinent Express Pipeline LLC 144A | 7,500 | 7,718 | ||||||
MIE Holdings Corp. 144A | 2,985 | 3,075 | ||||||
Petroleos de Venezuela SA | ||||||||
RegS | 10,000 | 10,025 | ||||||
| PAR VALUE | VALUE | |||||||
| Energy (continued) | ||||||||
Series 2014 | $ | 16,540 | $ | 15,605 | ||||
RegS | 80,300 | 72,953 | ||||||
Plains Exploration & Production Co. | 13,200 | 14,181 | ||||||
Pride International, Inc. | 4,065 | 5,156 | ||||||
QGOG Constellation SA 144A 6.250%, 11/9/19(4) | 7,925 | 7,549 | ||||||
Quicksilver Resources, Inc. | 1,600 | 1,528 | ||||||
Rosneft Finance SA RegS | 13,235 | 14,790 | ||||||
Rosneft Oil Co. 144A | 10,800 | 10,800 | ||||||
Sabine Pass Liquefaction LLC 144A | 8,000 | 7,870 | ||||||
Sinopec Capital 2013 Ltd. 144A | 11,750 | 11,413 | ||||||
Venoco, Inc. | 5,675 | 5,746 | ||||||
Weatherford International Ltd. | 4,110 | 5,176 | ||||||
|
| |||||||
| 285,423 | ||||||||
|
| |||||||
| Financials—18.1% | ||||||||
Abbey National Treasury Services plc 144A 3.875%, 11/10/14(4) | 11,599 | 11,969 | ||||||
ABN AMRO Bank N.V. | ||||||||
144A | 9,000 | 9,067 | ||||||
144A | 4,425 | 4,727 | ||||||
See Notes to Financial Statements
21
Table of Contents
VIRTUS MULTI-SECTOR SHORT TERM BOND FUND
SCHEDULE OF INVESTMENTS (Continued)
SEPTEMBER 30, 2013
($ reported in thousands)
| PAR VALUE | VALUE | |||||||
| CORPORATE BONDS (continued) | ||||||||
| Financials (continued) | ||||||||
ADCB Finance Cayman Ltd. 144A | $ | 5,290 | $ | 5,449 | ||||
Air Lease Corp. | ||||||||
5.625%, 4/1/17 | 6,370 | 6,784 | ||||||
4.750%, 3/1/20 | 16,710 | 16,418 | ||||||
Aircastle Ltd. | 10,400 | 11,050 | ||||||
Akbank TAS | ||||||||
144A | 8,900 | 9,167 | ||||||
144A | 12,140 | TRY | 5,464 | |||||
Alfa Bank OJSC (Alfa Bond Issuance plc) RegS | 19,275 | 21,313 | ||||||
Allstate Corp. | 4,730 | 4,931 | ||||||
Ally Financial, Inc. | 8,450 | 8,423 | ||||||
American International Group, Inc. | ||||||||
2.375%, 8/24/15 | 5,825 | 5,953 | ||||||
5.850%, 1/16/18 | 7,300 | 8,302 | ||||||
3.375%, 8/15/20 | 10,020 | 10,028 | ||||||
American Tower Trust I 144A | 6,900 | 6,729 | ||||||
Anglo American Capital plc 144A | 1,950 | 2,442 | ||||||
Associated Banc Corp. | 8,635 | 9,325 | ||||||
Assurant, Inc. 5.625%, 2/15/14 | 4,060 | 4,137 | ||||||
Aviation Capital Group Corp. 144A 3.875%, 9/27/16(4) | 4,880 | 4,929 | ||||||
Avis Budget Car Rental LLC 4.875%, 11/15/17 | 13,470 | 13,807 | ||||||
| PAR VALUE | VALUE | |||||||
| Financials (continued) | ||||||||
Banco Bradesco SA | ||||||||
144A | $ | 7,000 | $ | 7,280 | ||||
144A | 13,000 | 13,455 | ||||||
Banco Continental SA Via Continental Senior Trustees II Cayman Ltd. 144A 5.750%, 1/18/17(4)(6) | 10,000 | 10,637 | ||||||
Banco de Credito del Peru 144A | 14,800 | 15,466 | ||||||
Banco Santander Brasil SA | ||||||||
144A | 7,500 | 7,669 | ||||||
144A | 28,335 | BRL | 11,826 | |||||
144A | 9,300 | 9,579 | ||||||
Banco Santander Chile 144A | 5,300 | 5,326 | ||||||
Banco Votorantim SA 144A | 10,500 | 10,815 | ||||||
Bangkok Bank plc 144A | 16,550 | 16,299 | ||||||
Bank of America Corp. | ||||||||
2.000%, 1/11/18 | 14,905 | 14,661 | ||||||
5.490%, 3/15/19 | 2,868 | 3,130 | ||||||
Bank of Georgia JSC 144A | 5,810 | 5,984 | ||||||
Bank of India | ||||||||
144A | 24,470 | 23,381 | ||||||
144A | 20,380 | 19,292 | ||||||
Barclays Bank plc | ||||||||
5.200%, 7/10/14 | 1,610 | 1,666 | ||||||
144A 6.050%, 12/4/17(4) | 13,130 | 14,587 | ||||||
144A | 3,773 | 3,905 | ||||||
See Notes to Financial Statements
22
Table of Contents
VIRTUS MULTI-SECTOR SHORT TERM BOND FUND
SCHEDULE OF INVESTMENTS (Continued)
SEPTEMBER 30, 2013
($ reported in thousands)
| PAR VALUE | VALUE | |||||||
| CORPORATE BONDS (continued) | ||||||||
| Financials (continued) | ||||||||
BBVA Banco Continental SA 144A | $ | 8,270 | $ | 8,084 | ||||
BioMed Realty LP 3.850%, 4/15/16 | 9,375 | 9,831 | ||||||
Brazil Loan Trust 1 144A 5.477%, 7/24/23(4) | 21,035 | 21,613 | ||||||
Capital One Financial Corp. 6.150%, 9/1/16 | 5,364 | 5,975 | ||||||
Chubb Corp. (The) 6.375%, 3/29/67(3) | 8,205 | 8,800 | ||||||
Citigroup, Inc. | ||||||||
0.528%, 6/9/16(3) | 3,400 | 3,319 | ||||||
5.500%, 2/15/17 | 23,460 | 25,691 | ||||||
2.500%, 9/26/18 | 10,000 | 9,947 | ||||||
CNA Financial Corp. 5.850%, 12/15/14 | 7,575 | 8,010 | ||||||
CNH Capital LLC 3.625%, 4/15/18 | 20,225 | 20,225 | ||||||
Comerica Bank | ||||||||
Series A1 5.700%, 6/1/14 | 1,900 | 1,959 | ||||||
4.800%, 5/1/15 | 1,828 | 1,923 | ||||||
5.750%, 11/21/16 | 5,940 | 6,716 | ||||||
Countrywide Financial Corp. 6.250%, 5/15/16 | 9,110 | 10,076 | ||||||
Denali Borrower LLC (Denali Finance Corp.) 144A 5.625%, 10/15/20(4) | 5,500 | 5,349 | ||||||
Discover Bank 8.700%, 11/18/19 | 1,750 | 2,214 | ||||||
DNB Bank ASA 144A 3.200%, 4/3/17(4) | 24,700 | 25,890 | ||||||
E*TRADE Financial Corp. 6.375%, 11/15/19 | 10,155 | 10,866 | ||||||
Fifth Third Bancorp 4.500%, 6/1/18 | 6,745 | 7,293 | ||||||
Fifth Third Bank 4.750%, 2/1/15 | 750 | 786 | ||||||
| PAR VALUE | VALUE | |||||||
| Financials (continued) | ||||||||
First Tennessee Bank N.A. | $ | 15,664 | $ | 16,883 | ||||
Ford Motor Credit Co. LLC | ||||||||
4.207%, 4/15/16 | 10,000 | 10,600 | ||||||
5.000%, 5/15/18 | 10,000 | 10,958 | ||||||
General Electric Capital Corp. 0.646%, 5/5/26(3) | 8,000 | 7,361 | ||||||
General Motors Financial Co., Inc. 144A 4.750%, 8/15/17(4) | 17,940 | 18,658 | ||||||
Genworth Holdings, Inc. | ||||||||
7.200%, 2/15/21 | 5,000 | 5,770 | ||||||
7.625%, 9/24/21 | 8,750 | 10,345 | ||||||
Glen Meadow Pass-Through Trust 144A 6.505%, 2/12/67(4) | 10,345 | 9,621 | ||||||
Goldman Sachs Group, Inc. (The) | ||||||||
5.625%, 1/15/17 | 14,000 | 15,424 | ||||||
2.900%, 7/19/18 | 8,200 | 8,268 | ||||||
7.500%, 2/15/19 | 2,451 | 2,962 | ||||||
HBOS plc 144A 6.750%, | 685 | 761 | ||||||
HCP, Inc. | ||||||||
3.750%, 2/1/16 | 8,000 | 8,424 | ||||||
3.750%, 2/1/19 | 4,940 | 5,117 | ||||||
Health Care REIT, Inc. | ||||||||
4.700%, 9/15/17 | 8,565 | 9,322 | ||||||
4.125%, 4/1/19 | 4,100 | 4,319 | ||||||
Healthcare Realty Trust, Inc. 6.500%, 1/17/17 | 3,000 | 3,367 | ||||||
Hertz Corp. (The) | ||||||||
144A | 3,030 | 2,992 | ||||||
5.875%, 10/15/20 | 9,420 | 9,750 | ||||||
HSBC USA, Inc. 2.625%, 9/24/18 | 19,485 | 19,749 | ||||||
Huntington Bancshares, Inc. 7.000%, 12/15/20 | 3,390 | 4,018 | ||||||
See Notes to Financial Statements
23
Table of Contents
VIRTUS MULTI-SECTOR SHORT TERM BOND FUND
SCHEDULE OF INVESTMENTS (Continued)
SEPTEMBER 30, 2013
($ reported in thousands)
| PAR VALUE | VALUE | |||||||
| CORPORATE BONDS (continued) | ||||||||
| Financials (continued) | ||||||||
Huntington National Bank (The) 4.900%, 1/15/14 | $ | 1,400 | $ | 1,411 | ||||
Hutchison Whampoa International Ltd. Series 12, 144A 6.000%,(3)(4)(7)(8) | 13,210 | 13,887 | ||||||
Hyundai Capital Services, Inc. | ||||||||
144A 6.000%, 5/5/15(4) | 4,975 | 5,310 | ||||||
144A 3.750%, 4/6/16(4) | 500 | 525 | ||||||
144A 2.125%, 10/2/17(4) | 2,940 | 2,933 | ||||||
ICICI Bank RegS 4.700%, | 13,000 | 12,931 | ||||||
ING Bank NV | ||||||||
144A 2.375%, 6/9/14(4) | 5,000 | 5,053 | ||||||
144A 1.375%, 3/7/16(4) | 9,000 | 8,957 | ||||||
ING US, Inc. 2.900%, 2/15/18 | 25,620 | 25,730 | ||||||
International Lease Finance Corp. | ||||||||
3.875%, 4/15/18 | 12,835 | 12,402 | ||||||
5.875%, 4/1/19 | 5,800 | 6,040 | ||||||
Intesa San Paolo SpA 3.125%, 1/15/16 | 12,190 | 12,174 | ||||||
iStar Financial, Inc. 4.875%, 7/1/18 | 12,250 | 11,944 | ||||||
Jefferies Group, Inc. 5.125%, 4/13/18 | 6,541 | 7,020 | ||||||
JPMorgan Chase & Co. 6.125%, 6/27/17 | 8,850 | 10,056 | ||||||
Kazkommerts Bank International BV 144A 7.875%, 4/7/14(4) | 4,135 | 4,208 | ||||||
KeyBank N.A. | ||||||||
5.800%, 7/1/14 | 1,450 | 1,504 | ||||||
7.413%, 5/6/15 | 3,000 | 3,273 | ||||||
4.950%, 9/15/15 | 1,295 | 1,384 | ||||||
| PAR VALUE | VALUE | |||||||
| Financials (continued) | ||||||||
Korea Development Bank 144A 3.500%, 8/22/17(4) | $ | 9,750 | $ | 10,233 | ||||
Legg Mason, Inc. 5.500%, 5/21/19 | 13,868 | 15,108 | ||||||
Level 3 Financing, Inc. | 4,065 | 4,126 | ||||||
Lincoln National Corp. | ||||||||
8.750%, 7/1/19 | 15,040 | 19,493 | ||||||
6.050%, 4/20/67(3)(8) | 2,885 | 2,827 | ||||||
Lukoil International Finance Bv 144A 3.416%, 4/24/18(4) | 6,000 | 5,962 | ||||||
Manufacturers & Traders Trust Co. 5.629%, 12/1/21(3) | 5,000 | 5,130 | ||||||
MetLife, Inc. 6.750%, 6/1/16 | 910 | 1,043 | ||||||
Metropolitan Life Global Funding I 144A 1.700%, 6/29/15(4) | 13,770 | 13,957 | ||||||
Michaels FinCo Holdings LLC PIK Interest Capitalization, 144A 7.500%, 8/1/18(4)(13) | 6,550 | 6,665 | ||||||
Morgan Stanley | ||||||||
5.550%, 4/27/17 | 10,200 | 11,305 | ||||||
144A 10.090%, 5/3/17(4) | 22,595 | BRL | 9,838 | |||||
Nationstar Mortgage LLC 6.500%, 8/1/18 | 7,070 | 7,141 | ||||||
Nordea Bank AB 144A 2.125%, 1/14/14(4) | 5,000 | 5,025 | ||||||
ORIX Corp. 5.000%, 1/12/16 | 5,228 | 5,579 | ||||||
Penske Truck Leasing Co. LP (PTL Finance Corp.) 144A 2.875%, 7/17/18(4) | 8,505 | 8,501 | ||||||
See Notes to Financial Statements
24
Table of Contents
VIRTUS MULTI-SECTOR SHORT TERM BOND FUND
SCHEDULE OF INVESTMENTS (Continued)
SEPTEMBER 30, 2013
($ reported in thousands)
| PAR VALUE | VALUE | |||||||
| CORPORATE BONDS (continued) | ||||||||
| Financials (continued) | ||||||||
Phosagro OAO (Phosagro Bond Funding Ltd.) 144A 4.204%, 2/13/18(4)(6) | $ | 14,800 | $ | 14,541 | ||||
PNC Funding Corp. 5.625%, 2/1/17 | 3,130 | 3,490 | ||||||
Principal Life Global Funding II 144A 2.250%, 10/15/18(4) | 17,000 | 17,068 | ||||||
Progressive Corp. (The) 6.700%, 6/15/37(3) | 2,740 | 2,932 | ||||||
Prudential Financial, Inc. | ||||||||
4.750%, 9/17/15 | 4,770 | 5,118 | ||||||
8.875%, 6/15/38(3)(8) | 11,200 | 13,552 | ||||||
QBE Insurance Group Ltd. 144A 2.400%, 5/1/18(4) | 7,750 | 7,552 | ||||||
Regions Bank 7.500%, 5/15/18 | 12,001 | 14,145 | ||||||
Regions Financial Corp. 5.750%, 6/15/15 | 2,535 | 2,716 | ||||||
Royal Bank of Scotland Group plc (The) 6.400%, 10/21/19 | 3,130 | 3,578 | ||||||
Russian Agricultural Bank OJSC (RSHB Capital SA) | ||||||||
144A 6.299%, 5/15/17(4) | 2,905 | 3,110 | ||||||
144A 5.298%, 12/27/17(4) | 18,055 | 18,552 | ||||||
144A 5.100%, 7/25/18(4)(6) | 8,750 | 8,870 | ||||||
Ryder System, Inc. 2.500%, 3/1/17 | 11,980 | 12,101 | ||||||
Santander Holdings USA, Inc. 3.000%, 9/24/15 | 980 | 1,008 | ||||||
Santander U.S. Debt S.A.U. 144A 3.724%, 1/20/15(4) | 8,100 | 8,215 | ||||||
| PAR VALUE | VALUE | |||||||
| Financials (continued) | ||||||||
Unipersonal 144A 3.781%, | $ | 8,000 | $ | 8,160 | ||||
SBA Tower Trust 144A 2.933%, 12/15/17(4) | 13,275 | 13,378 | ||||||
Sberbank of Russia (Sberbank CapItal SA) 144A 4.950%, 2/7/17(4)(6) | 35,165 | 37,011 | ||||||
144A 5.125%, 10/29/22(4)(6) | 9,170 | 8,553 | ||||||
Schaeffler Holding Finance BV PIK Interest Capitalization, 144A 6.875%, 8/15/18(4)(13) | 2,210 | 2,326 | ||||||
Senior Housing Properties Trust 4.300%, 1/15/16 | 6,875 | 7,135 | ||||||
Shinhan Bank | ||||||||
144A 4.375%, 7/27/17(4) | 11,700 | 12,566 | ||||||
144A 1.875%, 7/30/18(4) | 1,000 | 957 | ||||||
Skandinaviska Enskilda Banken AB 144A 1.750%, 3/19/18(4) | 6,775 | 6,637 | ||||||
SLM Corp. 4.625%, 9/25/17 | 24,805 | 25,177 | ||||||
Societe Generale S.A. | ||||||||
144A 3.100%, 9/14/15(4) | 2,900 | 3,007 | ||||||
144A 3.500%, 1/15/16(3)(4) | 6,895 | 7,206 | ||||||
Spansion LLC 7.875%, 11/15/17 | 2,955 | 3,095 | ||||||
State Street Corp. 4.956%, | 5,000 | 5,502 | ||||||
Sun Merger Sub, Inc. 144A 5.250%, 8/1/18(4) | 6,850 | 7,038 | ||||||
SunTrust Bank, Inc. | ||||||||
6.000%, 9/11/17 | 4,925 | 5,640 | ||||||
5.450%, 12/1/17 | 3,750 | 4,142 | ||||||
Svenska Handelsbanken AB 3.125%, 7/12/16 | 10,000 | 10,483 | ||||||
See Notes to Financial Statements
25
Table of Contents
VIRTUS MULTI-SECTOR SHORT TERM BOND FUND
SCHEDULE OF INVESTMENTS (Continued)
SEPTEMBER 30, 2013
($ reported in thousands)
| PAR VALUE | VALUE | |||||||
| CORPORATE BONDS (continued) | ||||||||
| Financials (continued) | ||||||||
Telecom Italia Capital SA | ||||||||
6.175%, 6/18/14 | $ | 3,184 | $ | 3,277 | ||||
7.175%, 6/18/19 | 2,395 | 2,634 | ||||||
TMK OAO Via (TMK Capital) SA 144A 6.750%, 4/3/20(4)(6) | 12,135 | 11,559 | ||||||
Turkiye Garanti Bankasi AS 144A 4.000%, 9/13/17(4) | 12,500 | 12,187 | ||||||
Turkiye Is Bankasi 144A 3.750%, 10/10/18(4) | 12,630 | 11,746 | ||||||
Turkiye Vakiflar Bankasi Tao 144A 3.750%, 4/15/18(4) | 4,000 | 3,720 | ||||||
Union Bank NA | ||||||||
1.500%, 9/26/16 | 2,000 | 2,010 | ||||||
2.625%, 9/26/18 | 2,700 | 2,726 | ||||||
Unum Group 7.125%, 9/30/16 | 6,620 | 7,572 | ||||||
Ventas Realty LP (Ventas Capital Corp.) | ||||||||
4.000%, 4/30/19 | 7,100 | 7,449 | ||||||
2.700%, 4/1/20 | 2,948 | 2,810 | ||||||
Vnesheconombank (VEB Finance plc) | ||||||||
144A 5.375%, 2/13/17(4) | 12,915 | 13,671 | ||||||
144A 5.450%, 11/22/17(4)(6) | 3,500 | 3,723 | ||||||
VTB Bank OJSC (VTB Capital SA) | ||||||||
144A 6.465%, 3/4/15(4)(6) | 15,900 | 16,776 | ||||||
144A 6.000%, 4/12/17(4)(6) | 16,175 | 17,024 | ||||||
Wachovia Corp. 5.625%, 10/15/16 | 2,500 | 2,802 | ||||||
Webster Financial Corp. 5.125%, 4/15/14 | 2,500 | 2,531 | ||||||
Wells Fargo & Co. 5.125%, 9/15/16 | 5,000 | 5,526 | ||||||
| PAR VALUE | VALUE | |||||||
| Financials (continued) | ||||||||
Willis Group Holdings plc 4.125%, 3/15/16 | $ | 6,000 | $ | 6,302 | ||||
Willis North America, Inc. 6.200%, 3/28/17 | 4,960 | 5,476 | ||||||
Yapi ve Kredi Bankasi AS 144A 4.000%, 1/22/20(4) | 18,650 | 16,645 | ||||||
Zions Bancorp | ||||||||
5.650%, 5/15/14 | 1,775 | 1,830 | ||||||
4.500%, 3/27/17 | 8,120 | 8,528 | ||||||
|
| |||||||
| 1,506,368 | ||||||||
|
| |||||||
| Health Care—1.2% | ||||||||
Alere, Inc. 144A 6.500%, 6/15/20(4) | 6,175 | 6,152 | ||||||
Community Health Systems, Inc. (CHS) 5.125%, 8/15/18 | 9,320 | 9,506 | ||||||
Express Scripts Holding Co. 3.500%, 11/15/16 | 10,000 | 10,586 | ||||||
HCA, Inc. 6.500%, 2/15/20 | 19,575 | 21,263 | ||||||
inVentiv Health, Inc. 144A 9.000%, 1/15/18(4) | 3,810 | 3,848 | ||||||
Symbion, Inc. 8.000%, 6/15/16 | 6,517 | 6,908 | ||||||
Tenet Healthcare Corp. | ||||||||
4.750%, 6/1/20 | 9,275 | 8,974 | ||||||
144A 6.000%, 10/1/20(4) | 9,560 | 9,793 | ||||||
144A 8.125%, 4/1/22(4) | 8,265 | 8,647 | ||||||
Valeant Pharmaceuticals International, Inc. Escrow Corp. 144A 6.750%, | 8,590 | 9,234 | ||||||
Vanguard Health Holding Co. II, LLC (Vanguard Holding Co. II, Inc.) 7.750%, 2/1/19 | 3,212 | 3,461 | ||||||
See Notes to Financial Statements
26
Table of Contents
VIRTUS MULTI-SECTOR SHORT TERM BOND FUND
SCHEDULE OF INVESTMENTS (Continued)
SEPTEMBER 30, 2013
($ reported in thousands)
| PAR VALUE | VALUE | |||||||
| CORPORATE BONDS (continued) | ||||||||
| Health Care (continued) | ||||||||
Zoetis, Inc. 144A 1.875%, 2/1/18(4) | $ | 1,975 | $ | 1,956 | ||||
|
| |||||||
| 100,328 | ||||||||
|
| |||||||
| Industrials—5.8% | ||||||||
ADS Tactical, Inc. 144A 11.000%, 4/1/18(4) | 7,416 | 6,748 | ||||||
Air Canada Pass-Through-Trust 13-1, B 144A 5.375%, | 9,855 | 9,510 | ||||||
America West Airlines Pass-Through-Trust | ||||||||
98-1, A 6.870%, 1/2/17 | 1,917 | 2,013 | ||||||
99-1, G 7.930%, 1/2/19 | 8,872 | 9,493 | ||||||
00-1, G 8.057%, 7/2/20 | 8,222 | 8,921 | ||||||
01-1, G 7.100%, 4/2/21 | 41,273 | 43,646 | ||||||
American Airlines Pass-Through-Trust 13-1, A 144A 4.000%, 7/15/25(4) | 7,721 | 7,238 | ||||||
American Honda Finance Corp. 144A 6.700%, 10/1/13(4) | 4,850 | 4,850 | ||||||
Atlas Air Pass-Through-Trust | ||||||||
98-1, A 7.380%, 1/2/18 | 9,772 | 10,065 | ||||||
99-1, A1 7.200%, 1/2/19 | 1,914 | 1,998 | ||||||
00-1, A 8.707%, 1/2/19 | 4,778 | 5,065 | ||||||
AWAS Aviation Capital Ltd. 144A 7.000%, 10/17/16(4) | 9,846 | 10,190 | ||||||
British Airways plc 144A 5.625%, 6/20/20(4) | 8,863 | 9,107 | ||||||
| PAR VALUE | VALUE | |||||||
| Industrials (continued) | ||||||||
Continental Airlines Pass-Through-Trust | ||||||||
98-1, A 6.648%, 9/15/17 | $ | 4,806 | $ | 5,058 | ||||
97-4, A 6.900%, 1/2/18 | 5,040 | 5,292 | ||||||
99-1, A 6.545%, 2/2/19 | 11,374 | 12,370 | ||||||
09-2, A 7.250%, 11/10/19 | 788 | 891 | ||||||
99-2, C2 6.236%, 3/15/20 | 14,583 | 15,932 | ||||||
00-1, A1 8.048%, 11/1/20 | 7,432 | 8,435 | ||||||
01-1, A1 6.703%, 6/15/21 | 13,467 | 14,410 | ||||||
Delta Air Lines Pass-Through-Trust | ||||||||
11-1, A 5.300%, 4/15/19 | 10,188 | 10,901 | ||||||
09-1, A 7.750%, 12/17/19 | 5,566 | 6,463 | ||||||
12-1A, 1A 4.750%, 5/7/20 | 30,744 | 32,281 | ||||||
Deluxe Corp. | ||||||||
7.000%, 3/15/19 | 7,490 | 7,977 | ||||||
6.000%, 11/15/20 | 2,950 | 3,053 | ||||||
HD Supply, Inc. 8.125%, 4/15/19 | 2,935 | 3,272 | ||||||
Hellenic Railways 5.460%, 1/30/14 | 16,710 | EUR | 21,815 | |||||
Kratos Defense & Security Solutions, Inc. 10.000%, 6/1/17 | 12,365 | 13,509 | ||||||
Northwest Airlines Pass-Through-Trust 02-1, G2 6.264%, 11/20/21 | 25,512 | 26,313 | ||||||
Odebrecht Finance Ltd. 144A 8.250%, 4/25/18(4) | 12,850 | BRL | 4,811 | |||||
Parker Hannifin Corp. 5.500%, 5/15/18 | 7,970 | 9,151 | ||||||
Rexel SA 144A 5.250%, 6/15/20(4) | 15,970 | 15,651 | ||||||
See Notes to Financial Statements
27
Table of Contents
VIRTUS MULTI-SECTOR SHORT TERM BOND FUND
SCHEDULE OF INVESTMENTS (Continued)
SEPTEMBER 30, 2013
($ reported in thousands)
| PAR VALUE | VALUE | |||||||
| CORPORATE BONDS (continued) | ||||||||
| Industrials (continued) | ||||||||
Sappi Papier Holding GmbH | ||||||||
144A 7.750%, 7/15/17(4) | $ | 12,830 | $ | 13,407 | ||||
144A 8.375%, 6/15/19(4) | 7,770 | 8,149 | ||||||
Spirit Aerosystems, Inc. 7.500%, 10/1/17 | 6,330 | 6,607 | ||||||
Toledo Edison Co. (The) 7.250%, 5/1/20 | 224 | 272 | ||||||
Transnet SOC Ltd. 144A 4.500%, 2/10/16(4) | 9,000 | 9,283 | ||||||
U.S. Airways Pass-Through-Trust | ||||||||
98-1 6.850%, 1/30/18 | 4,533 | 4,737 | ||||||
01-1G 7.076%, 3/20/21 | 22,956 | 23,989 | ||||||
11-1 A 7.125%, 10/22/23 | 7,571 | 8,309 | ||||||
12-1A 5.900%, 10/1/24 | 11,479 | 11,996 | ||||||
UAL Pass-Through-Trust | ||||||||
09-2 9.750%, 1/15/17 | 24,434 | 27,793 | ||||||
07-01, A 6.636%, 7/2/22 | 11,103 | 11,547 | ||||||
United Rentals North America, Inc. 5.750%, 7/15/18 | 7,895 | 8,329 | ||||||
|
| |||||||
| 480,847 | ||||||||
|
| |||||||
| Information Technology—0.9% | ||||||||
Ceridian Corp. 144A 11.000%, 3/15/21(4) | 280 | 326 | ||||||
Digicel Ltd. 144A 8.250%, 9/1/17(4) | 7,886 | 8,211 | ||||||
Dun & Bradstreet Corp. (The) 3.250%, 12/1/17 | 16,800 | 16,946 | ||||||
EarthLink, Inc. | ||||||||
8.875%, 5/15/19 | 4,100 | 3,967 | ||||||
| PAR VALUE | VALUE | |||||||
| Information Technology (continued) | ||||||||
144A 7.375%, 6/1/20(4) | $ | 7,770 | $ | 7,615 | ||||
Equinix, Inc. 4.875%, 4/1/20 | 8,062 | 7,860 | ||||||
Fidelity National Financial, Inc. 6.600%, 5/15/17 | 6,475 | 7,225 | ||||||
First Data Corp. 11.250%, 3/31/16 | 15,454 | 15,531 | ||||||
MDC-GMTN B.V. 144A 3.750%, 4/20/16(4) | 4,000 | 4,216 | ||||||
|
| |||||||
| 71,897 | ||||||||
|
| |||||||
| Materials—2.6% | ||||||||
Allegheny Technologies, Inc. 9.375%, 6/1/19 | 7,245 | 8,836 | ||||||
Ardagh Packaging Finance plc 144A 7.375%, 10/15/17(4) | 8,145 | 8,746 | ||||||
Calumet Specialty Products Partners LP | 8,441 | 9,306 | ||||||
Cemex SAB de CV 144A 9.500%, 6/15/18(4) | 9,754 | 10,851 | ||||||
CRH America, Inc. | ||||||||
4.125%, 1/15/16 | 4,000 | 4,206 | ||||||
8.125%, 7/15/18 | 4,770 | 5,808 | ||||||
EuroChem Mineral & Chemical Co. OJSC 144A 5.125%, 12/12/17(4)(6) | 11,920 | 11,920 | ||||||
FMG Resources Property Ltd. | ||||||||
144A 6.000%, 4/1/17(4) | 2,485 | 2,560 | ||||||
144A 8.250%, 11/1/19(4) | 8,600 | 9,309 | ||||||
Freeport-Mcmoran Copper & Gold, Inc. 144A 2.375%, 3/15/18(4) | 9,000 | 8,700 | ||||||
See Notes to Financial Statements
28
Table of Contents
VIRTUS MULTI-SECTOR SHORT TERM BOND FUND
SCHEDULE OF INVESTMENTS (Continued)
SEPTEMBER 30, 2013
($ reported in thousands)
| PAR VALUE | VALUE | |||||||
| CORPORATE BONDS (continued) | ||||||||
| Materials (continued) | ||||||||
Gerdau Holdings, Inc. 144A 7.000%, 1/20/20(4) | $ | 10,280 | $ | 10,948 | ||||
Hexion U.S. Finance Corp. | ||||||||
144A 8.875%, 2/1/18 | 12,085 | 12,568 | ||||||
6.625%, 4/15/20 | 12,240 | 12,301 | ||||||
Huntsman International LLC 4.875%, 11/15/20 | 3,910 | 3,724 | ||||||
International Paper Co. 9.375%, 5/15/19 | 5,330 | 7,030 | ||||||
Nufarm Australia Ltd. 144A 6.375%, 10/15/19(4) | 16,010 | 16,090 | ||||||
Reynolds Group Issuer, Inc. | ||||||||
9.000%, 4/15/19 | 2,730 | 2,880 | ||||||
5.750%, 10/15/20 | 12,945 | 13,058 | ||||||
Sealed Air Corp. 144A 6.500%, 12/1/20(4) | 2,355 | 2,479 | ||||||
Severstal OAO (Steel Capital SA) 144A 6.700%, 10/25/17(4)(6) | 5,975 | 6,401 | ||||||
Sinopec Group Overseas Development Ltd. 144A 2.750%, 5/17/17(4) | 10,000 | 10,196 | ||||||
Tronox Finance LLC 144A 6.375%, 8/15/20 | 10,840 | 10,786 | ||||||
Turkiye Sise Ve Cam Fabrikalari AS 144A 4.250%, 5/9/20(4) | 12,755 | 11,084 | ||||||
Vedanta Resources plc 144A 9.500%, 7/18/18(4) | 13,090 | 14,432 | ||||||
144A 6.000%, 1/31/19(4) | 6,000 | 5,730 | ||||||
|
| |||||||
| 219,949 | ||||||||
|
| |||||||
| PAR VALUE | VALUE | |||||||
| Telecommunication Services—1.4% | ||||||||
AT&T, Inc. 5.500%, 2/1/18 | $ | 11,123 | $ | 12,613 | ||||
Crown Castle Towers LLC | ||||||||
144A 4.523%, 1/15/15(4) | 4,925 | 5,110 | ||||||
144A 3.214%, 8/15/15(4) | 4,950 | 5,049 | ||||||
144A 5.495%, 1/15/17(4) | 5,915 | 6,437 | ||||||
Frontier Communications Corp. 7.125%, 3/15/19 | 12,200 | 13,008 | ||||||
Intelsat Luxembourg SA 144A 7.750%, 6/1/21(4) | 8,000 | 8,310 | ||||||
Sprint Communications, Inc. 6.000%, 12/1/16 | 7,550 | 8,022 | ||||||
Sprint Corp. 144A 7.250%, 9/15/21(4) | 4,080 | 4,131 | ||||||
Telefonica Emisiones SAU 3.192%, 4/27/18 | 2,805 | 2,768 | ||||||
Verizon Communications, Inc. | ||||||||
2.500%, 9/15/16 | 5,900 | 6,082 | ||||||
3.650%, 9/14/18 | 13,800 | 14,544 | ||||||
Wind Acquisition Finance S.A. | ||||||||
144A 11.750%, 7/15/17(4) | 6,425 | 6,834 | ||||||
144A 7.250%, 2/15/18(4) | 7,000 | 7,280 | ||||||
Windstream Corp. 7.750%, 10/15/20 | 12,125 | 12,580 | ||||||
|
| |||||||
| 112,768 | ||||||||
|
| |||||||
| Utilities—1.1% | ||||||||
Abu Dhabi National Energy Co. 144A 2.500%, 1/12/18(4) | 13,930 | 13,651 | ||||||
See Notes to Financial Statements
29
Table of Contents
VIRTUS MULTI-SECTOR SHORT TERM BOND FUND
SCHEDULE OF INVESTMENTS (Continued)
SEPTEMBER 30, 2013
($ reported in thousands)
| PAR VALUE | VALUE | |||||||
| CORPORATE BONDS (continued) | ||||||||
| Utilities (continued) | ||||||||
AmeriGas Partners LP (AmeriGas Finance Corp.) | ||||||||
6.250%, 8/20/19 | $ | 5,670 | $ | 5,897 | ||||
6.750%, 5/20/20 | 4,000 | 4,270 | ||||||
Dayton Power & Light Co. (The) 144A 1.875%, 9/15/16(4) | 2,000 | 2,016 | ||||||
Energy Transfer Partners LP 4.150%, 10/1/20 | 14,620 | 15,030 | ||||||
Israel Electric Corp. Ltd. 144A 5.625%, 6/21/18(4) | 14,735 | 15,233 | ||||||
Korea Electric Power Corp. 144A 5.500%, 7/21/14(4) | 3,420 | 3,538 | ||||||
Korea Gas Corp. 144A 6.000%, 7/15/14(4) | 2,000 | 2,076 | ||||||
Korea Hydro & Nuclear Power Co., Ltd. 144A 3.125%, 9/16/15(4) | 1,000 | 1,033 | ||||||
Korea Western Power Co., Ltd. 144A 3.125%, 5/10/17(4) | 9,800 | 10,032 | ||||||
NRG Energy, Inc. | ||||||||
7.625%, 1/15/18 | 1,485 | 1,652 | ||||||
8.500%, 6/15/19 | 6,050 | 6,519 | ||||||
PPL WEM Holdings plc 144A 3.900%, 5/1/16(4) | 5,495 | 5,761 | ||||||
State Grid Overseas Investment Ltd. 144A 1.750%, 5/22/18(4) | 5,000 | 4,876 | ||||||
|
| |||||||
| 91,584 | ||||||||
| TOTAL CORPORATE BONDS | ||||||||
| (Identified Cost $3,004,721) | 3,050,293 | |||||||
| PAR VALUE | VALUE | |||||||
| LOAN AGREEMENTS(3)—15.9% | ||||||||
| Consumer Discretionary—4.1% | ||||||||
Acosta, Inc. | $ | 7,980 | $ | 8,008 | ||||
Acquisitions Cogeco Cable II LP (Atlantic Broadband (Penn) Holdings, Inc.) Tranche B, 3.250%, 11/30/19 | 4,049 | 4,015 | ||||||
Affinia Group, Inc. Tranche B-2, 4.750%, 4/25/20 | 4,648 | 4,669 | ||||||
Allison Transmission Tranche B-3, 3.750%, 8/23/19 | 7,677 | 7,694 | ||||||
Boyd Gaming Corp. Tranche B, 4.000%, 8/14/20 | 7,563 | 7,567 | ||||||
Caesars Entertainment Operating Co., Inc. (Harrah’s Operating Company, Inc.) | ||||||||
Tranche B-4, 9.500%, 10/31/16 | 5,905 | 5,903 | ||||||
Tranche B-6, 5.429%, 1/28/18 | 8,164 | 7,425 | ||||||
Charter Communications Operations LLC | ||||||||
Tranche E, 3.000%, 7/1/20 | 9,553 | 9,467 | ||||||
Tranche F, 3.000%, 12/31/20 | 14,683 | 14,556 | ||||||
Chrysler Group LLC Tranche B, 4.250%, 5/24/17 | 8,211 | 8,285 | ||||||
Clear Channel Communications, Inc. Tranche B, 3.829%, 1/29/16 | 9,000 | 8,502 | ||||||
CSC Holdings, Inc. (CSC Holdings, Inc. (Cablevision)) Tranche B, 2.679%, 4/17/20 | 10,636 | 10,537 | ||||||
See Notes to Financial Statements
30
Table of Contents
VIRTUS MULTI-SECTOR SHORT TERM BOND FUND
SCHEDULE OF INVESTMENTS (Continued)
SEPTEMBER 30, 2013
($ reported in thousands)
| PAR VALUE | VALUE | |||||||
| LOAN AGREEMENTS (continued) | ||||||||
| Consumer Discretionary (continued) | ||||||||
Cumulus Media Holdings, Inc. First Lien, 4.500%, 9/17/18 | $ | 9,081 | $ | 9,151 | ||||
Entercom Radio LLC Tranche B-1, 6.000%, 11/23/18 | 5,174 | 5,215 | ||||||
Estado de Santa Catarina 4.000%, 12/27/22 | 15,000 | 14,190 | ||||||
Fram Group Holdings, Inc. (Prestone Holdings, Inc.) First Lien, 6.500%, 7/31/17 | 4,808 | 4,731 | ||||||
Gateway Casinos & Entertainment Ltd. Tranche B, 7.500%, 5/12/16 | 2,830 | CAD | 2,751 | |||||
Hilton Worldwide, Inc. (Hilton Hotels Corp.) Tranche B-2 0.000%, 9/23/20(10) | 22,980 | 22,976 | ||||||
Hubbard Radio LLC Tranche 1, 4.500%, 4/29/19 | 4,679 | 4,696 | ||||||
Landry’s, Inc. (Landry’s Restaurant, Inc.) Tranche B, 4.750%, 4/24/18 | 10,640 | 10,733 | ||||||
MGM Resorts International (MGM Grand Detroit LLC) Tranche B, 3.500%, 12/20/19 | 7,207 | 7,193 | ||||||
Neiman Marcus Group, Inc. (The) 4.000%, 5/16/18 | 5,134 | 5,136 | ||||||
Penn National Gaming, Inc. Tranche B, 3.750%, 7/16/18 | 10,421 | 10,444 | ||||||
Phillips-Van Heusen Corp. Tranche B, 3.250%, 2/13/20 | 2,999 | 2,996 | ||||||
| PAR VALUE | VALUE | |||||||
| Consumer Discretionary (continued) | ||||||||
Radio One, Inc. 7.500%, 3/31/16 | $ | 1,880 | $ | 1,927 | ||||
Scientific Games International, Inc. 0.000%, 5/22/20(10) | 15,445 | 15,316 | ||||||
Seminole Hard Rock Entertainment, Inc. (Seminole Hard Rock International LLC) Tranche B, 3.500%, 5/14/20 | 2,838 | 2,836 | ||||||
Seminole Tribe of Florida 3.000%, 4/29/20 | 15,391 | 15,377 | ||||||
ServiceMaster Co. (The) | ||||||||
Tranche C, 4.250%, 1/31/17 | 3,970 | 3,877 | ||||||
Tranche B, 4.440%, 1/31/17 | 4,200 | 4,116 | ||||||
Seven Sea Cruises S. DE R.L. | 5,128 | 5,179 | ||||||
Sports Authority, Inc. (The) Tranche B, 7.500%, 11/16/17 | 2,237 | 2,251 | ||||||
SRAM LLC First Lien, 5.250%, 4/10/20 | 2,103 | 2,077 | ||||||
Station Casinos LLC Tranche B, 5.000%, 3/2/20 | 12,505 | 12,649 | ||||||
Tribune Co. Tranche B, | 4,578 | 4,586 | ||||||
TWCC Holding Corp. Second Lien, 7.000%, 6/26/20 | 8,500 | 8,744 | ||||||
Univision Communications, Inc. | ||||||||
4.000%, 3/1/20 | 10,899 | 10,791 | ||||||
First Lien, 4.500%, 3/1/20 | 19,900 | 19,850 | ||||||
Virgin Media Investment Holdings Ltd. Tranche B, 3.500%, 6/8/20 | 13,968 | 13,911 | ||||||
See Notes to Financial Statements
31
Table of Contents
VIRTUS MULTI-SECTOR SHORT TERM BOND FUND
SCHEDULE OF INVESTMENTS (Continued)
SEPTEMBER 30, 2013
($ reported in thousands)
| PAR VALUE | VALUE | |||||||
| LOAN AGREEMENTS (continued) | ||||||||
| Consumer Discretionary (continued) | ||||||||
WideOpenWest Finance LLC | ||||||||
Tranche B-1, 4.250%, 7/17/17 | $ | 1,207 | $ | 1,214 | ||||
Tranche B, 4.750%, 4/1/19 | 8,847 | 8,921 | ||||||
Zuffa LLC 4.500%, 2/25/20 | 10,923 | 10,944 | ||||||
|
| |||||||
| 341,406 | ||||||||
|
| |||||||
| Consumer Staples—0.8% | ||||||||
AdvancePierre Foods, Inc. First Lien, 5.750%, 7/10/17 | 211 | 213 | ||||||
American Rock Salt Co. LLC 5.500%, 4/25/17 | 10,678 | 10,684 | ||||||
Aramark Corp. Tranche D, 4.000%, 9/9/19 | 10,099 | 10,130 | ||||||
Del Monte Corp. 4.000%, 3/8/18 | 13,263 | 13,237 | ||||||
Heinz (H.J.) Co. Tranche B-2, 3.500%, 6/5/20 | 5,690 | 5,715 | ||||||
Hostess Brands Acquisition LLC Tranche B, 6.750%, 4/9/20 | 5,251 | 5,400 | ||||||
Rite Aid Corp. | ||||||||
Tranche 6, 4.000%, 2/21/20 | 6,965 | 6,965 | ||||||
Tranche 1, Second Lien, 5.750%, 8/21/20 | 720 | 739 | ||||||
Tranche 2, 4.875%, 6/21/21 | 14,688 | 14,766 | ||||||
|
| |||||||
| 67,849 | ||||||||
|
| |||||||
| Energy—0.7% | ||||||||
Buffalo Gulf Coast Terminals LLC 5.250%, 10/31/17 | 3,267 | 3,299 | ||||||
Chesapeake Energy Corp. 5.750%, 12/2/17 | 16,495 | 16,815 | ||||||
| PAR VALUE | VALUE | |||||||
| Energy (continued) | ||||||||
CITGO Petroleum Corp. Tranche C, 9.000%, 6/24/17 | $ | 1,880 | $ | 1,922 | ||||
EP Energy LLC (Everest Acquisition LLC) | ||||||||
Tranche B-3, 3.500%, 5/24/18 | 4,100 | 4,102 | ||||||
Tranche B-2, 4.500%, 4/30/19 | 768 | 769 | ||||||
FTS International, Inc. (Frac Tech International LLC) 8.500%, 5/6/16 | 11,340 | 11,153 | ||||||
NGPL Pipeco LLC 6.750%, 9/15/17 | 6,163 | 5,526 | ||||||
Quicksilver Reseources. Inc. Second Lien, 7.000%, 6/21/19 | 8,750 | 8,444 | ||||||
Samson Investment Co. Second Lien, 6.000%, 9/25/18 | 8,366 | 8,391 | ||||||
|
| |||||||
| 60,421 | ||||||||
|
| |||||||
| Financials—1.6% | ||||||||
AGFS Funding 0.000%, 9/25/19(10) | 6,383 | 6,396 | ||||||
Altisource Portfolio Solutions S.A.R.L Tranche B, 5.750%, 11/27/19 | 14,809 | 14,948 | ||||||
Asurion LLC (Asurion Corp.) Tranche B-1, 4.500%, 5/24/19 | 10,300 | 10,224 | ||||||
Capital Automotive LP | ||||||||
Tranche B-1, 4.000%, 4/10/19 | 3,696 | 3,707 | ||||||
Second Lien, 6.000%, 4/30/20 | 429 | 440 | ||||||
Clipper Acquisitions Corp. 4.000%, 2/6/20 | 6,330 | 6,367 | ||||||
iPayment, Inc . 6.750%, 5/8/17 | 6,546 | 6,333 | ||||||
See Notes to Financial Statements
32
Table of Contents
VIRTUS MULTI-SECTOR SHORT TERM BOND FUND
SCHEDULE OF INVESTMENTS (Continued)
SEPTEMBER 30, 2013
($ reported in thousands)
| PAR VALUE | VALUE | |||||||
| LOAN AGREEMENTS (continued) | ||||||||
| Financials (continued) | ||||||||
iStar Financial, Inc. | ||||||||
Tranche A-2, 7.000%, 3/19/17 | $ | 3,744 | $ | 3,847 | ||||
4.500%, 10/15/17 | 13,261 | 13,314 | ||||||
MIP Delaware LLC Tranche B-1, 4.000%, 3/9/20 | 1,866 | 1,877 | ||||||
Nuveen Investments, Inc. Tranche B, Second Lien 6.500%, 2/28/19 | 10,991 | 10,950 | ||||||
Realogy Corp. | ||||||||
Extended LOC, 0.030%, 10/10/16 | 743 | 749 | ||||||
Tranche B, | 17,962 | 18,099 | ||||||
RPI Finance Trust | 10,917 | 10,957 | ||||||
Springleaf Financial Funding Co. | 1,324 | 1,327 | ||||||
Trans Union LLC | 2,786 | 2,803 | ||||||
Walter Investment Management Corp. Tranche B, | 19,868 | 20,071 | ||||||
|
| |||||||
| 132,409 | ||||||||
|
| |||||||
| Health Care—1.9% | ||||||||
Alere, Inc. (IM U.S. Holdings LLC) | ||||||||
Tranche B-1, 4.250%, 6/30/17 | 2,454 | 2,470 | ||||||
Tranche B, | 1,323 | 1,332 | ||||||
American Renal Holdings, Inc. Tranche B, First Lien, 4.500%, 8/20/19 | 9,416 | 9,345 | ||||||
Aptalis Pharma, Inc. (Axcan Intermediate Holdings, Inc.) Tranche B-1, 5.500%, 2/10/17 | 3,039 | 3,046 | ||||||
| PAR VALUE | VALUE | |||||||
| Health Care (continued) | ||||||||
Ardent Medical Services, Inc. First Lien, 6.750%, 7/2/18 | $ | 4,339 | $ | 4,366 | ||||
Capsugel Holdings U.S., Inc. 3.500%, 8/1/18 | 2,720 | 2,709 | ||||||
Catalent Pharma Solutions, Inc. (Cardinal Health 409, Inc.) Tranche 2, 4.250%, 9/15/17 | 3,668 | 3,686 | ||||||
ConvaTec, Inc. 4.000%, 12/22/16 | 1,389 | 1,400 | ||||||
DaVita, Inc. | 10,703 | 10,759 | ||||||
Emdeon, Inc. Tranche B-2, 3.750%, 11/2/18 | 4,122 | 4,123 | ||||||
Health Management Associates, Inc. Tranche B, | 8,475 | 8,482 | ||||||
Hologic, Inc. | 12,657 | 12,699 | ||||||
Iasis Healthcare LLC Tranche B-2, | 5,819 | 5,838 | ||||||
InVentiv Health, Inc. (Ventive Health, Inc.) 7.500%, 8/4/16 | 8,750 | 8,488 | ||||||
Kinetic Concepts, Inc. | ||||||||
Tranche D-2, 4.000%, 11/4/16 | 6,737 | 6,776 | ||||||
Tranche D-1, 4.500%, 5/4/18 | 1,589 | 1,599 | ||||||
MedAssets, Inc. Tranche B, 4.000%, 12/13/19 | 558 | 560 | ||||||
Quintiles Transnational Corp. Tranche B-2, 4.000%, 6/8/18 | 4,429 | 4,447 | ||||||
See Notes to Financial Statements
33
Table of Contents
VIRTUS MULTI-SECTOR SHORT TERM BOND FUND
SCHEDULE OF INVESTMENTS (Continued)
SEPTEMBER 30, 2013
($ reported in thousands)
| PAR VALUE | VALUE | |||||||
| LOAN AGREEMENTS (continued) | ||||||||
| Health Care (continued) | ||||||||
Rural/Metro Operating Co. LLC First Lien, 5.750%, 6/30/18 | $ | 8,765 | $ | 8,354 | ||||
Sheridan Holdings, Inc. First Lien, 4.500%, 6/29/18 | 8,567 | 8,601 | ||||||
Surgery Center Holdings, Inc. First Lien 6.000%, 4/11/19 | 3,590 | 3,599 | ||||||
U.S. Renal Care, Inc. First Lien, 5.250%, 7/3/19 | 2,735 | 2,770 | ||||||
United Surgical Partners International, Inc. Tranche B, 4.750%, 4/3/19 | 3,798 | 3,823 | ||||||
Valeant Pharmaceuticals International, Inc. Escrow Corp. | ||||||||
Series D2, | 14,090 | 14,099 | ||||||
Series C2, | 3,891 | 3,905 | ||||||
Vanguard Health Holding Company II LLC Tranche B, 3.750%, 1/29/16 | 5,315 | 5,321 | ||||||
VWR Funding, Inc. | ||||||||
Tranche B-1, 4.179%, 4/3/17 | 827 | 828 | ||||||
4.429%, 4/3/17 | 3,169 | 3,174 | ||||||
Warner Chilcott Corp. | ||||||||
Tranche B-1, 5.500%, 3/15/18 | 1,430 | 1,433 | ||||||
Tranche B-1, 5.500%, 3/15/18 | 3,286 | 3,291 | ||||||
| PAR VALUE | VALUE | |||||||
| Health Care (continued) | ||||||||
(WC Luxco S.A.R.L.) | $ | 2,589 | $ | 2,593 | ||||
|
| |||||||
| 153,916 | ||||||||
|
| |||||||
| Industrials—1.9% | ||||||||
Aluma Systems, Inc. (Brand Energy & Infrastructure) Tranche 1, 6.250%, 10/23/18 | 1,859 | 1,870 | ||||||
American Airlines, Inc. Tranche B, 4.750%, 6/27/19 | 35,751 | 35,595 | ||||||
AWAS Finance Luxemborg S.A. Tranche 2012, 3.500%, 7/16/18 | 10,213 | 10,252 | ||||||
Brand Energy & Infrastructure Services, Inc. Tranche B-1, First Lien, 6.250%, 10/23/18 | 7,744 | 7,791 | ||||||
Brock Holdings Ill, Inc. First Lien, 6.750%, 3/16/17 | 1,483 | 1,492 | ||||||
Ceridian Corp. Tranche 2013, 4.429%, 8/14/15 | 19,564 | 19,605 | ||||||
CHG Buyer Corp. First Lien, 5.000%, 11/19/19 | 10,121 | 10,216 | ||||||
Delta Air Lines, Inc. Tranche B-1, 4.000%, 10/18/18 | 6,396 | 6,424 | ||||||
DynCorp International, Inc. 6.750%, 7/7/16 | 5,616 | 5,662 | ||||||
Envision Healthcare Corp. (Emergency Medical Services Corp.) 4.000%, 5/25/18 | 6,748 | 6,755 | ||||||
HD Supply, Inc. 4.500%, 10/12/17 | 11,722 | 11,754 | ||||||
Husky Injection Molding 4.250%, 7/2/18 | 5,258 | 5,272 | ||||||
See Notes to Financial Statements
34
Table of Contents
VIRTUS MULTI-SECTOR SHORT TERM BOND FUND
SCHEDULE OF INVESTMENTS (Continued)
SEPTEMBER 30, 2013
($ reported in thousands)
| PAR VALUE | VALUE | |||||||
| LOAN AGREEMENTS (continued) | ||||||||
| Industrials (continued) | ||||||||
McJunkin Red Man Corp. 7.000%, 11/8/19 | $ | 6,983 | $ | 7,038 | ||||
Spirit Aerosystems, Inc. Tranche B 3.750%, 4/18/19 | 13,790 | 13,876 | ||||||
Swift Transportation Tranche B-2, 4.000%, 12/21/17 | 815 | 819 | ||||||
US Airways, Inc. | ||||||||
Tranche B-2, 3.500%, 11/23/16 | 6,235 | 6,252 | ||||||
Tranche B-1, 4.250%, 5/23/19 | 7,126 | 7,098 | ||||||
WireCo Worldgroup, Inc. 6.000%, 2/15/17 | 2,490 | 2,502 | ||||||
|
| |||||||
| 160,273 | ||||||||
|
| |||||||
| Information Technology—2.9% | ||||||||
Activision Blizzard 0.000%, 7/26/20(10) | 13,167 | 13,177 | ||||||
Alcatel-Lucent U.S.A., Inc. 5.750%, 1/30/19 | 16,190 | 16,338 | ||||||
Avaya, Inc. | ||||||||
Tranche B-3, 4.762%, 10/26/17 | 11,071 | 9,938 | ||||||
Tranche B-5, 8.000%, 3/31/18 | 2,502 | 2,376 | ||||||
Blue Coat Systems, Inc. | ||||||||
4.500%, 5/31/19 | 8,283 | 8,328 | ||||||
Second Lien 9.500%, 6/28/20 | 11,569 | 11,656 | ||||||
BMC Software, Inc. 5.000%, 9/10/20 | 6,510 | 6,521 | ||||||
CCC Holdings, Inc. 4.000%, 12/20/19 | 5,900 | 5,887 | ||||||
CDW LLC 3.500%, 4/29/20 | 12,481 | 12,304 | ||||||
Dell, Inc. 0.000%, 3/24/20(10) | 12,940 | 12,730 | ||||||
Deltek, Inc. First Lien, 5.000%, 10/10/18 | 9,553 | 9,591 | ||||||
| PAR VALUE | VALUE | |||||||
| Information Technology (continued) | ||||||||
First Data Corp. | ||||||||
Tranche 2017, 4.180%, 3/24/17 | $ | 13,980 | $ | 13,881 | ||||
Tranche 2018, 4.180%, 3/23/18 | 22,100 | 21,934 | ||||||
Genpact Ltd. 3.500%, 8/30/19 | 3,705 | 3,708 | ||||||
Infor (U.S.), Inc. (Lawson Software, Inc.) | ||||||||
Tranche B-2, 5.250%, 4/5/18 | 7,358 | 7,410 | ||||||
Tranche B-3, 3.750%, 6/3/20 | 4,863 | 4,827 | ||||||
Information Resources, Inc. (Symphonyiri Group, Inc.) 4.750%, 9/30/20 | 1,914 | 1,918 | ||||||
Interactive Data Corp. 3.750%, 2/11/18 | 5,267 | 5,251 | ||||||
Kronos, Inc. First Lien, 4.500%, 10/30/19 | 3,126 | 3,132 | ||||||
Moneygram International, Inc. 4.250%, 3/27/20 | 4,662 | 4,666 | ||||||
Novell, Inc. (Attachmate Corp.) First Lien, 7.250%, 11/22/17 | 8,211 | 8,242 | ||||||
Presidio, Inc. 5.750%, 3/31/17 | 11,167 | 11,185 | ||||||
Riverbed Technology, Inc. 4.000%, 12/18/19 | 3,972 | 4,010 | ||||||
RP Crown Parent LLC First Lien 6.750%, 12/21/18 | 12,352 | 12,464 | ||||||
Sophia LP Tranche B, 4.500%, 7/19/18 | 6,353 | 6,392 | ||||||
Spansion LLC 5.250%, 12/13/18 | 4,220 | 4,253 | ||||||
SRA International, Inc. 6.500%, 7/20/18 | 6,905 | 6,849 | ||||||
See Notes to Financial Statements
35
Table of Contents
VIRTUS MULTI-SECTOR SHORT TERM BOND FUND
SCHEDULE OF INVESTMENTS (Continued)
SEPTEMBER 30, 2013
($ reported in thousands)
| PAR VALUE | VALUE | |||||||
| LOAN AGREEMENTS (continued) | ||||||||
| Information Technology (continued) | ||||||||
SSI Investments II Ltd. (Skillsoft) 5.000%, 5/26/17 | $ | 3,073 | $ | 3,091 | ||||
Wall Street Systems Holdings, Inc. First Lien, 5.750%, 10/25/19 | 6,506 | 6,536 | ||||||
|
| |||||||
| 238,595 | ||||||||
|
| |||||||
| Materials—0.9% | ||||||||
Air Distribution Technologies, Inc. (QS0001 Corp.) First Lien, 5.000%, 11/9/18 | 3,845 | 3,869 | ||||||
Avantor Performance Materials Holdings, Inc. 5.250%, 6/24/17 | 2,304 | 2,310 | ||||||
AZ Chem US, Inc. 5.250%, 12/22/17 | 4,696 | 4,746 | ||||||
Cyanco Intermediate Corp. 5.500%, 5/1/20 | 3,596 | 3,618 | ||||||
Fairmount Minerals Ltd. | ||||||||
Tranche B-2, 4.250%, 6/30/17 | 4,925 | 4,958 | ||||||
Tranche B-2, 5.000%, 9/5/19 | 3,899 | 3,913 | ||||||
Fortescue Metals Group Ltd. (FMG Resources Ltd.) 2006, 5.250%, 10/18/17 | 6,998 | 7,031 | ||||||
Houghton International, Inc. Holding Corp. First Lien, 4.000%, 12/20/19 | 14,361 | 14,331 | ||||||
Ineos US Finance LLC 4.000%, 5/4/18 | 12,574 | 12,452 | ||||||
Pact Group (USA), Inc. 3.750%, 5/29/20 | 10,089 | 9,963 | ||||||
| PAR VALUE | VALUE | |||||||
| Materials (continued) | ||||||||
Reynolds Group Holdings, Inc. 4.750%, 9/28/18 | $ | 6,085 | $ | 6,109 | ||||
Tronox Pigments B.V. 4.500%, 3/19/20 | 3,975 | 4,003 | ||||||
|
| |||||||
| 77,303 | ||||||||
|
| |||||||
| Telecommunication Services—0.9% | ||||||||
Cricket Communications, Inc. Tranche C, 4.750%, 3/8/20 | 15,362 | 15,381 | ||||||
Global Tel*link Corp. First Lien, 5.000%, 5/22/20 | 9,962 | 9,838 | ||||||
Intelsat Jackson Holding S.A. (Intelsat Jackson Holding Ltd.) Tranche B-1, 4.250%, 4/2/18 | 13,364 | 13,414 | ||||||
Level 3 Financing, Inc. | ||||||||
Tranche B-III 2019, 4.000%, 8/1/19 | 6,319 | 6,321 | ||||||
Tranche B-II 2019, 4.750%, 8/1/19 | 9,850 | 9,859 | ||||||
0.000%, 1/15/20(10) | 2,900 | 2,901 | ||||||
Tranche B, 4.000%, 1/15/20 | 585 | 585 | ||||||
West Corp. Tranche B-8, 3.750%, 6/30/18 | 6,343 | 6,356 | ||||||
Windstream Corp. Tranche B-4, 3.500%, 1/23/20 | 5,667 | 5,663 | ||||||
|
| |||||||
| 70,318 | ||||||||
|
| |||||||
| Utilities—0.2% | ||||||||
Calpine Corp. 4.000%, 10/9/19 | 6,683 | 6,694 | ||||||
NRG Energy, Inc. 2.750%, 7/1/18 | 6,818 | 6,784 | ||||||
See Notes to Financial Statements
36
Table of Contents
VIRTUS MULTI-SECTOR SHORT TERM BOND FUND
SCHEDULE OF INVESTMENTS (Continued)
SEPTEMBER 30, 2013
($ reported in thousands)
| PAR VALUE | VALUE | |||||||
| LOAN AGREEMENTS (continued) | ||||||||
| Utilities (continued) | ||||||||
Texas Compeptitive Electric Holdings Co. LLC 2017 Extended, 4.766%, 10/10/17 | $ | 5,925 | $ | 4,000 | ||||
|
| |||||||
| 17,478 | ||||||||
| TOTAL LOAN AGREEMENTS | ||||||||
| (Identified Cost $1,319,843) | 1,319,968 | |||||||
| SHARES | ||||||||
| PREFERRED STOCK—0.3% | ||||||||
| Financials—0.3% | ||||||||
Ally Financial, Inc. 144A(4) | 702 | 671 | ||||||
Banco Bilbao Vizcaya Argentaria S.A. International S.A. Unipersonal 5.919%(3) | 5,835,000 | (11) | 5,251 | |||||
Banco do Brasil S.A. 144A | 700,000 | (11) | 777 | |||||
JPMorgan Chase & Co. Series 1 7.90%(3) | 3,360,000 | (11) | 3,646 | |||||
Wells Fargo & Co. Series K, | 16,155,000 | (11) | 17,770 | |||||
| TOTAL PREFERRED STOCK | ||||||||
| (Identified Cost $27,807) | 28,115 | |||||||
| COMMON STOCKS—0.0% | ||||||||
| Financials—0.0% | ||||||||
CIT Group, Inc.(2) | 1 | — | (12) | |||||
|
| |||||||
| Materials—0.0% | ||||||||
Catalyst Paper Corp. | 2,284,459 | 1,348 | ||||||
| TOTAL COMMON STOCKS | ||||||||
| (Identified Cost $2,850) | 1,348 | |||||||
| TOTAL LONG TERM INVESTMENTS—98.6% | ||||||||
| (Identified Cost $8,135,572) | 8,203,065 | |||||||
| SHARES | VALUE | |||||||
| SHORT-TERM INVESTMENTS—1.7% | ||||||||
| Money Market Mutual Funds—1.7% | ||||||||
Fidelity Money Market Portfolio – Institutional Shares (Seven-day effective yield 0.090%) | 139,165,914 | $ | 139,166 | |||||
| TOTAL SHORT-TERM INVESTMENTS | ||||||||
| (Identified Cost $139,166) | 139,166 | |||||||
| TOTAL INVESTMENTS—100.3% (Identified Cost $8,274,738) | 8,342,231 | (1) | ||||||
Other assets and liabilities, net—(0.3)% |
| (27,401 | ) | |||||
|
| |||||||
| NET ASSETS—100.0% | $ | 8,314,830 | ||||||
|
| |||||||
Abbreviations:
| FHLMC | Federal Home Loan Mortgage Corporation (“Freddie Mac”). |
| FNMA | Federal National Mortgage Association (“Fannie Mae”). |
| GNMA | Government National Mortgage Association (“Ginnie Mae”) |
| PIK | Payment-in-Kind Security |
| REIT | Real Estate Investment Trust |
| REMIC | Real Estate Mortgage Investment Conduit |
See Notes to Financial Statements
37
Table of Contents
VIRTUS MULTI-SECTOR SHORT TERM BOND FUND
SCHEDULE OF INVESTMENTS (Continued)
SEPTEMBER 30, 2013
($ reported in thousands)
Footnote Legend:
| (1) | Federal Income Tax Information: For tax information at September 30, 2013, see Note 10 Federal Income Tax Information in the Notes to Financial Statements. |
| (2) | Non-income producing. |
| (3) | Variable or step coupon security; interest rate shown reflects the rate in effect at September 30, 2013. |
| (4) | Security exempt from registration under Rule 144A of the Securities Act of 1933. These securities may be resold in transactions exempt from registration, normally to qualified institutional buyers. At September 30, 2013, these securities amounted to a value of $2,635,190 or 31.7% of net assets. |
| (5) | Regulation S security. Security is offered and sold outside of the United States, therefore, it is exempt from registration with the SEC under rules 903 and 904 of the Securities Act of 1933. |
| (6) | This note was issued for the sole purpose of funding a loan agreement between the issuer and the borrower. As the credit risk for this security lies solely with the borrower, the name represented here is that of the borrower. |
| (7) | No contractual maturity date |
| (8) | Interest payments may be deferred. |
| (9) | Issuer may elect not to pay interest causing the payment to be forfeited and no longer due. The issuer has not invoked this election since the fund purchased this security. |
| (10) | This loan will settle after September 30, 2013, at which time the interest rate, based on the London Interbank Offered Rate (“LIBOR”) and the agreed upon spread on trade date, will be known. |
| (11) | Value shown as par value. |
| (12) | Amount less than $500. |
| (13) | 100% of the income received was in cash. |
| (14) | 69.7% of the income received was in cash and 30.3% in PIK. |
Foreign Currencies:
| AUD | Australian Dollar |
| BRL | Brazilian Real |
| CAD | Canadian Dollar |
| COP | Colombian Peso |
| EUR | European Currency Unit |
| IDR | Indonesian Rupiah |
| KRW | South Korean Won |
| MXN | Mexican Peso |
| NOK | Norwegian Krone |
| NZD | New Zealand Dollar |
| PEN | Peruvian Nuevo Sol |
| RUB | Russian Ruble |
| TRY | Turkish Lira |
| ZAR | South African Rand |
| Country Weightings (Unaudited)† | ||||
United States | 75 | % | ||
Luxembourg | 3 | |||
Brazil | 2 | |||
Canada | 2 | |||
Venezuela | 2 | |||
Mexico | 1 | |||
United Kingdom | 1 | |||
Other | 14 | |||
Total | 100 | % | ||
† % of total investments as of September 30, 2013 |
| |||
See Notes to Financial Statements
38
Table of Contents
VIRTUS MULTI-SECTOR SHORT TERM BOND FUND
SCHEDULE OF INVESTMENTS (Continued)
SEPTEMBER 30, 2013
($ reported in thousands)
The following table provides a summary of inputs used to value the Fund’s investments as of September 30, 2013 (See Security Valuation Note 2A in the Notes to Financial Statements):
| Total Value at September 30, 2013 | Level 1 Quoted Prices | Level 2 Significant Observable Inputs | Level 3 Significant Unobservable Inputs | |||||||||||||
Debt Securities: | ||||||||||||||||
Asset-Backed Securities | $ | 1,314,523 | $ | — | $ | 1,299,336 | $ | 15,187 | ||||||||
Corporate Bonds and Notes | 3,050,293 | — | 3,050,293 | — | ||||||||||||
Foreign Government Securities | 638,176 | — | 638,176 | — | ||||||||||||
Loan Agreements | 1,319,968 | — | 1,305,778 | 14,190 | ||||||||||||
Mortgage-Backed Securities | 1,738,756 | — | 1,738,756 | — | ||||||||||||
Municipal Bonds | 9,300 | — | 9,300 | — | ||||||||||||
U.S. Government Securities | 102,586 | — | 102,586 | — | ||||||||||||
Equity Securities: | ||||||||||||||||
Preferred Stocks | 28,115 | 671 | 27,444 | — | ||||||||||||
Common Stock | 1,348 | — | 1,348 | — | ||||||||||||
Short-Term Investments | 139,166 | 139,166 | — | — | ||||||||||||
|
|
|
|
|
|
|
| |||||||||
Total Investments | $ | 8,342,231 | $ | 139,837 | $ | 8,173,017 | $ | 29,377 | ||||||||
|
|
|
|
|
|
|
| |||||||||
Securities with an end of period value of $671 were transferred from level 2 to level 1 since starting to use an exchange price.
The following is a reconciliation of assets of the Fund for Level 3 investments for which significant unobservable inputs were used to determine fair value.
| Total | Asset-Backed Securities | Corporate Bonds and Notes | Loan Agreements | Common Stocks | ||||||||||||||||
Investments in Securities | ||||||||||||||||||||
Balance as of September 30, 2012: | $ | 133 | $ | — | $ | 21 | (c) | $ | — | $ | 112 | |||||||||
Accrued discount/(premium) | (36 | ) | (2 | ) | — | (34 | ) | — | ||||||||||||
Realized gain (loss) | (647 | ) | (4 | ) | 69 | — | (712 | ) | ||||||||||||
Change in unrealized appreciation/(depreciation) | (265 | ) | 81 | 921 | (2,126 | ) | 859 | |||||||||||||
Purchases | 31,918 | 15,567 | — | 16,350 | 1 | |||||||||||||||
Sales(b) | (1,726 | ) | (455 | ) | (1,011 | ) | — | (260 | ) | |||||||||||
Transfers into Level 3(a) | — | — | — | — | — | |||||||||||||||
Transfers from Level 3(a) | — | — | — | — | — | |||||||||||||||
|
|
|
|
|
|
|
|
|
| |||||||||||
Balance as of September 30, 2013 | $ | 29,377 | $ | 15,187 | $ | — | $ | 14,190 | $ | — | (d) | |||||||||
|
|
|
|
|
|
|
|
|
| |||||||||||
| (a) | “Transfers into and/or from” represent the ending value as of September 30, 2013, for any investment security where a change in the pricing level occurred from the beginning to the end of the period. |
| (b) | Includes paydowns on securities. |
| (c) | Includes internally fair valued security. |
| (d) | Amount is less than $500. |
None of the securities in the table are internally fair valued at September 30, 2013.
See Notes to Financial Statements
39
Table of Contents
VIRTUS MULTI-SECTOR SHORT TERM BOND FUND
STATEMENTS OF ASSETS AND LIABILITIES
SEPTEMBER 30, 2013
(Reported in thousands except shares and per share amounts)
| Assets | ||||
Investment in securities at value(1) | $ | 8,342,231 | ||
Foreign currency at value(2) | 438 | |||
Cash | 16,153 | |||
Receivables | ||||
Investment securities sold | 109,916 | |||
Fund shares sold | 51,189 | |||
Dividends and interest receivable | 69,710 | |||
Tax reclaims | 19 | |||
Prepaid expenses | 430 | |||
Prepaid trustee retainer | 46 | |||
|
| |||
Total assets | 8,590,132 | |||
|
| |||
| Liabilities | ||||
Payables | ||||
Fund shares repurchased | 31,383 | |||
Investment securities purchased | 232,908 | |||
Dividend distributions | 3,190 | |||
Investment advisory fee | 3,184 | |||
Distribution and service fees | 1,998 | |||
Administration fee | 868 | |||
Transfer agent fees and expenses | 1,055 | |||
Trustees’ fees and expenses | 7 | |||
Professional fees | 46 | |||
Other accrued expenses | 663 | |||
|
| |||
Total liabilities | 275,302 | |||
|
| |||
| Net Assets | $ | 8,314,830 | ||
|
| |||
| Net Assets Consist of: | ||||
Capital paid in on shares of beneficial interest | $ | 8,276,703 | ||
Accumulated undistributed net investment income (loss) | (332 | ) | ||
Accumulated undistributed net realized gain (loss) | (28,992 | ) | ||
Net unrealized appreciation (depreciation) on investments | 67,451 | |||
|
| |||
| Net Assets | $ | 8,314,830 | ||
|
| |||
| Class A | ||||
Net asset value (net assets/shares outstanding) per share | $ | 4.85 | ||
Maximum offering price per share NAV/(1-2.25%) | $ | 4.96 | ||
Shares of beneficial interest outstanding, no par value, unlimited authorization | 737,575,516 | |||
Net Assets | $ | 3,574,450 | ||
| Class B | ||||
Net asset value (net assets/shares outstanding) and offering price per share | $ | 4.82 | ||
Shares of beneficial interest outstanding, no par value, unlimited authorization | 533,753 | |||
Net Assets | $ | 2,572 | ||
| Class C | ||||
Net asset value (net assets/shares outstanding) and offering price per share | $ | 4.90 | ||
Shares of beneficial interest outstanding, no par value, unlimited authorization | 319,794,461 | |||
Net Assets | $ | 1,567,725 | ||
| Class T | ||||
Net asset value (net assets/shares outstanding) and offering price per share | $ | 4.89 | ||
Shares of beneficial interest outstanding, no par value, unlimited authorization | 153,626,748 | |||
Net Assets | $ | 751,220 | ||
| Class I | ||||
Net asset value (net assets/shares outstanding) and offering price per share | $ | 4.85 | ||
Shares of beneficial interest outstanding, no par value, unlimited authorization | 498,568,598 | |||
Net Assets | $ | 2,418,863 | ||
(1) Investment in securities at cost | $ | 8,274,738 | ||
(2) Foreign currency at cost | $ | 439 | ||
See Notes to Financial Statements
40
Table of Contents
VIRTUS MULTI-SECTOR SHORT TERM BOND FUND
YEAR ENDED SEPTEMBER 30, 2013
($ reported in thousands)
| Investment Income | ||||
Interest | $ | 358,756 | ||
Dividends | 647 | |||
Foreign taxes withheld | (227 | ) | ||
|
| |||
Total investment income | 359,176 | |||
|
| |||
| Expenses | ||||
Investment advisory fees | 36,323 | |||
Service fees, Class A | 8,579 | |||
Distribution and service fees, Class B | 22 | |||
Distribution and service fees, Class C | 7,208 | |||
Distribution and service fees, Class T | 7,496 | |||
Administration fees | 9,860 | |||
Transfer agent fees and expenses | 8,594 | |||
Registration fees | 717 | |||
Printing fees and expenses | 430 | |||
Trustees’ fees and expenses | 330 | |||
Custodian fees | 196 | |||
Professional fees | 99 | |||
Miscellaneous expenses | 702 | |||
|
| |||
Total expenses | 80,556 | |||
|
| |||
| Net investment income (loss) | 278,620 | |||
|
| |||
| Net Realized and Unrealized Gain (Loss) on Investments | ||||
Net realized gain (loss) on investments | 15,910 | |||
Net realized gain (loss) on foreign currency transactions | (3,098 | ) | ||
Capital gain distributions from underlying funds | — | (1) | ||
Net change in unrealized appreciation (depreciation) on investments | (179,753 | ) | ||
Net change in unrealized appreciation (depreciation) on foreign currency translation | (166 | ) | ||
|
| |||
| Net gain (loss) on investments | (167,107 | ) | ||
|
| |||
| Net increase (decrease) in net assets resulting from operations | $ | 111,513 | ||
|
|
| (1) | Amount is less than $500. |
See Notes to Financial Statements
41
Table of Contents
VIRTUS MULTI-SECTOR SHORT TERM BOND FUND
STATEMENT OF CHANGES IN NET ASSETS
(Reported in thousands)
| Year Ended September 30, 2013 | Year Ended September 30, 2012 | |||||||
| INCREASE/(DECREASE) IN NET ASSETS | ||||||||
| From Operations | ||||||||
Net investment income (loss) | $ | 278,620 | $ | 223,198 | ||||
Net realized gain (loss) | 12,812 | 43,775 | ||||||
Net change in unrealized appreciation (depreciation) | (179,919 | ) | 252,207 | |||||
|
|
|
| |||||
| Increase (decrease) in net assets resulting from operations | 111,513 | 519,180 | ||||||
|
|
|
| |||||
| From Distributions to Shareholders | ||||||||
Net investment income, Class A | (125,014 | ) | (117,018 | ) | ||||
Net investment income, Class B | (94 | ) | (178 | ) | ||||
Net investment income, Class C | (47,945 | ) | (31,198 | ) | ||||
Net investment income, Class T | (21,492 | ) | (22,443 | ) | ||||
Net investment income, Class I | (81,834 | ) | (59,595 | ) | ||||
|
|
|
| |||||
| Decrease in net assets from distributions to shareholders | (276,379 | ) | (230,432 | ) | ||||
|
|
|
| |||||
| From Share Transactions | ||||||||
| Sale of shares | ||||||||
Class A (346,749 and 243,732 shares, respectively) | 1,710,009 | 1,174,129 | ||||||
Class B (53 and 55 shares, respectively) | 259 | 263 | ||||||
Class C (221,042 and 124,342 shares, respectively) | 1,104,963 | 608,471 | ||||||
Class T (37,247 and 45,372 shares, respectively) | 185,325 | 220,411 | ||||||
Class I (349,093 and 211,432 shares, respectively) | 1,722,724 | 1,017,729 | ||||||
| Reinvestment of distributions | ||||||||
Class A (23,973 and 22,479 shares, respectively) | 117,820 | 108,432 | ||||||
Class B (18 and 33 shares, respectively) | 88 | 157 | ||||||
Class C (9,226 and 5,808 shares, respectively) | 45,806 | 28,350 | ||||||
Class T (2,838 and 2,957 shares, respectively) | 14,073 | 14,392 | ||||||
Class I (11,630 and 7,492 shares, respectively) | 57,145 | 36,212 | ||||||
| Shares repurchased | ||||||||
Class A (248,676 and 178,092 shares, respectively) | (1,221,380 | ) | (852,783 | ) | ||||
Class B (269 and 551 shares, respectively) | (1,320 | ) | (2,626 | ) | ||||
Class C (124,346 and 46,855 shares, respectively) | (617,286 | ) | (227,897 | ) | ||||
Class T (27,900 and 19,463 shares, respectively) | (138,155 | ) | (94,472 | ) | ||||
Class I (187,385 and 86,490 shares, respectively) | (920,516 | ) | (416,145 | ) | ||||
|
|
|
| |||||
| Increase (decrease) in net assets from share transactions | 2,059,555 | 1,614,623 | ||||||
|
|
|
| |||||
| Net increase (decrease) in net assets | 1,894,689 | 1,903,371 | ||||||
| Net Assets | ||||||||
Beginning of period | 6,420,141 | 4,516,770 | ||||||
|
|
|
| |||||
| End of period | $ | 8,314,830 | $ | 6,420,141 | ||||
|
|
|
| |||||
Accumulated undistributed net investment income (loss) at end of period | $ | (332 | ) | $ | (519 | ) | ||
See Notes to Financial Statements
42
Table of Contents
VIRTUS MULTI-SECTOR SHORT TERM BOND FUND
SELECTED PER SHARE DATA AND RATIOS FOR A SHARE OUTSTANDING
THROUGHOUT EACH PERIOD
| Net Asset Value, Beginning of Period | Net Investment Income (Loss)(2) | Net Realized and Unrealized Gain (Loss) | Total from Investment Operations | Dividends from Net Investment Income | Total Distributions | Change in Net Asset Value | Net Asset Value, End Period | Total Return(1) | Net Assets, End of Period (000's) | Ratio of Expenses to Average Net Assets(3) | Ratio of Net Investment Income to Average Net Assets | Portfolio Turnover Rate | |||||||||||||||||||||||||||||||||||||||||||||||||||||
Class A | |||||||||||||||||||||||||||||||||||||||||||||||||||||||||||||||||
10/1/12 to 9/30/13 | $ | 4.94 | 0.18 | (0.09 | ) | 0.09 | (0.18 | ) | (0.18 | ) | (0.09 | ) | $ | 4.85 | 1.84 | % | $ | 3,574,450 | 0.99 | % | 3.65 | % | 49 | % | |||||||||||||||||||||||||||||||||||||||||
10/1/11 to 9/30/12 | 4.67 | 0.21 | 0.27 | 0.48 | (0.21 | ) | (0.21 | ) | 0.27 | 4.94 | 10.58 | 3,038,093 | 1.01 | 4.31 | 52 | ||||||||||||||||||||||||||||||||||||||||||||||||||
10/1/10 to 9/30/11 | 4.80 | 0.22 | (0.12 | ) | 0.10 | (0.23 | ) | (0.23 | ) | (0.13 | ) | 4.67 | 2.02 | 2,463,360 | 1.05 | 4.59 | 35 | ||||||||||||||||||||||||||||||||||||||||||||||||
10/1/09 to 9/30/10 | 4.54 | 0.25 | 0.26 | 0.51 | (0.25 | ) | (0.25 | ) | 0.26 | 4.80 | 11.65 | 1,897,491 | 1.07 | 5.31 | 49 | ||||||||||||||||||||||||||||||||||||||||||||||||||
10/1/08 to 9/30/09 | 4.21 | 0.24 | 0.35 | 0.59 | (0.26 | ) | (0.26 | ) | 0.33 | 4.54 | 14.91 | 1,433,927 | 1.12 | 5.93 | 88 | ||||||||||||||||||||||||||||||||||||||||||||||||||
Class B | |||||||||||||||||||||||||||||||||||||||||||||||||||||||||||||||||
10/1/12 to 9/30/13 | $ | 4.91 | 0.16 | (0.09 | ) | 0.07 | (0.16 | ) | (0.16 | ) | (0.09 | ) | $ | 4.82 | 1.34 | % | $ | 2,572 | 1.49 | % | 3.17 | % | 49 | % | |||||||||||||||||||||||||||||||||||||||||
10/1/11 to 9/30/12 | 4.65 | 0.18 | 0.27 | 0.45 | (0.19 | ) | (0.19 | ) | 0.26 | 4.91 | 9.87 | 3,590 | 1.51 | 3.86 | 52 | ||||||||||||||||||||||||||||||||||||||||||||||||||
10/1/10 to 9/30/11 | 4.78 | 0.20 | (0.12 | ) | 0.08 | (0.21 | ) | (0.21 | ) | (0.13 | ) | 4.65 | 1.53 | 5,550 | 1.55 | 4.10 | 35 | ||||||||||||||||||||||||||||||||||||||||||||||||
10/1/09 to 9/30/10 | 4.52 | 0.23 | 0.26 | 0.49 | (0.23 | ) | (0.23 | ) | 0.26 | 4.78 | 11.16 | 9,435 | 1.56 | 4.86 | 49 | ||||||||||||||||||||||||||||||||||||||||||||||||||
10/1/08 to 9/30/09 | 4.19 | 0.22 | 0.35 | 0.57 | (0.24 | ) | (0.24 | ) | 0.33 | 4.52 | 14.41 | 12,753 | 1.62 | 5.47 | 88 | ||||||||||||||||||||||||||||||||||||||||||||||||||
Class C | |||||||||||||||||||||||||||||||||||||||||||||||||||||||||||||||||
10/1/12 to 9/30/13 | $ | 4.99 | 0.17 | (0.09 | ) | 0.08 | (0.17 | ) | (0.17 | ) | (0.09 | ) | $ | 4.90 | 1.56 | % | $ | 1,567,725 | 1.24 | % | 3.40 | % | 49 | % | |||||||||||||||||||||||||||||||||||||||||
10/1/11 to 9/30/12 | 4.72 | 0.20 | 0.27 | 0.47 | (0.20 | ) | (0.20 | ) | 0.27 | 4.99 | 10.19 | 1,067,276 | 1.27 | 4.04 | 52 | ||||||||||||||||||||||||||||||||||||||||||||||||||
10/1/10 to 9/30/11 | 4.85 | 0.21 | (0.12 | ) | 0.09 | (0.22 | ) | (0.22 | ) | (0.13 | ) | 4.72 | 1.75 | 616,170 | 1.30 | 4.33 | 35 | ||||||||||||||||||||||||||||||||||||||||||||||||
10/1/09 to 9/30/10 | 4.58 | 0.24 | 0.27 | 0.51 | (0.24 | ) | (0.24 | ) | 0.27 | 4.85 | 11.49 | 471,332 | 1.32 | 5.04 | 49 | ||||||||||||||||||||||||||||||||||||||||||||||||||
10/1/08 to 9/30/09 | 4.24 | 0.23 | 0.36 | 0.59 | (0.25 | ) | (0.25 | ) | 0.34 | 4.58 | 14.75 | 241,339 | 1.36 | 5.63 | 88 | ||||||||||||||||||||||||||||||||||||||||||||||||||
Class T | |||||||||||||||||||||||||||||||||||||||||||||||||||||||||||||||||
10/1/12 to 9/30/13 | $ | 4.98 | 0.14 | (0.09 | ) | 0.05 | (0.14 | ) | (0.14 | ) | (0.09 | ) | $ | 4.89 | 1.06 | % | $ | 751,220 | 1.74 | % | 2.91 | % | 49 | % | |||||||||||||||||||||||||||||||||||||||||
10/1/11 to 9/30/12 | 4.71 | 0.17 | 0.28 | 0.45 | (0.18 | ) | (0.18 | ) | 0.27 | 4.98 | 9.67 | 704,225 | 1.76 | 3.56 | 52 | ||||||||||||||||||||||||||||||||||||||||||||||||||
10/1/10 to 9/30/11 | 4.84 | 0.19 | (0.13 | ) | 0.06 | (0.19 | ) | (0.19 | ) | (0.13 | ) | 4.71 | 1.24 | 530,162 | 1.80 | 3.84 | 35 | ||||||||||||||||||||||||||||||||||||||||||||||||
10/1/09 to 9/30/10 | 4.57 | 0.21 | 0.28 | 0.49 | (0.22 | ) | (0.22 | ) | 0.27 | 4.84 | 10.96 | 394,183 | 1.82 | 4.54 | 49 | ||||||||||||||||||||||||||||||||||||||||||||||||||
10/1/08 to 9/30/09 | 4.23 | 0.21 | 0.36 | 0.57 | (0.23 | ) | (0.23 | ) | 0.34 | 4.57 | 14.21 | 219,501 | 1.86 | 5.11 | 88 | ||||||||||||||||||||||||||||||||||||||||||||||||||
Class I | |||||||||||||||||||||||||||||||||||||||||||||||||||||||||||||||||
10/1/12 to 9/30/13 | $ | 4.94 | 0.19 | (0.09 | ) | 0.10 | (0.19 | ) | (0.19 | ) | (0.09 | ) | $ | 4.85 | 2.09 | % | $ | 2,418,863 | 0.74 | % | 3.90 | % | 49 | % | |||||||||||||||||||||||||||||||||||||||||
10/1/11 to 9/30/12 | 4.68 | 0.22 | 0.27 | 0.49 | (0.23 | ) | (0.23 | ) | 0.26 | 4.94 | 10.62 | 1,606,957 | 0.77 | 4.55 | 52 | ||||||||||||||||||||||||||||||||||||||||||||||||||
10/1/10 to 9/30/11 | 4.81 | 0.23 | (0.12 | ) | 0.11 | (0.24 | ) | (0.24 | ) | (0.13 | ) | 4.68 | 2.28 | 901,528 | 0.80 | 4.83 | 35 | ||||||||||||||||||||||||||||||||||||||||||||||||
10/1/09 to 9/30/10 | 4.54 | 0.26 | 0.28 | 0.54 | (0.27 | ) | (0.27 | ) | 0.27 | 4.81 | 12.16 | 468,264 | 0.83 | 5.51 | 49 | ||||||||||||||||||||||||||||||||||||||||||||||||||
10/1/08 to 9/30/09 | 4.21 | 0.28 | 0.32 | 0.60 | (0.27 | ) | (0.27 | ) | 0.33 | 4.54 | 15.20 | 20,553 | 1.03 | 6.47 | 88 | ||||||||||||||||||||||||||||||||||||||||||||||||||
| (1) | Sales charges, where applicable, are not reflected in the total return calculation. |
| (2) | Computed using average shares outstanding. |
| (3) | The Fund may invest in other funds and the annualized expense ratios do not reflect fees and expenses associated with the underlying funds. |
See Notes to Financial Statements
43
Table of Contents
VIRTUS MULTI-SECTOR SHORT TERM BOND FUND
SEPTEMBER 30, 2013
Note 1. Organization
Virtus Opportunities Trust (the “Trust”) is organized as a Delaware statutory trust and is registered under the Investment Company Act of 1940, as amended (“1940 Act”), as an open-end management investment company.
As of the date of this report, 31 funds are offered for sale, of which the Virtus Multi-Sector Short Term Bond Fund (the “Fund”) is reported in this annual report. The Fund’s investment objective is outlined in the Fund summary page.
The Fund offers Class A shares, Class C shares, Class T shares and Class I shares. Class B shares are no longer available for purchase by new or existing shareholders, except by existing shareholders through Qualifying Transactions. (For information regarding Qualifying Transactions refer to the Trust’s prospectus.)
Class A shares are sold with a front-end sales charge of up to 2.25%. Generally, Class A shares are not subject to any charges by the Fund when redeemed; however, a 0.50% contingent deferred sales charge (“CDSC”) may be imposed on certain redemptions made within certain period following purchases on which a finder’s fee has been paid. The period for which the CDSC applies for the Fund is 18 months. The CDSC period begins on the last day of the month preceding the month in which the purchase was made.
Class B shares were sold with a CDSC which declines from 2% to zero depending on the period of time the shares are held. Class C shares are sold without a sales charge. Class T shares of the Fund are sold with a 1% contingent deferred sales charge, applicable, if redeemed within one year of purchase. Class I shares are sold without a front-end sales charge or CDSC.
Virtus Mutual Funds may impose an annual fee on accounts having balances of less than $2,500. The small account fee may be waived in certain circumstances, as disclosed in the prospectuses and/or statements of additional information. The fees collected will be used to offset certain expenses of the funds.
Each Class of shares has identical voting, dividend, liquidation and other rights and the same terms and conditions, except that each class bears different distribution and/or service fees under a Board-approved Rule 12b-1 and/or shareholder service plan (“12b-1 plan”) and has exclusive voting rights with respect to such plans. Class I shares are not subject to a 12b-1 plan. Income and other expenses and realized and unrealized gains and losses of the Fund are borne pro rata by the holders of each class of shares.
Note 2. Significant Accounting Policies
The following is a summary of significant accounting policies consistently followed by the Trust in the preparation of its financial statements. The preparation of financial statements in conformity with accounting principles generally accepted in the United States of America requires management to make estimates and assumptions that affect the reported amounts of assets and liabilities, disclosure of contingent assets and liabilities at the date of the financial statements and the reported amounts of increases and decreases in net assets from operations during the reporting period. Actual results could differ from those estimates and those differences could be significant.
| A. | Security Valuation |
Security valuation procedures for the Fund, which include, nightly price variance, as well as back-testing such as bi-weekly unchanged price, monthly secondary source and
44
Table of Contents
VIRTUS MULTI-SECTOR SHORT TERM BOND FUND
NOTES TO FINANCIAL STATEMENTS (Continued)
SEPTEMBER 30, 2013
transaction analysis, have been approved by the Board of Trustees (the “Board” or the “Trustees”). All internally fair valued securities are approved by a valuation committee (“Valuation Committee”) appointed by the Board. The Valuation Committee is comprised of the treasurer, assistant treasurer, and two other appropriate investment professionals of the Virtus Product Management team who previously have been identified to the Board. All internally fair valued securities, referred to below, are updated daily and reviewed in detail by the Valuation Committee monthly unless changes occur within the period. The Valuation Committee reviews the validity of the model inputs and any changes to the model. Fair valuations are ratified by the Board of Directors at least quarterly.
The Fund utilizes a fair value hierarchy which prioritizes the inputs to valuation techniques used to measure fair value into three broad levels.
| • Level 1 – | quoted prices in active markets for identical securities |
| • Level 2 – | prices determined using other significant observable inputs (including quoted prices for similar securities, interest rates, prepayment speeds, credit risk, etc.) |
| • Level 3 – | prices determined using significant unobservable inputs (including the valuation committee’s own assumptions in determining the fair value of investments) |
A description of the valuation techniques applied to the Fund’s major categories of assets and liabilities measured at fair value on a recurring basis is as follows:
Equity securities are valued at the official closing price (typically last sale) on the exchange on which the securities are primarily traded, or if no closing price is available, at the last bid price and are categorized as Level 1 in the hierarchy. Restricted equity securities and private placements that are not widely traded, are illiquid or are internally fair valued by the Valuation Committee, are generally categorized as Level 3 in the hierarchy.
Certain non-U.S. securities may be fair valued in cases where closing prices are not readily available or are deemed not reflective of readily available market prices. For example, significant events (such as movement in the U.S. securities market, or other regional and local developments) may occur between the time that non-U.S. markets close (where the security is principally traded) and the time that the Fund calculates its net asset value (“NAV”) (generally 4 p.m. Eastern time, the close of the New York Stock Exchange (“NYSE”)) that may impact the value of securities traded in these non-U.S. markets. In such cases the Fund fair values non-U.S. securities using an independent pricing service which considers the correlation of the trading patterns of the non-U.S. security to the intraday trading in the U.S. markets for investments such as ADRs, financial futures, ETFs, and certain indexes as well as prices for similar securities. Such fair valuations are categorized as Level 2 in the hierarchy. Because the frequency of significant events is not predictable, fair valuation of certain non-U.S. common stocks may occur on a frequent basis.
Debt securities, including restricted securities, are valued based on evaluated quotations received from independent pricing services or from dealers who make markets in such securities. For most bond types, the pricing service utilizes matrix pricing that considers one or more of the following factors: yield or price of bonds of comparable quality, coupon, maturity, current cash flows, type, and current day trade
45
Table of Contents
VIRTUS MULTI-SECTOR SHORT TERM BOND FUND
NOTES TO FINANCIAL STATEMENTS (Continued)
SEPTEMBER 30, 2013
information, as well as dealer-supplied prices. These valuations are generally categorized as Level 2 in the hierarchy. Structured debt instruments such as mortgage-backed and asset-backed securities may also incorporate collateral analysis and utilize cash flow models for valuation and are generally categorized as Level 2 in the hierarchy. Pricing services do not provide pricing for all securities and therefore indicative bids from dealers are utilized which are based on pricing models used by market makers in the security and are generally categorized as Level 2 in the hierarchy. Debt securities that are not widely traded, are illiquid, or are internally fair valued by the Valuation Committee are generally categorized as Level 3 in the hierarchy.
Listed derivatives that are actively traded are valued based on quoted prices from the exchange and are categorized as Level 1 in the hierarchy. Over-the-counter derivative contracts, which include forward currency contracts and equity-linked instruments, do not require material subjectivity as pricing inputs are observed from actively quoted markets and are categorized as Level 2 in the hierarchy.
Short-term notes having a maturity of 60 days or less are valued at amortized cost which approximates market and are generally categorized as Level 2 within the hierarchy.
Investments in open-end mutual funds are valued at their closing NAV determined as of the close of regular trading on the NYSE each business day and are categorized as Level 1 in the hierarchy.
A summary of the inputs used to value the Fund’s net assets by each major security type is disclosed at the end of the Schedule of Investments for the Fund. The inputs or methodologies used for valuing securities are not necessarily an indication of the risk associated with investing in those securities.
| B. | Security Transactions and Investment Income |
Security transactions are recorded on the trade date. Realized gains and losses from the sale of securities are determined on the identified cost basis. Dividend income is recognized on the ex-dividend date, or in the case of certain foreign securities, as soon as the Fund is notified. Interest income is recorded on the accrual basis. The Fund amortizes premiums and accretes discounts using the effective interest method.
| C. | Income Taxes |
The Fund is treated as a separate taxable entity. It is the intention of the Fund to comply with the requirements of Subchapter M of the Internal Revenue Code and to distribute substantially all of its taxable income to its shareholders. Therefore, no provision for federal income taxes or excise taxes has been made.
The Fund may be subject to foreign taxes on income, gains on investments or currency repatriation, a portion of which may be recoverable. The Fund will accrue such taxes and recoveries as applicable based upon current interpretations of the tax rules and regulations that exist in the markets in which it invests.
Management of the Fund has concluded that there are no significant uncertain tax positions that would require recognition in the financial statements. As of September 30, 2013, the tax years that remain subject to examination by the major tax jurisdictions under the statute of limitations are from the year 2010 forward (with limited exceptions).
46
Table of Contents
VIRTUS MULTI-SECTOR SHORT TERM BOND FUND
NOTES TO FINANCIAL STATEMENTS (Continued)
SEPTEMBER 30, 2013
| D. | Distributions to Shareholders |
Distributions are recorded by the Fund on the ex-dividend date. Income distributions are recorded daily. Income and capital gain distributions are determined in accordance with income tax regulations that may differ from accounting principles generally accepted in the United States of America. These differences may include the treatment of non-taxable dividends, market premium and discount, non-deductible expenses, expiring capital loss carryovers, foreign currency gain or loss, gain or loss on futures contracts, partnerships, operating losses and losses deferred due to wash sales. Permanent book and tax basis differences relating to shareholder distributions will result in reclassifications to capital paid in on shares of beneficial interest.
| E. | Expenses |
Expenses incurred together by the Fund and other affiliated mutual funds are allocated in proportion to the net assets of each such fund, except where allocation of direct expense to each fund or an alternative allocation method can be more appropriately used.
In addition to the net annual operating expenses that the Fund bears directly, the shareholders of a fund indirectly bear the Fund’s pro-rata expenses of any underlying mutual funds in which the Fund invests.
| F. | Foreign Currency Translation |
Non-U.S. investment securities and other assets and liabilities denominated in foreign currencies are translated into U.S. dollar amounts at the foreign currency exchange rate effective at the end of the reporting period. Cost of investments is translated at the currency exchange rate effective at the trade date. The gain or loss resulting from a change in currency exchange rates between the trade and settlement date of a portfolio transaction is treated as a gain or loss on non-U.S. currency. Likewise, the gain or loss resulting from a change in currency exchange rates between the date income is accrued and paid is treated as a gain or loss on foreign currency. The Fund does not isolate that portion of the results of operations arising from changes in foreign exchange rates on investments from the fluctuations arising from changes in the market prices of securities held. Such fluctuations are included with the net realized and unrealized gain or loss on investments.
| G. | When-issued Purchases and Forward Commitments (Delayed Delivery) |
The Fund may engage in when-issued or forward commitment transactions. Securities purchased on a when-issued or forward commitment basis are also known as delayed delivery transactions. Delayed delivery transactions involve a commitment by a fund to purchase or sell a security at a future date, ordinarily up to 90 days later. When-issued or forward commitments enable a fund to lock in what is believed to be an attractive price or yield on a particular security for a period of time, regardless of future changes in interest rates. The Fund records when-issued and delayed delivery securities on the trade date. The Fund maintains collateral for the securities purchased. Securities purchased on a when-issued or delayed delivery basis begin earning interest on the settlement date.
47
Table of Contents
VIRTUS MULTI-SECTOR SHORT TERM BOND FUND
NOTES TO FINANCIAL STATEMENTS (Continued)
SEPTEMBER 30, 2013
| H. | Loan Agreements |
The Fund may invest in direct debt instruments which are interests in amounts owed by a corporate, governmental, or other borrower to lenders or lending syndicates. Loan Agreements are generally non-investment grade, often involve borrowers that are highly leveraged. The Fund may invest in obligations of borrowers who are in bankruptcy proceedings. Loan agreements are typically senior in the corporate capital structure of the borrower. A loan is often administered by a bank or other financial institution (the “lender”) that acts as agent for all holders. The agent administers the terms of the loan, as specified in the loan agreement. A Fund’s investments in loans may be in the form of participations in loans or assignments of all or a portion of loans from third parties. When investing in loan participations, the Fund has the right to receive payments of principal, interest and any fees to which it is entitled only from the lender selling the loan participation and only upon receipt by the lender of payments from the borrower. The Fund generally has no right to enforce compliance with the terms of the loan agreement with the borrower. As a result, the Fund may be subject to the credit risk of both the borrower and the lender that is selling the loan agreement. When the Fund purchases assignments from lenders it acquires direct rights against the borrower on the loan. All loan agreements currently held by the Funds are assignment loans.
A Fund may invest in multiple series or tranches of a loan, which may have varying terms and carry different associated risks. Loan agreements may involve foreign borrowers, and investments may be denominated in foreign currencies. Direct indebtedness of emerging countries involves a risk that the government entities responsible for the repayment of the debt may be unable, or unwilling, to pay the principal and interest when due.
The loan agreements have floating rate loan interests which generally pay interest at rates that are periodically determined by reference to a base lending rate plus a premium. The base lending rates are generally LIBOR (London Interbank Offered Rate), the prime rate offered by one or more US banks or the certificate of deposit rate. When a loan agreement is purchased the Fund may pay an assignment fee. On an ongoing basis, the Funds may receive a commitment fee based on the undrawn portion of the underlying line of credit portion of a loan agreement. Prepayment penalty fees are received upon the prepayment of a loan agreement by a borrower. Prepayment penalty, facility, commitment, consent and amendment fees are recorded to income as earned or paid.
| I. | Credit-linked Notes |
The Fund may invest in credit-linked notes, which are usually issued by a special purpose vehicle that is selling credit protection through a credit default swap. The performance of the notes is linked to the performance of the underlying reference obligation. The special purpose vehicle invests the proceeds from the notes to cover its contingent obligation. Credit-linked notes may also have risks with default by the referenced obligation, currency and/or interest rates.
48
Table of Contents
VIRTUS MULTI-SECTOR SHORT TERM BOND FUND
NOTES TO FINANCIAL STATEMENTS (Continued)
SEPTEMBER 30, 2013
Note 3. Investment Advisory Fees and Related Party Transactions
($ reported in thousands except as noted)
| A. | Adviser |
Virtus Investment Advisers, Inc. (the “Adviser”), an indirect, wholly-owned subsidiary of Virtus Investment Partners, Inc. (“Virtus”), is the Adviser to the Trust. The Adviser manages the Fund’s investment program and general operations of the Fund, including oversight of the Fund’s subadviser.
As compensation for its services to the Fund, the Adviser is entitled to a fee based upon the following annual rates as a percentage of the average daily net assets of the Fund: 0.55% of the first $1 billion; 0.50% of $1 billion to $2 billion; 0.45% of $2+ billion.
| B. | Subadviser |
The subadviser manages the investments of the Fund for which it is paid a fee by the Adviser. Newfleet Asset Management, LLC, an indirect, wholly-owned subsidiary of Virtus, is the subadviser to the Fund.
| C. | Expense Limitations |
The Adviser has voluntarily agreed to limit the Fund’s total operating expenses (excluding interest, taxes, extraordinary expenses and acquired fund fees and expenses, if any) so that such expenses do not exceed, on an annualized basis the following percentages of the Fund’s average net asset values: 1.10% for Class A shares, 1.60% for Class B shares, 1.35% for Class C shares, 1.85% for Class T shares and 0.85% for Class I shares. The Adviser may discontinue these voluntary expense caps at any time. The Fund is currently below its expense cap.
| D. | Distributor |
VP Distributors, LLC (“VP Distributors”), an indirect wholly-owned subsidiary of Virtus, serves as the distributor of the Fund’s shares. VP Distributors has advised the Fund for the fiscal year (the “period”) ended September 30, 2013, it retained net commissions of $118 for Class A shares and deferred sales charges of $160, $—(1), $1 and $114 for Class A shares, Class B shares, Class C shares and Class T shares, respectively.
In addition, the Fund pays VP Distributors distribution and/or service fees under a 12b-1 plan as a percentage of the daily average net assets of each respective class, at the annual rate of 0.25% for Class A shares, 0.75% for Class B shares, 0.50% for Class C shares, and 1.00% for Class T shares. Class I shares are not subject to a 12b-1 plan.
Under certain circumstances, shares of certain Virtus Mutual Funds may be exchanged for shares of the same class of certain other Virtus Mutual Funds on the basis of the relative net asset values per share at the time of the exchange. On exchanges with share classes that carry a CDSC, the CDSC schedule of the original shares purchased continues to apply.
| E. | Administrator and Transfer Agent |
Effective January 1, 2013, with the approval of the Board, VP Distributors LLC, the Fund’s former Administrator and Transfer Agent, assigned its rights and obligations under the Administration Agreement and Transfer Agency and Service Agreement to Virtus Fund Services, LLC an indirect wholly-owned subsidiary of Virtus. For the period
49
Table of Contents
VIRTUS MULTI-SECTOR SHORT TERM BOND FUND
NOTES TO FINANCIAL STATEMENTS (Continued)
SEPTEMBER 30, 2013
of October 1, 2012 to December 31, 2012, VP Distributors LLC served as the Administrator and Transfer Agent to the Fund. For the period of January 1, 2013 to September 30, 2013 Virtus Fund Services LLC, served as Administrator and Transfer Agent to the Fund.
For the period ended September 30, 2013, the Fund incurred administration fees totaling $7,519 which are included in the Statement of Operations.
For the period ended September 30, 2013, the Fund incurred transfer agent fees totaling $8,287 which are included in the Statement of Operations. A portion of these fees is paid to outside entities that also provide services to the Trust.
| F. | Affiliated Shareholders |
At September 30, 2013, Virtus and its affiliates, BMO Bankcorp (a minority investor in Virtus) and its affiliates, and the retirement plans of Virtus and its affiliates, held shares of the Fund which may be redeemed at any time that aggregated the following.
| Shares | Aggregate Net Asset Value | |||||||
Class C Shares | 27,257 | $ | 134 | |||||
Class I Shares | 184,291 | 894 | ||||||
| (1) | Amount less than $500. |
Note 4. Purchases and Sales of Securities
Purchases and sales of securities for the Fund (excluding U.S. Government and agency securities, and short-term securities) during the period ended September 30, 2013, were as follows:
| Purchases | Sales | |||||||
| $ | 5,462,113 | $ | 3,567,118 | |||||
Purchases and sales of long-term U.S. Government and agency securities for the Fund during the period ended September 30, 2013, were as follows:
| Purchases | Sales | |||||||
| $ | 165,179 | $ | 201,316 | |||||
Note 5. 10% Shareholders
As of September 30, 2013, the Fund had individual shareholder account(s) and/or omnibus shareholder account(s) (comprised of a group of individual shareholders), which individually amounted to more than 10% of the total shares outstanding of the Fund as detailed below.
| % of Shares Outstanding | Number of Accounts | |||||||
| 19 | % | 1 | ||||||
The shareholder is not affiliated with Virtus.
Note 6. Credit Risk and Asset Concentrations
In countries with limited or developing markets, investments may present greater risks than in more developed markets and the prices of such investments may be volatile. The
50
Table of Contents
VIRTUS MULTI-SECTOR SHORT TERM BOND FUND
NOTES TO FINANCIAL STATEMENTS (Continued)
SEPTEMBER 30, 2013
consequences of political, social or economic changes in these markets may have disruptive effects on the market prices of these investments and the income they generate, as well as the Fund’s ability to repatriate such amounts.
High-yield/high risk securities typically entail greater price volatility and/or principal and interest rate risk. There is a greater chance that an issuer will not be able to make principal and interest payments on time. Analysis of the creditworthiness of issuers of high-yield securities may be complex, and as a result, it may be more difficult for the Adviser and/or Subadviser to accurately predict risk.
The Fund may invest a high percentage of its assets in specific sectors of the market in its pursuit of a greater investment return. Fluctuations in these sectors of concentration may have a greater impact on the Fund, positive or negative, than if the Fund did not concentrate its investments in such sectors.
Note 7. Illiquid and Restricted Securities
Investments generally are considered illiquid if they cannot be disposed of in seven days in the ordinary course of business at the approximate amount at which such securities have been valued by the Fund. Additionally, the following information is also considered in determining illiquidity: the frequency of trades and quotes for the investment, whether the investment is listed for trading on a recognized domestic exchange and/or whether two or more brokers are willing to purchase or sell the security at a comparable price, the extent of market making activity in the investment and the nature of the market for investment. Illiquid securities are footnoted as such at the end of the Fund’s Schedule of Investments where applicable.
Restricted securities are illiquid securities, as defined above not registered under the Securities Act of 1933 (the “1933 Act”), as amended. Generally, 144A securities are excluded from this category, except where defined as illiquid.
The Fund will bear any costs, including those involved in registration under the 1933 Act, in connection with the disposition of such securities.
At September 30, 2013, the Fund did not hold any illiquid and restricted securities.
Note 8. Indemnifications
Under the Trust’s organizational documents, its trustees and officers are indemnified against certain liabilities arising out of the performance of their duties to the Fund. Each Trustee has also entered into an indemnification agreement with the Trust. In addition, in the normal course of business the Fund enters into contracts that provide a variety of indemnifications to other parties. The Fund’s maximum exposure under these arrangements is unknown as this would involve future claims that may be made against the Fund and that have not occurred. However, the Fund has not had prior claims or losses pursuant to these arrangements and expect the risk of loss to be remote.
Note 9. Federal Income Tax Information
($ reported in thousands)
At September 30, 2013, federal tax cost and aggregate gross unrealized appreciation (depreciation) of securities held by the Fund were as follows:
Federal | Unrealized | Unrealized | Net Unrealized | |||
| $8,275,913 | $171,009 | $(104,691) | $66,318 |
51
Table of Contents
VIRTUS MULTI-SECTOR SHORT TERM BOND FUND
NOTES TO FINANCIAL STATEMENTS (Continued)
SEPTEMBER 30, 2013
The Fund has capital loss carryovers available which may be used to offset future realized capital gains, through the indicated expiration dates shown below:
2018 | Total | |
| $28,148 | $28,148 |
The Fund may not realize the benefit of these losses to the extent the Fund does not realize gains on investments prior to the expiration of the capital loss carryovers.
Under the Regulated Investment Company Modernization Act of 2010 (the “Act”), net capital losses recognized for tax years beginning after December 22, 2010 may be carried forward indefinitely, and their character is retained as short-term and/or long-term losses. Previously, net capital losses were carried forward for eight years and treated as short-term losses. As a transition rule, the Act requires that post-enactment net capital losses be used before pre-enactment net capital losses.
The Fund utilized $25,630 in losses deferred in prior years against current year capital gains.
The components of distributable earnings on a tax basis (excluding unrealized appreciation (depreciation) which is disclosed above) consist of undistributed ordinary income of $0 and undistributed long-term capital gains of $0.
The differences between the book and tax basis components of distributable earnings relate principally to the timing of recognition of income and gains for federal income tax purposes. Short-term gain distributions reported in the Statements of Changes in Net Assets, if any, are reported as ordinary income for federal tax purposes. Distributions are determined on a tax basis and may differ from net investment income and realized capital gains for financial reporting purposes.
Note 10. Reclassification of Capital Accounts
($ reported in thousands)
For financial reporting purposes, book basis capital accounts are adjusted to reflect the tax character of permanent book/tax differences. Permanent reclassifications can arise from differing treatment of certain income and gain transactions, nondeductible current year net operating losses, expiring capital loss carryovers and investments in passive foreign investment companies. The reclassifications have no impact on the net assets or net asset value of the Fund. As of September 30, 2013, the Fund recorded reclassifications to increase (decrease) the accounts as listed below:
Capital Paid in | Undistributed |
| ||
| $(10,661) | $(2,054) | $12,715 |
Note 11. Recent Accounting Pronouncement
In December 2011, the Financial Accounting Standards Board issued Accounting Standards Update (“ASU”) No. 2011-11 regarding “Disclosures about Offsetting Assets and Liabilities”. The amendments, which will be effective for annual reporting periods beginning on or after January 1, 2013 and interim periods within those annual periods, require an entity to disclose information about offsetting and related arrangements for assets and liabilities, financial instruments and derivatives that are either currently offset in accordance with current requirements or are subject to enforceable master netting arrangements or similar
52
Table of Contents
VIRTUS MULTI-SECTOR SHORT TERM BOND FUND
NOTES TO FINANCIAL STATEMENTS (Continued)
SEPTEMBER 30, 2013
agreements. At this time, management is evaluating the implications of ASU No. 2011-11 and its impact on the financial statements has not yet been determined.
Note 12. Subsequent Event Evaluations
Management has evaluated the impact of all subsequent events on the Fund through the date the financial statements were available for issuance, and has determined that there are no subsequent events requiring recognition or disclosure in the financial statements.
53
Table of Contents

REPORT OF INDEPENDENT REGISTERED PUBLIC
ACCOUNTING FIRM
To the Board of Trustees of
Virtus Opportunities Trust and Shareholders of
Virtus Multi-Sector Short Term Bond Fund:
In our opinion, the accompanying statement of assets and liabilities, including the schedule of investments, and the related statements of operations and of changes in net assets and the financial highlights present fairly, in all material respects, the financial position of Virtus Multi-Sector Short Term Bond Fund (the “Fund”) constituting Virtus Opportunities Trust, hereafter referred to as the “Trust”, at September 30, 2013, the results of its operations for the year then ended, the changes in its net assets for each of the two years in the period then ended and the financial highlights for each of the five years in the period then ended, in conformity with accounting principles generally accepted in the United States of America. These financial statements and financial highlights (hereafter referred to as “financial statements”) are the responsibility of the Trust’s management; our responsibility is to express an opinion on these financial statements based on our audits. We conducted our audits of these financial statements in accordance with the standards of the Public Company Accounting Oversight Board (United States). Those standards require that we plan and perform the audit to obtain reasonable assurance about whether the financial statements are free of material misstatement. An audit includes examining, on a test basis, evidence supporting the amounts and disclosures in the financial statements, assessing the accounting principles used and significant estimates made by management, and evaluating the overall financial statement presentation. We believe that our audits, which included confirmation of securities at September 30, 2013 by correspondence with the custodians and brokers, provide a reasonable basis for our opinion.

PricewaterhouseCoopers LLP
November 21, 2013
54
Table of Contents
VIRTUS MULTI-SECTOR SHORT TERM BOND FUND
SEPTEMBER 30, 2013 (Unaudited)
For the fiscal year ended September 30, 2013, the Fund makes the following disclosures for federal income tax purposes. Below is listed the percentage, or the maximum amount allowable, of its ordinary income dividends (“QDI”) to qualify for the lower tax rates applicable to individual shareholders, and the percentage of ordinary income dividends earned by the Fund which qualifies for the dividends received deduction (“DRD”) for corporate shareholders. The actual percentage of QDI and DRD for the calendar year will be designated in year-end tax statements. The Fund designates the amount below, or if subsequently different, as long-term capital gains dividends (“LTCG”) ($ reported in thousands).
QDI | DRD | LTCG | ||
| 0% | 0% | $— |
55
Table of Contents
FUND MANAGEMENT TABLES (UNAUDITED)
Information pertaining to the Trustees and officers of the Trust as of September 30, 2013, is set forth below. The statement of additional information (SAI) includes additional information about the Trustees and is available without charge, upon request, by calling (800) 243-1574. The address of each individual, unless otherwise noted, is 100 Pearl Street, Hartford, CT 06103-4506. There is no stated term of office for Trustees of the Trust.
Independent Trustees
| Name, Year of Birth, Year Elected and Number of Funds Overseen | Principal Occupation(s) During Past 5 Years and Other Directorships Held by Trustee | |
Leroy Keith, Jr. YOB: 1939 Elected: 2000 48 Funds | Chairman (since 2010), Bloc Global Services Group, LLC (construction and redevelopment company); Managing Director (2007 to 2008), Almanac Capital Management (commodities business); Director/Trustee (since 2010), Wells Fargo Funds (139 series) and their predecessors, Evergreen Funds (1989 to 2010); Director (2003 to 2010), Diversapack Co. (soft packaging company); and Trustee (since 1980), Virtus Mutual Fund Complex. | |
Philip R. McLoughlin Chairman YOB: 1946 Elected: 1999 66 Funds | Partner (since 2006), Cross Pond Partners, LLC (strategy consulting firm); Managing Director (2009 to 2010), SeaCap Asset Management Fund I, L.P. and SeaCap Partners, LLC (investment management); Director (since 1991) and Chairman (since 2010), World Trust Fund; Trustee and Chairman (since 2011), Virtus Closed-End Funds (2 portfolios); Trustee (since 1989), Virtus Mutual Fund Complex; Director (since 1996), closed-end funds managed by Duff & Phelps Investment Management Co. (4 portfolios); and Director (1985 to 2009), Argo Group International Holdings Inc. and its predecessor, PXRE Corporation (insurance). | |
Geraldine M. McNamara YOB: 1951 Elected: 2001 52 Funds | Retired. Director (since 2003), closed-end funds managed by Duff & Phelps Investment Management Co. (4 portfolios); and Trustee (since 2001), Virtus Mutual Fund Complex. | |
James M. Oates YOB: 1946 Elected: 2000 50 Funds | Managing Director (since 1994), Wydown Group (consulting firm); Chairman and Trustee (since 2005), John Hancock Fund Complex (collectively, 234 portfolios); Director (since 1996), Stifel Financial; Chairman and Director (since 1999), Connecticut River Bank and Director (since 1998), Connecticut River Bancorp; Chairman (since 2000), Emerson Investment Management, Inc.; Director (since 2002), New Hampshire Trust Company; Non-Executive Chairman (2007 to 2011), Hudson Castle Group, Inc. (formerly IBEX Capital Markets, Inc.) (financial services); and Trustee (since 1987), Virtus Mutual Fund Complex. | |
Richard E. Segerson YOB: 1948 Elected: 2000 48 Funds | Retired. Managing Director (1998 to 2013), Northway Management Company; and Trustee (since 1993), Virtus Mutual Fund Complex. | |
Ferdinand L.J. Verdonck YOB: 1942 Elected: 2005 48 Funds | Director (since 1998), The J.P. Morgan European Investment Trust; Director (since 2005), Galapagos N.V. (biotechnology); Mr. Verdonck is also a director of several non-U.S. companies. |
56
Table of Contents
FUND MANAGEMENT TABLES (UNAUDITED) (Continued)
Interested Trustee
The individual listed below is an “interested person” of the Trust, as defined in Section 2(a)(19) of the 1940 Act, as amended, and the rules and regulations thereunder.
| Name, Year of Birth, Year Elected and Number of Funds Overseen | Principal Occupation(s) During Past 5 Years and Other Directorships Held by Trustee | |
George R. Aylward* Trustee and President YOB: 1964 Elected: 2006 61 Funds | Director, President and Chief Executive Officer (since 2008), Virtus Investment Partners, Inc. and/or certain of its subsidiaries; various senior officer positions with Virtus affiliates (since 2005); Trustee (since 2012), Virtus Variable Insurance Trust; Trustee and President (since 2011), Virtus Closed-End Funds (2 portfolios); and Chairman, President and Chief Executive Officer (since 2006), The Zweig Closed-End Funds (2 portfolios) Funds; and Director (since 2013), Virtus Global Funds, PLC. |
| * | Mr. Aylward is an “interested person,” as defined in the 1940 Act, by reason of his position as President and Chief Executive Officer of Virtus Investment Partners, Inc. (“Virtus”), the ultimate parent company of the Adviser, and various positions with its affiliates, including the Adviser. |
57
Table of Contents
FUND MANAGEMENT TABLES (UNAUDITED) (Continued)
Officers of the Trust Who Are Not Trustees
| Name, Address and Year of Birth | Position(s) Held with Trust and Length of Time Served | Principal Occupation(s) During Past 5 Years | ||
W. Patrick Bradley YOB: 1972 | Senior Vice President (since 2013), Vice President since 2011, Chief Financial Officer and Treasurer since 2006. | Senior Vice President, Fund Services (since 2010), Virtus Investment Partners, Inc. and/or certain of its subsidiaries; various officer positions (since 2006) with Virtus affiliates; Vice President (since 2011), Chief Financial Officer and Treasurer (since 2004), Virtus Variable Insurance Trust; Vice President, Chief Financial Officer and Treasurer (since 2011), Virtus Global Multi-Sector Income Fund and Virtus Total Return Fund; Vice President (since 2012) and Treasurer (Chief Financial Officer) (since 2007), The Zweig Fund, Inc. and Zweig Total Return Fund, Inc.; Vice President and Assistant Treasurer (since 2011), Duff & Phelps Global Utility Income Fund Inc.; and Director (since 2013), Virtus Global Funds, PLC. | ||
Kevin J. Carr YOB: 1954 | Senior Vice President (since 2013), Vice President, Chief Legal Officer, Counsel and Secretary since 2005. | Senior Vice President (since 2009), Vice President, Counsel and Secretary (2008 to 2009), Virtus Investment Partners, Inc. and/or certain of its subsidiaries; various senior officer positions (since 2005) with Virtus affiliates; Vice President, Chief Legal Officer, Counsel and Secretary (since 2010), Virtus Variable Insurance Trust; Vice President and Assistant Secretary (since 2012), Vice President, Chief Legal Officer, Counsel and Secretary (2011-2012), Virtus Global Multi-Sector Income Fund and Virtus Total Return Fund; Vice President and Assistant Secretary (since 2012), Secretary and Chief Legal Officer (2005-2012), The Zweig Fund, Inc. and Zweig Total Return Fund, Inc.; and Vice President and Assistant Secretary (since 2011), Duff & Phelps Global Utility Income Fund Inc. | ||
Nancy J. Engberg YOB: 1956 | Vice President and Chief Compliance Officer since 2011. | Vice President (since 2008) and Chief Compliance Officer (2008 to 2011), Virtus Investment Partners, Inc. and/or certain of its subsidiaries; various officer positions (since 2003) with Virtus affiliates; Vice President (since 2010), Chief Compliance Officer (since 2011), Virtus Variable Insurance Trust; Vice President and Chief Compliance Officer (since 2011), Virtus Global Multi-Sector Income Fund and Virtus Total Return Fund; Vice President and Chief Compliance Officer (since 2012), The Zweig Fund, Inc. and Zweig Total Return Fund, Inc. | ||
Francis G. Waltman YOB: 1962 | Executive Vice President since 2013.
Senior Vice President 2008-2013. | Executive Vice President, Product Development (since 2009), Virtus Investment Partners, Inc. and/or certain of its subsidiaries; various senior officer positions (since 2006) with Virtus affiliates; Senior Vice President (since 2010), Virtus Variable Insurance Trust; Senior Vice President (since 2011), Virtus Global Multi-Sector Income Fund and Virtus Total Return Fund; and Director (since 2013), Virtus Global Funds, PLC.. |
58
Table of Contents
VIRTUS OPPORTUNITIES TRUST
101 Munson Street
Greenfield, MA 01301-9668
Trustees
George R. Aylward
Leroy Keith, Jr.
Philip R. McLoughlin, Chairman
Geraldine M. McNamara
James M. Oates
Richard E. Segerson
Ferdinand L.J. Verdonck
Officers
George R. Aylward, President
Francis G. Waltman, Executive Vice President
W. Patrick Bradley, Senior Vice President, Chief Financial Officer and Treasurer
Kevin J. Carr, Senior Vice President, Chief Legal Officer, Counsel and Secretary
Nancy J. Engberg, Vice President and Chief Compliance Officer
Investment Adviser
Virtus Investment Advisers, Inc.
100 Pearl Street
Hartford, CT 06103-4506
Principal Underwriter
VP Distributors, LLC
100 Pearl Street
Hartford, CT 06103-4506
Administrator and Transfer Agent
Virtus Fund Services
100 Pearl Street
Hartford, CT 06103-4506
Custodian
JPMorgan Chase Bank NA
1 Chase Manhattan Plaza
New York, NY 10005-1401
Independent Registered Public
Accounting Firm
PricewaterhouseCoopers LLC
2001 Market Street
Philadelphia, PA 19103-7042
How to Contact Us
Mutual Fund Services1-800-243-1574
Adviser Consulting Group1-800-243-4361
Telephone Orders1-800-367-5877
Text Telephone1-800-243-1926
Web siteVirtus.com
Important Notice to Shareholders
The Securities and Exchange Commission has modified mailing regulations for semiannual and annual shareholder fund reports to allow mutual fund companies to send a single copy of these reports to shareholders who share the same mailing address. If you would like additional copies, please call Mutual Fund Services at 1-800-243-1574.
Table of Contents
For more information about
Virtus Mutual Funds, please call
your financial representative, or
contact us at 1-800-243-1574
or Virtus.com
| 8010 | 11-13 |

Table of Contents

ANNUAL REPORT
Virtus Real Estate Securities Fund
September 30, 2013
TRUST NAME: VIRTUS OPPORTUNITIES TRUST
Not FDIC Insured
No Bank Guarantee
May Lose Value

Table of Contents
Virtus Real Estate Securities Fund
(“Real Estate Securities Fund”)
| 1 | ||||
| 2 | ||||
| 4 | ||||
| 5 | ||||
| 8 | ||||
| 10 | ||||
| 11 | ||||
| 12 | ||||
| 13 | ||||
| 14 | ||||
| 21 | ||||
| 22 | ||||
| 23 |
PROXY VOTING PROCEDURES AND VOTING RECORD (FORM N-PX)
The subadviser vote proxies relating to portfolio securities in accordance with procedures that have been approved by the Board of Trustees of the Trust (“Trustees,” the “Board”). You may obtain a description of these procedures, along with information regarding how the Fund voted proxies during the most recent 12-month period ended June 30, free of charge, by calling toll-free 1-800-243-1574. This information is also available through the Securities and Exchange Commission’s (“SEC”) website at http://www.sec.gov.
FORM N-Q INFORMATION
The Trust files a complete schedule of portfolio holdings for the Fund with the SEC for the first and third quarters of each fiscal year on Form N-Q. Form N-Q is available on the SEC’s website at http://www.sec.gov. Form N-Q may be reviewed and copied at the SEC’s Public Reference Room. Information on the operation of the SEC’s Public Reference Room can be obtained by calling toll-free 1-800-SEC-0330.
This report is not authorized for distribution to prospective investors in the Virtus Real Estate Securities Fund unless preceded or accompanied by an effective prospectus which includes information concerning the sales charge, the Fund’s record and other pertinent information.
Table of Contents
Dear Fellow Shareholders of Virtus Mutual Funds:
 | The financial markets experienced significant volatility during the 12-month period that ended September 30, 2013. The S&P 500® Index, a benchmark for U.S. equities, gained 19.3% while the Barclays U.S. Aggregate Bond Index, which tracks the U.S. fixed income market, declined 1.7%, and the MSCI All Country World Index (net), a measure of international equities, rose 17.7%.
The bond markets were particularly volatile during the second half of this period. U.S. Treasury yields climbed over the last few months as the market prepared for the Federal Reserve’s tapering of its bond purchases, which never occurred. The 10-year Treasury yield was at | |
2.6% as of September 30, 2013, compared with 1.7% a year earlier, and, as rates rose, most bond sectors suffered losses.
| ||
Despite this recent market unpredictability, there is reason for investors to be cautiously optimistic about the economy. The U.S. economy is showing signs of growth in hiring, consumer spending, and housing and, although China’s recovery remains tenuous, Europe appears to be coming out of its recession. The onus remains on the U.S. government to keep the country on strong fiscal footing and on corporations to produce robust earnings, which will play a pivotal role in determining future market direction.
Market uncertainty is a timely reminder of the importance of portfolio diversification. While diversification cannot guarantee a profit or prevent loss, owning a variety of asset classes may cushion your portfolio against inevitable market fluctuations. Your financial advisor can help you ensure that your portfolio is adequately diversified.
Thank you for entrusting Virtus with your assets. Should you have any questions or require support, the Virtus customer service team is ready to assist you at 1-866-270-7788. We appreciate your business and remain committed to your long-term financial success.
Sincerely, Whenever you have questions about your account, or require additional information, please visit us on the Web at www.virtus.com or call our shareowner service group toll-free at 1-800-243-1574.
George R. Aylward President, Virtus Mutual Funds
October 2013
Performance data quoted represents past results. Past performance is no guarantee of future results and current performance may be higher or lower than performance shown above. | ||

1
Table of Contents
VIRTUS REAL ESTATE SECURITIES FUND
DISCLOSURE OF FUND EXPENSES (UNAUDITED)
FOR THE SIX-MONTH PERIOD OF APRIL 1, 2013 TO SEPTEMBER 30, 2013
We believe it is important for you to understand the impact of costs on your investment. All mutual funds have operating expenses. As a shareholder of the Virtus Real Estate Securities Fund (the “Fund”), you may incur two types of costs: (1) transaction costs, including sales charges on purchases of Class A shares and contingent deferred sales charges on Class B and Class C shares; and (2) ongoing costs, including investment advisory fees, distribution and service fees, and other expenses. Class I shares are sold without a sales charge and do not incur distribution and service fees. For further information regarding applicable sales charges, see Note 1 in the Notes to Financial Statements. These examples are intended to help you understand your ongoing costs (in dollars) of investing in the Fund and to compare these costs with the ongoing costs of investing in other mutual funds. These examples are based on an investment of $1,000 invested at the beginning of the period and held for the entire six-month period. The following Expense Table illustrates your Fund’s costs in two ways.
Actual Expenses
The first section of the accompanying table provides information about actual account values and actual expenses. You may use the information in this section, together with the amount you invested, to estimate the expenses that you paid over the period. Simply divide your account value by $1,000 (for example, an $8,600 account value divided by $1,000 = 8.6), then multiply the result by the number in the first section under the heading entitled “Expenses Paid During Period” to estimate the expenses you paid on your account during the period.
Hypothetical Example for Comparison Purposes
The second section of the accompanying table provides information about hypothetical account values and hypothetical expenses based on the Fund’s actual expense ratio and an assumed rate of return of 5% per year before expenses, which is not your Fund’s actual return.The hypothetical account values and expenses may not be used to estimate the actual ending account balance or expenses you paid for the period. You may use this information to compare the ongoing costs of investing in your Fund and other funds. To do so, compare these 5% hypothetical examples with the 5% hypothetical examples that appear in the shareholder reports of the other funds.
Please note that the expenses shown in the accompanying table are meant to highlight your ongoing costs only and do not reflect any transactional costs, such as sales charges or contingent deferred sales charges. Therefore, the second section of the accompanying table is useful in comparing ongoing costs only, and will not help you determine the relative total costs of owning different funds. In addition, if these transactional costs were included, your costs would have been higher. The calculations assume no shares were bought or sold during the period. Your actual costs may have been higher or lower depending on the amount of your investment and timing of any purchases or redemptions.
2
Table of Contents
VIRTUS REAL ESTATE SECURITIES FUND
DISCLOSURE OF FUND EXPENSES (UNAUDITED) (CONTINUED)
FOR THE SIX-MONTH PERIOD OF APRIL 1, 2013 TO SEPTEMBER 30, 2013
| Expense Table | ||||||||||||||||
Beginning Value | Ending Account Value September 30, 2013 | Annualized Expense Ratio | Expenses Paid During Period* | |||||||||||||
Actual | ||||||||||||||||
| Class A | $ | 1,000.00 | $ | 963.00 | 1.40 | % | $ | 6.89 | ||||||||
| Class B | 1,000.00 | 959.10 | 2.15 | 10.56 | ||||||||||||
| Class C | 1,000.00 | 959.40 | 2.15 | 10.56 | ||||||||||||
| Class I | 1,000.00 | 964.00 | 1.15 | 5.66 | ||||||||||||
Hypothetical (5% return before expenses) |
| |||||||||||||||
| Class A | 1,000.00 | 1,017.96 | 1.40 | 7.11 | ||||||||||||
| Class B | 1,000.00 | 1,014.15 | 2.15 | 10.91 | ||||||||||||
| Class C | 1,000.00 | 1,014.15 | 2.15 | 10.91 | ||||||||||||
| Class I | 1,000.00 | 1,019.23 | 1.15 | 5.84 | ||||||||||||
| * | Expenses are equal to the Fund’s annualized expense ratio, which is net of waived fees and reimbursed expenses, if applicable, multiplied by the average account value over the period, multiplied by the number of days (183) expenses were accrued in the most recent fiscal half-year, then divided by 365 to reflect the one-half year period. |
| The Fund may invest in other funds, and the annualized expense ratios noted above do not reflect fees and expenses associated with the underlying funds. If such fees and expenses were included, the expenses would have been higher. |
| You can find more information about the Fund’s expenses in the Financial Statements section that follows. For additional information on operating expenses and other shareholder costs, refer to the prospectus. |
3
Table of Contents
VIRTUS REAL ESTATE SECURITIES FUND
Barclays U.S. Aggregate Bond Index
The Barclays U.S. Aggregate Bond Index measures the U.S. investment grade fixed rate bond market. The index is calculated on a total return basis. The index is unmanaged, its returns do not reflect any fees, expenses or sales charges, and it is not available for direct investment.
Federal Reserve (the “Fed”)
The central bank of the United States, responsible for controlling the money supply, interest rates and credit with the goal of keeping the U.S. economy and currency stable.
Governed by a seven-member board, the system includes 12 regional Federal Reserve Banks, 25 branches and all national and state banks that are part of the system.
FTSE NAREIT Equity REITs Index
The FTSE NAREIT Equity REITs Index is a free-float market capitalization index measuring equity tax-qualified real estate investment trusts, which meet minimum size and liquidity criteria, that are listed on the New York Stock Exchange, the American Stock Exchange and the NASDAQ National Market System. The index is calculated on a total return basis with dividends reinvested. The index is unmanaged, its returns do not reflect any fees, expenses or sales charges, and it is not available for direct investment.
MSCI All Country World Index (net)
The MSCI AC World Index (net) is a free float-adjusted market capitalization-weighted index that measures equity performance of developed and emerging markets. The index is calculated on a total return basis with net dividends reinvested. The index is unmanaged its returns do not reflect any fees, expenses or sales charges, and is not available for direct investment.
REIT (Real Estate Investment Trust)
A publicly traded company that owns, develops and operates income-producing real estate such as apartments, office buildings, hotels, shopping centers and other commercial properties.
S&P 500® Index
The S&P 500® Index is a free-float market capitalization-weighted index of 500 of the largest U.S. companies. The index is calculated on a total return basis with dividends reinvested. The index is unmanaged, its returns do not reflect any fees, expenses or sales charges, and it is not available for direct investment.
4
Table of Contents
Fund Summary | Ticker Symbols: Class A: PHRAX Class B: PHRBX Class C: PHRCX Class I: PHRIX |
| ¢ | The Fund is diversified and has an investment objective of capital appreciation and income with approximately equal emphasis. |
| ¢ | For the fiscal year ended September 30, 2013, the Fund’s Class A shares at NAV returned 3.70%, Class B shares returned 2.92%, Class C shares returned 2.93% and Class I shares returned 3.96%. For the same period, the S&P 500® Index, a broad-based equity index, returned 19.34%, and the FTSE NAREIT Equity REITs Index, the Fund’s style-specific index appropriate for comparison, returned 5.87%. |
All performance figures assume reinvestment of distributions and exclude the effect of sales charges. Past performance is no guarantee of future results and current performance may be higher or lower than the performance shown above.
How did the markets perform during the Fund’s fiscal year?
| ¢ | The Fund’s fiscal year overlapped the final phase of the great secular bull market in U.S. bonds. During this time, outperformance of lower quality real estate equities was prevalent. Within the real estate market, lower quality stocks, which lack rental rate pricing power, as well as high yield stocks and longer-lease duration sectors, which lack organic growth but offered external spread investing, outperformed. |
| ¢ | As noted by Green Street Advisors in March 2013, “REITs with characteristics associated with lower quality, i.e., ‘junk REITs,’ have massively outperformed over the last year, and the trend has intensified of late.” |
| ¢ | When the Federal Reserve (the “Fed”) signaled in May 2013 that it might taper its monthly bond purchases, bonds sold off in response, and we witnessed a nearly 100-basis point increase in U.S. 10-Year Treasury yields as of the Fund’s fiscal year-end. |
| ¢ | Real estate securities, as measured by the FTSE NAREIT Equity REITs Index, outperformed the S&P 500 Index from the start of the Fund’s fiscal year through May 21, the eve of the Fed’s tapering comments, and subsequently underperformed the S&P 500 Index to the Fund’s fiscal year-end. |
| ¢ | Once the U.S. bond market shifted, the pendulum tilted to favor higher quality stocks, which can benefit from pricing power in the form of higher rents. |
| ¢ | In addition, following the turn in the U.S. bond market, cyclical-oriented equities performed better than defensive equities and fixed income securities were broadly disfavored. Emerging market equities suffered as capital headed for the exits and their currencies came under pressure. |
| ¢ | The 10-Year Treasury sell-off period is reminiscent of April 2004, in our view. Back then, when strong payroll data was released for March of that year, the bond market was surprised and sold off. That pressured the REIT space, much like it has done recently, and created a rebalancing opportunity. REITs powered ahead that year and continued to do so as interest rates rose over the next couple of years. |
| ¢ | Despite the Fed’s hint at a bond taper back in May, U.S. fiscal policy concerns likely influenced its decision in September to postpone reducing its pace of monthly bond market purchases until the economic visibility improves. |
What factors affected the Fund’s performance during its fiscal year?
| ¢ | For the one-year period ending September 30, 2013, the Fund trailed its style-specific benchmark. Given the Fund’s philosophy and style, we would expect the aforementioned lower quality outperformance windows in the fiscal year to present a challenge. Property sector allocation was a positive contributor during the period, while security selection detracted from performance. |
For information regarding the indexes and certain investment terms, see the Key Investment Terms on page 4.
5
Table of Contents
| REAL ESTATE SECURITIES FUND (Continued) |
| ¢ | Within the U.S., the self storage, lodging, and industrial property sectors demonstrated the best total returns over the last 12 months and manufactured homes, regional malls, and apartments were the laggards. |
| ¢ | The most significant individual positive contributor to relative performance during the fiscal year was the Fund’s allocation to, and stock selection within, the self storage property sector. Specifically, its overweight exposure to a mid-cap self storage REIT was the primary driver. The office sector, primarily security selection within, and the industrial sector, primarily due to an overweight allocation to the property sector, were the second and third most positive contributors to the Fund’s relative performance. |
| ¢ | The most significant detractor from relative performance during the fiscal year was the Fund’s security selection and overweight allocation to the apartment property sector, followed by the diversified property sector, due to security selection and an underweight allocation, and the regional mall property sector, due to an overweight allocation and security selection. |
| ¢ | Going forward, we expect higher quality cash flow growth to play a more meaningful role in driving total returns as internal growth prospects (i.e., occupancy lift and rental rate pricing power) continue to accelerate against a backdrop of fairly limited new supply, and companies remain active with external growth initiatives. |
| ¢ | Dividend growth should be supported by the acceleration in cash flow growth, recapitalized balance sheets, and low historical dividend payout ratios. |
| ¢ | A favorable supply outlook should allow landlords to increase occupancy and achieve pricing power at a faster rate than they otherwise would in a recovery. |
The preceding information is the opinion of portfolio management. Any such opinions are subject to change at any time based upon market or other conditions and should not be relied upon as investment advice. Past performance is no guarantee of future results, and there is no guarantee that market forecasts will be realized.
There is no guarantee that the Fund will meet its objective.
The market price of equity securities may be affected by financial market, industry, or issuer-specific events. Focus on a particular style or on small or medium-sized companies may enhance that risk. The fund may be negatively affected by factors specific to the real estate market, including interest rate, leverage, property, and management. A fund that focuses its investments in a particular industry or sector will be more sensitive to conditions that affect that industry or sector than a non-concentrated fund.
| Asset Allocations | ||||
The following table presents asset allocations within certain sectors as a percentage of total investments at September 30, 2013.
|
| |||
Regional Malls | 19 | % | ||
Apartments | 17 | |||
Office | 11 | |||
Industrial | 10 | |||
Self Storage | 10 | |||
Lodging/Resorts | 9 | |||
Health Care | 9 | |||
Other (including short-term investments) | 15 | |||
|
| |||
| 100 | % | |||
|
| |||
6
Table of Contents
REAL ESTATE SECURITIES FUND (Continued)
| Average Annual Total Returns1 for periods ended 9/30/13 | ||||||||||||||||||||
| 1 Year | 5 Years | 10 Years | Since Inception | Inception Date | ||||||||||||||||
| Class A Shares at NAV 2 | 3.70 | % | 5.30 | % | 9.86 | % | — | — | ||||||||||||
| Class A Shares at POP 3,4 | -2.27 | 4.06 | 9.21 | — | — | |||||||||||||||
| Class B Shares at NAV 2 | 2.92 | 4.50 | 9.03 | — | — | |||||||||||||||
| Class B Shares with CDSC 4 | -1.08 | 4.50 | 9.03 | — | — | |||||||||||||||
| Class C Shares at NAV 2 and with CDSC4 | 2.93 | 4.51 | 9.04 | — | — | |||||||||||||||
| Class I Shares at NAV | 3.96 | 5.56 | — | 1.83 | % | 12/29/06 | ||||||||||||||
| S&P 500® Index | 19.34 | 10.02 | 7.56 | 4.795 | — | |||||||||||||||
| FTSE NAREIT Equity REITs Index | 5.87 | 5.75 | 9.54 | 1.886 | — | |||||||||||||||
Fund Expense Ratios6: A Shares: 1.41%, B Shares: 2.16%, C Shares: 2.16%, I Shares: 1.16%.
All returns represent past performance which is no guarantee of future results. Current performance may be higher or lower than the performance shown. The investment return and principal value of an investment will fluctuate so that an investor’s shares, when redeemed, may be worth more or less than their original cost. The above table and graph below do not reflect the deduction of taxes that a shareholder would pay on fund distributions or the redemption of fund shares. Please visit Virtus.com for performance data current to the most recent month-end.
| 1 | Total returns are historical and include changes in share price and the reinvestment of both dividends and capital gains distributions. |
| 2 | “NAV” (Net Asset Value) total returns do not include the effect of any sales charge. |
| 3 | “POP” (Public Offering Price) total returns include the effect of the maximum front-end 5.75% sales charge. |
| 4 | CDSC (contingent deferred sales charge) is applied to redemptions of certain classes of shares that do not have a sales charge applied at the time of purchase. CDSC charges for Class B shares decline from 5% to 0% over a five year period. CDSC charges for certain redemptions of Class A shares and all redemptions of Class C shares are 1% within the first year and 0% thereafter. |
| 5 | The since inception index returns are from Share Class I’s inception date. |
| 6 | The expense ratios of the Fund are set forth according to the prospectus for the Fund effective January 31, 2013, and as supplemented and revised and may differ from the expense ratios disclosed in the Financial Highlights tables in this report. See the Financial Highlights for more current expense ratios. |
Growth of $10,000 for periods ended 9/30
This chart assumes an initial investment of $10,000 made on September 30, 2003, for Class A and Class B shares including any applicable sales charges or fees. Performance assumes reinvestment of dividends and capital gain distributions.
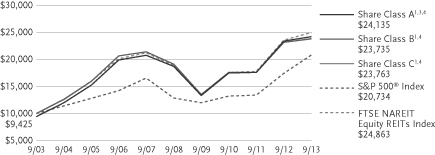
The indexes are unmanaged and not available for direct investment; therefore, their performance does not reflect the expenses associated with active management of an actual portfolio.
7
Table of Contents
VIRTUS REAL ESTATE SECURITIES FUND
SEPTEMBER 30, 2013
($ reported in thousands)
| SHARES | VALUE | |||||||
| COMMON STOCKS—99.4% | ||||||||
| REAL ESTATE INVESTMENT TRUSTS—99.4% | ||||||||
| DIVERSIFIED—1.6% | ||||||||
Digital Realty Trust, Inc. | 241,303 | $ | 12,813 | |||||
Vornado Realty Trust | 99,497 | 8,364 | ||||||
|
| |||||||
| 21,177 | ||||||||
|
| |||||||
| HEALTH CARE—8.7% | ||||||||
HCP, Inc. | 148,471 | 6,080 | ||||||
Health Care REIT, Inc. | 974,474 | 60,788 | ||||||
Ventas, Inc. | 755,261 | 46,448 | ||||||
|
| |||||||
| 113,316 | ||||||||
|
| |||||||
| INDUSTRIAL/OFFICE—23.6% | ||||||||
| Industrial—10.4% | ||||||||
DCT Industrial Trust, Inc. | 6,306,297 | 45,342 | ||||||
Eastgroup Properties, Inc. | 108,835 | 6,444 | ||||||
Prologis, Inc. | 2,216,325 | 83,378 | ||||||
|
| |||||||
| 135,164 | ||||||||
|
| |||||||
| Mixed—2.7% | ||||||||
Duke Realty Corp. | 617,500 | 9,534 | ||||||
Liberty Property Trust | 730,044 | 25,990 | ||||||
|
| |||||||
| 35,524 | ||||||||
|
| |||||||
| Office—10.5% | ||||||||
Boston Properties, Inc. | 580,283 | 62,032 | ||||||
Kilroy Realty Corp. | 1,038,856 | 51,891 | ||||||
SL Green Realty Corp. | 265,077 | 23,550 | ||||||
|
| |||||||
| 137,473 | ||||||||
|
| |||||||
| 308,161 | ||||||||
|
| |||||||
| LODGING/RESORTS—8.8% | ||||||||
Host Hotels & Resorts, Inc. | 3,435,972 | 60,714 | ||||||
LaSalle Hotel Properties | 1,097,379 | 31,297 | ||||||
Pebblebrook Hotel Trust | 825,092 | 23,688 | ||||||
|
| |||||||
| 115,699 | ||||||||
|
| |||||||
| RESIDENTIAL—18.8% | ||||||||
| Apartments—17.3% | ||||||||
American Campus Communities, Inc. | 787,617 | 26,897 | ||||||
AvalonBay Communities, Inc. | 449,256 | 57,096 | ||||||
| SHARES | VALUE | |||||||
| Apartments (continued) | ||||||||
Camden Property Trust | 624,400 | $ | 38,363 | |||||
Equity Residential | 1,186,691 | 63,571 | ||||||
Essex Property Trust, Inc. | 277,040 | 40,919 | ||||||
|
| |||||||
| 226,846 | ||||||||
|
| |||||||
| Manufactured Homes—1.5% | ||||||||
Equity Lifestyle Properties, Inc. | 568,728 | 19,434 | ||||||
|
| |||||||
| 246,280 | ||||||||
|
| |||||||
| RETAIL—27.7% | ||||||||
| Regional Malls—19.4% | ||||||||
General Growth Properties, Inc. | 3,086,775 | 59,544 | ||||||
Macerich Co. (The) | 920,575 | 51,957 | ||||||
Simon Property Group, Inc. | 959,091 | 142,166 | ||||||
|
| |||||||
| 253,667 | ||||||||
|
| |||||||
| Shopping Centers—8.3% | ||||||||
DDR Corp. | 2,088,416 | 32,809 | ||||||
Kimco Realty Corp. | 1,375,075 | 27,749 | ||||||
Retail Opportunity Investments Corp. | 270,000 | 3,732 | ||||||
Tanger Factory Outlet Centers | 1,348,300 | 44,022 | ||||||
|
| |||||||
| 108,312 | ||||||||
|
| |||||||
| 361,979 | ||||||||
|
| |||||||
| SELF STORAGE—10.2% | ||||||||
Extra Space Storage, Inc. | 957,345 | 43,798 | ||||||
Public Storage | 559,781 | 89,873 | ||||||
|
| |||||||
| 133,671 | ||||||||
| TOTAL COMMON STOCKS (Identified Cost $866,826) | 1,300,283 | |||||||
| TOTAL LONG TERM INVESTMENTS—99.4% | ||||||||
| (Identified cost $866,826) | 1,300,283 | |||||||
See Notes to Financial Statements
8
Table of Contents
VIRTUS REAL ESTATE SECURITIES FUND
SCHEDULE OF INVESTMENTS (Continued)
SEPTEMBER 30, 2013
($ reported in thousands)
| SHARES | VALUE | |||||||
| SHORT-TERM INVESTMENTS—0.3% | ||||||||
| Money Market Mutual Funds—0.3% | ||||||||
Fidelity Money Market Portfolio – Institutional Shares (Seven-day effective yield 0.090%) | 3,430,811 | $ | 3,431 | |||||
| TOTAL SHORT-TERM INVESTMENTS (Identified Cost $3,431) | 3,431 | |||||||
| TOTAL INVESTMENTS—99.7% (Identified Cost $870,257) | 1,303,714 | (1) | ||||||
Other assets and liabilities, net—0.3% |
| 3,863 | ||||||
|
| |||||||
| NET ASSETS—100.0% | $ | 1,307,577 | ||||||
|
| |||||||
Abbreviations:
| REIT | Real Estate Investment Trust |
Footnote Legend
| (1) | Federal Income Tax Information: For tax information at September 30, 2013, see Note 7 Federal Income Tax Information in the Notes to Financial Statements. |
The following table provides a summary of inputs used to value the Fund’s investments as of September 30, 2013 (See Security Valuation Note 2A in the Notes to Financial Statements):
| Total Value at September 30, 2013 | Level 1 Quoted Prices | |||||||
Equity Securities: | ||||||||
Common Stocks | $ | 1,300,283 | $ | 1,300,283 | ||||
Short-term Investments | 3,431 | 3,431 | ||||||
|
|
|
| |||||
Total Investments | $ | 1,303,714 | $ | 1,303,714 | ||||
|
|
|
| |||||
There are no Level 2 (significant observable inputs) or Level 3 (significant unobservable inputs) priced securities.
See Notes to Financial Statements
9
Table of Contents
VIRTUS REAL ESTATE SECURITIES FUND
STATEMENT OF ASSETS AND LIABILITIES
SEPTEMBER 30, 2013
(Reported in thousands except shares and per share amounts)
| Assets | ||||
Investment in securities at value(1) | $ | 1,303,714 | ||
Receivables | ||||
Investment securities sold | 4,787 | |||
Fund shares sold | 1,946 | |||
Dividends and interest receivable | 4,135 | |||
Prepaid expenses | 102 | |||
Prepaid trustee retainer | 8 | |||
|
| |||
Total assets | 1,314,692 | |||
|
| |||
| Liabilities | ||||
Payables | ||||
Fund shares repurchased | 4,764 | |||
Investment securities purchased | 652 | |||
Investment advisory fee | 801 | |||
Distribution and service fees | 211 | |||
Administration fee | 139 | |||
Transfer agent fees and expenses | 445 | |||
Professional fees | 29 | |||
Trustees’ fees and expenses | 1 | |||
Other accrued expenses | 73 | |||
|
| |||
Total liabilities | 7,115 | |||
|
| |||
| Net Assets | $ | 1,307,577 | ||
|
| |||
| Net Assets Consist of: | ||||
Capital paid in on shares of beneficial interest | $ | 831,653 | ||
Accumulated undistributed net investment income (loss) | 9 | |||
Accumulated undistributed net realized gain (loss) | 42,458 | |||
Net unrealized appreciation (depreciation) on investments | 433,457 | |||
|
| |||
| Net Assets | $ | 1,307,577 | ||
|
| |||
| Class A | ||||
Net asset value (net assets/shares outstanding) per share | $ | 35.10 | ||
Maximum offering price per share NAV/(1-5.75%) | $ | 37.24 | ||
Shares of beneficial interest outstanding, no par value, unlimited authorization | 21,245,123 | |||
Net Assets | $ | 745,631 | ||
| Class B | ||||
Net asset value (net assets/shares outstanding) and offering price per share | $ | 34.62 | ||
Shares of beneficial interest outstanding, no par value, unlimited authorization | 114,926 | |||
Net Assets | $ | 3,978 | ||
| Class C | ||||
Net asset value (net assets/shares outstanding) and offering price per share | $ | 35.04 | ||
Shares of beneficial interest outstanding, no par value, unlimited authorization | 1,798,285 | |||
Net Assets | $ | 63,005 | ||
| Class I | ||||
Net asset value (net assets/shares outstanding) and offering price per share | $ | 35.07 | ||
Shares of beneficial interest outstanding, no par value, unlimited authorization | 14,112,854 | |||
Net Assets | $ | 494,963 | ||
(1) Investment in securities at cost | $ | 870,257 | ||
See Notes to Financial Statements
10
Table of Contents
VIRTUS REAL ESTATE SECURITIES FUND
YEAR ENDED SEPTEMBER 30, 2013
($ reported in thousands)
| Investment Income | ||||
Dividends | $ | 32,727 | ||
|
| |||
Total investment income | 32,727 | |||
|
| |||
| Expenses | ||||
Investment advisory fees | 10,113 | |||
Service fees, Class A | 2,038 | |||
Distribution and service fees, Class B | 52 | |||
Distribution and service fees, Class C | 657 | |||
Administration fees | 1,750 | |||
Transfer agent fees and expenses | 3,439 | |||
Registration fees | 137 | |||
Printing fees and expenses | 158 | |||
Trustees’ fees and expenses | 62 | |||
Professional fees | 36 | |||
Custodian fees | 27 | |||
Miscellaneous expenses | 79 | |||
|
| |||
Total expenses | 18,548 | |||
|
| |||
| Net investment income (loss) | 14,179 | |||
|
| |||
| Net Realized and Unrealized Gain (Loss) on Investments | ||||
Net realized gain (loss) on investments | 106,086 | |||
Net change in unrealized appreciation (depreciation) on investments | (74,124 | ) | ||
|
| |||
| Net gain (loss) on investments | 31,962 | |||
|
| |||
| Net increase (decrease) in net assets resulting from operations | $ | 46,141 | ||
|
|
See Notes to Financial Statements
11
Table of Contents
VIRTUS REAL ESTATE SECURITIES FUND
STATEMENT OF CHANGES IN NET ASSETS
(Reported in thousands)
| Year Ended September 30, 2013 | Year Ended September 30, 2012 | |||||||
| INCREASE/(DECREASE) IN NET ASSETS | ||||||||
| From Operations | ||||||||
Net investment income (loss) | $ | 14,179 | $ | 8,629 | ||||
Net realized gain (loss) | 106,086 | 36,859 | ||||||
Net change in unrealized appreciation (depreciation) | (74,124 | ) | 266,599 | |||||
|
|
|
| |||||
| Increase (decrease) in net assets resulting from operations | 46,141 | 312,087 | ||||||
|
|
|
| |||||
| From Distributions to Shareholders | ||||||||
Net investment income, Class A | (7,908 | ) | (7,015 | ) | ||||
Net investment income, Class B | (12 | ) | (17 | ) | ||||
Net investment income, Class C | (187 | ) | (122 | ) | ||||
Net investment income, Class I | (6,061 | ) | (4,844 | ) | ||||
|
|
|
| |||||
| Decrease in net assets from distributions to shareholders | (14,168 | ) | (11,998 | ) | ||||
|
|
|
| |||||
| From Share Transactions | ||||||||
| Sale of shares | ||||||||
Class A (7,236 and 9,636 shares, respectively) | 262,310 | 314,117 | ||||||
Class B (1 and 1 shares, respectively) | 42 | 42 | ||||||
Class C (436 and 335 shares, respectively) | 15,736 | 11,063 | ||||||
Class I (5,443 and 4,347 shares, respectively) | 195,788 | 142,058 | ||||||
| Reinvestment of distributions | ||||||||
Class A (210 and 198 shares, respectively) | 7,411 | 6,493 | ||||||
Class B (—(1) and —(1) shares, respectively) | 10 | 14 | ||||||
Class C (4 and 3 shares, respectively) | 159 | 102 | ||||||
Class I (151 and 128 shares, respectively) | 5,337 | 4,194 | ||||||
| Shares repurchased | ||||||||
Class A (9,308 and 9,953 shares, respectively) | (334,732 | ) | (319,749 | ) | ||||
Class B (87 and 169 shares, respectively) | (3,069 | ) | (5,317 | ) | ||||
Class C (427 and 277 shares, respectively) | (15,361 | ) | (8,823 | ) | ||||
Class I (3,846 and 4,406 shares, respectively) | (138,028 | ) | (143,728 | ) | ||||
|
|
|
| |||||
| Increase (decrease) in net assets from share transactions | (4,397 | ) | 466 | |||||
|
|
|
| |||||
| Net increase (decrease) in net assets | 27,576 | 300,555 | ||||||
| Net Assets | ||||||||
Beginning of period | 1,280,001 | 979,446 | ||||||
|
|
|
| |||||
| End of period | $ | 1,307,577 | $ | 1,280,001 | ||||
|
|
|
| |||||
Accumulated undistributed net investment income (loss) at end of period | $ | 9 | $ | — | ||||
| (1) | Amount less than $500. |
See Notes to Financial Statements
12
Table of Contents
VIRTUS REAL ESTATE SECURITIES FUND
SELECTED PER SHARE DATA AND RATIOS FOR A SHARE OUTSTANDING
THROUGHOUT EACH PERIOD
| Net Asset Value, Beginning of Period | Net Investment Income (Loss)(2) | Net Realized and Unrealized Gain (Loss) | Total from Investment Operations | Dividends from Net Investment Income | Distributions from Net Realized Gains | Total Distributions | Change in Net Asset Value | Net Asset Value, End of Period | Total Return(1) | Net Assets, End of Period (000’s) | Ratio of Expenses to Average Net Assets(4) | Ratio of Net Investment Income (Loss) to Average Net Assets | Portfolio Turnover Rate | |||||||||||||||||||||||||||||||||||||||||||||||||||||||||
Class A | ||||||||||||||||||||||||||||||||||||||||||||||||||||||||||||||||||||||
| 10/1/12 to 9/30/13 | $ | 34.19 | 0.36 | 0.91 | 1.27 | (0.36 | ) | — | (0.36 | ) | 0.91 | $ | 35.10 | 3.70 | % | $ | 745,631 | 1.40 | % | 1.00 | % | 30 | % | |||||||||||||||||||||||||||||||||||||||||||||||
| 10/1/11 to 9/30/12 | 26.05 | 0.21 | 8.24 | 8.45 | (0.31 | ) | — | (0.31 | ) | 8.14 | 34.19 | 32.49 | 789,925 | 1.41 | 0.67 | 24 | ||||||||||||||||||||||||||||||||||||||||||||||||||||||
| 10/1/10 to 9/30/11 | 26.10 | 0.11 | 0.12 | 0.23 | (0.28 | ) | — | (0.28 | ) | (0.05 | ) | 26.05 | 0.82 | 605,073 | 1.46 | 0.39 | 36 | |||||||||||||||||||||||||||||||||||||||||||||||||||||
| 10/1/09 to 9/30/10 | 20.21 | 0.32 | 5.90 | 6.22 | (0.33 | ) | — | (0.33 | ) | 5.89 | 26.10 | 30.93 | 576,760 | 1.48 | 1.39 | 35 | ||||||||||||||||||||||||||||||||||||||||||||||||||||||
| 10/1/08 to 9/30/09 | 29.19 | 0.47 | (8.99 | ) | (8.52 | ) | (0.46 | ) | — | (0.46 | ) | (8.98 | ) | 20.21 | -28.61 | 552,518 | 1.59 | 2.88 | 48 | |||||||||||||||||||||||||||||||||||||||||||||||||||
Class B | ||||||||||||||||||||||||||||||||||||||||||||||||||||||||||||||||||||||
| 10/1/12 to 9/30/13 | $ | 33.72 | 0.10 | 0.89 | 0.99 | (0.09 | ) | — | (0.09 | ) | 0.90 | $ | 34.62 | 2.92 | % | $ | 3,978 | 2.15 | % | 0.29 | % | 30 | % | |||||||||||||||||||||||||||||||||||||||||||||||
| 10/1/11 to 9/30/12 | 25.71 | 0.02 | 8.06 | 8.08 | (0.07 | ) | — | (0.07 | ) | 8.01 | 33.72 | 31.49 | 6,761 | 2.16 | 0.07 | 24 | ||||||||||||||||||||||||||||||||||||||||||||||||||||||
| 10/1/10 to 9/30/11 | 25.76 | (0.01 | ) | 0.03 | 0.02 | (0.07 | ) | — | (0.07 | ) | (0.05 | ) | 25.71 | 0.03 | 9,461 | 2.21 | (0.05 | ) | 36 | |||||||||||||||||||||||||||||||||||||||||||||||||||
| 10/1/09 to 9/30/10 | 19.95 | 0.16 | 5.81 | 5.97 | (0.16 | ) | — | (0.16 | ) | 5.81 | 25.76 | 30.01 | 16,595 | 2.23 | 0.70 | 35 | ||||||||||||||||||||||||||||||||||||||||||||||||||||||
| 10/1/08 to 9/30/09 | 28.85 | 0.35 | (8.91 | ) | (8.56 | ) | (0.34 | ) | — | (0.34 | ) | (8.90 | ) | 19.95 | -29.20 | 17,648 | 2.34 | 2.16 | 48 | |||||||||||||||||||||||||||||||||||||||||||||||||||
Class C | ||||||||||||||||||||||||||||||||||||||||||||||||||||||||||||||||||||||
| 10/1/12 to 9/30/13 | $ | 34.14 | 0.08 | 0.92 | 1.00 | (0.10 | ) | — | (0.10 | ) | 0.90 | $ | 35.04 | 2.93 | % | $ | 63,005 | 2.15 | % | 0.23 | % | 30 | % | |||||||||||||||||||||||||||||||||||||||||||||||
| 10/1/11 to 9/30/12 | 26.02 | (0.03 | ) | 8.22 | 8.19 | (0.07 | ) | — | (0.07 | ) | 8.12 | 34.14 | 31.48 | 60,941 | 2.16 | (0.10 | ) | 24 | ||||||||||||||||||||||||||||||||||||||||||||||||||||
| 10/1/10 to 9/30/11 | 26.06 | (0.09 | ) | 0.12 | 0.03 | (0.07 | ) | — | (0.07 | ) | (0.04 | ) | 26.02 | 0.08 | 44,853 | 2.21 | (0.30 | ) | 36 | |||||||||||||||||||||||||||||||||||||||||||||||||||
| 10/1/09 to 9/30/10 | 20.19 | 0.15 | 5.88 | 6.03 | (0.16 | ) | — | (0.16 | ) | 5.87 | 26.06 | 29.95 | 46,722 | 2.23 | 0.65 | 35 | ||||||||||||||||||||||||||||||||||||||||||||||||||||||
| 10/1/08 to 9/30/09 | 29.17 | 0.35 | (8.99 | ) | (8.64 | ) | (0.34 | ) | — | (0.34 | ) | (8.98 | ) | 20.19 | -29.17 | 41,818 | 2.34 | 2.12 | 48 | |||||||||||||||||||||||||||||||||||||||||||||||||||
Class I | ||||||||||||||||||||||||||||||||||||||||||||||||||||||||||||||||||||||
| 10/1/12 to 9/30/13 | $ | 34.16 | 0.43 | 0.92 | 1.35 | (0.44 | ) | — | (0.44 | ) | 0.91 | $ | 35.07 | 3.96 | % | $ | 494,963 | 1.15 | % | 1.21 | % | 30 | % | |||||||||||||||||||||||||||||||||||||||||||||||
| 10/1/11 to 9/30/12 | 26.03 | 0.30 | 8.22 | 8.52 | (0.39 | ) | — | (0.39 | ) | 8.13 | 34.16 | 32.80 | 422,374 | 1.16 | 0.93 | 24 | ||||||||||||||||||||||||||||||||||||||||||||||||||||||
| 10/1/10 to 9/30/11 | 26.08 | 0.19 | 0.12 | 0.31 | (0.36 | ) | — | (0.36 | ) | (0.05 | ) | 26.03 | 1.08 | 320,059 | 1.21 | 0.65 | 36 | |||||||||||||||||||||||||||||||||||||||||||||||||||||
| 10/1/09 to 9/30/10 | 20.19 | 0.38 | 5.90 | 6.28 | (0.39 | ) | — | (0.39 | ) | 5.89 | 26.08 | 31.27 | 306,740 | 1.23 | 1.63 | 35 | ||||||||||||||||||||||||||||||||||||||||||||||||||||||
| 10/1/08 to 9/30/09 | 29.17 | 0.49 | (8.97 | ) | (8.48 | ) | (0.50 | ) | — | (0.50 | ) | (8.98 | ) | 20.19 | -28.45 | 206,474 | 1.32 | 3.00 | 48 | |||||||||||||||||||||||||||||||||||||||||||||||||||
Footnote Legend
| (1) | Sales charges, where applicable, are not reflected in the total return calculation. |
| (2) | Computed using average shares outstanding. |
| (3) | The Fund may invest in other funds, and the annualized expense ratios do not reflect fees and expenses associated with the underlying funds. |
See Notes to Financial Statements
13
Table of Contents
VIRTUS REAL ESTATE SECURITIES FUND
SEPTEMBER 30, 2013
Note 1. Organization
Virtus Opportunities Trust (the “Trust”) is organized as a Delaware statutory trust and is registered under the Investment Company Act of 1940, as amended (“1940 Act”), as an open-end management investment company.
As of the date of this report, 31 funds are offered for sale, of which the Real Estate Securities Fund (the “Fund”) is reported in this annual report. The Fund’s investment objective is outlined in the Fund summary page.
The Fund offers Class A shares, Class C shares and Class I shares for sale. Class B shares are no longer available for purchase by new or existing shareholders, except by existing shareholders through Qualifying Transactions. (For information regarding Qualifying Transactions, refer to the Trust’s prospectus.)
Class A shares are sold with a front-end sales charge of up to 5.75% with some exceptions. Generally, Class A shares are not subject to any charges by the Fund when redeemed; however, a 1% contingent deferred sales charge (“CDSC”) may be imposed on certain redemptions made within a certain period following purchases on which a finder’s fee has been paid. The period for which the CDSC applies for the Fund is 18 months. The CDSC period begins on the last day of the month preceding the month in which the purchase was made.
Class B shares were sold with a CDSC which declines from 5% to zero depending on the period of time the shares are held.
Class C shares are generally sold with a 1% CDSC, applicable if redeemed within one year of purchase. Class I shares are sold without a front-end sales charge or CDSC.
Virtus Mutual Funds may impose an annual fee on accounts having balances of less than $2,500. The small account fee may be waived in certain circumstances, as disclosed in the prospectuses and/or statements of additional information. The fees collected will be used to offset certain expenses of the funds.
Each Class of shares has identical voting, dividend, liquidation and other rights and the same terms and conditions, except that each class bears different distribution and/or service fees under a Board-approved Rule 12b-1 and/or shareholder service plan (“12b-1 plan”) and has exclusive voting rights with respect to such plans. Class I shares are not subject to a 12b-1 plan. Income and other expenses and realized and unrealized gains and losses of the Fund are borne pro rata by the holders of each class of shares.
Note 2. Significant Accounting Policies
The following is a summary of significant accounting policies consistently followed by the Trust in the preparation of its financial statements. The preparation of financial statements in conformity with accounting principles generally accepted in the United States of America requires management to make estimates and assumptions that affect the reported amounts of assets and liabilities, disclosure of contingent assets and liabilities at the date of the financial statements and the reported amounts of increases and decreases in net assets from operations during the reporting period. Actual results could differ from those estimates and those differences could be significant.
| A. | Security Valuation |
Security valuation procedures for the Fund, which include, nightly price variance, as well as back-testing such as bi-weekly unchanged price, monthly secondary source and
14
Table of Contents
VIRTUS REAL ESTATE SECURITIES FUND
NOTES TO FINANCIAL STATEMENTS (Continued)
SEPTEMBER 30, 2013
transaction analysis, have been approved by the Board of Trustees (the “Board” or the “Trustees”). All internally fair valued securities are approved by a valuation committee (“Valuation Committee”) appointed by the Board. The Valuation Committee is comprised of the treasurer, assistant treasurer, and two other appropriate investment professionals of the Virtus Product Management team who previously have been identified to the Board. All internally fair valued securities, referred to below, are updated daily and reviewed in detail by the Valuation Committee monthly unless changes occur within the period. The Valuation Committee reviews the validity of the model inputs and any changes to the model. Fair valuations are ratified by the Board of Directors at least quarterly.
The Fund utilizes a fair value hierarchy which prioritizes the inputs to valuation techniques used to measure fair value into three broad levels.
| Ÿ Level 1 – | quoted prices in active markets for identical securities |
| Ÿ Level 2 – | prices determined using other significant observable inputs (including quoted prices for similar securities, interest rates, prepayment speeds, credit risk, etc.) |
| Ÿ Level 3 – | prices determined using significant unobservable inputs (including the valuation committee’s own assumptions in determining the fair value of investments) |
A description of the valuation techniques applied to the Fund’s major categories of assets and liabilities measured at fair value on a recurring basis is as follows:
Equity securities are valued at the official closing price (typically last sale) on the exchange on which the securities are primarily traded, or if no closing price is available, at the last bid price and are categorized as Level 1 in the hierarchy. Restricted equity securities and private placements that are not widely traded, are illiquid or are internally fair valued by the valuation committee, are generally categorized as Level 3 in the hierarchy.
Certain non-U.S. securities may be fair valued in cases where closing prices are not readily available or are deemed not reflective of readily available market prices. For example, significant events (such as movement in the U.S. securities market, or other regional and local developments) may occur between the time that non-U.S. markets close (where the security is principally traded) and the time that the Fund calculates its net asset value (“NAV”) (generally 4 p.m. Eastern time, the close of the New York Stock Exchange (“NYSE”)) that may impact the value of securities traded in these non-U.S. markets. In such cases the Fund fair values non-U.S. securities using an independent pricing service which considers the correlation of the trading patterns of the non-U.S. security to the intraday trading in the U.S. markets for investments such as ADRs, financial futures, ETFs, and certain indexes as well as prices for similar securities. Such fair valuations are categorized as Level 2 in the hierarchy. Because the frequency of significant events is not predictable, fair valuation of certain non-U.S. common stocks may occur on a frequent basis.
Listed derivatives that are actively traded are valued based on quoted prices from the exchange and are categorized as Level 1 in the hierarchy. Over the counter derivative contracts, which include forward currency contracts and equity-linked instruments, do not require material subjectivity as pricing inputs are observed from actively quoted markets and are categorized as Level 2 in the hierarchy.
15
Table of Contents
VIRTUS REAL ESTATE SECURITIES FUND
NOTES TO FINANCIAL STATEMENTS (Continued)
SEPTEMBER 30, 2013
Investments in open-end mutual funds are valued at their closing NAV determined as of the close of regular trading on the NYSE each business day and are categorized as Level 1 in the hierarchy.
A summary of the inputs used to value the Fund’s net assets by each major security type is disclosed at the end of the Schedule of Investments for the Fund. The inputs or methodologies used for valuing securities are not necessarily an indication of the risk associated with investing in those securities.
| B. | Security Transactions and Investment Income |
Security transactions are recorded on the trade date. Realized gains and losses from the sale of securities are determined on the identified cost basis. Dividend income is recognized on the ex-dividend date, or in the case of certain foreign securities, as soon as the Fund is notified. Interest income is recorded on the accrual basis. The Fund amortizes premiums and accretes discounts using the effective interest method.
Dividend income from REIT investments is recorded using management’s estimate of the income included in distributions received from the REIT investments. Distributions received in excess of this estimated amount are recorded as a reduction of the cost of investments or reclassified to capital gains. The actual amounts of income, return of capital, and capital gains are only determined by each REIT after its fiscal year-end, and may differ from the estimated amounts.
| C. | Income Taxes |
The Fund is treated as a separate taxable entity. It is the intention of the Fund to comply with the requirements of Subchapter M of the Internal Revenue Code and to distribute substantially all of its taxable income to its shareholders. Therefore, no provision for federal income taxes or excise taxes has been made.
The Fund may be subject to foreign taxes on income, gains on investments or currency repatriation, a portion of which may be recoverable. The Fund will accrue such taxes and recoveries as applicable based upon current interpretations of the tax rules and regulations that exist in the markets in which it invests.
Management of the Fund has concluded that there are no significant uncertain tax positions which would require recognition in the financial statements. As of September 30, 2013, the tax years that remain subject to examination by the major tax jurisdictions under the statute of limitations are from the year 2010 forward (with limited exceptions).
| D. | Distributions to Shareholders |
Distributions are recorded by the Fund on the ex-dividend date. Income and capital gain distributions are determined in accordance with income tax regulations that may differ from accounting principles generally accepted in the United States of America. These differences may include the treatment of non-taxable dividends, market premium and discount, non-deductible expenses, expiring capital loss carryovers, foreign currency gain or loss, gain or loss on futures contracts, partnerships, operating losses and losses deferred due to wash sales. Permanent book and tax basis differences relating to shareholder distributions will result in reclassifications to capital paid in on shares of beneficial interest.
16
Table of Contents
VIRTUS REAL ESTATE SECURITIES FUND
NOTES TO FINANCIAL STATEMENTS (Continued)
SEPTEMBER 30, 2013
| E. | Expenses |
Expenses incurred together by the Fund and other affiliated mutual funds are allocated in proportion to the net assets of each such Fund, except where allocation of direct expense to each Fund or an alternative allocation method can be more appropriately used.
In addition to the net operating expenses that a Fund bears directly, the shareholders of the Fund indirectly bear the Fund’s pro-rata expenses of any underlying mutual funds in which the Fund invests.
Note 3. Investment Advisory Fees and Related Party Transactions
($ reported in thousands except as noted)
| A. | Adviser |
Virtus Investment Advisers, Inc. (the “Adviser”), an indirect, wholly-owned subsidiary of Virtus Investment Partners, Inc. (“Virtus”), is the Adviser to the Trust. The Adviser manages the Fund’s investment program and general operations of the Fund, including oversight of the Fund’s subadviser.
As compensation for its services to the Fund, the Adviser is entitled to a fee based upon the following annual rates as a percentage of the average daily net assets of the Fund: 0.75% of 1st $1 billion; 0.70% $1+ billion through $2 billion and 0.65% $2+ billion.
| B. | Subadviser |
The subadviser manages the investments of the Fund for which it is paid a fee by the Adviser. Duff & Phelps Investment Management Co., an indirect wholly-owned subsidiary of Virtus, is the subadviser to the Fund.
| C. | Distributor |
VP Distributors, LLC (“VP Distributors”), an indirect wholly-owned subsidiary of Virtus, serves as the distributor of the Fund’s shares. VP Distributors has advised the Fund that for the fiscal year (the “period”) ended September 30, 2013, it retained net commissions of $58 for Class A shares and deferred sales charges of $9, $2 and $6 for Class A shares, Class B shares and Class C shares respectively.
In addition, the Fund pays VP Distributors distribution and/or service fees under a 12b-1 plan as a percentage of the daily net assets of each respective class at the annual rates as follows: 0.25% for Class A shares, 1.00% for Class B shares, and 1.00% for Class C shares. Class I shares are not subject to a 12b-1 plan.
Under certain circumstances, shares of certain Virtus Mutual Funds may be exchanged for shares of the same class of certain other Virtus Mutual Funds on the basis of the relative NAV per share at the time of the exchange. On exchanges with share classes that carry a CDSC, the CDSC schedule of the original shares purchased continues to apply.
| D. | Administrator and Transfer Agent |
Effective January 1, 2013, with the approval of the Board, VP Distributors LLC, the Fund’s former Administrator and Transfer Agent, assigned its rights and obligations
17
Table of Contents
VIRTUS REAL ESTATE SECURITIES FUND
NOTES TO FINANCIAL STATEMENTS (Continued)
SEPTEMBER 30, 2013
under the Administration Agreement and Transfer Agency and Service Agreement to Virtus Fund Services, LLC an indirect wholly-owned subsidiary of Virtus. For the period of October 1, 2012 to December 31, 2012, VP Distributors LLC served as the Administrator and Transfer Agent to the Fund. For the period of January 1, 2013 to September 30, 2013 Virtus Fund Services LLC served as Administrator and Transfer Agent to the Fund.
For the period ended September 30, 2013, the Fund incurred administration fees totaling $1,335 which are included in the Statement of Operations.
For the period ended September 30, 2013, the Fund incurred transfer agent fees totaling $3,256 which are included in the Statement of Operations. A portion of these fees was paid to outside entities that also provide services to the Trust.
| E. | Affiliated Shareholders |
At September 30, 2013, Virtus and its affiliates, BMO Bankcorp. (a minority investor in Virtus) and its affiliates, and the retirement plans of Virtus and its affiliates, held shares of the Fund which may be redeemed at any time that aggregated the following:
| Shares | Aggregate Net Asset Value | |||||||
Class I shares | 509,251 | $ | 17,859 | |||||
Note 4. Purchases and Sales of Securities
($ reported in thousands)
Purchases and sales of securities (excluding U.S. Government and agency securities and short-term securities) during the period ended September 30, 2013, were as follows:
| Purchases | Sales | |||||||
| $ | 417,423 | $ | 408,086 | |||||
There were no purchases or sales of long-term U.S. Government or agency securities.
Note 5. Credit Risk and Asset Concentrations
The Fund may invest a high percentage of its assets in specific sectors of the market in its pursuit of a greater investment return. Fluctuations in these sectors of concentration may have a greater impact on the Fund, positive or negative, than if the Fund did not concentrate its investments in such sectors.
Note 6. Indemnifications
Under the Trust’s organizational documents, its trustees and officers are indemnified against certain liabilities arising out of the performance of their duties to the Fund. Each Trustee has also entered into an indemnification agreement with the Trust. In addition in the normal course of business, the Fund enters into contracts that provide a variety of indemnifications to other parties. The Fund’s maximum exposure under these arrangements is unknown as this would involve future claims that may be made against the Fund and that have not occurred. However, the Fund has not had prior claims or losses pursuant to these arrangements and expect the risk of loss to be remote.
18
Table of Contents
VIRTUS REAL ESTATE SECURITIES FUND
NOTES TO FINANCIAL STATEMENTS (Continued)
SEPTEMBER 30, 2013
Note 7. Federal Income Tax Information
($ reported in thousands)
At September 30, 2013, federal tax cost and aggregate gross unrealized appreciation (depreciation) of securities held by the Fund were as follows:
Federal | Unrealized | Unrealized | Net Unrealized | |||
| $902,025 | $412,536 | $(10,847) | $401,689 |
Under the Regulated Investment Company Modernization Act of 2010 (the “Act”), net capital losses recognized for tax years beginning after December 22, 2010 may be carried forward indefinitely, and their character is retained as short-term and/or long-term losses. Previously, net capital losses were carried forward for eight years and treated as short-term losses. As a transition rule, the Act requires that post-enactment net capital losses be used before pre-enactment net capital losses.
The Fund utilized $25,358 in losses deferred in prior years against current year capital gains.
The components of distributable earnings on a tax basis (excluding unrealized appreciation (depreciation) which is disclosed above) consist of undistributed ordinary income of $9 and undistributed long-term capital gains of $74,227.
The differences between the book and tax basis components of distributable earnings relate principally to the timing of recognition of income and gains for federal income tax purposes. Short-term gain distributions reported in the Statements of Changes in Net Assets, if any, are reported as ordinary income for federal tax purposes. Distributions are determined on a tax basis and may differ from net investment income and realized capital gains for financial reporting purposes.
Note 8. Reclassification of Capital Accounts
($ reported in thousands)
For financial reporting purposes, book basis capital accounts are adjusted to reflect the tax character of permanent book/tax differences. Permanent reclassifications can arise from differing treatment of certain income and gain transactions, nondeductible current year net operating losses, expiring capital loss carryovers and investments in passive foreign investment companies. The reclassifications have no impact on the net assets or net asset value of the Fund. As of September 30, 2013, the Fund recorded reclassifications to increase (decrease) the accounts as listed below:
Capital Paid | Undistributed | Accumulated | ||
| $ — | $(2) | $2 |
Note 9. Recent Accounting Pronouncement
In December 2011, the Financial Accounting Standards Board issued Accounting Standards Update (“ASU”) No. 2011-11 regarding “Disclosures about Offsetting Assets and Liabilities”. The amendments, which will be effective for annual reporting periods beginning on or after January 1, 2013, and interim periods within those annual periods, require an entity to
19
Table of Contents
VIRTUS REAL ESTATE SECURITIES FUND
NOTES TO FINANCIAL STATEMENTS (Continued)
SEPTEMBER 30, 2013
disclose information about offsetting and related arrangements for assets and liabilities, financial instruments and derivatives that are either currently offset in accordance with current requirements or are subject to enforceable master netting arrangements or similar agreements. At this time, management is evaluating the implications of ASU No. 2011-11 and its impact on the financial statements has not yet been determined.
Note 10. Subsequent Event Evaluations
Management has evaluated the impact of all subsequent events on the Fund through the date the financial statements were available for issuance, and has determined that there are no subsequent events requiring recognition or disclosure in the financial statements.
20
Table of Contents

Report of Independent Registered Public
Accounting Firm
To the Board of Trustees of
Virtus Opportunities Trust and Shareholders of
Virtus Real Estate Securities Fund:
In our opinion, the accompanying statement of assets and liabilities, including the schedule of investments, and the related statements of operations and of changes in net assets and the financial highlights present fairly, in all material respects, the financial position of Virtus Real Estate Securities Fund (the “Fund”) constituting Virtus Opportunities Trust, hereafter referred to as the “Trust”, at September 30, 2013, the results of its operations for the year then ended, the changes in its net assets for each of the two years in the period then ended and the financial highlights for each of the five years in the period then ended, in conformity with accounting principles generally accepted in the United States of America. These financial statements and financial highlights (hereafter referred to as “financial statements”) are the responsibility of the Trust’s management; our responsibility is to express an opinion on these financial statements based on our audits. We conducted our audits of these financial statements in accordance with the standards of the Public Company Accounting Oversight Board (United States). Those standards require that we plan and perform the audit to obtain reasonable assurance about whether the financial statements are free of material misstatement. An audit includes examining, on a test basis, evidence supporting the amounts and disclosures in the financial statements, assessing the accounting principles used and significant estimates made by management, and evaluating the overall financial statement presentation. We believe that our audits, which included confirmation of securities at September 30, 2013 by correspondence with the custodians and brokers, provide a reasonable basis for our opinion.

PricewaterhouseCoopers LLP
November 21, 2013
21
Table of Contents
VIRTUS REAL ESTATE SECURITIES FUND
SEPTEMBER 30, 2013 (UNAUDITED)
For the fiscal year ended September 30, 2013, the Fund makes the following disclosures for federal income tax purposes. Below is listed the percentage, or the maximum amount allowable, of its ordinary income dividends (“QDI”) to qualify for the lower tax rates applicable to individual shareholders, and the percentage of ordinary income dividends earned by the Fund which qualifies for the dividends received deduction (“DRD”) for corporate shareholders. The actual percentage of QDI and DRD for the calendar year will be designated in year-end tax statements. The Fund designates the amount below, or if subsequently different, as long-term capital gains dividends (“LTCG”) ($ reported in thousands).
QDI | DRD | LTCG | ||
| 0% | 0% | $74,227 |
22
Table of Contents
FUND MANAGEMENT TABLES (UNAUDITED)
Information pertaining to the Trustees and officers of the Trust as of September 30, 2013, is set forth below. The statement of additional information (SAI) includes additional information about the Trustees and is available without charge, upon request, by calling (800) 243-1574. The address of each individual, unless otherwise noted, is 100 Pearl Street, Hartford, CT 06103-4506. There is no stated term of office for Trustees of the Trust.
Independent Trustees
| Name, Year of Birth, Year Elected and Number of Funds Overseen | Principal Occupation(s) Other Directorships Held by Trustee | |
Leroy Keith, Jr. YOB: 1939 Elected: 2000 48 Funds | Chairman (since 2010), Bloc Global Services Group, LLC (construction and redevelopment company); Managing Director (2007 to 2008), Almanac Capital Management (commodities business); Director/Trustee (since 2010), Wells Fargo Funds (139 series) and their predecessors, Evergreen Funds (1989 to 2010); Director (2003 to 2010), Diversapack Co. (soft packaging company); and Trustee (since 1980), Virtus Mutual Fund Complex. | |
Philip R. McLoughlin Chairman YOB: 1946 Elected: 1999 66 Funds | Partner (since 2006), Cross Pond Partners, LLC (strategy consulting firm); Managing Director (2009 to 2010), SeaCap Asset Management Fund I, L.P. and SeaCap Partners, LLC (investment management); Director (since 1991) and Chairman (since 2010), World Trust Fund; Trustee and Chairman (since 2011), Virtus Closed-End Funds (2 portfolios); Trustee (since 1989), Virtus Mutual Fund Complex; Director (since 1996), closed-end funds managed by Duff & Phelps Investment Management Co. (4 portfolios); and Director (1985 to 2009), Argo Group International Holdings Inc. and its predecessor, PXRE Corporation (insurance). | |
Geraldine M. McNamara YOB: 1951 Elected: 2001 52 Funds | Retired. Director (since 2003), closed-end funds managed by Duff & Phelps Investment Management Co. (4 portfolios); and Trustee (since 2001), Virtus Mutual Fund Complex. | |
James M. Oates YOB: 1946 Elected: 2000 50 Funds | Managing Director (since 1994), Wydown Group (consulting firm); Chairman and Trustee (since 2005), John Hancock Fund Complex (collectively, 234 portfolios); Director (since 1996), Stifel Financial; Chairman and Director (since 1999), Connecticut River Bank and Director (since 1998), Connecticut River Bancorp; Chairman (since 2000), Emerson Investment Management, Inc.; Director (since 2002), New Hampshire Trust Company; Non-Executive Chairman (2007 to 2011), Hudson Castle Group, Inc. (formerly IBEX Capital Markets, Inc.) (financial services); and Trustee (since 1987), Virtus Mutual Fund Complex. | |
Richard E. Segerson YOB: 1948 Elected: 2000 48 Funds | Retired. Managing Director (1998 to 2013), Northway Management Company; and Trustee (since 1993), Virtus Mutual Fund Complex. | |
Ferdinand L.J. Verdonck YOB: 1942 Elected: 2005 48 Funds | Director (since 1998), The J.P. Morgan European Investment Trust; Director (since 2005), Galapagos N.V. (biotechnology); Mr. Verdonck is also a director of several non-U.S. companies. |
23
Table of Contents
FUND MANAGEMENT TABLES (UNAUDITED) (Continued)
Interested Trustee
The individual listed below is an “interested person” of the Trust, as defined in Section 2(a)(19) of the 1940 Act, as amended, and the rules and regulations thereunder.
| Name, Year of Birth, Year Elected and Number of Funds Overseen | Principal Occupation(s) During Past 5 Years and | |
George R. Aylward* Trustee and President YOB: 1964 Elected: 2006 61 Funds | Director, President and Chief Executive Officer (since 2008), Virtus Investment Partners, Inc. and/or certain of its subsidiaries; various senior officer positions with Virtus affiliates (since 2005); Trustee (since 2012), Virtus Variable Insurance Trust; Trustee and President (since 2011), Virtus Closed-End Funds (2 portfolios); and Chairman, President and Chief Executive Officer (since 2006), The Zweig Closed-End Funds (2 portfolios) Funds; and Director (since 2013), Virtus Global Funds, PLC. |
| * | Mr. Aylward is an “interested person,” as defined in the 1940 Act, by reason of his position as President and Chief Executive Officer of Virtus Investment Partners, Inc. (“Virtus”), the ultimate parent company of the Adviser, and various positions with its affiliates, including the Adviser. |
24
Table of Contents
FUND MANAGEMENT TABLES (UNAUDITED) (Continued)
Officers of the Trust Who Are Not Trustees
Name, Address and Year of Birth | Position(s) Held with Time Served | Principal Occupation(s) During Past 5 Years | ||
W. Patrick Bradley YOB: 1972 | Senior Vice President (since 2013), Vice President since 2011, Chief Financial Officer and Treasurer since 2006. | Senior Vice President, Fund Services (since 2010), Virtus Investment Partners, Inc. and/or certain of its subsidiaries; various officer positions (since 2006) with Virtus affiliates; Vice President (since 2011), Chief Financial Officer and Treasurer (since 2004), Virtus Variable Insurance Trust; Vice President, Chief Financial Officer and Treasurer (since 2011), Virtus Global Multi-Sector Income Fund and Virtus Total Return Fund; Vice President (since 2012) and Treasurer (Chief Financial Officer) (since 2007), The Zweig Fund, Inc. and Zweig Total Return Fund, Inc.; Vice President and Assistant Treasurer (since 2011), Duff & Phelps Global Utility Income Fund Inc. ; and Director (since 2013), Virtus Global Funds, PLC. | ||
Kevin J. Carr YOB: 1954 | Senior Vice President (since 2013), Vice President, Chief Legal Officer, Counsel and Secretary since 2005. | Senior Vice President (since 2009), Vice President, Counsel and Secretary (2008 to 2009), Virtus Investment Partners, Inc. and/or certain of its subsidiaries; various senior officer positions (since 2005) with Virtus affiliates; Vice President, Chief Legal Officer, Counsel and Secretary (since 2010), Virtus Variable Insurance Trust; Vice President and Assistant Secretary (since 2012), Vice President, Chief Legal Officer, Counsel and Secretary (2011-2012), Virtus Global Multi-Sector Income Fund and Virtus Total Return Fund; Vice President and Assistant Secretary (since 2012), Secretary and Chief Legal Officer (2005-2012), The Zweig Fund, Inc. and Zweig Total Return Fund, Inc.; and Vice President and Assistant Secretary (since 2011), Duff & Phelps Global Utility Income Fund Inc. | ||
Nancy J. Engberg YOB: 1956 | Vice President and Chief Compliance Officer since 2011. | Vice President (since 2008) and Chief Compliance Officer (2008 to 2011), Virtus Investment Partners, Inc. and/or certain of its subsidiaries; various officer positions (since 2003) with Virtus affiliates; Vice President (since 2010), Chief Compliance Officer (since 2011), Virtus Variable Insurance Trust; Vice President and Chief Compliance Officer (since 2011), Virtus Global Multi-Sector Income Fund and Virtus Total Return Fund; Vice President and Chief Compliance Officer (since 2012), The Zweig Fund, Inc. and Zweig Total Return Fund, Inc. | ||
Francis G. Waltman YOB: 1962 | Executive Vice President since 2013.
Senior Vice President 2008-2013. | Executive Vice President, Product Development (since 2009), Virtus Investment Partners, Inc. and/or certain of its subsidiaries; various senior officer positions (since 2006) with Virtus affiliates; Senior Vice President (since 2010), Virtus Variable Insurance Trust; Senior Vice President (since 2011), Virtus Global Multi-Sector Income Fund and Virtus Total Return Fund; and Director (since 2013), Virtus Global Funds, PLC.. |
25
Table of Contents
VIRTUS OPPORTUNITIES TRUST
101 Munson Street
Greenfield, MA 01301-9668
Trustees
George R. Aylward
Leroy Keith, Jr.
Philip R. McLoughlin, Chairman
Geraldine M. McNamara
James M. Oates
Richard E. Segerson
Ferdinand L.J. Verdonck
Officers
George R. Aylward, President
Francis G. Waltman, Executive Vice President
W. Patrick Bradley, Senior Vice President, Chief Financial Officer and Treasurer
Kevin J. Carr, Senior Vice President, Chief Legal Officer, Counsel and Secretary
Nancy J. Engberg, Vice President and Chief Compliance Officer
Investment Adviser
Virtus Investment Advisers, Inc.
100 Pearl Street
Hartford, CT 06103-4506
Principal Underwriter
VP Distributors, LLC
100 Pearl Street
Hartford, CT 06103-4506
Administrator and Transfer Agent
Virtus Fund Services, LLC
100 Pearl Street
Hartford, CT 06103-4506
Custodian
JPMorgan Chase Bank NA
1 Chase Manhattan Plaza
New York, NY 10005-1401
Independent Registered Public Accounting Firm
PricewaterhouseCoopers LLC
2001 Market Street
Philadelphia, PA 19103-7042
How to Contact Us
Mutual Fund Services 1-800-243-1574
Adviser Consulting Group 1-800-243-4361
Telephone Orders 1-800-367-5877
Text Telephone 1-800-243-1926
Web site Virtus.com
Important Notice to Shareholders
The Securities and Exchange Commission has modified mailing regulations for semiannual and annual shareholder fund reports to allow mutual fund companies to send a single copy of these reports to shareholders who share the same mailing address. If you would like additional copies, please call Mutual Fund Services at 1-800-243-1574.
Table of Contents
For more information about
Virtus Mutual Funds, please call
your financial representative, or
contact us at 1-800-243-1574
or Virtus.com
| 8009 | 11-13 |

Table of Contents

ANNUAL REPORT
Virtus Foreign Opportunities Fund
September 30, 2013
TRUST NAME: VIRTUS OPPORTUNITIES TRUST
Not FDIC Insured
No Bank Guarantee
May Lose Value

Table of Contents
Virtus Foreign Opportunities Fund
(“Foreign Opportunities Fund”)
| 1 | ||||
| 2 | ||||
| 4 | ||||
| 5 | ||||
| 9 | ||||
| 12 | ||||
| 13 | ||||
| 14 | ||||
| 15 | ||||
| 16 | ||||
| 24 | ||||
| 25 | ||||
| 26 |
PROXY VOTING PROCEDURES AND VOTING RECORD (FORM N-PX)
The subadviser vote proxies relating to portfolio securities in accordance with procedures that have been approved by the Board of Trustees of the Trust (“Trustees,” the “Board”). You may obtain a description of these procedures, along with information regarding how the Fund voted proxies during the most recent 12-month period ended June 30, free of charge, by calling toll-free 1-800-243-1574. This information is also available through the Securities and Exchange Commission’s (the “SEC”) website at http://www.sec.gov.
FORM N-Q INFORMATION
The Trust files a complete schedule of portfolio holdings for the Fund with the SEC for the first and third quarters of each fiscal year on Form N-Q. Form N-Q is available on the SEC’s website at http://www.sec.gov. Form N-Q may be reviewed and copied at the SEC’s Public Reference Room. Information on the operation of the SEC’s Public Reference Room can be obtained by calling toll-free 1-800-SEC-0330.
This report is not authorized for distribution to prospective investors in the Virtus Foreign Opportunities Fund unless preceded or accompanied by an effective prospectus which includes information concerning the sales charge, the Fund’s record and other pertinent information.
Table of Contents
Dear Fellow Shareholders of Virtus Mutual Funds:
 | The financial markets experienced significant volatility during the 12-month period that ended September 30, 2013. The S&P 500® Index, a benchmark for U.S. equities, gained 19.3% while the Barclays U.S. Aggregate Bond Index, which tracks the U.S. fixed income market, declined 1.7%, and the MSCI All Country World Index (net), a measure of international equities, rose 17.7%.
The bond markets were particularly volatile during the second half of this period. U.S. Treasury yields climbed over the last few months as the market prepared for the Federal Reserve’s tapering of its bond purchases, which never occurred. The 10-year Treasury yield was at | |
2.6% as of September 30, 2013, compared with 1.7% a year earlier, and, as rates rose, most bond sectors suffered losses.
Despite this recent market unpredictability, there is reason for investors to be cautiously optimistic about the economy. The U.S. economy is showing signs of growth in hiring, consumer spending, and housing and, although China’s recovery remains tenuous, Europe appears to be coming out of its recession. The onus remains on the U.S. government to keep the country on strong fiscal footing and on corporations to produce robust earnings, which will play a pivotal role in determining future market direction.
Market uncertainty is a timely reminder of the importance of portfolio diversification. While diversification cannot guarantee a profit or prevent loss, owning a variety of asset classes may cushion your portfolio against inevitable market fluctuations. Your financial advisor can help you ensure that your portfolio is adequately diversified.
Thank you for entrusting Virtus with your assets. Should you have any questions or require support, the Virtus customer service team is ready to assist you at 1-866-270-7788. We appreciate your business and remain committed to your long-term financial success.
Sincerely,
George R. Aylward President, Virtus Mutual Funds
October 2013
Whenever you have questions about your account, or require additional information, please visit us on the Web at www.virtus.com or call our shareowner service group toll-free at 1-800-243-1574.
Performance data quoted represents past results. Past performance is no guarantee of future results and current performance may be higher or lower than performance shown above. | ||

1
Table of Contents
VIRTUS FOREIGN OPPORTUNITIES FUND
DISCLOSURE OF FUND EXPENSES (Unaudited)
FOR THE SIX-MONTH PERIOD OF APRIL 1, 2013 TO SEPTEMBER 30, 2013
We believe it is important for you to understand the impact of costs on your investment. All mutual funds have operating expenses. As a shareholder of the Virtus Foreign Opportunities Fund (the “Fund”) you may incur two types of costs: (1) transaction costs, including sales charges on purchases of Class A shares and contingent deferred sales charges on Class C shares; and (2) ongoing costs, including investment advisory fees, distribution and service fees, and other expenses. Class I shares are sold without a sales charge and do not incur distribution and service fees. For further information regarding applicable sales charges, see Note 1 in the Notes to Financial Statements. These examples are intended to help you understand your ongoing costs (in dollars) of investing in the Fund and to compare these costs with the ongoing costs of investing in other mutual funds. These examples are based on an investment of $1,000 invested at the beginning of the period and held for the entire six-month period. The following Expense Table illustrates your Fund’s costs in two ways.
Actual Expenses
The first section of the accompanying table provides information about actual account values and actual expenses. You may use the information in this section, together with the amount you invested, to estimate the expenses that you paid over the period. Simply divide your account value by $1,000 (for example, an $8,600 account value divided by $1,000 = 8.6), then multiply the result by the number in the first section under the heading “Expenses Paid During Period” to estimate the expenses you paid on your account during the period.
Hypothetical Example for Comparison Purposes
The second section of the accompanying table provides information about hypothetical account values and hypothetical expenses based on the Fund’s actual expense ratio and an assumed rate of return of 5% per year before expenses, which is not your Fund’s actual return. The hypothetical account values and expenses may not be used to estimate the actual ending account balance or expenses you paid for the period. You may use this information to compare the ongoing costs of investing in your Fund and other funds. To do so, compare these 5% hypothetical examples with the 5% hypothetical examples that appear in the shareholder reports of the other funds.
Please note that the expenses shown in the accompanying table are meant to highlight your ongoing costs only and do not reflect any transactional costs, such as sales charges or contingent deferred sales charges. Therefore, the second section of the accompanying table is useful in comparing ongoing costs only, and will not help you determine the relative total costs of owning different funds. In addition, if these transactional costs were included, your costs would have been higher. The calculations assume no shares were bought or sold during the period. Your actual costs may have been higher or lower, depending on the amount of your investment and the timing of any purchases or redemptions.
2
Table of Contents
VIRTUS FOREIGN OPPORTUNITIES FUND
DISCLOSURE OF FUND EXPENSES (Unaudited) (Continued)
FOR THE SIX-MONTH PERIOD OF APRIL 1, 2013 TO SEPTEMBER 30, 2013
| Expense Table | ||||||||||||||||
Beginning April 1, 2013 | Ending September 30, 2013 | Annualized Expense Ratio | Expenses Paid During Period* | |||||||||||||
Actual | ||||||||||||||||
Class A | $ | 1,000.00 | $ | 979.10 | 1.46 | % | $ | 7.24 | ||||||||
Class C | 1,000.00 | 975.40 | 2.21 | 10.94 | ||||||||||||
Class I | 1,000.00 | 980.30 | 1.21 | 6.01 | ||||||||||||
Hypothetical (5% return before expenses) |
| |||||||||||||||
Class A | 1,000.00 | 1,017.66 | 1.46 | 7.41 | ||||||||||||
Class C | 1,000.00 | 1,013.85 | 2.21 | 11.22 | ||||||||||||
Class I | 1,000.00 | 1,018.93 | 1.21 | 6.14 | ||||||||||||
| * | Expenses are equal to the Fund’s annualized expense ratio which is net of waived fees and reimbursed expenses, if applicable, multiplied by the average account value over the period, multiplied by the number of days (183) expenses were accrued in the most recent fiscal half-year, then divided by 365 to reflect the one-half year period. |
| The Fund may invest in other funds, and the annualized expense ratios noted above do not reflect fees and expenses associated with the underlying funds. If such fees and expenses were included, the expenses would have been higher. |
| You can find more information about the Fund’s expenses in the Financial Statements section that follows. For additional information on operating expenses and other shareholder costs, refer to the prospectus. |
3
Table of Contents
| VIRTUS FOREIGN OPPORTUNITIES FUND |
American Depositary Receipt (ADR)
Represents shares of foreign companies traded in U.S. dollars on U.S. exchanges that are held by a U.S. bank or trust. Foreign companies use ADRs in order to make it easier for Americans to buy their shares.
Barclays U.S. Aggregate Bond Index
The Barclays U.S. Aggregate Bond Index measures the U.S. investment grade fixed rate bond market. The index is calculated on a total return basis its returns do not reflect any fees, expenses, or sales charges.
Federal Reserve (the “Fed”)
The central bank of the United States, responsible for controlling the money supply, interest rates and credit with the goal of keeping the U.S. economy and currency stable. Governed by a seven-member board, the system includes 12 regional Federal Reserve Banks, 25 branches and all national and state banks that are part of the system.
Gross Domestic Product (“GDP”)
The market value of all officially recognized final goods and services produced within a country in a given period.
MSCI All Country World Index (net)
The MSCI AC World Index (net) is a free float-adjusted market capitalization-weighted index that measures equity performance of developed and emerging markets. The index is calculated on a total return basis with net dividends reinvested. The index is unmanaged its returns do not reflect any fees, expenses, or sales charges and is not available for direct investment.
MSCI EAFE® Index (net)
A free float-adjusted market capitalization-weighted index that measures developed foreign market equity performance, excluding the U.S. and Canada. The index is calculated on a total return basis with net dividends reinvested. The index is unmanaged its returns do not reflect any fees, expenses, or sales charges and is not available for direct investment.
MSCI Europe Index (net)
The MSCI Europe Index is a free float-adjusted market capitalization weighted index that measures the equity market performance of the developed markets in Europe. The index is unmanaged its returns do not reflect any fees, expenses, or sales charges and is not available for direct investment.
Sponsored American Depositary Receipt (ADR)
An ADR which is issued with the cooperation of the company whose stock will underlie the ADR. Sponsored ADRs generally carry the same rights normally given to stockholders, such as voting rights. ADRs must be sponsored to be able to trade on a major U.S. exchange such as the New York Stock Exchange (NYSE).
S&P 500® Index
The S&P 500® Index is a free-float market capitalization-weighted index of 500 of the largest U.S. companies. The index is calculated on a total return basis with dividends reinvested. The index is unmanaged its returns do not reflect any fees, expenses, or sales charges and is not available for direct investment.
4
Table of Contents
VIRTUS FOREIGN OPPORTUNITIES FUND
Fund Summary | Ticker Symbols: Class A: JVIAX Class C: JVICX Class I: JVXIX |
| ¢ | The Fund is diversified and has an investment objective of long-term capital appreciation. |
| ¢ | For the fiscal year ended September 30, 2013, the Fund’s Class A shares at NAV returned 7.37%, Class C shares returned 6.56% and Class I shares returned 7.66%. For the same period, the S&P® 500 Index, a broad-based equity index, returned 19.34% and the MSCI EAFE® Index (net), the Fund’s style-specific index appropriate for comparison, returned 23.77%. |
All performance figures assume reinvestment of distribution and exclude the effect of sales charges. Past performance is no guarantee of future results and current performance may be higher or lower than the performance shown.
How did the market perform during the Fund’s fiscal year?
| ¢ | The start of an aggressive quantitative easing program led to a spectacular rise and then fall in the Japanese stock market, accompanied by a falling yen against all the major currencies. Prime Minister Shinzo Abe’s Liberal Democratic Party government announced three sets of initiatives (or “arrows” as they marketed them) that they will use to spur the economy into growth. |
| ¢ | In Mexico, the newly elected Institutional Revoluntionary Party government of Enrique Peña Nieto made a strong impact with its ability to draw multi-party support for much needed reforms, including allowing foreign investment into the energy industry, raising Mexico’s low tax collection relative to Gross Domestic Product (“GDP”), and increasing the flexibility of labor laws. |
| ¢ | In June, Standard & Poor’s downgraded Brazil’s BBB credit rating outlook to negative from stable on concerns of slow economic growth alongside expansionary fiscal policy. |
| ¢ | Greece was lowered by MSCI from developed to emerging market status – the first time MSCI has relegated a developed market country. |
| ¢ | Equity markets were strong across most major economies with cyclical stocks and periphery European markets performing well, supported |
by coincident market indicators, including stable Chinese economic growth and low interest rates across southern Europe. |
| ¢ | U.S. outlook began to improve but turned into a “rate normalization” scare following upbeat Fed comments that tested the structural integrity of a number of emerging markets to currency shock, as money that had streamed away from the U.S. and Europe since the 2008-2009 crisis flooded back. |
| ¢ | By fiscal year end, most emerging market currencies that had recovered lost ground and short-term rates were pulling back from the emergency measures used by central banks to keep investors from leaving. Focus shifted to the first U.S. government shutdown since 1996. |
| ¢ | After persistent disappointing economic data, the eurozone managed in the second quarter of 2013, its first quarter on quarter growth (0.3%) in seven quarters, although it remained negative (-0.5%) against the second quarter of 2012. This positive bump alongside Angela Merkel’s Christian Democratic Union party winning the German elections is regarded as a positive step towards stability. General comfort was also reflected in the market signals of low interest rates across the European periphery with the Spanish and Italian 10-year sovereign rates both ending the quarter around 4.4%. However, we are not comfortable that a return to sustainable growth is close for the eurozone. While GDP numbers appear stable in aggregate for the eurozone, we see little growth ahead. Serious problems remain in the periphery and exports with a strong currency and slowing China could be challenging for exporters such as Germany. |
| ¢ | In the second quarter of 2013, year-over-year GDP in Greece fell 4.6%, Spain 1.6%, Portugal 2%,, and Italy 2%. These declines without a quick solution would not matter so much if there was a transfer of wealth mechanism within Europe as there is in the U.S., but there is not. If a country is running a deficit, it needs to borrow or be forced to undergo fiscal consolidation, which further weakens growth in the short term. In addition, European banks |
For information regarding the indexes and certain investment terms, see Key Investment Terms starting on page 4.
5
Table of Contents
| VIRTUS FOREIGN OPPORTUNITIES FUND (continued) |
are shrinking their balance sheets (partly because of the need to improve their leverage ratios), which is another headwind to a return to sustained economic growth. |
| ¢ | During the second quarter of 2013, China recorded, GDP growth of 7.5%, a slightly slower rate than the previous year, but still a breakneck pace in a global context. |
What factors affected the Fund’s performance during its fiscal year?
| ¢ | The Fund’s stock selection in energy, as well as its underweight exposure to the sector, contributed to performance versus the MSCI EAFE® Index (net) during the fiscal year. |
| ¢ | The portfolio’s underweight to utilities was also beneficial to results, as the sector underperformed the overall MSCI EAFE® Index (net). |
| ¢ | Financial names held in the portfolio dragged down performance versus the MSCI EAFE® Index (net). Our underweight exposure to the sector was also a detractor. |
| ¢ | The Fund’s stock selection within materials hurt performance for the year. |
| ¢ | Our selection of Hong Kong stocks contributed to relative performance during the period. |
| ¢ | The portfolio’s Swiss holdings performed better than those in the MSCI Europe Index (net), contributing to relative performance for the period. Its overweight to the country was also beneficial. |
| ¢ | The portfolio’s out-of-index exposure to India detracted from relative results. |
| ¢ | The Fund’s underweight to Japanese stocks hurt performance, as the country was one of the top performers in the MSCI EAFE® Index (net). |
| ¢ | Absolute contributors: UBS, Valeant Pharmaceuticals, Core Laboratories, Sands China, and HSBC Holdings |
| ¢ | Absolute detractors: Newcrest Mining, Goldcorp, Fresnillo, Housing Development Finance Corp., and HDFC Bank |
| ¢ | Relative contributors: UBS, Valeant Pharmaceuticals, Sands China, Core Laboratories, and Royal Dutch Shell |
| ¢ | Relative detractors: Newcrest Mining, Housing Development Finance Corp., Goldcorp, HDFC Bank, and Fresnillo |
Performance Disclosure
Past performance is not indicative of future results. Any performance results portrayed reflect the reinvestment of dividends and other earnings. Any companies described in this commentary may or may not currently represent a position in our client portfolios. Also, any sector and industry weights described in the commentary may or may not have changed since the writing of this commentary. The information and methodology described in this commentary should not be construed as a recommendation to purchase or sell securities. Please contact a Vontobel representative for more information.
Any projections, forecasts or estimates contained in this commentary are based on a variety of estimates and assumptions. There can be no assurance that the estimates or assumptions made will prove accurate, and actual results may differ materially. The inclusion of projections or forecasts should not be regarded as an indication that Vontobel considers the projections or forecasts to be reliable predictors of future events, and they should not be relied upon as such.
In the event a company described in this commentary is a position in client portfolios, the securities identified and described do not represent all of the securities purchased, sold or recommended. The reader should not assume that an investment in any securities identified was or will be profitable or that investment recommendations or investment decisions we make in the future will be profitable.
For information about how contribution was calculated for any such securities, or to obtain a list showing the contribution of each holding to overall performance, please contact a Vontobel representative.
For information regarding the indexes and certain investment terms, see the Key Investment Terms on page 4.
6
Table of Contents
| VIRTUS FOREIGN OPPORTUNITIES FUND (continued) |
The preceding information is the opinion of portfolio management. Any such opinions are subject to change at any time based upon market or other conditions and should not be relied upon as investment advice. Past performance is no guarantee of future results, and there is no guarantee that market forecasts will be realized
There is no guarantee that the Fund will meet its objective.
The market price of equity securities may be affected by financial market, industry, or issuer-specific events. Focus on a particular style or on small or medium-sized companies may enhance that risk. A fund that focuses its investments in a particular industry or sector will be more sensitive to conditions that affect that industry or sector than a non-concentrated fund. Investing internationally, especially in emerging markets, involves additional risks such as currency, political, accounting, economic and market risk.
| Asset Allocations | ||||
The following table presents asset allocations within certain sectors and as a percentage of total investments as of September 30, 2013.
|
| |||
Consumer Staples | 33 | % | ||
Financials | 18 | |||
Health Care | 10 | |||
Industrials | 10 | |||
Consumer Discretionary | 7 | |||
Energy | 5 | |||
Materials | 5 | |||
Other (includes short-term investments) | 12 | |||
|
| |||
Total | 100 | % | ||
|
| |||
For information regarding the indexes and certain investment terms, see the Key Investment Terms on page 4.
7
Table of Contents
VIRTUS FOREIGN OPPORTUNITIES FUND (Continued)
| Average Annual Total Returns1 for periods ended 9/30/13 | ||||||||||||||||||||
1 Year | 5 Years | 10 Years | Since Inception | Inception Date | ||||||||||||||||
| Class A Shares at NAV 2 | 7.37 | % | 7.08 | % | 10.07 | % | — | — | ||||||||||||
| Class A Shares at POP 3,4 | 1.20 | 5.82 | 9.42 | — | — | |||||||||||||||
| Class C Shares at NAV 2 and with CDSC 4 | 6.56 | 6.28 | — | 8.96 | % | 10/10/03 | ||||||||||||||
| Class I Shares at NAV | 7.66 | 7.38 | — | 4.54 | 5/15/06 | |||||||||||||||
| S&P 500® Index | 19.34 | 10.02 | 7.56 | —5 | — | |||||||||||||||
| MSCI EAFE® Index (net) | 23.77 | 6.35 | 8.01 | —6 | — | |||||||||||||||
Fund Expense Ratios7: A Shares: 1.45%; C Shares: 2.20%; I Shares: 1.20%.
All returns represent past performance which is no guarantee of future results. Current performance may be higher or lower than the performance shown. The investment return and principal value of an investment will fluctuate so that an investor’s shares, when redeemed, may be worth more or less than their original cost. The above table and graph below do not reflect the deduction of taxes that a shareholder would pay on fund distributions or the redemption of fund shares. Please visit Virtus.com for performance data current to the most recent month-end.
| 1 | Total returns are historical and include changes in share price and the reinvestment of both dividends and capital gains distributions. |
| 2 | “NAV” (Net Asset Value) total returns do not include the effect of any sales charge. |
| 3 | “POP” (Public Offering Price) total returns include the effect of the maximum front-end 5.75% sales charge. |
| 4 | “CDSC” (contingent deferred sales charge) is applied to redemptions of certain classes of shares that do not have a sales charge applied at the time of purchase. CDSC charges for certain redemptions of Class A shares made within 18 months of purchases in which a finder’s fee was paid and all Class C shares are 1% within the first year and 0% thereafter. |
| 5 | The index returned 7.36% for Class C shares and 5.85% for Class I shares since the inception date of the respective share class. |
| 6 | The index returned 7.35% for Class C shares and 2.22% for Class I shares since the inception date of the respective share class. |
| 7 | The expense ratios of the Fund are set forth according to the prospectus for the Fund effective January 31, 2013, and may differ from the expense ratios disclosed in the Financial Highlights tables in this report. See the Financial Highlights for more current expense ratios. |
Growth of $10,000 for periods ended 9/30
This chart assumes an initial investment of $10,000 made on September 30, 2003 for Class A shares including any applicable sales charges or fees. Performance assumes reinvestment of dividends and capital gain distributions.
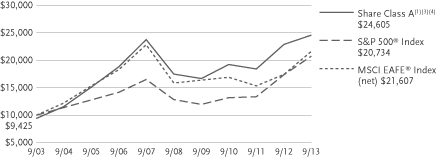
The indexes are unmanaged and not available for direct investment; therefore, their performance does not reflect the expenses associated with active management of an actual portfolio.
8
Table of Contents
VIRTUS FOREIGN OPPORTUNITIES FUND
SEPTEMBER 30, 2013
($ reported in thousands)
| SHARES | VALUE | |||||||
| COMMON STOCKS—93.9% | ||||||||
| Consumer Discretionary—7.4% | ||||||||
Barrat Developments plc (United Kingdom)(2) | 3,085,130 | $ | 15,413 | |||||
Domino’s Pizza plc (United Kingdom) | 1,942,280 | 18,363 | ||||||
Hermes International (France) | 41,044 | 14,776 | ||||||
L’Occitane International SA (Hong Kong) | 4,627,301 | 12,081 | ||||||
Luxottica Group SpA (Italy) | 214,691 | 11,420 | ||||||
Paddy Power plc (Ireland)(2) | 262,019 | 21,003 | ||||||
Persimmon plc (United Kingdom) | 1,169,921 | 20,569 | ||||||
Sands China Ltd. (Hong Kong) | 3,432,549 | 21,221 | ||||||
|
| |||||||
| 134,846 | ||||||||
|
| |||||||
| Consumer Staples—34.1% | ||||||||
Alimentation Couche Tard, Inc. Class B (Canada) | 234,737 | 14,635 | ||||||
British American Tobacco plc (United Kingdom) | 1,835,258 | 97,349 | ||||||
Diageo plc (United Kingdom) | 1,564,323 | 49,763 | ||||||
Hindustan Unilever Ltd. (India) | 1,190,693 | 11,934 | ||||||
ITC Ltd. (India) | 9,070,738 | 49,320 | ||||||
L’Oreal S.A. (France) | 165,171 | 28,367 | ||||||
Lindt & Spruengli AG (Switzerland) | 7,682 | 31,523 | ||||||
Nestle S.A. Registered Shares (Switzerland) | 1,066,689 | 74,604 | ||||||
Pernod-Ricard S.A. (France) | 233,453 | 28,990 | ||||||
Philip Morris International, Inc. (United States) | 1,018,945 | 88,230 | ||||||
SABMiller plc (United Kingdom) | 1,052,000 | 53,537 | ||||||
Unilever N.V. (Netherlands) | 1,937,331 | 75,364 | ||||||
| SHARES | VALUE | |||||||
| Consumer Staples (continued) | ||||||||
Wal-Mart de Mexico S.A.B. de C.V. (Mexico) | 7,479,895 | $ | 19,578 | |||||
|
| |||||||
| 623,194 | ||||||||
|
| |||||||
| Energy—4.7% | ||||||||
Core Laboratories N.V. (Netherlands) | 328,070 | 55,513 | ||||||
Enbridge, Inc. (Canada) | 745,560 | 31,138 | ||||||
|
| |||||||
| 86,651 | ||||||||
|
| |||||||
| Financials—17.9% | ||||||||
Bank of Nova Scotia (Canada)(3) | 490,361 | 28,087 | ||||||
Daito Trust Construction Co., Ltd. (Japan)(3) | 213,500 | 21,308 | ||||||
Housing Development Finance Corp. (India) | 4,964,566 | 60,605 | ||||||
Housing Development Finance Corp. Bank Ltd. (India) | 4,748,467 | 44,982 | ||||||
Housing Development Finance Corp. Bank Ltd. ADR (India) | 2,898 | 89 | ||||||
HSBC Holdings plc (United Kingdom) | 3,608,515 | 39,105 | ||||||
Link REIT (The) (Hong Kong) | 3,434,809 | 16,851 | ||||||
Standard Chartered plc (United Kingdom) | 1,476,342 | 35,397 | ||||||
UBS AG Registered Shares (Switzerland) | 3,931,552 | 80,426 | ||||||
|
| |||||||
| 326,850 | ||||||||
|
| |||||||
| Health Care—10.4% | ||||||||
Cie Generale D’optique Essilor International SA (France) | 253,293 | 27,242 | ||||||
Covidien plc (Ireland) | 438,300 | 26,710 | ||||||
CSL Ltd. (Australia) | 264,302 | 15,780 | ||||||
Elekta AB (Sweden) | 764,964 | 12,308 | ||||||
Grifols SA (Spain) | 342,595 | 14,067 | ||||||
Novartis AG Registered Shares (Switzerland) | 181,415 | 13,942 | ||||||
Novo Nordisk A/S Class B (Denmark) | 314,945 | 53,470 | ||||||
See Notes to Financial Statements
9
Table of Contents
VIRTUS FOREIGN OPPORTUNITIES FUND
SCHEDULE OF INVESTMENTS (Continued)
SEPTEMBER 30, 2013
($ reported in thousands)
| SHARES | VALUE | |||||||
| Health Care (continued) | ||||||||
Ramsay Health Care Ltd. (Australia) | 642,788 | $ | 21,713 | |||||
Roche Holding AG (Switzerland) | 16,351 | 4,410 | ||||||
|
| |||||||
| 189,642 | ||||||||
|
| |||||||
| Industrials—9.9% | ||||||||
Bureau Veritas SA (France) | 1,782,892 | 56,199 | ||||||
Cheung Kong Infrastructure Holdings Ltd. (Hong Kong) | 1,151,783 | 7,982 | ||||||
DKSH Holding AG (Switzerland) | 376,380 | 32,130 | ||||||
Intertek Group plc (United Kingdom) | 47,669 | 2,551 | ||||||
Rolls-Royce Holdings plc (United Kingdom) | 1,738,276 | 31,293 | ||||||
SGS SA Registered Shares (Switzerland) | 21,552 | 51,452 | ||||||
|
| |||||||
| 181,607 | ||||||||
|
| |||||||
| Information Technology—3.5% | ||||||||
Accenture plc Class A (Ireland) | 319,142 | 23,502 | ||||||
Cielo SA (Brazil) | 532,883 | 14,429 | ||||||
SAP AG (Germany) | 346,421 | 25,621 | ||||||
|
| |||||||
| 63,552 | ||||||||
|
| |||||||
| Materials—5.3% | ||||||||
Fresnillo plc (United Kingdom) | 1,931,123 | 30,419 | ||||||
Goldcorp, Inc. (Canada) | 1,452,332 | 37,787 | ||||||
Newcrest Mining Ltd. (Australia) | 2,027,754 | 22,133 | ||||||
Silver Wheaton Corp. (Canada) | 246,460 | 6,106 | ||||||
|
| |||||||
| 96,445 | ||||||||
|
| |||||||
| Telecommunication Services—0.7% | ||||||||
Advanced Info Service PCL (Thailand) | 439,800 | 3,585 | ||||||
| SHARES | VALUE | |||||||
| Telecommunication Services (continued) | ||||||||
Telekomunikasi Indonesia Persero Tbk PT (Indonesia) | 46,848,466 | $ | 8,497 | |||||
|
| |||||||
| 12,082 | ||||||||
| TOTAL COMMON STOCKS (Identified Cost $1,380,975) | 1,714,869 | |||||||
| TOTAL LONG TERM INVESTMENTS—93.9% | ||||||||
| (Identified cost $1,380,975) | 1,714,869 | |||||||
| SHORT-TERM INVESTMENTS—6.4% | ||||||||
| Money Market Mutual Funds—6.4% | ||||||||
Fidelity Money Market Portfolio – Institutional Shares (Seven-day effective yield 0.090%) | 116,009,956 | 116,010 | ||||||
| TOTAL SHORT-TERM INVESTMENTS | ||||||||
| (Identified Cost $116,010) | 116,010 | |||||||
| SECURITIES LENDING COLLATERAL—1.6% | ||||||||
INVESCO Short-Term Investments Liquid Assets Portfolio (The) Institutional Shares (seven-day effective yield 0.070%)(4) | 29,761,877 | 29,762 | ||||||
| TOTAL SECURITIES LENDING COLLATERAL | ||||||||
| (Identified Cost $29,762) | 29,762 | |||||||
| TOTAL INVESTMENTS—101.9% (Identified Cost $1,526,747) | 1,860,641 | (1) | ||||||
Other assets and liabilities, |
| (34,563 | ) | |||||
|
| |||||||
| NET ASSETS—100.0% | $ | 1,826,078 | ||||||
|
| |||||||
Abbreviations:
| ADR | American Depositary Receipt |
| REIT | Real Estate Investment Trust |
See Notes to Financial Statements
10
Table of Contents
VIRTUS FOREIGN OPPORTUNITIES FUND
SCHEDULE OF INVESTMENTS (Continued)
SEPTEMBER 30, 2013
($ reported in thousands)
FOOTNOTE LEGEND:
| (1) | Federal Income Tax Information: For tax information at September 30, 2013, see Note 10 Federal Income Tax Information in the Notes to Financial Statements. |
| (2) | Non-income producing. |
| (3) | All or a portion of security is on loan. |
| (4) | Represents security purchased with cash collateral received for securities on loan. |
| Country Weightings (Unaudited)† | ||||
United Kingdom | 21 | % | ||
Switzerland | 16 | |||
United States | 13 | |||
India | 9 | |||
France | 8 | |||
Netherlands | 7 | |||
Canada | 6 | |||
Other | 20 | |||
Total | 100 | % | ||
| † | % of total investments as of September 30, 2013 |
The following table provides a summary of inputs used to value the Fund’s investments as of September 30, 2013 (See Security Valuation Note 2A in the Notes to Financial Statements):
| Total Value at September 30, 2013 | Level 1 Quoted Prices | |||||||
Equity Securities: | ||||||||
Common Stocks | $ | 1,714,869 | $ | 1,714,869 | ||||
Securities Lending Collateral | 29,762 | 29,762 | ||||||
Short-Term Investments | 116,010 | 116,010 | ||||||
|
|
|
| |||||
Total Investments | $ | 1,860,641 | $ | 1,860,641 | ||||
|
|
|
| |||||
There are no Level 2 (significant observable inputs) or Level 3 (significant unobservable inputs) priced securities.
See Notes to Financial Statements
11
Table of Contents
VIRTUS FOREIGN OPPORTUNITIES FUND
STATEMENT OF ASSETS AND LIABILITIES
SEPTEMBER 30, 2013
(Reported in thousands except shares and per share amounts)
| Assets | ||||
Investment in securities at value(1)(3) | $ | 1,860,641 | ||
Foreign currency at value(2) | 717 | |||
Receivables | ||||
Investment securities sold | 1,419 | |||
Fund shares sold | 15,582 | |||
Dividends and interest receivable | 5,528 | |||
Tax reclaims | 2,069 | |||
Prepaid expenses | 86 | |||
Prepaid trustee retainer | 10 | |||
|
| |||
Total assets | 1,886,052 | |||
|
| |||
| Liabilities | ||||
Payables | ||||
Fund shares repurchased | 5,881 | |||
Investment securities purchased | 21,984 | |||
Collateral on securities loaned | 29,762 | |||
Investment advisory fee | 1,238 | |||
Distribution and service fees | 219 | |||
Administration fee | 186 | |||
Transfer agent fees and expenses | 469 | |||
Professional fees | 41 | |||
Trustees’ fees and expenses | 2 | |||
Other accrued expenses | 192 | |||
|
| |||
Total liabilities | 59,974 | |||
|
| |||
| Net Assets | $ | 1,826,078 | ||
|
| |||
| Net Assets Consist of: | ||||
Capital paid in on shares of beneficial interest | $ | 1,702,812 | ||
Accumulated undistributed net investment income (loss) | 5,953 | |||
Accumulated undistributed net realized gain (loss) | (216,733 | ) | ||
Net unrealized appreciation (depreciation) on investments | 334,046 | |||
|
| |||
| Net Assets | $ | 1,826,078 | ||
|
| |||
| Class A | ||||
Net asset value (net assets/shares outstanding) per share | $ | 27.01 | ||
Maximum offering price per share NAV/(1-5.75%) | $ | 28.66 | ||
Shares of beneficial interest outstanding, $0.001 par value, unlimited authorization | 25,030,818 | |||
Net Assets | $ | 676,149 | ||
| Class C | ||||
Net asset value (net assets/shares outstanding) and offering price per share | $ | 26.82 | ||
Shares of beneficial interest outstanding, $0.001 par value, unlimited authorization | 3,789,695 | |||
Net Assets | $ | 101,655 | ||
| Class I | ||||
Net asset value (net assets/shares outstanding) and offering price per share | $ | 27.03 | ||
Shares of beneficial interest outstanding, $0.001 par value, unlimited authorization | 38,781,790 | |||
Net Assets | $ | 1,048,274 | ||
(1) Investment in securities at cost | $ | 1,526,747 | ||
(2) Foreign currency at cost | 725 | |||
(3) Market value of securities on loan | 28,314 | |||
See Notes to Financial Statements
12
Table of Contents
VIRTUS FOREIGN OPPORTUNITIES FUND
YEAR ENDED SEPTEMBER 30, 2013
($ reported in thousands)
| Investment Income | ||||
Dividends | $ | 35,905 | ||
Security lending | 50 | |||
Foreign taxes withheld | (1,611 | ) | ||
|
| |||
Total investment income | 34,344 | |||
|
| |||
| Expenses | ||||
Investment advisory fees | 12,823 | |||
Service fees, Class A | 1,422 | |||
Distribution and service fees, Class C | 798 | |||
Administration fees | 1,921 | |||
Transfer agent fees and expenses | 2,667 | |||
Registration fees | 168 | |||
Printing fees and expenses | 138 | |||
Custodian fees | 306 | |||
Professional fees | 69 | |||
Trustees’ fees and expenses | 64 | |||
Miscellaneous expenses | 100 | |||
|
| |||
Total expenses | 20,476 | |||
|
| |||
| Net investment income (loss) | 13,868 | |||
|
| |||
| Net Realized and Unrealized Gain (Loss) on Investments | ||||
Net realized gain (loss) on investments | 42,861 | |||
Net realized gain (loss) on foreign currency transactions | (488 | ) | ||
Net change in unrealized appreciation (depreciation) on investments | 32,625 | |||
Net change in unrealized appreciation (depreciation) on foreign currency translation | 169 | |||
|
| |||
| Net gain (loss) on investments | 75,167 | |||
|
| |||
| Net increase (decrease) in net assets resulting from operations | $ | 89,035 | ||
|
|
See Notes to Financial Statements
13
Table of Contents
VIRTUS FOREIGN OPPORTUNITIES FUND
STATEMENT OF CHANGES IN NET ASSETS
(Reported in thousands)
| Year Ended September 30, 2013 | Year Ended September 30, 2012 | |||||||
| INCREASE/(DECREASE) IN NET ASSETS | ||||||||
| From Operations | ||||||||
Net investment income (loss) | $ | 13,868 | $ | 14,245 | ||||
Net realized gain (loss) | 42,373 | 111,601 | ||||||
Net change in unrealized appreciation (depreciation) | 32,794 | 104,734 | ||||||
|
|
|
| |||||
| Increase (decrease) in net assets resulting from operations | 89,035 | 230,580 | ||||||
|
|
|
| |||||
| From Distributions to Shareholders | ||||||||
Net investment income, Class A | (5,285 | ) | (6,356 | ) | ||||
Net investment income, Class C | (251 | ) | (218 | ) | ||||
Net investment income, Class I | (10,346 | ) | (14,928 | ) | ||||
|
|
|
| |||||
| Decrease in net assets from distributions to shareholders | (15,882 | ) | (21,502 | ) | ||||
|
|
|
| |||||
| From Share Transactions | ||||||||
| Sale of shares | ||||||||
Class A (15,519 and 4,161 shares, respectively) | 416,080 | 98,265 | ||||||
Class C (2,026 and 374 shares, respectively) | 54,362 | 8,914 | ||||||
Class I (24,364 and 11,066 shares, respectively) | 656,205 | 259,528 | ||||||
| Reinvestment of distributions | ||||||||
Class A (186 and 262 shares, respectively) | 4,866 | 5,769 | ||||||
Class C (8 and 8 shares, respectively) | 200 | 171 | ||||||
Class I (349 and 602 shares, respectively) | 9,111 | 13,255 | ||||||
| Shares repurchased | ||||||||
Class A (6,336 and 5,403 shares, respectively) | (170,133 | ) | (123,580 | ) | ||||
Class C (406 and 443 shares, respectively) | (10,783 | ) | (10,199 | ) | ||||
Class I (12,390 and 13,179 shares, respectively) | (332,731 | ) | (312,001 | ) | ||||
|
|
|
| |||||
| Increase (decrease) in net assets from share transactions | 627,177 | (59,878 | ) | |||||
|
|
|
| |||||
| Net increase (decrease) in net assets | 700,330 | 149,200 | ||||||
| Net Assets | ||||||||
Beginning of period | 1,125,748 | 976,548 | ||||||
|
|
|
| |||||
| End of period | $ | 1,826,078 | $ | 1,125,748 | ||||
|
|
|
| |||||
Accumulated undistributed net investment income (loss) at end of period | $ | 5,953 | $ | 8,455 | ||||
See Notes to Financial Statements
14
Table of Contents
VIRTUS FOREIGN OPPORTUNITIES FUND
SELECTED DATA FOR A SHARE OUTSTANDING
THROUGHOUT EACH PERIOD
| Net Asset Value, Beginning of Period | Net Investment Income (Loss)(2) | Net Realized and Unrealized Gain (Loss) | Total from Investment Operations | Dividends from Net Investment Income | Distributions from Net Realized Gains | Total Distributions | Change in Net Asset Value | Net Asset Value, End of Period | Total Return(1) | Net Assets, End of Period (000’s) | Ratio of Expenses to Average Net Assets(3) | Ratio of Net Investment Income (Loss) to Average Net Assets | Portfolio Turnover Rate | |||||||||||||||||||||||||||||||||||||||||||||||||||||||||
Class A | ||||||||||||||||||||||||||||||||||||||||||||||||||||||||||||||||||||||
10/1/12 to 9/30/13 | $ | 25.42 | 0.23 | 1.63 | 1.86 | (0.27 | ) | — | (0.27 | ) | 1.59 | $ | 27.01 | 7.37 | % | $ | 676,149 | 1.46 | % | 0.85 | % | 29 | % | |||||||||||||||||||||||||||||||||||||||||||||||
10/1/11 to 9/30/12 | 20.83 | 0.27 | 4.73 | 5.00 | (0.41 | ) | — | (0.41 | ) | 4.59 | 25.42 | 24.34 | 398,166 | 1.45 | 1.16 | 47 | ||||||||||||||||||||||||||||||||||||||||||||||||||||||
10/1/10 to 9/30/11 | 22.06 | 0.34 | (1.23 | ) | (0.89 | ) | (0.34 | ) | — | (0.34 | ) | (1.23 | ) | 20.83 | –4.15 | 346,594 | 1.47 | 1.48 | 31 | |||||||||||||||||||||||||||||||||||||||||||||||||||
10/1/09 to 9/30/10 | 19.40 | 0.37 | 2.54 | 2.91 | (0.25 | ) | — | (0.25 | ) | 2.66 | 22.06 | 15.34 | 493,214 | 1.47 | 1.82 | 34 | ||||||||||||||||||||||||||||||||||||||||||||||||||||||
10/1/08 to 9/30/09 | 20.54 | 0.34 | (1.29 | ) | (0.95 | ) | (0.18 | ) | (0.01 | ) | (0.19 | ) | (1.14 | ) | 19.40 | –4.41 | 505,009 | 1.48 | 2.09 | 63 | ||||||||||||||||||||||||||||||||||||||||||||||||||
Class C | ||||||||||||||||||||||||||||||||||||||||||||||||||||||||||||||||||||||
10/1/12 to 9/30/13 | $ | 25.27 | 0.03 | 1.62 | 1.65 | (0.10 | ) | — | (0.10 | ) | 1.55 | $ | 26.82 | 6.56 | % | $ | 101,655 | 2.21 | % | 0.10 | % | 29 | % | |||||||||||||||||||||||||||||||||||||||||||||||
10/1/11 to 9/30/12 | 20.57 | 0.10 | 4.70 | 4.80 | (0.10 | ) | — | (0.10 | ) | 4.70 | 25.27 | 23.43 | 54,634 | 2.20 | 0.42 | 47 | ||||||||||||||||||||||||||||||||||||||||||||||||||||||
10/1/10 to 9/30/11 | 21.81 | 0.17 | (1.22 | ) | (1.05 | ) | (0.19 | ) | — | (0.19 | ) | (1.24 | ) | 20.57 | –4.85 | 45,742 | 2.22 | 0.74 | 31 | |||||||||||||||||||||||||||||||||||||||||||||||||||
10/1/09 to 9/30/10 | 19.21 | 0.21 | 2.52 | 2.73 | (0.13 | ) | — | (0.13 | ) | 2.60 | 21.81 | 14.42 | 64,480 | 2.22 | 1.04 | 34 | ||||||||||||||||||||||||||||||||||||||||||||||||||||||
10/1/08 to 9/30/09 | 20.27 | 0.22 | (1.27 | ) | (1.05 | ) | — | (0.01 | ) | (0.01 | ) | (1.06 | ) | 19.21 | –5.18 | 70,201 | 2.23 | 1.33 | 63 | |||||||||||||||||||||||||||||||||||||||||||||||||||
Class I | ||||||||||||||||||||||||||||||||||||||||||||||||||||||||||||||||||||||
10/1/12 to 9/30/13 | $ | 25.43 | 0.28 | 1.66 | 1.94 | (0.34 | ) | — | (0.34 | ) | 1.60 | $ | 27.03 | 7.66 | % | $ | 1,048,274 | 1.21 | % | 1.04 | % | 29 | % | |||||||||||||||||||||||||||||||||||||||||||||||
10/1/11 to 9/30/12 | 20.89 | 0.34 | 4.72 | 5.06 | (0.52 | ) | — | (0.52 | ) | 4.54 | 25.43 | 24.64 | 672,948 | 1.20 | 1.46 | 47 | ||||||||||||||||||||||||||||||||||||||||||||||||||||||
10/1/10 to 9/30/11 | 22.12 | 0.42 | (1.26 | ) | (0.84 | ) | (0.39 | ) | — | (0.39 | ) | (1.23 | ) | 20.89 | – | 3.88 | 584,212 | 1.22 | 1.83 | 31 | ||||||||||||||||||||||||||||||||||||||||||||||||||
10/1/09 to 9/30/10 | 19.45 | 0.42 | 2.54 | 2.96 | (0.29 | ) | — | (0.29 | ) | 2.67 | 22.12 | 15.60 | 623,222 | 1.22 | 2.08 | 34 | ||||||||||||||||||||||||||||||||||||||||||||||||||||||
10/1/08 to 9/30/09 | 20.58 | 0.40 | (1.28 | ) | (0.88 | ) | (0.24 | ) | (0.01 | ) | (0.25 | ) | (1.13 | ) | 19.45 | –4.03 | 554,974 | 1.23 | 2.42 | 63 | ||||||||||||||||||||||||||||||||||||||||||||||||||
| (1) | Sales charges, where applicable, are not reflected in the total return calculation. |
| (2) | Computed using average shares outstanding. |
| (3) | The Fund may invest in other funds, and the annualized expense ratios do not reflect fees and expenses associated with the underlying funds. |
See Notes to Financial Statements
15
Table of Contents
VIRTUS FOREIGN OPPORTUNITIES FUND
SEPTEMBER 30, 2013
Note 1. Organization
Virtus Opportunities Trust (the “Trust”) is organized as a Delaware statutory trust and is registered under the Investment Company Act of 1940, as amended (“1940 Act”), as an open-end management investment company.
As of the date of this report, 31 funds are offered for sale, of which the Foreign Opportunities Fund (the “Fund”) is reported in this annual report. The Fund’s investment objective is outlined in the Fund Summary Page.
The Fund offers Class A shares, Class C shares and Class I shares.
Class A shares are sold with a front-end sales charge of up to 5.75% with some exceptions. Generally, Class A shares are not subject to any charges by the Fund when redeemed; however, a 1% contingent deferred sales charge (“CDSC”) may be imposed on certain redemptions made within a certain period following purchases on which a finder’s fee has been paid. The period for which the CDSC applies for the Fund is 18 months. The CDSC period begins on the last day of the month preceding the month in which the purchase was made.
Class C shares are generally sold with a 1% CDSC, applicable if redeemed within one year of purchase. Class I shares are sold without a front-end sales charge or CDSC.
Virtus Mutual Funds may impose an annual fee on accounts having balances of less than $2,500. The small account fee may be waived in certain circumstances, as disclosed in the prospectuses and/or statements of additional information. The fees collected will be used to offset certain expenses of the funds.
Each Class of shares has identical voting, dividend, liquidation and other rights and the same terms and conditions, except that each class bears different distribution and/or service fees under a Board-approved Rule 12b-1 and/or shareholder service plan (“12b-1 plan”) and has exclusive voting rights with respect to such plans. Class I shares are not subject to a 12b-1 plan. Income and other expenses and realized and unrealized gains and losses of the Fund are borne pro rata by the holders of each class of shares.
Note 2. Significant Accounting Policies
The following is a summary of significant accounting policies consistently followed by the Trust in the preparation of its financial statements. The preparation of financial statements in conformity with accounting principles generally accepted in the United States of America requires management to make estimates and assumptions that affect the reported amounts of assets and liabilities, disclosure of contingent assets and liabilities at the date of the financial statements and the reported amounts of increases and decreases in net assets from operations during the reporting period. Actual results could differ from those estimates and those differences could be significant.
| A. | Security Valuation |
Security valuation procedures for the Fund, which include, nightly price variance, as well as back-testing such as bi-weekly unchanged price, monthly secondary source and transaction analysis, have been approved by the Board of Trustees (the “Board” or the “Trustees”). All internally fair valued securities are approved by a valuation committee (“Valuation Committee”) appointed by the Board. The Valuation Committee is comprised of the treasurer, assistant treasurer, and two other appropriate investment professionals of the Virtus Product Management team who previously have been
16
Table of Contents
VIRTUS FOREIGN OPPORTUNITIES FUND
NOTES TO FINANCIAL STATEMENTS (Continued)
SEPTEMBER 30, 2013
identified to the Board. All internally fair valued securities, referred to below, are updated daily and reviewed in detail by the Valuation Committee monthly unless changes occur within the period. The Valuation Committee reviews the validity of the model inputs and any changes to the model. Fair valuations are ratified by the Board of Directors at least quarterly.
The Fund utilizes a fair value hierarchy which prioritizes the inputs to valuation techniques used to measure fair value into three broad levels.
| • Level 1 – | quoted prices in active markets for identical securities |
| • Level 2 – | prices determined using other significant observable inputs (including quoted prices for similar securities, interest rates, prepayment speeds, credit risk, etc.) |
| • Level 3 – | prices determined using significant unobservable inputs (including the valuation committee’s own assumptions in determining the fair value of investments) |
A description of the valuation techniques applied to the Fund’s major categories of assets and liabilities measured at fair value on a recurring basis is as follows:
Equity securities are valued at the official closing price (typically last sale) on the exchange on which the securities are primarily traded, or if no closing price is available, at the last bid price and are categorized as Level 1 in the hierarchy. Restricted equity securities and private placements that are not widely traded, are illiquid or are internally fair valued by the Valuation Committee, are generally categorized as Level 3 in the hierarchy.
Certain non-U.S. securities may be fair valued in cases where closing prices are not readily available or are deemed not reflective of readily available market prices. For example, significant events (such as movement in the U.S. securities market, or other regional and local developments) may occur between the time that non-U.S. markets close (where the security is principally traded) and the time that the Fund calculates its net asset value (“NAV”) (generally 4 p.m. Eastern time, the close of the New York Stock Exchange (“NYSE”)) that may impact the value of securities traded in these non-U.S. markets. In such cases the Fund fair values non-U.S. securities using an independent pricing service which considers the correlation of the trading patterns of the non-U.S. security to the intraday trading in the U.S. markets for investments such as ADRs, financial futures, ETFs, and certain indexes as well as prices for similar securities. Such fair valuations are categorized as Level 2 in the hierarchy. Because the frequency of significant events is not predictable, fair valuation of certain non-U.S. common stocks may occur on a frequent basis.
Listed derivatives that are actively traded are valued based on quoted prices from the exchange and are categorized as Level 1 in the hierarchy. Over-the-counter derivative contracts, which include forward currency contracts and equity-linked instruments, do not require material subjectivity as pricing inputs are observed from actively quoted markets and are categorized as Level 2 in the hierarchy.
Investments in open-end mutual funds are valued at their closing NAV determined as of the close of regular trading on the NYSE each business day and are categorized as Level 1 in the hierarchy.
17
Table of Contents
VIRTUS FOREIGN OPPORTUNITIES FUND
NOTES TO FINANCIAL STATEMENTS (Continued)
SEPTEMBER 30, 2013
A summary of the inputs used to value the Fund’s net assets by each major security type is disclosed at the end of the Schedule of Investments for the Fund. The inputs or methodologies used for valuing securities are not necessarily an indication of the risk associated with investing in those securities.
| B. | Security Transactions and Investment Income |
Security transactions are recorded on the trade date. Realized gains and losses from the sale of securities are determined on the identified cost basis. Dividend income is recognized on the ex-dividend date, or in the case of certain foreign securities, as soon as the Fund is notified. Interest income is recorded on the accrual basis. The Fund amortizes premiums and accretes discounts using the effective interest method.
| C. | Income Taxes |
The Fund is treated as a separate taxable entity. It is the intention of the Fund to comply with the requirements of Subchapter M of the Internal Revenue Code and to distribute substantially all of its taxable income to its shareholders. Therefore, no provision for federal income taxes or excise taxes has been made.
The Fund may be subject to foreign taxes on income, gains on investments or currency repatriation, a portion of which may be recoverable. The Fund will accrue such taxes and recoveries as applicable based upon current interpretations of the tax rules and regulations that exist in the markets in which it invests.
Management of the Fund has concluded that there are no significant uncertain tax positions that would require recognition in the financial statements. As of September 30, 2013, the tax years that remain subject to examination by the major tax jurisdictions under the statute of limitations is from the year 2010 forward (with limited exceptions).
| D. | Distributions to Shareholders |
Distributions are recorded by the Fund on the ex-dividend date. Income and capital gain distributions are determined in accordance with income tax regulations that may differ from accounting principles generally accepted in the United States of America. These differences may include the treatment of non-taxable dividends, market premium and discount, non-deductible expenses, expiring capital loss carryovers, foreign currency gain or loss, gain or loss on futures contracts, partnerships, operating losses and losses deferred due to wash sales. Permanent book and tax basis differences relating to shareholder distributions will result in reclassifications to capital paid in on shares of beneficial interest.
| E. | Expenses |
Expenses incurred together by the Fund and other affiliated mutual funds are allocated in proportion to the net assets of each such fund, except where allocation of direct expense to each fund or an alternative allocation method can be more appropriately used.
In addition to the net operating expenses that the Fund bears directly, the shareholders of the Fund indirectly bear the Fund’s pro-rata expenses of any underlying mutual funds in which the Fund invests.
18
Table of Contents
VIRTUS FOREIGN OPPORTUNITIES FUND
NOTES TO FINANCIAL STATEMENTS (Continued)
SEPTEMBER 30, 2013
| F. | Foreign Currency Translation |
Non-U.S. investment securities and other assets and liabilities denominated in foreign currencies are translated into U.S. dollar amounts at the foreign currency exchange rate effective at the end of the reporting period. Cost of investments is translated at the currency exchange rate effective at the trade date. The gain or loss resulting from a change in currency exchange rates between the trade and settlement date of a portfolio transaction is treated as a gain or loss on non-U.S. currency. Likewise, the gain or loss resulting from a change in currency exchange rates between the date income is accrued and paid is treated as a gain or loss on foreign currency. The Fund does not isolate that portion of the results of operations arising from changes in foreign exchange rates on investments from the fluctuations arising from changes in the market prices of securities held. Such fluctuations are included with the net realized and unrealized gain or loss on investments.
| G. | Securities Lending |
($ reported in thousands)
The Fund may loan securities to qualified brokers through an agreement with Brown Brothers Harriman (“BBH”), as a third party lending agent. Under the terms of agreement, the Fund is required to maintain collateral with a market value not less than 100% of the market value of loaned securities. Collateral is adjusted daily in connection with changes in the market value of securities on loan. Collateral may consist of cash and securities issued by the U.S. Government or its agencies. Cash collateral is invested in a short-term money market fund. Dividends earned on the collateral and premiums paid by the broker are recorded as income by the Fund net of fees and rebates charged by BBH for its services as securities lending agent and in connection with this securities lending program. Lending portfolio securities involves a risk of delay in the recovery of the loaned securities or in the declining value of the collateral.
At September 30, 2013, the Fund had securities on loan with a market value of $28,314 and cash collateral of $29,762.
Note 3. Investment Advisory Fees and Related Party Transactions
($ reported in thousands except as noted)
| A. | Adviser |
Virtus Investment Advisers, Inc. (the “Adviser”), an indirect, wholly-owned subsidiary of Virtus Investment Partners, Inc. (“Virtus”), is the Adviser to the Trust. The Adviser manages the Fund’s investment program and general operations of the Fund, including oversight of the Fund’s subadviser.
As compensation for its services to the Fund, the Adviser is entitled to a fee based upon the following annual rates as a percentage of the average daily net assets of the Fund: 0.85% of 1st $2 billion; 0.80% $2+ billion through $4 billion; and 0.75% $4+ billion.
| B. | Subadviser |
The subadviser manages the investments of the Fund for which it is paid a fee by the Adviser. Vontobel Asset Management, Inc. is the subadviser to the Fund.
19
Table of Contents
VIRTUS FOREIGN OPPORTUNITIES FUND
NOTES TO FINANCIAL STATEMENTS (Continued)
SEPTEMBER 30, 2013
| C. | Distributor |
VP Distributors, LLC (“VP Distributors”), an indirect wholly-owned subsidiary of Virtus, serves as the distributor of the Fund’s shares. VP Distributors has advised the Fund that for the fiscal year (the “period”) ended September 30, 2013, it retained net commissions of $116 for Class A shares and deferred sales charges of $5 for Class A shares and $13 for Class C shares.
In addition, the Fund pays VP Distributors distribution and/or service fees under a 12b-1 plan, as a percentage of the average daily net assets of each respective class at the annual rates as follows: Class A shares 0.25% and Class C shares 1.00%. Class I shares are not subject to a 12b-1 plan.
Under certain circumstances, shares of certain Virtus Mutual Funds may be exchanged for shares of the same class of certain other Virtus Mutual Funds on the basis of the relative NAV per share at the time of the exchange. On exchanges with share classes that carry a CDSC, the CDSC schedule of the original shares purchased continues to apply.
| D. | Administrator and Transfer Agent |
Effective January 1, 2013, with the approval of the Board, VP Distributors LLC, the Fund’s former Administrator and Transfer Agent, assigned its rights and obligations under the Administration Agreement and Transfer Agency and Service Agreement to Virtus Fund Services LLC, an indirect wholly-owned subsidiary of Virtus. For the period of October 1, 2012 to December 31, 2012, VP Distributors LLC, served as the Administrator and Transfer Agent to the Fund. For the period of January 1, 2013 to September 30, 2013 Virtus Fund Services LLC, served as the Administrator and Transfer Agent to the Fund.
For the period ended September 30, 2013, the Fund incurred administration fees totaling $1,465 which are included in the Statement of Operations.
For the period ended September 30, 2013, the Fund incurred transfer agent fees totaling $2,474 which are included in the Statement of Operations. A portion of these fees was paid to outside entities that also provide services to the Trust.
| E. | Affiliated Shareholders |
At September 30, 2013, Virtus and its affiliates, BMO Bankcorp. (a minority investor in Virtus) and its affiliates, and the retirement plans of Virtus and its affiliates, held shares of the Fund which may be redeemed at any time that aggregated the following:
| Shares | Aggregate Net Asset Value | |||||||
Class A shares | 672 | $ | 18 | |||||
Class I shares | 342,936 | 9,270 | ||||||
20
Table of Contents
VIRTUS FOREIGN OPPORTUNITIES FUND
NOTES TO FINANCIAL STATEMENTS (Continued)
SEPTEMBER 30, 2013
Note 4. Purchases and Sales of Securities
($ reported in thousands)
Purchases and sales of securities (excluding U.S. Government and agency securities, and short-term securities) during the period ended September 30, 2013, were as follows:
| Purchases | Sales | |||||||
| $ | 954,599 | $ | 412,949 | |||||
There were no purchases or sales of long-term U.S. Government and agency securities.
Note 5. 10% Shareholders
As of September 30, 2013, the Fund had individual shareholder account(s) and/or omnibus shareholder account(s) (comprised of a group of individual shareholders), which individually amounted to more than 10% of the total shares outstanding of the Fund as detailed below.
| % of Shares Outstanding | Number of Accounts | |||||||
| 26 | % | 2 | ||||||
The shareholders are not affiliated with Virtus.
Note 6. Credit Risk and Asset Concentrations
In countries with limited or developing markets, investments may present greater risks than in more developed markets and the prices of such investments may be volatile. The consequences of political, social or economic changes in these markets may have disruptive effects on the market prices of these investments and the income they generate, as well as the Fund’s ability to repatriate such amounts.
The Fund may invest a high percentage of its assets in specific sectors of the market in its pursuit of a greater investment return. Fluctuations in these sectors of concentration may have a greater impact on the Fund, positive or negative, than if the Fund did not concentrate its investments in such sectors.
At September 30, 2013, the Fund held securities issued by various companies in the consumer staples sector, representing 33% of the total investments of the Fund.
Note 7. Indemnifications
Under the Trust’s organizational documents, its trustees and officers are indemnified against certain liabilities arising out of the performance of their duties to the Fund. Each Trustee has also entered into an indemnification agreement with the Trust. In addition in the normal course of business, the Fund enters into contracts that provide a variety of indemnifications to other parties. The Fund’s maximum exposure under these arrangements is unknown as this would involve future claims that may be made against the Fund and that have not occurred. However, the Fund has not had prior claims or losses pursuant to these arrangements and expect the risk of loss to be remote.
21
Table of Contents
VIRTUS FOREIGN OPPORTUNITIES FUND
NOTES TO FINANCIAL STATEMENTS (Continued)
SEPTEMBER 30, 2013
Note 8. Federal Income Tax Information
($ reported in thousands)
At September 30, 2013, federal tax cost and aggregate gross unrealized appreciation (depreciation) of securities held by the Fund were as follows:
Federal | Unrealized | Unrealized | Net Unrealized | |||
| $1,539,562 | $367,263 | $(46,184) | $321,079 |
The Fund has capital loss carryovers available to offset future realized capital gains, through the indicated expiration dates shown below:
2018 | Total | |
| $203,918 | $203,918 |
The Fund may not realize the benefit of these losses to the extent the Fund does not realize gains on investments prior to the expiration of the capital loss carryovers.
Under the Regulated Investment Company Modernization Act of 2010 (the “Act”), net capital losses recognized for tax years beginning after December 22, 2010 may be carried forward indefinitely, and their character is retained as short-term and/or long-term losses. Previously, net capital losses were carried forward for eight years and treated as short-term losses. As a transition rule, the Act requires that post-enactment net capital losses be used before pre-enactment net capital losses.
The Fund utilized losses of $46,147, deferred in prior years against current year capital gains.
The components of distributable earnings on a tax basis (excluding unrealized appreciation (depreciation) which is disclosed above) consist of undistributed ordinary income of $5,953 and undistributed long-term capital gains of $0.
The differences between the book and tax basis components of distributable earnings relate principally to the timing of recognition of income and gains for federal income tax purposes. Short-term gain distributions reported in the Statements of Changes in Net Assets, if any, are reported as ordinary income for federal tax purposes. Distributions are determined on a tax basis and may differ from net investment income and realized capital gains for financial reporting purposes.
22
Table of Contents
VIRTUS FOREIGN OPPORTUNITIES FUND
NOTES TO FINANCIAL STATEMENT (Continued)
SEPTEMBER 30, 2013
Note 9. Reclassifications of Capital Accounts
($ reported in thousands)
For financial reporting purposes, book basis capital accounts are adjusted to reflect the tax character of permanent book/tax differences. Permanent reclassifications can arise from differing treatment of certain income and gain transactions, nondeductible current year net operating losses, expiring capital loss carryovers and investments in passive foreign investment companies. The reclassifications have no impact on the net assets or net asset value of the Fund. As of September 30, 2013, the Fund recorded reclassifications to increase (decrease) the accounts as listed below:
Capital Paid | Undistributed | Accumulated | ||
| $— | $(488) | $488 |
Note 10. Recent Accounting Pronouncement
In December 2011, the Financial Accounting Standards Board issued Accounting Standards Update (“ASU”) No. 2011-11 regarding “Disclosures about Offsetting Assets and Liabilities”. The amendments, which will be effective for annual reporting periods beginning on or after January 1, 2013, and interim periods within those annual periods, require an entity to disclose information about offsetting and related arrangements for assets and liabilities, financial instruments and derivatives that are either currently offset in accordance with current requirements or are subject to enforceable master netting arrangements or similar agreements. At this time, management is evaluating the implications of ASU No. 2011-11 and its impact on the financial statements has not yet been determined.
Note 11. Subsequent Event Evaluations
Management has evaluated the impact of all subsequent events on the Fund through the date the financial statements were available for issuance, and has determined that there are no subsequent events requiring recognition or disclosure in the financial statements.
23
Table of Contents

REPORT OF INDEPENDENT REGISTERED PUBLIC
ACCOUNTING FIRM
To the Board of Trustees of
Virtus Opportunities Trust and Shareholders of
Virtus Foreign Opportunities Fund:
In our opinion, the accompanying statement of assets and liabilities, including the schedule of investments, and the related statements of operations and of changes in net assets and the financial highlights present fairly, in all material respects, the financial position of Virtus Foreign Opportunities Fund (the “Fund”) constituting Virtus Opportunities Trust, hereafter referred to as the “Trust”, at September 30, 2013, the results of its operations for the year then ended, the changes in its net assets for each of the two years in the period then ended and the financial highlights for each of the five years in the period then ended, in conformity with accounting principles generally accepted in the United States of America. These financial statements and financial highlights (hereafter referred to as “financial statements”) are the responsibility of the Trust’s management; our responsibility is to express an opinion on these financial statements based on our audits. We conducted our audits of these financial statements in accordance with the standards of the Public Company Accounting Oversight Board (United States). Those standards require that we plan and perform the audit to obtain reasonable assurance about whether the financial statements are free of material misstatement. An audit includes examining, on a test basis, evidence supporting the amounts and disclosures in the financial statements, assessing the accounting principles used and significant estimates made by management, and evaluating the overall financial statement presentation. We believe that our audits, which included confirmation of securities at September 30, 2013 by correspondence with the custodians and brokers, provide a reasonable basis for our opinion.

PricewaterhouseCoopers LLP
November 21, 2013
24
Table of Contents
VIRTUS FOREIGN OPPORTUNITIES FUND
SEPTEMBER 30, 2013 (Unaudited)
For the fiscal year ended September 30, 2013, the Fund makes the following disclosures for federal income tax purposes. Below is listed the percentage, or the maximum amount allowable, of its ordinary income dividends (“QDI”) to qualify for the lower tax rates applicable to individual shareholders, and the percentage of ordinary income dividends earned by the Fund which qualifies for the dividends received deduction (“DRD”) for corporate shareholders. The actual percentage of QDI and DRD for the calendar year will be designated in year-end tax statements. The Fund designates the amount below, or if subsequently different, as long-term capital gains dividends (“LTCG”) ($ reported in thousands).
QDI | DRD | LTCG | ||
| 100% | 21% | $— |
For the fiscal year ended September 30, 2013, the Fund recognized $32,753 ($ reported in thousands), of foreign source income on which the Fund paid foreign taxes of $1,611 ($ reported in thousands). This information is being furnished to you pursuant to notice requirements of Section 853(a) and 855(d) of the Internal Revenue Code, as amended, and the Treasury Regulations thereunder.
25
Table of Contents
FUND MANAGEMENT TABLES (UNAUDITED)
Information pertaining to the Trustees and officers of the Trust as of September 30, 2013, is set forth below. The statement of additional information (SAI) includes additional information about the Trustees and is available without charge, upon request, by calling (800) 243-1574. The address of each individual, unless otherwise noted, is 100 Pearl Street, Hartford, CT 06103-4506. There is no stated term of office for Trustees of the Trust.
Independent Trustees
Name, Year of Birth, Year Elected and Number of Funds | Principal Occupation(s) During Past 5 Years and Other Directorships Held by Trustee | |
Leroy Keith, Jr. YOB: 1939 Elected: 2000 48 Funds | Chairman (since 2010), Bloc Global Services Group, LLC (construction and redevelopment company); Managing Director (2007 to 2008), Almanac Capital Management (commodities business); Director/Trustee (since 2010), Wells Fargo Funds (139 series) and their predecessors, Evergreen Funds (1989 to 2010); Director (2003 to 2010), Diversapack Co. (soft packaging company); and Trustee (since 1980), Virtus Mutual Fund Complex. | |
Philip R. McLoughlin Chairman YOB: 1946 Elected: 1999 66 Funds | Partner (since 2006), Cross Pond Partners, LLC (strategy consulting firm); Managing Director (2009 to 2010), SeaCap Asset Management Fund I, L.P. and SeaCap Partners, LLC (investment management); Director (since 1991) and Chairman (since 2010), World Trust Fund; Trustee and Chairman (since 2011), Virtus Closed-End Funds (2 portfolios); Trustee (since 1989), Virtus Mutual Fund Complex; Director (since 1996), closed-end funds managed by Duff & Phelps Investment Management Co. (4 portfolios); and Director (1985 to 2009), Argo Group International Holdings Inc. and its predecessor, PXRE Corporation (insurance). | |
Geraldine M. McNamara YOB: 1951 Elected: 2001 52 Funds | Retired. Director (since 2003), closed-end funds managed by Duff & Phelps Investment Management Co. (4 portfolios); and Trustee (since 2001), Virtus Mutual Fund Complex. | |
James M. Oates YOB: 1946 Elected: 2000 50 Funds | Managing Director (since 1994), Wydown Group (consulting firm); Chairman and Trustee (since 2005), John Hancock Fund Complex (collectively, 234 portfolios); Director (since 1996), Stifel Financial; Chairman and Director (since 1999), Connecticut River Bank and Director (since 1998), Connecticut River Bancorp; Chairman (since 2000), Emerson Investment Management, Inc.; Director (since 2002), New Hampshire Trust Company; Non-Executive Chairman (2007 to 2011), Hudson Castle Group, Inc. (formerly IBEX Capital Markets, Inc.) (financial services); and Trustee (since 1987), Virtus Mutual Fund Complex. | |
Richard E. Segerson YOB: 1948 Elected: 2000 48 Funds | Retired. Managing Director (1998 to 2013), Northway Management Company; and Trustee (since 1993), Virtus Mutual Fund Complex. | |
Ferdinand L.J. Verdonck YOB: 1942 Elected: 2005 48 Funds | Director (since 1998), The J.P. Morgan European Investment Trust; Director (since 2005), Galapagos N.V. (biotechnology); Mr. Verdonck is also a director of several non-U.S. companies. |
26
Table of Contents
FUND MANAGEMENT TABLES (UNAUDITED) (Continued)
Interested Trustee
The individual listed below is an “interested person” of the Trust, as defined in Section 2(a)(19) of the 1940 Act, as amended, and the rules and regulations thereunder.
Name, Year of Birth, Year Elected and Number of Funds | Principal Occupation(s) During Past 5 Years and Other Directorships Held by Trustee | |
George R. Aylward* Trustee and President YOB: 1964 Elected: 2006 61 Funds | Director, President and Chief Executive Officer (since 2008), Virtus Investment Partners, Inc. and/or certain of its subsidiaries; various senior officer positions with Virtus affiliates (since 2005); Trustee (since 2012), Virtus Variable Insurance Trust; Trustee and President (since 2011), Virtus Closed-End Funds (2 portfolios); and Chairman, President and Chief Executive Officer (since 2006), The Zweig Closed-End Funds (2 portfolios) Funds; and Director (since 2013), Virtus Global Funds, PLC. |
| * | Mr. Aylward is an “interested person,” as defined in the 1940 Act, by reason of his position as President and Chief Executive Officer of Virtus Investment Partners, Inc. (“Virtus”), the ultimate parent company of the Adviser, and various positions with its affiliates, including the Adviser. |
27
Table of Contents
FUND MANAGEMENT TABLES (UNAUDITED) (Continued)
Officers of the Trust Who Are Not Trustees
Name, Address and Year of Birth | Position(s) Held with Trust and Length of Time Served | Principal Occupation(s) During Past 5 Years | ||
W. Patrick Bradley YOB: 1972 | Senior Vice President (since 2013), Vice President since 2011, Chief Financial Officer and Treasurer since 2006. | Senior Vice President, Fund Services (since 2010), Virtus Investment Partners, Inc. and/or certain of its subsidiaries; various officer positions (since 2006) with Virtus affiliates; Vice President (since 2011), Chief Financial Officer and Treasurer (since 2004), Virtus Variable Insurance Trust; Vice President, Chief Financial Officer and Treasurer (since 2011), Virtus Global Multi-Sector Income Fund and Virtus Total Return Fund; Vice President (since 2012) and Treasurer (Chief Financial Officer) (since 2007), The Zweig Fund, Inc. and Zweig Total Return Fund, Inc.; Vice President and Assistant Treasurer (since 2011), Duff & Phelps Global Utility Income Fund Inc. ; and Director (since 2013), Virtus Global Funds, PLC. | ||
Kevin J. Carr YOB: 1954 | Senior Vice President (since 2013), Vice President, Chief Legal Officer, Counsel and Secretary since 2005. | Senior Vice President (since 2009), Vice President, Counsel and Secretary (2008 to 2009), Virtus Investment Partners, Inc. and/or certain of its subsidiaries; various senior officer positions (since 2005) with Virtus affiliates; Vice President, Chief Legal Officer, Counsel and Secretary (since 2010), Virtus Variable Insurance Trust; Vice President and Assistant Secretary (since 2012), Vice President, Chief Legal Officer, Counsel and Secretary (2011-2012), Virtus Global Multi-Sector Income Fund and Virtus Total Return Fund; Vice President and Assistant Secretary (since 2012), Secretary and Chief Legal Officer (2005-2012), The Zweig Fund, Inc. and Zweig Total Return Fund, Inc.; and Vice President and Assistant Secretary (since 2011), Duff & Phelps Global Utility Income Fund Inc. | ||
Nancy J. Engberg YOB: 1956 | Vice President and Chief Compliance Officer since 2011. | Vice President (since 2008) and Chief Compliance Officer (2008 to 2011), Virtus Investment Partners, Inc. and/or certain of its subsidiaries; various officer positions (since 2003) with Virtus affiliates; Vice President (since 2010), Chief Compliance Officer (since 2011), Virtus Variable Insurance Trust; Vice President and Chief Compliance Officer (since 2011), Virtus Global Multi-Sector Income Fund and Virtus Total Return Fund; Vice President and Chief Compliance Officer (since 2012), The Zweig Fund, Inc. and Zweig Total Return Fund, Inc. | ||
Francis G. Waltman YOB: 1962 | Executive Vice President since 2013.
Senior Vice President 2008-2013 | Executive Vice President, Product Development (since 2009), Virtus Investment Partners, Inc. and/or certain of its subsidiaries; various senior officer positions (since 2006) with Virtus affiliates; Senior Vice President (since 2010), Virtus Variable Insurance Trust; Senior Vice President (since 2011), Virtus Global Multi-Sector Income Fund and Virtus Total Return Fund; and Director (since 2013), Virtus Global Funds, PLC. |
28
Table of Contents
VIRTUS OPPORTUNITIES TRUST
101 Munson Street
Greenfield, MA 01301-9668
Trustees
George R. Aylward
Leroy Keith, Jr.
Philip R. McLoughlin, Chairman
Geraldine M. McNamara
James M. Oates
Richard E. Segerson
Ferdinand L.J. Verdonck
Officers
George R. Aylward, President
Francis G. Waltman, Executive Vice President
W. Patrick Bradley, Senior Vice President, Chief Financial Officer and Treasurer
Kevin J. Carr, Senior Vice President, Chief Legal Officer, Counsel and Secretary
Nancy J. Engberg, Vice President and Chief Compliance Officer
Investment Adviser
Virtus Investment Advisers, Inc.
100 Pearl Street
Hartford, CT 06103-4506
Principal Underwriter
VP Distributors, LLC
100 Pearl Street
Hartford, CT 06103-4506
Administrator and Transfer Agent
Virtus Fund Services, LLC
100 Pearl Street
Hartford, CT 06103-4506
Custodian
JPMorgan Chase Bank, NA
1 Chase Manhattan Plaza
New York, NY 10005-1401
Independent Registered Public Accounting Firm
PricewaterhouseCoopers LLC
2001 Market Street
Philadelphia, PA 19103-7042
How to Contact Us
Mutual Fund Services 1-800-243-1574
Adviser Consulting Group 1-800-243-4361
Telephone Orders 1-800-367-5877
Text Telephone 1-800-243-1926
Web site Virtus.com
Important Notice to Shareholders
The Securities and Exchange Commission has modified mailing regulations for semiannual and annual shareholder fund reports to allow mutual fund companies to send a single copy of these reports to shareholders who share the same mailing address. If you would like additional copies, please call Mutual Fund Services at 1-800-243-1574.
Table of Contents
For more information about
Virtus Mutual Funds, please call
your financial representative, or
contact us at 1-800-243-1574
or Virtus.com
| 8011 | 11-13 |

Table of Contents

ANNUAL REPORT
Virtus Allocator Premium AlphaSector™ Fund
Virtus AlphaSector™ Rotation Fund
Virtus Alternatives Diversifier Fund
Virtus Dynamic AlphaSector™ Fund*
Virtus Global Premium AlphaSector™ Fund
Virtus Premium AlphaSector™ Fund
September 30, 2013
TRUST NAME: VIRTUS OPPORTUNITIES TRUST
| * | Prospectus Supplement applicable to this fund appears at the back of this Annual Report. |
Not FDIC Insured
No Bank Guarantee
May Lose Value

Table of Contents
| 1 | ||||||||
| 2 | ||||||||
| 5 | ||||||||
| Fund | Fund Summary | Schedule of Investments | ||||||
Virtus Allocator Premium AlphaSector™ Fund | 7 | 25 | ||||||
Virtus AlphaSector™ Rotation Fund | 10 | 26 | ||||||
Virtus Alternatives Diversifier Fund | 13 | 32 | ||||||
Virtus Dynamic AlphaSector™ Fund | 16 | 33 | ||||||
Virtus Global Premium AlphaSector™ Fund | 19 | 34 | ||||||
Virtus Premium AlphaSector™ Fund | 22 | 35 | ||||||
| 42 | ||||||||
| 44 | ||||||||
| 46 | ||||||||
| 50 | ||||||||
| 51 | ||||||||
| 57 | ||||||||
| 72 | ||||||||
| 73 | ||||||||
| 74 | ||||||||
PROXY VOTING PROCEDURES AND VOTING RECORD (FORM N-PX)
The subadvisers vote proxies relating to portfolio securities in accordance with procedures that have been approved by the Board of Trustees (“Trustees” or the “Board”) of the Trust. You may obtain a description of these procedures, along with information regarding how the Funds voted proxies during the most recent 12-month period ended June 30, free of charge, by calling toll-free 1-800-243-1574. This information is also available through the Securities and Exchange Commission’s (the “SEC”) website at http://www.sec.gov.
FORM N-Q INFORMATION
The Trust files a complete schedule of portfolio holdings for each Fund with the SEC for the first and third quarters of each fiscal year on Form N-Q. Form N-Q is available on the SEC’s website at http://www.sec.gov. Form N-Q may be reviewed and copied at the SEC’s Public Reference Room. Information on the operation of the SEC’s Public Reference Room can be obtained by calling toll-free 1-800-SEC-0330.
This report is not authorized for distribution to prospective investors in the Funds presented in this book unless preceded or accompanied by an effective prospectus which includes information concerning the sales charge, each Fund’s record and other pertinent information.
Table of Contents
Dear Fellow Shareholders of Virtus Mutual Funds:
 | The financial markets experienced significant volatility during the 12-month period that ended September 30, 2013. The S&P 500® Index, a benchmark for U.S. equities, gained 19.3% while the Barclays U.S. Aggregate Bond Index, which tracks the U.S. fixed income market, declined 1.7%, and the MSCI All Country World Index (net), a measure of international equities, rose 17.7%.
The bond markets were particularly volatile during the second half of this period. U.S. Treasury yields climbed over the last few months as the market prepared for the Federal Reserve’s tapering of its bond purchases, which never occurred. The 10-year Treasury yield was at | |
2.6% as of September 30, 2013, compared with 1.7% a year earlier, and, as rates rose, most bond sectors suffered losses.
Despite this recent market unpredictability, there is reason for investors to be cautiously optimistic about the economy. The U.S. economy is showing signs of growth in hiring, consumer spending, and housing and, although China’s recovery remains tenuous, Europe appears to be coming out of its recession. The onus remains on the U.S. government to keep the country on strong fiscal footing and on corporations to produce robust earnings, which will play a pivotal role in determining future market direction.
Market uncertainty is a timely reminder of the importance of portfolio diversification. While diversification cannot guarantee a profit or prevent loss, owning a variety of asset classes may cushion your portfolio against inevitable market fluctuations. Your financial advisor can help you ensure that your portfolio is adequately diversified.
Thank you for entrusting Virtus with your assets. Should you have any questions or require support, the Virtus customer service team is ready to assist you at 1-866-270-7788. We appreciate your business and remain committed to your long-term financial success.
Sincerely,
George R. Aylward President, Virtus Mutual Funds
October 2013
Whenever you have questions about your account, or require additional information, please visit us on the Web at www.virtus.com or call our shareowner service group toll-free at 1-800-243-1574.
Performance data quoted represents past results. Past performance is no guarantee of future results and current performance may be higher or lower than performance shown above. | ||

1
Table of Contents
DISCLOSURE OF FUND EXPENSES
FOR THE SIX-MONTH PERIOD OF APRIL 1, 2013 TO SEPTEMBER 30, 2013
We believe it is important for you to understand the impact of costs on your investment. All mutual funds have operating expenses. As a shareholder of a Virtus Opportunities Trust fund (each, a “Fund”) you may incur two types of costs: (1) transaction costs, including sales charges on purchases of Class A shares and contingent deferred sales charges on Class B and Class C shares, and (2) ongoing costs, including investment advisory fees, distribution and service fees; and other expenses. Class I shares are sold without a sales charge and do not incur distribution and service fees. For further information regarding applicable sales charges, see Note 1 in the Notes to Financial Statements. These examples are intended to help you understand your ongoing costs (in dollars) of investing in a Fund and to compare these costs with the ongoing costs of investing in other mutual funds. These examples are based on an investment of $1,000 invested at the beginning of the period and held for the entire six-month period. The following Expense Table illustrates your Fund’s costs in two ways.
Actual Expenses
The first section of the accompanying table provides information about actual account values and actual expenses. You may use the information in this section, together with the amount you invested, to estimate the expenses that you paid over the period. Simply divide your account value by $1,000 (for example, an $8,600 account value divided by $1,000 = 8.6), then multiply the result by the number in the first section under the heading “Expenses Paid During Period” to estimate the expenses you paid on your account during the period.
Hypothetical Example for Comparison Purposes
The second section of the accompanying table provides information about hypothetical account values and hypothetical expenses based on the Fund’s actual expense ratio and an assumed rate of return of 5% per year before expenses, which is not your Fund’s actual return. The hypothetical account values and expenses may not be used to estimate the actual ending account balance or expenses you paid for the period. You may use this information to compare the ongoing costs of investing in your Fund and other funds. To do so, compare these 5% hypothetical examples with the 5% hypothetical examples that appear in the shareholder reports of the other funds.
Please note that the expenses shown in the accompanying table are meant to highlight your ongoing costs only and do not reflect any transactional costs, such as sales charges or contingent deferred sales charges. Therefore, the second section of the accompanying table is useful in comparing ongoing costs only, and will not help you determine the relative total costs of owning different funds. In addition, if these transactional costs were included, your costs would have been higher. The calculations assume no shares were bought or sold during the period. Your actual costs may have been higher or lower, depending on the amount of your investment and the timing of any purchases or redemptions.
2
Table of Contents
VIRTUS OPPORTUNITIES TRUST
DISCLOSURE OF FUND EXPENSES (Continued)
FOR THE SIX-MONTH PERIOD OF APRIL 1, 2013 TO SEPTEMBER 30, 2013
| Expense Table | ||||||||||||||||
| Beginning Account Value April 1, 2013 | Ending Account Value September 30, 2013 | Annualized Expense Ratio | Expenses Paid During Period* | |||||||||||||
Allocator Premium AlphaSector™ Fund |
| |||||||||||||||
Actual |
| |||||||||||||||
| Class A | $ | 1,000.00 | $ | 1,016.10 | 1.64 | % | $ | 8.29 | ||||||||
| Class C | 1,000.00 | 1,012.70 | 2.37 | 11.96 | ||||||||||||
| Class I | 1,000.00 | 1,017.20 | 1.39 | 7.03 | ||||||||||||
Hypothetical (5% return before expenses) |
| |||||||||||||||
| Class A | 1,000.00 | 1,016.74 | 1.64 | 8.33 | ||||||||||||
| Class C | 1,000.00 | 1,013.04 | 2.37 | 12.03 | ||||||||||||
Class I | 1,000.00 | 1,018.01 | 1.39 | 7.06 | ||||||||||||
AlphaSector™ Rotation Fund |
| |||||||||||||||
Actual |
| |||||||||||||||
| Class A | $ | 1,000.00 | $ | 1,074.10 | 1.00 | % | $ | 5.20 | ||||||||
| Class C | 1,000.00 | 1,070.40 | 1.74 | 9.03 | ||||||||||||
| Class I | 1,000.00 | 1,075.30 | 0.75 | 3.90 | ||||||||||||
Hypothetical (5% return before expenses) |
| |||||||||||||||
| Class A | 1,000.00 | 1,019.99 | 1.00 | 5.08 | ||||||||||||
| Class C | 1,000.00 | 1,016.24 | 1.74 | 8.83 | ||||||||||||
Class I | 1,000.00 | 1,021.26 | 0.75 | 3.81 | ||||||||||||
Alternatives Diversifier Fund |
| |||||||||||||||
Actual |
| |||||||||||||||
| Class A | $ | 1,000.00 | $ | 969.90 | 0.64 | % | $ | 3.16 | ||||||||
| Class C | 1,000.00 | 966.10 | 1.39 | 6.85 | ||||||||||||
| Class I | 1,000.00 | 970.80 | 0.39 | 1.93 | ||||||||||||
Hypothetical (5% return before expenses) |
| |||||||||||||||
| Class A | 1,000.00 | 1,021.82 | 0.64 | 3.25 | ||||||||||||
| Class C | 1,000.00 | 1,018.01 | 1.39 | 7.06 | ||||||||||||
Class I | 1,000.00 | 1,023.09 | 0.39 | 1.98 | ||||||||||||
Dynamic AlphaSector™ Fund** |
| |||||||||||||||
Actual | ||||||||||||||||
| Class A | $ | 1,000.00 | $ | 1,075.50 | 2.76 | % | $ | 14.36 | ||||||||
| Class B | 1,000.00 | 1,071.50 | 3.44 | 17.86 | ||||||||||||
| Class C | 1,000.00 | 1,071.20 | 3.56 | 18.48 | ||||||||||||
| Class I | 1,000.00 | 1,076.60 | 2.54 | 13.22 | ||||||||||||
Hypothetical (5% return before expenses) |
| |||||||||||||||
| Class A | 1,000.00 | 1,011.06 | 2.76 | 14.01 | ||||||||||||
| Class B | 1,000.00 | 1,007.61 | 3.44 | 17.46 | ||||||||||||
| Class C | 1,000.00 | 1,007.00 | 3.56 | 18.07 | ||||||||||||
| Class I | 1,000.00 | 1,012.17 | 2.54 | 12.89 | ||||||||||||
3
Table of Contents
VIRTUS OPPORTUNITIES TRUST
DISCLOSURE OF FUND EXPENSES (Continued)
FOR THE SIX-MONTH PERIOD OF APRIL 1, 2013 TO SEPTEMBER 30, 2013
| Expense Table | ||||||||||||||||
| Beginning Account Value April 1, 2013 | Ending Account Value September 30, 2013 | Annualized Expense Ratio | Expenses Paid During Period* | |||||||||||||
Global Premium AlphaSector™ Fund |
| |||||||||||||||
Actual |
| |||||||||||||||
| Class A | $ | 1,000.00 | $ | 1,044.40 | 1.75 | % | $ | 8.97 | ||||||||
| Class C | 1,000.00 | 1,041.10 | 2.47 | 12.64 | ||||||||||||
| Class I | 1,000.00 | 1,046.10 | 1.50 | 7.69 | ||||||||||||
Hypothetical (5% return before expenses) |
| |||||||||||||||
| Class A | 1,000.00 | 1,016.18 | 1.75 | 8.88 | ||||||||||||
| Class C | 1,000.00 | 1,012.53 | 2.47 | 12.54 | ||||||||||||
Class I | 1,000.00 | 1,017.45 | 1.50 | 7.61 | ||||||||||||
Premium AlphaSector™ Fund |
| |||||||||||||||
Actual |
| |||||||||||||||
| Class A | $ | 1,000.00 | $ | 1,063.80 | 1.62 | % | $ | 8.38 | ||||||||
| Class C | 1,000.00 | 1,059.90 | 2.37 | 12.24 | ||||||||||||
| Class I | 1,000.00 | 1,065.00 | 1.37 | 7.09 | ||||||||||||
Hypothetical (5% return before expenses) |
| |||||||||||||||
| Class A | 1,000.00 | 1,016.84 | 1.62 | 8.22 | ||||||||||||
| Class C | 1,000.00 | 1,013.04 | 2.37 | 12.03 | ||||||||||||
| Class I | 1,000.00 | 1,018.11 | 1.37 | 6.95 | ||||||||||||
| * | Expenses are equal to the relevant Fund’s annualized expense ratio, which is net of waived fees, reimbursed expenses, dividends and interest on short sales, if applicable, multiplied by the average account value over the period, multiplied by the number of days (183) expenses were accrued in the most recent fiscal half-year, then divided by 365 to reflect the one-half year period. |
| ** | Dynamic AlphaSector Fund’s annualized expense ratios include dividends and interest on short sales. |
| For Funds which may invest in other funds, the annualized expense ratios noted above do not reflect fees and expenses associated with the underlying funds. If such fees and expenses had been included, the expenses would have been higher. |
| You can find more information about the Funds’ expenses in the Financial Statements section that follows. For additional information on operating expenses and other shareholder costs, refer to the prospectus. |
4
Table of Contents
American Depositary Receipt (ADR)
Represents shares of foreign companies traded in U.S. dollars on U.S. exchanges that are held by a bank or a trust. Foreign companies use ADRs in order to make it easier for Americans to buy their shares.
AlphaSector™ Rotation Fund Composite Linked Index
The composite index allocation is 100% S&P 500® Index. Prior to September 29, 2009, the composite index consisted of 80% S&P 500® Index and 20% Barclays Capital U.S. Aggregate Bond Index.
Alternatives Diversifier Composite Index
The Alternatives Diversifier composite index consists of: Diversified Trends Index (15%), UBS Global Investors (Real Estate) Index (20%), Global Infrastructure, represented by the MSCI World Infrastructure Sector Capped Index (since 9/1/2008) (15%), S&P North American Natural Resources Sector Index (10%), Deutsche Bank Liquid Commodity Index (15%), Deutsche Bank G10 Currency Harvest Index (15%), and Credit Suisse Leveraged Loan Index (10%). From 9/1/2008 to 3/1/2012 the composite consisted of HFRX Equity Market Neutral Index (20%), UBS Global Investors (Real Estate) Index (20%), Global Infrastructure, represented by the MSCI World Infrastructure Sector Capped Index (since 9/1/2008) (15%), S&P North American Natural Resources Sector Index (10%), Deutsche Bank Liquid Commodity Index (15%), Deutsche Bank G10 Currency Harvest Index (10%) and Credit Suisse Leveraged Loan Index (10%). Prior to 9/1/2008, the Global Infrastructure component was represented by a mix of MSCI US Utilities Index (65%), MSCI World Telecom Services Index (20%) and MSCI World ex US Utilities Index (15%).
Barclays Capital U.S. Aggregate Bond Index
The Barclays Capital U.S. Aggregate Bond Index measures the U.S. investment grade fixed rate bond market. The index is calculated on a total return basis.
Barclays U.S. Aggregate Bond Index
The Barclays U.S. Aggregate Bond Index measures the U.S. investment grade fixed rate bond market. The index is calculated on a total return basis.
Dow Jones Global Moderate Portfolio IndexSM
The Dow Jones Global Moderate Portfolio Index is a benchmark that takes 60% of the risk of the global securities market. It is a total returns index that is a time-varying weighted average of stocks, bonds, and cash. The Index is the efficient allocation of stocks, bonds, and cash in a portfolio with 60% of the risk of the Dow Jones Aggressive Portfolio Index. The index is calculated on a total return basis with dividends reinvested. The index is unmanaged and not available for direct investment.
Dynamic AlphaSector™ Linked Benchmark
The Dynamic AlphaSector™ Linked Benchmark consists of the S&P 500® Index, a free-float market capitalization-weighted index of 500 of the largest U.S. companies. The index is calculated on a total return basis with dividends reinvested. Performance of the Dynamic AlphaSector™ Linked Benchmark prior to 2/6/2012 is that of the Citigroup 90-Day Treasury Bill Index. The index is unmanaged and not available for direct investment.
Exchange-Traded Funds (ETF)
Portfolios of stocks or bonds that track a specific market index.
5
Table of Contents
KEY INVESTMENT TERMS (Continued)
Fund of funds
A mutual fund that invests in the shares of other open-end mutual funds according to an established asset allocation model, resulting in a diversified portfolio of asset classes and investment strategies appropriate for pursuit of the overall investment objective.
iShares®
Represents shares of an open-end exchange-traded fund.
Long position (“long”)
Ownership of a security, giving the investor the right to transfer ownership to someone else, the right to receive income paid by the security, and the right to any profits or losses as the security’s value changes.
Morgan Stanley Capital International (MSCI)
A company that constructs a variety of indices covering many different asset classes, countries and regions.
MSCI All Country World Index (Net)
The MSCI AC World Index (Net) is a free float-adjusted market capitalization-weighted index that measures equity performance of developed and emerging markets. The index is calculated on a total return basis with net dividends reinvested. The index is unmanaged and not available for direct investment.
MSCI World Index (Net)
The MSCI World Index (net) is a free float-adjusted market capitalization-weighted index that measures developed global market equity performance. The index is calculated on a total return basis with net dividends reinvested. The index is unmanaged, its returns do not reflect any fees, expenses, or sales charges, and is not available for direct investment.
Premium AlphaSector™ Index (“ASRP”)
ASRP is composed of the nine Select Sector SPDR® exchange traded funds (“ETFs”) which represent the primary sectors of the S&P 500® Index plus an ETF representing short-term U.S. Treasuries.
REIT (Real Estate Investment Trust)
A publicly traded company that owns, develops and operates income-producing real estate such as apartments, office buildings, hotels, shopping centers and other commercial properties.
S&P 500® Index
The S&P 500® Index is a free-float market capitalization-weighted index of 500 of the largest U.S. companies. The index is calculated on a total return basis with dividends reinvested.
SPDR®
Represents shares of an open-end exchange-traded fund.
Short position (“short”)
Stock shares that an investor has sold without actually owning (by borrowing the certificates from a broker) in anticipation of a decline in the stock value by a certain date. If the price falls, the investor buys the shares at the lower rate and makes a profit on the difference. It the price rises, the investor must buy at the higher price and sustains a loss.
The indexes are unmanaged and not available for direct investment; therefore, their performance does not reflect any fees, expenses, or sales charges associated with active management of an actual portfolio.
6
Table of Contents
| Allocator Premium AlphaSector™ Fund | Ticker Symbols: Class A: VAAAV Class C: VAACX Class I: VAISX |
| ¢ | The Fund is diversified and has an investment objective of capital appreciation. In pursuing this objective, the Fund maintains an emphasis on preservation of capital. |
| ¢ | For the fiscal year ended September 30, 2013, the Fund’s Class A shares at NAV returned 6.39%, Class C shares returned 5.71%, and Class I shares returned 6.70%. For the same period, the S&P 500® Index, a broad-based equity index, returned 19.34%. Dow Jones Global Moderate Portfolio IndexSM, the Fund’s style-specific index appropriate for comparison, returned 11.47%. |
All performance figures assume reinvestment of distributions and exclude the effect of sales charges. Past performance is no guarantee of future results and current performance may be higher or lower than the performance shown above.
How did the market perform during the Fund’s fiscal period?
| ¢ | The Fund is a global balanced portfolio with four component “sleeves”: U.S. equity, international, fixed income, and real assets (focused on gold and real estate). |
| ¢ | In the year ending September 30, 2013, both the U.S. and international markets performed strongly. As noted above, the S&P 500 rose 19.3% and the MSCI All Country World Index ex U.S., a recognized benchmark for world markets outside the U.S., rose by 17.7%. |
| ¢ | Fixed income markets, as measured by the Barclays Capital U.S. Aggregate Bond Index, declined by 1.7% in the period. |
| ¢ | The “real asset” category of gold and real estate, represented by a custom benchmark mix of 50/50 in each asset class, declined by 11.2%. |
What factors affected the Fund’s performance during its fiscal year?
| ¢ | The Fund seeks to provide risk controls for down markets and participation in rising markets. A key feature of the Fund is that each |
of the four asset class “sleeves” – U.S. equities, international equities, fixed income, and alternatives (real assets) – can move independently to address risk if the quantitative model that drives the Fund projects a risk of loss. |
| ¢ | In bear market conditions, the risk controls are intended to help the Fund outperform the benchmark Dow Jones Global Moderate Portfolio Index. In very strong bull markets, the Fund may be expected to lag the benchmark to a moderate degree. The quantitative model will in some circumstances forego an extreme “up market” period if it is accompanied by a projection of risk. This philosophy, of seeking market participation but emphasizing risk controls first and foremost, is the key to performance expectations. |
| ¢ | In its U.S. equity component, the Fund delivered on its mission of active participation in a positive market environment, and returns were roughly in line with the rising market. |
| ¢ | The focus of the Fund’s strategy on risk management caused the international component of the portfolio to be partially defensively positioned, including some use of a cash alternative. As a result, reduced exposure to international equities caused the Fund to lag the benchmark. |
| ¢ | In its fixed income component, the Fund became more risk-focused and defensive in the period, as bond markets began to show weakness. The defensive positioning was beneficial for much of the period, but caused some underperformance to the benchmark in the third quarter. |
| ¢ | The alternatives (real assets) sleeve was defensively positioned for much of the period, avoiding risk in these investments. Based on a positive outlook for U.S. equities, the Fund reallocated from gold and real estate to U.S. equities, which reduced risk and improved results. |
| ¢ | Overall, the Fund delivered strong participation in U.S. equities and maintained a more |
For information regarding the indexes and certain investment terms, see Key Investment Terms starting on page 5.
7
Table of Contents
| Allocator Premium AlphaSector™ Fund (Continued) |
defensive stance in the other three asset class “sleeves” in the portfolio. As a result, during the one-year period, the Fund underperformed the benchmark Dow Jones Global Moderate Portfolio Index. |
The preceding information is the opinion of portfolio management. Any such opinions are subject to change at any time based upon market or other conditions and should not be relied upon as investment advice. Past performance is no guarantee of future results, and there is no guarantee that market forecasts will be realized.
There is no guarantee that the Fund will meet its objective.
A fund that focuses its investments in a particular industry or sector will be more sensitive to conditions that affect that industry or sector than a non-concentrated fund. Debt securities are subject to various risks, the most prominent of which are credit and interest rate risk. The issuer of a security may fail to make payments in a timely manner. Values of debt securities may rise and fall in response to changes in interest rates. This risk may be
enhanced with longer term maturities. Investing internationally, especially in emerging markets, involves additional risks such as currency, political, accounting, economic, and market risk. The value of an ETF may be more volatile than the underlying portfolio of securities the ETF is designed to track. The costs of owning the ETF may exceed the cost of investing directly in the underlying securities. U.S. government securities may be subject to price fluctuations. An agency may default on an obligation not backed by the United States. Any guarantee on U.S. government securities does not apply to the value of the fund’s shares. There is a greater level of credit risk and price volatility involved with high yield securities than investment grade securities. The Fund’s exposure to different asset classes may not be optimal for
market conditions at a given time. Asset allocation does not guarantee a profit or protect against a loss in declining markets.
| Asset Allocation | ||||
The following table presents asset allocations within certain sectors and as a percentage of total investments as of September 30, 2013.
|
| |||
Financials | 10 | % | ||
Consumer Discretionary | 5 | |||
Health Care | 5 | |||
Industrials | 5 | |||
Information Technology | 5 | |||
Materials | 5 | |||
Other (includes short-term investments) | 65 | |||
|
| |||
Total | 100 | % | ||
|
| |||
For information regarding the indexes and certain investment terms, see Key Investment Terms starting on page 5.
8
Table of Contents
| Allocator Premium AlphaSector™ Fund (Continued) |
| Average Annual Total Returns1 for periods ended 9/30/13 | ||||||||||||
1 Year | Since Inception | Inception Date | ||||||||||
| Class A Shares at NAV2 | 6.39 | % | 5.46 | % | 3/15/11 | |||||||
| Class A Shares at POP3,4 | 0.27 | 3.04 | 3/15/11 | |||||||||
| Class C Shares at NAV2 and with CDSC4 | 5.71 | 4.72 | 3/15/11 | |||||||||
| Class I Shares at NAV | 6.70 | 5.73 | 3/15/11 | |||||||||
| S&P 500® Index | 19.34 | 13.68 | 5 | — | ||||||||
| Dow Jones Global Moderate Portfolio IndexSM | 11.47 | 8.08 | 5 | — | ||||||||
Fund Expense Ratios6: A Shares: Gross and Net 2.02%; C Shares: Gross and Net 2.75%; I Shares: Gross and Net 1.77%.
All returns represent past performance which is no guarantee of future results. Current performance may be higher or lower than the performance shown. The investment return and principal value of an investment will fluctuate so that an investor’s shares, when redeemed, may be worth more or less than their original cost. The above table and graph below do not reflect the deduction of taxes that a shareholder would pay on fund distributions or the redemption of shares. Please visit Virtus.com for performance data current to the most recent month-end.
| 1 | Total returns are historical and include changes in share price and the reinvestment of both dividends and capital gains distributions. |
| 2 | “NAV” (Net Asset Value) total returns do not include the effect of any sales charge. |
| 3 | “POP” (Public Offering Price) total returns include the effect of the maximum front-end 5.75% sales charge. |
| 4 | “CDSC” (Contingent Deferred Sales Charge) is applied to redemptions of certain classes of shares that do not have a sales charge applied at the time of purchase. CDSC charges for certain redemptions of Class A shares made within 18 months of purchase in which a finder’s fee was paid and all redemptions of Class C shares within the first year are 1% and 0% thereafter. |
| 5 | The index returns are from the Fund’s inception date. |
| 6 | The expense ratios of the Fund are set forth according to the prospectus for the Fund effective January 31, 2013, as supplemented and revised, and may differ from the expense ratios disclosed in the Financial Highlights tables in this report. See the Financial Highlights for more current expense ratios. Expense ratios reflect fees and expenses associated with the underlying funds. Class C share ratio reflects distributors contractual waiver for 12b-1 fees. |
Growth of $10,000 for periods ended 9/30
This chart assumes an initial investment of $10,000 made on March 15, 2011 (inception date of the Fund), for Class A, Class C and Class I shares including any applicable sales charges or fees. Performance assumes reinvestment of dividends and capital gain distributions.
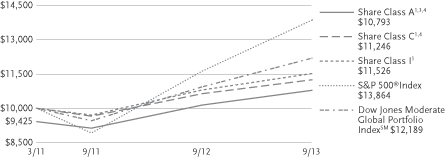
The indexes are unmanaged and not available for direct investment; therefore, their performance does not reflect the expenses associated with active management of an actual portfolio.
9
Table of Contents
| AlphaSector™ Rotation Fund | Ticker Symbols: Class A: PWBAX Class C: PWBCX Class I: VARIX |
| ¢ | The Fund is diversified and has an investment objective of long-term capital appreciation. |
| ¢ | For the fiscal year ended September 30, 2013, the Fund’s Class A shares at NAV returned 19.63%, Class C shares returned 18.80%, and Class I shares returned 19.92%. For the same period, the S&P 500® Index, a broad-based equity index, and the AlphaSector™ Rotation Fund Composite Linked Index, the Fund’s style-specific benchmark appropriate for comparison, each returned 19.34%. |
All performance figures assume reinvestment of distributions and exclude the effect of sales charges. Past performance is no guarantee of future results and current performance may be higher or lower than the performance shown above.
How did the market perform during the Fund’s fiscal period?
| ¢ | For the year ending September 30, 2013, the U.S. equity markets performed strongly. As noted above, the S&P 500 rose 19.3%. |
| ¢ | U.S. equity market performance varied by quarter across the period: The final quarter of 2012 saw a decline of 0.4% in the S&P 500. The first quarter of 2013 was very strong, with the benchmark up 10.6%. The second and third quarters of 2013 were more moderate, with increases of 2.9% and 5.2% respectively. |
| ¢ | Viewing the U.S. equity markets by sector, the overall picture is positive. In the fiscal period, the consumer discretionary, financials, healthcare, and industrials sectors outperformed the broader S&P 500 benchmark. Consumer staples, energy, utilities, and tech & telecom were below the S&P 500, but positive overall. |
What factors affected the Fund’s performance during its fiscal year?
| ¢ | The Virtus AlphaSector Rotation Fund is designed to track the Rotation AlphaSector Index (ASRX). The Index’s objective is to provide participation in normal, rising markets and risk controls for negative markets. |
| ¢ | The Fund performed as designed in the period: the U.S. equity market was positive, and the Fund was invested in U.S. equities throughout the period. |
| ¢ | Over the course of the Fund’s fiscal year ending September 30, 2013, the Fund outperformed the S&P 500 and was roughly in line with its quarterly returns during the period. |
| ¢ | The quantitative model driving the Fund does an independent assessment of each of the nine equity sectors described above. During the period, individual sectors turned “on” or “off” but the portfolio as a whole remained 100% invested in U.S. equities. There were no periods in which extreme or widespread risk caused the Index to take a position in a cash equivalent. |
| ¢ | The net result for the period is that the Fund delivered on expectations, providing participation in rising U.S. equity markets. |
The preceding information is the opinion of portfolio management. Any such opinions are subject to change at any time based upon market or other conditions and should not be relied upon as investment advice. Past performance is no guarantee of future results, and there is no guarantee that market forecasts will be realized.
There is no guarantee that the Fund will meet its objective.
A fund that focuses its investments in a particular industry or sector will be more sensitive to conditions that affect that industry or sector than a non-concentrated fund. The value of an ETF may be more volatile than the underlying portfolio of securities the ETF is designed to track. The costs of owning the ETF may exceed the cost of investing directly in the underlying securities. U.S. government securities may be subject to price fluctuations. An agency may default on an obligation not backed by the United States. Any guarantee on U.S. government securities does not apply to the value of the Fund’s shares. The Fund’s
For information regarding the indexes and certain investment terms, see Key Investment Terms starting on page 5.
10
Table of Contents
| AlphaSector™ Rotation Fund (Continued) |
exposure to different asset classes may not be optimal for market conditions at a given time. Asset allocation does not guarantee a profit or protect against a loss in declining markets.
| Asset Allocation | ||||
The following table presents asset allocations within certain sectors and as a percentage of total investments as of September 30, 2013.
|
| |||
Consumer Discretionary | 15 | % | ||
Health Care | 14 | |||
Energy | 14 | |||
Financials | 14 | |||
Industrials | 14 | |||
Materials | 14 | |||
Information Technology | 13 | |||
Other (includes short-term investments and securities lending collateral) | 2 | |||
|
| |||
Total | 100 | % | ||
|
| |||
For information regarding the indexes and certain investment terms, see Key Investment Terms starting on page 5.
11
Table of Contents
| AlphaSector™ Rotation Fund (Continued) |
| Average Annual Total Returns1 for periods ended 9/30/13 | ||||||||||||||||||||
1 Year | 5 Years | 10 Years | Since Inception | Inception Date | ||||||||||||||||
| Class A Shares at NAV2 | 19.63 | % | 9.73 | % | 6.92 | % | — | — | ||||||||||||
| Class A Shares at POP3,4 | 12.75 | 8.44 | 6.28 | — | — | |||||||||||||||
| Class C Shares at NAV2 and with CDSC4 | 18.80 | 8.96 | 6.15 | — | — | |||||||||||||||
| Class I Shares at NAV | 19.92 | — | — | 14.09 | % | 10/1/09 | ||||||||||||||
| S&P 500® Index | 19.34 | 10.02 | 7.56 | 15.46 | 5 | — | ||||||||||||||
| AlphaSector™ Rotation Fund Composite Linked Index | 19.34 | 10.97 | 7.94 | 15.46 | 5 | — | ||||||||||||||
Fund Expense Ratios6: A Shares: 1.13%; C Shares: 1.86%; I Shares 0.88%.
All returns represent past performance which is no guarantee of future results. Current performance may be higher or lower than the performance shown. The investment return and principal value of an investment will fluctuate so that an investor’s shares, when redeemed, may be worth more or less than their original cost. The above table and graph below do not reflect the deduction of taxes that a shareholder would pay on fund distributions or the redemption of shares. Please visit Virtus.com for performance data current to the most recent month-end.
| 1 | Total returns are historical and include changes in share price and the reinvestment of both dividends and capital gains distributions. |
| 2 | “NAV” (Net Asset Value) total returns do not include the effect of any sales charge. |
| 3 | “POP” (Public Offering Price) total returns include the effect of the maximum front-end 5.75% sales charge. |
| 4 | “CDSC” (Contingent Deferred Sales Charge) is applied to redemptions of certain classes of shares that do not have a sales charge applied at the time of purchase. CDSC charges for certain redemptions of Class A shares made within 18 months of purchase in which a finder’s fee was paid and all redemptions of Class C shares within the first year are 1% and 0% thereafter. |
| 5 | The since inception index returns are from the inception date of Class I shares. |
| 6 | The expense ratios of the Fund are set forth according to the prospectus for the Fund effective January 31, 2013, as supplemented and revised, and may differ from the expense ratios disclosed in the Financial Highlights tables in this report. See the Financial Highlights for more current expense ratios. Expense ratios reflect fees and expenses associated with the underlying funds. Class C share ratio reflects distributors contractual waiver for 12b-1 fees. |
Growth of $10,000 for periods ended 9/30
This chart assumes an initial investment of $10,000 made on September 1, 2003 (inception date of the Fund), for Class A and Class C shares including any applicable sales charges or fees. Performance assumes reinvestment of dividends and capital gain distributions.

The indexes are unmanaged and not available for direct investment; therefore, their performance does not reflect the expenses associated with active management of an actual portfolio.
12
Table of Contents
| Alternatives Diversifier Fund | Ticker Symbols: Class A: PDPAX Class C: PDPCX Class I: VADIX |
| ¢ | The Fund is diversified and has an investment objective of long-term capital appreciation. |
| ¢ | For the fiscal year ended September 30, 2013, the Fund’s Class A shares at NAV returned 0.73%, Class C shares returned -0.05%, and Class I shares returned 1.00%. For the same period, the S&P 500® Index, a broad-based equity index, returned 19.34%, and the Alternatives Diversifier Composite Index, the Fund’s style-specific index appropriate for comparison, returned 3.80%. |
All performance figures assume reinvestment of distributions and exclude the effect of sales charges. Past performance is no guarantee of future results and current performance may be higher or lower than the performance shown above.
How did the market perform during the Fund’s fiscal year?
| ¢ | The U.S. stock market experienced a generally strong period over the course of the Fund’s fiscal year. With the exception of the broad sell-off in October/November 2012, the U.S. equity market remains in a strong up-trend. |
| ¢ | Conversely, bonds, and specifically U.S. Treasuries, have had a very difficult run since late spring 2013. As economic data has improved at the margin, bond yields rose, driving prices lower for most high grade issues. |
| ¢ | Many areas in which the Fund invests were affected by the higher interest rates, especially REIT holdings, which did generate a positive return, albeit below the broad market. |
| ¢ | International stock markets did not fare as well, and the volatility in emerging market stocks and concerns over Chinese economic growth also had a negative impact on commodity prices. |
What factors affected the Fund’s performance during its fiscal year?
| ¢ | The Fund has several investments tied to commodity prices and natural resource issues. By design, these elements are included in the |
mix of assets as they tend to correlate much lower to stocks and bonds, and by definition diversify the investment mix. These areas struggled during the Fund’s fiscal year, negatively affecting performance. |
| ¢ | Furthermore, while the Fund’s exposure to floating rate securities, REITs, and global infrastructure all helped performance, none of these holdings was able to keep up with the remarkable strength of the S&P 500 Index. |
| ¢ | However, the Fund is meant as a diversification vehicle, and compared to many bond funds, it did outperform. |
| ¢ | Investors clearly decided that 2013, at least through fiscal year-end, is the year to own stocks, and many of the investments within the Fund were at a performance disadvantage in this environment. |
The preceding information is the opinion of portfolio management. Any such opinions are subject to change at any time based upon market or other conditions and should not be relied upon as investment advice. Past performance is no guarantee of future results, and there is no guarantee that market forecasts will be realized.
There is no guarantee that the Fund will meet its objective.
A fund that focuses its investments in a particular industry or sector will be more sensitive to conditions that affect that industry or sector than a non-concentrated fund. Investing internationally, especially in emerging markets, involves additional risks such as currency, political, accounting, economic, and market risk. The Fund may be negatively affected by factors specific to the real estate market, including interest rate, leverage, property, and management. Investments in derivatives such as futures, options, forwards, and swaps may increase volatility or cause a loss greater than the principal investment. Events negatively affecting a particular commodity in which the Fund focuses its investments may cause the value of the Fund’s
For information regarding the indexes and certain investment terms, see Key Investment Terms starting on page 5.
13
Table of Contents
| Alternatives Diversifier Fund (Continued) |
shares to decrease, perhaps significantly. Because the Fund can invest in other funds, it indirectly bears its proportionate share of the operating expenses and management fees of the underlying fund(s). The Fund’s exposure to different asset classes may not be optimal for market conditions at a given time. Asset allocation does not guarantee a profit or protect against a loss in declining markets. The Fund’s adviser can select affiliated and/or unaffiliated funds, which may create a conflict of interest.
| Asset Allocation | ||||
The following table presents asset allocations within certain sectors and as a percentage of total investments as of September 30, 2013.
|
| |||
Affiliated Equity Mutual Funds | 58 | % | ||
Exchange-Traded Funds | 30 | |||
Affiliated Fixed Income Mutual Funds | 11 | |||
Other (includes Short-term Investments) | 1 | |||
|
| |||
Total | 100 | % | ||
|
| |||
For information regarding the indexes and certain investment terms, see Key Investment Terms starting on page 5.
14
Table of Contents
| Alternatives Diversifier Fund (Continued) |
| Average Annual Total Returns1 for periods ended 9/30/13 | ||||||||||||||||
1 Year | 5 Year | Since Inception | Inception Date | |||||||||||||
| Class A Shares at NAV2 | 0.73 | % | 2.20 | % | 2.69 | % | 11/30/05 | |||||||||
| Class A Shares at POP3,4 | -5.06 | 1.00 | 1.92 | 11/30/05 | ||||||||||||
| Class C Shares at NAV2 and with CDSC4 | -0.05 | 1.45 | 1.92 | 11/30/05 | ||||||||||||
| Class I Shares at NAV | 1.00 | — | 6.22 | 10/1/09 | ||||||||||||
| S&P 500® Index | 19.34 | 10.02 | — | 5 | — | |||||||||||
| Alternatives Diversifier Composite Index | 3.80 | 3.35 | — | 6 | — | |||||||||||
Fund Expense Ratios7: A Shares: 1.68%; C Shares: 2.43%; I Shares: 1.43%.
All returns represent past performance which is no guarantee of future results. Current performance may be higher or lower than the performance shown. The investment return and principal value of an investment will fluctuate so that an investor’s shares, when redeemed, may be worth more or less than their original cost. The above table and graph below do not reflect the deduction of taxes that a shareholder would pay on fund distributions or the redemption of shares. Please visit Virtus.com for performance data current to the most recent month-end.
| 1 | Total returns are historical and include changes in share price and the reinvestment of both dividends and capital gains distributions. |
| 2 | “NAV” (Net Asset Value) total returns do not include the effect of any sales charge. |
| 3 | “POP” (Public Offering Price) total returns include the effect of the maximum front-end 5.75% sales charge. |
| 4 | “CDSC” (Contingent Deferred Sales Charge) is applied to redemptions of certain classes of shares that do not have a sales charge applied at the time of purchase. CDSC charges for certain redemptions of Class A shares made within 18 months of purchase in which a finder’s fee was paid and all redemptions of Class C shares within the first year are 1% and 0% thereafter. |
| 5 | The index returned 6.09% for Class A and Class C shares and 15.46% for Class I shares since the inception date of the respective share class. |
| 6 | The index returned 4.26% for Class A and Class C shares and 6.74% for Class I shares since the inception date of the respective share class. |
| 7 | The expense ratios of the Fund are set forth according to the prospectus for the Fund effective January 31, 2013, as supplemented and revised, and may differ from the expense ratios disclosed in the Financial Highlights tables in this report. See the financial highlights for more current expense ratios. Expense ratios reflect fees and expenses associated with the underlying funds. |
Growth of $10,000 for periods ended 9/30
This chart assumes an initial investment of $10,000 made on November 30, 2005 (inception date of the Fund), for Class A and Class C shares including any applicable sales charges or fees. Performance assumes reinvestment of dividends and capital gain distributions.
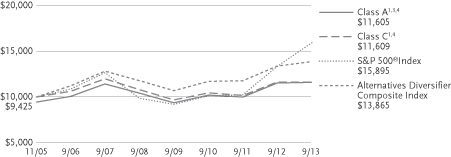
The indexes are unmanaged and not available for direct investment; therefore, their performance does not reflect the expenses associated with active management of an actual portfolio.
15
Table of Contents
Dynamic AlphaSector™ Fund | Ticker Symbols: Class A: EMNAX Class B: EMNBX Class C: EMNCX Class I: VIMNX |
| ¢ | The Fund is diversified and has an investment objective of long-term capital appreciation while maintaining minimal portfolio exposure to general equity market risk. |
| ¢ | For the fiscal year ended September 30, 2013, the Fund’s Class A shares at NAV returned 19.32%, Class B shares returned 18.40%, Class C shares returned 18.48%, and Class I shares returned 19.67%. For the same period, the S&P 500® Index, a broad-based equity index, returned 19.34%, and the Dynamic AlphaSector™ Fund Linked Benchmark Index, which is the Fund’s style-specific index appropriate for comparison, returned 19.34%. |
All performance figures assume reinvestment of distributions and exclude the effect of sales charges. Past performance is no guarantee of future results and current performance may be higher or lower than the performance shown above.
How did the market perform during the Fund’s fiscal period?
| ¢ | In the year ending September 30, 2013, the U.S. equity markets performed strongly. As noted above, the S&P 500 rose 19.3%. |
| ¢ | U.S. equity market performance varied by quarter across the period. The final quarter of 2012 saw a decline of 0.4% in the S&P 500, while the first quarter of 2013 was very strong, with the benchmark up 10.6%. The second and third quarters of 2013 were more moderate, with increases of 2.9% and 5.2% respectively. |
| ¢ | Broadly speaking, in the year-to-date 2013 period, U.S. equity markets experienced a general rise in performance, and volatility remained under control. |
What factors affected the Fund’s performance during its fiscal year?
| ¢ | The Virtus Dynamic AlphaSector Fund tracks the Dynamic AlphaSector Index, which can employ both leverage and take short positions. Performance is discussed below on a quarter-by-quarter basis. |
| ¢ | The Fund entered the fourth quarter of 2012 in its most bullish position, using leverage to reach a 130% equity exposure at the time of rebalancing. As the quarter progressed, market trends changed, and a number of sectors were transitioned to short positions during the middle period of the quarter. By the end of the fourth quarter of 2012, more positive volatility indications moved all but one of the nine equity sectors back to a long position. |
| ¢ | By assuming a more bullish stance as the first quarter of 2013 began, the Fund was well positioned for the stronger market and outperformed the S&P 500, benefiting from its leveraged stance. |
| ¢ | In the second quarter, market gains were much less robust than in the first quarter. The S&P 500 gained 2.9% in the 90-day period, while the Fund slightly trailed. |
| ¢ | During the third quarter of 2013, the S&P 500 rose by 5.2%, and was surpassed by the Fund. Over the quarter, the Fund managed its long exposure and leverage in a timely fashion, adding measurably to performance. |
| ¢ | For the 12-month reporting period, the Fund’s performance was closely in line with the benchmark, albeit just slightly behind. Overall, the Fund delivered strong absolute returns by actively managing its exposure to the U.S. equity markets using both leverage and shorting as designed. |
The preceding information is the opinion of portfolio management. Any such opinions are subject to change at any time based upon market or other conditions and should not be relied upon as investment advice. Past performance is no guarantee of future results, and there is no guarantee that market forecasts will be realized.
There is no guarantee that the Fund will meet its objective.
A fund that focuses its investments in a particular industry or sector will be more sensitive to conditions that affect that industry
For information regarding the indexes and certain investment terms, see Key Investment Terms starting on page 5.
16
Table of Contents
| Dynamic AlphaSector™ Fund (Continued) |
or sector than a non-concentrated fund. When a fund leverages its portfolio, the value of its shares may be more volatile and all other risks may be compounded. The Fund may engage in short sales, and may experience a loss if the price of a borrowed security increases before the date on which the Fund replaces the security. The value of an ETF may be more volatile than the underlying portfolio of securities the ETF is designed to track. The costs of owning the ETF may exceed the cost of investing directly in the underlying securities. U.S. government securities may be subject to price fluctuations. An agency may default on an obligation not backed by the United States. Any guarantee on U.S. government securities does not apply to the value of the Fund’s shares. The Fund’s exposure to different asset classes may not be optimal for market conditions at a given time. Asset allocation does not guarantee a profit or protect against a loss in declining markets.
| Asset Allocation – Long | ||||
The following table presents asset allocations within certain sectors as a percentage of total long investments as of September 30, 2013.
|
| |||
Consumer Discretionary | 15 | % | ||
Industrials | 15 | |||
Energy | 14 | |||
Financials | 14 | |||
Health Care | 14 | |||
Information Technology | 14 | |||
Materials | 14 | |||
|
| |||
Total | 100 | % | ||
|
| |||
| Asset Allocation – Short | ||||
The following table presents asset allocations within certain sectors as a percentage of total short investments as of September 30, 2013.
|
| |||
Utilities | 51 | % | ||
Consumer Staples | 49 | |||
|
| |||
Total | 100 | % | ||
|
| |||
For information regarding the indexes and certain investment terms, see Key Investment Terms starting on page 5.
17
Table of Contents
| Dynamic AlphaSector™ Fund (Continued) |
| Average Annual Total Returns1 for periods ended 9/30/13 | ||||||||||||||||||||
| 1 Year | 5 Years | 10 Years | Since Inception | Inception Date | ||||||||||||||||
| Class A Shares at NAV2 | 19.32 | % | 4.36 | % | 1.00 | % | — | — | ||||||||||||
| Class A Shares at POP3,4 | 12.46 | 3.13 | 0.40 | — | — | |||||||||||||||
| Class B Shares at NAV2 | 18.40 | 3.53 | 0.23 | — | — | |||||||||||||||
| Class B Shares with CDSC4 | 14.40 | 3.36 | 0.23 | — | — | |||||||||||||||
| Class C Shares at NAV2 and with CDSC4 | 18.48 | 3.57 | 0.25 | — | — | |||||||||||||||
| Class I Shares at NAV | 19.67 | — | — | 4.01 | % | 10/1/09 | ||||||||||||||
| S&P 500® Index | 19.34 | 10.02 | 7.56 | 15.46 | 5 | — | ||||||||||||||
| Dynamic AlphaSector Benchmark Index | 19.34 | 5.48 | 4.28 | 6.79 | 5 | — | ||||||||||||||
Fund Expense Ratios6: A Shares: 3.40%; B Shares: 4.15%; C Shares: 4.15%; I Shares: 3.15%.
All returns represent past performance which is no guarantee of future results. Current performance may be higher or lower than the performance shown. The investment return and principal value of an investment will fluctuate so that an investor’s shares, when redeemed, may be worth more or less than their original cost. The above table and graph below do not reflect the deduction of taxes that a shareholder would pay on fund distributions or the redemption of shares. Please visit Virtus.com for performance data current to the most recent month-end.
| 1 | Total returns are historical and include changes in share price and the reinvestment of both dividends and capital gains distributions. |
| 2 | “NAV” (Net Asset Value) total returns do not include the effect of any sales charge. |
| 3 | “POP” (Public Offering Price) total returns include the effect of the maximum front-end 5.75% sales charge. |
| 4 | “CDSC” (Contingent Deferred Sales Charge) is applied to redemptions of certain classes of shares that do not have a sales charge applied at the time of purchase. CDSC charges for certain redemptions of Class A shares made within 18 months of purchase in which a finder’s fee was paid and all redemptions of Class C shares within the first year are 1% and 0% thereafter. CDSC charges for B shares decline from 5% to 0% over a six year period. |
| 5 | The since inception index returns are from the inception date of Class I. |
| 6 | The expense ratios of the Fund are set forth according to the prospectus for the Fund effective January 31, 2013, as supplemented and revised and may differ from the expense ratios disclosed in the Financial Highlights tables in this report. See the Financial Highlights for more current expense ratios. Expense ratios include 0.64% of dividends on short sales and interest expenses. Expense ratios reflect fees and expenses associated with the underlying funds. |
Growth of $10,000 for periods ended 9/30
This chart assumes an initial investment of $10,000 made on September 30, 2003, for Class A, Class B, and Class C shares including any applicable sales charges or fees. Performance assumes reinvestment of dividends and capital gain distributions.
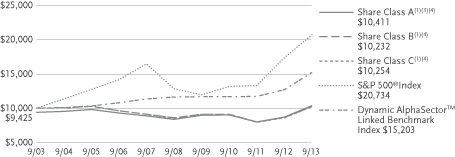
The indexes are unmanaged and not available for direct investment; therefore, their performance does not reflect the expenses associated with active management of an actual portfolio.
18
Table of Contents
| Global Premium AlphaSector™ Fund | Ticker Symbols: Class A: VGPAX Class C: VGPCX Class I: VGPIX |
| ¢ | The Fund is diversified and has an investment objective of capital appreciation. In pursuing this objective, the Fund maintains an emphasis on preservation of capital. |
| ¢ | For the fiscal year ended September 30, 2013, the Fund’s Class A shares at NAV returned 12.32%, Class C shares returned 11.52%, and Class I shares returned 12.59%. For the same period, the S&P 500® Index, a broad-based equity index, returned 19.34%. MSCI World® Index (net), the Fund’s style-specific index appropriate for comparison, returned 20.21%. |
All performance figures assume reinvestment of distributions and exclude the effect of sales charges. Past performance is no guarantee of future results and current performance may be higher or lower than the performance shown above.
How did the market perform during the Funds’ fiscal period?
| ¢ | The Fund is a global equity portfolio with two component asset class “sleeves”: U.S. equity and international equity. |
| ¢ | In the year ending September 30, 2013, both the U.S. and international equity markets performed strongly. As noted above, the S&P 500 rose 19.3%, and the MSCI All Country World Index ex U.S., a recognized benchmark for world markets outside the U.S., rose by 17.7%. |
What factors affected the Fund’s performance during its fiscal year?
| ¢ | The Virtus Global Premium AlphaSector Fund seeks to provide risk controls for down markets and participation in rising markets. A key feature of the Fund is that each of the two asset class “sleeves” – U.S. equities and international equities – can move independently to address risk, if the quantitative model that drives the Fund projects a risk of loss. |
| ¢ | In bear market conditions, the risk controls are intended to help the Fund outperform the benchmark MSCI All Country World Index |
ex-U.S. In very strong bull markets, the Fund may be expected to lag the benchmark to a moderate degree. The quantitative model will in some circumstances forego participating in an extreme “up market” period if it is accompanied by a projection of risk. |
| ¢ | In the U.S. equity component of the portfolio, the Fund delivered on its mission of providing participation in a positive market environment. The U.S. equity sleeve was 100% invested during the period, while making limited sector-by-sector adjustments. Returns in the Fund’s U.S. equity portion were roughly in line with the rising U.S. equity market. |
| ¢ | The Fund’s focus on risk management caused the international component of the portfolio to be partially defensively positioned, including some use of a cash alternative. Reduced exposure to international equities caused the Fund to lag the benchmark. |
| ¢ | The positioning and performance of the international component reflect the Fund’s primary goal of focusing on risk controls. Overall, the Fund participated in U.S. equity markets, while maintaining a more defensive stance in international equities, leading to a moderate underperformance to the benchmark but in keeping with the stated goals of the Fund’s strategy to mitigate volatility. |
The preceding information is the opinion of portfolio management. Any such opinions are subject to change at any time based upon market or other conditions and should not be relied upon as investment advice. Past performance is no guarantee of future results, and there is no guarantee that market forecasts will be realized.
There is no guarantee that the Fund will meet its objective.
A fund that focuses its investments in a particular industry or sector will be more sensitive to conditions that affect that industry or sector than a non-concentrated fund. Investing internationally, especially in emerging markets, involves additional risks such as
For information regarding the indexes and certain investment terms, see Key Investment Terms starting on page 5.
19
Table of Contents
| Global Premium AlphaSector™ Fund (Continued) |
currency, political, accounting, economic, and market risk. The value of an ETF may be more volatile than the underlying portfolio of securities the ETF is designed to track. The costs of owning the ETF may exceed the cost of investing directly in the underlying securities. U.S. government securities may be subject to price fluctuations. An agency may default on an obligation not backed by the United States. Any guarantee on U.S. government securities does not apply to the value of the fund’s shares. The Fund’s exposure to different asset classes may not be optimal for market conditions at a given time. Asset allocation does not guarantee a profit or protect against a loss in declining markets.
| Asset Allocation | ||||
The following table presents asset allocations within certain sectors and as a percentage of total investments as of September 30, 2013.
|
| |||
Consumer Discretionary | 9 | % | ||
Financials | 9 | |||
Industrials | 9 | |||
Health Care | 8 | |||
Information Technology | 8 | |||
Materials | 8 | |||
Other (includes short-term investments) | 49 | |||
|
| |||
Total | 100 | % | ||
|
| |||
For information regarding the indexes and certain investment terms, see Key Investment Terms starting on page 5.
20
Table of Contents
| Global Premium AlphaSector™ Fund (Continued) |
| Average Annual Total Returns1 for periods ended 9/30/13 | ||||||||||||
| 1 Year | Since Inception | Inception Date | ||||||||||
| Class A Shares at NAV2 | 12.32 | % | 7.25 | % | 3/15/11 | |||||||
| Class A Shares at POP3,4 | 5.87 | 4.79 | 3/15/11 | |||||||||
| Class C Shares at NAV2 and CDSC4 | 11.52 | 6.48 | 3/15/11 | |||||||||
| Class I Shares at NAV | 12.59 | 7.51 | 3/15/11 | |||||||||
| S&P 500® Index | 19.34 | 13.68 | 5 | — | ||||||||
| MSCI World® Index (net) | 20.21 | 10.42 | 5 | — | ||||||||
Fund Expense Ratios6: A Shares: Gross 2.05%, Net 2.03%; C Shares: Gross 2.77%, Net 2.75%; I Shares: Gross 1.80%, Net 1.78%.
All returns represent past performance which is no guarantee of future results. Current performance may be higher or lower than the performance shown. The investment return and principal value of an investment will fluctuate so that an investor’s shares, when redeemed, may be worth more or less than their original cost. The above table and graph below do not reflect the deduction of taxes that a shareholder would pay on fund distributions or the redemption of shares. Please visit Virtus.com for performance data current to the most recent month-end.
| 1 | Total returns are historical and include changes in share price and the reinvestment of both dividends and capital gains distributions. |
| 2 | “NAV” (Net Asset Value) total returns do not include the effect of any sales charge. |
| 3 | “POP” (Public Offering Price) total returns include the effect of the maximum front-end 5.75% sales charge. |
| 4 | “CDSC” (Contingent Deferred Sales Charge) is applied to redemptions of certain classes of shares that do not have a sales charge applied at the time of purchase. CDSC charges for certain redemptions of Class A shares made within 18 months of purchase in which a finder’s fee was paid and all redemptions of Class C shares within the first year are 1% and 0% thereafter. |
| 5 | The since inception index returns are from the Fund’s inception date. |
| 6 | The expense ratios of the Fund are set forth according to the prospectus for the Fund effective January 31, 2013, as supplemented and revised, and may differ from the expense ratios disclosed in the Financial Highlights tables in this report. See the Financial Highlights for more current expense ratios. Net Expense: Expenses reduced by a voluntary fee waiver, which may be discontinued at any time. Gross Expense: Does not reflect the effect of the voluntary fee waiver. Expense ratios reflect fees and expenses associated with the underlying funds. Class C share ratio reflects distributors contractual waiver for 12b-1 fees. |
Growth of $10,000 for periods ended 9/30
This chart assumes an initial investment of $10,000 made on March 15, 2011 (inception date of the Fund), for Class A, Class C and Class I shares including any applicable sales charges or fees. Performance assumes reinvestment of dividends and capital gain distributions.
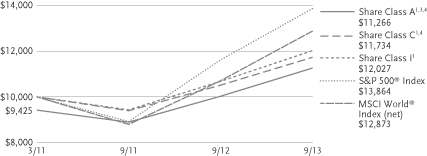
The indexes are unmanaged and not available for direct investment; therefore, their performance does not reflect the expenses associated with active management of an actual portfolio.
21
Table of Contents
| Premium AlphaSector™ Fund | Ticker Symbols: Class A: VAPAX Class C: VAPCX Class I: VAPIX |
| ¢ | The Fund is diversified and has an investment objective of long-term capital appreciation. |
| ¢ | For the fiscal year ended September 30, 2013, the Fund’s Class A shares at NAV returned 16.50%, Class C shares returned 15.55%, and Class I shares returned 16.75%. For the same period, the S&P 500® Index, a broad-based equity index, returned 19.34%. |
All performance figures assume reinvestment of distributions and exclude the effect of sales charges. Past performance is no guarantee of future results and current performance may be higher or lower than the performance shown above.
How did the market perform during the Fund’s fiscal period?
| ¢ | In the year ending September 30, 2013, U.S. equity markets performed strongly. As noted above, the S&P 500 rose 19.3%. |
| ¢ | The performance of the U.S. equity market varied by quarter. The fourth quarter of 2012 saw a decline of 0.4% in the S&P 500, while the first quarter of 2013 was very strong, with the benchmark up 10.6%. The second and third quarters of 2013 were more moderate, with increases of 2.9% and 5.2% respectively. |
| ¢ | Viewing the U.S. equity markets by sector, the overall picture was positive. In the fiscal period, the consumer discretionary, financials, healthcare, and industrials sectors outperformed the broader S&P 500 benchmark. Consumer staples, energy, utilities, and tech & telecom were below the S&P 500, but positive overall. |
What factors affected the Fund’s performance during its fiscal year?
| ¢ | The Fund is designed to track the Premium AlphaSector Index. The Index’s objective is to provide risk controls for declining markets and participation in rising markets. |
| ¢ | In bear market conditions, the risk controls are intended to help the Fund outperform the benchmark S&P 500 Index. In strong bull |
markets, the Fund may be expected to lag the benchmark to a moderate degree. |
| ¢ | During the fiscal year, the Fund performed as expected. The U.S. equity market was positive, and the Fund was invested in U.S. equities throughout the period. The Fund’s performance was roughly in line with the returns of the benchmark S&P 500 Index for each quarter. The Fund’s moderate underperformance versus the S&P 500 during this limited time period is in line with expectations for the strategy. |
| ¢ | The quantitative model that drives the Fund does an independent assessment of each of the nine equity sectors described above. During the period, individual sectors in the portfolio were turned “on” or “off,” but the Fund as a whole remained 100% invested in U.S. equities. There were no periods in which extreme or widespread risk caused the Fund to take a position in a cash equivalent. |
| ¢ | The net result for the period is that the Fund delivered on expectations, providing participation in rising U.S. equity markets. |
The preceding information is the opinion of portfolio management. Any such opinions are subject to change at any time based upon market or other conditions and should not be relied upon as investment advice. Past performance is no guarantee of future results, and there is no guarantee that market forecasts will be realized.
There is no guarantee that the Fund will meet its objective.
The market price of equity securities may be affected by financial market, industry, or issuer-specific events. Focus on a particular style or on small or medium-sized companies may enhance that risk. A fund that focuses its investments in a particular industry or sector will be more sensitive to conditions that affect that industry or sector than a non-concentrated fund. The value of an ETF may be more volatile than the underlying portfolio of securities the ETF is designed to track.
For information regarding the indexes and certain investment terms, see Key Investment Terms starting on page 5.
22
Table of Contents
| Premium AlphaSector™ Fund (Continued) |
The costs of owning the ETF may exceed the cost of investing directly in the underlying securities. U.S. government securities may be subject to price fluctuations. An agency may default on an obligation not backed by the United States. Any guarantee on U.S. government securities does not apply to the value of the fund’s shares. The Fund’s exposure to different asset classes may not be optimal for market conditions at a given time. Asset allocation does not guarantee a profit or protect against a loss in declining markets.
| Asset Allocation | ||||
The following table presents asset allocations within certain sectors and as a percentage of total investments as of September 30, 2013.
|
| |||
Industrials | 15 | % | ||
Consumer Discretionary | 14 | |||
Energy | 14 | |||
Financials | 14 | |||
Health Care | 14 | |||
Materials | 14 | |||
Information Technology | 13 | |||
Other (includes short-term investments and securities lending collateral) | 2 | |||
|
| |||
Total | 100 | % | ||
|
| |||
For information regarding the indexes and certain investment terms, see Key Investment Terms starting on page 5.
23
Table of Contents
| Premium AlphaSector™ Fund (Continued) |
| Average Annual Total Returns1 for periods ended 9/30/13 | ||||||||||||
1 Year | Since Inception | Inception Date | ||||||||||
| Class A Shares at NAV2 | 16.50 | % | 15.30 | % | 7/1/10 | |||||||
| Class A Shares at POP3,4 | 9.80 | 13.21 | 7/1/10 | |||||||||
| Class C Shares at NAV2 and CDSC4 | 15.55 | 14.42 | 7/1/10 | |||||||||
| Class I Shares at NAV | 16.75 | 15.55 | 7/1/10 | |||||||||
| S&P 500® Index | 19.34 | 18.88 | 5 | — | ||||||||
Fund Expense Ratios6: A Shares: Gross and Net 1.63%; C Shares: Gross and Net 2.38%; I Shares: Gross and Net 1.38%.
All returns represent past performance which is no guarantee of future results. Current performance may be higher or lower than the performance shown. The investment return and principal value of an investment will fluctuate so that an investor’s shares, when redeemed, may be worth more or less than their original cost. The above table and graph below do not reflect the deduction of taxes that a shareholder would pay on fund distributions or the redemption of shares. Please visit Virtus.com for performance data current to the most recent month-end.
| 1 | Total returns are historical and include changes in share price and the reinvestment of both dividends and capital gains distributions. |
| 2 | “NAV” (Net Asset Value) total returns do not include the effect of any sales charge. |
| 3 | “POP” (Public Offering Price) total returns include the effect of the maximum front-end 5.75% sales charge. |
| 4 | “CDSC” (Contingent Deferred Sales Charge) is applied to redemptions of certain classes of shares that do not have a sales charge applied at the time of purchase. CDSC charges for certain redemptions of Class A shares made within 18 months of purchase in which a finder’s fee was paid and all redemptions of Class C shares within the first year are 1% and 0% thereafter. |
| 5 | The since inception index return is from the Fund’s inception date. |
| 6 | The expense ratios of the Fund are set forth according to the prospectus for the Fund effective January 31, 2013, as supplemented and revised, and may differ from the expense ratios disclosed in the Financial Highlights tables in this report. See the Financial Highlights for more current expense ratios. |
Growth of $10,000 for periods ended 9/30
This chart assumes an initial investment of $10,000 made on July 1, 2010 (inception date of the Fund), for Class A, Class C and Class I shares including any applicable sales charges or fees. Performance assumes reinvestment of dividends and capital gain distributions.
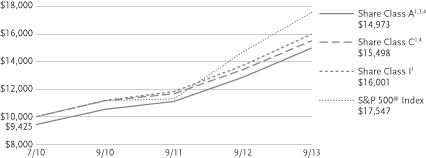
The indexes are unmanaged and not available for direct investment; therefore, their performance does not reflect the expenses associated with active management of an actual portfolio.
24
Table of Contents
VIRTUS ALLOCATOR PREMIUM ALPHASECTOR™ FUND
SCHEDULE OF INVESTMENTS
SEPTEMBER 30, 2013
($ reported in thousands)
| SHARES | VALUE | |||||||
| EXCHANGE-TRADED FUNDS—85.2% | ||||||||
Consumer Discretionary Select Sector SPDR Fund | 508,220 | $ | 30,813 | |||||
Energy Select Sector SPDR Fund | 359,660 | 29,809 | ||||||
Financial Select Sector SPDR Fund | 1,507,570 | 30,031 | ||||||
Health Care Select Sector SPDR Fund | 594,780 | 30,078 | ||||||
Industrial Select Sector SPDR Fund | 665,000 | 30,836 | ||||||
iShares Dow Jones U.S. Real Estate Index Fund | 442,860 | 28,237 | ||||||
iShares iBoxx $ High Yield Corporate Bond Fund | 471,270 | 43,150 | ||||||
iShares iBoxx Investment Grade Corporate Bond Fund | 385,260 | 43,735 | ||||||
iShares MSCI Canada Index Fund | 561,790 | 15,904 | ||||||
iShares MSCI Emerging Markets Index Fund | 1,167,040 | 47,580 | ||||||
iShares MSCI Japan Index Fund | 1,569,620 | 18,694 | ||||||
Ishares MSCI Pacific Ex-Japan Index Fund | 331,730 | 15,807 | ||||||
Materials Select Sector SPDR Fund | 726,210 | 30,501 | ||||||
SPDR S&P 500® ETF Trust Series 1 | 169,750 | 28,535 | ||||||
Technology Select Sector SPDR Fund | 939,310 | 30,086 | ||||||
Vanguard FTSE Europe ETF | 963,200 | 52,503 | ||||||
| TOTAL EXCHANGE-TRADED FUNDS (Identified Cost $464,524) | 506,299 | |||||||
| TOTAL LONG TERM INVESTMENTS—85.2% | ||||||||
| (Identified Cost $464,524) | 506,299 | |||||||
| SHARES | VALUE | |||||||
| SHORT-TERM INVESTMENTS—14.5% | ||||||||
| Money Market Mutual Funds—14.5% | ||||||||
Fidelity Money Market Portfolio – Institutional Shares (Seven-day effective yield 0.090%) | 86,002,174 | $ | 86,002 | |||||
| TOTAL SHORT-TERM INVESTMENTS (Identified Cost $86,002) | 86,002 | |||||||
| TOTAL INVESTMENTS—99.7% (Identified Cost $550,526) | 592,301 | (1) | ||||||
Other assets and liabilities, |
| 1,839 | ||||||
|
| |||||||
| NET ASSETS—100.0% | $ | 594,140 | ||||||
|
| |||||||
| Abbreviations: | ||
ETF | Exchange-Traded Fund | |
SPDR | S&P Depositary Receipt | |
FOOTNOTE LEGEND:
| (1) | Federal Income Tax Information: For tax information at September 30, 2013, see Note 10 Federal Income Tax Information in the Notes to Financial Statements. |
The following table provides a summary of inputs used to value the Fund’s investments as of September 30, 2013 (See Security Valuation Note 2A in the Notes to Financial Statements):
| Total Value at September 30, 2013 | Level 1 Quoted Prices | |||||||
Equity Securities: | ||||||||
Exchange-Traded Funds | $ | 506,299 | $ | 506,299 | ||||
Short-Term Investments | 86,002 | 86,002 | ||||||
|
|
|
| |||||
Total Investments | $ | 592,301 | $ | 592,301 | ||||
|
|
|
| |||||
There are no Level 2 (significant observable inputs) or Level 3 (significant unobservable inputs) priced securities.
See Notes to Financial Statements
25
Table of Contents
VIRTUS ALPHASECTOR™ ROTATION FUND
SCHEDULE OF INVESTMENTS
SEPTEMBER 30, 2013
($ reported in thousands)
| SHARES | VALUE | |||||||
| COMMON STOCKS—85.4% | ||||||||
| Consumer Discretionary—14.4% | ||||||||
Abercrombie & Fitch Co. Class A | 3,720 | $ | 132 | |||||
Amazon.com, Inc.(2) | 18,480 | 5,778 | ||||||
AutoNation, Inc.(2) | 3,140 | 164 | ||||||
AutoZone, Inc.(2) | 1,770 | 748 | ||||||
Bed Bath & Beyond, Inc.(2) | 10,840 | 839 | ||||||
Best Buy Co., Inc. | 13,390 | 502 | ||||||
BorgWarner, Inc. | 5,740 | 582 | ||||||
Cablevision Systems Corp. Class A | 10,860 | 183 | ||||||
CarMax, Inc.(2) | 11,160 | 541 | ||||||
Carnival Corp. | 21,870 | 714 | ||||||
CBS Corp. Class B | 28,100 | 1,550 | ||||||
Chipotle Mexican Grill, Inc.(2) | 1,530 | 656 | ||||||
Coach, Inc. | 14,140 | 771 | ||||||
Comcast Corp. Class A | 130,440 | 5,889 | ||||||
Darden Restaurants, Inc. | 6,430 | 298 | ||||||
Delphi Automotive plc | 14,150 | 827 | ||||||
DIRECTV Class A(2) | 25,530 | 1,525 | ||||||
Discovery Communications, Inc. Class A(2) | 11,490 | 970 | ||||||
Dollar General Corp.(2) | 14,920 | 842 | ||||||
Dollar Tree, Inc.(2) | 11,230 | 642 | ||||||
Expedia, Inc. | 5,360 | 278 | ||||||
Family Dollar Stores, Inc. | 4,800 | 346 | ||||||
Ford Motor Co. | 196,470 | 3,314 | ||||||
Fossil Group, Inc.(2) | 2,530 | 294 | ||||||
GameStop Corp. Class A | 5,840 | 290 | ||||||
Gannett Co., Inc. | 11,590 | 311 | ||||||
Gap, Inc. (The) | 13,860 | 558 | ||||||
Garmin Ltd.(3) | 6,140 | 277 | ||||||
General Motors Co.(2) | 47,070 | 1,693 | ||||||
Genuine Parts Co. | 7,730 | 625 | ||||||
Goodyear Tire & Rubber Co. (The)(2) | 12,250 | 275 | ||||||
H&R Block, Inc. | 13,820 | 368 | ||||||
Harley-Davidson, Inc. | 11,160 | 717 | ||||||
Harman International Industries, Inc. | 3,400 | 225 | ||||||
Hasbro, Inc. | 5,780 | 272 | ||||||
Home Depot, Inc. (The) | 71,440 | 5,419 | ||||||
Horton (D.R.), Inc. | 14,410 | 280 | ||||||
Host Hotels & Resorts, Inc. | 28,160 | 498 | ||||||
International Game Technology | 12,960 | 245 | ||||||
Interpublic Group of Cos., Inc. (The) | 21,290 | 366 | ||||||
| SHARES | VALUE | |||||||
| Consumer Discretionary (continued) | ||||||||
J.C. Penney Co., Inc.(2)(3) | 15,190 | $ | 134 | |||||
Johnson Controls, Inc. | 34,280 | 1,423 | ||||||
Kohl’s Corp. | 10,210 | 528 | ||||||
L Brands, Inc. | 12,140 | 742 | ||||||
Leggett & Platt, Inc. | 7,020 | 212 | ||||||
Lennar Corp. Class A | 8,290 | 293 | ||||||
Lowe’s Cos., Inc. | 52,600 | 2,504 | ||||||
Macy’s, Inc. | 18,830 | 815 | ||||||
Marriott International, Inc. | 11,260 | 474 | ||||||
Mattel, Inc. | 17,230 | 721 | ||||||
McDonald’s Corp. | 49,860 | 4,797 | ||||||
Netflix, Inc.(2) | 2,950 | 912 | ||||||
Newell Rubbermaid, Inc. | 14,290 | 393 | ||||||
News Corp.(2) | 24,622 | 395 | ||||||
NIKE, Inc. Class B | 37,330 | 2,712 | ||||||
Nordstrom, Inc. | 7,270 | 409 | ||||||
O’Reilly Automotive, Inc.(2) | 5,410 | 690 | ||||||
Omnicom Group, Inc. | 12,830 | 814 | ||||||
PetSmart, Inc. | 5,140 | 392 | ||||||
Phillips-Van Heusen Corp. | 4,090 | 485 | ||||||
priceline.com, Inc.(2) | 2,570 | 2,598 | ||||||
PulteGroup, Inc. | 17,450 | 288 | ||||||
Ralph Lauren Corp. | 3,050 | 502 | ||||||
Ross Stores, Inc. | 10,810 | 787 | ||||||
Scripps Networks Interactive, Inc. Class A | 5,450 | 426 | ||||||
Staples, Inc. | 32,940 | 483 | ||||||
Starbucks Corp. | 37,520 | 2,888 | ||||||
Starwood Hotels & Resorts Worldwide, Inc. | 9,770 | 649 | ||||||
Target Corp. | 31,510 | 2,016 | ||||||
Tiffany & Co. | 5,540 | 424 | ||||||
Time Warner Cable, Inc. | 14,290 | 1,595 | ||||||
Time Warner, Inc. | 45,920 | 3,022 | ||||||
TJX Cos., Inc. | 35,710 | 2,014 | ||||||
TripAdvisor, Inc.(2) | 5,570 | 422 | ||||||
Twenty-First Century Fox, Inc. | 99,050 | 3,318 | ||||||
Urban Outfitters, Inc.(2) | 5,500 | 202 | ||||||
VF Corp. | 4,420 | 880 | ||||||
Viacom, Inc. Class B | 21,700 | 1,814 | ||||||
Walt Disney Co. (The) | 82,850 | 5,343 | ||||||
Washington Post Co. (The) Class B | 190 | 116 | ||||||
Whirlpool Corp. | 3,950 | 578 | ||||||
Wyndham Worldwide Corp. | 6,620 | 404 | ||||||
Wynn Resorts Ltd. | 4,060 | 642 | ||||||
Yum! Brands, Inc. | 22,260 | 1,589 | ||||||
|
| |||||||
| 93,649 | ||||||||
|
| |||||||
See Notes to Financial Statements
26
Table of Contents
VIRTUS ALPHASECTOR™ ROTATION FUND
SCHEDULE OF INVESTMENTS (Continued)
SEPTEMBER 30, 2013
($ reported in thousands)
| SHARES | VALUE | |||||||
| Energy—14.2% | ||||||||
Anadarko Petroleum Corp. | 32,910 | $ | 3,060 | |||||
Apache Corp. | 26,170 | 2,228 | ||||||
Baker Hughes, Inc. | 32,960 | 1,618 | ||||||
Cabot Oil & Gas Corp. | 51,320 | 1,915 | ||||||
Cameron International Corp.(2) | 22,250 | 1,299 | ||||||
Chesapeake Energy Corp. | 37,850 | 980 | ||||||
Chevron Corp. | 110,850 | 13,468 | ||||||
ConocoPhillips | 50,760 | 3,528 | ||||||
CONSOL Energy, Inc. | 20,500 | 690 | ||||||
Denbury Resources, Inc.(2) | 41,960 | 772 | ||||||
Devon Energy Corp. | 24,680 | 1,425 | ||||||
Diamond Offshore Drilling, Inc. | 6,460 | 403 | ||||||
Ensco plc Class A | 13,130 | 706 | ||||||
EOG Resources, Inc. | 18,650 | 3,157 | ||||||
EQT Corp. | 8,470 | 751 | ||||||
Exxon Mobil Corp. | 166,930 | 14,363 | ||||||
FMC Technologies, Inc.(2) | 23,850 | 1,322 | ||||||
Halliburton Co. | 56,850 | 2,737 | ||||||
Helmerich & Payne, Inc. | 5,970 | 412 | ||||||
Hess Corp. | 20,200 | 1,562 | ||||||
Kinder Morgan, Inc. | 37,900 | 1,348 | ||||||
Marathon Oil Corp. | 46,690 | 1,629 | ||||||
Marathon Petroleum Corp. | 17,560 | 1,129 | ||||||
Murphy Oil Corp. | 13,360 | 806 | ||||||
Nabors Industries Ltd. | 26,970 | 433 | ||||||
National Oilwell Varco, Inc. | 30,480 | 2,381 | ||||||
Newfield Exploration Co.(2) | 7,740 | 212 | ||||||
Noble Corp. | 14,270 | 539 | ||||||
Noble Energy, Inc. | 27,520 | 1,844 | ||||||
Occidental Petroleum Corp. | 39,510 | 3,696 | ||||||
Peabody Energy Corp. | 22,300 | 385 | ||||||
Phillips 66 | 34,400 | 1,989 | ||||||
Pioneer Natural Resources Co. | 17,650 | 3,332 | ||||||
QEP Resources, Inc. | 9,980 | 276 | ||||||
Range Resources Corp. | 14,450 | 1,097 | ||||||
Rowan Cos. plc Class A(2) | 18,820 | 691 | ||||||
Schlumberger Ltd. | 77,590 | 6,856 | ||||||
Southwestern Energy Co.(2) | 25,200 | 917 | ||||||
Spectra Energy Corp. | 50,530 | 1,730 | ||||||
Tesoro Corp. | 23,800 | 1,047 | ||||||
Valero Energy Corp. | 42,430 | 1,449 | ||||||
Williams Cos., Inc. (The) | 54,050 | 1,965 | ||||||
WPX Energy, Inc.(2) | 11,480 | 221 | ||||||
|
| |||||||
| 92,368 | ||||||||
|
| |||||||
| SHARES | VALUE | |||||||
| Financials—14.0% | ||||||||
ACE Ltd. | 12,790 | $ | 1,197 | |||||
Aflac, Inc. | 17,460 | 1,082 | ||||||
Allstate Corp. (The) | 17,370 | 878 | ||||||
American Express Co. | 34,850 | 2,632 | ||||||
American International Group, Inc. | 55,340 | 2,691 | ||||||
American Tower Corp. | 14,860 | 1,102 | ||||||
Ameriprise Financial, Inc. | 7,460 | 679 | ||||||
AON plc | 11,590 | 863 | ||||||
Apartment Investment & Management Co. Class A | 5,550 | 155 | ||||||
Assurant, Inc. | 2,860 | 155 | ||||||
AvalonBay Communities, Inc. | 4,530 | 576 | ||||||
Bank of America Corp. | 403,010 | 5,562 | ||||||
Bank of New York Mellon Corp. (The) | 43,150 | 1,303 | ||||||
BB&T Corp. | 26,550 | 896 | ||||||
Berkshire Hathaway, Inc. Class B(2) | 67,540 | 7,666 | ||||||
BlackRock, Inc. | 4,710 | 1,275 | ||||||
Boston Properties, Inc. | 5,730 | 613 | ||||||
Capital One Financial Corp. | 21,970 | 1,510 | ||||||
CBRE Group, Inc.(2) | 10,240 | 237 | ||||||
Charles Schwab Corp. (The) | 43,400 | 917 | ||||||
Chubb Corp. (The) | 9,630 | 860 | ||||||
Cincinnati Financial Corp. | 5,460 | 258 | ||||||
Citigroup, Inc. | 114,110 | 5,535 | ||||||
CME Group, Inc. | 11,810 | 873 | ||||||
Comerica, Inc. | 6,980 | 274 | ||||||
Discover Financial Services | 18,240 | 922 | ||||||
E*Trade Financial Corp.(2) | 11,010 | 182 | ||||||
Equity Residential | 12,510 | 670 | ||||||
Fifth Third Bancorp | 33,080 | 597 | ||||||
Franklin Resources, Inc. | 15,200 | 768 | ||||||
Genworth Financial, Inc. Class A(2) | 18,730 | 240 | ||||||
Goldman Sachs Group, Inc. (The) | 15,650 | 2,476 | ||||||
Hartford Financial Services Group, Inc. (The) | 16,940 | 527 | ||||||
HCP, Inc. | 17,060 | 699 | ||||||
Health Care REIT, Inc. | 10,770 | 672 | ||||||
Hudson City Bancorp, Inc. | 17,370 | 157 | ||||||
Huntington Bancshares, Inc. | 31,100 | 257 | ||||||
IntercontinentalExchange, Inc.(2) | 2,740 | 497 | ||||||
Invesco Ltd. | 16,530 | 527 | ||||||
See Notes to Financial Statements
27
Table of Contents
VIRTUS ALPHASECTOR™ ROTATION FUND
SCHEDULE OF INVESTMENTS (Continued)
SEPTEMBER 30, 2013
($ reported in thousands)
| SHARES | VALUE | |||||||
| Financials (continued) | ||||||||
JPMorgan Chase & Co. | 141,290 | $ | 7,303 | |||||
KeyCorp | 34,550 | 394 | ||||||
Kimco Realty Corp. | 15,400 | 311 | ||||||
Legg Mason, Inc. | 4,040 | 135 | ||||||
Leucadia National Corp. | 11,860 | 323 | ||||||
Lincoln National Corp. | 9,830 | 413 | ||||||
Loews Corp. | 11,480 | 537 | ||||||
M&T Bank Corp. | 4,900 | 548 | ||||||
Macerich Co. (The) | 5,270 | 297 | ||||||
Marsh & McLennan Cos., Inc. | 20,530 | 894 | ||||||
McGraw-Hill Cos., Inc. (The) | 10,280 | 674 | ||||||
MetLife, Inc. | 42,060 | 1,975 | ||||||
Moody’s Corp. | 7,290 | 513 | ||||||
Morgan Stanley | 52,150 | 1,405 | ||||||
NASDAQ OMX Group, Inc. (The) | 4,280 | 137 | ||||||
Northern Trust Corp. | 8,490 | 462 | ||||||
NYSE Euronext, Inc. | 9,210 | 387 | ||||||
People’s United Financial, Inc. | 12,170 | 175 | ||||||
Plum Creek Timber Co., Inc. | 6,050 | 283 | ||||||
PNC Financial Services Group, Inc. | 19,930 | 1,444 | ||||||
Principal Financial Group, Inc. | 10,220 | 438 | ||||||
Progressive Corp. (The) | 20,680 | 563 | ||||||
Prologis, Inc. | 18,660 | 702 | ||||||
Prudential Financial, Inc. | 17,450 | 1,361 | ||||||
Public Storage | 5,430 | 872 | ||||||
Regions Financial Corp. | 51,910 | 481 | ||||||
Simon Property Group, Inc. | 11,620 | 1,722 | ||||||
SLM Corp. | 16,530 | 412 | ||||||
State Street Corp. | 16,700 | 1,098 | ||||||
SunTrust Banks, Inc. | 20,340 | 659 | ||||||
T. Rowe Price Group, Inc. | 9,820 | 706 | ||||||
Torchmark Corp. | 3,430 | 248 | ||||||
Travelers Cos., Inc. (The) | 14,000 | 1,187 | ||||||
U.S. Bancorp | 69,120 | 2,528 | ||||||
Unum Group | 9,930 | 302 | ||||||
Ventas, Inc. | 11,030 | 678 | ||||||
Vornado Realty Trust | 6,500 | 546 | ||||||
Wells Fargo & Co. | 181,370 | 7,494 | ||||||
Weyerhaeuser Co. | 22,010 | 630 | ||||||
XL Group plc | 10,700 | 330 | ||||||
Zions Bancorp | 6,980 | 191 | ||||||
|
| |||||||
| 90,738 | ||||||||
|
| |||||||
| SHARES | VALUE | |||||||
| Industrials—14.4% | ||||||||
3M Co. | 36,870 | $ | 4,403 | |||||
ADT Corp. (The) | 10,980 | 446 | ||||||
Ametek, Inc. | 13,590 | 625 | ||||||
Avery Dennison Corp. | 17,200 | 749 | ||||||
Boeing Co. (The) | 40,110 | 4,713 | ||||||
Caterpillar, Inc. | 37,570 | 3,132 | ||||||
Cintas Corp. | 6,790 | 348 | ||||||
CSX Corp. | 67,950 | 1,749 | ||||||
Cummins, Inc. | 17,780 | 2,362 | ||||||
Danaher Corp. | 37,270 | 2,584 | ||||||
Deere & Co. | 23,700 | 1,929 | ||||||
Delta Air Lines, Inc. | 47,350 | 1,117 | ||||||
Dover Corp. | 11,450 | 1,029 | ||||||
Dun & Bradstreet Corp. | 2,160 | 224 | ||||||
Eaton Corp. plc | 32,080 | 2,208 | ||||||
Emerson Electric Co. | 41,860 | 2,708 | ||||||
Equifax, Inc. | 9,170 | 549 | ||||||
Expeditors International of Washington, Inc. | 11,330 | 499 | ||||||
Fastenal Co. | 15,210 | 764 | ||||||
FedEx Corp. | 17,650 | 2,014 | ||||||
Flowserve Corp. | 7,770 | 485 | ||||||
Fluor Corp. | 13,150 | 933 | ||||||
General Dynamics Corp. | 20,050 | 1,755 | ||||||
General Electric Co. | 417,490 | 9,974 | ||||||
Grainger (W.W.), Inc. | 4,470 | 1,170 | ||||||
Honeywell International, Inc. | 45,850 | 3,807 | ||||||
Illinois Tool Works, Inc. | 24,280 | 1,852 | ||||||
Ingersoll-Rand plc | 14,960 | 972 | ||||||
Iron Mountain, Inc. | 9,400 | 254 | ||||||
Jacobs Engineering Group, Inc.(2) | 7,250 | 422 | ||||||
Joy Global, Inc. | 5,960 | 304 | ||||||
Kansas City Southern | 6,080 | 665 | ||||||
L-3 Communications Holdings, Inc. | 5,010 | 473 | ||||||
Lockheed Martin Corp. | 15,810 | 2,017 | ||||||
Masco Corp. | 21,920 | 466 | ||||||
Nielsen Holdings NV | 11,790 | 430 | ||||||
Norfolk Southern Corp. | 20,240 | 1,566 | ||||||
Northrop Grumman Corp. | 13,780 | 1,313 | ||||||
PACCAR, Inc. | 22,790 | 1,269 | ||||||
Pall Corp. | 9,110 | 702 | ||||||
Parker Hannifin Corp. | 10,440 | 1,135 | ||||||
PentAir, Inc. | 11,090 | 720 | ||||||
Pitney Bowes, Inc.(3) | 12,940 | 235 | ||||||
Precision Castparts Corp. | 8,070 | 1,834 | ||||||
Quanta Services, Inc.(2) | 11,860 | 326 | ||||||
See Notes to Financial Statements
28
Table of Contents
VIRTUS ALPHASECTOR™ ROTATION FUND
SCHEDULE OF INVESTMENTS (Continued)
SEPTEMBER 30, 2013
($ reported in thousands)
| SHARES | VALUE | |||||||
| Industrials (continued) | ||||||||
Raytheon Co. | 19,540 | $ | 1,506 | |||||
Republic Services, Inc. | 15,110 | 504 | ||||||
Robert Half International, Inc. | 10,910 | 426 | ||||||
Robinson (C.H.) Worldwide, Inc. | 8,810 | 525 | ||||||
Rockwell Automation, Inc. | 9,970 | 1,066 | ||||||
Rockwell Collins, Inc. | 9,730 | 660 | ||||||
Roper Industries, Inc. | 5,520 | 733 | ||||||
Ryder System, Inc. | 5,220 | 312 | ||||||
Snap-On, Inc. | 3,180 | 316 | ||||||
Southwest Airlines Co. | 42,740 | 622 | ||||||
Stanley Black & Decker, Inc. | 8,900 | 806 | ||||||
Stericycle, Inc.(2) | 4,770 | 550 | ||||||
Textron, Inc. | 19,230 | 531 | ||||||
Tyco International Ltd. | 25,590 | 895 | ||||||
Union Pacific Corp. | 27,970 | 4,345 | ||||||
United Parcel Service, Inc. Class B | 40,690 | 3,718 | ||||||
United Technologies Corp. | 48,590 | 5,239 | ||||||
Waste Management, Inc. | 26,310 | 1,085 | ||||||
Xylem, Inc. | 10,280 | 287 | ||||||
|
| |||||||
| 93,357 | ||||||||
|
| |||||||
| Information Technology—12.6% | ||||||||
Accenture plc Class A | 19,550 | 1,440 | ||||||
Adobe Systems, Inc.(2) | 14,560 | 756 | ||||||
Akamai Technologies, Inc.(2) | 6,130 | 317 | ||||||
Altera Corp. | 10,520 | 391 | ||||||
Amphenol Corp. Class A | 5,200 | 402 | ||||||
Analog Devices, Inc. | 10,000 | 471 | ||||||
Apple, Inc. | 27,480 | 13,101 | ||||||
Applied Materials, Inc. | 37,560 | 659 | ||||||
Autodesk, Inc.(2) | 7,330 | 302 | ||||||
Automatic Data Processing, Inc. | 15,010 | 1,086 | ||||||
Broadcom Corp. Class A | 17,200 | 447 | ||||||
CA, Inc. | 10,510 | 312 | ||||||
Cisco Systems, Inc. | 162,390 | 3,803 | ||||||
Citrix Systems, Inc.(2) | 6,080 | 429 | ||||||
Cognizant Technology Solutions Corp. Class A(2) | 9,480 | 779 | ||||||
Computer Sciences Corp. | 4,690 | 243 | ||||||
Corning, Inc. | 45,270 | 661 | ||||||
Dell, Inc. | 45,170 | 622 | ||||||
eBay, Inc.(2) | 35,790 | 1,997 | ||||||
Electronic Arts, Inc.(2) | 9,870 | 252 | ||||||
| SHARES | VALUE | |||||||
| Information Technology (continued) | ||||||||
EMC Corp. | 63,940 | $ | 1,634 | |||||
F5 Networks, Inc.(2) | 2,360 | 202 | ||||||
Fidelity National Information Services, Inc. | 9,590 | 445 | ||||||
First Solar, Inc.(2) | 2,160 | 87 | ||||||
Fiserv, Inc.(2) | 4,140 | 418 | ||||||
FLIR Systems, Inc. | 4,740 | 149 | ||||||
Google, Inc. Class A(2) | 8,450 | 7,401 | ||||||
Harris Corp. | 3,550 | 211 | ||||||
Hewlett-Packard Co. | 48,460 | 1,017 | ||||||
Intel Corp. | 128,350 | 2,942 | ||||||
International Business Machines Corp. | 31,180 | 5,774 | ||||||
Intuit, Inc. | 9,500 | 630 | ||||||
Jabil Circuit, Inc. | 6,710 | 145 | ||||||
JDS Uniphase Corp.(2) | 9,560 | 141 | ||||||
Juniper Networks, Inc.(2) | 15,750 | 313 | ||||||
KLA-Tencor Corp. | 5,360 | 326 | ||||||
Lam Research Corp.(2) | 4,960 | 254 | ||||||
Linear Technology Corp. | 7,490 | 297 | ||||||
LSI Corp. | 19,170 | 150 | ||||||
MasterCard, Inc. Class A | 3,200 | 2,153 | ||||||
Microchip Technology, Inc. | 6,630 | 267 | ||||||
Micron Technology, Inc.(2) | 33,500 | 585 | ||||||
Microsoft Corp. | 229,430 | 7,642 | ||||||
Molex, Inc. | 4,830 | 186 | ||||||
Motorola Solutions, Inc. | 7,330 | 435 | ||||||
NetApp, Inc. | 10,910 | 465 | ||||||
NVIDIA Corp. | 18,480 | 288 | ||||||
Oracle Corp. | 108,480 | 3,598 | ||||||
Paychex, Inc. | 10,340 | 420 | ||||||
QUALCOMM, Inc. | 52,170 | 3,514 | ||||||
Red Hat, Inc.(2) | 6,210 | 287 | ||||||
Salesforce.com, Inc.(2) | 17,770 | 922 | ||||||
SanDisk Corp. | 7,940 | 473 | ||||||
Seagate Technology plc | 9,400 | 411 | ||||||
Symantec Corp. | 21,980 | 544 | ||||||
TE Connectivity Ltd. | 12,520 | 648 | ||||||
Teradata Corp.(2) | 5,440 | 302 | ||||||
Teradyne, Inc.(2) | 7,350 | 121 | ||||||
Texas Instruments, Inc. | 33,890 | 1,365 | ||||||
Total System Services, Inc. | 5,770 | 170 | ||||||
VeriSign, Inc.(2) | 4,530 | 231 | ||||||
Visa, Inc. Class A | 15,630 | 2,987 | ||||||
Western Digital Corp. | 6,800 | 431 | ||||||
Western Union Co. (The) | 17,500 | 327 | ||||||
Xerox Corp. | 37,210 | 383 | ||||||
See Notes to Financial Statements
29
Table of Contents
VIRTUS ALPHASECTOR™ ROTATION FUND
SCHEDULE OF INVESTMENTS (Continued)
SEPTEMBER 30, 2013
($ reported in thousands)
| SHARES | VALUE | |||||||
| Information Technology (continued) | ||||||||
Xilinx, Inc. | 8,610 | $ | 403 | |||||
Yahoo!, Inc.(2) | 29,320 | 972 | ||||||
|
| |||||||
| 81,536 | ||||||||
|
| |||||||
| Materials—14.1% | ||||||||
Air Products & Chemicals, Inc. | 36,830 | 3,925 | ||||||
Airgas, Inc. | 11,680 | 1,239 | ||||||
Alcoa, Inc. | 188,060 | 1,527 | ||||||
Allegheny Technologies, Inc. | 19,310 | 589 | ||||||
Ball Corp. | 25,560 | 1,147 | ||||||
Bemis Co., Inc. | 18,190 | 710 | ||||||
CF Industries Holdings, Inc. | 10,100 | 2,129 | ||||||
Cliffs Natural Resources, Inc.(3) | 27,220 | 558 | ||||||
Dow Chemical Co. (The) | 211,900 | 8,137 | ||||||
Du Pont (E.I.) de Nemours & Co. | 161,790 | 9,475 | ||||||
Eastman Chemical Co. | 27,100 | 2,111 | ||||||
Ecolab, Inc. | 44,970 | 4,441 | ||||||
FMC Corp. | 24,070 | 1,726 | ||||||
Freeport-McMoRan Copper & Gold, Inc. | 181,750 | 6,012 | ||||||
International Flavors & Fragrances, Inc. | 14,390 | 1,184 | ||||||
International Paper Co. | 78,220 | 3,504 | ||||||
LyondellBasell Industries N.V. Class A | 78,520 | 5,750 | ||||||
MeadWestvaco Corp. | 31,280 | 1,201 | ||||||
Monsanto Co. | 93,350 | 9,743 | ||||||
Mosaic Co. (The) | 59,900 | 2,577 | ||||||
Newmont Mining Corp. | 87,610 | 2,462 | ||||||
Nucor Corp. | 55,970 | 2,744 | ||||||
Owens-Illinois, Inc.(2) | 28,990 | 870 | ||||||
PPG Industries, Inc. | 25,070 | 4,188 | ||||||
Praxair, Inc. | 51,660 | 6,210 | ||||||
Sealed Air Corp. | 34,780 | 946 | ||||||
Sherwin-Williams Co. (The) | 15,330 | 2,793 | ||||||
Sigma-Aldrich Corp. | 21,180 | 1,807 | ||||||
United States Steel Corp.(3) | 25,950 | 534 | ||||||
Vulcan Materials Co. | 22,890 | 1,186 | ||||||
|
| |||||||
| 91,425 | ||||||||
|
| |||||||
| Telecommunication Services—1.7% | ||||||||
AT&T, Inc. | 160,830 | 5,439 | ||||||
CenturyLink, Inc. | 18,910 | 593 | ||||||
Crown Castle International Corp.(2) | 8,910 | 651 | ||||||
| SHARES | VALUE | |||||||
| Telecommunication Services (continued) | ||||||||
Frontier Communications Corp.(3) | 36,820 | $ | 154 | |||||
Verizon Communications, Inc. | 87,090 | 4,064 | ||||||
Windstream Holdings, Inc.(3) | 19,560 | 156 | ||||||
|
| |||||||
| 11,057 | ||||||||
| TOTAL COMMON STOCKS (Identified Cost $477,566) | 554,130 | |||||||
| EXCHANGE-TRADED FUNDS—14.2% | ||||||||
Health Care Select Sector SPDR Fund | 1,818,180 | 91,945 | ||||||
| TOTAL EXCHANGE-TRADED FUNDS (Identified Cost $70,149) | 91,945 | |||||||
| TOTAL LONG TERM INVESTMENTS—99.6% | ||||||||
| (Identified Cost $547,715) | 646,075 | |||||||
| SHORT-TERM INVESTMENTS—0.2% | ||||||||
| Money Market Mutual Funds—0.2% | ||||||||
Fidelity Money Market Portfolio – Institutional Shares (Seven-day effective yield 0.090%) | 1,601,467 | 1,601 | ||||||
| TOTAL SHORT-TERM INVESTMENTS (Identified Cost $1,601) | 1,601 | |||||||
| SECURITIES LENDING COLLATERAL—0.2% | ||||||||
INVESCO Short-Term Investments Liquid Assets Portfolio (The) Institutional Shares (seven-day effective yield 0.070%)(4) | 990,040 | 990 | ||||||
| TOTAL SECURITIES LENDING COLLATERAL | ||||||||
| (Identified Cost $990) | 990 | |||||||
| TOTAL INVESTMENTS—100.0% (Identified Cost $550,306) | 648,666 | (1) | ||||||
Other assets and liabilities, net—0.0% | (217 | ) | ||||||
|
| |||||||
| NET ASSETS—100.0% | $ | 648,449 | ||||||
|
| |||||||
See Notes to Financial Statements
30
Table of Contents
VIRTUS ALPHASECTOR™ ROTATION FUND
SCHEDULE OF INVESTMENTS (Continued)
SEPTEMBER 30, 2013
($ reported in thousands)
| Abbreviations: | ||
REIT | Real Estate Investment Trust | |
SPDR | S&P Depositary Receipt | |
FOOTNOTE LEGEND:
| (1) | Federal Income Tax Information: For tax information at September 30, 2013, see Note 10 Federal Income Tax Information in the Notes to Financial Statements. |
| (2) | Non-income producing. |
| (3) | All or a portion of security is on loan. |
| (4) | Represents security purchased with cash collateral received for securities on loan. |
The following table provides a summary of inputs used to value the Fund’s investments as of September 30, 2013 (See Security Valuation Note 2A in the Notes to Financial Statements):
| Total Value at September 30, 2013 | Level 1 Quoted Prices | |||||||
Equity Securities: | ||||||||
Common Stocks | $ | 554,130 | $ | 554,130 | ||||
Exchange-Traded Funds | 91,945 | 91,945 | ||||||
Securities Lending Collateral | 990 | 990 | ||||||
Short-Term Investments | 1,601 | 1,601 | ||||||
|
|
|
| |||||
Total Investments | $ | 648,666 | $ | 648,666 | ||||
|
|
|
| |||||
There are no Level 2 (significant observable inputs) or Level 3 (significant unobservable inputs) priced securities.
See Notes to Financial Statements
31
Table of Contents
VIRTUS ALTERNATIVES DIVERSIFIER FUND
SCHEDULE OF INVESTMENTS
SEPTEMBER 30, 2013
($ reported in thousands)
| SHARES | VALUE | |||||||
| AFFILIATED MUTUAL FUNDS—69.6% | ||||||||
| Equity Funds—58.4% | ||||||||
Virtus Global Commodities Stock Fund Class I | 2,932,665 | $ | 26,306 | |||||
Virtus Global Dividend Fund Class I | 3,269,524 | 45,577 | ||||||
Virtus Global Real Estate Securities Fund Class I | 595,986 | 13,875 | ||||||
Virtus International Real Estate Securities Fund Class I | 2,684,111 | 17,742 | ||||||
Virtus Real Estate Securities Class I | 509,251 | 17,859 | ||||||
|
| |||||||
| 121,359 | ||||||||
|
| |||||||
| Fixed Income Funds—11.2% | ||||||||
Virtus Senior Floating Rate Fund Class I | 2,370,300 | 23,205 | ||||||
| TOTAL AFFILIATED MUTUAL FUNDS (Identified Cost $128,351) | 144,564 | |||||||
| EXCHANGE-TRADED FUNDS—30.2% | ||||||||
Market Vectors Agribusiness | 77,600 | 3,983 | ||||||
Market Vectors Coal | 199,700 | 3,794 | ||||||
PowerShares DB Commodity Index Tracking Fund(2) | 812,200 | 20,922 | ||||||
PowerShares DB G10 Currency Harvest Fund(2) | 1,219,400 | 31,156 | ||||||
WisdomTree Managed Futures Strategy Fund | 66,700 | 2,766 | ||||||
| TOTAL EXCHANGE-TRADED FUNDS (Identified Cost $61,421) | 62,621 | |||||||
| TOTAL LONG TERM INVESTMENTS—99.8% | ||||||||
| (Identified Cost $189,772) | 207,185 | |||||||
| SHORT-TERM INVESTMENTS—0.1% | ||||||||
| Money Market Mutual Funds—0.1% | ||||||||
Fidelity Money Market Portfolio – Institutional Shares (Seven-day effective yield 0.090%) | 240,029 | 240 | ||||||
| TOTAL SHORT-TERM INVESTMENTS (Identified Cost $240) | 240 | |||||||
| VALUE | ||||||
| TOTAL INVESTMENTS—99.9% (Identified Cost $190,012) | $ | 207,425 | (1) | |||
Other assets and liabilities, | 160 | |||||
|
| |||||
| NET ASSETS—100.0% | $ | 207,585 | ||||
|
| |||||
FOOTNOTE LEGEND:
| (1) | Federal Income Tax Information: For tax information at September 30, 2013, see Note 10 Federal Income Tax Information in the Notes to Financial Statements. |
| (2) | Non-income producing. |
The following table provides a summary of inputs used to value the Fund’s investments as of September 30, 2013 (See Security Valuation Note 2A in the Notes to Financial Statements):
| Total Value at September 30, 2013 | Level 1 Quoted Prices | |||||||
Equity Securities: |
| |||||||
Affiliated Mutual Funds | $ | 144,564 | $ | 144,564 | ||||
Exchange-Traded Funds | 62,621 | 62,621 | ||||||
Short-Term Investments | 240 | 240 | ||||||
|
|
|
| |||||
Total Investments | $ | 207,425 | $ | 207,425 | ||||
|
|
|
| |||||
There are no Level 2 (significant observable inputs) or Level 3 (significant unobservable inputs) priced securities.
See Notes to Financial Statements
32
Table of Contents
VIRTUS DYNAMIC ALPHASECTOR™ FUND
SCHEDULE OF INVESTMENTS AND SECURITIES SOLD SHORT
SEPTEMBER 30, 2013
($ reported in thousands)
| SHARES | VALUE | |||||||
| EXCHANGE-TRADED FUNDS—124.9% | ||||||||
Consumer Discretionary Select Sector SPDR Fund | 4,979,600 | $ | 301,913 | |||||
Energy Select Sector SPDR Fund | 3,541,200 | 293,495 | ||||||
Financial Select Sector SPDR Fund | 14,826,600 | 295,346 | ||||||
Health Care Select Sector SPDR Fund | 5,826,500 | 294,646 | ||||||
Industrial Select Sector SPDR Fund | 6,538,500 | 303,190 | ||||||
Materials Select Sector SPDR Fund | 7,147,200 | 300,182 | ||||||
Technology Select Sector SPDR Fund | 9,286,000 | 297,430 | ||||||
| TOTAL EXCHANGE-TRADED FUNDS (Identified Cost $1,939,913) | 2,086,202 | |||||||
| TOTAL LONG TERM INVESTMENTS—124.9% | ||||||||
| (Identified Cost $1,939,913) | 2,086,202 | (2) | ||||||
| SHORT-TERM INVESTMENTS—0.2% | ||||||||
| Money Market Mutual Funds—0.2% | ||||||||
Fidelity Money Market Portfolio – Institutional Shares (Seven-day effective yield 0.090%) | 2,698,537 | 2,699 | ||||||
| TOTAL SHORT-TERM INVESTMENTS | ||||||||
| (Identified Cost $2,699) | 2,699 | |||||||
| TOTAL INVESTMENTS, BEFORE SECURITIES SOLD SHORT—125.1% | ||||||||
| (Identified Cost $1,942,612) | 2,088,901 | (1) | ||||||
| SECURITIES SOLD SHORT—(10.8)% | ||||||||
| EXCHANGE-TRADED FUNDS SOLD SHORT—(10.8)% | ||||||||
Consumer Staples Select Sector SPDR Fund | 2,243,100 | (89,276 | ) | |||||
Utilities Select Sector SPDR Fund | 2,455,400 | (91,709 | ) | |||||
| TOTAL SECURITIES SOLD SHORT—(10.8)% | ||||||||
| (Proceeds ($179,296)) | (180,985 | ) | ||||||
| VALUE | |||||
| TOTAL INVESTMENTS, NET OF SECURITIES SOLD SHORT—114.3% | ||||||
| (Identified Cost $1,763,316) | $ | 1,907,916 | (1) | |||
Other assets and liabilities, | (238,772 | ) | ||||
|
| |||||
| NET ASSETS—100.0% | $ | 1,669,144 | ||||
|
| |||||
Abbreviations:
| SPDR | S&P Depositary Receipt |
FOOTNOTE LEGEND:
| (1) | Federal Income Tax Information: For tax information at September 30, 2013, see Note 10 Federal Income Tax Information in the Notes to Financial Statements. |
| (2) | All or a portion have been segregated as collateral for margin borrowing and securities sold short. |
The following table provides a summary of inputs used to value the Fund’s investments as of September 30, 2013 (See Security Valuation Note 2A in the Notes to Financial Statements):
| Total Value at September 30, 2013 | Level 1 Quoted Prices | |||||||
Equity Securities: | ||||||||
Exchange-Traded Funds | $ | 2,086,202 | $ | 2,086,202 | ||||
Short-Term Investments | 2,699 | 2,699 | ||||||
|
|
|
| |||||
Total Investments before Securities Sold Short | $ | 2,088,901 | $ | 2,088,901 | ||||
|
|
|
| |||||
Liabilities: | ||||||||
Exchange Traded Funds Sold Short | (180,985 | ) | (180,985 | ) | ||||
|
|
|
| |||||
Total Investments net of Securities Sold Short | $ | 1,907,916 | $ | 1,907,916 | ||||
|
|
|
| |||||
There are no Level 2 (significant observable inputs) or Level 3 (significant unobservable inputs) priced securities.
See Notes to Financial Statements
33
Table of Contents
VIRTUS GLOBAL PREMIUM ALPHASECTOR™ FUND
SCHEDULE OF INVESTMENTS
SEPTEMBER 30, 2013
($ reported in thousands)
| SHARES | VALUE | |||||||
| EXCHANGE-TRADED FUNDS—99.7% | ||||||||
Consumer Discretionary Select Sector SPDR Fund | 195,310 | $ | 11,842 | |||||
Energy Select Sector SPDR Fund | 138,190 | 11,453 | ||||||
Financial Select Sector SPDR Fund | 578,470 | 11,523 | ||||||
Health Care Select Sector SPDR Fund | 228,230 | 11,542 | ||||||
Industrial Select Sector SPDR Fund | 255,370 | 11,841 | ||||||
iShares MSCI Canada Index Fund | 215,800 | 6,109 | ||||||
iShares MSCI Emerging Markets Index Fund | 448,920 | 18,302 | ||||||
iShares MSCI Japan Index Fund | 604,500 | 7,200 | ||||||
iShares MSCI Pacific Ex-Japan Index Fund | 127,490 | 6,075 | ||||||
Materials Select Sector SPDR Fund | 278,800 | 11,710 | ||||||
Technology Select Sector SPDR Fund | 360,300 | 11,540 | ||||||
Vanguard FTSE Europe ETF | 370,350 | 20,188 | ||||||
| TOTAL EXCHANGE-TRADED FUNDS | ||||||||
| (Identified Cost $124,970) | 139,325 | |||||||
| TOTAL LONG TERM INVESTMENTS—99.7% | ||||||||
| (Identified Cost $124,970) | 139,325 | |||||||
| SHORT-TERM INVESTMENTS—0.1% | ||||||||
| Money Market Mutual Funds—0.1% | ||||||||
Fidelity Money Market Portfolio – Institutional Shares (Seven-day effective yield 0.090%) | 200,289 | 200 | ||||||
| TOTAL SHORT-TERM INVESTMENTS (Identified Cost $200) | 200 | |||||||
| TOTAL INVESTMENTS—99.8% (Identified Cost $125,170) | 139,525 | (1) | ||||||
Other assets and liabilities, |
| 292 | ||||||
|
| |||||||
| NET ASSETS—100.0% | $ | 139,817 | ||||||
|
| |||||||
| Abbreviations: | ||
ETF | Exchange-Traded Fund | |
SPDR | S&P Depositary Receipt | |
FOOTNOTE LEGEND:
| (1) | Federal Income Tax Information: For tax information at September 30, 2013, see Note 10 Federal Income Tax Information in the Notes to Financial Statements. |
The following table provides a summary of inputs used to value the Fund’s investments as of September 30, 2013 (See Security Valuation Note 2A in the Notes to Financial Statements):
| Total Value at September 30, 2013 | Level 1 Quoted Prices | |||||||
Equity Securities: | ||||||||
Exchange- Traded Funds | $ | 139,325 | $ | 139,325 | ||||
Short-Term Investments | 200 | 200 | ||||||
|
|
|
| |||||
Total Investments | $ | 139,525 | $ | 139,525 | ||||
|
|
|
| |||||
There are no Level 2 (significant observable inputs) or Level 3 (significant unobservable inputs) priced securities.
See Notes to Financial Statements
34
Table of Contents
VIRTUS PREMIUM ALPHASECTOR™ FUND
SCHEDULE OF INVESTMENTS
SEPTEMBER 30, 2013
($ reported in thousands)
| SHARES | VALUE | |||||||
| COMMON STOCKS—99.3% | ||||||||
| Consumer Discretionary—14.4% | ||||||||
Abercrombie & Fitch Co. Class A | 35,105 | $ | 1,242 | |||||
Amazon.com, Inc.(2) | 164,812 | 51,527 | ||||||
AutoNation, Inc.(2) | 28,687 | 1,497 | ||||||
AutoZone, Inc.(2) | 15,848 | 6,699 | ||||||
Bed Bath & Beyond, Inc.(2) | 97,393 | 7,534 | ||||||
Best Buy Co., Inc. | 120,268 | 4,510 | ||||||
BorgWarner, Inc. | 51,476 | 5,219 | ||||||
Cablevision Systems Corp. Class A | 98,220 | 1,654 | ||||||
CarMax, Inc.(2) | 100,868 | 4,889 | ||||||
Carnival Corp. | 195,883 | 6,394 | ||||||
CBS Corp. Class B | 251,680 | 13,883 | ||||||
Chipotle Mexican Grill, Inc.(2) | 13,748 | 5,894 | ||||||
Coach, Inc. | 125,426 | 6,839 | ||||||
Comcast Corp. Class A | 1,164,804 | 52,591 | ||||||
Darden Restaurants, Inc. | 58,117 | 2,690 | ||||||
Delphi Automotive plc | 126,307 | 7,379 | ||||||
DIRECTV Class A(2) | 228,456 | 13,650 | ||||||
Discovery Communications, Inc. Class A(2) | 103,310 | 8,721 | ||||||
Dollar General Corp.(2) | 133,220 | 7,522 | ||||||
Dollar Tree, Inc.(2) | 99,471 | 5,686 | ||||||
Expedia, Inc. | 48,071 | 2,490 | ||||||
Family Dollar Stores, Inc. | 43,248 | 3,115 | ||||||
Ford Motor Co. | 1,754,549 | 29,599 | ||||||
Fossil Group, Inc.(2) | 22,420 | 2,606 | ||||||
GameStop Corp. Class A | 52,310 | 2,597 | ||||||
Gannett Co., Inc. | 102,525 | 2,747 | ||||||
Gap, Inc. (The) | 123,425 | 4,972 | ||||||
Garmin Ltd.(3) | 55,053 | 2,488 | ||||||
General Motors Co.(2) | 421,151 | 15,149 | ||||||
Genuine Parts Co. | 69,494 | 5,621 | ||||||
Goodyear Tire & Rubber Co. (The)(2) | 109,546 | 2,459 | ||||||
H&R Block, Inc. | 122,375 | 3,263 | ||||||
Harley-Davidson, Inc. | 100,729 | 6,471 | ||||||
Harman International Industries, Inc. | 29,630 | 1,962 | ||||||
Hasbro, Inc. | 50,805 | 2,395 | ||||||
| SHARES | VALUE | |||||||
| Consumer Discretionary (continued) | ||||||||
Home Depot, Inc. (The) | 637,947 | $ | 48,388 | |||||
Horton (D.R.), Inc. | 127,119 | 2,470 | ||||||
Host Hotels & Resorts, Inc. | 253,890 | 4,486 | ||||||
International Game Technology | 116,089 | 2,198 | ||||||
Interpublic Group of Cos., Inc. (The) | 186,784 | 3,209 | ||||||
J.C. Penney Co., Inc.(2)(3) | 135,640 | 1,196 | ||||||
Johnson Controls, Inc. | 306,364 | 12,714 | ||||||
Kohl’s Corp. | 91,352 | 4,727 | ||||||
L Brands, Inc. | 108,968 | 6,658 | ||||||
Leggett & Platt, Inc. | 62,285 | 1,878 | ||||||
Lennar Corp. Class A | 74,273 | 2,629 | ||||||
Lowe’s Cos., Inc. | 468,414 | 22,301 | ||||||
Macy’s, Inc. | 168,346 | 7,284 | ||||||
Marriott International, Inc. | 101,739 | 4,279 | ||||||
Mattel, Inc. | 154,176 | 6,454 | ||||||
McDonald’s Corp. | 445,201 | 42,833 | ||||||
Netflix, Inc.(2) | 26,387 | 8,159 | ||||||
Newell Rubbermaid, Inc. | 127,449 | 3,505 | ||||||
News Corp.(2) | 222,815 | 3,578 | ||||||
NIKE, Inc. Class B | 334,653 | 24,309 | ||||||
Nordstrom, Inc. | 64,522 | 3,626 | ||||||
O’Reilly Automotive, Inc.(2) | 48,567 | 6,197 | ||||||
Omnicom Group, Inc. | 115,471 | 7,325 | ||||||
PetSmart, Inc. | 46,497 | 3,546 | ||||||
Phillips-Van Heusen Corp. | 37,028 | 4,395 | ||||||
priceline.com, Inc.(2) | 23,016 | 23,268 | ||||||
PulteGroup, Inc. | 156,384 | 2,580 | ||||||
Ralph Lauren Corp. | 27,202 | 4,481 | ||||||
Ross Stores, Inc. | 97,344 | 7,087 | ||||||
Scripps Networks Interactive, Inc. Class A | 48,950 | 3,824 | ||||||
Staples, Inc. | 294,152 | 4,309 | ||||||
Starbucks Corp. | 336,213 | 25,878 | ||||||
Starwood Hotels & Resorts Worldwide, Inc. | 86,781 | 5,767 | ||||||
Target Corp. | 282,397 | 18,068 | ||||||
Tiffany & Co. | 49,242 | 3,773 | ||||||
Time Warner Cable, Inc. | 127,870 | 14,270 | ||||||
Time Warner, Inc. | 409,724 | 26,964 | ||||||
See Notes to Financial Statements
35
Table of Contents
VIRTUS PREMIUM ALPHASECTOR™ FUND
SCHEDULE OF INVESTMENTS (Continued)
SEPTEMBER 30, 2013
($ reported in thousands)
| SHARES | VALUE | |||||||
| Consumer Discretionary (continued) | ||||||||
TJX Cos., Inc. | 320,034 | $ | 18,047 | |||||
TripAdvisor, Inc.(2) | 49,907 | 3,785 | ||||||
Twenty-First Century Fox, Inc. | 884,559 | 29,633 | ||||||
Urban Outfitters, Inc.(2) | 49,750 | 1,829 | ||||||
VF Corp. | 39,077 | 7,778 | ||||||
Viacom, Inc. Class B | 194,191 | 16,230 | ||||||
Walt Disney Co. (The) | 739,909 | 47,717 | ||||||
Washington Post Co. (The) Class B | 1,989 | 1,216 | ||||||
Whirlpool Corp. | 35,911 | 5,259 | ||||||
Wyndham Worldwide Corp. | 60,003 | 3,658 | ||||||
Wynn Resorts Ltd. | 36,188 | 5,718 | ||||||
Yum! Brands, Inc. | 199,686 | 14,256 | ||||||
|
| |||||||
| 837,693 | ||||||||
|
| |||||||
| Energy—14.1% | ||||||||
Anadarko Petroleum Corp. | 292,044 | 27,157 | ||||||
Apache Corp. | 232,301 | 19,778 | ||||||
Baker Hughes, Inc. | 292,950 | 14,384 | ||||||
Cabot Oil & Gas Corp. | 455,213 | 16,989 | ||||||
Cameron International Corp.(2) | 196,886 | 11,492 | ||||||
Chesapeake Energy Corp. | 336,400 | 8,706 | ||||||
Chevron Corp. | 984,501 | 119,617 | ||||||
ConocoPhillips | 450,974 | 31,347 | ||||||
CONSOL Energy, Inc. | 182,772 | 6,150 | ||||||
Denbury Resources, Inc.(2) | 374,531 | 6,895 | ||||||
Devon Energy Corp. | 219,811 | 12,696 | ||||||
Diamond Offshore Drilling, Inc. | 56,612 | 3,528 | ||||||
Ensco plc Class A | 116,536 | 6,264 | ||||||
EOG Resources, Inc. | 165,746 | 28,057 | ||||||
EQT Corp. | 75,128 | 6,665 | ||||||
Exxon Mobil Corp. | 1,482,048 | 127,515 | ||||||
FMC Technologies, Inc.(2) | 212,461 | 11,775 | ||||||
Halliburton Co. | 505,204 | 24,326 | ||||||
Helmerich & Payne, Inc. | 53,128 | 3,663 | ||||||
Hess Corp. | 178,897 | 13,836 | ||||||
Kinder Morgan, Inc. | 335,895 | 11,948 | ||||||
Marathon Oil Corp. | 415,737 | 14,501 | ||||||
| SHARES | VALUE | |||||||
| Energy (continued) | ||||||||
Marathon Petroleum Corp. | 156,180 | $ | 10,046 | |||||
Murphy Oil Corp. | 118,983 | 7,177 | ||||||
Nabors Industries Ltd. | 238,505 | 3,830 | ||||||
National Oilwell Varco, Inc. | 270,681 | 21,143 | ||||||
Newfield Exploration Co.(2) | 67,688 | 1,853 | ||||||
Noble Corp. | 126,405 | 4,774 | ||||||
Noble Energy, Inc. | 244,164 | 16,361 | ||||||
Occidental Petroleum Corp. | 350,931 | 32,826 | ||||||
Peabody Energy Corp. | 193,598 | 3,340 | ||||||
Phillips 66 | 306,230 | 17,706 | ||||||
Pioneer Natural Resources Co. | 156,652 | 29,576 | ||||||
QEP Resources, Inc. | 89,442 | 2,477 | ||||||
Range Resources Corp. | 127,980 | 9,712 | ||||||
Rowan Cos. plc Class A(2) | 167,668 | 6,157 | ||||||
Schlumberger Ltd. | 688,946 | 60,875 | ||||||
Southwestern Energy Co.(2) | 224,243 | 8,158 | ||||||
Spectra Energy Corp. | 449,276 | 15,379 | ||||||
Tesoro Corp. | 210,959 | 9,278 | ||||||
Valero Energy Corp. | 378,469 | 12,925 | ||||||
Williams Cos., Inc. (The) | 483,046 | 17,564 | ||||||
WPX Energy, Inc.(2) | 100,077 | 1,927 | ||||||
|
| |||||||
| 820,373 | ||||||||
|
| |||||||
| Financials—14.0% | ||||||||
ACE Ltd. | 115,135 | 10,772 | ||||||
Aflac, Inc. | 157,441 | 9,760 | ||||||
Allstate Corp. (The) | 156,882 | 7,930 | ||||||
American Express Co. | 314,080 | 23,719 | ||||||
American International Group, Inc. | 499,768 | 24,304 | ||||||
American Tower Corp. | 133,713 | 9,912 | ||||||
Ameriprise Financial, Inc. | 67,662 | 6,163 | ||||||
AON plc | 104,552 | 7,783 | ||||||
Apartment Investment & Management Co. Class A | 49,636 | 1,387 | ||||||
Assurant, Inc. | 24,985 | 1,352 | ||||||
See Notes to Financial Statements
36
Table of Contents
VIRTUS PREMIUM ALPHASECTOR™ FUND
SCHEDULE OF INVESTMENTS (Continued)
SEPTEMBER 30, 2013
($ reported in thousands)
| SHARES | VALUE | |||||||
| Financials (continued) | ||||||||
AvalonBay Communities, Inc. | 41,177 | $ | 5,233 | |||||
Bank of America Corp. | 3,636,659 | 50,186 | ||||||
Bank of New York Mellon Corp. (The) | 389,334 | 11,754 | ||||||
BB&T Corp. | 238,272 | 8,042 | ||||||
Berkshire Hathaway, Inc. Class B(2) | 609,211 | 69,152 | ||||||
BlackRock, Inc. | 42,614 | 11,532 | ||||||
Boston Properties, Inc. | 51,585 | 5,514 | ||||||
Capital One Financial Corp. | 198,144 | 13,620 | ||||||
CBRE Group, Inc.(2) | 93,859 | 2,171 | ||||||
Charles Schwab Corp. (The) | 391,453 | 8,275 | ||||||
Chubb Corp. (The) | 86,489 | 7,720 | ||||||
Cincinnati Financial Corp. | 49,961 | 2,356 | ||||||
Citigroup, Inc. | 1,029,298 | 49,931 | ||||||
CME Group, Inc. | 106,381 | 7,859 | ||||||
Comerica, Inc. | 63,222 | 2,485 | ||||||
Discover Financial Services | 162,966 | 8,236 | ||||||
E*Trade Financial Corp.(2) | 97,865 | 1,615 | ||||||
Equity Residential | 113,440 | 6,077 | ||||||
Fifth Third Bancorp | 300,256 | 5,417 | ||||||
Franklin Resources, Inc. | 137,950 | 6,973 | ||||||
Genworth Financial, Inc. Class A(2) | 166,574 | 2,131 | ||||||
Goldman Sachs Group, Inc. (The) | 141,390 | 22,369 | ||||||
Hartford Financial Services Group, Inc. (The) | 154,035 | 4,794 | ||||||
HCP, Inc. | 154,059 | 6,309 | ||||||
Health Care REIT, Inc. | 97,070 | 6,055 | ||||||
Hudson City Bancorp, Inc. | 164,361 | 1,487 | ||||||
Huntington Bancshares, Inc. | 280,841 | 2,320 | ||||||
IntercontinentalExchange, Inc.(2) | 24,685 | 4,478 | ||||||
Invesco Ltd. | 149,341 | 4,764 | ||||||
JPMorgan Chase & Co. | 1,274,210 | 65,864 | ||||||
KeyCorp | 310,733 | 3,542 | ||||||
Kimco Realty Corp. | 138,332 | 2,792 | ||||||
Legg Mason, Inc. | 36,755 | 1,229 | ||||||
Leucadia National Corp. | 106,092 | 2,890 | ||||||
Lincoln National Corp. | 90,404 | 3,796 | ||||||
| SHARES | VALUE | |||||||
| Financials (continued) | ||||||||
Loews Corp. | 102,949 | $ | 4,812 | |||||
M&T Bank Corp. | 44,016 | 4,926 | ||||||
Macerich Co. (The) | 47,579 | 2,685 | ||||||
Marsh & McLennan Cos., Inc. | 185,017 | 8,058 | ||||||
McGraw-Hill Cos., Inc. (The) | 92,359 | 6,058 | ||||||
MetLife, Inc. | 379,082 | 17,798 | ||||||
Moody’s Corp. | 65,086 | 4,578 | ||||||
Morgan Stanley | 470,722 | 12,686 | ||||||
NASDAQ OMX Group, Inc. (The) | 40,107 | 1,287 | ||||||
Northern Trust Corp. | 76,415 | 4,156 | ||||||
NYSE Euronext, Inc. | 82,255 | 3,453 | ||||||
People’s United Financial, Inc. | 108,696 | 1,563 | ||||||
Plum Creek Timber Co., Inc. | 54,210 | 2,539 | ||||||
PNC Financial Services Group, Inc. | 179,925 | 13,036 | ||||||
Principal Financial Group, Inc. | 93,102 | 3,987 | ||||||
Progressive Corp. (The) | 187,229 | 5,098 | ||||||
Prologis, Inc. | 168,784 | 6,350 | ||||||
Prudential Financial, Inc. | 157,780 | 12,304 | ||||||
Public Storage | 48,723 | 7,822 | ||||||
Regions Financial Corp. | 479,623 | 4,441 | ||||||
Simon Property Group, Inc. | 105,052 | 15,572 | ||||||
SLM Corp. | 146,929 | 3,659 | ||||||
State Street Corp. | 150,967 | 9,926 | ||||||
SunTrust Banks, Inc. | 182,446 | 5,915 | ||||||
T. Rowe Price Group, Inc. | 88,062 | 6,334 | ||||||
Torchmark Corp. | 30,741 | 2,224 | ||||||
Travelers Cos., Inc. (The) | 126,430 | 10,717 | ||||||
U.S. Bancorp | 622,109 | 22,757 | ||||||
Unum Group | 89,230 | 2,716 | ||||||
Ventas, Inc. | 99,058 | 6,092 | ||||||
Vornado Realty Trust | 58,876 | 4,949 | ||||||
Wells Fargo & Co. | 1,635,628 | 67,584 | ||||||
Weyerhaeuser Co. | 196,253 | 5,619 | ||||||
XL Group plc | 98,053 | 3,022 | ||||||
Zions Bancorp | 62,934 | 1,726 | ||||||
|
| |||||||
| 818,499 | ||||||||
|
| |||||||
See Notes to Financial Statements
37
Table of Contents
VIRTUS PREMIUM ALPHASECTOR™ FUND
SCHEDULE OF INVESTMENTS (Continued)
SEPTEMBER 30, 2013
($ reported in thousands)
| SHARES | VALUE | |||||||
| Health Care—14.1% | ||||||||
Abbott Laboratories | 555,004 | $ | 18,421 | |||||
AbbVie, Inc. | 666,378 | 29,807 | ||||||
Actavis, Inc.(2) | 76,888 | 11,072 | ||||||
Aetna, Inc. | 161,016 | 10,308 | ||||||
Agilent Technologies, Inc. | 139,364 | 7,142 | ||||||
Alexion Pharmaceuticals, Inc.(2) | 81,840 | 9,506 | ||||||
Allergan, Inc. | 128,544 | 11,627 | ||||||
AmerisourceBergen Corp. | 101,037 | 6,173 | ||||||
Amgen, Inc. | 316,652 | 35,446 | ||||||
Bard (C.R.), Inc. | 35,517 | 4,092 | ||||||
Baxter International, Inc. | 232,073 | 15,245 | ||||||
Becton, Dickinson & Co. | 83,604 | 8,362 | ||||||
Biogen Idec, Inc.(2) | 102,138 | 24,591 | ||||||
Boston Scientific Corp.(2) | 571,099 | 6,705 | ||||||
Bristol-Myers Squibb Co. | 697,127 | 32,263 | ||||||
Cardinal Health, Inc. | 143,558 | 7,487 | ||||||
CareFusion Corp.(2) | 90,321 | 3,333 | ||||||
Celgene Corp.(2) | 172,863 | 26,609 | ||||||
Cerner Corp.(2) | 124,308 | 6,532 | ||||||
CIGNA Corp. | 122,996 | 9,453 | ||||||
Covidien plc | 193,798 | 11,810 | ||||||
DaVita, Inc.(2) | 74,339 | 4,230 | ||||||
DENTSPLY International, Inc. | 60,137 | 2,611 | ||||||
Edwards Lifesciences Corp.(2) | 47,629 | 3,316 | ||||||
Eli Lilly & Co. | 417,696 | 21,023 | ||||||
Express Scripts Holding Co.(2) | 360,296 | 22,259 | ||||||
Forest Laboratories, Inc.(2) | 100,709 | 4,309 | ||||||
Gilead Sciences, Inc.(2) | 643,352 | 40,428 | ||||||
Hospira, Inc.(2) | 70,868 | 2,779 | ||||||
Humana, Inc. | 71,370 | 6,661 | ||||||
Intuitive Surgical, Inc.(2) | 16,679 | 6,276 | ||||||
Johnson & Johnson | 1,184,481 | 102,683 | ||||||
Laboratory Corp. of America Holdings(2) | 37,959 | 3,763 | ||||||
Life Technologies Corp.(2) | 72,586 | 5,432 | ||||||
| SHARES | VALUE | |||||||
| Health Care (continued) | ||||||||
McKesson Corp. | 99,220 | $ | 12,730 | |||||
Medtronic, Inc. | 422,194 | 22,482 | ||||||
Merck & Co., Inc. | 1,230,010 | 58,561 | ||||||
Mylan, Inc.(2) | 162,326 | 6,196 | ||||||
Patterson Cos., Inc. | 35,940 | 1,445 | ||||||
PerkinElmer, Inc. | 47,594 | 1,797 | ||||||
Perrigo Co. | 39,657 | 4,893 | ||||||
Pfizer, Inc. | 2,782,624 | 79,889 | ||||||
Quest Diagnostics, Inc. | 66,371 | 4,101 | ||||||
Regeneron Pharmaceuticals, Inc.(2) | 32,876 | 10,284 | ||||||
St. Jude Medical, Inc. | 124,305 | 6,668 | ||||||
Stryker Corp. | 126,314 | 8,538 | ||||||
Tenet Healthcare Corp.(2) | 44,410 | 1,829 | ||||||
Thermo Fisher Scientific, Inc. | 151,529 | 13,963 | ||||||
UnitedHealth Group, Inc. | 430,846 | 30,853 | ||||||
Varian Medical Systems, Inc.(2) | 44,915 | 3,356 | ||||||
Vertex Pharmaceuticals, Inc.(2) | 97,850 | 7,418 | ||||||
Waters Corp.(2) | 35,906 | 3,814 | ||||||
WellPoint, Inc. | 129,308 | 10,811 | ||||||
Zimmer Holdings, Inc. | 72,243 | 5,934 | ||||||
Zoetis, Inc. | 210,283 | 6,544 | ||||||
|
| |||||||
| 823,860 | ||||||||
|
| |||||||
| Industrials—14.4% | ||||||||
3M Co. | 330,748 | 39,495 | ||||||
ADT Corp. (The) | 99,348 | 4,039 | ||||||
Ametek, Inc. | 121,900 | 5,610 | ||||||
Avery Dennison Corp. | 153,950 | 6,700 | ||||||
Boeing Co. (The) | 359,792 | 42,276 | ||||||
Caterpillar, Inc. | 337,063 | 28,101 | ||||||
Cintas Corp. | 61,595 | 3,154 | ||||||
CSX Corp. | 610,118 | 15,704 | ||||||
Cummins, Inc. | 159,315 | 21,168 | ||||||
Danaher Corp. | 333,737 | 23,135 | ||||||
Deere & Co. | 212,353 | 17,283 | ||||||
Delta Air Lines, Inc. | 426,188 | 10,054 | ||||||
Dover Corp. | 102,590 | 9,216 | ||||||
Dun & Bradstreet Corp. | 19,211 | 1,995 | ||||||
Eaton Corp. plc | 287,833 | 19,814 | ||||||
Emerson Electric Co. | 375,845 | 24,317 | ||||||
Equifax, Inc. | 81,981 | 4,907 | ||||||
See Notes to Financial Statements
38
Table of Contents
VIRTUS PREMIUM ALPHASECTOR™ FUND
SCHEDULE OF INVESTMENTS (Continued)
SEPTEMBER 30, 2013
($ reported in thousands)
| SHARES | VALUE | |||||||
| Industrials (continued) | ||||||||
Expeditors International of Washington, Inc. | 103,543 | $ | 4,562 | |||||
Fastenal Co. | 135,525 | 6,810 | ||||||
FedEx Corp. | 158,276 | 18,061 | ||||||
Flowserve Corp. | 69,849 | 4,358 | ||||||
Fluor Corp. | 117,781 | 8,358 | ||||||
General Dynamics Corp. | 179,693 | 15,727 | ||||||
General Electric Co. | 3,745,746 | 89,486 | ||||||
Grainger (W.W.), Inc. | 40,281 | 10,542 | ||||||
Honeywell International, Inc. | 411,348 | 34,158 | ||||||
Illinois Tool Works, Inc. | 217,574 | 16,594 | ||||||
Ingersoll-Rand plc | 134,444 | 8,731 | ||||||
Iron Mountain, Inc. | 86,341 | 2,333 | ||||||
Jacobs Engineering Group, Inc.(2) | 65,312 | 3,800 | ||||||
Joy Global, Inc. | 53,473 | 2,729 | ||||||
Kansas City Southern | 54,754 | 5,988 | ||||||
L-3 Communications Holdings, Inc. | 45,120 | 4,264 | ||||||
Lockheed Martin Corp. | 141,992 | 18,111 | ||||||
Masco Corp. | 199,131 | 4,237 | ||||||
Nielsen Holdings NV | 106,533 | 3,883 | ||||||
Norfolk Southern Corp. | 181,922 | 14,072 | ||||||
Northrop Grumman Corp. | 123,525 | 11,767 | ||||||
PACCAR, Inc. | 204,551 | 11,385 | ||||||
Pall Corp. | 81,178 | 6,254 | ||||||
Parker Hannifin Corp. | 93,471 | 10,162 | ||||||
PentAir, Inc. | 98,928 | 6,424 | ||||||
Pitney Bowes, Inc.(3) | 117,786 | 2,142 | ||||||
Precision Castparts Corp. | 72,299 | 16,429 | ||||||
Quanta Services, Inc.(2) | 106,182 | 2,921 | ||||||
Raytheon Co. | 175,305 | 13,511 | ||||||
Republic Services, Inc. | 134,884 | 4,500 | ||||||
Robert Half International, Inc. | 97,554 | 3,808 | ||||||
Robinson (C.H.) Worldwide, Inc. | 79,186 | 4,716 | ||||||
Rockwell Automation, Inc. | 89,123 | 9,531 | ||||||
Rockwell Collins, Inc. | 86,661 | 5,881 | ||||||
Roper Industries, Inc. | 49,270 | 6,546 | ||||||
Ryder System, Inc. | 47,218 | 2,819 | ||||||
Snap-On, Inc. | 29,024 | 2,888 | ||||||
Southwest Airlines Co. | 384,655 | 5,601 | ||||||
| SHARES | VALUE | |||||||
| Industrials (continued) | ||||||||
Stanley Black & Decker, Inc. | 79,518 | $ | 7,202 | |||||
Stericycle, Inc.(2) | 42,657 | 4,923 | ||||||
Textron, Inc. | 175,817 | 4,854 | ||||||
Tyco International Ltd. | 229,638 | 8,033 | ||||||
Union Pacific Corp. | 250,788 | 38,957 | ||||||
United Parcel Service, Inc. Class B | 365,127 | 33,362 | ||||||
United Technologies Corp. | 435,638 | 46,970 | ||||||
Waste Management, Inc. | 236,333 | 9,746 | ||||||
Xylem, Inc. | 94,096 | 2,628 | ||||||
|
| |||||||
| 837,732 | ||||||||
|
| |||||||
| Information Technology—12.5% | ||||||||
Accenture plc Class A | 174,618 | 12,859 | ||||||
Adobe Systems, Inc.(2) | 129,852 | 6,745 | ||||||
Akamai Technologies, Inc.(2) | 54,703 | 2,828 | ||||||
Altera Corp. | 93,156 | 3,462 | ||||||
Amphenol Corp. Class A | 46,204 | 3,575 | ||||||
Analog Devices, Inc. | 88,911 | 4,183 | ||||||
Apple, Inc. | 246,059 | 117,309 | ||||||
Applied Materials, Inc. | 334,200 | 5,862 | ||||||
Autodesk, Inc.(2) | 64,420 | 2,652 | ||||||
Automatic Data Processing, Inc. | 133,179 | 9,639 | ||||||
Broadcom Corp. Class A | 154,325 | 4,014 | ||||||
CA, Inc. | 93,543 | 2,775 | ||||||
Cisco Systems, Inc. | 1,452,150 | 34,009 | ||||||
Citrix Systems, Inc.(2) | 54,076 | 3,818 | ||||||
Cognizant Technology Solutions Corp. Class A(2) | 84,955 | 6,977 | ||||||
Computer Sciences Corp. | 42,304 | 2,189 | ||||||
Corning, Inc. | 403,194 | 5,883 | ||||||
Dell, Inc. | 401,392 | 5,527 | ||||||
eBay, Inc.(2) | 321,019 | 17,910 | ||||||
Electronic Arts, Inc.(2) | 88,767 | 2,268 | ||||||
EMC Corp. | 571,206 | 14,600 | ||||||
F5 Networks, Inc.(2) | 21,173 | 1,816 | ||||||
Fidelity National Information Services, Inc. | 86,522 | 4,018 | ||||||
See Notes to Financial Statements
39
Table of Contents
VIRTUS PREMIUM ALPHASECTOR™ FUND
SCHEDULE OF INVESTMENTS (Continued)
SEPTEMBER 30, 2013
($ reported in thousands)
| SHARES | VALUE | |||||||
| Information Technology (continued) | ||||||||
First Solar, Inc.(2) | 18,668 | $ | 751 | |||||
Fiserv, Inc.(2) | 37,263 | 3,765 | ||||||
FLIR Systems, Inc. | 41,802 | 1,313 | ||||||
Google, Inc. Class A(2) | 75,758 | 66,357 | ||||||
Harris Corp. | 31,694 | 1,879 | ||||||
Hewlett-Packard Co. | 432,588 | 9,076 | ||||||
Intel Corp. | 1,150,648 | 26,373 | ||||||
International Business Machines Corp. | 278,901 | 51,647 | ||||||
Intuit, Inc. | 84,503 | 5,603 | ||||||
Jabil Circuit, Inc. | 58,301 | 1,264 | ||||||
JDS Uniphase Corp.(2) | 81,117 | 1,193 | ||||||
Juniper Networks, Inc.(2) | 141,752 | 2,815 | ||||||
KLA-Tencor Corp. | 48,291 | 2,939 | ||||||
Lam Research Corp.(2) | 44,195 | 2,262 | ||||||
Linear Technology Corp. | 67,851 | 2,691 | ||||||
LSI Corp. | 162,699 | 1,272 | ||||||
MasterCard, Inc. Class A | 28,744 | 19,338 | ||||||
Microchip Technology, Inc. | 58,478 | 2,356 | ||||||
Micron Technology, Inc.(2) | 299,366 | 5,230 | ||||||
Microsoft Corp. | 2,053,077 | 68,388 | ||||||
Molex, Inc. | 43,387 | 1,671 | ||||||
Motorola Solutions, Inc. | 65,643 | 3,898 | ||||||
NetApp, Inc. | 96,952 | 4,132 | ||||||
NVIDIA Corp. | 165,707 | 2,578 | ||||||
Oracle Corp. | 971,158 | 32,213 | ||||||
Paychex, Inc. | 92,438 | 3,757 | ||||||
QUALCOMM, Inc. | 467,445 | 31,487 | ||||||
Red Hat, Inc.(2) | 55,800 | 2,575 | ||||||
Salesforce.com, Inc.(2) | 159,451 | 8,277 | ||||||
SanDisk Corp. | 71,082 | 4,230 | ||||||
Seagate Technology plc | 84,927 | 3,715 | ||||||
Symantec Corp. | 195,296 | 4,834 | ||||||
TE Connectivity Ltd. | 111,958 | 5,797 | ||||||
Teradata Corp.(2) | 48,382 | 2,682 | ||||||
Teradyne, Inc.(2) | 64,801 | 1,071 | ||||||
Texas Instruments, Inc. | 302,879 | 12,197 | ||||||
Total System Services, Inc. | 51,603 | 1,518 | ||||||
VeriSign, Inc.(2) | 40,370 | 2,054 | ||||||
Visa, Inc. Class A | 139,810 | 26,718 | ||||||
Western Digital Corp. | 59,969 | 3,802 | ||||||
Western Union Co. (The) | 154,568 | 2,884 | ||||||
| SHARES | VALUE | |||||||
| Information Technology (continued) | ||||||||
Xerox Corp. | 335,230 | $ | 3,450 | |||||
Xilinx, Inc. | 77,248 | 3,620 | ||||||
Yahoo!, Inc.(2) | 261,420 | 8,669 | ||||||
|
| |||||||
| 729,259 | ||||||||
|
| |||||||
| Materials—14.1% | ||||||||
Air Products & Chemicals, Inc. | 329,905 | 35,158 | ||||||
Airgas, Inc. | 104,675 | 11,101 | ||||||
Alcoa, Inc. | 1,698,122 | 13,789 | ||||||
Allegheny Technologies, Inc. | 172,500 | 5,265 | ||||||
Ball Corp. | 229,634 | 10,306 | ||||||
Bemis Co., Inc. | 163,662 | 6,384 | ||||||
CF Industries Holdings, Inc. | 90,356 | 19,050 | ||||||
Cliffs Natural Resources, Inc.(3) | 245,551 | 5,034 | ||||||
Dow Chemical Co. (The) | 1,899,454 | 72,939 | ||||||
Du Pont (E.I.) de Nemours & Co. | 1,449,343 | 84,873 | ||||||
Eastman Chemical Co. | 243,216 | 18,947 | ||||||
Ecolab, Inc. | 402,961 | 39,796 | ||||||
FMC Corp. | 215,344 | 15,444 | ||||||
Freeport-McMoRan Copper & Gold, Inc. | 1,628,976 | 53,886 | ||||||
International Flavors & Fragrances, Inc. | 129,379 | 10,648 | ||||||
International Paper Co. | 701,811 | 31,441 | ||||||
LyondellBasell Industries N.V. Class A | 700,992 | 51,334 | ||||||
MeadWestvaco Corp. | 281,067 | 10,787 | ||||||
Monsanto Co. | 836,721 | 87,329 | ||||||
Mosaic Co. (The) | 536,508 | 23,081 | ||||||
Newmont Mining Corp. | 784,101 | 22,033 | ||||||
Nucor Corp. | 501,283 | 24,573 | ||||||
Owens-Illinois, Inc.(2) | 261,018 | 7,836 | ||||||
PPG Industries, Inc. | 224,853 | 37,564 | ||||||
Praxair, Inc. | 462,763 | 55,629 | ||||||
Sealed Air Corp. | 310,936 | 8,454 | ||||||
Sherwin-Williams Co. (The) | 137,220 | 24,999 | ||||||
Sigma-Aldrich Corp. | 189,736 | 16,184 | ||||||
United States Steel Corp.(3) | 232,006 | 4,777 | ||||||
See Notes to Financial Statements
40
Table of Contents
VIRTUS PREMIUM ALPHASECTOR™ FUND
SCHEDULE OF INVESTMENTS (Continued)
SEPTEMBER 30, 2013
($ reported in thousands)
| SHARES | VALUE | |||||||
| Materials (continued) | ||||||||
Vulcan Materials Co. | 206,566 | $ | 10,702 | |||||
|
| |||||||
| 819,343 | ||||||||
|
| |||||||
| Telecommunication Services—1.7% | ||||||||
AT&T, Inc. | 1,438,397 | 48,647 | ||||||
CenturyLink, Inc. | 170,267 | 5,343 | ||||||
Crown Castle International Corp.(2) | 79,398 | 5,798 | ||||||
Frontier Communications Corp.(3) | 320,861 | 1,338 | ||||||
Verizon Communications, Inc. | 779,218 | 36,358 | ||||||
Windstream Holdings, Inc.(3) | 175,468 | 1,404 | ||||||
|
| |||||||
| 98,888 | ||||||||
| TOTAL COMMON STOCKS (Identified Cost $4,981,063) | 5,785,647 | |||||||
| TOTAL LONG TERM INVESTMENTS—99.3% | ||||||||
| (Identified Cost $4,981,063) | 5,785,647 | |||||||
| SHORT-TERM INVESTMENTS—0.3% | ||||||||
| Money Market Mutual Funds—0.3% | ||||||||
Fidelity Money Market Portfolio – Institutional Shares (Seven-day effective yield 0.090%) | 14,611,575 | 14,612 | ||||||
| TOTAL SHORT-TERM INVESTMENTS | ||||||||
| (Identified Cost $14,612) | 14,612 | |||||||
| SECURITIES LENDING COLLATERAL—0.2% | ||||||||
INVESCO Short-Term Investments Liquid Assets Portfolio (The) Institutional Shares (seven-day effective yield 0.070%)(4) | 12,403,180 | 12,403 | ||||||
| TOTAL SECURITIES LENDING COLLATERAL | ||||||||
| (Identified Cost $12,403) | 12,403 | |||||||
| TOTAL INVESTMENTS—99.8% (Identified Cost $5,008,078) | 5,812,662 | (1) | ||||||
Other assets and liabilities, |
| 12,656 | ||||||
|
| |||||||
| NET ASSETS—100.0% | $ | 5,825,318 | ||||||
|
| |||||||
Abbreviations:
| REIT | Real Estate Investment Trust |
FOOTNOTE LEGEND:
| (1) | Federal Income Tax Information: For tax information at September 30, 2013, see Note 10 Federal Income Tax Information in the Notes to Financial Statements. |
| (2) | Non-income producing. |
| (3) | All or a portion of security is on loan. |
| (4) | Represents security purchased with cash collateral received for securities on loan. |
The following table provides a summary of inputs used to value the Fund’s investments as of September 30, 2013 (See Security Valuation Note 2A in the Notes to Financial Statements):
| Total Value at September 30, 2013 | Level 1 Quoted Prices | |||||||
Equity Securities: | ||||||||
Common Stocks | $ | 5,785,647 | $ | 5,785,647 | ||||
Securities Lending Collateral | 12,403 | 12,403 | ||||||
Short-Term Investments | 14,612 | 14,612 | ||||||
|
|
|
| |||||
Total Investments | $ | 5,812,662 | $ | 5,812,662 | ||||
|
|
|
| |||||
There are no Level 2 (significant observable inputs) or Level 3 (significant unobservable inputs) priced securities.
See Notes to Financial Statements
41
Table of Contents
STATEMENTS OF ASSETS AND LIABILITIES
SEPTEMBER 30, 2013
(Reported in thousands except shares and per share amounts)
| Allocator Premium AlphaSector® Fund | ||||
| Assets | ||||
Investment in unaffiliated securities at value(1)(3) | $ | 592,301 | ||
Investments in affiliated funds at value(2) | — | |||
Foreign currency at value(4) | — | |||
Cash | — | |||
Deposits with prime broker | — | |||
Receivables | ||||
Investment securities sold | — | |||
Fund shares sold | 5,632 | |||
Dividends and interest receivable | 294 | |||
Tax reclaims | — | |||
Prepaid trustee retainer | 3 | |||
Prepaid expenses | 37 | |||
|
| |||
Total assets | 598,267 | |||
|
| |||
| Liabilities | ||||
Securities sold short at value(5) | — | |||
Payables | ||||
Fund shares repurchased | 1,388 | |||
Investment securities purchased | 1,804 | |||
Collateral on securities loaned | — | |||
Loan payable (See Note 12) | — | |||
Investment advisory fee | 522 | |||
Distribution and service fees | 203 | |||
Administration fee | 61 | |||
Transfer agent fees and expenses | 89 | |||
Trustees’ fees and expenses | 1 | |||
Professional fees | 18 | |||
Other accrued expenses | 41 | |||
|
| |||
Total liabilities | 4,127 | |||
|
| |||
| Net Assets | $ | 594,140 | ||
|
| |||
| Net Assets Consist of: | ||||
Capital paid in on shares of beneficial interest | $ | 552,135 | ||
Accumulated undistributed net investment income (loss) | — | |||
Accumulated undistributed net realized gain (loss) | 230 | |||
Net unrealized appreciation (depreciation) on investments | 41,775 | |||
Net unrealized appreciation (depreciation) on securities sold short | — | |||
|
| |||
| Net Assets | $ | 594,140 | ||
|
| |||
| Class A | ||||
Net asset value (net assets/shares outstanding) per share | $ | 11.28 | ||
Maximum offering price per share NAV/(1–5.75%) | $ | 11.97 | ||
Shares of beneficial interest outstanding, no par value, unlimited authorization | 10,165,657 | |||
Net Assets | $ | 114,697 | ||
| Class B | ||||
Net asset value (net assets/shares outstanding) and offering price per share | $ | — | ||
Shares of beneficial interest outstanding, no par value, unlimited authorization | — | |||
Net Assets | $ | — | ||
| Class C | ||||
Net asset value (net assets/shares outstanding) and offering price per share | $ | 11.19 | ||
Shares of beneficial interest outstanding, no par value, unlimited authorization | 20,595,559 | |||
Net Assets | $ | 230,459 | ||
| Class I | ||||
Net asset value (net assets/shares outstanding) and offering price per share | $ | 11.31 | ||
Shares of beneficial interest outstanding, no par value, unlimited authorization | 22,015,336 | |||
Net Assets | $ | 248,984 | ||
(1) Investment in unaffiliated securities at cost | $ | 550,526 | ||
(2) Investment in affiliated funds at cost | — | |||
(3) Market value of securities on loan | — | |||
(4) Foreign currency at cost | — | |||
(5) Proceeds from securities sold short | — | |||
| (6) | Amount is less than $500. |
See Notes to Financial Statements
42
Table of Contents
VIRTUS OPPORTUNITIES TRUST
STATEMENTS OF ASSETS AND LIABILITIES (Continued)
SEPTEMBER 30, 2013
| AlphaSector® Rotation Fund | Alternatives Diversifier Fund | Dynamic AlphaSector® Fund | Global Premium AlphaSector® Fund | Premium AlphaSector® Fund | ||||||||||||||
| $ | 648,666 | $ | 62,861 | $ | 2,088,901 | $ | 139,525 | $ | 5,812,662 | |||||||||
| — | 144,564 | — | — | — | ||||||||||||||
| — | — | 1 | — | — | ||||||||||||||
| — | — | 5,461 | — | — | ||||||||||||||
| — | — | 174,399 | — | — | ||||||||||||||
| 83 | 1,228 | 1,827 | — | 3,196 | ||||||||||||||
| 2,894 | 315 | 25,070 | 1,280 | 33,504 | ||||||||||||||
| 654 | — | (6) | 14 | — | (6) | 6,344 | ||||||||||||
| — | — | 5 | — | — | ||||||||||||||
| 3 | 1 | 8 | 1 | 31 | ||||||||||||||
| 48 | 32 | 101 | 20 | 182 | ||||||||||||||
|
|
|
|
|
|
|
|
|
| |||||||||
| 652,348 | 209,001 | 2,295,787 | 140,826 | 5,855,919 | ||||||||||||||
|
|
|
|
|
|
|
|
|
| |||||||||
| — | — | 180,985 | — | — | ||||||||||||||
| 2,169 | 472 | 8,693 | 104 | 6,729 | ||||||||||||||
| 53 | 800 | 23,877 | 672 | 3,075 | ||||||||||||||
| 990 | — | — | — | 12,403 | ||||||||||||||
| — | — | 409,811 | — | — | ||||||||||||||
| 237 | — | 2,332 | 122 | 5,161 | ||||||||||||||
| 228 | 48 | 330 | 45 | 1,441 | ||||||||||||||
| 67 | 22 | 165 | 14 | 599 | ||||||||||||||
| 109 | 44 | 228 | 23 | 831 | ||||||||||||||
| 1 | — | (6) | 2 | — | (6) | 6 | ||||||||||||
| 18 | 18 | 18 | 18 | 22 | ||||||||||||||
| 27 | 12 | 202 | 11 | 334 | ||||||||||||||
|
|
|
|
|
|
|
|
|
| |||||||||
| 3,899 | 1,416 | 626,643 | 1,009 | 30,601 | ||||||||||||||
|
|
|
|
|
|
|
|
|
| |||||||||
| $ | 648,449 | $ | 207,585 | $ | 1,669,144 | $ | 139,817 | $ | 5,825,318 | |||||||||
|
|
|
|
|
|
|
|
|
| |||||||||
| $ | 506,069 | $ | 274,501 | $ | 1,536,632 | $ | 123,064 | $ | 4,932,944 | |||||||||
| 1,517 | 960 | — | — | 6,317 | ||||||||||||||
| 42,503 | (85,289 | ) | (12,088 | ) | 2,398 | 81,473 | ||||||||||||
| 98,360 | 17,413 | 146,289 | 14,355 | 804,584 | ||||||||||||||
| — | — | (1,689 | ) | — | — | |||||||||||||
|
|
|
|
|
|
|
|
|
| |||||||||
| $ | 648,449 | $ | 207,585 | $ | 1,669,144 | $ | 139,817 | $ | 5,825,318 | |||||||||
|
|
|
|
|
|
|
|
|
| |||||||||
| $ | 13.87 | $ | 10.97 | $ | 11.73 | $ | 11.76 | $ | 15.52 | |||||||||
| $ | 14.72 | $ | 11.64 | $ | 12.45 | $ | 12.48 | $ | 16.47 | |||||||||
| 18,562,495 | 4,681,262 | 56,335,473 | 4,821,784 | 124,835,059 | ||||||||||||||
| $ | 257,492 | $ | 51,339 | $ | 660,921 | $ | 56,689 | $ | 1,937,456 | |||||||||
| $ | — | $ | — | $ | 10.94 | $ | — | $ | — | |||||||||
| — | — | 11,867 | — | — | ||||||||||||||
| $ | — | $ | — | $ | 130 | $ | — | $ | — | |||||||||
| $ | 13.73 | $ | 10.83 | $ | 10.88 | $ | 11.64 | $ | 15.39 | |||||||||
| 15,872,997 | 4,141,661 | 24,239,929 | 3,799,013 | 84,962,362 | ||||||||||||||
| $ | 217,861 | $ | 44,850 | $ | 263,722 | $ | 44,239 | $ | 1,307,857 | |||||||||
| $ | 13.87 | $ | 10.98 | $ | 11.84 | $ | 11.80 | $ | 15.54 | |||||||||
| 12,480,319 | 10,146,177 | 62,884,632 | 3,296,370 | 165,970,951 | ||||||||||||||
| $ | 173,096 | $ | 111,396 | $ | 744,371 | $ | 38,889 | $ | 2,580,005 | |||||||||
| $ | 550,306 | $ | 61,661 | $ | 1,942,612 | $ | 125,170 | $ | 5,008,078 | |||||||||
| — | $ | 128,351 | — | — | — | |||||||||||||
| $ | 966 | — | — | — | $ | 12,102 | ||||||||||||
| — | — | 1 | — | — | ||||||||||||||
| — | — | 179,296 | — | — | ||||||||||||||
See Notes to Financial Statements
43
Table of Contents
STATEMENTS OF OPERATIONS
YEAR ENDED SEPTEMBER 30, 2013
(Reported in thousands)
| Allocator Premium AlphaSector® Fund | ||||
| Investment Income | ||||
Dividends | $ | 9,812 | ||
Dividend income from affiliated funds | — | |||
Interest | — | (1) | ||
Security lending | — | |||
Foreign taxes withheld | — | |||
|
| |||
Total investment income | 9,812 | |||
|
| |||
| Expenses | ||||
Investment advisory fees | 5,043 | |||
Service fees, Class A | 220 | |||
Distribution and service fees, Class B | — | |||
Distribution and service fees, Class C | 1,753 | |||
Administration fees | 584 | |||
Transfer agent fees and expenses | 534 | |||
Registration fees | 109 | |||
Printing fees and expenses | 29 | |||
Custodian fees | 12 | |||
Professional fees | 22 | |||
Trustees’ fees and expenses | 19 | |||
Miscellaneous expenses | 24 | |||
|
| |||
Total expenses | 8,349 | |||
|
| |||
Dividends on short sales | — | |||
Interest expense on short sales | — | |||
|
| |||
Total expenses, including dividends and interest expense on short sales | 8,349 | |||
Less expenses reimbursed, waiver and/or recaptured by investment adviser | (32 | ) | ||
|
| |||
Net expenses | 8,317 | |||
|
| |||
| Net investment income (loss) | 1,495 | |||
|
| |||
| Net Realized and Unrealized Gain (Loss) on Investments | ||||
Net realized gain (loss) on unaffiliated investments | 3,393 | |||
Net realized gain (loss) on affiliated investments | — | |||
Net realized gain (loss) on securities sold short | — | |||
Net realized gain (loss) on foreign currency transactions | — | |||
Capital gain distributions from affiliated funds | 59 | |||
Net change in unrealized appreciation (depreciation) on investments | 21,137 | |||
Net change in unrealized appreciation (depreciation) on securities sold short | — | |||
Net change in unrealized appreciation (depreciation) on foreign currency translation | — | |||
|
| |||
| Net gain (loss) on investments | 24,589 | |||
|
| |||
| Net increase (decrease) in net assets resulting from operations | $ | 26,084 | ||
|
| |||
| (1) | Amount is less than $500. |
See Notes to Financial Statements
44
Table of Contents
VIRTUS OPPORTUNITIES TRUST
STATEMENTS OF OPERATIONS (Continued)
YEAR ENDED SEPTEMBER 30, 2013
| AlphaSector® Rotation Fund | Alternatives Diversifier Fund | Dynamic AlphaSector® Fund | Global Premium AlphaSector® Fund | Premium AlphaSector® Fund | ||||||||||||||
| $ | 12,391 | $ | 3 | $ | 23,623 | $ | 2,086 | $ | 105,001 | |||||||||
| — | 4,227 | — | — | — | ||||||||||||||
| — | (1) | — | — | — | — | (1) | ||||||||||||
| — | (1) | — | — | — | 5 | |||||||||||||
| (25 | ) | — | — | — | (235 | ) | ||||||||||||
|
|
|
|
|
|
|
|
|
| |||||||||
| 12,366 | 4,230 | 23,623 | 2,086 | 104,771 | ||||||||||||||
|
|
|
|
|
|
|
|
|
| |||||||||
| 2,418 | — | 14,935 | 1,107 | 48,240 | ||||||||||||||
| 541 | 149 | 830 | 105 | 3,854 | ||||||||||||||
| — | — | 1 | — | — | ||||||||||||||
| 1,804 | 520 | 1,056 | 308 | 9,679 | ||||||||||||||
| 685 | 240 | 996 | 128 | 5,585 | ||||||||||||||
| 728 | 360 | 891 | 130 | 5,183 | ||||||||||||||
| 80 | 52 | 280 | 66 | 422 | ||||||||||||||
| 37 | 17 | 47 | 8 | 249 | ||||||||||||||
| 17 | 2 | 18 | 4 | 114 | ||||||||||||||
| 22 | 22 | 23 | 20 | 52 | ||||||||||||||
| 23 | 8 | 26 | 4 | 182 | ||||||||||||||
| 31 | 13 | 28 | 8 | 219 | ||||||||||||||
|
|
|
|
|
|
|
|
|
| |||||||||
| 6,386 | 1,383 | 19,131 | 1,888 | 73,779 | ||||||||||||||
|
|
|
|
|
|
|
|
|
| |||||||||
| — | — | 1,744 | — | — | ||||||||||||||
| — | — | 1,293 | — | — | ||||||||||||||
|
|
|
|
|
|
|
|
|
| |||||||||
| 6,386 | 1,383 | 22,168 | 1,888 | 73,779 | ||||||||||||||
| (22 | ) | (75 | ) | (794 | ) | 30 | — | |||||||||||
|
|
|
|
|
|
|
|
|
| |||||||||
| 6,364 | 1,308 | 21,374 | 1,918 | 73,779 | ||||||||||||||
|
|
|
|
|
|
|
|
|
| |||||||||
| 6,002 | 2,922 | 2,249 | 168 | 30,992 | ||||||||||||||
|
|
|
|
|
|
|
|
|
| |||||||||
| 49,042 | (1,043 | ) | (2,405 | ) | 3,515 | 125,067 | ||||||||||||
| — | 2,816 | — | — | — | ||||||||||||||
| — | — | (3,552 | ) | — | — | |||||||||||||
| — | — | (1 | ) | — | — | |||||||||||||
| — | 3 | — | — | — | ||||||||||||||
| 38,254 | (5,584 | ) | 132,288 | 8,020 | 493,185 | |||||||||||||
| — | — | (1,689 | ) | — | — | |||||||||||||
| | — | | — | 1 | — | — | ||||||||||||
|
|
|
|
|
|
|
|
|
| |||||||||
| 87,296 | (3,808 | ) | 124,642 | 11,535 | 618,252 | |||||||||||||
|
|
|
|
|
|
|
|
|
| |||||||||
| $ | 93,298 | $ | (886 | ) | $ | 126,891 | $ | 11,703 | $ | 649,244 | ||||||||
|
|
|
|
|
|
|
|
|
| |||||||||
See Notes to Financial Statements
45
Table of Contents
STATEMENT OF CHANGES IN NET ASSETS
($ reported in thousands)
| Allocator Premium AlphaSector® Fund | ||||||||
| Year Ended September 30, 2013 | Year Ended September 30, 2012 | |||||||
| INCREASE/(DECREASE) IN NET ASSETS | ||||||||
| From Operations | ||||||||
Net investment income (loss) | $ | 1,495 | $ | 1,298 | ||||
Net realized gain (loss) | 3,452 | (104 | ) | |||||
Net change in unrealized appreciation (depreciation) | 21,137 | 21,039 | ||||||
|
|
|
| |||||
| Increase (decrease) in net assets resulting from operations | 26,084 | 22,233 | ||||||
|
|
|
| |||||
| From Distributions to Shareholders | ||||||||
Net investment income, Class A | (380 | ) | (322 | ) | ||||
Net investment income, Class C | — | (284 | ) | |||||
Net investment income, Class I | (1,170 | ) | (778 | ) | ||||
Net realized short-term gains, Class A | (133 | ) | — | |||||
Net realized short-term gains, Class C | (198 | ) | — | |||||
Net realized short-term gains, Class I | (357 | ) | — | |||||
Net realized long-term gains, Class A | — | — | ||||||
Net realized long-term gains, Class B | — | — | ||||||
Net realized long-term gains, Class C | — | — | ||||||
Net realized long-term gains, Class I | — | — | ||||||
|
|
|
| |||||
| Decrease in net assets from distributions to shareholders | (2,238 | ) | (1,384 | ) | ||||
|
|
|
| |||||
| From Share Transactions (See Note 5) | ||||||||
Change in net assets from share transactions, Class A | 43,974 | 49,957 | ||||||
Change in net assets from share transactions, Class C | 90,181 | 90,479 | ||||||
Change in net assets from share transactions, Class I | 92,053 | 119,048 | ||||||
|
|
|
| |||||
| Increase (decrease) in net assets from share transactions | 226,208 | 259,484 | ||||||
|
|
|
| |||||
| Net increase (decrease) in net assets | 250,054 | 280,333 | ||||||
| Net Assets | ||||||||
Beginning of fiscal year | 344,086 | 63,753 | ||||||
|
|
|
| |||||
| End of fiscal year | $ | 594,140 | $ | 344,086 | ||||
|
|
|
| |||||
Accumulated undistributed net investment income (loss) at end of fiscal year | $ | — | $ | 54 | ||||
| (1) | Amount is less than $500. |
See Notes to Financial Statements
46
Table of Contents
VIRTUS OPPORTUNITIES TRUST
STATEMENT OF CHANGES IN NET ASSETS (Continued)
| AlphaSector® Rotation Fund | Alternatives Diversifier Fund | |||||||||||||
| Year Ended September 30, 2013 | Year Ended September 30, 2012 | Year Ended September 30, 2013 | Year Ended September 30, 2012 | |||||||||||
| $ | 6,002 | $ | 4,824 | $ | 2,922 | $ | 1,282 | |||||||
| 49,042 | 17,276 | 1,776 | (1,974 | ) | ||||||||||
| 38,254 | 49,879 | (5,584 | ) | 25,432 | ||||||||||
|
|
|
|
|
|
|
| |||||||
| 93,298 | 71,979 | (886 | ) | 24,740 | ||||||||||
|
|
|
|
|
|
|
| |||||||
| (2,779 | ) | (2,025 | ) | (1,146 | ) | (432 | ) | |||||||
| (1,082 | ) | (477 | ) | (471 | ) | — | ||||||||
| (2,166 | ) | (1,415 | ) | (811 | ) | (356 | ) | |||||||
| (6,055 | ) | — | — | — | ||||||||||
| (4,881 | ) | — | — | — | ||||||||||
| (3,799 | ) | — | — | — | ||||||||||
| (193 | ) | (3,678 | ) | — | — | |||||||||
| — | — | — | — | |||||||||||
| (156 | ) | (2,930 | ) | — | — | |||||||||
| (121 | ) | (2,065 | ) | — | — | |||||||||
|
|
|
|
|
|
|
| |||||||
| (21,232 | ) | (12,590 | ) | (2,428 | ) | (788 | ) | |||||||
|
|
|
|
|
|
|
| |||||||
| 29,158 | (10,816 | ) | (13,443 | ) | (23,700 | ) | ||||||||
| 36,189 | (7,053 | ) | (12,108 | ) | (17,771 | ) | ||||||||
| 32,109 | 22,396 | 76,061 | (4,101 | ) | ||||||||||
|
|
|
|
|
|
|
| |||||||
| 97,456 | 4,527 | 50,510 | (45,572 | ) | ||||||||||
|
|
|
|
|
|
|
| |||||||
| 169,522 | 63,916 | 47,196 | (21,620 | ) | ||||||||||
| 478,927 | 415,011 | 160,389 | 182,009 | |||||||||||
|
|
|
|
|
|
|
| |||||||
| $ | 648,449 | $478,927 | $ | 207,585 | $ | 160,389 | ||||||||
|
|
|
|
|
|
|
| |||||||
| $ | 1,517 | | $ | 1,541 | $ | 960 | $ | 817 | ||||||
See Notes to Financial Statements
47
Table of Contents
VIRTUS OPPORTUNITIES TRUST
STATEMENT OF CHANGES IN NET ASSETS (Continued)
($ reported in thousands)
| Dynamic AlphaSector® Fund | ||||||||
| Year Ended September 30, 2013 | Year Ended September 30, 2012 | |||||||
| INCREASE/(DECREASE) IN NET ASSETS | ||||||||
| From Operations | ||||||||
Net investment income (loss) | $ | 2,249 | $ | 435 | ||||
Net realized gain (loss) | (5,958 | ) | (1,637 | ) | ||||
Net change in unrealized appreciation (depreciation) | 130,600 | 13,842 | ||||||
|
|
|
| |||||
| Increase (decrease) in net assets resulting from operations | 126,891 | 12,640 | ||||||
|
|
|
| |||||
| From Distributions to Shareholders | ||||||||
Net investment income, Class A | (1,254 | ) | — | |||||
Net investment income, Class C | — | — | ||||||
Net investment income, Class I | (1,627 | ) | — | |||||
Net realized short-term gains, Class A | — | — | ||||||
Net realized short-term gains, Class C | — | — | ||||||
Net realized short-term gains, Class I | — | — | ||||||
Tax Return of Capital, Class A | (593 | ) | — | |||||
Tax Return of Capital, Class C | (162 | ) | — | |||||
Tax Return of Capital, Class I | (743 | ) | — | |||||
|
|
|
| |||||
| Decrease in net assets from distributions to shareholders | (4,379 | ) | — | |||||
|
|
|
| |||||
| From Share Transactions (See Note 5) | ||||||||
Change in net assets from share transactions, Class A | 498,319 | 97,804 | ||||||
Change in net assets from share transactions, Class B | (42 | ) | (123 | ) | ||||
Change in net assets from share transactions, Class C | 221,358 | 23,714 | ||||||
Change in net assets from share transactions, Class I | 577,651 | 78,130 | ||||||
|
|
|
| |||||
| Increase (decrease) in net assets from share transactions | 1,297,286 | 199,525 | ||||||
|
|
|
| |||||
| Net increase (decrease) in net assets | 1,419,798 | 212,165 | ||||||
| Net Assets | ||||||||
Beginning of fiscal year | 249,346 | 37,181 | ||||||
|
|
|
| |||||
| End of fiscal year | $ | 1,669,144 | $ | 249,346 | ||||
|
|
|
| |||||
Accumulated undistributed net investment income (loss) at end | $ | — | $ | 436 | ||||
| (1) | Amount is less than $500. |
See Notes to Financial Statements
48
Table of Contents
VIRTUS OPPORTUNITIES TRUST
STATEMENT OF CHANGES IN NET ASSETS (Continued)
| Global Premium AlphaSector® Fund | Premium AlphaSector® Fund | |||||||||||||
| Year Ended September 30, 2013 | Year Ended September 30, 2012 | Year Ended September 30, 2013 | Year Ended September 30, 2012 | |||||||||||
| $ | 168 | $ | 435 | $ | 30,992 | $ | 22,858 | |||||||
| 3,515 | 562 | 125,067 | 104,369 | |||||||||||
| 8,020 | 6,545 | 493,185 | 301,805 | |||||||||||
|
|
|
|
|
|
|
| |||||||
| 11,703 | 7,542 | 649,244 | 429,032 | |||||||||||
|
|
|
|
|
|
|
| |||||||
| (171 | ) | (101 | ) | (11,572 | ) | (8,316 | ) | |||||||
| (5 | ) | (26 | ) | (1,256 | ) | (520 | ) | |||||||
| (94 | ) | (241 | ) | (17,821 | ) | (11,441 | ) | |||||||
| (184 | ) | — | — | — | ||||||||||
| (115 | ) | — | — | — | ||||||||||
| (101 | ) | — | — | — | ||||||||||
| — | — | — | — | |||||||||||
| — | — | — | — | |||||||||||
| — | — | — | — | |||||||||||
|
|
|
|
|
|
|
| |||||||
| (670 | ) | (368 | ) | (30,649 | ) | (20,277 | ) | |||||||
|
|
|
|
|
|
|
| |||||||
| 23,979 | 20,024 | 395,391 | 207,329 | |||||||||||
| — | — | — | — | |||||||||||
| 20,113 | 14,429 | 404,585 | 224,349 | |||||||||||
| 16,830 | 6,318 | 836,994 | 558,672 | |||||||||||
|
|
|
|
|
|
|
| |||||||
| 60,922 | 40,771 | 1,636,970 | 990,350 | |||||||||||
|
|
|
|
|
|
|
| |||||||
| 71,955 | 47,945 | 2,255,565 | 1,399,105 | |||||||||||
| 67,862 | 19,917 | 3,569,753 | 2,170,648 | |||||||||||
|
|
|
|
|
|
|
| |||||||
| $ | 139,817 | $ | 67,862 | $ | 5,825,318 | $ | 3,569,753 | |||||||
|
|
|
|
|
|
|
| |||||||
| $ | — | $ | 102 | $ | 6,317 | $ | 5,974 |
| ||||||
See Notes to Financial Statements
49
Table of Contents
VIRTUS DYNAMIC ALPHASECTOR® FUND
STATEMENT OF CASH FLOWS
FOR THE PERIOD ENDED SEPTEMBER 30, 2013
($ reported in thousands)
| Cash Flows Provided by (Used for) Operating Activities: | ||||
Net increase in net assets resulting from operations | $ | 126,891 | ||
|
| |||
Adjustments to reconcile net increase in net assets resulting from operations to net cash provided by (used for) operating activities: | ||||
Proceeds from sales and paydowns of long-term investments | 1,099,265 | |||
Purchase of long-term investments | (2,732,698 | ) | ||
Proceeds from securities sold short | 323,468 | |||
Purchases to cover short positions | (147,724 | ) | ||
Net proceeds from sales of short-term securities | 1,044 | |||
Net change in unrealized (appreciation)/depreciation | (130,599 | ) | ||
Net realized loss from sales of long-term investments | 2,452 | |||
Net realized loss from sales of securities sold short | 3,552 | |||
Increase in deposits with broker for borrowings | (172,701 | ) | ||
Decrease in dividends and interest receivable | 1,690 | |||
Decrease in securities sold receivable | (1,827 | ) | ||
Increase in prepaid expenses | (53 | ) | ||
Increase in prepaid trustee retainer | (7 | ) | ||
Decrease in tax reclaim receivable | 7 | |||
Increase in purchases payable | 11,234 | |||
Increase in Trustees’ fees and expenses payable | 2 | |||
Increase in professional fees payable | — | (1) | ||
Increase in investment advisory fee payable | 2,005 | |||
Increase in distribution and service fees payable | 291 | |||
Increase in administration fee payable | 142 | |||
Increase in transfer agent fees and expenses payable | 191 | |||
Increase in other accrued expenses payable | 173 | |||
|
| |||
Cash used for operating activities | (1,613,202 | ) | ||
|
| |||
| Cash provided by (used for) financing activities: | ||||
Proceeds and repayments of borrowings | 335,241 | |||
Proceeds from shares sold | 1,440,752 | |||
Shares redeemed | (156,414 | ) | ||
Cash dividends paid to shareholders | (915 | ) | ||
|
| |||
Cash provided by financing activities: | 1,618,664 | |||
|
| |||
Cash impact from foreign exchange fluctuations | ||||
|
| |||
Net increase (decrease) in cash | 5,462 | |||
|
| |||
| Cash: | ||||
Cash and foreign currency at beginning of period | — | |||
|
| |||
Cash and foreign currency at end of period | $ | 5,462 | ||
|
| |||
| Cash flow information: | ||||
Reinvestment of dividends and distributions | $ | 3,464 | ||
Cash paid during the period for interest | 1,293 |
| (1) | Amount less than $500. |
See Notes to Financial Statements
50
Table of Contents
FINANCIAL HIGHLIGHTS
SELECTED PER SHARE DATA AND RATIOS FOR A SHARE OUTSTANDING
THROUGHOUT EACH PERIOD
| Net Asset Value, Beginning of Period | Net Investment Income (Loss)(2) | Net Realized and Unrealized Gain (Loss) | Total from Investment Operations | Dividends from Net Investment Income | Distributions from Net Realized Gains | Total Distributions | Change in Net Asset Value | Net Asset Value, End of Period | Total Return(1) | Net Assets, End of Period (In thousands) | Ratio of Net Operating Expenses to Average Net Assets(8) | Ratio of Gross Expenses to Average Net Assets (before waivers and reimbursements)(8) | Ratio of Net Investment Income (Loss) to Average Net Assets | Portfolio Turnover Rate | |||||||||||||||||||||||||||||||||||||||||||||||||||||||||||||
Allocator Premium AlphaSector® Fund | |||||||||||||||||||||||||||||||||||||||||||||||||||||||||||||||||||||||||||
Class A | |||||||||||||||||||||||||||||||||||||||||||||||||||||||||||||||||||||||||||
10/1/12 to 9/30/13 | $ | 10.67 | 0.06 | 0.62 | 0.68 | (0.05 | ) | (0.02 | ) | (0.07 | ) | 0.61 | $ | 11.28 | 6.39 | % | $ | 114,697 | 1.64 | %(13) | 1.64 | %(13) | 0.51 | % | 275 | % | |||||||||||||||||||||||||||||||||||||||||||||||||
10/1/11 to 9/30/12 | 9.69 | 0.09 | 0.98 | 1.07 | (0.09 | ) | — | (0.09 | ) | 0.98 | 10.67 | 11.08 | 66,122 | 1.73 | 1.70 | 0.84 | 211 | ||||||||||||||||||||||||||||||||||||||||||||||||||||||||||
3/15/11(6) to 9/30/11 | 10.00 | 0.07 | (0.38 | ) | (0.31 | ) | — | — | — | (0.31 | ) | 9.69 | (3.10 | )(4) | 12,232 | 1.75 | (3) | 2.17 | (3) | 1.35 | (3) | 153 | (4) | ||||||||||||||||||||||||||||||||||||||||||||||||||||
Class C | |||||||||||||||||||||||||||||||||||||||||||||||||||||||||||||||||||||||||||
10/1/12 to 9/30/13 | $ | 10.60 | (0.02 | ) | 0.63 | 0.61 | — | (0.02 | ) | (0.02 | ) | 0.59 | $ | 11.19 | 5.71 | % | $ | 230,459 | 2.37 | %(13) | 2.39 | %(13) | (0.23 | )% | 275 | % | |||||||||||||||||||||||||||||||||||||||||||||||||
10/1/11 to 9/30/12 | 9.66 | 0.02 | 0.96 | 0.98 | (0.04 | ) | — | (0.04 | ) | 0.94 | 10.60 | 10.13 | 131,330 | 2.45 | 2.45 | 0.16 | 211 | ||||||||||||||||||||||||||||||||||||||||||||||||||||||||||
3/15/11(6) to 9/30/11 | 10.00 | 0.02 | (0.36 | ) | (0.34 | ) | — | — | — | (0.34 | ) | 9.66 | (3.40 | )(4) | 32,390 | 2.50 | (3) | 2.85 | (3) | 0.43 | (3) | 153 | (4) | ||||||||||||||||||||||||||||||||||||||||||||||||||||
Class I | |||||||||||||||||||||||||||||||||||||||||||||||||||||||||||||||||||||||||||
10/1/12 to 9/30/13 | $ | 10.69 | 0.08 | 0.63 | 0.71 | (0.07 | ) | (0.02 | ) | (0.09 | ) | 0.62 | $ | 11.31 | 6.70 | % | $ | 248,984 | 1.39 | %(13) | 1.39 | %(13) | 0.74 | % | 275 | % | |||||||||||||||||||||||||||||||||||||||||||||||||
10/1/11 to 9/30/12 | 9.71 | 0.12 | 0.96 | 1.08 | (0.10 | ) | — | (0.10 | ) | 0.98 | 10.69 | 11.24 | 146,634 | 1.49 | 1.46 | 1.17 | 211 | ||||||||||||||||||||||||||||||||||||||||||||||||||||||||||
3/15/11(6) to 9/30/11 | 10.00 | 0.10 | (0.39 | ) | (0.29 | ) | — | — | — | (0.29 | ) | 9.71 | (2.90 | )(4) | 19,131 | 1.50 | (3) | 2.01 | (3) | 1.82 | (3) | 153 | (4) | ||||||||||||||||||||||||||||||||||||||||||||||||||||
The footnote legend is at the end of the Financial Highlights
See Notes to Financial Statements
51
Table of Contents
VIRTUS OPPORTUNITIES TRUST
FINANCIAL HIGHLIGHTS (Continued)
SELECTED PER SHARE DATA AND RATIOS FOR A SHARE OUTSTANDING
THROUGHOUT EACH PERIOD
| Net Asset Value, Beginning of Period | Net Investment Income (Loss)(2) | Capital Gains Distributions Received from Affiliated Funds(2) | Net Realized and Unrealized Gain (Loss) | Total from Investment Operations | Dividends from Net Investment Income | Distributions from Net Realized Gains | Total Distributions | Change in Net Asset Value | Net Asset Value, End of Period | Total Return(1) | Net Assets, End of Period (In thousands) | Ratio of Net Operating Expenses to Average Net Assets(8) | Ratio of Gross Expenses to Average Net Assets (before waivers and reimbursements)(8) | Ratio of Net Investment Income (Loss) to Average Net Assets | Portfolio Turnover Rate | |||||||||||||||||||||||||||||||||||||||||||||||||||||||||||||||||
AlphaSector® Rotation Fund | ||||||||||||||||||||||||||||||||||||||||||||||||||||||||||||||||||||||||||||||||
Class A | ||||||||||||||||||||||||||||||||||||||||||||||||||||||||||||||||||||||||||||||||
10/1/12 to 9/30/13 | $ | 12.15 | 0.17 | — | 2.11 | 2.28 | (0.17 | ) | (0.39 | ) | (0.56 | ) | 1.72 | $ | 13.87 | 19.63 | % | $ | 257,492 | 1.00 | % | 1.00 | % | 1.29 | % | 123 | % | |||||||||||||||||||||||||||||||||||||||||||||||||||||
10/1/11 to 9/30/12 | 10.67 | 0.14 | — | 1.68 | 1.82 | (0.12 | ) | (0.22 | ) | (0.34 | ) | 1.48 | 12.15 | 17.51 | 199,268 | 1.02 | 1.02 | 1.22 | 190 | |||||||||||||||||||||||||||||||||||||||||||||||||||||||||||||
10/1/10 to 9/30/11 | 10.18 | 0.11 | — | 0.54 | 0.65 | (0.16 | ) | — | (0.16 | ) | 0.49 | 10.67 | 6.20 | 184,613 | 1.04 | 1.04 | 0.97 | 134 | ||||||||||||||||||||||||||||||||||||||||||||||||||||||||||||||
10/1/09 to 9/30/10 | 9.34 | 0.14 | — | 0.76 | 0.90 | (0.06 | ) | — | (0.06 | ) | 0.84 | 10.18 | 9.63 | 192,375 | 1.06 | 1.06 | 1.41 | 245 | ||||||||||||||||||||||||||||||||||||||||||||||||||||||||||||||
10/1/08 to 9/30/09 | 9.95 | 0.15 | — | (0.48 | ) | (0.33 | ) | (0.15 | ) | (0.13 | ) | (0.28 | ) | (0.61 | ) | 9.34 | (2.81 | ) | 37,722 | 0.64 | 0.64 | 1.80 | 131 | |||||||||||||||||||||||||||||||||||||||||||||||||||||||||
Class C | ||||||||||||||||||||||||||||||||||||||||||||||||||||||||||||||||||||||||||||||||
10/1/12 to 9/30/13 | $ | 12.03 | 0.07 | — | 2.10 | 2.17 | (0.08 | ) | (0.39 | ) | (0.47 | ) | 1.70 | $ | 13.73 | 18.80 | % | $ | 217,861 | 1.74 | % | 1.75 | % | 0.57 | % | 123 | % | |||||||||||||||||||||||||||||||||||||||||||||||||||||
10/1/11 to 9/30/12 | 10.56 | 0.06 | — | 1.67 | 1.73 | (0.04 | ) | (0.22 | ) | (0.26 | ) | 1.47 | 12.03 | 16.60 | 157,461 | 1.75 | 1.77 | 0.53 | 190 | |||||||||||||||||||||||||||||||||||||||||||||||||||||||||||||
10/1/10 to 9/30/11 | 10.09 | 0.04 | — | 0.52 | 0.56 | (0.09 | ) | — | (0.09 | ) | 0.47 | 10.56 | 5.49 | 144,813 | 1.71 | 1.79 | 0.33 | 134 | ||||||||||||||||||||||||||||||||||||||||||||||||||||||||||||||
10/1/09 to 9/30/10 | 9.29 | 0.07 | — | 0.75 | 0.82 | (0.02 | ) | — | (0.02 | ) | 0.80 | 10.09 | 8.79 | 133,453 | 1.81 | 1.81 | 0.68 | 245 | ||||||||||||||||||||||||||||||||||||||||||||||||||||||||||||||
10/1/08 to 9/30/09 | 9.88 | 0.08 | — | (0.45 | ) | (0.37 | ) | (0.09 | ) | (0.13 | ) | (0.22 | ) | (0.59 | ) | 9.29 | (3.41 | ) | 40,118 | 1.38 | 1.38 | 1.03 | 131 | |||||||||||||||||||||||||||||||||||||||||||||||||||||||||
Class I | ||||||||||||||||||||||||||||||||||||||||||||||||||||||||||||||||||||||||||||||||
10/1/12 to 9/30/13 | $ | 12.15 | 0.20 | — | 2.11 | 2.31 | (0.20 | ) | (0.39 | ) | (0.59 | ) | 1.72 | $ | 13.87 | 19.92 | % | $ | 173,096 | 0.75 | % | 0.75 | % | 1.56 | % | 123 | % | |||||||||||||||||||||||||||||||||||||||||||||||||||||
10/1/11 to 9/30/12 | 10.67 | 0.17 | — | 1.68 | 1.85 | (0.15 | ) | (0.22 | ) | (0.37 | ) | 1.48 | 12.15 | 17.71 | 122,198 | 0.77 | 0.77 | 1.53 | 190 | |||||||||||||||||||||||||||||||||||||||||||||||||||||||||||||
10/1/10 to 9/30/11 | 10.18 | 0.14 | — | 0.54 | 0.68 | (0.19 | ) | — | (0.19 | ) | 0.49 | 10.67 | 6.56 | 85,585 | 0.82 | 0.82 | 1.26 | 134 | ||||||||||||||||||||||||||||||||||||||||||||||||||||||||||||||
10/1/09(6) to 9/30/10 | 9.11 | 0.20 | — | 0.94 | 1.14 | (0.07 | ) | — | (0.07 | ) | 1.07 | 10.18 | 12.63 | (4) | 112,132 | 0.83 | (3) | 0.83 | (3) | 2.04 | (3) | 245 | ||||||||||||||||||||||||||||||||||||||||||||||||||||||||||
The footnote legend is at the end of the Financial Highlights
See Notes to Financial Statements
52
Table of Contents
VIRTUS OPPORTUNITIES TRUST
FINANCIAL HIGHLIGHTS (Continued)
SELECTED PER SHARE DATA AND RATIOS FOR A SHARE OUTSTANDING
THROUGHOUT EACH PERIOD
| Net Asset Value, Beginning of Period | Net Investment Income (Loss)(2) | Capital Gains Distributions Received from Affiliated Funds(2) | Net Realized and Unrealized Gain (Loss) | Total from Investment Operations | Dividends from Net Investment Income | Distributions from Net Realized Gains | Total Distributions | Change in Net Asset Value | Net Asset Value, End of Period | Total Return(1) | Net Assets, End of Period (in thousands) | Ratio of Net Operating Expenses to Average Net Assets(8) | Ratio of Gross Expenses to Average Net Assets (before waivers and reimbursements)(8) | Ratio of Net Investment Income (Loss) to Average Net Assets | Portfolio Turnover | |||||||||||||||||||||||||||||||||||||||||||||||||||||||||||||||||
Alternatives Diversifier Fund | ||||||||||||||||||||||||||||||||||||||||||||||||||||||||||||||||||||||||||||||||
Class A | ||||||||||||||||||||||||||||||||||||||||||||||||||||||||||||||||||||||||||||||||
10/1/12 to 9/30/13 | $ | 11.10 | 0.21 | — | (0.13 | ) | 0.08 | (0.21 | ) | — | (0.21 | ) | (0.13 | ) | $ | 10.97 | 0.73 | % | $ | 51,339 | 0.58 | %(7) | 0.63 | % | 1.93 | % | 24 | % | ||||||||||||||||||||||||||||||||||||||||||||||||||||
10/1/11 to | ||||||||||||||||||||||||||||||||||||||||||||||||||||||||||||||||||||||||||||||||
9/30/12 | 9.68 | 0.10 | — | 1.38 | 1.48 | (0.06 | ) | — | (0.06 | ) | 1.42 | 11.10 | 15.37 | 65,463 | 0.45 | 0.65 | 0.95 | 29 | ||||||||||||||||||||||||||||||||||||||||||||||||||||||||||||||
10/1/10 to | ||||||||||||||||||||||||||||||||||||||||||||||||||||||||||||||||||||||||||||||||
9/30/11(11) | 10.05 | 0.21 | 0.07 | (0.49 | ) | (0.21 | ) | (0.16 | ) | — | (0.16 | ) | (0.37 | ) | 9.68 | (2.12 | ) | 79,103 | 0.45 | 0.65 | 1.96 | 18 | ||||||||||||||||||||||||||||||||||||||||||||||||||||||||||
10/1/09 to | ||||||||||||||||||||||||||||||||||||||||||||||||||||||||||||||||||||||||||||||||
9/30/10 | 9.43 | 0.18 | 0.02 | 0.64 | 0.84 | (0.22 | ) | — | (0.22 | ) | 0.62 | 10.05 | 8.91 | 115,081 | 0.45 | 0.75 | 1.87 | 4 | ||||||||||||||||||||||||||||||||||||||||||||||||||||||||||||||
10/1/08 to | ||||||||||||||||||||||||||||||||||||||||||||||||||||||||||||||||||||||||||||||||
9/30/09 | 10.62 | 0.13 | 0.01 | (1.22 | ) | (1.08 | ) | (0.11 | ) | — | (0.11 | ) | (1.19 | ) | 9.43 | (10.00 | ) | 167,472 | 0.29 | 0.58 | 1.62 | 20 | ||||||||||||||||||||||||||||||||||||||||||||||||||||||||||
Class C | ||||||||||||||||||||||||||||||||||||||||||||||||||||||||||||||||||||||||||||||||
10/1/12 to 9/30/13 | $ | 10.93 | 0.13 | — | (0.13 | ) | — | (0.10 | ) | — | (0.10 | ) | (0.10 | ) | $ | 10.83 | (0.05 | )% | $ | 44,850 | 1.33 | %(7) | 1.38 | % | 1.22 | % | 24 | % | ||||||||||||||||||||||||||||||||||||||||||||||||||||
10/1/11 to | ||||||||||||||||||||||||||||||||||||||||||||||||||||||||||||||||||||||||||||||||
9/30/12 | 9.55 | 0.02 | — | 1.36 | 1.38 | — | — | — | 1.38 | 10.93 | 14.45 | 57,336 | 1.20 | 1.40 | 0.20 | 29 | ||||||||||||||||||||||||||||||||||||||||||||||||||||||||||||||||
10/1/10 to | ||||||||||||||||||||||||||||||||||||||||||||||||||||||||||||||||||||||||||||||||
9/30/11(11) | 9.95 | 0.13 | 0.07 | (0.48 | ) | (0.28 | ) | (0.12 | ) | — | (0.12 | ) | (0.40 | ) | 9.55 | (2.82 | ) | 66,411 | 1.20 | 1.40 | 1.20 | 18 | ||||||||||||||||||||||||||||||||||||||||||||||||||||||||||
10/1/09 to | ||||||||||||||||||||||||||||||||||||||||||||||||||||||||||||||||||||||||||||||||
9/30/10 | 9.34 | 0.10 | 0.02 | 0.64 | 0.76 | (0.15 | ) | — | (0.15 | ) | 0.61 | 9.95 | 8.06 | 85,330 | 1.20 | 1.50 | 1.07 | 4 | ||||||||||||||||||||||||||||||||||||||||||||||||||||||||||||||
10/1/08 to | ||||||||||||||||||||||||||||||||||||||||||||||||||||||||||||||||||||||||||||||||
9/30/09 | 10.50 | 0.07 | 0.01 | (1.19 | ) | (1.11 | ) | (0.05 | ) | — | (0.05 | ) | (1.16 | ) | 9.34 | (10.55 | ) | 101,083 | 1.04 | 1.33 | 0.91 | 20 | ||||||||||||||||||||||||||||||||||||||||||||||||||||||||||
Class I | ||||||||||||||||||||||||||||||||||||||||||||||||||||||||||||||||||||||||||||||||
10/1/12 to 9/30/13 | $ | 11.12 | 0.16 | — | (0.05 | ) | 0.11 | (0.25 | ) | — | (0.25 | ) | (0.14 | ) | $ | 10.98 | 1.00 | % | $ | 111,396 | 0.36 | %(7) | 0.38 | % | 1.48 | % | 24 | % | ||||||||||||||||||||||||||||||||||||||||||||||||||||
10/1/11 to | ||||||||||||||||||||||||||||||||||||||||||||||||||||||||||||||||||||||||||||||||
9/30/12 | 9.70 | 0.13 | — | 1.38 | 1.51 | (0.09 | ) | — | (0.09 | ) | 1.42 | 11.12 | 15.63 | 37,590 | 0.20 | 0.40 | 1.21 | 29 | ||||||||||||||||||||||||||||||||||||||||||||||||||||||||||||||
10/1/10 to | ||||||||||||||||||||||||||||||||||||||||||||||||||||||||||||||||||||||||||||||||
9/30/11(11) | 10.06 | 0.23 | 0.06 | (0.48 | ) | (0.19 | ) | (0.17 | ) | — | (0.17 | ) | (0.36 | ) | 9.70 | (1.89 | ) | 36,495 | 0.20 | 0.39 | 2.16 | 18 | ||||||||||||||||||||||||||||||||||||||||||||||||||||||||||
10/1/09(6) to | ||||||||||||||||||||||||||||||||||||||||||||||||||||||||||||||||||||||||||||||||
9/30/10 | 9.27 | 0.18 | 0.01 | 0.84 | 1.03 | (0.24 | ) | — | (0.24 | ) | 0.79 | 10.06 | 11.11 | (4) | 31,732 | 0.20 | (3) | 0.51 | (3) | 1.83 | (3) | 4 | ||||||||||||||||||||||||||||||||||||||||||||||||||||||||||
The footnote legend is at the end of the Financial Highlights
See Notes to Financial Statements
53
Table of Contents
VIRTUS OPPORTUNITIES TRUST
FINANCIAL HIGHLIGHTS (Continued)
SELECTED PER SHARE DATA AND RATIOS FOR A SHARE OUTSTANDING
THROUGHOUT EACH PERIOD
| Net Asset Value, Beginning of Period | Net Investment Income (Loss)(2) | Net Realized and Unrealized Gain (Loss) | Total from Investment Operations | Dividends from Net Investment Income | Distributions from Net Realized Gains | Tax Return of Capital | Total Distributions | Change in Net Asset Value | Net Asset Value, End of Period | Total Return(1) | Net Assets, End of Period (in thousands) | Ratio of Expenses (including dividends and interest on short sales after expense waivers and reimbursements) to Average Net Assets(8) | Ratio of Expenses (including dividends and interest on short sales before expense waivers and reimbursements) to Average Net Assets(8) | Ratio of Net Investment Income (Loss) to Average Net Assets | Portfolio Turnover Rate | |||||||||||||||||||||||||||||||||||||||||||||||||||||||||||||||||
Dynamic AlphaSector® Fund | ||||||||||||||||||||||||||||||||||||||||||||||||||||||||||||||||||||||||||||||||
Class A | ||||||||||||||||||||||||||||||||||||||||||||||||||||||||||||||||||||||||||||||||
10/1/12 to 9/30/13 | $ | 9.90 | 0.03 | 1.87 | 1.90 | (0.04 | ) | — |
| (0.03 | ) | (0.07 | ) | 1.83 | $ | 11.73 | 19.32 | % | $ | 660,921 | 2.73 | %(7)(9) | 2.83 | %(9) | 0.27 | % | 137 | % | ||||||||||||||||||||||||||||||||||||||||||||||||||||
10/1/11 to 9/30/12 | 9.09 | 0.08 | 0.73 | 0.81 | — | — |
| — |
| — | 0.81 | 9.90 | 8.91 | 109,724 | 2.78 | (9) | 3.06 | (9) | 0.86 | 165 | ||||||||||||||||||||||||||||||||||||||||||||||||||||||||||||
10/1/10 to 9/30/11 | 10.57 | (0.28 | ) | (0.91 | ) | (1.19 | ) | — | (0.29 | ) | — | (0.29 | ) | (1.48 | ) | 9.09 | (11.59 | ) | 6,615 | 4.35 | 4.65 | (2.79 | ) | 186 | ||||||||||||||||||||||||||||||||||||||||||||||||||||||||
10/1/09 to 9/30/10 | 10.50 | (0.25 | ) | 0.32 | 0.07 | — | — | — | — | 0.07 | 10.57 | 0.67 | 17,556 | 3.76 | (7) | 4.04 | (2.33 | ) | 155 | |||||||||||||||||||||||||||||||||||||||||||||||||||||||||||||
10/1/08 to 9/30/09 | 9.81 | (0.01 | ) | 0.70 | 0.69 | — | — | — | — | 0.69 | 10.50 | 7.03 | 74,749 | 4.04 | 4.23 | (0.08 | ) | 253 | ||||||||||||||||||||||||||||||||||||||||||||||||||||||||||||||
Class B | ||||||||||||||||||||||||||||||||||||||||||||||||||||||||||||||||||||||||||||||||
10/1/12 to 9/30/13 | $ | 9.24 | (0.07 | ) | 1.77 | 1.70 | — | — |
| — |
| — | 1.70 | $ | 10.94 | 18.40 | % | $ | 130 | 3.41 | %(7)(9) | 3.52 | %(9) | (0.71 | )% | 137 | % | |||||||||||||||||||||||||||||||||||||||||||||||||||||
10/1/11 to 9/30/12 | 8.54 | (0.19 | ) | 0.89 | 0.70 | — | — |
| — |
| — | 0.70 | 9.24 | 8.20 | 150 | 4.23 | (9) | 4.81 | (9) | (2.19 | ) | 165 | ||||||||||||||||||||||||||||||||||||||||||||||||||||||||||
10/1/10 to 9/30/11 | 10.04 | (0.33 | ) | (0.88 | ) | (1.21 | ) | — | (0.29 | ) | — | (0.29 | ) | (1.50 | ) | 8.54 | (12.42 | ) | 260 | 5.02 | 5.32 | (3.49 | ) | 186 | ||||||||||||||||||||||||||||||||||||||||||||||||||||||||
10/1/09 to 9/30/10 | 10.06 | (0.32 | ) | 0.30 | (0.02 | ) | — | — | — | — | (0.02 | ) | 10.04 | (0.20 | ) | 670 | 4.55 | (7) | 4.83 | (3.15 | ) | 155 | ||||||||||||||||||||||||||||||||||||||||||||||||||||||||||
10/1/08 to 9/30/09 | 9.47 | (0.08 | ) | 0.67 | 0.59 | — | — | — | — | 0.59 | 10.06 | 6.23 | 1,435 | 4.83 | 5.02 | (0.79 | ) | 253 | ||||||||||||||||||||||||||||||||||||||||||||||||||||||||||||||
Class C | ||||||||||||||||||||||||||||||||||||||||||||||||||||||||||||||||||||||||||||||||
10/1/12 to 9/30/13 | $ | 9.21 | (0.04 | ) | 1.74 | 1.70 | — | — |
| (0.03 | ) | (0.03 | ) | 1.67 | $ | 10.88 | 18.48 | % | $ | 263,722 | 3.52 | %(7)(9) | 3.62 | %(9) | (0.38 | )% | 137 | % | ||||||||||||||||||||||||||||||||||||||||||||||||||||
10/1/11 to 9/30/12 | 8.52 | 0.01 | 0.68 | 0.69 | — | — |
| — |
| — | 0.69 | 9.21 | 8.10 | 27,123 | 3.61 | (9) | 3.91 | (9) | 0.12 | 165 | ||||||||||||||||||||||||||||||||||||||||||||||||||||||||||||
10/1/10 to 9/30/11 | 10.00 | (0.33 | ) | (0.86 | ) | (1.19 | ) | — | (0.29 | ) | — | (0.29 | ) | (1.48 | ) | 8.52 | (12.26 | ) | 2,330 | 5.07 | 5.38 | (3.50 | ) | 186 | ||||||||||||||||||||||||||||||||||||||||||||||||||||||||
10/1/09 to 9/30/10 | 10.02 | (0.32 | ) | 0.30 | (0.02 | ) | — | — | — | — | (0.02 | ) | 10.00 | (0.20 | ) | 4,249 | 4.62 | (7) | 4.90 | (3.17 | ) | 155 | ||||||||||||||||||||||||||||||||||||||||||||||||||||||||||
10/1/08 to 9/30/09 | 9.43 | (0.07 | ) | 0.66 | 0.59 | — | — | — | — | 0.59 | 10.02 | 6.26 | 4,434 | 4.84 | 5.03 | (0.77 | ) | 253 | ||||||||||||||||||||||||||||||||||||||||||||||||||||||||||||||
Class I | ||||||||||||||||||||||||||||||||||||||||||||||||||||||||||||||||||||||||||||||||
10/1/12 to 9/30/13 | $ | 9.98 | 0.06 | 1.89 | 1.95 | (0.06 | ) | — |
| (0.03 | ) | (0.09 | ) | 1.86 | $ | 11.84 | 19.67 | % | $ | 744,371 | 2.49 | %(7)(9) | 2.59 | %(9) | 0.50 | % | 137 | % | ||||||||||||||||||||||||||||||||||||||||||||||||||||
10/1/11 to 9/30/12 | 9.12 | 0.05 | 0.81 | 0.86 | — | — |
| — |
| — | 0.86 | 9.98 | 9.43 | 112,349 | 2.78 | (9) | 3.06 | (9) | 0.49 | 165 | ||||||||||||||||||||||||||||||||||||||||||||||||||||||||||||
10/1/10 to 9/30/11 | 10.58 | (0.25 | ) | (0.92 | ) | (1.17 | ) | — | (0.29 | ) | — | (0.29 | ) | (1.46 | ) | 9.12 | (11.47 | ) | 27,976 | 4.03 | 4.33 | (2.48 | ) | 186 | ||||||||||||||||||||||||||||||||||||||||||||||||||||||||
10/1/09(6) to 9/30/10 | 10.49 | (0.23 | ) | 0.32 | 0.09 | — | — | — | — | 0.09 | 10.58 | 0.95 | (4) | 70,434 | 3.69 | (3)(7) | 3.97 | (3) | (2.20 | )(3) | 155 | |||||||||||||||||||||||||||||||||||||||||||||||||||||||||||
The footnote legend is at the end of the Financial Highlights
See Notes to Financial Statements
54
Table of Contents
VIRTUS OPPORTUNITIES TRUST
FINANCIAL HIGHLIGHTS (Continued)
SELECTED PER SHARE DATA AND RATIOS FOR A SHARE OUTSTANDING
THROUGHOUT EACH PERIOD
| Net Asset Value, Beginning of Period | Net Investment Income (Loss)(2) | Net Realized and Unrealized Gain (Loss) | Total from Investment Operations | Dividends from Net Investment Income | Distributions from Net Realized Gains | Total Distributions | Change in Net Asset Value | Net Asset Value, End of Period | Total Return(1) | Net Assets, End of Period (In thousands) | Ratio of Net Operating Expenses to Average Net Assets(8) | Ratio of Gross Expenses to Average Net Assets (before waivers and reimbursements)(8) | Ratio of Net Investment Income (Loss) to Average Net Assets | Portfolio Turnover Rate | |||||||||||||||||||||||||||||||||||||||||||||||||||||||||||||
Global Premium AlphaSector® Fund | |||||||||||||||||||||||||||||||||||||||||||||||||||||||||||||||||||||||||||
Class A | |||||||||||||||||||||||||||||||||||||||||||||||||||||||||||||||||||||||||||
10/1/12 to 9/30/13 | $ | 10.56 | 0.04 | 1.26 | 1.30 | (0.06 | ) | (0.04 | ) | (0.10 | ) | 1.20 | $ | 11.76 | 12.32 | % | $ | 56,689 | 1.75 | %(10) | — | %(12) | 0.33 | % | 194 | % | |||||||||||||||||||||||||||||||||||||||||||||||||
10/1/11 to 9/30/12 | 9.42 | 0.08 | 1.12 | 1.20 | (0.06 | ) | — | (0.06 | ) | 1.14 | 10.56 | 12.75 | 27,699 | 1.75 | 1.78 | 0.83 | 258 | ||||||||||||||||||||||||||||||||||||||||||||||||||||||||||
3/15/11(6) to 9/30/11 | 10.00 | 0.07 | (0.63 | ) | (0.56 | ) | (0.02 | ) | — | (0.02 | ) | (0.58 | ) | 9.42 | (5.62 | )(4) | 5,467 | 1.75 | (3) | 2.88 | (3) | 1.23 | (3) | 199 | (4) | ||||||||||||||||||||||||||||||||||||||||||||||||||
Class C | |||||||||||||||||||||||||||||||||||||||||||||||||||||||||||||||||||||||||||
10/1/12 to 9/30/13 | $ | 10.50 | (0.05 | ) | 1.25 | 1.20 | (0.02 | ) | (0.04 | ) | (0.06 | ) | 1.14 | $ | 11.64 | 11.52 | % | $ | 44,239 | 2.48 | %(10) | — | %(12) | (0.42 | )% | 194 | % | ||||||||||||||||||||||||||||||||||||||||||||||||
10/1/11 to 9/30/12 | 9.40 | — | (5) | 1.12 | 1.12 | (0.02 | ) | — | (0.02 | ) | 1.10 | 10.50 | 12.04 | 21,051 | 2.50 | 2.53 | 0.01 | 258 | |||||||||||||||||||||||||||||||||||||||||||||||||||||||||
3/15/11(6) to 9/30/11 | 10.00 | 0.01 | (0.61 | ) | (0.60 | ) | — | (5) | — | — | (0.60 | ) | 9.40 | (6.09 | )(4) | 4,885 | 2.50 | (3) | 3.81 | (3) | 0.17 | (3) | 199 | (4) | |||||||||||||||||||||||||||||||||||||||||||||||||||
Class I | |||||||||||||||||||||||||||||||||||||||||||||||||||||||||||||||||||||||||||
10/1/12 to 9/30/13 | $ | 10.58 | 0.07 | 1.25 | 1.32 | (0.06 | ) | (0.04 | ) | (0.10 | ) | 1.22 | $ | 11.80 | 12.59 | % | $ | 38,889 | 1.50 | %(10) | — | %(12) | 0.58 | % | 194 | % | |||||||||||||||||||||||||||||||||||||||||||||||||
10/1/11 to 9/30/12 | 9.42 | 0.09 | 1.14 | 1.23 | (0.07 | ) | — | (0.07 | ) | 1.16 | 10.58 | 13.15 | 19,112 | 1.50 | 1.52 | 0.90 | 258 | ||||||||||||||||||||||||||||||||||||||||||||||||||||||||||
3/15/11(6) to 9/30/11 | 10.00 | 0.07 | (0.63 | ) | (0.56 | ) | (0.02 | ) | — | (0.02 | ) | (0.58 | ) | 9.42 | (5.59 | )(4) | 9,565 | 1.50 | (3) | 2.85 | (3) | 1.37 | (3) | 199 | (4) | ||||||||||||||||||||||||||||||||||||||||||||||||||
Premium | |||||||||||||||||||||||||||||||||||||||||||||||||||||||||||||||||||||||||||
AlphaSector® Fund | |||||||||||||||||||||||||||||||||||||||||||||||||||||||||||||||||||||||||||
Class A | |||||||||||||||||||||||||||||||||||||||||||||||||||||||||||||||||||||||||||
10/1/12 to 9/30/13 | $ | 13.43 | 0.11 | 2.09 | 2.20 | (0.11 | ) | — | (0.11 | ) | 2.09 | $ | 15.52 | 16.50 | % | $ | 1,937,456 | 1.62 | %(13) | 1.62 | % | 0.75 | % | 140 | % | ||||||||||||||||||||||||||||||||||||||||||||||||||
10/1/11 to | |||||||||||||||||||||||||||||||||||||||||||||||||||||||||||||||||||||||||||
9/30/12 | 11.69 | 0.10 | 1.73 | 1.83 | (0.09 | ) | — | (0.09 | ) | 1.74 | 13.43 | 15.74 | 1,323,109 | 1.64 | 1.64 | 0.80 | 297 | ||||||||||||||||||||||||||||||||||||||||||||||||||||||||||
10/1/10 to | |||||||||||||||||||||||||||||||||||||||||||||||||||||||||||||||||||||||||||
9/30/11 | 11.17 | 0.10 | 0.52 | 0.62 | (0.08 | ) | (0.02 | ) | (0.10 | ) | 0.52 | 11.69 | 5.47 | 958,603 | 1.67 | (10) | 1.67 | 0.80 | 247 | ||||||||||||||||||||||||||||||||||||||||||||||||||||||||
7/1/10(6) to | |||||||||||||||||||||||||||||||||||||||||||||||||||||||||||||||||||||||||||
9/30/10 | 10.00 | 0.12 | 1.05 | 1.17 | — | — | — | 1.17 | 11.17 | 11.70 | (4) | 88,916 | 1.70 | (3) | 1.83 | (3) | 4.64 | (3) | 47 | (4) | |||||||||||||||||||||||||||||||||||||||||||||||||||||||
Class C | |||||||||||||||||||||||||||||||||||||||||||||||||||||||||||||||||||||||||||
10/1/12 to 9/30/13 | $ | 13.34 | — | 2.07 | 2.07 | (0.02 | ) | — | (0.02 | ) | 2.05 | $ | 15.39 | 15.55 | % | $ | 1,307,857 | 2.37 | %(13) | 2.37 | % | 0.02 | % | 140 | % | ||||||||||||||||||||||||||||||||||||||||||||||||||
10/1/11 to | |||||||||||||||||||||||||||||||||||||||||||||||||||||||||||||||||||||||||||
9/30/12 | 11.62 | 0.01 | 1.72 | 1.73 | (0.01 | ) | — | (0.01 | ) | 1.72 | 13.34 | 14.91 | 767,602 | 2.38 | 2.39 | 0.09 | 297 | ||||||||||||||||||||||||||||||||||||||||||||||||||||||||||
10/1/10 to | |||||||||||||||||||||||||||||||||||||||||||||||||||||||||||||||||||||||||||
9/30/11 | 11.15 | 0.02 | 0.51 | 0.53 | (0.04 | ) | (0.02 | ) | (0.06 | ) | 0.47 | 11.62 | 4.68 | 457,630 | 2.38 | (10) | 2.42 | 0.13 | 247 | ||||||||||||||||||||||||||||||||||||||||||||||||||||||||
7/1/10(6) to | |||||||||||||||||||||||||||||||||||||||||||||||||||||||||||||||||||||||||||
9/30/10 | 10.00 | 0.09 | 1.06 | 1.15 | — | — | — | 1.15 | 11.15 | 11.50 | (4) | 29,864 | 2.45 | (3) | 2.67 | (3) | 3.51 | (3) | 47 | (4) | |||||||||||||||||||||||||||||||||||||||||||||||||||||||
Class I | |||||||||||||||||||||||||||||||||||||||||||||||||||||||||||||||||||||||||||
10/1/12 to 9/30/13 | $ | 13.45 | 0.15 | 2.08 | 2.23 | (0.14 | ) | — | (0.14 | ) | 2.09 | $ | 15.54 | 16.75 | % | $ | 2,580,005 | 1.37 | %(13) | 1.37 | % | 1.02 | % | 140 | % | ||||||||||||||||||||||||||||||||||||||||||||||||||
10/1/11 to | |||||||||||||||||||||||||||||||||||||||||||||||||||||||||||||||||||||||||||
9/30/12 | 11.71 | 0.14 | 1.72 | 1.86 | (0.12 | ) | — | (0.12 | ) | 1.74 | 13.45 | 15.98 | 1,479,042 | 1.39 | 1.39 | 1.10 | 297 | ||||||||||||||||||||||||||||||||||||||||||||||||||||||||||
10/1/10 to | |||||||||||||||||||||||||||||||||||||||||||||||||||||||||||||||||||||||||||
9/30/11 | 11.17 | 0.14 | 0.52 | 0.66 | (0.10 | ) | (0.02 | ) | (0.12 | ) | 0.54 | 11.71 | 5.78 | 754,415 | 1.42 | (10) | 1.42 | 1.09 | 247 | ||||||||||||||||||||||||||||||||||||||||||||||||||||||||
7/1/10(6) to | |||||||||||||||||||||||||||||||||||||||||||||||||||||||||||||||||||||||||||
9/30/10 | 10.00 | 0.11 | 1.06 | 1.17 | — | — | — | 1.17 | 11.17 | 11.70 | (4) | 24,549 | 1.45 | (3) | 1.75 | (3) | 4.02 | (3) | 47 | (4) | |||||||||||||||||||||||||||||||||||||||||||||||||||||||
The footnote legend is at the end of the Financial Highlights
See Notes to Financial Statements
55
Table of Contents
VIRTUS OPPORTUNITIES TRUST
FINANCIAL HIGHLIGHTS (Continued)
SELECTED PER SHARE DATA AND RATIOS FOR A SHARE OUTSTANDING
THROUGHOUT EACH PERIOD
Footnote Legend
| (1) | Sales charges, where applicable, are not reflected in the total return calculation. |
| (2) | Computed using average shares outstanding. |
| (3) | Annualized. |
| (4) | Not annualized. |
| (5) | Amount is less than $0.005. |
| (6) | Inception date. |
| (7) | Due to a change in expense cap, the ratio shown is a blended expense ratio. |
| (8) | The Funds will also indirectly bear their prorated share of expenses of the underlying funds in which they invest. Such expenses are not included in the calculation of this ratio. |
| (9) | The effect of dividend and interest expense on securities sold short, increased the expense ratio by the following: |
10/1/12 to 9/30/13 | 0.38 | % | ||
10/1/11 to 9/30/12 | 0.63 | % |
| If interest and dividends were excluded the ratio would be lower. |
| (10) | See Note 3C in the Notes to Financial Statements for information on recapture of expense previously waived. |
| (11) | Effective December 1, 2010, the Adviser has discontinued charging an advisory fee. |
| (12) | Prior to recapture of expenses previously waived, the gross ratio was 1.71%, 2.46%, and 1.46% for Class A, Class C, and Class I, respectively |
| (13) | The Fund is currently under its expense limitation. |
See Notes to Financial Statements
56
Table of Contents
NOTES TO FINANCIAL STATEMENTS
SEPTEMBER 30, 2013
Note 1. Organization
Virtus Opportunities Trust (the “Trust”) is organized as a Delaware statutory trust and is registered under the Investment Company Act of 1940 (“1940 Act”), as amended, as an open-end management investment company.
As of the date of this report, 31 funds are offered for sale, of which six (each a “Fund”) are reported in this annual report.
All of the Funds offer Class A shares, Class C shares, and Class I shares. Class B shares are no longer available for purchase by new or existing shareholders, except for existing shareholders through Qualifying Transactions, (For more information regarding Qualifying Transactions, refer to the prospectus.) Class A shares are sold with a front-end sales charge of up to 5.75% with some exceptions. Generally, Class A shares are not subject to any charges by the Funds when redeemed; however, a 0.50% – 1% contingent deferred sales charge (“CDSC”) may be imposed on certain redemptions made within a certain period following purchases on which a finder’s fee has been paid. The period for which the CDSC applies for the Funds is 18 months. The CDSC period begins on the last day of the month preceding the month in which the purchase was made.
Class B shares were generally sold with a CDSC, which declines from 5% to zero depending on the period of time the shares are held. Class C shares are generally sold with a 1% CDSC, applicable if redeemed within one year of purchase. Class I shares are sold without a front-end sales charge or CDSC.
Virtus Mutual Funds may impose an annual fee on accounts having balances of less than $2,500. The small account fee may be waived in certain circumstances, as disclosed in the prospectuses and/or statements of additional information. The fees collected will be used to offset certain expenses of the Funds.
Each Class of shares has identical voting, dividend, liquidation and other rights and the same terms and conditions, except that each class bears different distribution and/or service fees under a Board-approved Rule 12b-1 and/or shareholder servicing plan (“12b-1 plan”) and has exclusive voting rights with respect to such plans. Class I shares are not subject to a 12b-1 plan. Income and other expenses and realized and unrealized gains and losses of each Fund are borne pro rata by the holders of each class of shares.
| Note | 2. Significant Accounting Policies |
The following is a summary of significant accounting policies consistently followed by the Trust in the preparation of its financial statements. The preparation of financial statements in conformity with accounting principles generally accepted in the United States of America requires management to make estimates and assumptions that affect the reported amounts of assets and liabilities, and disclosure of contingent assets and liabilities at the date of the financial statements and the reported amounts of increases and decreases in net assets from operations during the reporting period. Actual results could differ from those estimates and those differences could be significant.
| A. | Security Valuation |
Security valuation procedures for each Fund, which include, nightly price variance, as well as back-testing such as bi-weekly unchanged price, monthly secondary source and transaction analysis, have been approved by the Board of Trustees (the “Board” or the “Trustees”). All internally fair valued securities are approved by a valuation committee
57
Table of Contents
VIRTUS OPPORTUNITIES TRUST
NOTES TO FINANCIAL STATEMENTS (Continued)
SEPTEMBER 30, 2013
appointed by the Board. The valuation committee is comprised of the treasurer, assistant treasurer, and two other appropriate investment professionals of the Virtus Product Management team who previously have been identified to the Board. All internally fair valued securities are updated daily and reviewed in detail by the valuation committee monthly unless changes occur within the period. The valuation committee reviews the validity of the model inputs and any changes to the model. Fair valuations are ratified by the Board of Directors at least quarterly.
Each Fund utilizes a fair value hierarchy which prioritizes the inputs to valuation techniques used to measure fair value into three broad levels.
| • Level 1 – | quoted prices in active markets for identical securities |
| • Level 2 – | prices determined using other significant observable inputs (including quoted prices for similar securities, interest rates, prepayment speeds, credit risk, etc.) |
| • Level 3 – | prices determined using significant unobservable inputs (including the valuation committee’s own assumptions in determining the fair value of investments) |
A description of the valuation techniques applied to a Fund’s major categories of assets and liabilities measured at fair value on a recurring basis is as follows:
Equity securities are valued at the official closing price (typically last sale) on the exchange on which the securities are primarily traded, or if no closing price is available, at the last bid price and are categorized as Level 1 in the hierarchy. Restricted equity securities and private placements that are not widely traded, are illiquid or are internally fair valued by the Valuation Committee, are generally categorized as Level 3 in the hierarchy.
Certain non-U.S. securities may be fair valued in cases where closing prices are not readily available or are deemed not reflective of readily available market prices. For example, significant events (such as movement in the U.S. securities market, or other regional and local developments) may occur between the time that non-U.S. markets close (where the security is principally traded) and the time that a Fund calculates its net asset value (“NAV”) (generally, 4 p.m. Eastern time the close of the New York Stock Exchange (“NYSE”)) that may impact the value of securities traded in these non-U.S. markets. In such cases the Funds fair value non-U.S. securities using an independent pricing service which considers the correlation of the trading patterns of the non-U.S. security to the intraday trading in the U.S. markets for investments such as ADRs, financial futures, ETFs, and certain indexes as well as prices for similar securities. Such fair valuations are categorized as Level 2 in the hierarchy. Because the frequency of significant events is not predictable, fair valuation of certain non-U.S. common stocks may occur on a frequent basis.
Debt securities, including restricted securities, are valued based on evaluated quotations received from independent pricing services or from dealers who make markets in such securities. For most bond types, the pricing service utilizes matrix pricing which considers one or more of the following factors: yield or price of bonds of comparable quality, coupon, maturity, current cash flows, type, and current day trade information, as well as dealer-supplied prices. These valuations are generally categorized as Level 2 in the hierarchy. Structured debt instruments such as
58
Table of Contents
VIRTUS OPPORTUNITIES TRUST
NOTES TO FINANCIAL STATEMENTS (Continued)
SEPTEMBER 30, 2013
mortgage-backed and asset-backed securities may also incorporate collateral analysis and utilize cash flow models for valuation and are generally categorized as Level 2 in the hierarchy. Pricing services do not provide pricing for all securities and therefore indicative bids from dealers are utilized which are based on pricing models used by market makers in the security and are generally categorized as Level 2 in the hierarchy. Debt securities that are not widely traded, are illiquid, or are internally fair valued by the valuation committee are generally categorized as Level 3 in the hierarchy.
Listed derivatives that are actively traded are valued based on quoted prices from the exchange and are categorized as Level 1 in the hierarchy. Over the counter derivative contracts, which include forward currency contracts and equity-linked instruments, do not require material subjectivity as pricing inputs are observed from actively quoted markets and are categorized as Level 2 in the hierarchy.
Investments in open-end mutual funds are valued at their closing NAV determined as of the close of regular trading on the NYSE each business day and are categorized as Level 1 in the hierarchy.
A summary of the inputs used to value the Funds’ net assets by each major security type is disclosed at the end of the Schedule of Investments for each Fund. The inputs or methodologies used for valuing securities are not necessarily an indication of the risk associated with investing in those securities.
| B. | Security Transactions and Investment Income |
Security transactions are recorded on the trade date. Realized gains and losses from sales of securities are determined on the identified cost basis. Dividend income is recognized on the ex-dividend date, or in the case of certain foreign securities, as soon as a Fund is notified. Interest income is recorded on the accrual basis. Each Fund amortizes premiums and accretes discounts using the effective interest method.
| C. | Income Taxes |
Each Fund is treated as a separate taxable entity. It is the intention of each Fund to comply with the requirements of Subchapter M of the Internal Revenue Code and to distribute substantially all of its taxable income to its shareholders. Therefore, no provision for federal income taxes or excise taxes has been made.
Certain Funds may be subject to foreign taxes on income, gains on investments or currency repatriation, a portion of which may be recoverable. Each Fund will accrue such taxes and recoveries as applicable based upon current interpretations of the tax rules and regulations that exist in the markets in which it invests.
Management of the Funds has concluded that there are no significant uncertain tax positions that would require recognition in the financial statements. As of September 30, 2013, the tax years that remain subject to examination by the major tax jurisdictions under the statute of limitations are from the year 2010 forward (with limited exceptions).
| D. | Distributions to Shareholders |
Distributions are recorded by each Fund on the ex-dividend date. Income and capital gain distributions are determined in accordance with income tax regulations which may differ from accounting principles generally accepted in the United States of America. These differences may include the treatment of non-taxable dividends, market premium
59
Table of Contents
VIRTUS OPPORTUNITIES TRUST
NOTES TO FINANCIAL STATEMENTS (Continued)
SEPTEMBER 30, 2013
and discount, non-deductible expenses, expiring capital loss carryovers, foreign currency gain or loss, gain or loss on futures contracts, partnerships, operating losses and losses deferred due to wash sales. Permanent book and tax basis differences relating to shareholder distributions will result in reclassifications to capital paid in on shares of beneficial interest.
| E. | Expenses |
Expenses incurred together by a Fund and other affiliated mutual funds are allocated in proportion to the net assets of each such fund, except where allocation of direct expense to each Fund or an alternative allocation method can be more appropriately used.
In addition to the net annual operating expenses that a Fund bears directly, the shareholders of the Funds indirectly bear the pro-rata expenses of any underlying mutual funds in which the Fund invests.
| F. | Foreign Currency Translation |
Non U.S. investment securities and other assets and liabilities denominated in foreign currencies are translated into U.S. dollar amounts at the foreign currency exchange rate effective at the end of the reporting period. Cost of investments is translated at the currency exchange rate effective at the trade date. The gain or loss resulting from a change in currency exchange rates between the trade and settlement date of a portfolio transaction is treated as a gain or loss on non-U.S. currency. Likewise, the gain or loss resulting from a change in currency exchange rates between the date income is accrued and paid is treated as a gain or loss on foreign currency. The Funds do not isolate that portion of the results of operations arising from changes in foreign exchange rates on investments from the fluctuations arising from changes in the market prices of securities held. Such fluctuations are included with the net realized and unrealized gain or loss on investments.
| G. | Short Sales |
($ reported in thousands)
Certain Funds may sell securities short. A short sale is a transaction in which a Fund sells a security it does not own in anticipation of a decline in market price. To sell a security short, a Fund must borrow the security. The Fund’s obligation to replace the security borrowed and sold short will be fully collateralized at all times by the proceeds from the short sale retained by the broker and by cash and securities deposited in a segregated account with the Fund’s custodian. If the price of the security sold short increases between the time of the short sale and the time the Fund replaces the borrowed security, the Fund will realize a loss, and if the price declines during the period, the Fund will realize a gain. Any realized gain will be decreased, and any realized loss increased, by the amount of transaction costs. On ex-dividend date, dividends on short sales are recorded as an expense to the Fund.
In accordance with the terms of its prime brokerage agreement, the Dynamic AlphaSector™ Fund may receive rebate income or be charged a fee on borrowed securities. Such income or fee is calculated on a daily basis based upon the market value of each borrowed security and a variable rate that is dependent upon the availability of such security. The Fund records these prime broker charges on a net
60
Table of Contents
VIRTUS OPPORTUNITIES TRUST
NOTES TO FINANCIAL STATEMENTS (Continued)
SEPTEMBER 30, 2013
basis as interest income or interest expense. For the year ended September 30, 2013, the Fund had net charges of $144 on borrowed securities. Such amounts are included in interest expense in the Statement of Operations.
At September 30, 2013, the value of securities sold short in the Dynamic AlphaSector™ Fund amounted to $(180,985) against which collateral of $208,133 was provided.
| H. | Securities Lending |
Certain Funds may loan securities to qualified brokers through an agreement with Brown Brothers Harriman (“BBH”), as a third party lending agent. Under the terms of agreement, the Fund is required to maintain collateral with a market value not less than 100% of the market value of loaned securities. Collateral is adjusted daily in connection with changes in the market value of securities on loan. Collateral may consist of cash and securities issued by the U.S. Government or its agencies. Cash collateral is invested in a short-term money market fund. Dividends earned on the collateral and premiums paid by the broker are recorded as income by the Fund net of fees and rebates charged by BBH for its services as securities lending agent and in connection with this securities lending program. Lending portfolio securities involves a risk of delay in the recovery of the loaned securities or in the declining value of the collateral.
At September 30, 2013, the following Funds had securities on loan ($ reported in thousands):
| Market Value | Cash Collateral | |||||||
AlphaSector™ Rotation Fund | $ | 966 | $ | 990 | ||||
Premium AlphaSector Fund | 12,102 | 12,403 | ||||||
Note 3. Investment Advisory Fee and Related Party Transactions
($ reported in thousands except as noted)
| A. | Adviser |
Virtus Investment Advisers, Inc. (the “Adviser”), an indirect wholly-owned
subsidiary of Virtus Investment Partners, Inc. (“Virtus”), is the Adviser to the Trust. The Adviser manages the Funds’ investment programs and general operations of the Funds, including oversight of the Funds’ subadvisers.
As compensation for its services to the Funds, the Adviser is entitled to a fee based upon the following annual rates as a percentage of the average daily net assets of the following Funds:
| 1st $2 Billion | $2 + Billion – $4 Billion | $4 + Billion | ||||||||||
Allocator Premium AlphaSector™ Fund | 1.10 | % | 1.05 | % | 1.00 | % | ||||||
Global Premium AlphaSector™ Fund | 1.10 | 1.05 | 1.00 | |||||||||
| 1st $1 Billion | $1 + Billion | |||||||
AlphaSector™ Rotation Fund | 0.45 | % | 0.40 | % | ||||
Dynamic AlphaSector™ Fund** | 1.50 | 1.40 | ||||||
Premium AlphaSector™ Fund – 1.10% of the average daily net assets.
Alternatives Diversifier Fund – the Adviser has discontinued charging an advisory fee.
| ** | The advisory fee is calculated based on average daily managed assets. Beginning February 6, 2013, the advisory fee for this Fund will be subject to a performance adjustment, which may increase or decrease the advisory fee based upon how well |
61
Table of Contents
VIRTUS OPPORTUNITIES TRUST
NOTES TO FINANCIAL STATEMENTS (Continued)
SEPTEMBER 30, 2013
| the Fund has performed relative to the S&P 500® Index. For the year ended September 30, 2013, there was $202 of additional advisory fee expense related to the performance fee adjustment. Such performance adjustment is included in the Investment Advisory Fees in the Statement of Operations. |
| B. | Subadvisers |
The Subadvisers manage the investments of each Fund for which they are paid a fee by the Adviser. A list of the Subadvisers and the Fund(s) they serve is as follows:
Fund | Subadviser(s) | |
Allocator Premium AlphaSector™ Fund | FSIA(1)(3), Euclid(4) | |
AlphaSector™ Rotation Fund | FSIA(1)(3), Euclid(4) | |
Alternatives Diversifier Fund | Euclid(4) | |
| Dynamic AlphaSector™ Fund | FSAA(2)(3), Euclid(4) | |
Global Premium AlphaSector™ Fund | FSIA(1)(3), Euclid(4) | |
Premium AlphaSector™ Fund | FSIA(1)(3), Euclid(4) |
| (1) | F-Squared Institutional Advisors, LLC (“FSIA”) |
| (2) | F-Squared Alternative Advisors LLC (“FSAA”) |
| (3) | FSIA or FSAA (collectively “F-Squared”) provides Euclid with a model portfolio. Final allocations and trading for each Fund are conducted by Euclid based on F-Squared’s recommendations. |
| (4) | Euclid Advisors, LLC, (“Euclid”) an indirect wholly-owned subsidiary of Virtus. |
| C. | Expense Limits and Fee Waivers |
The Adviser has voluntarily agreed to limit certain Funds’ total operating expenses (excluding interest, taxes, extraordinary expenses and acquired funds fees and expenses, if any), so that such expenses do not exceed the percentages of the Fund’s average daily net asset values as listed below. The Adviser may discontinue these voluntary expense caps at any time.
| Class A | Class C | Class I | ||||||||||
Allocator Premium AlphaSector™ Fund | 1.75 | % | 2.50 | % | 1.50 | % | ||||||
Alternatives Diversifier Fund(1) | N/A | N/A | N/A | |||||||||
Dynamic AlphaSectorTM Fund(2) | N/A | N/A | N/A | |||||||||
Global Premium AlphaSector™ Fund | 1.75 | 2.50 | 1.50 | |||||||||
Premium AlphaSector™ Fund | 1.70 | 2.45 | 1.45 | |||||||||
| (1) | For the period October 1, 2012 to December 31, 2012, the Adviser agreed to limit total operating expenses of the Alternatives Diversifier Fund so that such expense did not exceed 0.20% of the Fund’s average daily net asset value (excluding 12b-1 fees and/or shareholder servicing fees). Effective January 1, 2013 the Adviser discontinued this expense limitation. |
| (2) | For the period October 1, 2012 to August 21, 2013, the Adviser agreed to limit “other expenses” of the Dynamic AlphaSectorTM Fund, so that such expense did not exceed 0.15% of such Fund’s average daily net asset value. For purposes of this arrangement “other expenses” are all expenses necessary or appropriate for the operation of the Fund, excluding the Adviser’s investment advisory or management fee, Rule 12b-1 fees and/or shareholder servicing fees, front-end or contingent deferred loads, taxes, interest, brokerage commissions, prime brokerage interest expenses, dividends on short sales, expenses incurred in connection with any merger or reorganization, extraordinary expenses, and acquired fund fees and expenses. Effective August 22, 2013, the Adviser discontinued this expense limitation. |
62
Table of Contents
VIRTUS OPPORTUNITIES TRUST
NOTES TO FINANCIAL STATEMENTS (Continued)
SEPTEMBER 30, 2013
For certain Funds the Adviser may recapture operating expenses waived or reimbursed, within three fiscal years following the end of the fiscal year in which such waiver or reimbursement occurred. The Fund must pay its ordinary operating expenses before the Adviser is entitled to any reimbursement and must remain in compliance with any applicable expense limitations or, if none, the expense limitation in effect at the time of the waiver or reimbursement. All or a portion of the following Adviser-reimbursed expenses ($ reported in thousands) may be recaptured by the fiscal year ending:
| Expiration Date | ||||||||||||||||
| 2014 | 2015 | 2016 | �� | Total | ||||||||||||
Alternatives Diversifier Fund | $ | 435 | $ | 348 | $ | 75 | $ | 858 | ||||||||
Dynamic AlphaSector Fund | 221 | 205 | 794 | 1,220 | ||||||||||||
Global Premium AlphaSector* | 21 | 12 | — | 33 | ||||||||||||
| * | Adviser is currently recapturing previously waived or reimbursed expenses. |
| D. | Distributor |
($ reported in thousands)
VP Distributors, LLC (“VP Distributors”), an indirect wholly-owned subsidiary of Virtus, serves as the distributor of each Fund’s shares. VP Distributors has advised the Funds that for the fiscal year (the “period”) ended September 30, 2013, it retained net commissions of $1,365 of Class A shares and deferred sales charges of $23, $—(3) and $308 for Class A shares, Class B shares and Class C shares respectively.
In addition, each Fund pays VP Distributors distribution and/or service fees under a 12b-1 plan as a percentage of the average daily net assets of each respective class at the annual rates of 0.25%(1) for Class A shares and 1.00%(1)(2) for Class B and Class C shares. Class I shares are not subject to a 12b-1 plan.
Under certain circumstances, shares of certain Virtus Mutual Funds may be exchanged for shares of the same class of certain other Virtus Mutual Funds on the basis of the relative NAV per share at the time of the exchange. On exchanges with share classes that carry a CDSC, the CDSC schedule of the original shares purchased continues to apply.
| (1) | The Funds invest in ETFs. In addition to the fees listed the Funds bear their proportionate shares of any distribution and shareholder servicing fees of the ETFs. |
| (2) | The Funds’ distributor has contractually agreed to waive its 12b-1 fees applicable to Class C shares to the extent that the Funds’ investments in underlying ETFs with their own 12b-1 fees would otherwise cause the total 12b-1 fees paid directly or indirectly by the Fund to exceed the limits set forth in applicable law or regulation. |
| (3) | Amount is less than $500. |
| E. | Administrator and Transfer Agent |
($ reported in thousands)
Effective January 1, 2013, with the approval of the Board, VP Distributors, the Funds’ former Administrator and Transfer Agent, assigned its rights and obligations under the Administration Agreement and Transfer Agency and Service Agreement to Virtus Fund Services, LLC, an indirect wholly-owned subsidiary of Virtus. For the period of October 1, 2012 to December 31, 2012, VP Distributors served as the Administrator and Transfer Agent to the Funds.
63
Table of Contents
VIRTUS OPPORTUNITIES TRUST
NOTES TO FINANCIAL STATEMENTS (Continued)
SEPTEMBER 30, 2013
For the period ended September 30, 2013, the Funds incurred administration fees from the Trust totaling $6,268 which are included in the Statements of Operations.
For the period ended September 30, 2013, the Funds incurred transfer agent fees from the Trust totaling $7,472 which are included in the Statements of Operations. A portion of these fees was paid to outside entities that also provide services to the Trust.
| F. | Affiliated Shareholders |
($ reported in thousand)
At September 30, 2013, Virtus and its affiliates, BMO Bankcorp. (a minority investor in Virtus) and its affiliates, and the retirement plans of Virtus and its affiliates, held shares of the Funds which may be redeemed at any time that aggregated the following:
| Shares | Aggregate Net Asset Value | |||||||
Premium AlphaSector™ Fund | ||||||||
Class A | 1,880 | $ | 29 | |||||
Class I | 607 | 9 | ||||||
| G. | Investments in Affiliates |
A summary of the Alternatives Diversifier Fund’s total long-term and short-term purchases and sales of the Class I shares of the affiliated underlying funds(1) during the fiscal year ended September 30, 2013 is as follows:
| Value, beginning of fiscal year | Purchases(2) | Sales Proceeds | ||||||||||
Global Commodities Stock | $ | 17,903 | $ | 15,381 | $ | 4,500 | ||||||
Global Dividend Fund | 33,977 | 11,411 | 2,800 | |||||||||
Global Real Estate Securities Fund | 9,364 | 4,209 | — | |||||||||
International Real Estate Securities Fund | 20,012 | 5,526 | 7,857 | |||||||||
Real Estate Securities Fund | 14,101 | 14,435 | 10,450 | |||||||||
Senior Floating Rate Fund | 12,180 | 15,480 | 4,380 | |||||||||
|
|
|
|
|
| |||||||
| $ | 107,537 | $ | 66,442 | $ | 29,987 | |||||||
|
|
|
|
|
| |||||||
| Value, end of fiscal year | Dividend Income | Distributions of Realized Gains | ||||||||||
Global Commodities Stock | $ | 26,306 | $ | 381 | $ | — | ||||||
Global Dividend Fund | 45,577 | 1,150 | — | |||||||||
Global Real Estate Securities Fund | 13,875 | 309 | — | |||||||||
International Real Estate Securities Fund | 17,742 | 1,476 | — | |||||||||
Real Estate Securities Fund | 17,859 | 235 | — | |||||||||
Senior Floating Rate Fund | 23,205 | 676 | 3 | |||||||||
|
|
|
|
|
| |||||||
| $ | 144,564 | $ | 4,227 | $ | 3 | |||||||
|
|
|
|
|
| |||||||
| (1) | The Alternatives Diversifier Fund does not invest in the underlying funds for the purpose of exercising management or control; however, investments made by the Fund within each of its |
64
Table of Contents
VIRTUS OPPORTUNITIES TRUST
NOTES TO FINANCIAL STATEMENTS (Continued)
SEPTEMBER 30, 2013
| principal investment strategies may represent a significant portion of an underlying fund’s net assets. At September 30, 2013, the Fund was the owner of record of approximately 89% of the Global Commodities Stock Fund, 42% of the International Real Estate Securities Fund 31% of the Global Real Estate Securities Fund, and 32% of the Global Dividend Fund. |
| (2) | Includes reinvested dividends from income and capital gain distributions. |
Note 4. Purchases and Sales of Securities
($ reported in thousands)
Purchases and sales of securities (excluding U.S. Government and agency securities, and short-term securities) during the period ended September 30, 2013, were as follows:
| Purchases | Sales | |||||||
Allocator Premium AlphaSector™ Fund | $ | 1,216,754 | $ | 1,077,708 | ||||
AlphaSector™ Rotation Fund | 742,605 | 660,375 | ||||||
Alternatives Diversifier Fund | 94,919 | 44,580 | ||||||
Dynamic AlphaSector™ Fund | 2,732,698 | 1,099,265 | ||||||
Global Premium AlphaSector™ Fund | 242,560 | 182,525 | ||||||
Premium AlphaSector™ Fund | 7,748,134 | 6,145,686 | ||||||
| Short Sales | Purchases to Cover Shorts | |||||||
Dynamic AlphaSector™ Fund | 323,468 | 147,724 | ||||||
Note 5. Capital Share Transactions
(reported in thousands)
Transactions in shares of capital stock, during the periods ended as indicated below, were as follows:
| Allocator Premium AlphaSector™ Fund | ||||||||||||||||
| Year Ended September 30, 2013 | Year Ended September 30, 2012 | |||||||||||||||
| SHARES | AMOUNT | SHARES | AMOUNT | |||||||||||||
| Class A | ||||||||||||||||
| Sale of shares | 6,565 | $ | 72,792 | 6,058 | $ | 61,388 | ||||||||||
| Reinvestment of distributions | 46 | 493 | 31 | 305 | ||||||||||||
| Shares repurchased | (2,645 | ) | (29,311 | ) | (1,151 | ) | (11,736 | ) | ||||||||
|
|
|
|
|
|
|
| |||||||||
| Net Increase/(Decrease) | 3,966 | $ | 43,974 | 4,938 | $ | 49,957 | ||||||||||
|
|
|
|
|
|
|
| |||||||||
| Class C | ||||||||||||||||
| Sale of shares | 10,904 | $ | 119,789 | 10,032 | $ | 100,615 | ||||||||||
| Reinvestment of distributions | 18 | 192 | 28 | 274 | ||||||||||||
| Shares repurchased | (2,712 | ) | (29,800 | ) | (1,028 | ) | (10,410 | ) | ||||||||
|
|
|
|
|
|
|
| |||||||||
| Net Increase/(Decrease) | 8,210 | $ | 90,181 | 9,032 | $ | 90,479 | ||||||||||
|
|
|
|
|
|
|
| |||||||||
| Class I | ||||||||||||||||
| Sale of shares | 13,895 | $ | 154,327 | 13,694 | $ | 139,083 | ||||||||||
| Reinvestment of distributions | 134 | 1,436 | 75 | 755 | ||||||||||||
| Shares repurchased | (5,731 | ) | (63,710 | ) | (2,022 | ) | (20,790 | ) | ||||||||
|
|
|
|
|
|
|
| |||||||||
| Net Increase/(Decrease) | 8,298 | $ | 92,053 | 11,747 | $ | 119,048 | ||||||||||
|
|
|
|
|
|
|
| |||||||||
65
Table of Contents
VIRTUS OPPORTUNITIES TRUST
NOTES TO FINANCIAL STATEMENTS (Continued)
SEPTEMBER 30, 2013
| AlphaSector™ Rotation Fund | ||||||||||||||||
| Year Ended September 30, 2013 | Year Ended September 30, 2012 | |||||||||||||||
| SHARES | AMOUNT | SHARES | AMOUNT | |||||||||||||
| Class A | ||||||||||||||||
| Sale of shares | 5,882 | $ | 77,208 | 5,358 | $ | 60,143 | ||||||||||
| Reinvestment of distributions | 687 | 8,016 | 446 | 4,914 | ||||||||||||
| Shares repurchased | (4,402 | ) | (56,066 | ) | (6,717 | ) | (75,873 | ) | ||||||||
|
|
|
|
|
|
|
| |||||||||
| Net Increase/(Decrease) | 2,167 | $ | 29,158 | (913 | ) | $ | (10,816 | ) | ||||||||
|
|
|
|
|
|
|
| |||||||||
| Class C | ||||||||||||||||
| Sale of shares | 4,743 | $ | 61,118 | 1,996 | $ | 22,420 | ||||||||||
| Reinvestment of distributions | 369 | 4,230 | 207 | 2,251 | ||||||||||||
| Shares repurchased | (2,324 | ) | (29,159 | ) | (2,831 | ) | (31,724 | ) | ||||||||
|
|
|
|
|
|
|
| |||||||||
| Net Increase/(Decrease) | 2,788 | $ | 36,189 | (628 | ) | $ | (7,053 | ) | ||||||||
|
|
|
|
|
|
|
| |||||||||
| Class I | ||||||||||||||||
| Sale of shares | 6,710 | $ | 87,620 | 6,369 | $ | 71,270 | ||||||||||
| Reinvestment of distributions | 375 | 4,390 | 196 | 2,158 | ||||||||||||
| Shares repurchased | (4,660 | ) | (59,901 | ) | (4,532 | ) | (51,032 | ) | ||||||||
|
|
|
|
|
|
|
| |||||||||
| Net Increase/(Decrease) | 2,425 | $ | 32,109 | 2,033 | $ | 22,396 | ||||||||||
|
|
|
|
|
|
|
| |||||||||
| Alternatives Diversifier Fund | ||||||||||||||||
| Year Ended September 30, 2013 | Year Ended September 30, 2012 | |||||||||||||||
| SHARES | AMOUNT | SHARES | AMOUNT | |||||||||||||
| Class A | ||||||||||||||||
| Sale of shares | 750 | $ | 8,326 | 911 | $ | 9,669 | ||||||||||
| Reinvestment of distributions | 89 | 974 | 36 | 370 | ||||||||||||
| Shares repurchased | (2,058 | ) | (22,743 | ) | (3,218 | ) | (33,739 | ) | ||||||||
|
|
|
|
|
|
|
| |||||||||
| Net Increase / (Decrease) | (1,219 | ) | $ | (13,443 | ) | (2,271 | ) | $ | (23,700 | ) | ||||||
|
|
|
|
|
|
|
| |||||||||
| Class C | ||||||||||||||||
| Sale of shares | 253 | $ | 2,785 | 247 | $ | 2,567 | ||||||||||
| Reinvestment of distributions | 31 | 332 | — | — | ||||||||||||
| Shares repurchased | (1,390 | ) | (15,225 | ) | (1,955 | ) | (20,338 | ) | ||||||||
|
|
|
|
|
|
|
| |||||||||
| Net Increase / (Decrease) | (1,106 | ) | $ | (12,108 | ) | (1,708 | ) | $ | (17,771 | ) | ||||||
|
|
|
|
|
|
|
| |||||||||
| Class I | ||||||||||||||||
| Sale of shares | 8,421 | $ | 94,425 | 1,653 | $ | 17,300 | ||||||||||
| Reinvestment of distributions | 45 | 495 | 22 | 223 | ||||||||||||
| Shares repurchased | (1,701 | ) | (18,859 | ) | (2,056 | ) | (21,624 | ) | ||||||||
|
|
|
|
|
|
|
| |||||||||
| Net Increase / (Decrease) | 6,765 | $ | 76,061 | (381 | ) | $ | (4,101 | ) | ||||||||
|
|
|
|
|
|
|
| |||||||||
66
Table of Contents
VIRTUS OPPORTUNITIES TRUST
NOTES TO FINANCIAL STATEMENTS (Continued)
SEPTEMBER 30, 2013
| Dynamic AlphaSector™ Fund | ||||||||||||||||
| Year Ended September 30, 2013 | Year Ended September 30, 2012 | |||||||||||||||
| SHARES | AMOUNT | SHARES | AMOUNT | |||||||||||||
| Class A | ||||||||||||||||
| Sale of shares | 51,387 | $ | 567,419 | 11,370 | $ | 107,464 | ||||||||||
| Reinvestment of distributions | 124 | 1,293 | — | — | ||||||||||||
| Shares repurchased | (6,258 | ) | (70,393 | ) | (1,016 | ) | (9,660 | ) | ||||||||
|
|
|
|
|
|
|
| |||||||||
| Net Increase/(Decrease) | 45,253 | $ | 498,319 | 10,354 | $ | 97,804 | ||||||||||
|
|
|
|
|
|
|
| |||||||||
| Class B | ||||||||||||||||
| Sale of shares | 2 | $ | 22 | — | $ | — | ||||||||||
| Reinvestment of distributions | — | — | — | — | ||||||||||||
| Shares repurchased | (6 | ) | (64 | ) | (14 | ) | (123 | ) | ||||||||
|
|
|
|
|
|
|
| |||||||||
| Net Increase/(Decrease) | (4 | ) | $ | (42 | ) | (14 | ) | $ | (123 | ) | ||||||
|
|
|
|
|
|
|
| |||||||||
| Class C | ||||||||||||||||
| Sale of shares | 22,213 | $ | 230,795 | 2,818 | $ | 24,988 | ||||||||||
| Reinvestment of distributions | 15 | 138 | — | — | ||||||||||||
| Shares repurchased | (933 | ) | (9,575 | ) | (147 | ) | (1,274 | ) | ||||||||
|
|
|
|
|
|
|
| |||||||||
| Net Increase/(Decrease) | 21,295 | $ | 221,358 | 2,671 | $ | 23,714 | ||||||||||
|
|
|
|
|
|
|
| |||||||||
| Class I | ||||||||||||||||
| Sale of shares | 59,017 | $ | 660,499 | 11,614 | $ | 109,640 | ||||||||||
| Reinvestment of distributions | 195 | 2,034 | — | — | ||||||||||||
| Shares repurchased | (7,583 | ) | (84,882 | ) | (3,424 | ) | (31,510 | ) | ||||||||
|
|
|
|
|
|
|
| |||||||||
| Net Increase/(Decrease) | 51,629 | $ | 577,651 | 8,190 | $ | 78,130 | ||||||||||
|
|
|
|
|
|
|
| |||||||||
| Global Premium AlphaSector™ Fund | ||||||||||||||||
| Year Ended September 30, 2013 | Year Ended September 30, 2012 | |||||||||||||||
| SHARES | AMOUNT | SHARES | AMOUNT | |||||||||||||
| Class A | ||||||||||||||||
| Sale of shares | 4,499 | $ | 49,646 | 3,170 | $ | 31,188 | ||||||||||
| Reinvestment of distributions | 33 | 350 | 10 | 99 | ||||||||||||
| Shares repurchased | (2,334 | ) | (26,017 | ) | (1,138 | ) | (11,263 | ) | ||||||||
|
|
|
|
|
|
|
| |||||||||
| Net Increase / (Decrease) | 2,198 | $ | 23,979 | 2,042 | $ | 20,024 | ||||||||||
|
|
|
|
|
|
|
| |||||||||
| Class C | ||||||||||||||||
| Sale of shares | 2,120 | $ | 23,752 | 1,689 | $ | 16,438 | ||||||||||
| Reinvestment of distributions | 11 | 116 | 3 | 25 | ||||||||||||
| Shares repurchased | (337 | ) | (3,755 | ) | (207 | ) | (2,034 | ) | ||||||||
|
|
|
|
|
|
|
| |||||||||
| Net Increase / (Decrease) | 1,794 | $ | 20,113 | 1,485 | $ | 14,429 | ||||||||||
|
|
|
|
|
|
|
| |||||||||
| Class I | ||||||||||||||||
| Sale of shares | 2,234 | $ | 25,190 | 4,721 | $ | 45,889 | ||||||||||
| Reinvestment of distributions | 18 | 192 | 25 | 240 | ||||||||||||
| Shares repurchased | (763 | ) | (8,552 | ) | (3,954 | ) | (39,811 | ) | ||||||||
|
|
|
|
|
|
|
| |||||||||
| Net Increase / (Decrease) | 1,489 | $ | 16,830 | 792 | $ | 6,318 | ||||||||||
|
|
|
|
|
|
|
| |||||||||
67
Table of Contents
VIRTUS OPPORTUNITIES TRUST
NOTES TO FINANCIAL STATEMENTS (Continued)
SEPTEMBER 30, 2013
| Premium AlphaSector™ Fund | ||||||||||||||||
| Year Ended September 30, 2013 | Year Ended September 30, 2012 | |||||||||||||||
| SHARES | AMOUNT | SHARES | AMOUNT | |||||||||||||
| Class A | ||||||||||||||||
| Sale of shares | 60,488 | $ | 885,745 | 57,032 | $ | 708,895 | ||||||||||
| Reinvestment of distributions | 787 | 10,779 | 611 | 7,567 | ||||||||||||
| Shares repurchased | (34,940 | ) | (501,133 | ) | (41,148 | ) | (509,133 | ) | ||||||||
|
|
|
|
|
|
|
| |||||||||
| Net Increase / (Decrease) | 26,335 | $ | 395,391 | 16,495 | $ | 207,329 | ||||||||||
|
|
|
|
|
|
|
| |||||||||
| Class C | ||||||||||||||||
| Sale of shares | 37,863 | $ | 553,394 | 26,259 | $ | 325,982 | ||||||||||
| Reinvestment of distributions | 77 | 997 | 32 | 390 | ||||||||||||
| Shares repurchased | (10,536 | ) | (149,806 | ) | (8,126 | ) | (102,023 | ) | ||||||||
|
|
|
|
|
|
|
| |||||||||
| Net Increase / (Decrease) | 27,404 | $ | 404,585 | 18,165 | $ | 224,349 | ||||||||||
|
|
|
|
|
|
|
| |||||||||
| Class I | ||||||||||||||||
| Sale of shares | 97,169 | $ | 1,426,504 | 78,872 | $ | 976,545 | ||||||||||
| Reinvestment of distributions | 920 | 12,751 | 604 | 7,489 | ||||||||||||
| Shares repurchased | (42,065 | ) | (602,261 | ) | (33,976 | ) | (425,362 | ) | ||||||||
|
|
|
|
|
|
|
| |||||||||
| Net Increase / (Decrease) | 56,024 | $ | 836,994 | 45,500 | $ | 558,672 | ||||||||||
|
|
|
|
|
|
|
| |||||||||
Note 6. 10% Shareholders
As of September 30, 2013, certain Funds had individual shareholder account(s) and/or omnibus shareholder account(s) (comprised of a group of individual shareholders), which individually amounted to more than 10% of the total shares outstanding of each such Fund as detailed below.
| % of Shares Outstanding | Number of Accounts | |||||||
Allocator Premium AlphaSector Fund | 31 | % | 2 | |||||
AlphaSector Rotation Fund | 10 | 1 | ||||||
Alternatives Diversifier Fund | 26 | 1 | ||||||
Dynamic AlphaSector Fund | 44 | 4 | ||||||
These accounts are not affiliated with Virtus.
Note 7. Credit Risk and Asset Concentration
Certain Funds may invest a high percentage of their assets in specific sectors of the market in their pursuit of a greater investment return. Fluctuations in these sectors of concentration may have a greater impact on a Fund, positive or negative, than if the Fund did not concentrate its investments in such sectors. At September 30, 2013, the Funds did not invest a high percentage of their assets in specific sectors.
Note 8. Indemnifications
Under the Trust’s organizational documents, its trustees and officers are indemnified against certain liabilities arising out of the performance of their duties to the Funds. In addition, each Trustee has entered into an indemnification agreement with the Trust. In addition in the normal course of business, the Funds enter into contracts that provide a
68
Table of Contents
VIRTUS OPPORTUNITIES TRUST
NOTES TO FINANCIAL STATEMENTS (Continued)
SEPTEMBER 30, 2013
variety of indemnifications to other parties. The Funds’ maximum exposure under these arrangements is unknown as this would involve future claims that may be made against the Funds and that have not occurred. However, the Funds have not had prior claims or losses pursuant to these arrangements and, expect the risk of loss to be remote.
Note 9. Exemptive Order
On August 23, 2010, the SEC issued an amended order under Section 12(d) (1) (J) of the 1940 Act granting an exemption from Sections 12(d) (1) (A) and (B) of the 1940 Act and under Sections 6(c) and 17(b) of the 1940 Act granting an exemption from Section 17(a) of the 1940 Act, which permits the Trust to invest in other affiliated and unaffiliated funds, including exchange-traded funds, in each case subject to certain conditions.
Note 10. Federal Income Tax Information
($ reported in thousands)
At September 30, 2013, federal tax cost and aggregate gross unrealized appreciation (depreciation) of securities held by the Funds were as follows:
Fund | Federal | Unrealized | Unrealized | Net Unrealized | ||||||||||||
Allocator Premium AlphaSectorTM Fund | $ | 557,435 | $ | 35,518 | $ | (652 | ) | $ | 34,866 | |||||||
AlphaSectorTM Rotation Fund | 553,379 | 99,425 | (4,138 | ) | 95,287 | |||||||||||
Alternatives Diversifier Fund | 221,552 | 13,279 | (27,406 | ) | (14,127 | ) | ||||||||||
Dynamic AlphaSectorTM | 1,948,133 | 140,768 | — | 140,768 | ||||||||||||
Dynamic AlphaSectorTM | (179,296 | ) | — | (1,689 | ) | (1,689 | ) | |||||||||
Global Premium AlphaSectorTM Fund | 126,969 | 12,556 | — | 12,556 | ||||||||||||
Premium AlphaSectorTM Fund | 5,101,828 | 746,818 | (35,984 | ) | 710,834 | |||||||||||
The Funds have capital loss carryovers available to offset future realized capital gains, through the indicated expiration dates shown below:
| 2016 | 2018 | No Expiration | Total | |||||||||||||
| AlphaSector™ Rotation Fund | $ | — | $ | 1,080 | $ | — | $ | 1,080 | ||||||||
| Alternatives Diversifier Fund | — | 53,403 | — | 53,403 | ||||||||||||
Dynamic AlphaSector™ Fund | 24 | — | 2,010 | 2,034 | ||||||||||||
The Trust may not realize the benefit of these losses to the extent each Fund does not realize gains on investments prior to the expiration of the capital loss carryovers.
Under the Regulated Investment Company Modernization Act of 2010 (the “Act”), net capital losses recognized for tax years beginning after December 22, 2010, may be carried forward indefinitely, and their character is retained as short-term and/or long-term losses. Previously, net capital losses were carried forward for eight years and treated as short-term losses. As a transition rule, the Act requires that post-enactment net capital losses be used before pre-enactment net capital losses.
69
Table of Contents
VIRTUS OPPORTUNITIES TRUST
NOTES TO FINANCIAL STATEMENTS (Continued)
SEPTEMBER 30, 2013
For the period ended September 30, 2013, the following funds utilized losses deferred in prior years against current year capital gains:
Allocator Premium AlphaSector™ Fund | $ | 329 | ||
AlphaSectorSM Rotation Fund | 2,232 | |||
Alternatives Diversifier Fund | 8,353 | |||
Dynamic AlphaSector™ Fund | 1,319 | |||
Premium AlphaSector™ Fund | 6,721 |
Capital losses realized after October 31 and certain late year ordinary losses may be deferred and treated as occurring on the first day of the following fiscal year. For the fiscal year ended September 30, 2013, the Funds deferred and recognized post-October losses as follows:
| Capital Loss Deferred | Capital Loss Recognized | |||||||
Alternatives Diversifier Fund | $ | 347 | $ | 2,526 | ||||
Dynamic AlphaSector Fund | 4,533 | 1,621 | ||||||
The components of distributable earnings on a tax basis (excluding unrealized appreciation (depreciation) which are disclosed above) consist of the following:
| Undistributed Ordinary Income | Undistributed Long-Term Capital Gains | |||||||
Allocator Premium AlphaSectorTM Fund | $ | 6,067 | $ | 1,070 | ||||
AlphaSectorTM Rotation Fund | 22,553 | 25,620 | ||||||
Alternatives Diversifier Fund | 960 | — | ||||||
Global Premium AlphaSectorTM Fund | 3,900 | 298 | ||||||
Premium AlphaSectorTM Fund | 133,990 | 47,549 | ||||||
The differences between the book and tax basis components of distributable earnings relate principally to the timing of recognition of income and gains for federal income tax purposes. Short-term gain distributions reported in the Statements of Changes in Net Assets, if any, are reported as ordinary income for federal tax purposes. Distributions are determined on a tax basis and may differ from net investment income and realized capital gains for financial reporting purposes.
Note 11. Reclassification of Capital Accounts
($ reported in thousands)
For financial reporting purposes, book basis capital accounts are adjusted to reflect the tax character of permanent book/tax differences. Permanent reclassifications can arise from differing treatment of certain income and gain transactions, nondeductible current year net operating losses, expiring capital loss carryovers and investments in passive foreign investment companies. The reclassifications have no impact on the net assets or net asset value of the Funds. As of September 30, 2013, the Funds recorded reclassifications to increase (decrease) the accounts as listed below:
| Capital Paid in on Shares of Beneficial Interest | Undistributed Net Investment Income (Loss) | Accumulated Net Realized Gain (Loss) | ||||||||||
Allocator Premium AlphaSectorSM Fund | $ | — | $ | 1 | $ | (1 | ) | |||||
Alternatives Diversifier Fund | 32 | (351 | ) | 319 | ||||||||
Dynamic AlphaSector Fund | 24 | 197 | (221 | ) | ||||||||
70
Table of Contents
VIRTUS OPPORTUNITIES TRUST
NOTES TO FINANCIAL STATEMENTS (Continued)
SEPTEMBER 30, 2013
Note 12. Borrowings
($ reported in thousands)
The Dynamic AlphaSector Fund (the “Fund”) intends to employ leverage in the form of borrowing on its long positions in circumstances where the Fund has determined to take long positions representing four or more sectors. The aggregate amount of leverage being used by the Fund at any time will depend on the number of sectors in which the Fund takes a long position, with the maximum amount of leverage being used where the Fund takes long positions in all nine sectors. In that event, the amount of leverage will not exceed 30% of the Fund’s net assets, including borrowings.
Effective February 6, 2012, the Fund entered into a collaterized loan agreement with Merrill Lynch Professional Clearing Corp. (“prime broker”) to provide margin financing. During the year ended September 30, 2013, the Fund utilized margin financing for 365 days at an average interest rate of 0.535% and with an average daily borrowing balance during the year of $215,311. As of September 30, 2013, outstanding margin debt amounted to $409,811, which is located under “Loan payable” on the Statement of Assets and Liabilities. In order to attain leveraged exposure, the Fund incurs a cost of Open Fed Funds Rate plus a spread on debit financing. For the year ended September 30, 2013, these costs amounted to $1,149 and are included within “interest expenses” on the Statement of Operations.
| Note | 13. Recent Accounting Pronouncement |
In December 2011, the Financial Accounting Standards Board issued Accounting Standards Update (“ASU”) No. 2011-11 regarding “Disclosures about Offsetting Assets and Liabilities”. The amendments, which will be effective for annual reporting periods beginning on or after January 1, 2013 and interim periods within those annual periods, require an entity to disclose information about offsetting and related arrangements for assets and liabilities, financial instruments and derivatives that are either currently offset in accordance with current requirements or are subject to enforceable master netting arrangements or similar agreements. At this time, management is evaluating the implications of ASU No. 2011-11 and its impact on the financial statements has not yet been determined.
Note 14. Subsequent Event Evaluations
Management has evaluated the impact of all subsequent events on the Funds through the date the financial statements were available for issuance, and has determined that there are no subsequent events requiring recognition or disclosure in the financial statements.
71
Table of Contents

Report of Independent Registered Public
Accounting Firm
To the Board of Trustees of
Virtus Opportunities Trust and Shareholders of
the Funds, as defined:
In our opinion, the accompanying statements of assets and liabilities, including the schedules of investments and securities sold short, and the related statements of operations and of changes in net assets and the financial highlights present fairly, in all material respects, the financial position of Virtus Allocator Premium AlphaSector Fund, Virtus AlphaSector Rotation Fund, Virtus Dynamic AlphaSector Fund, Virtus Global Premium AlphaSector Fund, Virtus Premium AlphaSector Fund, and Virtus Alternatives Diversifier Fund, each a series of Virtus Opportunities Trust (the “Funds”), at September 30, 2013, the results of each of their operations for the year then ended, the changes in each of their net assets and the financial highlights for each of the periods indicated, in conformity with accounting principles generally accepted in the United States of America. These financial statements and financial highlights (hereafter referred to as “financial statements”) are the responsibility of the Funds’ management; our responsibility is to express an opinion on these financial statements based on our audits. We conducted our audits of these financial statements in accordance with the standards of the Public Company Accounting Oversight Board (United States). Those standards require that we plan and perform the audit to obtain reasonable assurance about whether the financial statements are free of material misstatement. An audit includes examining, on a test basis, evidence supporting the amounts and disclosures in the financial statements, assessing the accounting principles used and significant estimates made by management, and evaluating the overall financial statement presentation. We believe that our audits, which included confirmation of securities at September 30, 2013 by correspondence with the custodians, brokers, and transfer agent of the investee funds, provide a reasonable basis for our opinion.

PricewaterhouseCoopers LLP
November 21, 2013
PricewaterhouseCoopers LLP, Two Commerce Square, Suite 1700, 2001 Market Street, Philadelphia, PA 19103-7042 T: (267) 330 3000, F:(267) 330 3300, www.pwc.com/us/
72
Table of Contents
TAX INFORMATION NOTICE
SEPTEMBER 30, 2013
For the fiscal year ended September 30, 2013, the Funds make the following disclosures for federal income tax purposes. Below is listed the percentages, or the maximum amount allowable, of its ordinary income dividends (“QDI”) to qualify for the lower tax rates applicable to individual shareholders, and the percentage of ordinary income dividends earned by the Funds which qualifies for the dividends received deduction (“DRD”) for corporate shareholders. The Funds designate the amounts below as long-term capital gains dividends (“LTCG”) ($ reported in thousands), or if subsequently different, the amounts will be designated in the next annual report. The actual percentage for the calendar year will be designated in year-end tax statements.
Fund | QDI | DRD | LTCG | |||
| Allocator Premium AlphaSectorTM Fund | 62% | 46% | $1,070 | |||
| AlphaSectorTM Rotation Fund | 42 | 41 | 25,686 | |||
| Alternatives Diversifier Fund | 69 | 29 | — | |||
| Dynamic AlphaSectorTM Fund | 100 | 100 | — | |||
| Global Premium AlphaSectorTM Fund | 41 | 28 | 298 | |||
| Premium AlphaSectorTM Fund | 62 | 61 | 47,549 |
For the fiscal year ended September 30, 2013, the Funds are disclosing the following information pursuant to notice requirements of Section 853(a) and 855(d) of the Internal Revenue Code, as amended, and the Treasury Regulations thereunder ($ reported in thousands):
Foreign Source | Foreign Taxes | |||||||
| Allocator Premium AlphaSector Fund | $ | 1,944 | $ | 147 | ||||
| Alternatives Diversifier Fund | 1,857 | 39 | ||||||
| Global Premium AlphaSector Fund | 693 | 54 | ||||||
73
Table of Contents
Information pertaining to the trustees and officers of the Trust as of September 30, 2013, is set forth below. The statement of additional information (SAI) includes additional information about the trustees and is available without charge, upon request, by calling (800) 243-1574. The address of each individual, unless otherwise noted, is 100 Pearl Street, Hartford, CT 06103-4506. There is no stated term of office for trustees of the Trust.
Independent Trustees
| Name, Year of Birth, Year Elected and Number of Funds Overseen | Principal Occupation(s) Other Directorships Held by Trustee | |
Leroy Keith, Jr. YOB: 1939 Elected: 2000 48 Funds | Chairman (since 2010), Bloc Global Services Group, LLC (construction and redevelopment company); Managing Director (2007 to 2008), Almanac Capital Management (commodities business); Director/Trustee (since 2010), Wells Fargo Funds (139 series) and their predecessors, Evergreen Funds (1989 to 2010); Director (2003 to 2010), Diversapack Co. (soft packaging company); and Trustee (since 1980), Virtus Mutual Fund Complex. | |
Philip R. McLoughlin Chairman YOB: 1946 Elected: 1999 66 Funds | Partner (since 2006), Cross Pond Partners, LLC (strategy consulting firm); Managing Director (2009 to 2010), SeaCap Asset Management Fund I, L.P. and SeaCap Partners, LLC (investment management); Director (since 1991) and Chairman (since 2010), World Trust Fund; Trustee and Chairman (since 2011), Virtus Closed-End Funds (2 portfolios); Trustee (since 1989), Virtus Mutual Fund Complex; Director (since 1996), closed-end funds managed by Duff & Phelps Investment Management Co. (4 portfolios); and Director (1985 to 2009), Argo Group International Holdings Inc. and its predecessor, PXRE Corporation (insurance). | |
Geraldine M. McNamara YOB: 1951 Elected: 2001 52 Funds | Retired. Director (since 2003), closed-end funds managed by Duff & Phelps Investment Management Co. (4 portfolios); and Trustee (since 2001), Virtus Mutual Fund Complex. | |
James M. Oates YOB: 1946 Elected: 2000 50 Funds | Managing Director (since 1994), Wydown Group (consulting firm); Chairman and Trustee (since 2005), John Hancock Fund Complex (collectively, 234 portfolios); Director (since 1996), Stifel Financial; Chairman and Director (since 1999), Connecticut River Bank and Director (since 1998), Connecticut River Bancorp; Chairman (since 2000), Emerson Investment Management, Inc.; Director (since 2002), New Hampshire Trust Company; Non-Executive Chairman (2007 to 2011), Hudson Castle Group, Inc. (formerly IBEX Capital Markets, Inc.) (financial services); and Trustee (since 1987), Virtus Mutual Fund Complex. | |
Richard E. Segerson YOB: 1948 Elected: 2000 48 Funds | Retired. Managing Director (1998 to 2013), Northway Management Company; and Trustee (since 1993), Virtus Mutual Fund Complex. | |
Ferdinand L.J. Verdonck YOB: 1942 Elected: 2005 48 Funds | Director (since 1998), The J.P. Morgan European Investment Trust; Director (since 2005), Galapagos N.V. (biotechnology); Mr. Verdonck is also a director of several non-U.S. companies. |
74
Table of Contents
FUND MANAGEMENT TABLES (Continued)
Interested Trustee
The individual listed below is an “interested person” of the Trust, as defined in Section 2(a)(19) of the 1940 Act, as amended, and the rules and regulations thereunder.
| Name, Year of Birth, Year Elected and Number of Funds Overseen | Principal Occupation(s) During Past 5 Years and | |
George R. Aylward* Trustee and President YOB: 1964 Elected: 2006 61 Funds | Director, President and Chief Executive Officer (since 2008), Virtus Investment Partners, Inc. and/or certain of its subsidiaries; various senior officer positions with Virtus affiliates (since 2005); Trustee (since 2012), Virtus Variable Insurance Trust; Trustee and President (since 2011), Virtus Closed-End Funds (2 portfolios); and Chairman, President and Chief Executive Officer (since 2006), The Zweig Closed-End Funds (2 portfolios) Funds; and Director (since 2013), Virtus Global Funds, PLC. |
| * | Mr. Aylward is an “interested person,” as defined in the 1940 Act, by reason of his position as President and Chief Executive Officer of Virtus Investment Partners, Inc. (“Virtus”), the ultimate parent company of the Adviser, and various positions with its affiliates, including the Adviser. |
75
Table of Contents
FUND MANAGEMENT TABLES (Continued)
Officers of the Trust Who Are Not Trustees
Name, Address and Year of Birth | Position(s) Held with Time Served | Principal Occupation(s) During Past 5 Years | ||
W. Patrick Bradley YOB: 1972 | Senior Vice President (since 2013), Vice President since 2011, Chief Financial Officer and Treasurer since 2006. | Senior Vice President, Fund Services (since 2010), Virtus Investment Partners, Inc. and/or certain of its subsidiaries; various officer positions (since 2006) with Virtus affiliates; Vice President (since 2011), Chief Financial Officer and Treasurer (since 2004), Virtus Variable Insurance Trust; Vice President, Chief Financial Officer and Treasurer (since 2011), Virtus Global Multi-Sector Income Fund and Virtus Total Return Fund; Vice President (since 2012) and Treasurer (Chief Financial Officer) (since 2007), The Zweig Fund, Inc. and Zweig Total Return Fund, Inc.; Vice President and Assistant Treasurer (since 2011), Duff & Phelps Global Utility Income Fund Inc. ; and Director (since 2013), Virtus Global Funds, PLC. | ||
Kevin J. Carr YOB: 1954 | Senior Vice President Chief Legal Officer, Counsel and Secretary | Senior Vice President (since 2009), Vice President, Counsel and Secretary (2008 to 2009), Virtus Investment Partners, Inc. and/or certain of its subsidiaries; various senior officer positions (since 2005) with Virtus affiliates; Vice President, Chief Legal Officer, Counsel and Secretary (since 2010), Virtus Variable Insurance Trust; Vice President and Assistant Secretary (since 2012), Vice President, Chief Legal Officer, Counsel and Secretary (2011-2012), Virtus Global Multi-Sector Income Fund and Virtus Total Return Fund; Vice President and Assistant Secretary (since 2012), Secretary and Chief Legal Officer (2005-2012), The Zweig Fund, Inc. and Zweig Total Return Fund, Inc.; and Vice President and Assistant Secretary (since 2011), Duff & Phelps Global Utility Income Fund Inc. | ||
Nancy J. Engberg YOB: 1956 | Vice President and Chief Compliance Officer since 2011. | Vice President (since 2008) and Chief Compliance Officer (2008 to 2011), Virtus Investment Partners, Inc. and/or certain of its subsidiaries; various officer positions (since 2003) with Virtus affiliates; Vice President (since 2010), Chief Compliance Officer (since 2011), Virtus Variable Insurance Trust; Vice President and Chief Compliance Officer (since 2011), Virtus Global Multi-Sector Income Fund and Virtus Total Return Fund; Vice President and Chief Compliance Officer (since 2012), The Zweig Fund, Inc. and Zweig Total Return Fund, Inc. | ||
Francis G. Waltman YOB: 1962 | Executive Vice President since 2013; Senior Vice President 2008-2013. | Executive Vice President, Product Development (since 2009), Virtus Investment Partners, Inc. and/or certain of its subsidiaries; various senior officer positions (since 2006) with Virtus affiliates; Senior Vice President (since 2010), Virtus Variable Insurance Trust; Senior Vice President (since 2011), Virtus Global Multi-Sector Income Fund and Virtus Total Return Fund; and Director (since 2013), Virtus Global Funds, PLC. |
76
Table of Contents
Virtus Dynamic AlphaSector® Fund,
a series of Virtus Opportunities Trust
Supplement dated September 12, 2013 to the Prospectus dated January 31, 2013, as supplemented and revised, and to the Statement of Additional Information (“SAI”) dated June 10, 2013
THIS SUPPLEMENT SUPERCEDES THE SUPPLEMENT DATED SEPTEMBER 6, 2013 TO THE ABOVE-REFERENCED PROSPECTUS AND SAI. THIS SUPPLEMENT CORRECTS THE EXPENSE RATIOS SHOWN IN THE EARLIER SUPPLEMENT.
IMPORTANT NOTICETO INVESTORS
Effective August 22, 2013, the fund’s investment adviser, Virtus Investment Advisers, Inc. (“VIA”), has discontinued the voluntary limit on Other Expenses of the fund. Accordingly, all references to a voluntary limit of the fund’s Other Expenses in the Statutory Prospectus and SAI are hereby removed. For clarity, because the fund’s assets have increased significantly since the date of the Statutory Prospectus and SAI, after discontinuing the voluntary limit on Other Expenses the fund’s Total Annual Fund Operating Expenses are still well below those shown in the Fees and Expenses table in the fund’s Prospectuses. As of the date of this Supplement, the fund’s total operating expenses are as follows: Class A Shares, 2.90%; Class B Shares, 3.65%; Class C Shares, 3.65%; and Class I Shares, 2.65%. Under certain conditions, VIA may recapture fees waived and expenses reimbursed under the previous expense limitation arrangement for a period of three years from the end of the fiscal year in which such waivers and/or reimbursements occurred.
Investors should retain this supplement with the Prospectus and SAI for future reference.
VOT 8020/DASFCapRemoved4 (9/13)
Table of Contents
Virtus Dynamic AlphaSector® Fund,
a series of Virtus Opportunities Trust
Supplement dated August 1, 2013 to the Prospectuses and the Statement of Additional Information (“SAI”), each dated January 31, 2013
IMPORTANT NOTICETO INVESTORS
Effective September 1, 2013, the maximum contingent deferred sales charge (“CDSC”) applicable to Class C Shares will be reduced to 1.00% (as a percentage of the lesser of purchase price or redemption proceeds). Accordingly, effective September 1, 2013, all references in the fund’s summary prospectus, statutory prospectus and SAI to the Class C Shares CDSC are hereby revised to reflect this change.
Investors should retain this supplement with the Prospectuses and SAI for future reference.
VOT 8020/DynamicAlphaSector ClassCCDSC (7/13)
Table of Contents
VIRTUS OPPORTUNITIES TRUST
101 Munson Street
Greenfield, MA 01301-9668
Trustees
George R. Aylward
Leroy Keith, Jr.
Philip R. McLoughlin, Chairman
Geraldine M. McNamara
James M. Oates
Richard E. Segerson
Ferdinand L.J. Verdonck
Officers
George R. Aylward, President
Francis G. Waltman, Executive Vice President
Nancy J. Engberg, Vice President and Chief Compliance Officer
W. Patrick Bradley, Senior Vice President, Chief Financial Officer and Treasurer
Kevin J. Carr, Senior Vice President, Chief Legal Officer, Counsel and Secretary
Investment Adviser
Virtus Investment Advisers, Inc.
100 Pearl Street
Hartford, CT 06103-4506
Principal Underwriter
VP Distributors, LLC
100 Pearl Street
Hartford, CT 06103-4506
Administrator and Transfer Agent
Virtus Fund Services, LLC
100 Pearl Street
Hartford, CT 06103-4506
Custodian
JPMorgan Chase & Co.
1 Chase Manhattan Plaza,
New York, NY 10005-1401
Independent Registered Public Accounting Firm
PricewaterhouseCoopers LLP
2001 Market Street
Philadelphia, PA 19103-7042
How to Contact Us
Mutual Fund Services 1-800-243-1574
Adviser Consulting Group 1-800-243-4361
Telephone Orders 1-800-367-5877
Text Telephone 1-800-243-1926
Web siteVirtus.com
Important Notice to Shareholders
The Securities and Exchange Commission has modified mailing regulations for semiannual and annual shareholder fund reports to allow mutual fund companies to send a single copy of these reports to shareholders who share the same mailing address. If you would like additional copies, please call Mutual Fund Services at 1-800-243-1574.
Table of Contents
For more information about
Virtus Mutual Funds, please call
your financial representative, or
contact us at 1-800-243-1574
or Virtus.com
| 8454 | 11-13 |
 |
Table of Contents

ANNUAL REPORT
Virtus Emerging Markets Debt Fund
Virtus Emerging Markets Equity Income Fund
Virtus Global Commodities Stock Fund
Virtus Global Dividend Fund
Virtus Global Opportunities Fund
Virtus Global Real Estate Securities Fund
Virtus Greater Asia ex Japan Opportunities Fund
Virtus Greater European Opportunities Fund
Virtus International Equity Fund
Virtus International Real Estate Securities Fund
Virtus International Small-Cap Fund
September 30, 2013 TRUST NAME: VIRTUS OPPORTUNITIES TRUST |
 |
Not FDIC Insured
No Bank Guarantee
May Lose Value
Table of Contents
Proxy Voting Procedures and Voting Record (Form N-PX)
The subadvisers vote proxies relating to portfolio securities in accordance with procedures that have been approved by the Board of Trustees of the Trust (“Trustees,” the “Board”). You may obtain a description of these procedures, along with information regarding how the Funds voted proxies during the most recent 12-month period ended June 30, free of charge, by calling toll-free 1-800-243-1574. This information is also available through the Securities and Exchange Commission’s (the “SEC”) website at http://www.sec.gov.
Form N-Q Information
The Trust files a complete schedule of portfolio holdings for each Fund with the SEC for the first and third quarters of each fiscal year on Form N-Q. Form N-Q is available on the SEC’s website at http://www.sec.gov. Form N-Q may be reviewed and copied at the SEC’s Public Reference Room. Information on the operation of the SEC’s Public Reference Room can be obtained by calling toll-free 1-800-SEC-0330.
This report is not authorized for distribution to prospective investors in the Funds presented in this book unless preceded or accompanied by an effective prospectus which includes information concerning the sales charge, each Fund’s record and other pertinent information.
Table of Contents
Dear Fellow Shareholders of Virtus Mutual Funds:
 | The financial markets experienced significant volatility during the 12-month period that ended September 30, 2013. The S&P 500® Index, a benchmark for U.S. equities, gained 19.3% while the Barclays U.S. Aggregate Bond Index, which tracks the U.S. fixed income market, declined 1.7%, and the MSCI AC World Index (net), a measure of international equities, rose 17.7%.
The bond markets were particularly volatile during the second half of this period. U.S. Treasury yields climbed over the last few months as the market prepared for the Federal Reserve’s tapering of its bond purchases, which never occurred. The 10-year Treasury yield was at 2.6% as of September 30, 2013, | |
compared with 1.7% a year earlier, and, as rates rose, most bond sectors suffered losses.
Despite this recent market unpredictability, there is reason for investors to be cautiously optimistic about the economy. The U.S. economy is showing signs of growth in hiring, consumer spending, and housing and, although China’s recovery remains tenuous, Europe appears to be coming out of its recession. The onus remains on the U.S. government to keep the country on strong fiscal footing and on corporations to produce robust earnings, which will play a pivotal role in determining future market direction.
Market uncertainty is a timely reminder of the importance of portfolio diversification. While diversification cannot guarantee a profit or prevent loss, owning a variety of asset classes may cushion your portfolio against inevitable market fluctuations. Your financial advisor can help you ensure that your portfolio is adequately diversified.
Thank you for entrusting Virtus with your assets. Should you have any questions or require support, the Virtus customer service team is ready to assist you at 1-866-270-7788. We appreciate your business and remain committed to your long-term financial success.
Sincerely,
George R. Aylward President, Virtus Mutual Funds
October 2013 | ||

Whenever you have questions about your account, or require additional information, please visit us on the Web at www.virtus.com or call our shareowner service group toll-free at 1-800-243-1574.
Performance data quoted represents past results. Past performance is no guarantee of future results and current performance may be higher or lower than the performance shown above.
1
Table of Contents
VIRTUS OPPORTUNITIES TRUST
Disclosure of Fund Expenses (Unaudited)
For the six-month period of April 1, 2013 to September 30, 2013
We believe it is important for you to understand the impact of costs on your investment. All mutual funds have operating expenses. As a shareholder of a Virtus Opportunities Trust Fund (each, a “Fund”) you may incur two types of costs: (1) transaction costs, including sales charges on purchases of Class A shares and contingent deferred sales charges on Class B and Class C shares; and (2) ongoing costs, including investment advisory fees, distribution and service fees, and other expenses. Class I shares are sold without sales charges and do not incur distribution and service fees. For further information regarding applicable sales charges, see Note 1 in the Notes to Financial Statements. These examples are intended to help you understand your ongoing costs (in dollars) of investing in a Fund and to compare these costs with the ongoing costs of investing in other mutual funds. These examples are based on an investment of $1,000 invested at the beginning of the period and held for the entire six-month period. The following Expense Table illustrates your Fund’s costs in two ways.
Actual Expenses
The first section of the accompanying table provides information about actual account values and actual expenses. You may use the information in this section, together with the amount you invested, to estimate the expenses that you paid over the period. Simply divide your account value by $1,000 (for example, an $8,600 account value divided by $1,000 = 8.6), then multiply the result by the number given for your Fund under the heading “Expenses Paid During Period” to estimate the expenses you paid on your account during the period.
Hypothetical Example for Comparison Purposes
The second section of the accompanying table provides information about hypothetical account values and hypothetical expenses based on the Fund’s actual expense ratio and an assumed rate of return of 5% per year before expenses, which is not your Fund’s actual return. The hypothetical account values and expenses may not be used to estimate the actual ending account balance or expenses you paid for the period. You may use this information to compare the ongoing costs of investing in your Fund and other funds. To do so, compare these 5% hypothetical examples with the 5% hypothetical examples that appear in the shareholder reports of the other funds.
Please note that the expenses shown in the accompanying table are meant to highlight your ongoing costs only and do not reflect any transactional costs, such as sales charges or contingent deferred sales charges. Therefore, the second section of the accompanying table is useful in comparing ongoing costs only, and will not help you determine the relative total costs of owning different funds. In addition, if these transactional costs were included, your costs would have been higher. The calculations assume no shares were bought or sold during the period. Your actual costs may have been higher or lower, depending on the amount of your investment and the timing of any purchases or redemptions.
| Expense Table | ||||||||||||||||
| Beginning Account Value April 1, 2013 | Ending Account Value September 30, 2013 | Annualized Expense Ratio | Expenses Paid During Period* | |||||||||||||
Emerging Markets Debt Fund |
| |||||||||||||||
Actual |
| |||||||||||||||
Class A | $ | 1,000.00 | $ | 939.10 | 1.35 | % | $ | 6.56 | ||||||||
Class C | 1,000.00 | 936.30 | 2.10 | 10.19 | ||||||||||||
Class I | 1,000.00 | 940.20 | 1.10 | 5.35 | ||||||||||||
Hypothetical (5% return before expenses) |
| |||||||||||||||
Class A | 1,000.00 | 1,018.22 | 1.35 | 6.85 | ||||||||||||
Class C | 1,000.00 | 1,014.41 | 2.10 | 10.66 | ||||||||||||
Class I | 1,000.00 | 1,019.49 | 1.10 | 5.58 | ||||||||||||
Emerging Markets Equity Income Fund |
| |||||||||||||||
Actual |
| |||||||||||||||
Class A | $ | 1,000.00 | $ | 973.60 | 1.75 | % | $ | 8.66 | ||||||||
Class C | 1,000.00 | 969.50 | 2.50 | 12.34 | ||||||||||||
Class I | 1,000.00 | 974.00 | 1.50 | 7.42 | ||||||||||||
Hypothetical (5% return before expenses) |
| |||||||||||||||
Class A | 1,000.00 | 1,016.19 | 1.75 | 8.88 | ||||||||||||
Class C | 1,000.00 | 1,012.38 | 2.50 | 12.69 | ||||||||||||
Class I | 1,000.00 | 1,017.46 | 1.50 | 7.61 | ||||||||||||
Global Commodities Stock Fund |
| |||||||||||||||
Actual |
| |||||||||||||||
Class A | $ | 1,000.00 | $ | 944.00 | 1.65 | % | $ | 8.04 | ||||||||
Class C | 1,000.00 | 942.50 | 2.40 | 11.69 | ||||||||||||
Class I | 1,000.00 | 946.20 | 1.40 | 6.83 | ||||||||||||
Hypothetical (5% return before expenses) |
| |||||||||||||||
Class A | 1,000.00 | 1,016.69 | 1.65 | 8.38 | ||||||||||||
Class C | 1,000.00 | 1,012.89 | 2.40 | 12.18 | ||||||||||||
Class I | 1,000.00 | 1,017.96 | 1.40 | 7.11 | ||||||||||||
Global Dividend Fund |
| |||||||||||||||
Actual |
| |||||||||||||||
Class A | $ | 1,000.00 | $ | 1,029.00 | 1.27 | % | $ | 6.46 | ||||||||
Class C | 1,000.00 | �� | 1,025.40 | 2.02 | 10.26 | |||||||||||
Class I | 1,000.00 | 1,030.20 | 1.02 | 5.19 | ||||||||||||
Hypothetical (5% return before expenses) |
| |||||||||||||||
Class A | 1,000.00 | 1,018.62 | 1.27 | 6.45 | ||||||||||||
Class C | 1,000.00 | 1,014.82 | 2.02 | 10.25 | ||||||||||||
Class I | 1,000.00 | 1,019.89 | 1.02 | 5.18 | ||||||||||||
Global Opportunities Fund |
| |||||||||||||||
Actual |
| |||||||||||||||
Class A | $ | 1,000.00 | $ | 1,018.40 | 1.55 | % | $ | 7.84 | ||||||||
Class B | 1,000.00 | 1,014.50 | 2.30 | 11.62 | ||||||||||||
Class C | 1,000.00 | 1,014.60 | 2.30 | 11.62 | ||||||||||||
Class I | 1,000.00 | 1,020.30 | 1.30 | 6.58 | ||||||||||||
Hypothetical (5% return before expenses) |
| |||||||||||||||
Class A | 1,000.00 | 1,017.20 | 1.55 | 7.87 | ||||||||||||
Class B | 1,000.00 | 1,013.39 | 2.30 | 11.68 | ||||||||||||
Class C | 1,000.00 | 1,013.39 | 2.30 | 11.68 | ||||||||||||
Class I | 1,000.00 | 1,018.47 | 1.30 | 6.60 | ||||||||||||
Global Real Estate Securities Fund |
| |||||||||||||||
Actual |
| |||||||||||||||
Class A | $ | 1,000.00 | $ | 980.10 | 1.40 | % | $ | 6.95 | ||||||||
Class C | 1,000.00 | 976.40 | 2.15 | 10.65 | ||||||||||||
Class I | 1,000.00 | 981.40 | 1.15 | 5.71 | ||||||||||||
Hypothetical (5% return before expenses) |
| |||||||||||||||
Class A | 1,000.00 | 1,017.96 | 1.40 | 7.11 | ||||||||||||
Class C | 1,000.00 | 1,014.16 | 2.15 | 10.91 | ||||||||||||
Class I | 1,000.00 | 1,019.23 | 1.15 | 5.84 | ||||||||||||
2
Table of Contents
VIRTUS OPPORTUNITIES TRUST
Disclosure of Fund Expenses (Unaudited) (Continued)
For the six-month period of April 1, 2013 to September 30, 2013
| Expense Table | ||||||||||||||||
| Beginning Account Value April 1, 2013 | Ending Account Value September 30, 2013 | Annualized Expense Ratio | Expenses Paid During Period* | |||||||||||||
Greater Asia ex Japan Opportunities Fund |
| |||||||||||||||
Actual |
| |||||||||||||||
Class A | $ | 1,000.00 | $ | 936.60 | 1.80 | % | $ | 8.74 | ||||||||
Class C | 1,000.00 | 932.50 | 2.55 | 12.35 | ||||||||||||
Class I | 1,000.00 | 937.50 | 1.55 | 7.53 | ||||||||||||
Hypothetical (5% return before expenses) |
| |||||||||||||||
Class A | 1,000.00 | 1,015.93 | 1.80 | 9.14 | ||||||||||||
Class C | 1,000.00 | 1,012.12 | 2.55 | 12.95 | ||||||||||||
Class I | 1,000.00 | 1,017.20 | 1.55 | 7.87 | ||||||||||||
Greater European Opportunities Fund |
| |||||||||||||||
Actual |
| |||||||||||||||
Class A | $ | 1,000.00 | $ | 1,028.50 | 1.45 | % | $ | 7.37 | ||||||||
Class C | 1,000.00 | 1,024.10 | 2.20 | 11.16 | ||||||||||||
Class I | 1,000.00 | 1,029.80 | 1.20 | 6.11 | ||||||||||||
Hypothetical (5% return before expenses) |
| |||||||||||||||
Class A | 1,000.00 | 1,017.71 | 1.45 | 7.36 | ||||||||||||
Class C | 1,000.00 | 1,013.90 | 2.20 | 11.17 | ||||||||||||
Class I | 1,000.00 | 1,018.98 | 1.20 | 6.09 | ||||||||||||
International Equity Fund |
| |||||||||||||||
Actual |
| |||||||||||||||
Class A | $ | 1,000.00 | $ | 1,038.50 | 1.50 | % | $ | 7.67 | ||||||||
Class C | 1,000.00 | 1,034.20 | 2.25 | 11.47 | ||||||||||||
Class I | 1,000.00 | 1,039.30 | 1.25 | 6.39 | ||||||||||||
Hypothetical (5% return before expenses) |
| |||||||||||||||
Class A | 1,000.00 | 1,017.46 | 1.50 | 7.61 | ||||||||||||
Class C | 1,000.00 | 1,013.65 | 2.25 | 11.42 | ||||||||||||
Class I | 1,000.00 | 1,018.72 | 1.25 | 6.35 | ||||||||||||
International Real Estate Securities Fund |
| |||||||||||||||
Actual |
| |||||||||||||||
Class A | $ | 1,000.00 | $ | 995.50 | 1.50 | % | $ | 7.50 | ||||||||
Class C | 1,000.00 | 990.90 | 2.25 | 11.23 | ||||||||||||
Class I | 1,000.00 | 995.50 | 1.25 | 6.25 | ||||||||||||
Hypothetical (5% return before expenses) |
| |||||||||||||||
Class A | 1,000.00 | 1,017.46 | 1.50 | 7.61 | ||||||||||||
Class C | 1,000.00 | 1,013.65 | 2.25 | 11.42 | ||||||||||||
Class I | 1,000.00 | 1,018.72 | 1.25 | 6.35 | ||||||||||||
International Small-Cap Fund |
| |||||||||||||||
Actual |
| |||||||||||||||
Class A | $ | 1,000.00 | $ | 1,123.30 | 1.60 | % | $ | 8.52 | ||||||||
Class C | 1,000.00 | 1,118.60 | 2.35 | 12.48 | ||||||||||||
Class I | 1,000.00 | 1,124.00 | 1.35 | 7.19 | ||||||||||||
Hypothetical (5% return before expenses) |
| |||||||||||||||
Class A | 1,000.00 | 1,016.95 | 1.60 | 8.12 | ||||||||||||
Class C | 1,000.00 | 1,013.14 | 2.35 | 11.93 | ||||||||||||
Class I | 1,000.00 | 1,018.22 | 1.35 | 6.85 | ||||||||||||
| * | Expenses are equal to the relevant Funds’ annualized expense ratio, which is net of waived fees, reimbursed expenses, if applicable, multiplied by the average account value over the period, multiplied by the number of days (183) expenses were accrued in the most recent fiscal half-year, then divided by 365 to reflect the one-half year period. |
For Funds which may invest in other funds, the annualized expense ratios noted above do not reflect fees and expenses associated with the underlying funds. If such fees and expenses had been included, the expenses would have been higher.
You can find more information about the Funds’ expenses in the Financial Statements section that follows. For additional information on operating expenses and other shareholder costs, refer to the prospectus.
3
Table of Contents
ADR (American Depositary Receipt)
Represents shares of foreign companies traded in U.S. dollars on U.S. exchanges that are held by a U.S. bank or a trust. Foreign companies use ADRs in order to make it easier for Americans to buy their shares.
Barclays U.S. Aggregate Bond Index
The Barclays U.S. Aggregate Bond Index measures the U.S. investment grade fixed rate bond market. The index is calculated on a total return basis.
Exchange-Traded Funds (ETF)
Portfolios of stocks or bonds that track a specific market index.
ETN (Exchange-Traded Note)
A type of unsecured, unsubordinated debt security. This type of debt security differs from other types of bonds and notes because ETN returns are based upon the performance of a market index minus applicable fees, no period coupon payments are distributed and no principal protections exists. ETNs are traded on a major exchange, such as the NYSE during normal trading hours.
European Central Bank (“ECB”)
The European Central Bank (ECB) is responsible for conducting monetary policy for the euro area. The ECB was established as the core of the Eurosystem and the European System of Central Banks (ESCB). The ESCB comprises the ECB and the national central banks (NCBs) of all 17 EU Member States whether they have adopted the Euro or not.
Federal Reserve (the “Fed”)
The central bank of the United States, responsible for controlling the money supply, interest rates and credit with the goal of keeping the U.S. economy and currency stable. Governed by a seven-member board, the system includes 12 regional Federal Reserve Banks, 25 branches and all national and state banks that are part of the system.
FTSE EPRA/NAREIT Developed Rental ex U.S. Index (net)
The FTSE EPRA/NAREIT Developed Rental ex U.S. Index is a free-float market capitalization index measuring international real estate securities, which meet minimum size, liquidity and investment focus criteria. The index is a sub-set of the FTSE EPRA/NAREIT Investment Focus Index Series, which separates the existing constituents into both Rental and Non-Rental Indices. A company is classified as Rental if the rental revenue from properties is greater than or equal to 70% of total revenue. The classification is based on revenue sources as disclosed in the latest published financial statement. The index is calculated on a total return basis with net dividends reinvested.
FTSE EPRA/NAREIT Developed Rental Index (net)
The FTSE EPRA/NAREIT Developed Rental Index is a free-float market capitalization index measuring global real estate securities, which meet minimum size, liquidity and investment focus criteria. The index is a sub-set of the FTSE EPRA/ NAREIT Investment Focus Index Series, which separates the existing constituents into both Rental and Non-Rental Indices. A company is classified as Rental if the rental revenue from properties is greater than or equal to 70% of total revenue. The classification is based on revenue sources as disclosed in the latest published financial statement. The index is calculated on a total return basis with net dividends reinvested.
GDR (Global Depositary Receipt)
A bank certificate issued in more than one country for shares in a foreign company. The shares are held by a foreign branch of an international bank. The shares trade as domestic shares, but are offered for sale globally through the various bank branches.
Global Dividend Linked Benchmark
The Global Dividend Linked Benchmark consists of the MSCI World Infrastructure Sector Capped Index. This is a market capitalization weighted index that measures performance of global infrastructure companies by capturing broad and diversified opportunities across telecommunication, utilities, energy, transportation and social infrastructure sectors. The telecommunication infrastructure and utilities sector each represent one-third of the index weight, while energy, transportation and social infrastructure sectors have a combined weight of the remaining one-third of the index. Performance
4
Table of Contents
KEY INVESTMENT TERMS (Continued)
of the Global Dividend Linked Benchmark prior to 9/1/2008 represents an allocation consisting of 65% MSCI USA/Utilities Index, 20% MSCI World Telecom Services Index, and 15% MSCI World ex USA/Utilities Index. The index is unmanaged and not available for direct investment.
Gross Domestic Product (GDP)
The market value of all officially recognized final goods and services produced within a country in a given period.
iShares®
Represents shares of an open-end exchange-traded fund.
J.P. Morgan Emerging Markets Bond Global Diversified Index (EMBI Global Diversified)
The J.P. Morgan Emerging Markets Bond Global Diversified Index (EMBI Global Diversified) is a uniquely-weighted version of the J.P. Morgan EMBI Global Index. The index limits the weights of those countries with larger debt stock by only including specified portions of these countries’ eligible current face amounts of debt outstanding. The countries covered in the EMBI Global Diversified Index are identical to those covered by the EMBI Global Index. The EMBI Global Index tracks total returns for U.S. dollar-denominated debt instruments issued by emerging market sovereign and quasi-sovereign entities: Brady bonds, loans, Eurobonds. The index is unmanaged, its returns do not reflect any fees, expenses or sales charges and is not available for direct investment.
MSCI AC Asia Pacific ex Japan Index (net)
The MSCI AC Asia Pacific Japan Index (net) is a free float-adjusted market capitalization weighted index that measures equity market performance of developed and emerging markets in Asia (excluding Japan), as well as Australia and New Zealand. The index is unmanaged, its returns do not reflect any fees, expenses or sales charges and is not available for direct investment.
MSCI AC World Commodity Producer Sector Capped Index (net)
The MSCI AC World Commodity Producer Sector Capped Index (net) is a market capitalization weighted index that measures performance of developed and emerging market commodity producers within the energy, metals and agriculture sectors. Each of the three sectors is equally weighted within the index. The index is calculated on a total return basis with net dividends reinvested. The index is unmanaged, its returns do not reflect any fees, expenses or sales charges and is not available for direct investment.
MSCI AC World Ex U.S. Small Cap Index (net)
The MSCI AC World Index ex U.S. Small Cap Index (Net) is a free float-adjusted market capitalization-weighted index that measures small cap equity performance of developed and emerging markets, excluding the U.S. The index is calculated on a total return basis with net dividends reinvested. The index is unmanaged, its returns do not reflect any fees, expenses or sales charges and is not available for direct investment.
MSCI AC World Index (net)
The MSCI AC World Index (net) is a free float-adjusted market capitalization-weighted index that measures equity performance of developed and emerging markets. The index is calculated on a total return basis with net dividends reinvested. The index is unmanaged, its returns do not reflect any fees, expenses or sales charges and is not available for direct investment.
MSCI EAFE® Index (net)
The MSCI EAFE® (Europe, Australasia, Far East) Index is a free float-adjusted market capitalization index that measures equity market performance of developed markets, excluding the U.S. and Canada. The index is calculated on a total return basis with net dividends reinvested. The index is unmanaged, its returns do not reflect any fees, expenses or sales charges and is not available for direct investment.
MSCI Emerging Markets Index (net)
The MSCI Emerging Markets Index (net) is a free float-adjusted market capitalization-weighted index designed to measure equity market performance in the global emerging markets. The index is calculated on a total return basis with net dividends reinvested. The index is unmanaged, its returns do not reflect any fees, expenses or sales charges and is not available for direct investment.
5
Table of Contents
KEY INVESTMENT TERMS (Continued)
MSCI Europe Index (net)
The MSCI Europe Index is a free float-adjusted market capitalization weighted index that is designed to measure the equity market performance of the developed markets in Europe. Currently, the MSCI Europe Index consists of the following 16 developed market country indices: Austria, Belgium, Denmark, Finland, France, Germany, Greece, Ireland, Italy, the Netherlands, Norway, Portugal, Spain, Sweden, Switzerland and the United Kingdom. The index is unmanaged, its returns do not reflect any fees, expenses or sales charges and is not available for direct investment.
MSCI WorldSM Index (net)
A free float-adjusted market capitalization index that measures developed global market equity performance. The index is calculated on a total return basis with net dividends reinvested. The index is unmanaged, its returns do not reflect any fees, expenses or sales charges and is not available for direct investment.
MSCI World Infrastructure Sector Capped Index
The MSCI World Infrastructure Sector Capped Index is a market capitalization weighted index that measures performance of global infrastructure companies by capturing broad and diversified opportunities across telecommunication, utilities, energy, transportation and social infrastructure sectors. The telecommunication infrastructure and utilities sector each represent one-third of the index weight, while energy, transportation and social infrastructure sectors have a combined weight of the remaining one-third of the index. Prior to September 1, 2008, the index allocation was 65% MSCI USA/utilities index, 20% MSCI World Telcom Services index and 15% MSCI World ex USA utilities index. The index is unmanaged, its returns do not reflect any fees, expenses or sales charges and is not available for direct investment.
PIK (Payment-in-Kind Security)
A bond which pays interest in the form of additional bonds, or preferred stock which pays dividends in the form of additional preferred stock.
Quantitative Easing
A government monetary policy occasionally used to increase the money supply by buying government securities or other securities from the market. Quantitative easing increases the money supply by flooding financial institutions with capital in an effort to promote increased lending and liquidity.
REIT (Real Estate Investment Trust)
A publicly traded company that owns, develops and operates income-producing real estate such as apartments, office buildings, hotels, shopping centers and other commercial properties.
S&P 500® Index
The S&P 500® Index is a free-float market capitalization-weighted index of 500 of the largest U.S. companies. The index is calculated on a total return basis with dividends reinvested. The index is unmanaged, its returns do not reflect any fees, expenses or sales charges and is not available for direct investment.
Sponsored ADR (American Depositary Receipt)
An ADR which is issued with the cooperation of the company whose stock will underlie the ADR. Sponsored ADRs generally carry the same rights normally given to stockholders, such as voting rights. ADRs must be sponsored to be able to trade on a major U.S. exchange such as the New York Stock Exchange (“NYSE”).
Thomson Reuters/Jefferies CRB Index
The Thomson Reuters/Jefferies CRB Index is a weighted index designed to measure commodity performance. The index is calculated using 19 commodity sectors and rebalanced monthly to its fixed target weightings. The index is unmanaged and not available for direct investment.
When-issued and forward comitments (delayed delivery)
Securities purchased on a when-issued or forward commitment basis are also known as delayed delivery transactions. Delayed delivery transactions involve a commitment by a Fund to purchase or sell a security at a future date, ordinarily up to 90 days later. When-issued or forward commitments enable a Fund to lock in what is believed to be an attractive price or yield on a particular security for a period of time, regardless of future changes in interest rates.
6
Table of Contents
Fund Summary | Ticker Symbols: Class A: VEDAX Class C: VEDCX Class I: VIEDX |
| ¢ | The Fund is diversified and has an investment objective of seeking total return from current income and capital appreciation. |
| ¢ | For the fiscal year ended September 30, 2013, the Fund’s Class A shares at NAV returned -1.94%, Class C shares returned -2.68%, and Class I shares returned -1.80%. For the same period, the Barclays U.S. Aggregate Bond Index, a broad-based fixed income index, returned -1.68%, and the J.P. Morgan Emerging Markets Bond Global Diversified Index, the Fund’s style-specific benchmark appropriate for comparison, returned -4.06%. |
All performance figures assume reinvestment of distributions and exclude the effect of sales charges. Past performance is no guarantee of future results and current performance may be higher or lower than the performance shown above.
How did the markets perform during the Fund’s fiscal year?
| ¢ | Below-investment grade credit spread sectors, such as U.S. high yield and bank loans, outperformed U.S. Treasuries and other more interest rate-sensitive fixed income sectors during the Fund’s fiscal year. Spread sectors were supported by an overall improvement in the U.S. macroeconomic environment, a stabilization of the eurozone economy, steady credit fundamentals, and continued demand by investors for higher yields. |
| ¢ | The emerging market debt sector posted negative returns during the fiscal period due to wider spreads and higher U.S Treasury yields. Wider spreads reflected a weakening in emerging market fundamentals due to China’s slower growth, lower prices in many key commodities, and a sharp reversal of investor asset flows in the second half of the fiscal year (May to September 2013). |
| ¢ | Meanwhile, U.S. Treasuries and more interest rate-sensitive fixed income sectors were negatively impacted by a sharp backup in U.S. Treasury yields during the fiscal year, reflecting the Fed’s change in policy tone in May 2013. At that time, Fed Chairman Ben Bernanke indicated that the Central Bank was likely to begin to unwind its quantitative easing program sooner than markets had |
expected. The 10-year Treasury yield began the fiscal year at 1.62% and finished at 2.61%, and the yield curve steepened materially. |
| ¢ | During the fiscal year, bouts of volatility were experienced due to uncertainty surrounding the U.S. presidential elections, the economic impact of tax hikes and sequestration, and when the Fed will begin to end its quantitative easing program. |
What factors affected the Fund’s performance during its fiscal year?
| ¢ | The Fund’s outperformance relative to its style-specific benchmark during the period was driven by the portfolio allocation to below-investment grade issues, particularly within the emerging markets corporate sector. The Fund’s shorter duration relative to the style-specific benchmark also contributed positively to relative performance. |
| ¢ | During the fiscal year, the Fund’s allocation to the non-U.S. dollar sector detracted from overall performance. |
The preceding information is the opinion of portfolio management. Any such opinions are subject to change at any time based on market or other conditions and should not be relied upon as investment advice. Past performance is no guarantee of future results and there is no guarantee that market forecasts will be realized.
There is no guarantee that the Fund will meet its objective.
| Asset Allocation | ||||||||
The following table presents asset allocations within certain sectors and as a percentage of total investments as of September 30, 2013.
|
| |||||||
Corporate Bonds and Notes | 72 | % | ||||||
Financials | 36 | % | ||||||
Energy | 13 | |||||||
Materials | 9 | |||||||
Industrials | 6 | |||||||
All other Corporate Bonds and Notes | 8 | |||||||
Foreign Government Securities | 22 | |||||||
Other (includes short-term investments) | 6 | |||||||
|
| |||||||
Total | 100 | % | ||||||
|
| |||||||
Debt securities are subject to various risks, the most prominent of which are credit and interest rate risk. The issuer of a security may fail to make payments in a timely manner. Values of debt securities may rise and fall in response to changes in interest rates. This risk may be enhanced with longer-term maturities. There is a greater level of credit risk and price volatility involved with high yield securities than investment grade securities. Changes in interest rates can cause both extension and prepayment risks for asset and mortgage-backed securities. These securities are also subject to risks associated with the repayment of underlying collateral. There may be no ready market for loan participation interests. The fund may have to sell the interests at a substantial discount. Such interests are subject to the credit risk of the underlying corporate borrower. Investing internationally, especially in emerging markets, involves additional risks such as currency, political, accounting, economic, and market risk.
For information regarding the indexes and certain investment terms, see the Key Investment Terms starting on page 4.
7
Table of Contents
Emerging Markets Debt Fund (Continued)
| Average Annual Total Returns1 for periods ended 9/30/13 | ||||||||||||
| 1 year | Since Inception | Inception Date | ||||||||||
| Class A Shares at NAV2 | -1.94 | % | -0.90 | % | 9/5/12 | |||||||
| Class A Shares at POP3,4 | -5.62 | -4.38 | 9/5/12 | |||||||||
| Class C Shares at NAV2 and with CDSC4 | -2.68 | -1.69 | 9/5/12 | |||||||||
| Class I Shares at NAV2 | -1.80 | -0.76 | 9/5/12 | |||||||||
| Barclays U.S. Aggregate Bond Index | -1.68 | -1.39 | 5 | — | ||||||||
| J.P. Morgan Emerging Markets Bond Global Diversified Index | -4.06 | -2.78 | 5 | — | ||||||||
Fund Expense Ratios6: A Shares: Gross 1.60%, Net 1.35%; C Shares: Gross 2.35%, Net 2.10%; I Shares: Gross 1.35%, Net 1.10%.
All returns represent past performance which is no guarantee of future results. Current performance may be higher or lower than the performance shown. The investment return and principal value of an investment will fluctuate so that an investor’s shares, when redeemed, may be worth more or less than their original cost. The above table and graph below do not reflect the deduction of taxes that a shareholder would pay on fund distributions or the redemption of shares. Please visit Virtus.com for performance data current to the most recent month-end.
| 1 | Total returns are historical and include changes in share price and the reinvestment of both dividends and capital gains distributions. |
| 2 | “NAV” (Net Asset Value) total returns do not include the effect of any sales charge. |
| 3 | “POP” (Public Offering Price) total returns include the effect of the maximum front-end 5.75% sales charge. |
| 4 | “CDSC” (Contingent Deferred Sales Charge) is applied to redemptions of certain classes of shares that do not have a sales charge applied at the time of purchase. CDSC charges for certain redemptions of Class A shares made within 18 months of purchase in which a finder’s fee was paid and all redemptions of Class C shares within the first year are 1% and 0% thereafter. |
| 5 | The since inception index returns are from the Fund’s inception date. |
| 6 | The expense ratios of the Fund are set forth according to the prospectus for the Fund effective January 31, 2013 and may differ from the expense ratios disclosed in the Financial Highlights tables in this report. See the Financial Highlights for more current expense ratios. Net Expense: Expenses reduced by the contractual fee waiver in effect through January 31, 2014. Gross Expense: Does not reflect the effect of the fee waiver. |
Growth of $10,000 For periods ended 9/30
This chart assumes an initial investment of $10,000 made on September 5, 2012 (inception date of the Fund), for Class A, Class C, and Class I shares including any applicable sales charges or fees. Performance assumes reinvestment of dividends and capital gain distributions.
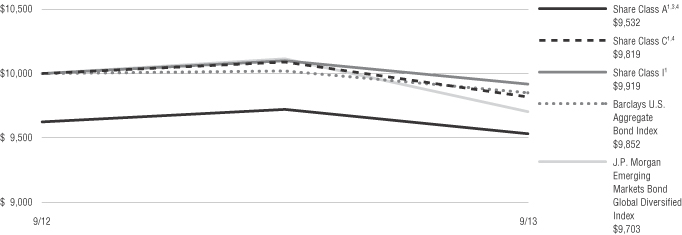
For information regarding the indexes and certain investment terms, see the Key Investment Terms starting on page 4.
8
Table of Contents
Emerging Markets Equity Income Fund
Fund Summary | Ticker Symbols: Class A: VEIAX Class C: VEICX Class I: VEIIX |
| ¢ | The Fund is diversified and has an investment objective of seeking capital appreciation and income. |
| ¢ | For the fiscal year ended September 30, 2013, the Fund’s Class A shares at NAV returned 2.19%, Class C shares returned 1.48%, and Class I shares returned 2.39%. For the same period, the S&P 500® Index, a broad-based equity index, returned 19.34%, and the MSCI Emerging Markets Index (net), the Fund’s style-specific benchmark appropriate for comparison, returned 0.98%. |
All performance figures assume reinvestment of distributions and exclude the effect of sales charges. Past performance is no guarantee of future results and current performance may be higher or lower than the performance shown above.
How did the market perform during the Fund’s fiscal year?
| ¢ | During the Fund’s fiscal year, global equity markets performed strongly, with the MSCI World Index (net) gaining 20.2%. Underpinning this performance was the consistent liquidity support from key central banks which have used various stimulus tools and extraordinary support measures along the way. In addition, economic fundamentals and corporate earnings also continued to slowly but steadily recover over the period. |
| ¢ | Despite the positive performance of developed markets, emerging markets struggled during the period. Investor sentiment toward these economies has deteriorated as a result of various factors, including slowing growth in China and potential fears of a hard economic landing; weakness in commodity prices and emerging market currencies; and more recently, the prospect of the Federal Reserve tapering its bond buying program has initiated flows back into U.S. assets. |
What factors affected the Fund’s performance during its fiscal period?
| ¢ | The Fund outperformed the benchmark MSCI Emerging Markets Index (net) during the fiscal year. In constructing the portfolio, we seek to ensure that all excess value is delivered through |
security selection rather than through regional or sector bets. This is due to our conviction that the characteristics exhibited by companies and managements that are committed to paying and growing their dividends are powerful indicators of a company’s future health and profitability. |
| ¢ | Our strategy proved beneficial during the year given the heightened level of uncertainty across the emerging markets. Investors emphasized companies generating stable and consistent earnings. As such, factors including high return on equity, high dividend yield, and low common equity issuance performed well and enabled the Fund to generate outperformance. |
| ¢ | The Fund’s excess return relative to the benchmark was primarily achieved through security selection, with the best results coming from Latin America (Brazil, Chile, and Mexico) as well as Emerging Asia (Korea, Taiwan, and China). |
| ¢ | The top two contributors to relative performance came from: |
| • | Anta Sports Products (China, consumer discretionary) – Anta, a leading sportswear manufacturer, has tightened its control on distributors and franchisees and offers superior production and distribution management. |
| • | SK Telecom (Korea, telecom) – As investors became increasingly concerned about the prospects for economic growth across the region, they sought refuge in the perceived safety of defensive stocks such as SK Telecom. |
The preceding information is the opinion of portfolio management. Any such opinions are subject to change based on market or other conditions and should not be relied upon as investment advice. Past performance is no guarantee of future results and there guarantee that market forecasts will be realized.
There is no guarantee that the Fund will meet its objective.
Asset Allocation | ||||
The following table presents asset allocations within certain sectors and as a percentage of total investments as of September 30, 2013. |
| |||
Financials | 30 | % | ||
Information Technology | 11 | |||
Energy | 9 | |||
Consumer Discretionary | 8 | |||
Consumer Staples | 8 | |||
Industrials | 8 | |||
Materials | 8 | |||
Other (includes short-term investments) | 18 | |||
|
| |||
Total | 100 | % | ||
|
| |||
The market price of equity securities may be affected by financial market, industry, or issuer-specific events. Focus on a particular style or on small or medium-sized companies may enhance that risk. Investing internationally, especially in emerging markets, involves additional risks such as currency, political, accounting, economic, and market risk. A fund that focuses its investments in a particular geographic location will be highly sensitive to financial, economic, political, and other developments affecting the fiscal stability of that location.
For information regarding the indexes and certain investment terms, see the Key Investment Terms starting on page 4.
9
Table of Contents
Emerging Markets Equity Income Fund (Continued)
| Average Annual Total Returns1 for periods ended 9/30/13 | ||||||||||||
| 1 year | Since Inception | Inception Date | ||||||||||
| Class A Shares at NAV2 | 2.19 | % | 7.67 | % | 9/5/12 | |||||||
| Class A Shares at POP3,4 | -3.69 | 1.87 | 9/5/12 | |||||||||
| Class C Shares at NAV2 and with CDSC4 | 1.48 | 6.88 | 9/5/12 | |||||||||
| Class I Shares at NAV2 | 2.39 | 7.87 | 9/5/12 | |||||||||
S&P 500® Index | | 19.34 | | | 21.07 | | | —5 | | |||
| MSCI Emerging Markets Index (net) | 0.98 | 7.40 | —5 | |||||||||
Fund Expense Ratios6: A Shares: Gross 2.20%, Net 1.75%; C Shares: Gross 2.95%, Net 2.50%; I Shares: Gross 1.95%, Net 1.50%.
All returns represent past performance which is no guarantee of future results. Current performance may be higher or lower than the performance shown. The investment return and principal value of an investment will fluctuate so that an investor’s shares, when redeemed, may be worth more or less than their original cost. The above table and graph below do not reflect the deduction of taxes that a shareholder would pay on fund distributions or the redemption of shares. Please visit Virtus.com for performance data current to the most recent month-end.
| 1 | Total returns are historical and include changes in share price and the reinvestment of both dividends and capital gains distributions. |
| 2 | “NAV” (Net Asset Value) total returns do not include the effect of any sales charge. |
| 3 | “POP” (Public Offering Price) total returns include the effect of the maximum front-end 5.75% sales charge. |
| 4 | “CDSC” (Contingent Deferred Sales Charge) is applied to redemptions of certain classes of shares that do not have a sales charge applied at the time of purchase. CDSC charges for certain redemptions of Class A shares made within 18 months of purchase in which a finder’s fee was paid and all redemptions of Class C shares within the first year are 1% and 0% thereafter. |
| 5 | The since inception index returns are from the Fund’s inception date. |
| 6 | The expense ratios of the Fund are set forth according to the prospectus for the Fund effective January 31, 2013 and may differ from the expense ratios disclosed in the Financial Highlights tables in this report. See the Financial Highlights for more current expense ratios. Net Expense: Expenses reduced by the contractual fee waiver in effect through January 31, 2014. Gross Expense: Does not reflect the effect of the fee waiver. |
Growth of $10,000 For periods ended 9/30
This chart assumes an initial investment of $10,000 made on September 5, 2012 (inception date of the Fund), for Class A, Class C, and Class I shares including any applicable sales charges or fees. Performance assumes reinvestment of dividends and capital gain distributions.
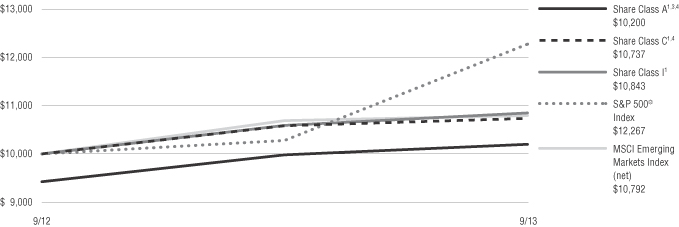
For information regarding the indexes and certain investment terms, see the Key Investment Terms starting on page 4.
10
Table of Contents
Fund Summary | Ticker Symbols: Class A: VGCAX Class C: VGCCX Class I: VGCIX |
| ¢ | The Fund is diversified and has an investment objective of capital appreciation. |
| ¢ | For the fiscal year ended September 30, 2013, the Fund’s Class A shares at NAV returned -8.61%, Class C shares returned -9.14%, and Class I shares returned -8.34%. For the same period, the S&P 500® Index, a broad-based equity index, returned 19.34%, and the MSCI AC World Commodity Producer Sector Capped Index (net), the Fund’s style-specific benchmark appropriate for comparison, returned -3.60%. |
All performance figures assume reinvestment of distributions and exclude the effect of sales charges. Past performance is no guarantee of future results and current performance may be higher or lower than the performance shown above.
How did the market perform during the Fund’s fiscal year?
| ¢ | For the fiscal year ending September 30, the total return for the S&P 500® Index, while strong, did not come close to the outperformance of the prior year of 30.20%. |
| ¢ | In June, the mere suggestion of the tapering of Fed monetary stimulus policies caused global market volatility, until assurances of their continuation was delivered in September. |
| ¢ | Central bank monetary policy continued to be the supporting hand under the stock market, although company earnings tended to disappoint – the exception was the shale oil and gas sector. The shale oil boom has only begun, but it is already altering the global power balance in crude oil – a truly historic development. |
| ¢ | Global economic growth is returning slowly but surely. We are now seeing tepid, but nonetheless positive, GDP growth in the eurozone and the United States; and Japan is experiencing a remarkable recovery after 22 years of somnolence. |
| ¢ | Much has been said about the collapse of the commodity super-cycle during the past year, however, on a 10-year basis, prices of key commodities – copper, iron, gold, silver, corn, soybeans, and crude oil – have remained strong, and producing companies are profitable. |
| ¢ | For the third straight year, global (Brent) oil prices have been trading above $100 a barrel, and U.S. (WTI) crude prices have been mostly in that range during all of that time. |
| ¢ | As a country with no commodities of its own, Japan’s resurgence provides for increased demand for all commodities but especially energy given the shutdown of nuclear power plants and its need to import far more oil and gas in order to fuel its recovery. |
| ¢ | In sum, the outlook is better and less risky for commodity producers than it has been for more than five years. (Precious metals are, as always, a special case.) |
What factors affected the Fund’s performance during its fiscal year?
| ¢ | The Fund underperformed its benchmark by having a higher allocation to precious metals stocks than the benchmark at a time of sharply falling prices for gold and silver. Although we reduced our allocations during the period – cutting precious metals exposure to an all-time low for the Fund – in retrospect we should have moved sooner. We had assumed that as long as the Fed was expanding its balance sheet at prodigious rates, investors would continue to fear a return of inflation, which has, historically, followed every major central bank’s resort to printing money at record rates. We still believe this will happen, but it has not happened yet. |
| ¢ | Otherwise, our stock selection was, in general, additive to results for the other commodity stock groups. |
| ¢ | The Fund is now weighted toward stronger economic growth globally, if not for the U.S. |
| ¢ | During the fiscal year, the big decisions we made in the portfolio were: |
Industrials
| ¢ | In January, we initiated a macro-overlay to our portfolio asset allocation for Japan, in recognition of our conviction for the success of “Abenomics,” the economic policies of Prime Minister Shinzo Abe. Over the period we added two steel companies, (a sector we previously eschewed), and mining, energy, and agricultural equipment holdings, |
bringing the Fund’s embedded exposure in export-oriented Japanese industrial companies to 8%. |
Materials
| ¢ | We strengthened our energy allocation, primarily by including, for the first time, exposure to refining companies. Within the energy producing group, although we kept a good weighting in companies supplying advanced technology for the exploration and production of oil and gas, we added considerably to exploration and production (E&P) companies, with an increase in exposure to Alberta (Canada) oil sands producers. |
| ¢ | Both energy technology companies and oil companies have been strong contributors to overall Fund performance. The outlook for U.S. natural gas prices remains dismally low, which is a bonus for the economy, but in our view is not an attractive commodity in which the Fund should invest. |
| ¢ | The Fund’s allocation to agricultural-related companies was reduced significantly over the period. Last year’s U.S. drought was not repeated, and the chief grain-growing regions are expecting a record crop, resulting in a corresponding drop in grain prices. As a result, we reversed the emphasis in the agriculture sector of the portfolio in 2013 by increasing exposure to companies engaged in the production and distribution of meats. |
| ¢ | We retained our overall weighting for mining companies but changed our emphasis to industrial metals from precious metals, reflecting our belief in a strengthening global economy. |
The preceding information is the opinion of portfolio management. Any such opinions are subject to change at any time based upon market or other conditions and should not be relied upon as investment advice. Past performance is no guarantee of future results, and there is no guarantee that market forecasts will be realized.
There is no guarantee that the Fund will meet its objective.
For information regarding the indexes and certain investment terms, see the Key Investment Terms starting on page 4.
11
Table of Contents
Global Commodities Stock Fund (Continued)
Fund Summary (continued) |
| Asset Allocation | ||||
The following table presents asset allocations within certain sectors and as a percentage of total investments as of September 30, 2013.
|
| |||
Materials | 40 | % | ||
Energy | 33 | |||
Consumer Staples | 13 | |||
Industrials | 7 | |||
Health Care | 1 | |||
Financials | 1 | |||
Other (includes short-term investments) | 5 | |||
|
| |||
Total | 100 | % | ||
|
| |||
The market price of equity securities may be affected by financial market, industry, or issuer-specific events. Focus on a particular style or on small or medium-sized companies may enhance that risk. Investing internationally, especially in emerging markets, involves additional risks such as currency, political, accounting, economic, and market risk. Commodity-linked instruments may experience a return different than the commodity they attempt to track and may also be exposed to counter party risk. The value of an ETF may be more volatile than the underlying portfolio of securities the ETF is designed to track. The costs of owning the ETF may exceed the cost of investing directly in the underlying securities.
For information regarding the indexes and certain investment terms, see the Key Investment Terms starting on page 4.
12
Table of Contents
Global Commodities Stock Fund (Continued)
| Average Annual Total Returns1 for period ended 9/30/13 | ||||||||||||
| 1 year | Since Inception | Inception Date | ||||||||||
| Class A Shares at NAV2 | -8.61 | % | -3.55 | % | 3/15/11 | |||||||
| Class A Shares at POP3,4 | -13.86 | -5.76 | 3/15/11 | |||||||||
| Class C Shares at NAV2 and with CDSC4 | -9.14 | -4.19 | 3/15/11 | |||||||||
| Class I Shares at NAV2 | -8.34 | -3.28 | 3/15/11 | |||||||||
| S&P 500® Index | 19.34 | 13.68 | 5 | — | ||||||||
| MSCI AC World Commodity Producer Sector Capped Index (net) | -3.60 | -5.35 | 5 | — | ||||||||
Fund Expense Ratios6: A Shares: Gross 1.88%, Net 1.65%; C Shares: Gross 2.63%, Net 2.40%; I Shares: Gross 1.63%, Net 1.40%.
All returns represent past performance which is no guarantee of future results. Current performance may be higher or lower than the performance shown. The investment return and principal value of an investment will fluctuate so that an investor’s shares, when redeemed, may be worth more or less than their original cost. The above table and graph below do not reflect the deduction of taxes that a shareholder would pay on fund distributions or the redemption of shares. Please visit Virtus.com for performance data current to the most recent month-end.
| 1 | Total returns are historical and include changes in share price and the reinvestment of both dividends and capital gains distributions. |
| 2 | “NAV” (Net Asset Value) total returns do not include the effect of any sales charge. |
| 3 | “POP” (Public Offering Price) total returns include the effect of the maximum front-end 5.75% sales charge. |
| 4 | “CDSC” (Contingent Deferred Sales Charge) is applied to redemptions of certain classes of shares that do not have a sales charge applied at the time of purchase. CDSC charges for B shares decline from 5% to 0% over a five year period. CDSC charges for certain redemptions of Class A shares made within 18 months of purchase in which a finder’s fee was paid and all redemptions of Class C shares within the first year are 1% and 0% thereafter. |
| 5 | The since inception index returns are from the Fund’s inception date. |
| 6 | The expense ratios of the Fund are set forth according to the prospectus for the Fund effective January 31, 2013 and may differ from the expense ratios disclosed in the Financial Highlights tables in this report. See the Financial Highlights for more current expense ratios. Net Expense: Expenses reduced by the contractual fee waiver in effect through March 31, 2012. Effective April 1, 2012, the waiver is voluntary and may discontinue at any time. Gross Expense: Does not reflect the effect of the fee waiver. |
Growth of $10,000 For periods ended 9/30
This chart assumes an initial investment of $10,000 made on March 15, 2011 (inception date of the Fund), for Class A, Class C, and Class I shares including any applicable sales charges or fees. Performance assumes reinvestment of dividends and capital gain distributions.

The indexes are unmanaged and not available for direct investment; therefore, their performance does not reflect the expenses associated with active management of an actual portfolio.
For information regarding the indexes and certain investment terms, see the Key Investment Terms starting on page 4.
13
Table of Contents
Fund Summary | Ticker Symbols: Class A: PGUAX Class C: PGUCX Class I: PGIUX |
| ¢ | The Fund is diversified and has an investment objective of both capital appreciation and current income. |
| ¢ | For the fiscal year ended September 30, 2013, the Fund’s Class A shares at NAV returned 11.05%, Class C shares returned 10.23%, and Class I shares returned 11.23%. For the same period, the S&P 500® Index, a broad-based equity index, returned 19.34%, and the Global Dividend Linked Benchmark, the Fund’s style-specific benchmark appropriate for comparison, returned 11.60%. |
All performance figures assume reinvestment of distributions and exclude the effect of sales charges. Past performance is no guarantee of future results and current performance may be higher or lower than the performance shown above.
How did the market perform during the Fund’s fiscal year?
| ¢ | Over the past 12 months, developed world equity markets posted remarkably strong returns, hitting new highs throughout the year. Global central banks have continued to provide stimulus in an effort to support economies, which has in turn underpinned global stock market gains. |
| ¢ | Slowly improving economies have outweighed political conflicts, both in the U.S. and abroad. Internationally, Europe appeared to be staging a tentative recovery, leading to significant outperformance relative to the U.S. equity market. |
| ¢ | The Fed’s talk of “tapering” its monthly bond purchases was on again, off again during the second half of the fiscal year. The markets turned down in June following comments made by Fed Chairman Ben Bernanke that the U.S. central bank might taper its monthly bond purchases. Concerns over this potential policy change sent bond markets tumbling and weighed heavily on classic defensive sectors. The Fed’s decision in September not to taper its monthly bond purchases caused the markets to rally once again. |
What factors affected the Fund’s performance during its fiscal year?
| ¢ | For the fiscal year ended September 30, 2013, the Fund posted solid absolute performance and performed mostly in line with its benchmark. It has |
been difficult to keep pace with the world equity markets since defensive stocks have lagged as investors have looked to capitalize on budding economic growth. Unsurprisingly, this type of market does not favor our higher-yielding dividend strategy. |
| ¢ | Transportation was the biggest contributor to relative performance as it outperformed all other sectors in the portfolio and was the Fund’s largest overweight. Fundamentally, transportation is benefiting from long contract periods, relatively low regulatory risk, and attractive demand prospects due to nascent economic improvements in Europe. A majority of the portfolio’s transportation holdings are located in Europe. |
| ¢ | Utility stock selection positively contributed to the Fund’s results versus the benchmark. This was primarily due to the portfolio’s overweight in U.S.-regulated utilities, which posted strong performance in the first half of the year. The recovery last quarter in European utilities, an area where the portfolio is underweight, served as a partial offset. In our opinion, the recent strong performance by European utilities is being driven by broader market sentiment, and we are still concerned about negative fundamentals for these companies. |
| ¢ | Despite solid returns in the communications sector, stock selection was the largest detractor for the Fund relative to the benchmark during the fiscal year. Lack of exposure to a strongly performing Japanese communications company was the main detractor. After posting significant gains over the past couple years, the Fund was negatively impacted by weakness in the overweight to tower holdings. A rebound in European communications stocks in the fourth fiscal quarter hurt as the Fund remains underweight due to continuing poor fundamentals. |
| ¢ | The Fund’s energy holdings posted the weakest performance over the fiscal year, primarily due to poor results from a global energy storage company. In general, North American shale gas and oil development continues to provide opportunities for pipeline companies. |
The preceding information is the opinion of portfolio management. Any such opinions are subject to change at any time based upon market or other
conditions and should not be relied upon as investment advice. Past performance is no guarantee of future results, and there is no guarantee that market forecasts will be realized.
There is no guarantee that the Fund will meet its objective.
| Asset Allocation | ||||
The following table presents asset allocations within certain sectors and as a percentage of total investments as of September 30, 2013.
|
| |||
Utilities | 32 | % | ||
Energy | 24 | |||
Telecommunication Services | 23 | |||
Industrials | 15 | |||
Consumer Discretionary | 3 | |||
Financials | 2 | |||
Other (includes short-term investments) | 1 | |||
|
| |||
Total | 100 | % | ||
|
| |||
The market price of equity securities may be affected by financial market, industry, or issuer-specific events. Focus on a particular style or on small or medium-sized companies may enhance that risk. Investing internationally involves additional risks such as currency, political, accounting, economic, and market risk. A fund that focuses its investments in infrastructure-related companies will be more sensitive to conditions affecting their business or operations. A fund that focuses its investments in a particular industry or sector will be more sensitive to conditions that affect that industry or sector than a non-concentrated fund.
For information regarding the indexes and certain investment terms, see the Key Investment Terms starting on page 4.
14
Table of Contents
Global Dividend Fund (Continued)
| Average Annual Total Returns1 for periods ended 9/30/13 | ||||||||||||||||
| 1 year | 5 years | Since Inception | Inception Date | |||||||||||||
| Class A Shares at NAV2 | 11.05 | % | 8.27 | % | 7.72 | % | 12/30/04 | |||||||||
| Class A Shares at POP3,4 | 4.66 | 6.99 | 7.00 | 12/30/04 | ||||||||||||
| Class C Shares at NAV2 and with CDSC4 | 10.23 | 7.46 | 6.93 | 12/30/04 | ||||||||||||
| Class I Shares at NAV | 11.23 | 8.55 | 4.18 | 6/6/08 | ||||||||||||
| S&P 500® Index | 19.34 | 10.02 | — | 5 | — | |||||||||||
| Global Dividend Linked Benchmark | 11.60 | 6.65 | — | 6 | — | |||||||||||
Fund Expense Ratios7: A Shares: 1.31%; C Shares: 2.06%, I Shares: 1.06%.
All returns represent past performance which is no guarantee of future results. Current performance may be higher or lower than the performance shown. The investment return and principal value of an investment will fluctuate so that an investor’s shares, when redeemed, may be worth more or less than their original cost. The above table and graph below do not reflect the deduction of taxes that a shareholder would pay on fund distributions or the redemption of shares. Please visit Virtus.com for performance data current to the most recent month-end.
| 1 | Total returns are historical and include changes in share price and the reinvestment of both dividends and capital gains distributions. |
| 2 | “NAV” (Net Asset Value) total returns do not include the effect of any sales charge. |
| 3 | “POP” (Public Offering Price) total returns include the effect of the maximum front-end 5.75% sales charge. |
| 4 | “CDSC” (Contingent Deferred Sales Charge) is applied to redemptions of certain classes of shares that do not have a sales charge applied at the time of purchase. CDSC charges for certain redemptions of Class A shares made within 18 months of purchase in which a finder’s fee was paid and all redemptions of Class C shares within the first year are 1% and 0% thereafter. |
| 5 | The index returned 6.03% for Class A and Class C shares and 6.40% for Class I shares since the inception date of the respective class. |
| 6 | The index returned 7.02% for Class A and Class C shares and 2.12% for Class I shares since the inception date of the respective class. |
| 7 | The expense ratios of the Fund are set forth according to the prospectus for the Fund effective January 31, 2013, as supplemented and revised and may differ from the expense ratios disclosed in the Financial Highlights tables in this report. See the Financial Highlights for more current expense ratios. |
Growth of $10,000 For periods ended 9/30
This chart assumes an initial investment of $10,000 made on December 30, 2004 (inception date of the Fund), for Class A and Class C shares including any applicable sales charges or fees. Performance assumes reinvestment of dividends and capital gain distributions.
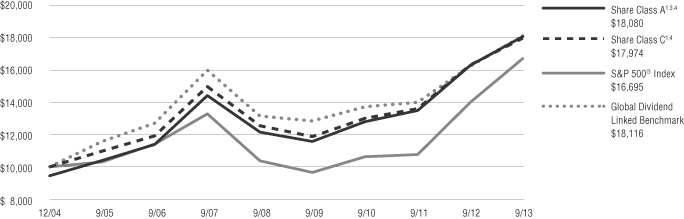
The indexes are unmanaged and not available for direct investment; therefore, their performance does not reflect the expenses associated with active management of an actual portfolio.
For information regarding the indexes and certain investment terms, see the Key Investment Terms starting on page 4.
15
Table of Contents
Fund Summary | Ticker Symbols: Class A: NWWOX Class B: WWOBX Class C: WWOCX Class I: WWOIX |
| ¢ | The Fund is diversified and has an investment objective of capital appreciation. |
| ¢ | For the fiscal year ended September 30, 2013, the Fund’s Class A shares at NAV returned 12.05%, Class B shares returned 11.22%, and Class C shares returned 11.29%. Class I shares returned 12.36% For the fiscal year ended September 30, 2012, the S&P 500® Index, a broad-based equity index, returned 19.34%, and the MSCI AC World Index (net), the Fund’s style-specific benchmark appropriate for comparison, returned 17.73%. |
All performance figures assume reinvestment of distributions and exclude the effect of sales charges. Past performance is no guarantee of future results and current performance may be higher or lower than the performance shown above.
How did the market perform during the Fund’s fiscal year?
| ¢ | The start of an aggressive quantitative easing program led to a spectacular rise and then fall in the Japanese stock market, accompanied by a falling yen against all the major currencies. Prime Minister Shinzo Abe’s LDP government announced three sets of initiatives (or “arrows” as they marketed them) that they will use to spur the economy into growth. |
| ¢ | In Mexico, the newly elected PRI government of Enrique Peña Nieto made a strong impact with its ability to draw multi-party support for much needed reforms, including allowing foreign investment into the energy industry, raising Mexico’s low tax collection relative to GDP, and increasing the flexibility of labor laws. |
| ¢ | In June, Standard & Poor’s downgraded Brazil’s BBB credit rating outlook to negative from stable on concerns of slow economic growth alongside expansionary fiscal policy. Greece was lowered from developed to emerging market status by MSCI – the first time MSCI has relegated a developed market country. |
| ¢ | Equity markets were strong across most major economies with cyclical stocks and periphery European markets performing well, supported by coincident market indicators, including stable Chinese economic growth and low interest rates across southern Europe. |
| ¢ | U.S. outlook began to improve but turned into a “rate normalization” scare following upbeat Federal Reserve comments that tested the structural integrity of a number of emerging markets to currency shock, as money that had streamed away from the U.S. and Europe since the 2008-2009 crisis flooded back. |
| ¢ | By fiscal year end, most emerging market currencies had recovered lost ground and short-term rates were pulling back from the emergency measures used by central banks to keep investors from leaving. Focus shifted to the first U.S. government shutdown since 1996. |
| ¢ | U.S. house prices continued to show solid improvement as measured by the S&P/Case-Shiller Home Price Index. |
| ¢ | In the second quarter of 2013, after persistent disappointing economic data, the eurozone managed its first quarter on quarter growth (0.3%) in seven quarters, although it remained negative (-0.5%) against the second quarter of 2012. This positive bump alongside Angela Merkel’s CDU party winning the German elections is regarded as a positive step towards stability. General comfort was also reflected in the market signals of low interest rates across the European periphery with the Spanish and Italian 10-year sovereign rates both ending the quarter around 4.4%. However, we are not comfortable that a return to sustainable growth is close for the eurozone. While GDP numbers appear stable in aggregate for the eurozone, we see little growth ahead. Serious problems remain in the periphery and exports with a strong currency and slowing China could be challenging for exporters such as Germany. |
| ¢ | In the second quarter of 2013, year-over-year GDP in Greece fell 4.6%, Spain 1.6%, Portugal 2%, and Italy 2%. These declines without a quick solution would not matter so much if there was a transfer of wealth mechanism within Europe as there is in the U.S., but there is not. If a country is running a deficit, it needs to borrow or be forced to undergo fiscal consolidation, which further weakens growth in the short term. In addition, European banks are shrinking their balance sheets (partly because of the need to improve their leverage ratios), which is another headwind to a return to sustained economic growth. |
| ¢ | China recorded GDP growth of 7.5% in the second quarter of 2013, a slightly slower rate than the previous year, but still a breakneck pace in a global context. |
What factors affected the Fund’s performance during its fiscal year?
| ¢ | Stock selection in the information technology sector contributed to the Fund’s relative performance for the fiscal year. The portfolio’s underweight to utilities was also beneficial to results, as the sector underperformed the overall index. |
| ¢ | Stock selection within the materials sector hurt performance during the period. The portfolio’s selection of consumer staples companies detracted from performance, as did the Fund’s overweight exposure to the sector. |
| ¢ | The Fund’s stock selection in the United States contributed to results during the fiscal year. The portfolio’s overweight to Switzerland also helped performance, as the country was one of the top performers in the MSCI ACWI. |
| ¢ | The Fund’s overweight exposure to India detracted from relative performance during the period, as the country underperformed the overall MSCI ACWI. The portfolio’s stock selection in the United Kingdom also hurt performance. |
| ¢ | On an absolute basis, leading contributors to performance were MasterCard (U.S.), Citigroup (U.S.), UBS (Switzerland), JPMorgan Chase (U.S.), and Visa (U.S.), while on a relative basis, top contributors were Citigroup, MasterCard, UBS, JPMorgan Chase, and Las Vegas Sands. |
| ¢ | The largest detractors to performance on an absolute performance basis were Newcrest Mining (Australia), Goldcorp (Canada), Fresnillo (U.K.), HDFC Bank (India), and Housing Development Finance Corp. (India). On a relative basis, the biggest detractors to performance were Newcrest Mining, Goldcorp, HDFC Bank, Fresnillo, and Housing Development Finance Corp. |
The preceding information is the opinion of portfolio management. Any such opinions are subject to change at any time based upon market or other conditions and should not be relied upon as investment advice. Past performance is no guarantee
For information regarding the indexes and certain investment terms, see the Key Investment Terms starting on page 4.
16
Table of Contents
| Global Opportunities Fund (Continued) |
of future results, and there is no guarantee that market forecasts will be realized.
There is no guarantee that the Fund will meet its objective.
| Asset Allocation | ||||
The following table presents asset allocations within certain sectors and as a percentage of total investments as of September 30, 2013.
|
| |||
Consumer Staples | 36 | % | ||
Financials | 16 | |||
Health Care | 12 | |||
Consumer Discretionary | 11 | |||
Information Technology | 11 | |||
Industrials | 5 | |||
Materials | 5 | |||
Other (includes short-term investments) | 4 | |||
|
| |||
Total | 100 | % | ||
|
| |||
Investing internationally, especially in emerging markets, involves additional risks such as currency, political, accounting, economic, and market risk. The market price of equity securities may be affected by financial market, industry, or issuer-specific events. Focus on a particular style or on small or medium-sized companies may enhance that risk. A fund that focuses its investments in a particular industry or sector will be more sensitive to conditions that affect that industry or sector than a non-concentrated fund.
For information regarding the indexes and certain investment terms, see the Key Investment Terms starting on page 4.
17
Table of Contents
Global Opportunities Fund (Continued)
| Average Annual Total Returns1 for periods ended 9/30/13 | ||||||||||||||||||||
| 1 year | 5 years | 10 years | Since Inception | Inception Date | ||||||||||||||||
| Class A Shares at NAV2 | 12.05 | % | 8.10 | % | 7.09 | % | — | — | ||||||||||||
| Class A Shares at POP3,4 | 5.61 | 6.83 | 6.46 | — | — | |||||||||||||||
| Class B Shares at NAV2 | 11.22 | 7.30 | 6.32 | — | — | |||||||||||||||
| Class B Shares with CDSC4 | 7.22 | 7.30 | 6.32 | — | — | |||||||||||||||
| Class C Shares at NAV2 and with CDSC4 | 11.29 | 7.28 | 6.31 | — | — | |||||||||||||||
| Class I Shares at NAV2 | 12.36 | — | — | 16.05 | % | 8/8/12 | ||||||||||||||
| S&P 500® Index | 19.34 | 10.02 | 7.56 | 19.86 | 5 | — | ||||||||||||||
| MSCI AC World Index (Net) | 17.73 | 7.71 | 7.86 | 18.56 | 5 | — | ||||||||||||||
Fund Expense Ratios6: A Shares: 1.54%; B Shares: 2.29%; C Shares: 2.29%; I Shares: 1.29%.
All returns represent past performance which is no guarantee of future results. Current performance may be higher or lower than the performance shown. The investment return and principal value of an investment will fluctuate so that an investor’s shares, when redeemed, may be worth more or less than their original cost. The above table and graph below do not reflect the deduction of taxes that a shareholder would pay on fund distributions or the redemption of shares. Please visit Virtus.com for performance data current to the most recent month-end.
| 1 | Total returns are historical and include changes in share price and the reinvestment of both dividends and capital gains distributions. |
| 2 | “NAV” (Net Asset Value) total returns do not include the effect of any sales charge. |
| 3 | “POP” (Public Offering Price) total returns include the effect of the maximum front-end 5.75% sales charge. |
| 4 | “CDSC” (Contingent Deferred Sales Charge) is applied to redemptions of certain classes of shares that do not have a sales charge applied at the time of purchase. CDSC charges for B shares decline from 5% to 0% over a five year period. CDSC charges for certain redemptions of Class A shares made within 18 months of purchase in which a finder’s fee was paid and all redemptions of Class C shares within the first year are 1% and 0% thereafter. |
| 5 | The since inception index returns are from Class I inception date (8/8/12). |
| 6 | The expense ratios of the Fund are set forth according to the prospectus for the Fund effective January 31, 2013, as supplemented and revised and may differ from the expense ratios disclosed in the Financial Highlights tables in this report. See the Financial Highlights for more current expense ratios. |
Growth of $10,000 For periods ended 9/30
This chart assumes an initial investment of $10,000 made on September 30, 2003, for Class A, Class B, and Class C shares including any applicable sales charges or fees. Performance assumes reinvestment of dividends and capital gain distributions.
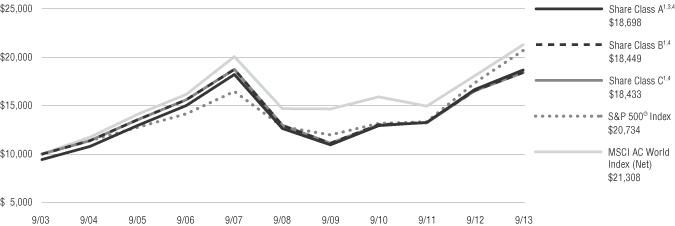
The indexes are unmanaged and not available for direct investment; therefore, their performance does not reflect the expenses associated with active management of an actual portfolio.
For information regarding the indexes and certain investment terms, see the Key Investment Terms starting on page 4.
18
Table of Contents
Global Real Estate Securities Fund
Fund Summary | Ticker Symbols: Class A: VGSAX Class C: VGSCX Class I: VGISX |
| ¢ | The Fund is diversified and has a primary investment objective of long-term capital appreciation and a secondary investment objective of income. |
| ¢ | For the fiscal year ended September 30, 2013, the Fund’s Class A shares at NAV returned 6.48%, Class C shares returned 5.70%, and Class I shares returned 6.78%. For the same period, the S&P 500® Index, a broad-based equity index, returned 19.34%, and the FTSE EPRA/NAREIT Developed Rental Index (net), the Fund’s style specific benchmark appropriate for comparison, returned 6.83%. |
All performance figures assume reinvestment of distributions and exclude the effect of sales charges. Past performance is no guarantee of future results and current performance may be higher or lower than the performance shown above.
How did the market perform during the Fund’s fiscal year?
| ¢ | The Fund’s fiscal year overlapped the final phase of the great secular bull market in U.S. bonds. During this time, outperformance of lower quality real estate equities was prevalent. Within the real estate market, lower quality stocks, which lack rental rate pricing power, as well as high yield stocks and longer-lease duration sectors, which lack organic growth but offered external spread investing, outperformed. |
| ¢ | As noted by Green Street Advisors in March 2013, “REITs with characteristics associated with lower quality, i.e., ‘junk REITs,’ have massively outperformed over the last year, and the trend has intensified of late.” |
| ¢ | When the Fed signaled in May 2013 that it might taper its monthly bond purchases, bonds sold off in response, and we witnessed a nearly 100-basis point increase in U.S. 10-Year Treasury yields as of the Fund’s fiscal year-end. |
| ¢ | Real estate securities, as measured by the FTSE NAREIT Equity REITs Index, outperformed the S&P 500 Index from the start of the Fund’s fiscal year through May 21, the eve of the Fed’s tapering comments, and subsequently underperformed the S&P 500 Index to the Fund’s fiscal year-end. |
| ¢ | Once the U.S. bond market shifted, the pendulum tilted to favor higher quality stocks, which can benefit from pricing power in the form of higher rents. In addition, following the turn in the U.S. bond market, cyclical-oriented equities performed better than defensive equities and fixed income securities were broadly disfavored. Emerging market equities suffered as capital headed for the exits and their currencies came under pressure. |
| ¢ | The 10-Year Treasury sell-off period is reminiscent of April 2004, in our view. Back then, when strong payroll data was released for March of that year, the bond market was surprised and sold off. That pressured the REIT space, much like it has done recently, and created a rebalancing opportunity. REITs powered ahead that year and continued to do so as interest rates rose over the next couple of years. |
| ¢ | Despite the Fed’s hint back in May that a bond taper might be forthcoming, U.S. fiscal policy concerns were likely part of the Fed’s decision in September to postpone reducing its pace of monthly bond market purchases until the economic visibility improves. |
| ¢ | The Japanese returned the Liberal Democratic Party to power as its platform of more aggressive fiscal and monetary policy expansion was embraced; and Japanese equities rallied during the fiscal period as the early results of these policies have been favorable. |
What factors affected the Fund’s performance during its fiscal year?
| ¢ | For the one-year period ending September 30, 2013, the Fund slightly trailed its style-specific benchmark. Given the Fund’s philosophy and style, we would expect the aforementioned lower quality outperformance windows in the fiscal year to present a challenge. Security selection was a positive contributor to performance during the period, while country allocation detracted from performance. |
| ¢ | On a regional basis, Europe and Japan outperformed the style-specific benchmark and the U.S., Asia Pacific ex- Japan, and Canada lagged the benchmark. |
| ¢ | Among the top 10 countries in the benchmark by index weight, the U.K, France, and Japan delivered strong performance, while Singapore, Australia, and Canada were weak. |
| ¢ | Within the U.S., the self-storage, lodging, and industrial property sectors demonstrated the best total returns over the last 12 months and manufactured homes, regional malls, and apartments were the laggards. |
| ¢ | From a country perspective, the most significant positive contributor to relative performance during the fiscal year was our stock selection within Canada. At the security level within Canada, our overweight exposure to a global office company with a presence in the U.S., Canada, and Australia, had the largest positive impact on performance as this company was subject to an acquisition offer at the end of the third quarter of 2013. |
| ¢ | The second most meaningful positive contributor at a country level to relative performance was our allocation to, and stock selection within, the United Kingdom. Namely, the portfolio’s lack of exposure to a U.K. regional mall REIT and our overweight exposure to a U.K. mid-capitalization self-storage REIT were the most important drivers of this performance. |
| ¢ | From a country perspective, the most significant detractor from relative performance during the fiscal year was the portfolio’s overweight allocation to Norway. The portfolio’s lone Norwegian holding disappointed the market with a write down associated with its large development/redevelopment pipeline. |
| ¢ | The second most important relative performance detractor at a country level was the portfolio’s small exposure to Mexico. The portfolio’s one Mexican REIT holding was impacted by the emerging markets sell-off that began in the second quarter of 2013. |
| ¢ | Going forward, we expect higher quality cash flow growth to play a more meaningful role in driving total returns as internal growth prospects (i.e., occupancy lift and rental rate pricing power) continue to accelerate against a backdrop of fairly limited new supply, and companies remain active with external growth initiatives. |
For information regarding the indexes and certain investment terms, see the Key Investment Terms starting on page 4.
19
Table of Contents
| Global Real Estate Securities Fund (Continued) |
| ¢ | Dividend growth should be supported by the acceleration in cash flow growth, recapitalized balance sheets, and low historical dividend payout ratios. |
| ¢ | A favorable supply outlook should allow landlords to increase occupancy and achieve pricing power at a faster rate than they otherwise would in a recovery. |
The preceding information is the opinion of portfolio management. Any such opinions are subject to change at any time based upon market or other conditions and should not be relied upon as investment advice. Past performance is no guarantee of future results, and there is no guarantee that market forecasts will be realized.
There is no guarantee that the Fund will meet its objective.
| Asset Allocation | ||||
The following table presents asset allocations within certain sectors and as a percentage of total investments as of September 30, 2013.
|
| |||
Retail REITs | 25 | % | ||
Diversified REITs | 16 | |||
Specialized REITs | 15 | |||
Office REITs | 12 | |||
Residential REITs | 11 | |||
Real Estate Operating Companies | 9 | |||
Industrial REITs | 4 | |||
Other (includes short-term investments) | 8 | |||
|
| |||
Total | 100 | % | ||
|
| |||
The market price of equity securities may be affected by financial market, industry, or issuer-specific events. Focus on a particular style or on small or medium-sized companies may enhance that risk. The fund may be negatively affected by factors specific to the real estate market, including interest rate, leverage, property, and management. Investing internationally, especially in emerging markets, involves additional risks such as currency, political, accounting, economic, and market risk. A fund that focuses its investments in a particular industry or sector will be more sensitive to conditions that affect that industry or sector than a non-concentrated fund. A fund that focuses its investments in a particular geographic location will be highly sensitive to financial, economic, political, and other developments affecting the fiscal stability of that location.
For information regarding the indexes and certain investment terms, see the Key Investment Terms starting on page 4.
20
Table of Contents
Global Real Estate Securities Fund (Continued)
| Average Annual Total Returns1 for periods ended 9/30/13 | ||||||||||||
| 1 year | Since Inception | Inception Date | ||||||||||
| Class A Shares at NAV2 | 6.48 | % | 27.16 | % | 3/2/09 | |||||||
| Class A Shares at POP3,4 | 0.36 | 25.53 | 3/2/09 | |||||||||
| Class C Shares at NAV2 and with CDSC4 | 5.70 | 26.22 | 3/2/09 | |||||||||
| Class I Shares at NAV | 6.78 | 27.51 | 3/2/09 | |||||||||
| S&P 500® Index | 19.34 | 23.66 | 5 | — | ||||||||
| FTSE EPRA/NAREIT Developed Rental Index (net) | 6.83 | 27.56 | 5 | — | ||||||||
Fund Expense Ratios6: A Shares: Gross 2.21%, Net 1.40%; C Shares: Gross 2.96%, Net 2.15%; Class I Shares: Gross 1.96%, Net 1.15%.
All returns represent past performance which is no guarantee of future results. Current performance may be higher or lower than the performance shown. The investment return and principal value of an investment will fluctuate so that an investor’s shares, when redeemed, may be worth more or less than their original cost. The above table and graph below do not reflect the deduction of taxes that a shareholder would pay on fund distributions or the redemption of shares. Please visit Virtus.com for performance data current to the most recent month-end.
| 1 | Total returns are historical and include changes in share price and the reinvestment of both dividends and capital gains distributions. |
| 2 | “NAV” (Net Asset Value) total returns do not include the effect of any sales charge. |
| 3 | “POP” (Public Offering Price) total returns include the effect of the maximum front-end 5.75% sales charge. |
| 4 | “CDSC” (Contingent Deferred Sales Charge) is applied to redemptions of certain classes of shares that do not have a sales charge applied at the time of purchase. CDSC charges for certain redemptions of Class A shares made within 18 months of purchase in which a finder’s fee was paid and all redemptions of Class C shares within the first year are 1% and 0% thereafter. |
| 5 | The since inception index returns are from the Fund’s inception date. |
| 6 | The expense ratios of the Fund are set forth according to the prospectus for the Fund effective January 31, 2013, as supplemented and revised and may differ from the expense ratios disclosed in the Financial Highlights tables in this report. See the Financial Highlights for more current expense ratios. Net Expense: Expenses reduced by voluntary fee waiver which may be discontinued at any time. Gross Expense: Does not reflect the effect of the voluntary fee waiver. |
Growth of $10,000 For periods ended 9/30
This chart assumes an initial investment of $10,000 made on March 2, 2009 (inception date of the Fund), for Class A, Class C and Class I shares including any applicable sales charges or fees. Performance assumes reinvestment of dividends and capital gain distributions.
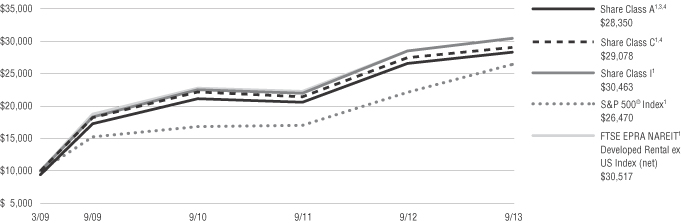
The indexes are unmanaged and not available for direct investment; therefore, their performance does not reflect the expenses associated with active management of an actual portfolio.
For information regarding the indexes and certain investment terms, see the Key Investment Terms starting on page 4.
21
Table of Contents
Greater Asia ex Japan Opportunities Fund
Fund Summary | Ticker Symbols: Class A: VGAAX Class C: VGACX Class I: VGAIX |
| ¢ | The Fund is diversified and has an investment objective of long-term capital appreciation. |
| ¢ | For the fiscal year ended September 30, 2013, the Fund’s Class A shares at NAV returned 0.14%, Class C shares returned -0.65%, and Class I shares returned 0.42%. For the same period, the S&P 500® Index, a broad-based equity index, returned 19.34%, and the MSCI AC Asia Pacific ex Japan Index (net) the Fund’s style-specific benchmark appropriate for comparison returned 7.15%. |
All performance figures assume reinvestment of distributions and exclude the effect of sales charges. Past performance is no guarantee of future results and current performance may be higher or lower than the performance shown above.
How did the market perform during the Fund’s fiscal year?
| ¢ | The start of an aggressive quantitative easing program led to a spectacular rise and then fall in the Japanese stock market, accompanied by a falling yen against all the major currencies. Prime Minister Shinzo Abe’s LDP government announced three sets of initiatives (or “arrows” as they marketed them) that they will use to spur the economy into growth. |
| ¢ | Equity markets were strong across most major economies with cyclical stocks and periphery European markets performing well, supported by coincident market indicators, including stable Chinese economic growth and low interest rates across southern Europe. |
| ¢ | U.S. outlook began to improve but turned into a “rate normalization” scare following upbeat Federal Reserve comments that tested the structural integrity of a number of emerging markets to currency shock, as money that had streamed away from the U.S. and Europe since the 2008-2009 crisis flooded back. |
| ¢ | By fiscal year end, all major emerging market currencies except the Indian rupee and Indonesian rupiah had recovered lost ground, and by September short-term rates were pulling back from the sharp rises that had been put in place as emergency measures by central banks to keep investors from leaving. |
| ¢ | The hardest hit currencies were those running current account deficits (CAD). The weaker currency and curbs put in place by the Indian authorities quickly led to a fall in the country’s CAD, and we anticipate the narrowing will continue, although we would not expect it to turn into a surplus. We regard the currency declines and changes that were made to stem ballooning CADs as healthy adjustments. |
| ¢ | China recorded GDP growth of 7.5% in the second quarter of 2013, a breakneck pace in a global context. Also in China, there has been a spate of accusations of illegal activity by Chinese authorities and press against foreign consumer and pharmaceuticals companies. |
What factors affected the Fund’s performance during its fiscal year?
| ¢ | Stock selection within the consumer staples sector contributed to the relative performance of the Fund during the fiscal year. The portfolio’s lack of exposure to energy helped performance, as the sector was one of the worst performers in the MSCI AC Asia Pacific ex Japan Index. The Fund’s out-of-index holdings in Bangladesh and Pakistan also helped relative performance during the year. |
| ¢ | The portfolio’s selection of financials names detracted from results, as did its underweight to the sector. While the portfolio’s underweight to materials was positive, the portfolio’s stock selection within the space hurt relative performance. The portfolio’s overweight to India detracted from performance during the year, as the country underperformed the overall index. The portfolio’s selection of Chinese names also hurt performance, as did the portfolio’s underweight exposure to the country, which was a top performed in the index. |
| ¢ | On an absolute basis, leading contributors to performance were British American Tobacco Bangladesh, Sands China (Hong Kong), HSBC Holdings (U.K.), Super Retail Group (Australia), and Unilever Pakistan, while on a relative basis, top contributors were British American Tobacco Bangladesh, Sands China, Super Retail Group, HSBC Holdings, and Sa Sa International Holdings (Hong Kong). |
| ¢ | The largest detractors to performance on an absolute performance basis were Newcrest Mining (Australia), HDFC Bank (India), Baidu (China), |
Jubilant Foodworks (India), and Housing Development Finance Corp. (India). On a relative basis, the biggest detractors to performance were Newcrest Mining, HDFC Bank, Baidu, Housing Development Finance Corp. and Jubilant Foodworks. |
The preceding information is the opinion of portfolio management. Any such opinions are subject to change at any time based upon market or other conditions and should not be relied upon as investment advice. Past performance is no guarantee of future results, and there is no guarantee that market forecasts will be realized.
There is no guarantee that the Fund will meet its objective.
| Asset Allocation | ||||
The following table presents asset allocations within certain sectors and as a percentage of total investments as of September 30, 2013.
|
| |||
Consumer Staples | 33 | % | ||
Financials | 30 | |||
Consumer Discretionary | 12 | |||
Health Care | 6 | |||
Utilities | 5 | |||
Industrials | 4 | |||
Materials | 4 | |||
Other (includes short-term investments) | 6 | |||
|
| |||
Total | 100 | % | ||
|
| |||
The market price of equity securities may be affected by financial market, industry, or issuer-specific events. Focus on a particular style or on small or medium-sized companies may enhance that risk. A fund that focuses its investments in a particular industry or sector will be more sensitive to conditions that affect that industry or sector than a non-concentrated fund. Investing internationally, especially in emerging markets, involves additional risks such as currency, political, accounting, economic, and market risk. A fund that focuses its investments in a particular geographic location will be highly sensitive to financial, economic, political, and other developments affecting the fiscal stability of that location.
For information regarding the indexes and certain investment terms, see the Key Investment Terms starting on page 4.
22
Table of Contents
Greater Asia ex Japan Opportunities Fund (Continued)
| Average Annual Total Returns1 for period ended 9/30/13 | ||||||||||||
| 1 year | Since Inception | Inception Date | ||||||||||
| Class A Shares at NAV2 | 0.14 | % | 15.29 | % | 4/21/09 | |||||||
| Class A Shares at POP3,4 | -5.62 | 13.76 | 4/21/09 | |||||||||
| Class C Shares at NAV2 and with CDSC4 | -0.65 | 14.43 | 4/21/09 | |||||||||
| Class I Shares at NAV | 0.42 | 15.60 | 4/21/09 | |||||||||
| S&P 500® Index | 19.34 | 19.10 | — | |||||||||
| MSCI AC Asia Pacific ex Japan Index (net) | 7.15 | 16.15 | — | |||||||||
Fund Expense Ratios6: A Shares: Gross 2.82%, Net 1.80%; C Shares: Gross 3.57%, Net 2.55%; Class I Shares: Gross 2.57%, Net 1.55%.
All returns represent past performance which is no guarantee of future results. Current performance may be higher or lower than the performance shown. The investment return and principal value of an investment will fluctuate so that an investor’s shares, when redeemed, may be worth more or less than their original cost. The above table and graph below do not reflect the deduction of taxes that a shareholder would pay on fund distributions or the redemption of shares. Please visit Virtus.com for performance data current to the most recent month-end.
| 1 | Total returns are historical and include changes in share price and the reinvestment of both dividends and capital gains distributions. |
| 2 | “NAV” (Net Asset Value) total returns do not include the effect of any sales charge. |
| 3 | “POP” (Public Offering Price) total returns include the effect of the maximum front-end 5.75% sales charge. |
| 4 | “CDSC” (Contingent Deferred Sales Charge) is applied to redemptions of certain classes of shares that do not have a sales charge applied at the time of purchase. CDSC charges for certain redemptions of Class A shares made within 18 months of purchase in which a finder’s fee was paid and all redemptions of Class C shares within the first year are 1% and 0% thereafter. |
| 5 | The since inception index returns are from the Fund’s inception date. |
| 6 | The expense ratios of the Fund are set forth according to the prospectus for the Fund effective January 31, 2013, as supplemented and revised and may differ from the expense ratios disclosed in the Financial Highlights tables in this report. See the Financial Highlights for more current expense ratios. Net Expense: Expenses reduced by voluntary fee waiver which may be discontinued at any time. Gross Expense: Does not reflect the effect of the voluntary fee waiver. |
Growth of $10,000 For period ended 9/30
This chart assumes an initial investment of $10,000 made on April 21, 2009 (inception date of the Fund), for Class A, Class C and Class I shares including any applicable sales charges or fees. Performance assumes reinvestment of dividends and capital gain distributions.
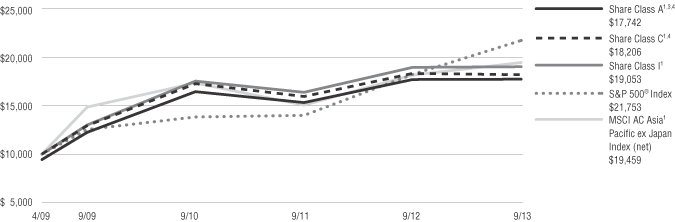
The indexes are unmanaged and not available for direct investment; therefore, their performance does not reflect the expenses associated with active management of an actual portfolio.
For information regarding the indexes and certain investment terms, see the Key Investment Terms starting on page 4.
23
Table of Contents
Greater European Opportunities Fund
Fund Summary | Ticker Symbols: Class A: VGEAX Class C: VGECX Class I: VGEIX |
| ¢ | The Fund is diversified and has an investment objective of long-term capital appreciation. |
| ¢ | For the fiscal year ended September 30, 2013, the Fund’s Class A shares at NAV returned 15.92%, Class C shares returned 15.11%, and Class I shares returned 16.19%. For the same period, the S&P 500® Index, a broad-based equity index, returned 19.34%, and the MSCI Europe Index (net), the Fund‘s style-specific benchmark appropriate for comparison, returned 24.23%. |
All performance figures assume reinvestment of distributions and exclude the effect of sales charges. Past performance is no guarantee of future results and current performance may be higher or lower than the performance shown above.
How did the market perform during the Fund’s fiscal year?*
| ¢ | Earlier in the year, Italian political issues and the Cyprus bailout kept the region’s issues in the global spotlight. The Cyprus bailout, which was orchestrated by the European Central Bank, European Union, and the International Monetary Fund, kept the country in the eurozone. Markets rallied on the announcement of the deal; however, concerns about the competence of eurozone leadership, negative economic outcomes for Cyprus, and the effect of the deal on bank depositors in other eurozone countries remained. |
| ¢ | Greece was lowered by MSCI from developed to emerging market status – the first time MSCI has relegated a developed market country. |
| ¢ | Equity markets were strong across most major economies with cyclical stocks and periphery European markets performing well, supported by coincident market indicators including stable Chinese economic growth and low interest rates across southern Europe. |
| ¢ | The U.S. economic outlook began to improve but turned into a “rate normalization” scare following upbeat Fed’s comments that tested the structural integrity of a number of emerging markets to currency shock, as money that had streamed away from the U.S. and Europe since the 2008-2009 crisis flooded back. |
| ¢ | By fiscal year-end, most emerging market currencies had recovered lost ground and short-term interest rates were pulling back from the emergency measures used by central banks to keep investors from leaving. The focus then shifted to the first U.S. government shutdown since 1996. |
| ¢ | In the second quarter of 2013, after persistent disappointing economic data, the eurozone managed its first quarter on quarter growth (0.3%) in seven quarters, although it remained negative (-0.5%) against the second quarter of 2012. This positive bump alongside Angela Merkel’s CDU party winning the German elections is regarded as a positive step towards stability. General comfort was also reflected in the market signals of low interest rates across the European periphery with the Spanish and Italian 10-year sovereign rates both ending the quarter around 4.4%. However, we are not comfortable that a return to sustainable growth is close for the eurozone. While GDP numbers appear stable in aggregate for the eurozone, we see little growth ahead. Serious problems remain in the periphery and exports with a strong currency and slowing China could be challenging for exporters such as Germany. |
| ¢ | In the second quarter of 2013, year-over-year GDP in Greece fell 4.6%, Spain 1.6%, Portugal 2%, and Italy 2%. These declines without a quick solution would not matter so much if there was a transfer of wealth mechanism within Europe as there is in the U.S., but there is not. If a country is running a deficit, it needs to borrow or be forced to undergo fiscal consolidation, which further weakens growth in the short term. In addition, European banks are shrinking their balance sheets (partly because of the need to improve their leverage ratios), which is another headwind to a return to sustained economic growth. |
What factors affected the Fund’s performance during its fiscal year?*
| ¢ | The Fund’s stock selection in energy, as well as its underweight exposure to the sector, contributed to performance versus the MSCI Europe Index (net) during the fiscal year. The portfolio’s lack of exposure to utilities was also beneficial to results, as the sector underperformed the overall index. |
| ¢ | The Fund’s overweight to consumer staples dragged down performance for the year. Our stock |
selection within the space also detracted. The financials names held in the portfolio hurt performance versus the MSCI Europe Index; and our underweight exposure to the sector was also a detractor. |
| ¢ | The Fund’s selection of Italian stocks contributed to relative performance, as did the portfolio’s underweight to the country. The portfolio’s Swiss holdings performed better than those in the MSCI Europe Index, contributing to relative performance for the period. |
| ¢ | While the portfolio’s underweight to the United Kingdom was positive during the year, our stock selection within the country detracted from performance. The Fund’s out-of-index exposure to the United States hurt relative results during the period. |
| ¢ | On an absolute basis, leading contributors to performance were UBS (Switzerland), Barratt Developments (U.K.), Bureau Veritas (France), Zodiac Aerospace (France), and Core Laboratories (U.S.), while on a relative basis, top contributors were UBS, Barratt Developments, Zodiac Aerospace, Wirecard (Germany), and Luxottica Group (Italy). |
| ¢ | The largest detractors to performance on an absolute performance basis were Fresnillo (U.K.), Statoil (Norway), Fresenius Medical Care (German), Paddy Power (Ireland), and Elekta (Sweden). On a relative basis, the biggest detractors to performance were Fresnillo, Philip Morris International (U.S.), British American Tobacco (U.K.), Statoil, and Paddy Power. |
| * | Unless fund is less than 1 year then it is fiscal period. |
The preceding information is the opinion of portfolio management. Any such opinions are subject to change at any time based upon market or other conditions and should not be relied upon as investment advice. Past performance is no guarantee of future results, and there is no guarantee that market forecasts will be realized.
There is no guarantee that the Fund will meet its objective.
For information regarding the indexes and certain investment terms, see the Key Investment Terms starting on page 4.
24
Table of Contents
| Greater European Opportunities Fund (Continued) | Ticker Symbols: Class A: VGEAX Class C: VGECX Class I: VGEIX |
| Asset Allocation | ||||
The following table presents asset allocations within certain sectors and as a percentage of total investments as of September 30, 2013.
|
| |||
Consumer Staples | 32 | % | ||
Industrials | 16 | |||
Financials | 13 | |||
Health Care | 11 | |||
Consumer Discretionary | 10 | |||
Information Technology | 6 | |||
Materials | 6 | |||
Other (includes short-term investments) | 6 | |||
|
| |||
Total | 100 | % | ||
|
| |||
The market price of equity securities may be affected by financial market, industry, or issuer-specific events. Focus on a particular style or on small or medium-sized companies may enhance that risk. A fund that focuses its investments in a particular industry or sector will be more sensitive to conditions that affect that industry or sector than a non-concentrated fund. Investing internationally, especially in emerging markets, involves additional risks such as currency, political, accounting, economic, and market risk. A fund that focuses its investments in a particular geographic location will be highly sensitive to financial, economic, political, and other developments affecting the fiscal stability of that location.
For information regarding the indexes and certain investment terms, see the Key Investment Terms starting on page 4.
25
Table of Contents
Greater European Opportunities Fund (Continued)
| Average Annual Total Returns1 for period ended 9/30/13 | ||||||||||||
| 1 year | Since Inception | Inception Date | ||||||||||
| Class A Shares at NAV2 | 15.92 | % | 17.34 | % | 4/21/09 | |||||||
| Class A Shares at POP3,4 | 9.25 | 15.79 | 4/21/09 | |||||||||
| Class C Shares at NAV2 and with CDSC4 | 15.11 | 16.47 | 4/21/09 | |||||||||
| Class I Shares at NAV | 16.19 | 17.63 | 4/21/09 | |||||||||
| S&P 500® Index | 19.34 | 19.10 | — | |||||||||
| MSCI Europe Index (net) | 24.23 | 15.94 | — | |||||||||
Fund Expense Ratios6: A Shares: Gross 2.68%, Net 1.45%; C Shares: Gross 3.43%, Net 2.20%; Class I Shares: Gross 2.43%, Net 1.20%.
All returns represent past performance which is no guarantee of future results. Current performance may be higher or lower than the performance shown. The investment return and principal value of an investment will fluctuate so that an investor’s shares, when redeemed, may be worth more or less than their original cost. The above table and graph below do not reflect the deduction of taxes that a shareholder would pay on fund distributions or the redemption of shares. Please visit Virtus.com for performance data current to the most recent month-end.
| 1 | Total returns are historical and include changes in share price and the reinvestment of both dividends and capital gains distributions. |
| 2 | “NAV” (Net Asset Value) total returns do not include the effect of any sales charge. |
| 3 | “POP” (Public Offering Price) total returns include the effect of the maximum front-end 5.75% sales charge. |
| 4 | “CDSC” (Contingent Deferred Sales Charge) is applied to redemptions of certain classes of shares that do not have a sales charge applied at the time of purchase. CDSC charges for certain redemptions of Class A shares made within 18 months of purchase in which a finder’s fee was paid and all redemptions of Class C shares within the first year are 1% and 0% thereafter. |
| 5 | The since inception index returns are from the Fund’s inception date. |
| 6 | The expense ratios of the Fund are set forth according to the prospectus for the Fund effective January 31, 2013, as supplemented and revised and may differ from the expense ratios disclosed in the Financial Highlights tables in this report. See the Financial Highlights for more current expense ratios. Net Expense: Expenses reduced by voluntary fee waiver which may be discontinued at any time. Gross Expense: Does not reflect the effect of the voluntary fee waiver. |
Growth of $10,000 For periods ended 9/30
This chart assumes an initial investment of $10,000 made on April 21, 2009 (inception date of the Fund), for Class A, Class C and Class I shares including any applicable sales charges or fees. Performance assumes reinvestment of dividends and capital gain distributions.
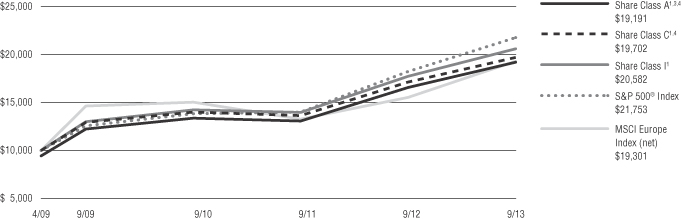
The indexes are unmanaged and not available for direct investment; therefore, their performance does not reflect the expenses associated with active management of an actual portfolio.
For information regarding the indexes and certain investment terms, see the Key Investment Terms starting on page 4.
26
Table of Contents
Fund Summary | Ticker Symbols: Class A: VIEAX Class C: VIECX Class I: VIIEX |
| ¢ | The Fund is diversified and has an investment objective of long-term capital appreciation. |
| ¢ | For the fiscal year ended September 30, 2013, the Fund’s Class A shares at NAV returned 13.38%, Class C shares returned 12.53%, and Class I shares returned 13.68%. For the same period, the S&P 500® Index, a broad-based equity index, returned 19.34%, and the MSCI EAFE® Index (net), the Fund’s style-specific benchmark appropriate for comparison, returned 23.77%. |
All performance figures assume reinvestment of distributions and exclude the effect of sales charges. Past performance is no guarantee of future results and current performance may be higher or lower than the performance shown above.
How did the market perform during the Fund’s fiscal year?
(Euclid Advisors LLC became the Fund’s subadvisor effective May 22, 2013, and Pyrford International Ltd. served as the subadviser from October 1, 2012 through May 21, 2013)
Euclid Advisors LLC
| ¢ | International stock markets, as represented by the MSCI EAFE Index (net), was up over 20% during the fiscal year, though experienced a challenging spring and early summer, largely driven by the Fed’s talk of tapering and the resulting sell-off in emerging markets. However, as the summer progressed and markets regained their composure, non-U.S. stocks rallied strongly through the end of September to produce a positive third quarter return. |
| ¢ | In the spring, defensive sectors such as consumer staples began to weaken from their lofty valuations and concerns about emerging market growth, but as the rally began to gain momentum in mid-summer, it was the more cyclical sectors such as materials, industrials, and financials that led the way. Also, as a result of cheap valuations and takeovers talks, the European telecom sector performed very well over the summer and into the fall. |
Pyrford International Ltd
| ¢ | For the year, developed markets posted strong returns, primarily boosted by the highly |
accommodating monetary policies of global central banks. Japanese equities were particularly strong, as investors were optimistic that the newly elected government would be able to engineer an economic recovery. European equity markets were not quite as strong as their Japanese counterparts, though still posted solid gains. Emerging markets continued their relative underperformance over the period, with particular focus on falling commodity prices and a slowdown in China. |
What factors affected the Fund’s performance during its fiscal year?
Euclid Advisors LLC
| ¢ | The Fund was well positioned for the rally in cyclical stocks during the third quarter of 2013, with an overweight to financials and industrials, and was a beneficiary of strong performance in those sectors. At the end of the third quarter, the Fund was still overweight more economically-sensitive sectors such as financial and industrials and underweight the more defensive sectors such as health care and consumer staples. |
| ¢ | With Japan still pursuing major economic reforms, and Europe beginning to show positive growth, the international equity markets appear attractively valued with a favorable outlook. |
Pyrford International Ltd
| ¢ | The Fund underperformed the MSCI EAFE® Index (net) for the fiscal year, due mainly to the defensive nature of equities held in the portfolio. |
| ¢ | The key detractor from performance was the portfolio’s large underweight allocation to Japanese equities which rallied over the period. However, stock selection in Japan was a key positive contributor. In addition, the Fund’s underweight to the Japanese yen was a strong positive contributor to currency returns, as was the underweight exposure to European equities. |
The preceding information is the opinion of portfolio management. Any such opinions are subject to change at any time based upon market or other conditions and should not be relied upon as investment advice. Past performance is no guarantee of future results, and there is no guarantee that market forecasts will be realized.
There is no guarantee that the Fund will meet its objective.
Asset Allocation | ||||
The following table presents asset allocations within certain sectors and as a percentage of total investments as of September 30, 2013.
|
| |||
Industrials | 29 | % | ||
Financials | 24 | |||
Materials | 10 | |||
Consumer Discretionary | 8 | |||
Telecommunication Services | 4 | |||
Health Care | 3 | |||
Information Technology | 3 | |||
Other (includes short-term investments) | 19 | |||
|
| |||
Total | 100 | % | ||
|
| |||
Investing internationally, especially in emerging markets, involves additional risks such as currency, political, accounting, economic, and market risk. The market price of equity securities may be affected by financial market, industry, or issuer-specific events. Focus on a particular style or on small or medium-sized companies may enhance that risk.
For information regarding the indexes and certain investment terms, see the Key Investment Terms starting on page 4.
27
Table of Contents
International Equity Fund (Continued)
| Average Annual Total Returns1 for periods ended 9/30/13 | ||||||||||||
| 1 year | Since Inception | Inception Date | ||||||||||
| Class A Shares at NAV2 | 13.38 | % | 9.18 | % | 9/16/10 | |||||||
| Class A Shares at POP3,4 | 6.87 | 7.07 | 9/16/10 | |||||||||
| Class C Shares at NAV2 and with CDSC4 | 12.53 | 8.23 | 9/16/10 | |||||||||
| Class I Shares at NAV | 13.68 | 9.32 | 9/16/10 | |||||||||
| S&P 500® Index | 19.34 | 16.61 | 5 | — | ||||||||
| MSCI EAFE® Index (net) | 23.77 | 9.24 | 5 | — | ||||||||
Fund Expense Ratios6: A Shares: Gross 1.74%, Net 1.50%; C Shares: Gross 2.49%, Net 2.25%; Class I Shares: Gross 1.49%, Net 1.25%.
All returns represent past performance which is no guarantee of future results. Current performance may be higher or lower than the performance shown. The investment return and principal value of an investment will fluctuate so that an investor’s shares, when redeemed, may be worth more or less than their original cost. The above table and graph below do not reflect the deduction of taxes that a shareholder would pay on fund distributions or the redemption of shares. Please visit Virtus.com for performance data current to the most recent month-end.
| 1 | Total returns are historical and include changes in share price and the reinvestment of both dividends and capital gains distributions. |
| 2 | “NAV” (Net Asset Value) total returns do not include the effect of any sales charge. |
| 3 | “POP” (Public Offering Price) total returns include the effect of the maximum front-end 5.75% sales charge. |
| 4 | “CDSC” (Contingent Deferred Sales Charge) is applied to redemptions of certain classes of shares that do not have a sales charge applied at the time of purchase. CDSC charges for certain redemptions of Class A shares made within 18 months of purchase in which a finder’s fee was paid and all redemptions of Class C shares within the first year are 1% and 0% thereafter. |
| 5 | The since inception index returns are from the Fund’s inception date. |
| 6 | The expense ratios of the Fund are set forth according to the prospectus for the Fund effective January 31, 2013, as supplemented and revised and may differ from the expense ratios disclosed in the Financial Highlights tables in this report. See the Financial Highlights for more current expense ratios. Net Expense: Expenses reduced by voluntary fee waiver which may be discontinued at any time. Gross Expense: Does not reflect the effect of the voluntary fee waiver. |
Growth of $10,000 For period ended 9/30
This chart assumes an initial investment of $10,000 made on September 16, 2010 (inception date of the Fund), for Class A, Class C and Class I shares including any applicable sales charges or fees. Performance assumes reinvestment of dividends and capital gain distributions.
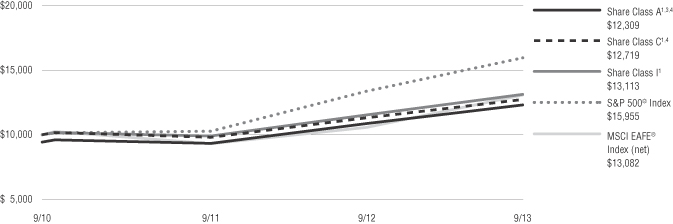
The indexes are unmanaged and not available for direct investment; therefore, their performance does not reflect the expenses associated with active management of an actual portfolio.
For information regarding the indexes and certain investment terms, see the Key Investment Terms starting on page 4.
28
Table of Contents
International Real Estate Securities Fund
Fund Summary | Ticker Symbols: Class A: PXRAX Class C: PXRCX Class I: PXRIX |
| ¢ | The Fund is diversified and has a primary investment objective of long-term capital appreciation and a secondary investment objective of income. |
| ¢ | For the fiscal year ended September 30, 2013, the Fund’s Class A shares at NAV returned 9.39%, Class C shares returned 8.55%, and Class I shares returned 9.66%. For the same period, the S&P 500® Index, a broad-based equity index, returned 19.34%, the FTSE EPRA/NAREIT Developed Rental ex U.S. Index (Net), the Fund’s style-specific benchmark appropriate for comparison, returned 9.84%. |
All performance figures assume reinvestment of distributions and exclude the effect of sales charges. Past performance is no guarantee of future results and current performance may be higher or lower than the performance shown above.
How did the market perform during the Fund’s fiscal year?
| ¢ | The U.S. presidential election and fiscal situation dominated the market’s attention in the fourth quarter of 2012 against a backdrop of improving global economic data. |
| ¢ | The Japanese returned the Liberal Democratic Party to power as its platform of more aggressive fiscal and monetary policy expansion was embraced; and Japanese equities rallied during the fiscal period as the early results of these policies have been favorable. |
| ¢ | Notably, during the first quarter of 2013, the Fed offered its first real look at how it would exit its open-ended quantitative easing program, just one quarter after starting it. The U.S. central bank established a shift from time-based metrics to a formula incorporating thresholds of 6.5% unemployment and 2.5% core CPI. |
| ¢ | The second quarter of 2013 witnessed a fairly meaningful uptick in global interest rates sparked by a concern that the Fed would begin to remove some of its policy stimulus during the second half of 2013. The sudden rise in rates caught many by surprise and drove a healthy correction in fixed income securities and more interest rate-sensitive equities during the second quarter of 2013. Market actors were surprised again in September 2013 as the Fed decided not to reduce the pace of its monthly bond market purchases after signaling in May 2013 that this was likely. |
| ¢ | Not surprisingly, given the nearly 1.00% increase in U.S. 10-Year Treasury bond yields during the fiscal period, cyclical-oriented equities performed better than defensive equities and fixed income securities were broadly disfavored. Emerging market equities suffered as capital headed for the exits and their currencies came under pressure. |
What factors affected the Fund’s performance during its fiscal year?
| ¢ | For the one-year period ending September 30, 2013, the Fund slightly trailed its style-specific benchmark. Security selection was a positive contributor to performance during the period, while country allocation detracted from performance. |
| ¢ | On a regional basis, Europe and Japan outperformed the style-specific benchmark and Asia Pacific ex- Japan and Canada lagged the benchmark. |
| ¢ | Among the top 10 countries in the benchmark by index weight, the U.K, France, and Japan delivered strong performance, while Singapore, Australia, and Canada were weak. |
| ¢ | From a country perspective, the most significant positive contributor to relative performance during the fiscal year was the Fund’s stock selection within Canada. At the security level within Canada, its overweight exposure to a global office company with a presence in the U.S., Canada, and Australia, had the largest positive impact on performance as this company was subject to an acquisition offer at the end of the third quarter of 2013. |
| ¢ | The second most meaningful positive contributor to relative performance at a country level was the Fund’s allocation to, and stock selection within, the United Kingdom. Namely, the portfolio’s lack of exposure to a U.K. regional mall REIT and the portfolio’s overweight exposure to a U.K. mid-capitalization self-storage REIT were the most important drivers of this performance. |
| ¢ | From a country perspective, the most significant detractor from relative performance during the fiscal year was the Fund’s overweight allocation to Norway. The Fund’s lone Norwegian holding disappointed the market with a write down associated with its large development/redevelopment pipeline. |
| ¢ | The second most important detractor from relative performance at a country level was the Fund’s small |
exposure to Mexico. The Fund’s one Mexican REIT holding was impacted by the emerging markets sell-off that began in the second quarter of 2013. |
| ¢ | Going forward, we expect higher quality cash flow growth to play a more meaningful role in driving total returns as internal growth prospects (i.e., occupancy lift and rental rate pricing power) continue to improve against a backdrop of fairly limited new supply, and companies remain active with external growth initiatives. |
The preceding information is the opinion of portfolio management. Any such opinions are subject to change at any time based upon market or other conditions and should not be relied upon as investment advice. Past performance is no guarantee of future results, and there is no guarantee that market forecasts will be realized.
There is no guarantee that the Fund will meet its objective.
| Asset Allocation | ||||
The following table presents asset allocations within certain sectors and as a percentage of total investments as of September 30, 2013.
|
| |||
Retail REITs | 25 | % | ||
Real Estate Operating Companies | 21 | |||
Diversified REITs | 19 | |||
Office REITs | 13 | |||
Industrial REITs | 3 | |||
Diversified Real Estate Activities | 3 | |||
Specialized REITs | 1 | |||
Other (includes short-term investments) | 15 | |||
|
| |||
Total | 100 | % | ||
|
| |||
The market price of equity securities may be affected by financial market, industry, or issuer-specific events. Focus on a particular style or on small or medium-sized companies may enhance that risk. The fund may be negatively affected by factors specific to the real estate market, including interest rate, leverage, property, and management. Investing internationally, especially in emerging markets, involves additional risks such as currency, political, accounting, economic, and market risk. A fund that focuses its investments in a particular industry or sector will be more sensitive to conditions that affect that industry or sector than a non-concentrated fund. A fund that focuses its investments in a particular geographic location will be highly sensitive to financial, economic, political, and other developments affecting the fiscal stability of that location.
For information regarding the indexes and certain investment terms, see the Key Investment Terms starting on page 4.
29
Table of Contents
International Real Estate Securities Fund (Continued)
| Average Annual Total Returns1 for periods ended 9/30/13 | ||||||||||||||||
| 1 Year | 5 Year | Since Inception | Inception Date | |||||||||||||
| Class A Shares at NAV2 | 9.39 | % | 6.92 | % | -0.72 | % | 10/1/07 | |||||||||
| Class A Shares at POP3,4 | 3.10 | 5.66 | -1.69 | 10/1/07 | ||||||||||||
| Class C Shares at NAV2 and with CDSC4 | 8.55 | 6.13 | -1.48 | 10/1/07 | ||||||||||||
| Class I Shares at NAV | 9.66 | 7.18 | -0.48 | 10/1/07 | ||||||||||||
| S&P 500® Index | 19.34 | 10.02 | 3.66 | 5 | — | |||||||||||
| FTSE EPRA/NAREIT Developed Rental ex U.S. Index (net) | 9.84 | 6.69 | -1.88 | 5 | — | |||||||||||
Fund Expense Ratios6: A Shares: Gross 1.82%, Net 1.50%; C Shares: Gross 2.57%, Net 2.25%; Class I Shares: Gross 1.57%, Net 1.25%.
All returns represent past performance which is no guarantee of future results. Current performance may be higher or lower than the performance shown. The investment return and principal value of an investment will fluctuate so that an investor’s shares, when redeemed, may be worth more or less than their original cost. The above table and graph below do not reflect the deduction of taxes that a shareholder would pay on fund distributions or the redemption of shares. Please visit Virtus.com for performance data current to the most recent month-end.
| 1 | Total returns are historical and include changes in share price and the reinvestment of both dividends and capital gains distributions. |
| 2 | “NAV” (Net Asset Value) total returns do not include the effect of any sales charge. |
| 3 | “POP” (Public Offering Price) total returns include the effect of the maximum front-end 5.75% sales charge. |
| 4 | “CDSC” (Contingent Deferred Sales Charge) is applied to redemptions of certain classes of shares that do not have a sales charge applied at the time of purchase. CDSC charges for certain redemptions of Class A shares made within 18 months of purchase in which a finder’s fee was paid and all redemptions of Class C shares within the first year are 1% and 0% thereafter. |
| 5 | The since inception index returns are from the Fund’s inception date. |
| 6 | The expense ratios of the Fund are set forth according to the prospectus for the Fund effective January 31, 2013, as supplemented and revised and may differ from the expense ratios disclosed in the Financial Highlights tables in this report. See the Financial Highlights for more current expense ratios. Net Expense: Expenses reduced by voluntary fee waiver which may be discontinued at any time. Gross Expense: Does not reflect the effect of the voluntary fee waiver. |
Growth of $10,000 For periods ended 9/30
This chart assumes an initial investment of $10,000 made on October 1, 2007 (inception date of the Fund), for Class A, Class C and Class I shares including any applicable sales charges or fees. Performance assumes reinvestment of dividends and capital gain distributions.
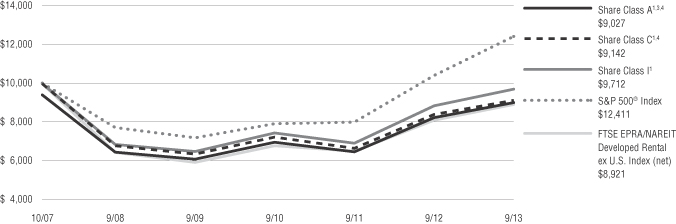
The indexes are unmanaged and not available for direct investment; therefore, their performance does not reflect the expenses associated with active management of an actual portfolio.
For information regarding the indexes and certain investment terms, see the Key Investment Terms starting on page 4.
30
Table of Contents
Fund Summary | Ticker Symbols: Class A: VISAX Class C: VCISX Class I: VIISX |
| ¢ | The Fund is diversified and has an investment objective of capital appreciation. |
| ¢ | For the fiscal year ended September 30, 2013, the Fund’s Class A shares at NAV returned 31.97%, Class C shares returned 30.92%, and Class I shares returned 32.13%. For the same period, the S&P 500® Index, a broad-based equity index, returned 19.34%, and the MSCI AC World Ex U.S. Small Cap Index (net), the Fund’s style-specific benchmark appropriate for comparison, returned 20.04%. |
All performance figures assume reinvestment of distributions and exclude the effect of sales charges. Past performance is no guarantee of future results and current performance may be higher or lower than the performance shown above.
How did the market perform during the Fund’s fiscal year?
| ¢ | Developed international equity markets were strong during the Fund’s fiscal year, producing solid double-digit returns. Although returns were positive, equity markets have been volatile during the period given the continued uncertainty in the global macroeconomic environment. However, more recently, markets have shown strength on better-than-expected economic data from Europe and China, as well as the Fed’s decision in September to leave monetary policy unchanged. Europe, in particular, appears to have moved from recession into recovery following the July announcement that the second-quarter GDP rate turned positive for the first time since 2011. Signs of actual growth, including improved auto sales, coupled with the absence of any further government bailouts helped fuel a rally in European equities. |
| ¢ | On the other hand, emerging markets underperformed developed markets, producing only slightly positive returns for the period. Several high-growth countries, such as Indonesia and India, declined significantly on currency and fiscal concerns. Growth in China clearly slowed during the period, but more recently, the growth rate appears to have at least stabilized with the country reporting improved manufacturing and export data. |
| ¢ | Most sectors were strongly positive for the Fund’s fiscal year, with utilities, consumer discretionary, and information technology posting the strongest performance. Materials was the only sector to post a negative return for the period, followed by energy which was only modestly positive. |
What factors affected the Fund’s performance during its fiscal year?
| ¢ | The Fund outperformed the MSCI AC World Ex-U.S. Small Cap Index (net) during the Fund’s fiscal year. The Fund tended to own larger positions than most managers and many of these positions are not highly correlated with the markets in which they trade. This will, at times, result in Fund performance that varies significantly from the benchmark. |
| ¢ | An example of this is the Fund’s relative performance in the materials sector. The Fund currently owns no commodity producers, which allowed its materials stocks to generate strong returns during a period where weak commodity prices led to a decline for materials stocks in the benchmark. Likewise, the Fund’s emerging markets holdings produced strongly positive returns versus a modest single-digit return for the benchmark. |
The preceding information is the opinion of portfolio management. Any such opinions are subject to change at any time based on market and or other conditions and should not be relied upon as investment advice. Past performance is no guarantee of future results and there is no guarantee market forecasts will be realized.
There is no guarantee that the Fund will meet its objective.
| Asset Allocation | ||||
The following table presents asset allocations within certain sectors and as a percentage of total investments as of September 30, 2013.
|
| |||
Industrials | 29 | % | ||
Materials | 13 | |||
Financials | 12 | |||
Consumer Discretionary | 8 | |||
Health Care | 6 | |||
Information Technology | 6 | |||
Energy | 5 | |||
Other (includes short-term investments) | 21 | |||
|
| |||
Total | 100 | % | ||
|
| |||
The market price of equity securities may be affected by financial market, industry, or issuer-specific events. Focus on a particular style or on small or medium-sized companies may enhance that risk. Investing internationally, especially in emerging markets, involves additional risks such as currency, political, accounting, economic, and market risk. Because the fund has a limited number of securities, it may be more susceptible to factors adversely affecting its securities than a less concentrated fund.
For information regarding the indexes and certain investment terms, see the Key Investment Terms starting on page 4.
31
Table of Contents
International Small-Cap Fund (Continued)
| Average Annual Total Returns1 for periods ended 9/30/13 | ||||||||||||
| 1 year | Since Inception | Inception Date | ||||||||||
| Class A Shares at NAV2 | 31.97 | % | 30.73 | % | 9/5/12 | |||||||
| Class A Shares at POP3,4 | 24.38 | 23.68 | 9/5/12 | |||||||||
| Class C Shares at NAV2 and with CDSC4 | 30.92 | 29.76 | 9/5/12 | |||||||||
| Class I Shares at NAV2 | 32.13 | 31.01 | 9/5/12 | |||||||||
| S&P 500® Index | 19.34 | 21.07 | 5 | — | ||||||||
| MSCI AC World Ex U.S. Small Cap Index (net) | 20.04 | 24.75 | 5 | — | ||||||||
Fund Expense Ratios6: A Shares: Gross 2.18%, Net 1.60%; C Shares: Gross 2.93%, Net 2.35%; I Shares: Gross 1.93%, Net 1.35%.
All returns represent past performance which is no guarantee of future results. Current performance may be higher or lower than the performance shown. The investment return and principal value of an investment will fluctuate so that an investor’s shares, when redeemed, may be worth more or less than their original cost. The above table and graph below do not reflect the deduction of taxes that a shareholder would pay on fund distributions or the redemption of shares. Please visit Virtus.com for performance data current to the most recent month-end.
| 1 | Total returns are historical and include changes in share price and the reinvestment of both dividends and capital gains distributions. |
| 2 | “NAV” (Net Asset Value) total returns do not include the effect of any sales charge. |
| 3 | “POP” (Public Offering Price) total returns include the effect of the maximum front-end 5.75% sales charge. |
| 4 | “CDSC” (Contingent Deferred Sales Charge) is applied to redemptions of certain classes of shares that do not have a sales charge applied at the time of purchase. CDSC charges for certain redemptions of Class A shares made within 18 months of purchase in which a finder’s fee was paid and all redemptions of Class C shares within the first year are 1% and 0% thereafter. |
| 5 | The since inception index returns are from the Fund’s inception date. |
| 6 | The expense ratios of the Fund are set forth according to the prospectus for the Fund effective January 31, 2013 and may differ from the expense ratios disclosed in the Financial Highlights tables in this report. See the Financial Highlights for more current expense ratios. Net Expense: Expenses reduced by the contractual fee waiver in effect through January 31, 2014. Gross Expense: Does not reflect the effect of the fee waiver. |
Growth of $10,000 For periods ended 9/30
This chart assumes an initial investment of $10,000 made on September 5, 2013 (inception date of the Fund), for Class A, Class C, and Class I shares including any applicable sales charges or fees. Performance assumes reinvestment of dividends and capital gain distributions.
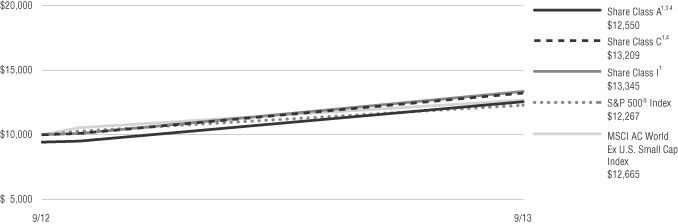
For information regarding the indexes and certain investment terms, see the Key Investment Terms starting on page 4.
32
Table of Contents
VIRTUS EMERGING MARKETS DEBT FUND
SCHEDULE OF INVESTMENTS
SEPTEMBER 30, 2013
($ reported in thousands)
| PAR VALUE | VALUE | |||||||
| FOREIGN GOVERNMENT SECURITIES—25.8% | ||||||||
Argentine Republic PIK Interest Capitalization | $ | 215 | $ | 138 | ||||
Bolivarian Republic of Venezuela | ||||||||
RegS 5.750%, 2/26/16(4) | 480 | 434 | ||||||
RegS 7.000%, 12/1/18(4) | 70 | 59 | ||||||
RegS 12.750%, 8/23/22(4) | 30 | 30 | ||||||
7.650%, 4/21/25 | 775 | 562 | ||||||
9.375%, 1/13/34 | 325 | 258 | ||||||
Dominican Republic 144A | 100 | 93 | ||||||
Federation of Russia 144A | ||||||||
7.850%, 3/10/18(3) | 5,000 | RUB | 160 | |||||
Series 6207 | 3,610 | RUB | 117 | |||||
Hellenic Republic | ||||||||
2.000%, 2/24/23(2) | 40 | EUR | 34 | |||||
2.000%, 2/24/27(2) | 235 | EUR | 170 | |||||
Honduras Republic | 200 | 171 | ||||||
Hungary | ||||||||
6.375%, 3/29/21 | 110 | 118 | ||||||
5.375%, 2/21/23 | 76 | 74 | ||||||
Kingdom of Morocco 144A | 200 | 182 | ||||||
Mongolia 144A | 200 | 171 | ||||||
Republic of Angola (Northern Lights III BV) RegS | 250 | 269 | ||||||
Republic of Belarus | 100 | 95 | ||||||
Republic of Cote d’ Ivoire 144A | 100 | 89 | ||||||
Republic of Croatia 144A | 300 | 310 | ||||||
Republic of Ecuador 144A | 100 | 105 | ||||||
Republic of El Salvador 144A | 70 | 71 | ||||||
Republic of Guatemala 144A | 200 | 184 | ||||||
Republic of Indonesia | 1,475,000 | IDR | 138 | |||||
Series FR63, | 624,000 | IDR | 44 | |||||
Republic of Peru 144A | 400 | PEN | 150 | |||||
Republic of Philippines | 5,000 | PHP | 124 | |||||
Republic of Poland | 300 | PLZ | 105 | |||||
Republic of Portugal Treasury Obligation | 45 | EUR | 53 | |||||
Republic of Serbia 144A | 79 | 77 | ||||||
| PAR VALUE | VALUE | |||||||
| FOREIGN GOVERNMENT SECURITIES—continued | ||||||||
Republic of South Africa Series R208, | 1,470 | ZAR | $ | 141 | ||||
Republic of Sri Lanka 144A | $ | 200 | 185 | |||||
Republic of Turkey | ||||||||
9.000%, 3/8/17 | 155 | TRY | 77 | |||||
5.125%, 3/25/22 | 200 | 199 | ||||||
6.750%, 5/30/40 | 225 | 235 | ||||||
Republic of Uruguay | 4,858 | UYU | 237 | |||||
Republic of Zambia 144A | 200 | 176 | ||||||
Romania 144A | 150 | 172 | ||||||
Ukraine | ||||||||
144A 7.950%, 6/4/14(3) | 200 | 191 | ||||||
144A 6.580%, 11/21/16(3) | 200 | 173 | ||||||
144A 7.750%, 9/23/20(3) | 325 | 279 | ||||||
144A 7.500%, 4/17/23(3) | 200 | 166 | ||||||
United Mexican States | ||||||||
Series M, 6.000%, 6/18/15 | 3,855 | MXN | 305 | |||||
Series M, 6.500%, 6/9/22 | 2,250 | MXN | 178 | |||||
| TOTAL FOREIGN GOVERNMENT SECURITIES | ||||||||
| (Identified Cost $8,013) | 7,299 | |||||||
| CORPORATE BONDS AND NOTES—71.5% | ||||||||
| Austria—0.7% | ||||||||
Sappi Papier Holding GmbH 144A | 200 | 210 | ||||||
|
| |||||||
| Bermuda—1.8% | ||||||||
Aircastle Ltd. | 100 | 106 | ||||||
Digicel Group Ltd. 144A | 200 | 208 | ||||||
GeoPark Latin America Ltd. (Agencia en Chile) 144A | 200 | 201 | ||||||
|
| |||||||
| 515 | ||||||||
|
| |||||||
| Brazil—4.8% | ||||||||
Banco ABC Brasil SA 144A | 100 | 101 | ||||||
Banco do Brasil SA 144A | 200 | 213 | ||||||
Banco Santander Brasil SA 144A | 300 | BRL | 125 | |||||
Banco Votorantim SA 144A | 125 | 130 | ||||||
BRF SA 144A | 400 | BRL | 143 | |||||
Embraer SA | 100 | 97 | ||||||
Gerdau Holdings, Inc. 144A | 125 | 133 | ||||||
Itau Unibanco Holding SA RegS | 250 | 238 | ||||||
| PAR VALUE | VALUE | |||||||
| Brazil—continued | ||||||||
Vale SA | ||||||||
5.625%, 9/11/42 | $ | 200 | $ | 174 | ||||
|
| |||||||
| 1,354 | ||||||||
|
| |||||||
| Canada—0.5% | ||||||||
Eldorado Gold Corp. 144A 6.125%, 12/15/20(3) | 45 | 44 | ||||||
Pacific Rubiales Energy Corp. 144A 5.125%, 3/28/23(3) | 100 | 90 | ||||||
|
| |||||||
| 134 | ||||||||
|
| |||||||
| Cayman Islands—6.7% | ||||||||
Braskem Finance Ltd. 144A 5.375%, 5/2/22(3) | 200 | 187 | ||||||
Country Garden Holdings Co., Ltd. 144A | 200 | 194 | ||||||
Hutchison Whampoa International Ltd. | 325 | 342 | ||||||
IPIC GMTN Ltd. 144A | 250 | 301 | ||||||
Kaisa Group Holdings Ltd. 144A | 200 | 202 | ||||||
MIE Holdings Corp. 144A | 200 | 206 | ||||||
Petrobras International Finance Co. | 300 | 290 | ||||||
Voto-Votorantim Ltd. 144A | 175 | 187 | ||||||
|
| |||||||
| 1,909 | ||||||||
|
| |||||||
| Chile—3.8% | ||||||||
Automotores Gildemeister SA 144A | 150 | 118 | ||||||
Banco Santander Chile 144A | 200 | 185 | ||||||
Cencosud SA 144A | 200 | 189 | ||||||
CorpGroup Banking SA 144A | 250 | 214 | ||||||
Inversiones CMPC SA 144A | 200 | 186 | ||||||
SACI Falabella RegS | 100,000 | CLP | 185 | |||||
|
| |||||||
| 1,077 | ||||||||
|
| |||||||
| China—0.6% | ||||||||
China Railway Resources Huitung Ltd. | 200 | 184 | ||||||
|
| |||||||
| Colombia—1.0% | ||||||||
Bancolombia SA | 250 | 228 | ||||||
See Notes to Financial Statements
33
Table of Contents
VIRTUS EMERGING MARKETS DEBT FUND
SCHEDULE OF INVESTMENTS (Continued)
SEPTEMBER 30, 2013
($ reported in thousands)
| PAR VALUE | VALUE | |||||||
| Colombia—continued | ||||||||
Ecopetrol SA | $ | 65 | $ | 68 | ||||
|
| |||||||
| 296 | ||||||||
|
| |||||||
| Georgia—0.7% | ||||||||
Bank of Georgia JSC 144A | 200 | 206 | ||||||
|
| |||||||
| Greece—0.3% | ||||||||
Hellenic Railways | 75 | EUR | 98 | |||||
|
| |||||||
| Hong Kong—0.8% | ||||||||
Bank of China Hong Kong Ltd. 144A | 200 | 217 | ||||||
|
| |||||||
| India—1.7% | ||||||||
Bank of India 144A | 200 | 189 | ||||||
ICICI Bank Ltd. 144A | 300 | 281 | ||||||
|
| |||||||
| 470 | ||||||||
|
| |||||||
| Indonesia—3.0% | ||||||||
Pertamina Persero PT | ||||||||
144A 5.250%, 5/23/21(3) | 200 | 190 | ||||||
144A 4.875%, 5/3/22(3) | 200 | 182 | ||||||
144A 6.000%, 5/3/42(3) | 275 | 223 | ||||||
Perusahaan Listrik Negara PT 144A 5.500%, 11/22/21(3) | 250 | 240 | ||||||
|
| |||||||
| 835 | ||||||||
|
| |||||||
| Ireland—4.0% | ||||||||
Alfa Bank OJSC 144A | 200 | 207 | ||||||
EuroChem Mineral & Chemical Co. OJSC 144A | 200 | 200 | ||||||
Metalloinvest Finance Ltd. 144A | 200 | 194 | ||||||
Nomos Bank Via Nomos Capital plc 144A | 200 | 201 | ||||||
Novatek OAO (Novatek Finance Ltd.) 144A | 200 | 184 | ||||||
Vimpel Communications OJSC (VIP Finance Ireland Ltd.) 144A | 125 | 145 | ||||||
|
| |||||||
| 1,131 | ||||||||
|
| |||||||
| Israel—0.8% | ||||||||
Israel Electric Corp. Ltd. RegS | 200 | 219 | ||||||
|
| |||||||
| PAR VALUE | VALUE | |||||||
| Kazakhstan—3.8% | ||||||||
Development Bank of Kazakhstan JSC 144A | $ | 200 | $ | 184 | ||||
Eurasian Development Bank 144A | 200 | 187 | ||||||
Kazakhstan Temir Zholy Finance BV 144A | 200 | 202 | ||||||
Kazkommerts Bank International BV 144A | 100 | 102 | ||||||
KazMunayGas National Co. JSC 144A | 200 | 176 | ||||||
Zhaikmunai LP 144A | 200 | 210 | ||||||
|
| |||||||
| 1,061 | ||||||||
|
| |||||||
| Luxembourg—6.3% | ||||||||
ALROSA Finance SA 144A | 200 | 223 | ||||||
Altice Financing SA 144A | 200 | 212 | ||||||
Expro Finance Luxembourg SCA 144A | 100 | 105 | ||||||
Gazprom Neft OAO (GPN Capital SA) 144A | 200 | 184 | ||||||
QGOG Constellation SA 144A | 200 | 191 | ||||||
Sberbank of Russia (Sberbank Capital SA) 144A | 400 | 373 | ||||||
Severstal OAO (Steel Capital SA) 144A | 100 | 107 | ||||||
TMK OAO Via (TMK Capital) SA 144A | 200 | 191 | ||||||
Wind Acquisition Finance S.A. 144A | 200 | 208 | ||||||
|
| |||||||
| 1,794 | ||||||||
|
| |||||||
| Mexico—4.2% | ||||||||
Alpek SA de C.V. 144A | 200 | 198 | ||||||
America Movil SAB de CV Series 12 | 2,000 | MXN | 143 | |||||
Banco Bilbao Vizcaya Argentaria Bancomer SA 144A | 150 | 155 | ||||||
Cemex SAB de CV 144A | 200 | 192 | ||||||
Grupo Televisa SAB | 2,000 | MXN | 129 | |||||
Mexichem SAB de CV 144A | 200 | 194 | ||||||
| PAR VALUE | VALUE | |||||||
| Mexico—continued | ||||||||
Petroleos Mexicanos | $ | 200 | $ | 182 | ||||
|
| |||||||
| 1,193 | ||||||||
|
| |||||||
| Netherlands—1.6% | ||||||||
Bharti Airtel International Netherlands BV 144A | 200 | 181 | ||||||
Lukoil International Finance BV 144A | 200 | 186 | ||||||
Petrobras Global Finance BV | 100 | 91 | ||||||
|
| |||||||
| 458 | ||||||||
|
| |||||||
| Panama—1.2% | ||||||||
AES El Salvador Trust II 144A | 200 | 191 | ||||||
Banco Latinoamericano de Comercio Exterior SA 144A 3.750%, 4/4/17(3) | 150 | 151 | ||||||
|
| |||||||
| 342 | ||||||||
|
| |||||||
| Peru—2.8% | ||||||||
Banco Bilbao Vizcaya Argentaria S.A. Banco Continental SA 144A | 125 | 120 | ||||||
Banco de Credito del Peru 144A | 200 | 201 | ||||||
Banco Internacional del Peru SAA 144A | 100 | 99 | ||||||
Transportadora de Gas del Peru SA 144A | 200 | 173 | ||||||
Volcan Compania Minera SAA 144A | 200 | 190 | ||||||
|
| |||||||
| 783 | ||||||||
|
| |||||||
| Russia—2.0% | ||||||||
AHML Finance Ltd. 144A | 5,000 | RUB | 150 | |||||
Brunswick Rail Finance Ltd. 144A | 200 | 201 | ||||||
VTB Bank OJSC 144A | 200 | 214 | ||||||
|
| |||||||
| 565 | ||||||||
|
| |||||||
| Sri Lanka—0.7% | ||||||||
Bank of Ceylon 144A | 200 | 200 | ||||||
|
| |||||||
| Sweden—0.7% | ||||||||
PKO Finance AB 144A | 200 | 196 | ||||||
|
| |||||||
See Notes to Financial Statements
34
Table of Contents
VIRTUS EMERGING MARKETS DEBT FUND
SCHEDULE OF INVESTMENTS (Continued)
SEPTEMBER 30, 2013
($ reported in thousands)
| PAR VALUE | VALUE | |||||||
| Thailand—1.4% | ||||||||
Bangkok Bank PCL 144A | $ | 200 | $ | 199 | ||||
PTT Global Chemical plc 144A | 200 | 190 | ||||||
|
| |||||||
| 389 | ||||||||
|
| |||||||
| Trinidad and Tobago—0.3% | ||||||||
Petroleum Co. of Trinidad & Tobago Ltd. RegS | 75 | 80 | ||||||
|
| |||||||
| Turkey—4.2% | ||||||||
Akbank TAS 144A | 300 | TRY | 135 | |||||
Arcelik AS 144A | 200 | 173 | ||||||
KOC Holding AS 144A | 200 | 170 | ||||||
Turkiye Is Bankasi AS 144A | 200 | 183 | ||||||
Turkiye Garanti Bankasi AS 144A | 200 | 184 | ||||||
Turkiye Sise Ve Cam Fabrikalari AS 144A | 200 | 174 | ||||||
Yapi ve Kredi Bankasi AS 144A | 200 | 179 | ||||||
|
| |||||||
| 1,198 | ||||||||
|
| |||||||
| Ukraine—0.9% | ||||||||
DP World Ltd. 144A | 250 | 251 | ||||||
|
| |||||||
| United Arab Emirates—1.1% | ||||||||
Abu Dhabi National Energy Co. 144A | 275 | 306 | ||||||
|
| |||||||
| United Kingdom—1.2% | ||||||||
Lloyds TSB Bank plc 144A | 100 | 110 | ||||||
Vedanta Resources plc 144A | 200 | 221 | ||||||
|
| |||||||
| 331 | ||||||||
|
| |||||||
| United States—3.3% | ||||||||
Brazil Loan Trust 1 144A | 250 | 257 | ||||||
First Data Corp. | ||||||||
11.250%, 3/31/16 | 32 | 32 | ||||||
144A 10.625%, 6/15/21(3) | 40 | 41 | ||||||
144A 11.750%, 8/15/21(3) | 50 | 49 | ||||||
Reliance Holdings USA, Inc. 144A | 250 | 251 | ||||||
Reynolds Group Issuer, Inc. | 100 | 101 | ||||||
Sealed Air Corp. 144A | 25 | 26 | ||||||
| PAR VALUE | VALUE | |||||||
| United States—continued | ||||||||
Tronox Finance LLC 144A | $ | 170 | $ | 169 | ||||
|
| |||||||
| 926 | ||||||||
|
| |||||||
| Venezuela—4.1% | ||||||||
Corp Andina de Fomento | 200 | 199 | ||||||
Petroleos de Venezuela SA RegS | 1,055 | 959 | ||||||
|
| |||||||
| 1,158 | ||||||||
|
| |||||||
| Virgin Islands (British)—0.4% | ||||||||
Arcos Dorados Holdings, Inc. 144A | 275 | BRL | 123 | |||||
| TOTAL CORPORATE BONDS AND NOTES (Identified Cost $21,495) | 20,209 | |||||||
| LOAN AGREEMENTS(2)—0.4% | ||||||||
| Information Technology—0.4% | ||||||||
Alcatel-Lucent U.S.A., Inc. 5.750%, 1/30/19 | 99 | 101 | ||||||
| TOTAL LOAN AGREEMENTS (Identified Cost $100) | 101 | |||||||
| TOTAL LONG TERM INVESTMENTS—97.7% | ||||||||
| (Identified Cost $29,608) | 27,609 | |||||||
| SHARES | ||||||||
| SHORT-TERM INVESTMENTS—1.3% | ||||||||
| Money Market Mutual Funds—1.3% | ||||||||
Fidelity Money Market Portfolio – Institutional Shares (Seven-day effective yield 0.090%) | 376,400 | 376 | ||||||
| TOTAL SHORT-TERM INVESTMENTS (Identified Cost $376) | 376 | |||||||
| TOTAL INVESTMENTS—99.0% (Identified Cost $29,984) | 27,985 | (1) | ||||||
Other assets and liabilities, net—1.0% |
| 275 | ||||||
|
| |||||||
| NET ASSETS—100.0% | $ | 28,260 | ||||||
|
| |||||||
Abbreviations:
| PIK | Payment-in-Kind Security |
Footnote Legend:
| (1) | Federal Income Tax Information: For tax information at September 30, 2013, see Note 10 Federal Income Tax Information in the Notes to Financial Statements. |
| (2) | Variable or step coupon security; interest rate shown reflects the rate in effect at September 30, 2013. |
| (3) | Security exempt from registration under Rule 144A of the Securities Act of 1933. These securities may be resold in transactions exempt from registration, normally to qualified institutional buyers. At September 30, 2013, these securities amounted to a value of $18,593 or 65.8% of net assets. |
| (4) | Regulation S security. Security is offered and sold outside of the United States, therefore, it is exempt from registration with the SEC under rules 903 and 904 of the Securities Act of 1933. |
| (5) | This note was issued for the sole purpose of funding a loan agreement between the issuer and the borrower. As the credit risk for this security lies solely with the borrower, the name represented here is that of the borrower. |
| (6) | No contractual maturity date |
| (7) | Interest payments may be deferred. |
| (8) | Principal amount is adjusted pursuant to the change in the Index. |
| (9) | 69.7% of the income received was in cash and 30.3% in PIK. |
Foreign Currencies:
| BRL | Brazilian Real |
| CLP | Chilean Peso |
| EUR | European Currency Unit |
| IDR | Indonesian Rupiah |
| MXN | Mexican Peso |
| PEN | Peruvian Nuevo Sol |
| PHP | Philippines Peso |
| PLZ | Polish Zloty |
| RUB | Russian Ruble |
| TRY | Turkish Lira |
| UYU | Uruguayan Peso |
| ZAR | South African Rand |
| Country Weightings (Unaudited)† | ||||
Venezuela | 9 | % | ||
Cayman Islands | 7 | |||
Luxembourg | 6 | |||
Mexico | 6 | |||
Turkey | 6 | |||
Brazil | 5 | |||
United States | 5 | |||
Other | 56 | |||
Total | 100 | % | ||
† % of total investments as of September 30, 2013 |
| |||
Security abbreviation definitions are located under the Key Investment Terms starting on page 4.
See Notes to Financial Statements
35
Table of Contents
VIRTUS EMERGING MARKETS DEBT FUND
SCHEDULE OF INVESTMENTS (Continued)
SEPTEMBER 30, 2013
($ reported in thousands)
The following table provides a summary of inputs used to value the Fund’s investments as of September 30, 2013 (See Security Valuation Note 2A in the Notes to Financial Statements):
| Total Value at September 30, 2013 | Level 1 Quoted Prices | Level 2 Significant Observable Inputs | ||||||||||
Debt Securities: | ||||||||||||
Corporate Bonds And Notes | $ | 20,209 | $ | — | $ | 20,209 | ||||||
Foreign Government Securities | 7,299 | — | 7,299 | |||||||||
Loan Agreements | 101 | — | 101 | |||||||||
Equity Securities: | ||||||||||||
Short-Term Investments | 376 | 376 | — | |||||||||
|
|
|
|
|
| |||||||
Total Investments | $ | 27,985 | $ | 376 | $ | 27,609 | ||||||
|
|
|
|
|
| |||||||
There are no Level 3 (significant unobservable inputs) priced securities.
See Notes to Financial Statements
36
Table of Contents
VIRTUS EMERGING MARKETS EQUITY INCOME FUND
SCHEDULE OF INVESTMENTS
SEPTEMBER 30, 2013
($ reported in thousands)
| SHARES | VALUE | |||||||
| PREFERRED STOCK—3.8% | ||||||||
| Consumer Staples—2.0% | ||||||||
Companhia Brasileira de Distribuicao Grupo Pao de Acucar 2.420% (Brazil) | 400 | $ | 19 | |||||
Companhia de Bebidas das Americas 2.290% (Brazil) | 4,600 | 176 | ||||||
|
| |||||||
| 195 | ||||||||
|
| |||||||
| Materials—0.4% | ||||||||
Klabin SA (Brazil) 2.54% | 8,200 | 43 | ||||||
|
| |||||||
| Utilities—1.4% | ||||||||
Cia Energetica de Sao Paulo, Class B (Brazil) 3.83% | 4,900 | 51 | ||||||
Companhia Paranaense de Energia 1.490%, Class B (Brazil) | 5,900 | 83 | ||||||
|
| |||||||
| 134 | ||||||||
| TOTAL PREFERRED STOCK (Identified Cost $355) | 372 | |||||||
| COMMON STOCKS—90.8% | ||||||||
| Consumer Discretionary—7.7% | ||||||||
Anta Sports Products Ltd. (China) | 68,000 | 88 | ||||||
Arcelik AS (Turkey) | 5,192 | 30 | ||||||
Bosideng International Holdings Ltd (Hong Kong) | 180,000 | 43 | ||||||
China Motor Corp. (Taiwan) | 61,000 | 55 | ||||||
Cia Hering (Brazil) | 2,200 | 33 | ||||||
Halla Visteon Climate Control Corp. (South Korea) | 2,050 | 78 | ||||||
Kangwon Land, Inc. (South Korea) | 3,570 | 95 | ||||||
Lojas Renner S.A. (Brazil) | 2,400 | 69 | ||||||
MRV Engenharia e Participacoes S.A. (Brazil) | 8,300 | 34 | ||||||
Naspers Ltd. (South Africa) | 709 | 65 | ||||||
Parkson Holdings Bhd (Malaysia) | 16,100 | 19 | ||||||
Pou Chen Corp. (Taiwan) | 16,000 | 19 | ||||||
Truworths International Ltd. (South Africa) | 4,007 | 36 | ||||||
UMW Holdings Bhd (Malaysia) | 28,400 | 103 | ||||||
|
| |||||||
| 767 | ||||||||
|
| |||||||
| Consumer Staples—6.3% | ||||||||
Almacenes Exito SA (Colombia) | 1,216 | 21 | ||||||
Foschini Group Ltd/The (South Africa) | 3,280 | 34 | ||||||
Hite Jinro (South Korea) | 1,910 | 49 | ||||||
Indofood Sukses Makmur Tbk PT (Indonesia) | 48,500 | 29 | ||||||
Kimberly-Clark de Mexico S.A.B. de C.V. Class A (Mexico) | 16,000 | 47 | ||||||
KT&G Corp. (South Korea) | 2,818 | 202 | ||||||
President Chain Store Corp. (Taiwan) | 10,000 | 72 | ||||||
Souza Cruz S.A. (Brazil) | 4,700 | 56 | ||||||
Spar Group Ltd. (The) (South Africa) | 4,459 | 54 | ||||||
| SHARES | VALUE | |||||||
| Consumer Staples—continued | ||||||||
Wal-Mart de Mexico S.A.B. de C.V. (Mexico) | 23,000 | $ | 60 | |||||
|
| |||||||
| 624 | ||||||||
|
| |||||||
| Energy—9.2% | ||||||||
China Petroleum & Chemical Corp. Class H (China) | 73,800 | 58 | ||||||
China Shenhua Energy Co., Ltd. Class H (China) | 24,000 | 73 | ||||||
CNOOC Ltd. (China) | 61,000 | 124 | ||||||
Ecopetrol S.A. (Colombia) | 43,514 | 100 | ||||||
Lukoil OAO Sponsored ADR (Russia) | 2,000 | 127 | ||||||
PTT PCL (Thailand) | 4,400 | 44 | ||||||
Sasol Ltd. (South Africa) | 3,259 | 156 | ||||||
Tambang Batubara Bukit Asam Persero Tbk PT (Indonesia) | 42,000 | 46 | ||||||
Tatneft OAO (Russia) | 3,667 | 146 | ||||||
Ultrapar Participacoes S.A. (Brazil) | 1,400 | 34 | ||||||
|
| |||||||
| 908 | ||||||||
|
| |||||||
| Financials—30.7% | ||||||||
African Bank Investments Ltd. (South Africa) | 19,045 | 32 | ||||||
Agricultural Bank of China Ltd. (China) | 140,000 | 64 | ||||||
Alliance Financial Group Bhd (Malaysia) | 52,100 | 80 | ||||||
AMMB Holdings Bhd (Malaysia) | 43,300 | 98 | ||||||
Banco de Chile (Chile) | 410,690 | 62 | ||||||
Banco do Brasil SA (Brazil) | 8,600 | 100 | ||||||
Banco Santander Chile SA (Chile) | 4,210,001 | 275 | ||||||
Bank of China Ltd. (China) | 610,000 | 278 | ||||||
Bank of the Philippine Islands (Philippines) | 21,750 | 48 | ||||||
Barclays Africa Group Ltd. (South Africa) | 1,679 | 25 | ||||||
BR Malls Participacoes SA (Brazil) | 1,900 | 17 | ||||||
BR Properties SA (Brazil) | 3,500 | 31 | ||||||
China Construction Bank Corp. (China) | 384,000 | 296 | ||||||
China Minsheng Banking Corp. Ltd. (China) | 45,000 | 54 | ||||||
Compartamos SAB de C.V. (Mexico) | 38,300 | 71 | ||||||
Dongbu Insurance Co., Ltd. (South Korea) | 2,300 | 99 | ||||||
Farglory Land Development Co., Ltd. (Taiwan) | 56,000 | 104 | ||||||
FirstRand Ltd. (South Africa) | 17,554 | 58 | ||||||
Grupo Financiero Inbursa Sab de CV (Mexico) | 19,300 | 44 | ||||||
Guangzhou R&F Properties Co., Ltd. (China) | 40,000 | 62 | ||||||
Highwealth Construction Corp. (Taiwan) | 7,400 | 16 | ||||||
Hyundai Marine & Fire Insurance Co., Ltd. (South Korea) | 4,560 | 124 | ||||||
| SHARES | VALUE | |||||||
| Financials—continued | ||||||||
Industrial & Commercial Bank of China Ltd. (China) | 374,000 | $ | 261 | |||||
Industrial Bank of Korea (South Korea) | 3,260 | 36 | ||||||
Komercni Banka A.S. (Czech Republic) | 439 | 98 | ||||||
OTP Bank plc (Hungary) | 1,603 | 32 | ||||||
Porto Seguro S.A. (Brazil) | 2,300 | 29 | ||||||
Powszechna Kasa Oszczednosci Bank Polski S.A. (Poland) | 12,836 | 152 | ||||||
Powszechny Zaklad Ubezpieczen S.A. (Poland) | 654 | 89 | ||||||
Redefine Properties Ltd. (South Africa)(2) | 56,379 | 55 | ||||||
Samsung Fire & Marine Insurance Co., Ltd. (South Korea) | 234 | 54 | ||||||
Siam Commercial Bank PCL (Thailand) | 13,800 | 69 | ||||||
Soho China Ltd. (China) | 60,000 | 52 | ||||||
Standard Bank Group Ltd. (South Africa) | 6,286 | 75 | ||||||
|
| |||||||
| 3,040 | ||||||||
|
| |||||||
| Health Care—0.2% | ||||||||
Kalbe Farma Tbk PT (Indonesia) | 150,500 | 15 | ||||||
|
| |||||||
| Industrials—8.2% | ||||||||
Aboitiz Equity Ventures, Inc. (Philippines) | 82,900 | 86 | ||||||
Alfa Sab de CV (Mexico) | 11,700 | 31 | ||||||
Arteris SA (Brazil) | 5,700 | 49 | ||||||
China Communications Construction Co., Ltd. (China) | 33,000 | 26 | ||||||
CTCI Corp. (Taiwan) | 4,000 | 6 | ||||||
Ecorodovias Infraestrutura e Logistica SA (Brazil) | 5,500 | 38 | ||||||
Grupo Aeroportuario del Pacifico Sab de CV (Mexico) | 6,800 | 35 | ||||||
Grupo Carso Sab de CV (Mexico) | 9,700 | 52 | ||||||
Imperial Holdings Ltd (South Africa) | 686 | 15 | ||||||
Jiangsu Expressway Co., Ltd. (China) | 70,000 | 83 | ||||||
Reunert Ltd. (South Africa) | 6,730 | 49 | ||||||
S-1 Corp. (South Korea) | 895 | 54 | ||||||
Samsung Engineering Co., Ltd. (South Korea) | 617 | 47 | ||||||
Samsung Heavy Industries Co., Ltd. (South Korea) | 1,130 | 45 | ||||||
Taiwan Cement Corp (Taiwan) | 42,000 | 61 | ||||||
Teco Electric and Machinery Co., Ltd. (Taiwan) | 55,000 | 58 | ||||||
Zhejiang Expressway Co., Ltd. (China) | 86,000 | 79 | ||||||
|
| |||||||
| 814 | ||||||||
|
| |||||||
| Information Technology—11.4% | ||||||||
Asustek Computer, Inc. (Taiwan) | 14,000 | 112 | ||||||
Catcher Technology Co., Ltd. (Taiwan) | 9,000 | 48 | ||||||
Cielo SA (Brazil) | 1,920 | 52 | ||||||
Kinsus Interconnect Technology Corp. (Taiwan) | 13,000 | 46 | ||||||
See Notes to Financial Statements
37
Table of Contents
VIRTUS EMERGING MARKETS EQUITY INCOME FUND
SCHEDULE OF INVESTMENTS (Continued)
SEPTEMBER 30, 2013
($ reported in thousands)
| SHARES | VALUE | |||||||
| Information Technology—continued | ||||||||
Lite-On Technology Corp. (Taiwan) | 44,184 | $ | 75 | |||||
MStar Semiconductor, Inc. (Taiwan) | 5,000 | 46 | ||||||
Quanta Computer, Inc. (Taiwan) | 52,000 | 113 | ||||||
Radiant Opto-Electronics Corp. (Taiwan) | 39,260 | 140 | ||||||
Taiwan Semiconductor Manufacturing Co., Ltd. (Taiwan) | 108,000 | 367 | ||||||
Transcend Information, Inc. (Taiwan) | 43,000 | 135 | ||||||
|
| |||||||
| 1,134 | ||||||||
|
| |||||||
| Materials—7.9% | ||||||||
Cementos Argos SA (Colombia) | 1,981 | 10 | ||||||
China Bluechemical Ltd. Class H (China) | 92,000 | 54 | ||||||
Grupo Mexico S.A.B. de C.V. Series B (Mexico) | 34,600 | 104 | ||||||
Industrias Penoles S.A.B de C.V. (Mexico) | 3,450 | 101 | ||||||
Jiangxi Copper Co., Ltd. (China) | 47,000 | 92 | ||||||
Kumba Iron Ore Ltd. (South Africa) | 2,701 | 125 | ||||||
Nampak Ltd (South Africa) | 5,039 | 16 | ||||||
Petronas Chemicals Group BHD (Malaysia) | 29,300 | 62 | ||||||
PTT Global Chemical PCL (Thailand) | 51,300 | 121 | ||||||
Shougang Fushan Resources Group Ltd. (Hong Kong) | 228,000 | 77 | ||||||
Uralkali OJSC Sponsored GDR (Russia) | 664 | 17 | ||||||
|
| |||||||
| 779 | ||||||||
|
| |||||||
| SHARES | VALUE | |||||||
| Telecommunication Services—6.9% | ||||||||
Advanced Info Service PCL (Thailand) | 5,100 | $ | 42 | |||||
China Communications Services Corp. Ltd. (China) | 90,000 | 52 | ||||||
China Mobile Ltd. (Hong Kong) | 18,500 | 207 | ||||||
MTN Group Ltd. (South Africa) | 3,441 | 67 | ||||||
SK Telecom Co., Ltd. (South Korea) | 704 | 143 | ||||||
Telekomunikasi Indonesia Persero Tbk PT (Indonesia) | 276,000 | 50 | ||||||
Tim Participacoes S.A. (Brazil) | 6,800 | 32 | ||||||
Turk Telekomunikasyon AS (Turkey) | 25,532 | 89 | ||||||
|
| |||||||
| 682 | ||||||||
|
| |||||||
| Utilities—2.3% | ||||||||
CEZ AS (Czech Republic) | 2,527 | 65 | ||||||
Delta Electronics Inc (Taiwan) | 8,000 | 39 | ||||||
Guangdong Investments Ltd. (China) | 58,000 | 50 | ||||||
Perusahaan Gas Negara Persero Tbk PT (Indonesia) | 175,500 | 79 | ||||||
|
| |||||||
| 233 | ||||||||
| TOTAL COMMON STOCKS (Identified Cost $8,628) | 8,996 | |||||||
| EXCHANGE-TRADED FUNDS—4.6% | ||||||||
iPath MSCI India Index ETN(2) | 8,991 | 455 | ||||||
iShares MSCI Emerging Markets Index Fund | 25 | 1 | ||||||
| TOTAL EXCHANGE-TRADED FUNDS (Identified Cost $459) | 456 | |||||||
| TOTAL LONG TERM INVESTMENTS—99.2% | ||||||||
| (Identified Cost $9,442) | 9,824 | |||||||
| SHARES | VALUE | |||||||
| SHORT-TERM INVESTMENTS—1.9% | ||||||||
| Money Market Mutual Funds—1.9% | ||||||||
Fidelity Money Market Portfolio – Institutional Shares (Seven-day effective yield 0.090%) | 183,820 | $ | 184 | |||||
| TOTAL SHORT-TERM INVESTMENTS (Identified Cost $184) | 184 | |||||||
| TOTAL INVESTMENTS—101.1% | ||||||||
| (Identified Cost $9,626) | 10,008 | (1) | ||||||
Other assets and liabilities, net—(1.1)% |
| (106 | ) | |||||
|
| |||||||
| NET ASSETS—100.0% | $ | 9,902 | ||||||
|
| |||||||
Abbreviations:
| ADR | American Depositary Receipt |
| ETN | Exchange-Traded Note |
| GDR | Global Depositary Receipt |
Footnote Legend:
| (1) | Federal Income Tax Information: For tax information at September 30, 2013, see Note 10 Federal Income Tax Information in the Notes to Financial Statements. |
| (2) | Non-income producing. |
| Country Weightings (Unaudited)† | ||||
China | 18 | % | ||
Taiwan | 15 | |||
Brazil | 10 | |||
South Korea | 10 | |||
South Africa | 9 | |||
India | 5 | |||
Mexico | 5 | |||
Other | 28 | |||
Total | 100 | % | ||
† % of total investments as of September 30, 2013 |
| |||
The following table provides a summary of inputs used to value the Fund’s investments as of September 30, 2013 (See Security Valuation Note 2A in the Notes to Financial Statements):
| Total Value at September 30, 2013 | Level 1 Quoted Prices | |||||||
Equity Securities: | ||||||||
Common Stocks | $ | 8,996 | $ | 8,996 | ||||
Exchange-Traded Funds | 456 | 456 | ||||||
Preferred Stock | 372 | 372 | ||||||
Short-Term Investments | 184 | 184 | ||||||
|
|
|
| |||||
Total Investments | $ | 10,008 | $ | 10,008 | ||||
|
|
|
| |||||
There are no Level 2 (significant observable inputs) or Level 3 (significant unobservable inputs) priced securities.
Security abbreviation definitions are located under the Key Investment Terms starting on page 4.
See Notes to Financial Statements
38
Table of Contents
VIRTUS GLOBAL COMMODITIES STOCK FUND
SCHEDULE OF INVESTMENTS
SEPTEMBER 30, 2013
($ reported in thousands)
| SHARES | VALUE | |||||||
| COMMON STOCKS—92.6% | ||||||||
| Consumer Staples—12.5% | ||||||||
Andersons, Inc. (The) (United States) | 9,031 | $ | 631 | |||||
BRF – Brasil Foods SA ADR (Brazil) | 29,918 | 734 | ||||||
KWS Saat AG (Germany) | 1,188 | 413 | ||||||
Nutreco N.V. (Netherlands) | 5,948 | 311 | ||||||
S&W Seed Co. (United States)(2) | 54,349 | 455 | ||||||
Tyson Foods, Inc. Class A (United States) | 40,521 | 1,146 | ||||||
|
| |||||||
| 3,690 | ||||||||
|
| |||||||
| Energy—33.1% | ||||||||
Athabasca Oil Corp. (Canada)(2) | 61,801 | 471 | ||||||
Bankers Petroleum Ltd. (Canada)(2) | 91,727 | 345 | ||||||
Cameron International Corp. (United States)(2) | 10,248 | 598 | ||||||
Canyon Services Group, Inc. (Canada) | 22,082 | 252 | ||||||
Concho Resources, Inc. (United States)(2) | 7,554 | 822 | ||||||
Continental Resources, Inc. (United States)(2) | 5,897 | 632 | ||||||
Core Laboratories N.V. (Netherlands) | 4,404 | 745 | ||||||
FX Energy, Inc. (United States)(2) | 70,800 | 244 | ||||||
GeoSpace Technologies Corp. (United States)(2) | 11,957 | 1,008 | ||||||
MEG Energy Corp. (Canada)(2) | 25,737 | 888 | ||||||
Noble Corp. (Switzerland) | 13,616 | 514 | ||||||
Painted Pony Petroleum Ltd. (Canada)(2) | 36,532 | 287 | ||||||
Seadrill Ltd. (Bermuda) | 20,373 | 918 | ||||||
Suncor Energy, Inc. (Canada) | 16,537 | 592 | ||||||
Tesoro Corp. (United States) | 3,739 | 164 | ||||||
Trilogy Energy Corp. (Canada) | 11,340 | 323 | ||||||
Valero Energy Corp. (United States) | 27,566 | 941 | ||||||
|
| |||||||
| 9,744 | ||||||||
|
| |||||||
| Health Care—0.6% | ||||||||
Evogene Ltd. (Israel)(2) | 22,805 | 178 | ||||||
|
| |||||||
| SHARES | VALUE | |||||||
| Industrials—7.2% | ||||||||
AGCO Corp. (United States) | 3,832 | $ | 232 | |||||
Cervus Equipment Corp. (Canada) | 3,140 | 63 | ||||||
JGC Corp. (Japan) | 16,800 | 605 | ||||||
Kubota Corp. Sponsored ADR (Japan) | 8,397 | 611 | ||||||
Lindsay Corp. (United States) | 4,281 | 350 | ||||||
Rocky Mountain Dealerships, Inc. (Canada) | 22,792 | 260 | ||||||
|
| |||||||
| 2,121 | ||||||||
|
| |||||||
| Materials—39.2% | ||||||||
Agnico-Eagle Mines Ltd. (Canada) | 18,086 | 479 | ||||||
Alamos Gold, Inc. (Canada) | 26,093 | 405 | ||||||
Barrick Gold Corp. (Canada) | 36,694 | 683 | ||||||
BHP Billiton Ltd. Sponsored ADR (Australia) | 14,732 | 980 | ||||||
CF Industries Holdings, Inc. (United States) | 869 | 183 | ||||||
Du Pont (E.I.) de Nemours & Co. (United States) | 7,057 | 413 | ||||||
Franco-Nevada Corp. (Canada) | 15,552 | 706 | ||||||
Goldcorp, Inc. (Canada) | 22,151 | 576 | ||||||
Grupo Mexico S.A.B. de C.V. Series B (Mexico) | 316,298 | 947 | ||||||
Imperial Metals Corp. (Canada)(2) | 44,958 | 541 | ||||||
JFE Holdings, Inc. (Japan) | 21,500 | 556 | ||||||
Johnson Matthey plc (United Kingdom) | 6,473 | 294 | ||||||
MBAC Fertilizer Corp. (Canada)(2) | 181,593 | 402 | ||||||
Monsanto Co. (United States) | 6,390 | 667 | ||||||
New Gold, Inc. (Canada)(2) | 34,930 | 209 | ||||||
Nippon Steel & Sumitomo Metal Corp. (Japan) | 166,000 | 562 | ||||||
Royal Gold, Inc. (United States) | 13,489 | 657 | ||||||
Silver Wheaton Corp. (Canada) | 16,142 | 400 | ||||||
Syngenta AG ADR (Switzerland) | 4,327 | 352 | ||||||
Teck Cominco Ltd. Class B (Canada) | 34,344 | 922 | ||||||
Vale SA Sponsored ADR (Brazil) | 38,717 | 603 | ||||||
|
| |||||||
| 11,537 | ||||||||
| TOTAL COMMON STOCKS (Identified Cost $25,069) | 27,270 | |||||||
| SHARES | VALUE | |||||||
| EXCHANGE-TRADED FUNDS—0.8% | ||||||||
PowerShares DB Gold Fund (United States)(2) | 5,112 | $ | 229 | |||||
| TOTAL EXCHANGE-TRADED FUNDS (Identified Cost $261) | 229 | |||||||
| TOTAL LONG TERM INVESTMENTS—93.4% | ||||||||
| (Identified Cost $25,330) | 27,499 | |||||||
| SHORT-TERM INVESTMENTS—5.5% | ||||||||
| Money Market Mutual Funds—5.5% | ||||||||
Fidelity Money Market Portfolio – Institutional Shares (Seven-day effective yield 0.090%) | 1,611,697 | 1,612 | ||||||
| TOTAL SHORT-TERM INVESTMENTS | ||||||||
| (Identified Cost $1,612) | 1,612 | |||||||
| TOTAL INVESTMENTS—98.9% (Identified Cost $26,942) | 29,111 | (1) | ||||||
Other assets and liabilities, net—1.1% |
| 323 | ||||||
|
| |||||||
| NET ASSETS—100.0% | $ | 29,434 | ||||||
|
| |||||||
Abbreviations:
| ADR | American Depositary Receipt |
Footnote Legend:
| (1) | Federal Income Tax Information: For tax information at September 30, 2013, see Note 10 Federal Income Tax Information in the Notes to Financial Statements. |
| (2) | Non-income producing. |
| Country Weightings (Unaudited)† | ||||
United States (short-term investments) | 38 | % | ||
Canada | 30 | |||
Japan | 8 | |||
Brazil | 5 | |||
Netherlands | 4 | |||
Australia | 3 | |||
Mexico | 3 | |||
Other | 9 | |||
Total | 100 | % | ||
† % of total investments as of September 30, 2013 |
| |||
The following table provides a summary of inputs used to value the Fund’s investments as of September 30, 2013 (See Security Valuation Note 2A in the Notes to Financial Statements):
| Total Value at September 30, 2013 | Level 1 Quoted Prices | |||||||
Equity Securities: | ||||||||
Common Stocks | $ | 27,270 | $ | 27,270 | ||||
Exchange-Traded Funds | 229 | 229 | ||||||
Short-Term Investments | 1,612 | 1,612 | ||||||
|
|
|
| |||||
Total Investments | $ | 29,111 | $ | 29,111 | ||||
|
|
|
| |||||
There are no Level 2 (significant observable inputs) or Level 3 (significant unobservable inputs) priced securities.
Security abbreviation definitions are located under the Key Investment Terms starting on page 4.
See Notes to Financial Statements
39
Table of Contents
SCHEDULE OF INVESTMENTS
SEPTEMBER 30, 2013
($ reported in thousands)
| SHARES | VALUE | |||||||
| COMMON STOCKS—98.7% | ||||||||
| Consumer Discretionary—2.4% | ||||||||
Eutelsat Communications SA (France) | 52,250 | $ | 1,652 | |||||
SES SA (Luxembourg) | 61,790 | 1,768 | ||||||
|
| |||||||
| 3,420 | ||||||||
|
| |||||||
| Energy—23.7% | ||||||||
Enbridge, Inc. (Canada) | 192,400 | 8,031 | ||||||
Keyera Corp. (Canada) | 27,940 | 1,588 | ||||||
Kinder Morgan, Inc. | 146,100 | 5,197 | ||||||
Koninklijke Vopak N.V. (Netherlands) | 25,200 | 1,444 | ||||||
Spectra Energy Corp. | 144,240 | 4,937 | ||||||
TransCanada Corp. (Canada) | 117,500 | 5,163 | ||||||
Williams Cos., Inc. (The) | 198,790 | 7,228 | ||||||
|
| |||||||
| 33,588 | ||||||||
|
| |||||||
| Financials—2.1% | ||||||||
American Tower Corp. | 39,910 | 2,958 | ||||||
|
| |||||||
| Industrials—15.1% | ||||||||
Abertis Infraestructuras S.A. (Spain) | 147,830 | 2,873 | ||||||
Atlantia SpA (Italy) | 146,301 | 2,975 | ||||||
Auckland International Airport Ltd. (New Zealand) | 638,050 | 1,757 | ||||||
Ferrovial SA (Spain) | 107,840 | 1,939 | ||||||
Flughafen Zuerich AG (Switzerland) | 3,708 | 1,955 | ||||||
Fraport AG Frankfurt Airport Services Worldwide (Germany) | 31,480 | 2,209 | ||||||
Sydney Airport (Australia) | 529,650 | 1,942 | ||||||
Transurban Group (Australia) | 627,070 | 3,978 | ||||||
Vinci SA (France) | 32,380 | 1,882 | ||||||
|
| |||||||
| 21,510 | ||||||||
|
| |||||||
| Telecommunication Services—23.4% | ||||||||
AT&T, Inc. (United States) | 183,320 | 6,200 | ||||||
BCE, Inc. (Canada) | 28,830 | 1,231 | ||||||
BT Group plc (United Kingdom) | 396,670 | 2,199 | ||||||
Crown Castle International Corp. (United States)(2) | 55,490 | 4,052 | ||||||
Nippon Telegraph & Telephone Corp. ADR (Japan) | 47,970 | 1,250 | ||||||
Singapore Telecommunications Ltd. (Singapore) | 818,400 | 2,433 | ||||||
| SHARES | VALUE | |||||||
| Telecommunication Services—continued | ||||||||
TDC A/S (Denmark) | 222,060 | $ | 1,879 | |||||
TELUS Corp. (Canada) | 56,550 | 1,874 | ||||||
Verizon Communications, Inc. (United States) | 69,580 | 3,247 | ||||||
Vodafone Group plc Sponsored ADR (United Kingdom) | 218,520 | 7,688 | ||||||
Windstream Holdings, Inc. (United States) | 142,690 | 1,141 | ||||||
|
| |||||||
| 33,194 | ||||||||
|
| |||||||
| Utilities—32.0% | ||||||||
Allette, Inc. (United States) | 29,840 | 1,441 | ||||||
Ameren Corp. (United States) | 41,480 | 1,445 | ||||||
APA Group (Australia) | 243,690 | 1,357 | ||||||
CenterPoint Energy, Inc. | 75,720 | 1,815 | ||||||
Centrica plc (United Kingdom) | 323,470 | 1,936 | ||||||
CMS Energy Corp. | 70,680 | 1,860 | ||||||
Dominion Resources, Inc. (United States) | 39,340 | 2,458 | ||||||
DTE Energy Co. (United States) | 20,560 | 1,357 | ||||||
National Grid plc | 363,650 | 4,301 | ||||||
NextEra Energy, Inc. | 41,440 | 3,322 | ||||||
NiSource, Inc. (United States) | 65,240 | 2,015 | ||||||
Northeast Utilities | 31,790 | 1,311 | ||||||
ONEOK, Inc. (United States) | 30,120 | 1,606 | ||||||
Pinnacle West Capital Corp. (United States) | 29,580 | 1,619 | ||||||
Public Service Enterprise Group, Inc. (United States) | 52,420 | 1,726 | ||||||
Questar Corp. (United States) | 52,580 | 1,183 | ||||||
Scottish & Southern Energy plc (United Kingdom) | 84,450 | 2,015 | ||||||
Sempra Energy (United States) | 36,720 | 3,143 | ||||||
SevernTrent plc (United Kingdom) | 52,635 | 1,502 | ||||||
Snam Rete Gas SpA (Italy) | 390,420 | 1,978 | ||||||
Terna Rete Elettrica Nazionale SpA (Italy) | 301,320 | 1,360 | ||||||
United Utilities Group plc (United Kingdom) | 106,340 | 1,190 | ||||||
UNS Energy Corp. | 30,500 | 1,422 | ||||||
Wisconsin Energy Corp. | 49,490 | 1,998 | ||||||
|
| |||||||
| 45,360 | ||||||||
| TOTAL COMMON STOCKS (Identified Cost $115,033) | 140,030 | |||||||
| SHARES | VALUE | |||||||
| RIGHTS—0.1% | ||||||||
| Industrials—0.1% | ||||||||
Abertis Infraestructuras SA (Spain)(2) | 147,830 | $ | 144 | |||||
| TOTAL RIGHTS (Identified Cost $0) | 144 | |||||||
| TOTAL LONG TERM INVESTMENTS—98.8% | ||||||||
| (Identified Cost $115,033) | 140,174 | |||||||
| SHORT-TERM INVESTMENTS—1.3% | ||||||||
| Money Market Mutual Funds—1.3% | ||||||||
Fidelity Money Market Portfolio – Institutional Shares (Seven-day effective yield 0.090%) | 1,841,991 | 1,842 | ||||||
| TOTAL SHORT-TERM INVESTMENTS (Identified Cost $1,842) | 1,842 | |||||||
| TOTAL INVESTMENTS—100.1% | ||||||||
| (Identified Cost $116,875) | 142,016 | (1) | ||||||
Other assets and liabilities, net—(0.1)% |
| (208 | ) | |||||
|
| |||||||
| NET ASSETS—100.0% | $ | 141,808 | ||||||
|
| |||||||
| ADR | American Depositary Receipt |
Footnote Legend:
| (1) | Federal Income Tax Information: For tax information at September 30, 2013, see Note 10 Federal Income Tax Information in the Notes to Financial Statements. |
| (2) | Non-income producing. |
| Country Weightings (Unaudited)† | ||||
United States | 47 | % | ||
United Kingdom | 15 | |||
Canada | 13 | |||
Australia | 5 | |||
Italy | 4 | |||
Spain | 4 | |||
France | 2 | |||
Other | 10 | |||
Total | 100 | % | ||
† % of total investments as of September 30, 2013 |
| |||
Security abbreviation definitions are located under the Key Investment Terms starting on page 4.
See Notes to Financial Statements
40
Table of Contents
VIRTUS GLOBAL DIVIDEND FUND
SCHEDULE OF INVESTMENTS (Continued)
SEPTEMBER 30, 2013
($ reported in thousands)
The following table provides a summary of inputs used to value the Fund’s investments as of September 30, 2013 (See Security Valuation Note 2A in the Notes to Financial Statements):
| Total Value at September 30, 2013 | Level 1 Quoted Prices | |||||||
Equity Securities: | ||||||||
Common Stocks | $ | 140,030 | $ | 140,030 | ||||
Rights | 144 | 144 | ||||||
Short-Term Investments | 1,842 | 1,842 | ||||||
|
|
|
| |||||
Total Investments | $ | 142,016 | $ | 142,016 | ||||
|
|
|
| |||||
There are no Level 2 (significant observable inputs) or Level 3 (significant unobservable inputs) priced securities.
See Notes to Financial Statements
41
Table of Contents
VIRTUS GLOBAL OPPORTUNITIES FUND
SCHEDULE OF INVESTMENTS
SEPTEMBER 30, 2013
($ reported in thousands)
| SHARES | VALUE | |||||||
| COMMON STOCKS—98.2% | ||||||||
| Consumer Discretionary—10.6% | ||||||||
Amazon.com, Inc. (United States)(2) | 6,189 | $ | 1,935 | |||||
Chipotle Mexican Grill, Inc. (United States)(2) | 3,007 | 1,289 | ||||||
Las Vegas Sands Corp. (United States) | 44,810 | 2,977 | ||||||
Norstar Founders Group Ltd. (Cayman Islands)(2)(3)(4) | 272,000 | 0 | ||||||
Paddy Power plc (Ireland)(2) | 13,688 | 1,097 | ||||||
Persimmon plc (United Kingdom) | 74,743 | 1,314 | ||||||
priceline.com, Inc. (United States)(2) | 1,283 | 1,297 | ||||||
TJX Cos., Inc. (United States) | 35,413 | 1,997 | ||||||
|
| |||||||
| 11,906 | ||||||||
|
| |||||||
| Consumer Staples—35.6% | ||||||||
Alimentation Couche Tard, Inc. Class B (Canada) | 14,752 | 920 | ||||||
Altria Group, Inc. (United States) | 74,997 | 2,576 | ||||||
British American Tobacco plc (United Kingdom) | 120,862 | 6,411 | ||||||
Coca-Cola Co. (The) (United States) | 138,034 | 5,229 | ||||||
Diageo plc (United Kingdom) | 57,445 | 1,827 | ||||||
ITC Ltd. (India) | 556,983 | 3,028 | ||||||
Mead Johnson Nutrition Co. (United States) | 17,666 | 1,312 | ||||||
Nestle S.A. Registered Shares (Switzerland) | 55,386 | 3,874 | ||||||
Philip Morris International, Inc. (United States) | 66,159 | 5,729 | ||||||
SABMiller plc (United Kingdom) | 36,093 | 1,837 | ||||||
Unilever N.V. (Netherlands) | 93,626 | 3,642 | ||||||
Wal-Mart de Mexico S.A.B. de C.V. (Mexico) | 210,700 | 551 | ||||||
Wal-Mart Stores, Inc. (United States) | 21,353 | 1,579 | ||||||
Whole Foods Market, Inc. (United States) | 21,711 | 1,270 | ||||||
|
| |||||||
| 39,785 | ||||||||
|
| |||||||
| Energy—2.2% | ||||||||
Core Laboratories N.V. (Netherlands) | 5,435 | 919 | ||||||
Enbridge, Inc. (Canada) | 36,751 | 1,535 | ||||||
|
| |||||||
| 2,454 | ||||||||
|
| |||||||
| Financials—15.9% | ||||||||
Capital One Financial Corp. (United States) | 8,238 | 566 | ||||||
Housing Development Finance Corp. (India) | 233,302 | 2,848 | ||||||
| SHARES | VALUE | |||||||
| Financials—continued | ||||||||
Housing Development Finance Corp. Bank Ltd. (India) | 313,425 | $ | 2,969 | |||||
HSBC Holdings plc (United Kingdom) | 148,074 | 1,605 | ||||||
Standard Chartered plc (United Kingdom) | 24,319 | 583 | ||||||
UBS AG Registered Shares (Switzerland) | 219,524 | 4,491 | ||||||
Wells Fargo & Co. (United States) | 113,194 | 4,677 | ||||||
|
| |||||||
| 17,739 | ||||||||
|
| |||||||
| Health Care—12.2% | ||||||||
Biogen Idec, Inc. (United States)(2) | 6,200 | 1,493 | ||||||
Celgene Corp. (United States)(2) | 10,200 | 1,570 | ||||||
Covidien plc (Ireland) | 27,779 | 1,693 | ||||||
Elekta AB (Sweden) | 40,031 | 644 | ||||||
Grifols SA (Spain) | 21,697 | 891 | ||||||
Johnson & Johnson (United States) | 26,205 | 2,272 | ||||||
Novartis AG Registered Shares (Switzerland) | 11,619 | 893 | ||||||
Novo Nordisk A/S Class B (Denmark) | 13,335 | 2,264 | ||||||
Roche Holding AG (Switzerland) | 979 | 264 | ||||||
Zoetis, Inc. (United States) | 53,486 | 1,664 | ||||||
|
| |||||||
| 13,648 | ||||||||
|
| |||||||
| Industrials—4.8% | ||||||||
Bureau Veritas SA (France) | 63,883 | 2,014 | ||||||
Cheung Kong Infrastructure Holdings Ltd. (Hong Kong) | 74,206 | 514 | ||||||
DKSH Holding AG (Switzerland) | 4,587 | 391 | ||||||
SGS SA Registered Shares (Switzerland) | 1,048 | 2,502 | ||||||
|
| |||||||
| 5,421 | ||||||||
|
| |||||||
| Information Technology—11.1% | ||||||||
Cielo SA (Brazil) | 33,635 | 911 | ||||||
Cognizant Technology Solutions Corp. Class A (United States)(2) | 21,325 | 1,751 | ||||||
MasterCard, Inc. Class A (United States) | 8,613 | 5,795 | ||||||
SAP AG (Germany) | 7,558 | 559 | ||||||
Visa, Inc. Class A (United States) | 17,620 | 3,367 | ||||||
|
| |||||||
| 12,383 | ||||||||
|
| |||||||
| Materials—5.1% | ||||||||
Fresnillo plc (United Kingdom) | 110,314 | 1,738 | ||||||
Goldcorp, Inc. (Canada) | 88,486 | 2,302 | ||||||
Newcrest Mining Ltd. (Australia) | 112,421 | 1,227 | ||||||
Silver Wheaton Corp. (Canada) | 15,470 | 383 | ||||||
|
| |||||||
| 5,650 | ||||||||
|
| |||||||
| SHARES | VALUE | |||||||
| Telecommunication Services—0.7% | ||||||||
Advanced Info Service PCL (Thailand) | 27,500 | $ | 226 | |||||
Telekomunikasi Indonesia Persero Tbk PT (Indonesia) | 2,981,936 | 540 | ||||||
|
| |||||||
| 766 | ||||||||
| TOTAL COMMON STOCKS (Identified Cost $88,749) | 109,752 | |||||||
| TOTAL LONG TERM INVESTMENTS—98.2% | ||||||||
| (Identified Cost $88,749) | 109,752 | |||||||
| SHORT-TERM INVESTMENTS—1.4% | ||||||||
| Money Market Mutual Funds—1.4% | ||||||||
Fidelity Money Market Portfolio – Institutional Shares (Seven-day effective yield 0.090%) | 1,589,667 | 1,590 | ||||||
| TOTAL SHORT-TERM INVESTMENTS (Identified Cost $1,590) | 1,590 | |||||||
| TOTAL INVESTMENTS—99.6% | ||||||||
| (Identified Cost $90,339) | 111,342 | (1) | ||||||
Other assets and liabilities, net—0.4% |
| 393 | ||||||
|
| |||||||
| NET ASSETS—100.0% | $ | 111,735 | ||||||
|
| |||||||
Footnote Legend:
| (1) | Federal Income Tax Information: For tax information at September 30, 2013, see Note 10 Federal Income Tax Information in the Notes to Financial Statements. |
| (2) | Non-income producing. |
| (3) | Illiquid security. |
| (4) | Security valued at fair value as determined in good faith by or under the direction of the Trustees. This security is disclosed as a Level 3 security in the disclosure table located after the Schedule of Investments. |
| Country Weightings (Unaudited)† | ||||
United States | 47 | % | ||
United Kingdom | 14 | |||
Switzerland | 11 | |||
India | 8 | |||
Canada | 5 | |||
Netherlands | 4 | |||
Ireland | 2 | |||
Other | 9 | |||
Total | 100 | % | ||
† % of total investments as of September 30, 2013 |
| |||
See Notes to Financial Statements
42
Table of Contents
VIRTUS GLOBAL OPPORTUNITIES FUND
SCHEDULE OF INVESTMENTS (Continued)
SEPTEMBER 30, 2013
($ reported in thousands)
The following table provides a summary of inputs used to value the Fund’s investments as of September 30, 2013 (See Security Valuation Note 2A in the Notes to Financial Statements):
| Total Value at September 30, 2013 | Level 1 Quoted Prices | Level 3 Significant Unobservable Inputs | ||||||||||
Equity Securities: | ||||||||||||
Common Stocks | $ | 109,752 | $ | 109,752 | $ | 0 | (1) | |||||
Short-Term Investments | 1,590 | 1,590 | — | |||||||||
|
|
|
|
|
| |||||||
Total Investments | $ | 111,342 | $ | 111,342 | $ | 0 | (1) | |||||
|
|
|
|
|
| |||||||
| (1) | Includes internally fair valued security currently priced at zero $0. |
There are no Level 2 (significant observable inputs) priced securities.
See Notes to Financial Statements
43
Table of Contents
VIRTUS GLOBAL REAL ESTATE SECURITIES FUND
SCHEDULE OF INVESTMENTS
SEPTEMBER 30, 2013
($ reported in thousands)
| SHARES | VALUE | |||||||
| COMMON STOCKS—97.0% | ||||||||
| Australia—6.1% | ||||||||
BGP Holdings plc(2)(3)(4) | 13,566 | $ | 0 | |||||
CFS Retail Property Trust | 53,600 | 100 | ||||||
Dexus Property Group | 587,440 | 551 | ||||||
GPT Group | 109,500 | 355 | ||||||
Westfield Group | 123,150 | 1,265 | ||||||
Westfield Retail Trust | 155,450 | 431 | ||||||
|
| |||||||
| 2,702 | ||||||||
|
| |||||||
| Bermuda—1.3% | ||||||||
Hongkong Land Holdings Ltd. | 84,900 | 560 | ||||||
|
| |||||||
| Canada—5.3% | ||||||||
Allied Properties Real Estate Investment Trust | 18,385 | 579 | ||||||
Brookfield Properties, Inc. | 27,870 | 534 | ||||||
Canadian Real Estate Investment Trust | 9,175 | 362 | ||||||
First Capital Realty, Inc. | 24,780 | 407 | ||||||
RioCan Real Estate Investment Trust | 19,262 | 455 | ||||||
|
| |||||||
| 2,337 | ||||||||
|
| |||||||
| Finland—0.4% | ||||||||
Citycon OYJ | 52,970 | 179 | ||||||
|
| |||||||
| France—3.9% | ||||||||
Fonciere Des Regions | 2,154 | 179 | ||||||
Klepierre | 5,220 | 226 | ||||||
Unibail-Rodamco SE | 5,373 | 1,333 | ||||||
|
| |||||||
| 1,738 | ||||||||
|
| |||||||
| Germany—1.1% | ||||||||
GSW Immobilien AG | 2,064 | 91 | ||||||
LEG Immobilien AG(2) | 7,354 | 423 | ||||||
|
| |||||||
| 514 | ||||||||
|
| |||||||
| Hong Kong—3.7% | ||||||||
Hang Lung Properties Ltd. | 155,000 | 528 | ||||||
Hysan Development Co. Ltd. | 73,000 | 325 | ||||||
Link REIT (The) | 159,504 | 782 | ||||||
|
| |||||||
| 1,635 | ||||||||
|
| |||||||
| Italy—0.3% | ||||||||
Beni Stabili SpA | 204,478 | 127 | ||||||
|
| |||||||
| Japan—5.6% | ||||||||
AEON Mall Co., Ltd. | 3,077 | 91 | ||||||
GLP J-REIT | 284 | 317 | ||||||
Japan Prime Realty Investment Corp. | 106 | 372 | ||||||
Japan Real Estate Investment Corp. | 28 | 327 | ||||||
Kenedix Realty Investment Corp. | 67 | 329 | ||||||
Nippon Building Fund, Inc. | 34 | 422 | ||||||
Nippon Prologis REIT, Inc. | 36 | 360 | ||||||
Tokyu REIT, Inc. | 41 | 260 | ||||||
|
| |||||||
| 2,478 | ||||||||
|
| |||||||
| SHARES | VALUE | |||||||
| Mexico—0.8% | ||||||||
TF Administradora Industrial S de Rl de CV | 176,222 | $ | 350 | |||||
|
| |||||||
| Netherlands—0.7% | ||||||||
Corio N.V. | 2,231 | 96 | ||||||
Eurocommercial Properties N.V. | 4,965 | 201 | ||||||
|
| |||||||
| 297 | ||||||||
|
| |||||||
| Norway—0.5% | ||||||||
Norwegian Property ASA | 156,775 | 207 | ||||||
|
| |||||||
| Singapore—3.1% | ||||||||
CapitaMall Trust | 114,450 | 179 | ||||||
CapitaRetail China Trust | 312,275 | 342 | ||||||
Global Logistic Properties Ltd. | 252,500 | 582 | ||||||
Mapletree Logistics Trust | 311,545 | 266 | ||||||
|
| |||||||
| 1,369 | ||||||||
|
| |||||||
| Sweden—0.8% | ||||||||
Castellum AB | 23,840 | 340 | ||||||
|
| |||||||
| United Kingdom—7.1% | ||||||||
Big Yellow Group plc | 29,628 | 211 | ||||||
British Land Co. plc | 47,400 | 443 | ||||||
Derwent London plc | 6,210 | 238 | ||||||
Great Portland Estates plc | 29,971 | 262 | ||||||
Hammerson plc | 58,620 | 475 | ||||||
Land Securities Group plc | 57,131 | 850 | ||||||
Safestore Holdings plc | 140,726 | 305 | ||||||
SEGRO plc | 68,490 | 344 | ||||||
|
| |||||||
| 3,128 | ||||||||
|
| |||||||
| United States—56.3% | ||||||||
American Campus Communities, Inc. | 14,638 | 500 | ||||||
AvalonBay Communities, Inc. | 8,495 | 1,080 | ||||||
Boston Properties, Inc. | 9,328 | 997 | ||||||
Camden Property Trust | 11,510 | 707 | ||||||
DCT Industrial Trust, Inc. | 119,293 | 858 | ||||||
DDR Corp. | 40,845 | 642 | ||||||
Digital Realty Trust, Inc. | 3,485 | 185 | ||||||
Duke Realty Corp. | 19,700 | 304 | ||||||
EastGroup Properties, Inc. | 3,400 | 201 | ||||||
Equity Lifestyle Properties, Inc. | 9,646 | 330 | ||||||
Equity Residential | 25,689 | 1,376 | ||||||
Essex Property Trust, Inc. | 5,379 | 794 | ||||||
Extra Space Storage, Inc. | 17,895 | 819 | ||||||
General Growth Properties, Inc. | 59,819 | 1,154 | ||||||
HCP, Inc. | 3,679 | 151 | ||||||
Health Care REIT, Inc. | 16,731 | 1,044 | ||||||
Host Hotels & Resorts, Inc. | 62,208 | 1,099 | ||||||
Kilroy Realty Corp. | 19,663 | 982 | ||||||
Kimco Realty Corp. | 29,285 | 591 | ||||||
LaSalle Hotel Properties | 20,398 | 582 | ||||||
Liberty Property Trust | 14,467 | 515 | ||||||
Macerich Co. (The) | 17,173 | 969 | ||||||
Pebblebrook Hotel Trust | 18,859 | 541 | ||||||
Prologis, Inc. | 41,848 | 1,574 | ||||||
Public Storage | 10,690 | 1,716 | ||||||
Retail Opportunity Investments Corp | 7,000 | 97 | ||||||
| SHARES | VALUE | |||||||
| United States—continued | ||||||||
Simon Property Group, Inc. | 18,731 | $ | 2,777 | |||||
SL Green Realty Corp. | 4,986 | 443 | ||||||
Tanger Factory Outlet Centers | 23,500 | 767 | ||||||
Taubman Centers, Inc. | 755 | 51 | ||||||
Ventas, Inc. | 13,472 | 829 | ||||||
Vornado Realty Trust | 2,575 | 215 | ||||||
|
| |||||||
| 24,890 | ||||||||
| TOTAL COMMON STOCKS (Identified Cost $40,022) | 42,851 | |||||||
| TOTAL LONG TERM INVESTMENTS—97.0% | ||||||||
| (Identified Cost $40,022) | 42,851 | |||||||
| SHORT-TERM INVESTMENTS—2.0% | ||||||||
| Money Market Mutual Funds—2.0% | ||||||||
Fidelity Money Market Portfolio – Institutional Shares (Seven-day effective yield 0.090%) | 887,857 | 888 | ||||||
| TOTAL SHORT-TERM INVESTMENTS | ||||||||
| (Identified Cost $888) | 888 | |||||||
| TOTAL INVESTMENTS—99.0% (Identified Cost $40,910) | 43,739 | (1) | ||||||
Other assets and liabilities, net—1.0% |
| 444 | ||||||
|
| |||||||
| NET ASSETS—100.0% | $ | 44,183 | ||||||
|
| |||||||
Abbreviations:
| REIT | Real Estate Investment Trust |
Footnote Legend:
| (1) | Federal Income Tax Information: For tax information at September 30, 2013, see Note 10 Federal Income Tax Information in the Notes to Financial Statements. |
| (2) | Non-income producing. |
| (3) | Illiquid security. |
| (4) | Security valued at fair value as determined in good faith by or under the direction of the Trustees. This security is disclosed as a level 3 security in the disclosure table located after the Schedule of Investments. |
| Country Weightings (Unaudited)† | ||||
United States | 59 | % | ||
United Kingdom | 7 | |||
Australia | 6 | |||
Japan | 6 | |||
Canada | 5 | |||
France | 4 | |||
Hong Kong | 4 | |||
Other | 9 | |||
Total | 100 | % | ||
† % of total investments as of September 30, 2013 |
| |||
Security abbreviation definitions are located under the Key Investment Terms starting on page 4.
See Notes to Financial Statements
44
Table of Contents
VIRTUS GLOBAL REAL ESTATE SECURITIES FUND
SCHEDULE OF INVESTMENTS (Continued)
SEPTEMBER 30, 2013
($ reported in thousands)
The following table provides a summary of inputs used to value the Fund’s investments as of September 30, 2013 (See Security Valuation Note 2A in the Notes to Financial Statements):
| Total Value at September 30, 2013 | Level 1 Quoted Prices | Level 3 Significant Unobservable Inputs | ||||||||||
Equity Securities: | ||||||||||||
Common Stocks | $ | 42,851 | $ | 42,851 | $ | 0 | (1) | |||||
Short-Term Investments | 888 | 888 | — | |||||||||
|
|
|
|
|
| |||||||
Total Investments | $ | 43,739 | $ | 43,739 | $ | 0 | (1) | |||||
|
|
|
|
|
| |||||||
| (1) | Includes internally fair valued security currently priced at zero ($0). |
There are no Level 2 (significant observable inputs) priced securities.
See Notes to Financial Statements
45
Table of Contents
VIRTUS GREATER ASIA ex JAPAN OPPORTUNITIES FUND
SCHEDULE OF INVESTMENTS
SEPTEMBER 30, 2013
($ reported in thousands)
| SHARES | VALUE | |||||||
| COMMON STOCKS—98.2% | ||||||||
| Consumer Discretionary—12.2% | ||||||||
Bajaj Auto Ltd. (India) | 3,244 | $ | 103 | |||||
BEC World plc (Thailand) | 75,100 | 136 | ||||||
Genting Malaysia Bhd (Malaysia) | 105,200 | 136 | ||||||
Jollibee Foods Corp. (Philippines) | 17,800 | 69 | ||||||
Kangwon Land, Inc. (South Korea) | 3,050 | 81 | ||||||
L’Occitane International SA (Hong Kong) | 51,559 | 135 | ||||||
Matahari Department Store Tbk PT (Indonesia)(2) | 89,873 | 81 | ||||||
SA International Holdings Ltd. (Cayman Islands) | 106,925 | 121 | ||||||
Samsonite International SA (Luxembourg) | 11,752 | 33 | ||||||
Sands China Ltd. (Hong Kong) | 40,123 | 248 | ||||||
Super Retail Group Ltd. (Australia) | 8,611 | 104 | ||||||
|
| |||||||
| 1,247 | ||||||||
|
| |||||||
| Consumer Staples—32.8% | ||||||||
British American Tobacco Bangldesh Co., Ltd. (Bangladesh) | 14,350 | 289 | ||||||
British American Tobacco Bhd (Malaysia) | 2,900 | 57 | ||||||
Coca-Cola Amatil Ltd. (Australia) | 7,545 | 86 | ||||||
Colgate Palmolive India Ltd. (India) | 2,900 | 58 | ||||||
CP ALL PCL (Thailand) | 187,500 | 211 | ||||||
Dairy Farm International Holdings Ltd. (Bermuda) | 11,250 | 114 | ||||||
Emami Ltd. (India)(2) | 17,676 | 137 | ||||||
Guinness Anchor Bhd (Malaysia) | 37,435 | 197 | ||||||
Hindustan Unilever Ltd. (India) | 33,667 | 337 | ||||||
ITC Ltd. (India) | 94,109 | 512 | ||||||
LG Household & Health Care Ltd. (South Korea) | 294 | 149 | ||||||
Nestle India Ltd. (India) | 2,708 | 226 | ||||||
Nestle Malaysia Bhd (Malaysia) | 9,100 | 190 | ||||||
Nestle Pakistan Ltd. (Pakistan) | 2,214 | 130 | ||||||
Orion Corp. (South Korea) | 88 | 78 | ||||||
Puregold Price Club, Inc. (Philippines) | 81,300 | 78 | ||||||
Thai Beverage PCL (Thailand) | 254,000 | 111 | ||||||
Tsingtao Brewery Co., Ltd. (China) | 20,283 | 154 | ||||||
Unilever Indonesia Tbk PT (Indonesia) | 52,497 | 137 | ||||||
United Spirits Ltd. (India) | 2,725 | 110 | ||||||
|
| |||||||
| 3,361 | ||||||||
|
| |||||||
| Financials—30.6% | ||||||||
Axis Bank Ltd. (India) | 6,948 | 112 | ||||||
Bangkok Bank plc (Thailand) | 23,100 | 145 | ||||||
Bank Central Asia Tbk PT (Indonesia) | 75,768 | 65 | ||||||
DBS Group Holdings Ltd. (Singapore) | 10,000 | 131 | ||||||
Delta Brac Housing Finance Corp., Ltd. (Bangladesh)(3) | 69,000 | 55 | ||||||
| SHARES | VALUE | |||||||
| Financials—continued | ||||||||
Housing Development Finance Corp. (India) | 38,009 | $ | 464 | |||||
Housing Development Finance Corp. Bank Ltd. (India) | 50,265 | 476 | ||||||
HSBC Holdings plc (United Kingdom) | 28,565 | 311 | ||||||
ICICI Bank Ltd. (India) | 6,280 | 89 | ||||||
Kasikornbank PCL (Thailand) | 25,200 | 142 | ||||||
Kotak Mahindra Bank Ltd. (India) | 10,550 | 114 | ||||||
Link REIT (The) (Hong Kong) | 32,968 | 162 | ||||||
Malayan Banking Bhd (Malaysia) | 59,117 | 178 | ||||||
Public Bank Bhd (Malaysia) | 24,200 | 132 | ||||||
Standard Chartered plc (United Kingdom) | 12,984 | 314 | ||||||
Westlife Development Ltd. (India)(2) | 38,300 | 245 | ||||||
|
| |||||||
| 3,135 | ||||||||
|
| |||||||
| Health Care—6.2% | ||||||||
Cipla Ltd. (India) | 15,283 | 106 | ||||||
CSL Ltd. (Australia) | 2,036 | 121 | ||||||
Kalbe Farma Tbk PT (Indonesia) | 992,013 | 101 | ||||||
Ramsay Health Care Ltd. (Australia) | 3,278 | 111 | ||||||
Sun Pharmaceutical Industries Ltd. (India) | 20,680 | 196 | ||||||
|
| |||||||
| 635 | ||||||||
|
| |||||||
| Industrials—3.6% | ||||||||
Havells India Ltd. (India) | 12,566 | 127 | ||||||
Jardine Matheson Holdings Ltd. (Bermuda) | 1,618 | 89 | ||||||
Keells (John) Holdings plc (Sri Lanka) | 52,854 | 87 | ||||||
SM Investments Corp. (Philippines) | 3,837 | 69 | ||||||
|
| |||||||
| 372 | ||||||||
|
| |||||||
| Information Technology—1.4% | ||||||||
NetEase, Inc. ADR (China) | 100 | 7 | ||||||
Tata Consultancy Services Ltd. (India) | 4,300 | 132 | ||||||
|
| |||||||
| 139 | ||||||||
|
| |||||||
| Materials—3.7% | ||||||||
Asian Paints Ltd. (India) | 11,000 | 81 | ||||||
Newcrest Mining Ltd. (Australia) | 20,846 | 227 | ||||||
Semen Gresik (Persero) tbk PT (Indonesia) | 62,290 | 70 | ||||||
|
| |||||||
| 378 | ||||||||
|
| |||||||
| Telecommunication Services—2.8% | ||||||||
Advanced Info Service PCL (Thailand) | 19,600 | 160 | ||||||
Telekomunikasi Indonesia Persero Tbk PT (Indonesia) | 728,130 | 132 | ||||||
|
| |||||||
| 292 | ||||||||
|
| |||||||
| SHARES | VALUE | |||||||
| Utilities—4.9% | ||||||||
NTPC Ltd. (India)(2) | 24,317 | $ | 57 | |||||
Power Assets Holdings Ltd. (Hong Kong) | 49,119 | 440 | ||||||
|
| |||||||
| 497 | ||||||||
| TOTAL COMMON STOCKS (Identified Cost $8,406) | 10,056 | |||||||
| TOTAL LONG TERM INVESTMENTS—98.2% | ||||||||
| (Identified Cost $8,406) | 10,056 | |||||||
| SHORT-TERM INVESTMENTS—1.9% | ||||||||
| Money Market Mutual Funds—1.9% | ||||||||
Fidelity Money Market Portfolio – Institutional Shares (Seven-day effective yield 0.090%) | 198,952 | 199 | ||||||
| TOTAL SHORT-TERM INVESTMENTS (Identified Cost $199) | 199 | |||||||
| TOTAL INVESTMENTS—100.1% | ||||||||
| (Identified Cost $8,605) | 10,255 | (1) | ||||||
Other assets and liabilities, net—(0.1)% |
| (31 | ) | |||||
|
| |||||||
| NET ASSETS—100.0% | $ | 10,224 | ||||||
|
| |||||||
Abbreviations:
| ADR | American Depositary Receipt |
| REIT | Real Estate Investment Trust |
Footnote Legend:
| (1) | Federal Income Tax Information: For tax information at September 30, 2013, see Note 10 Federal Income Tax Information in the Notes to Financial Statements. |
| (2) | Non-income producing. |
| (3) | Security valued at fair value as determined in good faith by or under the direction of the Trustees. This security is disclosed as a Level 3 security in the disclosure table located after the Schedule of Investments. |
| Country Weightings (Unaudited)† | ||||
India | 36 | % | ||
Hong Kong | 9 | |||
Malaysia | 9 | |||
Thailand | 9 | |||
Australia | 6 | |||
Indonesia | 6 | |||
United Kingdom | 6 | |||
Other | 19 | |||
Total | 100 | % | ||
† % of total investments as of September 30, 2013 |
| |||
Security abbreviation definitions are located under the Key Investment Terms starting on page 4.
See Notes to Financial Statements
46
Table of Contents
VIRTUS GREATER ASIA ex JAPAN OPPORTUNITIES FUND
SCHEDULE OF INVESTMENTS (Continued)
SEPTEMBER 30, 2013
($ reported in thousands)
The following table provides a summary of inputs used to value the Fund’s investments as of September 30, 2013 (See Security Valuation Note 2A in the Notes to Financial Statements):
| Total Value at September 30, 2013 | Level 1 Quoted Prices | Level 3 Significant Unobservable Inputs | ||||||||||
Equity Securities: | ||||||||||||
Common Stocks | $ | 10,056 | $ | 10,001 | $ | 55 | ||||||
Short-Term Investments | 199 | 199 | — | |||||||||
|
|
|
|
|
| |||||||
Total Investments | $ | 10,255 | $ | 10,200 | $ | 55 | ||||||
|
|
|
|
|
| |||||||
There are no Level 2 (significant observable inputs) priced securities.
The following is a reconciliation of assets of the Fund for Level 3 investments for which significant unobservable inputs were used to determine fair value.
| Common Stocks | ||||
Investments in Securities | ||||
Balance as of September 30, 2012: | $ | — | ||
Accrued discount/(premium) | — | |||
Realized gain (loss) | — | |||
Change in unrealized appreciation (depreciation) | — | |||
Purchases | — | |||
Sales | — | |||
Transfers into Level 3(a) | 55 | |||
Transfers from Level 3(a) | — | |||
|
| |||
Balance as of September 30, 2013 | $ | 55 | ||
|
| |||
| (a) | “Transfers into and/or from” represent the ending value as of September 30, 2013, for any investment security where a change in the pricing level occurred from the beginning to the end of the period. |
Refer to the last paragraph under “Note 2A Security Valuation” for a description of the valuation process in place and a qualitative discussion about sensitive inputs used in Level 3 internally fair valued measurements.
See Notes to Financial Statements
47
Table of Contents
VIRTUS GREATER EUROPEAN OPPORTUNITIES FUND
SCHEDULE OF INVESTMENTS
SEPTEMBER 30, 2013
($ reported in thousands)
| SHARES | VALUE | |||||||
| COMMON STOCKS—96.5% | ||||||||
| Consumer Discretionary—9.5% | ||||||||
Barrat Developments plc (United Kingdom)(2) | 63,853 | $ | 319 | |||||
Domino’s Pizza Group plc (United Kingdom) | 18,590 | 176 | ||||||
Hermes International (France) | 487 | 175 | ||||||
Luxottica Group SpA (Italy) | 6,070 | 323 | ||||||
Paddy Power plc (Ireland)(2) | 4,377 | 351 | ||||||
Persimmon plc (United Kingdom) | 9,662 | 170 | ||||||
|
| |||||||
| 1,514 | ||||||||
|
| |||||||
| Consumer Staples—32.3% | ||||||||
Anheuser-Busch InBev N.V. (Belgium) | 4,126 | 411 | ||||||
British American Tobacco plc (United Kingdom) | 16,069 | 852 | ||||||
Diageo plc (United Kingdom) | 17,083 | 544 | ||||||
L’Oreal S.A. (France) | 2,213 | 380 | ||||||
Lindt & Spruengli AG (Switzerland) | 43 | 177 | ||||||
Nestle S.A. Registered Shares (Switzerland) | 8,056 | 563 | ||||||
Pernod-Ricard S.A. (France) | 2,257 | 280 | ||||||
Philip Morris International, Inc. (United States) | 7,981 | 691 | ||||||
SABMiller plc (United Kingdom) | 12,001 | 611 | ||||||
Unilever N.V. (Netherlands) | 16,587 | 645 | ||||||
|
| |||||||
| 5,154 | ||||||||
|
| |||||||
| Energy—3.2% | ||||||||
Core Laboratories N.V. (Netherlands) | 3,019 | 511 | ||||||
|
| |||||||
| Financials—13.0% | ||||||||
Countrywide plc (United Kingdom) | 10,845 | 92 | ||||||
HSBC Holdings plc (United Kingdom) | 37,046 | 402 | ||||||
Reinet Investments SCA (Luxembourg)(2) | 9,755 | 187 | ||||||
Standard Chartered plc (United Kingdom) | 18,201 | 436 | ||||||
Svenska Handelsbanken AB Class A (Sweden) | 4,786 | 205 | ||||||
UBS AG Registered Shares (Switzerland) | 36,831 | 754 | ||||||
|
| |||||||
| 2,076 | ||||||||
|
| |||||||
| Health Care—11.3% | ||||||||
Cie Generale D’optique Essilor International SA (France) | 3,104 | 334 | ||||||
Elekta AB (Sweden) | 9,661 | 155 | ||||||
Grifols SA (Spain) | 4,835 | 198 | ||||||
Novartis AG Registered Shares (Switzerland) | 2,233 | 172 | ||||||
Novo Nordisk A/S Class B (Denmark) | 3,152 | 535 | ||||||
Novozymes A/S Class B (Denmark) | 4,258 | 163 | ||||||
Roche Holding AG (Switzerland) | 889 | 240 | ||||||
|
| |||||||
| 1,797 | ||||||||
|
| |||||||
| SHARES | VALUE | |||||||
| Industrials—15.6% | ||||||||
Bureau Veritas SA (France) | 21,126 | $ | 666 | |||||
DKSH Holding AG (Switzerland)(2) | 4,179 | 357 | ||||||
Indutrade AB (Sweden) | 4,985 | 194 | ||||||
Intertek Group plc (United Kingdom) | 1,386 | 74 | ||||||
Rolls-Royce Holdings plc (United Kingdom) | 22,466 | 404 | ||||||
SGS SA Registered Shares (Switzerland) | 165 | 394 | ||||||
Zodiac Aerospace (France) | 2,522 | 401 | ||||||
|
| |||||||
| 2,490 | ||||||||
|
| |||||||
| Information Technology—5.7% | ||||||||
Accenture plc Class A (Ireland) | 4,074 | 300 | ||||||
SAP AG (Germany) | 4,184 | 309 | ||||||
Wirecard AG (Germany) | 8,964 | 307 | ||||||
|
| |||||||
| 916 | ||||||||
|
| |||||||
| Materials—5.9% | ||||||||
Air Liquide SA (France) | 2,401 | 334 | ||||||
Fresnillo plc (United Kingdom) | 22,537 | 355 | ||||||
Randgold Resources Ltd (Jersey) | 1,660 | 120 | ||||||
Randgold Resources Ltd. ADR (Jersey) | 1,895 | 136 | ||||||
|
| |||||||
| 945 | ||||||||
| TOTAL COMMON STOCKS (Identified Cost $12,640) | 15,403 | |||||||
| TOTAL LONG TERM INVESTMENTS—96.5% | ||||||||
| (Identified Cost $12,640) | 15,403 | |||||||
| SHORT-TERM INVESTMENTS—3.1% | ||||||||
| Money Market Mutual Funds—3.1% | ||||||||
Fidelity Money Market Portfolio – Institutional Shares (Seven-day effective yield 0.090%) | 499,468 | 499 | ||||||
| TOTAL SHORT-TERM INVESTMENTS (Identified Cost $499) | 499 | |||||||
| TOTAL INVESTMENTS—99.6% | ||||||||
| (Identified Cost $13,139) | 15,902 | (1) | ||||||
Other assets and liabilities, net—0.4% |
| 56 | ||||||
|
| |||||||
| NET ASSETS—100.0% | $ | 15,958 | ||||||
|
| |||||||
Abbreviations:
| ADR | American Depositary Receipt |
Footnote Legend:
| (1) | Federal Income Tax Information: For tax information at September 30, 2013, see Note 10 Federal Income Tax Information in the Notes to Financial Statements. |
| (2) | Non-income producing. |
| Country Weightings (Unaudited)† | ||||
United Kingdom | 28 | % | ||
Switzerland | 17 | |||
France | 16 | |||
United States | 8 | |||
Netherlands | 7 | |||
Denmark | 4 | |||
Ireland | 4 | |||
Other | 16 | |||
Total | 100 | % | ||
† % of total investments as of September 30, 2013 |
| |||
The following table provides a summary of inputs used to value the Fund’s investments as of September 30, 2013 (See Security Valuation Note 2A in the Notes to Financial Statements):
| Total Value at September 30, 2013 | Level 1 Quoted Prices | |||||||
Equity Securities: | ||||||||
Common Stocks | $ | 15,403 | $ | 15,403 | ||||
Short-Term Investments | 499 | 499 | ||||||
|
|
|
| |||||
Total Investments | $ | 15,902 | $ | 15,902 | ||||
|
|
|
| |||||
There are no Level 2 (significant observable inputs) or Level 3 (significant unobservable inputs) priced securities.
Security abbreviation definitions are located under the Key Investment Terms starting on page 4.
See Notes to Financial Statements
48
Table of Contents
VIRTUS INTERNATIONAL EQUITY FUND
SCHEDULE OF INVESTMENTS
SEPTEMBER 30, 2013
($ reported in thousands)
| SHARES | VALUE | |||||||
| COMMON STOCKS—178.0% | ||||||||
| Consumer Discretionary—16.2% | ||||||||
Bayerische Motoren Werke AG (Germany) | 693 | $ | 74 | |||||
Bridgestone Corp. (Japan) | 7,200 | 262 | ||||||
Tata Motors Ltd. Sponsored ADR (India) | 2,400 | 64 | ||||||
|
| |||||||
| 400 | ||||||||
|
| |||||||
| Consumer Staples—5.5% | ||||||||
Koninklijke Ahold N.V. (Netherlands) | 2,850 | 49 | ||||||
Svenska Cellulosa AB SCA B Shares (Sweden) | 3,446 | 87 | ||||||
|
| |||||||
| 136 | ||||||||
|
| |||||||
| Energy—6.2% | ||||||||
Canadian Natural Resources Ltd. (Canada) | 2,350 | 74 | ||||||
Tullow Oil plc (United Kingdom) | 4,752 | 79 | ||||||
|
| |||||||
| 153 | ||||||||
|
| |||||||
| Financials—48.2% | ||||||||
Aviva plc (United Kingdom) | 12,896 | 83 | ||||||
AXA SA Sponsored ADR (France) | 3,700 | 86 | ||||||
Banco Bilbao Vizcaya Argentaria SA Sponsored ADR (Spain) | 5,700 | 64 | ||||||
Barclays plc Sponsored ADR (United Kingdom) | 4,398 | 75 | ||||||
BNP Paribas SA (France) | 953 | 64 | ||||||
Credit Suisse Group AG Sponsored ADR (Switzerland) | 2,700 | 83 | ||||||
Daiwa Securities Group, Inc. (Japan) | 26,700 | 239 | ||||||
DBS Group Holdings Ltd. (Singapore) | 22,100 | 289 | ||||||
Intesa Sanpaolo SpA (Italy) | 24,823 | 51 | ||||||
Prudential plc ADR (United Kingdom) | 2,300 | 86 | ||||||
Sumitomo Mitsui Financial Group, Inc. Sponsored ADR (Japan) | 7,850 | 76 | ||||||
|
| |||||||
| 1,196 | ||||||||
|
| |||||||
| Health Care—6.2% | ||||||||
H Lundbeck A/S Sponsored ADR (Denmark) | 3,800 | 82 | ||||||
Smith & Nephew plc Sponsored ADR (United Kingdom) | 1,150 | 72 | ||||||
|
| |||||||
| 154 | ||||||||
|
| |||||||
| Industrials—59.2% | ||||||||
FANUC Corp. (Japan) | 1,450 | 239 | ||||||
Hutchison Whampoa Ltd. (Hong Kong) | 20,850 | 250 | ||||||
Itochu Corp. (Japan) | 21,700 | 265 | ||||||
Komatsu Ltd. (Japan) | 7,600 | 188 | ||||||
Meggitt plc (United Kingdom) | 6,950 | 62 | ||||||
Nidec Corp. (Japan) | 3,800 | 313 | ||||||
Schneider Electric SA (France) | 850 | 72 | ||||||
Vallourec SA (France) | 1,300 | 78 | ||||||
|
| |||||||
| 1,467 | ||||||||
|
| |||||||
| SHARES | VALUE | |||||||
| Information Technology—6.3% | ||||||||
SAP AG Sponsored ADR (Germany) | 1,050 | $ | 77 | |||||
Taiwan Semiconductor Manufacturing Co., Ltd. Sponsored ADR (Taiwan) | 4,700 | 80 | ||||||
|
| |||||||
| 157 | ||||||||
|
| |||||||
| Materials—19.7% | ||||||||
Nitto Denko Corp. (Japan) | 4,000 | 260 | ||||||
Shin-Etsu Chemical Co., Ltd. (Japan) | 3,750 | 229 | ||||||
|
| |||||||
| 489 | ||||||||
|
| |||||||
| Telecommunication Services—7.7% | ||||||||
Deutsche Telekom AG Registered Shares (Germany) | 3,950 | 57 | ||||||
Nippon Telegraph & Telephone Corp. ADR (Japan) | 2,550 | 67 | ||||||
SK Telecom Co., Ltd. ADR (South Korea) | 2,900 | 66 | ||||||
|
| |||||||
| 190 | ||||||||
|
| |||||||
| Utilities—2.8% | ||||||||
Centrica plc (United Kingdom) | 11,663 | 70 | ||||||
| TOTAL COMMON STOCKS (Identified Cost $4,290) | 4,412 | |||||||
| RIGHTS—0.7% | ||||||||
| Financials—0.7% | ||||||||
Barclays plc expiring 10/10/13(2) | 3,475 | 18 | ||||||
| TOTAL RIGHTS (Identified Cost $0) | 18 | |||||||
| TOTAL LONG TERM INVESTMENTS—178.7% | ||||||||
| (Identified Cost $4,290) | 4,430 | |||||||
| SHORT-TERM INVESTMENTS—25.5% | ||||||||
| Money Market Mutual Funds—25.5% | ||||||||
Fidelity Money Market Portfolio – Institutional Shares (Seven-day effective yield 0.090%) | 630,504 | 631 | ||||||
| TOTAL SHORT-TERM INVESTMENTS (Identified Cost $631) | 631 | |||||||
| TOTAL INVESTMENTS—204.2%(3) (Identified Cost $4,921) | 5,061 | (1) | ||||||
Other assets and liabilities, net—(104.2)% |
| (2,582 | ) | |||||
|
| |||||||
| NET ASSETS—100.0% | $ | 2,479 | ||||||
|
| |||||||
Abbreviations:
| ADR | American Depositary Receipt |
Footnote Legend:
| (1) | Federal Income Tax Information: For tax information at September 30, 2013, see Note 10 Federal Income Tax Information in the Notes to Financial Statements. |
| (2) | Non-income producing. |
| (3) | See Note 13 in the Notes to Financial Statements. |
| Country Weightings (Unaudited)† | ||||
Japan | 42 | % | ||
United States | 12 | |||
United Kingdom | 11 | |||
France | 6 | |||
Singapore | 6 | |||
Hong Kong | 5 | |||
Germany | 4 | |||
Other | 14 | |||
Total | 100 | % | ||
† % of total investments as of September 30, 2013 |
| |||
Security abbreviation definitions are located under the Key Investment Terms starting on page 4.
See Notes to Financial Statements
49
Table of Contents
VIRTUS INTERNATIONAL EQUITY FUND
SCHEDULE OF INVESTMENTS (Continued)
SEPTEMBER 30, 2013
($ reported in thousands)
The following table provides a summary of inputs used to value the Fund’s investments as of September 30, 2013 (See Security Valuation Note 2A in the Notes to Financial Statements):
| Total Value at September 30, 2013 | Level 1 Quoted Prices | Level 3 Significant Unobservable Inputs | ||||||||||
Equity Securities: | ||||||||||||
Common Stocks | $ | 4,412 | $ | 4,412 | $ | — | ||||||
Rights | 18 | — | 18 | |||||||||
Short-Term Investments | 631 | 631 | — | |||||||||
|
|
|
|
|
| |||||||
Total Investments | $ | 5,061 | $ | 5,043 | $ | 18 | ||||||
|
|
|
|
|
| |||||||
There are no Level 2 (significant observable inputs) priced securities.
The following is a reconciliation of assets of the Fund for Level 3 investments for which significant unobservable inputs were used to determine fair value.
| Rights | ||||
Investments in Securities | ||||
Balance as of September 30, 2012 | $ | — | ||
Accrued discount/(premium) | — | |||
Realized gain/(loss) | — | |||
Change in unrealized appreciation/(depreciation) | — | |||
Purchases | 18 | |||
Sales | — | |||
Transfers into Level 3(a) | — | |||
Transfers from Level 3(a) | — | |||
|
| |||
| $ | 18 | |||
|
| |||
| (a) | “Transfers into and/or from” represent the ending value as of September 30, 2013, for any investment security where a change in the pricing level occurred from the beginning to the end of the period. |
Refer to the last paragraph under “Note 2A Security Valuation” for a description of the valuation process in place and a qualitative discussion about sensitive inputs used in Level 3 internally fair valued measurements.
See Notes to Financial Statements
50
Table of Contents
VIRTUS INTERNATIONAL REAL ESTATE SECURITIES FUND
SCHEDULE OF INVESTMENTS
SEPTEMBER 30, 2013
($ reported in thousands)
| SHARES | VALUE | |||||||
| COMMON STOCKS—98.5% | ||||||||
| Australia—15.2% | ||||||||
BGP Holdings plc(2)(3)(4) | 588,920 | $ | 0 | |||||
CFS Retail Property Trust | 108,552 | 203 | ||||||
Dexus Property Group | 1,361,115 | 1,276 | ||||||
GPT Group | 272,000 | 883 | ||||||
Westfield Group | 290,473 | 2,983 | ||||||
Westfield Retail Trust | 382,173 | 1,059 | ||||||
|
| |||||||
| 6,404 | ||||||||
|
| |||||||
| Bermuda—2.9% | ||||||||
Hongkong Land Holdings Ltd. | 185,100 | 1,222 | ||||||
|
| |||||||
| Canada—12.6% | ||||||||
Allied Properties Real Estate Investment Trust | 44,715 | 1,409 | ||||||
Brookfield Properties, Inc. | 55,250 | 1,059 | ||||||
Canadian Real Estate Investment Trust | 20,595 | 812 | ||||||
First Capital Realty, Inc. | 53,305 | 876 | ||||||
RioCan Real Estate Investment Trust | 49,050 | 1,157 | ||||||
|
| |||||||
| 5,313 | ||||||||
|
| |||||||
| Finland—1.0% | ||||||||
Citycon OYJ | 125,320 | 422 | ||||||
|
| |||||||
| France—9.8% | ||||||||
Fonciere Des Regions | 5,260 | 436 | ||||||
Klepierre | 10,856 | 471 | ||||||
Unibail-Rodamco SE | 13,010 | 3,228 | ||||||
|
| |||||||
| 4,135 | ||||||||
|
| |||||||
| Germany—2.8% | ||||||||
GSW Immobilien AG | 4,790 | 210 | ||||||
LEG Immobilien AG(2) | 17,061 | 983 | ||||||
|
| |||||||
| 1,193 | ||||||||
|
| |||||||
| Hong Kong—9.1% | ||||||||
Hang Lung Properties Ltd. | 377,000 | 1,283 | ||||||
Hysan Development Co. Ltd. | 170,000 | 757 | ||||||
Link REIT (The) | 365,441 | 1,793 | ||||||
|
| |||||||
| 3,833 | ||||||||
|
| |||||||
| Italy—0.7% | ||||||||
Beni Stabili SpA | 474,257 | 295 | ||||||
|
| |||||||
| Japan—14.0% | ||||||||
AEON Mall Co., Ltd. | 6,913 | 205 | ||||||
GLP J-REIT | 650 | 725 | ||||||
Japan Prime Realty Investment Corp. | 258 | 906 | ||||||
Japan Real Estate Investment Corp. | 67 | 783 | ||||||
Kenedix Realty Investment Corp. | 157 | 771 | ||||||
Nippon Building Fund, Inc. | 82 | 1,018 | ||||||
Nippon Prologis REIT, Inc. | 86 | 858 | ||||||
Tokyu REIT, Inc. | 101 | 641 | ||||||
|
| |||||||
| 5,907 | ||||||||
|
| |||||||
| SHARES | VALUE | |||||||
| Mexico—1.9% | ||||||||
TF Administradora Industrial S de Rl de CV | 396,852 | $ | 788 | |||||
|
| |||||||
| Netherlands—1.6% | ||||||||
Corio N.V. | 4,812 | 207 | ||||||
Eurocommercial Properties N.V. | 11,097 | 450 | ||||||
|
| |||||||
| 657 | ||||||||
|
| |||||||
| Norway—1.2% | ||||||||
Norwegian Property ASA | 385,600 | 510 | ||||||
|
| |||||||
| Singapore—7.0% | ||||||||
CapitaMall Trust | 225,650 | 353 | ||||||
CapitaRetail China Trust | 712,725 | 781 | ||||||
Global Logistic Properties Ltd. | 556,500 | 1,282 | ||||||
Mapletree Logistics Trust | 653,544 | 557 | ||||||
|
| |||||||
| 2,973 | ||||||||
|
| |||||||
| Sweden—2.0% | ||||||||
Castellum AB | 57,866 | 825 | ||||||
|
| |||||||
| United Kingdom—16.7% | ||||||||
Big Yellow Group plc | 66,188 | 471 | ||||||
British Land Co. plc | 110,305 | 1,031 | ||||||
Derwent London plc | 13,446 | 516 | ||||||
Great Portland Estates plc | 71,018 | 620 | ||||||
Hammerson plc | 134,809 | 1,093 | ||||||
Land Securities Group plc | 127,085 | 1,891 | ||||||
Safestore Holdings plc | 271,876 | 590 | ||||||
SEGRO plc | 161,457 | 810 | ||||||
|
| |||||||
| 7,022 | ||||||||
| TOTAL COMMON STOCKS (Identified Cost $33,123) | 41,499 | |||||||
| TOTAL LONG TERM INVESTMENTS—98.5% | ||||||||
| (Identified Cost $33,123) | 41,499 | |||||||
| SHORT-TERM INVESTMENTS—0.4% | ||||||||
| Money Market Mutual Funds—0.4% | ||||||||
Fidelity Money Market Portfolio – Institutional Shares (Seven-day effective yield 0.090%) | 186,401 | 186 | ||||||
| TOTAL SHORT-TERM INVESTMENTS (Identified Cost $186) | 186 | |||||||
| TOTAL INVESTMENTS—98.9% (Identified Cost $33,309) | 41,685 | (1) | ||||||
Other assets and liabilities, net—1.1% |
| 459 | ||||||
|
| |||||||
| NET ASSETS—100.0% | $ | 42,144 | ||||||
|
| |||||||
Abbreviations:
| REIT | Real Estate Investment Trust |
Footnote Legend:
| (1) | Federal Income Tax Information: For tax information at September 30, 2013, see Note 10 Federal Income Tax Information in the Notes to Financial Statements. |
| (2) | Non-income producing. |
| (3) | Illiquid security. |
| (4) | Security valued at fair value as determined in good faith by or under the direction of the Trustees. This security is disclosed as a level 3 security in the disclosure table located after the Schedule of Investments. |
| Country Weightings (Unaudited)† | ||||
United Kingdom | 17 | % | ||
Australia | 15 | |||
Japan | 14 | |||
Canada | 13 | |||
France | 10 | |||
Hong Kong | 9 | |||
Singapore | 7 | |||
Other | 15 | |||
Total | 100 | % | ||
† % of total investments as of September 30, 2013 |
| |||
The following table provides a summary of inputs used to value the Fund’s investments as of September 30, 2013 (See Security Valuation Note 2A in the Notes to Financial Statements):
| Total Value at September 30, 2013 | Level 1 Quoted Prices | Level 3 Significant Unobservable Inputs | ||||||||||
Equity Securities: | ||||||||||||
Common Stocks | $ | 41,499 | $ | 41,499 | $ | 0 | (1) | |||||
Short-Term Investments | 186 | 186 | — | |||||||||
|
|
|
|
|
| |||||||
Total Investments | $ | 41,685 | $ | 41,685 | $ | 0 | (1) | |||||
|
|
|
|
|
| |||||||
| (1) | Includes internally fair valued security currently priced at zero $0. |
There are no Level 2 (significant observable inputs) priced securities.
Security abbreviation definitions are located under the Key Investment Terms starting on page 4.
See Notes to Financial Statements
51
Table of Contents
VIRTUS INTERNATIONAL SMALL-CAP FUND
SCHEDULE OF INVESTMENTS
SEPTEMBER 30, 2013
($ reported in thousands)
| SHARES | VALUE | |||||||
| COMMON STOCKS—84.0% | ||||||||
| Consumer Discretionary—8.3% | ||||||||
Goldlion Holdings Ltd. | 947,600 | $ | 462 | |||||
Maisons France Confort (France) | 10,291 | 375 | ||||||
Rightmove plc | 3,100 | 119 | ||||||
Watts Co., Ltd. (Japan) | 28,700 | 267 | ||||||
Wotif.Com Holdings Ltd. (Australia) | 77,500 | 340 | ||||||
|
| |||||||
| 1,563 | ||||||||
|
| |||||||
| Consumer Staples—4.7% | ||||||||
Compania Cervecerias Unidas SA (Chile) | 17,400 | 231 | ||||||
Dongsuh Co., Inc. | 13,200 | 346 | ||||||
Wawel SA (Poland) | 940 | 307 | ||||||
|
| |||||||
| 884 | ||||||||
|
| |||||||
| Energy—5.2% | ||||||||
Calfrac Well Services Ltd. (Canada) | 9,900 | 301 | ||||||
Schoeller-Bleckmann Oilfield Equipment AG (Austria) | 3,076 | 364 | ||||||
TGS Nopec Geophysical Co., ASA (Norway) | 10,900 | 321 | ||||||
|
| |||||||
| 986 | ||||||||
|
| |||||||
| Financials—12.2% | ||||||||
ARA Asset Management Ltd. (Singapore) | 410,760 | 535 | ||||||
Euler Hermes SA (France) | 3,000 | 366 | ||||||
Euroz Ltd. (Australia) | 631,471 | 672 | ||||||
Hiscox Ltd. (Bermuda) | 52,800 | 554 | ||||||
Rathbone Brothers plc | 7,190 | 181 | ||||||
|
| |||||||
| 2,308 | ||||||||
|
| |||||||
| Health Care—6.1% | ||||||||
Haw Par Corp. Ltd. (Singapore) | 61,719 | 364 | ||||||
Nakanishi, Inc. (Japan) | 1,800 | 251 | ||||||
Stallergenes SA (France) | 1,800 | 140 | ||||||
WIN-Partners Co., Ltd. (Japan) | 40,105 | 391 | ||||||
|
| |||||||
| 1,146 | ||||||||
|
| |||||||
| Industrials—28.9% | ||||||||
AIT Corp. (Japan) | 56,000 | 818 | ||||||
Amadeus Fire AG (Germany) | 8,795 | 573 | ||||||
ASR Holdings Ltd. (Hong Kong) | 5,802,500 | 741 | ||||||
Clasquin (France) | 5,251 | 150 | ||||||
Freight Management Holdings Bhd (Malaysia) | 488,941 | 232 | ||||||
Goodpack Ltd. (Singapore) | 426,000 | 587 | ||||||
Pfeiffer Vacuum Technology AG (Germany) | 1,300 | 159 | ||||||
Richelieu Hardware Ltd. (Canada) | 7,350 | 316 | ||||||
Riverstone Holdings Ltd. (Singapore) | 1,288,000 | 698 | ||||||
| SHARES | VALUE | |||||||
| Industrials—continued | ||||||||
Rotork plc (United Kingdom) | 7,585 | $ | 335 | |||||
SMT Scharf AG (Germany) | 8,967 | 275 | ||||||
Thermador Groupe (France) | 4,800 | 409 | ||||||
Vicom Ltd. (Singapore) | 44,998 | 172 | ||||||
|
| |||||||
| 5,465 | ||||||||
|
| |||||||
| Information Technology—6.1% | ||||||||
Domino Printing Sciences plc (United Kingdom) | 42,800 | 444 | ||||||
Lumax International Corp., Ltd. (Taiwan) | 160,000 | 378 | ||||||
Pro-Ship, Inc. (Japan) | 17,700 | 322 | ||||||
|
| |||||||
| 1,144 | ||||||||
|
| |||||||
| Materials—12.5% | ||||||||
Corp. Moctezuma SAB de CV (Mexico) | 94,007 | 282 | ||||||
KPX Chemical Co., Ltd. | 11,676 | 735 | ||||||
Rimoni Industries Ltd. (Israel) | 51,160 | 414 | ||||||
Uyemura (C) & Co., Ltd. (Japan) | 9,300 | 392 | ||||||
Victrex plc (United Kingdom) | 21,200 | 548 | ||||||
|
| |||||||
| 2,371 | ||||||||
| TOTAL COMMON STOCKS (Identified Cost $13,808) | 15,867 | |||||||
| RIGHTS—0.0% | ||||||||
| Consumer Staples—0.0% | ||||||||
Compania Cervecerias Unidas SA (Chile)(2) | 2,786 | 1 | ||||||
| TOTAL RIGHTS (Identified Cost $0) | 1 | |||||||
| TOTAL LONG TERM INVESTMENTS—84.0% | ||||||||
| (Identified Cost $13,808) | 15,868 | |||||||
| SHORT-TERM INVESTMENTS—15.7% | ||||||||
| Money Market Mutual Funds—15.7% | ||||||||
Fidelity Money Market Portfolio – Institutional Shares (Seven-day effective yield 0.090%) | 2,973,440 | 2,973 | ||||||
| TOTAL SHORT-TERM INVESTMENTS (Identified Cost $2,973) | 2,973 | |||||||
| TOTAL INVESTMENTS—99.7% | ||||||||
| (Identified Cost $16,781) | 18,841 | (1) | ||||||
Other assets and liabilities, net—0.3% |
| 59 | ||||||
|
| |||||||
| NET ASSETS—100.0% | $ | 18,900 | ||||||
|
| |||||||
Footnote Legend:
| (1) | Federal Income Tax Information: For tax information at September 30, 2013, see Note 10 Federal Income Tax Information in the Notes to Financial Statements. |
| (2) | Non-income producing. |
| Country Weightings (Unaudited)† | ||||
United States (short-term investments) | 16 | % | ||
Japan | 13 | |||
Singapore | 12 | |||
United Kingdom | 9 | |||
France | 8 | |||
Hong Kong | 6 | |||
South Korea | 6 | |||
Other | 30 | |||
Total | 100 | % | ||
† % of total investments as of September 30, 2013 |
| |||
The following table provides a summary of inputs used to value the Fund’s investments as of September 30, 2013 (See Security Valuation Note 2A in the Notes to Financial Statements):
| Total Value at September 30, 2013 | Level 1 Quoted Prices | |||||||
Equity Securities: | ||||||||
Common Stocks | $ | 15,867 | $ | 15,867 | ||||
Short-Term Investments | 2,973 | 2,973 | ||||||
|
|
|
| |||||
Total Investments | $ | 18,841 | $ | 18,841 | ||||
|
|
|
| |||||
There are no Level 2 (significant observable inputs) or Level 3 (significant unobservable inputs) priced securities.
See Notes to Financial Statements
52
Table of Contents
VIRTUS OPPORTUNITIES TRUST
STATEMENTS OF ASSETS AND LIABILITIES
SEPTEMBER 30, 2013
(Reported in thousands except shares and per share amounts)
|
|
|
|
|
|
|
| |||||||||
| Emerging Markets Debt Fund | Emerging Markets Equity Income Fund | Global Commodities Stock Fund | Global Dividend Fund | |||||||||||||
| Assets | ||||||||||||||||
Investment in securities at value(1) | $ | 27,985 | $ | 10,008 | $ | 29,111 | $ | 142,016 | ||||||||
Foreign currency at value(2) | — | 28 | — | 9 | ||||||||||||
Receivables | ||||||||||||||||
Investment securities sold | — | 1,107 | 557 | — | ||||||||||||
Fund shares sold | 37 | 1 | 806 | 232 | ||||||||||||
Dividends and interest receivable | 483 | 18 | 12 | 213 | ||||||||||||
Tax reclaims | 2 | — | (3) | — | 84 | |||||||||||
Prepaid expenses | 26 | 26 | 16 | 48 | ||||||||||||
Prepaid trustee retainer | — | (3) | — | (3) | — | (3) | 1 | |||||||||
|
|
|
|
|
|
|
| |||||||||
Total assets | 28,533 | 11,188 | 30,502 | 142,603 | ||||||||||||
|
|
|
|
|
|
|
| |||||||||
| Liabilities | ||||||||||||||||
Cash overdraft | 4 | — | — | — | ||||||||||||
Payables | ||||||||||||||||
Fund shares repurchased | 10 | — | — | 609 | ||||||||||||
Investment securities purchased | 200 | 1,238 | 1,004 | — | ||||||||||||
Dividend distributions | 3 | — | — | — | ||||||||||||
Investment advisory fee | 10 | 6 | 24 | 75 | ||||||||||||
Distribution and service fees | 1 | — | (3) | — | (3) | 25 | ||||||||||
Administration fee | 3 | 1 | 3 | 15 | ||||||||||||
Transfer agent fees and expenses | 2 | 2 | 3 | 25 | ||||||||||||
Trustees’ fees and expenses | — | — | (3) | — | (3) | — | (3) | |||||||||
Professional fees | 37 | 28 | 29 | 28 | ||||||||||||
Other accrued expenses | 3 | 11 | 5 | 18 | ||||||||||||
|
|
|
|
|
|
|
| |||||||||
Total liabilities | 273 | 1,286 | 1,068 | 795 | ||||||||||||
|
|
|
|
|
|
|
| |||||||||
| Net Assets | $ | 28,260 | $ | 9,902 | $ | 29,434 | $ | 141,808 | ||||||||
|
|
|
|
|
|
|
| |||||||||
| Net Assets Consist of: | ||||||||||||||||
Capital paid in on shares of beneficial interest | $ | 30,361 | $ | 9,554 | $ | 31,820 | $ | 128,413 | ||||||||
Accumulated undistributed net investment income (loss) | 20 | 126 | — | 1 | ||||||||||||
Accumulated undistributed net realized gain (loss) | (122 | ) | (158 | ) | (4,554 | ) | (11,749 | ) | ||||||||
Net unrealized appreciation (depreciation) on investments | (1,999 | ) | 380 | 2,168 | 25,143 | |||||||||||
|
|
|
|
|
|
|
| |||||||||
| Net Assets | $ | 28,260 | $ | 9,902 | $ | 29,434 | $ | 141,808 | ||||||||
|
|
|
|
|
|
|
| |||||||||
| Class A | ||||||||||||||||
Net asset value (net assets/shares outstanding) per share | $ | 9.43 | $ | 10.57 | $ | 8.94 | $ | 13.94 | ||||||||
Maximum offering price per share NAV/(1–4.75%) | $ | 9.90 | $ | — | $ | — | $ | — | ||||||||
Maximum offering price per share NAV/(1–5.75%) | $ | — | $ | 11.21 | $ | 9.49 | $ | 14.79 | ||||||||
Shares of beneficial interest outstanding, no par value, unlimited authorization | 339,129 | 78,550 | 59,310 | 3,828,677 | ||||||||||||
Net Assets | $ | 3,200 | $ | 830 | $ | 530 | $ | 53,354 | ||||||||
| Class C | ||||||||||||||||
Net asset value (net assets/shares outstanding) and offering price per share | $ | 9.42 | $ | 10.54 | $ | 8.85 | $ | 13.90 | ||||||||
Shares of beneficial interest outstanding, no par value, unlimited authorization | 39,737 | 39,612 | 33,877 | 1,292,886 | ||||||||||||
Net Assets | $ | 374 | $ | 417 | $ | 300 | $ | 17,969 | ||||||||
| Class I | ||||||||||||||||
Net asset value (net assets/shares outstanding) and offering price per share | $ | 9.42 | $ | 10.58 | $ | 8.97 | $ | 13.94 | ||||||||
Shares of beneficial interest outstanding, no par value, unlimited authorization | 2,619,238 | 817,820 | 3,188,601 | 5,055,472 | ||||||||||||
Net Assets | $ | 24,686 | $ | 8,655 | $ | 28,604 | $ | 70,485 | ||||||||
(1) Investment in securities at cost | $ | 29,984 | $ | 9,626 | $ | 26,942 | $ | 116,875 | ||||||||
(2) Foreign currency at cost | $ | — | $ | 28 | $ | — | $ | 9 | ||||||||
(3) Amount is less than $500. | ||||||||||||||||
See Notes to Financial Statements
53
Table of Contents
VIRTUS OPPORTUNITIES TRUST
STATEMENTS OF ASSETS AND LIABILITIES (Continued)
SEPTEMBER 30, 2013
(Reported in thousands except shares and per share amounts)
|
|
|
|
|
|
|
| |||||||||
| Global Opportunities Fund | Global Real Estate Securities Fund | Greater Asia ex Japan Opportunities Fund | Greater European Opportunities Fund | |||||||||||||
| Assets | ||||||||||||||||
Investment in securities at value(1) | $ | 111,342 | $ | 43,739 | $ | 10,255 | $ | 15,902 | ||||||||
Foreign currency at value(2) | 46 | — | 7 | 1 | ||||||||||||
Cash | 35 | 50 | — | — | ||||||||||||
Receivables | ||||||||||||||||
Investment securities sold | 655 | 58 | 40 | — | ||||||||||||
Fund shares sold | 134 | 785 | 3 | 57 | ||||||||||||
Receivable from adviser | — | — | 4 | — | ||||||||||||
Dividends and interest receivable | 342 | 124 | 20 | 40 | ||||||||||||
Tax reclaims | 89 | 6 | — | 15 | ||||||||||||
Prepaid expenses | 25 | 17 | 14 | 14 | ||||||||||||
Prepaid trustee retainer | 1 | — | (3) | — | (3) | — | (3) | |||||||||
|
|
|
|
|
|
|
| |||||||||
Total assets | 112,669 | 44,779 | 10,343 | 16,029 | ||||||||||||
|
|
|
|
|
|
|
| |||||||||
| Liabilities | ||||||||||||||||
Payables | ||||||||||||||||
Fund shares repurchased | 253 | 62 | — | 26 | ||||||||||||
Investment securities purchased | 473 | 450 | 26 | — | ||||||||||||
Investment advisory fee | 89 | 29 | — | 4 | ||||||||||||
Distribution and service fees | 19 | 6 | 2 | 3 | ||||||||||||
Administration fee | 12 | 4 | 1 | 2 | ||||||||||||
Foreign capital gain taxes payable | 13 | — | 23 | — | ||||||||||||
Transfer agent fees and expenses | 28 | 8 | 1 | 2 | ||||||||||||
Trustees’ fee and expenses | — | (3) | — | (3) | — | (3) | — | (3) | ||||||||
Professional fee | 33 | 28 | 58 | 28 | ||||||||||||
Other accrued expenses | 14 | 9 | 8 | 6 | ||||||||||||
|
|
|
|
|
|
|
| |||||||||
Total liabilities | 934 | 596 | 119 | 71 | ||||||||||||
|
|
|
|
|
|
|
| |||||||||
| Net Assets | $ | 111,735 | $ | 44,183 | $ | 10,224 | $ | 15,958 | ||||||||
|
|
|
|
|
|
|
| |||||||||
| Net Assets Consist of: | ||||||||||||||||
Capital paid in on shares of beneficial interest | $ | 97,836 | $ | 41,245 | $ | 8,219 | $ | 12,849 | ||||||||
Accumulated undistributed net investment income (loss) | 611 | (35 | ) | 38 | 19 | |||||||||||
Accumulated undistributed net realized gain (loss) | (7,709 | ) | 143 | 340 | 326 | |||||||||||
Net unrealized appreciation (depreciation) on investments | 20,997 | 2,830 | 1,627 | 2,764 | ||||||||||||
|
|
|
|
|
|
|
| |||||||||
| Net Assets | $ | 111,735 | $ | 44,183 | $ | 10,224 | $ | 15,958 | ||||||||
|
|
|
|
|
|
|
| |||||||||
| Class A | ||||||||||||||||
Net asset value (net assets/shares outstanding) per share | $ | 11.07 | $ | 23.14 | $ | 14.90 | $ | 15.87 | ||||||||
Maximum offering price per share NAV/(1–5.75%) | $ | 11.75 | $ | 24.55 | $ | 15.81 | $ | 16.84 | ||||||||
Shares of beneficial interest outstanding, no par value, unlimited authorization | 7,083,661 | 661,586 | 592,990 | 846,729 | ||||||||||||
Net Assets | $ | 78,434 | $ | 15,306 | $ | 8,836 | $ | 13,433 | ||||||||
| Class B | ||||||||||||||||
Net asset value (net assets/shares outstanding) and offering price per share | $ | 9.81 | $ | — | $ | — | $ | — | ||||||||
Shares of beneficial interest outstanding, no par value, unlimited authorization | 81,264 | — | — | — | ||||||||||||
Net Assets | $ | 798 | $ | — | $ | — | $ | — | ||||||||
| Class C | ||||||||||||||||
Net asset value (net assets/shares outstanding) and offering price per share | $ | 9.76 | $ | 22.78 | $ | 14.63 | $ | 15.71 | ||||||||
Shares of beneficial interest outstanding, no par value, unlimited authorization | 303,513 | 155,604 | 26,769 | 38,650 | ||||||||||||
Net Assets | $ | 2,963 | $ | 3,545 | $ | 391 | $ | 607 | ||||||||
| Class I | ||||||||||||||||
Net asset value (net assets/shares outstanding) and offering price per share | $ | 11.07 | $ | 23.28 | $ | 14.96 | $ | 15.92 | ||||||||
Shares of beneficial interest outstanding, no par value, unlimited authorization | 2,668,049 | 1,088,124 | 66,634 | 120,460 | ||||||||||||
Net Assets | $ | 29,540 | $ | 25,332 | $ | 997 | $ | 1,918 | ||||||||
(1) Investment in securities at cost | $ | 90,339 | $ | 40,910 | $ | 8,605 | $ | 13,139 | ||||||||
(2) Foreign currency at cost | $ | 46 | $ | — | $ | 7 | $ | 1 | ||||||||
(3) Amount is less than $500. | ||||||||||||||||
See Notes to Financial Statements
54
Table of Contents
VIRTUS OPPORTUNITIES TRUST
STATEMENTS OF ASSETS AND LIABILITIES (Continued)
SEPTEMBER 30, 2013
(Reported in thousands except shares and per share amounts)
|
|
|
|
|
| |||||||
| International Equity Fund | International Real Estate Securities Fund | International Small-Cap Fund | ||||||||||
| Assets | ||||||||||||
Investment in securities at value(1)(3) | $ | 5,061 | $ | 41,685 | $ | 18,841 | ||||||
Receivables | ||||||||||||
Investment securities sold | 5,105 | 124 | — | |||||||||
Fund shares sold | — | (3) | 346 | 19 | ||||||||
Receivable from adviser | 2 | — | — | |||||||||
Dividends and interest receivable | 25 | 115 | 58 | |||||||||
Tax reclaims | 52 | 12 | 4 | |||||||||
Prepaid expenses | 24 | 27 | 27 | |||||||||
Prepaid trustee retainer | — | (3) | — | (3) | — | (3) | ||||||
|
|
|
|
|
| |||||||
Total assets | 10,269 | 42,309 | 18,949 | |||||||||
|
|
|
|
|
| |||||||
| Liabilities | ||||||||||||
Cash overdraft | — | 7 | — | |||||||||
Payables | ||||||||||||
Fund shares repurchased | 7,459 | 83 | — | |||||||||
Investment securities purchased | 292 | — | — | |||||||||
Investment advisory fee | — | 24 | 8 | |||||||||
Distribution and service fees | — | (3) | 4 | — | (3) | |||||||
Administration fee | 1 | 4 | 2 | |||||||||
Transfer agent fees and expenses | 2 | 7 | 2 | |||||||||
Trustees’ fee and expenses | — | — | (3) | — | (3) | |||||||
Professional fee | 28 | 28 | 29 | |||||||||
Other accrued expenses | 8 | 8 | 8 | |||||||||
|
|
|
|
|
| |||||||
Total liabilities | 7,790 | 165 | 49 | |||||||||
|
|
|
|
|
| |||||||
| Net Assets | $ | 2,479 | $ | 42,144 | $ | 18,900 | ||||||
|
|
|
|
|
| |||||||
| Net Assets Consist of: | ||||||||||||
Capital paid in on shares of beneficial interest | $ | 2,235 | $ | 46,140 | $ | 16,337 | ||||||
Accumulated undistributed net investment income (loss) | 97 | (1,493 | ) | 179 | ||||||||
Accumulated undistributed net realized gain (loss) | 5 | (10,881 | ) | 324 | ||||||||
Net unrealized appreciation (depreciation) on investments | 142 | 8,378 | 2,060 | |||||||||
|
|
|
|
|
| |||||||
| Net Assets | $ | 2,479 | $ | 42,144 | $ | 18,900 | ||||||
|
|
|
|
|
| |||||||
| Class A | ||||||||||||
Net asset value (net assets/shares outstanding) per share | $ | 10.50 | $ | 6.61 | $ | 13.20 | ||||||
Maximum offering price per share NAV/(1–5.75%) | $ | 11.14 | $ | 7.01 | $ | 14.01 | ||||||
Shares of beneficial interest outstanding, no par value, unlimited authorization | 16,182 | 1,549,063 | 30,508 | |||||||||
Net Assets | $ | 170 | $ | 10,234 | $ | 403 | ||||||
| Class C | ||||||||||||
Net asset value (net assets/shares outstanding) and offering price per share | $ | 10.37 | $ | 6.56 | $ | 13.16 | ||||||
Shares of beneficial interest outstanding, no par value, unlimited authorization | 11,915 | 291,219 | 28,460 | |||||||||
Net Assets | $ | 124 | $ | 1,911 | $ | 374 | ||||||
| Class I | ||||||||||||
Net asset value (net assets/shares outstanding) and offering price per share | $ | 10.45 | $ | 6.61 | $ | 13.21 | ||||||
Shares of beneficial interest outstanding, no par value, unlimited authorization | 209,031 | 4,537,387 | 1,371,384 | |||||||||
Net Assets | $ | 2,185 | $ | 29,999 | $ | 18,123 | ||||||
(1) Investment in securities at cost | $ | 4,921 | $ | 33,309 | $ | 16,781 | ||||||
See Notes to Financial Statements
55
Table of Contents
VIRTUS OPPORTUNITIES TRUST
YEAR ENDED SEPTEMBER 30, 2013
($ reported in thousands)
|
|
|
|
|
|
|
| |||||||||
| Emerging Markets Debt Fund | Emerging Markets Equity Income Fund | Global Commodities Stock Fund | Global Dividend Fund | |||||||||||||
| Investment Income | ||||||||||||||||
Dividends | $ | 1 | $ | 328 | $ | 412 | $ | 5,028 | ||||||||
Interest | 1,708 | — | (1) | — | (1) | — | (1) | |||||||||
Security lending | — | — | (1) | — | — | |||||||||||
Foreign taxes withheld | (3 | ) | (38 | ) | (26 | ) | (292 | ) | ||||||||
|
|
|
|
|
|
|
| |||||||||
Total investment income | 1,706 | 290 | 386 | 4,736 | ||||||||||||
|
|
|
|
|
|
|
| |||||||||
| Expenses | ||||||||||||||||
Investment advisory fees | 210 | 74 | 244 | 791 | ||||||||||||
Service fees, Class A | 5 | 1 | 2 | 119 | ||||||||||||
Distribution and service fees, Class C | 2 | 2 | 2 | 141 | ||||||||||||
Administration fees | 36 | 9 | 31 | 155 | ||||||||||||
Transfer agent fee and expenses | 15 | 4 | 31 | 154 | ||||||||||||
Registration fees | 55 | 52 | 40 | 68 | ||||||||||||
Printing fees and expenses | 11 | 4 | 5 | 18 | ||||||||||||
Custodian fees | 4 | 32 | 8 | 23 | ||||||||||||
Professional fees | 36 | 22 | 32 | 29 | ||||||||||||
Trustees’ fee and expenses | 1 | — | (1) | 1 | 5 | |||||||||||
Miscellaneous expenses | 4 | 5 | 5 | 9 | ||||||||||||
|
|
|
|
|
|
|
| |||||||||
Total expenses | 379 | 205 | 401 | 1,512 | ||||||||||||
Less expenses reimbursed and/or waived by investment adviser | (64 | ) | (95 | ) | (54 | ) | — | |||||||||
|
|
|
|
|
|
|
| |||||||||
Net expenses | 315 | 110 | 347 | 1,512 | ||||||||||||
|
|
|
|
|
|
|
| |||||||||
Net investment income (loss) | 1,391 | 180 | 39 | 3,224 | ||||||||||||
|
|
|
|
|
|
|
| |||||||||
| Net Realized and Unrealized Gain (Loss) on Investments | ||||||||||||||||
Net realized gain (loss) on investments | (107 | ) | (110 | ) | (2,139 | ) | 2,468 | |||||||||
Net realized gain (loss) on foreign currency transactions | (7 | ) | (4 | ) | 8 | (2 | ) | |||||||||
Net change in unrealized appreciation (depreciation) on investments | (2,192 | ) | 142 | (307 | ) | 6,666 | ||||||||||
Net change in unrealized appreciation (depreciation) on foreign currency translation | — | (1) | (2 | ) | (1 | ) | 3 | |||||||||
|
|
|
|
|
|
|
| |||||||||
| Net gain (loss) on investments | (2,306 | ) | 26 | (2,439 | ) | 9,135 | ||||||||||
|
|
|
|
|
|
|
| |||||||||
Net increase (decrease) in net assets resulting from operations | $ | (915 | ) | $ | 206 | $ | (2,400 | ) | $ | 12,359 | ||||||
|
|
|
|
|
|
|
| |||||||||
(1) Amount is less than $500.
See Notes to Financial Statements
56
Table of Contents
VIRTUS OPPORTUNITIES TRUST
STATEMENTS OF OPERATIONS (Continued)
YEAR ENDED SEPTEMBER 30, 2013
($ reported in thousands)
|
|
|
|
|
|
|
| |||||||||
| Global Opportunities Fund | Global Real Estate Securities Fund | Greater Asia ex Japan Opportunities Fund | Greater European Opportunities Fund | |||||||||||||
| Investment Income | ||||||||||||||||
Dividends | $ | 2,455 | $ | 1,072 | $ | 228 | $ | 274 | ||||||||
Interest | — | — | (1) | — | — | (1) | ||||||||||
Security lending | 2 | — | — | — | ||||||||||||
Foreign taxes withheld | (75 | ) | (56 | ) | (11 | ) | (18 | ) | ||||||||
|
|
|
|
|
|
|
| |||||||||
Total investment income | 2,382 | 1,016 | 217 | 256 | ||||||||||||
|
|
|
|
|
|
|
| |||||||||
| Expenses | ||||||||||||||||
Investment advisory fees | 903 | 295 | 101 | 97 | ||||||||||||
Service fees, Class A | 190 | 31 | 23 | 24 | ||||||||||||
Distribution and service fees, Class B | 9 | — | — | — | ||||||||||||
Distribution and service fees, Class C | 23 | 28 | 3 | 4 | ||||||||||||
Administration fees | 135 | 44 | 13 | 15 | ||||||||||||
Transfer agent fee and expenses | 130 | 56 | 8 | 13 | ||||||||||||
Registration fees | 60 | 42 | 38 | 38 | ||||||||||||
Printing fees and expenses | 15 | 5 | 2 | 3 | ||||||||||||
Custodian fees | 25 | 11 | 40 | 22 | ||||||||||||
Professional fees | 43 | 31 | 76 | 33 | ||||||||||||
Trustees’ fee and expenses | 5 | 1 | — | (1) | — | (1) | ||||||||||
Miscellaneous expenses | 10 | 4 | 5 | 3 | ||||||||||||
|
|
|
|
|
|
|
| |||||||||
Total expenses | 1,548 | 548 | 309 | 252 | ||||||||||||
Less expenses reimbursed, waived and/or recaptured by investment adviser | 56 | (90 | ) | (125 | ) | (87 | ) | |||||||||
|
|
|
|
|
|
|
| |||||||||
Net expenses | 1,604 | 458 | 184 | 165 | ||||||||||||
|
|
|
|
|
|
|
| |||||||||
Net investment income (loss) | 778 | 558 | 33 | 91 | ||||||||||||
|
|
|
|
|
|
|
| |||||||||
| Net Realized and Unrealized Gain (Loss) on Investments | ||||||||||||||||
Net realized gain (loss) on investments | 9,767 | 382 | 395 | 434 | ||||||||||||
Net realized gain (loss) on foreign currency transactions | (21 | ) | (4 | ) | 3 | (14 | ) | |||||||||
Net change in unrealized appreciation (depreciation) on investments | 1,292 | 254 | (433 | ) | 1,047 | |||||||||||
Net change in unrealized appreciation (depreciation) on foreign currency translation | 9 | 1 | (21 | ) | 1 | |||||||||||
Net change in foreign taxes on unrealized capital gains | 72 | — | — | — | ||||||||||||
|
|
|
|
|
|
|
| |||||||||
| Net gain (loss) on investments | 11,119 | 633 | (56 | ) | 1,468 | |||||||||||
|
|
|
|
|
|
|
| |||||||||
Net increase (decrease) in net assets resulting from operations | $ | 11,897 | $ | 1,191 | $ | (23 | ) | $ | 1,559 | |||||||
|
|
|
|
|
|
|
| |||||||||
(1) Amount is less than $500.
See Notes to Financial Statements
57
Table of Contents
VIRTUS OPPORTUNITIES TRUST
STATEMENTS OF OPERATIONS (Continued)
YEAR ENDED SEPTEMBER 30, 2013
($ reported in thousands)
|
|
|
|
|
| |||||||
| International Equity Fund | International Real Estate Securities Fund | International Small-Cap Fund | ||||||||||
| Investment Income | ||||||||||||
Dividends | $ | 801 | $ | 1,549 | $ | 433 | ||||||
Interest | — | — | (1) | — | (1) | |||||||
Security lending | — | (1) | — | — | ||||||||
Foreign taxes withheld | (66 | ) | (142 | ) | (32 | ) | ||||||
|
|
|
|
|
| |||||||
Total investment income | 735 | 1,407 | 401 | |||||||||
|
|
|
|
|
| |||||||
| Expenses | ||||||||||||
Investment advisory fees | 194 | 388 | 96 | |||||||||
Service fees, Class A | 1 | 18 | 1 | |||||||||
Distribution and service fees, Class C | 1 | 17 | 2 | |||||||||
Administration fees | 29 | 49 | 12 | |||||||||
Transfer agent fee and expenses | 27 | 48 | 7 | |||||||||
Registration fees | 39 | 42 | 54 | |||||||||
Printing fees and expenses | 3 | 5 | 4 | |||||||||
Custodian fees | 21 | 11 | 17 | |||||||||
Professional fees | 34 | 29 | 20 | |||||||||
Trustees’ fee and expenses | 1 | 2 | — | (1) | ||||||||
Miscellaneous expenses | 4 | 5 | 4 | |||||||||
|
|
|
|
|
| |||||||
Total expenses | 354 | 614 | 217 | |||||||||
Less expenses reimbursed and/or waived by investment adviser | (67 | ) | (95 | ) | (85 | ) | ||||||
|
|
|
|
|
| |||||||
Net expenses | 287 | 519 | 132 | |||||||||
|
|
|
|
|
| |||||||
Net investment income (loss) | 448 | 888 | 269 | |||||||||
|
|
|
|
|
| |||||||
| Net Realized and Unrealized Gain (Loss) on Investments | ||||||||||||
Net realized gain (loss) on investments | 4,049 | 702 | 328 | |||||||||
Net realized gain (loss) on foreign currency transactions | 46 | (18 | ) | 1 | ||||||||
Net change in unrealized appreciation (depreciation) on investments | (1,368 | ) | 1,367 | 2,039 | ||||||||
Net change in unrealized appreciation (depreciation) on foreign currency translation | 59 | 1 | — | (1) | ||||||||
|
|
|
|
|
| |||||||
| Net gain (loss) on investments | 2,786 | 2,052 | 2,368 | |||||||||
|
|
|
|
|
| |||||||
Net increase (decrease) in net assets resulting from operations | $ | 3,234 | $ | 2,940 | $ | 2,637 | ||||||
|
|
|
|
|
| |||||||
(1) Amount is less than $500.
See Notes to Financial Statements
58
Table of Contents
VIRTUS OPPORTUNITIES TRUST
STATEMENTS OF CHANGES IN NET ASSETS
($ reported in thousands)
|
|
|
| |||||||||||||
| Emerging Markets Debt Fund | Emerging Markets Equity Income Fund | |||||||||||||||
| Year Ended September 30, 2013 | From inception September 5, 2012 to September 30, 2012 | Year Ended September 30, 2013 | From inception September 5, 2012 to September 30, 2012 | |||||||||||||
| INCREASE/(DECREASE) IN NET ASSETS | ||||||||||||||||
| From Operations | ||||||||||||||||
Net investment income (loss) | $ | 1,391 | $ | 60 | $ | 180 | $ | (1 | ) | |||||||
Net realized gain (loss) | (114 | ) | (15 | ) | (114 | ) | 55 | |||||||||
Net change in unrealized appreciation (depreciation) | (2,192 | ) | 193 | 140 | 240 | |||||||||||
|
|
|
|
|
|
|
| |||||||||
Increase (decrease) in net assets resulting from operations | (915 | ) | 238 | 206 | 294 | |||||||||||
|
|
|
|
|
|
|
| |||||||||
| From Distributions to Shareholders | ||||||||||||||||
Net investment income, Class A | (97 | ) | — | (7 | ) | — | ||||||||||
Net investment income, Class C | (8 | ) | — | — | (1) | — | ||||||||||
Net investment income, Class I | (1,277 | ) | — | (48 | ) | — | ||||||||||
Net realized short-term gains, Class A | (1 | ) | — | (2 | ) | — | ||||||||||
Net realized short-term gains, Class C | — | (1) | — | (3 | ) | — | ||||||||||
Net realized short-term gains, Class I | (41 | ) | — | (92 | ) | — | ||||||||||
|
|
|
|
|
|
|
| |||||||||
Decrease in net assets from distributions to shareholders | (1,424 | ) | — | (152 | ) | — | ||||||||||
|
|
|
|
|
|
|
| |||||||||
| From Share Transactions (See Note 5) | ||||||||||||||||
Change in net assets from share transactions, Class A | 3,657 | 100 | 730 | 100 | ||||||||||||
Change in net assets from share transactions, Class C | 296 | 109 | 311 | 100 | ||||||||||||
Change in net assets from share transactions, Class I | 1,399 | 24,800 | 3,513 | 4,800 | ||||||||||||
|
|
|
|
|
|
|
| |||||||||
Increase (decrease) in net assets from share transactions | 5,352 | 25,009 | 4,554 | 5,000 | ||||||||||||
|
|
|
|
|
|
|
| |||||||||
Net increase (decrease) in net assets | 3,013 | 25,247 | 4,608 | 5,294 | ||||||||||||
| Net Assets | ||||||||||||||||
Beginning of period | 25,247 | — | 5,294 | — | ||||||||||||
|
|
|
|
|
|
|
| |||||||||
End of period | $ | 28,260 | $ | 25,247 | $ | 9,902 | $ | 5,294 | ||||||||
|
|
|
|
|
|
|
| |||||||||
Accumulated undistributed net investment income (loss) at end of period | $ | 20 | $ | 60 | $ | 126 | $ | — | (1) | |||||||
(1) Amount is less than $500.
See Notes to Financial Statements
59
Table of Contents
VIRTUS OPPORTUNITIES TRUST
STATEMENTS OF CHANGES IN NET ASSETS (Continued)
($ reported in thousands)
|
|
|
| |||||||||||||
| Global Commodities Stock Fund | Global Dividend Fund | |||||||||||||||
| Year Ended September 30, 2013 | Year Ended September 30, 2012 | Year Ended September 30, 2013 | Year Ended September 30, 2012 | |||||||||||||
| INCREASE/(DECREASE) IN NET ASSETS | ||||||||||||||||
| From Operations | ||||||||||||||||
Net investment income (loss) | $ | 39 | $ | 25 | $ | 3,224 | $ | 2,043 | ||||||||
Net realized gain (loss) | (2,131 | ) | (1,717 | ) | 2,466 | 738 | ||||||||||
Net change in unrealized appreciation (depreciation) | (308 | ) | 5,331 | 6,669 | 11,292 | |||||||||||
|
|
|
|
|
|
|
| |||||||||
Increase (decrease) in net assets resulting from operations | (2,400 | ) | 3,639 | 12,359 | 14,073 | |||||||||||
|
|
|
|
|
|
|
| |||||||||
| From Distributions to Shareholders | ||||||||||||||||
Net investment income, Class A | (22 | ) | — | (1) | (1,244 | ) | (817 | ) | ||||||||
Net investment income, Class C | (2 | ) | — | (277 | ) | (150 | ) | |||||||||
Net investment income, Class I | (411 | ) | (83 | ) | (1,726 | ) | (1,277 | ) | ||||||||
|
|
|
|
|
|
|
| |||||||||
Decrease in net assets from distributions to shareholders | (435 | ) | (83 | ) | (3,247 | ) | (2,244 | ) | ||||||||
|
|
|
|
|
|
|
| |||||||||
| From Share Transactions (See Note 5) | ||||||||||||||||
Change in net assets from share transactions, Class A | (257 | ) | 566 | 13,393 | 8,865 | |||||||||||
Change in net assets from share transactions, Class C | 202 | (2 | ) | 7,823 | 1,898 | |||||||||||
Change in net assets from share transactions, Class I | 12,613 | (404 | ) | 17,186 | 8,579 | |||||||||||
|
|
|
|
|
|
|
| |||||||||
Increase (decrease) in net assets from share transactions | 12,558 | 160 | 38,402 | 19,342 | ||||||||||||
|
|
|
|
|
|
|
| |||||||||
Net increase (decrease) in net assets | 9,723 | 3,716 | 47,514 | 31,171 | ||||||||||||
| Net Assets | ||||||||||||||||
Beginning of period | 19,711 | 15,995 | 94,294 | 63,123 | ||||||||||||
|
|
|
|
|
|
|
| |||||||||
End of period | $ | 29,434 | $ | 19,711 | $ | 141,808 | $ | 94,294 | ||||||||
|
|
|
|
|
|
|
| |||||||||
Accumulated undistributed net investment income (loss) at end of period | $ | — | $ | (14 | ) | $ | 1 | $ | 17 | |||||||
(1) Amount is less than $500.
See Notes to Financial Statements
60
Table of Contents
VIRTUS OPPORTUNITIES TRUST
STATEMENTS OF CHANGES IN NET ASSETS (Continued)
($ reported in thousands)
|
|
|
| |||||||||||||
| Global Opportunities Fund | Global Real Estate Securities Fund | |||||||||||||||
| Year Ended September 30, 2013 | Year Ended September 30, 2012 | Year Ended September 30, 2013 | Year Ended September 30, 2012 | |||||||||||||
| INCREASE/(DECREASE) IN NET ASSETS | ||||||||||||||||
| From Operations | ||||||||||||||||
Net investment income (loss) | $ | 778 | $ | 405 | $ | 558 | $ | 187 | ||||||||
Net realized gain (loss) | 9,746 | 5,434 | 378 | (97 | ) | |||||||||||
Net change in unrealized appreciation (depreciation) | 1,373 | 11,274 | 255 | 2,394 | ||||||||||||
|
|
|
|
|
|
|
| |||||||||
Increase (decrease) in net assets resulting from operations | 11,897 | 17,113 | 1,191 | 2,484 | ||||||||||||
|
|
|
|
|
|
|
| |||||||||
| From Distributions to Shareholders | ||||||||||||||||
Net investment income, Class A | (224 | ) | (275 | ) | (293 | ) | (34 | ) | ||||||||
Net investment income, Class C | — | — | (50 | ) | (1 | ) | ||||||||||
Net investment income, Class I | (143 | ) | — | (419 | ) | (5 | ) | |||||||||
Net realized short-term gains, Class A | — | — | — | (46 | ) | |||||||||||
Net realized short-term gains, Class C | — | — | — | (4 | ) | |||||||||||
Net realized short-term gains, Class I | — | — | — | (6 | ) | |||||||||||
Net realized long-term gains, Class A | — | — | — | (75 | ) | |||||||||||
Net realized long-term gains, Class C | — | — | — | (7 | ) | |||||||||||
Net realized long-term gains, Class I | — | — | — | (9 | ) | |||||||||||
|
|
|
|
|
|
|
| |||||||||
Decrease in net assets from distributions to shareholders | (367 | ) | (275 | ) | (762 | ) | (187 | ) | ||||||||
|
|
|
|
|
|
|
| |||||||||
| From Share Transactions (See Note 5) | ||||||||||||||||
Change in net assets from share transactions, Class A | (1,519 | ) | 1,538 | 6,449 | 2,120 | |||||||||||
Change in net assets from share transactions, Class B | (353 | ) | (90 | ) | — | — | ||||||||||
Change in net assets from share transactions, Class C | 1,040 | 627 | 2,172 | 726 | ||||||||||||
Change in net assets from share transactions, Class I | 3,080 | 22,400 | 13,019 | 10,601 | ||||||||||||
|
|
|
|
|
|
|
| |||||||||
Increase (decrease) in net assets from share transactions | 2,248 | 24,475 | 21,640 | 13,447 | ||||||||||||
|
|
|
|
|
|
|
| |||||||||
Net increase (decrease) in net assets | 13,778 | 41,313 | 22,069 | 15,744 | ||||||||||||
| Net Assets | ||||||||||||||||
Beginning of period | 97,957 | 56,644 | 22,114 | 6,370 | ||||||||||||
|
|
|
|
|
|
|
| |||||||||
End of period | $ | 111,735 | $ | 97,957 | $ | 44,183 | $ | 22,114 | ||||||||
|
|
|
|
|
|
|
| |||||||||
Accumulated undistributed net investment income (loss) at end of period | $ | 611 | $ | 233 | $ | (35 | ) | $ | 121 | |||||||
(1) Amount is less than $500.
See Notes to Financial Statements
61
Table of Contents
VIRTUS OPPORTUNITIES TRUST
STATEMENTS OF CHANGES IN NET ASSETS (Continued)
($ reported in thousands)
|
|
|
| |||||||||||||
| Greater Asia ex Japan Opportunities Fund | Greater European Opportunities Fund | |||||||||||||||
| Year Ended September 30, 2013 | Year Ended September 30, 2012 | Year Ended September 30, 2013 | Year Ended September 30, 2012 | |||||||||||||
| INCREASE/(DECREASE) IN NET ASSETS | ||||||||||||||||
| From Operations | ||||||||||||||||
Net investment income (loss) | $ | 33 | $ | 41 | $ | 91 | $ | 69 | ||||||||
Net realized gain (loss) | 398 | 290 | 420 | 233 | ||||||||||||
Net change in unrealized appreciation (depreciation) | (454 | ) | 830 | 1,048 | 1,039 | |||||||||||
|
|
|
|
|
|
|
| |||||||||
Increase (decrease) in net assets resulting from operations | (23 | ) | 1,161 | 1,559 | 1,341 | |||||||||||
|
|
|
|
|
|
|
| |||||||||
| From Distributions to Shareholders | ||||||||||||||||
Net investment income, Class A | (54 | ) | (12 | ) | (58 | ) | (58 | ) | ||||||||
Net investment income, Class C | — | — | (1) | (1 | ) | — | (1) | |||||||||
Net investment income, Class I | (3 | ) | (2 | ) | (34 | ) | (3 | ) | ||||||||
Net realized short-term gains, Class A | (4 | ) | (38 | ) | (9 | ) | (8 | ) | ||||||||
Net realized short-term gains, Class C | — | (1) | (1 | ) | — | (1) | — | (1) | ||||||||
Net realized short-term gains, Class I | — | (1) | (2 | ) | (5 | ) | — | (1) | ||||||||
Net realized long-term gains, Class A | (268 | ) | (309 | ) | (202 | ) | (182 | ) | ||||||||
Net realized long-term gains, Class C | (7 | ) | (8 | ) | (6 | ) | (6 | ) | ||||||||
Net realized long-term gains, Class I | (10 | ) | (15 | ) | (100 | ) | (8 | ) | ||||||||
|
|
|
|
|
|
|
| |||||||||
Decrease in net assets from distributions to shareholders | (346 | ) | (387 | ) | (415 | ) | (265 | ) | ||||||||
|
|
|
|
|
|
|
| |||||||||
| From Share Transactions (See Note 5) | ||||||||||||||||
Change in net assets from share transactions, Class A | 784 | (1,485 | ) | 5,895 | 920 | |||||||||||
Change in net assets from share transactions, Class C | 186 | (12 | ) | 383 | 12 | |||||||||||
Change in net assets from share transactions, Class I | 713 | 37 | 1,681 | (74 | ) | |||||||||||
|
|
|
|
|
|
|
| |||||||||
Increase (decrease) in net assets from share transactions | 1,683 | (1,460 | ) | 7,959 | 858 | |||||||||||
|
|
|
|
|
|
|
| |||||||||
Net increase (decrease) in net assets | 1,314 | (686 | ) | 9,103 | 1,934 | |||||||||||
| Net Assets | ||||||||||||||||
Beginning of period | 8,910 | 9,596 | 6,855 | 4,921 | ||||||||||||
|
|
|
|
|
|
|
| |||||||||
End of period | $ | 10,224 | $ | 8,910 | $ | 15,958 | $ | 6,855 | ||||||||
|
|
|
|
|
|
|
| |||||||||
Accumulated undistributed net investment income (loss) at end of period | $ | 38 | $ | 31 | $ | 19 | $ | 37 | ||||||||
(1) Amount is less than $500.
See Notes to Financial Statements
62
Table of Contents
VIRTUS OPPORTUNITIES TRUST
STATEMENTS OF CHANGES IN NET ASSETS (Continued)
($ reported in thousands)
|
|
|
| |||||||||||||
| International Equity Fund | International Real Estate Securities Fund | |||||||||||||||
| Year Ended September 30, 2013 | Year Ended September 30, 2012 | Year Ended September 30, 2013 | Year Ended September 30, 2012 | |||||||||||||
| INCREASE/(DECREASE) IN NET ASSETS | ||||||||||||||||
| From Operations | ||||||||||||||||
Net investment income (loss) | $ | 448 | $ | 586 | $ | 888 | $ | 799 | ||||||||
Net realized gain (loss) | 4,095 | (346 | ) | 684 | (1,603 | ) | ||||||||||
Net change in unrealized appreciation (depreciation) | (1,309 | ) | 3,073 | 1,368 | 7,113 | |||||||||||
|
|
|
|
|
|
|
| |||||||||
Increase (decrease) in net assets resulting from operations | 3,234 | 3,313 | 2,940 | 6,309 | ||||||||||||
|
|
|
|
|
|
|
| |||||||||
| From Distributions to Shareholders | ||||||||||||||||
Net investment income, Class A | (4 | ) | (5 | ) | (406 | ) | (72 | ) | ||||||||
Net investment income, Class C | (2 | ) | (3 | ) | (119 | ) | (15 | ) | ||||||||
Net investment income, Class I | (664 | ) | (624 | ) | (2,099 | ) | (639 | ) | ||||||||
Net realized short-term gains, Class A | (6 | ) | (3 | ) | — | — | ||||||||||
Net realized short-term gains, Class C | (4 | ) | (2 | ) | — | — | ||||||||||
Net realized short-term gains, Class I | (813 | ) | (331 | ) | — | — | ||||||||||
Net realized long-term gains, Class A | (17 | ) | — | — | — | |||||||||||
Net realized long-term gains, Class C | (13 | ) | — | — | — | |||||||||||
Net realized long-term gains, Class I | (2,568 | ) | — | — | — | |||||||||||
|
|
|
|
|
|
|
| |||||||||
Decrease in net assets from distributions to shareholders | (4,091 | ) | (968 | ) | (2,624 | ) | (726 | ) | ||||||||
|
|
|
|
|
|
|
| |||||||||
| From Share Transactions (See Note 5) | ||||||||||||||||
Change in net assets from share transactions, Class A | (19 | ) | (821 | ) | 6,221 | (58 | ) | |||||||||
Change in net assets from share transactions, Class C | 15 | 6 | 371 | 306 | ||||||||||||
Change in net assets from share transactions, Class I | (23,366 | ) | 6,437 | 1,694 | (914 | ) | ||||||||||
|
|
|
|
|
|
|
| |||||||||
Increase (decrease) in net assets from share transactions | (23,370 | ) | 5,622 | 8,286 | (666 | ) | ||||||||||
|
|
|
|
|
|
|
| |||||||||
Net increase (decrease) in net assets | (24,227 | )(1) | 7,967 | 8,602 | 4,917 | |||||||||||
| Net Assets | ||||||||||||||||
Beginning of period | 26,706 | 18,739 | 33,542 | 28,625 | ||||||||||||
|
|
|
|
|
|
|
| |||||||||
End of period | $ | 2,479 | $ | 26,706 | $ | 42,144 | $ | 33,542 | ||||||||
|
|
|
|
|
|
|
| |||||||||
Accumulated undistributed net investment income (loss) at end of period | $ | 97 | $ | 223 | $ | (1,493 | ) | $ | (142 | ) | ||||||
(1) See Note 13 in the Notes to Financial Statements.
See Notes to Financial Statements
63
Table of Contents
VIRTUS OPPORTUNITIES TRUST
STATEMENTS OF CHANGES IN NET ASSETS (Continued)
($ reported in thousands)
|
| |||||||
| International Small-Cap Fund | ||||||||
| Year Ended September 30, 2013 | From inception September 5, 2012 to September 30, 2012 | |||||||
| INCREASE/(DECREASE) IN NET ASSETS | ||||||||
| From Operations | ||||||||
Net investment income (loss) | $ | 269 | $ | 7 | ||||
Net realized gain (loss) | 329 | — | ||||||
Net change in unrealized appreciation (depreciation) | 2,039 | 21 | ||||||
|
|
|
| |||||
Increase (decrease) in net assets resulting from operations | 2,637 | 28 | ||||||
|
|
|
| |||||
| From Distributions to Shareholders | ||||||||
Net investment income, Class A | (2 | ) | — | |||||
Net investment income, Class C | (1 | ) | — | |||||
Net investment income, Class I | (95 | ) | — | |||||
Net realized short-term gains, Class A | — | (1) | — | |||||
Net realized short-term gains, Class C | — | (1) | — | |||||
Net realized short-term gains, Class I | (4 | ) | — | |||||
|
|
|
| |||||
Decrease in net assets from distributions to shareholders | (102 | ) | — | |||||
|
|
|
| |||||
| From Share Transactions (See Note 5) | ||||||||
Change in net assets from share transactions, Class A | 251 | 100 | ||||||
Change in net assets from share transactions, Class C | 222 | 106 | ||||||
Change in net assets from share transactions, Class I | 12,850 | 2,808 | ||||||
|
|
|
| |||||
Increase (decrease) in net assets from share transactions | 13,323 | 3,014 | ||||||
|
|
|
| |||||
Net increase (decrease) in net assets | 15,858 | 3,042 | ||||||
| Net Assets | ||||||||
Beginning of period | 3,042 | — | ||||||
|
|
|
| |||||
End of period | $ | 18,900 | $ | 3,042 | ||||
|
|
|
| |||||
Accumulated undistributed net investment income (loss) at end of period | $ | 179 | $ | 7 | ||||
(1) Amount is less than $500.
See Notes to Financial Statements
64
Table of Contents
VIRTUS OPPORTUNITIES TRUST
SELECTED PER SHARE DATA AND RATIOS FOR A SHARE OUTSTANDING
THROUGHOUT EACH PERIOD
| Net Asset Value, Beginning of Period | Net Investment Income (Loss)(2) | Net Realized and Unrealized Gain (Loss) | Total from Investment Operations | Dividends from Net Investment Income | Distributions from Net Realized Gains | Total Distributions | Change in Net Asset Value | Net Asset Value, End of Period | Total Return(1) | Net Assets, End of Period (in thousands) | Ratio of Net Expenses to Average Net Assets(8) | Ratio of Gross Expenses to Average Net Assets (before waivers and reimbursements)(8) | Ratio of Net Investment Income (Loss) to Average Net Assets | Portfolio Turnover Rate | ||||||||||||||||||||||||||||||||||||||||||||||||||||||||||||||
| Emerging Markets | |||||||||||||||||||||||||||||||||||||||||||||||||||||||||||||||||||||||||||||
| Debt Fund | |||||||||||||||||||||||||||||||||||||||||||||||||||||||||||||||||||||||||||||
Class A | |||||||||||||||||||||||||||||||||||||||||||||||||||||||||||||||||||||||||||||
10/1/12 to 9/30/13 | $ | 10.09 | 0.48 | (0.64 | ) | (0.16 | ) | (0.48 | ) | (0.02 | ) | (0.50 | ) | (0.66 | ) | $ | 9.43 | (1.94 | )% | $ | 3,200 | 1.35 | % | 1.55 | % | 4.92 | % | 60 | % | ||||||||||||||||||||||||||||||||||||||||||||||||
9/5/12(6) to 9/30/12 | 10.00 | 0.02 | 0.07 | 0.09 | — | — | — | 0.09 | 10.09 | 0.90 | (4) | 101 | 1.35 | (3) | 3.49 | (3) | 3.35 | (3) | 13 | (4) | |||||||||||||||||||||||||||||||||||||||||||||||||||||||||
Class C | |||||||||||||||||||||||||||||||||||||||||||||||||||||||||||||||||||||||||||||
10/1/12 to 9/30/13 | $ | 10.09 | 0.41 | (0.66 | ) | (0.25 | ) | (0.40 | ) | (0.02 | ) | (0.42 | ) | (0.67 | ) | $ | 9.42 | (2.68 | )% | $ | 374 | 2.10 | % | 2.32 | % | 4.11 | % | 60 | % | ||||||||||||||||||||||||||||||||||||||||||||||||
9/5/12(6) to 9/30/12 | 10.00 | 0.02 | 0.07 | 0.09 | — | — | — | 0.09 | 10.09 | 0.90 | (4) | 110 | 2.10 | (3) | 4.26 | (3) | 2.63 | (3) | 13 | (4) | |||||||||||||||||||||||||||||||||||||||||||||||||||||||||
Class I | |||||||||||||||||||||||||||||||||||||||||||||||||||||||||||||||||||||||||||||
10/1/12 to 9/30/13 | $ | 10.10 | 0.50 | (0.66 | ) | (0.16 | ) | (0.50 | ) | (0.02 | ) | (0.52 | ) | (0.68 | ) | $ | 9.42 | (1.80 | )% | $ | 24,686 | 1.10 | % | 1.33 | % | 4.99 | % | 60 | % | ||||||||||||||||||||||||||||||||||||||||||||||||
| 9/5/12(6) to 9/30/12 | 10.00 | 0.02 | 0.08 | 0.10 | — | — | — | 0.10 | 10.10 | 1.00 | (4) | 25,036 | 1.10 | (3) | 3.24 | (3) | 3.61 | (3) | 13 | (4) | |||||||||||||||||||||||||||||||||||||||||||||||||||||||||
| Emerging Markets | |||||||||||||||||||||||||||||||||||||||||||||||||||||||||||||||||||||||||||||
| Equity Income Fund | |||||||||||||||||||||||||||||||||||||||||||||||||||||||||||||||||||||||||||||
Class A | |||||||||||||||||||||||||||||||||||||||||||||||||||||||||||||||||||||||||||||
10/1/12 to 9/30/13 | $ | 10.59 | 0.31 | (0.07 | ) | 0.24 | (0.07 | ) | (0.19 | ) | (0.26 | ) | (0.02 | ) | $ | 10.57 | 2.19 | % | $ | 830 | 1.75 | % | 2.90 | % | 3.00 | % | 100 | % | |||||||||||||||||||||||||||||||||||||||||||||||||
9/5/12(6) to 9/30/12 | 10.00 | (0.01 | ) | 0.60 | 0.59 | — | — | — | 0.59 | 10.59 | 5.90 | (4) | 106 | 1.75 | (3) | 10.28 | (3) | (0.78 | )(3) | 37 | (4) | ||||||||||||||||||||||||||||||||||||||||||||||||||||||||
Class C | |||||||||||||||||||||||||||||||||||||||||||||||||||||||||||||||||||||||||||||
10/1/12 to 9/30/13 | $ | 10.58 | 0.20 | (0.03 | ) | 0.17 | (0.02 | ) | (0.19 | ) | (0.21 | ) | (0.04 | ) | $ | 10.54 | 1.48 | % | $ | 417 | 2.50 | % | 3.77 | % | 1.89 | % | 100 | % | |||||||||||||||||||||||||||||||||||||||||||||||||
9/5/12(6) to 9/30/12 | 10.00 | (0.01 | ) | 0.59 | 0.58 | — | — | — | 0.58 | 10.58 | 5.80 | (4) | 106 | 2.50 | (3) | 11.03 | (3) | (1.54 | )(3) | 37 | (4) | ||||||||||||||||||||||||||||||||||||||||||||||||||||||||
Class I | |||||||||||||||||||||||||||||||||||||||||||||||||||||||||||||||||||||||||||||
10/1/12 to 9/30/13 | $ | 10.59 | 0.27 | (0.01 | ) | 0.26 | (0.08 | ) | (0.19 | ) | (0.27 | ) | (0.01 | ) | $ | 10.58 | 2.39 | % | $ | 8,655 | 1.50 | % | 2.87 | % | 2.56 | % | 100 | % | |||||||||||||||||||||||||||||||||||||||||||||||||
| 9/5/12(6) to 9/30/12 | 10.00 | — | (5) | 0.59 | 0.59 | — | — | — | 0.59 | 10.59 | 5.90 | (4) | 5,082 | 1.50 | (3) | 10.03 | (3) | (0.54 | )(3) | 37 | (4) | ||||||||||||||||||||||||||||||||||||||||||||||||||||||||
| Global Commodities | |||||||||||||||||||||||||||||||||||||||||||||||||||||||||||||||||||||||||||||
| Stock Fund | |||||||||||||||||||||||||||||||||||||||||||||||||||||||||||||||||||||||||||||
Class A | |||||||||||||||||||||||||||||||||||||||||||||||||||||||||||||||||||||||||||||
10/1/12 to 9/30/13 | $ | 9.96 | (0.01 | ) | (0.84 | ) | (0.85 | ) | (0.17 | ) | — | (0.17 | ) | (1.02 | ) | $ | 8.94 | (8.61 | )% | $ | 530 | 1.65 | % | 1.87 | % | (0.07 | )% | 132 | % | ||||||||||||||||||||||||||||||||||||||||||||||||
10/1/11 to 9/30/12 | 8.16 | — | (5) | 1.82 | 1.82 | (0.02 | ) | — | (0.02 | ) | 1.80 | 9.96 | 22.30 | 936 | 1.65 | 1.91 | (0.03 | ) | 96 | ||||||||||||||||||||||||||||||||||||||||||||||||||||||||||
3/15/11(6) to 9/30/11 | 10.00 | (0.01 | ) | (1.83 | ) | (1.84 | ) | — | — | — | (1.84 | ) | 8.16 | (18.40 | )(4) | 204 | 1.65 | (3) | 5.40 | (3) | (0.14 | )(3) | 32 | (4) | |||||||||||||||||||||||||||||||||||||||||||||||||||||
Class C | |||||||||||||||||||||||||||||||||||||||||||||||||||||||||||||||||||||||||||||
10/1/12 to 9/30/13 | $ | 9.87 | (0.08 | ) | (0.82 | ) | (0.90 | ) | (0.12 | ) | — | (0.12 | ) | (1.02 | ) | $ | 8.85 | (9.14 | )% | $ | 300 | 2.40 | % | 2.62 | % | (0.84 | )% | 132 | % | ||||||||||||||||||||||||||||||||||||||||||||||||
10/1/11 to 9/30/12 | 8.13 | (0.08 | ) | 1.82 | 1.74 | — | — | — | 1.74 | 9.87 | 21.40 | 117 | 2.40 | 2.60 | (0.86 | ) | 96 | ||||||||||||||||||||||||||||||||||||||||||||||||||||||||||||
3/15/11(6) to 9/30/11 | 10.00 | (0.05 | ) | (1.82 | ) | (1.87 | ) | — | — | — | (1.87 | ) | 8.13 | (18.70 | )(4) | 99 | 2.40 | (3) | 6.73 | (3) | (0.90 | )(3) | 32 | (4) | |||||||||||||||||||||||||||||||||||||||||||||||||||||
Class I | |||||||||||||||||||||||||||||||||||||||||||||||||||||||||||||||||||||||||||||
10/1/12 to 9/30/13 | $ | 9.98 | 0.02 | (0.84 | ) | (0.82 | ) | (0.19 | ) | — | (0.19 | ) | (1.01 | ) | $ | 8.97 | (8.34 | )% | $ | 28,604 | 1.40 | % | 1.62 | % | 0.18 | % | 132 | % | |||||||||||||||||||||||||||||||||||||||||||||||||
10/1/11 to 9/30/12 | 8.17 | 0.01 | 1.84 | 1.85 | (0.04 | ) | — | (0.04 | ) | 1.81 | 9.98 | 22.67 | 18,658 | 1.40 | 1.59 | 0.14 | 96 | ||||||||||||||||||||||||||||||||||||||||||||||||||||||||||||
3/15/11(6) to 9/30/11 | 10.00 | 0.01 | (1.84 | ) | (1.83 | ) | — | — | — | (1.83 | ) | 8.17 | (18.30 | )(4) | 15,692 | 1.40 | (3) | 2.92 | (3) | 0.14 | (3) | 32 | (4) | ||||||||||||||||||||||||||||||||||||||||||||||||||||||
The footnote legend is at the end of the financial highlights.
See Notes to Financial Statements
65
Table of Contents
VIRTUS OPPORTUNITIES TRUST
FINANCIAL HIGHLIGHTS
SELECTED PER SHARE DATA AND RATIOS FOR A SHARE OUTSTANDING
THROUGHOUT EACH PERIOD
| Net Asset Value, Beginning of Period | Net Investment Income (Loss)(2) | Net Realized and Unrealized Gain (Loss) | Total from Investment Operations | Dividends from Net Investment Income | Distributions from Net Realized Gains | Total Distributions | Change in Net Asset Value | Net Asset Value, End of Period | Total Return(1) | Net Assets, End of Period (in thousands) | Ratio of Net Expenses to Average Net Assets(8) | Ratio of Gross Expenses to Average Net Assets (before waivers and reimbursements)(8) | Ratio of Net Investment Income (Loss) to Average Net Assets | Portfolio Turnover Rate | ||||||||||||||||||||||||||||||||||||||||||||||||||||||||||||||
| Global Dividend | |||||||||||||||||||||||||||||||||||||||||||||||||||||||||||||||||||||||||||||
| Fund | |||||||||||||||||||||||||||||||||||||||||||||||||||||||||||||||||||||||||||||
Class A | |||||||||||||||||||||||||||||||||||||||||||||||||||||||||||||||||||||||||||||
10/1/12 to 9/30/13 | $ | 12.88 | 0.35 | 1.05 | 1.40 | (0.34 | ) | — | (0.34 | ) | 1.06 | $ | 13.94 | 11.05 | % | $ | 53,354 | 1.28 | % | 1.28 | % | 2.62 | % | 14 | % | ||||||||||||||||||||||||||||||||||||||||||||||||||||
10/1/11 to 9/30/12 | 10.97 | 0.31 | 1.95 | 2.26 | (0.35 | ) | — | (0.35 | ) | 1.91 | 12.88 | 20.80 | 36,347 | 1.32 | 1.32 | 2.59 | 21 | ||||||||||||||||||||||||||||||||||||||||||||||||||||||||||||
10/1/10 to 9/30/11 | 10.71 | 0.33 | 0.25 | 0.58 | (0.32 | ) | — | (0.32 | ) | 0.26 | 10.97 | 5.40 | 23,120 | 1.34 | 1.34 | 2.89 | 16 | ||||||||||||||||||||||||||||||||||||||||||||||||||||||||||||
10/1/09 to 9/30/10 | 9.97 | 0.26 | 0.77 | 1.03 | (0.29 | ) | — | (0.29 | ) | 0.74 | 10.71 | 10.48 | 24,794 | 1.33 | 1.33 | 2.51 | 22 | ||||||||||||||||||||||||||||||||||||||||||||||||||||||||||||
10/1/08 to 9/30/09 | 10.91 | 0.31 | (0.87 | ) | (0.56 | ) | (0.30 | ) | (0.08 | ) | (0.38 | ) | (0.94 | ) | 9.97 | (4.76 | ) | 77,049 | 1.31 | 1.33 | 3.50 | 46 | |||||||||||||||||||||||||||||||||||||||||||||||||||||||
Class C | |||||||||||||||||||||||||||||||||||||||||||||||||||||||||||||||||||||||||||||
10/1/12 to 9/30/13 | $ | 12.85 | 0.25 | 1.05 | 1.30 | (0.25 | ) | — | (0.25 | ) | 1.05 | $ | 13.90 | 10.23 | % | $ | 17,969 | 2.03 | % | 2.03 | % | 1.85 | % | 14 | % | ||||||||||||||||||||||||||||||||||||||||||||||||||||
10/1/11 to 9/30/12 | 10.95 | 0.23 | 1.93 | 2.16 | (0.26 | ) | — | (0.26 | ) | 1.90 | 12.85 | 19.97 | 9,117 | 2.07 | 2.07 | 1.88 | 21 | ||||||||||||||||||||||||||||||||||||||||||||||||||||||||||||
10/1/10 to 9/30/11 | 10.69 | 0.24 | 0.26 | 0.50 | (0.24 | ) | — | (0.24 | ) | 0.26 | 10.95 | 4.51 | 6,138 | 2.09 | 2.09 | 2.11 | 16 | ||||||||||||||||||||||||||||||||||||||||||||||||||||||||||||
10/1/09 to 9/30/10 | 9.95 | 0.20 | 0.75 | 0.95 | (0.21 | ) | — | (0.21 | ) | 0.74 | 10.69 | 9.70 | 7,160 | 2.10 | 2.10 | 1.98 | 22 | ||||||||||||||||||||||||||||||||||||||||||||||||||||||||||||
10/1/08 to 9/30/09 | 10.89 | 0.26 | (0.89 | ) | (0.63 | ) | (0.23 | ) | (0.08 | ) | (0.31 | ) | (0.94 | ) | 9.95 | (5.49 | ) | 6,188 | 2.09 | 2.10 | 2.85 | 46 | |||||||||||||||||||||||||||||||||||||||||||||||||||||||
Class I | |||||||||||||||||||||||||||||||||||||||||||||||||||||||||||||||||||||||||||||
10/1/12 to 9/30/13 | $ | 12.89 | 0.39 | 1.04 | 1.43 | (0.38 | ) | — | (0.38 | ) | 1.05 | $ | 13.94 | 11.23 | % | $ | 70,485 | 1.03 | % | 1.03 | % | 2.86 | % | 14 | % | ||||||||||||||||||||||||||||||||||||||||||||||||||||
10/1/11 to 9/30/12 | 10.97 | 0.35 | 1.95 | 2.30 | (0.38 | ) | — | (0.38 | ) | 1.92 | 12.89 | 21.19 | 48,830 | 1.07 | 1.07 | 2.85 | 21 | ||||||||||||||||||||||||||||||||||||||||||||||||||||||||||||
10/1/10 to 9/30/11 | 10.72 | 0.36 | 0.24 | 0.60 | (0.35 | ) | — | (0.35 | ) | 0.25 | 10.97 | 5.56 | 33,865 | 1.09 | 1.09 | 3.16 | 16 | ||||||||||||||||||||||||||||||||||||||||||||||||||||||||||||
10/1/09 to 9/30/10 | 9.96 | 0.31 | 0.76 | 1.07 | (0.31 | ) | — | (0.31 | ) | 0.76 | 10.72 | 10.96 | 37,094 | 1.10 | 1.10 | 3.04 | 22 | ||||||||||||||||||||||||||||||||||||||||||||||||||||||||||||
| 10/1/08 to 9/30/09 | 10.90 | 0.34 | (0.87 | ) | (0.53 | ) | (0.33 | ) | (0.08 | ) | (0.41 | ) | (0.94 | ) | 9.96 | (4.54 | ) | 344 | 1.09 | 1.10 | 3.80 | 46 | |||||||||||||||||||||||||||||||||||||||||||||||||||||||
| Global Opportunities | |||||||||||||||||||||||||||||||||||||||||||||||||||||||||||||||||||||||||||||
| Fund | |||||||||||||||||||||||||||||||||||||||||||||||||||||||||||||||||||||||||||||
Class A | |||||||||||||||||||||||||||||||||||||||||||||||||||||||||||||||||||||||||||||
10/1/12 to 9/30/13 | $ | 9.91 | 0.07 | 1.12 | 1.19 | (0.03 | ) | — | (0.03 | ) | 1.16 | $ | 11.07 | 12.05 | % | $ | 78,434 | 1.55 | % | 1.50 | % | 0.69 | % | 61 | % | ||||||||||||||||||||||||||||||||||||||||||||||||||||
10/1/11 to 9/30/12 | 7.91 | 0.05 | 1.99 | 2.04 | (0.04 | ) | — | (0.04 | ) | 2.00 | 9.91 | 25.80 | 71,592 | 1.55 | 1.55 | 0.53 | 73 | ||||||||||||||||||||||||||||||||||||||||||||||||||||||||||||
10/1/10 to 9/30/11 | 7.79 | 0.05 | 0.15 | 0.20 | (0.08 | ) | — | (0.08 | ) | 0.12 | 7.91 | 2.54 | 54,916 | 1.55 | 1.67 | 0.65 | 56 | ||||||||||||||||||||||||||||||||||||||||||||||||||||||||||||
10/1/09 to 9/30/10 | 6.67 | 0.09 | 1.11 | 1.20 | (0.08 | ) | — | (0.08 | ) | 1.12 | 7.79 | 18.09 | 59,088 | 1.57 | (7) | 1.66 | 1.21 | 78 | |||||||||||||||||||||||||||||||||||||||||||||||||||||||||||
10/1/08 to 9/30/09 | 7.82 | 0.07 | (1.14 | ) | (1.07 | ) | (0.08 | ) | — | (0.08 | ) | (1.15 | ) | 6.67 | (13.53 | ) | 53,644 | 1.86 | 1.86 | 1.16 | 168 | ||||||||||||||||||||||||||||||||||||||||||||||||||||||||
Class B | |||||||||||||||||||||||||||||||||||||||||||||||||||||||||||||||||||||||||||||
10/1/12 to 9/30/13 | $ | 8.82 | (0.01 | ) | 1.00 | 0.99 | — | — | — | 0.99 | $ | 9.81 | 11.22 | % | $ | 798 | 2.30 | % | 2.25 | % | (0.10 | )% | 61 | % | |||||||||||||||||||||||||||||||||||||||||||||||||||||
10/1/11 to 9/30/12 | 7.06 | (0.02 | ) | 1.78 | 1.76 | — | — | — | 1.76 | 8.82 | 24.93 | 1,048 | 2.30 | 2.30 | (0.28 | ) | 73 | ||||||||||||||||||||||||||||||||||||||||||||||||||||||||||||
10/1/10 to 9/30/11 | 6.97 | (0.01 | ) | 0.13 | 0.12 | (0.03 | ) | — | (0.03 | ) | 0.09 | 7.06 | 1.76 | 915 | 2.30 | 2.42 | (0.14 | ) | 56 | ||||||||||||||||||||||||||||||||||||||||||||||||||||||||||
10/1/09 to 9/30/10 | 6.00 | 0.03 | 0.99 | 1.02 | (0.05 | ) | — | (0.05 | ) | 0.97 | 6.97 | 17.09 | 1,294 | 2.32 | (7) | 2.41 | 0.43 | 78 | |||||||||||||||||||||||||||||||||||||||||||||||||||||||||||
10/1/08 to 9/30/09 | 7.06 | 0.02 | (1.02 | ) | (1.00 | ) | (0.06 | ) | — | (0.06 | ) | (1.06 | ) | 6.00 | (14.10 | ) | 1,369 | 2.61 | 2.61 | 0.35 | 168 | ||||||||||||||||||||||||||||||||||||||||||||||||||||||||
Class C | |||||||||||||||||||||||||||||||||||||||||||||||||||||||||||||||||||||||||||||
10/1/12 to 9/30/13 | $ | 8.77 | — | 0.99 | 0.99 | — | — | — | 0.99 | $ | 9.76 | 11.29 | % | $ | 2,963 | 2.30 | % | 2.24 | % | (0.03 | )% | 61 | % | ||||||||||||||||||||||||||||||||||||||||||||||||||||||
10/1/11 to 9/30/12 | 7.02 | (0.02 | ) | 1.77 | 1.75 | — | — | — | 1.75 | 8.77 | 24.93 | 1,700 | 2.30 | 2.30 | (0.25 | ) | 73 | ||||||||||||||||||||||||||||||||||||||||||||||||||||||||||||
10/1/10 to 9/30/11 | 6.93 | (0.01 | ) | 0.13 | 0.12 | (0.03 | ) | — | (0.03 | ) | 0.09 | 7.02 | 1.77 | 813 | 2.30 | 2.42 | (0.11 | ) | 56 | ||||||||||||||||||||||||||||||||||||||||||||||||||||||||||
10/1/09 to 9/30/10 | 5.97 | 0.03 | 0.98 | 1.01 | (0.05 | ) | — | (0.05 | ) | 0.96 | 6.93 | 17.01 | 806 | 2.32 | (7) | 2.41 | 0.48 | 78 | |||||||||||||||||||||||||||||||||||||||||||||||||||||||||||
10/1/08 to 9/30/09 | 7.03 | 0.02 | (1.02 | ) | (1.00 | ) | (0.06 | ) | — | (0.06 | ) | (1.06 | ) | 5.97 | (14.16 | ) | 776 | 2.62 | 2.62 | 0.37 | 168 | ||||||||||||||||||||||||||||||||||||||||||||||||||||||||
The footnote legend is at the end of the financial highlights.
See Notes to Financial Statements
66
Table of Contents
VIRTUS OPPORTUNITIES TRUST
FINANCIAL HIGHLIGHTS
SELECTED PER SHARE DATA AND RATIOS FOR A SHARE OUTSTANDING
THROUGHOUT EACH PERIOD
| Net Asset Value, Beginning of Period | Net Investment Income (Loss)(2) | Net Realized and Unrealized Gain (Loss) | Total from Investment Operations | Dividends from Net Investment Income | Distributions from Net Realized Gains | Total Distributions | Change in Net Asset Value | Net Asset Value, End of Period | Total Return(1) | Net Assets, End of Period (in thousands) | Ratio of Net Expenses to Average Net Assets(8) | Ratio of Gross Expenses to Average Net Assets (before waivers and reimbursements)(8) | Ratio of Net Investment Income (Loss) to Average Net Assets | Portfolio Turnover Rate | ||||||||||||||||||||||||||||||||||||||||||||||||||||||||||||||
| Global Opportunities | |||||||||||||||||||||||||||||||||||||||||||||||||||||||||||||||||||||||||||||
| Fund (Continued) | |||||||||||||||||||||||||||||||||||||||||||||||||||||||||||||||||||||||||||||
Class I | |||||||||||||||||||||||||||||||||||||||||||||||||||||||||||||||||||||||||||||
10/1/12 to 9/30/13 | $ | 9.91 | 0.10 | 1.12 | 1.22 | (0.06 | ) | — | (0.06 | ) | 1.16 | $ | 11.07 | 12.36 | % | $ | 29,540 | 1.30 | % | 1.30 | % | 0.94 | % | 61 | % | ||||||||||||||||||||||||||||||||||||||||||||||||||||
| 8/8/12(6) to 9/30/12(6) | 9.38 | — | (5) | 0.53 | 0.53 | — | — | — | 0.53 | 9.91 | 5.54 | (4) | 23,617 | 1.30 | (3) | 1.30 | (3) | 0.02 | (3) | 73 | (4) | ||||||||||||||||||||||||||||||||||||||||||||||||||||||||
| Global Real Estate | |||||||||||||||||||||||||||||||||||||||||||||||||||||||||||||||||||||||||||||
| Securities Fund | |||||||||||||||||||||||||||||||||||||||||||||||||||||||||||||||||||||||||||||
Class A | |||||||||||||||||||||||||||||||||||||||||||||||||||||||||||||||||||||||||||||
10/1/12 to 9/30/13 | $ | 22.40 | 0.35 | 1.09 | 1.44 | (0.70 | ) | — | (0.70 | ) | 0.74 | $ | 23.14 | 6.48 | % | $ | 15,306 | 1.40 | % | 1.66 | % | 1.51 | % | 18 | % | ||||||||||||||||||||||||||||||||||||||||||||||||||||
10/1/11 to 9/30/12 | 17.78 | 0.33 | 4.77 | 5.10 | (0.11 | ) | (0.37 | ) | (0.48 | ) | 4.62 | 22.40 | 29.21 | 8,695 | 1.40 | 2.37 | 1.61 | 31 | |||||||||||||||||||||||||||||||||||||||||||||||||||||||||||
10/1/10 to 9/30/11 | 19.84 | 0.50 | (0.90 | ) | (0.40 | ) | (1.01 | ) | (0.65 | ) | (1.66 | ) | (2.06 | ) | 17.78 | (2.57 | ) | 5,275 | 1.40 | 3.16 | 2.48 | 41 | |||||||||||||||||||||||||||||||||||||||||||||||||||||||
10/1/09 to 9/30/10 | 18.33 | 0.40 | 3.31 | 3.71 | (1.55 | ) | (0.65 | ) | (2.20 | ) | 1.51 | 19.84 | 22.42 | 2,492 | 1.40 | 4.07 | 2.21 | 28 | |||||||||||||||||||||||||||||||||||||||||||||||||||||||||||
3/2/09(6) to 9/30/09 | 10.00 | 0.30 | 8.03 | 8.33 | — | — | — | 8.33 | 18.33 | 83.30 | (4) | 1,586 | 1.40 | (3) | 9.62 | (3) | 3.68 | (3) | 29 | (4) | |||||||||||||||||||||||||||||||||||||||||||||||||||||||||
Class C | |||||||||||||||||||||||||||||||||||||||||||||||||||||||||||||||||||||||||||||
10/1/12 to 9/30/13 | $ | 22.14 | 0.18 | 1.08 | 1.26 | (0.62 | ) | — | (0.62 | ) | 0.64 | $ | 22.78 | 5.70 | % | $ | 3,545 | 2.15 | % | 2.41 | % | 0.80 | % | 18 | % | ||||||||||||||||||||||||||||||||||||||||||||||||||||
10/1/11 to 9/30/12 | 17.65 | 0.17 | 4.72 | 4.89 | (0.03 | ) | (0.37 | ) | (0.40 | ) | 4.49 | 22.14 | 28.18 | 1,356 | 2.15 | 3.11 | 0.83 | 31 | |||||||||||||||||||||||||||||||||||||||||||||||||||||||||||
10/1/10 to 9/30/11 | 19.67 | 0.35 | (0.88 | ) | (0.53 | ) | (0.84 | ) | (0.65 | ) | (1.49 | ) | (2.02 | ) | 17.65 | (3.25 | ) | 486 | 2.15 | 3.91 | 1.73 | 41 | |||||||||||||||||||||||||||||||||||||||||||||||||||||||
10/1/09 to 9/30/10 | 18.25 | 0.27 | 3.29 | 3.56 | (1.49 | ) | (0.65 | ) | (2.14 | ) | 1.42 | 19.67 | 21.55 | 262 | 2.15 | 4.83 | 1.50 | 28 | |||||||||||||||||||||||||||||||||||||||||||||||||||||||||||
3/2/09(6) to 9/30/09 | 10.00 | 0.24 | 8.01 | 8.25 | — | — | — | 8.25 | 18.25 | 82.50 | (4) | 194 | 2.15 | (3) | 10.45 | (3) | 2.94 | (3) | 29 | (4) | |||||||||||||||||||||||||||||||||||||||||||||||||||||||||
Class I | |||||||||||||||||||||||||||||||||||||||||||||||||||||||||||||||||||||||||||||
10/1/12 to 9/30/13 | $ | 22.51 | 0.42 | 1.09 | 1.51 | (0.74 | ) | — | (0.74 | ) | 0.77 | $ | 23.28 | 6.78 | % | $ | 25,332 | 1.15 | % | 1.41 | % | 1.78 | % | 18 | % | ||||||||||||||||||||||||||||||||||||||||||||||||||||
10/1/11 to 9/30/12 | 17.85 | 0.45 | 4.71 | 5.16 | (0.13 | ) | (0.37 | ) | (0.50 | ) | 4.66 | 22.51 | 29.50 | 12,063 | 1.15 | 1.93 | 2.04 | 31 | |||||||||||||||||||||||||||||||||||||||||||||||||||||||||||
10/1/10 to 9/30/11 | 19.91 | 0.63 | (0.97 | ) | (0.34 | ) | (1.07 | ) | (0.65 | ) | (1.72 | ) | (2.06 | ) | 17.85 | (2.26 | ) | 609 | 1.15 | 2.92 | 3.07 | 41 | |||||||||||||||||||||||||||||||||||||||||||||||||||||||
10/1/09 to 9/30/10 | 18.36 | 0.47 | 3.30 | 3.77 | (1.57 | ) | (0.65 | ) | (2.22 | ) | 1.55 | 19.91 | 22.77 | 678 | 1.15 | 3.90 | 2.63 | 28 | |||||||||||||||||||||||||||||||||||||||||||||||||||||||||||
| 3/2/09(6) to 9/30/09 | 10.00 | 0.32 | 8.04 | 8.36 | — | — | — | 8.36 | 18.36 | 83.60 | (4) | 183 | 1.15 | (3) | 6.04 | (3) | 3.93 | (3) | 29 | (4) | |||||||||||||||||||||||||||||||||||||||||||||||||||||||||
| Greater Asia ex Japan | |||||||||||||||||||||||||||||||||||||||||||||||||||||||||||||||||||||||||||||
| Opportunities Fund | |||||||||||||||||||||||||||||||||||||||||||||||||||||||||||||||||||||||||||||
Class A | |||||||||||||||||||||||||||||||||||||||||||||||||||||||||||||||||||||||||||||
10/1/12 to 9/30/13 | $ | 15.44 | 0.05 | (0.04 | ) | 0.01 | (0.09 | ) | (0.46 | ) | (0.55 | ) | (0.54 | ) | $ | 14.90 | 0.14 | % | $ | 8,852 | 1.80 | % | 3.04 | % | 0.32 | % | 41 | % | |||||||||||||||||||||||||||||||||||||||||||||||||
10/1/11 to 9/30/12 | 13.93 | 0.07 | 1.99 | 2.06 | (0.02 | ) | (0.53 | ) | (0.55 | ) | 1.51 | 15.44 | 15.56 | 8,366 | 1.80 | 3.11 | 0.49 | 40 | |||||||||||||||||||||||||||||||||||||||||||||||||||||||||||
10/1/10 to 9/30/11 | 16.89 | 0.06 | (1.09 | ) | (1.03 | ) | (0.10 | ) | (1.83 | ) | (1.93 | ) | (2.96 | ) | 13.93 | (6.88 | ) | 9,125 | 1.80 | 3.06 | 0.39 | 60 | |||||||||||||||||||||||||||||||||||||||||||||||||||||||
10/1/09 to 9/30/10 | 13.01 | 0.14 | 4.19 | 4.33 | (0.13 | ) | (0.32 | ) | (0.45 | ) | 3.88 | 16.89 | 34.27 | 10,305 | 1.80 | 3.05 | 1.00 | 78 | |||||||||||||||||||||||||||||||||||||||||||||||||||||||||||
4/21/09(6) to 9/30/09 | 10.00 | 0.10 | 2.91 | 3.01 | — | — | — | 3.01 | 13.01 | 30.10 | (4) | 6,431 | 1.80 | (3) | 3.78 | (3) | 1.88 | (3) | 26 | (4) | |||||||||||||||||||||||||||||||||||||||||||||||||||||||||
Class C | |||||||||||||||||||||||||||||||||||||||||||||||||||||||||||||||||||||||||||||
10/1/12 to 9/30/13 | $ | 15.19 | (0.04 | ) | (0.06 | ) | (0.10 | ) | — | (0.46 | ) | (0.46 | ) | (0.56 | ) | $ | 14.63 | (0.65 | )% | $ | 392 | 2.55 | % | 3.78 | % | (0.29 | )% | 41 | % | ||||||||||||||||||||||||||||||||||||||||||||||||
10/1/11 to 9/30/12 | 13.79 | (0.03 | ) | 1.96 | 1.93 | — | (0.53 | ) | (0.53 | ) | 1.40 | 15.19 | 14.74 | 230 | 2.55 | 3.87 | (0.22 | ) | 40 | ||||||||||||||||||||||||||||||||||||||||||||||||||||||||||
10/1/10 to 9/30/11 | 16.77 | (0.07 | ) | (1.08 | ) | (1.15 | ) | — | (1.83 | ) | (1.83 | ) | (2.98 | ) | 13.79 | (7.61 | ) | 223 | 2.55 | 3.81 | (0.47 | ) | 60 | ||||||||||||||||||||||||||||||||||||||||||||||||||||||
10/1/09 to 9/30/10 | 12.96 | 0.07 | 4.16 | 4.23 | (0.10 | ) | (0.32 | ) | (0.42 | ) | 3.81 | 16.77 | 33.39 | 430 | 2.55 | 3.83 | 0.46 | 78 | |||||||||||||||||||||||||||||||||||||||||||||||||||||||||||
4/21/09(6) to 9/30/09 | 10.00 | 0.06 | 2.90 | 2.96 | — | — | — | 2.96 | 12.96 | 29.60 | (4) | 130 | 2.55 | (3) | 4.54 | (3) | 1.12 | (3) | 26 | (4) | |||||||||||||||||||||||||||||||||||||||||||||||||||||||||
The footnote legend is at the end of the financial highlights.
See Notes to Financial Statements
67
Table of Contents
VIRTUS OPPORTUNITIES TRUST
FINANCIAL HIGHLIGHTS
SELECTED PER SHARE DATA AND RATIOS FOR A SHARE OUTSTANDING
THROUGHOUT EACH PERIOD
| Net Asset Value, Beginning of Period | Net Investment Income (Loss)(2) | Net Realized and Unrealized Gain (Loss) | Total from Investment Operations | Dividends from Net Investment Income | Distributions from Net Realized Gains | Total Distributions | Change in Net Asset Value | Net Asset Value, End of Period | Total Return(1) | Net Assets, End of Period (in thousands) | Ratio of Net Expenses to Average Net Assets(8) | Ratio of Gross Expenses to Average Net Assets (before waivers and reimbursements)(8) | Ratio of Net Investment Income (Loss) to Average Net Assets | Portfolio Turnover Rate | ||||||||||||||||||||||||||||||||||||||||||||||||||||||||||||||
| Greater Asia ex Japan | |||||||||||||||||||||||||||||||||||||||||||||||||||||||||||||||||||||||||||||
| Opportunities Fund | |||||||||||||||||||||||||||||||||||||||||||||||||||||||||||||||||||||||||||||
| (Continued) | |||||||||||||||||||||||||||||||||||||||||||||||||||||||||||||||||||||||||||||
Class I | |||||||||||||||||||||||||||||||||||||||||||||||||||||||||||||||||||||||||||||
10/1/12 to 9/30/13 | $ | 15.50 | 0.11 | (0.19 | ) | (0.08 | ) | — | (0.46 | ) | (0.46 | ) | (0.54 | ) | $ | 14.96 | 0.42 | % | $ | 999 | 1.55 | % | 2.76 | % | 0.71 | % | 41 | % | |||||||||||||||||||||||||||||||||||||||||||||||||
10/1/11 to 9/30/12 | 13.99 | 0.10 | 2.00 | 2.10 | (0.06 | ) | (0.53 | ) | (0.59 | ) | 1.51 | 15.50 | 15.80 | 314 | 1.55 | 2.76 | 0.70 | 40 | |||||||||||||||||||||||||||||||||||||||||||||||||||||||||||
10/1/10 to 9/30/11 | 16.94 | 0.08 | (1.06 | ) | (0.98 | ) | (0.14 | ) | (1.83 | ) | (1.97 | ) | (2.95 | ) | 13.99 | (6.57 | ) | 248 | 1.55 | 2.78 | 0.50 | 60 | |||||||||||||||||||||||||||||||||||||||||||||||||||||||
10/1/09 to 9/30/10 | 13.02 | 0.18 | 4.21 | 4.39 | (0.15 | ) | (0.32 | ) | (0.47 | ) | 3.92 | 16.94 | 34.69 | 198 | 1.55 | 2.80 | 1.25 | 78 | |||||||||||||||||||||||||||||||||||||||||||||||||||||||||||
| 4/21/09(6) to 9/30/09 | 10.00 | 0.11 | 2.91 | 3.02 | — | — | — | 3.02 | 13.02 | 30.20 | (4) | 130 | 1.55 | (3) | 3.54 | (3) | 2.11 | (3) | 26 | (4) | |||||||||||||||||||||||||||||||||||||||||||||||||||||||||
| Greater European | |||||||||||||||||||||||||||||||||||||||||||||||||||||||||||||||||||||||||||||
| Opportunities Fund | |||||||||||||||||||||||||||||||||||||||||||||||||||||||||||||||||||||||||||||
Class A | |||||||||||||||||||||||||||||||||||||||||||||||||||||||||||||||||||||||||||||
10/1/12 to 9/30/13 | $ | 14.20 | 0.13 | 2.09 | 2.22 | (0.12 | ) | (0.43 | ) | (0.55 | ) | 1.67 | $ | 15.87 | 15.92 | % | $ | 13,433 | 1.45 | % | 2.22 | % | 0.86 | % | 75 | % | |||||||||||||||||||||||||||||||||||||||||||||||||||
10/1/11 to 9/30/12 | 11.80 | 0.16 | 2.87 | 3.03 | (0.15 | ) | (0.48 | ) | (0.63 | ) | 2.40 | 14.20 | 26.75 | 6,513 | 1.45 | 2.82 | 1.26 | 49 | |||||||||||||||||||||||||||||||||||||||||||||||||||||||||||
10/1/10 to 9/30/11 | 13.56 | 0.17 | (0.36 | ) | (0.19 | ) | (0.29 | ) | (1.28 | ) | (1.57 | ) | (1.76 | ) | 11.80 | (2.09 | ) | 4,571 | 1.45 | 3.03 | 1.26 | 46 | |||||||||||||||||||||||||||||||||||||||||||||||||||||||
10/1/09 to 9/30/10 | 12.97 | 0.21 | 0.95 | 1.16 | (0.15 | ) | (0.42 | ) | (0.57 | ) | 0.59 | 13.56 | 9.14 | 4,629 | 1.45 | 2.75 | 1.60 | 48 | |||||||||||||||||||||||||||||||||||||||||||||||||||||||||||
4/21/09(6) to 9/30/09 | 10.00 | 0.12 | 2.85 | 2.97 | — | — | — | 2.97 | 12.97 | 29.70 | (4) | 6,236 | 1.45 | (3) | 3.60 | (3) | 2.38 | (3) | 14 | (4) | |||||||||||||||||||||||||||||||||||||||||||||||||||||||||
Class C | |||||||||||||||||||||||||||||||||||||||||||||||||||||||||||||||||||||||||||||
10/1/12 to 9/30/13 | $ | 14.10 | 0.03 | 2.07 | 2.10 | (0.06 | ) | (0.43 | ) | (0.49 | ) | 1.61 | $ | 15.71 | 15.11 | % | $ | 607 | 2.20 | % | 2.92 | % | 0.21 | % | 75 | % | |||||||||||||||||||||||||||||||||||||||||||||||||||
10/1/11 to 9/30/12 | 11.69 | 0.07 | 2.85 | 2.92 | (0.03 | ) | (0.48 | ) | (0.51 | ) | 2.41 | 14.10 | 25.73 | 187 | 2.20 | 3.57 | 0.52 | 49 | |||||||||||||||||||||||||||||||||||||||||||||||||||||||||||
10/1/10 to 9/30/11 | 13.45 | 0.07 | (0.36 | ) | (0.29 | ) | (0.19 | ) | (1.28 | ) | (1.47 | ) | (1.76 | ) | 11.69 | (2.77 | ) | 144 | 2.20 | 3.78 | 0.53 | 46 | |||||||||||||||||||||||||||||||||||||||||||||||||||||||
10/1/09 to 9/30/10 | 12.93 | 0.07 | 0.98 | 1.05 | (0.11 | ) | (0.42 | ) | (0.53 | ) | 0.52 | 13.45 | 8.28 | 142 | 2.20 | 3.50 | 0.56 | 48 | |||||||||||||||||||||||||||||||||||||||||||||||||||||||||||
4/21/09(6) to 9/30/09 | 10.00 | 0.07 | 2.86 | 2.93 | — | — | — | 2.93 | 12.93 | 29.30 | (4) | 196 | 2.20 | (3) | 4.27 | (3) | 1.31 | (3) | 14 | (4) | |||||||||||||||||||||||||||||||||||||||||||||||||||||||||
Class I | |||||||||||||||||||||||||||||||||||||||||||||||||||||||||||||||||||||||||||||
10/1/12 to 9/30/13 | $ | 14.23 | 0.06 | 2.20 | 2.26 | (0.14 | ) | (0.43 | ) | (0.57 | ) | 1.69 | $ | 15.92 | 16.19 | % | $ | 1,918 | 1.20 | % | 1.96 | % | 0.39 | % | 75 | % | |||||||||||||||||||||||||||||||||||||||||||||||||||
10/1/11 to 9/30/12 | 11.83 | 0.17 | 2.90 | 3.07 | (0.19 | ) | (0.48 | ) | (0.67 | ) | 2.40 | 14.23 | 26.99 | 155 | 1.20 | 2.57 | 1.32 | 49 | |||||||||||||||||||||||||||||||||||||||||||||||||||||||||||
10/1/10 to 9/30/11 | 13.60 | 0.17 | (0.34 | ) | (0.17 | ) | (0.32 | ) | (1.28 | ) | (1.60 | ) | (1.77 | ) | 11.83 | (1.84 | ) | 206 | 1.20 | 2.78 | 1.33 | 46 | |||||||||||||||||||||||||||||||||||||||||||||||||||||||
10/1/09 to 9/30/10 | 12.98 | 0.24 | 0.96 | 1.20 | �� | (0.16 | ) | (0.42 | ) | (0.58 | ) | 0.62 | 13.60 | 9.48 | 142 | 1.20 | 2.56 | 1.83 | 48 | ||||||||||||||||||||||||||||||||||||||||||||||||||||||||||
| 4/21/09(6) to 9/30/09 | 10.00 | 0.14 | 2.84 | 2.98 | — | — | — | 2.98 | 12.98 | 29.80 | (4) | 130 | 1.20 | (3) | 3.34 | (3) | 2.63 | (3) | 14 | (4) | |||||||||||||||||||||||||||||||||||||||||||||||||||||||||
| International Equity Fund | |||||||||||||||||||||||||||||||||||||||||||||||||||||||||||||||||||||||||||||
Class A | |||||||||||||||||||||||||||||||||||||||||||||||||||||||||||||||||||||||||||||
10/1/12 to 9/30/13 | $ | 10.87 | 0.16 | 1.19 | 1.35 | (0.25 | ) | (1.47 | ) | (1.72 | ) | (0.37 | ) | $ | 10.50 | 13.38 | % | $ | 170 | 1.50 | % | 1.95 | % | 1.41 | % | 277 | %(9) | ||||||||||||||||||||||||||||||||||||||||||||||||||
10/1/11 to 9/30/12 | 9.79 | 0.21 | 1.36 | 1.57 | (0.30 | ) | (0.19 | ) | (0.49 | ) | 1.08 | 10.87 | 16.58 | 193 | 1.50 | 1.80 | 2.02 | 25 | |||||||||||||||||||||||||||||||||||||||||||||||||||||||||||
10/1/10 to 9/30/11 | 10.17 | 0.29 | (0.57 | ) | (0.28 | ) | (0.10 | ) | — | (0.10 | ) | (0.38 | ) | 9.79 | (2.85 | ) | 952 | 1.50 | 2.11 | 2.73 | 65 | ||||||||||||||||||||||||||||||||||||||||||||||||||||||||
9/16/10(6) to 9/30/10 | 10.00 | — | (5) | 0.17 | 0.17 | — | — | — | 0.17 | 10.17 | 1.70 | (4) | 102 | 1.50 | (3) | 19.64 | (3) | 1.36 | (3) | 0 | (4) | ||||||||||||||||||||||||||||||||||||||||||||||||||||||||
Class C | |||||||||||||||||||||||||||||||||||||||||||||||||||||||||||||||||||||||||||||
10/1/12 to 9/30/13 | $ | 10.77 | 0.08 | 1.20 | 1.28 | (0.21 | ) | (1.47 | ) | (1.68 | ) | (0.40 | ) | $ | 10.37 | 12.53 | % | $ | 124 | 2.25 | % | 2.73 | % | 0.70 | % | 277 | %(9) | ||||||||||||||||||||||||||||||||||||||||||||||||||
10/1/11 to 9/30/12 | 9.76 | 0.20 | 1.25 | 1.45 | (0.25 | ) | (0.19 | ) | (0.44 | ) | 1.01 | 10.77 | 15.37 | 115 | 2.25 | 2.51 | 1.94 | 25 | |||||||||||||||||||||||||||||||||||||||||||||||||||||||||||
10/1/10 to 9/30/11 | 10.16 | 0.18 | (0.53 | ) | (0.35 | ) | (0.05 | ) | — | (0.05 | ) | (0.40 | ) | 9.76 | (3.58 | ) | 98 | 2.25 | 3.15 | 1.70 | 65 | ||||||||||||||||||||||||||||||||||||||||||||||||||||||||
9/16/10(6) to 9/30/10 | 10.00 | — | (5) | 0.16 | 0.16 | — | — | — | 0.16 | 10.16 | 1.60 | (4) | 102 | 2.25 | (3) | 20.39 | (3) | 0.61 | (3) | 0 | (4) | ||||||||||||||||||||||||||||||||||||||||||||||||||||||||
The footnote legend is at the end of the financial highlights.
See Notes to Financial Statements
68
Table of Contents
VIRTUS OPPORTUNITIES TRUST
FINANCIAL HIGHLIGHTS
SELECTED PER SHARE DATA AND RATIOS FOR A SHARE OUTSTANDING
THROUGHOUT EACH PERIOD
| Net Asset Value, Beginning of Period | Net Investment Income (Loss)(2) | Net Realized and Unrealized Gain (Loss) | Total from Investment Operations | Dividends from Net Investment Income | Distributions from Net Realized Gains | Total Distributions | Change in Net Asset Value | Net Asset Value, End of Period | Total Return(1) | Net Assets, End of Period (in thousands) | Ratio of Net Expenses to Average Net Assets(8) | Ratio of Gross Expenses to Average Net Assets (before waivers and reimbursements)(8) | Ratio of Net Investment Income (Loss) to Average Net Assets | Portfolio Turnover Rate | ||||||||||||||||||||||||||||||||||||||||||||||||||||||||||||||
| International Equity | |||||||||||||||||||||||||||||||||||||||||||||||||||||||||||||||||||||||||||||
| Fund (Continued) | |||||||||||||||||||||||||||||||||||||||||||||||||||||||||||||||||||||||||||||
Class I | |||||||||||||||||||||||||||||||||||||||||||||||||||||||||||||||||||||||||||||
10/1/12 to 9/30/13 | $ | 10.82 | 0.22 | 1.16 | 1.38 | (0.28 | ) | (1.47 | ) | (1.75 | ) | (0.37 | ) | $ | 10.45 | 13.68 | % | $ | 2,185 | 1.25 | % | 1.54 | % | 1.97 | % | 277 | %(9) | ||||||||||||||||||||||||||||||||||||||||||||||||||
10/1/11 to 9/30/12 | 9.80 | 0.30 | 1.26 | 1.56 | (0.35 | ) | (0.19 | ) | (0.54 | ) | 1.02 | 10.82 | 16.47 | 26,398 | 1.25 | 1.50 | 2.94 | 25 | |||||||||||||||||||||||||||||||||||||||||||||||||||||||||||
10/1/10 to 9/30/11 | 10.18 | 0.34 | (0.60 | ) | (0.26 | ) | (0.12 | ) | — | (0.12 | ) | (0.38 | ) | 9.80 | (2.62 | ) | 17,689 | 1.25 | 1.88 | 3.16 | 65 | ||||||||||||||||||||||||||||||||||||||||||||||||||||||||
| 9/16/10(6) to 9/30/10 | 10.00 | 0.01 | 0.17 | 0.18 | — | — | — | 0.18 | 10.18 | 1.70 | (4) | 7,068 | 1.25 | (3) | 19.39 | (3) | 1.62 | (3) | 0 | (4) | |||||||||||||||||||||||||||||||||||||||||||||||||||||||||
| International Real | |||||||||||||||||||||||||||||||||||||||||||||||||||||||||||||||||||||||||||||
| Estate Securities Fund | |||||||||||||||||||||||||||||||||||||||||||||||||||||||||||||||||||||||||||||
Class A | |||||||||||||||||||||||||||||||||||||||||||||||||||||||||||||||||||||||||||||
10/1/12 to 9/30/13 | $ | 6.50 | 0.15 | 0.45 | 0.60 | (0.49 | ) | — | (0.49 | ) | 0.11 | $ | 6.61 | 9.39 | % | $ | 10,234 | 1.50 | % | 1.75 | % | 2.23 | % | 22 | % | ||||||||||||||||||||||||||||||||||||||||||||||||||||
10/1/11 to 9/30/12 | 5.23 | 0.16 | 1.24 | 1.40 | (0.13 | ) | — | (0.13 | ) | 1.27 | 6.50 | 27.35 | 3,916 | 1.50 | 1.85 | 2.69 | 41 | ||||||||||||||||||||||||||||||||||||||||||||||||||||||||||||
10/1/10 to 9/30/11 | 6.30 | 0.31 | (0.69 | ) | (0.38 | ) | (0.69 | ) | — | (0.69 | ) | (1.07 | ) | 5.23 | (7.15 | ) | 3,243 | 1.50 | 1.77 | 5.03 | 41 | ||||||||||||||||||||||||||||||||||||||||||||||||||||||||
10/1/09 to 9/30/10 | 6.00 | 0.13 | 0.65 | 0.78 | (0.48 | ) | — | (0.48 | ) | 0.30 | 6.30 | 14.44 | 2,474 | 1.50 | 1.70 | 2.21 | 20 | ||||||||||||||||||||||||||||||||||||||||||||||||||||||||||||
10/1/08 to 9/30/09 | 6.72 | 0.21 | (0.66 | ) | (0.45 | ) | (0.27 | ) | — | (0.27 | ) | (0.72 | ) | 6.00 | (5.59 | ) | 32,178 | 1.50 | 1.66 | 4.71 | 54 | ||||||||||||||||||||||||||||||||||||||||||||||||||||||||
Class C | |||||||||||||||||||||||||||||||||||||||||||||||||||||||||||||||||||||||||||||
10/1/12 to 9/30/13 | $ | 6.48 | 0.09 | 0.46 | 0.55 | (0.47 | ) | — | (0.47 | ) | 0.08 | $ | 6.56 | 8.55 | % | $ | 1,911 | 2.25 | % | 2.49 | % | 1.35 | % | 22 | % | ||||||||||||||||||||||||||||||||||||||||||||||||||||
10/1/11 to 9/30/12 | 5.20 | 0.12 | 1.24 | 1.36 | (0.08 | ) | — | (0.08 | ) | 1.28 | 6.48 | 26.36 | 1,531 | 2.25 | 2.60 | 2.04 | 41 | ||||||||||||||||||||||||||||||||||||||||||||||||||||||||||||
10/1/10 to 9/30/11 | 6.26 | 0.24 | (0.67 | ) | (0.43 | ) | (0.63 | ) | — | (0.63 | ) | (1.06 | ) | 5.20 | (7.90 | ) | 962 | 2.25 | 2.52 | 3.91 | 41 | ||||||||||||||||||||||||||||||||||||||||||||||||||||||||
10/1/09 to 9/30/10 | 6.00 | 0.13 | 0.61 | 0.74 | (0.48 | ) | — | (0.48 | ) | 0.26 | 6.26 | 13.73 | 494 | 2.25 | 2.51 | 2.28 | 20 | ||||||||||||||||||||||||||||||||||||||||||||||||||||||||||||
10/1/08 to 9/30/09 | 6.70 | 0.19 | (0.67 | ) | (0.48 | ) | (0.22 | ) | — | (0.22 | ) | (0.70 | ) | 6.00 | (6.30 | ) | 413 | 2.25 | 2.40 | 4.21 | 54 | ||||||||||||||||||||||||||||||||||||||||||||||||||||||||
Class I | |||||||||||||||||||||||||||||||||||||||||||||||||||||||||||||||||||||||||||||
10/1/12 to 9/30/13 | $ | 6.49 | 0.15 | 0.47 | 0.62 | (0.50 | ) | — | (0.50 | ) | 0.12 | $ | 6.61 | 9.66 | % | $ | 29,999 | 1.25 | % | 1.49 | % | 2.35 | % | 22 | % | ||||||||||||||||||||||||||||||||||||||||||||||||||||
10/1/11 to 9/30/12 | 5.23 | 0.17 | 1.25 | 1.42 | (0.16 | ) | — | (0.16 | ) | 1.26 | 6.49 | 27.74 | 28,095 | 1.25 | 1.59 | 2.92 | 41 | ||||||||||||||||||||||||||||||||||||||||||||||||||||||||||||
10/1/10 to 9/30/11 | 6.31 | 0.35 | (0.72 | ) | (0.37 | ) | (0.71 | ) | — | (0.71 | ) | (1.08 | ) | 5.23 | (7.04 | ) | 24,420 | 1.25 | 1.52 | 5.65 | 41 | ||||||||||||||||||||||||||||||||||||||||||||||||||||||||
10/1/09 to 9/30/10 | 5.99 | 0.19 | 0.61 | 0.80 | (0.48 | ) | — | (0.48 | ) | 0.32 | 6.31 | 14.83 | 24,052 | 1.25 | 1.51 | 3.31 | 20 | ||||||||||||||||||||||||||||||||||||||||||||||||||||||||||||
| 10/1/08 to 9/30/09 | 6.72 | 0.23 | (0.67 | ) | (0.44 | ) | (0.29 | ) | — | (0.29 | ) | (0.73 | ) | 5.99 | (5.43 | ) | 71 | 1.25 | 1.41 | 4.87 | 54 | ||||||||||||||||||||||||||||||||||||||||||||||||||||||||
| International Small-Cap | |||||||||||||||||||||||||||||||||||||||||||||||||||||||||||||||||||||||||||||
| Fund | |||||||||||||||||||||||||||||||||||||||||||||||||||||||||||||||||||||||||||||
Class A | |||||||||||||||||||||||||||||||||||||||||||||||||||||||||||||||||||||||||||||
10/1/12 to 9/30/13 | $ | 10.09 | 0.30 | 2.91 | 3.21 | (0.09 | ) | (0.01 | ) | (0.10 | ) | 3.11 | $ | 13.20 | 31.97 | % | $ | 403 | 1.60 | % | 2.51 | % | 2.52 | % | 26 | % | |||||||||||||||||||||||||||||||||||||||||||||||||||
9/5/12(6) to 9/30/12 | 10.00 | 0.02 | 0.07 | 0.09 | — | — | — | 0.09 | 10.09 | 0.90 | (4) | 101 | 1.60 | (3) | 16.64 | (3) | 3.65 | (3) | 0 | (4) | |||||||||||||||||||||||||||||||||||||||||||||||||||||||||
Class C | |||||||||||||||||||||||||||||||||||||||||||||||||||||||||||||||||||||||||||||
10/1/12 to 9/30/13 | $ | 10.09 | 0.19 | 2.93 | 3.12 | (0.04 | ) | (0.01 | ) | (0.05 | ) | 3.07 | $ | 13.16 | 30.92 | % | $ | 374 | 2.35 | % | 3.34 | % | 1.62 | % | 26 | % | |||||||||||||||||||||||||||||||||||||||||||||||||||
9/5/12(6) to 9/30/12 | 10.00 | 0.02 | 0.07 | 0.09 | — | — | — | 0.09 | 10.09 | 0.90 | (4) | 107 | 2.35 | (3) | 17.43 | (3) | 2.86 | (3) | 0 | (4) | |||||||||||||||||||||||||||||||||||||||||||||||||||||||||
Class I | |||||||||||||||||||||||||||||||||||||||||||||||||||||||||||||||||||||||||||||
10/1/12 to 9/30/13 | $ | 10.10 | 0.34 | 2.89 | 3.23 | (0.11 | ) | (0.01 | ) | (0.12 | ) | 3.11 | $ | 13.21 | 32.13 | % | $ | 18,123 | 1.35 | % | 2.23 | % | 2.82 | % | 26 | % | |||||||||||||||||||||||||||||||||||||||||||||||||||
9/5/12(6) to 9/30/12 | 10.00 | 0.03 | 0.07 | 0.10 | — | — | — | 0.10 | 10.10 | 1.00 | (4) | 2,834 | 1.35 | (3) | 16.39 | (3) | 3.89 | (3) | 0 | (4) | |||||||||||||||||||||||||||||||||||||||||||||||||||||||||
Footnote Legend
| (1) | Sales charges, where applicable, are not reflected in the total return calculation. |
| (2) | Computed using average shares outstanding. |
| (3) | Annualized. |
| (4) | Not annualized. |
See Notes to Financial Statements
69
Table of Contents
VIRTUS OPPORTUNITIES TRUST
FINANCIAL HIGHLIGHTS
SELECTED PER SHARE DATA AND RATIOS FOR A SHARE OUTSTANDING
THROUGHOUT EACH PERIOD
| (5) | Amount is less than $0.005. |
| (6) | Inception date. |
| (7) | Due to a change in expense ratio, the ratio shown is a blended expense ratio. |
| (8) | The Funds will also indirectly bear their prorated share of expenses of the underlying funds in which they invest. Such expenses are not included in the calculation of this ratio. |
| (9) | See Note 13 in the Notes to Financial Statements. |
See Notes to Financial Statements
70
Table of Contents
VIRTUS OPPORTUNITIES TRUST
SEPTEMBER 30, 2013
| Note | 1. Organization |
Virtus Opportunities Trust (the “Trust”) is organized as a Delaware statutory trust and is registered under the Investment Company Act of 1940 (“1940 Act”), as amended, as an open-end management investment company.
As of the date of this report, 31 funds are offered for sale, of which 11 (each a “Fund”) are reported in this annual report.
The Fund’s Investment objectives are outlined in each Fund’s Summary page.
All the Funds offer Class A, Class C shares and Class I shares. Class B shares are no longer available for purchase by new or existing shareholders, except for existing shareholders through Qualifying Transactions, For more information regarding Qualifying Transactions, refer to each Fund’s prospectus.
Class A shares of Emerging Markets Debt Fund are sold with a front-end sales charge of up to 3.75%. Class A shares of the remaining Funds are sold with a front-end sales charge of up to 5.75% with some exceptions. Generally, Class A shares are not subject to any charges by the Funds when redeemed; however, a 0.50% – 1% contingent deferred sales charge (“CDSC”) may be imposed on certain redemptions made within a certain period following purchases on which a finder’s fee has been paid. The period for which such CDSC applies for the Funds is 18 months. The CDSC period begins on the last day of the month preceding the month in which the purchase was made.
Class B shares were generally sold with a CDSC, which declines from 5% to zero depending on the period of time the shares are held. Class C shares are generally sold with a 1% CDSC if applicable, if redeemed within one year of purchase. Class I shares are sold without a front-end sales charge or CDSC.
Virtus Mutual Funds may impose an annual fee on accounts having balances of less than $2,500. The small account fee may be waived in certain circumstances, as disclosed in the prospectuses and/or statements of additional information. The fees collected will be used to offset certain expenses of the Funds.
Each Class of shares has identical voting, dividend, liquidation and other rights and the same terms and conditions, except that each class bears different distribution and/or service fees under a Board approved Rule 12b-1 and/or shareholder servicing plan (“12b-1 plan”) and has exclusive voting rights with respect to such plans. Class I shares are not subject to a 12b-1 plan. Income and other expenses and realized and unrealized gains and losses of each Fund are borne pro rata by the holders of each class of shares.
| Note | 2. Significant Accounting Policies |
The following is a summary of significant accounting policies consistently followed by the Trust in the preparation of its financial statements. The preparation of financial statements in conformity with accounting principles generally accepted in the United States of America requires management to make estimates and assumptions that affect the reported amounts of assets and liabilities, and disclosure of contingent assets and liabilities at the date of the financial statements and the reported amount of increases and decreases in net assets from operations during the reporting period. Actual results could differ from those estimates and those differences could be significant.
| A. | Security Valuation |
Security valuation procedures for each Fund, which include, nightly price variance, as well as back-testing such as bi-weekly unchanged price, monthly secondary source and transaction analysis, have been approved by the Board of Trustees (the “Board” or the “Trustees”). All internally fair valued securities are approved by a valuation committee appointed by the Board. The valuation committee is comprised of the treasurer, assistant treasurer, and two other appropriate investment professionals of the Virtus Product Management team who previously have been identified to the Board. All internally fair valued securities, referred to below, are updated daily and reviewed in detail by the valuation committee monthly unless changes occur within the period. The valuation committee reviews the validity of the model inputs and any changes to the model. Fair valuations are ratified by the Board of Directors at least quarterly.
Each Fund utilizes a fair value hierarchy which prioritizes the inputs to valuation techniques used to measure fair value into three broad levels.
| • Level 1 – | quoted prices in active markets for identical securities |
| • Level 2 – | prices determined using other significant observable inputs (including quoted prices for similar securities, interest rates, prepayment speeds, credit risk, etc.) |
| • Level 3 – | prices determined using significant unobservable inputs (including the valuation committee’s own assumptions in determining the fair value of investments) |
A description of the valuation techniques applied to a Fund’s major categories of assets and liabilities measured at fair value on a recurring basis is as follows:
Equity securities are valued at the official closing price (typically last sale) on the exchange on which the securities are primarily traded, or if no closing price is available, at the last bid price and are categorized as Level 1 in the hierarchy. Restricted equity securities and private placements that are not widely traded, are illiquid or are internally fair valued by the valuation committee, are generally categorized as Level 3 in the hierarchy.
Certain non-U.S. securities may be fair valued in cases where closing prices are not readily available or are deemed not reflective of readily available market prices. For example, significant events (such as movement in the U.S. securities market, or other regional and local developments) may occur between the time that non-U.S. markets close (where the security is principally traded) and the time that a Fund calculates its net asset value (“NAV”) (generally, 4 p.m. Eastern time the close of the New York Stock Exchange (“NYSE”)) that may impact the value of securities traded in these non-U.S. markets. In such cases the Funds fair value non-U.S. securities using an independent pricing service which considers the correlation of the trading patterns of the non-U.S. security to the intraday trading in the U.S. markets for investments such as ADRs, financial futures, ETFs, and certain indexes as well as prices for similar securities. Such fair valuations are categorized as Level 2 in the hierarchy. Because the frequency of significant events is not predictable, fair valuation of certain non-U.S. common stocks may occur on a frequent basis.
��
71
Table of Contents
VIRTUS OPPORTUNITIES TRUST
NOTES TO FINANCIAL STATEMENTS (Continued)
SEPTEMBER 30, 2013
Debt securities, including restricted securities, are valued based on evaluated quotations received from independent pricing services or from dealers who make markets in such securities. For most bond types, the pricing service utilizes matrix pricing that considers one or more of the following factors: yield or price of bonds of comparable quality, coupon, maturity, current cash flows, type, and current day trade information, as well as dealer-supplied prices. These valuations are generally categorized as Level 2 in the hierarchy. Structured debt instruments such as mortgage-backed and asset-backed securities may also incorporate collateral analysis and utilize cash flow models for valuation and are generally categorized as Level 2 in the hierarchy. Pricing services do not provide pricing for all securities and therefore indicative bids from dealers are utilized which are based on pricing models used by market makers in the security and are generally categorized as Level 2 in the hierarchy. Debt securities that are not widely traded, are illiquid, or are internally fair valued by the valuation committee are generally categorized as Level 3 in the hierarchy.
Listed derivatives such as treasury futures, that are actively traded are valued based on quoted prices from the exchange and are categorized as Level 1 in the hierarchy. Over-the-counter derivative contracts, which include forward currency contracts and equity-linked instruments, do not require material subjectivity as pricing inputs are observed from actively quoted markets and are categorized as Level 2 in the hierarchy.
Investments in open-end mutual funds are valued at their closing NAV determined as of the close of business of the NYSE each business day and are categorized as Level 1 in the hierarchy.
Short-term notes having a maturity of 60 days or less are valued at amortized cost, which approximates market, and are generally categorized as Level 2 in the hierarchy.
A summary of the inputs used to value the Funds’ net assets by each major security type is disclosed at the end of the Schedule of Investments for each Fund. The inputs or methodologies used for valuing securities are not necessarily an indication of the risk associated with investing in those securities.
The Funds own the following internally fair valued securities and which are categorized as Level 3 in the hierarchy.
These stocks are internally fair valued based on the details of pending corporate actions.
Virtus Greater Asia ex Japan Opportunities Fund | Delta Brac Housing Finance Corp. | |
Virtus International Equity Fund | Barclays ADS Rights |
| B. | Security Transactions and Investment Income |
Security transactions are recorded on the trade date. Realized gains and losses from the sales of securities are determined on the identified cost basis. Dividend income is recognized on the ex-dividend date, or in the case of certain foreign securities, as soon as a Fund is notified. Interest income is recorded on the accrual basis. Each Fund amortizes premiums and accretes discounts using the effective interest method.
Dividend income from REIT investments is recorded using management’s estimate of the income included in distributions received from the REIT investments. Distributions received in excess of this estimated amount are recorded as a reduction of the cost of investments or reclassified to capital gains. The actual amounts of income, return of capital, and capital gains are only determined by each REIT after its fiscal year-end, and may differ from the estimated amounts.
| C. | Income Taxes |
Each Fund is treated as a separate taxable entity. It is the intention of each Fund to comply with the requirements of Subchapter M of the Internal Revenue Code and to distribute substantially all of its taxable income to its shareholders. Therefore, no provision for federal income taxes or excise taxes has been made.
Certain Funds may be subject to foreign taxes on income, gains on investments or currency repatriation, a portion of which may be recoverable. Each Fund will accrue such taxes and recoveries as applicable based upon current interpretations of the tax rules and regulations that exist in the markets in which it invests.
Management of the Funds has concluded that there are no significant uncertain tax positions that would require recognition in the financial statements. As of September 30, 2013, the tax years that remain subject to examination by the major tax jurisdictions under the statute of limitations are from the year 2010 forward (with limited exceptions).
| D. | Distributions to Shareholders |
Distributions are recorded by each Fund on the ex-dividend date. Income and capital gain distributions are determined in accordance with income tax regulations that may differ from accounting principles generally accepted in the United States of America. These differences may include the treatment of non-taxable dividends, market premium and discount, non-deductible expenses, expiring capital loss carryovers, foreign currency gain or loss, gain or loss on futures contracts, partnerships, operating losses and losses deferred due to wash sales. Permanent book and tax basis differences relating to shareholder distributions will result in reclassifications to capital paid in on shares of beneficial interest.
| E. | Expenses |
Expenses incurred together by a Fund and other affiliated mutual funds are allocated in proportion to the net assets of each Fund, except where allocation of direct expense to each such fund or an alternative allocation method can be more appropriately used.
In addition to the net annual operating expenses that a Fund bears directly, the shareholders of a Fund indirectly bear the Fund’s pro-rata expenses of the underlying mutual funds in which a Fund invests.
| F. | Foreign Currency Translation |
Non-U.S. investment securities and other assets and liabilities denominated in foreign currencies are translated into U.S. dollar amounts at the foreign currency exchange rate effective at the end of the reporting period. Cost of investments is translated at the currency exchange rate effective at the trade date. The gain or loss resulting from a change in currency exchange rates between the trade and settlement date of a portfolio transaction is treated as a gain or loss on non-U.S. currency. Likewise, the gain or loss resulting from a change in currency exchange rates
72
Table of Contents
VIRTUS OPPORTUNITIES TRUST
NOTES TO FINANCIAL STATEMENTS (Continued)
SEPTEMBER 30, 2013
between the date income is accrued and paid is treated as a gain or loss on foreign currency. The Funds do not isolate that portion of the results of operations arising from changes in foreign exchange rates on investments from the fluctuations arising from changes in the market prices of securities held. Such fluctuations are included with the net realized and unrealized gain or loss on investments.
| G. | Derivative Financial Instruments |
Disclosures on derivative instruments and hedging activities are intended to improve financial reporting for derivative instruments by enhanced disclosure that enables the investors to understand how and why a fund uses derivatives, how derivatives are accounted for, and how derivative instruments affect a fund’s results of operations and financial position. Summarized below is the specific type of derivative instruments used by the Funds.
Forward Currency Contracts: A forward currency contract involves an obligation to purchase or sell a specific currency at a future date, which may be any number of days from the date of the contract agreed upon by the parties, at a price set at the time of the contract. These contracts are traded directly between currency traders and their customers. The contract is marked-to-market daily and the change in market value is recorded by the Funds as an unrealized gain or loss in the Statements of Operations. When the contract is closed or offset with the same counterparty, on settlement date, the Funds record a realized gain or loss equal to the change in the value of the contract when it was opened and the value at the time it was closed or offset. This is presented in the Statements of Operations as net realized gain (loss) from foreign currency transactions.
Funds enter into forward currency contracts in conjunction with the planned purchase or sale of foreign denominated securities in order to hedge the U.S. dollar cost or proceeds. The Funds also, from time to time, hedge the currency exposure of foreign denominated securities, held in the portfolio, back to U.S. dollars during perceived times of U.S. dollar strength. This is done in order to protect the U.S. dollar value of the portfolio. Forward currency contracts involve, to varying degrees, elements of market risk in excess of the amount recognized in the Statement of Assets and Liabilities. Risks arise from the possible movements in foreign exchange rates or if the counterparty does not perform under the contract.
| H. | Securities Lending |
Certain Funds may loan securities to qualified brokers through an agreement with Brown Brothers Harriman (“BBH”), as a third party lending agent. Under the terms of agreement, the Fund is required to maintain collateral with a market value not less than 100% of the market value of loaned securities. Collateral is adjusted daily in connection with changes in the market value of securities on loan. Collateral may consist of cash and securities issued by the U.S. Government or its agencies. Cash collateral is invested in a short-term money market fund. Dividends earned on the collateral and premiums paid by the broker are recorded as income by the Fund net of fees and rebates charged by BBH for its services as securities lending agent and in connection with this securities lending program. Lending portfolio securities involves a risk of delay in the recovery of the loaned securities or in the declining value of the collateral.
At September 30, 2013 none of the Funds had securities on loan.
| I. | Loan Agreements |
Certain Funds may invest in direct debt instruments which are interests in amounts owed by a corporate, governmental, or other borrower to lenders or lending syndicates. Loan Agreements are generally non-investment grade, often involve borrowers that are highly leveraged. The Funds may invest in obligations of borrowers who are in bankruptcy proceedings. Loan agreements are typically senior in the corporate capital structure of the borrower. A loan is often administered by a bank or other financial institution (the “lender”) that acts as agent for all holders. The agent administers the terms of the loan, as specified in the loan agreement. A Fund’s investments in loans may be in the form of participations in loans or assignments of all or a portion of loans from third parties. When investing in loan participations, the Fund has the right to receive payments of principal, interest and any fees to which it is entitled only from the lender selling the loan participation and only upon receipt by the lender of payments from the borrower. The Fund generally has no right to enforce compliance with the terms of the loan agreement with the borrower. As a result, the Fund may be subject to the credit risk of both the borrower and the lender that is selling the loan agreement. When the Fund purchases assignments from lenders it acquires direct rights against the borrower on the loan. All loan agreements currently held by the Funds are assignment loans.
A Fund may invest in multiple series or tranches of a loan, which may have varying terms and carry different associated risks. Loan agreements may involve foreign borrowers, and investments may be denominated in foreign currencies. Direct indebtedness of emerging countries involves a risk that the government entities responsible for the repayment of the debt may be unable, or unwilling, to pay the principal and interest when due.
The loan agreements have floating rate loan interests which generally pay interest at rates that are periodically determined by reference to a base lending rate plus a premium. The base lending rates are generally LIBOR (London Interbank Offered Rate), the prime rate offered by one or more US banks or the certificate of deposit rate. When a loan agreement is purchased the Fund may pay an assignment fee. On an ongoing basis, the Funds may receive a commitment fee based on the undrawn portion of the underlying line of credit portion of a loan agreement. Prepayment penalty fees are received upon the prepayment of a loan agreement by a borrower. Prepayment penalty, facility, commitment, consent and amendment fees are recorded to income as earned or paid.
| Note | 3. Investment Advisory Fee and Related Party Transactions |
($ reported in thousands except as noted)
| A. | Adviser |
Virtus Investment Advisers, Inc. (the “Adviser”), an indirect wholly-owned subsidiary of Virtus Investment Partners, Inc. (“Virtus”), is the Adviser to the Trust. The Adviser manages the Funds’ investment programs and general operations of the Funds, including oversight of the Funds’ subadvisers.
73
Table of Contents
VIRTUS OPPORTUNITIES TRUST
NOTES TO FINANCIAL STATEMENTS (Continued)
SEPTEMBER 30, 2013
As compensation for its services to the Funds, the Adviser is entitled to a fee based upon the following annual rates as a percentage of the average daily net assets of each Fund:
| 1st $1 Billion | $1 + Billion | |||||||
Emerging Markets Debt Fund | 0.75 | % | 0.70 | % | ||||
Emerging Markets Equity Income Fund | 1.05 | 1.00 | ||||||
Greater Asia ex Japan Opportunities Fund | 1.00 | 0.95 | ||||||
Greater European Opportunities Fund | 0.85 | 0.80 | ||||||
International Small-Cap Fund | 1.00 | 0.95 | ||||||
| 1st $1 Billion | $1+ Billion – $2 Billion | $2 + Billion | ||||||||||
Global Commodities Stock Fund | 1.00 | % | 0.95 | % | 0.90 | % | ||||||
Global Dividend Fund | 0.65 | 0.60 | 0.55 | |||||||||
Global Opportunities Fund | 0.85 | 0.80 | 0.75 | |||||||||
Global Real Estate Securities Fund | 0.85 | 0.80 | 0.75 | |||||||||
International Real Estate Securities Fund | 1.00 | 0.95 | 0.90 | |||||||||
| 1st $2 Billion | $2 + Billion – $4 Billion | $4 + Billion | ||||||||||
International Equity Fund | 0.85 | % | 0.80 | % | 0.75 | % | ||||||
| B. | Subadvisers |
The subadviser manages the investments of each Fund for which they are paid a fee by the Adviser. The subadvisers and the Funds they service are as follows:
Fund | Subadviser | Fund | Subadviser | |||
Emerging Markets Debt Fund | NF(6) | Greater Asia ex Japan Opportunities Fund | Vontobel(4) | |||
Emerging Markets Equity Income fund | KBI(2) | Greater European Opportunities Fund | Vontobel(4) | |||
| Global Commodities Stock Fund | BMO(5) | International Equity Fund | Euclid(3) | |||
| Global Dividend Fund | DPIM(1) | International Real Estate Securities Fund | DPIM(1) | |||
| Global Opportunities Fund | Vontobel(4) | International Small-Cap Fund | KAR(7) | |||
| Global Real Estate Securities Fund | DPIM(1) |
| (1) | Duff & Phelps Investment Management Co., an indirect, wholly-owned subsidiary of Virtus. |
| (2) | Kleinwort Benson Investors, International, Ltd |
| (3) | Effective May 22, 2013 Euclid Advisors, LLC an indirect wholly-owned subsidiary of Virtus, became the subadviser. Prior to that, Pyrford International Ltd. an indirect wholly-owned subsidiary of the Bank of Montreal (“BoM”) was the subadviser. BoM, through its subsidiary BMO Bankcorp, is a minority investor of Virtus. |
| (4) | Vontobel Asset Management, Inc. |
| (5) | BMO Asset Management Corp., an indirect, wholly-owned subsidiary of BoM. BoM, through its subsidiary BMO Bankcorp, is a minority investor of Virtus. |
| (6) | Newfleet Asset Management, LLC an indirect wholly-owned subsidiary of Virtus. |
| (7) | Kayne Anderson Rudnick Investment Management, LLC an indirect wholly-owned subsidiary of Virtus. |
| C. | Expense Limits and Fee Waivers |
The Adviser has voluntarily agreed to limit certain Fund’s total operating expenses (excluding taxes, extraordinary expenses and acquired fund fees and expenses, if any), so that such expenses do not exceed the below percentages of the Fund’s average daily net asset values as listed below. The Adviser may discontinue these voluntary expense caps at any time.
| Class A | Class B | Class C | Class I | |||||||||||||
Global Commodities Stock Fund | 1.65 | % | — | % | 2.40 | % | 1.40 | % | ||||||||
Global Opportunities Fund | 1.55 | 2.30 | 2.30 | 1.30 | ||||||||||||
Global Real Estate Securities Fund | 1.40 | — | 2.15 | 1.15 | ||||||||||||
Greater Asia ex Japan Opportunities Fund | 1.80 | — | 2.55 | 1.55 | ||||||||||||
Greater European Opportunities Fund | 1.45 | — | 2.20 | 1.20 | ||||||||||||
International Equity Fund | 1.50 | — | 2.25 | 1.25 | ||||||||||||
International Real Estate Securities Fund | 1.50 | — | 2.25 | 1.25 | ||||||||||||
The Adviser has contractually agreed to limit the following Fund’s total operating expenses (excluding interest, taxes, and extraordinary expenses, if any) so that such expenses do not exceed the below percentages of the Fund’s average daily net asset values as listed below.
| Class A | Class C | Class I | Through Date | |||||||||||||
Emerging Markets Debt Fund | 1.35 | % | 2.10 | % | 1.10 | % | 1/31/14 | |||||||||
Emerging Markets Equity Income Fund | 1.75 | 2.50 | 1.50 | 1/31/14 | ||||||||||||
International Small-Cap Fund | 1.60 | 2.35 | 1.35 | 1/31/14 | ||||||||||||
| D. | Expense Recapture |
For certain Funds the Adviser may recapture operating expenses waived or reimbursed under these arrangements, within three fiscal years following the end of the fiscal year in which such waiver or reimbursement occurred. The Fund must pay its ordinary operating expenses before the
74
Table of Contents
VIRTUS OPPORTUNITIES TRUST
NOTES TO FINANCIAL STATEMENTS (Continued)
SEPTEMBER 30, 2013
Adviser is entitled to any reimbursement and must remain in compliance with any applicable expense limitations or if none, the expense limitation in effect at the time of the waiver or reimbursement. All or a portion of the following Adviser reimbursed expenses may be recaptured as follows:
| Fiscal Year Ended | ||||||||||||||||
| 2014 | 2015 | 2016 | Total | |||||||||||||
Emerging Markets Debt Fund | $ | — | $ | 35 | $ | 64 | $ | 99 | ||||||||
Emerging Markets Equity Income Fund | — | 29 | 95 | 124 | ||||||||||||
Global Commodities Stock Fund | 85 | 38 | 54 | 177 | ||||||||||||
Global Opportunities Fund* | 20 | 5 | — | 25 | ||||||||||||
Global Real Estate Securities Fund | 86 | 98 | 90 | 274 | ||||||||||||
Greater Asia ex Japan Opportunities Fund | 149 | 132 | 125 | 406 | ||||||||||||
Greater European Opportunities Fund | 83 | 78 | 87 | 248 | ||||||||||||
International Equity Fund | 106 | 51 | 67 | 224 | ||||||||||||
International Real Estate Securities Fund | 82 | 96 | 95 | 273 | ||||||||||||
International Small Cap | — | 30 | 85 | 115 | ||||||||||||
| * | Advisor is currently recapturing waived or reimbursed expenses. |
| E. | Distributor |
VP Distributors, LLC (“VP Distributors”), an indirect wholly-owned subsidiary of Virtus, serves as the distributor of each Fund’s shares and has advised the Funds that for the fiscal year (the “period”) ended September 30, 2013, it retained net commissions of $83 Class A shares and deferred sales charges of $—*, and $5 for Class B shares and Class C shares respectively.
* Amount less than $500.
In addition, each Fund pays VP Distributors distribution and/or service fees under a 12b-1 plan as a percentage of the average daily net assets of each respective class at the annual rates as follows: Class A shares 0.25%; Class B shares 1.00%; Class C shares 1.00%; Class I shares are not subject to a 12b-1 plan.
Under certain circumstances, shares of certain Virtus Mutual Funds may be exchanged for shares of the same class of certain other Virtus Mutual Funds on the basis of the relative NAV per share at the time of the exchange. On exchanges with share classes that carry a CDSC, the CDSC schedule of the original shares purchased continues to apply.
| F. | Administrator and Transfer Agent |
Effective January 1, 2013, with the approval of the Board, VP Distributors LLC, the Fund’s former Administrator and Transfer Agent, assigned its rights and obligations under the Administration Agreement and Transfer Agency and Service Agreement to Virtus Fund Services, LLC, an indirect wholly-owned subsidiary of Virtus. For the period of October 1, 2012 to December 31, 2012, VP Distributors LLC served as the Administrator and Transfer Agent to the Funds. For the period of January 1, 2013 to September 30, 2013, Virtus Fund Services, LLC served as Administrator and Transfer Agent to the Funds.
For the period ended September 30, 2013, the Funds incurred administration fees from the Trust totaling $403 which are included in the Statements of Operations.
For the period ended September 30, 2013, the Funds incurred transfer agent fees from the Trust totaling $418 which are included in the Statements of Operations. A portion is paid to outside entities that also provide service to the Trust.
| G. | Affiliated Shareholders |
At September 30, 2013, Virtus and its affiliates, BMO Bankcorp (a minority investor in Virtus) and its affiliates, and the retirement plans of Virtus and its affiliates held shares of the Funds which may be redeemed at any time that aggregated the following:
| Shares | Aggregate Net Asset Value | |||||||
| Emerging Markets Debt Fund | ||||||||
Class A | 10,502 | $ | 99 | |||||
Class C | 10,424 | 98 | ||||||
Class I | 2,611,289 | 24,598 | ||||||
| Emerging Markets Equity Income Fund | ||||||||
Class A | 10,238 | 108 | ||||||
Class C | 10,187 | 107 | ||||||
Class I | 491,939 | 5,205 | ||||||
| Global Commodities Stock Fund | ||||||||
Class C | 10,133 | 90 | ||||||
Class I | 2,932,665 | 26,306 | ||||||
| Global Dividend Fund | ||||||||
Class I | 3,269,524 | 45,577 | ||||||
| Global Real Estate Securities Fund | ||||||||
Class A | 103,993 | 2,406 | ||||||
Class C | 12,765 | 291 | ||||||
Class I | 595,986 | 13,875 | ||||||
75
Table of Contents
VIRTUS OPPORTUNITIES TRUST
NOTES TO FINANCIAL STATEMENTS (Continued)
SEPTEMBER 30, 2013
| Shares | Aggregate Net Asset Value | |||||||
| International Equity Fund | ||||||||
Class A | 9,470 | $ | 99 | |||||
Class C | 9,588 | 99 | ||||||
Class I | 76,118 | 795 | ||||||
| International Real Estate Securities Fund | ||||||||
Class A | 285,227 | 1,885 | ||||||
Class I | 2,684,111 | 17,742 | ||||||
| International Small-Cap Fund | ||||||||
Class A | 10,087 | 133 | ||||||
Class C | 10,038 | 132 | ||||||
Class I | 282,871 | 3,737 | ||||||
| Note | 4. Purchases and Sales of Securities |
($ reported in thousands)
Purchases and sales of securities (excluding U.S. Government securities and agency securities, forward currency contracts, futures and short-term securities) during the period ended September 30, 2013, were as follows:
Purchases | Sales | |||||||
Emerging Markets Debt Fund | $ | 21,568 | $ | 15,947 | ||||
Emerging Markets Equity Income Fund | 11,437 | 6,909 | ||||||
Global Commodities Stock Fund | 41,892 | 30,878 | ||||||
Global Dividend Fund | 57,725 | 16,118 | ||||||
Global Opportunities Fund | 65,564 | 62,535 | ||||||
Global Real Estate Securities Fund | 27,345 | 6,220 | ||||||
Greater Asia ex Japan Opportunities Fund | 5,280 | 3,940 | ||||||
Greater European Opportunities Fund | 15,236 | 8,054 | ||||||
International Equity Fund | 59,044 | 82,864 | ||||||
International Real Estate Securities Fund | 15,000 | 8,134 | ||||||
International Small-Cap Fund | 12,945 | 2,230 | ||||||
Purchases and sales of long term U.S. Government and agency securities for the Funds during the period ended September 30, 2013 were as follows:
Purchases | Sales | |||||||
Emerging Markets Debt Fund | $ | — | $ | 293 | ||||
| Note | 5. Capital Share Transactions |
(reported in thousands)
Transactions in shares of capital stock, during the periods ended as indicated below, were as follows:
| Emerging Markets Debt Fund | Emerging Markets Equity Income Fund | |||||||||||||||||||||||||||||||
| Year Ended September 30, 2013 | From Inception September 5, 2012 to September 30, 2012 | Year Ended September 30, 2013 | From Inception September 5, 2012 to September 30, 2012 | |||||||||||||||||||||||||||||
| SHARES | AMOUNT | SHARES | AMOUNT | SHARES | AMOUNT | SHARES | AMOUNT | |||||||||||||||||||||||||
| Class A | ||||||||||||||||||||||||||||||||
| Sale of shares | 606 | $ | 6,287 | 10 | $ | 100 | 131 | $ | 1,374 | 10 | $ | 100 | ||||||||||||||||||||
| Reinvestment of distributions | 8 | 74 | — | — | 1 | 9 | — | — | ||||||||||||||||||||||||
| Shares repurchased | (285 | ) | (2,704 | ) | — | — | (63 | ) | (653 | ) | — | — | ||||||||||||||||||||
|
|
|
|
|
|
|
|
|
|
|
|
|
|
|
| |||||||||||||||||
| Net Increase / (Decrease) | 329 | $ | 3,657 | 10 | $ | 100 | 69 | $ | 730 | 10 | $ | 100 | ||||||||||||||||||||
|
|
|
|
|
|
|
|
|
|
|
|
|
|
|
| |||||||||||||||||
| Class C | ||||||||||||||||||||||||||||||||
| Sale of shares | 31 | $ | 319 | 11 | $ | 109 | 31 | $ | 329 | 10 | $ | 100 | ||||||||||||||||||||
| Reinvestment of distributions | 1 | 9 | — | — | — | (1) | 3 | — | — | |||||||||||||||||||||||
| Shares repurchased | (3 | ) | (32 | ) | — | — | (2 | ) | (21 | ) | — | — | ||||||||||||||||||||
|
|
|
|
|
|
|
|
|
|
|
|
|
|
|
| |||||||||||||||||
| Net Increase / (Decrease) | 29 | $ | 296 | 11 | $ | 109 | 29 | $ | 311 | 10 | $ | 100 | ||||||||||||||||||||
|
|
|
|
|
|
|
|
|
|
|
|
|
|
|
| |||||||||||||||||
| Class I | ||||||||||||||||||||||||||||||||
| Sale of shares | 10 | $ | 107 | 2,480 | $ | 24,800 | 337 | $ | 3,496 | 480 | $ | 4,800 | ||||||||||||||||||||
| Reinvestment of distributions | 132 | 1,317 | — | — | 12 | 131 | — | — | ||||||||||||||||||||||||
| Shares repurchased | (3 | ) | (25 | ) | — | — | (11 | ) | (114 | ) | — | — | ||||||||||||||||||||
|
|
|
|
|
|
|
|
|
|
|
|
|
|
|
| |||||||||||||||||
| Net Increase / (Decrease) | 139 | $ | 1,399 | 2,480 | $ | 24,800 | 338 | $ | 3,513 | 480 | $ | 4,800 | ||||||||||||||||||||
|
|
|
|
|
|
|
|
|
|
|
|
|
|
|
| |||||||||||||||||
| (1) | Amount is less than 500. |
76
Table of Contents
VIRTUS OPPORTUNITIES TRUST
NOTES TO FINANCIAL STATEMENTS (Continued)
SEPTEMBER 30, 2013
| Global Commodities Stock Fund | Global Dividend Fund | |||||||||||||||||||||||||||||||
| Year Ended September 30, 2013 | Year Ended September 30, 2012 | Year Ended September 30, 2013 | Year Ended September 30, 2012 | |||||||||||||||||||||||||||||
| SHARES | AMOUNT | SHARES | AMOUNT | SHARES | AMOUNT | SHARES | AMOUNT | |||||||||||||||||||||||||
| Class A | ||||||||||||||||||||||||||||||||
| Sale of shares | 80 | $ | 742 | 140 | $ | 1,240 | 2,127 | $ | 28,633 | 1,597 | $ | 19,592 | ||||||||||||||||||||
| Reinvestment of distributions | 2 | 22 | — | (1) | — | (1) | 84 | 1,117 | 62 | 753 | ||||||||||||||||||||||
| Shares repurchased | (117 | ) | (1,021 | ) | (71 | ) | (674 | ) | (1,204 | ) | (16,357 | ) | (944 | ) | (11,480 | ) | ||||||||||||||||
|
|
|
|
|
|
|
|
|
|
|
|
|
|
|
| |||||||||||||||||
| Net Increase / (Decrease) | (35 | ) | $ | (257 | ) | 69 | $ | 566 | 1,007 | $ | 13,393 | 715 | $ | 8,865 | ||||||||||||||||||
|
|
|
|
|
|
|
|
|
|
|
|
|
|
|
| |||||||||||||||||
| Class C | ||||||||||||||||||||||||||||||||
| Sale of shares | 27 | $ | 242 | 1 | $ | 9 | 704 | $ | 9,451 | 274 | $ | 3,393 | ||||||||||||||||||||
| Reinvestment of distributions | — | (1) | 2 | — | — | 15 | 199 | 9 | 113 | |||||||||||||||||||||||
| Shares repurchased | (5 | ) | (42 | ) | (1 | ) | (11 | ) | (135 | ) | (1,827 | ) | (135 | ) | (1,608 | ) | ||||||||||||||||
|
|
|
|
|
|
|
|
|
|
|
|
|
|
|
| |||||||||||||||||
| Net Increase / (Decrease) | 22 | $ | 202 | — | (1) | $ | (2 | ) | 584 | $ | 7,823 | 148 | $ | 1,898 | ||||||||||||||||||
|
|
|
|
|
|
|
|
|
|
|
|
|
|
|
| |||||||||||||||||
| Class I | ||||||||||||||||||||||||||||||||
| Sale of shares | 1,805 | $ | 17,009 | 488 | $ | 4,563 | 1,932 | $ | 26,030 | 1,600 | $ | 19,736 | ||||||||||||||||||||
| Reinvestment of distributions | 44 | 411 | 9 | 83 | 122 | 1,626 | 101 | 1,234 | ||||||||||||||||||||||||
| Shares repurchased | (530 | ) | (4,807 | ) | (548 | ) | (5,050 | ) | (788 | ) | (10,470 | ) | (999 | ) | (12,391 | ) | ||||||||||||||||
|
|
|
|
|
|
|
|
|
|
|
|
|
|
|
| |||||||||||||||||
| Net Increase / (Decrease) | 1,319 | $ | 12,613 | (51 | ) | $ | (404 | ) | 1,266 | $ | 17,186 | 702 | $ | 8,579 | ||||||||||||||||||
|
|
|
|
|
|
|
|
|
|
|
|
|
|
|
| |||||||||||||||||
| Global Opportunities Fund | Global Real Estate Securities Fund | |||||||||||||||||||||||||||||||
| Year Ended September 30, 2013 | Year Ended September 30, 2012 | Year Ended September 30, 2013 | Year Ended September 30, 2012 | |||||||||||||||||||||||||||||
| SHARES | AMOUNT | SHARES | AMOUNT | SHARES | AMOUNT | SHARES | AMOUNT | |||||||||||||||||||||||||
| Class A | ||||||||||||||||||||||||||||||||
| Sale of shares | 1,572 | $ | 16,673 | 4,217 | $ | 37,925 | 513 | $ | 12,029 | 307 | $ | 6,515 | ||||||||||||||||||||
| Reinvestment of distributions | 20 | 200 | 29 | 247 | 13 | 286 | 8 | 153 | ||||||||||||||||||||||||
| Shares repurchased | (1,733 | ) | (18,392 | ) | (3,966 | ) | (36,634 | ) | (252 | ) | (5,866 | ) | (224 | ) | (4,548 | ) | ||||||||||||||||
|
|
|
|
|
|
|
|
|
|
|
|
|
|
|
| |||||||||||||||||
| Net Increase / (Decrease) | (141 | ) | $ | (1,519 | ) | 280 | $ | 1,538 | 274 | $ | 6,449 | 91 | $ | 2,120 | ||||||||||||||||||
|
|
|
|
|
|
|
|
|
|
|
|
|
|
|
| |||||||||||||||||
| Class B | ||||||||||||||||||||||||||||||||
| Sale of shares | 3 | $ | 28 | 30 | $ | 240 | — | $ | — | — | $ | — | ||||||||||||||||||||
| Shares repurchased | (41 | ) | (381 | ) | (41 | ) | (330 | ) | — | — | — | — | ||||||||||||||||||||
|
|
|
|
|
|
|
|
|
|
|
|
|
|
|
| |||||||||||||||||
| Net Increase / (Decrease) | (38 | ) | $ | (353 | ) | (11 | ) | $ | (90 | ) | — | $ | — | — | $ | — | ||||||||||||||||
|
|
|
|
|
|
|
|
|
|
|
|
|
|
|
| |||||||||||||||||
| Class C | ||||||||||||||||||||||||||||||||
| Sale of shares | 177 | $ | 1,670 | 113 | $ | 911 | 109 | $ | 2,503 | 40 | $ | 864 | ||||||||||||||||||||
| Reinvestment of distributions | — | — | — | — | 2 | 49 | 1 | 11 | ||||||||||||||||||||||||
| Shares repurchased | (67 | ) | (630 | ) | (35 | ) | (284 | ) | (17 | ) | (380 | ) | (7 | ) | (149 | ) | ||||||||||||||||
|
|
|
|
|
|
|
|
|
|
|
|
|
|
|
| |||||||||||||||||
| Net Increase / (Decrease) | 110 | $ | 1,040 | 78 | $ | 627 | 94 | $ | 2,172 | 34 | $ | 726 | ||||||||||||||||||||
|
|
|
|
|
|
|
|
|
|
|
|
|
|
|
| |||||||||||||||||
| Class I | ||||||||||||||||||||||||||||||||
| Sale of shares | 403 | $ | 4,324 | 2,383 | $ | 22,400 | 607 | $ | 14,299 | 516 | $ | 10,922 | ||||||||||||||||||||
| Reinvestment of distributions | 14 | 143 | — | — | 18 | 403 | 1 | 20 | ||||||||||||||||||||||||
| Shares repurchased | (132 | ) | (1,387 | ) | — | — | (72 | ) | (1,683 | ) | (16 | ) | (341 | ) | ||||||||||||||||||
|
|
|
|
|
|
|
|
|
|
|
|
|
|
|
| |||||||||||||||||
| Net Increase / (Decrease) | 285 | $ | 3,080 | 2,383 | $ | 22,400 | 553 | $ | 13,019 | 501 | $ | 10,601 | ||||||||||||||||||||
|
|
|
|
|
|
|
|
|
|
|
|
|
|
|
| |||||||||||||||||
| (1) | Amount is less than 500. |
77
Table of Contents
VIRTUS OPPORTUNITIES TRUST
NOTES TO FINANCIAL STATEMENTS (Continued)
SEPTEMBER 30, 2013
| Greater Asia ex Japan Opportunities Fund | Greater European Opportunities Fund | |||||||||||||||||||||||||||||||
| Year Ended September 30, 2013 | Year Ended September 30, 2012 | Year Ended September 30, 2013 | Year Ended September 30, 2012 | |||||||||||||||||||||||||||||
| SHARES | AMOUNT | SHARES | AMOUNT | SHARES | AMOUNT | SHARES | AMOUNT | |||||||||||||||||||||||||
| Class A | ||||||||||||||||||||||||||||||||
| Sale of shares | 103 | $ | 1,601 | 12 | $ | 170 | 578 | $ | 8,821 | 64 | $ | 852 | ||||||||||||||||||||
| Reinvestment of distributions | 21 | 325 | 28 | 360 | 18 | 270 | 21 | 247 | ||||||||||||||||||||||||
| Shares repurchased | (72 | ) | (1,142 | ) | (153 | ) | (2,015 | ) | (208 | ) | (3,196 | ) | (14 | ) | (179 | ) | ||||||||||||||||
|
|
|
|
|
|
|
|
|
|
|
|
|
|
|
| |||||||||||||||||
| Net Increase / (Decrease) | 52 | $ | 784 | (113 | ) | $ | (1,485 | ) | 388 | $ | 5,895 | 71 | $ | 920 | ||||||||||||||||||
|
|
|
|
|
|
|
|
|
|
|
|
|
|
|
| |||||||||||||||||
| Class C | ||||||||||||||||||||||||||||||||
| Sale of shares | 13 | $ | 208 | 1 | $ | 18 | 43 | $ | 656 | — | (1) | $ | 6 | |||||||||||||||||||
| Reinvestment of distributions | — | (1) | 7 | 1 | 8 | — | (1) | 7 | 1 | 6 | ||||||||||||||||||||||
| Shares repurchased | (2 | ) | (29 | ) | (3 | ) | (38 | ) | (18 | ) | (280 | ) | — | (1) | — | (1) | ||||||||||||||||
|
|
|
|
|
|
|
|
|
|
|
|
|
|
|
| |||||||||||||||||
| Net Increase / (Decrease) | 11 | $ | 186 | (1 | ) | $ | (12 | ) | 25 | $ | 383 | 1 | $ | 12 | ||||||||||||||||||
|
|
|
|
|
|
|
|
|
|
|
|
|
|
|
| |||||||||||||||||
| Class I | ||||||||||||||||||||||||||||||||
| Sale of shares | 48 | $ | 738 | 16 | $ | 223 | 361 | $ | 5,441 | 8 | $ | 100 | ||||||||||||||||||||
| Reinvestment of distributions | 1 | 12 | 1 | 18 | 6 | 94 | — | (1) | 5 | |||||||||||||||||||||||
| Shares repurchased | (2 | ) | (37 | ) | (15 | ) | (204 | ) | (258 | ) | (3,854 | ) | (15 | ) | (179 | ) | ||||||||||||||||
|
|
|
|
|
|
|
|
|
|
|
|
|
|
|
| |||||||||||||||||
| Net Increase / (Decrease) | 47 | $ | 713 | 2 | $ | 37 | 109 | $ | 1,681 | (7 | ) | $ | (74 | ) | ||||||||||||||||||
|
|
|
|
|
|
|
|
|
|
|
|
|
|
|
| |||||||||||||||||
| (1) | Amount is less than 500. |
| International Equity Fund | International Real Estate Securities Fund | |||||||||||||||||||||||||||||||
| Year Ended September 30, 2013 | Year Ended September 30, 2012 | Year Ended September 30, 2013 | Year Ended September 30, 2012 | |||||||||||||||||||||||||||||
| SHARES | AMOUNT | SHARES | AMOUNT | SHARES | AMOUNT | SHARES | AMOUNT | |||||||||||||||||||||||||
| Class A | ||||||||||||||||||||||||||||||||
| Sale of shares | 13 | $ | 135 | 8 | $ | 88 | 1,121 | $ | 7,391 | 200 | $ | 1,197 | ||||||||||||||||||||
| Reinvestment of distributions | 3 | 26 | 1 | 7 | 60 | 394 | 12 | 66 | ||||||||||||||||||||||||
| Shares repurchased | (17 | ) | (180 | ) | (88 | ) | (916 | ) | (235 | ) | (1,564 | ) | (230 | ) | (1,321 | ) | ||||||||||||||||
|
|
|
|
|
|
|
|
|
|
|
|
|
|
|
| |||||||||||||||||
| Net Increase / (Decrease) | (1 | ) | $ | (19 | ) | (79 | ) | $ | (821 | ) | 946 | $ | 6,221 | (18 | ) | $ | (58 | ) | ||||||||||||||
|
|
|
|
|
|
|
|
|
|
|
|
|
|
|
| |||||||||||||||||
| Class C | ||||||||||||||||||||||||||||||||
| Sale of shares | 11 | $ | 121 | — | (1) | $ | 2 | 119 | $ | 791 | 94 | $ | 550 | |||||||||||||||||||
| Reinvestment of distributions | 2 | 18 | — | (1) | 4 | 15 | 99 | 2 | 12 | |||||||||||||||||||||||
| Shares repurchased | (12 | ) | (124 | ) | — | — | (1) | (79 | ) | (519 | ) | (45 | ) | (256 | ) | |||||||||||||||||
|
|
|
|
|
|
|
|
|
|
|
|
|
|
|
| |||||||||||||||||
| Net Increase / (Decrease) | 1 | $ | 15 | — | (1) | $ | 6 | 55 | $ | 371 | 51 | $ | 306 | |||||||||||||||||||
|
|
|
|
|
|
|
|
|
|
|
|
|
|
|
| |||||||||||||||||
| Class I | ||||||||||||||||||||||||||||||||
| Sale of shares | 158 | $ | 1,674 | 724 | $ | 7,394 | 1,550 | $ | 10,345 | 1,993 | $ | 11,674 | ||||||||||||||||||||
| Reinvestment of distributions | 402 | 4,045 | 96 | 945 | 321 | 2,093 | 116 | 630 | ||||||||||||||||||||||||
| Shares repurchased | (2,790 | ) | (29,085 | ) | (186 | ) | (1,902 | ) | (1,661 | ) | (10,744 | ) | (2,447 | ) | (13,218 | ) | ||||||||||||||||
|
|
|
|
|
|
|
|
|
|
|
|
|
|
|
| |||||||||||||||||
| Net Increase / (Decrease) | (2,230 | ) | $ | (23,366 | ) | 634 | $ | 6,437 | 210 | $ | 1,694 | (338 | ) | $ | (914 | ) | ||||||||||||||||
|
|
|
|
|
|
|
|
|
|
|
|
|
|
|
| |||||||||||||||||
| (1) | Amount is less than 500. |
78
Table of Contents
VIRTUS OPPORTUNITIES TRUST
NOTES TO FINANCIAL STATEMENTS (Continued)
SEPTEMBER 30, 2013
| International Small-Cap Fund | ||||||||||||||||
| Year Ended September 30, 2013 | From Inception September 5, 2012 to September 30, 2012 | |||||||||||||||
| SHARES | AMOUNT | SHARES | AMOUNT | |||||||||||||
| Class A | ||||||||||||||||
| Sale of shares | 20 | $ | 250 | 10 | $ | 100 | ||||||||||
| Reinvestment of distributions | — | (1) | 2 | — | — | |||||||||||
| Shares repurchased | — | (1) | (1 | ) | — | — | ||||||||||
|
|
|
|
|
|
|
| |||||||||
| Net Increase / (Decrease) | 20 | $ | 251 | 10 | $ | 100 | ||||||||||
|
|
|
|
|
|
|
| |||||||||
| Class C | ||||||||||||||||
| Sale of shares | 18 | $ | 223 | 11 | $ | 106 | ||||||||||
| Reinvestment of distributions | — | (1) | 1 | — | — | |||||||||||
| Shares repurchased | — | (1) | (2 | ) | — | — | ||||||||||
|
|
|
|
|
|
|
| |||||||||
| Net Increase / (Decrease) | 18 | $ | 222 | 11 | $ | 106 | ||||||||||
|
|
|
|
|
|
|
| |||||||||
| Class I | ||||||||||||||||
| Sale of shares | 1,088 | $ | 12,819 | 281 | $ | 2,808 | ||||||||||
| Reinvestment of distributions | 6 | 65 | — | — | ||||||||||||
| Shares repurchased | (3 | )(1) | (34 | ) | — | — | ||||||||||
|
|
|
|
|
|
|
| |||||||||
| Net Increase / (Decrease) | 1,091 | $ | 12,850 | 281 | $ | 2,808 | ||||||||||
|
|
|
|
|
|
|
| |||||||||
| (1) | Amount is less than 500. |
| Note | 6. Derivative Transactions |
($ reported in thousands)
The International Equity Fund invested in derivative instruments during the reporting period in the form of forward currency contracts. The primary type of risk associated with the forward currency contracts is foreign exchange risk, associated with the conversion of foreign currency to U.S. dollars. The Fund may invest in forward currency contracts in an attempt to manage such risk and protect the U.S. dollar value of the portfolio.
For additional information on forward currency contracts in which the Fund invested in during the reporting period, refer to the Schedule of Investments and Note 2G.
The following is a summary of the International Equity Fund’s derivative instrument holdings categorized by primary risk exposure as of September 30, 2013 ($ reported in thousands):
Statements of Assets and Liabilities | Statements of Operations | |||||||||
Assets: Unrealized appreciation on forward currency contracts | $ | — | Net realized gain (loss) on foreign currency transactions | $ | 40 | |||||
Liabilities: Unrealized depreciation on forward currency contracts | Net change in unrealized appreciation (depreciation) on foreign currency translation | 61 | ||||||||
|
|
|
| |||||||
Net asset (liability) balance | $ | — | Total realized and unrealized gain (loss) on foreign currency transactions | $ | 101 | |||||
|
|
|
| |||||||
For the fiscal year ended September 30, 2013, the International Equity Fund’s average volume of derivative activities is as follows:
| Forward Currency Contracts – Purchased(1) | Forward Currency Contracts – Sold(2) | |||||||
| $1,050 | $(2,388) | |||||||
| (1) | Value at Settlement Date Payable. |
| (2) | Value at Settlement Date Receivable. |
| Note | 7. 10% Shareholders |
As of September 30, 2013, certain Funds had individual shareholder account(s) and/or omnibus shareholder account(s) (comprised of a group of individual shareholders), which individually amounted to more than 10% of the total shares outstanding of each such Fund as detailed below:
| % of Shares Outstanding | Number of Accounts | |||||
Emerging Markets Debt Fund | 87 | % | 1 | |||
Emerging Markets Equity Income Fund | 83 | 2* | ||||
Global Commodities Stock Fund# | 89 | 1* | ||||
Global Dividend Fund# | 32 | 1 | ||||
Global Opportunities Fund | 23 | 2* | ||||
Global Real Estate Securities Fund | 48 | 2 | ||||
79
Table of Contents
VIRTUS OPPORTUNITIES TRUST
NOTES TO FINANCIAL STATEMENTS (Continued)
SEPTEMBER 30, 2013
| % of Shares Outstanding | Number of Accounts | |||||
Greater Asia ex Japan Opportunities Fund | 72 | % | 3 | |||
Greater European Opportunities Fund | 61 | 1 | ||||
International Real Estate Securities Fund# | 42 | 1* | ||||
International Small-Cap Fund | 20 | 1 | ||||
| * | Includes affiliated shareholder accounts. |
| # | The Fund is owned by Virtus Alternatives Diversifier Fund. Virtus Alternatives Diversifier Fund does not invest in the underlying Funds for the purpose of exercising management or control; however, investments made may represent a significant portion of an underlying Fund’s net assets. At September 30, 2013, Virtus Alternatives Diversifier Fund was the owner of record of approximately 89% of the Global Commodities Stock Fund, 42% of the International Real Estate Securities Fund, 31% of Global Real Estate Fund and 32% of the Global Dividend Fund. |
| Note | 8. Credit Risk and Asset Concentration |
In countries with limited or developing markets, investments may present greater risks than in more developed markets and the prices of such investments may be volatile. The consequences of political, social or economic changes in these markets may have disruptive effects on the market prices of these investments and the income they generate, as well as a Fund’s ability to repatriate such amounts.
High-yield/high-risk securities typically entail greater price volatility and/or principal and interest rate risk. There is a greater chance that an issuer will not be able to make principal and interest payments on time. Analysis of the creditworthiness of issuers of high-yield securities may be complex, and as a result, it may be more difficult for the adviser and/or subadviser to accurately predict risk.
Certain Funds may invest a high percentage of their assets in specific sectors of the market in their pursuit of a greater investment return. Fluctuations in these sectors of concentration may have a greater impact on a Fund, positive or negative, than if the Fund did not concentrate its investments in such sectors.
At September 30, 2013, the following Funds held securities issued by various companies in specific sectors as detailed below:
Fund | Sector | Percentage of Total Investments | ||||
| Emerging Markets Debt Fund | Financials | 36 | % | |||
| Emerging Markets Equity Income Fund | Financials | 30 | ||||
| Global Commodities Stock Fund | Materials | 40 | ||||
| Global Commodities Stock Fund | Energy | 33 | ||||
| Global Dividend Fund | Utilities | 32 | ||||
| Global Opportunities Fund | Consumer Staples | 36 | ||||
| Global Real Estate Securities Fund | Retail REITs | 25 | ||||
| Greater Asia ex Japan Opportunities Fund | Consumer Staples | 33 | ||||
| Greater Asia ex Japan Opportunities Fund | Financials | 30 | ||||
| Greater European Opportunities Fund | Consumer Staples | 32 | ||||
| International Equity Fund | Industrials | 29 | ||||
| International Real Estate Securities Fund | Retail REITs | 25 | ||||
| International Small Cap | Industrials | 29 | ||||
| Note | 9. Indemnifications |
Under the Trust’s organizational documents, their trustees and officers are indemnified against certain liabilities arising out of the performance of their duties to the Funds. Each Trustee has entered into an indemnification agreement with the Trust. In addition, in the normal course of business the Funds enter into contracts that provide a variety of indemnifications to other parties. The Funds’ maximum exposure under these arrangements is unknown as this would involve future claims that may be made against the Funds and that have not occurred. However, the Funds have not had prior claims or losses pursuant to these arrangements and expect the risk of loss to be remote.
| Note | 10. Federal Income Tax Information |
($ reported in thousands)
At September 30, 2013, federal tax cost and aggregate gross unrealized appreciation (depreciation) of securities held by the Funds were as follows:
| Federal Tax Cost | Unrealized Appreciation | Unrealized (Depreciation) | Net Unrealized Appreciation (Depreciation) | |||||||||||||
Emerging Markets Debt Fund | $ | 29,985 | $ | 165 | $ | (2,165 | ) | $ | (2,000 | ) | ||||||
Emerging Markets Equity Income Fund | 9,696 | 569 | (257 | ) | 312 | |||||||||||
Global Commodities Stock Fund | 27,185 | 3,014 | (1,088 | ) | 1,926 | |||||||||||
Global Dividend Fund | 117,249 | 25,338 | (571 | ) | 24,767 | |||||||||||
Global Opportunities Fund | 90,661 | 23,547 | (2,866 | ) | 20,681 | |||||||||||
Global Real Estate Securities Fund | 41,637 | 2,821 | (719 | ) | 2,102 | |||||||||||
Greater Asia ex Japan Opportunities Fund | 8,676 | 2,045 | (466 | ) | 1,579 | |||||||||||
Greater European Opportunities Fund | 13,248 | 2,817 | (163 | ) | 2,654 | |||||||||||
International Equity Fund | 4,981 | 180 | (100 | ) | 80 | |||||||||||
International Real Estate Securities Fund | 38,599 | 3,513 | (427 | ) | 3,086 | |||||||||||
International Small-Cap Fund | 16,831 | 2,155 | (145 | ) | 2,010 | |||||||||||
80
Table of Contents
VIRTUS OPPORTUNITIES TRUST
NOTES TO FINANCIAL STATEMENTS (Continued)
SEPTEMBER 30, 2013
The Funds have capital loss carryovers available to offset future realized capital gains, through the indicated expiration dates shown below:
| 2018 | 2019 | No Expiration | Total | |||||||||||||
Global Commodities Stock Fund | $ | — | $ | — | $ | 1,664 | $ | 1,664 | ||||||||
Global Dividend Fund | 7,599 | 3,627 | — | 11,226 | ||||||||||||
Global Opportunities Fund | 7,385 | — | — | 7,385 | ||||||||||||
International Real Estate Securities Fund | 3,850 | 883 | 3,062 | 7,795 | ||||||||||||
The Trust may not realize the benefit of these losses to the extent each Fund does not realize gains on investments prior to the expiration of the capital loss carryovers.
Under the Regulated Investment Company Modernization Act of 2010 (the “Act”), net capital losses recognized for tax years beginning after December 22, 2010 may be carried forward indefinitely, and their character is retained as short-term and/or long-term losses. Previously, net capital losses were carried forward for eight years and treated as short-term losses. As a transition rule, the Act requires that post-enactment net capital losses be used before pre-enactment net capital losses.
For the year ended September 30, 2013 the following Funds utilized losses deferred in prior years against current year capital gains:
Emerging Markets Debt Fund | $ | 15 | ||
Global Dividend Fund | 1,902 | |||
Global Opportunities Fund | 9,698 | |||
International Equity Fund | 219 |
The International Real Estate Securities Fund had $16,239 capital loss carryover which expired in 2013.
Capital losses realized after October 31 and certain late year ordinary losses may be deferred and treated as occurring on the first day of the following fiscal year. For the fiscal year ended September 30, 2013, the Funds deferred and recognized losses as follow:
| Capital Loss Deferred | Capital Loss Recognized | |||||||
Emerging Markets Debt Fund | $ | 120 | $ | — | ||||
Emerging Markets Equity Income Fund | 89 | — | ||||||
Global Commodities Stock Fund | 2,646 | 1,202 | ||||||
Global Dividend Fund | 148 | 536 | ||||||
Global Real Estate Securities Fund | — | 67 | ||||||
International Equity Fund | — | 309 | ||||||
International Real Estate Securities Fund | — | 2,639 | ||||||
The components of distributable earnings on a tax basis (excluding unrealized appreciation (depreciation) which are disclosed above) consist of the following:
| Undistributed Ordinary Income | Undistributed Long-Term Capital Gains | |||||||
Emerging Markets Debt Fund | $ | 20 | $ | — | ||||
Emerging Markets Equity Income Fund | 128 | — | ||||||
Global Commodities Stock Fund | — | — | ||||||
Global Dividend Fund | — | — | ||||||
Global Opportunities Fund | 610 | — | ||||||
Global Real Estate Securities Fund | 612 | 222 | ||||||
Greater Asia ex Japan Opportunities Fund | 65 | 385 | ||||||
Greater European Opportunities Fund | 303 | 152 | ||||||
International Equity Fund | 162 | — | ||||||
International Real Estate Securities Fund | 710 | — | ||||||
International Small-Cap Fund | 553 | — | ||||||
The differences between the book and tax basis components of distributable earnings relate principally to the timing of recognition of income and gains for federal income tax purposes. Short-term gain distributions reported in the Statements of Changes in Net Assets, if any, are reported as ordinary income for federal tax purposes. Distributions are determined on a tax basis and may differ from net investment income and realized capital gains for financial reporting purposes.
81
Table of Contents
VIRTUS OPPORTUNITIES TRUST
NOTES TO FINANCIAL STATEMENTS (Continued)
SEPTEMBER 30, 2013
| Note | 11. Reclassification of Capital Accounts |
($ reported in thousands)
For financial reporting purposes, book basis capital accounts are adjusted to reflect the tax character of permanent book/tax differences. Permanent reclassifications can arise from differing treatment of certain income and gain transactions, nondeductible current year net operating losses, expiring capital loss carryovers and investments in passive foreign investment companies. The reclassifications have no impact on the net assets or net asset value of the Funds. As of September 30, 2013, the Funds recorded reclassifications to increase (decrease) the accounts as listed below:
| Capital Paid in on Shares of Beneficial Interest | Undistributed Net Investment Income (Loss) | Accumulated Net Realized Gain (Loss) | ||||||||||
Emerging Markets Debt Fund | $ | — | $ | (49 | ) | $ | 49 | |||||
Emerging Markets Equity Income Fund | — | (1) | 2 | (2 | ) | |||||||
Global Commodities Stock Fund | (40 | ) | 410 | (370 | ) | |||||||
Global Dividend Fund | (9 | ) | 7 | 2 | ||||||||
Global Opportunities Fund | — | (33 | ) | 33 | ||||||||
Global Real Estate Securities Fund | — | 48 | (48 | ) | ||||||||
Greater Asia ex Japan Opportunities Fund | — | (1) | 31 | (31 | ) | |||||||
Greater European Opportunities Fund | — | (1) | (16 | ) | 16 | |||||||
International Equity Fund | — | (1) | 96 | (96 | ) | |||||||
International Real Estate Securities Fund | (16,239 | ) | 385 | 15,854 | ||||||||
International Small-Cap Fund | — | 1 | (1 | ) | ||||||||
(1) Amount less than $500.
| Note | 12. Illiquid and Restricted Securities |
Investments are generally considered illiquid if they cannot be disposed of within seven days in the ordinary course of business at the approximate amount at which such securities have been valued by a Fund. Additionally, the following information is also considered in determining liquidity: the frequency of trades and quotes for the investment, whether the investment is listed for trading on a recognized domestic exchange and/or whether two or more brokers are willing to purchase or sell the security at a comparable price, the extent of market making activity in the investment and the nature of the market for investment. Illiquid securities are footnoted as such at the end of each Fund’s Schedule of Investments where applicable.
Restricted securities are not illiquid securities as defined above registered under the Securities Act of 1933 as amended (the “1933 Act”). Generally, 144A securities are excluded from this category, except where defined as illiquid.
Each Fund will bear any costs, including those involved in registration under the 1933 Act, in connection with the disposition of such securities.
At September 30, 2013, the Funds did not hold any illiquid and restricted securities.
| Note | 13. Portfolio Turnover and Redemptions in the International Equity Fund (the “Fund”) |
($ in thousands)
Management, in the interest of protecting the fund shareholders from an adverse tax consequence, directed the sale of and subsequent repurchase of, certain portfolio securities ($34,629 of securities were sold). After this sale, the Fund conducted a capital gains distribution of $3,420 on April 19, 2013. This event along with the change in sub advisor, as mentioned in Note 3. B. above, resulted in a high portfolio turnover for this fund.
The Fund experienced large redemptions of $5,520, $9,069 and $7,459 on June 23, 2013, July 17, 2013 and September 27, 2013, respectively. In order for the Fund to payout the large redemption received on September 27, 2013, securities were sold over a period of one week resulting in a high percentage of Total Investments to Net Assets in the Schedule of Investments as of September 30, 2013.
| Note | 14. Recent Accounting Pronouncement |
In December 2011, the Financial Accounting Standards Board issued Accounting Standards Update (“ASU”) No. 2011-11 regarding “Disclosures about Offsetting Assets and Liabilities”. The amendments, which will be effective for annual reporting periods beginning on or after January 1, 2013 and interim periods within those annual periods, require an entity to disclose information about offsetting and related arrangements for assets and liabilities, financial instruments and derivatives that are either currently offset in accordance with current requirements or are subject to enforceable master netting arrangements or similar agreements. At this time, management is evaluating the implications of ASU No. 2011-11 and its impact on the financial statements has not yet been determined.
| Note | 15. Subsequent Event Evaluations |
Management has evaluated the impact of all subsequent events on the Funds through the date the financial statements were available for issuance, and has determined that the following subsequent events require recognition or disclosure in the financial statements.
82
Table of Contents

REPORT OF INDEPENDENT REGISTERED PUBLIC ACCOUNTING FIRM
To the Board of Trustees of
Virtus Opportunities Trust and
Shareholders of the Funds, as defined:
In our opinion, the accompanying statements of assets and liabilities, including the schedules of investments, and the related statements of operations and of changes in net assets and the financial highlights present fairly, in all material respects, the financial position of Virtus Emerging Markets Debt Fund, Virtus Emerging Markets Equity Income Fund, Virtus Global Commodities Stock Fund, Virtus Global Dividend Fund, Virtus Global Opportunities Fund, Virtus Global Real Estate Securities Fund, Virtus Greater Asia ex Japan Opportunities Fund, Virtus Greater European Opportunities Fund, Virtus International Equity Fund, Virtus International Real Estate Securities Fund, and Virtus International Small Cap Fund, each a series of Virtus Opportunities Trust (the “Funds”), at September 30, 2013, the results of each of their operations, the changes in each of their net assets, and the financial highlights for each of the periods indicated, in conformity with accounting principles generally accepted in the United States of America. These financial statements and financial highlights (hereafter referred to as “financial statements”) are the responsibility of the Funds’ management; our responsibility is to express an opinion on these financial statements based on our audits. We conducted our audits of these financial statements in accordance with the standards of the Public Company Accounting Oversight Board (United States). Those standards require that we plan and perform the audits to obtain reasonable assurance about whether the financial statements are free of material misstatement. An audit includes examining, on a test basis, evidence supporting the amounts and disclosures in the financial statements, assessing the accounting principles used and significant estimates made by management, and evaluating the overall financial statement presentation. We believe that our audits, which included confirmation of securities at September 30, 2013 by correspondence with the custodians and brokers, provide a reasonable basis for our opinion.

PricewaterhouseCoopers LLP
November 21, 2013
83
Table of Contents
VIRTUS OPPORTUNITIES TRUST
SEPTEMBER 30, 2013
For the fiscal year ended September 30, 2013, the Funds make the following disclosures for federal income tax purposes. Below is listed the percentages, or the maximum amount allowable, of its ordinary income dividends (“QDI”) to qualify for the lower tax rates applicable to individual shareholders, and the percentage of ordinary income dividends earned by the Funds which qualifies for the dividends received deduction (“DRD”) for corporate shareholders. The Funds designate the amounts below as long-term capital gains dividends (“LTCG”) ($ reported in thousands), or if subsequently different, the amounts will be designated in the next annual report. The actual percentage for the calendar year will be designated in year-end tax statements.
| QDI | DRD | LTCG | ||||||||||
Emerging Markets Debt Fund | 0 | % | 0 | % | $ | — | ||||||
Emerging Markets Equity Income Fund | 66 | 2 | — | |||||||||
Global Commodities Stock Fund | — | — | — | |||||||||
Global Dividend Fund | 100 | 60 | — | |||||||||
Global Opportunities Fund | 100 | 100 | — | |||||||||
Global Real Estate Securities Fund | 39 | — | 222 | |||||||||
Greater Asia ex Japan Opportunities Fund | 100 | — | 394 | |||||||||
Greater European Opportunities Fund | 75 | 6 | 236 | |||||||||
International Equity Fund | 26 | — | 2,598 | |||||||||
International Real Estate Securities Fund | 60 | — | — | |||||||||
International Small-Cap Fund | 44 | — | — | |||||||||
For the period ended September 30, 2013, the Funds are disclosing the following information pursuant to notice requirements of Section 853(a) and 855(d) of the Internal Revenue Code, as amended, and the Treasury Regulations thereunder ($ reported in thousands).
| Foreign Source Income Recognized | Foreign Taxes Paid on Foreign Source Income | |||||||
Emerging Markets Equity Income Fund | $ | 323 | $ | 40 | ||||
Global Dividend Fund | 2,932 | 292 | ||||||
Global Opportunities Fund | 1,271 | 75 | ||||||
Greater Asia ex Japan Opportunities Fund | 227 | 11 | ||||||
Greater European Opportunities Fund | 251 | 18 | ||||||
International Real Estate Securities Fund | 1,549 | 142 | ||||||
International Small-Cap Fund | 431 | 32 | ||||||
84
Table of Contents
Information pertaining to the trustees and officers of the Trust as of September 30, 2013, is set forth below. The statement of additional information (SAI) includes additional information about the trustees and is available without charge, upon request, by calling (800) 243-1574. The address of each individual, unless otherwise noted, is 100 Pearl Street, Hartford, CT 06103-4506. There is no stated term of office for trustees of the Trust.
Independent Trustees
| Name, Year of Birth, Year Elected and Number of Funds Overseen | Principal Occupation(s) During Past 5 Years and Other Directorships Held by Trustee | |
Leroy Keith, Jr. YOB: 1939 Elected: 2000 48 Funds | Chairman (since 2010), Bloc Global Services Group, LLC (construction and redevelopment company); Managing Director (2007 to 2008), Almanac Capital Management (commodities business); Director/Trustee (since 2010), Wells Fargo Funds (139 series) and their predecessors, Evergreen Funds (1989 to 2010); Director (2003 to 2010), Diversapack Co. (soft packaging company); and Trustee (since 1980), Virtus Mutual Fund Complex. | |
Philip R. McLoughlin Chairman YOB: 1946 Elected: 1999 66 Funds | Partner (since 2006), Cross Pond Partners, LLC (strategy consulting firm); Managing Director (2009 to 2010), SeaCap Asset Management Fund I, L.P. and SeaCap Partners, LLC (investment management); Director (since 1991) and Chairman (since 2010), World Trust Fund; Trustee and Chairman (since 2011), Virtus Closed-End Funds (2 portfolios); Trustee (since 1989), Virtus Mutual Fund Complex; Director (since 1996), closed-end funds managed by Duff & Phelps Investment Management Co. (4 portfolios); and Director (1985 to 2009), Argo Group International Holdings Inc. and its predecessor, PXRE Corporation (insurance). | |
Geraldine M. McNamara YOB: 1951 Elected: 2001 52 Funds | Retired. Director (since 2003), closed-end funds managed by Duff & Phelps Investment Management Co. (4 portfolios); and Trustee (since 2001), Virtus Mutual Fund Complex. | |
James M. Oates YOB: 1946 Elected: 2000 50 Funds | Managing Director (since 1994), Wydown Group (consulting firm); Chairman and Trustee (since 2005), John Hancock Fund Complex (collectively, 234 portfolios); Director (since 1996), Stifel Financial; Chairman and Director (since 1999), Connecticut River Bank and Director (since 1998), Connecticut River Bancorp; Chairman (since 2000), Emerson Investment Management, Inc.; Director (since 2002), New Hampshire Trust Company; Non-Executive Chairman (2007 to 2011), Hudson Castle Group, Inc. (formerly IBEX Capital Markets, Inc.) (financial services); and Trustee (since 1987), Virtus Mutual Fund Complex. | |
Richard E. Segerson YOB: 1948 Elected: 2000 48 Funds | Retired. Managing Director (1998 to 2013), Northway Management Company; and Trustee (since 1993), Virtus Mutual Fund Complex. | |
Ferdinand L.J. Verdonck YOB: 1942 Elected: 2005 48 Funds | Director (since 1998), The J.P. Morgan European Investment Trust; Director (since 2005), Galapagos N.V. (biotechnology); Mr. Verdonck is also a director of several non-U.S. companies. | |
Interested Trustee
The individual listed below is an “interested person” of the Trust, as defined in Section 2(a)(19) of the 1940 Act, as amended, and the rules and regulations thereunder.
| Name, Year of Birth, Year Elected and Number of Funds Overseen | Principal Occupation(s) During Past 5 Years and Other Directorships Held by Trustee | |
George R. Aylward* Trustee and President YOB: 1964 Elected: 2006 61 Funds | Director, President and Chief Executive Officer (since 2008), Virtus Investment Partners, Inc. and/or certain of its subsidiaries; various senior officer positions with Virtus affiliates (since 2005); Trustee (since 2012), Virtus Variable Insurance Trust; Trustee and President (since 2011), Virtus Closed-End Funds (2 portfolios); and Chairman, President and Chief Executive Officer (since 2006), The Zweig Closed-End Funds (2 portfolios) Funds; and Director (since 2013), Virtus Global Funds, PLC. | |
* Mr. Aylward is an “interested person,” as defined in the 1940 Act, by reason of his position as President and Chief Executive Officer of Virtus Investment Partners, Inc. (“Virtus”), the ultimate parent company of the Adviser, and various positions with its affiliates, including the Adviser.
85
Table of Contents
FUND MANAGEMENT TABLES (Continued)
Officers of the Trust Who Are Not Trustees
Name, Address and Year of Birth | Position(s) Held with Trust and Length of Time Served | Principal Occupation(s) During Past 5 Years | ||
W. Patrick Bradley YOB: 1972 | Senior Vice President (since 2013), Vice President since 2011, Chief Financial Officer and Treasurer since 2006. | Senior Vice President, Fund Services (since 2010), Virtus Investment Partners, Inc. and/or certain of its subsidiaries; various officer positions (since 2006) with Virtus affiliates; Vice President (since 2011), Chief Financial Officer and Treasurer (since 2004), Virtus Variable Insurance Trust; Vice President, Chief Financial Officer and Treasurer (since 2011), Virtus Global Multi-Sector Income Fund and Virtus Total Return Fund; Vice President (since 2012) and Treasurer (Chief Financial Officer) (since 2007), The Zweig Fund, Inc. and Zweig Total Return Fund, Inc.; Vice President and Assistant Treasurer (since 2011), Duff & Phelps Global Utility Income Fund Inc. ; and Director (since 2013), Virtus Global Funds, PLC. | ||
Kevin J. Carr YOB: 1954 | Senior Vice President (since 2013), Vice President, Chief Legal Officer, Counsel and Secretary since 2005. | Senior Vice President (since 2009), Vice President, Counsel and Secretary (2008 to 2009), Virtus Investment Partners, Inc. and/or certain of its subsidiaries; various senior officer positions (since 2005) with Virtus affiliates; Vice President, Chief Legal Officer, Counsel and Secretary (since 2010), Virtus Variable Insurance Trust; Vice President and Assistant Secretary (since 2012), Vice President, Chief Legal Officer, Counsel and Secretary (2011-2012), Virtus Global Multi-Sector Income Fund and Virtus Total Return Fund; Vice President and Assistant Secretary (since 2012), Secretary and Chief Legal Officer (2005-2012), The Zweig Fund, Inc. and Zweig Total Return Fund, Inc.; and Vice President and Assistant Secretary (since 2011), Duff & Phelps Global Utility Income Fund Inc. | ||
Nancy J. Engberg YOB: 1956 | Vice President and Chief Compliance Officer since 2011. | Vice President (since 2008) and Chief Compliance Officer (2008 to 2011), Virtus Investment Partners, Inc. and/or certain of its subsidiaries; various officer positions (since 2003) with Virtus affiliates; Vice President (since 2010), Chief Compliance Officer (since 2011), Virtus Variable Insurance Trust; Vice President and Chief Compliance Officer (since 2011), Virtus Global Multi-Sector Income Fund and Virtus Total Return Fund; Vice President and Chief Compliance Officer (since 2012), The Zweig Fund, Inc. and Zweig Total Return Fund, Inc. | ||
Francis G. Waltman YOB: 1962 | Executive Vice President since 2013.
Senior Vice President 2008-2013. | Executive Vice President, Product Development (since 2009), Virtus Investment Partners, Inc. and/or certain of its subsidiaries; various senior officer positions (since 2006) with Virtus affiliates; Senior Vice President (since 2010), Virtus Variable Insurance Trust; Senior Vice President (since 2011), Virtus Global Multi-Sector Income Fund and Virtus Total Return Fund; and Director (since 2013), Virtus Global Funds, PLC. | ||
86
Table of Contents
CONSIDERATION OF SUBADVISORY AGREEMENT FOR VIRTUS INTERNATIONAL EQUITY FUND BY THE BOARD OF TRUSTEES
The Board of Trustees (the “Board”) of Virtus Opportunities Trust (the “Trust”), including a majority of the Trustees who are not interested persons as defined in Section 2(a)(19) of the Investment Company Act of 1940, as amended (the “Independent Trustees”), last renewed the investment advisory agreement between Virtus Investment Advisers, Inc. (the “Adviser” or “VIA”) and the Trust, with respect to the Virtus International Equity Fund (the “Fund”) and certain other funds of the Trust (the “Advisory Agreement”), at an in-person meeting held on November 14-16, 2012. At an in-person Board meeting held on May 14, 2013, Fund Management recommended that Euclid Advisors, LLC (“Euclid” or the “Subadviser”) be appointed as subadviser to the Fund and that the Adviser enter into a new subadvisory agreement with Euclid (the “Subadvisory Agreement”). VIA will remain as investment adviser to the Fund. The Board, including the Independent Trustees, considered and approved the Subadvisory Agreement with Euclid for the Fund, as further discussed below.
In evaluating the proposal to appoint Euclid, the Board requested and evaluated information provided by the Adviser and Euclid which, in the Board’s view, constituted information necessary for the Board to form a judgment as to whether the subadviser change would be in the best interests of the Fund and its shareholders. The Board noted that due to the resignation of the previous subadviser it was necessary to appoint a new one. The Board noted the affiliation of the Subadviser with VIA and any potential conflicts of interest.
The Independent Trustees were separately advised by independent legal counsel throughout the process. The Board considered all the criteria separately with respect to the Fund and its shareholders. In their deliberations, the Trustees considered various factors, including those discussed below, none of which were controlling, and each Trustee may have attributed different weights to the various factors. The Board also discussed the proposed approval of the Subadvisory Agreement in private sessions with their independent legal counsel at which no representatives of management were present.
Basis for the Board’s Recommendation
In making its determination with respect to the Subadvisory Agreement, the Board considered various factors, including:
| Ÿ | Nature, extent, and quality of the services to be provided by the Subadviser. The Trustees received in advance of the meeting information in the form of an extensive questionnaire completed by the Subadviser concerning a number of topics, including its investment philosophy, resources, operations and compliance structure. The Trustees noted that the Subadviser would provide portfolio management, compliance with the Fund’s investment policies and procedures, compliance with applicable securities laws, and assurances thereof. The Trustees reviewed biographical information for the portfolio manager who would provide services under the Subadvisory Agreement and noted the breadth and depth of experience of the portfolio manager. In considering the approval of the Subadvisory Agreement, the Trustees considered the Subadviser’s investment management process, including (a) the experience, capability and integrity of the Subadviser’s management and other personnel committed by the Subadviser to the Fund; (b) the financial position of the Subadviser; (c) the quality and commitment of the Subadviser’s regulatory and legal compliance policies, procedures and systems; and (d) the Subadviser’s brokerage and trading practices. The Board also took into account its familiarity with the Subadviser in providing services to other funds of the Trust. The Board concluded that the nature, extent and quality of the services to be provided by the Subadviser to the Fund was reasonable. |
| Ÿ | Investment Performance. The Board considered the performance of a composite managed by the proposed Subadviser versus a peer group, an appropriate index and the Fund’s historical performance and was satisfied with the proposed Subadviser’s performance. |
| Ÿ | Subadvisory Fee. The Board took into account that the Fund’s subadvisory fees are paid by VIA and not by the Fund, so that the Fund’s shareholders would not be directly impacted by those fees. The Board concluded that the proposed subadvisory fees were fair and reasonable in light of services to be provided by the Subadviser and all factors considered. |
| Ÿ | Profitability and economies of scale. In considering the expected profitability to the Subadviser of its relationship with the Fund, the Board noted that the fees under the Subadvisory Agreement are paid by VIA out of the advisory fees that it receives under the Advisory Agreement and not by the Fund, so that Fund shareholders are not directly impacted by those fees. While the Board noted that, because the Subadviser is an affiliate of VIA, such profitability might be directly or indirectly shared by VIA, for the reasons discussed above, the expected profitability to the Subadviser of its relationships with the Fund was not a material factor in the Board’s deliberations at this time. For similar reasons, the Board did not consider the potential economies of scale in the Subadviser’s management of the Fund to be a material factor in its consideration at this time. |
| Ÿ | Other Benefits. The Board considered other benefits that may be realized by the Subadviser and its affiliates from their relationship with the Fund. The Board noted management’s discussion of the fact that, while the Subadviser is an affiliate of VIA, there are no other tangible benefits to the Subadviser or VIA in providing investment advisory services to the Fund, other than the fees to be earned under the Subadvisory Agreement. There may be certain intangible benefits gained to the extent that serving the Fund could provide the opportunity to provide advisory services to additional funds of the Trust or could enhance the Subadviser’s reputation in the marketplace, and, therefore, would enable the Subadviser to attract additional client relationships. |
Based on all of the foregoing considerations, the Board, including the Independent Trustees, determined that approval of the Subadvisory Agreement was in the best interests of the Fund and its shareholders. Accordingly, the Board, and the Independent Trustees voting separately, approved the Subadvisory Agreement with respect to the Fund.
87
Table of Contents
RESULTS OF SHAREHOLDER MEETING
VIRTUS OPPORTUNITIES TRUST
JULY 23, 2013 (Unaudited)
At a reconvened Special Meeting of Shareholders of Virtus International Equity Fund, a series of Virtus Opportunities Trust, held on July 23, 2013, shareholders voted on the following proposal:
| NUMBER OF ELIGIBLE SHARES VOTED: | ||||||||||||
| FOR | AGAINST | ABSTAIN | ||||||||||
To approve a Subadvisory Agreement between Virtus Investment Advisers, Inc. and Euclid Advisors LLC | 1,890,976.000 | 0 | 2,279.885 | |||||||||
Shareholders of the Fund voted to approve the above proposal.
88
Table of Contents
VIRTUS OPPORTUNITIES TRUST
101 Munson Street
Greenfield, MA 01301-9668
Trustees
George R. Aylward
Leroy Keith, Jr.
Philip R. McLoughlin, Chairman
Geraldine M. McNamara
James M. Oates
Richard E. Segerson
Ferdinand L.J. Verdonck
Officers
George R. Aylward, President
Francis G. Waltman, Executive Vice President
W. Patrick Bradley, Senior Vice President,
Chief Financial Officer and Treasurer
Kevin J. Carr, Senior Vice President, Chief Legal
Officer, Counsel and Secretary
Nancy J. Engberg, Vice President and
Chief Compliance Officer
Investment Adviser
Virtus Investment Advisers, Inc.
100 Pearl Street
Hartford, CT 06103-4506
Principal Underwriter
VP Distributors, LLC
100 Pearl Street
Hartford, CT 06103-4506
Administrator and Transfer Agent
Virtus Fund Services, LLC
100 Pearl Street
Hartford, CT 06103-4506
Custodian
JPMorgan Chase Bank NA
1 Chase Manhattan Plaza
New York, NY 10005-1401
Independent Registered Public
Accounting Firm
PricewaterhouseCoopers LLC
2001 Market Street
Philadelphia, PA 19103-7042
How to Contact Us
Mutual Fund Services 1-800-243-1574
Adviser Consulting Group 1-800-243-4361
Telephone Orders 1-800-367-5877
Web sitehttp://Virtus.com
Important Notice to Shareholders
The Securities and Exchange Commission has modified mailing regulations for semiannual and annual shareholder fund reports to allow mutual fund companies to send a single copy of these reports to shareholders who share the same mailing address. If you would like additional copies, please call Mutual Fund Services at 1-800-243-1574.
Table of Contents
| ||
P.O. Box 9874 Providence, RI 02940-8074 |

For more information about Virtus Mutual Funds,
please call your financial representative, or contact us
at 1-800-243-1574 or Virtus.com.
8032 | 11-13 |
Table of Contents
Item 2. Code of Ethics.
| (a) | The registrant, as of the end of the period covered by this report, has adopted a code of ethics that applies to the registrant’s principal executive officer, principal financial officer, principal accounting officer or controller, or persons performing similar functions, regardless of whether these individuals are employed by the registrant or a third party. |
| (c) | There have been no amendments, during the period covered by this report, to a provision of the code of ethics that applies to the registrant’s principal executive officer, principal financial officer, principal accounting officer or controller, or persons performing similar functions, regardless of whether these individuals are employed by the registrant or a third party, and that relates to any element of the code of ethics described in Item 2(b) of the instructions for completion of Form N-CSR. |
| (d) | The registrant has not granted any waivers, during the period covered by this report, including an implicit waiver, from a provision of the code of ethics that applies to the registrant’s principal executive officer, principal financial officer, principal accounting officer or controller, or persons performing similar functions, regardless of whether these individuals are employed by the registrant or a third party, that relates to one or more of the items set forth in paragraph (b) of the instructions for completion of this Item. |
Item 3. Audit Committee Financial Expert.
| (a)(1) | The Registrant’s Board of Trustees has determined that the Registrant has an “audit committee financial expert” serving on its Audit Committee. |
| (a)(2) | The Registrant’s Board of Trustees has determined that James M. Oates and Richard E. Segerson each possess the technical attributes identified in Instruction 2(b) of Item 3 to Form N-CSR to qualify as an “audit committee financial expert.” Each of Mr. Oates and Mr. Segerson is an “independent” trustee pursuant to paragraph (a)(2) of Item 3 to Form N-CSR. |
| (a)(3) | Not applicable. |
Item 4. Principal Accountant Fees and Services.
Audit Fees
| (a) | The aggregate fees billed for each of the last two fiscal years for professional services rendered by the principal accountant for the audit of the registrant’s annual financial statements or services that are normally provided by the accountant in connection with statutory and regulatory filings or engagements for those fiscal years are $548,950 for 2012 and $504,238 for 2013. |
Audit-Related Fees
| (b) | The aggregate fees billed in each of the last two fiscal years for assurance and related services by the principal accountant that are reasonably related to the performance of the audit of the registrant’s financial statements and are not reported under paragraph (a) of this Item are $73,344 for 2012 and $73,059 for 2013. Such audit-related fees include the review of the semi-annual financial statements, out of pocket expenses and cross fund fees. |
Table of Contents
Tax Fees
| (c) | The aggregate fees billed in each of the last two fiscal years for professional services rendered by the principal accountant for tax compliance, tax advice, and tax planning are $74,075 for 2012 and $89,675 for 2013. |
“Tax Fees” are those primarily associated with review of the Trust’s tax provision and qualification as a regulated investment company (RIC) in connection with audits of the Trust’s financial statement, review of year-end distributions by the Fund to avoid excise tax for the Trust, periodic discussion with management on tax issues affecting the Trust, and reviewing and signing the Fund’s federal income returns. |
All Other Fees
| (d) | The aggregate fees billed in each of the last two fiscal years for products and services provided by the principal accountant, other than the services reported in paragraphs (a) through (c) of this Item are $0 for 2012 and $0 for 2013. |
| (e)(1) | Disclose the audit committee’s pre-approval policies and procedures described in paragraph (c)(7) of Rule 2-01 of Regulation S-X. |
The Virtus Opportunities Trust (the “Fund”) Board has adopted policies and procedures with regard to the pre-approval of services provided by PwC. Audit, audit-related and tax compliance services provided to the Fund on an annual basis require specific pre-approval by the Board. As noted above, the Board must also approve other non-audit services provided to the Fund and those non-audit services provided to the Fund’s Affiliated Service Providers that relate directly to the operations and financial reporting of the Fund. Certain of these non-audit services that the Board believes are a) consistent with the SEC’s auditor independence rules and b) routine and recurring services that will not impair the independence of the independent auditors may be approved by the Board without consideration on a specific case-by-case basis (“general pre-approval”). |
The Audit Committee has determined that James M. Oates, Chair of the Audit Committee, may provide pre-approval for such services that meet the above requirements in the event such approval is sought between regularly scheduled meetings. In any event, the Board is informed of each service approved subject to general pre-approval at the next regularly scheduled in-person board meeting. |
| (e)(2) | The percentage of services described in each of paragraphs (b) through (d) of this Item that were approved by the audit committee pursuant to paragraph (c)(7)(i)(C) of Rule 2-01 of Regulation S-X are as follows: |
(b) 0%
(c) 0%
(d) N/A
Table of Contents
| (f) | The percentage of hours expended on the principal accountant’s engagement to audit the registrant’s financial statements for the most recent fiscal year that were attributed to work performed by persons other than the principal accountant’s full-time, permanent employees was less than fifty percent. |
| (g) | The aggregate non-audit fees billed by the registrant’s accountant for services rendered to the registrant, and rendered to the registrant’s investment adviser (not including any sub-adviser whose role is primarily portfolio management and is subcontracted with or overseen by another investment adviser), and any entity controlling, controlled by, or under common control with the adviser that provides ongoing services to the registrant for each of the last two fiscal years of the registrant was $436,127 for 2012 and $384,427 for 2013. |
| (h) | The registrant’s audit committee of the board of directors has considered whether the provision of non-audit services that were rendered to the registrant’s investment adviser (not including any sub-adviser whose role is primarily portfolio management and is subcontracted with or overseen by another investment adviser), and any entity controlling, controlled by, or under common control with the investment adviser that provides ongoing services to the registrant that were not pre-approved pursuant to paragraph (c)(7)(ii) of Rule 2-01 of Regulation S-X is compatible with maintaining the principal accountant’s independence. |
Item 5. Audit Committee of Listed registrants.
Not applicable.
Item 6. Investments.
| (a) | Schedule of Investments in securities of unaffiliated issuers as of the close of the reporting period is included as part of the report to shareholders filed under Item 1 of this form. |
| (b) | Not applicable. |
Item 7. Disclosure of Proxy Voting Policies and Procedures for Closed-End Management
Investment Companies.
Not applicable.
Item 8. Portfolio Managers of Closed-End Management Investment Companies.
Not applicable.
Table of Contents
Item 9. Purchases of Equity Securities by Closed-End Management Investment Company and
Affiliated Purchasers.
Not applicable.
Item 10. Submission of Matters to a Vote of Security Holders.
There have been no material changes to the procedures by which the shareholders may recommend nominees to the registrant’s board of trustees, where those changes were implemented after the registrant last provided disclosure in response to the requirements of Item 407(c)(2)(iv) of Regulation S-K (17 CFR 229.407) (as required by Item 22(b)(15) of Schedule 14A (17 CFR 240.14a-101)), or this Item.
Item 11. Controls and Procedures.
| (a) | The registrant’s principal executive and principal financial officers, or persons performing similar functions, have concluded that the registrant’s disclosure controls and procedures (as defined in Rule 30a-3(c) under the Investment Company Act of 1940, as amended (the “1940 Act”) (17 CFR 270.30a-3(c))) are effective, as of a date within 90 days of the filing date of the report that includes the disclosure required by this paragraph, based on their evaluation of these controls and procedures required by Rule 30a-3(b) under the 1940 Act (17 CFR 270.30a-3(b)) and Rules 13a-15(b) or 15d-15(b) under the Securities Exchange Act of 1934, as amended (17 CFR 240.13a-15(b) or 240.15d-15(b)). |
| (b) | There were no changes in the registrant’s internal control over financial reporting (as defined in Rule 30a-3(d) under the 1940 Act (17 CFR 270.30a-3(d)) that occurred during the registrant’s second fiscal quarter of the period covered by this report that has materially affected, or is reasonably likely to materially affect, the registrant’s internal control over financial reporting. |
Item 12. Exhibits.
| (a)(1) | Code of ethics, or any amendment thereto, that is the subject of disclosure required by Item 2 is attached hereto. |
| (a)(2) | Certifications pursuant to Rule 30a-2(a) under the 1940 Act and Section 302 of the Sarbanes-Oxley Act of 2002 are attached hereto. |
| (a)(3) | Not applicable. |
| (b) | Certifications pursuant to Rule 30a-2(b) under the 1940 Act and Section 906 of the Sarbanes-Oxley Act of 2002 are attached hereto. |
(12.other) Not applicable.
Table of Contents
SIGNATURES
Pursuant to the requirements of the Securities Exchange Act of 1934 and the Investment Company Act of 1940, the registrant has duly caused this report to be signed on its behalf by the undersigned, thereunto duly authorized.
(Registrant) | Virtus Opportunities Trust |
| By (Signature and Title)* | /s/ George R. Aylward | |
George R. Aylward, President | ||
(principal executive officer) |
Date 12/06/2013
Pursuant to the requirements of the Securities Exchange Act of 1934 and the Investment Company Act of 1940, this report has been signed below by the following persons on behalf of the registrant and in the capacities and on the dates indicated.
| By (Signature and Title)* | /s/ George R. Aylward | |
George R. Aylward, President | ||
(principal executive officer) |
Date 12/06/2013
| By (Signature and Title)* | /s/ W. Patrick Bradley |
W. Patrick Bradley, Senior Vice President, Chief Financial Officer, and Treasurer | ||
(principal financial officer) |
Date 12/06/2013
* Print the name and title of each signing officer under his or her signature.