Table of Contents
UNITED STATES
SECURITIES AND EXCHANGE COMMISSION
Washington, D.C. 20549
FORM N-CSR
CERTIFIED SHAREHOLDER REPORT OF REGISTERED MANAGEMENT
INVESTMENT COMPANIES
Investment Company Act file number 811-07455
Virtus Opportunities Trust
(Exact name of registrant as specified in charter)
101 Munson Street
Greenfield, MA 01301-9668
(Address of principal executive offices) (Zip code)
Kevin J. Carr, Esq.
Vice President, Chief Legal Officer, Counsel and Secretary for Registrant
100 Pearl Street
Hartford, CT 06103-4506
(Name and address of agent for service)
Registrant’s telephone number, including area code: (800) 243-1574
Date of fiscal year end: September 30
Date of reporting period: September 30, 2014
Form N-CSR is to be used by management investment companies to file reports with the Commission not later than 10 days after the transmission to stockholders of any report that is required to be transmitted to stockholders under Rule 30e-1 under the Investment Company Act of 1940 (17 CFR 270.30e-1). The Commission may use the information provided on Form N-CSR in its regulatory, disclosure review, inspection, and policymaking roles.
A registrant is required to disclose the information specified by Form N-CSR, and the Commission will make this information public. A registrant is not required to respond to the collection of information contained in Form N-CSR unless the Form displays a currently valid Office of Management and Budget (“OMB”) control number. Please direct comments concerning the accuracy of the information collection burden estimate and any suggestions for reducing the burden to Secretary, Securities and Exchange Commission, 100 F Street, NE, Washington, DC 20549. The OMB has reviewed this collection of information under the clearance requirements of 44 U.S.C. § 3507.
Table of Contents
Item 1. Reports to Stockholders.
The Report to Shareholders is attached herewith.
Table of Contents

ANNUAL REPORT
Virtus Bond Fund
Virtus CA Tax-Exempt Bond Fund
Virtus High Yield Fund
Virtus Low Volatility Equity Fund
Virtus Multi-Sector Intermediate Bond Fund
Virtus Senior Floating Rate Fund
Virtus Wealth Masters Fund
September 30, 2014 TRUST NAME: VIRTUS OPPORTUNITIES TRUST |
 |
Not FDIC Insured
No Bank Guarantee
May Lose Value
Table of Contents
| 1 | ||||||||
| 2 | ||||||||
| 4 | ||||||||
| Fund | Fund Summary | Schedule of Investments | ||||||
| 6 | 21 | |||||||
| 8 | 28 | |||||||
| 11 | 30 | |||||||
Virtus Low Volatility Equity Fund (“Low Volatility Equity Fund”) | 13 | 36 | ||||||
Virtus Multi-Sector Intermediate Bond Fund (“Multi-Sector Intermediate Bond Fund”) | 15 | 37 | ||||||
Virtus Senior Floating Rate Fund (“Senior Floating Rate Fund”) | 17 | 46 | ||||||
| 19 | 53 | |||||||
| 55 | ||||||||
| 57 | ||||||||
| 59 | ||||||||
| 63 | ||||||||
| 68 | ||||||||
| 80 | ||||||||
| 81 | ||||||||
| 82 | ||||||||
Proxy Voting Procedures and Voting Record (Form N-PX)
The subadvisers vote proxies relating to portfolio securities in accordance with procedures that have been approved by the Board of Trustees of the Trust (“Trustees,” or the “Board”). You may obtain a description of these procedures, along with information regarding how the Funds voted proxies during the most recent 12-month period ended June 30, free of charge, by calling toll-free 1-800-243-1574. This information is also available through the Securities and Exchange Commission’s (the “SEC”) website at http://www.sec.gov.
Form N-Q Information
The Trust files a complete schedule of portfolio holdings for each Fund with the SEC for the first and third quarters of each fiscal year on Form N-Q. Form N-Q is available on the SEC’s website at http://www.sec.gov. Form N-Q may be reviewed and copied at the SEC’s Public Reference Room. Information on the operation of the SEC’s Public Reference Room can be obtained by calling toll-free 1-800-SEC-0330.
This report is not authorized for distribution to prospective investors in the Funds presented in this book unless preceded or accompanied by an effective prospectus which includes information concerning the sales charge, each Fund’s record and other pertinent information.
Table of Contents
Dear Fellow Shareholders of Virtus Mutual Funds:
 | I am pleased to present this annual report which highlights performance of your fund for the 12 months ended September 30, 2014, including comments from the money manager.
The past 12 months were generally strong for equities, although market volatility increased over the last quarter, driven by geopolitical risks and a slowdown in the global economy. While the economies of Europe, Japan, and China weakened, the U.S. economy accelerated and the U.S. dollar rallied strongly. Broad U.S. equity indexes registered double-digit gains for the 12 months ended September 30, 2014. The S&P 500® Index returned 19.73%, the Dow Jones Industrial Average rose 15.29%, and the NASDAQ | |
Composite Index® was up 20.61%. By comparison, international equity returns were significantly smaller, including for both developed markets and emerging markets.
In mid-September, the Federal Reserve provided much needed assurance to investors by announcing that it intends to keep interest rates low for a “considerable time” after its bond buying program ends in October. Against this backdrop, the bellwether 10-year U.S. Treasury yield ended at 2.52% on September 30, 2014 compared with 2.64% a year earlier. The broader fixed income market, as measured by the Barclays U.S. Aggregate Bond Index, rose 3.96% for the 12 months ended September 30, 2014.
The uncertain state of the global economy is likely to remain a concern for markets in the months ahead. However, the health of the U.S. economy – including improving hiring, manufacturing, and housing data – gives investors reason for optimism. Future market direction will be determined largely by the ability of corporations to continue to produce robust earnings.
Market volatility is an ever-present reminder of the importance of portfolio diversification. While diversification cannot guarantee a profit or prevent loss, owning a variety of asset classes may cushion your portfolio against inevitable market fluctuations. Your financial advisor can help you ensure that your portfolio is adequately diversified across asset classes and investment strategies.
As always, thank you for entrusting Virtus with your assets. Should you have questions or require assistance, our customer service team is here to help at 1-866-270-7788. We appreciate your business and remain committed to your long-term financial success.
Sincerely,
George R. Aylward President, Virtus Mutual Funds
October 2014 | ||

Whenever you have questions about your account, or require additional information, please visit us on the Web at www.virtus.com or call our shareowner service group toll-free at 1-800-243-1574.
Performance data quoted represents past results. Past performance is no guarantee of future results and current performance may be higher or lower than the performance shown above.
1
Table of Contents
VIRTUS OPPORTUNITIES TRUST
Disclosure of Fund Expenses (Unaudited)
For the six-month period of April 1, 2014 to September 30, 2014
We believe it is important for you to understand the impact of costs on your investment. All mutual funds have operating expenses. As a shareholder of a Virtus Opportunities Trust Fund (each, a “Fund”) you may incur two types of costs: (1) transaction costs, including sales charges on purchases of Class A shares and contingent deferred sales charges on Class B and Class C shares; and (2) ongoing costs, including investment advisory fees, distribution and service fees, and other expenses. Class I shares are sold without sales charges. For further information regarding applicable sales charges, see Note 1 in the Notes to Financial Statements. These examples are intended to help you understand your ongoing costs (in dollars) of investing in a Fund and to compare these costs with the ongoing costs of investing in other mutual funds. These examples are based on an investment of $1,000 invested at the beginning of the period and held for the entire six-month period. The following Expense Table illustrates your Fund’s costs in two ways.
Actual Expenses
The first section of the accompanying table provides information about actual account values and actual expenses. You may use the information in this section, together with the amount you invested, to estimate the expenses that you paid over the period. Simply divide your account value by $1,000 (for example, an $8,600 account value divided by $1,000 = 8.6), then multiply the result by the number given for your Fund under the heading “Expenses Paid During Period” to estimate the expenses you paid on your account during the period.
Hypothetical Example for Comparison Purposes
The second section of the accompanying table provides information about hypothetical account values and hypothetical expenses based on the Fund’s actual expense ratio and an assumed rate of return of 5% per year before expenses, which is not your Fund’s actual return. The hypothetical account values and expenses may not be used to estimate the actual ending account balance or expenses you paid for the period. You may use this information to compare the ongoing costs of investing in your Fund and other funds. To do so, compare these 5% hypothetical examples with the 5% hypothetical examples that appear in the shareholder reports of the other funds.
Please note that the expenses shown in the accompanying table are meant to highlight your ongoing costs only and do not reflect any transactional costs, such as sales charges or contingent deferred sales charges. Therefore, the second section of the accompanying table is useful in comparing ongoing costs only, and will not help you determine the relative total costs of owning different funds. In addition, if these transactional costs were included, your costs would have been higher. The calculations assume no shares were bought or sold during the period. Your actual costs may have been higher or lower, depending on the amount of your investment and the timing of any purchases or redemptions.
| Expense Table | ||||||||||||||||
| Beginning Account Value April 1, 2014 | Ending Account Value September 30, 2014 | Annualized Expense Ratio | Expenses Paid During the Period* | |||||||||||||
Bond Fund |
| |||||||||||||||
Actual | ||||||||||||||||
Class A | $ | 1,000.00 | $ | 1,018.10 | 0.85 | % | $4.30 | |||||||||
Class B | 1,000.00 | 1,013.80 | 1.60 | 8.08 | ||||||||||||
Class C | 1,000.00 | 1,014.70 | 1.60 | 8.08 | ||||||||||||
Class I | 1,000.00 | 1,019.10 | 0.60 | 3.04 | ||||||||||||
Hypothetical (5% return before expenses) |
| |||||||||||||||
Class A | 1,000.00 | 1,020.75 | 0.85 | 4.32 | ||||||||||||
Class B | 1,000.00 | 1,016.95 | 1.60 | 8.12 | ||||||||||||
Class C | 1,000.00 | 1,016.95 | 1.60 | 8.12 | ||||||||||||
Class I | 1,000.00 | 1,022.02 | 0.60 | 3.05 | ||||||||||||
CA Tax Exempt Bond Fund |
| |||||||||||||||
Actual | ||||||||||||||||
Class A | $ | 1,000.00 | $ | 1,049.70 | 0.85 | % | $4.37 | |||||||||
Class I | 1,000.00 | 1,050.20 | 0.60 | 3.08 | ||||||||||||
Hypothetical (5% return before expenses) |
| |||||||||||||||
Class A | 1,000.00 | 1,020.75 | 0.85 | 4.32 | ||||||||||||
Class I | 1,000.00 | 1,022.02 | 0.60 | 3.05 | ||||||||||||
High Yield Fund |
| |||||||||||||||
Actual | ||||||||||||||||
Class A | $ | 1,000.00 | $ | 1,005.70 | 1.15 | % | $5.78 | |||||||||
Class B | 1,000.00 | 1,002.10 | 1.90 | 9.54 | ||||||||||||
Class C | 1,000.00 | 1,002.00 | 1.90 | 9.54 | ||||||||||||
Class I | 1,000.00 | 1,009.30 | 0.90 | 4.53 | ||||||||||||
Hypothetical (5% return before expenses) |
| |||||||||||||||
Class A | 1,000.00 | 1,019.23 | 1.15 | 5.84 | ||||||||||||
Class B | 1,000.00 | 1,015.42 | 1.90 | 9.65 | ||||||||||||
Class C | 1,000.00 | 1,015.42 | 1.90 | 9.65 | ||||||||||||
Class I | 1,000.00 | 1,020.50 | 0.90 | 4.57 | ||||||||||||
Low Volatility Equity Fund |
| |||||||||||||||
Actual | ||||||||||||||||
Class A | $ | 1,000.00 | $ | 1,045.50 | | 1.55 | % | | $7.95 | | ||||||
Class C | 1,000.00 | 1,042.10 | 2.30 | 11.77 | ||||||||||||
Class I | 1,000.00 | 1,046.40 | 1.30 | 6.67 | ||||||||||||
Hypothetical (5% return before expenses) |
| |||||||||||||||
Class A | 1,000.00 | 1,017.20 | 1.55 | 7.87 | ||||||||||||
Class C | 1,000.00 | 1,013.39 | 2.30 | 11.68 | ||||||||||||
Class I | 1,000.00 | 1,018.47 | 1.30 | 6.60 | ||||||||||||
Multi-Sector Intermediate Bond Fund |
| |||||||||||||||
Actual | ||||||||||||||||
Class A | $ | 1,000.00 | $ | 1,013.50 | 1.11 | % | $5.60 | |||||||||
Class B | 1,000.00 | 1,008.80 | 1.86 | 9.37 | ||||||||||||
Class C | 1,000.00 | 1,009.60 | 1.86 | 9.37 | ||||||||||||
Class I | 1,000.00 | 1,014.80 | 0.86 | 4.34 | ||||||||||||
Hypothetical (5% return before expenses) |
| |||||||||||||||
Class A | 1,000.00 | 1,019.43 | 1.11 | 5.63 | ||||||||||||
Class B | 1,000.00 | 1,015.63 | 1.86 | 9.44 | ||||||||||||
Class C | 1,000.00 | 1,015.63 | 1.86 | 9.44 | ||||||||||||
Class I | 1,000.00 | 1,020.70 | 0.86 | 4.37 | ||||||||||||
2
Table of Contents
VIRTUS OPPORTUNITIES TRUST
Disclosure of Fund Expenses (Unaudited) (Continued)
For the six-month period of April 1, 2014 to September 30, 2014
| Expense Table | ||||||||||||||||
| Beginning Account Value April 1, 2014 | Ending Account Value September 30, 2014 | Annualized Expense Ratio | Expenses Paid During the Period* | |||||||||||||
Senior Floating Rate Fund |
| |||||||||||||||
Actual | ||||||||||||||||
Class A | $ | 1,000.00 | $ | 1,002.30 | 1.19 | % | $5.97 | |||||||||
Class C | 1,000.00 | 998.50 | 1.94 | 9.72 | ||||||||||||
Class I | 1,000.00 | 1,003.60 | 0.94 | 4.72 | ||||||||||||
Hypothetical (5% return before expenses) |
| |||||||||||||||
Class A | 1,000.00 | 1,019.03 | 1.19 | 6.04 | ||||||||||||
Class C | 1,000.00 | 1,015.22 | 1.94 | 9.85 | ||||||||||||
Class I | 1,000.00 | 1,020.30 | 0.94 | 4.77 | ||||||||||||
Wealth Masters Fund |
| |||||||||||||||
Actual | ||||||||||||||||
Class A | $ | 1,000.00 | $ | 1,005.50 | 1.45 | % | $7.29 | |||||||||
Class C | 1,000.00 | 1,002.10 | 2.20 | 11.04 | ||||||||||||
Class I | 1,000.00 | 1,006.90 | 1.20 | 6.04 | ||||||||||||
Hypothetical (5% return before expenses) |
| |||||||||||||||
Class A | 1,000.00 | 1,017.71 | 1.45 | 7.36 | ||||||||||||
Class C | 1,000.00 | 1,013.90 | 2.20 | 11.17 | ||||||||||||
Class I | 1,000.00 | 1,018.98 | 1.20 | 6.09 | ||||||||||||
| * | Expenses are equal to the relevant Funds’ annualized expense ratio, which is net of waived fees and reimbursed expenses, if applicable, multiplied by the average account value over the period, multiplied by the number of days (183) expenses were accrued in the most recent fiscal half-year, then divided by 365 to reflect the one-half year period. |
For Funds which may invest in other funds, the annualized expense ratios noted above do not reflect fees and expenses associated with the underlying funds. If such fees and expenses had been included, the expenses would have been higher.
You can find more information about the Funds’ expenses in the Financial Statements section that follows. For additional information on operating expenses and other shareholder costs, refer to the prospectus.
3
Table of Contents
American Depositary Receipt (ADR)
Represents shares of foreign companies traded in U.S. dollars on U.S. exchanges that are held by a U.S. bank or a trust. Foreign companies use ADRs in order to make it easier for Americans to buy their shares.
Barclays California Municipal Bond Index
The Barclays California Municipal Bond Index measures long term investment grade, tax-exempt and fixed rate bonds issued in California. The index is calculated on a total return basis. The index is unmanaged, its returns do not reflect any fees, expenses or sales charges, and it is not available for direct investment.
Barclays High Yield 2% Issuer Capped Bond Index
The Barclays High-Yield 2% Issuer Capped Bond Index is a market capitalization-weighted index that measures fixed rate non-investment grade debt securities of U.S. and non-U.S. corporations. No single issuer accounts for more than 2% of market cap. The index is calculated on a total return basis. The index is unmanaged, its returns do not reflect any fees, expenses or sales charges, and it is not available for direct investment.
Barclays U.S. Aggregate Bond Index
The Barclays U.S. Aggregate Bond Index measures the U.S. investment grade fixed rate bond market. The index is calculated on a total return basis. The index is unmanaged, its returns do not reflect any fees, expenses or sales charges, and it is not available for direct investment.
Dow Jones Industrial Average
A price weighted average of 30 blue chip stocks. The index is calculated on total return basis with dividends reinvested. The index is unmanaged, its returns do not reflect any fees, expenses or sales charges, and it is not available for direct investment.
Exchange-Traded Funds (ETF)
Portfolios of stocks or bonds that track a specific market index.
Federal Reserve (the “Fed”)
The Central Bank of the United States, responsible for controlling the money supply, interest rates and credit with the goal of keeping the U.S. economy and currency stable. Governed by a seven-member board, the system includes 12 regional Federal Reserve Banks, 25 branches and all national and state banks that are part of the system.
Horizon Kinetics ISE Wealth Index (RCH)
Is a public index published by International Securities Exchange, LLC. The index is composed of companies with wealthy individuals in positions of influence or control who have a substantial amount of their personal wealth invested in the business. The index is unmanaged, its returns do not reflect any fees, expenses or sales charges, and it is not available for direct investment.
iShares®
Represents shares of an open-end exchange-traded fund.
NASDAQ Composite Index®
A market-capitalization weighted index of the more than 3,000 common equities listed on the Nasdaq stock exchange. Unlike other market indexes, the NASDAQ composite is not limited to companies that have U.S. headquarters. The index is unmanaged, its returns do not reflect any fees, expenses or sales charges and it is not available for direct investment.
Payment-in-Kind Security (PIK)
A bond which pays interest in the form of additional bonds, or preferred stock which pays dividends in the form of additional preferred stock.
Real Estate Investment Trust (REIT)
A publicly traded company that owns, develops and operates income-producing real estate such as apartments, office buildings, hotels, shopping centers and other commercial properties.
4
Table of Contents
KEY INVESTMENT TERMS (Continued)
Russell 2000® Index
The Russell 2000® Index is a market capitalization-weighted index that measures the performance of the smallest 2,000 companies in the Russell Universe which comprises the 3,000 largest U.S. companies. The index is calculated on a total return basis with dividends reinvested. The index is unmanaged, its returns do not reflect any fees, expenses or sales charges and it is not available for direct investment.
S&P 100® Index
The S&P 100 Index, a sub-set of the S&P 500®, measures the performance of large-cap U.S. companies, and comprises 100 major, blue chip companies across multiple industry groups.
S&P 500® Index
The S&P 500® Index is a free-float market capitalization-weighted index of 500 of the largest U.S. companies. The index is calculated on a total return basis with dividends reinvested. The index is unmanaged, its returns do not reflect any fees, expenses or sales charges, and it is not available for direct investment.
S&P/LSTA Leveraged Loan Index
The S&P/LSTA Leveraged Loan Index is a daily total return index that uses LSTA/LPC Mark-to-Market Pricing (third-party research data on the price movements of senior secured floating rate loans in the secondary loan market) to calculate market value change. On a real-time basis, the Index tracks the current outstanding balance and spread over LIBOR for fully funded term loans. The facilities included in the Index represent a broad cross section of leveraged loans syndicated in the United States, including dollar-denominated loans to overseas issuers. The index is unmanaged, its returns do not reflect any fees, expenses or sales charges and it is not available for direct investment.
Sponsored ADR (American Depositary Receipt)
An ADR which is issued with the cooperation of the company whose stock will underlie the ADR. Sponsored ADRs generally carry the same rights normally given to stock holders, such as voting rights. ADRs must be sponsored to be able to trade on a major U.S. exchange such as the New York Stock Exchange (NYSE).
When-issued and Forward Commitments (Delayed Delivery)
Securities purchased on a when-issued or forward commitment basis are also known as delayed delivery transactions. Delayed delivery transactions involve a commitment by a Fund to purchase or sell a security at a future date, ordinarily up to 90 days later. When-issued or forward commitments enable a Fund to lock in what is believed to be an attractive price or yield on a particular security for a period of time, regardless of future changes in interest rates.
5
Table of Contents
Bond Fund
Fund Summary | Ticker Symbols: Class A: SAVAX Class B: SAVBX Class C: SAVCX Class I: SAVYX |
| ¢ | The Fund is diversified and has an investment objective of high total return from both current income and capital appreciation. |
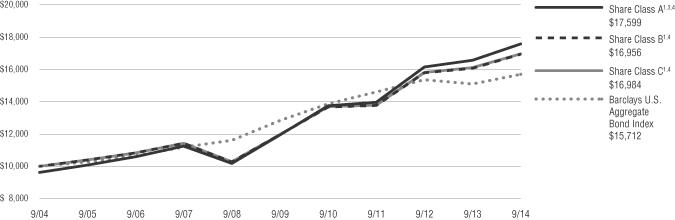
| ¢ | For the fiscal year ended September 30, 2014, the Fund’s Class A shares at NAV returned 6.18%, Class B shares returned 5.27%, Class C shares returned 5.34%, and Class I shares returned 6.35%. For the same period, the Barclays U.S. Aggregate Bond Index, which serves as the broad-based and style-specific benchmark index appropriate for comparison, returned 3.96%. |
All performance figures assume reinvestment of distributions and exclude the effect of sales charges. Past performance is no guarantee of future results, and current performance may be higher or lower than the performance shown above.
How did the markets perform during the Fund’s fiscal year?
| ¢ | Most spread sectors outperformed U.S. Treasuries during the fiscal year. Economic growth in the U.S. improved, but the level of growth remains moderate, which is supportive of fixed income spread sectors. The economy continues to be tempered by a lack of wage growth. This, when combined with slow global growth, concern over a stronger U.S. dollar, and a lack of inflation across the globe, will likely keep the Fed from raising short-term interest rates in the immediate future. Over the fiscal year, spread sectors were supported by an overall improvement in the U.S. macroeconomic environment, positive credit fundamentals, and continued demand for spread product. |
| ¢ | Globally, concerns over slowing growth in China and Europe, as well as increased geopolitical risks stemming from tensions between Ukraine and Russia and the escalation of issues in the Middle East have weighed on the fixed income markets. The global markets were also unsettled over the likelihood that the Fed would raise short-term interest rates sooner than anticipated due to stronger U.S. growth. |
| ¢ | The Fed continued to taper its monthly bond purchases with the expectation that it would be ending its stimulus program during the fourth quarter of 2014. However, the Central Bank has also |
acknowledged that signs of weakness remain in the U.S. economy, and has indicated that short-term rates will remain low in the near term and any future decision on rates will be driven by economic data. |
| ¢ | Over the last 12 months, yields increased at the short maturity end of the U.S. Treasury curve and decreased on the long maturity end, and overall the yield curve flattened. |
What factors affected the Fund’s performance during its fiscal year?
| ¢ | The outperformance of fixed income spread sectors relative to U.S. Treasuries was the key driver of the Fund’s strong performance for the fiscal year. |
| ¢ | The Fund’s allocation to the corporate high yield and corporate high quality sectors made positive contributions to performance for the fiscal year. |
| ¢ | During the fiscal year, the Fund’s allocation to the non-U.S. dollar sector and non-agency commercial mortgage- backed securities detracted from performance. |
The preceding information is the opinion of portfolio management. Any such opinions are subject to change at any time based upon market or other conditions and should not be relied upon as investment advice. Past performance is no guarantee of future results, and there is no guarantee that market forecasts will be realized.
There is no guarantee that the Fund will meet its objective.
Debt securities are subject to various risks, the most prominent of which are credit and interest rate risk. The issuer of a security may fail to make payments in a timely manner. Values of debt securities may rise and fall in response to changes in interest rates. This risk may be enhanced with longer-term maturities. Changes in interest rates can cause both extension and prepayment risks for asset and mortgage-backed securities. These securities are also subject to risks associated with the repayment of underlying collateral. Investing internationally, especially in emerging markets, involves additional risks such as currency, political, accounting, economic, and market risk. There is a greater level of credit risk and price volatility involved with high-yield securities than investment grade securities.
| Asset Allocation | ||||||||
The following table presents asset allocations within certain sectors and as a percentage of total investments as of September 30, 2014.
|
| |||||||
Corporate Bonds and Notes | 54 | % | ||||||
Financials | 22 | % | ||||||
Energy | 7 | |||||||
Consumer Discretionary | 6 | |||||||
All other Corporate Bonds and Notes | 19 | |||||||
Mortgage-Backed Securities | 21 | |||||||
Loan Agreements | 8 | |||||||
Asset-Backed Securities | 5 | |||||||
Foreign Government Securities | 5 | |||||||
Preferred Stocks | 3 | |||||||
Other (includes short-term investments) | 4 | |||||||
|
| |||||||
Total | 100 | % | ||||||
|
| |||||||
For information regarding the indexes and certain investment terms, see the Key Investment Terms starting on page 4.
6
Table of Contents
Bond Fund (Continued)
| Average Annual Total Returns1 for periods ended 9/30/14 | ||||||||||||
| 1 year | 5 years | 10 years | ||||||||||
| Class A Shares at NAV2 | 6.18 | % | 5.63 | % | 5.00 | % | ||||||
| Class A Shares at POP3 | 2.20 | 4.82 | 4.60 | |||||||||
| Class B Shares at NAV2 | 5.27 | 4.82 | 4.20 | |||||||||
| Class B Shares with CDSC4 | 1.27 | 4.82 | 4.20 | |||||||||
| Class C Shares at NAV2 and with CDSC4 | 5.34 | 4.84 | 4.22 | |||||||||
| Class I Shares at NAV | 6.35 | 5.89 | 5.27 | |||||||||
| Barclays U.S. Aggregate Bond Index | 3.96 | 4.12 | 4.62 | |||||||||
Fund Expense Ratios5: A Shares: Gross 1.06%, Net 0.85%; B Shares: Gross 1.81%, Net 1.60%; C Shares: Gross 1.81%, Net 1.60%; I Shares: Gross 0.81%, Net 0.60%.
All returns represent past performance which is no guarantee of future results. Current performance may be higher or lower than the performance shown. The investment return and principal value of an investment will fluctuate so that an investor’s shares, when redeemed, may be worth more or less than their original cost. The above table and graph below do not reflect the deduction of taxes that a shareholder would pay on fund distributions or the redemption of shares. Please visit Virtus.com for performance data current to the most recent month-end.
| 1 | Total returns are historical and include changes in share price and the reinvestment of both dividends and capital gains distributions. |
| 2 | “NAV” (Net Asset Value) total returns do not include the effect of any sales charge. |
| 3 | “POP” (Public Offering Price) total returns include the effect of the maximum front-end 3.75% sales charge. |
| 4 | “CDSC” (Contingent Deferred Sales Charge) is applied to redemptions of certain classes of shares that do not have a sales charge applied at the time of purchase. CDSC charges for B shares decline from 5% to 0% over a five-year period. CDSC charges for certain redemptions of Class A shares made within 18 months of purchase in which a finder’s fee was paid and all redemptions of Class C shares within the first year are 1% and 0% thereafter. |
| 5 | The expense ratios of the Fund are set forth according to the prospectus for the Fund effective January 28, 2014, as supplemented and revised, and may differ from the expense ratios disclosed in the Financial Highlights tables in this report. See the Financial Highlights for more current expense ratios. Net Expense: Expenses reduced by voluntary fee waiver which may be discontinued at any time. Gross Expense: Does not reflect the effect of the fee waiver. |
Growth of $10,000 For periods ended 9/30
This chart assumes an initial investment of $10,000 made on September 30, 2004, for Class A, Class B, Class C, and Class I shares including any applicable sales charges or fees. Performance assumes reinvestment of dividends and capital gain distributions.
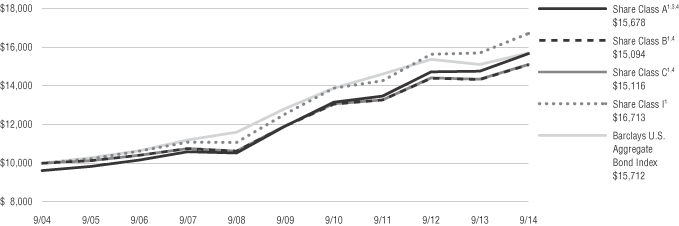
The indexes are unmanaged and not available for direct investment; therefore, their performance does not reflect the expenses associated with active management of an actual portfolio.
For information regarding the indexes and certain investment terms, see the Key Investment Terms starting on page 4.
7
Table of Contents
Fund Summary | Ticker Symbols: Class A: CTESX Class I: CTXEX |
| ¢ | The Fund is diversified and has an investment objective of obtaining a high level of current income exempt from California state and local income taxes, as well as federal income tax, consistent with the preservation of capital. |
| ¢ | For the fiscal year ended September 30, 2014, the Fund’s Class A shares at NAV returned 9.16% and Class I shares returned 9.36%. For the same period, the Barclays U.S. Aggregate Bond Index, a broad-based fixed income index, returned 3.96%, and the Barclays California Municipal Bond Index, the Fund’s style-specific benchmark appropriate for comparison, returned 9.20%. |
All performance figures assume reinvestment of distributions and exclude the effect of sales charges. Past performance is no guarantee of future results, and current performance may be higher or lower than the performance shown above.
How did the markets perform during the Fund’s fiscal year?
The municipal bond market experienced strong performance over the past 12 months, as AAA-rated tax-free interest rates declined by 37 basis points on 10-year maturities, and by over 100 basis points on 30-year maturities, according to Municipal Market Data. The result of this decline in tax-free interest rates was an increase in the principal value of tax-free municipal bonds, including the bonds in the Virtus California Tax-Exempt Bond Fund. Several factors contributed to the decline in rates over the past year:
| ¢ | Declining U.S. Treasury bond yields driven by economic uncertainty and global tensions |
| ¢ | Reversal of flows into open-end municipal bond mutual funds after record outflows in 2013 |
| ¢ | Substantial decline in the issuance of municipal bonds |
Aided by these strong technical conditions, the municipal market produced a solid 9.20% return over the 12-month period as measured by the Barclays California Municipal Bond Index.
According to the Investment Company Institute (ICI), open-end municipal bond mutual funds have experienced over $15 billion of net inflows through the first nine months of 2014, following $58 billion of
outflows in 2013. Riskier high yield municipal funds have been the beneficiary of much of this year’s inflows, as investor appetite for higher yields, in a declining interest rate environment, is quite strong. In addition to buyers of mutual funds, the market is experiencing strong demand for municipal bonds from other buyers such as retail investors buying individual bonds, separately managed accounts, and banks and insurance companies.
Issuance of new municipal bonds was lower by 10% through September 30, 2014, compared to the same time period in 2013. This lower issuance has been driven by, among other things, fiscal austerity on the part of municipalities, lower levels of refunding deals (after experiencing elevated levels of refundings in 2011- 2013), and a higher percentage of issuers borrowing directly from banks (thus bypassing the public debt markets). In fact, direct lending to municipalities exceeded $40 billion in 2013, which was close to 15% of the market’s municipal bond issuance for the year. This meaningful reduction in the issuance of municipal bonds, combined with a reversal in fund flows, has improved the balance of supply and demand, thereby helping bond prices to rise.
Credit fundamentals for municipal bond issuers have generally moderated across the country, although some states are faring much better than others. Revenues have been slowing at both state and local levels, mostly as a result of lower personal income tax collections. Instead of spending to address aging infrastructure, many municipalities are choosing to implement austerity measures to bring their expenses in line with revenues. While infrastructure is a growing concern among voters, there appears to be little support to meaningfully increase the funding for it. With 36 states casting ballots for new governors in the upcoming midterm elections, it is unlikely the market will see any large-scale changes in municipality spending and increased bond issuance. An issue of particular focus for credit rating agencies is pension funding levels and the ability for states to maintain sustainable budgets. Despite positive assessments for some municipalities, this has not been consistent across the board. Downgrades exceed upgrades, as pensions and other increased fixed costs continue to strain local government budgets. This is one example of why credit selection is a critical component to investing in the municipal bond market.
What factors affected the Fund’s performance during its fiscal year?
Relative portfolio performance was impacted by the exposure to short- to intermediate-term holdings, bonds with shorter call options, and higher quality issues.
Relative portfolio performance benefited from exposure to long maturity bonds, healthcare issues, lower quality issues, and zero coupon securities.
Over the past 12 months, the market’s best performers have been longer duration, lower coupon, and lower credit quality bonds as interest rates have declined and risk premiums have narrowed. While still producing positive performance, bonds will shorter maturities, lower duration, and higher coupons and credit quality have performed relatively weaker.
The preceding information is the opinion of portfolio management. Any such opinions are subject to change at any time based upon market or other conditions and should not be relied upon as investment advice. Past performance is no guarantee of future results, and there is no guarantee that market forecasts will be realized.
There is no guarantee that the Fund will meet its objective.
Debt securities are subject to various risks, the most prominent of which are credit and interest rate risk. The issuer of a security may fail to make payments in a timely manner. Values of debt securities may rise and fall in response to changes in interest rates. This risk may be enhanced with longer-term maturities. A fund that focuses its investments in a particular geographic location will be highly sensitive to financial, economic, political, and other developments affecting the fiscal stability of that location. Events negatively impacting a municipal security, or the municipal bond market in general, may cause the fund to decrease in value. A portion of income may be subject to some state and/or local taxes and, for certain investors, a portion may be subject to the federal alternative minimum tax.
For information regarding the indexes and certain investment terms, see the Key Investment Terms starting on page 4.
8
Table of Contents
| CA Tax-Exempt Bond Fund (Continued) |
| Asset Allocation | ||||||||
The following table presents asset allocations within certain sectors and as a percentage of total investments as of September 30, 2014.
|
| |||||||
Tax-Exempt Municipal Bonds | 100 | % | ||||||
General Revenue | 27 | % | ||||||
General Obligation | 20 | |||||||
Pre-Refunded | 13 | |||||||
Water & Sewer Revenue | 7 | |||||||
Development Revenue | 6 | |||||||
Medical Revenue | 6 | |||||||
Transportation Revenue | 6 | |||||||
Other | 15 | |||||||
|
| |||||||
Total | 100 | % | ||||||
|
| |||||||
For information regarding the indexes and certain investment terms, see the Key Investment Terms starting on page 4.
9
Table of Contents
CA Tax-Exempt Bond Fund (Continued)
| Average Annual Total Returns1 for periods ended 9/30/14 | ||||||||||||||||||||
| 1 year | 5 years | 10 years | Since Inception | Inception Date | ||||||||||||||||
| Class A Shares at NAV2 | 9.16 | % | 4.84 | % | 4.30 | % | — | — | ||||||||||||
| Class A Shares at POP3,4 | 6.16 | 4.25 | 4.01 | — | — | |||||||||||||||
| Class I Shares at NAV | 9.36 | 5.09 | — | 4.73 | % | 9/29/06 | ||||||||||||||
| Barclays U.S. Aggregate Bond Index | 3.96 | 4.12 | 4.62 | 4.97 | 5 | — | ||||||||||||||
| Barclays California Municipal Bond Index | 9.20 | 5.41 | 5.06 | 5.12 | 5 | — | ||||||||||||||
Fund Expense Ratios6: A Shares: Gross 1.03%, Net 0.85%; I Shares: Gross 0.78%, Net 0.60%.
All returns represent past performance which is no guarantee of future results. Current performance may be higher or lower than the performance shown. The investment return and principal value of an investment will fluctuate so that an investor’s shares, when redeemed, may be worth more or less than their original cost. The above table and graph below do not reflect the deduction of taxes that a shareholder would pay on fund distributions or the redemption of shares. Please visit Virtus.com for performance data current to the most recent month-end.
| 1 | Total returns are historical and include changes in share price and the reinvestment of both dividends and capital gains distributions. |
| 2 | “NAV” (Net Asset Value) total returns do not include the effect of any sales charge. |
| 3 | “POP” (Public Offering Price) total returns include the effect of the maximum front-end 2.75% sales charge. |
| 4 | “CDSC” (Contingent Deferred Sales Charge) is applied to redemptions of certain classes of shares that do not have a sales charge applied at the time of purchase. CDSC charges for certain redemptions of Class A shares made within 18 months of purchase in which a finder’s fee was paid are 1% and 0% thereafter. |
| 5 | The since inception index returns are from the inception date of Class I. |
| 6 | The expense ratios of the Fund are set forth according to the prospectus for the Fund effective January 28, 2014, as supplemented and revised, and may differ from the expense ratios disclosed in the Financial Highlights tables in this report. See the Financial Highlights for more current expense ratios. Net Expense: Expenses reduced by voluntary fee waiver which may be discontinued at any time. Gross Expense: Does not reflect the effect of the fee waiver. |
Growth of $10,000 For periods ended 9/30
This chart assumes an initial investment of $10,000 made on September 30, 2004 for Class A shares including any applicable sales charges or fees. Performance assumes reinvestment of dividends and capital gain distributions.
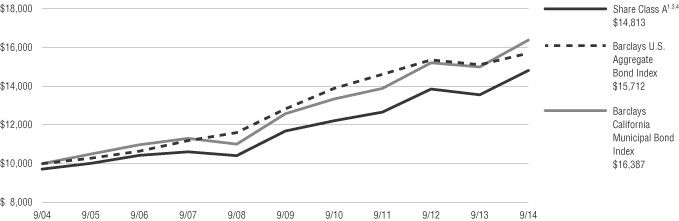
The indexes are unmanaged and not available for direct investment; therefore, their performance does not reflect the expenses associated with active management of an actual portfolio.
For information regarding the indexes and certain investment terms, see the Key Investment Terms starting on page 4.
10
Table of Contents
Fund Summary | Ticker Symbols: Class A: PHCHX Class B: PHCCX Class C: PGHCX Class I: PHCIX |
| ¢ | The Fund is diversified and has a primary investment objective of high current income and a secondary objective of capital growth. |
| ¢ | For the fiscal year ended September 30, 2014, the Fund’s Class A shares at NAV returned 7.53%, Class B shares returned 6.68%, and Class C shares returned 6.60%. Class I shares returned 7.80%. For the same period, the Barclays U.S. Aggregate Bond Index, a broad-based fixed income index, returned 3.96%, and the Barclays U.S. High-Yield 2% Issuer Capped Bond Index, the Fund‘s style-specific index appropriate for comparison, returned 7.19%. |
All performance figures assume reinvestment of distributions and exclude the effect of sales charges. Past performance is no guarantee of future results, and current performance may be higher or lower than the performance shown above.
How did the market perform during the Fund’s fiscal year?
| ¢ | The U.S. high yield market, as measured by the Barclays High Yield 2% Issuer Capped Bond Index, delivered a 7.19% return for the fiscal year ended September 30, 2014. The streak of consecutive months of positive returns was broken at nine months as volatility increased heading into July. The last three months of the fiscal year saw rather large swings in returns as they turned decidedly negative in July, flipping back to positive in August and finally back to negative in September. The decrease in interest rates over the year helped BB-rated bonds, which tend to have a longer duration, outperform B and CCC-rated bonds. Only a handful of industries actually posted negative returns over the year compared to others such as paper, brokerages, environmental services, wirelines, tobacco, electric utility, insurance, and pipelines which posted double-digit returns. |
| ¢ | In the past, high yield investors have been rewarded during similar stages within a given credit cycle by taking on credit risk. Even though fundamentals have remained solid and defaults remain low relative to historical averages, a blind beta grab of buying any and all CCC bonds has not led to significant outperformance. This fiscal year has been dominated by the unexpected decline in |
interest rates, which has actually helped BBs take the crown as the high yield market’s best performing credit tier. |
| ¢ | Fundamentals remained strong as high yield issuers maintained leverage ratios below those seen right before the last increase in the default rate which happened to be a precursor for the 2008 financial crisis. On the technical side, flows were volatile over the fiscal year, starting out positive for most of the first three quarters and then turned decidedly negative during the fourth quarter. New issuance continued to be robust over the year as companies continued to take advantage of historically low interest rates. Companies have been wise to term out the debt within their capital structures with interest cost savings driving the interest coverage ratio to historical highs for the high yield universe. |
What factors affected the Fund’s performance during its fiscal year?
| ¢ | The strong performance of the high yield sector significantly contributed to the Fund’s positive return for the year. |
| ¢ | The positive contributors to the Fund’s performance during the year were the issue selection within high yield, along with some of our conscientious overweights/underweights within certain industries. The Fund benefited from strong issue selection within health care and technology, which were two of the three most overweight industries within the Fund. The Fund also made a conscious bet to be significantly underweight the metals & mining industry, which added alpha to the portfolio as it continued to underperform with weak economic data flowing out of China. |
| ¢ | The detractors from Fund performance were poor issue selection within the portfolio’s retailer exposure, as well as not having enough exposure within the pipelines industry which was a significant outperformer during the year. |
The preceding information is the opinion of portfolio management. Any such opinions are subject to change at any time based upon market or other conditions and should not be relied upon as investment advice. Past performance is no guarantee of future results, and there is no guarantee that market forecasts will be realized.
There is no guarantee that the Fund will meet its objectives.
Debt securities are subject to various risks, the most prominent of which are credit and interest rate risk. The issuer of a security may fail to make payments in a timely manner. Values of debt securities may rise and fall in response to changes in interest rates. This risk may be enhanced with longer-term maturities. There is a greater level of credit risk and price volatility involved with high-yield securities than investment grade securities. Investing internationally, especially in emerging markets, involves additional risks such as currency, political, accounting, economic, and market risk. A fund that focuses its investments in a particular industry or sector will be more sensitive to conditions that affect that industry or sector than a non-concentrated fund.
| Asset Allocation | ||||||||
The following table presents asset allocations within certain sectors as a percentage of total investments as of September 30, 2014.
|
| |||||||
Corporate Bonds and Notes | 79 | % | ||||||
Consumer Discretionary | 18 | % | ||||||
Energy | 11 | |||||||
Financials | 10 | |||||||
Health Care | 9 | |||||||
Materials | 8 | |||||||
Telecommunication Services | 7 | |||||||
Industrials | 6 | |||||||
All other Corporate Bonds and Notes | 10 | |||||||
Loan Agreements | 16 | |||||||
Other (includes short-term investments) | 5 | |||||||
|
| |||||||
Total | 100 | % | ||||||
|
| |||||||
For information regarding the indexes and certain investment terms, see the Key Investment Terms starting on page 4.
11
Table of Contents
High Yield Fund (Continued)
| Average Annual Total Returns1 for periods ended 9/30/14 | ||||||||||||||||||||
| 1 year | 5 years | 10 years | Since Inception | Inception Date | ||||||||||||||||
| Class A Shares at NAV2 | 7.53 | % | 9.23 | % | 5.68 | % | — | — | ||||||||||||
| Class A Shares at POP3,4 | 3.50 | 8.40 | 5.28 | — | — | |||||||||||||||
| Class B Shares at NAV2 | 6.68 | 8.40 | 4.89 | — | — | |||||||||||||||
| Class B Shares with CDSC4 | 2.61 | 8.40 | 4.89 | — | — | |||||||||||||||
| Class C Shares at NAV2 and with CDSC4 | 6.60 | 8.38 | 4.89 | — | — | |||||||||||||||
| Class I Shares at NAV2 | 7.80 | — | — | 7.70 | % | 8/8/12 | ||||||||||||||
| Barclays U.S. Aggregate Bond Index | 3.96 | 4.12 | 4.62 | 1.34 | 5 | — | ||||||||||||||
| Barclays U.S. High-Yield 2% Issuer Capped Bond Index | 7.19 | 10.52 | 8.32 | 7.60 | 5 | — | ||||||||||||||
Fund Expense Ratios6: A Shares: Gross 1.30%, Net 1.15% B Shares: Gross 2.05%, Net 1.90% C Shares: Gross 2.05%, Net 1.90% Class I: Gross 1.05% Net 0.90%.
All returns represent past performance which is no guarantee of future results. Current performance may be higher or lower than the performance shown. The investment return and principal value of an investment will fluctuate so that an investor’s shares, when redeemed, may be worth more or less than their original cost. The above table and graph below do not reflect the deduction of taxes that a shareholder would pay on fund distributions or the redemption of shares. Please visit Virtus.com for performance data current to the most recent month-end.
| 1 | Total returns are historical and include changes in share price and the reinvestment of both dividends and capital gains distributions. |
| 2 | “NAV” (Net Asset Value) total returns do not include the effect of any sales charge. |
| 3 | “POP” (Public Offering Price) total returns include the effect of the maximum front-end 3.75% sales charge. |
| 4 | “CDSC” (Contingent Deferred Sales Charge) is applied to redemptions of certain classes of shares that do not have a sales charge applied at the time of purchase. CDSC charges for B shares decline from 5% to 0% over a five-year period. CDSC charges for certain redemptions of Class A shares made within 18 months of purchase in which a finder’s fee was paid and all redemptions of Class C shares within the first year are 1% and 0% thereafter. |
| 5 | The since inception index returns are from the inception date of Class I. |
| 6 | The expense ratios of the Fund are set forth according to the prospectus for the Fund effective January 28, 2014, as supplemented and revised, and may differ from the expense ratios disclosed in the Financial Highlights tables in this report. See the Financial Highlights for more current expense ratios. Net Expense: Expenses reduced by voluntary fee waiver which may be discontinued at any time. Gross Expense: Does not reflect the effect of the fee waiver. |
Growth of $10,000 For periods ended 9/30
This chart assumes an initial investment of $10,000 made on September 30, 2004, for Class A, Class B, and Class C shares including any applicable sales charges or fees. Performance assumes reinvestment of dividends and capital gain distributions.
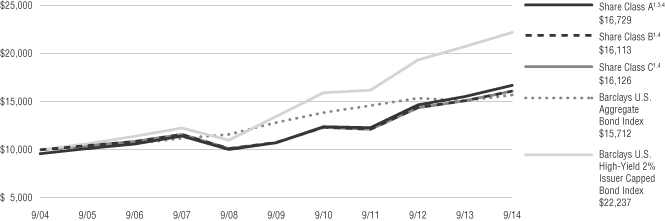
The indexes are unmanaged and not available for direct investment; therefore, their performance does not reflect the expenses associated with active management of an actual portfolio.
For information regarding the indexes and certain investment terms, see the Key Investment Terms starting on page 4.
12
Table of Contents
Fund Summary | Ticker Symbols: Class A: VLVAX Class C: VLVIX Class I: VLVCX |
| ¢ | The Fund is diversified and has an investment objective of capital appreciation with lower volatility than U.S. equity markets over a full market cycle. |
| ¢ | For the fiscal year ended September 30, 2014, the Fund’s Class A shares at NAV returned 15.23%, Class C shares returned 14.47%, and Class I shares returned 15.45%. For the same period, the S&P 500® Index, a broad-based fixed equity index, and the Fund’s style-specific benchmark appropriate for comparison returned 19.73%. |
All performance figures assume reinvestment of distributions and exclude the effect of sales charges. Past performance is no guarantee of future results, and current performance may be higher or lower than the performance shown above.
How did the markets perform during the Fund’s fiscal year?
| ¢ | In the fourth quarter of 2013, capital markets continued to experience strong performance as they had seen throughout the year. Concerns over a government shutdown eased around a federal debt deal, and the S&P 500® Index was up 10.49% during the period. The S&P 500® Index remained strong during the first nine months of 2014, briefly pulling back in January and again over the final two weeks of September. During the Fund’s fiscal year ended September 30, 2014, the S&P 500® Index was up 19.73%. |
| ¢ | Geopolitical risk was a concern throughout the year from the Russian-Ukraine tensions, concerns over the crises in Middle East (ISIS and Hamas-Israel), to the most recent protests in Hong Kong. These risks have increased the level of fear in the market and raised the concern on how they could affect corporate profits going forward. |
| ¢ | Strong U.S. economic numbers raised fears that the Fed might allow rates to rise earlier than anticipated. But, with growing concern over the eurozone’s and China’s economic growth potential, Central Banks have universally remained accommodative. |
What factors affected the Fund’s performance during its fiscal year?
| ¢ | The Fund benefited from its allocation to the larger-capitalization stocks in the S&P 500® Index. The equity portion was invested in the S&P 100® Index, which returned 20.47% over the fiscal year period ended September 30, 2014, while the S&P 500® Index returned 19.73%. |
| ¢ | One of the strategies the Fund utilizes is the selling of S&P 500® Index calls to generate income. This income is then used to purchase a negatively correlated investment, which can rise in value when the S&P 500® Index falls. This defensive investment is a call option on the futures contract of the Chicago Board of Options Exchange Volatility Index (“VIX”). |
| ¢ | The VIX index, a proxy for the 30-day implied volatility of the S&P 500® Index, averaged 13.72 during the fiscal year. Historically, the average level of the VIX, dating back to December 31, 2002, is 19.90. Although we view current levels for the VIX low on a historic basis, we also understand that these periods of low implied volatility can last for extended periods. With implied volatility at the low levels we have seen recently, the defensive allocation to VIX calls will likely continue to be a drag on performance, since the premium generated by writing S&P 500® Index calls has not fully offset this cost. |
The preceding information is the opinion of portfolio management. Any such opinions are subject to change at any time based upon market or other conditions and should not be relied upon as investment advice. Past performance is no guarantee of future results and there is no guarantee market forecasts will be realized.
There is no guarantee that the Fund will meet its objectives.
The market price of equity securities may be affected by financial market, industry, or issuer-specific events. Focus on a particular style or on small or medium-sized companies may enhance that risk. The value of an ETF may be more volatile than the underlying portfolio of securities the ETF is designed to track. The costs of owning the ETF may exceed the cost of investing directly in the underlying securities. Securities in the fund may go up or down in response to the prospects of individual companies
and general economic conditions. Price changes may be short or long term. Selling call options may limit a fund’s opportunity to profit from the increase in price of its underlying portfolio. Buying call options risks the loss of the premium paid for those options.
| Asset Allocation | ||||
The following table presents asset allocations within certain sectors and as a percentage of total investments as of September 30, 2014.
|
| |||
Exchange Traded Funds | 99 | % | ||
Other (includes short-term investments) | 1 | |||
|
| |||
Total | 100 | % | ||
|
| |||
For information regarding the indexes and certain investment terms, see the Key Investment Terms starting on page 4.
13
Table of Contents
Low Volatility Equity Fund (Continued)
| Average Annual Total Returns1 for periods ended 9/30/14 | ||||||||||||
| 1 year | Since Inception | Inception Date | ||||||||||
| Class A Shares at NAV2 | 15.23 | % | 13.53 | % | 6/11/13 | |||||||
| Class A Shares at POP3,4 | 8.61 | 8.49 | 6/11/13 | |||||||||
| Class C Shares at NAV2 and with CDSC4 | 14.47 | 12.70 | 6/11/13 | |||||||||
| Class I Shares at NAV2 | 15.45 | 13.78 | 6/11/13 | |||||||||
| S&P 500® Index | 19.73 | 18.37 | 5 | — | ||||||||
Fund Expense Ratios6: A Shares: Gross 2.10%, Net 1.55%; C Shares: Gross 2.85%, Net 2.30%; I Shares: Gross 1.85%, Net 1.30%.
All returns represent past performance which is no guarantee of future results. Current performance may be higher or lower than the performance shown. The investment return and principal value of an investment will fluctuate so that an investor’s shares, when redeemed, may be worth more or less than their original cost. The above table and graph below do not reflect the deduction of taxes that a shareholder would pay on fund distributions or the redemption of shares. Please visit Virtus.com for performance data current to the most recent month-end.
| 1 | Total returns are historical and include changes in share price and the reinvestment of both dividends and capital gains distributions. |
| 2 | “NAV” (Net Asset Value) total returns do not include the effect of any sales charge. |
| 3 | “POP” (Public Offering Price) total returns include the effect of the maximum front-end 5.75% sales charge. |
| 4 | “CDSC” (Contingent Deferred Sales Charge) is applied to redemptions of certain classes of shares that do not have a sales charge applied at the time of purchase. CDSC charges for certain redemptions of Class A shares made within 18 months of purchase in which a finder’s fee was paid and all redemptions of Class C shares within the first year are 1% and 0% thereafter. |
| 5 | The since inception index returns are from the Fund’s inception date. |
| 6 | The expense ratios of the Fund are set forth according to the prospectus for the Fund effective January 28, 2014, and may differ from the expense ratios disclosed in the Financial Highlights tables in this report. See the Financial Highlights for more current expense ratios. Net Expense: Expenses reduced by a contractual fee waiver in effect through January 31, 2015. Gross Expense: Does not reflect the effect of the fee waiver. |
Growth of $10,000 For periods ended 9/30
This chart assumes an initial investment of $10,000 made on June 11, 2013 (inception date of the Fund) for Class A, Class C, and Class I shares including any applicable sales charges or fees. Performance assumes reinvestment of dividends and capital gain distributions.
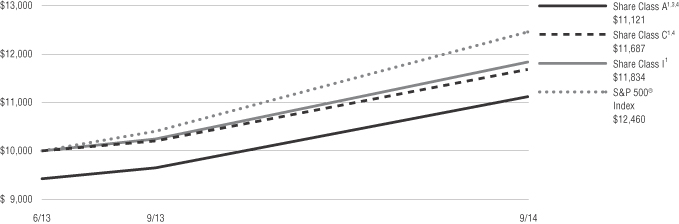
The indexes are unmanaged and not available for direct investment; therefore, their performance does not reflect the expenses associated with active management of an actual portfolio.
For information regarding the indexes and certain investment terms, see the Key Investment Terms starting on page 4.
14
Table of Contents
Multi-Sector Intermediate Bond Fund
Fund Summary | Ticker Symbols: Class A: NAMFX Class B: NBMFX Class C: NCMFX Class I: VMFIX |
| ¢ | The Fund is diversified and has an investment objective of maximizing current income while preserving capital. |
| ¢ | For the fiscal year ended September 30, 2014, the Fund’s Class A shares at NAV returned 6.18%, Class B shares returned 5.40%, Class C shares returned 5.33%, and Class I shares returned 6.54%. For the same period, the Barclays U.S. Aggregate Bond Index, which is both the Fund’s broad-based and style-specific fixed income index, returned 3.96%. |
All performance figures assume reinvestment of distributions and exclude the effect of sales charges. Past performance is no guarantee of future results, and current performance may be higher or lower than the performance shown above.
How did the market perform during the Fund’s fiscal year?
| ¢ | Most spread sectors outperformed U.S. Treasuries during the fiscal year. Economic growth in the U.S. improved, but the level of growth remains moderate, which is supportive of fixed income spread sectors. The economy continues to be tempered by a lack of wage growth. This, when combined with slow global growth, concern over a stronger U.S. dollar, and a lack of inflation across the globe, will likely keep the Fed from raising short-term interest rates in the immediate future. Over the fiscal year, spread sectors were supported by an overall improvement in the U.S. macroeconomic environment, positive credit fundamentals, and continued demand for spread product. |
| ¢ | Globally, concerns over slowing growth in China and Europe, as well as increased geopolitical risks stemming from tensions between Ukraine and Russia and the escalation of issues in the Middle East have weighed on the fixed income markets. The global markets were also unsettled over the likelihood that the Fed would raise short-term interest rates sooner than anticipated due to stronger U.S. growth. |
| ¢ | The Fed continued to taper its monthly bond purchases with the expectation that it would be ending its stimulus program during the fourth quarter of 2014. However, the Central Bank has also |
acknowledged that signs of weakness remain in the U.S. economy, and has indicated that short-term rates will remain low in the near term and any future decision on rates will be driven by economic data. |
| ¢ | Over the last 12 months, yields increased at the short maturity end of the U.S. Treasury curve and decreased on the long maturity end, and overall the yield curve flattened. |
What factors affected the Fund’s performance during its fiscal year?
| ¢ | The outperformance of fixed income spread sectors relative to U.S. Treasuries was the key driver of the Fund’s strong performance for the fiscal year. |
| ¢ | Among fixed income sectors, the Fund’s allocation to corporate high yield, corporate high quality, and Yankee high quality securities were all positive contributors to performance for the fiscal year. |
| ¢ | During the fiscal year, the Fund’s allocation to the non-U.S. dollar sector detracted from performance. |
The preceding information is the opinion of portfolio management. Any such opinions are subject to change at any time based upon market or other conditions and should not be relied upon as investment advice. Past performance is no guarantee of future results, and there is no guarantee that market forecasts will be realized.
There is no guarantee that the Fund will meet its objective.
Debt securities are subject to various risks, the most prominent of which are credit and interest rate risk. The issuer of a security may fail to make payments in a timely manner. Values of debt securities may rise and fall in response to changes in interest rates. This risk may be enhanced with longer-term maturities. There is a greater level of credit risk and price volatility involved with high-yield securities than investment grade securities. Changes in interest rates can cause both extension and prepayment risks for asset-backed securities and mortgage-backed securities. These securities are also subject to risks associated with the repayment of underlying collateral. There may be no ready market for loan participation
interests. The fund may have to sell the interests at a substantial discount. Such interests are subject to the credit risk of the underlying corporate borrower. Investing internationally, especially in emerging markets, involves additional risks such as currency, political, accounting, economic, and market risk.
| Asset Allocation | ||||||||
The following table presents asset allocations within certain sectors and as a percentage of total investments as of September 30, 2014.
|
| |||||||
Corporate Bonds and Notes | 59 | % | ||||||
Financials | 20 | % | ||||||
Energy | 11 | |||||||
Consumer Discretionary | 7 | |||||||
Industrials | 6 | |||||||
All other Corporate Bonds and Notes | 15 | |||||||
Loan Agreements | 14 | |||||||
Foreign Government Securities | 10 | |||||||
Mortgage-Backed Securities | 9 | |||||||
Other (includes short-term investments) | 8 | |||||||
|
| |||||||
Total | 100 | % | ||||||
|
| |||||||
For information regarding the indexes and certain investment terms, see the Key Investment Terms starting on page 4.
15
Table of Contents
Multi-Sector Intermediate Bond Fund (Continued)
| Average Annual Total Returns1 for periods ended 9/30/14 | ||||||||||||||||||||
| 1 year | 5 years | 10 years | Since Inception | Inception Date | ||||||||||||||||
| Class A Shares at NAV2 | 6.18 | % | 8.03 | % | 6.22 | % | — | — | ||||||||||||
| Class A Shares at POP3,4 | 2.19 | 7.21 | 5.82 | — | — | |||||||||||||||
| Class B Shares at NAV2 | 5.40 | 7.20 | 5.42 | — | — | |||||||||||||||
| Class B Shares with CDSC4 | 1.43 | 7.20 | 5.42 | — | — | |||||||||||||||
| Class C Shares at NAV2 and with CDSC4 | 5.33 | 7.23 | 5.44 | — | — | |||||||||||||||
| Class I Shares at NAV | 6.54 | — | — | 8.34 | % | 10/1/09 | ||||||||||||||
| Barclays U.S. Aggregate Bond Index | 3.96 | 4.12 | 4.62 | 4.04 | 5 | — | ||||||||||||||
Fund Expense Ratios6: A Shares: 1.09%, B Shares: 1.84%, C Shares: 1.84%, I Shares: 0.84%.
All returns represent past performance which is no guarantee of future results. Current performance may be higher or lower than the performance shown. The investment return and principal value of an investment will fluctuate so that an investor’s shares, when redeemed, may be worth more or less than their original cost. The above table and graph below do not reflect the deduction of taxes that a shareholder would pay on fund distributions or the redemption of shares. Please visit Virtus.com for performance data current to the most recent month-end.
| 1 | Total returns are historical and include changes in share price and the reinvestment of both dividends and capital gains distributions. |
| 2 | “NAV” (Net Asset Value) total returns do not include the effect of any sales charge. |
| 3 | “POP” (Public Offering Price) total returns include the effect of the maximum front-end 3.75% sales charge. |
| 4 | “CDSC” (Contingent Deferred Sales Charge) is applied to redemptions of certain classes of shares that do not have a sales charge applied at the time of purchase. CDSC charges for B shares decline from 5% to 0% over a five-year period. CDSC charges for certain redemptions of Class A shares made within 18 months of purchase in which a finder’s fee was paid and all redemptions of Class C shares within the first year are 1% and 0% thereafter. |
| 5 | The since inception index returns are from the inception date of Class I Shares. |
| 6 | The expense ratios of the Fund are set forth according to the prospectus for the Fund effective January 28, 2014, as supplemented and revised, and may differ from the expense ratios disclosed in the Financial Highlights tables in this report. See the Financial Highlights for more current expense ratios. |
Growth of $10,000 For periods ended 9/30
This chart assumes an initial investment of $10,000 made on September 30, 2004, for Class A, Class B, and Class C shares including any applicable sales charges or fees. Performance assumes reinvestment of dividends and capital gain distributions.
The index is unmanaged and not available for direct investment; therefore, its performance does not reflect the expenses associated with active management of an actual portfolio.
For information regarding the indexes and certain investment terms, see the Key Investment Terms starting on page 4.
16
Table of Contents
Fund Summary | Ticker Symbols: Class A: PSFRX Class C: PFSRX Class I: PSFIX |
| ¢ | The Fund is diversified and has an investment objective of high total return from both current income and capital appreciation. |
| ¢ | For the fiscal year ended September 30, 2014, the Fund’s Class A shares at NAV returned 3.08%, Class C shares returned 2.20%, and Class I shares returned 3.23%. For the same period, the Barclays U.S. Aggregate Bond Index, a fixed income index, returned 3.96%, and the S&P/LSTA Leveraged Loan Index, the Fund’s style-specific benchmark, returned 3.85%. |
All performance figures assume reinvestment of distributions and exclude the effect of sales charges. Past performance is no guarantee of future results, and current performance may be higher or lower than the performance shown above.
How did the market perform during the Fund’s fiscal year?
| ¢ | The U.S. leveraged loan market, represented by the S&P/LSTA Leveraged Loan Index, returned 3.85% for the fiscal year ended September 30, 2014. Returns were positive through the first three quarters of the fiscal year but turned negative in the fourth quarter due to weakening technical factors as a result of retail fund outflows and rising net supply due to increased mergers and acquisitions (M&A) issuance. After 21 consecutive monthly inflows, retail fund flows turned negative in April and have experienced six consecutive months of outflows as investor concern over rising interest rates receded as a primary focus with the unexpected rally in U.S. Treasury rates during the first nine months of 2014. |
| ¢ | Bank loans have performed well on a relative basis over the past year despite retail fund outflows, as institutional demand has picked up and mostly replaced the decline in retail demand. In fact, collateralized loan obligation (CLO) issuance has reached a new annual record in calendar year 2014. Fundamentals in the bank loan market remain strong as defaults, by number of issuers, declined to 0.64% as of the end of September, a two-and-a-half year low and well below the 1.78% level from one year ago and the long-term average of 3.0%. |
| ¢ | Within the bank loan market, the lower quality credit rating tiers outperformed over the past year due to very liquid capital markets, strong fundamentals, and strong demand from CLOs. Specifically, distressed, CCC/split-CCC, not rated, and single-B loans outperformed the index while BB loans underperformed the index. |
What factors affected the Fund’s performance during its fiscal year?
| ¢ | The positive return of the U.S. leveraged loan market contributed to the Fund’s positive return during the year. |
| ¢ | Overall, positive issue selection and industry allocation in the Fund relative to the index benefited performance. Specifically, issue selection within the service, retail, and food and tobacco industries helped the Fund’s performance. Issue selection within the utility, diversified media, and energy industries detracted from performance. Remaining nearly fully invested, as well as the Fund’s out-of-index sector allocation to high yield, which is part of its liquidity strategy, also made a positive contribution to performance. |
| ¢ | Overall, a modest overweight to higher quality tiers with an underweight to the lower quality distressed credit tier detracted from Fund performance relative to the index. Issue selection in the split BB and CCC credit tiers contributed positively to performance relative to the index while selection in the single-B and not rated credit tiers detracted from Fund performance relative to the index. |
The preceding information is the opinion of portfolio management. Any such opinions are subject to change at any time based upon market or other conditions and should not be relied upon as investment advice. Past performance is no guarantee of future results, and there is no guarantee that market forecasts will be realized.
There is no guarantee that the Fund will meet its objective.
Debt securities are subject to various risks, the most prominent of which are credit and interest rate risk. The issuer of a security may fail to make payments in a timely manner. Values of debt securities may rise and fall in response to changes in interest rates. This risk may be enhanced with longer-term maturities.
There may be no ready market for loan participation interests. The fund may have to sell the interests at a substantial discount. Such interests are subject to the credit risk of the underlying corporate borrower. There is a greater level of credit risk and price volatility involved with high-yield securities than investment grade securities. When a fund leverages its portfolio, the value of its shares may be more volatile and all other risks may be compounded. Certain securities may be difficult to sell at a time and price beneficial to the fund.
| Asset Allocation | ||||||||
The following table presents asset allocations within certain sectors and as a percentage of total investments as of September 30, 2014.
|
| |||||||
Loan Agreements | 92 | % | ||||||
Consumer Discretionary | 28 | % | ||||||
Health Care | 14 | |||||||
Information Technology | 12 | |||||||
Industrials | 11 | |||||||
Materials | 6 | |||||||
All other Loan Agreements | 21 | |||||||
Corporate Bonds and Notes | 7 | |||||||
Other | 1 | |||||||
|
| |||||||
Total | 100 | % | ||||||
|
| |||||||
For information regarding the indexes and certain investment terms, see the Key Investment Terms starting on page 4.
17
Table of Contents
Senior Floating Rate Fund (Continued)
| Average Annual Total Returns1 for periods ended 9/30/14 | ||||||||||||||||
| 1 year | 5 years | Since Inception | Inception Date | |||||||||||||
| Class A Shares at NAV2 | 3.08 | % | 5.62 | % | 5.59 | % | 1/31/08 | |||||||||
| Class A Shares at POP3,4 | 0.24 | 5.03 | 5.15 | 1/31/08 | ||||||||||||
| Class C Shares at NAV2 and with CDSC4 | �� | 2.20 | 4.84 | 4.82 | 1/31/08 | |||||||||||
| Class I Shares at NAV | 3.23 | 5.89 | 5.85 | 1/31/08 | ||||||||||||
| Barclays U.S. Aggregate Bond Index | 3.96 | 4.12 | 4.48 | 5 | — | |||||||||||
| S&P/LSTA Leveraged Loan Index | 3.85 | 6.47 | 5.89 | 5 | — | |||||||||||
Fund Expense Ratios6: A Shares: Gross 1.22%, Net 1.20%; C Shares: Gross 1.97%, Net 1.95%; I Shares: Gross 0.97%, Net 0.95%.
All returns represent past performance which is no guarantee of future results. Current performance may be higher or lower than the performance shown. The investment return and principal value of an investment will fluctuate so that an investor’s shares, when redeemed, may be worth more or less than their original cost. The above table and graph below do not reflect the deduction of taxes that a shareholder would pay on fund distributions or the redemption of shares. Please visit Virtus.com for performance data current to the most recent month-end.
| 1 | Total returns are historical and include changes in share price and the reinvestment of both dividends and capital gains distributions. |
| 2 | “NAV” (Net Asset Value) total returns do not include the effect of any sales charge. |
| 3 | “POP” (Public Offering Price) total returns include the effect of the maximum front-end 2.75% sales charge. |
| 4 | “CDSC” (Contingent Deferred Sales Charge) is applied to redemptions of certain classes of shares that do not have a sales charge applied at the time of purchase. CDSC charges for certain redemptions of Class A shares made within 18 months of purchase in which a finder’s fee was paid and all redemptions of Class C shares within the first year are 1% and 0% thereafter. |
| 5 | The since inception index returns are from the Fund’s inception date. |
| 6 | The expense ratios of the Fund are set forth according to the prospectus for the Fund effective January 28, 2014, as supplemented and revised, and may differ from the expense ratios disclosed in the Financial Highlights tables in this report. See the Financial Highlights for more current expense ratios. Net Expense: Expenses reduced by voluntary fee waiver which may be discontinued at any time. Gross Expense: Includes leverage expenses and does not reflect the effect of the fee waiver. |
Growth of $10,000 For periods ended 9/30
This chart assumes an initial investment of $10,000 made on January 31, 2008 (inception date of the Fund), for Class A, Class C and Class I shares including any applicable sales charges or fees. Performance assumes reinvestment of dividends and capital gain distributions.
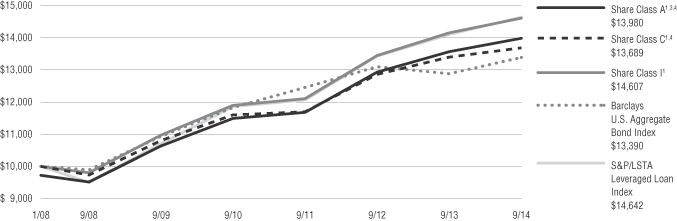
The indexes are unmanaged and not available for direct investment; therefore, their performance does not reflect the expenses associated with active management of an actual portfolio.
For information regarding the indexes and certain investment terms, see the Key Investment Terms starting on page 4.
18
Table of Contents
Fund Summary | Ticker Symbols: Class A: VWMAX Class C: VWMCX Class I: VWMIX |
| ¢ | The Fund is diversified and has an investment objective of capital appreciation. |
| ¢ | For the fiscal year ended September 30, 2014, the Fund’s Class A shares at NAV returned 10.67%, Class C shares returned 9.90%, and Class I shares returned 10.96%. For the same period, the S&P 500® Index, a broad-based equity index, and the Fund’s style-specific benchmark, returned 19.73%. |
All performance figures assume reinvestment of distributions and exclude the effect of sales charges. Past performance is no guarantee of future results, and current performance may be higher or lower than the performance shown above.
How did the markets perform during the Fund’s fiscal year?
During the 12-month fiscal period, the broader equity markets appreciated considerably, with the S&P 500® Index returning 19.73%. However, while valuations expanded, the operating results of S&P 500 constituents did not necessarily improve.
For the 20 largest, non-financial companies in the S&P 500® Index, revenues for the most recent fiscal year increased 1.3%, on average from the prior fiscal year. If Google is removed from the list, that average drops to 0.4%. With little revenue expansion, and in the wake of cutbacks (and possible underinvestment) during and after the financial crisis, one must wonder whether the largest companies have the potential for the scale of revenue growth or margin expansion necessary to deliver satisfactory returns going forward. For the largest companies, even growth by acquisition becomes challenging, given the size of the acquisition necessary to materially impact revenues or earnings for mega-cap corporations.
Nevertheless, during the Fund’s fiscal year, the S&P 500® Index returned 19.73% compared to only 3.93% for the Russell 2000® Index. Assets flowed in step with performance of the indexes, out of products tracking the small cap index and into products tracking the S&P 500® Index.
What factors affected the Fund’s performance during its fiscal year?
The Fund is designed to track the Horizon Kinetics ISE Wealth Index (the “Wealth Index”). The Wealth
Index is composed of publicly-listed companies owned and operated by the wealthiest, most successful investors, business executives, and entrepreneurs in the United States (“owner-operators”). The Fund allows investors to readily leverage the business acumen of the highly skilled individuals represented in the Wealth Index.
The Fund’s underperformance relative to the benchmark is explained, in part, by the outperformance of large-cap stocks relative to small-cap stocks described above. The constituents of the Wealth Index tend to be in the small- to mid-cap range, which underperformed larger cap stocks during the fiscal year. Though the constituents of the Wealth Index tend to be poorly represented in indexes, many were caught in the orbit of small-cap outflows, and experienced stock price pressure as a result.
The main criteria for inclusion in the Wealth Index are that the companies must have a wealthy individual in a decision-making role and that individual must also own a significant vested interest in the common equity of the company. Owner-operator management is considered to be a predictive attribute for long-term outperformance. Accordingly, the underperformance in the last fiscal year is expected to be temporary in nature.
The Wealth Index is rebalanced quarterly and uses an equal-weighting methodology. Sector representation is a by-product of the index inclusion criteria. In general, the Wealth Index tends to be overweight consumer discretionary stocks relative to the benchmark, as owner-operators, while present in all sectors, are most frequently found at the helm of consumer discretionary companies. In the last fiscal year, the Index (and therefore the Fund) was overweight the consumer discretionary sector, which detracted from relative performance. Stock representation within the financial sector also detracted from relative performance.
At the stock level, the five largest contributors to relative performance (and their owner-operators) were Forest Laboratories, Inc. (Carl Icahn), Amkor Technology, Inc. (James Kim), American Railcar Industries, Inc. (Carl Icahn), Akorn, Inc. (John Kapoor), and Liberty Ventures (John Malone).
The five largest detractors from relative performance were Rackspace Hosting, Inc. (Graham Weston), Central European Media Enterprises Ltd. (Ronald Lauder), Sears Holdings Corporation (Edward Lampert), Sears Hometown & Outlet Stores, Inc. (Edward Lampert), and Ocwen Financial Corporation (William Erbey).
The preceding information is the opinion of portfolio management. Any such opinions are subject to change at any time based on market or other conditions and should not be relied upon as investment advice. Past performance is no guarantee of future results, and there is no guarantee that market forecasts will be realized.
There is no guarantee the Fund will meet its objective.
| Asset Allocation | ||||
The following table presents asset allocations within certain sectors and as a percentage of total investments as of September 30, 2014.
|
| |||
Consumer Discretionary | 33 | % | ||
Financials | 17 | |||
Information Technology | 13 | |||
Industrials | 9 | |||
Energy | 6 | |||
Materials | 5 | |||
Consumer Staples | 5 | |||
Other (includes Short-Term investments and securities lending collateral) | 12 | |||
|
| |||
Total | 100 | % | ||
|
| |||
The market price of equity securities may be affected by financial market, industry, or issuer-specific events. Focus on a particular style or on small or medium-sized companies may enhance that risk. A fund that focuses its investments in a particular industry or sector will be more sensitive to conditions that affect that industry or sector than a non-concentrated fund. The performance of the Fund and its index may vary somewhat due to factors such as fund flows, transaction costs, and timing differences associated with additions to and deletions from its index.
For information regarding the indexes and certain investment terms, see the Key Investment Terms starting on page 4.
19
Table of Contents
Wealth Masters Fund (Continued)
| Average Annual Total Returns1 for periods ended 9/30/14 | ||||||||||||
| 1 year | Since Inception | Inception Date | ||||||||||
| Class A Shares at NAV2 | 10.67 | % | 20.53 | % | 9/5/12 | |||||||
| Class A Shares at POP3,4 | 4.31 | 17.13 | 9/5/12 | |||||||||
| Class C Shares at NAV2 and with CDSC4 | 9.90 | 19.63 | 9/5/12 | |||||||||
| Class I Shares at NAV2 | 10.96 | 20.82 | 9/5/12 | |||||||||
| S&P 500® Index | 19.73 | 20.42 | 5 | — | ||||||||
Fund Expense Ratios6: A Shares: Gross 1.50%, Net 1.45%; C Shares: Gross 2.25%, Net 2.20%; I Shares: Gross 1.25%, Net 1.20%.
All returns represent past performance which is no guarantee of future results. Current performance may be higher or lower than the performance shown. The investment return and principal value of an investment will fluctuate so that an investor’s shares, when redeemed, may be worth more or less than their original cost. The above table and graph below do not reflect the deduction of taxes that a shareholder would pay on fund distributions or the redemption of shares. Please visit Virtus.com for performance data current to the most recent month-end.
| 1 | Total returns are historical and include changes in share price and the reinvestment of both dividends and capital gains distributions. |
| 2 | “NAV” (Net Asset Value) total returns do not include the effect of any sales charge. |
| 3 | “POP” (Public Offering Price) total returns include the effect of the maximum front-end 5.75% sales charge. |
| 4 | “CDSC” (Contingent Deferred Sales Charge) is applied to redemptions of certain classes of shares that do not have a sales charge applied at the time of purchase. CDSC charges for certain redemptions of Class A shares made within 18 months of purchase in which a finder’s fee was paid and all redemptions of Class C shares within the first year are 1% and 0% thereafter. |
| 5 | The since inception index returns are from the Fund’s inception date. |
| 6 | The expense ratios of the Fund are set forth according to the prospectus for the Fund effective January 28, 2014 and may differ from the expense ratios disclosed in the Financial Highlights tables in this report. See the Financial Highlights for more current expense ratios. Net Expense: Expenses reduced by voluntary fee waiver which may be discontinued at any time. Gross Expense: Does not reflect the effect of the fee waiver. |
Growth of $10,000 For periods ended 9/30
This chart assumes an initial investment of $10,000 made on September 5, 2012 (inception date of the Fund), for Class A, Class C, and Class I shares including any applicable sales charges or fees. Performance assumes reinvestment of dividends and capital gain distributions.
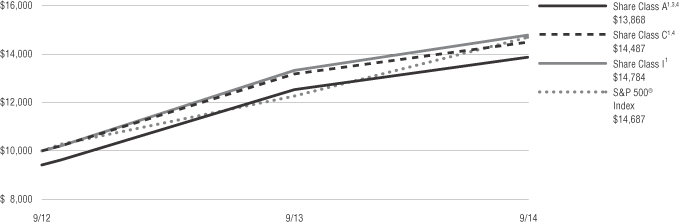
The indexes are unmanaged and not available for direct investment; therefore, their performance does not reflect the expenses associated with active management of an actual portfolio.
For information regarding the indexes and certain investment terms, see the Key Investment Terms starting on page 4.
20
Table of Contents
SCHEDULE OF INVESTMENTS
SEPTEMBER 30, 2014
($ reported in thousands)
| PAR VALUE | VALUE | |||||||
| U.S. GOVERNMENT SECURITIES—1.4% | ||||||||
U.S. Treasury Note | ||||||||
0.375%, 4/30/16 | $ | 500 | $ | 500 | ||||
0.500%, 6/30/16 | 600 | 600 | ||||||
| TOTAL U.S. GOVERNMENT SECURITIES (Identified Cost $1,100) | 1,100 | |||||||
| MUNICIPAL BONDS—0.4% | ||||||||
| Georgia—0.3% | ||||||||
Rockdale County Water & Sewerage Authority Revenue Taxable | 255 | 252 | ||||||
|
| |||||||
| Michigan—0.1% | ||||||||
City of Flat Rock Finance Authority Series A, Taxable | 50 | 52 | ||||||
| TOTAL MUNICIPAL BONDS (Identified Cost $306) | 304 | |||||||
| FOREIGN GOVERNMENT SECURITIES—4.8% | ||||||||
Argentine Republic Series NY, | 245 | 212 | ||||||
Bolivarian Republic of Venezuela | ||||||||
RegS 8.250%, 10/13/24(4) | 125 | 80 | ||||||
7.650%, 4/21/25 | 185 | 115 | ||||||
Commonwealth of Australia Series 130, | 90 | AUD | 82 | |||||
Commonwealth of New Zealand Series 415, | 120 | NZD | 95 | |||||
Kingdom of Morocco 144A | 270 | 268 | ||||||
Mongolia 144A | 200 | 179 | ||||||
New South Wales, Australia Treasury Corp., Series 17 | 190 | AUD | 177 | |||||
Republic of Chile | 84,000 | CLP | 148 | |||||
Republic of Colombia | 490,000 | COP | 208 | |||||
Republic of Croatia 144A | 280 | 305 | ||||||
Republic of El Salvador 144A | 155 | 156 | ||||||
Republic of Indonesia | ||||||||
Series FR30, | 1,745,000 | IDR | 150 | |||||
Series FR63, | 1,478,000 | IDR | 101 | |||||
Republic of Peru GDN 144A | 575 | PEN | 227 | |||||
Republic of Philippines | 6,000 | PHP | 140 | |||||
Republic of Romania 144A | 210 | 223 | ||||||
| PAR VALUE | VALUE | |||||||
| FOREIGN GOVERNMENT SECURITIES—continued | ||||||||
Republic of Uruguay | 4,400 | UYU | $ | 250 | ||||
United Mexican States Series M, | 6,990 | MXN | 531 | |||||
| TOTAL FOREIGN GOVERNMENT SECURITIES | ||||||||
| (Identified Cost $3,969) | 3,647 | |||||||
| MORTGAGE-BACKED SECURITIES—21.3% | ||||||||
| Agency—7.0% | ||||||||
FHLMC | ||||||||
7.000%, 4/1/16 | $ | 2 | 2 | |||||
5.000%, 12/1/35 | 44 | 49 | ||||||
FNMA | ||||||||
6.500%, 6/1/16 | 19 | 20 | ||||||
6.000%, 7/1/17 | 13 | 13 | ||||||
5.500%, 9/1/17 | 26 | 28 | ||||||
5.000%, 4/1/20 | 112 | 120 | ||||||
5.000%, 8/1/21 | 35 | 37 | ||||||
6.000%, 5/1/29 | 45 | 51 | ||||||
6.500%, 5/1/30 | 2 | 2 | ||||||
7.500%, 3/1/31 | 41 | 49 | ||||||
7.000%, 7/1/31 | 29 | 33 | ||||||
7.000%, 9/1/31 | 42 | 49 | ||||||
6.500%, 3/1/32 | 34 | 39 | ||||||
5.500%, 4/1/36 | 74 | 82 | ||||||
5.500%, 9/1/36 | 254 | 284 | ||||||
6.000%, 9/1/37 | 29 | 33 | ||||||
6.000%, 1/1/38 | 58 | 67 | ||||||
6.000%, 2/1/38 | 52 | 59 | ||||||
6.000%, 3/1/38 | 263 | 299 | ||||||
6.000%, 7/1/38 | 713 | 816 | ||||||
6.000%, 8/1/38 | 105 | 121 | ||||||
6.000%, 8/1/38 | 286 | 323 | ||||||
6.000%, 8/1/38 | 465 | 529 | ||||||
6.000%, 8/1/38 | 26 | 29 | ||||||
5.000%, 6/1/39 | 863 | 957 | ||||||
5.000%, 9/1/39 | 230 | 254 | ||||||
5.500%, 9/1/39 | 449 | 504 | ||||||
4.500%, 9/1/40 | 347 | 380 | ||||||
GNMA | ||||||||
8.500%, 11/15/22 | — | (12) | — | (12) | ||||
6.500%, 9/15/28 | 54 | 61 | ||||||
7.500%, 9/15/29 | 72 | 83 | ||||||
|
| |||||||
| 5,373 | ||||||||
|
| |||||||
| Non-Agency—14.3% | ||||||||
A-10 Securitization LLC | 260 | 259 | ||||||
A-10 Term Asset Financing LLC 14-1, A1 144A | 250 | 250 | ||||||
Aventura Mall Trust | 205 | 209 | ||||||
Banc of America (Merrill Lynch) Commercial Mortgage, Inc. 05-2, B | 440 | 448 | ||||||
| PAR VALUE | VALUE | |||||||
| Non-Agency—continued | ||||||||
Banc of America Funding Corp. 04-B, 2A1 | $ | 121 | $ | 120 | ||||
Banc of America Funding Trust 05-1, 1A1 | 162 | 168 | ||||||
Banc of America Mortgage Securities, Inc. 05-3, 1A15 | 154 | 161 | ||||||
Bank of America (Merrill | 386 | 387 | ||||||
Bayview Commercial Asset Trust 08-1, A2A 144A | 153 | 152 | ||||||
BCAP LLC Trust 06-RR1, PE | 457 | 466 | ||||||
Citigroup Commercial Mortgage Trust 07-6, A4 | 350 | 384 | ||||||
Extended Stay America Trust | 270 | 272 | ||||||
Goldman Sachs Mortgage Securities Trust II 07-GG10, A4 | 862 | 941 | ||||||
Greenwich Capital Commercial Funding Corp. 07-GG9, A4 | 145 | 156 | ||||||
JPMorgan Chase (Bear Stearns) Commercial Mortgage Securities, Inc. | ||||||||
06-PW13, AM | 385 | 411 | ||||||
07-T28, A3 | 679 | 678 | ||||||
07- PW15, AM | 250 | 260 | ||||||
JPMorgan Chase (WaMu) Mortgage Pass-Through Certificates 03-S11, 3A5 | 244 | 260 | ||||||
JPMorgan Chase Commercial Mortgage Securities Trust | ||||||||
10-CNTR, A2 144A | 400 | 432 | ||||||
06-LDP7, AM 6.058%, 4/15/45(2) | 475 | 510 | ||||||
JPMorgan Chase Mortgage Trust | ||||||||
04-A4, 2A1 | 320 | 326 | ||||||
14-1, 1A1 144A | 184 | 190 | ||||||
Morgan Stanley Capital I Trust | ||||||||
07-T27, A4 | 565 | 621 | ||||||
05-IQ10, A4B | 855 | 885 | ||||||
08-T29, A4 | 650 | 733 | ||||||
See Notes to Financial Statements
21
Table of Contents
VIRTUS BOND FUND
SCHEDULE OF INVESTMENTS (Continued)
SEPTEMBER 30, 2014
($ reported in thousands)
| PAR VALUE | VALUE | |||||||
| Non-Agency—continued | ||||||||
07-IQ14, A4 | $ | 300 | $ | 326 | ||||
07-IQ14, AM 5.869%, 4/15/49(2) | 190 | 199 | ||||||
Motel 6 Trust 12-MTL6 D 144A | 270 | 270 | ||||||
New Residential Mortgage Loan Trust 14-1A, A 144A | 94 | 97 | ||||||
Residential Funding Mortgage Securities I, Inc. 05-S9, A9 | 175 | 174 | ||||||
Sequoia Mortgage Trust | 216 | 223 | ||||||
|
| |||||||
| 10,968 | ||||||||
| TOTAL MORTGAGE-BACKED SECURITIES (Identified Cost $15,848) | 16,341 | |||||||
| ASSET-BACKED SECURITIES—4.8% | ||||||||
American Home 4 Rent | 195 | 195 | ||||||
Avis Budget Rental Car Funding LLC (AESOP) 12-3A, A 144A | 375 | 375 | ||||||
Bank of America (Merrill Lynch – Countrywide) Asset-Backed Certificates 05-1 AF5A | 317 | 316 | ||||||
Centre Point Funding LLC | 312 | 310 | ||||||
Drug Royalty LP II 14-1, A2 144A | 245 | 245 | ||||||
Fairway Outdoor Funding LLC 12-1A, A2 144A | 152 | 151 | ||||||
GSAA Home Equity Trust | 171 | 174 | ||||||
MASTR Specialized Loan Trust 05-3, A2 144A | 184 | 189 | ||||||
Orange Lake Timeshare Trust 12-AA, A 144A | 91 | 94 | ||||||
Santander Drive Auto Receivables Trust | ||||||||
12-2, D 3.870%, 2/15/18 | 500 | 518 | ||||||
13-1, D 2.270%, 1/15/19 | 215 | 216 | ||||||
Sierra Timeshare Receivables Funding LLC 12-3A, A 144A | 194 | 196 | ||||||
Silverleaf Finance XV LLC 12-D, A144A | 106 | 107 | ||||||
TAL Advantage V LLC 13-1A A 144A | 253 | 249 | ||||||
| PAR VALUE | VALUE | |||||||
| ASSET-BACKED SECURITIES—continued | ||||||||
Tidewater Auto Receivables Trust 12-AA, B 144A | $ | 215 | $ | 218 | ||||
Westgate Resorts LLC 12-2A, A 144A | 133 | 134 | ||||||
| TOTAL ASSET-BACKED SECURITIES (Identified Cost $3,651) | 3,687 | |||||||
| CORPORATE BONDS AND NOTES—54.3% | ||||||||
| Consumer Discretionary—6.6% | ||||||||
Boyd Gaming Corp. | 200 | 211 | ||||||
Brookfield Residential Properties, Inc. 144A | 215 | 224 | ||||||
Caesars Entertainment Operating Co., Inc. | 100 | 78 | ||||||
Caesars Growth Properties Holdings LLC 144A | 70 | 61 | ||||||
CCO Holdings LLC | 80 | 79 | ||||||
Chrysler Group LLC | 205 | 224 | ||||||
Clear Channel Worldwide Holdings, Inc. Series B | 175 | 182 | ||||||
Columbus International, Inc. 144A | 200 | 209 | ||||||
Guitar Center, Inc. 144A | 35 | 27 | ||||||
iHeartCommunications, Inc. | ||||||||
10.000%, 1/15/18 | 35 | 29 | ||||||
144A 9.000%, 9/15/22(3) | 65 | 65 | ||||||
Intelsat Jackson Holdings SA | 185 | 177 | ||||||
Isle of Capri Casinos, Inc. | 210 | 214 | ||||||
JC Penney Corp., Inc. | 40 | 39 | ||||||
Landry’s, Inc. 144A | 260 | 276 | ||||||
Meritor, Inc. | 170 | 178 | ||||||
MHGE Parent LLC 144A | 120 | 114 | ||||||
Mohegan Tribal Gaming Authority | 155 | 158 | ||||||
Numericable Group SA 144A | 200 | 202 | ||||||
Penn National Gaming, Inc. | 110 | 102 | ||||||
Pinnacle Entertainment, Inc. | 175 | 184 | ||||||
QVC, Inc. | 265 | 264 | ||||||
| PAR VALUE | VALUE | |||||||
| Consumer Discretionary—continued | ||||||||
Scientific Games International, Inc. 144A | $ | 160 | $ | 134 | ||||
Seminole Hard Rock Entertainment, Inc. 144A | 65 | 63 | ||||||
Signet UK Finance plc | 210 | 212 | ||||||
Six Flags Entertainment Corp. 144A | 235 | 229 | ||||||
Station Casinos LLC | 230 | 241 | ||||||
Taylor Morrison Communities, Inc. 144A | 265 | 260 | ||||||
Toll Brothers Finance Corp. | 180 | 202 | ||||||
United Artists Theatre Circuit, Inc. Series BD-1 | 5 | 5 | ||||||
Viking Cruises Ltd. 144A | 160 | 175 | ||||||
Wyndham Worldwide Corp. | 235 | 261 | ||||||
|
| |||||||
| 5,079 | ||||||||
|
| |||||||
| Consumer Staples—1.1% | ||||||||
Elizabeth Arden, Inc. | 100 | 89 | ||||||
Flowers Foods, Inc. | 275 | 291 | ||||||
Ingles Markets, Inc. | 170 | 172 | ||||||
Reynolds American, Inc. | 295 | 285 | ||||||
|
| |||||||
| 837 | ||||||||
|
| |||||||
| Energy—6.5% | ||||||||
Atlas Energy Holdings Operating Co. LLC 144A | 60 | 59 | ||||||
California Resources Corp. 144A | 135 | 139 | ||||||
Calumet Specialty Products Partners LP 144A | 150 | 143 | ||||||
CHC Helicopter SA | 144 | 154 | ||||||
CITGO Petroleum Corp. 144A | 80 | 83 | ||||||
Compagnie Generale de Geophysique-Veritas | 200 | 177 | ||||||
CONSOL Energy, Inc. 144A | 105 | 104 | ||||||
Denbury Resources, Inc. | 160 | 159 | ||||||
El Paso Pipeline Partners Operating Co. LLC | 245 | 312 | ||||||
See Notes to Financial Statements
22
Table of Contents
VIRTUS BOND FUND
SCHEDULE OF INVESTMENTS (Continued)
SEPTEMBER 30, 2014
($ reported in thousands)
| PAR VALUE | VALUE | |||||||
| Energy—continued | ||||||||
Endeavor Energy Resources LP 144A | $ | 85 | $ | 88 | ||||
Energy XXI Gulf Coast, Inc. | 210 | 198 | ||||||
EnQuest plc 144A | 200 | 189 | ||||||
FTS International, Inc. 144A | 60 | 59 | ||||||
Gulfport Energy Corp. 144A | 30 | 31 | ||||||
Linn Energy LLC | 95 | 93 | ||||||
Lukoil OAO International Finance BV 144A | 275 | 247 | ||||||
MEG Energy Corp. 144A | 50 | 52 | ||||||
NGL Energy Partners LP (NGL Energy Finance Corp.) 144A | 85 | 84 | ||||||
Novatek OAO (Novatek Finance Ltd.) 144A | 285 | 247 | ||||||
Pacific Rubiales Energy Corp. 144A | 200 | 203 | ||||||
Petrobras International Finance Co. | 515 | 520 | ||||||
Petroleos Mexicanos | ||||||||
3.500%, 1/30/23 | 355 | 341 | ||||||
144A 4.875%, 1/18/24(3) | 65 | 68 | ||||||
QGOG Constellation SA 144A | 220 | 221 | ||||||
Rosetta Resources, Inc. | 160 | 157 | ||||||
Transocean, Inc. | 180 | 165 | ||||||
Weatherford International Ltd. | 310 | 323 | ||||||
Williams Cos., Inc. (The) | ||||||||
3.700%, 1/15/23 | 200 | 189 | ||||||
4.550%, 6/24/24 | 170 | 169 | ||||||
|
| |||||||
| 4,974 | ||||||||
|
| |||||||
| Financials—21.9% | ||||||||
Aircastle Ltd. | ||||||||
4.625%, 12/15/18 | 10 | 10 | ||||||
6.250%, 12/1/19 | 225 | 238 | ||||||
5.125%, 3/15/21 | 95 | 94 | ||||||
Akbank TAS 144A | 375 | TRY | 147 | |||||
Allstate Corp. (The) | 310 | 330 | ||||||
ALROSA Finance S.A. 144A | 240 | 248 | ||||||
Apollo Management Holdings LP 144A | 190 | 191 | ||||||
Banco de Credito del Peru 144A | 240 | 256 | ||||||
| PAR VALUE | VALUE | |||||||
| Financials—continued | ||||||||
Banco de Credito e Inversiones 144A | $ | 275 | $ | 272 | ||||
Banco Inbursa SA Institucion de Banca Multiple 144A | 160 | 155 | ||||||
Banco Internacional del Peru SAA 144A | 300 | 325 | ||||||
Banco Santander Brasil SA 144A | 415 | BRL | 162 | |||||
Banco Santander Chile 144A | 450 | 443 | ||||||
Banco Votorantim S.A. 144A | 300 | 332 | ||||||
Bancolombia S.A. | 260 | 261 | ||||||
Bank of America Corp. | 235 | 266 | ||||||
Bank of Baroda 144A | 200 | 211 | ||||||
Bank of India 144A | 265 | 268 | ||||||
Barclays Bank plc 144A | 250 | 278 | ||||||
Braskem Finance Ltd. | 200 | 208 | ||||||
CareTrust Partnership LP 144A | 130 | 131 | ||||||
Carlyle Holdings Finance LLC 144A | 270 | 277 | ||||||
CCO Holdings LLC (CCO Holdings Capital Corp.) | 75 | 74 | ||||||
Chubb Corp. (The) | 250 | 274 | ||||||
Corporate Office Properties LP | 265 | 254 | ||||||
Developers Diversified Realty Corp. | ||||||||
7.875%, 9/1/20 | 155 | 193 | ||||||
3.500%, 1/15/21 | 130 | 131 | ||||||
Development Bank of Kazakhstan OJSC 144A | 290 | 274 | ||||||
Digital Realty Trust LP | 165 | 179 | ||||||
Excel Trust LP | 85 | 86 | ||||||
First Cash Financial Services, Inc. | 100 | 104 | ||||||
Ford Motor Credit Co. LLC | 235 | 267 | ||||||
General Electric Capital Corp. | 95 | 105 | ||||||
General Motors Financial Co., Inc. | 220 | 232 | ||||||
Genworth Holdings, Inc. | 320 | 330 | ||||||
| PAR VALUE | VALUE | |||||||
| Financials—continued | ||||||||
GLP Capital LP (GLP Financing II, Inc.) | ||||||||
4.375%, 11/1/18 | $ | 9 | $ | 9 | ||||
4.875%, 11/1/20 | 145 | 148 | ||||||
5.375%, 11/1/23 | 5 | 5 | ||||||
Goldman Sachs Group, Inc. (The) | 500 | 569 | ||||||
Hutchison Whampoa International Ltd. | 310 | 333 | ||||||
ICAHN Enterprises LP (ICAHN Enterprises Finance Corp.) | ||||||||
4.875%, 3/15/19 | 15 | 15 | ||||||
6.000%, 8/1/20 | 80 | 82 | ||||||
5.875%, 2/1/22 | 150 | 150 | ||||||
ICICI Bank Ltd. 144A | 200 | 212 | ||||||
Intesa San Paolo SpA | 215 | 220 | ||||||
iStar Financial, Inc. | 90 | 87 | ||||||
Itau Unibanco Holding S.A. 144A | 295 | 288 | ||||||
Kazakhstan Temir Zholy Finance BV 144A | 215 | 233 | ||||||
Leucadia National Corp. | 150 | 157 | ||||||
Level 3 Financing, Inc. | 160 | 169 | ||||||
Liberty Mutual Group, Inc. 144A | 245 | 250 | ||||||
Lincoln National Corp. | 250 | 264 | ||||||
Macquarie Bank Ltd. 144A | 15 | 17 | ||||||
Macquarie Group Ltd. 144A | 210 | 238 | ||||||
Morgan Stanley | ||||||||
5.550%, 4/27/17 | 330 | 361 | ||||||
4.100%, 5/22/23 | 155 | 155 | ||||||
6.375%, 7/24/42 | 435 | 543 | ||||||
Series H, 5.450%, 12/29/49(2) | 25 | 25 | ||||||
MPT Operating Partnership LP | 55 | 56 | ||||||
Nationstar Mortgage LLC | ||||||||
6.500%, 8/1/18 | 115 | 115 | ||||||
6.500%, 7/1/21 | 125 | 120 | ||||||
Navient Corp. (SLM Corp.) | 200 | 192 | ||||||
Nordea Bank AB 144A | 265 | 273 | ||||||
Onex York Acquisition Corp. 144A | 90 | 90 | ||||||
PennantPark Investment Corp. | 165 | 166 | ||||||
PKO Finance AB 144A | 255 | 265 | ||||||
Prudential Financial, Inc. | ||||||||
5.875%, 9/15/42(2) | 190 | 201 | ||||||
5.625%, 6/15/43(2)(10) | 280 | 292 | ||||||
See Notes to Financial Statements
23
Table of Contents
VIRTUS BOND FUND
SCHEDULE OF INVESTMENTS (Continued)
SEPTEMBER 30, 2014
($ reported in thousands)
| PAR VALUE | VALUE | |||||||
| Financials—continued | ||||||||
Schaeffler Holding Finance BV PIK Interest Capitalization, 144A | $ | 200 | $ | 209 | ||||
Teachers Insurance & Annuity Association of America 144A | 160 | 161 | ||||||
Turkiye Garanti Bankasi AS 144A | 305 | 301 | ||||||
UBS AG | 500 | 581 | ||||||
Ventas Realty LP (Ventas Capital Corp.) | 250 | 243 | ||||||
Voya Financial, Inc. (f.k.a. ING (U.S.), Inc.) | 210 | 212 | ||||||
VTB Bank OJSC (VTB Capital SA) 144A | 300 | 300 | ||||||
Walter Investment Management Corp. 144A | 210 | 208 | ||||||
WP Carey, Inc. | 160 | 165 | ||||||
XL Group plc Series E, | 240 | 230 | ||||||
Yapi ve Kredi Bankasi AS 144A | 270 | 256 | ||||||
|
| |||||||
| 16,772 | ||||||||
|
| |||||||
| Health Care—3.0% | ||||||||
Acadia Healthcare Co.,Inc. | 65 | 64 | ||||||
Capsugel SA 144A | 35 | 35 | ||||||
Cardinal Health, Inc. | 130 | 127 | ||||||
Catamaran Corp. | 120 | 116 | ||||||
Community Health Systems, Inc. (CHS) | ||||||||
144A 5.125%, 8/1/21(3) | 45 | 45 | ||||||
144A 6.875%, 2/1/22(3) | 25 | 26 | ||||||
Crimson Merger Sub, Inc. 144A | 120 | 109 | ||||||
Forest Laboratories, Inc. 144A | 160 | 171 | ||||||
HCA, Inc. | 160 | 175 | ||||||
IASIS Healthcare LLC | 80 | 84 | ||||||
LifePoint Hospitals, Inc. | 80 | 81 | ||||||
Mallinckrodt International Finance S.A. 144A | 60 | 61 | ||||||
MPH Acquisition Holdings LLC 144A | 115 | 116 | ||||||
Mylan, Inc. 144A | 325 | 311 | ||||||
| PAR VALUE | VALUE | |||||||
| Health Care—continued | ||||||||
Owens & Minor, Inc. | $ | 35 | $ | 35 | ||||
Select Medical Corp. | 205 | 206 | ||||||
Tenet Healthcare Corp. | ||||||||
144A 5.500%, 3/1/19(3) | 80 | 81 | ||||||
4.500%, 4/1/21 | 160 | 157 | ||||||
8.125%, 4/1/22 | 220 | 242 | ||||||
Valeant Pharmaceuticals International, Inc. Escrow Corp. 144A | 25 | 27 | ||||||
|
| |||||||
| 2,269 | ||||||||
|
| |||||||
| Industrials—4.8% | ||||||||
AAR Corp. | 190 | 205 | ||||||
ADT Corp.(The) | 260 | 270 | ||||||
Ahern Rentals, Inc. 144A | 160 | 172 | ||||||
Air Canada | ||||||||
144A 6.750%, 10/1/19(3) | 260 | 275 | ||||||
Pass-Through-Trust, 13-1, B 144A 5.375%, 5/15/21(3) | 97 | 99 | ||||||
Bombardier, Inc. | ||||||||
144A 4.750%, 4/15/19(3) | 155 | 155 | ||||||
144A 6.125%, 1/15/23(3) | 235 | 236 | ||||||
Carpenter Technology Corp. | 250 | 257 | ||||||
Continental Airlines Pass-Through-Trust | ||||||||
99-1, A 6.545%, 2/2/19 | 370 | 411 | ||||||
00-1, A1 8.048%, 11/1/20 | 420 | 483 | ||||||
CPG Merger Sub LLC 144A | 70 | 71 | ||||||
Delta Air Lines Pass-Through-Trust 12-1, A | 309 | 335 | ||||||
Masco Corp. | 145 | 158 | ||||||
Northwest Airlines Pass-Through-Trust 02-1, G2 | 188 | 204 | ||||||
Odebrecht Finance Ltd. 144A | 320 | BRL | 118 | |||||
Spirit AeroSystems, Inc. 144A | 45 | 45 | ||||||
TransDigm, Inc. 144A | 160 | 158 | ||||||
|
| |||||||
| 3,652 | ||||||||
|
| |||||||
| Information Technology—1.6% | ||||||||
Ceridian LLC (Comdata, Inc.) 144A | 5 | 5 | ||||||
Dun & Bradstreet Corp. (The) | 270 | 275 | ||||||
| PAR VALUE | VALUE | |||||||
| Information Technology—continued | ||||||||
First Data Corp. | ||||||||
144A 8.250%, 1/15/21(3) | $ | 45 | $ | 48 | ||||
11.750%, 8/15/21 | 338 | 393 | ||||||
PIK Interest Capitalization, 144A 8.750%, 1/15/22(3)(13) | 135 | 144 | ||||||
Infinity Acquisition LLC (Infinity Acquisition Finance Corp.) 144A | 120 | 116 | ||||||
Infor Software Parent LLC PIK Interest Capitalization, 144A | 40 | 40 | ||||||
Interactive Data Corp. 144A | 120 | 118 | ||||||
QualityTech LP (QTS Finance Corp.) 144A | 15 | 15 | ||||||
Sanmina Corp. 144A | 5 | 5 | ||||||
Sungard Availability Services Capital, Inc. 144A | 85 | 64 | ||||||
|
| |||||||
| 1,223 | ||||||||
|
| |||||||
| Materials—4.4% | ||||||||
Alpek SA de C.V. 144A | 310 | 321 | ||||||
Beverage Packaging Holdings Luxembourg II SA 144A | 160 | 158 | ||||||
Cemex SAB de CV 144A | 265 | 281 | ||||||
Eldorado Gold Corp. 144A | 95 | 95 | ||||||
Gerdau Holdings, Inc. | ||||||||
144A 7.000%, 1/20/20(3) | 100 | 112 | ||||||
144A 4.750%, 4/15/23(3) | 315 | 301 | ||||||
Hexion U.S. Finance Corp. | ||||||||
8.875%, 2/1/18 | 130 | 133 | ||||||
6.625%, 4/15/20 | 130 | 131 | ||||||
Inversiones CMPC S.A. 144A | 375 | 364 | ||||||
NewMarket Corp. | 288 | 289 | ||||||
Rayonier AM Products, Inc. 144A | 100 | 95 | ||||||
Reynolds Group Issuer, Inc. | 140 | 149 | ||||||
Tronox Finance LLC | 160 | 162 | ||||||
United States Steel Corp. | 265 | 284 | ||||||
Vale Overseas Ltd. | 330 | 332 | ||||||
Vedanta Resources plc 144A | 115 | 132 | ||||||
|
| |||||||
| 3,339 | ||||||||
|
| |||||||
See Notes to Financial Statements
24
Table of Contents
VIRTUS BOND FUND
SCHEDULE OF INVESTMENTS (Continued)
SEPTEMBER 30, 2014
($ reported in thousands)
| PAR VALUE | VALUE | |||||||
| Telecommunication Services—2.7% | ||||||||
AT&T, Inc. | $ | 425 | $ | 446 | ||||
Cincinnati Bell, Inc. | 210 | 223 | ||||||
Empresa Nacional de Telecomunicaciones S.A. 144A | 215 | 220 | ||||||
Frontier Communications Corp. | 90 | 90 | ||||||
Koninklijke KPN NV 144A | 210 | 218 | ||||||
Millicom International Cellular SA 144A | 200 | 208 | ||||||
Telefonica Emisiones SAU | 225 | 235 | ||||||
Wind Acquisition Finance S.A. 144A | 200 | 193 | ||||||
Windstream Corp. | 200 | 211 | ||||||
|
| |||||||
| 2,044 | ||||||||
|
| |||||||
| Utilities—1.7% | ||||||||
Abu Dhabi National Energy Co. 144A | 270 | 272 | ||||||
Electricite de France SA 144A | 280 | 285 | ||||||
FirstEnergy Transmission LLC 144A | 210 | 214 | ||||||
Israel Electric Corp. Ltd. 144A | 250 | 266 | ||||||
RJS Power Holdings LLC 144A | 90 | 89 | ||||||
State Grid Overseas Investment Ltd. 144A | 200 | 205 | ||||||
|
| |||||||
| 1,331 | ||||||||
| TOTAL CORPORATE BONDS AND NOTES (Identified Cost $41,240) | 41,520 | |||||||
| CONVERTIBLE BOND—0.4% | ||||||||
General Electric Capital Corp. Series A | 290 | 336 | ||||||
| TOTAL CONVERTIBLE BOND (Identified Cost $290) | 336 | |||||||
| LOAN AGREEMENTS(2)—8.3% | ||||||||
| Consumer Discretionary—1.7% | ||||||||
Brickman Group Ltd. LLC (The) Second Lien, | 78 | 77 | ||||||
Caesars Entertainment Operating Co., Inc. Tranche B-7, | 50 | 47 | ||||||
| PAR VALUE | VALUE | |||||||
| Consumer Discretionary—continued | ||||||||
Caesars Growth Properties Holdings LLC Tranche B, First Lien | $ | 61 | $ | 58 | ||||
CBAC Borrower LLC Tranche B, | 109 | 111 | ||||||
Charter Communications Operating LLC Tranche G, | 37 | 37 | ||||||
Clear Channel Communications, Inc. Tranche D, | 150 | 144 | ||||||
Delta 2 (Lux) S.A.R.L. Second Lien, | 88 | 88 | ||||||
Key Safety Systems, Inc. | 78 | 78 | ||||||
Marina District Finance Co., Inc. | 119 | 119 | ||||||
Peppermill Casinos, Inc. Tranche B, | 213 | 217 | ||||||
Shingle Springs Tribal Gaming Authority | 113 | 115 | ||||||
TWCC Holding Corp. Second Lien, | 202 | 199 | ||||||
|
| |||||||
| 1,290 | ||||||||
|
| |||||||
| Consumer Staples—0.6% | ||||||||
Albertson’s Holdings LLC Tranche B-4 | 102 | 102 | ||||||
New Hostess Brand Acquisition LLC Tranche B, | 177 | 182 | ||||||
Rite Aid Corp. | ||||||||
Tranche 1, Second Lien, | 14 | 14 | ||||||
Tranche 2, | 145 | 144 | ||||||
|
| |||||||
| 442 | ||||||||
|
| |||||||
| Energy—1.0% | ||||||||
Arch Coal, Inc. | 160 | 147 | ||||||
Chief Exploration & Development LLC Second Lien | 117 | 117 | ||||||
Drillships Financing Holding, Inc. | 100 | 97 | ||||||
Fieldwood Energy LLC Second Lien, | 159 | 160 | ||||||
Jonah Energy LLC Second Lien, | 94 | 93 | ||||||
Templar Energy LLC Second Lien, | 156 | 151 | ||||||
|
| |||||||
| 765 | ||||||||
|
| |||||||
| PAR VALUE | VALUE | |||||||
| Financials—0.4% | ||||||||
Altisource Solutions S.A R.L. Tranche B, | $ | 119 | $ | 113 | ||||
Asurion LLC Second Lien, | 120 | 122 | ||||||
Capital Automotive LP Second Lien, | 71 | 72 | ||||||
|
| |||||||
| 307 | ||||||||
|
| |||||||
| Health Care—1.3% | ||||||||
Ardent Medical Services, Inc. | ||||||||
First Lien, 6.750%, 7/2/18 | 63 | 63 | ||||||
Second Lien, 11.000%, 1/2/19 | 56 | 57 | ||||||
CRC Health Corp. Tranche B, First Lien, | 37 | 37 | ||||||
Gentiva Health Services, Inc. Tranche B, | 159 | 159 | ||||||
InVentiv Health, Inc. Tranche B-4 | 110 | 109 | ||||||
MMM Holdings, Inc. | 57 | 57 | ||||||
MSO of Puerto Rico, Inc. | 41 | 41 | ||||||
NVA Holdings, Inc. Second Lien | 74 | 74 | ||||||
Regional Care, Inc. (RCHP, Inc.) First Lien, | 71 | 71 | ||||||
Surgery Center Holdings, Inc. | ||||||||
First Lien, 6.000%, 4/11/19 | 110 | 110 | ||||||
Second Lien, 9.750%, 4/10/20 | 90 | 90 | ||||||
0.000%, 7/24/20(14) | 21 | 21 | ||||||
0.000%, 7/23/21(14) | 63 | 62 | ||||||
United Surgical Partners Tranche B | 79 | 79 | ||||||
|
| |||||||
| 1,030 | ||||||||
|
| |||||||
| Industrials—1.0% | ||||||||
Alliance Laundry Systems LLC Second Lien, | 25 | 25 | ||||||
American Airlines, Inc. Tranche B, | 189 | 186 | ||||||
CHG Healthcare Services, Inc. Second Lien, | 57 | 58 | ||||||
Harland Clarke Holdings Corp. | ||||||||
Tranche B-3, 7.000%, 5/22/18 | 71 | 72 | ||||||
Tranche B-4, 6.000%, 8/4/19 | 31 | 32 | ||||||
International Equipment Solutions Global B.V. | 89 | 89 | ||||||
Landmark U.S. Member LLC (Landmark U.S. Corp Acquisition, Inc.) Second Lien, | 120 | 120 | ||||||
See Notes to Financial Statements
25
Table of Contents
VIRTUS BOND FUND
SCHEDULE OF INVESTMENTS (Continued)
SEPTEMBER 30, 2014
($ reported in thousands)
| PAR VALUE | VALUE | |||||||
| Industrials—continued | ||||||||
Navistar, Inc. Tranche B, | $ | 149 | $ | 150 | ||||
|
| |||||||
| 732 | ||||||||
|
| |||||||
| Information Technology—1.5% | ||||||||
Allflex Holdings III, Inc. Second Lien, | 109 | 109 | ||||||
Applied Systems, Inc. Second Lien, | 4 | 4 | ||||||
Blue Coat Systems, Inc. Second Lien, | 293 | 293 | ||||||
First Data Corp. | 300 | 295 | ||||||
Infinity Acquisition Ltd. | 77 | 75 | ||||||
Kronos, Inc. Second Lien, | 110 | 113 | ||||||
Mitchell International, Inc. Second Lien, | 108 | 108 | ||||||
RP Crown Parent LLC Second Lien, | 80 | 77 | ||||||
Sungard Availability Services Capital, Inc. Tranche B, | 105 | 98 | ||||||
|
| |||||||
| 1,172 | ||||||||
|
| |||||||
| Materials—0.7% | ||||||||
Berlin Packaging LLC S.À R.L. | 11 | 11 | ||||||
Fortescue Metals Group (FMG) Resources Property Ltd. | 279 | 274 | ||||||
Houghton International, Inc. Holding Corp. Second Lien, | 110 | 111 | ||||||
Noranda Aluminum Acquisition Corp. Tranche B, | 151 | 148 | ||||||
|
| |||||||
| 544 | ||||||||
|
| |||||||
| Utilities—0.1% | ||||||||
Atlantic Power LP | 35 | 35 | ||||||
ExGen Renewables I LLC | 40 | 40 | ||||||
|
| |||||||
| 75 | ||||||||
| TOTAL LOAN AGREEMENTS (Identified Cost $6,398) | 6,357 | |||||||
| SHARES | ||||||||
| PREFERRED STOCKS—2.8% | ||||||||
| Energy—0.3% | ||||||||
PTT Exploration & Production PCL, 144A, 4.875%(2)(3) | 200 | (15) | 202 | |||||
|
| |||||||
| SHARES | VALUE | |||||||
| Financials—2.5% | ||||||||
Citigroup, Inc. | 8,000 | $ | 214 | |||||
General Electric Capital Corp. Series C, 5.250%(2) | 300 | (15) | 300 | |||||
Goldman Sachs Group, Inc. (The) | 160 | (15) | 162 | |||||
JPMorgan Chase & Co. | 315 | (15) | 307 | |||||
Series Q, 5.150%(2) | 255 | (15) | 243 | |||||
PNC Financial Services Group, Inc. (The) | 215 | (15) | 204 | |||||
Wells Fargo & Co. Series K, 7.980%(2) | 230 | (15) | 252 | |||||
Zions Bancorp, | 8,800 | 233 | ||||||
|
| |||||||
| 1,915 | ||||||||
| TOTAL PREFERRED STOCKS (Identified Cost $2,148) | 2,117 | |||||||
| TOTAL LONG-TERM INVESTMENTS—98.5% | ||||||||
| (Identified Cost $74,950) | 75,409 | (16) | ||||||
| SHORT-TERM INVESTMENT—1.0% | ||||||||
| Money Market Mutual Fund—1.0% | ||||||||
Fidelity Money Market Portfolio – Institutional Shares (seven-day effective yield 0.080%) | 795,612 | 796 | ||||||
| TOTAL SHORT-TERM INVESTMENT (Identified Cost $796) | 796 | |||||||
| TOTAL INVESTMENTS—99.5% (Identified Cost $75,746) | 76,205 | (1) | ||||||
Other assets and liabilities, net—0.5% |
| 414 | ||||||
|
| |||||||
| NET ASSETS—100.0% | $ | 76,619 | ||||||
|
| |||||||
Abbreviations:
| FHLMC | Federal Home Loan Mortgage Corporation (“Freddie Mac”). |
| FNMA | Federal National Mortgage Association (“Fannie Mae”). |
| GNMA | Government National Mortgage Association (“Ginnie Mae”) |
| PIK | Payment-in-Kind Security |
Footnote Legend:
| (1) | Federal Income Tax Information: For tax information at September 30, 2014, see Note 10 Federal Income Tax Information in the Notes to Financial Statements. |
| (2) | Variable or step coupon security; interest rate shown reflects the rate in effect at September 30, 2014. |
| (3) | Security exempt from registration under Rule 144A of the Securities Act of 1933. These securities may be resold in transactions exempt from registration, normally to qualified institutional buyers. At September 30, 2014, these securities amounted to a value of $25,130 or 32.8% of net assets. |
| (4) | Regulation S security. Security is offered and sold outside of the United States, therefore, it is exempt from registration with the SEC under rules 903 and 904 of the Securities Act of 1933. |
| (5) | Security in default. |
| (6) | Principal amount is adjusted daily pursuant to the change in the Consumer Price Index. |
| (7) | Security valued at fair value as determined in good faith by or under the direction of the Trustees. This security is disclosed as a level 3 security in the disclosure table located after the Schedule of Investments. |
| (8) | Illiquid security. |
| (9) | No contractual maturity date. |
| (10) | Interest payments may be deferred. |
| (11) | This Note was issued for the sole purpose of funding a loan agreement between the issuer and the borrower. As the credit risk for this security lies solely with the borrower, the name represented here is that of the borrower. |
| (12) | Amounts are less than $500 (not reported in 000s). |
| (13) | 100% of the income received was in cash. |
| (14) | This loan will settle after September 30, 2014, at which time the interest rate, based on the London Interbank Offered Rate (“LIBOR”) and the agreed upon spread on trade date, will be reflected. |
| (15) | Value shown as par value. |
| (16) | A portion of the Fund’s assets have been segregated as collateral for delayed delivery settlements. |
Foreign Currencies:
| AUD | Australian Dollar |
| BRL | Brazilian Real |
| CLP | Chilean Peso |
| COP | Colombian Peso |
| IDR | Indonesian Rupiah |
| MXN | Mexican Peso |
| NZD | New Zealand Dollar |
| PEN | Peruvian Nuevo Sol |
| PHP | Philippine Peso |
| TRY | Turkish Lira |
| UYU | Uruguayan Peso |
| Country Weightings (Unaudited)† | ||||
United States | 72 | % | ||
Luxembourg | 3 | |||
Brazil | 2 | |||
Canada | 2 | |||
Chile | 2 | |||
Mexico | 2 | |||
Cayman Islands | 1 | |||
Other | 16 | |||
Total | 100 | % | ||
† % of total investments as of September 30, 2014 |
| |||
Security abbreviation definitions are located under the Key Investment Terms starting on page 4.
See Notes to Financial Statements
26
Table of Contents
VIRTUS BOND FUND
SCHEDULE OF INVESTMENTS (Continued)
SEPTEMBER 30, 2014
($ reported in thousands)
The following table provides a summary of inputs used to value the Fund’s investments as of September 30, 2014 (See Security Valuation Note 2A in the Notes to Financial Statements):
| Total Value at September 30, 2014 | Level 1 Quoted Prices | Level 2 Significant Observable Inputs | Level 3 Significant Unobservable Inputs | |||||||||||||
Debt Securities: | ||||||||||||||||
Asset-Backed Securities | $ | 3,687 | $ | — | $ | 3,687 | $ | — | ||||||||
Convertible Bond | 336 | — | 336 | — | ||||||||||||
Corporate Bonds | 41,520 | — | 41,515 | 5 | ||||||||||||
Foreign Government Securities | 3,647 | — | 3,647 | — | ||||||||||||
Loan Agreements | 6,357 | — | 6,357 | — | ||||||||||||
Mortgage-Backed Securities | 16,341 | — | 16,341 | — | ||||||||||||
Municipal Bonds | 304 | — | 304 | — | ||||||||||||
U.S. Government Securities | 1,100 | — | 1,100 | — | ||||||||||||
Equity Securities: | ||||||||||||||||
Preferred Stocks | 2,117 | 448 | 1,669 | — | ||||||||||||
Short-Term Investment | 796 | 796 | — | — | ||||||||||||
|
|
|
|
|
|
|
| |||||||||
Total Investments | $ | 76,205 | $ | 1,244 | $ | 74,956 | $ | 5 | ||||||||
|
|
|
|
|
|
|
| |||||||||
There were no transfers between Level 1 and Level 2 for the period.
The following is a reconciliation of assets of the Fund for Level 3 investments for which significant unobservable inputs were used to determine fair value.
| Corporate Bonds | ||||
Investments in Securities | ||||
Balance as of September 30, 2013: | $ | 10 | (e) | |
Accrued discount/(premium) | — | (c) | ||
Realized gain (loss) | — | |||
Change in unrealized appreciation (depreciation)(d) | — | (c)(d) | ||
Purchases | — | |||
Sales(b) | (5 | ) | ||
Transfers into Level 3(a) | — | |||
Transfers from Level 3(a) | — | |||
|
| |||
Balance as of September 30, 2014 | $ | 5 | (e) | |
|
| |||
| (a) | “Transfers into and/or from” represent the ending value as of September 30, 2014, for any investment security where a change in the pricing level occurred from the beginning to the end of the period. |
| (b) | Includes paydowns on securities. |
| (c) | Amount less than $500. |
| (d) | Included in the related net change in unrealized appreciation/(depreciation) in the Statements of Operations. There was no change in unrealized appreciation/(depreciation) during the period on investments still held as of September 30, 2014. |
| (e) | Includes internally fair valued security. See the last paragraph under “Note 2A Security Valuation” for a description of the valuation process in place and a qualitative discussion about sensitive inputs used in Level 3 internally fair valued measurements. |
See Notes to Financial Statements
27
Table of Contents
SCHEDULE OF INVESTMENTS
SEPTEMBER 30, 2014
($ reported in thousands)
| PAR VALUE | VALUE | |||||||
| MUNICIPAL TAX-EXEMPT BONDS(3)—97.8% | ||||||||
| Development Revenue—6.1% | ||||||||
Hercules Redevelopment Agency, Tax-Allocation (AMBAC Insured) | $ | 500 | $ | 492 | ||||
San Diego Redevelopment Agency Center City, | ||||||||
Tax Allocation Series B (AMBAC Insured) | 500 | 502 | ||||||
Tax Allocation Series A (AMBAC Insured) | 500 | 512 | ||||||
Santa Clara Redevelopment Agency, Bayshore North Project (NATL Insured) | 500 | 502 | ||||||
|
| |||||||
| 2,008 | ||||||||
|
| |||||||
| General Obligation—19.8% | ||||||||
Brea Olinda Unified School District, Series A (NATL Insured) | 150 | 157 | ||||||
Cajon Valley Union School District Union School District | 250 | 287 | ||||||
Contra Costa Community College District, | ||||||||
4.000%, 8/1/28 | 45 | 48 | ||||||
Election of 2006 | 200 | 227 | ||||||
Los Alamitos Unified School District, School Facilities Improvement District1, 2008 Election – Series E | 250 | 282 | ||||||
Los Angeles Unified School District, Series A-1 (NATL Insured) | 440 | 477 | ||||||
Placer Union High School District, (AGM Insured) | 1,500 | 722 | ||||||
Rancho Santiago Community College District, 2002 Election Series C (AGM Insured) | 1,100 | 687 | ||||||
Riverside Unified School District, Series C (AGM Insured) | 275 | 305 | ||||||
Ross Valley School District, 2010 Election Series B | 350 | 388 | ||||||
San Diego Community College District, Election of 2006 | 100 | 114 | ||||||
San Diego Unified School District, 1998 Election, Series C2 (AGM Insured) | 225 | 290 | ||||||
San Jose Evergreen Community College District University & College Improvement, Election of 2010 Series A | 400 | 446 | ||||||
| PAR VALUE | VALUE | |||||||
| General Obligation—continued | ||||||||
Sequoia Union High School District, | $ | 250 | $ | 276 | ||||
State of California, | ||||||||
5.500%, 3/1/26 | 250 | 287 | ||||||
(AMBAC Insured) 5.000%, 2/1/27 | 290 | 357 | ||||||
5.000%, 9/1/32 | 300 | 340 | ||||||
5.000%, 12/1/37 | 275 | 301 | ||||||
6.000%, 4/1/38 | 250 | 297 | ||||||
5.000%, 2/1/43 | 250 | 278 | ||||||
|
| |||||||
| 6,566 | ||||||||
|
| |||||||
| General Revenue—26.4% | ||||||||
Anaheim Public Financing Authority, Series C (AGM Insured) | 1,435 | 1,541 | ||||||
City of Pomona, Certificates of Participation, (AMBAC Insured) | 700 | 716 | ||||||
Contra Costa Transportation Authority, Series B | 220 | 259 | ||||||
Golden State Tobacco Securitization Corp., | ||||||||
Enhanced Asset, Series A | 350 | 391 | ||||||
Series A-1 5.125%, 6/1/47 | 950 | 696 | ||||||
Imperial County Local Transportation Authority, Series E | 300 | 325 | ||||||
Los Angeles County Public Works Financing Authority, Series A (AGM Insured) | 60 | 65 | ||||||
North City West School Facilities Financing Authority, Series B (AMBAC Insured) | 750 | 857 | ||||||
Sacramento Area Flood Control Agency, | ||||||||
Consolidated Capital Assessment District (BHAC Insured) | 250 | 287 | ||||||
Consolidated Capital Assessment District | 500 | 552 | ||||||
South Bay Regional Public Communications Authority, Hawthorne Projects, Series B (ACA Insured) | 435 | 441 | ||||||
State of California Public Works Board, | ||||||||
Department of General Services, Buildings 8&9 | 500 | 589 | ||||||
Capital Projects, Series G-1 | 550 | 639 | ||||||
Department of Forestry & Fire Protection, Series E | 500 | 548 | ||||||
| PAR VALUE | VALUE | |||||||
| General Revenue—continued | ||||||||
Ventura County Public Financing Authority, Series A | $ | 250 | $ | 299 | ||||
Virgin Islands Public Finance Authority Series A | 500 | 544 | ||||||
|
| |||||||
| 8,749 | ||||||||
|
| |||||||
| Higher Education Revenue—5.3% | ||||||||
California Educational Facilities Authority, Pomona College, Series A | 500 | 513 | ||||||
California State University, Series A | 435 | 492 | ||||||
University of California, Series D (NATL Insured) | 710 | 765 | ||||||
|
| |||||||
| 1,770 | ||||||||
|
| |||||||
| Medical Revenue—6.0% | ||||||||
California Health Facilities Financing Authority, | ||||||||
Cedars-Sinai Medical Center, | 400 | 416 | ||||||
Kaiser Permanente, Series A | 400 | 414 | ||||||
California Statewide Communities Development Authority, | ||||||||
Sutter Health, Series B, (AMBAC Insured) | 205 | 217 | ||||||
St. Joseph Health System, (FGIC Insured) | 350 | 387 | ||||||
San Benito Health Care District, (CA MTG Insured) | 140 | 151 | ||||||
State Health Facilities Financing Authority Lucille Salter Packard Children Hospital at Sanford, Series A | 100 | 112 | ||||||
University of California, Regents Medical, Series A (NATL Insured) | 300 | 306 | ||||||
|
| |||||||
| 2,003 | ||||||||
|
| |||||||
| Natural Gas Revenue—2.2% | ||||||||
Roseville Natural Gas Financing Authority, | ||||||||
5.000%, 2/15/24 | 450 | 512 | ||||||
5.000%, 2/15/27 | 195 | 221 | ||||||
|
| |||||||
| 733 | ||||||||
|
| |||||||
| Power Revenue—6.4% | ||||||||
Imperial Irrigation District, Series B | 200 | 220 | ||||||
Northern California Power Agency, Hydroelectric Project No 1 | 200 | 222 | ||||||
See Notes to Financial Statements
28
Table of Contents
VIRTUS CA TAX-EXEMPT BOND
SCHEDULE OF INVESTMENTS (Continued)
SEPTEMBER 30, 2014
($ reported in thousands)
| PAR VALUE | VALUE | |||||||
| Power Revenue—continued | ||||||||
Sacramento Municipal Utility District, | $ | 500 | $ | 530 | ||||
Series X 5.000%, 8/15/26 | 350 | 405 | ||||||
Series B 5.000%, 8/15/29 | 150 | 177 | ||||||
Series A 5.000%, 8/15/37 | 250 | 284 | ||||||
Southern California Public Power Authority, Windy Project Series 1, | 250 | 294 | ||||||
|
| |||||||
| 2,132 | ||||||||
|
| |||||||
| Pre-Refunded—12.4% | ||||||||
Bay Area Toll Authority, Series F-1 (Pre-refunded 4/1/19 @100) | 400 | 473 | ||||||
California Health Facilities Financing Authority, | ||||||||
Providence Health & Services, Series C (Pre-refunded 10/1/18 @100) | 200 | 245 | ||||||
California Infrastructure & Economic Development Bank, Bay Area Toll Bridges (Pre-refunded 7/1/26 @100) (AMBAC Insured) | 755 | 973 | ||||||
City of Stockton, O’Connors Woods Project, Series A (Pre-refunded 9/20/17 @ 100) (GNMA Collateralized) | 165 | 166 | ||||||
East Bay Municipal Utility District Water System, Sub-Series A – Unrefunded Portion (Pre-refunded 6/15/15 @ 100) (NATL Insured) | 290 | 299 | ||||||
Los Angeles Unified School District, 2002 Election Series C (Pre-refunded 7/1/17 @100)(AGM Insured) | 300 | 336 | ||||||
Northern California Power Agency, Series A (Pre-refunded 7/1/21 @ 100) (AMBAC Insured) | 195 | 251 | ||||||
Riverside County Single Family, Series A (GNMA Collateralized) | 1,000 | 1,358 | ||||||
|
| |||||||
| 4,101 | ||||||||
|
| |||||||
| Transportation Revenue—5.9% | ||||||||
Bay Area Toll Authority, Series F-1 | 350 | 397 | ||||||
City of Long Beach Airport, Series A | 200 | 215 | ||||||
San Diego County Regional Airport Authority, | ||||||||
Subordinate Series A | 250 | 270 | ||||||
Series B 5.000%, 7/1/40 | 500 | 540 | ||||||
| PAR VALUE | VALUE | |||||||
| Transportation Revenue—continued | ||||||||
San Diego Unified Port District, Series A | $ | 200 | $ | 227 | ||||
San Francisco City & County Airports Community-San Francisco International Airport, 2nd Series B | 150 | 167 | ||||||
San Francisco Municipal Transportation Agency, | 125 | 145 | ||||||
|
| |||||||
| 1,961 | ||||||||
|
| |||||||
| Water & Sewer Revenue—7.3% | ||||||||
California State Department of Water Resources, Central Valley Projects Series AE | 35 | 40 | ||||||
City of Manteca Water Revenue, | 300 | 340 | ||||||
City of Oakland Sewer Revenue, Series A | 200 | 235 | ||||||
East Bay Municipal Utility District Water System Revenue Sub-Series A (NATL Insured) | 110 | 113 | ||||||
Ross Valley Public Financing Authority, Sanitary District #1, (AGM Insured) | 225 | 257 | ||||||
Sacramento County Sanitation Districts Financing Authority Series A | 250 | 291 | ||||||
San Diego County Water Authority, | 250 | 294 | ||||||
Santa Margarita-Dana Point Authority, Water Districts Improvements, Districts 2,3,4, Series A | 630 | 686 | ||||||
Silicon Valley Clean Water, Sewer Improvement | 150 | 172 | ||||||
|
| |||||||
| 2,428 | ||||||||
| TOTAL MUNICIPAL TAX-EXEMPT BONDS (Identified Cost $30,217) | 32,451 | |||||||
| TOTAL LONG-TERM INVESTMENTS—97.8% | ||||||||
| (Identified Cost $30,217) | 32,451 | |||||||
| TOTAL INVESTMENTS—97.8% (Identified Cost $30,217) | 32,451 | (1) | ||||||
Other assets and liabilities, net—2.2% |
| 731 | ||||||
|
| |||||||
| NET ASSETS—100.0% | $ | 33,182 | ||||||
|
| |||||||
Abbreviations:
| ACA | American Capital Access Financial Guarantee Corp. |
| AGM | Assured Guaranty Municipal Corp. |
| AMBAC | American Municipal Bond Assurance Corp. |
| BHAC | Berkshire Hathaway Assurance Corp. |
| FGIC | Financial Guaranty Insurance Company |
| GNMA | Government National Mortgage Association (“Ginnie Mae”) |
| NATL | National Public Finance Guarantee Corp. |
Footnote Legend:
| (1) | Federal Income Tax Information: For tax information at September 30, 2014, see Note 10 Federal Income Tax Information in the Notes to Financial Statements. |
| (2) | Escrowed to maturity. |
| (3) | At September 30, 2014, the concentration of the Fund’s investments by state or territory determined as a percentage of net assets is as follows: California 97.8%. At September 30, 2014 43.3% of the securities in the portfolio are backed by insurance of financial institutions and financial guaranty assurance agencies. Insurers with a concentration greater than 10% of net assets are as follows: NATL10.1%, AGM 12.7%, and AMBAC 16.7%. |
The following table provides a summary of inputs used to value the Fund’s investments as of September 30, 2014 (See Security Valuation Note 2A in the Notes to Financial Statements):
| Total Value at September 30, 2014 | Level 2 Significant Observable Inputs | |||||||
Debt Securities: | ||||||||
Municipal Tax-Exempt Bonds | $ | 32,451 | $ | 32,451 | ||||
|
|
|
| |||||
Total Investments | $ | 32,451 | $ | 32,451 | ||||
|
|
|
| |||||
There are no Level 1 (quoted Prices) or Level 3 (significant unobservable inputs) priced securities.
There were no transfers between Level 1 and Level 2 for the period.
Security abbreviation definitions are located under the Key Investment Terms starting on page 4.
See Notes to Financial Statements
29
Table of Contents
SCHEDULE OF INVESTMENTS
SEPTEMBER 30, 2014
($ reported in thousands)
| PAR VALUE | VALUE | |||||||
| MORTGAGE-BACKED SECURITIES—1.5% | ||||||||
| Non-Agency—1.5% | ||||||||
Banc of America Alternative Loan Trust 07-2, 2A4 | $ | 221 | $ | 174 | ||||
Citigroup Mortgage Loan Trust, Inc. 05-5, 2A3 | 161 | 160 | ||||||
Goldman Sachs Mortgage Pass-Through-Securities Mortgage Loan Trust 05-RP1, 1A3 144A | 202 | 214 | ||||||
MASTR Reperforming Loan Trust 05-1, 1A5 144A | 261 | 269 | ||||||
Residential Accredit Loans, Inc. 05-QS1, A5 | 193 | 195 | ||||||
Residential Asset Securities Corp. 01-KS2, AI5 | 230 | 232 | ||||||
| TOTAL MORTGAGE-BACKED SECURITIES (Identified Cost $1,221) | 1,244 | |||||||
| ASSET-BACKED SECURITIES—0.8% | ||||||||
CarNow Auto Receivables Trust 14-1A, E 144A | 300 | 299 | ||||||
LEAF Receivables Funding 9 LLC 13-1, E1 144A | 270 | 276 | ||||||
Terwin Mortgage Trust 04-15AL, A1 144A | 118 | 115 | ||||||
| TOTAL ASSET-BACKED SECURITIES (Identified Cost $677) | 690 | |||||||
| CORPORATE BONDS AND NOTES—79.7% | ||||||||
| Consumer Discretionary—18.5% | ||||||||
Anna Merger Sub, Inc. 144A | 235 | 237 | ||||||
Ashton Woods USA LLC (Ashton Woods Finance Co.) 144A | 340 | 326 | ||||||
Boyd Gaming Corp. | 500 | 527 | ||||||
Brookfield Residential Properties, Inc. | ||||||||
144A 6.500%, 12/15/20(3) | 385 | 401 | ||||||
144A 6.125%, 7/1/22(3) | 35 | 35 | ||||||
Caesars Entertainment Operating Co., Inc. | 500 | 389 | ||||||
Caesars Entertainment Resort Properties LLC | ||||||||
144A 8.000%, 10/1/20(3) | 235 | 233 | ||||||
144A 11.000%, 10/1/21(3) | 410 | 386 | ||||||
Caesars Growth Properties Holdings LLC 144A | 260 | 228 | ||||||
CCO Holdings LLC (CCO Holdings Capital Corp.) | 415 | 434 | ||||||
| PAR VALUE | VALUE | |||||||
| Consumer Discretionary—continued | ||||||||
Cequel Communications Holdings I LLC 144A | $ | 650 | $ | 672 | ||||
Chrysler Group LLC | 380 | 416 | ||||||
Churchill Downs, Inc. 144A | 300 | 301 | ||||||
Clear Channel Worldwide Holdings, Inc. | ||||||||
Series B 7.625%, 3/15/20 | 990 | 1,032 | ||||||
Series A 7.625%, 3/15/20 | 130 | 135 | ||||||
Columbus International, Inc. 144A | 245 | 256 | ||||||
DISH DBS Corp. | 640 | 616 | ||||||
Guitar Center, Inc. 144A | 90 | 69 | ||||||
Hilton Worldwide Finance LLC 144A | 440 | 454 | ||||||
iHeartCommunications, Inc. | ||||||||
10.000%, 1/15/18 | 280 | 236 | ||||||
144A 9.000%, 9/15/22(3) | 195 | 194 | ||||||
Isle of Capri Casinos, Inc. | 390 | 397 | ||||||
JC Penney Corp., Inc. | 70 | 69 | ||||||
Landry’s, Inc. 144A | 355 | 377 | ||||||
Meritor, Inc. | 445 | 465 | ||||||
MGM Resorts International | 545 | 582 | ||||||
MHGE Parent LLC 144A | 265 | 251 | ||||||
Mohegan Tribal Gaming Authority | 450 | 460 | ||||||
Numericable Group SA | ||||||||
144A 6.000%, 5/15/22(3) | 200 | 202 | ||||||
144A 6.250%, 5/15/24(3) | 200 | 200 | ||||||
Penn National Gaming, Inc. | 140 | 130 | ||||||
Pinnacle Entertainment, Inc. | ||||||||
7.500%, 4/15/21 | 250 | 261 | ||||||
6.375%, 8/1/21 | 250 | 263 | ||||||
Playa Resorts Holding B.V. 144A | 200 | 210 | ||||||
Quiksilver Wholesale, Inc. | 200 | 120 | ||||||
Scientific Games International, Inc. 144A | 270 | 226 | ||||||
Sinclair Television Group, Inc. | 560 | �� | 554 | |||||
Sirius XM Radio, Inc. 144A | 430 | 413 | ||||||
Six Flags Entertainment Corp. 144A | 365 | 356 | ||||||
| PAR VALUE | VALUE | |||||||
| Consumer Discretionary—continued | ||||||||
Taylor Morrison Communities, Inc. 144A | $ | 475 | $ | 465 | ||||
United Artists Theatre Circuit, Inc. | ||||||||
Series 95-A | 57 | 58 | ||||||
Series BD-1 | 65 | 65 | ||||||
Series AW-0 | — | (10) | — | (10) | ||||
Series BE-9 | 2 | 2 | ||||||
Viking Cruises Ltd. 144A | 260 | 284 | ||||||
VTR Finance B.V. 144A | 250 | 259 | ||||||
WMG Acquisition Corp. | ||||||||
144A 5.625%, 4/15/22(3) | 250 | 251 | ||||||
144A 6.750%, 4/15/22(3) | 250 | 241 | ||||||
Wynn Macau Ltd. 144A | 295 | 286 | ||||||
|
| |||||||
| 15,024 | ||||||||
|
| |||||||
| Consumer Staples—3.1% | ||||||||
Elizabeth Arden, Inc. | 165 | 147 | ||||||
Ingles Markets, Inc. | 550 | 554 | ||||||
Post Holdings, Inc. | 250 | 230 | ||||||
Rite Aid Corp. | 250 | 257 | ||||||
Roundy’s Supermarkets, Inc. 144A | 250 | 233 | ||||||
Spectrum Brands Escrow Corp. | 385 | 403 | ||||||
SUPERVALU, Inc. | 300 | 297 | ||||||
Vector Group Ltd. | 300 | 317 | ||||||
Whitewave Foods Co. (The) | 95 | 96 | ||||||
|
| |||||||
| 2,534 | ||||||||
|
| |||||||
| Energy—11.4% | ||||||||
Atlas Energy Holdings Operating Co. LLC 144A | 95 | 94 | ||||||
BreitBurn Energy Partners | 360 | 366 | ||||||
California Resources Corp. | ||||||||
144A 5.500%, 9/15/21(3) | 95 | 97 | ||||||
144A 6.000%, 11/15/24(3) | 95 | 98 | ||||||
Calumet Specialty Products Partners LP 144A | 445 | 425 | ||||||
Carrizo Oil & Gas, Inc. | 50 | 52 | ||||||
CHC Helicopter SA | 252 | 270 | ||||||
See Notes to Financial Statements
30
Table of Contents
VIRTUS HIGH YIELD FUND
SCHEDULE OF INVESTMENTS (Continued)
SEPTEMBER 30, 2014
($ reported in thousands)
| PAR VALUE | VALUE | |||||||
| Energy—continued | ||||||||
CITGO Petroleum Corp. 144A | $ | 180 | $ | 188 | ||||
Compagnie Generale de Geophysique-Veritas | 235 | 208 | ||||||
CONSOL Energy, Inc. 144A | 260 | 257 | ||||||
Denbury Resources, Inc. | 285 | 283 | ||||||
Endeavor Energy Resources LP 144A | 110 | 114 | ||||||
Energy Transfer Equity LP | 345 | 354 | ||||||
Energy XXI Gulf Coast, Inc. | 500 | 493 | ||||||
EnQuest plc 144A | 250 | 236 | ||||||
EP Energy LLC | 215 | 235 | ||||||
EV Energy Partners LP | 125 | 130 | ||||||
Exterran Partners LP 144A | 355 | 347 | ||||||
Forest Oil Corp. | 329 | 311 | ||||||
FTS International, Inc. 144A | 190 | 188 | ||||||
Gulfmark Offshore, Inc. | 400 | 388 | ||||||
Gulfport Energy Corp. 144A | 45 | 47 | ||||||
Halcon Resources Corp. | 390 | 386 | ||||||
Laredo Petroleum, Inc. | 350 | 345 | ||||||
Linn Energy LLC (Linn Energy Finance Corp.) | 490 | 496 | ||||||
MEG Energy Corp. 144A | 375 | 389 | ||||||
NGL Energy Partners LP (NGL Energy Finance Corp.) 144A | 160 | 157 | ||||||
Odebrecht Offshore Drilling Finance Ltd. 144A | 234 | 242 | ||||||
Pacific Rubiales Energy Corp. 144A | 360 | 366 | ||||||
Parker Drilling Co. (The) | 275 | 289 | ||||||
QEP Resources, Inc. | 185 | 202 | ||||||
Regency Energy Partners LP | 390 | 409 | ||||||
Rosetta Resources, Inc. | 280 | 280 | ||||||
Sabine Pass Liquefaction LLC | 285 | 294 | ||||||
Tullow Oil plc 144A | 270 | 271 | ||||||
|
| |||||||
| 9,307 | ||||||||
|
| |||||||
| PAR VALUE | VALUE | |||||||
| Financials—9.9% | ||||||||
Aircastle Ltd. | $ | 470 | $ | 465 | ||||
Caixa Economica Federal 144A | 220 | 221 | ||||||
CareTrust Partnership LP 144A | 250 | 251 | ||||||
CNL Lifestyle Properties, Inc. | 500 | 516 | ||||||
Drawbridge Special Opportunities Fund LP 144A | 250 | 247 | ||||||
DuPont Fabros Technology LP | 305 | 314 | ||||||
First Cash Financial Services, Inc. | 205 | 214 | ||||||
General Motors Financial Co., Inc. | 205 | 229 | ||||||
GLP Capital LP (GLP Financing II, Inc.) | ||||||||
4.375%, 11/1/18 | 10 | 10 | ||||||
4.875%, 11/1/20 | 205 | 209 | ||||||
5.375%, 11/1/23 | 5 | 5 | ||||||
ICAHN Enterprises LP (ICAHN Enterprises Finance Corp.) | 150 | 154 | ||||||
5.875%, 2/1/22 | 250 | 249 | ||||||
iStar Financial, Inc. | ||||||||
4.875%, 7/1/18 | 335 | 327 | ||||||
5.000%, 7/1/19 | 195 | 189 | ||||||
Landry’s Holdings II, Inc. 144A | 175 | 181 | ||||||
Level 3 Financing, Inc. | ||||||||
7.000%, 6/1/20 | 200 | 212 | ||||||
144A 6.125%, 1/15/21(3) | 250 | 258 | ||||||
MPT Operating Partnership LP | 100 | 102 | ||||||
Nationstar Mortgage LLC | ||||||||
6.500%, 8/1/18 | 215 | 216 | ||||||
6.500%, 7/1/21 | 610 | 584 | ||||||
Navient Corp. | ||||||||
(SLM Corp.) 4.875%, 6/17/19 | 75 | 75 | ||||||
(SLM Corp.) 5.500%, 1/25/23 | 240 | 231 | ||||||
Onex York Acquisition Corp. 144A | 160 | 160 | ||||||
Sabra Health Care LP | 180 | 183 | ||||||
Springleaf Finance Corp. | 300 | 316 | ||||||
Sprint Capital Corp. | 265 | 280 | ||||||
Ukreximbank Via Biz Finance plc RegS | 100 | 85 | ||||||
UPCB Finance Ltd. Series V 144A | 250 | 269 | ||||||
Voya Financial, Inc. ( f.k.a. ING (U.S.), Inc.) | 570 | 576 | ||||||
| PAR VALUE | VALUE | |||||||
| Financials—continued | ||||||||
Walter Investment Management Corp. 144A | $ | 410 | $ | 406 | ||||
WideOpenWest Finance LLC | 265 | 288 | ||||||
|
| |||||||
| 8,022 | ||||||||
|
| |||||||
| Health Care—9.5% | ||||||||
Acadia Healthcare Co.,Inc. | 105 | 103 | ||||||
Alere, Inc. | 415 | 416 | ||||||
Capsugel SA PIK Interest Capitalization 144A | 65 | 65 | ||||||
Catamaran Corp. | 325 | 313 | ||||||
Community Health Systems, Inc. (CHS) | ||||||||
144A 5.125%, 8/1/21(3) | 535 | 536 | ||||||
144A 6.875%, 2/1/22(3) | 320 | 335 | ||||||
Crimson Merger Sub, Inc. 144A | 265 | 242 | ||||||
DaVita Healthcare Partners, Inc. | 230 | 226 | ||||||
Endo Finance LLC 144A | 265 | 254 | ||||||
Envision Healthcare Corp. 144A | 250 | 247 | ||||||
HCA, Inc. | ||||||||
6.500%, 2/15/20 | 775 | 848 | ||||||
7.500%, 2/15/22 | 415 | 468 | ||||||
inVentiv Health, Inc. 144A | 130 | 135 | ||||||
LifePoint Hospitals, Inc. | 155 | 158 | ||||||
Mallinckrodt International Finance S.A. 144A | 105 | 107 | ||||||
MPH Acquisition Holdings LLC 144A | 445 | 450 | ||||||
Par Pharmaceutical Cos., Inc. | 350 | 367 | ||||||
Salix Pharmaceuticals Ltd. 144A | 80 | 87 | ||||||
Select Medical Corp. | 400 | 402 | ||||||
Tenet Healthcare Corp. | ||||||||
144A 5.500%, 3/1/19(3) | 210 | 212 | ||||||
6.000%, 10/1/20 | 310 | 329 | ||||||
4.500%, 4/1/21 | 230 | 225 | ||||||
8.125%, 4/1/22 | 635 | 698 | ||||||
Valeant Pharmaceuticals International, Inc. Escrow Corp. | ||||||||
144A 6.750%, 8/15/18(3) | 155 | 164 | ||||||
144A 7.250%, 7/15/22(3) | 300 | 318 | ||||||
|
| |||||||
| 7,705 | ||||||||
|
| |||||||
See Notes to Financial Statements
31
Table of Contents
VIRTUS HIGH YIELD FUND
SCHEDULE OF INVESTMENTS (Continued)
SEPTEMBER 30, 2014
($ reported in thousands)
| PAR VALUE | VALUE | |||||||
| Industrials—6.3% | ||||||||
AAR Corp. | $ | 285 | $ | 308 | ||||
ADS Waste Holdings, Inc. | 250 | 262 | ||||||
ADT Corp.(The) | 620 | 643 | ||||||
AECOM Technology Corp. 144A | 140 | 142 | ||||||
Ahern Rentals, Inc. 144A | 300 | 322 | ||||||
Air Canada 144A | 310 | 328 | ||||||
Ashtead Capital, Inc. 144A | 260 | 263 | ||||||
Bombardier, Inc. 144A | 500 | 503 | ||||||
CPG Merger Sub LLC 144A | 90 | 92 | ||||||
Dycom Investments, Inc. | 250 | 265 | ||||||
Garda World Security Corp. 144A | 300 | 300 | ||||||
Harland Clarke Holdings Corp. 144A | 350 | 356 | ||||||
Iron Mountain, Inc. | 215 | 212 | ||||||
Rexel SA 144A | 335 | 338 | ||||||
Spirit AeroSystems, Inc. 144A | 140 | 140 | ||||||
TransDigm, Inc. 144A | 440 | 435 | ||||||
United Rentals, Inc. | 215 | 218 | ||||||
|
| |||||||
| 5,127 | ||||||||
|
| |||||||
| Information Technology—3.4% | ||||||||
Alcatel-Lucent USA, Inc. 144A | 335 | 343 | ||||||
Avaya, Inc. 144A | 250 | 244 | ||||||
Ceridian LLC (Comdata, Inc.) 144A | 10 | 10 | ||||||
CommScope, Inc. 144A | 140 | 138 | ||||||
First Data Corp. | 718 | 835 | ||||||
Infinity Acquisition LLC (Infinity Acquisition Finance Corp.) 144A | 220 | 213 | ||||||
Infor Software Parent LLC PIK Interest Capitalization, 144A | 255 | 254 | ||||||
Interactive Data Corp. 144A | 360 | 355 | ||||||
QualityTech LP (QTS Finance Corp.) 144A | 25 | 25 | ||||||
| PAR VALUE | VALUE | |||||||
| Information Technology—continued | ||||||||
Sanmina Corp. 144A | $ | 80 | $ | 79 | ||||
Sophia Holding Finance LP PIK Interest Capitalization, 144A | 165 | 167 | ||||||
Sungard Availability Services Capital, Inc. 144A | 180 | 135 | ||||||
|
| |||||||
| 2,798 | ||||||||
|
| |||||||
| Materials—8.0% | ||||||||
Ardagh Packaging Finance plc | ||||||||
144A 6.250%, 1/31/19(3) | 295 | 293 | ||||||
144A 9.125%, 10/15/20(3) | 275 | 298 | ||||||
144A 6.750%, 1/31/21(3) | 295 | 296 | ||||||
Beverage Packaging Holdings Luxembourg II SA 144A | 215 | 212 | ||||||
Cascades, Inc. | 940 | 915 | ||||||
Cemex SAB de CV | ||||||||
144A 9.500%, 6/15/18(3) | 225 | 252 | ||||||
144A 7.250%, 1/15/21(3) | 245 | 260 | ||||||
Eldorado Gold Corp. 144A | 190 | 189 | ||||||
FMG Resources Property Ltd. 144A | 280 | 290 | ||||||
Hexion U.S. Finance Corp. | 215 | 217 | ||||||
INEOS Finance plc 144A | 220 | 235 | ||||||
INEOS Group Holdings SA | ||||||||
144A 6.125%, 8/15/18(3) | 235 | 235 | ||||||
144A 5.875%, 2/15/19(3) | 340 | 336 | ||||||
Rayonier AM Products, Inc. 144A | 140 | 134 | ||||||
Reynolds Group Issuer, Inc. | 665 | 707 | ||||||
Sappi Papier Holding GmbH 144A | 500 | 520 | ||||||
7.750%, 7/15/17(3) | 250 | 269 | ||||||
Tronox Finance LLC | 230 | 232 | ||||||
United States Steel Corp. | 340 | 364 | ||||||
Vedanta Resources plc 144A | 200 | 230 | ||||||
|
| |||||||
| 6,484 | ||||||||
|
| |||||||
| Telecommunication Services—7.4% | ||||||||
CenturyLink, Inc. Series V | 550 | 569 | ||||||
Cogent Communications Finance, Inc. 144A | 250 | 247 | ||||||
Digicel Group Ltd. 144A | 310 | 321 | ||||||
Frontier Communications Corp. | ||||||||
8.500%, 4/15/20 | 335 | 373 | ||||||
6.250%, 9/15/21 | 160 | 159 | ||||||
| PAR VALUE | VALUE | |||||||
| Telecommunication Services—continued | ||||||||
MetroPCS Wireless, Inc. | $ | 310 | $ | 320 | ||||
Millicom International Cellular SA 144A | 225 | 235 | ||||||
RCN Telecom Services LLC 144A | 500 | 512 | ||||||
SBA Communications Corp. | 250 | 241 | ||||||
Sprint Capital Corp. | 260 | 250 | ||||||
Sprint Communications, Inc. | 170 | 165 | ||||||
Sprint Corp. | ||||||||
144A 7.250%, 9/15/21(3) | 330 | 344 | ||||||
144A 7.875%, 9/15/23(3) | 270 | 287 | ||||||
T-Mobile USA, Inc. | ||||||||
6.250%, 4/1/21 | 490 | 497 | ||||||
6.125%, 1/15/22 | 230 | 232 | ||||||
6.836%, 4/28/23 | 210 | 217 | ||||||
6.500%, 1/15/24 | 235 | 238 | ||||||
Vimpel Communications OJSC 144A | 220 | 228 | ||||||
Wind Acquisition Finance S.A. 144A | 220 | 213 | ||||||
Windstream Corp. | 340 | 364 | ||||||
|
| |||||||
| 6,012 | ||||||||
|
| |||||||
| Utilities—2.2% | ||||||||
AmeriGas Partners LP | 200 | 210 | ||||||
Calpine Corp. | ||||||||
144A 6.000%, 1/15/22(3) | 35 | 37 | ||||||
5.375%, 1/15/23 | 250 | 243 | ||||||
NRG Energy, Inc. | ||||||||
7.875%, 5/15/21 | 210 | 227 | ||||||
144A 6.250%, 7/15/22(3) | 250 | 258 | ||||||
RJS Power Holdings LLC 144A | 375 | 373 | ||||||
Texas Competitive Electric Holdings Co. LLC 144A | 500 | 421 | ||||||
|
| |||||||
| 1,769 | ||||||||
| TOTAL CORPORATE BONDS AND NOTES (Identified Cost $64,674) | 64,782 | |||||||
| LOAN AGREEMENTS(2)—16.5% | ||||||||
| Consumer Discretionary—3.7% | ||||||||
Aristocrat International Ltd. Tranche B, | 285 | 283 | ||||||
Brickman Group Ltd. LLC (The) Second Lien, | 248 | 246 | ||||||
Caesars Entertainment Operating Co., Inc. Tranche B-7, | 166 | 157 | ||||||
See Notes to Financial Statements
32
Table of Contents
VIRTUS HIGH YIELD FUND
SCHEDULE OF INVESTMENTS (Continued)
SEPTEMBER 30, 2014
($ reported in thousands)
| PAR VALUE | VALUE | |||||||
| Consumer Discretionary—continued | ||||||||
CBAC Borrower LLC Tranche B, | $ | 142 | $ | 145 | ||||
Clear Channel Communications, Inc. Tranche D, | 614 | 589 | ||||||
Delta 2 (Lux) S.A.R.L. | 171 | 171 | ||||||
Granite Broadcasting Corp. Tranche B, First Lien | 110 | 110 | ||||||
Marina District Finance Co., Inc. | 164 | 164 | ||||||
Peppermill Casinos, Inc. Tranche B, | 334 | 339 | ||||||
Progrexion | 250 | 250 | ||||||
Transtar Holding Co. Second Lien, | 200 | 199 | ||||||
TWCC Holding Corp. Second Lien, | 332 | 326 | ||||||
|
| |||||||
| 2,979 | ||||||||
|
| |||||||
| Consumer Staples—0.7% | ||||||||
Albertson’s Holdings LLC Tranche B-4 | 165 | 164 | ||||||
Crossmark Holdings, Inc. Second Lien, | 190 | 189 | ||||||
New Hostess Brand Acquisition LLC Tranche B, | 261 | 268 | ||||||
|
| |||||||
| 621 | ||||||||
|
| |||||||
| Energy—2.1% | ||||||||
Arch Coal, Inc. | 175 | 160 | ||||||
Chief Exploration & Development LLC Second Lien | 183 | 183 | ||||||
Drillships Financing Holding, Inc. | 137 | 133 | ||||||
Fieldwood Energy LLC Second Lien, | 285 | 287 | ||||||
Jonah Energy LLC Second Lien, | 159 | 158 | ||||||
Quicksilver Resources, Inc. Second Lien, | 202 | 184 | ||||||
Sabine Oil & Gas LLC Second Lien, | 285 | 286 | ||||||
| PAR VALUE | VALUE | |||||||
| Energy—continued | ||||||||
Templar Energy LLC Second Lien, | $ | 355 | $ | 345 | ||||
|
| |||||||
| 1,736 | ||||||||
|
| |||||||
| Financials—0.4% | ||||||||
Asurion LLC Second Lien, | 295 | 299 | ||||||
|
| |||||||
| Health Care—2.6% | ||||||||
American Renal Holdings, Inc. Second Lien, | 292 | 290 | ||||||
Ardent Medical Services, Inc. | ||||||||
First Lien, | 153 | 153 | ||||||
Second Lien, | 86 | 87 | ||||||
Gentiva Health Services, Inc. Tranche B, | 429 | 430 | ||||||
InVentiv Health, Inc. Tranche B-4 | 119 | 119 | ||||||
MMM Holdings, Inc. | 90 | 90 | ||||||
MSO of Puerto Rico, Inc. | 65 | 65 | ||||||
NVA Holdings, Inc. Second Lien | 195 | 195 | ||||||
PharMEDium Healthcare Corp. Second Lien, | 76 | 75 | ||||||
Regional Care, Inc. (RCHP, Inc.) First Lien, | 173 | 173 | ||||||
Surgery Center Holdings, Inc. | ||||||||
Second Lien, | 275 | 276 | ||||||
0.000%, 7/24/20(8) | 32 | 32 | ||||||
0.000%, 7/23/21(8) | 103 | 102 | ||||||
|
| |||||||
| 2,087 | ||||||||
|
| |||||||
| Industrials—1.8% | ||||||||
Alliance Laundry Systems LLC Second Lien, | 59 | 60 | ||||||
CHG Healthcare Services, Inc. Second Lien, | 136 | 139 | ||||||
DynCorp International, Inc. | 128 | 127 | ||||||
Filtration Group Corp. Second Lien, | 310 | 311 | ||||||
International Equipment Solutions Global B.V. | 312 | 312 | ||||||
| PAR VALUE | VALUE | |||||||
| Industrials—continued | ||||||||
Landmark U.S. Member LLC (Landmark U.S. Corp Acquisition, Inc.) Second Lien, | $ | 220 | $ | 221 | ||||
Sedgwick, Inc. Second Lien | 290 | 284 | ||||||
|
| |||||||
| 1,454 | ||||||||
|
| |||||||
| Information Technology—3.7% | ||||||||
Allflex Holdings III, Inc. Second Lien, | 193 | 192 | ||||||
Applied Systems, Inc. Second Lien, | 324 | 324 | ||||||
Blue Coat Systems, Inc. Second Lien, | 445 | 445 | ||||||
Deltek, Inc. Second Lien, | 268 | 272 | ||||||
Evergreen Skills Lux S.A.R.L. | 252 | 244 | ||||||
IPC Systems, Inc. First Lien, | 171 | 171 | ||||||
Kronos, Inc. Second Lien, | 380 | 393 | ||||||
Mitchell International, Inc. | 435 | 436 | ||||||
RP Crown Parent LLC Second Lien, | 415 | 397 | ||||||
Sungard Availability Services Capital, Inc. Tranche B, | 179 | 166 | ||||||
|
| |||||||
| 3,040 | ||||||||
|
| |||||||
| Materials—1.0% | ||||||||
Berlin Packaging LLC | 24 | 24 | ||||||
Essar Steel Algoma, Inc. (Algoma Steel, Inc.) | 413 | 414 | ||||||
Houghton International, Inc. Holding Corp. Second Lien, | 370 | 374 | ||||||
|
| |||||||
| 812 | ||||||||
|
| |||||||
| Telecommunication Services—0.5% | ||||||||
Integra Telecom Holdings, Inc. Second Lien, | 126 | 126 | ||||||
Securus Technologies Holdings, Inc. Second Lien, | 285 | 284 | ||||||
|
| |||||||
| 410 | ||||||||
| TOTAL LOAN AGREEMENTS (Identified Cost $13,468) | 13,438 | |||||||
See Notes to Financial Statements
33
Table of Contents
VIRTUS HIGH YIELD FUND
SCHEDULE OF INVESTMENTS (Continued)
SEPTEMBER 30, 2014
($ reported in thousands)
| SHARES | VALUE | |||||||
| PREFERRED STOCKS—1.6% | ||||||||
| Financials—1.6% | ||||||||
Ally Financial, Inc. Series A, | 11,530 | $ | 311 | |||||
Citigroup, Inc. Series J, | 20,000 | 535 | ||||||
Goldman Sachs Group, Inc. (The) Series L, | 225 | (9) | 228 | |||||
JPMorgan Chase & Co. Series V, | 220 | (9) | $ | 214 | ||||
| TOTAL PREFERRED STOCKS (Identified Cost $1,291) | 1,288 | |||||||
| TOTAL LONG-TERM INVESTMENTS—100.1% | ||||||||
| (Identified Cost $81,331) | 81,442 | (13) | ||||||
| SHORT-TERM INVESTMENT—0.5% | ||||||||
| Money Market Mutual Fund—0.5% | ||||||||
Fidelity Money Market Portfolio – Institutional Shares (seven-day effective yield 0.080%) | 389,613 | 390 | ||||||
| TOTAL SHORT-TERM INVESTMENT (Identified Cost $390) | 390 | |||||||
| TOTAL INVESTMENTS—100.6% (Identified Cost $81,721) | 81,832 | (1) | ||||||
Other assets and liabilities, net—(0.6)% |
| (526 | ) | |||||
|
| |||||||
| NET ASSETS—100.0% | $ | 81,306 | ||||||
|
| |||||||
Abbreviation:
| PIK | Payment-in-Kind Security |
Footnote Legend:
| (1) | Federal Income Tax Information: For tax information at September 30, 2014, see Note 10 Federal Income Tax Information in the Notes to Financial Statements. |
| (2) | Variable or step coupon security; interest rate shown reflects the rate in effect at September 30, 2014. |
| (3) | Security exempt from registration under Rule 144A of the Securities Act of 1933. These securities may be resold in transactions exempt from registration, normally to qualified institutional buyers. At September 30, 2014, these securities amounted to a value of $31,972 or 39.3% of net assets. |
| (4) | Regulation S security. Security is offered and sold outside of the United States, therefore, it is exempt from registration with the SEC under rules 903 and 904 of the Securities Act of 1933. |
| (5) | Security valued at fair value as determined in good faith by or under the direction of the Trustees. This security is disclosed as a Level 3 security in the disclosure table located after the Schedule of Investments. |
| (6) | Illiquid security. |
| (7) | This Note was issued for the sole purpose of funding a loan agreement between the issuer and the borrower. As the credit risk for this security lies solely with the borrower, the name represented here is that of the borrower. |
| (8) | This loan will settle after September 30, 2014, at which time the interest rate, based on the London Interbank Offered Rate (“LIBOR”) and the agreed upon spread on trade date, will be reflected. |
| (9) | Value shown as par value. |
| (10) | Amounts are less than $500 (not reported in 000s). |
| (11) | 100% of the income received was in cash. |
| (12) | Security in default, interest payments are being received during the bankruptcy proceedings. |
| (13) | A portion of the Fund’s assets have been segregated as collateral for delayed delivery settlements. |
| Country Weightings (Unaudited)† | ||||
United States | 83 | % | ||
Canada | 5 | |||
Luxembourg | 3 | |||
Austria | 1 | |||
France | 1 | |||
Ireland | 1 | |||
United Kingdom | 1 | |||
Other | 5 | |||
Total | 100 | % | ||
† % of total investments as of September 30, 2014 |
| |||
Security abbreviation definitions are located under the Key Investment Terms starting on page 4.
See Notes to Financial Statements
34
Table of Contents
VIRTUS HIGH YIELD FUND
SCHEDULE OF INVESTMENTS (Continued)
SEPTEMBER 30, 2014
($ reported in thousands)
The following table provides a summary of inputs used to value the Fund’s investments as of September 30, 2014 (See Security Valuation Note 2A in the Notes to Financial Statements):
| Total Value at September 30, 2014 | Level 1 Quoted Prices | Level 2 Significant Observable Inputs | Level 3 Significant Unobservable Inputs | |||||||||||||
Debt Securities: | ||||||||||||||||
Asset-Backed Securities | $ | 690 | $ | — | $ | 690 | $ | — | ||||||||
Corporate Bonds and Notes | 64,782 | — | 64,657 | 125 | ||||||||||||
Loan Agreements | 13,438 | — | 13,438 | — | ||||||||||||
Mortgage-Backed Securities | 1,244 | — | 1,244 | — | ||||||||||||
Equity Securities: | ||||||||||||||||
Preferred Stocks | 1,288 | 846 | 442 | — | ||||||||||||
Short-Term Investment | 390 | 390 | — | — | ||||||||||||
|
|
|
|
|
|
|
| |||||||||
Total Investments | $ | 81,832 | $ | 1,236 | $ | 80,471 | $ | 125 | ||||||||
|
|
|
|
|
|
|
| |||||||||
There were no transfers between Level 1 and Level 2 for the period.
The following is a reconciliation of assets of the Fund for Level 3 investments for which significant unobservable inputs were used to determine fair value.
| Corporate Bonds and Notes | ||||
Investments in Securities | ||||
Balance as of September 30, 2013: | $ | 243 | (d) | |
Accrued discount/(premium) | 2 | |||
Realized gain (loss) | — | |||
Change in unrealized appreciation (depreciation)(c) | (6 | ) | ||
Purchases | — | |||
Sales(b) | (114 | ) | ||
Transfers into Level 3(a) | — | |||
Transfers from Level 3(a) | — | |||
|
| |||
Balance as of September 30, 2014 | $ | 125 | (d) | |
|
| |||
| (a) | “Transfers into and/or from” represent the ending value as of September 30, 2014, for any investment security where a change in the pricing level occurred from the beginning to the end of the period. |
| (b) | Includes paydowns on securities. |
| (c) | Included in the related net change in unrealized appreciation/(depreciation) in the Statements of Operations. The change in unrealized appreciation/(depreciation) on investments still held on September 30, 2014, was $1. |
| (d) | Includes internally fair valued security. See the last paragraph under “Note 2A Security Valuation” for a description of the valuation process in place and a qualitative discussion about sensitive inputs used in Level 3 internally fair valued measurements. |
See Notes to Financial Statements
35
Table of Contents
VIRTUS LOW VOLATILITY EQUITY FUND
SCHEDULE OF INVESTMENTS
SEPTEMBER 30, 2014
($ reported in thousands)
| SHARES | VALUE | |||||||
| EXCHANGE-TRADED FUNDS—97.0% | ||||||||
iShares S&P 100 Index Fund(3)(4) | 25,484 | $ | 2,246 | |||||
| TOTAL EXCHANGE-TRADED FUNDS (Identified Cost $1,915) | 2,246 | |||||||
| PURCHASED OPTIONS—0.1% | ||||||||
| Call Options—0.1% | ||||||||
CBOE Volatility Index expiration 10/22/14 strike price $18(2) | 19 | 2 | ||||||
| TOTAL PURCHASED OPTIONS (Premiums Paid $2) | 2 | |||||||
| TOTAL LONG-TERM INVESTMENTS—97.1% | ||||||||
| (Identified Cost $1,917) | 2,248 | (1) | ||||||
| SHORT-TERM INVESTMENTS—1.2% | ||||||||
| Money Market Mutual Funds—1.2% | ||||||||
Fidelity Money Market Portfolio – Institutional Shares (Seven-day effective yield 0.080%) | 27,862 | 28 | ||||||
| TOTAL SHORT-TERM INVESTMENTS (Identified Cost $28) | 28 | |||||||
| TOTAL INVESTMENTS, BEFORE WRITTEN OPTIONS—98.3% | ||||||||
| (Identified Cost $1,945) | 2,276 | (1) | ||||||
| SHARES | VALUE | |||||||
| WRITTEN OPTIONS—0.0% | ||||||||
| Call Options—0.0% | ||||||||
S&P 500® Index expiration 10/18/14 strike price $2,085(2) | 11 | $ | (— | )(5) | ||||
| TOTAL WRITTEN OPTIONS (Premiums Received $1) | (— | )(5) | ||||||
| TOTAL INVESTMENTS, NET OF WRITTEN OPTIONS—98.3% (Identified Cost $1,944) | 2,276 | (1) | ||||||
Other assets and liabilities, net—1.7% |
| 39 | ||||||
|
| |||||||
| NET ASSETS—100.0% | $ | 2,315 | ||||||
|
| |||||||
Footnote Legend:
| (1) | Federal Income Tax Information: For tax information at September 30, 2014, see Note 10 Federal Income Tax Information in the Notes to Financial Statements. |
| (2) | Non-income producing. |
| (3) | All or a portion segregated as collateral for written options. |
| (4) | The Fund is a public fund and the prospectus and the annual report are publicly available. |
| (5) | Amount less than $500. |
The following table provides a summary of inputs used to value the Fund’s investments as of September 30, 2014 (See Security Valuation Note 2A in the Notes to Financial Statements):
| Total Value at September 30, 2014 | Level 1 Quoted Prices | |||||||
Equity Securities: | ||||||||
Exchange-Traded Funds | $ | 2,246 | $ | 2,246 | ||||
Purchased Options | 2 | 2 | ||||||
Short-Term Investments | 28 | 28 | ||||||
|
|
|
| |||||
Total Investments before Written Options | 2,276 | 2,276 | ||||||
|
|
|
| |||||
Written Options | (— | )(5) | (— | )(5) | ||||
|
|
|
| |||||
Total Investments Net of Written Options | $ | 2,276 | $ | 2,276 | ||||
|
|
|
| |||||
There are no Level 2 (significant observable inputs) or Level 3 (significant unobservable inputs) priced securities.
There were no transfers between Level 1 and Level 2 for the period.
See Notes to Financial Statements
36
Table of Contents
VIRTUS MULTI-SECTOR INTERMEDIATE BOND FUND
SCHEDULE OF INVESTMENTS
SEPTEMBER 30, 2014
($ reported in thousands)
| PAR VALUE | VALUE | |||||||
| MUNICIPAL BONDS—0.3% | ||||||||
| Kentucky—0.1% | ||||||||
Commonwealth of Kentucky Taxable | $ | 327 | $ | 340 | ||||
|
| |||||||
| Michigan—0.0% | ||||||||
Tobacco Settlement Finance Authority Taxable | 145 | 124 | ||||||
|
| |||||||
| Texas—0.1% | ||||||||
City of Houston Airport System Revenue United Airlines, Inc., Terminal E Project | 200 | 210 | ||||||
|
| |||||||
| Virginia—0.1% | ||||||||
Tobacco Settlement Financing Corp. Taxable | 335 | 245 | ||||||
| TOTAL MUNICIPAL BONDS (Identified Cost $987) | 919 | |||||||
| FOREIGN GOVERNMENT SECURITIES—9.7% | ||||||||
Argentine Republic | ||||||||
Series X, | 575 | 516 | ||||||
8.750%, 5/7/24 | 405 | 367 | ||||||
Series NY, | 2,762 | 2,389 | ||||||
Bolivarian Republic of Venezuela | ||||||||
RegS 7.000%, 12/1/18(4) | 510 | 363 | ||||||
RegS 8.250%, 10/13/24(4) | 1,110 | 713 | ||||||
7.650%, 4/21/25 | 1,500 | 930 | ||||||
9.250%, 9/15/27 | 360 | 251 | ||||||
9.375%, 1/13/34 | 2,145 | 1,432 | ||||||
Commonwealth of Australia Series 130, | 1,220 | AUD | 1,107 | |||||
Commonwealth of New Zealand | ||||||||
Series 415, | 2,010 | NZD | 1,590 | |||||
Series 1217, | 625 | NZD | 518 | |||||
Federative Republic of Brazil | 4,990 | BRL | 1,845 | |||||
Kingdom of Morocco 144A | 1,030 | 1,023 | ||||||
Mongolia | ||||||||
144A 4.125%, 1/5/18(3) | 450 | 428 | ||||||
144A 5.125%, 12/5/22(3) | 825 | 738 | ||||||
New South Wales, Australia Treasury Corp., Series 17 | 610 | AUD | 568 | |||||
| PAR VALUE | VALUE | |||||||
| FOREIGN GOVERNMENT SECURITIES—continued | ||||||||
Provincia de Neuquen, Argentina 144A | $ | 515 | $ | 511 | ||||
Republic of Chile | 474,000 | CLP | 836 | |||||
Republic of Colombia | ||||||||
12.000%, 10/22/15 | 925,000 | COP | 488 | |||||
Treasury Note, Series B, | 865,000 | COP | 510 | |||||
4.375%, 3/21/23 | 1,867,000 | COP | 794 | |||||
Republic of Costa Rica 144A | 795 | 726 | ||||||
Republic of Croatia 144A | 1,045 | 1,139 | ||||||
Republic of El Salvador 144A | 905 | 910 | ||||||
Republic of Ghana 144A | 400 | 402 | ||||||
Republic of Indonesia | ||||||||
Series FR30, | 18,654,000 | IDR | 1,605 | |||||
Series FR55, | 9,559,000 | IDR | 781 | |||||
Series FR63, | 6,141,000 | IDR | 418 | |||||
Republic of Iraq RegS | 610 | 551 | ||||||
Republic of Peru | ||||||||
144A | 1,065 | PEN | 420 | |||||
RegS 6.900%, 8/12/37(4) | 2,010 | PEN | 702 | |||||
Republic of Philippines | 32,000 | PHP | 748 | |||||
Republic of South Africa | ||||||||
Series R203, | 3,690 | ZAR | 336 | |||||
Series R208, | 6,720 | ZAR | 561 | |||||
Republic of Sri Lanka 144A | 925 | 978 | ||||||
Republic of Uruguay | 22,021 | UYU(9) | 995 | |||||
Russian Federation 144A | 60,000 | RUB | 1,447 | |||||
United Mexican States | ||||||||
Series M, 6.000%, 6/18/15 | 30,592 | MXN | 2,323 | |||||
Series M, 6.500%, 6/9/22 | 30,825 | MXN | 2,376 | |||||
| TOTAL FOREIGN GOVERNMENT SECURITIES | ||||||||
| (Identified Cost $39,013) | 35,335 | |||||||
| MORTGAGE-BACKED SECURITIES—8.7% | ||||||||
| Non-Agency—8.7% | ||||||||
A-10 Securitization LLC | 1,100 | 1,094 | ||||||
Aventura Mall Trust | 245 | 250 | ||||||
| PAR VALUE | VALUE | |||||||
| Non-Agency—continued | ||||||||
Banc of America Alternative Loan Trust | ||||||||
03-2, CB3 5.750%, 4/25/33 | $ | 1,008 | $ | 1,045 | ||||
07-2, 2A4 5.750%, 6/25/37 | 886 | 695 | ||||||
Banc of America Funding Corp. 06-2, 3A1 | 392 | 395 | ||||||
Banc of America Funding Trust 05-1, 1A1 | 748 | 775 | ||||||
Bank of America (Merrill Lynch – Countrywide) Alternative Loan Trust | ||||||||
04-22CB, 1A1 | 616 | 655 | ||||||
04-24CB, 1A1 | 137 | 143 | ||||||
Bank of America (Merrill Lynch – Countrywide) Mortgage Trust 06-C1, AM | 715 | 759 | ||||||
Bank of America (Merrill Lynch) Mortgage Investors Trust | 1,260 | 1,418 | ||||||
Barclays (Lehman Brothers) – UBS Commercial Mortgage Trust 07-C7, A3 | 452 | 500 | ||||||
Citigroup Mortgage Loan Trust, Inc. 05-5, 2A3 | 449 | 447 | ||||||
Commercial Mortgage Trust 07-GG11, AM | 1,200 | 1,310 | ||||||
Credit Suisse Commercial Mortgage Trust | 564 | 577 | ||||||
Extended Stay America Trust 13-ESH7, A17 144A | 750 | 731 | ||||||
Fannie Mae Connecticut Avenue Securities 14-C02, 2M2 | 1,080 | 1,001 | ||||||
Goldman Sachs Mortgage Pass-Through-Securities Mortgage Loan Trust | ||||||||
05-RP1, 1A3 144A | 1,143 | 1,211 | ||||||
06-RP1, 1A4 144A | 802 | 864 | ||||||
Goldman Sachs Mortgage Securities Trust II 07-GG10, A4 | 680 | 743 | ||||||
See Notes to Financial Statements
37
Table of Contents
VIRTUS MULTI-SECTOR INTERMEDIATE BOND FUND
SCHEDULE OF INVESTMENTS (Continued)
SEPTEMBER 30, 2014
($ reported in thousands)
| PAR VALUE | VALUE | |||||||
| Non-Agency—continued | ||||||||
Hilton USA Trust | $ | 720 | $ | 731 | ||||
Jefferies Resecuritization Trust 14-R1, 2A1 144A | 1,065 | 1,062 | ||||||
JPMorgan Chase (Bear Stearns) Commercial Mortgage Securities, Inc. | ||||||||
06-PW12, AM | 650 | 692 | ||||||
05-PW10, AM | 895 | 933 | ||||||
06-PW13, AM | 1,360 | 1,453 | ||||||
07-PW18, AM | 1,525 | 1,697 | ||||||
JPMorgan Chase (Washington Mutual) Commercial Mortgage Securities Trust | 10 | 10 | ||||||
JPMorgan Chase Commercial Mortgage Securities Trust 10-CNTR, A2 144A | 750 | 811 | ||||||
JPMorgan Chase Mortgage Trust 14-1, 1A1 144A | 1,058 | 1,095 | ||||||
MASTR Alternative Loan Trust 04-6, 7A1 | 511 | 521 | ||||||
MASTR Reperforming Loan Trust 05-1, 1A5 144A | 696 | 715 | ||||||
Motel 6 Trust 12-MTL6 D 144A | 1,075 | 1,076 | ||||||
Nomura Asset Acceptance Corp. | ||||||||
04-R1, A1 144A | 1,362 | 1,398 | ||||||
04-R3, A1 144A | 300 | 308 | ||||||
Residential Funding Mortgage Securities I, Inc. | ||||||||
05-S1, 1A2 | 1,037 | 1,048 | ||||||
05-S9, A9 | 1,011 | 1,004 | ||||||
Sequoia Mortgage Trust | 550 | 568 | ||||||
SunTrust Adjustable Rate Mortgage Loan Trust | 616 | 615 | ||||||
| PAR VALUE | VALUE | |||||||
| Non-Agency—continued | ||||||||
Wells Fargo (Wachovia Bank) Commercial Mortgage Trust) | ||||||||
06-C25, AM | $ | 1,125 | $ | 1,197 | ||||
07-C32, A3 | 360 | 389 | ||||||
| TOTAL MORTGAGE-BACKED SECURITIES (Identified Cost $31,047) | 31,936 | |||||||
| ASSET-BACKED SECURITIES—4.2% | ||||||||
American Home 4 Rent | 915 | 916 | ||||||
Applebee’s (IHOP Funding LLC) 14-1, A2 144A | 1,260 | 1,248 | ||||||
Bank of America (Merrill Lynch – Countrywide) Asset-Backed Certificates | ||||||||
05-1 AF5A | 1,220 | 1,216 | ||||||
05-12, 1A4 5.323%, 2/25/36(2) | 699 | 701 | ||||||
05-12, 2A4 | 540 | 522 | ||||||
Carfinance Capital Auto Trust 14-1A, D 144A | 1,316 | 1,345 | ||||||
Cheesecake Restaurant Holdings, Inc. 13-1A, A2 144A | 948 | 957 | ||||||
Conseco Financial Corp. | 403 | 447 | ||||||
Domino’s Pizza Master Issuer LLC 12-1A, A2 144A | 1,208 | 1,276 | ||||||
Fairway Outdoor Funding LLC 12-1A, A2 144A | 563 | 561 | ||||||
GMAC Mortgage Corp. Loan Trust 06-HLTV, A4 | 385 | 389 | ||||||
GSAA Home Equity Trust 05-12, AF3W | 768 | 782 | ||||||
IndyMac Manufactured Housing Contract 98-1, A3 | 288 | 296 | ||||||
MASTR Specialized Loan Trust 05-3, A2 144A | 481 | 493 | ||||||
Origen Manufactured Housing Contract Trust 04-B, M1 | 531 | 555 | ||||||
Residential Asset Mortgage Trust 04-RZ1, M1 | 1,081 | 1,085 | ||||||
| PAR VALUE | VALUE | |||||||
| ASSET-BACKED SECURITIES—continued | ||||||||
Residential Funding Mortgage Securities II Home Loan Trust | ||||||||
03-HS3, AI4 5.550%, 9/25/33(2) | $ | 498 | $ | 516 | ||||
07-HI1, A3 5.720%, 3/25/37 | 357 | 366 | ||||||
SolarCity LMC Series III LLC 14-2, A 144A | 1,000 | 1,003 | ||||||
Terwin Mortgage Trust 04-15AL, A1 144A | 343 | 334 | ||||||
Trip Rail Master Funding LLC 11-1A, A1A 144A | 268 | 280 | ||||||
| TOTAL ASSET-BACKED SECURITIES (Identified Cost $14,986) | 15,288 | |||||||
| CORPORATE BONDS AND NOTES—58.2% | ||||||||
| Consumer Discretionary—7.5% | ||||||||
Anna Merger Sub, Inc. | 715 | 720 | ||||||
Arcos Dorados Holdings, Inc. 144A | 1,125 | BRL | 437 | |||||
Ashton Woods USA LLC (Ashton Woods Finance Co.) 144A | 1,100 | 1,053 | ||||||
Boyd Gaming Corp. | 870 | 917 | ||||||
Brookfield Residential Properties, Inc. | ||||||||
144A 6.500%, 12/15/20(3) | 1,065 | 1,110 | ||||||
144A 6.125%, | 185 | 187 | ||||||
Caesars Entertainment Operating Co., Inc. | 535 | 416 | ||||||
Caesars Entertainment Resort Properties LLC 144A | 320 | 317 | ||||||
Caesars Growth Properties Holdings LLC 144A | 495 | 435 | ||||||
CCO Holdings LLC | 495 | 486 | ||||||
Chrysler Group LLC | 1,140 | 1,248 | ||||||
Clear Channel Worldwide Holdings, Inc. | ||||||||
Series B 7.625%, 3/15/20 | 1,595 | 1,663 | ||||||
Series A 7.625%, 3/15/20 | 320 | 331 | ||||||
Columbus International, Inc. 144A | 200 | 209 | ||||||
Guitar Center, Inc. 144A | 200 | 154 | ||||||
iHeartCommunications, Inc. | ||||||||
10.000%, 1/15/18 | 615 | 518 | ||||||
144A 9.000%, 9/15/22(3) | 320 | 318 | ||||||
See Notes to Financial Statements
38
Table of Contents
VIRTUS MULTI-SECTOR INTERMEDIATE BOND FUND
SCHEDULE OF INVESTMENTS (Continued)
SEPTEMBER 30, 2014
($ reported in thousands)
| PAR VALUE | VALUE | |||||||
| Consumer Discretionary—continued | ||||||||
Intelsat Jackson Holdings SA | $ | 760 | $ | 729 | ||||
International Game Technology | 580 | 656 | ||||||
Isle of Capri Casinos, Inc. | 1,320 | 1,343 | ||||||
JC Penney Corp., Inc. | 255 | 250 | ||||||
Landry’s, Inc. 144A | 475 | 505 | ||||||
Meritor, Inc. | 960 | 1,003 | ||||||
MHGE Parent LLC 144A | 730 | 693 | ||||||
Mohegan Tribal Gaming Authority | 1,000 | 1,021 | ||||||
Numericable Group SA 144A | 605 | 610 | ||||||
Penn National Gaming, Inc. | 490 | 453 | ||||||
Pinnacle Entertainment, Inc. | 1,035 | 1,087 | ||||||
QVC, Inc. | 240 | 252 | ||||||
Scientific Games International, Inc. 144A | 910 | 763 | ||||||
Sinclair Television Group, Inc. | 1,155 | 1,143 | ||||||
Sirius XM Radio, Inc. 144A | 1,185 | 1,138 | ||||||
Station Casinos LLC | 970 | 1,016 | ||||||
Taylor Morrison Communities, Inc. 144A | 1,410 | 1,382 | ||||||
Toll Brothers Finance Corp. | 465 | 522 | ||||||
Viking Cruises Ltd. 144A | 870 | 951 | ||||||
VTR Finance B.V. 144A | 600 | 623 | ||||||
Wynn Macau Ltd. 144A | 700 | 679 | ||||||
|
| |||||||
| 27,338 | ||||||||
|
| |||||||
| Consumer Staples—0.7% | ||||||||
Darling Ingredients, Inc. | 840 | 851 | ||||||
Elizabeth Arden, Inc. | 485 | 433 | ||||||
Ingles Markets, Inc. | 975 | 982 | ||||||
Whitewave Foods Co. (The) | 305 | 309 | ||||||
|
| |||||||
| 2,575 | ||||||||
|
| |||||||
| PAR VALUE | VALUE | |||||||
| Energy—10.6% | ||||||||
Afren plc 144A | $ | 475 | $ | 502 | ||||
Atlas Energy Holdings Operating Co. LLC 144A | 325 | 322 | ||||||
California Resources Corp. 144A | 750 | 773 | ||||||
Calumet Specialty Products Partners LP 144A | 1,130 | 1,079 | ||||||
Carrizo Oil & Gas, Inc. | 365 | 381 | ||||||
CHC Helicopter SA | 653 | 698 | ||||||
CITGO Petroleum Corp. 144A | 470 | 490 | ||||||
Compagnie Generale de Geophysique-Veritas | 725 | 642 | ||||||
CONSOL Energy, Inc. 144A | 650 | 643 | ||||||
Denbury Resources, Inc. | 885 | 879 | ||||||
Endeavor Energy Resources LP 144A | 655 | 678 | ||||||
Energy Transfer Equity LP | 885 | 909 | ||||||
Energy XXI Gulf Coast, Inc. 144A | 1,105 | 1,041 | ||||||
EnQuest plc 144A | 885 | 836 | ||||||
EP Energy LLC | 840 | 920 | ||||||
EPL Oil & Gas, Inc. | 1,120 | 1,151 | ||||||
EV Energy Partners LP | 325 | 338 | ||||||
Exterran Partners LP 144A | 740 | 723 | ||||||
Forest Oil Corp. | 935 | 884 | ||||||
FTS International, Inc. 144A | 450 | 444 | ||||||
Gazprom OAO | ||||||||
3.850%, 2/6/20(3)(7) | 1,115 | 1,023 | ||||||
6.000%, 11/27/23(3)(7) | 255 | 241 | ||||||
Gulfmark Offshore, Inc. | 960 | 931 | ||||||
Gulfport Energy Corp. 144A | 160 | 168 | ||||||
Halcon Resources Corp. | 910 | 901 | ||||||
Laredo Petroleum, Inc. | 830 | 876 | ||||||
Linn Energy LLC | ||||||||
6.500%, 5/15/19 | 512 | 504 | ||||||
6.500%, 9/15/21 | 155 | 152 | ||||||
| PAR VALUE | VALUE | |||||||
| Energy—continued | ||||||||
Lukoil OAO International Finance BV | ||||||||
144A 7.250%, 11/5/19(3) | $ | 525 | $ | 557 | ||||
144A 4.563%, 4/24/23(3) | 495 | 444 | ||||||
MEG Energy Corp. 144A | 500 | 519 | ||||||
NGL Energy Partners LP (NGL Energy Finance Corp.) 144A | 485 | 477 | ||||||
Novatek OAO (Novatek Finance Ltd.) 144A | 1,105 | 956 | ||||||
Odebrecht Offshore Drilling Finance Ltd. 144A | 1,168 | 1,212 | ||||||
Pacific Rubiales Energy Corp. 144A | 915 | 930 | ||||||
Parker Drilling Co. (The) | 1,075 | 1,129 | ||||||
Petrobras Global Finance BV | 895 | 936 | ||||||
Petrobras International Finance Co. | 500 | 505 | ||||||
Petroleos de Venezuela SA | ||||||||
Series 2015, 5.000%, 10/28/15 | 385 | 330 | ||||||
RegS 8.500%, 11/2/17(4) | 2,605 | 2,058 | ||||||
144A 6.000%, 5/16/24(3) | 2,530 | 1,313 | ||||||
Petroleos Mexicanos | ||||||||
144A 4.875%, 1/18/24(3) | 305 | 320 | ||||||
5.500%, 6/27/44 | 650 | 663 | ||||||
PHI, Inc. | 360 | 363 | ||||||
Plains Exploration & Production Co. | 645 | 732 | ||||||
QEP Resources, Inc. | 480 | 523 | ||||||
QGOG Constellation SA 144A | 1,000 | 1,002 | ||||||
Rosetta Resources, Inc. | 945 | 946 | ||||||
Sabine Pass Liquefaction LLC | 915 | 945 | ||||||
Targa Resources Partners LP | 787 | 842 | ||||||
Transocean, Inc. | 1,050 | 964 | ||||||
Tullow Oil plc 144A | 945 | 950 | ||||||
|
| |||||||
| 38,745 | ||||||||
|
| |||||||
| Financials—19.0% | ||||||||
ADCB Finance Cayman Ltd. 144A | 560 | 560 | ||||||
See Notes to Financial Statements
39
Table of Contents
VIRTUS MULTI-SECTOR INTERMEDIATE BOND FUND
SCHEDULE OF INVESTMENTS (Continued)
SEPTEMBER 30, 2014
($ reported in thousands)
| PAR VALUE | VALUE | |||||||
| Financials—continued | ||||||||
Aircastle Ltd. | $ | 1,715 | $ | 1,698 | ||||
Akbank TAS 144A | 1,565 | TRY | 612 | |||||
Allstate Corp. (The) | 1,455 | 1,550 | ||||||
ALROSA Finance S.A. 144A | 1,065 | 1,101 | ||||||
Banco ABC Brasil S.A. 144A | 1,025 | 1,101 | ||||||
Banco Bilbao Vizcaya Argentaria Bancomer S.A. | ||||||||
144A 6.500%, 3/10/21(3) | 425 | 463 | ||||||
144A 6.750%, 9/30/22(3) | 1,000 | 1,120 | ||||||
Banco Bradesco S.A. 144A | 1,150 | 1,199 | ||||||
Banco de Credito del Peru | ||||||||
144A 4.250%, | 657 | 654 | ||||||
144A 6.125%, 4/24/27(2)(3) | 1,095 | 1,169 | ||||||
Banco do Brasil S.A. 144A | 600 | 606 | ||||||
Banco Internacional del Peru SAA | ||||||||
144A 5.750%, 10/7/20(3) | 1,060 | 1,142 | ||||||
144A 6.625%, 3/19/29(2)(3) | 395 | 429 | ||||||
Banco Santander Brasil SA 144A | 900 | BRL | 351 | |||||
Banco Votorantim S.A. 144A | 1,660 | 1,838 | ||||||
Bancolombia S.A. | 1,015 | 1,019 | ||||||
Bank of Georgia JSC 144A | 515 | 552 | ||||||
Bank of India 144A | 1,150 | 1,161 | ||||||
Barclays Bank plc 144A | 600 | 636 | ||||||
Braskem Finance Ltd. | ||||||||
144A 5.750%, 4/15/21(3) | 500 | 511 | ||||||
6.450%, 2/3/24 | 800 | 832 | ||||||
Brazil Loan Trust 1 144A | 1,050 | 1,092 | ||||||
Caixa Economica Federal 144A | 910 | 915 | ||||||
CareTrust Partnership LP 144A | 720 | 724 | ||||||
CCO Holdings LLC (CCO Holdings Capital Corp.) | 467 | 459 | ||||||
CorpGroup Banking S.A. 144A | 1,075 | 1,079 | ||||||
| PAR VALUE | VALUE | |||||||
| Financials—continued | ||||||||
Credit Bank of Moscow 144A | $ | 245 | $ | 240 | ||||
Development Bank of Kazakhstan OJSC 144A | 1,090 | 1,030 | ||||||
Drawbridge Special Opportunities Fund LP 144A | 915 | 906 | ||||||
Eurasian Development Bank 144A | 925 | 896 | ||||||
Evergrande Real Estate Group Ltd. 144A | 620 | 581 | ||||||
Excel Trust LP | 230 | 234 | ||||||
First Cash Financial Services, Inc. | 530 | 554 | ||||||
First Niagara Financial Group, Inc. | 1,160 | 1,338 | ||||||
General Motors Financial Co., Inc. | 1,535 | 1,619 | ||||||
Genworth Holdings, Inc. | 750 | 773 | ||||||
GLP Capital LP (GLP Financing II, Inc.) | ||||||||
4.375%, 11/1/18 | 34 | 35 | ||||||
4.875%, 11/1/20 | 720 | 734 | ||||||
5.375%, 11/1/23 | 25 | 26 | ||||||
HSBC Finance Corp. | 500 | 586 | ||||||
Hutchison Whampoa International Ltd. Series 12, 144A | 1,130 | 1,213 | ||||||
ICAHN Enterprises LP (ICAHN Enterprises Finance Corp.) | ||||||||
4.875%, 3/15/19 | 65 | 64 | ||||||
6.000%, 8/1/20 | 370 | 380 | ||||||
5.875%, 2/1/22 | 755 | 753 | ||||||
ICICI Bank Ltd. 144A | 940 | 995 | ||||||
iStar Financial, Inc. | 500 | 484 | ||||||
Itau Unibanco Holding S.A. 144A | 1,085 | 1,061 | ||||||
Kazakhstan Temir Zholy Finance BV 144A | 795 | 861 | ||||||
Landry’s Holdings II, Inc. 144A | 425 | 440 | ||||||
Leucadia National Corp. | 575 | 601 | ||||||
Level 3 Financing, Inc. | 935 | 990 | ||||||
| PAR VALUE | VALUE | |||||||
| Financials—continued | ||||||||
Lincoln National Corp. | $ | 300 | $ | 307 | ||||
Macquarie Bank Ltd. 144A | 189 | 216 | ||||||
Morgan Stanley | ||||||||
144A 10.090%, 5/3/17(3) | 2,400 | BRL | 957 | |||||
Series H, 5.450%, 12/29/49(2) | 925 | 919 | ||||||
MPT Operating Partnership LP | 325 | 331 | ||||||
Nationstar Mortgage LLC | 1,665 | 1,594 | ||||||
Navient Corp. (SLM Corp.) | 850 | 817 | ||||||
Nordea Bank AB 144A | 1,360 | 1,398 | ||||||
Onex York Acquisition Corp. 144A | 570 | 569 | ||||||
PennantPark Investment Corp. | 785 | 789 | ||||||
Phosagro OAO (Phosagro Bond Funding Ltd.) 144A | 875 | 847 | ||||||
PKO Finance AB 144A | 1,315 | 1,366 | ||||||
Progressive Corp. (The) | 1,200 | 1,315 | ||||||
Prudential Financial, Inc. | ||||||||
5.875%, 9/15/42(2) | 2,155 | 2,284 | ||||||
5.625%, 6/15/43(2)(6) | 450 | 469 | ||||||
Regency Energy Partners LP | 1,160 | 1,128 | ||||||
Reliance Holdings USA, Inc. 144A | 1,000 | 1,092 | ||||||
Royal Bank of Scotland Group plc (The) | ||||||||
6.400%, 10/21/19 | 370 | 431 | ||||||
7.648%(2)(5)(6) | 550 | 646 | ||||||
Russian Agricultural Bank OJSC (RSHB Capital SA) 144A | 315 | 308 | ||||||
Sabra Health Care LP | 470 | 478 | ||||||
Schaeffler Holding Finance BV PIK Interest Capitalization, 144A | 255 | 266 | ||||||
Sovereign Bank | 400 | 484 | ||||||
SunTrust Bank, Inc. | 250 | 276 | ||||||
Teachers Insurance & Annuity Association of America 144A | 740 | 746 | ||||||
See Notes to Financial Statements
40
Table of Contents
VIRTUS MULTI-SECTOR INTERMEDIATE BOND FUND
SCHEDULE OF INVESTMENTS (Continued)
SEPTEMBER 30, 2014
($ reported in thousands)
| PAR VALUE | VALUE | |||||||
| Financials—continued | ||||||||
Turkiye Garanti Bankasi AS 144A | $ | 1,285 | $ | 1,270 | ||||
Ukreximbank Via Biz Finance plc RegS | 450 | 380 | ||||||
Vnesheconombank (VEB Finance plc) 144A | 500 | 487 | ||||||
Voya Financial, Inc. ( f.k.a. ING (U.S.), Inc.) | 1,210 | 1,222 | ||||||
VTB Bank OJSC (VTB Capital SA) 144A | 1,430 | 1,428 | ||||||
Walter Investment Management Corp. 144A | 1,100 | 1,089 | ||||||
WideOpenWest Finance LLC | 490 | 532 | ||||||
Yapi ve Kredi Bankasi AS 144A | 1,080 | 1,026 | ||||||
|
| |||||||
| 69,434 | ||||||||
|
| |||||||
| Health Care—3.5% | ||||||||
Acadia Healthcare Co.,Inc. | 300 | 294 | ||||||
Capsugel SA PIK Interest Capitalization 144A | 200 | 200 | ||||||
Catamaran Corp. | 585 | 564 | ||||||
Centene Corp. | 715 | 718 | ||||||
Community Health Systems, Inc. (CHS) 144A | 525 | 550 | ||||||
Crimson Merger Sub, Inc. 144A | 710 | 648 | ||||||
DaVita Healthcare Partners, Inc. | 935 | 920 | ||||||
Endo Finance LLC 144A | 1,270 | 1,216 | ||||||
HCA, Inc. | 990 | 1,083 | ||||||
IASIS Healthcare LLC | 545 | 572 | ||||||
LifePoint Hospitals, Inc. | 435 | 443 | ||||||
Mallinckrodt International Finance S.A. 144A | 360 | 364 | ||||||
MPH Acquisition Holdings LLC 144A | 595 | 602 | ||||||
Select Medical Corp. | 905 | 909 | ||||||
| PAR VALUE | VALUE | |||||||
| Health Care—continued | ||||||||
Tenet Healthcare Corp. | ||||||||
144A 5.500%, | $ | 550 | $ | 554 | ||||
4.750%, 6/1/20 | 1,150 | 1,147 | ||||||
6.000%, 10/1/20 | 180 | 191 | ||||||
4.500%, 4/1/21 | 470 | 460 | ||||||
8.125%, 4/1/22 | 770 | 847 | ||||||
Valeant Pharmaceuticals International, Inc. Escrow Corp. | ||||||||
144A 6.750%, 8/15/18(3) | 255 | 270 | ||||||
144A 7.500%, 7/15/21(3) | 130 | 140 | ||||||
144A 5.625%, 12/1/21(3) | 140 | 140 | ||||||
|
| |||||||
| 12,832 | ||||||||
|
| |||||||
| Industrials—5.4% | ||||||||
AAR Corp. | 1,135 | 1,226 | ||||||
ADT Corp.(The) | 1,130 | 1,172 | ||||||
AECOM Technology Corp. 144A | 365 | 369 | ||||||
Ahern Rentals, Inc. 144A | 925 | 992 | ||||||
Air Canada | ||||||||
144A 6.750%, 10/1/19(3) | 1,050 | 1,112 | ||||||
Pass-Through-Trust, 13-1, B 144A | 521 | 534 | ||||||
American Airlines Pass-Through-Trust 14-1, B | 900 | 914 | ||||||
Ashtead Capital, Inc. 144A | 940 | 952 | ||||||
Atlas Air Pass-Through-Trust | ||||||||
98-1, A 7.380%, 1/2/18 | 225 | 229 | ||||||
99-1, A1 7.200%, 1/2/19 | 446 | 465 | ||||||
00-1, A 8.707%, 1/2/19 | 153 | 161 | ||||||
AWAS Aviation Capital Ltd. 144A | 867 | 885 | ||||||
Bombardier, Inc. 144A | 1,570 | 1,580 | ||||||
Carpenter Technology Corp. | 600 | 648 | ||||||
Continental Airlines Pass-Through-Trust | ||||||||
98-, A | 156 | 165 | ||||||
00-1, A1 8.048%, 11/1/20 | 780 | 898 | ||||||
01-1, A1 6.703%, 6/15/21 | 237 | 256 | ||||||
CPG Merger Sub LLC 144A | 310 | 315 | ||||||
DP World Ltd. 144A | 400 | 448 | ||||||
ESAL GmbH 144A | 1,110 | 1,082 | ||||||
| PAR VALUE | VALUE | |||||||
| Industrials—continued | ||||||||
Masco Corp. | $ | 640 | $ | 699 | ||||
Northwest Airlines Pass-Through-Trust 02-1, G2 | 456 | 493 | ||||||
Odebrecht Finance Ltd. 144A | 650 | BRL | 240 | |||||
Rexel SA 144A | 1,130 | 1,141 | ||||||
Spirit AeroSystems, Inc. 144A | 250 | 251 | ||||||
TransDigm, Inc. 144A | 900 | 890 | ||||||
U.S. Airways Pass-Through-Trust 11-1, A | 614 | 712 | ||||||
United Rentals, Inc. | 895 | 909 | ||||||
|
| |||||||
| 19,738 | ||||||||
|
| |||||||
| Information Technology—2.6% | ||||||||
Alcatel-Lucent USA, Inc. 144A | 490 | 501 | ||||||
Avaya, Inc. 144A | 1,385 | 1,355 | ||||||
Ceridian LLC (Comdata, Inc.) 144A | 30 | 30 | ||||||
Equinix, Inc. | 465 | 463 | ||||||
First Data Corp. | ||||||||
144A 8.250%, 1/15/21(3) | 475 | 506 | ||||||
11.750%, 8/15/21 | 1,854 | 2,155 | ||||||
PIK Interest Capitalization, 144A | 645 | 687 | ||||||
Infinity Acquisition LLC (Infinity Acquisition Finance Corp.) 144A | 745 | 723 | ||||||
Infor Software Parent LLC PIK Interest Capitalization, 144A | 275 | 273 | ||||||
Interactive Data Corp. 144A | 675 | 666 | ||||||
QualityTech LP (QTS Finance Corp.) 144A | 75 | 74 | ||||||
Sanmina Corp. 144A | 205 | 201 | ||||||
Sophia Holding Finance LP PIK Interest Capitalization, 144A | 710 | 721 | ||||||
Sungard Availability Services Capital, Inc. 144A | 470 | 352 | ||||||
See Notes to Financial Statements
41
Table of Contents
VIRTUS MULTI-SECTOR INTERMEDIATE BOND FUND
SCHEDULE OF INVESTMENTS (Continued)
SEPTEMBER 30, 2014
($ reported in thousands)
| PAR VALUE | VALUE | |||||||
| Information Technology—continued | ||||||||
VeriSign, Inc. | $ | 810 | $ | 786 | ||||
|
| |||||||
| 9,493 | ||||||||
|
| |||||||
| Materials—5.3% | ||||||||
Alpek SA de C.V. 144A | 1,460 | 1,511 | ||||||
Beverage Packaging Holdings Luxembourg II SA 144A | 1,700 | 1,679 | ||||||
Cascades, Inc. 144A | 1,100 | 1,071 | ||||||
Cemex SAB de CV 144A | 976 | 1,092 | ||||||
Eldorado Gold Corp. 144A | 455 | 454 | ||||||
EuroChem Mineral & Chemical Co. OJSC 144A | 550 | 538 | ||||||
Gerdau Holdings, Inc. 144A | 835 | 939 | ||||||
Gerdau Trade, Inc. | ||||||||
144A 5.750%, | 250 | 258 | ||||||
144A 4.750%, | 590 | 563 | ||||||
Hexion U.S. Finance Corp. | ||||||||
8.875%, 2/1/18 | 595 | 608 | ||||||
6.625%, 4/15/20 | 580 | 586 | ||||||
Nufarm Australia Ltd. 144A | 580 | 594 | ||||||
Rayonier AM Products, Inc. 144A | 555 | 530 | ||||||
Samarco Mineracao SA 144A | 920 | 909 | ||||||
Sappi Papier Holding GmbH 144A | ||||||||
8.375%, 6/15/19(3) | 440 | 476 | ||||||
6.625%, 4/15/21(3) | 1,710 | 1,778 | ||||||
Severstal OAO (Steel Capital SA) 144A | 425 | 444 | ||||||
Tronox Finance LLC | 865 | 874 | ||||||
Turkiye Sise Ve Cam Fabrikalari AS 144A | 695 | 667 | ||||||
United States Steel Corp. | 1,360 | 1,455 | ||||||
Vale Overseas Ltd. | 1,355 | 1,365 | ||||||
Vedanta Resources plc 144A | 745 | 857 | ||||||
|
| |||||||
| 19,248 | ||||||||
|
| |||||||
| Telecommunication Services—2.6% | ||||||||
America Movil SAB de C.V. Series 12 | 5,000 | MXN | 360 | |||||
| PAR VALUE | VALUE | |||||||
| Telecommunication Services—continued | ||||||||
Bharti Airtel International Netherlands BV 144A | $ | 880 | $ | 930 | ||||
CenturyLink, Inc. Series V | 975 | 1,009 | ||||||
Comcel Trust 144A | 475 | 502 | ||||||
Digicel Group Ltd. 144A | 550 | 569 | ||||||
Empresa Nacional de Telecomunicaciones S.A. 144A | 430 | 441 | ||||||
Frontier Communications Corp. | 410 | 408 | ||||||
Koninklijke KPN NV 144A | 885 | 918 | ||||||
Millicom International Cellular SA 144A | 400 | 417 | ||||||
Sprint Communications, Inc. | 935 | 910 | ||||||
T-Mobile USA, Inc. | ||||||||
6.125%, 1/15/22 | 540 | 545 | ||||||
6.500%, 1/15/24 | 380 | 386 | ||||||
Vimpel Communications OJSC 144A | 840 | 869 | ||||||
Wind Acquisition Finance S.A. 144A | 460 | 445 | ||||||
Windstream Corp. | 780 | 825 | ||||||
|
| |||||||
| 9,534 | ||||||||
|
| |||||||
| Utilities—1.0% | ||||||||
AmeriGas Partners LP | 450 | 474 | ||||||
Calpine Corp. 144A | 40 | 42 | ||||||
Electricite de France SA 144A | 1,360 | 1,382 | ||||||
Enel SpA 144A | 375 | 436 | ||||||
Israel Electric Corp. Ltd. 144A | 500 | 532 | ||||||
NRG Energy, Inc. | 75 | 78 | ||||||
RJS Power Holdings LLC 144A | 625 | 622 | ||||||
Texas Competitive Electric Holdings Co. LLC | 200 | 25 | ||||||
|
| |||||||
| 3,591 | ||||||||
| TOTAL CORPORATE BONDS AND NOTES (Identified Cost $212,188) | 212,528 | |||||||
| PAR VALUE | VALUE | |||||||
| LOAN AGREEMENTS(2)—13.6% | ||||||||
| Consumer Discretionary—3.1% | ||||||||
Advantage Sales & Marketing, Inc. Second Lien, | $ | 740 | $ | 731 | ||||
Affinity Gaming LLC | 541 | 544 | ||||||
Aristocrat International Ltd. Tranche B, | 550 | 545 | ||||||
Brickman Group Ltd. LLC (The) Second Lien, | 344 | 341 | ||||||
Caesars Entertainment Operating Co., Inc. | ||||||||
Tranche B-6, | 512 | 469 | ||||||
Tranche B-7, | 103 | 98 | ||||||
Caesars Growth Properties Holdings LLC Tranche B, First Lien | 356 | 339 | ||||||
CBAC Borrower LLC Tranche B, | 692 | 708 | ||||||
Clear Channel Communications, Inc. Tranche D, | 1,333 | 1,278 | ||||||
Delta 2 (Lux) S.A.R.L. Second Lien, | 405 | 404 | ||||||
Fitness International LLC Tranche B, | 655 | 650 | ||||||
Granite Broadcasting Corp. Tranche B, First Lien | 419 | 420 | ||||||
Key Safety Systems, Inc. | 444 | 443 | ||||||
Landry’s, Inc. Tranche B, | 987 | 981 | ||||||
Marina District Finance Co., Inc. | 414 | 415 | ||||||
Peppermill Casinos, Inc. Tranche B, | 1,053 | 1,070 | ||||||
Shingle Springs Tribal Gaming Authority | 645 | 661 | ||||||
Transtar Holding Co. Second Lien, | 380 | 377 | ||||||
TWCC Holding Corp. Second Lien, | 1,088 | 1,069 | ||||||
|
| |||||||
| 11,543 | ||||||||
|
| |||||||
See Notes to Financial Statements
42
Table of Contents
VIRTUS MULTI-SECTOR INTERMEDIATE BOND FUND
SCHEDULE OF INVESTMENTS (Continued)
SEPTEMBER 30, 2014
($ reported in thousands)
| PAR VALUE | VALUE | |||||||
| Consumer Staples—0.2% | ||||||||
Albertson’s Holdings LLC Tranche B-4 | $ | 595 | $ | 593 | ||||
|
| |||||||
| Energy—1.5% | ||||||||
Arch Coal, Inc. | 1,113 | 1,022 | ||||||
Chief Exploration & Development LLC Second Lien | 649 | 650 | ||||||
Drillships Financing Holding, Inc. | 570 | 554 | ||||||
Expro Finservices S.A.R.L. | 461 | 460 | ||||||
Fieldwood Energy LLC Second Lien, | 861 | 866 | ||||||
Jonah Energy LLC Second Lien, | 520 | 516 | ||||||
Seadrill Operating LP | 507 | 484 | ||||||
Templar Energy LLC Second Lien, | 925 | 899 | ||||||
|
| |||||||
| 5,451 | ||||||||
|
| |||||||
| Financials—0.7% | ||||||||
Altisource Solutions S.A R.L. Tranche B, | 890 | 848 | ||||||
Asurion LLC Second Lien, | 945 | 958 | ||||||
Capital Automotive LP Second Lien, | 450 | 456 | ||||||
Walter Investment Management Corp. Tranche B | 344 | 330 | ||||||
|
| |||||||
| 2,592 | ||||||||
|
| |||||||
| Health Care—1.6% | ||||||||
American Renal Holdings, Inc. Second Lien, | 909 | 904 | ||||||
Ardent Medical Services, Inc. | ||||||||
First Lien, 6.750%, 7/2/18 | 317 | 319 | ||||||
Second Lien, | 206 | 209 | ||||||
CRC Health Corp. Tranche B, First Lien, | 222 | 220 | ||||||
Gentiva Health Services, Inc. | 886 | 889 | ||||||
InVentiv Health, Inc. Tranche B-4 | 583 | 580 | ||||||
| PAR VALUE | VALUE | |||||||
| Health Care—continued | ||||||||
MMM Holdings, Inc. | $ | 277 | $ | 277 | ||||
MSO of Puerto Rico, Inc. | 202 | 202 | ||||||
NVA Holdings, Inc. Second Lien | 509 | 508 | ||||||
PharMEDium Healthcare Corp. Second Lien, | 187 | 185 | ||||||
Regional Care, Inc. (RCHP, Inc.) First Lien, | 420 | 421 | ||||||
Surgery Center Holdings, Inc. | ||||||||
First Lien, 6.000%, 4/11/19 | 298 | 299 | ||||||
Second Lien, | 409 | 410 | ||||||
0.000%, 7/24/20(8) | 95 | 95 | ||||||
0.000%, 7/23/21(8) | 288 | 284 | ||||||
|
| |||||||
| 5,802 | ||||||||
|
| |||||||
| Industrials—2.3% | ||||||||
Alliance Laundry Systems LLC Second Lien, | 93 | 94 | ||||||
American Airlines, Inc. Tranche B, | 1,018 | 1,003 | ||||||
Brock Holdings Ill, Inc. | ||||||||
First Lien, | 553 | 542 | ||||||
Second Lien, | 285 | 281 | ||||||
CHG Healthcare Services, Inc. Second Lien, | 217 | 222 | ||||||
Commercial Barge Line Co. | 1,113 | 1,119 | ||||||
DynCorp International, Inc. | 448 | 446 | ||||||
Filtration Group Corp. | 740 | 743 | ||||||
Harland Clarke Holdings Corp. | ||||||||
Tranche B-3, | 406 | 411 | ||||||
Tranche B-4, | 177 | 178 | ||||||
Husky Injection Molding Systems Ltd. (Yukon Acquisition, Inc.) | 533 | 526 | ||||||
International Equipment Solutions Global B.V. | 609 | 609 | ||||||
Landmark U.S. Member LLC (Landmark U.S. Corp Acquisition, Inc.) | 725 | 727 | ||||||
| PAR VALUE | VALUE | |||||||
| Industrials—continued | ||||||||
Navistar, Inc. Tranche B, | $ | 729 | $ | 733 | ||||
Sedgwick, Inc. | 730 | 715 | ||||||
|
| |||||||
| 8,349 | ||||||||
|
| |||||||
| Information Technology—3.3% | ||||||||
Active Network, Inc. (Lanyon Solutions, Inc.) | 568 | 565 | ||||||
Allflex Holdings III, Inc. | 599 | 597 | ||||||
Applied Systems, Inc. | 45 | 45 | ||||||
Attachmate Group, Inc. (The) First Lien, | 314 | 315 | ||||||
Blue Coat Systems, Inc. | ||||||||
4.000%, 5/31/19 | 558 | 549 | ||||||
Second Lien, | 1,660 | 1,660 | ||||||
Deltek, Inc. Second Lien, | 638 | 648 | ||||||
Evergreen Skills Lux S.A.R.L. Second Lien, | 393 | 380 | ||||||
First Data Corp. | 1,349 | 1,325 | ||||||
Infinity Acquisition Ltd. | 358 | 350 | ||||||
IPC Systems, Inc. First Lien, | 481 | 482 | ||||||
Kronos, Inc. | ||||||||
First Lien, 4.500%, 10/30/19 | 8 | 8 | ||||||
Second Lien, | 827 | 853 | ||||||
Mitchell International, Inc. | 1,323 | 1,325 | ||||||
RP Crown Parent LLC | 365 | 349 | ||||||
SRA International, Inc. | 463 | 463 | ||||||
Sungard Availability Services Capital, Inc. Tranche B, | 464 | 430 | ||||||
Travelport LLC | 434 | 434 | ||||||
Vision Solutions, Inc. | 541 | 540 | ||||||
Wall Street Systems, Inc. | 593 | 590 | ||||||
|
| |||||||
| 11,908 | ||||||||
|
| |||||||
See Notes to Financial Statements
43
Table of Contents
VIRTUS MULTI-SECTOR INTERMEDIATE BOND FUND
SCHEDULE OF INVESTMENTS (Continued)
SEPTEMBER 30, 2014
($ reported in thousands)
| PAR VALUE | VALUE | |||||||
| Materials—0.6% | ||||||||
Berlin Packaging LLC | $ | 73 | $ | 74 | ||||
Fortescue Metals Group (FMG) Resources Property Ltd. | 321 | 315 | ||||||
Houghton International, Inc. Holding Corp. Second Lien, | 630 | 637 | ||||||
Noranda Aluminum Acquisition Corp. Tranche B, | 1,300 | 1,269 | ||||||
|
| |||||||
| 2,295 | ||||||||
|
| |||||||
| Telecommunication Services—0.1% | ||||||||
Securus Technologies Holdings, Inc. | 480 | 478 | ||||||
|
| |||||||
| Utilities—0.2% | ||||||||
Atlantic Power LP | 197 | 196 | ||||||
ExGen Renewables I LLC | 226 | 228 | ||||||
Texas Competitive Electric Holdings Co. LLC 2017 Extended, | 375 | 279 | ||||||
|
| |||||||
| 703 | ||||||||
| TOTAL LOAN AGREEMENTS (Identified Cost $49,963) | 49,714 | |||||||
| SHARES | ||||||||
| PREFERRED STOCKS—3.0% | ||||||||
| Energy—0.3% | ||||||||
PTT Exploration & Production PCL, 144A, | 905 | (11) | 914 | |||||
|
| |||||||
| Financials—2.6% | ||||||||
Ally Financial, Inc. Series A, | 20,000 | 539 | ||||||
Ally Financial, Inc. Series G, 144A, | 321 | 321 | ||||||
Banco Bilbao Vizcaya Argentaria S.A. International S.A. Unipersonal | 265 | (11) | 270 | |||||
Citigroup, Inc. Series J, | 46,600 | 1,246 | ||||||
General Electric Capital Corp. Series B, | 700 | (11) | 754 | |||||
| SHARES | VALUE | |||||||
| Financials—continued | ||||||||
General Electric Capital Corp. Series C, | 600 | (11) | $ | 601 | ||||
Goldman Sachs Group, Inc. (The) Series L, | 890 | (11) | 903 | |||||
JPMorgan Chase & Co. | ||||||||
Series Q, 5.150%(2) | 1,595 | (11) | 1,519 | |||||
Series V, 5.000%(2) | 285 | (11) | 277 | |||||
PNC Financial Services Group, Inc. (The) Series R, | 965 | (11) | 914 | |||||
Wells Fargo & Co. Series K, | 950 | (11) | 1,040 | |||||
Zions Bancorp, | 38,525 | (11) | 1,026 | |||||
|
| |||||||
| 9,410 | ||||||||
|
| |||||||
| Industrials—0.1% | ||||||||
Seaspan Corp. Series C, | 20,000 | 535 | ||||||
| TOTAL PREFERRED STOCKS (Identified Cost $10,498) | 10,859 | |||||||
| COMMON STOCK—0.0% | ||||||||
| Consumer Discretionary—0.0% | ||||||||
Mark IV Industries | 446 | 24 | ||||||
| TOTAL COMMON STOCK (Identified Cost $4) | 24 | |||||||
| EXCHANGE-TRADED FUND—0.5% | ||||||||
SPDR S&P 500® ETF Trust Series 1 | 9,500 | 1,872 | ||||||
| TOTAL EXCHANGE-TRADED FUNDS (Identified Cost $1,799) | 1,872 | |||||||
| TOTAL LONG-TERM INVESTMENTS—98.2% | ||||||||
| (Identified Cost $360,485) | 358,475 | (10) | ||||||
| SHORT-TERM INVESTMENT—1.4% | ||||||||
| Money Market Mutual Fund—1.4% | ||||||||
Fidelity Money Market Portfolio – Institutional Shares (seven-day effective yield 0.080%) | 5,034,488 | 5,034 | ||||||
| TOTAL SHORT-TERM INVESTMENT (Identified Cost $5,034) | 5,034 | |||||||
| TOTAL INVESTMENTS—99.6% (Identified Cost $365,519) | 363,509 | (1) | ||||||
Other assets and liabilities, |
| 1,644 | ||||||
|
| |||||||
| NET ASSETS—100.0% | $ | 365,153 | ||||||
|
| |||||||
Abbreviations:
| ETF | Exchange-Traded Fund |
| PIK | Payment-in-Kind Security |
| SPDR | S&P Depositary Receipt |
Footnote Legend:
| (1) | Federal Income Tax Information: For tax information at September 30, 2014, see Note 10 Federal Income Tax Information in the Notes to Financial Statements. |
| (2) | Variable or step coupon security; interest rate shown reflects the rate in effect at September 30, 2014. |
| (3) | Security exempt from registration under Rule 144A of the Securities Act of 1933. These securities may be resold in transactions exempt from registration, normally to qualified institutional buyers. At September 30, 2014, these securities amounted to a value of $144,554 or 39.6% of net assets. |
| (4) | Regulation S security. Security is offered and sold outside of the United States, therefore, it is exempt from registration with the SEC under rules 903 and 904 of the Securities Act of 1933. |
| (5) | No contractual maturity date. |
| (6) | Interest payments may be deferred. |
| (7) | This Note was issued for the sole purpose of funding a loan agreement between the issuer and the borrower. As the credit risk for this security lies solely with the borrower, the name represented here is that of the borrower. |
| (8) | This loan will settle after September 30, 2014, at which time the interest rate, based on the London Interbank Offered Rate (“LIBOR”) and the agreed upon spread on trade date, will be reflected. |
| (9) | Principal amount is adjusted pursuant to the change in the local inflation index. |
| (10) | A portion of the Fund’s assets have been segregated as collateral for delayed delivery settlements. |
| (11) | Value shown as par value. |
| (12) | 100% of the income received was in cash. |
| (13) | Security in default, the interest payments are being received during the bankruptcy proceedings. |
| (14) | Security in default. |
Security abbreviation definitions are located under the Key Investment Terms starting on page 4.
See Notes to Financial Statements
44
Table of Contents
VIRTUS MULTI-SECTOR INTERMEDIATE BOND FUND
SCHEDULE OF INVESTMENTS (Continued)
SEPTEMBER 30, 2014
($ reported in thousands)
| Country Weightings (Unaudited)† | ||||
United States | 64 | % | ||
Brazil | 4 | |||
Luxembourg | 3 | |||
Mexico | 3 | |||
Canada | 2 | |||
United Kingdom | 2 | |||
Venezuela | 2 | |||
Other | 20 | |||
Total | 100 | % | ||
† % of total investments as of September 30, 2014 |
| |||
Foreign Currencies:
| AUD | Australian Dollar |
| BRL | Brazilian Real |
| CLP | Chilean Peso |
| COP | Colombian Peso |
| IDR | Indonesian Rupiah |
| MXN | Mexican Peso |
| NZD | New Zealand Dollar |
| PEN | Peruvian Nuevo Sol |
| PHP | Philippine Peso |
| RUB | Russian Ruble |
| TRY | Turkish Lira |
| UYU | Uruguayan Peso |
| ZAR | South African Rand |
The following table provides a summary of inputs used to value the Fund’s investments as of September 30, 2014 (See Security Valuation Note 2A in the Notes to Financial Statements):
| Total Value at September 30, 2014 | Level 1 Quoted Prices | Level 2 Significant Observable Inputs | Level 3 Significant Unobservable Inputs | |||||||||||||
Debt Securities: | ||||||||||||||||
Asset-Backed Securities | $ | 15,288 | $ | — | $ | 15,288 | $ | — | ||||||||
Corporate Bonds and Notes | 212,528 | — | 212,528 | — | ||||||||||||
Foreign Government Securities | 35,335 | — | 35,335 | — | ||||||||||||
Loan Agreements | 49,714 | — | 49,714 | — | ||||||||||||
Mortgage-Backed Securities | 31,936 | — | 31,936 | — | ||||||||||||
Municipal Bonds | 919 | — | 919 | — | ||||||||||||
Equity Securities: | ||||||||||||||||
Common Stocks | 24 | — | — | 24 | ||||||||||||
Exchange-Traded Funds | 1,872 | 1,872 | — | — | ||||||||||||
Preferred Stock | 10,859 | 3,346 | 7,513 | — | ||||||||||||
Short-Term Investments | 5,034 | 5,034 | — | — | ||||||||||||
|
|
|
|
|
|
|
| |||||||||
Total Investments | $ | 363,509 | $ | 10,252 | $ | 353,233 | $ | 24 | ||||||||
|
|
|
|
|
|
|
| |||||||||
Securities held by the Fund with an end of period value of $321 were transferred from Level 1 to Level 2 since an exchange price was no longer available.
The following is a reconciliation of assets of the Fund for Level 3 investments for which significant unobservable inputs were used to determine fair value.
| Total | Asset-Backed Securities | Common Stocks | ||||||||||
Investments in Securities | ||||||||||||
Balance as of September 30, 2013: | $ | 691 | $ | 673 | $ | 18 | ||||||
Accrued discount/(premium) | — | — | — | |||||||||
Realized gain (loss) | 13 | 13 | — | |||||||||
Change in unrealized appreciation (depreciation)(c) | 11 | 5 | 6 | |||||||||
Purchases | — | — | — | |||||||||
Sales(b) | (691 | ) | (691 | ) | — | |||||||
Transfers into Level 3(a) | — | — | — | |||||||||
Transfers from Level 3(a) | — | — | — | |||||||||
|
|
|
|
|
| |||||||
Balance as of September 30, 2014 | $ | 24 | $ | 0 | $ | 24 | ||||||
|
|
|
|
|
| |||||||
| (a) | “Transfers into and/or from” represent the ending value as of September 30, 2014, for any investment security where a change in the pricing level occurred from the beginning to the end of the period. |
| (b) | Includes paydowns on securities. |
| (c) | Included in the related net change in unrealized appreciation/(depreciation) in the Statements of Operations. The change in unrealized appreciation/(depreciation) on investments still held on September 30, 2014, was $6. |
None of the securities in this table are fair valued.
See Notes to Financial Statements
45
Table of Contents
VIRTUS SENIOR FLOATING RATE FUND
SCHEDULE OF INVESTMENTS
SEPTEMBER 30, 2014
($ reported in thousands)
| PAR VALUE | VALUE | |||||||
| MORTGAGE-BACKED SECURITIES—0.2% | ||||||||
| Non-Agency—0.2% | ||||||||
Hilton USA Trust 13-HLT, EFX 144A | $ | 1,500 | $ | 1,524 | ||||
| TOTAL MORTGAGE-BACKED SECURITIES (Identified Cost $1,507) | 1,524 | |||||||
| ASSET-BACKED SECURITIES—0.1% | ||||||||
New Century Home Equity Loan Trust 05-A, A4W | 823 | 857 | ||||||
Terwin Mortgage Trust | 496 | 483 | ||||||
| TOTAL ASSET-BACKED SECURITIES (Identified Cost $1,210) | 1,340 | |||||||
| CORPORATE BONDS—7.9% | ||||||||
| Consumer Discretionary—1.5% | ||||||||
American Axle & Manufacturing, Inc. | 835 | 835 | ||||||
Boyd Gaming Corp. | 1,150 | 1,205 | ||||||
Cequel Communications Holdings I LLC 144A | 1,000 | 1,034 | ||||||
iHeartCommunications, Inc. | ||||||||
10.000%, 1/15/18 | 1,815 | 1,528 | ||||||
144A 9.000%, 9/15/22(3) | 1,170 | 1,164 | ||||||
Isle of Capri Casinos, Inc. | 830 | 845 | ||||||
Jaguar Land Rover Automotive plc 144A | 495 | 498 | ||||||
Landry’s, Inc. 144A | 950 | 1,009 | ||||||
MGM Resorts International | 500 | 545 | ||||||
MHGE Parent LLC 144A | 1,265 | 1,200 | ||||||
Numericable Group SA 144A | 755 | 748 | ||||||
ServiceMaster Co. | 484 | 506 | ||||||
Sirius XM Radio, Inc. 144A | 1,800 | 1,728 | ||||||
Wynn Macau Ltd. 144A | 1,085 | 1,052 | ||||||
|
| |||||||
| 13,897 | ||||||||
|
| |||||||
| Consumer Staples—0.3% | ||||||||
Heinz (H.J.) Co. | 2,170 | 2,162 | ||||||
Spectrum Brands, Inc. | 715 | 749 | ||||||
|
| |||||||
| 2,911 | ||||||||
|
| |||||||
| PAR VALUE | VALUE | |||||||
| Energy—0.7% | ||||||||
California Resources Corp. 144A | $ | 1,335 | $ | 1,358 | ||||
Calumet Specialty Products Partners LP 144A | 490 | 468 | ||||||
Compagnie Generale de Geophysique-Veritas | 182 | 181 | ||||||
EPL Oil & Gas, Inc. | 1,250 | 1,284 | ||||||
FTS International, Inc. 144A | 825 | 815 | ||||||
NGL Energy Partners LP (NGL Energy Finance Corp.) 144A | 1,525 | 1,500 | ||||||
PHI, Inc. | 450 | 454 | ||||||
|
| |||||||
| 6,060 | ||||||||
|
| |||||||
| Financials—1.5% | ||||||||
AerCap Ireland Capital Ltd. (AerCap Global Aviation Trust) 144A | 550 | 534 | ||||||
Aircastle Ltd. | ||||||||
4.625%, 12/15/18 | 1,305 | 1,308 | ||||||
6.250%, 12/1/19 | 1,190 | 1,259 | ||||||
Banco Santander Brasil SA 144A | 1,300 | BRL | 507 | |||||
GLP Capital LP (GLP Financing II, Inc.) | ||||||||
4.375%, 11/1/18 | 85 | 86 | ||||||
4.875%, 11/1/20 | 950 | 969 | ||||||
ICAHN Enterprises LP (ICAHN Enterprises Finance Corp.) | 195 | 193 | ||||||
Intelsat Jackson Holdings SA | 1,230 | 1,255 | ||||||
iStar Financial, Inc. | ||||||||
4.000%, 11/1/17 | 1,465 | 1,428 | ||||||
4.875%, 7/1/18 | 1,415 | 1,383 | ||||||
5.000%, 7/1/19 | 865 | 837 | ||||||
Level 3 Financing, Inc. | 1,105 | 1,170 | ||||||
Nationstar Mortgage LLC | ||||||||
6.500%, 8/1/18 | 835 | 837 | ||||||
6.500%, 7/1/21 | 1,295 | 1,240 | ||||||
Navient LLC | 785 | 785 | ||||||
Schaeffler Holding Finance BV PIK Interest Capitalization, 144A | 335 | 350 | ||||||
|
| |||||||
| 14,141 | ||||||||
|
| |||||||
| Health Care—0.4% | ||||||||
Capsugel SA PIK Interest Capitalization 144A | 350 | 350 | ||||||
| PAR VALUE | VALUE | |||||||
| Health Care—continued | ||||||||
Community Health Systems, Inc. (CHS) | $ | 1,055 | $ | 1,087 | ||||
Salix Pharmaceuticals Ltd. 144A | 180 | 195 | ||||||
Tenet Healthcare Corp. | ||||||||
144A 5.000%, 3/1/19(3) | 415 | 411 | ||||||
6.000%, 10/1/20 | 435 | 461 | ||||||
Valeant Pharmaceuticals International, Inc. 144A | 965 | 1,020 | ||||||
|
| |||||||
| 3,524 | ||||||||
|
| |||||||
| Industrials—0.3% | ||||||||
Air Canada 144A | 965 | 1,022 | ||||||
Atlas Air Pass-Through-Trust 98-1, A | 326 | 332 | ||||||
United Rentals, Inc. | 1,000 | 1,068 | ||||||
|
| |||||||
| 2,422 | ||||||||
|
| |||||||
| Information Technology—1.2% | ||||||||
Alcatel-Lucent USA, Inc. 144A | 560 | 573 | ||||||
Avaya, Inc. 144A | 3,015 | 2,949 | ||||||
Ceridian LLC (Comdata, Inc.) 144A | 95 | 95 | ||||||
First Data Corp. | ||||||||
144A 8.250%, 1/15/21(3) | 1,015 | 1,081 | ||||||
11.750%, 8/15/21 | 2,331 | 2,710 | ||||||
Infor Software Parent LLC PIK Interest Capitalization, 144A | 1,430 | 1,423 | ||||||
Interactive Data Corp. 144A | 2,050 | 2,023 | ||||||
Sanmina Corp. 144A | 595 | 584 | ||||||
|
| |||||||
| 11,438 | ||||||||
|
| |||||||
| Materials—1.7% | ||||||||
Ardagh Packaging Finance plc 144A | 400 | 397 | ||||||
Beverage Packaging Holdings Luxembourg II SA 144A | 3,200 | 3,160 | ||||||
Cemex SAB de CV | ||||||||
144A 9.500%, 6/15/18(3) | 1,499 | 1,677 | ||||||
144A 5.875%, 3/25/19(3) | 815 | 821 | ||||||
FMG Resources Property Ltd. 144A | 750 | 778 | ||||||
Hexion U.S. Finance Corp. | ||||||||
8.875%, 2/1/18 | 1,375 | 1,404 | ||||||
6.625%, 4/15/20 | 1,370 | 1,384 | ||||||
INEOS Group Holdings SA 144A | 1,130 | 1,116 | ||||||
See Notes to Financial Statements
46
Table of Contents
VIRTUS SENIOR FLOATING RATE FUND
SCHEDULE OF INVESTMENTS (Continued)
SEPTEMBER 30, 2014
($ reported in thousands)
| PAR VALUE | VALUE | |||||||
| Materials—continued | ||||||||
Sappi Papier Holding GmbH 144A | $ | 670 | $ | 720 | ||||
Reynolds Group Issuer, Inc. | ||||||||
9.000%, 4/15/19 | 1,500 | 1,569 | ||||||
5.750%, 10/15/20 | 940 | 961 | ||||||
United States Steel Corp. | 1,235 | 1,322 | ||||||
Vedanta Resources plc 144A | 685 | 788 | ||||||
|
| |||||||
| 16,097 | ||||||||
|
| |||||||
| Telecommunication Services—0.1% | ||||||||
Frontier Communications Corp. | 1,085 | 1,080 | ||||||
|
| |||||||
| Utilities—0.2% | ||||||||
RJS Power Holdings LLC 144A | 1,510 | 1,502 | ||||||
| TOTAL CORPORATE BONDS (Identified Cost $72,987) | 73,072 | |||||||
| LOAN AGREEMENTS(2)—98.0% | ||||||||
| Consumer Discretionary—29.3% | ||||||||
Acosta, Inc. | 3,267 | 3,267 | ||||||
Acquisitions Cogeco Cable II LP Tranche B, | 816 | 799 | ||||||
Advantage Sales & Marketing, Inc. | ||||||||
Delayed Draw 3.750%, 7/23/21 | 60 | 59 | ||||||
4.250%, 7/23/21 | 1,804 | 1,775 | ||||||
Second Lien, | 2,530 | 2,501 | ||||||
Affinia Group, Inc. Tranche B-2, | 547 | 545 | ||||||
Affinity Gaming LLC | 971 | 977 | ||||||
Allison Transmission Tranche B-3, | 1,728 | 1,712 | ||||||
Aristocrat International Ltd. Tranche B, | 4,925 | 4,880 | ||||||
Bally Technologies, Inc. Tranche B, | 2,977 | 2,968 | ||||||
Boyd Gaming Corp. Tranche B, | 4,816 | 4,757 | ||||||
Brickman Group Ltd. LLC (The) Second Lien, | 1,971 | 1,956 | ||||||
Caesars Entertainment Operating Co., Inc. | ||||||||
Tranche B-4, | 943 | 908 | ||||||
Tranche B-6, | 4,558 | 4,168 | ||||||
Tranche B-7, | 2,225 | 2,115 | ||||||
| PAR VALUE | VALUE | |||||||
| Consumer Discretionary—continued | ||||||||
Caesars Entertainment Operating Co., Inc. (Harrah’s Operating Company, Inc.) Tranche B-5, | $ | 945 | $ | 863 | ||||
Caesars Entertainment Resort Properties LLC Tranche B, | 3,972 | 3,814 | ||||||
Caesars Growth Properties Holdings LLC | 4,529 | 4,309 | ||||||
CBAC Borrower LLC | 3,654 | 3,736 | ||||||
Cequel Communications LLC | 1,703 | 1,676 | ||||||
Charter Communications Operations LLC | ||||||||
Tranche E, | 4,368 | 4,246 | ||||||
Tranche F, | 6,243 | 6,068 | ||||||
Tranche G, | 1,233 | 1,232 | ||||||
Checkout Holding Corp. | 2,894 | 2,824 | ||||||
Chrysler Group LLC | ||||||||
Tranche B, | 3,657 | 3,633 | ||||||
Tranche B, | 2,599 | 2,558 | ||||||
CityCenter Holdings LLC | 2,560 | 2,538 | ||||||
Clear Channel Communications, Inc. Tranche D, | 15,188 | 14,553 | ||||||
Cooper-Standard Automotive, Inc. | 3,774 | 3,736 | ||||||
CSC Holdings, Inc. Tranche B, | 2,444 | 2,379 | ||||||
Cumulus Media Holdings, Inc. | 3,650 | 3,593 | ||||||
Delta 2 (Lux) S.A.R.L. | ||||||||
Tranche B-3, | 5,593 | 5,534 | ||||||
Second Lien, | 1,462 | 1,459 | ||||||
Federal-Mogul Corp. | 4,250 | 4,220 | ||||||
Gates Global LLC | 2,815 | 2,769 | ||||||
General Nutrition Center | 3,033 | 2,958 | ||||||
Golden Nugget, Inc. | ||||||||
5.500%, 11/21/19 | 1,042 | 1,051 | ||||||
Delayed Draw 5.500%, 11/21/19 | 447 | 451 | ||||||
Granite Broadcasting Corp. Tranche B, First Lien | 832 | 833 | ||||||
| PAR VALUE | VALUE | |||||||
| Consumer Discretionary—continued | ||||||||
Great Wolf Resorts Tranche B, | $ | 2,963 | $ | 2,937 | ||||
Harbor Freight Tools | 1,474 | 1,474 | ||||||
Hilton Worldwide Finance LLC | 17,917 | 17,663 | ||||||
Intelsat Jackson Holdings S.A. Tranche B-2, | 2,838 | 2,798 | ||||||
KAR Auction Services, Inc. | 2,592 | 2,561 | ||||||
Key Safety Systems, Inc. | 2,051 | 2,048 | ||||||
Laureate Education, Inc. | 5,498 | 5,282 | ||||||
Leslie’s Poolmart Tranche B, | 5,254 | 5,183 | ||||||
Libbey Glass, Inc. | 3,545 | 3,519 | ||||||
Live Nation Entertainment Tranche B-1, | 3,360 | 3,325 | ||||||
Marina District Finance Co., Inc. | 2,352 | 2,358 | ||||||
MCC LLC (Mediacom Broadband Group) | ||||||||
Tranche H, | 1,975 | 1,930 | ||||||
3.750%, 6/30/21 | 935 | 930 | ||||||
3.750%, 6/30/21 | 2,342 | 2,304 | ||||||
Media General, Inc. Tranche B, | 4,535 | 4,495 | ||||||
Metaldyne LLC Tranche 2014, | 1,463 | 1,461 | ||||||
MGM Resort International | 5,785 | 5,692 | ||||||
Michaels Stores, Inc. | ||||||||
Tranche B, | 3,950 | 3,880 | ||||||
4.000%, 1/28/20 | 1,833 | 1,817 | ||||||
Mohegan Tribal Gaming Authority Tranche B, | 3,190 | 3,142 | ||||||
Neiman Marcus Group | 3,970 | 3,908 | ||||||
Numericable SFR | ||||||||
Tranche B-1, | 1,852 | 1,843 | ||||||
Tranche B-2, | 1,605 | 1,596 | ||||||
Oceania Cruises Tranche B-1, | 2,601 | 2,609 | ||||||
Peninsula Gaming LLC | 905 | 898 | ||||||
Penn National Gaming, Inc. | 2,978 | 2,956 | ||||||
See Notes to Financial Statements
47
Table of Contents
VIRTUS SENIOR FLOATING RATE FUND
SCHEDULE OF INVESTMENTS (Continued)
SEPTEMBER 30, 2014
($ reported in thousands)
| PAR VALUE | VALUE | |||||||
| Consumer Discretionary—continued | ||||||||
Peppermill Casinos, Inc. | $ | 2,290 | $ | 2,326 | ||||
PGX Holdings, Inc. | 2,975 | 2,975 | ||||||
Pinnacle Entertainment, Inc. | 4,271 | 4,222 | ||||||
Radio One, Inc. Tranche 2011, | 584 | 594 | ||||||
Remy International, Inc. | 1,965 | 1,950 | ||||||
Schrader International | ||||||||
5.000%, 4/27/18 | 1,060 | 1,058 | ||||||
5.000%, 4/27/18 | 910 | 909 | ||||||
Scientific Games International, Inc. Tranche B-2, | 2,807 | 2,757 | ||||||
Seminole Hard Rock Entertainment, Inc. Tranche B, | 954 | 937 | ||||||
ServiceMaster Co. LLC (The) | 5,870 | 5,790 | ||||||
Seven Seas Cruises S. DE R.L. Tranche B-2, | 2,256 | 2,245 | ||||||
Shingle Springs Tribal Gaming Authority | 1,702 | 1,745 | ||||||
Sinclair Television Group, Inc. Tranche B-1, | 2,610 | 2,579 | ||||||
SRAM LLC First Lien, | 2,604 | 2,526 | ||||||
Station Casinos LLC Tranche B, | 3,165 | 3,123 | ||||||
TI Group Automotive Systems LLC | 1,770 | 1,749 | ||||||
Transtar Holding Co. | ||||||||
First Lien, | 1,429 | 1,426 | ||||||
Second Lien, | 460 | 457 | ||||||
Tribune Co. | 6,847 | 6,766 | ||||||
Tribune Publishing Co. | 1,267 | 1,258 | ||||||
TWCC Holding Corp. Second Lien, | 3,524 | 3,462 | ||||||
Univision Communications, Inc. | ||||||||
4.000%, 3/1/20 | 2,659 | 2,612 | ||||||
First Lien, | 4,442 | 4,366 | ||||||
Virgin Media Investment Holdings Ltd. Tranche B, | 3,847 | 3,752 | ||||||
Ziggo B.V. | ||||||||
Tranche B-3, | 1,482 | 1,442 | ||||||
Tranche B-1 | 1,398 | 1,361 | ||||||
| PAR VALUE | VALUE | |||||||
| Consumer Discretionary—continued | ||||||||
Tranche B-2, | $ | 901 | $ | 877 | ||||
Zuffa LLC | 3,647 | 3,606 | ||||||
|
| |||||||
| 271,899 | ||||||||
|
| |||||||
| Consumer Staples—5.4% | ||||||||
AdvancePierre Foods, Inc. First Lien, | 1,071 | 1,073 | ||||||
Albertson’s LLC Tranche B-4 | 2,688 | 2,679 | ||||||
ARAMARK Corp. | ||||||||
3.250%, 9/6/19 | 4,323 | 4,256 | ||||||
3.250%, 2/24/21 | 993 | 975 | ||||||
Big Heart Pet Brands (Del Monte Corp.) | 2,950 | 2,842 | ||||||
Crossmark Holdings, Inc. | ||||||||
First Lien, | 2,991 | 2,946 | ||||||
Second Lien, | 520 | 516 | ||||||
D.E Master Blenders (Charges OpCo BV) | 1,083 | 1,064 | ||||||
Del Monte Corp. First Lien, | 955 | 898 | ||||||
Dole Food Co., Inc. Tranche B, | 1,958 | 1,943 | ||||||
Heinz (H.J.) Co. Tranche B-2, | 13,128 | 12,985 | ||||||
New Hostess Brand Acquisition LLC Tranche B, | 4,027 | 4,132 | ||||||
Prestige Brands | 300 | 300 | ||||||
Reynolds Group Holdings, Inc. 4.000%, 11/30/18 | 4,107 | 4,071 | ||||||
Rite Aid Corp. | ||||||||
Tranche 7, | 5,925 | 5,826 | ||||||
Tranche 1, Second Lien, | 101 | 103 | ||||||
Tranche 2, | 1,417 | 1,413 | ||||||
Spectrum Brands, Inc. Tranche C, | 1,980 | 1,964 | ||||||
|
| |||||||
| 49,986 | ||||||||
|
| |||||||
| Energy—4.0% | ||||||||
Arch Coal, Inc. | 4,466 | 4,101 | ||||||
Azure Midstream | 2,314 | 2,297 | ||||||
Chief Exploration & Development LLC Second Lien | 2,739 | 2,744 | ||||||
Drillships Financing Holding, Inc. | 1,525 | 1,483 | ||||||
| PAR VALUE | VALUE | |||||||
| Energy—continued | ||||||||
Expro Finservices S.A.R.L. | $ | 1,542 | $ | 1,538 | ||||
Fieldwood Energy LLC | ||||||||
Closing Date Loan, | 855 | 844 | ||||||
Second Lien, | 2,613 | 2,626 | ||||||
FTS International, Inc. | 1,451 | 1,455 | ||||||
Jonah Energy LLC Second Lien, | 1,885 | 1,871 | ||||||
MEG Energy Corp. | 3,441 | 3,427 | ||||||
Paragon Offshore Finance Co. | 2,271 | 2,132 | ||||||
Quicksilver Resources, Inc. Second Lien, | 1,745 | 1,592 | ||||||
Sabine Oil & Gas LLC Second Lien, | 1,290 | 1,292 | ||||||
Seadrill Operating LP | 7,341 | 7,007 | ||||||
Templar Energy LLC | 3,000 | 2,914 | ||||||
|
| |||||||
| 37,323 | ||||||||
|
| |||||||
| Financials—6.6% | ||||||||
Altisource Solutions S.A.R.L. Tranche B, | 3,245 | 3,091 | ||||||
Asurion LLC | ||||||||
Tranche B-1, | 2,194 | 2,187 | ||||||
4.250%, 7/8/20 | 1,481 | 1,460 | ||||||
Second Lien, | 3,140 | 3,183 | ||||||
Capital Automotive LP | ||||||||
Tranche B-1, | 1,518 | 1,512 | ||||||
Second Lien, | 1,828 | 1,855 | ||||||
Clipper Acquisitions Corp. Tranche B, | 996 | 977 | ||||||
Delos Finance S.A.R.L. | 6,026 | 5,962 | ||||||
Guggenheim Partners LLC | 2,970 | 2,954 | ||||||
Home Loan Servicing Solutions Ltd. | 3,950 | 3,901 | ||||||
iStar Financial, Inc. Tranche A-2, | 407 | 418 | ||||||
National Financial Partners LLC | 2,828 | 2,808 | ||||||
Ocean Rig | 2,970 | 2,855 | ||||||
Realogy Corp. | ||||||||
Extended LOC, | 206 | 204 | ||||||
See Notes to Financial Statements
48
Table of Contents
VIRTUS SENIOR FLOATING RATE FUND
SCHEDULE OF INVESTMENTS (Continued)
SEPTEMBER 30, 2014
($ reported in thousands)
| PAR VALUE | VALUE | |||||||
| Financials—continued | ||||||||
Tranche B, | $ | 7,452 | $ | 7,331 | ||||
SAM Finance Lux S.A.R.L. | 2,859 | 2,853 | ||||||
Starwood Property Trust, Inc. | 6,330 | 6,247 | ||||||
Trans Union LLC 2014 Replacement, | 5,267 | 5,193 | ||||||
Walter Investment Management Corp. Tranche B | 7,089 | 6,803 | ||||||
|
| |||||||
| 61,794 | ||||||||
|
| |||||||
| Health Care—14.0% | ||||||||
Accellent, Inc. First Lien, | 3,296 | 3,244 | ||||||
Akorn, Inc. Tranche B, | 4,250 | 4,235 | ||||||
Alere, Inc. Tranche B, | 2,598 | 2,582 | ||||||
American Renal Holdings, Inc. | ||||||||
Tranche B, First Lien, | 2,504 | 2,471 | ||||||
Second Lien, | 1,860 | 1,850 | ||||||
Amneal Pharmaceuticals LLC | 2,869 | 2,869 | ||||||
AmSurg Corp. | 1,204 | 1,194 | ||||||
Ardent Medical Services, Inc. | ||||||||
First Lien, | 792 | 796 | ||||||
Second Lien, | 268 | 272 | ||||||
BSN Medical GmbH & Co. KG Tranche B-1B | 1,979 | 1,975 | ||||||
Capsugel Holdings US, Inc. | 4,080 | 4,010 | ||||||
CHG Healthcare Services, Inc. First Lien, | 2,087 | 2,079 | ||||||
Community Health Systems, Inc. (CHS) | ||||||||
3.485%, 1/25/17 | 887 | 883 | ||||||
Tranche D, | 3,730 | 3,724 | ||||||
ConvaTec, Inc. | 1,531 | 1,525 | ||||||
CRC Health Corp. Tranche B, First Lien, | 1,353 | 1,345 | ||||||
DaVita HealthCare Partners, Inc. Tranche B, | 3,147 | 3,117 | ||||||
Drumm Investors LLC (Golden Living) | 1,474 | 1,479 | ||||||
Emdeon, Inc. Tranche B-2, | 3,043 | 3,013 | ||||||
| PAR VALUE | VALUE | |||||||
| Health Care—continued | ||||||||
Endo Luxembourg Finance S.A.R.L. Tranche B, | $ | 920 | $ | 911 | ||||
Envision Healthcare Corp. (aka Emergency Medical Services Corp.) | 3,684 | 3,654 | ||||||
Gentiva Health Services, Inc. Tranche B, | 3,653 | 3,664 | ||||||
Hologic, Inc. Refinancing Tranche B, | 2,682 | 2,660 | ||||||
Iasis Healthcare LLC | 1,992 | 1,988 | ||||||
IMS Health, Inc. Tranche B, | 5,331 | 5,231 | ||||||
INC Research LLC | 2,392 | 2,377 | ||||||
InVentiv Health, Inc. | 2,887 | 2,869 | ||||||
Kinetic Concepts, Inc. | ||||||||
Tranche E-2, | 937 | 927 | ||||||
Tranche E-1, | 577 | 570 | ||||||
Mallinckrodt International S.A. | 292 | 288 | ||||||
Tranche B, | 2,775 | 2,737 | ||||||
Medpace Holdings, Inc. | 3,383 | 3,391 | ||||||
MMM Holdings, Inc. | 414 | 413 | ||||||
MSO of Puerto Rico, Inc. | 301 | 301 | ||||||
Multiplan, Inc. Tranche B-1, | 3,650 | 3,571 | ||||||
National Mentor Holdings, Inc. Tranche B, | 751 | 746 | ||||||
National Surgical Hospitals, Inc. | 1,404 | 1,403 | ||||||
NBTY, Inc. Tranche B-2, | 2,782 | 2,733 | ||||||
NVA Holdings, Inc. | ||||||||
First Lien, | 423 | 422 | ||||||
Second Lien | 986 | 984 | ||||||
Ortho-Clinical Diagnostics, Inc. | 3,344 | 3,309 | ||||||
Par Pharmaceutical Tranche B-2, | 1,742 | 1,710 | ||||||
Pharmaceutical Product Development, Inc. (Jaguar Holdings LLC) | 1,965 | 1,949 | ||||||
| PAR VALUE | VALUE | |||||||
| Health Care—continued | ||||||||
PharMEDium Healthcare Corp. | ||||||||
First Lien, | $ | 3,686 | $ | 3,621 | ||||
Second Lien, | 540 | 536 | ||||||
PRA Holdings, Inc. | 2,970 | 2,950 | ||||||
Quintiles Transnational Corp. Tranche B-3, | 4,550 | 4,491 | ||||||
Regional Care, Inc. (RCHP, Inc.) First Lien, | 3,004 | 3,014 | ||||||
Rexam Healthcare LLC (Devix) | 1,881 | 1,871 | ||||||
Salix Pharmaceuticals Ltd. First Lien, | 2,464 | 2,461 | ||||||
Surgery Center Holdings, Inc. | ||||||||
First Lien, | 1,271 | 1,274 | ||||||
Second Lien, | 1,800 | 1,805 | ||||||
0.000%, 7/24/20(5) | 656 | 655 | ||||||
0.000%, 7/23/21(5) | 1,693 | 1,672 | ||||||
Surgical Care Affiliates LLC Tranche C, | 3,430 | 3,402 | ||||||
U.S. Renal Care, Inc. | 3,012 | 2,982 | ||||||
United Surgical Partners Tranche B | 2,079 | 2,080 | ||||||
Valeant Pharmaceuticals International, Inc. | ||||||||
Series D-2, Tranche B, 3.750%, 2/13/19 | 2,158 | 2,138 | ||||||
Series C2, Tranche B 3.750%, 12/11/19 | 2 | 2 | ||||||
3.750%, 8/5/20 | 3,981 | 3,940 | ||||||
|
| |||||||
| 130,365 | ||||||||
|
| |||||||
| Industrials—11.6% | ||||||||
Air Canada | 4,254 | 4,313 | ||||||
Alliance Laundry Systems LLC Second Lien, | 110 | 111 | ||||||
Allied Security Holdings LLC | ||||||||
First Lien, | 1,391 | 1,377 | ||||||
Second Lien, | 688 | 679 | ||||||
American Airlines, Inc. Tranche B, | 7,560 | 7,445 | ||||||
Brickman Group Holdings, Inc. First Lien, | 3,860 | 3,784 | ||||||
See Notes to Financial Statements
49
Table of Contents
VIRTUS SENIOR FLOATING RATE FUND
SCHEDULE OF INVESTMENTS (Continued)
SEPTEMBER 30, 2014
($ reported in thousands)
| PAR VALUE | VALUE | |||||||
| Industrials—continued | ||||||||
Brock Holdings Ill, Inc. | ||||||||
First Lien, | $ | 3,918 | $ | 3,839 | ||||
Second Lien, | 450 | 443 | ||||||
Ceridian Corp. Tranche B-2, | 2,379 | 2,356 | ||||||
CHG Healthcare Services, Inc. Second Lien, | 379 | 386 | ||||||
Commercial Barge Line Co. | 2,670 | 2,685 | ||||||
CPI International, Inc. | 3,778 | 3,753 | ||||||
DynCorp International, Inc. | 2,372 | 2,363 | ||||||
Filtration Group Corp. | 2,075 | 2,083 | ||||||
Harland Clarke Holdings Corp. | ||||||||
Tranche B-3, | 2,168 | 2,195 | ||||||
Tranche B-4, | 1,287 | 1,297 | ||||||
HD Supply, Inc. | 4,243 | 4,203 | ||||||
HHI Holdings LLC | 936 | 936 | ||||||
Husky Injection Molding Systems Ltd. (Yukon Acquisition, Inc.) | 3,291 | 3,249 | ||||||
International Equipment Solutions Global B.V. | 2,972 | 2,974 | ||||||
Landmark U.S. Member LLC (Landmark U.S. Corp Acquisition, Inc.) | ||||||||
4.750%, 10/25/19 | 2,847 | 2,839 | ||||||
4.750%, 10/25/19 | 113 | 113 | ||||||
Second Lien, | 970 | 973 | ||||||
McJunkin Red Man Corp. | 1,544 | 1,546 | ||||||
Navistar, Inc. Tranche B, | 1,319 | 1,326 | ||||||
Nortek, Inc. | 3,969 | 3,921 | ||||||
OPE USIC Holdings, Inc. | 4,027 | 3,952 | ||||||
Ply Gem Industries, Inc. | 934 | 919 | ||||||
Quikrete Co., Inc. First Lien, | 2,848 | 2,820 | ||||||
Rexnord LLC Tranche B, | 4,950 | 4,878 | ||||||
Sedgwick, Inc. First Lien, | 7,861 | 7,628 | ||||||
Second Lien | 2,510 | 2,458 | ||||||
Spin Holdco, Inc. First Lien, | 4,923 | 4,846 | ||||||
| PAR VALUE | VALUE | |||||||
| Industrials—continued | ||||||||
Spirit Aerosystems, Inc. Tranche B, | $ | 3,886 | $ | 3,859 | ||||
TransDigm, Inc. | ||||||||
Tranche C, | 7,924 | 7,803 | ||||||
Tranche D, | 2,668 | 2,625 | ||||||
United Airlines, Inc. (Continental Airlines, Inc.) Tranche B-1, | 4,298 | 4,257 | ||||||
WireCo Worldgroup, Inc. | 437 | 440 | ||||||
|
| |||||||
| 107,674 | ||||||||
|
| |||||||
| Information Technology—12.8% | ||||||||
Allflex Holdings III, Inc. | ||||||||
First Lien, | 4,950 | 4,915 | ||||||
Second Lien, | 789 | 786 | ||||||
Applied Systems, Inc. | ||||||||
4.250%, 1/25/21 | 592 | 586 | ||||||
Second Lien, | 207 | 207 | ||||||
Avago Technologies Cayman Ltd. | 6,541 | 6,491 | ||||||
Blue Coat Systems, Inc. | ||||||||
4.000%, 5/31/19 | 2,987 | 2,939 | ||||||
Second Lien, | 3,154 | 3,154 | ||||||
CCC Information Services | 2,906 | 2,878 | ||||||
CDW LLC | 8,236 | 8,053 | ||||||
Deltek, Inc. Second Lien, | 2,629 | 2,671 | ||||||
Electronic Funds Source LLC | 4,224 | 4,223 | ||||||
Evergreen Skills Lux S.A.R.L. (Skillsoft Corp.) | ||||||||
4.500%, 4/28/21 | 3,800 | 3,737 | ||||||
Second Lien, | 2,515 | 2,430 | ||||||
Excelitas Technologies Corp. Tranche B, | 3,675 | 3,678 | ||||||
First Data Corp. | ||||||||
3.655%, 3/23/18 | 10,874 | 10,680 | ||||||
Tranche 2021, | 4,381 | 4,327 | ||||||
Freescale Semiconductor, Inc. Tranche B-4, | 1,980 | 1,976 | ||||||
Genpact Ltd. | 3,817 | 3,797 | ||||||
Infinity Acquisition Ltd. | 3,400 | 3,329 | ||||||
Infor (U.S.), Inc. | 4,419 | 4,328 | ||||||
Tranche B-5, 3.750%, 6/3/20 | 3,544 | 3,470 | ||||||
| PAR VALUE | VALUE | |||||||
| Information Technology—continued | ||||||||
Information Resources, Inc. | $ | 1,111 | $ | 1,113 | ||||
Interactive Data Corp. | 4,200 | 4,188 | ||||||
ION Trading Technologies S.A.R.L. | 1,124 | 1,113 | ||||||
IPC Systems, Inc. First Lien, | 1,907 | 1,913 | ||||||
Kronos, Inc. | ||||||||
First Lien, | 568 | 565 | ||||||
Second Lien, | 4,320 | 4,460 | ||||||
Lanyon Solutions, Inc. First Lien, 5.500%, 11/13/20 | 2,893 | 2,878 | ||||||
Mitchell International, Inc. | ||||||||
4.500%, 10/13/20 | 3,186 | 3,161 | ||||||
Second Lien, 8.500%, 10/11/21 | 3,057 | 3,061 | ||||||
Presidio, Inc. | 1,854 | 1,856 | ||||||
RP Crown Parent LLC | ||||||||
First Lien, | 2,223 | 2,170 | ||||||
Second Lien, | 3,333 | 3,185 | ||||||
SRA International, Inc. | 1,157 | 1,159 | ||||||
Sungard Availability Services Capital, Inc. Tranche B, | 4,058 | 3,765 | ||||||
Travelport LLC | 2,096 | 2,097 | ||||||
Vision Solutions, Inc. First Lien, | 2,072 | 2,067 | ||||||
Wall Street Systems, Inc. | 1,883 | 1,871 | ||||||
|
| |||||||
| 119,277 | ||||||||
|
| |||||||
| Materials—7.0% | ||||||||
American Builders & Contractors Supply Co., Inc. Tranche B, | 5,940 | 5,834 | ||||||
Anchor Glass Container Corp. | 6,400 | 6,357 | ||||||
Ardagh Packaging Finance plc | 872 | 861 | ||||||
AZ Chem US, Inc. First Lien, | 1,681 | 1,682 | ||||||
Berlin Packaging, Inc. S.A.R.L. | ||||||||
First Lien, | 2,475 | 2,476 | ||||||
0.000%, 9/24/21(5) | 1,846 | 1,846 | ||||||
0.000%, 9/23/22(5) | 258 | 260 | ||||||
Berry Plastics Groups, Inc. | ||||||||
Tranche D, | 4,578 | 4,468 | ||||||
Tranche E, | 2,024 | 1,982 | ||||||
CEMEX Espana S.A. | 819 | 817 | ||||||
See Notes to Financial Statements
50
Table of Contents
VIRTUS SENIOR FLOATING RATE FUND
SCHEDULE OF INVESTMENTS (Continued)
SEPTEMBER 30, 2014
($ reported in thousands)
| PAR VALUE | VALUE | |||||||
| Materials—continued | ||||||||
Distribution International, Inc. | $ | 1,975 | $ | 1,980 | ||||
Essar Steel Algoma, Inc. (Algoma Steel, Inc.) | 1,916 | 1,923 | ||||||
Fortescue Metals Group (FMG) Resources Property Ltd. | 4,959 | 4,862 | ||||||
Houghton International, Inc. Holding Corp. | ||||||||
First Lien, | 1,670 | 1,656 | ||||||
Second Lien, | 630 | 637 | ||||||
Huntsman International LLC | 4,000 | 3,965 | ||||||
Ineos Group Holdings, Inc. | 9,091 | 8,921 | ||||||
Minerals Technologies, Inc. | 3,690 | 3,667 | ||||||
Noranda Aluminum Acquisition Corp. Tranche B, | 2,252 | 2,198 | ||||||
Solenis International LP | 2,344 | 2,307 | ||||||
Univar, Inc. Tranche B, | 1,347 | 1,335 | ||||||
W.R. Grace & Co. | ||||||||
Delayed Draw, 1.000%, 2/3/21 | 1,247 | 1,240 | ||||||
3.000%, 2/3/21 | 3,475 | 3,454 | ||||||
|
| |||||||
| 64,728 | ||||||||
|
| |||||||
| Telecommunication Services—4.5% | ||||||||
Cincinnati Bell, Inc. Tranche B, | 3,218 | 3,193 | ||||||
Crown Castle Operating Co. | 2,657 | 2,628 | ||||||
Global Tel*Link Corp. | ||||||||
First Lien, | 1,842 | 1,830 | ||||||
Second Lien, | 660 | 656 | ||||||
Hawaiian Telcom Communications, Inc. | 1,970 | 1,973 | ||||||
Integra Telecom Holdings, Inc. | ||||||||
Tranche B, | 1,175 | 1,170 | ||||||
Second Lien, | 449 | 451 | ||||||
Level 3 Financing, Inc. | ||||||||
Tranche B-III 2019, | 3,875 | 3,812 | ||||||
Tranche B, | 3,388 | 3,333 | ||||||
| PAR VALUE | VALUE | |||||||
| Telecommunication Services—continued | ||||||||
SBA Communications | $ | 3,777 | $ | 3,705 | ||||
Securus Technologies Holdings, Inc. | ||||||||
First Lien, | 2,376 | 2,357 | ||||||
Second Lien, | 685 | 682 | ||||||
Telesat Canada, Inc. Tranche B-2, | 3,734 | 3,677 | ||||||
West Corp. Tranche B-10, | 2,203 | 2,159 | ||||||
Windstream Corp. Tranche B-4, | 3,212 | 3,180 | ||||||
XO Communications LLC | 4,711 | 4,670 | ||||||
Zayo Group LLC | 2,664 | 2,631 | ||||||
|
| |||||||
| 42,107 | ||||||||
|
| |||||||
| Utilities—2.8% | ||||||||
Atlantic Power LP | 1,166 | 1,158 | ||||||
Calpine Construction Finance Co. LP | ||||||||
Tranche B-1, | 5,099 | 4,944 | ||||||
Tranche B-2, | 3,857 | 3,760 | ||||||
Energy Future Holdings | 2,000 | 1,994 | ||||||
ExGen Renewables I LLC | 1,059 | 1,070 | ||||||
NRG Energy, Inc. | 5,347 | 5,254 | ||||||
Texas Competitive Electric Holdings Co. LLC | 9,165 | 6,807 | ||||||
TPF II LC, LLC | 1,385 | 1,384 | ||||||
|
| |||||||
| 26,371 | ||||||||
| TOTAL LOAN AGREEMENTS (Identified Cost $920,926) | 911,524 | |||||||
| TOTAL LONG-TERM INVESTMENTS—106.2% | ||||||||
| (Identified Cost $996,630) | 987,460 | (8) | ||||||
| TOTAL INVESTMENTS—106.2% (Identified Cost $996,630) | 987,460 | (1) | ||||||
Other assets and liabilities, net—(6.2)% |
| (57,864 | ) | |||||
|
| |||||||
| NET ASSETS—100.0% | $ | 929,596 | ||||||
|
| |||||||
Abbreviations:
| PIK | Payment-in-Kind Security |
Footnote Legend:
| (1) | Federal Income Tax Information: For tax information at September 30, 2014, see Note 10 Federal Income Tax Information in the Notes to Financial Statements. |
| (2) | Variable or step coupon security; interest rate shown reflects the rate in effect at September 30, 2014. |
| (3) | Security exempt from registration under Rule 144A of the Securities Act of 1933. These securities may be resold in transactions exempt from registration, normally to qualified institutional buyers. At September 30, 2014, these securities amounted to a value of $38,657 or 4.2% of net assets. |
| (4) | 100% of the income received was in cash. |
| (5) | This loan will settle after September 30, 2014, at which time the interest rate, based on the London Interbank Offered Rate (“LIBOR”) and the agreed upon spread on trade date, will be reflected. |
| (6) | Illiquid security. |
| (7) | Security in default, interest payments are being received during the bankruptcy proceedings. |
| (8) | All or a portion of the Fund’s assets has been segregated as collateral for delay delivery settlements and leverage. |
Foreign Currencies:
| BRL | Brazilian Real |
| Country Weightings (Unaudited)† | ||||
United States | 90 | % | ||
Luxembourg | 3 | |||
Canada | 2 | |||
Australia | 1 | |||
Bermuda | 1 | |||
Singapore | 1 | |||
United Kingdom | 1 | |||
Other | 1 | |||
Total | 100 | % | ||
† % of total investments as of September 30, 2014 |
| |||
Security abbreviation definitions are located under the Key Investment Terms starting on page 4.
See Notes to Financial Statements
51
Table of Contents
VIRTUS SENIOR FLOATING RATE FUND
SCHEDULE OF INVESTMENTS (Continued)
SEPTEMBER 30, 2014
($ reported in thousands)
The following table provides a summary of inputs used to value the Fund’s investments as of September 30, 2014 (See Security Valuation Note 2A in the Notes to Financial Statements):
| Total Value at September 30, 2014 | Level 2 Significant Observable Inputs | |||||||
Debt Securities: | ||||||||
Asset-Backed Securities | $ | 1,340 | $ | 1,340 | ||||
Corporate Bonds | 73,072 | 73,072 | ||||||
Loan Agreements | 911,524 | 911,524 | ||||||
Mortgage-Backed Securities | 1,524 | 1,524 | ||||||
|
|
|
| |||||
Total Investments | $ | 987,460 | $ | 987,460 | ||||
|
|
|
| |||||
There are no Level 1 (quoted prices) or Level 3 (significant unobservable inputs) priced securities.
There were no transfers between Level 1 and Level 2 for the period.
The following is a reconciliation of assets of the Fund for Level 3 investments for which significant unobservable inputs were used to determine fair value.
| Total | Asset-Backed Securities | Common Stocks | ||||||||||
Investments in Securities | ||||||||||||
Balance as of September 30, 2013: | $ | 793 | $ | 793 | $ | — | (c) | |||||
Accrued discount/(premium) | — | — | — | |||||||||
Realized gain (loss) | 15 | 15 | — | |||||||||
Change in unrealized appreciation (depreciation) | 6 | 6 | — | |||||||||
Purchases | — | — | ||||||||||
Sales(b) | (814 | ) | (814 | ) | — | (c) | ||||||
Transfers into Level 3(a) | — | — | — | |||||||||
Transfers from Level 3(a) | — | — | — | |||||||||
|
|
|
|
|
| |||||||
Balance as of September 30, 2014: | $ | — | $ | — | $ | — | ||||||
|
|
|
|
|
| |||||||
| (a) | “Transfers into and/or from” represent the ending value as of September 30, 2014, for any investment security where a change in the pricing level occurred from the beginning to the end of the period. |
| (b) | Includes paydowns on securities. |
| (c) | Includes internally fair valued security priced at zero ($0). |
See Notes to Financial Statements
52
Table of Contents
SCHEDULE OF INVESTMENTS
SEPTEMBER 30, 2014
($ reported in thousands)
| SHARES | VALUE | |||||||
| COMMON STOCKS—99.8% | ||||||||
| Consumer Discretionary—35.8% | ||||||||
Amazon.com, Inc.(2) | 2,546 | $ | 821 | |||||
AMC Networks, Inc. Class A(2) | 13,965 | 816 | ||||||
American Eagle Outfitters, Inc. | 56,219 | 816 | ||||||
Apollo Group, Inc. Class A(2) | 32,479 | 817 | ||||||
AutoNation, Inc.(2) | 16,826 | 847 | ||||||
Buckle, Inc. (The)(3) | 18,180 | 825 | ||||||
Cabela’s, Inc.(2) | 13,949 | 822 | ||||||
Cablevision Systems Corp. Class A | 45,110 | 790 | ||||||
Carnival Corp. | 20,339 | 817 | ||||||
CBS Corp. Class B | 14,969 | 801 | ||||||
Choice Hotels International, Inc. | 15,882 | 826 | ||||||
Columbia Sportswear Co. | 22,334 | 799 | ||||||
Comcast Corp. Class A | 14,986 | 806 | ||||||
Dick’s Sporting Goods, Inc. | 18,859 | 828 | ||||||
Dillard’s, Inc. Class A | 7,389 | 805 | ||||||
Discovery Communications, Inc.(2) | 21,869 | 815 | ||||||
DISH Network Corp. | 13,087 | 845 | ||||||
DSW, Inc. Class A | 27,439 | 826 | ||||||
Expedia, Inc. | 9,812 | 860 | ||||||
Family Dollar Stores, Inc. | 10,554 | 815 | ||||||
Federal-Mogul Corp.(2) | 52,171 | 776 | ||||||
Fossil Group, Inc.(2) | 8,585 | 806 | ||||||
Gap, Inc. (The) | 19,264 | 803 | ||||||
Garmin Ltd.(3) | 16,244 | 845 | ||||||
Horton (D.R.), Inc. | 38,725 | 795 | ||||||
Hyatt Hotels Corp. Class A(2) | 13,361 | 809 | ||||||
International Speedway Corp. Class A | 26,005 | 823 | ||||||
L Brands, Inc. | 12,441 | 833 | ||||||
Lands’ End, Inc.(2)(3) | 19,259 | 792 | ||||||
Las Vegas Sands Corp. | 13,498 | 840 | ||||||
Lennar Corp. Class A | 20,566 | 799 | ||||||
Liberty Global plc Class C(2) | 19,617 | 805 | ||||||
Liberty Interactive Corp. | 29,559 | 843 | ||||||
Liberty Media Corp.(2) | 17,565 | 825 | ||||||
Liberty Tripadvisor Holdings, Class A(2) | 24,340 | 825 | ||||||
Liberty Ventures Class A(2) | 22,321 | 847 | ||||||
Madison Square Garden Co. (The)(2) | 12,287 | 812 | ||||||
Marriott International, Inc. | 11,623 | 812 | ||||||
Marriott Vacations Worldwide Corp.(2) | 13,095 | 830 | ||||||
MGM Resorts International(2) | 36,213 | 825 | ||||||
Mohawk Industries, Inc.(2) | 6,051 | 816 | ||||||
Morningstar, Inc. | 12,164 | 826 | ||||||
News Corp. Class A(2) | 48,624 | 795 | ||||||
NIKE, Inc. Class B | 10,291 | 918 | ||||||
Nordstrom, Inc. | 12,168 | 832 | ||||||
Papa John’s International, Inc. | 20,360 | 814 | ||||||
Penske Automotive Group, Inc. | 19,894 | 807 | ||||||
Ralph Lauren Corp. | 4,847 | 798 | ||||||
Sears Holdings Corp.(2)(3) | 29,727 | 750 | ||||||
Sears Hometown and Outlet Stores, Inc.(2)(3) | 52,239 | 810 | ||||||
| SHARES | VALUE | |||||||
| Consumer Discretionary—continued | ||||||||
Starbucks Corp. | 11,147 | $ | 841 | |||||
Starz – Liberty Capital Class A(2) | 27,848 | 921 | ||||||
Tesla Motors, Inc.(2) | 3,291 | 799 | ||||||
Twenty-First Century Fox, Inc. Class A | 24,098 | 826 | ||||||
Under Armour, Inc. | 12,321 | 851 | ||||||
Urban Outfitters, Inc.(2) | 22,060 | 810 | ||||||
Viacom, Inc. Class B | 10,631 | 818 | ||||||
Wendy’s Co. (The) | 100,706 | 832 | ||||||
Wynn Resorts Ltd. | 4,502 | 842 | ||||||
|
| |||||||
| 48,448 | ||||||||
|
| |||||||
| Consumer Staples—4.9% | ||||||||
Boston Beer Co., Inc. (The) Class A(2) | 3,791 | 841 | ||||||
Brown-Forman Corp. Class B | 9,050 | 817 | ||||||
Estee Lauder Cos., Inc. (The) Class A | 11,064 | 827 | ||||||
Harbinger Group, Inc.(2) | 63,509 | 833 | ||||||
Lancaster Colony Corp. | 9,632 | 821 | ||||||
Monster Beverage Corp.(2) | 9,091 | 833 | ||||||
PriceSmart, Inc. | 9,555 | 818 | ||||||
Tootsie Roll Industries, Inc. | 29,708 | 832 | ||||||
|
| |||||||
| 6,622 | ||||||||
|
| |||||||
| Energy—6.5% | ||||||||
Chesapeake Energy Corp. | 34,001 | 782 | ||||||
Continental Resources, | 12,345 | 821 | ||||||
CVR Energy, Inc.(3) | 18,070 | 808 | ||||||
Exterran Holdings, Inc. | 18,624 | 825 | ||||||
Halcon Resources Corp.(2)(3) | 196,760 | 779 | ||||||
Hess Corp. | 8,576 | 809 | ||||||
RPC, Inc. | 38,534 | 846 | ||||||
Talisman Energy, Inc. | 88,704 | 767 | ||||||
Transocean Ltd.(3) | 24,662 | 788 | ||||||
W&T Offshore, Inc. | 67,956 | 748 | ||||||
Western Refining, Inc. | 19,740 | 829 | ||||||
|
| |||||||
| 8,802 | ||||||||
|
| |||||||
| Financials—18.2% | ||||||||
Altisource Portfolio Solutions SA(2)(3) | 8,170 | 824 | ||||||
American Financial Group, Inc. | 14,150 | 819 | ||||||
AmTrust Financial Services, Inc. | 21,400 | 852 | ||||||
Berkley (W.R.) Corp. | 17,317 | 828 | ||||||
Berkshire Hathaway, Inc. Class B(2) | 5,939 | 820 | ||||||
BOK Financial Corp. | 12,193 | 811 | ||||||
Boston Properties, Inc. | 7,129 | 825 | ||||||
Brown & Brown, Inc. | 25,418 | 817 | ||||||
Charles Schwab Corp. (The) | 27,593 | 811 | ||||||
Credit Acceptance Corp.(2) | 6,610 | 833 | ||||||
Equity Lifestyle Properties, Inc. | 19,520 | 827 | ||||||
Equity Residential | 13,276 | 818 | ||||||
Erie Indemnity Co. Class A | 10,749 | 815 | ||||||
First Citizens BancShares, Inc. Class A | 3,829 | 829 | ||||||
Franklin Resources, Inc. | 15,072 | 823 | ||||||
| SHARES | VALUE | |||||||
| Financials—continued | ||||||||
Gaming and Leisure Properties, Inc. | 25,902 | $ | 800 | |||||
Greenlight Capital Re Ltd. Class A(2) | 25,184 | 816 | ||||||
Hilltop Holdings, Inc.(2) | 40,746 | 817 | ||||||
Host Hotels & Resorts, Inc. | 38,902 | 830 | ||||||
Howard Hughes Corp. | 5,540 | 831 | ||||||
Leucadia National Corp. | 33,396 | 796 | ||||||
Loews Corp. | 19,598 | 816 | ||||||
Mercury General Corp. | 16,928 | 826 | ||||||
Ocwen Financial Corp.(2) | 30,354 | 795 | ||||||
Raymond James Financial, Inc. | 15,140 | 811 | ||||||
Simon Property Group, Inc. | 5,015 | 825 | ||||||
Taubman Centers, Inc. | 11,255 | 822 | ||||||
Vornado Realty Trust | 8,215 | 821 | ||||||
Washington Prime Group, Inc. | 47,951 | 838 | ||||||
WisdomTree Investments, Inc.(2)(3) | 72,988 | 832 | ||||||
|
| |||||||
| 24,628 | ||||||||
|
| |||||||
| Health Care—4.9% | ||||||||
Akorn, Inc.(2) | 23,011 | 835 | ||||||
Bruker Corp.(2) | 43,262 | 801 | ||||||
Cerner Corp.(2) | 14,093 | 839 | ||||||
Halozyme Therapeutics, | 84,283 | 767 | ||||||
Hologic, Inc.(2) | 33,815 | 823 | ||||||
MannKind Corp.(2)(3) | 136,771 | 808 | ||||||
Opko Health, Inc.(2)(3) | 99,885 | 850 | ||||||
Pharmacyclics, Inc.(2) | 7,003 | 822 | ||||||
|
| |||||||
| 6,545 | ||||||||
|
| |||||||
| Industrials—10.2% | ||||||||
Air Lease Corp. | 24,248 | 788 | ||||||
American Railcar Industries, Inc.(3) | 10,879 | 804 | ||||||
Cintas Corp. | 12,407 | 876 | ||||||
Colfax Corp.(2) | 13,675 | 779 | ||||||
Covanta Holding Corp. | 38,348 | 814 | ||||||
Danaher Corp. | 10,653 | 809 | ||||||
FedEx Corp. | 5,216 | 842 | ||||||
Grainger (W.W.), Inc. | 3,270 | 823 | ||||||
Heartland Express, Inc. | 34,413 | 825 | ||||||
Illinois Tool Works, Inc. | 9,505 | 802 | ||||||
MasTec, Inc.(2) | 26,371 | 807 | ||||||
MSC Industrial Direct Co., Inc. Class A | 9,409 | 804 | ||||||
Navistar International | 23,382 | 770 | ||||||
Rollins, Inc. | 28,142 | 824 | ||||||
Timken Co. (The) | 18,919 | 802 | ||||||
Werner Enterprises, Inc. | 33,139 | 835 | ||||||
XPO Logistics, Inc.(2)(3) | 21,278 | 802 | ||||||
|
| |||||||
| 13,806 | ||||||||
|
| |||||||
| Information Technology—14.0% | ||||||||
Amkor Technology, Inc.(2) | 92,044 | 774 | ||||||
Anixter International, Inc. | 9,596 | 814 | ||||||
Broadcom Corp. Class A | 20,596 | 833 | ||||||
eBay, Inc.(2) | 15,618 | 884 | ||||||
EchoStar Corp. Class A(2) | 16,446 | 802 | ||||||
See Notes to Financial Statements
53
Table of Contents
VIRTUS WEALTH MASTERS FUND
SCHEDULE OF INVESTMENTS (Continued)
SEPTEMBER 30, 2014
($ reported in thousands)
| SHARES | VALUE | |||||||
| Information Technology—continued | ||||||||
Google, Inc. Class C(2) | 1,417 | $ | 818 | |||||
IAC/InterActiveCorp. | 12,361 | 815 | ||||||
Intuit, Inc. | 9,650 | 846 | ||||||
Marvell Technology Group Ltd. | 61,448 | 828 | ||||||
Mentor Graphics Corp. | 38,397 | 787 | ||||||
National Instruments Corp. | 26,398 | 817 | ||||||
Nuance Communications, Inc.(2) | 53,727 | 828 | ||||||
Oracle Corp. | 21,230 | 813 | ||||||
Paychex, Inc. | 19,420 | 858 | ||||||
Pegasystems, Inc. | 41,469 | 793 | ||||||
QUALCOMM, Inc. | 10,866 | 812 | ||||||
Rackspace Hosting, Inc.(2) | 26,409 | 860 | ||||||
RealPage, Inc.(2) | 53,809 | 834 | ||||||
Salesforce.com, Inc.(2) | 14,503 | 834 | ||||||
SS&C Technologies Holdings, Inc.(2) | 18,592 | 816 | ||||||
Syntel Co.(2) | 9,516 | 837 | ||||||
TeleTech Holdings, Inc.(2) | 32,879 | 808 | ||||||
Yahoo!, Inc.(2) | 21,113 | 860 | ||||||
|
| |||||||
| 18,971 | ||||||||
|
| |||||||
| Materials—5.3% | ||||||||
Airgas, Inc. | 7,365 | 815 | ||||||
Huntsman Corp. | 30,473 | 792 | ||||||
| SHARES | VALUE | |||||||
| Materials—continued | ||||||||
LyondellBasell Industries N.V. Class A | 7,468 | $ | 812 | |||||
NewMarket Corp. | 2,089 | 796 | ||||||
Novagold Resources, Inc.(2)(3) | 259,697 | 787 | ||||||
Scotts Miracle-Gro Co. (The) Class A | 14,880 | 818 | ||||||
Silgan Holdings, Inc. | 17,404 | 818 | ||||||
Timkensteel Corp. | 17,174 | 798 | ||||||
Westlake Chemical Corp. | 8,971 | 777 | ||||||
|
| |||||||
| 7,213 | ||||||||
| TOTAL COMMON STOCKS (Identified Cost $126,960) | 135,035 | |||||||
| TOTAL LONG-TERM INVESTMENTS—99.9% | ||||||||
| (Identified Cost $126,960) | 135,035 | |||||||
| SHORT-TERM INVESTMENTS—0.3% | ||||||||
| Money Market Mutual Funds—0.3% | ||||||||
Fidelity Money Market Portfolio – Institutional Shares (Seven-day effective yield 0.080%) | 428,774 | 429 | ||||||
| TOTAL SHORT-TERM INVESTMENTS (Identified Cost $429) | 429 | |||||||
| SHARES | VALUE | |||||||
| SECURITIES LENDING COLLATERAL—8.3% | ||||||||
INVESCO Trust Short-Term Investments Liquid Assets Portfolio (The) Institutional Shares (seven-day effective yield 0.060%)(4) | 11,155,298 | $ | 11,155 | |||||
| TOTAL SECURITIES LENDING COLLATERAL | ||||||||
| (Identified Cost $11,155) | 11,155 | |||||||
| TOTAL INVESTMENTS—108.4% (Identified Cost $138,544) | 146,619 | (1) | ||||||
Other assets and liabilities, net—(8.4)% |
| (11,309 | ) | |||||
|
| |||||||
| NET ASSETS—100.0% | $ | 135,310 | ||||||
|
| |||||||
Footnote Legend:
| (1) | Federal Income Tax Information: For tax information at September 30, 2014, see Note 10 Federal Income Tax Information in the Notes to Financial Statements. |
| (2) | Non-income producing. |
| (3) | All or a portion of security is on loan. |
| (4) | Represents security purchased with cash collateral received for securities on loan. |
The following table provides a summary of inputs used to value the Fund’s investments as of September 30, 2014 (See Security Valuation Note 2A in the Notes to Financial Statements):
| Total Value at September 30, 2014 | Level 1 Quoted Prices | |||||||
Equity Securities: | ||||||||
Common Stocks | $ | 135,035 | $ | 135,035 | ||||
Securities Lending Collateral | 11,155 | 11,155 | ||||||
Short-Term Investments | 429 | 429 | ||||||
|
|
|
| |||||
Total Investments | $ | 146,619 | $ | 146,619 | ||||
|
|
|
| |||||
There are no Level 2 (significant observable inputs) or Level 3 (significant unobservable inputs) priced securities.
There were no transfers between Level 1 and Level 2 for the period.
See Notes to Financial Statements
54
Table of Contents
VIRTUS OPPORTUNITIES TRUST
STATEMENTS OF ASSETS AND LIABILITIES
SEPTEMBER 30, 2014
(Reported in thousands except shares and per share amounts)
|
|
|
|
|
|
|
| |||||||||
| Bond Fund | CA Tax-Exempt Bond | High Yield Fund | Low Volatility Equity Fund | |||||||||||||
| Assets | ||||||||||||||||
Investment in securities at value(1) | $ | 76,205 | $ | 32,451 | $ | 81,832 | $ | 2,276 | ||||||||
Cash | 51 | 396 | 118 | 3 | ||||||||||||
Deposits with prime broker for options written | — | — | — | 2 | ||||||||||||
Receivables | ||||||||||||||||
Investment securities sold | 292 | — | 298 | — | ||||||||||||
Fund shares sold | 240 | 2 | 28 | 1 | ||||||||||||
Receivable from adviser | — | 5 | — | 36 | ||||||||||||
Dividends and interest receivable | 819 | 402 | 1,307 | — | (4) | |||||||||||
Tax reclaims | — | — | — | (4) | — | |||||||||||
Prepaid expenses | 24 | 13 | 29 | 18 | ||||||||||||
Prepaid trustee retainer | — | (4) | — | (4) | — | (4) | — | (4) | ||||||||
|
|
|
|
|
|
|
| |||||||||
Total assets | 77,631 | 33,269 | 83,612 | 2,336 | ||||||||||||
|
|
|
|
|
|
|
| |||||||||
| Liabilities | ||||||||||||||||
Written options outstanding at value (Note 6)(2) | — | — | — | — | (4) | |||||||||||
Payables | ||||||||||||||||
Fund shares repurchased | 244 | 12 | 71 | — | (4) | |||||||||||
Investment securities purchased | 636 | — | 2,034 | — | ||||||||||||
Dividend distributions | 37 | 30 | 71 | — | ||||||||||||
Investment advisory fees | 13 | — | 31 | — | ||||||||||||
Distribution and service fees | 17 | 4 | 18 | — | (4) | |||||||||||
Administration fees | 8 | 4 | 9 | 1 | ||||||||||||
Transfer agent fees and expenses | 19 | 4 | 27 | — | (4) | |||||||||||
Trustees’ fees and expenses | — | (4) | — | (4) | — | (4) | — | (4) | ||||||||
Professional fees | 31 | 31 | 37 | 19 | ||||||||||||
Other accrued expenses | 7 | 2 | 8 | 1 | ||||||||||||
|
|
|
|
|
|
|
| |||||||||
Total liabilities | 1,012 | 87 | 2,306 | 21 | ||||||||||||
|
|
|
|
|
|
|
| |||||||||
| Net Assets | $ | 76,619 | $ | 33,182 | $ | 81,306 | $ | 2,315 | ||||||||
|
|
|
|
|
|
|
| |||||||||
| Net Assets Consist of: | ||||||||||||||||
Capital paid in on shares of beneficial interest | $ | 79,316 | $ | 29,817 | $ | 103,992 | $ | 2,028 | ||||||||
Accumulated undistributed net investment income (loss) | (4 | ) | 46 | 113 | 7 | |||||||||||
Accumulated undistributed net realized gain (loss) | (3,150 | ) | 1,085 | (22,910 | ) | (52 | ) | |||||||||
Net unrealized appreciation (depreciation) on investments | 457 | 2,234 | 111 | 332 | ||||||||||||
|
|
|
|
|
|
|
| |||||||||
| Net Assets | $ | 76,619 | $ | 33,182 | $ | 81,306 | $ | 2,315 | ||||||||
|
|
|
|
|
|
|
| |||||||||
| Class A | ||||||||||||||||
Net asset value (net assets/shares outstanding) per share | $ | 11.43 | $ | 12.51 | $ | 4.35 | $ | 11.71 | ||||||||
Maximum offering price per share NAV/(1-2.75%) | $ | — | $ | 12.86 | $ | — | $ | — | ||||||||
Maximum offering price per share NAV/(1-3.75%) | $ | 11.87 | $ | — | $ | 4.52 | $ | — | ||||||||
Maximum offering price per share NAV/(1-5.75%) | $ | — | $ | — | $ | — | $ | 12.42 | ||||||||
Shares of beneficial interest outstanding, no par value(3), unlimited authorization | 4,691,497 | 1,736,994 | 16,342,912 | 41,409 | ||||||||||||
Net Assets | $ | 53,603 | $ | 21,729 | $ | 71,042 | $ | 485 | ||||||||
| Class B | ||||||||||||||||
Net asset value (net assets/shares outstanding) and offering price per share | $ | 11.14 | $ | — | $ | 4.24 | $ | — | ||||||||
Shares of beneficial interest outstanding, no par value(3), unlimited authorization | 20,904 | — | 24,984 | — | ||||||||||||
Net Assets | $ | 233 | $ | — | $ | 106 | $ | — | ||||||||
| Class C | ||||||||||||||||
Net asset value (net assets/shares outstanding) and offering price per share | $ | 11.19 | $ | — | $ | 4.28 | $ | 11.64 | ||||||||
Shares of beneficial interest outstanding, no par value(3), unlimited authorization | 564,590 | — | 943,123 | 25,030 | ||||||||||||
Net Assets | $ | 6,315 | $ | — | $ | 4,038 | $ | 291 | ||||||||
| Class I | ||||||||||||||||
Net asset value (net assets/shares outstanding) and offering price per share | $ | 11.59 | $ | 12.49 | $ | 4.35 | $ | 11.73 | ||||||||
Shares of beneficial interest outstanding, no par value(3), unlimited authorization | 1,420,475 | 917,294 | 1,408,213 | 131,148 | ||||||||||||
Net Assets | $ | 16,468 | $ | 11,453 | $ | 6,120 | $ | 1,539 | ||||||||
(1) Investment in securities at cost | $ | 75,746 | $ | 30,217 | $ | 81,721 | $ | 1,945 | ||||||||
(2) Written options premiums received | — | — | — | (1 | ) | |||||||||||
(3) All Funds with the exception of the Bond Fund have no par value. Bond Fund has a par value of $1.00. | ||||||||||||||||
(4) Amount less than $500. | ||||||||||||||||
See Notes to Financial Statements
55
Table of Contents
VIRTUS OPPORTUNITIES TRUST
STATEMENTS OF ASSETS AND LIABILITIES (Continued)
SEPTEMBER 30, 2014
(Reported in thousands except shares and per share amounts)
|
|
|
|
|
| |||||||
| Multi-Sector Intermediate Bond Fund | Senior Floating Rate Fund | Wealth Masters Fund | ||||||||||
| Assets | ||||||||||||
Investment in securities at value(1)(3) | $ | 363,509 | $ | 987,460 | $ | 146,619 | ||||||
Foreign currency at value(2) | — | (4) | — | — | ||||||||
Cash | 435 | — | — | |||||||||
Receivables | ||||||||||||
Investment securities sold | 4,270 | 45,986 | 7,956 | |||||||||
Fund shares sold | 738 | 1,431 | 595 | |||||||||
Dividends and interest receivable | 4,903 | 4,546 | 122 | |||||||||
Tax reclaims | 1 | — | — | |||||||||
Prepaid expenses | 37 | 42 | 36 | |||||||||
Prepaid trustee retainer | 2 | 6 | 1 | |||||||||
|
|
|
|
|
| |||||||
Total assets | 373,895 | 1,039,471 | 155,329 | |||||||||
|
|
|
|
|
| |||||||
| Liabilities | ||||||||||||
Cash overdraft | — | 1,592 | — | |||||||||
Payables | ||||||||||||
Fund shares repurchased | 561 | 5,670 | 98 | |||||||||
Investment securities purchased | 7,431 | 43,882 | 8,573 | |||||||||
Borrowings (Note 12) | — | 57,000 | — | |||||||||
Collateral on securities loaned | — | — | 11,155 | |||||||||
Dividend distributions | 268 | 556 | — | |||||||||
Investment advisory fees | 166 | 468 | 69 | |||||||||
Distribution and service fees | 108 | 212 | 37 | |||||||||
Administration fees | 37 | 95 | 14 | |||||||||
Transfer agent fees and expenses | 108 | 248 | 26 | |||||||||
Trustees’ fees and expenses | 1 | 1 | — | (4) | ||||||||
Professional fees | 37 | 38 | 28 | |||||||||
Interest payable on line of credit | — | 12 | — | |||||||||
Other accrued expenses | 25 | 101 | 19 | |||||||||
|
|
|
|
|
| |||||||
Total liabilities | 8,742 | 109,875 | 20,019 | |||||||||
|
|
|
|
|
| |||||||
| Net Assets | $ | 365,153 | $ | 929,596 | $ | 135,310 | ||||||
|
|
|
|
|
| |||||||
| Net Assets Consist of: | ||||||||||||
Capital paid in on shares of beneficial interest | $ | 362,654 | $ | 936,363 | $ | 127,153 | ||||||
Accumulated undistributed net investment income (loss) | (55 | ) | 350 | 152 | ||||||||
Accumulated undistributed net realized gain (loss) | 4,590 | 2,053 | (70 | ) | ||||||||
Net unrealized appreciation (depreciation) on investments | (2,036 | ) | (9,170 | ) | 8,075 | |||||||
|
|
|
|
|
| |||||||
| Net Assets | $ | 365,153 | $ | 929,596 | $ | 135,310 | ||||||
|
|
|
|
|
| |||||||
| Class A | ||||||||||||
Net asset value (net assets/shares outstanding) per share | $ | 10.70 | $ | 9.72 | $ | 14.50 | ||||||
Maximum offering price per share NAV/(1–2.75%) | $ | — | $ | 9.99 | $ | — | ||||||
Maximum offering price per share NAV/(1–3.75%) | $ | 11.12 | $ | — | $ | — | ||||||
Maximum offering price per share NAV/(1–5.75%) | $ | — | $ | — | $ | 15.38 | ||||||
Shares of beneficial interest outstanding, no par value, unlimited authorization | 11,160,277 | 30,314,994 | 3,852,722 | |||||||||
Net Assets | $ | 119,423 | $ | 294,617 | $ | 55,881 | ||||||
| Class B | ||||||||||||
Net asset value (net assets/shares outstanding) and offering price per share | $ | 10.67 | $ | — | $ | — | ||||||
Shares of beneficial interest outstanding, no par value, unlimited authorization | 502,144 | — | — | |||||||||
Net Assets | $ | 5,360 | $ | — | $ | — | ||||||
| Class C | ||||||||||||
Net asset value (net assets/shares outstanding) and offering price per share | $ | 10.79 | $ | 9.73 | $ | 14.32 | ||||||
Shares of beneficial interest outstanding, no par value, unlimited authorization | 8,903,051 | 18,239,547 | 2,131,293 | |||||||||
Net Assets | $ | 96,072 | $ | 177,485 | $ | 30,511 | ||||||
| Class I | ||||||||||||
Net asset value (net assets/shares outstanding) and offering price per share | $ | 10.71 | $ | 9.71 | $ | 14.56 | ||||||
Shares of beneficial interest outstanding, no par value, unlimited authorization | 13,478,403 | 47,112,468 | 3,360,626 | |||||||||
Net Assets | $ | 144,298 | $ | 457,494 | $ | 48,918 | ||||||
(1) Investment in securities at cost | $ | 365,519 | $ | 996,630 | $ | 138,544 | ||||||
(2) Foreign currency at cost | — | (4) | — | — | ||||||||
(3) Market value of securities on loan | — | — | 10,623 | |||||||||
(4) Amount less than $500. | ||||||||||||
See Notes to Financial Statements
56
Table of Contents
VIRTUS OPPORTUNITIES TRUST
YEAR ENDED SEPTEMBER 30, 2014
($ reported in thousands)
|
|
|
|
|
|
|
| |||||||||
| Bond Fund | CA Tax-Exempt Bond | High Yield Fund | Low Volatility Equity Fund | |||||||||||||
| Investment Income | ||||||||||||||||
Dividends | $ | 35 | $ | — | $ | 86 | $ | 40 | ||||||||
Interest | 3,926 | 1,808 | 5,989 | — | ||||||||||||
Foreign taxes withheld | (3 | ) | — | — | — | |||||||||||
|
|
|
|
|
|
|
| |||||||||
Total investment income | 3,958 | 1,808 | 6,075 | 40 | ||||||||||||
|
|
|
|
|
|
|
| |||||||||
| Expenses | ||||||||||||||||
Investment advisory fees | 361 | 188 | 590 | 19 | ||||||||||||
Service fees, Class A | 140 | 56 | 203 | 1 | ||||||||||||
Distribution and service fees, Class B | 3 | — | 1 | — | ||||||||||||
Distribution and service fees, Class C | 63 | — | 36 | 2 | ||||||||||||
Administration fees | 97 | 51 | 110 | 3 | ||||||||||||
Transfer agent fees and expenses | 106 | 29 | 138 | 1 | ||||||||||||
Registration fees | 54 | 29 | 57 | 56 | ||||||||||||
Printing fees and expenses | 9 | 4 | 11 | 1 | ||||||||||||
Custodian fees | 6 | 2 | 7 | 1 | ||||||||||||
Professional fees | 32 | 45 | 38 | 23 | ||||||||||||
Trustees’ fees and expenses | 3 | 2 | 4 | — | (1) | |||||||||||
Miscellaneous expenses | 11 | 3 | 11 | 2 | ||||||||||||
|
|
|
|
|
|
|
| |||||||||
Total expenses | 885 | 409 | 1,206 | 109 | ||||||||||||
Less expenses reimbursed and/or waived by investment adviser | (197 | ) | (103 | ) | (150 | ) | (81 | ) | ||||||||
|
|
|
|
|
|
|
| |||||||||
Net expenses | 688 | 306 | 1,056 | 28 | ||||||||||||
|
|
|
|
|
|
|
| |||||||||
Net investment income (loss) | 3,270 | 1,502 | 5,019 | 12 | ||||||||||||
|
|
|
|
|
|
|
| |||||||||
| Net Realized and Unrealized Gain (Loss) on Investments | ||||||||||||||||
Net realized gain (loss) on investments | 387 | 1,095 | 2,459 | (27 | ) | |||||||||||
Net realized gain (loss) on foreign currency transactions | (1 | ) | — | (3 | ) | — | ||||||||||
Net realized gain (loss) on written options | — | — | — | (17 | ) | |||||||||||
Net change in unrealized appreciation (depreciation) on investments | 1,223 | 1,137 | (680 | ) | 299 | |||||||||||
Net change in unrealized appreciation (depreciation) on foreign currency translation | (2 | ) | — | — | (1) | — | ||||||||||
Net change in unrealized appreciation (depreciation) on written options | — | — | — | (2 | ) | |||||||||||
|
|
|
|
|
|
|
| |||||||||
| Net gain (loss) on investments | 1,607 | 2,232 | 1,776 | 253 | ||||||||||||
|
|
|
|
|
|
|
| |||||||||
Net increase (decrease) in net assets resulting from operations | $ | 4,877 | $ | 3,734 | $ | 6,795 | $ | 265 | ||||||||
|
|
|
|
|
|
|
| |||||||||
(1) Amount is less than $500.
See Notes to Financial Statements
57
Table of Contents
VIRTUS OPPORTUNITIES TRUST
STATEMENTS OF OPERATIONS (Continued)
YEAR ENDED SEPTEMBER 30, 2014
($ reported in thousands)
|
|
|
|
|
| |||||||
| Multi-Sector Intermediate Bond Fund | Senior Floating Rate Fund | Wealth Masters Fund | ||||||||||
| Investment Income | ||||||||||||
Dividends | $ | 253 | $ | 61 | $ | 1,481 | ||||||
Interest | 21,991 | 50,537 | — | |||||||||
Security lending | — | — | 163 | |||||||||
Foreign taxes withheld | (16 | ) | — | (5 | ) | |||||||
|
|
|
|
|
| |||||||
Total investment income | 22,228 | 50,598 | 1,639 | |||||||||
|
|
|
|
|
| |||||||
| Expenses | ||||||||||||
Investment advisory fees | 2,002 | 6,086 | 903 | |||||||||
Service fees, Class A | 413 | 995 | 94 | |||||||||
Distribution and service fees, Class B | 64 | — | — | |||||||||
Distribution and service fees, Class C | 981 | 1,910 | 168 | |||||||||
Administration fees | 438 | 1,223 | 128 | |||||||||
Transfer agent fees and expenses | 453 | 1,116 | 126 | |||||||||
Interest expense and fees | — | 366 | — | |||||||||
Registration fees | 83 | 117 | 70 | |||||||||
Printing fees and expenses | 35 | 88 | 11 | |||||||||
Custodian fees | 23 | 25 | 7 | |||||||||
Professional fees | 41 | 46 | 29 | |||||||||
Trustees’ fees and expenses | 15 | 41 | 3 | |||||||||
Miscellaneous expenses | 34 | 360 | 5 | |||||||||
|
|
|
|
|
| |||||||
Total expenses | 4,582 | 12,373 | 1,544 | |||||||||
Less expenses reimbursed and/or waived by investment adviser | — | — | (8 | ) | ||||||||
|
|
|
|
|
| |||||||
Total expenses | 4,582 | 12,373 | 1,536 | |||||||||
|
|
|
|
|
| |||||||
Net investment income (loss) | 17,646 | 38,225 | 103 | |||||||||
|
|
|
|
|
| |||||||
| Net Realized and Unrealized Gain (Loss) on Investments | ||||||||||||
Net realized gain (loss) on investments | 4,320 | 2,056 | 51 | |||||||||
Net realized gain (loss) on foreign currency transactions | (39 | ) | (33 | ) | — | |||||||
Net change in unrealized appreciation (depreciation) on investments | (587 | ) | (9,946 | ) | 7,065 | |||||||
Net change in unrealized appreciation (depreciation) on foreign currency translation | (27 | ) | — | (1) | — | |||||||
|
|
|
|
|
| |||||||
| Net gain (loss) on investments | 3,667 | (7,923 | ) | 7,116 | ||||||||
|
|
|
|
|
| |||||||
Net increase (decrease) in net assets resulting from operations | $ | 21,313 | $ | 30,302 | $ | 7,219 | ||||||
|
|
|
|
|
| |||||||
(1) Amount is less than $500.
See Notes to Financial Statements
58
Table of Contents
VIRTUS OPPORTUNITIES TRUST
STATEMENTS OF CHANGES IN NET ASSETS
($ reported in thousands)
|
|
|
| |||||||||||||
| Bond Fund | CA Tax-Exempt Bond | |||||||||||||||
| Year Ended September 30, 2014 | Year Ended September 30, 2013 | Year Ended September 30, 2014 | Year Ended September 30, 2013 | |||||||||||||
| INCREASE/(DECREASE) IN NET ASSETS | ||||||||||||||||
| From Operations | ||||||||||||||||
Net investment income (loss) | $ | 3,270 | $ | 3,822 | $ | 1,502 | $ | 1,887 | ||||||||
Net realized gain (loss) | 386 | 2,962 | 1,095 | 945 | ||||||||||||
Net change in unrealized appreciation (depreciation) | 1,221 | (6,514 | ) | 1,137 | (3,790 | ) | ||||||||||
|
|
|
|
|
|
|
| |||||||||
Increase (decrease) in net assets resulting from operations | 4,877 | 270 | 3,734 | (958 | ) | |||||||||||
|
|
|
|
|
|
|
| |||||||||
| From Distributions to Shareholders | ||||||||||||||||
Net investment income, Class A | (2,272 | ) | (2,348 | ) | (757 | ) | (872 | ) | ||||||||
Net investment income, Class B | (11 | ) | (16 | ) | — | — | ||||||||||
Net investment income, Class C | (214 | ) | (252 | ) | — | — | ||||||||||
Net investment income, Class I | (759 | ) | (1,086 | ) | (724 | ) | (990 | ) | ||||||||
Net realized short-term gains, Class A | — | — | (7 | ) | — | |||||||||||
Net realized short-term gains, Class I | — | — | (8 | ) | — | |||||||||||
Net realized long-term gains, Class A | — | — | (437 | ) | (386 | ) | ||||||||||
Net realized long-term gains, Class I | — | — | (501 | ) | (385 | ) | ||||||||||
|
|
|
|
|
|
|
| |||||||||
Decrease in net assets from distributions to shareholders | (3,256 | ) | (3,702 | ) | (2,434 | ) | (2,633 | ) | ||||||||
|
|
|
|
|
|
|
| |||||||||
| From Share Transactions (See Note 5) | ||||||||||||||||
Change in net assets from share transactions, Class A | (4,781 | ) | (8,371 | ) | (1,622 | ) | (4,460 | ) | ||||||||
Change in net assets from share transactions, Class B | (175 | ) | (310 | ) | — | — | ||||||||||
Change in net assets from share transactions, Class C | (620 | ) | (1,638 | ) | — | — | ||||||||||
Change in net assets from share transactions, Class I | (5,975 | ) | (6,514 | ) | (15,134 | ) | (753 | ) | ||||||||
|
|
|
|
|
|
|
| |||||||||
Increase (decrease) in net assets from share transactions | (11,551 | ) | (16,833 | ) | (16,756 | ) | (5,213 | ) | ||||||||
|
|
|
|
|
|
|
| |||||||||
Net increase (decrease) in net assets | (9,930 | ) | (20,265 | ) | (15,456 | ) | (8,804 | ) | ||||||||
| Net Assets | ||||||||||||||||
Beginning of period | 86,549 | 106,814 | 48,638 | 57,442 | ||||||||||||
|
|
|
|
|
|
|
| |||||||||
End of period | $ | 76,619 | $ | 86,549 | $ | 33,182 | $ | 48,638 | ||||||||
|
|
|
|
|
|
|
| |||||||||
Accumulated undistributed net investment income (loss) at end of period | $ | (4 | ) | $ | 51 | $ | 46 | $ | 25 | |||||||
See Notes to Financial Statements
59
Table of Contents
VIRTUS OPPORTUNITIES TRUST
STATEMENTS OF CHANGES IN NET ASSETS (Continued)
($ reported in thousands)
|
|
|
| |||||||||||||
| High Yield Fund | Low Volatility Equity Fund | |||||||||||||||
| Year Ended September 30, 2014 | Year Ended September 30, 2013 | Year Ended September 30, 2014 | From Inception June 11, 2013 to September 30, 2013 | |||||||||||||
| INCREASE/(DECREASE) IN NET ASSETS | ||||||||||||||||
| From Operations | ||||||||||||||||
Net investment income (loss) | $ | 5,019 | $ | 6,230 | $ | 12 | $ | 10 | ||||||||
Net realized gain (loss) | 2,456 | 3,629 | (44 | ) | (8 | ) | ||||||||||
Net change in unrealized appreciation (depreciation) | (680 | ) | (3,657 | ) | 297 | 35 | ||||||||||
|
|
|
|
|
|
|
| |||||||||
Increase (decrease) in net assets resulting from operations | 6,795 | 6,202 | 265 | 37 | ||||||||||||
|
|
|
|
|
|
|
| |||||||||
| From Distributions to Shareholders | ||||||||||||||||
Net investment income, Class A | (4,402 | ) | (5,953 | ) | (1 | ) | — | |||||||||
Net investment income, Class B | (5 | ) | (11 | ) | — | — | ||||||||||
Net investment income, Class C | (170 | ) | (174 | ) | (1 | ) | — | |||||||||
Net investment income, Class I | (333 | ) | (58 | ) | (13 | ) | — | |||||||||
|
|
|
|
|
|
|
| |||||||||
Decrease in net assets from distributions to shareholders | (4,910 | ) | (6,196 | ) | (15 | ) | — | |||||||||
|
|
|
|
|
|
|
| |||||||||
| From Share Transactions (See Note 5) | ||||||||||||||||
Change in net assets from share transactions, Class A | (10,859 | ) | (18,586 | ) | 316 | 134 | ||||||||||
Change in net assets from share transactions, Class B | (28 | ) | (179 | ) | — | — | ||||||||||
Change in net assets from share transactions, Class C | 697 | 381 | 138 | 127 | ||||||||||||
Change in net assets from share transactions, Class I | 211 | 5,724 | 13 | 1,300 | ||||||||||||
|
|
|
|
|
|
|
| |||||||||
Increase (decrease) in net assets from share transactions | (9,979 | ) | (12,660 | ) | 467 | 1,561 | ||||||||||
|
|
|
|
|
|
|
| |||||||||
Net increase (decrease) in net assets | (8,094 | ) | (12,654 | ) | 717 | 1,598 | ||||||||||
| Net Assets | ||||||||||||||||
Beginning of period | 89,400 | 102,054 | 1,598 | — | ||||||||||||
|
|
|
|
|
|
|
| |||||||||
End of period | $ | 81,306 | $ | 89,400 | $ | 2,315 | $ | 1,598 | ||||||||
|
|
|
|
|
|
|
| |||||||||
Accumulated undistributed net investment income (loss) at end of period | $ | 113 | $ | — | $ | 7 | $ | 10 | ||||||||
See Notes to Financial Statements
60
Table of Contents
VIRTUS OPPORTUNITIES TRUST
STATEMENTS OF CHANGES IN NET ASSETS (Continued)
($ reported in thousands)
|
|
|
| |||||||||||||
| Multi-Sector Intermediate Bond Fund | Senior Floating Rate Fund | |||||||||||||||
| Year Ended September 30, 2014 | Year Ended September 30, 2013 | Year Ended September 30, 2014 | Year Ended September 30, 2013 | |||||||||||||
| INCREASE/(DECREASE) IN NET ASSETS | ||||||||||||||||
| From Operations | ||||||||||||||||
Net investment income (loss) | $ | 17,646 | $ | 21,269 | $ | 38,225 | $ | 26,801 | ||||||||
Net realized gain (loss) | 4,281 | 5,423 | 2,023 | 1,303 | ||||||||||||
Net change in unrealized appreciation (depreciation) | (614 | ) | (17,487 | ) | (9,946 | ) | (2,563 | ) | ||||||||
|
|
|
|
|
|
|
| |||||||||
Increase (decrease) in net assets resulting from operations | 21,313 | 9,205 | 30,302 | 25,541 | ||||||||||||
|
|
|
|
|
|
|
| |||||||||
| From Distributions to Shareholders | ||||||||||||||||
Net investment income, Class A | (7,869 | ) | (10,445 | ) | (14,890 | ) | (13,583 | ) | ||||||||
Net investment income, Class B | (260 | ) | (373 | ) | — | — | ||||||||||
Net investment income, Class C | (3,889 | ) | (4,820 | ) | (5,719 | ) | (4,698 | ) | ||||||||
Net investment income, Class I | (4,673 | ) | (4,792 | ) | (17,118 | ) | (9,239 | ) | ||||||||
Net realized short-term gains, Class A | (1,570 | ) | (151 | ) | — | (612 | ) | |||||||||
Net realized short-term gains, Class B | (63 | ) | (7 | ) | — | — | ||||||||||
Net realized short-term gains, Class C | (905 | ) | (82 | ) | — | (255 | ) | |||||||||
Net realized short-term gains, Class I | (823 | ) | (61 | ) | — | (408 | ) | |||||||||
Net realized long-term gains, Class A | (1,696 | ) | (2,107 | ) | — | (90 | ) | |||||||||
Net realized long-term gains, Class B | (68 | ) | (94 | ) | — | — | ||||||||||
Net realized long-term gains, Class C | (968 | ) | (1,141 | ) | — | (35 | ) | |||||||||
Net realized long-term gains, Class I | (865 | ) | (849 | ) | — | (37 | ) | |||||||||
|
|
|
|
|
|
|
| |||||||||
Decrease in net assets from distributions to shareholders | (23,649 | ) | (24,922 | ) | (37,727 | ) | (28,957 | ) | ||||||||
|
|
|
|
|
|
|
| |||||||||
| From Share Transactions (See Note 5) | ||||||||||||||||
Change in net assets from share transactions, Class A | (65,126 | ) | (4,488 | ) | (89,707 | ) | 130,677 | |||||||||
Change in net assets from share transactions, Class B | (2,224 | ) | (2,090 | ) | — | — | ||||||||||
Change in net assets from share transactions, Class C | (7,973 | ) | 105 | (3,743 | ) | 88,171 | ||||||||||
Change in net assets from share transactions, Class I | 59,707 | 15,325 | 79,900 | 289,471 | ||||||||||||
|
|
|
|
|
|
|
| |||||||||
Increase (decrease) in net assets from share transactions | (15,616 | ) | 8,852 | (13,550 | ) | 508,319 | ||||||||||
|
|
|
|
|
|
|
| |||||||||
Net increase (decrease) in net assets | (17,952 | ) | (6,865 | ) | (20,975 | ) | 504,903 | |||||||||
| Net Assets | ||||||||||||||||
Beginning of period | 383,105 | 389,970 | 950,571 | 445,668 | ||||||||||||
|
|
|
|
|
|
|
| |||||||||
End of period | $ | 365,153 | $ | 383,105 | $ | 929,596 | $ | 950,571 | ||||||||
|
|
|
|
|
|
|
| |||||||||
Accumulated undistributed net investment income (loss) at end of period | $ | (55 | ) | $ | 271 | $ | 350 | $ | — | |||||||
See Notes to Financial Statements
61
Table of Contents
VIRTUS OPPORTUNITIES TRUST
STATEMENTS OF CHANGES IN NET ASSETS (Continued)
($ reported in thousands)
|
| |||||||
| Wealth Masters Fund | ||||||||
| Year Ended September 30, 2014 | Year Ended September 30, 2013 | |||||||
| INCREASE/(DECREASE) IN NET ASSETS | ||||||||
| From Operations | ||||||||
Net investment income (loss) | $ | 103 | $ | 3 | ||||
Net realized gain (loss) | 51 | 27 | ||||||
Net change in unrealized appreciation (depreciation) | 7,065 | 994 | ||||||
|
|
|
| |||||
Increase (decrease) in net assets resulting from operations | 7,219 | 1,024 | ||||||
|
|
|
| |||||
| From Distributions to Shareholders | ||||||||
Net investment income, Class A | — | — | ||||||
Net investment income, Class C | — | — | ||||||
Net investment income, Class I | (35 | ) | (5 | ) | ||||
Net realized short-term gains, Class A | (13 | ) | (2 | ) | ||||
Net realized short-term gains, Class C | (4 | ) | (2 | ) | ||||
Net realized short-term gains, Class I | (38 | ) | (7 | ) | ||||
Net realized long-term gains, Class A | (1 | ) | (— | )(1) | ||||
Net realized long-term gains, Class C | — | (1) | (— | )(1) | ||||
Net realized long-term gains, Class I | (1 | ) | (— | )(1) | ||||
|
|
|
| |||||
Decrease in net assets from distributions to shareholders | (92 | ) | (16 | ) | ||||
|
|
|
| |||||
| From Share Transactions (See Note 5) | ||||||||
Change in net assets from share transactions, Class A | 48,771 | 4,610 | ||||||
Change in net assets from share transactions, Class C | 28,200 | 1,509 | ||||||
Change in net assets from share transactions, Class I | (512 | ) | 43,566 | |||||
|
|
|
| |||||
Increase (decrease) in net assets from share transactions | 76,459 | 49,685 | ||||||
|
|
|
| |||||
Net increase (decrease) in net assets | 83,586 | 50,693 | ||||||
| Net Assets | ||||||||
Beginning of period | 51,724 | 1,031 | ||||||
|
|
|
| |||||
End of period | $ | 135,310 | $ | 51,724 | ||||
|
|
|
| |||||
Accumulated undistributed net investment income (loss) at end of period | $ | 152 | $ | — | ||||
(1) Amount is less than $500.
See Notes to Financial Statements
62
Table of Contents
VIRTUS OPPORTUNITIES TRUST
SELECTED PER SHARE DATA AND RATIOS FOR A SHARE OUTSTANDING
THROUGHOUT EACH PERIOD
| Net Asset Value, Beginning of Period | Net Investment Income (Loss)(2) | Net Realized and Unrealized Gain (Loss) | Total from Investment Operations | Dividends from Net Investment Income | Distributions from Net Realized Gains | Total Distributions | Change in Net Asset Value | Net Asset Value, End of Period | Total Return(1) | Net Assets, End of Period (in thousands) | Ratio of Net Expenses to Average Net Assets(8) | Ratio of Gross Expenses to Average Net Assets (before waivers and reimburse ments)(8) | Ratio of Net Investment Income (Loss) to Average Net Assets | Portfolio Turnover Rate | ||||||||||||||||||||||||||||||||||||||||||||||||||||||||||||||
Bond Fund | |||||||||||||||||||||||||||||||||||||||||||||||||||||||||||||||||||||||||||||
Class A | |||||||||||||||||||||||||||||||||||||||||||||||||||||||||||||||||||||||||||||
10/1/13 to 9/30/14 | $ | 11.21 | 0.47 | 0.22 | 0.69 | (0.47 | ) | — | (0.47 | ) | 0.22 | $ | 11.43 | 6.18 | % | $ | 53,603 | 0.85 | % | 1.10 | % | 4.08 | % | 38 | % | ||||||||||||||||||||||||||||||||||||||||||||||||||||
10/1/12 to 9/30/13 | 11.61 | 0.43 | (0.41 | ) | 0.02 | (0.42 | ) | — | (0.42 | ) | (0.40 | ) | 11.21 | 0.17 | 57,286 | 0.85 | 1.07 | 3.75 | 107 | ||||||||||||||||||||||||||||||||||||||||||||||||||||||||||
10/1/11 to 9/30/12 | 10.96 | 0.35 | 0.67 | 1.02 | (0.37 | ) | — | (0.37 | ) | 0.65 | 11.61 | 9.34 | 67,804 | 0.85 | 1.02 | 3.12 | 210 | ||||||||||||||||||||||||||||||||||||||||||||||||||||||||||||
10/1/10 to 9/30/11 | 11.18 | 0.46 | (0.21 | ) | 0.25 | (0.47 | ) | — | (0.47 | ) | (0.22 | ) | 10.96 | 2.39 | 64,449 | 0.85 | 1.04 | 4.16 | 169 | ||||||||||||||||||||||||||||||||||||||||||||||||||||||||||
10/1/09 to 9/30/10 | 10.57 | 0.46 | 0.62 | 1.08 | (0.47 | ) | — | (0.47 | ) | 0.61 | 11.18 | 10.42 | 67,147 | 0.84 | (10) | 0.98 | 4.26 | 160 | |||||||||||||||||||||||||||||||||||||||||||||||||||||||||||
Class B | |||||||||||||||||||||||||||||||||||||||||||||||||||||||||||||||||||||||||||||
10/1/13 to 9/30/14 | $ | 10.95 | 0.37 | 0.20 | 0.57 | (0.38 | ) | — | (0.38 | ) | 0.19 | $ | 11.14 | 5.27 | % | $ | 233 | 1.60 | % | 1.84 | % | 3.34 | % | 38 | % | ||||||||||||||||||||||||||||||||||||||||||||||||||||
10/1/12 to 9/30/13 | 11.34 | 0.33 | (0.38 | ) | (0.05 | ) | (0.34 | ) | — | (0.34 | ) | (0.39 | ) | 10.95 | (0.50 | ) | 401 | 1.60 | 1.82 | 2.95 | 107 | ||||||||||||||||||||||||||||||||||||||||||||||||||||||||
10/1/11 to 9/30/12 | 10.71 | 0.27 | 0.64 | 0.91 | (0.28 | ) | — | (0.28 | ) | 0.63 | 11.34 | 8.48 | 727 | 1.60 | 1.77 | 2.43 | 210 | ||||||||||||||||||||||||||||||||||||||||||||||||||||||||||||
10/1/10 to 9/30/11 | 10.93 | 0.37 | (0.20 | ) | 0.17 | (0.39 | ) | — | (0.39 | ) | (0.22 | ) | 10.71 | 1.64 | 1,171 | 1.60 | 1.80 | 3.38 | 169 | ||||||||||||||||||||||||||||||||||||||||||||||||||||||||||
10/1/09 to 9/30/10 | 10.34 | 0.37 | 0.60 | 0.97 | (0.38 | ) | — | (0.38 | ) | 0.59 | 10.93 | 9.60 | 2,812 | 1.59 | (10) | 1.72 | 3.50 | 160 | |||||||||||||||||||||||||||||||||||||||||||||||||||||||||||
Class C | |||||||||||||||||||||||||||||||||||||||||||||||||||||||||||||||||||||||||||||
10/1/13 to 9/30/14 | $ | 10.99 | 0.37 | 0.21 | 0.58 | (0.38 | ) | — | (0.38 | ) | 0.20 | $ | 11.19 | 5.34 | % | $ | 6,315 | 1.60 | % | 1.85 | % | 3.33 | % | 38 | % | ||||||||||||||||||||||||||||||||||||||||||||||||||||
10/1/12 to 9/30/13 | 11.38 | 0.34 | (0.39 | ) | (0.05 | ) | (0.34 | ) | — | (0.34 | ) | (0.39 | ) | 10.99 | (0.51 | ) | 6,825 | 1.60 | 1.82 | 2.99 | 107 | ||||||||||||||||||||||||||||||||||||||||||||||||||||||||
10/1/11 to 9/30/12 | 10.75 | 0.26 | 0.65 | 0.91 | (0.28 | ) | — | (0.28 | ) | 0.63 | 11.38 | 8.55 | 8,756 | 1.60 | 1.77 | 2.36 | 210 | ||||||||||||||||||||||||||||||||||||||||||||||||||||||||||||
10/1/10 to 9/30/11 | 10.96 | 0.37 | (0.19 | ) | 0.18 | (0.39 | ) | — | (0.39 | ) | (0.21 | ) | 10.75 | 1.63 | 7,984 | 1.60 | 1.79 | 3.41 | 169 | ||||||||||||||||||||||||||||||||||||||||||||||||||||||||||
10/1/09 to 9/30/10 | 10.37 | 0.37 | 0.60 | 0.97 | (0.38 | ) | — | (0.38 | ) | 0.59 | 10.96 | 9.57 | 8,663 | 1.59 | (10) | 1.73 | 3.50 | 160 | |||||||||||||||||||||||||||||||||||||||||||||||||||||||||||
Class I | |||||||||||||||||||||||||||||||||||||||||||||||||||||||||||||||||||||||||||||
10/1/13 to 9/30/14 | $ | 11.37 | 0.50 | 0.21 | 0.71 | (0.49 | ) | — | (0.49 | ) | 0.22 | $ | 11.59 | 6.35 | % | $ | 16,468 | 0.60 | % | 0.85 | % | 4.33 | % | 38 | % | ||||||||||||||||||||||||||||||||||||||||||||||||||||
10/1/12 to 9/30/13 | 11.76 | 0.47 | (0.41 | ) | 0.06 | (0.45 | ) | — | (0.45 | ) | (0.39 | ) | 11.37 | 0.49 | 22,037 | 0.60 | 0.82 | 3.98 | 107 | ||||||||||||||||||||||||||||||||||||||||||||||||||||||||||
10/1/11 to 9/30/12 | 11.10 | 0.39 | 0.66 | 1.05 | (0.39 | ) | — | (0.39 | ) | 0.66 | 11.76 | 9.64 | 29,527 | 0.60 | 0.77 | 3.39 | 210 | ||||||||||||||||||||||||||||||||||||||||||||||||||||||||||||
10/1/10 to 9/30/11 | 11.30 | 0.49 | (0.19 | ) | 0.30 | (0.50 | ) | — | (0.50 | ) | (0.20 | ) | 11.10 | 2.67 | 76,169 | 0.60 | 0.79 | 4.39 | 169 | ||||||||||||||||||||||||||||||||||||||||||||||||||||||||||
10/1/09 to 9/30/10 | 10.68 | 0.49 | 0.62 | 1.11 | (0.49 | ) | — | (0.49 | ) | 0.62 | 11.30 | 10.65 | 120,459 | 0.59 | (10) | 0.73 | 4.51 | 160 | |||||||||||||||||||||||||||||||||||||||||||||||||||||||||||
CA Tax-Exempt | |||||||||||||||||||||||||||||||||||||||||||||||||||||||||||||||||||||||||||||
Bond Fund | |||||||||||||||||||||||||||||||||||||||||||||||||||||||||||||||||||||||||||||
Class A | |||||||||||||||||||||||||||||||||||||||||||||||||||||||||||||||||||||||||||||
10/1/13 to 9/30/14 | $ | 12.10 | 0.43 | 0.64 | 1.07 | (0.42 | ) | (0.24 | ) | (0.66 | ) | 0.41 | $ | 12.51 | 9.16 | % | $ | 21,729 | 0.85 | % | 1.11 | % | 3.49 | % | 7 | % | |||||||||||||||||||||||||||||||||||||||||||||||||||
10/1/12 to 9/30/13 | 12.96 | 0.43 | (0.68 | ) | (0.25 | ) | (0.43 | ) | (0.18 | ) | (0.61 | ) | (0.86 | ) | 12.10 | (2.12 | ) | 22,612 | 0.85 | 1.04 | 3.39 | 22 | |||||||||||||||||||||||||||||||||||||||||||||||||||||||
10/1/11 to 9/30/12 | 12.30 | 0.46 | 0.68 | 1.14 | (0.48 | ) | — | (0.48 | ) | 0.66 | 12.96 | 9.40 | 28,803 | 0.85 | 1.04 | 3.65 | 16 | ||||||||||||||||||||||||||||||||||||||||||||||||||||||||||||
10/1/10 to 9/30/11 | 12.34 | 0.48 | (0.04 | ) | 0.44 | (0.48 | ) | — | (0.48 | ) | (0.04 | ) | 12.30 | 3.75 | 29,688 | 0.85 | 1.05 | 4.04 | 12 | ||||||||||||||||||||||||||||||||||||||||||||||||||||||||||
10/1/09 to 9/30/10 | 12.29 | 0.48 | 0.04 | 0.52 | (0.47 | ) | — | (0.47 | ) | 0.05 | 12.34 | 4.43 | 31,945 | 0.85 | 1.03 | 3.94 | 10 | ||||||||||||||||||||||||||||||||||||||||||||||||||||||||||||
The footnote legend is at the end of the Financial Highlights.
See Notes to Financial Statements
63
Table of Contents
VIRTUS OPPORTUNITIES TRUST
FINANCIAL HIGHLIGHTS
SELECTED PER SHARE DATA AND RATIOS FOR A SHARE OUTSTANDING
THROUGHOUT EACH PERIOD
| Net Asset Value, Beginning of Period | Net Investment Income (Loss)(2) | Net Realized and Unrealized Gain (Loss) | Total from Investment Operations | Dividends from Net Investment Income | Distributions from Net Realized Gains | Total Distributions | Change in Net Asset Value | Net Asset Value, End of Period | Total Return(1) | Net Assets, End of Period (in thousands) | Ratio of Net Expenses to Average Net Assets(8) | Ratio of Gross Expenses to Average Net Assets (before waivers and reimbursements)(8) | Ratio of Net Investment Income (Loss) to Average Net Assets | Portfolio Turnover Rate | ||||||||||||||||||||||||||||||||||||||||||||||||||||||||||||||
CA Tax-Exempt | |||||||||||||||||||||||||||||||||||||||||||||||||||||||||||||||||||||||||||||
Bond Fund (Continued) | |||||||||||||||||||||||||||||||||||||||||||||||||||||||||||||||||||||||||||||
Class I | |||||||||||||||||||||||||||||||||||||||||||||||||||||||||||||||||||||||||||||
10/1/13 to 9/30/14 | $ | 12.09 | 0.45 | 0.64 | 1.09 | (0.45 | ) | (0.24 | ) | (0.69 | ) | 0.40 | $ | 12.49 | 9.36 | % | $ | 11,453 | 0.60 | % | 0.83 | % | 3.74 | % | 7 | % | |||||||||||||||||||||||||||||||||||||||||||||||||||
10/1/12 to 9/30/13 | 12.95 | 0.46 | (0.68 | ) | (0.22 | ) | (0.46 | ) | (0.18 | ) | (0.64 | ) | (0.86 | ) | 12.09 | (1.88 | ) | 26,026 | 0.60 | 0.79 | 3.65 | 22 | |||||||||||||||||||||||||||||||||||||||||||||||||||||||
10/1/11 to 9/30/12 | 12.29 | 0.49 | 0.68 | 1.17 | (0.51 | ) | — | (0.51 | ) | 0.66 | 12.95 | 9.68 | 28,639 | 0.60 | 0.79 | 3.90 | 16 | ||||||||||||||||||||||||||||||||||||||||||||||||||||||||||||
10/1/10 to 9/30/11 | 12.33 | 0.51 | (0.04 | ) | 0.47 | (0.51 | ) | — | (0.51 | ) | (0.04 | ) | 12.29 | 4.01 | 27,417 | 0.60 | 0.80 | 4.29 | 12 | ||||||||||||||||||||||||||||||||||||||||||||||||||||||||||
10/1/09 to 9/30/10 | 12.28 | 0.51 | 0.04 | 0.55 | (0.50 | ) | — | (0.50 | ) | 0.05 | 12.33 | 4.69 | 28,169 | 0.60 | 0.78 | 4.19 | 10 | ||||||||||||||||||||||||||||||||||||||||||||||||||||||||||||
High Yield Fund | |||||||||||||||||||||||||||||||||||||||||||||||||||||||||||||||||||||||||||||
Class A | |||||||||||||||||||||||||||||||||||||||||||||||||||||||||||||||||||||||||||||
10/1/13 to 9/30/14 | $ | 4.27 | 0.24 | 0.08 | 0.32 | (0.24 | ) | — | (0.24 | ) | 0.08 | $ | 4.35 | 7.53 | % | $ | 71,042 | 1.15 | % | 1.31 | % | 5.55 | % | 82 | % | ||||||||||||||||||||||||||||||||||||||||||||||||||||
10/1/12 to 9/30/13 | 4.28 | 0.26 | (0.01 | ) | 0.25 | (0.26 | ) | — | (0.26 | ) | (0.01 | ) | 4.27 | 5.98 | 80,155 | 1.15 | 1.31 | 6.05 | 100 | ||||||||||||||||||||||||||||||||||||||||||||||||||||||||||
10/1/11 to 9/30/12 | 3.85 | 0.28 | 0.44 | 0.72 | (0.29 | ) | — | (0.29 | ) | 0.43 | 4.28 | 19.19 | 98,701 | 1.15 | 1.31 | 6.82 | 92 | ||||||||||||||||||||||||||||||||||||||||||||||||||||||||||||
10/1/10 to 9/30/11 | 4.17 | 0.29 | (0.32 | ) | (0.03 | ) | (0.29 | ) | — | (0.29 | ) | (0.32 | ) | 3.85 | (0.82 | ) | 86,530 | 1.21 | (7) | 1.35 | 6.93 | 106 | |||||||||||||||||||||||||||||||||||||||||||||||||||||||
10/1/09 to 9/30/10 | 3.89 | 0.31 | 0.28 | 0.59 | (0.31 | ) | — | (0.31 | ) | 0.28 | 4.17 | 15.43 | 101,326 | 1.35 | 1.35 | (3) | 7.69 | 92 | |||||||||||||||||||||||||||||||||||||||||||||||||||||||||||
Class B | |||||||||||||||||||||||||||||||||||||||||||||||||||||||||||||||||||||||||||||
10/1/13 to 9/30/14 | $ | 4.17 | 0.21 | 0.07 | 0.28 | (0.21 | ) | — | (0.21 | ) | 0.07 | $ | 4.24 | 6.68 | % | $ | 106 | 1.90 | % | 2.07 | % | 4.80 | % | 82 | % | ||||||||||||||||||||||||||||||||||||||||||||||||||||
10/1/12 to 9/30/13 | 4.19 | 0.23 | (0.02 | ) | 0.21 | (0.23 | ) | — | (0.23 | ) | (0.02 | ) | 4.17 | 5.06 | 131 | 1.90 | 2.05 | 5.31 | 100 | ||||||||||||||||||||||||||||||||||||||||||||||||||||||||||
10/1/11 to 9/30/12 | 3.77 | 0.24 | 0.44 | 0.68 | (0.26 | ) | — | (0.26 | ) | 0.42 | 4.19 | 18.46 | 307 | 1.90 | 2.06 | 6.07 | 92 | ||||||||||||||||||||||||||||||||||||||||||||||||||||||||||||
10/1/10 to 9/30/11 | 4.08 | 0.25 | (0.31 | ) | (0.06 | ) | (0.25 | ) | — | (0.25 | ) | (0.31 | ) | 3.77 | (1.66 | ) | 404 | 1.96 | (7) | 2.10 | 6.17 | 106 | |||||||||||||||||||||||||||||||||||||||||||||||||||||||
10/1/09 to 9/30/10 | 3.82 | 0.27 | 0.27 | 0.54 | (0.28 | ) | — | (0.28 | ) | 0.26 | 4.08 | 14.65 | 663 | 2.10 | 2.10 | (3) | 6.95 | 92 | |||||||||||||||||||||||||||||||||||||||||||||||||||||||||||
Class C | |||||||||||||||||||||||||||||||||||||||||||||||||||||||||||||||||||||||||||||
10/1/13 to 9/30/14 | $ | 4.21 | 0.21 | 0.07 | 0.28 | (0.21 | ) | — | (0.21 | ) | 0.07 | $ | 4.28 | 6.60 | % | $ | 4,038 | 1.90 | % | 2.07 | % | 4.79 | % | 82 | % | ||||||||||||||||||||||||||||||||||||||||||||||||||||
10/1/12 to 9/30/13 | 4.23 | 0.23 | (0.02 | ) | 0.21 | (0.23 | ) | — | (0.23 | ) | (0.02 | ) | 4.21 | 5.00 | 3,302 | 1.90 | 2.06 | 5.31 | 100 | ||||||||||||||||||||||||||||||||||||||||||||||||||||||||||
10/1/11 to 9/30/12 | 3.80 | 0.25 | 0.44 | 0.69 | (0.26 | ) | — | (0.26 | ) | 0.43 | 4.23 | 18.59 | 2,944 | 1.90 | 2.07 | 6.07 | 92 | ||||||||||||||||||||||||||||||||||||||||||||||||||||||||||||
10/1/10 to 9/30/11 | 4.11 | 0.25 | (0.31 | ) | (0.06 | ) | (0.25 | ) | — | (0.25 | ) | (0.31 | ) | 3.80 | (1.65 | ) | 2,028 | 1.95 | (7) | 2.10 | 6.18 | 106 | |||||||||||||||||||||||||||||||||||||||||||||||||||||||
10/1/09 to 9/30/10 | 3.85 | 0.27 | 0.27 | 0.54 | (0.28 | ) | — | (0.28 | ) | 0.26 | 4.11 | 14.53 | 2,119 | 2.10 | 2.10 | (3) | 6.93 | 92 | |||||||||||||||||||||||||||||||||||||||||||||||||||||||||||
Class I | |||||||||||||||||||||||||||||||||||||||||||||||||||||||||||||||||||||||||||||
10/1/13 to 9/30/14 | $ | 4.27 | 0.26 | 0.07 | 0.33 | (0.25 | ) | — | (0.25 | ) | 0.08 | $ | 4.35 | 7.80 | % | $ | 6,120 | 0.90 | % | 1.07 | % | 5.80 | % | 82 | % | ||||||||||||||||||||||||||||||||||||||||||||||||||||
10/1/12 to 9/30/13 | 4.28 | 0.27 | (0.01 | ) | 0.26 | (0.27 | ) | — | (0.27 | ) | (0.01 | ) | 4.27 | 6.25 | 5,812 | 0.90 | 1.05 | 6.37 | 100 | ||||||||||||||||||||||||||||||||||||||||||||||||||||||||||
8/8/12(6) to 9/30/12 | 4.23 | 0.04 | 0.06 | 0.10 | (0.05 | ) | — | (0.05 | ) | 0.05 | 4.28 | 2.37 | (4) | 102 | 0.90 | (3) | 1.08 | (3) | 6.86 | (3) | 92 | (4) | |||||||||||||||||||||||||||||||||||||||||||||||||||||||
The footnote legend is at the end of the Financial Highlights.
See Notes to Financial Statements
64
Table of Contents
VIRTUS OPPORTUNITIES TRUST
FINANCIAL HIGHLIGHTS
SELECTED PER SHARE DATA AND RATIOS FOR A SHARE OUTSTANDING
THROUGHOUT EACH PERIOD
| Net Asset Value, Beginning of Period | Net Investment Income (Loss)(2) | Net Realized and Unrealized Gain (Loss) | Total from Investment Operations | Dividends from Net Investment Income | Distributions from Net Realized Gains | Total Distributions | Change in Net Asset Value | Net Asset Value, End of Period | Total Return(1) | Net Assets, End of Period (in thousands) | Ratio of Net Expenses to Average Net Assets(8) | Ratio of Gross Expenses to Average Net Assets (before waivers and reimbursements)(8) | Ratio of Net Investment Income (Loss) to Average Net Assets | Portfolio Turnover Rate | ||||||||||||||||||||||||||||||||||||||||||||||||||||||||||||||
Low Volatility Equity Fund | |||||||||||||||||||||||||||||||||||||||||||||||||||||||||||||||||||||||||||||
Class A | |||||||||||||||||||||||||||||||||||||||||||||||||||||||||||||||||||||||||||||
10/1/13 to 9/30/14 | $ | 10.24 | 0.06 | 1.50 | 1.56 | (0.09 | ) | — | (0.09 | ) | 1.47 | $ | 11.71 | 15.23 | % | $ | 485 | 1.55 | % | 6.15 | % | 0.56 | % | 3 | % | ||||||||||||||||||||||||||||||||||||||||||||||||||||
6/11/13(6) to 9/30/13 | 10.00 | 0.06 | 0.18 | 0.24 | — | — | — | 0.24 | 10.24 | 2.40 | (4) | 136 | 1.55 | (3) | 7.66 | (3) | 2.00 | (3) | 0 | ||||||||||||||||||||||||||||||||||||||||||||||||||||||||||
Class C | |||||||||||||||||||||||||||||||||||||||||||||||||||||||||||||||||||||||||||||
10/1/13 to 9/30/14 | $ | 10.21 | (0.02 | ) | 1.50 | 1.48 | (0.05 | ) | — | (0.05 | ) | 1.43 | $ | 11.64 | 14.47 | % | $ | 291 | 2.30 | % | 6.72 | % | (0.19 | )% | 3 | % | |||||||||||||||||||||||||||||||||||||||||||||||||||
6/11/13(6) to 9/30/13 | 10.00 | 0.03 | 0.18 | 0.21 | — | — | — | 0.21 | 10.21 | 2.10 | (4) | 130 | 2.30 | (3) | 8.49 | (3) | 0.99 | (3) | 0 | ||||||||||||||||||||||||||||||||||||||||||||||||||||||||||
Class I | |||||||||||||||||||||||||||||||||||||||||||||||||||||||||||||||||||||||||||||
10/1/13 to 9/30/14 | $ | 10.25 | 0.07 | 1.51 | 1.58 | (0.10 | ) | — | (0.10 | ) | 1.48 | $ | 11.73 | 15.45 | % | $ | 1,539 | 1.30 | % | 5.32 | % | 0.67 | % | 3 | % | ||||||||||||||||||||||||||||||||||||||||||||||||||||
6/11/13(6) to 9/30/13 | 10.00 | 0.07 | 0.18 | 0.25 | — | — | — | 0.25 | 10.25 | 2.50 | (4) | 1,332 | 1.30 | (3) | 7.51 | (3) | 2.23 | (3) | 0 | ||||||||||||||||||||||||||||||||||||||||||||||||||||||||||
| Multi-Sector Intermediate | |||||||||||||||||||||||||||||||||||||||||||||||||||||||||||||||||||||||||||||
Bond Fund | |||||||||||||||||||||||||||||||||||||||||||||||||||||||||||||||||||||||||||||
Class A | |||||||||||||||||||||||||||||||||||||||||||||||||||||||||||||||||||||||||||||
10/1/13 to 9/30/14 | $ | 10.77 | 0.54 | 0.11 | 0.65 | (0.52 | ) | (0.20 | ) | (0.72 | ) | (0.07 | ) | $ | 10.70 | 6.18 | % | $ | 119,423 | 1.11 | % | 1.11 | % | 5.00 | % | 54 | % | ||||||||||||||||||||||||||||||||||||||||||||||||||
10/1/12 to 9/30/13 | 11.15 | 0.57 | (0.28 | ) | 0.29 | (0.55 | ) | (0.12 | ) | (0.67 | ) | (0.38 | ) | 10.77 | 2.59 | 184,524 | 1.10 | 1.10 | 5.13 | 77 | |||||||||||||||||||||||||||||||||||||||||||||||||||||||||
10/1/11 to 9/30/12 | 10.24 | 0.62 | 0.93 | 1.55 | (0.64 | ) | — | (0.64 | ) | 0.91 | 11.15 | 15.51 | 196,554 | 1.13 | 1.13 | 5.73 | 76 | ||||||||||||||||||||||||||||||||||||||||||||||||||||||||||||
10/1/10 to 9/30/11 | 10.77 | 0.66 | (0.47 | ) | 0.19 | (0.72 | ) | — | (0.72 | ) | (0.53 | ) | 10.24 | 1.58 | 137,395 | 1.16 | 1.16 | 6.07 | 45 | ||||||||||||||||||||||||||||||||||||||||||||||||||||||||||
10/1/09 to 9/30/10 | 9.96 | 0.67 | 0.79 | 1.46 | (0.65 | ) | — | (0.65 | ) | 0.81 | 10.77 | 15.14 | 125,962 | 1.16 | 1.16 | 6.46 | 74 | ||||||||||||||||||||||||||||||||||||||||||||||||||||||||||||
Class B | |||||||||||||||||||||||||||||||||||||||||||||||||||||||||||||||||||||||||||||
10/1/13 to 9/30/14 | $ | 10.74 | 0.46 | 0.11 | 0.57 | (0.44 | ) | (0.20 | ) | (0.64 | ) | (0.07 | ) | $ | 10.67 | 5.40 | % | $ | 5,360 | 1.86 | % | 1.86 | % | 4.26 | % | 54 | % | ||||||||||||||||||||||||||||||||||||||||||||||||||
10/1/12 to 9/30/13 | 11.12 | 0.49 | (0.28 | ) | 0.21 | (0.47 | ) | (0.12 | ) | (0.59 | ) | (0.38 | ) | 10.74 | 1.83 | 7,603 | 1.85 | 1.85 | 4.39 | 77 | |||||||||||||||||||||||||||||||||||||||||||||||||||||||||
10/1/11 to 9/30/12 | 10.22 | 0.54 | 0.92 | 1.46 | (0.56 | ) | — | (0.56 | ) | 0.90 | 11.12 | 14.59 | 9,974 | 1.88 | 1.88 | 5.02 | 76 | ||||||||||||||||||||||||||||||||||||||||||||||||||||||||||||
10/1/10 to 9/30/11 | 10.75 | 0.58 | (0.47 | ) | 0.11 | (0.64 | ) | — | (0.64 | ) | (0.53 | ) | 10.22 | 0.82 | 10,685 | 1.91 | 1.91 | 5.31 | 45 | ||||||||||||||||||||||||||||||||||||||||||||||||||||||||||
10/1/09 to 9/30/10 | 9.95 | 0.59 | 0.79 | 1.38 | (0.58 | ) | — | (0.58 | ) | 0.80 | 10.75 | 14.20 | 13,590 | 1.91 | 1.91 | 5.72 | 74 | ||||||||||||||||||||||||||||||||||||||||||||||||||||||||||||
Class C | |||||||||||||||||||||||||||||||||||||||||||||||||||||||||||||||||||||||||||||
10/1/13 to 9/30/14 | $ | 10.86 | 0.47 | 0.10 | 0.57 | (0.44 | ) | (0.20 | ) | (0.64 | ) | (0.07 | ) | $ | 10.79 | 5.33 | % | $ | 96,072 | 1.86 | % | 1.86 | % | 4.25 | % | 54 | % | ||||||||||||||||||||||||||||||||||||||||||||||||||
10/1/12 to 9/30/13 | 11.23 | 0.49 | (0.27 | ) | 0.22 | (0.47 | ) | (0.12 | ) | (0.59 | ) | (0.37 | ) | 10.86 | 1.90 | 104,591 | 1.85 | 1.85 | 4.39 | 77 | |||||||||||||||||||||||||||||||||||||||||||||||||||||||||
10/1/11 to 9/30/12 | 10.31 | 0.54 | 0.94 | 1.48 | (0.56 | ) | — | (0.56 | ) | 0.92 | 11.23 | 14.65 | 108,595 | 1.88 | 1.88 | 4.98 | 76 | ||||||||||||||||||||||||||||||||||||||||||||||||||||||||||||
10/1/10 to 9/30/11 | 10.84 | 0.58 | (0.47 | ) | 0.11 | (0.64 | ) | — | (0.64 | ) | (0.53 | ) | 10.31 | 0.80 | 70,735 | 1.91 | 1.91 | 5.32 | 45 | ||||||||||||||||||||||||||||||||||||||||||||||||||||||||||
10/1/09 to 9/30/10 | 10.02 | 0.59 | 0.80 | 1.39 | (0.57 | ) | — | (0.57 | ) | 0.82 | 10.84 | 14.29 | 62,214 | 1.91 | 1.91 | 5.71 | 74 | ||||||||||||||||||||||||||||||||||||||||||||||||||||||||||||
Class I | |||||||||||||||||||||||||||||||||||||||||||||||||||||||||||||||||||||||||||||
10/1/13 to 9/30/14 | $ | 10.77 | 0.57 | 0.12 | 0.69 | (0.55 | ) | (0.20 | ) | (0.75 | ) | (0.06 | ) | $ | 10.71 | 6.54 | % | $ | 144,298 | 0.86 | % | 0.86 | % | 5.24 | % | 54 | % | ||||||||||||||||||||||||||||||||||||||||||||||||||
10/1/12 to 9/30/13 | 11.15 | 0.60 | (0.28 | ) | 0.32 | (0.58 | ) | (0.12 | ) | (0.70 | ) | (0.38 | ) | 10.77 | 2.85 | 86,387 | 0.85 | 0.85 | 5.38 | 77 | |||||||||||||||||||||||||||||||||||||||||||||||||||||||||
10/1/11 to 9/30/12 | 10.24 | 0.64 | 0.93 | 1.57 | (0.66 | ) | — | (0.66 | ) | 0.91 | 11.15 | 15.80 | 74,847 | 0.88 | 0.88 | 5.93 | 76 | ||||||||||||||||||||||||||||||||||||||||||||||||||||||||||||
10/1/10 to 9/30/11 | 10.76 | 0.69 | (0.46 | ) | 0.23 | (0.75 | ) | — | (0.75 | ) | (0.52 | ) | 10.24 | 1.93 | 22,408 | 0.91 | 0.91 | 6.32 | 45 | ||||||||||||||||||||||||||||||||||||||||||||||||||||||||||
10/1/09(6) to 9/30/10 | 9.95 | 0.70 | 0.79 | 1.49 | (0.68 | ) | — | (0.68 | ) | 0.81 | 10.76 | 15.41 | (4) | 7,633 | 0.91 | (3) | 0.91 | (3) | 6.78 | (3) | 74 | ||||||||||||||||||||||||||||||||||||||||||||||||||||||||
The footnote legend is at the end of the Financial Highlights.
See Notes to Financial Statements
65
Table of Contents
VIRTUS OPPORTUNITIES TRUST
FINANCIAL HIGHLIGHTS
SELECTED PER SHARE DATA AND RATIOS FOR A SHARE OUTSTANDING
THROUGHOUT EACH PERIOD
| Net Asset Value, Beginning of Period | Net Investment Income (Loss)(2) | Net Realized and Unrealized Gain (Loss) | Total from Investment Operations | Dividends from Net Investment Income | Distributions from Net Realized Gains | Total Return of Capital | Total Distributions | Change in Net Asset Value | Net Asset Value, End of Period | Total Return(1) | Net Assets, End of Period (in thousands) | Ratio of Net Expenses to Average Net Assets(8) | Ratio of Gross Expenses to Average Net Assets(8) | Ratio of Net Investment Income to Average Net Assets | Portfolio Turnover Rate | ||||||||||||||||||||||||||||||||||||||||||||||||||||||||||||||||||
| Senior Floating | ||||||||||||||||||||||||||||||||||||||||||||||||||||||||||||||||||||||||||||||||||
Rate Fund | ||||||||||||||||||||||||||||||||||||||||||||||||||||||||||||||||||||||||||||||||||
Class A | ||||||||||||||||||||||||||||||||||||||||||||||||||||||||||||||||||||||||||||||||||
10/1/13 to 9/30/14 | $ | 9.79 | 0.37 | (0.07 | ) | 0.30 | (0.37 | ) | — | — | (0.37 | ) | (0.07 | ) | $ | 9.72 | 3.08 | % | $ | 294,617 | 1.18 | %(11) | 1.18 | % | 3.79 | % | 77 | % | ||||||||||||||||||||||||||||||||||||||||||||||||||||||
10/1/12 to 9/30/13 | 9.79 | 0.42 | 0.04 | 0.46 | (0.46 | ) | — | (5) | — | (0.46 | ) | — | 9.79 | 4.84 | 386,113 | 1.21 | (11) | 1.21 | 4.29 | 68 | ||||||||||||||||||||||||||||||||||||||||||||||||||||||||||||||
10/1/11 to 9/30/12 | 9.28 | 0.49 | 0.49 | 0.98 | (0.47 | ) | — | — | (0.47 | ) | 0.51 | 9.79 | 10.75 | 256,397 | 1.23 | (11) | 1.23 | 5.06 | 56 | |||||||||||||||||||||||||||||||||||||||||||||||||||||||||||||||
10/1/10 to 9/30/11 | 9.80 | 0.45 | (0.27 | ) | 0.18 | (0.49 | ) | (0.07 | ) | (0.14 | ) | (0.70 | ) | (0.52 | ) | 9.28 | 1.62 | 215,427 | 1.20 | (9) | 1.19 | 4.58 | 69 | |||||||||||||||||||||||||||||||||||||||||||||||||||||||||||
10/1/09 to 9/30/10 | 9.87 | 0.67 | 0.09 | 0.76 | (0.64 | ) | (0.19 | ) | — | (0.83 | ) | (0.07 | ) | 9.80 | 8.05 | 98,790 | 1.20 | (9) | 1.15 | 6.86 | 41 | |||||||||||||||||||||||||||||||||||||||||||||||||||||||||||||
Class C | ||||||||||||||||||||||||||||||||||||||||||||||||||||||||||||||||||||||||||||||||||
10/1/13 to 9/30/14 | $ | 9.81 | 0.30 | (0.08 | ) | 0.22 | (0.30 | ) | — | — | (0.30 | ) | (0.08 | ) | $ | 9.73 | 2.20 | % | $ | 177,485 | 1.93 | %(11) | 1.93 | % | 3.04 | % | 77 | % | ||||||||||||||||||||||||||||||||||||||||||||||||||||||
10/1/12 to 9/30/13 | 9.80 | 0.35 | 0.05 | 0.40 | (0.39 | ) | — | (5) | — | (0.39 | ) | 0.01 | 9.81 | 4.15 | 182,667 | 1.96 | (11) | 1.96 | 3.51 | 68 | ||||||||||||||||||||||||||||||||||||||||||||||||||||||||||||||
10/1/11 to 9/30/12 | 9.29 | 0.41 | 0.50 | 0.91 | (0.40 | ) | — | — | (0.40 | ) | 0.51 | 9.80 | 9.92 | 95,078 | 1.98 | (11) | 1.98 | 4.31 | 56 | |||||||||||||||||||||||||||||||||||||||||||||||||||||||||||||||
10/1/10 to 9/30/11 | 9.81 | 0.36 | (0.26 | ) | 0.10 | (0.41 | ) | (0.07 | ) | (0.14 | ) | (0.62 | ) | (0.52 | ) | 9.29 | 0.85 | 92,623 | 1.95 | (9) | 1.94 | 3.69 | 69 | |||||||||||||||||||||||||||||||||||||||||||||||||||||||||||
10/1/09 to 9/30/10 | 9.87 | 0.59 | 0.10 | 0.69 | (0.56 | ) | (0.19 | ) | — | (0.75 | ) | (0.06 | ) | 9.81 | 7.35 | 30,116 | 1.95 | (9) | 1.92 | 6.02 | 41 | |||||||||||||||||||||||||||||||||||||||||||||||||||||||||||||
Class I | ||||||||||||||||||||||||||||||||||||||||||||||||||||||||||||||||||||||||||||||||||
10/1/13 to 9/30/14 | $ | 9.79 | 0.40 | (0.09 | ) | 0.31 | (0.39 | ) | — | — | (0.39 | ) | (0.08 | ) | $ | 9.71 | 3.23 | % | $ | 457,494 | 0.93 | %(11) | 0.93 | % | 4.06 | % | 77 | % | ||||||||||||||||||||||||||||||||||||||||||||||||||||||
10/1/12 to 9/30/13 | 9.78 | 0.43 | 0.07 | 0.50 | (0.49 | ) | — | (5) | — | (0.49 | ) | 0.01 | 9.79 | 5.21 | 381,791 | | 0.96 | (11) | 0.96 | 4.41 | 68 | |||||||||||||||||||||||||||||||||||||||||||||||||||||||||||||
10/1/11 to 9/30/12 | 9.27 | 0.51 | 0.49 | 1.00 | (0.49 | ) | — | — | (0.49 | ) | 0.51 | 9.78 | 11.04 | 94,193 | 0.98 | (11) | 0.98 | 5.31 | 56 | |||||||||||||||||||||||||||||||||||||||||||||||||||||||||||||||
10/1/10 to 9/30/11 | 9.80 | 0.46 | (0.27 | ) | 0.19 | (0.51 | ) | (0.07 | ) | (0.14 | ) | (0.72 | ) | (0.53 | ) | 9.27 | 1.78 | 71,584 | 0.95 | (9) | 0.93 | 4.67 | 69 | |||||||||||||||||||||||||||||||||||||||||||||||||||||||||||
10/1/09 to 9/30/10 | 9.86 | 0.64 | 0.15 | 0.79 | (0.66 | ) | (0.19 | ) | — | (0.85 | ) | (0.06 | ) | 9.80 | 8.44 | 32,679 | 0.95 | (9) | 0.89 | 6.56 | 41 | |||||||||||||||||||||||||||||||||||||||||||||||||||||||||||||
Wealth Masters | ||||||||||||||||||||||||||||||||||||||||||||||||||||||||||||||||||||||||||||||||||
Fund | ||||||||||||||||||||||||||||||||||||||||||||||||||||||||||||||||||||||||||||||||||
Class A | ||||||||||||||||||||||||||||||||||||||||||||||||||||||||||||||||||||||||||||||||||
10/1/13 to 9/30/14 | $ | 13.12 | 0.02 | 1.37 | 1.39 | — | (0.01 | ) | — | (0.01 | ) | 1.38 | $ | 14.50 | 10.67 | % | $ | 55,881 | 1.45 | % | 1.46 | % | 0.11 | % | 62 | % | ||||||||||||||||||||||||||||||||||||||||||||||||||||||||
10/1/12 to 9/30/13 | 10.22 | (0.01 | ) | 3.05 | 3.04 | (0.09 | ) | (0.05 | ) | — | (0.14 | ) | 2.90 | 13.12 | 30.09 | 5,169 | 1.45 | 3.29 | (0.10 | ) | 22 | |||||||||||||||||||||||||||||||||||||||||||||||||||||||||||||
9/5/12(6) to 9/30/12 | 10.00 | 0.01 | 0.21 | 0.22 | — | — | — | — | 0.22 | 10.22 | 2.20 | (4) | 106 | 1.45 | (3) | 44.72 | (3) | 0.78 | (3) | 26 | (4) | |||||||||||||||||||||||||||||||||||||||||||||||||||||||||||||
Class C | ||||||||||||||||||||||||||||||||||||||||||||||||||||||||||||||||||||||||||||||||||
10/1/13 to 9/30/14 | $ | 13.04 | (0.09 | ) | 1.38 | 1.29 | — | (0.01 | ) | — | (0.01 | ) | 1.28 | $ | 14.32 | 9.90 | % | $ | 30,511 | 2.20 | % | 2.22 | % | (0.65 | )% | 62 | % | |||||||||||||||||||||||||||||||||||||||||||||||||||||||
10/1/12 to 9/30/13 | 10.21 | (0.08 | ) | 3.03 | 2.95 | (0.07 | ) | (0.05 | ) | — | (0.12 | ) | 2.83 | 13.04 | 29.11 | 1,742 | 2.20 | 4.41 | (0.66 | ) | 22 | |||||||||||||||||||||||||||||||||||||||||||||||||||||||||||||
9/5/12(6) to 9/30/12 | 10.00 | — | (5) | 0.21 | 0.21 | — | — | — | — | 0.21 | 10.21 | 2.10 | (4) | 107 | 2.20 | (3) | 45.67 | (3) | 0.04 | (3) | 26 | (4) | ||||||||||||||||||||||||||||||||||||||||||||||||||||||||||||
Class I | ||||||||||||||||||||||||||||||||||||||||||||||||||||||||||||||||||||||||||||||||||
10/1/13 to 9/30/14 | $ | 13.14 | 0.05 | 1.39 | 1.44 | (0.01 | ) | (0.01 | ) | — | (0.02 | ) | 1.42 | $ | 14.56 | 10.96 | % | $ | 48,918 | 1.20 | % | 1.20 | % | 0.33 | % | 62 | % | |||||||||||||||||||||||||||||||||||||||||||||||||||||||
10/1/12 to 9/30/13 | 10.22 | 0.06 | 3.01 | 3.07 | (0.10 | ) | (0.05 | ) | — | (0.15 | ) | 2.92 | 13.14 | 30.37 | 44,813 | 1.20 | 4.64 | 0.52 | 22 | |||||||||||||||||||||||||||||||||||||||||||||||||||||||||||||||
9/5/12(6) to 9/30/12 | 10.00 | 0.01 | 0.21 | 0.22 | — | — | — | — | 0.22 | 10.22 | 2.20 | (4) | 818 | 1.20 | (3) | 44.40 | (3) | 1.04 | (3) | 26 | (4) | |||||||||||||||||||||||||||||||||||||||||||||||||||||||||||||
Footnote Legend
| (1) | Sales charges, where applicable, are not reflected in the total return calculation. |
| (2) | Computed using average shares outstanding. |
| (3) | Annualized. |
| (4) | Not annualized. |
| (5) | Amount is less than $0.005 per share. |
| (6) | Inception date. |
| (7) | Due to a change in expense ratio, the ratio shown is a blended expense ratio. |
| (8) | The Funds will also indirectly bear their prorated share of expenses of the underlying funds in which they invest. Such expenses are not included in the calculation of this ratio. |
See Notes to Financial Statements
66
Table of Contents
VIRTUS OPPORTUNITIES TRUST
FINANCIAL HIGHLIGHTS
SELECTED PER SHARE DATA AND RATIOS FOR A SHARE OUTSTANDING
THROUGHOUT EACH PERIOD
| (9) | See Note 3D in the Notes to Financial Statements for information on recapture of expenses previously waived. |
| (10) | Includes extraordinary expenses. |
| (11) | The Fund is currently under its expense limitation. |
See Notes to Financial Statements
67
Table of Contents
VIRTUS OPPORTUNITIES TRUST
SEPTEMBER 30, 2014
| Note 1. Organization |
Virtus Opportunities Trust (the “Trust”) is organized as a Delaware statutory trust and is registered under the Investment Company Act of 1940 (“1940 Act”), as amended, as an open-end management investment company.
As of the date of this report, 31 funds of the Trust are offered for sale, of which seven (each a “Fund”) are reported in this annual report.
The Fund’s investment objectives are outlined in each Fund’s Summary page.
| There | is no guarantee that a Fund will achieve its objective. |
All the Funds offer Class A and Class C shares with the exception of the CA Tax-Exempt Bond Fund which does not offer Class C shares. All Funds offer Class I shares. Class B shares are no longer available for purchase by new or existing shareholders, except for existing shareholders through Qualifying Transactions. For more information regarding Qualifying Transactions, refer to each Fund’s prospectus.
Class A shares of the CA Tax-Exempt Bond Fund and Senior Floating Rate Fund are sold with a front-end sales charge of up to 2.75% with some exceptions. Class A shares of the Bond Fund, High Yield Fund, and Multi-Sector Intermediate Bond Fund are sold with a front-end sales charge of up to 3.75% with some exceptions. Class A shares of the Low Volatility Equity and Wealth Masters Funds are sold with a front-end sales charge of up to 5.75% with some exceptions. Generally, Class A shares are not subject to any charges by the Funds when redeemed; however, a 0.50% – 1% contingent deferred sales charge (“CDSC”) may be imposed on certain redemptions made within a certain period following purchases on which a finder’s fee has been paid. The period for which such CDSC applies for the Funds is 18 months. The CDSC period begins on the last day of the month preceding the month in which the purchase was made.
Class B shares were generally sold with a CDSC, which declines from 5% to zero depending on the period of time the shares are held. Class C shares are generally sold with a 1% CDSC if applicable if redeemed within one year of purchase. Class I shares are sold without a front-end sales charge or CDSC.
Virtus Mutual Funds may impose an annual fee on accounts having balances of less than $2,500. The small account fee may be waived in certain circumstances, as disclosed in the prospectuses and/or statements of additional information. The fees collected will be used to offset certain expenses of the Funds.
Each class of shares has identical voting, dividend, liquidation and other rights and the same terms and conditions, except that each class bears different distribution and/or service fees under a Board approved Rule 12b-1 and/or shareholder servicing plan (“12b-1 plan”) and has exclusive voting rights with respect to such plans. Class I shares are not subject to a 12b-1 plan. Income and other expenses as well as realized and unrealized gains and losses of each Fund are borne pro rata by the holders of each class of shares.
| Note 2. Significant Accounting Policies |
The following is a summary of significant accounting policies consistently followed by the Trust in the preparation of its financial statements. The preparation of financial statements in conformity with accounting principles generally accepted in the United States of America requires management to make estimates and assumptions that affect the reported amounts of assets and liabilities, and disclosure of contingent assets and liabilities at the date of the financial statements and the reported amount of increases and decreases in net assets from operations during the reporting period. Actual results could differ from those estimates and those differences could be significant.
| A. | Security Valuation |
Security valuation procedures for each Fund, which include nightly price variance as well as back-testing such as bi-weekly unchanged price, monthly secondary source and transaction analysis, have been approved by the Board of Trustees (the “Board” or the “Trustees”). All internally fair valued securities are approved by a valuation committee (the “Valuation Committee”) appointed by the Board. The Valuation Committee is comprised of certain members of management as identified by the Board and convenes independently from portfolio management. All internally fair valued securities, referred to below, are updated daily and reviewed in detail by the Valuation Committee monthly unless changes occur within the period. The Valuation Committee reviews the validity of the model inputs and any changes to the model. Fair valuations are reviewed by the Board at least quarterly.
Each Fund utilizes a fair value hierarchy which prioritizes the inputs to valuation techniques used to measure fair value into three broad levels.
| • Level 1 – | quoted prices in active markets for identical securities (security types generally include listed equities). |
| • Level 2 – | prices determined using other significant observable inputs (including quoted prices for similar securities, interest rates, prepayment speeds, credit risk, etc.). |
| • Level 3 – | prices determined using significant unobservable inputs (including the Valuation Committee’s own assumptions in determining the fair value of investments). |
A description of the valuation techniques applied to a Fund’s major categories of assets and liabilities measured at fair value on a recurring basis is as follows:
Equity securities are valued at the official closing price (typically last sale) on the exchange on which the securities are primarily traded, or if no closing price is available, at the last bid price and are categorized as Level 1 in the hierarchy. Restricted equity securities and private placements that are not widely traded, are illiquid or are internally fair valued by the Valuation Committee, are generally categorized as Level 3 in the hierarchy.
Certain non-U.S. securities may be fair valued in cases where closing prices are not readily available or are deemed not reflective of readily available market prices. For example, significant events (such as movement in the U.S. securities market, or other regional and local developments) may occur between the time that non-U.S. markets close (where the security is principally traded) and the time that a Fund calculates its net asset value (“NAV”) at the close of regular trading on the New York Stock Exchange (“NYSE”) (generally 4 p.m. Eastern time) that may impact the value of
68
Table of Contents
VIRTUS OPPORTUNITIES TRUST
NOTES TO FINANCIAL STATEMENTS (Continued)
SEPTEMBER 30, 2014
securities traded in these non-U.S. markets. In such cases the Fund fair values non-U.S. securities using an independent pricing service which considers the correlation of the trading patterns of the non-U.S. security to the intraday trading in the U.S. markets for investments such as ADRs, financial futures, ETFs, and certain indexes as well as prices for similar securities. Such fair valuations are categorized as Level 2 in the hierarchy. Because the frequency of significant events is not predictable, fair valuation of certain non-U.S. common stocks may occur on a frequent basis.
Debt securities, including restricted securities, are valued based on evaluated quotations received from independent pricing services or from dealers who make markets in such securities. For most bond types, the pricing service utilizes matrix pricing that considers one or more of the following factors: yield or price of bonds of comparable quality, coupon, maturity, current cash flows, type, and current day trade information, as well as dealer-supplied prices. These valuations are generally categorized as Level 2 in the hierarchy. Structured debt instruments such as mortgage-backed and asset-backed securities may also incorporate collateral analysis and utilize cash flow models for valuation and are generally categorized as Level 2 in the hierarchy. Pricing services do not provide pricing for all securities and therefore indicative bids from dealers are utilized which are based on pricing models used by market makers in the security and are generally categorized as Level 2 in the hierarchy. Debt securities that are not widely traded, are illiquid, or are internally fair valued by the Valuation Committee are generally categorized as Level 3 in the hierarchy.
Listed derivatives such as treasury futures, that are actively traded are valued based on quoted prices from the exchange and are categorized as Level 1 in the hierarchy. Over-the-counter derivative contracts, which include forward currency contracts and equity-linked instruments, do not require material subjectivity as pricing inputs are observed from actively quoted markets and are categorized as Level 2 in the hierarchy.
Investments in open-end mutual funds are valued at NAV. Investments in closed-end mutual funds are valued as of the close of regular trading on the NYSE each business day. Both are categorized as Level 1 in the hierarchy.
Short-term notes having a maturity of 60 days or less are valued at amortized cost which approximates market and are generally categorized as Level 2 in the hierarchy.
A summary of the inputs used to value the Funds’ net assets by each major security type is disclosed at the end of the Schedule of Investments for each Fund. The inputs or methodologies used for valuing securities are not necessarily an indication of the risk associated with investing in those securities.
The Funds own the following internally fair valued securities and which are categorized as Level 3 in the hierarchy.
| Bond Fund | United Artists Theatre Circuit | |
| High Yield Fund | United Artists Theatre Circuit |
The significant unobservable inputs used in the fair value measurement of these corporate bonds are based on comparable liquid assets adjusted for accretion/amortization rate, current yield, current swap rates, and discount rates related to differences in capital structure and liquidity. Significant changes in any of these inputs in isolation would result in a significantly lower or higher fair value measurement. Generally, a change in the observable market assumptions would have direct impacts to the discount rates used related to capital structure and/or liquidity discounts.
| B. | Security Transactions and Investment Income |
Security transactions are recorded on the trade date. Realized gains and losses from sales of securities are determined on the identified cost basis. Dividend income is recognized on the ex-dividend date, or in the case of certain foreign securities, as soon as a Fund is notified. Interest income is recorded on the accrual basis. Each Fund amortizes premiums and accretes discounts using the effective interest method.
Dividend income from REIT Investments is recorded using management’s estimate of the income included in distributions received from the REIT investments. Distributions received in excess of this estimated amount are recorded as a reduction of the cost of investments or reclassified to capital gains. The actual amounts of income, return of capital, and capital gains are only determined by each REIT after its fiscal year-end, and may differ from the estimated amounts.
| C. | Income Taxes |
Each Fund is treated as a separate taxable entity. It is the intention of each Fund to comply with the requirements of Subchapter M of the Internal Revenue Code and to distribute substantially all of its taxable income to its shareholders. Therefore, no provision for federal income taxes or excise taxes has been made.
Certain Funds may be subject to foreign taxes on income, gains on investments or currency repatriation, a portion of which may be recoverable. Each Fund will accrue such taxes and recoveries as applicable based upon current interpretations of the tax rules and regulations that exist in the markets in which it invests.
Management of the Funds has concluded that there are no significant uncertain tax positions that would require recognition in the financial statements. As of September 30, 2014, the tax years that remain subject to examination by the major tax jurisdictions under the statute of limitations are from the year 2011 forward (with limited exceptions).
| D. | Distributions to Shareholders |
Distributions are recorded by each Fund on the ex-dividend date. For the Bond Fund, CA Tax-Exempt Fund, High Yield Fund, Multi-Sector Intermediate Bond Fund and Senior Floating Rate Fund income distributions are declared and recorded daily and distributed monthly. Income and capital gain distributions are determined in accordance with income tax regulations that may differ from accounting principles generally accepted in the United States of America. These differences may include the treatment of non-taxable dividends, market premium and discount, non-deductible expenses, expiring capital loss carryovers, foreign currency gain or loss, gain or loss on futures contracts, partnerships, operating losses and losses deferred due to wash sales. Permanent book and tax basis differences relating to shareholder distributions will result in reclassifications to capital paid in on shares of beneficial interest.
69
Table of Contents
VIRTUS OPPORTUNITIES TRUST
NOTES TO FINANCIAL STATEMENTS (Continued)
SEPTEMBER 30, 2014
| E. | Expenses |
Expenses incurred together by a Fund and other affiliated mutual funds are allocated in proportion to the net assets of each such fund, except where allocation of direct expense to each fund or an alternative allocation method can be more appropriately used.
In addition to the net annual operating expenses that a Fund bears directly, the shareholders of a Fund indirectly bear the pro-rata expenses of the underlying mutual funds in which a Fund invests.
| F. | Foreign Currency Translation |
Non-U.S. investment securities and other assets and liabilities denominated in foreign currencies are translated into U.S. dollar amounts at the foreign currency exchange rate effective at the end of the reporting period. Cost of investments is translated at the currency exchange rate effective at the trade date. The gain or loss resulting from a change in currency exchange rates between the trade and settlement date of a portfolio transaction is treated as a gain or loss on non-U.S. currency. Likewise, the gain or loss resulting from a change in currency exchange rates between the date income is accrued and paid is treated as a gain or loss on foreign currency. The Funds do not isolate that portion of the results of
operations arising from changes in foreign exchange rates on investments from the fluctuations arising from changes in the market prices of securities held. Such fluctuations are included with the net realized and unrealized gain or loss on investments.
| G. | Derivative Financial Instruments |
Disclosures about derivative instruments and hedging activities are intended to improve financial reporting for derivative instruments by better enabling the investors to understand how and why a Fund uses derivatives, how derivatives are accounted for, and how derivative instruments affect a fund’s results of operations and financial position. Summarized below is the specific type of derivative instruments used by the Funds.
Options contracts
An options contract provides the purchaser with the right, but not the obligation, to buy (call option) or sell (put option) a financial instrument at an agreed upon price. Certain Funds may purchase or write both put and call options on portfolio securities. The Fund is subject to equity price risk in the normal course of pursuing its investment objectives. The Fund uses options contracts to hedge against changes in the values of equities.
When a Fund purchases an option, it pays a premium and an amount equal to that premium is recorded as an asset. When a Fund writes an option, it receives a premium and an amount equal to that premium is recorded as a liability. The asset or liability is adjusted daily to reflect the current market value of the option. Holdings of the Fund designated to cover outstanding written options are noted in the Schedules of Investments. Purchased options are reported as an asset within “Investment securities at value” in the Statement of Assets and Liabilities. Options written are reported as a liability within “Written options outstanding at value”. Changes in value of the purchased option is included in “Net change in unrealized appreciation/(depreciation) on investments” in the Statement of Operations. Changes in value of written options is included in “Net change in unrealized appreciation/(depreciation) on written options”.
If an option expires unexercised, the Fund realizes a gain or loss to the extent of the premium received or paid. If an option is exercised, the premium received or paid is recorded as an adjustment to the proceeds from the sale or the cost basis of the purchase. The difference between the premium and the amount received or paid on effecting a closing purchase or sale transaction is also treated as a realized gain or loss. Gain or loss on purchased options is included in “Net realized gain/(loss) on investments” in the Statement of Operations. Gain or loss on written options is presented separately as “Net realized gain/(loss) on written options” in the Statement of Operations.
The risk in writing call options is that the Fund gives up the opportunity for profit if the market price of the security increases and the option is exercised. The risk in writing put options is that the Fund may incur a loss if the market price of the security decreases and the option is exercised. The risk in buying options is that the Fund pays a premium whether or not the option is exercised. The use of such instruments may involve certain additional risks as a result of unanticipated movements in the market. Writers (sellers) of options are subject to unlimited risk of loss, as the seller will be obligated to deliver or take delivery of the security at a predetermined price which may, upon exercise of the option, be significantly different from the then-market value.
| H. | When-issued Purchases and Forward Commitments (Delayed Delivery) |
Certain Funds may engage in when-issued or forward commitment transactions. Securities purchased on a when-issued or forward commitment basis are also known as delayed delivery transactions. Delayed delivery transactions involve a commitment by a Fund to purchase or sell a security at a future date (ordinarily up to 90 days later). When-issued or forward commitments enable a Fund to lock in what is believed to be an attractive price or yield on a particular security for a period of time, regardless of future changes in interest rates. Each Fund records when-issued and delayed delivery securities on the trade date. Each Fund maintains collateral for the securities purchased. Securities purchased on a when-issued or delayed delivery basis begin earning interest on the settlement date.
| I. | Loan Agreements |
Certain Funds may invest in direct debt instruments which are interests in amounts owed by a corporate, governmental, or other borrower to lenders or lending syndicates. Loan agreements are generally non-investment grade, often involve borrowers that are highly leveraged. The Funds may invest in obligations of borrowers who are in bankruptcy proceedings. Loan agreements are typically senior in the corporate capital structure of the borrower. A loan is often administered by a bank or other financial institution (the “lender”) that acts as agent for all holders. The agent administers the terms of the loan, as specified in the loan agreement. A Fund’s investments in loans may be in the form of participations in loans or assignments of all or a portion of loans from third parties. When investing in loan participations, the Fund has the right to receive payments of principal, interest and any fees to which it is entitled only from the lender selling the loan participation and only upon receipt by the lender of payments from the borrower. The Fund generally has no right to enforce compliance with the terms of the loan agreement with the borrower. As a result, the Fund may be subject to the credit risk of both the borrower and the lender that is selling the loan agreement. When the Fund purchases assignments from lenders it acquires direct rights against the borrower on the loan.
70
Table of Contents
VIRTUS OPPORTUNITIES TRUST
NOTES TO FINANCIAL STATEMENTS (Continued)
SEPTEMBER 30, 2014
A Fund may invest in multiple series or tranches of a loan, which may have varying terms and carry different associated risks. Loan agreements may involve foreign borrowers, and investments may be denominated in foreign currencies. Direct indebtedness of emerging countries involves a risk that the government entities responsible for the repayment of the debt may be unable, or unwilling, to pay the principal and interest when due.
The loan agreements have floating rate loan interests which generally pay interest at rates that are periodically determined by reference to a base lending rate plus a premium. The base lending rates are generally LIBOR (London Interbank Offered Rate), the prime rate offered by one or more U.S. banks or the certificate of deposit rate. When a loan agreement is purchased the Fund may pay an assignment fee. On an ongoing basis, the Funds may receive a commitment fee based on the undrawn portion of the underlying line of credit portion of a loan agreement. Prepayment penalty fees are received upon the prepayment of a loan agreement by a borrower. Prepayment penalty, facility, commitment, consent and amendment fees are recorded to income as earned or paid.
At September 30, 2014, all loan agreements held by the Funds are assignment loans.
| J. | Securities Lending |
(reported in thousands)
Certain Funds may loan securities to qualified brokers through an agreement with Brown Brothers Harriman (“BBH”), as a third party lending agent. Under the terms of agreement, a Fund is required to maintain collateral with a market value not less than 100% of the market value of loaned securities. Collateral is adjusted daily in connection with changes in the market value of securities on loan. Collateral may consist of cash and securities issued by the U.S. Government or its agencies. Cash collateral is invested in a short-term money market fund. Dividends earned on the collateral and premiums paid by the broker are recorded as income by the Fund net of fees and rebates charged by BBH for its services as securities lending agent and in connection with this securities lending program. Lending portfolio securities involves a risk of delay in the recovery of the loaned securities or in the declining value of the collateral.
At September 30, 2014, the Wealth Masters Fund had securities on loan with a market value of $10,623 and cash collateral of $11,155.
| Note 3. Investment | Advisory Fee and Related Party Transactions |
($ reported in thousands except as noted)
| A. | Adviser |
Virtus Investment Advisers, Inc. (the “Adviser”), an indirect wholly-owned subsidiary of Virtus Investment Partners, Inc. (“Virtus”), is the adviser to the Trust. The Adviser manages the Funds’ investment programs and general operations of the Funds, including oversight of the Funds’ subadvisers.
As compensation for its services to the Funds, the Adviser is entitled to a fee based upon the following annual rates as a percentage of the average daily net assets of each Fund:
| 1st $1 Billion | $1+ Billion | |||||||
Bond Fund | 0.45 | % | 0.40 | % | ||||
Wealth Masters Fund | 0.85 | 0.80 | ||||||
| 1st $1 Billion | $1+ Billion through $2 Billion | $2 + Billion | ||||||||||
CA Tax-Exempt Bond Fund | 0.45 | % | 0.40 | % | 0.35 | % | ||||||
High Yield Fund | 0.65 | 0.60 | 0.55 | |||||||||
Multi-Sector Intermediate Bond Fund | 0.55 | 0.50 | 0.45 | |||||||||
Senior Floating Rate Fund | 0.60 | 0.55 | 0.50 | |||||||||
| 1st $2 Billion | $2+ Billion through $4 Billion | $4+ Billion | ||||||||||
Low Volatility Equity Fund | 0.95 | % | 0.90 | % | 0.85 | % | ||||||
| B. | Subadvisers |
The subadvisers manage the investments of each Fund for which they are paid a fee by the Adviser. The subadvisers and the Fund(s) they service are as follows:
Fund | Subadviser | Fund | Subadviser | |||
| Bond Fund | NF(1) | Low Volatility Equity Fund | Rampart(3) | |||
| CA Tax-Exempt Bond Fund | NF(1) | Multi-Sector Intermediate Bond Fund | NF(1) | |||
High Yield Fund | NF(1) | Senior Floating Rate Fund | NF(1) | |||
| Wealth Masters Fund | Horizon(2) |
| (1) | Newfleet Asset Management, LLC an indirect wholly-owned subsidiary of Virtus. (“NF”) |
| (2) | Horizon Asset Management, LLC (“Horizon”) |
| (3) | Rampart Investment Management Company LLC (“Rampart”) |
71
Table of Contents
VIRTUS OPPORTUNITIES TRUST
NOTES TO FINANCIAL STATEMENTS (Continued)
SEPTEMBER 30, 2014
| C. | Expense Limits and Fee Waivers |
The Adviser has voluntarily agreed to limit certain Fund’s total expenses (excluding interest, taxes, extraordinary expenses and acquired fund fees and expenses, if any), so that such expenses do not exceed the percentages of the Fund’s average daily net asset values as listed below. The Adviser may discontinue these voluntary expense caps at any time.
| Class A | Class B | Class C | Class I | |||||||||||||
Bond Fund | 0.85 | % | 1.60 | % | 1.60 | % | 0.60 | % | ||||||||
CA Tax-Exempt Bond Fund | 0.85 | — | — | 0.60 | ||||||||||||
High Yield Fund | 1.15 | 1.90 | 1.90 | 0.90 | ||||||||||||
Senior Floating Rate Fund(1) | 1.20 | — | 1.95 | 0.95 | ||||||||||||
Wealth Masters Fund | 1.45 | — | 2.20 | 1.20 | ||||||||||||
| (1) | Excluding leverage expenses, if any. |
The Adviser has contractually agreed to limit the following Fund’s total operating expenses (excluding interest, taxes, extraordinary expenses and acquired fund fees and expenses):
| Class A | Class C | Class I | Through Date | |||||||||||||
Low Volatility Equity Fund | 1.55 | % | 2.30 | % | 1.30 | % | 1/31/15 | |||||||||
| D. | Expense Recapture |
For certain Funds the Adviser may recapture operating expenses waived or reimbursed under these arrangements, within three fiscal years following the end of the fiscal year in which such waiver or reimbursement occurred. The Fund must pay its ordinary operating expenses before the Adviser is entitled to any reimbursement and must remain in compliance with any applicable expense limitations or if none, the expense limitation in effect at the time of the waiver or reimbursement. All or a portion of the following Adviser reimbursed expenses may be recaptured as follows:
| Fiscal Year Ended | ||||||||||||||||
| 2015 | 2016 | 2017 | Total | |||||||||||||
Bond Fund | $ | 263 | $ | 222 | $ | 197 | $ | 682 | ||||||||
CA Tax-Exempt Bond Fund | 112 | 100 | 103 | 315 | ||||||||||||
High Yield Fund | 159 | 161 | 150 | 470 | ||||||||||||
Low Volatility Equity Fund | — | 29 | 81 | 110 | ||||||||||||
Wealth Masters Fund | 29 | 96 | 8 | 133 | ||||||||||||
| E. | Distributor |
VP Distributors, LLC (“VP Distributors”), an indirect wholly-owned subsidiary of Virtus, serves as the distributor of each Fund’s shares and has advised the Funds that for the fiscal year (the “period”) ended September 30, 2014, it retained net commissions of $172 for Class A shares and deferred sales charges of $62, $2, $67 and $—(1) for Class A shares, Class B shares, Class C shares and Class I shares, respectively.
In addition, each Fund pays VP Distributors distribution and/or service fees under Board approved 12b-1 plan as a percentage of the average daily net assets of each respective class at the annual rates of 0.25% for Class A shares, 1.00% for Class B shares and 1.00% for Class C shares; Class I shares are not subject to a 12b-1 plan.
Under certain circumstances, shares of certain Virtus Mutual Funds may be exchanged for shares of the same class of certain other Virtus Mutual Funds on the basis of the relative net asset values per share at the time of the exchange. On exchanges with share classes that carry a CDSC, the CDSC schedule of the original shares purchased continues to apply.
| (1) | Amount less than $500. |
| F. | Administrator and Transfer Agent |
Virtus Fund Services LLC, an indirect wholly-owned subsidiary of Virtus, serves as the administrator and transfer agent to the Funds.
For the period ended September 30, 2014, the Funds incurred administration fees totaling $1,639 which are included in the Statements of Operations.
For the period ended September 30, 2014, the Funds incurred transfer agent fees totaling $1,808 which are included in the Statements of Operations. A portion is paid to outside entities that also provide services to the Trust.
72
Table of Contents
VIRTUS OPPORTUNITIES TRUST
NOTES TO FINANCIAL STATEMENTS (Continued)
SEPTEMBER 30, 2014
| G. | Affiliated Shareholders |
At September 30, 2014, Virtus and its affiliates, BMO Bankcorp (a minority investor in Virtus) and its affiliates, and the retirement plans of Virtus and its affiliates held shares of the Funds which may be redeemed at any time that aggregated to the following:
| Shares | Aggregate Net Asset Value | |||||||
| Low Volatility Equity Fund | ||||||||
Class A | 10,077 | $ | 118 | |||||
Class C | 10,041 | 117 | ||||||
Class I | 131,148 | 1,538 | ||||||
| Senior Floating Rate Fund | ||||||||
Class I | 1,195,297 | 11,606 | ||||||
| Note 4. Purchases and Sales of Securities |
($ reported in thousands)
Purchases and sales of securities (excluding U.S. Government and agency securities, and short-term securities) during the period ended September 30, 2014, were as follows:
| Purchases | Sales | |||||||
Bond Fund | $ | 27,575 | $ | 38,478 | ||||
CA Tax-Exempt Bond | 2,824 | 19,682 | ||||||
High Yield Fund | 72,573 | 79,306 | ||||||
Low Volatility Equity Fund | 420 | 60 | ||||||
Multi-Sector Intermediate Bond Fund | 194,553 | 216,593 | ||||||
Senior Floating Rate Fund | 826,425 | 805,492 | ||||||
Wealth Masters Fund | 141,399 | 64,984 | ||||||
Purchases and sales of long term U.S. Government and agency securities for the Funds during the period ended September 30, 2014, were as follows:
| Purchases | Sales | |||||||
Bond Fund | $ | 2,098 | $ | 2,440 | ||||
73
Table of Contents
VIRTUS OPPORTUNITIES TRUST
NOTES TO FINANCIAL STATEMENTS (Continued)
SEPTEMBER 30, 2014
| Note 5. Capital | Share Transactions |
(reported in thousands)
Transactions in shares of capital stock, during the periods ended as indicated below, were as follows:
| Bond Fund | CA Tax-Exempt Bond Fund | |||||||||||||||||||||||||||||||
| Year Ended September 30, 2014 | Year Ended September 30, 2013 | Year Ended September 30, 2014 | Year Ended September 30, 2013 | |||||||||||||||||||||||||||||
| SHARES | AMOUNT | SHARES | AMOUNT | SHARES | AMOUNT | SHARES | AMOUNT | |||||||||||||||||||||||||
| Class A | ||||||||||||||||||||||||||||||||
| Sale of shares | 372 | $ | 4,261 | 324 | $ | 3,770 | 10 | $ | 118 | 11 | $ | 143 | ||||||||||||||||||||
| Reinvestment of distributions | 158 | 1,810 | 160 | 1,843 | 73 | 880 | 71 | 902 | ||||||||||||||||||||||||
| Shares repurchased | (948 | ) | (10,852 | ) | (1,216 | ) | (13,984 | ) | (214 | ) | (2,620 | ) | (437 | ) | (5,505 | ) | ||||||||||||||||
|
|
|
|
|
|
|
|
|
|
|
|
|
|
|
| |||||||||||||||||
| Net Increase / (Decrease) | (418 | ) | $ | (4,781 | ) | (732 | ) | $ | (8,371 | ) | (131 | ) | $ | (1,622 | ) | (355 | ) | $ | (4,460 | ) | ||||||||||||
|
|
|
|
|
|
|
|
|
|
|
|
|
|
|
| |||||||||||||||||
| Class B | ||||||||||||||||||||||||||||||||
| Sale of shares | — | $ | — | 1 | $ | 9 | — | $ | — | — | $ | — | ||||||||||||||||||||
| Reinvestment of distributions | 1 | 9 | 1 | 14 | — | — | — | — | ||||||||||||||||||||||||
| Shares repurchased | (16 | ) | (184 | ) | (30 | ) | (333 | ) | — | — | — | — | ||||||||||||||||||||
|
|
|
|
|
|
|
|
|
|
|
|
|
|
|
| |||||||||||||||||
| Net Increase / (Decrease) | (15 | ) | $ | (175 | ) | (28 | ) | $ | (310 | ) | — | $ | — | — | $ | — | ||||||||||||||||
|
|
|
|
|
|
|
|
|
|
|
|
|
|
|
| |||||||||||||||||
| Class C | ||||||||||||||||||||||||||||||||
| Sale of shares | 128 | $ | 1,442 | 194 | $ | 2,223 | — | $ | — | — | $ | — | ||||||||||||||||||||
| Reinvestment of distributions | 16 | 179 | 19 | 211 | — | — | — | — | ||||||||||||||||||||||||
| Shares repurchased | (201 | ) | (2,241 | ) | (361 | ) | (4,072 | ) | — | — | — | — | ||||||||||||||||||||
|
|
|
|
|
|
|
|
|
|
|
|
|
|
|
| |||||||||||||||||
| Net Increase / (Decrease) | (57 | ) | $ | (620 | ) | (148 | ) | $ | (1,638 | ) | — | $ | — | — | $ | — | ||||||||||||||||
|
|
|
|
|
|
|
|
|
|
|
|
|
|
|
| |||||||||||||||||
| Class I | ||||||||||||||||||||||||||||||||
| Sale of shares | 298 | $ | 3,463 | 517 | $ | 6,083 | 101 | $ | 1,222 | 59 | $ | 744 | ||||||||||||||||||||
| Reinvestment of distributions | 58 | 673 | 83 | 969 | 32 | 383 | 31 | 391 | ||||||||||||||||||||||||
| Shares repurchased | (874 | ) | (10,111 | ) | (1,172 | ) | (13,566 | ) | (1,367 | ) | (16,739 | ) | (150 | ) | (1,888 | ) | ||||||||||||||||
|
|
|
|
|
|
|
|
|
|
|
|
|
|
|
| |||||||||||||||||
| Net Increase / (Decrease) | (518 | ) | $ | (5,975 | ) | (572 | ) | $ | (6,514 | ) | (1,234 | ) | $ | (15,134 | ) | (60 | ) | $ | (753 | ) | ||||||||||||
|
|
|
|
|
|
|
|
|
|
|
|
|
|
|
| |||||||||||||||||
| High Yield Fund | Low Volatility Equity Fund | |||||||||||||||||||||||||||||||
| Year Ended September 30, 2014 | Year Ended September 30, 2013 | Year Ended September 30, 2014 | From Inception June 11, 2013 to September 30, 2013 | |||||||||||||||||||||||||||||
| SHARES | AMOUNT | SHARES | AMOUNT | SHARES | AMOUNT | SHARES | AMOUNT | |||||||||||||||||||||||||
Class A | ||||||||||||||||||||||||||||||||
Sale of shares | 2,906 | $ | 12,699 | 3,825 | $ | 16,511 | 31 | $ | 355 | 13 | $ | 134 | ||||||||||||||||||||
Reinvestment of distributions | 792 | 3,494 | 1,095 | 4,758 | — | (1) | 1 | — | — | |||||||||||||||||||||||
Shares repurchased | (6,129 | ) | (27,052 | ) | (9,186 | ) | (39,855 | ) | (3 | ) | (40 | ) | — | — | ||||||||||||||||||
|
|
|
|
|
|
|
|
|
|
|
|
|
|
|
| |||||||||||||||||
Net Increase / (Decrease) | (2,431 | ) | $ | (10,859 | ) | (4,266 | ) | $ | (18,586 | ) | 28 | $ | 316 | 13 | $ | 134 | ||||||||||||||||
|
|
|
|
|
|
|
|
|
|
|
|
|
|
|
| |||||||||||||||||
Class B | ||||||||||||||||||||||||||||||||
Sale of shares | — | $ | — | — | $ | — | — | $ | — | — | $ | — | ||||||||||||||||||||
Reinvestment of distributions | 1 | 5 | 2 | 11 | — | — | — | — | ||||||||||||||||||||||||
Shares repurchased | (8 | ) | (33 | ) | (44 | ) | (190 | ) | — | — | — | — | ||||||||||||||||||||
|
|
|
|
|
|
|
|
|
|
|
|
|
|
|
| |||||||||||||||||
Net Increase / (Decrease) | (7 | ) | $ | (28 | ) | (42 | ) | $ | (179 | ) | — | $ | — | — | $ | — | ||||||||||||||||
|
|
|
|
|
|
|
|
|
|
|
|
|
|
|
| |||||||||||||||||
Class C | ||||||||||||||||||||||||||||||||
Sale of shares | 374 | $ | 1,629 | 237 | $ | 1,017 | 12 | $ | 137 | 13 | $ | 127 | ||||||||||||||||||||
Reinvestment of distributions | 33 | 143 | 34 | 144 | — | (1) | 1 | — | — | |||||||||||||||||||||||
Shares repurchased | (249 | ) | (1,075 | ) | (182 | ) | (780 | ) | — | — | — | — | ||||||||||||||||||||
|
|
|
|
|
|
|
|
|
|
|
|
|
|
|
| |||||||||||||||||
Net Increase / (Decrease) | 158 | $ | 697 | 89 | $ | 381 | 12 | $ | 138 | 13 | $ | 127 | ||||||||||||||||||||
|
|
|
|
|
|
|
|
|
|
|
|
|
|
|
| |||||||||||||||||
Class I | ||||||||||||||||||||||||||||||||
Sale of shares | 190 | $ | 844 | 1,420 | $ | 6,079 | — | $ | — | 130 | $ | 1,300 | ||||||||||||||||||||
Reinvestment of distributions | 65 | 285 | 12 | 54 | 1 | 13 | — | — | ||||||||||||||||||||||||
Shares repurchased | (208 | ) | (918 | ) | (94 | ) | (409 | ) | — | — | — | — | ||||||||||||||||||||
|
|
|
|
|
|
|
|
|
|
|
|
|
|
|
| |||||||||||||||||
Net Increase / (Decrease) | 47 | $ | 211 | 1,338 | $ | 5,724 | 1 | $ | 13 | 130 | $ | 1,300 | ||||||||||||||||||||
|
|
|
|
|
|
|
|
|
|
|
|
|
|
|
| |||||||||||||||||
| (1) | Amount less than 500. |
74
Table of Contents
VIRTUS OPPORTUNITIES TRUST
NOTES TO FINANCIAL STATEMENTS (Continued)
SEPTEMBER 30, 2014
| Multi-Sector Intermediate Bond Fund | Senior Floating Rate Fund | |||||||||||||||||||||||||||||||
| Year Ended September 30, 2014 | Year Ended September 30, 2013 | Year Ended September 30, 2014 | Year Ended September 30, 2013 | |||||||||||||||||||||||||||||
| SHARES | AMOUNT | SHARES | AMOUNT | SHARES | AMOUNT | SHARES | AMOUNT | |||||||||||||||||||||||||
| Class A | ||||||||||||||||||||||||||||||||
| Sale of shares | 3,763 | $ | 40,776 | 6,732 | $ | 75,034 | 20,351 | $ | 200,743 | 23,426 | $ | 231,001 | ||||||||||||||||||||
| Reinvestment of distributions | 908 | 9,799 | 991 | 10,979 | 1,405 | 13,850 | 1,353 | 13,312 | ||||||||||||||||||||||||
| Shares repurchased | (10,641 | ) | (115,701 | ) | (8,226 | ) | (90,501 | ) | (30,864 | ) | (304,300 | ) | (11,539 | ) | (113,636 | ) | ||||||||||||||||
|
|
|
|
|
|
|
|
|
|
|
|
|
|
|
| |||||||||||||||||
| Net Increase / (Decrease) | (5,970 | ) | $ | (65,126 | ) | (503 | ) | $ | (4,488 | ) | (9,108 | ) | $ | (89,707 | ) | 13,240 | $ | 130,677 | ||||||||||||||
|
|
|
|
|
|
|
|
|
|
|
|
|
|
|
| |||||||||||||||||
| Class B | ||||||||||||||||||||||||||||||||
| Sale of shares | — | (1) | $ | 5 | 1 | $ | 7 | — | $ | — | — | $ | — | |||||||||||||||||||
| Reinvestment of distributions | 35 | 372 | 41 | 453 | — | — | — | — | ||||||||||||||||||||||||
| Shares repurchased | (241 | ) | (2,601 | ) | (231 | ) | (2,550 | ) | — | — | — | — | ||||||||||||||||||||
|
|
|
|
|
|
|
|
|
|
|
|
|
|
|
| |||||||||||||||||
| Net Increase / (Decrease) | (206 | ) | $ | (2,224 | ) | (189 | ) | $ | (2,090 | ) | — | $ | — | — | $ | — | ||||||||||||||||
|
|
|
|
|
|
|
|
|
|
|
|
|
|
|
| |||||||||||||||||
| Class C | ||||||||||||||||||||||||||||||||
| Sale of shares | 1,482 | $ | 16,227 | 2,390 | $ | 26,943 | 4,222 | $ | 41,705 | 10,676 | $ | 105,397 | ||||||||||||||||||||
| Reinvestment of distributions | 388 | 4,218 | 393 | 4,385 | 472 | 4,661 | 405 | 3,992 | ||||||||||||||||||||||||
| Shares repurchased | (2,602 | ) | (28,418 | ) | (2,820 | ) | (31,223 | ) | (5,080 | ) | (50,109 | ) | (2,153 | ) | (21,218 | ) | ||||||||||||||||
|
|
|
|
|
|
|
|
|
|
|
|
|
|
|
| |||||||||||||||||
| Net Increase / (Decrease) | (732 | ) | $ | (7,973 | ) | (37 | ) | $ | 105 | (386 | ) | $ | (3,743 | ) | 8,928 | $ | 88,171 | |||||||||||||||
|
|
|
|
|
|
|
|
|
|
|
|
|
|
|
| |||||||||||||||||
| Class I | ||||||||||||||||||||||||||||||||
| Sale of shares | 9,376 | $ | 102,122 | 6,255 | $ | 69,805 | 33,480 | $ | 329,745 | 35,281 | $ | 347,516 | ||||||||||||||||||||
| Reinvestment of distributions | 411 | 4,444 | 329 | 3,645 | 1,218 | 11,990 | 694 | 6,824 | ||||||||||||||||||||||||
| Shares repurchased | (4,327 | ) | (46,859 | ) | (5,280 | ) | (58,125 | ) | (26,595 | ) | (261,835 | ) | (6,593 | ) | (64,869 | ) | ||||||||||||||||
|
|
|
|
|
|
|
|
|
|
|
|
|
|
|
| |||||||||||||||||
| Net Increase / (Decrease) | 5,460 | $ | 59,707 | 1,304 | $ | 15,325 | 8,103 | $ | 79,900 | 29,382 | $ | 289,471 | ||||||||||||||||||||
|
|
|
|
|
|
|
|
|
|
|
|
|
|
|
| |||||||||||||||||
| Wealth Masters Fund | ||||||||||||||||||||||||||||||||
| Year Ended September 30, 2014 | Year Ended September 30, 2013 | |||||||||||||||||||||||||||||||
| SHARES | AMOUNT | SHARES | AMOUNT | |||||||||||||||||||||||||||||
| Class A | ||||||||||||||||||||||||||||||||
| Sale of shares | 4,607 | $ | 65,457 | 401 | $ | 4,836 | ||||||||||||||||||||||||||
| Reinvestment of distributions | 1 | 14 | — | (1) | 2 | |||||||||||||||||||||||||||
| Shares repurchased | (1,149 | ) | (16,700 | ) | (18 | ) | (228 | ) | ||||||||||||||||||||||||
|
|
|
|
|
|
|
| |||||||||||||||||||||||||
| Net Increase / (Decrease) | 3,459 | $ | 48,771 | 383 | $ | 4,610 | ||||||||||||||||||||||||||
|
|
|
|
|
|
|
| |||||||||||||||||||||||||
| Class C | ||||||||||||||||||||||||||||||||
| Sale of shares | 2,113 | $ | 29,835 | 129 | $ | 1,582 | ||||||||||||||||||||||||||
| Reinvestment of distributions | — | (1) | 4 | — | (1) | 1 | ||||||||||||||||||||||||||
| Shares repurchased | (115 | ) | (1,639 | ) | (6 | ) | (74 | ) | ||||||||||||||||||||||||
|
|
|
|
|
|
|
| |||||||||||||||||||||||||
| Net Increase / (Decrease) | 1,998 | $ | 28,200 | 123 | $ | 1,509 | ||||||||||||||||||||||||||
|
|
|
|
|
|
|
| |||||||||||||||||||||||||
| Class I | ||||||||||||||||||||||||||||||||
| Sale of shares | 3,818 | $ | 54,849 | 3,347 | $ | 43,746 | ||||||||||||||||||||||||||
| Reinvestment of distributions | 5 | 73 | 1 | 12 | ||||||||||||||||||||||||||||
| Shares repurchased | (3,873 | ) | (55,434 | ) | (17 | ) | (192 | ) | ||||||||||||||||||||||||
|
|
|
|
|
|
|
| |||||||||||||||||||||||||
| Net Increase / (Decrease) | (50 | ) | $ | (512 | ) | 3,331 | $ | 43,566 | ||||||||||||||||||||||||
|
|
|
|
|
|
|
| |||||||||||||||||||||||||
| (1) | Amount less than 500. |
75
Table of Contents
VIRTUS OPPORTUNITIES TRUST
NOTES TO FINANCIAL STATEMENTS (Continued)
SEPTEMBER 30, 2014
| Note 6. Derivative Transactions |
($’s reported in thousands)
The Low Volatility Equity Fund invested in derivative instruments during the fiscal period in the form of writing index call options and buying call options on VIX futures. The primary risk associated with call options is that selling index call options may limit the Fund’s opportunity to profit from increases in the value of its equity portfolio, and the risk that buying call options may result in the loss of the premium paid for those options. The Fund invested in writing index call options and buying call options on VIX futures both are used as techniques for limiting the volatility of the Fund’s portfolio. For additional information on call options in which the Fund invested in during the reporting period, refer to Note 2G.
Written call options | Number of | Premium | ||||||
Written Options outstanding at September 30, 2013 | 9 | $ | 2 | |||||
Options written | 117 | 19 | ||||||
Options closed | (115 | ) | (20 | ) | ||||
Options expired | — | — | ||||||
Options exercised | — | — | ||||||
|
|
|
| |||||
Written Options outstanding at September 30, 2014 | 11 | $ | 1 | |||||
|
|
|
| |||||
The following is a summary of the Fund’s purchased and written options contracts which have a primary risk exposure to equity contracts as of September 30, 2014:
Statements of Assets and Liabilities | ||||
Assets: Purchased options at value | $ | 2 | (1) | |
Liabilities: Written call options at value | (— | )(2) | ||
|
| |||
Net asset (liability) balance | $ | 2 | ||
|
| |||
Statements of Operations | ||||
| Net realized gain (loss) on purchased options | $ | (29 | )(3) | |
Net realized gain (loss) on written options | (17 | ) | ||
Net change in unrealized appreciation (depreciation) on purchased options | — | |||
Net change in unrealized appreciation (depreciation) on written options | (2 | ) | ||
|
| |||
Total realized and unrealized gain (loss) on purchased and written options | $ | (48 | ) | |
|
| |||
| (1) | Amount included in Investment in securities at value. |
| (2) | Amount less than $500 |
| (3) | Amount included in Net realized gain (loss) on investments |
For the period ended September 30, 2014, the average daily premiums paid by the Fund for purchased options were $2, and the average daily premiums received for written call options by the Fund were $(2).
| Note 7. 10% Shareholders |
As of September 30, 2014, certain Funds had individual shareholder account(s) and/or omnibus shareholder account(s) (comprised of a group of individual shareholders), which individually amounted to more than 10% of the total shares outstanding of each such Fund as detailed below:
| % of Shares Outstanding | Number of Accounts | |||||||
CA-Tax Exempt Bond Fund | 12 | % | 1 | |||||
Low Volatility Equity Fund | 66 | 1 | * | |||||
Multi-Sector Intermediate Bond Fund | 13 | 1 | ||||||
Senior Floating Rate Fund | 50 | 4 | ||||||
Wealth Masters Fund | 15 | 1 | ||||||
| * | Includes affiliated shareholder accounts. |
| Note 8. Credit Risk and Asset Concentration |
In countries with limited or developing markets, investments may present greater risks than in more developed markets and the prices of such investments may be volatile. The consequences of political, social or economic changes in these markets may have disruptive effects on the market prices of these investments and the income they generate, as well as a Fund’s ability to repatriate such amounts.
High-yield/high-risk securities typically entail greater price volatility and/or principal and interest rate risk. There is a greater chance that an issuer will not be able to make principal and interest payments on time. Analysis of the creditworthiness of issuers of high-yield/high-risk securities may be complex, and as a result it may be more difficult for the Adviser and/or Subadviser to accurately predict risk.
Many municipalities insure repayment for their obligations. Although bond insurance reduces the risk of loss due to default by an issuer, such bonds remain subject to the risk that the market may fluctuate for other reasons, and there is no assurance that the insurance company will meet its obligations. Insured securities have been identified in the Schedule of Investments. A real or perceived decline in creditworthiness of a bond insurer can have an adverse impact on the value of insured bonds held in the Funds.
Certain Funds may invest a high percentage of their assets in specific sectors of the market in their pursuit of a greater investment return. Fluctuations in these sectors of concentration may have a greater impact on a Fund, positive or negative, than if a Fund did not concentrate its investments in such sectors.
76
Table of Contents
VIRTUS OPPORTUNITIES TRUST
NOTES TO FINANCIAL STATEMENTS (Continued)
SEPTEMBER 30, 2014
At September 30, 2014, the following Funds held securities issued by various companies in specific sectors or countries as detailed below:
Fund | Sector | Percentage of Total Investments | ||||
| CA-Tax Exempt Bond Fund | General Revenue | 27 | % | |||
Senior Floating Rate Fund | Consumer Discretionary (Loan Agreements) | 28 | ||||
Wealth Masters Fund | Consumer Discretionary | 33 | ||||
| Note 9. Indemnifications |
Under the Trust’s organizational documents, their trustees and officers are indemnified against certain liabilities arising out of the performance of their duties to the Funds. Each Trustee has also entered into an indemnification agreement with the Trust. In addition, in the normal course of business the Funds enter into contracts that provide a variety of indemnifications to other parties. The Funds’ maximum exposure under these arrangements is unknown as this would involve future claims that may be made against the Funds and that have not occurred. However, the Funds have not had prior claims or losses pursuant to these arrangements and expect the risk loss to be remote.
| Note 10. Federal Income Tax Information |
($ reported in thousands)
At September 30, 2014, federal tax cost and aggregate gross unrealized appreciation (depreciation) of securities held by the Funds were as follows:
Fund | Federal Tax Cost | Unrealized Appreciation | Unrealized (Depreciation) | Net Unrealized Appreciation (Depreciation) | ||||||||||||
Bond Fund | $ | 75,751 | $ | 1,932 | $ | (1,478 | ) | $ | 454 | |||||||
CA Tax-Exempt Bond Fund | 30,217 | 2,496 | (262 | ) | 2,234 | |||||||||||
High Yield Fund | 81,767 | 1,341 | (1,276 | ) | 65 | |||||||||||
Low Volatility Equity Fund Securities and Purchased Options | 1,945 | 331 | — | 331 | ||||||||||||
Low Volatility Equity Fund Written Options | — | (1) | — | — | — | |||||||||||
Multi-Sector Intermediate Bond Fund | 365,653 | 7,920 | (10,064 | ) | (2,144 | ) | ||||||||||
Senior Floating Rate Fund | 996,831 | 2,565 | (11,936 | ) | (9,371 | ) | ||||||||||
Wealth Masters Fund | 141,301 | 9,995 | (4,677 | ) | 5,318 | |||||||||||
(1) Amount less than $500
The Funds have capital loss available to offset future realized capital gains, through the indicated expiration dates shown below:
| 2017 | 2018 | No Expiration | Total | |||||||||||||
Bond Fund | $ | 3,149 | $ | — | $ | — | $ | 3,149 | ||||||||
High Yield Fund | 13,758 | 9,151 | — | 22,909 | ||||||||||||
Low Volatility Equity Fund | — | — | 12 | 12 | ||||||||||||
The Trust may not realize the benefit of these losses to the extent each Fund does not realize gains on investments prior to the expiration of the capital loss carryovers.
Under the Regulated Investment Company Modernization Act of 2010 (the “Act”), net capital losses recognized for tax years beginning after December 22, 2010 may be carried forward indefinitely, and their character is retained as short-term and/or long-term losses. Previously, net capital losses were carried forward for eight years and treated as short-term losses. As a transition rule, the Act requires that post-enactment net capital losses be used before pre-enactment net capital losses.
For the Period ended September 30, 2014, the following Funds utilized losses deferred in prior years against current year capital gains:
Bond Fund | $ | 496 | ||
High Yield Fund | 2,452 |
Capital losses realized after October 31 and certain late year ordinary losses may be deferred and treated as occurring on the first day of the following fiscal year. For the fiscal period ended September 30, 2014, the Funds deferred and recognized post-October losses as follows:
Fund | Capital Loss Deferred | Capital Loss Recognized | ||||||
Low Volatility Equity Fund | $ | 39 | $ | — | ||||
Senior Floating Rate Fund | — | 107 | ||||||
77
Table of Contents
VIRTUS OPPORTUNITIES TRUST
NOTES TO FINANCIAL STATEMENTS (Continued)
SEPTEMBER 30, 2014
The components of distributable earnings on a tax basis (excluding unrealized appreciation (depreciation) which are disclosed above) consist of the following:
| Undistributed Ordinary Income | Undistributed Long-Term Capital Gains | Undistributed Tax-Exempt Income | ||||||||||
Bond Fund | $ | — | $ | — | $ | — | ||||||
CA Tax-Exempt Bond Fund | 27 | 1,057 | 46 | |||||||||
High Yield Fund | 158 | — | — | |||||||||
Low Volatility Equity Fund | 6 | — | — | |||||||||
Multi-Sector Intermediate Bond Fund | 692 | 3,975 | — | |||||||||
Senior Floating Rate Fund | 1,692 | 912 | — | |||||||||
Wealth Masters Fund | 2,795 | 45 | — | |||||||||
For the period ended September 30, 2014, the CA Tax-Exempt Bond Fund distributed $1,479 of exempt interest dividends.
The differences between the book and tax basis components of distributable earnings relate principally to the timing of recognition of income and gains for federal income tax purposes. Short-term gain distributions reported in the Statements of Changes in Net Assets, if any, are reported as ordinary income for federal tax purposes. Distributions are determined on a tax basis and may differ from net investment income and realized capital gains for financial reporting purposes.
| Note 11. Reclassification of Capital Accounts |
($ reported in thousands)
For financial reporting purposes, book basis capital accounts are adjusted to reflect the tax character of permanent book/tax differences. Permanent reclassifications can arise from differing treatment of certain income and gain transactions, nondeductible current year net operating losses, expiring capital loss carryovers and investments in passive foreign investment companies. The reclassifications have no impact on the net assets or net asset value of the Funds. As of September 30, 2014, the Funds recorded reclassifications to increase (decrease) the accounts as listed below ($ reported in thousands):
| Capital Paid in on Shares of Beneficial Interest | Undistributed Net Investment Income (Loss) | Accumulated Net Realized Gain (Loss) | ||||||||||
Bond Fund | $ | (42 | ) | $ | (69 | ) | $ | 111 | ||||
CA Tax-Exempt Bond Fund | — | — | — | |||||||||
High Yield Fund | — | 4 | (4 | ) | ||||||||
Low Volatility Equity Fund | — | — | — | |||||||||
Multi-Sector Intermediate Bond Fund | — | (1,280 | ) | 1,280 | ||||||||
Senior Floating Rate Fund | — | (148 | ) | 148 | ||||||||
Wealth Masters Fund | — | 86 | (86 | ) | ||||||||
| Note 12. Borrowings |
($ reported in thousands)
On April 30, 2012, the Senior Floating Rate Fund entered into a Credit Agreement (the “Agreement”) with a commercial bank (the “Bank”) that allows the Fund to borrow cash from the Bank, up to a limit of $90,000. Borrowings under the Agreement are collateralized by investments of the Fund. Interest is charged at LIBOR (London Interbank Offered Rate) plus an additional percentage rate on the amount borrowed. Commitment fees are charged on the undrawn balance. Total commitment fees paid and accrued for the period ended September 30, 2014, were $96 and are included in interest expense and fees on the Statement of Operations. The Agreement is renewable by the Fund with the Bank’s consent. The Agreement can also be converted to a 364 day fixed term facility, one time at the Fund’s option. The Bank has the ability to require repayment of outstanding borrowings under the Agreement upon certain circumstances such as an event of default. From October 1, 2013 to September 30, 2014, the average daily borrowings under the Agreement and the weighted daily average interest rate were $30,723 and 1.01%, respectively. At September 30, 2014, the amount of such outstanding borrowings was as follows:
Outstanding | Interest Rate | |||
$57,000 | 1.004 | % | ||
| Note 13. Illiquid and Restricted Securities |
Investments are generally considered illiquid if they cannot be disposed of within seven days in the ordinary course of business at the approximate amount at which such securities have been valued by a Fund. Additionally, the following information is also considered in determining liquidity: the frequency of trades and quotes for the investment, whether the investment is listed for trading on a recognized domestic exchange and/or whether two or more brokers are willing to purchase or sell the security at a comparable price, the extent of market making activity in the investment and the nature of the market for investment. Illiquid securities are footnoted as such at the end of each Fund’s Schedule of Investments where applicable. However, a portion of such footnoted securities could be liquid where the Subadviser determines that some, though not all of the position could be disposed of within seven days in the ordinary course of business at the approximate amount at which such securities have been valued by the Fund.
Restricted securities are illiquid securities as defined above, not registered under the Securities Act of 1933 as amended (the “1933 Act”). Generally, 144A securities are excluded from this category, except where defined as illiquid.
78
Table of Contents
VIRTUS OPPORTUNITIES TRUST
NOTES TO FINANCIAL STATEMENTS (Continued)
SEPTEMBER 30, 2014
Each Fund will bear any costs, including those involved in registration under the 1933 Act, in connection with the disposition of such securities.
At September 30, 2014, the Funds did not hold any Securities that are both illiquid and restricted.
| Note 14. Subsequent Event Evaluations |
Management has evaluated the impact of all subsequent events on the Funds through the date the financial statements were available for issuance, and has determined that the following subsequent event requires recognition or disclosure in the financial statements.
Effective November 12, 2014, the Multi-Sector Intermediate Bond Fund began offering Class R6 Shares.
79
Table of Contents

REPORT OF INDEPENDENT REGISTERED PUBLIC ACCOUNTING FIRM
To the Board of Trustees of Virtus Opportunities Trust and Shareholders of the Funds, as defined:
In our opinion, the accompanying statements of assets and liabilities, including the schedules of investments, and the related statements of operations and of changes in net assets and the financial highlights present fairly, in all material respects, the financial position of Virtus Bond Fund, Virtus CA Tax-Exempt Bond Fund, Virtus High Yield Fund, Virtus Low Volatility Equity Fund, Virtus Multi-Sector Intermediate Bond Fund, Virtus Senior Floating Rate Fund and Virtus Wealth Masters Fund (constituting funds within Virtus Opportunities Trust, hereafter referred to as the “Funds”) at September 30, 2014, the results of each of their operations for the year then ended, the changes in each of their net assets and the financial highlights for each of the periods indicated, in conformity with accounting principles generally accepted in the United States of America. These financial statements and financial highlights (hereafter referred to as “financial statements”) are the responsibility of the Funds’ management. Our responsibility is to express an opinion on these financial statements based on our audits. We conducted our audits of these financial statements in accordance with the standards of the Public Company Accounting Oversight Board (United States). Those standards require that we plan and perform the audit to obtain reasonable assurance about whether the financial statements are free of material misstatement. An audit includes examining, on a test basis, evidence supporting the amounts and disclosures in the financial statements, assessing the accounting principles used and significant estimates made by management, and evaluating the overall financial statement presentation. We believe that our audits, which included confirmation of securities at September 30, 2014 by correspondence with the custodian and brokers, provide a reasonable basis for our opinion.
PricewaterhouseCoopers LLP
Philadelphia, Pennsylvania
November 19, 2014
80
Table of Contents
VIRTUS OPPORTUNITIES TRUST
SEPTEMBER 30, 2014
For the fiscal year ended September 30, 2014, the Funds make the following disclosures for federal income tax purposes. Below is listed the percentages, or the maximum amount allowable, of its ordinary income dividends (“QDI”) to qualify for the lower tax rates applicable to individual shareholders, and the percentage of ordinary income dividends earned by the Funds which qualifies for the dividends received deduction (“DRD”) for corporate shareholders. The Funds designate the amounts below as long-term capital gains dividends (“LTCG”) ($ reported in thousands), or if subsequently different, the amounts will be designated in the next annual report. The actual percentage for the calendar year will be designated in year-end tax statements.
Fund | QDI | DRD | LTCG | |||||||||
Bond Fund | 0 | % | 0 | % | $ | — | ||||||
CA Tax-Exempt Bond Fund | — | — | 1,063 | |||||||||
High Yield Fund | — | — | — | |||||||||
Low Volatility Equity Fund | 100 | 100 | — | |||||||||
Multi-Sector Intermediate Bond Fund | — | — | 4,005 | |||||||||
Senior Floating Rate Fund | — | — | 912 | |||||||||
Wealth Masters Fund | 41 | 35 | 45 | |||||||||
For federal income tax purposes, 100% of the income dividends paid by the CA Tax-Exempt Bond Fund qualify as exempt-interest dividends.
81
Table of Contents
Information pertaining to the trustees and officers of the Trust as of September 30, 2014, is set forth below. The statement of additional information (SAI) includes additional information about the trustees and is available without charge, upon request, by calling (800) 243-1574. The address of each individual, unless otherwise noted, is 100 Pearl Street, Hartford, CT 06103-4506. There is no stated term of office for trustees of the Trust.
Independent Trustees
| Name and Year of Birth, Year Elected and Number of Funds Overseen | Principal Occupation(s) During Past 5 Years and Other Directorships Held by Trustee | |
Keith, Leroy Jr. YOB: 1939 Elected: 2000 48 Funds | Chairman (since 2010), Bloc Global Services Group, LLC (construction and redevelopment company); Director/Trustee (since 2010), Wells Fargo Funds and their predecessors, Evergreen Funds (1989 to 2010) (137 series); Director (2003 to 2010), Diversapack Co. (soft packaging company); and Trustee (since 1980), Virtus Mutual Fund Complex (48 portfolios). | |
McLoughlin, Philip Chairman YOB: 1946 Elected: 1999 68 Funds | Partner (2006 to 2012), Cross Pond Partners, LLC (strategy consulting firm); Managing Director (2009 to 2010), SeaCap Asset Management Fund I, L.P. and SeaCap Partners, LLC (investment management); Director (since 1991) and Chairman (since 2010), World Trust Fund; Director (since 1995), closed-end funds managed by Duff & Phelps Investment Management Co. (4 portfolios); Chairman (since 2002) and Trustee (since 1989), Virtus Mutual Fund Complex (48 portfolios); Chairman and Trustee (since 2003), Virtus Variable Insurance Trust (9 portfolios); Trustee and Chairman (since 2011), Virtus Closed-End Funds (3 portfolios); Trustee and Chairman (since 2013), Virtus Alternative Solutions Trust (3 portfolios); and Director (1985 to 2009), Argo Group International Holdings Inc. and its predecessor, PXRE Corporation (insurance). | |
McNamara, Geraldine M. YOB: 1951 Elected: 2001 52 Funds | Retired; Trustee (since 2001), Virtus Mutual Fund Complex (48 portfolios); and Director (since 2003), closed-end funds managed by Duff & Phelps Investment Management Co. (4 portfolios). | |
Oates, James M. YOB: 1946 Elected: 2000 55 Funds | Managing Director (since 1994), Wydown Group (consulting firm); Trustee (since 1987), Virtus Mutual Fund Complex (48 portfolios); Director (since 1996), Stifel Financial; Director (since 1998), Connecticut River Bancorp; Chairman and Director (since 1999), Connecticut River Bank; Chairman (since 2000), Emerson Investment Management, Inc.; Director (since 2002), New Hampshire Trust Company; Chairman and Trustee (since 2005), John Hancock Fund Complex (234 portfolios); Non-Executive Chairman (2007 to 2011), Hudson Castle Group, Inc. (formerly IBEX Capital Markets, Inc.) (financial services); Trustee (since 2013), Virtus Closed-End Funds (3 portfolios); and Trustee (since 2013), Virtus Alternative Solutions Trust (3 portfolios). | |
Segerson, Richard E. YOB: 1946 Elected: 2000 48 Funds | Retired; Trustee (since 1993), Virtus Mutual Fund Complex (48 portfolios); and Managing Director (since 1998), Northway Management Company. | |
Verdonck, Ferdinand L.J. YOB: 1942 Elected: 2005 48 Funds | Director (since 1998), The J.P. Morgan European Investment Trust; Director (since 2005), Galapagos N.V. (biotechnology); Mr. Verdonck is also a director of several non-U.S. companies; Trustee (since 2002), Virtus Mutual Fund Complex (48 portfolios). | |
Interested Trustee
The individual listed below is an “interested person” of the Trust, as defined in Section 2(a)(19) of the 1940 Act, as amended, and the rules and regulations thereunder.
| Name and Year of Birth | Principal Occupation(s) During Past 5 Years and Other Directorships Held by Trustee | |
Aylward, George R. YOB: 1964 Elected: 2006 66 Funds | Director, President and Chief Executive Officer (since 2008), Virtus Investment Partners, Inc. and/or certain of its subsidiaries; and various senior officer positions with Virtus affiliates (since 2005); Trustee (since 2006), Virtus Mutual Funds (48 portfolios); Chairman, President and Chief Executive Officer (since 2006), The Zweig Closed-End Funds (2 portfolios); Trustee (since 2012), Virtus Variable Insurance Trust (9 portfolios); Trustee and President (since 2011), Virtus Closed-End Funds (3 portfolios); Director (since 2013), Virtus Global Funds, PLC (2 portfolios); and Trustee (since 2013), Virtus Alternative Solutions Trust (3 portfolios). | |
82
Table of Contents
FUND MANAGEMENT TABLES (Continued)
(UNAUDITED)
Officers of the Trust Who Are Not Trustees
Name, Address and Year of Birth | Position(s) Held with the Trust and Length of Time Served and Principal Occupation(s) During Past 5 Years | |||
Bradley, W. Patrick YOB: 1972 | Senior Vice President (since 2013), Vice President (2011 to 2013), Chief Financial Officer and Treasurer (since 2006). | Senior Vice President, Fund Services (since 2010), Virtus Investment Partners, Inc. and/or certain of its subsidiaries; various officer positions (since 2006) with Virtus affiliates; Senior Vice President (since 2013), Vice President (2011 to 2013), Chief Financial Officer and Treasurer (since 2004), Virtus Variable Insurance Trust; Senior Vice President (since 2013), Vice President (2011 to 2013), Chief Financial Officer and Treasurer (since 2006), Virtus Mutual Fund Complex; Senior Vice President (since 2013), Vice President (2012 to 2013) and Treasurer (Chief Financial Officer) (since 2007), The Zweig Closed-End Funds; Senior Vice President (since 2013), Vice President (2011 to 2013), Chief Financial Officer and Treasurer (since 2011), Virtus Closed-End Funds; Vice President and Assistant Treasurer (since 2011), Duff & Phelps Global Utility Income Fund Inc.; Director (since 2013), Virtus Global Funds, PLC; and Senior Vice President, Chief Financial Officer and Treasurer (since 2013), Virtus Alternative Solutions Trust. | ||
Carr, Kevin J. YOB: 1954 | Senior Vice President (since 2013), Vice President (2005 to 2013), Chief Legal Officer, Counsel and Secretary (since 2005). | Senior Vice President (since 2009), Vice President, Counsel and Secretary (2008 to 2009), Virtus Investment Partners, Inc. and/or certain of its subsidiaries; various senior officer positions (since 2005) with Virtus affiliates; Senior Vice President (since 2013), Vice President (2005 to 2013), Chief Legal Officer, Counsel and Secretary (since 2005), Virtus Mutual Fund Complex; Senior Vice President (2013 to 2014), Vice President (2012 to 2013) and Assistant Secretary (since 2012), Secretary and Chief Legal Officer (2005 to 2012), The Zweig Closed-End Funds; Assistant Secretary (since 2013), Vice President, Chief Legal Officer, Counsel and Secretary (2010 to 2013), Virtus Variable Insurance Trust; Vice President and Assistant Secretary (since 2011), Duff & Phelps Global Utility Income Fund Inc.; Senior Vice President and Assistant Secretary (2013 to 2014), Vice President and Assistant Secretary (2012 to 2013), Vice President, Chief Legal Officer, Counsel and Secretary (2011 to 2012), Virtus Closed-End Funds ; and Assistant Secretary (since 2013), Virtus Alternative Solutions Trust. | ||
Engberg, Nancy J. YOB: 1956 | Vice President and Chief Compliance Officer (since 2011). | Vice President (since 2008) and Chief Compliance Officer (2008 to 2011), Virtus Investment Partners, Inc. and/or certain of its subsidiaries; various officer positions (since 2003) with Virtus affiliates; Vice President and Chief Compliance Officer (since 2011), Virtus Mutual Fund Complex; Vice President (since 2010), Chief Compliance Officer (since 2011), Virtus Variable Insurance Trust; Vice President and Chief Compliance Officer (since 2011), Virtus Closed-End Funds; Vice President and Chief Compliance Officer (since 2012), The Zweig Closed-End Funds; and Vice President and Chief Compliance Officer (since 2013), Virtus Alternative Solutions Trust. | ||
Waltman, Francis G. YOB: 1962 | Executive Vice President (since 2013), Senior Vice President (2008 to 2013). | Virtus Investment Partners, Inc. and/or certain of its subsidiaries; various senior officer positions (since 2006) with Virtus affiliates; Executive Vice President (since 2013), Senior Vice President (2008 to 2013), Virtus Mutual Fund Complex; Executive Vice President (since 2013), Senior Vice President (2010 to 2013), Virtus Variable Insurance Trust; Executive Vice President (since 2013), Senior Vice President (2011 to 2013), Virtus Closed-End Funds; Director (since 2013), Virtus Global Funds PLC; and Executive Vice President (since 2013), Virtus Alternative Solutions Trust. | ||
83
Table of Contents
VIRTUS OPPORTUNITIES TRUST
101 Munson Street
Greenfield, MA 01301-9668
Trustees
George R. Aylward
Leroy Keith, Jr.
Philip R. McLoughlin, Chairman
Geraldine M. McNamara
James M. Oates
Richard E. Segerson
Ferdinand L.J. Verdonck
Officers
George R. Aylward, President
Francis G. Waltman, Executive Vice President
W. Patrick Bradley, Senior Vice President, Chief Financial Officer and Treasurer
Kevin J. Carr, Senior Vice President, Chief Legal Officer, Counsel and Secretary
Nancy J. Engberg, Vice President and Chief Compliance Officer
Investment Adviser
Virtus Investment Advisers, Inc.
100 Pearl Street
Hartford, CT 06103-4506
Principal Underwriter
VP Distributors, LLC
100 Pearl Street
Hartford, CT 06103-4506
Administrator and Transfer Agent
Virtus Fund Services, LLC
100 Pearl Street
Hartford, CT 06103-4506
Custodian
JPMorgan Chase Bank, NA
1 Chase Manhattan Plaza
New York, NY 10005-1401
Independent Registered Public Accounting Firm
PricewaterhouseCoopers LLP
2001 Market Street
Philadelphia, PA 19103-7042
How to Contact Us
Mutual Fund Services | 1-800-243-1574 | |||
Adviser Consulting Group | 1-800-243-4361 | |||
Telephone Orders | 1-800-367-5877 | |||
Text Telephone | 1-800-243-1926 | |||
Web site | http://Virtus.com |
Important Notice to Shareholders
The Securities and Exchange Commission has modified mailing regulations for semiannual and annual shareholder fund reports to allow mutual fund companies to send a single copy of these reports to shareholders who share the same mailing address. If you would like additional copies, please call Mutual Fund Services at 1-800-243-1574.
Table of Contents
| ||
P.O. Box 9874 Providence, RI 02940-8074 |

For more information about Virtus Mutual Funds,
please call your financial representative, or contact us
at 1-800-243-1574 or Virtus.com.
8008 | 11-14 |
Table of Contents

ANNUAL REPORT
Virtus Multi-Sector Short Term Bond Fund
September 30, 2014
TRUST NAME: VIRTUS OPPORTUNITIES TRUST
Not FDIC Insured
No Bank Guarantee
May Lose Value

Table of Contents
Virtus Multi-Sector Short Term Bond Fund
(“Multi-Sector Short Term Bond Fund”)
| 1 | ||||
| 2 | ||||
| 4 | ||||
| 5 | ||||
| 8 | ||||
| 41 | ||||
| 42 | ||||
| 43 | ||||
| 44 | ||||
| 46 | ||||
| 55 | ||||
| 56 | ||||
| 57 |
PROXY VOTING PROCEDURES AND VOTING RECORD (FORM N-PX)
The subadviser votes proxies relating to portfolio securities in accordance with procedures that have been approved by the Board of Trustees of the Trust (“Trustees,” or the “Board”). You may obtain a description of these procedures, along with information regarding how the Fund voted proxies during the most recent 12-month period ended June 30, free of charge, by calling toll-free 1-800-243-1574. This information is also available through the Securities and Exchange Commission’s (the “SEC”) website at http://www.sec.gov.
FORM N-Q INFORMATION
The Trust files a complete schedule of portfolio holdings for the Fund with the SEC for the first and third quarters of each fiscal year on Form N-Q. Form N-Q is available on the SEC’s website at http://www.sec.gov. Form N-Q may be reviewed and copied at the SEC’s Public Reference Room. Information on the operation of the SEC’s Public Reference Room can be obtained by calling toll-free 1-800-SEC-0330.
This report is not authorized for distribution to prospective investors in the Virtus Multi-Sector Short Term Bond Fund unless preceded or accompanied by an effective prospectus which includes information concerning the sales charge, the Fund’s record and other pertinent information.
Table of Contents
Dear Fellow Shareholders of Virtus Mutual Funds:
 | I am pleased to present this annual report which highlights performance of your fund for the 12 months ended September 30, 2014, including comments from the money manager.
The past 12 months were generally strong for equities, although market volatility increased over the last quarter, driven by geopolitical risks and a slowdown in the global economy. While the economies of Europe, Japan, and China weakened, the U.S. economy accelerated and the U.S. dollar rallied strongly. Broad U.S. equity indexes registered double-digit gains for the 12 months ended September 30, 2014. The S&P 500® Index returned 19.73%, the Dow Jones Industrial Average rose 15.29%, and the | |
NASDAQ Composite Index® was up 20.61%. By comparison, international equity returns were significantly smaller, including for both developed markets and emerging markets.
In mid-September, the Federal Reserve provided much needed assurance to investors by announcing that it intends to keep interest rates low for a “considerable time” after its bond buying program ends in October. Against this backdrop, the bellwether 10-year U.S. Treasury yield ended at 2.52% on September 30, 2014 compared with 2.64% a year earlier. The broader fixed income market, as measured by the Barclays U.S. Aggregate Bond Index, rose 3.96% for the 12 months ended September 30, 2014.
The uncertain state of the global economy is likely to remain a concern for markets in the months ahead. However, the health of the U.S. economy – including improving hiring, manufacturing, and housing data – gives investors reason for optimism. Future market direction will be determined largely by the ability of corporations to continue to produce robust earnings.
Market volatility is an ever-present reminder of the importance of portfolio diversification. While diversification cannot guarantee a profit or prevent loss, owning a variety of asset classes may cushion your portfolio against inevitable market fluctuations. Your financial advisor can help you ensure that your portfolio is adequately diversified across asset classes and investment strategies.
As always, thank you for entrusting Virtus with your assets. Should you have questions or require assistance, our customer service team is here to help at 1-866-270-7788. We appreciate your business and remain committed to your long-term financial success. | ||
Sincerely,
George R. Aylward President, Virtus Mutual Funds
October 2014
Whenever you have questions about your account, or require additional information, please visit us on the Web at www.virtus.com or call our shareowner service group toll-free at 1-800-243-1574.
Performance data quoted represents past results. Past performance is no guarantee of future results, and current performance may be higher or lower than the performance shown above. | ||

1
Table of Contents
VIRTUS MULTI-SECTOR SHORT TERM BOND FUND
DISCLOSURE OF FUND EXPENSES (Unaudited)
FOR THE SIX-MONTH PERIOD OF APRIL 1, 2014 TO SEPTEMBER 30, 2014
We believe it is important for you to understand the impact of costs on your investment. All mutual funds have operating expenses. As a shareholder of the Virtus Multi-Sector Short Term Bond Fund (the “Fund”) you may incur two types of costs: (1) transaction costs, including sales charges on purchases of Class A shares and contingent deferred sales charges on Class B and Class T shares; and (2) ongoing costs, including investment advisory fees, distribution and service fees, and other expenses. Class C shares are sold without a sales charge. Class I shares are sold without a sales charge and do not incur distribution and service fees. For further information regarding applicable sales charges, see Note 1 in the Notes to Financial Statements. These examples are intended to help you understand your ongoing costs (in dollars) of investing in the Fund and to compare these costs with the ongoing costs of investing in other mutual funds. These examples are based on an investment of $1,000 invested at the beginning of the period and held for the entire six-month period. The following Expense Table illustrates your Fund’s costs in two ways.
Actual Expenses
The first section of the accompanying table provides information about actual account values and actual expenses. You may use the information in this section, together with the amount you invested, to estimate the expenses that you paid over the period. Simply divide your account value by $1,000 (for example, an $8,600 account value divided by $1,000 = 8.6), then multiply the result by the number given in the first section under the heading “Expenses Paid During Period” to estimate the expenses you paid on your account during the period.
Hypothetical Example for Comparison Purposes
The second section of the accompanying table provides information about hypothetical account values and hypothetical expenses based on the Fund’s actual expense ratio and an assumed rate of return of 5% per year before expenses, which is not your Fund’s actual return. The hypothetical account values and expenses may not be used to estimate the actual ending account balance or expenses you paid for the period. You may use this information to compare the ongoing costs of investing in your Fund and other funds. To do so, compare these 5% hypothetical examples with the 5% hypothetical examples that appear in the shareholder reports of the other funds.
Please note that the expenses shown in the accompanying table are meant to highlight your ongoing costs only and do not reflect any transactional costs, such as sales charges or contingent deferred sales charges. Therefore, the second section of the accompanying table is useful in comparing ongoing costs only, and will not help you determine the relative total costs of owning different funds. In addition, if those transactional costs were included, your costs would have been higher. The calculations assume no shares were bought or sold during the period. Your actual costs may have been higher or lower, depending on the amount of your investment and the timing of any purchases or redemptions.
2
Table of Contents
VIRTUS MULTI-SECTOR SHORT TERM BOND FUND
DISCLOSURE OF FUND EXPENSES (Unaudited) (Continued)
FOR THE SIX-MONTH PERIOD OF APRIL 1, 2014 TO SEPTEMBER 30, 2014
| Expense Table | ||||||||||||||||
| Beginning Account Value April 1, 2014 | Ending Account Value September 30, 2014 | Annualized Expense Ratio | Expenses Paid During Period* | |||||||||||||
Actual | ||||||||||||||||
| Class A | $ | 1,000.00 | �� | $ | 1,006.90 | 0.98 | % | $ | 4.93 | |||||||
| Class B | 1,000.00 | 1,004.40 | 1.48 | 7.44 | ||||||||||||
| Class C | 1,000.00 | 1,003.50 | 1.23 | 6.18 | ||||||||||||
| Class T | 1,000.00 | 1,003.00 | 1.73 | 8.69 | ||||||||||||
| Class I | 1,000.00 | 1,006.10 | 0.73 | 3.67 | ||||||||||||
Hypothetical (5% return before expenses) |
| |||||||||||||||
| Class A | 1,000.00 | 1,020.90 | 0.98 | 4.98 | ||||||||||||
| Class B | 1,000.00 | 1,017.56 | 1.48 | 7.51 | ||||||||||||
| Class C | 1,000.00 | 1,018.82 | 1.23 | 6.24 | ||||||||||||
| Class T | 1,000.00 | 1,016.29 | 1.73 | 8.78 | ||||||||||||
| Class I | 1,000.00 | 1,021.36 | 0.73 | 3.71 | ||||||||||||
| * | Expenses are equal to the Fund’s annualized expense ratio, which is net of fees waived and reimbursed expenses, if applicable, multiplied by the average account value over the period, multiplied by the number of days (183) expenses were accrued in the most recent fiscal half-year, then divided by 365 to reflect the one-half year period. |
| The Fund may invest in other funds, and the annualized expense ratios noted above do not reflect fees and expenses associated with the underlying funds. If such fees and expenses were included, the expenses would have been higher. |
| You can find more information about the Fund’s expenses in the Financial Statements section that follows. For additional information on operating expenses and other shareholder costs, refer to the prospectus. |
3
Table of Contents
VIRTUS MULTI-SECTOR SHORT TERM BOND FUND
BofA Merrill Lynch 1–2.99 Year Medium Quality Corporate Bonds Index
The BofA Merrill Lynch 1–2.99 Year Medium Quality Corporate Bonds Index measures performance of U.S. investment grade corporate bond issues rated “BBB” and “A” by Standard & Poor’s/Moody’s with maturities between one and three years. The index is calculated on a total return basis. The index is unmanaged, its returns do not reflect any fees, expenses, or sales charges and it is not available for direct investment.
Barclays U.S. Aggregate Bond Index
The Barclays U.S. Aggregate Bond Index measures the U.S. investment grade fixed rate bond market. The index is calculated on a total return basis. The index is unmanaged, its returns do not reflect any fees, expenses or sales charges, and it is not available for direct investment.
Dow Jones Industrial Average
A price weighted average of 30 blue chip stocks. The index is calculated on total return basis with dividends reinvested. The index is unmanaged, its returns do not reflect any fees, expenses or sales charges, and it is not available for direct investment.
Exchange-Traded Funds (ETF)
Portfolios of stocks or bonds that track a specific market index.
Federal Reserve (the “Fed”)
The Central Bank of the United States, responsible for controlling the money supply, interest rates and credit with the goal of keeping the U.S. economy and currency stable. Governed by a seven-member board, the system includes 12 regional Federal Reserve Banks, 25 branches and all national and state banks that are part of the system.
NASDAQ Composite Index®
A market-capitalization weighted index of the more than 3,000 common equities listed on the Nasdaq stock exchange. Unlike other market indexes, the NASDAQ composite is not limited to companies that have U.S. headquarters. The index is unmanaged, its returns do not reflect any fees, expenses or sales charges, and it is not available for direct investment.
Payment-in-Kind Security (PIK)
A bond which pays some or all interest in the form of additional bonds, or preferred stock which pays dividends in the form of additional preferred stock.
Real Estate Investment Trust (REIT)
A publicly traded company that owns, develops, and operates income-producing real estate such as apartments, office buildings, hotels, shopping centers, and other commercial properties.
S&P 500® Index
The S&P 500® Index is a free-float market capitalization-weighted index of 500 of the largest U.S. companies. The index is calculated on a total return basis with dividends reinvested. The index is unmanaged, its returns do not reflect any fees, expenses, or sales charges, and it is not available for direct investment.
4
Table of Contents
MULTI-SECTOR SHORT TERM BOND FUND
Fund Summary | Ticker Symbols: Class A: NARAX Class B: PBARX Class C: PSTCX Class T: PMSTX Class I: PIMSX |
| ¢ | The Fund is diversified and has an investment objective of providing high current income while attempting to limit changes in the Fund’s net asset value per share caused by interest rate changes. |
| ¢ | For the fiscal year ended September 30, 2014, the Fund’s Class A shares at NAV returned 3.03%; Class B shares returned 2.53%; Class C shares returned 2.73%; Class T shares returned 2.23%; and Class I shares returned 3.28%. For the same period, the Barclays U.S. Aggregate Bond Index, a broad-based fixed income index, returned 3.96%; and the BofA Merrill Lynch 1–2.99 Year Medium Quality Corporate Bonds Index, the Fund’s style-specific index appropriate for comparison, returned 1.97%. |
All performance figures assume reinvestment of distributions and exclude the effect of sales charges. Past performance is no guarantee of future results, and current performance may be higher or lower than the performance shown.
How did the market perform during the Fund’s fiscal year?
| ¢ | Most spread sectors outperformed U.S. Treasuries during the fiscal year. Economic growth in the U.S. improved, but the level of growth remains moderate, which is supportive of fixed income spread sectors. The economy continues to be tempered by a lack of wage growth. This, when combined with slow global growth, concern over a stronger U.S. dollar, and a lack of inflation across the globe, will likely keep the Fed from raising short-term interest rates in the immediate future. Over the fiscal year, spread sectors were supported by an overall improvement in the U.S. macroeconomic environment, positive credit fundamentals, and continued demand for spread product. |
| ¢ | Globally, concerns over slowing growth in China and Europe, as well as increased geopolitical risks stemming from tensions |
between Ukraine and Russia and the escalation of issues in the Middle East have weighed on the fixed income markets. The global markets were also unsettled over the likelihood that the Fed would raise short-term interest rates sooner than anticipated due to stronger U.S. growth. |
| ¢ | The Fed continued to taper its monthly bond purchases with the expectation that it would be ending its stimulus program during the fourth quarter of 2014. However, the Central Bank has also acknowledged that signs of weakness remain in the U.S. economy, and has indicated that short-term rates will remain low in the near term and any future decision on rates will be driven by economic data. |
| ¢ | Over the last 12 months, yields increased at the short maturity end of the U.S. Treasury curve and decreased on the long maturity end, and overall the yield curve flattened. |
What factors affected the Fund’s performance during its fiscal year?
| ¢ | The outperformance of fixed income spread sectors relative to U.S. Treasuries was the key driver of the Fund’s strong performance for the fiscal year. |
| ¢ | Among fixed income sectors, the Fund’s allocation to high-yield and high-quality corporate securities made positive contributions to performance for the fiscal year. |
| ¢ | The allocation to the non-U.S. dollar sector detracted from Fund performance. |
The preceding information is the opinion of portfolio management. Any such opinions are subject to change at any time based upon market or other conditions and should not be relied upon as investment advice. Past performance is no guarantee of future results, and there is no guarantee that market forecasts will be realized.
There is no guarantee that the Fund will meet its objective.
For information regarding the indexes and certain investment terms, see the Key Investment Terms on page 4.
5
Table of Contents
| MULTI-SECTOR SHORT TERM BOND FUND (Continued) |
Debt securities are subject to various risks, the most prominent of which are credit and interest rate risk. The issuer of a security may fail to make payments in a timely manner. Values of debt securities may rise and fall in response to changes in interest rates. This risk may be enhanced with longer-term maturities. There is a greater level of credit risk and price volatility involved with high-yield securities than investment grade securities. Changes in interest rates can cause both extension and prepayment risks for asset and mortgage-backed securities. These securities are also subject to risks associated with the repayment of underlying collateral. There may be no ready market for loan participation interests. The Fund may have to sell the interests at a substantial discount. Such interests are subject to the credit risk of the underlying corporate borrower. Investing internationally, especially in emerging markets, involves additional risks such as currency, political, accounting, economic, and market risk.
| Asset Allocations | ||||
The following table presents the portfolio holdings within certain sectors as a percentage of total investments as of September 30, 2014.
|
| |||
Corporate Bonds | 36 | % | ||
Mortgage-Backed Securities | 21 | |||
Asset-Backed Securities | 17 | |||
Loan Agreements | 17 | |||
Foreign Government Securities | 6 | |||
Other (includes short-term investments) | 3 | |||
|
| |||
Total | 100 | % | ||
|
| |||
For information regarding the indexes and certain investment terms, see the Key Investment Terms on page 4.
6
Table of Contents
| MULTI-SECTOR SHORT TERM BOND FUND (Continued) |
| Average Annual Total Returns1 for periods ended 9/30/14 | ||||||||||||||||||||
| 1 Year | 5 Years | 10 Years | Since Inception | Inception Date | ||||||||||||||||
| Class A Shares at NAV2 | 3.03 | % | 5.74 | % | 4.92 | % | — | — | ||||||||||||
| Class A Shares at POP3,4 | 0.71 | 5.26 | 4.68 | — | — | |||||||||||||||
| Class B Shares at NAV2 | 2.53 | 5.20 | 4.37 | — | — | |||||||||||||||
| Class B Shares with CDSC4 | 1.09 | 5.20 | 4.37 | — | — | |||||||||||||||
| Class C Shares at NAV2 | 2.73 | 5.45 | 4.63 | — | — | |||||||||||||||
| Class T Shares at NAV2 and with CDSC4 | 2.23 | 4.94 | 4.12 | — | — | |||||||||||||||
| Class I Shares at NAV | 3.28 | 6.00 | — | 6.20 | % | 6/6/08 | ||||||||||||||
| Barclays U.S. Aggregate Bond Index | 3.96 | 4.12 | 4.62 | 4.75 | 5 | — | ||||||||||||||
| BofA Merrill Lynch 1–2.99 Year Medium Quality Corporate Bonds Index | 1.97 | 3.39 | 3.81 | 3.74 | (5) | — | ||||||||||||||
Fund Expense Ratios6: A Shares: 0.98%; B Shares: 1.48%; C Shares: 1.23%; T Shares: 1.73%; I Shares: 0.73%.
All returns represent past performance which is no guarantee of future results. Current performance may be higher or lower than the performance shown. The investment return and principal value of an investment will fluctuate so that an investor’s shares, when redeemed, may be worth more or less than their original cost. The above table and graph below do not reflect the deduction of taxes that a shareholder would pay on fund distributions or the redemption of fund shares. Please visit Virtus.com for performance data current to the most recent month-end.
| 1 | Total returns are historical and include changes in share price and the reinvestment of both dividends and capital gain distributions. |
| 2 | “NAV” (Net Asset Value) total returns do not include the effect of any sales charge. |
| 3 | “POP” (Public Offering Price) total returns include the effect of the maximum front-end 2.25% sales charge. |
| 4 | CDSC (Contingent Deferred Sales Charge) is applied to redemptions of certain classes of shares that do not have a sales charge applied at the time of purchase. CDSC charges for Class B shares decline from 2% to 0% over a three-year period. CDSC charges for certain redemptions of Class A shares made within 18 months of purchase in which a finder’s fee was paid and all redemptions of Class T shares are 1% within the first year and 0% thereafter. |
| 5 | The since inception index returns are from the inception date of Class I shares. |
| 6 | The expense ratios of the Fund are set forth according to the prospectus for the Fund effective January 28, 2014, as supplemented and revised, and may differ from the expense ratios disclosed in the Financial Highlights tables in this report. See the Financial Highlights for more current expense ratios. |
Growth of $10,000 for periods ended 9/30
This chart assumes an initial investment of $10,000 made on September 30, 2004, for Class A, Class B, Class C and Class T shares including any applicable sales charges or fees. Performance assumes reinvestment of dividends and capital gain distributions.
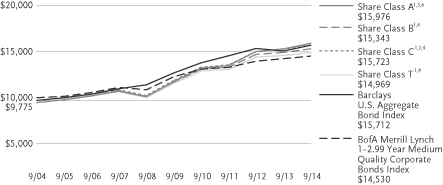
The indexes are unmanaged and not available for direct investment; therefore, their performance does not reflect the expenses associated with active management of an actual portfolio.
7
Table of Contents
VIRTUS MULTI-SECTOR SHORT TERM BOND FUND
SEPTEMBER 30, 2014
($ reported in thousands)
| PAR VALUE | VALUE | |||||||
| U.S. GOVERNMENT SECURITIES—1.9% | ||||||||
U.S. Treasury Note | ||||||||
0.750%, 3/15/17 | $ | 15,000 | $ | 14,972 | ||||
0.875%, 6/15/17 | 130,000 | 129,705 | ||||||
1.375%, 9/30/18 | 33,000 | 32,804 | ||||||
| TOTAL U.S. GOVERNMENT SECURITIES | ||||||||
| (Identified Cost $177,692) | 177,481 | |||||||
| MUNICIPAL BONDS—0.1% | ||||||||
| Kentucky—0.1% | ||||||||
Commonwealth of Kentucky Taxable 3.165%, 4/1/18 | 4,597 | 4,776 | ||||||
|
| |||||||
| Virginia—0.0% | ||||||||
Tobacco Settlement Financing Corp. Taxable Series 07-A1, 6.706%, 6/1/46 | 4,715 | 3,451 | ||||||
| TOTAL MUNICIPAL BONDS (Identified Cost $8,956) | 8,227 | |||||||
| FOREIGN GOVERNMENT SECURITIES—5.8% | ||||||||
Argentine Republic Series X, 7.000%, 4/17/17 | 14,375 | 12,902 | ||||||
8.750%, 5/7/24 | 9,930 | 9,007 | ||||||
Series NY, 8.280%, 12/31/33(11) | 24,360 | 21,072 | ||||||
Bolivarian Republic of Venezuela | ||||||||
RegS 5.750%, 2/26/16(4) | 14,300 | 12,226 | ||||||
RegS 7.000%, 12/1/18(4) | 34,975 | 24,920 | ||||||
Commonwealth of Australia Series 130, 4.750%, 6/15/16 | 33,080 | AUD | 30,000 | |||||
Commonwealth of New Zealand | ||||||||
Series 415, 6.000%, 4/15/15 | 40,545 | NZD | 32,064 | |||||
Series 1217, 6.000%, 12/15/17 | 20,280 | NZD | 16,821 | |||||
Federative Republic of Brazil 12.500%, 1/5/16 | 92,159 | BRL | 38,121 | |||||
| PAR VALUE | VALUE | |||||||
| FOREIGN GOVERNMENT SECURITIES (continued) | ||||||||
Hungary 4.000%, 3/25/19 | $ | 9,025 | $ | 9,228 | ||||
Mongolia 144A 4.125%, 1/5/18(3) | 16,000 | 15,200 | ||||||
New South Wales, Australia Treasury Corp., Series 17 5.500%, 3/1/17 | 10,665 | AUD | 9,936 | |||||
Provincia de Neuquen, Argentina 144A 7.875%, 4/26/21(3) | 5,366 | 5,326 | ||||||
Republic of Chile 5.500%, 8/5/20 | 11,647,000 | CLP | 20,546 | |||||
Republic of Colombia | ||||||||
12.000%, 10/22/15 | 27,535,000 | COP | 14,529 | |||||
Treasury Note, Series B, 11.250%, 10/24/18 | 21,072,000 | COP | 12,426 | |||||
Republic of Indonesia | ||||||||
Series FR30, 10.750%, 5/15/16 | 415,359,000 | IDR | 35,733 | |||||
Series FR55, 7.375%, 9/15/16 | 229,481,000 | IDR | 18,755 | |||||
Republic of Latvia RegS 2.750%, 1/12/20(4) | 8,560 | 8,442 | ||||||
Republic of Panama 5.200%, 1/30/20 | 3,800 | 4,180 | ||||||
Republic of Peru GDN 144A 7.840%, 8/12/20(3) | 50,140 | PEN | 19,753 | |||||
Republic of South Africa Series R203, 8.250%, 9/15/17 | 134,520 | ZAR | 12,250 | |||||
Republic of Sri Lanka 144A 6.000%, 1/14/19(3) | 17,450 | 18,453 | ||||||
Russian Federation 144A 7.850%, 3/10/18 | 1,005,000 | RUB | 24,240 | |||||
RegS 7.500%, 3/31/30(2)(4) | 1,310 | 1,468 | ||||||
State of Qatar 144A 3.125%, 1/20/17(3) | 12,000 | 12,510 | ||||||
See Notes to Financial Statements
8
Table of Contents
VIRTUS MULTI-SECTOR SHORT TERM BOND FUND
SCHEDULE OF INVESTMENTS (Continued)
SEPTEMBER 30, 2014
($ reported in thousands)
| PAR VALUE | VALUE | |||||||
| FOREIGN GOVERNMENT SECURITIES (continued) | ||||||||
United Mexican States Series M, 6.000%, 6/18/15 | 1,096,623 | MXN | $ | 83,287 | ||||
| TOTAL FOREIGN GOVERNMENT SECURITIES | ||||||||
| (Identified Cost $569,762) | 523,395 | |||||||
| MORTGAGE-BACKED SECURITIES—21.3% | ||||||||
| Agency—1.7% | ||||||||
FHLMC | ||||||||
14-DN2, M2 1.805%, 4/25/24(2) | $ | 21,365 | 20,750 | |||||
6.000%, 8/1/34 | 469 | 535 | ||||||
FNMA | ||||||||
5.500%, 1/1/17 | 59 | 62 | ||||||
6.000%, 5/1/17 | 18 | 19 | ||||||
4.500%, 4/1/18 | 164 | 173 | ||||||
5.000%, 10/1/19 | 483 | 515 | ||||||
5.500%, 2/1/20 | 172 | 182 | ||||||
5.500%, 3/1/20 | 149 | 158 | ||||||
5.500%, 3/1/20 | 19 | 20 | ||||||
5.500%, 3/1/20 | 87 | 93 | ||||||
5.500%, 3/1/20 | 83 | 88 | ||||||
5.500%, 4/1/20 | 259 | 281 | ||||||
5.000%, 6/1/20 | 505 | 536 | ||||||
4.000%, 8/1/25 | 16,036 | 17,112 | ||||||
3.000%, 6/1/27 | 1,322 | 1,367 | ||||||
2.500%, 5/1/28 | 19,126 | 19,349 | ||||||
6.000%, 12/1/32 | 56 | 64 | ||||||
5.500%, 2/1/33 | 99 | 111 | ||||||
5.500%, 5/1/34 | 427 | 479 | ||||||
6.000%, 8/1/34 | 319 | 364 | ||||||
6.000%, 10/1/34 | 266 | 302 | ||||||
6.000%, 10/1/34 | 248 | 282 | ||||||
5.500%, 11/1/34 | 405 | 451 | ||||||
5.500%, 11/1/34 | 148 | 165 | ||||||
6.000%, 11/1/34 | 527 | 598 | ||||||
5.500%, 12/1/34 | 192 | 215 | ||||||
5.500%, 1/1/35 | 329 | 369 | ||||||
6.000%, 1/1/37 | 394 | 447 | ||||||
6.000%, 1/1/37 | 574 | 652 | ||||||
5.500%, 7/1/37 | 8 | 9 | ||||||
6.000%, 7/1/37 | 91 | 103 | ||||||
6.000%, 12/1/37 | 304 | 344 | ||||||
6.000%, 4/1/38 | 277 | 313 | ||||||
5.000%, 12/1/39 | 9,966 | 11,099 | ||||||
4.500%, 4/1/40 | 12,110 | 13,097 | ||||||
5.000%, 8/1/40 | 19,012 | 21,057 | ||||||
4.000%, 10/1/40 | 244 | 257 | ||||||
| PAR VALUE | VALUE | |||||||
| Agency (continued) | ||||||||
4.000%, 3/1/41 | $ | 7,181 | $ | 7,579 | ||||
4.500%, 5/1/41 | 8,336 | 9,013 | ||||||
3.500%, 4/1/42 | 12,571 | 12,874 | ||||||
GNMA | ||||||||
6.500%, 7/15/31 | 12 | 14 | ||||||
6.500%, 8/15/31 | 35 | 39 | ||||||
6.500%, 11/15/31 | 21 | 24 | ||||||
6.500%, 2/15/32 | 24 | 27 | ||||||
6.500%, 4/15/32 | 52 | 60 | ||||||
6.500%, 4/15/32 | 51 | 59 | ||||||
12-147, AK 2.587%, 4/16/54 | 9,484 | 9,694 | ||||||
|
| |||||||
| 151,401 | ||||||||
|
| |||||||
| Non-Agency—19.6% | ||||||||
A-10 Securitization LLC 13-1, A 144A 2.400%, 11/15/25(3) | 3,538 | 3,548 | ||||||
A-10 Term Asset Financing LLC 14-1, A1 144A 1.720%, 4/15/33(3) | 13,885 | 13,873 | ||||||
ABN AMRO Mortgage Corp. 02-9, M 5.750%, 12/25/32 | 726 | 696 | ||||||
Americold LLC Trust 10-ARTA, A1 144A 3.847%, 1/14/29(3) | 9,857 | 10,309 | ||||||
Banc of America (Merrill Lynch) Commercial Mortgage, Inc. 05-2, B 5.298%, 7/10/43(2) | 10,916 | 11,114 | ||||||
Banc of America Alternative Loan Trust | ||||||||
03-2, CB3 5.750%, 4/25/33 | 20,315 | 21,061 | ||||||
03-10, 2A1 6.000%, 12/25/33 | 3,987 | 4,303 | ||||||
07-2, 2A4 5.750%, 6/25/37 | 6,069 | 4,763 | ||||||
Banc of America Commercial Mortgage Trust 07-2, A4 5.781%, 4/10/49(2) | 17,178 | 18,641 | ||||||
See Notes to Financial Statements
9
Table of Contents
VIRTUS MULTI-SECTOR SHORT TERM BOND FUND
SCHEDULE OF INVESTMENTS (Continued)
SEPTEMBER 30, 2014
($ reported in thousands)
| PAR VALUE | VALUE | |||||||
| MORTGAGE-BACKED SECURITIES (continued) | ||||||||
| Non-Agency (continued) | ||||||||
Banc of America Funding Corp. | ||||||||
04-4, 3A1 4.750%, 10/25/19 | $ | 3,319 | $ | 3,385 | ||||
04-B, 2A1 5.429%, 11/20/34(2) | 1,073 | 1,064 | ||||||
06-2, 3A1 6.000%, 3/25/36 | 3,987 | 4,025 | ||||||
Banc of America Funding Trust 05-1, 1A1 5.500%, 2/25/35 | 834 | 864 | ||||||
Banc of America Mortgage Securities, Inc. | ||||||||
04-11, 2A1 5.750%, 1/25/35 | 2,877 | 2,926 | ||||||
05-3, 1A15 5.500%, 4/25/35 | 2,876 | 3,009 | ||||||
Banc of America Mortgage Trust 04-7, 6A3 4.500%, 8/25/19 | 1,527 | 1,540 | ||||||
Bank of America (Merrill Lynch – Countrywide) Alternative Loan Trust | ||||||||
04-18CB, 1A1 6.000%, 9/25/34 | 14,325 | 14,512 | ||||||
04-22CB, 1A1 6.000%, 10/25/34 | 32,438 | 34,492 | ||||||
04-36CBC, 2A1 5.500%, 2/25/35 | 6,460 | 6,519 | ||||||
Bank of America (Merrill Lynch – Countrywide) Commercial Mortgage Trust 06-4, A3 5.172%, 12/12/49 | 10,300 | 10,960 | ||||||
| PAR VALUE | VALUE | |||||||
| Non-Agency (continued) | ||||||||
Bank of America (Merrill Lynch – Countrywide) Home Loan Mortgage Pass-Through-Trust | ||||||||
02-35, 1A2 5.000%, 2/25/18 | $ | 789 | $ | 801 | ||||
04-6, 1A2 2.458%, 5/25/34(2) | 2,042 | 2,048 | ||||||
04-4, A6 5.500%, 5/25/34 | 1,453 | 1,493 | ||||||
Bank of America (Merrill Lynch – Countrywide) Mortgage Trust 06-C1, AM 5.862%, 5/12/39(2) | 7,570 | 8,034 | ||||||
Bank of America (Merrill Lynch – Deutsche Bank Trust) 12-OSI, A2FX 144A 3.352%, 4/13/29(3) | 19,916 | 20,463 | ||||||
Bank of America (Merrill Lynch) Mortgage Investors, Inc. 98-C1, B 6.750%, 11/15/26(2) | 10,000 | 11,091 | ||||||
Bank of America (Merrill Lynch) Commercial Mortgage Trust 06-3, A4 5.414%, 7/12/46(2) | 10,949 | 11,627 | ||||||
Barclays (Lehman Brothers) – UBS Commercial Mortgage Trust | ||||||||
06-C3, AM 5.712%, 3/15/39(2) | 7,615 | 8,062 | ||||||
07-C2, A3 5.430%, 2/15/40 | 6,406 | 6,937 | ||||||
07-C6, A4 5.858%, 7/15/40(2) | 20,411 | 21,625 | ||||||
07-C7, A3 5.866%, 9/15/45(2) | 11,098 | 12,281 | ||||||
See Notes to Financial Statements
10
Table of Contents
VIRTUS MULTI-SECTOR SHORT TERM BOND FUND
SCHEDULE OF INVESTMENTS (Continued)
SEPTEMBER 30, 2014
($ reported in thousands)
| PAR VALUE | VALUE | |||||||
| MORTGAGE-BACKED SECURITIES (continued) | ||||||||
| Non-Agency (continued) | ||||||||
Bayview Commercial Asset Trust | ||||||||
07-5A, A2 144A 1.055%, 10/25/37(2)(3) | $ | 12,163 | $ | 12,233 | ||||
08-1, A2A 144A 1.155%, 1/25/38(2)(3) | 10,847 | 10,745 | ||||||
08-1, A3 144A 1.655%, 1/25/38(2)(3) | 32,808 | 31,175 | ||||||
BCAP LLC Trust 06-RR1, PE 5.000%, 11/25/36 | 2,853 | 2,914 | ||||||
Citicorp Mortgage Securities, Inc. 07-1, A1 5.500%, 1/25/22 | 249 | 251 | ||||||
Citigroup – Deutsche Bank Commercial Mortgage Trust | ||||||||
05-CD1, AM 5.400%, 7/15/44(2) | 6,410 | 6,648 | ||||||
06-CD2, A4 5.480%, 1/15/46(2) | 2,659 | 2,770 | ||||||
07-CD4, A4 5.322%, 12/11/49 | 3,730 | 3,984 | ||||||
07-CD4, AMFX 5.366%, 12/11/49(2) | 13,955 | 14,632 | ||||||
Citigroup Commercial Mortgage Trust | ||||||||
07-6, A4 5.898%, 12/10/49(2) | 388 | 426 | ||||||
07-C6, A1A 5.899%, 12/10/49(2) | 28,850 | 31,465 | ||||||
08-C7, AM 6.339%, 12/10/49(2) | 12,335 | 13,592 | ||||||
10-RR3, MLSR 144A 5.810%, 6/14/50(2)(3) | 3,460 | 3,729 | ||||||
Citigroup Mortgage Loan Trust, Inc. | ||||||||
03-UP3, A2 7.000%, 9/25/33 | 1,070 | 1,128 | ||||||
04-UST1, A3 2.178%, 8/25/34(2) | 2,083 | 2,093 | ||||||
04-MCL2, 2CB2 6.750%, 8/25/34 | 14,440 | 15,749 | ||||||
14-A, A 144A 4.000%, 1/25/35(2)(3) | 23,925 | 24,896 | ||||||
| PAR VALUE | VALUE | |||||||
| Non-Agency (continued) | ||||||||
05-5, 2A3 5.000%, 8/25/35 | $ | 809 | $ | 805 | ||||
Commercial Mortgage Trust 07-GG11, AM 5.867%, 12/10/49(2) | 18,174 | 19,843 | ||||||
Credit Suisse Commercial Mortgage Trust | ||||||||
07-C1, A1A 5.361%, 2/15/40 | 38,917 | 41,338 | ||||||
07-C5, A1AM 5.870%, 9/15/40(2) | 17,414 | 17,820 | ||||||
14-LVR2, A2 144A 4.000%, 4/25/44(2)(3) | 18,652 | 19,290 | ||||||
07-C2, A3 5.542%, 1/15/49(2) | 12,995 | 14,032 | ||||||
Credit Suisse First Boston Mortgage Securities Corp. | ||||||||
03-27, 5A3 5.250%, 11/25/33 | 2,622 | 2,685 | ||||||
04-AR8, 6A1 2.397%, 9/25/34(2) | 10,609 | 10,712 | ||||||
04-8, 7A1 6.000%, 12/25/34 | 7,396 | 7,818 | ||||||
Extended Stay America Trust | ||||||||
13-ESH7, A17 144A 2.295%, 12/5/31(3) | 29,200 | 28,473 | ||||||
13-ESH7, A27 144A 2.958%, 12/5/31(3) | 8,340 | 8,414 | ||||||
Fannie Mae Connecticut Avenue Securities 14-C02, 2M2 2.755%, 5/25/24(2) | 1,420 | 1,316 | ||||||
FDIC Trust 13-N1, A 144A 4.500%, 10/25/18(3) | 8,166 | 8,237 | ||||||
GMAC Mortgage Corp. Loan Trust | ||||||||
03-J7, A10 5.500%, 11/25/33 | 1,833 | 1,916 | ||||||
04-AR1, 12A 2.990%, 6/25/34(2) | 10,692 | 10,931 | ||||||
05-AR1, 5A 5.056%, 3/18/35(2) | 3,942 | 3,949 | ||||||
See Notes to Financial Statements
11
Table of Contents
VIRTUS MULTI-SECTOR SHORT TERM BOND FUND
SCHEDULE OF INVESTMENTS (Continued)
SEPTEMBER 30, 2014
($ reported in thousands)
| PAR VALUE | VALUE | |||||||
| MORTGAGE-BACKED SECURITIES (continued) | ||||||||
| Non-Agency (continued) | ||||||||
Goldman Sachs Mortgage Securities Trust | ||||||||
07-GG,10 5.991%, 8/10/45(2) | $ | 2,988 | $ | 3,278 | ||||
II 07-GG10, A4 5.991%, 8/10/45(2) | 21,763 | 23,766 | ||||||
GSR Mortgage Loan Trust | ||||||||
04-15F, 2A2 5.000%, 12/25/34 | 3,173 | 3,340 | ||||||
05-5F, 2A8 5.500%, 6/25/35 | 421 | 421 | ||||||
05-AR4, 6A1 5.229%, 7/25/35(2) | 6,663 | 6,654 | ||||||
07-1F, 2A2 5.500%, 1/25/37 | 647 | 620 | ||||||
Hilton USA Trust 13-HLT, EFX 144A 5.609%, 11/5/30(2)(3) | 21,980 | 22,324 | ||||||
Jefferies Resecuritization Trust | ||||||||
14-R1, 2A1 144A 4.000%, 12/27/37(3) | 11,713 | 11,683 | ||||||
14-R1, 1A1 144A 4.000%, 12/27/37(3) | 13,405 | 13,377 | ||||||
JPMorgan Chase (Bear Stearns) Adjustable Rate Mortgage Trust | ||||||||
03-9, 4A1 2.645%, 2/25/34(2) | 7,528 | 7,515 | ||||||
04-10, 14A1 5.022%, 1/25/35(2) | 2,143 | 2,154 | ||||||
JPMorgan Chase (Bear Stearns) Asset Backed Securities Trust 03-AC4. A 5.500%, 9/25/33(2) | 9,399 | 9,712 | ||||||
JPMorgan Chase (Bear Stearns) Commercial Mortgage Securities, Inc. | ||||||||
06-T22, AM 5.757%, 4/12/38(2) | 10,700 | 11,364 | ||||||
| PAR VALUE | VALUE | |||||||
| Non-Agency (continued) | ||||||||
06-PW12, AM | $ | 9,250 | $ | 9,847 | ||||
06-PW14, AM | 5,000 | 5,375 | ||||||
05-PW10, AM | 14,480 | 15,092 | ||||||
06-PW13, AM | 3,272 | 3,496 | ||||||
07-PW15, AM | 27,100 | 28,188 | ||||||
07-PW17, A4 | 21,890 | 23,927 | ||||||
07-PW18, A4 | 17,330 | 19,040 | ||||||
07-PW18, AM | 12,400 | 13,798 | ||||||
JPMorgan Chase (Washington Mutual) Commercial Mortgage Securities Trust 06-SL1, A 144A 4.465%, 11/23/43(2)(3) | 233 | 233 | ||||||
JPMorgan Chase (Washington Mutual) Mortgage Pass-Through Certificates Trust | ||||||||
04-CB1, 5A 5.000%, 6/25/19 | 1,833 | 1,882 | ||||||
03-AR6, A1 | 1,330 | 1,342 | ||||||
03-AR4, 2A1 | 397 | 397 | ||||||
04-CB1, 2A 5.000%, 6/25/34 | 4,053 | 4,324 | ||||||
JPMorgan Chase Commercial Mortgage Securities Trust | ||||||||
13-ALC, A 144A | 8,700 | 8,716 | ||||||
09-IWST, A1 144A | 6,886 | 7,367 | ||||||
09-IWST, A2 144A | 4,900 | 5,582 | ||||||
See Notes to Financial Statements
12
Table of Contents
VIRTUS MULTI-SECTOR SHORT TERM BOND FUND
SCHEDULE OF INVESTMENTS (Continued)
SEPTEMBER 30, 2014
($ reported in thousands)
| PAR VALUE | VALUE | |||||||
| MORTGAGE-BACKED SECURITIES (continued) | ||||||||
| Non-Agency (continued) | ||||||||
10-CNTR, A1 144A 3.300%, 8/5/32(3) | $ | 2,031 | $ | 2,104 | ||||
10-CNTR, A2 144A 4.311%, 8/5/32(3) | 14,828 | 16,029 | ||||||
06-LDP7, A4 6.058%, 4/15/45(2) | 12,301 | 13,048 | ||||||
06-LDP7, AM 6.058%, 4/15/45(2) | 22,312 | 23,946 | ||||||
06-LDP9, A3 5.336%, 5/15/47 | 20,373 | 21,828 | ||||||
07-LDPX, AM 5.464%, 1/15/49(2) | 24,049 | 25,151 | ||||||
07-LD12, A4 5.882%, 2/15/51(2) | 11,529 | 12,551 | ||||||
JPMorgan Chase Mortgage Trust | ||||||||
06-A2, 4A1 2.503%, 8/25/34(2) | 2,646 | 2,643 | ||||||
04-A4, 2A1 2.351%, 9/25/34(2) | 4,915 | 5,010 | ||||||
05-A1, 4A1 2.590%, 2/25/35(2) | 989 | 1,005 | ||||||
05-A2, 4A1 5.021%, 4/25/35(2) | 1,297 | 1,280 | ||||||
05-A4, 3A1 2.205%, 7/25/35(2) | 7,666 | 7,679 | ||||||
06-A4, 3A1 5.551%, 6/25/36(2) | 7,110 | 6,373 | ||||||
06-A6, 3A3L 5.052%, 10/25/36(2) | 1,942 | 1,770 | ||||||
14-1, 1A1 144A 4.000%, 1/25/44(2)(3) | 35,286 | 36,515 | ||||||
JPMorgan Mortgage Trust 14-2, 2A2 144A 3.500%, 6/25/29(2)(3) | 17,861 | 18,473 | ||||||
JPMorgan Mortgage Trust 14-IVR3, 2A1 3.000%, 10/25/29(2) | 8,605 | 8,694 | ||||||
Leaf II Receivables Funding LLC 13-1, C 144A 3.460%, 9/15/21(3) | 6,850 | 6,859 | ||||||
MASTR Adjustable Rate Mortgages Trust 04-12,3A1 2.514%, 11/25/34(2) | 2,379 | 2,385 | ||||||
| PAR VALUE | VALUE | |||||||
| Non-Agency (continued) | ||||||||
MASTR Alternative Loan Trust | ||||||||
04-7, 4A1 4.500%, 7/25/19 | $ | 4,317 | $ | 4,407 | ||||
03-8, 2A1 5.750%, 11/25/33 | 8,409 | 8,795 | ||||||
04-4, 6A1 5.500%, 4/25/34 | 4,598 | 4,836 | ||||||
04-6, 7A1 6.000%, 7/25/34 | 7,277 | 7,408 | ||||||
04-7, 9A1 6.000%, 8/25/34 | 17,912 | 18,690 | ||||||
05-2, 2A1 6.000%, 1/25/35 | 4,468 | 4,611 | ||||||
05-2, 1A1 6.500%, 3/25/35 | 12,023 | 12,661 | ||||||
MASTR Asset Securitization Trust | ||||||||
04-6, 4A1 5.000%, 7/25/19 | 1,290 | 1,308 | ||||||
05-1, 1A1 5.000%, 5/25/20 | 909 | 933 | ||||||
MASTR Reperforming Loan Trust 05-1, 1A2 144A 6.500%, 8/25/34(3) | 2,077 | 2,128 | ||||||
Monty Parent Issuer 1 LLC 13-LTR1, A 144A 3.470%, 11/20/28(3) | 4,720 | 4,726 | ||||||
Morgan Stanley Capital I Trust | ||||||||
06-T23, AM 5.984%, 8/12/41(2) | 10,575 | 11,419 | ||||||
06-IQ12, A4 5.332%, 12/15/43 | 14,189 | 15,195 | ||||||
07-IQ14, A4 5.692%, 4/15/49(2) | 17,390 | 18,889 | ||||||
07-IQ14, AM 5.869%, 4/15/49(2) | 25,932 | 27,174 | ||||||
07- LQ16, A4 5.809%, 12/12/49 | 22,674 | 24,778 | ||||||
Morgan Stanley Mortgage Loan Trust | ||||||||
04-2AR, 3A 2.162%, 2/25/34(2) | 2,098 | 2,107 | ||||||
04-2AR, 4A 2.541%, 2/25/34(2) | 1,804 | 1,833 | ||||||
See Notes to Financial Statements
13
Table of Contents
VIRTUS MULTI-SECTOR SHORT TERM BOND FUND
SCHEDULE OF INVESTMENTS (Continued)
SEPTEMBER 30, 2014
($ reported in thousands)
| PAR VALUE | VALUE | |||||||
| MORTGAGE-BACKED SECURITIES (continued) | ||||||||
| Non-Agency (continued) | ||||||||
Morgan Stanley Residential Mortgage Loan Trust 14-1A, A1 144A 2.993%, 6/25/44(2)(3) | $ | 9,374 | $ | 9,557 | ||||
Motel 6 Trust 12-MTL6 D 144A 3.781%, 10/5/25(3) | 20,790 | 20,809 | ||||||
New Residential Mortgage Loan Trust 14-1A, A 144A 3.750%, 1/25/54(2)(3) | 11,025 | 11,320 | ||||||
Nomura Asset Acceptance Corp. | ||||||||
04-R1, A1 144A 6.500%, 3/25/34(3) | 12,141 | 12,456 | ||||||
04-R3, A1 144A 6.500%, 2/25/35(3) | 8,384 | 8,621 | ||||||
05-WF1, 2A2 4.786%, 3/25/35 | 2,160 | 2,219 | ||||||
Residential Accredit Loans, Inc. | ||||||||
03-QS6, A4 4.250%, 3/25/33 | 2,166 | 2,202 | ||||||
05-QS1, A5 5.500%, 1/25/35 | 1,648 | 1,671 | ||||||
Residential Asset Mortgage Products, Inc. | ||||||||
04-SL2, A3 7.000%, 10/25/31 | 2,671 | 2,813 | ||||||
04-SL1, A8 6.500%, 11/25/31 | 3,258 | 3,351 | ||||||
05-SL2, A4 7.500%, 2/25/32 | 2,755 | 2,902 | ||||||
04-SL4, A3 6.500%, 7/25/32 | 1,871 | 1,930 | ||||||
Residential Asset Securities Corp. 01-KS2, AI5 7.514%, 6/25/31(2) | 3,208 | 3,242 | ||||||
| PAR VALUE | VALUE | |||||||
| Non-Agency (continued) | ||||||||
Residential Asset Securitization Trust | ||||||||
03,A11, A9 5.750%, 11/25/33 | $ | 3,554 | $ | 3,724 | ||||
04-A1, A5 5.500%, 4/25/34 | 14,836 | 15,467 | ||||||
04-QS8, A6 5.500%, 6/25/34 | 3,362 | 3,443 | ||||||
Residential Funding Mortgage Securities I, Inc. | ||||||||
06-S12, 1A1 5.500%, 12/25/21 | 1,805 | 1,871 | ||||||
05-S1, 1A2 5.500%, 2/25/35 | 1,729 | 1,746 | ||||||
05-S9, A9 5.500%, 12/25/35 | 801 | 795 | ||||||
SBA Tower Trust 144A 4.254%, 4/15/15(3) | 13,535 | 13,788 | ||||||
Sequoia Mortgage Trust 14-2, A1 144A 4.000%, 7/25/44(2)(3) | 15,456 | 15,980 | ||||||
SilverLeaf Finance XVII LLC 13-12, A1 144A 2.680%, 3/16/26(3) | 8,067 | 7,972 | ||||||
Springleaf Mortgage Loan Trust 12-3A, A 144A 1.570%, 12/25/59(2)(3) | 3,533 | 3,531 | ||||||
Structured Adjustable Rate Mortgage Loan Trust | ||||||||
03-30, 2A1 5.097%, 10/25/33(2) | 5,413 | 5,644 | ||||||
04-4, 3A2 2.463%, 4/25/34(2) | 4,273 | 4,264 | ||||||
04-4, 3A1 2.463%, 4/25/34(2) | 1,082 | 1,079 | ||||||
04-4, 3A4 2.463%, 4/25/34(2) | 3,691 | 3,682 | ||||||
04-5, 3A2 2.419%, 5/25/34(2) | 2,206 | 2,210 | ||||||
04-14, 7A 2.368%, 10/25/34(2) | 15,918 | 16,010 | ||||||
See Notes to Financial Statements
14
Table of Contents
VIRTUS MULTI-SECTOR SHORT TERM BOND FUND
SCHEDULE OF INVESTMENTS (Continued)
SEPTEMBER 30, 2014
($ reported in thousands)
| PAR VALUE | VALUE | |||||||
| MORTGAGE-BACKED SECURITIES (continued) | ||||||||
| Non-Agency (continued) | ||||||||
Structured Asset Securities Corp. Assistance Loan Trust 03-AL1, A 144A 3.357%, 4/25/31(3) | $ | 10,933 | $ | 10,743 | ||||
Structured Asset Securities Corp. Mortgage Pass-Through Certificates | ||||||||
02-AL1, A3 3.450%, 2/25/32 | 13,628 | 13,474 | ||||||
03-33H, 1A1 5.500%, 10/25/33 | 4,637 | 4,741 | ||||||
03-34A, 6A 2.540%, 11/25/33(2) | 3,540 | 3,478 | ||||||
04-15, 3A3 5.500%, 9/25/34 | 3,712 | 3,774 | ||||||
SunTrust Adjustable Rate Mortgage Loan Trust 07-S1, 5A1 3.600%, 1/25/37(2) | 1,278 | 1,276 | ||||||
VFC LLC 14-2, A 144A 2.750%, 7/20/30(3) | 7,449 | 7,449 | ||||||
Wells Fargo (Wachovia Bank Commercial Mortgage Trust) | ||||||||
04-C15, B 4.892%, 10/15/41 | 14,875 | 14,861 | ||||||
06-C25, A4 5.896%, 5/15/43(2) | 8,473 | 8,897 | ||||||
07-C30, A5 5.342%, 12/15/43 | 39,765 | 42,867 | ||||||
07-C30, AM 5.383%, 12/15/43 | 25,695 | 27,494 | ||||||
07-C31, A4 5.509%, 4/15/47 | 14,562 | 15,566 | ||||||
07-31, AM 5.591%, 4/15/47(2) | 34,000 | 36,947 | ||||||
07-C33, A5 6.140%, 2/15/51(2) | 1,265 | 1,388 | ||||||
| PAR VALUE | VALUE | |||||||
| Non-Agency (continued) | ||||||||
Wells Fargo (Wachovia Bank) Commercial Mortgage Trust) | ||||||||
06-C25, AM 5.896%, 5/15/43(2) | $ | 18,625 | $ | 19,818 | ||||
07-C32, A3 5.933%, 6/15/49(2) | 22,577 | 24,422 | ||||||
Wells Fargo Mortgage Backed Securities Trust | ||||||||
06-17, A1 5.500%, 11/25/21 | 236 | 239 | ||||||
03-G, A1 2.490%, 6/25/33(2) | 1,685 | 1,711 | ||||||
03-J, 5A1 2.490%, 10/25/33(2) | 601 | 608 | ||||||
04-4, A9 5.500%, 5/25/34 | 2,623 | 2,700 | ||||||
04-U, A1 2.579%, 10/25/34(2) | 1,262 | 1,269 | ||||||
04-Z, 2A1 2.615%, 12/25/34(2) | 8,916 | 9,075 | ||||||
04-CC, A1 2.615%, 1/25/35(2) | 3,749 | 3,763 | ||||||
05-12, 1A1 5.500%, 11/25/35 | 6,334 | 6,525 | ||||||
05-14, 2A1 5.500%, 12/25/35 | 4,708 | 4,831 | ||||||
06-6, 1A15 5.750%, 5/25/36 | 615 | 611 | ||||||
06-16, A5 5.000%, 11/25/36 | 1,484 | 1,535 | ||||||
07-16, 1A1 6.000%, 12/28/37 | 5,819 | 6,008 | ||||||
07-AR10, 2A1 6.108%, 1/25/38(2) | 5,414 | 5,405 | ||||||
WinWater Mortgage Loan Trust 14-1, A1 144A 4.000%, 6/20/44(2)(3) | 17,580 | 18,097 | ||||||
|
| |||||||
| 1,786,001 | ||||||||
| TOTAL MORTGAGE-BACKED SECURITIES | ||||||||
| (Identified Cost $1,894,207) | 1,937,402 | |||||||
See Notes to Financial Statements
15
Table of Contents
VIRTUS MULTI-SECTOR SHORT TERM BOND FUND
SCHEDULE OF INVESTMENTS (Continued)
SEPTEMBER 30, 2014
($ reported in thousands)
| PAR VALUE | VALUE | |||||||
| ASSET-BACKED SECURITIES—16.8% | ||||||||
1st Financial Bank U.S.A. 10-D, C 144A 5.920%, 6/17/19(3) | $ | 1,581 | $ | 1,586 | ||||
American Credit Acceptance Receivables Trust 14-3, C 144A 3.430%, 6/10/20(3) | 19,200 | 19,192 | ||||||
American Home 4 Rent 14-SFR1, A 144A 1.250%, 6/17/31(2)(3) | 7,427 | 7,382 | ||||||
AmeriCredit Automobile Receivables Trust | ||||||||
10-4, C 2.760%, 5/9/16 | 764 | 766 | ||||||
11-1, C 2.850%, 8/8/16 | 549 | 551 | ||||||
10-4, D 4.200%, 11/8/16 | 7,700 | 7,820 | ||||||
11-1, D 4.260%, 2/8/17 | 11,119 | 11,380 | ||||||
11-5, D 5.050%, 12/8/17 | 5,010 | 5,255 | ||||||
12-1, C 2.670%, 1/8/18 | 4,625 | 4,696 | ||||||
12-3, C 2.420%, 5/8/18 | 16,750 | 17,038 | ||||||
12-3, D 3.030%, 7/9/18 | 19,762 | 20,243 | ||||||
12-4, D 2.680%, 10/9/18 | 7,150 | 7,234 | ||||||
13-2, D 2.420%, 5/8/19 | 22,050 | 21,841 | ||||||
14-2, C 2.180%, 6/8/20 | 19,450 | 19,260 | ||||||
14-1, D 2.540%, 6/8/20 | 15,200 | 14,960 | ||||||
Ameriquest Mortgage Securities, Inc. 03-10, AF6 5.210%, 11/25/33(2) | 1,523 | 1,575 | ||||||
Applebee’s (IHOP Funding LLC) 14-1, A2 144A 4.277%, 9/5/44(3) | 17,803 | 17,636 | ||||||
| PAR VALUE | VALUE | |||||||
| ASSET-BACKED SECURITIES (continued) | ||||||||
Asset Backed Funding Certificates 05-AQ1, A6 4.780%, 6/25/35(2) | $ | 5,208 | $ | 5,349 | ||||
Associates Manufactured Housing Pass-Through Certificates 96-1, B1 8.000%, 3/15/27(2) | 2,285 | 2,506 | ||||||
Avis Budget Rental Car Funding LLC | ||||||||
(AESOP) 11-3A, A 144A 3.410%, 11/20/17(3) | 12,848 | 13,380 | ||||||
(AESOP) 12-3A, A 144A 2.100%, 3/20/19(3) | 23,085 | 23,109 | ||||||
(AESOP) 13-1A, A 144A 1.920%, 9/20/19(3) | 18,200 | 18,043 | ||||||
Bank of America (Merrill Lynch – Countrywide) Asset-Backed Certificates | ||||||||
04-10, AF6 4.485%, 12/25/34(2) | 2,016 | 2,075 | ||||||
05-1 AF5A 5.374%, 7/25/35(2) | 13,675 | 13,625 | ||||||
05-12, 2A3 5.069%, 2/25/36(2) | 4,191 | 4,261 | ||||||
BankAmerica Manufactured Housing Contract Trust 98-1, B1 7.810%, 8/10/25(2) | 4,170 | 4,426 | ||||||
Barclays (Lehman Brothers) Manufactured Housing Contract Trust 01-B, A3 4.350%, 4/15/40 | 4,537 | 4,777 | ||||||
Bayview Financial Acquisition Trust 07-A, 1A2 6.205%, 5/28/37(2) | 9,588 | 10,159 | ||||||
See Notes to Financial Statements
16
Table of Contents
VIRTUS MULTI-SECTOR SHORT TERM BOND FUND
SCHEDULE OF INVESTMENTS (Continued)
SEPTEMBER 30, 2014
($ reported in thousands)
| PAR VALUE | VALUE | |||||||
| ASSET-BACKED SECURITIES (continued) | ||||||||
Bayview Financial Mortgage-Pass-Through Trust | ||||||||
06-B, 1A2 5.800%, 4/28/36(2) | $ | 48 | $ | 51 | ||||
06-A, 1A2 5.483%, 2/28/41(2) | 157 | 160 | ||||||
06-A, 1A4 6.087%, 2/28/41(2) | 16,408 | 16,816 | ||||||
BCC Funding VIII LLC | ||||||||
14-A, B 144A 3.123%, 8/20/20(3) | 2,799 | 2,789 | ||||||
14-1A, C 144A 4.216%, 8/20/20(3) | 5,519 | 5,500 | ||||||
Beacon Container Finance LLC 12-1A, A 144A 3.720%, 9/20/27(3) | 20,320 | 20,628 | ||||||
Bush Truck Leasing LLC 11-44, A 144A 5.000%, 9/25/18(3) | 334 | 332 | ||||||
BXG Receivables Note Trust | ||||||||
10-A, A 144A 5.100%, 3/2/26(3) | 2,616 | 2,732 | ||||||
12-A, A 144A 2.660%, 12/2/27(3) | 5,538 | 5,505 | ||||||
13-A, A 144A 3.010%, 12/4/28(3) | 9,526 | 9,595 | ||||||
California Republic Auto Receivables Trust | ||||||||
12-1, B 144A 1.760%, 1/16/18(3) | 13,570 | 13,743 | ||||||
13-1, B 144A 2.240%, 1/15/19(3) | 11,600 | 11,759 | ||||||
14-2, B 2.340%, 4/15/20 | 7,090 | 6,996 | ||||||
14-2, C 3.290%, 3/15/21 | 2,700 | 2,666 | ||||||
Capital Auto Receivables Asset Trust | ||||||||
13-1, C 1.740%, 10/22/18 | 5,425 | 5,427 | ||||||
13-4, C 2.670%, 2/20/19 | 2,550 | 2,575 | ||||||
| PAR VALUE | VALUE | |||||||
| ASSET-BACKED SECURITIES (continued) | ||||||||
Capital One Multi-Asset Execution Trust 14-A2, A2 1.260%, 1/15/20 | $ | 19,412 | $ | 19,397 | ||||
Carfinance Capital Auto Trust | ||||||||
13-A, B 144A 2.750%, 11/15/18(3) | 6,740 | 6,839 | ||||||
13-A1, C 144A 3.450%, 3/15/19(3) | 2,210 | 2,229 | ||||||
13-2A, B 144A 3.150%, 8/15/19(3) | 19,350 | 19,663 | ||||||
CarMax Auto Owner Trust | ||||||||
12-1, B 1.760%, 8/15/17 | 6,190 | 6,273 | ||||||
14-2, B 1.880%, 11/15/19 | 1,000 | 994 | ||||||
14-2, C 2.080%, 1/15/20 | 7,175 | 7,122 | ||||||
CarNow Auto Receivables Trust | ||||||||
13-1A, B 144A 1.970%, 11/15/17(3) | 4,570 | 4,567 | ||||||
13-1A,C 144A 2.980%, 11/15/17(3) | 7,244 | 7,260 | ||||||
14-1A, D 144A 4.160%, 11/15/18(3) | 3,000 | 2,991 | ||||||
14-1A, E 144A 5.530%, 1/15/20(3) | 4,350 | 4,335 | ||||||
CCG Receivables Trust 14-1, B 144A 2.150%, 11/15/21(3) | 5,080 | 5,081 | ||||||
Centre Point Funding LLC 12-2A, 1 144A 2.610%, 8/20/21(3) | 8,884 | 8,841 | ||||||
CFC LLC | ||||||||
14-1A, B 144A 2.720%, 4/15/20(3) | 5,550 | 5,584 | ||||||
14-2A, B 144A 2.640%, 11/16/20(3) | 3,455 | 3,443 | ||||||
14-2A, C 144A 3.240%, 11/16/20(3) | 2,750 | 2,740 | ||||||
Chase Funding Trust 04-2, 1A4 5.323%, 2/26/35 | 1,260 | 1,271 | ||||||
See Notes to Financial Statements
17
Table of Contents
VIRTUS MULTI-SECTOR SHORT TERM BOND FUND
SCHEDULE OF INVESTMENTS (Continued)
SEPTEMBER 30, 2014
($ reported in thousands)
| PAR VALUE | VALUE | |||||||
| ASSET-BACKED SECURITIES (continued) | ||||||||
Cheesecake Restaurant Holdings, Inc. 13-1A, A2 144A 4.474%, 3/20/43(3) | $ | 34,545 | $ | 34,869 | ||||
CIT Equipment Collateral 12-VT1, D 144A 4.120%, 10/21/19(3) | 10,000 | 10,101 | ||||||
Citicorp Residential Mortgage Securities, Inc. 07-12, A6 5.696%, 6/25/37(2) | 9,443 | 9,757 | ||||||
CNH Equipment Trust | ||||||||
12-B, A4 1.160%, 6/15/20 | 10,000 | 10,037 | ||||||
12-B, B 1.780%, 6/15/20 | 4,000 | 4,055 | ||||||
Conseco Financial Corp. | ||||||||
94-1, A5 7.650%, 4/15/19 | 113 | 117 | ||||||
01-3, A4 6.910%, 5/1/33(2) | 12,122 | 13,424 | ||||||
Cronos Containers Program Ltd. 12-2A, A 144A 3.810%, 9/18/27(3) | 17,876 | 17,887 | ||||||
Direct Capital Funding IV LLC | ||||||||
13-1, D 144A 4.599%, 10/20/19(3) | 3,555 | 3,615 | ||||||
13-A1, C 144A 4.830%, 11/20/20(3) | 5,000 | 5,078 | ||||||
Domino’s Pizza Master Issuer LLC 12-1A, A2 144A 5.216%, 1/25/42(3) | 39,545 | 41,771 | ||||||
Drug Royalty LP | ||||||||
II 14-1, A2 144A 3.484%, 7/15/23(3) | 19,662 | 19,659 | ||||||
I 12-1, A2 144A 5.800%, 7/15/24(3) | 3,860 | 3,987 | ||||||
DT Auto Owner Trust | ||||||||
13-1A, C 144A 2.730%, 2/15/19(3) | 17,775 | 17,935 | ||||||
| PAR VALUE | VALUE | |||||||
| ASSET-BACKED SECURITIES (continued) | ||||||||
13-2A, C 144A 3.060%, 9/16/19(3) | $ | 17,500 | $ | 17,729 | ||||
14-1A, C 144A 2.640%, 10/15/19(3) | 14,400 | 14,465 | ||||||
14-2A, C 144A 2.460%, 1/15/20(3) | 14,370 | 14,336 | ||||||
Exeter Automobile Receivables Trust | ||||||||
12-1A, C 144A 5.270%, 10/16/17(3) | 8,500 | 8,743 | ||||||
12-2A, C 144A 3.060%, 7/16/18(3) | 8,050 | 8,193 | ||||||
13-2A, B 144A 3.090%, 7/16/18(3) | 17,820 | 18,161 | ||||||
14-1A, B 144A 2.420%, 1/15/19(3) | 9,220 | 9,264 | ||||||
13-1A, C 144A 3.520%, 2/15/19(3) | 15,000 | 15,449 | ||||||
14-1A, C 144A 3.570%, 7/15/19(3) | 15,830 | 16,035 | ||||||
13-1A, D 144A 5.050%, 10/15/19(3) | 13,000 | 13,177 | ||||||
14-2A, C 144A 3.260%, 12/16/19(3) | 14,615 | 14,607 | ||||||
Fairway Outdoor Funding LLC 12-1A, A2 144A 4.212%, 10/15/42(3) | 15,890 | 15,827 | ||||||
Foursight Capital Automobile Receivables Trust 14-1, B 144A 3.560%, 11/22/21(3) | 4,704 | 4,703 | ||||||
Global Science Finance S.A.R.L. | ||||||||
13-1A, A 144A 2.980%, 4/17/28(3) | 21,845 | 21,692 | ||||||
13-2A, A 144A 3.670%, 11/17/28(3) | 6,417 | 6,512 | ||||||
GMAC Mortgage Corp. Loan Trust 06-HLTV, A4 5.810%, 10/25/29 | 3,822 | 3,860 | ||||||
GreatAmerica Leasing Receivables Funding, LLC 13-1, A4 144A 1.160%, 5/15/18(3) | 2,235 | 2,239 | ||||||
See Notes to Financial Statements
18
Table of Contents
VIRTUS MULTI-SECTOR SHORT TERM BOND FUND
SCHEDULE OF INVESTMENTS (Continued)
SEPTEMBER 30, 2014
($ reported in thousands)
| PAR VALUE | VALUE | |||||||
| ASSET-BACKED SECURITIES (continued) | ||||||||
GSAA Home Equity Trust | ||||||||
05-1, AF4 5.619%, 11/25/34(2) | $ | 796 | $ | 848 | ||||
05-12, AF3W 4.999%, 9/25/35(2) | 10,775 | 10,971 | ||||||
Harley-Davidson Motorcycle Trust 10-1, C 2.590%, 4/15/18 | 3,319 | 3,327 | ||||||
Hertz Vehicle Financing LLC | ||||||||
09-2A, A2 144A 5.290%, 3/25/16(3) | 5,000 | 5,061 | ||||||
13-1A, A1 144A 1.120%, 8/25/17(3) | 18,325 | 18,302 | ||||||
11-1A, A2 144A 3.290%, 3/25/18(3) | 12,290 | 12,762 | ||||||
Hilton Grand Vacations Trust | ||||||||
13-A, A 144A 2.280%, 1/25/26(3) | 14,286 | 14,369 | ||||||
14-AA, A 144A 1.770%, 11/25/26(3) | 17,935 | 17,776 | ||||||
Hyundai Auto Receivables Trust | ||||||||
12-B, C 1.950%, 10/15/18 | 10,000 | 10,179 | ||||||
14-B, D 2.510%, 12/15/20 | 9,675 | 9,619 | ||||||
IMC Home Equity Loan Trust 97-5, A9 7.310%, 11/20/28 | 3,708 | 3,725 | ||||||
IndyMac Manufactured Housing Contract 98-1, A3 6.370%, 9/25/28 | 1,181 | 1,216 | ||||||
LEAF Receivables Funding LLC | ||||||||
12-1, D 144A 4.680%, 9/15/20(3) | 5,859 | 5,939 | ||||||
13-1, D 144A 5.110%, 9/15/21(3) | 655 | 668 | ||||||
| PAR VALUE | VALUE | |||||||
| ASSET-BACKED SECURITIES (continued) | ||||||||
Marriott Vacation Club Owner Trust | ||||||||
12-1A, A 144A 2.510%, 5/20/30(3) | $ | 21,551 | $ | 21,807 | ||||
10-1A, A 144A 3.540%, 10/20/32(3) | 716 | 742 | ||||||
10-1A, B 144A 4.520%, 10/20/32(3) | 1,397 | 1,447 | ||||||
MMCA Auto Owner Trust 11-A, B 144A 2.720%, 10/17/16(3) | 3,500 | 3,523 | ||||||
Nations Equipment Finance Funding I LLC | ||||||||
13-1A, B 144A 3.818%, 5/20/21(3) | 4,000 | 4,059 | ||||||
13-1A, C 144A 5.500%, 5/20/21(3) | 7,833 | 8,047 | ||||||
New Century Home Equity Loan Trust 05-A, A4W 5.035%, 8/25/35(2) | 16,474 | 17,154 | ||||||
OneMain Financial Issuance Trust 14-1A, A 144A 2.430%, 6/18/24(3) | 9,270 | 9,270 | ||||||
Orange Lake Timeshare Trust | ||||||||
12-AA, A 144A 3.450%, 3/10/27(3) | 5,715 | 5,886 | ||||||
14-AA, A 2.290%, 7/9/29(3) | 5,850 | 5,845 | ||||||
Prestige Auto Receivables Trust 14-1A, C 144A 2.390%, 5/15/20(3) | 7,000 | 6,945 | ||||||
Residential Asset Mortgage Products, Inc. 03-RS8, AI7 5.015%, 9/25/33(2) | 964 | 980 | ||||||
Residential Funding Mortgage Securities II Home Loan Trust 06-H11, M1 6.010%, 2/25/36(2) | 4,024 | 4,063 | ||||||
See Notes to Financial Statements
19
Table of Contents
VIRTUS MULTI-SECTOR SHORT TERM BOND FUND
SCHEDULE OF INVESTMENTS (Continued)
SEPTEMBER 30, 2014
($ reported in thousands)
| PAR VALUE | VALUE | |||||||
| ASSET-BACKED SECURITIES (continued) | ||||||||
Santander Drive Auto Receivables Trust | ||||||||
10-B, C 144A 3.020%, 10/17/16(3) | $ | 138 | $ | 138 | ||||
12-4, C 2.940%, 12/15/17 | 5,170 | 5,275 | ||||||
12-2, D 3.870%, 2/15/18 | 31,045 | 32,185 | ||||||
12-6, C 1.940%, 3/15/18 | 9,645 | 9,719 | ||||||
12-5, C 2.700%, 8/15/18 | 4,850 | 4,954 | ||||||
12-6, D 2.520%, 9/17/18 | 17,455 | 17,716 | ||||||
13-1, D 2.270%, 1/15/19 | 23,445 | 23,495 | ||||||
13-3, C 1.810%, 4/15/19 | 17,215 | 17,150 | ||||||
13-5, D 2.730%, 10/15/19 | 19,500 | 19,606 | ||||||
14-3, C 2.130%, 8/17/20 | 16,400 | 16,264 | ||||||
14-4, D 3.100%, 11/16/20 | 6,650 | 6,648 | ||||||
Sierra Timeshare Receivables Funding LLC | ||||||||
10-3A, B 144A 4.440%, 11/20/25(3) | 3,192 | 3,261 | ||||||
11-1A, B 144A 4.230%, 4/20/26(3) | 3,088 | 3,185 | ||||||
12-2A, B 144A 3.420%, 3/20/29(3) | 4,304 | 4,395 | ||||||
12-3A, A 144A 1.870%, 8/20/29(3) | 15,086 | 15,165 | ||||||
13-1A, A 144A 1.590%, 11/20/29(3) | 5,892 | 5,897 | ||||||
14-1A, A 144A 2.070%, 3/20/30(3) | 6,661 | 6,676 | ||||||
14-2A, A 144A 2.050%, 6/20/31(3) | 10,137 | 10,074 | ||||||
Silverleaf Finance XV LLC 12-D, A144A 3.000%, 3/17/25(3) | 9,496 | 9,593 | ||||||
SLM Private Education Loan Trust | ||||||||
14-A, 2A2 144A 2.590%, 1/15/26(3) | 3,850 | 3,857 | ||||||
| PAR VALUE | VALUE | |||||||
| ASSET-BACKED SECURITIES (continued) | ||||||||
13-B, A2A 144A 1.850%, 6/17/30(3) | $ | 14,500 | $ | 14,121 | ||||
13-C, A2A 144A 2.940%, 10/15/31(3) | 10,805 | 11,036 | ||||||
SNAAC Auto Receivables Trust 14-1A, C 144A 2.210%, 1/15/20(3) | 3,470 | 3,468 | ||||||
SoFi Professional Loan Program 14-A, A2 144A 3.020%, 10/25/27(3) | 17,817 | 17,832 | ||||||
SolarCity LMC Series III LLC 14-2, A 144A 4.020%, 7/20/44(3) | 8,620 | 8,649 | ||||||
Structured Asset Investment Loan Trust 05-HE1, M1 0.860%, 7/25/35(2) | 4,864 | 4,778 | ||||||
Structured Asset Securities Corp. 01-SB1, A2 3.375%, 8/25/31 | 2,594 | 2,558 | ||||||
SVO VOI Mortgage Corp. | ||||||||
10-AA, A 144A 3.650%, 7/20/27(3) | 4,601 | 4,717 | ||||||
12-AA, A 144A 2.000%, 9/20/29(3) | 9,130 | 9,123 | ||||||
TAL Advantage V LLC 13-1A A 144A 2.830%, 2/22/38(3) | 14,090 | 13,906 | ||||||
TCF Auto Receivables Owner Trust | ||||||||
14-1A, B 144A 2.330%, 5/15/20(3) | 1,733 | 1,733 | ||||||
14-1A, C 144A 3.120%, 4/15/21(3) | 2,035 | 2,034 | ||||||
Terwin Mortgage Trust 04-15ALT, A1 144A 5.665%, 7/25/34(2)(3) | 6,533 | 6,359 | ||||||
Textainer Marine Containers Ltd. 13-1A, A 144A 3.900%, 9/20/38(3) | 18,000 | 18,285 | ||||||
See Notes to Financial Statements
20
Table of Contents
VIRTUS MULTI-SECTOR SHORT TERM BOND FUND
SCHEDULE OF INVESTMENTS (Continued)
SEPTEMBER 30, 2014
($ reported in thousands)
| PAR VALUE | VALUE | |||||||
| ASSET-BACKED SECURITIES (continued) | ||||||||
Tidewater Auto Receivables Trust | ||||||||
12-AA, B 144A 2.430%, 4/15/19(3) | $ | 7,488 | $ | 7,593 | ||||
14-AA, C 2.560%, 8/15/19(3) | 3,500 | 3,464 | ||||||
Trinity Rail Leasing LP 03-1A, A 144A 5.640%, 10/12/26(3) | 5,360 | 5,787 | ||||||
Trip Rail Master Funding LLC | ||||||||
11-1A, A1A 144A 4.370%, 7/15/41(3) | 17,680 | 18,482 | ||||||
14-1A, A1 144A 2.863%, 4/15/44(3) | 4,558 | 4,494 | ||||||
U-Haul S Fleet LLC 10-BT1A, 1 144A 4.899%, 10/25/23(3) | 19,901 | 20,580 | ||||||
Volvo Financial Equipment LLC | ||||||||
13-1A, B 144A 1.240%, 8/15/19(3) | 15,835 | 15,838 | ||||||
14-1A, C 144A 1.940%, 11/15/21(3) | 6,000 | 5,958 | ||||||
Welk Resorts LLC 13-A, A 144A 3.100%, 3/15/29(3) | 5,971 | 6,014 | ||||||
Westgate Resorts LLC 12-2A, A 144A 3.000%, 1/20/25(3) | 944 | 952 | ||||||
Westlake Automobile Receivables Trust 14-1A, C 144A 1.700%, 11/15/19(3) | 6,165 | 6,152 | ||||||
| TOTAL ASSET-BACKED SECURITIES | ||||||||
| (Identified Cost $1,515,363) | 1,527,009 | |||||||
| CORPORATE BONDS AND NOTES—35.8% | ||||||||
| Consumer Discretionary—2.0% | ||||||||
Arcos Dorados Holdings, Inc. 144A 10.250%, 7/13/16(3) | 14,225 | BRL | 5,521 | |||||
Boyd Gaming Corp. | ||||||||
9.125%, 12/1/18 | 2,425 | 2,540 | ||||||
9.000%, 7/1/20 | 5,350 | 5,638 | ||||||
| PAR VALUE | VALUE | |||||||
| Consumer Discretionary (continued) | ||||||||
Brookfield Residential Properties, Inc. 144A 6.500%, 12/15/20(3) | $ | 5,810 | $ | 6,057 | ||||
Caesars Entertainment Operating Co., Inc. 9.000%, 2/15/20 | 3,625 | 2,818 | ||||||
CCO Holdings LLC 7.375%, 6/1/20 | 6,700 | 7,102 | ||||||
Clear Channel Worldwide Holdings, Inc. Series B 7.625%, 3/15/20 | 16,440 | 17,139 | ||||||
Columbus International, Inc. 144A 7.375%, 3/30/21(3) | 2,330 | 2,432 | ||||||
Daimler Finance North America LLC 144A 1.875%, 1/11/18(3) | 7,100 | 7,094 | ||||||
Dana Holding Corp. 6.500%, 2/15/19 | 3,973 | 4,142 | ||||||
Hyatt Hotels Corp. 3.875%, 8/15/16 | 7,000 | 7,335 | ||||||
Hyundai Motor Manufacturing 144A 4.500%, 4/15/15(3) | 6,000 | 6,106 | ||||||
iHeartCommunications, Inc. | ||||||||
10.000%, 1/15/18 | 4,025 | 3,388 | ||||||
144A 9.000%, 9/15/22(3) | 5,530 | 5,502 | ||||||
International Game Technology 7.500%, 6/15/19 | 1,115 | 1,262 | ||||||
Jaguar Land Rover Automotive plc 144A 4.125%, 12/15/18(3) | 3,845 | 3,867 | ||||||
MGM Resorts International 6.750%, 10/1/20 | 6,500 | 6,939 | ||||||
See Notes to Financial Statements
21
Table of Contents
VIRTUS MULTI-SECTOR SHORT TERM BOND FUND
SCHEDULE OF INVESTMENTS (Continued)
SEPTEMBER 30, 2014
($ reported in thousands)
| PAR VALUE | VALUE | |||||||
| CORPORATE BONDS AND NOTES (continued) | ||||||||
| Consumer Discretionary (continued) | ||||||||
Numericable Group SA 144A 4.875%, 5/15/19(3) | $ | 8,295 | $ | 8,222 | ||||
QVC, Inc. 3.125%, 4/1/19 | 12,765 | 12,812 | ||||||
Sirius XM Radio, Inc. 144A 4.250%, 5/15/20(3) | 20,955 | 20,117 | ||||||
Toll Brothers Finance Corp. | ||||||||
4.000%, 12/31/18 | 10,375 | 10,388 | ||||||
6.750%, 11/1/19 | 10,036 | 11,265 | ||||||
Virgin Media Secured Finance plc 144A 5.375%, 4/15/21(3) | 3,405 | 3,448 | ||||||
Weyerhaeuser Real Estate Co. 144A 4.375%, 6/15/19(3) | 3,330 | 3,268 | ||||||
Wyndham Worldwide Corp. | 2,960 | 2,969 | ||||||
Wynn Macau Ltd. 144A 5.250%, 10/15/21(3) | 11,050 | 10,718 | ||||||
|
| |||||||
| 178,089 | ||||||||
|
| |||||||
| Consumer Staples—0.3% | ||||||||
Heinz (H.J.) Co. 4.250%, 10/15/20 | 20,949 | 20,871 | ||||||
Smithfield Foods, Inc. 144A 5.250%, 8/1/18(3) | 6,850 | 6,884 | ||||||
|
| |||||||
| 27,755 | ||||||||
|
| |||||||
| Energy—3.9% | ||||||||
Afren plc 144A 11.500%, 2/1/16(3) | 4,790 | 5,060 | ||||||
California Resources Corp. | ||||||||
5.000%, 1/15/20(3) | 6,165 | 6,273 | ||||||
144A 5.500%, 9/15/21(3) | 10,710 | 10,884 | ||||||
Calumet Specialty Products Partners LP 144A 6.500%, 4/15/21(3) | 17,435 | 16,650 | ||||||
| PAR VALUE | VALUE | |||||||
| Energy (continued) | ||||||||
Carrizo Oil & Gas, Inc. 7.500%, 9/15/20 | $ | 5,450 | $ | 5,695 | ||||
Compagnie Generale de Geophysique-Veritas 7.750%, 5/15/17 | 778 | 772 | ||||||
Energy Transfer Partners LP 4.150%, 10/1/20 | 14,620 | 15,186 | ||||||
Forest Oil Corp. 7.250%, 6/15/19 | 9,035 | 8,538 | ||||||
Frontier Oil Corp. 6.875%, 11/15/18 | 2,550 | 2,652 | ||||||
FTS International, Inc. 144A 6.250%, 5/1/22(3) | 2,245 | 2,217 | ||||||
Gazprom OAO (Gaz Capital SA) 144A 4.950%, 5/23/16(3)(5) | 5,000 | 5,063 | ||||||
IPIC GMTN Ltd. RegS 3.750%, 3/1/17(4) | 10,000 | 10,450 | ||||||
Linn Energy LLC 6.500%, 5/15/19 | 9,980 | 9,830 | ||||||
Lukoil OAO International Finance BV 144A 6.375%, 11/5/14(3) | 4,900 | 4,911 | ||||||
3.416%, 4/24/18(3) | 6,000 | 5,618 | ||||||
Midcontinent Express Pipeline LLC 144A 6.700%, 9/15/19(3) | 7,500 | 8,513 | ||||||
NGL Energy Partners LP (NGL Energy Finance Corp.) 144A 5.125%, 7/15/19(3) | 4,940 | 4,860 | ||||||
Pacific Rubiales Energy Corp. 144A 5.375%, 1/26/19(3) | 20,870 | 21,209 | ||||||
Petrobras Global Finance BV 3.250%, 3/17/17 | 21,600 | 21,859 | ||||||
Petrobras International Finance Co. 3.500%, 2/6/17 | 10,000 | 10,174 | ||||||
See Notes to Financial Statements
22
Table of Contents
VIRTUS MULTI-SECTOR SHORT TERM BOND FUND
SCHEDULE OF INVESTMENTS (Continued)
SEPTEMBER 30, 2014
($ reported in thousands)
| PAR VALUE | VALUE | |||||||
| CORPORATE BONDS AND NOTES (continued) | ||||||||
| Energy (continued) | ||||||||
Petroleos de Venezuela SA | ||||||||
Series 2015, 5.000%, 10/28/15 | $ | 25,905 | $ | 22,214 | ||||
RegS 8.500%, 11/2/17(4) | 86,335 | 68,196 | ||||||
Petroleos Mexicanos 144A 3.125%, 1/23/19(3) | 20,730 | 21,248 | ||||||
PHI, Inc. 5.250%, 3/15/19 | 6,275 | 6,330 | ||||||
Plains Exploration & Production Co. 6.500%, 11/15/20 | 8,568 | 9,404 | ||||||
Pride International, Inc. 8.500%, 6/15/19 | 4,065 | 5,037 | ||||||
QGOG Constellation SA 144A 6.250%, 11/9/19(3) | 7,925 | 7,945 | ||||||
Rosneft Finance SA RegS 7.500%, 7/18/16(4)(5) | 13,235 | 13,781 | ||||||
Sabine Pass Liquefaction LLC 5.625%, 2/1/21 | 8,000 | 8,260 | ||||||
Sinopec Capital Ltd. 144A 1.875%, 4/24/18(3) | 11,750 | 11,469 | ||||||
Weatherford International Ltd. 9.625%, 3/1/19 | 4,110 | 5,277 | ||||||
|
| |||||||
| 355,575 | ||||||||
|
| |||||||
| Financials—17.4% | ||||||||
ABN AMRO Bank N.V. 144A 4.250%, 2/2/17(3) | 4,425 | 4,705 | ||||||
ADCB Finance Cayman Ltd. 144A 4.750%, 10/8/14(3) | 5,290 | 5,292 | ||||||
AerCap Ireland Capital Ltd. (AerCap Global Aviation Trust) 144A 3.750%, 5/15/19(3) | 5,930 | 5,760 | ||||||
| PAR VALUE | VALUE | |||||||
| Financials (continued) | ||||||||
Aircastle Ltd. | ||||||||
4.625%, 12/15/18 | $ | 7,740 | $ | 7,759 | ||||
6.250%, 12/1/19 | 10,400 | 10,998 | ||||||
Akbank TAS | ||||||||
144A 5.125%, 7/22/15(3) | 8,900 | 9,136 | ||||||
144A 7.500%, 2/5/18(3) | 12,140 | TRY | 4,744 | |||||
Allstate Corp. 6.125%, 5/15/37(2) | 4,730 | 5,055 | ||||||
American International Group, Inc. | ||||||||
2.375%, 8/24/15 | 5,825 | 5,912 | ||||||
5.850%, 1/16/18 | 7,300 | 8,213 | ||||||
American Tower Trust I 144A 1.551%, 3/15/18(3) | 6,900 | 6,787 | ||||||
Associated Banc Corp. 5.125%, 3/28/16 | 8,635 | 9,117 | ||||||
Aviation Capital Group Corp. 144A 3.875%, 9/27/16(3) | 10,380 | 10,681 | ||||||
Avis Budget Car Rental LLC 4.875%, 11/15/17 | 13,470 | 13,807 | ||||||
Banco Bradesco SA | ||||||||
144A 4.125%, 5/16/16(3) | 7,000 | 7,263 | ||||||
144A 4.500%, 1/12/17(3) | 13,000 | 13,634 | ||||||
Banco Continental SA (Continental Senior Trustees II Cayman Ltd.) 144A 5.750%, 1/18/17(3)(5) | 10,000 | 10,725 | ||||||
Banco de Credito del Peru 144A 2.750%, 1/9/18(3) | 15,836 | 15,836 | ||||||
Banco Santander Brasil SA | ||||||||
144A 4.500%, 4/6/15(3) | 7,500 | 7,584 | ||||||
144A 8.000%, 3/18/16(3) | 28,335 | BRL | 11,055 | |||||
144A 4.625%, 2/13/17(3) | 9,300 | 9,707 | ||||||
See Notes to Financial Statements
23
Table of Contents
VIRTUS MULTI-SECTOR SHORT TERM BOND FUND
SCHEDULE OF INVESTMENTS (Continued)
SEPTEMBER 30, 2014
($ reported in thousands)
| PAR VALUE | VALUE | |||||||
| CORPORATE BONDS AND NOTES (continued) | ||||||||
| Financials (continued) | ||||||||
Banco Santander Chile 144A 2.106%, 6/7/18(2)(3) | $ | 5,300 | $ | 5,386 | ||||
Banco Votorantim SA 144A 5.250%, 2/11/16(3) | 10,500 | 10,868 | ||||||
Bangkok Bank plc 144A 2.750%, 3/27/18(3) | 16,550 | 16,649 | ||||||
Bank of America Corp. (Countrywide Financial Corp.) 6.250%, 5/15/16 | 9,110 | 9,819 | ||||||
2.000%, 1/11/18 | 14,905 | 14,842 | ||||||
5.490%, 3/15/19 | 2,868 | 3,167 | ||||||
Bank of Baroda 144A 4.875%, 7/23/19(3) | 23,575 | 24,844 | ||||||
Bank of Georgia JSC 144A 7.750%, 7/5/17(3) | 10,110 | 10,835 | ||||||
Bank of India | ||||||||
144A 3.250%, 4/18/18(3) | 22,470 | 22,694 | ||||||
144A 3.625%, 9/21/18(3) | 10,200 | 10,371 | ||||||
Barclays Bank plc | ||||||||
144A 6.050%, 12/4/17(3) | 13,130 | 14,596 | ||||||
144A | 3,773 | 3,999 | ||||||
BBVA Banco Continental SA 144A 3.250%, 4/8/18(3) | 8,270 | 8,402 | ||||||
BioMed Realty LP 3.850%, 4/15/16 | 9,375 | 9,771 | ||||||
Blackstone Holdings Finance Co. LLC 144A 6.625%, 8/15/19(3) | 7,105 | 8,431 | ||||||
Brazil Loan Trust 1 144A 5.477%, 7/24/23(3) | 21,035 | 21,876 | ||||||
Caixa Economica Federal 144A 7.250%, 7/23/24(2)(3) | 13,775 | 13,844 | ||||||
| PAR VALUE | VALUE | |||||||
| Financials (continued) | ||||||||
Capital One Na/Mclean VA 2.400%, 9/5/19 | $ | 5,000 | $ | 4,949 | ||||
China Cinda Finance Ltd. 144A 4.000%, 5/14/19(3) | 12,775 | 12,827 | ||||||
Chubb Corp. (The) 6.375%, 3/29/67(2) | 8,205 | 8,995 | ||||||
Citigroup, Inc. | ||||||||
0.502%, 6/9/16(2) | 3,400 | 3,382 | ||||||
5.500%, 2/15/17 | 23,460 | 25,433 | ||||||
2.500%, 9/26/18 | 10,000 | 10,067 | ||||||
CNA Financial Corp. 5.850%, 12/15/14 | 7,575 | 7,662 | ||||||
CNH Capital LLC 3.625%, 4/15/18 | 20,225 | 19,871 | ||||||
Comerica Bank, Inc. | ||||||||
4.800%, 5/1/15 | 1,828 | 1,873 | ||||||
5.750%, 11/21/16 | 5,940 | 6,508 | ||||||
Continental Airlines Pass-Through-Trust 99-2, C2 AMBC 6.236%, 3/15/20 | 12,783 | 13,678 | ||||||
Corpbanca SA | ||||||||
3.125%, 1/15/18 | 8,000 | 8,036 | ||||||
144A 3.875%, 9/22/19(3) | 17,000 | 17,085 | ||||||
Daimler Finance North America LLC 144A 2.625%, 9/15/16(3) | 11,000 | 11,321 | ||||||
Discover Bank 8.700%, 11/18/19 | 1,750 | 2,185 | ||||||
DNB Bank ASA 144A 3.200%, 4/3/17(3) | 24,700 | 25,788 | ||||||
Drawbridge Special Opportunities Fund LP 144A 5.000%, 8/1/21(3) | 8,295 | 8,212 | ||||||
Fifth Third Bancorp 4.500%, 6/1/18 | 6,745 | 7,286 | ||||||
Fifth Third Bank 4.750%, 2/1/15 | 750 | 761 | ||||||
First Tennessee Bank N.A. | ||||||||
5.050%, 1/15/15 | 13,750 | 13,911 | ||||||
5.650%, 4/1/16 | 15,664 | 16,503 | ||||||
See Notes to Financial Statements
24
Table of Contents
VIRTUS MULTI-SECTOR SHORT TERM BOND FUND
SCHEDULE OF INVESTMENTS (Continued)
SEPTEMBER 30, 2014
($ reported in thousands)
| PAR VALUE | VALUE | |||||||
| CORPORATE BONDS AND NOTES (continued) | ||||||||
| Financials (continued) | ||||||||
Ford Motor Credit Co. LLC | ||||||||
4.207%, 4/15/16 | $ | 10,000 | $ | 10,458 | ||||
5.000%, 5/15/18 | 10,000 | 10,923 | ||||||
General Electric Capital Corp. 0.618%, 5/5/26(2) | 8,000 | 7,625 | ||||||
General Motors Financial Co., Inc. | ||||||||
4.750%, 8/15/17 | 25,655 | 27,066 | ||||||
3.500%, 7/10/19 | 9,715 | 9,801 | ||||||
Genworth Holdings, Inc. | ||||||||
7.200%, 2/15/21 | 5,000 | 5,898 | ||||||
7.625%, 9/24/21 | 13,825 | 16,775 | ||||||
GLP Capital LP (GLP Financing II, Inc.) | ||||||||
4.375%, 11/1/18 | 4,085 | 4,146 | ||||||
4.875%, 11/1/20 | 13,800 | 14,072 | ||||||
Goldman Sachs Group, Inc. (The) | ||||||||
5.625%, 1/15/17 | 14,000 | 15,205 | ||||||
2.900%, 7/19/18 | 8,200 | 8,401 | ||||||
7.500%, 2/15/19 | 2,451 | 2,923 | ||||||
Government Properties Income Trust 3.750%, 8/15/19 | 2,905 | 2,926 | ||||||
Guanay Finance Ltd. 144A 6.000%, 12/15/20(3) | 18,800 | 19,951 | ||||||
HBOS plc 144A 6.750%, 5/21/18(3) | 685 | 775 | ||||||
HCP, Inc. 3.750%, 2/1/19 | 4,940 | 5,204 | ||||||
Health Care REIT, Inc. | ||||||||
4.700%, 9/15/17 | 8,565 | 9,304 | ||||||
4.125%, 4/1/19 | 4,100 | 4,369 | ||||||
Healthcare Realty Trust, Inc. 6.500%, 1/17/17 | 3,000 | 3,318 | ||||||
Hertz Corp. (The) 5.875%, 10/15/20 | 9,420 | 9,608 | ||||||
HSBC USA, Inc. 2.625%, 9/24/18 | 19,485 | 19,936 | ||||||
| PAR VALUE | VALUE | |||||||
| Financials (continued) | ||||||||
Huntington Bancshares, Inc. 7.000%, 12/15/20 | $ | 17,065 | $ | 20,445 | ||||
Hutchison Whampoa International Ltd. Series 12, 144A 6.000%(2)(3)(6)(7) | 13,210 | 14,183 | ||||||
Hyundai Capital Services, Inc. | ||||||||
144A 6.000%, 5/5/15(3) | 4,975 | 5,125 | ||||||
144A 3.750%, 4/6/16(3) | 500 | 519 | ||||||
144A 1.450%, 2/6/17(3) | 8,000 | 7,994 | ||||||
144A 2.125%, 10/2/17(3) | 2,940 | 2,976 | ||||||
ICAHN Enterprises LP (ICAHN Enterprises Finance Corp.) | ||||||||
3.500%, 3/15/17 | 965 | 955 | ||||||
4.875%, 3/15/19 | 1,520 | 1,505 | ||||||
ICICI Bank Ltd. | ||||||||
RegS 4.700%, 2/21/18(4) | 13,000 | 13,727 | ||||||
144A 4.800%, 5/22/19(3) | 13,000 | 13,767 | ||||||
ING Bank NV 144A 1.375%, 3/7/16(3) | 9,000 | 9,053 | ||||||
International Lease Finance Corp. 3.875%, 4/15/18 | 18,635 | 18,495 | ||||||
Intesa San Paolo SpA 3.125%, 1/15/16 | 12,190 | 12,470 | ||||||
iStar Financial, Inc. | ||||||||
4.000%, 11/1/17 | 12,900 | 12,577 | ||||||
4.875%, 7/1/18 | 12,250 | 11,974 | ||||||
5.000%, 7/1/19 | 2,440 | 2,361 | ||||||
Jefferies Group, Inc. 5.125%, 4/13/18 | 6,541 | 7,125 | ||||||
JPMorgan Chase & Co. 6.125%, 6/27/17 | 8,850 | 9,866 | ||||||
KeyBank N.A. | ||||||||
7.413%, 5/6/15 | 3,000 | 3,120 | ||||||
4.950%, 9/15/15 | 1,295 | 1,347 | ||||||
See Notes to Financial Statements
25
Table of Contents
VIRTUS MULTI-SECTOR SHORT TERM BOND FUND
SCHEDULE OF INVESTMENTS (Continued)
SEPTEMBER 30, 2014
($ reported in thousands)
| PAR VALUE | VALUE | |||||||
| CORPORATE BONDS AND NOTES (continued) | ||||||||
| Financials (continued) | ||||||||
Korea Development Bank 3.500%, 8/22/17 | $ | 9,750 | $ | 10,224 | ||||
Lazard Group LLC 4.250%, 11/14/20 | 7,765 | 8,120 | ||||||
Level 3 Financing, Inc. | 4,065 | 4,304 | ||||||
Lincoln National Corp. | ||||||||
8.750%, 7/1/19 | 15,040 | 19,163 | ||||||
6.050%, 4/20/67(2)(7) | 2,885 | 2,950 | ||||||
Macquarie Group Ltd. | ||||||||
144A 3.000%, 12/3/18(3) | 4,870 | 4,972 | ||||||
144A 6.000%, 1/14/20(3) | 10,950 | 12,289 | ||||||
Magyar Fejlesztesi Bank Zrt. 144A 6.250%, 10/21/20(3) | 2,960 | 3,286 | ||||||
Manufacturers & Traders Trust Co. 5.629%, 12/1/21(2) | 5,000 | 5,188 | ||||||
MetLife, Inc. 6.750%, 6/1/16 | 910 | 998 | ||||||
Morgan Stanley | ||||||||
5.550%, 4/27/17 | 10,200 | 11,168 | ||||||
144A 10.090%, 5/3/17(3) | 22,595 | BRL | 9,009 | |||||
Nationstar Mortgage LLC 6.500%, 8/1/18 | 19,865 | 19,915 | ||||||
Navient LLC | ||||||||
4.625%, 9/25/17 | 24,805 | 25,146 | ||||||
4.875%, 6/17/19 | 9,140 | 9,140 | ||||||
ORIX Corp. 5.000%, 1/12/16 | 5,228 | 5,475 | ||||||
PennantPark Investment Corp. 4.500%, 10/1/19 | 7,710 | 7,753 | ||||||
Phosagro OAO (Phosagro Bond Funding Ltd.) 144A 4.204%, 2/13/18(3)(5) | 14,800 | 14,319 | ||||||
PNC Funding Corp. 5.625%, 2/1/17 | 3,130 | 3,412 | ||||||
| PAR VALUE | VALUE | |||||||
| Financials (continued) | ||||||||
Principal Life Global Funding II 144A 2.250%, 10/15/18(3) | $ | 17,580 | $ | 17,650 | ||||
Progressive Corp. (The) 6.700%, 6/15/37(2) | 2,740 | 3,002 | ||||||
Prudential Financial, Inc. | ||||||||
4.750%, 9/17/15 | 4,770 | 4,958 | ||||||
8.875%, 6/15/38(2)(7) | 11,200 | 13,510 | ||||||
QBE Insurance Group Ltd. 144A 2.400%, 5/1/18(3) | 7,750 | 7,755 | ||||||
Regions Bank 7.500%, 5/15/18 | 12,001 | 14,017 | ||||||
Regions Financial Corp. 5.750%, 6/15/15 | 2,535 | 2,616 | ||||||
Royal Bank of Scotland Group plc (The) 6.400%, 10/21/19 | 3,130 | 3,642 | ||||||
Russian Agricultural Bank OJSC (RSHB Capital SA) | ||||||||
144A 5.298%, 12/27/17(3) | 13,655 | 13,348 | ||||||
144A 5.100%, 7/25/18(3)(5) | 8,750 | 8,457 | ||||||
Sabra Health Care LP 5.500%, 2/1/21 | 6,435 | 6,548 | ||||||
Santander Holdings USA, Inc. 3.000%, 9/24/15 | 980 | 1,000 | ||||||
Santander U.S. Debt S.A.U. | ||||||||
144A 3.724%, 1/20/15(3) | 8,100 | 8,169 | ||||||
Unipersonal 144A 3.781%, 10/7/15(3) | 8,000 | 8,219 | ||||||
SBA Tower Trust 144A 2.933%, 12/15/17(3) | 13,275 | 13,463 | ||||||
Schaeffler Finance BV 144A 4.250%, 5/15/21(3) | 14,140 | 13,645 | ||||||
See Notes to Financial Statements
26
Table of Contents
VIRTUS MULTI-SECTOR SHORT TERM BOND FUND
SCHEDULE OF INVESTMENTS (Continued)
SEPTEMBER 30, 2014
($ reported in thousands)
| PAR VALUE | VALUE | |||||||
| CORPORATE BONDS AND NOTES (continued) | ||||||||
| Financials (continued) | ||||||||
Schaeffler Holding Finance BV PIK Interest Capitalization, 144A 6.875%, 8/15/18(3)(10) | $ | 2,210 | $ | 2,309 | ||||
Senior Housing Properties Trust | ||||||||
4.300%, 1/15/16 | 6,875 | 7,073 | ||||||
3.250%, 5/1/19 | 6,685 | 6,729 | ||||||
Shinhan Bank | ||||||||
144A 4.375%, 7/27/17(3) | 11,700 | 12,499 | ||||||
144A 1.875%, 7/30/18(3) | 1,000 | 981 | ||||||
Skandinaviska Enskilda Banken AB 144A 1.750%, 3/19/18(3) | 6,775 | 6,747 | ||||||
Societe Generale S.A. | ||||||||
144A 3.100%, 9/14/15(3) | 2,900 | 2,960 | ||||||
144A 3.500%, 1/15/16(3) | 6,895 | 7,114 | ||||||
State Street Corp. 4.956%, 3/15/18(7) | 9,845 | 10,716 | ||||||
SunTrust Bank, Inc. | ||||||||
6.000%, 9/11/17 | 4,925 | 5,532 | ||||||
5.450%, 12/1/17 | 3,750 | 4,137 | ||||||
Svenska Handelsbanken AB 3.125%, 7/12/16 | 10,000 | 10,393 | ||||||
Telecom Italia Capital SA 7.175%, 6/18/19 | 2,395 | 2,706 | ||||||
Turkiye Garanti Bankasi AS 144A 4.750%, 10/17/19(3) | 8,500 | 8,466 | ||||||
Turkiye Is Bankasi 144A 3.750%, 10/10/18(3) | 12,630 | 12,314 | ||||||
Turkiye Vakiflar Bankasi Tao 144A 3.750%, 4/15/18(3) | 4,000 | 3,878 | ||||||
Union Bank NA | ||||||||
1.500%, 9/26/16 | 2,000 | 2,017 | ||||||
2.625%, 9/26/18 | 2,700 | 2,745 | ||||||
| PAR VALUE | VALUE | |||||||
| Financials (continued) | ||||||||
Unum Group 7.125%, 9/30/16 | $ | 6,620 | $ | 7,394 | ||||
Ventas Realty LP (Ventas Capital Corp.) | ||||||||
4.000%, 4/30/19 | 7,100 | 7,553 | ||||||
2.700%, 4/1/20 | 2,948 | 2,901 | ||||||
Vnesheconombank (VEB Finance plc) 144A 4.224%, 11/21/18(3)(5) | 16,710 | 15,534 | ||||||
Voya Financials, Inc. 2.900%, 2/15/18 | 25,620 | 26,362 | ||||||
VTB Bank OJSC (VTB Capital SA) | ||||||||
144A 6.465%, 3/4/15(3)(5) | 15,900 | 16,042 | ||||||
144A 6.000%, 4/12/17(3)(5) | 12,300 | 12,284 | ||||||
Wachovia Corp. 5.625%, 10/15/16 | 2,500 | 2,721 | ||||||
Wells Fargo & Co. 5.125%, 9/15/16 | 5,000 | 5,387 | ||||||
Willis Group Holdings plc 4.125%, 3/15/16 | 6,000 | 6,232 | ||||||
Willis North America, Inc. 6.200%, 3/28/17 | 4,960 | 5,422 | ||||||
XL Group plc Series E, 6.500%, 12/29/49(2) | 12,790 | 12,278 | ||||||
XLIT Ltd. 2.300%, 12/15/18 | 9,730 | 9,723 | ||||||
Yapi ve Kredi Bankasi AS 144A 4.000%, 1/22/20(3) | 18,650 | 17,717 | ||||||
Zions Bancorp 4.500%, 3/27/17 | 8,120 | 8,595 | ||||||
|
| |||||||
| 1,581,056 | ||||||||
|
| |||||||
| Health Care—1.5% | ||||||||
Alere, Inc. 6.500%, 6/15/20 | 6,175 | 6,190 | ||||||
Catamaran Corp. 4.750%, 3/15/21 | 7,165 | 6,910 | ||||||
See Notes to Financial Statements
27
Table of Contents
VIRTUS MULTI-SECTOR SHORT TERM BOND FUND
SCHEDULE OF INVESTMENTS (Continued)
SEPTEMBER 30, 2014
($ reported in thousands)
| PAR VALUE | VALUE | |||||||
| CORPORATE BONDS AND NOTES (continued) | ||||||||
| Health Care (continued) | ||||||||
Community Health Systems, Inc. (CHS) | ||||||||
144A 5.125%, 8/1/21(3) | $ | 4,790 | $ | 4,802 | ||||
144A 6.875%, 2/1/22(3) | 860 | 901 | ||||||
Forest Laboratories, Inc. 144A 4.375%, 2/1/19(3) | 13,430 | 14,153 | ||||||
HCA, Inc. | ||||||||
3.750%, 3/15/19 | 9,580 | 9,388 | ||||||
6.500%, 2/15/20 | 19,575 | 21,410 | ||||||
inVentiv Health, Inc. 144A 9.000%, 1/15/18(3) | 8,625 | 8,992 | ||||||
Owens & Minor, Inc. 3.875%, 9/15/21 | 2,485 | 2,492 | ||||||
Salix Pharmaceuticals Ltd. 144A 6.000%, 1/15/21(3) | 3,465 | 3,760 | ||||||
Symbion, Inc. 8.000%, 6/15/16 | 6,517 | 6,761 | ||||||
Tenet Healthcare Corp. | ||||||||
144A 5.500%, 3/1/19(3) | 9,905 | 9,979 | ||||||
4.750%, 6/1/20 | 9,275 | 9,252 | ||||||
6.000%, 10/1/20 | 9,560 | 10,134 | ||||||
8.125%, 4/1/22 | 8,265 | 9,091 | ||||||
Valeant Pharmaceuticals International, Inc. 144A 6.750%, 8/15/18(3) | 6,110 | 6,461 | ||||||
Valeant Pharmaceuticals International, Inc. Escrow Corp. 144A 5.625%, 12/1/21(3) | 7,310 | 7,301 | ||||||
Zoetis, Inc. 1.875%, 2/1/18 | 1,975 | 1,961 | ||||||
|
| |||||||
| 139,938 | ||||||||
|
| |||||||
| PAR VALUE | VALUE | |||||||
| Industrials—4.5% | ||||||||
ADT Corp.(The) 6.250%, 10/15/21 | $ | 13,360 | $ | 13,861 | ||||
Air Canada Pass-Through-Trust, 13-1, B 144A 5.375%, 5/15/21(3) | 12,034 | 12,335 | ||||||
America West Airlines Pass-Through-Trust | ||||||||
98-1, A 6.870%, 1/2/17 | 1,340 | 1,400 | ||||||
99-1, G 7.930%, 1/2/19 | 9,020 | 10,035 | ||||||
01-1, G 7.100%, 4/2/21 | 45,158 | 50,351 | ||||||
American Airlines Pass-Through-Trust | ||||||||
13-2, B 144A 5.600%, 7/15/20(3) | 9,663 | 9,953 | ||||||
14-1, B 4.375%, 10/1/22 | 8,250 | 8,375 | ||||||
Atlas Air Pass-Through-Trust | ||||||||
98-1, A 7.380%, 1/2/18 | 5,834 | 5,943 | ||||||
99-1, A1 7.200%, 1/2/19 | 1,534 | 1,599 | ||||||
00-1, A 8.707%, 1/2/19 | 4,341 | 4,563 | ||||||
AWAS Aviation Capital Ltd. 144A 7.000%, 10/17/16(3) | 8,602 | 8,785 | ||||||
Bombardier, Inc. 144A 4.750%, 4/15/19(3) | 19,060 | 19,036 | ||||||
British Airways plc 144A 5.625%, 6/20/20(3) | 13,496 | 14,374 | ||||||
Continental Airlines Pass-Through-Trust | ||||||||
98-, A 6.648%, 9/15/17 | 3,540 | 3,752 | ||||||
99-1, A 6.545%, 2/2/19 | 10,180 | 11,287 | ||||||
See Notes to Financial Statements
28
Table of Contents
VIRTUS MULTI-SECTOR SHORT TERM BOND FUND
SCHEDULE OF INVESTMENTS (Continued)
SEPTEMBER 30, 2014
($ reported in thousands)
| PAR VALUE | VALUE | |||||||
| CORPORATE BONDS AND NOTES (continued) | ||||||||
| Industrials (continued) | ||||||||
09-2, A 7.250%, 11/10/19 | $ | 1,980 | $ | 2,322 | ||||
00-1, A1 8.048%, 11/1/20 | 7,184 | 8,270 | ||||||
01-1, A1 6.703%, 6/15/21 | 13,963 | 15,080 | ||||||
Delta Air Lines Pass-Through-Trust 12-1, A 4.750%, 5/7/20 | 30,345 | 32,848 | ||||||
Deluxe Corp. 6.000%, 11/15/20 | 2,950 | 3,083 | ||||||
HD Supply, Inc. 8.125%, 4/15/19 | 2,935 | 3,184 | ||||||
Northwest Airlines Pass-Through-Trust | ||||||||
07-1, B 8.028%, 11/1/17 | 2,705 | 3,017 | ||||||
02-1, G2 6.264%, 11/20/21 | 13,520 | 14,618 | ||||||
Odebrecht Finance Ltd. 144A 8.250%, 4/25/18(3) | 12,850 | BRL | 4,738 | |||||
Parker Hannifin Corp. 5.500%, 5/15/18 | 7,970 | 8,956 | ||||||
Rexel SA 144A 5.250%, 6/15/20(3) | 15,970 | 16,120 | ||||||
Spirit AeroSystems, Inc. 144A | 2,905 | 2,912 | ||||||
Toledo Edison Co. (The) 7.250%, 5/1/20 | 224 | 267 | ||||||
Transnet SOC Ltd. 144A 4.500%, 2/10/16(3) | 9,000 | 9,315 | ||||||
U.S. Airways Pass-Through-Trust | ||||||||
12-2, C | 10,000 | 10,000 | ||||||
01-1, G | 19,058 | 20,821 | ||||||
11-1, A 7.125%, 10/22/23 | 7,879 | 9,140 | ||||||
| PAR VALUE | VALUE | |||||||
| Industrials (continued) | ||||||||
UAL Pass-Through-Trust | ||||||||
09-2 | $ | 22,572 | $ | 25,507 | ||||
07-01, A | 18,489 | 19,968 | ||||||
United Rentals North America, Inc. 5.750%, 7/15/18 | 7,895 | 8,270 | ||||||
Virgin Australia Trust 13-1A 144A 5.000%, 10/23/23(3) | 18,411 | 19,193 | ||||||
|
| |||||||
| 413,278 | ||||||||
|
| |||||||
| Information Technology—1.2% | ||||||||
Alcatel-Lucent USA, Inc. 144A | 10,810 | 11,053 | ||||||
Avaya, Inc. 144A | 25,510 | 24,952 | ||||||
Ceridian LLC (Comdata, Inc.) 144A | 795 | 798 | ||||||
Dun & Bradstreet Corp. (The) | 16,800 | 17,371 | ||||||
Equinix, Inc. | 8,062 | 8,022 | ||||||
Fidelity National Financial, Inc. | 6,475 | 7,202 | ||||||
First Data Corp. | ||||||||
11.750%, 8/15/21 | 11,439 | 13,298 | ||||||
PIK Interest Capitalization, 144A | 3,250 | 3,461 | ||||||
Infor Software Parent LLC PIK Interest Capitalization, 144A 7.125%, 5/1/21(3)(10) | 4,455 | 4,433 | ||||||
MDC-GMTN B.V. 144A 3.750%, 4/20/16(3) | 4,000 | 4,162 | ||||||
Sanmina Corp. 144A 4.375%, 6/1/19(3) | 3,280 | 3,223 | ||||||
See Notes to Financial Statements
29
Table of Contents
VIRTUS MULTI-SECTOR SHORT TERM BOND FUND
SCHEDULE OF INVESTMENTS (Continued)
SEPTEMBER 30, 2014
($ reported in thousands)
| PAR VALUE | VALUE | |||||||
| CORPORATE BONDS AND NOTES (continued) | ||||||||
| Information Technology (continued) | ||||||||
Sophia Holding Finance LP PIK Interest Capitalization, 144A 9.625%, 12/1/18(3)(10) | $ | 8,835 | $ | 8,968 | ||||
SunGard Availability Services Capital, Inc. 144A 8.750%, 4/1/22(3) | 4,550 | 3,412 | ||||||
|
| |||||||
| 110,355 | ||||||||
|
| |||||||
| Materials—2.5% | ||||||||
Allegheny Technologies, Inc. | 7,245 | 8,846 | ||||||
Anglo American Capital plc 144A | 1,950 | 2,475 | ||||||
Ardagh Packaging Finance plc 144A | 2,705 | 2,685 | ||||||
Beverage Packaging Holdings Luxembourg II SA 144A | 6,050 | 5,974 | ||||||
Cemex SAB de CV 144A 9.500%, 6/15/18(3) | 9,754 | 10,909 | ||||||
CRH America, Inc. | ||||||||
4.125%, 1/15/16 | 4,000 | 4,154 | ||||||
8.125%, 7/15/18 | 4,770 | 5,760 | ||||||
EuroChem Mineral & Chemical Co. OJSC 144A 5.125%, 12/12/17(3)(5) | 11,920 | 11,660 | ||||||
FMG Resources Property Ltd. 144A 8.250%, 11/1/19(3) | 8,600 | 8,922 | ||||||
Freeport-McMoRan Copper & Gold, Inc. 2.375%, 3/15/18 | 9,000 | 9,024 | ||||||
Gerdau Holdings, Inc. 144A 7.000%, 1/20/20(3) | 8,330 | 9,371 | ||||||
Gerdau Trade, Inc. 144A 5.750%, 1/30/21(3) | 2,000 | 2,063 | ||||||
| PAR VALUE | VALUE | |||||||
| Materials (continued) | ||||||||
Hexion U.S. Finance Corp. | ||||||||
8.875%, 2/1/18 | $ | 12,085 | $ | 12,342 | ||||
6.625%, 4/15/20 | 12,240 | 12,362 | ||||||
Huntsman International LLC 4.875%, 11/15/20 | 3,910 | 3,871 | ||||||
INEOS Group Holdings SA 144A 5.875%, 2/15/19(3) | 5,870 | 5,797 | ||||||
International Paper Co. 9.375%, 5/15/19 | 5,330 | 6,942 | ||||||
Nufarm Australia Ltd. 144A 6.375%, 10/15/19(3) | 8,005 | 8,205 | ||||||
Reynolds Group Issuer, Inc. | ||||||||
5.750%, 10/15/20 | 12,945 | 13,236 | ||||||
8.250%, 2/15/21 | 3,120 | 3,315 | ||||||
Sappi Papier Holding GmbH | ||||||||
144A | 12,830 | 13,792 | ||||||
144A | 7,770 | 8,411 | ||||||
Severstal OAO (Steel Capital SA) 144A 6.700%, 10/25/17(3)(5) | 5,975 | 6,245 | ||||||
Sinopec Group Overseas Development Ltd. 144A 2.750%, 5/17/17(3) | 10,000 | 10,248 | ||||||
Tronox Finance LLC 6.375%, 8/15/20 | 10,840 | 10,948 | ||||||
Turkiye Sise Ve Cam Fabrikalari AS 144A 4.250%, 5/9/20(3) | 12,755 | 12,245 | ||||||
Vedanta Resources plc | 10,640 | 12,236 | ||||||
144A | 6,000 | 6,090 | ||||||
|
| |||||||
| 228,128 | ||||||||
|
| |||||||
See Notes to Financial Statements
30
Table of Contents
VIRTUS MULTI-SECTOR SHORT TERM BOND FUND
SCHEDULE OF INVESTMENTS (Continued)
SEPTEMBER 30, 2014
($ reported in thousands)
| PAR VALUE | VALUE | |||||||
| CORPORATE BONDS AND NOTES (continued) | ||||||||
| Telecommunication Services—1.5% | ||||||||
AT&T, Inc. | $ | 11,123 | $ | 12,441 | ||||
CenturyLink, Inc. Series V | 10,050 | 10,404 | ||||||
Crown Castle Towers LLC | 4,950 | 5,056 | ||||||
144A | 5,915 | 6,331 | ||||||
Digicel Group Ltd. 144A 8.250%, 9/30/20(3) | 8,360 | 8,653 | ||||||
Frontier Communications Corp. | ||||||||
7.125%, 3/15/19 | 12,200 | 13,237 | ||||||
6.250%, 9/15/21 | 4,890 | 4,869 | ||||||
Millicom International Cellular SA 144A | 6,045 | 6,302 | ||||||
Sprint Corp. 144A | 4,080 | 4,259 | ||||||
T-Mobile USA, Inc. | ||||||||
6.464%, 4/28/19 | 7,630 | 7,945 | ||||||
6.542%, 4/28/20 | 7,905 | 8,132 | ||||||
Telefonica Emisiones SAU | 2,805 | 2,894 | ||||||
Verizon Communications, Inc. | ||||||||
2.500%, 9/15/16 | 5,900 | 6,054 | ||||||
3.650%, 9/14/18 | 13,800 | 14,543 | ||||||
Wind Acquisition Finance S.A. 144A | 9,005 | 8,701 | ||||||
Windstream Corp. | 12,125 | 12,822 | ||||||
|
| |||||||
| 132,643 | ||||||||
|
| |||||||
| PAR VALUE | VALUE | |||||||
| Utilities—1.0% | ||||||||
Abu Dhabi National Energy Co. 144A | $ | 13,930 | $ | 14,051 | ||||
AmeriGas Partners LP | ||||||||
6.250%, 8/20/19 | 5,670 | 5,854 | ||||||
6.750%, 5/20/20 | 4,000 | 4,180 | ||||||
Dayton Power & Light Co.(The) 1.875%, 9/15/16 | 2,000 | 2,026 | ||||||
Israel Electric Corp. Ltd. 144A | 14,735 | 15,674 | ||||||
Korea Western Power Co., Ltd. 144A | 9,800 | 10,102 | ||||||
Majapahit Holding BV 144A 7.750%, 1/20/20(3) | 8,800 | 10,230 | ||||||
PPL WEM Holdings plc 144A 3.900%, 5/1/16(3) | 5,495 | 5,719 | ||||||
RJS Power Holdings LLC 144A | 12,340 | 12,278 | ||||||
State Grid Overseas Investment Ltd. | ||||||||
144A 1.750%, 5/22/18(3) | 5,000 | 4,898 | ||||||
144A 2.750%, 5/7/19(3) | 9,370 | 9,394 | ||||||
|
| |||||||
| 94,406 | ||||||||
| TOTAL CORPORATE BONDS AND NOTES | ||||||||
| (Identified Cost $3,218,279) | 3,261,223 | |||||||
| LOAN AGREEMENTS(2)—16.7% | ||||||||
| Consumer Discretionary—4.9% | ||||||||
Acquisitions Cogeco Cable II LP Tranche B, 3.250%, 11/30/19 | 3,667 | 3,592 | ||||||
Affinia Group, Inc. Tranche B-2, 4.750%, 4/25/20 | 3,794 | 3,782 | ||||||
Allison Transmission Tranche B-3, 3.750%, 8/23/19 | 11,747 | 11,641 | ||||||
See Notes to Financial Statements
31
Table of Contents
VIRTUS MULTI-SECTOR SHORT TERM BOND FUND
SCHEDULE OF INVESTMENTS (Continued)
SEPTEMBER 30, 2014
($ reported in thousands)
| PAR VALUE | VALUE | |||||||
| LOAN AGREEMENTS (continued) | ||||||||
| Consumer Discretionary (continued) | ||||||||
Aristocrat International Ltd. Tranche B, 0.000%, 9/29/21(8) | $ | 13,610 | $ | 13,485 | ||||
Boyd Gaming Corp. Tranche B, 4.000%, 8/14/20 | 7,216 | 7,128 | ||||||
Caesars Entertainment Operating Co., Inc. | ||||||||
Tranche B-4, 10.500%, 10/31/16 | 3,616 | 3,481 | ||||||
Tranche B-6, 6.949%, 3/1/17 | 3,861 | 3,531 | ||||||
Tranche B-7, 9.750%, 1/28/18 | 1,746 | 1,659 | ||||||
Caesars Entertainment Resort Properties LLC Tranche B, 7.000%, 10/11/20 | 7,940 | 7,622 | ||||||
Caesars Growth Properties Holdings LLC Tranche B, First Lien 6.250%, 5/8/21 | 4,339 | 4,129 | ||||||
Charter Communications Operating LLC Tranche G, 4.250%, 9/10/21 | 4,242 | 4,237 | ||||||
Charter Communications Operations LLC | ||||||||
Tranche E, 3.000%, 7/1/20 | 9,457 | 9,194 | ||||||
Tranche F, 3.000%, 1/3/21 | 14,526 | 14,120 | ||||||
Checkout Holding Corp. Tranche B, First Lien 4.500%, 4/9/21 | 8,688 | 8,478 | ||||||
Chrysler Group LLC | ||||||||
Tranche B, 3.500%, 5/24/17 | 8,127 | 8,074 | ||||||
Tranche B, 3.250%, 12/31/18 | 4,153 | 4,087 | ||||||
| PAR VALUE | VALUE | |||||||
| Consumer Discretionary (continued) | ||||||||
CityCenter Holdings LLC Tranche B, 4.250%, 10/16/20 | $ | 9,919 | $ | 9,837 | ||||
Clear Channel Communications, Inc. Tranche D, 6.904%, 1/30/19 | 21,650 | 20,745 | ||||||
CSC Holdings, Inc. Tranche B, 2.654%, 4/17/20 | 6,239 | 6,073 | ||||||
Cumulus Media Holdings, Inc. | 10,140 | 9,984 | ||||||
Delta 2 (Lux) S.A.R.L. | ||||||||
Tranche B-3, 4.750%, 7/30/21 | 9,421 | 9,321 | ||||||
Second Lien, 0.000%, 7/29/22(8) | 5,065 | 5,055 | ||||||
Hilton Worldwide Finance LLC | 16,026 | 15,798 | ||||||
Intelsat Jackson Holdings S A. Tranche B-2, | 12,912 | 12,730 | ||||||
Key Safety Systems, Inc. | 6,629 | 6,619 | ||||||
Landry’s, Inc. Tranche B, | 9,770 | 9,706 | ||||||
Las Vegas Sands LLC Tranche B, | 21,543 | 21,433 | ||||||
Libbey Glass, Inc. | 5,947 | 5,902 | ||||||
MGM Resort International Tranche B | 7,135 | 7,021 | ||||||
Mohegan Tribal Gaming Authority Tranche B, | 3,375 | 3,324 | ||||||
Numericable SFR | ||||||||
Tranche B-1, | 6,074 | 6,043 | ||||||
See Notes to Financial Statements
32
Table of Contents
VIRTUS MULTI-SECTOR SHORT TERM BOND FUND
SCHEDULE OF INVESTMENTS (Continued)
SEPTEMBER 30, 2014
($ reported in thousands)
| PAR VALUE | VALUE | |||||||
| LOAN AGREEMENTS (continued) | ||||||||
| Consumer Discretionary (continued) | ||||||||
Tranche B-2, | $ | 5,254 | $ | 5,228 | ||||
PVH Corp. Tranche B | 14,476 | 14,514 | ||||||
Radio One, Inc. Tranche 2011, | 1,850 | 1,882 | ||||||
Scientific Games International, Inc. | ||||||||
4.250%, 10/18/20 | 2,810 | 2,760 | ||||||
Tranche B-2, | 6,426 | 6,311 | ||||||
Seminole Hard Rock Entertainment, Inc. Tranche B, | 2,809 | 2,760 | ||||||
Seminole Tribe of Florida | 14,274 | 14,201 | ||||||
ServiceMaster Co. LLC (The) | 7,653 | 7,549 | ||||||
Seven Seas Cruises S. DE R.L. Tranche B-2, | 4,256 | 4,235 | ||||||
Sinclair Television Group, Inc. Tranche B-1, | 11,660 | 11,522 | ||||||
SRAM LLC First Lien, | 1,948 | 1,889 | ||||||
Station Casinos LLC Tranche B, | 11,988 | 11,825 | ||||||
TI Group Automotive Systems LLC | 3,037 | 3,001 | ||||||
Tribune Co. | 10,971 | 10,843 | ||||||
Tribune Publishing Co. | 10,515 | 10,436 | ||||||
TWCC Holding Corp. Second Lien, | 14,060 | 13,814 | ||||||
| PAR VALUE | VALUE | |||||||
| Consumer Discretionary (continued) | ||||||||
Univision Communications, Inc. | ||||||||
4.000%, 3/1/20 | $ | 10,790 | $ | 10,598 | ||||
First Lien, | 21,707 | 21,333 | ||||||
Virgin Media Investment Holdings Ltd. Tranche B, | 13,968 | 13,624 | ||||||
WideOpenWest Finance LLC Tranche B, | 8,758 | 8,743 | ||||||
Zuffa LLC | 10,813 | 10,692 | ||||||
|
| |||||||
| 445,591 | ||||||||
|
| |||||||
| Consumer Staples—1.0% | ||||||||
AdvancePierre Foods, Inc. First Lien, | 209 | 210 | ||||||
Albertson’s LLC Tranche B-4 | 14,888 | 14,840 | ||||||
ARAMARK Corp. | ||||||||
3.250%, 9/6/19 | 19,195 | 18,895 | ||||||
3.250%, 2/24/21 | 6,194 | 6,084 | ||||||
Big Heart Pet Brands (Del Monte Corp.) | 11,475 | 11,054 | ||||||
D.E Master Blenders (Charges OpCo BV) | 3,785 | 3,719 | ||||||
Heinz (H.J.) Co. Tranche B-2, | 5,633 | 5,571 | ||||||
New Hostess Brand Acquisition LLC Tranche B, | 5,225 | 5,362 | ||||||
Prestige Brands | 1,605 | 1,605 | ||||||
Rite Aid Corp. | ||||||||
Tranche 7, | 6,913 | 6,798 | ||||||
See Notes to Financial Statements
33
Table of Contents
VIRTUS MULTI-SECTOR SHORT TERM BOND FUND
SCHEDULE OF INVESTMENTS (Continued)
SEPTEMBER 30, 2014
($ reported in thousands)
| PAR VALUE | VALUE | |||||||
| LOAN AGREEMENTS (continued) | ||||||||
| Consumer Staples (continued) | ||||||||
Tranche 1, Second Lien, | $ | 720 | $ | 731 | ||||
Tranche 2, 4.875%, 6/21/21 | 14,688 | 14,642 | ||||||
|
| |||||||
| 89,511 | ||||||||
|
| |||||||
| Energy—0.9% | ||||||||
Arch Coal, Inc. | 16,463 | 15,115 | ||||||
CITGO Petroleum Corp. Tranche B, | 1,393 | 1,394 | ||||||
Drillships Financing Holding, Inc. | 6,226 | 6,055 | ||||||
EP Energy LLC (Everest Acquisition LLC) | ||||||||
Tranche B-3, | 4,100 | 4,037 | ||||||
Tranche B-2, | 768 | 766 | ||||||
Expro Finservices S.A.R.L. | 11,521 | 11,487 | ||||||
FTS International, Inc. | 2,820 | 2,828 | ||||||
Paragon Offshore Finance Co. | 13,176 | 12,369 | ||||||
Quicksilver Resources, Inc. Second Lien, | 4,598 | 4,196 | ||||||
Seadrill Operating LP | 21,805 | 20,810 | ||||||
|
| |||||||
| 79,057 | ||||||||
|
| |||||||
| Financials—1.5% | ||||||||
Altisource Solutions S.A.R.L. Tranche B, 4.500%, 12/9/20 | 19,165 | 18,255 | ||||||
Asurion LLC Tranche B-1, 5.000%, 5/24/19 | 10,024 | 9,990 | ||||||
| PAR VALUE | VALUE | |||||||
| Financials (continued) | ||||||||
Capital Automotive LP | ||||||||
Tranche B-1, 4.000%, 4/10/19 | $ | 3,587 | $ | 3,574 | ||||
Second Lien, 6.000%, 4/30/20 | 6,047 | 6,137 | ||||||
Clipper Acquisitions Corp. Tranche B, 3.000%, 2/6/20 | 6,267 | 6,145 | ||||||
Delos Finance S.A.R.L. 3.500%, 3/6/21 | 21,956 | 21,723 | ||||||
Guggenheim Partners LLC 4.875%, 7/22/20 | 4,872 | 4,845 | ||||||
iStar Financial, Inc. Tranche A-2, 7.000%, 3/19/17 | 3,253 | 3,343 | ||||||
Realogy Corp. Tranche B, 3.750%, 3/5/20 | 17,782 | 17,494 | ||||||
RPI Finance Trust Tranche B-3, 3.250%, 11/9/18 | 10,710 | 10,706 | ||||||
Trans Union LLC 2014 Replacement, 4.000%, 4/9/21 | 11,997 | 11,828 | ||||||
Walter Investment Management Corp. Tranche B 4.750%, 12/18/20 | 24,778 | 23,779 | ||||||
|
| |||||||
| 137,819 | ||||||||
|
| |||||||
| Health Care—1.5% | ||||||||
Alere, Inc. Tranche B, 4.875%, 6/30/17 | 8,613 | 8,560 | ||||||
American Renal Holdings, Inc. Tranche B, First Lien, 4.500%, 8/20/19 | 9,321 | 9,199 | ||||||
AmSurg Corp. 3.750%, 7/16/21 | 2,591 | 2,568 | ||||||
Ardent Medical Services, Inc. First Lien, 6.750%, 7/2/18 | 3,994 | 4,016 | ||||||
See Notes to Financial Statements
34
Table of Contents
VIRTUS MULTI-SECTOR SHORT TERM BOND FUND
SCHEDULE OF INVESTMENTS (Continued)
SEPTEMBER 30, 2014
($ reported in thousands)
| PAR VALUE | VALUE | |||||||
| LOAN AGREEMENTS (continued) | ||||||||
| Health Care (continued) | ||||||||
Capsugel Holdings US, Inc. 3.500%, 8/1/18 | $ | 2,323 | $ | 2,283 | ||||
CHG Healthcare Services, Inc. First Lien, 4.250%, 11/19/19 | 10,038 | 9,997 | ||||||
ConvaTec, Inc. 4.000%, 12/22/16 | 1,331 | 1,326 | ||||||
DaVita HealthCare Partners, Inc. Tranche B, 3.500%, 6/24/21 | 3,917 | 3,880 | ||||||
Emdeon, Inc. Tranche B-2, 3.750%, 11/2/18 | 4,105 | 4,065 | ||||||
Envision Healthcare Corp. (aka Emergency Medical Services Corp.) 4.000%, 5/25/18 | 6,679 | 6,625 | ||||||
Hologic, Inc. Refinancing Tranche B, 3.250%, 8/1/19 | 14,742 | 14,621 | ||||||
Iasis Healthcare LLC Tranche B-2, 4.500%, 5/3/18 | 5,760 | 5,750 | ||||||
InVentiv Health, Inc. Tranche B-4 | 8,750 | 8,695 | ||||||
Kinetic Concepts, Inc. | ||||||||
Tranche E-2, 3.500%, 11/4/16 | 6,669 | 6,597 | ||||||
Tranche E-1, 4.000%, 5/4/18 | 1,573 | 1,555 | ||||||
Mallinckrodt International Finance S.A. Tranche B-1, 3.500%, 3/19/21 | 1,655 | 1,635 | ||||||
NVA Holdings, Inc. First Lien, 4.750%, 8/14/21 | 2,535 | 2,530 | ||||||
| PAR VALUE | VALUE | |||||||
| Health Care (continued) | ||||||||
Quintiles Transnational Corp. Tranche B-3, 3.750%, 6/8/18 | $ | 8,757 | $ | 8,644 | ||||
Salix Pharmaceuticals Ltd. First Lien, 4.250%, 1/2/20 | 4,988 | 4,982 | ||||||
Surgery Center Holdings, Inc. | ||||||||
First Lien, 6.000%, 4/11/19 | 3,517 | 3,526 | ||||||
0.000%, 7/24/20(8) | 1,430 | 1,428 | ||||||
U.S. Renal Care, Inc. Tranche B-2, First Lien, 4.250%, 7/3/19 | 4,605 | 4,560 | ||||||
United Surgical Partners Tranche B 4.750%, 4/3/19 | 3,760 | 3,762 | ||||||
Valeant Pharmaceuticals International, Inc. Series D-2, Tranche B, 3.750%, 2/13/19 | 12,168 | 12,053 | ||||||
|
| |||||||
| 132,857 | ||||||||
|
| |||||||
| Industrials—1.8% | ||||||||
American Airlines, Inc. Tranche B, 3.750%, 6/27/19 | 35,393 | 34,853 | ||||||
AWAS Finance Luxembourg SA 3.500%, 7/16/18 | 9,528 | 9,496 | ||||||
Brock Holdings Ill, Inc. First Lien, 6.000%, 3/16/17 | 11,516 | 11,285 | ||||||
Ceridian Corp. Tranche B-2, 4.500%, 5/9/17 | 18,650 | 18,470 | ||||||
DynCorp International, Inc. 6.250%, 7/7/16 | 10,443 | 10,404 | ||||||
HD Supply, Inc. Term Loan 2014, | 11,603 | 11,494 | ||||||
See Notes to Financial Statements
35
Table of Contents
VIRTUS MULTI-SECTOR SHORT TERM BOND FUND
SCHEDULE OF INVESTMENTS (Continued)
SEPTEMBER 30, 2014
($ reported in thousands)
| PAR VALUE | VALUE | |||||||
| LOAN AGREEMENTS (continued) | ||||||||
| Industrials (continued) | ||||||||
Husky Injection Molding Systems Ltd. (Yukon Acquisition, Inc.) 4.250%, 6/30/21 | $ | 5,238 | $ | 5,171 | ||||
McJunkin Red Man Corp. 5.625%, 11/8/19 | 4,590 | 4,597 | ||||||
Nortek, Inc. 3.750%, 10/30/20 | 1,873 | 1,851 | ||||||
Spirit Aerosystems, Inc. Tranche B, 3.250%, 9/15/20 | 13,650 | 13,554 | ||||||
U.S. Airways, Inc. Tranche B-1, 3.500%, 5/23/19 | 25,121 | 24,564 | ||||||
United Airlines, Inc. (Continental Airlines, Inc.) Tranche B-1, 3.750%, 9/15/21 | 12,277 | 12,159 | ||||||
WireCo WorldGroup, Inc. 6.000%, 2/15/17 | 2,441 | 2,459 | ||||||
|
| |||||||
| 160,357 | ||||||||
|
| |||||||
| Information Technology—3.7% | ||||||||
Activision Blizzard, Inc. 3.250%, 10/12/20 | 11,159 | 11,144 | ||||||
Aecom Technology Corp. 0.000%, 9/17/21(8) | 3,932 | 3,928 | ||||||
Applied Systems, Inc. Second Lien, 7.500%, 1/24/22 | 610 | 611 | ||||||
Attachmate Group, Inc. (The) First Lien, 7.250%, 11/22/17 | 5,198 | 5,213 | ||||||
Avago Technologies Cayman Ltd. 3.750%, 5/6/21 | 20,084 | 19,931 | ||||||
Blue Coat Systems, Inc. | ||||||||
4.000%, 5/31/19 | 4,334 | 4,264 | ||||||
| PAR VALUE | VALUE | |||||||
| Information Technology (continued) | ||||||||
Second Lien, 9.500%, 6/26/20 | $ | 21,813 | $ | 21,813 | ||||
CCC Information Services 4.000%, 12/20/19 | 5,841 | 5,784 | ||||||
CDW LLC 3.250%, 4/29/20 | 12,356 | 12,081 | ||||||
Deltek, Inc. | ||||||||
First Lien, 4.500%, 10/10/18 | 9,457 | 9,419 | ||||||
Second Lien, 0.000%, 10/10/19(8) | 4,420 | 4,490 | ||||||
Evergreen Skills Lux S.A.R.L. | ||||||||
0.000%, 4/28/21(8) | 3,924 | 3,859 | ||||||
Second Lien, 7.750%, 4/28/22 | 6,352 | 6,138 | ||||||
Excelitas Technologies Corp. Tranche B, 6.000%, 11/2/20 | 9,381 | 9,389 | ||||||
First Data Corp. | ||||||||
3.655%, 3/23/18 | 41,869 | 41,123 | ||||||
Tranche 2021, 4.155%, 3/24/21 | 13,980 | 13,810 | ||||||
Genpact Ltd. 3.500%, 8/30/19 | 17,358 | 17,268 | ||||||
Infinity Acquisition Ltd. 4.250%, 8/6/21 | 14,787 | 14,479 | ||||||
Infor (U.S.), Inc. Tranche B-3, 3.750%, 6/3/20 | 4,758 | 4,659 | ||||||
Tranche B-5, 3.750%, 6/3/20 | 7,162 | 7,012 | ||||||
Information Resources, Inc. 5.000%, 9/30/20 | 1,895 | 1,899 | ||||||
Interactive Data Corp. 4.750%, 5/2/21 | 8,120 | 8,096 | ||||||
IPC Systems, Inc. First Lien, 6.000%, 11/8/20 | 7,753 | 7,777 | ||||||
Kronos, Inc. | ||||||||
First Lien, 4.500%, 10/30/19 | 4,359 | 4,337 | ||||||
Second Lien, 9.750%, 4/30/20 | 4,177 | 4,312 | ||||||
See Notes to Financial Statements
36
Table of Contents
VIRTUS MULTI-SECTOR SHORT TERM BOND FUND
SCHEDULE OF INVESTMENTS (Continued)
SEPTEMBER 30, 2014
($ reported in thousands)
| PAR VALUE | VALUE | |||||||
| LOAN AGREEMENTS (continued) | ||||||||
| Information Technology (continued) | ||||||||
Lanyon Solutions, Inc. First Lien, 5.500%, 11/13/20 | $ | 10,622 | $ | 10,567 | ||||
Mitchell International, Inc. | ||||||||
4.500%, 10/13/20 | 4,191 | 4,159 | ||||||
Second Lien, 8.500%, 10/11/21 | 19,067 | 19,091 | ||||||
Presidio, Inc. 5.000%, 3/31/17 | 9,397 | 9,409 | ||||||
RP Crown Parent LLC | ||||||||
First Lien, 6.000%, 12/21/18 | 12,696 | 12,389 | ||||||
Second Lien, 11.250%, 12/21/19 | 6,675 | 6,378 | ||||||
Sophia LP Tranche B-1, 4.000%, 7/19/18 | 6,064 | 5,990 | ||||||
SRA International, Inc. 6.500%, 7/20/18 | 6,519 | 6,527 | ||||||
Sungard Availability Services Capital, Inc. Tranche B, 6.000%, 3/29/19 | 11,216 | 10,408 | ||||||
Vantiv LLC Tranche B, 3.750%, 6/14/21 | 3,013 | 2,998 | ||||||
Wall Street Systems, Inc. 4.500%, 4/30/21 | 10,379 | 10,314 | ||||||
|
| |||||||
| 341,066 | ||||||||
|
| |||||||
| Materials—0.5% | ||||||||
Ardagh Packaging Finance plc 4.000%, 12/17/19 | 2,067 | 2,041 | ||||||
AZ Chem US, Inc. First Lien, 5.125%, 6/11/21 | 2,821 | 2,823 | ||||||
Fairmount Minerals Ltd. Tranche B-2, 4.500%, 9/5/19 | 3,860 | 3,861 | ||||||
| PAR VALUE | VALUE | |||||||
| Materials (continued) | ||||||||
Fortescue Metals Group (FMG) Resources Property Ltd. 3.750%, 6/30/19 | $ | 13,372 | $ | 13,111 | ||||
Houghton International, Inc. Holding Corp. First Lien, 4.000%, 12/20/19 | 14,217 | 14,092 | ||||||
Ineos Group Holdings, Inc. 3.750%, 5/4/18 | 12,448 | 12,215 | ||||||
|
| |||||||
| 48,143 | ||||||||
|
| |||||||
| Telecommunication Services—0.4% | ||||||||
Global Tel*Link Corp. First Lien, 5.000%, 5/22/20 | 9,138 | 9,078 | ||||||
Level 3 Financing, Inc. Tranche B-III 2019, 4.000%, 8/1/19 | 6,319 | 6,216 | ||||||
UPC Financing Partnership Facility AH, 3.250%, 6/30/21 | 10,000 | 9,763 | ||||||
Windstream Corp. Tranche B-4, 3.500%, 1/23/20 | 14,049 | 13,908 | ||||||
|
| |||||||
| 38,965 | ||||||||
|
| |||||||
| Utilities—0.5% | ||||||||
Atlantic Power LP 4.750%, 2/24/21 | 2,853 | 2,833 | ||||||
NRG Energy, Inc. 2.750%, 7/1/18 | 23,908 | 23,491 | ||||||
State of Santa Catarina (The) 4.000%, 12/27/22 | 14,790 | 14,320 | ||||||
Texas Competitive Electric Holdings Co. LLC 2017 Extended, 4.650%, 10/10/17(12) | 5,925 | 4,401 | ||||||
|
| |||||||
| 45,045 | ||||||||
| TOTAL LOAN AGREEMENTS | ||||||||
| (Identified Cost $1,539,917) | 1,518,411 | |||||||
See Notes to Financial Statements
37
Table of Contents
VIRTUS MULTI-SECTOR SHORT TERM BOND FUND
SCHEDULE OF INVESTMENTS (Continued)
SEPTEMBER 30, 2014
($ reported in thousands)
| SHARES | VALUE | |||||||
| PREFERRED STOCKS—0.4% | ||||||||
| Energy—0.1% | ||||||||
PTT Exploration & Production PCL, 144A, | 8,645 | (9) | $ | 8,732 | ||||
|
| |||||||
| Financials—0.3% | ||||||||
Ally Financial, Inc. Series G, 144A, 7.000%(3) | 702 | 703 | ||||||
Banco Bilbao Vizcaya Argentaria S.A. International S.A. Unipersonal | 2,295 | (9) | 2,338 | |||||
Banco do Brasil S.A., Tranche B, 144A, 8.500%(2)(3) | 700 | (9) | 801 | |||||
JPMorgan Chase & Co. Series V, | 4,395 | (9) | 4,279 | |||||
Wells Fargo & Co. Series K, | 16,155 | (9) | 17,678 | |||||
|
| |||||||
| 25,799 | ||||||||
| TOTAL PREFERRED STOCKS | ||||||||
| (Identified Cost $34,437) | 34,531 | |||||||
| EXCHANGE-TRADED FUNDS—0.2% | ||||||||
SPDR S&P 500® ETF Trust Series 1 | 114,000 | 22,460 | ||||||
| TOTAL EXCHANGE-TRADED FUNDS | ||||||||
| (Identified Cost $21,590) | 22,460 | |||||||
| TOTAL LONG-TERM INVESTMENTS—99.0% | ||||||||
| (Identified Cost $8,980,203) | 9,010,139 | (13) | ||||||
| SHARES | VALUE | |||||||
| SHORT-TERM INVESTMENT—0.4% | ||||||||
| Money Market Mutual Fund—0.4% | ||||||||
Fidelity Money Market Portfolio – Institutional Shares (seven-day effective yield 0.080%) | 35,741,497 | $ | 35,741 | |||||
| TOTAL SHORT-TERM INVESTMENT | ||||||||
| (Identified Cost $35,741) | 35,741 | |||||||
| TOTAL INVESTMENTS—99.4% (Identified Cost $9,015,944) | 9,045,880 | (1) | ||||||
Other assets and liabilities, net—0.6% |
| 56,750 | ||||||
|
| |||||||
| NET ASSETS—100.0% | $ | 9,102,630 | ||||||
|
| |||||||
Abbreviations:
| ETF | Exchange-Traded Fund |
| FDIC | Federal Deposit Insurance Corporation |
| FHLMC | Federal Home Loan Mortgage Corporation (“Freddie Mac”). |
| FNMA | Federal National Mortgage Association (“Fannie Mae”). |
| GNMA | Government National Mortgage Association (“Ginnie Mae”) |
| PIK | Payment-in-Kind Security |
| REIT | Real Estate Investment Trust |
| SPDR | S&P Depositary Receipt |
FOOTNOTE LEGEND:
| (1) | Federal Income Tax Information: For tax information at September 30, 2014, see Note 9 Federal Income Tax Information in the Notes to Financial Statements. |
| (2) | Variable or step coupon security; interest rate shown reflects the rate in effect at September 30, 2014. |
| (3) | Security exempt from registration under Rule 144A of the Securities Act of 1933. These securities may be resold in transactions exempt from registration, normally to qualified institutional buyers. At September 30, 2014, these securities amounted to a value of $3,003,495 or 33.0% of net assets. |
See Notes to Financial Statements
38
Table of Contents
VIRTUS MULTI-SECTOR SHORT TERM BOND FUND
SCHEDULE OF INVESTMENTS (Continued)
SEPTEMBER 30, 2014
| (4) | Regulation S security. Security is offered and sold outside of the United States, therefore, it is exempt from registration with the SEC under rules 903 and 904 of the Securities Act of 1933. |
| (5) | This Note was issued for the sole purpose of funding a loan agreement between the issuer and the borrower. As the credit risk for this security lies solely with the borrower, the name represented here is that of the borrower. |
| (6) | No contractual maturity date. |
| (7) | Interest payments may be deferred. |
| (8) | This loan will settle after September 30, 2014, at which time the interest rate, based on the London Interbank Offered Rate (“LIBOR”) and the agreed upon spread on trade date, will be reflected. |
| (9) | Value shown as par value. |
| (10) | 100% of the income received was in cash. |
| (11) | Security in default. |
| (12) | Security in default, interest payments are being received during the bankruptcy proceedings. |
| (13) | All or a portion of the Fund’s assets have been segregated for delayed delivery settlements. |
Foreign Currencies:
| AUD | Australian Dollar |
| BRL | Brazilian Real |
| CLP | Chilean Peso |
| COP | Colombian Peso |
| IDR | Indonesian Rupiah |
| MXN | Mexican Peso |
| NZD | New Zealand Dollar |
| PEN | Peruvian Nuevo Sol |
| RUB | Russian Ruble |
| TRY | Turkish Lira |
| ZAR | South African Rand |
| Country Weightings (Unaudited)† | ||||
United States | 76 | % | ||
Brazil | 2 | |||
Luxembourg | 2 | |||
Venezuela | 2 | |||
Australia | 1 | |||
Mexico | 1 | |||
United Kingdom | 1 | |||
Other | 15 | |||
Total | 100 | % | ||
| † | % of total investments as of September 30, 2014 |
See Notes to Financial Statements
39
Table of Contents
VIRTUS MULTI-SECTOR SHORT TERM BOND FUND
SCHEDULE OF INVESTMENTS (Continued)
SEPTEMBER 30, 2014
($ reported in thousands)
The following table provides a summary of inputs used to value the Fund’s investments as of September 30, 2014 (See Security Valuation Note 2A in the Notes to Financial Statements):
| Total Value at September 30, 2014 | Level 1 Quoted Prices | Level 2 Significant Observable Inputs | Level 3 Significant Unobservable Inputs | |||||||||||||
Debt Securities: | ||||||||||||||||
Asset-Backed Securities | $ | 1,527,009 | $ | — | $ | 1,527,009 | $ | — | ||||||||
Corporate Bonds and Notes | 3,261,223 | — | 3,261,223 | — | ||||||||||||
Foreign Government Securities | 523,395 | — | 523,395 | — | ||||||||||||
Loan Agreements | 1,518,411 | — | 1,504,091 | 14,320 | ||||||||||||
Mortgage-Backed Securities | 1,937,402 | — | 1,937,402 | — | ||||||||||||
Municipal Bonds | 8,227 | — | 8,227 | — | ||||||||||||
U.S. Government Securities | 177,481 | — | 177,481 | — | ||||||||||||
Equity Securities: | ||||||||||||||||
Exchange-Traded Funds | 22,460 | 22,460 | — | — | ||||||||||||
Preferred Stocks | 34,531 | — | 34,531 | — | ||||||||||||
Short-Term Investment | 35,741 | 35,741 | — | — | ||||||||||||
|
|
|
|
|
|
|
| |||||||||
Total Investments | $ | 9,045,880 | $ | 58,201 | $ | 8,973,359 | $ | 14,320 | ||||||||
|
|
|
|
|
|
|
| |||||||||
Securities held by the Fund with an end of period value of $703 were transferred from Level 1 to Level 2 since an exchange price was no longer available.
The following is a reconciliation of assets of the Fund for Level 3 investments for which significant unobservable inputs were used to determine fair value.
| Total | Asset-Backed Securities | Loan Agreements | ||||||||||
Investments in Securities | ||||||||||||
Balance as of September 30, 2013: | $ | 29,377 | $ | 15,187 | $ | 14,190 | ||||||
Accrued discount/(premium) | (137 | ) | (2 | ) | (135 | ) | ||||||
Realized gain (loss) | 265 | 428 | (163 | ) | ||||||||
Change in unrealized appreciation/(depreciation)(c) | (17 | ) | (655 | ) | 638 | |||||||
Purchases | — | — | — | |||||||||
Sales(b) | (15,168 | ) | (14,958 | ) | (210 | ) | ||||||
Transfers into Level 3(a) | — | — | — | |||||||||
Transfers from Level 3(a) | — | — | — | |||||||||
|
|
|
|
|
| |||||||
Balance as of September 30, 2014 | $ | 14,320 | $ | — | $ | 14,320 | ||||||
|
|
|
|
|
| |||||||
| (a) | “Transfers into and/or from” represent the ending value as of September 30, 2014, for any investment security where a change in the pricing level occurred from the beginning to the end of the period. |
| (b) | Includes paydowns on securities. |
| (c) | Included in the related net change in unrealized appreciation/(depreciation) in the Statement of Operations. The change in unrealized appreciation/(depreciation) on investments still held as of September 30, 2014 was $329. |
None of the securities in the table are internally fair valued at September 30, 2014.
See Notes to Financial Statements
40
Table of Contents
VIRTUS MULTI-SECTOR SHORT TERM BOND FUND
STATEMENT OF ASSETS AND LIABILITIES
SEPTEMBER 30, 2014
(Reported in thousands except shares and per share amounts)
| Assets | ||||
Investment in securities at value(1) | $ | 9,045,880 | ||
Foreign currency at value(2) | — | (3) | ||
Cash | 11,369 | |||
| Receivables | ||||
Investment securities sold | 40,431 | |||
Fund shares sold | 71,359 | |||
Dividends and interest receivable | 73,303 | |||
Tax reclaims | 19 | |||
Prepaid expenses | 277 | |||
Prepaid trustee retainer | 54 | |||
|
| |||
Total assets | 9,242,692 | |||
|
| |||
| Liabilities | ||||
| Payables | ||||
Fund shares repurchased | 34,610 | |||
Investment securities purchased | 93,245 | |||
Dividend distributions | 3,276 | |||
Investment advisory fees | 3,484 | |||
Distribution and service fees | 1,710 | |||
Administration fees | 907 | |||
Transfer agent fees and expenses | 2,338 | |||
Professional fees | 47 | |||
Trustees’ fees and expenses | 9 | |||
Other accrued expenses | 436 | |||
|
| |||
Total liabilities | 140,062 | |||
|
| |||
| Net Assets | $ | 9,102,630 | ||
|
| |||
| Net Assets Consist of: | ||||
Capital paid in on shares of beneficial interest | $ | 9,074,071 | ||
Accumulated undistributed net investment income (loss) | (544 | ) | ||
Accumulated undistributed net realized gain (loss) | (337 | ) | ||
Net unrealized appreciation (depreciation) on investments | 29,440 | |||
|
| |||
| Net Assets | $ | 9,102,630 | ||
|
| |||
| Class A | ||||
Net asset value (net assets/shares outstanding) per share | $ | 4.84 | ||
Maximum offering price per share NAV/(1–2.25%) | $ | 4.95 | ||
Shares of beneficial interest outstanding, no par value, unlimited authorization | 391,792,809 | |||
Net Assets | $ | 1,894,633 | ||
| Class B | ||||
Net asset value (net assets/shares outstanding) and offering price per share | $ | 4.81 | ||
Shares of beneficial interest outstanding, no par value, unlimited authorization | 295,662 | |||
Net Assets | $ | 1,421 | ||
| Class C | ||||
Net asset value (net assets/shares outstanding) and offering price per share | $ | 4.89 | ||
Shares of beneficial interest outstanding, no par value, unlimited authorization | 351,516,343 | |||
Net Assets | $ | 1,720,245 | ||
| Class T | ||||
Net asset value (net assets/shares outstanding) and offering price per share | $ | 4.88 | ||
Shares of beneficial interest outstanding, no par value, unlimited authorization | 147,491,267 | |||
Net Assets | $ | 719,840 | ||
| Class I | ||||
Net asset value (net assets/shares outstanding) and offering price per share | $ | 4.84 | ||
Shares of beneficial interest outstanding, no par value, unlimited authorization | 984,628,371 | |||
Net Assets | $ | 4,766,491 | ||
(1) Investment in securities at cost. | $ | 9,015,944 | ||
(2) Foreign currency at cost. | — | (3) | ||
(3) Amount less than $500. | ||||
See Notes to Financial Statements
41
Table of Contents
VIRTUS MULTI-SECTOR SHORT TERM BOND FUND
YEAR ENDED SEPTEMBER 30, 2014
($ reported in thousands)
| Investment Income | ||||
Dividends | $ | 278 | ||
Interest | 368,998 | |||
Foreign taxes withheld | (272 | ) | ||
|
| |||
Total investment income | 369,004 | |||
|
| |||
| Expenses | ||||
Investment advisory fees | 40,406 | |||
Service fees, Class A | 8,305 | |||
Distribution and service fees, Class B | 15 | |||
Distribution and service fees, Class C | 8,083 | |||
Distribution and service fees, Class T | 7,412 | |||
Administration fees | 10,396 | |||
Transfer agent fees and expenses | 10,455 | |||
Registration fees | 646 | |||
Printing fees and expenses | 474 | |||
Trustees’ fees and expenses | 353 | |||
Custodian fees | 127 | |||
Professional fees | 91 | |||
Miscellaneous expenses | 811 | |||
|
| |||
Total expenses | 87,574 | |||
|
| |||
| Net investment income (loss) | 281,430 | |||
|
| |||
| Net Realized and Unrealized Gain (Loss) on Investments | ||||
Net realized gain (loss) on investments | 3,533 | |||
Net realized gain (loss) on foreign currency transactions | (1,085 | ) | ||
Net change in unrealized appreciation (depreciation) on investments | (37,557 | ) | ||
Net change in unrealized appreciation (depreciation) on foreign currency translation | (454 | ) | ||
|
| |||
| Net gain (loss) on investments | (35,563 | ) | ||
|
| |||
| Net increase (decrease) in net assets resulting from operations | $ | 245,867 | ||
|
|
See Notes to Financial Statements
42
Table of Contents
VIRTUS MULTI-SECTOR SHORT TERM BOND FUND
STATEMENTS OF CHANGES IN NET ASSETS
(Reported in thousands)
| Year Ended September 30, 2014 | Year Ended September 30, 2013 | |||||||
| INCREASE/(DECREASE) IN NET ASSETS | ||||||||
| From Operations | ||||||||
Net investment income (loss) | $ | 281,430 | $ | 278,620 | ||||
Net realized gain (loss) | 2,448 | 12,812 | ||||||
Net change in unrealized appreciation (depreciation) | (38,011 | ) | (179,919 | ) | ||||
|
|
|
| |||||
| Increase (decrease) in net assets resulting from operations | 245,867 | 111,513 | ||||||
|
|
|
| |||||
| From Distributions to Shareholders | ||||||||
Net investment income, Class A | (105,722 | ) | (125,014 | ) | ||||
Net investment income, Class B | (56 | ) | (94 | ) | ||||
Net investment income, Class C | (46,403 | ) | (47,945 | ) | ||||
Net investment income, Class T | (17,738 | ) | (21,492 | ) | ||||
Net investment income, Class I | (100,400 | ) | (81,834 | ) | ||||
Net realized long-term gains Class A | (630 | ) | — | |||||
Net realized long-term gains Class B | (— | )(1) | — | |||||
Net realized long-term gains Class C | (306 | ) | — | |||||
Net realized long-term gains Class T | (140 | ) | — | |||||
Net realized long-term gains Class I | (562 | ) | — | |||||
|
|
|
| |||||
| Decrease in net assets from distributions to shareholders | (271,957 | ) | (276,379 | ) | ||||
|
|
|
| |||||
| From Share Transactions | ||||||||
| Sale of shares | ||||||||
Class A (213,985 and 346,749 shares, respectively) | 1,043,710 | 1,710,009 | ||||||
Class B (11 and 53 shares, respectively) | 52 | 259 | ||||||
Class C (148,857 and 221,042 shares, respectively) | 735,299 | 1,104,963 | ||||||
Class T (23,586 and 37,247 shares, respectively) | 116,148 | 185,325 | ||||||
Class I (672,603 and 349,093 shares, respectively) | 3,291,503 | 1,722,724 | ||||||
| Reinvestment of distributions | ||||||||
Class A (20,365 and 23,973 shares, respectively) | 99,389 | 117,820 | ||||||
Class B (11 and 18 shares, respectively) | 53 | 88 | ||||||
Class C (9,071 and 9,226 shares, respectively) | 44,772 | 45,806 | ||||||
Class T (2,309 and 2,838 shares, respectively) | 11,365 | 14,073 | ||||||
Class I (15,682 and 11,630 shares, respectively) | 76,553 | 57,145 | ||||||
| Shares repurchased | ||||||||
Class A (580,132 and 248,676 shares, respectively) | (2,835,996 | ) | (1,221,380 | ) | ||||
Class B (260 and 269 shares, respectively) | (1,262 | ) | (1,320 | ) | ||||
Class C (126,206 and 124,346 shares, respectively) | (622,784 | ) | (617,286 | ) | ||||
Class T (32,030 and 27,900 shares, respectively) | (157,686 | ) | (138,155 | ) | ||||
Class I (202,225 and 187,385 shares, respectively) | (987,226 | ) | (920,516 | ) | ||||
|
|
|
| |||||
| Increase (decrease) in net assets from share transactions | 813,890 | 2,059,555 | ||||||
|
|
|
| |||||
| Net increase (decrease) in net assets | 787,800 | 1,894,689 | ||||||
| Net Assets | ||||||||
Beginning of period | 8,314,830 | 6,420,141 | ||||||
|
|
|
| |||||
| End of period | $ | 9,102,630 | $ | 8,314,830 | ||||
|
|
|
| |||||
Accumulated undistributed net investment income (loss) at end of period | $ | (544 | ) | $ | (332 | ) | ||
| (1) | Amount less than $500. |
See Notes to Financial Statements
43
Table of Contents
VIRTUS MULTI-SECTOR SHORT TERM BOND FUND
SELECTED PER SHARE DATA AND RATIOS FOR A SHARE OUTSTANDING
THROUGHOUT EACH PERIOD
| Net Asset Value, Beginning of Period | Net Investment Income (Loss)(2) | Net Realized and Unrealized Gain (Loss) | Total from Investment Operations | Dividends from Net Investment Income | Distributions from Net Realized Gains | Total Distributions | Change in Net Asset Value | Net Asset Value, End of Period | Total Return(1) | Net Assets, End of Period (000’s) | Ratio of Expenses to Average Net Assets(3) | Ratio of Net Investment Income to Average Net Assets | Portfolio Turnover Rate | |||||||||||||||||||||||||||||||||||||||||||||||||||||||||
Class A | ||||||||||||||||||||||||||||||||||||||||||||||||||||||||||||||||||||||
| 10/1/13 to 9/30/14 | $ | 4.85 | 0.16 | (0.01 | ) | 0.15 | (0.16 | ) | — | (4) | (0.16 | ) | (0.01 | ) | $ | 4.84 | 3.03 | % | $ | 1,894,633 | 0.99 | % | 3.30 | % | 39 | % | ||||||||||||||||||||||||||||||||||||||||||||
| 10/1/12 to 9/30/13 | 4.94 | 0.18 | (0.09 | ) | 0.09 | (0.18 | ) | — | (0.18 | ) | (0.09 | ) | 4.85 | 1.84 | 3,574,450 | 0.99 | 3.65 | 49 | ||||||||||||||||||||||||||||||||||||||||||||||||||||
| 10/1/11 to 9/30/12 | 4.67 | 0.21 | 0.27 | 0.48 | (0.21 | ) | — | (0.21 | ) | 0.27 | 4.94 | 10.58 | 3,038,093 | 1.01 | 4.31 | 52 | ||||||||||||||||||||||||||||||||||||||||||||||||||||||
| 10/1/10 to 9/30/11 | 4.80 | 0.22 | (0.12 | ) | 0.10 | (0.23 | ) | — | (0.23 | ) | (0.13 | ) | 4.67 | 2.02 | 2,463,360 | 1.05 | 4.59 | 35 | ||||||||||||||||||||||||||||||||||||||||||||||||||||
| 10/1/09 to 9/30/10 | 4.54 | 0.25 | 0.26 | 0.51 | (0.25 | ) | — | (0.25 | ) | 0.26 | 4.80 | 11.65 | 1,897,491 | 1.07 | 5.31 | 49 | ||||||||||||||||||||||||||||||||||||||||||||||||||||||
Class B | ||||||||||||||||||||||||||||||||||||||||||||||||||||||||||||||||||||||
| 10/1/13 to 9/30/14 | $ | 4.82 | 0.14 | (0.02 | ) | 0.12 | (0.13 | ) | — | (4) | (0.13 | ) | (0.01 | ) | $ | 4.81 | 2.53 | % | $ | 1,421 | 1.49 | % | 2.80 | % | 39 | % | ||||||||||||||||||||||||||||||||||||||||||||
| 10/1/12 to 9/30/13 | 4.91 | 0.16 | (0.09 | ) | 0.07 | (0.16 | ) | — | (0.16 | ) | (0.09 | ) | 4.82 | 1.34 | 2,572 | 1.49 | 3.17 | 49 | ||||||||||||||||||||||||||||||||||||||||||||||||||||
| 10/1/11 to 9/30/12 | 4.65 | 0.18 | 0.27 | 0.45 | (0.19 | ) | — | (0.19 | ) | 0.26 | 4.91 | 9.87 | 3,590 | 1.51 | 3.86 | 52 | ||||||||||||||||||||||||||||||||||||||||||||||||||||||
| 10/1/10 to 9/30/11 | 4.78 | 0.20 | (0.12 | ) | 0.08 | (0.21 | ) | — | (0.21 | ) | (0.13 | ) | 4.65 | 1.53 | 5,550 | 1.55 | 4.10 | 35 | ||||||||||||||||||||||||||||||||||||||||||||||||||||
| 10/1/09 to 9/30/10 | 4.52 | 0.23 | 0.26 | 0.49 | (0.23 | ) | — | (0.23 | ) | 0.26 | 4.78 | 11.16 | 9,435 | 1.56 | 4.86 | 49 | ||||||||||||||||||||||||||||||||||||||||||||||||||||||
Class C | ||||||||||||||||||||||||||||||||||||||||||||||||||||||||||||||||||||||
| 10/1/13 to 9/30/14 | $ | 4.90 | 0.15 | (0.02 | ) | 0.13 | (0.14 | ) | — | (4) | (0.14 | ) | (0.01 | ) | $ | 4.89 | 2.73 | % | $ | 1,720,245 | 1.24 | % | 3.03 | % | 39 | % | ||||||||||||||||||||||||||||||||||||||||||||
| 10/1/12 to 9/30/13 | 4.99 | 0.17 | (0.09 | ) | 0.08 | (0.17 | ) | — | (0.17 | ) | (0.09 | ) | 4.90 | 1.56 | 1,567,725 | 1.24 | 3.40 | 49 | ||||||||||||||||||||||||||||||||||||||||||||||||||||
| 10/1/11 to 9/30/12 | 4.72 | 0.20 | 0.27 | 0.47 | (0.20 | ) | — | (0.20 | ) | 0.27 | 4.99 | 10.19 | 1,067,276 | 1.27 | 4.04 | 52 | ||||||||||||||||||||||||||||||||||||||||||||||||||||||
| 10/1/10 to 9/30/11 | 4.85 | 0.21 | (0.12 | ) | 0.09 | (0.22 | ) | — | (0.22 | ) | (0.13 | ) | 4.72 | 1.75 | 616,170 | 1.30 | 4.33 | 35 | ||||||||||||||||||||||||||||||||||||||||||||||||||||
| 10/1/09 to 9/30/10 | 4.58 | 0.24 | 0.27 | 0.51 | (0.24 | ) | — | (0.24 | ) | 0.27 | 4.85 | 11.49 | 471,332 | 1.32 | 5.04 | 49 | ||||||||||||||||||||||||||||||||||||||||||||||||||||||
The footnote legend is at the end of the financial highlights
See Notes to Financial Statements
44
Table of Contents
VIRTUS MULTI-SECTOR SHORT TERM BOND FUND
FINANCIAL HIGHLIGHTS (Continued)
SELECTED PER SHARE DATA AND RATIOS FOR A SHARE OUTSTANDING
THROUGHOUT EACH PERIOD
| Net Asset Value, Beginning of Period | Net Investment Income (Loss)(2) | Net Realized and Unrealized Gain (Loss) | Total from Investment Operations | Dividends from Net Investment Income | Distributions from Net Realized Gains | Total Distributions | Change in Net Asset Value | Net Asset Value, End of Period | Total Return(1) | Net Assets, End of Period (000’s) | Ratio of Expenses to Average Net Assets(3) | Ratio of Net Investment Income to Average Net Assets | Portfolio Turnover Rate | |||||||||||||||||||||||||||||||||||||||||||||||||||||||||
Class T | ||||||||||||||||||||||||||||||||||||||||||||||||||||||||||||||||||||||
| 10/1/13 to 9/30/14 | $ | 4.89 | 0.12 | (0.01 | ) | 0.11 | (0.12 | ) | — | (4) | (0.12 | ) | (0.01 | ) | $ | 4.88 | 2.23 | % | $ | 719,840 | 1.74 | % | 2.53 | % | 39 | % | ||||||||||||||||||||||||||||||||||||||||||||
| 10/1/12 to 9/30/13 | 4.98 | 0.14 | (0.09 | ) | 0.05 | (0.14 | ) | — | (0.14 | ) | (0.09 | ) | 4.89 | 1.06 | 751,220 | 1.74 | 2.91 | 49 | ||||||||||||||||||||||||||||||||||||||||||||||||||||
| 10/1/11 to 9/30/12 | 4.71 | 0.17 | 0.28 | 0.45 | (0.18 | ) | — | (0.18 | ) | 0.27 | 4.98 | 9.67 | 704,225 | 1.76 | 3.56 | 52 | ||||||||||||||||||||||||||||||||||||||||||||||||||||||
| 10/1/10 to 9/30/11 | 4.84 | 0.19 | (0.13 | ) | 0.06 | (0.19 | ) | — | (0.19 | ) | (0.13 | ) | 4.71 | 1.24 | 530,162 | 1.80 | 3.84 | 35 | ||||||||||||||||||||||||||||||||||||||||||||||||||||
| 10/1/09 to 9/30/10 | 4.57 | 0.21 | 0.28 | 0.49 | (0.22 | ) | — | (0.22 | ) | 0.27 | 4.84 | 10.96 | 394,183 | 1.82 | 4.54 | 49 | ||||||||||||||||||||||||||||||||||||||||||||||||||||||
Class I | ||||||||||||||||||||||||||||||||||||||||||||||||||||||||||||||||||||||
| 10/1/13 to 9/30/14 | $ | 4.85 | 0.17 | (0.01 | ) | 0.16 | (0.17 | ) | — | (4) | (0.17 | ) | (0.01 | ) | $ | 4.84 | 3.28 | % | $ | 4,766,491 | 0.74 | % | 3.51 | % | 39 | % | ||||||||||||||||||||||||||||||||||||||||||||
| 10/1/12 to 9/30/13 | 4.94 | 0.19 | (0.09 | ) | 0.10 | (0.19 | ) | — | (0.19 | ) | (0.09 | ) | 4.85 | 2.09 | 2,418,863 | 0.74 | 3.90 | 49 | ||||||||||||||||||||||||||||||||||||||||||||||||||||
| 10/1/11 to 9/30/12 | 4.68 | 0.22 | 0.27 | 0.49 | (0.23 | ) | — | (0.23 | ) | 0.26 | 4.94 | 10.62 | 1,606,957 | 0.77 | 4.55 | 52 | ||||||||||||||||||||||||||||||||||||||||||||||||||||||
| 10/1/10 to 9/30/11 | 4.81 | 0.23 | (0.12 | ) | 0.11 | (0.24 | ) | — | (0.24 | ) | (0.13 | ) | 4.68 | 2.28 | 901,528 | 0.80 | 4.83 | 35 | ||||||||||||||||||||||||||||||||||||||||||||||||||||
| 10/1/09 to 9/30/10 | 4.54 | 0.26 | 0.28 | 0.54 | (0.27 | ) | — | (0.27 | ) | 0.27 | 4.81 | 12.16 | 468,264 | 0.83 | 5.51 | 49 | ||||||||||||||||||||||||||||||||||||||||||||||||||||||
Footnote Legend
| (1) | Sales charges, where applicable, are not reflected in the total return calculation. |
| (2) | Computed using average shares outstanding. |
| (3) | The Fund may invest in other funds and the annualized expense ratios do not reflect fees and expenses associated with the underlying funds. |
| (4) | Amount is less than $0.005. |
See Notes to Financial Statements
45
Table of Contents
VIRTUS MULTI-SECTOR SHORT TERM BOND FUND
SEPTEMBER 30, 2014
Note 1. Organization
Virtus Opportunities Trust (the “Trust”) is organized as a Delaware statutory trust and is registered under the Investment Company Act of 1940, as amended (“1940 Act”), as an open-end management investment company.
As of the date of this report, 31 funds of the Trust are offered for sale, of which the Virtus Multi-Sector Short Term Bond Fund (the “Fund”) is reported in this annual report. The Fund’s investment objective is outlined in the Fund Summary page.
The Fund offers Class A shares, Class C shares, Class T shares and Class I shares. Class B shares are no longer available for purchase by new or existing shareholders, except by existing shareholders through Qualifying Transactions. (For information regarding Qualifying Transactions refer to the Trust’s prospectus.)
Class A shares are sold with a front-end sales charge of up to 2.25%. Generally, Class A shares are not subject to any charges by the Fund when redeemed; however, a 0.50% contingent deferred sales charge (“CDSC”) may be imposed on certain redemptions made within a certain period following purchases on which a finder’s fee has been paid. The period for which the CDSC applies for the Fund is 18 months. The CDSC period begins on the last day of the month preceding the month in which the purchase was made.
Class B shares were sold with a CDSC which declines from 2% to zero depending on the period of time the shares are held. Class C shares are sold without a sales charge. Class T shares of the Fund are sold with a 1% CDSC, applicable if redeemed within one year of purchase. Class I shares are sold without a front-end sales charge or CDSC.
Virtus Mutual Funds may impose an annual fee on accounts having balances of less than $2,500. The small account fee may be waived in certain circumstances, as disclosed in the prospectuses and/or statements of additional information. The fees collected will be used to offset certain expenses of the funds.
Each class of shares has identical voting, dividend, liquidation and other rights and the same terms and conditions, except that each class bears different distribution and/or service fees under a Board-approved Rule 12b-1 and/or shareholder service plan (“12b-1 plan”) and has exclusive voting rights with respect to such plans. Class I shares are not subject to a 12b-1 plan. Income and other expenses as well as realized and unrealized gains and losses of the Fund are borne pro rata by the holders of each class of shares.
Note 2. Significant Accounting Policies
The following is a summary of significant accounting policies consistently followed by the Trust in the preparation of its financial statements. The preparation of financial statements in conformity with accounting principles generally accepted in the United States of America requires management to make estimates and assumptions that affect the reported amounts of assets and liabilities, disclosure of contingent assets and liabilities at the date of the financial statements and the reported amounts of increases and decreases in net assets from operations during the reporting period. Actual results could differ from those estimates and those differences could be significant.
| A. | Security Valuation |
Security valuation procedures for the Fund, which include nightly price variance, as well as back-testing such as bi-weekly unchanged price, monthly secondary source and
46
Table of Contents
VIRTUS MULTI-SECTOR SHORT TERM BOND FUND
NOTES TO FINANCIAL STATEMENTS (Continued)
SEPTEMBER 30, 2014
transaction analysis, have been approved by the Board of Trustees (the “Board” or the “Trustees”). All internally fair valued securities are approved by a valuation committee (the “Valuation Committee”) appointed by the Board. The Valuation Committee is comprised of certain members of management as identified by the Board and convenes independently from portfolio management. All internally fair valued securities are updated daily and reviewed in detail by the Valuation Committee monthly unless changes occur within the period. The Valuation Committee reviews the validity of the model inputs and any changes to the model. Fair valuations are reviewed by the Board at least quarterly.
The Fund utilizes a fair value hierarchy which prioritizes the inputs to valuation techniques used to measure fair value into three broad levels.
| • Level 1 – | quoted prices in active markets for identical securities (security types generally include listed equities). |
| • Level 2 – | prices determined using other significant observable inputs (including quoted prices for similar securities, interest rates, prepayment speeds, credit risk, etc.) |
| • Level 3 – | prices determined using significant unobservable inputs (including the Valuation Committee’s own assumptions in determining the fair value of investments) |
A description of the valuation techniques applied to the Fund’s major categories of assets and liabilities measured at fair value on a recurring basis is as follows:
Equity securities are valued at the official closing price (typically last sale) on the exchange on which the securities are primarily traded, or if no closing price is available, at the last bid price and are categorized as Level 1 in the hierarchy. Restricted equity securities and private placements that are not widely traded, are illiquid or are internally fair valued by the Valuation Committee, are generally categorized as Level 3 in the hierarchy.
Certain non-U.S. securities may be fair valued in cases where closing prices are not readily available or are deemed not reflective of readily available market prices. For example, significant events (such as movement in the U.S. securities market, or other regional and local developments) may occur between the time that non-U.S. markets close (where the security is principally traded) and the time that the Fund calculates its net asset value (“NAV”) (at the close of regular trading on the New York Stock Exchange (“NYSE”) generally 4 p.m. Eastern time) that may impact the value of securities traded in these non-U.S. markets. In such cases the Fund fair values non-U.S. securities using an independent pricing service which considers the correlation of the trading patterns of the non-U.S. security to the intraday trading in the U.S. markets for investments such as American Depositary Receipts, financial futures, ETFs, and certain indexes as well as prices for similar securities. Such fair valuations are categorized as Level 2 in the hierarchy. Because the frequency of significant events is not predictable, fair valuation of certain non-U.S. common stocks may occur on a frequent basis.
Debt securities, including restricted securities, are valued based on evaluated quotations received from independent pricing services or from dealers who make markets in such securities. For most bond types, the pricing service utilizes matrix pricing that considers one or more of the following factors: yield or price of bonds of
47
Table of Contents
VIRTUS MULTI-SECTOR SHORT TERM BOND FUND
NOTES TO FINANCIAL STATEMENTS (Continued)
SEPTEMBER 30, 2014
comparable quality, coupon, maturity, current cash flows, type, and current day trade information, as well as dealer-supplied prices. These valuations are generally categorized as Level 2 in the hierarchy. Structured debt instruments such as mortgage-backed and asset-backed securities may also incorporate collateral analysis and utilize cash flow models for valuation and are generally categorized as Level 2 in the hierarchy. Pricing services do not provide pricing for all securities, and therefore indicative bids from dealers are utilized which are based on pricing models used by market makers in the security and are generally categorized as Level 2 in the hierarchy. Debt securities that are not widely traded, are illiquid, or are internally fair valued by the Valuation Committee, are generally categorized as Level 3 in the hierarchy.
Listed derivatives that are actively traded are valued based on quoted prices from the exchange and are categorized as Level 1 in the hierarchy. Over-the-counter derivative contracts, which include forward currency contracts and equity-linked instruments, do not require material subjectivity as pricing inputs are observed from actively quoted markets and are categorized as Level 2 in the hierarchy.
Short-term notes having a maturity of 60 days or less are valued at amortized cost which approximates market and are generally categorized as Level 2 within the hierarchy.
Investments in open-end mutual funds are valued at NAV. Investments in closed-end mutual funds are valued as of the close of regular trading on the NYSE each business day. Both are categorized as Level 1 in the hierarchy.
A summary of the inputs used to value the Fund’s net assets by each major security type is disclosed at the end of the Schedule of Investments for the Fund. The inputs or methodologies used for valuing securities are not necessarily an indication of the risk associated with investing in those securities.
| B. | Security Transactions and Investment Income |
Security transactions are recorded on the trade date. Realized gains and losses from the sale of securities are determined on the identified cost basis. Dividend income is recognized on the ex-dividend date, or in the case of certain foreign securities, as soon as the Fund is notified. Interest income is recorded on the accrual basis. The Fund amortizes premiums and accretes discounts using the effective interest method.
| C. | Income Taxes |
The Fund is treated as a separate taxable entity. It is the intention of the Fund to comply with the requirements of Subchapter M of the Internal Revenue Code and to distribute substantially all of its taxable income to its shareholders. Therefore, no provision for federal income taxes or excise taxes has been made.
The Fund may be subject to foreign taxes on income, gains on investments or currency repatriation, a portion of which may be recoverable. The Fund will accrue such taxes and recoveries as applicable based upon current interpretations of the tax rules and regulations that exist in the markets in which it invests.
Management of the Fund has concluded that there are no significant uncertain tax positions that would require recognition in the financial statements. As of September 30, 2014, the tax years that remain subject to examination by the major tax jurisdictions under the statute of limitations are from the year 2011 forward (with limited exceptions).
48
Table of Contents
VIRTUS MULTI-SECTOR SHORT TERM BOND FUND
NOTES TO FINANCIAL STATEMENTS (Continued)
SEPTEMBER 30, 2014
| D. | Distributions to Shareholders |
Distributions are recorded by the Fund on the ex-dividend date. Income distributions are recorded daily. Income and capital gain distributions are determined in accordance with income tax regulations that may differ from accounting principles generally accepted in the United States of America. These differences may include the treatment of non-taxable dividends, market premium and discount, non-deductible expenses, expiring capital loss carryovers, foreign currency gain or loss, gain or loss on futures contracts, partnerships, operating losses and losses deferred due to wash sales. Permanent book and tax basis differences relating to shareholder distributions will result in reclassifications to capital paid in on shares of beneficial interest.
| E. | Expenses |
Expenses incurred together by the Fund and other affiliated mutual funds are allocated in proportion to the net assets of each such fund, except where allocation of direct expense to each fund or an alternative allocation method can be more appropriately used.
In addition to the net annual operating expenses that the Fund bears directly, the shareholders of the Fund indirectly bear the Fund’s pro-rata expenses of any underlying mutual funds in which the Fund invests.
| F. | Foreign Currency Translation |
Non-U.S. investment securities and other assets and liabilities denominated in foreign currencies are translated into U.S. dollar amounts at the foreign currency exchange rate effective at the end of the reporting period. Cost of investments is translated at the currency exchange rate effective at the trade date. The gain or loss resulting from a change in currency exchange rates between the trade and settlement date of a portfolio transaction is treated as a gain or loss on non-U.S. currency. Likewise, the gain or loss resulting from a change in currency exchange rates between the date income is accrued and the date it is paid is treated as a gain or loss on foreign currency. The Fund does not isolate that portion of the results of operations arising from changes in foreign exchange rates on investments from the fluctuations arising from changes in the market prices of securities held. Such fluctuations are included with the net realized and unrealized gain or loss on investments.
| G. | When-issued Purchases and Forward Commitments (Delayed Delivery) |
The Fund may engage in when-issued or forward commitment transactions. Securities purchased on a when-issued or forward commitment basis are also known as delayed delivery transactions. Delayed delivery transactions involve a commitment by a fund to purchase or sell a security at a future date, ordinarily up to 90 days later. When-issued or forward commitments enable a fund to lock in what is believed to be an attractive price or yield on a particular security for a period of time, regardless of future changes in interest rates. The Fund records when-issued and delayed delivery securities on the trade date. The Fund maintains collateral for the securities purchased. Securities purchased on a when-issued or delayed delivery basis begin earning interest on the settlement date.
49
Table of Contents
VIRTUS MULTI-SECTOR SHORT TERM BOND FUND
NOTES TO FINANCIAL STATEMENTS (Continued)
SEPTEMBER 30, 2014
| H. | Loan Agreements |
The Fund may invest in direct debt instruments which are interests in amounts owed by a corporate, governmental, or other borrower to lenders or lending syndicates. Loan agreements are generally non-investment grade and often involve borrowers that are highly leveraged. The Fund may invest in obligations of borrowers who are in bankruptcy proceedings. Loan agreements are typically senior in the corporate capital structure of the borrower. A loan is often administered by a bank or other financial institution (the “lender”) that acts as agent for all holders. The agent administers the terms of the loan, as specified in the loan agreement. The Fund’s investments in loans may be in the form of participations in loans or assignments of all or a portion of loans from third parties. When investing in loan participations, the Fund has the right to receive payments of principal, interest and any fees to which it is entitled only from the lender selling the loan participation and only upon receipt by the lender of payments from the borrower. The Fund generally has no right to enforce compliance with the terms of the loan agreement with the borrower. As a result, the Fund may be subject to the credit risk of both the borrower and the lender that is selling the loan agreement. When the Fund purchases assignments from lenders it acquires direct rights against the borrower on the loan.
The Fund may invest in multiple series or tranches of a loan, which may have varying terms and carry different associated risks. Loan agreements may involve foreign borrowers, and investments may be denominated in foreign currencies. Direct indebtedness of emerging countries involves a risk that the government entities responsible for the repayment of the debt may be unable, or unwilling, to pay the principal and interest when due.
The loan agreements have floating rate loan interests which generally pay interest at rates that are periodically determined by reference to a base lending rate plus a premium. The base lending rates are generally LIBOR (London Interbank Offered Rate), the prime rate offered by one or more U.S. banks or the certificate of deposit rate. When a loan agreement is purchased the Fund may pay an assignment fee. On an ongoing basis, the Fund may receive a commitment fee based on the undrawn portion of the underlying line of credit portion of a loan agreement. Prepayment penalty fees are received upon the prepayment of a loan agreement by a borrower. Prepayment penalty, facility, commitment, consent and amendment fees are recorded to income as earned or paid.
At September 30, 2014, the Fund only holds assignment loans.
Note 3. Investment Advisory Fees and Related Party Transactions
($ reported in thousands except as noted)
| A. | Adviser |
Virtus Investment Advisers, Inc. (the “Adviser”), an indirect, wholly-owned subsidiary of Virtus Investment Partners, Inc. (“Virtus”), is the adviser to the Trust. The Adviser manages the Fund’s investment program and general operations of the Fund, including oversight of the Fund’s subadviser.
50
Table of Contents
VIRTUS MULTI-SECTOR SHORT TERM BOND FUND
NOTES TO FINANCIAL STATEMENTS (Continued)
SEPTEMBER 30, 2014
As compensation for its services to the Fund, the Adviser is entitled to a fee based upon the following annual rates as a percentage of the average daily net assets of the Fund:
1st $1 Billion | $1+ Billion – | $2+ Billion | ||
| 0.55% | 0.50% | 0.45% |
| B. | Subadviser |
Newfleet Asset Management, LLC (the “Subadviser”), an indirect, wholly-owned subsidiary of Virtus, is the subadviser to the Fund. The Subadviser manages the investments of the Fund for which it is paid a fee by the Adviser.
| C. | Expense Limitations |
The Adviser has voluntarily agreed to limit the Fund’s total operating expenses (excluding interest, taxes, extraordinary expenses and acquired fund fees and expenses, if any) so that such expenses do not exceed, on an annualized basis the following percentages of the Fund’s average net asset values: 1.10% for Class A shares, 1.60% for Class B shares, 1.35% for Class C shares, 1.85% for Class T shares and 0.85% for Class I shares. The Adviser may discontinue these voluntary expense caps at any time. The Fund is currently below its expense cap.
| D. | Distributor |
VP Distributors, LLC (“VP Distributors”), an indirect wholly-owned subsidiary of Virtus, serves as the distributor of the Fund’s shares. VP Distributors has advised the Fund that for the fiscal year (the “period”) ended September 30, 2014, it retained net commissions of $60 for Class A shares and deferred sales charges of $152, $—(1), $1 and $83 for Class A shares, Class B shares, Class C shares and Class T shares, respectively.
In addition, the Fund pays VP Distributors distribution and/or service fees under a 12b-1 plan as a percentage of the daily average net assets of each respective class, at the annual rate of 0.25% for Class A shares, 0.75% for Class B shares, 0.50% for Class C shares, and 1.00% for Class T shares. Class I shares are not subject to a 12b-1 plan.
Under certain circumstances, shares of certain Virtus Mutual Funds may be exchanged for shares of the same class of certain other Virtus Mutual Funds on the basis of the relative net asset values per share at the time of the exchange. On exchanges with share classes that carry a CDSC, the CDSC schedule of the original shares purchased continues to apply.
| (1) | Amount less than $500. |
| E. | Administrator and Transfer Agent |
Virtus Fund Services LLC, an indirect wholly-owned subsidiary of Virtus, serves as the administrator and transfer agent to the Fund.
For the period ended September 30, 2014, the Fund incurred administration fees totaling $8,309 which are included in the Statement of Operations.
For the period ended September 30, 2014, the Fund incurred transfer agent fees totaling $10,087 which are included in the Statement of Operations. A portion of these fees is paid to outside entities that also provide services to the Trust.
51
Table of Contents
VIRTUS MULTI-SECTOR SHORT TERM BOND FUND
NOTES TO FINANCIAL STATEMENTS (Continued)
SEPTEMBER 30, 2014
| F. | Affiliated Shareholders |
At September 30, 2014, Virtus and its affiliates, BMO Bankcorp (a minority investor in Virtus) and its affiliates, and the retirement plans of Virtus and its affiliates, held shares of the Fund which may be redeemed at any time that aggregated to the following:
| Shares | Aggregate Net Asset Value | |||||||
Class I Shares | 2,628,404 | $ | 12,721 | |||||
Note 4. Purchases and Sales of Securities
Purchases and sales of securities for the Fund (excluding U.S. Government and agency securities, and short-term securities) during the period ended September 30, 2014, were as follows:
| Purchases | Sales | |||||||
| $ | 4,061,972 | $ | 3,222,371 | |||||
Purchases and sales of long-term U.S. Government and agency securities for the Fund during the period ended September 30, 2014, were as follows:
| Purchases | Sales | |||||||
| $ | 181,574 | $ | 138,726 | |||||
Note 5. 10% Shareholders
As of September 30, 2014, the Fund had individual shareholder account(s) and/or omnibus shareholder account(s) (comprised of a group of individual shareholders), which individually amounted to more than 10% of the total shares outstanding of the Fund as detailed below.
| % of Shares Outstanding | Number of Accounts | |||||||
| 30 | % | 2 | ||||||
The shareholders are not affiliated with Virtus.
Note 6. Credit Risk and Asset Concentrations
In countries with limited or developing markets, investments may present greater risks than in more developed markets and the prices of such investments may be volatile. The consequences of political, social or economic changes in these markets may have disruptive effects on the market prices of these investments and the income they generate, as well as the Fund’s ability to repatriate such amounts.
High-yield/high-risk securities typically entail greater price volatility and/or principal and interest rate risk. There is a greater chance that an issuer will not be able to make principal and interest payments on time. Analysis of the creditworthiness of issuers of high-yield/high-risk securities may be complex, and as a result it may be more difficult for the Adviser and/or Subadviser to accurately predict risk.
The Fund may invest a high percentage of its assets in specific sectors of the market in its pursuit of a greater investment return. Fluctuations in these sectors of concentration may have a greater impact on the Fund, positive or negative, than if the Fund did not concentrate its investments in such sectors.
52
Table of Contents
VIRTUS MULTI-SECTOR SHORT TERM BOND FUND
NOTES TO FINANCIAL STATEMENTS (Continued)
SEPTEMBER 30, 2014
Note 7. Illiquid and Restricted Securities
Investments generally are considered illiquid if they cannot be disposed of in seven days in the ordinary course of business at the approximate amount at which such securities have been valued by the Fund. Additionally, the following information is also considered in determining illiquidity: the frequency of trades and quotes for the investment, whether the investment is listed for trading on a recognized domestic exchange and/or whether two or more brokers are willing to purchase or sell the security at a comparable price, the extent of market making activity in the investment and the nature of the market for investment. Illiquid securities are footnoted as such at the end of the Fund’s Schedule of Investments where applicable. However, a portion of such footnoted securities could be liquid where the Subadviser determines that some, though not all, of the position could be disposed of within seven days in the ordinary course of business at the approximate amount at which such securities have been valued by the Fund.
Restricted securities are illiquid securities, as defined above, not registered under the Securities Act of 1933 (the “1933 Act”), as amended. Generally, 144A securities are excluded from this category, except where defined as illiquid.
The Fund will bear any costs, including those involved in registration under the 1933 Act, in connection with the disposition of such securities.
At September 30, 2014, the Fund did not hold any securities that are both illiquid and restricted.
Note 8. Indemnifications
Under the Trust’s organizational documents, its Trustees and officers are indemnified against certain liabilities arising out of the performance of their duties to the Fund. Each Trustee has also entered into an indemnification agreement with the Trust. In addition, in the normal course of business the Fund enters into contracts that provide a variety of indemnifications to other parties. The Fund’s maximum exposure under these arrangements is unknown as this would involve future claims that may be made against the Fund and that have not occurred. However, the Fund has not had prior claims or losses pursuant to these arrangements and expects the risk of loss to be remote.
Note 9. Federal Income Tax Information
($ reported in thousands)
At September 30, 2014, federal tax cost and aggregate gross unrealized appreciation (depreciation) of securities held by the Fund were as follows:
Federal | Unrealized | Unrealized | Net Unrealized | |||
| $9,016,825 | $166,349 | $(137,294) | $29,055 |
Under the Regulated Investment Company Modernization Act of 2010 (the “Act”), net capital losses recognized for tax years beginning after December 22, 2010 may be carried forward indefinitely, and their character is retained as short-term and/or long-term losses. Previously, net capital losses were carried forward for eight years and treated as short-term losses. As a transition rule, the Act requires that post-enactment net capital losses be used before pre-enactment net capital losses.
The Fund utilized $28,148 in losses deferred in prior years against current year capital gains.
53
Table of Contents
VIRTUS MULTI-SECTOR SHORT TERM BOND FUND
NOTES TO FINANCIAL STATEMENTS (Continued)
SEPTEMBER 30, 2014
The components of distributable earnings on a tax basis (excluding unrealized appreciation (depreciation) which is disclosed above) consist of undistributed ordinary income of $0 and undistributed long-term capital gains of $0.
The differences between the book and tax basis components of distributable earnings relate principally to the timing of recognition of income and gains for federal income tax purposes. Short-term gain distributions reported in the Statements of Changes in Net Assets, if any, are reported as ordinary income for federal tax purposes. Distributions are determined on a tax basis and may differ from net investment income and realized capital gains for financial reporting purposes.
Note 10. Reclassifications of Capital Accounts
($ reported in thousands)
For financial reporting purposes, book basis capital accounts are adjusted to reflect the tax character of permanent book/tax differences. Permanent reclassifications can arise from differing treatment of certain income and gain transactions, nondeductible current year net operating losses, expiring capital loss carryovers and investments in passive foreign investment companies. The reclassifications have no impact on the net assets or net asset value of the Fund. As of September 30, 2014, the Fund recorded reclassifications to increase (decrease) the accounts as listed below:
Capital Paid in | Undistributed |
| ||
| $(16,521) | $(11,323) | $27,844 |
Note 11. Subsequent Event Evaluations
Management has evaluated the impact of all subsequent events on the Fund through the date the financial statements were available for issuance, and has determined that there are no subsequent events requiring recognition or disclosure in the financial statements.
54
Table of Contents

Report of Independent Registered Public
Accounting Firm
To the Board of Trustees of
Virtus Opportunities Trust and Shareholders of
Virtus Multi-Sector Short Term Bond Fund:
In our opinion, the accompanying statement of assets and liabilities, including the schedule of investments, and the related statements of operations and of changes in net assets and the financial highlights present fairly, in all material respects, the financial position of Virtus Multi-Sector Short Term Bond Fund (one of the funds constituting Virtus Opportunities Trust, hereafter referred to as “the Fund”) at September 30, 2014, the results of its operations for the year then ended, the changes in its net assets for each of the two years in the period then ended and the financial highlights for each of the five years in the period then ended, in conformity with accounting principles generally accepted in the United States of America. These financial statements and financial highlights (hereafter referred to as “financial statements”) are the responsibility of the Fund’s management. Our responsibility is to express an opinion on these financial statements based on our audits. We conducted our audits of these financial statements in accordance with the standards of the Public Company Accounting Oversight Board (United States). Those standards require that we plan and perform the audit to obtain reasonable assurance about whether the financial statements are free of material misstatement. An audit includes examining, on a test basis, evidence supporting the amounts and disclosures in the financial statements, assessing the accounting principles used and significant estimates made by management, and evaluating the overall financial statement presentation. We believe that our audits, which included confirmation of securities at September 30, 2014 by correspondence with the custodian and brokers, provide a reasonable basis for our opinion.
PricewaterhouseCoopers LLP
Philadelphia, Pennsylvania
November 19, 2014
55
Table of Contents
VIRTUS MULTI-SECTOR SHORT TERM BOND FUND
SEPTEMBER 30, 2014 (Unaudited)
For the fiscal year ended September 30, 2014, the Fund makes the following disclosures for federal income tax purposes. Below is listed the percentage, or the maximum amount allowable, of its ordinary income dividends (“QDI”) to qualify for the lower tax rates applicable to individual shareholders, and the percentage of ordinary income dividends earned by the Fund which qualifies for the dividends received deduction (“DRD”) for corporate shareholders. The actual percentage of QDI and DRD for the calendar year will be designated in year-end tax statements. The Fund designates the amount below, or if subsequently different, as long-term capital gains dividends (“LTCG”) ($ reported in thousands).
QDI | DRD | LTCG | ||
| 0% | 0% | $1,639 |
56
Table of Contents
FUND MANAGEMENT TABLES (UNAUDITED)
Information pertaining to the Trustees and officers of the Trust as of September 30, 2014, is set forth below. The statement of additional information (SAI) includes additional information about the Trustees and is available without charge, upon request, by calling (800) 243-1574. The address of each individual, unless otherwise noted, is 100 Pearl Street, Hartford, CT 06103-4506. There is no stated term of office for Trustees of the Trust.
Independent Trustees
| Name and Year of Birth, Year Elected and Number of Funds Overseen | Principal Occupation(s) Other Directorships Held by Trustee | |
Keith, Leroy Jr. YOB: 1939 Elected: 2000 48 Funds | Chairman (since 2010), Bloc Global Services Group, LLC (construction and redevelopment company); Director/Trustee (since 2010), Wells Fargo Funds and their predecessors, Evergreen Funds (1989 to 2010) (137 series); Director (2003 to 2010), Diversapack Co. (soft packaging company); and Trustee (since 1980), Virtus Mutual Fund Complex (48 portfolios). | |
McLoughlin, Philip Chairman YOB: 1946 Elected: 1999 68 Funds | Partner (2006 to 2012), Cross Pond Partners, LLC (strategy consulting firm); Managing Director (2009 to 2010), SeaCap Asset Management Fund I, L.P. and SeaCap Partners, LLC (investment management); Director (since 1991) and Chairman (since 2010), World Trust Fund; Director (since 1995), closed-end funds managed by Duff & Phelps Investment Management Co. (4 portfolios); Chairman (since 2002) and Trustee (since 1989), Virtus Mutual Fund Complex (48 portfolios); Chairman and Trustee (since 2003), Virtus Variable Insurance Trust (9 portfolios); Trustee and Chairman (since 2011), Virtus Closed-End Funds (3 portfolios); Trustee and Chairman (since 2013), Virtus Alternative Solutions Trust (3 portfolios); and Director (1985 to 2009), Argo Group International Holdings Inc. and its predecessor, PXRE Corporation (insurance). | |
McNamara, Geraldine M. YOB: 1951 Elected: 2001 52 Funds | Retired; Trustee (since 2001), Virtus Mutual Fund Complex (48 portfolios); and Director (since 2003), closed-end funds managed by Duff & Phelps Investment Management Co. (4 portfolios). | |
Oates, James M. YOB: 1946 Elected: 2000 55 Funds | Managing Director (since 1994), Wydown Group (consulting firm); Trustee (since 1987), Virtus Mutual Fund Complex (48 portfolios); Director (since 1996), Stifel Financial; Director (since 1998), Connecticut River Bancorp; Chairman and Director (since 1999), Connecticut River Bank; Chairman (since 2000), Emerson Investment Management, Inc.; Director (since 2002), New Hampshire Trust Company; Chairman and Trustee (since 2005), John Hancock Fund Complex (234 portfolios); Non-Executive Chairman (2007 to 2011), Hudson Castle Group, Inc. (formerly IBEX Capital Markets, Inc.) (financial services); Trustee (since 2013), Virtus Closed-End Funds (3 portfolios); and Trustee (since 2013), Virtus Alternative Solutions Trust (3 portfolios). | |
Segerson, Richard E. YOB: 1946 Elected: 2000 48 Funds | Retired; Trustee (since 1993), Virtus Mutual Fund Complex (48 portfolios); and Managing Director (since 1998), Northway Management Company. | |
Verdonck, Ferdinand L.J. YOB: 1942 Elected: 2005 48 Funds | Director (since 1998), The J.P. Morgan European Investment Trust; Director (since 2005), Galapagos N.V. (biotechnology); Mr. Verdonck is also a director of several non-U.S. companies; Trustee (since 2002), Virtus Mutual Fund Complex (48 portfolios). |
57
Table of Contents
FUND MANAGEMENT TABLES (UNAUDITED) (Continued)
Interested Trustee
The individual listed below is an “interested person” of the Trust, as defined in Section 2(a)(19) of the 1940 Act, as amended, and the rules and regulations thereunder.
| Name and Year of Birth | Principal Occupation(s) Other Directorships Held by Trustee | |
Aylward, George R. YOB: 1964 Elected: 2006 66 Funds | Director, President and Chief Executive Officer (since 2008), Virtus Investment Partners, Inc. and/or certain of its subsidiaries; and various senior officer positions with Virtus affiliates (since 2005); Trustee (since 2006), Virtus Mutual Funds (48 portfolios); Chairman, President and Chief Executive Officer (since 2006), The Zweig Closed-End Funds (2 portfolios); Trustee (since 2012), Virtus Variable Insurance Trust (9 portfolios); Trustee and President (since 2011), Virtus Closed-End Funds (3 portfolios); Director (since 2013), Virtus Global Funds, PLC (2 portfolios); and Trustee (since 2013), Virtus Alternative Solutions Trust (3 portfolios). |
58
Table of Contents
FUND MANAGEMENT TABLES (UNAUDITED) (Continued)
Officers of the Trust Who Are Not Trustees
Name, Address and Year of Birth | Position(s) Held with the Trust and Length of Time Served and Principal Occupation(s) During Past 5 Years | |||
Bradley, W. Patrick YOB: 1972 | Senior Vice President (since 2013), Vice President (2011 to 2013), Chief Financial Officer and Treasurer (since 2006). | Senior Vice President, Fund Services (since 2010), Virtus Investment Partners, Inc. and/or certain of its subsidiaries; various officer positions (since 2006) with Virtus affiliates; Senior Vice President (since 2013), Vice President (2011 to 2013), Chief Financial Officer and Treasurer (since 2004), Virtus Variable Insurance Trust; Senior Vice President (since 2013), Vice President (2011 to 2013), Chief Financial Officer and Treasurer (since 2006), Virtus Mutual Fund Complex; Senior Vice President (since 2013), Vice President (2012 to 2013) and Treasurer (Chief Financial Officer) (since 2007), The Zweig Closed-End Funds; Senior Vice President (since 2013), Vice President (2011 to 2013), Chief Financial Officer and Treasurer (since 2011), Virtus Closed-End Funds; Vice President and Assistant Treasurer (since 2011), Duff & Phelps Global Utility Income Fund Inc.; Director (since 2013), Virtus Global Funds, PLC; and Senior Vice President, Chief Financial Officer and Treasurer (since 2013), Virtus Alternative Solutions Trust. | ||
Carr, Kevin J. YOB: 1954 | Senior Vice President (since 2013), Vice President (2005 to 2013), Chief Legal Officer, Counsel and Secretary (since 2005). | Senior Vice President (since 2009), Vice President, Counsel and Secretary (2008 to 2009), Virtus Investment Partners, Inc. and/or certain of its subsidiaries; various senior officer positions (since 2005) with Virtus affiliates; Senior Vice President (since 2013), Vice President (2005 to 2013), Chief Legal Officer, Counsel and Secretary (since 2005), Virtus Mutual Fund Complex; Senior Vice President (2013 to 2014), Vice President (2012 to 2013) and Assistant Secretary (since 2012), Secretary and Chief Legal Officer (2005 to 2012), The Zweig Closed-End Funds; Assistant Secretary (since 2013), Vice President, Chief Legal Officer, Counsel and Secretary (2010 to 2013), Virtus Variable Insurance Trust; Vice President and Assistant Secretary (since 2011), Duff & Phelps Global Utility Income Fund Inc.; Senior Vice President and Assistant Secretary (2013 to 2014), Vice President and Assistant Secretary (2012 to 2013), Vice President, Chief Legal Officer, Counsel and Secretary (2011 to 2012), Virtus Closed-End Funds; and Assistant Secretary (since 2013), Virtus Alternative Solutions Trust. |
59
Table of Contents
FUND MANAGEMENT TABLES (UNAUDITED) (Continued)
Name, Address and Year of Birth | Position(s) Held with the Trust and Length of Time Served and Principal Occupation(s) During Past 5 Years | |||
Engberg, Nancy J. YOB: 1956 | Vice President and Chief Compliance Officer (since 2011). | Vice President (since 2008) and Chief Compliance Officer (2008 to 2011), Virtus Investment Partners, Inc. and/or certain of its subsidiaries; various officer positions (since 2003) with Virtus affiliates; Vice President and Chief Compliance Officer (since 2011), Virtus Mutual Fund Complex; Vice President (since 2010), Chief Compliance Officer (since 2011), Virtus Variable Insurance Trust; Vice President and Chief Compliance Officer (since 2011), Virtus Closed-End Funds; Vice President and Chief Compliance Officer (since 2012), The Zweig Closed-End Funds; and Vice President and Chief Compliance Officer (since 2013), Virtus Alternative Solutions Trust. | ||
Waltman, Francis G. YOB: 1962 | Executive Vice President (since 2013), Senior Vice President (2008 to 2013). | Virtus Investment Partners, Inc. and/or certain of its subsidiaries; various senior officer positions (since 2006) with Virtus affiliates; Executive Vice President (since 2013), Senior Vice President (2008 to 2013), Virtus Mutual Fund Complex; Executive Vice President (since 2013), Senior Vice President (2010 to 2013), Virtus Variable Insurance Trust; Executive Vice President (since 2013), Senior Vice President (2011 to 2013), Virtus Closed-End Funds; Director (since 2013), Virtus Global Funds PLC; and Executive Vice President (since 2013), Virtus Alternative Solutions Trust. |
60
Table of Contents
VIRTUS OPPORTUNITIES TRUST
101 Munson Street
Greenfield, MA 01301-9668
Trustees
George R. Aylward
Leroy Keith, Jr.
Philip R. McLoughlin, Chairman
Geraldine M. McNamara
James M. Oates
Richard E. Segerson
Ferdinand L.J. Verdonck
Officers
George R. Aylward, President
Francis G. Waltman, Executive Vice President
W. Patrick Bradley, Senior Vice President, Chief Financial Officer and Treasurer
Kevin J. Carr, Senior Vice President, Chief Legal Officer, Counsel and Secretary
Nancy J. Engberg, Vice President and Chief Compliance Officer
Investment Adviser
Virtus Investment Advisers, Inc.
100 Pearl Street
Hartford, CT 06103-4506
Principal Underwriter
VP Distributors, LLC
100 Pearl Street
Hartford, CT 06103-4506
Administrator and Transfer Agent
Virtus Fund Services, LLC
100 Pearl Street
Hartford, CT 06103-4506
Custodian
JPMorgan Chase Bank, NA
1 Chase Manhattan Plaza
New York, NY 10005-1401
Independent Registered Public
Accounting Firm
PricewaterhouseCoopers LLP
2001 Market Street
Philadelphia, PA 19103-7042
How to Contact Us
Mutual Fund Services | 1-800-243-1574 | |||
Adviser Consulting Group | 1-800-243-4361 | |||
Telephone Orders | 1-800-367-5877 | |||
Text Telephone | 1-800-243-1926 | |||
Web site | Virtus.com |
Important Notice to Shareholders
The Securities and Exchange Commission has modified mailing regulations for semiannual and annual shareholder fund reports to allow mutual fund companies to send a single copy of these reports to shareholders who share the same mailing address. If you would like additional copies, please call Mutual Fund Services at 1-800-243-1574.
Table of Contents
For more information about
Virtus Mutual Funds, please call
your financial representative, or
contact us at 1-800-243-1574
or Virtus.com
| 8010 | 11-14 |

Table of Contents

ANNUAL REPORT
Virtus Real Estate Securities Fund
September 30, 2014
TRUST NAME: VIRTUS OPPORTUNITIES TRUST
Not FDIC Insured
No Bank Guarantee
May Lose Value

Table of Contents
Virtus Real Estate Securities Fund
(“Real Estate Securities Fund”)
| 1 | ||||
| 2 | ||||
| 4 | ||||
| 5 | ||||
| 9 | ||||
| 11 | ||||
| 12 | ||||
| 13 | ||||
| 14 | ||||
| 15 | ||||
| 21 | ||||
| 22 | ||||
| 23 |
PROXY VOTING PROCEDURES AND VOTING RECORD (FORM N-PX)
The subadviser votes proxies relating to portfolio securities in accordance with procedures that have been approved by the Board of Trustees of the Trust (“Trustees,” or the “Board”). You may obtain a description of these procedures, along with information regarding how the Fund voted proxies during the most recent 12-month period ended June 30, free of charge, by calling toll-free 1-800-243-1574. This information is also available through the Securities and Exchange Commission’s (“SEC”) website at http://www.sec.gov.
FORM N-Q INFORMATION
The Trust files a complete schedule of portfolio holdings for the Fund with the SEC for the first and third quarters of each fiscal year on Form N-Q. Form N-Q is available on the SEC’s website at http://www.sec.gov. Form N-Q may be reviewed and copied at the SEC’s Public Reference Room. Information on the operation of the SEC’s Public Reference Room can be obtained by calling toll-free 1-800-SEC-0330.
This report is not authorized for distribution to prospective investors in the Virtus Real Estate Securities Fund unless preceded or accompanied by an effective prospectus which includes information concerning the sales charge, the Fund’s record and other pertinent information.
Table of Contents
Dear Fellow Shareholders of Virtus Mutual Funds:
 | I am pleased to present this annual report which highlights performance of your fund for the 12 months ended September 30, 2014, including comments from the money manager.
The past 12 months were generally strong for equities, although market volatility increased over the last quarter, driven by geopolitical risks and a slowdown in the global economy. While the economies of Europe, Japan, and China weakened, the U.S. economy accelerated and the U.S. dollar rallied strongly. Broad U.S. equity indexes registered double-digit gains for the 12 months ended September 30, 2014. The S&P 500® Index returned 19.73%, the Dow Jones Industrial Average rose 15.29%, and the | |
NASDAQ Composite Index® was up 20.61%. By comparison, international equity returns were significantly smaller, including for both developed markets and emerging markets.
In mid-September, the Federal Reserve provided much needed assurance to investors by announcing that it intends to keep interest rates low for a “considerable time” after its bond buying program ends in October. Against this backdrop, the bellwether 10-year U.S. Treasury yield ended at 2.52% on September 30, 2014 compared with 2.64% a year earlier. The broader fixed income market, as measured by the Barclays U.S. Aggregate Bond Index, rose 3.96% for the 12 months ended September 30, 2014.
The uncertain state of the global economy is likely to remain a concern for markets in the months ahead. However, the health of the U.S. economy – including improving hiring, manufacturing, and housing data – gives investors reason for optimism. Future market direction will be determined largely by the ability of corporations to continue to produce robust earnings.
Market volatility is an ever-present reminder of the importance of portfolio diversification. While diversification cannot guarantee a profit or prevent loss, owning a variety of asset classes may cushion your portfolio against inevitable market fluctuations. Your financial advisor can help you ensure that your portfolio is adequately diversified across asset classes and investment strategies.
As always, thank you for entrusting Virtus with your assets. Should you have questions or require assistance, our customer service team is here to help at 1-866-270-7788. We appreciate your business and remain committed to your long-term financial success.
Sincerely,
George R. Aylward President, Virtus Mutual Funds
October 2014
Whenever you have questions about your account, or require additional information, please visit us on the Web at www.virtus.com or call our shareowner service group toll-free at 1-800-243-1574.
Performance data quoted represents past results. Past performance is no guarantee of future results, and current performance may be higher or lower than the performance shown above. | ||

1
Table of Contents
VIRTUS REAL ESTATE SECURITIES FUND
DISCLOSURE OF FUND EXPENSES (Unaudited)
FOR THE SIX-MONTH PERIOD OF APRIL 1, 2014 TO SEPTEMBER 30, 2014
We believe it is important for you to understand the impact of costs on your investment. All mutual funds have operating expenses. As a shareholder of the Virtus Real Estate Securities Fund (the “Fund”), you may incur two types of costs: (1) transaction costs, including sales charges on purchases of Class A shares and contingent deferred sales charges on Class B and Class C shares; and (2) ongoing costs, including investment advisory fees, distribution and service fees, and other expenses. Class I shares are sold without a sales charge and do not incur distribution and service fees. For further information regarding applicable sales charges, see Note 1 in the Notes to Financial Statements. These examples are intended to help you understand your ongoing costs (in dollars) of investing in the Fund and to compare these costs with the ongoing costs of investing in other mutual funds. These examples are based on an investment of $1,000 invested at the beginning of the period and held for the entire six-month period. The following Expense Table illustrates your Fund’s costs in two ways.
Actual Expenses
The first section of the accompanying table provides information about actual account values and actual expenses. You may use the information in this section, together with the amount you invested, to estimate the expenses that you paid over the period. Simply divide your account value by $1,000 (for example, an $8,600 account value divided by $1,000 = 8.6), then multiply the result by the number in the first section under the heading entitled “Expenses Paid During Period” to estimate the expenses you paid on your account during the period.
Hypothetical Example for Comparison Purposes
The second section of the accompanying table provides information about hypothetical account values and hypothetical expenses based on the Fund’s actual expense ratio and an assumed rate of return of 5% per year before expenses, which is not your Fund’s actual return. The hypothetical account values and expenses may not be used to estimate the actual ending account balance or expenses you paid for the period. You may use this information to compare the ongoing costs of investing in your Fund and other funds. To do so, compare these 5% hypothetical examples with the 5% hypothetical examples that appear in the shareholder reports of the other funds.
Please note that the expenses shown in the accompanying table are meant to highlight your ongoing costs only and do not reflect any transactional costs, such as sales charges or contingent deferred sales charges. Therefore, the second section of the accompanying table is useful in comparing ongoing costs only, and will not help you determine the relative total costs of owning different funds. In addition, if these transactional costs were included, your costs would have been higher. The calculations assume no shares were bought or sold during the period. Your actual costs may have been higher or lower, depending on the amount of your investment and timing of any purchases or redemptions.
2
Table of Contents
VIRTUS REAL ESTATE SECURITIES FUND
DISCLOSURE OF FUND EXPENSES (Unaudited) (Continued)
FOR THE SIX-MONTH PERIOD OF APRIL 1, 2014 TO SEPTEMBER 30, 2014
| Expense Table | ||||||||||||||||
Beginning Value | Ending Account Value September 30, 2014 | Annualized Expense Ratio | Expenses Paid During Period* | |||||||||||||
Actual | ||||||||||||||||
| Class A | $ | 1,000.00 | $ | 1,027.80 | 1.37 | % | $ | 6.96 | ||||||||
| Class B | 1,000.00 | 1,023.80 | 2.12 | 10.76 | ||||||||||||
| Class C | 1,000.00 | 1,024.20 | 2.12 | 10.76 | ||||||||||||
| Class I | 1,000.00 | 1,029.10 | 1.12 | 5.70 | ||||||||||||
Hypothetical (5% return before expenses) |
| |||||||||||||||
| Class A | 1,000.00 | 1,017.96 | 1.37 | 6.95 | ||||||||||||
| Class B | 1,000.00 | 1,014.15 | 2.12 | 10.76 | ||||||||||||
| Class C | 1,000.00 | 1,014.15 | 2.12 | 10.76 | ||||||||||||
| Class I | 1,000.00 | 1,019.23 | 1.12 | 5.69 | ||||||||||||
| * | Expenses are equal to the Fund’s annualized expense ratio, which is net of waived fees and reimbursed expenses, if applicable, multiplied by the average account value over the period, multiplied by the number of days (183) expenses were accrued in the most recent fiscal half-year, then divided by 365 to reflect the one-half year period. |
| The Fund may invest in other funds, and the annualized expense ratios noted above do not reflect fees and expenses associated with the underlying funds. If such fees and expenses were included, the expenses would have been higher. |
| You can find more information about the Fund’s expenses in the Financial Statements section that follows. For additional information on operating expenses and other shareholder costs, refer to the prospectus. |
3
Table of Contents
VIRTUS REAL ESTATE SECURITIES FUND
Barclays U.S. Aggregate Bond Index
The Barclays U.S. Aggregate Bond Index measures the U.S. investment grade fixed rate bond market. The index is calculated on a total return basis. The index is unmanaged, its returns do not reflect any fees, expenses or sales charges, and it is not available for direct investment.
Basel III
A comprehensive series of reform measures intended to strengthen the regulation, supervision, and risk management of the global banking sector.
Dow Jones Industrial AverageSM
A price weighted average of 30 blue chip stocks. The index is calculated on total return basis with dividends reinvested. The index is unmanaged, its returns do not reflect any fees, expenses or sales charges and it is not available for direct investment.
Federal Reserve (the “Fed”)
The Central Bank of the United States, responsible for controlling the money supply, interest rates and credit with the goal of keeping the U.S. economy and currency stable.
Governed by a seven-member board, the system includes 12 regional Federal Reserve Banks, 25 branches and all national and state banks that are part of the system.
FTSE NAREIT Equity REITs Index
The FTSE NAREIT Equity REITs Index is a free-float market capitalization index measuring equity tax-qualified real estate investment trusts, which meet minimum size and liquidity criteria, that are listed on the New York Stock Exchange, the American Stock Exchange and the NASDAQ National Market System. The index is calculated on a total return basis with dividends reinvested. The index is unmanaged, its returns do not reflect any fees, expenses or sales charges, and it is not available for direct investment.
NASDAQ Composite Index®
A market-capitalization weighted index of the more than 3,000 common equities listed on the Nasdaq stock exchange. Unlike other market indexes, the NASDAQ composite is not limited to companies that have U.S. headquarters. The index is unmanaged, its returns do not reflect any fees, expenses or sales charges and it is not available for direct investment.
REIT (Real Estate Investment Trust)
A publicly traded company that owns, develops and operates income-producing real estate such as apartments, office buildings, hotels, shopping centers and other commercial properties.
S&P 500® Index
The S&P 500® Index is a free-float market capitalization-weighted index of 500 of the largest U.S. companies. The index is calculated on a total return basis with dividends reinvested. The index is unmanaged, its returns do not reflect any fees, expenses or sales charges, and it is not available for direct investment.
4
Table of Contents
Fund Summary | Ticker Symbols: Class A: PHRAX Class B: PHRBX Class C: PHRCX Class I: PHRIX |
| ¢ | The Fund is diversified and has an investment objectives of capital appreciation and income with approximately equal emphasis. |
| ¢ | For the fiscal year ended September 30, 2014, the Fund’s Class A shares at NAV returned 12.75%, Class B shares returned 11.91%, Class C shares returned 11.91% and Class I shares returned 13.04%. For the same period, the S&P 500® Index, a broad-based equity index, returned 19.73%, and the FTSE NAREIT Equity REITs Index, the Fund’s style-specific index appropriate for comparison, returned 13.14%. |
All performance figures assume reinvestment of distributions and exclude the effect of sales charges. Past performance is no guarantee of future results, and current performance may be higher or lower than the performance shown above.
How did the markets perform during the Fund’s fiscal year?
| ¢ | The equity markets as measured by the S&P 500® Index did well during the Fund’s fiscal year, as did real estate investment trusts (REITs). |
| ¢ | Over the fiscal year, the 10-Year U.S. Treasury defied the consensus forecast and rallied a bit, ending the year with a 2.49% yield as of September 30, 2014 compared with 2.61% as of September 30, 2013. The key to the initial move was slowing global growth estimates following a historically cold winter throughout several areas of the world. While a bounce in economic activity did occur as expected following the depressed first quarter of 2014, global growth concerns resurfaced post a relatively calm summer for the capital markets. |
| ¢ | Across the major regions of the world, economic growth remained the most resilient in the U.S., the U.K., and the Nordics, as we evidenced during our property tours, while areas of increasing concern were Continental Europe and China. Europe was also an area of growing concern on the geopolitical front as the Russia/Ukraine crisis erupted. |
| ¢ | Keep in mind, in the previous fiscal year the 10-Year U.S. Treasury yield moved up from 1.62% as of September 30, 2012, largely driven by the Fed Chairman’s tapering comments in May 2013 and signs of an improving economy, to 2.61% as of September 30, 2013. |
| ¢ | During the fourth quarter of 2013, the Fed began to taper its monthly asset purchases with an ultimate stated goal of eliminating these asset purchases by October 2014. |
| ¢ | As the impacts of the cold winter were experienced and the 10-Year U.S. Treasury rallied from December 31, 2013 through September 30, 2014, REITs outperformed the S&P 500® Index. REITs had entered 2014 following record equity issuance and multiple compression on solid cash flow growth, whereas the broader equity market entered 2014 following multiple expansion given strong returns. |
| ¢ | One question we continue to respond to is: how will REITs be impacted by both an improving economy and interest rate increases? What is important to understand is why interest rates are rising. If rates are rising in a controlled manner as the economy is improving, it can be beneficial for the group because REITs, especially those that are more economically sensitive with shorter leases, have the ability to grow cash flow by increasing occupancy and rents as demand increases, and benefit from a lift in replacement costs. In terms of industries, the TAMI (tech, advertising, media, and info) and energy employers have been experiencing the most growth. |
| ¢ | Importantly, one differentiator between this recovery and others is the lack of overbuilding. Basel III’s capital restrictions are providing new constraints to this cycle. Supply is increasing, but remains contained at 1% or less of existing space in core property sectors such as office, retail, self-storage, multi-family, and industrial, versus historical levels at 2% or more. Controlled supply is a net positive for the REITs we invest in, as it can lead to greater occupancy and pricing power. |
For information regarding the indexes and certain investment terms, see the Key Investment Terms on page 4.
5
Table of Contents
| REAL ESTATE SECURITIES FUND (Continued) |
| ¢ | Stepping back, global real estate asset markets remained strongly positive in most areas of the world. The “wall of capital” looking to find a home in high-quality, core commercial real estate continued to grow during the Fund’s fiscal year. A continuing backdrop of moderate macro-economic growth and low interest rate environment sustained the search for yield among large institutional investors like pension funds and sovereign wealth funds. This pursuit resulted in an increased bid, and greater real estate transaction volumes and commercial real estate values across a majority of the developed markets we track. |
| ¢ | Should this positive capital flow dynamic remain in place, we believe the values for institutional quality real estate represented among listed real estate companies globally will remain well underpinned. |
What factors affected the Fund’s performance during its fiscal year?
| ¢ | For the one-year period ended September 30, 2014, the Fund benefited from both security selection and property sector allocation, with the bulk of the relative performance driven by security selection. Overall, the Fund performed mostly in line with its style-specific benchmark. |
| ¢ | Within the U.S., the manufactured home, lodging, and regional mall property sectors demonstrated the best total returns over the last twelve months, while the mixed office & industrial, industrial, and health care were the laggards. |
| ¢ | The most significant individual positive contributor to relative performance during the fiscal year was allocation to, and stock selection within, the regional mall property sector. Lodging and office, primarily a result of security selection, were the second and third most positive contributors to relative performance. |
| ¢ | The most significant detractor from relative performance during the fiscal year was our overweight allocation to the industrial property sector, followed by the shopping center |
property sector, due to security selection, and the mixed office & industrial sector due to an overweight allocation, partially offset by the benefit of security selection. |
| ¢ | Going forward, we expect higher quality cash flow growth to play a more meaningful role in driving total returns as internal growth prospects (i.e., occupancy lift and rental rate pricing power) continue to accelerate against a backdrop of fairly limited new supply, and companies remain active with external growth initiatives. |
| ¢ | Dividend growth should be supported by the acceleration in cash flow growth, recapitalized balance sheets, and low historical dividend payout ratios. |
| ¢ | A favorable supply outlook should allow landlords to increase occupancy and achieve pricing power at a faster rate than they otherwise would in a recovery. |
The preceding information is the opinion of portfolio management. Any such opinions are subject to change at any time based upon market or other conditions and should not be relied upon as investment advice. Past performance is no guarantee of future results, and there is no guarantee that market forecasts will be realized.
There is no guarantee that the Fund will meet its objectives.
The market price of equity securities may be affected by financial market, industry, or issuer-specific events. Focus on a particular style or on small or medium-sized companies may enhance that risk. The Fund may be negatively affected by factors specific to the real estate market, including interest rate, leverage, property, and management. A Fund that focuses its investments in a particular industry or sector will be more sensitive to conditions that affect that industry or sector than a non-concentrated fund.
6
Table of Contents
| REAL ESTATE SECURITIES FUND (Continued) |
| Asset Allocations | ||||
The following table presents asset allocations within certain sectors as a percentage of total investments at September 30, 2014.
|
| |||
Regional Malls | 19 | % | ||
Apartments | 16 | |||
Office | 13 | |||
Lodging/Resorts | 12 | |||
Self Storage | 11 | |||
Industrials | 9 | |||
Shopping Centers | 8 | |||
Other (includes short-term investments) | 12 | |||
|
| |||
| 100 | % | |||
|
| |||
7
Table of Contents
| REAL ESTATE SECURITIES FUND (Continued) |
| Average Annual Total Returns1 for periods ended 9/30/14 | ||||||||||||||||||||
| 1 Year | 5 Years | 10 Years | Since Inception | Inception Date | ||||||||||||||||
| Class A Shares at NAV2 | 12.75 | % | 15.38 | % | 8.58 | % | — | — | ||||||||||||
| Class A Shares at POP3,4 | 6.26 | 14.02 | 7.94 | — | — | |||||||||||||||
| Class B Shares at NAV2 | 11.91 | 14.52 | 7.76 | — | — | |||||||||||||||
| Class B Shares with CDSC4 | 7.91 | 14.52 | 7.76 | — | — | |||||||||||||||
| Class C Shares at NAV2 and with CDSC4 | 11.91 | 14.52 | 7.77 | — | — | |||||||||||||||
| Class I Shares at NAV | 13.04 | 15.67 | — | 3.21 | % | 12/29/06 | ||||||||||||||
| S&P 500® Index | 19.73 | 15.70 | 8.11 | 6.61 | 5 | — | ||||||||||||||
| FTSE NAREIT Equity REITs Index | 13.14 | 15.88 | 8.40 | 3.27 | 5 | — | ||||||||||||||
Fund Expense Ratios6: A Shares: 1.40%, B Shares: 2.15%, C Shares: 2.15%, I Shares: 1.15%.
All returns represent past performance which is no guarantee of future results. Current performance may be higher or lower than the performance shown. The investment return and principal value of an investment will fluctuate so that an investor’s shares, when redeemed, may be worth more or less than their original cost. The above table and graph below do not reflect the deduction of taxes that a shareholder would pay on fund distributions or the redemption of fund shares. Please visit Virtus.com for performance data current to the most recent month-end.
| 1 | Total returns are historical and include changes in share price and the reinvestment of both dividends and capital gains distributions. |
| 2 | “NAV” (Net Asset Value) total returns do not include the effect of any sales charge. |
| 3 | “POP” (Public Offering Price) total returns include the effect of the maximum front-end 5.75% sales charge. |
| 4 | CDSC (contingent deferred sales charge) is applied to redemptions of certain classes of shares that do not have a sales charge applied at the time of purchase. CDSC charges for Class B shares decline from 5% to 0% over a five-year period. CDSC charges for certain redemptions of Class A shares made within 18 months of purchases on which a finder’s fee was paid and all redemptions of Class C shares are 1% within the first year and 0% thereafter. |
| 5 | The since inception index returns are from the inception date of Class I shares. |
| 6 | The expense ratios of the Fund are set forth according to the prospectus for the Fund effective January 28, 2014, as supplemented and revised, and may differ from the expense ratios disclosed in the Financial Highlights tables in this report. See the Financial Highlights for more current expense ratios. |
Growth of $10,000 for periods ended 9/30
This chart assumes an initial investment of $10,000 made on September 30, 2004, for Class A and Class B shares including any applicable sales charges or fees. Performance assumes reinvestment of dividends and capital gain distributions.
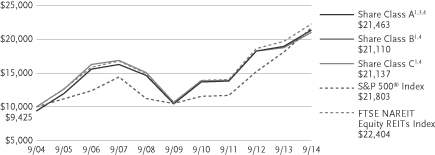
The indexes are unmanaged and not available for direct investment; therefore, their performance does not reflect the expenses associated with active management of an actual portfolio.
8
Table of Contents
VIRTUS REAL ESTATE SECURITIES FUND
SEPTEMBER 30, 2014
($ reported in thousands)
| SHARES | VALUE | |||||||
| COMMON STOCKS—99.1% | ||||||||
| REAL ESTATE INVESTMENT TRUSTS—99.1% | ||||||||
| HEALTH CARE—5.6% | ||||||||
HCP, Inc. | 944,571 | $ | 37,509 | |||||
Ventas, Inc. | 735,061 | 45,537 | ||||||
|
| |||||||
| 83,046 | ||||||||
|
| |||||||
| INDUSTRIAL/OFFICE—26.7% | ||||||||
| Industrial—9.3% | ||||||||
DCT Industrial Trust, Inc. | 7,390,297 | 55,501 | ||||||
Eastgroup Properties, Inc. | 34,335 | 2,080 | ||||||
Prologis, Inc. | 2,148,425 | 80,996 | ||||||
|
| |||||||
| 138,577 | ||||||||
|
| |||||||
| Mixed—4.9% | ||||||||
Duke Realty Corp. | 1,718,800 | 29,530 | ||||||
Liberty Property Trust | 1,291,644 | 42,960 | ||||||
|
| |||||||
| 72,490 | ||||||||
|
| |||||||
| Office—12.5% | ||||||||
Boston Properties, Inc. | 477,183 | 55,239 | ||||||
Douglas Emmett, Inc. | 1,274,833 | 32,725 | ||||||
Highwoods Properties, Inc. | 449,142 | 17,471 | ||||||
Kilroy Realty Corp. | 1,038,242 | 61,713 | ||||||
SL Green Realty Corp. | 188,877 | 19,137 | ||||||
|
| |||||||
| 186,285 | ||||||||
|
| |||||||
| 397,352 | ||||||||
|
| |||||||
| LODGING/RESORTS—11.8% | ||||||||
Host Hotels & Resorts, Inc. | 3,127,672 | 66,713 | ||||||
LaSalle Hotel Properties | 1,214,747 | 41,593 | ||||||
Pebblebrook Hotel Trust | 1,259,813 | 47,042 | ||||||
RLJ Lodging Trust | 680,800 | 19,382 | ||||||
|
| |||||||
| 174,730 | ||||||||
|
| |||||||
| RESIDENTIAL—17.1% | ||||||||
| Apartments—16.3% | ||||||||
American Campus Communities, Inc. | 800,617 | 29,183 | ||||||
AvalonBay Communities, Inc. | 219,090 | 30,885 | ||||||
| SHARES | VALUE | |||||||
| Apartments (continued) | ||||||||
Camden Property Trust | 660,400 | $ | 45,257 | |||||
Equity Residential | 1,119,522 | 68,940 | ||||||
Essex Property Trust, Inc. | 379,540 | 67,843 | ||||||
|
| |||||||
| 242,108 | ||||||||
|
| |||||||
| Manufactured Homes—0.8% | ||||||||
Equity Lifestyle Properties, Inc. | 269,953 | 11,435 | ||||||
|
| |||||||
| 253,543 | ||||||||
|
| |||||||
| RETAIL—27.2% | ||||||||
| Regional Malls—19.6% | ||||||||
General Growth Properties, Inc. | 2,509,575 | 59,100 | ||||||
Macerich Co. (The) | 1,058,275 | 67,550 | ||||||
Simon Property Group, Inc. | 942,991 | 155,047 | ||||||
Washington Prime Group, Inc. | 570,795 | 9,977 | ||||||
|
| |||||||
| 291,674 | ||||||||
|
| |||||||
| Shopping Centers—7.6% | ||||||||
Brixmor Property Group, Inc. | 656,196 | 14,607 | ||||||
DDR Corp. | 1,361,616 | 22,780 | ||||||
Kimco Realty Corp. | 1,305,573 | 28,605 | ||||||
Tanger Factory Outlet Centers | 1,410,600 | 46,155 | ||||||
|
| |||||||
| 112,147 | ||||||||
|
| |||||||
| 403,821 | ||||||||
|
| |||||||
| SELF STORAGE—10.7% | ||||||||
CubeSmart | 335,700 | 6,036 | ||||||
Extra Space Storage, Inc. | 1,046,175 | 53,951 | ||||||
Public Storage | 594,981 | 98,672 | ||||||
|
| |||||||
| 158,659 | ||||||||
| TOTAL COMMON STOCKS (Identified Cost $962,000) | 1,471,151 | |||||||
| TOTAL LONG-TERM INVESTMENTS—99.1% | ||||||||
| (Identified cost $962,000) | 1,471,151 | |||||||
See Notes to Financial Statements
9
Table of Contents
VIRTUS REAL ESTATE SECURITIES FUND
SCHEDULE OF INVESTMENTS (Continued)
SEPTEMBER 30, 2014
($ reported in thousands)
| SHARES | VALUE | |||||||
| SHORT-TERM INVESTMENTS—1.0% | ||||||||
| Money Market Mutual Funds—1.0% | ||||||||
Fidelity Money Market Portfolio – Institutional Shares (Seven-day effective yield 0.080%) | 14,853,377 | $ | 14,853 | |||||
| TOTAL SHORT-TERM INVESTMENTS (Identified Cost $14,853) | 14,853 | |||||||
| TOTAL INVESTMENTS—100.1% (Identified Cost $976,853) | 1,486,004 | (1) | ||||||
Other assets and liabilities, net—(0.1)% |
| (1,867 | ) | |||||
|
| |||||||
| NET ASSETS—100.0% | $ | 1,484,137 | ||||||
|
| |||||||
FOOTNOTE LEGEND:
| (1) | Federal Income Tax Information: For tax information at September 30, 2014, see Note 8 Federal Income Tax Information in the Notes to Financial Statements. |
The following table provides a summary of inputs used to value the Fund’s investments as of September 30, 2014 (See Security Valuation Note 2A in the Notes to Financial Statements):
| Total Value at September 30, 2014 | Level 1 Quoted Prices | |||||||
Equity Securities: | ||||||||
Common Stocks | $ | 1,471,151 | $ | 1,471,151 | ||||
Short-term Investments | 14,853 | 14,853 | ||||||
|
|
|
| |||||
Total Investments | $ | 1,486,004 | $ | 1,486,004 | ||||
|
|
|
| |||||
There are no Level 2 (significant observable inputs) or Level 3 (significant unobservable inputs) priced securities.
There were no transfers between Level 1 and Level 2 for the period.
See Notes to Financial Statements
10
Table of Contents
VIRTUS REAL ESTATE SECURITIES FUND
STATEMENT OF ASSETS AND LIABILITIES
SEPTEMBER 30, 2014
($ Reported in thousands except shares and per share amounts)
| Assets | ||||
Investment in securities at value(1) | $ | 1,486,004 | ||
Receivables | ||||
Fund shares sold | 1,956 | |||
Dividends receivable | 5,294 | |||
Prepaid expenses | 56 | |||
Prepaid trustee retainer | 9 | |||
|
| |||
Total assets | 1,493,319 | |||
|
| |||
| Liabilities | ||||
Payables | ||||
Fund shares repurchased | 3,055 | |||
Investment securities purchased | 4,154 | |||
Investment advisory fees | 923 | |||
Distribution and service fees | 216 | |||
Administration fees | 153 | |||
Transfer agent fees and expenses | 565 | |||
Professional fees | 29 | |||
Trustees’ fees and expenses | 2 | |||
Other accrued expenses | 85 | |||
|
| |||
Total liabilities | 9,182 | |||
|
| |||
| Net Assets | $ | 1,484,137 | ||
|
| |||
| Net Assets Consist of: | ||||
Capital paid in on shares of beneficial interest | $ | 939,428 | ||
Accumulated undistributed net investment income (loss) | — | |||
Accumulated undistributed net realized gain (loss) | 35,558 | |||
Net unrealized appreciation (depreciation) on investments | 509,151 | |||
|
| |||
| Net Assets | $ | 1,484,137 | ||
|
| |||
| Class A | ||||
Net asset value (net assets/shares outstanding) per share | $ | 36.65 | ||
Maximum offering price per share NAV/(1–5.75%) | $ | 38.89 | ||
Shares of beneficial interest outstanding, no par value, unlimited authorization | 20,338,647 | |||
Net Assets | $ | 745,473 | ||
| Class B | ||||
Net asset value (net assets/shares outstanding) and offering price per share | $ | 36.13 | ||
Shares of beneficial interest outstanding, no par value, unlimited authorization | 76,656 | |||
Net Assets | $ | 2,770 | ||
| Class C | ||||
Net asset value (net assets/shares outstanding) and offering price per share | $ | 36.59 | ||
Shares of beneficial interest outstanding, no par value, unlimited authorization | 1,718,840 | |||
Net Assets | $ | 62,889 | ||
| Class I | ||||
Net asset value (net assets/shares outstanding) and offering price per share | $ | 36.62 | ||
Shares of beneficial interest outstanding, no par value, unlimited authorization | 18,376,587 | |||
Net Assets | $ | 673,005 | ||
(1) Investment in securities at cost | $ | 976,853 | ||
See Notes to Financial Statements
11
Table of Contents
VIRTUS REAL ESTATE SECURITIES FUND
YEAR ENDED SEPTEMBER 30, 2014
($ reported in thousands)
| Investment Income | ||||
Dividends | $ | 31,560 | ||
|
| |||
Total investment income | 31,560 | |||
|
| |||
| Expenses | ||||
Investment advisory fees | 10,618 | |||
Service fees, Class A | 1,915 | |||
Distribution and service fees, Class B | 34 | |||
Distribution and service fees, Class C | 636 | |||
Administration fees | 1,738 | |||
Transfer agent fees and expenses | 3,463 | |||
Registration fees | 197 | |||
Printing fees and expenses | 155 | |||
Trustees’ fees and expenses | 59 | |||
Professional fees | 36 | |||
Custodian fees | 22 | |||
Miscellaneous expenses | 66 | |||
|
| |||
Total expenses | 18,939 | |||
|
| |||
| Net investment income (loss) | 12,621 | |||
|
| |||
| Net Realized and Unrealized Gain (Loss) on Investments | ||||
Net realized gain (loss) on investments | 82,965 | |||
Net change in unrealized appreciation (depreciation) on investments | 75,694 | |||
|
| |||
| Net gain (loss) on investments | 158,659 | |||
|
| |||
| Net increase (decrease) in net assets resulting from operations | $ | 171,280 | ||
|
|
See Notes to Financial Statements
12
Table of Contents
VIRTUS REAL ESTATE SECURITIES FUND
STATEMENTS OF CHANGES IN NET ASSETS
(Reported in thousands)
| Year Ended September 30, 2014 | Year Ended September 30, 2013 | |||||||
| INCREASE/(DECREASE) IN NET ASSETS | ||||||||
| From Operations | ||||||||
Net investment income (loss) | $ | 12,621 | $ | 14,179 | ||||
Net realized gain (loss) | 82,965 | 106,086 | ||||||
Net change in unrealized appreciation (depreciation) | 75,694 | (74,124 | ) | |||||
|
|
|
| |||||
| Increase (decrease) in net assets resulting from operations | 171,280 | 46,141 | ||||||
|
|
|
| |||||
| From Distributions to Shareholders | ||||||||
Net investment income, Class A | (5,947 | ) | (7,908 | ) | ||||
Net investment income, Class B | — | (12 | ) | |||||
Net investment income, Class C | (22 | ) | (187 | ) | ||||
Net investment income, Class I | (6,661 | ) | (6,061 | ) | ||||
Net realized short-term gains, Class A | (3,484 | ) | — | |||||
Net realized short-term gains, Class B | (16 | ) | — | |||||
Net realized short-term gains, Class C | (289 | ) | — | |||||
Net realized short-term gains, Class I | (2,785 | ) | — | |||||
Net realized long-term gains, Class A | (44,343 | ) | — | |||||
Net realized long-term gains, Class B | (231 | ) | — | |||||
Net realized long-term gains, Class C | (3,706 | ) | — | |||||
Net realized long-term gains, Class I | (35,011 | ) | — | |||||
|
|
|
| |||||
| Decrease in net assets from distributions to shareholders | (102,495 | ) | (14,168 | ) | ||||
|
|
|
| |||||
| From Share Transactions | ||||||||
| Sale of shares | ||||||||
Class A (7,009 and 7,236 shares, respectively) | 255,043 | 262,310 | ||||||
Class B (1 and 1 shares, respectively) | 24 | 42 | ||||||
Class C (226 and 436 shares, respectively) | 8,175 | 15,736 | ||||||
Class I (8,981 and 5,443 shares, respectively) | 320,980 | 195,788 | ||||||
| Reinvestment of distributions | ||||||||
Class A (1,522 and 210 shares, respectively) | 50,196 | 7,411 | ||||||
Class B (6 and 0 shares, respectively) | 207 | 10 | ||||||
Class C (106 and 4 shares, respectively) | 3,460 | 159 | ||||||
Class I (1,207 and 151 shares, respectively) | 39,908 | 5,337 | ||||||
| Shares repurchased | ||||||||
Class A (9,437 and 9,308 shares, respectively) | (339,925 | ) | (334,732 | ) | ||||
Class B (45 and 87 shares, respectively) | (1,607 | ) | (3,069 | ) | ||||
Class C (412 and 427 shares, respectively) | (14,730 | ) | (15,361 | ) | ||||
Class I (5,925 and 3,846 shares, respectively) | (213,956 | ) | (138,028 | ) | ||||
|
|
|
| |||||
| Increase (decrease) in net assets from share transactions | 107,775 | (4,397 | ) | |||||
|
|
|
| |||||
| Net increase (decrease) in net assets | 176,560 | 27,576 | ||||||
| Net Assets | ||||||||
Beginning of period | 1,307,577 | 1,280,001 | ||||||
|
|
|
| |||||
| End of period | $ | 1,484,137 | $ | 1,307,577 | ||||
|
|
|
| |||||
Accumulated undistributed net investment income (loss) at end of period | $ | — | $ | 9 | ||||
See Notes to Financial Statements
13
Table of Contents
VIRTUS REAL ESTATE SECURITIES FUND
SELECTED PER SHARE DATA AND RATIOS FOR A SHARE OUTSTANDING
THROUGHOUT EACH PERIOD
| Net Asset Value, Beginning of Period | Net Investment Income (Loss)(2) | Net Realized and Unrealized Gain (Loss) | Total from Investment Operations | Dividends from Net Investment Income | Distributions from Net Realized Gains | Total Distributions | Change in Net Asset Value | Net Asset Value, End of Period | Total Return(1) | Net Assets, End of Period (000’s) | Ratio of Expenses to Average Net Assets(3) | Ratio of Net Investment Income (Loss) to Average Net Assets | Portfolio Turnover Rate | |||||||||||||||||||||||||||||||||||||||||||||||||||||||||
Class A | ||||||||||||||||||||||||||||||||||||||||||||||||||||||||||||||||||||||
| 10/1/13 to 9/30/14 | $ | 35.10 | 0.29 | 3.86 | 4.15 | (0.29 | ) | (2.31 | ) | (2.60 | ) | 1.55 | $ | 36.65 | 12.75 | % | $ | 745,473 | 1.38 | % | 0.79 | % | 28 | % | ||||||||||||||||||||||||||||||||||||||||||||||
| 10/1/12 to 9/30/13 | 34.19 | 0.36 | 0.91 | 1.27 | (0.36 | ) | — | (0.36 | ) | 0.91 | 35.10 | 3.70 | 745,631 | 1.40 | 1.00 | 30 | ||||||||||||||||||||||||||||||||||||||||||||||||||||||
| 10/1/11 to 9/30/12 | 26.05 | 0.21 | 8.24 | 8.45 | (0.31 | ) | — | (0.31 | ) | 8.14 | 34.19 | 32.49 | 789,925 | 1.41 | 0.67 | 24 | ||||||||||||||||||||||||||||||||||||||||||||||||||||||
| 10/1/10 to 9/30/11 | 26.10 | 0.11 | 0.12 | 0.23 | (0.28 | ) | — | (0.28 | ) | (0.05 | ) | 26.05 | 0.82 | 605,073 | 1.46 | 0.39 | 36 | |||||||||||||||||||||||||||||||||||||||||||||||||||||
| 10/1/09 to 9/30/10 | 20.21 | 0.32 | 5.90 | 6.22 | (0.33 | ) | — | (0.33 | ) | 5.89 | 26.10 | 30.93 | 576,760 | 1.48 | 1.39 | 35 | ||||||||||||||||||||||||||||||||||||||||||||||||||||||
Class B | ||||||||||||||||||||||||||||||||||||||||||||||||||||||||||||||||||||||
| 10/1/13 to 9/30/14 | $ | 34.62 | (0.01 | ) | 3.84 | 3.83 | (0.01 | ) | (2.31 | ) | (2.32 | ) | 1.51 | $ | 36.13 | 11.91 | % | $ | 2,770 | 2.13 | % | (0.02 | )% | 28 | % | |||||||||||||||||||||||||||||||||||||||||||||
| 10/1/12 to 9/30/13 | 33.72 | 0.10 | 0.89 | 0.99 | (0.09 | ) | — | (0.09 | ) | 0.90 | 34.62 | 2.92 | 3,978 | 2.15 | 0.29 | 30 | ||||||||||||||||||||||||||||||||||||||||||||||||||||||
| 10/1/11 to 9/30/12 | 25.71 | 0.02 | 8.06 | 8.08 | (0.07 | ) | — | (0.07 | ) | 8.01 | 33.72 | 31.49 | 6,761 | 2.16 | 0.07 | 24 | ||||||||||||||||||||||||||||||||||||||||||||||||||||||
| 10/1/10 to 9/30/11 | 25.76 | (0.01 | ) | 0.03 | 0.02 | (0.07 | ) | — | (0.07 | ) | (0.05 | ) | 25.71 | 0.03 | 9,461 | 2.21 | (0.05 | ) | 36 | |||||||||||||||||||||||||||||||||||||||||||||||||||
| 10/1/09 to 9/30/10 | 19.95 | 0.16 | 5.81 | 5.97 | (0.16 | ) | — | (0.16 | ) | 5.81 | 25.76 | 30.01 | 16,595 | 2.23 | 0.70 | 35 | ||||||||||||||||||||||||||||||||||||||||||||||||||||||
Class C | ||||||||||||||||||||||||||||||||||||||||||||||||||||||||||||||||||||||
| 10/1/13 to 9/30/14 | $ | 35.04 | 0.01 | 3.87 | 3.88 | (0.02 | ) | (2.31 | ) | (2.33 | ) | 1.55 | $ | 36.59 | 11.91 | % | $ | 62,889 | 2.13 | % | 0.04 | % | 28 | % | ||||||||||||||||||||||||||||||||||||||||||||||
| 10/1/12 to 9/30/13 | 34.14 | 0.08 | 0.92 | 1.00 | (0.10 | ) | — | (0.10 | ) | 0.90 | 35.04 | 2.93 | 63,005 | 2.15 | 0.23 | 30 | ||||||||||||||||||||||||||||||||||||||||||||||||||||||
| 10/1/11 to 9/30/12 | 26.02 | (0.03 | ) | 8.22 | 8.19 | (0.07 | ) | — | (0.07 | ) | 8.12 | 34.14 | 31.48 | 60,941 | 2.16 | (0.10 | ) | 24 | ||||||||||||||||||||||||||||||||||||||||||||||||||||
| 10/1/10 to 9/30/11 | 26.06 | (0.09 | ) | 0.12 | 0.03 | (0.07 | ) | — | (0.07 | ) | (0.04 | ) | 26.02 | 0.08 | 44,853 | 2.21 | (0.30 | ) | 36 | |||||||||||||||||||||||||||||||||||||||||||||||||||
| 10/1/09 to 9/30/10 | 20.19 | 0.15 | 5.88 | 6.03 | (0.16 | ) | — | (0.16 | ) | 5.87 | 26.06 | 29.95 | 46,722 | 2.23 | 0.65 | 35 | ||||||||||||||||||||||||||||||||||||||||||||||||||||||
Class I | ||||||||||||||||||||||||||||||||||||||||||||||||||||||||||||||||||||||
| 10/1/13 to 9/30/14 | $ | 35.07 | 0.39 | 3.86 | 4.25 | (0.39 | ) | (2.31 | ) | (2.70 | ) | 1.55 | $ | 36.62 | 13.04 | % | $ | 673,005 | 1.13 | % | 1.07 | % | 28 | % | ||||||||||||||||||||||||||||||||||||||||||||||
| 10/1/12 to 9/30/13 | 34.16 | 0.43 | 0.92 | 1.35 | (0.44 | ) | — | (0.44 | ) | 0.91 | 35.07 | 3.96 | 494,963 | 1.15 | 1.21 | 30 | ||||||||||||||||||||||||||||||||||||||||||||||||||||||
| 10/1/11 to 9/30/12 | 26.03 | 0.30 | 8.22 | 8.52 | (0.39 | ) | — | (0.39 | ) | 8.13 | 34.16 | 32.80 | 422,374 | 1.16 | 0.93 | 24 | ||||||||||||||||||||||||||||||||||||||||||||||||||||||
| 10/1/10 to 9/30/11 | 26.08 | 0.19 | 0.12 | 0.31 | (0.36 | ) | — | (0.36 | ) | (0.05 | ) | 26.03 | 1.08 | 320,059 | 1.21 | 0.65 | 36 | |||||||||||||||||||||||||||||||||||||||||||||||||||||
| 10/1/09 to 9/30/10 | 20.19 | 0.38 | 5.90 | 6.28 | (0.39 | ) | — | (0.39 | ) | 5.89 | 26.08 | 31.27 | 306,740 | 1.23 | 1.63 | 35 | ||||||||||||||||||||||||||||||||||||||||||||||||||||||
Footnote Legend
| (1) | Sales charges, where applicable, are not reflected in the total return calculation. |
| (2) | Computed using average shares outstanding. |
| (3) | The Fund may invest in other funds, and the annualized expense ratios do not reflect fees and expenses associated with the underlying funds. |
See Notes to Financial Statements
14
Table of Contents
VIRTUS REAL ESTATE SECURITIES FUND
SEPTEMBER 30, 2014
Note 1. Organization
Virtus Opportunities Trust (the “Trust”) is organized as a Delaware statutory trust and is registered under the Investment Company Act of 1940, as amended (“1940 Act”), as an open-end management investment company.
As of the date of this report, 31 funds of the Trust are offered for sale, of which the Real Estate Securities Fund (the “Fund”) is reported in this annual report. The Fund’s investment objective is outlined in the Fund Summary page.
The Fund offers Class A shares, Class C shares and Class I shares for sale. Class B shares are no longer available for purchase by new or existing shareholders, except by existing shareholders through Qualifying Transactions. (For information regarding Qualifying Transactions, refer to the Trust’s prospectus.)
Class A shares are sold with a front-end sales charge of up to 5.75% with some exceptions. Generally, Class A shares are not subject to any charges by the Fund when redeemed; however, a 1% contingent deferred sales charge (“CDSC”) may be imposed on certain redemptions made within a certain period following purchases on which a finder’s fee has been paid. The period for which the CDSC applies for the Fund is 18 months. The CDSC period begins on the last day of the month preceding the month in which the purchase was made.
Class B shares were sold with a CDSC which declines from 5% to zero depending on the period of time the shares are held.
Class C shares are generally sold with a 1% CDSC, applicable if redeemed within one year of purchase. Class I shares are sold without a front-end sales charge or CDSC.
Virtus Mutual Funds may impose an annual fee on accounts having balances of less than $2,500. The small account fee may be waived in certain circumstances, as disclosed in the prospectuses and/or statements of additional information. The fees collected will be used to offset certain expenses of the funds.
Each class of shares has identical voting, dividend, liquidation and other rights and the same terms and conditions, except that each class bears different distribution and/or service fees under a Board-approved Rule 12b-1 and/or shareholder service plan (“12b-1 plan”) and has exclusive voting rights with respect to such plans. Class I shares are not subject to a 12b-1 plan. Income and other expenses as well as realized and unrealized gains and losses of the Fund are borne pro rata by the holders of each class of shares.
Note 2. Significant Accounting Policies
The following is a summary of significant accounting policies consistently followed by the Trust in the preparation of its financial statements. The preparation of financial statements in conformity with accounting principles generally accepted in the United States of America requires management to make estimates and assumptions that affect the reported amounts of assets and liabilities, disclosure of contingent assets and liabilities at the date of the financial statements and the reported amounts of increases and decreases in net assets from operations during the reporting period. Actual results could differ from those estimates and those differences could be significant.
15
Table of Contents
VIRTUS REAL ESTATE SECURITIES FUND
NOTES TO FINANCIAL STATEMENTS (Continued)
SEPTEMBER 30, 2014
| A. | Security Valuation |
Security valuation procedures for the Fund, which include nightly price variance, as well as back-testing such as bi-weekly unchanged price, monthly secondary source and transaction analysis, have been approved by the Board of Trustees (the “Board” or the “Trustees”). All internally fair valued securities are approved by a valuation committee (the “Valuation Committee”) appointed by the Board. The Valuation Committee is comprised of certain members of management as identified by the Board and convenes independently from portfolio management. All internally fair valued securities are updated daily and reviewed in detail by the Valuation Committee monthly unless changes occur within the period. The Valuation Committee reviews the validity of the model inputs and any changes to the model. Fair valuations are reviewed by the Board at least quarterly.
The Fund utilizes a fair value hierarchy which prioritizes the inputs to valuation techniques used to measure fair value into three broad levels.
| Ÿ Level 1 – | quoted prices in active markets for identical securities (security types generally include listed equities). |
| Ÿ Level 2 – | prices determined using other significant observable inputs (including quoted prices for similar securities, interest rates, prepayment speeds, credit risk, etc.). |
| Ÿ Level 3 – | prices determined using significant unobservable inputs (including the Valuation Committee’s own assumptions in determining the fair value of investments). |
A description of the valuation techniques applied to the Fund’s major categories of assets and liabilities measured at fair value on a recurring basis is as follows:
Equity securities are valued at the official closing price (typically last sale) on the exchange on which the securities are primarily traded, or if no closing price is available, at the last bid price and are categorized as Level 1 in the hierarchy. Restricted equity securities and private placements that are not widely traded, are illiquid or are internally fair valued by the Valuation Committee, are generally categorized as Level 3 in the hierarchy.
Certain non-U.S. securities may be fair valued in cases where closing prices are not readily available or are deemed not reflective of readily available market prices. For example, significant events (such as movement in the U.S. securities market, or other regional and local developments) may occur between the time that non-U.S. markets close (where the security is principally traded) and the time that the Fund calculates its net asset value (“NAV”) (at the close of regular trading on the New York Stock Exchange (“NYSE”) generally 4 p.m. Eastern time) that may impact the value of securities traded in these non-U.S. markets. In such cases the Fund fair values non-U.S. securities using an independent pricing service which considers the correlation of the trading patterns of the non-U.S. security to the intraday trading in the U.S. markets for investments such as American Depositary, financial futures, exchange-traded funds, and certain indexes as well as prices for similar securities. Such fair valuations are categorized as Level 2 in the hierarchy. Because the frequency of significant events is not predictable, fair valuation of certain non-U.S. common stocks may occur on a frequent basis.
Listed derivatives that are actively traded are valued based on quoted prices from the exchange and are categorized as Level 1 in the hierarchy. Over-the-counter derivative
16
Table of Contents
VIRTUS REAL ESTATE SECURITIES FUND
NOTES TO FINANCIAL STATEMENTS (Continued)
SEPTEMBER 30, 2014
contracts, which include forward currency contracts and equity-linked instruments, do not require material subjectivity as pricing inputs are observed from actively quoted markets and are categorized as Level 2 in the hierarchy.
Investments in open-end mutual funds are valued at NAV. Investments in closed-end mutual funds are valued as of the close of regular trading on the NYSE each business day. Both are categorized as Level 1 in the hierarchy.
A summary of the inputs used to value the Fund’s net assets by each major security type is disclosed at the end of the Schedule of Investments for the Fund. The inputs or methodologies used for valuing securities are not necessarily an indication of the risk associated with investing in those securities.
| B. | Security Transactions and Investment Income |
Security transactions are recorded on the trade date. Realized gains and losses from the sale of securities are determined on the identified cost basis. Dividend income is recognized on the ex-dividend date, or in the case of certain foreign securities, as soon as the Fund is notified. Interest income is recorded on the accrual basis. The Fund amortizes premiums and accretes discounts using the effective interest method.
Dividend income from REIT investments is recorded using management’s estimate of the income included in distributions received from the REIT investments. Distributions received in excess of this estimated amount are recorded as a reduction of the cost of investments or reclassified to capital gains. The actual amounts of income, return of capital, and capital gains are only determined by each REIT after its fiscal year-end, and may differ from the estimated amounts.
| C. | Income Taxes |
The Fund is treated as a separate taxable entity. It is the intention of the Fund to comply with the requirements of Subchapter M of the Internal Revenue Code and to distribute substantially all of its taxable income to its shareholders. Therefore, no provision for federal income taxes or excise taxes has been made.
The Fund may be subject to foreign taxes on income, gains on investments or currency repatriation, a portion of which may be recoverable. The Fund will accrue such taxes and recoveries as applicable based upon current interpretations of the tax rules and regulations that exist in the markets in which it invests.
Management of the Fund has concluded that there are no significant uncertain tax positions that would require recognition in the financial statements. As of September 30, 2014, the tax years that remain subject to examination by the major tax jurisdictions under the statute of limitations are from the year 2011 forward (with limited exceptions).
| D. | Distributions to Shareholders |
Distributions are recorded by the Fund on the ex-dividend date. Income and capital gain distributions are determined in accordance with income tax regulations that may differ from accounting principles generally accepted in the United States of America. These differences may include the treatment of non-taxable dividends, market premium and discount, non-deductible expenses, expiring capital loss carryovers, foreign currency gain or loss, gain or loss on futures contracts, partnerships, operating losses and losses deferred due to wash sales. Permanent book and tax basis differences relating to shareholder distributions will result in reclassifications to capital paid in on shares of beneficial interest.
17
Table of Contents
VIRTUS REAL ESTATE SECURITIES FUND
NOTES TO FINANCIAL STATEMENTS (Continued)
SEPTEMBER 30, 2014
| E. | Expenses |
Expenses incurred together by the Fund and other affiliated mutual funds are allocated in proportion to the net assets of each such fund, except where allocation of direct expense to each fund or an alternative allocation method can be more appropriately used.
In addition to the net operating expenses that the Fund bears directly, the shareholders of the Fund indirectly bear the Fund’s pro-rata expenses of any underlying mutual funds in which the Fund invests.
Note 3. Investment Advisory Fees and Related Party Transactions
($ reported in thousands except as noted)
| A. | Adviser |
Virtus Investment Advisers, Inc. (the “Adviser”), an indirect, wholly-owned subsidiary of Virtus Investment Partners, Inc. (“Virtus”), is the adviser to the Trust. The Adviser manages the Fund’s investment program and general operations of the Fund, including oversight of the Fund’s subadviser.
As compensation for its services to the Fund, the Adviser is entitled to a fee based upon the following annual rates as a percentage of the average daily net assets of the Fund:
1st $1 Billion | $1 Billion through | $2+ Billion | ||
| 0.75% | 0.70% | 0.65% |
| B. | Subadviser |
Duff & Phelps Investment Management Co., (the “Subadviser”) an indirect wholly-owned subsidiary of Virtus, is the subadviser to the Fund. The Subadviser manages the investments of the Fund for which it is paid a fee by the Adviser.
| C. | Distributor |
VP Distributors, LLC (“VP Distributors”), an indirect wholly-owned subsidiary of Virtus, serves as the distributor of the Fund’s shares. VP Distributors has advised the Fund that for the fiscal year (the “period”) ended September 30, 2014, it retained net commissions of $22 for Class A shares and deferred sales charges of $1, $—(1) and $8 for Class A shares, Class B shares and Class C shares respectively.
In addition, the Fund pays VP Distributors distribution and/or service fees under a 12b-1 plan as a percentage of the daily net assets of each respective class at the annual rates as follows: 0.25% for Class A shares, 1.00% for Class B shares, and 1.00% for Class C shares. Class I shares are not subject to a 12b-1 plan.
Under certain circumstances, shares of certain Virtus Mutual Funds may be exchanged for shares of the same class of certain other Virtus Mutual Funds on the basis of the relative NAV per share at the time of the exchange. On exchanges with share classes that carry a CDSC, the CDSC schedule of the original shares purchased continues to apply.
| (1) | Amount less than $500. |
18
Table of Contents
VIRTUS REAL ESTATE SECURITIES FUND
NOTES TO FINANCIAL STATEMENTS (Continued)
SEPTEMBER 30, 2014
| D. | Administrator and Transfer Agent |
Virtus Fund Services LLC, an indirect wholly-owned subsidiary of Virtus, serves as administrator and transfer agent to the Fund.
For the period ended September 30, 2014, the Fund incurred administration fees totaling $1,390 which are included in the Statement of Operations.
For the period ended September 30, 2014, the Fund incurred transfer agent fees totaling $3,282 which are included in the Statement of Operations. A portion of these fees was paid to outside entities that also provide services to the Trust.
| E. | Affiliated Shareholders |
At September 30, 2014, Virtus and its affiliates, BMO Bankcorp. (a minority investor in Virtus) and its affiliates, and the retirement plans of Virtus and its affiliates, held shares of the Fund which may be redeemed at any time that aggregated to the following:
| Shares | Aggregate Net Asset Value | |||||||
Class I shares | 362,125 | $ | 13,261 | |||||
Note 4. Purchases and Sales of Securities
($ reported in thousands)
Purchases and sales of securities (excluding U.S. Government and agency securities and short-term securities) during the period ended September 30, 2014, were as follows:
| Purchases | Sales | |||||||
| $ | 420,822 | $ | 389,919 | |||||
There were no purchases or sales of long-term U.S. Government and agency securities.
Note 5. 10% Shareholder
As of September 30, 2014, the Fund had individual shareholder account(s) and/or omnibus shareholder account(s) (comprised of a group of individual shareholders), which individually amounted to more than 10% of the total shares outstanding of the Fund as detailed below.
| % of Shares Outstanding | �� | Number of Accounts | ||||||
|
| 16
| %
| 1 | |||||
The shareholder is not affiliated with Virtus.
Note 6. Credit Risk and Asset Concentrations
The Fund may invest a high percentage of its assets in specific sectors of the market in its pursuit of a greater investment return. Fluctuations in these sectors of concentration may have a greater impact on the Fund, positive or negative, than if the Fund did not concentrate its investments in such sectors.
Note 7. Indemnifications
Under the Trust’s organizational documents, its Trustees and officers are indemnified against certain liabilities arising out of the performance of their duties to the Fund. Each Trustee has also entered into an indemnification agreement with the Trust. In addition, in the
19
Table of Contents
VIRTUS REAL ESTATE SECURITIES FUND
NOTES TO FINANCIAL STATEMENTS (Continued)
SEPTEMBER 30, 2014
normal course of business, the Fund enters into contracts that provide a variety of indemnifications to other parties. The Fund’s maximum exposure under these arrangements is unknown as this would involve future claims that may be made against the Fund and that have not occurred. However, the Fund has not had prior claims or losses pursuant to these arrangements and expects the risk of loss to be remote.
Note 8. Federal Income Tax Information
($ reported in thousands)
At September 30, 2014, federal tax cost and aggregate gross unrealized appreciation (depreciation) of securities held by the Fund were as follows:
Federal | Unrealized | Unrealized | Net Unrealized | |||
| $1,006,832 | $490,008 | $(10,836) | $479,172 |
Under the Regulated Investment Company Modernization Act of 2010 (the “Act”), net capital losses recognized for tax years beginning after December 22, 2010 may be carried forward indefinitely, and their character is retained as short-term and/or long-term losses. Previously, net capital losses were carried forward for eight years and treated as short-term losses. As a transition rule, the Act requires that post-enactment net capital losses be used before pre-enactment net capital losses.
At September 30, 2014, the Fund did not have any capital loss to carry forward.
The components of distributable earnings on a tax basis (excluding unrealized appreciation (depreciation) which is disclosed above) consist of undistributed ordinary income of $3,552 and undistributed long-term capital gains of $61,985.
The differences between the book and tax basis components of distributable earnings relate principally to the timing of recognition of income and gains for federal income tax purposes. Short-term gain distributions reported in the Statements of Changes in Net Assets, if any, are reported as ordinary income for federal tax purposes. Distributions are determined on a tax basis and may differ from net investment income and realized capital gains for financial reporting purposes.
Note 9. Subsequent Event Evaluations
Management has evaluated the impact of all subsequent events on the Fund through the date the financial statements were available for issuance, and has determined that the following subsequent event requires recognition or disclosure in the financial statements.
Effective November 12, 2014, the Fund began offering Class R6 Shares.
20
Table of Contents

Report of Independent Registered Public
Accounting Firm
To the Board of Trustees of
Virtus Opportunities Trust and Shareholders of
Virtus Real Estate Securities Fund:
In our opinion, the accompanying statement of assets and liabilities, including the schedule of investments, and the related statements of operations and of changes in net assets and the financial highlights present fairly, in all material respects, the financial position of Virtus Real Estate Securities Fund (one of the funds constituting Virtus Opportunities Trust, hereafter referred to as “the Fund”) at September 30, 2014, the results of its operations for the year then ended, the changes in its net assets for each of the two years in the period then ended and the financial highlights for each of the five years in the period then ended, in conformity with accounting principles generally accepted in the United States of America. These financial statements and financial highlights (hereafter referred to as “financial statements”) are the responsibility of the Fund’s management. Our responsibility is to express an opinion on these financial statements based on our audits. We conducted our audits of these financial statements in accordance with the standards of the Public Company Accounting Oversight Board (United States). Those standards require that we plan and perform the audit to obtain reasonable assurance about whether the financial statements are free of material misstatement. An audit includes examining, on a test basis, evidence supporting the amounts and disclosures in the financial statements, assessing the accounting principles used and significant estimates made by management, and evaluating the overall financial statement presentation. We believe that our audits, which included confirmation of securities at September 30, 2014 by correspondence with the custodian and brokers, provide a reasonable basis for our opinion.
PricewaterhouseCoopers LLP
Philadelphia, Pennsylvania
November 19, 2014
21
Table of Contents
VIRTUS REAL ESTATE SECURITIES FUND
TAX INFORMATION NOTICE (Unaudited)
SEPTEMBER 30, 2014
For the fiscal year ended September 30, 2014, the Fund makes the following disclosures for federal income tax purposes. Below is listed the percentage, or the maximum amount allowable, of its ordinary income dividends (“QDI”) to qualify for the lower tax rates applicable to individual shareholders, and the percentage of ordinary income dividends earned by the Fund which qualifies for the dividends received deduction (“DRD”) for corporate shareholders. The actual percentage of QDI and DRD for the calendar year will be designated in year-end tax statements. The Fund designates the amount below, or if subsequently different, as long-term capital gains dividends (“LTCG”) ($ reported in thousands).
QDI | DRD | LTCG | ||
| —% | —% | $71,049 |
22
Table of Contents
FUND MANAGEMENT TABLES (UNAUDITED)
Information pertaining to the Trustees and officers of the Trust as of September 30, 2014, is set forth below. The statement of additional information (SAI) includes additional information about the Trustees and is available without charge, upon request, by calling (800) 243-1574. The address of each individual, unless otherwise noted, is 100 Pearl Street, Hartford, CT 06103-4506. There is no stated term of office for Trustees of the Trust.
Independent Trustees
Name and Year of Birth, | Principal Occupation(s) | |
Keith, Leroy Jr. YOB: 1939 Elected: 2000 48 Funds | Chairman (since 2010), Bloc Global Services Group, LLC (construction and redevelopment company); Director/Trustee (since 2010), Wells Fargo Funds and their predecessors, Evergreen Funds (1989 to 2010) (137 series); Director (2003 to 2010), Diversapack Co. (soft packaging company); and Trustee (since 1980), Virtus Mutual Fund Complex (48 portfolios). | |
McLoughlin, Philip Chairman YOB: 1946 Elected: 1999 68 Funds | Partner (2006 to 2012), Cross Pond Partners, LLC (strategy consulting firm); Managing Director (2009 to 2010), SeaCap Asset Management Fund I, L.P. and SeaCap Partners, LLC (investment management); Director (since 1991) and Chairman (since 2010), World Trust Fund; Director (since 1995), closed-end funds managed by Duff & Phelps Investment Management Co. (4 portfolios); Chairman (since 2002) and Trustee (since 1989), Virtus Mutual Fund Complex (48 portfolios); Chairman and Trustee (since 2003), Virtus Variable Insurance Trust (9 portfolios); Trustee and Chairman (since 2011), Virtus Closed-End Funds (3 portfolios); Trustee and Chairman (since 2013), Virtus Alternative Solutions Trust (3 portfolios); and Director (1985 to 2009), Argo Group International Holdings Inc. and its predecessor, PXRE Corporation (insurance). | |
McNamara, Geraldine M. YOB: 1951 Elected: 2001 52 Funds | Retired; Trustee (since 2001), Virtus Mutual Fund Complex (48 portfolios); and Director (since 2003), closed-end funds managed by Duff & Phelps Investment Management Co. (4 portfolios). | |
Oates, James M. YOB: 1946 Elected: 2000 55 Funds | Managing Director (since 1994), Wydown Group (consulting firm); Trustee (since 1987), Virtus Mutual Fund Complex (48 portfolios); Director (since 1996), Stifel Financial; Director (since 1998), Connecticut River Bancorp; Chairman and Director (since 1999), Connecticut River Bank; Chairman (since 2000), Emerson Investment Management, Inc.; Director (since 2002), New Hampshire Trust Company; Chairman and Trustee (since 2005), John Hancock Fund Complex (234 portfolios); Non-Executive Chairman (2007 to 2011), Hudson Castle Group, Inc. (formerly IBEX Capital Markets, Inc.) (financial services); Trustee (since 2013), Virtus Closed-End Funds (3 portfolios); and Trustee (since 2013), Virtus Alternative Solutions Trust (3 portfolios). | |
Segerson, Richard E. YOB: 1946 Elected: 2000 48 Funds | Retired; Trustee (since 1993), Virtus Mutual Fund Complex (48 portfolios); and Managing Director (since 1998), Northway Management Company. | |
Verdonck, Ferdinand L.J. YOB: 1942 Elected: 2005 48 Funds | Director (since 1998), The J.P. Morgan European Investment Trust; Director (since 2005), Galapagos N.V. (biotechnology); Mr. Verdonck is also a director of several non-U.S. companies; Trustee (since 2002), Virtus Mutual Fund Complex (48 portfolios). |
23
Table of Contents
FUND MANAGEMENT TABLES (UNAUDITED) (Continued)
Interested Trustee
The individual listed below is an “interested person” of the Trust, as defined in Section 2(a)(19) of the 1940 Act, as amended, and the rules and regulations thereunder.
Name and Year of Birth | Principal Occupation(s) | |
Aylward, George R. YOB: 1964 Elected: 2006 66 Funds | Director, President and Chief Executive Officer (since 2008), Virtus Investment Partners, Inc. and/or certain of its subsidiaries; and various senior officer positions with Virtus affiliates (since 2005); Trustee (since 2006), Virtus Mutual Funds (48 portfolios); Chairman, President and Chief Executive Officer (since 2006), The Zweig Closed-End Funds (2 portfolios); Trustee (since 2012), Virtus Variable Insurance Trust (9 portfolios); Trustee and President (since 2011), Virtus Closed-End Funds (3 portfolios); Director (since 2013), Virtus Global Funds, PLC (2 portfolios); and Trustee (since 2013), Virtus Alternative Solutions Trust (3 portfolios). |
24
Table of Contents
FUND MANAGEMENT TABLES (UNAUDITED) (Continued)
Officers of the Trust Who Are Not Trustees
Name, Address and Year of Birth | Position(s) Held with the Trust and | |||
Bradley, W. Patrick YOB: 1972 | Senior Vice President (since 2013), Vice President (2011 to 2013), Chief Financial Officer and Treasurer (since 2006). | Senior Vice President, Fund Services (since 2010), Virtus Investment Partners, Inc. and/or certain of its subsidiaries; various officer positions (since 2006) with Virtus affiliates; Senior Vice President (since 2013), Vice President (2011 to 2013), Chief Financial Officer and Treasurer (since 2004), Virtus Variable Insurance Trust; Senior Vice President (since 2013), Vice President (2011 to 2013), Chief Financial Officer and Treasurer (since 2006), Virtus Mutual Fund Complex; Senior Vice President (since 2013), Vice President (2012 to 2013) and Treasurer (Chief Financial Officer) (since 2007), The Zweig Closed-End Funds; Senior Vice President (since 2013), Vice President (2011 to 2013), Chief Financial Officer and Treasurer (since 2011), Virtus Closed-End Funds; Vice President and Assistant Treasurer (since 2011), Duff & Phelps Global Utility Income Fund Inc.; Director (since 2013), Virtus Global Funds, PLC; and Senior Vice President, Chief Financial Officer and Treasurer (since 2013), Virtus Alternative Solutions Trust. | ||
Carr, Kevin J. YOB: 1954 | Senior Vice President (since 2013), Vice President (2005 to 2013), Chief Legal Officer, Counsel and Secretary (since 2005). | Senior Vice President (since 2009), Vice President, Counsel and Secretary (2008 to 2009), Virtus Investment Partners, Inc. and/or certain of its subsidiaries; various senior officer positions (since 2005) with Virtus affiliates; Senior Vice President (since 2013), Vice President (2005 to 2013), Chief Legal Officer, Counsel and Secretary (since 2005), Virtus Mutual Fund Complex; Senior Vice President (2013 to 2014), Vice President (2012 to 2013) and Assistant Secretary (since 2012), Secretary and Chief Legal Officer (2005 to 2012), The Zweig Closed-End Funds; Assistant Secretary (since 2013), Vice President, Chief Legal Officer, Counsel and Secretary (2010 to 2013), Virtus Variable Insurance Trust; Vice President and Assistant Secretary (since 2011), Duff & Phelps Global Utility Income Fund Inc.; Senior Vice President and Assistant Secretary (2013 to 2014), Vice President and Assistant Secretary (2012 to 2013), Vice President, Chief Legal Officer, Counsel and Secretary (2011 to 2012), Virtus Closed-End Funds; and Assistant Secretary (since 2013), Virtus Alternative Solutions Trust. |
25
Table of Contents
FUND MANAGEMENT TABLES (UNAUDITED) (Continued)
Name, Address and Year of Birth | Position(s) Held with the Trust and | |||
Engberg, Nancy J. YOB: 1956 | Vice President and Chief Compliance Officer (since 2011). | Vice President (since 2008) and Chief Compliance Officer (2008 to 2011), Virtus Investment Partners, Inc. and/or certain of its subsidiaries; various officer positions (since 2003) with Virtus affiliates; Vice President and Chief Compliance Officer (since 2011), Virtus Mutual Fund Complex; Vice President (since 2010), Chief Compliance Officer (since 2011), Virtus Variable Insurance Trust; Vice President and Chief Compliance Officer (since 2011), Virtus Closed-End Funds; Vice President and Chief Compliance Officer (since 2012), The Zweig Closed-End Funds; and Vice President and Chief Compliance Officer (since 2013), Virtus Alternative Solutions Trust. | ||
Waltman, Francis G. YOB: 1962 | Executive Vice President (since 2013), Senior Vice President (2008 to 2013). | Virtus Investment Partners, Inc. and/or certain of its subsidiaries; various senior officer positions (since 2006) with Virtus affiliates; Executive Vice President (since 2013), Senior Vice President (2008 to 2013), Virtus Mutual Fund Complex; Executive Vice President (since 2013), Senior Vice President (2010 to 2013), Virtus Variable Insurance Trust; Executive Vice President (since 2013), Senior Vice President (2011 to 2013), Virtus Closed-End Funds; Director (since 2013), Virtus Global Funds PLC; and Executive Vice President (since 2013), Virtus Alternative Solutions Trust. |
26
Table of Contents
VIRTUS OPPORTUNITIES TRUST
101 Munson Street
Greenfield, MA 01301-9668
Trustees
George R. Aylward
Leroy Keith, Jr.
Philip R. McLoughlin, Chairman
Geraldine M. McNamara
James M. Oates
Richard E. Segerson
Ferdinand L.J. Verdonck
Officers
George R. Aylward, President
Francis G. Waltman, Executive Vice President
W. Patrick Bradley, Senior Vice President, Chief Financial Officer and Treasurer
Kevin J. Carr, Senior Vice President, Chief Legal Officer, Counsel and Secretary
Nancy J. Engberg, Vice President and Chief Compliance Officer
Investment Adviser
Virtus Investment Advisers, Inc.
100 Pearl Street
Hartford, CT 06103-4506
Principal Underwriter
VP Distributors, LLC
100 Pearl Street
Hartford, CT 06103-4506
Administrator and Transfer Agent
Virtus Fund Services, LLC
100 Pearl Street
Hartford, CT 06103-4506
Custodian
JPMorgan Chase Bank, NA
1 Chase Manhattan Plaza
New York, NY 10005-1401
Independent Registered Public Accounting Firm
PricewaterhouseCoopers LLP
2001 Market Street
Philadelphia, PA 19103-7042
How to Contact Us
Mutual Fund Services | 1-800-243-1574 | |||
Adviser Consulting Group | 1-800-243-4361 | |||
Telephone Orders | 1-800-367-5877 | |||
Text Telephone | 1-800-243-1926 | |||
Web site | Virtus.com |
Important Notice to Shareholders
The Securities and Exchange Commission has modified mailing regulations for semiannual and annual shareholder fund reports to allow mutual fund companies to send a single copy of these reports to shareholders who share the same mailing address. If you would like additional copies, please call Mutual Fund Services at 1-800-243-1574.
Table of Contents
For more information about
Virtus Mutual Funds, please call
your financial representative, or
contact us at 1-800-243-1574
or Virtus.com
| 8009 | 11-14 |

Table of Contents

ANNUAL REPORT
Virtus Foreign Opportunities Fund
September 30, 2014
TRUST NAME: VIRTUS OPPORTUNITIES TRUST
Not FDIC Insured
No Bank Guarantee
May Lose Value

Table of Contents
Virtus Foreign Opportunities Fund
(“Foreign Opportunities Fund”)
| 1 | ||||
| 2 | ||||
| 4 | ||||
| 6 | ||||
| 11 | ||||
| 14 | ||||
| 15 | ||||
| 16 | ||||
| 17 | ||||
| 18 | ||||
| 25 | ||||
| 26 | ||||
| 27 |
PROXY VOTING PROCEDURES AND VOTING RECORD (FORM N-PX)
The subadviser votes proxies relating to portfolio securities in accordance with procedures that have been approved by the Board of Trustees of the Trust (“Trustees,” or the “Board”). You may obtain a description of these procedures, along with information regarding how the Fund voted proxies during the most recent 12-month period ended June 30, free of charge, by calling toll-free 1-800-243-1574. This information is also available through the Securities and Exchange Commission’s (the “SEC”) website at http://www.sec.gov.
FORM N-Q INFORMATION
The Trust files a complete schedule of portfolio holdings for the Fund with the SEC for the first and third quarters of each fiscal year on Form N-Q. Form N-Q is available on the SEC’s website at http://www.sec.gov. Form N-Q may be reviewed and copied at the SEC’s Public Reference Room. Information on the operation of the SEC’s Public Reference Room can be obtained by calling toll-free 1-800-SEC-0330.
This report is not authorized for distribution to prospective investors in the Virtus Foreign Opportunities Fund unless preceded or accompanied by an effective prospectus which includes information concerning the sales charge, the Fund’s record and other pertinent information.
Table of Contents
Dear Fellow Shareholders of Virtus Mutual Funds:
 | I am pleased to present this annual report which highlights performance of your fund for the 12 months ended September 30, 2014, including comments from the money manager.
The past 12 months were generally strong for equities, although market volatility increased over the last quarter, driven by geopolitical risks and a slowdown in the global economy. While the economies of Europe, Japan, and China weakened, the U.S. economy accelerated and the U.S. dollar rallied strongly. Broad U.S. equity indexes registered double-digit gains for the 12 months ended September 30, 2014. The S&P 500® Index returned 19.73%, the Dow Jones Industrial Average rose 15.29%, and the | |
NASDAQ Composite Index® was up 20.61%. By comparison, international equity returns were significantly smaller, including for both developed markets and emerging markets.
In mid-September, the Federal Reserve provided much needed assurance to investors by announcing that it intends to keep interest rates low for a “considerable time” after its bond buying program ends in October. Against this backdrop, the bellwether 10-year U.S. Treasury yield ended at 2.52% on September 30, 2014 compared with 2.64% a year earlier. The broader fixed income market, as measured by the Barclays U.S. Aggregate Bond Index, rose 3.96% for the 12 months ended September 30, 2014.
The uncertain state of the global economy is likely to remain a concern for markets in the months ahead. However, the health of the U.S. economy – including improving hiring, manufacturing, and housing data – gives investors reason for optimism. Future market direction will be determined largely by the ability of corporations to continue to produce robust earnings.
Market volatility is an ever-present reminder of the importance of portfolio diversification. While diversification cannot guarantee a profit or prevent loss, owning a variety of asset classes may cushion your portfolio against inevitable market fluctuations. Your financial advisor can help you ensure that your portfolio is adequately diversified across asset classes and investment strategies.
As always, thank you for entrusting Virtus with your assets. Should you have questions or require assistance, our customer service team is here to help at 1-866-270-7788. We appreciate your business and remain committed to your long-term financial success.
Sincerely,
George R. Aylward President, Virtus Mutual Funds
October 2014
Whenever you have questions about your account, or require additional information, please visit us on the Web at www.virtus.com or call our shareowner service group toll-free at 1-800-243-1574.
Performance data quoted represents past results. Past performance is no guarantee of future results, and current performance may be higher or lower than the performance shown above. | ||

1
Table of Contents
VIRTUS FOREIGN OPPORTUNITIES FUND
DISCLOSURE OF FUND EXPENSES (Unaudited)
FOR THE SIX-MONTH PERIOD OF APRIL 1, 2014 TO SEPTEMBER 30, 2014
We believe it is important for you to understand the impact of costs on your investment. All mutual funds have operating expenses. As a shareholder of the Virtus Foreign Opportunities Fund (the “Fund”) you may incur two types of costs: (1) transaction costs, including sales charges on purchases of Class A shares and contingent deferred sales charges on Class C shares; and (2) ongoing costs, including investment advisory fees, distribution and service fees, and other expenses. Class I shares are sold without a sales charge and do not incur distribution and service fees. For further information regarding applicable sales charges, see Note 1 in the Notes to Financial Statements. These examples are intended to help you understand your ongoing costs (in dollars) of investing in the Fund and to compare these costs with the ongoing costs of investing in other mutual funds. These examples are based on an investment of $1,000 invested at the beginning of the period and held for the entire six-month period. The following Expense Table illustrates your Fund’s costs in two ways.
Actual Expenses
The first section of the accompanying table provides information about actual account values and actual expenses. You may use the information in this section, together with the amount you invested, to estimate the expenses that you paid over the period. Simply divide your account value by $1,000 (for example, an $8,600 account value divided by $1,000 = 8.6), then multiply the result by the number in the first section under the heading “Expenses Paid During Period” to estimate the expenses you paid on your account during the period.
Hypothetical Example for Comparison Purposes
The second section of the accompanying table provides information about hypothetical account values and hypothetical expenses based on the Fund’s actual expense ratio and an assumed rate of return of 5% per year before expenses, which is not your Fund’s actual return. The hypothetical account values and expenses may not be used to estimate the actual ending account balance or expenses you paid for the period. You may use this information to compare the ongoing costs of investing in your Fund and other funds. To do so, compare these 5% hypothetical examples with the 5% hypothetical examples that appear in the shareholder reports of the other funds.
Please note that the expenses shown in the accompanying table are meant to highlight your ongoing costs only and do not reflect any transactional costs, such as sales charges or contingent deferred sales charges. Therefore, the second section of the accompanying table is useful in comparing ongoing costs only, and will not help you determine the relative total costs of owning different funds. In addition, if these transactional costs were included, your costs would have been higher. The calculations assume no shares were bought or sold during the period. Your actual costs may have been higher or lower, depending on the amount of your investment and the timing of any purchases or redemptions.
2
Table of Contents
VIRTUS FOREIGN OPPORTUNITIES FUND
DISCLOSURE OF FUND EXPENSES (Unaudited) (Continued)
FOR THE SIX-MONTH PERIOD OF APRIL 1, 2014 TO SEPTEMBER 30, 2014
| Expense Table | ||||||||||||||||
Beginning April 1, 2014 | Ending September 30, 2014 | Annualized Expense Ratio | Expenses Paid During Period* | |||||||||||||
Actual | ||||||||||||||||
Class A | $ | 1,000.00 | $ | 990.70 | 1.43 | % | $ | 7.14 | ||||||||
Class C | 1,000.00 | 986.90 | 2.18 | 10.86 | ||||||||||||
Class I | 1,000.00 | 991.90 | 1.18 | 5.89 | ||||||||||||
Hypothetical (5% return before expenses) |
| |||||||||||||||
Class A | 1,000.00 | 1,017.81 | 1.43 | 7.26 | ||||||||||||
Class C | 1,000.00 | 1,014.00 | 2.18 | 11.07 | ||||||||||||
Class I | 1,000.00 | 1,019.08 | 1.18 | 5.99 | ||||||||||||
| * | Expenses are equal to the Fund’s annualized expense ratio which is net of waived fees and reimbursed expenses, if applicable, multiplied by the average account value over the period, multiplied by the number of days (183) expenses were accrued in the most recent fiscal half-year, then divided by 365 to reflect the one-half year period. |
| The Fund may invest in other funds, and the annualized expense ratios noted above do not reflect fees and expenses associated with the underlying funds. If such fees and expenses were included, the expenses would have been higher. |
| You can find more information about the Fund’s expenses in the Financial Statements section that follows. For additional information on operating expenses and other shareholder costs, refer to the prospectus. |
3
Table of Contents
VIRTUS FOREIGN OPPORTUNITIES FUND
American Depositary Receipt (ADR)
Represents shares of foreign companies traded in U.S. dollars on U.S. exchanges that are held by a U.S. bank or trust. Foreign companies use ADRs in order to make it easier for Americans to buy their shares.
Barclays U.S. Aggregate Bond Index
The Barclays U.S. Aggregate Bond Index measures the U.S. investment grade fixed rate bond market. The index is calculated on a total return basis. The index is unmanaged its returns do not reflect any fees, expenses, or sales charges, and it is not available for direct investment.
Dow Jones Industrial Average
A price weighted average of 30 blue chip stocks. The index is calculated on total return basis with dividends reinvested. The index is unmanaged, its returns do not reflect any fees, expenses or sales charges, and it is not available for direct investment.
Federal Reserve (the “Fed”)
The Central Bank of the United States, responsible for controlling the money supply, interest rates and credit with the goal of keeping the U.S. economy and currency stable. Governed by a seven-member board, the system includes 12 regional Federal Reserve Banks, 25 branches and all national and state banks that are part of the system.
Gross Domestic Product (“GDP”)
The market value of all officially recognized final goods and services produced within a country in a given period.
MSCI All Country World Index (net)
The MSCI All Country World Index (net) is a free float-adjusted market capitalization-weighted index that measures equity performance of developed and emerging markets. The index is calculated on a total return basis with net dividends reinvested. The index is unmanaged its returns do not reflect any fees, expenses, or sales charges, and it is not available for direct investment.
MSCI EAFE® Index (net)
A free float-adjusted market capitalization-weighted index that measures developed foreign market equity performance, excluding the U.S. and Canada. The index is calculated on a total return basis with net dividends reinvested. The index is unmanaged its returns do not reflect any fees, expenses, or sales charges, and it is not available for direct investment.
MSCI Europe Index (net)
The MSCI Europe Index is a free float-adjusted market capitalization weighted index that measures the equity market performance of the developed markets in Europe. The index is unmanaged its returns do not reflect any fees, expenses, or sales charges, and it is not available for direct investment.
4
Table of Contents
VIRTUS FOREIGN OPPORTUNITIES FUND (Continued)
NASDAQ Composite Index®
A market-capitalization weighted index of the more than 3,000 common equities listed on the Nasdaq stock exchange. Unlike other market indexes, the NASDAQ composite is not limited to companies that have U.S. headquarters. The index is unmanaged, its returns do not reflect any fees, expenses or sales charges, and it is not available for direct investment.
Quantitative Easing
A government monetary policy occasionally used to increase the money supply by buying government securities or other securities from the market. Quantitative Easing increases the money supply by flooding financial institutions with capital in an effort to promote increased lending and liquidity.
Real Estate Investment Trust (REIT)
A publicly traded company that owns, develops, and operates income producing real estate such as apartments, office buildings, hotels, shopping centers, and other commercial properties.
Sponsored American Depositary Receipt (ADR)
An ADR which is issued with the cooperation of the company whose stock will underlie the ADR. Sponsored ADRs generally carry the same rights normally given to stockholders, such as voting rights. ADRs must be sponsored to be able to trade on a major U.S. exchange such as the New York Stock Exchange (NYSE).
S&P 500® Index
The S&P 500® Index is a free-float market capitalization-weighted index of 500 of the largest U.S. companies. The index is calculated on a total return basis with dividends reinvested. The index is unmanaged its returns do not reflect any fees, expenses, or sales charges, and it is not available for direct investment.
5
Table of Contents
VIRTUS FOREIGN OPPORTUNITIES FUND
Fund Summary | Ticker Symbols: Class A: JVIAX Class C: JVICX Class I: JVXIX |
| ¢ | The Fund is diversified and has an investment objective of long-term capital appreciation. |
| ¢ | For the fiscal year ended September 30, 2014, the Fund’s Class A shares at NAV returned 4.72%, Class C shares returned 3.95% and Class I shares returned 4.97%. For the same period, the S&P® 500 Index, a broad-based equity index, returned 19.73% and the MSCI EAFE® Index (net), the Fund’s style-specific index appropriate for comparison, returned 4.25%. |
All performance figures assume reinvestment of distribution and exclude the effect of sales charges. Past performance is no guarantee of future results, and current performance may be higher or lower than the performance shown.
How did the market perform during the Fund’s fiscal year?
| ¢ | Global stock markets posted positive returns for the fiscal year, with emerging markets underperforming developed markets. International conflicts in Ukraine and the Middle East continued to develop over the summer and fall, and contributed to heightened market volatility, as did recent protests in Hong Kong. |
| ¢ | In the U.S., strong economic data, continued mergers and acquisitions activity, and low long-term interest rates have helped investor sentiment. |
| ¢ | Macro headwinds in Europe have not abated and the European Central Bank is moving closer to a quantitative easing program similar to that of the Fed. |
| ¢ | In emerging markets, national elections this year in Thailand, India, and Turkey added some stability, while uncertainties regarding the October presidential elections in Brazil contributed to volatility in this market. |
| ¢ | Most macro events did not directly impact our portfolio companies, as we focus on identifying businesses that are less dependent on the overall economy, with unique earnings drivers and strong underlying fundamentals. We continue to find a disproportionate number of |
opportunities in the consumer staples and health care sectors and in companies with exposure to emerging markets. We are confident that our portfolio is well positioned to perform in a variety of market environments. |
What factors affected the Fund’s performance during its fiscal year?
| ¢ | The following discussion highlights specific stocks – those that provided the largest contribution to absolute performance and those that were the largest detractors for the quarter. As bottom-up stock pickers, we hope that the Fund’s shareholders find this useful and gain a greater understanding of how we invest their capital. |
| ¢ | Two stocks that helped the Fund’s absolute performance the most during the period are Housing Development Finance Corporation and HDFC Bank. |
| ¢ | Housing Development Finance Corporation benefited from the strong recovery in the Indian stock market, as investors are convinced that the newly elected reform-focused government of Prime Minister Narendra Modi will help transform the Indian economy for the better. In addition, the company continues to grow its earnings at a fast pace. HDFC is well placed for long-term growth as it is the leader in mortgage lending in India, with margins supported by industry-leading low costs from both efficient operations and low borrowing costs due to its excellent credit history. The company has been around since 1977 and is usually considered a “gold standard” in terms of corporate governance and risk management. The business should benefit from better macro, but the underpinnings are strong irrespective of who is running the government. |
| ¢ | HDFC Bank, like Housing Development Finance Corporation, was a beneficiary of optimism surrounding Prime Minister Modi and strong business performance. HDFC Bank is a high-quality Indian private sector bank, which has been a cornerstone investment in the portfolio for many years. It is the largest |
For information regarding the indexes and certain investment terms, see Key Investment Terms starting on page 4.
6
Table of Contents
| VIRTUS FOREIGN OPPORTUNITIES FUND (Continued) |
privately owned retail bank in India with a network of 3,403 branches nationwide. The bank has delivered solid growth while maintaining high credit and underwriting standards. HDFC Bank has a strong deposit franchise and powerful technology backbone that has allowed it to significantly grow earnings over the past 10 years. |
| ¢ | Two stocks that hurt absolute performance the most are Bureau Veritas and Galaxy Entertainment. |
| ¢ | Bureau Veritas is one of the world’s largest testing and inspection companies. Its principal activities are to inspect, analyze, audit, and certify products, assets, and management systems. The testing business is an asset-light business that generates significant amounts of free cash flow and requires very little ongoing maintenance spending. The primary drivers of long-term growth have been, and should continue to be, the globalization of business and increasing regulation. Although there are three large listed players, namely SGS, Bureau Veritas, and Intertek, the rest of the industry is still highly fragmented globally, which provides many years of roll-up acquisitions for the larger players to add very accretive mergers and acquisition (“M&A”) growth on top of their organic expansion. |
| ¢ | After many good years, the stocks of all the companies in the testing space, not just Bureau Veritas, have been under some pressure over the last couple of years. We do not believe the stocks were expensive to begin with; however, over that period, the multiples have derated a bit as underlying organic growth rates of the companies have slowed from 7% to 8% top-line rates to rates more around the 4% to 5% level. This has happened because of a combination of both cyclical and structural forces, neither of which we are concerned with over the long run. The cyclical pressures they have faced are obvious, as global growth post-crisis has generally been lower than the past normalized rates. The reason that growth rates have been slower |
structurally has to do with the business mix evolution of the companies. Over time through acquisitions, the businesses have diversified further across the global testing and inspection landscape, and as such today have more diversified overall businesses both geographically and in terms of end market exposure. In Bureau Veritas’ case, the cost of diversification has been somewhat of a dilution in its underlying top-line growth rate, particularly as the company has meaningfully beefed up its more cyclical basic materials business versus the shape of the company five years ago. In addition, Bureau Veritas has traditionally had a more meaningful presence in its home country of France, which, we would argue, is now growing much slower than in the past due to a combination of both cyclical and structural reasons. The good news is that the company has worked hard to reduce overall exposure to France and Western Europe in its portfolio, and, as such, Bureau Veritas sits today with a fairly well-balanced global footprint. |
| ¢ | The company is set to release a new three- or five-year long-term plan in the spring of 2015, which will provide the market with valuable guidance and a vision of the business evolution from here forward given the changed global economy post the financial crisis. We believe, however, that this company, and the industry, is still a normalized mid-single digit organic top-line grower with the ability to add another 3% to 6% annually to top-line growth via acquisitions depending on the year. Given the highly attractive underlying business economics of high returns on capital, attractive and steadily increasing operating margins, and prodigious free cash flow generation, we believe Bureau Veritas is a very attractive long-term investment opportunity selling at roughly 17x forward earnings with the ability to compound earnings at a low double-digit rate. |
| ¢ | Galaxy Entertainment, as well as other Macau-exposed gaming stocks, has been weak following poor monthly gross gaming revenue |
For information regarding the indexes and certain investment terms, see the Key Investment Terms on page 4.
7
Table of Contents
| VIRTUS FOREIGN OPPORTUNITIES FUND (Continued) |
(GGR) numbers in the market. This slowdown does not surprise us and, we believe, was to be expected. The weak share price reactions do not surprise us either, given the market’s historical nature to be very short-term focused when it comes to the monthly GGR numbers in Macau. While the VIP business in the gaming market has continued to show contractions year over year, the mass market – the portion of the market to which our holdings are more exposed and that is at the core of our long-term investment thesis for the gaming stocks in which we invest – has continued to grow at a healthy double-digit rate. It is inevitable that the market in Macau will continue to slow; year-over-year “comps” for casino customers are very challenging given the blistering pace of growth over the last couple of years. And, equally important, in the near term there is no new major supply coming on stream in the market, which makes incremental growth even more challenging. We are highly confident, however, given the projects currently in progress in Macau, particularly by Sands China and Galaxy, that new supply will begin to come online in mid-to-late 2015, and once again reinvigorate market growth, and most critically, mass market growth. |
| ¢ | While the ongoing corruption crackdown in China has certainly had some impact on demand, we continue to reiterate our view that the current slowdown is more cyclical and temporary in nature and not a permanent structural change. Important indicators that bolster our view, particularly with respect to the mass market, are that hotel occupancy rates continue to run in the high 90% range, and table betting minimums continue to be on average in the high $200 range. These facts, in our view, point to a more supply-constrained market, which is why we believe, as blocks of new hotel rooms and gaming tables are added into the market beginning in mid-2015, the overall market and the names we hold disproportionately should begin to reaccelerate their growth rates. |
| ¢ | We believe that Galaxy’s stock was inexpensive to begin with, before the sell-off of the last six months, and is now entering “cheap” territory. With a forward P/E multiple around 14x, this is a highly predictable growth story with an increased cash return profile down the line, in our opinion. |
Past performance is not indicative of future results. Any performance results portrayed reflect the reinvestment of dividends and other earnings. Any companies described in this commentary may or may not currently represent a position in our client portfolios. Also, any sector and industry weights described in the commentary may or may not have changed since the writing of this commentary. The information and methodology described in this commentary should not be construed as a recommendation to purchase or sell securities. Please contact a Vontobel representative for more information.
Any projections, forecasts or estimates contained in this commentary are based on a variety of estimates and assumptions. There can be no assurance that the estimates or assumptions made will prove accurate, and actual results may differ materially. The inclusion of projections or forecasts should not be regarded as an indication that Vontobel considers the projections or forecasts to be reliable predictors of future events, and they should not be relied upon as such.
In the event a company described in this commentary is a position in client portfolios, the securities identified and described do not represent all of the securities purchased, sold or recommended. The reader should not assume that an investment in any securities identified was or will be profitable or that investment recommendations or investment decisions we make in the future will be profitable.
For information about how contribution was calculated for any such securities, or to obtain a list showing the contribution of each holding
For information regarding the indexes and certain investment terms, see the Key Investment Terms on page 4.
8
Table of Contents
| VIRTUS FOREIGN OPPORTUNITIES FUND (Continued) |
to overall performance, please contact a Vontobel representative.
The preceding information is the opinion of portfolio management. Any such opinions are subject to change at any time based upon market or other conditions and should not be relied upon as investment advice. Past performance is no guarantee of future results, and there is no guarantee that market forecasts will be realized
There is no guarantee that the Fund will meet its objective.
The market price of equity securities may be affected by financial market, industry, or issuer-specific events. Focus on a particular style or on small or medium-sized companies may enhance that risk. A fund that focuses its investments in a particular industry or sector will be more sensitive to conditions that affect that industry or sector than a non-concentrated fund. Investing internationally, especially in emerging markets, involves additional risks such as currency, political, accounting, economic and market risk.
| Asset Allocations | ||||
The following table presents asset allocations within certain sectors and as a percentage of total investments as of September 30, 2014.
|
| |||
Consumer Staples | 36 | % | ||
Financials | 14 | |||
Health Care | 14 | |||
Consumer Discretionary | 13 | |||
Industrials | 7 | |||
Energy | 5 | |||
Information Technology | 4 | |||
Other (includes short-term investments) | 7 | |||
|
| |||
Total | 100 | % | ||
|
| |||
9
Table of Contents
| VIRTUS FOREIGN OPPORTUNITIES FUND (Continued) |
| Average Annual Total Returns1 for periods ended 9/30/14 | ||||||||||||||||||||
1 Year | 5 Years | 10 Years | Since Inception | Inception Date | ||||||||||||||||
| Class A Shares at NAV2 | 4.72 | % | 9.10 | % | 8.34 | % | — | — | ||||||||||||
| Class A Shares at POP3,4 | -1.30 | 7.81 | 7.70 | — | — | |||||||||||||||
| Class C Shares at NAV2 and with CDSC4 | 3.95 | 8.28 | 7.53 | — | — | |||||||||||||||
| Class I Shares at NAV | 4.97 | 9.37 | — | 4.59 | % | 5/15/06 | ||||||||||||||
| S&P 500® Index | 19.73 | 15.70 | 8.11 | 7.42 | 5 | — | ||||||||||||||
| MSCI EAFE® Index (net) | 4.25 | 6.56 | 6.32 | 2.46 | 5 | — | ||||||||||||||
Fund Expense Ratios6: A Shares: 1.45%; C Shares: 2.20%; I Shares: 1.20%.
All returns represent past performance which is no guarantee of future results. Current performance may be higher or lower than the performance shown. The investment return and principal value of an investment will fluctuate so that an investor’s shares, when redeemed, may be worth more or less than their original cost. The above table and graph below do not reflect the deduction of taxes that a shareholder would pay on fund distributions or the redemption of fund shares. Please visit Virtus.com for performance data current to the most recent month-end.
| 1 | Total returns are historical and include changes in share price and the reinvestment of both dividends and capital gains distributions. |
| 2 | “NAV” (Net Asset Value) total returns do not include the effect of any sales charge. |
| 3 | “POP” (Public Offering Price) total returns include the effect of the maximum front-end 5.75% sales charge. |
| 4 | “CDSC” (contingent deferred sales charge) is applied to redemptions of certain classes of shares that do not have a sales charge applied at the time of purchase. CDSC charges for certain redemptions of Class A shares made within 18 months of purchases in which a finder’s fee was paid and all Class C shares are 1% within the first year and 0% thereafter. |
| 5 | The since inception index returns are from the inception date of Class I shares. |
| 6 | The expense ratios of the Fund are set forth according to the prospectus for the Fund effective January 28, 2014, as supplemented and revised, and may differ from the expense ratios disclosed in the Financial Highlights tables in this report. See the Financial Highlights for more current expense ratios. |
Growth of $10,000 for periods ended 9/30
This chart assumes an initial investment of $10,000 made on September 30, 2004 for Class A and Class C shares including any applicable sales charges or fees. Performance assumes reinvestment of dividends and capital gain distributions.
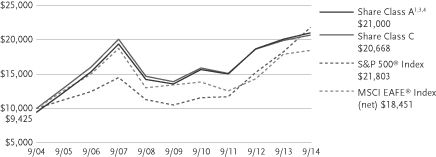
The indexes are unmanaged and not available for direct investment; therefore, their performance does not reflect the expenses associated with active management of an actual portfolio.
10
Table of Contents
VIRTUS FOREIGN OPPORTUNITIES FUND
SEPTEMBER 30, 2014
($ reported in thousands)
| SHARES | VALUE | |||||||
| PREFERRED STOCK—1.4% | ||||||||
| Financials—1.4% | ||||||||
Itau Unibanco Holding S.A. ADR 0.52% (Brazil) | 1,880,542 | $ | 26,102 | |||||
| TOTAL PREFERRED STOCK (Identified Cost $24,913) | 26,102 | |||||||
| COMMON STOCKS—95.7% | ||||||||
| Consumer Discretionary—13.0% | ||||||||
Alimentation Couche-Tard, Inc. Class B (Canada) | 675,402 | 21,596 | ||||||
Compagnie Financiere Richemont SA Registered Shares (Switzerland) | 305,300 | 25,055 | ||||||
Domino��s Pizza Group plc (United Kingdom) | 1,895,180 | 17,451 | ||||||
Galaxy Entertainment Group Ltd. (Hong Kong) | 2,735,286 | 15,887 | ||||||
Hermes International SA (France)(3) | 65,826 | 19,684 | ||||||
Naspers Ltd. Class N (South Africa) | 197,708 | 21,816 | ||||||
Paddy Power plc (Ireland)(2) | 262,430 | 18,950 | ||||||
Persimmon plc (United Kingdom) | 1,115,705 | 24,128 | ||||||
Priceline Group, Inc. (The) (United States)(2) | 33,207 | 38,473 | ||||||
Sands China Ltd. (China) | 5,507,884 | 28,728 | ||||||
Shaw Communications, Inc. (Canada) | 376,546 | 9,229 | ||||||
|
| |||||||
| 240,997 | ||||||||
|
| |||||||
| Consumer Staples—36.3% | ||||||||
British American Tobacco plc (United Kingdom) | 1,978,287 | 111,671 | ||||||
Diageo plc (United Kingdom) | 1,597,062 | 46,215 | ||||||
Hindustan Unilever Ltd. (India) | 1,157,049 | 13,976 | ||||||
ITC Ltd. (India) | 8,734,338 | 52,355 | ||||||
| SHARES | VALUE | |||||||
| Consumer Staples (continued) | ||||||||
L’Oreal S.A. (France) | 154,038 | $ | 24,456 | |||||
Lindt & Spruengli AG (Switzerland) | 5,714 | 28,555 | ||||||
Nestle S.A. Registered Shares (Switzerland) | 1,099,789 | 80,926 | ||||||
Pernod-Ricard S.A. (France) | 158,066 | 17,896 | ||||||
Philip Morris International, Inc. (United States) | 1,101,845 | 91,894 | ||||||
Reckitt Benckiser Group plc (United Kingdom) | 860,495 | 74,632 | ||||||
SABMiller plc (United Kingdom) | 661,880 | 36,782 | ||||||
Unilever N.V. (Netherlands) | 1,988,833 | 79,204 | ||||||
Wal-Mart de Mexico S.A.B. de C.V. (Mexico) | 6,709,395 | 16,885 | ||||||
|
| |||||||
| 675,447 | ||||||||
|
| |||||||
| Energy—4.6% | ||||||||
Core Laboratories N.V. (United States) | 302,953 | 44,337 | ||||||
Enbridge, Inc. (Canada) | 860,306 | 41,181 | ||||||
|
| |||||||
| 85,518 | ||||||||
|
| |||||||
| Financials—13.1% | ||||||||
Bank of Nova Scotia (Canada) | 603,218 | 37,310 | ||||||
Daito Trust Construction Co., Ltd. (Japan) | 211,100 | 24,936 | ||||||
Housing Development Finance Corp. (India) | 5,194,012 | 88,746 | ||||||
Housing Development Finance Corp. Bank Ltd. (India) | 4,884,767 | 69,020 | ||||||
Link REIT (The) (Hong Kong) | 4,190,994 | 24,153 | ||||||
|
| |||||||
| 244,165 | ||||||||
|
| |||||||
| Health Care—14.2% | ||||||||
Cie Generale D’optique Essilor International SA (France) | 290,271 | 31,875 | ||||||
CSL Ltd. (Australia) | 524,371 | 34,052 | ||||||
See Notes to Financial Statements
11
Table of Contents
VIRTUS FOREIGN OPPORTUNITIES FUND
SCHEDULE OF INVESTMENTS (Continued)
SEPTEMBER 30, 2014
($ reported in thousands)
| SHARES | VALUE | |||||||
| COMMON STOCKS (continued) | ||||||||
| Health Care (continued) | ||||||||
Grifols SA (Spain) | 664,661 | $ | 27,233 | |||||
Novo Nordisk A/S Class B (Denmark) | 1,277,430 | 61,124 | ||||||
Ramsay Health Care Ltd. (Australia) | 624,394 | 27,384 | ||||||
Roche Holding AG (Switzerland) | 274,108 | 81,282 | ||||||
|
| |||||||
| 262,950 | ||||||||
|
| |||||||
| Industrials—7.0% | ||||||||
Bureau Veritas SA (France) | 1,433,050 | 31,666 | ||||||
Cheung Kong Infrastructure Holdings Ltd. (Hong Kong) | 1,409,974 | 9,896 | ||||||
DKSH Holding AG (Switzerland) | 357,181 | 26,657 | ||||||
Rolls-Royce Holdings plc C Shares (United Kingdom) | 1,544,585 | 24,151 | ||||||
SGS SA Registered Shares (Switzerland) | 18,202 | 37,769 | ||||||
|
| |||||||
| 130,139 | ||||||||
|
| |||||||
| Information Technology—4.1% | ||||||||
Alibaba Group Holding Ltd. (Cayman Islands)(2) | 17,408 | 1,547 | ||||||
Baidu, Inc. Sponsored ADR (China)(2) | 144,279 | 31,486 | ||||||
Cielo SA (Brazil) | 1,300,924 | 21,169 | ||||||
Tencent Holdings Ltd. (China) | 1,499,835 | 22,309 | ||||||
|
| |||||||
| 76,511 | ||||||||
|
| |||||||
| Materials—3.4% | ||||||||
Air Liquide SA (France) | 183,500 | 22,382 | ||||||
Fresnillo plc (United Kingdom) | 1,081,079 | 13,320 | ||||||
Goldcorp, Inc. (Canada) | 715,499 | 16,495 | ||||||
| SHARES | VALUE | |||||||
| Materials (continued) | ||||||||
Silver Wheaton Corp. (Canada) | 585,131 | $ | 11,672 | |||||
|
| |||||||
| 63,869 | ||||||||
| TOTAL COMMON STOCKS (Identified Cost $1,403,654) | 1,779,596 | |||||||
| TOTAL LONG TERM INVESTMENTS—97.1% | ||||||||
| (Identified cost $1,428,567) | 1,805,698 | |||||||
| SHORT-TERM INVESTMENT—4.1% | ||||||||
| Money Market Mutual Fund—4.1% | ||||||||
Fidelity Money Market Portfolio – Institutional Shares (Seven-day effective yield 0.080%) | 76,100,035 | 76,100 | ||||||
| TOTAL SHORT-TERM INVESTMENT | ||||||||
| (Identified Cost $76,100) | 76,100 | |||||||
| SECURITIES LENDING COLLATERAL—0.4% | ||||||||
INVESCO Trust Short-Term Investments Liquid Assets Portfolio (The) Institutional Shares (seven-day effective yield 0.060%)(4) | 6,920,760 | 6,921 | ||||||
| TOTAL SECURITIES LENDING COLLATERAL | ||||||||
| (Identified Cost $6,921) | 6,921 | |||||||
| TOTAL INVESTMENTS—101.6% (Identified Cost $1,511,588) | 1,888,719 | (1) | ||||||
Other assets and liabilities, |
| (30,379 | ) | |||||
|
| |||||||
| NET ASSETS—100.0% | $ | 1,858,340 | ||||||
|
| |||||||
Abbreviations:
| ADR American Depositary Receipt |
| REIT Real Estate Investment Trust |
See Notes to Financial Statements
12
Table of Contents
VIRTUS FOREIGN OPPORTUNITIES FUND
SCHEDULE OF INVESTMENTS (Continued)
SEPTEMBER 30, 2014
($ reported in thousands)
FOOTNOTE LEGEND:
| (1) | Federal Income Tax Information: For tax information at September 30, 2014, see Note 8 Federal Income Tax Information in the Notes to Financial Statements. |
| (2) | Non-income producing. |
| (3) | All or a portion of security is on loan. |
| (4) | Represents security purchased with cash collateral received for securities on loan. |
| Country Weightings (Unaudited)† | ||||
United Kingdom | 18 | % | ||
Switzerland | 15 | |||
United States | 14 | |||
India | 12 | |||
France | 8 | |||
Canada | 7 | |||
Netherlands | 4 | |||
Other | 22 | |||
Total | 100 | % | ||
| † | % of total investments as of September 30, 2014 |
The following table provides a summary of inputs used to value the Fund’s investments as of September 30, 2014 (See Security Valuation Note 2A in the Notes to Financial Statements):
| Total Value at September 30, 2014 | Level 1 Quoted Prices | |||||||
Equity Securities: | ||||||||
Common Stocks | $ | 1,779,596 | $ | 1,779,596 | ||||
Preferred Stock | 26,102 | 26,102 | ||||||
Securities Lending Collateral | 6,921 | 6,921 | ||||||
Short-Term Investments | 76,100 | 76,100 | ||||||
|
|
|
| |||||
Total Investments | $ | 1,888,719 | $ | 1,888,719 | ||||
|
|
|
| |||||
There are no Level 2 (significant observable inputs) or Level 3 (significant unobservable inputs) priced securities.
There were no transfers between Level 1 and Level 2 for the period.
See Notes to Financial Statements
13
Table of Contents
VIRTUS FOREIGN OPPORTUNITIES FUND
STATEMENT OF ASSETS AND LIABILITIES
SEPTEMBER 30, 2014
($ Reported in thousands except shares and per share amounts)
| Assets | ||||
Investment in securities at value(1)(3) | $ | 1,888,719 | ||
Foreign currency at value(2) | 884 | |||
| Receivables | ||||
Fund shares sold | 5,286 | |||
Dividends receivable | 2,701 | |||
Tax reclaims | 3,133 | |||
Prepaid expenses | 61 | |||
Prepaid trustee retainer | 12 | |||
|
| |||
Total assets | 1,900,796 | |||
|
| |||
| Liabilities | ||||
| Payables | ||||
Fund shares repurchased | 22,318 | |||
Investment securities purchased | 10,539 | |||
Collateral on securities loaned | 6,921 | |||
Investment advisory fees | 1,349 | |||
Distribution and service fees | 206 | |||
Administration fees | 193 | |||
Transfer agent fees and expenses | 726 | |||
Professional fees | 38 | |||
Trustees’ fees and expenses | 2 | |||
Other accrued expenses | 164 | |||
|
| |||
Total liabilities | 42,456 | |||
|
| |||
| Net Assets | $ | 1,858,340 | ||
|
| |||
| Net Assets Consist of: | ||||
Capital paid in on shares of beneficial interest | $ | 1,662,097 | ||
Accumulated undistributed net investment income (loss) | 11,326 | |||
Accumulated undistributed net realized gain (loss) | (192,004 | ) | ||
Net unrealized appreciation (depreciation) on investments | 376,921 | |||
|
| |||
| Net Assets | $ | 1,858,340 | ||
|
| |||
| Class A | ||||
Net asset value (net assets/shares outstanding) per share | $ | 28.12 | ||
Maximum offering price per share NAV/(1–5.75%) | $ | 29.84 | ||
Shares of beneficial interest outstanding, $0.001 par value, unlimited authorization | 16,962,394 | |||
Net Assets | $ | 477,036 | ||
| Class C | ||||
Net asset value (net assets/shares outstanding) and offering price per share | $ | 27.88 | ||
Shares of beneficial interest outstanding, $0.001 par value, unlimited authorization | 4,228,988 | |||
Net Assets | $ | 117,906 | ||
| Class I | ||||
Net asset value (net assets/shares outstanding) and offering price per share | $ | 28.14 | ||
Shares of beneficial interest outstanding, $0.001 par value, unlimited authorization | 44,891,266 | |||
Net Assets | $ | 1,263,398 | ||
(1) Investment in securities at cost | $ | 1,511,588 | ||
(2) Foreign currency at cost | 890 | |||
(3) Market value of securities on loan | 6,591 | |||
See Notes to Financial Statements
14
Table of Contents
VIRTUS FOREIGN OPPORTUNITIES FUND
YEAR ENDED SEPTEMBER 30, 2014
($ reported in thousands)
| Investment Income | ||||
Dividends | $ | 45,717 | ||
Security lending | 194 | |||
Foreign taxes withheld | (2,418 | ) | ||
|
| |||
Total investment income | 43,493 | |||
|
| |||
| Expenses | ||||
Investment advisory fees | 16,103 | |||
Service fees, Class A | 1,637 | |||
Distribution and service fees, Class C | 1,135 | |||
Administration fees | 2,279 | |||
Transfer agent fees and expenses | 3,199 | |||
Custodian fees | 237 | |||
Printing fees and expenses | 144 | |||
Registration fees | 121 | |||
Trustees’ fees and expenses | 77 | |||
Professional fees | 52 | |||
Miscellaneous expenses | 92 | |||
|
| |||
Total expenses | 25,076 | |||
|
| |||
| Net investment income (loss) | 18,417 | |||
|
| |||
| Net Realized and Unrealized Gain (Loss) on Investments | ||||
Net realized gain (loss) on investments | 24,729 | |||
Net realized gain (loss) on foreign currency transactions | 23 | |||
Net change in unrealized appreciation (depreciation) on investments | 43,237 | |||
Net change in unrealized appreciation (depreciation) on foreign currency translation | (362 | ) | ||
|
| |||
| Net gain (loss) on investments | 67,627 | |||
|
| |||
| Net increase (decrease) in net assets resulting from operations | $ | 86,044 | ||
|
|
See Notes to Financial Statements
15
Table of Contents
VIRTUS FOREIGN OPPORTUNITIES FUND
STATEMENTS OF CHANGES IN NET ASSETS
($ Reported in thousands)
| Year Ended September 30, 2014 | Year Ended September 30, 2013 | |||||||
| INCREASE/(DECREASE) IN NET ASSETS | ||||||||
| From Operations | ||||||||
Net investment income (loss) | $ | 18,417 | $ | 13,868 | ||||
Net realized gain (loss) | 24,752 | 42,373 | ||||||
Net change in unrealized appreciation (depreciation) | 42,875 | 32,794 | ||||||
|
|
|
| |||||
| Increase (decrease) in net assets resulting from operations | 86,044 | 89,035 | ||||||
|
|
|
| |||||
| From Distributions to Shareholders | ||||||||
Net investment income, Class A | (3,966 | ) | (5,285 | ) | ||||
Net investment income, Class C | — | (251 | ) | |||||
Net investment income, Class I | (9,101 | ) | (10,346 | ) | ||||
|
|
|
| |||||
| Decrease in net assets from distributions to shareholders | (13,067 | ) | (15,882 | ) | ||||
|
|
|
| |||||
| From Share Transactions | ||||||||
| Sale of shares | ||||||||
Class A (6,394 and 15,519 shares, respectively) | 178,539 | 416,080 | ||||||
Class C (1,172 and 2,026 shares, respectively) | 32,538 | 54,362 | ||||||
Class I (19,587 and 24,364 shares, respectively) | 553,830 | 656,205 | ||||||
| Reinvestment of distributions | ||||||||
Class A (129 and 186 shares, respectively) | 3,591 | 4,866 | ||||||
Class C (0 and 8 shares, respectively) | — | 200 | ||||||
Class I (298 and 349 shares, respectively) | 8,294 | 9,111 | ||||||
| Shares repurchased | ||||||||
Class A (14,591 and 6,336 shares, respectively) | (413,237 | ) | (170,133 | ) | ||||
Class C (733 and 406 shares, respectively) | (20,420 | ) | (10,783 | ) | ||||
Class I (13,775 and 12,390 shares, respectively) | (383,850 | ) | (332,731 | ) | ||||
|
|
|
| |||||
| Increase (decrease) in net assets from share transactions | (40,715 | ) | 627,177 | |||||
|
|
|
| |||||
| Net increase (decrease) in net assets | 32,262 | 700,330 | ||||||
| Net Assets | ||||||||
Beginning of period | 1,826,078 | 1,125,748 | ||||||
|
|
|
| |||||
| End of period | $ | 1,858,340 | $ | 1,826,078 | ||||
|
|
|
| |||||
Accumulated undistributed net investment income (loss) at end | $ | 11,326 | $ | 5,953 | ||||
See Notes to Financial Statements
16
Table of Contents
VIRTUS FOREIGN OPPORTUNITIES FUND
SELECTED DATA FOR A SHARE OUTSTANDING
THROUGHOUT EACH PERIOD
| Net Asset Value, Beginning of Period | Net Investment Income (Loss)(2) | Net Realized and Unrealized Gain (Loss) | Total from Investment Operations | Dividends from Net Investment Income | Distributions from Net Realized Gains | Total Distributions | Change in Net Asset Value | Net Asset Value, End of Period | Total Return(1) | Net Assets, End of Period (000’s) | Ratio of Expenses to Average Net Assets(3) | Ratio of Net Investment Income (Loss) to Average Net Assets | Portfolio Turnover Rate | |||||||||||||||||||||||||||||||||||||||||||||||||||||||||
Class A | ||||||||||||||||||||||||||||||||||||||||||||||||||||||||||||||||||||||
10/1/13 to 9/30/14 | $ | 27.01 | 0.24 | 1.03 | 1.27 | (0.16 | ) | — | (0.16 | ) | 1.11 | $ | 28.12 | 4.72 | % | $ | 477,036 | 1.43 | % | 0.85 | % | 31 | % | |||||||||||||||||||||||||||||||||||||||||||||||
10/1/12 to 9/30/13 | 25.42 | 0.23 | 1.63 | 1.86 | (0.27 | ) | — | (0.27 | ) | 1.59 | 27.01 | 7.37 | 676,149 | 1.46 | 0.85 | 29 | ||||||||||||||||||||||||||||||||||||||||||||||||||||||
10/1/11 to 9/30/12 | 20.83 | 0.27 | 4.73 | 5.00 | (0.41 | ) | — | (0.41 | ) | 4.59 | 25.42 | 24.34 | 398,166 | 1.45 | 1.16 | 47 | ||||||||||||||||||||||||||||||||||||||||||||||||||||||
10/1/10 to 9/30/11 | 22.06 | 0.34 | (1.23 | ) | (0.89 | ) | (0.34 | ) | — | (0.34 | ) | (1.23 | ) | 20.83 | (4.15 | ) | 346,594 | 1.47 | 1.48 | 31 | ||||||||||||||||||||||||||||||||||||||||||||||||||
10/1/09 to 9/30/10 | 19.40 | 0.37 | 2.54 | 2.91 | (0.25 | ) | — | (0.25 | ) | 2.66 | 22.06 | 15.34 | 493,214 | 1.47 | 1.82 | 34 | ||||||||||||||||||||||||||||||||||||||||||||||||||||||
Class C | ||||||||||||||||||||||||||||||||||||||||||||||||||||||||||||||||||||||
10/1/13 to 9/30/14 | $ | 26.82 | 0.04 | 1.02 | 1.06 | — | — | — | 1.06 | $ | 27.88 | 3.95 | % | $ | 117,906 | 2.18 | % | 0.15 | % | 31 | % | |||||||||||||||||||||||||||||||||||||||||||||||||
10/1/12 to 9/30/13 | 25.27 | 0.03 | 1.62 | 1.65 | (0.10 | ) | — | (0.10 | ) | 1.55 | 26.82 | 6.56 | 101,655 | 2.21 | 0.10 | 29 | ||||||||||||||||||||||||||||||||||||||||||||||||||||||
10/1/11 to 9/30/12 | 20.57 | 0.10 | 4.70 | 4.80 | (0.10 | ) | — | (0.10 | ) | 4.70 | 25.27 | 23.43 | 54,634 | 2.20 | 0.42 | 47 | ||||||||||||||||||||||||||||||||||||||||||||||||||||||
10/1/10 to 9/30/11 | 21.81 | 0.17 | (1.22 | ) | (1.05 | ) | (0.19 | ) | — | (0.19 | ) | (1.24 | ) | 20.57 | (4.85 | ) | 45,742 | 2.22 | 0.74 | 31 | ||||||||||||||||||||||||||||||||||||||||||||||||||
10/1/09 to 9/30/10 | 19.21 | 0.21 | 2.52 | 2.73 | (0.13 | ) | — | (0.13 | ) | 2.60 | 21.81 | 14.42 | 64,480 | 2.22 | 1.04 | 34 | ||||||||||||||||||||||||||||||||||||||||||||||||||||||
Class I | ||||||||||||||||||||||||||||||||||||||||||||||||||||||||||||||||||||||
10/1/13 to 9/30/14 | $ | 27.03 | 0.32 | 1.02 | 1.34 | (0.23 | ) | — | (0.23 | ) | 1.11 | $ | 28.14 | 4.97 | % | $ | 1,263,398 | 1.18 | % | 1.13 | % | 31 | % | |||||||||||||||||||||||||||||||||||||||||||||||
10/1/12 to 9/30/13 | 25.43 | 0.28 | 1.66 | 1.94 | (0.34 | ) | — | (0.34 | ) | 1.60 | 27.03 | 7.66 | 1,048,274 | 1.21 | 1.04 | 29 | ||||||||||||||||||||||||||||||||||||||||||||||||||||||
10/1/11 to 9/30/12 | 20.89 | 0.34 | 4.72 | 5.06 | (0.52 | ) | — | (0.52 | ) | 4.54 | 25.43 | 24.64 | 672,948 | 1.20 | 1.46 | 47 | ||||||||||||||||||||||||||||||||||||||||||||||||||||||
10/1/10 to 9/30/11 | 22.12 | 0.42 | (1.26 | ) | (0.84 | ) | (0.39 | ) | — | (0.39 | ) | (1.23 | ) | 20.89 | (3.88 | ) | 584,212 | 1.22 | 1.83 | 31 | ||||||||||||||||||||||||||||||||||||||||||||||||||
10/1/09 to 9/30/10 | 19.45 | 0.42 | 2.54 | 2.96 | (0.29 | ) | — | (0.29 | ) | 2.67 | 22.12 | 15.60 | 623,222 | 1.22 | 2.08 | 34 | ||||||||||||||||||||||||||||||||||||||||||||||||||||||
Footnote Legend
| (1) | Sales charges, where applicable, are not reflected in the total return calculation. |
| (2) | Computed using average shares outstanding. |
| (3) | The Fund may invest in other funds, and the annualized expense ratios do not reflect fees and expenses associated with the underlying funds. |
See Notes to Financial Statements
17
Table of Contents
VIRTUS FOREIGN OPPORTUNITIES FUND
SEPTEMBER 30, 2014
Note 1. Organization
Virtus Opportunities Trust (the “Trust”) is organized as a Delaware statutory trust and is registered under the Investment Company Act of 1940, as amended (“1940 Act”), as an open-end management investment company.
As of the date of this report, 31 funds of the Trust are offered for sale, of which the Foreign Opportunities Fund (the “Fund”) is reported in this annual report. The Fund’s investment objective is outlined in the Fund Summary page.
The Fund offers Class A shares, Class C shares and Class I shares.
Class A shares are sold with a front-end sales charge of up to 5.75% with some exceptions. Generally, Class A shares are not subject to any charges by the Fund when redeemed; however, a 1% contingent deferred sales charge (“CDSC”) may be imposed on certain redemptions made within a certain period following purchases on which a finder’s fee has been paid. The period for which the CDSC applies for the Fund is 18 months. The CDSC period begins on the last day of the month preceding the month in which the purchase was made.
Class C shares are generally sold with a 1% CDSC, applicable if redeemed within one year of purchase. Class I shares are sold without a front-end sales charge or CDSC.
Virtus Mutual Funds may impose an annual fee on accounts having balances of less than $2,500. The small account fee may be waived in certain circumstances, as disclosed in the prospectuses and/or statements of additional information. The fees collected will be used to offset certain expenses of the funds.
Each class of shares has identical voting, dividend, liquidation and other rights and the same terms and conditions, except that each class bears different distribution and/or service fees under a Board-approved Rule 12b-1 and/or shareholder service plan (“12b-1 plan”) and has exclusive voting rights with respect to such plans. Class I shares are not subject to a 12b-1 plan. Income and other expenses as well as realized and unrealized gains and losses of the Fund are borne pro rata by the holders of each class of shares.
Note 2. Significant Accounting Policies
The following is a summary of significant accounting policies consistently followed by the Trust in the preparation of its financial statements. The preparation of financial statements in conformity with accounting principles generally accepted in the United States of America requires management to make estimates and assumptions that affect the reported amounts of assets and liabilities, disclosure of contingent assets and liabilities at the date of the financial statements and the reported amounts of increases and decreases in net assets from operations during the reporting period. Actual results could differ from those estimates and those differences could be significant.
| A. | Security Valuation |
Security valuation procedures for the Fund, which include nightly price variance, as well as back-testing such as bi-weekly unchanged price, monthly secondary source and transaction analysis, have been approved by the Board of Trustees (the “Board” or the “Trustees”). All internally fair valued securities are approved by a valuation committee (the “Valuation Committee”) appointed by the Board. The Valuation Committee is comprised of certain members of management as identified by the Board and convenes independently from portfolio management. All internally fair valued securities are
18
Table of Contents
VIRTUS FOREIGN OPPORTUNITIES FUND
NOTES TO FINANCIAL STATEMENTS (Continued)
SEPTEMBER 30, 2014
updated daily and reviewed in detail by the Valuation Committee monthly unless changes occur within the period. The Valuation Committee reviews the validity of the model inputs and any changes to the model. Fair valuations are reviewed by the Board at least quarterly.
The Fund utilizes a fair value hierarchy which prioritizes the inputs to valuation techniques used to measure fair value into three broad levels.
| • Level 1 – | quoted prices in active markets for identical securities (security types generally include listed equities). |
| • Level 2 – | prices determined using other significant observable inputs (including quoted prices for similar securities, interest rates, prepayment speeds, credit risk, etc.). |
| • Level 3 – | prices determined using significant unobservable inputs (including the Valuation Committee’s own assumptions in determining the fair value of investments). |
A description of the valuation techniques applied to the Fund’s major categories of assets and liabilities measured at fair value on a recurring basis is as follows:
Equity securities are valued at the official closing price (typically last sale) on the exchange on which the securities are primarily traded, or if no closing price is available, at the last bid price and are categorized as Level 1 in the hierarchy. Restricted equity securities and private placements that are not widely traded, are illiquid or are internally fair valued by the Valuation Committee, are generally categorized as Level 3 in the hierarchy.
Certain non-U.S. securities may be fair valued in cases where closing prices are not readily available or are deemed not reflective of readily available market prices. For example, significant events (such as movement in the U.S. securities market, or other regional and local developments) may occur between the time that non-U.S. markets close (where the security is principally traded) and the time that the Fund calculates its net asset value (“NAV”) (at the close of regular trading on the New York Stock Exchange (“NYSE”) generally 4 p.m. Eastern time) that may impact the value of securities traded in these non-U.S. markets. In such cases the Fund fair values non-U.S. securities using an independent pricing service which considers the correlation of the trading patterns of the non-U.S. security to the intraday trading in the U.S. markets for investments such as ADRs, financial futures, exchange-traded funds, and certain indexes as well as prices for similar securities. Such fair valuations are categorized as Level 2 in the hierarchy. Because the frequency of significant events is not predictable, fair valuation of certain non-U.S. common stocks may occur on a frequent basis.
Listed derivatives that are actively traded are valued based on quoted prices from the exchange and are categorized as Level 1 in the hierarchy. Over-the-counter derivative contracts, which include forward currency contracts and equity-linked instruments, do not require material subjectivity as pricing inputs are observed from actively quoted markets and are categorized as Level 2 in the hierarchy.
Investments in open-end mutual funds are valued at NAV. Investments in closed-end mutual funds are valued as of the close of regular trading on the NYSE each business day. Both are categorized as Level 1 in the hierarchy.
19
Table of Contents
VIRTUS FOREIGN OPPORTUNITIES FUND
NOTES TO FINANCIAL STATEMENTS (Continued)
SEPTEMBER 30, 2014
A summary of the inputs used to value the Fund’s net assets by each major security type is disclosed at the end of the Schedule of Investments for the Fund. The inputs or methodologies used for valuing securities are not necessarily an indication of the risk associated with investing in those securities.
| B. | Security Transactions and Investment Income |
Security transactions are recorded on the trade date. Realized gains and losses from the sale of securities are determined on the identified cost basis. Dividend income is recognized on the ex-dividend date, or in the case of certain foreign securities, as soon as the Fund is notified. Interest income is recorded on the accrual basis. The Fund amortizes premiums and accretes discounts using the effective interest method.
| C. | Income Taxes |
The Fund is treated as a separate taxable entity. It is the intention of the Fund to comply with the requirements of Subchapter M of the Internal Revenue Code and to distribute substantially all of its taxable income to its shareholders. Therefore, no provision for federal income taxes or excise taxes has been made.
The Fund may be subject to foreign taxes on income, gains on investments or currency repatriation, a portion of which may be recoverable. The Fund will accrue such taxes and recoveries as applicable based upon current interpretations of the tax rules and regulations that exist in the markets in which it invests.
Management of the Fund has concluded that there are no significant uncertain tax positions that would require recognition in the financial statements. As of September 30, 2014, the tax years that remain subject to examination by the major tax jurisdictions under the statute of limitations are from the year 2011 forward (with limited exceptions).
| D. | Distributions to Shareholders |
Distributions are recorded by the Fund on the ex-dividend date. Income and capital gain distributions are determined in accordance with income tax regulations that may differ from accounting principles generally accepted in the United States of America. These differences may include the treatment of non-taxable dividends, market premium and discount, non-deductible expenses, expiring capital loss carryovers, foreign currency gain or loss, gain or loss on futures contracts, partnerships, operating losses and losses deferred due to wash sales. Permanent book and tax basis differences relating to shareholder distributions will result in reclassifications to capital paid in on shares of beneficial interest.
| E. | Expenses |
Expenses incurred together by the Fund and other affiliated mutual funds are allocated in proportion to the net assets of each such fund, except where allocation of direct expense to each fund or an alternative allocation method can be more appropriately used.
In addition to the net operating expenses that the Fund bears directly, the shareholders of the Fund indirectly bear the Fund’s pro-rata expenses of any underlying mutual funds in which the Fund invests.
20
Table of Contents
VIRTUS FOREIGN OPPORTUNITIES FUND
NOTES TO FINANCIAL STATEMENTS (Continued)
SEPTEMBER 30, 2014
| F. | Foreign Currency Translation |
Non-U.S. investment securities and other assets and liabilities denominated in foreign currencies are translated into U.S. dollar amounts at the foreign currency exchange rate effective at the end of the reporting period. Cost of investments is translated at the currency exchange rate effective at the trade date. The gain or loss resulting from a change in currency exchange rates between the trade and settlement date of a portfolio transaction is treated as a gain or loss on non-U.S. currency. Likewise, the gain or loss resulting from a change in currency exchange rates between the date income is accrued and paid is treated as a gain or loss on foreign currency. The Fund does not isolate that portion of the results of operations arising from changes in foreign exchange rates on investments from the fluctuations arising from changes in the market prices of securities held. Such fluctuations are included with the net realized and unrealized gain or loss on investments.
| G. | Securities Lending |
($ reported in thousands)
The Fund may loan securities to qualified brokers through an agreement with Brown Brothers Harriman (“BBH”), as a third party lending agent. Under the terms of the agreement, the Fund is required to maintain collateral with a market value not less than 100% of the market value of loaned securities. Collateral is adjusted daily in connection with changes in the market value of securities on loan. Collateral may consist of cash and securities issued by the U.S. Government or its agencies. Cash collateral is invested in a short-term money market fund. Dividends earned on the collateral and premiums paid by the broker are recorded as income by the Fund net of fees and rebates charged by BBH for its services as securities lending agent and in connection with this securities lending program. Lending portfolio securities involves a risk of delay in the recovery of the loaned securities or in the declining value of the collateral.
At September 30, 2014, the Fund had securities on loan with a market value of $6,591 and cash collateral of $6,921.
Note 3. Investment Advisory Fees and Related Party Transactions
($ reported in thousands except as noted)
| A. | Adviser |
Virtus Investment Advisers, Inc. (the “Adviser”), an indirect, wholly-owned subsidiary of Virtus Investment Partners, Inc. (“Virtus”), is the adviser to the Trust. The Adviser manages the Fund’s investment program and general operations of the Fund, including oversight of the Fund’s subadviser.
As compensation for its services to the Fund, the Adviser is entitled to a fee based upon the following annual rates as a percentage of the average daily net assets of the Fund:
1st $2 Billion | $2+ Billion – | $4+ Billion | ||
| 0.85% | 0.80% | 0.75% |
21
Table of Contents
VIRTUS FOREIGN OPPORTUNITIES FUND
NOTES TO FINANCIAL STATEMENTS (Continued)
SEPTEMBER 30, 2014
| B. | Subadviser |
Vontobel Asset Management, Inc. (the “Subadviser”) is the Subadviser to the Fund. The Subadviser manages the investments of the Fund for which it is paid a fee by the Adviser.
| C. | Distributor |
VP Distributors, LLC (“VP Distributors”), an indirect wholly-owned subsidiary of Virtus, serves as the distributor of the Fund’s shares. VP Distributors has advised the Fund that for the fiscal year (the “period”) ended September 30, 2014, it retained net commissions of $42 for Class A shares and deferred sales charges of $14 for Class A shares and $20 for Class C shares.
In addition, the Fund pays VP Distributors distribution and/or service fees under a 12b-1 plan, as a percentage of the average daily net assets of each respective class at the annual rates as follows: Class A shares 0.25% and Class C shares 1.00%. Class I shares are not subject to a 12b-1 plan.
Under certain circumstances, shares of certain Virtus Mutual Funds may be exchanged for shares of the same class of certain other Virtus Mutual Funds on the basis of the relative NAV per share at the time of the exchange. On exchanges with share classes that carry a CDSC, the CDSC schedule of the original shares purchased continues to apply.
| D. | Administrator and Transfer Agent |
Virtus Fund Services LLC, an indirect wholly-owned subsidiary of Virtus, serves as the administrator and transfer agent to the Fund.
For the period ended September 30, 2014, the Fund incurred administration fees totaling $1,821 which are included in the Statement of Operations.
For the period ended September 30, 2014, the Fund incurred transfer agent fees totaling $2,998 which are included in the Statement of Operations. A portion of these fees was paid to outside entities that also provide services to the Trust.
| E. | Affiliated Shareholders |
At September 30, 2014, Virtus and its affiliates, BMO Bankcorp. (a minority investor in Virtus) and its affiliates, and the retirement plans of Virtus and its affiliates, held shares of the Fund which may be redeemed at any time that aggregated the following:
| Shares | Aggregate Net Asset Value | |||||||
Class I shares | 1,334 | $ | 38 | |||||
Note 4. Purchases and Sales of Securities
($ reported in thousands)
Purchases and sales of securities (excluding U.S. Government and agency securities, and short-term securities) during the period ended September 30, 2014, were as follows:
| Purchases | Sales | |||||||
| $ | 586,705 | $ | 576,153 | |||||
There were no purchases or sales of long-term U.S. Government and agency securities.
22
Table of Contents
VIRTUS FOREIGN OPPORTUNITIES FUND
NOTES TO FINANCIAL STATEMENTS (Continued)
SEPTEMBER 30, 2014
Note 5. 10% Shareholders
As of September 30, 2014, the Fund had individual shareholder account(s) and/or omnibus shareholder account(s) (comprised of a group of individual shareholders), which individually amounted to more than 10% of the total shares outstanding of the Fund as detailed below.
| % of Shares Outstanding | Number of Accounts | |||||||
| 32 | % | 2 | ||||||
The shareholders are not affiliated with Virtus.
Note 6. Credit Risk and Asset Concentrations
In countries with limited or developing markets, investments may present greater risks than in more developed markets and the prices of such investments may be volatile. The consequences of political, social or economic changes in these markets may have disruptive effects on the market prices of these investments and the income they generate, as well as the Fund’s ability to repatriate such amounts.
The Fund may invest a high percentage of its assets in specific sectors of the market in its pursuit of a greater investment return. Fluctuations in these sectors of concentration may have a greater impact on the Fund, positive or negative, than if the Fund did not concentrate its investments in such sectors.
At September 30, 2014, the Fund held securities issued by various companies in the Consumer Staples sector, representing 36% of the total investments of the Fund.
Note 7. Indemnifications
Under the Trust’s organizational documents, its Trustees and officers are indemnified against certain liabilities arising out of the performance of their duties to the Fund. Each Trustee has also entered into an indemnification agreement with the Trust. In addition, in the normal course of business, the Fund enters into contracts that provide a variety of indemnifications to other parties. The Fund’s maximum exposure under these arrangements is unknown as this would involve future claims that may be made against the Fund and that have not occurred. However, the Fund has not had prior claims or losses pursuant to these arrangements and expects the risk of loss to be remote.
Note 8. Federal Income Tax Information
($ reported in thousands)
At September 30, 2014, federal tax cost and aggregate gross unrealized appreciation (depreciation) of securities held by the Fund were as follows:
Federal | Unrealized | Unrealized | Net Unrealized | |||
| $1,556,582 | $367,897 | $(35,759) | $332,138 |
The Fund has capital loss carryovers available to offset future realized capital gains, through the indicated expiration dates shown below:
2018 | Total | |
| $183,072 | $183,072 |
23
Table of Contents
VIRTUS FOREIGN OPPORTUNITIES FUND
NOTES TO FINANCIAL STATEMENTS (Continued)
SEPTEMBER 30, 2014
The Fund may not realize the benefit of these losses to the extent the Fund does not realize gains on investments prior to the expiration of the capital loss carryovers.
Under the Regulated Investment Company Modernization Act of 2010 (the “Act”), net capital losses recognized for tax years beginning after December 22, 2010 may be carried forward indefinitely, and their character is retained as short-term and/or long-term losses. Previously, net capital losses were carried forward for eight years and treated as short-term losses. As a transition rule, the Act requires that post-enactment net capital losses be used before pre-enactment net capital losses.
The Fund utilized losses of $20,846, deferred in prior years against current year capital gains.
The components of distributable earnings on a tax basis (excluding unrealized appreciation (depreciation) which is disclosed above) consist of undistributed ordinary income of $47,386 and undistributed long-term capital gains of $0.
The differences between the book and tax basis components of distributable earnings relate principally to the timing of recognition of income and gains for federal income tax purposes. Short-term gain distributions reported in the Statements of Changes in Net Assets, if any, are reported as ordinary income for federal tax purposes. Distributions are determined on a tax basis and may differ from net investment income and realized capital gains for financial reporting purposes.
Note 9. Reclassifications of Capital Accounts
($ reported in thousands)
For financial reporting purposes, book basis capital accounts are adjusted to reflect the tax character of permanent book/tax differences. Permanent reclassifications can arise from differing treatment of certain income and gain transactions, nondeductible current year net operating losses, expiring capital loss carryovers and investments in passive foreign investment companies. The reclassifications have no impact on the net assets or net asset value of the Fund. As of September 30, 2014, the Fund recorded reclassifications to increase (decrease) the accounts as listed below:
Capital Paid | Undistributed | Accumulated | ||
| $ — | $23 | $(23) |
Note 10. Subsequent Event Evaluations
Management has evaluated the impact of all subsequent events on the Fund through the date the financial statements were available for issuance, and has determined that the following subsequent event requires recognition or disclosure in the financial statements.
Effective November 12, 2014, the Fund began offering Class R6 Shares.
24
Table of Contents

Report of Independent Registered Public
Accounting Firm
To the Board of Trustees of
Virtus Opportunities Trust and Shareholders of
Virtus Foreign Opportunities Fund:
In our opinion, the accompanying statement of assets and liabilities, including the schedule of investments, and the related statements of operations and of changes in net assets and the financial highlights present fairly, in all material respects, the financial position of Virtus Foreign Opportunities Fund (one of the funds constituting Virtus Opportunities Trust, hereafter referred to as “the Fund”) at September 30, 2014, the results of its operations for the year then ended, the changes in its net assets for each of the two years in the period then ended and the financial highlights for each of the five years in the period then ended, in conformity with accounting principles generally accepted in the United States of America. These financial statements and financial highlights (hereafter referred to as “financial statements”) are the responsibility of the Fund’s management. Our responsibility is to express an opinion on these financial statements based on our audits. We conducted our audits of these financial statements in accordance with the standards of the Public Company Accounting Oversight Board (United States). Those standards require that we plan and perform the audit to obtain reasonable assurance about whether the financial statements are free of material misstatement. An audit includes examining, on a test basis, evidence supporting the amounts and disclosures in the financial statements, assessing the accounting principles used and significant estimates made by management, and evaluating the overall financial statement presentation. We believe that our audits, which included confirmation of securities at September 30, 2014 by correspondence with the custodian and brokers, provide a reasonable basis for our opinion.
PricewaterhouseCoopers LLP
Philadelphia, Pennsylvania
November 19, 2014
25
Table of Contents
VIRTUS FOREIGN OPPORTUNITIES FUND
TAX INFORMATION NOTICE (Unaudited)
SEPTEMBER 30, 2014
For the fiscal year ended September 30, 2014, the Fund makes the following disclosures for federal income tax purposes. Below is listed the percentage, or the maximum amount allowable, of its ordinary income dividends (“QDI”) to qualify for the lower tax rates applicable to individual shareholders, and the percentage of ordinary income dividends earned by the Fund which qualifies for the dividends received deduction (“DRD”) for corporate shareholders. The actual percentage of QDI and DRD for the calendar year will be designated in year-end tax statements. The Fund designates the amount below, or if subsequently different, as long-term capital gains dividends (“LTCG”) ($ reported in thousands).
QDI | DRD | LTCG | ||
| 69% | 7% | $— |
For the fiscal year ended September 30, 2014, the Fund recognized $41,555 ($ reported in thousands), of foreign source income on which the Fund paid foreign taxes of $2,418 ($ reported in thousands). This information is being furnished to you pursuant to notice requirements of Section 853(a) and 855(d) of the Internal Revenue Code, as amended, and the Treasury Regulations thereunder.
26
Table of Contents
FUND MANAGEMENT TABLES (UNAUDITED)
Information pertaining to the Trustees and officers of the Trust as of September 30, 2014, is set forth below. The statement of additional information (SAI) includes additional information about the Trustees and is available without charge, upon request, by calling (800) 243-1574. The address of each individual, unless otherwise noted, is 100 Pearl Street, Hartford, CT 06103-4506. There is no stated term of office for Trustees of the Trust.
Independent Trustees
Name and Year of Birth, | Principal Occupation(s) Other Directorships Held by Trustee | |
Keith, Leroy Jr. YOB: 1939 Elected: 2000 48 Funds | Chairman (since 2010), Bloc Global Services Group, LLC (construction and redevelopment company); Director/Trustee (since 2010), Wells Fargo Funds and their predecessors, Evergreen Funds (1989 to 2010) (137 series); Director (2003 to 2010), Diversapack Co. (soft packaging company); and Trustee (since 1980), Virtus Mutual Fund Complex (48 portfolios). | |
McLoughlin, Philip Chairman YOB: 1946 Elected: 1999 68 Funds | Partner (2006 to 2012), Cross Pond Partners, LLC (strategy consulting firm); Managing Director (2009 to 2010), SeaCap Asset Management Fund I, L.P. and SeaCap Partners, LLC (investment management); Director (since 1991) and Chairman (since 2010), World Trust Fund; Director (since 1995), closed-end funds managed by Duff & Phelps Investment Management Co. (4 portfolios); Chairman (since 2002) and Trustee (since 1989), Virtus Mutual Fund Complex (48 portfolios); Chairman and Trustee (since 2003), Virtus Variable Insurance Trust (9 portfolios); Trustee and Chairman (since 2011), Virtus Closed-End Funds (3 portfolios); Trustee and Chairman (since 2013), Virtus Alternative Solutions Trust (3 portfolios); and Director (1985 to 2009), Argo Group International Holdings Inc. and its predecessor, PXRE Corporation (insurance). | |
McNamara, Geraldine M. YOB: 1951 Elected: 2001 52 Funds | Retired; Trustee (since 2001), Virtus Mutual Fund Complex (48 portfolios); and Director (since 2003), closed-end funds managed by Duff & Phelps Investment Management Co. (4 portfolios). | |
Oates, James M. YOB: 1946 Elected: 2000 55 Funds | Managing Director (since 1994), Wydown Group (consulting firm); Trustee (since 1987), Virtus Mutual Fund Complex (48 portfolios); Director (since 1996), Stifel Financial; Director (since 1998), Connecticut River Bancorp; Chairman and Director (since 1999), Connecticut River Bank; Chairman (since 2000), Emerson Investment Management, Inc.; Director (since 2002), New Hampshire Trust Company; Chairman and Trustee (since 2005), John Hancock Fund Complex (234 portfolios); Non-Executive Chairman (2007 to 2011), Hudson Castle Group, Inc. (formerly IBEX Capital Markets, Inc.) (financial services); Trustee (since 2013), Virtus Closed-End Funds (3 portfolios); and Trustee (since 2013), Virtus Alternative Solutions Trust (3 portfolios). | |
Segerson, Richard E. YOB: 1946 Elected: 2000 48 Funds | Retired; Trustee (since 1993), Virtus Mutual Fund Complex (48 portfolios); and Managing Director (since 1998), Northway Management Company. | |
Verdonck, Ferdinand L.J. YOB: 1942 Elected: 2005 48 Funds | Director (since 1998), The J.P. Morgan European Investment Trust; Director (since 2005), Galapagos N.V. (biotechnology); Mr. Verdonck is also a director of several non-U.S. companies; Trustee (since 2002), Virtus Mutual Fund Complex (48 portfolios). |
27
Table of Contents
FUND MANAGEMENT TABLES (UNAUDITED) (Continued)
Interested Trustee
The individual listed below is an “interested person” of the Trust, as defined in Section 2(a)(19) of the 1940 Act, as amended, and the rules and regulations thereunder.
Name and Year of Birth | Principal Occupation(s) | |
Aylward, George R. YOB: 1964 Elected: 2006 66 Funds | Director, President and Chief Executive Officer (since 2008), Virtus Investment Partners, Inc. and/or certain of its subsidiaries; and various senior officer positions with Virtus affiliates (since 2005); Trustee (since 2006), Virtus Mutual Funds (48 portfolios); Chairman, President and Chief Executive Officer (since 2006), The Zweig Closed-End Funds (2 portfolios); Trustee (since 2012), Virtus Variable Insurance Trust (9 portfolios); Trustee and President (since 2011), Virtus Closed-End Funds (3 portfolios); Director (since 2013), Virtus Global Funds, PLC (2 portfolios); and Trustee (since 2013), Virtus Alternative Solutions Trust (3 portfolios). |
28
Table of Contents
FUND MANAGEMENT TABLES (UNAUDITED) (Continued)
Officers of the Trust Who Are Not Trustees
Name, Address and Year of Birth | Position(s) Held with the Trust and | |||
Bradley, W. Patrick YOB: 1972 | Senior Vice President (since 2013), Vice President (2011 to 2013), Chief Financial Officer and Treasurer (since 2006). | Senior Vice President, Fund Services (since 2010), Virtus Investment Partners, Inc. and/or certain of its subsidiaries; various officer positions (since 2006) with Virtus affiliates; Senior Vice President (since 2013), Vice President (2011 to 2013), Chief Financial Officer and Treasurer (since 2004), Virtus Variable Insurance Trust; Senior Vice President (since 2013), Vice President (2011 to 2013), Chief Financial Officer and Treasurer (since 2006), Virtus Mutual Fund Complex; Senior Vice President (since 2013), Vice President (2012 to 2013) and Treasurer (Chief Financial Officer) (since 2007), The Zweig Closed-End Funds; Senior Vice President (since 2013), Vice President (2011 to 2013), Chief Financial Officer and Treasurer (since 2011), Virtus Closed-End Funds; Vice President and Assistant Treasurer (since 2011), Duff & Phelps Global Utility Income Fund Inc.; Director (since 2013), Virtus Global Funds, PLC; and Senior Vice President, Chief Financial Officer and Treasurer (since 2013), Virtus Alternative Solutions Trust. | ||
Carr, Kevin J. YOB: 1954 | Senior Vice President (since 2013), Vice President (2005 to 2013), Chief Legal Officer, Counsel and Secretary (since 2005). | Senior Vice President (since 2009), Vice President, Counsel and Secretary (2008 to 2009), Virtus Investment Partners, Inc. and/or certain of its subsidiaries; various senior officer positions (since 2005) with Virtus affiliates; Senior Vice President (since 2013), Vice President (2005 to 2013), Chief Legal Officer, Counsel and Secretary (since 2005), Virtus Mutual Fund Complex; Senior Vice President (2013 to 2014), Vice President (2012 to 2013) and Assistant Secretary (since 2012), Secretary and Chief Legal Officer (2005 to 2012), The Zweig Closed-End Funds; Assistant Secretary (since 2013), Vice President, Chief Legal Officer, Counsel and Secretary (2010 to 2013), Virtus Variable Insurance Trust; Vice President and Assistant Secretary (since 2011), Duff & Phelps Global Utility Income Fund Inc.; Senior Vice President and Assistant Secretary (2013 to 2014), Vice President and Assistant Secretary (2012 to 2013), Vice President, Chief Legal Officer, Counsel and Secretary (2011 to 2012), Virtus Closed-End Funds; and Assistant Secretary (since 2013), Virtus Alternative Solutions Trust. |
29
Table of Contents
FUND MANAGEMENT TABLES (UNAUDITED) (Continued)
Name, Address and Year of Birth | Position(s) Held with the Trust and | |||
Engberg, Nancy J. YOB: 1956 | Vice President and Chief Compliance Officer (since 2011). | Vice President (since 2008) and Chief Compliance Officer (2008 to 2011), Virtus Investment Partners, Inc. and/or certain of its subsidiaries; various officer positions (since 2003) with Virtus affiliates; Vice President and Chief Compliance Officer (since 2011), Virtus Mutual Fund Complex; Vice President (since 2010), Chief Compliance Officer (since 2011), Virtus Variable Insurance Trust; Vice President and Chief Compliance Officer (since 2011), Virtus Closed-End Funds; Vice President and Chief Compliance Officer (since 2012), The Zweig Closed-End Funds; and Vice President and Chief Compliance Officer (since 2013), Virtus Alternative Solutions Trust. | ||
Waltman, Francis G. YOB: 1962 | Executive Vice President (since 2013), Senior Vice President (2008 to 2013). | Virtus Investment Partners, Inc. and/or certain of its subsidiaries; various senior officer positions (since 2006) with Virtus affiliates; Executive Vice President (since 2013), Senior Vice President (2008 to 2013), Virtus Mutual Fund Complex; Executive Vice President (since 2013), Senior Vice President (2010 to 2013), Virtus Variable Insurance Trust; Executive Vice President (since 2013), Senior Vice President (2011 to 2013), Virtus Closed-End Funds; Director (since 2013), Virtus Global Funds PLC; and Executive Vice President (since 2013), Virtus Alternative Solutions Trust. |
30
Table of Contents
VIRTUS OPPORTUNITIES TRUST
101 Munson Street
Greenfield, MA 01301-9668
Trustees
George R. Aylward
Leroy Keith, Jr.
Philip R. McLoughlin, Chairman
Geraldine M. McNamara
James M. Oates
Richard E. Segerson
Ferdinand L.J. Verdonck
Officers
George R. Aylward, President
Francis G. Waltman, Executive Vice President
W. Patrick Bradley, Senior Vice President, Chief Financial Officer and Treasurer
Kevin J. Carr, Senior Vice President, Chief Legal Officer, Counsel and Secretary
Nancy J. Engberg, Vice President and Chief Compliance Officer
Investment Adviser
Virtus Investment Advisers, Inc.
100 Pearl Street
Hartford, CT 06103-4506
Principal Underwriter
VP Distributors, LLC
100 Pearl Street
Hartford, CT 06103-4506
Administrator and Transfer Agent
Virtus Fund Services, LLC
100 Pearl Street
Hartford, CT 06103-4506
Custodian
JPMorgan Chase Bank, NA
1 Chase Manhattan Plaza
New York, NY 10005-1401
Independent Registered Public Accounting Firm
PricewaterhouseCoopers LLP
2001 Market Street
Philadelphia, PA 19103-7042
How to Contact Us
Mutual Fund Services | 1-800-243-1574 | |||
Adviser Consulting Group | 1-800-243-4361 | |||
Telephone Orders | 1-800-367-5877 | |||
Text Telephone | 1-800-243-1926 | |||
Web site | Virtus.com |
Important Notice to Shareholders
The Securities and Exchange Commission has modified mailing regulations for semiannual and annual shareholder fund reports to allow mutual fund companies to send a single copy of these reports to shareholders who share the same mailing address. If you would like additional copies, please call Mutual Fund Services at 1-800-243-1574.
Table of Contents
For more information about
Virtus Mutual Funds, please call
your financial representative, or
contact us at 1-800-243-1574
or Virtus.com
| 8011 | 11-14 |

Table of Contents

ANNUAL REPORT
Virtus Allocator Premium AlphaSector® Fund*
Virtus AlphaSector® Rotation Fund*
Virtus Alternatives Diversifier Fund
Virtus Disciplined Equity Style Fund
Virtus Disciplined Select Bond Fund
Virtus Disciplined Select Country Fund
Virtus Dynamic AlphaSector® Fund*
Virtus Global Premium AlphaSector® Fund*
Virtus Herzfeld Fund*
Virtus Premium AlphaSector® Fund*
September 30, 2014 TRUST NAME: VIRTUS OPPORTUNITIES TRUST * Prospectus supplement applicable to this Fund appears at the back of this annual report. |
 |
Not FDIC Insured
No Bank Guarantee
May Lose Value
Table of Contents
Proxy Voting Procedures and Voting Record (Form N-PX)
The subadvisers vote proxies relating to portfolio securities in accordance with procedures that have been approved by the Board of Trustees (“Trustees” or the “Board”) of the Trust. You may obtain a description of these procedures, along with information regarding how the Funds voted proxies during the most recent 12-month period ended June 30, free of charge, by calling toll-free 1-800-243-1574. This information is also available through the Securities and Exchange Commission’s (the “SEC”) website at http://www.sec.gov.
Form N-Q Information
The Trust files a complete schedule of portfolio holdings for each Fund with the SEC for the first and third quarters of each fiscal year on Form N-Q. Form N-Q is available on the SEC’s website at http://www.sec.gov. Form N-Q may be reviewed and copied at the SEC’s Public Reference Room. Information on the operation of the SEC’s Public Reference Room can be obtained by calling toll-free 1-800-SEC-0330.
This report is not authorized for distribution to prospective investors in the Funds presented in this book unless preceded or accompanied by an effective prospectus which includes information concerning the sales charge, each Fund’s record and other pertinent information.
Table of Contents
Dear Fellow Shareholders of Virtus Mutual Funds:
 | I am pleased to present this annual report which highlights performance of your fund for the 12 months ended September 30, 2014, including comments from the money manager.
The past 12 months were generally strong for equities, although market volatility increased over the last quarter, driven by geopolitical risks and a slowdown in the global economy. While the economies of Europe, Japan, and China weakened, the U.S. economy accelerated and the U.S. dollar rallied strongly. Broad U.S. equity indexes registered double-digit gains for the 12 months ended September 30, 2014. The S&P 500® Index returned 19.73%, the Dow Jones Industrial AverageSM rose 15.29%, and the NASDAQ | |
Composite Index® was up 20.61%. By comparison, international equity returns were significantly smaller, including for both developed markets and emerging markets.
In mid-September, the Federal Reserve provided much needed assurance to investors by announcing that it intends to keep interest rates low for a “considerable time” after its bond buying program ends in October. Against this backdrop, the bellwether 10-year U.S. Treasury yield ended at 2.52% on September 30, 2014 compared with 2.64% a year earlier. The broader fixed income market, as measured by the Barclays U.S. Aggregate Bond Index, rose 3.96% for the 12 months ended September 30, 2014.
The uncertain state of the global economy is likely to remain a concern for markets in the months ahead. However, the health of the U.S. economy – including improving hiring, manufacturing, and housing data – gives investors reason for optimism. Future market direction will be determined largely by the ability of corporations to continue to produce robust earnings.
Market volatility is an ever-present reminder of the importance of portfolio diversification. While diversification cannot guarantee a profit or prevent loss, owning a variety of asset classes may cushion your portfolio against inevitable market fluctuations. Your financial advisor can help you ensure that your portfolio is adequately diversified across asset classes and investment strategies.
As always, thank you for entrusting Virtus with your assets. Should you have questions or require assistance, our customer service team is here to help at 1-866-270-7788. We appreciate your business and remain committed to your long-term financial success. | ||
Sincerely,
George R. Aylward President, Virtus Mutual Funds
October 2014 | ||

Whenever you have questions about your account, or require additional information, please visit us on the Web at www.virtus.com or call our shareowner service group toll-free at 1-800-243-1574.
Performance data quoted represents past results. Past performance is no guarantee of future results and current performance may be higher or lower than the performance shown above.
1
Table of Contents
Disclosure of Fund Expenses (Unaudited)
For the six-month period of April 1, 2014 to September 30, 2014
We believe it is important for you to understand the impact of costs on your investment. All mutual funds have operating expenses. As a shareholder of a Virtus Opportunities Trust fund (each, a “Fund”) you may incur two types of costs: (1) transaction costs, including sales charges on purchases of Class A shares and contingent deferred sales charges on Class B and Class C shares, and (2) ongoing costs, including investment advisory fees, distribution and service fees; and other expenses. Class I shares are sold without a sales charge and do not incur distribution and service fees. For further information regarding applicable sales charges, see Note 1 in the Notes to Financial Statements. These examples are intended to help you understand your ongoing costs (in dollars) of investing in a Fund and to compare these costs with the ongoing costs of investing in other mutual funds. These examples are based on an investment of $1,000 invested at the beginning of the period and held for the entire six-month period. The following Expense Table illustrates your Fund’s costs in two ways.
Actual Expenses
The first section of the accompanying table provides information about actual account values and actual expenses. You may use the information in this section, together with the amount you invested, to estimate the expenses that you paid over the period. Simply divide your account value by $1,000 (for example, an $8,600 account value divided by $1,000 = 8.6), then multiply the result by the number in the first section under the heading “Expenses Paid During Period” to estimate the expenses you paid on your account during the period.
Hypothetical Example for Comparison Purposes
The second section of the accompanying table provides information about hypothetical account values and hypothetical expenses based on the Fund’s actual expense ratio and an assumed rate of return of 5% per year before expenses, which is not your Fund’s actual return. The hypothetical account values and expenses may not be used to estimate the actual ending account balance or expenses you paid for the period. You may use this information to compare the ongoing costs of investing in your Fund and other funds. To do so, compare these 5% hypothetical examples with the 5% hypothetical examples that appear in the shareholder reports of the other funds.
Please note that the expenses shown in the accompanying table are meant to highlight your ongoing costs only and do not reflect any transactional costs, such as sales charges or contingent deferred sales charges. Therefore, the second section of the accompanying table is useful in comparing ongoing costs only, and will not help you determine the relative total costs of owning different funds. In addition, if these transactional costs were included, your costs would have been higher. The calculations assume no shares were bought or sold during the period. Your actual costs may have been higher or lower, depending on the amount of your investment and the timing of any purchases or redemptions.
| Expense Table | ||||||||||||||||
| Beginning Account Value April 1, 2014 | Ending Account Value September 30, 2014 | Annualized Expense Ratio | Expenses Paid During the Period* | |||||||||||||
Allocator Premium AlphaSector® Fund |
| |||||||||||||||
Actual | ||||||||||||||||
Class A | $ | 1,000.00 | $ | 1,012.70 | 1.63 | % | $ | 8.22 | ||||||||
Class C | 1,000.00 | 1,008.60 | 2.36 | 11.88 | ||||||||||||
Class I | 1,000.00 | 1,013.80 | 1.38 | 6.97 | ||||||||||||
Hypothetical (5% return before expenses) |
| |||||||||||||||
Class A | 1,000.00 | 1,016.79 | 1.63 | 8.27 | ||||||||||||
Class C | 1,000.00 | 1,013.09 | 2.36 | 11.98 | ||||||||||||
Class I | 1,000.00 | 1,018.06 | 1.38 | 7.01 | ||||||||||||
AlphaSector® Rotation Fund |
| |||||||||||||||
Actual | ||||||||||||||||
Class A | $ | 1,000.00 | $ | 1,049.20 | 0.99 | % | $ | 5.09 | ||||||||
Class C | 1,000.00 | 1,045.40 | 1.74 | 8.92 | ||||||||||||
Class I | 1,000.00 | 1,050.30 | 0.74 | 3.80 | ||||||||||||
Hypothetical (5% return before expenses) |
| |||||||||||||||
Class A | 1,000.00 | 1,020.04 | 0.99 | 5.03 | ||||||||||||
Class C | 1,000.00 | 1,016.24 | 1.74 | 8.83 | ||||||||||||
Class I | 1,000.00 | 1,021.31 | 0.74 | 3.76 | ||||||||||||
Alternatives Diversifier Fund |
| |||||||||||||||
Actual | ||||||||||||||||
Class A | $ | 1,000.00 | $ | 996.20 | 0.66 | % | $ | 3.30 | ||||||||
Class C | 1,000.00 | 991.70 | 1.41 | 7.04 | ||||||||||||
Class I | 1,000.00 | 996.50 | 0.41 | 2.05 | ||||||||||||
Hypothetical (5% return before expenses) |
| |||||||||||||||
Class A | 1,000.00 | 1,021.72 | 0.66 | 3.35 | ||||||||||||
Class C | 1,000.00 | 1,017.91 | 1.41 | 7.16 | ||||||||||||
Class I | 1,000.00 | 1,022.99 | 0.41 | 2.08 | ||||||||||||
Disciplined Equity Style Fund |
| |||||||||||||||
Actual | ||||||||||||||||
Class A | $ | 1,000.00 | $ | 1,025.00 | 1.60 | % | $ | 8.12 | ||||||||
Class C | 1,000.00 | 1,021.30 | 2.35 | 11.91 | ||||||||||||
Class I | 1,000.00 | 1,026.50 | 1.35 | 6.86 | ||||||||||||
Hypothetical (5% return before expenses) |
| |||||||||||||||
Class A | 1,000.00 | 1,016.95 | 1.60 | 8.12 | ||||||||||||
Class C | 1,000.00 | 1,013.14 | 2.35 | 11.93 | ||||||||||||
Class I | 1,000.00 | 1,018.22 | 1.35 | 6.85 | ||||||||||||
Disciplined Select Bond Fund |
| |||||||||||||||
Actual | ||||||||||||||||
Class A | $ | 1,000.00 | $ | 1,017.80 | 1.40 | % | $ | 7.08 | ||||||||
Class C | 1,000.00 | 1,013.20 | 2.15 | 10.85 | ||||||||||||
Class I | 1,000.00 | 1,018.10 | 1.15 | �� | 5.82 | |||||||||||
Hypothetical (5% return before expenses) |
| |||||||||||||||
Class A | 1,000.00 | 1,017.96 | 1.40 | 7.11 | ||||||||||||
Class C | 1,000.00 | 1,014.15 | 2.15 | 10.91 | ||||||||||||
Class I | 1,000.00 | 1,019.23 | 1.15 | 5.84 | ||||||||||||
Disciplined Select Country Fund |
| |||||||||||||||
Actual | ||||||||||||||||
Class A | $ | 1,000.00 | $ | 956.40 | 1.70 | % | $ | 8.34 | ||||||||
Class C | 1,000.00 | 952.70 | 2.45 | 11.99 | ||||||||||||
Class I | 1,000.00 | 957.30 | 1.45 | 7.11 | ||||||||||||
Hypothetical (5% return before expenses) |
| |||||||||||||||
Class A | 1,000.00 | 1,016.44 | 1.70 | 8.63 | ||||||||||||
Class C | 1,000.00 | 1,012.63 | 2.45 | 12.44 | ||||||||||||
Class I | 1,000.00 | 1,017.71 | 1.45 | 7.36 | ||||||||||||
2
Table of Contents
Disclosure of Fund Expenses (Unaudited) (Continued)
For the six-month period of April 1, 2014 to September 30, 2014
| Expense Table | ||||||||||||||||
| Beginning Account Value April 1, 2014 | Ending Account Value September 30, 2014 | Annualized Expense Ratio | Expenses Paid During the Period* | |||||||||||||
Dynamic AlphaSector® Fund** |
| |||||||||||||||
Actual | ||||||||||||||||
Class A | $ | 1,000.00 | $ | 1,018.40 | 2.53 | % | $ | 12.80 | ||||||||
Class B | 1,000.00 | 1,014.90 | 3.27 | 16.52 | ||||||||||||
Class C | 1,000.00 | 1,014.90 | 3.28 | 16.57 | ||||||||||||
Class I | 1,000.00 | 1,020.50 | 2.28 | 11.55 | ||||||||||||
Hypothetical (5% return before expenses) |
| |||||||||||||||
Class A | 1,000.00 | 1,012.22 | 2.53 | 12.84 | ||||||||||||
Class B | 1,000.00 | 1,008.47 | 3.27 | 16.60 | ||||||||||||
Class C | 1,000.00 | 1,008.42 | 3.28 | 16.65 | ||||||||||||
Class I | 1,000.00 | 1,013.49 | 2.28 | 11.57 | ||||||||||||
Global Premium AlphaSector® Fund |
| |||||||||||||||
Actual | ||||||||||||||||
Class A | $ | 1,000.00 | $ | 1,015.50 | 1.66 | % | $8.39 | |||||||||
Class C | 1,000.00 | 1,012.40 | 2.38 | 12.01 | ||||||||||||
Class I | 1,000.00 | 1,016.30 | 1.41 | 7.13 | ||||||||||||
Hypothetical (5% return before expenses) |
| |||||||||||||||
Class A | 1,000.00 | 1,016.64 | 1.66 | 8.43 | ||||||||||||
Class C | 1,000.00 | 1,012.99 | 2.38 | 12.08 | ||||||||||||
Class I | 1,000.00 | 1,017.91 | 1.41 | 7.16 | ||||||||||||
Herzfeld Fund |
| |||||||||||||||
Actual | ||||||||||||||||
Class A | $ | 1,000.00 | $ | 1,047.60 | 1.60 | % | $8.21 | |||||||||
Class C | 1,000.00 | 1,043.90 | 2.35 | 12.04 | ||||||||||||
Class I | 1,000.00 | 1,049.60 | 1.35 | 6.94 | ||||||||||||
Hypothetical (5% return before expenses) |
| |||||||||||||||
Class A | 1,000.00 | 1,016.95 | 1.60 | 8.12 | ||||||||||||
Class C | 1,000.00 | 1,013.14 | 2.35 | 11.93 | ||||||||||||
Class I | 1,000.00 | 1,018.22 | 1.35 | 6.85 | ||||||||||||
Premium AlphaSector® Fund |
| |||||||||||||||
Actual | ||||||||||||||||
Class A | $ | 1,000.00 | $ | 1,036.20 | 1.61 | % | $8.22 | |||||||||
Class C | 1,000.00 | 1,031.90 | 2.36 | 12.02 | ||||||||||||
Class I | 1,000.00 | 1,037.30 | 1.36 | 6.95 | ||||||||||||
Hypothetical (5% return before expenses) |
| |||||||||||||||
Class A | 1,000.00 | 1,016.90 | 1.61 | 8.17 | ||||||||||||
Class C | 1,000.00 | 1,013.09 | 2.36 | 11.98 | ||||||||||||
Class I | 1,000.00 | 1,018.16 | 1.36 | 6.90 | ||||||||||||
| * | Expenses are equal to the relevant Fund’s annualized expense ratio, which is net of waived fees, reimbursed expenses, dividends and interest on short sales, if applicable, multiplied by the average account value over the period, multiplied by the number of days (183) expenses were accrued in the most recent fiscal half-year, then divided by 365 to reflect the one-half year period. |
| ** | Dynamic AlphaSector Fund’s annualized expense ratios include interest expense due to leverage and dividends and interest expense on short sales. |
For Funds which may invest in other funds, the annualized expense ratios noted above do not reflect fees and expenses associated with the underlying funds. If such fees and expenses had been included, the expenses would have been higher.
You can find more information about the Funds’ expenses in the Financial Statements section that follows. For additional information on operating expenses and other shareholder costs, refer to the prospectus.
3
Table of Contents
American Depositary Receipt (ADR)
Represents shares of foreign companies traded in U.S. dollars on U.S. exchanges that are held by a bank or a trust. Foreign companies use ADRs in order to make it easier for Americans to buy their shares.
AlphaSector® Rotation Fund Composite Linked Index
The composite index allocation is 100% S&P 500® Index. Prior to September 29, 2009, the composite index consisted of 80% S&P 500® Index and 20% Barclays Capital U.S. Aggregate Bond Index. The index is unmanaged, its returns do not reflect any fees, expenses or sales charges, and it is not available for direct investment.
Alternatives Diversifier Composite Index
The Alternatives Diversifier composite index consists of: Diversified Trends Index (15%), UBS Global Investors (Real Estate) Index (20%), Global Infrastructure, represented by the MSCI World Infrastructure Sector Capped Index (since 9/1/2008) (15%), S&P North American Natural Resources Sector Index (10%), Deutsche Bank Liquid Commodity Index (15%), Deutsche Bank G10 Currency Harvest Index (15%), and Credit Suisse Leveraged Loan Index (10%). From 9/1/2008 to 3/1/2012 the composite consisted of HFRX Equity Market Neutral Index (20%), UBS Global Investors (Real Estate) Index (20%), Global Infrastructure, represented by the MSCI World Infrastructure Sector Capped Index (since 9/1/2008) (15%), S&P North American Natural Resources Sector Index (10%), Deutsche Bank Liquid Commodity Index (15%), Deutsche Bank G10 Currency Harvest Index (10%) and Credit Suisse Leveraged Loan Index (10%). Prior to 9/1/2008, the Global Infrastructure component was represented by a mix of MSCI US Utilities Index (65%), MSCI World Telecom Services Index (20%) and MSCI World ex US Utilities Index (15%). The index is unmanaged, its returns do not reflect any fees, expenses or sales charges, and it is not available for direct investment.
Barclays U.S. Aggregate Bond Index
The Barclays U.S. Aggregate Bond Index measures the U.S. investment grade fixed rate bond market. The index is calculated on a total return basis. The index is unmanaged, its returns do not reflect any fees, expenses or sales charges, and it is not available for direct investment.
Dow Jones Global Moderate Portfolio Index
The Dow Jones Global Moderate Portfolio Index is a benchmark that takes 60% of the risk of the global securities market. It is a total returns index that is a time-varying weighted average of stocks, bonds, and cash. The index is the efficient allocation of stocks, bonds, and cash in a portfolio with 60% of the risk of the Dow Jones Aggressive Portfolio Index. The index is calculated on a total return basis with dividends reinvested. The index is unmanaged, its returns do not reflect any fees, expenses or sales charges, and it is not available for direct investment.
Dow Jones Industrial Average
A market indicator composed of 30 actively traded blue chip U.S. stocks. While the index attempts to be representative of the U.S. economy as a whole, it is somewhat heavily weighted toward industrials. It is a price-weighted average, which means that the price movement of each stock is weighted equally regardless of its market capitalization. The index is unmanaged, its returns do not reflect any fees, expenses or sales charges, and it is not available for direct investment.
Dynamic AlphaSector® Index
The Dynamic AlphaSector® Index consists of the S&P 500® Index, a free-float market capitalization-weighted index of 500 of the largest U.S. companies. The index is calculated on a total return basis with dividends reinvested. Performance of the Dynamic AlphaSector® Linked Benchmark prior to 2/6/2012 is that of the Citigroup 90-Day Treasury Bill Index. The index is unmanaged, its returns do not reflect any fees, expenses or sales charges and it is not available for direct investment.
Exchange-Traded Funds (ETF)
Portfolios of stocks or bonds that track a specific market index.
Federal Reserve (the “Fed”)
The Central Bank of the United States, responsible for controlling the money supply, interest rates and credit with the goal of keeping the U.S. economy and currency stable. Governed by a seven-member board, the system includes 12 regional Federal Reserve Banks, 25 branches and all national and state banks that are part of the system.
4
Table of Contents
KEY INVESTMENT TERMS (Continued)
Fund of funds
A mutual fund that invests in the shares of other open-end mutual funds according to an established asset allocation model, resulting in a diversified portfolio of asset classes and investment strategies appropriate for pursuit of the overall investment objective.
Herzfeld Composite Index (60% MSCI AC World Index (net)/40% Barclays U.S. Aggregate Bond Index)
The composite index consists of 60% MSCI AC World Index (net) and 40% Barclays U.S. Aggregate Bond Index. The MSCI AC World Index (net) is a free float-adjusted market capitalization-weighted index that measures equity performance of developed and emerging markets. The index is calculated on a total return basis with net dividends reinvested. The Barclays U.S. Aggregate Bond Index measures the U.S. investment grade fixed rate bond market. The index is calculated on a total return basis. Each index is unmanaged, its returns do not reflect any fees, expenses, or sales charges, and is not available for direct investment.
iShares®
Represents shares of an open-end exchange-traded fund.
Long position (“long”)
Ownership of a security, giving the investor the right to transfer ownership to someone else, the right to receive income paid by the security, and the right to any profits or losses as the security’s value changes.
MLP (Master Limited Partnership)
A type of limited partnership that is publicly traded. The partnership must derive most of its cash flows from real estate, natural resources and commodities.
MSCI EAFE® Index (net)
The MSCI EAFE® Index (net) is a free float-adjusted market capitalization-weighted index that measures developed foreign market equity performance, excluding the U.S. and Canada. The index is calculated on a total return basis with net dividends reinvested. The index is unmanaged, its returns do not reflect any fees, expenses, or sales charges, and it is not available for direct investment.
MSCI All Country World Index (Net)
The MSCI All Country World Index (Net) is a free float-adjusted market capitalization-weighted index that measures equity performance of developed and emerging markets. The index is calculated on a total return basis with net dividends reinvested. The index is unmanaged, its returns do not reflect any fees, expenses or sales charges, and is not available for direct investment.
MSCI World Index (Net)
The MSCI World Index (net) is a free float-adjusted market capitalization-weighted index that measures developed global market equity performance. The index is calculated on a total return basis with net dividends reinvested. The index is unmanaged, its returns do not reflect any fees, expenses, or sales charges, and it is not available for direct investment.
MSCI All World ex U.S. Index (Net)
The MSCI All World ex U.S. Index (Net) is a market-capitalization-weighted index designed to provide a broad measure of stock performance throughout the world, with the exception of U.S.-based companies. The MSCI All Country World Index Ex-U.S. includes both developed and emerging markets. The index is unmanaged, its returns do not reflect any fees, expenses, or sales charges, and it is not available for direct investment.
NASDAQ Composite Index®
A market-capitalization weighted index of the more than 3,000 common equities listed on the Nasdaq stock exchange. Unlike other market indexes, the NASDAQ composite is not limited to companies that have U.S. headquarters. The index is unmanaged, its returns do not reflect any fees, expenses or sales charges and it is not available for direct investment.
REIT (Real Estate Investment Trust)
A publicly traded company that owns, develops and operates income-producing real estate such as apartments, office buildings, hotels, shopping centers and other commercial properties.
5
Table of Contents
KEY INVESTMENT TERMS (Continued)
Russell 3000® Index
The Russell 3000® Index is a market capitalization-weighted index that measures the performance of the 3,000 largest U.S. companies. The index is calculated on a total return basis with dividends reinvested. The index is unmanaged, its returns do not reflect any fees, expenses or sales charges, and it is not available for direct investment.
S&P 500® Index
The S&P 500® Index is a free-float market capitalization-weighted index of 500 of the largest U.S. companies. The index is calculated on a total return basis with dividends reinvested. The index is unmanaged, its returns do not reflect any fees, expenses or sales charges, and it is not available for direct investment.
SPDR®
Represents shares of an open-end exchange-traded fund.
Short position (“short”)
Stock shares that an investor has sold without actually owning (by borrowing the certificates from a broker) in anticipation of a decline in the stock value by a certain date. If the price falls, the investor buys the shares at the lower rate and makes a profit on the difference. It the price rises, the investor must buy at the higher price and sustains a loss.
6
Table of Contents
Allocator Premium AlphaSector® Fund
Fund Summary | Ticker Symbols: Class A: VAAAV Class C: VAACX Class I: VAISX |
| ¢ | The Fund is diversified and has an investment objective of capital appreciation. In pursuing this objective, the Fund maintains an emphasis on preservation of capital. |
| ¢ | For the fiscal year ended September 30, 2014, the Fund’s Class A shares at NAV returned 6.97%, Class C shares returned 6.15%, and Class I shares returned 7.20%. For the same period, the S&P 500® Index, a broad-based equity index, returned 19.73%. Dow Jones Global Moderate Portfolio Index, the Fund’s style-specific index appropriate for comparison, returned 7.93%. |
All performance figures assume reinvestment of distributions and exclude the effect of sales charges. Past performance is no guarantee of future results, and current performance may be higher or lower than the performance shown above.
How did the markets perform during the Fund’s fiscal year?
| ¢ | The Fund is a global balanced portfolio with four component sleeves: U.S. equity, international, fixed income, and real assets (focused on gold and real estate). |
| ¢ | In the year ended September 30, 2014, the U.S. equity market performed strongly, as the S&P 500® Index rose 19.73%. International markets were up modestly, with the MSCI All Country World ex U.S. Index, a recognized benchmark for world markets outside the U.S., up 4.77% for the period. |
| ¢ | The fixed income market, as measured by the Barclays U.S. Aggregate Bond Index, was up 3.96%. |
| ¢ | The real assets custom benchmark, which includes a mix of 50/50 in gold and real estate, was up 2.78%. |
What factors affected the Fund’s performance during its fiscal year?
| ¢ | The Fund seeks to provide risk controls for down markets and participation in rising markets. A key feature of the Fund is that each of the four asset class sleeves – U.S. equities, international equities, fixed income, and real assets – can move independently to address risk if the quantitative model that drives the Fund projects a risk of loss. |
| ¢ | In bear market conditions, the risk controls are intended to help the Fund outperform the benchmark Dow Jones Global Moderate Portfolio Index. In very strong bull markets, the Fund may be expected to lag the benchmark to a moderate degree. The quantitative model will in some circumstances forego an extreme “up market” period if it is accompanied by a projection of risk. This philosophy, of seeking market participation but emphasizing risk controls first and foremost, is the key to performance expectations. |
| ¢ | In its U.S. equity component, the Fund delivered on its mission of active participation in a rising market environment, and returns were slightly behind that of the market. |
| ¢ | The focus of the Fund’s strategy on risk management caused the international component of the portfolio to be partially defensively positioned at times during the year, including some use of a cash alternative. As a result, the Fund lagged the benchmark during the period. |
| ¢ | In its fixed income component, the Fund became more risk-focused and defensive at times during the period, holding cash alternative positions as dictated by the quantitative model. Although the defensive positioning was beneficial at times during the period, there was some underperformance during the third quarter. |
| ¢ | The real assets sleeve moved in and out of positions in gold and real estate for much of the period, avoiding risk in these investments. Based on a positive outlook for U.S. equities, the Fund reallocated from gold and real estate to U.S. equities towards the end of the period, which allowed the real assets sleeve to outperform its custom benchmark. |
| ¢ | Overall, the Fund delivered strong participation in U.S. equities and maintained a more defensive stance at times in the remaining three sleeves of the Fund. As a result, during the one-year period, the Fund slightly underperformed the benchmark Dow Jones Global Moderate Portfolio Index. |
The preceding information is the opinion of portfolio management. Any such opinions are subject to change at any time based upon market or other conditions and should not be relied upon as investment
advice. Past performance is no guarantee of future results, and there is no guarantee that market forecasts will be realized.
There is no guarantee that the Fund will meet its objective.
A fund that focuses its investments in a particular industry or sector will be more sensitive to conditions that affect that industry or sector than a non-concentrated fund. Debt securities are subject to various risks, the most prominent of which are credit and interest rate risk. The issuer of a security may fail to make payments in a timely manner. Values of debt securities may rise and fall in response to changes in interest rates. This risk may be enhanced with longer term maturities. Investing internationally, especially in emerging markets, involves additional risks such as currency, political, accounting, economic, and market risk. The value of an ETF may be more volatile than the underlying portfolio of securities the ETF is designed to track. The costs of owning the ETF may exceed the cost of investing directly in the underlying securities. U.S. government securities may be subject to price fluctuations. An agency may default on an obligation not backed by the United States. Any guarantee on U.S. government securities does not apply to the value of the Fund’s shares. There is a greater level of credit risk and price volatility involved with high yield securities than investment grade securities. The Fund’s exposure to different asset classes may not be optimal for market conditions at a given time. Asset allocation does not guarantee a profit or protect against a loss in declining markets.
The market price of equity securities may be affected by financial market, industry, or issuer-specific events. Focus on a particular style or on small or medium-sized companies may enhance that risk.
| Asset Allocation | ||||
The following table presents asset allocations within certain sectors and as a percentage of total investments as of September 30, 2014.
|
| |||
Financials | 15 | % | ||
Consumer Staples | 5 | |||
Information Technology | 5 | |||
Health Care | 5 | |||
Materials | 5 | |||
Industrials | 5 | |||
Other (includes short-term investments) | 60 | |||
|
| |||
Total | 100 | % | ||
|
| |||
For information regarding the indexes and certain investment terms, see the Key Investment Terms starting on page 4.
7
Table of Contents
Allocator Premium AlphaSector® Fund (Continued)
| Average Annual Total Returns1 for periods ended 9/30/14 | ||||||||||||
| 1 year | Since Inception | Inception Date | ||||||||||
| Class A Shares at NAV2 | 6.97 | % | 5.89 | % | 3/15/11 | |||||||
| Class A Shares at POP3,4 | 0.82 | 4.13 | 3/15/11 | |||||||||
| Class C Shares at NAV2 and with CDSC4 | 6.15 | 5.12 | 3/15/11 | |||||||||
| Class I Shares at NAV | 7.20 | 6.14 | 3/15/11 | |||||||||
| S&P 500® Index | 19.73 | 15.35 | 5 | — | ||||||||
| Dow Jones Global Moderate Portfolio IndexSM | 7.93 | 8.04 | 5 | — | ||||||||
Fund Expense Ratios6: A Shares: Gross 1.88%, Net 1.75%; C Shares: Gross 2.61%, Net 2.50%; I Shares: Gross 1.63%, Net 1.50%.
All returns represent past performance which is no guarantee of future results. Current performance may be higher or lower than the performance shown. The investment return and principal value of an investment will fluctuate so that an investor’s shares, when redeemed, may be worth more or less than their original cost. The above table and graph below do not reflect the deduction of taxes that a shareholder would pay on fund distributions or the redemption of shares. Please visit Virtus.com for performance data current to the most recent month-end.
| 1 | Total returns are historical and include changes in share price and the reinvestment of both dividends and capital gains distributions. |
| 2 | “NAV” (Net Asset Value) total returns do not include the effect of any sales charge. |
| 3 | “POP” (Public Offering Price) total returns include the effect of the maximum front-end 5.75% sales charge. |
| 4 | “CDSC” (Contingent Deferred Sales Charge) is applied to redemptions of certain classes of shares that do not have a sales charge applied at the time of purchase. CDSC charges for certain redemptions of Class A shares made within 18 months of purchase in which a finder’s fee was paid and all redemptions of Class C shares within the first year are 1% and 0% thereafter. |
| 5 | The index returns are from the Fund’s inception date. |
| 6 | The expense ratios of the Fund are set forth according to the prospectus for the Fund effective January 28, 2014, as supplemented and revised, and may differ from the expense ratios disclosed in the Financial Highlights tables in this report. See the Financial Highlights for more current expense ratios. Net Expense: Expenses reduced by voluntary fee waiver which may be discontinued at any time. Gross Expense: Does not reflect the effect of the fee waiver. Expense ratios reflect fees and expenses associated with the underlying funds. Class C share ratio reflects distributor’s contractual waiver for 12b-1 fees. |
Growth of $10,000 For periods ended 9/30
This chart assumes an initial investment of $10,000 made on March 15, 2011 (inception date of the Fund), for Class A, Class C, and Class I shares including any applicable sales charges or fees. Performance assumes reinvestment of dividends and capital gain distributions.
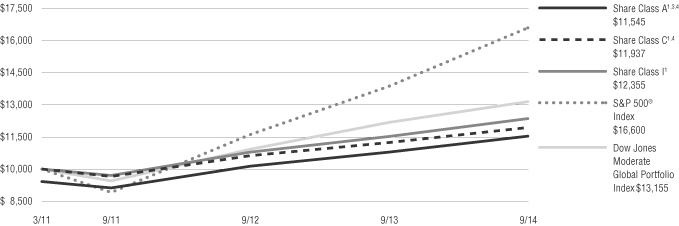
The indexes are unmanaged and not available for direct investment; therefore, their performance does not reflect the expenses associated with active management of an actual portfolio.
For information regarding the indexes and certain investment terms, see the Key Investment Terms starting on page 4.
8
Table of Contents
Fund Summary | Ticker Symbols: Class A: PWBAX Class C: PWBCX Class I: VARIX |
| ¢ | The Fund is diversified and has an investment objective of long-term capital appreciation. |
| ¢ | For the fiscal year ended September 30, 2014, the Fund’s Class A shares at NAV returned 17.81%, Class C shares returned 16.89%, and Class I shares returned 18.08%. For the same period, the S&P 500® Index, a broad-based equity index, and the AlphaSector® Rotation Fund Composite Linked Index, the Fund’s style-specific benchmark appropriate for comparison, each returned 19.73%. |
All performance figures assume reinvestment of distributions and exclude the effect of sales charges. Past performance is no guarantee of future results, and current performance may be higher or lower than the performance shown above.
How did the markets perform during the Fund’s fiscal year?
| ¢ | In the fiscal year ended September 30, 2014, the U.S. equity market performed strongly, as the S&P 500® Index rose 19.73%. |
| ¢ | U.S. equity market performance was strongest during the fourth quarter of 2013, with the S&P 500® Index up 10.51%. Performance was more modest during the first and third quarters of 2014, at 1.81% and 1.13%, respectively. Second quarter performance was also quite strong at 5.23%. |
| ¢ | Viewing the U.S. equity markets by sector, the overall picture is positive. In the fiscal period, the healthcare, technology, and materials sectors outperformed the broader S&P 500® Index. Consumer staples, consumer discretionary, financials, energy, industrials, and utilities underperformed the S&P 500® Index, but were positive overall. |
What factors affected the Fund’s performance during its fiscal year?
| ¢ | The Fund has an investment objective of long-term capital appreciation and strives to outperform the S&P 500® Index over market cycles while also seeking to deliver lower volatility, low beta, and low correlation. The Fund employs a flexible, proprietary quantitative model which can invest in any combination of the nine primary sectors of the S&P 500® Index, a combination of sectors and cash equivalents, or 100% cash equivalents. |
| ¢ | The Fund performed as designed for the period: the U.S. equity market was positive, and the Fund was invested in U.S. equities throughout the period. Over the course of the Fund’s fiscal year ended September 30, 2014, the Fund performed in line with the S&P 500® Index, although it slightly lagged the benchmark during the third quarter. |
| ¢ | The quantitative model driving the Fund does an independent assessment of each of the nine equity sectors of the S&P 500® Index. During the period, individual sectors turned “on” or “off,” but the portfolio as a whole remained 100% invested in U.S. equities. There were no periods in which extreme or widespread risk caused the Fund to take a position in cash equivalents. |
| ¢ | The net result for the period is that the Fund delivered on expectations, providing participation in a rising U.S. equity market. |
The preceding information is the opinion of portfolio management. Any such opinions are subject to change at any time based upon market or other conditions and should not be relied upon as investment advice. Past performance is no guarantee of future results, and there is no guarantee that market forecasts will be realized.
There is no guarantee that the Fund will meet its objective.
A fund that focuses its investments in a particular industry or sector will be more sensitive to conditions that affect that industry or sector than a non-concentrated fund. The value of an ETF may be more volatile than the underlying portfolio of securities the ETF is designed to track. The costs of owning the ETF may exceed the cost of investing directly in the underlying securities. U.S. government securities may be subject to price fluctuations. An agency may default on an obligation not backed by the United States. Any guarantee on U.S. government securities does not apply to the value of the Fund’s shares. The Fund’s exposure to different asset classes may not be optimal for market conditions at a given time. Asset allocation does not guarantee a profit or protect against a loss in declining markets.
The market price of equity securities may be affected by financial market, industry, or issuer-specific events. Focus on a particular style or on small or medium-sized companies may enhance that risk.
| Asset Allocation | ||||
The following table presents asset allocations within certain sectors and as a percentage of total investments as of September 30, 2014.
|
| |||
Health Care | 13 | % | ||
Consumer Staples | 13 | |||
Financials | 13 | |||
Industrials | 12 | |||
Energy | 12 | |||
Materials | 12 | |||
Consumer Discretionary | 12 | |||
Information Technology | 11 | |||
Telecommunication Services | 2 | |||
|
| |||
Total | 100 | % | ||
|
| |||
For information regarding the indexes and certain investment terms, see the Key Investment Terms starting on page 4.
9
Table of Contents
AlphaSector® Rotation Fund (Continued)
| Average Annual Total Returns1 for periods ended 9/30/14 | ||||||||||||||||||||
| 1 year | 5 years | 10 years | Since Inception | Inception Date | ||||||||||||||||
| Class A Shares at NAV2 | 17.81 | % | 14.03 | % | 7.61 | % | — | — | ||||||||||||
| Class A Shares at POP3,4 | 11.04 | 12.69 | 6.98 | — | — | |||||||||||||||
| Class C Shares at NAV2 and with CDSC4 | 16.89 | 13.19 | 6.83 | — | — | |||||||||||||||
| Class I Shares at NAV | 18.08 | — | — | 14.88 | % | 10/1/09 | ||||||||||||||
| S&P 500® Index | 19.73 | 15.70 | 8.11 | 16.30 | 5 | — | ||||||||||||||
| AlphaSector™ Rotation Fund Composite Linked Index | 19.73 | 15.70 | 8.68 | 16.30 | 5 | — | ||||||||||||||
Fund Expense Ratios6: A Shares 1.03%; C Shares 1.77%; I Shares 0.78%.
All returns represent past performance which is no guarantee of future results. Current performance may be higher or lower than the performance shown. The investment return and principal value of an investment will fluctuate so that an investor’s shares, when redeemed, may be worth more or less than their original cost. The above table and graph below do not reflect the deduction of taxes that a shareholder would pay on fund distributions or the redemption of shares. Please visit Virtus.com for performance data current to the most recent month-end.
| 1 | Total returns are historical and include changes in share price and the reinvestment of both dividends and capital gains distributions. |
| 2 | “NAV” (Net Asset Value) total returns do not include the effect of any sales charge. |
| 3 | “POP” (Public Offering Price) total returns include the effect of the maximum front-end 5.75% sales charge. |
| 4 | “CDSC” (Contingent Deferred Sales Charge) is applied to redemptions of certain classes of shares that do not have a sales charge applied at the time of purchase. CDSC charges for certain redemptions of Class A shares made within 18 months of purchase in which a finder’s fee was paid and all redemptions of Class C shares within the first year are 1% and 0% thereafter. |
| 5 | The since inception index returns are from the inception date of Class I shares. |
| 6 | The expense ratios of the Fund are set forth according to the prospectus for the Fund effective January 28, 2014, as supplemented and revised, and may differ from the expense ratios disclosed in the Financial Highlights tables in this report. See the Financial Highlights for more current expense ratios. Expense ratios reflect fees and expenses associated with the underlying funds. Class C share ratio reflects distributor’s contractual waiver for 12b-1 fees. |
Growth of $10,000 For periods ended 9/30
This chart assumes an initial investment of $10,000 made on September 30, 2004, for Class A and Class C shares including any applicable sales charges or fees. Performance assumes reinvestment of dividends and capital gain distributions.
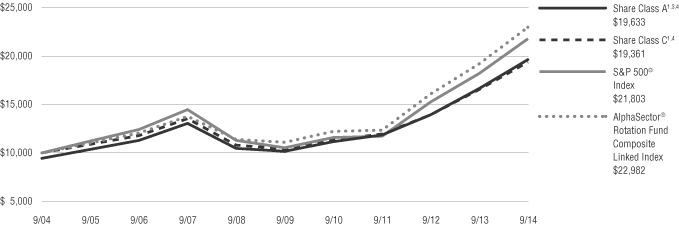
The indexes are unmanaged and not available for direct investment; therefore, their performance does not reflect the expenses associated with active management of an actual portfolio.
For information regarding the indexes and certain investment terms, see the Key Investment Terms starting on page 4.
10
Table of Contents
Fund Summary | Ticker Symbols: Class A: PDPAX Class C: PDPCX Class I: VADIX |
| ¢ | The Fund is diversified and has an investment objective of long-term capital appreciation. |
| ¢ | For the fiscal year ended September 30, 2014, the Fund’s Class A shares at NAV returned 4.28%, Class C shares returned 3.47%, and Class I shares returned 4.52%. For the same period, the S&P 500® Index, a broad-based equity index, returned 19.73%, and the Alternatives Diversifier Composite Index, the Fund’s style-specific index appropriate for comparison, returned 5.44%. |
All performance figures assume reinvestment of distributions and exclude the effect of sales charges. Past performance is no guarantee of future results, and current performance may be higher or lower than the performance shown above.
How did the markets perform during the Fund’s fiscal year?
| ¢ | Major U.S. stock market indexes all had powerful rallies during the fiscal year, with the S&P 500® Index regularly setting new all-time highs. Bonds also shook off a late 2013 sell-off as yields in the benchmark 10-year U.S. Treasury note spiked to 3.0%, but eventually fell precipitously as the year progressed. |
| ¢ | A combination of low inflation, friendly Central Bank policy, and mixed economic data led to good financial conditions for traditional stock and bond investors. While there were a few hiccups, generally investors were rewarded with solid returns across most U.S. stock categories. |
| ¢ | Bond investors, especially those in corporate and high-yield issuers, also experienced friendly outcomes as spreads tightened against “risk-free” Treasury bonds and yields generally fell during the period. |
What factors affected the Fund’s performance during its fiscal year?
| ¢ | The Fund experienced a wide variation in the investment performance of its underlying investments. Any investments related to commodities or natural resources struggled as these areas tend to do best when either inflation is rising or there is a global economic boom. Most of the emerging markets, and China in particular, have been experiencing slow growth, which has kept commodity |
prices weak. Furthermore, inflation is very tame, thus the Fund’s commodity exposure, while lower than the benchmark, did hurt performance. |
| ¢ | On the positive side, the exposure to global infrastructure and REITs (both international and domestic) were very good performance drivers. While neither area kept up with the S&P 500® Index, they generally outperformed most bond indexes, and on the whole the Fund was able to deliver positive returns. |
| ¢ | The drag from commodities and natural resource investments did decrease returns, however given the diversification the Fund is designed to offer, that is the trade-off of having exposure in these areas. |
The preceding information is the opinion of portfolio management. Any such opinions are subject to change at any time based upon market or other conditions and should not be relied upon as investment advice. Past performance is no guarantee of future results, and there is no guarantee that market forecasts will be realized.
There is no guarantee that the Fund will meet its objective.
A fund that focuses its investments in a particular industry or sector will be more sensitive to conditions that affect that industry or sector than a non-concentrated fund. Investing internationally, especially in emerging markets, involves additional risks such as currency, political, accounting, economic, and market risk. The Fund may be negatively affected by factors specific to the real estate market, including interest rate, leverage, property, and management. Investments in derivatives such as futures, options, forwards, and swaps may increase volatility or cause a loss greater than the principal investment. Events negatively affecting a particular commodity in which the Fund focuses its investments may cause the value of the Fund’s shares to decrease, perhaps significantly. Because the Fund can invest in other funds, it indirectly bears its proportionate share of the operating expenses and management fees of the underlying fund(s). The Fund’s exposure to different asset classes may not be optimal for market conditions at a given time. Asset allocation does not guarantee a profit or protect against a loss in declining markets. The Fund’s adviser may select affiliated and/or unaffiliated funds, which may create a conflict of interest.
| Asset Allocation | ||||
The following table presents asset allocations within certain sectors and as a percentage of total investments as of September 30, 2014.
|
| |||
Affiliated Equity Mutual Funds | 61 | % | ||
Exchange-Traded Funds | 29 | |||
Affiliated Fixed Income Mutual Funds | 9 | |||
Other (includes short-term investments) | 1 | |||
|
| |||
Total | 100 | % | ||
|
| |||
For information regarding the indexes and certain investment terms, see the Key Investment Terms starting on page 4.
11
Table of Contents
Alternatives Diversifier Fund (Continued)
| Average Annual Total Returns1 for periods ended 9/30/14 | ||||||||||||||||
| 1 year | 5 years | Since Inception | Inception Date | |||||||||||||
| Class A Shares at NAV2 | 4.28 | % | 5.25 | % | 2.87 | % | 11/30/05 | |||||||||
| Class A Shares at POP3,4 | -1.72 | 4.01 | 2.18 | 11/30/05 | ||||||||||||
| Class C Shares at NAV2 and with CDSC4 | 3.47 | 4.45 | 2.10 | 11/30/05 | ||||||||||||
| Class I Shares at NAV | 4.52 | — | 5.88 | 10/1/09 | ||||||||||||
| S&P 500® Index | 19.73 | 15.70 | — | 5 | — | |||||||||||
| Alternatives Diversifier Composite Index | 5.44 | 6.48 | — | 6 | — | |||||||||||
Fund Expense Ratios7: A Shares: 1.66%; C Shares: 2.41%; I Shares: 1.41%.
All returns represent past performance which is no guarantee of future results. Current performance may be higher or lower than the performance shown. The investment return and principal value of an investment will fluctuate so that an investor’s shares, when redeemed, may be worth more or less than their original cost. The above table and graph below do not reflect the deduction of taxes that a shareholder would pay on fund distributions or the redemption of shares. Please visit Virtus.com for performance data current to the most recent month-end.
| 1 | Total returns are historical and include changes in share price and the reinvestment of both dividends and capital gains distributions. |
| 2 | “NAV” (Net Asset Value) total returns do not include the effect of any sales charge. |
| 3 | “POP” (Public Offering Price) total returns include the effect of the maximum front-end 5.75% sales charge. |
| 4 | “CDSC” (Contingent Deferred Sales Charge) is applied to redemptions of certain classes of shares that do not have a sales charge applied at the time of purchase. CDSC charges for certain redemptions of Class A shares made within 18 months of purchase in which a finder’s fee was paid and all redemptions of Class C shares within the first year are 1% and 0% thereafter. |
| 5 | The index returned 7.55% for Class A and Class C shares and 16.30% for Class I shares since the inception date of the respective share class. |
| 6 | The index returned 4.39% for Class A and Class C shares and 6.48% for Class I shares since the inception date of the respective share class. |
| 7 | The expense ratios of the Fund are set forth according to the prospectus for the Fund effective January 28, 2014, as supplemented and revised, and may differ from the expense ratios disclosed in the Financial Highlights tables in this report. See the Financial Highlights for more current expense ratios. Expense ratios reflect fees and expenses associated with the underlying funds. |
Growth of $10,000 For periods ended 9/30
This chart assumes an initial investment of $10,000 made on November 30, 2005 (inception date of the Fund), for Class A and Class C shares including any applicable sales charges or fees. Performance assumes reinvestment of dividends and capital gain distributions.
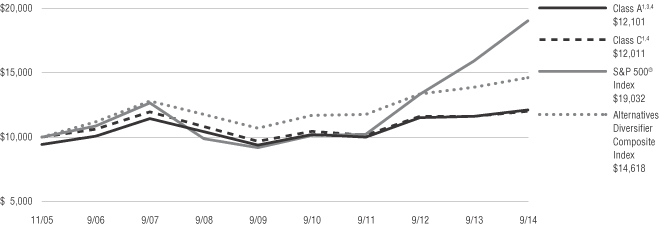
The indexes are unmanaged and not available for direct investment; therefore, their performance does not reflect the expenses associated with active management of an actual portfolio.
For information regarding the indexes and certain investment terms, see the Key Investment Terms starting on page 4.
12
Table of Contents
Fund Summary | Ticker Symbols: Class A: VDEAX Class C: VDECX Class I: VDEIX |
| ¢ | The Fund is diversified and has an investment objective of capital appreciation. |
| ¢ | For the fiscal year ended September 30, 2014, the Fund’s Class A shares at NAV returned 11.77%, Class C shares returned 10.91%, and Class I shares returned 12.09%. For the same period, the S&P 500® Index, a broad-based equity index, returned 19.73%, and the Russell 3000® Index the Fund’s style-specific benchmark appropriate for comparison returned 17.76%. |
All performance figures assume reinvestment of distributions and exclude the effect of sales charges. Past performance is no guarantee of future results, and current performance may be higher or lower than the performance shown above.
How did the markets perform during the Fund’s fiscal year?
| ¢ | Generally, domestic equity performance remained strong over the Fund’s fiscal year, providing tailwinds for total return. |
| ¢ | Domestic equity market performance was primarily capitalization-driven, with large- and mega-cap equities dramatically outperforming their small- and micro-cap cousins. In the prior 12 months, large-cap growth (“IWF” ETF) outperformed small-cap growth (“IWO” ETF) by over 1500 basis points; and large-cap value (“IWD” ETF) outperformed small-cap value (“IWN” ETF) by over 1450 basis points. |
What factors affected the Fund’s performance during its fiscal year?
| ¢ | Due to the short-term nature of the trends this strategy seeks to capture, the multi-day quality assurance implementation lag enforced by the NASDAQ Composite Index® was a drag on performance. Due to this drag, on May 31, 2014, it was determined that the Fund would no longer track the index and instead implement the trading signals in a more timely manner. |
| ¢ | The Fund’s structural tilt toward small-cap equities served as a drag on performance, as small-cap equities dramatically underperformed large-cap equities over the period. |
| ¢ | The Fund made three tactical shifts over the year. The first occurred on March 21, 2014, when the Fund switched from a position in growth to one in value. From March 21, 2014 to June 20, 2014, the Fund invested in value equities. Finally, from June 20, 2014 to September 30, 2014, the Fund was invested in growth equities. We estimate that the style shifts added in excess of 400 basis points over the period. |
The preceding information is the opinion of portfolio management. Any such opinions are subject to change at any time based on market or other conditions and should not be relied upon as investment advice. Past performance is no guarantee of future results, and there is no guarantee that market forecasts will be realized.
There is no guarantee that the Fund will meet its objectives.
| Asset Allocation | ||||
The following table presents asset allocations within certain sectors and as a percentage of total investments as of September 30, 2014.
|
| |||
Exchange Traded Funds | 99 | % | ||
Other (includes short-term investments) | 1 | |||
|
| |||
Total | 100 | % | ||
|
| |||
The market price of equity securities may be affected by financial market, industry, or issuer-specific events. Focus on a particular style or on small or medium sized companies may enhance that risk. The value of an ETF may be more volatile than the underlying portfolio of securities the ETF is designed to track. The costs of owning the ETF may exceed the cost of investing directly in the underlying securities.
For information regarding the indexes and certain investment terms, see the Key Investment Terms starting on page 4.
13
Table of Contents
Disciplined Equity Style Fund (Continued)
| Average Annual Total Returns1 for periods ended 9/30/14 | ||||||||||||
| 1 year | Since Inception | Inception Date | ||||||||||
| Class A Shares at NAV2 | 11.77 | % | 21.03 | % | 12/18/12 | |||||||
| Class A Shares at POP3,4 | 5.34 | 17.07 | 12/18/12 | |||||||||
| Class C Shares at NAV2 and with CDSC4 | 10.91 | 20.11 | 12/18/12 | |||||||||
| Class I Shares at NAV | 12.09 | 21.33 | 12/18/12 | |||||||||
S&P 500® Index | 19.73 | 21.49 | 5 | — | ||||||||
Russell 3000® Index | 17.76 | 21.36 | 5 | — | ||||||||
Fund Expense Ratios6: A Shares: Gross 8.29%, Net 1.60%; C Shares: Gross 9.04%, Net 2.35%; I Shares: Gross 8.04%, Net 1.35%.
All returns represent past performance which is no guarantee of future results. Current performance may be higher or lower than the performance shown. The investment return and principal value of an investment will fluctuate so that an investor’s shares, when redeemed, may be worth more or less than their original cost. The above table and graph below do not reflect the deduction of taxes that a shareholder would pay on fund distributions or the redemption of shares. Please visit Virtus.com for performance data current to the most recent month-end.
| 1 | Total returns are historical and include changes in share price and the reinvestment of both dividends and capital gains distributions. |
| 2 | “NAV” (Net Asset Value) total returns do not include the effect of any sales charge. |
| 3 | “POP” (Public Offering Price) total returns include the effect of the maximum front-end 5.75% sales charge. |
| 4 | “CDSC” (Contingent Deferred Sales Charge) is applied to redemptions of certain classes of shares that do not have a sales charge applied at the time of purchase. CDSC charges for certain redemptions of Class A shares made within 18 months of purchase in which a finder’s fee was paid and all redemptions of Class C shares within the first year are 1% and 0% thereafter. |
| 5 | The since inception index returns are from the Fund’s inception date. |
| 6 | The expense ratios of the Fund are set forth according to the prospectus for the Fund effective January 28, 2014 and may differ from the expense ratios disclosed in the Financial Highlights tables in this report. See the Financial Highlights for more current expense ratios. Net Expense: Expenses reduced by the contractual fee waiver in effect through January 31, 2014. Effective February 1, 2014, the waiver is voluntary and may be discontinued at any time. Gross Expense: Does not reflect the effect of the fee waiver. Expense ratios do reflect fees and expenses associated with the underlying funds. |
Growth of $10,000 For periods ended 9/30
This chart assumes an initial investment of $10,000 made on December 18, 2012 (inception date of the Fund), for Class A, Class C, and Class I shares including any applicable sales charges or fees. Performance assumes reinvestment of dividends and capital gain distributions.
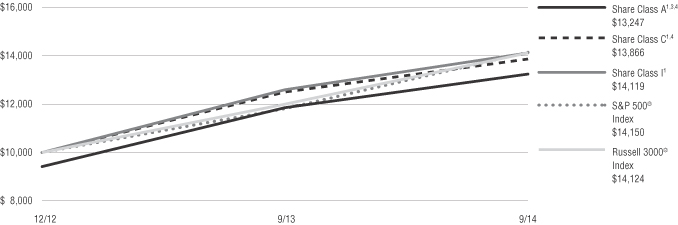
The indexes are unmanaged and not available for direct investment; therefore, their performance does not reflect the expense associated with active management of an actual portfolio.
For information regarding the indexes and certain investment terms, see the Key Investment Terms starting on page 4.
14
Table of Contents
Fund Summary | Ticker Symbols: Class A: VDBAX Class C: VDBCX Class I: VDBIX |
| ¢ | The Fund is diversified and has an investment objective of high total return from current income and capital appreciation. |
| ¢ | For the fiscal ended September 30, 2014, the Fund’s Class A shares at NAV returned 3.59%, Class C shares returned 2.73%, and Class I shares returned 3.75%. For the same period, the Barclays U.S. Aggregate Bond Index, a broad-based fixed income index, returned 3.96%. |
All performance figures assume reinvestment of distributions and exclude the effect of sales charges. Past performance is no guarantee of future results and current performance may be higher or lower than the performance shown above.
How did the markets perform during the Fund’s fiscal year?
| ¢ | Over the Fund’s fiscal year, there were two dramatic effects at play. First was the volatility in interest rates. From September 30, 2013, the 10-year U.S. Treasury rate rose from 2.64% to a peak of 3.04% on December 31, 2013, before falling back to as low as 2.34% on August 15, 2014. The volatile level of interest rates had a dramatic effect on long-dated fixed-income. In particular, 7-10 Year Treasuries, 20+ Year Treasuries, and Treasury Inflation Protected Securities (“TIPS”) suffered sell-offs in the fourth quarter of 2013 with strong rallies over the first three quarters of 2014. |
| ¢ | The second effect was a continued decline in credit spreads (measured as Moody’s Seasoned Baa Corporate Bond Yield – Moody’s Seasoned Aaa Corporate Bond Yield). From October 2013 to July 2014, credit spreads fell from 78 basis points to 57 basis points, before subsequently climbing back up to 69 basis points. The fall in credit spreads translated to a strong rally in credit-based fixed-income. |
| ¢ | Of a more minor note is the recent pullback in inflation expectations, causing a sell-off in TIPS from August 31, 2014 to September 30, 2014. |
What factors affected the Fund’s performance during its fiscal year?
| ¢ | Due to the short-term nature of the trends this strategy seeks to capture, the multi-day quality assurance implementation lag enforced by the |
NASDAQ Composite Index® was a drag on performance. Due to this drag, on May 31, 2014, it was determined that the Fund would no longer track the index and instead implement the trading signals in a more timely manner. |
| ¢ | General market tailwinds served as a benefit to total return performance throughout the year. From December 30, 2013 to August 31, 2014, there was little disparity between the three internal nominal, credit-based, and inflation-linked fixed-income indices we track. Disparities that did occur were short-lived. |
The preceding information is the opinion of portfolio management. Any such opinions are subject to change at any time based on market or other conditions and should not be relied upon as investment advice. Past performance is no guarantee of future results, and there is no guarantee that market forecasts will be realized.
There is no guarantee that the Fund will meet its objectives.
| Asset Allocation | ||||
The following table presents asset allocations within certain sectors and as a percentage of total investments as of September 30, 2014.
|
| |||
Exchange Traded Funds | 98 | % | ||
Other (includes short-term investments) | 2 | |||
|
| |||
Total | 100 | % | ||
|
| |||
Debt securities are subject to various risks, the most prominent of which are credit and interest rate risk. The issuer of a security may fail to make payments in a timely manner. Values of debt securities may rise and fall in response to changes in interest rates. This risk may be enhanced with longer-term maturities. The value of an ETF may be more volatile than the underlying portfolio of securities the ETF is designed to track. The costs of owning the ETF may exceed the cost of investing directly in the underlying securities. There is a greater level of credit risk and price volatility involved with high yield securities than investment grade securities. Securities in the fund may go up or down in response to the prospects of individual companies and general economic conditions. Price changes may be short or long term. U.S. government securities may be subject to price fluctuations. An
agency may default on an obligation not backed by the United States. Any guarantee on U.S. government securities does not apply to the value of the fund’s shares.
For information regarding the indexes and certain investment terms, see the Key Investment Terms starting on page 4.
15
Table of Contents
Disciplined Select Bond Fund (Continued)
| Average Annual Total Returns1 for periods ended 9/30/14 | ||||||||||||
| 1 year | Since Inception | Inception Date | ||||||||||
| Class A Shares at NAV2 | 3.59 | % | -0.62 | % | 12/18/12 | |||||||
| Class A Shares at POP3,4 | -0.29 | -2.73 | 12/18/12 | |||||||||
| Class C Shares at NAV2 and with CDSC4 | 2.73 | -1.33 | 12/18/12 | |||||||||
| Class I Shares at NAV | 3.75 | -0.39 | 12/18/12 | |||||||||
| Barclays U.S. Aggregate Bond Index | 3.96 | 1.35 | 5 | — | ||||||||
Fund Expense Ratios6: A Shares: Gross 9.63%, Net 1.40%; C Shares: Gross 10.38%, Net 2.15%; I Shares: Gross 9.38%, Net 1.15%.
All returns represent past performance which is no guarantee of future results. Current performance may be higher or lower than the performance shown. The investment return and principal value of an investment will fluctuate so that an investor’s shares, when redeemed, may be worth more or less than their original cost. The above table and graph below do not reflect the deduction of taxes that a shareholder would pay on fund distributions or the redemption of shares. Please visit Virtus.com for performance data current to the most recent month-end.
| 1 | Total returns are historical and include changes in share price and the reinvestment of both dividends and capital gains distributions. |
| 2 | “NAV” (Net Asset Value) total returns do not include the effect of any sales charge. |
| 3 | “POP” (Public Offering Price) total returns include the effect of the maximum front-end 3.75% sales charge. |
| 4 | “CDSC” (Contingent Deferred Sales Charge) is applied to redemptions of certain classes of shares that do not have a sales charge applied at the time of purchase. CDSC charges for certain redemptions of Class A shares made within 18 months of purchase in which a finder’s fee was paid and all redemptions of Class C shares within the first year are 1% and 0% thereafter. |
| 5 | The since inception index returns are from the Fund’s inception date. |
| 6 | The expense ratios of the Fund are set forth according to the prospectus for the Fund effective January 28, 2014 and may differ from the expense ratios disclosed in the Financial Highlights tables in this report. See the Financial Highlights for more current expense ratios. Net Expense: Expenses reduced by the contractual fee waiver in effect through January 31, 2014. Effective February 1, 2014, the waiver is voluntary and may be discontinued at any time. Gross Expense: Does not reflect the effect of the fee waiver. Expense ratios do reflect fees and expenses associated with the underlying funds. |
Growth of $10,000 For periods ended 9/30
This chart assumes an initial investment of $10,000 made on December 18, 2012 (inception date of the Fund), for Class A, Class C, and Class I shares including any applicable sales charges or fees. Performance assumes reinvestment of dividends and capital gain distributions.
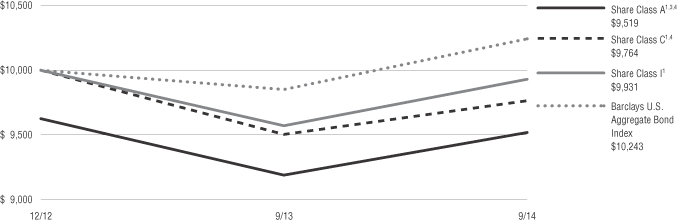
The index is unmanaged and not available for direct investment; therefore, its performance does not reflect the expense associated with active management of an actual portfolio.
For information regarding the indexes and certain investment terms, see the Key Investment Terms starting on page 4.
16
Table of Contents
Disciplined Select Country Fund
Fund Summary | Ticker Symbols: Class A: VDCAX Class C: VDCCX Class I: VDCIX |
| ¢ | The Fund is diversified and has an investment objective of capital appreciation. |
| ¢ | For the fiscal year ended September 30, 2014, the Fund’s Class A shares at NAV returned 0.29%, Class C shares returned -0.51%, and Class I shares returned 0.48%. For the same period, S&P 500® Index, a broad-based equity index, returned 19.73%, and the MSCI EAFE® Index (net), the Fund’s style-specific benchmark appropriate for comparison, returned 4.25%. |
All performance figures assume reinvestment of distributions and exclude the effect of sales charges. Past performance is no guarantee of future results, and current performance may be higher or lower than the performance shown above.
How did the markets perform during the Fund’s fiscal year?
| ¢ | Despite posting a positive return over the Fund’s fiscal year, foreign developed equity markets (as measured by the ETF “EFA”) were particularly tumultuous relative to U.S. large-cap equities. |
| ¢ | The fourth quarter of 2013 and first quarter of 2014 were marked by sell-offs in Pacific region countries. The second quarter of 2014 was a brief reprise before strong sell-offs in European countries in the third quarter of 2014. Mixed economic indicators and geopolitical instability continue to be a drag on equity performance as foreign countries struggle to create a steady foundation for growth. |
What factors affected the Fund’s performance during its fiscal year?
| ¢ | Due to the short-term nature of the trends this strategy seeks to capture, the multi-day quality assurance implementation lag enforced by the NASDAQ Composite Index® was a drag on performance. Due to this drag, on May 31, 2014, it was determined that the Fund would no longer track the index and instead implement the trading signals in a more timely manner. |
| ¢ | The Fund dramatically shifted off-benchmark during the period; in the vast majority of weeks, at least one or two countries were selectively removed. Between trading and opportunity costs, |
the selected removal was a detractor from performance over the benchmark. The portfolio is currently positioned aggressively off benchmark toward its minimum-volatility portfolio, which should add significant value if the global equity sell-off continues into the next fiscal year. |
The preceding information is the opinion of portfolio management. Any such opinions are subject to change at any time based on market or other conditions and should not be relied upon as investment advice. Past performance is no guarantee of future results, and there is no guarantee that market forecasts will be realized.
There is no guarantee that the Fund will meet its objectives.
| Asset Allocation | ||||
The following table presents asset allocations within certain sectors and as a percentage of total investments as of September 30, 2014.
|
| |||
Exchange Traded Funds | 97 | % | ||
Other (includes short-term investments) | 3 | |||
|
| |||
Total | 100 | % | ||
|
| |||
The market price of equity securities may be affected by financial market, industry, or issuer-specific events. Focus on a particular style or on small or medium sized companies may enhance that risk. The value of an ETF may be more volatile than the underlying portfolio of securities the ETF is designed to track. The costs of owning the ETF may exceed the cost of investing directly in the underlying securities. Investing internationally involves additional risks such as currency, political, accounting, economic and market risk.
For information regarding the indexes and certain investment terms, see the Key Investment Terms starting on page 4.
17
Table of Contents
Disciplined Select Country Fund (Continued)
| Average Annual Total Returns1 for periods ended 9/30/14 | ||||||||||||
| 1 year | Since Inception | Inception Date | ||||||||||
| Class A Shares at NAV2 | 0.29 | % | 7.48 | % | 12/18/12 | |||||||
| Class A Shares at POP3,4 | -5.48 | 3.97 | 12/18/12 | |||||||||
| Class C Shares at NAV2 and with CDSC4 | -0.51 | 6.68 | 12/18/12 | |||||||||
| Class I Shares at NAV | 0.48 | 7.75 | 12/18/12 | |||||||||
S&P 500® Index | 19.73 | 21.49 | 5 | — | ||||||||
| MSCI EAFE® Index (net) | 4.25 | 11.41 | 5 | — | ||||||||
Fund Expense Ratios6: A Shares: Gross 9.33%, Net 1.70%; C Shares: Gross 10.08%, Net 2.45%; I Shares: Gross 9.08%, Net 1.45%.
All returns represent past performance which is no guarantee of future results. Current performance may be higher or lower than the performance shown. The investment return and principal value of an investment will fluctuate so that an investor’s shares, when redeemed, may be worth more or less than their original cost. The above table and graph below do not reflect the deduction of taxes that a shareholder would pay on fund distributions or the redemption of shares. Please visit Virtus.com for performance data current to the most recent month-end.
| 1 | Total returns are historical and include changes in share price and the reinvestment of both dividends and capital gains distributions. |
| 2 | “NAV” (Net Asset Value) total returns do not include the effect of any sales charge. |
| 3 | “POP” (Public Offering Price) total returns include the effect of the maximum front-end 5.75% sales charge. |
| 4 | “CDSC” (Contingent Deferred Sales Charge) is applied to redemptions of certain classes of shares that do not have a sales charge applied at the time of purchase. CDSC charges for certain redemptions of Class A shares made within 18 months of purchase in which a finder’s fee was paid and all redemptions of Class C shares within the first year are 1% and 0% thereafter. |
| 5 | The since inception index returns are from the Fund’s inception date. |
| 6 | The expense ratios of the Fund are set forth according to the prospectus for the Fund effective January 28, 2014 and may differ from the expense ratios disclosed in the Financial Highlights tables in this report. See the Financial Highlights for more current expense ratios. Net Expense: Expenses reduced by the contractual fee waiver in effect through January 31, 2014. Effective February 1, 2014, the waiver is voluntary and may be discontinued at any time. Gross Expense: Does not reflect the effect of the fee waiver. Expense ratios do reflect fees and expenses associated with the underlying funds. |
Growth of $10,000 For periods ended 9/30
This chart assumes an initial investment of $10,000 made on December 18, 2012 (inception date of the Fund), for Class A, Class C, and Class I shares including any applicable sales charges or fees. Performance assumes reinvestment of dividends and capital gain distributions.
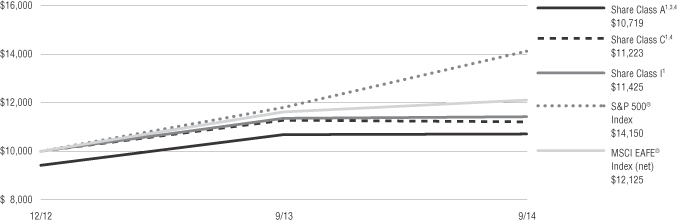
The indexes are unmanaged and not available for direct investment; therefore, their performance does not reflect the expense associated with active management of an actual portfolio.
For information regarding the indexes and certain investment terms, see the Key Investment Terms starting on page 4.
18
Table of Contents
Fund Summary | Ticker Symbols: Class A: EMNAX Class B: EMNBX Class C: EMNCX Class I: VIMNX |
| ¢ | The Fund is diversified and has an investment objective of long-term capital appreciation. |
| ¢ | For the fiscal year ended September 30, 2014, the Fund’s Class A shares at NAV returned 13.30%, Class B shares returned 12.43%, Class C shares returned 12.50%, and Class I shares returned 13.60%. For the same period, the S&P 500® Index, a broad-based equity index, returned 19.73%, and the Dynamic AlphaSector® Linked Index, which is the Fund’s style-specific index appropriate for comparison, returned 19.73%. |
All performance figures assume reinvestment of distributions and exclude the effect of sales charges. Past performance is no guarantee of future results, and current performance may be higher or lower than the performance shown above.
How did the markets perform during the Fund’s fiscal year?
| ¢ | In the year ended September 30, 2014, U.S. equities performed strongly, and the S&P 500® Index rose 19.73%. |
| ¢ | U.S. equity market performance was strongest during the fourth quarter of 2013, with the S&P 500® Index up 10.51%. Performance was more modest during the first and third quarters of 2014, at 1.81% and 1.13%, respectively. Second quarter performance was also quite strong at 5.23%. |
| ¢ | Broadly speaking, in the year-to-date 2013 period, U.S. equity markets experienced a general rise in performance, and volatility remained under control. |
What factors affected the Fund’s performance during its fiscal year?
| ¢ | The Fund tracks the Dynamic AlphaSector® Index, which can employ both leverage and take short positions. Performance is discussed below on a quarter-by-quarter basis. |
| ¢ | The Fund entered the final quarter of 2013 bullishly positioned. December’s rally capped fourth quarter gains of 10.5% and put a stamp on an exceptional year for U.S. equities. The S&P 500® Index finished the year up 32.4% on a total return basis, its best annual performance in 16 years, and the third best since 1980. In the later part of the quarter, through its long positions across eight of nine major sectors and moderate use of leverage, the Fund carried |
equity exposure of greater than 105% for the majority of the quarter. |
| ¢ | The outset of calendar year 2014, specifically the mid-winter months, saw more pronounced volatility across sectors and other broad asset classes. As volatility and price trend dynamics diverged across sectors, the Fund took short positions in three additional sectors, up from one previously, and for a period brought the average net equity exposure of the Fund to below 100%. Given the swiftness with which the markets and most sectors regained their highs into the later part of the first quarter, and with the Fund maintaining more conservative net equity exposure and short positions through that period, the Fund’s performance lagged slightly that of the S&P 500® Index. |
| ¢ | Through the later portion of the second quarter of 2014, market volatility was more benign as measured by our proprietary metrics, and the Fund covered its short exposures and reallocated long to eight of the nine major sectors, bringing overall net equity exposures back above 100%, and allowing the Fund to participate materially in the broad market rally of the second quarter. |
| ¢ | The final quarter of the Fund’s fiscal year, July through September, marked a more volatile market environment than our metrics have measured since January 2014. As the volatility increased and price trends deteriorated over the course of the period, our models detected these changes and the Fund managed its sector exposures more actively than in prior periods. Specifically, the Fund employed short positions in five sectors for brief times at various points in the quarter. With the overall muted U.S. equity market gains, the Fund underperformed slightly over the final quarterly period. |
| ¢ | For the 12-month reporting period, the Fund delivered strong absolute returns by actively managing its exposure to the U.S. equity markets using both leverage and shorting as designed, although it lagged the S&P 500® Index return. |
The preceding information is the opinion of portfolio management. Any such opinions are subject to change at any time based upon market or other conditions and should not be relied upon as investment advice. Past performance is no guarantee of future results, and there is no guarantee that market forecasts will be realized.
There is no guarantee that the Fund will meet its objective.
A fund that focuses its investments in a particular industry or sector will be more sensitive to conditions that affect that industry or sector than a non-concentrated fund. When a fund leverages its portfolio, the value of its shares may be more volatile and all other risks may be compounded. The Fund may engage in short sales, and may experience a loss if the price of a borrowed security increases before the date on which the Fund replaces the security. The value of an ETF may be more volatile than the underlying portfolio of securities the ETF is designed to track. The costs of owning the ETF may exceed the cost of investing directly in the underlying securities. U.S. government securities may be subject to price fluctuations. An agency may default on an obligation not backed by the United States. Any guarantee on U.S. government securities does not apply to the value of the Fund’s shares. The Fund’s exposure to different asset classes may not be optimal for market conditions at a given time. Asset allocation does not guarantee a profit or protect against a loss in declining markets.
The market price of equity securities may be affected by financial market, industry, or issuer-specific events. Focus on a particular style or on small or medium-sized companies may enhance that risk.
| Asset Allocation – Long | ||||
The following table presents asset allocations within certain sectors as a percentage of total long investments as of September 30, 2014.
|
| |||
Information Technology | 15 | % | ||
Consumer Staples | 15 | |||
Materials | 14 | |||
Financials | 14 | |||
Industrials | 14 | |||
Health Care | 14 | |||
Consumer Discretionary | 14 | |||
|
| |||
Total | 100 | % | ||
|
| |||
| Asset Allocation – Short | ||||
The following table presents asset allocations within certain sectors as a percentage of total short investments as of September 30, 2014.
|
| |||
Utilities | 51 | % | ||
Energy | 49 | |||
|
| |||
Total | 100 | % | ||
|
| |||
For information regarding the indexes and certain investment terms, see the Key Investment Terms starting on page 4.
19
Table of Contents
Dynamic AlphaSector® Fund (Continued)
| Average Annual Total Returns1 for periods ended 9/30/14 | ||||||||||||||||||||
| 1 year | 5 years | 10 years | Since Inception | Inception Date | ||||||||||||||||
| Class A Shares at NAV2 | 13.30 | % | 5.56 | % | 2.12 | % | — | — | ||||||||||||
| Class A Shares at POP3,4 | 6.78 | 4.31 | 1.51 | — | — | |||||||||||||||
| Class B Shares at NAV2 | 12.43 | 4.71 | 1.34 | — | — | |||||||||||||||
| Class B Shares with CDSC4 | 8.43 | 4.55 | 1.34 | — | — | |||||||||||||||
| Class C Shares at NAV2 and with CDSC4 | 12.50 | 4.76 | 1.37 | — | — | |||||||||||||||
| Class I Shares at NAV | 13.60 | — | — | 5.86 | % | 10/1/09 | ||||||||||||||
| S&P 500® Index | 19.73 | 15.70 | 8.11 | 16.30 | 5 | — | ||||||||||||||
| Dynamic AlphaSector Benchmark Index | 19.73 | 9.26 | 6.06 | 9.26 | 5 | — | ||||||||||||||
Fund Expense Ratios6: A Shares: 3.06%; B Shares: 3.81%; C Shares: 3.81%; I Shares: 2.81%.
All returns represent past performance which is no guarantee of future results. Current performance may be higher or lower than the performance shown. The investment return and principal value of an investment will fluctuate so that an investor’s shares, when redeemed, may be worth more or less than their original cost. The above table and graph below do not reflect the deduction of taxes that a shareholder would pay on fund distributions or the redemption of shares. Please visit Virtus.com for performance data current to the most recent month-end.
| 1 | Total returns are historical and include changes in share price and the reinvestment of both dividends and capital gains distributions. |
| 2 | “NAV” (Net Asset Value) total returns do not include the effect of any sales charge. |
| 3 | “POP” (Public Offering Price) total returns include the effect of the maximum front-end 5.75% sales charge. |
| 4 | “CDSC” (Contingent Deferred Sales Charge) is applied to redemptions of certain classes of shares that do not have a sales charge applied at the time of purchase. CDSC charges for certain redemptions of Class A shares made within 18 months of purchase in which a finder’s fee was paid and all redemptions of Class C shares within the first year are 1% and 0% thereafter. CDSC charges for B shares decline from 5% to 0% over a six year period. |
| 5 | The since inception index returns are from the inception date of Class I. |
| 6 | The expense ratios of the Fund are set forth according to the prospectus for the Fund effective January 28, 2014, as supplemented and revised, and may differ from the expense ratios disclosed in the Financial Highlights tables in this report. See the Financial Highlights for more current expense ratios. Expense ratios include 0.39% of dividends on short sales and interest expenses. Expense ratios reflect fees and expenses associated with the underlying funds. |
Growth of $10,000 For periods ended 9/30
This chart assumes an initial investment of $10,000 made on September 30, 2004, for Class A, Class B, and Class C shares including any applicable sales charges or fees. Performance assumes reinvestment of dividends and capital gain distributions.
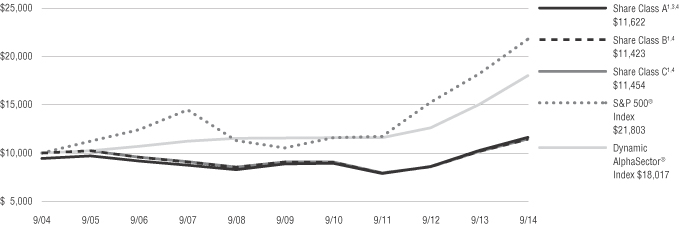
The indexes are unmanaged and not available for direct investment; therefore, their performance does not reflect the expenses associated with active management of an actual portfolio.
For information regarding the indexes and certain investment terms, see the Key Investment Terms starting on page 4.
20
Table of Contents
Global Premium AlphaSector® Fund
Fund Summary | Ticker Symbols: Class A: VGPAX Class C: VGPCX Class I: VGPIX |
| ¢ | The Fund is diversified and has an investment objective of capital appreciation. In pursuing this objective, the Fund maintains an emphasis on preservation of capital. |
| ¢ | For the fiscal year ended September 30, 2014, the Fund’s Class A shares at NAV returned 8.43%, Class C shares returned 7.69%, and Class I shares returned 8.68%. For the same period, the S&P 500® Index, a broad-based equity index, returned 19.73%. MSCI World Index (net), the Fund’s former style-specific index appropriate for comparison, returned 12.20% and MSCI All Country World Index (net), the Fund’s new style-specific benchmark appropriate for comparison returned 11.32%. |
All performance figures assume reinvestment of distributions and exclude the effect of sales charges. Past performance is no guarantee of future results, and current performance may be higher or lower than the performance shown above.
How did the markets perform during the Fund’s fiscal year?
| ¢ | The Fund is a global equity portfolio with two component asset class sleeves: U.S. equity and international equity. |
| ¢ | In the year ended September 30, 2014, the U.S. equity market performed strongly, as the S&P 500® Index rose 19.73%. International markets were up modestly, with the MSCI World Index, a recognized benchmark for world markets outside the U.S., up 12.20% for the period. |
What factors affected the Fund’s performance during its fiscal year?
| ¢ | The Fund seeks to provide risk controls for down markets and participation in rising markets. A key feature of the Fund is that each of the two asset class sleeves – U.S. equities and international equities – can move independently to address risk, if the quantitative model that drives the Fund projects a risk of loss. |
| ¢ | In bear market conditions, the risk controls are intended to help the Fund outperform the benchmark MSCI World Index. In very strong bull markets, the Fund may be expected to lag the |
benchmark to a moderate degree. The quantitative model will in some circumstances forego participating in an extreme “up market” period if it is accompanied by a projection of risk. |
| ¢ | In its U.S. equity component, the Fund delivered on its mission of active participation in a rising market environment, and returns were slightly behind that of the market. |
| ¢ | The focus of the Fund’s strategy on risk management caused the international component of the portfolio to be partially defensively positioned at times during the year, including some use of a cash alternative. As a result, the Fund lagged the benchmark during the period. |
| ¢ | The positioning and performance of the international component reflect the Fund’s primary goal of focusing on risk controls. Overall, the Fund participated in U.S. equity markets, while at times maintaining a more defensive stance in international equities, leading to moderate underperformance compared with the benchmark but in keeping with the stated goals of the Fund’s strategy to mitigate volatility. |
The preceding information is the opinion of portfolio management. Any such opinions are subject to change at any time based upon market or other conditions and should not be relied upon as investment advice. Past performance is no guarantee of future results, and there is no guarantee that market forecasts will be realized.
There is no guarantee that the Fund will meet its objective.
A fund that focuses its investments in a particular industry or sector will be more sensitive to conditions that affect that industry or sector than a non-concentrated fund. Investing internationally, especially in emerging markets, involves additional risks such as currency, political, accounting, economic, and market risk. The value of an ETF may be more volatile than the underlying portfolio of securities the ETF is designed to track. The costs of owning the ETF may exceed the cost of investing directly in the underlying securities. U.S. government securities may be subject to price fluctuations. An agency may default on an obligation not backed by the United States. Any guarantee on U.S. government
securities does not apply to the value of the Fund’s shares. The Fund’s exposure to different asset classes may not be optimal for market conditions at a given time. Asset allocation does not guarantee a profit or protect against a loss in declining markets.
The market price of equity securities may be affected by financial market, industry, or issuer-specific events. Focus on a particular style or on small or medium-sized companies may enhance that risk.
| Asset Allocation | ||||
The following table presents asset allocations within certain sectors and as a percentage of total investments as of September 30, 2014. |
| |||
Consumer Staples | 8 | % | ||
Information Technology | 8 | |||
Health Care | 8 | |||
Materials | 8 | |||
Financials | 8 | |||
Industrials | 8 | |||
Consumer Discretionary | 8 | |||
Other (includes short-term investments) | 44 | |||
|
| |||
Total | 100 | % | ||
|
| |||
For information regarding the indexes and certain investment terms, see the Key Investment Terms starting on page 4.
21
Table of Contents
Global Premium AlphaSector® Fund (Continued)
| Average Annual Total Returns1 for periods ended 9/30/14 | ||||||||||||
| 1 year | Since Inception | Inception Date | ||||||||||
| Class A Shares at NAV2 | 8.43 | % | 7.58 | % | 3/15/11 | |||||||
| Class A Shares at POP3,4 | 2.19 | 5.80 | 3/15/11 | |||||||||
| Class C Shares at NAV2 and CDSC4 | 7.69 | 6.82 | 3/15/11 | |||||||||
| Class I Shares at NAV | 8.68 | 7.84 | 3/15/11 | |||||||||
| S&P 500® Index | 19.73 | 15.35 | 5 | — | ||||||||
| MSCI AC World Index (Net) | 11.32 | 9.58 | 5 | — | ||||||||
| MSCI World® Index (net) | 12.20 | 10.92 | 5 | — | ||||||||
Fund Expense Ratios6: A Shares: Gross 2.00%, Net 1.75%; C Shares: Gross 2.72%, Net 2.50%; I Shares: Gross 1.75%, Net 1.50%.
All returns represent past performance which is no guarantee of future results. Current performance may be higher or lower than the performance shown. The investment return and principal value of an investment will fluctuate so that an investor’s shares, when redeemed, may be worth more or less than their original cost. The above table and graph below do not reflect the deduction of taxes that a shareholder would pay on fund distributions or the redemption of shares. Please visit Virtus.com for performance data current to the most recent month-end.
| 1 | Total returns are historical and include changes in share price and the reinvestment of both dividends and capital gains distributions. |
| 2 | “NAV” (Net Asset Value) total returns do not include the effect of any sales charge. |
| 3 | “POP” (Public Offering Price) total returns include the effect of the maximum front-end 5.75% sales charge. |
| 4 | “CDSC” (Contingent Deferred Sales Charge) is applied to redemptions of certain classes of shares that do not have a sales charge applied at the time of purchase. CDSC charges for certain redemptions of Class A shares made within 18 months of purchase in which a finder’s fee was paid and all redemptions of Class C shares within the first year are 1% and 0% thereafter. |
| 5 | The since inception index returns are from the Fund’s inception date. |
| 6 | The expense ratios of the Fund are set forth according to the prospectus for the Fund effective January 28, 2014, as supplemented and revised, and may differ from the expense ratios disclosed in the Financial Highlights tables in this report. See the Financial Highlights for more current expense ratios. Net Expense: Expenses reduced by a voluntary fee waiver, which may be discontinued at any time. Gross Expense: Does not reflect the effect of the fee waiver. Expense ratios reflect fees and expenses associated with the underlying funds. Class C share ratio reflects distributor’s contractual waiver for 12b-1 fees. |
Growth of $10,000 For periods ended 9/30
This chart assumes an initial investment of $10,000 made on March 15, 2011 (inception date of the Fund), for Class A, Class C, and Class I shares including any applicable sales charges or fees. Performance assumes reinvestment of dividends and capital gain distributions.
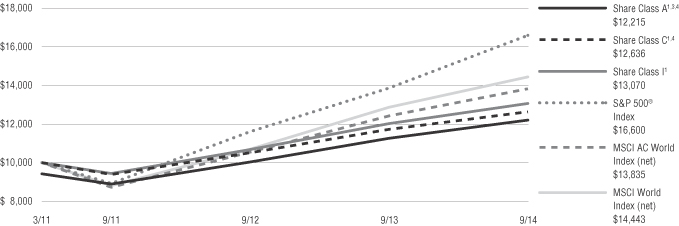
The indexes are unmanaged and not available for direct investment; therefore, their performance does not reflect the expenses associated with active management of an actual portfolio.
For information regarding the indexes and certain investment terms, see the Key Investment Terms starting on page 4.
22
Table of Contents
Fund Summary | Ticker Symbols: Class A: VHFAX Class C: VHFCX Class I: VHFIX |
| ¢ | The Fund is diversified and has an investment objective of seeking capital appreciation and current income. |
| ¢ | For the fiscal year ended September 30, 2014, the Fund’s Class A shares at NAV returned 13.21%, Class C shares returned 12.34%, and Class I shares returned 13.54%. For the same period, the MSCI AC World Index (net), a broad-based fixed equity index returned 11.32%, the Barclays U.S. Aggregate Bond Index returned 3.96% and the Herzfeld Composite Index the Fund’s style specific benchmark appropriate for comparison returned 8.42%. |
All performance figures assume reinvestment of distributions and exclude the effect of sales charges. Past performance is no guarantee of future results and current performance may be higher or lower than the performance shown above.
How did the markets perform during the Fund’s fiscal year?
| ¢ | Over the Fund’s fiscal year, the domestic stock market continued its multi-year rally while the rest of the world’s equity markets lagged after years of impressive gains. Fixed income also performed well over the period following the initial shock to the interest rate markets after former Fed Chairman Ben Bernanke’s congressional testimony in May 2013 set off the “taper tantrum.” Global fixed income sold off sharply over the following months but found a bottom and rallied for most of 2014. As the Fund invests in closed-end funds which have strategies that incorporate equity, fixed income, or both, the portfolio saw strong performance over the fiscal year. |
| ¢ | The steep yield curve and deep discounts in many fixed income closed-end funds provided the perfect environment for strong fixed income gains as the predominantly levered funds were able to borrow at extremely low rates while investing in the long end of the curve at much higher rates. The best performing fixed income closed-end fund categories, municipal bonds and Build America Bonds, averaged returns of 13.26% and 19.92%, respectively, over the period. The rally in rates led to poor performance of senior loan closed-end funds as many funds cut dividends over the period |
as lower rates hampered their ability to earn their yields. Average total returns of senior loans funds finished the fiscal year unchanged. |
| ¢ | The top performing equity closed-end fund sectors were healthcare, MLPs, and infrastructure, which all posted gains above 20%. Strong fundamentals and expected future growth in these sectors helped these funds outperform over the fiscal year. Emerging market equity, commodity, and metal closed-end funds all performed poorly over the period as they were the only closed-end fund sectors to produce negative total returns. |
What factors affected the Fund’s performance during its fiscal year?
| ¢ | At the start of our fiscal year, fixed income closed-end funds were coming off one of their largest sell-offs in years. At the start of calendar year 2013, 33% of closed-end funds were trading at premiums, and only 15.4% of funds were trading at substantial discounts (below -10%). By the beginning of the Fund’s fiscal year, only 10.5% of funds were trading at premiums, and 31.7% of funds were trading at substantial discounts. Many of the heavily discounted funds were in the fixed income space as the sharp sell-off that started in May 2013 spooked many income-oriented closed-end fund investors. The Fund was rebalanced to take advantage of the rare wide discounts in fixed income as the closed-end funds were well positioned to take advantage of the steep yield curve and cheap leverage costs. |
| 12/31/2012 | 9/30/2013 | 9/30/2014 | ||||||||||
Premium | 33.7 | % | 10.52 | % | 7.84 | % | ||||||
Discount | 66.3 | % | 89.15 | % | 91.81 | % | ||||||
< -5% Discount | 34.4 | % | 70.28 | % | 81.36 | % | ||||||
< -10% | 15.4 | % | 31.72 | % | 42.68 | % | ||||||
| ¢ | The widening premium/discount valuations made it harder as the Fund had to fight against weakening valuations over the fiscal year. As of September 30, 2014, only 7.84% of funds were trading at premiums with 42.68% trading at discounts of -10% or wider. |
| ¢ | With approximately three quarters of all closed-end funds utilizing leverage, the low interest rate environment and rallying fixed income provided cheap leverage costs for many closed-end funds over the period. This provided the perfect environment for strong net asset value performance as there were |
strong gains across almost all asset classes within closed-end funds. |
| ¢ | Even with discounts near long-term historical lows to start the Fund’s fiscal year, closed-end fund discounts widened further over the period from -6.72% to -7.80%. Many funds, especially municipal bond, senior loan, and Master Limited Partnership (“MLP”) funds, had total returns that greatly underperformed their net asset value returns by as much as 5.80 percentage points, making it more difficult for the Fund to outperform as it was overweight MLPs and had positions in municipal and senior loan funds. |
| ¢ | Due to persistent large discounts in closed end funds, there has been a substantial pickup in shareholder activism and corporate actions by proactive boards, however it remains lower than we were expecting when we began the year. Funds that have continued to trade at double-digit discounts for more than a year have been the most targeted by activist shareholders. As a result, tender offers, managed distributions, share buybacks, and other discount narrowing techniques have been proactively and reactively administered by numerous funds over the fiscal year. This is expected to continue as significant discounts still persist for many closed-end funds. |
| ¢ | The Fund took advantage of multiple tender offers, mergers, and a few rights offerings over the period. Many of the tender offers and mergers were for Nuveen’s family of funds. TIAA-CREF’s purchase of Nuveen Asset Management and their 100+ closed-end funds forced the manager to receive shareholder approval for change in ownership for each of its funds. As a result, many activists flocked to these funds to put pressure on the boards to enact more shareholder-friendly policies and actions. Nuveen responded by merging numerous funds, reorganizing strategies, lowering fund management fees, and announcing tender offers for many of their funds. |
| ¢ | The Fund added its first closed-end fund preferred shares in 2014. At the end of its fiscal year, the Fund invested 7.20% of its assets in preferreds. With coupons of 7.50% and higher, they outperformed our fixed broad index and provided solid monthly distributions for the Fund, boosting the distribution rate. The preferreds are even more |
For information regarding the indexes and certain investment terms, see the Key Investment Terms starting on page 4.
23
Table of Contents
| Herzfeld Fund (Continued) |
attractive now after the bond rally as they are still providing a yield-to-worst above 8% with the added benefit of strong coverage ratio protections which the underlying funds must adhere to. |
| ¢ | The Fund enters the fourth quarter of 2014 with 14% cash, up from 9% the prior year, and less exposure to premium/discount volatility as the Fund now owns 7.2% preferred shares which it did not have any exposure to in 2013. The Fund is better positioned at the end of the fiscal year than the prior fiscal year to take advantage of sell-offs in the closed-end fund market that typically appear over the last quarter of each calendar year. |
The preceding information is the opinion of portfolio management. Any such opinions are subject to change at any time based on market or other conditions and should not be relied upon as investment advice. Past performance is no guarantee of future results, and there is no guarantee that market forecasts will be realized.
There is no guarantee that the Fund will meet its objectives.
| Asset Allocation | ||||
The following table presents asset allocations within certain sectors and as a percentage of total investments as of September 30, 2014.
|
| |||
Equity Funds | 33 | % | ||
Fixed Income Funds | 20 | |||
International Equity Funds | 13 | |||
Preferred Stock | 7 | |||
Convertible Funds | 5 | |||
International Fixed Income Funds | 4 | |||
Municipal Bond Funds | 3 | |||
Other (includes short-term investments) | 15 | |||
|
| |||
Total | 100 | % | ||
|
| |||
Closed-end funds may trade at a discount from their net asset values, which may affect whether the Fund will realize gains or losses. They may also employ leverage, which may increase volatility. The market price of equity securities may be affected by financial market, industry, or issuer-specific events. Focus on a particular style or on small or medium-sized companies may enhance that risk. Debt securities are subject to various risks, the most prominent of which are credit and interest rate risk. The issuer of a security may fail to make payments in a timely manner. Values of debt securities may rise and fall in response to changes in interest rates. This risk may be enhanced with longer-term maturities. Investing internationally, especially in emerging markets, involves additional risks such as currency, political, accounting, economic, and market risk. U.S. government securities may be subject to price fluctuations. An agency may default on an obligation not backed by the United States. Any guarantee on U.S. government securities does not apply to the value of the Fund’s shares. Because the Fund can invest in other funds, it indirectly bears its proportionate share of the operating expenses and management fees of the underlying fund(s). For additional information on these and other risk considerations, please see the Fund’s prospectus.
For information regarding the indexes and certain investment terms, see the Key Investment Terms starting on page 4.
24
Table of Contents
Herzfeld Fund (Continued)
| Average Annual Total Returns1 for periods ended 9/30/14 | ||||||||||||
| 1 year | Since Inception | Inception Date | ||||||||||
| Class A Shares at NAV2 | 13.21 | % | 9.86 | % | 9/5/12 | |||||||
| Class A Shares at POP3,4 | 6.70 | 6.76 | 9/5/12 | |||||||||
| Class C Shares at NAV2 and with CDSC4 | 12.34 | 9.08 | 9/5/12 | |||||||||
| Class I Shares at NAV2 | 13.54 | 10.17 | 9/5/12 | |||||||||
MSCI AC World Index (net) | 11.32 | 15.96 | 5 | — | ||||||||
| Barclays U.S. Aggregate Bond Index | 3.96 | 1.16 | 5 | — | ||||||||
| Herzfeld Composite Index | 8.42 | 9.91 | 5 | — | ||||||||
Fund Expense Ratios6: A Shares: Gross 4.26%, Net 1.60%; C Shares: Gross 5.01%, Net 2.35%; I Shares: Gross 4.01%, Net 1.35%.
All returns represent past performance which is no guarantee of future results. Current performance may be higher or lower than the performance shown. The investment return and principal value of an investment will fluctuate so that an investor’s shares, when redeemed, may be worth more or less than their original cost. The above table and graph below do not reflect the deduction of taxes that a shareholder would pay on fund distributions or the redemption of shares. Please visit Virtus.com for performance data current to the most recent month-end.
| 1 | Total returns are historical and include changes in share price and the reinvestment of both dividends and capital gains distributions. |
| 2 | “NAV” (Net Asset Value) total returns do not include the effect of any sales charge. |
| 3 | “POP” (Public Offering Price) total returns include the effect of the maximum front-end 5.75% sales charge. |
| 4 | “CDSC” (Contingent Deferred Sales Charge) is applied to redemptions of certain classes of shares that do not have a sales charge applied at the time of purchase. CDSC charges for certain redemptions of Class A shares made within 18 months of purchase in which a finder’s fee was paid and all redemptions of Class C shares within the first year are 1% and 0% thereafter. |
| 5 | The since inception index returns are from the Fund’s inception date. |
| 6 | The expense ratios of the Fund are set forth according to the prospectus for the Fund effective January 28, 2014, as supplemented and revised, and may differ from the expense ratios disclosed in the Financial Highlights tables in this report. See the Financial Highlights for more current expense ratios. Net Expense: Expenses reduced by the contractual fee waiver in effect through January 31, 2014. Effective February 1, 2014, the waiver is voluntary and may be discontinued at any time. Gross Expense: Does not reflect the effect of the fee waiver. Expense ratios reflect fees and expenses associated with the underlying funds. |
Growth of $10,000 For periods ended 9/30
This chart assumes an initial investment of $10,000 made on September 5, 2012 (inception date of the Fund), for Class A, Class C, and Class I shares including any applicable sales charges or fees. Performance assumes reinvestment of dividends and capital gain distributions.
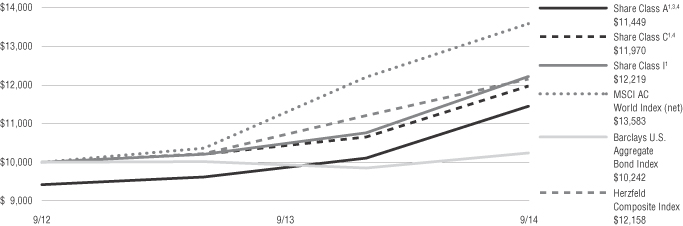
The indexes are unmanaged and not available for direct investment; therefore, their performance does not reflect the expenses associated with active management of an actual portfolio.
For information regarding the indexes and certain investment terms, see the Key Investment Terms starting on page 4.
25
Table of Contents
Fund Summary | Ticker Symbols: Class A: VAPAX Class C: VAPCX Class I: VAPIX |
| ¢ | The Fund is diversified and has an investment objective of long-term capital appreciation. |
| ¢ | For the fiscal year ended September 30, 2014, the Fund’s Class A shares at NAV returned 15.31%, Class C shares returned 14.48%, and Class I shares returned 15.61%. For the same period, the S&P 500® Index, a broad-based equity index, returned 19.73%. |
All performance figures assume reinvestment of distributions and exclude the effect of sales charges. Past performance is no guarantee of future results, and current performance may be higher or lower than the performance shown above.
How did the markets perform during the Fund’s fiscal year?
| ¢ | In the year ended September 30, 2014, the U.S. equity market performed strongly, as the S&P 500® Index rose 19.73%. |
| ¢ | U.S. equity market performance was strongest during the fourth quarter of 2013, with the S&P 500® Index up 10.51%. Performance was more modest during the first and third quarters of 2014, at 1.81% and 1.13%, respectively. Second quarter performance was also quite strong at 5.23%. |
| ¢ | Viewing the U.S. equity markets by sector, the overall picture is positive. In the fiscal period, the healthcare, technology, and materials sectors outperformed the broader S&P 500® Index benchmark. Consumer staples, consumer discretionary, financials, energy, industrials, and utilities underperformed the S&P 500® Index, but were positive overall. |
What factors affected the Fund’s performance during its fiscal year?
| ¢ | The Fund’s objective seeks to help meet the real needs of individual investors by participating in rising markets while placing an emphasis on preserving capital during severe and extended market declines. |
| ¢ | The Fund has an investment objective of long-term capital appreciation and strives to outperform the benchmark S&P 500® Index over market cycles while also seeking to deliver lower volatility, low beta, and low correlation. |
| ¢ | In bear market conditions, the risk controls are intended to help the Fund outperform the benchmark. In strong bull markets, the Fund may be expected to lag the benchmark to a moderate degree. |
| ¢ | During the fiscal year, the Fund performed as expected. The U.S. equity market was positive, and the Fund was invested in U.S. equities throughout the period. The Fund performed in line with the S&P 500® Index over the course of the Fund’s fiscal year ended September 30, 2014, although it slightly lagged the benchmark during the third quarter. |
| ¢ | The quantitative model that drives the Fund does an independent assessment of each of the nine equity sectors of the S&P 500® Index. During the period, individual sectors in the portfolio were turned “on” or “off,” but the Fund as a whole remained 100% invested in U.S. equities. There were no periods in which extreme or widespread risk caused the Fund to take a position in cash equivalents. |
| ¢ | The net result for the period is that the Fund delivered on expectations, providing participation in a rising U.S. equity market. |
The preceding information is the opinion of portfolio management. Any such opinions are subject to change at any time based upon market or other conditions and should not be relied upon as investment advice. Past performance is no guarantee of future results, and there is no guarantee that market forecasts will be realized.
There is no guarantee that the Fund will meet its objective.
The market price of equity securities may be affected by financial market, industry, or issuer-specific events. Focus on a particular style or on small or medium-sized companies may enhance that risk. A fund that focuses its investments in a particular industry or sector will be more sensitive to conditions that affect that industry or sector than a non-concentrated fund. The value of an ETF may be more volatile than the underlying portfolio of securities the ETF is designed to track. The costs of owning the ETF may exceed the cost of investing directly in the underlying securities. U.S. government
securities may be subject to price fluctuations. An agency may default on an obligation not backed by the United States. Any guarantee on U.S. government securities does not apply to the value of the Fund’s shares. The Fund’s exposure to different asset classes may not be optimal for market conditions at a given time. Asset allocation does not guarantee a profit or protect against a loss in declining markets.
The market price of equity securities may be affected by financial market, industry, or issuer-specific events. Focus on a particular style or on small or medium-sized companies may enhance that risk.
| Asset Allocation | ||||
The following table presents asset allocations within certain sectors and as a percentage of total investments as of September 30, 2014. |
| |||
Consumer Staples | 14 | % | ||
Health Care | 14 | |||
Industrials | 14 | |||
Financials | 14 | |||
Materials | 14 | |||
Consumer Discretionary | 14 | |||
Information Technology | 13 | |||
Telecommunication Services | 2 | |||
Other (includes short-term investments and securities lending collateral) | 1 | |||
|
| |||
Total | 100 | % | ||
|
| |||
For information regarding the indexes and certain investment terms, see the Key Investment Terms starting on page 4.
26
Table of Contents
Premium AlphaSector® Fund (Continued)
| Average Annual Total Returns1 for periods ended 9/30/14 | ||||||||||||
| 1 year | Since Inception | Inception Date | ||||||||||
| Class A Shares at NAV2 | 15.31 | % | 15.30 | % | 7/1/10 | |||||||
| Class A Shares at POP3,4 | 8.68 | 13.70 | 7/1/10 | |||||||||
| Class C Shares at NAV2 and CDSC4 | 14.48 | 14.44 | 7/1/10 | |||||||||
| Class I Shares at NAV | 15.61 | 15.56 | 7/1/10 | |||||||||
| S&P 500® Index | 19.73 | 19.08 | 5 | — | ||||||||
Fund Expense Ratios6: A Shares: 1.62%; C Shares: 2.37%; I Shares: 1.37%.
All returns represent past performance which is no guarantee of future results. Current performance may be higher or lower than the performance shown. The investment return and principal value of an investment will fluctuate so that an investor’s shares, when redeemed, may be worth more or less than their original cost. The above table and graph below do not reflect the deduction of taxes that a shareholder would pay on fund distributions or the redemption of shares. Please visit Virtus.com for performance data current to the most recent month-end.
| 1 | Total returns are historical and include changes in share price and the reinvestment of both dividends and capital gains distributions. |
| 2 | “NAV” (Net Asset Value) total returns do not include the effect of any sales charge. |
| 3 | “POP” (Public Offering Price) total returns include the effect of the maximum front-end 5.75% sales charge. |
| 4 | “CDSC” (Contingent Deferred Sales Charge) is applied to redemptions of certain classes of shares that do not have a sales charge applied at the time of purchase. CDSC charges for certain redemptions of Class A shares made within 18 months of purchase in which a finder’s fee was paid and all redemptions of Class C shares within the first year are 1% and 0% thereafter. |
| 5 | The since inception index return is from the Fund’s inception date. |
| 6 | The expense ratios of the Fund are set forth according to the prospectus for the Fund effective January 28, 2014, and may differ from the expense ratios disclosed in the Financial Highlights tables in this report. See the Financial Highlights for more current expense ratios. |
Growth of $10,000 For periods ended 9/30
This chart assumes an initial investment of $10,000 made on July 1, 2010 (inception date of the Fund), for Class A, Class C, and Class I shares including any applicable sales charges or fees. Performance assumes reinvestment of dividends and capital gain distributions.
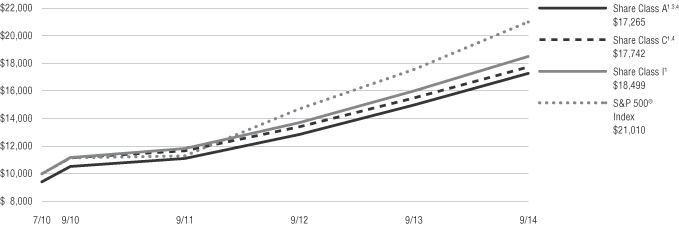
The indexes are unmanaged and not available for direct investment; therefore, their performance does not reflect the expenses associated with active management of an actual portfolio.
For information regarding the indexes and certain investment terms, see the Key Investment Terms starting on page 4.
27
Table of Contents
VIRTUS ALLOCATOR PREMIUM ALPHASECTOR® FUND
SCHEDULE OF INVESTMENTS
SEPTEMBER 30, 2014
($ reported in thousands)
| SHARES | VALUE | |||||||
| EXCHANGE-TRADED FUNDS(2)—93.1% | ||||||||
Consumer Discretionary Select Sector SPDR Fund | 611,700 | $ | 40,794 | |||||
Consumer Staples Select Sector SPDR Fund | 921,830 | 41,584 | ||||||
Financial Select Sector SPDR Fund | 1,772,640 | 41,072 | ||||||
Health Care Select Sector SPDR Fund | 645,930 | 41,281 | ||||||
Industrial Select Sector SPDR Fund | 770,220 | 40,937 | ||||||
iShares Barclays 7-10 Year Treasury Bond Fund | 593,770 | 61,526 | ||||||
iShares Barclays MBS Bond Fund | 566,670 | 61,263 | ||||||
iShares iBoxx $ High Yield Corporate Bond Fund | 655,700 | 60,292 | ||||||
iShares MSCI Canada Index Fund | 754,457 | 23,162 | ||||||
iShares MSCI Emerging Markets Index Fund | 1,092,690 | 45,412 | ||||||
iShares MSCI EMU Index Fund | 1,240,350 | 47,753 | ||||||
iShares MSCI Pacific Ex-Japan Index Fund | 477,950 | 22,019 | ||||||
iShares MSCI Switzerland Index Fund Capped | 734,990 | 23,895 | ||||||
iShares MSCI United Kingdom Index Fund | 1,204,030 | 23,334 | ||||||
Materials Select Sector SPDR Fund | 830,890 | 41,204 | ||||||
SPDR S&P 500® ETF Trust Series 1 | 409,180 | 80,617 | ||||||
Technology Select Sector SPDR Fund | 1,038,430 | 41,444 | ||||||
| TOTAL EXCHANGE-TRADED FUNDS (Identified Cost $714,533) | 737,589 | |||||||
| TOTAL LONG-TERM INVESTMENTS—93.1% | ||||||||
| (Identified Cost $714,533) | 737,589 | |||||||
| SHARES | VALUE | |||||||
| SHORT-TERM INVESTMENTS—7.5% | ||||||||
| Money Market Mutual Funds—7.5% | ||||||||
Fidelity Money Market Portfolio – Institutional Shares (Seven-day effective yield 0.080%) | 59,158,291 | $ | 59,158 | |||||
| TOTAL SHORT-TERM INVESTMENTS (Identified Cost $59,158) | 59,158 | |||||||
| TOTAL INVESTMENTS—100.6% | ||||||||
| (Identified Cost $773,691) | 796,747 | (1) | ||||||
Other assets and liabilities, net—(0.6)% |
| (4,403 | ) | |||||
|
| |||||||
| NET ASSETS—100.0% | $ | 792,344 | ||||||
|
| |||||||
Abbreviations:
| ETF | Exchange-Traded Fund |
| SPDR | S&P Depositary Receipt |
Footnote Legend:
| (1) | Federal Income Tax Information: For tax information at September 30, 2014, see Note 10 Federal Income Tax Information in the Notes to Financial Statements. |
| (2) | All of these funds are public funds and the prospectus and annual reports of each are publicly available. |
The following table provides a summary of inputs used to value the Fund’s investments as of September 30, 2014 (See Security Valuation Note 2A in the Notes to Financial Statements):
| Total Value at September 30, 2014 | Level 1 Quoted Prices | |||||||
Equity Securities: | ||||||||
Exchange-Traded Funds | $ | 737,589 | $ | 737,589 | ||||
Short-Term Invest | 59,158 | 59,158 | ||||||
|
|
|
| |||||
Total Investments | $ | 796,747 | $ | 796,747 | ||||
|
|
|
| |||||
There are no Level 2 (significant observable inputs) or Level 3 (significant unobservable inputs) priced securities.
There were no transfers between Level 1 and Level 2 for the period.
Security abbreviation definitions are located under the Key Investment Terms starting on page 4.
See Notes to Financial Statements
28
Table of Contents
VIRTUS ALPHASECTOR® ROTATION FUND
SCHEDULE OF INVESTMENTS
SEPTEMBER 30, 2014
($ reported in thousands)
| SHARES | VALUE | |||||||
| COMMON STOCKS—100.4% | ||||||||
| Consumer Discretionary—12.4% | ||||||||
Amazon.com, Inc.(2) | 21,290 | $ | 6,865 | |||||
AutoNation, Inc.(2) | 4,400 | 221 | ||||||
AutoZone, Inc.(2) | 1,850 | 943 | ||||||
Bed Bath & Beyond, Inc.(2) | 11,300 | 744 | ||||||
Best Buy Co., Inc. | 16,310 | 548 | ||||||
BorgWarner, Inc. | 12,820 | 674 | ||||||
Cablevision Systems Corp. Class A | 12,350 | 216 | ||||||
CarMax, Inc.(2) | 12,320 | 572 | ||||||
Carnival Corp. | 25,310 | 1,017 | ||||||
CBS Corp. Class B | 27,340 | 1,463 | ||||||
Chipotle Mexican Grill, Inc.(2) | 1,740 | 1,160 | ||||||
Coach, Inc. | 15,320 | 546 | ||||||
Comcast Corp. Class A | 145,020 | 7,799 | ||||||
Darden Restaurants, Inc. | 7,350 | 378 | ||||||
Delphi Automotive plc | 16,840 | 1,033 | ||||||
DIRECTV Class A(2) | 28,230 | 2,442 | ||||||
Discovery Communications, Inc.(2) | 15,360 | 573 | ||||||
Discovery Communications, Inc. Class A(2) | 8,320 | 315 | ||||||
Dollar General Corp.(2) | 17,070 | 1,043 | ||||||
Dollar Tree, Inc.(2) | 11,610 | 651 | ||||||
Expedia, Inc. | 5,700 | 499 | ||||||
Family Dollar Stores, Inc. | 5,400 | 417 | ||||||
Ford Motor Co. | 217,340 | 3,214 | ||||||
Fossil Group, Inc.(2) | 2,650 | 249 | ||||||
GameStop Corp. Class A | 6,340 | 261 | ||||||
Gannett Co., Inc. | 12,740 | 378 | ||||||
Gap, Inc. (The) | 15,400 | 642 | ||||||
Garmin Ltd. | 6,780 | 353 | ||||||
General Motors Co. | 75,530 | 2,412 | ||||||
Genuine Parts Co. | 8,590 | 753 | ||||||
Goodyear Tire & Rubber Co. (The) | 15,370 | 347 | ||||||
H&R Block, Inc. | 15,420 | 478 | ||||||
Harley-Davidson, Inc. | 12,170 | 708 | ||||||
Harman International Industries, Inc. | 3,780 | 371 | ||||||
Hasbro, Inc. | 6,350 | 349 | ||||||
Home Depot, Inc. (The) | 75,420 | 6,919 | ||||||
Horton (D.R.), Inc. | 17,900 | 367 | ||||||
Interpublic Group of Cos., Inc. (The) | 23,630 | 433 | ||||||
Johnson Controls, Inc. | 37,320 | 1,642 | ||||||
Kohl’s Corp. | 11,500 | 702 | ||||||
L Brands, Inc. | 13,720 | 919 | ||||||
Leggett & Platt, Inc. | 7,680 | 268 | ||||||
Lennar Corp. Class A | 9,810 | 381 | ||||||
Lowe’s Cos., Inc. | 55,310 | 2,927 | ||||||
Macy’s, Inc. | 19,850 | 1,155 | ||||||
Marriott International, Inc. | 12,240 | 856 | ||||||
Mattel, Inc. | 19,010 | 583 | ||||||
McDonald’s Corp. | 55,020 | 5,216 | ||||||
Michael Kors Holdings Ltd.(2) | 11,540 | 824 | ||||||
Mohawk Industries, Inc.(2) | 3,430 | 462 | ||||||
Netflix, Inc.(2) | 3,390 | 1,530 | ||||||
Newell Rubbermaid, Inc. | 15,270 | 525 | ||||||
News Corp. Class A(2) | 27,810 | 455 | ||||||
NIKE, Inc. Class B | 39,190 | 3,496 | ||||||
Nordstrom, Inc. | 7,840 | 536 | ||||||
O’Reilly Automotive, Inc.(2) | 5,890 | 886 | ||||||
| SHARES | VALUE | |||||||
| Consumer Discretionary—continued | ||||||||
Omnicom Group, Inc. | 14,350 | $ | 988 | |||||
PetSmart, Inc. | 5,580 | 391 | ||||||
Phillips-Van Heusen Corp. | 4,620 | 560 | ||||||
Priceline Group, Inc. (The)(2) | 2,980 | 3,453 | ||||||
PulteGroup, Inc. | 18,850 | 333 | ||||||
Ralph Lauren Corp. | 3,410 | 562 | ||||||
Ross Stores, Inc. | 11,870 | 897 | ||||||
Scripps Networks Interactive, Inc. Class A | 5,970 | 466 | ||||||
Staples, Inc. | 36,330 | 440 | ||||||
Starbucks Corp. | 42,090 | 3,176 | ||||||
Starwood Hotels & Resorts Worldwide, Inc. | 10,650 | 886 | ||||||
Target Corp. | 35,510 | 2,226 | ||||||
Tiffany & Co. | 6,240 | 601 | ||||||
Time Warner Cable, Inc. | 15,660 | 2,247 | ||||||
Time Warner, Inc. | 47,910 | 3,603 | ||||||
TJX Cos., Inc. | 38,830 | 2,298 | ||||||
Tractor Supply Co. | 7,780 | 479 | ||||||
TripAdvisor, Inc.(2) | 6,250 | 571 | ||||||
Twenty-First Century Fox, Inc. Class A | 104,930 | 3,598 | ||||||
Under Armour, Inc. Class A(2) | 9,350 | 646 | ||||||
Urban Outfitters, Inc.(2) | 5,840 | 214 | ||||||
VF Corp. | 19,360 | 1,278 | ||||||
Viacom, Inc. Class B | 21,400 | 1,647 | ||||||
Walt Disney Co. (The) | 88,210 | 7,853 | ||||||
Whirlpool Corp. | 4,340 | 632 | ||||||
Wyndham Worldwide Corp. | 7,060 | 574 | ||||||
Wynn Resorts Ltd. | 4,550 | 851 | ||||||
Yum! Brands, Inc. | 24,710 | 1,779 | ||||||
|
| |||||||
| 114,965 | ||||||||
|
| |||||||
| Consumer Staples—12.7% | ||||||||
Altria Group, Inc. | 125,350 | 5,759 | ||||||
Archer-Daniels-Midland Co.(The) | 49,100 | 2,509 | ||||||
Avon Products, Inc. | 37,960 | 478 | ||||||
Brown-Forman Corp. Class B | 13,060 | 1,178 | ||||||
Campbell Soup Co. | 16,080 | 687 | ||||||
Clorox Co. (The) | 10,540 | 1,012 | ||||||
Coca-Cola Co. (The) | 275,960 | 11,772 | ||||||
Coca-Cola Enterprises, Inc. | 19,170 | 850 | ||||||
Colgate-Palmolive Co. | 62,090 | 4,050 | ||||||
ConAgra Foods, Inc. | 34,100 | 1,127 | ||||||
Constellation Brands, Inc. Class A(2) | 17,730 | 1,545 | ||||||
Costco Wholesale Corp. | 31,940 | 4,003 | ||||||
CVS Caremark Corp. | 83,270 | 6,628 | ||||||
Dr. Pepper Snapple Group, Inc. | 16,170 | 1,040 | ||||||
Estee Lauder Cos., Inc. (The) Class A | 17,950 | 1,341 | ||||||
General Mills, Inc. | 45,490 | 2,295 | ||||||
Hershey Co. (The) | 12,110 | 1,156 | ||||||
Hormel Foods Corp. | 13,320 | 685 | ||||||
J.M. Smucker Co. (The) | 8,690 | 860 | ||||||
Kellogg Co. | 20,270 | 1,249 | ||||||
Keurig Green Mountain, Inc. | 8,540 | 1,111 | ||||||
Kimberly-Clark Corp. | 27,740 | 2,984 | ||||||
Kraft Foods Group, Inc. | 41,240 | 2,326 | ||||||
Kroger Co. (The) | 38,760 | 2,016 | ||||||
Lorillard, Inc. | 27,790 | 1,665 | ||||||
McCormick & Co., Inc. | 11,090 | 742 | ||||||
Mead Johnson Nutrition Co. | 15,520 | 1,493 | ||||||
| SHARES | VALUE | |||||||
| Consumer Staples—continued | ||||||||
Molson Coors Brewing Co. Class B | 14,070 | $ | 1,047 | |||||
Mondelez International, Inc. | 110,720 | 3,794 | ||||||
Monster Beverage Corp.(2) | 11,630 | 1,066 | ||||||
PepsiCo, Inc. | 60,350 | 5,618 | ||||||
Philip Morris International, Inc. | 109,210 | 9,108 | ||||||
Procter & Gamble Co. (The) | 189,290 | 15,851 | ||||||
Reynolds American, Inc. | 24,310 | 1,434 | ||||||
Safeway, Inc. | 22,330 | 766 | ||||||
SYSCO Corp. | 44,710 | 1,697 | ||||||
Tyson Foods, Inc. Class A | 27,080 | 1,066 | ||||||
Wal-Mart Stores, Inc. | 110,480 | 8,448 | ||||||
Walgreen Co. | 65,580 | 3,887 | ||||||
Whole Foods Market, Inc. | 28,310 | 1,079 | ||||||
|
| |||||||
| 117,422 | ||||||||
|
| |||||||
| Energy—12.4% | ||||||||
Anadarko Petroleum Corp. | 38,090 | 3,864 | ||||||
Apache Corp. | 28,590 | 2,684 | ||||||
Baker Hughes, Inc. | 37,270 | 2,425 | ||||||
Cabot Oil & Gas Corp. | 58,500 | 1,912 | ||||||
Cameron International Corp.(2) | 21,090 | 1,400 | ||||||
Chesapeake Energy Corp. | 44,690 | 1,027 | ||||||
Chevron Corp. | 125,370 | 14,959 | ||||||
Cimarex Energy Co. | 5,640 | 714 | ||||||
ConocoPhillips | 58,740 | 4,495 | ||||||
CONSOL Energy, Inc. | 23,890 | 905 | ||||||
Denbury Resources, Inc. | 45,840 | 689 | ||||||
Devon Energy Corp. | 28,790 | 1,963 | ||||||
Diamond Offshore Drilling, Inc.(3) | 6,920 | 237 | ||||||
Ensco plc Class A | 15,150 | 626 | ||||||
EOG Resources, Inc. | 43,160 | 4,274 | ||||||
EQT Corp. | 9,820 | 899 | ||||||
Exxon Mobil Corp. | 186,050 | 17,498 | ||||||
FMC Technologies, Inc.(2) | 27,370 | 1,486 | ||||||
Halliburton Co. | 65,840 | 4,247 | ||||||
Helmerich & Payne, Inc. | 7,020 | 687 | ||||||
Hess Corp. | 21,080 | 1,988 | ||||||
Kinder Morgan, Inc.(3) | 42,520 | 1,630 | ||||||
Marathon Oil Corp. | 51,200 | 1,925 | ||||||
Marathon Petroleum Corp. | 18,370 | 1,555 | ||||||
Murphy Oil Corp. | 14,690 | 836 | ||||||
Nabors Industries Ltd. | 34,320 | 781 | ||||||
National Oilwell Varco, Inc. | 35,290 | 2,686 | ||||||
Newfield Exploration Co.(2) | 8,860 | 328 | ||||||
Noble Corp. plc | 16,490 | 366 | ||||||
Noble Energy, Inc. | 31,730 | 2,169 | ||||||
Occidental Petroleum Corp. | 44,000 | 4,231 | ||||||
ONEOK, Inc. | 13,490 | 884 | ||||||
Phillips 66 | 36,130 | 2,938 | ||||||
Pioneer Natural Resources Co. | 21,030 | 4,142 | ||||||
QEP Resources, Inc. | 10,810 | 333 | ||||||
Range Resources Corp. | 17,170 | 1,164 | ||||||
Schlumberger Ltd. | 87,470 | 8,895 | ||||||
Southwestern Energy Co.(2) | 29,280 | 1,023 | ||||||
Spectra Energy Corp. | 58,220 | 2,286 | ||||||
Tesoro Corp. | 26,150 | 1,595 | ||||||
Transocean Ltd.(3) | 22,070 | 706 | ||||||
Valero Energy Corp. | 47,660 | 2,205 | ||||||
Williams Cos., Inc. (The) | 61,360 | 3,396 | ||||||
|
| |||||||
| 115,053 | ||||||||
|
| |||||||
See Notes to Financial Statements
29
Table of Contents
VIRTUS ALPHASECTOR® ROTATION FUND
SCHEDULE OF INVESTMENTS (Continued)
SEPTEMBER 30, 2014
($ reported in thousands)
| SHARES | VALUE | |||||||
| Financials—12.6% | ||||||||
ACE Ltd. | 13,820 | $ | 1,449 | |||||
Affiliated Managers Group, Inc.(2) | 2,310 | 463 | ||||||
Aflac, Inc. | 18,550 | 1,080 | ||||||
Allstate Corp. (The) | 17,730 | 1,088 | ||||||
American Express Co. | 36,550 | 3,200 | ||||||
American International Group, Inc. | 57,950 | 3,130 | ||||||
American Tower Corp. | 16,270 | 1,523 | ||||||
Ameriprise Financial, Inc. | 7,770 | 959 | ||||||
AON plc | 11,830 | 1,037 | ||||||
Apartment Investment & Management Co. Class A | 5,910 | 188 | ||||||
Assurant, Inc. | 2,980 | 192 | ||||||
AvalonBay Communities, Inc. | 5,340 | 753 | ||||||
Bank of America Corp. | 427,050 | 7,281 | ||||||
Bank of New York Mellon Corp. (The) | 45,950 | 1,780 | ||||||
BB&T Corp. | 29,530 | 1,099 | ||||||
Berkshire Hathaway, Inc. Class B(2) | 74,040 | 10,228 | ||||||
BlackRock, Inc. | 5,110 | 1,678 | ||||||
Boston Properties, Inc. | 6,270 | 726 | ||||||
Capital One Financial Corp. | 22,860 | 1,866 | ||||||
CBRE Group, Inc.(2) | 11,590 | 345 | ||||||
Charles Schwab Corp. (The) | 46,580 | 1,369 | ||||||
Chubb Corp. (The) | 9,790 | 892 | ||||||
Cincinnati Financial Corp. | 6,030 | 284 | ||||||
Citigroup, Inc. | 123,120 | 6,380 | ||||||
CME Group, Inc. | 12,970 | 1,037 | ||||||
Comerica, Inc. | 7,330 | 365 | ||||||
Crown Castle International Corp. | 13,540 | 1,090 | ||||||
Discover Financial Services | 18,810 | 1,211 | ||||||
E*Trade Financial Corp.(2) | 11,770 | 266 | ||||||
Equity Residential | 14,740 | 908 | ||||||
Essex Property Trust, Inc. | 2,580 | 461 | ||||||
Fifth Third Bancorp | 34,430 | 689 | ||||||
Franklin Resources, Inc. | 16,050 | 876 | ||||||
General Growth Properties, Inc. | 25,560 | 602 | ||||||
Genworth Financial, Inc. Class A(2) | 20,170 | 264 | ||||||
Goldman Sachs Group, Inc. (The) | 16,690 | 3,064 | ||||||
Hartford Financial Services Group, Inc. (The) | 18,490 | 689 | ||||||
HCP, Inc. | 18,810 | 747 | ||||||
Health Care REIT, Inc. | 13,090 | 816 | ||||||
Host Hotels & Resorts, Inc. | 30,830 | 658 | ||||||
Hudson City Bancorp, Inc. | 19,710 | 192 | ||||||
Huntington Bancshares, Inc. | 33,280 | 324 | ||||||
IntercontinentalExchange Group, Inc. | 4,620 | 901 | ||||||
Invesco Ltd. | 17,790 | 702 | ||||||
JPMorgan Chase & Co. | 152,750 | 9,202 | ||||||
KeyCorp | 36,080 | 481 | ||||||
Kimco Realty Corp. | 16,780 | 368 | ||||||
Legg Mason, Inc. | 4,300 | 220 | ||||||
Leucadia National Corp. | 13,210 | 315 | ||||||
Lincoln National Corp. | 10,630 | 570 | ||||||
Loews Corp. | 12,430 | 518 | ||||||
M&T Bank Corp. | 5,340 | 658 | ||||||
Macerich Co. (The) | 5,690 | 363 | ||||||
Marsh & McLennan Cos., Inc. | 22,440 | 1,174 | ||||||
McGraw-Hill Cos., Inc. (The) | 11,030 | 931 | ||||||
| SHARES | VALUE | |||||||
| Financials—continued | ||||||||
MetLife, Inc. | 45,670 | $ | 2,453 | |||||
Moody’s Corp. | 7,750 | 732 | ||||||
Morgan Stanley | 62,190 | 2,150 | ||||||
NASDAQ OMX Group, Inc. (The) | 4,730 | 201 | ||||||
Navient Corp. | 17,260 | 306 | ||||||
Northern Trust Corp. | 9,040 | 615 | ||||||
People’s United Financial, Inc. | 12,710 | 184 | ||||||
Plum Creek Timber Co., Inc. | 7,240 | 282 | ||||||
PNC Financial Services Group, Inc. (The) | 21,930 | 1,877 | ||||||
Principal Financial Group, Inc. | 11,230 | 589 | ||||||
Progressive Corp. (The) | 22,390 | 566 | ||||||
Prologis, Inc. | 20,400 | 769 | ||||||
Prudential Financial, Inc. | 18,740 | 1,648 | ||||||
Public Storage | 5,980 | 992 | ||||||
Regions Financial Corp. | 55,870 | 561 | ||||||
Simon Property Group, Inc. | 12,750 | 2,096 | ||||||
State Street Corp. | 17,250 | 1,270 | ||||||
SunTrust Banks, Inc. | 21,890 | 832 | ||||||
T. Rowe Price Group, Inc. | 10,670 | 836 | ||||||
Torchmark Corp. | 5,310 | 278 | ||||||
Travelers Cos., Inc. (The) | 13,810 | 1,297 | ||||||
U.S. Bancorp | 73,180 | 3,061 | ||||||
Unum Group | 10,580 | 364 | ||||||
Ventas, Inc. | 12,070 | 748 | ||||||
Vornado Realty Trust | 7,190 | 719 | ||||||
Wells Fargo & Co. | 192,920 | 10,007 | ||||||
Weyerhaeuser Co. | 21,550 | 687 | ||||||
XL Group plc | 10,900 | 362 | ||||||
Zions Bancorp | 8,200 | 238 | ||||||
|
| |||||||
| 116,372 | ||||||||
|
| |||||||
| Health Care—12.7% | ||||||||
Abbott Laboratories | 61,080 | 2,540 | ||||||
AbbVie, Inc. | 76,270 | 4,405 | ||||||
Actavis plc(2) | 13,400 | 3,233 | ||||||
Aetna, Inc. | 17,510 | 1,418 | ||||||
Agilent Technologies, Inc. | 16,340 | 931 | ||||||
Alexion Pharmaceuticals, Inc.(2) | 9,570 | 1,587 | ||||||
Allergan, Inc. | 14,500 | 2,584 | ||||||
AmerisourceBergen Corp. | 10,640 | 822 | ||||||
Amgen, Inc. | 36,400 | 5,113 | ||||||
Bard (C.R.), Inc. | 3,930 | 561 | ||||||
Baxter International, Inc. | 26,420 | 1,896 | ||||||
Becton, Dickinson & Co. | 9,470 | 1,078 | ||||||
Biogen Idec, Inc.(2) | 11,600 | 3,837 | ||||||
Boston Scientific Corp.(2) | 64,130 | 757 | ||||||
Bristol-Myers Squibb Co. | 79,850 | 4,087 | ||||||
Cardinal Health, Inc. | 16,340 | 1,224 | ||||||
CareFusion Corp.(2) | 10,170 | 460 | ||||||
Celgene Corp.(2) | 38,306 | 3,631 | ||||||
Cerner Corp.(2) | 14,280 | 851 | ||||||
CIGNA Corp. | 13,120 | 1,190 | ||||||
Covidien plc | 21,710 | 1,878 | ||||||
DaVita, Inc.(2) | 8,260 | 604 | ||||||
DENTSPLY International, Inc. | 6,810 | 311 | ||||||
Edwards Lifesciences Corp.(2) | 5,140 | 525 | ||||||
Eli Lilly & Co. | 47,120 | 3,056 | ||||||
Express Scripts Holding Co.(2) | 37,610 | 2,656 | ||||||
Gilead Sciences, Inc.(2) | 72,620 | 7,730 | ||||||
Hospira, Inc.(2) | 8,210 | 427 | ||||||
Humana, Inc. | 8,130 | 1,059 | ||||||
Intuitive Surgical, Inc.(2) | 1,750 | 808 | ||||||
| SHARES | VALUE | |||||||
| Health Care—continued | ||||||||
Johnson & Johnson | 135,140 | $ | 14,405 | |||||
Laboratory Corp. of America Holdings(2) | 4,150 | 422 | ||||||
Mallinckrodt plc(2) | 5,420 | 489 | ||||||
McKesson Corp. | 11,570 | 2,252 | ||||||
Medtronic, Inc. | 47,160 | 2,922 | ||||||
Merck & Co., Inc. | 138,230 | 8,194 | ||||||
Mylan, Inc.(2) | 18,290 | 832 | ||||||
Patterson Cos., Inc. | 4,100 | 170 | ||||||
PerkinElmer, Inc. | 5,520 | 241 | ||||||
Perrigo Co. plc | 6,470 | 972 | ||||||
Pfizer, Inc. | 303,940 | 8,988 | ||||||
Quest Diagnostics, Inc. | 7,200 | 437 | ||||||
Regeneron Pharmaceuticals, Inc.(2) | 3,550 | 1,280 | ||||||
St. Jude Medical, Inc. | 14,150 | 851 | ||||||
Stryker Corp. | 14,640 | 1,182 | ||||||
Tenet Healthcare Corp.(2) | 4,910 | 292 | ||||||
Thermo Fisher Scientific, Inc. | 19,170 | 2,333 | ||||||
UnitedHealth Group, Inc. | 46,650 | 4,024 | ||||||
Universal Health Services, Inc. Class B | 4,320 | 451 | ||||||
Varian Medical Systems, Inc.(2) | 5,130 | 411 | ||||||
Vertex Pharmaceuticals, Inc.(2) | 11,450 | 1,286 | ||||||
Waters Corp.(2) | 4,160 | 412 | ||||||
WellPoint, Inc. | 13,530 | 1,618 | ||||||
Zimmer Holdings, Inc. | 8,260 | 831 | ||||||
Zoetis, Inc. | 24,090 | 890 | ||||||
|
| |||||||
| 117,444 | ||||||||
|
| |||||||
| Industrials—12.6% | ||||||||
3M Co. | 40,930 | 5,799 | ||||||
ADT Corp. (The) | 10,700 | 379 | ||||||
Allegion plc | 5,576 | 266 | ||||||
Ametek, Inc. | 14,920 | 749 | ||||||
Avery Dennison Corp. | 19,520 | 872 | ||||||
Boeing Co. (The) | 43,120 | 5,493 | ||||||
Caterpillar, Inc. | 41,250 | 4,085 | ||||||
Cintas Corp. | 7,340 | 518 | ||||||
CSX Corp. | 73,250 | 2,348 | ||||||
Cummins, Inc. | 19,350 | 2,554 | ||||||
Danaher Corp. | 42,170 | 3,204 | ||||||
Deere & Co. | 24,400 | 2,000 | ||||||
Delta Air Lines, Inc. | 51,450 | 1,860 | ||||||
Dover Corp. | 12,210 | 981 | ||||||
Dun & Bradstreet Corp. | 2,250 | 264 | ||||||
Eaton Corp. plc | 35,360 | 2,241 | ||||||
Emerson Electric Co. | 45,060 | 2,820 | ||||||
Equifax, Inc. | 9,990 | 747 | ||||||
Expeditors International of Washington, Inc. | 11,900 | 483 | ||||||
Fastenal Co. | 16,670 | 748 | ||||||
FedEx Corp. | 17,350 | 2,801 | ||||||
Flowserve Corp. | 8,340 | 588 | ||||||
Fluor Corp. | 14,090 | 941 | ||||||
General Dynamics Corp. | 21,050 | 2,675 | ||||||
General Electric Co. | 457,640 | 11,725 | ||||||
Grainger (W.W.), Inc. | 4,830 | 1,215 | ||||||
Honeywell International, Inc. | 50,860 | 4,736 | ||||||
Illinois Tool Works, Inc. | 23,640 | 1,996 | ||||||
Ingersoll-Rand plc | 16,310 | 919 | ||||||
Iron Mountain, Inc. | 7,250 | 237 | ||||||
Jacobs Engineering Group, Inc.(2) | 7,980 | 390 | ||||||
See Notes to Financial Statements
30
Table of Contents
VIRTUS ALPHASECTOR® ROTATION FUND
SCHEDULE OF INVESTMENTS (Continued)
SEPTEMBER 30, 2014
($ reported in thousands)
| SHARES | VALUE | |||||||
| Industrials—continued | ||||||||
Joy Global, Inc. | 6,090 | $ | 332 | |||||
Kansas City Southern | 6,790 | 823 | ||||||
L-3 Communications Holdings, Inc. | 5,230 | 622 | ||||||
Lockheed Martin Corp. | 17,280 | 3,158 | ||||||
Masco Corp. | 24,080 | 576 | ||||||
Nielsen Holdings NV | 18,530 | 821 | ||||||
Norfolk Southern Corp. | 22,150 | 2,472 | ||||||
Northrop Grumman Corp. | 13,690 | 1,804 | ||||||
PACCAR, Inc. | 25,060 | 1,425 | ||||||
Pall Corp. | 9,540 | 798 | ||||||
Parker Hannifin Corp. | 11,470 | 1,309 | ||||||
Pentair plc | 11,890 | 779 | ||||||
Pitney Bowes, Inc. | 14,150 | 354 | ||||||
Precision Castparts Corp. | 8,750 | 2,073 | ||||||
Quanta Services, Inc.(2) | 13,120 | 476 | ||||||
Raytheon Co. | 20,730 | 2,107 | ||||||
Republic Services, Inc. | 15,390 | 600 | ||||||
Robert Half International, Inc. | 11,800 | 578 | ||||||
Robinson (C.H.) Worldwide, Inc. | 9,040 | 599 | ||||||
Rockwell Automation, Inc. | 10,930 | 1,201 | ||||||
Rockwell Collins, Inc. | 10,650 | 836 | ||||||
Roper Industries, Inc. | 6,110 | 894 | ||||||
Ryder System, Inc. | 5,920 | 533 | ||||||
Snap-On, Inc. | 3,560 | 431 | ||||||
Southwest Airlines Co. | 45,650 | 1,542 | ||||||
Stanley Black & Decker, Inc. | 9,480 | 842 | ||||||
Stericycle, Inc.(2) | 5,140 | 599 | ||||||
Textron, Inc. | 21,380 | 769 | ||||||
Tyco International Ltd. | 27,040 | 1,205 | ||||||
Union Pacific Corp. | 60,170 | 6,524 | ||||||
United Parcel Service, Inc. Class B | 44,110 | 4,336 | ||||||
United Rentals, Inc.(2) | 5,850 | 650 | ||||||
United Technologies Corp. | 54,450 | 5,750 | ||||||
Waste Management, Inc. | 28,670 | 1,363 | ||||||
Xylem, Inc. | 11,240 | 399 | ||||||
|
| |||||||
| 116,214 | ||||||||
|
| |||||||
| Information Technology—11.2% | ||||||||
Accenture plc Class A | 19,090 | 1,552 | ||||||
Adobe Systems, Inc.(2) | 14,690 | 1,016 | ||||||
Akamai Technologies, Inc.(2) | 6,170 | 369 | ||||||
Alliance Data Systems Corp.(2) | 1,640 | 407 | ||||||
Altera Corp. | 10,310 | 369 | ||||||
Amphenol Corp. Class A | 5,120 | 511 | ||||||
Analog Devices, Inc. | 10,170 | 503 | ||||||
Apple, Inc. | 179,090 | 18,043 | ||||||
Applied Materials, Inc. | 37,550 | 812 | ||||||
Autodesk, Inc.(2) | 7,610 | 419 | ||||||
Automatic Data Processing, Inc. | 14,910 | 1,239 | ||||||
Avago Technologies Ltd. | 7,550 | 657 | ||||||
Broadcom Corp. Class A | 16,710 | 675 | ||||||
CA, Inc. | 10,140 | 283 | ||||||
Cisco Systems, Inc. | 153,330 | 3,859 | ||||||
Citrix Systems, Inc.(2) | 5,350 | 382 | ||||||
Cognizant Technology Solutions Corp. Class A(2) | 19,180 | 859 | ||||||
Computer Sciences Corp. | 4,720 | 289 | ||||||
Corning, Inc. | 40,360 | 781 | ||||||
eBay, Inc.(2) | 34,370 | 1,946 | ||||||
Electronic Arts, Inc.(2) | 10,150 | 361 | ||||||
EMC Corp. | 62,020 | 1,815 | ||||||
| SHARES | VALUE | |||||||
| Information Technology—continued | ||||||||
F5 Networks, Inc.(2) | 2,350 | $ | 279 | |||||
Facebook, Inc. Class A(2) | 58,320 | 4,610 | ||||||
Fidelity National Information Services, Inc. | 9,580 | 539 | ||||||
First Solar, Inc.(2) | 2,110 | 139 | ||||||
Fiserv, Inc.(2) | 8,020 | 518 | ||||||
FLIR Systems, Inc. | 4,830 | 151 | ||||||
Google, Inc. Class A(2) | 8,540 | 5,025 | ||||||
Google, Inc. Class C(2) | 8,540 | 4,931 | ||||||
Harris Corp. | 3,580 | 238 | ||||||
Hewlett-Packard Co. | 46,690 | 1,656 | ||||||
Intel Corp. | 126,270 | 4,397 | ||||||
International Business Machines Corp. | 27,730 | 5,264 | ||||||
Intuit, Inc. | 9,050 | 793 | ||||||
Jabil Circuit, Inc. | 7,000 | 141 | ||||||
Juniper Networks, Inc. | 12,440 | 276 | ||||||
KLA-Tencor Corp. | 5,310 | 418 | ||||||
Lam Research Corp. | 4,880 | 365 | ||||||
Linear Technology Corp. | 7,820 | 347 | ||||||
MasterCard, Inc. Class A | 30,210 | 2,233 | ||||||
Microchip Technology, Inc. | 6,650 | 314 | ||||||
Micron Technology, Inc.(2) | 34,100 | 1,168 | ||||||
Microsoft Corp. | 246,450 | 11,425 | ||||||
Motorola Solutions, Inc. | 7,040 | 446 | ||||||
NetApp, Inc. | 10,530 | 452 | ||||||
NVIDIA Corp. | 16,320 | 301 | ||||||
Oracle Corp. | 97,810 | 3,744 | ||||||
Paychex, Inc. | 10,250 | 453 | ||||||
QUALCOMM, Inc. | 50,430 | 3,771 | ||||||
Red Hat, Inc.(2) | 6,140 | 345 | ||||||
Salesforce.com, Inc.(2) | 18,350 | 1,056 | ||||||
SanDisk Corp. | 7,430 | 728 | ||||||
Seagate Technology plc | 9,980 | 572 | ||||||
Symantec Corp. | 21,400 | 503 | ||||||
TE Connectivity Ltd. | 12,280 | 679 | ||||||
Teradata Corp.(2) | 5,300 | 222 | ||||||
Texas Instruments, Inc. | 32,420 | 1,546 | ||||||
Total System Services, Inc. | 5,810 | 180 | ||||||
VeriSign, Inc.(2) | 3,720 | 205 | ||||||
Visa, Inc. Class A | 14,770 | 3,152 | ||||||
Western Digital Corp. | 6,970 | 678 | ||||||
Western Union Co. (The) | 16,840 | 270 | ||||||
Xerox Corp. | 34,920 | 462 | ||||||
Xilinx, Inc. | 8,810 | 373 | ||||||
Yahoo!, Inc.(2) | 28,360 | 1,156 | ||||||
|
| |||||||
| 103,668 | ||||||||
|
| |||||||
| Materials—12.4% | ||||||||
Air Products & Chemicals, Inc. | 37,240 | 4,848 | ||||||
Airgas, Inc. | 13,580 | 1,503 | ||||||
Alcoa, Inc. | 230,290 | 3,705 | ||||||
Allegheny Technologies, Inc. | 22,590 | 838 | ||||||
Ball Corp. | 27,790 | 1,758 | ||||||
Bemis Co., Inc. | 20,940 | 796 | ||||||
CF Industries Holdings, Inc. | 9,840 | 2,748 | ||||||
Dow Chemical Co. (The) | 214,920 | 11,270 | ||||||
Du Pont (E.I.) de Nemours & Co. | 175,240 | 12,575 | ||||||
Eastman Chemical Co. | 29,500 | 2,386 | ||||||
Ecolab, Inc. | 51,630 | 5,929 | ||||||
FMC Corp. | 26,510 | 1,516 | ||||||
Freeport-McMoRan Copper & Gold, Inc. | 150,460 | 4,912 | ||||||
| SHARES | VALUE | |||||||
| Materials—continued | ||||||||
International Flavors & Fragrances, Inc. | 16,320 | $ | 1,565 | |||||
International Paper Co. | 82,730 | 3,950 | ||||||
LyondellBasell Industries N.V. Class A | 81,420 | 8,847 | ||||||
Martin Marietta Materials, Inc. | 11,820 | 1,524 | ||||||
MeadWestvaco Corp. | 33,970 | 1,391 | ||||||
Monsanto Co. | 100,450 | 11,302 | ||||||
Mosaic Co. (The) | 62,220 | 2,763 | ||||||
Newmont Mining Corp. | 98,500 | 2,270 | ||||||
Nucor Corp. | 62,560 | 3,396 | ||||||
Owens-Illinois, Inc.(2) | 33,600 | 875 | ||||||
PPG Industries, Inc. | 26,740 | 5,261 | ||||||
Praxair, Inc. | 55,910 | 7,212 | ||||||
Sealed Air Corp. | 42,980 | 1,499 | ||||||
Sherwin-Williams Co. (The) | 16,360 | 3,583 | ||||||
Sigma-Aldrich Corp. | 23,600 | 3,210 | ||||||
Vulcan Materials Co. | 26,030 | 1,568 | ||||||
|
| |||||||
| 115,000 | ||||||||
|
| |||||||
| Telecommunication Services—1.4% | ||||||||
AT&T, Inc. | 155,100 | 5,466 | ||||||
CenturyLink, Inc. | 17,980 | 735 | ||||||
Frontier Communications Corp. | 35,770 | 233 | ||||||
Verizon Communications, Inc. | 124,890 | 6,243 | ||||||
Windstream Holdings, Inc. | 20,240 | 218 | ||||||
|
| |||||||
| 12,895 | ||||||||
| TOTAL COMMON STOCKS (Identified Cost $792,965) | 929,033 | |||||||
| TOTAL LONG-TERM INVESTMENTS—100.4% | ||||||||
| (Identified Cost $792,965) | 929,033 | |||||||
| SECURITIES LENDING COLLATERAL—0.2% | ||||||||
INVESCO Trust Short-Term Investments Liquid Assets Portfolio (The) Institutional Shares (seven-day effective yield 0.060%)(4) | 1,938,510 | 1,939 | ||||||
| TOTAL SECURITIES LENDING COLLATERAL | ||||||||
| (Identified Cost $1,939) | 1,939 | |||||||
| TOTAL INVESTMENTS—100.6% (Identified Cost $794,904) | 930,972 | (1) | ||||||
Other assets and liabilities, net—(0.6)% |
| (5,094 | ) | |||||
|
| |||||||
| NET ASSETS—100.0% | $ | 925,878 | ||||||
|
| |||||||
Abbreviations:
| REIT | Real Estate Investment Trust |
Footnote Legend:
| (1) | Federal Income Tax Information: For tax information at September 30, 2014, see Note 10 Federal Income Tax Information in the Notes to Financial Statements. |
| (2) | Non-income producing. |
| (3) | All or a portion of security is on loan. |
| (4) | Represents security purchased with cash collateral received for securities on loan. |
Security abbreviation definitions are located under the Key Investment Terms starting on page 4.
See Notes to Financial Statements
31
Table of Contents
VIRTUS ALPHASECTOR® ROTATION FUND
SCHEDULE OF INVESTMENTS (Continued)
SEPTEMBER 30, 2014
($ reported in thousands)
The following table provides a summary of inputs used to value the Fund’s investments as of September 30, 2014 (See Security Valuation Note 2A in the Notes to Financial Statements):
| Total Value at September 30, 2014 | Level 1 Quoted Prices | |||||||
Equity Securities: | ||||||||
Common Stocks | $ | 929,033 | $ | 929,033 | ||||
Securities | 1,939 | 1,939 | ||||||
|
|
|
| |||||
Total Investments | $ | 930,972 | $ | 930,972 | ||||
|
|
|
| |||||
There are no Level 2 (significant observable inputs) or Level 3 (significant unobservable inputs) priced securities.
There were no transfers between Level 1 and Level 2 for the period.
See Notes to Financial Statements
32
Table of Contents
VIRTUS ALTERNATIVES DIVERSIFIER FUND
SCHEDULE OF INVESTMENTS
SEPTEMBER 30, 2014
($ reported in thousands)
| SHARES | VALUE | |||||||
| AFFILIATED MUTUAL FUNDS(3)—70.2% | ||||||||
| Equity Funds—60.9% | ||||||||
Virtus Global Commodities Stock Fund Class I(2) | 1,754,619 | $ | 14,721 | |||||
Virtus Global Dividend Fund Class I | 1,596,057 | 24,548 | ||||||
Virtus Global Real Estate Securities Fund Class I | 417,772 | 10,582 | ||||||
Virtus International Real Estate Securities Fund Class I | 1,856,475 | 13,051 | ||||||
Virtus Real Estate Securities Class I | 362,125 | 13,261 | ||||||
|
| |||||||
| 76,163 | ||||||||
|
| |||||||
| Fixed Income Funds—9.3% | ||||||||
Virtus Senior Floating Rate Fund Class I | 1,195,297 | 11,606 | ||||||
| TOTAL AFFILIATED MUTUAL FUNDS (Identified Cost $69,405) | 87,769 | |||||||
| EXCHANGE-TRADED FUNDS(3)—29.0% | ||||||||
Market Vectors Agribusiness | 40,950 | 2,166 | ||||||
Market Vectors Coal | 163,400 | 2,796 | ||||||
PowerShares DB Commodity Index Tracking Fund(2) | 491,000 | 11,401 | ||||||
PowerShares DB G10 Currency Harvest Fund(2) | 582,150 | 14,961 | ||||||
WisdomTree Managed Futures Strategy Fund | 113,700 | 4,957 | ||||||
| TOTAL EXCHANGE-TRADED FUNDS (Identified Cost $34,520) | 36,281 | |||||||
| TOTAL LONG-TERM INVESTMENTS—99.2% | ||||||||
| (Identified Cost $103,925) | 124,050 | |||||||
| SHARES | VALUE | |||||||
| SHORT-TERM INVESTMENTS—0.9% | ||||||||
| Money Market Mutual Funds—0.9% | ||||||||
Fidelity Money Market Portfolio – Institutional Shares (seven-day effective yield 0.080%) | 1,069,616 | $ | 1,070 | |||||
| TOTAL SHORT-TERM INVESTMENTS (Identified Cost $1,070) | 1,070 | |||||||
| TOTAL INVESTMENTS—100.1% (Identified Cost $104,995) | 125,120 | (1) | ||||||
Other assets and liabilities, net—(0.1)% |
| (90 | ) | |||||
|
| |||||||
| NET ASSETS—100.0% | $ | 125,030 | ||||||
|
| |||||||
Footnote Legend:
| (1) | Federal Income Tax Information: For tax information at September 30, 2014, see Note 10 Federal Income Tax Information in the Notes to Financial Statements. |
| (2) | Non-income producing. |
| (3) | All of these funds are public funds and the prospectus and annual reports of each are publicly available. |
The following table provides a summary of inputs used to value the Fund’s investments as of
September 30, 2014 (See Security Valuation Note 2A in the Notes to Financial Statements):
| Total Value at September 30, 2014 | Level 1 Quoted Prices | |||||||
Equity Securities: |
| |||||||
Affiliated Mutual Funds | $ | 87,769 | $ | 87,769 | ||||
Exchange-Traded Funds | 36,281 | 36,281 | ||||||
Short-Term Investments | 1,070 | 1,070 | ||||||
|
|
|
| |||||
Total Investments | $ | 125,120 | $ | 125,120 | ||||
|
|
|
| |||||
There are no Level 2 (significant observable inputs) or Level 3 (significant unobservable inputs) priced securities.
There were no transfers between Level 1 and Level 2 for the period.
See Notes to Financial Statements
33
Table of Contents
VIRTUS DISCIPLINED EQUITY STYLE FUND
SCHEDULE OF INVESTMENTS
SEPTEMBER 30, 2014
($ reported in thousands)
| SHARES | VALUE | |||||||
| EXCHANGE-TRADED FUNDS(2)—98.8% | ||||||||
iShares Russell 1000® Growth Index Fund | 7,530 | $ | 690 | |||||
iShares Russell 2000® Growth Index Fund | 4,930 | 639 | ||||||
iShares Russell Midcap® Growth Index Fund | 7,640 | 675 | ||||||
| TOTAL EXCHANGE-TRADED FUNDS (Identified Cost $2,041) | 2,004 | |||||||
| TOTAL LONG-TERM INVESTMENTS—98.8% | ||||||||
| (Identified Cost $2,041) | 2,004 | |||||||
| SHARES | VALUE | |||||||
| SHORT-TERM INVESTMENTS—0.9% | ||||||||
| Money Market Mutual Funds—0.9% | ||||||||
Fidelity Money Market Portfolio – Institutional Shares (Seven-day effective yield 0.080%) | 18,909 | $ | 19 | |||||
| TOTAL SHORT-TERM INVESTMENTS (Identified Cost $19) | 19 | |||||||
| TOTAL INVESTMENTS—99.7% (Identified Cost $2,060) | 2,023 | (1) | ||||||
Other assets and liabilities, net—0.3% |
| 6 | ||||||
|
| |||||||
| NET ASSETS—100.0% | $ | 2,029 | ||||||
|
| |||||||
Footnote Legend:
| (1) | Federal Income Tax Information: For tax information at September 30, 2014, see Note 10 Federal Income Tax Information in the Notes to Financial Statements. |
| (2) | All of these funds are public funds and the prospectus and annual reports of each are publicly available. |
The following table provides a summary of inputs used to value the Fund’s investments as of September 30, 2014 (See Security Valuation Note 2A in the Notes to Financial Statements):
| Total Value at September 30, 2014 | Level 1 Quoted Prices | |||||||
Equity Securities: | ||||||||
Exchange-Traded Funds | $ | 2,004 | $ | 2,004 | ||||
Short-Term Invest | 19 | 19 | ||||||
|
|
|
| |||||
Total Investments | $ | 2,023 | $ | 2,023 | ||||
|
|
|
| |||||
There are no Level 2 (significant observable inputs) or Level 3 (significant unobservable inputs) priced securities.
There were no transfers between Level 1 and Level 2 for the period.
See Notes to Financial Statements
34
Table of Contents
VIRTUS DISCIPLINED SELECT BOND FUND
SCHEDULE OF INVESTMENTS
SEPTEMBER 30, 2014
($ reported in thousands)
| SHARES | VALUE | |||||||
| EXCHANGE-TRADED FUNDS(2)—98.3% | ||||||||
iShares Barclays 7-10 Year Treasury Bond Fund | 1,650 | $ | 171 | |||||
iShares Barclays Treasury Inflation Protected Securities Bond Fund | 4,560 | 510 | ||||||
iShares Lehman 1-3 Year Treasury Bond Fund | 2,020 | 171 | ||||||
iShares Lehman 20+ Year Treasury Bond Fund | 1,470 | 171 | ||||||
| TOTAL EXCHANGE-TRADED FUNDS (Identified Cost $1,025) | 1,023 | |||||||
| TOTAL LONG-TERM INVESTMENTS—98.3% | ||||||||
| (Identified Cost $1,025) | 1,023 | |||||||
| SHORT-TERM INVESTMENTS—1.4% | ||||||||
| Money Market Mutual Funds—1.4% | ||||||||
Fidelity Money Market Portfolio – Institutional Shares (Seven-day effective yield 0.080%) | 14,870 | 15 | ||||||
| TOTAL SHORT-TERM INVESTMENTS (Identified Cost $15) | 15 | |||||||
| TOTAL INVESTMENTS—99.7% (Identified Cost $1,040) | 1,038 | (1) | ||||||
Other assets and liabilities, net—0.3% |
| 4 | ||||||
|
| |||||||
| NET ASSETS—100.0% | $ | 1,042 | ||||||
|
| |||||||
Abbreviations:
Footnote Legend:
| (1) | Federal Income Tax Information: For tax information at September 30, 2014, see Note 10 Federal Income Tax Information in the Notes to Financial Statements. |
| (2) | All of these funds are public funds and the prospectus and annual reports of each are publicly available. |
The following table provides a summary of inputs used to value the Fund’s investments as of September 30, 2014 (See Security Valuation Note 2A in the Notes to Financial Statements):
| Total Value at September 30, 2014 | Level 1 Quoted Prices | |||||||
Equity Securities: | ||||||||
Exchange-Traded Funds | $ | 1,023 | $ | 1,023 | ||||
Short-Term Invest | 15 | 15 | ||||||
|
|
|
| |||||
Total Investments | $ | 1,038 | $ | 1,038 | ||||
|
|
|
| |||||
There are no Level 2 (significant observable inputs) or Level 3 (significant unobservable inputs) priced securities.
There were no transfers between Level 1 and Level 2 for the period.
Security abbreviation definitions are located under the Key Investment Terms starting on page 4.
See Notes to Financial Statements
35
Table of Contents
VIRTUS DISCIPLINED SELECT COUNTRY FUND
SCHEDULE OF INVESTMENTS
SEPTEMBER 30, 2014
($ reported in thousands)
| SHARES | VALUE | |||||||
| EXCHANGE-TRADED FUNDS(2)—97.1% | ||||||||
iShares MSCI France Index Fund | 9,800 | $ | 260 | |||||
iShares MSCI Hong Kong Index Fund | 1,890 | 38 | ||||||
iShares MSCI Japan Index Fund | 25,700 | 302 | ||||||
iShares MSCI Singapore Index Fund | 20,990 | 280 | ||||||
iShares MSCI Switzerland Index Fund Capped | 8,020 | 261 | ||||||
iShares MSCI United Kingdom Index Fund | 13,350 | 260 | ||||||
| TOTAL EXCHANGE-TRADED FUNDS (Identified Cost $1,373) | 1,401 | |||||||
| TOTAL LONG-TERM INVESTMENTS—97.1% | ||||||||
| (Identified Cost $1,373) | 1,401 | |||||||
| SHARES | VALUE | |||||||
| SHORT-TERM INVESTMENTS—1.1% | ||||||||
| Money Market Mutual Funds—1.1% | ||||||||
Fidelity Money Market Portfolio – Institutional Shares (Seven-day effective yield 0.080%) | 15,737 | $ | 16 | |||||
| TOTAL SHORT-TERM INVESTMENTS (Identified Cost $16) | 16 | |||||||
| TOTAL INVESTMENTS—98.2% | ||||||||
| (Identified Cost $1,389) | 1,417 | (1) | ||||||
Other assets and liabilities, net—1.8% |
| 25 | ||||||
|
| |||||||
| NET ASSETS—100.0% | $ | 1,442 | ||||||
|
| |||||||
Abbreviations:
Footnote Legend:
| (1) | Federal Income Tax Information: For tax information at September 30, 2014, see Note 10 Federal Income Tax Information in the Notes to Financial Statements. |
| (2) | All of these funds are public funds and the prospectus and annual reports of each are publicly available. |
The following table provides a summary of inputs used to value the Fund’s investments as of
September 30, 2014 (See Security Valuation Note 2A in the Notes to Financial Statements):
| Total Value at September 30, 2014 | Level 1 Quoted Prices | |||||||
Equity Securities: | ||||||||
Exchange-Traded Funds | $ | 1,401 | $ | 1,401 | ||||
Short-Term Invest | 16 | 16 | ||||||
|
|
|
| |||||
Total Investments | $ | 1,417 | $ | 1,417 | ||||
|
|
|
| |||||
There are no Level 2 (significant observable inputs) or Level 3 (significant unobservable inputs) priced securities.
There were no transfers between Level 1 and Level 2 for the period.
Security abbreviation definitions are located under the Key Investment Terms starting on page 4.
See Notes to Financial Statements
36
Table of Contents
VIRTUS DYNAMIC ALPHASECTOR® FUND
SCHEDULE OF INVESTMENTS AND SECURITIES SOLD SHORT
SEPTEMBER 30, 2014
($ reported in thousands)
| SHARES | VALUE | |||||||
| EXCHANGE-TRADED FUNDS(6)—126.4% | ||||||||
Consumer Discretionary Select Sector SPDR Fund(4) | 7,296,400 | $ | 486,597 | |||||
Consumer Staples Select Sector SPDR Fund(4) | 10,936,800 | 493,359 | ||||||
Financial Select Sector SPDR Fund | 21,184,100 | 490,836 | ||||||
Health Care Select Sector SPDR Fund(4) | 7,657,500 | 489,391 | ||||||
Industrial Select Sector SPDR Fund(4) | 9,212,600 | 489,650 | ||||||
Materials Select Sector SPDR Fund(4) | 9,911,100 | 491,491 | ||||||
Technology Select Sector SPDR Fund(4) | 12,422,400 | 495,778 | ||||||
| TOTAL EXCHANGE-TRADED FUNDS (Identified Cost $3,170,681) | 3,437,102 | (5) | ||||||
| TOTAL LONG-TERM INVESTMENTS—126.4% | ||||||||
| (Identified Cost $3,170,681) | 3,437,102 | (2) | ||||||
| SHORT-TERM INVESTMENTS—0.0% | ||||||||
| Money Market Mutual Funds—0.0% | ||||||||
Fidelity Money Market Portfolio – Institutional Shares (seven-day effective yield 0.080%) | 332 | — | (3) | |||||
| TOTAL SHORT-TERM INVESTMENTS (Identified Cost $—(3)) | — | (3) | ||||||
| TOTAL INVESTMENTS, BEFORE SECURITIES SOLD SHORT—126.4% | ||||||||
| (Identified Cost $3,170,681) | 3,437,102 | (1) | ||||||
| SHARES | VALUE | |||||||
| SECURITIES SOLD SHORT—(11.3)% | ||||||||
| EXCHANGE-TRADED FUNDS SOLD SHORT—(11.3)% | ||||||||
Energy Select Sector SPDR Fund | 1,666,400 | $ | (151,009 | ) | ||||
Utilities Select Sector SPDR Fund | 3,739,000 | (157,375 | ) | |||||
| TOTAL SECURITIES SOLD SHORT—(11.3)% (Proceeds ($302,572)) | (308,384 | ) | ||||||
| TOTAL INVESTMENTS, NET OF SECURITIES SOLD SHORT—115.1% | ||||||||
| (Identified Cost $2,868,109) | 3,128,718 | |||||||
Other assets and liabilities, net—(15.1)% |
| (410,524 | ) | |||||
|
| |||||||
| NET ASSETS—100.0% | $ | 2,718,194 | ||||||
|
| |||||||
Abbreviations:
| SPDR | S&P Depositary Receipt |
Footnote Legend:
| (1) | Federal Income Tax Information: For tax information at September 30, 2014, see Note 10 Federal Income Tax Information in the Notes to Financial Statements. |
| (2) | All or a portion have been segregated as collateral for securities sold short. |
| (3) | Amounts are less than $500 (not reported in 000s). |
| (4) | A portion of security is on loan. |
| (5) | Includes securities purchased with cash collateral of $727,366 received from securities on loan. |
| (6) | All of these funds are public funds and the prospectus and annual reports of each are publicly available. |
The following table provides a summary of inputs used to value the Fund’s investments as of September 30, 2014 (See Security Valuation Note 2A in the Notes to Financial Statements):
| Total Value at September 30, 2014 | Level 1 Quoted Prices | |||||||
Equity Securities: | ||||||||
Exchange-Traded Funds | $ | 3,437,102 | $ | 3,437,102 | ||||
Short-Term Investments | — | (3) | — | (3) | ||||
|
|
|
| |||||
Total Investments before Securities Sold Short | $ | 3,437,102 | $ | 3,437,102 | ||||
|
|
|
| |||||
Liabilities: | ||||||||
Exchange Traded Funds Sold Short | (308,384 | ) | (308,384 | ) | ||||
|
|
|
| |||||
Total Investments net of Securities Sold Short | $ | 3,128,718 | $ | 3,128,718 | ||||
|
|
|
| |||||
There are no Level 2 (significant observable inputs) or Level 3 (significant unobservable inputs) priced securities.
There were no transfers between Level 1 and Level 2 for the period.
Security abbreviation definitions are located under the Key Investment Terms starting on page 4.
See Notes to Financial Statements
37
Table of Contents
VIRTUS GLOBAL PREMIUM ALPHASECTOR® FUND
SCHEDULE OF INVESTMENTS
SEPTEMBER 30, 2014
($ reported in thousands)
| SHARES | VALUE | |||||||
| EXCHANGE-TRADED FUNDS(2)—98.0% | ||||||||
Consumer Discretionary Select Sector SPDR Fund | 313,300 | $ | 20,894 | |||||
Consumer Staples Select Sector SPDR Fund | 472,670 | 21,322 | ||||||
Financial Select Sector SPDR Fund | 907,530 | 21,027 | ||||||
Health Care Select Sector SPDR Fund | 330,820 | 21,143 | ||||||
Industrial Select Sector SPDR Fund | 394,350 | 20,960 | ||||||
iShares MSCI Canada Index Fund | 386,023 | 11,851 | ||||||
iShares MSCI Emerging Markets Index Fund | 559,730 | 23,262 | ||||||
iShares MSCI EMU | 635,570 | 24,469 | ||||||
iShares MSCI Pacific Ex-Japan Index Fund | 244,100 | 11,246 | ||||||
iShares MSCI Switzerland Index Fund Capped | 376,010 | 12,224 | ||||||
iShares MSCI United Kingdom | 615,200 | 11,923 | ||||||
Materials Select Sector SPDR Fund | 425,530 | 21,102 | ||||||
Technology Select Sector SPDR Fund | 532,040 | 21,234 | ||||||
| TOTAL EXCHANGE-TRADED FUNDS (Identified Cost $232,200) | 242,657 | |||||||
| TOTAL LONG-TERM INVESTMENTS—98.0% | ||||||||
| (Identified Cost $232,200) | 242,657 | |||||||
| SHARES | VALUE | |||||||
| SHORT-TERM INVESTMENTS—0.7% | ||||||||
| Money Market Mutual Funds—0.7% | ||||||||
Fidelity Money Market Portfolio – Institutional Shares (Seven-day effective yield 0.080%) | 1,774,251 | $ | 1,774 | |||||
| TOTAL SHORT-TERM INVESTMENTS (Identified Cost $1,774) | 1,774 | |||||||
| TOTAL INVESTMENTS—98.7% (Identified Cost $233,974) | 244,431 | (1) | ||||||
Other assets and liabilities, net—1.3% |
| 3,103 | ||||||
|
| |||||||
| NET ASSETS—100.0% | $ | 247,534 | ||||||
|
| |||||||
Abbreviations:
| EMU | European Economic and Monetary Union |
| SPDR | S&P Depositary Receipt |
Footnote Legend:
| (1) | Federal Income Tax Information: For tax information at September 30, 2014, see Note 10 Federal Income Tax Information in the Notes to Financial Statements. |
| (2) | All of these funds are public funds and the prospectus and annual reports of each are publicly available. |
The following table provides a summary of inputs used to value the Fund’s investments as of September 30, 2014 (See Security Valuation Note 2A in the Notes to Financial Statements):
| Total Value at September 30, 2014 | Level 1 Quoted Prices | |||||||
Equity Securities: | ||||||||
Exchange-Traded Funds | $ | 242,657 | $ | 242,657 | ||||
Short-Term Investments | 1,774 | 1,774 | ||||||
|
|
|
| |||||
Total Investments | $ | 244,431 | $ | 244,431 | ||||
|
|
|
| |||||
There are no Level 2 (significant observable inputs) or Level 3 (significant unobservable inputs) priced securities.
There were no transfers between Level 1 and Level 2 for the period.
Security abbreviation definitions are located under the Key Investment Terms starting on page 4.
See Notes to Financial Statements
38
Table of Contents
SCHEDULE OF INVESTMENTS
SEPTEMBER 30, 2014
($ reported in thousands)
| SHARES | VALUE | |||||||
| CLOSED END FUNDS—79.0% | ||||||||
| Convertible Funds—4.8% | ||||||||
AllianzGI Equity & Convertible Income Fund | 37,208 | $ | 739 | |||||
Putnam High Income Securities Fund | 44,103 | 367 | ||||||
|
| |||||||
| 1,106 | ||||||||
|
| |||||||
| Equity Funds—33.1% | ||||||||
Adams Express Co. | 42,270 | 589 | ||||||
Alpine Total Dynamic Dividend Fund | 61,634 | 525 | ||||||
ASA Gold and Precious Metals Ltd. | 4,500 | 53 | ||||||
Boulder Growth & Income Fund, Inc. | 18,023 | 159 | ||||||
Cohen & Steers Infrastructure Fund, Inc. | 23,500 | 544 | ||||||
Cohen & Steers Total Return Realty Fund, Inc. | 16,684 | 199 | ||||||
Diversified Real Asset Income Fund | 29,582 | 525 | ||||||
Eaton Vance Tax-Advantaged Dividend Income Fund | 5,363 | 108 | ||||||
First Opportunity Fund, Inc. | 27,471 | 266 | ||||||
Gabelli Healthcare & WellnessRx Trust (The) | 56,157 | 557 | ||||||
Gabelli Multimedia Trust, Inc. | 45,000 | 423 | ||||||
General American Investors Co., Inc. | 12,235 | 453 | ||||||
H&Q Healthcare Investors | 5,100 | 145 | ||||||
Kayne Anderson Energy Total Return Fund, Inc. | 9,016 | 288 | ||||||
Kayne Anderson Midstream/Energy Fund Inc. | 9,700 | 389 | ||||||
Liberty All Star Equity Fund | 58,347 | 340 | ||||||
Petroleum & Resources Corp. | 12,354 | 356 | ||||||
RMR Real Estate Income Fund | 10,502 | 198 | ||||||
Salient Midstream & MLP Fund | 11,520 | 336 | ||||||
Tortoise Energy Independence Fund, Inc. | 13,190 | 326 | ||||||
Tortoise Energy Infrastructure Corp. | 16,555 | 796 | ||||||
Tri-Continental Corp. | 5,847 | 122 | ||||||
|
| |||||||
| 7,697 | ||||||||
|
| |||||||
| Income Funds—20.5% | ||||||||
BlackRock Credit Allocation Income Trust IV | 23,768 | 316 | ||||||
First Trust High Income Long/Short Fund | 32,500 | 555 | ||||||
First Trust Intermediate Duration Preferred & Income Fund | 40,871 | 888 | ||||||
First Trust Mortgage Income Fund | 14,600 | 220 | ||||||
Guggenheim Build America Bonds Managed Duration Trust | 4,219 | 90 | ||||||
Montgomery Street Income Securities, Inc. | 10,307 | 168 | ||||||
Morgan Stanley Income Securities, Inc. | 6,582 | 117 | ||||||
Nuveen Credit Strategies Income Fund | 97,525 | 871 | ||||||
Nuveen Multi-Market Income Fund Inc. | 86,997 | 657 | ||||||
| SHARES | VALUE | |||||||
| Income Funds—continued | ||||||||
Pimco Dynamic Income Fund | 10,000 | $ | 316 | |||||
Pimco Income Strategy Fund II | 5,000 | 53 | ||||||
Putnam Master Intermediate Income Trust | 14,700 | 74 | ||||||
Putnam Premier Income Trust | 72,407 | 397 | ||||||
Western Asset/Claymore Inflation-Linked Opportunities & Income Fund | 5,000 | 58 | ||||||
|
| |||||||
| 4,780 | ||||||||
|
| |||||||
| International Equity Funds—13.1% | ||||||||
Aberdeen Japan Equity Fund, Inc. | 61,284 | 436 | ||||||
Aberdeen Singapore Fund, Inc. | 5,100 | 63 | ||||||
Alpine Global Dynamic Dividend Fund | 46,097 | 456 | ||||||
Brookfield Global Listed Infrastructure Income Fund, Inc. | 14,717 | 343 | ||||||
Clough Global Opportunities Fund | 19,477 | 232 | ||||||
Delaware Enhanced Global Dividend and Income Fund | 10,400 | 125 | ||||||
Japan Smaller Capitalization Fund, Inc. | 39,077 | 379 | ||||||
Korea Fund, Inc. (The)(2) | 5,918 | 246 | ||||||
Macquarie Global Infrastructure Total Return Fund, Inc. | 4,900 | 121 | ||||||
New Germany Fund, Inc. (The) | 21,133 | 353 | ||||||
Taiwan Fund, Inc. (The)(2) | 10,308 | 194 | ||||||
Templeton Dragon Fund, Inc. | 4,400 | 113 | ||||||
|
| |||||||
| 3,061 | ||||||||
|
| |||||||
| International Income Funds—4.4% | ||||||||
Aberdeen Asia-Pacific Income Fund, Inc. | 17,034 | 100 | ||||||
Pimco Dynamic Credit Income Fund | 41,300 | 928 | ||||||
|
| |||||||
| 1,028 | ||||||||
|
| |||||||
| Municipal Bond Funds—3.1% | ||||||||
BlackRock Municipal Target Term Trust | 10,598 | 210 | ||||||
Nuveen Dividend Advantage Municipal Fund 3 | 16,451 | 225 | ||||||
Nuveen Dividend Advantage Municipal Income Fund | 19,635 | 277 | ||||||
|
| |||||||
| 712 | ||||||||
| TOTAL CLOSED END FUNDS (Identified Cost $17,930) | 18,384 | |||||||
| PREFERRED STOCK—7.2% | ||||||||
| Financials—7.2% | ||||||||
Oxford Lane Capital Corp. | 36,764 | 897 | ||||||
Oxford Lane Capital Corp. | 31,035 | 780 | ||||||
| TOTAL PREFERRED STOCK (Identified Cost $1,673) | 1,677 | |||||||
| TOTAL LONG-TERM INVESTMENTS—86.2% | ||||||||
| (Identified Cost $19,603) | 20,061 | |||||||
| SHARES | VALUE | |||||||
| SHORT-TERM INVESTMENTS—15.1% | ||||||||
| Money Market Mutual Funds—15.1% | ||||||||
Fidelity Money Market Portfolio – Institutional Shares (seven-day effective yield 0.080%) | 3,506,688 | $ | 3,507 | |||||
| TOTAL SHORT-TERM INVESTMENTS (Identified Cost $3,507) | 3,507 | |||||||
| TOTAL INVESTMENTS—101.3% (Identified Cost $23,110) | 23,568 | (1) | ||||||
Other assets and liabilities, net—(1.3)% |
| (291 | ) | |||||
|
| |||||||
| NET ASSETS—100.0% | $ | 23,277 | ||||||
|
| |||||||
Footnote Legend:
| (1) | Federal Income Tax Information: For tax information at September 30, 2014, see Note 10 Federal Income Tax Information in the Notes to Financial Statements. |
| (2) | Non-income producing. |
The following table provides a summary of inputs used to value the Fund’s investments as of September 30, 2014 (See Security Valuation Note 2A in the Notes to Financial Statements):
| Total Value at September 30, 2014 | Level 1 Quoted Prices | |||||||
Equity Securities: | ||||||||
Closed-End Funds | $ | 18,384 | $ | 18,384 | ||||
Preferred Stock | 1,677 | 1,677 | ||||||
Short-Term Investments | 3,507 | 3,507 | ||||||
|
|
|
| |||||
Total Investments | $ | 23,568 | $ | 23,568 | ||||
|
|
|
| |||||
There are no Level 2 (significant observable inputs) or Level 3 (significant unobservable inputs) priced securities.
There were no transfers between Level 1 and Level 2 for the period.
See Notes to Financial Statements
39
Table of Contents
VIRTUS PREMIUM ALPHASECTOR® FUND
SCHEDULE OF INVESTMENTS
SEPTEMBER 30, 2014
($ reported in thousands)
| SHARES | VALUE | |||||||
| COMMON STOCKS—99.9% | ||||||||
| Consumer Discretionary—14.1% | ||||||||
Amazon.com, Inc.(2) | 205,670 | $ | 66,316 | |||||
AutoNation, Inc.(2) | 43,410 | 2,184 | ||||||
AutoZone, Inc.(2) | 17,630 | 8,985 | ||||||
Bed Bath & Beyond, Inc.(2) | 108,850 | 7,166 | ||||||
Best Buy Co., Inc. | 157,610 | 5,294 | ||||||
BorgWarner, Inc. | 123,150 | 6,479 | ||||||
Cablevision Systems Corp. Class A | 116,210 | 2,035 | ||||||
CarMax, Inc.(2) | 119,360 | 5,544 | ||||||
Carnival Corp. | 245,780 | 9,873 | ||||||
CBS Corp. Class B | 264,280 | 14,139 | ||||||
Chipotle Mexican Grill, Inc.(2) | 16,920 | 11,279 | ||||||
Coach, Inc. | 149,440 | 5,322 | ||||||
Comcast Corp. Class A | 1,406,260 | 75,629 | ||||||
Darden Restaurants, Inc. | 71,100 | 3,659 | ||||||
Delphi Automotive plc | 163,520 | 10,030 | ||||||
DIRECTV Class A(2) | 273,140 | 23,632 | ||||||
Discovery Communications, Inc.(2) | 148,510 | 5,536 | ||||||
Discovery Communications, Inc. Class A(2) | 79,030 | 2,987 | ||||||
Dollar General Corp.(2) | 164,280 | 10,039 | ||||||
Dollar Tree, Inc.(2) | 112,300 | 6,297 | ||||||
Expedia, Inc. | 53,320 | 4,672 | ||||||
Family Dollar Stores, Inc. | 51,570 | 3,983 | ||||||
Ford Motor Co. | 2,110,100 | 31,208 | ||||||
Fossil Group, Inc.(2) | 25,660 | 2,409 | ||||||
GameStop Corp. Class A(3) | 60,710 | 2,501 | ||||||
Gannett Co., Inc. | 122,460 | 3,633 | ||||||
Gap, Inc. (The) | 149,190 | 6,220 | ||||||
Garmin Ltd.(3) | 66,130 | 3,438 | ||||||
General Motors Co. | 730,760 | 23,340 | ||||||
Genuine Parts Co. | 82,900 | 7,271 | ||||||
Goodyear Tire & Rubber Co. (The) | 151,620 | 3,424 | ||||||
H&R Block, Inc. | 149,070 | 4,623 | ||||||
Harley-Davidson, Inc. | 117,610 | 6,845 | ||||||
Harman International Industries, Inc. | 37,490 | 3,675 | ||||||
Hasbro, Inc. | 61,280 | 3,370 | ||||||
Home Depot, Inc. (The) | 731,210 | 67,081 | ||||||
Horton (D.R.), Inc. | 178,740 | 3,668 | ||||||
Interpublic Group of Cos., Inc. (The) | 228,050 | 4,178 | ||||||
Johnson Controls, Inc. | 363,020 | 15,973 | ||||||
Kohl’s Corp. | 112,070 | 6,840 | ||||||
L Brands, Inc. | 133,400 | 8,935 | ||||||
Leggett & Platt, Inc. | 73,510 | 2,567 | ||||||
Lennar Corp. Class A | 97,760 | 3,796 | ||||||
Lowe’s Cos., Inc. | 537,030 | 28,420 | ||||||
Macy’s, Inc. | 192,680 | 11,210 | ||||||
Marriott International, Inc. | 118,310 | 8,270 | ||||||
Mattel, Inc. | 184,880 | 5,667 | ||||||
McDonald’s Corp. | 533,570 | 50,588 | ||||||
Michael Kors Holdings Ltd.(2) | 111,190 | 7,938 | ||||||
Mohawk Industries, Inc.(2) | 33,670 | 4,539 | ||||||
Netflix, Inc.(2) | 32,760 | 14,781 | ||||||
Newell Rubbermaid, Inc. | 150,180 | 5,168 | ||||||
News Corp. Class A(2) | 271,080 | 4,432 | ||||||
NIKE, Inc. Class B | 382,580 | 34,126 | ||||||
Nordstrom, Inc. | 77,710 | 5,313 | ||||||
O’Reilly Automotive, Inc.(2) | 56,370 | 8,476 | ||||||
Omnicom Group, Inc. | 136,720 | 9,415 | ||||||
| SHARES | VALUE | |||||||
| Consumer Discretionary—continued | ||||||||
PetSmart, Inc. | 54,330 | $ | 3,808 | |||||
Phillips-Van Heusen Corp. | 44,640 | 5,408 | ||||||
Priceline Group, Inc. (The)(2) | 28,490 | 33,008 | ||||||
PulteGroup, Inc. | 182,300 | 3,219 | ||||||
Ralph Lauren Corp. | 32,900 | 5,420 | ||||||
Ross Stores, Inc. | 114,640 | 8,664 | ||||||
Scripps Networks Interactive, Inc. Class A | 56,030 | 4,375 | ||||||
Staples, Inc. | 349,320 | 4,227 | ||||||
Starbucks Corp. | 408,420 | 30,819 | ||||||
Starwood Hotels & Resorts Worldwide, Inc. | 103,550 | 8,616 | ||||||
Target Corp. | 344,050 | 21,565 | ||||||
Tiffany & Co. | 60,600 | 5,836 | ||||||
Time Warner Cable, Inc. | 151,320 | 21,713 | ||||||
Time Warner, Inc. | 463,710 | 34,876 | ||||||
TJX Cos., Inc. | 376,960 | 22,305 | ||||||
Tractor Supply Co. | 74,570 | 4,587 | ||||||
TripAdvisor, Inc.(2) | 60,180 | 5,502 | ||||||
Twenty-First Century Fox, Inc. Class A | 1,023,240 | 35,087 | ||||||
Under Armour, Inc. Class A(2) | 90,330 | 6,242 | ||||||
Urban Outfitters, Inc.(2) | 53,970 | 1,981 | ||||||
VF Corp. | 187,490 | 12,380 | ||||||
Viacom, Inc. Class B | 206,390 | 15,880 | ||||||
Walt Disney Co. (The) | 857,610 | 76,353 | ||||||
Whirlpool Corp. | 42,550 | 6,197 | ||||||
Wyndham Worldwide Corp. | 67,760 | 5,506 | ||||||
Wynn Resorts Ltd. | 44,060 | 8,243 | ||||||
Yum! Brands, Inc. | 238,550 | 17,171 | ||||||
|
| |||||||
| 1,113,406 | ||||||||
|
| |||||||
| Consumer Staples—14.4% | ||||||||
Altria Group, Inc. | 1,212,460 | 55,700 | ||||||
Archer-Daniels-Midland Co.(The) | 474,980 | 24,272 | ||||||
Avon Products, Inc. | 370,200 | 4,665 | ||||||
Brown-Forman Corp. Class B | 125,520 | 11,324 | ||||||
Campbell Soup Co. | 156,870 | 6,703 | ||||||
Clorox Co. (The) | 102,650 | 9,859 | ||||||
Coca-Cola Co. (The) | 2,670,210 | 113,911 | ||||||
Coca-Cola Enterprises, Inc. | 185,930 | 8,248 | ||||||
Colgate-Palmolive Co. | 600,690 | 39,177 | ||||||
ConAgra Foods, Inc. | 331,370 | 10,949 | ||||||
Constellation Brands, Inc. Class A(2) | 170,330 | 14,846 | ||||||
Costco Wholesale Corp. | 309,400 | 38,774 | ||||||
CVS Caremark Corp. | 805,330 | 64,096 | ||||||
Dr. Pepper Snapple Group, Inc. | 156,160 | 10,043 | ||||||
Estee Lauder Cos., Inc. (The) Class A | 173,400 | 12,956 | ||||||
General Mills, Inc. | 442,430 | 22,321 | ||||||
Hershey Co. (The) | 116,320 | 11,100 | ||||||
Hormel Foods Corp. | 129,060 | 6,632 | ||||||
J.M. Smucker Co. (The) | 82,500 | 8,167 | ||||||
Kellogg Co. | 196,590 | 12,110 | ||||||
Keurig Green Mountain, Inc. | 82,560 | 10,744 | ||||||
Kimberly-Clark Corp. | 265,840 | 28,596 | ||||||
Kraft Foods Group, Inc. | 401,950 | 22,670 | ||||||
Kroger Co. (The) | 374,260 | 19,462 | ||||||
Lorillard, Inc. | 267,610 | 16,033 | ||||||
McCormick & Co., Inc. | 107,240 | 7,174 | ||||||
Mead Johnson Nutrition Co. | 149,950 | 14,428 | ||||||
| SHARES | VALUE | |||||||
| Consumer Staples—continued | ||||||||
Molson Coors Brewing Co. Class B | 136,260 | $ | 10,143 | |||||
Mondelez International, Inc. | 1,075,580 | 36,855 | ||||||
Monster Beverage Corp.(2) | 112,550 | 10,317 | ||||||
PepsiCo, Inc. | 584,770 | 54,436 | ||||||
Philip Morris International, Inc. | 1,056,900 | 88,145 | ||||||
Procter & Gamble Co. (The) | 1,831,480 | 153,368 | ||||||
Reynolds American, Inc. | 232,100 | 13,694 | ||||||
Safeway, Inc. | 218,740 | 7,503 | ||||||
SYSCO Corp. | 437,450 | 16,601 | ||||||
Tyson Foods, Inc. Class A | 261,520 | 10,296 | ||||||
Wal-Mart Stores, Inc. | 1,067,740 | 81,650 | ||||||
Walgreen Co. | 633,700 | 37,559 | ||||||
Whole Foods Market, Inc. | 270,160 | 10,296 | ||||||
|
| |||||||
| 1,135,823 | ||||||||
|
| |||||||
| Financials—14.2% | ||||||||
ACE Ltd. | 131,720 | 13,813 | ||||||
Affiliated Managers Group, Inc.(2) | 21,690 | 4,346 | ||||||
Aflac, Inc. | 177,561 | 10,343 | ||||||
Allstate Corp. (The) | 169,412 | 10,397 | ||||||
American Express Co. | 352,840 | 30,888 | ||||||
American International Group, Inc. | 559,208 | 30,208 | ||||||
American Tower Corp. | 155,053 | 14,518 | ||||||
Ameriprise Financial, Inc. | 73,827 | 9,109 | ||||||
AON plc | 113,852 | 9,981 | ||||||
Apartment Investment & Management Co. Class A | 56,136 | 1,786 | ||||||
Assurant, Inc. | 27,855 | 1,791 | ||||||
AvalonBay Communities, Inc. | 51,617 | 7,276 | ||||||
Bank of America Corp. | 4,125,229 | 70,335 | ||||||
Bank of New York Mellon Corp. (The) | 443,364 | 17,171 | ||||||
BB&T Corp. | 283,442 | 10,547 | ||||||
Berkshire Hathaway, Inc. Class B(2) | 715,881 | 98,892 | ||||||
BlackRock, Inc. | 49,664 | 16,306 | ||||||
Boston Properties, Inc. | 59,645 | 6,904 | ||||||
Capital One Financial Corp. | 220,154 | 17,969 | ||||||
CBRE Group, Inc.(2) | 109,319 | 3,251 | ||||||
Charles Schwab Corp. (The) | 449,473 | 13,210 | ||||||
Chubb Corp. (The) | 94,819 | 8,636 | ||||||
Cincinnati Financial Corp. | 57,201 | 2,691 | ||||||
Citigroup, Inc. | 1,190,078 | 61,670 | ||||||
CME Group, Inc. | 123,851 | 9,902 | ||||||
Comerica, Inc. | 71,202 | 3,550 | ||||||
Crown Castle International Corp. | 130,848 | 10,537 | ||||||
Discover Financial Services | 180,626 | 11,630 | ||||||
E*Trade Financial Corp.(2) | 111,205 | 2,512 | ||||||
Equity Residential | 141,830 | 8,734 | ||||||
Essex Property Trust, Inc. | 24,970 | 4,463 | ||||||
Fifth Third Bancorp | 329,946 | 6,606 | ||||||
Franklin Resources, Inc. | 154,820 | 8,455 | ||||||
General Growth Properties, Inc. | 243,970 | 5,745 | ||||||
Genworth Financial, Inc. Class A(2) | 197,164 | 2,583 | ||||||
Goldman Sachs Group, Inc. (The) | 161,030 | 29,560 | ||||||
See Notes to Financial Statements
40
Table of Contents
VIRTUS PREMIUM ALPHASECTOR® FUND
SCHEDULE OF INVESTMENTS (Continued)
SEPTEMBER 30, 2014
($ reported in thousands)
| SHARES | VALUE | |||||||
| Financials—continued | ||||||||
Hartford Financial Services Group, Inc. (The) | 176,645 | $ | 6,580 | |||||
HCP, Inc. | 179,969 | 7,147 | ||||||
Health Care REIT, Inc. | 127,820 | 7,972 | ||||||
Host Hotels & Resorts, Inc. | 298,220 | 6,361 | ||||||
Hudson City Bancorp, Inc. | 190,781 | 1,854 | ||||||
Huntington Bancshares, Inc. | 318,661 | 3,101 | ||||||
IntercontinentalExchange Group, Inc. | 44,703 | 8,719 | ||||||
Invesco Ltd. | 171,011 | 6,751 | ||||||
JPMorgan Chase & Co. | 1,476,520 | 88,946 | ||||||
KeyCorp | 340,603 | 4,540 | ||||||
Kimco Realty Corp. | 159,372 | 3,492 | ||||||
Legg Mason, Inc. | 40,845 | 2,090 | ||||||
Leucadia National Corp. | 123,512 | 2,945 | ||||||
Lincoln National Corp. | 101,744 | 5,451 | ||||||
Loews Corp. | 120,819 | 5,033 | ||||||
M&T Bank Corp. | 52,236 | 6,440 | ||||||
Macerich Co. (The) | 54,849 | 3,501 | ||||||
Marsh & McLennan Cos., Inc. | 213,337 | 11,166 | ||||||
McGraw-Hill Cos., Inc. (The) | 106,699 | 9,011 | ||||||
MetLife, Inc. | 441,282 | 23,706 | ||||||
Moody’s Corp. | 72,536 | 6,855 | ||||||
Morgan Stanley | 599,622 | 20,729 | ||||||
NASDAQ OMX Group, Inc. (The) | 45,087 | 1,913 | ||||||
Navient Corp. | 166,780 | 2,954 | ||||||
Northern Trust Corp. | 86,655 | 5,895 | ||||||
People’s United Financial, Inc. | 123,136 | 1,782 | ||||||
Plum Creek Timber Co., Inc. | 68,980 | 2,691 | ||||||
PNC Financial Services Group, Inc. (The) | 212,665 | 18,200 | ||||||
Principal Financial Group, Inc. | 107,582 | 5,645 | ||||||
Progressive Corp. (The) | 210,399 | 5,319 | ||||||
Prologis, Inc. | 196,294 | 7,400 | ||||||
Prudential Financial, Inc. | 179,990 | 15,828 | ||||||
Public Storage | 56,783 | 9,417 | ||||||
Regions Financial Corp. | 543,413 | 5,456 | ||||||
Simon Property Group, Inc. | 122,282 | 20,106 | ||||||
State Street Corp. | 166,427 | 12,251 | ||||||
SunTrust Banks, Inc. | 208,106 | 7,914 | ||||||
T. Rowe Price Group, Inc. | 102,842 | 8,063 | ||||||
Torchmark Corp. | 51,491 | 2,697 | ||||||
Travelers Cos., Inc. (The) | 132,750 | 12,471 | ||||||
U.S. Bancorp | 707,759 | 29,606 | ||||||
Unum Group | 100,110 | 3,442 | ||||||
Ventas, Inc. | 115,318 | 7,144 | ||||||
Vornado Realty Trust | 68,651 | 6,862 | ||||||
Wells Fargo & Co. | 1,863,568 | 96,663 | ||||||
Weyerhaeuser Co. | 206,893 | 6,592 | ||||||
XL Group plc | 105,193 | 3,489 | ||||||
Zions Bancorp | 81,004 | 2,354 | ||||||
|
| |||||||
| 1,120,859 | ||||||||
|
| |||||||
| Health Care—14.3% | ||||||||
Abbott Laboratories | 588,300 | 24,467 | ||||||
AbbVie, Inc. | 733,130 | 42,346 | ||||||
Actavis plc(2) | 128,710 | 31,055 | ||||||
Aetna, Inc. | 168,080 | 13,615 | ||||||
Agilent Technologies, Inc. | 152,890 | 8,712 | ||||||
Alexion Pharmaceuticals, Inc.(2) | 91,270 | 15,134 | ||||||
Allergan, Inc. | 140,430 | 25,023 | ||||||
| SHARES | VALUE | |||||||
| Health Care—continued | ||||||||
AmerisourceBergen Corp. | 101,660 | $ | 7,858 | |||||
Amgen, Inc. | 349,830 | 49,137 | ||||||
Bard (C.R.), Inc. | 36,670 | 5,233 | ||||||
Baxter International, Inc. | 253,970 | 18,227 | ||||||
Becton, Dickinson & Co. | 90,400 | 10,288 | ||||||
Biogen Idec, Inc.(2) | 111,350 | 36,836 | ||||||
Boston Scientific Corp.(2) | 613,550 | 7,246 | ||||||
Bristol-Myers Squibb Co. | 767,610 | 39,286 | ||||||
Cardinal Health, Inc. | 156,590 | 11,732 | ||||||
CareFusion Corp.(2) | 93,680 | 4,239 | ||||||
Celgene Corp.(2) | 368,129 | 34,891 | ||||||
Cerner Corp.(2) | 139,290 | 8,298 | ||||||
CIGNA Corp. | 125,330 | 11,366 | ||||||
Covidien plc | 208,010 | 17,995 | ||||||
DaVita, Inc.(2) | 79,490 | 5,814 | ||||||
DENTSPLY International, Inc. | 64,260 | 2,930 | ||||||
Edwards Lifesciences Corp.(2) | 49,340 | 5,040 | ||||||
Eli Lilly & Co. | 452,880 | 29,369 | ||||||
Express Scripts Holding Co.(2) | 361,650 | 25,543 | ||||||
Gilead Sciences, Inc.(2) | 696,690 | 74,163 | ||||||
Hospira, Inc.(2) | 78,110 | 4,064 | ||||||
Humana, Inc. | 76,080 | 9,913 | ||||||
Intuitive Surgical, Inc.(2) | 16,620 | 7,675 | ||||||
Johnson & Johnson | 1,299,160 | 138,478 | ||||||
Laboratory Corp. of America Holdings(2) | 39,560 | 4,025 | ||||||
Mallinckrodt plc(2) | 52,370 | 4,721 | ||||||
McKesson Corp. | 109,830 | 21,381 | ||||||
Medtronic, Inc. | 453,740 | 28,109 | ||||||
Merck & Co., Inc. | 1,328,790 | 78,771 | ||||||
Mylan, Inc.(2) | 172,340 | 7,840 | ||||||
Patterson Cos., Inc. | 40,940 | 1,696 | ||||||
PerkinElmer, Inc. | 51,680 | 2,253 | ||||||
Perrigo Co. plc | 61,330 | 9,211 | ||||||
Pfizer, Inc. | 2,921,550 | 86,390 | ||||||
Quest Diagnostics, Inc. | 69,920 | 4,243 | ||||||
Regeneron Pharmaceuticals, Inc.(2) | 33,890 | 12,218 | ||||||
St. Jude Medical, Inc. | 133,900 | 8,051 | ||||||
Stryker Corp. | 140,190 | 11,320 | ||||||
Tenet Healthcare Corp.(2) | 47,190 | 2,803 | ||||||
Thermo Fisher Scientific, Inc. | 183,950 | 22,387 | ||||||
UnitedHealth Group, Inc. | 450,760 | 38,878 | ||||||
Universal Health Services, Inc. Class B | 42,130 | 4,403 | ||||||
Varian Medical Systems, Inc.(2) | 47,110 | 3,775 | ||||||
Vertex Pharmaceuticals, Inc.(2) | 110,080 | 12,364 | ||||||
Waters Corp.(2) | 38,220 | 3,788 | ||||||
WellPoint, Inc. | 129,860 | 15,534 | ||||||
Zimmer Holdings, Inc. | 79,530 | 7,997 | ||||||
Zoetis, Inc. | 230,180 | 8,505 | ||||||
|
| |||||||
| 1,126,636 | ||||||||
|
| |||||||
| Industrials—14.3% | ||||||||
3M Co. | 393,480 | 55,748 | ||||||
ADT Corp. (The)(3) | 104,510 | 3,706 | ||||||
Allegion plc | 57,370 | 2,733 | ||||||
Ametek, Inc. | 145,970 | 7,329 | ||||||
Avery Dennison Corp. | 192,480 | 8,594 | ||||||
Boeing Co. (The) | 415,110 | 52,877 | ||||||
| SHARES | VALUE | |||||||
| Industrials—continued | ||||||||
Caterpillar, Inc. | 396,340 | $ | 39,250 | |||||
Cintas Corp. | 69,290 | 4,891 | ||||||
CSX Corp. | 714,930 | 22,921 | ||||||
Cummins, Inc. | 186,840 | 24,659 | ||||||
Danaher Corp. | 406,020 | 30,849 | ||||||
Deere & Co. | 237,140 | 19,443 | ||||||
Delta Air Lines, Inc. | 500,280 | 18,085 | ||||||
Dover Corp. | 119,940 | 9,635 | ||||||
Dun & Bradstreet Corp. | 21,190 | 2,489 | ||||||
Eaton Corp. plc | 344,690 | 21,843 | ||||||
Emerson Electric Co. | 438,450 | 27,438 | ||||||
Equifax, Inc. | 98,450 | 7,358 | ||||||
Expeditors International of Washington, Inc. | 114,610 | 4,651 | ||||||
Fastenal Co. | 160,800 | 7,220 | ||||||
FedEx Corp. | 168,400 | 27,188 | ||||||
Flowserve Corp. | 80,540 | 5,680 | ||||||
Fluor Corp. | 135,040 | 9,019 | ||||||
General Dynamics Corp. | 204,980 | 26,051 | ||||||
General Electric Co. | 4,400,850 | 112,750 | ||||||
Grainger (W.W.), Inc. | 47,290 | 11,901 | ||||||
Honeywell International, Inc. | 489,260 | 45,560 | ||||||
Illinois Tool Works, Inc. | 230,410 | 19,451 | ||||||
Ingersoll-Rand plc | 158,690 | 8,944 | ||||||
Iron Mountain, Inc. | 71,590 | 2,337 | ||||||
Jacobs Engineering Group, Inc.(2) | 79,220 | 3,867 | ||||||
Joy Global, Inc. | 59,050 | 3,221 | ||||||
Kansas City Southern | 65,040 | 7,883 | ||||||
L-3 Communications Holdings, Inc. | 50,740 | 6,034 | ||||||
Lockheed Martin Corp. | 169,350 | 30,954 | ||||||
Masco Corp. | 234,480 | 5,609 | ||||||
Nielsen Holdings NV | 179,120 | 7,940 | ||||||
Norfolk Southern Corp. | 215,230 | 24,020 | ||||||
Northrop Grumman Corp. | 133,320 | 17,566 | ||||||
PACCAR, Inc. | 243,930 | 13,873 | ||||||
Pall Corp. | 92,520 | 7,744 | ||||||
Parker Hannifin Corp. | 111,580 | 12,737 | ||||||
Pentair plc | 114,270 | 7,484 | ||||||
Pitney Bowes, Inc. | 138,210 | 3,454 | ||||||
Precision Castparts Corp. | 84,950 | 20,123 | ||||||
Quanta Services, Inc.(2) | 127,960 | 4,644 | ||||||
Raytheon Co. | 202,030 | 20,530 | ||||||
Republic Services, Inc. | 149,230 | 5,823 | ||||||
Robert Half International, Inc. | 116,220 | 5,695 | ||||||
Robinson (C.H.) Worldwide, Inc. | 87,870 | 5,828 | ||||||
Rockwell Automation, Inc. | 106,110 | 11,659 | ||||||
Rockwell Collins, Inc. | 102,980 | 8,084 | ||||||
Roper Industries, Inc. | 59,600 | 8,719 | ||||||
Ryder System, Inc. | 57,270 | 5,153 | ||||||
Snap-On, Inc. | 34,070 | 4,125 | ||||||
Southwest Airlines Co. | 445,550 | 15,046 | ||||||
Stanley Black & Decker, Inc. | 92,060 | 8,174 | ||||||
Stericycle, Inc.(2) | 50,520 | 5,889 | ||||||
Textron, Inc. | 205,190 | 7,385 | ||||||
Tyco International Ltd. | 263,260 | 11,733 | ||||||
Union Pacific Corp. | 579,030 | 62,778 | ||||||
United Parcel Service, Inc. Class B | 424,510 | 41,725 | ||||||
United Rentals, Inc.(2) | 56,400 | 6,266 | ||||||
United Technologies Corp. | 523,950 | 55,329 | ||||||
Waste Management, Inc. | 279,950 | 13,306 | ||||||
See Notes to Financial Statements
41
Table of Contents
VIRTUS PREMIUM ALPHASECTOR® FUND
SCHEDULE OF INVESTMENTS (Continued)
SEPTEMBER 30, 2014
($ reported in thousands)
| SHARES | VALUE | |||||||
| Industrials—continued | ||||||||
Xylem, Inc. | 108,090 | $ | 3,836 | |||||
|
| |||||||
| 1,124,836 | ||||||||
|
| |||||||
| Information Technology—12.8% | ||||||||
Accenture plc Class A | 183,858 | 14,951 | ||||||
Adobe Systems, Inc.(2) | 140,582 | 9,727 | ||||||
Akamai Technologies, Inc.(2) | 58,002 | 3,469 | ||||||
Alliance Data Systems Corp.(2) | 16,240 | 4,032 | ||||||
Altera Corp. | 97,656 | 3,494 | ||||||
Amphenol Corp. Class A | 49,034 | 4,897 | ||||||
Analog Devices, Inc. | 95,936 | 4,748 | ||||||
Apple, Inc. | 1,745,313 | 175,840 | ||||||
Applied Materials, Inc. | 361,910 | 7,821 | ||||||
Autodesk, Inc.(2) | 72,260 | 3,982 | ||||||
Automatic Data Processing, Inc. | 142,829 | 11,866 | ||||||
Avago Technologies Ltd. | 73,860 | 6,425 | ||||||
Broadcom Corp. Class A | 161,745 | 6,538 | ||||||
CA, Inc. | 100,043 | 2,795 | ||||||
Cisco Systems, Inc. | 1,488,180 | 37,457 | ||||||
Citrix Systems, Inc.(2) | 51,446 | 3,670 | ||||||
Cognizant Technology Solutions Corp. Class A(2) | 183,520 | 8,216 | ||||||
Computer Sciences Corp. | 45,594 | 2,788 | ||||||
Corning, Inc. | 381,204 | 7,372 | ||||||
eBay, Inc.(2) | 335,579 | 19,004 | ||||||
Electronic Arts, Inc.(2) | 99,007 | 3,526 | ||||||
EMC Corp. | 600,506 | 17,571 | ||||||
F5 Networks, Inc.(2) | 21,653 | 2,571 | ||||||
Facebook, Inc. Class A(2) | 568,050 | 44,899 | ||||||
Fidelity National Information Services, Inc. | 91,722 | 5,164 | ||||||
First Solar, Inc.(2) | 21,768 | 1,433 | ||||||
Fiserv, Inc.(2) | 77,416 | 5,004 | ||||||
FLIR Systems, Inc. | 45,832 | 1,436 | ||||||
Google, Inc. Class A(2) | 82,708 | 48,666 | ||||||
Google, Inc. Class C(2) | 82,778 | 47,793 | ||||||
Harris Corp. | 33,424 | 2,219 | ||||||
Hewlett-Packard Co. | 450,128 | 15,966 | ||||||
Intel Corp. | 1,229,438 | 42,809 | ||||||
International Business Machines Corp. | 270,571 | 51,362 | ||||||
Intuit, Inc. | 86,333 | 7,567 | ||||||
Jabil Circuit, Inc. | 70,671 | 1,425 | ||||||
Juniper Networks, Inc. | 120,852 | 2,677 | ||||||
KLA-Tencor Corp. | 52,471 | 4,134 | ||||||
Lam Research Corp. | 47,275 | 3,531 | ||||||
Linear Technology Corp. | 75,571 | 3,355 | ||||||
MasterCard, Inc. Class A | 292,980 | 21,657 | ||||||
Microchip Technology, Inc.(3) | 64,488 | 3,046 | ||||||
Micron Technology, Inc.(2) | 330,896 | 11,336 | ||||||
Microsoft Corp. | 2,402,547 | 111,382 | ||||||
Motorola Solutions, Inc. | 66,333 | 4,198 | ||||||
NetApp, Inc. | 97,462 | 4,187 | ||||||
NVIDIA Corp. | 156,817 | 2,893 | ||||||
Oracle Corp. | 952,488 | 36,461 | ||||||
Paychex, Inc. | 98,978 | 4,375 | ||||||
QUALCOMM, Inc. | 490,725 | 36,692 | ||||||
Red Hat, Inc.(2) | 60,420 | 3,393 | ||||||
Salesforce.com, Inc.(2) | 179,731 | 10,340 | ||||||
SanDisk Corp. | 71,062 | 6,961 | ||||||
Seagate Technology plc | 95,887 | 5,491 | ||||||
Symantec Corp. | 207,126 | 4,870 | ||||||
TE Connectivity Ltd. | 118,578 | 6,556 | ||||||
Teradata Corp.(2) | 50,542 | 2,119 | ||||||
| SHARES | VALUE | |||||||
| Information Technology—continued | ||||||||
Texas Instruments, Inc. | 314,789 | $ | 15,012 | |||||
Total System Services, Inc. | 54,733 | 1,695 | ||||||
VeriSign, Inc.(2) | 36,910 | 2,034 | ||||||
Visa, Inc. Class A | 143,640 | 30,648 | ||||||
Western Digital Corp. | 67,819 | 6,600 | ||||||
Western Union Co. (The) | 160,478 | 2,574 | ||||||
Xerox Corp. | 334,170 | 4,421 | ||||||
Xilinx, Inc. | 83,988 | 3,557 | ||||||
Yahoo!, Inc.(2) | 276,000 | 11,247 | ||||||
|
| |||||||
| 1,005,945 | ||||||||
|
| |||||||
| Materials—14.2% | ||||||||
Air Products & Chemicals, Inc. | 360,715 | 46,958 | ||||||
Airgas, Inc. | 131,195 | 14,517 | ||||||
Alcoa, Inc. | 2,231,862 | 35,911 | ||||||
Allegheny Technologies, Inc. | 217,040 | 8,052 | ||||||
Ball Corp. | 268,754 | 17,004 | ||||||
Bemis Co., Inc. | 202,152 | 7,686 | ||||||
CF Industries Holdings, Inc. | 95,026 | 26,533 | ||||||
Dow Chemical Co. (The) | 2,083,974 | 109,284 | ||||||
Du Pont (E.I.) de Nemours & Co. | 1,699,143 | 121,930 | ||||||
Eastman Chemical Co. | 285,866 | 23,124 | ||||||
Ecolab, Inc. | 500,781 | 57,505 | ||||||
FMC Corp. | 257,744 | 14,740 | ||||||
Freeport-McMoRan Copper & Gold, Inc. | 1,460,056 | 47,671 | ||||||
International Flavors & Fragrances, Inc. | 157,529 | 15,104 | ||||||
International Paper Co. | 807,611 | 38,555 | ||||||
LyondellBasell Industries N.V. Class A | 790,002 | 85,842 | ||||||
Martin Marietta Materials, Inc. | 114,640 | 14,782 | ||||||
MeadWestvaco Corp. | 328,967 | 13,468 | ||||||
Monsanto Co. | 974,121 | 109,598 | ||||||
Mosaic Co. (The) | 605,833 | 26,905 | ||||||
Newmont Mining Corp. | 953,201 | 21,971 | ||||||
Nucor Corp. | 605,953 | 32,891 | ||||||
Owens-Illinois, Inc.(2) | 328,738 | 8,564 | ||||||
PPG Industries, Inc. | 259,343 | 51,023 | ||||||
Praxair, Inc. | 541,953 | 69,912 | ||||||
Sealed Air Corp. | 417,316 | 14,556 | ||||||
Sherwin-Williams Co. (The) | 157,775 | 34,551 | ||||||
Sigma-Aldrich Corp. | 227,921 | 30,999 | ||||||
Vulcan Materials Co. | 254,501 | 15,328 | ||||||
|
| |||||||
| 1,114,964 | ||||||||
|
| |||||||
| Telecommunication Services—1.6% | ||||||||
AT&T, Inc. | 1,512,247 | 53,292 | ||||||
CenturyLink, Inc. | 173,847 | 7,109 | ||||||
Frontier Communications Corp. | 344,311 | 2,241 | ||||||
Verizon Communications, Inc. | 1,213,838 | 60,680 | ||||||
Windstream Holdings, Inc. | 191,948 | 2,069 | ||||||
|
| |||||||
| 125,391 | ||||||||
| TOTAL COMMON STOCKS (Identified Cost $7,111,924) | 7,867,860 | |||||||
| TOTAL LONG-TERM INVESTMENTS—99.9% | ||||||||
| (Identified Cost $7,111,924) | 7,867,860 | |||||||
| SHARES | VALUE | |||||||
| SECURITIES LENDING COLLATERAL—0.1% | ||||||||
INVESCO Trust Short-Term Investments Liquid Assets Portfolio (The) Institutional Shares (seven-day effective yield 0.060%)(4) | 8,132,820 | $ | 8,133 | |||||
| TOTAL SECURITIES LENDING COLLATERAL (Identified Cost $8,133) | 8,133 | |||||||
| TOTAL INVESTMENTS—100.0% (Identified Cost $7,120,057) | 7,875,993 | (1) | ||||||
Other assets and liabilities, net—0.0% |
| (2,477 | ) | |||||
|
| |||||||
| NET ASSETS—100.0% | $ | 7,873,516 | ||||||
|
| |||||||
Abbreviations:
| REIT | Real Estate Investment Trust |
Footnote Legend:
| (1) | Federal Income Tax Information: For tax information at September 30, 2014, see Note 10 Federal Income Tax Information in the Notes to Financial Statements. |
| (2) | Non-income producing. |
| (3) | All or a portion of security is on loan. |
| (4) | Represents security purchased with cash collateral received for securities on loan. |
The following table provides a summary of inputs used to value the Fund’s investments as of
September 30, 2014 (See Security Valuation Note 2A in the Notes to Financial Statements):
| Total Value at September 30, 2014 | Level 1 Quoted Prices | |||||||
Equity Securities: | ||||||||
Common Stocks | $ | 7,867,860 | $ | 7,867,860 | | |||
Securities Lending Collateral | 8,133 | 8,133 | ||||||
|
|
|
| |||||
Total Investments | $ | 7,875,993 | $ | 7,875,993 | ||||
|
|
|
| |||||
There are no Level 2 (significant observable inputs) or Level 3 (significant unobservable inputs) priced securities.
There were no transfers between Level 1 and Level 2 for the period.
Security abbreviation definitions are located under the Key Investment Terms starting on page 4.
See Notes to Financial Statements
42
Table of Contents
STATEMENTS OF ASSETS AND LIABILITIES
SEPTEMBER 30, 2014
(Reported in thousands except shares and per share amounts)
|
|
|
|
|
|
|
| |||||||||
| Allocator Premium AlphaSector® Fund | AlphaSector® Rotation Fund | Alternatives Diversifier Fund | Disciplined Equity Style Fund | |||||||||||||
| Assets | ||||||||||||||||
Investment in unaffiliated securities at value(1)(3) | $ | 796,747 | $ | 930,972 | $ | 37,351 | $ | 2,023 | ||||||||
Investments in affiliated funds at value(2) | — | — | 87,769 | — | ||||||||||||
Receivables | ||||||||||||||||
Investment securities sold | — | 1,922 | 799 | — | ||||||||||||
Fund shares sold | 2,939 | 2,101 | 161 | — | (4) | |||||||||||
Receivable from adviser | — | — | — | 17 | ||||||||||||
Dividends and interest receivable | 381 | 1,176 | 39 | — | (4) | |||||||||||
Prepaid trustee retainer | 5 | 5 | 1 | — | (4) | |||||||||||
Prepaid expenses | 53 | 59 | 21 | 9 | ||||||||||||
|
|
|
|
|
|
|
| |||||||||
Total assets | 800,125 | 936,235 | 126,141 | 2,049 | ||||||||||||
|
|
|
|
|
|
|
| |||||||||
| Liabilities | ||||||||||||||||
Cash overdraft | — | 2,453 | — | — | ||||||||||||
Payables | ||||||||||||||||
Fund shares repurchased | 6,453 | 4,212 | 128 | — | ||||||||||||
Investment securities purchased | — | 705 | 839 | — | ||||||||||||
Collateral on securities loaned | — | 1,939 | — | — | ||||||||||||
Investment advisory fee | 735 | 348 | — | — | ||||||||||||
Distribution and service fees | 303 | 313 | 41 | — | (4) | |||||||||||
Administration fee | 82 | 94 | 14 | 1 | ||||||||||||
Transfer agent fees and expenses | 143 | 222 | 66 | 1 | ||||||||||||
Trustees’ fees and expenses | 1 | 1 | — | (4) | — | (4) | ||||||||||
Professional fees | 19 | 19 | 18 | 17 | ||||||||||||
Other accrued expenses | 45 | 51 | 5 | 1 | ||||||||||||
|
|
|
|
|
|
|
| |||||||||
Total liabilities | 7,781 | 10,357 | 1,111 | 20 | ||||||||||||
|
|
|
|
|
|
|
| |||||||||
| Net Assets | $ | 792,344 | $ | 925,878 | $ | 125,030 | $ | 2,029 | ||||||||
|
|
|
|
|
|
|
| |||||||||
| Net Assets Consist of: | ||||||||||||||||
Capital paid in on shares of beneficial interest | $ | 719,865 | $ | 718,874 | $ | 185,979 | $ | 1,654 | ||||||||
Accumulated undistributed net investment income (loss) | 1,359 | 2,325 | 794 | — | ||||||||||||
Accumulated undistributed net realized gain (loss) | 48,064 | 68,611 | (81,868 | ) | 412 | |||||||||||
Net unrealized appreciation (depreciation) on investments | 23,056 | 136,068 | 20,125 | (37 | ) | |||||||||||
|
|
|
|
|
|
|
| |||||||||
| Net Assets | $ | 792,344 | $ | 925,878 | $ | 125,030 | $ | 2,029 | ||||||||
|
|
|
|
|
|
|
| |||||||||
| Class A | ||||||||||||||||
Net asset value (net assets/shares outstanding) per share | $ | 11.85 | $ | 15.21 | $ | 11.31 | $ | 13.13 | ||||||||
Maximum offering price per share NAV/(1–5.75%) | $ | 12.57 | $ | 16.14 | $ | 12.00 | $ | 13.93 | ||||||||
Shares of beneficial interest outstanding, no par value, unlimited authorization | 12,130,211 | 20,819,285 | 3,454,631 | 45,213 | ||||||||||||
Net Assets | $ | 143,765 | $ | 316,571 | $ | 39,076 | $ | 594 | ||||||||
| Class C | ||||||||||||||||
Net asset value (net assets/shares outstanding) and offering price per share | $ | 11.73 | $ | 15.02 | $ | 11.21 | $ | 12.95 | ||||||||
Shares of beneficial interest outstanding, no par value, unlimited authorization | 28,292,423 | 19,711,250 | 3,391,287 | 23,166 | ||||||||||||
Net Assets | $ | 331,980 | $ | 296,160 | $ | 38,005 | $ | 300 | ||||||||
| Class I | ||||||||||||||||
Net asset value (net assets/shares outstanding) and offering price per share | $ | 11.88 | $ | 15.21 | $ | 11.30 | $ | 13.19 | ||||||||
Shares of beneficial interest outstanding, no par value, unlimited authorization | 26,641,719 | 20,591,050 | 4,241,832 | 86,072 | ||||||||||||
Net Assets | $ | 316,599 | $ | 313,147 | $ | 47,949 | $ | 1,135 | ||||||||
(1) Investment in unaffiliated securities at cost | $ | 773,691 | $ | 794,904 | $ | 35,590 | $ | 2,060 | ||||||||
(2) Investment in affiliated funds at cost | $ | — | $ | — | $ | 69,405 | $ | — | ||||||||
(3) Market value of securities on loan | $ | — | $ | 1,894 | $ | — | $ | — | ||||||||
(4) Amount is less than $500. | ||||||||||||||||
See Notes to Financial Statements
43
Table of Contents
VIRTUS OPPORTUNITIES TRUST
STATEMENTS OF ASSETS AND LIABILITIES (Continued)
SEPTEMBER 30, 2014
(Reported in thousands except shares and per share amounts)
|
|
|
|
|
|
|
| |||||||||
| Disciplined Select Bond Fund | Disciplined Select Country Fund | Dynamic AlphaSector® Fund | Global Premium AlphaSector® Fund | |||||||||||||
| Assets | ||||||||||||||||
Investment in unaffiliated securities at value(1)(4) | $ | 1,038 | $ | 1,417 | $ | 3,437,102 | $ | 244,431 | ||||||||
Foreign currency at value(2) | — | — | 4 | — | ||||||||||||
Cash | — | — | 9,330 | — | ||||||||||||
Deposits with broker for securities sold short | — | — | 316,277 | — | ||||||||||||
Receivables | ||||||||||||||||
Investment securities sold | 816 | 272 | — | — | ||||||||||||
Fund shares sold | — | 20 | 5,409 | 5,495 | ||||||||||||
Receivable from adviser | 18 | 17 | — | — | ||||||||||||
Dividends and interest receivable | — | (5) | — | (5) | — | — | (5) | |||||||||
Tax reclaims | — | — | 4 | — | ||||||||||||
Prepaid trustee retainer | — | (5) | — | (5) | 17 | 1 | ||||||||||
Prepaid expenses | 8 | 8 | 122 | 25 | ||||||||||||
|
|
|
|
|
|
|
| |||||||||
Total assets | 1,880 | 1,734 | 3,768,265 | 249,952 | ||||||||||||
|
|
|
|
|
|
|
| |||||||||
| Liabilities | ||||||||||||||||
Cash overdraft | — | — | — | 150 | ||||||||||||
Securities sold short at value(3) | — | — | 308,384 | — | ||||||||||||
Payables | ||||||||||||||||
Fund shares repurchased | — | — | 8,357 | 1,060 | ||||||||||||
Investment securities purchased | 819 | 272 | — | 802 | ||||||||||||
Collateral on securities loaned | — | — | 727,366 | — | ||||||||||||
Investment advisory fee | — | — | 4,169 | 224 | ||||||||||||
Distribution and service fees | — | (5) | — | (5) | 619 | 75 | ||||||||||
Administration fees | 1 | 1 | 282 | 25 | ||||||||||||
Transfer agent fees and expenses | — | (5) | — | (5) | 624 | 44 | ||||||||||
Trustees’ fees and expenses | — | (5) | — | (5) | 3 | — | (5) | |||||||||
Professional fees | 18 | 18 | 21 | 18 | ||||||||||||
Other accrued expenses | — | (5) | 1 | 246 | 20 | |||||||||||
|
|
|
|
|
|
|
| |||||||||
Total liabilities | 838 | 292 | 1,050,071 | 2,418 | ||||||||||||
|
|
|
|
|
|
|
| |||||||||
| Net Assets | $ | 1,042 | $ | 1,442 | $ | 2,718,194 | $ | 247,534 | ||||||||
|
|
|
|
|
|
|
| |||||||||
| Net Assets Consist of: | ||||||||||||||||
Capital paid in on shares of beneficial interest | $ | 1,085 | $ | 1,332 | $ | 2,325,647 | $ | 222,476 | ||||||||
Accumulated undistributed net investment income (loss) | 1 | 14 | — | 526 | ||||||||||||
Accumulated undistributed net realized gain (loss) | (42 | ) | 68 | 131,937 | 14,075 | |||||||||||
Net unrealized appreciation (depreciation) on investments | (2 | ) | 28 | 266,422 | 10,457 | |||||||||||
Net unrealized appreciation (depreciation) on securities sold short | — | — | (5,812 | ) | — | |||||||||||
|
|
|
|
|
|
|
| |||||||||
| Net Assets | $ | 1,042 | $ | 1,442 | $ | 2,718,194 | $ | 247,534 | ||||||||
|
|
|
|
|
|
|
| |||||||||
| Class A | ||||||||||||||||
Net asset value (net assets/shares outstanding) per share | $ | 9.59 | $ | 11.18 | $ | 13.29 | $ | 12.42 | ||||||||
Maximum offering price per share NAV/(1–3.75%) | $ | 10.18 | $ | — | $ | — | $ | — | ||||||||
Maximum offering price per share NAV/(1–5.75%) | $ | — | $ | 11.86 | $ | 14.10 | $ | 13.18 | ||||||||
Shares of beneficial interest outstanding, no par value, unlimited authorization | 11,237 | 26,785 | 54,263,937 | 6,108,510 | ||||||||||||
Net Assets | $ | 108 | $ | 299 | $ | 721,407 | $ | 75,879 | ||||||||
| Class B | ||||||||||||||||
Net asset value (net assets/shares outstanding) and offering price per share | $ | — | $ | — | $ | 12.30 | $ | — | ||||||||
Shares of beneficial interest outstanding, no par value, unlimited authorization | — | — | 11,713 | — | ||||||||||||
Net Assets | $ | — | $ | — | $ | 144 | $ | — | ||||||||
| Class C | ||||||||||||||||
Net asset value (net assets/shares outstanding) and offering price per share | $ | 9.57 | $ | 11.09 | $ | 12.24 | $ | 12.24 | ||||||||
Shares of beneficial interest outstanding, no par value, unlimited authorization | 14,612 | 14,026 | 44,698,263 | 5,884,632 | ||||||||||||
Net Assets | $ | 140 | $ | 156 | $ | 546,986 | $ | 72,013 | ||||||||
| Class I | ||||||||||||||||
Net asset value (net assets/shares outstanding) and offering price per share | $ | 9.59 | $ | 11.21 | $ | 13.45 | $ | 12.47 | ||||||||
Shares of beneficial interest outstanding, no par value, unlimited authorization | 82,846 | 88,005 | 107,795,963 | 7,991,221 | ||||||||||||
Net Assets | $ | 794 | $ | 987 | $ | 1,449,657 | $ | 99,642 | ||||||||
(1) Investment in securities at cost | $ | 1,040 | $ | 1,389 | $ | 3,170,681 | $ | 233,974 | ||||||||
(2) Foreign currency at cost | $ | — | $ | — | $ | 4 | $ | — | ||||||||
(3) Proceeds from securities sold short | $ | — | $ | — | $ | 302,572 | $ | — | ||||||||
(4) Market value of securities on loan | $ | — | $ | — | $ | 721,157 | $ | — | ||||||||
(5) Amounts is less than $500. | ||||||||||||||||
See Notes to Financial Statements
44
Table of Contents
VIRTUS OPPORTUNITIES TRUST
STATEMENTS OF ASSETS AND LIABILITIES (Continued)
SEPTEMBER 30, 2014
(Reported in thousands except shares and per share amounts)
|
|
|
| |||||
| Herzfeld Fund | Premium AlphaSector® Fund | |||||||
| Assets | ||||||||
Investment in unaffiliated securities at value(1)(2) | $ | 23,568 | $ | 7,875,993 | ||||
Receivables | ||||||||
Investment securities sold | 460 | 3,149 | ||||||
Fund shares sold | 66 | 27,339 | ||||||
Dividends and interest receivable | 26 | 10,444 | ||||||
Tax reclaims | ||||||||
Prepaid trustee retainer | — | (3) | 46 | |||||
Prepaid expenses | 24 | 279 | ||||||
|
|
|
| |||||
Total assets | 24,144 | 7,917,250 | ||||||
|
|
|
| |||||
| Liabilities | ||||||||
Cash overdraft | — | 8,047 | ||||||
Payables | ||||||||
Fund shares repurchased | — | 15,163 | ||||||
Investment securities purchased | 812 | 235 | ||||||
Collateral on securities loaned | — | 8,133 | ||||||
Investment advisory fees | 15 | 7,210 | ||||||
Distribution and service fees | 11 | 2,089 | ||||||
Administration fees | 3 | 796 | ||||||
Transfer agent fees and expenses | 4 | 1,636 | ||||||
Trustees’ fees and expenses | — | (3) | 8 | |||||
Professional fees | 19 | 26 | ||||||
Other accrued expenses | 3 | 391 | ||||||
|
|
|
| |||||
Total liabilities | 867 | 43,734 | ||||||
|
|
|
| |||||
| Net Assets | $ | 23,277 | $ | 7,873,516 | ||||
|
|
|
| |||||
| Net Assets Consist of: | ||||||||
Capital paid in on shares of beneficial interest | $ | 22,313 | $ | 6,280,346 | ||||
Accumulated undistributed net investment income (loss) | 6 | 6,248 | ||||||
Accumulated undistributed net realized gain (loss) | 500 | 830,986 | ||||||
Net unrealized appreciation (depreciation) on investments | 458 | 755,936 | ||||||
|
|
|
| |||||
| Net Assets | $ | 23,277 | $ | 7,873,516 | ||||
|
|
|
| |||||
| Class A | ||||||||
Net asset value (net assets/shares outstanding) per share | $ | 11.37 | $ | 17.39 | ||||
Maximum offering price per share NAV/(1–5.75%) | $ | 12.06 | $ | 18.45 | ||||
Shares of beneficial interest outstanding, no par value, unlimited authorization | 809,906 | 117,586,896 | ||||||
Net Assets | $ | 9,212 | $ | 2,044,955 | ||||
| Class C | ||||||||
Net asset value (net assets/shares outstanding) and offering price per share | $ | 11.34 | $ | 17.16 | ||||
Shares of beneficial interest outstanding, no par value, unlimited authorization | 937,107 | 115,872,775 | ||||||
Net Assets | $ | 10,624 | $ | 1,988,290 | ||||
| Class I | ||||||||
Net asset value (net assets/shares outstanding) and offering price per share | $ | 11.39 | $ | 17.42 | ||||
Shares of beneficial interest outstanding, no par value, unlimited authorization | 302,225 | 220,392,986 | ||||||
Net Assets | $ | 3,441 | $ | 3,840,271 | ||||
(1) Investment in unaffiliated securities at cost | $ | 23,110 | $ | 7,120,057 | ||||
(2) Market value of securities on loan | $ | — | $ | 7,963 | ||||
(3) Amount is less than $500. | ||||||||
See Notes to Financial Statements
45
Table of Contents
STATEMENTS OF OPERATIONS
YEAR ENDED SEPTEMBER 30, 2014
($ reported in thousands)
|
|
|
|
|
|
|
| |||||||||
| Allocator Premium AlphaSector® Fund | AlphaSector® Rotation Fund | Alternatives Diversifier Fund | Disciplined Equity Style Fund | |||||||||||||
| Investment Income | ||||||||||||||||
Dividends | $ | 17,553 | $ | 16,390 | $ | 168 | $ | 19 | ||||||||
Dividend income from affiliated funds | — | — | 3,145 | — | ||||||||||||
Security lending | — | 29 | — | — | ||||||||||||
Foreign taxes withheld | — | (3 | ) | — | — | |||||||||||
|
|
|
|
|
|
|
| |||||||||
Total investment income | 17,553 | 16,416 | 3,313 | 19 | ||||||||||||
|
|
|
|
|
|
|
| |||||||||
| Expenses | ||||||||||||||||
Investment advisory fees | 7,914 | 3,671 | — | 19 | ||||||||||||
Service fees, Class A | 343 | 790 | 119 | 1 | ||||||||||||
Distribution and service fees, Class C | 2,970 | 2,686 | 410 | 3 | ||||||||||||
Administration fees | 865 | 980 | 204 | 3 | ||||||||||||
Transfer agent fees and expenses | 826 | 1,059 | 336 | 2 | ||||||||||||
Registration fees | 111 | 113 | 59 | 44 | ||||||||||||
Printing fees and expenses | 47 | 56 | 15 | — | (1) | |||||||||||
Custodian fees | 13 | 12 | 14 | 1 | ||||||||||||
Professional fees | 25 | 27 | 24 | 18 | ||||||||||||
Trustees’ fees and expenses | 28 | 32 | 7 | — | (1) | |||||||||||
Miscellaneous expenses | 32 | 35 | 9 | 2 | ||||||||||||
|
|
|
|
|
|
|
| |||||||||
Total expenses | 13,174 | 9,461 | 1,197 | 93 | ||||||||||||
Less expenses reimbursed and/or waived by investment adviser | (53 | ) | (11 | ) | — | (64 | ) | |||||||||
|
|
|
|
|
|
|
| |||||||||
Net expenses | 13,121 | 9,450 | 1,197 | 29 | ||||||||||||
|
|
|
|
|
|
|
| |||||||||
Net investment income (loss) | 4,432 | 6,966 | 2,116 | (10 | ) | |||||||||||
|
|
|
|
|
|
|
| |||||||||
| Net Realized and Unrealized Gain (Loss) on Investments | ||||||||||||||||
Net realized gain (loss) on unaffiliated investments | 56,144 | 79,066 | (2,014 | ) | 423 | |||||||||||
Net realized gain (loss) on affiliated investments | — | — | 4,480 | — | ||||||||||||
Capital gain distributions from affiliated funds | — | — | 1,099 | — | ||||||||||||
Net change in unrealized appreciation (depreciation) on investments | (18,719 | ) | 37,708 | 2,712 | (215 | ) | ||||||||||
|
|
|
|
|
|
|
| |||||||||
| Net gain (loss) on investments | 37,425 | 116,774 | 6,277 | 208 | ||||||||||||
|
|
|
|
|
|
|
| |||||||||
Net increase (decrease) in net assets resulting from operations | $ | 41,857 | $ | 123,740 | $ | 8,393 | $ | 198 | ||||||||
|
|
|
|
|
|
|
| |||||||||
(1) Amount is less than $500.
See Notes to Financial Statements
46
Table of Contents
VIRTUS OPPORTUNITIES TRUST
STATEMENTS OF OPERATIONS (Continued)
YEAR ENDED SEPTEMBER 30, 2014
($ reported in thousands)
|
|
|
|
|
|
|
| |||||||||
| Disciplined Select Bond Fund | Disciplined Select Country Fund | Dynamic AlphaSector® Fund | Global Premium AlphaSector® Fund | |||||||||||||
| Investment Income | ||||||||||||||||
Dividends | $ | 35 | $ | 44 | $ | 62,943 | $ | 4,468 | ||||||||
|
|
|
|
|
|
|
| |||||||||
Total investment income | 35 | 44 | 62,943 | 4,468 | ||||||||||||
|
|
|
|
|
|
|
| |||||||||
| Expenses | ||||||||||||||||
Investment advisory fees | 8 | 15 | 42,738 | 2,215 | ||||||||||||
Service fees, Class A | — | (1) | 1 | 2,232 | 184 | |||||||||||
Distribution and service fees, Class B | — | — | 2 | — | ||||||||||||
Distribution and service fees, Class C | 1 | 1 | 4,633 | 607 | ||||||||||||
Administration fees | 2 | 2 | 3,007 | 242 | ||||||||||||
Transfer agent fees and expenses | 1 | 1 | 2,845 | 256 | ||||||||||||
Interest expense | — | — | 3,277 | — | ||||||||||||
Registration fees | 44 | 44 | 359 | 59 | ||||||||||||
Printing fees and expenses | — | (1) | — | (1) | 159 | 14 | ||||||||||
Custodian fees | 1 | 1 | 69 | 4 | ||||||||||||
Professional fees | 18 | 19 | 41 | 20 | ||||||||||||
Trustees’ fees and expenses | — | (1) | — | (1) | 94 | 8 | ||||||||||
Miscellaneous expenses | 2 | 3 | 94 | 10 | ||||||||||||
|
|
|
|
|
|
|
| |||||||||
Total expenses | 77 | 87 | 59,550 | 3,619 | ||||||||||||
|
|
|
|
|
|
|
| |||||||||
Dividends on short sales | — | — | 6,163 | — | ||||||||||||
Interest expense on short sales | — | — | 2,060 | — | ||||||||||||
|
|
|
|
|
|
|
| |||||||||
Total expenses, including dividends and interest expense on short sales | 77 | 87 | 67,773 | 3,619 | ||||||||||||
|
|
|
|
|
|
|
| |||||||||
Less expenses reimbursed and/or waived by investment adviser | (65 | ) | (64 | ) | — | — | ||||||||||
Plus expenses recaptured by investment adviser | — | — | — | 15 | ||||||||||||
|
|
|
|
|
|
|
| |||||||||
Net expenses | 12 | 23 | 67,773 | 3,634 | ||||||||||||
|
|
|
|
|
|
|
| |||||||||
Net investment income (loss) | 23 | 21 | (4,830 | ) | 834 | |||||||||||
|
|
|
|
|
|
|
| |||||||||
| Net Realized and Unrealized Gain (Loss) on Investments | ||||||||||||||||
Net realized gain (loss) on unaffiliated investments | (4 | ) | 70 | 235,011 | 15,899 | |||||||||||
Net realized gain (loss) on securities sold short | — | — | (80,207 | ) | — | |||||||||||
Net realized gain (loss) on foreign currency transactions | — | — | — | (1) | — | |||||||||||
Net change in unrealized appreciation (depreciation) on investments | 19 | (100 | ) | 120,132 | (3,898 | ) | ||||||||||
Net change in unrealized appreciation (depreciation) on securities sold short | — | — | (4,122 | ) | — | |||||||||||
Net change in unrealized appreciation (depreciation) on foreign currency translation | — | — | — | (1) | — | |||||||||||
|
|
|
|
|
|
|
| |||||||||
| Net gain (loss) on investments | 15 | (30 | ) | 270,814 | 12,001 | |||||||||||
|
|
|
|
|
|
|
| |||||||||
Net increase (decrease) in net assets resulting from operations | $ | 38 | $ | (9 | ) | $ | 265,984 | $ | 12,835 | |||||||
|
|
|
|
|
|
|
| |||||||||
(1) Amount is less than $500.
See Notes to Financial Statements
47
Table of Contents
VIRTUS OPPORTUNITIES TRUST
STATEMENTS OF OPERATIONS (Continued)
YEAR ENDED SEPTEMBER 30, 2014
($ reported in thousands)
|
|
|
| |||||
| Herzfeld Fund | Premium AlphaSector® Fund | |||||||
| Investment Income | ||||||||
Dividends | $ | 758 | $ | 143,853 | ||||
Security lending | — | 189 | ||||||
Foreign taxes withheld | — | (14 | ) | |||||
|
|
|
| |||||
Total investment income | 758 | 144,028 | ||||||
|
|
|
| |||||
| Expenses | ||||||||
Investment advisory fees | 162 | 80,241 | ||||||
Service fees, Class A | 14 | 5,727 | ||||||
Distribution and service fees, Class C | 83 | 17,376 | �� | |||||
Administration fees | 20 | 8,764 | ||||||
Transfer agent fees and expenses | 18 | 8,318 | ||||||
Registration fees | 46 | 503 | ||||||
Printing fees and expenses | 3 | 452 | ||||||
Custodian fees | 2 | 108 | ||||||
Professional fees | 21 | 83 | ||||||
Trustees’ fees and expenses | 1 | 285 | ||||||
Miscellaneous expenses | 2 | 292 | ||||||
|
|
|
| |||||
Total expenses | 372 | 122,149 | ||||||
Less expenses reimbursed and/or waived by investment adviser | (56 | ) | — | |||||
|
|
|
| |||||
Net expenses | 316 | 122,149 | ||||||
|
|
|
| |||||
Net investment income (loss) | 442 | 21,879 | ||||||
|
|
|
| |||||
| Net Realized and Unrealized Gain (Loss) on Investments | ||||||||
Net realized gain (loss) on unaffiliated investments | (16 | ) | 999,509 | |||||
Capital gain distributions from underlying funds | 562 | — | ||||||
Net change in unrealized appreciation (depreciation) on investments | 709 | (48,648 | ) | |||||
|
|
|
| |||||
| Net gain (loss) on investments | 1,255 | 950,861 | ||||||
|
|
|
| |||||
Net increase (decrease) in net assets resulting from operations | $ | 1,697 | $ | 972,740 | ||||
|
|
|
| |||||
(1) Amount is less than $500.
See Notes to Financial Statements
48
Table of Contents
STATEMENTS OF CHANGES IN NET ASSETS
($ reported in thousands)
|
|
|
| |||||||||||||
| Allocator Premium AlphaSector® Fund | AlphaSector® Rotation Fund | |||||||||||||||
| Year Ended September 30, 2014 | Year Ended September 30, 2013 | Year Ended September 30, 2014 | Year Ended September 30, 2013 | |||||||||||||
| INCREASE/(DECREASE) IN NET ASSETS | ||||||||||||||||
| From Operations | ||||||||||||||||
Net investment income (loss) | $ | 4,432 | $ | 1,495 | $ | 6,966 | $ | 6,002 | ||||||||
Net realized gain (loss) | 56,144 | 3,452 | 79,066 | 49,042 | ||||||||||||
Net change in unrealized appreciation (depreciation) | (18,719 | ) | 21,137 | 37,708 | 38,254 | |||||||||||
|
|
|
|
|
|
|
| |||||||||
| Increase (decrease) in net assets resulting from operations | 41,857 | 26,084 | 123,740 | 93,298 | ||||||||||||
|
|
|
|
|
|
|
| |||||||||
| From Distributions to Shareholders | ||||||||||||||||
Net investment income, Class A | (790 | ) | (380 | ) | (2,909 | ) | (2,779 | ) | ||||||||
Net investment income, Class C | — | — | (577 | ) | (1,082 | ) | ||||||||||
Net investment income, Class I | (2,285 | ) | (1,170 | ) | (2,482 | ) | (2,166 | ) | ||||||||
Net realized short-term gains, Class A | (1,344 | ) | (133 | ) | (8,366 | ) | (6,055 | ) | ||||||||
Net realized short-term gains, Class C | (2,898 | ) | (198 | ) | (7,087 | ) | (4,881 | ) | ||||||||
Net realized short-term gains, Class I | (2,928 | ) | (357 | ) | (5,701 | ) | (3,799 | ) | ||||||||
Net realized long-term gains, Class A | (213 | ) | — | (10,147 | ) | (193 | ) | |||||||||
Net realized long-term gains, Class C | (460 | ) | — | (8,594 | ) | (156 | ) | |||||||||
Net realized long-term gains, Class I | (465 | ) | — | (6,915 | ) | (121 | ) | |||||||||
|
|
|
|
|
|
|
| |||||||||
| Decrease in net assets from distributions to shareholders | (11,383 | ) | (2,238 | ) | (52,778 | ) | (21,232 | ) | ||||||||
|
|
|
|
|
|
|
| |||||||||
| From Share Transactions (See Note 5) | ||||||||||||||||
Change in net assets from share transactions, Class A | 22,647 | 43,974 | 30,534 | 29,158 | ||||||||||||
Change in net assets from share transactions, Class C | 89,286 | 90,181 | 54,832 | 36,189 | ||||||||||||
Change in net assets from share transactions, Class I | 55,797 | 92,053 | 121,101 | 32,109 | ||||||||||||
|
|
|
|
|
|
|
| |||||||||
| Increase (decrease) in net assets from share transactions | 167,730 | 226,208 | 206,467 | 97,456 | ||||||||||||
|
|
|
|
|
|
|
| |||||||||
| Net increase (decrease) in net assets | 198,204 | 250,054 | 277,429 | 169,522 | ||||||||||||
| Net Assets | ||||||||||||||||
Beginning of fiscal year | 594,140 | 344,086 | 648,449 | 478,927 | ||||||||||||
|
|
|
|
|
|
|
| |||||||||
| End of fiscal year | $ | 792,344 | $ | 594,140 | $ | 925,878 | $ | 648,449 | ||||||||
|
|
|
|
|
|
|
| |||||||||
Accumulated undistributed net investment income (loss) at end of fiscal year | $ | 1,359 | $ | — | $ | 2,325 | $ | 1,517 | ||||||||
(1) Amount is less than $500.
See Notes to Financial Statements
49
Table of Contents
VIRTUS OPPORTUNITIES TRUST
STATEMENTS OF CHANGES IN NET ASSETS (Continued)
($ reported in thousands)
|
|
|
| |||||||||||||
| Alternatives Diversifier Fund | Disciplined Equity Style Fund | |||||||||||||||
| Year Ended September 30, 2014 | Year Ended September 30, 2013 | Year Ended September 30, 2014 | From Inception December 18, 2012 to September 30, 2013 | |||||||||||||
| INCREASE/(DECREASE) IN NET ASSETS | ||||||||||||||||
| From Operations | ||||||||||||||||
Net investment income (loss) | $ | 2,116 | $ | 2,922 | $ | (10 | ) | $ | 4 | |||||||
Net realized gain (loss) | 3,565 | 1,776 | 423 | 104 | ||||||||||||
Net change in unrealized appreciation (depreciation) | 2,712 | (5,584 | ) | (215 | ) | 178 | ||||||||||
|
|
|
|
|
|
|
| |||||||||
| Increase (decrease) in net assets resulting from operations | 8,393 | (886 | ) | 198 | 286 | |||||||||||
|
|
|
|
|
|
|
| |||||||||
| From Distributions to Shareholders | ||||||||||||||||
Net investment income, Class A | (549 | ) | (1,146 | ) | — | (— | )(1) | |||||||||
Net investment income, Class C | (21 | ) | (471 | ) | — | (— | )(1) | |||||||||
Net investment income, Class I | (1,358 | ) | (811 | ) | — | (4 | ) | |||||||||
Net realized short-term gains, Class A | — | — | (22 | ) | (1 | ) | ||||||||||
Net realized short-term gains, Class C | — | — | (15 | ) | (1 | ) | ||||||||||
Net realized short-term gains, Class I | — | — | (63 | ) | (3 | ) | ||||||||||
|
|
|
|
|
|
|
| |||||||||
| Decrease in net assets from distributions to shareholders | (1,928 | ) | (2,428 | ) | (100 | ) | (9 | ) | ||||||||
|
|
|
|
|
|
|
| |||||||||
| From Share Transactions (See Note 5) | ||||||||||||||||
Change in net assets from share transactions, Class A | (14,109 | ) | (13,443 | ) | 242 | 279 | ||||||||||
Change in net assets from share transactions, Class C | (8,314 | ) | (12,108 | ) | 51 | 207 | ||||||||||
Change in net assets from share transactions, Class I | (66,597 | ) | 76,061 | 63 | 812 | |||||||||||
|
|
|
|
|
|
|
| |||||||||
| Increase (decrease) in net assets from share transactions | (89,020 | ) | 50,510 | 356 | 1,298 | |||||||||||
|
|
|
|
|
|
|
| |||||||||
| Net increase (decrease) in net assets | (82,555 | ) | 47,196 | 454 | 1,575 | |||||||||||
| Net Assets | ||||||||||||||||
Beginning of fiscal year | 207,585 | 160,389 | 1,575 | — | ||||||||||||
|
|
|
|
|
|
|
| |||||||||
| End of fiscal year | $ | 125,030 | $ | 207,585 | $ | 2,029 | $ | 1,575 | ||||||||
|
|
|
|
|
|
|
| |||||||||
Accumulated undistributed net investment income (loss) at end of fiscal year | $ | 794 | $ | 960 | $ | — | $ | — | ||||||||
(1) Amount is less than $500.
See Notes to Financial Statements
50
Table of Contents
VIRTUS OPPORTUNITIES TRUST
STATEMENTS OF CHANGES IN NET ASSETS (Continued)
($ reported in thousands)
|
|
|
| |||||||||||||
| Disciplined Select Bond Fund | Disciplined Select Country Fund | |||||||||||||||
| Year Ended September 30, 2014 | From Inception December 18, 2012 to September 30, 2013 | Year Ended September 30, 2014 | From Inception December 18, 2012 to September 30, 2013 | |||||||||||||
| INCREASE/(DECREASE) IN NET ASSETS | ||||||||||||||||
| From Operations | ||||||||||||||||
Net investment income (loss) | $ | 23 | $ | 13 | $ | 21 | $ | 4 | ||||||||
Net realized gain (loss) | (4 | ) | (38 | ) | 70 | 9 | ||||||||||
Net change in unrealized appreciation (depreciation) | 19 | (21 | ) | (100 | ) | 128 | ||||||||||
|
|
|
|
|
|
|
| |||||||||
| Increase (decrease) in net assets resulting from operations | 38 | (46 | ) | (9 | ) | 141 | ||||||||||
|
|
|
|
|
|
|
| |||||||||
| From Distributions to Shareholders | ||||||||||||||||
Net investment income, Class A | (3 | ) | (2 | ) | (1 | ) | — | |||||||||
Net investment income, Class C | (2 | ) | (1 | ) | — | — | ||||||||||
Net investment income, Class I | (17 | ) | (10 | ) | (10 | ) | — | |||||||||
Net realized short-term gains, Class A | — | — | (2 | ) | — | |||||||||||
Net realized short-term gains, Class C | — | — | (1 | ) | — | |||||||||||
Net realized short-term gains, Class I | — | — | (8 | ) | — | |||||||||||
|
|
|
|
|
|
|
| |||||||||
| Decrease in net assets from distributions to shareholders | (22 | ) | (13 | ) | (22 | ) | — | |||||||||
|
|
|
|
|
|
|
| |||||||||
| From Share Transactions (See Note 5) | ||||||||||||||||
Change in net assets from share transactions, Class A | (53 | ) | 166 | 139 | 152 | |||||||||||
Change in net assets from share transactions, Class C | 25 | 120 | 46 | 100 | ||||||||||||
Change in net assets from share transactions, Class I | 17 | 810 | 95 | 800 | ||||||||||||
|
|
|
|
|
|
|
| |||||||||
| Increase (decrease) in net assets from share transactions | (11 | ) | 1,096 | 280 | 1,052 | |||||||||||
|
|
|
|
|
|
|
| |||||||||
| Net increase (decrease) in net assets | 5 | 1,037 | 249 | 1,193 | ||||||||||||
| Net Assets | ||||||||||||||||
Beginning of fiscal year | 1,037 | — | 1,193 | — | ||||||||||||
|
|
|
|
|
|
|
| |||||||||
| End of fiscal year | $ | 1,042 | $ | 1,037 | $ | 1,442 | $ | 1,193 | ||||||||
|
|
|
|
|
|
|
| |||||||||
Accumulated undistributed net investment income (loss) at end of fiscal year | $ | 1 | $ | — | (1) | $ | 14 | $ | 4 | |||||||
(1) Amount is less than $500.
See Notes to Financial Statements
51
Table of Contents
VIRTUS OPPORTUNITIES TRUST
STATEMENTS OF CHANGES IN NET ASSETS (Continued)
($ reported in thousands)
|
|
|
| |||||||||||||
| Dynamic AlphaSector® Fund | Global Premium AlphaSector® Fund | |||||||||||||||
| Year Ended September 30, 2014 | Year Ended September 30, 2013 | Year Ended September 30, 2014 | Year Ended September 30, 2013 | |||||||||||||
| INCREASE/(DECREASE) IN NET ASSETS | ||||||||||||||||
| From Operations | ||||||||||||||||
Net investment income (loss) | $ | (4,830 | ) | $ | 2,249 | $ | 834 | $ | 168 | |||||||
Net realized gain (loss) | 154,804 | (5,958 | ) | 15,899 | 3,515 | |||||||||||
Net change in unrealized appreciation (depreciation) | 116,010 | 130,600 | (3,898 | ) | 8,020 | |||||||||||
|
|
|
|
|
|
|
| |||||||||
| Increase (decrease) in net assets resulting from operations | 265,984 | 126,891 | 12,835 | 11,703 | ||||||||||||
|
|
|
|
|
|
|
| |||||||||
| From Distributions to Shareholders | ||||||||||||||||
Net investment income, Class A | — | (1,254 | ) | (129 | ) | (171 | ) | |||||||||
Net investment income, Class C | — | — | — | (5 | ) | |||||||||||
Net investment income, Class I | — | (1,627 | ) | (179 | ) | (94 | ) | |||||||||
Net realized short-term gains, Class A | — | — | (1,574 | ) | (184 | ) | ||||||||||
Net realized short-term gains, Class C | — | — | (1,227 | ) | (115 | ) | ||||||||||
Net realized short-term gains, Class I | — | — | (1,115 | ) | (101 | ) | ||||||||||
Net realized long-term gains, Class A | — | — | (123 | ) | — | |||||||||||
Net realized long-term gains, Class C | — | — | (96 | ) | — | |||||||||||
Net realized long-term gains, Class I | — | — | (87 | ) | — | |||||||||||
Tax Return of Capital, Class A | — | (593 | ) | — | — | |||||||||||
Tax Return of Capital, Class C | — | (162 | ) | — | — | |||||||||||
Tax Return of Capital, Class I | — | (743 | ) | — | — | |||||||||||
|
|
|
|
|
|
|
| |||||||||
| Decrease in net assets from distributions to shareholders | — | (4,379 | ) | (4,530 | ) | (670 | ) | |||||||||
|
|
|
|
|
|
|
| |||||||||
| From Share Transactions (See Note 5) | ||||||||||||||||
Change in net assets from share transactions, Class A | (45,309 | ) | 498,319 | 15,714 | 23,979 | |||||||||||
Change in net assets from share transactions, Class B | (4 | ) | (42 | ) | — | — | ||||||||||
Change in net assets from share transactions, Class C | 240,321 | 221,358 | 25,459 | 20,113 | ||||||||||||
Change in net assets from share transactions, Class I | 588,058 | 577,651 | 58,239 | 16,830 | ||||||||||||
|
|
|
|
|
|
|
| |||||||||
| Increase (decrease) in net assets from share transactions | 783,066 | 1,297,286 | 99,412 | 60,922 | ||||||||||||
|
|
|
|
|
|
|
| |||||||||
| Net increase (decrease) in net assets | 1,049,050 | 1,419,798 | 107,717 | 71,955 | ||||||||||||
| Net Assets | ||||||||||||||||
Beginning of fiscal year | 1,669,144 | 249,346 | 139,817 | 67,862 | ||||||||||||
|
|
|
|
|
|
|
| |||||||||
| End of fiscal year | $ | 2,718,194 | $ | 1,669,144 | $ | 247,534 | $ | 139,817 | ||||||||
|
|
|
|
|
|
|
| |||||||||
Accumulated undistributed net investment income (loss) at end of fiscal year | $ | — | $ | — | $ | 526 | $ | — | ||||||||
(1) Amount is less than $500.
See Notes to Financial Statements
52
Table of Contents
VIRTUS OPPORTUNITIES TRUST
STATEMENTS OF CHANGES IN NET ASSETS (Continued)
($ reported in thousands)
|
|
|
| |||||||||||||
| Herzfeld Fund | Premium AlphaSector® Fund | |||||||||||||||
| Year Ended September 30, 2014 | Year Ended September 30, 2013 | Year Ended September 30, 2014 | Year Ended September 30, 2013 | |||||||||||||
| INCREASE/(DECREASE) IN NET ASSETS | ||||||||||||||||
| From Operations | ||||||||||||||||
Net investment income (loss) | $ | 442 | $ | 103 | $ | 21,879 | $ | 30,992 | ||||||||
Net realized gain (loss) | 546 | 106 | 999,509 | 125,067 | ||||||||||||
Net change in unrealized appreciation (depreciation) | 709 | (269 | ) | (48,648 | ) | 493,185 | ||||||||||
|
|
|
|
|
|
|
| |||||||||
| Increase (decrease) in net assets resulting from operations | 1,697 | (60 | ) | 972,740 | 649,244 | |||||||||||
|
|
|
|
|
|
|
| |||||||||
| From Distributions to Shareholders | ||||||||||||||||
Net investment income, Class A | (182 | ) | (35 | ) | (6,111 | ) | (11,572 | ) | ||||||||
Net investment income, Class C | (209 | ) | (42 | ) | — | (1,256 | ) | |||||||||
Net investment income, Class I | (86 | ) | (41 | ) | (15,369 | ) | (17,821 | ) | ||||||||
Net realized short-term gains, Class A | (20 | ) | (1 | ) | (42,252 | ) | — | |||||||||
Net realized short-term gains, Class C | (37 | ) | (— | )(1) | (29,718 | ) | — | |||||||||
Net realized short-term gains, Class I | (12 | ) | (1 | ) | (56,898 | ) | — | |||||||||
Net realized long-term gains, Class A | (8 | ) | (— | )(1) | (16,551 | ) | — | |||||||||
Net realized long-term gains, Class C | (15 | ) | (— | )(1) | (11,641 | ) | — | |||||||||
Net realized long-term gains, Class I | (5 | ) | (— | )(1) | (22,288 | ) | �� | — | ||||||||
|
|
|
|
|
|
|
| |||||||||
| Decrease in net assets from distributions to shareholders | (574 | ) | (120 | ) | (200,828 | ) | (30,649 | ) | ||||||||
|
|
|
|
|
|
|
| |||||||||
| From Share Transactions (See Note 5) | ||||||||||||||||
Change in net assets from share transactions, Class A | 5,951 | 2,876 | (150,111 | ) | 395,391 | |||||||||||
Change in net assets from share transactions, Class C | 5,063 | 4,960 | 508,692 | 404,585 | ||||||||||||
Change in net assets from share transactions, Class I | 1,516 | 744 | 917,705 | 836,994 | ||||||||||||
|
|
|
|
|
|
|
| |||||||||
| Increase (decrease) in net assets from share transactions | 12,530 | 8,580 | 1,276,286 | 1,636,970 | ||||||||||||
|
|
|
|
|
|
|
| |||||||||
| Net increase (decrease) in net assets | 13,653 | 8,400 | 2,048,198 | 2,255,565 | ||||||||||||
| Net Assets | ||||||||||||||||
Beginning of fiscal year | 9,624 | 1,224 | 5,825,318 | 3,569,753 | ||||||||||||
|
|
|
|
|
|
|
| |||||||||
| End of fiscal year | $ | 23,277 | $ | 9,624 | $ | 7,873,516 | $ | 5,825,318 | ||||||||
|
|
|
|
|
|
|
| |||||||||
Accumulated undistributed net investment income (loss) at end of fiscal year | $ | 6 | $ | — | $ | 6,248 | $ | 6,317 | ||||||||
(1) Amount is less than $500.
See Notes to Financial Statements
53
Table of Contents
VIRTUS DYNAMIC ALPHASECTOR® FUND
STATEMENT OF CASH FLOWS
FOR THE YEAR ENDED SEPTEMBER 30, 2014
($ reported in thousands)
| Cash Flows Provided by (Used for) Operating Activities: | ||||
Net increase in net assets resulting from operations | $ | 265,984 | ||
|
| |||
Adjustments to reconcile net increase in net assets resulting from operations to net cash provided by (used for) operating activities: | ||||
Proceeds from sales and paydowns of long-term investments | 6,412,360 | |||
Purchase of investments | (7,408,122 | ) | ||
Proceeds from securities sold short | 1,421,246 | |||
Purchases to cover short positions | (1,378,176 | ) | ||
Net proceeds from sales of short-term securities | 2,698 | |||
Net change in unrealized (appreciation)/depreciation | (116,010 | ) | ||
Net realized (gains)/loss from sales of investments | (235,005 | ) | ||
Net realized (gains)/loss from sales of securities sold short | 80,207 | |||
(Increase)/Decrease in deposits with broker for borrowings | (141,878 | ) | ||
(Increase)/Decrease in dividends and interest receivable | 14 | |||
(Increase)/Decrease in securities sold receivable | 1,827 | |||
(Increase)/Decrease in prepaid expenses | (22 | ) | ||
(Increase)/Decrease in prepaid trustee retainer | (9 | ) | ||
(Increase)/Decrease in tax reclaim receivable | 2 | |||
(Increase)/Decrease in purchases payable | (23,877 | ) | ||
Increase/(Decrease) in Trustees’ fees and expenses payable | 1 | |||
Increase/(Decrease) in professional fees payable | 3 | |||
Increase/(Decrease) in investment advisory fee payable | 1,836 | |||
Increase/(Decrease) in distribution and service fees payable | 289 | |||
Increase/(Decrease) in administration fee payable | 116 | |||
Increase/(Decrease) in transfer agent fees and expenses payable | 395 | |||
Increase/(Decrease) in other accrued expenses payable | 46 | |||
|
| |||
Cash used for operating activities | (1,116,075 | ) | ||
|
| |||
| Cash provided by (used) for financing activities: | ||||
Proceeds of borrowings | 896,980 | |||
Repayment of borrowings | (1,306,790 | ) | ||
Proceeds from shares sold | 1,715,579 | |||
Shares redeemed | (913,188 | ) | ||
Securities lending | 727,366 | |||
|
| |||
Cash provided by financing activities: | 1,119,947 | |||
|
| |||
Net increase (decrease) in cash | 3,872 | |||
|
| |||
| Cash: | ||||
Cash and foreign currency at beginning of period | 5,462 | |||
|
| |||
Cash and foreign currency at end of period | $ | 9,334 | ||
|
| |||
| Cash flow information: | ||||
Cash paid during the period for interest | $ | 5,337 |
(1) Amount less than $500.
See Notes to Financial Statements
54
Table of Contents
FINANCIAL HIGHLIGHTS
SELECTED PER SHARE DATA AND RATIOS FOR A SHARE OUTSTANDING
THROUGHOUT EACH PERIOD
| Net Asset Value, Beginning of Period | Net Investment Income (Loss)(2) | Net Realized and Unrealized Gain (Loss) | Total from Investment Operations | Dividends from Net Investment Income | Distributions from Net Realized Gains | Total Distributions | Change in Net Asset Value | Net Asset Value, End of Period | Total Return(1) | Net Assets End of Period (in thousands) | Ratio of Net Expenses to Average Net Assets(8) | Ratio of Gross Expenses to Average Net Assets (before waivers and reimbursements)(8) | Ratio of Net Investment Income (Loss) to Average Net Assets | Portfolio Turnover Rate | ||||||||||||||||||||||||||||||||||||||||||||||||||||||||||||||
| Allocator Premium | |||||||||||||||||||||||||||||||||||||||||||||||||||||||||||||||||||||||||||||
AlphaSector® Fund | |||||||||||||||||||||||||||||||||||||||||||||||||||||||||||||||||||||||||||||
Class A | |||||||||||||||||||||||||||||||||||||||||||||||||||||||||||||||||||||||||||||
10/1/13 to 9/30/14 | $ | 11.28 | 0.10 | 0.69 | 0.79 | (0.07 | ) | (0.15 | ) | (0.22 | ) | 0.57 | $ | 11.85 | 6.97 | % | $ | 143,765 | 1.62 | %(12) | 1.62 | %(12) | 0.83 | % | 337 | % | |||||||||||||||||||||||||||||||||||||||||||||||||||
10/1/12 to 9/30/13 | 10.67 | 0.06 | 0.62 | 0.68 | (0.05 | ) | (0.02 | ) | (0.07 | ) | 0.61 | 11.28 | 6.39 | 114,697 | 1.64 | (12) | 1.64 | (12) | 0.51 | 275 | |||||||||||||||||||||||||||||||||||||||||||||||||||||||||
10/1/11 to 9/30/12 | 9.69 | 0.09 | 0.98 | 1.07 | (0.09 | ) | — | (0.09 | ) | 0.98 | 10.67 | 11.08 | 66,122 | 1.73 | 1.70 | 0.84 | 211 | ||||||||||||||||||||||||||||||||||||||||||||||||||||||||||||
3/15/11(6) to 9/30/11 | 10.00 | 0.07 | (0.38 | ) | (0.31 | ) | — | — | — | (0.31 | ) | 9.69 | (3.10 | )(4) | 12,232 | 1.75 | (3) | 2.17 | (3) | 1.35 | (3) | 153 | (4) | ||||||||||||||||||||||||||||||||||||||||||||||||||||||
Class C | |||||||||||||||||||||||||||||||||||||||||||||||||||||||||||||||||||||||||||||
10/1/13 to 9/30/14 | $ | 11.19 | 0.01 | 0.68 | 0.69 | — | (0.15 | ) | (0.15 | ) | 0.54 | $ | 11.73 | 6.15 | % | $ | 331,980 | 2.35 | %(12) | 2.37 | %(12) | 0.09 | % | 337 | % | ||||||||||||||||||||||||||||||||||||||||||||||||||||
10/1/12 to 9/30/13 | 10.60 | (0.02 | ) | 0.63 | 0.61 | — | (0.02 | ) | (0.02 | ) | 0.59 | 11.19 | 5.71 | 230,459 | 2.37 | (12) | 2.39 | (12) | (0.23 | ) | 275 | ||||||||||||||||||||||||||||||||||||||||||||||||||||||||
10/1/11 to 9/30/12 | 9.66 | 0.02 | 0.96 | 0.98 | (0.04 | ) | — | (0.04 | ) | 0.94 | 10.60 | 10.13 | 131,330 | 2.45 | 2.45 | 0.16 | 211 | ||||||||||||||||||||||||||||||||||||||||||||||||||||||||||||
3/15/11(6) to 9/30/11 | 10.00 | 0.02 | (0.36 | ) | (0.34 | ) | — | — | — | (0.34 | ) | 9.66 | (3.40 | )(4) | 32,390 | 2.50 | (3) | 2.85 | (3) | 0.43 | (3) | 153 | (4) | ||||||||||||||||||||||||||||||||||||||||||||||||||||||
Class I | |||||||||||||||||||||||||||||||||||||||||||||||||||||||||||||||||||||||||||||
10/1/13 to 9/30/14 | $ | 11.31 | 0.13 | 0.69 | 0.82 | (0.10 | ) | (0.15 | ) | (0.25 | ) | 0.57 | $ | 11.88 | 7.20 | % | $ | 316,599 | 1.37 | %(12) | 1.37 | %(12) | 1.06 | % | 337 | % | |||||||||||||||||||||||||||||||||||||||||||||||||||
10/1/12 to 9/30/13 | 10.69 | 0.08 | 0.63 | 0.71 | (0.07 | ) | (0.02 | ) | (0.09 | ) | 0.62 | 11.31 | 6.70 | 248,984 | 1.39 | (12) | 1.39 | (12) | 0.74 | 275 | |||||||||||||||||||||||||||||||||||||||||||||||||||||||||
10/1/11 to 9/30/12 | 9.71 | 0.12 | 0.96 | 1.08 | (0.10 | ) | — | (0.10 | ) | 0.98 | 10.69 | 11.24 | 146,634 | 1.49 | 1.46 | 1.17 | 211 | ||||||||||||||||||||||||||||||||||||||||||||||||||||||||||||
3/15/11(6) to 9/30/11 | 10.00 | 0.10 | (0.39 | ) | (0.29 | ) | — | — | — | (0.29 | ) | 9.71 | (2.90 | )(4) | 19,131 | 1.50 | (3) | 2.01 | (3) | 1.82 | (3) | 153 | (4) | ||||||||||||||||||||||||||||||||||||||||||||||||||||||
| AlphaSector® | |||||||||||||||||||||||||||||||||||||||||||||||||||||||||||||||||||||||||||||
Rotation Fund | |||||||||||||||||||||||||||||||||||||||||||||||||||||||||||||||||||||||||||||
Class A | |||||||||||||||||||||||||||||||||||||||||||||||||||||||||||||||||||||||||||||
10/1/13 to 9/30/14 | $ | 13.87 | 0.15 | 2.25 | 2.40 | (0.13 | ) | (0.93 | ) | (1.06 | ) | 1.34 | $ | 15.21 | 17.81 | % | $ | 316,571 | 0.98 | % | 0.98 | % | 1.02 | % | 129 | % | |||||||||||||||||||||||||||||||||||||||||||||||||||
10/1/12 to 9/30/13 | 12.15 | 0.17 | 2.11 | 2.28 | (0.17 | ) | (0.39 | ) | (0.56 | ) | 1.72 | 13.87 | 19.63 | 257,492 | 1.00 | 1.00 | 1.29 | 123 | |||||||||||||||||||||||||||||||||||||||||||||||||||||||||||
10/1/11 to 9/30/12 | 10.67 | 0.14 | 1.68 | 1.82 | (0.12 | ) | (0.22 | ) | (0.34 | ) | 1.48 | 12.15 | 17.51 | 199,268 | 1.02 | 1.02 | 1.22 | 190 | |||||||||||||||||||||||||||||||||||||||||||||||||||||||||||
10/1/10 to 9/30/11 | 10.18 | 0.11 | 0.54 | 0.65 | (0.16 | ) | — | (0.16 | ) | 0.49 | 10.67 | 6.20 | 184,613 | 1.04 | 1.04 | 0.97 | 134 | ||||||||||||||||||||||||||||||||||||||||||||||||||||||||||||
10/1/09 to 9/30/10 | 9.34 | 0.14 | 0.76 | 0.90 | (0.06 | ) | — | (0.06 | ) | 0.84 | 10.18 | 9.63 | 192,375 | 1.06 | 1.06 | 1.41 | 245 | ||||||||||||||||||||||||||||||||||||||||||||||||||||||||||||
Class C | |||||||||||||||||||||||||||||||||||||||||||||||||||||||||||||||||||||||||||||
10/1/13 to 9/30/14 | $ | 13.73 | 0.04 | 2.21 | 2.25 | (0.03 | ) | (0.93 | ) | (0.96 | ) | 1.29 | $ | 15.02 | 16.89 | % | $ | 296,160 | 1.73 | % | 1.73 | % | 0.28 | % | 129 | % | |||||||||||||||||||||||||||||||||||||||||||||||||||
10/1/12 to 9/30/13 | 12.03 | 0.07 | 2.10 | 2.17 | (0.08 | ) | (0.39 | ) | (0.47 | ) | 1.70 | 13.73 | 18.80 | 217,861 | 1.74 | 1.75 | 0.57 | 123 | |||||||||||||||||||||||||||||||||||||||||||||||||||||||||||
10/1/11 to 9/30/12 | 10.56 | 0.06 | 1.67 | 1.73 | (0.04 | ) | (0.22 | ) | (0.26 | ) | 1.47 | 12.03 | 16.60 | 157,461 | 1.75 | 1.77 | 0.53 | 190 | |||||||||||||||||||||||||||||||||||||||||||||||||||||||||||
10/1/10 to 9/30/11 | 10.09 | 0.04 | 0.52 | 0.56 | (0.09 | ) | — | (0.09 | ) | 0.47 | 10.56 | 5.49 | 144,813 | 1.71 | 1.79 | 0.33 | 134 | ||||||||||||||||||||||||||||||||||||||||||||||||||||||||||||
10/1/09 to 9/30/10 | 9.29 | 0.07 | 0.75 | 0.82 | (0.02 | ) | — | (0.02 | ) | 0.80 | 10.09 | 8.79 | 133,453 | 1.81 | 1.81 | 0.68 | 245 | ||||||||||||||||||||||||||||||||||||||||||||||||||||||||||||
Class I | |||||||||||||||||||||||||||||||||||||||||||||||||||||||||||||||||||||||||||||
10/1/13 to 9/30/14 | $ | 13.87 | 0.19 | 2.25 | 2.44 | (0.17 | ) | (0.93 | ) | (1.10 | ) | 1.34 | $ | 15.21 | 18.08 | % | $ | 313,147 | 0.73 | % | 0.73 | % | 1.29 | % | 129 | % | |||||||||||||||||||||||||||||||||||||||||||||||||||
10/1/12 to 9/30/13 | 12.15 | 0.20 | 2.11 | 2.31 | (0.20 | ) | (0.39 | ) | (0.59 | ) | 1.72 | 13.87 | 19.92 | 173,096 | 0.75 | 0.75 | 1.56 | 123 | |||||||||||||||||||||||||||||||||||||||||||||||||||||||||||
10/1/11 to 9/30/12 | 10.67 | 0.17 | 1.68 | 1.85 | (0.15 | ) | (0.22 | ) | (0.37 | ) | 1.48 | 12.15 | 17.71 | 122,198 | 0.77 | 0.77 | 1.53 | 190 | |||||||||||||||||||||||||||||||||||||||||||||||||||||||||||
10/1/10 to 9/30/11 | 10.18 | 0.14 | 0.54 | 0.68 | (0.19 | ) | — | (0.19 | ) | 0.49 | 10.67 | 6.56 | 85,585 | 0.82 | 0.82 | 1.26 | 134 | ||||||||||||||||||||||||||||||||||||||||||||||||||||||||||||
10/1/09(6) to 9/30/10 | 9.11 | 0.20 | 0.94 | 1.14 | (0.07 | ) | — | (0.07 | ) | 1.07 | 10.18 | 12.63 | (4) | 112,132 | 0.83 | (3) | 0.83 | (3) | 2.04 | (3) | 245 | ||||||||||||||||||||||||||||||||||||||||||||||||||||||||
The footnote legend is at the end of the Financial Highlights
See Notes to Financial Statements
55
Table of Contents
FINANCIAL HIGHLIGHTS
SELECTED PER SHARE DATA AND RATIOS FOR A SHARE OUTSTANDING
THROUGHOUT EACH PERIOD
| Net Asset Value, Beginning of Period | Net Investment Income (Loss)(2) | Capital Gains Distributions Received from Affiliated Funds(2) | Net Realized and Unrealized Gain (Loss) | Total from Investment Operations | Dividends from Net Investment Income | Distributions from Net Realized Gains | Total Distributions | Change in Net Asset Value | Net Asset Value, End of Period | Total Return(1) | Net Assets, End of Period (in thousands) | Ratio of Net Expenses to Average Net Assets(8) | Ratio of Gross Expenses to Average Net Assets (before waivers and reimbursements)(8) | Ratio of Net Investment Income (Loss) to Average Net Assets | Portfolio Turnover Rate | ||||||||||||||||||||||||||||||||||||||||||||||||||||||||||||||||||
| Alternatives | ||||||||||||||||||||||||||||||||||||||||||||||||||||||||||||||||||||||||||||||||||
Diversifier Fund | ||||||||||||||||||||||||||||||||||||||||||||||||||||||||||||||||||||||||||||||||||
Class A | ||||||||||||||||||||||||||||||||||||||||||||||||||||||||||||||||||||||||||||||||||
10/1/13 to 9/30/14 | $ | 10.97 | 0.15 | 0.07 | 0.25 | 0.47 | (0.13 | ) | (0.13 | ) | 0.34 | $ | 11.31 | 4.28 | % | $ | 39,076 | 0.65 | % | 0.65 | % | 1.32 | % | 27 | % | |||||||||||||||||||||||||||||||||||||||||||||||||||||||||
10/1/12 to 9/30/13 | 11.10 | 0.21 | — | (0.13 | ) | 0.08 | (0.21 | ) | — | (0.21 | ) | (0.13 | ) | 10.97 | 0.73 | 51,339 | 0.58 | (7) | 0.63 | 1.93 | 24 | |||||||||||||||||||||||||||||||||||||||||||||||||||||||||||||
10/1/11 to 9/30/12 | 9.68 | 0.10 | — | 1.38 | 1.48 | (0.06 | ) | — | (0.06 | ) | 1.42 | 11.10 | 15.37 | 65,463 | 0.45 | 0.65 | 0.95 | 29 | ||||||||||||||||||||||||||||||||||||||||||||||||||||||||||||||||
10/1/10 to 9/30/11(11) | 10.05 | 0.21 | 0.07 | (0.49 | ) | (0.21 | ) | (0.16 | ) | — | (0.16 | ) | (0.37 | ) | 9.68 | (2.12 | ) | 79,103 | 0.45 | 0.65 | 1.96 | 18 | ||||||||||||||||||||||||||||||||||||||||||||||||||||||||||||
10/1/09 to 9/30/10 | 9.43 | 0.18 | 0.02 | 0.64 | 0.84 | (0.22 | ) | — | (0.22 | ) | 0.62 | 10.05 | 8.91 | 115,081 | 0.45 | 0.75 | 1.87 | 4 | ||||||||||||||||||||||||||||||||||||||||||||||||||||||||||||||||
Class C | ||||||||||||||||||||||||||||||||||||||||||||||||||||||||||||||||||||||||||||||||||
10/1/13 to 9/30/14 | $ | 10.83 | 0.07 | 0.07 | 0.25 | 0.39 | (0.01 | ) | (0.01 | ) | 0.38 | $ | 11.21 | 3.47 | % | $ | 38,005 | 1.40 | % | 1.40 | % | 0.58 | % | 27 | % | |||||||||||||||||||||||||||||||||||||||||||||||||||||||||
10/1/12 to 9/30/13 | 10.93 | 0.13 | — | (0.13 | ) | — | (0.10 | ) | — | (0.10 | ) | (0.10 | ) | 10.83 | (0.05 | ) | 44,850 | 1.33 | (7) | 1.38 | 1.22 | 24 | ||||||||||||||||||||||||||||||||||||||||||||||||||||||||||||
10/1/11 to 9/30/12 | 9.55 | 0.02 | — | 1.36 | 1.38 | — | — | — | 1.38 | 10.93 | 14.45 | 57,336 | 1.20 | 1.40 | 0.20 | 29 | ||||||||||||||||||||||||||||||||||||||||||||||||||||||||||||||||||
10/1/10 to 9/30/11(11) | 9.95 | 0.13 | 0.07 | (0.48 | ) | (0.28 | ) | (0.12 | ) | — | (0.12 | ) | (0.40 | ) | 9.55 | (2.82 | ) | 66,411 | 1.20 | 1.40 | 1.20 | 18 | ||||||||||||||||||||||||||||||||||||||||||||||||||||||||||||
10/1/09 to 9/30/10 | 9.34 | 0.10 | 0.02 | 0.64 | 0.76 | (0.15 | ) | — | (0.15 | ) | 0.61 | 9.95 | 8.06 | 85,330 | 1.20 | 1.50 | 1.07 | 4 | ||||||||||||||||||||||||||||||||||||||||||||||||||||||||||||||||
Class I | ||||||||||||||||||||||||||||||||||||||||||||||||||||||||||||||||||||||||||||||||||
10/1/13 to 9/30/14 | $ | 10.98 | 0.18 | 0.08 | 0.24 | 0.50 | (0.18 | ) | (0.18 | ) | 0.32 | $ | 11.30 | 4.52 | % | $ | 47,949 | 0.40 | % | 0.40 | % | 1.56 | % | 27 | % | |||||||||||||||||||||||||||||||||||||||||||||||||||||||||
10/1/12 to 9/30/13 | 11.12 | 0.16 | — | (0.05 | ) | 0.11 | (0.25 | ) | — | (0.25 | ) | (0.14 | ) | 10.98 | 1.00 | 111,396 | 0.36 | (7) | 0.38 | 1.48 | 24 | |||||||||||||||||||||||||||||||||||||||||||||||||||||||||||||
10/1/11 to 9/30/12 | 9.70 | 0.13 | — | 1.38 | 1.51 | (0.09 | ) | — | (0.09 | ) | 1.42 | 11.12 | 15.63 | 37,590 | 0.20 | 0.40 | 1.21 | 29 | ||||||||||||||||||||||||||||||||||||||||||||||||||||||||||||||||
10/1/10 to 9/30/11(11) | 10.06 | 0.23 | 0.06 | (0.48 | ) | (0.19 | ) | (0.17 | ) | — | (0.17 | ) | (0.36 | ) | 9.70 | (1.89 | ) | 36,495 | 0.20 | 0.39 | 2.16 | 18 | ||||||||||||||||||||||||||||||||||||||||||||||||||||||||||||
10/1/09(6) to 9/30/10 | 9.27 | 0.18 | 0.01 | 0.84 | 1.03 | (0.24 | ) | — | (0.24 | ) | 0.79 | 10.06 | 11.11 | (4) | 31,732 | 0.20 | (3) | 0.51 | (3) | 1.83 | (3) | 4 | ||||||||||||||||||||||||||||||||||||||||||||||||||||||||||||
The footnote legend is at the end of the Financial Highlights
See Notes to Financial Statements
56
Table of Contents
FINANCIAL HIGHLIGHTS
SELECTED PER SHARE DATA AND RATIOS FOR A SHARE OUTSTANDING
THROUGHOUT EACH PERIOD
| Net Asset Value, Beginning of Period | Net Investment Income (Loss)(2) | Net Realized and Unrealized Gain (Loss) | Total from Investment Operations | Dividends from Net Investment Income | Distributions from Net Realized Gains | Total Distributions | Change in Net Asset Value | Net Asset Value, End of Period | Total Return(1) | Net Assets, End of Period (in thousands) | Ratio of Net Expenses to Average Net Assets(8) | Ratio of Gross Expenses to Average Net Assets (before waivers and reimbursements)(8) | Ratio of Net Investment Income (Loss) to Average Net Assets | Portfolio Turnover Rate | ||||||||||||||||||||||||||||||||||||||||||||||||||||||||||||||
| Disciplined Equity | |||||||||||||||||||||||||||||||||||||||||||||||||||||||||||||||||||||||||||||
Style Fund | |||||||||||||||||||||||||||||||||||||||||||||||||||||||||||||||||||||||||||||
Class A | |||||||||||||||||||||||||||||||||||||||||||||||||||||||||||||||||||||||||||||
10/1/13 to 9/30/14 | $ | 12.47 | (0.07 | ) | 1.51 | 1.44 | — | (0.78 | ) | (0.78 | ) | 0.66 | $ | 13.13 | 11.77 | % | $ | 594 | 1.60 | % | 4.97 | % | (0.56 | )% | 220 | % | |||||||||||||||||||||||||||||||||||||||||||||||||||
12/18/12(6) to 9/30/13 | 10.00 | — | 2.55 | 2.55 | (0.08 | ) | — | (5) | (0.08 | ) | 2.47 | 12.47 | 25.75 | (4) | 326 | 1.60 | (3) | 7.63 | (3) | 0.02 | (3) | 447 | (4) | ||||||||||||||||||||||||||||||||||||||||||||||||||||||
Class C | |||||||||||||||||||||||||||||||||||||||||||||||||||||||||||||||||||||||||||||
10/1/13 to 9/30/14 | $ | 12.40 | (0.17 | ) | 1.50 | 1.33 | — | (0.78 | ) | (0.78 | ) | 0.55 | $ | 12.95 | 10.91 | % | $ | 300 | 2.35 | % | 5.76 | % | (1.32 | )% | 220 | % | |||||||||||||||||||||||||||||||||||||||||||||||||||
12/18/12(6) to 9/30/13 | 10.00 | (0.05 | ) | 2.53 | 2.48 | (0.08 | ) | — | (5) | (0.08 | ) | 2.40 | 12.40 | 25.02 | (4) | 237 | 2.35 | (3) | 8.53 | (3) | (0.51 | )(3) | 447 | (4) | |||||||||||||||||||||||||||||||||||||||||||||||||||||
Class I | |||||||||||||||||||||||||||||||||||||||||||||||||||||||||||||||||||||||||||||
10/1/13 to 9/30/14 | $ | 12.49 | (0.04 | ) | 1.52 | 1.48 | — | (0.78 | ) | (0.78 | ) | 0.70 | $ | 13.19 | 12.09 | % | $ | 1,135 | 1.35 | % | 4.74 | % | (0.33 | )% | 220 | % | |||||||||||||||||||||||||||||||||||||||||||||||||||
12/18/12(6) to 9/30/13 | 10.00 | 0.05 | 2.52 | 2.57 | (0.08 | ) | — | (5) | (0.08 | ) | 2.49 | 12.49 | 25.96 | (4) | 1,012 | 1.35 | (3) | 7.87 | (3) | 0.59 | (3) | 447 | (4) | ||||||||||||||||||||||||||||||||||||||||||||||||||||||
| Disciplined Select | |||||||||||||||||||||||||||||||||||||||||||||||||||||||||||||||||||||||||||||
Bond Fund | |||||||||||||||||||||||||||||||||||||||||||||||||||||||||||||||||||||||||||||
Class A | |||||||||||||||||||||||||||||||||||||||||||||||||||||||||||||||||||||||||||||
10/1/13 to 9/30/14 | $ | 9.44 | 0.19 | 0.15 | 0.34 | (0.19 | ) | (0.19 | ) | 0.15 | $ | 9.59 | 3.59 | % | $ | 108 | 1.40 | % | 7.28 | % | 2.02 | % | 1,126 | % | |||||||||||||||||||||||||||||||||||||||||||||||||||||
12/18/12(6) to 9/30/13 | 10.00 | 0.11 | (0.57 | ) | (0.46 | ) | (0.10 | ) | — | (0.10 | ) | (0.56 | ) | 9.44 | (4.53 | )(4) | 157 | 1.40 | (3) | 9.27 | (3) | 1.46 | (3) | 401 | (4) | ||||||||||||||||||||||||||||||||||||||||||||||||||||
Class C | |||||||||||||||||||||||||||||||||||||||||||||||||||||||||||||||||||||||||||||
10/1/13 to 9/30/14 | $ | 9.44 | 0.11 | 0.15 | 0.26 | (0.13 | ) | (0.13 | ) | 0.13 | $ | 9.57 | 2.73 | % | $ | 140 | 2.15 | % | 8.57 | % | 1.19 | % | 1,126 | % | |||||||||||||||||||||||||||||||||||||||||||||||||||||
12/18/12(6) to 9/30/13 | 10.00 | 0.05 | (0.54 | ) | (0.49 | ) | (0.07 | ) | — | (0.05 | ) | (0.56 | ) | 9.44 | (4.95 | )(4) | 114 | 2.15 | (3) | 10.14 | (3) | 0.70 | (3) | 401 | (4) | ||||||||||||||||||||||||||||||||||||||||||||||||||||
Class I | |||||||||||||||||||||||||||||||||||||||||||||||||||||||||||||||||||||||||||||
10/1/13 to 9/30/14 | $ | 9.45 | 0.21 | 0.14 | 0.35 | (0.21 | ) | (0.21 | ) | 0.14 | $ | 9.59 | 3.75 | % | $ | 794 | 1.15 | % | 7.35 | % | 2.22 | % | 1,126 | % | |||||||||||||||||||||||||||||||||||||||||||||||||||||
12/18/12(6) to 9/30/13 | 10.00 | 0.13 | (0.55 | ) | (0.42 | ) | (0.13 | ) | — | (0.13 | ) | (0.55 | ) | 9.45 | (4.28 | )(4) | 766 | 1.15 | (3) | 9.18 | (3) | 1.71 | (3) | 401 | (4) | ||||||||||||||||||||||||||||||||||||||||||||||||||||
| Disciplined Select | |||||||||||||||||||||||||||||||||||||||||||||||||||||||||||||||||||||||||||||
Country Fund | |||||||||||||||||||||||||||||||||||||||||||||||||||||||||||||||||||||||||||||
Class A | |||||||||||||||||||||||||||||||||||||||||||||||||||||||||||||||||||||||||||||
10/1/13 to 9/30/14 | $ | 11.34 | 0.25 | (0.21 | ) | 0.04 | (0.06 | ) | (0.14 | ) | (0.20 | ) | (0.16 | ) | $ | 11.18 | 0.29 | % | $ | 299 | 1.70 | % | 6.45 | % | 2.09 | % | 217 | % | |||||||||||||||||||||||||||||||||||||||||||||||||
12/18/12(6) to 9/30/13 | 10.00 | 0.03 | 1.31 | 1.34 | — | — | — | 1.34 | 11.34 | 13.40 | (4) | 171 | 1.70 | (3) | 8.97 | (3) | 0.38 | (3) | 115 | (4) | |||||||||||||||||||||||||||||||||||||||||||||||||||||||||
Class C | |||||||||||||||||||||||||||||||||||||||||||||||||||||||||||||||||||||||||||||
10/1/13 to 9/30/14 | $ | 11.28 | 0.11 | (0.16 | ) | (0.05 | ) | — | (0.14 | ) | (0.14 | ) | (0.19 | ) | $ | 11.09 | (0.51 | )% | $ | 156 | 2.45 | % | 7.16 | % | 0.94 | % | 217 | % | |||||||||||||||||||||||||||||||||||||||||||||||||
12/18/12(6) to 9/30/13 | 10.00 | (0.04 | ) | 1.32 | 1.28 | — | — | — | 1.28 | 11.28 | 12.80 | (4) | 113 | 2.45 | (3) | 9.87 | (3) | (0.55 | )(3) | 115 | (4) | ||||||||||||||||||||||||||||||||||||||||||||||||||||||||
Class I | |||||||||||||||||||||||||||||||||||||||||||||||||||||||||||||||||||||||||||||
10/1/13 to 9/30/14 | $ | 11.37 | 0.19 | (0.12 | ) | 0.07 | (0.09 | ) | (0.14 | ) | (0.23 | ) | (0.16 | ) | $ | 11.21 | 0.48 | % | $ | 987 | 1.45 | % | 6.17 | % | 1.65 | % | 217 | % | |||||||||||||||||||||||||||||||||||||||||||||||||
12/18/12(6) to 9/30/13 | 10.00 | 0.04 | 1.33 | 1.37 | — | — | — | 1.37 | 11.37 | 13.70 | (4) | 909 | 1.45 | (3) | 8.87 | (3) | 0.46 | (3) | 115 | (4) | |||||||||||||||||||||||||||||||||||||||||||||||||||||||||
The footnote legend is at the end of the Financial Highlights
See Notes to Financial Statements
57
Table of Contents
VIRTUS OPPORTUNITIES TRUST
FINANCIAL HIGHLIGHTS
SELECTED PER SHARE DATA AND RATIOS FOR A SHARE OUTSTANDING
THROUGHOUT EACH PERIOD
| Net Asset Value, Beginning of Period | Net Investment Income (Loss)(2) | Net Realized and Unrealized Gain (Loss) | Total from Investment Operations | Dividends from Net Investment Income | Distributions from Net Realized Gains | Tax Return of Capital | Total Distributions | Change in Net Asset Value | Net Asset Value, End of Period | Total Return(1) | Net Assets, End of Period (in thousands) | Ratio of Expenses (including dividends and interest on short sales after expense waivers and reimbursements) to Average Net Assets(8) | Ratio of Expenses (including dividends and interest on short sales before expense waivers and reimburse ments) to Average Net Assets(8) | Ratio of Net Investment Income (Loss) to Average Net Assets | Portfolio Turnover Rate | ||||||||||||||||||||||||||||||||||||||||||||||||||||||||||||||||||
Dynamic | ||||||||||||||||||||||||||||||||||||||||||||||||||||||||||||||||||||||||||||||||||
Fund | ||||||||||||||||||||||||||||||||||||||||||||||||||||||||||||||||||||||||||||||||||
Class A | ||||||||||||||||||||||||||||||||||||||||||||||||||||||||||||||||||||||||||||||||||
10/1/13 to 9/30/14 | $ | 11.73 | (0.03 | ) | 1.59 | 1.56 | — | — | — | — | 1.56 | $ | 13.29 | 13.30 | % | $ | 721,407 | 2.68 | %(7)(9) | 2.68 | %(9) | (0.23 | )% | 233 | % | |||||||||||||||||||||||||||||||||||||||||||||||||||||||||
10/1/12 to 9/30/13 | 9.90 | 0.03 | 1.87 | 1.90 | (0.04 | ) | — | (0.03 | ) | (0.07 | ) | 1.83 | 11.73 | 19.32 | 660,921 | 2.73 | (7)(9) | 2.83 | (9) | 0.27 | 137 | |||||||||||||||||||||||||||||||||||||||||||||||||||||||||||||
10/1/11 to 9/30/12 | 9.09 | 0.08 | 0.73 | 0.81 | — | — | — | — | 0.81 | 9.90 | 8.91 | 109,724 | 2.78 | (9) | 3.06 | (9) | 0.86 | 165 | ||||||||||||||||||||||||||||||||||||||||||||||||||||||||||||||||
10/1/10 to 9/30/11 | 10.57 | (0.28 | ) | (0.91 | ) | (1.19 | ) | — | (0.29 | ) | — | (0.29 | ) | (1.48 | ) | 9.09 | (11.59 | ) | 6,615 | 4.35 | 4.65 | (2.79 | ) | 186 | ||||||||||||||||||||||||||||||||||||||||||||||||||||||||||
10/1/09 to 9/30/10 | 10.50 | (0.25 | ) | 0.32 | 0.07 | — | — | — | — | 0.07 | 10.57 | 0.67 | 17,556 | 3.76 | (7) | 4.04 | (2.33 | ) | 155 | |||||||||||||||||||||||||||||||||||||||||||||||||||||||||||||||
Class B | ||||||||||||||||||||||||||||||||||||||||||||||||||||||||||||||||||||||||||||||||||
10/1/13 to 9/30/14 | $ | 10.94 | (0.12 | ) | 1.48 | 1.36 | — | — | — | — | 1.36 | $ | 12.30 | 12.43 | % | $ | 144 | 3.44 | %(7)(9) | 3.44 | %(9) | (0.99 | )% | 233 | % | |||||||||||||||||||||||||||||||||||||||||||||||||||||||||
10/1/12 to 9/30/13 | 9.24 | (0.07 | ) | 1.77 | 1.70 | — | — | — | — | 1.70 | 10.94 | 18.40 | 130 | 3.41 | (7)(9) | 3.52 | (9) | (0.71 | ) | 137 | ||||||||||||||||||||||||||||||||||||||||||||||||||||||||||||||
10/1/11 to 9/30/12 | 8.54 | (0.19 | ) | 0.89 | 0.70 | — | — | — | — | 0.70 | 9.24 | 8.20 | 150 | 4.23 | (9) | 4.81 | (9) | (2.19 | ) | 165 | ||||||||||||||||||||||||||||||||||||||||||||||||||||||||||||||
10/1/10 to 9/30/11 | 10.04 | (0.33 | ) | (0.88 | ) | (1.21 | ) | — | (0.29 | ) | — | (0.29 | ) | (1.50 | ) | 8.54 | (12.42 | ) | 260 | 5.02 | 5.32 | (3.49 | ) | 186 | ||||||||||||||||||||||||||||||||||||||||||||||||||||||||||
10/1/09 to 9/30/10 | 10.06 | (0.32 | ) | 0.30 | (0.02 | ) | — | — | — | — | (0.02 | ) | 10.04 | (0.20 | ) | 670 | 4.55 | (7) | 4.83 | (3.15 | ) | 155 | ||||||||||||||||||||||||||||||||||||||||||||||||||||||||||||
Class C | ||||||||||||||||||||||||||||||||||||||||||||||||||||||||||||||||||||||||||||||||||
10/1/13 to 9/30/14 | $ | 10.88 | (0.11 | ) | 1.47 | 1.36 | — | — | — | — | 1.36 | $ | 12.24 | 12.50 | % | $ | 546,986 | 3.44 | %(7)(9) | 3.44 | %(9) | (0.87 | )% | 233 | % | |||||||||||||||||||||||||||||||||||||||||||||||||||||||||
10/1/12 to 9/30/13 | 9.21 | (0.04 | ) | 1.74 | 1.70 | — | — | (0.03 | ) | (0.03 | ) | 1.67 | 10.88 | 18.48 | 263,722 | 3.52 | (7)(9) | 3.62 | (9) | (0.38 | ) | 137 | ||||||||||||||||||||||||||||||||||||||||||||||||||||||||||||
10/1/11 to 9/30/12 | 8.52 | 0.01 | 0.68 | 0.69 | — | — | — | — | 0.69 | 9.21 | 8.10 | 27,123 | 3.61 | (9) | 3.91 | (9) | 0.12 | 165 | ||||||||||||||||||||||||||||||||||||||||||||||||||||||||||||||||
10/1/10 to 9/30/11 | 10.00 | (0.33 | ) | (0.86 | ) | (1.19 | ) | — | (0.29 | ) | — | (0.29 | ) | (1.48 | ) | 8.52 | (12.26 | ) | 2,330 | 5.07 | 5.38 | (3.50 | ) | 186 | ||||||||||||||||||||||||||||||||||||||||||||||||||||||||||
10/1/09 to 9/30/10 | 10.02 | (0.32 | ) | 0.30 | (0.02 | ) | — | — | — | — | (0.02 | ) | 10.00 | (0.20 | ) | 4,249 | 4.62 | (7) | 4.90 | (3.17 | ) | 155 | ||||||||||||||||||||||||||||||||||||||||||||||||||||||||||||
Class I | ||||||||||||||||||||||||||||||||||||||||||||||||||||||||||||||||||||||||||||||||||
10/1/13 to 9/30/14 | $ | 11.84 | 0.01 | 1.60 | 1.61 | — | — | — | — | 1.61 | $ | 13.45 | 13.60 | % | $ | 1,449,657 | 2.43 | %(7)(9) | 2.43 | %(9) | 0.11 | % | 233 | % | ||||||||||||||||||||||||||||||||||||||||||||||||||||||||||
10/1/12 to 9/30/13 | 9.98 | 0.06 | 1.89 | 1.95 | (0.06 | ) | — | (0.03 | ) | (0.09 | ) | 1.86 | 11.84 | 19.67 | 744,371 | 2.49 | (7)(9) | 2.59 | (9) | 0.50 | 137 | |||||||||||||||||||||||||||||||||||||||||||||||||||||||||||||
10/1/11 to 9/30/12 | 9.12 | 0.05 | 0.81 | 0.86 | — | — | — | — | 0.86 | 9.98 | 9.43 | 112,349 | 2.78 | (9) | 3.06 | (9) | 0.49 | 165 | ||||||||||||||||||||||||||||||||||||||||||||||||||||||||||||||||
10/1/10 to 9/30/11 | 10.58 | (0.25 | ) | (0.92 | ) | (1.17 | ) | — | (0.29 | ) | — | (0.29 | ) | (1.46 | ) | 9.12 | (11.47 | ) | 27,976 | 4.03 | 4.33 | (2.48 | ) | 186 | ||||||||||||||||||||||||||||||||||||||||||||||||||||||||||
10/1/09(6) to 9/30/10 | 10.49 | (0.23 | ) | 0.32 | 0.09 | — | — | — | — | 0.09 | 10.58 | 0.95 | (4) | 70,434 | 3.69 | (3)(7) | 3.97 | (3) | (2.20 | )(3) | 155 | |||||||||||||||||||||||||||||||||||||||||||||||||||||||||||||
The footnote legend is at the end of the Financial Highlights
See Notes to Financial Statements
58
Table of Contents
VIRTUS OPPORTUNITIES TRUST
FINANCIAL HIGHLIGHTS
SELECTED PER SHARE DATA AND RATIOS FOR A SHARE OUTSTANDING
THROUGHOUT EACH PERIOD
| Net Asset Value, Beginning of Period | Net Investment Income (Loss)(2) | Net Realized and Unrealized Gain (Loss) | Total from Investment Operations | Dividends from Net Investment Income | Distributions from Net Realized Gains | Total Distributions | Change in Net Asset Value | Net Asset Value, End of Period | Total Return(1) | Net Assets, End of Period (In thousands) | Ratio of Net Expenses to Average Net Assets(8) | Ratio of Gross Expenses to Average Net Assets (before waivers and reimbursements)(8) | Ratio of Net Investment Income (Loss) to Average Net Assets | Portfolio Turnover Rate | ||||||||||||||||||||||||||||||||||||||||||||||||||||||||||||||
Global Premium AlphaSector® | |||||||||||||||||||||||||||||||||||||||||||||||||||||||||||||||||||||||||||||
Fund | |||||||||||||||||||||||||||||||||||||||||||||||||||||||||||||||||||||||||||||
Class A | |||||||||||||||||||||||||||||||||||||||||||||||||||||||||||||||||||||||||||||
10/1/13 to 9/30/14 | $ | 11.76 | 0.07 | 0.91 | 0.98 | (0.02 | ) | (0.30 | ) | (0.32 | ) | 0.66 | $ | 12.42 | 8.43 | % | $ | 75,879 | 1.66 | %(10) | 1.65 | % | 0.55 | % | 205 | % | |||||||||||||||||||||||||||||||||||||||||||||||||||
10/1/12 to 9/30/13 | 10.56 | 0.04 | 1.26 | 1.30 | (0.06 | ) | (0.04 | ) | (0.10 | ) | 1.20 | 11.76 | 12.32 | 56,689 | 1.75 | (10) | 1.71 | 0.33 | 194 | ||||||||||||||||||||||||||||||||||||||||||||||||||||||||||
10/1/11 to 9/30/12 | 9.42 | 0.08 | 1.12 | 1.20 | (0.06 | ) | — | (0.06 | ) | 1.14 | 10.56 | 12.75 | 27,699 | 1.75 | 1.78 | 0.83 | 258 | ||||||||||||||||||||||||||||||||||||||||||||||||||||||||||||
3/15/11(6) to 9/30/11 | 10.00 | 0.07 | (0.63 | ) | (0.56 | ) | (0.02 | ) | — | (0.02 | ) | (0.58 | ) | 9.42 | (5.62 | )(4) | 5,467 | 1.75 | (3) | 2.88 | (3) | 1.23 | (3) | 199 | (4) | ||||||||||||||||||||||||||||||||||||||||||||||||||||
Class C | |||||||||||||||||||||||||||||||||||||||||||||||||||||||||||||||||||||||||||||
10/1/13 to 9/30/14 | $ | 11.64 | (0.02 | ) | 0.92 | 0.90 | — | (0.30 | ) | (0.30 | ) | 0.60 | $ | 12.24 | 7.69 | % | $ | 72,013 | 2.37 | %(10) | 2.40 | % | (0.17 | )% | 205 | % | |||||||||||||||||||||||||||||||||||||||||||||||||||
10/1/12 to 9/30/13 | 10.50 | (0.05 | ) | 1.25 | 1.20 | (0.02 | ) | (0.04 | ) | (0.06 | ) | 1.14 | 11.64 | 11.52 | 44,239 | 2.48 | (10) | 2.46 | (0.42 | ) | 194 | ||||||||||||||||||||||||||||||||||||||||||||||||||||||||
10/1/11 to 9/30/12 | 9.40 | — | (5) | 1.12 | 1.12 | (0.02 | ) | — | (0.02 | ) | 1.10 | 10.50 | 12.04 | 21,051 | 2.50 | 2.53 | 0.01 | 258 | |||||||||||||||||||||||||||||||||||||||||||||||||||||||||||
3/15/11(6) to 9/30/11 | 10.00 | 0.01 | (0.61 | ) | (0.60 | ) | — | (5) | — | — | (0.60 | ) | 9.40 | (6.09 | )(4) | 4,885 | 2.50 | (3) | 3.81 | (3) | 0.17 | (3) | 199 | (4) | |||||||||||||||||||||||||||||||||||||||||||||||||||||
Class I | |||||||||||||||||||||||||||||||||||||||||||||||||||||||||||||||||||||||||||||
10/1/13 to 9/30/14 | $ | 11.80 | 0.10 | 0.92 | 1.02 | (0.05 | ) | (0.30 | ) | (0.35 | ) | 0.67 | $ | 12.47 | 8.68 | % | $ | 99,642 | 1.44 | %(10) | 1.41 | % | 0.80 | % | 205 | % | |||||||||||||||||||||||||||||||||||||||||||||||||||
10/1/12 to 9/30/13 | 10.58 | 0.07 | 1.25 | 1.32 | (0.06 | ) | (0.04 | ) | (0.10 | ) | 1.22 | 11.80 | 12.59 | 38,889 | 1.50 | (10) | 1.46 | 0.58 | 194 | ||||||||||||||||||||||||||||||||||||||||||||||||||||||||||
10/1/11 to 9/30/12 | 9.42 | 0.09 | 1.14 | 1.23 | (0.07 | ) | — | (0.07 | ) | 1.16 | 10.58 | 13.15 | 19,112 | 1.50 | 1.52 | 0.90 | 258 | ||||||||||||||||||||||||||||||||||||||||||||||||||||||||||||
3/15/11(6) to 9/30/11 | 10.00 | 0.07 | (0.63 | ) | (0.56 | ) | (0.02 | ) | — | (0.02 | ) | (0.58 | ) | 9.42 | (5.59 | )(4) | 9,565 | 1.50 | (3) | 2.85 | (3) | 1.37 | (3) | 199 | (4) | ||||||||||||||||||||||||||||||||||||||||||||||||||||
Herzfeld Fund | |||||||||||||||||||||||||||||||||||||||||||||||||||||||||||||||||||||||||||||
Class A | |||||||||||||||||||||||||||||||||||||||||||||||||||||||||||||||||||||||||||||
10/1/13 to 9/30/14 | $ | 10.45 | 0.34 | 1.02 | 1.36 | (0.36 | ) | (0.08 | ) | (0.44 | ) | 0.92 | $ | 11.37 | 13.21 | % | $ | 9,212 | 1.60 | % | 1.93 | % | 3.04 | % | 53 | % | |||||||||||||||||||||||||||||||||||||||||||||||||||
10/1/12 to 9/30/13 | 10.21 | 0.33 | 0.18 | 0.51 | (0.26 | ) | (0.01 | ) | (0.27 | ) | 0.24 | 10.45 | 5.10 | 2,917 | 1.60 | 2.60 | 3.13 | 22 | |||||||||||||||||||||||||||||||||||||||||||||||||||||||||||
9/5/12(6) to 9/30/12 | 10.00 | 0.04 | 0.17 | 0.21 | — | — | — | 0.21 | 10.21 | 2.10 | (4) | 105 | 1.60 | (3) | 37.91 | (3) | 5.93 | 3 | (4) | ||||||||||||||||||||||||||||||||||||||||||||||||||||||||||
Class C | |||||||||||||||||||||||||||||||||||||||||||||||||||||||||||||||||||||||||||||
10/1/13 to 9/30/14 | $ | 10.43 | 0.26 | 1.01 | 1.27 | (0.28 | ) | (0.08 | ) | (0.36 | ) | 0.91 | $ | 11.34 | 12.34 | % | $ | 10,624 | 2.35 | % | 2.70 | % | 2.35 | % | 53 | % | |||||||||||||||||||||||||||||||||||||||||||||||||||
10/1/12 to 9/30/13 | 10.21 | 0.25 | 0.19 | 0.44 | (0.21 | ) | (0.01 | ) | (0.22 | ) | 0.22 | 10.43 | 4.36 | 4,942 | 2.35 | 3.25 | 2.40 | 22 | |||||||||||||||||||||||||||||||||||||||||||||||||||||||||||
9/5/12(6) to 9/30/12 | 10.00 | 0.03 | 0.18 | 0.21 | — | — | — | 0.21 | 10.21 | 2.10 | (4) | 102 | 2.35 | (3) | 38.62 | (3) | 5.21 | 3 | (4) | ||||||||||||||||||||||||||||||||||||||||||||||||||||||||||
Class I | |||||||||||||||||||||||||||||||||||||||||||||||||||||||||||||||||||||||||||||
10/1/13 to 9/30/14 | $ | 10.46 | 0.38 | 1.01 | 1.39 | (0.38 | ) | (0.08 | ) | (0.46 | ) | 0.93 | $ | 11.39 | 13.54 | % | $ | 3,441 | 1.35 | % | 1.71 | % | 3.40 | % | 53 | % | |||||||||||||||||||||||||||||||||||||||||||||||||||
10/1/12 to 9/30/13 | 10.21 | 0.09 | 0.46 | 0.55 | (0.29 | ) | (0.01 | ) | (0.30 | ) | 0.25 | 10.46 | 5.41 | 1,765 | 1.35 | 3.71 | 0.86 | 22 | |||||||||||||||||||||||||||||||||||||||||||||||||||||||||||
9/5/12(6) to 9/30/12 | 10.00 | 0.03 | 0.18 | 0.21 | — | — | — | 0.21 | 10.21 | 2.10 | (4) | 1,017 | 1.35 | (3) | 38.61 | (3) | 4.39 | 3 | (4) | ||||||||||||||||||||||||||||||||||||||||||||||||||||||||||
The footnote legend is at the end of the Financial Highlights
See Notes to Financial Statements
59
Table of Contents
VIRTUS OPPORTUNITIES TRUST
FINANCIAL HIGHLIGHTS
SELECTED PER SHARE DATA AND RATIOS FOR A SHARE OUTSTANDING
THROUGHOUT EACH PERIOD
| Net Asset Value, Beginning of Period | Net Investment Income (Loss)(2) | Net Realized and Unrealized Gain (Loss) | Total from Investment Operations | Dividends from Net Investment Income | Distributions from Net Realized Gains | Total Distributions | Change in Net Asset Value | Net Asset Value, End of Period | Total Return(1) | Net Assets, End of Period (In thousands) | Ratio of Net Expenses to Average Net Assets(8) | Ratio of Gross Expenses to Average Net Assets (before waivers and reimbursements)(8) | Ratio of Net Investment Income (Loss) to Average Net Assets | Portfolio Turnover Rate | ||||||||||||||||||||||||||||||||||||||||||||||||||||||||||||||
| Premium AlphaSector® | |||||||||||||||||||||||||||||||||||||||||||||||||||||||||||||||||||||||||||||
Fund | |||||||||||||||||||||||||||||||||||||||||||||||||||||||||||||||||||||||||||||
Class A | |||||||||||||||||||||||||||||||||||||||||||||||||||||||||||||||||||||||||||||
10/1/13 to 9/30/14 | $ | 15.52 | 0.06 | 2.29 | 2.35 | (0.04 | ) | (0.44 | ) | (0.48 | ) | 1.87 | $ | 17.39 | 15.31 | % | $ | 2,044,955 | 1.61 | %(12) | 1.61 | % | 0.36 | % | 227 | % | |||||||||||||||||||||||||||||||||||||||||||||||||||
10/1/12 to 9/30/13 | 13.43 | 0.11 | 2.09 | 2.20 | (0.11 | ) | — | (0.11 | ) | 2.09 | 15.52 | 16.50 | 1,937,456 | 1.62 | (12) | 1.62 | 0.75 | 140 | |||||||||||||||||||||||||||||||||||||||||||||||||||||||||||
10/1/11 to 9/30/12 | 11.69 | 0.10 | 1.73 | 1.83 | (0.09 | ) | — | (0.09 | ) | 1.74 | 13.43 | 15.74 | 1,323,109 | 1.64 | 1.64 | 0.80 | 297 | ||||||||||||||||||||||||||||||||||||||||||||||||||||||||||||
10/1/10 to 9/30/11 | 11.17 | 0.10 | 0.52 | 0.62 | (0.08 | ) | (0.02 | ) | (0.10 | ) | 0.52 | 11.69 | 5.47 | 958,603 | 1.67 | (10) | 1.67 | 0.80 | 247 | ||||||||||||||||||||||||||||||||||||||||||||||||||||||||||
7/1/10(6) to 9/30/10 | 10.00 | 0.12 | 1.05 | 1.17 | — | — | — | 1.17 | 11.17 | 11.70 | (4) | 88,916 | 1.70 | (3) | 1.83 | (3) | 4.64 | (3) | 47 | (4) | |||||||||||||||||||||||||||||||||||||||||||||||||||||||||
Class C | |||||||||||||||||||||||||||||||||||||||||||||||||||||||||||||||||||||||||||||
10/1/13 to 9/30/14 | $ | 15.39 | (0.06 | ) | 2.27 | 2.21 | — | (0.44 | ) | (0.44 | ) | 1.77 | $ | 17.16 | 14.48 | % | $ | 1,988,290 | 2.36 | %(12) | 2.36 | % | (0.38 | )% | 227 | % | |||||||||||||||||||||||||||||||||||||||||||||||||||
10/1/12 to 9/30/13 | 13.34 | — | 2.07 | 2.07 | (0.02 | ) | — | (0.02 | ) | 2.05 | 15.39 | 15.55 | 1,307,857 | 2.37 | (12) | 2.37 | 0.02 | 140 | |||||||||||||||||||||||||||||||||||||||||||||||||||||||||||
10/1/11 to 9/30/12 | 11.62 | 0.01 | 1.72 | 1.73 | (0.01 | ) | — | (0.01 | ) | 1.72 | 13.34 | 14.91 | 767,602 | 2.38 | 2.39 | 0.09 | 297 | ||||||||||||||||||||||||||||||||||||||||||||||||||||||||||||
10/1/10 to 9/30/11 | 11.15 | 0.02 | 0.51 | 0.53 | (0.04 | ) | (0.02 | ) | (0.06 | ) | 0.47 | 11.62 | 4.68 | 457,630 | 2.38 | (10) | 2.42 | 0.13 | 247 | ||||||||||||||||||||||||||||||||||||||||||||||||||||||||||
7/1/10(6) to 9/30/10 | 10.00 | 0.09 | 1.06 | 1.15 | — | — | — | 1.15 | 11.15 | 11.50 | (4) | 29,864 | 2.45 | (3) | 2.67 | (3) | 3.51 | (3) | 47 | (4) | |||||||||||||||||||||||||||||||||||||||||||||||||||||||||
Class I | |||||||||||||||||||||||||||||||||||||||||||||||||||||||||||||||||||||||||||||
10/1/13 to 9/30/14 | $ | 15.54 | 0.10 | 2.30 | 2.40 | (0.08 | ) | (0.44 | ) | (0.52 | ) | 1.88 | $ | 17.42 | 15.61 | % | $ | 3,840,271 | 1.36 | %(12) | 1.36 | % | 0.62 | % | 227 | % | |||||||||||||||||||||||||||||||||||||||||||||||||||
10/1/12 to 9/30/13 | 13.45 | 0.15 | 2.08 | 2.23 | (0.14 | ) | — | (0.14 | ) | 2.09 | 15.54 | 16.75 | 2,580,005 | 1.37 | (12) | 1.37 | 1.02 | 140 | |||||||||||||||||||||||||||||||||||||||||||||||||||||||||||
10/1/11 to 9/30/12 | 11.71 | 0.14 | 1.72 | 1.86 | (0.12 | ) | — | (0.12 | ) | 1.74 | 13.45 | 15.98 | 1,479,042 | 1.39 | 1.39 | 1.10 | 297 | ||||||||||||||||||||||||||||||||||||||||||||||||||||||||||||
10/1/10 to 9/30/11 | 11.17 | 0.14 | 0.52 | 0.66 | (0.10 | ) | (0.02 | ) | (0.12 | ) | 0.54 | 11.71 | 5.78 | 754,415 | 1.42 | (10) | 1.42 | 1.09 | 247 | ||||||||||||||||||||||||||||||||||||||||||||||||||||||||||
7/1/10(6) to 9/30/10 | 10.00 | 0.11 | 1.06 | 1.17 | — | — | — | 1.17 | 11.17 | 11.70 | (4) | 24,549 | 1.45 | (3) | 1.75 | (3) | 4.02 | (3) | 47 | (4) | |||||||||||||||||||||||||||||||||||||||||||||||||||||||||
Footnote Legend
| (1) | Sales charges, where applicable, are not reflected in the total return calculation. |
| (2) | Computed using average shares outstanding. |
| (3) | Annualized. |
| (4) | Not annualized. |
| (5) | Amount is less than $0.005. |
| (6) | Inception date. |
| (7) | Due to a change in expense cap, the ratio shown is a blended expense ratio. |
| (8) | The Funds will also indirectly bear their prorated share of expenses of the underlying funds in which they invest. Such expenses are not included in the calculation of this ratio. |
| (9) | The effect of interest expense due to leverage, as well as dividends and interest expense on securities sold short, increased the expense ratio by the following: |
10/1/13 to 9/30/14 | 0.45 | % | ||
10/1/12 to 9/30/13 | 0.38 | % | ||
10/1/11 to 9/30/12 | 0.63 | % |
| If interest and dividends were excluded the ratio would be lower. |
| (10) | See Note 3C in the Notes to Financial Statements for information on recapture of expense previously waived. |
| (11) | Effective December 1, 2010, the Adviser has discontinued charging an advisory fee. |
| (12) | The Fund is currently under its expense limitation. |
See Notes to Financial Statements
60
Table of Contents
VIRTUS OPPORTUNITIES TRUST
SEPTEMBER 30, 2014
| Note | 1. Organization |
Virtus Opportunities Trust (the “Trust”) is organized as a Delaware statutory trust and is registered under the Investment Company Act of 1940, as amended (“1940 Act”), as an open-end management investment company.
As of the date of this report, 31 funds of the Trust are offered for sale, of which ten (each a “Fund”) are reported in this annual report.
The Funds’ investment objectives are outlined in their respective Summary pages.
All of the Funds offer Class A shares, Class C shares, and Class I shares. Class B shares are no longer available for purchase by new or existing shareholders, except for existing shareholders through Qualifying Transactions, (For more information regarding Qualifying Transactions, refer to the prospectus.) Class A shares are sold with a front-end sales charge of up to 5.75% with some exceptions. Generally, Class A shares are not subject to any charges by the Funds when redeemed; however, a 0.50% – 1% contingent deferred sales charge (“CDSC”) may be imposed on certain redemptions made within a certain period following purchases on which a finder’s fee has been paid. The period for which the CDSC applies for the Funds is 18 months. The CDSC period begins on the last day of the month preceding the month in which the purchase was made.
Class B shares were generally sold with a CDSC, which declines from 5% to zero depending on the period of time the shares are held. Class C shares are generally sold with a 1% CDSC, applicable if redeemed within one year of purchase. Class I shares are sold without a front-end sales charge or CDSC.
Virtus Mutual Funds may impose an annual fee on accounts having balances of less than $2,500. The small account fee may be waived in certain circumstances, as disclosed in the prospectuses and/or statements of additional information. The fees collected will be used to offset certain expenses of the Funds.
Each Class of shares has identical voting, dividend, liquidation and other rights and the same terms and conditions, except that each Class bears different distribution and/or service fees under a Board-approved Rule 12b-1 and/or shareholder servicing plan (“12b-1 plan”) and has exclusive voting rights with respect to such plans. Class I shares are not subject to a 12b-1 plan. Income and other expenses and realized and unrealized gains and losses of each Fund are borne pro rata by the holders of each Class of shares.
| Note | 2. Significant Accounting Policies |
The following is a summary of significant accounting policies consistently followed by the Trust in the preparation of its financial statements. The preparation of financial statements in conformity with accounting principles generally accepted in the United States of America requires management to make estimates and assumptions that affect the reported amounts of assets and liabilities, and disclosure of contingent assets and liabilities at the date of the financial statements and the reported amounts of increases and decreases in net assets from operations during the reporting period. Actual results could differ from those estimates and those differences could be significant.
| A. | Security Valuation |
Security valuation procedures for each Fund, which include nightly price variance, as well as back-testing such as bi-weekly unchanged price, monthly secondary source and transaction analysis, have been approved by the Board of Trustees (the “Board” or the “Trustees”). All internally fair valued securities are approved by a valuation committee (the “Valuation Committee”) appointed by the Board. The Valuation Committee is comprised of certain members of management as identified by the Board and convenes independently from portfolio management. All internally fair valued securities are updated daily and reviewed in detail by the Valuation Committee monthly unless changes occur within the period. The Valuation Committee reviews the validity of the model inputs and any changes to the model. Fair valuations are reviewed by the Board at least quarterly.
Each Fund utilizes a fair value hierarchy which prioritizes the inputs to valuation techniques used to measure fair value into three broad levels.
| • Level 1 – | quoted prices in active markets for identical securities (security types generally include listed equities) |
| • Level 2 – | prices determined using other significant observable inputs (including quoted prices for similar securities, interest rates, prepayment speeds, credit risk, etc.) |
| • Level 3 – | prices determined using significant unobservable inputs (including the Valuation Committee’s own assumptions in determining the fair value of investments) |
A description of the valuation techniques applied to a Fund’s major categories of assets and liabilities measured at fair value on a recurring basis is as follows:
Equity securities are valued at the official closing price (typically last sale) on the exchange on which the securities are primarily traded, or if no closing price is available, at the last bid price and are categorized as Level 1 in the hierarchy. Restricted equity securities and private placements that are not widely traded, are illiquid or are internally fair valued by the Valuation Committee, are generally categorized as Level 3 in the hierarchy.
Certain non-U.S. securities may be fair valued in cases where closing prices are not readily available or are deemed not reflective of readily available market prices. For example, significant events (such as movement in the U.S. securities market, or other regional and local developments) may occur between the time that non-U.S. markets close (where the security is principally traded) and the time that a Fund calculates its net asset value (“NAV”) (generally, 4 p.m. Eastern time the close of the New York Stock Exchange (“NYSE”)) that may impact the value of securities traded in these non-U.S. markets. In such cases the Fund fair values non-U.S. securities using an independent pricing service which considers the correlation of the trading patterns of the non-U.S. security to the intraday trading in the U.S. markets for investments such as ADRs, financial futures, exchange traded funds “ETFs”, and certain indexes as well as prices for similar securities. Such fair valuations are categorized as Level 2 in the hierarchy. Because the frequency of significant events is not predictable, fair valuation of certain non-U.S. common stocks may occur on a frequent basis.
61
Table of Contents
VIRTUS OPPORTUNITIES TRUST
NOTES TO FINANCIAL STATEMENTS (Continued)
SEPTEMBER 30, 2014
Debt securities, including restricted securities, are valued based on evaluated quotations received from independent pricing services or from dealers who make markets in such securities. For most bond types, the pricing service utilizes matrix pricing which considers one or more of the following factors: yield or price of bonds of comparable quality, coupon, maturity, current cash flows, type, and current day trade information, as well as dealer-supplied prices. These valuations are generally categorized as Level 2 in the hierarchy. Structured debt instruments such as mortgage-backed and asset-backed securities may also incorporate collateral analysis and utilize cash flow models for valuation and are generally categorized as Level 2 in the hierarchy. Pricing services do not provide pricing for all securities and therefore indicative bids from dealers are utilized which are based on pricing models used by market makers in the security and are generally categorized as Level 2 in the hierarchy. Debt securities that are not widely traded, are illiquid, or are internally fair valued by the valuation committee are generally categorized as Level 3 in the hierarchy.
Listed derivatives that are actively traded are valued based on quoted prices from the exchange and are categorized as Level 1 in the hierarchy. Over-the-counter derivative contracts, which include forward currency contracts and equity-linked instruments, do not require material subjectivity as pricing inputs are observed from actively quoted markets and are categorized as Level 2 in the hierarchy.
Investments in open-end mutual funds are valued at NAV. Investments in closed-end mutual funds and exchange-traded funds, are valued as of the close of regular trading on the NYSE, generally 4 pm Eastern time each business day. Both are categorized as Level 1 in the hierarchy.
A summary of the inputs used to value the Funds’ net assets by each major security type is disclosed at the end of the Schedule of Investments for each Fund. The inputs or methodologies used for valuing securities are not necessarily an indication of the risk associated with investing in those securities.
| B. | Security Transactions and Investment Income |
Security transactions are recorded on the trade date. Realized gains and losses from sales of securities are determined on the identified cost basis. Dividend income is recognized on the ex-dividend date, or in the case of certain foreign securities, as soon as a Fund is notified. Interest income is recorded on the accrual basis. Each Fund amortizes premiums and accretes discounts using the effective interest method. Any distributions from underlying funds are recorded in accordance with the character of the distributions as designated by the underlying funds.
| C. | Income Taxes |
Each Fund is treated as a separate taxable entity. It is the intention of each Fund to comply with the requirements of Subchapter M of the Internal Revenue Code and to distribute substantially all of its taxable income to its shareholders. Therefore, no provision for federal income taxes or excise taxes has been made.
Certain Funds may be subject to foreign taxes on income, gains on investments or currency repatriation, a portion of which may be recoverable. Each Fund will accrue such taxes and recoveries as applicable based upon current interpretations of the tax rules and regulations that exist in the markets in which it invests.
Management of the Funds has concluded that there are no significant uncertain tax positions that would require recognition in the financial statements. As of September 30, 2014, the tax years that remain subject to examination by the major tax jurisdictions under the statute of limitations are from the year 2011 forward (with limited exceptions).
| D. | Distributions to Shareholders |
Distributions are recorded by each Fund on the ex-dividend date. Income and capital gain distributions are determined in accordance with income tax regulations which may differ from accounting principles generally accepted in the United States of America. These differences may include the treatment of non-taxable dividends, market premium and discount, non-deductible expenses, expiring capital loss carryovers, foreign currency gain or loss, gain or loss on futures contracts, partnerships, operating losses and losses deferred due to wash sales. Permanent book and tax basis differences relating to shareholder distributions will result in reclassifications to capital paid in on shares of beneficial interest.
| E. | Expenses |
Expenses incurred together by a Fund and other affiliated mutual funds are allocated in proportion to the net assets of each such fund, except where allocation of direct expense to each fund or an alternative allocation method can be more appropriately used.
In addition to the net annual operating expenses that a Fund bears directly, the shareholders of the Fund indirectly bear the pro-rata expenses of any underlying mutual funds in which the Fund invests.
| F. | Foreign Currency Translation |
Non-U.S. investment securities and other assets and liabilities denominated in foreign currencies are translated into U.S. dollar amounts at the foreign currency exchange rate effective at the end of the reporting period. Cost of investments is translated at the currency exchange rate effective at the trade date. The gain or loss resulting from a change in currency exchange rates between the trade and settlement date of a portfolio transaction is treated as a gain or loss on non-U.S. currency. Likewise, the gain or loss resulting from a change in currency exchange rates between the date income is accrued and paid is treated as a gain or loss on foreign currency. The Funds do not isolate that portion of the results of operations arising from changes in foreign exchange rates on investments from the fluctuations arising from changes in the market prices of securities held. Such fluctuations are included with the net realized and unrealized gain or loss on investments.
| G. | Short Sales |
($ reported in thousands)
Certain Funds may sell securities short. A short sale is a transaction in which a Fund sells a security it does not own in anticipation of a decline in market price. To sell a security short, a Fund must borrow the security. The Fund’s obligation to replace the security borrowed and sold short will be fully collateralized at all times by the proceeds from the short sale retained by the broker and by cash and securities deposited in a segregated account with the Fund’s custodian. If the price of the security sold short increases between the time of the short sale and the time the Fund
62
Table of Contents
VIRTUS OPPORTUNITIES TRUST
NOTES TO FINANCIAL STATEMENTS (Continued)
SEPTEMBER 30, 2014
replaces the borrowed security, the Fund will realize a loss, and if the price declines during the period, the Fund will realize a gain. Any realized gain will be decreased, and any realized loss increased, by the amount of transaction costs. On ex-dividend date, dividends on short sales are recorded as an expense to the Fund.
In accordance with the terms of its prime brokerage agreement, the Dynamic AlphaSector® Fund may receive rebate income or be charged a fee on borrowed securities which is under Interest expense on short sales on the Statements of Operations. Such income or fee is calculated on a daily basis based upon the market value of each borrowed security and a variable rate that is dependent upon the availability of such security.
| H. | Securities Lending |
Certain Funds may loan securities to qualified brokers through an agreement with Brown Brothers Harriman (“BBH”), as a third party lending agent. Under the terms of agreement, a Fund doing so is required to maintain collateral with a market value not less than 100% of the market value of loaned securities. Collateral is adjusted daily in connection with changes in the market value of securities on loan. Collateral may consist of cash and securities issued by the U.S. Government or its agencies. Cash collateral is invested in a short-term money market fund. Dividends earned on the collateral and premiums paid by the broker are recorded as income by the Fund net of fees and rebates charged by BBH for its services as securities lending agent and in connection with this securities lending program. Lending portfolio securities involves a risk of delay in the recovery of the loaned securities or in the declining value of the collateral.
Effective August 29, 2014, the Dynamic AlphaSector® Fund loans securities through an agreement with JP Morgan Clearing Corp. (“JPMCC”). Under the terms of agreement, the Fund lends directly to JPMCC and in doing so is required to maintain collateral with a market value not less than 100% of the market value of loaned securities. Collateral is adjusted daily in connection with changes in the market value of securities on loan. Collateral is received in cash which is invested in additional portfolio securities of the Fund. The agreement also provides that the Fund pay a “Spread Fee” on the cash collateral received at a rate equal to the difference between (a) the return payable on such collateral at the reinvestment rate and (b) the cash collateral fee (rebate). The Fund also pays a fee based on the one-week London Interbank Offering Rate (LIBOR) plus a negotiated spread. For the period August 29, 2014 through September 30, 2014, the cost incurred by the Fund is $42 and is disclosed as “Interest expense” on the Statement of Operations.
At September 30, 2014, the following Funds had securities on loan ($ reported in thousands):
| Market Value | Cash Collateral | |||||||
AlphaSector® Rotation Fund | $ | 1,894 | $ | 1,939 | ||||
Premium AlphaSector® Fund | 7,963 | 8,133 | ||||||
Dynamic AlphaSector® Fund | 721,157 | 727,366 | ||||||
| Note | 3. Investment Advisory Fee and Related Party Transactions |
($ reported in thousands except as noted)
| A. | Adviser |
Virtus Investment Advisers, Inc. (the “Adviser”), an indirect wholly-owned subsidiary of Virtus Investment Partners, Inc. (“Virtus”), is the adviser to the Trust. The Adviser manages the Funds’ investment programs and general operations of the Funds, including oversight of the Funds’ subadvisers.
As compensation for its services to the Funds, the Adviser is entitled to a fee based upon the following annual rates as a percentage of the average daily net assets (except as otherwise noted) of the following Funds:
| 1st $2 Billion | $2 + Billion through $4 Billion | $4 + Billion | ||||||||||
Allocator Premium AlphaSector® Fund | 1.10 | % | 1.05 | % | 1.00 | % | ||||||
Disciplined Equity Style Fund | 1.00 | 0.95 | 0.90 | |||||||||
Disciplined Select Bond Fund | 0.80 | 0.75 | 0.70 | |||||||||
Disciplined Select Country Fund | 1.10 | 1.05 | 1.00 | |||||||||
Global Premium AlphaSector® Fund | 1.10 | 1.05 | 1.00 | |||||||||
| 1st $1 Billion | $1 + Billion | |||||||||||
AlphaSector® Rotation Fund | 0.45 | % | 0.40 | % | ||||||||
Dynamic AlphaSector® Fund* | 1.50 | 1.40 | ||||||||||
Herzfeld Fund | 1.00 | 0.95 | ||||||||||
Premium AlphaSector® Fund – 1.10% of the average daily net assets.
Alternatives Diversifier Fund – the Adviser has discontinued charging an advisory fee.
| * | The advisory fee is calculated based on the average daily managed assets (“managed assets” means the total assets of the Fund including any assets attributable to borrowings, minus the Fund’s accrued liabilities other than such borrowings). Beginning February 6, 2013, the advisory fee for this Fund became subject to a performance adjustment, which may increase or decrease the advisory fee based upon how well the Fund has performed relative to the S&P 500® Index (“Index”). The fee rate is adjusted by adding or subtracting 0.10% for each 1.00% of absolute performance by which the Fund’s performance exceeds or lags that of the Index. The maximum performance adjustment may be plus or minus 1.00%. Performance is measured for purposes of the performance adjustment over the most recent 36-month period or such shorter period (but not less than 12 months) if the performance fee has been in effect for less than 36 months. For the year ended September 30, 2014, there was a $(702) of additional advisory fee expense/(income) related to the performance fee adjustment. Such performance adjustment is included in the Investment Advisory Fees in the Statement of Operations. |
63
Table of Contents
VIRTUS OPPORTUNITIES TRUST
NOTES TO FINANCIAL STATEMENTS (Continued)
SEPTEMBER 30, 2014
| B. | Subadvisers |
The Subadvisers manage the investments of each Fund for which they are paid a fee by the Adviser. A list of the Subadvisers and the Fund(s) they serve is as follows:
Fund | Subadviser(s) | |||||
| Allocator Premium AlphaSector® Fund | FSIA(1)(3), Euclid(4) | |||||
| AlphaSector® Rotation Fund | FSIA(1)(3), Euclid(4) | |||||
| Alternatives Diversifier Fund | Euclid(4) | |||||
Disciplined Equity Style Fund | Newfound(5) | |||||
Disciplined Select Bond Fund | Newfound(5) | |||||
Disciplined Select Country Fund | Newfound(5) | |||||
| Dynamic AlphaSector® Fund | FSAA(2)(3), Euclid(4) | |||||
| Global Premium AlphaSector® Fund | FSIA(1)(3), Euclid(4) | |||||
| Herzfeld Fund | Herzfeld(6) | |||||
| Premium AlphaSector® Fund | FSIA(1)(3), Euclid(4) |
| (1) | F-Squared Institutional Advisors, LLC (“FSIA”) |
| (2) | F-Squared Alternative Advisors LLC (“FSAA”) |
| (3) | FSIA or FSAA (collectively “F-Squared”) provides Euclid with a model portfolio. Final allocations and trading for each Fund are conducted by Euclid based on F-Squared’s recommendations. |
| (4) | Euclid Advisors, LLC, (“Euclid”) an indirect wholly-owned subsidiary of Virtus. |
| (5) | Newfound Investments, LLC, an indirect wholly-owned subsidiary of Virtus. |
| (6) | Thomas J, Herzfeld Advisors, Inc. |
| C. | Expense Limits and Fee Waivers |
The Adviser has voluntarily agreed to limit certain Funds’ total operating expenses (excluding interest, taxes, extraordinary expenses and acquired funds fees and expenses, if any), so that such expenses do not exceed the percentages of the Fund’s average daily net asset values as listed below. The Adviser may discontinue these voluntary expense caps at any time.
| Class A | Class C | Class I | ||||||||||
Allocator Premium AlphaSector® Fund | 1.75 | % | 2.50 | % | 1.50 | % | ||||||
Disciplined Equity Style Fund | 1.60 | 2.35 | 1.35 | |||||||||
Disciplined Select Bond Fund | 1.40 | 2.15 | 1.15 | |||||||||
Disciplined Select Country Fund | 1.70 | 2.45 | 1.45 | |||||||||
Global Premium AlphaSector® Fund | 1.75 | 2.50 | 1.50 | |||||||||
Herzfeld Fund | 1.60 | 2.35 | 1.35 | |||||||||
Premium AlphaSector® Fund | 1.70 | 2.45 | 1.45 | |||||||||
For certain Funds the Adviser may recapture operating expenses waived or reimbursed, within three fiscal years following the end of the fiscal year in which such waiver or reimbursement occurred. The Fund must pay its ordinary operating expenses before the Adviser is entitled to any reimbursement and must remain in compliance with any applicable expense limitations or, if none, the expense limitation in effect at the time of the waiver or reimbursement. All or a portion of the following Adviser-reimbursed expenses ($ reported in thousands) may be recaptured by the fiscal year ending:
| Expiration Date | ||||||||||||||||
| 2015 | 2016 | 2017 | Total | |||||||||||||
Alternatives Diversifier Fund | $ | 348 | $ | 75 | $ | — | $ | 423 | ||||||||
Disciplined Equity Style Fund | — | 64 | 64 | 128 | ||||||||||||
Disciplined Select Bond Fund | — | 64 | 65 | 129 | ||||||||||||
Disciplined Select Country Fund | — | 64 | 64 | 128 | ||||||||||||
Dynamic AlphaSector Fund | 205 | 794 | — | 999 | ||||||||||||
Herzfeld Fund | 25 | 68 | 56 | 149 | ||||||||||||
| D. | Distributor |
VP Distributors, LLC (“VP Distributors”), an indirect wholly-owned subsidiary of Virtus, serves as the distributor of each Fund’s shares. VP Distributors has advised the Funds that for the fiscal year (the “period”) ended September 30, 2014, it retained net commissions of $1,986 of Class A shares and deferred sales charges of $145, $—(3) and $—(3) for Class A shares, Class B shares and Class C shares respectively.
In addition, each Fund pays VP Distributors distribution and/or service fees under a 12b-1 plan as a percentage of the average daily net assets of each respective class at the annual rates of 0.25%(1) for Class A shares and 1.00%(1)(2) for Class B and Class C shares. Class I shares are not subject to a 12b-1 plan.
Under certain circumstances, shares of certain Virtus Mutual Funds may be exchanged for shares of the same class of certain other Virtus Mutual Funds on the basis of the relative NAV per share at the time of the exchange. On exchanges with share classes that carry a CDSC, the CDSC schedule of the original shares purchased continues to apply.
| (1) | The Funds invest in ETFs. In addition to the fees listed the Funds bear their proportionate shares of any distribution and shareholder servicing fees of the ETFs. |
| (2) | The Funds’ distributor has contractually agreed to waive its 12b-1 fees applicable to Class C shares to the extent that the Funds’ investments in underlying ETFs with their own 12b-1 fees would otherwise cause the total 12b-1 fees paid directly or indirectly by the Fund to exceed the limits set forth in applicable law or regulation. |
| (3) | Amount is less than $500. |
64
Table of Contents
VIRTUS OPPORTUNITIES TRUST
NOTES TO FINANCIAL STATEMENTS (Continued)
SEPTEMBER 30, 2014
| E. | Administrator and Transfer Agent |
Virtus Fund Services LLC, an indirect wholly-owned subsidiary of Virtus serves as the administrator and transfer agent of the Trust.
For the period ended September 30, 2014, the Funds incurred administration fees from the Trust totaling $11,261 which are included in the Statements of Operations.
For the period ended September 30, 2014, the Funds incurred transfer agent fees from the Trust totaling $13,075 which are included in the Statements of Operations. A portion of these fees was paid to outside entities that also provide services to the Trust.
| F. | Affiliated Shareholders |
At September 30, 2014, Virtus and its affiliates, BMO Bankcorp. (a minority investor in Virtus) and its affiliates, and the retirement plans of Virtus and its affiliates, held shares of the Funds which may be redeemed at any time that aggregated the following:
| Shares | Aggregate Net Asset Value | |||||||
| Disciplined Equity Style Fund | ||||||||
Class A | 10,704 | $ | 141 | |||||
Class C | 10,707 | 139 | ||||||
Class I | 85,632 | 1,129 | ||||||
| Disciplined Select Bond Fund | ||||||||
Class A | 10,313 | 99 | ||||||
Class C | 10,202 | 98 | ||||||
Class I | 82,845 | 794 | ||||||
| Disciplined Select Country Fund | ||||||||
Class A | 10,172 | 114 | ||||||
Class C | 10,120 | 112 | ||||||
Class I | 81,533 | 914 | ||||||
| Herzfeld Fund | ||||||||
Class A | 10,684 | 121 | ||||||
Class C | 10,556 | 120 | ||||||
Class I | 85,825 | 978 | ||||||
| Premium AlphaSector™ Fund | ||||||||
Class A | 3,185 | �� | 55 | |||||
Class C | 250 | 4 | ||||||
| G. | Investments in Affiliates |
A summary of the Alternatives Diversifier Fund’s total long-term and short-term purchases and sales of the Class I shares of the affiliated underlying funds(1) during the period ended September 30, 2014 is as follows:
| Value, beginning of fiscal year | Purchases(2) | Sales Proceeds | ||||||||||
Global Commodities Stock Fund | $ | 26,306 | $ | 8,000 | $ | 18,595 | ||||||
Global Dividend Fund | 45,577 | 2,656 | 28,294 | |||||||||
Global Real Estate Securities Fund | 13,875 | 334 | 4,775 | |||||||||
International Real Estate Securities Fund | 17,742 | 5,617 | 11,400 | |||||||||
Real Estate Securities Fund | 17,859 | 4,842 | 10,210 | |||||||||
Senior Floating Rate Fund | 23,205 | 6,043 | 17,645 | |||||||||
|
|
|
|
|
| |||||||
| $ | 144,564 | $ | 27,492 | $ | 90,919 | |||||||
|
|
|
|
|
| |||||||
| Value, end of fiscal year | Dividend Income | Distributions of Realized Gains | ||||||||||
Global Commodities Stock Fund | $ | 14,721 | $ | — | $ | — | ||||||
Global Dividend Fund | 24,548 | 1,556 | — | |||||||||
Global Real Estate Securities Fund | 10,582 | 238 | 96 | |||||||||
International Real Estate Securities Fund | 13,051 | 418 | — | |||||||||
Real Estate Securities Fund | 13,261 | 239 | 1,003 | |||||||||
Senior Floating Rate Fund | 11,606 | 694 | — | |||||||||
|
|
|
|
|
| |||||||
| $ | 87,769 | $ | 3,145 | $ | 1,099 | |||||||
|
|
|
|
|
| |||||||
| (1) | The Alternatives Diversifier Fund does not invest in the underlying funds for the purpose of exercising management or control; however, investments made by the Fund within each of its principal investment strategies may represent a significant portion of an underlying fund’s net assets. At September 30, 2014, the Fund was the owner of record of approximately 88% of the Global Commodities Stock Fund, 31% of the International Real Estate Securities Fund, 20% of the Global Real Estate Securities Fund, and 17% of the Global Dividend Fund. |
| (2) | Includes reinvested dividends from income and capital gain distributions. |
65
Table of Contents
VIRTUS OPPORTUNITIES TRUST
NOTES TO FINANCIAL STATEMENTS (Continued)
SEPTEMBER 30, 2014
| Note | 4. Purchases and Sales of Securities |
($ reported in thousands)
Purchases and sales of securities (excluding U.S. Government and agency securities, and short-term securities) during the period ended September 30, 2014, were as follows:
| Purchases | Sales | |||||||
Allocator Premium AlphaSector® Fund | $ | 2,489,321 | $ | 2,295,457 | ||||
AlphaSector® Rotation Fund | 1,213,037 | 1,046,573 | ||||||
Alternatives Diversifier Fund | 45,895 | 134,208 | ||||||
Disciplined Equity Style Fund | 4,309 | 4,083 | ||||||
Disciplined Select Bond Fund | 11,518 | 11,557 | ||||||
Disciplined Select Country Fund | 3,121 | 2,890 | ||||||
Dynamic AlphaSector Fund | 7,408,122 | 6,412,360 | ||||||
Herzfeld Fund | 18,165 | 7,706 | ||||||
Global Premium AlphaSector® Fund | 492,527 | 401,197 | ||||||
Premium AlphaSector® Fund | 17,621,184 | 16,506,701 | ||||||
| Buy Cover | Short Sales | |||||||
Dynamic AlphaSector® Fund | $ | 1,378,176 | $ | 1,421,246 | ||||
66
Table of Contents
VIRTUS OPPORTUNITIES TRUST
NOTES TO FINANCIAL STATEMENTS (Continued)
SEPTEMBER 30, 2014
| Note | 5. Capital Share Transactions |
(reported in thousands)
Transactions in shares of capital stock, during the periods ended as indicated below, were as follows:
| Allocator Premium AlphaSector® Fund | AlphaSector® Rotation Fund | |||||||||||||||||||||||||||||||
| Year Ended September 30, 2014 | Year Ended September 30, 2013 | Year Ended September 30, 2014 | Year Ended September 30, 2013 | |||||||||||||||||||||||||||||
| SHARES | AMOUNT | SHARES | AMOUNT | SHARES | AMOUNT | SHARES | AMOUNT | |||||||||||||||||||||||||
| Class A | ||||||||||||||||||||||||||||||||
| Sale of shares | 6,643 | $ | 78,209 | 6,565 | $ | 72,792 | 10,445 | $ | 153,503 | 5,882 | $ | 77,208 | ||||||||||||||||||||
| Reinvestment of distributions | 184 | 2,162 | 46 | 493 | 1,358 | 19,450 | 687 | 8,016 | ||||||||||||||||||||||||
| Shares repurchased | (4,863 | ) | (57,724 | ) | (2,645 | ) | (29,311 | ) | (9,546 | ) | (142,419 | ) | (4,402 | ) | (56,066 | ) | ||||||||||||||||
|
|
|
|
|
|
|
|
|
|
|
|
|
|
|
| |||||||||||||||||
| Net Increase / (Decrease) | 1,964 | $ | 22,647 | 3,966 | $ | 43,974 | 2,257 | $ | 30,534 | 2,167 | $ | 29,158 | ||||||||||||||||||||
|
|
|
|
|
|
|
|
|
|
|
|
|
|
|
| |||||||||||||||||
| Class C | ||||||||||||||||||||||||||||||||
| Sale of shares | 12,269 | $ | 142,783 | 10,904 | $ | 119,789 | 5,634 | $ | 81,499 | 4,743 | $ | 61,118 | ||||||||||||||||||||
| Reinvestment of distributions | 274 | 3,169 | 18 | 192 | 866 | 12,234 | 369 | 4,230 | ||||||||||||||||||||||||
| Shares repurchased | (4,846 | ) | (56,666 | ) | (2,712 | ) | (29,800 | ) | (2,662 | ) | (38,901 | ) | (2,324 | ) | (29,159 | ) | ||||||||||||||||
|
|
|
|
|
|
|
|
|
|
|
|
|
|
|
| |||||||||||||||||
| Net Increase / (Decrease) | 7,697 | $ | 89,286 | 8,210 | $ | 90,181 | 3,838 | $ | 54,832 | 2,788 | $ | 36,189 | ||||||||||||||||||||
|
|
|
|
|
|
|
|
|
|
|
|
|
|
|
| |||||||||||||||||
| Class I | ||||||||||||||||||||||||||||||||
| Sale of shares | 15,715 | $ | 185,802 | 13,895 | $ | 154,327 | 12,354 | $ | 184,057 | 6,710 | $ | 87,620 | ||||||||||||||||||||
| Reinvestment of distributions | 450 | 5,304 | 134 | 1,436 | 784 | 11,234 | 375 | 4,390 | ||||||||||||||||||||||||
| Shares repurchased | (11,539 | ) | (135,309 | ) | (5,731 | ) | (63,710 | ) | (5,027 | ) | (74,190 | ) | (4,660 | ) | (59,901 | ) | ||||||||||||||||
|
|
|
|
|
|
|
|
|
|
|
|
|
|
|
| |||||||||||||||||
| Net Increase / (Decrease) | 4,626 | $ | 55,797 | 8,298 | $ | 92,053 | 8,111 | $ | 121,101 | 2,425 | $ | 32,109 | ||||||||||||||||||||
|
|
|
|
|
|
|
|
|
|
|
|
|
|
|
| |||||||||||||||||
| Alternatives Diversifier Fund | Disciplined Equity Style Fund | |||||||||||||||||||||||||||||||
| Year Ended September 30, 2014 | Year Ended September 30, 2013 | Year Ended September 30, 2014 | From Inception December 18, 2012 to September 30, 2013 | |||||||||||||||||||||||||||||
| SHARES | AMOUNT | SHARES | AMOUNT | SHARES | AMOUNT | SHARES | AMOUNT | |||||||||||||||||||||||||
| Class A | ||||||||||||||||||||||||||||||||
| Sale of shares | 686 | $ | 7,882 | 750 | $ | 8,326 | 27 | $ | 345 | 27 | $ | 289 | ||||||||||||||||||||
| Reinvestment of distributions | 44 | 492 | 89 | 974 | 2 | 22 | — | (1) | 1 | |||||||||||||||||||||||
| Shares repurchased | (1,956 | ) | (22,483 | ) | (2,058 | ) | (22,743 | ) | (10 | ) | (125 | ) | (1 | ) | (11 | ) | ||||||||||||||||
|
|
|
|
|
|
|
|
|
|
|
|
|
|
|
| |||||||||||||||||
| Net Increase / (Decrease) | (1,226 | ) | $ | (14,109 | ) | (1,219 | ) | $ | (13,443 | ) | 19 | $ | 242 | 26 | $ | 279 | ||||||||||||||||
|
|
|
|
|
|
|
|
|
|
|
|
|
|
|
| |||||||||||||||||
| Class C | ||||||||||||||||||||||||||||||||
| Sale of shares | 211 | $ | 2,411 | 253 | $ | 2,785 | 3 | $ | 37 | 19 | $ | 207 | ||||||||||||||||||||
| Reinvestment of distributions | 1 | 16 | 31 | 332 | 1 | 15 | — | (1) | 1 | |||||||||||||||||||||||
| Shares repurchased | (963 | ) | (10,741 | ) | (1,390 | ) | (15,225 | ) | — | (1) | (1 | ) | — | (1) | (1 | ) | ||||||||||||||||
|
|
|
|
|
|
|
|
|
|
|
|
|
|
|
| |||||||||||||||||
| Net Increase / (Decrease) | (751 | ) | $ | (8,314 | ) | (1,106 | ) | $ | (12,108 | ) | 4 | $ | 51 | 19 | $ | 207 | ||||||||||||||||
|
|
|
|
|
|
|
|
|
|
|
|
|
|
|
| |||||||||||||||||
| Class I | ||||||||||||||||||||||||||||||||
| Sale of shares | 3,719 | $ | 42,297 | 8,421 | $ | 94,425 | — | $ | — | 80 | $ | 805 | ||||||||||||||||||||
| Reinvestment of distributions | 43 | 491 | 45 | 495 | 5 | 63 | 1 | 7 | ||||||||||||||||||||||||
| Shares repurchased | (9,667 | ) | (109,385 | ) | (1,701 | ) | (18,859 | ) | — | — | — | — | ||||||||||||||||||||
|
|
|
|
|
|
|
|
|
|
|
|
|
|
|
| |||||||||||||||||
| Net Increase / (Decrease) | (5,905 | ) | $ | (66,597 | ) | 6,765 | $ | 76,061 | 5 | $ | 63 | 81 | $ | 812 | ||||||||||||||||||
|
|
|
|
|
|
|
|
|
|
|
|
|
|
|
| |||||||||||||||||
| (1) | Amount is less than 500. |
67
Table of Contents
VIRTUS OPPORTUNITIES TRUST
NOTES TO FINANCIAL STATEMENTS (Continued)
SEPTEMBER 30, 2014
| Disciplined Select Bond Fund | Disciplined Select Country Fund | |||||||||||||||||||||||||||||||
| Year Ended September 30, 2014 | From Inception December 18, 2012 to September 30, 2013 | Year Ended September 30, 2014 | From Inception December 18, 2012 to September 30, 2013 | |||||||||||||||||||||||||||||
| SHARES | AMOUNT | SHARES | AMOUNT | SHARES | AMOUNT | SHARES | AMOUNT | |||||||||||||||||||||||||
| Class A | ||||||||||||||||||||||||||||||||
| Sale of shares | — | (1) | $ | 5 | 17 | $ | 164 | 18 | $ | 207 | 15 | $ | 152 | |||||||||||||||||||
| Reinvestment of distributions | — | (1) | 3 | — | (1) | 2 | — | (1) | 4 | — | — | |||||||||||||||||||||
| Shares repurchased | (6 | ) | (61 | ) | — | — | (6 | ) | (72 | ) | — | — | ||||||||||||||||||||
|
|
|
|
|
|
|
|
|
|
|
|
|
|
|
| |||||||||||||||||
| Net Increase / (Decrease) | (6 | ) | $ | (53 | ) | 17 | $ | 166 | 12 | $ | 139 | 15 | $ | 152 | ||||||||||||||||||
|
|
|
|
|
|
|
|
|
|
|
|
|
|
|
| |||||||||||||||||
| Class C | ||||||||||||||||||||||||||||||||
| Sale of shares | 2 | $ | 23 | 12 | $ | 119 | 4 | $ | 45 | 10 | $ | 100 | ||||||||||||||||||||
| Reinvestment of distributions | — | (1) | 2 | — | (1) | 1 | — | (1) | 1 | — | — | |||||||||||||||||||||
| Shares repurchased | — | — | — | — | — | — | — | — | ||||||||||||||||||||||||
|
|
|
|
|
|
|
|
|
|
|
|
|
|
|
| |||||||||||||||||
| Net Increase / (Decrease) | 2 | $ | 25 | 12 | $ | 120 | 4 | $ | 46 | 10 | $ | 100 | ||||||||||||||||||||
|
|
|
|
|
|
|
|
|
|
|
|
|
|
|
| |||||||||||||||||
| Class I | ||||||||||||||||||||||||||||||||
| Sale of shares | — | $ | — | 80 | $ | 800 | 6 | $ | 77 | 80 | $ | 800 | ||||||||||||||||||||
| Reinvestment of distributions | 2 | 17 | 1 | 10 | 2 | 18 | — | — | ||||||||||||||||||||||||
| Shares repurchased | — | — | — | — | — | — | — | — | ||||||||||||||||||||||||
|
|
|
|
|
|
|
|
|
|
|
|
|
|
|
| |||||||||||||||||
| Net Increase / (Decrease) | 2 | $ | 17 | 81 | $ | 810 | 8 | $ | 95 | 80 | $ | 800 | ||||||||||||||||||||
|
|
|
|
|
|
|
|
|
|
|
|
|
|
|
| |||||||||||||||||
| Dynamic AlphaSector® Fund | Global Premium AlphaSector® Fund | |||||||||||||||||||||||||||||||
| Year Ended September 30, 2014 | Year Ended September 30, 2013 | Year Ended September 30, 2014 | Year Ended September 30, 2013 | |||||||||||||||||||||||||||||
| SHARES | AMOUNT | SHARES | AMOUNT | SHARES | AMOUNT | SHARES | AMOUNT | |||||||||||||||||||||||||
Class A | ||||||||||||||||||||||||||||||||
| Sale of shares | 36,001 | $ | 459,530 | 51,387 | $ | 567,419 | 3,483 | $ | 42,832 | 4,499 | $ | 49,646 | ||||||||||||||||||||
| Reinvestment of distributions | — | — | 124 | 1,293 | 137 | 1,674 | 33 | 350 | ||||||||||||||||||||||||
| Shares repurchased | (38,073 | ) | (504,839 | ) | (6,258 | ) | (70,393 | ) | (2,333 | ) | (28,792 | ) | (2,334 | ) | (26,017 | ) | ||||||||||||||||
|
|
|
|
|
|
|
|
|
|
|
|
|
|
|
| |||||||||||||||||
| Net Increase / (Decrease) | (2,072 | ) | $ | (45,309 | ) | 45,253 | $ | 498,319 | 1,287 | $ | 15,714 | 2,198 | $ | 23,979 | ||||||||||||||||||
|
|
|
|
|
|
|
|
|
|
|
|
|
|
|
| |||||||||||||||||
| Class B | ||||||||||||||||||||||||||||||||
| Sale of shares | 4 | $ | 42 | 2 | $ | 22 | — | — | — | $ | — | |||||||||||||||||||||
| Reinvestment of distributions | — | — | — | — | — | — | — | — | ||||||||||||||||||||||||
| Shares repurchased | (4 | ) | (46 | ) | (6 | ) | (64 | ) | — | — | — | — | ||||||||||||||||||||
|
|
|
|
|
|
|
|
|
|
|
|
|
|
|
| |||||||||||||||||
| Net Increase / (Decrease) | �� | (1) | $ | (4 | ) | (4 | ) | $ | (42 | ) | — | — | — | $ | — | |||||||||||||||||
|
|
|
|
|
|
|
|
|
|
|
|
|
|
|
| |||||||||||||||||
| Class C | ||||||||||||||||||||||||||||||||
| Sale of shares | 24,796 | $ | 292,883 | 22,213 | $ | 230,795 | 2,528 | $ | 30,806 | 2,120 | $ | 23,752 | ||||||||||||||||||||
| Reinvestment of distributions | — | (1) | — | (2) | 15 | 138 | 107 | 1,299 | 11 | 116 | ||||||||||||||||||||||
| Shares repurchased | (4,338 | ) | (52,562 | ) | (933 | ) | (9,575 | ) | (550 | ) | (6,646 | ) | (337 | ) | (3,755 | ) | ||||||||||||||||
|
|
|
|
|
|
|
|
|
|
|
|
|
|
|
| |||||||||||||||||
| Net Increase / (Decrease) | 20,458 | $ | 240,321 | 21,295 | $ | 221,358 | 2,085 | $ | 25,459 | 1,794 | $ | 20,113 | ||||||||||||||||||||
|
|
|
|
|
|
|
|
|
|
|
|
|
|
|
| |||||||||||||||||
| Class I | ||||||||||||||||||||||||||||||||
| Sale of shares | 71,916 | $ | 943,464 | 59,017 | $ | 660,499 | 5,607 | $ | 69,477 | 2,234 | $ | 25,190 | ||||||||||||||||||||
| Reinvestment of distributions | — | (1) | — | (2) | 195 | 2,034 | 106 | 1,295 | 18 | 192 | ||||||||||||||||||||||
| Shares repurchased | (27,004 | ) | (355,406 | ) | (7,583 | ) | (84,882 | ) | (1,018 | ) | (12,533 | ) | (763 | ) | (8,552 | ) | ||||||||||||||||
|
|
|
|
|
|
|
|
|
|
|
|
|
|
|
| |||||||||||||||||
| Net Increase / (Decrease) | 44,912 | $ | 588,058 | 51,629 | $ | 577,651 | 4,695 | $ | 58,239 | 1,489 | $ | 16,830 | ||||||||||||||||||||
|
|
|
|
|
|
|
|
|
|
|
|
|
|
|
| |||||||||||||||||
| (1) | Amount is less than 500. |
| (2) | Amount is less than $500. |
68
Table of Contents
VIRTUS OPPORTUNITIES TRUST
NOTES TO FINANCIAL STATEMENTS (Continued)
SEPTEMBER 30, 2014
| Herzfeld Fund | Premium AlphaSector® Fund | |||||||||||||||||||||||||||||||
| Year Ended September 30, 2014 | Year Ended September 30, 2013 | Year Ended September 30, 2014 | Year Ended September 30, 2013 | |||||||||||||||||||||||||||||
| SHARES | AMOUNT | SHARES | AMOUNT | SHARES | AMOUNT | SHARES | AMOUNT | |||||||||||||||||||||||||
| Class A | ||||||||||||||||||||||||||||||||
| Sale of shares | 547 | $ | 6,139 | 270 | $ | 2,890 | 54,862 | $ | 915,782 | 60,488 | $ | 885,745 | ||||||||||||||||||||
| Reinvestment of distributions | 18 | 203 | 3 | 32 | 3,699 | 61,192 | 787 | 10,779 | ||||||||||||||||||||||||
| Shares repurchased | (35 | ) | (391 | ) | (5 | ) | (46 | ) | (65,809 | ) | (1,127,085 | ) | (34,940 | ) | (501,133 | ) | ||||||||||||||||
|
|
|
|
|
|
|
|
|
|
|
|
|
|
|
| |||||||||||||||||
| Net Increase / (Decrease) | 530 | $ | 5,951 | 268 | $ | 2,876 | (7,248 | ) | $ | (150,111 | ) | 26,335 | $ | 395,391 | ||||||||||||||||||
|
|
|
|
|
|
|
|
|
|
|
|
|
|
|
| |||||||||||||||||
| Class C | ||||||||||||||||||||||||||||||||
| Sale of shares | 482 | $ | 5,281 | 481 | $ | 5,140 | 43,028 | $ | 712,397 | 37,863 | $ | 553,394 | ||||||||||||||||||||
| Reinvestment of distributions | 22 | 240 | 4 | 37 | 2,071 | 33,878 | 77 | 997 | ||||||||||||||||||||||||
| Shares repurchased | (41 | ) | (458 | ) | (21 | ) | (217 | ) | (14,189 | ) | (237,583 | ) | (10,536 | ) | (149,806 | ) | ||||||||||||||||
|
|
|
|
|
|
|
|
|
|
|
|
|
|
|
| |||||||||||||||||
| Net Increase / (Decrease) | 463 | $ | 5,063 | 464 | $ | 4,960 | 30,910 | $ | 508,692 | 27,404 | $ | 404,585 | ||||||||||||||||||||
|
|
|
|
|
|
|
|
|
|
|
|
|
|
|
| |||||||||||||||||
| Class I | ||||||||||||||||||||||||||||||||
| Sale of shares | 149 | $ | 1,689 | 100 | $ | 1,063 | 112,965 | $ | 1,913,873 | 97,169 | $ | 1,426,504 | ||||||||||||||||||||
| Reinvestment of distributions | 9 | 100 | 4 | 40 | 4,322 | 71,756 | 920 | 12,751 | ||||||||||||||||||||||||
| Shares repurchased | (25 | ) | (273 | ) | (35 | ) | (359 | ) | (62,865 | ) | (1,067,924 | ) | (42,065 | ) | (602,261 | ) | ||||||||||||||||
|
|
|
|
|
|
|
|
|
|
|
|
|
|
|
| |||||||||||||||||
| Net Increase / (Decrease) | 133 | $ | 1,516 | 69 | $ | 744 | 54,422 | $ | 917,705 | 56,024 | $ | 836,994 | ||||||||||||||||||||
|
|
|
|
|
|
|
|
|
|
|
|
|
|
|
| |||||||||||||||||
69
Table of Contents
VIRTUS OPPORTUNITIES TRUST
NOTES TO FINANCIAL STATEMENTS (Continued)
SEPTEMBER 30, 2014
| Note | 6. 10% Shareholders |
As of September 30, 2014, certain Funds had individual shareholder account(s) and/or omnibus shareholder account(s) (comprised of a group of individual shareholders), which individually amounted to more than 10% of the total shares outstanding of each such Fund as detailed below.
| % of Shares Outstanding | Number of Accounts | |||||||
Allocator Premium AlphaSector® Fund | 41 | % | 3 | |||||
Alternatives Diversifier Fund | 12 | 1 | ||||||
Disciplined Equity Style Fund | 55 | 1 | * | |||||
Disciplined Select Bond Fund | 76 | 1 | * | |||||
Disciplined Select Country Fund | 74 | 2 | * | |||||
Dynamic AlphaSector® Fund | 23 | 2 | ||||||
Herzfeld Fund | 35 | 2 | ||||||
Premium AlphaSector® Fund | 21 | 2 | ||||||
| * | Includes affiliated shareholder accounts. |
| Note | 7. Credit Risk and Asset Concentration |
Certain Funds may invest a high percentage of their assets in specific sectors of the market in their pursuit of a greater investment return. Fluctuations in these sectors of concentration may have a greater impact on a Fund, positive or negative, than if the Fund did not concentrate its investments in such sectors. At September 30, 2014, the Funds did not invest a high percentage of their assets in specific sectors.
| Note | 8. Indemnifications |
Under the Trust’s organizational documents, its trustees and officers are indemnified against certain liabilities arising out of the performance of their duties to the Funds. In addition, each Trustee has entered into an indemnification agreement with the Trust. In addition in the normal course of business, the Funds enter into contracts that provide a variety of indemnifications to other parties. The Funds’ maximum exposure under these arrangements is unknown as this would involve future claims that may be made against the Funds and that have not occurred. However, the Funds have not had prior claims or losses pursuant to these arrangements and expect the risk of loss to be remote.
| Note | 9. Exemptive Order |
On August 23, 2010, the SEC issued an amended order under Section 12(d) (1) (J) of the 1940 Act granting an exemption from Sections 12(d) (1) (A) and (B) of the 1940 Act and under Sections 6(c) and 17(b) of the 1940 Act granting an exemption from Section 17(a) of the 1940 Act, which permits the Trust to invest in other affiliated and unaffiliated funds, including exchange-traded funds, in each case subject to certain conditions.
| Note | 10. Federal Income Tax Information |
($ reported in thousands)
At September 30, 2014, federal tax cost and aggregate gross unrealized appreciation (depreciation) of securities held by the Funds were as follows:
| Federal Tax Cost | Unrealized Appreciation | Unrealized (Depreciation) | Net Unrealized Appreciation (Depreciation) | |||||||||||||
Alternative Book | ||||||||||||||||
Allocator Premium AlphaSector® Fund | $ | 779,099 | $ | 26,645 | $ | (8,997 | ) | $ | 17,648 | |||||||
Alpha-Sector® Rotation Fund | 801,255 | 137,171 | (7,454 | ) | 129,717 | |||||||||||
Alternatives Diversifier Fund | 135,182 | 15,625 | (25,687 | ) | (10,062 | ) | ||||||||||
Disciplined Equity Style Fund | 2,060 | 8 | (45 | ) | (37 | ) | ||||||||||
Disciplined Select Bond Fund | 1,056 | — | (18 | ) | (18 | ) | ||||||||||
Disciplined Select Country Fund | 1,399 | 30 | (12 | ) | 18 | |||||||||||
Dynamic AlphaSector® Fund - Investments | 3,187,189 | 261,415 | (11,502 | ) | 249,913 | |||||||||||
Dynamic AlphaSector® Fund - Short Sales | (302,572 | ) | 1,343 | (7,154 | ) | (5,811 | ) | |||||||||
Global Premium AlphaSector® Fund | 237,080 | 10,725 | (3,374 | ) | 7,351 | |||||||||||
Herzfeld Fund | 23,112 | 694 | (238 | ) | 456 | |||||||||||
Premium AlphaSector® Fund | 7,232,282 | 721,373 | (77,662 | ) | 643,711 | |||||||||||
The Funds have capital loss carryovers available to offset future realized capital gains, through the indicated expiration dates shown below:
| 2016 | 2017 | 2018 | 2019 | No Expiration | Total | |||||||||||||||||||
Alpha-Sector® Rotation Fund | $ | — | $ | — | $ | 720 | $ | — | $ | — | $ | 720 | ||||||||||||
Alternatives Diversifier Fund | — | — | 49,764 | — | — | 49,764 | ||||||||||||||||||
Disciplined Select Bond Fund | — | — | — | — | 17 | 17 | ||||||||||||||||||
Dynamic AlphaSector® Fund | 24 | — | — | — | 403 | 427 | ||||||||||||||||||
The Trust may not realize the benefit of these losses to the extent each Fund does not realize gains on investments prior to the expiration of the capital loss carryovers.
Under the Regulated Investment Company Modernization Act of 2010 (the “Act”), net capital losses recognized for tax years beginning after December 22, 2010, may be carried forward indefinitely, and their character is retained as short-term and/or long-term losses. Previously, net capital losses were carried forward for eight years and treated as short-term losses. As a transition rule, the Act requires that post-enactment net capital losses be used before pre-enactment net capital losses.
70
Table of Contents
VIRTUS OPPORTUNITIES TRUST
NOTES TO FINANCIAL STATEMENTS (Continued)
SEPTEMBER 30, 2014
For the period ended September 30, 2014, the following Funds utilized losses deferred in prior years against current year capital gains:
AlphaSector® Rotation Fund | $ | 360 | ||
Alternatives Diversifier Fund | 3,639 | |||
Dynamic AlphaSector® Fund | 1,607 |
Capital losses realized after October 31 and certain late year ordinary losses may be deferred and treated as occurring on the first day of the following fiscal year. For the fiscal year ended September 30, 2014, the Funds deferred and recognized post-October losses as follows:
| Late Year Ordinary Losses Deferred | Late Year Ordinary Losses Recognized | Capital Loss Deferred | Capital Loss Recognized | |||||||||||||
Alternatives Diversifier Fund | $ | — | $ | — | $ | 1,917 | $ | 347 | ||||||||
Disciplined Select Bond Fund | — | — | 8 | — | ||||||||||||
Dynamic AlphaSector® Fund | — | — | — | 4,533 | ||||||||||||
The components of distributable earnings on a tax basis (excluding unrealized appreciation (depreciation) which are disclosed above) consist of the following:
| Undistributed Ordinary Income | Undistributed Long-Term Capital Gains | |||||||
Allocator Premium AlphaSector® Fund | $ | 18,002 | $ | 36,829 | ||||
Alpha-Sector® Rotation Fund | 25,830 | 52,176 | ||||||
Alternatives Diversifier Fund | 794 | — | ||||||
Disciplined Equity Style Fund | 410 | 2 | ||||||
Disciplined Select Bond Fund | — | (1) | — | |||||
Disciplined Select Country Fund | 14 | 78 | ||||||
Dynamic AlphaSector® Fund | 34,159 | 114,714 | ||||||
Global Premium AlphaSector® Fund | 5,578 | 12,129 | ||||||
Herzfeld Fund | 292 | 216 | ||||||
Premium AlphaSector® Fund | 361,284 | 588,176 | ||||||
The differences between the book and tax basis components of distributable earnings relate principally to the timing of recognition of income and gains for federal income tax purposes. Short-term gain distributions reported in the Statements of Changes in Net Assets, if any, are reported as ordinary income for federal tax purposes. Distributions are determined on a tax basis and may differ from net investment income and realized capital gains for financial reporting purposes.
| (1) | Amount is less than $500. |
| Note | 11. Reclassification of Capital Accounts |
($ reported in thousands)
For financial reporting purposes, book basis capital accounts are adjusted to reflect the tax character of permanent book/tax differences. Permanent reclassifications can arise from differing treatment of certain income and gain transactions, nondeductible current year net operating losses, expiring capital loss carryovers and investments in passive foreign investment companies. The reclassifications have no impact on the net assets or net asset value of the Funds. As of September 30, 2014, the Funds recorded reclassifications to increase (decrease) the accounts as listed below:
| Capital Paid in on Shares of Beneficial Interest | Undistributed Net Investment Income (Loss) | Accumulated Net Realized Gain (Loss) | ||||||||||
Alpha-Sector® Rotation Fund | $ | 6,338 | $ | (189 | ) | $ | (6,149 | ) | ||||
Alternatives Diversifier Fund | 498 | (354 | ) | (144 | ) | |||||||
Disciplined Equity Style Fund | — | 10 | (10 | ) | ||||||||
Dynamic AlphaSector® Fund | 5,950 | 4,829 | (10,779 | ) | ||||||||
Herzfeld Fund | — | 41 | (41 | ) | ||||||||
Premium AlphaSector® Fund | 71,116 | (468 | ) | (70,648 | ) | |||||||
| Note | 12. Borrowings |
($ reported in thousands)
The Dynamic AlphaSector Fund (the “Fund”) employed leverage in the form of borrowing on its long positions in circumstances where the Fund had determined to take long positions representing four or more sectors. The aggregate amount of leverage used by the Fund at any time depended on the number of sectors in which the Fund took a long position, with the maximum amount of leverage used where the Fund took long positions in all nine sectors. In that event, the amount of leverage did not exceed 30% of the Fund’s net assets, including borrowings.
Effective February 6, 2012, the Fund entered into a collateralized loan agreement with Merrill Lynch Professional Clearing Corp. (“prime broker”) to provide margin financing. During the period October 1, 2013 through August 29, 2014, the Fund utilized margin financing for 333 days at an average interest rate of 0.623% and with an average daily borrowing balance during the period of $509,265. In order to attain leveraged exposure, the Fund incurred a cost of Open Fed Funds Rate plus a spread on debit financing. For the period October 1, 2013 through August 29, 2014, these costs amounted to $3,235 and are included within “interest expense” on the Statement of Operations.
Effective August 29, 2014, the Fund terminated this collateralized loan agreement.
71
Table of Contents
VIRTUS OPPORTUNITIES TRUST
NOTES TO FINANCIAL STATEMENTS (Continued)
SEPTEMBER 30, 2014
| Note | 13. Recent Accounting Pronouncement |
In June 2014, the Financial Accounting Standards Board issued guidance to improve the financial reporting of agreements and transactions that are considered secured borrowings. The guidance includes expanded disclosure requirements for entities that enter into these types of agreements. The guidance is effective for financial statements with fiscal years beginning on or after December 15, 2014 and interim periods within those fiscal years. Management is evaluating the impact of this guidance on the Trust’s financial statement disclosures.
| Note | 14. Subsequent Event Evaluations |
Management has evaluated the impact of all subsequent events on the Funds through the date the financial statements were available for issuance, and has determined that the following subsequent event requires recognition or disclosure in the financial statements.
Effective November 12, 2014, Virtus Dynamic AlphaSector® Fund and Virtus Premium AlphaSector® Fund began offering Class R6 Shares.
72
Table of Contents

REPORT OF INDEPENDENT REGISTERED PUBLIC ACCOUNTING FIRM
To the Board of Trustees of
Virtus Opportunities Trust and
Shareholders of the Funds, as defined:
In our opinion, the accompanying statements of assets and liabilities, including the schedules of investments, and the related statements of operations, of changes in net assets and of cash flows (for Virtus Dynamic AlphaSector Fund) and the financial highlights present fairly, in all material respects, the financial position of Virtus Allocator Premium AlphaSector Fund, Virtus AlphaSector Rotation Fund, Virtus Alternatives Diversifier Fund, Virtus Disciplined Equity Style Fund, Virtus Disciplined Select Bond Fund, Virtus Disciplined Select Country Fund, Virtus Dynamic AlphaSector Fund, Virtus Global Premium AlphaSector Fund, Virtus Herzfeld Fund and Virtus Premium AlphaSector Fund (constituting funds within Virtus Opportunities Trust, hereafter referred to as the “Funds”) at September 30, 2014, the results of each of their operations for the year then ended, the changes in each of their net assets for the periods indicated, cash flows for the Virtus Dynamic AlphaSector Fund for the year then ended and the financial highlights for each of the periods indicated, in conformity with accounting principles generally accepted in the United States of America. These financial statements and financial highlights (hereafter referred to as “financial statements”) are the responsibility of the Funds’ management. Our responsibility is to express an opinion on these financial statements based on our audits. We conducted our audits of these financial statements in accordance with the standards of the Public Company Accounting Oversight Board (United States). Those standards require that we plan and perform the audit to obtain reasonable assurance about whether the financial statements are free of material misstatement. An audit includes examining, on a test basis, evidence supporting the amounts and disclosures in the financial statements, assessing the accounting principles used and significant estimates made by management, and evaluating the overall financial statement presentation. We believe that our audits, which included confirmation of securities at September 30, 2014 by correspondence with the custodians, brokers, and transfer agent of the investee funds, provide a reasonable basis for our opinion.
PricewaterhouseCoopers LLP
Philadelphia, Pennsylvania
November 19, 2014
73
Table of Contents
TAX INFORMATION NOTICE
SEPTEMBER 30, 2014
For the fiscal year ended September 30, 2014, the Funds make the following disclosures for federal income tax purposes. Below is listed the percentages, or the maximum amount allowable, of its ordinary income dividends (“QDI”) to qualify for the lower tax rates applicable to individual shareholders, and the percentage of ordinary income dividends earned by the Funds which qualifies for the dividends received deduction (“DRD”) for corporate shareholders. The Funds designate the amounts below as long-term capital gains dividends (“LTCG”) ($ reported in thousands), or if subsequently different, the amounts will be designated in the next annual report. The actual percentage for the calendar year will be designated in year-end tax statements.
Fund | QDI | DRD | LTCG | |||||||||
Allocator Premium AlphaSector® Fund | 37 | % | 24 | % | $ | 36,895 | ||||||
AlphaSector® Rotation Fund | 46 | 45 | 56,451 | |||||||||
Alternatives Diversifier Fund | 100 | 54 | — | |||||||||
Disciplined Equity Style Fund | 4 | 4 | 2 | |||||||||
Disciplined Select Country Fund | 100 | — | 78 | |||||||||
Dynamic AlphaSector® Fund | 100 | 100 | 119,298 | |||||||||
Global Premium AlphaSector® Fund | 57 | | 35 | | 12,138 | |||||||
Herzfeld Fund | 31 | 8 | 217 | |||||||||
Premium AlphaSector® Fund | 31 | 31 | 635,162 | |||||||||
For the fiscal year ended September 30, 2014, the Funds are disclosing the following information pursuant to notice requirements of Section 853(a) and 855(d) of the Internal Revenue Code, as amended, and the Treasury Regulations thereunder ($ reported in thousands):
| Foreign Source Income Recognized | Foreign Taxes Paid on Foreign Source Income | |||||||
Allocator Premium AlphaSector® Fund | $ | 4,252 | $ | 397 | ||||
Alternatives Diversifier Fund | 1,441 | 99 | ||||||
Disciplined Select Country Fund | 43 | 3 | ||||||
Global Premium AlphaSector® Fund | 1,977 | 188 | ||||||
Herzfeld Fund | 58 | 5 | ||||||
74
Table of Contents
Information pertaining to the trustees and officers of the Trust as of September 30, 2014, is set forth below. The statement of additional information (SAI) includes additional information about the trustees and is available without charge, upon request, by calling (800) 243-1574. The address of each individual, unless otherwise noted, is 100 Pearl Street, Hartford, CT 06103-4506. There is no stated term of office for trustees of the Trust.
Independent Trustees
| Name and Year of Birth, Year Elected and Number of Funds Overseen | Principal Occupation(s) During Past 5 Years and Other Directorships Held by Trustee | |
Keith, Leroy Jr. YOB: 1939 Elected: 2000 48 Funds | Chairman (since 2010), Bloc Global Services Group, LLC (construction and redevelopment company); Director/Trustee (since 2010), Wells Fargo Funds and their predecessors, Evergreen Funds (1989 to 2010) (137 series); Director (2003 to 2010), Diversapack Co. (soft packaging company); and Trustee (since 1980), Virtus Mutual Fund Complex (48 portfolios). | |
McLoughlin, Philip Chairman YOB: 1946 Elected: 1999 68 Funds | Partner (2006 to 2012), Cross Pond Partners, LLC (strategy consulting firm); Managing Director (2009 to 2010), SeaCap Asset Management Fund I, L.P. and SeaCap Partners, LLC (investment management); Director (since 1991) and Chairman (since 2010), World Trust Fund; Director (since 1995), closed-end funds managed by Duff & Phelps Investment Management Co. (4 portfolios); Chairman (since 2002) and Trustee (since 1989), Virtus Mutual Fund Complex (48 portfolios); Chairman and Trustee (since 2003), Virtus Variable Insurance Trust (9 portfolios); Trustee and Chairman (since 2011), Virtus Closed-End Funds (3 portfolios); Trustee and Chairman (since 2013), Virtus Alternative Solutions Trust (3 portfolios); and Director (1985 to 2009), Argo Group International Holdings Inc. and its predecessor, PXRE Corporation (insurance). | |
McNamara, Geraldine M. YOB: 1951 Elected: 2001 52 Funds | Retired; Trustee (since 2001), Virtus Mutual Fund Complex (48 portfolios); and Director (since 2003), closed-end funds managed by Duff & Phelps Investment Management Co. (4 portfolios). | |
Oates, James M. YOB: 1946 Elected: 2000 55 Funds | Managing Director (since 1994), Wydown Group (consulting firm); Trustee (since 1987), Virtus Mutual Fund Complex (48 portfolios); Director (since 1996), Stifel Financial; Director (since 1998), Connecticut River Bancorp; Chairman and Director (since 1999), Connecticut River Bank; Chairman (since 2000), Emerson Investment Management, Inc.; Director (since 2002), New Hampshire Trust Company; Chairman and Trustee (since 2005), John Hancock Fund Complex (234 portfolios); Non-Executive Chairman (2007 to 2011), Hudson Castle Group, Inc. (formerly IBEX Capital Markets, Inc.) (financial services); Trustee (since 2013), Virtus Closed-End Funds (3 portfolios); and Trustee (since 2013), Virtus Alternative Solutions Trust (3 portfolios). | |
Segerson, Richard E. YOB: 1946 Elected: 2000 48 Funds | Retired; Trustee (since 1993), Virtus Mutual Fund Complex (48 portfolios); and Managing Director (since 1998), Northway Management Company. | |
Verdonck, Ferdinand L.J. YOB: 1942 Elected: 2005 48 Funds | Director (since 1998), The J.P. Morgan European Investment Trust; Director (since 2005), Galapagos N.V. (biotechnology); Mr. Verdonck is also a director of several non-U.S. companies; Trustee (since 2002), Virtus Mutual Fund Complex (48 portfolios). | |
Interested Trustee
The individual listed below is an “interested person” of the Trust, as defined in Section 2(a)(19) of the 1940 Act, as amended, and the rules and regulations thereunder.
| Name and Year of Birth | Principal Occupation(s) During Past 5 Years and Other Directorships Held by Trustee | |
Aylward, George R. YOB: 1964 Elected: 2006 66 Funds | Director, President and Chief Executive Officer (since 2008), Virtus Investment Partners, Inc. and/or certain of its subsidiaries; and various senior officer positions with Virtus affiliates (since 2005); Trustee (since 2006), Virtus Mutual Funds (48 portfolios); Chairman, President and Chief Executive Officer (since 2006), The Zweig Closed-End Funds (2 portfolios); Trustee (since 2012), Virtus Variable Insurance Trust (9 portfolios); Trustee and President (since 2011), Virtus Closed-End Funds (3 portfolios); Director (since 2013), Virtus Global Funds, PLC (2 portfolios); and Trustee (since 2013), Virtus Alternative Solutions Trust (3 portfolios). | |
75
Table of Contents
FUND MANAGEMENT TABLES (Continued)
Officers of the Trust Who Are Not Trustees
Name, Address and Year of Birth | Position(s) Held with the Trust and Length of Time Served and Principal Occupation(s) During Past 5 Years | |||
Bradley, W. Patrick YOB: 1972 | Senior Vice President (since 2013), Vice President (2011 to 2013), Chief Financial Officer and Treasurer (since 2006). | Senior Vice President, Fund Services (since 2010), Virtus Investment Partners, Inc. and/or certain of its subsidiaries; various officer positions (since 2006) with Virtus affiliates; Senior Vice President (since 2013), Vice President (2011 to 2013), Chief Financial Officer and Treasurer (since 2004), Virtus Variable Insurance Trust; Senior Vice President (since 2013), Vice President (2011 to 2013), Chief Financial Officer and Treasurer (since 2006), Virtus Mutual Fund Complex; Senior Vice President (since 2013), Vice President (2012 to 2013) and Treasurer (Chief Financial Officer) (since 2007), The Zweig Closed-End Funds; Senior Vice President (since 2013), Vice President (2011 to 2013), Chief Financial Officer and Treasurer (since 2011), Virtus Closed-End Funds; Vice President and Assistant Treasurer (since 2011), Duff & Phelps Global Utility Income Fund Inc.; Director (since 2013), Virtus Global Funds, PLC; and Senior Vice President, Chief Financial Officer and Treasurer (since 2013), Virtus Alternative Solutions Trust. | ||
Carr, Kevin J. YOB: 1954 | Senior Vice President (since 2013), Vice President (2005 to 2013), Chief Legal Officer, Counsel and Secretary (since 2005). | Senior Vice President (since 2009), Vice President, Counsel and Secretary (2008 to 2009), Virtus Investment Partners, Inc. and/or certain of its subsidiaries; various senior officer positions (since 2005) with Virtus affiliates; Senior Vice President (since 2013), Vice President (2005 to 2013), Chief Legal Officer, Counsel and Secretary (since 2005), Virtus Mutual Fund Complex; Senior Vice President (2013 to 2014), Vice President (2012 to 2013) and Assistant Secretary (since 2012), Secretary and Chief Legal Officer (2005 to 2012), The Zweig Closed-End Funds; Assistant Secretary (since 2013), Vice President, Chief Legal Officer, Counsel and Secretary (2010 to 2013), Virtus Variable Insurance Trust; Vice President and Assistant Secretary (since 2011), Duff & Phelps Global Utility Income Fund Inc.; Senior Vice President and Assistant Secretary (2013 to 2014), Vice President and Assistant Secretary (2012 to 2013), Vice President, Chief Legal Officer, Counsel and Secretary (2011 to 2012), Virtus Closed-End Funds ; and Assistant Secretary (since 2013), Virtus Alternative Solutions Trust. | ||
Engberg, Nancy J. YOB: 1956 | Vice President and Chief Compliance Officer (since 2011). | Vice President (since 2008) and Chief Compliance Officer (2008 to 2011), Virtus Investment Partners, Inc. and/or certain of its subsidiaries; various officer positions (since 2003) with Virtus affiliates; Vice President and Chief Compliance Officer (since 2011), Virtus Mutual Fund Complex; Vice President (since 2010), Chief Compliance Officer (since 2011), Virtus Variable Insurance Trust; Vice President and Chief Compliance Officer (since 2011), Virtus Closed-End Funds; Vice President and Chief Compliance Officer (since 2012), The Zweig Closed-End Funds; and Vice President and Chief Compliance Officer (since 2013), Virtus Alternative Solutions Trust. | ||
Waltman, Francis G. YOB: 1962 | Executive Vice President (since 2013), Senior Vice President (2008 to 2013). | Virtus Investment Partners, Inc. and/or certain of its subsidiaries; various senior officer positions (since 2006) with Virtus affiliates; Executive Vice President (since 2013), Senior Vice President (2008 to 2013), Virtus Mutual Fund Complex; Executive Vice President (since 2013), Senior Vice President (2010 to 2013), Virtus Variable Insurance Trust; Executive Vice President (since 2013), Senior Vice President (2011 to 2013), Virtus Closed-End Funds; Director (since 2013), Virtus Global Funds PLC; and Executive Vice President (since 2013), Virtus Alternative Solutions Trust. | ||
76
Table of Contents
Virtus Allocator Premium AlphaSector® Fund,
Virtus AlphaSector® Rotation Fund,
Virtus Dynamic AlphaSector® Fund,
Virtus Global Premium AlphaSector® Fund,
Virtus Premium AlphaSector® Fund,
each a series of Virtus Opportunities Trust
Supplement dated November 14, 2014 to the Summary and
Statutory Prospectuses and Statement of Additional Information (“SAI”) dated January 28, 2014, as supplemented
THIS SUPPLEMENT SUPERCEDES THE SUPPLEMENT DATED NOVEMBER 12, 2014 TO THE ABOVE-REFERENCED PROSPECTUS AND SAI. DUE TO MORE RECENT DEVELOPMENTS, THIS SUPPLEMENT PROVIDES REVISED INFORMATION ABOUT PORTFOLIO MANAGEMENT.
IMPORTANT NOTICE TO INVESTORS
The disclosure under “Principal Investment Strategies” in the summary prospectuses of Virtus AlphaSector® Rotation Fund and Virtus Premium AlphaSector® Fund, and in the summary section of each such fund’s statutory prospectus, is hereby amended to remove the reference to the index each such fund seeks to track being published by NASDAQ. This is due to the fact that although the performance of each such index continues to be calculated by NASDAQ, the returns are no longer widely disseminated.
The disclosure under “Portfolio Management” in the summary prospectus of Virtus Allocator Premium AlphaSector® Fund and Virtus Global Premium AlphaSector® Fund, and in the summary section of each such fund’s statutory prospectus, is hereby replaced with the following:
| ð | Alexey Panchekha, CFA, PhD, Senior Vice President, Research at F-Squared Institutional, is a manager of the fund. Mr. Panchekha has served as a Portfolio Manager of the fund since November 2014. |
| ð | Amy Robinson, Managing Director at Euclid, is a manager of the fund. Ms. Robinson has served as a Portfolio Manager of the fund since inception in March 2011. |
The disclosure under “Portfolio Management” in the summary prospectus of Virtus AlphaSector® Rotation Fund, and in the summary section of such fund’s statutory prospectus, is hereby replaced with the following:
| ð | Alexey Panchekha, CFA, PhD, Senior Vice President, Research at F-Squared Institutional, is a manager of the fund. Mr. Panchekha has served as a Portfolio Manager of the fund since November 2014. |
| ð | Amy Robinson, Managing Director at Euclid, is a manager of the fund. Ms. Robinson has served as a Portfolio Manager of the fund since 2009. |
The disclosure under “Portfolio Management” in the summary prospectus of Virtus Dynamic AlphaSector® Fund, and in the summary section of such fund’s statutory prospectus, is hereby amended to add the following:
| ð | Alexey Panchekha, CFA, PhD, Senior Vice President, Research at F-Squared Alternative, is a manager of the fund. Mr. Panchekha has served as a Portfolio Manager of the fund since November 2014. |
| ð | Amy Robinson, Managing Director at Euclid, is a manager of the fund. Ms. Robinson has served as a Portfolio Manager of the fund since February 2012. |
The disclosure under “Portfolio Management” in the summary prospectus of Virtus Premium AlphaSector® Fund, and in the summary section of such fund’s statutory prospectus, is hereby replaced with the following:
| ð | Alexey Panchekha, CFA, PhD, Senior Vice President, Research at F-Squared Institutional, is a manager of the fund. Mr. Panchekha has served as a Portfolio Manager of the fund since November 2014. |
| ð | Amy Robinson, Managing Director at Euclid, is a manager of the fund. Ms. Robinson has served as a Portfolio Manager of the fund since inception in July 2012. |
The information relating to F-Squared Alternative and F-Squared Institutional under “Portfolio Management” beginning on page 200 of the funds’ statutory prospectus is hereby replaced with the following:
| Virtus Allocator Premium AlphaSector Fund | Alexey Panchekha (since November 2014) | |
| Virtus AlphaSector Rotation Fund | Alexey Panchekha (since November 2014) | |
| Virtus Dynamic AlphaSector Fund | Alexey Panchekha (since November 2014) | |
| Virtus Global Premium AlphaSector Fund | Alexey Panchekha (since November 2014) | |
| Virtus Premium AlphaSector Fund | Alexey Panchekha (since November 2014) |
Table of Contents
Virtus Allocator Premium AlphaSector® Fund,
Virtus AlphaSector® Rotation Fund,
Virtus Dynamic AlphaSector® Fund,
Virtus Global Premium AlphaSector® Fund,
Virtus Premium AlphaSector® Fund,
each a series of Virtus Opportunities Trust
Supplement dated November 14, 2014 to the Summary and
Statutory Prospectuses and Statement of Additional Information (“SAI”) dated January 28, 2014, as supplemented (Continued)
Alexey Panchekha, CFA, PhD. Mr. Panchekha is Senior Vice President of F-Squared Alternative and F-Squared Institutional (“F-Squared”). As Portfolio Manager of the above-named funds, he is responsible for providing the model portfolios to Euclid. Prior to F-Squared, he was Senior Vice President of Markov Processes International (2010 to 2012), a provider of investment research and technology within the financial services industry. Prior thereto, he was a Quant Researcher (2009 to 2010), Head of Portfolio Risk Analytics (2006 to 2009) and Senior Software Engineer (2004 to 2006) at Bloomberg. Mr. Panchekha has over 15 years of investment management industry experience.
The information for each of the funds in the “Portfolio Managers” section of the funds’ SAI is hereby replaced with the following:
| Fund | Portfolio Managers | |
| Virtus Allocator Premium AlphaSector Fund | Alexey Panchekha Amy Robinson | |
| Virtus AlphaSector Rotation Fund | Alexey Panchekha Amy Robinson | |
| Virtus Dynamic AlphaSector Fund | Alexey Panchekha Amy Robinson | |
| Virtus Global Premium AlphaSector Fund | Alexey Panchekha Amy Robinson | |
| Virtus Premium AlphaSector Fund | Alexey Panchekha Amy Robinson |
All other disclosure concerning the funds, including fees and expenses, remains unchanged from their prospectuses and SAI dated January 28, 2014.
Investors should retain this supplement with the Prospectuses and SAI for future reference.
VOT ASFs SAStrat&PMChanges2 (11/2014)
Table of Contents
Virtus Dynamic AlphaSector® Fund,
a series of Virtus Opportunities Trust
Supplement dated August 26, 2014 to the
Summary Prospectus and the Virtus Opportunities Trust Statutory Prospectus,
each dated January 31, 2014
IMPORTANT NOTICE TO INVESTORS
The second paragraph under “Principal Investment Strategies” in the fund’s summary prospectus and the summary section of the statutory prospectus is hereby replaced with the following:
The fund intends to employ leverage on its long positions in circumstances where the fund has determined to take long positions representing four or more sectors. Leverage may be generated through borrowings, cash collateral received under securities lending arrangements, or derivative transactions. The fund intends to take short positions in sectors projected to have negative absolute performance, up to approximately 5.5% of the fund’s net assets, for each such sector. In the event that all nine sectors are projected to have negative absolute performance, the fund may take short positions worth up to 50% of the fund’s net assets, with the remainder of the fund’s assets remaining in cash and cash equivalents.
The following disclosure is hereby added to the fund’s summary prospectus and the summary section of the statutory prospectus under “Principal Risks:”
Derivatives. The risk that the fund will incur a loss greater than the fund’s investment in, or will experience greater share price volatility as a result of investing in, a derivative contract. Derivatives may include, among other things, futures, options, forwards and swap agreements and may be used in order to hedge portfolio risks, create leverage, or to attempt to increase yield.
On page 151 of the fund’s statutory prospectus, the third paragraph under “Principal Investment Strategies” is hereby replaced with the following:
The fund intends to employ leverage on its long positions in circumstances where the fund has determined to take long positions representing four or more sectors. Leverage may be generated through borrowings, cash collateral received under securities lending arrangements, or derivative transactions. With respect to leverage in the form of borrowings, the aggregate amount of leverage being used by the fund at any time will depend on the number of sectors in which the fund takes a long position, with the maximum amount of leverage being used where the fund takes long positions in all nine sectors. In that event, the amount of leverage utilized for the strategy will not exceed 33-1/3% of the fund’s net assets. With respect to leverage generated through securities lending, to the extent potential borrowers do not wish to borrow the fund’s securities, no cash collateral would be provided to the fund in order to generate leverage.
Additionally, the chart in the section “More Information About Risks Related to Principal Investment Strategies” is hereby amended to include an “X” in the row entitled “Derivatives” to indicate that such risk is applicable to the fund.
Investors should retain this supplement with the Prospectuses for future reference.
VOT 8020/DASF-PIS&RChanges (8/14)
Table of Contents
Virtus Herzfeld Fund,
a series of Virtus Opportunities Trust
Supplement dated June 16, 2014 to the
Summary Prospectus and the Virtus Opportunities Trust Statutory Prospectus,
each dated January 31, 2014, as supplemented and revised
IMPORTANT NOTICE TO INVESTORS
The following disclosure hereby corrects and replaces the last sentence of the paragraph under “Portfolio Turnover” in the fund’s summary prospectus and in the summary section of the statutory prospectus: “During the most recent fiscal year, the fund’s portfolio turnover rate was 22% of the average value of its portfolio.”
Investors should retain this supplement with the Prospectuses for future reference.
VOT 8020/HerzfeldPortfolioTurnover (6/14)
Table of Contents
FUND MANAGEMENT TABLES (Continued)
(UNAUDITED)
VIRTUS OPPORTUNITIES TRUST
101 Munson Street
Greenfield, MA 01301-9668
Trustees
George R. Aylward
Leroy Keith, Jr.
Philip R. McLoughlin, Chairman
Geraldine M. McNamara
James M. Oates
Richard E. Segerson
Ferdinand L.J. Verdonck
Officers
George R. Aylward, President
Francis G. Waltman, Executive Vice President
Nancy J. Engberg, Vice President and Chief Compliance Officer
W. Patrick Bradley, Senior Vice President, Chief Financial Officer and Treasurer
Kevin J. Carr, Senior Vice President, Chief Legal Officer, Counsel and Secretary
Investment Adviser
Virtus Investment Advisers, Inc.
100 Pearl Street
Hartford, CT 06103-4506
Principal Underwriter
VP Distributors, LLC
100 Pearl Street
Hartford, CT 06103-4506
Administrator and Transfer Agent
Virtus Fund Services, LLC
100 Pearl Street
Hartford, CT 06103-4506
Custodian
JPMorgan Chase Bank, NA
1 Chase Manhattan Plaza,
New York, NY 10005-1401
Independent Registered Public
Accounting Firm
PricewaterhouseCoopers LLP
2001 Market Street
Philadelphia PA 19103-7042
How to Contact Us
Mutual Fund Services | 1-800-243-1574 | |
Adviser Consulting Group | 1-800-243-4361 | |
Telephone Orders | 1-800-367-5877 | |
Text Telephone | 1-800-243-1926 | |
Web site | Virtus.com |
Important Notice to Shareholders
The Securities and Exchange Commission has modified mailing regulations for semiannual and annual shareholder fund reports to allow mutual fund companies to send a single copy of these reports to shareholders who share the same mailing address. If you would like additional copies, please call Mutual Fund Services at 1-800-243-1574.
Table of Contents
| ||
P.O. Box 9874 Providence, RI 02940-8074 |

For more information about Virtus Mutual Funds,
please call your financial representative, or contact us
at 1-800-243-1574 or Virtus.com
| 8454 | 11-14 |
Table of Contents

ANNUAL REPORT
Virtus Emerging Markets Debt Fund
Virtus Emerging Markets Equity Income Fund*
Virtus Emerging Markets Small-Cap Fund
Virtus Global Commodities Stock Fund
Virtus Global Dividend Fund
Virtus Global Opportunities Fund
Virtus Global Real Estate Securities Fund
Virtus Greater European Opportunities Fund
Virtus International Equity Fund
Virtus International Real Estate Securities Fund
Virtus International Small-Cap Fund
September 30, 2014 TRUST NAME: VIRTUS OPPORTUNITIES TRUST * Prospectus supplement applicable to this Fund appears at the back of this annual report. |
 |
Not FDIC Insured
No Bank Guarantee
May Lose Value
Table of Contents
Proxy Voting Procedures and Voting Record (Form N-PX)
The subadvisers vote proxies relating to portfolio securities in accordance with procedures that have been approved by the Board of Trustees of the Trust (“Trustees,” or the “Board”). You may obtain a description of these procedures, along with information regarding how the Funds voted proxies during the most recent 12-month period ended June 30, free of charge, by calling toll-free 1-800-243-1574. This information is also available through the Securities and Exchange Commission’s (the “SEC”) website at http://www.sec.gov.
Form N-Q Information
The Trust files a complete schedule of portfolio holdings for each Fund with the SEC for the first and third quarters of each fiscal year on Form N-Q. Form N-Q is available on the SEC’s website at http://www.sec.gov. Form N-Q may be reviewed and copied at the SEC’s Public Reference Room. Information on the operation of the SEC’s Public Reference Room can be obtained by calling toll-free 1-800-SEC-0330.
This report is not authorized for distribution to prospective investors in the Funds presented in this book unless preceded or accompanied by an effective prospectus which includes information concerning the sales charge, each Fund’s record and other pertinent information.
Table of Contents
Dear Fellow Shareholders of Virtus Mutual Funds:
 | I am pleased to present this annual report which highlights performance of your fund for the 12 months ended September 30, 2014, including comments from the money manager.
The past 12 months were generally strong for equities, although market volatility increased over the last quarter, driven by geopolitical risks and a slowdown in the global economy. While the economies of Europe, Japan, and China weakened, the U.S. economy accelerated and the U.S. dollar rallied strongly. Broad U.S. equity indexes registered double-digit gains for the 12 months ended September 30, 2014. The S&P 500® Index returned 19.73%, the Dow Jones Industrial AverageSM rose 15.29%, and the | |
NASDAQ Composite Index® was up 20.61%. By comparison, international equity returns were significantly smaller, including for both developed markets and emerging markets.
In mid-September, the Federal Reserve provided much needed assurance to investors by announcing that it intends to keep interest rates low for a “considerable time” after its bond buying program ends in October. Against this backdrop, the bellwether 10-year U.S. Treasury yield ended at 2.52% on September 30, 2014 compared with 2.64% a year earlier. The broader fixed income market, as measured by the Barclays U.S. Aggregate Bond Index, rose 3.96% for the 12 months ended September 30, 2014.
The uncertain state of the global economy is likely to remain a concern for markets in the months ahead. However, the health of the U.S. economy – including improving hiring, manufacturing, and housing data – gives investors reason for optimism. Future market direction will be determined largely by the ability of corporations to continue to produce robust earnings.
Market volatility is an ever-present reminder of the importance of portfolio diversification. While diversification cannot guarantee a profit or prevent loss, owning a variety of asset classes may cushion your portfolio against inevitable market fluctuations. Your financial advisor can help you ensure that your portfolio is adequately diversified across asset classes and investment strategies.
As always, thank you for entrusting Virtus with your assets. Should you have questions or require assistance, our customer service team is here to help at 1-866-270-7788. We appreciate your business and remain committed to your long-term financial success.
Sincerely,
George R. Aylward President, Virtus Mutual Funds
October 2014 | ||

Whenever you have questions about your account, or require additional information, please visit us on the Web at www.virtus.com or call our shareowner service group toll-free at 1-800-243-1574.
Performance data quoted represents past results. Past performance is no guarantee of future results, and current performance may be higher or lower than the performance shown above.
1
Table of Contents
VIRTUS OPPORTUNITIES TRUST
Disclosure of Fund Expenses (Unaudited)
For the six-month period of April 1, 2014 to September 30, 2014
We believe it is important for you to understand the impact of costs on your investment. All mutual funds have operating expenses. As a shareholder of a Virtus Opportunities Trust Fund (each, a “Fund”) you may incur two types of costs: (1) transaction costs, including sales charges on purchases of Class A shares and contingent deferred sales charges on Class B and Class C shares; and (2) ongoing costs, including investment advisory fees, distribution and service fees, and other expenses. Class I shares are sold without sales charges and do not incur distribution and service fees. For further information regarding applicable sales charges, see Note 1 in the Notes to Financial Statements. These examples are intended to help you understand your ongoing costs (in dollars) of investing in a Fund and to compare these costs with the ongoing costs of investing in other mutual funds. These examples are based on an investment of $1,000 invested at the beginning of the period and held for the entire six-month period. The following Expense Table illustrates your Fund’s costs in two ways.
Actual Expenses
The first section of the accompanying table provides information about actual account values and actual expenses. You may use the information in this section, together with the amount you invested, to estimate the expenses that you paid over the period. Simply divide your account value by $1,000 (for example, an $8,600 account value divided by $1,000 = 8.6), then multiply the result by the number given for your Fund under the heading “Expenses Paid During Period” to estimate the expenses you paid on your account during the period.
Hypothetical Example for Comparison Purposes
The second section of the accompanying table provides information about hypothetical account values and hypothetical expenses based on the Fund’s actual expense ratio and an assumed rate of return of 5% per year before expenses, which is not your Fund’s actual return. The hypothetical account values and expenses may not be used to estimate the actual ending account balance or expenses you paid for the period. You may use this information to compare the ongoing costs of investing in your Fund and other funds. To do so, compare these 5% hypothetical examples with the 5% hypothetical examples that appear in the shareholder reports of the other funds.
Please note that the expenses shown in the accompanying table are meant to highlight your ongoing costs only and do not reflect any transactional costs, such as sales charges or contingent deferred sales charges. Therefore, the second section of the accompanying table is useful in comparing ongoing costs only, and will not help you determine the relative total costs of owning different funds. In addition, if these transactional costs were included, your costs would have been higher. The calculations assume no shares were bought or sold during the period. Your actual costs may have been higher or lower, depending on the amount of your investment and the timing of any purchases or redemptions.
| Expense Table | ||||||||||||||||
| Beginning Account Value April 1, 2014 | Ending Account Value September 30, 2014 | Annualized Expense Ratio | Expenses Paid During the Period* | |||||||||||||
Emerging Markets Debt Fund |
| |||||||||||||||
Actual |
| |||||||||||||||
Class A | $ | 1,000.00 | $ | 1,032.10 | 1.35 | % | $ | 6.88 | ||||||||
Class C | 1,000.00 | 1,028.20 | 2.10 | 10.68 | ||||||||||||
Class I | 1,000.00 | 1,033.40 | 1.10 | 5.61 | ||||||||||||
Hypothetical (5% return before expenses) |
| |||||||||||||||
Class A | 1,000.00 | 1,018.22 | 1.35 | 6.85 | ||||||||||||
Class C | 1,000.00 | 1,014.41 | 2.10 | 10.66 | ||||||||||||
Class I | 1,000.00 | 1,019.48 | 1.10 | 5.58 | ||||||||||||
Emerging Markets Equity Income Fund |
| |||||||||||||||
Actual |
| |||||||||||||||
Class A | $ | 1,000.00 | $ | 1,025.00 | 1.75 | % | $ | 8.88 | ||||||||
Class C | 1,000.00 | 1,020.70 | 2.50 | 12.66 | ||||||||||||
Class I | 1,000.00 | 1,026.10 | 1.50 | 7.62 | ||||||||||||
Hypothetical (5% return before expenses) |
| |||||||||||||||
Class A | 1,000.00 | 1,016.18 | 1.75 | 8.88 | ||||||||||||
Class C | 1,000.00 | 1,012.38 | 2.50 | 12.69 | ||||||||||||
Class I | 1,000.00 | 1,017.45 | 1.50 | 7.61 | ||||||||||||
Emerging Markets Small-Cap Fund |
| |||||||||||||||
Actual |
| |||||||||||||||
Class A | $ | 1,000.00 | $ | 1,039.30 | 1.85 | % | $ | 9.46 | ||||||||
Class C | 1,000.00 | 1,035.30 | 2.60 | 13.27 | ||||||||||||
Class I | 1,000.00 | 1,040.20 | 1.60 | 8.18 | ||||||||||||
Hypothetical (5% return before expenses) |
| |||||||||||||||
Class A | 1,000.00 | 1,015.68 | 1.85 | 9.39 | ||||||||||||
Class C | 1,000.00 | 1,011.87 | 2.60 | 13.20 | ||||||||||||
Class I | 1,000.00 | 1,016.95 | 1.60 | 8.12 | ||||||||||||
Global Commodities Stock Fund |
| |||||||||||||||
Actual |
| |||||||||||||||
Class A | $ | 1,000.00 | $ | 927.60 | 1.65 | % | $ | 7.97 | ||||||||
Class C | 1,000.00 | 924.40 | 2.40 | 11.58 | ||||||||||||
Class I | 1,000.00 | 928.00 | 1.40 | 6.77 | ||||||||||||
Hypothetical (5% return before expenses) |
| |||||||||||||||
Class A | 1,000.00 | 1,016.69 | 1.65 | 8.38 | ||||||||||||
Class C | 1,000.00 | 1,012.88 | 2.40 | 12.18 | ||||||||||||
Class I | 1,000.00 | 1,017.96 | 1.40 | 7.11 | ||||||||||||
Global Dividend Fund |
| |||||||||||||||
Actual |
| |||||||||||||||
Class A | $ | 1,000.00 | $ | 1,040.40 | 1.30 | % | $ | 6.65 | ||||||||
Class C | 1,000.00 | 1,036.20 | 2.05 | 10.46 | ||||||||||||
Class I | 1,000.00 | 1,041.00 | 1.05 | 5.37 | ||||||||||||
Hypothetical (5% return before expenses) |
| |||||||||||||||
Class A | 1,000.00 | 1,018.47 | 1.30 | 6.60 | ||||||||||||
Class C | 1,000.00 | 1,014.66 | 2.05 | 10.41 | ||||||||||||
Class I | 1,000.00 | 1,019.74 | 1.05 | 5.33 | ||||||||||||
Global Opportunities Fund |
| |||||||||||||||
Actual |
| |||||||||||||||
Class A | $ | 1,000.00 | $ | 1,020.20 | 1.48 | % | $ | 7.50 | ||||||||
Class B | 1,000.00 | 1,016.10 | 2.23 | 11.27 | ||||||||||||
Class C | 1,000.00 | 1,016.20 | 2.23 | 11.27 | ||||||||||||
Class I | 1,000.00 | 1,021.40 | 1.23 | 6.23 | ||||||||||||
Hypothetical (5% return before expenses) |
| |||||||||||||||
Class A | 1,000.00 | 1,017.56 | 1.48 | 7.51 | ||||||||||||
Class B | 1,000.00 | 1,013.75 | 2.23 | 11.32 | ||||||||||||
Class C | 1,000.00 | 1,013.75 | 2.23 | 11.32 | ||||||||||||
Class I | 1,000.00 | 1,018.82 | 1.23 | 6.24 | ||||||||||||
2
Table of Contents
VIRTUS OPPORTUNITIES TRUST
Disclosure of Fund Expenses (Unaudited) (Continued)
For the six-month period of April 1, 2014 to September 30, 2014
| Expense Table | ||||||||||||||||
| Beginning Account Value April 1, 2014 | Ending Account Value September 30, 2014 | Annualized Expense Ratio | Expenses Paid During the Period* | |||||||||||||
Global Real Estate Securities Fund |
| |||||||||||||||
Actual |
| |||||||||||||||
Class A | $ | 1,000.00 | $ | 1,034.50 | 1.40 | % | $ | 7.14 | ||||||||
Class C | 1,000.00 | 1,030.40 | 2.15 | 10.94 | ||||||||||||
Class I | 1,000.00 | 1,035.60 | 1.15 | 5.87 | ||||||||||||
Hypothetical (5% return before expenses) |
| |||||||||||||||
Class A | 1,000.00 | 1,017.96 | 1.40 | 7.11 | ||||||||||||
Class C | 1,000.00 | 1,014.15 | 2.15 | 10.91 | ||||||||||||
Class I | 1,000.00 | 1,019.23 | 1.15 | 5.84 | ||||||||||||
Greater European Opportunities Fund |
| |||||||||||||||
Actual |
| |||||||||||||||
Class A | $ | 1,000.00 | $ | 942.20 | 1.45 | % | $ | 7.06 | ||||||||
Class C | 1,000.00 | 938.40 | 2.20 | 10.69 | ||||||||||||
Class I | 1,000.00 | 943.60 | 1.20 | 5.85 | ||||||||||||
Hypothetical (5% return before expenses) |
| |||||||||||||||
Class A | 1,000.00 | 1,017.71 | 1.45 | 7.36 | ||||||||||||
Class C | 1,000.00 | 1,013.90 | 2.20 | 11.17 | ||||||||||||
Class I | 1,000.00 | 1,018.98 | 1.20 | 6.09 | ||||||||||||
International Equity Fund |
| |||||||||||||||
Actual |
| |||||||||||||||
Class A | $ | 1,000.00 | $ | 979.30 | 1.50 | % | $ | 7.44 | ||||||||
Class C | 1,000.00 | 975.30 | 2.25 | 11.14 | ||||||||||||
Class I | 1,000.00 | 981.00 | 1.25 | 6.21 | ||||||||||||
Hypothetical (5% return before expenses) |
| |||||||||||||||
Class A | 1,000.00 | 1,017.45 | 1.50 | 7.61 | ||||||||||||
Class C | 1,000.00 | 1,013.65 | 2.25 | 11.42 | ||||||||||||
Class I | 1,000.00 | 1,018.72 | 1.25 | 6.35 | ||||||||||||
International Real Estate Securities Fund |
| |||||||||||||||
Actual |
| |||||||||||||||
Class A | $ | 1,000.00 | $ | 1,038.40 | 1.50 | % | $ | 7.66 | ||||||||
Class C | 1,000.00 | 1,034.10 | 2.25 | 11.47 | ||||||||||||
Class I | 1,000.00 | 1,039.90 | 1.25 | 6.39 | ||||||||||||
Hypothetical (5% return before expenses) |
| |||||||||||||||
Class A | 1,000.00 | 1,017.45 | 1.50 | 7.61 | ||||||||||||
Class C | 1,000.00 | 1,013.65 | 2.25 | 11.42 | ||||||||||||
Class I | 1,000.00 | 1,018.72 | 1.25 | 6.35 | ||||||||||||
International Small-Cap Fund |
| |||||||||||||||
Actual |
| |||||||||||||||
Class A | $ | 1,000.00 | $ | 978.50 | 1.60 | % | $ | 7.94 | ||||||||
Class C | 1,000.00 | 975.10 | 2.35 | 11.64 | ||||||||||||
Class I | 1,000.00 | 980.80 | 1.35 | 6.70 | ||||||||||||
Hypothetical (5% return before expenses) |
| |||||||||||||||
Class A | 1,000.00 | 1,016.95 | 1.60 | 8.12 | ||||||||||||
Class C | 1,000.00 | 1,013.14 | 2.35 | 11.93 | ||||||||||||
Class I | 1,000.00 | 1,018.22 | 1.35 | 6.85 | ||||||||||||
| * | Expenses are equal to the relevant Funds’ annualized expense ratio, which is net of waived fees and reimbursed expenses, if applicable, multiplied by the average account value over the period, multiplied by the number of days (183) expenses were accrued in the most recent fiscal half-year, then divided by 365 to reflect the one-half year period. |
For Funds which may invest in other funds, the annualized expense ratios noted above do not reflect fees and expenses associated with the underlying funds. If such fees and expenses had been included, the expenses would have been higher.
You can find more information about the Funds’ expenses in the Financial Statements section that follows. For additional information on operating expenses and other shareholder costs, refer to the prospectus.
3
Table of Contents
American Depositary Receipt (ADR)
Represents shares of foreign companies traded in U.S. dollars on U.S. exchanges that are held by a U.S. bank or a trust. Foreign companies use ADRs in order to make it easier for Americans to buy their shares.
Barclays U.S. Aggregate Bond Index
The Barclays U.S. Aggregate Bond Index measures the U.S. investment grade fixed rate bond market. The index is calculated on a total return basis. The index is unmanaged, its returns do not reflect any fees, expenses, or sales charges, and it is not available for direct investment.
Dow Jones Industrial Average
A price weighted average of 30 blue chip stocks. The index is calculated on total return basis with dividends reinvested. The index is unmanaged, its returns do not reflect any fees, expenses or sales charges, and it is not available for direct investment.
Exchange-Traded Funds (ETF)
Portfolios of stocks or bonds that track a specific market index.
Exchange-Traded Note (ETN)
A type of unsecured, unsubordinated debt security. This type of debt security differs from other types of bonds and notes because ETN returns are based upon the performance of a market index minus applicable fees, no period coupon payments are distributed and no principal protections exists. ETNs are traded on a major exchange, such as the NYSE during normal trading hours.
European Central Bank (“ECB”)
The European Central Bank (ECB) is responsible for conducting monetary policy for the euro area. The ECB was established as the core of the Eurosystem and the European System of Central Banks (ESCB). The ESCB comprises the ECB and the National Central Banks (NCBs) of all 17 EU Member States whether they have adopted the Euro or not.
Federal Reserve (the “Fed”)
The Central Bank of the United States, responsible for controlling the money supply, interest rates and credit with the goal of keeping the U.S. economy and currency stable. Governed by a seven-member board, the system includes 12 regional Federal Reserve Banks, 25 branches and all national and state banks that are part of the system.
FTSE EPRA/NAREIT Developed Rental ex U.S. Index (net)
The FTSE EPRA/NAREIT Developed Rental ex U.S. Index (net) is a free-float market capitalization-weighted index measuring international real estate securities, which meet minimum size, liquidity and investment focus criteria. The index is a sub-set of the FTSE EPRA/NAREIT Investment Focus Index Series, which separates the existing constituents into both Rental and Non-Rental Indices. A company is classified as Rental if the rental revenue from properties is greater than or equal to 70% of total revenue. The classification is based on revenue sources as disclosed in the latest published financial statement. The index is calculated on a total return basis with net dividends reinvested. The index is unmanaged, its returns do not reflect any fees, expenses, or sales charges, and it is not available for direct investment.
FTSE EPRA/NAREIT Developed Rental Index (net)
The FTSE EPRA/NAREIT Developed Rental Index (net) is a free-float market capitalization-weighted index measuring global real estate securities, which meet minimum size, liquidity and investment focus criteria. The index is a sub-set of the FTSE EPRA/ NAREIT Investment Focus Index Series, which separates the existing constituents into both Rental and Non-Rental Indices. A company is classified as Rental if the rental revenue from properties is greater than or equal to 70% of total revenue. The classification is based on revenue sources as disclosed in the latest published financial statement. The index is calculated on a total return basis with net dividends reinvested. The index is unmanaged, its returns do not reflect any fees, expenses or sales charges, and it is not available for direct investment.
Global Dividend Linked Benchmark
The Global Dividend Linked Benchmark consists of the MSCI World Infrastructure Sector Capped Index, a market capitalization weighted index that measures performance of global infrastructure companies by capturing broad and diversified opportunities across telecommunication, utilities, energy, transportation and social infrastructure sectors. The telecommunication infrastructure and utilities sector each represent one-third of the index weight, while energy,
4
Table of Contents
KEY INVESTMENT TERMS (Continued)
transportation and social infrastructure sectors have a combined weight of the remaining one-third of the index. The index is calculated on a total return basis with net dividends reinvested. The index is unmanaged, its returns do not reflect any fees, expenses, or sales charges, and it is not available for direct investment. Performance of the Global Dividend Linked Benchmark prior to 9/1/2008 represents an allocation consisting of 65% MSCI USA/Utilities Index, 20% MSCI World Telecom Services Index, and 15% MSCI World ex USA/Utilities Index. The index is unmanaged, its returns do not reflect any fees, expenses, or sales charges, and it is not available for direct investment.
Gross Domestic Product (GDP)
The market value of all officially recognized final goods and services produced within a country in a given period.
iShares®
Represents shares of an open-end exchange-traded fund.
JPMorgan Corporate Emerging Markets Bond Index (CEMBI)
The JPMorgan Corporate Emerging Markets Bond Index (CEMBI) is a global, liquid corporate emerging markets benchmark that tracks U.S. dollar-denominated corporate bonds issued by emerging markets entities.
JPMorgan Emerging Markets Bond Global Diversified Index (EMBI Global Diversified)
The JPMorgan Emerging Markets Bond Global Diversified Index (EMBI Global Diversified) is a uniquely-weighted version of the JPMorgan EMBI Global Index. The index limits the weights of those countries with larger debt stock by only including specified portions of these countries’ eligible current face amounts of debt outstanding. The countries covered in the EMBI Global Diversified Index are identical to those covered by the EMBI Global Index. The EMBI Global Index tracks total returns for U.S. dollar-denominated debt instruments issued by emerging market sovereign and quasi-sovereign entities: Brady bonds, loans, Eurobonds. The index is unmanaged, its returns do not reflect any fees, expenses, or sales charges, and it is not available for direct investment.
MSCI All Country World Commodity Producer Sector Capped Index (net)
The MSCI All Country World Commodity Producer Sector Capped Index (net) is a market capitalization weighted index that measures performance of developed and emerging market commodity producers within the energy, metals and agriculture sectors. Each of the three sectors is equally weighted within the index. The index is calculated on a total return basis with net dividends reinvested. The index is unmanaged, its returns do not reflect any fees, expenses, or sales charges, and it is not available for direct investment.
MSCI All Country World ex U.S. Small Cap Index (net)
The MSCI All Country World Index ex U.S. Small Cap Index (net) is a free float-adjusted market capitalization-weighted index that measures small cap equity performance of developed and emerging markets, excluding the U.S. The index is calculated on a total return basis with net dividends reinvested. The index is unmanaged, its returns do not reflect any fees, expenses, or sales charges, and it is not available for direct investment.
MSCI All Country World Index (net)
The MSCI All Country World Index (net) is a free float-adjusted market capitalization-weighted index that measures equity performance of developed and emerging markets. The index is calculated on a total return basis with net dividends reinvested. The index is unmanaged, its returns do not reflect any fees, expenses, or sales charges, and it is not available for direct investment.
MSCI EAFE® Index (net)
The MSCI EAFE® (Europe, Australasia, Far East) Index (net) is a free float-adjusted market capitalization-weighted index that measures developed foreign market equity performance, excluding the U.S. and Canada. The index is calculated on a total return basis with net dividends reinvested. The index is unmanaged, its returns do not reflect any fees, expenses, or sales charges, and it is not available for direct investment.
MSCI Emerging Markets Index (net)
The MSCI Emerging Markets Index (net) is a free float-adjusted market capitalization-weighted index designed to measure equity market performance in the global emerging markets. The index is calculated on a total return basis with net dividends reinvested. The index is unmanaged, its returns do not reflect any fees, expenses, or sales charges, and it is not available for direct investment.
5
Table of Contents
KEY INVESTMENT TERMS (Continued)
MSCI Emerging Markets Small Cap Index (net)
The MSCI Emerging Markets Small Cap Index (net) is a free float-adjusted market capitalization-weighted index designed to measure small cap equity market performance in the global emerging markets. The index is calculated on a total return basis with net dividends reinvested. The index is unmanaged, its returns do not reflect any fees, expenses, or sales charges, and it is not available for direct investment.
MSCI Europe Index (net)
The MSCI Europe Index (net) is a free float-adjusted market capitalization weighted index that measures equity market performance of the developed markets in Europe. The index is calculated on a total return basis with net dividends reinvested. The index is unmanaged, its returns do not reflect any fees, expenses, or sales charges, and it is not available for direct investment.
MSCI World Index (net)
The MSCI World Index (net) is a free float-adjusted market capitalization-weighted index that measures developed global market equity performance. The index is calculated on a total return basis with net dividends reinvested. The index is unmanaged, its returns do not reflect any fees, expenses, or sales charges, and it is not available for direct investment.
MSCI World Infrastructure Sector Capped Index
The MSCI World Infrastructure Sector Capped Index is a market capitalization weighted index that measures performance of global infrastructure companies by capturing broad and diversified opportunities across telecommunication, utilities, energy, transportation and social infrastructure sectors. The telecommunication infrastructure and utilities sector each represent one-third of the index weight, while energy, transportation and social infrastructure sectors have a combined weight of the remaining one-third of the index. Prior to September 1, 2008, the index allocation was 65% MSCI USA/utilities index, 20% MSCI World Telcom Services index and 15% MSCI World ex USA utilities index. The index is unmanaged, its returns do not reflect any fees, expenses, or sales charges, and it is not available for direct investment.
NASDAQ Composite Index®
A market-capitalization weighted index of the more than 3,000 common equities listed on the Nasdaq stock exchange. Unlike other market indexes, the NASDAQ composite is not limited to companies that have U.S. headquarters. The index is unmanaged, its returns do not reflect any fees, expenses or sales charges, and it is not available for direct investment.
Payment-in-Kind Security (PIK)
A bond which pays interest in the form of additional bonds, or preferred stock which pays dividends in the form of additional preferred stock.
Quantitative Easing
A government monetary policy occasionally used to increase the money supply by buying government securities or other securities from the market. Quantitative easing increases the money supply by flooding financial institutions with capital in an effort to promote increased lending and liquidity.
Real Estate Investment Trust (REIT)
A publicly traded company that owns, develops and operates income-producing real estate such as apartments, office buildings, hotels, shopping centers and other commercial properties.
S&P 500® Index
The S&P 500® Index is a free-float market capitalization-weighted index of 500 of the largest U.S. companies. The index is calculated on a total return basis with dividends reinvested. The index is unmanaged, its returns do not reflect any fees, expenses, or sales charges, and it is not available for direct investment.
Sponsored ADR (American Depositary Receipt)
An ADR which is issued with the cooperation of the company whose stock will underlie the ADR. Sponsored ADRs generally carry the same rights normally given to stockholders, such as voting rights. ADRs must be sponsored to be able to trade on a major U.S. exchange such as the New York Stock Exchange (“NYSE”).
6
Table of Contents
Fund Summary | Ticker Symbols: Class A: VEDAX Class C: VEDCX Class I: VIEDX |
| ¢ | The Fund is non-diversified and has an investment objective of total return from current income and capital appreciation. |
| ¢ | For the fiscal year ended September 30, 2014, the Fund’s Class A shares at NAV returned 7.83%, Class C shares returned 7.03%, and Class I shares returned 8.11%. For the same period, the Barclays U.S. Aggregate Bond Index, a broad-based fixed income index, returned 3.96%, and the JPMorgan Emerging Markets Bond Global Diversified Index, the Fund’s style-specific benchmark appropriate for comparison, returned 9.67%. |
All performance figures assume reinvestment of distributions and exclude the effect of sales charges. Past performance is no guarantee of future results, and current performance may be higher or lower than the performance shown above.
How did the markets perform during the Fund’s fiscal year?
Emerging market (EM) dollar-denominated debt outperformed other U.S. fixed income sectors including high yield, investment grade, and Treasuries during the fiscal year ended September 30, 2014. EM sovereign dollar-denominated debt, as represented by the J.P. Morgan EMBI Global Diversified Index, returned 9.67% for the period. EM corporate dollar-denominated debt, as represented by the J.P. Morgan Corporate Emerging Markets Bond Index (CEMBI), returned 8.36% for the period.
EM returns were aided by a flattening U.S. yield curve with 30-year U.S. Treasury yields dropping 49 basis points (bp) during the period and 10-year U.S. Treasury yields dropping 12 bp. The 2- to 30-year yield differential compressed by 74 bp during the period while the 2-10-year yield compressed by 37 bp. As a result, long duration fixed income assets, like EM debt, enjoyed strong performance during the period.
Returns were also supported by a good credit environment which reflected easy global monetary conditions emanating from developed market Central Bank policies and strong investor demand for yield. Reflecting these conditions, the credit spread of the benchmark style index compressed by 42 bp during the period despite moderate weakness in overall EM sovereign fundamentals. During the period, EM technical factors improved, with lower net supply combined with increased investor flows.
Within EM sovereign debt, the lower quality tier led performance over the last year. Frontier markets like Argentina, Sri Lanka, and Ivory Coast led nominal returns while on a dollar-weighted basis larger issuers such as Indonesia and Mexico contributed strong returns. Venezuela and Russia were meaningful underperformers, reflecting a combination of higher geopolitical risk and weaker fundamentals.
In the EM corporate sector, high quality debt outperformed, led by issuers from Mexico and India which benefited from positive political change and/or reforms. Russian corporate issuer performance significantly lagged due to an evolving negative geopolitical situation, which has resulted in economic sanctions and a weaker overall fundamental backdrop.
Overall, the EM sector performed well during the period despite increased geopolitical risk, lower commodity prices, increased investor concern over global growth, and the threat of tighter U.S. monetary policy. We would also note that valuations easily absorbed a heavy election calendar, which in the past would have likely created material volatility. We think this speaks well to the overall maturity of the asset class compared to only a decade ago.
What factors affected the Fund’s performance during its fiscal year?
The Fund’s overall performance for the period lagged its style-specific benchmark.
Country exposure and issue selection, excluding local market debt, within Colombia, India, Indonesia, Mexico, Peru, and Turkey contributed positively to the Fund’s relative performance. In addition, issue selection within the out-of-index corporate sectors, both high quality and high yield, enhanced relative performance.
Overweight exposure to Venezuela and Russia detracted from overall performance during the period. Out-of-index local market non-dollar exposure also materially hurt relative performance. The Fund’s shorter duration relative to the style-specific benchmark was also a modest negative contribution to relative performance.
High yield sovereign issue selection detracted moderately from the Fund’s performance.
Specifically, the negative impact of the Fund’s overweight to Venezuela more than offset positive selection to various frontier market issuers including Argentina, Dominican Republic, El Salvador, Guatemala, Iraq, Ivory Coast, Sri Lanka, and Zambia.
The preceding information is the opinion of portfolio management. Any such opinions are subject to change at any time based upon market or other conditions and should not be relied upon as investment advice. Past performance is no guarantee of future results, and there is no guarantee that market forecasts will be realized.
There is no guarantee that the Fund will meet its objective.
| Asset Allocation | ||||||||
The following table presents asset allocations within certain sectors and as a percentage of total investments as of September 30, 2014.
|
| |||||||
Corporate Bonds and Notes | 70 | % | ||||||
Financials | 32 | % | ||||||
Energy | 14 | |||||||
Materials | 8 | |||||||
Industrials | 6 | |||||||
All other Corporate Bonds | 10 | |||||||
Foreign Government Securities | 27 | |||||||
Other (includes short-term investments) | 3 | |||||||
|
| |||||||
Total | 100 | % | ||||||
|
| |||||||
Debt securities are subject to various risks, the most prominent of which are credit and interest rate risk. The issuer of a security may fail to make payments in a timely manner. Values of debt securities may rise and fall in response to changes in interest rates. This risk may be enhanced with longer-term maturities. There is a greater level of credit risk and price volatility involved with high yield securities than investment grade securities. Changes in interest rates can cause both extension and prepayment risks for asset and mortgage-backed securities. These securities are also subject to risks associated with the repayment of underlying collateral. There may be no ready market for loan participation interests. The fund may have to sell the interests at a substantial discount. Such interests are subject to the credit risk of the underlying corporate borrower. Investing internationally, especially in emerging markets, involves additional risks such as currency, political, accounting, economic, and market risk.
For information regarding the indexes and certain investment terms, see the Key Investment Terms starting on page 4.
7
Table of Contents
Emerging Markets Debt Fund (Continued)
| Average Annual Total Returns1 for periods ended 9/30/14 | ||||||||||||
| 1 year | Since Inception | Inception Date | ||||||||||
| Class A Shares at NAV2 | 7.83 | % | 3.23 | % | 9/5/12 | |||||||
| Class A Shares at POP3,4 | 3.78 | 1.34 | 9/5/12 | |||||||||
| Class C Shares at NAV2 and with CDSC4 | 7.03 | 2.43 | 9/5/12 | |||||||||
| Class I Shares at NAV | 8.11 | 3.43 | 9/5/12 | |||||||||
| Barclays U.S. Aggregate Bond Index | 3.96 | 1.16 | 5 | — | ||||||||
| JPMorgan Emerging Markets Bond Global Diversified Index | 9.67 | 3.05 | 5 | — | ||||||||
Fund Expense Ratios6: A Shares: Gross 1.57%, Net 1.35%; C Shares: Gross 2.32%, Net 2.10%; I Shares: Gross 1.32%, Net 1.10%.
All returns represent past performance which is no guarantee of future results. Current performance may be higher or lower than the performance shown. The investment return and principal value of an investment will fluctuate so that an investor’s shares, when redeemed, may be worth more or less than their original cost. The above table and graph below do not reflect the deduction of taxes that a shareholder would pay on fund distributions or the redemption of shares. Please visit Virtus.com for performance data current to the most recent month-end.
| 1 | Total returns are historical and include changes in share price and the reinvestment of both dividends and capital gains distributions. |
| 2 | “NAV” (Net Asset Value) total returns do not include the effect of any sales charge. |
| 3 | “POP” (Public Offering Price) total returns include the effect of the maximum front-end 3.75% sales charge. |
| 4 | “CDSC” (Contingent Deferred Sales Charge) is applied to redemptions of certain classes of shares that do not have a sales charge applied at the time of purchase. CDSC charges for certain redemptions of Class A shares made within 18 months of purchase in which a finder’s fee was paid and all redemptions of Class C shares within the first year are 1% and 0% thereafter. |
| 5 | The since inception index returns are from the Fund’s inception date. |
| 6 | The expense ratios of the Fund are set forth according to the prospectus for the Fund effective January 28, 2014 and may differ from the expense ratios disclosed in the Financial Highlights tables in this report. See the Financial Highlights for more current expense ratios. Net Expense: Expenses reduced by the voluntary fee waiver which may be discontinued at any time. Gross Expense: Does not reflect the effect of the fee waiver. |
Growth of $10,000 For periods ended 9/30
This chart assumes an initial investment of $10,000 made on September 5, 2012 (inception date of the Fund), for Class A, Class C, and Class I shares including any applicable sales charges or fees. Performance assumes reinvestment of dividends and capital gain distributions.
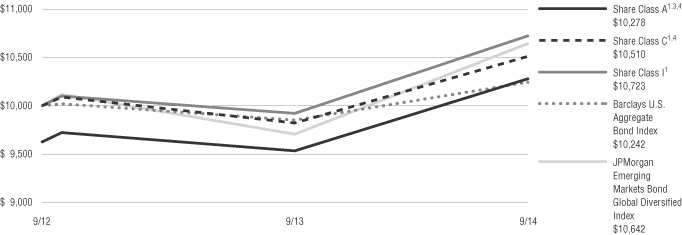
The indexes are unmanaged and not available for direct investment; therefore, their performance does not reflect the expenses associated with active management of an actual portfolio.
For information regarding the indexes and certain investment terms, see the Key Investment Terms starting on page 4.
8
Table of Contents
Emerging Markets Equity Income Fund
Fund Summary | Ticker Symbols: Class A: VEIAX Class C: VEICX Class I: VEIIX |
| ¢ | The Fund is diversified and has investment objectives of seeking capital appreciation and income. |
| ¢ | For the fiscal year ended September 30, 2014, the Fund’s Class A shares at NAV returned 1.54%, Class C shares returned 0.80%, and Class I shares returned 1.87%. For the same period, the S&P 500® Index, a broad-based equity index, returned 19.73%, and the MSCI Emerging Markets Index (net), the Fund’s style-specific benchmark appropriate for comparison, returned 4.30%. |
All performance figures assume reinvestment of distributions and exclude the effect of sales charges. Past performance is no guarantee of future results, and current performance may be higher or lower than the performance shown above.
How did the markets perform during the Fund’s fiscal year?
During the Fund’s fiscal year, global equity markets performed strongly, with the MSCI World Index (net) gaining 12.2%. Underpinning this performance was the U.S. stock market, with the S&P 500® Index gaining almost 20%. The U.S. economy has performed well despite a contraction in the first calendar quarter of 2014. Whilst the Federal Reserve has been gradually reducing its monthly bond purchases, it has also reiterated its willingness to support labor market improvements and a gradual rise in inflation. This has provided the key support for the positive tone to the market.
Returns in other international markets have been positive through the 12 months, but much more muted due to weaker economic performance, notably in Europe and China. The MSCI Emerging Market Equity Index returned 4.3% with investor sentiment kept in check by a strengthening U.S. dollar, expectations that the Federal Reserve will raise rates sooner than expected, and weak economic data from China. The main problem for emerging market exporters has been that the stronger economic data from the U.S. has been offset by disappointing economic news in both Europe and Japan. This, however, is likely to lead to additional monetary stimulus in these regions and should improve the prospects for recovery as we enter 2015.
What factors affected the Fund’s performance during its fiscal year?
Whilst the Fund’s strategy moderately underperformed the benchmark during the fiscal year, the Fund incurred a larger underperformance due to the impact of cash flow, i.e., the timing of large cash flow on a relatively small mutual fund.
In constructing the portfolio, we seek to ensure that all excess value is delivered through security selection rather than through regional or sector bets. This is due to our conviction that the characteristics exhibited by companies and managements that are committed to paying and growing their dividends are powerful indicators of a company’s future health and profitability. Style factors do inevitably have an impact, however. During the fiscal year, value outperformed growth as investors were unsurprisingly attracted to the relative valuation of the region in a global context. Dividend yield, in line with other value factors such as low price-to-earnings ratios, performed well, and this was to the benefit of the strategy. In contrast, quality underperformed with investors rewarding companies with high accruals, high net debt to enterprise value, and low returns on invested capital. Our emphasis on high quality companies that have strong dividend characteristics combined with high levels of free cash flow, low levels of debt, strong capital management discipline, and stable earnings negatively impacted performance. As noted, given our portfolio construction methodology, there is little impact on relative performance of industry and regional tilts. Stock selection was moderately negative through the 12-month period.
The preceding information is the opinion of portfolio management. Any such opinions are subject to change based upon market or other conditions and should not be relied upon as investment advice. Past performance is no guarantee of future results, and there is no guarantee that market forecasts will be realized.
There is no guarantee that the Fund will meet its objectives.
Asset Allocation | ||||
The following table presents asset allocations within certain sectors and as a percentage of total investments as of September 30, 2014.
|
| |||
Financials | 27 | % | ||
Information Technology | 12 | |||
Energy | 10 | |||
Consumer Discretionary | 8 | |||
Industrials | 8 | |||
Materials | 8 | |||
Telecommunication Services | 7 | |||
Other (includes short-term investments) | 20 | |||
|
| |||
Total | 100 | % | ||
|
| |||
The market price of equity securities may be affected by financial market, industry, or issuer-specific events. Focus on a particular style or on small or medium-sized companies may enhance that risk. Investing internationally, especially in emerging markets, involves additional risks such as currency, political, accounting, economic, and market risk. A fund that focuses its investments in a particular geographic location will be highly sensitive to financial, economic, political, and other developments affecting the fiscal stability of that location.
For information regarding the indexes and certain investment terms, see the Key Investment Terms starting on page 4.
9
Table of Contents
Emerging Markets Equity Income Fund (Continued)
| Average Annual Total Returns1 for periods ended 9/30/14 | ||||||||||||
| 1 year | Since Inception | Inception Date | ||||||||||
| Class A Shares at NAV2 | 1.54 | % | 4.66 | % | 9/5/12 | |||||||
| Class A Shares at POP3,4 | -4.30 | 1.71 | 9/5/12 | |||||||||
| Class C Shares at NAV2 and with CDSC4 | 0.80 | 3.90 | 9/5/12 | |||||||||
| Class I Shares at NAV | 1.87 | 4.92 | 9/5/12 | |||||||||
S&P 500® Index | 19.73 | �� | 20.42 | | —5 | | ||||||
| MSCI Emerging Markets Index (net) | 4.30 | 5.89 | —5 | |||||||||
Fund Expense Ratios6: A Shares: Gross 1.75%, Net 1.75%; C Shares: Gross 2.50%, Net 2.50%; I Shares: Gross 1.50%, Net 1.50%.
All returns represent past performance which is no guarantee of future results. Current performance may be higher or lower than the performance shown. The investment return and principal value of an investment will fluctuate so that an investor’s shares, when redeemed, may be worth more or less than their original cost. The above table and graph below do not reflect the deduction of taxes that a shareholder would pay on fund distributions or the redemption of shares. Please visit Virtus.com for performance data current to the most recent month-end.
| 1 | Total returns are historical and include changes in share price and the reinvestment of both dividends and capital gains distributions. |
| 2 | “NAV” (Net Asset Value) total returns do not include the effect of any sales charge. |
| 3 | “POP” (Public Offering Price) total returns include the effect of the maximum front-end 5.75% sales charge. |
| 4 | “CDSC” (Contingent Deferred Sales Charge) is applied to redemptions of certain classes of shares that do not have a sales charge applied at the time of purchase. CDSC charges for certain redemptions of Class A shares made within 18 months of purchase in which a finder’s fee was paid and all redemptions of Class C shares within the first year are 1% and 0% thereafter. |
| 5 | The since inception index returns are from the Fund’s inception date. |
| 6 | The expense ratios of the Fund are set forth according to the prospectus for the Fund effective January 28, 2014 and may differ from the expense ratios disclosed in the Financial Highlights tables in this report. See the Financial Highlights for more current expense ratios. Net Expense: Expenses reduced by the voluntary fee waiver which may be discontinued at any time. Gross Expense: Does not reflect the effect of the fee waiver. |
Growth of $10,000 For periods ended 9/30
This chart assumes an initial investment of $10,000 made on September 5, 2012 (inception date of the Fund), for Class A, Class C, and Class I shares including any applicable sales charges or fees. Performance assumes reinvestment of dividends and capital gain distributions.
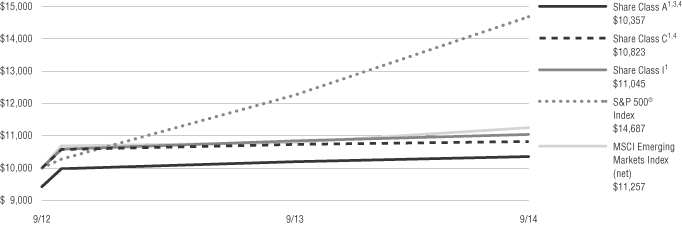
The indexes are unmanaged and not available for direct investment; therefore, their performance does not reflect the expenses associated with active management of an actual portfolio.
For information regarding the indexes and certain investment terms, see the Key Investment Terms starting on page 4.
10
Table of Contents
Emerging Markets Small-Cap Fund
Fund Summary | Ticker Symbols: Class A: VAESX Class C: VCESX Class I: VIESX |
| ¢ | The Fund is diversified and has an investment objective of capital appreciation. |
| ¢ | For the fiscal period December 17, 2013 (inception date) through September 30, 2014, the Fund’s Class A shares at NAV returned 3.45%*, Class C shares returned 2.82%*, and Class I shares returned 3.66%*. For the same period, the S&P 500® Index, a broad-based equity index, returned 12.53%*, and the MSCI Small Cap Index (net), the Fund’s style-specific benchmark appropriate for comparison, returned 9.36%*. |
| * | Returns less than 1 year are not annualized. |
All performance figures assume reinvestment of distributions and exclude the effect of sales charges. Past performance is no guarantee of future results, and current performance may be higher or lower than the performance shown above.
How did the market perform during the Fund’s fiscal period?
Emerging market equity markets rose since the inception of the Fund (December 17, 2013). Although positive, equity markets were volatile during the period given the continued uncertainty in the global macroeconomic environment. The volatility during the period was driven by political turmoil in Ukraine, currency devaluations in Argentina and Venezuela, and slowing growth in China and Europe. Positive election results in Indonesia and India propelled these specific markets higher. Despite the volatility in the markets, small-cap stocks in emerging markets outperformed their large-cap counterparts by over 500 basis points during the period, which is in direct contrast to U.S. stocks where small-caps underperformed large-cap stocks over the same period.
There was substantial variation in returns by region within emerging markets. Asia ex-Japan performed strongly, led by sharp gains in India, Thailand, and Indonesia, whereas Emerging Europe and Latin America both experienced losses during the period. Global commodity prices fell during the period, which put pressure on the commodity-linked economies in emerging markets, such as Brazil and Chile. Most emerging market currencies depreciated during the period as well.
Most sectors were positive since the Fund’s inception with telecommunication services, health care, and information technology posting the strongest performance. Energy was the only sector to post a negative return for the period.
What factors affected the Fund’s performance during its fiscal period?
The Fund underperformed the MSCI Emerging Markets Small Cap Index since inception of the Fund (December 17, 2013). We tend to own larger positions than most managers, and many of these positions are not highly correlated with the markets in which they trade. This will, at times, result in performance for the Fund that varies materially from the benchmark. Additionally, performance during the period included the Fund’s initial ramp-up period, where performance was negatively impacted in its initial weeks as registration in certain markets took longer than expected.
Since inception of the Fund, relative overweights in underperforming countries with higher currency volatility, such as Chile, Brazil, and Poland, negatively affected results. Additionally, our portfolio’s focus on high-quality, domestically-focused companies resulted in a higher allocation to consumer staples and industrials, which underperformed during the period. In more recent months, however, as rising global uncertainty has prompted market declines and increased volatility, our portfolio has benefited from a flight to higher-quality, more defensive stocks. We believe that our high-quality approach will achieve excess returns over a complete market cycle.
The preceding information is the opinion of portfolio management. Any such opinions are subject to change at any time based upon market or other conditions and should not be relied upon as investment advice. Past performance is no guarantee of future results, and there is no guarantee that market forecasts will be realized.
There is no guarantee that the Fund will meet its objective.
| Asset Allocation | ||||
The following table presents asset allocations within certain sectors and as a percentage of total investments as of September 30, 2014.
|
| |||
Consumer Staples | 22 | % | ||
Industrials | 22 | |||
Financials | 17 | |||
Information Technology | 13 | |||
Consumer Discretionary | 9 | |||
Materials | 9 | |||
Health Care | 2 | |||
Other (includes short-term investments) | 6 | |||
|
| |||
Total | 100 | % | ||
|
| |||
The market price of equity securities may be affected by financial market, industry, or issuer-specific events. Focus on a particular style or on small or medium-sized companies may enhance that risk. Investing internationally, especially in emerging markets, involves additional risks such as currency, political, accounting, economic, and market risk. Because the fund has a limited number of securities, it may be more susceptible to factors adversely affecting its securities than a less concentrated fund. Securities in the fund may go up or down in response to the prospects of individual companies and general economic conditions. Price changes may be short or long term. A fund that focuses its investments in a particular industry or sector will be more sensitive to conditions that affect that industry or sector than a non-concentrated fund.
For information regarding the indexes and certain investment terms, see the Key Investment Terms starting on page 4.
11
Table of Contents
Emerging Markets Small-Cap Fund (Continued)
| Average Annual Total Returns1 for periods ended 9/30/14 | ||||||||
Since Inception | Inception Date | |||||||
| Class A Shares at NAV2 | 3.45 | % | 12/17/13 | |||||
| Class A Shares at POP3,4 | -2.50 | 12/17/13 | ||||||
| Class C Shares at NAV2 | 2.82 | 12/17/13 | ||||||
| Class C Shares with CDSC4 | 1.82 | 12/17/13 | ||||||
| Class I Shares at NAV | 3.66 | 12/17/13 | ||||||
| S&P 500® Index | 12.53 | — | ||||||
| MSCI Small Cap Index | 9.36 | — | ||||||
Fund Expense Ratios6: A Shares: Gross 2.11%, Net 1.85%; C Shares: Gross 2.86%, Net 2.60%; I Shares: Gross 1.86%, Net 1.60%.
All returns represent past performance which is no guarantee of future results. Current performance may be higher or lower than the performance shown. The investment return and principal value of an investment will fluctuate so that an investor’s shares, when redeemed, may be worth more or less than their original cost. The above table and graph below do not reflect the deduction of taxes that a shareholder would pay on fund distributions or the redemption of shares. Please visit Virtus.com for performance data current to the most recent month-end.
| 1 | Total returns are historical and include changes in share price and the reinvestment of both dividends and capital gains distributions. |
| 2 | “NAV” (Net Asset Value) total returns do not include the effect of any sales charge. |
| 3 | “POP” (Public Offering Price) total returns include the effect of the maximum front-end 5.75% sales charge. |
| 4 | “CDSC” (Contingent Deferred Sales Charge) is applied to redemptions of certain classes of shares that do not have a sales charge applied at the time of purchase. CDSC charges for certain redemptions of Class A shares made within 18 months of purchase in which a finder’s fee was paid and all redemptions of Class C shares within the first year are 1% and 0% thereafter. |
| 5 | The since inception index returns are from the Fund’s inception date. |
| 6 | The expense ratios of the Fund are set forth according to the prospectus for the Fund effective January 28, 2014, as supplemented and revised, and may differ from the expense ratios disclosed in the Financial Highlights tables in this report. See the Financial Highlights for more current expense ratios. Net Expense: Expenses reduced by the contractual fee waiver in effect through January 31, 2015. Gross Expense: Does not reflect the effect of the fee waiver. |
Growth of $10,000 For periods ended 9/30
This chart assumes an initial investment of $10,000 made on December 17, 2013 (inception date of the Fund), for Class A, Class C, and Class I shares including any applicable sales charges or fees. Performance assumes reinvestment of dividends and capital gain distributions.
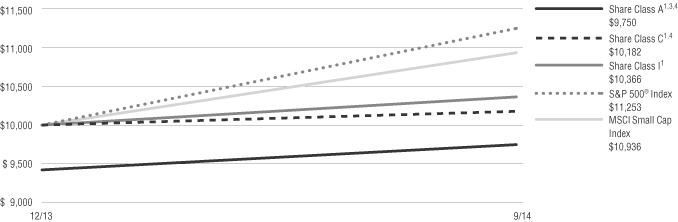
The indexes are unmanaged and not available for direct investment; therefore, their performance does not reflect the expenses associated with active management of an actual portfolio.
For information regarding the indexes and certain investment terms, see the Key Investment Terms starting on page 4.
12
Table of Contents
Fund Summary | Ticker Symbols: Class A: VGCAX Class C: VGCCX Class I: VGCIX |
| ¢ | The Fund is diversified and has an investment objective of capital appreciation. |
| ¢ | For the fiscal year ended September 30, 2014, the Fund’s Class A shares at NAV returned -6.82%, Class C shares returned -7.46%, and Class I shares returned -6.58%. For the same period, the S&P 500® Index, a broad-based equity index, returned 19.73%, and the MSCI AC World Commodity Producer Sector Capped Index (net), the Fund’s style-specific benchmark appropriate for comparison, returned 2.45%. |
All performance figures assume reinvestment of distributions and exclude the effect of sales charges. Past performance is no guarantee of future results, and current performance may be higher or lower than the performance shown above.
How did the markets perform during the Fund’s fiscal year?
| ¢ | Stock markets were, on balance, strong, but the surprise (for most analysts) was the strong performance of long-term bonds, which outperformed stock markets this year, thanks to weakening economies and the re-emergence of political risk. |
| ¢ | Our macro view for 2014, has been that the long, post-Cold War peaceful era is over, and that the global economic recovery will, partly due to geopolitical problems, continue to have problems meeting optimistic expectations. Russian President Vladimir Putin revived memories of the Cold War, and China revived memories of the ruling party prior to the Nixon visit to Beijing, while ISIS and Al Qaeda revived memories of 9/11 and of the 14 centuries of conflict between Sunnis and Shias. That means underweighting the metals of economic growth – iron ore, copper and zinc – and overweighting the metals of fear – gold and silver. |
| ¢ | When Europe awakened to its dangerous dependence on Russian energy, a new potential catalyst developed for higher natural gas prices, and for North American natural gas stocks. |
| ¢ | U.S. economic performance in the first quarter of 2014 was buffeted by winter storms, and only recovered modestly as spring warmed the land. Nonetheless, the U.S. economy strengthened, thanks, in great part, to the fracking revolution for oil and gas production. |
| ¢ | With the expiration of tapering, the Fed exited the bond market, which astonished economists by strengthening, as new economic doubts emerged. |
| ¢ | The Japanese economic recovery faltered during 2014. Prime Minister Shinzo Abe drew criticism for failing to placate neighbors with historical grievances; energy imports kept the economy in a sustained deficit; and as the April implementation of a sales tax increase approached, investors departed to the sidelines to wait for evidence that the “Three Arrows” of “Abenomics” reform would be able to invoke genuine growth. |
| ¢ | During 2014, China’s economy began to exhibit slower growth amid rising vacancy rates from a busted boom, and declining exports – most notably to Europe, China’s biggest market. The result: falling demand for commodities, particularly iron ore and copper – and even oil. |
| ¢ | Energy: From the third quarter of 2013 through the first half of 2014, oil prices stayed high, partially propped by fears of Mideast catastrophe. When President Obama finally intervened against ISIS, oil prices began a 20% plunge. Saudi Arabia (the world’s No.1 oil producer) and their Sunni allies seem to have decided to (1) rein in the growth in U.S. fracking production, and (2) slash Russia and Iran’s oil profits in punishment for their support of Syria, by increasing oil production at a time of softening global demand, and contributing to the further decline in the price of oil. Natural gas prices fell from lofty levels caused by a cold winter, which was followed by a balmy (not hot) summer. |
| ¢ | Base metals: Iron ore prices took a brutal beating, as Chinese demand fell and the four biggest exporters of iron ore ramped up production, each hoping to force its competitors to blink. Steelmakers could hardly believe their good fortune at a time of slumping global demand. |
| ¢ | Agriculture: After U.S. farmers produced near-record crops in 2013, followed by a winter that seemed Alaskan in potency, investors assumed a return to yield normalcy. Instead, Midwest weather swiftly became perfect and stayed that way until the 2014 harvest began. “Bin-busting” is an inadequate adjective for the supplies of corn and soybeans. Grain futures suffered, much to the delight of producers of pork, beef, and chicken. |
| ¢ | Precious metals: With deflation stalking much of the world, and geopolitical crises headlining the news, this has been a tumultuous year for gold and silver – and for the stocks of the precious metals mining companies. Gold stocks rose sharply after Putin seized Crimea and pro-Russia rebels in Ukraine shot down the Malaysian airliner. However, as fears of war cooled, with Putin showing little desire to overrun near-bankrupt Ukraine, and with a strong U.S. dollar, gold fell from $1390 to as low as $1184, and the gold mining stocks fell. |
What factors affected the Fund’s performance during its fiscal year?
Over the reporting period, the base metals stocks suffered steep declines, while the other three commodity sectors – energy, precious metals, and agriculture – had tiny returns, as if becalmed. However, during the year, in response to geopolitical events and market volatility, the commodity stocks exhibited big returns at times, followed by big plunges. We actively adjusted portfolio weights in response to changes in perceived risks and rewards. During the reporting period, we were generally overweight energy and precious metals relative to the benchmark, and close to the benchmark in agriculture. We were underweight base metals throughout.
Materials
Energy ended the period with modestly positive returns. The strong performance for the oil fracking companies had made this our best performing sector during the year – until the robust Saudi production levels drove down the price of oil. We are retaining our oil and gas overweight, because our companies remain profitable, and the huge geopolitical perils in the profoundly toxic Mideast have the potential to produce another upside oil shock.
Our agriculture weighting reflects the huge yields of soybean and corn crops, the most important crops for the production of meat and dairy products: We are heavily committed to users of grains – meat and feed producers, and suppliers of transportation and storage to grain farmers. We are underweight the inputs to farming, the seed, fertilizer, and farm equipment suppliers.
Our low base metal weight continues, because, although the iron ore operators are still profitable, as
For information regarding the indexes and certain investment terms, see the Key Investment Terms starting on page 4.
13
Table of Contents
| Global Commodities Stock Fund (Continued) |
are the copper mining companies, only an unlikely strengthening of the Chinese and European economies could cause base metal prices to rebound substantially from their current lows.
Our precious metals companies experienced significant volatility through the reporting period, serving the purpose of gold in a commodity portfolio; they gave us modest profits when almost every other kind of stock was performing poorly. There is currently no sign of inflation, but our portfolio maintains a modest precious metals weighting against geopolitical and financial shocks. Despite all the screaming Street commentary about the demise of commodities and the onset of deflation and a new sustained boom for the S&P 500® Index, the actual data are not what the consensus proclaims. As has been often observed, you are free to change your forecasts but not to change the results of previous forecasts.
As the Millennium dawned, amid ululations of joy among the same Wall Street organizations now proclaiming disaster for raw materials, the S&P 500® Index was $1469, WTI was $25.60, and Gold was $290. In the intervening years, commodity prices have been much higher than today, but the S&P 500® Index is near its all-time high. For 15 years, then, commodities have hugely outperformed the S&P 500® Index, despite their two year sell-off. We are told that this means the commodity story is over. It will be when windmills have displaced oil, and governments have stopped running deficits and printing money.
Industrials
Our portfolio increased its Japanese exposure in 2013, assuming that the weakening yen meant strengthening corporate profits for exporters. In early 2014, as the Japanese economy faced a sales tax increase, and as the yen strengthened, we stepped back, temporarily, from our Japanese exposure. The recent approval of nuclear power plant restarts has improved the outlook for the Japanese economy.
The preceding information is the opinion of portfolio management. Any such opinions are subject to change at any time based upon market or other conditions and should not be relied upon as investment advice. Past performance is no guarantee of future results, and there is no guarantee that market forecasts will be realized.
There is no guarantee that the Fund will meet its objective.
| Asset Allocation | ||||
The following table presents asset allocations within certain sectors and as a percentage of total investments as of September 30, 2014.
|
| |||
Energy | 41 | % | ||
Materials | 28 | |||
Consumer Staples | 21 | |||
Industrials | 5 | |||
Consumer Discretionary | 1 | |||
Other (includes short-term investments) | 4 | |||
|
| |||
Total | 100 | % | ||
|
| |||
The market price of equity securities may be affected by financial market, industry, or issuer-specific events. Focus on a particular style or on small or medium-sized companies may enhance that risk. Investing internationally, especially in emerging markets, involves additional risks such as currency, political, accounting, economic, and market risk. Commodity-linked instruments may experience a return different than the commodity they attempt to track and may also be exposed to counter party risk. The value of an ETF may be more volatile than the underlying portfolio of securities the ETF is designed to track. The costs of owning the ETF may exceed the cost of investing directly in the underlying securities.
For information regarding the indexes and certain investment terms, see the Key Investment Terms starting on page 4.
14
Table of Contents
Global Commodities Stock Fund (Continued)
| Average Annual Total Returns1 for periods ended 9/30/14 | ||||||||||||
| 1 year | Since Inception | Inception Date | ||||||||||
| Class A Shares at NAV2 | -6.82 | % | -4.48 | % | 3/15/11 | |||||||
| Class A Shares at POP3,4 | -12.18 | -6.06 | 3/15/11 | |||||||||
| Class C Shares at NAV2 and with CDSC4 | -7.46 | -5.12 | 3/15/11 | |||||||||
| Class I Shares at NAV | -6.58 | -4.22 | 3/15/11 | |||||||||
| S&P 500® Index | 19.73 | 15.35 | 5 | — | ||||||||
| MSCI AC World Commodity Producer Sector Capped Index (net) | 2.45 | -3.21 | 5 | — | ||||||||
Fund Expense Ratios6: A Shares: Gross 1.91%, Net 1.65%; C Shares: Gross 2.66%, Net 2.40%; I Shares: Gross 1.66%, Net 1.40%.
All returns represent past performance which is no guarantee of future results. Current performance may be higher or lower than the performance shown. The investment return and principal value of an investment will fluctuate so that an investor’s shares, when redeemed, may be worth more or less than their original cost. The above table and graph below do not reflect the deduction of taxes that a shareholder would pay on fund distributions or the redemption of shares. Please visit Virtus.com for performance data current to the most recent month-end.
| 1 | Total returns are historical and include changes in share price and the reinvestment of both dividends and capital gains distributions. |
| 2 | “NAV” (Net Asset Value) total returns do not include the effect of any sales charge. |
| 3 | “POP” (Public Offering Price) total returns include the effect of the maximum front-end 5.75% sales charge. |
| 4 | “CDSC” (Contingent Deferred Sales Charge) is applied to redemptions of certain classes of shares that do not have a sales charge applied at the time of purchase. CDSC charges for certain redemptions of Class A shares made within 18 months of purchase in which a finder’s fee was paid and all redemptions of Class C shares within the first year are 1% and 0% thereafter. |
| 5 | The since inception index returns are from the Fund’s inception date. |
| 6 | The expense ratios of the Fund are set forth according to the prospectus for the Fund effective January 28, 2014 and may differ from the expense ratios disclosed in the Financial Highlights tables in this report. See the Financial Highlights for more current expense ratios. Net Expense: Expenses reduced by the voluntary fee waiver and may be discontinued at any time. Gross Expense: Does not reflect the effect of the fee waiver. |
Growth of $10,000 For periods ended 9/30
This chart assumes an initial investment of $10,000 made on March 15, 2011 (inception date of the Fund), for Class A, Class C, and Class I shares including any applicable sales charges or fees. Performance assumes reinvestment of dividends and capital gain distributions.
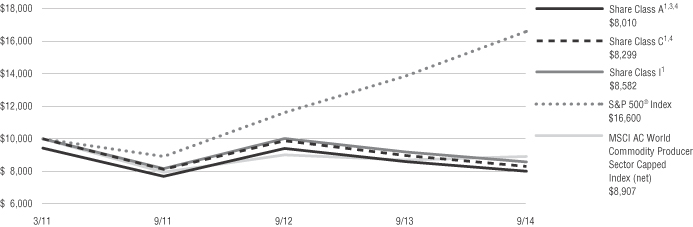
The indexes are unmanaged and not available for direct investment; therefore, their performance does not reflect the expenses associated with active management of an actual portfolio.
For information regarding the indexes and certain investment terms, see the Key Investment Terms starting on page 4.
15
Table of Contents
Fund Summary | Ticker Symbols: Class A: PGUAX Class C: PGUCX Class I: PGIUX |
| ¢ | The Fund is diversified and has investment objectives of both capital appreciation and current income. |
| ¢ | For the fiscal year ended September 30, 2014, the Fund’s Class A shares at NAV returned 15.21%, Class C shares returned 14.37%, and Class I shares returned 15.49%. For the same period, the S&P 500® Index, a broad-based equity index, returned 19.73%, and the Global Dividend Linked Benchmark, the Fund’s style-specific benchmark appropriate for comparison, returned 16.49%. |
All performance figures assume reinvestment of distributions and exclude the effect of sales charges. Past performance is no guarantee of future results, and current performance may be higher or lower than the performance shown above.
How did the markets perform during the Fund’s fiscal year?
During the 12 months ended September 30, 2014, equity markets across the developed world advanced significantly. In the United States, higher equity prices were attributable to positive economic data, a continuation of fiscal stimulus, and strengthening company fundamentals. Outside of the U.S., developed markets were lifted by stabilizing economies and falling sovereign spreads as Central Banks implemented accommodative monetary policies.
The advancement in developed world equity markets was sustained despite a sharp pull back near the end of the last quarter. After attaining all-time highs in mid-September, U.S. markets retreated due to soft economic data, geopolitical concerns, and declining commodity prices. In Europe, despite record low bond yields, equity markets declined during the quarter amid weakening economic growth, deflation worries, and depreciating currencies.
What factors affected the Fund’s performance during its fiscal year?
Many of the same factors that drove broader equity markets higher were also beneficial for the Fund’s strategy. The Fund posted strong absolute performance for the 12-month period ended September 30, 2014, but lagged both the benchmark and broader U.S. equities.
The utilities sector was a significant contributor to relative performance primarily due to strong stock selection. We were underweight utilities largely because of a cautious stance on European companies. In Europe, the regulatory/political pressures that have engulfed utilities over the past several years appear to have mostly subsided. However, fundamentally prospects remained weak given a lack of credible growth options for many of the companies. In the U.S., our focus on the regulated utility names was constructive as those stocks contributed positively.
Communications, the Fund’s largest underweight, was a positive contributor to performance as it was the worst performing sector in the benchmark. Stock selection also benefited performance compared to the benchmark. The significant underweight of communications in the Fund is primarily due to weak fundamentals in European integrated telecommunications companies. The Fund is also underweight U.S. integrated telecommunications companies as concerns about increased wireless competition continue to weigh on the stocks. The Fund remains overweight the U.S. tower and European satellite companies as the revenue growth profiles and high margins provide for attractive long-term investment opportunities.
The strongest performer in the Fund’s benchmark was the social services sector, which was up significantly due to strong appreciation in three of the four health care stocks. The Fund does not invest in social services because there are a limited number of companies in the sector, and we do not believe they meet our investment criteria for revenue and cash flow visibility, dividend yield, and geographic diversification.
Transportation, the Fund’s largest overweight, significantly detracted from relative performance over the 12-month period. Our holdings outperformed during the first three quarters, but gave it all back during the final quarter of the year. The overweight was based on our expectations that traffic demand would continue to recover in the hardest hit southern European countries, and the strong trends would continue in the Australasia companies. While our fundamental view on traffic trends were correct, our holdings were negatively impacted by currency movements and higher sovereign bond yields, particularly in Europe, during the fourth fiscal quarter.
Energy had a negative impact on relative performance. We were positive on the space given robust growth prospects tied to North American oil and shale gas development, and our expectations for the continued build-out of oil and gas infrastructure in North America. Like transportation, our energy holdings outperformed during the first three fiscal quarters, but pulled back in the final quarter when falling oil prices negatively impacted investor sentiment.
The preceding information is the opinion of portfolio management. Any such opinions are subject to change at any time based upon market or other conditions and should not be relied upon as investment advice. Past performance is no guarantee of future results, and there is no guarantee that market forecasts will be realized.
There is no guarantee that the Fund will meet its objectives.
| Asset Allocation | ||||
The following table presents asset allocations within certain sectors and as a percentage of total investments as of September 30, 2014.
|
| |||
Utilities | 31 | % | ||
Energy | 27 | |||
Telecommunication Services | 18 | |||
Industrials | 14 | |||
Financials | 5 | |||
Consumer Discretionary | 2 | |||
Other (includes short-term investments) | 3 | |||
|
| |||
Total | 100 | % | ||
|
| |||
The market price of equity securities may be affected by financial market, industry, or issuer-specific events. Focus on a particular style or on small or medium-sized companies may enhance that risk. Investing internationally involves additional risks such as currency, political, accounting, economic, and market risk. A fund that focuses its investments in infrastructure-related companies will be more sensitive to conditions affecting their business or operations. A fund that focuses its investments in a particular industry or sector will be more sensitive to conditions that affect that industry or sector than a non-concentrated fund.
For information regarding the indexes and certain investment terms, see the Key Investment Terms starting on page 4.
16
Table of Contents
Global Dividend Fund (Continued)
| Average Annual Total Returns1 for periods ended 9/30/14 | ||||||||||||||||
| 1 year | 5 years | Since Inception | Inception Date | |||||||||||||
| Class A Shares at NAV2 | 15.21 | % | 12.47 | % | 8.47 | % | 12/30/04 | |||||||||
| Class A Shares at POP3,4 | 8.59 | 11.15 | 7.81 | 12/30/04 | ||||||||||||
| Class C Shares at NAV2 and with CDSC4 | 14.37 | 11.64 | 7.67 | 12/30/04 | ||||||||||||
| Class I Shares at NAV | 15.49 | 12.77 | 5.89 | 6/6/08 | ||||||||||||
| S&P 500® Index | 19.73 | 15.70 | — | 5 | — | |||||||||||
| Global Dividend Linked Benchmark | 16.49 | 10.45 | — | 6 | — | |||||||||||
Fund Expense Ratios7: A Shares: 1.26%; C Shares: 2.01%, I Shares: 1.01%.
All returns represent past performance which is no guarantee of future results. Current performance may be higher or lower than the performance shown. The investment return and principal value of an investment will fluctuate so that an investor’s shares, when redeemed, may be worth more or less than their original cost. The above table and graph below do not reflect the deduction of taxes that a shareholder would pay on fund distributions or the redemption of shares. Please visit Virtus.com for performance data current to the most recent month-end.
| 1 | Total returns are historical and include changes in share price and the reinvestment of both dividends and capital gains distributions. |
| 2 | “NAV” (Net Asset Value) total returns do not include the effect of any sales charge. |
| 3 | “POP” (Public Offering Price) total returns include the effect of the maximum front-end 5.75% sales charge. |
| 4 | “CDSC” (Contingent Deferred Sales Charge) is applied to redemptions of certain classes of shares that do not have a sales charge applied at the time of purchase. CDSC charges for certain redemptions of Class A shares made within 18 months of purchase in which a finder’s fee was paid and all redemptions of Class C shares within the first year are 1% and 0% thereafter. |
| 5 | The index returned 7.36% for Class A and Class C shares and 8.40% for Class I shares since the inception date of the respective class. |
| 6 | The index returned 7.96% for Class A and Class C shares and 4.27% for Class I shares since the inception date of the respective class. |
| 7 | The expense ratios of the Fund are set forth according to the prospectus for the Fund effective January 28, 2014, as supplemented and revised, and may differ from the expense ratios disclosed in the Financial Highlights tables in this report. See the Financial Highlights for more current expense ratios. |
Growth of $10,000 For periods ended 9/30
This chart assumes an initial investment of $10,000 made on December 30, 2004 (inception date of the Fund), for Class A and Class C shares including any applicable sales charges or fees. Performance assumes reinvestment of dividends and capital gain distributions.
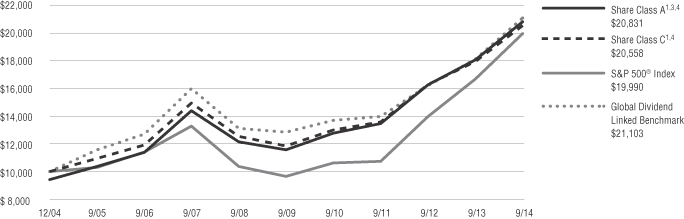
The indexes are unmanaged and not available for direct investment; therefore, their performance does not reflect the expenses associated with active management of an actual portfolio.
For information regarding the indexes and certain investment terms, see the Key Investment Terms starting on page 4.
17
Table of Contents
Fund Summary | Ticker Symbols: Class A: NWWOX Class B: WWOBX Class C: WWOCX Class I: WWOIX |
| ¢ | The Fund is diversified and has an investment objective of capital appreciation. |
| ¢ | For the fiscal year ended September 30, 2014, the Fund’s Class A shares at NAV returned 10.18%, Class B shares returned 9.38%, Class C shares returned 9.32%, and Class I shares returned 10.49%. For the same period, the S&P 500® Index, a broad-based equity index, returned 19.73%, and the MSCI AC World Index (net), the Fund’s style-specific benchmark appropriate for comparison, returned 11.32%. |
All performance figures assume reinvestment of distributions and exclude the effect of sales charges. Past performance is no guarantee of future results, and current performance may be higher or lower than the performance shown above.
How did the market perform during the Fund’s fiscal year?
| ¢ | Global stock markets posted positive returns for the fiscal year, with emerging markets underperforming developed markets. International conflicts in Ukraine and the Middle East continued to develop over the summer and fall, and contributed to heightened market volatility, as did recent protests in Hong Kong. |
| ¢ | In the U.S., strong economic data, continued mergers and acquisitions activity, and low long-term interest rates have helped investor sentiment. |
| ¢ | Macro headwinds in Europe have not abated, and the European Central Bank is moving closer to a quantitative easing program similar to that of the U.S. Federal Reserve. |
| ¢ | In emerging markets, national elections this year in Thailand, India, and Turkey added some stability, while uncertainties regarding the October presidential elections in Brazil contributed to volatility in this market. |
| ¢ | Most macro events did not directly impact our portfolio companies, as we focus on identifying businesses that are less dependent on the overall economy, with unique earnings drivers and strong underlying fundamentals. We continue to find a disproportionate number of opportunities in the consumer staples and health care sectors and in |
companies with exposure to emerging markets. We are confident that our portfolio is well positioned to perform in a variety of market environments. |
What factors affected the Fund’s performance during its fiscal year?
| ¢ | The following discussion highlights specific stocks–those that provided the largest contribution to absolute performance and those that were the largest detractors for the quarter. As bottom-up stock pickers, we hope that the Fund’s shareholders find this useful and gain a greater understanding of how we invest their capital. |
| ¢ | Two stocks that helped the Fund’s absolute performance the most during the period are HDFC Bank and Housing Development Finance Corporation. |
| ¢ | HDFC Bank benefited from the strong recovery in the Indian stock market, as investors are convinced that the newly elected reform-focused government of Prime Minister Narendra Modi will help transform the Indian economy for the better. In addition, the company continues to grow its earnings at a fast pace. HDFC Bank is a high-quality Indian private sector bank which has been a cornerstone investment in the portfolio for many years. It is the largest privately owned retail bank in India with a network of 3,403 branches nationwide. The bank has delivered solid growth while maintaining high credit and underwriting standards. HDFC Bank has a strong deposit franchise and powerful technology backbone that has allowed it to significantly grow earnings over the past 10 years. |
| ¢ | Housing Development Finance Corporation, like HDFC Bank, was a beneficiary of optimism surrounding Prime Minister Modi and strong business performance. HDFC is well placed for long-term growth as it is the leader in mortgage lending in India, with margins supported by industry-leading low costs from both efficient operations and low borrowing costs due to its excellent credit history. The company has been around since 1977 and is usually considered a “gold standard” in terms of corporate governance and risk management. The business should benefit from better macro, but the underpinnings were strong irrespective of who is running the government. |
| ¢ | Two stocks that hurt absolute performance the most are Bureau Veritas and Whole Foods. |
| ¢ | Bureau Veritas is one of the world’s largest testing and inspection companies. Its principal activities are to inspect, analyze, audit, and certify products, assets, and management systems. The testing business is an asset-light business that generates significant amounts of free cash flow and requires very little ongoing maintenance spending. The primary drivers of long-term growth have been, and should continue to be, the globalization of business and increasing regulation. Although there are three large listed players, namely SGS, Bureau Veritas, and Intertek, the rest of the industry is still highly fragmented globally, which provides many years of roll-up acquisitions for the larger players to add very accretive mergers and acquisition (M&A) growth on top of their organic expansion. |
| ¢ | After many good years, the stocks of all the companies in the testing space, not just Bureau Veritas, have been under some pressure over the last couple of years. We do not believe the stocks were expensive to begin with; however, over that period, the multiples have derated a bit as underlying organic growth rates of the companies have slowed from 7% to 8% top-line rates to rates more around the 4% to 5% level. This has happened because of a combination of both cyclical and structural forces, neither of which we are concerned with over the long run. The cyclical pressures they have faced are obvious, as global growth post-crisis has generally been lower than the past normalized rates. The reason that growth rates have been slower structurally has to do with the business mix evolution of the companies. Over time through acquisitions, the businesses have diversified further across the global testing and inspection landscape, and as such today have more diversified overall businesses both geographically and in terms of end market exposure. In Bureau Veritas’ case, the cost of diversification has been somewhat of a dilution in its underlying top-line growth rate, particularly as the company has meaningfully beefed up its more cyclical basic materials business versus the shape of the company five years ago. In addition, Bureau Veritas has traditionally had a more meaningful presence in its home country of France, which, we would argue, is now growing much slower than in |
For information regarding the indexes and certain investment terms, see the Key Investment Terms starting on page 4.
18
Table of Contents
| Global Opportunities Fund (Continued) |
the past due to a combination of both cyclical and structural reasons. The good news is that the company has worked hard to reduce overall exposure to France and Western Europe in its portfolio, and, as such, Bureau Veritas sits today with a fairly well-balanced global footprint. |
| ¢ | The company is set to release a new three- or five-year long-term plan in the spring of 2015, which will provide the market with valuable guidance and a vision of the business evolution from here forward given the changed global economy post the financial crisis. We believe, however, that this company, and the industry, is still a normalized mid-single digit organic top-line grower with the ability to add another 3% to 6% annually to top-line growth via acquisitions depending on the year. Given the highly attractive underlying business economics of high returns on capital, attractive and steadily increasing operating margins, and prodigious free cash flow generation, we believe Bureau Veritas is a very attractive long-term investment opportunity selling at roughly 17x forward earnings with the ability to compound earnings at a low double-digit rate. |
| ¢ | Whole Foods downgraded its guidance several times this past year, which weighed on the stock price. Whole Foods owns and operates the largest chain of natural food supermarkets in the U.S. Whole Foods also develops, produces, and markets nutritional supplements. The company has been in business for over 30 years and has a very strong track record of delivering both strong revenue and earnings growth, alongside industry-leading operating margins. The business strategy centers on selling premium and high-in-demand food that capitalizes on people’s interest in clean and healthy eating. In addition, Whole Foods has a strong corporate culture as a highly rated employer that heavily empowers its teams of workers and motivates them with good benefits and a profit sharing program. This winning recipe has allowed the company to grow at a fast pace given the high rate of growth of the underlying category in which it operates, as well as consistent market share gains within the space. In addition, the company’s growth is buttressed by a highly visible new store opening program, which alone will drive high single-digit annual growth. With a very strong balance sheet, continued strong long-term growth prospects, and |
a consistently high return on invested capital (ROIC), we believe that even though Whole Foods’ growth prospects have come down marginally, the company is poised to continue delivering mid-teens earnings compounding, which is highly attractive and undervalued in the share price. As such, despite the recent share weakness and multiple compression, we continue to invest in the company. |
The preceding information is the opinion of portfolio management. Any such opinions are subject to change at any time based upon market or other conditions and should not be relied upon as investment advice. Past performance is no guarantee of future results, and there is no guarantee that market forecasts will be realized.
There is no guarantee that the Fund will meet its objective.
| Asset Allocation | ||||
The following table presents asset allocations within certain sectors and as a percentage of total investments as of September 30, 2014.
|
| |||
Consumer Staples | 33 | % | ||
Information Technology | 17 | |||
Health Care | 16 | |||
Consumer Discretionary | 13 | |||
Financials | 13 | |||
Energy | 3 | |||
Industrials | 3 | |||
Other (includes short-term investments) | 2 | |||
|
| |||
Total | 100 | % | ||
|
| |||
Investing internationally, especially in emerging markets, involves additional risks such as currency, political, accounting, economic, and market risk. The market price of equity securities may be affected by financial market, industry, or issuer-specific events. Focus on a particular style or on small or medium-sized companies may enhance that risk. A fund that focuses its investments in a particular industry or sector will be more sensitive to conditions that affect that industry or sector than a non-concentrated fund.
For information regarding the indexes and certain investment terms, see the Key Investment Terms starting on page 4.
19
Table of Contents
Global Opportunities Fund (Continued)
| Average Annual Total Returns1 for periods ended 9/30/14 | ||||||||||||||||||||
| 1 year | 5 years | 10 years | Since Inception | Inception Date | ||||||||||||||||
| Class A Shares at NAV2 | 10.18 | % | 13.47 | % | 6.67 | % | — | — | ||||||||||||
| Class A Shares at POP3,4 | 3.84 | 12.13 | 6.04 | — | — | |||||||||||||||
| Class B Shares at NAV2 | 9.38 | 12.61 | 5.89 | — | — | |||||||||||||||
| Class B Shares with CDSC4 | 5.00 | 12.61 | 5.89 | — | — | |||||||||||||||
| Class C Shares at NAV2 and with CDSC4 | 9.32 | 12.60 | 5.87 | — | — | |||||||||||||||
| Class I Shares at NAV | 10.49 | — | — | 13.42 | % | 8/8/12 | ||||||||||||||
| S&P 500® Index | 19.73 | 15.70 | 8.11 | 19.80 | 5 | — | ||||||||||||||
| MSCI AC World Index (net) | 11.32 | 10.07 | 7.28 | 15.13 | 5 | — | ||||||||||||||
Fund Expense Ratios6: A Shares: 1.55%; B Shares: 2.30%; C Shares: 2.30%; I Shares: 1.30%.
All returns represent past performance which is no guarantee of future results. Current performance may be higher or lower than the performance shown. The investment return and principal value of an investment will fluctuate so that an investor’s shares, when redeemed, may be worth more or less than their original cost. The above table and graph below do not reflect the deduction of taxes that a shareholder would pay on fund distributions or the redemption of shares. Please visit Virtus.com for performance data current to the most recent month-end.
| 1 | Total returns are historical and include changes in share price and the reinvestment of both dividends and capital gains distributions. |
| 2 | “NAV” (Net Asset Value) total returns do not include the effect of any sales charge. |
| 3 | “POP” (Public Offering Price) total returns include the effect of the maximum front-end 5.75% sales charge. |
| 4 | “CDSC” (Contingent Deferred Sales Charge) is applied to redemptions of certain classes of shares that do not have a sales charge applied at the time of purchase. CDSC charges for B shares decline from 5% to 0% over a five year period. CDSC charges for certain redemptions of Class A shares made within 18 months of purchase in which a finder’s fee was paid and all redemptions of Class C shares within the first year are 1% and 0% thereafter. |
| 5 | The since inception index returns are from Class I inception date (8/8/12). |
| 6 | The expense ratios of the Fund are set forth according to the prospectus for the Fund effective January 28, 2014, as supplemented and revised, and may differ from the expense ratios disclosed in the Financial Highlights tables in this report. See the Financial Highlights for more current expense ratios. |
Growth of $10,000 For periods ended 9/30
This chart assumes an initial investment of $10,000 made on September 30, 2004, for Class A, Class B, and Class C shares including any applicable sales charges or fees. Performance assumes reinvestment of dividends and capital gain distributions.
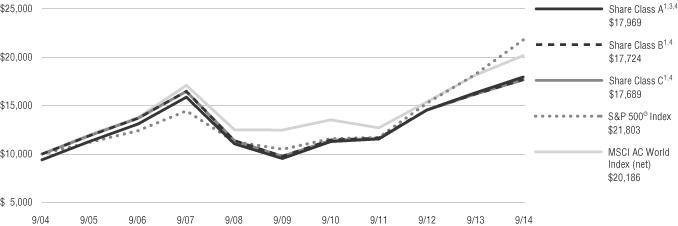
The indexes are unmanaged and not available for direct investment; therefore, their performance does not reflect the expenses associated with active management of an actual portfolio.
For information regarding the indexes and certain investment terms, see the Key Investment Terms starting on page 4.
20
Table of Contents
Global Real Estate Securities Fund
Fund Summary | Ticker Symbols: Class A: VGSAX Class C: VGSCX Class I: VGISX |
| ¢ | The Fund is diversified and has a primary investment objective of long-term capital appreciation, with a secondary investment objective of income. |
| ¢ | For the fiscal year ended September 30, 2014, the Fund’s Class A shares at NAV returned 11.36%, Class C shares returned 10.51%, and Class I shares returned 11.60%. For the same period, the S&P 500® Index, a broad-based equity index, returned 19.73%, and the FTSE EPRA/NAREIT Developed Rental Index (net), the Fund’s style specific benchmark appropriate for comparison, returned 9.55%. |
All performance figures assume reinvestment of distributions and exclude the effect of sales charges. Past performance is no guarantee of future results, and current performance may be higher or lower than the performance shown above.
How did the markets perform during the Fund’s fiscal year?
| ¢ | The equity markets did well during the Fund’s fiscal year, as did listed real estate equities. |
| ¢ | Over the fiscal year, the market defied the consensus forecasts for higher sovereign bond yields, and instead bonds rallied and yields fell. The key to the initial move was slowing global growth estimates following a historically cold winter throughout several areas of the world. Many of us became familiar with the weather phenomenon known as a polar vortex. While a bounce in economic activity did occur as expected following the depressed first quarter of 2014, growth concerns resurfaced post a relatively calm summer for the capital markets. |
| ¢ | Across the major regions of the world, economic growth remained the most resilient in the U.S., the U.K., and the Nordics, as we evidenced during our property tours, while areas of increasing concern were Continental Europe and China. Europe was also an area of growing concern on the geopolitical front as the Russia/Ukraine crisis erupted. |
| ¢ | Keep in mind, in the previous fiscal year the 10-Year Treasury yield moved up from 1.62% as of September 30, 2012, largely driven by the Fed Chairman’s tapering comments in May 2013 and signs of an improving economy, to 2.61% as of September 30, 2013. This move higher in rates |
was felt across the capital markets in the U.S. and around the world, with fixed income markets, interest rate-sensitive equities, and emerging markets feeling the brunt of this rise in rates. |
| ¢ | During the fourth quarter of 2013, the U.S. Federal Reserve began to taper its monthly asset purchases with an ultimate stated goal of eliminating these asset purchases by October 2014. |
| ¢ | As the global economic growth outlook began to shift lower, following the historically cold winter during the early part of 2014 and then again in the third quarter of 2014, interest rates in developed markets moved to new intra-year lows. This reversal in rates was positive for fixed income markets and more defensive-oriented equities, like utilities and listed real estate. |
| ¢ | Real estate rental markets on the whole remained stable to improving during the Fund’s fiscal year depending on the particular country and property sector. Not surprisingly, the divergence in observed performance of the global rental markets was largely a function of the difference in underlying economic performance across the markets as this is a foundation for real estate space demand. |
| ¢ | On balance, the rental markets in the U.S., the U.K., and the Nordics performed better over the Fund’s fiscal year, while performance was subdued in most other parts of the world. Generally speaking, the best rental market dynamics were found in local markets that are benefiting from the growth in the technology, life science, and energy industries. Importantly, even in the best performing rental markets, new real estate supply remains in check with underlying demand for most property types, which will support the ongoing improvement of this rental cycle. |
| ¢ | From a capital markets perspective, global real estate asset markets remained strongly positive in most areas of the world as the “wall of capital” looking to find a home in high quality, core commercial real estate continued to grow during the Fund’s fiscal year. The relatively uncertain macroeconomic backdrop and the low interest rate environment continued to drive a search for yield among large institutional investors like pension funds and sovereign wealth funds. This pursuit resulted in an increased bid, and greater real estate |
transaction volumes and commercial real estate values across a majority of the developed markets we track. |
| ¢ | Should this positive capital flow dynamic remain in place, we believe the values for institutional quality real estate represented among listed real estate companies globally will remain well underpinned. |
What factors affected the Fund’s performance during its fiscal year?
| ¢ | For the one-year period ended September 30, 2014, the Fund outperformed its style-specific benchmark. The Fund’s performance benefited from both security selection and country allocation, but security selection was the primary driver of performance relative to the benchmark. |
| ¢ | On a regional basis, total returns during the fiscal year were strongest in the U.K., Europe, and the U.S. and lagged in Canada and Asia. Among the top 10 countries in the benchmark by index weight, the U.K., Germany, Sweden, and the U.S. posted the best performance, while Singapore, Canada, and Japan were the weakest performers. |
| ¢ | From a country perspective, the most significant positive contributor to relative performance during the fiscal year was our stock selection within the U.S. At the security level within the U.S., our overweight exposures to a mid-capitalization lodging REIT and a West Coast-oriented apartment REIT, had the largest positive impacts on performance as these companies benefited from their geographic positioning and the strong underlying fundamentals in these markets. |
| ¢ | The second most meaningful positive contributor at a country level to relative performance was our stock selection within the U.K. At the security level within the U.K., our overweight exposure to a small-capitalization self-storage REIT, had the largest positive impact on performance as this company benefited from a positive fundamental back-drop for self-storage and an improvement in its balance sheet position. |
| ¢ | From a country perspective, the most significant detractor from relative performance during the fiscal year was our overweight allocation to Hong Kong. While our collective Hong Kong-based |
For information regarding the indexes and certain investment terms, see the Key Investment Terms starting on page 4.
21
Table of Contents
| Global Real Estate Securities Fund (Continued) |
positions performed in line with their country-listed peers, Hong Kong underperformed the overall portfolio return. |
| ¢ | The second most important detractor at a country level from relative performance was our lack of exposure to Austria. This country is represented by one company in the benchmark, which significantly outperformed on the year following some balance sheet restructuring. |
| ¢ | We continue to view a backdrop of low, but positive global economic growth and minimal new real estate supply as positive fundamental tailwinds for the global real estate sector going forward. We believe improving global economic growth will facilitate further increases in real estate operating cash flows and dividends through higher property occupancies, and in cases where occupancy has reached equilibrium, higher rents. |
The preceding information is the opinion of portfolio management. Any such opinions are subject to change at any time based upon market or other conditions and should not be relied upon as investment advice. Past performance is no guarantee of future results, and there is no guarantee that market forecasts will be realized.
There is no guarantee that the Fund will meet its objectives.
| Asset Allocation | ||||
The following table presents asset allocations within certain sectors and as a percentage of total investments as of September 30, 2014.
|
| |||
Retail REITs | 26 | % | ||
Real Estate Operating Companies | 17 | |||
Office REITs | 13 | |||
Residential REITs | 13 | |||
Diversified REITs | 12 | |||
Financials | 10 | |||
Specialized REITs | 5 | |||
Other (includes short-term investments) | 4 | |||
|
| |||
Total | 100 | % | ||
|
| |||
The market price of equity securities may be affected by financial market, industry, or issuer-specific events. Focus on a particular style or on small or medium-sized companies may enhance that risk. The Fund may be negatively affected by factors specific to the real estate market, including interest rate, leverage, property, and management. Investing internationally, especially in emerging markets, involves additional risks such as currency, political, accounting, economic, and market risk. A fund that focuses its investments in a particular industry or sector will be more sensitive to conditions that affect that industry or sector than a non-concentrated fund. A fund that focuses its investments in a particular geographic location will be highly sensitive to financial, economic, political, and other developments affecting the fiscal stability of that location.
For information regarding the indexes and certain investment terms, see the Key Investment Terms starting on page 4.
22
Table of Contents
Global Real Estate Securities Fund (Continued)
| Average Annual Total Returns1 for periods ended 9/30/14 | ||||||||||||||||
| 1 year | 5 years | Since Inception | Inception Date | |||||||||||||
| Class A Shares at NAV2 | 11.36 | % | 12.82 | % | 24.17 | % | 3/2/09 | |||||||||
| Class A Shares at POP3,4 | 4.96 | 11.49 | 22.86 | 3/2/09 | ||||||||||||
| Class C Shares at NAV2 and with CDSC4 | 10.51 | 11.98 | 23.25 | 3/2/09 | ||||||||||||
| Class I Shares at NAV | 11.60 | 13.11 | 24.50 | 3/2/09 | ||||||||||||
| S&P 500® Index | 19.73 | 15.70 | 22.95 | 5 | — | |||||||||||
| FTSE EPRA/NAREIT Developed Rental Index (net) | 9.55 | 12.21 | 24.13 | 5 | — | |||||||||||
Fund Expense Ratios6: A Shares: Gross 1.64%, Net 1.40%; C Shares: Gross 2.39%, Net 2.15%; I Shares: Gross 1.39%, Net 1.15%.
All returns represent past performance which is no guarantee of future results. Current performance may be higher or lower than the performance shown. The investment return and principal value of an investment will fluctuate so that an investor’s shares, when redeemed, may be worth more or less than their original cost. The above table and graph below do not reflect the deduction of taxes that a shareholder would pay on fund distributions or the redemption of shares. Please visit Virtus.com for performance data current to the most recent month-end.
| 1 | Total returns are historical and include changes in share price and the reinvestment of both dividends and capital gains distributions. |
| 2 | “NAV” (Net Asset Value) total returns do not include the effect of any sales charge. |
| 3 | “POP” (Public Offering Price) total returns include the effect of the maximum front-end 5.75% sales charge. |
| 4 | “CDSC” (Contingent Deferred Sales Charge) is applied to redemptions of certain classes of shares that do not have a sales charge applied at the time of purchase. CDSC charges for certain redemptions of Class A shares made within 18 months of purchase in which a finder’s fee was paid and all redemptions of Class C shares within the first year are 1% and 0% thereafter. |
| 5 | The since inception index returns are from the Fund’s inception date. |
| 6 | The expense ratios of the Fund are set forth according to the prospectus for the Fund effective January 28, 2014, as supplemented and revised, and may differ from the expense ratios disclosed in the Financial Highlights tables in this report. See the Financial Highlights for more current expense ratios. Net Expense: Expenses reduced by the voluntary fee waiver which may be discontinued at any time. Gross Expense: Does not reflect the effect of the fee waiver. |
Growth of $10,000 For periods ended 9/30
This chart assumes an initial investment of $10,000 made on March 2, 2009 (inception date of the Fund), for Class A, Class C, and Class I shares including any applicable sales charges or fees. Performance assumes reinvestment of dividends and capital gain distributions.
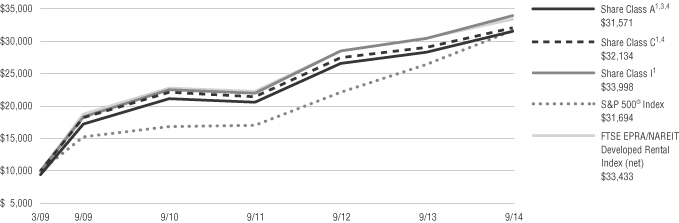
The indexes are unmanaged and not available for direct investment; therefore, their performance does not reflect the expenses associated with active management of an actual portfolio.
For information regarding the indexes and certain investment terms, see the Key Investment Terms starting on page 4.
23
Table of Contents
Greater European Opportunities Fund
Fund Summary | Ticker Symbols: Class A: VGEAX Class C: VGECX Class I: VGEIX |
| ¢ | The Fund is diversified and has an investment objective of long-term capital appreciation. |
| ¢ | For the fiscal year ended September 30, 2014, the Fund’s Class A shares at NAV returned -0.88%, Class C shares returned -1.62%, and Class I shares returned -0.64%. For the same period, the S&P 500® Index, a broad-based equity index, returned 19.73%, and the MSCI Europe Index (net), the Fund‘s style-specific benchmark appropriate for comparison, returned 5.82%. |
All performance figures assume reinvestment of distributions and exclude the effect of sales charges. Past performance is no guarantee of future results, and current performance may be higher or lower than the performance shown above.
How did the market perform during the Fund’s fiscal year?
| ¢ | Global stock markets posted positive returns for the fiscal year, with emerging markets underperforming developed markets. International conflicts in Ukraine and the Middle East continued to develop over the summer and fall, and contributed to heightened market volatility, as did recent protests in Hong Kong. |
| ¢ | In the U.S., strong economic data, continued mergers and acquisitions activity, and low long-term interest rates have helped investor sentiment. |
| ¢ | Macro headwinds in Europe have not abated and the European Central Bank is moving closer to a quantitative easing program similar to that of the U.S. Federal Reserve. |
| ¢ | In emerging markets, national elections this year in Thailand, India, and Turkey added some stability, while uncertainties regarding the October presidential elections in Brazil contributed to volatility in this market. |
| ¢ | Most macro events did not directly impact our portfolio companies, as we focus on identifying businesses that are less dependent on the overall economy, with unique earnings drivers and strong underlying fundamentals. We continue to find a disproportionate number of opportunities in the consumer staples and health care sectors and in companies with exposure to emerging markets. |
We are confident that our portfolio is well positioned to perform in a variety of market environments. |
What factors affected the Fund’s performance during its fiscal year?
| ¢ | The following discussion highlights specific stocks–those that provided the largest contribution to absolute performance and those that were the largest detractors for the quarter. As bottom-up stock pickers, we hope that the Fund’s shareholders find this useful and gain a greater understanding of how we invest their capital. |
| ¢ | Two stocks that helped the Fund’s absolute performance the most during the period are Novo Nordisk and SABMiller. |
| ¢ | Novo Nordisk performed well this past year as it continued to grow its earnings and got a positive response from an FDA advisory committee on its drug Victoza for the treatment of obesity. Novo is a world leader in diabetes care, which has been one of the fastest-growing pharmaceutical segments. Novo is highly focused on its few core therapeutic areas and has rewarded shareholders with industry leading growth rates and cash returns. |
| ¢ | SABMiller reported strong constant currency performance over the past year. In addition, the stock was helped by ongoing rumors of a possible acquisition by Anheuser-Busch Inbev. While we do not invest based on rumors of possible buyouts, the news helped push the stock price up. Longer term, SABMiller’s business prospects are robust. It is the second largest brewer in the world, but of the international brewers, the one with the largest exposure to fast growing emerging markets. This gives the company the longest runway for organic growth, and we believe SABMiller’s management will be able to exploit it. Growth will come from increased per capita consumption with rising discretionary income in many of its markets as well as pricing and a mix to more premium beer. |
| ¢ | Two stocks that hurt absolute performance the most are Bureau Veritas and Richemont. |
| ¢ | Bureau Veritas is one of the world’s largest testing and inspection companies. Its principal activities are to inspect, analyze, audit, and certify products, assets, and management systems. The testing |
business is an asset-light business that generates significant amounts of free cash flow and requires very little ongoing maintenance spending. The primary drivers of long-term growth have been, and should continue to be, the globalization of business and increasing regulation. Although there are three large listed players, namely SGS, Bureau Veritas, and Intertek, the rest of the industry is still highly fragmented globally, which provides many years of roll-up acquisitions for the larger players to add very accretive mergers and acquisition (M&A) growth on top of their organic expansion. |
| ¢ | After many good years, the stocks of all the companies in the testing space, not just Bureau Veritas, have been under some pressure over the last couple of years. We do not believe the stocks were expensive to begin with; however, over that period, the multiples have derated a bit as underlying organic growth rates of the companies have slowed from 7% to 8% top-line rates to rates more around the 4% to 5% level. This has happened because of a combination of both cyclical and structural forces, neither of which we are concerned with over the long run. The cyclical pressures they have faced are obvious, as global growth post-crisis has generally been lower than the past normalized rates. The reason that growth rates have been slower structurally has to do with the business mix evolution of the companies. Over time through acquisitions, the businesses have diversified further across the global testing and inspection landscape, and as such today have more diversified overall businesses both geographically and in terms of end market exposure. In Bureau Veritas’ case, the cost of diversification has been somewhat of a dilution in its underlying top-line growth rate, particularly as the company has meaningfully beefed up its more cyclical basic materials business versus the shape of the company five years ago. In addition, Bureau Veritas has traditionally had a more meaningful presence in its home country of France, which, we would argue, is now growing much slower than in the past due to a combination of both cyclical and structural reasons. The good news is that the company has worked hard to reduce overall exposure to France and Western Europe in its portfolio, and, as such, Bureau Veritas sits today with a fairly well-balanced global footprint. |
For information regarding the indexes and certain investment terms, see the Key Investment Terms starting on page 4.
24
Table of Contents
| Greater European Opportunities Fund (Continued) |
| ¢ | The company is set to release a new three- or five-year long-term plan in the spring of 2015, which will provide the market with valuable guidance and a vision of the business evolution from here forward given the changed global economy post the financial crisis. We believe, however, that this company, and the industry, is still a normalized mid-single digit organic top-line grower with the ability to add another 3% to 6% annually to top-line growth via acquisitions depending on the year. Given the highly attractive underlying business economics of high returns on capital, attractive and steadily increasing operating margins, and prodigious free cash flow generation, we believe Bureau Veritas is a very attractive long-term investment opportunity selling at roughly 17x forward earnings with the ability to compound earnings at a low double-digit rate. |
| ¢ | The reason for Richemont’s weak performance has been weaker-than-expected sales growth, as a result of the slowdown in Hong Kong/China. Hong Kong has been affected by the crackdown on corruption, slowing tourist arrivals, and, more recently, street protests. Longer term, however, we are comfortable that Richemont has a strong brand portfolio with good pricing power, has managed retail expansion very well, and still has solid room for space growth. Richemont is a global leader in hard luxury goods and is focused on the high end. The company sells primarily top-end watches and jewelry, as well as writing instruments, leather goods and clothing. It has built one of the strongest collections of brands across the space, including Cartier, Van Cleef & Arpels, and Montblanc, and is focused on growing brand equity with many of its brands over 100 years old. |
The preceding information is the opinion of portfolio management. Any such opinions are subject to change at any time based upon market or other conditions and should not be relied upon as investment advice. Past performance is no guarantee of future results, and there is no guarantee that market forecasts will be realized.
There is no guarantee that the Fund will meet its objective.
| Asset Allocation | ||||
The following table presents asset allocations within certain sectors and as a percentage of total investments as of September 30, 2014.
|
| |||
Consumer Staples | 36 | % | ||
Health Care | 18 | |||
Consumer Discretionary | 16 | |||
Industrials | 10 | |||
Materials | 8 | |||
Financials | 3 | |||
Energy | 3 | |||
Other (includes short-term investments) | 6 | |||
|
| |||
Total | 100 | % | ||
|
| |||
The market price of equity securities may be affected by financial market, industry, or issuer-specific events. Focus on a particular style or on small or medium-sized companies may enhance that risk. A fund that focuses its investments in a particular industry or sector will be more sensitive to conditions that affect that industry or sector than a non-concentrated fund. Investing internationally, especially in emerging markets, involves additional risks such as currency, political, accounting, economic, and market risk. A fund that focuses its investments in a particular geographic location will be highly sensitive to financial, economic, political, and other developments affecting the fiscal stability of that location.
For information regarding the indexes and certain investment terms, see the Key Investment Terms starting on page 4.
25
Table of Contents
Greater European Opportunities Fund (Continued)
| Average Annual Total Returns1 for periods ended 9/30/14 | ||||||||||||||||
| 1 year | 5 years | Since Inception | Inception Date | |||||||||||||
| Class A Shares at NAV2 | -0.88 | % | 9.25 | % | 13.76 | % | 4/21/09 | |||||||||
| Class A Shares at POP3,4 | -6.58 | 7.96 | 12.53 | 4/21/09 | ||||||||||||
| Class C Shares at NAV2 and with CDSC4 | -1.62 | 8.43 | 12.92 | 4/21/09 | ||||||||||||
| Class I Shares at NAV | -0.64 | 9.52 | 14.04 | 4/21/09 | ||||||||||||
| S&P 500® Index | 19.73 | 15.70 | 19.21 | — | ||||||||||||
| MSCI Europe Index (net) | 5.82 | 6.90 | 14.01 | — | ||||||||||||
Fund Expense Ratios6: A Shares: Gross 2.11%, Net 1.45%; C Shares: Gross 2.86%, Net 2.20%; I Shares: Gross 1.86%, Net 1.20%.
All returns represent past performance which is no guarantee of future results. Current performance may be higher or lower than the performance shown. The investment return and principal value of an investment will fluctuate so that an investor’s shares, when redeemed, may be worth more or less than their original cost. The above table and graph below do not reflect the deduction of taxes that a shareholder would pay on fund distributions or the redemption of shares. Please visit Virtus.com for performance data current to the most recent month-end.
| 1 | Total returns are historical and include changes in share price and the reinvestment of both dividends and capital gains distributions. |
| 2 | “NAV” (Net Asset Value) total returns do not include the effect of any sales charge. |
| 3 | “POP” (Public Offering Price) total returns include the effect of the maximum front-end 5.75% sales charge. |
| 4 | “CDSC” (Contingent Deferred Sales Charge) is applied to redemptions of certain classes of shares that do not have a sales charge applied at the time of purchase. CDSC charges for certain redemptions of Class A shares made within 18 months of purchase in which a finder’s fee was paid and all redemptions of Class C shares within the first year are 1% and 0% thereafter. |
| 5 | The since inception index returns are from the Fund’s inception date. |
| 6 | The expense ratios of the Fund are set forth according to the prospectus for the Fund effective January 28, 2014, as supplemented and revised, and may differ from the expense ratios disclosed in the Financial Highlights tables in this report. See the Financial Highlights for more current expense ratios. Net Expense: Expenses reduced by the voluntary fee waiver which may be discontinued at any time. Gross Expense: Does not reflect the effect of the fee waiver. |
Growth of $10,000 For periods ended 9/30
This chart assumes an initial investment of $10,000 made on April 21, 2009 (inception date of the Fund), for Class A, Class C, and Class I shares including any applicable sales charges or fees. Performance assumes reinvestment of dividends and capital gain distributions.
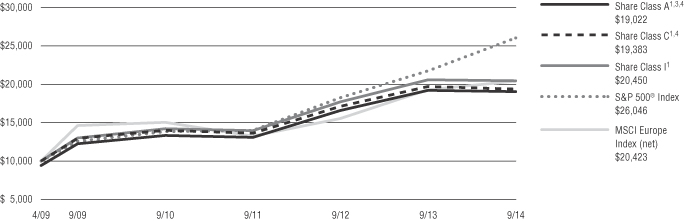
The indexes are unmanaged and not available for direct investment; therefore, their performance does not reflect the expenses associated with active management of an actual portfolio.
For information regarding the indexes and certain investment terms, see the Key Investment Terms starting on page 4.
26
Table of Contents
Fund Summary | Ticker Symbols: Class A: VIEAX Class C: VIECX Class I: VIIEX |
| ¢ | The Fund is diversified and has an investment objective of long-term capital appreciation. |
| ¢ | For the fiscal year ended September 30, 2014, the Fund’s Class A shares at NAV returned 7.42%, Class C shares returned 6.56%, and Class I shares returned 7.67%. For the same period, the S&P 500® Index, a broad-based equity index, returned 19.73%, and the MSCI EAFE® Index (net), the Fund’s style-specific benchmark appropriate for comparison, returned 4.25%. |
All performance figures assume reinvestment of distributions and exclude the effect of sales charges. Past performance is no guarantee of future results, and current performance may be higher or lower than the performance shown above.
How did the markets perform during the Fund’s fiscal year?
| ¢ | Developed international stock markets, as represented by the MSCI EAFE® Index (net), were up 4.2% during the Fund’s fiscal year, although most of the gains came in the first nine months, with the final three months of the fiscal year producing negative returns. The end of 2013 produced strong returns to cap off a very strong calendar year in which the index did very well and the bigger names in the index drove returns. To the degree a manager did not own the top 50 names in the index, performance was negatively impacted. That began to change in the first six months of 2014 as correlations came down, the index returns were positive but more sanguine, and individual stock picking began to be rewarded once again by the market. |
| ¢ | Despite almost monthly macro events that rattled the market, including significant events such as turmoil in Ukraine and Iraq, the market continued upward. Valuations, while not cheap, were reasonable, and positive global growth coupled with continued Central Bank support, reinforced the rally. Energy and technology did particularly well in this environment. However, the markets turned negative for the final three months of the fiscal year as negative macro news, including a rising U.S. dollar and slower rates of global growth, proved to be a drag on international equity performance. |
| ¢ | After rising for much of the year, energy experienced a big sell-off toward the end of the fiscal year with the rise in the dollar and oil approaching $80 a barrel. Health care and utilities on the other hand were the primary drivers of positive performance. One bright spot appears to be Japan which, despite still reporting average GDP growth, is continuing on the path of making the necessary reforms to structurally move its economy and markets forward. This combined with strong corporate earnings has helped to make it a more attractive market in which to invest. |
What factors affected the Fund’s performance during its fiscal year?
| ¢ | For the fiscal year ended September 30, 2014, the Fund significantly outperformed its primary benchmark as well as its peer group. The primary source of this outperformance was related to security selection. |
| ¢ | The Fund was able to add the greatest amount of excess return in the financial, consumer discretionary, and health care sectors, all of which were weighted similarly to the index, but with names that outperformed the index. In health care, performance was strong due to mergers and acquisitions (M&A) activity among the names in the portfolio. And in consumer discretionary, the companies held by the Fund, which had a concentration in the auto industry, produced positive returns, while the names in the index were negative for the period. |
| ¢ | The Fund was overweight energy relative to the index, and underweight in materials relative to the index, but in both cases stock selection detracted from performance. |
| ¢ | Financials are the largest component of the index and the largest weighting in the portfolio. The Fund’s manager continues to see value in the sector with opportunities especially prevalent in European commercial banks. |
| ¢ | Japan is another market that is priced attractively with changes going on within the country that make it a more attractive investment for outside capital. While global growth has slowed, it is still growing at a positive rate and provides a broad range of investment ideas for the Fund. |
The preceding information is the opinion of portfolio management. Any such opinions are subject to change at any time based upon market or other conditions and should not be relied upon as investment advice. Past performance is no guarantee of future results, and there is no guarantee that market forecasts will be realized.
There is no guarantee that the Fund will meet its objective.
Asset Allocation | ||||
The following table presents asset allocations within certain sectors and as a percentage of total investments as of September 30, 2014.
|
| |||
Financials | 21 | % | ||
Consumer Discretionary | 17 | |||
Energy | 11 | |||
Health Care | 11 | |||
Industrials | 11 | |||
Telecommunication Services | 8 | |||
Consumer Staples | 5 | |||
Other (includes short-term investments) | 16 | |||
|
| |||
Total | 100 | % | ||
|
| |||
Investing internationally, especially in emerging markets, involves additional risks such as currency, political, accounting, economic, and market risk. The market price of equity securities may be affected by financial market, industry, or issuer-specific events. Focus on a particular style or on small or medium-sized companies may enhance that risk.
For information regarding the indexes and certain investment terms, see the Key Investment Terms starting on page 4.
27
Table of Contents
International Equity Fund (Continued)
| Average Annual Total Returns1 for periods ended 9/30/14 | ||||||||||||
| 1 year | Since Inception | Inception Date | ||||||||||
| Class A Shares at NAV2 | 7.42 | % | 8.74 | % | 9/16/10 | |||||||
| Class A Shares at POP3,4 | 1.25 | 7.16 | 9/16/10 | |||||||||
| Class C Shares at NAV2 and with CDSC4 | 6.56 | 7.81 | 9/16/10 | |||||||||
| Class I Shares at NAV | 7.67 | 8.91 | 9/16/10 | |||||||||
| S&P 500® Index | 19.73 | 17.37 | 5 | — | ||||||||
| MSCI EAFE® Index (net) | 4.25 | 7.98 | 5 | — | ||||||||
Fund Expense Ratios6: A Shares: Gross 4.11%, Net 1.50%; C Shares: Gross 4.86%, Net 2.25%; I Shares: Gross 3.86%, Net 1.25%.
All returns represent past performance which is no guarantee of future results. Current performance may be higher or lower than the performance shown. The investment return and principal value of an investment will fluctuate so that an investor’s shares, when redeemed, may be worth more or less than their original cost. The above table and graph below do not reflect the deduction of taxes that a shareholder would pay on fund distributions or the redemption of shares. Please visit Virtus.com for performance data current to the most recent month-end.
| 1 | Total returns are historical and include changes in share price and the reinvestment of both dividends and capital gains distributions. |
| 2 | “NAV” (Net Asset Value) total returns do not include the effect of any sales charge. |
| 3 | “POP” (Public Offering Price) total returns include the effect of the maximum front-end 5.75% sales charge. |
| 4 | “CDSC” (Contingent Deferred Sales Charge) is applied to redemptions of certain classes of shares that do not have a sales charge applied at the time of purchase. CDSC charges for certain redemptions of Class A shares made within 18 months of purchase in which a finder’s fee was paid and all redemptions of Class C shares within the first year are 1% and 0% thereafter. |
| 5 | The since inception index returns are from the Fund’s inception date. |
| 6 | The expense ratios of the Fund are set forth according to the prospectus for the Fund effective January 28, 2014, as supplemented and revised, and may differ from the expense ratios disclosed in the Financial Highlights tables in this report. See the Financial Highlights for more current expense ratios. Net Expense: Expenses reduced by the voluntary fee waiver which may be discontinued at any time. Gross Expense: Does not reflect the effect of the fee waiver. |
Growth of $10,000 For periods ended 9/30
This chart assumes an initial investment of $10,000 made on September 16, 2010 (inception date of the Fund), for Class A, Class C, and Class I shares including any applicable sales charges or fees. Performance assumes reinvestment of dividends and capital gain distributions.
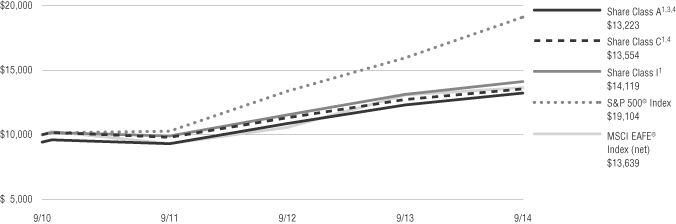
The indexes are unmanaged and not available for direct investment; therefore, their performance does not reflect the expenses associated with active management of an actual portfolio.
For information regarding the indexes and certain investment terms, see the Key Investment Terms starting on page 4.
28
Table of Contents
International Real Estate Securities Fund
Fund Summary | Ticker Symbols: Class A: PXRAX Class C: PXRCX Class I: PXRIX |
| ¢ | The Fund is diversified and has a primary investment objective of long-term capital appreciation, with a secondary investment objective of income. |
| ¢ | For the fiscal year ended September 30, 2014, the Fund’s Class A shares at NAV returned 8.61%, Class C shares returned 7.75%, and Class I shares returned 8.87%. For the same period, the S&P 500® Index, a broad-based equity index, returned 19.73%, and the FTSE EPRA/NAREIT Developed Rental ex U.S. Index (net), the Fund’s style-specific benchmark appropriate for comparison, returned 6.41%. |
All performance figures assume reinvestment of distributions and exclude the effect of sales charges. Past performance is no guarantee of future results, and current performance may be higher or lower than the performance shown above.
How did the markets perform during the Fund’s fiscal year?
| ¢ | The equity markets did well during the Fund’s fiscal year, as did listed real estate equities. |
| ¢ | Over the fiscal year, the market defied the consensus forecasts for higher sovereign bond yields, and instead bonds rallied and yields fell. The key to the initial move was slowing global growth estimates following a historically cold winter throughout several areas of the world. Many of us became familiar with the weather phenomenon known as a polar vortex. While a bounce in economic activity did occur as expected following the depressed first quarter of 2014, growth concerns resurfaced post a relatively calm summer for the capital markets. |
| ¢ | Across the major regions of the world, economic growth remained the most resilient in the U.S., the U.K., and the Nordics, as we evidenced during our property tours, while areas of increasing concern were Continental Europe and China. Europe was also an area of growing concern on the geopolitical front as the Russia/Ukraine crisis erupted. |
| ¢ | Keep in mind, in the previous fiscal year the 10-Year Treasury yield moved up from 1.62% as of September 30, 2012, largely driven by the Fed Chairman’s tapering comments in May 2013 and signs of an improving economy, to 2.61% as of September 30, 2013. This move higher in rates was felt across the capital markets in the U.S. and around the world, with fixed income markets, |
interest rate-sensitive equities, and emerging markets feeling the brunt of this rise in rates. |
| ¢ | During the fourth quarter of 2013, the U.S. Federal Reserve began to taper its monthly asset purchases with an ultimate stated goal of eliminating these asset purchases by October 2014. |
| ¢ | As the global economic growth outlook began to shift lower, following the historically cold winter during the early part of 2014 and then again in the third quarter of 2014, interest rates in developed markets moved to new intra-year lows. This reversal in rates was positive for fixed income markets and more defensive-oriented equities, like utilities and listed real estate. |
| ¢ | Real estate rental markets on the whole remained stable to improving during the Fund’s fiscal year depending on the particular country and property sector. Not surprisingly, the divergence in observed performance of the global rental markets was largely a function of the difference in underlying economic performance across the markets as this is a foundation for real estate space demand. |
| ¢ | On balance, the rental markets in the U.S., the U.K., and the Nordics performed better over the Fund’s fiscal year, while performance was subdued in most other parts of the world. Generally speaking, the best rental market dynamics were found in local markets that are benefiting from the growth in the technology, life science, and energy industries. Importantly, even in the best performing rental markets, new real estate supply remains in check with underlying demand for most property types, which will support the ongoing improvement of this rental cycle. |
| ¢ | From a capital markets perspective, global real estate asset markets remained strongly positive in most areas of the world as the “wall of capital” looking to find a home in high quality, core commercial real estate continued to grow during the Fund’s fiscal year. The relatively uncertain macroeconomic backdrop and the low interest rate environment continued to drive a search for yield among large institutional investors like pension funds and sovereign wealth funds. This pursuit resulted in an increased bid, and greater real estate transaction volumes and commercial real estate values across a majority of the developed markets we track. |
| ¢ | Should this positive capital flow dynamic remain in place, we believe the values for institutional quality real estate represented among listed real estate companies globally will remain well underpinned. |
What factors affected the Fund’s performance during its fiscal year?
| ¢ | For the one-year period ended September 30, 2014, the Fund outperformed its style-specific benchmark. The Fund’s performance benefited from both security selection and country allocation, but security selection was the primary driver of performance relative to the benchmark. |
| ¢ | On a regional basis, total returns during the fiscal year were strongest in the U.K. and Europe and lagged in Canada and Asia. Among the top 10 countries in the benchmark by index weight, the U.K., Germany, and Sweden posted the best performance, while Singapore, Canada, and Japan were the weakest performers. |
| ¢ | From a country perspective, the most significant positive contributor to relative performance during the fiscal year was our stock selection within the U.K. At the security level within the U.K., our overweight exposure to a small capitalization self-storage REIT had the largest positive impact on performance as this company benefited from a positive fundamental backdrop for self-storage and an improvement in its balance sheet position. |
| ¢ | The second most meaningful positive contributor at a country level to relative performance was our stock selection within Japan. Namely, our overweight exposure to a logistics-focused REIT and a medium-size office-focused REIT were the most important drivers of this performance. |
| ¢ | From a country perspective, the most significant detractor from relative performance during the fiscal year was our overweight allocation to Hong Kong. While our collective Hong Kong-based positions performed in line with their country-listed peers, Hong Kong underperformed the overall portfolio return. |
| ¢ | The second most important detractor at a country level from relative performance was our lack of exposure to Austria. This country is represented by one company in the benchmark, which significantly outperformed on the year following some balance sheet restructuring. |
For information regarding the indexes and certain investment terms, see the Key Investment Terms starting on page 4.
29
Table of Contents
| International Real Estate Securities Fund (Continued) |
| ¢ | We continue to view a backdrop of low, but positive global economic growth and minimal new real estate supply as positive fundamental tailwinds for the global real estate sector going forward. We believe improving global economic growth will facilitate further increases in real estate operating cash flows and dividends through higher property occupancies, and in cases where occupancy has reached equilibrium, higher rents. |
The preceding information is the opinion of portfolio management. Any such opinions are subject to change at any time based upon market or other conditions and should not be relied upon as investment advice. Past performance is no guarantee of future results, and there is no guarantee that market forecasts will be realized.
There is no guarantee that the Fund will meet its objectives.
| Asset Allocation | ||||
The following table presents asset allocations within certain sectors and as a percentage of total investments as of September 30, 2014.
|
| |||
Real Estate Operating Companies | 35 | % | ||
Retail REITs | 28 | |||
Diversified REITs | 16 | |||
Office REITs | 10 | |||
Residential REITs | 4 | |||
Industrial REITs | 3 | |||
Specialized REITs | 2 | |||
Other (includes short-term investments) | 2 | |||
|
| |||
Total | 100 | % | ||
|
| |||
The market price of equity securities may be affected by financial market, industry, or issuer-specific events. Focus on a particular style or on small or medium-sized companies may enhance that risk. The Fund may be negatively affected by factors specific to the real estate market, including interest rate, leverage, property, and management. Investing internationally, especially in emerging markets, involves additional risks such as currency, political, accounting, economic, and market risk. A fund that focuses its investments in a particular industry or sector will be more sensitive to conditions that affect that industry or sector than a non-concentrated fund. A fund that focuses its investments in a particular geographic location will be highly sensitive to financial, economic, political, and other developments affecting the fiscal stability of that location.
For information regarding the indexes and certain investment terms, see the Key Investment Terms starting on page 4.
30
Table of Contents
International Real Estate Securities Fund (Continued)
| Average Annual Total Returns1 for periods ended 9/30/14 | ||||||||||||||||
| 1 year | 5 years | Since Inception | Inception Date | |||||||||||||
| Class A Shares at NAV2 | 8.61 | % | 9.96 | % | 0.56 | % | 10/1/07 | |||||||||
| Class A Shares at POP3,4 | 2.36 | 8.66 | -0.28 | 10/1/07 | ||||||||||||
| Class C Shares at NAV2 and with CDSC4 | 7.75 | 9.13 | -0.21 | 10/1/07 | ||||||||||||
| Class I Shares at NAV | 8.87 | 10.23 | 0.80 | 10/1/07 | ||||||||||||
| S&P 500® Index | 19.73 | 15.70 | 5.82 | 5 | — | |||||||||||
| FTSE EPRA/NAREIT Developed Rental ex U.S. Index (net) | 6.41 | 9.82 | -0.745 | — | ||||||||||||
Fund Expense Ratios6: A Shares: Gross 1.73%, Net 1.50%; C Shares: Gross 2.48%, Net 2.25%; I Shares: Gross 1.48%, Net 1.25%.
All returns represent past performance which is no guarantee of future results. Current performance may be higher or lower than the performance shown. The investment return and principal value of an investment will fluctuate so that an investor’s shares, when redeemed, may be worth more or less than their original cost. The above table and graph below do not reflect the deduction of taxes that a shareholder would pay on fund distributions or the redemption of shares. Please visit Virtus.com for performance data current to the most recent month-end.
| 1 | Total returns are historical and include changes in share price and the reinvestment of both dividends and capital gains distributions. |
| 2 | “NAV” (Net Asset Value) total returns do not include the effect of any sales charge. |
| 3 | “POP” (Public Offering Price) total returns include the effect of the maximum front-end 5.75% sales charge. |
| 4 | “CDSC” (Contingent Deferred Sales Charge) is applied to redemptions of certain classes of shares that do not have a sales charge applied at the time of purchase. CDSC charges for certain redemptions of Class A shares made within 18 months of purchase in which a finder’s fee was paid and all redemptions of Class C shares within the first year are 1% and 0% thereafter. |
| 5 | The since inception index returns are from the Fund’s inception date. |
| 6 | The expense ratios of the Fund are set forth according to the prospectus for the Fund effective January 28, 2014, as supplemented and revised, and may differ from the expense ratios disclosed in the Financial Highlights tables in this report. See the Financial Highlights for more current expense ratios. Net Expense: Expenses reduced by the voluntary fee waiver which may be discontinued at any time. Gross Expense: Does not reflect the effect of the fee waiver. |
Growth of $10,000 For periods ended 9/30
This chart assumes an initial investment of $10,000 made on October 1, 2007 (inception date of the Fund), for Class A, Class C, and Class I shares including any applicable sales charges or fees. Performance assumes reinvestment of dividends and capital gain distributions.
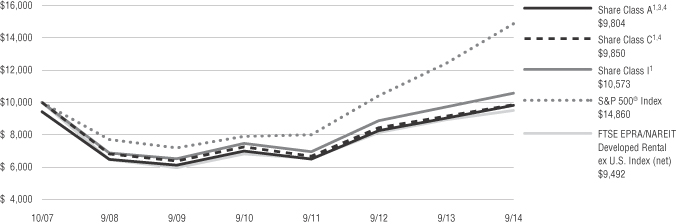
The indexes are unmanaged and not available for direct investment; therefore, their performance does not reflect the expenses associated with active management of an actual portfolio.
For information regarding the indexes and certain investment terms, see the Key Investment Terms starting on page 4.
31
Table of Contents
Fund Summary | Ticker Symbols: Class A: VISAX Class C: VCISX Class I: VIISX |
| ¢ | The Fund is diversified and has an investment objective of capital appreciation. |
| ¢ | For the fiscal year ended September 30, 2014, the Fund’s Class A shares at NAV returned 6.65%, Class C shares returned 5.89%, and Class I shares returned 7.04%. For the same period, the S&P 500® Index, a broad-based equity index, returned 19.73%, and the MSCI AC World ex U.S. Small Cap Index (net), the Fund’s style-specific benchmark appropriate for comparison, returned 4.56%. |
All performance figures assume reinvestment of distributions and exclude the effect of sales charges. Past performance is no guarantee of future results, and current performance may be higher or lower than the performance shown above.
How did the market perform during the Fund’s fiscal year?
| ¢ | Overall, international markets produced positive returns during the Fund’s fiscal year. Although positive, equity markets were volatile during the period given the continued uncertainty in the global macroeconomic environment. |
| ¢ | The best performing equity sectors during the period were telecommunications services and utilities. The worst performing sectors were energy and materials, both of which experienced negative returns during the period. |
| ¢ | In a reversal of trends from last year, emerging markets outperformed developed markets. From a regional perspective, Asia excluding Japan was the strongest performing, while Latin America experienced the worst performance, declining over 14% for the period. |
What factors affected the Fund’s performance during its fiscal year?
| ¢ | The Fund outperformed the MSCI AC World ex U.S. Small Cap Index during the Fund’s fiscal year. We tend to own larger positions than most managers and many of these positions are not highly correlated with the markets in which they trade. This will, at times, result in performance for the Fund that varies significantly from the benchmark. |
| ¢ | From a sector perspective, the Fund’s performance was helped by strong stock selection in the health care and industrials sectors. Stock selection in the consumer discretionary sector detracted from performance. |
| ¢ | From a country perspective, the Fund’s performance was most helped by strong stock selection in developed markets. Specifically, strong stock selection in Singapore and Japan had the largest impact on performance. The Fund’s holdings were up over 20% despite negative or low single-digit performance for these countries, respectively. An underweight in India (the strongest performing country in the index for the period) and negative stock selection in Hong Kong detracted from performance. |
The preceding information is the opinion of portfolio management. Any such opinions are subject to change at any time based upon market and or other conditions and should not be relied upon as investment advice. Past performance is no guarantee of future results, and there is no guarantee market forecasts will be realized.
There is no guarantee that the Fund will meet its objective.
| Asset Allocation | ||||
The following table presents asset allocations within certain sectors and as a percentage of total investments as of September 30, 2014.
|
| |||
Industrials | 22 | % | ||
Financials | 17 | |||
Information Technology | 14 | |||
Consumer Discretionary | 10 | |||
Consumer Staples | 9 | |||
Materials | 8 | |||
Health Care | 7 | |||
Other (includes short-term investments) | 13 | |||
|
| |||
Total | 100 | % | ||
|
| |||
The market price of equity securities may be affected by financial market, industry, or issuer-specific events. Focus on a particular style or on small or medium-sized companies may enhance that risk. Investing internationally, especially in emerging markets, involves additional risks such as currency, political, accounting, economic, and market risk. Because the Fund has a limited number of securities, it may be more susceptible to factors adversely affecting its securities than a less concentrated fund.
For information regarding the indexes and certain investment terms, see the Key Investment Terms starting on page 4.
32
Table of Contents
International Small-Cap Fund (Continued)
| Average Annual Total Returns1 for periods ended 9/30/14 | ||||||||||||
| 1 year | Since Inception | Inception Date | ||||||||||
| Class A Shares at NAV2 | 6.65 | % | 18.48 | % | 9/5/12 | |||||||
| Class A Shares at POP3,4 | 0.52 | 15.13 | 9/5/12 | |||||||||
| Class C Shares at NAV2 and with CDSC4 | 5.89 | 17.61 | 9/5/12 | |||||||||
| Class I Shares at NAV | 7.04 | 18.82 | 9/5/12 | |||||||||
| S&P 500® Index | 19.73 | 20.42 | 5 | — | ||||||||
| MSCI AC World ex U.S. Small Cap Index (net) | 4.56 | 14.54 | 5 | — | ||||||||
Fund Expense Ratios6: A Shares: Gross 2.45%, Net 1.60%; C Shares: Gross 3.20%, Net 2.35%; I Shares: Gross 2.20%, Net 1.35%.
All returns represent past performance which is no guarantee of future results. Current performance may be higher or lower than the performance shown. The investment return and principal value of an investment will fluctuate so that an investor’s shares, when redeemed, may be worth more or less than their original cost. The above table and graph below do not reflect the deduction of taxes that a shareholder would pay on fund distributions or the redemption of shares. Please visit Virtus.com for performance data current to the most recent month-end.
| 1 | Total returns are historical and include changes in share price and the reinvestment of both dividends and capital gains distributions. |
| 2 | “NAV” (Net Asset Value) total returns do not include the effect of any sales charge. |
| 3 | “POP” (Public Offering Price) total returns include the effect of the maximum front-end 5.75% sales charge. |
| 4 | “CDSC” (Contingent Deferred Sales Charge) is applied to redemptions of certain classes of shares that do not have a sales charge applied at the time of purchase. CDSC charges for certain redemptions of Class A shares made within 18 months of purchase in which a finder’s fee was paid and all redemptions of Class C shares within the first year are 1% and 0% thereafter. |
| 5 | The since inception index returns are from the Fund’s inception date. |
| 6 | The expense ratios of the Fund are set forth according to the prospectus for the Fund effective January 28, 2014 and may differ from the expense ratios disclosed in the Financial Highlights tables in this report. See the Financial Highlights for more current expense ratios. Net Expense: Expenses reduced by the voluntary fee waiver which may be discontinued at any time. Gross Expense: Does not reflect the effect of the fee waiver. |
Growth of $10,000 For periods ended 9/30
This chart assumes an initial investment of $10,000 made on September 5, 2012 (inception date of the Fund), for Class A, Class C, and Class I shares including any applicable sales charges or fees. Performance assumes reinvestment of dividends and capital gain distributions.
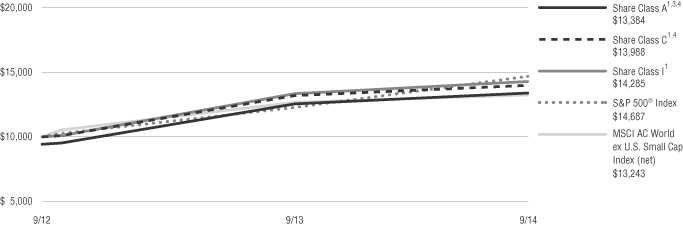
The indexes are unmanaged and not available for direct investment; therefore, their performance does not reflect the expenses associated with active management of an actual portfolio.
For information regarding the indexes and certain investment terms, see the Key Investment Terms starting on page 4.
33
Table of Contents
VIRTUS EMERGING MARKETS DEBT FUND
SCHEDULE OF INVESTMENTS
SEPTEMBER 30, 2014
($ reported in thousands)
| PAR VALUE | VALUE | |||||||
| FOREIGN GOVERNMENT SECURITIES—26.6% | ||||||||
Argentine Republic | ||||||||
7.000%, 10/3/15 | $ | 100 | $ | 94 | ||||
8.750%, 5/7/24 | 50 | 45 | ||||||
Series NY, | 301 | 261 | ||||||
Bolivarian Republic of Venezuela | ||||||||
RegS 5.750%, 2/26/16(4) | 135 | 115 | ||||||
RegS 7.000%, 12/1/18(4) | 220 | 157 | ||||||
7.650%, 4/21/25 | 885 | 549 | ||||||
9.375%, 1/13/34 | 325 | 217 | ||||||
Dominican Republic 144A | 100 | 103 | ||||||
Federal Republic of Nigeria RegS | 200 | 215 | ||||||
Gabonese Republic 144A | 200 | 214 | ||||||
Honduras Republic RegS | 200 | 216 | ||||||
Hungary | ||||||||
5.375%, 2/21/23 | 146 | 155 | ||||||
5.750%, 11/22/23 | 22 | 24 | ||||||
5.375%, 3/25/24 | 60 | 63 | ||||||
Kingdom of Bahrain 144A | 200 | 201 | ||||||
Mongolia 144A | 200 | 179 | ||||||
Republic of Azerbaijan 144A | 200 | 204 | ||||||
Republic of Chile | 70,000 | CLP | 123 | |||||
Republic of Colombia Treasury Note, | 192,000 | COP | 113 | |||||
Republic of Costa Rica 144A | 200 | 201 | ||||||
Republic of Cote d’ Ivoire 144A | 100 | 96 | ||||||
Republic of Croatia | ||||||||
144A 6.625%, 7/14/20(3) | 100 | 110 | ||||||
144A 6.000%, 1/26/24(3) | 200 | 214 | ||||||
Republic of Ecuador | ||||||||
144A 9.375%, 12/15/15(3) | 100 | 105 | ||||||
144A 7.950%, 6/20/24(3) | 200 | 211 | ||||||
Republic of El Salvador | ||||||||
144A 6.375%, 1/18/27(3) | 130 | 131 | ||||||
144A 7.650%, 6/15/35(3) | 70 | 75 | ||||||
Republic of Ghana 144A | 200 | 201 | ||||||
Republic of Guatemala 144A | 200 | 205 | ||||||
Republic of Indonesia | ||||||||
Series FR30, | 3,273,000 | IDR | 282 | |||||
Series FR55, | 379,000 | IDR | 31 | |||||
Series FR63, | 624,000 | IDR | 43 | |||||
Republic of Iraq RegS | 250 | 226 | ||||||
| PAR VALUE | VALUE | |||||||
| FOREIGN GOVERNMENT SECURITIES—continued | ||||||||
Republic of Mozambique EMATUM Finance BV, | $ | 200 | $ | 202 | ||||
Republic of Panama | 200 | 220 | ||||||
Republic of Peru 144A | 400 | PEN | 140 | |||||
Republic of Philippines | 5,000 | PHP | 117 | |||||
Republic of Poland | ||||||||
Series 1021, | 300 | PLN | 108 | |||||
4.000%, 1/22/24 | 84 | 87 | ||||||
Republic of Romania 144A 4.875%, 1/22/24(3) | 84 | 89 | ||||||
Republic of South Africa | ||||||||
Series R203, | 758 | ZAR | 69 | |||||
Series R208, | 1,470 | ZAR | 123 | |||||
Republic of Sri Lanka 144A 5.875%, 7/25/22(3) | 200 | 208 | ||||||
Republic of Turkey | ||||||||
5.125%, 3/25/22 | 200 | 206 | ||||||
6.750%, 5/30/40 | 225 | 255 | ||||||
Republic of Uruguay | 4,200 | UYU | 239 | |||||
Republic of Zambia 144A 5.375%, 9/20/22(3) | 200 | 191 | ||||||
Romania 144A | 150 | 178 | ||||||
Russian Federation 144A 7.850%, 3/10/18(3) | 5,000 | RUB | 121 | |||||
Ukraine | ||||||||
144A 6.750%, 11/14/17(3) | 300 | 257 | ||||||
144A 7.500%, 4/17/23(3) | 200 | 169 | ||||||
United Mexican States | ||||||||
Series M, | 3,855 | MXN | 293 | |||||
Series M, | 2,250 | MXN | 173 | |||||
| TOTAL FOREIGN GOVERNMENT SECURITIES | ||||||||
| (Identified Cost $9,416) | 8,824 | |||||||
| CORPORATE BONDS AND NOTES—70.0% | ||||||||
| Australia—0.4% | ||||||||
FMG Resources Property Ltd. 144A | 130 | 135 | ||||||
|
| |||||||
| Austria—1.3% | ||||||||
Sappi Papier Holding GmbH | ||||||||
144A 8.375%, 6/15/19(3) | 200 | 216 | ||||||
144A 6.625%, 4/15/21(3) | 200 | 208 | ||||||
|
| |||||||
| 424 | ||||||||
|
| |||||||
| Barbados—0.6% | ||||||||
Columbus International, Inc. 144A | 200 | 209 | ||||||
|
| |||||||
| PAR VALUE | VALUE | |||||||
| Bermuda—2.0% | ||||||||
Aircastle Ltd. | ||||||||
6.250%, 12/1/19 | $ | 100 | $ | 106 | ||||
5.125%, 3/15/21 | 120 | 119 | ||||||
Digicel Group Ltd. 144A | 200 | 207 | ||||||
GeoPark Latin America Ltd. 144A | 200 | 214 | ||||||
|
| |||||||
| 646 | ||||||||
|
| |||||||
| Brazil—6.1% | ||||||||
Banco ABC Brasil S.A. 144A | 100 | 107 | ||||||
Banco do Brasil SA 144A | 200 | 206 | ||||||
Banco Santander Brasil SA 144A | 300 | BRL | 117 | |||||
Banco Votorantim S.A. 144A | 125 | 138 | ||||||
Braskem Finance Ltd. 144A | 200 | 198 | ||||||
BRF SA 144A | 400 | BRL | 143 | |||||
Caixa Economica Federal 144A | 200 | 201 | ||||||
Companhia Brasileira de Aluminio 144A | 200 | 189 | ||||||
Gerdau Holdings, Inc. 144A | 125 | 141 | ||||||
Itau Unibanco Holding SA RegS | 250 | 251 | ||||||
Petrobras International Finance Co. | 100 | 101 | ||||||
Vale Overseas Ltd. | 200 | 225 | ||||||
|
| |||||||
| 2,017 | ||||||||
|
| |||||||
| Canada—1.4% | ||||||||
Bombardier, Inc. 144A | 135 | 135 | ||||||
Eldorado Gold Corp. 144A | 45 | 45 | ||||||
Pacific Rubiales Energy Corp. | ||||||||
144A 5.375%, 1/26/19(3) | 100 | 101 | ||||||
144A 5.125%, 3/28/23(3) | 200 | 192 | ||||||
|
| |||||||
| 473 | ||||||||
|
| |||||||
| Cayman Islands—1.7% | ||||||||
Marfrig Overseas Ltd. 144A | 200 | 213 | ||||||
Odebrecht Offshore Drilling Finance Ltd. 144A | 191 | 198 | ||||||
Transocean, Inc. | 150 | 138 | ||||||
|
| |||||||
| 549 | ||||||||
|
| |||||||
See Notes to Financial Statements
34
Table of Contents
VIRTUS EMERGING MARKETS DEBT FUND
SCHEDULE OF INVESTMENTS (Continued)
SEPTEMBER 30, 2014
($ reported in thousands)
| PAR VALUE | VALUE | |||||||
| Chile—2.7% | ||||||||
CorpGroup Banking S.A. 144A | $ | 250 | $ | 251 | ||||
Guanay Finance Ltd. 144A | 250 | 265 | ||||||
Inversiones CMPC S.A. 144A | 200 | 194 | ||||||
Transelec S.A. 144A | 200 | 199 | ||||||
|
| |||||||
| 909 | ||||||||
|
| |||||||
| China—2.3% | ||||||||
China Railway Resources Huitung Ltd. | 200 | 195 | ||||||
Country Garden Holdings Co., Ltd. 144A | 200 | 192 | ||||||
Evergrande Real Estate Group Ltd. 144A | 200 | 188 | ||||||
Kaisa Group Holdings Ltd. 144A | 200 | 203 | ||||||
|
| |||||||
| 778 | ||||||||
|
| |||||||
| Colombia—1.4% | ||||||||
Bancolombia S.A. | 250 | 251 | ||||||
Comcel Trust 144A | 200 | 211 | ||||||
|
| |||||||
| 462 | ||||||||
|
| |||||||
| Georgia—0.7% | ||||||||
Bank of Georgia JSC 144A | 200 | 214 | ||||||
|
| |||||||
| Hong Kong—1.7% | ||||||||
Bank of China Hong Kong Ltd. 144A | 200 | 215 | ||||||
Hutchison Whampoa International Ltd. | 325 | 349 | ||||||
|
| |||||||
| 564 | ||||||||
|
| |||||||
| Hungary—0.7% | ||||||||
Magyar Fejlesztesi Bank Zrt. 144A | 200 | 222 | ||||||
|
| |||||||
| India—1.6% | ||||||||
Bank of Baroda 144A | 200 | 211 | ||||||
ICICI Bank Ltd. 144A | 300 | 314 | ||||||
|
| |||||||
| 525 | ||||||||
|
| |||||||
| PAR VALUE | VALUE | |||||||
| Indonesia—2.2% | ||||||||
Pertamina Persero PT | ||||||||
144A 4.875%, 5/3/22(3) | $ | 200 | $ | 201 | ||||
144A 6.000%, 5/3/42(3) | 275 | 264 | ||||||
Perusahaan Listrik Negara PT 144A | 250 | 262 | ||||||
|
| |||||||
| 727 | ||||||||
|
| |||||||
| Ireland—2.2% | ||||||||
Alfa Bank OJSC (Alfa Bond Issuance plc) 144A | 200 | 197 | ||||||
EuroChem Mineral & Chemical Co. OJSC 144A | 200 | 196 | ||||||
Metalloinvest Finance Ltd. 144A | 200 | 183 | ||||||
Vimpel Communications OJSC (VIP Finance Ireland Ltd.) 144A | 125 | 136 | ||||||
|
| |||||||
| 712 | ||||||||
|
| |||||||
| Israel—0.7% | ||||||||
Israel Electric Corp. Ltd. RegS | 200 | 225 | ||||||
|
| |||||||
| Kazakhstan—2.4% | ||||||||
Development Bank of Kazakhstan OJSC 144A | 200 | 189 | ||||||
Eurasian Development Bank 144A | 200 | 194 | ||||||
KazMunayGas National Co. JSC 144A | 200 | 187 | ||||||
Zhaikmunai LP 144A | 200 | 211 | ||||||
|
| |||||||
| 781 | ||||||||
|
| |||||||
| Luxembourg—3.9% | ||||||||
ALROSA Finance S.A. 144A | 200 | 207 | ||||||
Ardagh Finance Holdings SA PIK Interest Capitalization, 144A | 200 | 202 | ||||||
Gazprom Neft OAO (GPN Capital SA) 144A | 200 | 189 | ||||||
Millicom International Cellular SA 144A | 200 | 208 | ||||||
QGOG Constellation SA 144A | 200 | 200 | ||||||
Sberbank of Russia (Sberbank Capital SA) 144A | 200 | 181 | ||||||
Severstal OAO (Steel Capital SA) 144A | 100 | 105 | ||||||
|
| |||||||
| 1,292 | ||||||||
|
| |||||||
| PAR VALUE | VALUE | |||||||
| Macau—0.6% | ||||||||
Wynn Macau Ltd. 144A | $ | 200 | $ | 194 | ||||
|
| |||||||
| Macedonia—0.6% | ||||||||
Office Cherifien des Phosphates S.A. (OCP) 144A | 200 | 208 | ||||||
|
| |||||||
| Mexico—5.6% | ||||||||
Alfa SAB de CV 144A | 200 | 213 | ||||||
Alpek SA de C.V. 144A | 200 | 207 | ||||||
America Movil SAB de C.V. | 2,000 | MXN | 144 | |||||
Banco Bilbao Vizcaya Argentaria Bancomer S.A. 144A | 150 | 168 | ||||||
Banco Inbursa SA Institucion de Banca Multiple 144A | 150 | 145 | ||||||
Banco Santander Mexico SA 144A | 200 | 212 | ||||||
Cemex SAB de CV 144A | 200 | 212 | ||||||
Fermaca Enterprises S de RL de CV 144A | 200 | 210 | ||||||
Grupo Televisa SAB | 2,000 | MXN | 125 | |||||
Petroleos Mexicanos 144A | 200 | 226 | ||||||
|
| |||||||
| 1,862 | ||||||||
|
| |||||||
| Netherlands—2.4% | ||||||||
Bharti Airtel International Netherlands BV 144A | 200 | 211 | ||||||
Lukoil OAO International Finance BV 144A | 200 | 180 | ||||||
Petrobras Global Finance BV | 200 | 209 | ||||||
VTR Finance B.V. 144A | 200 | 207 | ||||||
|
| |||||||
| 807 | ||||||||
|
| |||||||
| Panama—1.7% | ||||||||
AES El Salvador Trust II 144A | 200 | 194 | ||||||
Avianca Holdings SA (Avianca Leasing LLC) 144A | 200 | 214 | ||||||
Banco Latinoamericano de Comercio Exterior SA 144A | 150 | 156 | ||||||
|
| |||||||
| 564 | ||||||||
|
| |||||||
See Notes to Financial Statements
35
Table of Contents
VIRTUS EMERGING MARKETS DEBT FUND
SCHEDULE OF INVESTMENTS (Continued)
SEPTEMBER 30, 2014
($ reported in thousands)
| PAR VALUE | VALUE | |||||||
| Peru—2.5% | ||||||||
Banco de Credito del Peru | ||||||||
144A 5.375%, 9/16/20(3) | $ | 100 | $ | 108 | ||||
144A 6.125%, 4/24/27(2)(3) | 100 | 107 | ||||||
Banco Internacional del Peru SAA | ||||||||
144A 5.750%, 10/7/20(3) | 100 | 108 | ||||||
144A 6.625%, 3/19/29(2)(3) | 100 | 108 | ||||||
Transportadora de Gas del Peru SA 144A | 200 | 189 | ||||||
Volcan Compania Minera SAA 144A | 200 | 199 | ||||||
|
| |||||||
| 819 | ||||||||
|
| |||||||
| Russia—0.9% | ||||||||
AHML Finance Ltd. 144A | 5,000 | RUB | 115 | |||||
VTB Bank OJSC 144A | 200 | 188 | ||||||
|
| |||||||
| 303 | ||||||||
|
| |||||||
| Singapore—1.2% | ||||||||
BOC Aviation Pte Ltd. | 200 | 202 | ||||||
Oversea-Chinese Banking Corp. Ltd. 144A | 200 | 202 | ||||||
|
| |||||||
| 404 | ||||||||
|
| |||||||
| South Africa—0.6% | ||||||||
Transnet SOC Ltd. 144A | 200 | 188 | ||||||
|
| |||||||
| Sri Lanka—0.6% | ||||||||
Bank of Ceylon 144A | 200 | 212 | ||||||
|
| |||||||
| Sweden—0.6% | ||||||||
PKO Finance AB 144A | 200 | 208 | ||||||
|
| |||||||
| Thailand—0.6% | ||||||||
Bangkok Bank Plc 144A | 200 | 205 | ||||||
|
| |||||||
| Trinidad and Tobago—0.2% | ||||||||
Petroleum Co. of Trinidad & Tobago Ltd. RegS | 67 | 72 | ||||||
|
| |||||||
| Turkey—2.4% | ||||||||
Turkiye Garanti Bankasi AS 144A | 200 | 198 | ||||||
Turkiye Is Bankasi A.S 144A | 200 | 218 | ||||||
Turkiye Sise Ve Cam Fabrikalari AS 144A | 200 | 192 | ||||||
| PAR VALUE | VALUE | |||||||
| Turkey—continued | ||||||||
Yapi ve Kredi Bankasi AS 144A | $ | 200 | $ | 190 | ||||
|
| |||||||
| 798 | ||||||||
|
| |||||||
| Ukraine—0.8% | ||||||||
DP World Ltd. 144A | 250 | 280 | ||||||
|
| |||||||
| United Arab Emirates—1.9% | ||||||||
Abu Dhabi National Energy Co. 144A | 275 | 320 | ||||||
IPIC GMTN Ltd. 144A | 250 | 325 | ||||||
|
| |||||||
| 645 | ||||||||
|
| |||||||
| United Kingdom—2.7% | ||||||||
EnQuest plc 144A | 200 | 189 | ||||||
Tullow Oil plc 144A | 200 | 201 | ||||||
Ukreximbank Via Biz Finance plc RegS | 100 | 84 | ||||||
Vedanta Resources plc | ||||||||
144A 9.500%, 7/18/18(3) | 200 | 230 | ||||||
144A 7.125%, 5/31/23(3) | 200 | 206 | ||||||
|
| |||||||
| 910 | ||||||||
|
| |||||||
| United States—3.0% | ||||||||
Brazil Loan Trust 1 144A | 250 | 260 | ||||||
Clear Channel Worldwide Holdings, Inc. Series B | 150 | 156 | ||||||
First Data Corp. | 107 | 125 | ||||||
iHeartCommunications, Inc. | 100 | 84 | ||||||
Interactive Data Corp. 144A | 55 | 54 | ||||||
Parker Drilling Co.(The) 144A | 50 | 51 | ||||||
Reliance Holdings USA, Inc. 144A | 250 | 273 | ||||||
|
| |||||||
| 1,003 | ||||||||
|
| |||||||
| Venezuela—3.6% | ||||||||
Corp Andina de Fomento | 200 | 214 | ||||||
Petroleos de Venezuela SA | ||||||||
RegS 8.500%, 11/2/17(4) | 765 | 604 | ||||||
144A 6.000%, 5/16/24(3) | 720 | 374 | ||||||
|
| |||||||
| 1,192 | ||||||||
|
| |||||||
| Virgin Islands (British)—1.5% | ||||||||
Arcos Dorados Holdings, Inc. 144A | 275 | BRL | 107 | |||||
| PAR VALUE | VALUE | |||||||
| Virgin Islands (British)—continued | ||||||||
China Cinda Finance Ltd. 144A | $ | 200 | $ | 201 | ||||
State Grid Overseas Investment Ltd. 144A | 200 | 205 | ||||||
|
| |||||||
| 513 | ||||||||
| TOTAL CORPORATE BONDS AND NOTES (Identified Cost $23,580) | 23,251 | |||||||
| SHARES | ||||||||
| PREFERRED STOCK—0.6% | ||||||||
| Energy—0.6% | ||||||||
PTT Exploration & Production PCL, 144A, | 200 | (11) | 202 | |||||
| TOTAL PREFERRED STOCK (Identified Cost $201) | 202 | |||||||
| PAR VALUE | ||||||||
| LOAN AGREEMENTS(2)—0.9% | ||||||||
| Consumer Discretionary—0.7% | ||||||||
Delta 2 (Lux) S.A R.L. | ||||||||
Tranche B-3, | $ | 47 | 47 | |||||
Second Lien, | 55 | 55 | ||||||
Laureate Education, Inc. 2018 Extended, | 149 | 143 | ||||||
|
| |||||||
| 245 | ||||||||
|
| |||||||
| Information Technology—0.2% | ||||||||
IPC Systems, Inc. First Lien, | 54 | 54 | ||||||
| TOTAL LOAN AGREEMENTS (Identified Cost $303) | 299 | |||||||
| TOTAL LONG TERM INVESTMENTS—98.1% | ||||||||
| (Identified Cost $33,500) | 32,576 | |||||||
| SHARES | ||||||||
| SHORT-TERM INVESTMENTS—1.5% | ||||||||
| Money Market Mutual Funds—1.5% | ||||||||
Fidelity Money Market Portfolio – Institutional Shares (seven-day effective yield 0.080%) | 504,770 | 505 | ||||||
| TOTAL SHORT-TERM INVESTMENTS (Identified Cost $505) | 505 | |||||||
| TOTAL INVESTMENTS—99.6% (Identified Cost $34,005) | 33,081 | (1) | ||||||
Other assets and liabilities, net—0.4% |
| 141 | ||||||
|
| |||||||
| NET ASSETS—100.0% | $ | 33,222 | ||||||
|
| |||||||
See Notes to Financial Statements
36
Table of Contents
VIRTUS EMERGING MARKETS DEBT FUND
SCHEDULE OF INVESTMENTS (Continued)
SEPTEMBER 30, 2014
($ reported in thousands)
Abbreviations:
| PIK | Payment-in-Kind Security |
Footnote Legend:
| (1) | Federal Income Tax Information: For tax information at September 30, 2014, see Note 10 Federal Income Tax Information in the Notes to Financial Statements. |
| (2) | Variable or step coupon security; interest rate shown reflects the rate in effect at September 30, 2014. |
| (3) | Security exempt from registration under Rule 144A of the Securities Act of 1933. These securities may be resold in transactions exempt from registration, normally to qualified institutional buyers. At September 30, 2014, these securities amounted to a value of $23,626 or 71.1% of net assets. |
| (4) | Regulation S security. Security is offered and sold outside of the United States, therefore, it is exempt from registration with the SEC under rules 903 and 904 of the Securities Act of 1933. |
| (5) | This Note was issued for the sole purpose of funding a loan agreement between the issuer and the borrower. As the credit risk for this security lies solely with the borrower, the name represented here is that of the borrower. |
| (6) | No contractual maturity date. |
| (7) | Interest payments may be deferred. |
| (8) | Principal amount is adjusted pursuant to the change in the Index. |
| (9) | 100% of the income received was in cash. |
| (10) | This loan will settle after September 30, 2014, at which time the interest rate, based on the London Interbank Offered Rate (“LIBOR”) and the agreed upon spread on trade date, will be reflected. |
| (11) | Value shown as par value. |
| (12) | Security in default. |
Foreign Currencies:
| BRL | Brazilian Real |
| CLP | Chilean Peso |
| COP | Colombian Peso |
| IDR | Indonesian Rupiah |
| MXN | Mexican Peso |
| PEN | Peruvian Nuevo Sol |
| PHP | Philippine Peso |
| PLN | Polish Zloty |
| RUB | Russian Ruble |
| UYU | Uruguayan Peso |
| ZAR | South African Rand |
| Country Weightings (Unaudited)† | ||||
Mexico | 7 | % | ||
Venezuela | 7 | |||
Brazil | 6 | |||
United States | 5 | |||
Luxembourg | 4 | |||
Turkey | 4 | |||
Indonesia | 3 | |||
Other | 64 | |||
Total | 100 | % | ||
† % of total investments as of September 30, 2014 |
| |||
The following table provides a summary of inputs used to value the Fund’s investments as of September 30, 2014 (See Security Valuation Note 2A in the Notes to Financial Statements):
| Total Value at September 30, 2014 | Level 1 Quoted Prices | Level 2 Significant Observable Inputs | ||||||||||
Debt Securities: | ||||||||||||
Corporate Bonds and Notes | $ | 23,251 | $ | — | $ | 23,251 | ||||||
Foreign Government Securities | 8,824 | — | 8,824 | |||||||||
Loan Agreements | 299 | — | 299 | |||||||||
Equity Securities: | ||||||||||||
Preferred Stock | 202 | 202 | ||||||||||
Short-Term Investments | 505 | 505 | — | |||||||||
|
|
|
|
|
| |||||||
Total Investments | $ | 33,081 | $ | 505 | $ | 32,576 | ||||||
|
|
|
|
|
| |||||||
There are no Level 3 (significant unobservable inputs) priced securities.
There were no transfers between Level 1 and Level 2 for the period.
Security abbreviation definitions are located under the Key Investment Terms starting on page 4.
See Notes to Financial Statements
37
Table of Contents
VIRTUS EMERGING MARKETS EQUITY INCOME FUND
SCHEDULE OF INVESTMENTS
SEPTEMBER 30, 2014
($ reported in thousands)
| SHARES | VALUE | |||||||
| PREFERRED STOCK—4.8% | ||||||||
| Financials—1.2% | ||||||||
Banco Davivienda SA 4.360% (Colombia) | 23,969 | $ | 346 | |||||
Banco do Estado do Rio Grande do Sul S.A. 0.920% (Brazil) | 38,500 | 230 | ||||||
Bancolombia SA 2.670% (Colombia) | 27,517 | 390 | ||||||
|
| |||||||
| 966 | ||||||||
|
| |||||||
| Materials—2.3% | ||||||||
Klabin SA 4.22% (Brazil) | 387,600 | 372 | ||||||
Vale SA 8.200% (Brazil) | 157,500 | 1,530 | ||||||
|
| |||||||
| 1,902 | ||||||||
|
| |||||||
| Utilities—1.3% | ||||||||
Cia Energetica de Sao Paulo, Class B 4.650% (Brazil) | 60,100 | 651 | ||||||
Companhia Paranaense de Energia 2.450%, Class B (Brazil) | 31,200 | 427 | ||||||
|
| |||||||
| 1,078 | ||||||||
| TOTAL PREFERRED STOCK (Identified Cost $4,219) | 3,946 | |||||||
| COMMON STOCKS—84.7% | ||||||||
| Consumer Discretionary—7.6% | ||||||||
Arcelik AS (Turkey) | 45,270 | 242 | ||||||
China Motor Corp. (Taiwan) | 436,000 | 388 | ||||||
Coway Co. Ltd. (South Korea) | 8,658 | 692 | ||||||
Cyrela Brazil Realty S.A. (Brazil) | 78,200 | 395 | ||||||
Foschini Group Ltd. (The) (South Africa) | 21,108 | 219 | ||||||
Great Wall Motor Co., Ltd. (China) | 97,000 | 377 | ||||||
Grupo Televisa SA (Mexico) | 29,500 | 200 | ||||||
Halla Visteon Climate Control Corp. (South Korea) | 14,641 | 710 | ||||||
Imperial Holdings Ltd. (South Africa) | 14,067 | 217 | ||||||
Kangwon Land, Inc. (South Korea) | 23,600 | 802 | ||||||
Lojas Renner S.A. (Brazil) | 10,600 | 306 | ||||||
Pou Chen Corp. (Taiwan) | 215,000 | 239 | ||||||
Surya Citra Media Tbk PT (Indonesia) | 558,200 | 175 | ||||||
Tofas Turk Otomobil Fabrikasi AS (Turkey) | 58,870 | 331 | ||||||
Truworths International Ltd. (South Africa) | 35,291 | 212 | ||||||
UMW Holdings Bhd (Malaysia) | 216,400 | 809 | ||||||
|
| |||||||
| 6,314 | ||||||||
|
| |||||||
| Consumer Staples—5.0% | ||||||||
Ambev SA (Brazil)(2) | 156,100 | 1,027 | ||||||
Fomento Economico Mexicano S.A.B. de CV (Mexico) | 47,000 | 432 | ||||||
Hite Jinro Co., Ltd. (South Korea) | 19,220 | 422 | ||||||
Kimberly-Clark de Mexico S.A.B. de C.V. Class A (Mexico) | 77,100 | 182 | ||||||
KT&G Corp. (South Korea) | 13,262 | 1,188 | ||||||
Spar Group Ltd. (The) (South Africa) | 63,631 | 708 | ||||||
| SHARES | VALUE | |||||||
| Consumer Staples—continued | ||||||||
Wal-Mart de Mexico S.A.B. de C.V. (Mexico) | 84,100 | $ | 212 | |||||
|
| |||||||
| 4,171 | ||||||||
|
| |||||||
| Energy—9.7% | ||||||||
China Petroleum & Chemical Corp. Class H (China) | 671,800 | 588 | ||||||
China Shenhua Energy Co., Ltd. Class H (China) | 258,500 | 721 | ||||||
CNOOC Ltd. (China) | 571,000 | 980 | ||||||
Ecopetrol S.A. (Colombia) | 932,304 | 1,462 | ||||||
Gazprom OAO (Gazstream S.A.) Sponsored ADR (Russia) | 56,497 | 394 | ||||||
Lukoil OAO Sponsored ADR (Russia) | 18,750 | 954 | ||||||
PT Indo Tambangraya Megah ADR (Indonesia) | 88,700 | 189 | ||||||
PTT PCL (Thailand) | 54,800 | 608 | ||||||
Sasol Ltd. (South Africa) | 22,332 | 1,214 | ||||||
Sk Innovation Co. Ltd. (South Korea) | 3,195 | 246 | ||||||
Tatneft OAO ADR (Russia) | 19,691 | 698 | ||||||
|
| |||||||
| 8,054 | ||||||||
|
| |||||||
| Financials—26.6% | ||||||||
Agricultural Bank of China Ltd. (China) | 1,254,000 | 556 | ||||||
Alliance Financial Group Bhd (Malaysia) | 383,000 | 583 | ||||||
AMMB Holdings Bhd (Malaysia) | 237,600 | 498 | ||||||
Banco de Chile (Chile) | 6,061,210 | 747 | ||||||
Banco do Brasil S.A. (Brazil) | 18,200 | 189 | ||||||
Banco Santander Chile SA (Chile) | 28,670,919 | 1,599 | ||||||
Bank of China Ltd. (China) | 4,363,000 | 1,955 | ||||||
Barclays Africa Group Ltd. (South Africa) | 57,737 | 789 | ||||||
BR Malls Participacoes S.A. (Brazil) | 27,500 | 216 | ||||||
China Construction Bank Corp. (China) | 3,305,000 | 2,315 | ||||||
China Life Insurance Co. Ltd. (China) | 286,000 | 794 | ||||||
China Minsheng Banking Corp. Ltd. (China) | 337,000 | 308 | ||||||
Compartamos Sab de CV (Mexico) | 369,800 | 792 | ||||||
Dongbu Insurance Co., Ltd. (South Korea) | 8,590 | 484 | ||||||
Evergrande Real Estate Group Ltd. (China) | 642,000 | 241 | ||||||
Far East Horizon Ltd. (Hong Kong) | 308,000 | 276 | ||||||
Farglory Land Development Co., Ltd. (Taiwan) | 252,000 | 297 | ||||||
FirstRand Ltd. (South Africa) | 193,981 | 740 | ||||||
Guangzhou R&F Properties Co., Ltd. (China) | 363,200 | 367 | ||||||
Hanwha Life Insurance Co. Ltd. (South Korea) | 56,017 | 377 | ||||||
| SHARES | VALUE | |||||||
| Financials—continued | ||||||||
Hyundai Marine & Fire Insurance Co., Ltd. (South Korea) | 18,376 | $ | 507 | |||||
Industrial & Commercial Bank of China Ltd. (China) | 3,026,000 | 1,886 | ||||||
Industrial Bank of Korea (South Korea) | 33,109 | 500 | ||||||
Komercni Banka A.S. (Czech Republic) | 4,196 | 998 | ||||||
Mirae Asset Securities Co., Ltd. (South Korea) | 3,403 | 144 | ||||||
Porto Seguro S.A. (Brazil) | 21,300 | 248 | ||||||
Powszechny Zaklad Ubezpieczen S.A. (Poland) | 5,882 | 855 | ||||||
Redefine Properties Ltd. (South Africa) | 627,853 | 541 | ||||||
Samsung Fire & Marine Insurance Co., Ltd. (South Korea) | 956 | 256 | ||||||
Sberbank of Russia ADR (Russia) | 70,927 | 558 | ||||||
Shimao Property Holdings Ltd. (China) | 130,000 | 263 | ||||||
Siam Commercial Bank PCL (Thailand) | 92,600 | 520 | ||||||
Standard Bank Group Ltd. (South Africa) | 49,467 | 573 | ||||||
|
| |||||||
| 21,972 | ||||||||
|
| |||||||
| Industrials—8.1% | ||||||||
Aboitiz Equity Ventures, Inc. (Philippines) | 311,000 | 373 | ||||||
Alfa Sab de C.V. (Mexico) | 108,600 | 374 | ||||||
CTCI Corp. (Taiwan) | 229,000 | 390 | ||||||
Doosan Heavy Industries & Construction Co. Ltd. (South Korea) | 23,285 | 575 | ||||||
EcoRodovias Infraestrutura e Logistica S.A. (Brazil) | 144,800 | 706 | ||||||
Jiangsu Expressway Co., Ltd. (China) | 588,000 | 620 | ||||||
LG Corp. (South Korea) | 12,661 | 921 | ||||||
LS Industrial Systems Co. Ltd. (South Korea) | 8,818 | 490 | ||||||
Pegatron Corp. (Taiwan) | 315,000 | 580 | ||||||
S-1 Corp. (South Korea) | 4,190 | 324 | ||||||
Samsung Heavy Industries Co., Ltd. (South Korea) | 20,420 | 489 | ||||||
Tav Havalimanlari Holding AS (Turkey) | 34,349 | 276 | ||||||
Zhejiang Expressway Co., Ltd. (China) | 542,000 | 551 | ||||||
|
| |||||||
| 6,669 | ||||||||
|
| |||||||
| Information Technology—12.3% | ||||||||
Asustek Computer, Inc. (Taiwan) | 68,000 | 648 | ||||||
Cielo SA (Brazil) | 39,040 | 635 | ||||||
Compal Electronics, Inc. (Taiwan) | 503,000 | 376 | ||||||
Delta Electronics, Inc. (Taiwan) | 104,000 | 657 | ||||||
Inventec Corp. (Taiwan) | 687,000 | 447 | ||||||
See Notes to Financial Statements
38
Table of Contents
VIRTUS EMERGING MARKETS EQUITY INCOME FUND
SCHEDULE OF INVESTMENTS (Continued)
SEPTEMBER 30, 2014
($ reported in thousands)
| SHARES | VALUE | |||||||
| Information Technology—continued | ||||||||
Lite-On Technology Corp. (Taiwan) | 388,105 | $ | 560 | |||||
MediaTek, Inc. (Taiwan) | 33,000 | 489 | ||||||
Quanta Computer, Inc. (Taiwan) | 309,000 | 784 | ||||||
Radiant Opto-Electronics Corp. (Taiwan) | 80,260 | 318 | ||||||
Realtek Semiconductor Corp. (Taiwan) | 109,000 | 387 | ||||||
SK C&C Co. Ltd. (South Korea) | 3,529 | 811 | ||||||
Taiwan Semiconductor Manufacturing Co., Ltd. (Taiwan) | 538,000 | 2,122 | ||||||
Transcend Information, Inc. (Taiwan) | 154,000 | 511 | ||||||
Vanguard International Semiconductor Corp. (Taiwan) | 173,000 | 254 | ||||||
Wistron Corp. (Taiwan) | 503,000 | 514 | ||||||
Wpg Holdings Ltd. (Taiwan) | 531,000 | 649 | ||||||
|
| |||||||
| 10,162 | ||||||||
|
| |||||||
| Materials—6.0% | ||||||||
China Bluechemical Ltd. Class H (China) | 502,000 | 218 | ||||||
Eregli Demir Ve Celik Fabrikalari TAS (Turkey) | 138,156 | 257 | ||||||
Grupo Mexico S.A.B. de C.V. Series B (Mexico) | 215,200 | 723 | ||||||
Indocement Tunggal Prakarsa Tbk PT (Indonesia) | 142,700 | 252 | ||||||
Jiangxi Copper Co., Ltd. (China) | 444,000 | 731 | ||||||
Kumba Iron Ore Ltd. (South Africa) | 16,156 | 382 | ||||||
MMC Norilsk Nickel ADR (Russia) | 41,525 | 771 | ||||||
PTT Global Chemical PCL (Thailand) | 374,300 | 704 | ||||||
Semen Indonesia (Persero) Tbk PT (Indonesia) | 214,000 | 271 | ||||||
Taiwan Cement Corp. (Taiwan) | 451,000 | 672 | ||||||
|
| |||||||
| 4,981 | ||||||||
|
| |||||||
| SHARES | VALUE | |||||||
| Telecommunication Services—6.8% | ||||||||
Advanced Info Service PCL (Thailand) | 57,600 | $ | 400 | |||||
America Movil S.A.B. de C.V. Series L (Mexico) | 487,200 | 614 | ||||||
China Mobile Ltd. (China) | 124,500 | 1,439 | ||||||
MTN Group Ltd. (South Africa) | 50,526 | 1,067 | ||||||
SK Telecom Co., Ltd. (South Korea) | 3,088 | 849 | ||||||
Telekomunikasi Indonesia Persero Tbk PT (Indonesia) | 2,706,000 | 647 | ||||||
Tim Participacoes S.A. (Brazil) | 40,800 | 214 | ||||||
Turk Telekomunikasyon AS (Turkey) | 157,809 | 416 | ||||||
|
| |||||||
| 5,646 | ||||||||
|
| |||||||
| Utilities—2.6% | ||||||||
CEZ AS (Czech Republic) | 28,969 | 881 | ||||||
Huaneng Power International, Inc. Class H (China) | 544,000 | 594 | ||||||
Perusahaan Gas Negara Persero Tbk PT (Indonesia) | 1,326,000 | 653 | ||||||
|
| |||||||
| 2,128 | ||||||||
| TOTAL COMMON STOCKS (Identified Cost $70,123) | 70,097 | |||||||
| EXCHANGE-TRADED FUNDS—6.8% | ||||||||
iPath MSCI India Index ETN (India)(2) | 40,109 | 2,816 | ||||||
iShares MSCI India ETF (India) | 92,600 | 2,811 | ||||||
| TOTAL EXCHANGE-TRADED FUNDS (Identified Cost $4,908) | 5,627 | |||||||
| TOTAL LONG TERM INVESTMENTS—96.3% | ||||||||
| (Identified Cost $79,250) | 79,670 | |||||||
| SHARES | VALUE | |||||||
| SHORT-TERM INVESTMENTS—3.3% | ||||||||
| Money Market Mutual Funds—3.3% | ||||||||
Fidelity Money Market Portfolio – Institutional Shares (seven-day effective yield 0.080%) | 2,716,127 | $ | 2,716 | |||||
| TOTAL SHORT-TERM INVESTMENTS (Identified Cost $2,716) | 2,716 | |||||||
| TOTAL INVESTMENTS—99.6% | ||||||||
| (Identified Cost $81,966) | 82,386 | (1) | ||||||
Other assets and liabilities, net—0.4% |
| 368 | ||||||
|
| |||||||
| NET ASSETS—100.0% | $ | 82,754 | ||||||
|
| |||||||
Abbreviations:
| ADR | American Depositary Receipt |
| ETF | Exchange-Traded Fund |
| ETN | Exchange-Traded Note |
Footnote Legend:
| (1) | Federal Income Tax Information: For tax information at September 30, 2014, see Note 10 Federal Income Tax Information in the Notes to Financial Statements. |
| (2) | Non-income producing. |
| Country Weightings (Unaudited)† | ||||
China | 19 | % | ||
Taiwan | 14 | |||
South Korea | 13 | |||
Brazil | 9 | |||
South Africa | 8 | |||
India | 7 | |||
Mexico | 4 | |||
Other | 26 | |||
Total | 100 | % | ||
† % of total investments as of September 30, 2014 |
| |||
The following table provides a summary of inputs used to value the Fund’s investments as of September 30, 2014 (See Security Valuation Note 2A in the Notes to Financial Statements):
| Total Value at September 30, 2014 | Level 1 Quoted Prices | |||||||
Equity Securities: | ||||||||
Common Stocks | $ | 70,097 | $ | 70,097 | ||||
Exchange-Traded Funds | 5,627 | 5,627 | ||||||
Preferred Stock | 3,946 | 3,946 | ||||||
Short-Term Investments | 2,716 | 2,716 | ||||||
|
|
|
| |||||
Total Investments | $ | 82,386 | $ | 82,386 | ||||
|
|
|
| |||||
There are no Level 2 (significant observable inputs) or Level 3 (significant unobservable inputs) priced securities.
There were no transfers between Level 1 and Level 2 for the period.
Security abbreviation definitions are located under the Key Investment Terms starting on page 4.
See Notes to Financial Statements
39
Table of Contents
VIRTUS EMERGING MARKETS SMALL-CAP FUND
SCHEDULE OF INVESTMENTS
SEPTEMBER 30, 2014
($ reported in thousands)
| SHARES | VALUE | |||||||
| PREFERRED STOCK—1.3% | ||||||||
| Industrials—1.3% | ||||||||
Marcopolo S.A. 1.680% (Brazil) | 29,100 | $ | 47 | |||||
| TOTAL PREFERRED STOCK (Identified Cost $64) | 47 | |||||||
| COMMON STOCKS—88.8% | ||||||||
| Consumer Discretionary—8.9% | ||||||||
Ace Hardware Indonesia Tbk PT (Indonesia) | 985,000 | 71 | ||||||
Goldlion Holdings Ltd. (Hong Kong) | 266,000 | 111 | ||||||
Pico Far East Holdings Ltd. (Hong Kong) | 477,780 | 108 | ||||||
Truworths International Ltd. (South Africa) | 8,900 | 54 | ||||||
|
| |||||||
| 344 | ||||||||
|
| |||||||
| Consumer Staples—21.9% | ||||||||
AVI Ltd. (South Africa) | 12,000 | 74 | ||||||
Compania Cervecerias Unidas SA ADR (Chile) | 2,735 | 60 | ||||||
Embotelladora Andina ADR S.A. (Chile) | 3,610 | 69 | ||||||
Eurocash S.A. (Poland) | 6,100 | 60 | ||||||
Grupo Herdez Sab de CV (Mexico) | 19,300 | 52 | ||||||
Guinness Anchor Bhd (Malaysia) | 20,500 | 80 | ||||||
Massmart Holdings Ltd. (South Africa) | 7,700 | 84 | ||||||
Oldtown Bhd (Malaysia) | 109,750 | 60 | ||||||
Premier Marketing PCL (Thailand) | 562,000 | 171 | ||||||
Wawel SA (Poland) | 310 | 93 | ||||||
Wumart Stores, Inc. (China) | 42,000 | 39 | ||||||
|
| |||||||
| 842 | ||||||||
|
| |||||||
| Financials—13.6% | ||||||||
ARA Asset Management Ltd. (Singapore) | 70,000 | 96 | ||||||
BFI Finance Indonesia Tbk PT (Indonesia) | 680,000 | 117 | ||||||
Bolsa Mexicana de Valores Sab de CV SA (Mexico) | 27,900 | 60 | ||||||
Equity Bank Ltd. (Kenya) | 164,000 | 95 | ||||||
Korea Ratings Corp. (South Korea) | 2,100 | 80 | ||||||
Tisco Financial Group PCL (Thailand) | 54,700 | 77 | ||||||
|
| |||||||
| 525 | ||||||||
|
| |||||||
| Health Care—2.3% | ||||||||
OdontoPrev S.A. (Brazil) | 24,800 | 90 | ||||||
|
| |||||||
| Industrials—21.2% | ||||||||
ASR Logistics Holdings Ltd. (Hong Kong) | 591,000 | 55 | ||||||
Freight Management Holdings Bhd (Malaysia) | 108,029 | 56 | ||||||
Prosegur Cia de Seguridad S.A. (Spain) | 17,200 | 107 | ||||||
Riverstone Holdings Ltd. (Singapore) | 172,000 | 127 | ||||||
S-1 Corp. (South Korea) | 1,000 | 77 | ||||||
| SHARES | VALUE | |||||||
| Industrials—continued | ||||||||
Taiwan Secom Co., Ltd. (Taiwan) | 38,875 | $ | 107 | |||||
Tegma Gestao Logistica (Brazil) | 8,900 | 64 | ||||||
Turk Traktor Ve Ziraat Makineleri AS (Turkey) | 3,700 | 115 | ||||||
Valid Solucoes e Servicos de Seguranca Em Meios de Pagamento e Identificacao S.A (Brazil) | 7,000 | 108 | ||||||
|
| |||||||
| 816 | ||||||||
|
| |||||||
| Information Technology—11.5% | ||||||||
Bitauto Holdings Ltd. ADR (China)(2) | 1,900 | 148 | ||||||
Lumax International Corp., Ltd. (Taiwan) | 55,800 | 131 | ||||||
MercadoLibre, Inc. (United States) | 650 | 70 | ||||||
Totvs S.A. Com NPV (Brazil) | 6,200 | 94 | ||||||
|
| |||||||
| 443 | ||||||||
|
| |||||||
| Materials—9.4% | ||||||||
Assore Ltd. (South Africa) | 3,200 | 61 | ||||||
Cimsa Cimento Sanayi Ve Ticaret AS (Turkey) | 13,900 | 90 | ||||||
Corp. Moctezuma SAB de C.V. (Mexico) | 21,300 | 74 | ||||||
KPX Chemical Co. Ltd. (South Korea) | 1,600 | 90 | ||||||
Synthos SA (Poland) | 35,000 | 49 | ||||||
|
| |||||||
| 364 | ||||||||
| TOTAL COMMON STOCKS (Identified Cost $3,520) | 3,424 | |||||||
| WARRANTS—5.1% | ||||||||
| Financials—3.1% | ||||||||
Crisil Ltd. Strike price $0.01 Expiration Date 06/02/16 (India) | 3,600 | 118 | ||||||
|
| |||||||
| Information Technology—2.0% | ||||||||
eClerx Services Ltd. Strike price $0.01 Expiration Date 12/31/18 (India)(2) | 3,500 | 79 | ||||||
| TOTAL WARRANTS (Identified Cost $147) | 197 | |||||||
| TOTAL LONG TERM INVESTMENTS—95.2% | ||||||||
| (Identified Cost $3,731) | 3,668 | |||||||
| SHORT-TERM INVESTMENTS—5.4% | ||||||||
| Money Market Mutual Funds—5.4% | ||||||||
Fidelity Money Market Portfolio – Institutional Shares (seven-day effective yield 0.080%) | 210,027 | 210 | ||||||
| TOTAL SHORT-TERM INVESTMENTS (Identified Cost $210) | 210 | |||||||
| TOTAL INVESTMENTS—100.6% | ||||||||
| (Identified Cost $3,941) | 3,878 | (1) | ||||||
Other assets and liabilities, net—(0.6)% |
| (22 | ) | |||||
|
| |||||||
| NET ASSETS—100.0% | $ | 3,856 | ||||||
|
| |||||||
Abbreviations:
| ADR | American Depositary Receipt |
Footnote Legend:
| (1) | Federal Income Tax Information: For tax information at September 30, 2014, see Note 10 Federal Income Tax Information in the Notes to Financial Statements. |
| (2) | Non-income producing. |
| Country Weightings (Unaudited)† | ||||
Brazil | 11 | % | ||
Hong Kong | 7 | |||
South Africa | 7 | |||
Thailand | 7 | |||
United States | 7 | |||
South Korea | 6 | |||
Taiwan | 6 | |||
Other | 49 | |||
Total | 100 | % | ||
† % of total investments as of September 30, 2014 |
| |||
The following table provides a summary of inputs used to value the Fund’s investments as of September 30, 2014 (See Security Valuation Note 2A in the Notes to Financial Statements):
| Total Value at September 30, 2014 | Level 1 Quoted Prices | Level 2 Significant Observable Inputs | ||||||||||
Equity Securities: | ||||||||||||
Common Stocks | $ | 3,424 | $ | 3,424 | $ | — | ||||||
Preferred Stock | 47 | 47 | — | |||||||||
Short-Term Invest | 210 | 210 | — | |||||||||
Warrants | 197 | — | 197 | |||||||||
|
|
|
|
|
| |||||||
Total Invest | $ | 3,878 | $ | 3,681 | $ | 197 | ||||||
|
|
|
|
|
| |||||||
There are no Level 3 (significant unobservable inputs) priced securities.
There were no transfers between Level 1 and Level 2 for the period.
Security abbreviation definitions are located under the Key Investment Terms starting on page 4.
See Notes to Financial Statements
40
Table of Contents
VIRTUS GLOBAL COMMODITIES STOCK FUND
SCHEDULE OF INVESTMENTS
SEPTEMBER 30, 2014
($ reported in thousands)
| SHARES | VALUE | |||||||
| COMMON STOCKS—98.0% | ||||||||
| Consumer Discretionary—1.5% | ||||||||
Mahindra & Mahindra Ltd. (India) | 11,334 | $ | 250 | |||||
|
| |||||||
| Consumer Staples—21.0% | ||||||||
Andersons, Inc. (The) (United States) | 11,288 | 710 | ||||||
Archer-Daniels-Midland Co. (The) (United States) | 6,266 | 320 | ||||||
BRF – Brasil Foods S.A. ADR (Brazil) | 17,374 | 413 | ||||||
Kikkoman Corp (Japan) | 12,000 | 255 | ||||||
KWS Saat AG (Germany) | 333 | 117 | ||||||
Marine Harvest Asa (Norway) | 13,567 | 190 | ||||||
S&W Seed Co. (United States)(2) | 13,753 | 58 | ||||||
Sanderson Farms, Inc. (United States) | 5,138 | 452 | ||||||
Tyson Foods, Inc. Class A (United States) | 23,383 | 921 | ||||||
|
| |||||||
| 3,436 | ||||||||
|
| |||||||
| Energy—41.6% | ||||||||
Abraxas Petroleum Corp. (United States)(2) | 36,502 | 193 | ||||||
Athabasca Oil Corp. (Canada)(2) | 58,453 | 299 | ||||||
Bankers Petroleum Ltd. (Canada)(2) | 63,111 | 304 | ||||||
Bellatrix Exploration Ltd. (Canada)(2) | 42,674 | 262 | ||||||
Cabot Oil & Gas Corp. (United States) | 2,681 | 88 | ||||||
Canadian Natural Resources Ltd. (Canada) | 6,539 | 254 | ||||||
Concho Resources, Inc. (United States)(2) | 2,360 | 296 | ||||||
Crew Energy, Inc. (Canada)(2) | 9,459 | 83 | ||||||
Encana Corp. (Canada) | 11,654 | 247 | ||||||
EOG Resources, Inc. (United States) | 3,821 | 378 | ||||||
EQT Corp. (United States) | 1,453 | 133 | ||||||
FX Energy, Inc. (United States)(2) | 39,595 | 120 | ||||||
Halliburton Co. (United States) | 5,401 | 348 | ||||||
Interoil Corp. (Canada)(2) | 5,618 | 305 | ||||||
Keyera Corp. (Canada) | 4,154 | 335 | ||||||
MEG Energy Corp. (Canada)(2) | 14,873 | 457 | ||||||
Nabors Industries Ltd. (Bermuda) | 4,767 | 108 | ||||||
Painted Pony Petroleum Ltd. (Canada)(2) | 11,119 | 125 | ||||||
Pembina Pipeline Corp. (Canada) | 5,049 | 213 | ||||||
Pioneer Natural Resources Co. (United States) | 1,433 | 282 | ||||||
Precision Drilling Corp. (Canada) | 15,728 | 170 | ||||||
Schlumberger Ltd. (United States) | 1,574 | 160 | ||||||
Shawcor Ltd. (Canada) | 4,342 | 219 | ||||||
Suncor Energy, Inc. (Canada) | 16,365 | 592 | ||||||
Trican Well Service Ltd. (Canada) | 8,927 | 104 | ||||||
Valero Energy Corp. (United States) | 13,106 | 605 | ||||||
Whiting Petroleum Corp. (United States)(2) | 1,645 | 128 | ||||||
|
| |||||||
| 6,808 | ||||||||
|
| |||||||
| SHARES | VALUE | |||||||
| Industrials—5.2% | ||||||||
Ihi Corp (Japan) | 37,000 | $ | 192 | |||||
Kubota Corp. Sponsored ADR (Japan) | 4,322 | 340 | ||||||
Lindsay Corp. (United States) | 982 | 73 | ||||||
Trinity Industries, Inc. (United States) | 5,339 | 250 | ||||||
|
| |||||||
| 855 | ||||||||
|
| |||||||
| Materials—28.7% | ||||||||
Agnico-Eagle Mines Ltd. (Canada) | 3,219 | 94 | ||||||
Agrium, Inc. (Canada) | 2,103 | 187 | ||||||
Balchem Corp. (United States) | 5,673 | 321 | ||||||
BHP Billiton Ltd. Sponsored ADR (Australia) | 7,717 | 454 | ||||||
CF Industries Holdings, Inc. (United States) | 867 | 242 | ||||||
Du Pont (E.I.) de Nemours & Co. (United States) | 4,112 | 295 | ||||||
First Quantum Minerals Ltd. (Canada) | 17,002 | 328 | ||||||
Franco-Nevada Corp. (Canada) | 9,923 | 487 | ||||||
Goldcorp, Inc. (Canada) | 8,220 | 189 | ||||||
Grupo Mexico S.A.B. de C.V. | 41,149 | 138 | ||||||
Hudbay Minerals, Inc. (Canada) | 38,766 | 331 | ||||||
Monsanto Co. (United States) | 1,642 | 185 | ||||||
Nippon Steel & Sumitomo Metal Corp. (Japan) | 47,000 | 122 | ||||||
Potash Corp. of Saskatchewan, Inc. (Canada) | 5,279 | 183 | ||||||
Royal Gold, Inc. (United States) | 6,816 | 443 | ||||||
Silver Wheaton Corp. (Canada) | 12,792 | 255 | ||||||
Stillwater Mining Co. (United States)(2) | 9,780 | 147 | ||||||
Tahoe Resources, Inc. (Canada)(2) | 8,841 | 180 | ||||||
Teck Cominco Ltd. Class B (Canada) | 6,542 | 124 | ||||||
|
| |||||||
| 4,705 | ||||||||
| TOTAL COMMON STOCKS (Identified Cost $14,458) | 16,054 | |||||||
| TOTAL LONG TERM INVESTMENTS—98.0% | ||||||||
| (Identified Cost $14,458) | 16,054 | |||||||
| SHORT-TERM INVESTMENTS—3.8% | ||||||||
| Money Market Mutual Funds—3.8% | ||||||||
Fidelity Money Market Portfolio – Institutional Shares (seven-day effective yield 0.080%) | 630,227 | 630 | ||||||
| TOTAL SHORT-TERM INVESTMENTS (Identified Cost $630) | 630 | |||||||
| TOTAL INVESTMENTS—101.8% (Identified Cost $15,088) | 16,684 | (1) | ||||||
Other assets and liabilities, net—(1.8)% |
| (296 | ) | |||||
|
| |||||||
| NET ASSETS—100.0% | $ | 16,388 | ||||||
|
| |||||||
Abbreviations:
| ADR | American Depositary Receipt |
Footnote Legend:
| (1) | Federal Income Tax Information: For tax information at September 30, 2014, see Note 10 Federal Income Tax Information in the Notes to Financial Statements. |
| (2) | Non-income producing. |
| Country Weightings (Unaudited)† | ||||
United States | 47 | % | ||
Canada | 38 | |||
Japan | 5 | |||
Australia | 3 | |||
Brazil | 2 | |||
India | 2 | |||
Norway | 1 | |||
Other | 2 | |||
Total | 100 | % | ||
† % of total investments as of September 30, 2014 |
| |||
The following table provides a summary of inputs used to value the Fund’s investments as of September 30, 2014 (See Security Valuation Note 2A in the Notes to Financial Statements):
| Total Value at September 30, 2014 | Level 1 Quoted Prices | |||||||
Equity Securities: | ||||||||
Common Stocks | $ | 16,054 | $ | 16,054 | ||||
Short-Term Investments | 630 | 630 | ||||||
|
|
|
| |||||
Total Investments | $ | 16,684 | $ | 16,684 | ||||
|
|
|
| |||||
There are no Level 2 (significant observable inputs) or Level 3 (significant unobservable inputs) priced securities.
There were no transfers between Level 1 and Level 2 for the period.
Security abbreviation definitions are located under the Key Investment Terms starting on page 4.
See Notes to Financial Statements
41
Table of Contents
SCHEDULE OF INVESTMENTS
SEPTEMBER 30, 2014
($ reported in thousands)
| SHARES | VALUE | |||||||
| COMMON STOCKS—97.1% | ||||||||
| Consumer Discretionary—2.4% | ||||||||
Eutelsat Communications SA (France) | 46,580 | $ | 1,504 | |||||
SES SA (Luxembourg) | 55,015 | 1,902 | ||||||
|
| |||||||
| 3,406 | ||||||||
|
| |||||||
| Energy—27.0% | ||||||||
Enbridge, Inc. (Canada) | 155,405 | 7,441 | ||||||
Keyera Corp. (Canada) | 24,770 | 1,996 | ||||||
Kinder Morgan, Inc. (United States) | 103,940 | 3,985 | ||||||
ONEOK, Inc. (United States) | 32,425 | 2,125 | ||||||
Pembina Pipeline Corp. (Canada) | 65,500 | 2,759 | ||||||
Plains GP Holdings LP (United States) | 50,140 | 1,537 | ||||||
Spectra Energy Corp. (United States) | 117,120 | 4,598 | ||||||
TransCanada Corp. (Canada) | 104,575 | 5,389 | ||||||
Williams Cos., Inc. (The) (United States) | 155,990 | 8,634 | ||||||
|
| |||||||
| 38,464 | ||||||||
|
| |||||||
| Financials—4.9% | ||||||||
American Tower Corp. (United States) | 35,515 | 3,325 | ||||||
Crown Castle International Corp. (United States) | 44,960 | 3,621 | ||||||
|
| |||||||
| 6,946 | ||||||||
|
| |||||||
| Industrials—13.5% | ||||||||
Abertis Infraestructuras S.A. (Spain) | 131,590 | 2,600 | ||||||
Atlantia SpA (Italy) | 130,201 | 3,215 | ||||||
Auckland International Airport Ltd. (New Zealand) | 519,169 | 1,560 | ||||||
Ferrovial S.A. (Spain) | 96,075 | 1,863 | ||||||
Flughafen Zuerich AG (Switzerland) | 2,691 | 1,690 | ||||||
Fraport AG Frankfurt Airport Services Worldwide (Germany) | 23,650 | 1,555 | ||||||
Sydney Airport (Australia) | 471,940 | 1,765 | ||||||
Transurban Group (Australia) | 505,685 | 3,418 | ||||||
Vinci SA (France) | 28,795 | 1,673 | ||||||
|
| |||||||
| 19,339 | ||||||||
|
| |||||||
| Telecommunication Services—18.1% | ||||||||
AT&T, Inc. (United States) | 162,940 | 5,742 | ||||||
BCE, Inc. (Canada) | 25,665 | 1,097 | ||||||
BT Group plc (United Kingdom) | 353,215 | 2,174 | ||||||
Nippon Telegraph & Telephone Corp. ADR (Japan) | 42,660 | 1,327 | ||||||
Singapore Telecommunications Ltd. (Singapore) | 728,600 | 2,170 | ||||||
TDC A/S (Denmark) | 197,740 | 1,502 | ||||||
TELUS Corp. (Canada) | 50,355 | 1,728 | ||||||
Verizon Communications, Inc. (United States) | 108,899 | 5,444 | ||||||
Vodafone Group plc ADR (United Kingdom) | 97,351 | 3,202 | ||||||
| SHARES | VALUE | |||||||
| Telecommunication Services—continued | ||||||||
Windstream Holdings, Inc. (United States) | 127,000 | $ | 1,369 | |||||
|
| |||||||
| 25,755 | ||||||||
|
| |||||||
| Utilities—31.2% | ||||||||
Allette, Inc. (United States) | 26,540 | 1,178 | ||||||
American Water Works Co., Inc. (United States) | 39,050 | 1,883 | ||||||
APA Group (Australia) | 217,025 | 1,414 | ||||||
Cleco Corp. (United States) | 27,740 | 1,336 | ||||||
CMS Energy Corp. (United States) | 47,445 | 1,407 | ||||||
Dominion Resources, Inc. (United States) | 36,985 | 2,555 | ||||||
DTE Energy Co. (United States) | 20,055 | 1,526 | ||||||
Edison International (United States) | 24,385 | 1,364 | ||||||
Gas Natural SDG S.A. (Spain) | 48,350 | 1,423 | ||||||
Hera SpA (Italy) | 471,420 | 1,248 | ||||||
Iberdrola S.A. (Spain) | 249,220 | 1,785 | ||||||
ITC Holdings Corp. (United States) | 38,635 | 1,377 | ||||||
National Grid plc (United Kingdom) | 328,515 | 4,729 | ||||||
NextEra Energy, Inc. (United States) | 42,645 | 4,003 | ||||||
NiSource, Inc. (United States) | 58,005 | 2,377 | ||||||
Northeast Utilities (United States) | 30,530 | 1,352 | ||||||
Pennon Group plc (United Kingdom) | 113,845 | 1,460 | ||||||
Portland General Electric Co. (United States) | 45,350 | 1,457 | ||||||
PPL Corp. (United States) | 41,305 | 1,356 | ||||||
Public Service Enterprise Group, Inc. (United States) | 42,830 | 1,595 | ||||||
Questar Corp. (United States) | 46,870 | 1,045 | ||||||
Scottish & Southern Energy plc (United Kingdom) | 75,215 | 1,886 | ||||||
Sempra Energy (United States) | 32,660 | 3,442 | ||||||
Snam Rete Gas SpA (Italy) | 240,565 | 1,331 | ||||||
|
| |||||||
| 44,529 | ||||||||
| TOTAL COMMON STOCKS (Identified Cost $111,725) | 138,439 | |||||||
| TOTAL LONG TERM INVESTMENTS—97.1% | ||||||||
| (Identified Cost $111,725) | 138,439 | |||||||
| SHARES | VALUE | |||||||
| SHORT-TERM INVESTMENTS—3.3% | ||||||||
| Money Market Mutual Funds—3.3% | ||||||||
Fidelity Money Market Portfolio – Institutional Shares (seven-day effective yield 0.080%) | 4,639,697 | $ | 4,640 | |||||
| TOTAL SHORT-TERM INVESTMENTS (Identified Cost $4,640) | 4,640 | |||||||
| TOTAL INVESTMENTS—100.4% | ||||||||
| (Identified Cost $116,365) | 143,079 | (1) | ||||||
Other assets and liabilities, net—(0.4)% |
| (527 | ) | |||||
|
| |||||||
| NET ASSETS—100.0% | $ | 142,552 | ||||||
|
| |||||||
Abbreviations:
| ADR | American Depositary Receipt |
Footnote Legend:
| (1) | Federal Income Tax Information: For tax information at September 30, 2014, see Note 10 Federal Income Tax Information in the Notes to Financial Statements. |
| Country Weightings (Unaudited)† | ||||
United States | 52 | % | ||
Canada | 14 | |||
United Kingdom | 10 | |||
Australia | 5 | |||
Spain | 5 | |||
Italy | 4 | |||
France | 2 | |||
Other | 8 | |||
Total | 100 | % | ||
† % of total investments as of September 30, 2014 |
| |||
The following table provides a summary of inputs used to value the Fund’s investments as of September 30, 2014 (See Security Valuation Note 2A in the Notes to Financial Statements):
| Total Value at September 30, 2014 | Level 1 Quoted Prices | |||||||
Equity Securities: | ||||||||
Common Stocks | $ | 138,439 | $ | 138,439 | ||||
Short-Term Investments | 4,640 | 4,640 | ||||||
|
|
|
| |||||
Total Investments | $ | 143,079 | $ | 143,079 | ||||
|
|
|
| |||||
There are no Level 2 (significant observable inputs) or Level 3 (significant unobservable inputs) priced securities.
There were no transfers between Level 1 and Level 2 for the period.
Security abbreviation definitions are located under the Key Investment Terms starting on page 4.
See Notes to Financial Statements
42
Table of Contents
VIRTUS GLOBAL OPPORTUNITIES FUND
SCHEDULE OF INVESTMENTS
SEPTEMBER 30, 2014
($ reported in thousands)
| SHARES | VALUE | |||||||
| PREFERRED STOCK—1.2% | ||||||||
| Financials—1.2% | ||||||||
Itau Unibanco Holding S.A. ADR 0.52% (Brazil) | 98,872 | $ | 1,372 | |||||
| TOTAL PREFERRED STOCK (Identified Cost $1,185) | 1,372 | |||||||
| COMMON STOCKS—98.1% | ||||||||
| Consumer Discretionary—12.8% | ||||||||
Alimentation Couche-Tard, Inc. Class B (Canada) | 39,756 | 1,271 | ||||||
Galaxy Entertainment Group Ltd. (Hong Kong) | 97,723 | 568 | ||||||
Las Vegas Sands Corp. (United States) | 46,897 | 2,918 | ||||||
Naspers Ltd. Class N (South Africa) | 10,207 | 1,126 | ||||||
Persimmon plc (United Kingdom) | 56,888 | 1,230 | ||||||
Priceline Group, Inc. (The) (United States)(2) | 2,937 | 3,403 | ||||||
TJX Cos., Inc. (United States) | 31,813 | 1,882 | ||||||
Twenty-First Century Fox, Inc. Class A (United States) | 68,887 | 2,362 | ||||||
|
| |||||||
| 14,760 | ||||||||
|
| |||||||
| Consumer Staples—33.4% | ||||||||
Altria Group, Inc. (United States) | 75,240 | 3,457 | ||||||
British American Tobacco plc (United Kingdom) | 116,291 | 6,564 | ||||||
Coca-Cola Co. (The) (United States) | 56,243 | 2,399 | ||||||
Diageo plc (United Kingdom) | 73,191 | 2,118 | ||||||
Hershey Co. (The) (United States) | 30,218 | 2,884 | ||||||
ITC Ltd. (India) | 482,783 | 2,894 | ||||||
Nestle S.A. Registered Shares (Switzerland) | 59,798 | 4,400 | ||||||
Philip Morris International, Inc. (United States) | 68,724 | 5,732 | ||||||
Reckitt Benckiser Group plc (United Kingdom) | 31,579 | 2,739 | ||||||
SABMiller plc (United Kingdom) | 20,306 | 1,128 | ||||||
Unilever N.V. (Netherlands) | 89,923 | 3,581 | ||||||
Whole Foods Market, Inc. (United States) | 21,011 | 801 | ||||||
|
| |||||||
| 38,697 | ||||||||
|
| |||||||
| Energy—2.6% | ||||||||
Core Laboratories N.V. (United States) | 7,305 | 1,069 | ||||||
Enbridge, Inc. (Canada) | 41,758 | 1,999 | ||||||
|
| |||||||
| 3,068 | ||||||||
|
| |||||||
| Financials—12.5% | ||||||||
American Tower Corp. (United States) | 16,239 | 1,520 | ||||||
Housing Development Finance Corp. (India) | 275,710 | 4,711 | ||||||
Housing Development Finance Corp. Bank Ltd. (India) | 259,125 | 3,661 | ||||||
| SHARES | VALUE | |||||||
| Financials—continued | ||||||||
Prosperity Bancshares, Inc. (United States) | 10,000 | $ | 572 | |||||
Wells Fargo & Co. (United States) | 76,320 | 3,959 | ||||||
|
| |||||||
| 14,423 | ||||||||
|
| |||||||
| Health Care—16.1% | ||||||||
Abbott Laboratories (United States) | 37,261 | 1,549 | ||||||
Biogen Idec, Inc. (United States)(2) | 4,640 | 1,535 | ||||||
Bristol-Myers Squibb Co. (United States) | 29,055 | 1,487 | ||||||
Celgene Corp. (United States)(2) | 27,118 | 2,570 | ||||||
Grifols SA (Spain) | 36,554 | 1,498 | ||||||
HealthSouth Corp. (United States) | 290 | 11 | ||||||
Johnson & Johnson (United States) | 16,712 | 1,781 | ||||||
Novo Nordisk A/S Class B (Denmark) | 42,568 | 2,037 | ||||||
Roche Holding AG (Switzerland) | 14,763 | 4,378 | ||||||
Zoetis, Inc. (United States) | 48,584 | 1,795 | ||||||
|
| |||||||
| 18,641 | ||||||||
|
| |||||||
| Industrials—3.3% | ||||||||
Bureau Veritas SA (France) | 47,327 | 1,046 | ||||||
Precision Castparts Corp. (United States) | 4,500 | 1,066 | ||||||
SGS SA Registered Shares (Switzerland) | 814 | 1,689 | ||||||
|
| |||||||
| 3,801 | ||||||||
|
| |||||||
| Information Technology—16.7% | ||||||||
Alibaba Group Holding Ltd. ADR (Cayman Islands)(2) | 1,007 | 89 | ||||||
Apple, Inc. (United States) | 4,177 | 421 | ||||||
Baidu, Inc. Sponsored ADR (China)(2) | 7,223 | 1,576 | ||||||
Cielo SA (Brazil) | 68,331 | 1,112 | ||||||
Cognizant Technology Solutions Corp. Class A (United States)(2) | 41,250 | 1,847 | ||||||
Facebook, Inc. Class A (United States)(2) | 10,885 | 860 | ||||||
Google, Inc. Class C (United States)(2) | 6,211 | 3,586 | ||||||
MasterCard, Inc. Class A (United States) | 73,630 | 5,443 | ||||||
Tencent Holdings Ltd. (Cayman Islands) | 92,565 | 1,377 | ||||||
Visa, Inc. Class A (United States) | 14,340 | 3,060 | ||||||
|
| |||||||
| 19,371 | ||||||||
|
| |||||||
| Materials—0.7% | ||||||||
Fresnillo plc (United Kingdom) | 64,111 | 790 | ||||||
| TOTAL COMMON STOCKS (Identified Cost $87,477) | 113,551 | |||||||
| TOTAL LONG TERM INVESTMENTS—99.3% | ||||||||
| (Identified Cost $88,662) | 114,923 | |||||||
| SHARES | VALUE | |||||||
| SHORT-TERM INVESTMENTS—1.6% | ||||||||
| Money Market Mutual Funds—1.6% | ||||||||
Fidelity Money Market Portfolio – Institutional Shares (seven-day effective yield 0.080%) | 1,831,866 | $ | 1,832 | |||||
| TOTAL SHORT-TERM INVESTMENTS (Identified Cost $1,832) | 1,832 | |||||||
| TOTAL INVESTMENTS—100.9% | ||||||||
| (Identified Cost $90,494) | 116,755 | (1) | ||||||
Other assets and liabilities, net—(0.9)% |
| (993 | ) | |||||
|
| |||||||
| NET ASSETS—100.0% | $ | 115,762 | ||||||
|
| |||||||
Abbreviations:
| ADR | American Depositary Receipt |
Footnote Legend:
| (1) | Federal Income Tax Information: For tax information at September 30, 2014, see Note 10 Federal Income Tax Information in the Notes to Financial Statements. |
| (2) | Non-income producing. |
| Country Weightings (Unaudited)† | ||||
United States | 53 | % | ||
United Kingdom | 12 | |||
India | 10 | |||
Switzerland | 9 | |||
Canada | 3 | |||
Netherlands | 3 | |||
Brazil | 2 | |||
Other | 8 | |||
Total | 100 | % | ||
† % of total investments as of September 30, 2014 |
| |||
The following table provides a summary of inputs used to value the Fund’s investments as of September 30, 2014 (See Security Valuation Note 2A in the Notes to Financial Statements):
| Total Value at September 30, 2014 | Level 1 Quoted Prices | |||||||
Equity Securities: | ||||||||
Common Stocks | $ | 113,551 | $ | 113,551 | ||||
Preferred Stock | 1,372 | 1,372 | ||||||
Short-Term Investments | 1,832 | 1,832 | ||||||
|
|
|
| |||||
Total Investments | $ | 116,755 | $ | 116,755 | ||||
|
|
|
| |||||
There are no Level 2 (significant observable inputs) or Level 3 (significant unobservable inputs) priced securities.
There were no transfers between Level 1 and Level 2 for the period.
Security abbreviation definitions are located under the Key Investment Terms starting on page 4.
See Notes to Financial Statements
43
Table of Contents
VIRTUS GLOBAL REAL ESTATE SECURITIES FUND
SCHEDULE OF INVESTMENTS
SEPTEMBER 30, 2014
($ reported in thousands)
| SHARES | VALUE | |||||||
| COMMON STOCKS—97.9% | ||||||||
| Australia—4.8% | ||||||||
BGP Holdings plc(2)(3)(4) | 13,566 | $ | 0 | |||||
Dexus Property Group | 519,440 | 505 | ||||||
GPT Group | 76,500 | 259 | ||||||
Scentre Group(2) | 338,989 | 974 | ||||||
Westfield Corp. | 136,950 | 893 | ||||||
|
| |||||||
| 2,631 | ||||||||
|
| |||||||
| Canada—4.0% | ||||||||
Allied Properties Real Estate Investment Trust | 22,285 | 680 | ||||||
Canadian Real Estate Investment Trust | 9,175 | 397 | ||||||
First Capital Realty, Inc. | 25,880 | 405 | ||||||
RioCan Real Estate Investment Trust | 29,562 | 678 | ||||||
|
| |||||||
| 2,160 | ||||||||
|
| |||||||
| Finland—0.8% | ||||||||
Citycon OYJ | 133,822 | 448 | ||||||
|
| |||||||
| France—1.7% | ||||||||
Fonciere Des Regions | 2,554 | 230 | ||||||
Klepierre | 6,320 | 277 | ||||||
Mercialys SA | 17,900 | 390 | ||||||
|
| |||||||
| 897 | ||||||||
|
| |||||||
| Germany—2.1% | ||||||||
Deutsche Annington Immobilien SE | 19,380 | 562 | ||||||
LEG Immobilien AG | 8,554 | 593 | ||||||
|
| |||||||
| 1,155 | ||||||||
|
| |||||||
| Hong Kong—3.9% | ||||||||
Hang Lung Properties Ltd. | 152,000 | 433 | ||||||
Hongkong Land Holdings Ltd. | 56,900 | 387 | ||||||
Hysan Development Co. Ltd. | 82,000 | 379 | ||||||
Link REIT (The) | 154,504 | 890 | ||||||
|
| |||||||
| 2,089 | ||||||||
|
| |||||||
| Italy—0.1% | ||||||||
Beni Stabili SpA | 79,478 | 56 | ||||||
|
| |||||||
| Japan—5.5% | ||||||||
AEON Mall Co., Ltd. | 17,677 | 337 | ||||||
GLP J-REIT | 401 | 463 | ||||||
Hulic Co., Ltd. | 17,000 | 180 | ||||||
Industrial & Infrastructure Fund Investment Corp. | 23 | 191 | ||||||
Japan Real Estate Investment Corp. | 67 | 345 | ||||||
Kenedix Realty Investment Corp. | 64 | 344 | ||||||
Nippon Building Fund, Inc. | 77 | 405 | ||||||
Nippon Prologis REIT, Inc. | 170 | 395 | ||||||
Nomura Real Estate Office Fund, Inc. | 74 | 339 | ||||||
|
| |||||||
| 2,999 | ||||||||
|
| |||||||
| SHARES | VALUE | |||||||
| Mexico—1.7% | ||||||||
Prologis Property Mexico SA de CV | 306,800 | $ | 642 | |||||
TF Administradora Industrial S de Rl de CV | 133,222 | 293 | ||||||
|
| |||||||
| 935 | ||||||||
|
| |||||||
| Netherlands—3.0% | ||||||||
Unibail-Rodamco SE | 6,373 | 1,640 | ||||||
|
| |||||||
| Norway—0.6% | ||||||||
Norwegian Property ASA | 216,575 | 324 | ||||||
|
| |||||||
| Singapore—3.5% | ||||||||
CapitaMall Trust | 266,450 | 399 | ||||||
CapitaRetail China Trust | 376,331 | 463 | ||||||
Global Logistic Properties Ltd. | 362,500 | 770 | ||||||
Mapletree Logistics Trust | 291,545 | 264 | ||||||
|
| |||||||
| 1,896 | ||||||||
|
| |||||||
| Sweden—0.7% | ||||||||
Castellum AB | 25,740 | 392 | ||||||
|
| |||||||
| United Kingdom—8.0% | ||||||||
Big Yellow Group plc | 38,728 | 326 | ||||||
British Land Co. plc | 44,600 | 508 | ||||||
Derwent London plc | 6,410 | 284 | ||||||
Great Portland Estates plc | 21,671 | 225 | ||||||
Hammerson plc | 78,320 | 729 | ||||||
Land Securities Group plc | 43,631 | 735 | ||||||
Safestore Holdings plc | 162,726 | 564 | ||||||
SEGRO plc | 74,190 | 437 | ||||||
Unite Group plc (The) | 74,400 | 512 | ||||||
|
| |||||||
| 4,320 | ||||||||
|
| |||||||
| United States—57.5% | ||||||||
American Campus Communities, Inc. | 16,038 | 585 | ||||||
AvalonBay Communities, Inc. | 4,515 | 636 | ||||||
Boston Properties, Inc. | 9,928 | 1,149 | ||||||
Brixmor Property Group, Inc. | 16,483 | 367 | ||||||
Camden Property Trust | 13,610 | 933 | ||||||
CubeSmart | 11,000 | 198 | ||||||
DCT Industrial Trust, Inc. | 151,393 | 1,137 | ||||||
DDR Corp. | 27,845 | 466 | ||||||
Douglas Emmett, Inc. | 28,369 | 728 | ||||||
Duke Realty Corp. | 36,200 | 622 | ||||||
EastGroup Properties, Inc. | 1,700 | 103 | ||||||
Equity Lifestyle Properties, Inc. | 5,546 | 235 | ||||||
Equity Residential | 23,815 | 1,466 | ||||||
Essex Property Trust, Inc. | 8,104 | 1,449 | ||||||
Extra Space Storage, Inc. | 22,595 | 1,165 | ||||||
General Growth Properties, Inc. | 49,719 | 1,171 | ||||||
HCP, Inc. | 19,029 | 756 | ||||||
Highwoods Properties, Inc. | 12,760 | 496 | ||||||
Host Hotels & Resorts, Inc. | 66,708 | 1,423 | ||||||
Kilroy Realty Corp. | 22,275 | 1,324 | ||||||
Kimco Realty Corp. | 27,985 | 613 | ||||||
LaSalle Hotel Properties | 26,315 | 901 | ||||||
Liberty Property Trust | 27,617 | 918 | ||||||
Macerich Co. (The) | 22,173 | 1,415 | ||||||
Pebblebrook Hotel Trust | 26,109 | 975 | ||||||
| SHARES | VALUE | |||||||
| United States—continued | ||||||||
Prologis, Inc. | 45,648 | $ | 1,721 | |||||
Public Storage | 12,740 | 2,113 | ||||||
RLJ Lodging Trust | 15,200 | 433 | ||||||
Simon Property Group, Inc. | 19,931 | 3,277 | ||||||
SL Green Realty Corp. | 3,386 | 343 | ||||||
Tanger Factory Outlet Centers | 29,400 | 962 | ||||||
Ventas, Inc. | 15,272 | 946 | ||||||
Washington Prime Group, Inc. | 11,615 | 203 | ||||||
|
| |||||||
| 31,229 | ||||||||
| TOTAL COMMON STOCKS (Identified Cost $47,563) | 53,171 | |||||||
| RIGHTS—0.0% | ||||||||
| Italy—0.0% | ||||||||
Beni Stabili SpA | 49,478 | 1 | ||||||
| TOTAL RIGHTS (Identified Cost $0) | 1 | |||||||
| TOTAL LONG TERM INVESTMENTS—97.9% | ||||||||
| (Identified Cost $47,563) | 53,172 | |||||||
| SHORT-TERM INVESTMENTS—3.0% | ||||||||
| Money Market Mutual Funds—3.0% | ||||||||
Fidelity Money Market Portfolio – Institutional Shares (seven-day effective yield 0.080%) | 1,628,744 | 1,629 | ||||||
| TOTAL SHORT-TERM INVESTMENTS (Identified Cost $1,629) | 1,629 | |||||||
| TOTAL INVESTMENTS—100.9% (Identified Cost $49,192) | 54,801 | (1) | ||||||
Other assets and liabilities, net—(0.9)% |
| (464 | ) | |||||
|
| |||||||
| NET ASSETS—100.0% | $ | 54,337 | ||||||
|
| |||||||
Abbreviations:
| REIT | Real Estate Investment Trust |
Footnote Legend:
| (1) | Federal Income Tax Information: For tax information at September 30, 2014, see Note 10 Federal Income Tax Information in the Notes to Financial Statements. |
| (2) | Non-income producing. |
| (3) | Illiquid security. |
| (4) | Security valued at fair value as determined in good faith by or under the direction of the Trustees. This security is disclosed as a level 3 security in the disclosure table located after the Schedule of Investments. |
Foreign Currencies:
| EUR | Euro |
Security abbreviation definitions are located under the Key Investment Terms starting on page 4.
See Notes to Financial Statements
44
Table of Contents
VIRTUS GLOBAL REAL ESTATE SECURITIES FUND
SCHEDULE OF INVESTMENTS (Continued)
SEPTEMBER 30, 2014
($ reported in thousands)
| Country Weightings (Unaudited)† | ||||
United States | 60 | % | ||
United Kingdom | 8 | |||
Australia | 5 | |||
Japan | 5 | |||
Canada | 4 | |||
Hong Kong | 4 | |||
Singapore | 3 | |||
Other | 11 | |||
Total | 100 | % | ||
† % of total investments as of September 30, 2014 |
| |||
The following table provides a summary of inputs used to value the Fund’s investments as of September 30, 2014 (See Security Valuation Note 2A in the Notes to Financial Statements):
| Total Value at September 30, 2014 | Level 1 Quoted Prices | Level 3 Significant Unobservable Inputs | ||||||||||
Equity Securities: | ||||||||||||
Common Stocks | $ | 53,171 | $ | 53,171 | $ | 0 | (1) | |||||
Rights | 1 | 1 | — | |||||||||
Short-Term Investments | 1,629 | 1,629 | — | |||||||||
|
|
|
|
|
| |||||||
Total Investments | $ | 54,801 | $ | 54,801 | $ | 0 | (1) | |||||
|
|
|
|
|
| |||||||
| (1) | Includes internally fair valued security currently priced at zero ($0). |
There are no Level 2 (significant observable inputs) priced securities.
There were no transfers between Level 1 and Level 2 for the period.
See Notes to Financial Statements
45
Table of Contents
VIRTUS GREATER EUROPEAN OPPORTUNITIES FUND
SCHEDULE OF INVESTMENTS
SEPTEMBER 30, 2014
($ reported in thousands)
| SHARES | VALUE | |||||||
| COMMON STOCKS—98.8% | ||||||||
| Consumer Discretionary—16.5% | ||||||||
Barrat Developments plc (United Kingdom) | 40,817 | $ | 262 | |||||
Compagnie Financiere Richemont SA Registered Shares (Switzerland) | 7,315 | 600 | ||||||
Domino’s Pizza Group plc (United Kingdom) | 20,097 | 185 | ||||||
Hermes International SA (France) | 750 | 224 | ||||||
Luxottica Group SpA (Italy) | 1,641 | 86 | ||||||
Naspers Ltd. Class N (South Africa) | 1,893 | 209 | ||||||
Paddy Power plc (Ireland)(2) | 4,162 | 301 | ||||||
Persimmon plc (United Kingdom) | 12,574 | 272 | ||||||
Priceline Group, Inc. (The) (United States)(2) | 297 | 344 | ||||||
William Hill plc (United Kingdom) | 41,215 | 247 | ||||||
|
| |||||||
| 2,730 | ||||||||
|
| |||||||
| Consumer Staples—36.3% | ||||||||
Anheuser-Busch InBev N.V. (Belgium) | 3,214 | 358 | ||||||
British American Tobacco plc (United Kingdom) | 15,872 | 896 | ||||||
Diageo plc (United Kingdom) | 16,348 | 473 | ||||||
L’Oreal S.A. (France) | 1,946 | 309 | ||||||
Lindt & Spruengli AG (Switzerland) | 42 | 210 | ||||||
Nestle S.A. Registered Shares (Switzerland) | 11,457 | 843 | ||||||
Pernod-Ricard S.A. (France) | 2,106 | 238 | ||||||
Philip Morris International, Inc. (United States) | 8,996 | 750 | ||||||
Reckitt Benckiser Group plc (United Kingdom) | 8,930 | 775 | ||||||
SABMiller plc (United Kingdom) | 8,836 | 491 | ||||||
Unilever N.V. (Netherlands) | 16,980 | 676 | ||||||
|
| |||||||
| 6,019 | ||||||||
|
| |||||||
| Energy—3.1% | ||||||||
Core Laboratories N.V. (United States) | 3,557 | 521 | ||||||
|
| |||||||
| Financials—2.7% | ||||||||
Countrywide plc (United Kingdom) | 11,306 | 83 | ||||||
Reinet Investments SCA (Luxembourg) | 8,943 | 193 | ||||||
Svenska Handelsbanken Class A (Sweden) | 3,632 | 171 | ||||||
|
| |||||||
| 447 | ||||||||
|
| |||||||
| SHARES | VALUE | |||||||
| Health Care—18.2% | ||||||||
Cie Generale D’optique Essilor International SA (France) | 4,385 | $ | 481 | |||||
Coloplast A/S Class B (Denmark) | 500 | 42 | ||||||
Fresenius Medical Care AG & Co KGaA (Germany) | 3,750 | 262 | ||||||
Grifols SA (Spain) | 9,660 | 396 | ||||||
Novo Nordisk A/S Class B (Denmark) | 11,370 | 544 | ||||||
Novozymes A/S Class B (Denmark) | 4,255 | 185 | ||||||
Roche Holding AG (Switzerland) | 3,143 | 932 | ||||||
Sanofi (France) | 1,561 | 176 | ||||||
|
| |||||||
| 3,018 | ||||||||
|
| |||||||
| Industrials—10.5% | ||||||||
Bureau Veritas SA (France) | 17,169 | 379 | ||||||
DKSH Holding AG (Switzerland) | 3,922 | 293 | ||||||
Indutrade AB (Sweden) | 4,040 | 154 | ||||||
Legrand SA (France) | 2,062 | 107 | ||||||
Rolls-Royce Holdings plc C Shares (United Kingdom) | 20,328 | 318 | ||||||
SGS SA Registered Shares (Switzerland) | 148 | 307 | ||||||
Zodiac Aerospace (France) | 5,545 | 177 | ||||||
|
| |||||||
| 1,735 | ||||||||
|
| |||||||
| Information Technology—2.2% | ||||||||
Accenture plc Class A (United States) | 2,311 | 188 | ||||||
Wirecard AG (Germany) | 4,988 | 184 | ||||||
|
| |||||||
| 372 | ||||||||
|
| |||||||
| Materials—8.0% | ||||||||
Air Liquide SA (France) | 4,695 | 572 | ||||||
Fresnillo plc (United Kingdom) | 18,423 | 227 | ||||||
HeidelbergCement AG (Germany) | 2,176 | 144 | ||||||
Randgold Resources Ltd. (Jersey) | 1,598 | 109 | ||||||
Randgold Resources Ltd. ADR (Jersey) | 1,758 | 119 | ||||||
Sika AG (Switzerland) | 47 | 163 | ||||||
|
| |||||||
| 1,334 | ||||||||
|
| |||||||
| Retail REIT—1.3% | ||||||||
Unibail-Rodamco SE (Netherlands) | 827 | 213 | ||||||
| TOTAL COMMON STOCKS (Identified Cost $14,223) | 16,389 | |||||||
| TOTAL LONG TERM INVESTMENTS—98.8% | ||||||||
| (Identified Cost $14,223) | 16,389 | |||||||
| SHARES | VALUE | |||||||
| SHORT-TERM INVESTMENTS—1.2% | ||||||||
| Money Market Mutual Funds—1.2% | ||||||||
Fidelity Money Market Portfolio – Institutional Shares (seven-day effective yield 0.080%) | 193,383 | $ | 193 | |||||
| TOTAL SHORT-TERM INVESTMENTS (Identified Cost $193) | 193 | |||||||
| TOTAL INVESTMENTS—100.0% | ||||||||
| (Identified Cost $14,416) | 16,582 | (1) | ||||||
Other assets and liabilities, net—0.0% |
| 2 | ||||||
|
| |||||||
| NET ASSETS—100.0% | $ | 16,584 | ||||||
|
| |||||||
Abbreviations:
| ADR | American Depositary Receipt |
Footnote Legend:
| (1) | Federal Income Tax Information: For tax information at September 30, 2014, see Note 10 Federal Income Tax Information in the Notes to Financial Statements. |
| (2) | Non-income producing. |
| Country Weightings (Unaudited)† | ||||
United Kingdom | 25 | % | ||
Switzerland | 20 | |||
France | 16 | |||
United States | 12 | |||
Denmark | 5 | |||
Netherlands | 5 | |||
Germany | 4 | |||
Other | 13 | |||
Total | 100 | % | ||
† % of total investments as of September 30, 2014 |
| |||
Security abbreviation definitions are located under the Key Investment Terms starting on page 4.
See Notes to Financial Statements
46
Table of Contents
VIRTUS GREATER EUROPEAN OPPORTUNITIES FUND
SCHEDULE OF INVESTMENTS (Continued)
SEPTEMBER 30, 2014
($ reported in thousands)
The following table provides a summary of inputs used to value the Fund’s investments as of September 30, 2014 (See Security Valuation Note 2A in the Notes to Financial Statements):
| Total Value at September 30, 2014 | Level 1 Quoted Prices | |||||||
Equity Securities: | ||||||||
Common Stocks | $ | 16,389 | $ | 16,389 | ||||
Short-Term Investments | 193 | 193 | ||||||
|
|
|
| |||||
Total Investments | $ | 16,582 | $ | 16,582 | ||||
|
|
|
| |||||
There are no Level 2 (significant observable inputs) or Level 3 (significant unobservable inputs) priced securities.
There were no transfers between Level 1 and Level 2 for the period.
See Notes to Financial Statements
47
Table of Contents
VIRTUS INTERNATIONAL EQUITY FUND
SCHEDULE OF INVESTMENTS
SEPTEMBER 30, 2014
($ reported in thousands)
| SHARES | VALUE | |||||||
| COMMON STOCKS—91.6% | ||||||||
| Consumer Discretionary—14.9% | ||||||||
Bridgestone Corp. (Japan) | 8,200 | $ | 271 | |||||
Fuji Heavy Industries Ltd. (Japan) | 10,500 | 347 | ||||||
Li & Fung Ltd. (Hong Kong) | 219,300 | 249 | ||||||
Melco Crown Entertainment Ltd. ADR (United States) | 9,850 | 259 | ||||||
Tata Motors Ltd. Sponsored ADR (India) | 5,900 | 258 | ||||||
Toyota Motor Corp. Sponsored ADR (Japan) | 2,400 | 282 | ||||||
|
| |||||||
| 1,666 | ||||||||
|
| |||||||
| Consumer Staples—4.5% | ||||||||
Companhia Brasileira de Distribuicao Grupo Pao de Acucar ADR (Brazil) | 5,400 | 235 | ||||||
Marine Harvest Asa ADR (Norway) | 19,350 | 272 | ||||||
|
| |||||||
| 507 | ||||||||
|
| |||||||
| Energy—11.2% | ||||||||
Cameco Corp. (Canada) | 14,700 | 260 | ||||||
Canadian Natural Resources Ltd. (Canada) | 6,700 | 260 | ||||||
Encana Corp. (Canada) | 14,100 | 299 | ||||||
Royal Dutch Shell plc Class B ADR (United Kingdom) | 3,550 | 281 | ||||||
Uranium Participation Corp. (Canada)(2) | 33,000 | 148 | ||||||
|
| |||||||
| 1,248 | ||||||||
|
| |||||||
| Financials—20.7% | ||||||||
Aviva plc (United Kingdom) | 35,011 | 297 | ||||||
Banco Bilbao Vizcaya Argentaria SA Sponsored ADR (Spain) | 21,716 | 261 | ||||||
BNP Paribas SA (France) | 4,153 | 276 | ||||||
Credit Agricole SA (France) | 21,837 | 329 | ||||||
ING Groep N.V. ADR (Netherlands)(2) | 21,750 | 309 | ||||||
Intesa Sanpaolo SpA (Italy) | 111,173 | 338 | ||||||
ORIX Corp. (Japan) | 20,900 | 288 | ||||||
Unicredit SPA (Italy) | 26,950 | 213 | ||||||
|
| |||||||
| 2,311 | ||||||||
|
| |||||||
| SHARES | VALUE | |||||||
| Health Care—10.9% | ||||||||
H Lundbeck A/S (Denmark) | 10,750 | $ | 240 | |||||
Novartis AG ADR (Switzerland) | 3,300 | 310 | ||||||
Shire plc ADR (United Kingdom) | 1,300 | 337 | ||||||
Valeant Pharmaceuticals International, Inc. (Canada)(2) | 2,500 | 328 | ||||||
|
| |||||||
| 1,215 | ||||||||
|
| |||||||
| Industrials—10.7% | ||||||||
Hitachi Ltd. (Japan) | 40,350 | 308 | ||||||
Hutchison Whampoa Ltd. (Hong Kong) | 18,200 | 221 | ||||||
Nidec Corp. (Japan) | 5,900 | 399 | ||||||
Schneider Electric SE (France) | 3,400 | 261 | ||||||
|
| |||||||
| 1,189 | ||||||||
|
| |||||||
| Information Technology—4.2% | ||||||||
NXP Semiconductor NV (Netherlands)(2) | 3,150 | 216 | ||||||
Taiwan Semiconductors Manufacturing Co., Ltd. Sponsored ADR (Taiwan) | 12,700 | 256 | ||||||
|
| |||||||
| 472 | ||||||||
|
| |||||||
| Materials—4.2% | ||||||||
Newcrest Mining Ltd. (Australia)(2) | 26,300 | 243 | ||||||
Syngenta AG ADR (Switzerland) | 3,550 | 225 | ||||||
|
| |||||||
| 468 | ||||||||
|
| |||||||
| Telecommunication Services—8.3% | ||||||||
KDDI Corp. (Japan) | 4,700 | 283 | ||||||
Nippon Telegraph & Telephone Corp. ADR (Japan) | 12,000 | 373 | ||||||
Spark New Zealand Ltd. (New Zealand) | 115,200 | 267 | ||||||
|
| |||||||
| 923 | ||||||||
|
| |||||||
| Utilities—2.0% | ||||||||
GDF Suez (France) | 8,800 | 221 | ||||||
| TOTAL COMMON STOCKS (Identified Cost $9,816) | 10,220 | |||||||
| SHARES | VALUE | |||||||
| RIGHTS—1.6% | ||||||||
| Consumer Discretionary—1.6% | ||||||||
Hyundai Motor Co. Pref (South Korea) | 1,550 | $ | 176 | |||||
| TOTAL RIGHTS (Identified Cost $231) | 176 | |||||||
| TOTAL LONG TERM INVESTMENTS—93.2% | ||||||||
| (Identified Cost $10,047) | 10,396 | |||||||
| SHORT-TERM INVESTMENTS—5.9% | ||||||||
| Money Market Mutual Funds—5.9% | ||||||||
Fidelity Money Market Portfolio – Institutional Shares (seven-day effective yield 0.080%) | 658,923 | 659 | ||||||
| TOTAL SHORT-TERM INVESTMENTS (Identified Cost $659) | 659 | |||||||
| TOTAL INVESTMENTS—99.1% (Identified Cost $10,706) | 11,055 | (1) | ||||||
Other assets and liabilities, net—0.9% |
| 99 | ||||||
|
| |||||||
| NET ASSETS—100.0% | $ | 11,154 | ||||||
|
| |||||||
Abbreviations:
| ADR | American Depositary Receipt |
Footnote Legend:
| (1) | Federal Income Tax Information: For tax information at September 30, 2014, see Note 10 Federal Income Tax Information in the Notes to Financial Statements. |
| (2) | Non-income producing. |
Foreign Currencies:
| JPY | Japanese Yen |
At September 30, 2014, the Fund had entered into forward currency contracts as follows (reported in 000’s):
Contracts to Sell | In Exchange for | Counterparty | Settlement Date | Value | Unrealized Appreciation (Depreciation) | |||||||||||||||
JPY 1,050 | USD 1,000 | JPMorgan | 3/09/15 | $ | 959 | $ | 41 | |||||||||||||
|
| |||||||||||||||||||
| $ | 41 | |||||||||||||||||||
|
| |||||||||||||||||||
Security abbreviation definitions are located under the Key Investment Terms starting on page 4.
See Notes to Financial Statements
48
Table of Contents
VIRTUS INTERNATIONAL EQUITY FUND
SCHEDULE OF INVESTMENTS (Continued)
SEPTEMBER 30, 2014
($ reported in thousands)
| Country Weightings (Unaudited)† | ||||
Japan | 23 | % | ||
Canada | 12 | |||
France | 10 | |||
United Kingdom | 8 | |||
United States | 8 | |||
Italy | 5 | |||
Switzerland | 5 | |||
Other | 29 | |||
Total | 100 | % | ||
† % of total investments as of September 30, 2014 |
| |||
The following table provides a summary of inputs used to value the Fund’s investments as of September 30, 2014 (See Security Valuation Note 2A in the Notes to Financial Statements):
| Total Value at September 30, 2014 | Level 1 Quoted Prices | Level 2 Significant Observable Inputs | ||||||||||
Equity Securities: | ||||||||||||
Common Stocks | $ | 10,220 | $ | 10,220 | $ | — | ||||||
Rights | 176 | 176 | — | |||||||||
Short-Term Investments | 659 | 659 | — | |||||||||
|
|
|
|
|
| |||||||
Total Investments | $ | 11,055 | $ | 11,055 | $ | — | ||||||
|
|
|
|
|
| |||||||
Other Financial Instruments: | ||||||||||||
Forward Currency Contracts* | $ | 41 | $ | — | $ | 41 | ||||||
|
|
|
|
|
| |||||||
There are no Level 3 (significant unobservable inputs) priced securities.
| * | Valued at the unrealized appreciation (depreciation) on the investment. |
There were no transfers between Level 1 and Level 2 for the period.
The following is a reconciliation of assets of the Fund for Level 3 investments for which significant unobservable inputs were used to determine fair value.
| Rights | ||||
Investments in Securities | ||||
Balance as of September 30, 2013: | $ | 18 | ||
Accrued discount/(premium) | — | |||
Realized gain/(loss) | 18 | |||
Change in unrealized appreciation/(depreciation) | (18 | ) | ||
Purchases | — | |||
Sales | (18 | ) | ||
Transfers into Level 3(a) | — | |||
Transfers from Level 3(a) | — | |||
|
| |||
Balance as of September 30, 2014 | $ | — | ||
|
| |||
| (a) | “Transfers into and/or from” represent the ending value as of September 30, 2014, for any investment security where a change in the pricing level occurred from the beginning to the end of the period. |
See Notes to Financial Statements
49
Table of Contents
VIRTUS INTERNATIONAL REAL ESTATE SECURITIES FUND
SCHEDULE OF INVESTMENTS
SEPTEMBER 30, 2014
($ reported in thousands)
| SHARES | VALUE | |||||||
| COMMON STOCKS—98.3% | ||||||||
| Australia—12.2% | ||||||||
BGP Holdings plc(2)(3)(4) | 588,920 | $ | 0 | |||||
Dexus Property Group | 1,088,115 | 1,058 | ||||||
GPT Group | 152,000 | 515 | ||||||
Scentre Group(2) | 652,271 | 1,873 | ||||||
Westfield Corp. | 266,473 | 1,738 | ||||||
|
| |||||||
| 5,184 | ||||||||
|
| |||||||
| Canada—9.7% | ||||||||
Allied Properties Real Estate Investment Trust | 42,215 | 1,288 | ||||||
Canadian Real Estate Investment Trust | 17,195 | 745 | ||||||
First Capital Realty, Inc. | 50,405 | 788 | ||||||
RioCan Real Estate Investment Trust | 56,150 | 1,287 | ||||||
|
| |||||||
| 4,108 | ||||||||
|
| |||||||
| Finland—1.9% | ||||||||
Citycon OYJ | 243,794 | 816 | ||||||
|
| |||||||
| France—3.6% | ||||||||
Fonciere Des Regions | 3,260 | 294 | ||||||
Klepierre | 11,856 | 519 | ||||||
Mercialys SA | 32,000 | 698 | ||||||
|
| |||||||
| 1,511 | ||||||||
|
| |||||||
| Germany—4.9% | ||||||||
Deutsche Annington Immobilien SE | 37,420 | 1,086 | ||||||
LEG Immobilien AG | 14,461 | 1,002 | ||||||
|
| |||||||
| 2,088 | ||||||||
|
| |||||||
| Hong Kong—10.0% | ||||||||
Hang Lung Properties Ltd. | 311,000 | 885 | ||||||
Hongkong Land Holdings Ltd. | 131,100 | 892 | ||||||
Hysan Development Co. Ltd. | 162,000 | 749 | ||||||
Link REIT (The) | 301,441 | 1,737 | ||||||
|
| |||||||
| 4,263 | ||||||||
|
| |||||||
| Italy—0.2% | ||||||||
Beni Stabili SpA | 127,257 | 90 | ||||||
|
| |||||||
| Japan—14.2% | ||||||||
AEON Mall Co., Ltd. | 38,613 | 737 | ||||||
GLP J-REIT | 739 | 854 | ||||||
Hulic Co., Ltd. | 33,000 | 349 | ||||||
Industrial & Infrastructure Fund Investment Corp. | 52 | 431 | ||||||
Japan Real Estate Investment Corp. | 129 | 663 | ||||||
Kenedix Realty Investment Corp. | 149 | 800 | ||||||
Nippon Building Fund, Inc. | 147 | 773 | ||||||
Nippon Prologis REIT, Inc. | 318 | 740 | ||||||
Nomura Real Estate Office Fund, Inc. | 149 | 682 | ||||||
|
| |||||||
| 6,029 | ||||||||
|
| |||||||
| SHARES | VALUE | |||||||
| Mexico—3.2% | ||||||||
Prologis Property Mexico SA de CV | 402,200 | $ | 842 | |||||
TF Administradora Industrial S de Rl de CV | 243,852 | 537 | ||||||
|
| |||||||
| 1,379 | ||||||||
|
| |||||||
| Netherlands—7.1% | ||||||||
Unibail-Rodamco SE | 11,760 | 3,026 | ||||||
|
| |||||||
| Norway—1.5% | ||||||||
Norwegian Property ASA | 419,600 | 627 | ||||||
|
| |||||||
| Singapore—8.8% | ||||||||
CapitaMall Trust | 499,650 | 748 | ||||||
CapitaRetail China Trust | 733,868 | 903 | ||||||
Global Logistic Properties Ltd. | 744,500 | 1,582 | ||||||
Mapletree Logistics Trust | 583,544 | 528 | ||||||
|
| |||||||
| 3,761 | ||||||||
|
| |||||||
| Sweden—1.5% | ||||||||
Castellum AB | 40,866 | 622 | ||||||
|
| |||||||
| United Kingdom—19.5% | ||||||||
Big Yellow Group plc | 76,688 | 646 | ||||||
British Land Co. plc | 100,305 | 1,142 | ||||||
Derwent London plc | 12,346 | 547 | ||||||
Great Portland Estates plc | 42,118 | 437 | ||||||
Hammerson plc | 143,809 | 1,339 | ||||||
Land Securities Group plc | 87,885 | 1,480 | ||||||
Safestore Holdings plc | 293,876 | 1,020 | ||||||
SEGRO plc | 128,057 | 754 | ||||||
Unite Group plc (The) | 138,000 | 950 | ||||||
|
| |||||||
| 8,315 | ||||||||
| TOTAL COMMON STOCKS (Identified Cost $33,121) | 41,819 | |||||||
| RIGHTS—0.0% | ||||||||
| Italy—0.0% | ||||||||
Beni Stabili SpA | 127,257 | 3 | ||||||
| TOTAL RIGHTS (Identified Cost $0) | 3 | |||||||
| TOTAL LONG TERM INVESTMENTS—98.3% | ||||||||
| (Identified Cost $33,121) | 41,822 | |||||||
| SHORT-TERM INVESTMENTS—1.6% | ||||||||
| Money Market Mutual Funds—1.6% | ||||||||
Fidelity Money Market Portfolio – Institutional Shares (seven-day effective yield 0.080%) | 700,456 | 700 | ||||||
| TOTAL SHORT-TERM INVESTMENTS (Identified Cost $700) | 700 | |||||||
| TOTAL INVESTMENTS—99.9% (Identified Cost $33,821) | 42,522 | (1) | ||||||
Other assets and liabilities, net—0.1% |
| 26 | ||||||
|
| |||||||
| NET ASSETS—100.0% | $ | 42,548 | ||||||
|
| |||||||
Abbreviations:
| REIT | Real Estate Investment Trust |
Footnote Legend:
| (1) | Federal Income Tax Information: For tax information at September 30, 2014, see Note 10 Federal Income Tax Information in the Notes to Financial Statements. |
| (2) | Non-income producing. |
| (3) | Illiquid security. |
| (4) | Security valued at fair value as determined in good faith by or under the direction of the Trustees. This security is disclosed as a level 3 security in the disclosure table located after the Schedule of Investments. |
Foreign Currencies:
| EUR | Euro |
| Country Weightings (Unaudited)† | ||||
United Kingdom | 20 | % | ||
Japan | 14 | |||
Australia | 12 | |||
Canada | 10 | |||
Hong Kong | 10 | |||
Singapore | 9 | |||
Netherlands | 7 | |||
Other | 18 | |||
Total | 100 | % | ||
† % of total investments as of September 30, 2014 |
| |||
The following table provides a summary of inputs used to value the Fund’s investments as of September 30, 2014 (See Security Valuation Note 2A in the Notes to Financial Statements):
| Total Value at September 30, 2014 | Level 1 Quoted Prices | Level 3 Significant Unobservable Inputs | ||||||||||
Equity Securities: | ||||||||||||
Common Stocks | $ | 41,819 | $ | 41,819 | $ | 0 | * | |||||
Rights | 3 | 3 | ||||||||||
Short-Term Investments | 700 | 700 | — | |||||||||
|
|
|
|
|
| |||||||
Total Investments | $ | 42,522 | $ | 42,522 | $ | 0 | * | |||||
|
|
|
|
|
| |||||||
| * | Includes internally fair valued security currently priced at zero ($0). |
There are no Level 2 (significant observable inputs) priced securities.
There were no transfers between Level 1 and Level 2 for the period.
Security abbreviation definitions are located under the Key Investment Terms starting on page 4.
See Notes to Financial Statements
50
Table of Contents
VIRTUS INTERNATIONAL SMALL-CAP FUND
SCHEDULE OF INVESTMENTS
SEPTEMBER 30, 2014
($ reported in thousands)
| SHARES | VALUE | |||||||
| COMMON STOCKS—91.6% | ||||||||
| Consumer Discretionary—10.2% | ||||||||
Goldlion Holdings Ltd. (Hong Kong) | 3,999,600 | $ | 1,669 | |||||
Pico Far East Holdings Ltd. (Hong Kong) | 7,049,122 | 1,589 | ||||||
Rightmove plc (United Kingdom) | 27,950 | 975 | ||||||
Watts Co. Ltd. (Japan) | 108,091 | 889 | ||||||
|
| |||||||
| 5,122 | ||||||||
|
| |||||||
| Consumer Staples—9.5% | ||||||||
Compania Cervecerias Unidas S.A. (Chile) | 135,986 | 1,497 | ||||||
Dongsuh Co., Inc. (South Korea)(4) | 1 | 0 | ||||||
Oldtown Bhd (Malaysia) | 1,193,750 | 648 | ||||||
Premier Marketing PCL (Thailand) | 6,867,727 | 2,086 | ||||||
Wawel SA (Poland) | 1,900 | 573 | ||||||
|
| |||||||
| 4,804 | ||||||||
|
| |||||||
| Energy—3.4% | ||||||||
Schoeller-Bleckmann Oilfield Equipment AG (Austria) | 4,648 | 453 | ||||||
TGS Nopec Geophysical Co. ASA (Norway) | 49,000 | 1,247 | ||||||
|
| |||||||
| 1,700 | ||||||||
|
| |||||||
| Financials—17.3% | ||||||||
ARA Asset Management Ltd. (Singapore) | 1,121,760 | 1,539 | ||||||
Euler Hermes SA (France) | 14,150 | 1,510 | ||||||
Euroz Ltd. (Australia) | 1,760,867 | 1,866 | ||||||
Financiere Marc de Lacharriere (France) | 7,111 | 517 | ||||||
Hiscox Ltd (United Kingdom) | 159,226 | 1,626 | ||||||
Korea Ratings Corp. (South Korea) | 39,500 | 1,512 | ||||||
Lsl Property Services PLC (United Kingdom) | 23,342 | 124 | ||||||
|
| |||||||
| 8,694 | ||||||||
|
| |||||||
| Health Care—7.1% | ||||||||
Haw Par Corp. Ltd. (Singapore) | 158,719 | 1,091 | ||||||
Sirona Dental Systems, Inc. (United States)(2) | 3,000 | 230 | ||||||
WIN-Partners Co. Ltd. (Japan) | 163,010 | 2,259 | ||||||
|
| |||||||
| 3,580 | ||||||||
|
| |||||||
| Industrials—21.9% | ||||||||
AIT Corp. (Japan) | 348,000 | 2,526 | ||||||
Amadeus Fire AG (Germany) | 7,541 | 527 | ||||||
ASR Logistics Holdings Ltd. (Hong Kong) | 841,770 | 79 | ||||||
Clasquin (France) | 9,707 | 288 | ||||||
Freight Management Holdings Bhd (Malaysia)(3) | 701,312 | 361 | ||||||
Konecranes Oyj (Finland) | 52,000 | 1,399 | ||||||
Riverstone Holdings Ltd. (Singapore) | 1,243,000 | 916 | ||||||
| SHARES | VALUE | |||||||
| Industrials—continued | ||||||||
Rotork plc (United Kingdom) | 11,449 | $ | 513 | |||||
SMT Scharf AG (Germany) | 18,667 | 401 | ||||||
Tegma Gestao Logistica (Brazil) | 95,000 | 687 | ||||||
Thermador Groupe (France) | 10,339 | 982 | ||||||
Turk Traktor Ve Ziraat Makineleri AS (Turkey) | 52,500 | 1,626 | ||||||
WABCO Holdings, Inc. (United States)(2) | 8,000 | 728 | ||||||
|
| |||||||
| 11,033 | ||||||||
|
| |||||||
| Information Technology—14.2% | ||||||||
Alten SA (France) | 11,300 | 485 | ||||||
Bouvet ASA (Norway) | 191,945 | 2,539 | ||||||
Carsales.com Ltd. (Australia) | 60,000 | 518 | ||||||
Lumax International Corp., Ltd. (Taiwan) | 942,000 | 2,208 | ||||||
MercadoLibre, Inc. (United States) | 4,500 | 489 | ||||||
Pro-Ship, Inc. (Japan) | 39,500 | 880 | ||||||
|
| |||||||
| 7,119 | ||||||||
|
| |||||||
| Materials—8.0% | ||||||||
Assore Ltd. (South Africa) | 31,200 | 595 | ||||||
KPX Chemical Co. Ltd. (South Korea) | 27,399 | 1,535 | ||||||
Rimoni Industries Ltd. (Israel) | 32,663 | 270 | ||||||
Uyemura (C) & Co. Ltd. (Japan) | 14,000 | 721 | ||||||
Victrex plc (United Kingdom) | 35,000 | 911 | ||||||
|
| |||||||
| 4,032 | ||||||||
| TOTAL COMMON STOCKS (Identified Cost $45,475) | 46,084 | |||||||
| TOTAL LONG TERM INVESTMENTS—91.6% | ||||||||
| (Identified Cost $45,475) | 46,084 | |||||||
| SHORT-TERM INVESTMENTS—9.0% | ||||||||
| Money Market Mutual Funds—9.0% | ||||||||
Fidelity Money Market Portfolio – Institutional Shares (seven-day effective yield 0.080%) | 4,504,511 | 4,505 | ||||||
| TOTAL SHORT-TERM INVESTMENTS (Identified Cost $4,505) | 4,505 | |||||||
| TOTAL INVESTMENTS—100.6% | ||||||||
| (Identified Cost $49,980) | 50,589 | (1) | ||||||
Other assets and liabilities, net—(0.6)% |
| (319 | ) | |||||
|
| |||||||
| NET ASSETS—100.0% | $ | 50,270 | ||||||
|
| |||||||
Footnote Legend:
| (1) | Federal Income Tax Information: For tax information at September 30, 2014, see Note 10 Federal Income Tax Information in the Notes to Financial Statements. |
| (2) | Non-income producing. |
| (3) | Illiquid security. |
| (4) | Amounts are less than $500 (not reported in 000s). |
| Country Weightings (Unaudited)† | ||||
Japan | 14 | % | ||
United States | 12 | |||
Norway | 8 | |||
United Kingdom | 8 | |||
France | 7 | |||
Hong Kong | 7 | |||
Singapore | 7 | |||
Other | 37 | |||
Total | 100 | % | ||
† % of total investments as of September 30, 2014 |
| |||
The following table provides a summary of inputs used to value the Fund’s investments as of September 30, 2014 (See Security Valuation Note 2A in the Notes to Financial Statements):
| Total Value at September 30, 2014 | Level 1 Quoted Prices | |||||||
Equity Securities: | ||||||||
Common Stocks | $ | 46,084 | $ | 46,084 | ||||
Short-Term Investments | 4,505 | 4,505 | ||||||
|
|
|
| |||||
Total Investments | $ | 50,589 | $ | 50,589 | ||||
|
|
|
| |||||
There are no Level 2 (significant observable inputs) or Level 3 (significant unobservable inputs) priced securities.
There were no transfers between Level 1 and Level 2 for the period.
See Notes to Financial Statements
51
Table of Contents
VIRTUS OPPORTUNITIES TRUST
STATEMENTS OF ASSETS AND LIABILITIES
SEPTEMBER 30, 2014
($ reported in thousands except shares and per share amounts)
|
|
|
|
|
| |||||||
| Emerging Markets Debt Fund | Emerging Markets Equity Income Fund | Emerging Markets Small-Cap Fund | ||||||||||
| Assets | ||||||||||||
Investment in securities at value(1) | $ | 33,081 | $ | 82,386 | $ | 3,878 | ||||||
Foreign currency at value(2) | — | 357 | — | |||||||||
Cash | 5 | — | — | |||||||||
Receivables | ||||||||||||
Fund shares sold | 5 | 187 | — | (3) | ||||||||
Receivable from adviser | — | — | 4 | |||||||||
Dividends and interest receivable | 574 | 152 | 7 | |||||||||
Tax reclaims | 2 | — | — | (3) | ||||||||
Prepaid expenses | 23 | 25 | — | (3) | ||||||||
Prepaid trustee retainer | — | (3) | 1 | — | (3) | |||||||
|
|
|
|
|
| |||||||
Total assets | 33,690 | 83,108 | 3,889 | |||||||||
|
|
|
|
|
| |||||||
| Liabilities | ||||||||||||
Cash overdraft | — | — | — | (3) | ||||||||
Payables | ||||||||||||
Fund shares repurchased | 2 | 186 | — | |||||||||
Investment securities purchased | 392 | — | — | |||||||||
Dividend distributions | 1 | — | — | |||||||||
Investment advisory fees | 26 | 72 | — | |||||||||
Distribution and service fees | 1 | 1 | — | (3) | ||||||||
Administration fees | 4 | 9 | 1 | |||||||||
Transfer agent fees and expenses | 2 | 10 | — | (3) | ||||||||
Trustees’ fees and expenses | — | (3) | — | (3) | — | (3) | ||||||
Professional fees | 37 | 28 | 29 | |||||||||
Other accrued expenses | 3 | 48 | 3 | |||||||||
|
|
|
|
|
| |||||||
Total liabilities | 468 | 354 | 33 | |||||||||
|
|
|
|
|
| |||||||
| Net Assets | $ | 33,222 | $ | 82,754 | $ | 3,856 | ||||||
|
|
|
|
|
| |||||||
| Net Assets Consist of: | ||||||||||||
Capital paid in on shares of beneficial interest | $ | 34,614 | $ | 81,089 | $ | 3,764 | ||||||
Accumulated undistributed net investment income (loss) | (4 | ) | 1,246 | 61 | ||||||||
Accumulated undistributed net realized gain (loss) | (461 | ) | 5 | 94 | ||||||||
Net unrealized appreciation (depreciation) on investments | (927 | ) | 414 | (63 | ) | |||||||
|
|
|
|
|
| |||||||
| Net Assets | $ | 33,222 | $ | 82,754 | $ | 3,856 | ||||||
|
|
|
|
|
| |||||||
| Class A | ||||||||||||
Net asset value (net assets/shares outstanding) per share | $ | 9.69 | $ | 10.54 | $ | 10.32 | ||||||
Maximum offering price per share NAV/(1–3.75%) | $ | 10.07 | — | — | ||||||||
Maximum offering price per share NAV/(1–5.75%) | $ | — | $ | 11.18 | $ | 10.95 | ||||||
Shares of beneficial interest outstanding, no par value, unlimited authorization | 101,376 | 114,737 | 21,009 | |||||||||
Net Assets | $ | 982 | $ | 1,210 | $ | 217 | ||||||
| Class C | ||||||||||||
Net asset value (net assets/shares outstanding) and offering price per share | $ | 9.68 | $ | 10.50 | $ | 10.26 | ||||||
Shares of beneficial interest outstanding, no par value, unlimited authorization | 81,408 | 76,119 | 15,532 | |||||||||
Net Assets | $ | 788 | $ | 799 | $ | 159 | ||||||
| Class I | ||||||||||||
Net asset value (net assets/shares outstanding) and offering price per share | $ | 9.68 | $ | 10.56 | $ | 10.34 | ||||||
Shares of beneficial interest outstanding, no par value, unlimited authorization | 3,249,943 | 7,643,747 | 336,612 | |||||||||
Net Assets | $ | 31,452 | $ | 80,745 | $ | 3,480 | ||||||
(1) Investment in securities at cost | $ | 34,005 | $ | 81,966 | $ | 3,941 | ||||||
(2) Foreign currency at cost | $ | — | $ | 359 | $ | — | ||||||
(3) Amount is less than $500. | ||||||||||||
See Notes to Financial Statements
52
Table of Contents
VIRTUS OPPORTUNITIES TRUST
STATEMENTS OF ASSETS AND LIABILITIES (Continued)
SEPTEMBER 30, 2014
($ reported in thousands except shares and per share amounts)
|
|
|
|
|
| |||||||
| Global Commodities Stock Fund | Global Dividend Fund | Global Opportunities Fund | ||||||||||
| Assets | ||||||||||||
Investment in securities at value(1) | $ | 16,684 | $ | 143,079 | $ | 116,755 | ||||||
Foreign currency at value(2) | 107 | — | — | |||||||||
Receivables | ||||||||||||
Investment securities sold | 171 | — | 1,214 | |||||||||
Fund shares sold | — | 1,606 | 31 | |||||||||
Dividends and interest receivable | 11 | 231 | 282 | |||||||||
Tax reclaims | 1 | 96 | 95 | |||||||||
Prepaid expenses | 15 | 21 | 25 | |||||||||
Prepaid trustee retainer | — | (3) | 1 | 1 | ||||||||
|
|
|
|
|
| |||||||
Total assets | 16,989 | 145,034 | 118,403 | |||||||||
|
|
|
|
|
| |||||||
| Liabilities | ||||||||||||
Payables | ||||||||||||
Fund shares repurchased | 421 | 1,155 | 99 | |||||||||
Investment securities purchased | 132 | 1,110 | 2,333 | |||||||||
Foreign capital gain taxes payable | — | — | 17 | |||||||||
Investment advisory fees | 9 | 77 | 82 | |||||||||
Distribution and service fees | — | (3) | 34 | 20 | ||||||||
Administration fees | 2 | 16 | 12 | |||||||||
Transfer agent fees and expenses | 2 | 49 | 28 | |||||||||
Trustees’ fees and expenses | — | (3) | — | (3) | — | (3) | ||||||
Professional fees | 29 | 29 | 35 | |||||||||
Other accrued expenses | 6 | 12 | 15 | |||||||||
|
|
|
|
|
| |||||||
Total liabilities | 601 | 2,482 | 2,641 | |||||||||
|
|
|
|
|
| |||||||
| Net Assets | $ | 16,388 | $ | 142,552 | $ | 115,762 | ||||||
|
|
|
|
|
| |||||||
| Net Assets Consist of: | ||||||||||||
Capital paid in on shares of beneficial interest | $ | 19,908 | $ | 115,073 | $ | 91,348 | ||||||
Accumulated undistributed net investment income (loss) | (40 | ) | 552 | 674 | ||||||||
Accumulated undistributed net realized gain (loss) | (5,075 | ) | 221 | (2,497 | ) | |||||||
Net unrealized appreciation (depreciation) on investments | 1,595 | 26,706 | 26,237 | |||||||||
|
|
|
|
|
| |||||||
| Net Assets | $ | 16,388 | $ | 142,552 | $ | 115,762 | ||||||
|
|
|
|
|
| |||||||
| Class A | ||||||||||||
Net asset value (net assets/shares outstanding) per share | $ | 8.33 | $ | 15.38 | $ | 12.12 | ||||||
Maximum offering price per share NAV/(1–5.75%) | $ | 8.84 | $ | 16.32 | $ | 12.86 | ||||||
Shares of beneficial interest outstanding, no par value, unlimited authorization | 70,535 | 3,945,884 | 6,414,110 | |||||||||
Net Assets | $ | 587 | $ | 60,673 | $ | 77,738 | ||||||
| Class B | ||||||||||||
Net asset value (net assets/shares outstanding) and offering price per share | $ | — | $ | — | $ | 10.73 | ||||||
Shares of beneficial interest outstanding, no par value, unlimited authorization | — | — | 60,788 | |||||||||
Net Assets | $ | — | $ | — | $ | 652 | ||||||
| Class C | ||||||||||||
Net asset value (net assets/shares outstanding) and offering price per share | $ | 8.18 | $ | 15.33 | $ | 10.66 | ||||||
Shares of beneficial interest outstanding, no par value, unlimited authorization | 40,158 | 1,717,321 | 324,055 | |||||||||
Net Assets | $ | 329 | $ | 26,322 | $ | 3,455 | ||||||
| Class I | ||||||||||||
Net asset value (net assets/shares outstanding) and offering price per share | $ | 8.39 | $ | 15.38 | $ | 12.11 | ||||||
Shares of beneficial interest outstanding, no par value, unlimited authorization | 1,845,209 | 3,611,147 | 2,801,784 | |||||||||
Net Assets | $ | 15,472 | $ | 55,557 | $ | 33,917 | ||||||
(1) Investment in securities at cost | $ | 15,088 | $ | 116,365 | $ | 90,494 | ||||||
(2) Foreign currency at cost | $ | 107 | $ | — | $ | — | ||||||
(3) Amount is less than $500. | ||||||||||||
See Notes to Financial Statements
53
Table of Contents
VIRTUS OPPORTUNITIES TRUST
STATEMENTS OF ASSETS AND LIABILITIES (Continued)
SEPTEMBER 30, 2014
($ reported in thousands except shares and per share amounts)
|
|
|
|
|
| |||||||
| Global Real Estate Securities Fund | Greater European Opportunities Fund | International Equity Fund | ||||||||||
| Assets | ||||||||||||
Investment in securities at value(1)(3) | $ | 54,801 | $ | 16,582 | $ | 11,055 | ||||||
Foreign currency at value(2) | — | 1 | — | |||||||||
Receivables | ||||||||||||
Investment securities sold | — | 34 | — | |||||||||
Fund shares sold | 422 | 30 | 61 | |||||||||
Receivable from adviser | — | — | (3) | — | (3) | |||||||
Prepaid trustee retainer | — | (3) | — | (3) | — | (3) | ||||||
Dividends and interest receivable | 156 | 30 | 21 | |||||||||
Tax reclaims | 13 | 27 | 34 | |||||||||
Prepaid expenses | 15 | 15 | 24 | |||||||||
Unrealized appreciation on forward currency contracts | — | — | 41 | |||||||||
|
|
|
|
|
| |||||||
Total assets | 55,407 | 16,719 | 11,236 | |||||||||
|
|
|
|
|
| |||||||
| Liabilities | ||||||||||||
Cash overdraft | 117 | — | — | |||||||||
Payables | ||||||||||||
Fund shares repurchased | 12 | 1 | — | (3) | ||||||||
Investment securities purchased | 851 | 86 | 41 | |||||||||
Investment advisory fees | 26 | — | — | |||||||||
Distribution and service fees | 9 | 4 | 1 | |||||||||
Administration fees | 6 | 2 | 2 | |||||||||
Transfer agent fees and expenses | 11 | 6 | 2 | |||||||||
Trustees’ fees and expenses | — | (3) | — | (3) | — | (3) | ||||||
Professional fees | 29 | 28 | 32 | |||||||||
Other accrued expenses | 9 | 8 | 4 | |||||||||
|
|
|
|
|
| |||||||
Total liabilities | 1,070 | 135 | 82 | |||||||||
|
|
|
|
|
| |||||||
| Net Assets | $ | 54,337 | $ | 16,584 | $ | 11,154 | ||||||
|
|
|
|
|
| |||||||
| Net Assets Consist of: | ||||||||||||
Capital paid in on shares of beneficial interest | $ | 48,054 | $ | 14,301 | $ | 10,901 | ||||||
Accumulated undistributed net investment income (loss) | 259 | 41 | 54 | |||||||||
Accumulated undistributed net realized gain (loss) | 416 | 78 | (190 | ) | ||||||||
Net unrealized appreciation (depreciation) on investments | 5,608 | 2,164 | 389 | |||||||||
|
|
|
|
|
| |||||||
| Net Assets | $ | 54,337 | $ | 16,584 | $ | 11,154 | ||||||
|
|
|
|
|
| |||||||
| Class A | ||||||||||||
Net asset value (net assets/shares outstanding) per share | $ | 25.18 | $ | 15.32 | $ | 10.90 | ||||||
Maximum offering price per share NAV/(1–5.75%) | $ | 26.72 | $ | 16.25 | $ | 11.57 | ||||||
Shares of beneficial interest outstanding, no par value, unlimited authorization | 854,116 | 829,299 | 359,259 | |||||||||
Net Assets | $ | 21,502 | $ | 12,703 | $ | 3,915 | ||||||
| Class C | ||||||||||||
Net asset value (net assets/shares outstanding) and offering price per share | $ | 24.77 | $ | 15.08 | $ | 10.68 | ||||||
Shares of beneficial interest outstanding, no par value, unlimited authorization | 236,136 | 74,886 | 75,199 | |||||||||
Net Assets | $ | 5,850 | $ | 1,130 | $ | 804 | ||||||
| Class I | ||||||||||||
Net asset value (net assets/shares outstanding) and offering price per share | $ | 25.33 | $ | 15.38 | $ | 10.87 | ||||||
Shares of beneficial interest outstanding, no par value, unlimited authorization | 1,065,285 | 178,826 | 592,277 | |||||||||
Net Assets | $ | 26,985 | $ | 2,751 | $ | 6,435 | ||||||
(1) Investment in securities at cost | $ | 49,192 | $ | 14,416 | $ | 10,706 | ||||||
(2) Foreign currency at cost | $ | — | $ | 1 | $ | — | ||||||
(3) Amount is less than $500. | ||||||||||||
See Notes to Financial Statements
54
Table of Contents
VIRTUS OPPORTUNITIES TRUST
STATEMENTS OF ASSETS AND LIABILITIES (Continued)
SEPTEMBER 30, 2014
($ reported in thousands except shares and per share amounts)
|
|
|
| |||||
| International Real Estate Securities Fund | International Small-Cap Fund | |||||||
| Assets | ||||||||
Investment in securities at value(1) | $ | 42,522 | $ | 50,589 | ||||
Foreign currency at value(2) | — | — | (3) | |||||
Receivables | ||||||||
Investment securities sold | — | 58 | ||||||
Fund shares sold | 64 | 291 | ||||||
Prepaid trustee retainer | — | (3) | — | (3) | ||||
Dividends and interest receivable | 99 | 69 | ||||||
Tax reclaims | 35 | 22 | ||||||
Prepaid expenses | 21 | 25 | ||||||
Prepaid trustee retainer | — | (3) | — | (3) | ||||
|
|
|
| |||||
Total assets | 42,741 | 51,054 | ||||||
|
|
|
| |||||
| Liabilities | ||||||||
Payables | ||||||||
Fund shares repurchased | 5 | 116 | ||||||
Investment securities purchased | 101 | 570 | ||||||
Investment advisory fees | 29 | 35 | ||||||
Distribution and service fees | 5 | 1 | ||||||
Administration fees | 5 | 6 | ||||||
Transfer agent fees and expenses | 11 | 6 | ||||||
Trustees’ fees and expenses | — | (3) | — | (3) | ||||
Professional fees | 28 | 29 | ||||||
Other accrued expenses | 9 | 21 | ||||||
|
|
|
| |||||
Total liabilities | 193 | 784 | ||||||
|
|
|
| |||||
| Net Assets | $ | 42,548 | $ | 50,270 | ||||
|
|
|
| |||||
| Net Assets Consist of: | ||||||||
Capital paid in on shares of beneficial interest | $ | 44,032 | $ | 46,607 | ||||
Accumulated undistributed net investment income (loss) | (140 | ) | 526 | |||||
Accumulated undistributed net realized gain (loss) | (10,042 | ) | 2,532 | |||||
Net unrealized appreciation (depreciation) on investments | 8,698 | 605 | ||||||
|
|
|
| |||||
| Net Assets | $ | 42,548 | $ | 50,270 | ||||
|
|
|
| |||||
| Class A | ||||||||
Net asset value (net assets/shares outstanding) per share | $ | 7.03 | $ | 13.70 | ||||
Maximum offering price per share NAV/(1–5.75%) | $ | 7.46 | $ | 14.54 | ||||
Shares of beneficial interest outstanding, no par value, unlimited authorization | 1,602,340 | 180,762 | ||||||
Net Assets | $ | 11,257 | $ | 2,477 | ||||
| Class C | ||||||||
Net asset value (net assets/shares outstanding) and offering price per share | $ | 6.97 | $ | 13.63 | ||||
Shares of beneficial interest outstanding, no par value, unlimited authorization | 365,985 | 87,580 | ||||||
Net Assets | $ | 2,553 | $ | 1,194 | ||||
| Class I | ||||||||
Net asset value (net assets/shares outstanding) and offering price per share | $ | 7.03 | $ | 13.74 | ||||
Shares of beneficial interest outstanding, no par value, unlimited authorization | 4,085,931 | 3,392,603 | ||||||
Net Assets | $ | 28,738 | $ | 46,599 | ||||
(1) Investment in securities at cost | $ | 33,821 | $ | 49,980 | ||||
(2) Foreign currency at cost | $ | — | $ | — | (3) | |||
(3) Amount is less than $500. | ||||||||
See Notes to Financial Statements
55
Table of Contents
VIRTUS OPPORTUNITIES TRUST
YEAR ENDED SEPTEMBER 30, 2014
($ reported in thousands)
|
|
|
|
|
| |||||||
| Emerging Markets Debt Fund | Emerging Markets Equity Income Fund | Emerging Markets Small-Cap Fund(2) | ||||||||||
| Investment Income | ||||||||||||
Dividends | $ | 1 | $ | 3,087 | $ | 116 | ||||||
Interest | 1,866 | — | (1) | — | (1) | |||||||
Foreign taxes withheld | (2 | ) | (369 | ) | (10 | ) | ||||||
|
|
|
|
|
| |||||||
Total investment income | 1,865 | 2,718 | 106 | |||||||||
|
|
|
|
|
| |||||||
| Expenses | ||||||||||||
Investment advisory fees | 226 | 698 | 32 | |||||||||
Service fees, Class A | 6 | 3 | — | (1) | ||||||||
Distribution and service fees, Class C | 5 | 7 | 1 | |||||||||
Administration fees | 37 | 80 | 3 | |||||||||
Transfer agent fees and expenses | 16 | 54 | 2 | |||||||||
Registration fees | 43 | 53 | 38 | |||||||||
Printing fees and expenses | 4 | 8 | 7 | |||||||||
Custodian fees | 3 | 72 | 4 | |||||||||
Professional fees | 38 | 35 | 31 | |||||||||
Trustees’ fees and expenses | 2 | 2 | — | (1) | ||||||||
Miscellaneous expenses | 3 | 7 | 4 | |||||||||
|
|
|
|
|
| |||||||
Total expenses | 383 | 1,019 | 122 | |||||||||
Less expenses reimbursed and/or waived by investment adviser | (40 | ) | (13 | ) | (80 | ) | ||||||
|
|
|
|
|
| |||||||
Net expenses | 343 | 1,006 | 42 | |||||||||
|
|
|
|
|
| |||||||
Net investment income (loss) | 1,522 | 1,712 | 64 | |||||||||
|
|
|
|
|
| |||||||
| Net Realized and Unrealized Gain (Loss) on Investments | ||||||||||||
Net realized gain (loss) on investments | (421 | ) | 179 | 94 | ||||||||
Net realized gain (loss) on foreign currency transactions | (4 | ) | 4 | 4 | ||||||||
Net change in unrealized appreciation (depreciation) on investments | 1,075 | 38 | (63 | ) | ||||||||
Net change in unrealized appreciation (depreciation) on foreign currency translation | (3 | ) | (4 | ) | — | (1) | ||||||
|
|
|
|
|
| |||||||
| Net gain (loss) on investments | 647 | 217 | 35 | |||||||||
|
|
|
|
|
| |||||||
Net increase (decrease) in net assets resulting from operations | $ | 2,169 | $ | 1,929 | $ | 99 | ||||||
|
|
|
|
|
| |||||||
(1) Amount is less than $500.
(2) From Inception date December 17, 2013.
See Notes to Financial Statements
56
Table of Contents
VIRTUS OPPORTUNITIES TRUST
STATEMENTS OF OPERATIONS (Continued)
YEAR ENDED SEPTEMBER 30, 2014
($ reported in thousands)
|
|
|
|
|
| |||||||
| Global Commodities Stock Fund | Global Dividend Fund | Global Opportunities Fund | ||||||||||
| Investment Income | ||||||||||||
Dividends | $ | 339 | $ | 8,824 | $ | 2,663 | ||||||
Interest | — | (1) | — | (1) | — | (1) | ||||||
Security lending | — | — | 7 | |||||||||
Foreign taxes withheld | (23 | ) | (337 | ) | (82 | ) | ||||||
|
|
|
|
|
| |||||||
Total investment income | 316 | 8,487 | 2,588 | |||||||||
|
|
|
|
|
| |||||||
| Expenses | ||||||||||||
Investment advisory fees | 243 | 930 | 1,006 | |||||||||
Service fees, Class A | 2 | 145 | 205 | |||||||||
Distribution and service fees, Class B | — | — | 7 | |||||||||
Distribution and service fees, Class C | 4 | 213 | 33 | |||||||||
Administration fees | 30 | 173 | 143 | |||||||||
Transfer agent fees and expenses | 14 | 203 | 147 | |||||||||
Registration fees | 37 | 99 | 52 | |||||||||
Printing fees and expenses | 3 | 20 | 17 | |||||||||
Custodian fees | 10 | 15 | 15 | |||||||||
Professional fees | 32 | 31 | 40 | |||||||||
Trustees’ fees and expenses | 1 | 6 | 5 | |||||||||
Miscellaneous expenses | 5 | 9 | 11 | |||||||||
|
|
|
|
|
| |||||||
Total expenses | 381 | 1,844 | 1,681 | |||||||||
Less expenses reimbursed and/or waived by investment adviser | (36 | ) | — | — | ||||||||
Plus expenses recaptured by investment adviser | — | — | 25 | (2) | ||||||||
|
|
|
|
|
| |||||||
Net expenses | 345 | 1,844 | 1,706 | |||||||||
|
|
|
|
|
| |||||||
Net investment income (loss) | (29 | ) | 6,643 | 882 | ||||||||
|
|
|
|
|
| |||||||
| Net Realized and Unrealized Gain (Loss) on Investments | ||||||||||||
Net realized gain (loss) on investments | (517 | ) | 11,970 | 5,227 | ||||||||
Net realized gain (loss) on foreign currency transactions | (18 | ) | (3 | ) | (6 | ) | ||||||
Net change in unrealized appreciation (depreciation) on investments | (575 | ) | 1,573 | 5,258 | ||||||||
Net change in unrealized appreciation (depreciation) on foreign currency translation | 2 | (10 | ) | (14 | ) | |||||||
Net change in foreign taxes on unrealized capital gains | — | — | (4 | ) | ||||||||
|
|
|
|
|
| |||||||
| Net gain (loss) on investments | (1,108 | ) | 13,530 | 10,461 | ||||||||
|
|
|
|
|
| |||||||
Net increase (decrease) in net assets resulting from operations | $ | (1,137 | ) | $ | 20,173 | $ | 11,343 | |||||
|
|
|
|
|
| |||||||
(1) Amount is less than $500.
(2) See Note 3D in the Notes to Financial Statements.
See Notes to Financial Statements
57
Table of Contents
VIRTUS OPPORTUNITIES TRUST
STATEMENTS OF OPERATIONS (Continued)
YEAR ENDED SEPTEMBER 30, 2014
($ reported in thousands)
|
|
|
|
|
| |||||||
| Global Real Estate Securities Fund | Greater European Opportunities Fund | International Equity Fund | ||||||||||
| Investment Income | ||||||||||||
Dividends | $ | 1,413 | $ | 369 | $ | 229 | ||||||
Interest | — | — | (1) | — | ||||||||
Foreign taxes withheld | (68 | ) | (24 | ) | (23 | ) | ||||||
|
|
|
|
|
| |||||||
Total investment income | 1,345 | 345 | 206 | |||||||||
|
|
|
|
|
| |||||||
| Expenses | ||||||||||||
Investment advisory fees | 398 | 145 | 68 | |||||||||
Service fees, Class A | 44 | 34 | 7 | |||||||||
Distribution and service fees, Class C | 41 | 10 | 5 | |||||||||
Administration fees | 57 | 21 | 10 | |||||||||
Transfer agent fees and expenses | 67 | 28 | 9 | |||||||||
Registration fees | 42 | 39 | 40 | |||||||||
Printing fees and expenses | 8 | 3 | 2 | |||||||||
Custodian fees | 8 | 11 | 5 | |||||||||
Professional fees | 33 | 35 | 36 | |||||||||
Trustees’ fees and expenses | 2 | 1 | — | (1) | ||||||||
Miscellaneous expenses | 4 | 3 | 4 | |||||||||
|
|
|
|
|
| |||||||
Total expenses | 704 | 330 | 186 | |||||||||
Less expenses reimbursed and/or waived by investment adviser | (79 | ) | (80 | ) | (74 | ) | ||||||
|
|
|
|
|
| |||||||
Net expenses | 625 | 250 | 112 | |||||||||
|
|
|
|
|
| |||||||
Net investment income (loss) | 720 | 95 | 94 | |||||||||
|
|
|
|
|
| |||||||
| Net Realized and Unrealized Gain (Loss) on Investments | ||||||||||||
Net realized gain (loss) on investments | 857 | 147 | (130 | ) | ||||||||
Net realized gain (loss) on foreign currency transactions | (2 | ) | (7 | ) | — | (1) | ||||||
Net change in unrealized appreciation (depreciation) on investments | 2,780 | (597 | ) | 209 | ||||||||
Net change in unrealized appreciation (depreciation) on foreign currency translation | (2 | ) | (3 | ) | 38 | |||||||
|
|
|
|
|
| |||||||
| Net gain (loss) on investments | 3,633 | (460 | ) | 117 | ||||||||
|
|
|
|
|
| |||||||
Net increase (decrease) in net assets resulting from operations | $ | 4,353 | $ | (365 | ) | $ | 211 | |||||
|
|
|
|
|
| |||||||
(1) Amount is less than $500.
See Notes to Financial Statements
58
Table of Contents
VIRTUS OPPORTUNITIES TRUST
STATEMENTS OF OPERATIONS (Continued)
YEAR ENDED SEPTEMBER 30, 2014
($ reported in thousands)
|
|
|
| |||||
| International Real Estate Securities Fund | International Small-Cap Fund | |||||||
| Investment Income | ||||||||
Dividends | $ | 1,848 | $ | 1,885 | ||||
Interest | — | — | (1) | |||||
Foreign taxes withheld | (152 | ) | (167 | ) | ||||
|
|
|
| |||||
Total investment income | 1,696 | 1,718 | ||||||
|
|
|
| |||||
| Expenses | ||||||||
Investment advisory fees | 436 | 432 | ||||||
Service fees, Class A | 26 | 5 | ||||||
Distribution and service fees, Class C | 23 | 10 | ||||||
Administration fees | 53 | 52 | ||||||
Transfer agent fees and expenses | 60 | 37 | ||||||
Registration fees | 43 | 49 | ||||||
Printing fees and expenses | 7 | 6 | ||||||
Custodian fees | 11 | 31 | ||||||
Professional fees | 29 | 31 | ||||||
Trustees’ fees and expenses | 2 | 2 | ||||||
Miscellaneous expenses | 3 | 3 | ||||||
|
|
|
| |||||
Total expenses | 693 | 658 | ||||||
Less expenses reimbursed and/or waived by investment adviser | (100 | ) | (60 | ) | ||||
|
|
|
| |||||
Net expenses | 593 | 598 | ||||||
|
|
|
| |||||
Net investment income (loss) | 1,103 | 1,120 | ||||||
|
|
|
| |||||
| Net Realized and Unrealized Gain (Loss) on Investments | ||||||||
Net realized gain (loss) on investments | 2,039 | 2,651 | ||||||
Net realized gain (loss) on foreign currency transactions | (5 | ) | (9 | ) | ||||
Net change in unrealized appreciation (depreciation) on investments | 325 | (1,451 | ) | |||||
Net change in unrealized appreciation (depreciation) on foreign currency translation | (5 | ) | (4 | ) | ||||
|
|
|
| |||||
| Net gain (loss) on investments | 2,354 | 1,187 | ||||||
|
|
|
| |||||
Net increase (decrease) in net assets resulting from operations | $ | 3,457 | $ | 2,307 | ||||
|
|
|
| |||||
(1) Amount is less than $500.
See Notes to Financial Statements
59
Table of Contents
VIRTUS OPPORTUNITIES TRUST
STATEMENTS OF CHANGES IN NET ASSETS
($ reported in thousands)
|
|
|
| |||||||||||||
| Emerging Markets Debt Fund | Emerging Markets Equity Income Fund | |||||||||||||||
| Year Ended September 30, 2014 | Year Ended September 30, 2013 | Year Ended September 30, 2014 | Year Ended September 30, 2013 | |||||||||||||
| INCREASE/(DECREASE) IN NET ASSETS | ||||||||||||||||
| From Operations | ||||||||||||||||
Net investment income (loss) | $ | 1,522 | $ | 1,391 | $ | 1,712 | $ | 180 | ||||||||
Net realized gain (loss) | (425 | ) | (114 | ) | 183 | (114 | ) | |||||||||
Net change in unrealized appreciation (depreciation) | 1,072 | (2,192 | ) | 34 | 140 | |||||||||||
|
|
|
|
|
|
|
| |||||||||
Increase (decrease) in net assets resulting from operations | 2,169 | (915 | ) | 1,929 | 206 | |||||||||||
|
|
|
|
|
|
|
| |||||||||
| From Distributions to Shareholders | ||||||||||||||||
Net investment income, Class A | (104 | ) | (97 | ) | (20 | ) | (7 | ) | ||||||||
Net investment income, Class C | (19 | ) | (8 | ) | (6 | ) | — | (1) | ||||||||
Net investment income, Class I | (1,338 | ) | (1,277 | ) | (586 | ) | (48 | ) | ||||||||
Net realized short-term gains, Class A | — | (1 | ) | — | (2 | ) | ||||||||||
Net realized short-term gains, Class C | — | — | (1) | — | (3 | ) | ||||||||||
Net realized short-term gains, Class I | — | (41 | ) | — | (92 | ) | ||||||||||
Tax return of capital, Class A | (3 | ) | — | — | — | |||||||||||
Tax return of capital, Class C | (— | )(1) | — | — | — | |||||||||||
Tax return of capital, Class I | (44 | ) | — | — | — | |||||||||||
|
|
|
|
|
|
|
| |||||||||
Decrease in net assets from distributions to shareholders | (1,508 | ) | (1,424 | ) | (612 | ) | (152 | ) | ||||||||
|
|
|
|
|
|
|
| |||||||||
| From Share Transactions (See Note 5) | ||||||||||||||||
Change in net assets from share transactions, Class A | (2,299 | ) | 3,657 | 390 | 730 | |||||||||||
Change in net assets from share transactions, Class C | 410 | 296 | 373 | 311 | ||||||||||||
Change in net assets from share transactions, Class I | 6,190 | 1,399 | 70,772 | 3,513 | ||||||||||||
|
|
|
|
|
|
|
| |||||||||
Increase (decrease) in net assets from share transactions | 4,301 | 5,352 | 71,535 | 4,554 | ||||||||||||
|
|
|
|
|
|
|
| |||||||||
Net increase (decrease) in net assets | 4,962 | 3,013 | 72,852 | 4,608 | ||||||||||||
| Net Assets | ||||||||||||||||
Beginning of period | 28,260 | 25,247 | 9,902 | 5,294 | ||||||||||||
|
|
|
|
|
|
|
| |||||||||
End of period | $ | 33,222 | $ | 28,260 | $ | 82,754 | $ | 9,902 | ||||||||
|
|
|
|
|
|
|
| |||||||||
Accumulated undistributed net investment income (loss) at end of period | $ | (4 | ) | $ | 20 | $ | 1,246 | $ | 126 | |||||||
(1) Amount is less than $500.
See Notes to Financial Statements
60
Table of Contents
VIRTUS OPPORTUNITIES TRUST
STATEMENTS OF CHANGES IN NET ASSETS (Continued)
($ reported in thousands)
|
|
|
| |||||||||
| Emerging Markets Small-Cap Fund | Global Commodities Stock Fund | |||||||||||
| From Inception December 17, 2013 to September 30, 2014 | Year Ended September 30, 2014 | Year Ended September 30, 2013 | ||||||||||
| INCREASE/(DECREASE) IN NET ASSETS | ||||||||||||
| From Operations | ||||||||||||
Net investment income (loss) | $ | 64 | $ | (29 | ) | $ | 39 | |||||
Net realized gain (loss) | 98 | (535 | ) | (2,131 | ) | |||||||
Net change in unrealized appreciation (depreciation) | (63 | ) | (573 | ) | (308 | ) | ||||||
|
|
|
|
|
| |||||||
Increase (decrease) in net assets resulting from operations | 99 | (1,137 | ) | (2,400 | ) | |||||||
|
|
|
|
|
| |||||||
| From Distributions to Shareholders | ||||||||||||
Net investment income, Class A | — | (1) | — | (22 | ) | |||||||
Net investment income, Class C | — | (1) | — | (2 | ) | |||||||
Net investment income, Class I | (7 | ) | — | (411 | ) | |||||||
|
|
|
|
|
| |||||||
Decrease in net assets from distributions to shareholders | (7 | ) | — | (435 | ) | |||||||
|
|
|
|
|
| |||||||
| From Share Transactions (See Note 5) | ||||||||||||
Change in net assets from share transactions, Class A | 215 | 99 | (257 | ) | ||||||||
Change in net assets from share transactions, Class C | 155 | 55 | 202 | |||||||||
Change in net assets from share transactions, Class I | 3,394 | (12,063 | ) | 12,613 | ||||||||
|
|
|
|
|
| |||||||
Increase (decrease) in net assets from share transactions | 3,764 | (11,909 | ) | 12,558 | ||||||||
|
|
|
|
|
| |||||||
Net increase (decrease) in net assets | 3,856 | (13,046 | ) | 9,723 | ||||||||
| Net Assets | ||||||||||||
Beginning of period | — | 29,434 | 19,711 | |||||||||
|
|
|
|
|
| |||||||
End of period | $ | 3,856 | $ | 16,388 | $ | 29,434 | ||||||
|
|
|
|
|
| |||||||
Accumulated undistributed net investment income (loss) at end of period | $ | 61 | $ | (40 | ) | $ | — | |||||
(1) Amount is less than $500.
See Notes to Financial Statements
61
Table of Contents
VIRTUS OPPORTUNITIES TRUST
STATEMENTS OF CHANGES IN NET ASSETS (Continued)
($ reported in thousands)
|
|
|
| |||||||||||||
| Global Dividend Fund | Global Opportunities Fund | |||||||||||||||
| Year Ended September 30, 2014 | Year Ended September 30, 2013 | Year Ended September 30, 2014 | Year Ended September 30, 2013 | |||||||||||||
| INCREASE/(DECREASE) IN NET ASSETS | ||||||||||||||||
| From Operations | ||||||||||||||||
Net investment income (loss) | $ | 6,643 | $ | 3,224 | $ | 882 | $ | 778 | ||||||||
Net realized gain (loss) | 11,967 | 2,466 | 5,221 | 9,746 | ||||||||||||
Net change in unrealized appreciation (depreciation) | 1,563 | 6,669 | 5,240 | 1,373 | ||||||||||||
|
|
|
|
|
|
|
| |||||||||
Increase (decrease) in net assets resulting from operations | 20,173 | 12,359 | 11,343 | 11,897 | ||||||||||||
|
|
|
|
|
|
|
| |||||||||
| From Distributions to Shareholders | ||||||||||||||||
Net investment income, Class A | (2,550 | ) | (1,244 | ) | (512 | ) | (224 | ) | ||||||||
Net investment income, Class B | — | — | — | (1) | — | |||||||||||
Net investment income, Class C | (820 | ) | (277 | ) | (3 | ) | — | |||||||||
Net investment income, Class I | (2,785 | ) | (1,726 | ) | (313 | ) | (143 | ) | ||||||||
|
|
|
|
|
|
|
| |||||||||
Decrease in net assets from distributions to shareholders | (6,155 | ) | (3,247 | ) | (828 | ) | (367 | ) | ||||||||
|
|
|
|
|
|
|
| |||||||||
| From Share Transactions (See Note 5) | ||||||||||||||||
Change in net assets from share transactions, Class A | 1,908 | 13,393 | (8,082 | ) | (1,519 | ) | ||||||||||
Change in net assets from share transactions, Class B | — | — | (213 | ) | (353 | ) | ||||||||||
Change in net assets from share transactions, Class C | 6,599 | 7,823 | 213 | 1,040 | ||||||||||||
Change in net assets from share transactions, Class I | (21,781 | ) | 17,186 | 1,594 | 3,080 | |||||||||||
|
|
|
|
|
|
|
| |||||||||
Increase (decrease) in net assets from share transactions | (13,274 | ) | 38,402 | (6,488 | ) | 2,248 | ||||||||||
|
|
|
|
|
|
|
| |||||||||
Net increase (decrease) in net assets | 744 | 47,514 | 4,027 | 13,778 | ||||||||||||
| Net Assets | ||||||||||||||||
Beginning of period | 141,808 | 94,294 | 111,735 | 97,957 | ||||||||||||
|
|
|
|
|
|
|
| |||||||||
End of period | $ | 142,552 | $ | 141,808 | $ | 115,762 | $ | 111,735 | ||||||||
|
|
|
|
|
|
|
| |||||||||
Accumulated undistributed net investment income (loss) at end of period | $ | 552 | $ | 1 | $ | 674 | $ | 611 | ||||||||
(1) Amount is less than $500.
See Notes to Financial Statements
62
Table of Contents
VIRTUS OPPORTUNITIES TRUST
STATEMENTS OF CHANGES IN NET ASSETS (Continued)
($ reported in thousands)
|
|
|
| |||||||||||||
| Global Real Estate Securities Fund | Greater European Opportunities Fund | |||||||||||||||
| Year Ended September 30, 2014 | Year Ended September 30, 2013 | Year Ended September 30, 2014 | Year Ended September 30, 2013 | |||||||||||||
| INCREASE/(DECREASE) IN NET ASSETS | ||||||||||||||||
| From Operations | ||||||||||||||||
Net investment income (loss) | $ | 720 | $ | 558 | $ | 95 | $ | 91 | ||||||||
Net realized gain (loss) | 855 | 378 | 140 | 420 | ||||||||||||
Net change in unrealized appreciation (depreciation) | 2,778 | 255 | (600 | ) | 1,048 | |||||||||||
|
|
|
|
|
|
|
| |||||||||
Increase (decrease) in net assets resulting from operations | 4,353 | 1,191 | (365 | ) | 1,559 | |||||||||||
|
|
|
|
|
|
|
| |||||||||
| From Distributions to Shareholders | ||||||||||||||||
Net investment income, Class A | (230 | ) | (293 | ) | (52 | ) | (58 | ) | ||||||||
Net investment income, Class C | (29 | ) | (50 | ) | (2 | ) | (1 | ) | ||||||||
Net investment income, Class I | (440 | ) | (419 | ) | (12 | ) | (34 | ) | ||||||||
Net realized short-term gains, Class A | (21 | ) | — | (197 | ) | (9 | ) | |||||||||
Net realized short-term gains, Class C | (5 | ) | — | (15 | ) | — | (1) | |||||||||
Net realized short-term gains, Class I | (34 | ) | — | (30 | ) | (5 | ) | |||||||||
Net realized long-term gains, Class A | (86 | ) | — | (125 | ) | (202 | ) | |||||||||
Net realized long-term gains, Class C | (20 | ) | — | (9 | ) | (6 | ) | |||||||||
Net realized long-term gains, Class I | (143 | ) | — | (19 | ) | (100 | ) | |||||||||
|
|
|
|
|
|
|
| |||||||||
Decrease in net assets from distributions to shareholders | (1,008 | ) | (762 | ) | (461 | ) | (415 | ) | ||||||||
|
|
|
|
|
|
|
| |||||||||
| From Share Transactions (See Note 5) | ||||||||||||||||
Change in net assets from share transactions, Class A | 4,968 | 6,449 | (83 | ) | 5,895 | |||||||||||
Change in net assets from share transactions, Class C | 2,073 | 2,172 | 576 | 383 | ||||||||||||
Change in net assets from share transactions, Class I | (232 | ) | 13,019 | 959 | 1,681 | |||||||||||
|
|
|
|
|
|
|
| |||||||||
Increase (decrease) in net assets from share transactions | 6,809 | 21,640 | 1,452 | 7,959 | ||||||||||||
|
|
|
|
|
|
|
| |||||||||
Net increase (decrease) in net assets | 10,154 | 22,069 | 626 | 9,103 | ||||||||||||
| Net Assets | ||||||||||||||||
Beginning of period | 44,183 | 22,114 | 15,958 | 6,855 | ||||||||||||
|
|
|
|
|
|
|
| |||||||||
End of period | $ | 54,337 | $ | 44,183 | $ | 16,584 | $ | 15,958 | ||||||||
|
|
|
|
|
|
|
| |||||||||
Accumulated undistributed net investment income (loss) at end of period | $ | 259 | $ | (35 | ) | $ | 41 | $ | 19 | |||||||
(1) Amount is less than $500.
See Notes to Financial Statements
63
Table of Contents
VIRTUS OPPORTUNITIES TRUST
STATEMENTS OF CHANGES IN NET ASSETS (Continued)
($ reported in thousands)
|
|
|
| |||||||||||||
| International Equity Fund | International Real Estate Securities Fund | |||||||||||||||
| Year Ended September 30, 2014 | Year Ended September 30, 2013 | Year Ended September 30, 2014 | Year Ended September 30, 2013 | |||||||||||||
| INCREASE/(DECREASE) IN NET ASSETS | ||||||||||||||||
| From Operations | ||||||||||||||||
Net investment income (loss) | $ | 94 | $ | 448 | $ | 1,103 | $ | 888 | ||||||||
Net realized gain (loss) | (130 | ) | 4,095 | 2,034 | 684 | |||||||||||
Net change in unrealized appreciation (depreciation) | 247 | (1,309 | ) | 320 | 1,368 | |||||||||||
|
|
|
|
|
|
|
| |||||||||
Increase (decrease) in net assets resulting from operations | 211 | 3,234 | 3,457 | 2,940 | ||||||||||||
|
|
|
|
|
|
|
| |||||||||
| From Distributions to Shareholders | ||||||||||||||||
Net investment income, Class A | (61 | ) | (4 | ) | (188 | ) | (406 | ) | ||||||||
Net investment income, Class C | (7 | ) | (2 | ) | (27 | ) | (119 | ) | ||||||||
Net investment income, Class I | (69 | ) | (664 | ) | (696 | ) | (2,099 | ) | ||||||||
Net realized short-term gains, Class A | (34 | ) | (6 | ) | — | — | ||||||||||
Net realized short-term gains, Class C | (2 | ) | (4 | ) | — | — | ||||||||||
Net realized short-term gains, Class I | (29 | ) | (813 | ) | — | — | ||||||||||
Net realized long-term gains, Class A | — | (17 | ) | — | — | |||||||||||
Net realized long-term gains, Class C | — | (13 | ) | — | — | |||||||||||
Net realized long-term gains, Class I | — | (2,568 | ) | — | — | |||||||||||
|
|
|
|
|
|
|
| |||||||||
Decrease in net assets from distributions to shareholders | (202 | ) | (4,091 | ) | (911 | ) | (2,624 | ) | ||||||||
|
|
|
|
|
|
|
| |||||||||
| From Share Transactions (See Note 5) | ||||||||||||||||
Change in net assets from share transactions, Class A | 3,770 | (19 | ) | 427 | 6,221 | |||||||||||
Change in net assets from share transactions, Class C | 686 | 15 | 525 | 371 | ||||||||||||
Change in net assets from share transactions, Class I | 4,210 | (23,366 | ) | (3,094 | ) | 1,694 | ||||||||||
|
|
|
|
|
|
|
| |||||||||
Increase (decrease) in net assets from share transactions | 8,666 | (23,370 | ) | (2,142 | ) | 8,286 | ||||||||||
|
|
|
|
|
|
|
| |||||||||
Net increase (decrease) in net assets | 8,675 | (24,227 | )(1) | 404 | 8,602 | |||||||||||
| Net Assets | ||||||||||||||||
Beginning of period | 2,479 | 26,706 | 42,144 | 33,542 | ||||||||||||
|
|
|
|
|
|
|
| |||||||||
End of period | $ | 11,154 | $ | 2,479 | $ | 42,548 | $ | 42,144 | ||||||||
|
|
|
|
|
|
|
| |||||||||
Accumulated undistributed net investment income (loss) at end of period | $ | 54 | $ | 97 | $ | (140 | ) | $ | (1,493 | ) | ||||||
(1) See Note 13 in the Notes to Financial Statements.
See Notes to Financial Statements
64
Table of Contents
VIRTUS OPPORTUNITIES TRUST
STATEMENTS OF CHANGES IN NET ASSETS (Continued)
($ reported in thousands)
|
| |||||||
| International Small-Cap Fund | ||||||||
| Year Ended September 30, 2014 | Year Ended September 30, 2013 | |||||||
| INCREASE/(DECREASE) IN NET ASSETS | ||||||||
| From Operations | ||||||||
Net investment income (loss) | $ | 1,120 | $ | 269 | ||||
Net realized gain (loss) | 2,642 | 329 | ||||||
Net change in unrealized appreciation (depreciation) | (1,455 | ) | 2,039 | |||||
|
|
|
| |||||
Increase (decrease) in net assets resulting from operations | 2,307 | 2,637 | ||||||
|
|
|
| |||||
| From Distributions to Shareholders | ||||||||
Net investment income, Class A | (45 | ) | (2 | ) | ||||
Net investment income, Class C | (14 | ) | (1 | ) | ||||
Net investment income, Class I | (815 | ) | (95 | ) | ||||
Net realized short-term gains, Class A | (8 | ) | — | (1) | ||||
Net realized short-term gains, Class C | (9 | ) | — | (1) | ||||
Net realized short-term gains, Class I | (316 | ) | (4 | ) | ||||
|
|
|
| |||||
Decrease in net assets from distributions to shareholders | (1,207 | ) | (102 | ) | ||||
|
|
|
| |||||
| From Share Transactions (See Note 5) | ||||||||
Change in net assets from share transactions, Class A | 2,059 | 251 | ||||||
Change in net assets from share transactions, Class C | 802 | 222 | ||||||
Change in net assets from share transactions, Class I | 27,409 | 12,850 | ||||||
|
|
|
| |||||
Increase (decrease) in net assets from share transactions | 30,270 | 13,323 | ||||||
|
|
|
| |||||
Net increase (decrease) in net assets | 31,370 | 15,858 | ||||||
| Net Assets | ||||||||
Beginning of period | 18,900 | 3,042 | ||||||
|
|
|
| |||||
End of period | $ | 50,270 | $ | 18,900 | ||||
|
|
|
| |||||
Accumulated undistributed net investment income (loss) at end of period | $ | 526 | $ | 179 | ||||
(1) Amount is less than $500.
See Notes to Financial Statements
65
Table of Contents
VIRTUS OPPORTUNITIES TRUST
SELECTED PER SHARE DATA AND RATIOS FOR A SHARE OUTSTANDING
THROUGHOUT EACH PERIOD
| Net Asset Value, Beginning of Period | Net Investment Income (Loss)(2) | Net Realized and Unrealized Gain (Loss) | Total from Investment Operations | Dividends from Net Investment Income | Distributions from Net Realized Gains | Tax Return of Capital | Total Distributions | Change in Net Asset Value | Net Asset Value, End of Period | Total Return(1) | Net Assets, End of Period (in thousands) | Ratio of Net Expenses to Average Net Assets(8) | Ratio of Gross Expenses to Average Net Assets (before waivers and reimbursements)(8) | Ratio of Net Investment Income (Loss) to Average Net Assets | Portfolio Turnover Rate | ||||||||||||||||||||||||||||||||||||||||||||||||||||||||||||||||||
| Emerging Markets | ||||||||||||||||||||||||||||||||||||||||||||||||||||||||||||||||||||||||||||||||||
Debt Fund | ||||||||||||||||||||||||||||||||||||||||||||||||||||||||||||||||||||||||||||||||||
Class A | ||||||||||||||||||||||||||||||||||||||||||||||||||||||||||||||||||||||||||||||||||
10/1/13 to 9/30/14 | $ | 9.43 | 0.47 | 0.26 | 0.73 | (0.46 | ) | — | (0.01 | ) | (0.47 | ) | 0.26 | $ | 9.69 | 7.83 | % | $ | 982 | 1.35 | % | 1.52 | % | 4.88 | % | 39 | % | |||||||||||||||||||||||||||||||||||||||||||||||||||||||
10/1/12 to 9/30/13 | 10.09 | 0.48 | (0.64 | ) | (0.16 | ) | (0.48 | ) | (0.02 | ) | — | (0.50 | ) | (0.66 | ) | 9.43 | (1.94 | ) | 3,200 | 1.35 | 1.55 | 4.92 | 60 | |||||||||||||||||||||||||||||||||||||||||||||||||||||||||||
9/5/12(6) to 9/30/12 | 10.00 | 0.02 | 0.07 | 0.09 | — | — | — | — | 0.09 | 10.09 | 0.90 | (4) | 101 | 1.35 | (3) | 3.49 | (3) | 3.35 | (3) | 13 | (4) | |||||||||||||||||||||||||||||||||||||||||||||||||||||||||||||
Class C | ||||||||||||||||||||||||||||||||||||||||||||||||||||||||||||||||||||||||||||||||||
10/1/13 to 9/30/14 | $ | 9.42 | 0.40 | 0.25 | 0.65 | (0.38 | ) | — | (0.01 | ) | (0.39 | ) | 0.26 | $ | 9.68 | 7.03 | % | $ | 788 | 2.10 | % | 2.21 | % | 4.08 | % | 39 | % | |||||||||||||||||||||||||||||||||||||||||||||||||||||||
10/1/12 to 9/30/13 | 10.09 | 0.41 | (0.66 | ) | (0.25 | ) | (0.40 | ) | (0.02 | ) | — | (0.42 | ) | (0.67 | ) | 9.42 | (2.68 | ) | 374 | 2.10 | 2.32 | 4.11 | 60 | |||||||||||||||||||||||||||||||||||||||||||||||||||||||||||
9/5/12(6) to 9/30/12 | 10.00 | 0.02 | 0.07 | 0.09 | — | — | — | — | 0.09 | 10.09 | 0.90 | (4) | 110 | 2.10 | (3) | 4.26 | (3) | 2.63 | (3) | 13 | (4) | |||||||||||||||||||||||||||||||||||||||||||||||||||||||||||||
Class I | ||||||||||||||||||||||||||||||||||||||||||||||||||||||||||||||||||||||||||||||||||
10/1/13 to 9/30/14 | $ | 9.42 | 0.49 | 0.26 | 0.75 | (0.48 | ) | — | (0.01 | ) | (0.49 | ) | 0.26 | $ | 9.68 | 8.11 | % | $ | 31,452 | 1.10 | % | 1.23 | % | 5.09 | % | 39 | % | |||||||||||||||||||||||||||||||||||||||||||||||||||||||
10/1/12 to 9/30/13 | 10.10 | 0.50 | (0.66 | ) | (0.16 | ) | (0.50 | ) | (0.02 | ) | | — | | (0.52 | ) | (0.68 | ) | 9.42 | (1.80 | ) | 24,686 | 1.10 | 1.33 | 4.99 | 60 | |||||||||||||||||||||||||||||||||||||||||||||||||||||||||
9/5/12(6) to 9/30/12 | 10.00 | 0.02 | 0.08 | 0.10 | — | — | — | — | 0.10 | 10.10 | 1.00 | (4) | 25,036 | 1.10 | (3) | 3.24 | (3) | 3.61 | (3) | 13 | (4) | |||||||||||||||||||||||||||||||||||||||||||||||||||||||||||||
| Emerging Markets | ||||||||||||||||||||||||||||||||||||||||||||||||||||||||||||||||||||||||||||||||||
Equity Income Fund | ||||||||||||||||||||||||||||||||||||||||||||||||||||||||||||||||||||||||||||||||||
Class A | ||||||||||||||||||||||||||||||||||||||||||||||||||||||||||||||||||||||||||||||||||
10/1/13 to 9/30/14 | $ | 10.57 | 0.21 | (0.05 | ) | 0.16 | (0.19 | ) | — | — | (0.19 | ) | (0.03 | ) | $ | 10.54 | 1.54 | % | $ | 1,210 | 1.75 | % | 1.95 | % | 1.96 | % | 72 | % | ||||||||||||||||||||||||||||||||||||||||||||||||||||||
10/1/12 to 9/30/13 | 10.59 | 0.31 | (0.07 | ) | 0.24 | (0.07 | ) | (0.19 | ) | — | (0.26 | ) | (0.02 | ) | 10.57 | 2.19 | 830 | 1.75 | 2.90 | 3.00 | 100 | |||||||||||||||||||||||||||||||||||||||||||||||||||||||||||||
9/5/12(6) to 9/30/12 | 10.00 | (0.01 | ) | 0.60 | 0.59 | — | — | — | — | 0.59 | 10.59 | 5.90 | (4) | 106 | 1.75 | (3) | 10.28 | (3) | (0.78 | )(3) | 37 | (4) | ||||||||||||||||||||||||||||||||||||||||||||||||||||||||||||
Class C | ||||||||||||||||||||||||||||||||||||||||||||||||||||||||||||||||||||||||||||||||||
10/1/13 to 9/30/14 | $ | 10.54 | 0.15 | (0.07 | ) | 0.08 | (0.12 | ) | — | — | (0.12 | ) | (0.04 | ) | $ | 10.50 | 0.80 | % | $ | 799 | 2.50 | % | 2.65 | % | 1.39 | % | 72 | % | ||||||||||||||||||||||||||||||||||||||||||||||||||||||
10/1/12 to 9/30/13 | 10.58 | 0.20 | (0.03 | ) | 0.17 | (0.02 | ) | (0.19 | ) | — | (0.21 | ) | (0.04 | ) | 10.54 | 1.48 | 417 | 2.50 | 3.77 | 1.89 | 100 | |||||||||||||||||||||||||||||||||||||||||||||||||||||||||||||
9/5/12(6) to 9/30/12 | 10.00 | (0.01 | ) | 0.59 | 0.58 | — | — | — | — | 0.58 | 10.58 | 5.80 | (4) | 106 | 2.50 | (3) | 11.03 | (3) | (1.54 | )(3) | 37 | (4) | ||||||||||||||||||||||||||||||||||||||||||||||||||||||||||||
Class I | ||||||||||||||||||||||||||||||||||||||||||||||||||||||||||||||||||||||||||||||||||
10/1/13 to 9/30/14 | $ | 10.58 | 0.27 | (0.08 | ) | 0.19 | (0.21 | ) | — | — | (0.21 | ) | (0.02 | ) | $ | 10.56 | 1.87 | % | $ | 80,745 | 1.50 | % | 1.51 | % | 2.60 | % | 72 | % | ||||||||||||||||||||||||||||||||||||||||||||||||||||||
10/1/12 to 9/30/13 | 10.59 | 0.27 | (0.01 | ) | 0.26 | (0.08 | ) | (0.19 | ) | — | (0.27 | ) | (0.01 | ) | 10.58 | 2.39 | 8,655 | 1.50 | 2.87 | 2.56 | 100 | |||||||||||||||||||||||||||||||||||||||||||||||||||||||||||||
9/5/12(6) to 9/30/12 | 10.00 | — | (5) | 0.59 | 0.59 | — | — | — | — | 0.59 | 10.59 | 5.90 | (4) | 5,082 | 1.50 | (3) | 10.03 | (3) | (0.54 | )(3) | 37 | (4) | ||||||||||||||||||||||||||||||||||||||||||||||||||||||||||||
| Emerging Markets | ||||||||||||||||||||||||||||||||||||||||||||||||||||||||||||||||||||||||||||||||||
Small-Cap Fund | ||||||||||||||||||||||||||||||||||||||||||||||||||||||||||||||||||||||||||||||||||
Class A | ||||||||||||||||||||||||||||||||||||||||||||||||||||||||||||||||||||||||||||||||||
12/17/13(6) to 9/30/14 | $ | 10.00 | 0.18 | 0.16 | 0.34 | (0.02 | ) | — | — | (0.02 | ) | 0.32 | $ | 10.32 | 3.45 | %(4) | $ | 217 | 1.85 | %(3) | 4.82 | %(3) | 2.25 | %(3) | 44 | %(4) | ||||||||||||||||||||||||||||||||||||||||||||||||||||||||
Class C | ||||||||||||||||||||||||||||||||||||||||||||||||||||||||||||||||||||||||||||||||||
12/17/13(6) to 9/30/14 | $ | 10.00 | 0.12 | 0.16 | 0.28 | (0.02 | ) | — | — | (0.02 | ) | 0.26 | $ | 10.26 | 2.82 | %(4) | $ | 159 | 2.60 | %(3) | 5.59 | %(3) | 1.54 | %(3) | 44 | %(4) | ||||||||||||||||||||||||||||||||||||||||||||||||||||||||
Class I | ||||||||||||||||||||||||||||||||||||||||||||||||||||||||||||||||||||||||||||||||||
12/17/13(6) to 9/30/14 | $ | 10.00 | 0.20 | 0.17 | 0.37 | (0.03 | ) | — | — | (0.03 | ) | 0.34 | $ | 10.34 | 3.66 | %(4) | $ | 3,480 | 1.60 | %(3) | 4.64 | %(3) | 2.50 | %(3) | 44 | %(4) | ||||||||||||||||||||||||||||||||||||||||||||||||||||||||
The footnote legend is at the end of the financial highlights.
See Notes to Financial Statements
66
Table of Contents
VIRTUS OPPORTUNITIES TRUST
FINANCIAL HIGHLIGHTS
SELECTED PER SHARE DATA AND RATIOS FOR A SHARE OUTSTANDING
THROUGHOUT EACH PERIOD
| Net Asset Value, Beginning of Period | Net Investment Income (Loss)(2) | Net Realized and Unrealized Gain (Loss) | Total from Investment Operations | Dividends from Net Investment Income | Distributions from Net Realized Gains | Total Distributions | Change in Net Asset Value | Net Asset Value, End of Period | Total Return(1) | Net Assets, End of Period (in thousands) | Ratio of Net Expenses to Average Net Assets(8) | Ratio of Gross Expenses to Average Net Assets (before waivers and reimbursements)(8) | Ratio of Net Investment Income (Loss) to Average Net Assets | Portfolio Turnover Rate | ||||||||||||||||||||||||||||||||||||||||||||||||||||||||||||||
| Global Commodities | |||||||||||||||||||||||||||||||||||||||||||||||||||||||||||||||||||||||||||||
Stock Fund | |||||||||||||||||||||||||||||||||||||||||||||||||||||||||||||||||||||||||||||
Class A | �� | ||||||||||||||||||||||||||||||||||||||||||||||||||||||||||||||||||||||||||||
10/1/13 to 9/30/14 | $ | 8.94 | (0.03 | ) | (0.58 | ) | (0.61 | ) | — | — | — | (0.61 | ) | $ | 8.33 | (6.82 | )% | $ | 587 | 1.65 | % | 1.81 | % | (0.33 | )% | 164 | % | ||||||||||||||||||||||||||||||||||||||||||||||||||
10/1/12 to 9/30/13 | 9.96 | (0.01 | ) | (0.84 | ) | (0.85 | ) | (0.17 | ) | — | (0.17 | ) | (1.02 | ) | 8.94 | (8.61 | ) | 530 | 1.65 | 1.87 | (0.07 | ) | 132 | ||||||||||||||||||||||||||||||||||||||||||||||||||||||
10/1/11 to 9/30/12 | 8.16 | — | (5) | 1.82 | 1.82 | (0.02 | ) | — | (0.02 | ) | 1.80 | 9.96 | 22.30 | 936 | 1.65 | 1.91 | (0.03 | ) | 96 | ||||||||||||||||||||||||||||||||||||||||||||||||||||||||||
3/15/11(6) to 9/30/11 | 10.00 | (0.01 | ) | (1.83 | ) | (1.84 | ) | — | — | — | (1.84 | ) | 8.16 | (18.40 | )(4) | 204 | 1.65 | (3) | 5.40 | (3) | (0.14 | )(3) | 32 | (4) | |||||||||||||||||||||||||||||||||||||||||||||||||||||
Class C | |||||||||||||||||||||||||||||||||||||||||||||||||||||||||||||||||||||||||||||
10/1/13 to 9/30/14 | $ | 8.85 | (0.10 | ) | (0.57 | ) | (0.67 | ) | — | — | — | (0.67 | ) | $ | 8.18 | (7.46 | )% | $ | 329 | 2.40 | % | 2.56 | % | (1.08 | )% | 164 | % | ||||||||||||||||||||||||||||||||||||||||||||||||||
10/1/12 to 9/30/13 | 9.87 | (0.08 | ) | (0.82 | ) | (0.90 | ) | (0.12 | ) | — | (0.12 | ) | (1.02 | ) | 8.85 | (9.14 | ) | 300 | 2.40 | 2.62 | (0.84 | ) | 132 | ||||||||||||||||||||||||||||||||||||||||||||||||||||||
10/1/11 to 9/30/12 | 8.13 | (0.08 | ) | 1.82 | 1.74 | — | — | — | 1.74 | 9.87 | 21.40 | 117 | 2.40 | 2.60 | (0.86 | ) | 96 | ||||||||||||||||||||||||||||||||||||||||||||||||||||||||||||
3/15/11(6) to 9/30/11 | 10.00 | (0.05 | ) | (1.82 | ) | (1.87 | ) | — | — | — | (1.87 | ) | 8.13 | (18.70 | )(4) | 99 | 2.40 | (3) | 6.73 | (3) | (0.90 | )(3) | 32 | (4) | |||||||||||||||||||||||||||||||||||||||||||||||||||||
Class I | |||||||||||||||||||||||||||||||||||||||||||||||||||||||||||||||||||||||||||||
10/1/13 to 9/30/14 | $ | 8.97 | (0.01 | ) | (0.57 | ) | (0.58 | ) | — | — | — | (0.58 | ) | $ | 8.39 | (6.58 | )% | $ | 15,472 | 1.40 | % | 1.55 | % | (0.10 | )% | 164 | % | ||||||||||||||||||||||||||||||||||||||||||||||||||
10/1/12 to 9/30/13 | 9.98 | 0.02 | (0.84 | ) | (0.82 | ) | (0.19 | ) | — | (0.19 | ) | (1.01 | ) | 8.97 | (8.34 | ) | 28,604 | 1.40 | 1.62 | 0.18 | 132 | ||||||||||||||||||||||||||||||||||||||||||||||||||||||||
10/1/11 to 9/30/12 | 8.17 | 0.01 | 1.84 | 1.85 | (0.04 | ) | — | (0.04 | ) | 1.81 | 9.98 | 22.67 | 18,658 | 1.40 | 1.59 | 0.14 | 96 | ||||||||||||||||||||||||||||||||||||||||||||||||||||||||||||
3/15/11(6) to 9/30/11 | 10.00 | 0.01 | (1.84 | ) | (1.83 | ) | — | — | — | (1.83 | ) | 8.17 | (18.30 | )(4) | 15,692 | 1.40 | (3) | 2.92 | (3) | 0.14 | (3) | 32 | (4) | ||||||||||||||||||||||||||||||||||||||||||||||||||||||
| Global Dividend | |||||||||||||||||||||||||||||||||||||||||||||||||||||||||||||||||||||||||||||
Fund | |||||||||||||||||||||||||||||||||||||||||||||||||||||||||||||||||||||||||||||
Class A | |||||||||||||||||||||||||||||||||||||||||||||||||||||||||||||||||||||||||||||
10/1/13 to 9/30/14 | $ | 13.94 | 0.71 | 1.40 | 2.11 | (0.67 | ) | — | (0.67 | ) | 1.44 | $ | 15.38 | 15.21 | % | $ | 60,673 | 1.29 | % | 1.29 | % | 4.69 | % | 24 | % | ||||||||||||||||||||||||||||||||||||||||||||||||||||
10/1/12 to 9/30/13 | 12.88 | 0.35 | 1.05 | 1.40 | (0.34 | ) | — | (0.34 | ) | 1.06 | 13.94 | 11.05 | 53,354 | 1.28 | 1.28 | 2.62 | 14 | ||||||||||||||||||||||||||||||||||||||||||||||||||||||||||||
10/1/11 to 9/30/12 | 10.97 | 0.31 | 1.95 | 2.26 | (0.35 | ) | — | (0.35 | ) | 1.91 | 12.88 | 20.80 | 36,347 | 1.32 | 1.32 | 2.59 | 21 | ||||||||||||||||||||||||||||||||||||||||||||||||||||||||||||
10/1/10 to 9/30/11 | 10.71 | 0.33 | 0.25 | 0.58 | (0.32 | ) | — | (0.32 | ) | 0.26 | 10.97 | 5.40 | 23,120 | 1.34 | 1.34 | 2.89 | 16 | ||||||||||||||||||||||||||||||||||||||||||||||||||||||||||||
10/1/09 to 9/30/10 | 9.97 | 0.26 | 0.77 | 1.03 | (0.29 | ) | — | (0.29 | ) | 0.74 | 10.71 | 10.48 | 24,794 | 1.33 | 1.33 | 2.51 | 22 | ||||||||||||||||||||||||||||||||||||||||||||||||||||||||||||
Class C | |||||||||||||||||||||||||||||||||||||||||||||||||||||||||||||||||||||||||||||
10/1/13 to 9/30/14 | $ | 13.90 | 0.58 | 1.41 | 1.99 | (0.56 | ) | — | (0.56 | ) | 1.43 | $ | 15.33 | 14.37 | % | $ | 26,322 | 2.04 | % | 2.04 | % | 3.82 | % | 24 | % | ||||||||||||||||||||||||||||||||||||||||||||||||||||
10/1/12 to 9/30/13 | 12.85 | 0.25 | 1.05 | 1.30 | (0.25 | ) | — | (0.25 | ) | 1.05 | 13.90 | 10.23 | 17,969 | 2.03 | 2.03 | 1.85 | 14 | ||||||||||||||||||||||||||||||||||||||||||||||||||||||||||||
10/1/11 to 9/30/12 | 10.95 | 0.23 | 1.93 | 2.16 | (0.26 | ) | — | (0.26 | ) | 1.90 | 12.85 | 19.97 | 9,117 | 2.07 | 2.07 | 1.88 | 21 | ||||||||||||||||||||||||||||||||||||||||||||||||||||||||||||
10/1/10 to 9/30/11 | 10.69 | 0.24 | 0.26 | 0.50 | (0.24 | ) | — | (0.24 | ) | 0.26 | 10.95 | 4.51 | 6,138 | 2.09 | 2.09 | 2.11 | 16 | ||||||||||||||||||||||||||||||||||||||||||||||||||||||||||||
10/1/09 to 9/30/10 | 9.95 | 0.20 | 0.75 | 0.95 | (0.21 | ) | — | (0.21 | ) | 0.74 | 10.69 | 9.70 | 7,160 | 2.10 | 2.10 | 1.98 | 22 | ||||||||||||||||||||||||||||||||||||||||||||||||||||||||||||
Class I | |||||||||||||||||||||||||||||||||||||||||||||||||||||||||||||||||||||||||||||
10/1/13 to 9/30/14 | $ | 13.94 | 0.74 | 1.41 | 2.15 | (0.71 | ) | — | (0.71 | ) | 1.44 | $ | 15.38 | 15.49 | % | $ | 55,557 | 1.04 | % | 1.04 | % | 4.87 | % | 24 | % | ||||||||||||||||||||||||||||||||||||||||||||||||||||
10/1/12 to 9/30/13 | 12.89 | 0.39 | 1.04 | 1.43 | (0.38 | ) | — | (0.38 | ) | 1.05 | 13.94 | 11.23 | 70,485 | 1.03 | 1.03 | 2.86 | 14 | ||||||||||||||||||||||||||||||||||||||||||||||||||||||||||||
10/1/11 to 9/30/12 | 10.97 | 0.35 | 1.95 | 2.30 | (0.38 | ) | — | (0.38 | ) | 1.92 | 12.89 | 21.19 | 48,830 | 1.07 | 1.07 | 2.85 | 21 | ||||||||||||||||||||||||||||||||||||||||||||||||||||||||||||
10/1/10 to 9/30/11 | 10.72 | 0.36 | 0.24 | 0.60 | (0.35 | ) | — | (0.35 | ) | 0.25 | 10.97 | 5.56 | 33,865 | 1.09 | 1.09 | 3.16 | 16 | ||||||||||||||||||||||||||||||||||||||||||||||||||||||||||||
10/1/09 to 9/30/10 | 9.96 | 0.31 | 0.76 | 1.07 | (0.31 | ) | — | (0.31 | ) | 0.76 | 10.72 | 10.96 | 37,094 | 1.10 | 1.10 | 3.04 | 22 | ||||||||||||||||||||||||||||||||||||||||||||||||||||||||||||
The footnote legend is at the end of the financial highlights.
See Notes to Financial Statements
67
Table of Contents
VIRTUS OPPORTUNITIES TRUST
FINANCIAL HIGHLIGHTS
SELECTED PER SHARE DATA AND RATIOS FOR A SHARE OUTSTANDING
THROUGHOUT EACH PERIOD
| Net Asset Value, Beginning of Period | Net Investment Income (Loss)(2) | Net Realized and Unrealized Gain (Loss) | Total from Investment Operations | Dividends from Net Investment Income | Distributions from Net Realized Gains | Total Distributions | Change in Net Asset Value | Net Asset Value, End of Period | Total Return(1) | Net Assets, End of Period (in thousands) | Ratio of Net Expenses to Average Net Assets(8) | Ratio of Gross Expenses to Average Net Assets (before waivers and reimbursements)(8) | Ratio of Net Investment Income (Loss) to Average Net Assets | Portfolio Turnover Rate | ||||||||||||||||||||||||||||||||||||||||||||||||||||||||||||||
| Global Opportunities | |||||||||||||||||||||||||||||||||||||||||||||||||||||||||||||||||||||||||||||
Fund | |||||||||||||||||||||||||||||||||||||||||||||||||||||||||||||||||||||||||||||
Class A | |||||||||||||||||||||||||||||||||||||||||||||||||||||||||||||||||||||||||||||
10/1/13 to 9/30/14 | $ | 11.07 | 0.08 | 1.04 | 1.12 | (0.07 | ) | — | (0.07 | ) | 1.05 | $ | 12.12 | 10.18 | % | $ | 77,738 | 1.48 | % | 1.46 | % | 0.70 | % | 41 | % | ||||||||||||||||||||||||||||||||||||||||||||||||||||
10/1/12 to 9/30/13 | 9.91 | 0.07 | 1.12 | 1.19 | (0.03 | ) | — | (0.03 | ) | 1.16 | 11.07 | 12.05 | 78,434 | 1.55 | 1.50 | 0.69 | 61 | ||||||||||||||||||||||||||||||||||||||||||||||||||||||||||||
10/1/11 to 9/30/12 | 7.91 | 0.05 | 1.99 | 2.04 | (0.04 | ) | — | (0.04 | ) | 2.00 | 9.91 | 25.80 | 71,592 | 1.55 | 1.55 | 0.53 | 73 | ||||||||||||||||||||||||||||||||||||||||||||||||||||||||||||
10/1/10 to 9/30/11 | 7.79 | 0.05 | 0.15 | 0.20 | (0.08 | ) | — | (0.08 | ) | 0.12 | 7.91 | 2.54 | 54,916 | 1.55 | 1.67 | 0.65 | 56 | ||||||||||||||||||||||||||||||||||||||||||||||||||||||||||||
10/1/09 to 9/30/10 | 6.67 | 0.09 | 1.11 | 1.20 | (0.08 | ) | — | (0.08 | ) | 1.12 | 7.79 | 18.09 | 59,088 | 1.57 | (7) | 1.66 | 1.21 | 78 | |||||||||||||||||||||||||||||||||||||||||||||||||||||||||||
Class B | |||||||||||||||||||||||||||||||||||||||||||||||||||||||||||||||||||||||||||||
10/1/13 to 9/30/14 | $ | 9.81 | (0.01 | ) | 0.93 | 0.92 | — | — | — | 0.92 | $ | 10.73 | 9.38 | % | $ | 652 | 2.23 | % | 2.21 | % | (0.09 | )% | 41 | % | |||||||||||||||||||||||||||||||||||||||||||||||||||||
10/1/12 to 9/30/13 | 8.82 | (0.01 | ) | 1.00 | 0.99 | — | — | — | 0.99 | 9.81 | 11.22 | 798 | 2.30 | 2.25 | (0.10 | ) | 61 | ||||||||||||||||||||||||||||||||||||||||||||||||||||||||||||
10/1/11 to 9/30/12 | 7.06 | (0.02 | ) | 1.78 | 1.76 | — | — | — | 1.76 | 8.82 | 24.93 | 1,048 | 2.30 | 2.30 | (0.28 | ) | 73 | ||||||||||||||||||||||||||||||||||||||||||||||||||||||||||||
10/1/10 to 9/30/11 | 6.97 | (0.01 | ) | 0.13 | 0.12 | (0.03 | ) | — | (0.03 | ) | 0.09 | 7.06 | 1.76 | 915 | 2.30 | 2.42 | (0.14 | ) | 56 | ||||||||||||||||||||||||||||||||||||||||||||||||||||||||||
10/1/09 to 9/30/10 | 6.00 | 0.03 | 0.99 | 1.02 | (0.05 | ) | — | (0.05 | ) | 0.97 | 6.97 | 17.09 | �� | 1,294 | 2.32 | (7) | 2.41 | 0.43 | 78 | ||||||||||||||||||||||||||||||||||||||||||||||||||||||||||
Class C | |||||||||||||||||||||||||||||||||||||||||||||||||||||||||||||||||||||||||||||
10/1/13 to 9/30/14 | $ | 9.76 | — | (5) | 0.91 | 0.91 | (0.01 | ) | — | (0.01 | ) | 0.90 | $ | 10.66 | 9.32 | % | $ | 3,455 | 2.23 | % | 2.21 | % | (0.04 | )% | 41 | % | |||||||||||||||||||||||||||||||||||||||||||||||||||
10/1/12 to 9/30/13 | 8.77 | — | 0.99 | 0.99 | — | — | — | 0.99 | 9.76 | 11.29 | 2,963 | 2.30 | 2.24 | (0.03 | ) | 61 | |||||||||||||||||||||||||||||||||||||||||||||||||||||||||||||
10/1/11 to 9/30/12 | 7.02 | (0.02 | ) | 1.77 | 1.75 | — | — | — | 1.75 | 8.77 | 24.93 | 1,700 | 2.30 | 2.30 | (0.25 | ) | 73 | ||||||||||||||||||||||||||||||||||||||||||||||||||||||||||||
10/1/10 to 9/30/11 | 6.93 | (0.01 | ) | 0.13 | 0.12 | (0.03 | ) | — | (0.03 | ) | 0.09 | 7.02 | 1.77 | 813 | 2.30 | 2.42 | (0.11 | ) | 56 | ||||||||||||||||||||||||||||||||||||||||||||||||||||||||||
10/1/09 to 9/30/10 | 5.97 | 0.03 | 0.98 | 1.01 | (0.05 | ) | — | (0.05 | ) | 0.96 | 6.93 | 17.01 | 806 | 2.32 | (7) | 2.41 | 0.48 | 78 | |||||||||||||||||||||||||||||||||||||||||||||||||||||||||||
Class I | |||||||||||||||||||||||||||||||||||||||||||||||||||||||||||||||||||||||||||||
10/1/13 to 9/30/14 | $ | 11.07 | 0.11 | 1.05 | 1.16 | (0.12 | ) | — | (0.12 | ) | 1.04 | $ | 12.11 | 10.49 | % | $ | 33,917 | 1.23 | % | 1.21 | % | 0.97 | % | 41 | % | ||||||||||||||||||||||||||||||||||||||||||||||||||||
10/1/12 to 9/30/13 | 9.91 | 0.10 | 1.12 | 1.22 | (0.06 | ) | — | (0.06 | ) | 1.16 | 11.07 | 12.36 | 29,540 | 1.30 | 1.30 | 0.94 | 61 | ||||||||||||||||||||||||||||||||||||||||||||||||||||||||||||
8/8/12(6) to 9/30/12(6) | 9.38 | — | (5) | 0.53 | 0.53 | — | — | — | 0.53 | 9.91 | 5.54 | (4) | 23,617 | 1.30 | (3) | 1.30 | (3) | 0.02 | (3) | 73 | (4) | ||||||||||||||||||||||||||||||||||||||||||||||||||||||||
| Global Real Estate | |||||||||||||||||||||||||||||||||||||||||||||||||||||||||||||||||||||||||||||
Securities Fund | |||||||||||||||||||||||||||||||||||||||||||||||||||||||||||||||||||||||||||||
Class A | |||||||||||||||||||||||||||||||||||||||||||||||||||||||||||||||||||||||||||||
10/1/13 to 9/30/14 | $ | 23.14 | 0.38 | 2.19 | 2.57 | (0.36 | ) | (0.17 | ) | (0.53 | ) | 2.04 | $ | 25.18 | 11.36 | % | $ | 21,502 | 1.40 | % | 1.57 | % | 1.52 | % | 29 | % | |||||||||||||||||||||||||||||||||||||||||||||||||||
10/1/12 to 9/30/13 | 22.40 | 0.35 | 1.09 | 1.44 | (0.70 | ) | — | (0.70 | ) | 0.74 | 23.14 | 6.48 | 15,306 | 1.40 | 1.66 | 1.51 | 18 | ||||||||||||||||||||||||||||||||||||||||||||||||||||||||||||
10/1/11 to 9/30/12 | 17.78 | 0.33 | 4.77 | 5.10 | (0.11 | ) | (0.37 | ) | (0.48 | ) | 4.62 | 22.40 | 29.21 | 8,695 | 1.40 | 2.37 | 1.61 | 31 | |||||||||||||||||||||||||||||||||||||||||||||||||||||||||||
10/1/10 to 9/30/11 | 19.84 | 0.50 | (0.90 | ) | (0.40 | ) | (1.01 | ) | (0.65 | ) | (1.66 | ) | (2.06 | ) | 17.78 | (2.57 | ) | 5,275 | 1.40 | 3.16 | 2.48 | 41 | |||||||||||||||||||||||||||||||||||||||||||||||||||||||
10/1/09 to 9/30/10 | 18.33 | 0.40 | 3.31 | 3.71 | (1.55 | ) | (0.65 | ) | (2.20 | ) | 1.51 | 19.84 | 22.42 | 2,492 | 1.40 | 4.07 | 2.21 | 28 | |||||||||||||||||||||||||||||||||||||||||||||||||||||||||||
Class C | |||||||||||||||||||||||||||||||||||||||||||||||||||||||||||||||||||||||||||||
10/1/13 to 9/30/14 | $ | 22.78 | 0.22 | 2.13 | 2.35 | (0.19 | ) | (0.17 | ) | (0.36 | ) | 1.99 | $ | 24.77 | 10.51 | % | $ | 5,850 | 2.15 | % | 2.32 | % | 0.92 | % | 29 | % | |||||||||||||||||||||||||||||||||||||||||||||||||||
10/1/12 to 9/30/13 | 22.14 | 0.18 | 1.08 | 1.26 | (0.62 | ) | — | (0.62 | ) | 0.64 | 22.78 | 5.70 | 3,545 | 2.15 | 2.41 | 0.80 | 18 | ||||||||||||||||||||||||||||||||||||||||||||||||||||||||||||
10/1/11 to 9/30/12 | 17.65 | 0.17 | 4.72 | 4.89 | (0.03 | ) | (0.37 | ) | (0.40 | ) | 4.49 | 22.14 | 28.18 | 1,356 | 2.15 | 3.11 | 0.83 | 31 | |||||||||||||||||||||||||||||||||||||||||||||||||||||||||||
10/1/10 to 9/30/11 | 19.67 | 0.35 | (0.88 | ) | (0.53 | ) | (0.84 | ) | (0.65 | ) | (1.49 | ) | (2.02 | ) | 17.65 | (3.25 | ) | 486 | 2.15 | 3.91 | 1.73 | 41 | |||||||||||||||||||||||||||||||||||||||||||||||||||||||
10/1/09 to 9/30/10 | 18.25 | 0.27 | 3.29 | 3.56 | (1.49 | ) | (0.65 | ) | (2.14 | ) | 1.42 | 19.67 | 21.55 | 262 | 2.15 | 4.83 | 1.50 | 28 | |||||||||||||||||||||||||||||||||||||||||||||||||||||||||||
Class I | |||||||||||||||||||||||||||||||||||||||||||||||||||||||||||||||||||||||||||||
10/1/13 to 9/30/14 | $ | 23.28 | 0.41 | 2.22 | 2.63 | (0.41 | ) | (0.17 | ) | (0.58 | ) | 2.05 | $ | 25.33 | 11.60 | % | $ | 26,985 | 1.15 | % | 1.32 | % | 1.65 | % | 29 | % | |||||||||||||||||||||||||||||||||||||||||||||||||||
10/1/12 to 9/30/13 | 22.51 | 0.42 | 1.09 | 1.51 | (0.74 | ) | — | (0.74 | ) | 0.77 | 23.28 | 6.78 | 25,332 | 1.15 | 1.41 | 1.78 | 18 | ||||||||||||||||||||||||||||||||||||||||||||||||||||||||||||
10/1/11 to 9/30/12 | 17.85 | 0.45 | 4.71 | 5.16 | (0.13 | ) | (0.37 | ) | (0.50 | ) | 4.66 | 22.51 | 29.50 | 12,063 | 1.15 | 1.93 | 2.04 | 31 | |||||||||||||||||||||||||||||||||||||||||||||||||||||||||||
10/1/10 to 9/30/11 | 19.91 | 0.63 | (0.97 | ) | (0.34 | ) | (1.07 | ) | (0.65 | ) | (1.72 | ) | (2.06 | ) | 17.85 | (2.26 | ) | 609 | 1.15 | 2.92 | 3.07 | 41 | |||||||||||||||||||||||||||||||||||||||||||||||||||||||
10/1/09 to 9/30/10 | 18.36 | 0.47 | 3.30 | 3.77 | (1.57 | ) | (0.65 | ) | (2.22 | ) | 1.55 | 19.91 | 22.77 | 678 | 1.15 | 3.90 | 2.63 | 28 | |||||||||||||||||||||||||||||||||||||||||||||||||||||||||||
The footnote legend is at the end of the financial highlights.
See Notes to Financial Statements
68
Table of Contents
VIRTUS OPPORTUNITIES TRUST
FINANCIAL HIGHLIGHTS
SELECTED PER SHARE DATA AND RATIOS FOR A SHARE OUTSTANDING
THROUGHOUT EACH PERIOD
| Net Asset Value, Beginning of Period | Net Investment Income (Loss)(2) | Net Realized and Unrealized Gain (Loss) | Total from Investment Operations | Dividends from Net Investment Income | Distributions from Net Realized Gains | Total Distributions | Change in Net Asset Value | Net Asset Value, End of Period | Total Return(1) | Net Assets, End of Period (in thousands) | Ratio of Net Expenses to Average Net Assets(8) | Ratio of Gross Expenses to Average Net Assets (before waivers and reimbursements)(8) | Ratio of Net Investment Income (Loss) to Average Net Assets | Portfolio Turnover Rate | ||||||||||||||||||||||||||||||||||||||||||||||||||||||||||||||
| Greater European | |||||||||||||||||||||||||||||||||||||||||||||||||||||||||||||||||||||||||||||
Opportunities Fund | |||||||||||||||||||||||||||||||||||||||||||||||||||||||||||||||||||||||||||||
Class A | |||||||||||||||||||||||||||||||||||||||||||||||||||||||||||||||||||||||||||||
10/1/13 to 9/30/14 | $ | 15.87 | 0.09 | (0.22 | ) | (0.13 | ) | (0.06 | ) | (0.36 | ) | (0.42 | ) | (0.55 | ) | $ | 15.32 | (0.88 | )% | $ | 12,703 | 1.45 | % | 1.91 | % | 0.54 | % | 65 | % | ||||||||||||||||||||||||||||||||||||||||||||||||
10/1/12 to 9/30/13 | 14.20 | 0.13 | 2.09 | 2.22 | (0.12 | ) | (0.43 | ) | (0.55 | ) | 1.67 | 15.87 | 15.92 | 13,433 | 1.45 | 2.22 | 0.86 | 75 | |||||||||||||||||||||||||||||||||||||||||||||||||||||||||||
10/1/11 to 9/30/12 | 11.80 | 0.16 | 2.87 | 3.03 | (0.15 | ) | (0.48 | ) | (0.63 | ) | 2.40 | 14.20 | 26.75 | 6,513 | 1.45 | 2.82 | 1.26 | 49 | |||||||||||||||||||||||||||||||||||||||||||||||||||||||||||
10/1/10 to 9/30/11 | 13.56 | 0.17 | (0.36 | ) | (0.19 | ) | (0.29 | ) | (1.28 | ) | (1.57 | ) | (1.76 | ) | 11.80 | (2.09 | ) | 4,571 | 1.45 | 3.03 | 1.26 | 46 | |||||||||||||||||||||||||||||||||||||||||||||||||||||||
10/1/09 to 9/30/10 | 12.97 | 0.21 | 0.95 | 1.16 | (0.15 | ) | (0.42 | ) | (0.57 | ) | 0.59 | 13.56 | 9.14 | 4,629 | 1.45 | 2.75 | 1.60 | 48 | |||||||||||||||||||||||||||||||||||||||||||||||||||||||||||
Class C | |||||||||||||||||||||||||||||||||||||||||||||||||||||||||||||||||||||||||||||
10/1/13 to 9/30/14 | $ | 15.71 | (0.02 | ) | (0.23 | ) | (0.25 | ) | (0.02 | ) | (0.36 | ) | (0.38 | ) | (0.63 | ) | $ | 15.08 | (1.62 | )% | $ | 1,130 | 2.20 | % | 2.67 | % | (0.12 | )% | 65 | % | |||||||||||||||||||||||||||||||||||||||||||||||
10/1/12 to 9/30/13 | 14.10 | 0.03 | 2.07 | 2.10 | (0.06 | ) | (0.43 | ) | (0.49 | ) | 1.61 | 15.71 | 15.11 | 607 | 2.20 | 2.92 | 0.21 | 75 | |||||||||||||||||||||||||||||||||||||||||||||||||||||||||||
10/1/11 to 9/30/12 | 11.69 | 0.07 | 2.85 | 2.92 | (0.03 | ) | (0.48 | ) | (0.51 | ) | 2.41 | 14.10 | 25.73 | 187 | 2.20 | 3.57 | 0.52 | 49 | |||||||||||||||||||||||||||||||||||||||||||||||||||||||||||
10/1/10 to 9/30/11 | 13.45 | 0.07 | (0.36 | ) | (0.29 | ) | (0.19 | ) | (1.28 | ) | (1.47 | ) | (1.76 | ) | 11.69 | (2.77 | ) | 144 | 2.20 | 3.78 | 0.53 | 46 | |||||||||||||||||||||||||||||||||||||||||||||||||||||||
10/1/09 to 9/30/10 | 12.93 | 0.07 | 0.98 | 1.05 | (0.11 | ) | (0.42 | ) | (0.53 | ) | 0.52 | 13.45 | 8.28 | 142 | 2.20 | 3.50 | 0.56 | 48 | |||||||||||||||||||||||||||||||||||||||||||||||||||||||||||
Class I | |||||||||||||||||||||||||||||||||||||||||||||||||||||||||||||||||||||||||||||
10/1/13 to 9/30/14 | $ | 15.92 | 0.14 | (0.24 | ) | (0.10 | ) | (0.08 | ) | (0.36 | ) | (0.44 | ) | (0.54 | ) | $ | 15.38 | (0.64 | )% | $ | 2,751 | 1.20 | % | 1.68 | % | 0.89 | % | 65 | % | ||||||||||||||||||||||||||||||||||||||||||||||||
10/1/12 to 9/30/13 | 14.23 | 0.06 | 2.20 | 2.26 | (0.14 | ) | (0.43 | ) | (0.57 | ) | 1.69 | 15.92 | 16.19 | 1,918 | 1.20 | 1.96 | 0.39 | 75 | |||||||||||||||||||||||||||||||||||||||||||||||||||||||||||
10/1/11 to 9/30/12 | 11.83 | 0.17 | 2.90 | 3.07 | (0.19 | ) | (0.48 | ) | (0.67 | ) | 2.40 | 14.23 | 26.99 | 155 | 1.20 | 2.57 | 1.32 | 49 | |||||||||||||||||||||||||||||||||||||||||||||||||||||||||||
10/1/10 to 9/30/11 | 13.60 | 0.17 | (0.34 | ) | (0.17 | ) | (0.32 | ) | (1.28 | ) | (1.60 | ) | (1.77 | ) | 11.83 | (1.84 | ) | 206 | 1.20 | 2.78 | 1.33 | 46 | |||||||||||||||||||||||||||||||||||||||||||||||||||||||
10/1/09 to 9/30/10 | 12.98 | 0.24 | 0.96 | 1.20 | (0.16 | ) | (0.42 | ) | (0.58 | ) | 0.62 | 13.60 | 9.48 | 142 | 1.20 | 2.56 | 1.83 | 48 | |||||||||||||||||||||||||||||||||||||||||||||||||||||||||||
International Equity Fund | |||||||||||||||||||||||||||||||||||||||||||||||||||||||||||||||||||||||||||||
Class A | |||||||||||||||||||||||||||||||||||||||||||||||||||||||||||||||||||||||||||||
10/1/13 to 9/30/14 | $ | 10.50 | 0.13 | 0.64 | 0.77 | (0.24 | ) | (0.13 | ) | (0.37 | ) | 0.40 | $ | 10.90 | 7.42 | % | $ | 3,915 | 1.50 | % | 2.42 | % | 1.18 | % | 115 | % | |||||||||||||||||||||||||||||||||||||||||||||||||||
10/1/12 to 9/30/13 | 10.87 | 0.16 | 1.19 | 1.35 | (0.25 | ) | (1.47 | ) | (1.72 | ) | (0.37 | ) | 10.50 | 13.38 | 170 | 1.50 | 1.95 | 1.41 | 277 | (9) | |||||||||||||||||||||||||||||||||||||||||||||||||||||||||
10/1/11 to 9/30/12 | 9.79 | 0.21 | 1.36 | 1.57 | (0.30 | ) | (0.19 | ) | (0.49 | ) | 1.08 | 10.87 | 16.58 | 193 | 1.50 | 1.80 | 2.02 | 25 | |||||||||||||||||||||||||||||||||||||||||||||||||||||||||||
10/1/10 to 9/30/11 | 10.17 | 0.29 | (0.57 | ) | (0.28 | ) | (0.10 | ) | — | (0.10 | ) | (0.38 | ) | 9.79 | (2.85 | ) | 952 | 1.50 | 2.11 | 2.73 | 65 | ||||||||||||||||||||||||||||||||||||||||||||||||||||||||
9/16/10(6) to 9/30/10 | 10.00 | — | (5) | 0.17 | 0.17 | — | — | — | 0.17 | 10.17 | 1.70 | (4) | 102 | 1.50 | (3) | 19.64 | (3) | 1.36 | (3) | 0 | (4) | ||||||||||||||||||||||||||||||||||||||||||||||||||||||||
Class C | |||||||||||||||||||||||||||||||||||||||||||||||||||||||||||||||||||||||||||||
10/1/13 to 9/30/14 | $ | 10.37 | 0.04 | 0.62 | 0.66 | (0.22 | ) | (0.13 | ) | (0.35 | ) | 0.31 | $ | 10.68 | 6.56 | % | $ | 804 | 2.25 | % | 3.13 | % | 0.38 | % | 115 | % | |||||||||||||||||||||||||||||||||||||||||||||||||||
10/1/12 to 9/30/13 | 10.77 | 0.08 | 1.20 | 1.28 | (0.21 | ) | (1.47 | ) | (1.68 | ) | (0.40 | ) | 10.37 | 12.53 | 124 | 2.25 | 2.73 | 0.70 | 277 | (9) | |||||||||||||||||||||||||||||||||||||||||||||||||||||||||
10/1/11 to 9/30/12 | 9.76 | 0.20 | 1.25 | 1.45 | (0.25 | ) | (0.19 | ) | (0.44 | ) | 1.01 | 10.77 | 15.37 | 115 | 2.25 | 2.51 | 1.94 | 25 | |||||||||||||||||||||||||||||||||||||||||||||||||||||||||||
10/1/10 to 9/30/11 | 10.16 | 0.18 | (0.53 | ) | (0.35 | ) | (0.05 | ) | — | (0.05 | ) | (0.40 | ) | 9.76 | (3.58 | ) | 98 | 2.25 | 3.15 | 1.70 | 65 | ||||||||||||||||||||||||||||||||||||||||||||||||||||||||
9/16/10(6) to 9/30/10 | 10.00 | — | (5) | 0.16 | 0.16 | — | — | — | 0.16 | 10.16 | 1.60 | (4) | 102 | 2.25 | (3) | 20.39 | (3) | 0.61 | (3) | 0 | (4) | ||||||||||||||||||||||||||||||||||||||||||||||||||||||||
Class I | |||||||||||||||||||||||||||||||||||||||||||||||||||||||||||||||||||||||||||||
10/1/13 to 9/30/14 | $ | 10.45 | 0.14 | 0.65 | 0.79 | (0.24 | ) | (0.13 | ) | (0.37 | ) | 0.42 | $ | 10.87 | 7.67 | % | $ | 6,435 | 1.25 | % | 2.19 | % | 1.24 | % | 115 | % | |||||||||||||||||||||||||||||||||||||||||||||||||||
10/1/12 to 9/30/13 | 10.82 | 0.22 | 1.16 | 1.38 | (0.28 | ) | (1.47 | ) | (1.75 | ) | (0.37 | ) | 10.45 | 13.68 | 2,185 | 1.25 | 1.54 | 1.97 | 277 | (9) | |||||||||||||||||||||||||||||||||||||||||||||||||||||||||
10/1/11 to 9/30/12 | 9.80 | 0.30 | 1.26 | 1.56 | (0.35 | ) | (0.19 | ) | (0.54 | ) | 1.02 | 10.82 | 16.47 | 26,398 | 1.25 | 1.50 | 2.94 | 25 | |||||||||||||||||||||||||||||||||||||||||||||||||||||||||||
10/1/10 to 9/30/11 | 10.18 | 0.34 | (0.60 | ) | (0.26 | ) | (0.12 | ) | — | (0.12 | ) | (0.38 | ) | 9.80 | (2.62 | ) | 17,689 | 1.25 | 1.88 | 3.16 | 65 | ||||||||||||||||||||||||||||||||||||||||||||||||||||||||
9/16/10(6) to 9/30/10 | 10.00 | 0.01 | 0.17 | 0.18 | — | — | — | 0.18 | 10.18 | 1.70 | (4) | 7,068 | 1.25 | (3) | 19.39 | (3) | 1.62 | (3) | 0 | (4) | |||||||||||||||||||||||||||||||||||||||||||||||||||||||||
The footnote legend is at the end of the financial highlights.
See Notes to Financial Statements
69
Table of Contents
VIRTUS OPPORTUNITIES TRUST
FINANCIAL HIGHLIGHTS
SELECTED PER SHARE DATA AND RATIOS FOR A SHARE OUTSTANDING
THROUGHOUT EACH PERIOD
| Net Asset Value, Beginning of Period | Net Investment Income (Loss)(2) | Net Realized and Unrealized Gain (Loss) | Total from Investment Operations | Dividends from Net Investment Income | Distributions from Net Realized Gains | Total Distributions | Change in Net Asset Value | Net Asset Value, End of Period | Total Return(1) | Net Assets, End of Period (in thousands) | Ratio of Net Expenses to Average Net Assets(8) | Ratio of Gross Expenses to Average Net Assets (before waivers and reimbursements)(8) | Ratio of Net Investment Income (Loss) to Average Net Assets | Portfolio Turnover Rate | ||||||||||||||||||||||||||||||||||||||||||||||||||||||||||||||
| International Real | |||||||||||||||||||||||||||||||||||||||||||||||||||||||||||||||||||||||||||||
Estate Securities Fund | |||||||||||||||||||||||||||||||||||||||||||||||||||||||||||||||||||||||||||||
Class A | |||||||||||||||||||||||||||||||||||||||||||||||||||||||||||||||||||||||||||||
10/1/13 to 9/30/14 | $ | 6.61 | 0.16 | 0.39 | 0.55 | (0.13 | ) | — | (0.13 | ) | 0.42 | $ | 7.03 | 8.61 | % | $ | 11,257 | 1.50 | % | 1.73 | % | 2.38 | % | 32 | % | ||||||||||||||||||||||||||||||||||||||||||||||||||||
10/1/12 to 9/30/13 | 6.50 | 0.15 | 0.45 | 0.60 | (0.49 | ) | — | (0.49 | ) | 0.11 | 6.61 | 9.39 | 10,234 | 1.50 | 1.75 | 2.23 | 22 | ||||||||||||||||||||||||||||||||||||||||||||||||||||||||||||
10/1/11 to 9/30/12 | 5.23 | 0.16 | 1.24 | 1.40 | (0.13 | ) | — | (0.13 | ) | 1.27 | 6.50 | 27.35 | 3,916 | 1.50 | 1.85 | 2.69 | 41 | ||||||||||||||||||||||||||||||||||||||||||||||||||||||||||||
10/1/10 to 9/30/11 | 6.30 | 0.31 | (0.69 | ) | (0.38 | ) | (0.69 | ) | — | (0.69 | ) | (1.07 | ) | 5.23 | (7.15 | ) | 3,243 | 1.50 | 1.77 | 5.03 | 41 | ||||||||||||||||||||||||||||||||||||||||||||||||||||||||
10/1/09 to 9/30/10 | 6.00 | 0.13 | 0.65 | 0.78 | (0.48 | ) | — | (0.48 | ) | 0.30 | 6.30 | 14.44 | 2,474 | 1.50 | 1.70 | 2.21 | 20 | ||||||||||||||||||||||||||||||||||||||||||||||||||||||||||||
Class C | |||||||||||||||||||||||||||||||||||||||||||||||||||||||||||||||||||||||||||||
10/1/13 to 9/30/14 | $ | 6.56 | 0.12 | 0.38 | 0.50 | (0.09 | ) | — | (0.09 | ) | 0.41 | $ | 6.97 | 7.75 | % | $ | 2,553 | 2.25 | % | 2.48 | % | 1.68 | % | 32 | % | ||||||||||||||||||||||||||||||||||||||||||||||||||||
10/1/12 to 9/30/13 | 6.48 | 0.09 | 0.46 | 0.55 | (0.47 | ) | — | (0.47 | ) | 0.08 | 6.56 | 8.55 | 1,911 | 2.25 | 2.49 | 1.35 | 22 | ||||||||||||||||||||||||||||||||||||||||||||||||||||||||||||
10/1/11 to 9/30/12 | 5.20 | 0.12 | 1.24 | 1.36 | (0.08 | ) | — | (0.08 | ) | 1.28 | 6.48 | 26.36 | 1,531 | 2.25 | 2.60 | 2.04 | 41 | ||||||||||||||||||||||||||||||||||||||||||||||||||||||||||||
10/1/10 to 9/30/11 | 6.26 | 0.24 | (0.67 | ) | (0.43 | ) | (0.63 | ) | — | (0.63 | ) | (1.06 | ) | 5.20 | (7.90 | ) | 962 | 2.25 | 2.52 | 3.91 | 41 | ||||||||||||||||||||||||||||||||||||||||||||||||||||||||
10/1/09 to 9/30/10 | 6.00 | 0.13 | 0.61 | 0.74 | (0.48 | ) | — | (0.48 | ) | 0.26 | 6.26 | 13.73 | 494 | 2.25 | 2.51 | 2.28 | 20 | ||||||||||||||||||||||||||||||||||||||||||||||||||||||||||||
Class I | |||||||||||||||||||||||||||||||||||||||||||||||||||||||||||||||||||||||||||||
10/1/13 to 9/30/14 | $ | 6.61 | 0.18 | 0.39 | 0.57 | (0.15 | ) | — | (0.15 | ) | 0.42 | $ | 7.03 | 8.87 | % | $ | 28,738 | 1.25 | % | 1.48 | % | 2.64 | % | 32 | % | ||||||||||||||||||||||||||||||||||||||||||||||||||||
10/1/12 to 9/30/13 | 6.49 | 0.15 | 0.47 | 0.62 | (0.50 | ) | — | (0.50 | ) | 0.12 | 6.61 | 9.66 | 29,999 | 1.25 | 1.49 | 2.35 | 22 | ||||||||||||||||||||||||||||||||||||||||||||||||||||||||||||
10/1/11 to 9/30/12 | 5.23 | 0.17 | 1.25 | 1.42 | (0.16 | ) | — | (0.16 | ) | 1.26 | 6.49 | 27.74 | 28,095 | 1.25 | 1.59 | 2.92 | 41 | ||||||||||||||||||||||||||||||||||||||||||||||||||||||||||||
10/1/10 to 9/30/11 | 6.31 | 0.35 | (0.72 | ) | (0.37 | ) | (0.71 | ) | — | (0.71 | ) | (1.08 | ) | 5.23 | (7.04 | ) | 24,420 | 1.25 | 1.52 | 5.65 | 41 | ||||||||||||||||||||||||||||||||||||||||||||||||||||||||
10/1/09 to 9/30/10 | 5.99 | 0.19 | 0.61 | 0.80 | (0.48 | ) | — | (0.48 | ) | 0.32 | 6.31 | 14.83 | 24,052 | 1.25 | 1.51 | 3.31 | 20 | ||||||||||||||||||||||||||||||||||||||||||||||||||||||||||||
| International Small-Cap | |||||||||||||||||||||||||||||||||||||||||||||||||||||||||||||||||||||||||||||
Fund | |||||||||||||||||||||||||||||||||||||||||||||||||||||||||||||||||||||||||||||
Class A | |||||||||||||||||||||||||||||||||||||||||||||||||||||||||||||||||||||||||||||
10/1/13 to 9/30/14 | $ | 13.20 | 0.47 | 0.41 | 0.88 | (0.25 | ) | (0.13 | ) | (0.38 | ) | 0.50 | $ | 13.70 | 6.65 | % | $ | 2,477 | 1.60 | % | 1.73 | % | 3.31 | % | 44 | % | |||||||||||||||||||||||||||||||||||||||||||||||||||
10/1/12 to 9/30/13 | 10.09 | 0.30 | 2.91 | 3.21 | (0.09 | ) | (0.01 | ) | (0.10 | ) | 3.11 | 13.20 | 31.97 | 403 | 1.60 | 2.51 | 2.52 | 26 | |||||||||||||||||||||||||||||||||||||||||||||||||||||||||||
9/5/12(6) to 9/30/12 | 10.00 | 0.02 | 0.07 | 0.09 | — | — | — | 0.09 | 10.09 | 0.90 | (4) | 101 | 1.60 | (3) | 16.64 | (3) | 3.65 | (3) | 0 | (4) | |||||||||||||||||||||||||||||||||||||||||||||||||||||||||
Class C | |||||||||||||||||||||||||||||||||||||||||||||||||||||||||||||||||||||||||||||
10/1/13 to 9/30/14 | $ | 13.16 | 0.24 | 0.54 | 0.78 | (0.18 | ) | (0.13 | ) | (0.31 | ) | 0.47 | $ | 13.63 | 5.89 | % | $ | 1,194 | 2.35 | % | 2.49 | % | 1.73 | % | 44 | % | |||||||||||||||||||||||||||||||||||||||||||||||||||
10/1/12 to 9/30/13 | 10.09 | 0.19 | 2.93 | 3.12 | (0.04 | ) | (0.01 | ) | (0.05 | ) | 3.07 | 13.16 | 30.92 | 374 | 2.35 | 3.34 | 1.62 | 26 | |||||||||||||||||||||||||||||||||||||||||||||||||||||||||||
9/5/12(6) to 9/30/12 | 10.00 | 0.02 | 0.07 | 0.09 | — | — | — | 0.09 | 10.09 | 0.90 | (4) | 107 | 2.35 | (3) | 17.43 | (3) | 2.86 | (3) | 0 | (4) | |||||||||||||||||||||||||||||||||||||||||||||||||||||||||
Class I | |||||||||||||||||||||||||||||||||||||||||||||||||||||||||||||||||||||||||||||
10/1/13 to 9/30/14 | $ | 13.21 | 0.36 | 0.57 | 0.93 | (0.27 | ) | (0.13 | ) | (0.40 | ) | 0.53 | $ | 13.74 | 7.04 | % | $ | 46,599 | 1.35 | % | 1.49 | % | 2.57 | % | 44 | % | |||||||||||||||||||||||||||||||||||||||||||||||||||
10/1/12 to 9/30/13 | 10.10 | 0.34 | 2.89 | 3.23 | (0.11 | ) | (0.01 | ) | (0.12 | ) | 3.11 | 13.21 | 32.13 | 18,123 | 1.35 | 2.23 | 2.82 | 26 | |||||||||||||||||||||||||||||||||||||||||||||||||||||||||||
9/5/12(6) to 9/30/12 | 10.00 | 0.03 | 0.07 | 0.10 | — | — | — | 0.10 | 10.10 | 1.00 | (4) | 2,834 | 1.35 | (3) | 16.39 | (3) | 3.89 | (3) | 0 | (4) | |||||||||||||||||||||||||||||||||||||||||||||||||||||||||
Footnote Legend
| (1) | Sales charges, where applicable, are not reflected in the total return calculation. |
| (2) | Computed using average shares outstanding. |
| (3) | Annualized. |
| (4) | Not annualized. |
| (5) | Amount is less than $0.005. |
| (6) | Inception date. |
| (7) | Due to a change in expense ratio, the ratio shown is a blended expense ratio. |
| (8) | The Funds will also indirectly bear their prorated share of expenses of the underlying funds in which they invest. Such expenses are not included in the calculation of this ratio. |
| (9) | See Note 13 in the Notes to Financial Statements. |
See Notes to Financial Statements
70
Table of Contents
VIRTUS OPPORTUNITIES TRUST
SEPTEMBER 30, 2014
| Note | 1. Organization |
Virtus Opportunities Trust (the “Trust”) is organized as a Delaware statutory trust and is registered under the Investment Company Act of 1940 (“1940 Act”), as amended, as an open-end management investment company.
As of the date of this report, 31 funds of the Trust are offered for sale, of which 11 (each a “Fund”) are reported in this annual report.
The Fund’s Investment objectives are outlined in each Fund’s Summary page.
All the Funds offer Class A, Class C shares and Class I shares. Class B shares are no longer available for purchase by new or existing shareholders, except for existing shareholders through Qualifying Transactions, For more information regarding Qualifying Transactions, refer to each Fund’s prospectus.
Class A shares of Emerging Markets Debt Fund are sold with a front-end sales charge of up to 3.75%. Class A shares of the remaining Funds are sold with a front-end sales charge of up to 5.75% with some exceptions. Generally, Class A shares are not subject to any charges by the Funds when redeemed; however, a 0.50% – 1% contingent deferred sales charge (“CDSC”) may be imposed on certain redemptions made within a certain period following purchases on which a finder’s fee has been paid. The period for which such CDSC applies for the Funds is 18 months. The CDSC period begins on the last day of the month preceding the month in which the purchase was made.
Class B shares were generally sold with a CDSC, which declines from 5% to zero depending on the period of time the shares are held. Class C shares are generally sold with a 1% CDSC if applicable, if redeemed within one year of purchase. Class I shares are sold without a front-end sales charge or CDSC.
Virtus Mutual Funds may impose an annual fee on accounts having balances of less than $2,500. The small account fee may be waived in certain circumstances, as disclosed in the prospectuses and/or statements of additional information. The fees collected will be used to offset certain expenses of the Funds.
Each Class of shares has identical voting, dividend, liquidation and other rights and the same terms and conditions, except that each Class bears different distribution and/or service fees under a Board approved Rule 12b-1 and/or shareholder servicing plan (“12b-1 plan”) and has exclusive voting rights with respect to such plans. Class I shares are not subject to a 12b-1 plan. Income and other expenses as well as realized and unrealized gains and losses of each Fund are borne pro rata by the holders of each Class of shares.
| Note | 2. Significant Accounting Policies |
The following is a summary of significant accounting policies consistently followed by the Trust in the preparation of its financial statements. The preparation of financial statements in conformity with accounting principles generally accepted in the United States of America requires management to make estimates and assumptions that affect the reported amounts of assets and liabilities, and disclosure of contingent assets and liabilities at the date of the financial statements and the reported amount of increases and decreases in net assets from operations during the reporting period. Actual results could differ from those estimates and those differences could be significant.
| A. | Security Valuation |
Security valuation procedures for each Fund, which include nightly price variance as well as back-testing such as bi-weekly unchanged price, monthly secondary source and transaction analysis, have been approved by the Board of Trustees (the “Board” or the “Trustees”). All internally fair valued securities are approved by a valuation committee (the “Valuation Committee”) appointed by the Board. The Valuation Committee is comprised of certain members of management as identified by the Board and convenes independently from portfolio management. All internally fair valued securities, are updated daily and reviewed in detail by the Valuation Committee monthly unless changes occur within the period. The Valuation Committee reviews the validity of the model inputs and any changes to the model. Fair valuations are reviewed by the Board at least quarterly.
Each Fund utilizes a fair value hierarchy which prioritizes the inputs to valuation techniques used to measure fair value into three broad levels.
| • Level 1 – | quoted prices in active markets for identical securities (security types generally include listed equities). |
| • Level 2 – | prices determined using other significant observable inputs (including quoted prices for similar securities, interest rates, prepayment speeds, credit risk, etc.). |
| • Level 3 – | prices determined using significant unobservable inputs (including the Valuation Committee’s own assumptions in determining the fair value of investments). |
A description of the valuation techniques applied to a Fund’s major categories of assets and liabilities measured at fair value on a recurring basis is as follows:
Equity securities are valued at the official closing price (typically last sale) on the exchange on which the securities are primarily traded, or if no closing price is available, at the last bid price and are categorized as Level 1 in the hierarchy. Restricted equity securities and private placements that are not widely traded, are illiquid or are internally fair valued by the Valuation Committee, are generally categorized as Level 3 in the hierarchy.
Certain non-U.S. securities may be fair valued in cases where closing prices are not readily available or are deemed not reflective of readily available market prices. For example, significant events (such as movement in the U.S. securities market, or other regional and local developments) may occur between the time that non-U.S. markets close (where the security is principally traded) and the time that a Fund calculates its net asset value (“NAV”) (at the close of regular trading on the New York Stock Exchange (“NYSE”) generally, 4 p.m. Eastern time) that may impact the value of securities traded in these non-U.S. markets. In such cases the Funds fair value non-U.S. securities using an independent pricing service which considers the correlation of the trading patterns of the non-U.S. security to the intraday trading in the U.S. markets for investments such as ADRs, financial futures, ETFs, and certain indexes as well as prices for similar securities. Such fair valuations are categorized as Level 2 in the hierarchy. Because the frequency of significant events is not predictable, fair valuation of certain non-U.S. common stocks may occur on a frequent basis.
71
Table of Contents
VIRTUS OPPORTUNITIES TRUST
NOTES TO FINANCIAL STATEMENTS (Continued)
SEPTEMBER 30, 2014
Debt securities, including restricted securities, are valued based on evaluated quotations received from independent pricing services or from dealers who make markets in such securities. For most bond types, the pricing service utilizes matrix pricing that considers one or more of the following factors: yield or price of bonds of comparable quality, coupon, maturity, current cash flows, type, and current day trade information, as well as dealer-supplied prices. These valuations are generally categorized as Level 2 in the hierarchy. Structured debt instruments such as mortgage-backed and asset-backed securities may also incorporate collateral analysis and utilize cash flow models for valuation and are generally categorized as Level 2 in the hierarchy. Pricing services do not provide pricing for all securities, and therefore indicative bids from dealers are utilized which are based on pricing models used by market makers in the security and are generally categorized as Level 2 in the hierarchy. Debt securities that are not widely traded, are illiquid, or are internally fair valued by the Valuation Committee are generally categorized as Level 3 in the hierarchy.
Listed derivatives such as treasury futures, that are actively traded are valued based on quoted prices from the exchange and are categorized as Level 1 in the hierarchy. Over-the-counter derivative contracts, which include forward currency contracts and equity-linked instruments, do not require material subjectivity, as pricing inputs are observed from actively quoted markets and are categorized as Level 2 in the hierarchy.
Investments in open-end mutual funds are valued at NAV. Investments in closed-end mutual funds are valued as of the close of regular trading on the NYSE each business day. Both are categorized as Level 1 in the hierarchy.
Short-term notes having a maturity of 60 days or less are valued at amortized cost, which approximates market, and are generally categorized as Level 2 in the hierarchy.
A summary of the inputs used to value the Funds’ net assets by each major security type is disclosed at the end of the Schedule of Investments for each Fund. The inputs or methodologies used for valuing securities are not necessarily an indication of the risk associated with investing in those securities.
| B. | Security Transactions and Investment Income |
Security transactions are recorded on the trade date. Realized gains and losses from the sales of securities are determined on the identified cost basis. Dividend income is recognized on the ex-dividend date, or in the case of certain foreign securities, as soon as a Fund is notified. Interest income is recorded on the accrual basis. Each Fund amortizes premiums and accretes discounts using the effective interest method. Any distributions from underlying funds are recorded in accordance with the character of the distributions as designated by the underlying funds.
Dividend income from REIT investments is recorded using management’s estimate of the income included in distributions received from the REIT investments. Distributions received in excess of this estimated amount are recorded as a reduction of the cost of investments or reclassified to capital gains. The actual amounts of income, return of capital, and capital gains are only determined by each Domestic REIT after its fiscal year-end, and may differ from the estimated amounts.
| C. | Income Taxes |
Each Fund is treated as a separate taxable entity. It is the intention of each Fund to comply with the requirements of Subchapter M of the Internal Revenue Code and to distribute substantially all of its taxable income to its shareholders. Therefore, no provision for federal income taxes or excise taxes has been made.
Certain Funds may be subject to foreign taxes on income, gains on investments or currency repatriation, a portion of which may be recoverable. Each Fund will accrue such taxes and recoveries as applicable based upon current interpretations of the tax rules and regulations that exist in the markets in which it invests.
Management of the Funds has concluded that there are no significant uncertain tax positions that would require recognition in the financial statements. As of September 30, 2014, the tax years that remain subject to examination by the major tax jurisdictions under the statute of limitations are from the year 2011 forward (with limited exceptions).
| D. | Distributions to Shareholders |
Distributions are recorded by each Fund on the ex-dividend date. Income and capital gain distributions are determined in accordance with income tax regulations that may differ from accounting principles generally accepted in the United States of America. These differences may include the treatment of non-taxable dividends, market premium and discount, non-deductible expenses, expiring capital loss carryovers, foreign currency gain or loss, gain or loss on futures contracts, partnerships, operating losses and losses deferred due to wash sales. Permanent book and tax basis differences relating to shareholder distributions will result in reclassifications to capital paid in on shares of beneficial interest.
| E. | Expenses |
Expenses incurred together by a Fund and other affiliated mutual funds are allocated in proportion to the net assets of each Fund, except where allocation of direct expense to each such fund or an alternative allocation method can be more appropriately used.
In addition to the net annual operating expenses that a Fund bears directly, the shareholders of a Fund indirectly bear the Fund’s pro-rata expenses of the underlying mutual funds in which a Fund invests.
| F. | Foreign Currency Translation |
Non-U.S. investment securities and other assets and liabilities denominated in foreign currencies are translated into U.S. dollar amounts at the foreign currency exchange rate effective at the end of the reporting period. Cost of investments is translated at the currency exchange rate effective at the trade date. The gain or loss resulting from a change in currency exchange rates between the trade and settlement date of a portfolio transaction is treated as a gain or loss on non-U.S. currency. Likewise, the gain or loss resulting from a change in currency exchange rates between the date income is accrued and paid is treated as a gain or loss on foreign currency. The Funds do not isolate that portion of the results of operations arising from changes in foreign exchange rates on investments from the fluctuations arising from changes in the market prices of securities held. Such fluctuations are included with the net realized and unrealized gain or loss on investments.
72
Table of Contents
VIRTUS OPPORTUNITIES TRUST
NOTES TO FINANCIAL STATEMENTS (Continued)
SEPTEMBER 30, 2014
| G. | Derivative Financial Instruments |
Enhanced disclosures about derivative instruments and hedging activities are intended to improve financial reporting for derivative instruments by better enabling investors to understand how and why a fund uses derivatives, how derivatives are accounted for, and how derivative instruments affect a fund’s results of operations and financial position. Summarized below is the specific type of derivative instruments used by certain Funds.
Forward Currency Contracts: A forward currency contract involves an obligation to purchase or sell a specific currency at a future date, which may be any number of days from the date of the contract agreed upon by the parties, at a price set at the time of the contract. These contracts are traded directly between currency traders and their customers. The contract is marked-to-market daily and the change in market value is recorded by the Funds as an unrealized gain or loss in the Statements of Operations. When the contract is closed or offset with the same counterparty, on settlement date, the Funds record a realized gain or loss equal to the change in the value of the contract when it was opened and the value at the time it was closed or offset. This is presented in the Statements of Operations as net realized gain (loss) from foreign currency transactions.
Funds enter into forward currency contracts in conjunction with the planned purchase or sale of foreign denominated securities in order to hedge the U.S. dollar cost or proceeds. The Funds also, from time to time, hedge the currency exposure of foreign denominated securities, held in the portfolio, back to U.S. dollars during perceived times of U.S. dollar strength. This is done in order to protect the U.S. dollar value of the portfolio. Forward currency contracts involve, to varying degrees, elements of market risk in excess of the amount recognized in the Statement of Assets and Liabilities. Risks arise from the possible movements in foreign exchange rates or if the counterparty does not perform under the contract.
| H. | Securities Lending |
Certain Funds may loan securities to qualified brokers through an agreement with Brown Brothers Harriman (“BBH”), as a third party lending agent. Under the terms of the agreement, a Fund is required to maintain collateral with a market value not less than 100% of the market value of loaned securities. Collateral is adjusted daily in connection with changes in the market value of securities on loan. Collateral may consist of cash and securities issued by the U.S. Government or its agencies. Cash collateral is invested in a short-term money market fund. Dividends earned on the collateral and premiums paid by the broker are recorded as income by the Fund net of fees and rebates charged by BBH for its services as securities lending agent and in connection with this securities lending program. Lending portfolio securities involves a risk of delay in the recovery of the loaned securities or in the declining value of the collateral.
At September 30, 2014, none of the Funds in this report had securities on loan.
| I. | Loan Agreements |
Certain Funds may invest in direct debt instruments which are interests in amounts owed by a corporate, governmental, or other borrower to lenders or lending syndicates. Loan agreements are generally non-investment grade, and often involve borrowers that are highly leveraged. The Funds may invest in obligations of borrowers who are in bankruptcy proceedings. Loan agreements are typically senior in the corporate capital structure of the borrower. A loan is often administered by a bank or other financial institution (the “lender”) that acts as agent for all holders. The agent administers the terms of the loan, as specified in the loan agreement. A Fund’s investments in loans may be in the form of participations in loans or assignments of all or a portion of loans from third parties. When investing in loan participations, the Fund has the right to receive payments of principal, interest and any fees to which it is entitled only from the lender selling the loan participation and only upon receipt by the lender of payments from the borrower. The Fund generally has no right to enforce compliance with the terms of the loan agreement with the borrower. As a result, the Fund may be subject to the credit risk of both the borrower and the lender that is selling the loan agreement. When the Fund purchases assignments from lenders it acquires direct rights against the borrower on the loan.
A Fund may invest in multiple series or tranches of a loan, which may have varying terms and carry different associated risks. Loan agreements may involve foreign borrowers, and investments may be denominated in foreign currencies. Direct indebtedness of emerging countries involves a risk that the government entities responsible for the repayment of the debt may be unable, or unwilling, to pay the principal and interest when due.
The loan agreements have floating rate loan interests which generally pay interest at rates that are periodically determined by reference to a base lending rate plus a premium. The base lending rates are generally LIBOR (London Interbank Offered Rate), the prime rate offered by one or more U.S. banks or the certificate of deposit rate. When a loan agreement is purchased the Fund may pay an assignment fee. On an ongoing basis, the Fund may receive a commitment fee based on the undrawn portion of the underlying line of credit portion of a loan agreement. Prepayment penalty fees are received upon the prepayment of a loan agreement by a borrower. Prepayment penalty, facility, commitment, consent and amendment fees are recorded to income as earned or paid.
At September 30, 2014, the Funds only hold assignment loans.
| Note | 3. Investment Advisory Fee and Related Party Transactions |
($ reported in thousands except as noted)
| A. | Adviser |
Virtus Investment Advisers, Inc. (the “Adviser”), an indirect wholly-owned subsidiary of Virtus Investment Partners, Inc. (“Virtus”), is the adviser to the Trust. The Adviser manages the Funds’ investment programs and general operations of the Funds, including oversight of the Funds’ subadvisers.
73
Table of Contents
VIRTUS OPPORTUNITIES TRUST
NOTES TO FINANCIAL STATEMENTS (Continued)
SEPTEMBER 30, 2014
As compensation for its services to the Funds, the Adviser is entitled to a fee based upon the following annual rates as a percentage of the average daily net assets of each Fund:
| 1st $1 Billion | $1 + Billion | |||||||||||
Emerging Markets Debt Fund | 0.75 | % | 0.70 | % | ||||||||
Emerging Markets Equity Income Fund | 1.05 | 1.00 | ||||||||||
Emerging Markets Small-Cap Fund | 1.20 | 1.15 | ||||||||||
Greater European Opportunities Fund | 0.85 | 0.80 | ||||||||||
International Small-Cap Fund | 1.00 | 0.95 | ||||||||||
| 1st $1 Billion | $1+ Billion through $2 Billion | $2 + Billion | ||||||||||
Global Commodities Stock Fund | 1.00 | % | 0.95 | % | 0.90 | % | ||||||
Global Dividend Fund | 0.65 | 0.60 | 0.55 | |||||||||
Global Opportunities Fund | 0.85 | 0.80 | 0.75 | |||||||||
Global Real Estate Securities Fund | 0.85 | 0.80 | 0.75 | |||||||||
International Real Estate Securities Fund | 1.00 | 0.95 | 0.90 | |||||||||
| 1st $2 Billion | $2 + Billion through $4 Billion | $4 + Billion | ||||||||||
International Equity Fund | 0.85 | % | 0.80 | % | 0.75 | % | ||||||
| B. | Subadvisers |
The subadviser manages the investments of each Fund for which they are paid a fee by the Adviser. The subadvisers and the Funds they service are as follows:
Fund | Subadviser | Fund | Subadviser | |||
Emerging Markets Debt Fund | NF(6) | Global Real Estate Securities Fund | DPIM(1) | |||
Emerging Markets Equity Income fund | KBI(2) | Greater European Opportunities Fund | Vontobel(4) | |||
| Emerging Markets Small-Cap Fund | KAR(7) | International Equity Fund | Euclid(3) | |||
| Global Commodities Stock Fund | BMO(5) | International Real Estate Securities Fund | DPIM(1) | |||
| Global Dividend Fund | DPIM(1) | International Small-Cap Fund | KAR(7) | |||
| Global Opportunities Fund | Vontobel(4) |
| (1) | Duff & Phelps Investment Management Co., an indirect, wholly-owned subsidiary of Virtus. |
| (2) | Kleinwort Benson Investors, International, Ltd |
| (3) | Euclid Advisors LLC an indirect wholly-owned subsidiary of Virtus. |
| (4) | Vontobel Asset Management, Inc. |
| (5) | BMO Asset Management Corp., an indirect, wholly-owned subsidiary of Bank of Montreal (“BoM”). BoM, through its subsidiary BMO Bankcorp, is a minority investor of Virtus. |
| (6) | Newfleet Asset Management, LLC an indirect wholly-owned subsidiary of Virtus. |
| (7) | Kayne Anderson Rudnick Investment Management, LLC an indirect wholly-owned subsidiary of Virtus. |
| C. | Expense Limits and Fee Waivers |
The Adviser has voluntarily agreed to limit certain Fund’s total operating expenses (excluding taxes, extraordinary expenses and acquired fund fees and expenses, if any), so that such expenses do not exceed the below percentages of the Fund’s average daily net asset values as listed below. The Adviser may discontinue these voluntary expense caps at any time.
| Class A | Class B | Class C | Class I | |||||||||||||
Emerging Markets Debt Fund | 1.35 | % | — | % | 2.10 | % | 1.10 | % | ||||||||
Emerging Markets Equity Income Fund | 1.75 | — | 2.50 | 1.50 | ||||||||||||
Global Commodities Stock Fund | 1.65 | — | 2.40 | 1.40 | ||||||||||||
Global Opportunities Fund | 1.55 | 2.30 | 2.30 | 1.30 | ||||||||||||
Global Real Estate Securities Fund | 1.40 | — | 2.15 | 1.15 | ||||||||||||
Greater European Opportunities Fund | 1.45 | — | 2.20 | 1.20 | ||||||||||||
International Equity Fund | 1.50 | — | 2.25 | 1.25 | ||||||||||||
International Real Estate Securities Fund | 1.50 | — | 2.25 | 1.25 | ||||||||||||
International Small-Cap Fund | 1.60 | — | 2.35 | 1.35 | ||||||||||||
The Adviser has contractually agreed to limit the following Fund’s total operating expenses (excluding interest, taxes, and extraordinary expenses, if any), so that such expenses do not exceed the below percentages of the Fund’s average daily net asset values as listed below.
| Class A | Class C | Class I | Through Date | |||||||||||||
Emerging Markets Small-Cap Fund | 1.85 | % | 2.60 | % | 1.60 | % | 1/31/15 | |||||||||
74
Table of Contents
VIRTUS OPPORTUNITIES TRUST
NOTES TO FINANCIAL STATEMENTS (Continued)
SEPTEMBER 30, 2014
| D. | Expense Recapture |
For certain Funds the Adviser may recapture operating expenses waived or reimbursed under these arrangements, within three fiscal years following the end of the fiscal year in which such waiver or reimbursement occurred. The Fund must pay its ordinary operating expenses before the Adviser is entitled to any reimbursement and must remain in compliance with any applicable expense limitations or if none, the expense limitation in effect at the time of the waiver or reimbursement. All or a portion of the following Adviser reimbursed expenses may be recaptured as follows:
| Fiscal Year Ended | ||||||||||||||||
| 2015 | 2016 | 2017 | Total | |||||||||||||
Emerging Markets Debt Fund | $ | 35 | $ | 64 | $ | 40 | $ | 139 | ||||||||
Emerging Markets Equity Income Fund | 29 | 95 | 13 | 137 | ||||||||||||
Emerging Markets Small-Cap Fund | — | — | 80 | 80 | ||||||||||||
Global Commodities Stock Fund | 38 | 54 | 36 | 128 | ||||||||||||
Global Real Estate Securities Fund | 98 | 90 | 79 | 267 | ||||||||||||
Greater European Opportunities Fund | 78 | 87 | 80 | 245 | ||||||||||||
International Equity Fund | 51 | 67 | 74 | 192 | ||||||||||||
International Real Estate Securities Fund | 96 | 95 | 100 | 291 | ||||||||||||
International Small-Cap Fund | 30 | 85 | 60 | 175 | ||||||||||||
| E. | Distributor |
VP Distributors, LLC (“VP Distributors”), an indirect wholly-owned subsidiary of Virtus, serves as the distributor of each Fund’s shares and has advised the Funds that for the fiscal year (the “period”) ended September 30, 2014, it retained net commissions of $50 for Class A shares and deferred sales charges of $8, $—*, and $6 for Class A shares, Class B shares and Class C shares, respectively.
* Amount is less than $500.
In addition, each Fund pays VP Distributors distribution and/or service fees under a 12b-1 plan as a percentage of the average daily net assets of each respective Class at the annual rates as follows: Class A shares 0.25%; Class B shares 1.00%; Class C shares 1.00%; Class I shares are not subject to a 12b-1 plan.
Under certain circumstances, shares of certain Virtus Mutual Funds may be exchanged for shares of the same class of certain other Virtus Mutual Funds on the basis of the relative NAV per share at the time of the exchange. On exchanges with share classes that carry a CDSC, the CDSC schedule of the original shares purchased continues to apply.
| F. | Administrator and Transfer Agent |
Virtus Fund Services LLC, an indirect wholly-owned subsidiary of Virtus, serves as the administrator and transfer agent to the Funds.
For the period ended September 30, 2014, the Funds incurred administration fees totaling $527 which are included in the Statements of Operations.
For the period ended September 30, 2014, the Funds incurred transfer agent fees totaling $523 which are included in the Statements of Operations. A portion is paid to outside entities that also provide service to the Trust.
| G. | Affiliated Shareholders |
At September 30, 2014, Virtus and its affiliates, BMO Bankcorp (a minority investor in Virtus) and its affiliates, and the retirement plans of Virtus and its affiliates held shares of the Funds which may be redeemed at any time that aggregated to the following:
| Shares | Aggregate Net Asset Value | |||||||
| Emerging Markets Debt Fund | ||||||||
Class A | 11,021 | $ | 107 | |||||
Class C | 10,857 | 105 | ||||||
Class I | 2,747,146 | 26,592 | ||||||
| Emerging Markets Equity Income Fund | ||||||||
Class A | 10,426 | 110 | ||||||
Class C | 10,307 | 108 | ||||||
Class I | 502,064 | 5,302 | ||||||
| Emerging Markets Small-Cap Fund | ||||||||
Class A | 10,024 | 103 | ||||||
Class C | 10,307 | 103 | ||||||
Class I | 502,064 | 2,902 | ||||||
| Global Commodities Stock Fund | ||||||||
Class C | 10,133 | 83 | ||||||
Class I | 1,802,351 | 15,122 | ||||||
| Global Dividend Fund | ||||||||
Class I | 1,570,049 | 24,147 | ||||||
| Global Real Estate Securities Fund | ||||||||
Class A | 106,426 | 2,680 | ||||||
Class C | 12,973 | 321 | ||||||
Class I | 417,772 | 10,582 | ||||||
75
Table of Contents
VIRTUS OPPORTUNITIES TRUST
NOTES TO FINANCIAL STATEMENTS (Continued)
SEPTEMBER 30, 2014
| Shares | Aggregate Net Asset Value | |||||||
| International Equity Fund | ||||||||
Class A | 9,799 | $ | 107 | |||||
Class C | 9,911 | 106 | ||||||
Class I | 78,788 | 856 | ||||||
| International Real Estate Securities Fund | ||||||||
Class A | 291,275 | 2,048 | ||||||
Class I | 1,856,475 | 13,051 | ||||||
| Note | 4. Purchases and Sales of Securities |
($ reported in thousands)
Purchases and sales of securities (excluding U.S. Government and agency securities, forward currency contracts, futures and short-term securities) during the period ended September 30, 2014, were as follows:
| Purchases | Sales | |||||||
Emerging Markets Debt Fund | $ | 15,700 | $ | 11,345 | ||||
Emerging Markets Equity Income Fund | 115,931 | 46,301 | ||||||
Emerging Markets Small-Cap Fund | 4,733 | 1,096 | ||||||
Global Commodities Stock Fund | 37,890 | 48,249 | ||||||
Global Dividend Fund | 33,908 | 51,396 | ||||||
Global Opportunities Fund | 48,411 | 54,182 | ||||||
Global Real Estate Securities Fund | 20,375 | 13,336 | ||||||
Greater European Opportunities Fund | 11,796 | 10,453 | ||||||
International Equity Fund | 14,731 | 8,862 | ||||||
International Real Estate Securities Fund | 13,862 | 15,904 | ||||||
International Small-Cap Fund | 45,461 | 16,469 | ||||||
There were no purchases and sales of long term U.S. Government and agency securities for the Funds during the period ended September 30, 2014.
76
Table of Contents
VIRTUS OPPORTUNITIES TRUST
NOTES TO FINANCIAL STATEMENTS (Continued)
SEPTEMBER 30, 2014
| Note | 5. Capital Share Transactions |
(reported in thousands)
Transactions in shares of capital stock, during the periods ended as indicated below, were as follows:
| Emerging Markets Debt Fund | Emerging Equity Income Fund | |||||||||||||||||||||||||||||||
| Year Ended September 30, 2014 | Year Ended September 30, 2013 | Year Ended September 30, 2014 | Year Ended September 30, 2013 | |||||||||||||||||||||||||||||
| SHARES | AMOUNT | SHARES | AMOUNT | SHARES | AMOUNT | SHARES | AMOUNT | |||||||||||||||||||||||||
| Class A | ||||||||||||||||||||||||||||||||
| Sale of shares | 103 | $ | 997 | 606 | $ | 6,287 | 64 | $ | 683 | 131 | $ | 1,374 | ||||||||||||||||||||
| Reinvestment of distributions | 10 | 94 | 8 | 74 | 2 | 18 | 1 | 9 | ||||||||||||||||||||||||
| Shares repurchased | (350 | ) | (3,390 | ) | (285 | ) | (2,704 | ) | (29 | ) | (311 | ) | (63 | ) | (653 | ) | ||||||||||||||||
|
|
|
|
|
|
|
|
|
|
|
|
|
|
|
| |||||||||||||||||
| Net Increase / (Decrease) | (237 | ) | $ | (2,299 | ) | 329 | $ | 3,657 | 37 | $ | 390 | 69 | $ | 730 | ||||||||||||||||||
|
|
|
|
|
|
|
|
|
|
|
|
|
|
|
| |||||||||||||||||
| Class C | ||||||||||||||||||||||||||||||||
| Sale of shares | 48 | $ | 471 | 31 | $ | 319 | 40 | $ | 408 | 31 | $ | 329 | ||||||||||||||||||||
| Reinvestment of distributions | 2 | 19 | 1 | 9 | 1 | 6 | — | (1) | 3 | |||||||||||||||||||||||
| Shares repurchased | (8 | ) | (80 | ) | (3 | ) | (32 | ) | (4 | ) | (41 | ) | (2 | ) | (21 | ) | ||||||||||||||||
|
|
|
|
|
|
|
|
|
|
|
|
|
|
|
| |||||||||||||||||
| Net Increase / (Decrease) | 42 | $ | 410 | 29 | $ | 296 | 37 | $ | 373 | 29 | $ | 311 | ||||||||||||||||||||
|
|
|
|
|
|
|
|
|
|
|
|
|
|
|
| |||||||||||||||||
| Class I | ||||||||||||||||||||||||||||||||
| Sale of shares | 505 | $ | 4,980 | 10 | $ | 107 | 9,101 | $ | 93,703 | 337 | $ | 3,496 | ||||||||||||||||||||
| Reinvestment of distributions | 143 | 1,378 | 132 | 1,317 | 11 | 116 | 12 | 131 | ||||||||||||||||||||||||
| Shares repurchased | (17 | ) | (168 | ) | (3 | ) | (25 | ) | (2,286 | ) | (23,047 | ) | (11 | ) | (114 | ) | ||||||||||||||||
|
|
|
|
|
|
|
|
|
|
|
|
|
|
|
| |||||||||||||||||
| Net Increase / (Decrease) | 631 | $ | 6,190 | 139 | $ | 1,399 | 6,826 | $ | 70,772 | 338 | $ | 3,513 | ||||||||||||||||||||
|
|
|
|
|
|
|
|
|
|
|
|
|
|
|
| |||||||||||||||||
| Emerging Markets Small-Cap Fund | ||||||||||||||||||||||||||||||||
| From Inception December 17, 2013 to September 30, 2014 | ||||||||||||||||||||||||||||||||
| SHARES | AMOUNT | |||||||||||||||||||||||||||||||
| Class A | ||||||||||||||||||||||||||||||||
| Sale of shares | 22 | $ | 226 | |||||||||||||||||||||||||||||
| Reinvestment of distributions | — | (1) | — | (2) | ||||||||||||||||||||||||||||
| Shares repurchased | (1 | ) | (11 | ) | ||||||||||||||||||||||||||||
|
|
|
| |||||||||||||||||||||||||||||
| Net Increase / (Decrease) | 21 | $ | 215 | |||||||||||||||||||||||||||||
|
|
|
| |||||||||||||||||||||||||||||
| Class C | ||||||||||||||||||||||||||||||||
| Sale of shares | 16 | $ | 155 | |||||||||||||||||||||||||||||
| Reinvestment of distributions | — | (1) | — | (2) | ||||||||||||||||||||||||||||
|
|
|
| |||||||||||||||||||||||||||||
| Net Increase / (Decrease) | 16 | $ | 155 | |||||||||||||||||||||||||||||
|
|
|
| |||||||||||||||||||||||||||||
| Class I | ||||||||||||||||||||||||||||||||
| Sale of shares | 336 | $ | 3,387 | |||||||||||||||||||||||||||||
| Reinvestment of distributions | 1 | 7 | ||||||||||||||||||||||||||||||
|
|
|
| |||||||||||||||||||||||||||||
| Net Increase / (Decrease) | 337 | $ | 3,394 | |||||||||||||||||||||||||||||
|
|
|
| |||||||||||||||||||||||||||||
| (1) | Amount is less than 500. |
| (2) | Amount is less than $500. |
77
Table of Contents
VIRTUS OPPORTUNITIES TRUST
NOTES TO FINANCIAL STATEMENTS (Continued)
SEPTEMBER 30, 2014
| Global Commodities Stock Fund | Global Dividend Fund | |||||||||||||||||||||||||||||||
| Year Ended September 30, 2014 | Year Ended September 30, 2013 | Year Ended September 30, 2014 | Year Ended September 30, 2013 | |||||||||||||||||||||||||||||
| SHARES | AMOUNT | SHARES | AMOUNT | SHARES | AMOUNT | SHARES | AMOUNT | |||||||||||||||||||||||||
| Class A | ||||||||||||||||||||||||||||||||
| Sale of shares | 41 | $ | 364 | 80 | $ | 742 | 1,305 | $ | 19,911 | 2,127 | $ | 28,633 | ||||||||||||||||||||
| Reinvestment of distributions | — | — | 2 | 22 | 150 | 2,293 | 84 | 1,117 | ||||||||||||||||||||||||
| Shares repurchased | (30 | ) | (265 | ) | (117 | ) | (1,021 | ) | (1,338 | ) | (20,296 | ) | (1,204 | ) | (16,357 | ) | ||||||||||||||||
|
|
|
|
|
|
|
|
|
|
|
|
|
|
|
| |||||||||||||||||
| Net Increase / (Decrease) | 11 | $ | 99 | (35 | ) | $ | (257 | ) | 117 | $ | 1,908 | 1,007 | $ | 13.393 | ||||||||||||||||||
|
|
|
|
|
|
|
|
|
|
|
|
|
|
|
| |||||||||||||||||
| Class C | ||||||||||||||||||||||||||||||||
| Sale of shares | 12 | $ | 110 | 27 | $ | 242 | 590 | $ | 9,117 | 704 | $ | 9,451 | ||||||||||||||||||||
| Reinvestment of distributions | — | — | — | (1) | 2 | 40 | 620 | 15 | 199 | |||||||||||||||||||||||
| Shares repurchased | (6 | ) | (55 | ) | (5 | ) | (42 | ) | (206 | ) | (3,138 | ) | (135 | ) | (1,827 | ) | ||||||||||||||||
|
|
|
|
|
|
|
|
|
|
|
|
|
|
|
| |||||||||||||||||
| Net Increase / (Decrease) | 6 | $ | 55 | 22 | $ | 202 | 424 | $ | 6,599 | 584 | $ | 7,823 | ||||||||||||||||||||
|
|
|
|
|
|
|
|
|
|
|
|
|
|
|
| |||||||||||||||||
| Class I | ||||||||||||||||||||||||||||||||
| Sale of shares | 909 | $ | 8,294 | 1,805 | $ | 17,009 | 1,142 | $ | 17,698 | 1,932 | $ | 26,030 | ||||||||||||||||||||
| Reinvestment of distributions | — | — | 44 | 411 | 164 | 2,501 | 122 | 1,626 | ||||||||||||||||||||||||
| Shares repurchased | (2,253 | ) | (20,357 | ) | (530 | ) | (4,807 | ) | (2,750 | ) | (41,980 | ) | (788 | ) | (10,470 | ) | ||||||||||||||||
|
|
|
|
|
|
|
|
|
|
|
|
|
|
|
| |||||||||||||||||
| Net Increase / (Decrease) | (1,344 | ) | $ | (12,063 | ) | 1,319 | $ | 12,613 | (1,444 | ) | $ | (21,781 | ) | 1,266 | $ | 17,186 | ||||||||||||||||
|
|
|
|
|
|
|
|
|
|
|
|
|
|
|
| |||||||||||||||||
| Global Opportunities Fund | ||||||||||||||||||||||||||||||||
| Year Ended September 30, 2014 | Year Ended September 30, 2013 | |||||||||||||||||||||||||||||||
| SHARES | AMOUNT | SHARES | AMOUNT | |||||||||||||||||||||||||||||
| Class A | ||||||||||||||||||||||||||||||||
| Sale of shares | 572 | $ | 6,675 | 1,572 | $ | 16,673 | ||||||||||||||||||||||||||
| Reinvestment of distributions | 40 | 467 | 20 | 200 | ||||||||||||||||||||||||||||
| Shares repurchased | (1,282 | ) | (15,224 | ) | (1,733 | ) | (18,392 | ) | ||||||||||||||||||||||||
|
|
|
|
|
|
|
| |||||||||||||||||||||||||
| Net Increase / (Decrease) | (670 | ) | $ | (8,082 | ) | (141 | ) | $ | (1,519 | ) | ||||||||||||||||||||||
|
|
|
|
|
|
|
| |||||||||||||||||||||||||
| Class B | ||||||||||||||||||||||||||||||||
| Sale of shares | 5 | $ | 52 | 3 | $ | 28 | ||||||||||||||||||||||||||
| Shares repurchased | (25 | ) | (265 | ) | (41 | ) | (381 | ) | ||||||||||||||||||||||||
|
|
|
|
|
|
|
| |||||||||||||||||||||||||
| Net Increase / (Decrease) | (20 | ) | $ | (213 | ) | (38 | ) | $ | (353 | ) | ||||||||||||||||||||||
|
|
|
|
|
|
|
| |||||||||||||||||||||||||
| Class C | ||||||||||||||||||||||||||||||||
| Sale of shares | 87 | $ | 904 | 177 | $ | 1,670 | ||||||||||||||||||||||||||
| Reinvestment of distributions | — | (1) | 2 | — | — | |||||||||||||||||||||||||||
| Shares repurchased | (67 | ) | (693 | ) | (67 | ) | (630 | ) | ||||||||||||||||||||||||
|
|
|
|
|
|
|
| |||||||||||||||||||||||||
| Net Increase / (Decrease) | 20 | $ | 213 | 110 | $ | 1,040 | ||||||||||||||||||||||||||
|
|
|
|
|
|
|
| |||||||||||||||||||||||||
| Class I | ||||||||||||||||||||||||||||||||
| Sale of shares | 171 | $ | 2,037 | 403 | $ | 4,324 | ||||||||||||||||||||||||||
| Reinvestment of distributions | 22 | 252 | 14 | 143 | ||||||||||||||||||||||||||||
| Shares repurchased | (60 | ) | (695 | ) | (132 | ) | (1,387 | ) | ||||||||||||||||||||||||
|
|
|
|
|
|
|
| |||||||||||||||||||||||||
| Net Increase / (Decrease) | 133 | $ | 1,594 | 285 | $ | 3,080 | ||||||||||||||||||||||||||
|
|
|
|
|
|
|
| |||||||||||||||||||||||||
| (1) | Amount is less than 500. |
78
Table of Contents
VIRTUS OPPORTUNITIES TRUST
NOTES TO FINANCIAL STATEMENTS (Continued)
SEPTEMBER 30, 2014
| Global Real Estate Securities Fund | Greater European Opportunities Fund | |||||||||||||||||||||||||||||||
| Year Ended September 30, 2014 | Year Ended September 30, 2013 | Year Ended September 30, 2014 | Year Ended September 30, 2013 | |||||||||||||||||||||||||||||
| SHARES | AMOUNT | SHARES | AMOUNT | SHARES | AMOUNT | SHARES | AMOUNT | |||||||||||||||||||||||||
| Class A | ||||||||||||||||||||||||||||||||
| Sale of shares | 500 | $ | 12,687 | 513 | $ | 12,029 | 701 | $ | 11,317 | 578 | $ | 8,821 | ||||||||||||||||||||
| Reinvestment of distributions | 15 | 333 | 13 | 286 | 24 | 374 | 18 | 270 | ||||||||||||||||||||||||
| Shares repurchased | (323 | ) | (8,052 | ) | (252 | ) | (5,866 | ) | (743 | ) | (11,774 | ) | (208 | ) | (3,196 | ) | ||||||||||||||||
|
|
|
|
|
|
|
|
|
|
|
|
|
|
|
| |||||||||||||||||
| Net Increase / (Decrease) | 192 | $ | 4,968 | 274 | $ | 6,449 | (18 | ) | $ | (83 | ) | 388 | $ | 5,895 | ||||||||||||||||||
|
|
|
|
|
|
|
|
|
|
|
|
|
|
|
| |||||||||||||||||
| Class C | ||||||||||||||||||||||||||||||||
| Sale of shares | 115 | $ | 2,906 | 109 | $ | 2,503 | 59 | $ | 935 | 43 | $ | 656 | ||||||||||||||||||||
| Reinvestment of distributions | 2 | 52 | 2 | 49 | 2 | 25 | — | (1) | 7 | |||||||||||||||||||||||
| Shares repurchased | (37 | ) | (885 | ) | (17 | ) | (380 | ) | (25 | ) | (384 | ) | (18 | ) | (280 | ) | ||||||||||||||||
|
|
|
|
|
|
|
|
|
|
|
|
|
|
|
| |||||||||||||||||
| Net Increase / (Decrease) | 80 | $ | 2,073 | 94 | $ | 2,172 | 36 | $ | 576 | 25 | $ | 383 | ||||||||||||||||||||
|
|
|
|
|
|
|
|
|
|
|
|
|
|
|
| |||||||||||||||||
| Class I | ||||||||||||||||||||||||||||||||
| Sale of shares | 467 | $ | 11,814 | 607 | $ | 14,299 | 141 | $ | 2,287 | 361 | $ | 5,441 | ||||||||||||||||||||
| Reinvestment of distributions | 27 | 609 | 18 | 403 | 2 | 36 | 6 | 94 | ||||||||||||||||||||||||
| Shares repurchased | (517 | ) | (12,655 | ) | (72 | ) | (1,683 | ) | (85 | ) | (1,364 | ) | (258 | ) | (3,854 | ) | ||||||||||||||||
|
|
|
|
|
|
|
|
|
|
|
|
|
|
|
| |||||||||||||||||
| Net Increase / (Decrease) | (23 | ) | $ | (232 | ) | 553 | $ | 13,019 | 58 | $ | 959 | 109 | $ | 1,681 | ||||||||||||||||||
|
|
|
|
|
|
|
|
|
|
|
|
|
|
|
| |||||||||||||||||
| International Equity Fund | International Real Estate Securities Fund | |||||||||||||||||||||||||||||||
| Year Ended September 30, 2014 | Year Ended September 30, 2013 | Year Ended September 30, 2014 | Year Ended September 30, 2013 | |||||||||||||||||||||||||||||
| SHARES | AMOUNT | SHARES | AMOUNT | SHARES | AMOUNT | SHARES | AMOUNT | |||||||||||||||||||||||||
| Class A | ||||||||||||||||||||||||||||||||
| Sale of shares | 416 | $ | 4,580 | 13 | $ | 135 | 601 | $ | 4,140 | 1,121 | $ | 7,391 | ||||||||||||||||||||
| Reinvestment of distributions | 9 | 94 | 3 | 26 | 29 | 186 | 60 | 394 | ||||||||||||||||||||||||
| Shares repurchased | (82 | ) | (904 | ) | (17 | ) | (180 | ) | (577 | ) | (3,899 | ) | (235 | ) | (1,564 | ) | ||||||||||||||||
|
|
|
|
|
|
|
|
|
|
|
|
|
|
|
| |||||||||||||||||
| Net Increase / (Decrease) | 343 | $ | 3,770 | (1 | ) | $ | (19 | ) | 53 | $ | 427 | 946 | $ | 6,221 | ||||||||||||||||||
|
|
|
|
|
|
|
|
|
|
|
|
|
|
|
| |||||||||||||||||
| Class C | ||||||||||||||||||||||||||||||||
| Sale of shares | 67 | $ | 724 | 11 | $ | 121 | 140 | $ | 986 | 119 | $ | 791 | ||||||||||||||||||||
| Reinvestment of distributions | 1 | 9 | 2 | 18 | 4 | 25 | 15 | 99 | ||||||||||||||||||||||||
| Shares repurchased | (4 | ) | (47 | ) | (12 | ) | (124 | ) | (69 | ) | (486 | ) | (79 | ) | (519 | ) | ||||||||||||||||
|
|
|
|
|
|
|
|
|
|
|
|
|
|
|
| |||||||||||||||||
| Net Increase / (Decrease) | 64 | $ | 686 | 1 | $ | 15 | 75 | $ | 525 | 55 | $ | 371 | ||||||||||||||||||||
|
|
|
|
|
|
|
|
|
|
|
|
|
|
|
| |||||||||||||||||
| Class I | ||||||||||||||||||||||||||||||||
| Sale of shares | 456 | $ | 5,025 | 158 | $ | 1,674 | 1,686 | $ | 11,674 | 1,550 | $ | 10,345 | ||||||||||||||||||||
| Reinvestment of distributions | 8 | 83 | 402 | 4,045 | 107 | 677 | 321 | 2,093 | ||||||||||||||||||||||||
| Shares repurchased | (81 | ) | (898 | ) | (2,790 | ) | (29,085 | ) | (2,245 | ) | (15,445 | ) | (1,661 | ) | (10,744 | ) | ||||||||||||||||
|
|
|
|
|
|
|
|
|
|
|
|
|
|
|
| |||||||||||||||||
| Net Increase / (Decrease) | 383 | $ | 4,210 | (2,230 | ) | $ | (23,366 | ) | (452 | ) | $ | (3,094 | ) | 210 | $ | 1,694 | ||||||||||||||||
|
|
|
|
|
|
|
|
|
|
|
|
|
|
|
| |||||||||||||||||
| (1) | Amount is less than 500. |
79
Table of Contents
VIRTUS OPPORTUNITIES TRUST
NOTES TO FINANCIAL STATEMENTS (Continued)
SEPTEMBER 30, 2014
| International Small-Cap Fund | ||||||||||||||||||||||||
| Year Ended September 30, 2014 | Year Ended September 30, 2013 | |||||||||||||||||||||||
| SHARES | AMOUNT | SHARES | AMOUNT | |||||||||||||||||||||
| Class A | ||||||||||||||||||||||||
| Sale of shares | 307 | $ | 4,315 | 20 | $ | 250 | ||||||||||||||||||
| Reinvestment of distributions | 4 | 52 | — | (1) | 2 | |||||||||||||||||||
| Shares repurchased | (161 | ) | (2,308 | ) | — | (1) | (1 | ) | ||||||||||||||||
|
|
|
|
|
|
|
| |||||||||||||||||
| Net Increase / (Decrease) | 150 | $ | 2,059 | 20 | $ | 251 | ||||||||||||||||||
|
|
|
|
|
|
|
| |||||||||||||||||
| Class C | ||||||||||||||||||||||||
| Sale of shares | 70 | $ | 958 | 18 | $ | 223 | ||||||||||||||||||
| Reinvestment of distributions | 2 | 23 | — | (1) | 1 | |||||||||||||||||||
| Shares repurchased | (13 | ) | (179 | ) | — | (1) | (2 | ) | ||||||||||||||||
|
|
|
|
|
|
|
| |||||||||||||||||
| Net Increase / (Decrease) | 59 | $ | 802 | 18 | $ | 222 | ||||||||||||||||||
|
|
|
|
|
|
|
| |||||||||||||||||
| Class I | ||||||||||||||||||||||||
| Sale of shares | 2,604 | $ | 35,793 | 1,088 | $ | 12,819 | ||||||||||||||||||
| Reinvestment of distributions | 71 | 976 | 6 | 65 | ||||||||||||||||||||
| Shares repurchased | (653 | ) | (9,360 | ) | (3 | ) | (34 | ) | ||||||||||||||||
|
|
|
|
|
|
|
| |||||||||||||||||
| Net Increase / (Decrease) | 2,022 | $ | 27,409 | 1,091 | $ | 12,850 | ||||||||||||||||||
|
|
|
|
|
|
|
| |||||||||||||||||
| (1) | Amount is less than 500. |
80
Table of Contents
VIRTUS OPPORTUNITIES TRUST
NOTES TO FINANCIAL STATEMENTS (Continued)
SEPTEMBER 30, 2014
| Note | 6. Derivative Transactions and Master Netting Agreements |
($ reported in thousands)
The International Equity Fund invested in a derivative instrument during the reporting period in the form of a forward currency contract. The primary type of risk associated with forward currency contracts is the risk associated with the conversion of foreign currency to U.S. dollars. The Fund may invest in forward currency contracts in an attempt to manage such risk and protect the U.S. dollar value of the portfolio. For additional information on forward currency contracts refer to Note 2G.
As of September 30, 2014, the International Equity Fund has an amount of $41 disclosed as “unrealized appreciation on forward currency contracts” in the Statements of Assets and Liabilities. This forward currency contract was executed under the ISDA 2002 Master Agreement without any Schedule thereto and without the requirement of posting any collateral to the counterparty. During the year ended September 30, 2014, and as of that date the International Equity Fund has entered into one forward currency contract as disclosed in the Schedule of Investments with a value of $41.
| Note | 7. 10% Shareholders |
As of September 30, 2014, certain Funds had individual shareholder account(s) and/or omnibus shareholder account(s) (comprised of a group of individual shareholders), which individually amounted to more than 10% of the total shares outstanding of each such Fund as detailed below:
| % of Shares Outstanding | Number of Accounts | |||||||
Emerging Markets Debt Fund | 80 | % | 1 | |||||
Emerging Markets Small-Cap Fund | 75 | 1 | ||||||
Global Commodities Stock Fund# | 92 | 1 | * | |||||
Global Dividend Fund# | 29 | 2 | * | |||||
Global Opportunities Fund | 25 | 1 | ||||||
Global Real Estate Securities Fund# | 32 | 2 | * | |||||
Greater European Opportunities Fund | 59 | 3 | ||||||
International Equity Fund | 21 | 1 | ||||||
International Real Estate Securities Fund# | 45 | 2 | * | |||||
| * | Includes affiliated shareholder accounts. |
| # | The Fund is owned by Virtus Alternatives Diversifier Fund. Virtus Alternatives Diversifier Fund does not invest in the underlying Funds for the purpose of exercising management or control; however, investments made may represent a significant portion of an underlying Fund’s net assets. At September 30, 2014, Virtus Alternatives Diversifier Fund was the owner of record of approximately 88% of the Global Commodities Stock Fund, 31% of the International Real Estate Securities Fund, 20% of Global Real Estate Fund and 17% of the Global Dividend Fund. |
| Note | 8. Credit Risk and Asset Concentration |
In countries with limited or developing markets, investments may present greater risks than in more developed markets and the prices of such investments may be volatile. The consequences of political, social or economic changes in these markets may have disruptive effects on the market prices of these investments and the income they generate, as well as a Fund’s ability to repatriate such amounts.
High-yield/high-risk securities typically entail greater price volatility and/or principal and interest rate risk. There is a greater chance that an issuer will not be able to make principal and interest payments on time. Analysis of the creditworthiness of issuers of high-yield/high-risk securities may be complex, and as a result, it may be more difficult for the adviser and/or subadviser to accurately predict risk.
Certain Funds may invest a high percentage of their assets in specific sectors of the market in their pursuit of a greater investment return. Fluctuations in these sectors of concentration may have a greater impact on a Fund, positive or negative, than if a Fund did not concentrate its investments in such sectors.
At September 30, 2014, the following Funds held securities issued by various companies in specific sectors as detailed below:
Fund | Sector | Percentage of Total Investments | ||||
| Emerging Markets Debt Fund | Financials | 32 | % | |||
| Emerging Markets Equity Income Fund | Financials | 27 | ||||
| Global Commodities Stock Fund | Energy | 41 | ||||
| Global Commodities Stock Fund | Materials | 28 | ||||
| Global Dividend Fund | Utilities | 31 | ||||
| Global Dividend Fund | Energy | 27 | ||||
| Global Opportunities Fund | Consumer Staples | 33 | ||||
| Global Real Estate Securities Fund | Retail REITs | 26 | ||||
| Greater European Opportunities Fund | Consumer Staples | 36 | ||||
| International Real Estate Securities Fund | Real Estate Operating Companies | 35 | ||||
| International Real Estate Securities Fund | Retail REITs | 28 | ||||
| Note | 9. Indemnifications |
Under the Trust’s organizational documents, the Trustees and officers are indemnified against certain liabilities arising out of the performance of their duties to the Funds. Each Trustee has entered into an indemnification agreement with the Trust. In addition, in the normal course of business the Funds enter into contracts that provide a variety of indemnifications to other parties. The Funds’ maximum exposure under these arrangements is unknown as this would involve future claims that may be made against the Funds and that have not occurred. However, the Funds have not had prior claims or losses pursuant to these arrangements and expect the risk of loss to be remote.
81
Table of Contents
VIRTUS OPPORTUNITIES TRUST
NOTES TO FINANCIAL STATEMENTS (Continued)
SEPTEMBER 30, 2014
| Note | 10. Federal Income Tax Information |
($ reported in thousands)
At September 30, 2014, federal tax cost and aggregate gross unrealized appreciation (depreciation) of securities held by the Funds were as follows:
| Federal Tax Cost | Unrealized Appreciation | Unrealized (Depreciation) | Net Unrealized Appreciation (Depreciation) | |||||||||||||
Emerging Markets Debt Fund | $ | 34,009 | $ | 617 | $ | (1,545 | ) | $ | (928 | ) | ||||||
Emerging Markets Equity Income Fund | 82,468 | 4,739 | (4,821 | ) | (82 | ) | ||||||||||
Emerging Markets Small-Cap Fund | 3,941 | 320 | (383 | ) | (63 | ) | ||||||||||
Global Commodities Stock Fund | 15,360 | 2,012 | (688 | ) | 1,324 | |||||||||||
Global Dividend Fund | 116,705 | 28,317 | (1,943 | ) | 26,374 | |||||||||||
Global Opportunities Fund | 91,742 | 26,574 | (1,561 | ) | 25,013 | |||||||||||
Global Real Estate Securities Fund | 49,785 | 5,569 | (553 | ) | 5,016 | |||||||||||
Greater European Opportunities Fund | 14,597 | 2,331 | (346 | ) | 1,985 | |||||||||||
International Equity Fund | 10,735 | 778 | (458 | ) | 320 | |||||||||||
International Real Estate Securities Fund | 37,242 | 5,717 | (437 | ) | 5,280 | |||||||||||
International Small-Cap Fund | 50,271 | 2,838 | (2,520 | ) | 318 | |||||||||||
Certain Funds have capital loss carryovers available to offset future realized capital gains, through the indicated expiration dates shown below:
| 2018 | 2019 | No Expiration | Total | |||||||||||||
Emerging Markets Debt Fund | $ | — | $ | — | $ | 76 | $ | 76 | ||||||||
Global Commodities Stock Fund | — | — | 3,472 | 3,472 | ||||||||||||
Global Opportunities Fund | 2,328 | — | — | 2,328 | ||||||||||||
International Real Estate Securities Fund | 3,884 | 883 | 2,948 | 7,715 | ||||||||||||
The Trust may not realize the benefit of these losses to the extent each Fund does not realize gains on investments prior to the expiration of the capital loss carryovers.
Under the Regulated Investment Company Modernization Act of 2010 (the “Act”), net capital losses recognized for tax years beginning after December 22, 2010, may be carried forward indefinitely, and their character is retained as short-term and/or long-term losses. Previously, net capital losses were carried forward for eight years and treated as short-term losses. As a transition rule, the Act requires that post-enactment net capital losses be used before pre-enactment net capital losses.
For the year ended September 30, 2014 the following Funds utilized losses deferred in prior years against current year capital gains:
Global Dividend Fund | $ | 11,226 | ||
Global Opportunities Fund | 5,054 | |||
International Real Estate Securities Fund | 80 |
Capital losses realized after October 31 and certain late year ordinary losses may be deferred and treated as occurring on the first day of the following fiscal year. For the fiscal year ended September 30, 2014, the Funds deferred and recognized losses as follow:
| Late Year Ordinary Losses Deferred | Capital Loss Deferred | Capital Loss Recognized | ||||||||||
Emerging Markets Debt Fund | $ | — | $ | 385 | $ | 120 | ||||||
Emerging Markets Equity Income Fund | — | — | 89 | |||||||||
Global Commodities Stock Fund | 23 | 1,348 | 2,646 | |||||||||
Global Dividend Fund | — | — | 149 | |||||||||
International Equity Fund | — | 120 | — | |||||||||
International Real Estate Securities Fund | — | 171 | — | |||||||||
The components of distributable earnings on a tax basis (excluding unrealized appreciation (depreciation) which are disclosed above) consist of the following:
| Undistributed Ordinary Income | Undistributed Long-Term Capital Gains | |||||||
Emerging Markets Equity Income Fund | $ | 1,753 | $ | — | ||||
Emerging Markets Small-Cap Fund | 155 | — | ||||||
Global Dividend Fund | 551 | 562 | ||||||
Global Opportunities Fund | 1,753 | — | ||||||
Global Real Estate Securities Fund | 704 | 565 | ||||||
Greater European Opportunities Fund | 104 | 197 | ||||||
International Equity Fund | 54 | — | ||||||
International Real Estate Securities Fund | 1,125 | — | ||||||
International Small-Cap Fund | 2,278 | 1,072 | ||||||
82
Table of Contents
VIRTUS OPPORTUNITIES TRUST
NOTES TO FINANCIAL STATEMENTS (Continued)
SEPTEMBER 30, 2014
The differences between the book and tax basis components of distributable earnings relate principally to the timing of recognition of income and gains for federal income tax purposes. Short-term gain distributions reported in the Statements of Changes in Net Assets, if any, are reported as ordinary income for federal tax purposes. Distributions are determined on a tax basis and may differ from net investment income and realized capital gains for financial reporting purposes.
| Note | 11. Reclassifications of Capital Accounts |
($ reported in thousands)
For financial reporting purposes, book basis capital accounts are adjusted to reflect the tax character of permanent book/tax differences. Permanent reclassifications can arise from differing treatment of certain income and gain transactions, nondeductible current year net operating losses, expiring capital loss carryovers and investments in passive foreign investment companies. The reclassifications have no impact on the net assets or net asset value of the Funds. As of September 30, 2014, the Funds recorded reclassifications to increase (decrease) the accounts as listed below:
| Capital Paid in on Shares of Beneficial Interest | Undistributed Net Investment Income (Loss) | Accumulated Net Realized Gain (Loss) | ||||||||||
Emerging Markets Debt Fund | $ | — | $ | (86 | ) | $ | 86 | |||||
Emerging Markets Equity Income Fund | — | 20 | (20 | ) | ||||||||
Emerging Markets Small-Cap Fund | — | 4 | (4 | ) | ||||||||
Global Commodities Stock Fund | (3 | ) | (11 | ) | 14 | |||||||
Global Dividend Fund | (66 | ) | 63 | 3 | ||||||||
Global Opportunities Fund | — | 10 | (10 | ) | ||||||||
Global Real Estate Securities Fund | — | 273 | (273 | ) | ||||||||
Greater European Opportunities Fund | — | (7 | ) | 7 | ||||||||
International Equity Fund | | — | | | — | (1) | | — | (1) | |||
International Real Estate Securities Fund | 34 | 1,162 | (1,196 | ) | ||||||||
International Small-Cap Fund | — | 101 | (101 | ) | ||||||||
| (1) | Amount less than $500. |
| Note | 12. Illiquid and Restricted Securities |
Investments generally are considered illiquid if they cannot be disposed of within seven days in the ordinary course of business at the approximate amount at which such securities have been valued by a Fund. Additionally, the following information is also considered in determining liquidity: the frequency of trades and quotes for the investment, whether the investment is listed for trading on a recognized domestic exchange and/or whether two or more brokers are willing to purchase or sell the security at a comparable price, the extent of market making activity in the investment and the nature of the market for investment. Illiquid securities are footnoted as such at the end of each Fund’s Schedule of Investments where applicable. However, a portion of such footnoted securities could be liquid where the applicable subadviser determines that some, though not all of the position could be disposed of within seven days in the ordinary course of business at the approximate amount at which such securities have been valued by the Fund.
Restricted securities are illiquid securities, as defined above, not registered under the Securities Act of 1933, as amended (the “1933 Act”). Generally, 144A securities are excluded from this category, except where defined as illiquid.
Each Fund will bear any costs, including those involved in registration under the 1933 Act, in connection with the disposition of such securities.
At September 30, 2014, the Funds did not hold any securities that are both illiquid and restricted.
| Note | 13. Portfolio Turnover and Redemptions in the International Equity Fund (the “Fund”) |
($ in thousands)
Management, in the interest of protecting the Fund shareholders from an adverse tax consequence, directed the sale of, and subsequent repurchase of, certain portfolio securities ($34,629 of securities were sold). After this sale, the Fund conducted a capital gains distribution of $3,420 on April 19, 2013. This event along with the change in subadviser, on May 22, 2013, resulted in a high portfolio turnover for this Fund. The Fund experienced large redemptions of $5,520, $9,069 and $7,459 on June 23, 2013, July 17, 2013 and September 27, 2013, respectively
| Note | 14. Subsequent Event Evaluations |
Management has evaluated the impact of all subsequent events on the Funds through the date the financial statements were available for issuance, and has determined that the following subsequent event requires recognition or disclosure in the financial statements.
Effective November 12, 2014, the International Small-Cap Fund began offering Class R6 Shares.
83
Table of Contents

REPORT OF INDEPENDENT REGISTERED PUBLIC ACCOUNTING FIRM
To the Board of Trustees of
Virtus Opportunities Trust and
Shareholders of the Funds, as defined:
In our opinion, the accompanying statements of assets and liabilities, including the schedules of investments, and the related statements of operations and of changes in net assets and the financial highlights present fairly, in all material respects, the financial position of Virtus Emerging Markets Debt Fund, Virtus Emerging Markets Equity Income Fund, Virtus Emerging Markets Small-Cap Fund, Virtus Global Commodities Stock Fund, Virtus Global Dividend Fund, Virtus Global Opportunities Fund, Virtus Global Real Estate Securities Fund, Virtus Greater European Opportunities Fund, Virtus International Equity Fund, Virtus International Real Estate Securities Fund, and Virtus International Small-Cap Fund (constituting funds within Virtus Opportunities Trust, hereafter referred to as the “Funds”) at September 30, 2014, the results of each of their operations, the changes in each of their net assets, and the financial highlights for each of the periods indicated, in conformity with accounting principles generally accepted in the United States of America. These financial statements and financial highlights (hereafter referred to as “financial statements”) are the responsibility of the Funds’ management. Our responsibility is to express an opinion on these financial statements based on our audits. We conducted our audits of these financial statements in accordance with the standards of the Public Company Accounting Oversight Board (United States). Those standards require that we plan and perform the audit to obtain reasonable assurance about whether the financial statements are free of material misstatement. An audit includes examining, on a test basis, evidence supporting the amounts and disclosures in the financial statements, assessing the accounting principles used and significant estimates made by management, and evaluating the overall financial statement presentation. We believe that our audits, which included confirmation of securities at September 30, 2014 by correspondence with the custodian and brokers, provide a reasonable basis for our opinion.
PricewaterhouseCoopers LLP
Philadelphia, Pennsylvania
November 19, 2014
84
Table of Contents
VIRTUS OPPORTUNITIES TRUST
SEPTEMBER 30, 2014
For the fiscal year ended September 30, 2014, the Funds make the following disclosures for federal income tax purposes. Below is listed the percentages, or the maximum amount allowable, of its ordinary income dividends (“QDI”) to qualify for the lower tax rates applicable to individual shareholders, and the percentage of ordinary income dividends earned by the Funds which qualifies for the dividends received deduction (“DRD”) for corporate shareholders. The Funds designate the amounts below as long-term capital gains dividends (“LTCG”) ($ reported in thousands), or if subsequently different, the amounts will be designated in the next annual report. The actual percentage for the calendar year will be designated in year-end tax statements.
| QDI | DRD | LTCG | ||||||||||
Emerging Markets Debt Fund | 0 | % | 0 | % | $ | — | ||||||
Emerging Markets Equity Income Fund | 70 | 0 | — | |||||||||
Emerging Markets Small-Cap Fund | 31 | 0 | — | |||||||||
Global Commodities Stock Fund | 0 | 0 | — | |||||||||
Global Dividend Fund | 100 | 36 | 562 | |||||||||
Global Opportunities Fund | 100 | 55 | — | |||||||||
Global Real Estate Securities Fund | 40 | 0 | 591 | |||||||||
Greater European Opportunities Fund | 100 | 31 | 198 | |||||||||
International Equity Fund | 100 | 0 | — | |||||||||
International Real Estate Securities Fund | 53 | 0 | — | |||||||||
International Small-Cap Fund | 30 | 0 | 1,072 | |||||||||
For the period ended September 30, 2014, the Funds are disclosing the following information pursuant to notice requirements of Section 853(a) and 855(d) of the Internal Revenue Code, as amended, and the Treasury Regulations thereunder ($ reported in thousands).
| Foreign Source Income Recognized | Foreign Taxes Paid on Foreign Source Income | |||||||
Emerging Markets Equity Income Fund | $ | 3,084 | $ | 370 | ||||
Emerging Markets Small-Cap Fund | 109 | 12 | ||||||
Greater European Opportunities Fund | 335 | 24 | ||||||
International Equity Fund | 228 | 23 | ||||||
International Real Estate Securities Fund | 1,848 | 152 | ||||||
International Small-Cap Fund | 1,876 | 167 | ||||||
85
Table of Contents
Information pertaining to the trustees and officers of the Trust as of September 30, 2014, is set forth below. The statement of additional information (SAI) includes additional information about the trustees and is available without charge, upon request, by calling (800) 243-1574. The address of each individual, unless otherwise noted, is 100 Pearl Street, Hartford, CT 06103-4506. There is no stated term of office for trustees of the Trust.
Independent Trustees
| Name and Year of Birth, Year Elected and Number of Funds Overseen | Principal Occupation(s) During Past 5 Years and Other Directorships Held by Trustee | |
Keith, Leroy Jr. YOB: 1939 Elected: 2000 48 Funds | Chairman (since 2010), Bloc Global Services Group, LLC (construction and redevelopment company); Director/Trustee (since 2010), Wells Fargo Funds and their predecessors, Evergreen Funds (1989 to 2010) (137 series); Director (2003 to 2010), Diversapack Co. (soft packaging company); and Trustee (since 1980), Virtus Mutual Fund Complex (48 portfolios). | |
McLoughlin, Philip Chairman YOB: 1946 Elected: 1999 68 Funds | Partner (2006 to 2012), Cross Pond Partners, LLC (strategy consulting firm); Managing Director (2009 to 2010), SeaCap Asset Management Fund I, L.P. and SeaCap Partners, LLC (investment management); Director (since 1991) and Chairman (since 2010), World Trust Fund; Director (since 1995), closed-end funds managed by Duff & Phelps Investment Management Co. (4 portfolios); Chairman (since 2002) and Trustee (since 1989), Virtus Mutual Fund Complex (48 portfolios); Chairman and Trustee (since 2003), Virtus Variable Insurance Trust (9 portfolios); Trustee and Chairman (since 2011), Virtus Closed-End Funds (3 portfolios); Trustee and Chairman (since 2013), Virtus Alternative Solutions Trust (3 portfolios); and Director (1985 to 2009), Argo Group International Holdings Inc. and its predecessor, PXRE Corporation (insurance). | |
McNamara, Geraldine M. YOB: 1951 Elected: 2001 52 Funds | Retired; Trustee (since 2001), Virtus Mutual Fund Complex (48 portfolios); and Director (since 2003), closed-end funds managed by Duff & Phelps Investment Management Co. (4 portfolios). | |
Oates, James M. YOB: 1946 Elected: 2000 55 Funds | Managing Director (since 1994), Wydown Group (consulting firm); Trustee (since 1987), Virtus Mutual Fund Complex (48 portfolios); Director (since 1996), Stifel Financial; Director (since 1998), Connecticut River Bancorp; Chairman and Director (since 1999), Connecticut River Bank; Chairman (since 2000), Emerson Investment Management, Inc.; Director (since 2002), New Hampshire Trust Company; Chairman and Trustee (since 2005), John Hancock Fund Complex (234 portfolios); Non-Executive Chairman (2007 to 2011), Hudson Castle Group, Inc. (formerly IBEX Capital Markets, Inc.) (financial services); Trustee (since 2013), Virtus Closed-End Funds (3 portfolios); and Trustee (since 2013), Virtus Alternative Solutions Trust (3 portfolios). | |
Segerson, Richard E. YOB: 1946 Elected: 2000 48 Funds | Retired; Trustee (since 1993), Virtus Mutual Fund Complex (48 portfolios); and Managing Director (since 1998), Northway Management Company. | |
Verdonck, Ferdinand L.J. YOB: 1942 Elected: 2005 48 Funds | Director (since 1998), The J.P. Morgan European Investment Trust; Director (since 2005), Galapagos N.V. (biotechnology); Mr. Verdonck is also a director of several non-U.S. companies; Trustee (since 2002), Virtus Mutual Fund Complex (48 portfolios). | |
Interested Trustees
| Name and Year of Birth | Principal Occupation(s) During Past 5 Years and Other Directorships Held by Trustee | |
Aylward, George R. YOB: 1964 Elected: 2006 66 Funds | Director, President and Chief Executive Officer (since 2008), Virtus Investment Partners, Inc. and/or certain of its subsidiaries; and various senior officer positions with Virtus affiliates (since 2005); Trustee (since 2006), Virtus Mutual Funds (48 portfolios); Chairman, President and Chief Executive Officer (since 2006), The Zweig Closed-End Funds (2 portfolios); Trustee (since 2012), Virtus Variable Insurance Trust (9 portfolios); Trustee and President (since 2011), Virtus Closed-End Funds (3 portfolios); Director (since 2013), Virtus Global Funds, PLC (2 portfolios); and Trustee (since 2013), Virtus Alternative Solutions Trust (3 portfolios). | |
86
Table of Contents
FUND MANAGEMENT TABLES (Continued)
Officers of the Trust Who Are Not Trustees
Name, Address and Year of Birth | Position(s) Held with the Trust and Length of Time Served and Principal Occupation(s) During Past 5 Years | |||
Bradley, W. Patrick YOB: 1972 | Senior Vice President (since 2013), Vice President (2011 to 2013), Chief Financial Officer and Treasurer (since 2006). | Senior Vice President, Fund Services (since 2010), Virtus Investment Partners, Inc. and/or certain of its subsidiaries; various officer positions (since 2006) with Virtus affiliates; Senior Vice President (since 2013), Vice President (2011 to 2013), Chief Financial Officer and Treasurer (since 2004), Virtus Variable Insurance Trust; Senior Vice President (since 2013), Vice President (2011 to 2013), Chief Financial Officer and Treasurer (since 2006), Virtus Mutual Fund Complex; Senior Vice President (since 2013), Vice President (2012 to 2013) and Treasurer (Chief Financial Officer) (since 2007), The Zweig Closed-End Funds; Senior Vice President (since 2013), Vice President (2011 to 2013), Chief Financial Officer and Treasurer (since 2011), Virtus Closed-End Funds; Vice President and Assistant Treasurer (since 2011), Duff & Phelps Global Utility Income Fund Inc.; Director (since 2013), Virtus Global Funds, PLC; and Senior Vice President, Chief Financial Officer and Treasurer (since 2013), Virtus Alternative Solutions Trust. | ||
Carr, Kevin J. YOB: 1954 | Senior Vice President (since 2013), Vice President (2005 to 2013), Chief Legal Officer, Counsel and Secretary (since 2005). | Senior Vice President (since 2009), Vice President, Counsel and Secretary (2008 to 2009), Virtus Investment Partners, Inc. and/or certain of its subsidiaries; various senior officer positions (since 2005) with Virtus affiliates; Senior Vice President (since 2013), Vice President (2005 to 2013), Chief Legal Officer, Counsel and Secretary (since 2005), Virtus Mutual Fund Complex; Senior Vice President (2013 to 2014), Vice President (2012 to 2013) and Assistant Secretary (since 2012), Secretary and Chief Legal Officer (2005 to 2012), The Zweig Closed-End Funds; Assistant Secretary (since 2013), Vice President, Chief Legal Officer, Counsel and Secretary (2010 to 2013), Virtus Variable Insurance Trust; Vice President and Assistant Secretary (since 2011), Duff & Phelps Global Utility Income Fund Inc.; Senior Vice President and Assistant Secretary (2013 to 2014), Vice President and Assistant Secretary (2012 to 2013), Vice President, Chief Legal Officer, Counsel and Secretary (2011 to 2012), Virtus Closed-End Funds ; and Assistant Secretary (since 2013), Virtus Alternative Solutions Trust. | ||
Engberg, Nancy J. YOB: 1956 | Vice President and Chief Compliance Officer (since 2011). | Vice President (since 2008) and Chief Compliance Officer (2008 to 2011), Virtus Investment Partners, Inc. and/or certain of its subsidiaries; various officer positions (since 2003) with Virtus affiliates; Vice President and Chief Compliance Officer (since 2011), Virtus Mutual Fund Complex; Vice President (since 2010), Chief Compliance Officer (since 2011), Virtus Variable Insurance Trust; Vice President and Chief Compliance Officer (since 2011), Virtus Closed-End Funds; Vice President and Chief Compliance Officer (since 2012), The Zweig Closed-End Funds; and Vice President and Chief Compliance Officer (since 2013), Virtus Alternative Solutions Trust. | ||
Waltman, Francis G. YOB: 1962 | Executive Vice President (since 2013), Senior Vice President (2008 to 2013). | Virtus Investment Partners, Inc. and/or certain of its subsidiaries; various senior officer positions (since 2006) with Virtus affiliates; Executive Vice President (since 2013), Senior Vice President (2008 to 2013), Virtus Mutual Fund Complex; Executive Vice President (since 2013), Senior Vice President (2010 to 2013), Virtus Variable Insurance Trust; Executive Vice President (since 2013), Senior Vice President (2011 to 2013), Virtus Closed-End Funds; Director (since 2013), Virtus Global Funds PLC; and Executive Vice President (since 2013), Virtus Alternative Solutions Trust. | ||
87
Table of Contents
Virtus Emerging Markets Equity Income Fund,
a series of Virtus Opportunities Trust
Supplement dated November 10, 2014 to the
Summary Prospectus and the Virtus Opportunities Trust Statutory Prospectus,
each dated January 28, 2014, as supplemented and revised
IMPORTANT NOTICE TO INVESTORS
The following disclosure hereby replaces the current disclosure under “Portfolio Management” in the fund’s summary prospectus and in the summary section of the statutory prospectus:
| ð | James Collery, Senior Portfolio Manager – Global Equity Strategies at KBI. Mr. Collery has served as a Portfolio Manager of the fund since inception in September 2012. |
| ð | David Hogarty, Head of Strategy Development – Global Equity Strategies at KBI. Mr. Hogarty has served as a Portfolio Manager of the fund since inception in September 2012. |
| ð | John Looby, Senior Portfolio Manager – Global Equity Strategies at KBI. Mr. Looby has served as a Portfolio Manager of the fund since October 2014. |
| ð | Ian Madden, Senior Portfolio Manager – Global Equity Strategies at KBI. Mr. Madden has served as a Portfolio Manager of the fund since inception in September 2012. |
| ð | Gareth Maher, Head of Portfolio Management – Global Equity Strategies at KBI. Mr. Maher has served as a Portfolio Manager of the fund since inception in September 2012. |
| ð | Massimiliano Tondi, CFA, Senior Portfolio Manager – Global Equity Strategies at KBI. Mr. Tondi has served as a Portfolio Manager of the fund since October 2014. |
The table and the biographical information under “KBI” in the section “Portfolio Management” on page 199 is hereby replaced with the following:
| Virtus Emerging Markets Equity Income Fund | James Collery (since the fund’s inception in September 2012) David Hogarty (since the fund’s inception in September 2012) John Looby (since October 2014) Ian Madden (since the fund’s inception in September 2012) Gareth Maher (since the fund’s inception in September 2012) Massimiliano Tondi, CFA (since October 2014) |
James Collery. Mr. Collery is Senior Portfolio Manager – Global Equity Strategies at KBI. Mr. Collery joined the firm in 2001 as a Performance & Risk Analyst. In 2003, he was appointed as a Portfolio Manager on a hedge fund team. During this time, he worked on a fund of funds where he was responsible for manager due diligence as well as portfolio construction, and on a direct equity long short fund, which was quantitatively managed. Mr. Collery joined the Dividend Plus team in 2007.
David Hogarty. Mr. Hogarty is Head of Strategy Development – Global Equity Strategies at KBI. Mr. Hogarty joined the firm in 1994 and has held a number of senior management roles including responsibility for Product Development, Business Development and Consultant Relationships. Mr. Hogarty was instrumental in developing the Dividend Plus equity strategy in 2003 and has been a member of the investment team since launch. He is also a former member of the Irish Association of Pension Funds (IAPF) Investment Committee.
John Looby. Mr. Looby is Senior Portfolio Manager – Global Equity Strategies at KBI. Mr. Looby joined the firm in September 2014. Prior to joining KBI, he was senior investment manager at Setanta Asset Management, where he was the lead portfolio manager of the flagship Global Equity Fund. Mr. Looby began his investment management career in 1990 and has had roles spanning fixed income, absolute return and equities.
Ian Madden. Mr. Madden is Senior Portfolio Manager – Global Equity Strategies at KBI. Mr. Madden joined the firm in November 2000 as a Portfolio Assistant and joined the Dividend Plus team in 2004. In 2002, Ian was appointed Manager of the Institutional Business Support unit, responsible for unit trust dealing, client cash flow, audit reporting and client queries. Prior to joining KBI, he worked for the international division of National Irish Bank.
Gareth Maher. Mr. Maher is Head of Portfolio Management – Global Equity Strategies at KBI. He joined the KBI Dividend Plus team in 2008, having managed U.S., Irish and Far Eastern equities for the firm from 2000. Previously, Mr. Maher managed Japanese, Far Eastern and U.S. equity portfolios for Irish Life Investment Managers and Eagle Star (Zurich) from 1987 to 2000.
Massimiliano Tondi, CFA. Mr. Tondi is Senior Portfolio Manager – Global Equity Strategies at KBI. Mr. Tondi joined the firm in September 2014. Prior to joining KBI, he was a quantitative portfolio manager at Fideuram Asset Management (2011 to 2014), where he previously served as a risk manager (2007 to 2011). Mr. Tondi began his career in the financial sector in 2004.
Investors should retain this supplement with the Prospectuses for future reference.
VOT 8020/KBI PMs (11/14)
Table of Contents
VIRTUS OPPORTUNITIES TRUST
101 Munson Street
Greenfield, MA 01301-9668
Trustees
George R. Aylward
Leroy Keith, Jr.
Philip R. McLoughlin, Chairman
Geraldine M. McNamara
James M. Oates
Richard E. Segerson
Ferdinand L.J. Verdonck
Officers
George R. Aylward, President
Francis G. Waltman, Executive Vice President
W. Patrick Bradley, Senior Vice President, Chief Financial Officer and Treasurer
Kevin J. Carr, Senior Vice President, Chief Legal Officer, Counsel and Secretary
Nancy J. Engberg, Vice President and Chief Compliance Officer
Investment Adviser
Virtus Investment Advisers, Inc.
100 Pearl Street
Hartford, CT 06103-4506
Principal Underwriter
VP Distributors, LLC
100 Pearl Street
Hartford, CT 06103-4506
Administrator and Transfer Agent
Virtus Fund Services, LLC
100 Pearl Street
Hartford, CT 06103-4506
Custodian
JPMorgan Chase Bank NA
1 Chase Manhattan Plaza
New York, NY 10005-1401
Independent Registered Public
Accounting Firm
PricewaterhouseCoopers LLP
2001 Market Street
Philadelphia, PA 19103-7042
How to Contact Us
Mutual Fund Services | 1-800-243-1574 | |
Adviser Consulting Group | 1-800-243-4361 | |
Telephone Orders | 1-800-367-5877 | |
Web site | http://Virtus.com |
Important Notice to Shareholders
The Securities and Exchange Commission has modified mailing regulations for semiannual and annual shareholder fund reports to allow mutual fund companies to send a single copy of these reports to shareholders who share the same mailing address. If you would like additional copies, please call Mutual Fund Services at 1-800-243-1574.
Table of Contents
| ||
P.O. Box 9874 Providence, RI 02940-8074 |

For more information about Virtus Mutual Funds,
please call your financial representative, or contact us
at 1-800-243-1574 or Virtus.com.
8032 | 11-14 |
Table of Contents
Item 2. Code of Ethics.
| (a) | The registrant, as of the end of the period covered by this report, has adopted a code of ethics that applies to the registrant’s principal executive officer, principal financial officer, principal accounting officer or controller, or persons performing similar functions, regardless of whether these individuals are employed by the registrant or a third party. |
| (c) | There have been no amendments, during the period covered by this report, to a provision of the code of ethics that applies to the registrant’s principal executive officer, principal financial officer, principal accounting officer or controller, or persons performing similar functions, regardless of whether these individuals are employed by the registrant or a third party, and that relates to any element of the code of ethics described in Item 2(b) of the instructions for completion of Form N-CSR. |
| (d) | The registrant has not granted any waivers, during the period covered by this report, including an implicit waiver, from a provision of the code of ethics that applies to the registrant’s principal executive officer, principal financial officer, principal accounting officer or controller, or persons performing similar functions, regardless of whether these individuals are employed by the registrant or a third party, that relates to one or more of the items set forth in paragraph (b) of the instructions for completion of this Item. |
Item 3. Audit Committee Financial Expert.
| (a)(1) | The Registrant’s Board of Trustees has determined that the Registrant has an “audit committee financial expert” serving on its Audit Committee. |
| (a)(2) | The Registrant’s Board of Trustees has determined that James M. Oates and Richard E. Segerson each possess the technical attributes identified in Instruction 2(b) of Item 3 to Form N-CSR to qualify as an “audit committee financial expert.” Each of Mr. Oates and Mr. Segerson is an “independent” trustee pursuant to paragraph (a)(2) of Item 3 to Form N-CSR. |
| (a)(3) | Not applicable. |
Item 4. Principal Accountant Fees and Services.
Audit Fees
| (a) | The aggregate fees billed for each of the last two fiscal years for professional services rendered by the principal accountant for the audit of the registrant’s annual financial statements or services |
Table of Contents
that are normally provided by the accountant in connection with statutory and regulatory filings or engagements for those fiscal years are $504,238 for 2013 and $666,850 for 2014. |
Audit-Related Fees
| (b) | The aggregate fees billed in each of the last two fiscal years for assurance and related services by the principal accountant that are reasonably related to the performance of the audit of the registrant’s financial statements and are not reported under paragraph (a) of this Item are $73,059 for 2013 and $62,664 for 2014. Such audit-related fees include the review of the semi-annual financial statements, out of pocket expenses and cross fund fees. |
Tax Fees
| (c) | The aggregate fees billed in each of the last two fiscal years for professional services rendered by the principal accountant for tax compliance, tax advice, and tax planning are $89,675 for 2013 and $111,750 for 2014. |
“Tax Fees” are those primarily associated with review of the Trust’s tax provision and qualification as a regulated investment company (RIC) in connection with audits of the Trust’s financial statement, review of year-end distributions by the Fund to avoid excise tax for the Trust, periodic discussion with management on tax issues affecting the Trust, and reviewing and signing the Fund’s federal income returns.
All Other Fees
| (d) | The aggregate fees billed in each of the last two fiscal years for products and services provided by the principal accountant, other than the services reported in paragraphs (a) through (c) of this Item are $0 for 2013 and $0 for 2014. |
| (e)(1) | Disclose the audit committee’s pre-approval policies and procedures described in paragraph (c)(7) of Rule 2-01 of Regulation S-X. |
The Virtus Opportunities Trust (the “Fund”) Board has adopted policies and procedures with regard to the pre-approval of services provided by PwC. Audit, audit-related and tax compliance services provided to the Fund on an annual basis require specific pre-approval by the Board. The Audit Committee must approve other non-audit services provided to the Fund and those non-audit services provided to the Fund’s Affiliated Service Providers that relate directly to the operations and financial reporting of the Fund. Certain of these non-audit services that the Audit Committee believes are a) consistent with the SEC’s auditor independence rules and b) routine and recurring services that will not impair the independence of the independent auditors may be approved by the Committee without consideration on a specific case-by-case basis (“general pre-approval”).
The Audit Committee has determined that James M. Oates, Chair of the Audit Committee, may provide pre-approval for such services that meet the above requirements in the event such approval is sought between regularly scheduled meetings. In any event, the Audit Committee is informed of each service approved subject to general pre-approval at the next regularly scheduled in-person board meeting.
Table of Contents
| (e)(2) | The percentage of services described in each of paragraphs (b) through (d) of this Item that were approved by the audit committee pursuant to paragraph (c)(7)(i)(C) of Rule 2-01 of Regulation S-X are as follows: |
(b) 0%
(c) 0%
(d) N/A
| (f) | The percentage of hours expended on the principal accountant’s engagement to audit the registrant’s financial statements for the most recent fiscal year that were attributed to work performed by persons other than the principal accountant’s full-time, permanent employees was less than fifty percent. |
| (g) | The aggregate non-audit fees billed by the registrant’s accountant for services rendered to the registrant, and rendered to the registrant’s investment adviser (not including any sub-adviser whose role is primarily portfolio management and is subcontracted with or overseen by another investment adviser), and any entity controlling, controlled by, or under common control with the adviser that provides ongoing services to the registrant for each of the last two fiscal years of the registrant was $384,427 for 2013 and $490,957 for 2014. |
| (h) | The registrant’s audit committee of the board of directors has considered whether the provision of non-audit services that were rendered to the registrant’s investment adviser (not including any sub-adviser whose role is primarily portfolio management and is subcontracted with or overseen by another investment adviser), and any entity controlling, controlled by, or under common control with the investment adviser that provides ongoing services to the registrant that were not pre-approved pursuant to paragraph (c)(7)(ii) of Rule 2-01 of Regulation S-X is compatible with maintaining the principal accountant’s independence. |
Item 5. Audit Committee of Listed Registrants.
Not applicable.
Item 6. Investments.
| (a) | Schedule of Investments in securities of unaffiliated issuers as of the close of the reporting period is included as part of the report to shareholders filed under Item 1 of this form. |
| (b) | Not applicable. |
| Item 7. | Disclosure of Proxy Voting Policies and Procedures for Closed-End Management Investment Companies. |
Not applicable.
Table of Contents
Item 8. Portfolio Managers of Closed-End Management Investment Companies.
Not applicable.
| Item 9. | Purchases of Equity Securities by Closed-End Management Investment Company and Affiliated Purchasers. |
Not applicable.
Item 10. Submission of Matters to a Vote of Security Holders.
There have been no material changes to the procedures by which the shareholders may recommend nominees to the registrant’s board of trustees, where those changes were implemented after the registrant last provided disclosure in response to the requirements of Item 407(c)(2)(iv) of Regulation S-K (17 CFR 229.407) (as required by Item 22(b)(15) of Schedule 14A (17 CFR 240.14a-101)), or this Item.
Item 11. Controls and Procedures.
| (a) | The registrant’s principal executive and principal financial officers, or persons performing similar functions, have concluded that the registrant’s disclosure controls and procedures (as defined in Rule 30a-3(c) under the Investment Company Act of 1940, as amended (the “1940 Act”) (17 CFR 270.30a-3(c))) are effective, as of a date within 90 days of the filing date of the report that includes the disclosure required by this paragraph, based on their evaluation of these controls and procedures required by Rule 30a-3(b) under the 1940 Act (17 CFR 270.30a-3(b)) and Rules 13a-15(b) or 15d-15(b) under the Securities Exchange Act of 1934, as amended (17 CFR 240.13a-15(b) or 240.15d-15(b)). |
| (b) | There were no changes in the registrant’s internal control over financial reporting (as defined in Rule 30a-3(d) under the 1940 Act (17 CFR 270.30a-3(d)) that occurred during the registrant’s second fiscal quarter of the period covered by this report that has materially affected, or is reasonably likely to materially affect, the registrant’s internal control over financial reporting. |
Item 12. Exhibits.
| (a)(1) | Code of ethics, or any amendment thereto, that is the subject of disclosure required by Item 2 is attached hereto. |
| (a)(2) | Certifications pursuant to Rule 30a-2(a) under the 1940 Act and Section 302 of the Sarbanes-Oxley Act of 2002 are attached hereto. |
| (a)(3) | Not applicable. |
| (b) | Certifications pursuant to Rule 30a-2(b) under the 1940 Act and Section 906 of the Sarbanes-Oxley Act of 2002 are attached hereto. |
(12.other) Not applicable.
Table of Contents
SIGNATURES
Pursuant to the requirements of the Securities Exchange Act of 1934 and the Investment Company Act of 1940, the registrant has duly caused this report to be signed on its behalf by the undersigned, thereunto duly authorized.
(Registrant) | Virtus Opportunities Trust |
| By (Signature and Title)* | /s/ George R. Aylward | |
George R. Aylward, President | ||
(principal executive officer) |
Date December 5, 2014
Pursuant to the requirements of the Securities Exchange Act of 1934 and the Investment Company Act of 1940, this report has been signed below by the following persons on behalf of the registrant and in the capacities and on the dates indicated.
| By (Signature and Title)* | /s/ George R. Aylward | |
George R. Aylward, President | ||
(principal executive officer) |
Date December 5, 2014
| By (Signature and Title)* | /s/ W. Patrick Bradley | |||
W. Patrick Bradley, Senior Vice President, Chief Financial Officer, and Treasurer | ||||
(principal financial officer) | ||||
Date December 5, 2014
* Print the name and title of each signing officer under his or her signature.